UNITED STATES
SECURITIES AND EXCHANGE COMMISSION
Washington, D.C. 20549
Form N-CSR
CERTIFIED SHAREHOLDER REPORT OF REGISTERED
MANAGEMENT INVESTMENT COMPANIES
Investment Company Act File Number 811-5344
William Blair Funds
(Exact name of registrant as specified in charter)
| | |
| 222 West Adams Street, Chicago, IL | | 60606 |
| (Address of principal executive offices) | | (Zip Code) |
Michelle R. Seitz
William Blair Funds
222 West Adams Street, Chicago, IL 60606
(Name and address of agent for service)
Registrant’s telephone number, including area code: 312-236-1600
Date of fiscal year end: December 31
Date of reporting period: June 30, 2010
Form N-CSR is to be used by management investment companies to file reports with the Commission not later than 10 days after the transmission to stockholders of any report that is required to be transmitted to stockholders under Rule 30e-1 under the Investment Company Act of 1940 (17 CFR 270.30e-1). The Commission may use the information provided on Form N-CSR in its regulatory, disclosure review, inspection, and policymaking roles.
A registrant is required to disclose the information specified by Form N-CSR, and the Commission will make this information public. A Registrant is not required to respond to the collection of information contained in Form N-CSR unless the form displays a currently valid Office of Management and Budget (“OMB”) control number. Please direct comments concerning the accuracy of the information collection burden estimates and any suggestions for reducing the burden to Secretary, Securities and Exchange Commission, 450 Fifth Street, NW, Washington, DC 20549-0609. The OMB has reviewed this collection of information under the clearance requirements of 44 U.S.C. (ss) 3507.
| Item 1. | June 30, 2010 Annual Reports transmitted to shareholders. |

SEMI-ANNUAL REPORT
JUNE 30, 2010
Table of Contents
This report is submitted for the general information of the shareholders of the William Blair Funds. It is not authorized for distribution to prospective investors unless accompanied or preceded by a prospectus of the William Blair Funds. Please carefully consider the Funds’ investment objectives, risks, charges, and expenses before investing. This and other information is contained in the Funds’ prospectus, which you may obtain by calling 1-800-742-7272. Read it carefully before you invest or send money.
June 30, 2010 | William Blair Funds 1 |
PERFORMANCE AS OF JUNE 30, 2010—CLASS N SHARES (unaudited)
| | | | | | | | | | | | | | | | | | |
| | | Year
to Date | | | 1 Yr. | | 3 Yr. | | | 5 Yr. | | | 10 Yr
(or since
inception) | | | Inception
Date | | Overall
Morningstar
Rating |
Growth Fund | | | | | | | | | | | | | | | | | | ««««
Among 1,545 large growth funds |
Class N | | (8.09 | ) | | 8.47 | | (5.81 | ) | | 2.30 | | | (1.83 | ) | | 3/20/1946 | |
Morningstar Large Growth | | (8.24 | ) | | 12.41 | | (8.11 | ) | | (0.18 | ) | | (3.37 | ) | | | |
Russell 3000® Growth | | (7.25 | ) | | 13.95 | | (6.97 | ) | | 0.44 | | | (4.89 | ) | | | | |
Standard & Poor’s 500 | | (6.65 | ) | | 14.43 | | (9.81 | ) | | (0.79 | ) | | (1.59 | ) | | | | |
| | | | | | | |
Large Cap Growth Fund | | | | | | | | | | | | | | | | | | «««
Among 1,545 large growth funds |
Class N | | (8.44 | ) | | 9.09 | | (8.16 | ) | | (1.65 | ) | | (5.68 | ) | | 12/27/1999 | |
Morningstar Large Growth | | (8.24 | ) | | 12.41 | | (8.11 | ) | | (0.18 | ) | | (3.37 | ) | | | |
Russell 1000® Growth | | (7.65 | ) | | 13.62 | | (6.91 | ) | | 0.38 | | | (5.14 | ) | | | | |
| | | | | | | |
Small Cap Growth Fund | | | | | | | | | | | | | | | | | | ««««
Among 666 small growth funds |
Class N | | (3.65 | ) | | 17.44 | | (7.96 | ) | | 0.47 | | | 6.76 | | | 12/27/1999 | |
Morningstar Small Growth | | (2.45 | ) | | 19.07 | | (8.73 | ) | | 0.33 | | | (0.31 | ) | | | |
Russell 2000® Growth | | (2.31 | ) | | 17.96 | | (7.54 | ) | | 1.14 | | | (1.72 | ) | | | | |
Russell 2000® | | (1.95 | ) | | 21.48 | | (8.60 | ) | | 0.37 | | | 3.00 | | | | | |
| The Small Cap Growth Fund’s Performance during 2000 was primarily attributable to investments in initial public offerings (IPOs) during a rising market. Since then, IPOs have had an insignificant effect on the Fund’s performance. | | | | | | | | |
| | | | | | | |
Mid Cap Growth Fund | | | | | | | | | | | | | | | | | | ««««
Among 694 mid-cap growth funds |
Class N | | (2.58 | ) | | 16.49 | | (4.23 | ) | | — | | | 0.83 | | | 2/1/2006 | |
Morningstar Mid-Cap Growth | | (3.53 | ) | | 19.58 | | (7.94 | ) | | — | | | — | | | | |
Russell MidCap® Growth | | (3.31 | ) | | 21.30 | | (7.53 | ) | | — | | | (1.99 | ) | | | | |
| | | | | | | |
Small-Mid Cap Growth Fund | | | | | | | | | | | | | | | | | | ««««
Among 694 mid-cap growth funds |
Class N | | (3.07 | ) | | 16.86 | | (4.87 | ) | | 3.55 | | | 4.55 | | | 12/29/2003 | |
Morningstar Mid-Cap Growth | | (3.53 | ) | | 19.58 | | (7.94 | ) | | 1.13 | | | — | | | | |
Russell 2500™ Growth | | (1.82 | ) | | 21.44 | | (7.10 | ) | | 1.81 | | | 3.28 | | | | | |
| | | | | | | |
Global Growth Fund | | | | | | | | | | | | | | | | | | Not rated. |
Class N | | (5.74 | ) | | 13.86 | | — | | | — | | | (14.15 | ) | | 10/15/2007 | | |
Morningstar World Stock | | (8.42 | ) | | 12.13 | | — | | | — | | | — | | | | | |
MSCI All Country World IMI (net) | | (8.65 | ) | | 13.07 | | — | | | — | | | (12.92 | ) | | | | |
| | | | | | | |
International Growth Fund | | | | | | | | | | | | | | | | | | ««««
Among 215 foreign large growth funds |
Class N | | (4.20 | ) | | 16.42 | | (11.75 | ) | | 2.51 | | | 2.47 | | | 10/1/1992 | |
Morningstar Foreign Large Growth | | (9.44 | ) | | 11.03 | | (10.92 | ) | | 2.53 | | | (0.23 | ) | | | |
MSCI All Country World Ex-U.S. IMI (net) | | (10.41 | ) | | 11.49 | | (10.50 | ) | | 3.63 | | | 2.23 | | | | | |
| | | | | | | |
International Equity Fund | | | | | | | | | | | | | | | | | | ««
Among 215
foreign large growth funds |
Class N | | (9.21 | ) | | 9.45 | | (12.77 | ) | | 0.01 | | | 1.89 | | | 5/24/2004 | |
Morningstar Foreign Large Growth | | (9.44 | ) | | 11.03 | | (10.92 | ) | | 2.53 | | | — | | | | |
MSCI All Country World Ex-U.S. IMI (net) | | (10.41 | ) | | 11.49 | | (10.50 | ) | | 3.63 | | | 6.49 | | | | | |
| | | | | | | |
International Small Cap Growth Fund | | | | | | | | | | | | | | | | | | «««
Among 112 foreign small/mid
growth funds |
Class N | | (2.31 | ) | | 23.00 | | (9.91 | ) | | — | | | 2.51 | | | 11/1/2005 | |
Morningstar Foreign Small/Mid Growth | | (6.76 | ) | | 16.12 | | (12.27 | ) | | — | | | — | | | | |
MSCI All Country World Small Cap
Ex-U.S. (net) | | (5.32 | ) | | 19.98 | | (9.68 | ) | | — | | | 3.76 | | | | |
| | | | | | | |
Emerging Markets Growth Fund | | | | | | | | | | | | | | | | | | ««
Among 269 diversified emerging
markets funds |
Class N | | (4.27 | ) | | 25.02 | | (9.01 | ) | | 10.95 | | | 11.36 | | | 6/6/2005 | |
Morningstar Diversified Emerging Markets | | (6.28 | ) | | 21.84 | | (5.33 | ) | | 10.64 | | | — | | | | |
MSCI Emerging Markets IMI (net) | | (5.68 | ) | | 24.57 | | (2.17 | ) | | 12.98 | | | 13.20 | | | | |
Please see the next page for important disclosure information.
2 Semi-Annual Report | June 30, 2010 |
PERFORMANCE AS OF JUNE 30, 2010—CLASS N SHARES—CONTINUED (unaudited)
| | | | | | | | | | | | | | | | | | |
| | | Year to
Date | | | 1 Yr. | | 3 Yr. | | | 5 Yr. | | | 10 Yr
(or since
inception) | | | Inception
Date | | Overall
Morningstar
Rating |
Small Cap Value Fund | | | | | | | | | | | | | | | | | | ««««
Among 321 small value funds |
Class N | | 0.38 | | | 27.49 | | (5.88 | ) | | 2.65 | | | 6.57 | | | 12/23/1996 | |
Morningstar Small Value | | (0.70 | ) | | 25.88 | | (8.66 | ) | | 0.36 | | | 8.13 | | | | |
Russell 2000® Value | | (1.64 | ) | | 25.07 | | (9.85 | ) | | (0.51 | ) | | 7.48 | | | | | |
Russell 2000® | | (1.95 | ) | | 21.48 | | (8.60 | ) | | 0.37 | | | 3.00 | | | | | |
| | | | | | | |
Mid Cap Value Fund | | | | | | | | | | | | | | | | | | |
Class N | | — | | | — | | — | | | — | | | (13.20 | ) | | 5/3/2010 | | Not rated. |
Russell Midcap® Value | | — | | | — | | — | | | — | | | (13.47 | ) | | | | |
| | | | | | | |
Bond Fund | | | | | | | | | | | | | | | | | | ««««
Among 1,011 intermediate-term
bond funds |
Class N | | 5.27 | | | 11.42 | | 7.53 | | | — | | | 6.73 | | | 5/1/2007 | |
Morningstar Intermediate-Term Bond | | 5.21 | | | 13.11 | | 6.03 | | | — | | | — | | | | |
Barclays Capital U.S. Aggregate Bond Index | | 5.33 | | | 9.50 | | 7.55 | | | — | | | 6.77 | | | | |
| | | | | | | |
Income Fund | | | | | | | | | | | | | | | | | | «««
Among 398 short-term bond funds |
Class N | | 3.94 | | | 8.69 | | 3.88 | | | 3.34 | | | 4.57 | | | 10/1/1990 | |
Morningstar Short-term Bond | | 2.46 | | | 7.12 | | 3.65 | | | 3.51 | | | 4.13 | | | | |
Barclays Capital Intermediate Govt./Credit
Bond Index | | 4.56 | | | 8.29 | | 6.97 | | | 5.26 | | | 6.06 | | | | | |
| | | | | | | |
Low Duration Fund | | | | | | | | | | | | | | | | | | Not rated. |
Class N | | 1.43 | | | — | | — | | | — | | | 0.82 | | | 12/1/2009 | | |
Merrill Lynch 1-Year U.S. Treasury Note Index | | 0.51 | | | — | | — | | | — | | | 0.36 | | | | | |
Performance cited represents past performance. Past performance does not guarantee future results and current performance may be lower or higher than the data quoted. Results shown are average annual total returns, which assume reinvestment of dividends and capital gains. Investment returns and principal will fluctuate and you may have a gain or a loss when you sell shares. For the most current month-end performance information, please call 1-800-742-7272, or visit our Web site at www.williamblairfunds.com. From time to time, the Advisor may waive fees or reimburse expenses for the Fund. Without these waivers, performance would be lower. Investing in smaller companies involves special risks, including higher volatility and lower liquidity. International and emerging markets investing involves special risk considerations, including currency fluctuations, lower liquidity, economic and political risk. As interest rates rise, bond prices will fall and bond funds may become more volatile. Class N shares are available to the general public without a sales load. The Emerging Leaders Class N commenced operations on May 3, 2010 and had one share outstanding as of June 30, 2010.
Morningstar RatingsTM are as of 6/30/2010 and are subject to change every month. The ratings are based on a risk-adjusted return measure that accounts for variation in a fund’s monthly performance, placing more emphasis on downward variations and rewarding consistent performance. The top 10% of funds in each Category receive 5 stars, the next 22.5% receive 4 stars, the middle 35% receive 3 stars, the next 22.5% receive 2 stars, and the bottom 10% receive 1 star. The Overall Morningstar Rating for a fund is derived from a weighted-average of the performance figures associated with its three-, five- and ten-year (if applicable) Morningstar Rating metrics. The 3/5/10 year Morningstar ratings were as follows: Growth Fund ««««/«« ««/««« , and Large Cap Growth Fund «««/««« /««, out of 1,545/1,298/739 large growth funds; Small Cap Growth Fund «««/««« /«««« out of 666/549/315 small growth funds; Mid Cap Growth Fund ««««/NA /NA and Small-Mid Cap Growth Fund ««««/«« ««/NA out of 694/612/NA mid cap growth funds; Small Cap Value Fund ««««/«« ««/««« out of 321/251/129 small value funds; International Growth Fund «««/««« /«««« and International Equity Fund «««/««/NA out of 215/158/81 foreign large growth funds; International Small Cap Growth Fund «««/NA/NA out of 112/NA/NA foreign small/mid growth funds; Emerging Markets Growth Fund ««/««/NA out of 269/205/NA diversified emerging markets growth funds; Income Fund «««/««« /««« out of 398/336/180 short-term bond funds; Bond Fund ««««/NA/NA out of 1,011/NA/NA intermediate-term bond funds.
Please carefully consider the Funds’ investment objectives, risks, charges, and expenses before investing. This and other information is contained in the Funds’ prospectus, which you may obtain by calling 1-800-742-7272. Read it carefully before you invest or send money.
June 30, 2010 | William Blair Funds 3 |

David C. Fording

John F. Jostrand
GROWTH FUND
The Growth Fund seeks long-term capital appreciation.
AN OVERVIEW FROM THE PORTFOLIO MANAGERS
How did the Fund perform over the first half of the year? How did the Fund’s performance compare to its benchmark?
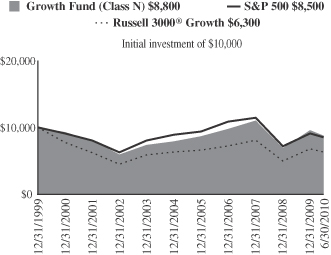
The Growth Fund posted an 8.09% decrease (Class N Shares) for the six months ended June 30, 2010. By comparison, the Fund’s benchmark, the Russell 3000® Growth Index, declined 7.25%.
What were the most significant factors impacting Fund performance?
The Fund fell in response to overall negative market sentiment and stock specific exposures. In the first quarter, U.S. equity markets had strong gains followed by deep second quarter declines. The Russell 3000® Growth rose 4.87% in the first quarter due to continued signs of economic recovery and above expectation corporate earnings. Like 2009, investors continued to seek riskier assets. In the second quarter, investors worried about the sustainability of global economic growth due to mixed economic data, and continued sovereign debt issues, especially in Europe, where calls for fiscal austerity reinforced concerns over economic growth into 2011. With greater uncertainty, market volatility increased, but never reached the extremes of late 2008 and early 2009. Many pundits discussed the possibility of a “double-dip” recession (a recession that is followed by a short-lived recovery and then another recession) even though this phenomenon is very rare, which added to the downward pressures. The Russell 3000® Growth fell 11.55% in the second quarter. During the first half, there were several notable positives such as continued improvement of corporate profitability, China’s move away from its currency’s peg to the U.S. dollar and some clarity around financial regulation; however, they were outweighed by the questions over economic stability and recovery.
All benchmark sectors declined in the first six months of the year. Consumer Discretionary stocks held up well and benefited from the return of some consumer activity or the potential for it in the future. The Industrials sector was also a relative performer as investors sought companies that would benefit from the late stages of economic recovery. Energy and Materials stocks tumbled sharply as demand came into question with a global slowdown particularly in emerging markets. Utilities were also weak. From a market capitalization perspective, smaller cap stocks outshined larger caps, which may seem uncharacteristic in a challenging environment. Smaller cap stocks had strong relative results in the first quarter, which carried into April as investors continued to seek riskier assets. However, as the second quarter progressed, smaller caps lost steam and in June were the weakest performers.
Were there any investment strategies or themes that did not measure up to your expectations?
We were disappointed that the portfolio lagged in the period, but it did hold up well in the market downturn in the last two months of the period as you would expect from a quality growth manager. We had stock specific issues in Health Care and Information Technology and not enough strength in our contributors to outweigh them. In the Health Care sector, one of our largest stocks and a more defensive position, in our view, disappointed unexpectedly.
4 Semi-Annual Report | June 30, 2010 |
Baxter International, Inc., a leading global diversified manufacturer of hospital supplies and medical equipment, had a weak earnings report due to competitive pricing pressures in its blood plasma division and lower than anticipated guidance for 2010. We sold the company on these issues amid lower confidence in management’s ability to execute in a more competitive environment. Select Information Technology stocks also struggled, which is a reversal from last year where it was the best performing group. QUALCOMM, Inc., one of our larger positions, declined on a disappointment in the company’s estimate for handset ASPs (average selling price). Handset ASPs came under pressure due to a change in geographic mix increasing emerging markets exposure where a larger portion of sales occurred in lower-end phones. A lower ASP negatively affected the company’s royalty calculation and its revenue outlook. In our view, the secular growth case for the stock remains intact; it should continue to benefit from the shift from 2G to 3G technologies and a strong position in smartphones. Globally, there are only 900 million 3G subscribers and over four billion 2G subscribers. Additionally, we think its competitive position remains very strong and will likely continue to take more market share in a less competitive chipset market (with Texas Instruments and Freescale Semiconductor exiting). Lastly, despite solid earnings reports, Google, Inc. declined on high expectations from investors and concerns about its strategy in China. We believe the firm continues to have a strong market position, and is well positioned to benefit from an increase in ad spending as the economy recovers.
Which sectors enhanced the Fund’s return? What were among the best performing investments for the Fund?
The Fund had strong stock selection in both Industrials and Consumer Discretionary. Both of these groups were also overweighted in comparison to the benchmark and held up well, which was helpful. In Industrials, the biggest contributors were Fastenal Co. and IHS, Inc. Fastenal Co., the largest fastener supplier in North America, benefited from improving sales to manufacturing and non-residential construction customers as well as its U.S. focus. We believe it can take advantage of further store and sales force expansion in combination with strong management execution and accelerating fundamentals. IHS, Inc., the leading global provider of critical technical information to customers primarily in the energy field, also gained ground driven by subscription-based organic growth.
In Consumer Discretionary, McDonald’s Corporation and our education stocks were additive. McDonald’s Corporation, one of our larger positions, continued to demonstrate sustainable growth. It had revenue driving initiatives with the dollar breakfast, new beverage platform, advertising spending, strong margins due to higher than industry average unit volumes and buying power on commodities, as well as strong performance in several geographic regions. In education—a group that rebounded from 2009—our best performers were Capella Education Co. and K12, Inc. Capella Education Co., an on-line post secondary education company, had strong enrollment growth across degree levels. With the market turmoil, it held up well; many view it as more defensive since individuals seek higher education when unemployed to gain new skills or to advance their career at their current employer. In addition, K12, Inc., a technology-based provider of curriculum to students in kindergarten through 12th grade, reported strong quarterly earnings due to solid management execution leveraging its instructional costs. In our view, K12, Inc. should see attractive growth as the firm continues to leverage costs as it expands into new markets, and state budget headwinds subside further.
What is your current strategy? How is the Fund Positioned?
The U.S. economy should continue to see growth, though slower, in the second half of 2010 as indicated by the Conference Board’s Leading Economic Index (LEI). However, we remain concerned about a slowdown in the global economic recovery as fiscal stimulus begins to wear off. Also, growth prospects could be negatively impacted by continued consumer deleveraging, the government deficit, the effects of Chinese interest rate tightening as this
June 30, 2010 | William Blair Funds 5 |
country attempts to slowdown its residential real estate market, and the depths of European government fiscal austerity and the weakness of Europe’s banking group. In our view, a double dip economic recession is unlikely unless China has a hard landing or European sovereign debt contagion spreads.
For the U.S., it is likely that the Federal Reserve will continue to hold interest rates low in order to continue to assist growth. A low interest environment is critical for businesses nationwide as well as the housing group, which appears to have stabilized, but has yet to show recovery. For improvement in housing, employment and wages will need to rise. A catalyst for growth may be corporations where a positive bias for capital spending remains as many firms have pulled back expenditures over the last several years. Also, for many companies, their balance sheets are cash rich and ripe for investment in their business or M&A activity.
In this slow growth environment, we believe our quality growth investment discipline should benefit; companies with superior and sustainable earnings growth will be rewarded as weaker firms fall behind. With the recent change in market sentiment in the quarter, we have begun to see a return to quality stocks, especially in May and June. We would expect this trend to strengthen as the year unfolds and the slow growth environment continues.
In regard to the portfolio, we have adopted a modestly more defensive stance, given the aforementioned concerns over risks to growth in the second half of 2010 and 2011. We expect this positioning to continue with the uncertainty in the market direction. As always, we remain focused on our research intensive investment process, which will be even more critical in identifying durable business franchises in a slow growth economic environment.
6 Semi-Annual Report | June 30, 2010 |
Growth Fund
Performance Highlights (unaudited)
Average Annual Total Return at 6/30/2010
| | | | | | | | | | | | | | | |
| | | Year to
Date | | | 1
Year | | | 3
Year | | | 5
Year | | | 10
Year | |
Class N | | (8.09 | )% | | 8.47 | % | | (5.81 | )% | | 2.30 | % | | (1.83 | )% |
Class I | | (8.01 | ) | | 8.79 | | | (5.52 | ) | | 2.61 | | | (1.56 | ) |
Russell 3000® Growth Index | | (7.25 | ) | | 13.95 | | | (6.97 | ) | | 0.44 | | | (4.89 | ) |
S&P 500 Index | | (6.65 | ) | | 14.43 | | | (9.81 | ) | | (0.79 | ) | | (1.59 | ) |
Performance cited represents past performance. Past performance does not guarantee future results and current performance may be lower or higher than the data quoted. Results shown are average annual returns, which assume reinvestment of dividends and capital gains. Investment returns and principal will fluctuate and you may have a gain or loss when you sell shares. For the most current month-end performance information, please call 1-800-742-7272, or visit our Web site at www.williamblairfunds.com. Class N shares are available to the general public without a sales load. Class I shares are available to certain institutional investors and advisory clients of William Blair & Company L.L.C. without a sales load or distribution (12b-1) or service fees.
The performance highlights and graph presented above do not reflect the deduction of taxes that a shareholder would pay on fund distributions or the redemption of fund shares.
The Russell 3000® Growth Index consists of large, medium, and small capitalization companies with above average price-to-book ratios and forecasted growth rates. The index is weighted by market capitalization and large/medium/small companies make up approximately 80%/15%/5% of the index.
The S&P 500 Index indicates broad larger capitalization equity market performance.
This report identifies the Fund’s investments on June 30, 2010. These holdings are subject to change. Not all stocks in the Fund performed the same, nor is there any guarantee that these stocks will perform as well in the future. Market forecasts provided in this report may not necessarily come to pass.
Sector Diversification (unaudited)
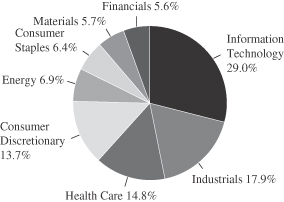
The sector diversification shown is based on the total long-term securities.
June 30, 2010 | William Blair Funds 7 |
Growth Fund
Portfolio of Investments, June 30, 2010 (all dollar amounts in thousands) (unaudited)
| | | | | |
Issuer | | Shares | | Value |
| | |
Common Stocks | | | | | |
Information Technology—28.1% | | | | | |
*Apple, Inc. | | 77,985 | | $ | 19,616 |
*Genpact, Ltd.† | | 256,740 | | | 3,987 |
*Google, Inc. Class “A” | | 29,505 | | | 13,128 |
Hewlett-Packard Co. | | 423,300 | | | 18,320 |
*McAfee, Inc. | | 174,800 | | | 5,370 |
Microsoft Corporation | | 798,700 | | | 18,378 |
QUALCOMM, Inc. | | 280,740 | | | 9,220 |
*Silicon Laboratories, Inc. | | 185,440 | | | 7,522 |
Solera Holdings, Inc. | | 120,667 | | | 4,368 |
*Trimble Navigation, Ltd. | | 196,500 | | | 5,502 |
*Ultimate Software Group, Inc. | | 191,450 | | | 6,291 |
*VistaPrint N.V.† | | 150,607 | | | 7,152 |
| | | | | |
| | | | | 118,854 |
| | | | | |
Industrials—17.4% | | | | | |
Allegiant Travel Co. | | 85,900 | | | 3,667 |
Fastenal Co. | | 212,129 | | | 10,647 |
Flowserve Corporation | | 57,600 | | | 4,884 |
Goodrich Corporation | | 100,100 | | | 6,632 |
*IHS, Inc. Class “A” | | 218,415 | | | 12,760 |
Knight Transportation, Inc. | | 312,430 | | | 6,323 |
Manpower, Inc. | | 187,700 | | | 8,105 |
Roper Industries, Inc. | | 131,070 | | | 7,335 |
TransDigm Group, Inc. | | 164,380 | | | 8,388 |
Union Pacific Corporation | | 69,700 | | | 4,845 |
| | | | | |
| | | | | 73,586 |
| | | | | |
Health Care—14.4% | | | | | |
Allergan, Inc. | | 154,300 | | | 8,989 |
*CareFusion Corporation | | 183,400 | | | 4,163 |
*Celgene Corporation | | 233,180 | | | 11,850 |
*Cerner Corporation | | 72,000 | | | 5,464 |
*Gilead Sciences, Inc. | | 184,935 | | | 6,340 |
*IDEXX Laboratories, Inc. | | 113,230 | | | 6,896 |
*Illumina, Inc. | | 141,900 | | | 6,177 |
*NuVasive, Inc. | | 113,600 | | | 4,028 |
*NxStage Medical, Inc. | | 81,987 | | | 1,217 |
*VCA Antech, Inc. | | 231,500 | | | 5,732 |
| | | | | |
| | | | | 60,856 |
| | | | | |
Consumer Discretionary—13.3% | | | | | |
*Bed Bath & Beyond, Inc. | | 129,900 | | | 4,817 |
*Capella Education Co. | | 69,328 | | | 5,640 |
DeVry, Inc. | | 209,948 | | | 11,020 |
*Dick’s Sporting Goods, Inc. | | 207,500 | | | 5,164 |
Johnson Controls, Inc. | | 263,600 | | | 7,083 |
*K12, Inc. | | 202,188 | | | 4,484 |
McDonald’s Corporation | | 214,464 | | | 14,127 |
P.F. Chang’s China Bistro, Inc. | | 97,200 | | | 3,854 |
| | | | | |
| | | | | 56,189 |
| | | | | |
*Non-income producing securities
† = U.S. listed foreign security
| | | | | | |
Issuer | | Shares or
Principal
Amount | | Value |
| | |
Common Stocks—(continued) | | | | | | |
Energy—6.7% | | | | | | |
Apache Corporation | | | 93,465 | | $ | 7,869 |
*Cameron International Corporation | | | 145,147 | | | 4,720 |
Occidental Petroleum Corporation | | | 117,600 | | | 9,073 |
*Southwestern Energy Co. | | | 166,427 | | | 6,431 |
| | | | | | |
| | | | | | 28,093 |
| | | | | | |
Consumer Staples—6.2% | | | | | | |
*Green Mountain Coffee Roasters, Inc. | | | 287,400 | | | 7,386 |
PepsiCo, Inc. | | | 311,100 | | | 18,962 |
| | | | | | |
| | | | | | 26,348 |
| | | | | | |
Materials—5.5% | | | | | | |
Ecolab, Inc. | | | 222,320 | | | 9,985 |
Freeport-McMoRan Copper & Gold, Inc. | | | 58,400 | | | 3,453 |
Monsanto Co. | | | 55,930 | | | 2,585 |
Praxair, Inc. | | | 95,765 | | | 7,277 |
| | | | | | |
| | | | | | 23,300 |
| | | | | | |
Financials—5.5% | | | | | | |
*Affiliated Managers Group, Inc. | | | 87,763 | | | 5,333 |
Greenhill & Co., Inc. | | | 141,700 | | | 8,662 |
*MSCI, Inc. | | | 118,905 | | | 3,220 |
The Charles Schwab Corporation | | | 409,975 | | | 5,814 |
| | | | | | |
| | | | | | 23,029 |
| | | | | | |
Total Common Stocks—97.1%
(cost $391,070) | | | 410,255 |
| | | | | | |
| | |
Investment in Affiliate | | | | | | |
William Blair Ready Reserves Fund | | | 1,262,245 | | | 1,262 |
| | | | | | |
Total Investment in Affiliate—0.3%
(cost $1,262) | | | 1,262 |
| | | | | | |
| | |
Repurchase Agreement | | | | | | |
Fixed Income Clearing Corporation, 0.000% dated 6/30/10, due 7/1/10, repurchase price $9,847, collateralized by FHLMC, 2.000%, due 4/15/13 | | $ | 9,847 | | | 9,847 |
| | | | | | |
Total Repurchase Agreement—2.3%
(cost $9,847) | | | 9,847 |
| | | | | | |
Total Investments—99.7%
(cost $402,179) | | | 421,364 |
Cash and other assets, less liabilities—0.3% | | | 1,447 |
| | | | | | |
Net assets—100.0% | | $ | 422,811 |
| | | | | | |
See accompanying Notes to Financial Statements.
8 Semi-Annual Report | June 30, 2010 |

James S. Golan
John F. Jostrand

Tracy McCormick
LARGE CAP GROWTH FUND
The Large Cap Growth Fund seeks long-term capital appreciation.
AN OVERVIEW FROM THE PORTFOLIO MANAGERS
How did the Fund perform over the first half of the year? How did the Fund’s performance compare to its benchmark?
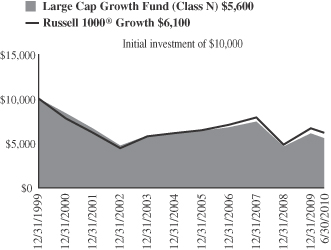
The Large Cap Growth Fund posted an 8.44% decrease (Class N Shares) for the six months ended June 30, 2010. By comparison, the Fund’s benchmark, the Russell 1000® Growth Index, declined 7.65%.
What were the most significant factors impacting Fund performance?
The Fund fell in response to overall negative market sentiment and stock specific exposures. In the first quarter, U.S. equity markets had strong gains followed by deep second quarter declines. The Russell 1000® Growth rose 4.65% in the first quarter due to continued signs of economic recovery and above expectation corporate earnings. Like 2009, investors continued to seek riskier assets. In the second quarter, investors worried about the sustainability of global economic growth due to mixed economic data, and continued sovereign debt issues, especially in Europe, where calls for fiscal austerity reinforced concerns over economic growth into 2011. With greater uncertainty, market volatility increased, but never reached the extremes of late 2008 and early 2009. Many pundits discussed the possibility of a “double-dip” recession (a recession that is followed by a short-lived recovery and then another recession) even though this phenomenon is very rare, which added to the downward pressures. The Russell 1000® Growth fell 11.75% in the second quarter. During the first half, there were several notable positives such as continued improvement in corporate profitability, China’s move away from its currency’s peg to the U.S. dollar and some clarity around financial regulation; however, they were outweighed by the questions over economic stability and recovery.
All benchmark sectors declined in the first six months of the year. The more defensive Telecommunication Services sector was best, followed by Industrials, where investors sought companies that would benefit from the late stages of economic recovery. Consumer Discretionary also held up well and benefited from the return of some consumer activity or the potential for it in the future. Energy and Materials stocks tumbled sharply as demand came into question with a global slowdown particularly in emerging markets. Utilities were also weak. From a market capitalization perspective, smaller cap stocks outshined larger caps, which may seem uncharacteristic in a challenging environment. Smaller cap stocks had strong relative results in the first quarter, which carried into April as investors continued to seek riskier assets. However, as the second quarter progressed, smaller caps lost steam and in June were the weakest performers.
What sectors and investments did not measure up to your expectations?
We were disappointed that the portfolio lagged in the period, but it did hold up well in the market downturn in the last two months of the period as you would expect from a quality growth manager. We had stock specific issues in Information Technology and Health Care and not enough strength in our contributors to outweigh them. In Information Technology,
June 30, 2010 | William Blair Funds 9 |
select stocks struggled, which is a reversal from last year where it was the best performing group. QUALCOMM, Inc., one of our larger positions, declined on a disappointment in the company’s estimate for handset ASPs (average selling price). Handset ASPs came under pressure due to a change in geographic mix increasing emerging markets exposure where a larger portion of sales occurred in lower-end phones. A lower ASP negatively affected the company’s royalty calculation and its revenue outlook. In our view, the secular growth case for the stock remains intact; it should continue to benefit from the shift from 2G to 3G technologies and a strong position in smartphones. Globally, there are only 900 million 3G subscribers and over four billion 2G subscribers. Additionally, we think its competitive position remains very strong and will likely continue to take more market share in a less competitive chipset market (with Texas Instruments and Freescale Semiconductor exiting). Lastly, Microsoft Corporation, our largest position, trailed even though it had very strong earnings reports in the first half. Windows sales exceeded consensus expectations combined with favorable cost of goods sold and continued cost control. However, investors were more focused on technology companies where confidence was greater that growth expectations could be met regardless of the macro backdrop. A good example would be Apple, Inc., which did well and which we continue to own.
In the Health Care sector, one of our largest stocks and a more defensive position, in our view, disappointed unexpectedly. Baxter International, Inc., a leading global diversified manufacturer of hospital supplies and medical equipment, had a weak earnings report due to competitive pricing pressures in its blood plasma division and lower than anticipated guidance for 2010. We sold the company on these issues amid lower confidence in management’s ability to execute in a more competitive environment.
Which sectors enhanced the Fund’s return? What were among the best performing investments for the Fund?
The Fund had strong stock selection in both the Consumer Discretionary and Industrials sectors. Both of these groups were also overweighted in comparison to the benchmark and held up well, which was helpful. In Consumer Discretionary, O’Reilly Automotive, Inc., Discovery Communications, Inc. and Yum! Brands, Inc. each were additive. One of the best overall portfolio performers was O’Reilly Automotive, Inc., an automotive specialty retailer. The company reported better than expected earnings results driven by strength in core O’Reilly stores and newly acquired CSK stores. We believe it is well positioned to continue to gain market share. Discovery Communications, Inc. benefited from solid international and U.S. advertising growth as a result of strong programming. It will launch the Oprah Winfrey Network (OWN) early next year, which should provide additional earnings upside in our view. Yum! Brands, Inc.’s stock price was assisted by strengthened sales and profits from China, a key driver to growth going forward. The company added 15% to its store base in China during 2009.
In Industrials, Rockwell Automation, Inc. and W.W. Grainger, Inc. were best. As a global provider of industrial automation power, control and information solutions, Rockwell Automation, Inc. had upside surprise in its earnings. Its results were driven by higher demand and volume growth, which dramatically improved its operating margin leverage. W.W. Grainger, Inc., a leading supplier of facilities maintenance products, also had above expectations earnings due to improving industrial activity. We believe the firm has a leading market position and brand, broad product offering, seasoned management, and a strong balance sheet.
What is your current strategy? How is the Fund positioned?
The U.S. economy should continue to see growth, though slower, in the second half of 2010 as indicated by the Conference Board’s Leading Economic Index (LEI). However, we remain concerned about a slowdown in the global economic recovery as fiscal stimulus begins to
10 Semi-Annual Report | June 30, 2010 |
wear off. Also, growth prospects could be negatively impacted by continued consumer deleveraging, the government deficit, the effects of Chinese interest rate tightening as this country attempts to slowdown its residential real estate market, and the depths of European government fiscal austerity and the weakness of Europe’s banking group. In our view, a double dip economic recession is unlikely unless China has a hard landing or European sovereign debt contagion spreads.
For the U.S., it is likely that the Federal Reserve will continue to hold interest rates low in order to continue to assist growth. A low interest environment is critical for businesses nationwide as well as the housing group, which appears to have stabilized, but has yet to show recovery. For improvement in housing, employment and wages will need to rise. A catalyst for growth may be corporations where a positive bias for capital spending remains as many firms have pulled back expenditures over the last several years. Also, for many companies, their balance sheets are cash rich and ripe for investment in their business or M&A activity.
In this slow growth environment, we believe our quality growth investment discipline should benefit; companies with superior and sustainable earnings growth will be rewarded as weaker firms fall behind. With the recent change in market sentiment in the quarter, we have begun to see a return to quality stocks, especially in May and June. We would expect this trend to strengthen as the year unfolds and the slow growth environment continues.
In regard to the portfolio, we have adopted a modestly more defensive stance, given the aforementioned concerns over risks to growth in the second half of 2010 and 2011. We expect this positioning to continue with the uncertainty in the market direction. As always, we remain focused on our research intensive investment process, which will be even more critical in identifying durable business franchises in a slow growth economic environment.
June 30, 2010 | William Blair Funds 11 |
Large Cap Growth Fund
Performance Highlights (unaudited)
Average Annual Total Return at 6/30/2010
| | | | | | | | | | | | | | | |
| | | Year to
Date | | | 1
Year | | | 3
Year | | | 5
Year | | | 10
Year | |
Class N | | (8.44 | )% | | 9.09 | % | | (8.16 | )% | | (1.65 | )% | | (5.68 | )% |
Class I | | (8.57 | ) | | 9.17 | | | (7.93 | ) | | (1.44 | ) | | (5.49 | ) |
Russell 1000® Growth Index | | (7.65 | ) | | 13.62 | | | (6.91 | ) | | 0.38 | | | (5.14 | ) |
Performance cited represents past performance. Past performance does not guarantee future results and current performance may be lower or higher than the data quoted. Results shown are average annual total returns, which assume reinvestment of dividends and capital gains. Investment returns and principal will fluctuate and you may have a gain or loss when you sell shares. For the most current month-end performance information, please call 1-800-742-7272, or visit our Web site at www.williamblairfunds.com. From time to time, the investment advisor may waive fees or reimburse expenses for the Fund. Without these waivers, performance would be lower. Class N shares are available to the general public without a sales load. Class I shares are available to certain institutional investors and advisory clients of William Blair & Company, L.L.C., without a sales load or distribution (12b-1) or service fees.
The performance highlights and graph presented above do not reflect the deduction of taxes that a shareholder would pay on fund distributions or the redemption of fund shares.
The Russell 1000® Growth Index consists of large capitalization companies with above average price-to-book ratios and forecasted growth rates.
This report identifies the Fund’s investments on June 30, 2010. These holdings are subject to change. Not all stocks in the Fund performed the same, nor is there any guarantee that these stocks will perform as well in the future. Market forecasts provided in this report may not necessarily come to pass.
Sector Diversification (unaudited)
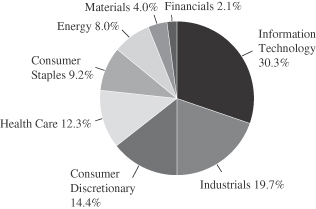
The sector diversification shown is based on the total long-term securities.
12 Semi-Annual Report | June 30, 2010 |
Large Cap Growth Fund
Portfolio of Investments, June 30, 2010 (all dollar amounts in thousands) (unaudited)
| | | | | |
| |
Issuer | | Shares | | Value |
| | |
Common Stocks | | | | | |
Information Technology—29.4% | | | | | |
*Apple, Inc. | | 6,225 | | $ | 1,566 |
Broadcom Corporation Class “A” | | 13,950 | | | 460 |
*eBay, Inc. | | 36,750 | | | 721 |
*EMC Corporation | | 36,750 | | | 672 |
*Google, Inc. Class “A” | | 2,065 | | | 919 |
Hewlett-Packard Co. | | 24,645 | | | 1,067 |
*McAfee, Inc. | | 18,050 | | | 554 |
Microsoft Corporation | | 69,135 | | | 1,591 |
QUALCOMM, Inc. | | 12,215 | | | 401 |
| | | | | |
| | | | | 7,951 |
| | | | | |
Industrials—19.2% | | | | | |
Danaher Corporation | | 15,644 | | | 581 |
Goodrich Corporation | | 8,750 | | | 580 |
J.B. Hunt Transport Services, Inc. | | 12,020 | | | 393 |
Manpower, Inc. | | 10,800 | | | 466 |
Rockwell Automation, Inc. | | 13,250 | | | 650 |
Roper Industries, Inc. | | 8,400 | | | 470 |
*Stericycle, Inc. | | 6,650 | | | 436 |
United Parcel Service, Inc. Class “B” | | 17,470 | | | 994 |
W.W. Grainger, Inc. | | 6,180 | | | 615 |
| | | | | |
| | | | | 5,185 |
| | | | | |
Consumer Discretionary—13.9% | | | | | |
*Discovery Communications, Inc. | | 17,000 | | | 607 |
Johnson Controls, Inc. | | 21,650 | | | 582 |
*Kohl’s Corporation | | 12,246 | | | 582 |
McDonald’s Corporation | | 10,685 | | | 704 |
*O’Reilly Automotive, Inc. | | 13,530 | | | 643 |
Yum! Brands, Inc. | | 16,700 | | | 652 |
| | | | | |
| | | | | 3,770 |
| | | | | |
Health Care—12.0% | | | | | |
Allergan, Inc. | | 9,565 | | | 557 |
*Celgene Corporation | | 15,240 | | | 775 |
*Illumina, Inc. | | 9,600 | | | 418 |
*Medco Health Solutions, Inc. | | 9,350 | | | 515 |
*Thermo Fisher Scientific, Inc. | | 19,945 | | | 978 |
| | | | | |
| | | | | 3,243 |
| | | | | |
Consumer Staples—9.0% | | | | | |
Colgate-Palmolive Co. | | 10,730 | | | 845 |
Mead Johnson Nutrition Co. | | 12,550 | | | 629 |
PepsiCo, Inc. | | 15,600 | | | 951 |
| | | | | |
| | | | | 2,425 |
| | | | | |
* Non-income producing securities
† = U.S. listed foreign security
| | | | | | | |
| | |
Issuer | | Shares or
Principal
Amount | | Value | |
| | |
Common Stocks—(continued) | | | | | | | |
Energy—7.7% | | | | | | | |
Apache Corporation | | | 3,665 | | $ | 309 | |
EOG Resources, Inc. | | | 4,570 | | | 450 | |
Occidental Petroleum Corporation | | | 8,050 | | | 621 | |
Schlumberger, Ltd.† | | | 12,980 | | | 718 | |
| | | | | | | |
| | | | | | 2,098 | |
| | | | | | | |
Materials—3.8% | | | | | | | |
Freeport-McMoRan Copper & Gold, Inc. | | | 5,550 | | | 328 | |
Praxair, Inc. | | | 9,425 | | | 716 | |
| | | | | | | |
| | | | | | 1,044 | |
| | | | | | | |
Financials—2.1% | | | | | | | |
CME Group, Inc. | | | 2,000 | | | 563 | |
| | | | | | | |
Total Common Stocks—97.1%
(cost $24,228) | | | 26,279 | |
| | | | | | | |
| | |
Repurchase Agreement | | | | | | | |
State Street Bank and Trust Company, 0.000% dated 6/30/10, due 7/1/10, repurchase price $803, collateralized by FHLB,
4.375%, due 9/17/10 | | $ | 803 | | | 803 | |
| | | | | | | |
Total Repurchase Agreement—3.0%
(cost $803) | | | 803 | |
| | | | | | | |
Total Investments—100.1%
(cost $25,031) | | | 27,082 | |
Liabilities, plus cash and other assets—(0.1)% | | | (32 | ) |
| | | | | | | |
Net assets—100.0% | | $ | 27,050 | |
| | | | | | | |
See accompanying Notes to Financial Statements.
June 30, 2010 | William Blair Funds 13 |

Michael P. Balkin

Karl W. Brewer
SMALL CAP GROWTH FUND
The Small Cap Growth Fund seeks long-term capital appreciation.
AN OVERVIEW FROM THE PORTFOLIO MANAGERS
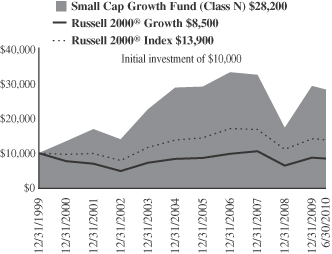
The Small Cap Growth Fund posted a 3.65% decrease (Class N Shares) for the six months ended June 30, 2010. By comparison, the Fund’s benchmark, the Russell 2000® Growth Index, declined 2.31%.
After a strong first quarter, the U.S. equity market reversed course during the second quarter to finish in negative territory for the first half of the year. The Russell 2000® Growth returned -9.22% during the second quarter to produce a -2.31% return for 2010 through June. The Fund underperformed during the second quarter and is now slightly behind for the six-month period.
While the year started off on a positive note on the heels of better-than-expected corporate sales and earnings, macro concerns across the globe instilled fear and volatility back into the markets. European sovereign debt downgrades and fiscal austerity measures, the Gulf of Mexico oil catastrophe, U.S. state budget woes and expiring stimulus programs all contributed to investor skepticism. More importantly, given the significance of job growth to a sustainable economic recovery, stubbornly lackluster employment and housing data have stoked fears of slipping back into a recession. Given these negative developments and with the 2008 downturn fresh in investors’ minds, stock prices corrected as they once again succumbed to macro factors rather than specific company fundamentals.
During the second quarter, all sectors within the Russell 2000® Growth finished well into the red. The Consumer Discretionary (-11%) and Energy (-14%) sectors were the worst performing sectors given the macro concerns discussed above. Industrials and Consumer Staples posted the “best” returns in the down market, finishing -6% apiece.
For the year-to-date period, sector returns were more dispersed. Energy was the outlying loser at down 13% for the six-month period. Consumer Discretionary and Consumer Staples performed well over the period, finishing up 3% each. Most of the other major economic sectors such as Information Technology, Industrials, Financials and Health Care were each down 2-3%.
The Fund’s underperformance during the second quarter is primarily attributable to negative stock selection. This was most pronounced in Consumer Discretionary, Financials and Materials. On the other hand, positive stock selection in Telecommunication Services, Energy and Information Technology each buoyed relative results.
For the first half of the year, the Fund’s narrower underperformance was the result of mixed stock selection across sectors. While stock selection was good in Information Technology, Telecommunication Services and Energy, stock selection in Consumer Discretionary, Materials, Industrials and Health Care outweighed and brought relative performance below the benchmark for the six-month period overall.
Two specific stocks detracting from returns were Cenveo Inc. and Healthways Inc. Cenveo is a specialty printing company. The company operates in two segments: Envelopes, Forms and Labels, and Commercial Printing. The stock was a leading detractor from returns during the second quarter and the year-to-date period as investors became increasingly nervous about the economic sensitivity of Cenveo’s business. However, we added to our position in the stock as we continue to believe the stock offers an attractive reward-to-risk ratio given a solid management team (many of whom have bought stock recently), its leading position in a higher growth segment of the printing industry and an unjustifiably low valuation.
14 Semi-Annual Report | June 30, 2010 |
Healthways Inc. is a healthcare services firm that provides disease management solutions. The company’s services are implemented by managed care companies, governments, employers and hospitals in order to reduce both short term and long term healthcare costs within their patient populations. The stock detracted from returns during the second quarter and the year-to-date period overall in part due to skepticism toward the healthcare reform bill’s impact on managed care, Healthways’ primary customer base. Also, lackluster employment data hurt investor sentiment as Healthways’ business model benefits as the employed base increases. We maintained our position as we believe disease management solutions and Healthways specifically will be a partial solution to lower healthcare costs. Nearer term, we believe data on new contract wins, contract renewals and the new business pipeline are encouraging.
Two specific stocks boosting relative performance were Lionbridge Technologies Inc. and Stanley Inc. Lionbridge Technologies is a market leader in language translation for online content, software manuals and training for leading global companies. The stock was the Fund’s number one contributor during both the first quarter and second quarter, and therefore the year-to-date period as well. Lionbridge’s business momentum has been driven by new business wins from large companies such as Caterpillar and a new contract with IBM to provide its translation technology. The company has also benefitted from existing customers such as Microsoft and Google restarting projects after the recession. We continue to hold the stock as we believe the company is well positioned for additional new customer wins and will benefit from the secular increase in cross-border business activity.
Stanley Inc. is a government information technology services company. The stock was one of the leading contributors to returns during the second quarter and the year-to-date period as it was announced to be acquired by CGI Group, one of the largest independent information technology and business process services firms in the world. We liquidated our position on the rally following this announcement.
Looking forward, while the economic recovery may have a different trajectory (less steep) than some were expecting earlier this year, the market’s decline has improved valuations and lowered expectations. Corporate financial discipline and balance sheets remain strong while inventories are lean throughout most industries. This should lay the groundwork for operating margin expansion, likely beyond prior peak margins, and drive continued earnings growth over the intermediate term. However, investor pessimism is understandably high given the expiration of stimulus plans and diminished appetite for additional programs, U.S. state budget crunches, still absent employment growth and likely further consumer deleveraging.
We consider the impact of these economic scenarios into our stock-specific risk/reward assessments, and focus our time analyzing business models and managements of growth companies who “control their own destiny” to a greater degree and are less dependent on broad economic growth. We continue to find solid investment opportunities across sectors. We believe the Fund consists of great companies with solid competitive positions whose stock prices are trading at attractive valuations.
June 30, 2010 | William Blair Funds 15 |
Small Cap Growth Fund
Performance Highlights (unaudited)
Average Annual Total Return at 6/30/2010
| | | | | | | | | | | | | | | |
| | | Year to
Date | | | 1
Year | | | 3
Year | | | 5
Year | | | 10
Year | |
Class N | | (3.65 | )% | | 17.44 | % | | (7.96 | )% | | 0.47 | % | | 6.76 | % |
Class I | | (3.49 | ) | | 17.80 | | | (7.70 | ) | | 0.75 | | | 7.03 | |
Russell 2000® Growth Index | | (2.31 | ) | | 17.96 | | | (7.54 | ) | | 1.14 | | | (1.72 | ) |
Russell 2000® Index | | (1.95 | ) | | 21.48 | | | (8.60 | ) | | 0.37 | | | 3.00 | |
Performance cited represents past performance. Past performance does not guarantee future results and current performance may be lower or higher than the data quoted. Results shown are average annual total returns, which assume reinvestment of dividends and capital gains. Investment returns and principal will fluctuate and you may have a gain or loss when you sell shares. For the most current month-end performance information, please call 1-800-742-7272, or visit our Web site at www.williamblairfunds.com. Investing in smaller companies involves special risks, including higher volatility and lower liquidity. From time to time, the investment advisor may waive fees or reimburse expenses for the Fund. Without these waivers, performance would be lower. Class N shares are available to the general public without a sales load. Class I shares are available to certain institutional investors and advisory clients of William Blair & Company, L.L.C., without a sales load or distribution (12b-1) or service fees.
The performance highlights and graph presented above do not reflect the deduction of taxes that a shareholder would pay on fund distributions or the redemption of fund shares.
The Russell 2000® Growth Index consists of small-capitalization companies with above average price-to-book ratios and forecasted growth rates.
The Russell 2000® Index is an unmanaged composite of the smallest 2000 stocks of the Russell 3000® Index.
This report identifies the Fund’s investments on June 30, 2010. These holdings are subject to change. Not all stocks in the Fund performed the same, nor is there any guarantee that these stocks will perform as well in the future. Market forecasts provided in this report may not necessarily come to pass.
Sector Diversification (unaudited)
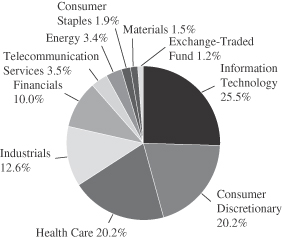
The sector diversification shown is based on the total long-term securities.
16 Semi-Annual Report | June 30, 2010 |
Small Cap Growth Fund
Portfolio of Investments, June 30, 2010 (all dollar amounts in thousands) (unaudited)
| | | | | |
Issuer | | Shares | | Value |
| | |
Common Stocks | | | | | |
Information Technology—25.1% | | | | | |
*BancTec, Inc.—144A§** | | 603,327 | | $ | 3,017 |
*Cavium Networks, Inc. | | 344,300 | | | 9,017 |
*DG FastChannel, Inc. | | 523,989 | | | 17,072 |
*DJSP Enterprises, Inc.† | | 633,000 | | | 3,576 |
*Internet Capital Group, Inc. | | 1,035,346 | | | 7,869 |
*Inuvo, Inc. | | 8,813,761 | | | 1,498 |
*j2 Global Communications, Inc. | | 699,948 | | | 15,287 |
*Lionbridge Technologies, Inc. | | 4,326,258 | | | 19,771 |
*MaxLinear, Inc. Class “A” | | 385,140 | | | 5,384 |
*Monolithic Power Systems, Inc. | | 528,471 | | | 9,438 |
*ShoreTel, Inc. | | 695,800 | | | 3,229 |
*Silicon Laboratories, Inc. | | 178,677 | | | 7,247 |
*Sonic Solutions, Inc. | | 906,916 | | | 7,573 |
*TeleNav, Inc. | | 907,925 | | | 7,617 |
*TeleTech Holdings, Inc. | | 644,900 | | | 8,313 |
*Ultimate Software Group, Inc. | | 559,085 | | | 18,372 |
United Online, Inc. | | 2,416,546 | | | 13,919 |
*ValueClick, Inc. | | 1,344,740 | | | 14,375 |
*Vertro, Inc. | | 4,333,215 | | | 2,145 |
*VistaPrint N.V.† | | 222,768 | | | 10,579 |
| | | | | |
| | | | | 185,298 |
| | | | | |
Consumer Discretionary—19.9% | | | | | |
Abercrombie & Fitch Co. Class “A” | | 257,200 | | | 7,893 |
*Belo Corporation | | 2,128,943 | | | 12,114 |
*Career Education Corporation | | 547,226 | | | 12,597 |
*ChinaCast Education Corporation† | | 1,387,639 | | | 8,243 |
*Duckwall-ALCO Stores, Inc. | | 439,493 | | | 6,439 |
Gaiam, Inc. Class “A” | | 1,358,374 | | | 8,245 |
*Grand Canyon Education, Inc. | | 569,210 | | | 13,337 |
Jarden Corporation | | 657,717 | | | 17,673 |
*Kona Grill, Inc. | | 1,042,992 | | | 3,828 |
*Lincoln Educational Services Corporation | | 377,098 | | | 7,764 |
MDC Partners, Inc. Class “A”† | | 949,988 | | | 10,146 |
*Office Depot, Inc. | | 1,483,300 | | | 5,993 |
*Princeton Review, Inc. | | 3,381,896 | | | 7,846 |
Strayer Education, Inc. | | 36,695 | | | 7,628 |
*U.S. Auto Parts Network, Inc. | | 1,047,636 | | | 6,286 |
*WMS Industries, Inc. | | 279,500 | | | 10,970 |
| | | | | |
| | | | | 147,002 |
| | | | | |
Health Care—19.9% | | | | | |
*AGA Medical Holdings, Inc. | | 634,500 | | | 8,052 |
*Air Methods Corporation | | 455,882 | | | 13,562 |
*American Medical Systems Holdings, Inc. | | 511,800 | | | 11,321 |
*Brookdale Senior Living, Inc. | | 439,900 | | | 6,598 |
*CardioNet, Inc. | | 471,713 | | | 2,585 |
*Eurand N.V.† | | 1,013,712 | | | 9,823 |
*Haemonetics Corporation | | 143,265 | | | 7,668 |
*Healthways, Inc. | | 844,253 | | | 10,063 |
*Integra LifeSciences Holdings Corporation | | 217,400 | | | 8,044 |
*Kensey Nash Corporation | | 541,501 | | | 12,839 |
*LCA-Vision, Inc. | | 808,806 | | | 4,481 |
*MedAssets, Inc. | | 349,200 | | | 8,060 |
*Natus Medical, Inc. | | 571,600 | | | 9,311 |
*Quidel Corporation | | 576,846 | | | 7,320 |
*SurModics, Inc. | | 475,248 | | | 7,799 |
*The Providence Service Corporation | | 575,911 | | | 8,063 |
*Trinity Biotech plc—ADR | | 1,853,763 | | | 11,252 |
| | | | | |
| | | | | 146,841 |
| | | | | |
| | | | | |
Issuer | | Shares | | Value |
| | |
Common Stocks—(continued) | | | | | |
Industrials—12.3% | | | | | |
*Cenveo, Inc. | | 2,494,045 | | $ | 13,667 |
*Dolan Media Co. | | 1,178,966 | | | 13,110 |
*Franklin Covey Co. | | 647,917 | | | 4,212 |
*GrafTech International, Ltd. | | 802,900 | | | 11,738 |
*ICF International, Inc. | | 285,139 | | | 6,823 |
Kaydon Corporation | | 310,460 | | | 10,202 |
MSC Industrial Direct Co. Class “A” | | 87,226 | | | 4,419 |
*Odyssey Marine Exploration, Inc. | | 3,454,930 | | | 3,455 |
*On Assignment, Inc. | | 1,936,419 | | | 9,740 |
TransDigm Group, Inc. | | 270,014 | | | 13,779 |
| | | | | |
| | | | | 91,145 |
| | | | | |
Financials—8.9% | | | | | |
*Affiliated Managers Group, Inc. | | 137,282 | | | 8,342 |
Allied World Assurance Co. Holdings, Ltd.† | | 198,100 | | | 8,990 |
*CBOE Holdings, Inc. | | 124,028 | | | 4,037 |
*Cowen Group, Inc. | | 1,766,517 | | | 7,243 |
*FirstService Corporation† | | 554,971 | | | 11,527 |
*Marlin Business Services Corporation | | 970,279 | | | 11,731 |
*National Financial Partners Corporation | | 1,094,330 | | | 10,691 |
*Penson Worldwide, Inc. | | 255,201 | | | 1,439 |
United Western Bancorp, Inc. | | 2,342,215 | | | 1,874 |
| | | | | |
| | | | | 65,874 |
| | | | | |
Telecommunication Services—3.4% | | | | | |
*Cbeyond, Inc. | | 459,231 | | | 5,741 |
*Syniverse Holdings, Inc. | | 958,300 | | | 19,597 |
| | | | | |
| | | | | 25,338 |
| | | | | |
Energy—3.4% | | | | | |
*Comstock Resources, Inc. | | 276,460 | | | 7,663 |
*Concho Resources, Inc. | | 129,113 | | | 7,144 |
*Oil States International, Inc. | | 255,800 | | | 10,125 |
| | | | | |
| | | | | 24,932 |
| | | | | |
Consumer Staples—1.9% | | | | | |
*Overhill Farms, Inc. | | 959,252 | | | 5,650 |
*Smart Balance, Inc. | | 2,077,700 | | | 8,498 |
| | | | | |
| | | | | 14,148 |
| | | | | |
Materials—1.5% | | | | | |
*Horsehead Holding Corporation | | 987,100 | | | 7,463 |
*Stillwater Mining Co. | | 284,100 | | | 3,301 |
| | | | | |
| | | | | 10,764 |
| | | | | |
Total Common Stocks—96.3%
(cost $725,989) | | | 711,342 |
| | | | | |
| | |
Preferred Stock | | | | | |
Grubb & Ellis Co.—144A, 12.00%§ | | 83,121 | | | 6,484 |
| | | | | |
Total Preferred Stock—0.9%
(cost $8,312) | | | 6,484 |
| | | | | |
| | |
Exchange-Traded Fund | | | | | |
iShares Russell 2000 Growth Index Fund | | 126,500 | | | 8,422 |
| | | | | |
Total Exchange-Traded Fund—1.2%
(cost $8,194) | | | 8,422 |
| | | | | |
See accompanying Notes to Financial Statements.
June 30, 2010 | William Blair Funds 17 |
Small Cap Growth Fund
Portfolio of Investments, June 30, 2010 (all dollar amounts in thousands) (unaudited)
| | | | | | |
Issuer | | Shares or
Principal
Amount | | Value |
| | |
Investment in Affiliate | | | | | | |
William Blair Ready Reserves Fund | | | 3,296,931 | | | 3,297 |
| | | | | | |
Total Investment in Affiliate—0.4%
(cost $3,297) | | | 3,297 |
| | | | | | |
| | |
Short-Term Investment | | | | | | |
American Express Credit Corporation Demand Note, VRN, 0.191%, due 7/1/10 | | $ | 500 | | | 500 |
| | | | | | |
Total Short-Term Investment—0.1%
(cost $500) | | | 500 |
| | | | | | |
| | |
Repurchase Agreement | | | | | | |
Fixed Income Clearing Corporation, 0.000% dated 6/30/10, due 7/1/10, repurchase price $4,705 collateralized by FFCB, 1.625%, due 3/7/13 | | | 4,705 | | | 4,705 |
| | | | | | |
Total Repurchase Agreement—0.6%
(cost $4,705) | | | 4,705 |
| | | | | | |
Total Investments—99.5%
(cost $750,997) | | | 734,750 |
Cash and other assets, less liabilities—0.5% | | | 3,728 |
| | | | | | |
Net assets—100.0% | | $ | 738,478 |
| | | | | | |
ADR = American Depository Receipt
VRN = Variable Rate Note
*Non-income producing securities
§ = Deemed illiquid pursuant to Liquidity Procedures approved by the Board of Trustees. These holdings represent 1.29% of the net assets at June 30, 2010.
** = Fair valued pursuant to Valuation Procedures adopted by the Board of Trustees. This holding represents 0.41% of the Fund’s net assets at June 30, 2010.
† = U.S. listed foreign security
See accompanying Notes to Financial Statements.
18 Semi-Annual Report | June 30, 2010 |
Small Cap Growth Fund
If the Fund’s portfolio holdings represent ownership of 5% or more of the voting securities of a company, the company is deemed to be a affiliate as defined in the Investment Company Act of 1940. The Small Cap Growth Fund had the following transactions during the period ended June 30, 2010 with companies deemed affiliated during the period or at June 30, 2010:
| | | | | | | | | | | | | | |
| | | Share Activity | | Period Ended June 30, 2010 |
| | | | | | | | | | | (in thousands) |
Security Name | | Balance
12/31/2009 | | Purchases | | Sales | | Balance
6/30/2010 | | Value | | Dividends
Included in
Income |
CardioNet, Inc. | | 1,344,381 | | 208,600 | | 1,081,268 | | 471,713 | | $ | 2,585 | | $ | — |
pDJSP Enterprises | | — | | 633,000 | | — | | 633,000 | | | 3,576 | | | — |
pDuckwall-ALCO Stores, Inc. | | 460,853 | | — | | 21,360 | | 439,493 | | | 6,439 | | | — |
pGaiam, Inc. | | 1,511,007 | | 62,900 | | 215,533 | | 1,358,374 | | | 8,254 | | | 214 |
pInuvo, Inc | | 8,037,127 | | 776,634 | | — | | 8,813,761 | | | 1,498 | | | — |
pKensey Nash | | 422,340 | | 119,161 | | — | | 541,501 | | | 12,839 | | | — |
pKona Grill, Inc. | | 1,042,992 | | — | | — | | 1,042,992 | | | 3,828 | | | — |
LCA-Vision Inc. | | 948,955 | | 66,854 | | 207,003 | | 808,806 | | | 4,481 | | | — |
pLionbridge Technologies, Inc. | | 4,293,158 | | 509,700 | | 476,600 | | 4,326,258 | | | 19,771 | | | — |
pMarlin Business Services Corp. | | 988,701 | | — | | 18,422 | | 970,279 | | | 11,731 | | | — |
pOdyssey Marine Exploration | | 2,677,030 | | 777,900 | | — | | 3,454,930 | | | 3,455 | | | — |
pOn Assignment Inc | | 1,516,133 | | 891,986 | | 471,700 | | 1,936,419 | | | 9,740 | | | — |
pOverhill Farms, Inc. | | 1,184,052 | | 53,900 | | 278,700 | | 959,252 | | | 5,650 | | | — |
pPrinceton Review | | — | | 3,381,896 | | — | | 3,381,896 | | | 7,846 | | | — |
The Providence Service Corporation | | 547,293 | | 166,918 | | 138,300 | | 575,911 | | | 8,063 | | | — |
pTrinity Biotech | | 1,501,163 | | 352,600 | | — | | 1,853,763 | | | 11,252 | | | — |
pUnited Western Bancorp, Inc. | | 2,342,215 | | — | | — | | 2,342,215 | | | 1,874 | | | — |
pVertro, Inc. | | 4,333,215 | | — | | — | | 4,333,215 | | | 2,145 | | | — |
| | | | | | | | | | | | | | |
| | | | | | | | | | $ | 125,027 | | $ | 214 |
| | | | | | | | | | | | | | |
p Affiliated company at June 30, 2010. The Small Cap Growth Fund’s total value in companies deemed to be affiliated at June 30, 2010 was $ 109,898 (thousands).
See accompanying Notes to Financial Statements.
June 30, 2010 | William Blair Funds 19 |

Robert C. Lanphier, IV

David P. Ricci
MID CAP GROWTH FUND
The Mid Cap Growth Fund seeks long-term capital appreciation.
AN OVERVIEW FROM THE PORTFOLIO MANAGERS
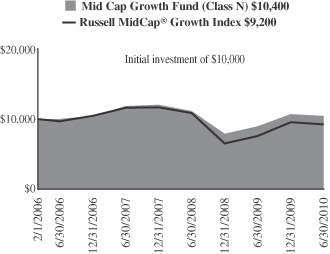
The Mid Cap Growth Fund posted a 2.58% decrease (Class N Shares) for the six months ended June 30, 2009. By comparison, the Fund’s benchmark, the Russell Midcap® Growth Index, declined 3.31%.
After a strong first quarter, the U.S. equity market reversed course during the second quarter to finish in negative territory for the first half of the year. The Russell Midcap® Growth Index returned -10.20% during the second quarter to produce a -3.31% return for 2010 through June. The Fund outperformed during the second quarter’s decline and is ahead of the benchmark for the year-to-date period as well.
While the year started off on a positive note on the heels of better-than-expected corporate sales and earnings, macro concerns across the globe instilled fear, and volatility, back into the markets. European sovereign debt downgrades and fiscal austerity measures, the Gulf of Mexico oil catastrophe, U.S. state budget woes, and expiring stimulus programs all contributed to investor skepticism. More importantly, given the significance of job growth to a sustainable economic recovery, stubbornly lackluster employment and housing data have stoked fears of slipping back into a recession. Because of these negative developments and with the 2008 downturn fresh in investors’ minds, stock prices corrected as they once again succumbed to macro factors rather than company fundamentals.
During the second quarter, all sectors within the Russell Midcap® Growth Index finished in the red. The Energy sector (-19%) was the worst performing sector given the macro concerns discussed above. Financials also underperformed with a -13% return. Outperforming modestly were Information Technology (-8%) and the typical defensive sectors, Health Care (-7%) and Consumer Staples (-8%).
For the year-to-date period, sector returns were more dispersed. Energy was the standout loser at -16%. Information Technology (-6%) and Financials (-5%) were the next worst performing sectors. Of the other major economic sectors in the index, Health Care performed best at +4%, while Consumer Discretionary also outperformed, (+1)%.
The Fund’s outperformance during the second quarter is attributable to strong stock selection and our typical lower-beta investment style coming into favor. Fund holdings in Consumer Discretionary, Industrials, Materials and Energy were the largest positive contributors to relative return during the quarter. On the other hand, certain stocks in Health Care and Financials weighed on relative results.
For the first half of the year, the Fund’s outperformance was the result of good stock selection and a positive benefit of our typical smaller-than-benchmark weighted average market capitalization. Stock selection was most significant in the Industrials, Materials, Information Technology and Consumer Discretionary sectors. Detracting from relative performance were some of the Fund’s Health Care and Financials holdings.
Two specific stocks boosting relative performance were Illumina, Inc. and Stericycle, Inc. Illumina, Inc. develops and markets integrated systems used in the gene sequencing and genotyping markets. The company’s machines enable medical and academic institutions to understand the genetic make-up of individuals which allows for more productive research in disease treatment and prevention. With its next generation machine launching soon, investors
20 Semi-Annual Report | June 30, 2010 |
were expecting weak sales out of the company due to prospective customers delaying purchases in anticipation of the new machines. In reality, sales were better-than-expected. Illumina, Inc.’s order book remains robust and sales from non-genome research centers, the company’s core customer base, were quite strong. We maintained our position in the name given Illumina, Inc.’s technological leadership position and growth in the genetic sciences.
Stericycle, Inc. is the leading medical waste management company. The company collects and disposes of medical waste as a service for smaller facilities such as outpatient clinics and dental offices and larger facilities such as hospitals and blood banks. The stock was a leading contributor to returns during the second quarter and for the first half of the year. Given the non-cyclical nature of Stericycle, Inc.’s business, investors often flock to the stock when economic concerns are high as they were during the second quarter. We continue to own the stock, as we have for several years, given the growth opportunity and stability driven by its dominate market position.
On the other hand, two stocks detracting from returns were athenahealth, Inc. and Greenhill & Co., Inc. Athenahealth, Inc. is a provider of internet-based business services for physician practices. For example, the company’s solutions allow physician practices to improve accounts receivable days outstanding, bad debt expenses, and patient scheduling and follow-up. The stock was one of the leading detractors from returns during the second quarter and the first half of the year. During the first quarter, the company had to change a revenue recognition policy for a small piece of its business that weighed on investor confidence. During the second quarter, athenahealth, Inc. announced disappointing contract wins with new physician practices, which brought into question whether the company has the appropriate infrastructure in place to compete with larger competitors. We liquidated our position on the news, but would consider it for repurchase if we became comfortable with the company’s investment in infrastructure to support its growth.
Greenhill & Co., Inc. is a boutique merger and acquisition (M&A) advisory firm which has attracted many talented bankers from large Wall Street investment banks, allowing it to expand into new industry verticals and new geographies across the globe. The stock detracted from returns during the quarter and year-to-date period mainly due to disappointment regarding the expected reacceleration of the M&A cycle. We continue to hold a position as we believe the company is well-positioned to steal market share from larger competitors and will benefit when M&A activity improves.
Looking forward, while the economic recovery may have a different trajectory (less steep) than some were expecting earlier this year, the market’s decline has improved valuations and lowered expectations. Corporate financial discipline and balance sheets remain strong, and inventories are lean throughout most industries. This should lay the ground work for operating margin expansion, likely beyond prior peak margins, and drive continued earnings growth over the intermediate term. However, investor pessimism is understandably high given the expiration of stimulus plans and diminished appetite for additional programs, U.S. state budget crunches, still absent employment growth and likely further consumer deleveraging.
We consider the impact of these economic scenarios into our stock-specific risk/reward assessments, and focus our time analyzing business models and managements of growth companies who “control their own destiny” to a greater degree and are less dependent on broad economic growth. We continue to find solid investment opportunities across sectors. We believe the Fund consists of great companies with solid competitive positions whose stock prices are trading at attractive valuations.
June 30, 2010 | William Blair Funds 21 |
Mid Cap Growth Fund
Performance Highlights (unaudited)
Average Annual Total Return at 6/30/2010
| | | | | | | | | | | | |
| | | Year to
Date | | | 1
Year | | | 3
Year | | | Since
Inception(a) | |
Class N | | (2.58 | )% | | 16.49 | % | | (4.23 | )% | | 0.83 | % |
Class I | | (2.45 | ) | | 16.78 | | | (3.99 | ) | | 1.13 | |
Russell MidCap® Growth Index | | (3.31 | ) | | 21.30 | | | (7.53 | ) | | (1.99 | ) |
| | (a) | | For the period from February 1, 2006 (Commencement of Operations) to June 30, 2010. |
Performance cited represents past performance. Past performance does not guarantee future results and current performance may be lower or higher than the data quoted. Results shown are average annual total returns, which assume reinvestment of dividends and capital gains. Investment returns and principal will fluctuate and you may have a gain or loss when you sell shares. For the most current month-end performance information, please call 1-800-742-7272, or visit our Web site at www.williamblairfunds.com. Investing in smaller and medium capitalization companies involves special risks, including higher volatility and lower liquidity. Mid Cap stocks are also more sensitive to purchase/sale transactions and changes in the issuer’s financial condition. From time to time, the investment advisor may waive fees or reimburse expenses for the Fund. Without these waivers, performance would be lower. Class N shares are available to the general public without a sales load. Class I shares are available to certain institutional investors and advisory clients of William Blair & Company, L.L.C., without a sales load or distribution (12b-1) or service fees.
The performance highlights and graph presented above do not reflect the deduction of taxes that a shareholder would pay on fund distributions or the redemption of fund shares.
The Russell MidCap® Growth Index is an index that is constructed to provide a comprehensive and unbiased barometer of the mid-cap growth market.
This report identifies the Fund’s investments on June 30, 2010. These holdings are subject to change. Not all stocks in the Fund performed the same, nor is there any guarantee that these stocks will perform as well in the future. Market forecasts provided in this report may not necessarily come to pass.
Sector Diversification (unaudited)
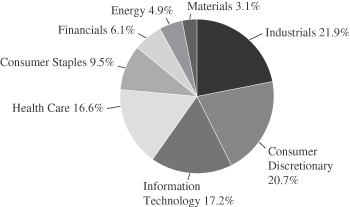
The sector diversification shown is based on the total long-term securities.
22 Semi-Annual Report | June 30, 2010 |
Mid Cap Growth Fund
Portfolio of Investments, June 30, 2010 (all dollar amounts in thousands) (unaudited)
| | | | | |
Issuer | | Shares | | Value |
| | |
Common Stocks | | | | | |
Industrials—20.9% | | | | | |
CH Robinson Worldwide, Inc. | | 20,400 | | $ | 1,135 |
Fastenal Co. | | 34,075 | | | 1,710 |
Gardner Denver, Inc. | | 21,400 | | | 954 |
Manpower, Inc. | | 16,790 | | | 725 |
MSC Industrial Direct Co. Class “A” | | 30,900 | | | 1,565 |
Precision Castparts Corporation | | 4,050 | | | 417 |
Robert Half International, Inc. | | 59,100 | | | 1,392 |
Rockwell Automation, Inc. | | 22,000 | | | 1,080 |
Roper Industries, Inc. | | 27,160 | | | 1,520 |
*Stericycle, Inc. | | 50,930 | | | 3,340 |
TransDigm Group, Inc. | | 34,950 | | | 1,784 |
| | | | | |
| | | | | 15,622 |
| | | | | |
Consumer Discretionary—19.7% | | | | | |
*Bed Bath & Beyond, Inc. | | 39,460 | | | 1,463 |
*CarMax, Inc. | | 95,770 | | | 1,906 |
*Chipotle Mexican Grill, Inc. | | 8,600 | | | 1,177 |
DeVry, Inc. | | 26,110 | | | 1,370 |
*Dick’s Sporting Goods, Inc. | | 84,529 | | | 2,104 |
*Discovery Communications, Inc. | | 42,400 | | | 1,514 |
Gentex Corporation | | 58,780 | | | 1,057 |
*Harman International Industries, Inc. | | 29,200 | | | 873 |
*O’Reilly Automotive, Inc. | | 39,380 | | | 1,873 |
*WMS Industries, Inc. | | 35,540 | | | 1,395 |
| | | | | |
| | | | | 14,732 |
| | | | | |
Information Technology—16.4% | | | | | |
*Alliance Data Systems Corporation | | 18,850 | | | 1,122 |
*Concur Technologies, Inc. | | 33,130 | | | 1,414 |
*Dolby Laboratories, Inc. Class “A” | | 12,770 | | | 801 |
*Genpact, Ltd.† | | 49,900 | | | 775 |
*McAfee, Inc. | | 38,100 | | | 1,170 |
*Silicon Laboratories, Inc. | | 33,910 | | | 1,375 |
Solera Holdings, Inc. | | 20,500 | | | 742 |
*Trimble Navigation, Ltd. | | 51,700 | | | 1,448 |
*VeriSign, Inc. | | 82,200 | | | 2,182 |
*VistaPrint N.V.† | | 25,830 | | | 1,227 |
| | | | | |
| | | | | 12,256 |
| | | | | |
Health Care—15.9% | | | | | |
*American Medical Systems Holdings, Inc. | | 33,300 | | | 737 |
*Brookdale Senior Living, Inc. | | 41,262 | | | 619 |
*CareFusion Corporation | | 67,339 | | | 1,528 |
*Cerner Corporation | | 14,600 | | | 1,108 |
DENTSPLY International, Inc. | | 22,400 | | | 670 |
*HMS Holdings Corporation | | 14,000 | | | 759 |
*IDEXX Laboratories, Inc. | | 31,172 | | | 1,898 |
*Illumina, Inc. | | 58,020 | | | 2,526 |
Perrigo Co. | | 13,300 | | | 786 |
*QIAGEN N.V.† | | 62,846 | | | 1,208 |
| | | | | |
| | | | | 11,839 |
| | | | | |
* Non-income producing securities
† = U.S. listed foreign security
| | | | | | |
Issuer | | Shares or
Principal
Amount | | Value |
| | |
Common Stocks—(continued) | | | | | | |
Consumer Staples—9.1% | | | | | | |
Church & Dwight Co., Inc. | | | 18,900 | | $ | 1,185 |
*Green Mountain Coffee Roasters, Inc. | | | 127,756 | | | 3,283 |
McCormick & Co., Inc. | | | 41,100 | | | 1,560 |
Mead Johnson Nutrition Co. | | | 15,700 | | | 787 |
| | | | | | |
| | | | | | 6,815 |
| | | | | | |
Financials—5.8% | | | | | | |
*Affiliated Managers Group, Inc. | | | 16,175 | | | 983 |
Greenhill & Co., Inc. | | | 20,320 | | | 1,242 |
*IntercontinentalExchange, Inc. | | | 6,550 | | | 740 |
Invesco, Ltd.† | | | 82,500 | | | 1,389 |
| | | | | | |
| | | | | | 4,354 |
| | | | | | |
Energy—4.7% | | | | | | |
*Cameron International Corporation | | | 18,600 | | | 605 |
*Denbury Resources, Inc. | | | 67,270 | | | 985 |
*Newfield Exploration Co. | | | 19,930 | | | 974 |
Range Resources Corporation | | | 11,200 | | | 449 |
*Southwestern Energy Co. | | | 12,570 | | | 486 |
| | | | | | |
| | | | | | 3,499 |
| | | | | | |
Materials—3.0% | | | | | | |
Ecolab, Inc. | | | 48,800 | | | 2,191 |
| | | | | | |
Total Common Stocks—95.5%
(cost $65,540) | | | 71,308 |
| | | | | | |
| | |
Investment in Affiliate | | | | | | |
William Blair Ready Reserves Fund | | | 18,725 | | | 19 |
| | | | | | |
Total Investment in Affiliate—0.0%
(cost $19) | | | 19 |
| | | | | | |
| | |
Repurchase Agreement | | | | | | |
State Street Bank and Trust Company, 0.000% dated 6/30/10, due 7/1/10, repurchase price $3,090, collateralized by FHLB,
4.375%, due 9/17/10 | | $ | 3,090 | | | 3,090 |
| | | | | | |
Total Repurchase Agreement—4.1%
(cost $3,090) | | | 3,090 |
| | | | | | |
Total Investments—99.6%
(cost $68,649) | | | 74,417 |
| | | | | | |
Cash and other assets, less liabilities—0.4% | | | 287 |
| | | | | | |
Net assets—100.0% | | $ | 74,704 |
| | | | | | |
See accompanying Notes to Financial Statements.
June 30, 2010 | William Blair Funds 23 |
Karl W. Brewer
Robert C. Lanphier, IV

Matthew A. Litfin
SMALL-MID CAP GROWTH FUND
The Small-Mid Cap Growth Fund seeks long-term capital appreciation.
AN OVERVIEW FROM THE PORTFOLIO MANAGERS
The Small-Mid Cap Growth Fund posted a 3.07% decrease (Class N Shares) for the six months ended June 30, 2010. By comparison, the Fund’s benchmark, the Russell 2500™ Growth Index, declined 1.82%.
After a strong first quarter, the U.S. equity market reversed course during the second quarter to finish in negative territory for the first half of 2010. The Russell 2500™ Growth Index returned -9.77% during the second quarter to produce a -1.82% return for 2010 through June. The William Blair Small-Mid Cap Growth Fund outperformed during the second quarter’s decline and is now modestly behind the benchmark for the year-to-date period.
While the year started off on a positive note on the heels of better-than-expected corporate sales and earnings, macroeconomic concerns across the globe instilled fear and volatility back into the markets. European sovereign debt downgrades and fiscal austerity measures, the Gulf of Mexico oil catastrophe, U.S. state budget woes and expiring stimulus programs all contributed to investor skepticism. Stubbornly lackluster employment and housing data have stoked fears of slipping back into a recession. Because of these negative developments and with the 2008 downturn fresh in investors’ minds, stock prices corrected as this new data raised doubts about future corporate earnings growth.
During the second quarter, all sectors within the Russell 2500™ Growth Index finished in the red. The Energy sector (-17%) was the worst performing given the concerns discussed above. Consumer Discretionary stocks (-12%) also underperformed as investors anticipated a potential slip in consumer spending due to an uncertain income tax outlook and a potentially weaker economic environment. Financials were down 12% as well, while Information Technology was the best performing major economic sector, returning -7%.
For the year-to-date period, most sectors ranged from -2% to +4%, with Energy being the one outlier at -13%. Of the significant economic sectors in the index, Health Care and Consumer Discretionary led the way (+2%), while Financials (-4%), Industrials (-3%) and Information Technology (-3%) all modestly underperformed.
The Small-Mid Cap Growth Fund’s outperformance during the second quarter is attributable to strong stock selection and our more conservative investment style coming into favor. Fund holdings in Consumer Discretionary, Health Care and Energy were the largest positive contributors to relative returns during the quarter. On the other hand, certain stocks in Information Technology and Financials weighed on relative results.
For the first half of the year, the Fund’s narrow underperformance was the result of mixed stock selection across sectors. Positive contributors to relative return came within the Consumer Discretionary, Materials and Telecommunication Services sectors, while certain underperforming stocks in Financials, Industrials and Health Care detracted from relative performance.
Two specific stocks detracting from returns were Invesco, Ltd. and McAfee, Inc. Invesco, Ltd. is a global asset management firm. The stock was a leading detractor from return during the second quarter and year-to-date period. Despite better-than-expected flows and management guidance regarding synergies of the Van Kampen acquisition in the second quarter, asset flows for the year have been disappointing and investors have concerns regarding the integration of the Van Kampen acquisition. However, the primary factor
24 Semi-Annual Report | June 30, 2010 |
contributing to the stock’s underperformance was the stock market’s second quarter decline and its anticipated effect on assets under management and thus, future revenue growth. We maintained our position in the stock as we continue to believe in Invesco, Ltd.’s management team, its investment products, and believe the Van Kampen acquisition will be highly complementary to its existing business.
McAfee, Inc. is a security technology company that protects systems and networks from known and unknown threats worldwide. The stock detracted from returns during the second quarter and for the first half of the year overall. Earnings announced during the second quarter were disappointing as was management’s guidance for future earnings. While McAfee, Inc.’s consumer business performed well, the corporate side was weaker than expected. Given the previous trends of market share gains with corporate customers, this was disappointing. In addition, one of McAfee, Inc.’s regular software updates caused customer computers to effectively shut down, most likely distracting the sales force (as they dealt with customer issues) and denting the company’s reputation. Despite what we believe is a disappointing development, we continue to own this market leader within a growth industry.
Two specific stocks that boosted relative results were SXC Health Solutions Corporation and Stericycle, Inc. SXC Health Solutions Corporation provides pharmacy benefit management (PBM) services and healthcare information technology solutions. The stock performed well during the second quarter and throughout the first half of the year. The company has strong business momentum and is benefitting from continued growth in mail delivery and generic utilization of pharmaceuticals. During the first quarter, the company announced a large new PBM contract win with HealthSpring, a managed care company, and sales momentum continued to build in the second quarter. SXC Health Solutions Corporation’s recent business strength is in part driven by leveraging its strong customer relationships in its legacy healthcare information technology business to cross-sell the company’s PBM capabilities. We trimmed our position on the strength, but continue to hold a position as we believe the company’s focused management team and differentiated customer solutions will drive further growth.
Stericycle, Inc. is the leading medical waste management company. The company collects and disposes of medical waste as a service for smaller facilities such as outpatient clinics and dental offices, and larger facilities such as hospitals and blood banks. The stock was a leading contributor to returns during the second quarter and for the first half of the year. Given the acyclical nature of Stericycle, Inc.’s business, investors often flock to the stock when economic concerns are high as they were during the second quarter. We continue to own the stock, as we have for several years, given the growth opportunity and stability driven by its dominant market position.
Looking forward, we believe the business environment for U.S. companies remains favorable, and thus the U.S. equity market is attractive, especially for small- and mid-cap growth companies in which your Fund invests. Measures of investor sentiment have become bearish in recent weeks, and periods of outperformance often follow such sentiment shifts. The earnings growth outlook remains intact, valuations are cheaper than normal, profit margins are higher than average (at similar periods of bearishness), interest rates are at all-time lows, and the Federal Reserve remains accommodative. We recognize that either a global recession or significant further weakness in the U.S. housing market could pressure equity returns further in the near-term, but overall we believe the reward-to-risk ratios remain positive.
We consider the impact of these varying economic scenarios in our stock research and earnings estimation process. However, we focus our time analyzing business models and managements of growth companies that control their own destiny and are less dependent on broader economic growth to boost earnings. We continue to find solid investment opportunities across sectors and are confident that your Fund consists of great companies with strong competitive positions whose stock prices are trading at attractive valuations.
June 30, 2010 | William Blair Funds 25 |
Small-Mid Cap Growth Fund
Performance Highlights (unaudited)
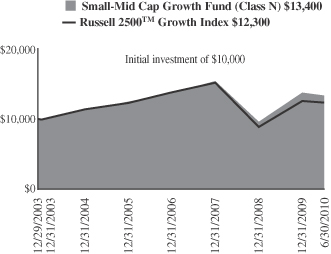
Average Annual Total Return at 6/30/2010
| | | | | | | | | | | | | | | |
| | | Year to
Date | | | 1
Year | | | 3
Year | | | 5
Year | | | Since
Inception(a) | |
Class N | | (3.07 | )% | | 16.86 | % | | (4.87 | )% | | 3.55 | % | | 4.55 | % |
Class I | | (2.93 | ) | | 17.21 | | | (4.61 | ) | | 3.82 | | | 4.82 | |
Russell 2500™ Growth Index | | (1.82 | ) | | 21.44 | | | (7.10 | ) | | 1.81 | | | 3.28 | |
| | (a) | | For the period from December 29, 2003 (Commencement of Operations) to June 30, 2010. | |
Performance cited represents past performance. Past performance does not guarantee future results and current performance may be lower or higher than the data quoted. Results shown are average annual total returns, which assume reinvestment of dividends and capital gains. Investment returns and principal will fluctuate and you may have a gain or loss when you sell shares. For the most current month-end performance information, please call 1-800-742-7272, or visit our Web site at www.williamblairfunds.com. Investing in smaller and medium capitalization companies involves special risks, including higher volatility and lower liquidity. Small and Mid cap stocks are also more sensitive to purchase/sale transactions and changes in the issuer’s financial condition. From time to time, the investment advisor may waive fees or reimburse expenses for the Fund. Without these waivers, performance would be lower. Class N shares are available to the general public without a sales load. Class I shares are available to certain institutional investors and advisory clients of William Blair & Company, L.L.C., without a sales load or distribution (12b-1) or service fees.
The performance highlights and graph presented above do not reflect the deduction of taxes that a shareholder would pay on fund distributions or the redemption of fund shares.
The Russell 2500™ Growth Index measures the performance of those Russell 2500 companies with above average price-to-book ratios and forecasted growth rates.
This report identifies the Fund’s investments on June 30, 2010. These holdings are subject to change. Not all stocks in the Fund performed the same, nor is there any guarantee that these stocks will perform as well in the future. Market forecasts provided in this report may not necessarily come to pass.
Sector Diversification (unaudited)
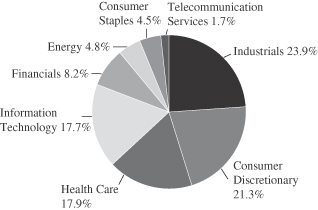
The sector diversification shown is based on the total long-term securities.
26 Semi-Annual Report | June 30, 2010 |
Small-Mid Cap Growth Fund
Portfolio of Investments, June 30, 2010 (all dollar amounts in thousands) (unaudited)
| | | | | |
Issuer | | Shares | | Value |
| | |
Common Stocks | | | | | |
Industrials—23.6% | | | | | |
Allegiant Travel Co. | | 46,865 | | $ | 2,001 |
*Cenveo, Inc. | | 209,100 | | | 1,146 |
*Corrections Corporation of America | | 73,455 | | | 1,401 |
*CoStar Group, Inc. | | 47,800 | | | 1,855 |
Fastenal Co. | | 57,860 | | | 2,904 |
*GrafTech International, Ltd. | | 215,700 | | | 3,154 |
Heidrick & Struggles International, Inc. | | 72,540 | | | 1,655 |
*Huron Consulting Group, Inc. | | 85,700 | | | 1,663 |
*ICF International, Inc. | | 59,471 | | | 1,423 |
Kaydon Corporation | | 51,959 | | | 1,707 |
Manpower, Inc. | | 69,250 | | | 2,990 |
Robert Half International, Inc. | | 52,003 | | | 1,225 |
Roper Industries, Inc. | | 40,800 | | | 2,283 |
*Stericycle, Inc. | | 66,420 | | | 4,356 |
The Corporate Executive Board Co. | | 63,300 | | | 1,663 |
TransDigm Group, Inc. | | 39,508 | | | 2,016 |
| | | | | |
| | | | | 33,442 |
| | | | | |
Consumer Discretionary—21.0% | | | | | |
*Career Education Corporation | | 82,925 | | | 1,909 |
*Chipotle Mexican Grill, Inc. | | 10,165 | | | 1,391 |
DeVry, Inc. | | 36,865 | | | 1,935 |
*Dick’s Sporting Goods, Inc. | | 175,500 | | | 4,368 |
*Education Management Corporation | | 88,000 | | | 1,342 |
Gentex Corporation | | 122,400 | | | 2,201 |
Jarden Corporation | | 92,200 | | | 2,477 |
*K12, Inc. | | 83,950 | | | 1,862 |
*O’Reilly Automotive, Inc. | | 46,150 | | | 2,195 |
P.F. Chang’s China Bistro, Inc. | | 31,822 | | | 1,262 |
*Steiner Leisure, Ltd.† | | 38,300 | | | 1,472 |
Strayer Education, Inc. | | 6,400 | | | 1,330 |
*Tempur-Pedic International, Inc. | | 78,000 | | | 2,398 |
*Under Armour, Inc. Class “A” | | 52,960 | | | 1,755 |
*Urban Outfitters, Inc. | | 52,800 | | | 1,816 |
| | | | | |
| | | | | 29,713 |
| | | | | |
Health Care—17.7% | | | | | |
*AGA Medical Holdings, Inc. | | 169,159 | | | 2,147 |
*American Medical Systems Holdings, Inc. | | 81,800 | | | 1,809 |
*athenahealth, Inc. | | 62,140 | | | 1,624 |
*Brookdale Senior Living, Inc. | | 56,876 | | | 853 |
*Cerner Corporation | | 36,600 | | | 2,778 |
*Covance, Inc. | | 32,900 | | | 1,688 |
CR Bard, Inc. | | 21,700 | | | 1,682 |
*HMS Holdings Corporation | | 33,900 | | | 1,838 |
*IDEXX Laboratories, Inc. | | 25,905 | | | 1,578 |
*Illumina, Inc. | | 57,700 | | | 2,512 |
*Kensey Nash Corporation | | 45,816 | | | 1,086 |
*NuVasive, Inc. | | 39,900 | | | 1,415 |
Perrigo Co. | | 43,900 | | | 2,593 |
*SXC Health Solutions Corporation† | | 19,809 | | | 1,451 |
| | | | | |
| | | | | 25,054 |
| | | | | |
Information Technology—17.4% | | | | | |
Blackbaud, Inc. | | 69,600 | | | 1,515 |
*Cavium Networks, Inc. | | 62,600 | | | 1,640 |
*Concur Technologies, Inc. | | 52,400 | | | 2,236 |
*DG FastChannel, Inc. | | 49,257 | | | 1,605 |
*Non-income producing securities
† = U.S. listed foreign security
| | | | | | | |
Issuer | | Shares or
Principal
Amount | | Value | |
| | |
Common Stocks—(continued) | | | | | | | |
Information Technology—(continued) | | | | | | | |
*j2 Global Communications, Inc. | | | 108,075 | | $ | 2,360 | |
*McAfee, Inc. | | | 73,400 | | | 2,255 | |
*Silicon Laboratories, Inc. | | | 42,560 | | | 1,726 | |
*Trimble Navigation, Ltd. | | | 62,200 | | | 1,742 | |
*Ultimate Software Group, Inc. | | | 74,125 | | | 2,436 | |
United Online, Inc. | | | 288,687 | | | 1,663 | |
*VeriSign, Inc. | | | 76,200 | | | 2,023 | |
*VistaPrint N.V.† | | | 72,757 | | | 3,455 | |
| | | | | | | |
| | | | | | 24,656 | |
| | | | | | | |
Financials—8.1% | | | | | | | |
*Affiliated Managers Group, Inc. | | | 53,980 | | | 3,280 | |
*First Horizon National Corporation | | | 157,633 | | | 1,805 | |
*FirstService Corporation† | | | 62,375 | | | 1,295 | |
Invesco, Ltd.† | | | 173,600 | | | 2,922 | |
Jones Lang LaSalle, Inc. | | | 33,200 | | | 2,179 | |
| | | | | | | |
| | | | | | 11,481 | |
| | | | | | | |
Energy—4.7% | | | | | | | |
*Comstock Resources, Inc. | | | 61,800 | | | 1,713 | |
*Concho Resources, Inc. | | | 41,740 | | | 2,310 | |
*Oceaneering International, Inc. | | | 29,800 | | | 1,338 | |
*Oil States International, Inc. | | | 35,200 | | | 1,393 | |
| | | | | | | |
| | | | | | 6,754 | |
| | | | | | | |
Consumer Staples—4.4% | | | | | | | |
Alberto-Culver Co. | | | 118,450 | | | 3,209 | |
*Green Mountain Coffee Roasters, Inc. | | | 117,021 | | | 3,007 | |
| | | | | | | |
| | | | | | 6,216 | |
| | | | | | | |
Telecommunication Services—1.6% | | | | | | | |
*Syniverse Holdings, Inc. | | | 112,700 | | | 2,305 | |
| | | | | | | |
Total Common Stocks—98.5%
(cost $129,979) | | | 139,621 | |
| | | | | | | |
| | |
Investment in Affiliate | | | | | | | |
William Blair Ready Reserves Fund | | | 22,697 | | | 23 | |
| | | | | | | |
Total Investment in Affiliate—0.0%
(cost $23) | | | 23 | |
| | | | | | | |
| | |
Repurchase Agreement | | | | | | | |
State Street Bank and Trust Company, 0.000% dated 6/30/10, due 7/1/10, repurchase price $2,109, collateralized by FHLB, 4.375%, due 09/17/10 | | $ | 2,109 | | | 2,109 | |
| | | | | | | |
Total Repurchase Agreement—1.5%
(cost $2,109) | | | 2,109 | |
| | | | | | | |
Total Investments—100.0%
(cost $132,111) | | | 141,753 | |
| | | | | | | |
Liabilities, plus cash and other assets—0.0% | | | (55 | ) |
| | | | | | | |
Net assets—100.0% | | $ | 141,698 | |
| | | | | | | |
See accompanying Notes to Financial Statements.
June 30, 2010 | William Blair Funds 27 |
GLOBAL MARKETS OVERVIEW
Summary
Year to date, the global equity market fell 8.65% as measured by the MSCI AC World IMI (net), with the MSCI World Ex-U.S. Index falling 11.78%. Developed non-U.S. markets underperformed Emerging markets, which fell 5.68%, as measured by the MSCI Emerging Markets IMI (net). The U.S. also underperformed other Developed equity markets, falling 6.28%, as measured by the MSCI US IMI (net), as significant U.S. dollar appreciation particularly hurt European, U.K. and Pacific Ex-Japan returns to U.S. dollar investors. In addition, investor sentiment was hampered by concerns regarding the debt crisis in Europe and the response to it, coupled with concerns about a “double dip” recession. Emerging markets were led by Asia, particularly Indonesia and India, which offset relative weakness from China, while Latin America underperformed, due to weakness in Brazil. Within Emerging Europe, Middle East and Africa (EMEA), South Africa, Egypt and Turkey outperformed Russia and the Central/Eastern European countries. Year to date developed small cap stocks were down 6.31%, as small cap stocks outperformed their larger cap counterparts across most regions. Sectorally, global Consumer and Industrials stocks led relative results, each falling between 3.5% and 4.0%, while Energy fell nearly 16%, and Materials and Utilities were each down approximately 11%. Commodity-related sectors underperformed as the Chinese monetary authorities tightened policy in an attempt to constrain speculation in that market, and the market became concerned about the sustainability of prices amidst potentially softening near term demand.
Outlook
As we enter a more mature phase of recovery, we have seen economic readings begin to weaken throughout the second quarter. Composite leading indicators are rolling over, with the evidence of a potential peak in growth strongest in China. This potential deceleration should not be surprising given the Chinese government’s efforts to restrain real estate markets, but it has become a cause for concern in the markets given China’s important role in global growth. Producer Manufacturing Indices (PMIs) in China and elsewhere are still pointing to growth but are now declining.
Stimulus is fading in the U.S. and employment is stagnant. Sovereign debt concerns have at times threatened to overwhelm Europe and the ECB (European Central Bank) is supporting austerity measures. Fears of a double-dip have re-emerged, and the uncertainties regarding global growth have led to a shift away from risky assets. This risk-off tone has been evidenced by the rally in U.S. Treasuries, the strength of the dollar and the rising price of gold. Despite a fiscal deficit and total debt to GDP ratios that are similar to the worst of the European offenders, the U.S. dollar has appreciated as it is considered to be the best of a dodgy breed.
While the odds of a slowdown have increased and the risks to global growth are now to the downside, double-dips are indeed rare. Indicators are not pointing to negative growth and the reality is that we have likely entered a soft patch as slower growth in the second half will follow the better than expected growth in the first half. We believe that China will avoid a hard landing, the U.S. will maintain positive growth, albeit at a slower rate, and Europe will continue to muddle through.
Earlier this year, with a bubble forming in sections of the residential property market, China put the brakes on lending to moderate prices. While it is possible that they overshoot to the downside, we believe that a hard landing will be averted as policy measures to moderate the housing market are implemented and growth slows from 11.9% in the first quarter to 8-9% in the 2nd half. China’s removal of the U.S. dollar peg was applauded by global leaders and is a
28 Semi-Annual Report | June 30, 2010 |
positive for the Chinese consumer. China’s inflation rose slightly above target but is very moderate at 3.1% especially given its growth and is expected to stay below 4%. Commodity prices (ex-gold) have retreated promoting lower inflation rates.
Economic readings in the U.S. have become more mixed and fears of a double-dip in housing have resurfaced. Data were strong through the quarter spurred by the $8,000 tax credit but starts and sales plummeted after its expiration. But while purchase applications are depressed, record low mortgage rates have stimulated refinancing activity. U.S. employment data disappointed throughout the quarter. At 9.5%, the unemployment rate is now flat versus a year ago but the most recent decline came from lower participation and not job creation. With the small business recovery yet to come, improvements in the NFIB small business optimism index are a promising sign that we can hope to see a new leg of growth and employment gains. The weak outlook for jobs is negatively impacting confidence but has not flowed through to consumer spending as much as expected. Consumers are also less leveraged than they were going into the crisis.
The sovereign debt crisis in Europe has created pressure for countries to set forth fiscal consolidation plans and some austerity measures have already been imposed. While these measures threaten to weaken already subdued growth, a Euro area double-dip is not the consensus view. The southern countries have remained weak but the German recovery remains intact as industrial production has been strong and exports, as well as those of the rest of the Euro-area have been helped by weakness of the Euro. A weaker exchange rate should be broadly expansionary as strong exports will help to boost government tax receipts and will support employment providing a much needed growth driver.
Aggressive fiscal policy around the world was quite effective during the crisis and prevented a prolonged global recession. Policy makers in the developed economies now face difficult decisions as they must face the deficit positions that they have created or exacerbated. A global debate is heating up between proponents of fiscal austerity and continued stimulative spending. The sovereign debt crisis in Europe has shifted the bias towards tightening while the U.S. has not jumped on the austerity bandwagon and is unlikely to do so ahead of the mid-term elections. Emerging markets do not face the same conflict as their debt-to-GDP ratios are considerably lower.
Monetary policy decisions in the developed world are much simpler as high unemployment persists while near-term inflation threats are benign. Additionally, there are no looming asset bubbles because the impairments in the financial system have prevented excess liquidity from flowing into the system. Central banks are expected to err on the side of tightening too late versus too early given the fragility of growth prospects. This “looser for longer” bias is pro-growth and could be a positive for equity markets.
Earnings expectations have rebounded around the globe. New highs in earnings are predicted for the current fiscal year in the emerging markets regions. Estimates for the developed world still remain 10-40% below prior peaks but earnings revisions going forward will likely slow. Of the cyclical sectors, technology has had the strongest rebound especially in the U.S. Multiples have contracted in every region as macro concerns dominated company fundamentals. Dividend yields are above 3% in Europe (including the U.K.) and companies around the world have substantial cash balances which could be used for future buybacks and/or incremental dividends. Uncertainties remain, but attractive valuations and strong balance sheets create an opportunity for solid returns going forward.
June 30, 2010 | William Blair Funds 29 |

W. George Greig

Kenneth J. McAtamney
GLOBAL GROWTH FUND
The Global Growth Fund seeks long-term capital appreciation.
AN OVERVIEW FROM THE PORTFOLIO MANAGERS
Please see page 28 for the Global Markets Overview.
The Global Growth Fund posted a 5.74% decrease (Class N Shares) for the six months ended June 30, 2010. By comparison, the Fund’s benchmark, the MSCI All Country World IMI index (net) declined 8.65%.
The Fund outpaced the Index year to date. Strong stock selection across most sectors and regions augmented first half results. The Fund’s Consumer Discretionary holdings added significant value during the period, driven by positive relative performance across regions, with particular value added in U.S. media and retailing, and Asian auto. Energy stock selection was boosted by good performance with Developed Europe, the U.S. and emerging Asia, while the Fund’s U.S. Healthcare names performed well. Telecommunication Services stock selection was strong due to the performance of sole sector holding, Softbank, due to strength from iPhone and iPad sales and subscriber increases. Regionally, Developed Europe, U.S., and emerging markets stock selection was strong during the first half of the year. Within Developed Europe, the Fund benefited from an underweighting and stock selection in the underperforming Financials sector, coupled with strong performance by European Discretionary, Energy and Materials holdings. Within the U.K., Energy and Financials outperformed. U.S. stock selection was particularly strong within Consumer Discretionary, Consumer Staples, Energy, and Health Care, which more than offset relative weakness within U.S. Financials.
As of June 30, the Fund maintained its focus on Consumer Discretionary holdings at 26.0% of the Fund, with approximately half of that exposure in the U.S. This weighting increased substantially from year end, when Consumer Discretionary represented approximately 16.8%. Financials, while representing approximately 16.0% of the Fund at June 30, was underweighted versus the Index despite significant exposure in emerging markets, due to the underweighting in Developed Asia, the U.S. and Europe Ex-U.K. This positioning did not change substantially since year end. Health Care and Information Technology represented 11.0% and 13.3% of the Fund, above Index weightings and similar to year end, while Industrials declined. Regionally, the Fund increased exposure in Europe Ex-U.K. to 18.3% from 14.1%, and was overweighted versus the market as of June 30. Conversely, U.S. exposure remained relatively stable as of year end and June 30; however, those endpoints belie an increase in the U.S. weighting during the first quarter and a nearly comparable decrease during the second quarter, due largely to a reduction in Energy, Financials, and Health Care names. Emerging markets declined slightly during the six month period, from approximately 22.4% to 20.5%, as exposure within Emerging Asia decreased.
30 Semi-Annual Report | June 30, 2010 |
Global Growth Fund
Performance Highlights (unaudited)
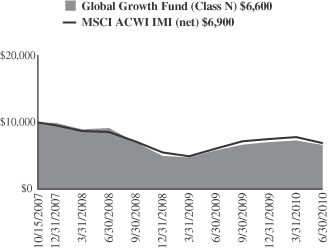
Average Annual Total Return at 6/30/2010
| | | | | | | | | |
| | | Year to
Date | | | 1
Year | | | Since
Inception(a) | |
Class N | | (5.74 | )% | | 13.86 | % | | (14.15 | )% |
Class I | | (5.60 | ) | | 14.27 | | | (13.87 | ) |
MSCI All Country World IMI (net) | | (8.65 | ) | | 13.07 | | | (12.92 | ) |
| | (a) | | For the period from October 15, 2007 (Commencement of Operations) to June 30, 2010. |
Performance cited represents past performance. Past performance does not guarantee future results and current performance may be lower or higher than the data quoted. Results shown are average annual total returns, which assume reinvestment of dividends and capital gains. Investment returns and principal will fluctuate and you may have a gain or loss when you sell shares. For the most current month-end performance information, please call 1-800-742-7272, or visit our Web site at www.williamblairfunds.com. Investing in smaller and medium capitalization companies involves special risks, including higher volatility and lower liquidity. Small and Mid Cap stocks are also more sensitive to purchase/sale transactions and changes in the issuer’s financial condition. International investing involves special risk considerations, including currency fluctuations, lower liquidity, economic and political risk. From time to time, the investment advisor may waive fees or reimburse expenses for the Fund. Without these waivers, performance would be lower. Class N shares are available to the general public without a sales load. Class I shares are available to certain institutional investors and advisory clients of William Blair & Company, L.L.C., without a sales load or distribution fees (12b-1).
The performance highlights and graph presented above do not reflect the deduction of taxes that a shareholder would pay on fund distributions or the redemption of fund shares.
The Morgan Stanley Capital International (MSCI) All Country World Investable Market Index (IMI) (net) is a free float-adjusted market capitalization weighted index that is designed to measure the equity market of developed and emerging markets. This series approximates the minimum possible dividend reinvestment.
This report identifies the Fund’s investments on June 30, 2010. These holdings are subject to change. Not all stocks in the Fund performed the same, nor is there any guarantee that these stocks will perform as well in the future. Market forecasts provided in this report may not necessarily come to pass.
Sector Diversification (unaudited)
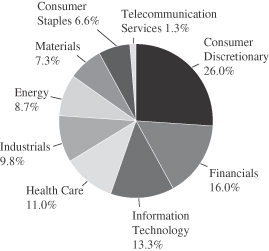
The sector diversification shown is based on the total long-term securities.
June 30, 2010 | William Blair Funds 31 |
Global Growth Fund
Portfolio of Investments, June 30, 2010 (all dollar amounts in thousands) (unaudited)
| | | | | |
Issuer | | Shares | | Value |
| |
Common Stocks—Western Hemisphere—42.0% | | | |
Canada—2.8% | | | | | |
Brookfield Asset Management, Inc. Class “A” (Real estate management & development)† | | 17,345 | | $ | 392 |
Crescent Point Energy Corporation (Oil, gas & consumable fuels) | | 7,689 | | | 269 |
*Gildan Activewear, Inc. (Textiles, apparel & luxury goods) | | 10,800 | | | 310 |
| | | | | |
| | | | | 971 |
| | | | | |
United States—39.2% | | | | | |
*Affiliated Managers Group, Inc. (Capital markets) | | 4,882 | | | 297 |
American Express Co. (Consumer finance) | | 15,191 | | | 603 |
*Apple, Inc. (Computers & peripherals) | | 3,551 | | | 893 |
*AutoZone, Inc. (Specialty retail) | | 2,426 | | | 469 |
*Bed Bath & Beyond, Inc. (Specialty retail) | | 11,484 | | | 426 |
*CareFusion Corporation (Health care equipment & supplies) | | 15,472 | | | 351 |
*Cerner Corporation (Health care technology) | | 4,462 | | | 339 |
*Chipotle Mexican Grill, Inc. (Hotels, restaurants & leisure) | | 3,390 | | | 464 |
DeVry, Inc. (Diversified consumer services) | | 4,670 | | | 245 |
EOG Resources, Inc. (Oil, gas & consumable fuels) | | 6,320 | | | 622 |
*Express Scripts, Inc. (Health care providers & services) | | 10,692 | | | 503 |
Family Dollar Stores, Inc. (Multiline retail) | | 7,931 | | | 299 |
Freeport-McMoRan Copper & Gold, Inc. (Metals & mining) | | 6,604 | | | 390 |
Gentex Corporation (Auto components) | | 18,173 | | | 327 |
Goodrich Corporation (Aerospace & defense) | | 4,801 | | | 318 |
*Google, Inc. Class “A” (Internet software & services) | | 1,331 | | | 592 |
*GrafTech International, Ltd. (Electrical equipment) | | 11,720 | | | 171 |
Hewlett-Packard Co. (Computers & peripherals) | | 14,605 | | | 632 |
*IDEXX Laboratories, Inc. (Health care equipment & supplies) | | 6,890 | | | 420 |
J.B. Hunt Transport Services, Inc. (Road & rail) | | 11,126 | | | 363 |
*j2 Global Communications, Inc. (Internet software & services) | | 7,957 | | | 174 |
*Kohl’s Corporation (Multiline retail) | | 8,705 | | | 413 |
Lockheed Martin Corporation (Aerospace & defense) | | 7,148 | | | 533 |
Lowe’s Cos., Inc. (Specialty retail) | | 20,009 | | | 409 |
Mead Johnson Nutrition Co. (Food products) | | 8,324 | | | 417 |
MSC Industrial Direct Co. Class “A” (Trading companies & distributors) | | 6,100 | | | 309 |
*Newfield Exploration Co. (Oil, gas & consumable fuels) | | 6,964 | | | 340 |
*Silicon Laboratories, Inc. (Semiconductors & semiconductor equipment) | | 6,022 | | | 244 |
Starbucks Corporation (Hotels, restaurants & leisure) | | 23,783 | | | 578 |
The Goldman Sachs Group, Inc. (Capital markets) | | 4,380 | | | 575 |
*Urban Outfitters, Inc. (Specialty retail) | | 12,022 | | | 413 |
Yum! Brands, Inc. (Hotels, restaurants & leisure) | | 13,294 | | | 519 |
| | | | | |
| | | | | 13,648 |
| | | | | |
| | | | | |
Issuer | | Shares | | Value |
|
Common Stocks—Europe—18.3% |
Denmark—3.1% | | | | | |
Coloplast A/S (Health care equipment & supplies) | | 2,002 | | $ | 199 |
Novo Nordisk A/S (Pharmaceuticals) | | 6,900 | | | 557 |
Novozymes A/S (Chemicals) | | 2,999 | | | 320 |
| | | | | |
| | | | | 1,076 |
| | | | | |
Finland—0.9% | | | | | |
Kone Oyj (Machinery) | | 7,707 | | | 307 |
| | | | | |
Germany—5.9% | | | | | |
Aixtron AG (Semiconductors & semiconductor equipment) | | 6,073 | | | 143 |
BASF SE (Chemicals) | | 9,453 | | | 516 |
*Daimler AG (Automobiles) | | 12,414 | | | 628 |
SAP AG (Software) | | 13,870 | | | 617 |
Wincor Nixdorf AG (Computers & peripherals) | | 2,981 | | | 167 |
| | | | | |
| | | | | 2,071 |
| | | | | |
Israel—1.6% | | | | | |
Teva Pharmaceutical Industries, Ltd.—ADR (Pharmaceuticals) | | 10,297 | | | 535 |
| | | | | |
Norway—1.6% | | | | | |
Statoil ASA (Oil, gas & consumable fuels) | | 28,100 | | | 541 |
| | | | | |
Portugal—1.0% | | | | | |
Jeronimo Martins SGPS S.A. (Food & staples retailing) | | 37,643 | | | 345 |
| | | | | |
Spain—0.4% | | | | | |
Tecnicas Reunidas S.A. (Energy equipment & services) | | 3,321 | | | 151 |
| | | | | |
Switzerland—3.8% | | | | | |
Cie Financiere Richemont S.A. (Textiles, apparel & luxury goods) | | 11,647 | | | 407 |
*Mettler-Toledo International, Inc. (Life sciences tools & services) | | 2,327 | | | 260 |
Partners Group Holding AG (Capital markets) | | 3,051 | | | 368 |
Sika AG (Chemicals) | | 163 | | | 289 |
| | | | | |
| | | | | 1,324 |
| | | | | |
United Kingdom—10.2% | | | | | |
Amlin plc (Insurance) | | 51,366 | | | 296 |
BlueBay Asset Management plc (Capital markets) | | 56,147 | | | 241 |
Compass Group plc (Hotels, restaurants & leisure) | | 56,371 | | | 429 |
Intertek Group plc (Professional services) | | 8,459 | | | 181 |
Michael Page International plc (Professional services) | | 29,630 | | | 164 |
Next plc (Multiline retail) | | 11,109 | | | 331 |
Petrofac, Ltd. (Energy equipment & services) | | 22,913 | | | 403 |
Reckitt Benckiser Group plc (Household products) | | 9,050 | | | 421 |
Standard Chartered plc (Commercial banks) | | 21,245 | | | 517 |
The Weir Group plc (Machinery) | | 15,751 | | | 242 |
Vedanta Resources plc (Metals & mining) | | 10,228 | | | 321 |
| | | | | |
| | | | | 3,546 |
| | | | | |
See accompanying Notes to Financial Statements.
32 Semi-Annual Report | June 30, 2010 |
Global Growth Fund
Portfolio of Investments, June 30, 2010 (all dollar amounts in thousands) (unaudited)
| | | | | |
Issuer | | Shares | | Value |
|
Common Stocks—Emerging Asia—10.2% |
China—3.7% | | | | | |
CNOOC, Ltd. (Oil, gas & consumable fuels) | | 373,000 | | $ | 634 |
Dongfeng Motor Group Co., Ltd. (Automobiles) | | 272,000 | | | 315 |
Industrial and Commercial Bank of China (Commercial banks) | | 459,000 | | | 334 |
| | | | | |
| | | | | 1,283 |
| | | | | |
Indonesia—2.0% | | | | | |
PT Astra International Tbk (Automobiles) | | 129,500 | | | 684 |
| | | | | |
Malaysia—0.6% | | | | | |
Top Glove Corporation Bhd (Health care equipment & supplies) | | 51,200 | | | 216 |
| | | | | |
South Korea—2.4% | | | | | |
Hyundai Motor Co. (Automobiles) | | 6,979 | | | 817 |
| | | | | |
Taiwan—1.5% | | | | | |
Taiwan Semiconductor Manufacturing Co., Ltd. (Semiconductors & semiconductor equipment) | | 178,000 | | | 333 |
Tripod Technology Corporation (Electronic equipment, instruments & components) | | 53,000 | | | 196 |
| | | | | |
| | | | | 529 |
| | | | | |
| | |
Emerging Latin America—4.2% | | | | | |
Brazil—1.4% | | | | | |
Natura Cosmeticos S.A. (Personal products) | | 21,400 | | | 474 |
| | | | | |
Chile—1.1% | | | | | |
Banco Santander Chile—ADR (Commercial banks) | | 5,894 | | | 396 |
| | | | | |
Mexico—1.7% | | | | | |
Wal-Mart de Mexico S.A.B. de C.V. (Food & staples retailing) | | 268,200 | | | 594 |
| | | | | |
| |
Emerging Europe, Mid-East, Africa—3.9% | | | |
South Africa—2.7% | | | | | |
*Aspen Pharmacare Holdings, Ltd. (Pharmaceuticals) | | 34,128 | | | 337 |
Mr Price Group, Ltd. (Specialty retail) | | 33,495 | | | 195 |
Standard Bank Group, Ltd. (Commercial banks) | | 31,518 | | | 418 |
| | | | | |
| | | | | 950 |
| | | | | |
ADR = American Depository Receipt
† = U.S. listed foreign security
*Non-income producing securities
| | | | | | |
Issuer | | Shares or
Principal
Amount | | Value |
| |
Common Stocks—Emerging Europe, Mid-East, Africa—3.9%—(continued) | | | |
Turkey—1.2% | | | | | | |
Turkiye Garanti Bankasi A.S. (Commercial banks) | | | 102,137 | | $ | 425 |
| | | | | | |
Japan—4.8% | | | | | | |
Canon, Inc. (Office electronics) | | | 14,100 | | | 526 |
Exedy Corporation (Auto components) | | | 5,900 | | | 151 |
Fanuc, Ltd. (Machinery) | | | 4,900 | | | 553 |
Softbank Corporation (Wireless telecommunication services) | | | 16,300 | | | 433 |
| | | | | | |
| | | | | | 1,663 |
| | | | | | |
| | |
Asia—1.8% | | | | | | |
Australia—1.8% | | | | | | |
BHP Billiton, Ltd. (Metals & mining) | | | 19,983 | | | 622 |
| | | | | | |
Total Common Stocks—95.4%
(cost $30,423) | | | 33,168 |
| | | | | | |
| | |
Preferred Stocks | | | | | | |
| | |
Emerging Latin America | | | | | | |
Itau Unibanco Holding S.A. (Commercial banks) | | | 31,800 | | | 572 |
Randon Participacoes S.A. (Machinery) | | | 34,500 | | | 197 |
| | | | | | |
Total Preferred Stocks—2.2%
(cost $794) | | | 769 |
| | | | | | |
| | |
Investment in Affiliate | | | | | | |
William Blair Ready Reserves Fund | | | 28,800 | | | 29 |
| | | | | | |
Total Investment in Affiliate—0.1%
(cost $29) | | | 29 |
| | | | | | |
| | |
Repurchase Agreement | | | | | | |
State Street Bank and Trust Company, 0.000% dated 6/30/10, due 7/1/10, repurchase price $809, collateralized by FHLB,
4.375%, due 9/17/10 | | $ | 809 | | | 809 |
| | | | | | |
Total Repurchase Agreement—2.3%
(cost $809) | | | 809 |
| | | | | | |
Total Investments—100.0%
(cost $32,055) | | | 34,775 |
Cash and other assets, less liabilities—0.0% | | | 11 |
| | | | | | |
Net assets—100.0% | | $ | 34,786 |
| | | | | | |
See accompanying Notes to Financial Statements.
June 30, 2010 | William Blair Funds 33 |
Global Growth Fund
Portfolio of Investments, June 30, 2010 (all dollar amounts in thousands) (unaudited)
For securities primarily traded on exchanges or markets that close before the close of regular trading on the New York Stock Exchange, the Fund may use an independent pricing service to fair value price the securities pursuant to Valuation Procedures approved by the Board of Trustees.
At June 30, 2010, the Fund’s Portfolio of Investments includes the following industry categories:
| | |
Consumer Discretionary | | 26.0% |
Financials | | 16.0% |
Information Technology | | 13.3% |
Health Care | | 11.0% |
Industrials | | 9.8% |
Energy | | 8.7% |
Materials | | 7.3% |
Consumer Staples | | 6.6% |
Telecommunication Services | | 1.3% |
| | |
Total | | 100.0% |
| | |
At June 30, 2010, the Fund’s Portfolio of Investments includes the following currency categories:
| | |
U.S. Dollar | | 44.9% |
British Pound Sterling | | 10.4% |
Euro | | 8.5% |
Japanese Yen | | 4.9% |
Hong Kong Dollar | | 3.8% |
Brazilian Real | | 3.7% |
Danish Krone | | 3.2% |
Swiss Franc | | 3.1% |
South African Rand | | 2.8% |
South Korean Won | | 2.4% |
Indonesian Rupiah | | 2.0% |
Australian Dollar | | 1.8% |
Mexican Peso | | 1.7% |
Canadian Dollar | | 1.7% |
Norwegian Krone | | 1.6% |
New Taiwan Dollar | | 1.6% |
Turkish Lira | | 1.3% |
All Other Currencies | | 0.6% |
| | |
Total | | 100.0% |
| | |
See accompanying Notes to Financial Statements.
34 Semi-Annual Report | June 30, 2010 |
W. George Greig
INTERNATIONAL GROWTH FUND
The International Growth Fund seeks long-term capital appreciation.
AN OVERVIEW FROM THE PORTFOLIO MANAGER
Please see page 28 for the Global Markets Overview.
The International Growth Fund posted a 4.20% decrease (Class N Shares) for the six months ended June 30, 2010. By comparison, the Fund’s benchmark, the MSCI All Country World Ex-U.S. IMI Index (net), declined 10.41%.
Year to date, the Fund’s stock selection was strong in virtually every sector, with the exception of the Fund’s one Utilities holding. In particular, Consumer Discretionary stock selection was strong, added by performance by a number of the Fund’s auto- and transportation-related holdings, coupled with strong performance within the U.K.. Energy stock selection augmented results, as the Fund’s holdings outpaced the Index by nearly 10%. Strong Financials stock selection was driven by the significant underweighting in European Financials stocks, coupled with limited exposure to commercial banks and capital markets companies within the European Union. Moreover, the Fund’s tilt towards Financials with significant Emerging Markets exposure added value. Strong performance in U.K. and Emerging Markets Industrials was also positive. Somewhat detracting from results was performance by EDF Energies Nouvelles S.A., the French alternative Utilities company, which was hampered by concerns about demand and subsidies within the alternative energy space. Regionally, stock selection was strong across most regions, with the exception of Pacific Ex-Japan and Canada. In addition, the Fund’s currency hedging strategy also added just shy of 1% to relative performance.
The Fund’s overall positioning did not substantially change since year end, with its focus remaining in Consumer Discretionary and Industrials at the expense of Materials and Financials. Regionally, the Fund remained underweighted in Developed Market Financials due not only to concerns emanating from the European situation and potential regulatory changes, but also from a growth perspective relative to other opportunities. While the European Financial sector was slightly underweighted versus the Index, the European geographic weighting increased from approximately 23% as of year end, due to the reclassification of Israel (and Teva Pharmaceutical Industries, Ltd.) into Europe from Emerging Europe, Middle East, and Africa (EMEA), coupled with an increase in Consumer Discretionary, Energy and Materials. Emerging Markets exposure was 27.0%, slightly below the 29.4% weighting as of year end, although the complexion of the underlying Emerging Markets regional exposures changed. In particular, we reduced exposure in Emerging Asian Consumer Staples, Industrials, Information Technology and Materials holdings due to concerns about a slowdown in these economies amidst potential overheating concerns, as well as specific valuation concerns. Conversely, exposure in Emerging Latin American Energy, Industrials and Telecommunication Services companies increased. After increasing currency hedges against the Pound Sterling, Euro and Japanese Yen in the first quarter of the year, we began unwinding most exposure following the European debt crisis when the Euro and Sterling significantly depreciated. As a result, as of June 30, the only hedge against U.S. dollar appreciation we maintained in the Fund was a partial hedge against the Japanese Yen. This hedge represented approximately 4% of the Fund’s Net Assets at June 30.
June 30, 2010 | William Blair Funds 35 |
International Growth Fund
Performance Highlights (unaudited)
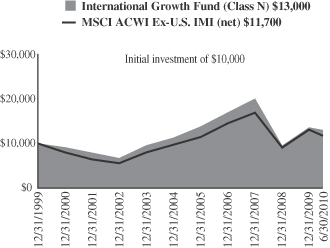
Average Annual Total Return at 6/30/2010
| | | | | | | | | | | | | | | |
| | | Year to
Date | | | 1
Year | | | 3
Year | | | 5
Year | | | 10
Year | |
Class N | | (4.20 | )% | | 16.42 | % | | (11.75 | )% | | 2.51 | % | | 2.47 | % |
Class I | | (4.01 | ) | | 16.78 | | | (11.47 | ) | | 2.83 | | | 2.76 | |
MSCI All Country World Ex-U.S. IMI (net) | | (10.41 | ) | | 11.49 | | | (10.50 | ) | | 3.63 | | | 2.23 | |
Performance cited represents past performance. Past performance does not guarantee future results and current performance may be lower or higher than the data quoted. Results shown are average annual total returns, which assume reinvestment of dividends and capital gains. Investment returns and principal will fluctuate and you may have a gain or loss when you sell shares. For the most current month-end performance information, please call 1-800-742-7272, or visit our Web site at www.williamblairfunds.com. From time to time, the investment advisor may waive fees or reimburse expenses for the Fund. Without these waivers, performance would be lower. International investing involves special risk considerations, including currency fluctuations, lower liquidity, economic and political risk. Class N shares are available to the general public without a sales load. Class I shares are available to certain institutional investors and advisory clients of William Blair & Company, L.L.C., without a sales load or distribution (12b-1) or service fees.
The performance highlights and graph presented above do not reflect the deduction of taxes that a shareholder would pay on fund distributions or the redemption of fund shares.
The Morgan Stanley Capital International (MSCI) All Country World Ex-U.S. Investable Market Index (IMI) (net) is a free float-adjusted market capitalization weighted index that is designed to measure the equity market performance of developed and emerging markets, excluding the United States. This series approximates the minimum possible dividend reinvestment.
This report identifies the Fund’s investments on June 30, 2010. These holdings are subject to change. Not all stocks in the Fund performed the same, nor is there any guarantee that these stocks will perform as well in the future. Market forecasts provided in this report may not necessarily come to pass.
Sector Diversification (unaudited)
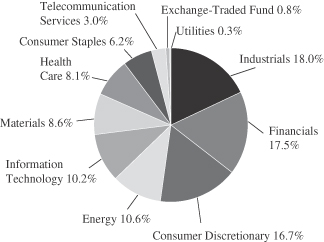
The sector diversification shown is based on the total long-term securities.
36 Semi-Annual Report | June 30, 2010 |
International Growth Fund
Portfolio of Investments, June 30, 2010 (all dollar amounts in thousands) (unaudited)
| | | | | |
Issuer | | Shares | | Value |
| | |
Common Stocks—Europe—28.5% | | | | | |
Belgium—0.6% | | | | | |
Colruyt S.A. (Food & staples retailing) | | 106,844 | | $ | 25,134 |
| | | | | |
Denmark—2.0% | | | | | |
Coloplast A/S (Health care equipment & supplies) | | 179,998 | | | 17,866 |
FLSmidth & Co. A/S (Construction & engineering) | | 279,902 | | | 18,064 |
Novo Nordisk A/S (Pharmaceuticals) | | 314,100 | | | 25,377 |
Novozymes A/S (Chemicals) | | 154,371 | | | 16,472 |
SimCorp A/S (Software) | | 43,303 | | | 6,897 |
| | | | | |
| | | | | 84,676 |
| | | | | |
Finland—1.1% | | | | | |
Kone Oyj (Machinery) | | 763,884 | | | 30,414 |
Nokian Renkaat Oyj (Auto components) | | 649,181 | | | 15,888 |
| | | | | |
| | | | | 46,302 |
| | | | | |
France—5.3% | | | | | |
Air Liquide S.A. (Chemicals) | | 422,793 | | | 42,696 |
bioMerieux (Health care equipment & supplies) | | 142,300 | | | 14,610 |
Cie Generale des Etablissements Michelin (Auto components) | | 479,355 | | | 33,398 |
EDF Energies Nouvelles S.A. (Independent power producers & energy traders) | | 396,564 | | | 13,416 |
Essilor International S.A. (Health care equipment & supplies) | | 434,102 | | | 25,796 |
Hermes International (Textiles, apparel & luxury goods) | | 157,772 | | | 20,915 |
L’Oreal S.A. (Personal products) | | 425,984 | | | 41,708 |
Schneider Electric S.A. (Electrical equipment) | | 318,909 | | | 32,210 |
| | | | | |
| | | | | 224,749 |
| | | | | |
Germany—4.5% | | | | | |
BASF SE (Chemicals) | | 1,161,830 | | | 63,483 |
*Daimler AG (Automobiles) | | 718,533 | | | 36,347 |
Fielmann AG (Specialty retail) | | 132,990 | | | 10,067 |
Lanxess AG (Chemicals) | | 270,359 | | | 11,380 |
MAN SE (Machinery) | | 243,840 | | | 20,103 |
SAP AG (Software) | | 980,997 | | | 43,622 |
Wincor Nixdorf AG (Computers & peripherals) | | 94,858 | | | 5,302 |
| | | | | |
| | | | | 190,304 |
| | | | | |
Ireland—0.3% | | | | | |
Paddy Power plc (Hotels, restaurants & leisure) | | 368,386 | | | 11,445 |
| | | | | |
Israel—1.9% | | | | | |
Bezeq Israeli Telecommunication Corp., Ltd. (Diversified telecommunication services) | | 9,484,302 | | | 20,732 |
Israel Chemicals, Ltd. (Chemicals) | | 2,509,008 | | | 26,138 |
Teva Pharmaceutical Industries, Ltd.—ADR (Pharmaceuticals) | | 659,925 | | | 34,309 |
| | | | | |
| | | | | 81,179 |
| | | | | |
Italy—0.8% | | | | | |
Ansaldo STS SpA (Transportation infrastructure) | | 681,263 | | | 10,936 |
DiaSorin SpA (Health care equipment & supplies) | | 273,591 | | | 10,022 |
| | | | | |
Issuer | | Shares | | Value |
| |
Common Stocks—Europe—28.5%—(continued) | | | |
Italy—(continued) | | | | | |
Saipem SpA (Energy equipment & services) | | 466,147 | | $ | 14,198 |
| | | | | |
| | | | | 35,156 |
| | | | | |
Norway—1.3% | | | | | |
*Norwegian Air Shuttle ASA (Airlines) | | 348,631 | | | 5,574 |
Statoil ASA (Oil, gas & consumable fuels) | | 2,608,900 | | | 50,260 |
| | | | | |
| | | | | 55,834 |
| | | | | |
Portugal—0.4% | | | | | |
Jeronimo Martins SGPS S.A. (Food & staples retailing) | | 1,773,207 | | | 16,246 |
| | | | | |
Spain—2.2% | | | | | |
Banco Santander S.A. (Commercial banks) | | 5,337,036 | | | 55,965 |
Inditex S.A. (Specialty retail) | | 375,281 | | | 21,399 |
Tecnicas Reunidas S.A. (Energy equipment & services) | | 310,555 | | | 14,123 |
| | | | | |
| | | | | 91,487 |
| | | | | |
Sweden—0.2% | | | | | |
Elekta AB (Health care equipment & supplies) | | 332,018 | | | 8,402 |
| | | | | |
Switzerland—7.9% | | | | | |
*ABB, Ltd. (Electrical equipment) | | 904,993 | | | 15,757 |
Cie Financiere Richemont S.A. (Textiles, apparel & luxury goods) | | 1,517,355 | | | 52,974 |
Credit Suisse Group AG (Capital markets) | | 349,132 | | | 13,126 |
Geberit AG (Building products) | | 117,166 | | | 18,231 |
Kuehne + Nagel International AG (Marine) | | 188,115 | | | 19,364 |
Novartis AG (Pharmaceuticals) | | 890,273 | | | 43,145 |
*Orascom Development Holding AG (Hotels, restaurants & leisure) | | 109,528 | | | 6,076 |
Partners Group Holding AG (Capital markets) | | 208,232 | | | 25,125 |
Roche Holding AG (Pharmaceuticals) | | 94,921 | | | 13,792 |
SGS S.A. (Professional services) | | 25,338 | | | 34,198 |
Sika AG (Chemicals) | | 9,633 | | | 17,076 |
Sonova Holding AG (Health care equipment & supplies) | | 188,900 | | | 23,181 |
Zurich Financial Services AG (Insurance) | | 247,079 | | | 54,460 |
| | | | | |
| | | | | 336,505 |
| | | | | |
| | |
United Kingdom—19.6% | | | | | |
Abcam plc (Biotechnology) | | 390,302 | | | 7,129 |
Admiral Group plc (Insurance) | | 1,372,535 | | | 28,744 |
Aggreko plc (Commercial services & supplies) | | 795,726 | | | 16,705 |
AMEC plc (Energy equipment & services) | | 1,460,458 | | | 17,893 |
Amlin plc (Insurance) | | 2,922,234 | | | 16,819 |
Aveva Group plc (Software) | | 626,588 | | | 10,516 |
Babcock International Group plc (Commercial services & supplies) | | 2,961,723 | | | 26,312 |
Barclays plc (Commercial banks) | | 10,037,646 | | | 40,065 |
BHP Billiton plc (Metals & mining) | | 2,124,238 | | | 55,078 |
BlueBay Asset Management plc (Capital markets) | | 1,981,156 | | | 8,484 |
Britvic plc (Beverages) | | 1,727,867 | | | 12,245 |
Burberry Group plc (Textiles, apparel & luxury goods) | | 1,148,165 | | | 12,967 |
See accompanying Notes to Financial Statements.
June 30, 2010 | William Blair Funds 37 |
International Growth Fund
Portfolio of Investments, June 30, 2010 (all dollar amounts in thousands) (unaudited)
| | | | | |
Issuer | | Shares | | Value |
|
Common Stocks—United Kingdom—19.6%—(continued) |
*Cairn Energy plc (Oil, gas & consumable fuels) | | 2,909,808 | | $ | 17,876 |
Chemring Group plc (Aerospace & defense) | | 365,436 | | | 16,160 |
Compass Group plc (Hotels, restaurants & leisure) | | 3,286,320 | | | 25,001 |
*Dana Petroleum plc (Oil, gas & consumable fuels) | | 811,644 | | | 13,663 |
Domino’s Pizza UK & IRL plc (Hotels, restaurants & leisure) | | 1,449,531 | | | 8,190 |
Experian plc (Professional services) | | 1,917,523 | | | 16,675 |
*Heritage Oil plc (Oil, gas & consumable fuels) | | 1,852,566 | | | 10,850 |
HSBC Holdings plc (Commercial banks) | | 485,200 | | | 4,448 |
Inmarsat plc (Diversified telecommunication services) | | 1,143,139 | | | 12,121 |
Intertek Group plc (Professional services) | | 803,325 | | | 17,221 |
Johnson Matthey plc (Chemicals) | | 918,153 | | | 20,399 |
Lancashire Holdings, Ltd. (Insurance) | | 1,093,134 | | | 8,103 |
Meggitt plc (Aerospace & defense) | | 1,900,607 | | | 8,857 |
Michael Page International plc (Professional services) | | 2,398,335 | | | 13,277 |
Micro Focus International plc (Software) | | 812,865 | | | 5,108 |
Mothercare plc (Multiline retail) | | 715,393 | | | 6,071 |
Next plc (Multiline retail) | | 1,359,638 | | | 40,537 |
Petrofac, Ltd. (Energy equipment & services) | | 1,438,148 | | | 25,301 |
Rightmove plc (Media) | | 690,174 | | | 6,474 |
*Rolls-Royce Group plc (Aerospace & defense) | | 5,542,009 | | | 46,258 |
Rotork plc (Machinery) | | 1,039,984 | | | 19,873 |
RPS Group plc (Commercial services & supplies) | | 2,849,484 | | | 7,930 |
Serco Group plc (Commercial services & supplies) | | 2,417,037 | | | 21,108 |
Smith & Nephew plc (Health care equipment & supplies) | | 2,077,300 | | | 19,625 |
Spirax-Sarco Engineering plc (Machinery) | | 529,194 | | | 10,782 |
Standard Chartered plc (Commercial banks) | | 2,560,181 | | | 62,341 |
*Telecity Group plc (Internet software & services) | | 967,535 | | | 5,764 |
*The Berkeley Group Holdings plc (Household durables) | | 1,150,950 | | | 13,059 |
The Capita Group plc (Professional services) | | 1,998,602 | | | 22,019 |
The Weir Group plc (Machinery) | | 1,118,870 | | | 17,189 |
Ultra Electronics Holdings plc (Aerospace & defense) | | 544,922 | | | 12,446 |
Vedanta Resources plc (Metals & mining) | | 789,268 | | | 24,798 |
Victrex plc (Chemicals) | | 669,386 | | | 10,889 |
VT Group plc (Commercial services & supplies) | | 560,541 | | | 6,449 |
| | | | | |
| | | | | 829,819 |
| | | | | |
| | |
Emerging Asia—13.8% | | | | | |
China—3.7% | | | | | |
China Yurun Food Group, Ltd. (Food products) | | 3,718,000 | | | 11,692 |
China Zhongwang Holdings, Ltd. (Metals & mining) | | 20,880,400 | | | 13,226 |
| | | | | |
Issuer | | Shares | | Value |
|
Common Stocks—Emerging Asia—13.8%—(continued) |
China—(continued) | | | | | |
CNOOC, Ltd. (Oil, gas & consumable fuels) | | 35,740,000 | | $ | 60,747 |
Dongfeng Motor Group Co., Ltd. (Automobiles) | | 15,590,000 | | | 18,083 |
Industrial and Commercial Bank of China (Commercial banks) | | 55,356,000 | | | 40,236 |
Lonking Holdings, Ltd. (Machinery) | | 8,970,000 | | | 5,942 |
Minth Group, Ltd. (Auto components) | | 5,484,000 | | | 6,480 |
| | | | | |
| | | | | 156,406 |
| | | | | |
India—3.7% | | | | | |
Asian Paints, Ltd. (Chemicals) | | 259,124 | | | 12,771 |
Axis Bank, Ltd. (Commercial banks) | | 351,121 | | | 9,308 |
Housing Development Finance Corporation (Thrifts & mortgage finance) | | 369,798 | | | 23,305 |
Infosys Technologies, Ltd. (IT services) | | 624,655 | | | 37,269 |
Jindal Steel & Power, Ltd. (Metals & mining) | | 1,714,531 | | | 22,894 |
Lupin, Ltd. (Pharmaceuticals) | | 275,819 | | | 11,612 |
Reliance Industries, Ltd. (Oil, gas & consumable fuels) | | 769,984 | | | 17,920 |
Tata Motors, Ltd. (Machinery) | | 1,044,319 | | | 17,294 |
Yes Bank, Ltd. (Commercial banks) | | 763,463 | | | 4,376 |
| | | | | |
| | | | | 156,749 |
| | | | | |
Indonesia—2.8% | | | | | |
PT Astra International Tbk (Automobiles) | | 8,692,000 | �� | | 45,924 |
PT Bank Rakyat Indonesia (Commercial banks) | | 38,297,500 | | | 38,882 |
PT Perusahaan Perkebunan London Sumatra Indonesia Tbk (Food products) | | 10,998,000 | | | 9,977 |
PT United Tractors Tbk (Machinery) | | 11,861,000 | | | 24,311 |
| | | | | |
| | | | | 119,094 |
| | | | | |
Malaysia—0.2% | | | | | |
Top Glove Corporation Bhd (Health care equipment & supplies) | | 1,634,400 | | | 6,908 |
| | | | | |
Papua New Guinea—0.2% | | | | | |
Oil Search, Ltd. (Oil, gas & consumable fuels) | | 2,101,336 | | | 9,668 |
| | | | | |
South Korea—1.6% | | | | | |
Hyundai Mobis (Auto components) | | 109,731 | | | 18,404 |
Hyundai Motor Co. (Automobiles) | | 430,170 | | | 50,334 |
| | | | | |
| | | | | 68,738 |
| | | | | |
Taiwan—1.3% | | | | | |
Taiwan Semiconductor Manufacturing Co., Ltd. (Semiconductors & semiconductor equipment) | | 22,655,000 | | | 42,343 |
Tripod Technology Corporation (Electronic equipment, instruments & components) | | 1,788,000 | | | 6,612 |
Wistron Corporation (Computers & peripherals) | | 5,014,000 | | | 7,347 |
| | | | | |
| | | | | 56,302 |
| | | | | |
Thailand—0.3% | | | | | |
CP ALL PCL (Food & staples retailing) | | 11,964,700 | | | 10,620 |
| | | | | |
See accompanying Notes to Financial Statements.
38 Semi-Annual Report | June 30, 2010 |
International Growth Fund
Portfolio of Investments, June 30, 2010 (all dollar amounts in thousands) (unaudited)
| | | | | |
Issuer | | Shares | | Value |
| |
Common Stocks—Japan—12.7% | | | |
ABC-Mart, Inc. (Specialty retail) | | 128,500 | | $ | 5,041 |
Canon, Inc. (Office electronics) | | 1,756,400 | | | 65,460 |
Dena Co., Ltd. (Internet & catalog retail) | | 201,000 | | | 5,307 |
Exedy Corporation (Auto components) | | 264,000 | | | 6,768 |
F.C.C. Co., Ltd. (Auto components) | | 213,203 | | | 3,984 |
Fanuc, Ltd. (Machinery) | | 458,100 | | | 51,730 |
*Gree, Inc. (Internet software & services) | | 150,600 | | | 12,026 |
Hoya Corporation (Electronic equipment, instruments & components) | | 1,048,000 | | | 22,299 |
K’s Holdings Corporation (Specialty retail) | | 460,200 | | | 9,408 |
kabu.com Securities Co., Ltd. (Capital markets) | | 1,257,600 | | | 5,899 |
Kakaku.com, Inc. (Internet software & services) | | 1,720 | | | 7,106 |
Keyence Corporation (Electronic equipment, instruments & components) | | 138,100 | | | 31,934 |
Komatsu, Ltd. (Machinery) | | 1,255,100 | | | 22,599 |
Makita Corporation (Machinery) | | 505,200 | | | 13,519 |
Miraca Holdings, Inc. (Health care providers & services) | | 295,000 | | | 8,830 |
MISUMI Group, Inc. (Trading companies & distributors) | | 558,500 | | | 10,314 |
Murata Manufacturing Co., Ltd. (Electronic equipment, instruments & components) | | 404,100 | | | 19,271 |
Nabtesco Corporation (Machinery) | | 464,000 | | | 7,152 |
Nippon Electric Glass Co., Ltd. (Electronic equipment, instruments & components) | | 1,743,000 | | | 19,965 |
Nitori Co., Ltd. (Specialty retail) | | 188,270 | | | 16,229 |
Osaka Securities Exchange Co., Ltd. (Diversified financial services) | | 1,506 | | | 6,396 |
Park24 Co., Ltd. (Commercial services & supplies) | | 859,800 | | | 9,223 |
Point, Inc. (Specialty retail) | | 179,170 | | | 9,827 |
Sawai Pharmaceutical Co., Ltd. (Pharmaceuticals) | | 78,600 | | | 7,521 |
Softbank Corporation (Wireless telecommunication services) | | 1,864,800 | | | 49,461 |
Sony Financial Holdings, Inc. (Insurance) | | 3,283 | | | 10,951 |
Terumo Corporation (Health care equipment & supplies) | | 265,500 | | | 12,715 |
USS Co., Ltd. (Specialty retail) | | 160,030 | | | 11,432 |
Yahoo! Japan Corporation (Internet software & services) | | 134,301 | | | 53,529 |
Yamada Denki Co., Ltd. (Specialty retail) | | 328,510 | | | 21,465 |
| | | | | |
| | | | | 537,361 |
| | | | | |
| | |
Emerging Latin America—9.6% | | | | | |
Brazil—5.3% | | | | | |
Amil Participacoes S.A. (Insurance) | | 562,000 | | | 4,561 |
BR Malls Participacoes S.A. (Real estate management & development) | | 522,300 | | | 6,800 |
BR Properties S.A. (Real estate management & development) | | 1,293,570 | | | 9,209 |
Cyrela Brazil Realty S.A. (Household durables) | | 1,506,100 | | | 16,279 |
Diagnosticos da America S.A. (Health care providers & services) | | 928,800 | | | 8,743 |
*GP Investments, Ltd. (Capital markets) | | 1,442,043 | | | 4,809 |
Localiza Rent a Car S.A. (Road & rail) | | 1,349,300 | | | 15,661 |
Lojas Renner S.A. (Multiline retail) | | 583,600 | | | 15,843 |
*Mills Estruturas e Servicos de Engenharia S.A. (Trading companies & distributors) | | 982,410 | | | 7,429 |
| | | | | |
Issuer | | Shares | | Value |
|
Common Stocks— Emerging Latin America—9.6%—(continued) |
Brazil—(continued) | | | | | |
MRV Engenharia e Participacoes S.A. (Household durables) | | 1,086,164 | | $ | 7,648 |
Natura Cosmeticos S.A. (Personal products) | | 1,484,200 | | | 32,891 |
OdontoPrev S.A. (Health care providers & services) | | 196,900 | | | 6,862 |
*OGX Petroleo e Gas Participacoes S.A. (Oil, gas & consumable fuels) | | 2,330,000 | | | 21,583 |
PDG Realty S.A. Empreendimentos e Participacoes (Household durables) | | 925,700 | | | 7,816 |
Petroleo Brasileiro S.A. (Oil, gas & consumable fuels) | | 2,718,563 | | | 46,690 |
SLC Agricola S.A. (Food products) | | 619,200 | | | 4,597 |
Totvs S.A. (Software) | | 89,700 | | | 6,657 |
| | | | | |
| | | | | 224,078 |
| | | | | |
Chile—0.9% | | | | | |
Banco Santander Chile—ADR (Commercial banks) | | 294,527 | | | 19,760 |
Lan Airlines S.A. (Airlines) | | 1,020,184 | | | 19,056 |
| | | | | |
| | | | | 38,816 |
| | | | | |
Colombia—0.8% | | | | | |
*Pacific Rubiales Energy Corporation (Oil, gas & consumable fuels) | | 1,401,531 | | | 31,413 |
| | | | | |
Mexico—1.9% | | | | | |
America Movil S.A.B. de C.V.—ADR (Wireless telecommunication services) | | 855,059 | | | 40,615 |
Banco Compartamos S.A. de C.V. (Consumer finance) | | 1,776,700 | | | 9,234 |
*Genomma Lab Internacional S.A.B. de C.V. (Pharmaceuticals) | | 1,293,628 | | | 4,296 |
Grupo Mexico S.A.B. de C.V. Series “B” (Metals & mining) | | 2,570,000 | | | 6,101 |
Wal-Mart de Mexico S.A.B. de C.V. (Food & staples retailing) | | 9,714,800 | | | 21,521 |
| | | | | |
| | | | | 81,767 |
| | | | | |
Panama—0.2% | | | | | |
Copa Holdings S.A. Class “A” (Airlines)† | | 178,576 | | | 7,897 |
| | | | | |
Peru—0.5% | | | | | |
Credicorp, Ltd. (Commercial banks)† | | 249,712 | | | 22,696 |
| | | | | |
| | |
Canada—4.6% | | | | | |
Brookfield Asset Management, Inc. Class “A” (Real estate management & development)† | | 1,546,028 | | | 34,971 |
Canadian Western Bank (Commercial banks) | | 395,232 | | | 8,777 |
Crescent Point Energy Corporation (Oil, gas & consumable fuels) | | 561,409 | | | 19,597 |
First Quantum Minerals, Ltd. (Metals & mining) | | 182,938 | | | 9,202 |
*Gildan Activewear, Inc. (Textiles, apparel & luxury goods) | | 554,200 | | | 15,920 |
Home Capital Group, Inc. (Thrifts &
mortgage finance) | | 104,016 | | | 4,120 |
Niko Resources, Ltd. (Oil, gas &
consuma ble fuels) | | 291,539 | | | 27,115 |
PetroBakken Energy, Ltd. Class “A” (Oil, gas & consumable fuels) | | 902,529 | | | 17,957 |
See accompanying Notes to Financial Statements.
June 30, 2010 | William Blair Funds 39 |
International Growth Fund
Portfolio of Investments, June 30, 2010 (all dollar amounts in thousands) (unaudited)
| | | | | |
Issuer | | Shares | | Value |
| |
Common Stocks—Canada—4.6%—(continued) | | | |
Petrominerales, Ltd. (Oil, gas & consumable fuels) | | 271,698 | | $ | 6,342 |
The Toronto-Dominion Bank (Commercial banks) | | 447,365 | | | 28,988 |
Tim Hortons, Inc. (Hotels, restaurants & leisure) | | 669,585 | | | 21,436 |
| | | | | |
| | | | | 194,425 |
| | | | | |
| |
Emerging Europe, Mid-East, Africa—3.6% | | | |
Egypt—0.3% | | | | | |
Commercial International Bank Egypt S.A.E. (Commercial banks) | | 750,509 | | | 8,786 |
Egyptian Financial Group-Hermes Holding (Capital markets) | | 1,052,537 | | | 5,310 |
| | | | | |
| | | | | 14,096 |
| | | | | |
South Africa—2.0% | | | | | |
*Aspen Pharmacare Holdings, Ltd. (Pharmaceuticals) | | 1,809,481 | | | 17,868 |
Clicks Group, Ltd. (Multiline retail) | | 1,422,030 | | | 6,256 |
Shoprite Holdings, Ltd. (Food &
staples retailing) | | 1,970,795 | | | 21,188 |
Standard Bank Group, Ltd. (Commercial banks) | | 2,185,896 | | | 28,987 |
Wilson Bayly Holmes-Ovcon, Ltd. (Construction & engineering) | | 726,838 | | | 10,347 |
| | | | | |
| | | | | 84,646 |
| | | | | |
Turkey—1.1% | | | | | |
BIM Birlesik Magazalar A.S. (Food &
staples retailing) | | 896,238 | | | 24,840 |
Turkiye Garanti Bankasi A.S. (Commercial banks) | | 5,092,541 | | | 21,193 |
| | | | | |
| | | | | 46,033 |
| | | | | |
United Arab Emirates—0.2% | | | | | |
First Gulf Bank PJSC (Commercial banks) | | 2,330,208 | | | 9,426 |
| | | | | |
| | |
Asia—3.2% | | | | | |
Australia—0.8% | | | | | |
Seek, Ltd. (Professional services) | | 740,725 | | | 4,313 |
Wesfarmers, Ltd. (Food & staples retailing) | | 872,175 | | | 20,846 |
WorleyParsons, Ltd. (Energy equipment & services) | | 469,259 | | | 8,634 |
| | | | | |
| | | | | 33,793 |
| | | | | |
Hong Kong—1.7% | | | | | |
ASM Pacific Technology, Ltd. (Semiconductors & semiconductor equipment) | | 1,057,500 | | | 8,215 |
ADR = American Depository Receipt
VRN = Variable Rate Note
*Non-income producing securities
† = U.S. listed foreign security
** = Fair valued pursuant to Valuation Procedures adopted by the Board of Trustees. This holding represents 0.04% of the Fund’s net assets at June 30, 2010.
§ = Deemed illiquid pursuant to Liquidity Procedures approved by the Board of Trustees. This holding represents 0.04% of the net assets at June 30, 2010.
| | | | | | |
Issuer | | Shares or
Principal
Amount | | Value |
| |
Common Stocks—Asia—3.2%—(continued) | | | |
Hong Kong—(continued) | | | | | | |
Li & Fung, Ltd. (Distributors) | | | 8,932,000 | | $ | 39,962 |
Noble Group, Ltd. (Trading companies & distributors) | | | 19,075,916 | | | 23,057 |
| | | | | | |
| | | | | | 71,234 |
| | | | | | |
Singapore—0.7% | | | | | | |
CapitaLand, Ltd. (Real estate management & development) | | | 5,710,000 | | | 14,560 |
CapitaMalls Asia, Ltd. (Real estate management & development) | | | 9,862,000 | | | 14,745 |
| | | | | | |
| | | | | | 29,305 |
| | | | | | |
Total Common Stocks—95.6%
(cost $3,748,423) | | | 4,048,709 |
| | | | | | |
| | |
Convertible Bond | | | | | | |
Brazil—0.0% | | | | | | |
Lupatech S.A., 6.500%, due 4/15/18 (Machinery)**§ | | $ | 2,875 | | | 1,633 |
| | | | | | |
Total Convertible Bond—0.0%
(cost $1,491) | | | 1,633 |
| | | | | | |
| | |
Exchange-Traded Fund | | | | | | |
China—0.8% | | | | | | |
iShares FTSE/Xinhua A50 China Index | | | 21,306,100 | | | 31,411 |
| | | | | | |
Total Exchange-Traded Fund—0.8%
(cost $34,326) | | | 31,411 |
| | | | | | |
| | |
Investment in Affiliate | | | | | | |
William Blair Ready Reserves Fund | | | 6,376,231 | | | 6,376 |
| | | | | | |
Total Investment in Affiliate—0.2%
(cost $6,376) | | | 6,376 |
| | | | | | |
| | |
Short-Term Investment | | | | | | |
American Express Credit Corporation Demand Note, VRN, 0.191%,
due 7/1/10 | | $ | 6,000 | | | 6,000 |
| | | | | | |
Total Short-Term Investment—0.1%
(cost $6,000) | | | 6,000 |
| | | | | | |
| | |
Repurchase Agreement | | | | | | |
Fixed Income Clearing Corporation, 0.000% dated 6/30/10, due 7/1/10, repurchase price $84,717, collateralized by various U.S. Agency securities,
1.625%—2.000%, due 3/7/13—4/15/13 | | | 84,717 | | | 84,717 |
| | | | | | |
Total Repurchase Agreement—2.0%
(cost $84,717) | | | 84,717 |
| | | | | | |
Total Investments—98.7%
(cost $3,881,333) | | | 4,178,846 |
Cash and other assets, less liabilities—1.3% | | | 54,375 |
| | | | | | |
Net assets—100.0% | | $ | 4,233,221 |
| | | | | | |
See accompanying Notes to Financial Statements.
40 Semi-Annual Report | June 30, 2010 |
International Growth Fund
Portfolio of Investments, June 30, 2010 (all dollar amounts in thousands) (unaudited)
For securities primarily traded on exchanges or markets that close before the close of regular trading on the New York Stock Exchange, the Fund may use an independent pricing service to fair value price the securities pursuant to Valuation Procedures approved by the Board of Trustees.
At June 30, 2010, the Fund’s Portfolio of Investments includes the following industry categories:
| | |
Industrials | | 18.0% |
Financials | | 17.5% |
Consumer Discretionary | | 16.7% |
Energy | | 10.6% |
Information Technology | | 10.2% |
Materials | | 8.6% |
Health Care | | 8.1% |
Consumer Staples | | 6.2% |
Telecommunication Services | | 3.0% |
Exchange-Traded Fund | | 0.8% |
Utilities | | 0.3% |
| | |
Total | | 100.0% |
| | |
At June 30, 2010, the Fund’s Portfolio of Investments includes the following currency categories:
| | |
British Pound Sterling | | 20.2% |
Euro | | 15.7% |
Japanese Yen | | 13.2% |
Swiss Franc | | 8.2% |
Hong Kong Dollar | | 5.9% |
Brazilian Real | | 5.5% |
Canadian Dollar | | 4.7% |
U.S. Dollar | | 3.9% |
Indian Rupee | | 3.8% |
Indonesian Rupiah | | 2.9% |
Danish Krone | | 2.1% |
South African Rand | | 2.1% |
South Korean Won | | 1.7% |
New Taiwan Dollar | | 1.4% |
Norwegian Krone | | 1.4% |
Singapore Dollar | | 1.3% |
Israeli Shekel | | 1.1% |
Turkish Lira | | 1.1% |
Australian Dollar | | 1.1% |
Mexican Peso | | 1.0% |
All Other Currencies | | 1.7% |
| | |
Total | | 100.0% |
| | |
See accompanying Notes to Financial Statements.
June 30, 2010 | William Blair Funds 41 |
W. George Greig

David Merjan
INTERNATIONAL EQUITY FUND
The International Equity Fund seeks long-term capital appreciation.
AN OVERVIEW FROM THE PORTFOLIO MANAGERS
Please see page 28 for the Global Markets Overview.
The International Equity Fund posted a 9.21% decrease (Class N Shares) for the six months ended June 30, 2010. By comparison, the Fund’s benchmark, the MSCI All Country World Ex-U.S. IMI Index (net), declined 10.41%.
Year to date stock selection was particularly strong in Discretionary, Energy and Financials. Within Financials, the Fund’s underweighting and stock selection in Europe Ex-U.K. added value, as the Fund eschewed a number of the E.U. commercial banks and capital markets financial institutions, given concerns about debt within the peripheral E.U. economies and ramifications for cross-border financial institutions. Emerging markets Financials performance also augmented results during the first half, as these holdings were not weighed down by slowdown concerns. Regionally, Developed European stock selection added value as did strong performance within Canada and Emerging Asia. The key detractor from performance year to date was Japanese Discretionary and Industrials stock selection.
As of June 30, the Fund maintained its focus in Industrials at 22.7% of the Fund, nearly double that of the MSCI ACWI Ex-U.S. IMI. Financials, while underweighted versus the Index, represented 20.6% of the Fund. Consumer Discretionary and Information Technology each represented approximately 12% of the Fund, above Index weightings. The Fund was most significantly underweighted in Materials, Telecommunication Services and Utilities at quarter end. These exposures did not appreciably change during the six month period. Regionally, the Fund maintained its focus in Developed Europe and Canada at the expense of Developed Asia. Within Europe Ex-U.K., specifically, the Fund was significantly overweighted in Healthcare and Industrials, sectors that generally benefit from a weak euro, and significantly underweighted in Financials, with no exposure in Materials, Telecommunication Services and Utilities. Emerging markets represented 18.4% of the Fund, below the index weighting of 23.5%, and a decrease since year end, due largely to an underweighting in Emerging Asia, and a reclassification of Israel into Europe Ex-U.K. during the quarter, as one of our largest Emerging Markets Europe, Mid-East and Africa holdings was reclassified.
42 Semi-Annual Report | June 30, 2010 |
International Equity Fund
Performance Highlights (unaudited)
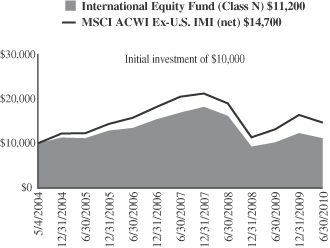
Average Annual Total Return at 6/30/2010
| | | | | | | | | | | | | | | |
| | | Year to
Date | | | 1
Year | | | 3
Year | | | 5
Year | | | Since
Inception(a) | |
Class N | | (9.21 | )% | | 9.45 | % | | (12.77 | )% | | 0.01 | % | | 1.89 | % |
Class I | | (9.05 | ) | | 9.72 | | | (12.55 | ) | | 0.27 | | | 2.17 | |
MSCI All Country World
Ex-U.S. IMI (net) | | (10.41 | ) | | 11.49 | | | (10.50 | ) | | 3.63 | | | 6.49 | |
| | (a) | | For the period from May 24, 2004 (Commencement of Operations) to June 30, 2010. | |
Performance cited represents past performance. Past performance does not guarantee future results and current performance may be lower or higher than the data quoted. Results shown are average annual returns, which assume reinvestment of dividends and capital gains. Investment returns and principal will fluctuate and you may have a gain or loss when you sell shares. For the most current month-end performance information, please call 1-800-742-7272, or visit our Web site at www.williamblairfunds.com. From time to time the investment advisor may waive fees or reimburse expenses for the Fund. Without these waivers, performance would be lower. International investing involves special risk considerations, including currency fluctuations, lower liquidity, economic and political risk. Class N shares are available to the general public without a sales load. Class I shares are available to certain institutional investors and advisory clients of William Blair & Company L.L.C. without a sales load or distribution (12b-1) or service fees.
The performance highlights and graph presented above do not reflect the deduction of taxes that a shareholder would pay on fund distributions or the redemption of fund shares.
The Morgan Stanley Capital International (MSCI) All Country World Ex-U.S. Investable Market Index (IMI) (net) is a free float-adjusted market capitalization weighted index that is designed to measure the equity market performance of developed and emerging markets, excluding the United States. This series approximates the minimum possible dividend reinvestment.
This report identifies the Fund’s investments on June 30, 2010. These holdings are subject to change. Not all stocks in the Fund performed the same, nor is there any guarantee that these stocks will perform as well in the future. Market forecasts provided in this report may not necessarily come to pass.
Sector Diversification (unaudited)
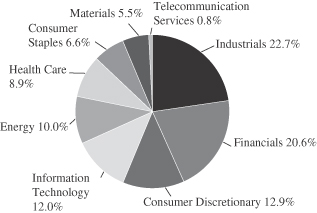
The sector diversification shown is based on the total long-term securities.
June 30, 2010 | William Blair Funds 43 |
International Equity Fund
Portfolio of Investments, June 30, 2010 (all dollar amounts in thousands) (unaudited)
| | | | | |
Issuer | | Shares | | Value |
| | |
Common Stocks—Europe—29.5% | | | | | |
Denmark—1.8% | | | | | |
Novo Nordisk A/S (Pharmaceuticals) | | 62,789 | | $ | 5,073 |
| | | | | |
Finland—1.2% | | | | | |
Kone Oyj (Machinery) | | 82,794 | | | 3,296 |
| | | | | |
France—5.1% | | | | | |
AXA S.A. (Insurance) | | 127,788 | | | 1,952 |
Cie Generale des Etablissements Michelin (Auto components) | | 40,015 | | | 2,788 |
L’Oreal S.A. (Personal products) | | 37,232 | | | 3,645 |
Schneider Electric S.A. (Electrical equipment) | | 39,425 | | | 3,982 |
Vinci S.A. (Construction & engineering) | | 53,464 | | | 2,220 |
| | | | | |
| | | | | 14,587 |
| | | | | |
Germany—4.5% | | | | | |
*Infineon Technologies AG (Semiconductors & semiconductor equipment) | | 274,090 | | | 1,589 |
MAN SE (Machinery) | | 52,704 | | | 4,345 |
*QIAGEN N.V. (Life sciences tools & services) | | 143,769 | | | 2,797 |
SAP AG (Software) | | 93,755 | | | 4,169 |
| | | | | |
| | | | | 12,900 |
| | | | | |
Ireland—1.6% | | | | | |
*Ryanair Holdings plc—ADR (Airlines) | | 171,745 | | | 4,653 |
| | | | | |
Israel—2.0% | | | | | |
Teva Pharmaceutical Industries, Ltd.—ADR (Pharmaceuticals) | | 111,349 | | | 5,789 |
| | | | | |
Italy—1.6% | | | | | |
Saipem SpA (Energy equipment & services) | | 153,903 | | | 4,688 |
| | | | | |
Spain—2.3% | | | | | |
Banco Santander S.A. (Commercial banks) | | 226,014 | | | 2,370 |
Inditex S.A. (Specialty retail) | | 75,868 | | | 4,326 |
| | | | | |
| | | | | 6,696 |
| | | | | |
Switzerland—9.4% | | | | | |
*ABB, Ltd. (Electrical equipment) | | 199,825 | | | 3,479 |
*Actelion, Ltd. (Biotechnology) | | 52,820 | | | 1,978 |
Credit Suisse Group AG (Capital markets) | | 100,774 | | | 3,789 |
Julius Baer Group, Ltd. (Capital markets) | | 48,098 | | | 1,371 |
Nestle S.A. (Food products) | | 114,991 | | | 5,545 |
Roche Holding AG (Pharmaceuticals) | | 31,895 | | | 4,390 |
Sonova Holding AG (Health care equipment & supplies) | | 16,525 | | | 2,028 |
Zurich Financial Services AG (Insurance) | | 19,487 | | | 4,295 |
| | | | | |
| | | | | 26,875 |
| | | | | |
United Kingdom—20.3% | | | | | |
Amlin plc (Insurance) | | 257,422 | | | 1,482 |
*Autonomy Corporation plc (Software) | | 125,456 | | | 3,420 |
Barclays plc (Commercial banks) | | 807,935 | | | 3,225 |
BG Group plc (Oil, gas & consumable fuels) | | 288,209 | | | 4,286 |
British Sky Broadcasting Group plc (Media) | | 421,982 | | | 4,406 |
Burberry Group plc (Textiles, apparel & luxury goods) | | 246,195 | | | 2,780 |
Compass Group plc (Hotels, restaurants & leisure) | | 463,369 | | | 3,525 |
Experian plc (Professional services) | | 267,250 | | | 2,324 |
HSBC Holdings plc (Commercial banks) | | 277,620 | | | 2,545 |
Johnson Matthey plc (Chemicals) | | 99,047 | | | 2,201 |
Petrofac, Ltd. (Energy equipment & services) | | 155,776 | | | 2,741 |
| | | | | |
Issuer | | Shares | | Value |
| | |
Common Stocks—Europe—(continued) | | | | | |
United Kingdom—(continued) | | | | | |
Reckitt Benckiser Group plc (Household products) | | 129,689 | | $ | 6,032 |
*Rolls-Royce Group plc (Aerospace & defense) | | 469,821 | | | 3,921 |
Rotork plc (Machinery) | | 83,564 | | | 1,597 |
Standard Chartered plc (Commercial banks) | | 184,259 | | | 4,487 |
The Capita Group plc (Professional services) | | 249,804 | | | 2,752 |
Tullow Oil plc (Oil, gas & consumable fuels) | | 226,389 | | | 3,368 |
Vedanta Resources plc (Metals & mining) | | 89,953 | | | 2,826 |
| | | | | |
| | | | | 57,918 |
| | | | | |
Japan—13.1% | | | | | |
Canon, Inc. (Office electronics) | | 76,200 | | | 2,840 |
Daikin Industries, Ltd. (Building products) | | 74,700 | | | 2,278 |
Fanuc, Ltd. (Machinery) | | 38,700 | | | 4,370 |
Hoya Corporation (Electronic equipment, instruments & components) | | 119,800 | | | 2,549 |
Keyence Corporation (Electronic equipment, instruments & components) | | 16,300 | | | 3,769 |
Komatsu, Ltd. (Machinery) | | 175,200 | | | 3,155 |
Makita Corporation (Machinery) | | 43,300 | | | 1,159 |
Mitsubishi Corporation (Trading companies & distributors) | | 187,900 | | | 3,887 |
Mitsubishi UFJ Financial Group, Inc. (Commercial banks) | | 666,500 | | | 3,026 |
Nippon Electric Glass Co., Ltd. (Electronic equipment, instruments & components) | | 200,000 | | | 2,291 |
Softbank Corporation (Wireless telecommunication services) | | 86,100 | | | 2,284 |
Terumo Corporation (Health care equipment & supplies) | | 41,100 | | | 1,968 |
Yahoo! Japan Corporation (Internet software & services) | | 5,448 | | | 2,171 |
Yamada Denki Co., Ltd. (Specialty retail) | | 25,370 | | | 1,658 |
| | | | | |
| | | | | 37,405 |
| | | | | |
| | |
Emerging Asia—11.2% | | | | | |
China—3.1% | | | | | |
China Life Insurance Co., Ltd. (Insurance) | | 781,000 | | | 3,415 |
CNOOC, Ltd. (Oil, gas & consumable fuels) | | 2,229,000 | | | 3,789 |
Li Ning Co., Ltd. (Textiles, apparel & luxury goods) | | 538,500 | | | 1,765 |
| | | | | |
| | | | | 8,969 |
| | | | | |
India—4.4% | | | | | |
Bharat Heavy Electricals, Ltd. (Electrical equipment) | | 73,874 | | | 3,892 |
*Cairn India, Ltd. (Oil, gas & consumable fuels) | | 378,966 | | | 2,454 |
HDFC Bank, Ltd.—ADR (Commercial banks) | | 15,028 | | | 2,149 |
Infosys Technologies, Ltd. (IT services) | | 67,838 | | | 4,047 |
| | | | | |
| | | | | 12,542 |
| | | | | |
Indonesia—0.8% | | | | | |
PT Bank Rakyat Indonesia (Commercial banks) | | 2,314,000 | | | 2,350 |
| | | | | |
South Korea—1.5% | | | | | |
Hyundai Motor Co. (Automobiles) | | 35,282 | | | 4,128 |
| | | | | |
See accompanying Notes to Financial Statements.
44 Semi-Annual Report | June 30, 2010 |
International Equity Fund
Portfolio of Investments, June 30, 2010 (all dollar amounts in thousands) (unaudited)
| | | | | |
Issuer | | Shares | | Value |
|
Common Stocks—Emerging Asia—(continued) |
Taiwan—1.4% | | | | | |
*Hon Hai Precision Industry Co., Ltd. (Electronic equipment, instruments & components) | | 667,000 | | $ | 2,338 |
MediaTek, Inc. (Semiconductors & semiconductor equipment) | | 120,312 | | | 1,679 |
| | | | | |
| | | | | 4,017 |
| | | | | |
Canada—8.1% | | | | | |
Brookfield Asset Management, Inc. Class “A” (Real estate management & development)† | | 143,397 | | | 3,244 |
Canadian National Railway Co. (Road & rail)† | | 81,895 | | | 4,699 |
Goldcorp, Inc. (Metals & mining)† | | 86,477 | | | 3,792 |
Royal Bank of Canada (Commercial banks) | | 54,477 | | | 2,595 |
The Toronto-Dominion Bank (Commercial banks) | | 48,363 | | | 3,134 |
Thomson Reuters Corporation (Media) | | 63,680 | | | 2,279 |
Tim Hortons, Inc. (Hotels, restaurants & leisure) | | 105,343 | | | 3,372 |
| | | | | |
| | | | | 23,115 |
| | | | | |
| | |
Asia—5.2% | | | | | |
Australia—1.6% | | | | | |
BHP Billiton, Ltd.—ADR (Metals & mining) | | 44,797 | | | 2,777 |
WorleyParsons, Ltd. (Energy equipment & services) | | 102,583 | | | 1,887 |
| | | | | |
| | | | | 4,664 |
| | | | | |
Hong Kong—2.9% | | | | | |
ASM Pacific Technology, Ltd. (Semiconductors & semiconductor equipment) | | 216,900 | | | 1,685 |
Li & Fung, Ltd. (Distributors) | | 874,000 | | | 3,910 |
Noble Group, Ltd. (Trading companies & distributors) | | 2,103,727 | | | 2,543 |
| | | | | |
| | | | | 8,138 |
| | | | | |
Singapore—0.7% | | | | | |
CapitaLand, Ltd. (Real estate management & development) | | 813,000 | | | 2,073 |
| | | | | |
| | |
Emerging Latin America—4.6% | | | | | |
Brazil—3.6% | | | | | |
BM&F BOVESPA S.A. (Diversified financial services) | | 514,771 | | | 3,308 |
Petroleo Brasileiro S.A.—ADR (Oil, gas & consumable fuels) | | 35,245 | | | 1,210 |
Vale S.A.—ADR (Metals & mining) | | 133,569 | | | 3,252 |
Weg S.A. (Machinery) | | 286,000 | | | 2,646 |
| | | | | |
| | | | | 10,416 |
| | | | | |
ADR = American Depository Receipt
*Non-income producing securities
† = U.S. listed foreign security
| | | | | | |
Issuer | | Shares or
Principal
Amount | | Value |
|
Common Stocks—Emerging Latin America—(continued) |
Mexico—1.0% | | | | | | |
Wal-Mart de Mexico S.A.B. de C.V. (Food & staples retailing) | | | 1,217,800 | | $ | 2,698 |
| | | | | | |
| |
Emerging Europe, Mid-East, Africa—1.7% | | | |
South Africa—0.8% | | | | | | |
Standard Bank Group, Ltd. (Commercial banks) | | | 171,625 | | | 2,276 |
| | | | | | |
Turkey—0.9% | | | | | | |
Turkiye Garanti Bankasi A.S. (Commercial banks) | | | 630,652 | | | 2,625 |
| | | | | | |
Total Common Stocks—93.7%
(cost $243,904) | | | 267,891 |
| | | | | | |
| | |
Preferred Stock | | | | | | |
Brazil—0.9% | | | | | | |
Petroleo Brasileiro S.A. (Oil, gas & consumable fuels) | | | 182,323 | | | 2,713 |
| | | | | | |
Total Preferred Stock—0.9%
(cost $2,057) | | | 2,713 |
| | | | | | |
| | |
Investment in Affiliate | | | | | | |
William Blair Ready Reserves Fund | | | 4,954 | | | 5 |
| | | | | | |
Total Investment in Affiliate—0.0%
(cost $5) | | | 5 |
| | | | | | |
| | |
Repurchase Agreement | | | | | | |
Fixed Income Clearing Corporation, 0.000% dated 6/30/10, due 7/1/10, repurchase price $10,007, collateralized by FFCB,
1.625%, due 3/7/13 | | $ | 10,007 | | | 10,007 |
| | | | | | |
Total Repurchase Agreement—3.5%
(cost $10,007) | | | 10,007 |
| | | | | | |
Total Investments—98.1%
(cost $255,973) | | | 280,616 |
Cash and other assets, less liabilities—1.9% | | | 5,297 |
| | | | | | |
Net assets—100.0% | | $ | 285,913 |
| | | | | | |
See accompanying Notes to Financial Statements.
June 30, 2010 | William Blair Funds 45 |
International Equity Fund
Portfolio of Investments, June 30, 2010 (all dollar amounts in thousands) (unaudited)
For securities, primarily traded on exchanges or markets that close before the close of regular trading on the New York Stock Exchange, the Fund may use an independent pricing service to fair value price the securities pursuant to Valuation Procedures approved by the Board of Trustees.
At June 30, 2010, the Fund’s Portfolio of Investments includes the following industry categories:
| | |
Industrials | | 22.7% |
Financials | | 20.6% |
Consumer Discretionary | | 12.9% |
Information Technology | | 12.0% |
Energy | | 10.0% |
Health Care | | 8.9% |
Consumer Staples | | 6.6% |
Materials | | 5.5% |
Telecommunication Services | | 0.8% |
| | |
Total | | 100.0% |
| | |
At June 30, 2010, the Fund’s Portfolio of Investments includes the following currency categories:
| | |
British Pound Sterling | | 20.5% |
Euro | | 15.6% |
Japanese Yen | | 13.8% |
U.S. Dollar | | 11.7% |
Swiss Franc | | 9.9% |
Hong Kong Dollar | | 6.3% |
Canadian Dollar | | 4.2% |
Indian Rupee | | 3.8% |
Brazilian Real | | 3.2% |
Danish Krone | | 1.9% |
Singapore Dollar | | 1.7% |
South Korean Won | | 1.5% |
New Taiwan Dollar | | 1.5% |
All Other Currencies | | 4.4% |
| | |
Total | | 100.0% |
| | |
See accompanying Notes to Financial Statements.
46 Semi-Annual Report | June 30, 2010 |

Jeffrey A. Urbina
INTERNATIONAL SMALL CAP GROWTH FUND
The International Small Cap Growth Fund seeks long-term capital appreciation.
AN OVERVIEW FROM THE PORTFOLIO MANAGER
Please see page 28 for the Global Markets Overview.
The International Small Cap Growth Fund decreased 2.31% (Class N Shares) for the six months ended June 30, 2010. By comparison, the Fund’s benchmark, the MSCI All Country Ex-U.S. Small Cap Index (net), declined 5.32%.
Sector stock selection drove year to date outperformance, coupled with good performance across most regions, except for Emerging Asia. Within Consumer Discretionary, Japanese internet website Start Today Co., Ltd. performed well, as did footwear retailer ABC-Mart, Inc. U.K. Consumer Discretionary stock selection was strong, outperforming by nearly 21%, while Emerging Europe, Middle East and Africa (EMEA) and Latin American stocks also added value. Consumer Staples stock selection benefited from good performance by Unicharm Petcare Corporation as its parent company made a tender offer for the remaining outstanding publicly traded shares. Industrials stock selection was bolstered by strong Developed Europe and Emerging Markets stock selection, particularly within the defense, services, and transportation industries. Materials and Energy stock selection was also additive to results for the year to date period, as the Fund’s Materials holdings outperformed by over 31%, and Energy by nearly 13% versus the Index. Somewhat detracting from year to date results was Financials, Information Technology, and Utilities stock selection. Within Financials, the Fund’s underweighting and stock selection in Europe was more than offset by underperformance in Asian Financials holdings and U.K. asset management firms. Information Technology stock selection was hampered by several stock-specific issues, while EDF Energies Nouvelles S.A., the sole Utilities holding, underperformed the sector as a whole, as investors were concerned about the timing of wind farm development in the U.S., coupled with potentially reduced subsidies for alternative energy within Europe as a result of austerity measures.
As of June 30, the Fund maintained its focus in Consumer Discretionary at 26.6% of the Fund, with just over 7% within emerging markets specifically, well above the 16.5% Index weighting, and an increase since year end. Industrials was the second largest sector at 19.1% of the Fund, albeit underweighted versus the Index’s 21.7% weighting. Information Technology and Healthcare represented 15.0% and 13.5% of the Fund, respectively, well above Index weightings. We increased exposure to Emerging Markets and U.K. Healthcare holdings during the period, at the expense of Japanese Industrials. Since year end, we reduced our already underweighted Financials exposure from 12.6% to 9.9%. Materials, representing 4.1% of the Fund, remained significantly underweighted versus the market throughout the six month period. Regionally, the Fund was overweighted in Developed European stocks, due largely to Healthcare, Information Technology and Consumer Discretionary weightings within Europe Ex-U.K. and Industrials holdings within the U.K. Emerging markets represented 22.8% of the Fund at June 30, above the 18.8% as of year end, but lower than the Index weighting, due largely to an underweighting in the emerging Asian region.
June 30, 2010 | William Blair Funds 47 |
International Small Cap Growth Fund
Performance Highlights (unaudited)
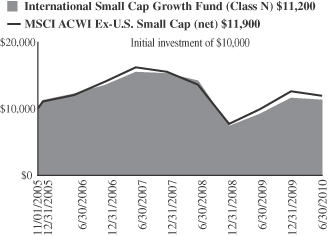
Average Annual Total Return at 6/30/2010
| | | | | | | | | | | | |
| | | Year to
Date | | | 1
Year | | | 3
Year | | | Since
Inception(a) | |
Class N | | (2.31 | )% | | 23.00 | % | | (9.91 | )% | | 2.51 | % |
Class I | | (2.19 | ) | | 23.21 | | | (9.60 | ) | | 2.83 | |
MSCI AC World Ex-U.S. Small Cap Index (net) | | (5.32 | ) | | 19.98 | | | (9.68 | ) | | 3.76 | |
| | (a) | | For the period from November 1, 2005 (Commencement of Operations) to June 30, 2010. |
Performance cited represents past performance. Past performance does not guarantee future results and current performance may be lower or higher than the data quoted. Results shown are average annual returns, which assume reinvestment of dividends and capital gains. Investment returns and principal will fluctuate and you may have a gain or loss when you sell shares. For the most current month-end performance information, please call 1-800-742-7272, or visit our Web site at www.williamblairfunds.com. From time to time, the investment advisor may waive fees or reimburse expenses for the Fund. Without these waivers, performance would be lower. International investing involves special risk considerations, including currency fluctuations, lower liquidity, economic and political risk. Class N shares are available to the general public without a sales load. Class I shares are available to certain institutional investors and advisory clients of William Blair & Company L.L.C. without a sales load or distribution (12b-1) fees.
The performance highlights and graph presented above do not reflect the deduction of taxes that a shareholder would pay on fund distributions or the redemption of fund shares.
The Morgan Stanley Capital International (MSCI) All Country World Ex-U.S. Small Cap Index (net) is a free float-adjusted market capitalization weighted index that is designed to measure the equity market performance of small capitalization developed and emerging markets, excluding the United States. This series approximates the minimum possible dividend reinvestment.
This report identifies the Fund’s investments on June 30, 2010. These holdings are subject to change. Not all stocks in the Fund performed the same, nor is there any guarantee that these stocks will perform as well in the future. Market forecasts provided in this report may not necessarily come to pass.
Sector Diversification (unaudited)
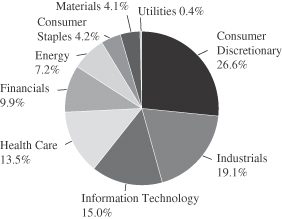
The sector diversification shown is based on the total long-term securities.
48 Semi-Annual Report | June 30, 2010 |
International Small Cap Growth Fund
Portfolio of Investments, June 30, 2010 (all dollar amounts in thousands) (unaudited)
| | | | | |
Issuer | | Shares | | Value |
| | |
Common Stocks—Europe—27.1% | | | | | |
Austria—0.4% | | | | | |
Schoeller-Bleckmann Oilfield Equipment AG (Energy equipment & services) | | 40,651 | | $ | 1,843 |
| | | | | |
Denmark—1.7% | | | | | |
FLSmidth & Co. A/S (Construction & engineering) | | 99,420 | | | 6,416 |
SimCorp A/S (Software) | | 5,318 | | | 847 |
| | | | | |
| | | | | 7,263 |
| | | | | |
Finland—2.0% | | | | | |
Nokian Renkaat Oyj (Auto components) | | 361,056 | | | 8,836 |
| | | | | |
France—3.0% | | | | | |
bioMerieux (Health care equipment & supplies) | | 58,739 | | | 6,031 |
*Boursorama (Capital markets) | | 152,766 | | | 1,518 |
EDF Energies Nouvelles S.A. (Independent power producers & energy traders) | | 49,132 | | | 1,662 |
Gemalto N.V. (Computers & peripherals) | | 108,366 | | | 4,078 |
| | | | | |
| | | | | 13,289 |
| | | | | |
Germany—3.9% | | | | | |
Aixtron AG (Semiconductors & semiconductor equipment) | | 247,766 | | | 5,857 |
CTS Eventim AG (Media) | | 43,054 | | | 2,074 |
Fielmann AG (Specialty retail) | | 44,923 | | | 3,401 |
Wincor Nixdorf AG (Computers & peripherals) | | 50,204 | | | 2,806 |
Wirecard AG (IT services) | | 365,197 | | | 3,111 |
| | | | | |
| | | | | 17,249 |
| | | | | |
Ireland—1.5% | | | | | |
*Norkom Group plc (Software) | | 215,133 | | | 347 |
Paddy Power plc (Hotels, restaurants & leisure) | | 195,972 | | | 6,088 |
| | | | | |
| | | | | 6,435 |
| | | | | |
Italy—2.5% | | | | | |
Ansaldo STS SpA (Transportation infrastructure) | | 217,207 | | | 3,487 |
DiaSorin SpA (Health care equipment & supplies) | | 99,945 | | | 3,661 |
Trevi Finanziaria SpA (Construction & engineering) | | 266,974 | | | 3,831 |
| | | | | |
| | | | | 10,979 |
| | | | | |
Luxembourg—1.0% | | | | | |
Oriflame Cosmetics S.A. (Personal products) | | 83,200 | | | 4,321 |
| | | | | |
Netherlands—0.5% | | | | | |
BinckBank N.V. (Capital markets) | | 179,314 | | | 2,231 |
| | | | | |
Norway—0.7% | | | | | |
*Norwegian Air Shuttle ASA (Airlines) | | 95,256 | | | 1,523 |
Opera Software ASA (Internet software & services) | | 171,405 | | | 590 |
*Pronova BioPharma A/S (Pharmaceuticals) | | 510,609 | | | 1,006 |
| | | | | |
| | | | | 3,119 |
| | | | | |
Spain—1.6% | | | | | |
Tecnicas Reunidas S.A. (Energy equipment & services) | | 158,310 | | | 7,200 |
| | | | | |
Sweden—1.6% | | | | | |
Elekta AB (Health care equipment & supplies) | | 283,883 | | | 7,184 |
| | | | | |
| | | | | |
Issuer | | Shares | | Value |
| |
Common Stocks—Europe—27.1%—(continued) | | | |
Switzerland—6.7% | | | | | |
*Dufry Group (Specialty retail) | | 55,866 | | $ | 4,178 |
*Orascom Development Holding AG (Hotels, restaurants & leisure) | | 39,856 | | | 2,211 |
Partners Group Holding AG (Capital markets) | | 78,830 | | | 9,512 |
Sika AG (Chemicals) | | 2,919 | | | 5,174 |
*Temenos Group AG (Software) | | 357,555 | | | 8,608 |
| | | | | |
| | | | | 29,683 |
| | | | | |
| | |
United Kingdom—22.1% | | | | | |
Abcam plc (Biotechnology) | | 141,429 | | | 2,583 |
Aggreko plc (Commercial services & supplies) | | 214,055 | | | 4,494 |
Amlin plc (Insurance) | | 1,009,467 | | | 5,810 |
Ashmore Group plc (Capital markets) | | 589,384 | | | 2,127 |
*ASOS plc (Internet & catalog retail) | | 154,303 | | | 1,973 |
Aveva Group plc (Software) | | 201,540 | | | 3,382 |
Babcock International Group plc (Commercial services & supplies) | | 814,504 | | | 7,236 |
*Blinkx plc (Internet software & services) | | 2,006,326 | | | 1,109 |
BlueBay Asset Management plc (Capital markets) | | 199,031 | | | 852 |
Britvic plc (Beverages) | | 735,535 | | | 5,213 |
*Ceres Power Holdings plc (Electrical equipment) | | 262,261 | | | 295 |
Chemring Group plc (Aerospace & defense) | | 75,742 | | | 3,349 |
*Dana Petroleum plc (Oil, gas & consumable fuels) | | 359,274 | | | 6,048 |
Domino’s Pizza UK & IRL plc (Hotels, restaurants & leisure) | | 255,283 | | | 1,442 |
*EnQuest plc (Oil, gas & consumable fuels) | | 299,681 | | | 445 |
Intertek Group plc (Professional services) | | 113,091 | | | 2,424 |
Lancashire Holdings, Ltd. (Insurance) | | 232,960 | | | 1,727 |
Meggitt plc (Aerospace & defense) | | 784,642 | | | 3,657 |
Michael Page International plc (Professional services) | | 799,923 | | | 4,429 |
Micro Focus International plc (Software) | | 544,439 | | | 3,421 |
Mothercare plc (Multiline retail) | | 264,430 | | | 2,244 |
Petrofac, Ltd. (Energy equipment & services) | | 257,082 | | | 4,523 |
*Promethean World plc (Diversified consumer services) | | 350,726 | | | 953 |
Rightmove plc (Media) | | 248,521 | | | 2,331 |
RPS Group plc (Commercial services & supplies) | | 316,754 | | | 882 |
Serco Group plc (Commercial services & supplies) | | 978,331 | | | 8,544 |
Spirax-Sarco Engineering plc (Machinery) | | 158,159 | | | 3,222 |
*Telecity Group plc (Internet software & services) | | 338,559 | | | 2,017 |
The Weir Group plc (Machinery) | | 536,643 | | | 8,244 |
Victrex plc (Chemicals) | | 166,542 | | | 2,709 |
| | | | | |
| | | | | 97,685 |
| | | | | |
| | |
Japan—16.7% | | | | | |
ABC-Mart, Inc. (Specialty retail) | | 232,414 | | | 9,117 |
Aeon Delight Co., Ltd. (Commercial services & supplies) | | 83,700 | | | 1,629 |
CyberAgent, Inc. (Media) | | 1,378 | | | 2,042 |
Dena Co., Ltd. (Internet & catalog retail) | | 173,700 | | | 4,587 |
Disco Corporation (Semiconductors & semiconductor equipment) | | 53,900 | | | 3,410 |
See accompanying Notes to Financial Statements.
June 30, 2010 | William Blair Funds 49 |
International Small Cap Growth Fund
Portfolio of Investments, June 30, 2010 (all dollar amounts in thousands) (unaudited)
| | | | | |
Issuer | | Shares | | Value |
| |
Common Stocks—Japan—16.7%—(continued) | | | |
EPS Co., Ltd. (Life sciences tools & services) | | 560 | | $ | 1,416 |
Exedy Corporation (Auto components) | | 148,800 | | | 3,815 |
F.C.C. Co., Ltd. (Auto components) | | 160,709 | | | 3,003 |
*Gree, Inc. (Internet software & services) | | 60,130 | | | 4,802 |
kabu.com Securities Co., Ltd. (Capital markets) | | 201,900 | | | 947 |
Kakaku.com, Inc. (Internet software & services) | | 614 | | | 2,537 |
Miraca Holdings, Inc. (Health care providers & services) | | 294,500 | | | 8,815 |
Nabtesco Corporation (Machinery) | | 244,000 | | | 3,761 |
Nitori Co., Ltd. (Specialty retail) | | 59,950 | | | 5,168 |
Osaka Securities Exchange Co., Ltd. (Diversified financial services) | | 1,367 | | | 5,805 |
Point, Inc. (Specialty retail) | | 71,440 | | | 3,919 |
Sawai Pharmaceutical Co., Ltd. (Pharmaceuticals) | | 26,300 | | | 2,517 |
Start Today Co., Ltd. (Internet & catalog retail) | | 245 | | | 671 |
USS Co., Ltd. (Specialty retail) | | 82,050 | | | 5,861 |
| | | | | |
| | | | | 73,822 |
| | | | | |
| | |
Emerging Asia—14.6% | | | | | |
China—8.1% | | | | | |
361 Degrees International, Ltd. (Textiles, apparel & luxury goods) | | 6,448,000 | | | 4,594 |
AAC Acoustic Technologies Holdings, Inc. (Communications equipment) | | 2,613,559 | | | 3,736 |
Ajisen China Holdings, Ltd. (Hotels, restaurants & leisure) | | 1,796,429 | | | 2,005 |
China Green (Holdings), Ltd. (Food products) | | 1,754,556 | | | 1,761 |
China High Speed Transmission Equipment Group Co., Ltd. (Electrical equipment) | | 1,056,000 | | | 2,218 |
Comba Telecom Systems Holdings, Ltd. (Communications equipment) | | 1,752,998 | | | 1,932 |
*Concord Medical Services Holdings, Ltd.—ADR (Health care providers & services) | | 99,812 | | | 595 |
Golden Eagle Retail Group, Ltd. (Multiline retail) | | 285,000 | | | 595 |
Haitian International Holdings, Ltd. (Machinery) | | 1,481,496 | | | 1,034 |
Li Ning Co., Ltd. (Textiles, apparel & luxury goods) | | 1,278,373 | | | 4,189 |
Lonking Holdings, Ltd. (Machinery) | | 4,126,000 | | | 2,733 |
Minth Group, Ltd. (Auto components) | | 2,463,384 | | | 2,911 |
Peak Sport Products, Ltd. (Textiles, apparel & luxury goods) | | 5,779,000 | | | 3,806 |
Shandong Weigao Group Medical Polymer Co., Ltd. (Health care equipment & supplies) | | 300,800 | | | 1,310 |
Zhuzhou CSR Times Electric Co., Ltd. (Electrical equipment) | | 1,132,865 | | | 2,398 |
| | | | | |
| | | | | 35,817 |
| | | | | |
India—3.0% | | | | | |
Ipca Laboratories, Ltd. (Pharmaceuticals) | | 378,865 | | | 2,368 |
Lupin, Ltd. (Pharmaceuticals) | | 178,480 | | | 7,514 |
Yes Bank, Ltd. (Commercial banks) | | 598,128 | | | 3,428 |
| | | | | |
| | | | | 13,310 |
| | | | | |
| | | | | |
Issuer | | Shares | | Value |
|
Common Stocks—Emerging Asia—14.6%—(continued) |
Indonesia—1.1% | | | | | |
*PT Ciputra Development Tbk (Real estate management & development) | | 14,294,000 | | $ | 523 |
PT Kalbe Farma Tbk (Pharmaceuticals) | | 10,314,500 | | | 2,368 |
PT Perusahaan Perkebunan London Sumatra Indonesia Tbk (Food products) | | 2,159,000 | | | 1,959 |
| | | | | |
| | | | | 4,850 |
| | | | | |
Taiwan—2.4% | | | | | |
Chicony Electronics Co., Ltd. (Computers & peripherals) | | 1,306,000 | | | 2,895 |
Tripod Technology Corporation (Electronic equipment, instruments & components) | | 1,041,000 | | | 3,849 |
Wistron Corporation (Computers & peripherals) | | 2,441,000 | | | 3,577 |
| | | | | |
| | | | | 10,321 |
| | | | | |
Canada—6.0% | | | | | |
*Bankers Petroleum, Ltd. (Oil, gas & consumable fuels) | | 191,809 | | | 1,265 |
Canadian Western Bank (Commercial banks) | | 143,600 | | | 3,189 |
*Consolidated Thompson Iron Mines, Ltd. (Metals & mining) | | 403,378 | | | 2,751 |
*Gildan Activewear, Inc. (Textiles, apparel & luxury goods) | | 240,700 | | | 6,914 |
Home Capital Group, Inc. (Thrifts & mortgage finance) | | 54,147 | | | 2,145 |
*Legacy Oil + Gas, Inc. (Oil, gas & consumable fuels) | | 200,562 | | | 2,163 |
Petrominerales, Ltd. (Oil, gas & consumable fuels) | | 121,785 | | | 2,843 |
*Red Back Mining, Inc. (Metals & mining) | | 203,289 | | | 5,138 |
| | | | | |
| | | | | 26,408 |
| | | | | |
| | |
Emerging Latin America—4.6% | | | | | |
Brazil—2.5% | | | | | |
Brasil Brokers Participacoes S.A. (Real estate management & development) | | 319,800 | | | 1,031 |
Localiza Rent a Car S.A. (Road & rail) | | 201,400 | | | 2,338 |
Lojas Renner S.A. (Multiline retail) | | 146,900 | | | 3,988 |
OdontoPrev S.A. (Health care providers & services) | | 38,700 | | | 1,349 |
Positivo Informatica S.A. (Computers & peripherals) | | 213,000 | | | 2,002 |
Tegma Gestao Logistica S.A. (Road & rail) | | 44,455 | | | 376 |
| | | | | |
| | | | | 11,084 |
| | | | | |
Colombia—1.1% | | | | | |
*Pacific Rubiales Energy Corporation (Oil, gas & consumable fuels) | | 225,671 | | | 5,058 |
| | | | | |
Mexico—1.0% | | | | | |
*Genomma Lab Internacional S.A.B. de C.V. (Pharmaceuticals) | | 668,910 | | | 2,221 |
*Grupo Comercial Chedraui S.A. de C.V. (Food & staples retailing) | | 789,787 | | | 2,064 |
| | | | | |
| | | | | 4,285 |
| | | | | |
See accompanying Notes to Financial Statements.
50 Semi-Annual Report | June 30, 2010 |
International Small Cap Growth Fund
Portfolio of Investments, June 30, 2010 (all dollar amounts in thousands) (unaudited)
| | | | | | |
Issuer | | Shares or
Principal
Amount | | Value |
|
Common Stocks—Emerging Europe, Mid-East, Africa—3.6% |
South Africa—2.5% | | | | | | |
*Aspen Pharmacare Holdings, Ltd. (Pharmaceuticals) | | | 259,678 | | $ | 2,564 |
Clicks Group, Ltd. (Multiline retail) | | | 1,192,055 | | | 5,244 |
Mr Price Group, Ltd. (Specialty retail) | | | 395,587 | | | 2,297 |
Wilson Bayly Holmes-Ovcon, Ltd. (Construction & engineering) | | | 48,854 | | | 696 |
| | | | | | |
| | | | | | 10,801 |
| | | | | | |
Turkey—1.1% | | | | | | |
Asya Katilim Bankasi A.S. (Commercial banks) | | | 877,427 | | | 2,003 |
BIM Birlesik Magazalar A.S. (Food & staples retailing) | | | 100,074 | | | 2,774 |
| | | | | | |
| | | | | | 4,777 |
| | | | | | |
| | |
Asia—3.5% | | | | | | |
Australia—2.5% | | | | | | |
Cochlear, Ltd. (Health care equipment & supplies) | | | 80,252 | | | 4,999 |
JB Hi-Fi, Ltd. (Specialty retail) | | | 256,719 | | | 4,084 |
Seek, Ltd. (Professional services) | | | 366,928 | | | 2,136 |
| | | | | | |
| | | | | | 11,219 |
| | | | | | |
Singapore—1.0% | | | | | | |
Midas Holdings, Ltd. (Metals & mining) | | | 3,017,000 | | | 1,952 |
Olam International, Ltd. (Food & staples retailing) | | | 1,284,700 | | | 2,358 |
| | | | | | |
| | | | | | 4,310 |
| | | | | | |
Total Common Stocks—98.2%
(cost $392,593) | | | 433,379 |
| | | | | | |
| | |
Convertible Bond | | | | | | |
Brazil—0.1% | | | | | | |
Lupatech S.A., 6.500%, due 4/15/18 (Machinery)**§ | | $ | 959 | | | 545 |
| | | | | | |
Total Convertible Bond—0.1%
(cost $497) | | | 545 |
| | | | | | |
| | |
Investment in Affiliate | | | | | | |
William Blair Ready Reserves Fund | | | 488,907 | | | 489 |
| | | | | | |
Total Investment in Affiliate—0.1%
(cost $489) | | | 489 |
| | | | | | |
| | |
Short-Term Investment | | | | | | |
American Express Credit Corporation Demand Note, VRN, 0.191%, due 7/1/10 | | $ | 500 | | | 500 |
| | | | | | |
Total Short-Term Investment—0.1%
(cost $500) | | | 500 |
| | | | | | |
| | | | | | | |
Issuer | | Principal
Amount | | Value | |
| | |
Repurchase Agreement | | | | | | | |
Fixed Income Clearing Corporation,
0.000% dated 6/30/10, due 7/1/10, repurchase price $7,130, collateralized by FHLMC, 2.000%, due 4/15/13 | | $ | 7,130 | | $ | 7,130 | |
| | | | | | | |
Total Repurchase Agreement—1.6%
(cost $7,130) | | | 7,130 | |
| | | | | | | |
Total Investments—100.1%
(cost $401,209) | | | 442,043 | |
Liabilities, plus cash and other assets—(0.1)% | | | (454 | ) |
| | | | | | | |
Net assets—100.0% | | $ | 441,589 | |
| | | | | | | |
ADR = American Depository Receipt
VRN = Variable Rate Note
*Non-income producing securities
** = Fair valued pursuant to Valuation Procedures adopted by the Board of Trustees. This holding represents 0.12% of the Fund’s net assets at June 30, 2010.
§ = Deemed illiquid pursuant to Liquidity Procedures approved by the Board of Trustees. This holding represents 0.12% of the net assets at June 30, 2010.
For securities primarily traded on exchanges or markets that close before the close of regular trading on the New York Stock Exchange, the Fund may use an independent pricing service to fair value price the securities pursuant to Valuation Procedures approved by the Board of Trustees.
At June 30, 2010, the Fund’s Portfolio of Investments includes the following industry categories:
| | |
Consumer Discretionary | | 26.6% |
Industrials | | 19.1% |
Information Technology | | 15.0% |
Health Care | | 13.5% |
Financials | | 9.9% |
Energy | | 7.2% |
Consumer Staples | | 4.2% |
Materials | | 4.1% |
Utilities | | 0.4% |
| | |
Total | | 100.0% |
| | |
At June 30, 2010, the Fund’s Portfolio of Investments includes the following currency categories:
| | |
British Pound Sterling | | 22.5% |
Japanese Yen | | 17.0% |
Euro | | 15.7% |
Hong Kong Dollar | | 8.1% |
Canadian Dollar | | 7.3% |
Swiss Franc | | 6.8% |
Indian Rupee | | 3.1% |
Brazilian Real | | 2.7% |
Swedish Krona | | 2.6% |
Australian Dollar | | 2.6% |
South African Rand | | 2.5% |
New Taiwan Dollar | | 2.4% |
Danish Krone | | 1.7% |
Indonesian Rupiah | | 1.1% |
Turkish Lira | | 1.1% |
All Other Currencies | | 2.8% |
| | |
Total | | 100.0% |
| | |
See accompanying Notes to Financial Statements.
June 30, 2010 | William Blair Funds 51 |

Todd M. McClone
Jeffrey A. Urbina
EMERGING MARKETS GROWTH FUND
The Emerging Markets Growth Fund seeks long-term capital appreciation.
AN OVERVIEW FROM THE PORTFOLIO MANAGERS
Please see page 28 for the Global Markets Overview.
The Emerging Markets Growth Fund posted a 4.27% decrease (Class N Shares) for the six months ended June 30, 2010. By comparison, the Fund’s benchmark, the MSCI Emerging Markets IMI Index, declined 5.68%.
The emerging markets growth strategy outpaced the Index year to date as stock selection was strong across most sectors and regions, due largely to second quarter performance. In particular, the Fund added significant value in Consumer, Financials, and Industrials. Within Consumer, the Fund’s focus in Asian auto companies and Consumer Staples added value, as did stock selection within Latin America. Emerging Markets Europe, Mid-East and Africa (EMEA) grocery holdings augmented results, as did Brazilian Consumer Staples performance. Financials stock selection was strong across regions, while transportation and infrastructure-related Asian Industrials added value. The Fund outperformed across each emerging markets region, benefiting largely from individual stock selection, rather than overall sector positioning within regions. Somewhat detracting from performance was Materials stock selection, which was focused on mining and fertilizers, areas which underperformed due to concerns about demand for commodities amidst a slowdown in China property development specifically and a potential global slowdown in general.
As of June 30, the Fund maintained its focus in Consumer stocks with 34.5% of the Fund invested across Consumer Discretionary and Consumer Staples names, a slight increase since year end. Financials was the largest single sector within the portfolio at 25.2%. While Asian Financials represented approximately 10% of the overall exposure, the weighting was significantly lower than the Index. We reduced Information Technology from a 13.7% weighting as of year end to 8.8% during the second quarter, as a result of concerns about near-intermediate term earnings sustainability. Materials and Telecommunication Services were also significantly underweighted versus the Index, and remained relatively stable during the period. Regionally, while 48.2% of the Fund was in Emerging Asian stocks, it remained very underweighted versus the Index, due largely to lower exposure in Korea and Taiwan. Conversely, the Fund was significantly overweighted in Latin America at 26.7% of the Fund, particularly in the Consumer, Energy and Financials sectors.
52 Semi-Annual Report | June 30, 2010 |
Emerging Markets Growth Fund
Performance Highlights (unaudited)
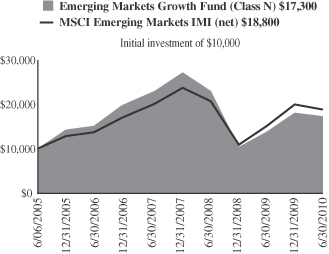
Average Annual Total Return at 6/30/2010
| | | | | | | | | | | | | | | |
| | | Year to
Date | | | 1
Year | | | 3
Year | | | 5
Year | | | Since
Inception(a) | |
Class N | | (4.27 | )% | | 25.02 | % | | (9.01 | )% | | 10.95 | % | | 11.36 | % |
Class I | | (4.09 | ) | | 25.46 | | | (8.78 | ) | | 11.22 | | | 11.62 | |
MSCI Emerging Markets IMI (net) | | (5.68 | ) | | 24.57 | | | (2.17 | ) | | 12.98 | | | 13.20 | |
| | (a) | | For the period from June 6, 2005 (Commencement of Operations) to June 30, 2010. | |
Performance cited represents past performance. Past performance does not guarantee future results and current performance may be lower or higher than the data quoted. Results shown are average annual returns, which assume reinvestment of dividends and capital gains. Investment returns and principal will fluctuate and you may have a gain or loss when you sell shares. For the most current month-end performance information, please call 1-800-742-7272, or visit our Web site at www.williamblairfunds.com. From time to time, the investment advisor may waive fees or reimburse expenses for the Fund. Without these waivers, performance would be lower. International investing involves special risk considerations, including currency fluctuations, lower liquidity, economic and political risk. Class N shares are available to the general public without a sales load. Class I shares are available to certain institutional investors and advisory clients of William Blair & Company L.L.C. without a sales load or distribution (12b-1) fees.
The performance highlights and graph presented above do not reflect the deduction of taxes that a shareholder would pay on fund distributions or the redemption of fund shares.
The Morgan Stanley Capital International (MSCI) Emerging Markets Investable Market Index (IMI) (net) is a free float-adjusted market capitalization weighted index that is designed to measure the equity market performance of emerging markets. This series approximates the minimum possible dividend reinvestment.
This report identifies the Fund’s investments on June 30, 2010. These holdings are subject to change. Not all stocks in the Fund performed the same, nor is there any guarantee that these stocks will perform as well in the future. Market forecasts provided in this report may not necessarily come to pass.
Sector Diversification (unaudited)
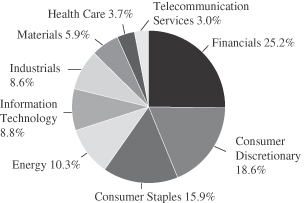
The sector diversification shown is based on the total long-term securities.
June 30, 2010 | William Blair Funds 53 |
Emerging Markets Growth Fund
Portfolio of Investments, June 30, 2010 (all dollar amounts in thousands) (unaudited)
| | | | | |
Issuer | | Shares | | Value |
| |
Common Stocks—Emerging Asia—48.2% | | | |
China—18.6% | | | | | |
361 Degrees International, Ltd. (Textiles, apparel & luxury goods) | | 3,259,000 | | $ | 2,322 |
AAC Acoustic Technologies Holdings, Inc. (Communications equipment) | | 1,511,949 | | | 2,161 |
Ajisen China Holdings, Ltd. (Hotels, restaurants & leisure) | | 2,175,078 | | | 2,428 |
*Baidu, Inc.—ADR (Internet software & services) | | 177,193 | | | 12,063 |
China Dongxiang Group Co. (Textiles, apparel & luxury goods) | | 4,154,000 | | | 2,769 |
China Green (Holdings), Ltd. (Food products) | | 2,409,000 | | | 2,417 |
China High Speed Transmission Equipment Group Co., Ltd. (Electrical equipment) | | 1,708,000 | | | 3,588 |
China Life Insurance Co., Ltd. (Insurance) | | 4,004,000 | | | 17,510 |
China Shenhua Energy Co., Ltd. (Oil, gas & consumable fuels) | | 3,693,406 | | | 13,325 |
China Vanke Co., Ltd. (Real estate management & development) | | 1,345,426 | | | 1,411 |
China Yurun Food Group, Ltd. (Food products) | | 2,479,000 | | | 7,796 |
CNOOC, Ltd. (Oil, gas & consumable fuels) | | 18,107,000 | | | 30,776 |
Comba Telecom Systems Holdings, Ltd. (Communications equipment) | | 1,964,600 | | | 2,165 |
*Concord Medical Services Holdings, Ltd.—ADR (Health care providers & services) | | 150,368 | | | 896 |
*Ctrip.com International, Ltd.—ADR (Hotels, restaurants & leisure) | | 154,717 | | | 5,811 |
Dongfeng Motor Group Co., Ltd. (Automobiles) | | 13,550,000 | | | 15,717 |
Golden Eagle Retail Group, Ltd. (Multiline retail) | | 1,754,000 | | | 3,662 |
Haitian International Holdings, Ltd. (Machinery) | | 1,960,185 | | | 1,368 |
Hengan International Group Co., Ltd. (Personal products) | | 987,000 | | | 7,992 |
Industrial and Commercial Bank of China (Commercial banks) | | 47,465,000 | | | 34,500 |
Li Ning Co., Ltd. (Textiles, apparel & luxury goods) | | 1,035,000 | | | 3,391 |
Lonking Holdings, Ltd. (Machinery) | | 4,894,000 | | | 3,242 |
Mindray Medical International, Ltd.—ADR (Health care equipment & supplies) | | 108,484 | | | 3,409 |
Minth Group, Ltd. (Auto components) | | 1,004,000 | | | 1,186 |
Peak Sport Products, Ltd. (Textiles, apparel & luxury goods) | | 3,331,000 | | | 2,194 |
Shandong Weigao Group Medical Polymer Co., Ltd. (Health care equipment & supplies) | | 640,700 | | | 2,791 |
Zhuzhou CSR Times Electric Co., Ltd. (Electrical equipment) | | 784,861 | | | 1,662 |
| | | | | |
| | | | | 188,552 |
| | | | | |
India—13.3% | | | | | |
Asian Paints, Ltd. (Chemicals) | | 63,367 | | | 3,123 |
Axis Bank, Ltd. (Commercial banks) | | 391,009 | | | 10,366 |
Bharat Heavy Electricals, Ltd. (Electrical equipment) | | 248,597 | | | 13,098 |
*Cairn India, Ltd. (Oil, gas & consumable fuels) | | 807,585 | | | 5,229 |
| | | | | |
Issuer | | Shares | | Value |
|
Common Stocks—Emerging Asia—48.2%—(continued) |
India—(continued) | | | | | |
Dabur India, Ltd. (Personal products) | | 849,316 | | $ | 3,830 |
Financial Technologies (India), Ltd. (Software) | | 71,919 | | | 2,054 |
Hero Honda Motors, Ltd. (Automobiles) | | 86,847 | | | 3,810 |
Housing Development Finance Corporation (Thrifts & mortgage finance) | | 135,622 | | | 8,547 |
Infosys Technologies, Ltd. (IT services) | | 354,841 | | | 21,171 |
Jindal Steel & Power, Ltd. (Metals & mining) | | 691,867 | | | 9,238 |
Larsen & Toubro, Ltd. (Construction & engineering) | | 439,205 | | | 16,987 |
Lupin, Ltd. (Pharmaceuticals) | | 137,292 | | | 5,780 |
Sterlite Industries India, Ltd. (Metals & mining) | | 4,299,728 | | | 15,518 |
Sun TV Network, Ltd. (Media) | | 277,889 | | | 2,598 |
Tata Motors, Ltd. (Machinery) | | 607,261 | | | 10,056 |
Yes Bank, Ltd. (Commercial banks) | | 619,020 | | | 3,548 |
| | | | | |
| | | | | 134,953 |
| | | | | |
Indonesia—3.9% | | | | | |
PT Astra International Tbk (Automobiles) | | 2,998,500 | | | 15,842 |
PT Bank Rakyat Indonesia (Commercial banks) | | 10,504,000 | | | 10,664 |
*PT Ciputra Development Tbk (Real estate management & development) | | 54,385,456 | | | 1,991 |
PT Unilever Indonesia Tbk (Household products) | | 2,137,500 | | | 3,986 |
PT United Tractors Tbk (Machinery) | | 3,545,000 | | | 7,266 |
| | | | | |
| | | | | 39,749 |
| | | | | |
Malaysia—1.3% | | | | | |
CIMB Group Holdings Bhd (Commercial banks) | | 4,551,200 | | | 9,799 |
Top Glove Corporation Bhd (Health care equipment & supplies) | | 708,900 | | | 2,996 |
| | | | | |
| | | | | 12,795 |
| | | | | |
Papua New Guinea—0.7% | | | | | |
Oil Search, Ltd. (Oil, gas & consumable fuels) | | 1,451,850 | | | 6,680 |
| | | | | |
South Korea—6.8% | | | | | |
Amorepacific Corporation (Personal products) | | 7,331 | | | 6,237 |
Hyundai Mobis (Auto components) | | 106,180 | | | 17,809 |
Hyundai Motor Co. (Automobiles) | | 252,022 | | | 29,489 |
LG Household & Health Care, Ltd. (Household products) | | 19,694 | | | 5,593 |
Samsung Electronics Co., Ltd. (Semiconductors & semiconductor equipment) | | 15,020 | | | 9,421 |
| | | | | |
| | | | | 68,549 |
| | | | | |
Taiwan—2.8% | | | | | |
Chicony Electronics Co., Ltd. (Computers & peripherals) | | 1,056,000 | | | 2,341 |
*Hon Hai Precision Industry Co., Ltd. (Electronic equipment, instruments & components) | | 2,721,100 | | | 9,538 |
MediaTek, Inc. (Semiconductors & semiconductor equipment) | | 627,142 | | | 8,753 |
See accompanying Notes to Financial Statements.
54 Semi-Annual Report | June 30, 2010 |
Emerging Markets Growth Fund
Portfolio of Investments, June 30, 2010 (all dollar amounts in thousands) (unaudited)
| | | | | |
Issuer | | Shares | | Value |
|
Common Stocks—Emerging Asia—48.2%—(continued) |
Taiwan—(continued) | | | | | |
Tripod Technology Corporation (Electronic equipment, instruments & components) | | 809,000 | | $ | 2,991 |
Wistron Corporation (Computers & peripherals) | | 2,888,000 | | | 4,232 |
| | | | | |
| | | | | 27,855 |
| | | | | |
Thailand—0.8% | | | | | |
CP ALL PCL (Food & staples retailing) | | 8,734,700 | | | 7,753 |
Minor International PCL (Hotels, restaurants & leisure) | | 2,544,400 | | | 794 |
| | | | | |
| | | | | 8,547 |
| | | | | |
| | |
Emerging Latin America—26.7% | | | | | |
Brazil—14.0% | | | | | |
Amil Participacoes S.A. (Insurance) | | 696,384 | | | 5,652 |
Anhanguera Educacional Participacoes S.A. (Diversified consumer services) | | 162,800 | | | 2,461 |
BR Malls Participacoes S.A. (Real estate management & development) | | 601,900 | | | 7,836 |
BR Properties S.A. (Real estate management & development) | | 305,241 | | | 2,173 |
Brasil Brokers Participacoes S.A. (Real estate management & development) | | 438,200 | | | 1,413 |
Cia de Bebidas das Americas—ADR (Beverages) | | 204,409 | | | 20,647 |
Cyrela Brazil Realty S.A. (Household durables) | | 423,400 | | | 4,577 |
Diagnosticos da America S.A. (Health care providers & services) | | 971,600 | | | 9,145 |
*Hypermarcas S.A. (Personal products) | | 601,228 | | | 7,721 |
Localiza Rent a Car S.A. (Road & rail) | | 677,500 | | | 7,864 |
Lojas Renner S.A. (Multiline retail) | | 334,000 | | | 9,067 |
M Dias Branco S.A. (Food products) | | 112,934 | | | 2,440 |
MRV Engenharia e Participacoes S.A. (Household durables) | | 1,129,880 | | | 7,956 |
Natura Cosmeticos S.A. (Personal products) | | 525,200 | | | 11,639 |
OdontoPrev S.A. (Health care providers & services) | | 61,900 | | | 2,157 |
*OGX Petroleo e Gas Participacoes S.A. (Oil, gas & consumable fuels) | | 987,300 | | | 9,146 |
PDG Realty S.A. Empreendimentos e Participacoes (Household durables) | | 583,500 | | | 4,927 |
Positivo Informatica S.A. (Computers & peripherals) | | 242,700 | | | 2,282 |
Totvs S.A. (Software) | | 62,800 | | | 4,660 |
Vale S.A.—ADR (Metals & mining) | | 747,662 | | | 18,206 |
| | | | | |
| | | | | 141,969 |
| | | | | |
Chile—1.9% | | | | | |
Banco Santander Chile—ADR (Commercial banks) | | 133,920 | | | 8,985 |
Lan Airlines S.A. (Airlines) | | 254,122 | | | 4,747 |
S.A.C.I. Falabella (Multiline retail) | | 912,778 | | | 5,942 |
| | | | | |
| | | | | 19,674 |
| | | | | |
Colombia—0.6% | | | | | |
*Pacific Rubiales Energy Corporation (Oil, gas & consumable fuels) | | 266,540 | | | 5,974 |
| | | | | |
| | | | | |
Issuer | | Shares | | Value |
|
Common Stocks—Emerging Latin
America—26.7%—(continued) |
Mexico—8.1% | | | | | |
America Movil S.A.B. de C.V. (Wireless telecommunication services) | | 12,208,300 | | $ | 28,885 |
Banco Compartamos S.A. de C.V. (Consumer finance) | | 884,400 | | | 4,597 |
*Genomma Lab Internacional S.A.B. de C.V. (Pharmaceuticals) | | 748,917 | | | 2,487 |
*Grupo Comercial Chedraui S.A. de C.V. (Food & staples retailing) | | 1,163,002 | | | 3,040 |
Grupo Mexico S.A.B. de C.V. Series “B” (Metals & mining) | | 4,028,428 | | | 9,563 |
Grupo Televisa S.A.—ADR (Media) | | 371,363 | | | 6,465 |
Wal-Mart de Mexico S.A.B. de C.V. (Food & staples retailing) | | 12,396,300 | | | 27,461 |
| | | | | |
| | | | | 82,498 |
| | | | | |
Panama—0.5% | | | | | |
Copa Holdings S.A. Class “A” (Airlines)† | | 102,809 | | | 4,546 |
| | | | | |
Peru—1.6% | | | | | |
Credicorp, Ltd. (Commercial banks)† | | 177,258 | | | 16,111 |
| | | | | |
| |
Emerging Europe, Mid-East, Africa—14.0% | | | |
Egypt—0.6% | | | | | |
Commercial International Bank Egypt S.A.E. (Commercial banks) | | 406,718 | | | 4,761 |
Egyptian Financial Group-Hermes Holding (Capital markets) | | 282,784 | | | 1,427 |
| | | | | |
| | | | | 6,188 |
| | | | | |
Qatar—1.4% | | | | | |
Qatar National Bank S.A.Q. (Commercial banks) | | 386,845 | | | 14,219 |
| | | | | |
Russia—1.8% | | | | | |
Magnit OAO (Food & staples retailing)† | | 120,984 | | | 8,048 |
*X5 Retail Group N.V.—GDR (Food & staples retailing) | | 304,600 | | | 10,222 |
| | | | | |
| | | | | 18,270 |
| | | | | |
South Africa—6.3% | | | | | |
*Aspen Pharmacare Holdings, Ltd. (Pharmaceuticals) | | 516,628 | | | 5,102 |
Clicks Group, Ltd. (Multiline retail) | | 904,081 | | | 3,977 |
Mr Price Group, Ltd. (Specialty retail) | | 538,924 | | | 3,130 |
Naspers, Ltd. (Media) | | 227,587 | | | 7,664 |
Shoprite Holdings, Ltd. (Food & staples retailing) | | 955,130 | | | 10,269 |
Standard Bank Group, Ltd. (Commercial banks) | | 1,758,112 | | | 23,314 |
Truworths International, Ltd. (Specialty retail) | | 1,095,500 | | | 7,625 |
Wilson Bayly Holmes-Ovcon, Ltd. (Construction & engineering) | | 169,068 | | | 2,407 |
| | | | | |
| | | | | 63,488 |
| | | | | |
Turkey—3.4% | | | | | |
Asya Katilim Bankasi A.S. (Commercial banks) | | 2,012,230 | | | 4,594 |
BIM Birlesik Magazalar A.S. (Food & staples retailing) | | 240,426 | | | 6,664 |
See accompanying Notes to Financial Statements.
June 30, 2010 | William Blair Funds 55 |
Emerging Markets Growth Fund
Portfolio of Investments, June 30, 2010 (all dollar amounts in thousands) (unaudited)
| | | | | | |
Issuer | | Shares or
Principal
Amount | | Value |
|
Common Stocks—Emerging Europe, Mid-East,
Africa—14.0%—(continued) |
Turkey—(continued) | | | | | | |
Turkiye Garanti Bankasi A.S. (Commercial banks) | | | 5,611,846 | | $ | 23,354 |
| | | | | | |
| | | | | | 34,612 |
| | | | | | |
United Arab Emirates—0.5% | | | | | | |
First Gulf Bank PJSC (Commercial banks) | | | 1,173,086 | | | 4,745 |
| | | | | | |
Total Common Stocks—88.9%
(cost $746,081) | | | 899,974 |
| | | | | | |
| | |
Preferred Stocks | | | | | | |
Brazil—4.6% | | | | | | |
Itau Unibanco Holding S.A. (Commercial banks) | | | 955,854 | | | 17,211 |
Petroleo Brasileiro S.A. (Oil, gas & consumable fuels) | | | 1,764,180 | | | 26,252 |
Randon Participacoes S.A. (Machinery) | | | 662,300 | | | 3,776 |
| | | | | | |
| | | | | | 47,239 |
| | | | | | |
Total Preferred Stocks—4.6%
(cost $48,102) | | | 47,239 |
| | | | | | |
| | |
Investment in Warrants | | | | | | |
Thailand—0.0% | | | | | | |
*Minor International PCL 2013, $13.00 (Hotels, restaurants & leisure) | | | 575,650 | | | 43 |
| | | | | | |
Total Warrants—0.0%
(cost $0) | | | 43 |
| | | | | | |
| | |
Convertible Bond | | | | | | |
Brazil—0.1% | | | | | | |
Lupatech S.A., 6.500%, due 4/15/18 (Machinery)**§ | | $ | 1,602 | | | 910 |
| | | | | | |
Total Convertible Bond—0.1%
(cost $831) | | | 910 |
| | | | | | |
| | |
Investment in Affiliate | | | | | | |
William Blair Ready Reserves Fund | | | 66,217 | | | 66 |
| | | | | | |
Total Investment in Affiliate—0.0%
(cost $66) | | | 66 |
| | | | | | |
| | |
Short-Term Investment | | | | | | |
American Express Credit Corporation Demand Note, VRN,
0.191%, due 7/1/10 | | $ | 2,000 | | | 2,000 |
| | | | | | |
Total Short-Term Investment—0.2%
(cost $2,000) | | | 2,000 |
| | | | | | |
| | | | | | |
Issuer | | Principal
Amount | | Value |
| | |
Repurchase Agreement | | | | | | |
Fixed Income Clearing Corporation, 0.000% dated 6/30/10, due 7/1/10, repurchase price $44,125, collateralized by FFCB,
1.625%, due 3/7/13 | | $ | 44,125 | | $ | 44,125 |
| | | | | | |
Total Repurchase Agreement—4.4%
(cost $44,125) | | | 44,125 |
| | | | | | |
Total Investments—98.2%
(cost $841,205) | | | 994,357 |
Cash and other assets, less liabilities—1.8% | | | 18,124 |
| | | | | | |
Net assets—100.0% | | $ | 1,012,481 |
| | | | | | |
ADR = American Depository Receipt
GDR = Global Depository Receipt
VRN = Variable Rate Note
*Non-income producing securities
† = U.S. listed foreign security
** = Fair valued pursuant to Valuation Procedures adopted by the Board of Trustees. This holding represents 0.09% of the Fund’s net assets at June 30, 2010.
§ = Deemed illiquid pursuant to Liquidity Procedures approved by the Board of Trustees. This holding represents 0.09% of the net assets at June 30, 2010.
For securities primarily traded on exchanges or markets that close before the close of regular trading on the New York Stock Exchange the Fund may use an independent pricing service to fair value price the securities pursuant to Valuation Procedures approved by the Board of Trustees.
At June 30, 2010, the Fund’s Portfolio of Investments includes the following industry categories:
| | |
Financials | | 25.2% |
Consumer Discretionary | | 18.6% |
Consumer Staples | | 15.9% |
Energy | | 10.3% |
Information Technology | | 8.8% |
Industrials | | 8.6% |
Materials | | 5.9% |
Health Care | | 3.7% |
Telecommunication Services | | 3.0% |
| | |
Total | | 100.0% |
| | |
At June 30, 2010, the Fund’s Portfolio of Investments includes the following currency categories:
| | |
Hong Kong Dollar | | 17.5% |
Brazilian Real | | 16.0% |
Indian Rupee | | 14.2% |
U.S. Dollar | | 12.2% |
Mexican Peso | | 8.0% |
South Korean Won | | 7.2% |
South African Rand | | 6.7% |
Indonesian Rupiah | | 4.2% |
Turkish Lira | | 3.7% |
New Taiwan Dollar | | 2.9% |
Qatari Rial | | 1.5% |
Malaysian Ringgit | | 1.4% |
Chilean Peso | | 1.1% |
All Other Currencies | | 3.4% |
| | |
Total | | 100.0% |
| | |
See accompanying Notes to Financial Statements.
56 Semi-Annual Report | June 30, 2010 |
Todd M. McClone
Jeffrey A. Urbina
EMERGING LEADERS GROWTH FUND
The Emerging Leaders Growth Fund seeks long-term capital appreciation.
AN OVERVIEW FROM THE PORTFOLIO MANAGERS
Please see page 28 for the Global Markets Overview.
The Emerging Leaders Growth Fund posted a 2.02% decrease (Class I Shares) for the six months ended June 30, 2010. By comparison, the Fund’s benchmark, the MSCI Emerging Markets Large Cap Index (net) declined 6.55%.
Class N Shares, which commenced operations on May 3, decreased 6.14% in the two-month period ended June 30, 2010, while the MSCI Emerging Markets Large Cap Index (net) decreased 8.69%.
Year to date performance was augmented by the Fund’s significant weighting in Consumer Discretionary and Staples stocks at the expense of Materials and Information Technology (IT). Stock selection was also a key determinant of outperformance during the first half of 2010 across regions and sectors. The Fund’s Staples holdings were up just over 13%, significantly outpacing the Index, due primarily to strong performance in the Fund’s Emerging Asian consumer products and grocery holdings, coupled with strong Emerging Europe, Middle East, and Africa (EMEA) grocery/discount performance. Industrials stock selection was also particularly strong, with infrastructure related holdings driving results. Regionally, the Fund benefited from good performance across most sectors within Emerging Asia, as well as the overweighting in Consumer Discretionary and Staples at the expense of Asian IT and Materials stocks. EMEA value added was largely within the Consumer Staples sector, while Emerging Latin America performance benefited from the underweighting and stock performance within Energy, coupled with strong Financials stock selection.
As of June 30, the Fund maintained its significant exposure in Consumer Discretionary and Staples stocks, with 28.0% in Consumer Staples and another 14.8% in Consumer Discretionary, compared to the 5.94% and 4.36% Index weightings, respectively. Consumer Staples exposure increased by nearly 10% since year end, particularly in Emerging Asia and Emerging Latin America, while Consumer Discretionary decreased by nearly 5%. The Fund maintained its marginal overweighting of Financials at 28.2% of the Fund, with higher weightings in EMEA and Emerging Latin America offset by an underweighting in Asian Financials. The Fund was most significantly underweighted in Energy stocks, which represented 8.0% of the Fund, compared with nearly 16.0% in the Index, and in IT and Materials, which were also significantly underweighted. IT decreased by approximately 9% during the six month period, while Materials decreased by approximately 8%, as we sold holdings in these sectors due to deteriorating short-intermediate term earnings growth in favor of Consumer Staples holdings and, to some extent, cash equivalents.
June 30, 2010 | William Blair Funds 57 |
Emerging Leaders Growth Fund
Performance Highlights (unaudited)
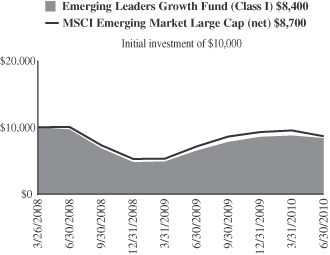
Average Annual Total Return at 6/30/2010
| | | | | | | | | |
| | | Year to
Date | | | 1
Year | | | Since
Inception | |
Class I | | (2.02 | )% | | 28.80 | % | | (7.53 | )(a) |
MSCI Emerging Markets Large
Cap Index (net) | | (6.55 | ) | | 21.93 | | | (6.11 | )(a) |
| | (a) | | For the period from March 26, 2008 (Commencement of Operations) to June 30, 2010. | |
Performance cited represents past performance. Past performance does not guarantee future results and current performance may be lower or higher than the data quoted. Results shown are average annual total returns, which assume reinvestment of dividends and capital gains. Investment returns and principal will fluctuate and you may have a gain or loss when you sell shares. For the most current month-end performance information, please call 1-800-742-7272, or visit our Web site at www.williamblairfunds.com. International investing involves special risk considerations, including currency fluctuations, lower liquidity, economic and political risk. From time to time, the investment advisor may waive fees or reimburse expenses for the Fund. Without these waivers, performance would be lower. Class N shares are available to the general public without a sales load. Class I shares are available to certain institutional investors and advisory clients of William Blair & Company, L.L.C., without a sales load or distribution fees (12b-1). The Emerging Leaders Class N commenced operations on May 3, 2010 and had one share outstanding as of June 30, 2010.
The performance highlights and graph presented above do not reflect the deduction of taxes that a shareholder would pay on fund distributions or the redemption of fund shares.
The Morgan Stanley Capital International (MSCI) Emerging Markets Large Cap Index (net) is a free float-adjusted market capitalization weighted index that is designed to measure market performance of large capitalization stocks in emerging markets. This series approximates the minimum possible dividend reinvestment.
This report identifies the Fund’s investments on June 30, 2010. These holdings are subject to change. Not all stocks in the Fund performed the same, nor is there any guarantee that these stocks will perform as well in the future. Market forecasts provided in this report may not necessarily come to pass.
Sector Diversification (unaudited)
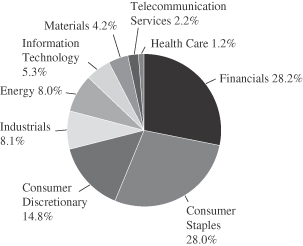
The sector diversification shown is based on the total long-term securities.
58 Semi-Annual Report | June 30, 2010 |
Emerging Leaders Growth Fund
Portfolio of Investments, June 30, 2010 (all dollar amounts in thousands) (unaudited)
| | | | | |
Issuer | | Shares | | Value |
|
Common Stocks—Emerging Asia—55.8% |
China—19.7% | | | | | |
*Baidu, Inc.—ADR (Internet software & services) | | 12,159 | | $ | 828 |
Belle International Holdings, Ltd. (Specialty retail) | | 865,000 | | | 1,227 |
China Dongxiang Group Co. (Textiles, apparel & luxury goods) | | 1,304,000 | | | 869 |
China Life Insurance Co., Ltd. (Insurance) | | 270,000 | | | 1,181 |
China Oilfield Services, Ltd. (Energy equipment & services) | | 638,000 | | | 742 |
China Yurun Food Group, Ltd. (Food products) | | 280,000 | | | 880 |
CNOOC, Ltd. (Oil, gas & consumable fuels) | | 1,463,000 | | | 2,487 |
*Ctrip.com International, Ltd.—ADR (Hotels, restaurants & leisure) | | 17,354 | | | 652 |
Dongfeng Motor Group Co., Ltd. (Automobiles) | | 536,000 | | | 622 |
Golden Eagle Retail Group, Ltd. (Multiline retail) | | 470,000 | | | 981 |
Hengan International Group Co., Ltd. (Personal products) | | 116,000 | | | 939 |
Industrial and Commercial Bank of China (Commercial banks) | | 3,181,000 | | | 2,312 |
Want Want China Holdings, Ltd. (Food products) | | 1,410,000 | | | 1,183 |
| | | | | |
| | | | | 14,903 |
| | | | | |
India—17.1% | | | | | |
Axis Bank, Ltd. (Commercial banks) | | 40,528 | | | 1,075 |
Bharat Heavy Electricals, Ltd. (Electrical equipment) | | 18,157 | | | 957 |
*Cairn India, Ltd. (Oil, gas & consumable fuels) | | 153,377 | | | 993 |
Dabur India, Ltd. (Personal products) | | 249,748 | | | 1,126 |
HDFC Bank, Ltd. (Commercial banks) | | 35,862 | | | 1,473 |
Housing Development Finance Corporation (Thrifts & mortgage finance) | | 8,191 | | | 516 |
Infosys Technologies, Ltd. (IT services) | | 22,404 | | | 1,337 |
ITC, Ltd. (Tobacco) | | 140,246 | | | 915 |
Jindal Steel & Power, Ltd. (Metals & mining) | | 85,364 | | | 1,140 |
Larsen & Toubro, Ltd. (Construction & engineering) | | 39,463 | | | 1,526 |
Nestle India, Ltd. (Food products) | | 14,634 | | | 908 |
Tata Motors, Ltd. (Machinery) | | 58,945 | | | 976 |
| | | | | |
| | | | | 12,942 |
| | | | | |
Indonesia—7.1% | | | | | |
PT Astra International Tbk (Automobiles) | | 281,000 | | | 1,485 |
PT Bank Rakyat Indonesia (Commercial banks) | | 1,326,000 | | | 1,346 |
PT Unilever Indonesia Tbk (Household products) | | 667,000 | | | 1,244 |
PT United Tractors Tbk (Machinery) | | 644,000 | | | 1,320 |
| | | | | |
| | | | | 5,395 |
| | | | | |
Malaysia—2.7% | | | | | |
CIMB Group Holdings Bhd (Commercial banks) | | 957,500 | | | 2,062 |
| | | | | |
South Korea—6.4% | | | | | |
Hyundai Mobis (Auto components) | | 7,579 | | | 1,271 |
Hyundai Motor Co. (Automobiles) | | 13,180 | | | 1,542 |
| | | | | |
Issuer | | Shares | | Value |
|
Common Stocks—Emerging Asia—55.8%—(continued) |
South Korea—(continued) | | | | | |
LG Household & Health Care, Ltd. (Household products) | | 4,198 | | $ | 1,192 |
Samsung Electronics Co., Ltd. (Semiconductors & semiconductor equipment) | | 1,280 | | | 803 |
| | | | | |
| | | | | 4,808 |
| | | | | |
Taiwan—1.0% | | | | | |
*Hon Hai Precision Industry Co., Ltd. (Electronic equipment, instruments & components) | | 222,000 | | | 778 |
| | | | | |
Thailand—1.8% | | | | | |
CP ALL PCL (Food & staples retailing) | | 1,504,200 | | | 1,335 |
| | | | | |
| | |
Emerging Latin America—21.2% | | | | | |
Brazil—8.4% | | | | | |
Cia de Bebidas das Americas—ADR (Beverages) | | 14,721 | | | 1,487 |
Cyrela Brazil Realty S.A. (Household durables) | | 14,500 | | | 157 |
*Hypermarcas S.A. (Personal products) | | 123,100 | | | 1,581 |
Natura Cosmeticos S.A. (Personal products) | | 45,800 | | | 1,015 |
*OGX Petroleo e Gas Participacoes S.A. (Oil, gas & consumable fuels) | | 57,000 | | | 528 |
PDG Realty S.A. Empreendimentos e Participacoes (Household durables) | | 55,900 | | | 472 |
Vale S.A.—ADR (Metals & mining) | | 44,252 | | | 1,077 |
| | | | | |
| | | | | 6,317 |
| | | | | |
Chile—3.9% | | | | | |
Banco Santander Chile—ADR (Commercial banks) | | 13,259 | | | 890 |
Lan Airlines S.A. (Airlines) | | 49,913 | | | 932 |
S.A.C.I. Falabella (Multiline retail) | | 172,523 | | | 1,123 |
| | | | | |
| | | | | 2,945 |
| | | | | |
Colombia—1.2% | | | | | |
*Pacific Rubiales Energy Corporation (Oil, gas & consumable fuels) | | 40,415 | | | 906 |
| | | | | |
Mexico—6.1% | | | | | |
America Movil S.A.B. de C.V.—ADR (Wireless telecommunication services) | | 31,637 | | | 1,503 |
Grupo Financiero Banorte S.A.B. de C.V. (Commercial banks) | | 229,400 | | | 869 |
Grupo Mexico S.A.B. de C.V. Series “B” (Metals & mining) | | 317,626 | | | 754 |
Wal-Mart de Mexico S.A.B. de C.V. (Food & staples retailing) | | 664,800 | | | 1,473 |
| | | | | |
| | | | | 4,599 |
| | | | | |
Peru—1.6% | | | | | |
Credicorp, Ltd. (Commercial banks)† | | 13,436 | | | 1,221 |
| | | | | |
|
Emerging Europe, Mid-East, Africa—13.7% |
Egypt—0.9% | | | | | |
Commercial International Bank Egypt S.A.E. (Commercial banks) | | 55,505 | | | 650 |
| | | | | |
Russia—4.0% | | | | | |
*Magnit OJSC—144A—GDR (Food & staples retailing) | | 53,628 | | | 751 |
See accompanying Notes to Financial Statements.
June 30, 2010 | William Blair Funds 59 |
Emerging Leaders Growth Fund
Portfolio of Investments, June 30, 2010 (all dollar amounts in thousands) (unaudited)
| | | | | | |
Issuer | | Shares or
Principal
Amount | | Value |
|
Common Stocks—Emerging Europe, Mid-East, Africa—13.7%—(continued) |
Russia—4.0%—(continued) | | | | | | |
Sberbank of Russian Federation (Commercial banks)† | | | 425,545 | | $ | 1,022 |
*X5 Retail Group N.V.—GDR (Food & staples retailing) | | | 36,350 | | | 1,227 |
| | | | | | |
| | | | | | 3,000 |
| | | | | | |
South Africa—4.3% | | | | | | |
*Aspen Pharmacare Holdings, Ltd. (Pharmaceuticals) | | | 86,313 | | | 852 |
Shoprite Holdings, Ltd. (Food & staples retailing) | | | 117,179 | | | 1,260 |
Standard Bank Group, Ltd. (Commercial banks) | | | 88,959 | | | 1,180 |
| | | | | | |
| | | | | | 3,292 |
| | | | | | |
Turkey—4.0% | | | | | | |
BIM Birlesik Magazalar A.S. (Food & staples retailing) | | | 43,371 | | | 1,202 |
Turkiye Garanti Bankasi A.S. (Commercial banks) | | | 435,175 | | | 1,811 |
| | | | | | |
| | | | | | 3,013 |
| | | | | | |
United Arab Emirates—0.5% | | | | | | |
First Gulf Bank PJSC (Commercial banks) | | | 99,024 | | | 400 |
| | | | | | |
Total Common Stocks—90.7%
(cost $59,694) | | | 68,566 |
| | | | | | |
| | |
Preferred Stock | | | | | | |
Brazil—2.4% | | | | | | |
Itau Unibanco Holding S.A. (Commercial banks) | | | 101,085 | | $ | 1,820 |
| | | | | | |
Total Preferred Stock—2.4%
(cost $1,494) | | | 1,820 |
| | | | | | |
| | |
Investment in Affiliate | | | | | | |
William Blair Ready Reserves Fund | | | 440,296 | | | 440 |
| | | | | | |
Total Investment in Affiliate—0.6%
(cost $440) | | | 440 |
| | | | | | |
| | |
Repurchase Agreement | | | | | | |
State Street Bank and Trust Company, 0.000% dated 6/30/10, due 7/1/10, repurchase price $2,709, collateralized by FHLB,
4.375% due 9/17/10 | | $ | 2,709 | | | 2,709 |
| | | | | | |
Total Repurchase Agreement—3.6%
(cost $2,709) | | | 2,709 |
| | | | | | |
Total Investments—97.3%
(cost $64,337) | | | 73,535 |
| | | | | | |
Cash and other assets, less liabilities—2.7% | | | 2,074 |
| | | | | | |
Net assets—100.0% | | $ | 75,609 |
| | | | | | |
ADR = American Depository Receipt
GDR = Global Depository Receipt
* Non-income producing securities
† = U.S. listed foreign security
For securities primarily traded on exchanges or markets that close before the close of regular trading on the New York Stock Exchange, the Fund may use an independent pricing service to fair value price the securities pursuant to Valuation Procedures approved by the Board of Trustees.
At June 30, 2010, the Fund’s Portfolio of Investments includes the following industry categories:
| | |
Financials | | 28.2% |
Consumer Staples | | 28.0% |
Consumer Discretionary | | 14.8% |
Industrials | | 8.1% |
Energy | | 8.0% |
Information Technology | | 5.3% |
Materials | | 4.2% |
Telecommunication Services | | 2.2% |
Health Care | | 1.2% |
| | |
Total | | 100.0% |
| | |
At June 30, 2010, the Fund’s Portfolio of Investments includes the following currency categories:
| | |
Hong Kong Dollar | | 19.1% |
Indian Rupee | | 18.4% |
U.S. Dollar | | 15.1% |
Brazilian Real | | 7.9% |
Indonesian Rupiah | | 7.7% |
South Korean Won | | 6.8% |
South African Rand | | 4.7% |
Mexican Peso | | 4.4% |
Turkish Lira | | 4.3% |
Malaysian Ringgit | | 2.9% |
Chilean Peso | | 2.9% |
Thai Baht | | 1.9% |
Canadian Dollar | | 1.3% |
New Taiwan Dollar | | 1.1% |
All Other Currencies | | 1.5% |
| | |
Total | | 100.0% |
| | |
See accompanying Notes to Financial Statements.
60 Semi-Annual Report | June 30, 2010 |

Chad M. Kilmer

Mark T. Leslie

David S. Mitchell
Small Cap Value Fund (formerly known as Value Discovery Fund)
The Small Cap Value Fund seeks long-term capital appreciation.
AN OVERVIEW FROM THE PORTFOLIO MANAGERS
The Fund posted a 0.38% increase (Class N Shares) for the six months ended June 30, 2010. By comparison, the Fund’s benchmark, the Russell 2000® Value Index, declined 1.64%.
After a strong first quarter, the U.S. equity market reversed course during the second quarter to finish in negative territory for the first half of the year. The Russell 2000® Value Index returned -10.60% during the second quarter to produce a -1.64% return for 2010 through June. The Fund outperformed during the second quarter’s decline and is ahead on the year-to-date period as well.
While the year started off on a positive note on the heels of better-than-expected corporate sales and earnings, macro concerns across the globe instilled fear, and volatility, back into the markets. European sovereign debt downgrades and fiscal austerity measures, the Gulf of Mexico oil catastrophe, U.S. state budget woes, and expiring stimulus programs all contributed to investor skepticism. More importantly, given the significance of job growth to a sustainable economic recovery, stubbornly lackluster employment and housing data have stoked fears of slipping back into a recession. Because of these negative developments and with the 2008 downturn fresh in investors’ minds, stock prices corrected as they once again succumbed to macro factors rather than company fundamentals.
During the second quarter, all sectors within the Russell 2000® Value Index finished in the red. Consumer Discretionary (-17%), Materials (-15%) and Energy (-13%) were the worst performing sectors. The typically defensive Utilities and Consumer Staples sectors performed best at -3% and -7%, respectively.
For the year-to-date period, sector returns were more or less in line with the benchmark, with a few exceptions. Energy and Materials were the outliers at - -9% apiece. Financials were the best performing sector finishing at +1% for the six-month period.
The Fund’s outperformance during the second quarter is attributable to strong stock selection across several sectors. The Fund’s holdings in Information Technology, Energy and Financials were the largest positive contributors to relative return during the quarter. On the other hand, certain stocks in Consumer Discretionary and Materials weighed on relative results.
For the first half of the year, the Fund’s outperformance was the result of good stock selection across most sectors. Stock selection was most significant in the Information Technology, Energy and Telecommunication Services sectors. Detracting from relative performance during the period were some of the Fund’s Health Care holdings.
Two specific stocks boosting relative performance were Sybase, Inc. and TAL International Group, Inc. Sybase, Inc. develops enterprise software and services to manage, analyze and mobilize information. During the second quarter, it announced it was being acquired by SAP, the large cap German software and services company. We sold our position after shares rallied on the announcement.
TAL International Group, Inc. owns, leases and trades intermodal shipping containers. The stock was a top contributor during the second quarter and first half of the year overall. The
June 30, 2010 | William Blair Funds 61 |
company is benefitting from its investment in additional containers during the downturn and the secular trend of shipping companies leasing containers as opposed to owning them outright. We continue to own the name given its solid cash flow characteristics and high caliber management team.
Two stocks detracting from return were Pacific Sunwear of California, Inc. and Intrepid Potash, Inc. Pacific Sunwear of California, Inc. is a specialty retailer. The stock was the leading detractor from return during the second quarter and the year-to-date period. The market downdraft during the second quarter was led down by the consumer sector and by specialty retailers in particular as fears of a double-dip recession started to cause consumer confidence to fall. Because Pacific Sunwear of California, Inc. is a corporate transformation story and high-beta stock it will demonstrate particularly high volatility (in both strong and weak markets). We added to our position during the weakness as we saw nothing stock specific to point to as the reason for the weakness. Valuation on the stock is attractive and the company has a solid net cash position. The new management team has been assembled and we are nearing the time when some of their early actions will start to be noticed (improved merchandise and focused strategy should lead to improving comps in the latter part of 2010 and beyond).
Intrepid Potash, Inc., a producer of potash-based fertilizer and related products, underperformed during the second quarter and for the first half of the year due to weaker than expected volumes. We believe this was likely triggered by dealer reluctance to refill inventory ahead of the fall application season, production constraints at one of its mining facilities and weak demand in the oil and gas drilling fluid additive market.
Looking forward, while the economic recovery may have a different trajectory (less steep) than some were expecting earlier this year, the market’s decline has improved valuations and lowered expectations. Corporate financial discipline and balance sheets remain strong, and inventories are lean throughout most industries. This should lay the ground work for operating margin expansion, likely beyond prior peak margins, and drive continued earnings growth over the intermediate term. However, investor pessimism is understandably high given the expiration of stimulus plans and diminished appetite for additional programs, U.S. state budget crunches, still absent employment growth and likely further consumer deleveraging.
We consider the impact of these economic scenarios into our stock-specific risk/reward assessments, and remain focused on finding quality companies at discount prices and corporate transformation opportunities. As always, we believe building the Fund with these types of companies should produce solid investment results over the long term.
62 Semi-Annual Report | June 30, 2010 |
Small Cap Value Fund
Performance Highlights (unaudited)
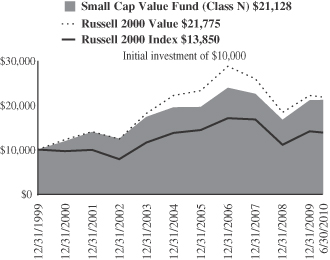
Average Annual Total Return at 6/30/2010
| | | | | | | | | | | | | | | |
| | | Year to
Date | | | 1
Year | | | 3
Year | | | 5
Year | | | 10
Year | |
Class N | | 0.38 | % | | 27.49 | % | | (5.88 | )% | | 2.65 | % | | 6.57 | % |
Class I | | 0.47 | | | 27.76 | | | (5.69 | ) | | 2.86 | | | 6.81 | |
Russell 2000® Value | | (1.64 | ) | | 25.07 | | | (9.85 | ) | | (0.51 | ) | | 7.48 | |
Russell 2000® Index | | (1.95 | ) | | 21.48 | | | (8.60 | ) | | 0.37 | | | 3.00 | |
Performance cited represents past performance. Past performance does not guarantee future results and current performance may be lower or higher than the data quoted. Results shown are average annual total returns, which assume reinvestment of dividends and capital gains. Investment returns and principal will fluctuate and you may have a gain or loss when you sell shares. For the most current month-end performance information, please call 1-800-742-7272, or visit our Web site at www.williamblairfunds.com. Investing in smaller companies involves special risks, including higher volatility and lower liquidity. From time to time, the investment advisor may waive fees or reimburse expenses for the Fund. Without these waivers, performance would be lower. Class N shares are available to the general public without a sales load. Class I shares are available to certain institutional investors and advisory clients of William Blair & Company, L.L.C., without a sales load or distribution (12b-1) or service fees.
The performance highlights and graph presented above do not reflect the deduction of taxes that a shareholder would pay on fund distributions or the redemption of fund shares.
The Russell 2000® Value Index is the Fund’s primary benchmark. The Russell 2000® Value consists of small-capitalization companies with below average price-to-book ratios and forecasted growth rates.
The Russell 2000® Index is an unmanaged composite of the smallest 2000 stocks of the Russell 3000® Index.
This report identifies the Fund’s investments on June 30, 2010. These holdings are subject to change. Not all stocks in the Fund performed the same, nor is there any guarantee that these stocks will perform as well in the future. Market forecasts provided in this report may not necessarily come to pass.
Sector Diversification (unaudited)
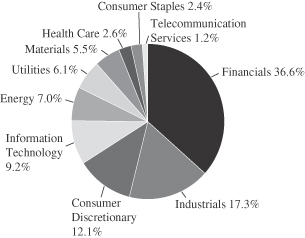
The sector diversification shown is based on the total long-term securities.
June 30, 2010 | William Blair Funds 63 |
Small Cap Value Fund
Portfolio of Investments, June 30, 2010 (all dollar amounts in thousands) (unaudited)
| | | | | |
Issuer | | Shares | | Value |
| | |
Common Stocks | | | | | |
Financials—36.3% | | | | | |
American Campus Communities, Inc. | | 24,665 | | $ | 673 |
Astoria Financial Corporation | | 81,360 | | | 1,119 |
BioMed Realty Trust, Inc. | | 69,020 | | | 1,111 |
Boston Private Financial Holdings, Inc. | | 192,128 | | | 1,235 |
*Eagle Bancorp, Inc. | | 68,546 | | | 807 |
Education Realty Trust, Inc. | | 187,805 | | | 1,132 |
*Excel Trust, Inc. | | 98,525 | | | 1,182 |
First Niagara Financial Group, Inc. | | 58,670 | | | 735 |
First Potomac Realty Trust | | 95,587 | | | 1,374 |
FirstMerit Corporation | | 47,507 | | | 814 |
Highwoods Properties, Inc. | | 41,770 | | | 1,160 |
Iberiabank Corporation | | 28,775 | | | 1,481 |
LaSalle Hotel Properties | | 35,377 | | | 728 |
MarketAxess Holdings, Inc. | | 76,520 | | | 1,055 |
Meadowbrook Insurance Group, Inc. | | 137,755 | | | 1,189 |
Mid-America Apartment Communities, Inc. | | 24,790 | | | 1,276 |
National Retail Properties, Inc. | | 55,565 | | | 1,191 |
NewAlliance Bancshares, Inc. | | 90,775 | | | 1,018 |
Old National Bancorp | | 114,522 | | | 1,186 |
*PHH Corporation | | 46,610 | | | 887 |
Platinum Underwriters Holdings, Ltd.† | | 28,645 | | | 1,040 |
*PMA Capital Corporation Class “A” | | 143,960 | | | 943 |
*ProAssurance Corporation | | 19,710 | | | 1,119 |
Realty Income Corporation | | 23,395 | | | 710 |
*Safeguard Scientifics, Inc. | | 90,775 | | | 959 |
Sandy Spring Bancorp, Inc. | | 80,585 | | | 1,129 |
*SVB Financial Group | | 21,875 | | | 902 |
*Texas Capital Bancshares, Inc. | | 32,933 | | | 540 |
The Hanover Insurance Group, Inc. | | 36,500 | | | 1,588 |
Umpqua Holdings Corporation | | 112,498 | | | 1,291 |
Washington Federal, Inc. | | 51,745 | | | 837 |
| | | | | |
| | | | | 32,411 |
| | | | | |
Industrials—17.2% | | | | | |
Acuity Brands, Inc. | | 21,450 | | | 780 |
Belden, Inc. | | 47,375 | | | 1,042 |
*EMCOR Group, Inc. | | 39,815 | | | 923 |
ESCO Technologies, Inc. | | 25,460 | | | 656 |
G&K Services, Inc. Class “A” | | 54,670 | | | 1,129 |
*Global Defense Technology & Systems, Inc. | | 55,815 | | | 713 |
*GrafTech International, Ltd. | | 60,180 | | | 880 |
Interface, Inc. Class “A” | | 76,020 | | | 816 |
*Kadant, Inc. | | 54,480 | | | 949 |
Kaydon Corporation | | 30,520 | | | 1,003 |
*Marten Transport, Ltd. | | 39,335 | | | 817 |
*Old Dominion Freight Line, Inc. | | 27,190 | | | 956 |
*On Assignment, Inc. | | 156,855 | | | 789 |
Quanex Building Products Corporation | | 52,750 | | | 912 |
Robbins & Myers, Inc. | | 42,395 | | | 922 |
TAL International Group, Inc. | | 50,795 | | | 1,141 |
Towers Watson & Co. Class “A” | | 23,275 | | | 904 |
| | | | | |
| | | | | 15,332 |
| | | | | |
Consumer Discretionary—12.0% | | | | | |
*AFC Enterprises, Inc. | | 98,504 | | | 896 |
Ameristar Casinos, Inc. | | 58,065 | | | 875 |
*Carter’s, Inc. | | 36,665 | | | 962 |
Christopher & Banks Corporation | | 132,982 | | | 823 |
Fred’s, Inc. Class “A” | | 88,400 | | | 978 |
*Gaylord Entertainment Co. | | 36,710 | | | 811 |
| | | | | |
Issuer | | Shares | | Value |
| | |
Common Stocks—(continued) | | | | | |
Consumer Discretionary—(continued) | | | | | |
*Jo-Ann Stores, Inc. | | 22,895 | | $ | 859 |
*Kirkland’s, Inc. | | 46,270 | | | 781 |
*Maidenform Brands, Inc. | | 44,295 | | | 902 |
Meredith Corporation | | 29,625 | | | 922 |
*Pacific Sunwear of California, Inc. | | 295,650 | | | 946 |
*Pinnacle Entertainment, Inc. | | 103,565 | | | 980 |
| | | | | |
| | | | | 10,735 |
| | | | | |
Information Technology—9.1% | | | | | |
ADTRAN, Inc. | | 34,145 | | | 931 |
*Atmel Corporation | | 261,320 | | | 1,254 |
* Avid Technology, Inc. | | 69,316 | | | 882 |
Cognex Corporation | | 40,315 | | | 709 |
*Digital River, Inc. | | 44,145 | | | 1,056 |
Earthlink, Inc. | | 118,335 | | | 942 |
*MaxLinear, Inc. Class “A” | | 21,233 | | | 297 |
*Parametric Technology Corporation | | 76,210 | | | 1,194 |
*Ultra Clean Holdings | | 101,273 | | | 863 |
| | | | | |
| | | | | 8,128 |
| | | | | |
Energy—6.9% | | | | | |
Berry Petroleum Co. Class “A” | | 48,899 | | | 1,258 |
*Forest Oil Corporation | | 49,543 | | | 1,356 |
*Magnum Hunter Resources Corporation | | 135,741 | | | 592 |
*Newpark Resources, Inc. | | 128,815 | | | 779 |
*Northern Oil and Gas, Inc. | | 26,588 | | | 341 |
SM Energy Co. | | 28,545 | | | 1,146 |
*TETRA Technologies, Inc. | | 74,440 | | | 676 |
| | | | | |
| | | | | 6,148 |
| | | | | |
Utilities—6.1% | | | | | |
Chesapeake Utilities Corporation | | 29,940 | | | 940 |
Cleco Corporation | | 51,960 | | | 1,372 |
Northwest Natural Gas Co. | | 28,937 | | | 1,261 |
NorthWestern Corporation | | 34,975 | | | 916 |
South Jersey Industries, Inc. | | 21,460 | | | 922 |
| | | | | |
| | | | | 5,411 |
| | | | | |
Materials—5.5% | | | | | |
*Intrepid Potash, Inc. | | 33,949 | | | 664 |
Minerals Technologies, Inc. | | 28,230 | | | 1,342 |
*PolyOne Corporation | | 124,105 | | | 1,045 |
*RTI International Metals, Inc. | | 38,730 | | | 934 |
Silgan Holdings, Inc. | | 32,165 | | | 913 |
| | | | | |
| | | | | 4,898 |
| | | | | |
Health Care—2.6% | | | | | |
*Magellan Health Services, Inc. | | 23,355 | | | 848 |
*Mednax, Inc. | | 10,418 | | | 580 |
*Zoll Medical Corporation | | 31,855 | | | 863 |
| | | | | |
| | | | | 2,291 |
| | | | | |
Consumer Staples—2.3% | | | | | |
J&J Snack Foods Corporation | | 19,252 | | | 811 |
Spartan Stores, Inc. | | 93,315 | | | 1,280 |
| | | | | |
| | | | | 2,091 |
| | | | | |
Telecommunication Services—1.2% | | | | | |
*Syniverse Holdings, Inc. | | 52,375 | | | 1,071 |
| | | | | |
Total Common Stocks—99.2%
(cost $86,834) | | | 88,516 |
| | | | | |
See accompanying Notes to Financial Statements.
64 Semi-Annual Report | June 30, 2010 |
Small Cap Value Fund
Portfolio of Investments, June 30, 2010 (all dollar amounts in thousands) (unaudited)
| | | | | | | |
Issuer | | Shares or
Principal
Amount | | Value | |
| | |
Investment in Affiliate | | | | | | | |
William Blair Ready Reserves Fund | | | 3,605 | | $ | 4 | |
| | | | | | | |
Total Investment in Affiliate—0.0%
(cost $4) | | | 4 | |
| | | | | | | |
| | |
Repurchase Agreement | | | | | | | |
State Street Bank and Trust Company, 0.000% dated 6/30/10, due 7/1/10, repurchase price $1,625, collateralized by FHLB,
4.375%, due 9/17/10 | | $ | 1,625 | | | 1,625 | |
| | | | | | | |
Total Repurchase Agreement—1.8%
(cost $1,625) | | | 1,625 | |
| | | | | | | |
Total Investments—101.0%
(cost $88,463) | | | 90,145 | |
Liabilities, plus cash and other assets—(1.0)% | | | (866 | ) |
| | | | | | | |
Net assets—100.0% | | $ | 89,279 | |
| | | | | | | |
* Non-income producing securities
† = U.S. listed foreign security
See accompanying Notes to Financial Statements.
June 30, 2010 | William Blair Funds 65 |
Chad M. Kilmer
Mark T. Leslie
David S. Mitchell
MID CAP VALUE FUND
The Mid Cap Value Fund seeks long-term capital appreciation.
AN OVERVIEW FROM THE PORTFOLIO MANAGERS
We are pleased to have the Mid Cap Value Fund become the newest addition to the William Blair Fund Family and would like to thank our shareholders for investing with us.
We are enthusiastic about the opportunities available to us as the Managers of the Mid Cap Value Fund. We believe the key to successful investing is striking a balance between attractive valuations and solid fundamentals. We look for this balance in two separate ways: quality companies at discount prices and corporate transformation opportunities. Critical to our long-term investment success is controlling stock-specific downside risk, and the consistent application of this philosophy.
How did the Fund perform since its inception? How did the Fund’s performance compare to its benchmark?
The Mid Cap Value Fund commenced operations on May 3, 2010. Through the two-month period ending June 30, 2010, the Fund posted a decrease of 13.20% (Class N Shares). By comparison, the Fund’s benchmark the Russell Midcap® Value Index declined 13.47% for this short time period.
This narrow outperformance over the shortened two-month period was the result of mixed stock selection across sectors. Positive stock selection in Materials, including Pactiv Corporation, was offset by negative stock selection in Consumer Discretionary, including Chico’s FAS, Inc.
Looking forward, while the economic recovery may have a different trajectory (less steep) than some were expecting earlier this year, the market’s decline has improved valuations and lowered expectations. Corporate financial discipline and balance sheets remain strong, and inventories are lean throughout most industries. This should lay the ground work for operating margin expansion, likely beyond prior peak margins, and drive continued earnings growth over the intermediate term. However, investor pessimism is understandably high given the expiration of stimulus plans and diminished appetite for additional programs, U.S. state budget crunches, still absent employment growth and likely further consumer deleveraging.
We consider the impact of these economic scenarios into our stock-specific risk/reward assessments, and remain focused on finding quality companies at discount prices and corporate transformation opportunities. As always, we believe building a portfolio with these types of companies should produce solid investment results over the long term.
66 Semi-Annual Report | June 30, 2010 |
Mid Cap Value Fund
Performance Highlights (unaudited)
Average Annual Total Return at 6/30/2010
| | | |
| | | Since
Inception(a) | |
Class N | | (13.20 | )% |
Class I | | (13.10 | ) |
Russell Midcap® Value Index | | (13.47 | ) |
| | (a) | | For the period May 3, 2010 (Commencement of Operations) to June 30, 2010. | |
Performance cited represents past performance. Past performance does not guarantee future results and current performance may be lower or higher than the data quoted. Results shown are average annual total returns, which assume reinvestment of dividends and capital gains. Investment returns and principal will fluctuate and you may have a gain or loss when you sell shares. For the most current month-end performance information, please call 1-800-742-7272, or visit our Web site at www.williamblairfunds.com. Investing in smaller and medium capitalization companies involves special risks, including higher volatility and lower liquidity. Mid Cap stocks are also more sensitive to purchase/sale transactions and changes in the issuer’s financial condition. From time to time, the investment advisor may waive fees or reimburse expenses for the Fund. Without these waivers, performance would be lower. Class N shares are available to the general public without a sales load. Class I shares are available to certain institutional investors and advisory clients of William Blair & Company, L.L.C., without a sales load or distribution (12b-1) or service fees.
The performance highlights and graph presented above do not reflect the deduction of taxes that a shareholder would pay on fund distributions or the redemption of fund shares.
The Russell 2000® Midcap Value consists of Midcap-capitalization companies with below average price-to-book ratios and forecasted growth rates.
This report identifies the Fund’s investments on June 30, 2010. These holdings are subject to change. Not all stocks in the Fund performed the same, nor is there any guarantee that these stocks will perform as well in the future. Market forecasts provided in this report may not necessarily come to pass.
Sector Diversification (unaudited)
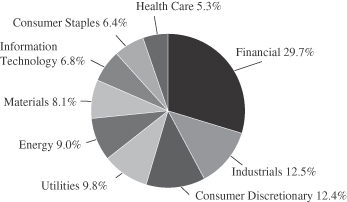
The sector diversification shown is based on the total long-term securities.
June 30, 2010 | William Blair Funds 67 |
Mid Cap Value Fund
Portfolio of Investments, June 30, 2010 (all dollar amounts in thousands) (unaudited)
| | | | | |
Issuer | | Shares | | Value |
| | |
Common Stocks | | | | | |
Financials—28.9% | | | | | |
Alexandria Real Estate Equities, Inc. | | 400 | | $ | 25 |
Allied World Assurance Co. Holdings, Ltd.† | | 560 | | | 25 |
Ameriprise Financial, Inc. | | 1,060 | | | 38 |
Apartment Investment & Management Co. | | 1,300 | | | 25 |
Boston Properties, Inc. | | 300 | | | 21 |
Brandywine Realty Trust | | 1,780 | | | 19 |
Comerica, Inc. | | 1,440 | | | 53 |
Corporate Office Properties Trust | | 700 | | | 27 |
Discover Financial Services | | 2,100 | | | 29 |
Fifth Third Bancorp | | 3,490 | | | 43 |
*Forest City Enterprises, Inc. Class “A” | | 2,020 | | | 23 |
Host Hotels & Resorts, Inc. | | 1,730 | | | 23 |
KeyCorp | | 2,160 | | | 17 |
PartnerRe, Ltd.† | | 350 | | | 25 |
People’s United Financial, Inc. | | 3,010 | | | 41 |
Realty Income Corporation | | 750 | | | 23 |
The Hanover Insurance Group, Inc. | | 810 | | | 35 |
Unum Group | | 1,040 | | | 23 |
Validus Holdings, Ltd.† | | 950 | | | 23 |
Ventas, Inc. | | 470 | | | 22 |
Washington Federal, Inc. | | 1,600 | | | 26 |
| | | | | |
| | | | | 586 |
| | | | | |
Industrials—12.1% | | | | | |
*AGCO Corporation | | 810 | | | 22 |
Cintas Corporation | | 1,070 | | | 26 |
Eaton Corporation | | 600 | | | 39 |
Goodrich Corporation | | 400 | | | 26 |
J.B. Hunt Transport Services, Inc. | | 780 | | | 25 |
Kennametal, Inc. | | 970 | | | 25 |
Manpower, Inc. | | 470 | | | 20 |
Parker Hannifin Corporation | | 680 | | | 38 |
Snap-On, Inc. | | 610 | | | 25 |
| | | | | |
| | | | | 246 |
| | | | | |
Consumer Discretionary—12.1% | | | | | |
*Big Lots, Inc. | | 710 | | | 23 |
Chico’s FAS, Inc. | | 2,980 | | | 29 |
DISH Network Corporation | | 980 | | | 18 |
Fortune Brands, Inc. | | 720 | | | 28 |
Meredith Corporation | | 840 | | | 26 |
*Mohawk Industries, Inc. | | 430 | | | 20 |
Newell Rubbermaid, Inc. | | 2,000 | | | 29 |
Whirlpool Corporation | | 380 | | | 33 |
*WMS Industries, Inc. | | 980 | | | 39 |
| | | | | |
| | | | | 245 |
| | | | | |
Utilities—9.5% | | | | | |
DPL, Inc. | | 1,190 | | | 28 |
DTE Energy Co. | | 820 | | | 37 |
Northeast Utilities | | 830 | | | 21 |
TECO Energy, Inc. | | 1,990 | | | 30 |
Wisconsin Energy Corporation | | 720 | | | 37 |
Xcel Energy, Inc. | | 1,920 | | | 40 |
| | | | | |
| | | | | 193 |
| | | | | |
ADR = American Depository Receipt
† = U.S. listed foreign security
* Non-income producing securities
| | | | | | | |
Issuer | | Shares or
Principal
Amount | | Value | |
| | |
Common Stocks—(continued) | | | | | | | |
Energy—8.8% | | | | | | | |
Cabot Oil & Gas Corporation | | | 700 | | $ | 22 | |
Ensco plc—ADR | | | 490 | | | 19 | |
*Forest Oil Corporation | | | 1,360 | | | 37 | |
Helmerich & Payne, Inc. | | | 510 | | | 19 | |
*Petrohawk Energy Corporation | | | 1,270 | | | 22 | |
Pioneer Natural Resources Co. | | | 530 | | | 31 | |
*Whiting Petroleum Corporation | | | 360 | | | 28 | |
| | | | | | | |
| | | | | | 178 | |
| | | | | | | |
Materials—7.9% | | | | | | | |
Airgas, Inc. | | | 460 | | | 29 | |
Carpenter Technology Corporation | | | 750 | | | 25 | |
Lubrizol Corporation | | | 280 | | | 22 | |
*Pactiv Corporation | | | 1,070 | | | 30 | |
Sonoco Products Co. | | | 1,040 | | | 32 | |
Steel Dynamics, Inc. | | | 1,710 | | | 22 | |
| | | | | | | |
| | | | | | 160 | |
| | | | | | | |
Information Technology—6.6% | | | | | | | |
*Atmel Corporation | | | 6,690 | | | 32 | |
*Hewitt Associates, Inc. Class “A” | | | 610 | | | 21 | |
*Ingram Micro, Inc. Class “A” | | | 1,160 | | | 17 | |
Tellabs, Inc. | | | 4,520 | | | 29 | |
*VeriSign, Inc. | | | 1,270 | | | 34 | |
| | | | | | | |
| | | | | | 133 | |
| | | | | | | |
Consumer Staples—6.2% | | | | | | | |
Bunge, Ltd.† | | | 330 | | | 16 | |
Campbell Soup Co. | | | 760 | | | 27 | |
ConAgra Foods, Inc. | | | 1,340 | | | 32 | |
HJ Heinz Co. | | | 720 | | | 31 | |
The Kroger Co. | | | 1,010 | | | 20 | |
| | | | | | | |
| | | | | | 126 | |
| | | | | | | |
Health Care—5.1% | | | | | | | |
CIGNA Corporation | | | 730 | | | 23 | |
Hill-Rom Holdings, Inc. | | | 870 | | | 27 | |
*Laboratory Corporation of America Holdings | | | 350 | | | 26 | |
*Mettler-Toledo International, Inc.† | | | 250 | | | 28 | |
| | | | | | | |
| | | | | | 104 | |
| | | | | | | |
Total Common Stocks—97.2%
(cost $2,275) | | | 1,971 | |
| | | | | | | |
| | |
Repurchase Agreement | | | | | | | |
State Street Bank and Trust Company, 0.000% dated 6/30/10, due 7/1/10, repurchase price $65, collateralized by FHLB, 4.375%, due 9/17/10 | | $ | 65 | | $ | 65 | |
| | | | | | | |
Total Repurchase Agreement—3.2%
(cost $65) | | | 65 | |
| | | | | | | |
Total Investments—100.4%
(cost $2,340) | | | 2,036 | |
| | | | | | | |
Liabilities, plus cash and other assets—(0.4)% | | | (9 | ) |
| | | | | | | |
Net assets—100.0% | | $ | 2,027 | |
| | | | | | | |
See accompanying Notes to Financial Statements.
68 Semi-Annual Report | June 30, 2010 |
Fixed Income Markets Overview
Summary
The first half of 2010 was a tale of two quarters for the fixed-income markets.
The first quarter of 2010 reflected investor optimism about economic recovery and growth. Prices of fixed-income securities began to reflect expectations for a healthy rebound in the U.S. economy.
The second quarter was a much more challenging environment. Weaker economic data, stubbornly high unemployment and nervousness about government debt levels in the U.S. and in Europe began to undermine investor confidence. To add to these worries was news on April 16th that the Securities and Exchange Commission (SEC) had filed a civil lawsuit accusing the Wall Street firm Goldman Sachs of securities fraud. All these factors caused investors to turn more bearish towards all “risk” assets.
There were two Federal Reserve Open Market Committee meetings (FOMC) that were held during the second quarter and both confirmed that the Federal Reserve Board had decided to keep short-term interest rates near zero for “an extended period.” The Fed cited impediments to economic growth, including the effect of new financial problems abroad. In its statement following its most recent meeting on June 23, the Fed said, “financial conditions have become less supportive of economic growth on balance, largely reflecting developments abroad.”
It is worth noting that among the Federal Reserve Board’s arsenal of tools for stimulating growth in the economy is to purchase higher-coupon mortgage-backed securities. The demand created by the Fed’s purchases, in turn, prompts loan originators to lower interest rates, and has driven 30-year mortgages rates to low levels that are unprecedented.
Longer-term interest rates trended lower during the second quarter, with the 10-Year U.S. Treasury Note, which finished at 3.83% at the end of the first quarter, to end the second quarter at 2.93%.
Outlook
In hindsight, during the first quarter investors were probably too optimistic about an economy which was supported by government stimulus. Conversely, this sentiment swung to extreme pessimism during the second quarter. We believe the reality is that the economy is self-sustaining, but serious headwinds remain.
We believe that U.S. GDP growth will likely remain subpar due to structural unemployment in the U.S. economy. We believe this current environment is one that should be favorable for Corporate bonds, and we intend to maintain an overweight position in that sector, as well as higher-coupon Agency Mortgage-backed securities.
It is important to note that the fundamentals for U.S. corporations—for example, corporate balance sheets—remain strong. We believe demand for Corporate bonds will remain robust, and we think Corporate bonds will perform well, based on the prospects for further stabilization in the economy.
We anticipate continued strong fixed-income demand as insurance companies, pension funds, and other investors still carry high cash balances and are looking to invest funds at yields higher than the near zero cash and money market yields offered.
June 30, 2010 | William Blair Funds 69 |
We remain encouraged that the fixed-income markets have been able to absorb major potential policy changes in the health care and financial services industries with relatively minor changes in risk premiums.
Interest rates are at historic lows. We don’t anticipate any major changes in Federal Reserve policy or interest rates until 2011.
As a firmer root structure emerges to the nascent economic recovery, there is the possibility that upward pressure might be placed on interest rates. While we do not expect this to materially have an impact on the prices of fixed income securities, we nonetheless believe the current structure of the Fund will help provide protection.
70 Semi-Annual Report | June 30, 2010 |

Christopher T. Vincent

Paul J. Sularz
BOND FUND
The Bond Fund seeks to outperform the Barclays Capital U.S. Aggregate Bond Index by maximizing total return through a combination of income and capital appreciation.
AN OVERVIEW FROM THE PORTFOLIO MANAGERS
Please see page 69 for the Fixed Income Market Overview.
How did the Fund perform during the past six months? How did the Fund’s performance compare to its benchmark?
The Bond Fund posted a 5.27% increase on a total return basis (Class N Shares) for the six months ended June 30, 2010. By comparison, the Fund’s benchmark, the Barclays Capital U.S. Aggregate Bond Index, gained 5.33%.
Which sectors enhanced the Fund’s return? What were among the best performing investments for the Fund?
The Fund’s significant overweight in investment grade Corporate securities and its roughly 10% exposure to high yield securities boosted performance during the first quarter. However, these sectors struggled during the second quarter with the paradigm shift of investor sentiment from expectations of economic growth to fears of a double-dip recession.
The Fund nearly doubled its holdings in below investment grade securities (those rated below BBB). Investment grade securities, at almost 50% of the Fund’s portfolio, were double the weight of the Fund’s benchmark Barclays Capital U.S. Aggregate Bond Index.
The Fund’s underweight in Commercial Mortgage-backed securities (which comprise 1% of the Fund and approximately 3% of the benchmark Index), was a slight drag on performance, when compared to the benchmark.
We made a conscious decision to invest in Corporate REITs, which are actively managed rather than the static pools of mortgages typically held in Commercial Mortgage-backed securities. We believe this is more prudent in the event of continued weakness in commercial real estate.
We also avoided owning U.S. Agency debentures, but instead emphasized U.S. Agency Mortgage-backed securities via higher coupon pools that are “seasoned,” as well as low loan balance pools. We believe the above-market coupons in these pools will experience slower amortization and should protect the Fund in a rising rate environment, while still providing an attractive level of current income.
We continue to position the Fund with a significant underweight to U.S. Treasuries, and maintain a very modest allocation to U.S. Treasury securities via TIPs (Treasury Inflation Protected Securities).
While we do not believe inflation is an immediate concern, we think our Fund’s positioning overall is defensive and appropriate in the event that interest rates rise sharply.
June 30, 2010 | William Blair Funds 71 |
Bond Fund
Performance Highlights (unaudited)
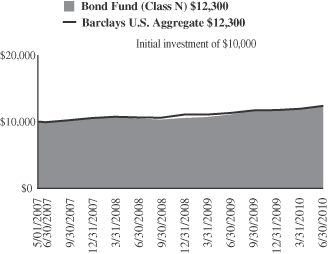
Average Annual Total Return at 6/30/2010
| | | | | | | | | | | | |
| | | Year to
Date | | | 1
Year | | | 3
Year | | | Since
Inception(a) | |
Class N | | 5.27 | % | | 11.42 | % | | 7.53 | % | | 6.73 | % |
Class I | | 5.29 | | | 11.62 | | | 7.70 | | | 6.89 | |
Barclays Capital U.S. Aggregate Bond Index | | 5.33 | | | 9.50 | | | 7.55 | | | 6.77 | |
| | (a) | | For the period from May 1, 2007 (Commencement of Operations) to June 30, 2010. | |
Performance cited represents past performance. Past performance does not guarantee future results and current performance may be lower or higher than the data quoted. Results shown are average annual total returns, which assume reinvestment of dividends and capital gains. Investment returns and principal will fluctuate and you may have a gain or loss when you sell shares. For the most current month-end performance information, please call 1-800-742-7272, or visit our Web site at www.williamblairfunds.com. From time to time, the investment advisor may waive fees or reimburse expenses for the Fund. Without these waivers, performance would be lower. Class N shares are available to the general public without a sales load. Class I shares are available to certain institutional investors and advisory clients of William Blair & Company, L.L.C., without a sales load or distribution fees (12b-1).
The performance highlights and graph presented above do not reflect the deduction of taxes that a shareholder would pay on fund distributions or the redemption of fund shares.
The Barclays Capital U.S. Aggregate Bond Index indicates broad intermediate government/corporate bond market performance.
This report identifies the Fund’s investments on June 30, 2010. These holdings are subject to change. Not all investments in the Fund performed the same, nor is there any guarantee that these investments will perform as well in the future. Market forecasts provided in this report may not necessarily come to pass.
Sector Diversification (unaudited)
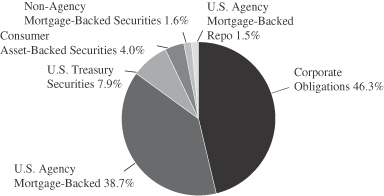
The sector diversification shown is based on the total investments.
72 Semi-Annual Report | June 30, 2010 |
Bond Fund
Portfolio of Investments, June 30, 2010 (all dollar amounts in thousands) (unaudited)
| | | | | | | | |
Issuer | | | | Principal
Amount | | Value |
|
U.S. Government and U.S. Government Agency—46.8% |
U.S. Treasury Inflation Indexed Notes/Bonds—7.9% |
U.S. Treasury Inflation Indexed Bond, 3.875%, due 4/15/29 | | | | $ | 7,956 | | $ | 10,677 |
U.S. Treasury Inflation Indexed Note, 1.875%, due 7/15/13 | | | | | 593 | | | 628 |
U.S. Treasury Inflation Indexed Note, 2.375%, due 1/15/17 | | | | | 3,243 | | | 3,580 |
| | | | | | | | |
Total U.S. Treasury Inflation Indexed Notes/Bonds | | | 14,885 |
| | | | | | | | |
Government National Mortgage Association (GNMA)—1.0% | | | | | | | | |
GNR 2004-2 M5, 4.891%, due 7/16/34 | | | | | 125 | | | 136 |
GNR 2006-67 GB, 4.324%, due 9/16/34, VRN | | | | | 1,540 | | | 1,666 |
| | | | | | | | |
Total GNMA Mortgage Obligations | | | 1,802 |
| | | | | | | | |
Federal Home Loan Mortgage Corp. (FHLMC)—8.9% | | | | | | | | |
#G90024, 7.000%, due 1/20/13 | | | | | 49 | | | 52 |
#G30093, 7.000%, due 12/1/17 | | | | | 41 | | | 45 |
#G30255, 7.000%, due 7/1/21 | | | | | 88 | | | 97 |
#G12792, 4.500%, due 12/1/21 | | | | | 563 | | | 600 |
#D95897, 5.500%, due 3/1/23 | | | | | 292 | | | 317 |
#G30372, 5.000%, due 9/1/27 | | | | | 676 | | | 718 |
#G01728, 7.500%, due 7/1/32 | | | | | 322 | | | 368 |
#C01385, 6.500%, due 8/1/32 | | | | | 439 | | | 488 |
#G02141, 6.000%, due 3/1/36 | | | | | 2,053 | | | 2,275 |
#A62179, 6.000%, due 6/1/37 | | | | | 1,083 | | | 1,198 |
#A63539, 6.000%, due 7/1/37 | | | | | 1,401 | | | 1,542 |
#G03170, 6.500%, due 8/1/37 | | | | | 2,195 | | | 2,413 |
#A66843, 6.500%, due 10/1/37 | | | | | 1,153 | | | 1,281 |
#A78138, 5.500%, due 6/1/38 | | | | | 1,572 | | | 1,711 |
#A81799, 6.500%, due 9/1/38 | | | | | 3,309 | | | 3,682 |
| | | | | | | | |
Total FHLMC Mortgage Obligations | | | 16,787 |
| | | | | | | | |
Federal National Mortgage Association (FNMA)—29.0% | | | | | | | | |
#535559, 7.500%, due 9/1/12 | | | | | 126 | | | 128 |
#598453, 7.000%, due 6/1/15 | | | | | 1 | | | 1 |
#689612, 5.000%, due 5/1/18 | | | | | 479 | | | 517 |
#695910, 5.000%, due 5/1/18 | | | | | 845 | | | 915 |
#747903, 4.500%, due 6/1/19 | | | | | 438 | | | 468 |
#745735, 5.000%, due 3/1/21 | | | | | 1,036 | | | 1,112 |
#253847, 6.000%, due 5/1/21 | | | | | 290 | | | 319 |
#900725, 6.000%, due 8/1/21 | | | | | 247 | | | 271 |
#545437, 7.000%, due 2/1/32 | | | | | 227 | | | 257 |
#545759, 6.500%, due 7/1/32 | | | | | 2,495 | | | 2,785 |
#254548, 5.500%, due 12/1/32 | | | | | 1,073 | | | 1,158 |
#684601, 6.000%, due 3/1/33 | | | | | 2,307 | | | 2,591 |
#190340, 5.000%, due 9/1/33 | | | | | 2,216 | | | 2,357 |
#254868, 5.000%, due 9/1/33 | | | | | 1,083 | | | 1,152 |
#555800, 5.500%, due 10/1/33 | | | | | 485 | | | 523 |
#725027, 5.000%, due 11/1/33 | | | | | 874 | | | 930 |
#555880, 5.500%, due 11/1/33 | | | | | 568 | | | 613 |
#555946, 5.500%, due 11/1/33 | | | | | 899 | | | 980 |
#756153, 5.500%, due 11/1/33 | | | | | 2,474 | | | 2,668 |
#725231, 5.000%, due 2/1/34 | | | | | 893 | | | 950 |
#725205, 5.000%, due 3/1/34 | | | | | 1,902 | | | 2,023 |
#725220, 5.000%, due 3/1/34 | | | | | 831 | | | 884 |
#725232, 5.000%, due 3/1/34 | | | | | 2,692 | | | 2,863 |
#725238, 5.000%, due 3/1/34 | | | | | 1,512 | | | 1,608 |
| | | | | | | | |
Issuer | | NRSRO
Rating | | Principal
Amount | | Value |
|
U.S. Government and U.S. Government Agency—(continued) |
Federal National Mortgage Association (FNMA)—(continued) |
#725424, 5.500%, due 4/1/34 | | | | $ | 610 | | $ | 657 |
#725611, 5.500%, due 6/1/34 | | | | | 543 | | | 586 |
#786546, 6.000%, due 7/1/34 | | | | | 1,031 | | | 1,145 |
#787816, 6.000%, due 7/1/34 | | | | | 979 | | | 1,076 |
#190353, 5.000%, due 8/1/34 | | | | | 644 | | | 684 |
#357883, 5.000%, due 5/1/35 | | | | | 1,320 | | | 1,404 |
#745092, 6.500%, due 7/1/35 | | | | | 677 | | | 756 |
#357944, 6.000%, due 9/1/35 | | | | | 126 | | | 139 |
#829306, 6.000%, due 9/1/35 | | | | | 356 | | | 395 |
#843487, 6.000%, due 10/1/35 | | | | | 302 | | | 333 |
#849191, 6.000%, due 1/1/36 | | | | | 195 | | | 216 |
#848782, 6.500%, due 1/1/36 | | | | | 876 | | | 970 |
#745349, 6.500%, due 2/1/36 | | | | | 1,229 | | | 1,353 |
#831540, 6.000%, due 6/1/36 | | | | | 251 | | | 273 |
#745802, 6.000%, due 7/1/36 | | | | | 719 | | | 792 |
#886220, 6.000%, due 7/1/36 | | | | | 1,225 | | | 1,346 |
#893318, 6.500%, due 8/1/36 | | | | | 287 | | | 317 |
#256859, 5.500%, due 8/1/37 | | | | | 1,119 | | | 1,196 |
#928561, 6.000%, due 8/1/37 | | | | | 883 | | | 969 |
#948689, 6.000%, due 8/1/37 | | | | | 2,570 | | | 2,799 |
#888967, 6.000%, due 12/1/37 | | | | | 1,986 | | | 2,173 |
#962058, 6.500%, due 3/1/38 | | | | | 3,411 | | | 3,815 |
#934006, 6.500%, due 9/1/38 | | | | | 1,812 | | | 2,008 |
#986856, 6.500%, due 9/1/38 | | | | | 1,198 | | | 1,319 |
| | | | | | | | |
Total FNMA Mortgage Obligations | | | 54,794 |
| | | | | | | | |
Non-Agency Mortgage-Backed Obligations—1.6% | | | | | | | | |
Countrywide Alternative Loan Trust, 2003-11T1, Tranche M,
4.750%, 7/25/18 | | CCC | | | 252 | | | 178 |
Lehman Structured Securities Corp.—144A, 2004-2, Tranche M2, 2.759%, 2/28/33, VRN§ | | CC | | | 162 | | | 21 |
First Horizon Asset Securities, Inc., 2004-AR4, Tranche 3A1,
4.653%, 8/25/34, VRN | | AAA | | | 680 | | | 711 |
Chase Mortgage Finance Corporation, 2006-A1, Tranche 2A3, 6.000%, 9/25/36, VRN | | CCC | | | 2,460 | | | 2,074 |
| | | | | | | | |
Total Non-Agency Mortgage-Backed Obligations | | | 2,984 |
| | | | | | | | |
| |
Consumer Asset-Backed Securities—4.1% | | | |
Avis Budget Rental Car Funding AESOP LLC—144A, 2009-1A, Tranche A, 9.310%, 10/20/13 | | A2 | | | 2,000 | | | 2,225 |
Avis Budget Rental Car Funding AESOP LLC—144A, 2009-2A, Tranche A, 5.680%, 2/20/14 | | Aaa | | | 1,800 | | | 1,919 |
Hertz Vehicle Financing LLC—144A, 2009-2A, Tranche A1, 4.260%, 3/25/14 | | Aaa | | | 2,230 | | | 2,324 |
Centre Point Funding LLC—144A, 2010-1A, Tranche 1,
5.430%, 7/20/16 | | A2 | | | 954 | | | 985 |
First Plus Home Loan Trust, 1997-4, Tranche M1,
7.640%, 9/11/23**§ | | C | | | 199 | | | 119 |
See accompanying Notes to Financial Statements.
June 30, 2010 | William Blair Funds 73 |
Bond Fund
Portfolio of Investments, June 30, 2010 (all dollar amounts in thousands) (unaudited)
| | | | | | | | |
Issuer | | NRSRO
Rating | | Principal
Amount | | Value |
|
Consumer Asset-Backed Securities—(continued) |
Renaissance Home Equity Loan Trust, 2004-2, Tranche M5,
6.455%, 7/25/34 | | A2 | | $ | 463 | | $ | 111 |
Soundview Home Equity Loan Trust, 2005-B, Tranche M1,
6.135%, 5/25/35 | | AA+ | | | 40 | | | 40 |
| | | | | | | | |
Total Consumer Asset-Backed Securities | | | 7,723 |
| | | | | | | | |
|
Corporate Obligations—46.0% |
Morgan Stanley,
6.600%, due 4/1/12 | | A | | | 545 | | | 578 |
Wells Fargo & Co.,
4.375%, due 1/31/13 | | AA- | | | 350 | | | 370 |
Weatherford International, Ltd.,
5.150%, due 3/15/13 | | Baa1 | | | 1,425 | | | 1,493 |
John Deere Capital Corporation,
4.500%, due 4/3/13 | | A | | | 700 | | | 754 |
Citigroup, Inc.,
5.500%, due 4/11/13 | | A+ | | | 1,500 | | | 1,559 |
General Electric Capital Corporation,
4.800%, due 5/1/13 | | AA+ | | | 600 | | | 640 |
Kansas City Southern de Mexico S.A. de C.V.,
7.625%, due 12/1/13 | | BB- | | | 1,000 | | | 1,020 |
CME Group, Inc.,
5.750%, due 2/15/14 | | AA | | | 700 | | | 779 |
PACCAR, Inc.,
6.875%, due 2/15/14 | | A+ | | | 800 | | | 927 |
America Movil S.A.B. de C.V.,
5.500%, due 3/1/14 | | A2 | | | 700 | | | 763 |
Smith International, Inc.,
8.625%, due 3/15/14 | | BBB+ | | | 970 | | | 1,152 |
General Electric Capital Corporation,
5.900%, due 5/13/14 | | AA+ | | | 225 | | | 248 |
Bank of America Corporation,
7.375%, due 5/15/14 | | A+ | | | 700 | | | 785 |
American Express Co.,
7.250%, due 5/20/14 | | A+ | | | 500 | | | 568 |
Capital One Financial Corporation,
7.375%, due 5/23/14 | | A- | | | 1,235 | | | 1,412 |
Hewlett-Packard Co.,
4.750%, due 6/2/14 | | A+ | | | 800 | | | 886 |
Macquarie Group Ltd.—144A,
7.300%, due 8/1/14 | | A2 | | | 1,000 | | | 1,102 |
Petrohawk Energy Corporation,
10.500%, due 8/1/14 | | B | | | 1,000 | | | 1,075 |
AT&T, Inc.,
5.100%, due 9/15/14 | | A | | | 1,250 | | | 1,387 |
D.R. Horton, Inc.,
5.625%, due 9/15/14 | | BB | | | 1,000 | | | 980 |
Corporation Nacional del Cobre de Chile—144A,
4.750%, due 10/15/14 | | A1 | | | 1,350 | | | 1,457 |
Boeing Capital Corporation,
3.250%, due 10/27/14 | | A+ | | | 1,400 | | | 1,458 |
Crown Castle International Corporation,
9.000%, due 1/15/15 | | B1 | | | 1,000 | | | 1,058 |
EI du Pont de Nemours & Co.,
3.250%, due 1/15/15 | | A | | | 500 | | | 522 |
| | | | | | | | |
Issuer | | NRSRO
Rating | | Principal
Amount | | Value |
|
Corporate Obligations—(continued) |
Georgia-Pacific LLC—144A,
7.000%, due 1/15/15 | | BB+ | | $ | 1,000 | | $ | 1,010 |
The Kroger Co.,
4.950%, due 1/15/15 | | BBB | | | 1,175 | | | 1,266 |
Simon Property Group L.P.,
4.200%, due 2/1/15 | | A- | | | 1,500 | | | 1,541 |
DIRECTV Holdings LLC,
3.550%, due 3/15/15 | | Baa2 | | | 1,600 | | | 1,611 |
Yum! Brands, Inc.,
4.250%, due 9/15/15 | | BBB- | | | 350 | | | 371 |
Cisco Systems, Inc.,
5.500%, due 2/22/16 | | A+ | | | 2,000 | | | 2,304 |
Omnicom Group, Inc.,
5.900%, due 4/15/16 | | A- | | | 750 | | | 853 |
Yum! Brands, Inc.,
6.250%, due 4/15/16 | | BBB- | | | 700 | | | 800 |
Owens-Brockway Glass Container, Inc., 7.375%, due 5/15/16 | | BB+ | | | 1,250 | | | 1,303 |
SABMiller plc—144A,
6.500%, due 7/1/16 | | BBB+ | | | 700 | | | 822 |
Petrobras International Finance Co.,
6.125%, due 10/6/16 | | Baa1 | | | 1,350 | | | 1,433 |
EI du Pont de Nemours & Co.,
5.250%, due 12/15/16 | | A | | | 500 | | | 570 |
Comcast Corporation,
6.500%, due 1/15/17 | | BBB+ | | | 350 | | | 401 |
Corrections Corporation of America, 7.750%, due 6/1/17 | | BB | | | 1,250 | | | 1,297 |
ERP Operating L.P.,
5.750%, due 6/15/17 | | A- | | | 1,100 | | | 1,185 |
JPMorgan Chase & Co.,
6.125%, due 6/27/17 | | A1 | | | 600 | | | 656 |
BB&T Corporation,
4.900%, due 6/30/17 | | A2 | | | 665 | | | 686 |
American Express Co.,
6.150%, due 8/28/17 | | A+ | | | 1,000 | | | 1,096 |
IBM Corporation,
5.700%, due 9/14/17 | | A+ | | | 1,250 | | | 1,453 |
Exelon Generation Co. LLC,
6.200%, due 10/1/17 | | A3 | | | 1,100 | | | 1,250 |
Toll Brothers Finance Corporation,
8.910%, due 10/15/17 | | BBB- | | | 950 | | | 1,059 |
Triumph Group, Inc.,
8.000%, due 11/15/17 | | B+ | | | 1,000 | | | 955 |
Union Pacific Corporation,
5.750%, due 11/15/17 | | BBB | | | 800 | | | 903 |
Wells Fargo & Co.,
5.625%, due 12/11/17 | | AA- | | | 1,000 | | | 1,093 |
Kohl’s Corporation,
6.250%, due 12/15/17 | | BBB+ | | | 350 | | | 408 |
Morgan Stanley,
6.625%, due 4/1/18 | | A | | | 950 | | | 996 |
General Electric Capital Corporation,
5.625%, due 5/1/18 | | AA+ | | | 350 | | | 372 |
Philip Morris International, Inc.,
5.650%, due 5/16/18 | | A | | | 1,000 | | | 1,094 |
Time Warner Cable, Inc.,
6.750%, due 7/1/18 | | BBB | | | 1,000 | | | 1,148 |
Merrill Lynch & Co., Inc.,
6.875%, due 11/15/18 | | A+ | | | 1,075 | | | 1,143 |
See accompanying Notes to Financial Statements.
74 Semi-Annual Report | June 30, 2010 |
Bond Fund
Portfolio of Investments, June 30, 2010 (all dollar amounts in thousands) (unaudited)
| | | | | | | | |
Issuer | | NRSRO
Rating | | Principal
Amount | | Value |
|
Corporate Obligations—(continued) |
Anheuser-Busch InBev Worldwide, Inc.—144A,
7.750%, due 1/15/19 | | BBB+ | | $ | 700 | | $ | 850 |
FedEx Corporation,
8.000%, due 1/15/19 | | BBB | | | 750 | | | 952 |
CSX Corporation,
7.375%, due 2/1/19 | | BBB- | | | 800 | | | 980 |
Honeywell International, Inc.,
5.000%, due 2/15/19 | | A | | | 925 | | | 1,035 |
Pfizer, Inc., 6.200%, due 3/15/19 | | AA | | | 1,250 | | | 1,486 |
BHP Billiton Finance USA, Ltd., 6.500%, due 4/1/19 | | A+ | | | 1,300 | | | 1,559 |
Owens Corning,
9.000%, due 6/15/19 | | BBB- | | | 950 | | | 1,123 |
Jefferies Group, Inc.,
8.500%, due 7/15/19 | | BBB | | | 1,300 | | | 1,460 |
Discovery Communications LLC,
5.625%, due 8/15/19 | | Baa2 | | | 500 | | | 541 |
Roper Industries, Inc.,
6.250%, due 9/1/19 | | BBB- | | | 1,225 | | | 1,358 |
Boston Properties L.P.,
5.875%, due 10/15/19 | | A- | | | 1,500 | | | 1,605 |
Macquarie Group Ltd.—144A,
6.000%, due 1/14/20 | | A2 | | | 250 | | | 253 |
Ford Motor Credit Co. LLC,
8.125%, due 1/15/20 | | Ba3 | | | 1,515 | | | 1,546 |
Jarden Corporation,
7.500%, due 1/15/20 | | B | | | 1,000 | | | 978 |
Motiva Enterprises LLC—144A,
5.750%, due 1/15/20 | | A | | | 1,500 | | | 1,650 |
Johnson Controls, Inc.,
5.000%, due 3/30/20 | | BBB | | | 1,625 | | | 1,708 |
United Technologies Corporation,
4.500%, due 4/15/20 | | A+ | | | 1,500 | | | 1,623 |
Iron Mountain, Inc.,
8.000%, due 6/15/20 | | B+ | | | 1,250 | | | 1,269 |
HCA, Inc., 7.250%, due 9/15/20 | | BB | | | 1,000 | | | 1,005 |
Ras Laffan Liquefied Natural Gas Co., Ltd. II—144A,
5.298%, due 9/30/20 | | Aa2 | | | 400 | | | 415 |
Southwest Airlines Co. 2007-1 Pass Through Trust,
6.150%, due 8/1/22 | | A | | | 679 | | | 699 |
The Kroger Co.,
8.000%, due 9/15/29 | | BBB | | | 325 | | | 419 |
Conoco Funding Co.,
7.250%, due 10/15/31 | | A1 | | | 400 | | | 496 |
NRSRO = Nationally Recognized Statistical Rating Organization—The credit quality ratings of the securities in the Fund reflect the highest category rating by either Fitch Ratings, Moody’s Investors Service Inc., or Standard & Poor’s, a division of the McGraw-Hill Companies, Inc.
The obligations of certain U. S. Government-sponsored securities are neither issued nor guaranteed by the U. S. Treasury.
VRN = Variable Rate Note
§ = Deemed illiquid pursuant to Liquidity Procedures approved by the Board of Trustees. These holdings represent 0.07% of the net assets at June 30, 2010.
** = Fair valued pursuant to Valuation Procedures adopted by the Board of Trustees. This holding represents 0.06% of the Fund’s net assets at June 30, 2010.
| | | | | | | | |
Issuer | | NRSRO
Rating | | Principal
Amount | | Value |
|
Corporate Obligations—(continued) |
Kohl’s Corporation,
6.000%, due 1/15/33 | | BBB+ | | $ | 1,000 | | $ | 1,069 |
Pacific Gas & Electric Co.,
6.050%, due 3/1/34 | | A | | | 750 | | | 837 |
Wisconsin Electric Power Co.,
5.700%, due 12/1/36 | | A1 | | | 500 | | | 542 |
Comcast Corporation,
6.450%, due 3/15/37 | | BBB+ | | | 650 | | | 703 |
Yum! Brands, Inc.,
6.875%, due 11/15/37 | | BBB- | | | 600 | | | 689 |
JPMorgan Chase & Co.,
6.400%, due 5/15/38 | | Aa3 | | | 900 | | | 1,042 |
COX Communications, Inc.—144A, 6.950%, due 6/1/38 | | Baa2 | | | 350 | | | 402 |
General Electric Capital Corporation,
6.875%, due 1/10/39 | | AA+ | | | 750 | | | 828 |
Burlington Northern Santa Fe LLC,
5.750%, due 5/1/40 | | A3 | | | 1,515 | | | 1,602 |
| | | | | | | | |
Total Corporate Obligations | | | 86,776 |
| | | | | | | | |
Total Long-Term Investments—98.5%
(cost $175,529) | | | 185,751 |
| | | | | | | | |
| | | |
Repurchase Agreement | | | | | | | | |
State Street Bank and Trust Company, 0.000% dated 6/30/10, due 7/1/10, repurchase price $2,878, collateralized by FHLB, 4.375%, due 9/17/10 | | AAA | | | 2,878 | | | 2,878 |
| | | | | | | | |
Total Repurchase Agreement—1.5%
(cost $2,878) | | | 2,878 |
| | | | | | | | |
Total Investments—100.0%
(cost $178,407) | | | 188,629 |
Cash and other assets, less liabilities—0.0% | | | 35 |
| | | | | | | | |
Net assets—100.0% | | $ | 188,664 |
| | | | | | | | |
See accompanying Notes to Financial Statements.
June 30, 2010 | William Blair Funds 75 |
Christopher T. Vincent
INCOME FUND
The Income Fund seeks a high level of current income with relative stability of principal.
AN OVERVIEW FROM THE PORTFOLIO MANAGER
Please see page 69 for the Fixed Income Market Overview.
The Income Fund posted a 3.94% increase on a total return basis (Class N Shares) for the six months ended June 30, 2010. By comparison, the Fund’s benchmark, the Barclays Capital Intermediate Government /Credit Bond Index, gained 4.56%.
Which sectors enhanced the Fund’s return? What were among the best performing investments for the Fund?
The Fund’s significant overweight in investment grade Corporate securities boosted performance during the first quarter. However, this sector struggled during the second quarter with the paradigm shift of investor sentiment from expectations of economic growth to fears of a double-dip recession.
The Fund’s underweight in Commercial Mortgage-backed securities (which comprise 1% of the Fund and approximately 3% of the benchmark Index), was a slight drag on performance, when compared to the benchmark.
We made a conscious decision to invest in Corporate REITs, which are actively managed rather than the static pools of mortgages typically held in Commercial Mortgage-backed securities. We believe this is more prudent in the event of continued weakness in commercial real estate.
We also avoided owning U.S. Agency debentures, but instead emphasized U.S. Agency Mortgage-backed securities via higher coupon pools that are “seasoned,” as well as low loan balance pools. We believe the above-market coupons in these pools will experience slower amortization and should protect the Fund in a rising rate environment, while still providing an attractive level of current income.
We continue to position the Fund with a significant underweight to U.S. Treasuries, and maintain a very modest allocation to U.S. Treasury securities via TIPs (Treasury Inflation Protected Securities).
While we do not believe inflation is an immediate concern, we think our Fund’s positioning overall is defensive and appropriate in the event that interest rates rise sharply.
76 Semi-Annual Report | June 30, 2010 |
Income Fund
Performance Highlights (unaudited)
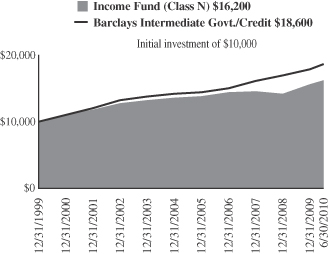
Average Annual Total Return at 6/30/2010
| | | | | | | | | | | | | | | |
| | | Year to
Date | | | 1
Year | | | 3
Year | | | 5
Year | | | 10
Year | |
Class N | | 3.94 | % | | 8.69 | % | | 3.88 | % | | 3.34 | % | | 4.57 | % |
Class I | | 4.06 | | | 8.80 | | | 4.04 | | | 3.51 | | | 4.73 | |
Barclays Capital Intermediate Government/Credit Bond Index | | 4.56 | | | 8.29 | | | 6.97 | | | 5.26 | | | 6.06 | |
Performance cited represents past performance. Past performance does not guarantee future results and current performance may be lower or higher than the data quoted. Results shown are average annual total returns, which assume reinvestment of dividends and capital gains. Investment returns and principal will fluctuate and you may have a gain or loss when you sell shares. For the most current month-end performance information, please call 1-800-742-7272, or visit our Web site at www.williamblairfunds.com. From time to time, the investment advisor may waive fees or reimburse expenses for the Fund. Without these waivers, performance would be lower. Class N shares are available to the general public without a sales load. Class I shares are available to certain institutional investors and advisory clients of William Blair & Company, L.L.C., without a sales load or distribution (12b-1) or service fees.
The performance highlights and graph presented above do not reflect the deduction of taxes that a shareholder would pay on fund distributions or the redemption of fund shares.
The Barclays Capital Intermediate Government/Credit Bond Index indicates broad intermediate government/corporate bond market performance.
This report identifies the Fund’s investments on June 30, 2010. These holdings are subject to change. Not all investments in the Fund performed the same, nor is there any guarantee that these investments will perform as well in the future. Market forecasts provided in this report may not necessarily come to pass.
Sector Diversification (unaudited)
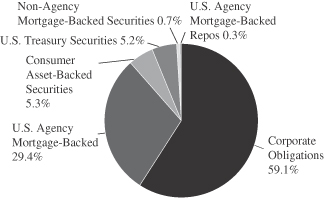
The sector diversification shown is based on the total investments.
June 30, 2010 | William Blair Funds 77 |
Income Fund
Portfolio of Investments, June 30, 2010 (all dollar amounts in thousands) (unaudited)
| | | | | | | | |
Issuer | | | | Principal
Amount | | Value |
|
U.S. Government and U.S. Government Agency—34.3% |
U.S. Treasury Inflation Indexed Notes/Bonds—3.5% | | | | | | | | |
U.S. Treasury Inflation Indexed Note, 2.375%, due 1/15/17 | | | | $ | 3,783 | | $ | 4,177 |
| | | | | | | | |
U.S. Treasury—1.6% |
U.S. Treasury Note, 5.125%, due 5/15/16 | | | | | 1,000 | | | 1,167 |
U.S. Treasury Note, 3.125%, due 5/15/19 | | | | | 700 | | | 714 |
| | | | | | | | |
Total U.S. Treasury Obligations | | | 1,881 |
| | | | | | | | |
Government National Mortgage Association (GNMA)—0.3% | | | | | | | | |
#780405, 9.500%, due 11/15/17 | | | | | 180 | | | 196 |
#357322, 7.000%, due 9/15/23 | | | | | 123 | | | 138 |
Total GNMA Mortgage Obligations | | | |
| | | 334 |
| | | | | | | | |
Federal Home Loan Mortgage Corp. (FHLMC)—10.3% | | | | | | | | |
#M80925, 5.000%, due 6/1/11 | | | | | 367 | | | 369 |
#E00436, 7.000%, due 6/1/11 | | | | | 45 | | | 47 |
#G10708, 6.500%, due 8/1/12 | | | | | 40 | | | 42 |
#E72924, 7.000%, due 10/1/13 | | | | | 314 | | | 331 |
#E81703, 7.000%, due 5/1/15 | | | | | 339 | | | 361 |
#E81697, 8.000%, due 5/1/15 | | | | | 878 | | | 957 |
#E81908, 8.500%, due 12/1/15 | | | | | 78 | | | 90 |
#J02184, 8.000%, due 4/1/16 | | | | | 617 | | | 663 |
#G90022, 8.000%, due 9/17/16 | | | | | 262 | | | 281 |
#M30028, 5.500%, due 5/1/17 | | | | | 63 | | | 66 |
#E90398, 7.000%, due 5/1/17 | | | | | 706 | | | 767 |
#E96536, 5.000%, due 3/1/18 | | | | | 985 | | | 1,059 |
#E97112, 4.000%, due 5/1/18 | | | | | 386 | | | 407 |
#B13459, 4.500%, due 4/1/19 | | | | | 318 | | | 339 |
#C67537, 9.500%, due 8/1/21 | | | | | 19 | | | 20 |
#D95621, 6.500%, due 7/1/22 | | | | | 2,052 | | | 2,276 |
#A45790, 7.500%, due 5/1/35 | | | | | 364 | | | 417 |
#G02141, 6.000%, due 3/1/36 | | | | | 1,142 | | | 1,265 |
#A81799, 6.500%, due 9/1/38 | | | | | 2,115 | | | 2,354 |
| | | | | | | | |
Total FHLMC Mortgage Obligations | | | 12,111 |
| | | | | | | | |
Federal National Mortgage Association (FNMA)—18.6% | | | | | | | | |
#695512, 8.000%, due 9/1/10 | | | | | 2 | | | 2 |
#313816, 6.000%, due 4/1/11 | | | | | 16 | | | 16 |
#577393, 10.000%, due 6/1/11 | | | | | 11 | | | 12 |
#577395, 10.000%, due 8/1/11 | | | | | 44 | | | 45 |
#254788, 6.500%, due 4/1/13 | | | | | 108 | | | 112 |
#725315, 8.000%, due 5/1/13 | | | | | 113 | | | 121 |
#593561, 9.500%, due 8/1/14 | | | | | 175 | | | 191 |
#567027, 7.000%, due 9/1/14 | | | | | 650 | | | 694 |
#567026, 6.500%, due 10/1/14 | | | | | 527 | | | 573 |
#458124, 7.000%, due 12/15/14 | | | | | 89 | | | 95 |
#576554, 8.000%, due 1/1/16 | | | | | 672 | | | 737 |
#256106, 5.000%, due 2/1/16 | | | | | 1,021 | | | 1,066 |
#576553, 8.000%, due 2/1/16 | | | | | 1,132 | | | 1,267 |
#555747, 8.000%, due 5/1/16 | | | | | 113 | | | 120 |
#735569, 8.000%, due 10/1/16 | | | | | 693 | | | 758 |
#725410, 7.500%, due 4/1/17 | | | | | 432 | | | 458 |
#643217, 6.500%, due 6/1/17 | | | | | 205 | | | 223 |
#679247, 7.000%, due 8/1/17 | | | | | 862 | | | 960 |
#888979, 6.000%, due 12/1/17 | | | | | 853 | | | 905 |
#685194, 4.500%, due 3/1/18 | | | | | 1,349 | | | 1,441 |
| | | | | | | | |
Issuer | | NRSRO
Rating | | Principal
Amount | | Value |
|
U.S. Government and U.S. Government Agency—(continued) |
Federal National Mortgage Association (FNMA)—(continued) | | | | | | |
#689334, 5.000%, due 3/1/18 | | | | $ | 197 | | $ | 211 |
#695910, 5.000%, due 5/1/18 | | | | | 845 | | | 915 |
#740847, 6.000%, due 10/1/18 | | | | | 552 | | | 602 |
#323501, 6.500%, due 1/1/19 | | | | | 162 | | | 179 |
#255358, 5.000%, due 9/1/19 | | | | | 257 | | | 276 |
#852864, 7.000%, due 7/1/20 | | | | | 1,699 | | | 1,897 |
#458147, 10.000%, due 8/15/20 | | | | | 424 | | | 478 |
#835563, 7.000%, due 10/1/20 | | | | | 758 | | | 842 |
#735574, 8.000%, due 3/1/22 | | | | | 440 | | | 511 |
#679253, 6.000%, due 10/1/22 | | | | | 1,010 | | | 1,110 |
FNR G93-19 SH,
11.234%, due 4/25/23, VRN | | | | | 11 | | | 13 |
#255956, 5.500%, due 10/1/25 | | | | | 223 | | | 241 |
#806458, 8.000%, due 6/1/28 | | | | | 402 | | | 465 |
#880155, 8.500%, due 7/1/29 | | | | | 796 | | | 925 |
#797846, 7.000%, due 3/1/32 | | | | | 1,043 | | | 1,153 |
#745519, 8.500%, due 5/1/32 | | | | | 504 | | | 586 |
#654674, 6.500%, due 9/1/32 | | | | | 241 | | | 269 |
#733897, 6.500%, due 12/1/32 | | | | | 283 | | | 315 |
#886220, 6.000%, due 7/1/36 | | | | | 1,017 | | | 1,118 |
| | | | | | | | |
Total FNMA Mortgage Obligations | | | 21,902 |
| | | | | | | | |
|
Non-Agency Mortgage-Backed Obligations—0.2% |
Lehman Structured Securities Corp.—144A, 2004-2, Tranche M1, 2.759%, 2/28/33, VRN§ | | CCC | | | 424 | | | 169 |
Lehman Structured Securities Corp.—144A, 2004-2, Tranche M2, 2.759%, 2/28/33, VRN§ | | CC | | | 325 | | | 42 |
| | | | | | | | |
Total Non-Agency Mortgage-Backed Obligations | | | 211 |
| | | | | | | | |
|
Consumer Asset-Backed Securities—5.8% |
Peco Energy Transition Trust,
2001-A, Tranche A1,
6.520%, 12/31/10 | | AAA | | | 301 | | | 304 |
Citibank Credit Card Issuance Trust, 2009-A3, Tranche A3,
2.700%, 6/24/13 | | AAA | | | 965 | | | 982 |
John Deere Owner Trust,
2009-A, Tranche A3,
2.590%, 10/15/13 | | AAA | | | 432 | | | 437 |
Avis Budget Rental Car Funding
AESOP LLC—144A, 2009-1A, Tranche A, 9.310%, 10/20/13 | | A2 | | | 1,000 | | | 1,112 |
Mercedes-Benz Auto Receivables Trust, 2009-1, Tranche A3,
1.670%, 1/15/14 | | AAA | | | 405 | | | 409 |
Avis Budget Rental Car Funding
AESOP LLC—144A, 2009-2A, Tranche A, 5.680%, 2/20/14 | | Aaa | | | 1,200 | | | 1,279 |
Hertz Vehicle Financing LLC—144A, 2009-2A, Tranche A1,
4.260%, 3/25/14 | | Aaa | | | 1,500 | | | 1,563 |
First Plus Home Loan Trust, 1997-4, Tranche M1,
7.640%, 9/11/23**§ | | C | | | 676 | | | 405 |
See accompanying Notes to Financial Statements.
78 Semi-Annual Report | June 30, 2010 |
Income Fund
Portfolio of Investments, June 30, 2010 (all dollar amounts in thousands) (unaudited)
| | | | | | | | |
Issuer | | NRSRO
Rating | | Principal
Amount | | Value |
| |
Consumer Asset-Backed Securities—(continued) | | | |
First Plus Home Loan Trust, 1997-4, Tranche M2,
7.830%, 9/11/23**§ | | C | | $ | 143 | | $ | 86 |
First Plus Home Loan Trust, 1998-3, Tranche M2,
7.920%, 5/10/24**§ | | Caa1 | | | 256 | | | 154 |
ABFS Mortgage Loan Trust, 2002-2, Tranche A7,
5.715%, 7/15/33 | | AAA | | | 5 | | | 5 |
Soundview Home Equity Loan Trust, 2005-B, Tranche M1,
6.135%, 5/25/35 | | AA+ | | | 101 | | | 99 |
| | | | | | | | |
Total Consumer Asset-Backed Securities | | | 6,835 |
| | | | | | | | |
| | | |
Corporate Obligations—58.3% | | | | | | | | |
Pacific Gas & Electric Co.,
4.200%, due 3/1/11 | | A | | | 1,250 | | | 1,276 |
Wisconsin Energy Corporation,
6.500%, due 4/1/11 | | A3 | | | 1,250 | | | 1,300 |
Eli Lilly & Co.,
3.550%, due 3/6/12 | | AA | | | 500 | | | 521 |
BHP Billiton Finance USA, Ltd.,
5.125%, due 3/29/12 | | A+ | | | 1,195 | | | 1,272 |
Morgan Stanley,
6.600%, due 4/1/12 | | A | | | 1,600 | | | 1,698 |
COX Communications, Inc.,
7.125%, due 10/1/12 | | Baa2 | | | 500 | | | 556 |
Wells Fargo & Co.,
4.375%, due 1/31/13 | | AA- | | | 1,400 | | | 1,480 |
PepsiCo, Inc.,
4.650%, due 2/15/13 | | Aa3 | | | 540 | | | 587 |
John Deere Capital Corporation,
4.500%, due 4/3/13 | | A | | | 1,000 | | | 1,077 |
Citigroup, Inc.,
5.500%, due 4/11/13 | | A+ | | | 1,000 | | | 1,039 |
General Electric Capital Corporation,
4.800%, due 5/1/13 | | AA+ | | | 1,500 | | | 1,599 |
Novartis Capital Corporation,
4.125%, due 2/10/14 | | Aa2 | | | 1,000 | | | 1,079 |
CME Group, Inc.,
5.750%, due 2/15/14 | | AA | | | 1,000 | | | 1,112 |
PACCAR, Inc.,
6.875%, due 2/15/14 | | A+ | | | 1,000 | | | 1,158 |
PepsiAmericas, Inc.,
4.375%, due 2/15/14 | | A+ | | | 500 | | | 545 |
America Movil S.A.B. de C.V.,
5.500%, due 3/1/14 | | A2 | | | 1,000 | | | 1,090 |
Coca-Cola Enterprises, Inc.,
7.375%, due 3/3/14 | | A+ | | | 900 | | | 1,073 |
General Electric Capital Corporation,
5.900%, due 5/13/14 | | AA+ | | | 225 | | | 248 |
Bank of America Corporation,
7.375%, due 5/15/14 | | A+ | | | 500 | | | 560 |
Hewlett-Packard Co.,
4.750%, due 6/2/14 | | A+ | | | 1,100 | | | 1,219 |
St. Jude Medical, Inc.,
3.750%, due 7/15/14 | | A | | | 500 | | | 528 |
| | | | | | | | |
Issuer | | NRSRO
Rating | | Principal
Amount | | Value |
| | |
Corporate Obligations—(continued) | | | | | | |
AT&T, Inc.,
5.100%, due 9/15/14 | | A | | $ | 1,750 | | $ | 1,941 |
Corporation Nacional del Cobre de Chile—144A,
4.750%, due 10/15/14 | | A1 | | | 1,000 | | | 1,079 |
Boeing Capital Corporation,
3.250%, due 10/27/14 | | A+ | | | 1,000 | | | 1,042 |
EI du Pont de Nemours & Co.,
3.250%, due 1/15/15 | | A | | | 1,200 | | | 1,252 |
Simon Property Group L.P.,
4.200%, due 2/1/15 | | A- | | | 1,125 | | | 1,156 |
DIRECTV Holdings LLC,
3.550%, due 3/15/15 | | Baa2 | | | 750 | | | 755 |
United Technologies Corporation,
4.875%, due 5/1/15 | | A+ | | | 1,000 | | | 1,118 |
Cisco Systems, Inc.,
5.500%, due 2/22/16 | | A+ | | | 1,250 | | | 1,440 |
Omnicom Group, Inc.,
5.900%, due 4/15/16 | | A- | | | 1,000 | | | 1,137 |
Yum! Brands, Inc.,
6.250%, due 4/15/16 | | BBB- | | | 1,000 | | | 1,143 |
Petrobras International Finance Co.,
6.125%, due 10/6/16 | | Baa1 | | | 1,000 | | | 1,062 |
BHP Billiton Finance USA, Ltd.,
5.400%, due 3/29/17 | | A+ | | | 1,000 | | | 1,127 |
ERP Operating L.P.,
5.750%, due 6/15/17 | | A- | | | 1,000 | | | 1,077 |
JPMorgan Chase & Co.,
6.125%, due 6/27/17 | | A1 | | | 1,750 | | | 1,915 |
BB&T Corporation,
4.900%, due 6/30/17 | | A2 | | | 1,500 | | | 1,546 |
Kimberly-Clark Corporation,
6.125%, due 8/1/17 | | A | | | 1,000 | | | 1,184 |
American Express Co.,
6.150%, due 8/28/17 | | A+ | | | 1,500 | | | 1,644 |
IBM Corporation,
5.700%, due 9/14/17 | | A+ | | | 1,750 | | | 2,034 |
Exelon Generation Co. LLC,
6.200%, due 10/1/17 | | A3 | | | 2,000 | | | 2,274 |
Tesco plc—144A,
5.500%, due 11/15/17 | | A- | | | 1,750 | | | 1,945 |
Abbott Laboratories,
5.600%, due 11/30/17 | | AA | | | 500 | | | 580 |
Wells Fargo & Co.,
5.625%, due 12/11/17 | | AA- | | | 750 | | | 820 |
Kohl’s Corporation,
6.250%, due 12/15/17 | | BBB+ | | | 1,000 | | | 1,165 |
Philip Morris International, Inc.,
5.650%, due 5/16/18 | | A | | | 1,250 | | | 1,367 |
Time Warner Cable, Inc.,
6.750%, due 7/1/18 | | BBB | | | 1,000 | | | 1,148 |
Anheuser-Busch InBev Worldwide, Inc.—144A,
7.750%, due 1/15/19 | | BBB+ | | | 800 | | | 971 |
FedEx Corporation,
8.000%, due 1/15/19 | | BBB | | | 1,000 | | | 1,270 |
Honeywell International, Inc.,
5.000%, due 2/15/19 | | A | | | 1,225 | | | 1,370 |
The Procter & Gamble Co.,
4.700%, due 2/15/19 | | AA- | | | 500 | | | 548 |
See accompanying Notes to Financial Statements.
June 30, 2010 | William Blair Funds 79 |
Income Fund
Portfolio of Investments, June 30, 2010 (all dollar amounts in thousands) (unaudited)
| | | | | | | | |
Issuer | | NRSRO
Rating | | Principal
Amount | | Value |
| | |
Corporate Obligations—(continued) | | | | | | |
Unilever Capital Corporation,
4.800%, due 2/15/19 | | A+ | | $ | 500 | | $ | 547 |
Pfizer, Inc.,
6.200%, due 3/15/19 | | AA | | | 1,000 | | | 1,188 |
Jefferies Group, Inc.,
8.500%, due 7/15/19 | | BBB | | | 1,100 | | | 1,236 |
Boston Properties L.P.,
5.875%, due 10/15/19 | | A- | | | 1,350 | | | 1,444 |
Macquarie Group Ltd.—144A,
6.000%, due 1/14/20 | | A2 | | | 1,000 | | | 1,014 |
Motiva Enterprises LLC—144A,
5.750%, due 1/15/20 | | A | | | 1,000 | | | 1,100 |
Johnson Controls, Inc.,
5.000%, due 3/30/20 | | BBB | | | 1,000 | | | 1,051 |
Ras Laffan Liquefied Natural Gas Co., Ltd. II—144A,
5.298%, due 9/30/20 | | Aa2 | | | 1,250 | | | 1,296 |
Southwest Airlines Co. 2007-1 Pass Through Trust,
6.150%, due 8/1/22 | | A | | | 1,493 | | | 1,538 |
| | | | | | | | |
Total Corporate Obligations | | | 68,541 |
| | | | | | | | |
Total Long-Term Investments—98.6%
(cost $109,106) | | | 115,992 |
| | | | | | | | |
NRSRO = Nationally Recognized Statistical Rating Organization—The credit quality ratings of the securities in the Fund reflect the highest category rating by either Fitch Ratings, Moody’s Investors Service Inc., or Standard & Poor’s, a division of the McGraw-Hill Companies, Inc. The obligations of certain U. S. Government-sponsored securities are neither issued nor guaranteed by the U. S. Treasury.
VRN = Variable Rate Note
§ = Deemed illiquid pursuant to Liquidity Procedures approved by the Board of Trustees. These holdings represent 0.73% of the net assets at June 30, 2010.
** = Fair valued pursuant to Valuation Procedures adopted by the Board of Trustees. These holdings represent 0.55% of the Fund’s net assets at June 30, 2010.
| | | | | | | | |
Issuer | | NRSRO
Rating | | Principal
Amount | | Value |
| | | |
Repurchase Agreement | | | | | | | | |
State Street Bank and Trust Company, 0.000% dated 6/30/10, due 7/1/10, repurchase price $373, collateralized by FHLB,
4.375%, due 9/17/10 | | AAA | | $ | 373 | | $ | 373 |
| | | | | | | | |
Total Repurchase Agreement—0.3%
(cost $373) | | | 373 |
| | | | | | | | |
Total Investments—98.9%
(cost $109,479) | | | 116,365 |
Cash and other assets, less liabilities—1.1% | | | 1,248 |
| | | | | | | | |
Net assets—100.0% | | $ | 117,613 |
| | | | | | | | |
See accompanying Notes to Financial Statements.
80 Semi-Annual Report | June 30, 2010 |
Christopher T. Vincent
Paul J. Sularz
LOW DURATION FUND
The Low Duration Fund seeks to maximize total return. Total return includes both income and capital appreciation.
AN OVERVIEW FROM THE PORTFOLIO MANAGERS
Please see page 69 for the Fixed Income Market Overview.
The Low Duration Fund posted a 1.43% increase on a total return basis (Class N Shares) for the six months ended June 30, 2010. By comparison, the Fund’s benchmark, the Merrill Lynch 1-Year U.S. Treasury Note Index, gained 0.51%.
What were the most significant factors impacting Fund performance during the first half of 2010? What factors were behind the Fund’s performance versus the benchmark?
Assets in this new Fund continued to build since the Fund’s inception on December 1, 2009, with assets increasing to $132 million by June 30, 2010.
The Fund had a very positive six months, with the Fund outperforming its Merrill Lynch 1-Year U.S. Treasury Note Index benchmark. We believe the Fund has been able to accomplish this objective without sacrificing credit quality. The Fund does not own below-investment grade securities as mandated by the Prospectus.
We are especially pleased with the way the Fund performed during the first quarter of the year. Short-term interest rate volatility is the worst enemy of a fixed income fund, and the Fund experienced a bout of rising rates at the end of March—which was preceded by a similar episode during the last week of December.
The Fund invested capital as the Fund’s asset flows grew steadily from its inception. We continued to invest in new Consumer Asset-backed securities (such as “top tier” banks and auto receivables) as well as seasoned U.S. Agency Mortgage-backed securities and Corporate Bonds.
We consider the Consumer Asset-backed securities that the Fund invests in to be highly liquid. Nearly a third of these investments are floating rate instruments that reset on monthly basis, which helps offset the negative impact of rising short-term rates on the Fund’s portfolio. The benefits of this strategy are especially evident in a rising rate environment such as the one the Fund experienced in December and March.
Similarly, the Fund’s U.S. Government-guaranteed short duration Mortgage-backed Fannie Mae and Freddie Mac securities pay monthly principal and interest, which we then are able to reinvest.
The Fund kept its exposure to cash and cash equivalents extremely low, given the very low rates currently available from money market instruments.
Finally it is worth noting that the Fund paid a total of $0.09157 per share (Class N Shares) in income distributions to shareholders of record during the first half of 2010.
June 30, 2010 | William Blair Funds 81 |
Low Duration Fund
Performance Highlights (unaudited)
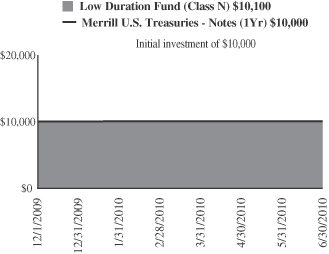
Average Annual Total Return at 6/30/2010
| | | | | | |
| | | Year to
Date | | | Since
Inception | |
Class N | | 1.43 | % | | 0.82 | % |
Class I | | 1.49 | | | 0.89 | |
Merrill Lynch 1-Year U.S. Treasury Note Index | | 0.51 | | | 0.36 | |
| | (a) | | For the period from December 1, 2009 (Commencement of Operations) to June 30, 2010. | |
Performance cited represents past performance. Past performance does not guarantee future results and current performance may be lower or higher than the data quoted. Results shown are average annual total returns, which assume reinvestment of dividends and capital gains. Investment returns and principal will fluctuate and you may have a gain or loss when you sell shares. For the most current month-end performance information, please call 1-800-742-7272, or visit our Web site at www.williamblairfunds.com. From time to time, the investment advisor may waive fees or reimburse expenses for the Fund. Without these waivers, performance would be lower. Class N shares are available to the general public without a sales load. Class I shares are available to certain institutional investors and advisory clients of William Blair & Company, L.L.C., without a sales load or distribution fees (12b-1).
The performance highlights and graph presented above do not reflect the deduction of taxes that a shareholder would pay on fund distributions or the redemption of fund shares.
The Merrill Lynch 1-Year U.S. Treasury Note Index is comprised of a single U.S. Treasury Note issue purchased at the beginning of the month and held for a full month. Each month the index is rebalanced and the issue selected is the outstanding U.S. Treasury Note that matures closest to, but not beyond one year from the rebalancing date.
This report identifies the Fund’s investments on June 30, 2010. These holdings are subject to change. Not all investments in the Fund performed the same, nor is there any guarantee that these investments will perform as well in the future. Market forecasts provided in this report may not necessarily come to pass.
Sector Diversification (unaudited)
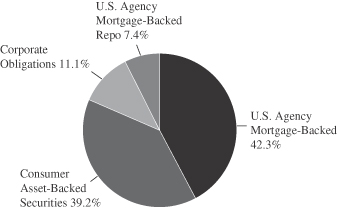
The sector diversification shown is based on the total investments.
82 Semi-Annual Report | June 30, 2010 |
Low Duration Fund
Portfolio of Investments, June 30, 2010 (all dollar amounts in thousands) (unaudited)
| | | | | | | | |
Issuer | | | | Principal
Amount | | Value |
|
U.S. Government and U.S. Government Agency—44.8% |
Government National Mortgage Association (GNMA)—0.3% | | | | | | | | |
#003438, 4.500%, due 9/20/18 | | | | $ | 363 | | $ | 387 |
| | | | | | | | |
Federal Home Loan Mortgage Corp. (FHLMC)—17.2% | | | | | | | | |
#M80856, 4.500%, due 10/1/10 | | | | | 104 | | | 105 |
#M80898, 4.500%, due 2/1/11 | | | | | 191 | | | 196 |
#M80903, 4.000%, due 3/1/11 | | | | | 369 | | | 374 |
#M80953, 4.000%, due 12/1/11 | | | | | 342 | | | 350 |
#E70847, 5.500%, due 6/1/13 | | | | | 3 | | | 4 |
#G11320, 6.000%, due 4/1/14 | | | | | 761 | | | 826 |
#G11211, 6.000%, due 7/1/16 | | | | | 419 | | | 455 |
#G11187, 5.500%, due 9/1/16 | | | | | 566 | | | 614 |
#E86134, 5.000%, due 11/1/16 | | | | | 308 | | | 331 |
#G11337, 5.500%, due 11/1/17 | | | | | 2,103 | | | 2,283 |
#E96536, 5.000%, due 3/1/18 | | | | | 614 | | | 660 |
#E95355, 5.000%, due 4/1/18 | | | | | 695 | | | 747 |
#E01377, 4.500%, due 5/1/18 | | | | | 707 | | | 749 |
#G11618, 4.500%, due 5/1/18 | | | | | 3,337 | | | 3,560 |
#E01488, 5.000%, due 10/1/18 | | | | | 725 | | | 780 |
#E99895, 5.000%, due 10/1/18 | | | | | 1,483 | | | 1,594 |
#G12093, 4.500%, due 12/1/18 | | | | | 827 | | | 882 |
#B11386, 5.000%, due 12/1/18 | | | | | 324 | | | 348 |
#G11506, 5.500%, due 12/1/18 | | | | | 541 | | | 587 |
#G11567, 5.500%, due 12/1/18 | | | | | 592 | | | 643 |
#E01545, 5.000%, due 1/1/19 | | | | | 410 | | | 440 |
#G11766, 5.000%, due 3/1/19 | | | | | 295 | | | 317 |
#G18001, 4.500%, due 7/1/19 | | | | | 381 | | | 406 |
#G11596, 5.500%, due 8/1/19 | | | | | 300 | | | 326 |
#B16291, 5.000%, due 9/1/19 | | | | | 1,867 | | | 2,006 |
#G18045, 5.000%, due 3/1/20 | | | | | 329 | | | 353 |
#G11892, 4.000%, due 4/1/20 | | | | | 323 | | | 340 |
#G18048, 5.000%, due 4/1/20 | | | | | 234 | | | 251 |
#J08152, 5.000%, due 5/1/20 | | | | | 258 | | | 277 |
#G12827, 5.500%, due 2/1/21 | | | | | 765 | | | 830 |
#G12394, 5.000%, due 5/1/21 | | | | | 433 | | | 465 |
#G12113, 5.500%, due 5/1/21 | | | | | 496 | | | 538 |
#J06402, 5.500%, due 11/1/22 | | | | | 119 | | | 128 |
| | | | | | | | |
Total FHLMC Mortgage Obligations | | | 22,765 |
| | | | | | | | |
Federal National Mortgage Association (FNMA)—27.3% | | | | | | | | |
#254956, 4.000%, due 11/1/10 | | | | | 267 | | | 268 |
#255325, 4.500%, due 7/1/11 | | | | | 1,303 | | | 1,337 |
#545898, 5.500%, due 9/1/17 | | | | | 961 | | | 1,041 |
#545899, 5.500%, due 9/1/17 | | | | | 1,102 | | | 1,195 |
#735647, 5.000%, due 12/1/17 | | | | | 2,952 | | | 3,175 |
#254591, 5.500%, due 1/1/18 | | | | | 641 | | | 695 |
#681310, 4.500%, due 2/1/18 | | | | | 668 | | | 714 |
#683100, 5.500%, due 2/1/18 | | | | | 781 | | | 851 |
#675717, 5.000%, due 3/1/18 | | | | | 710 | | | 764 |
#656564, 5.000%, due 4/1/18 | | | | | 3,198 | | | 3,440 |
#555456, 5.500%, due 4/1/18 | | | | | 3,372 | | | 3,655 |
#929388, 4.500%, due 5/1/18 | | | | | 923 | | | 964 |
#704049, 5.500%, due 5/1/18 | | | | | 1,505 | | | 1,635 |
#555622, 4.500%, due 6/1/18 | | | | | 746 | | | 796 |
#656573, 5.000%, due 6/1/18 | | | | | 417 | | | 449 |
#709848, 5.000%, due 6/1/18 | | | | | 393 | | | 423 |
#713807, 4.500%, due 7/1/18 | | | | | 355 | | | 379 |
#711991, 5.000%, due 8/1/18 | | | | | 370 | | | 398 |
| | | | | | | | |
Issuer | | NRSRO
Rating | | Principal
Amount | | Value |
|
U.S. Government and U.S. Government Agency—(continued) |
Federal National Mortgage Association (FNMA)—(continued) | | | | | | | | |
#740444, 4.500%, due 9/1/18 | | | | $ | 567 | | $ | 606 |
#743183, 5.000%, due 10/1/18 | | | | | 154 | | | 166 |
#749596, 5.000%, due 11/1/18 | | | | | 512 | | | 550 |
#255233, 4.000%, due 5/1/19 | | | | | 813 | | | 860 |
#725445, 4.500%, due 5/1/19 | | | | | 915 | | | 976 |
#995234, 5.000%, due 7/1/19 | | | | | 3,335 | | | 3,587 |
#785259, 5.000%, due 8/1/19 | | | | | 630 | | | 677 |
#725953, 5.000%, due 10/1/19 | | | | | 182 | | | 196 |
#745240, 4.500%, due 12/1/19 | | | | | 875 | | | 935 |
#735401, 5.500%, due 3/1/20 | | | | | 547 | | | 593 |
#735646, 4.500%, due 7/1/20 | | | | | 1,098 | | | 1,172 |
#836016, 4.500%, due 9/1/20 | | | | | 1,799 | | | 1,916 |
#881284, 4.500%, due 12/1/21 | | | | | 1,652 | | | 1,758 |
| | | | | | | | |
Total FNMA Mortgage Obligations | | | 36,171 |
| | | | | | | | |
Consumer Asset-Backed
Securities—41.6% | | | | | | | | |
BMW Vehicle Lease Trust, 2009-1, Tranche A2, 2.040%, 4/15/11 | | AAA | | | 483 | | | 484 |
Nissan Auto Lease Trust, 2009-A, Tranche A2, 2.010%, 4/15/11 | | AAA | | | 558 | | | 559 |
Nissan Auto Receivables Owner Trust, 2009-1, Tranche A2,
3.920%, 4/15/11 | | AAA | | | 80 | | | 81 |
Mercedes-Benz Auto Receivables Trust, 2010-1, Tranche A1,
0.309%, 5/13/11 | | A-1+ | | | 763 | | | 762 |
Volkswagen Auto Lease Trust, 2009-A, Tranche A2, 2.870%, 7/15/11 | | AAA | | | 364 | | | 365 |
Honda Auto Receivables Owner Trust, 2009-2, Tranche A2,
2.220%, 8/15/11 | | AAA | | | 61 | | | 61 |
Nissan Auto Lease Trust, 2009-B, Tranche A2, 1.220%, 9/15/11 | | AAA | | | 1,568 | | | 1,568 |
Ford Credit Auto Owner Trust, 2009-D, Tranche A2, 1.210%, 1/15/12 | | AAA | | | 1,835 | | | 1,837 |
Honda Auto Receivables Owner Trust, 2008-1, Tranche A3,
4.470%, 1/18/12 | | AAA | | | 771 | | | 779 |
Honda Auto Receivables Owner Trust, 2010-1, Tranche A2,
0.620%, 2/21/12 | | AAA | | | 2,375 | | | 2,373 |
USAA Auto Owner Trust, 2009-2, Tranche A2, 0.740%, 3/15/12 | | AAA | | | 165 | | | 165 |
Ally Auto Receivables Trust, 2010-1, Tranche A2, 0.750%, 4/15/12 | | AAA | | | 1,000 | | | 999 |
Volkswagen Auto Lease Trust, 2009-A, Tranche A3, 3.410%, 4/16/12 | | AAA | | | 1,550 | | | 1,582 |
CNH Equipment Trust, 2008-A, Tranche A3, 4.120%, 5/15/12 | | AAA | | | 555 | | | 559 |
Harley-Davidson Motorcycle Trust, 2009-1, Tranche A2,
2.520%, 5/15/12 | | AAA | | | 45 | | | 45 |
Volkswagen Auto Loan Enhanced Trust, 2010-1, Tranche A2,
0.660%, 5/21/12 | | AAA | | | 2,000 | | | 1,999 |
USAA Auto Owner Trust, 2010-1, Tranche A2, 0.630%, 6/15/12 | | AAA | | | 1,350 | | | 1,349 |
See accompanying Notes to Financial Statements.
June 30, 2010 | William Blair Funds 83 |
Low Duration Fund
Portfolio of Investments, June 30, 2010 (all dollar amounts in thousands) (unaudited)
| | | | | | | | |
Issuer | | NRSRO
Rating | | Principal
Amount | | Value |
|
U.S. Government and U.S. Government Agency—(continued) |
Consumer Asset-Backed
Securities—(continued) | | | | | | | | |
Ford Credit Auto Owner Trust, 2007-B, Tranche A4A, 5.240%, 7/15/12 | | AAA | | $ | 530 | | $ | 551 |
Chase Issuance Trust, 2009-A6, Tranche A6, 1.200%, 7/16/12, VRN | | AAA | | | 1,300 | | | 1,300 |
CNH Equipment Trust, 2008-B, Tranche A3A, 4.780%, 7/16/12 | | AAA | | | 442 | | | 447 |
CNH Equipment Trust, 2009-C, Tranche A2, 0.950%, 8/15/12 | | AAA | | | 1,000 | | | 1,001 |
CNH Equipment Trust, 2010-A, Tranche A2, 0.810%, 8/15/12 | | AAA | | | 1,000 | | | 1,000 |
Chase Issuance Trust, 2007-A15, Tranche A, 4.960%, 9/17/12 | | AAA | | | 198 | | | 200 |
BMW Vehicle Owner Trust, 2010-A, Tranche A2, 0.680%, 9/25/12 | | AAA | | | 1,500 | | | 1,499 |
Capital Auto Receivables Asset Trust, 2008-2, Tranche A3B,
1.800%, 10/15/12, VRN | | AAA | | | 840 | | | 847 |
Citibank Credit Card Issuance Trust, 2005-A7, Tranche A7,
4.750%, 10/22/12 | | AAA | | | 200 | | | 202 |
MBNA Credit Card Master Note Trust, 2005-A6, Tranche A6,
4.500%, 1/15/13 | | AAA | | | 150 | | | 151 |
CarMax Auto Owner Trust, 2009-1, Tranche A3, 4.120%, 3/15/13 | | AAA | | | 421 | | | 432 |
Bank of America Credit Card Trust, 2008-A1, Tranche A1,
0.930%, 4/15/13, VRN | | AAA | | | 320 | | | 320 |
Ford Credit Auto Owner Trust, 2009-A, Tranche A3A, 3.960%, 5/15/13 | | AAA | | | 600 | | | 615 |
Bank of America Credit Card Trust, 2007-A2, Tranche A2,
0.370%, 6/17/13, VRN | | AAA | | | 1,283 | | | 1,282 |
USAA Auto Owner Trust, 2009-1, Tranche A3, 3.020%, 6/17/13 | | AAA | | | 1,500 | | | 1,524 |
American Express Issuance Trust, 2007-2, Tranche A, 0.600%, 7/15/13, VRN | | AAA | | | 373 | | | 373 |
Capital One Multi-Asset Execution Trust, 2003-A5, Tranche A5, 0.640%, 7/15/13, VRN | | AAA | | | 1,000 | | | 1,000 |
American Express Credit Account Master Trust, 2008-1, Tranche A, 0.800%, 8/15/13, VRN | | AAA | | | 1,200 | | | 1,202 |
American Express Credit Account Master Trust—144A, 2006-B, Tranche A, 0.390%, 8/15/13, VRN | | AAA | | | 1,070 | | | 1,070 |
American Express Issuance Trust, 2005-2, Tranche A, 0.420%, 8/15/13, VRN | | AAA | | | 730 | | | 727 |
Discover Card Master Trust I, 2006-1, Tranche A2, 0.400%, 8/16/13, VRN | | AAA | | | 354 | | | 353 |
Ford Credit Auto Owner Trust, 2009-D, Tranche A3, 2.170%, 10/15/13 | | AAA | | | 1,160 | | | 1,176 |
John Deere Owner Trust, 2009-A, Tranche A3, 2.590%, 10/15/13 | | AAA | | | 1,728 | | | 1,749 |
| | | | | | | | |
Issuer | | NRSRO
Rating | | Principal
Amount | | Value |
|
U.S. Government and U.S. Government Agency—(continued) |
Consumer Asset-Backed
Securities—(continued) | | | | | | | | |
John Deere Owner Trust, 2009-B, Tranche A3, 1.570%, 10/15/13 | | AAA | | $ | 865 | | $ | 866 |
Avis Budget Rental Car Funding AESOP LLC—144A, 2009-1A, Tranche A, 9.310%, 10/20/13 | | A2 | | | 2,000 | | | 2,225 |
Harley-Davidson Motorcycle Trust, 2009-1, Tranche A3,
3.190%, 11/15/13 | | AAA | | | 2,007 | | | 2,049 |
Avis Budget Rental Car Funding AESOP LLC—144A, 2009-2A, Tranche A, 5.680%, 2/20/14 | | Aaa | | | 1,000 | | | 1,066 |
Capital One Multi-Asset Execution Trust, 2006-A7, Tranche A7, 0.380%, 3/17/14, VRN | | AAA | | | 1,000 | | | 998 |
Capital One Multi-Asset Execution Trust, 2008-A6, Tranche A6, 1.450%, 3/17/14, VRN | | AAA | | | 1,610 | | | 1,622 |
Hertz Vehicle Financing LLC—144A, 2009-2A, Tranche A1,
4.260%, 3/25/14 | | Aaa | | | 1,765 | | | 1,839 |
Chase Issuance Trust, 2007-A9, Tranche A, 0.380%, 6/16/14, VRN | | AAA | | | 2,000 | | | 1,990 |
Nissan Auto Receivables Owner Trust, 2008-A, Tranche A4,
4.280%, 6/16/14 | | AAA | | | 150 | | | 155 |
CNH Equipment Trust, 2010-A, Tranche A3, 1.540%, 7/15/14 | | AAA | | | 550 | | | 553 |
Citibank Credit Card Issuance Trust, 2007-A7, Tranche A7,
0.698%, 8/20/14, VRN | | AAA | | | 200 | | | 200 |
American Express Credit Account Master Trust, 2007-5, Tranche A, 0.380%, 12/15/14, VRN | | AAA | | | 1,000 | | | 995 |
Nissan Master Owner Trust Receivables—144A, 2010-AA, Tranche A, 1.500%, 1/15/15, VRN | | AAA | | | 2,000 | | | 2,005 |
Capital One Multi-Asset Execution Trust, 2007-A4, Tranche A4, 0.380%, 3/16/15, VRN | | AAA | | | 620 | | | 616 |
Bank of America Credit Card Trust, 2010-A1, Tranche A1,
0.650%, 9/15/15, VRN | | AAA | | | 1,300 | | | 1,297 |
Chase Issuance Trust, 2008-A3, Tranche A, 1.450%, 3/15/16, VRN | | AAA | | | 2,000 | | | 2,054 |
| | | | | | | | |
Total Consumer Asset-Backed Securities | | | 55,118 |
| | | | | | | | |
Corporate Obligations—11.7% | | | | | | |
Teva Pharmaceutical Finance III LLC, 1.500%, due 6/15/12 | | A- | | | 1,000 | | | 1,004 |
General Electric Capital Corporation, 3.500%, due 8/13/12 | | AA+ | | | 1,000 | | | 1,032 |
Johnson & Johnson,
5.150%, due 8/15/12 | | AAA | | | 1,900 | | | 2,071 |
Bank of America Corporation,
5.375%, due 9/11/12 | | A+ | | | 1,000 | | | 1,044 |
See accompanying Notes to Financial Statements.
84 Semi-Annual Report | June 30, 2010 |
Low Duration Fund
Portfolio of Investments, June 30, 2010 (all dollar amounts in thousands) (unaudited)
| | | | | | | | |
Issuer | | NRSRO
Rating | | Principal
Amount | | Value |
|
U.S. Government and U.S. Government Agency—(continued) |
Corporate Obligations—(continued) | | | | | | |
ConocoPhillips,
4.750%, due 10/15/12 | | A1 | | $ | 1,000 | | $ | 1,074 |
Citigroup, Inc.,
5.300%, due 10/17/12 | | A+ | | | 1,000 | | | 1,036 |
Wells Fargo & Co.,
5.250%, due 10/23/12 | | AA- | | | 1,000 | | | 1,070 |
Morgan Stanley,
5.250%, due 11/2/12 | | A | | | 1,000 | | | 1,040 |
The Walt Disney Co.,
4.700%, due 12/1/12 | | A | | | 1,500 | | | 1,627 |
Hewlett-Packard Co.,
4.500%, due 3/1/13 | | A+ | | | 1,000 | | | 1,079 |
American Honda Finance Corp.—144A, 2.375%, due 3/18/13 | | A+ | | | 1,000 | | | 1,014 |
Novartis Capital Corporation,
1.900%, due 4/24/13 | | Aa2 | | | 1,235 | | | 1,254 |
American Express Co.,
4.875%, due 7/15/13 | | A+ | | | 1,000 | | | 1,068 |
| | | | | | | | |
Total Corporate Obligations | | | 15,413 |
| | | | | | | | |
Total Long-Term Investments—98.1%
(cost $129,421) | | | 129,854 |
| | | | | | | | |
NRSRO = Nationally Recognized Statistical Rating Organization—The credit quality ratings of the securities in the Fund reflect the highest category rating by either Fitch Ratings, Moody’s Investors Service Inc., or Standard & Poor’s, a division of the McGraw-Hill Companies, Inc.
The obligations of certain U. S. Government-sponsored securities are neither issued nor guaranteed by the U. S. Treasury.
VRN = Variable Rate Note
| | | | | | | | | |
Issuer | | NRSRO
Rating | | Principal
Amount | | Value | |
Repurchase Agreement | | | | | | | | | |
State Street Bank and Trust Company, 0.000% dated 6/30/10, due 7/1/10, repurchase price $10,438, collateralized by FHLB, 4.375%, due 9/17/10 | | AAA | | $ | 10,438 | | $ | 10,438 | |
| | | | | | | | | |
Total Repurchase Agreement—7.9%
(cost $10,438) | | | 10,438 | |
| | | | | | | | | |
Total Investments—106.0%
(cost $139,859) | | | 140,292 | |
Liabilities, plus cash and other assets—(6.0)% | | | (7,939 | ) |
| | | | | | | | | |
Net assets—100.0% | | $ | 132,353 | |
| | | | |
See accompanying Notes to Financial Statements.
June 30, 2010 | William Blair Funds 85 |
Christopher T. Vincent

Kathleen M. Lynch
READY RESERVES FUND
The Ready Reserves Fund seeks current income, a stable share price and daily liquidity.
AN OVERVIEW FROM THE PORTFOLIO MANAGERS
The return for the six months ended June 30, 2009, of the Fund’s Class N Shares was 0.00%, versus the 0.02% return of the Fund’s benchmark, the AAA-Rated Money Market Funds Average. Total assets were $1.27 billion, compared to $1.35 billion at December 31, 2009, and $1.51 billion at June 30, 2009.
Federal Open Market Committee (FOMC) meetings held during the first half of 2010 confirmed that the Federal Reserve Board had decided to keep short-term interest rates near zero for “an extended period.” The Fed cited impediments to economic growth, including the effect of new financial problems abroad.
In its statement following its most recent two-day meeting on June 23, the Fed said, “financial conditions have become less supportive of economic growth on balance, largely reflecting developments abroad.”
Although the rate decision announced by the FOMC at the end of its meeting was in line with what Fed observers had expected, many considered the remarks to be remarkably dovish, and reflected the Fed’s concern over consumer spending and an unemployment rate that stands at 9.7%
The FOMC did not change its basic characterization of the pace of economic recovery, which it described as “likely to be moderate for a time.” However, it did change its language on growth, saying the economic recovery was “proceeding.” (In April, the FOMC said economic activity “has continued to strengthen.”)
This slight change in language was an indication to observers that the Fed is more concerned about the pace of economic growth.
Although the FOMC did not change its language on inflation, which was described as “likely to be subdued for some time,” it acknowledged declining prices for items such as energy and other commodities. Inflation in recent months has been largely flat, and is well below the Fed’s unofficial annual target of about 2.0%.
The FOMC left the Federal Funds target rate unchanged at a range of 0.00% -0.25% (It has stood at that level since December 2008.) The FOMC had previously raised the Discount Rate (on February 18) from 0.50% to 0.75%.
More notable was that the Fed has now exited many of the temporary liquidity programs enacted during the recent financial crisis. The last remaining program was the Term Asset-Backed Securities Loan Facility (TALF), which closed on June 30. Many Fed watchers believe that the Fed’s willingness to let these programs wind down reflects their cautious optimism about the economy.
As we wrote about at the end of last year, as the extreme financial conditions of 2009 eased—and in particular the lingering effects of the credit crisis—money market funds experienced gradual liquidations and orderly outflows to longer-fixed income securities, as well as equities. Corporations are rightly and rationally looking to longer-term funding markets as a source for capital, and less short-term Commercial Paper is being issued.
In such a low interest rate environment, with an exceedingly low federal funds rate, managing the Fund is a challenge, and we expect it to remain so until 2011, when we expect economic fundamentals to strengthen, and short-term rates to firm somewhat.
86 Semi-Annual Report | June 30, 2010 |
We continue to favor overnight repurchase agreements, in an effort to maintain a high degree of overnight liquidity.
The Fund also continues to maintain a relatively short Average Maturity. At June 30, 2010, the Fund’s Average Maturity was 38 days, compared to 48 days at March 31, 2010, 50 days at December 31, 2009, and 51 days at the same time one year ago.
June 30, 2010 | William Blair Funds 87 |
Ready Reserves Fund
Performance Highlights (unaudited)
The Fund’s 7 day yield on June 30, 2010 was 0.01%.
Average Annual Total Returns—Class N Shares period ended June 30, 2010.
| | | | | | | | | | | | | | | |
| | | Year to
Date | | | 1
Year | | | 3
Year | | | 5
Year | | | 10
Year | |
Ready Reserves Fund | | 0.00 | % | | 0.01 | % | | 1.54 | % | | 2.60 | % | | 2.35 | % |
AAA-Rated Money Market Funds | | 0.01 | | | 0.04 | | | 1.54 | | | 2.55 | | | 2.30 | |
Performance cited represents past performance. Past performance does not guarantee future results and current performance may be lower or higher than the data quoted. For the most current month-end performance information, please call 1-800-742-7272, or visit our Web site at www.williamblairfunds.com. Class N Shares are available to the general public without a sales load. Total return includes reinvestment of income. Yields fluctuate and are not guaranteed. An investment in the Fund is neither insured nor guaranteed by the Federal Deposit Insurance Corp. (FDIC) or any government agency. Although the Fund seeks to preserve the value of your investment at $1.00 per share, it is possible to lose money by investing in the Fund.
The AAA Rated Money Market Funds Average represents the average annual composite performance of all AAA rated First Tier Retail Money Market Funds listed by iMoneyNet data.
This report identifies the Fund’s investments on June 30, 2010. These holdings are subject to change. Not all fixed-income securities in the Fund performed the same, nor is there any guarantee that these fixed-income securities will perform as well in the future. Market forecasts provided in this report may not necessarily come to pass.
Sector Diversification (unaudited)
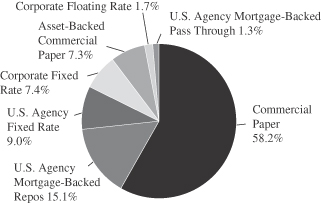
The sector diversification shown is based on the total Investments.
88 Semi-Annual Report | June 30, 2010 |
Ready Reserves Fund
Portfolio of Investments, June 30, 2010 (all dollar amounts in thousands) (unaudited)
| | | | | | |
Issuer | | Principal
Amount | | Amortized
Cost |
U.S. Government Agency Mortgage-Backed Notes—1.2% |
Federal Home Loan Mortgage
Corporation (FHLMC),
3.000%—5.000%, 7/1/10—11/1/10 | | $ | 12,601 | | $ | 12,662 |
Federal National Mortgage Association (FNMA),
3.500%—5.000%, 7/1/10—12/1/10 | | | 3,353 | | | 3,370 |
| | | | | | |
Total U.S. Government Agency Mortgage-Backed Notes | | | 16,032 |
| | | | | | |
U.S. Government Agency Notes—9.0% |
Federal Home Loan Bank (FHLB), 0.500%—5.125%, 9/10/10—2/18/11 | | | 38,735 | | | 39,013 |
Federal Home Loan Mortgage
Corporation (FHLMC),
2.875%—4.750%, 7/12/10—2/3/11 | | | 40,733 | | | 41,122 |
Federal National Mortgage
Association (FNMA),
1.750%—4.500%, 7/12/10—5/19/11 | | | 33,772 | | | 34,073 |
| | | | | | |
Total U.S. Government Agency Notes | | | | | | 114,208 |
| | | | | | |
Corporate Notes—9.1% |
Abbott Laboratories, 5.600%, 5/15/11 | | | 618 | | | 644 |
Caterpillar Financial Services Corporation, 0.853%, 8/6/10, VRN | | | 5,515 | | | 5,518 |
CME Group, Inc., 1.003%, 8/6/10, VRN | | | 7,075 | | | 7,080 |
General Electric Capital Corporation, 4.250%—6.875%, 9/13/10—4/28/11 | | | 16,691 | | | 17,148 |
JPMorgan Chase & Co., 2.625%, 12/1/10 | | | 15,310 | | | 15,451 |
Kimberly-Clark Corporation,
0.438%, 7/30/10, VRN | | | 4,575 | | | 4,575 |
Morgan Stanley, 2.900%, 12/1/10 | | | 14,000 | | | 14,144 |
Regions Bank, 2.750%, 12/10/10 | | | 3,000 | | | 3,031 |
Wal-Mart Stores, Inc.,
4.125%—4.750%, 7/1/10—2/15/11 | | | 29,815 | | | 30,071 |
Wells Fargo & Co., 0.766%, 1/24/11, VRN | | | 4,712 | | | 4,723 |
Wells Fargo & Co.,
4.000%—4.875%, 8/9/10—6/2/11 | | | 13,054 | | | 13,252 |
| | | | | | |
Total Corporate Notes | | | 115,637 |
| | | | | | |
Commercial Paper—58.1% |
Abbott Laboratories,
0.130%—0.240%, 7/8/10—8/10/10 | | | 25,000 | | | 24,995 |
American Honda Finance Corporation, 0.180%—0.300%, 7/6/10—8/16/10 | | | 45,000 | | | 44,994 |
AT&T, Inc.,
0.180%—0.190%, 7/8/10—7/26/10 | | | 35,000 | | | 34,997 |
Caterpillar Financial Services Corporation, 0.210%—0.300%, 7/7/10—9/9/10 | | | 26,000 | | | 25,993 |
Chevron Funding Corporation,
0.090%—0.190%, 7/1/10—7/9/10 | | | 22,000 | | | 22,000 |
Coca-Cola Co.,
0.150%—0.300%, 7/8/10—9/13/10 | | | 46,000 | | | 45,987 |
Colgate Palmolive Co.,
0.120%, 7/12/10—7/13/10 | | | 12,000 | | | 12,000 |
ConocoPhillips Qatar Funding, Ltd.,
0.180%—0.260%, 7/6/10—9/16/10 | | | 50,000 | | | 49,988 |
EI du Pont de Nemours & Co.,
0.150%—0.180%, 7/2/10—7/16/10 | | | 19,750 | | | 19,750 |
| | | | | | |
Issuer | | Principal
Amount | | Amortized
Cost |
Commercial Paper—(continued) |
General Electric Capital Corporation,
0.170%—0.310%, 7/9/10—8/24/10 | | $ | 31,000 | | $ | 30,994 |
Hewlett Packard Co.,
0.180%—0.240%, 7/8/10—7/27/10 | | | 45,000 | | | 44,995 |
IBM Corporation,
0.130%—0.190%, 7/1/10—7/8/10 | | | 33,000 | | | 33,000 |
John Deere Credit, Inc.,
0.200%, 7/19/10—7/22/10 | | | 15,000 | | | 14,997 |
John Deere Credit, Ltd.,
0.170%—0.180%, 7/2/10—7/26/10 | | | 17,000 | | | 16,998 |
John Deere, Ltd., 0.190%, 7/28/10 | | | 14,000 | | | 13,998 |
Johnson & Johnson,
0.150%—0.190%, 8/5/10 | | | 14,000 | | | 13,998 |
Kimberly-Clark Corporation,
0.180%—0.190%, 7/6/10—7/14/10 | | | 21,000 | | | 20,999 |
Merck & Co., Inc.,
0.200%—0.250%, 7/7/10—8/3/10 | | | 17,000 | | | 16,999 |
Microsoft Corporation,
0.170%—0.200%, 7/6/10—7/28/10 | | | 18,800 | | | 18,799 |
Nestle Capital Corporation,
0.210%—0.250%, 7/12/10—9/8/10 | | | 44,000 | | | 43,992 |
Oracle Corporation, 0.250%, 7/15/10 | | | 5,000 | | | 4,999 |
PACCAR Financial Corporation,
0.150%—0.320%, 7/1/10—8/6/10 | | | 21,100 | | | 21,097 |
Private Export Funding,
0.220%—0.300%, 7/13/10—10/1/10 | | | 35,000 | | | 34,987 |
Procter & Gamble International Funding,
0.160%—0.240%, 7/1/10—7/21/10 | | | 48,100 | | | 48,100 |
Roche Holding, Inc.,
0.160%—0.210%, 7/6/10—7/23/10 | | | 20,000 | | | 19,999 |
Toyota Credit Corporation,
0.120%—0.370%, 7/6/10—7/30/10 | | | 48,000 | | | 47,994 |
Wal-Mart Stores, Inc.,
0.150%—0.160%, 7/2/10—7/9/10 | | | 12,000 | | | 12,000 |
| | | | | | |
Total Commercial Paper | | | 739,649 |
| | | | | | |
Asset-Backed Commercial Paper—7.3% | | | | | | |
Chariot Funding L.L.C.,
0.270%—0.430%, 7/6/10—9/15/10 | | | 38,500 | | | 38,492 |
Govco L.L.C,
0.280%—0.400%, 7/7/10—7/29/10 | | | 45,000 | | | 44,992 |
Wal-Mart Funding Corporation,
0.350%, 7/9/10 | | | 10,000 | | | 9,999 |
| | | | | | |
Total Asset-Backed Commercial Paper | | | 93,483 |
| | | | | | |
Repurchase Agreements—15.1% | | | | | | |
Bank of America, 0.020% dated 6/30/10,
due 7/1/10, repurchase price $63,000 collateralized by FNMA,
5.500%, due 8/1/37 | | | 63,000 | | | 63,000 |
Fixed Income Clearing Corporation, 0.000% dated 6/30/10, due 7/1/10, repurchase price $41,653 collateralized by FFCB,
1.625%, due 3/7/13 | | | 41,653 | | | 41,653 |
Goldman Sachs, 0.040% dated 6/30/10, due 7/1/10, repurchase price $63,000, collateralized by FDIC guaranteed securities, 2.250%-3.125%, 12/1/11-12/10/12 | | | 63,000 | | | 63,000 |
See accompanying Notes to Financial Statements.
June 30, 2010 | William Blair Funds 89 |
Ready Reserves Fund
Portfolio of Investments, June 30, 2010 (all dollar amounts in thousands) (unaudited)
| | | | | | |
Issuer | | Principal
Amount | | Amortized
Cost |
Repurchase Agreements—(continued) | | | | | | |
JPMorgan & Co., 0.030% dated 6/30/10, due 7/1/10, repurchase price $25,000, collateralized by GNMA,
0.738%-6.341%, due 12/20/34-3/20/40 | | $ | 25,000 | | $ | 25,000 |
| | | | | | |
Total Repurchase Agreements | | | 192,653 |
| | | | | | |
Total Investments—99.8%
(cost $1,271,662) | | | 1,271,662 |
Cash and other assets, less liabilities—0.2% | | | 2,055 |
| | | | | | |
Net assets—100.0% | | $ | 1,273,717 |
| | | | | | |
Portfolio Weighted Average Maturity | | | 38 Days |
VRN = Variable Rate Note
See accompanying Notes to Financial Statements.
90 Semi-Annual Report | June 30, 2010 |
Statements of Assets and Liabilities
June 30, 2010 (dollar amounts in thousands) (unaudited)
| | | | | | | | | | | | | | | | |
| | | Growth
Fund | | | Large Cap
Growth
Fund | | | Small Cap
Growth
Fund | | | Mid Cap
Growth
Fund | |
Assets | | | | | | | | | | | | | | | | |
Investments in securities, at cost | | $ | 400,917 | | | $ | 25,031 | | | $ | 608,731 | | | $ | 68,630 | |
Investments in Affiliated Companies, at cost | | | — | | | | — | | | | 138,969 | | | | — | |
Investments in Affiliated Fund, at cost | | | 1,262 | | | | — | | | | 3,297 | | | | 19 | |
| | | | | | | | | | | | | | | | |
| | | | |
Investments in securities, at value | | $ | 420,102 | | | $ | 27,082 | | | $ | 621,555 | | | $ | 74,398 | |
Investments in Affiliated Companies, at value | | | — | | | | — | | | | 109,898 | | | | — | |
Investments in Affiliated Fund, at amortized cost | | | 1,262 | | | | — | | | | 3,297 | | | | 19 | |
Receivable for securities sold | | | 8,426 | | | | — | | | | 10,137 | | | | 316 | |
Receivable for fund shares sold | | | 460 | | | | 29 | | | | 757 | | | | 1,153 | |
Receivable from Advisor | | | — | | | | 2 | | | | 4 | | | | — | |
Dividend and interest receivable | | | 243 | | | | 17 | | | | 407 | | | | 21 | |
| | | | | | | | | | | | | | | | |
Total assets | | | 430,493 | | | | 27,130 | | | | 746,055 | | | | 75,907 | |
Liabilities | | | | | | | | | | | | | | | | |
Payable for investment securities purchased | | | 6,683 | | | | 5 | | | | 4,486 | | | | 1,058 | |
Payable for fund shares redeemed | | | 633 | | | | 26 | | | | 2,151 | | | | 48 | |
Management fee payable | | | 275 | | | | 19 | | | | 722 | | | | 67 | |
Distribution fee payable | | | 36 | | | | 1 | | | | 101 | | | | 2 | |
Other payables and accrued expenses | | | 55 | | | | 29 | | | | 117 | | | | 28 | |
| | | | | | | | | | | | | | | | |
Total liabilities | | | 7,682 | | | | 80 | | | | 7,577 | | | | 1,203 | |
| | | | | | | | | | | | | | | | |
Net Assets | | $ | 422,811 | | | $ | 27,050 | | | $ | 738,478 | | | $ | 74,704 | |
| | | | | | | | | | | | | | | | |
Capital | | | | | | | | | | | | | | | | |
Composition of Net Assets | | | | | | | | | | | | | | | | |
Par value of shares of beneficial interest | | $ | 46 | | | $ | 5 | | | $ | 38 | | | $ | 8 | |
Capital paid in excess of par value | | | 432,172 | | | | 33,237 | | | | 860,765 | | | | 75,927 | |
Accumulated net investment income (loss) | | | (101 | ) | | | 20 | | | | (3,454 | ) | | | (248 | ) |
Accumulated realized gain (loss) | | | (28,491 | ) | | | (8,263 | ) | | | (102,624 | ) | | | (6,751 | ) |
Net unrealized appreciation (depreciation) of investments and foreign currencies | | | 19,185 | | | | 2,051 | | | | (16,247 | ) | | | 5,768 | |
| | | | | | | | | | | | | | | | |
Net Assets | | $ | 422,811 | | | $ | 27,050 | | | $ | 738,478 | | | $ | 74,704 | |
| | | | | | | | | | | | | | | | |
| | | | |
Class N Shares | | | | | | | | | | | | | | | | |
Net Assets | | $ | 164,119 | | | $ | 5,685 | | | $ | 454,616 | | | $ | 10,912 | |
Shares Outstanding | | | 18,058,169 | | | | 1,008,941 | | | | 23,590,977 | | | | 1,111,295 | |
Net Asset Value Per Share | | $ | 9.09 | | | $ | 5.64 | | | $ | 19.26 | | | $ | 9.82 | |
Class I Shares | | | | | | | | | | | | | | | | |
Net Assets | | $ | 258,692 | | | $ | 21,365 | | | $ | 283,862 | | | $ | 63,792 | |
Shares Outstanding | | | 27,456,811 | | | | 3,707,013 | | | | 14,244,244 | | | | 6,412,320 | |
Net Asset Value Per Share | | $ | 9.42 | | | $ | 5.76 | | | $ | 19.93 | | | $ | 9.95 | |
See accompanying Notes to Financial Statements.
June 30, 2010 | William Blair Funds 91 |
Statements of Operations
for the Period Ended June 30, 2010 (all amounts in thousands) (unaudited)
| | | | | | | | | | | | | | | | |
| | | Growth Fund | | | Large Cap
Growth Fund | | | Small Cap
Growth Fund | | | Mid Cap
Growth Fund | |
Investment income | | | | | | | | | | | | | | | | |
Dividends . . . . . . . . . . . | | $ | 2,034 | | | $ | 170 | | | $ | 1,759 | | | $ | 180 | |
Less foreign tax withheld | | | — | | | | — | | | | (22 | ) | | | — | |
Dividend Income from Affiliated Companies | | | — | | | | — | | | | 214 | | | | — | |
Interest | | | 7 | | | | — | | | | 11 | | | | 1 | |
| | | | | | | | | | | | | | | | |
Total income . . . . . . . . . . . . . . . . . . . . | | | 2,041 | | | | 170 | | | | 1,962 | | | | 181 | |
Expenses | | | | | | | | | | | | | | | | |
Investment advisory fees | | | 1,678 | | | | 118 | | | | 4,335 | | | | 356 | |
Distribution fees | | | 218 | | | | 8 | | | | 608 | | | | 14 | |
Custodian fees | | | 19 | | | | 19 | | | | 22 | | | | 21 | |
Transfer agent fees | | | 57 | | | | 5 | | | | 43 | | | | 6 | |
Sub-transfer agent fees | | | | | | | | | | | | | | | | |
Class N | | | 65 | | | | 3 | | | | 205 | | | | 5 | |
Class I | | | 46 | | | | — | | | | 68 | | | | 10 | |
Professional fees | | | 17 | | | | 13 | | | | 22 | | | | 13 | |
Registration fees | | | 15 | | | | 18 | | | | 33 | | | | 15 | |
Shareholder reporting fees | | | 25 | | | | 2 | | | | 61 | | | | 7 | |
Trustee fees | | | 6 | | | | — | | | | 11 | | | | 1 | |
Other expenses | | | 9 | | | | 2 | | | | 12 | | | | 3 | |
| | | | | | | | | | | | | | | | |
Total expenses before waiver | | | 2,155 | | | | 188 | | | | 5,420 | | | | 451 | |
Expenses reimbursed to (waived or absorbed by) the Advisor | | | — | | | | (37 | ) | | | (4 | ) | | | (22 | ) |
| | | | | | | | | | | | | | | | |
Net expenses | | | 2,155 | | | | 151 | | | | 5,416 | | | | 429 | |
| | | | | | | | | | | | | | | | |
Net investment income (loss) | | | (114 | ) | | | 19 | | | | (3,454 | ) | | | (248 | ) |
Realized and unrealized gain (loss) | | | | | | | | | | | | | | | | |
Net realized gain (loss) on transactions from: | | | | | | | | | | | | | | | | |
Investments | | | 9,445 | | | | 217 | | | | 86,090 | (a) | | | 5,587 | |
Foreign currency transactions | | | — | | | | — | | | | 6 | | | | — | |
| | | | | | | | | | | | | | | | |
Total net realized gain (loss) | | | 9,445 | | | | 217 | | | | 86,096 | | | | 5,587 | |
| | | | | | | | | | | | | | | | |
Change in net unrealized appreciation (depreciation) of investments | | | (47,002 | ) | | | (2,742 | ) | | | (115,199 | ) | | | (7,324 | ) |
| | | | | | | | | | | | | | | | |
Net increase (decrease) in net assets resulting from operations | | $ | (37,671 | ) | | $ | (2,506 | ) | | $ | (32,557 | ) | | $ | (1,985 | ) |
| | | | | | | | | | | | | | | | |
| (a) | | Affiliated Companies accounted for $1,616 of the net realized gain on investments and $(100,538) of the change in unrealized depreciation on investments during the period. |
See accompanying Notes to Financial Statements.
92 Semi-Annual Report | June 30, 2010 |
Statements of Changes in Net Assets
for the Period Ended June 30, 2010 (unaudited) and the Year Ended December 31, 2009 (all amounts in thousands)
| | | | | | | | | | | | | | | | | | | | | | | | | | | | | | | | |
| | | Growth
Fund | | | Large Cap
Growth
Fund | | | Small Cap
Growth
Fund | | | Mid Cap
Growth
Fund | |
| | | 2010 | | | 2009 | | | 2010 | | | 2009 | | | 2010 | | | 2009 | | | 2010 | | | 2009 | |
Operations | | | | | | | | | | | | | | | | | | | | | | | | | | | | | | | | |
Net investment income (loss) | | $ | (114 | ) | | $ | 56 | | | $ | 19 | | | $ | 17 | | | $ | (3,454 | ) | | $ | (4,618 | ) | | $ | (248 | ) | | $ | (147 | ) |
Net realized gain (loss) on investments, foreign currency transactions and other assets and liabilities | | | 9,445 | | | | (19,046 | ) | | | 217 | | | | (2,753 | ) | | | 86,096 | | | | (34,140 | ) | | | 5,587 | | | | (6,206 | ) |
Change in net unrealized appreciation (depreciation) on investments, and other assets and liabilities | | | (47,002 | ) | | | 119,029 | | | | (2,742 | ) | | | 9,950 | | | | (115,199 | ) | | | 322,910 | | | | (7,324 | ) | | | 22,569 | |
| | | | | | | | | | | | | | | | | | | | | | | | | | | | | | | | |
Net increase (decrease) in net assets resulting from operations | | | (37,671 | ) | | | 100,039 | | | | (2,506 | ) | | | 7,214 | | | | (32,557 | ) | | | 284,152 | | | | (1,985 | ) | | | 16,216 | |
Distributions to shareholders from | | | | | | | | | | | | | | | | | | | | | | | | | | | | | | | | |
Net investment income . . . . . . . . | | | — | | | | (43 | ) | | | — | | | | (16 | ) | | | — | | | | — | | | | — | | | | — | |
Net realized gain | | | — | | | | — | | | | — | | | | — | | | | — | | | | — | | | | — | | | | — | |
| | | | | | | | | | | | | | | | | | | | | | | | | | | | | | | | |
| | | — | | | | (43 | ) | | | — | | | | (16 | ) | | | — | | | | — | | | | — | | | | — | |
Capital stock transactions | | | | | | | | | | | | | | | | | | | | | | | | | | | | | | | | |
Net proceeds from sale of shares | | | 76,489 | | | | 131,594 | | | | 1,574 | | | | 6,234 | | | | 128,743 | | | | 317,852 | | | | 13,766 | | | | 21,823 | |
Shares issued in reinvestment of income dividends and capital gain distributions | | | — | | | | 34 | | | | — | | | | 14 | | | | — | | | | — | | | | — | | | | — | |
Less cost of shares redeemed | | | (35,527 | ) | | | (50,690 | ) | | | (2,329 | ) | | | (6,414 | ) | | | (120,506 | ) | | | (240,833 | ) | | | (7,911 | ) | | | (7,731 | ) |
| | | | | | | | | | | | | | | | | | | | | | | | | | | | | | | | |
Net increase (decrease) in net assets resulting from capital share transactions | | | 40,962 | | | | 80,938 | | | | (755 | ) | | | (166 | ) | | | 8,237 | | | | 77,019 | | | | 5,855 | | | | 14,092 | |
| | | | | | | | | | | | | | | | | | | | | | | | | | | | | | | | |
Increase (decrease) in net assets | | | 3,291 | | | | 180,934 | | | | (3,261 | ) | | | 7,032 | | | | (24,320 | ) | | | 361,171 | | | | 3,870 | | | | 30,308 | |
Net assets | | | | | | | | | | | | | | | | | | | | | | | | | | | | | | | | |
Beginning of period | | | 419,520 | | | | 238,586 | | | | 30,311 | | | | 23,279 | | | | 762,798 | | | | 401,627 | | | | 70,834 | | | | 40,526 | |
| | | | | | | | | | | | | | | | | | | | | | | | | | | | | | | | |
End of period | | $ | 422,811 | | | $ | 419,520 | | | $ | 27,050 | | | $ | 30,311 | | | $ | 738,478 | | | $ | 762,798 | | | $ | 74,704 | | | $ | 70,834 | |
| | | | | | | | | | | | | | | | | | | | | | | | | | | | | | | | |
Undistributed net investment income (loss) at the end of the period | | $ | (101 | ) | | $ | 13 | | | $ | 20 | | | $ | 1 | | | $ | (3,454 | ) | | $ | — | | | $ | (248 | ) | | $ | — | |
| | | | | | | | | | | | | | | | | | | | | | | | | | | | | | | | |
See accompanying Notes to Financial Statements.
June 30, 2010 | William Blair Funds 93 |
Statements of Assets and Liabilities
June 30, 2010 (dollar amounts in thousands) (unaudited)
| | | | | | | | | | | | | | | | |
| | | Small-Mid
Cap Growth
Fund | | | Global
Growth
Fund | | | International
Growth
Fund | | | International
Equity
Fund | |
Assets | | | | | | | | | | | | | | | | |
| | | | |
Investments in securities, at cost | | $ | 132,088 | | | $ | 32,026 | | | $ | 3,874,957 | | | $ | 255,968 | |
Investments in Affiliated Fund, at cost | | | 23 | | | | 29 | | | | 6,376 | | | | 5 | |
| | | | | | | | | | | | | | | | |
| | | | |
Investments in securities, at value | | $ | 141,730 | | | $ | 34,746 | | | $ | 4,172,470 | | | $ | 280,611 | |
Investments in Affiliated Fund, at amortized cost | | | 23 | | | | 29 | | | | 6,376 | | | | 5 | |
Foreign currency, at value (cost $—, $23,$32,387,$60) | | | — | | | | 23 | | | | 32,416 | | | | 60 | |
Receivable for securities sold | | | 876 | | | | — | | | | 66,062 | | | | 1,945 | |
Receivable for fund shares sold | | | 42 | | | | 5 | | | | 18,176 | | | | 5,189 | |
Receivable from Advisor | | | 6 | | | | 7 | | | | — | | | | 23 | |
Dividend and interest receivable | | | 26 | | | | 61 | | | | 15,549 | | | | 778 | |
| | | | | | | | | | | | | | | | |
Total assets | | | 142,703 | | | | 34,871 | | | | 4,311,049 | | | | 288,611 | |
Liabilities | | | | | | | | | | | | | | | | |
Payable for investment securities purchased | | | 782 | | | | — | | | | 65,453 | | | | 2,296 | |
Payable for fund shares redeemed | | | 75 | | | | 3 | | | | 6,648 | | | | 33 | |
Unrealized depreciation on forward foreign currency contracts | | | — | | | | — | | | | 313 | | | | — | |
Management fee payable | | | 123 | | | | 30 | | | | 3,548 | | | | 257 | |
Distribution and shareholder administration fee payable | | | 5 | | | | 5 | | | | 492 | | | | 3 | |
Other payables and accrued expenses | | | 20 | | | | 47 | | | | 1,374 | | | | 109 | |
| | | | | | | | | | | | | | | | |
Total liabilities | | | 1,005 | | | | 85 | | | | 77,828 | | | | 2,698 | |
| | | | | | | | | | | | | | | | |
Net Assets | | $ | 141,698 | | | $ | 34,786 | | | $ | 4,233,221 | | | $ | 285,913 | |
| | | | | | | | | | | | | | | | |
Capital | | | | | | | | | | | | | | | | |
Composition of Net Assets | | | | | | | | | | | | | | | | |
Par value of shares of beneficial interest | | $ | 12 | | | $ | 5 | | | $ | 236 | | | $ | 28 | |
Capital paid in excess of par value | | | 142,709 | | | | 56,116 | | | | 5,618,310 | | | | 400,484 | |
Accumulated net investment income (loss) | | | (458 | ) | | | 97 | | | | 20,619 | | | | 1,869 | |
Accumulated realized gain (loss) | | | (10,207 | ) | | | (24,152 | ) | | | (1,703,234 | ) | | | (141,120 | ) |
Net unrealized appreciation (depreciation) of investments and foreign currencies | | | 9,642 | | | | 2,720 | | | | 297,290 | | | | 24,652 | |
| | | | | | | | | | | | | | | | |
Net Assets | | $ | 141,698 | | | $ | 34,786 | | | $ | 4,233,221 | | | $ | 285,913 | |
| | | | | | | | | | | | | | | | |
| | | | |
Class N Shares | | | | | | | | | | | | | | | | |
Net Assets | | $ | 21,860 | | | $ | 3,820 | | | $ | 2,370,531 | | | $ | 12,619 | |
Shares Outstanding | | | 1,922,212 | | | | 581,160 | | | | 133,387,195 | | | | 1,255,647 | |
Net Asset Value Per Share | | $ | 11.37 | | | $ | 6.57 | | | $ | 17.77 | | | $ | 10.05 | |
Class I Shares | | | | | | | | | | | | | | | | |
Net Assets | | $ | 119,838 | | | $ | 30,966 | | | $ | 1,862,690 | | | $ | 273,294 | |
Shares Outstanding | | | 10,349,890 | | | | 4,714,606 | | | | 102,431,412 | | | | 26,937,236 | |
Net Asset Value Per Share | | $ | 11.58 | | | $ | 6.57 | | | $ | 18.19 | | | $ | 10.15 | |
See accompanying Notes to Financial Statements.
94 Semi-Annual Report | June 30, 2010 |
Statements of Operations
for the Period Ended June 30, 2010 (all amounts in thousands) (unaudited)
| | | | | | | | | | | | | | | | |
| | | Small-Mid
Cap Growth
Fund | | | Global
Growth
Fund | | | International
Growth
Fund | | | International
Equity
Fund | |
Investment income | | | | | | | | | | | | | | | | |
Dividends | | $ | 404 | | | $ | 358 | | | $ | 68,146 | | | $ | 4,054 | |
Less foreign tax withheld | | | — | | | | (27 | ) | | | (5,716 | ) | | | (366 | ) |
Interest | | | 1 | | | | — | | | | 239 | | | | 6 | |
| | | | | | | | | | | | | | | | |
Total income | | | 405 | | | | 331 | | | | 62,669 | | | | 3,694 | |
Expenses | | | | | | | | | | | | | | | | |
Investment advisory fees | | | 753 | | | | 186 | | | | 21,883 | | | | 1,597 | |
Distribution fees | | | 30 | | | | 5 | | | | 3,053 | | | | 18 | |
Shareholder services fees | | | — | | | | 28 | | | | — | | | | — | |
Custodian fees | | | 25 | | | | 37 | | | | 418 | | | | 57 | |
Transfer agent fees | | | 17 | | | | 9 | | | | 194 | | | | 6 | |
Sub-transfer agent fees | | | | | | | | | | | | | | | | |
Class N | | | 6 | | | | 2 | | | | 1,223 | | | | 6 | |
Class I | | | 6 | | | | 1 | | | | 512 | | | | 141 | |
Professional fees | | | 15 | | | | 18 | | | | 62 | | | | 21 | |
Registration fees | | | 15 | | | | 23 | | | | 61 | | | | 23 | |
Shareholder reporting fees | | | 5 | | | | 3 | | | | 712 | | | | 7 | |
Trustee fees | | | 2 | | | | 1 | | | | 70 | | | | 5 | |
Other expenses | | | 7 | | | | 3 | | | | 85 | | | | 5 | |
| | | | | | | | | | | | | | | | |
Total expenses before waiver | | | 881 | | | | 316 | | | | 28,273 | | | | 1,886 | |
Expenses reimbursed to (waived or absorbed by) the Advisor | | | (18 | ) | | | (72 | ) | | | — | | | | (100 | ) |
| | | | | | | | | | | | | | | | |
Net expenses | | | 863 | | | | 244 | | | | 28,273 | | | | 1,786 | |
| | | | | | | | | | | | | | | | |
Net investment income (loss) | | | (458 | ) | | | 87 | | | | 34,396 | | | | 1,908 | |
Realized and unrealized gain (loss) | | | | | | | | | | | | | | | | |
Net realized gain (loss) on transactions from: | | | | | | | | | | | | | | | | |
Investments | | | 13,922 | | | | 2,332 | | | | 344,236 | | | | 7,042 | |
Foreign currency transactions | | | — | | | | (47 | ) | | | 44,079 | | | | (300 | ) |
| | | | | | | | | | | | | | | | |
Total net realized gain (loss) | | | 13,922 | | | | 2,285 | | | | 388,315 | | | | 6,742 | |
Change in net unrealized appreciation (depreciation) of: | | | | | | | | | | | | | | | | |
Investments | | | (17,589 | ) | | | (4,485 | ) | | | (591,335 | ) | | | (37,134 | ) |
Foreign currency translations | | | — | | | | — | | | | (15,437 | ) | | | (22 | ) |
| | | | | | | | | | | | | | | | |
Total change in net unrealized appreciation (depreciation) | | | (17,589 | ) | | | (4,485 | ) | | | (606,772 | ) | | | (37,156 | ) |
| | | | | | | | | | | | | | | | |
Net increase (decrease) in net assets resulting from operations | | $ | (4,125 | ) | | $ | (2,113 | ) | | $ | (184,061 | ) | | $ | (28,506 | ) |
| | | | | | | | | | | | | | | | |
See accompanying Notes to Financial Statements.
June 30, 2010 | William Blair Funds 95 |
Statements of Changes in Net Assets
for the Period Ended June 30, 2010 (unaudited) and the Year Ended December 31, 2009 (all amounts in thousands)
| | | | | | | | | | | | | | | | | | | | | | | | | | | | | | | | |
| | | Small-Mid Cap
Growth
Fund | | | Global
Growth
Fund | | | International
Growth
Fund | | | International
Equity
Fund | |
| | | 2010 | | | 2009 | | | 2010 | | | 2009 | | | 2010 | | | 2009 | | | 2010 | | | 2009 | |
Operations | | | | | | | | | | | | | | | | | | | | | | | | | | | | | | | | |
Net investment income (loss) | | $ | (458 | ) | | $ | (382 | ) | | $ | 87 | | | $ | 7 | | | $ | 34,396 | | | $ | 21,404 | | | $ | 1,908 | | | $ | 2,131 | |
Net realized gain (loss) on investments, foreign currency transactions and other assets and liabilities | | | 13,922 | | | | (7,046 | ) | | | 2,285 | | | | (3,204 | ) | | | 388,315 | | | | (397,479 | ) | | | 6,742 | | | | (47,092 | ) |
Change in net unrealized appreciation (depreciation) on investments, and other assets and liabilities | | | (17,589 | ) | | | 47,865 | | | | (4,485 | ) | | | 14,318 | | | | (606,772 | ) | | | 1,657,928 | | | | (37,156 | ) | | | 112,766 | |
| | | | | | | | | | | | | | | | | | | | | | | | | | | | | | | | |
Net increase (decrease) in net assets resulting from operations | | | (4,125 | ) | | | 40,437 | | | | (2,113 | ) | | | 11,121 | | | | (184,061 | ) | | | 1,281,853 | | | | (28,506 | ) | | | 67,805 | |
Distributions to shareholders from | | | | | | | | | | | | | | | | | | | | | | | | | | | | | | | | |
Net investment income | | | — | | | | — | | | | — | | | | (3 | ) | | | — | | | | (31,541 | ) | | | — | | | | (1,449 | ) |
Net realized gain | | | — | | | | — | | | | — | | | | — | | | | — | | | | — | | | | — | | | | — | |
| | | | | | | | | | �� | | | | | | | | | | | | | | | | | | | | | | |
| | | — | | | | — | | | | — | | | | (3 | ) | | | — | | | | (31,541 | ) | | | — | | | | (1,449 | ) |
Capital stock transactions | | | | | | | | | | | | | | | | | | | | | | | | | | | | | | | | |
Net proceeds from sale of shares | | | 14,360 | | | | 52,642 | | | | 3,089 | | | | 4,434 | | | | 722,087 | | | | 1,361,082 | | | | 44,494 | | | | 87,167 | |
Shares issued in reinvestment of income dividends and capital gain distributions | | | — | | | | — | | | | — | | | | 3 | | | | — | | | | 28,646 | | | | — | | | | 1,387 | |
Less cost of shares redeemed | | | (15,365 | ) | | | (29,730 | ) | | | (4,477 | ) | | | (5,273 | ) | | | (778,213 | ) | | | (1,297,570 | ) | | | (28,243 | ) | | | (85,228 | ) |
| | | | | | | | | | | | | | | | | | | | | | | | | | | | | | | | |
Net increase (decrease) in net assets resulting from capital share transactions | | | (1,005 | ) | | | 22,912 | | | | (1,388 | ) | | | (836 | ) | | | (56,126 | ) | | | 92,158 | | | | 16,251 | | | | 3,326 | |
| | | | | | | | | | | | | | | | | | | | | | | | | | | | | | | | |
Increase (decrease) in net assets | | | (5,130 | ) | | | 63,349 | | | | (3,501 | ) | | | 10,282 | | | | (240,187 | ) | | | 1,342,470 | | | | (12,255 | ) | | | 69,682 | |
Net assets | | | | | | | | | | | | | | | | | | | | | | | | | | | | | | | | |
Beginning of period | | | 146,828 | | | | 83,479 | | | | 38,287 | | | | 28,005 | | | | 4,473,408 | | | | 3,130,938 | | | | 298,168 | | | | 228,486 | |
| | | | | | | | | | | | | | | | | | | | | | | | | | | | | | | | |
End of period | | $ | 141,698 | | | $ | 146,828 | | | $ | 34,786 | | | $ | 38,287 | | | $ | 4,233,221 | | | $ | 4,473,408 | | | $ | 285,913 | | | $ | 298,168 | |
| | | | | | | | | | | | | | | | | | | | | | | | | | | | | | | | |
Undistributed net investment income (loss) at the end of the period | | $ | (458 | ) | | $ | — | | | $ | 97 | | | $ | 10 | | | $ | 20,619 | | | $ | (13,777 | ) | | $ | 1,869 | | | $ | (39 | ) |
| | | | | | | | | | | | | | | | | | | | | | | | | | | | | | | | |
See accompanying Notes to Financial Statements.
96 Semi-Annual Report | June 30, 2010 |
Statements of Assets and Liabilities
June 30, 2010 (dollar amounts in thousands) (unaudited)
| | | | | | | | | | | | |
| | | International
Small Cap
Growth
Fund | | | Emerging
Markets
Growth
Fund | | | Emerging
Leaders
Growth
Fund | |
Assets | | | | | | | | | | | | |
Investments in securities, at cost | | $ | 400,720 | | | $ | 841,139 | | | $ | 63,897 | |
Investments in Affiliated Fund, at cost | | | 489 | | | | 66 | | | | 440 | |
| | | | | | | | | | | | |
| | | |
Investments in securities, at value | | $ | 441,554 | | | $ | 994,291 | | | $ | 73,095 | |
Investments in Affiliated Fund, at amortized cost | | | 489 | | | | 66 | | | | 440 | |
Foreign currency, at value (cost $287,$15,312,$445) | | | 283 | | | | 15,340 | | | | 444 | |
Receivable for securities sold | | | 1,532 | | | | 7,319 | | | | 4,977 | |
Receivable for fund shares sold | | | 103 | | | | 139 | | | | 42 | |
Receivable from Advisor | | | — | | | | — | | | | 8 | |
Dividend and interest receivable | | | 886 | | | | 1,866 | | | | 231 | |
| | | | | | | | | | | | |
Total assets | | | 444,847 | | | | 1,019,021 | | | | 79,237 | |
Liabilities | | | | | | | | | | | | |
Payable for investment securities purchased | | | 2,554 | | | | 5,170 | | | | 1,106 | |
Payable for fund shares redeemed | | | 184 | | | | 108 | | | | 2,379 | |
Unrealized depreciation on forward foreign currency contracts | | | 26 | | | | — | | | | — | |
Management fee payable | | | 371 | | | | 902 | | | | 88 | |
Distribution and shareholder administration fee payable | | | 35 | | | | 26 | | | | 1 | |
Other payables and accrued expenses | | | 88 | | | | 334 | | | | 54 | |
| | | | | | | | | | | | |
Total liabilities | | | 3,258 | | | | 6,540 | | | | 3,628 | |
| | | | | | | | | | | | |
Net Assets | | $ | 441,589 | | | $ | 1,012,481 | | | $ | 75,609 | |
| | | | | | | | | | | | |
Capital | | | | | | | | | | | | |
Composition of Net Assets | | | | | | | | | | | | |
Par value of shares of beneficial interest | | $ | 43 | | | $ | 81 | | | $ | 9 | |
Capital paid in excess of par value | | | 554,469 | | | | 1,022,262 | | | | 76,172 | |
Accumulated net investment income (loss) | | | 2,169 | | | | (4,033 | ) | | | 209 | |
Accumulated realized gain (loss) | | | (155,912 | ) | | | (159,015 | ) | | | (9,981 | ) |
Net unrealized appreciation (depreciation) of investments and foreign currencies | | | 40,820 | | | | 153,186 | | | | 9,200 | |
| | | | | | | | | | | | |
Net Assets | | $ | 441,589 | | | $ | 1,012,481 | | | $ | 75,609 | |
| | | | | | | | | | | | |
| | | |
Class N Shares | | | | | | | | | | | | |
Net Assets | | $ | 17,130 | | | $ | 23,929 | | | | — | (a) |
Shares Outstanding | | | 1,686,843 | | | | 1,941,918 | | | | 1 | |
Net Asset Value Per Share | | $ | 10.16 | | | $ | 12.32 | | | $ | 8.26 | |
Class I Shares | | | | | | | | | | | | |
Net Assets | | $ | 226,458 | | | $ | 144,783 | | | $ | 10,455 | |
Shares Outstanding | | | 22,072,747 | | | | 11,654,720 | | | | 1,265,620 | |
Net Asset Value Per Share | | $ | 10.26 | | | $ | 12.42 | | | $ | 8.26 | |
(a) The class commenced operations on May 3, 2010 and had one share outstanding as of June 30, 2010.
See accompanying Notes to Financial Statements.
June 30, 2010 | William Blair Funds 97 |
Statements of Operations
for the Period Ended June 30, 2010 (all amounts in thousands) (unaudited)
| | | | | | | | | | | | |
| | | International
Small Cap
Growth
Fund | | | Emerging
Markets
Growth
Fund | | | Emerging
Leaders
Growth
Fund | |
Investment income | | | | | | | | | | | | |
Dividends | | $ | 5,104 | | | $ | 10,396 | | | $ | 1,344 | |
Less foreign tax withheld | | | (269 | ) | | | (791 | ) | | | (140 | ) |
Interest | | | 72 | | | | 94 | | | | 1 | |
| | | | | | | | | | | | |
Total income | | | 4,907 | | | | 9,699 | | | | 1,205 | |
Expenses | | | | | | | | | | | | |
Investment advisory fees | | | 2,124 | | | | 5,526 | | | | 609 | |
Distribution fees | | | 20 | | | | 32 | | | | — | |
Shareholder services fees | | | 184 | | | | 148 | | | | 7 | |
Custodian fees | | | 77 | | | | 266 | | | | 59 | |
Transfer agent fees | | | 18 | | | | 23 | | | | 4 | |
Sub-transfer agent fees | | | | | | | | | | | | |
Class N | | | 6 | | | | 11 | | | | — | |
Class I | | | 25 | | | | 35 | | | | — | |
Professional fees | | | 21 | | | | 27 | | | | 16 | |
Registration fees | | | 35 | | | | 40 | | | | 25 | |
Shareholder reporting fees | | | 23 | | | | 11 | | | | 2 | |
Trustee fees | | | 6 | | | | 14 | | | | 2 | |
Other expenses | | | 8 | | | | 15 | | | | 4 | |
| | | | | | | | | | | | |
Total expenses before waiver | | | 2,547 | | | | 6,148 | | | | 728 | |
Expenses reimbursed to (waived or absorbed by) the Advisor | | | — | | | | — | | | | (29 | ) |
| | | | | | | | | | | | |
Net expenses | | | 2,547 | | | | 6,148 | | | | 699 | |
| | | | | | | | | | | | |
Net investment income (loss) | | | 2,360 | | | | 3,551 | | | | 506 | |
Realized and unrealized gain (loss) | | | | | | | | | | | | |
Net realized gain (loss) on transactions from: | | | | | | | | | | | | |
Investments | | | 17,578 | | | | 71,759 | | | | 22,851 | |
Foreign currency transactions | | | 113 | | | | (2,200 | ) | | | (295 | ) |
| | | | | | | | | | | | |
Total net realized gain (loss) | | | 17,691 | | | | 69,559 | | | | 22,556 | |
Change in net unrealized appreciation (depreciation) of: | | | | | | | | | | | | |
Investments | | | (32,179 | ) | | | (118,023 | ) | | | (24,739 | ) |
Foreign currency translations | | | (33 | ) | | | (29 | ) | | | 2 | |
| | | | | | | | | | | | |
Total change in net unrealized appreciation (depreciation) | | | (32,212 | ) | | | (118,052 | ) | | | (24,737 | ) |
| | | | | | | | | | | | |
Net increase (decrease) in net assets resulting from operations | | $ | (12,161 | ) | | $ | (44,942 | ) | | $ | (1,675 | ) |
| | | | | | | | | | | | |
See accompanying Notes to Financial Statements.
98 Semi-Annual Report | June 30, 2010 |
Statements of Changes in Net Assets
for the Period Ended June 30, 2010 (unaudited) and the Year Ended December 31, 2009 (all amounts in thousands)
| | | | | | | | | | | | | | | | | | | | | | | | |
| | | International
Small Cap
Growth
Fund
| | | Emerging
Markets
Growth
Fund | | | Emerging
Leaders
Growth
Fund | |
| | | 2010 | | | 2009 | | | 2010 | | | 2009 | | | 2010 | | | 2009 | |
Operations | | | | | | | | | | | | | | | | | | | | | | | | |
Net investment income (loss) | | $ | 2,360 | | | $ | 1,001 | | | $ | 3,551 | | | $ | 3,476 | | | $ | 506 | | | $ | 507 | |
Net realized gain (loss) on investments, foreign currency transactions and other assets and liabilities | | | 17,691 | | | | (30,308 | ) | | | 69,559 | | | | (59,561 | ) | | | 22,556 | | | | 3,205 | |
Change in net unrealized appreciation (depreciation) on investments, and other assets and liabilities | | | (32,212 | ) | | | 174,254 | | | | (118,052 | ) | | | 461,348 | | | | (24,737 | ) | | | 51,098 | |
| | | | | | | | | | | | | | | | | | | | | | | | |
Net increase (decrease) in net assets resulting from operations | | | (12,161 | ) | | | 144,947 | | | | (44,942 | ) | | | 405,263 | | | | (1,675 | ) | | | 54,810 | |
Distributions to shareholders from | | | | | | | | | | | | | | | | | | | | | | | | |
Net investment income | | | — | | | | (778 | ) | | | — | | | | (11,127 | ) | | | — | | | | (1,588 | ) |
Net realized gain | | | — | | | | — | | | | — | | | | — | | | | — | | | | — | |
| | | | | | | | | | | | | | | | | | | | | | | | |
| | | — | | | | (778 | ) | | | — | | | | (11,127 | ) | | | — | | | | (1,588 | ) |
Capital stock transactions | | | | | | | | | | | | | | | | | | | | | | | | |
Net proceeds from sale of shares | | | 121,773 | | | | 139,125 | | | | 162,010 | | | | 422,203 | | | | 3,502 | | | | 42,409 | |
Shares issued in reinvestment of income dividends and capital gain distributions | | | — | | | | 676 | | | | — | | | | 10,336 | | | | — | | | | 1,466 | |
Less cost of shares redeemed | | | (58,874 | ) | | | (185,107 | ) | | | (142,847 | ) | | | (174,003 | ) | | | (41,354 | ) | | | (28,637 | ) |
| | | | | | | | | | | | | | | | | | | | | | | | |
Net increase (decrease) in net assets resulting from capital share transactions | | | 62,899 | | | | (45,306 | ) | | | 19,163 | | | | 258,536 | | | | (37,852 | ) | | | 15,238 | |
| | | | | | | | | | | | | | | | | | | | | | | | |
Increase (decrease) in net assets | | | 50,738 | | | | 98,863 | | | | (25,779 | ) | | | 652,672 | | | | (39,527 | ) | | | 68,460 | |
Net assets | | | | | | | | | | | | | | | | | | | | | | | | |
Beginning of period | | | 390,851 | | | | 291,988 | | | | 1,038,260 | | | | 385,588 | | | | 115,136 | | | | 46,676 | |
| | | | | | | | | | | | | | | | | | | | | | | | |
End of period | | $ | 441,589 | | | $ | 390,851 | | | $ | 1,012,481 | | | $ | 1,038,260 | | | $ | 75,609 | | | $ | 115,136 | |
| | | | | | | | | | | | | | | | | | | | | | | | |
Undistributed net investment income (loss) at the end of the period | | $ | 2,169 | | | $ | (191 | ) | | $ | (4,033 | ) | | $ | (7,584 | ) | | $ | 209 | | | $ | (297 | ) |
| | | | | | | | | | | | | | | | | | | | | | | | |
See accompanying Notes to Financial Statements.
June 30, 2010 | William Blair Funds 99 |
Statements of Assets and Liabilities
June 30, 2010 (dollar amounts in thousands) (unaudited)
| | | | | | | | |
| | | Small Cap
Value
Fund | | | Mid Cap
Value
Fund | |
Assets | | | | | | | | |
Investments in securities, at cost | | $ | 88,459 | | | $ | 2,340 | |
Investments in Affiliated Fund, at cost | | | 4 | | | | — | |
| | | | | | | | |
| | |
Investments in securities, at value | | $ | 90,141 | | | $ | 2,036 | |
Investments in Affiliated Fund, at amortized cost | | | 4 | | | | — | |
Receivable for securities sold | | | 1,767 | | | | — | |
Receivable for fund shares sold | | | 285 | | | | — | |
Receivable from Advisor | | | 15 | | | | 13 | |
Dividend and interest receivable | | | 52 | | | | 2 | |
| | | | | | | | |
Total assets | | | 92,264 | | | | 2,051 | |
Liabilities | | | | | | | | |
Payable for investment securities purchased | | | 2,832 | | | | — | |
Payable for fund shares redeemed | | | 36 | | | | — | |
Management fee payable | | | 85 | | | | 2 | |
Distribution fee payable | | | 2 | | | | — | |
Other accrued expenses | | | 30 | | | | 22 | |
| | | | | | | | |
Total liabilities | | | 2,985 | | | | 24 | |
| | | | | | | | |
Net Assets | | $ | 89,279 | | | $ | 2,027 | |
| | | | | | | | |
Capital | | | | | | | | |
Composition of Net Assets | | | | | | | | |
Par value of shares of beneficial interest | | $ | 8 | | | $ | 1 | |
Capital paid in excess of par value | | | 92,944 | | | | 2,314 | |
Accumulated net investment income (loss) | | | 151 | | | | 3 | |
Accumulated realized gain (loss) | | | (5,506 | ) | | | 13 | |
Net unrealized appreciation (depreciation) of investments and foreign currencies | | | 1,682 | | | | (304 | ) |
| | | | | | | | |
Net Assets | | $ | 89,279 | | | $ | 2,027 | |
| | | | | | | | |
| | |
Class N Shares | | | | | | | | |
Net Assets | | $ | 8,250 | | | $ | 3 | |
Shares Outstanding | | | 783,690 | | | | 393 | |
Net Asset Value Per Share | | $ | 10.53 | | | $ | 8.68 | |
Class I Shares | | | | | | | | |
Net Assets | | $ | 81,029 | | | $ | 2,024 | |
Shares Outstanding | | | 7,574,617 | | | | 232,980 | |
Net Asset Value Per Share | | $ | 10.70 | | | $ | 8.69 | |
See accompanying Notes to Financial Statements.
100 Semi-Annual Report | June 30, 2010 |
Statements of Operations
for the Period Ended June 30, 2010 (all amounts in thousands) (unaudited)
| | | | | | | | |
| | | Small Cap
Value
Fund | | | Mid Cap
Value
Fund(a) | |
Investment income | | | | | | | | |
Dividends | | $ | 602 | | | $ | 7 | |
Interest | | | 1 | | | | — | |
| | | | | | | | |
Total income | | | 603 | | | | 7 | |
Expenses | | | | | | | | |
Investment advisory fees | | | 463 | | | | 3 | |
Distribution fees | | | 10 | | | | — | |
Custodian fees | | | 25 | | | | 7 | |
Transfer agent fees | | | 11 | | | | 2 | |
Sub-transfer agent fees | | | | | | | | |
Class N | | | 9 | | | | — | |
Class I | | | 7 | | | | — | |
Professional fees | | | 12 | | | | 4 | |
Registration fees | | | 14 | | | | 9 | |
Shareholder reporting fees | | | 6 | | | | 1 | |
Trustee fees | | | 1 | | | | — | |
Other expenses | | | 3 | | | | 1 | |
| | | | | | | | |
Total expenses before waiver | | | 561 | | | | 27 | |
Expenses reimbursed to (waived or absorbed by) the Advisor | | | (91 | ) | | | (23 | ) |
| | | | | | | | |
Net expenses | | | 470 | | | | 4 | |
| | | | | | | | |
Net investment income (loss) | | | 133 | | | | 3 | |
Realized and unrealized gain (loss) | | | | | | | | |
Net realized gain (loss) on transaction | | | 3,869 | | | | 13 | |
Change in net unrealized appreciation (depreciation) of investments | | | (4,055 | ) | | | (304 | ) |
| | | | | | | | |
Net increase (decrease) in net assets resulting from operations | | $ | (53 | ) | | $ | (288 | ) |
| | | | | | | | |
| (a) | | For the period from May 3, 2010 (Commencement of Operations) to June 30, 2010. |
See accompanying Notes to Financial Statements.
June 30, 2010 | William Blair Funds 101 |
Statements of Changes in Net Assets
for the Period Ended June 30, 2010 (unaudited) and the Year Ended December 31, 2009 (all amounts in thousands)
| | | | | | | | | | | | |
| | | Small Cap
Value
Fund | | | Mid Cap
Value
Fund | |
| | | 2010 | | | 2009 | | | 2010(a) | |
Operations | | | | | | | | | | | | |
Net investment income (loss) | | $ | 133 | | | $ | 347 | | | $ | 3 | |
Net realized gain (loss) on investments, foreign currency transactions and other assets and liabilities | | | 3,869 | | | | (3,891 | ) | | | 13 | |
Change in net unrealized appreciation (depreciation) on investments, and other assets and liabilities | | | (4,055 | ) | | | 14,493 | | | | (304 | ) |
| | | | | | | | | | | | |
Net increase (decrease) in net assets resulting from operations | | | (53 | ) | | | 10,949 | | | | (288 | ) |
Distributions to shareholders from | | | | | | | | | | | | |
Net investment income | | | — | | | | (213 | ) | | | — | |
Net realized gain | | | — | | | | — | | | | — | |
| | | | | | | | | | | | |
| | | — | | | | (213 | ) | | | — | |
Capital stock transactions | | | | | | | | | | | | |
Net proceeds from sale of shares | | | 40,089 | | | | 14,901 | | | | 2,320 | |
Shares issued in reinvestment of income dividends and capital gain distributions | | | — | | | | 170 | | | | — | |
Less cost of shares redeemed | | | (5,616 | ) | | | (7,197 | ) | | | (5 | ) |
| | | | | | | | | | | | |
Net increase (decrease) in net assets resulting from capital share transactions | | | 34,473 | | | | 7,874 | | | | 2,315 | |
| | | | | | | | | | | | |
Increase (decrease) in net assets | | | 34,420 | | | | 18,610 | | | | 2,027 | |
Net assets | | | | | | | | | | | | |
Beginning of period | | | 54,859 | | | | 36,249 | | | | — | |
| | | | | | | | | | | | |
End of period | | $ | 89,279 | | | $ | 54,859 | | | $ | 2,027 | |
| | | | | | | | | | | | |
Undistributed net investment income (loss) at the end of the period | | $ | 151 | | | $ | 18 | | | $ | 3 | |
| | | | | | | | | | | | |
| (a) | | For the period from May 3, 2010 (Commencement of Operations) to June 30, 2010. |
See accompanying Notes to Financial Statements.
102 Semi-Annual Report | June 30, 2010 |
Statements of Assets and Liabilities
June 30, 2010 (dollar amounts in thousands) (unaudited)
| | | | | | | | | | | | | | | |
| | | Bond
Fund | | Income
Fund | | | Low
Duration
Fund | | | Ready
Reserves
Fund | |
Assets | | | | | | | | | | | | | | | |
Investments in securities, at cost | | $ | 178,407 | | $ | 109,479 | | | $ | 139,859 | | | $ | 1,271,662 | |
| | | | | | | | | | | | | | | |
| | | | |
Investments in securities, at value | | $ | 188,629 | | $ | 116,365 | | | $ | 140,292 | | | $ | 1,271,662 | |
Receivable for fund shares sold | | | 1,073 | | | 438 | | | | 1,527 | | | | — | |
Receivable from Advisor | | | 5 | | | — | | | | 46 | | | | 359 | |
Dividend and interest receivable | | | 1,889 | | | 1,240 | | | | 422 | | | | 2,387 | |
| | | | | | | | | | | | | | | |
Total assets | | | 191,596 | | | 118,043 | | | | 142,287 | | | | 1,274,408 | |
Liabilities | | | | | | | | | | | | | | | |
Payable for investment securities purchased | | | 2,478 | | | — | | | | 8,470 | | | | — | |
Payable for fund shares redeemed | | | 372 | | | 331 | | | | 1,411 | | | | — | |
Management fee payable | | | 45 | | | 48 | | | | 31 | | | | 255 | |
Distribution and shareholder administration fee payable | | | 18 | | | 5 | | | | 11 | | | | — | |
Other accrued expenses | | | 19 | | | 46 | | | | 11 | | | | 436 | |
| | | | | | | | | | | | | | | |
Total liabilities | | | 2,932 | | | 430 | | | | 9,934 | | | | 691 | |
| | | | | | | | | | | | | | | |
Net Assets | | $ | 188,664 | | $ | 117,613 | | | $ | 132,353 | | | $ | 1,273,717 | |
| | | | | | | | | | | | | | | |
Capital | | | | | | | | | | | | | | | |
Composition of Net Assets | | | | | | | | | | | | | | | |
Par value of shares of beneficial interest | | $ | 18 | | $ | 13 | | | $ | 13 | | | $ | 1,274 | |
Capital paid in excess of par value | | | 178,222 | | | 153,425 | | | | 132,344 | | | | 1,273,312 | |
Accumulated net investment income (loss) | | | 152 | | | (38 | ) | | | (295 | ) | | | 84 | |
Accumulated realized gain (loss) | | | 50 | | | (42,673 | ) | | | (142 | ) | | | (953 | ) |
Net unrealized appreciation (depreciation) of investments and foreign currencies | | | 10,222 | | | 6,886 | | | | 433 | | | | — | |
| | | | | | | | | | | | | | | |
Net Assets | | $ | 188,664 | | $ | 117,613 | | | $ | 132,353 | | | $ | 1,273,717 | |
| | | | | | | | | | | | | | | |
| | | | |
Class N Shares | | | | | | | | | | | | | | | |
Net Assets | | $ | 4,041 | | $ | 37,746 | | | $ | 4,794 | | | $ | 1,273,717 | |
Shares Outstanding | | | 376,963 | | | 4,084,615 | | | | 480,226 | | | | 1,273,773,916 | |
Net Asset Value Per Share | | $ | 10.72 | | $ | 9.24 | | | $ | 9.98 | | | $ | 1.00 | |
Class I Shares | | | | | | | | | | | | | | | |
Net Assets | | $ | 149,991 | | $ | 79,867 | | | $ | 87,149 | | | | | |
Shares Outstanding | | | 14,126,812 | | | 8,705,818 | | | | 8,729,865 | | | | | |
Net Asset Value Per Share | | $ | 10.62 | | $ | 9.17 | | | $ | 9.98 | | | | | |
See accompanying Notes to Financial Statements.
June 30, 2010 | William Blair Funds 103 |
Statements of Operations
for the Period Ended June 30, 2010 (all amounts in thousands) (unaudited)
| | | | | | | | | | | | | | | | |
| | | Bond
Fund | | | Income
Fund | | | Low
Duration
Fund | | | Ready
Reserves
Fund | |
Investment income | | | | | | | | | | | | | | | | |
Interest | | $ | 4,208 | | | $ | 2,792 | | | $ | 1,143 | | | $ | 1,654 | |
| | | | | | | | | | | | | | | | |
Total income | | | 4,208 | | | | 2,792 | | | | 1,143 | | | | 1,654 | |
Expenses | | | | | | | | | | | | | | | | |
Investment advisory fees | | | 246 | | | | 287 | | | | 172 | | | | 1,522 | |
Distribution fees | | | 3 | | | | 27 | | | | 2 | | | | — | |
Shareholder services fees | | | 105 | | | | — | | | | 58 | | | | 2,223 | |
Custodian fees | | | 29 | | | | 27 | | | | 20 | | | | 18 | |
Transfer agent fees | | | 9 | | | | 12 | | | | 7 | | | | 18 | |
Sub-transfer agent fees | | | | | | | | | | | | | | | | |
Class N | | | — | | | | 14 | | | | — | | | | — | |
Class I | | | 1 | | | | 1 | | | | — | | | | — | |
Professional fees | | | 15 | | | | 16 | | | | 15 | | | | 37 | |
Registration fees | | | 29 | | | | 16 | | | | 43 | | | | 13 | |
Shareholder reporting fees | | | 2 | | | | 10 | | | | 2 | | | | 23 | |
Trustee fees | | | 2 | | | | 2 | | | | 1 | | | | 27 | |
Other expenses | | | 6 | | | | 5 | | | | 3 | | | | 37 | |
| | | | | | | | | | | | | | | | |
Total expenses before waiver | | | 447 | | | | 417 | | | | 323 | | | | 3,918 | |
Expenses reimbursed to (waived or absorbed by) the Advisor | | | (53 | ) | | | (5 | ) | | | (34 | ) | | | (2,326 | ) |
| | | | | | | | | | | | | | | | |
Net expenses | | | 394 | | | | 412 | | | | 289 | | | | 1,592 | |
| | | | | | | | | | | | | | | | |
Net investment income (loss) | | | 3,814 | | | | 2,380 | | | | 854 | | | | 62 | |
Realized and unrealized gain (loss) | | | | | | | | | | | | | | | | |
Net realized gain (loss) on transactions of investments | | | 1,015 | | | | 1,045 | | | | (141 | ) | | | — | |
Change in net unrealized appreciation (depreciation) of investments | | | 3,709 | | | | 1,233 | | | | 1,001 | | | | — | |
| | | | | | | | | | | | | | | | |
Net increase (decrease) in net assets resulting from operations | | $ | 8,538 | | | $ | 4,658 | | | $ | 1,714 | | | $ | 62 | |
| | | | | | | | | | | | | | | | |
See accompanying Notes to Financial Statements.
104 Semi-Annual Report | June 30, 2010 |
Statements of Changes in Net Assets
for the Period Ended June 30, 2010 (unaudited) and the Year Ended December 31, 2009 (all amounts in thousands)
| | | | | | | | | | | | | | | | | | | | | | | | | | | | | | | | |
| | | Bond
Fund | | | Income
Fund | | | Low
Duration
Fund | | | Ready
Reserves
Fund | |
| | | 2010 | | | 2009 | | | 2010 | | | 2009 | | | 2010 | | | 2009(a) | | | 2010 | | | 2009 | |
Operations | | | | | | | | | | | | | | | | | | | | | | | | | | | | | | | | |
Net investment income (loss) | | $ | 3,814 | | | $ | 6,076 | | | $ | 2,380 | | | $ | 5,749 | | | $ | 854 | | | $ | 78 | | | $ | 62 | | | $ | 1,639 | |
Net realized gain (loss) on investments, foreign currency transactions and other assets and liabilities | | | 1,015 | | | | 284 | | | | 1,045 | | | | (4,058 | ) | | | (141 | ) | | | — | | | | — | | | | — | |
Change in net unrealized appreciation (depreciation) on investments, and other assets and liabilities | | | 3,709 | | | | 7,229 | | | | 1,233 | | | | 9,909 | | | | 1,001 | | | | (568 | ) | | | — | | | | — | |
| | | | | | | | | | | | | | | | | | | | | | | | | | | | | | | | |
Net increase (decrease) in net assets resulting from operations | | | 8,538 | | | | 13,589 | | | | 4,658 | | | | 11,600 | | | | 1,714 | | | | (490 | ) | | | 62 | | | | 1,639 | |
Distributions to shareholders from | | | | | | | | | | | | | | | | | | | | | | | | | | | | | | | | |
Net investment income | | | (3,662 | ) | | | (6,213 | ) | | | (2,418 | ) | | | (6,533 | ) | | | (1,149 | ) | | | (86 | ) | | | (62 | ) | | | (1,639 | ) |
Net realized gain | | | — | | | | — | | | | — | | | | — | | | | — | | | | — | | | | — | | | | — | |
| | | | | | | | | | | | | | | | | | | | | | | | | | | | | | | | |
| | | (3,662 | ) | | | (6,213 | ) | | | (2,418 | ) | | | (6,533 | ) | | | (1,149 | ) | | | (86 | ) | | | (62 | ) | | | (1,639 | ) |
Capital stock transactions | | | | | | | | | | | | | | | | | | | | | | | | | | | | | | | | |
Net proceeds from sale of shares | | | 60,462 | | | | 77,912 | | | | 8,682 | | | | 16,970 | | | | 93,547 | | | | 97,472 | | | | 357,462 | | | | 638,552 | |
Shares issued in reinvestment of income dividends and capital gain distributions | | | 2,336 | | | | 4,029 | | | | 2,038 | | | | 5,431 | | | | 882 | | | | 37 | | | | 62 | | | | 1,710 | |
Less cost of shares redeemed | | | (26,354 | ) | | | (16,586 | ) | | | (12,955 | ) | | | (50,295 | ) | | | (57,775 | ) | | | (1,799 | ) | | | (436,708 | ) | | | (1,128,550 | ) |
| | | | | | | | | | | | | | | | | | | | | | | | | | | | | | | | |
Net increase (decrease) in net assets resulting from capital share transactions | | | 36,444 | | | | 65,355 | | | | (2,235 | ) | | | (27,894 | ) | | | 36,654 | | | | 95,710 | | | | (79,184 | ) | | | (488,288 | ) |
| | | | | | | | | | | | | | | | | | | | | | | | | | | | | | | | |
Increase (decrease) in net assets | | | 41,320 | | | | 72,731 | | | | 5 | | | | (22,827 | ) | | | 37,219 | | | | 95,134 | | | | (79,184 | ) | | | (488,288 | ) |
Net assets | | | | | | | | | | | | | | | | | | | | | | | | | | | | | | | | |
Beginning of period | | | 147,344 | | | | 74,613 | | | | 117,608 | | | | 140,435 | | | | 95,134 | | | | — | | | | 1,352,901 | | | | 1,841,189 | |
| | | | | | | | | | | | | | | | | | | | | | | | | | | | | | | | |
End of period | | $ | 188,664 | | | $ | 147,344 | | | $ | 117,613 | | | $ | 117,608 | | | $ | 132,353 | | | $ | 95,134 | | | $ | 1,273,717 | | | $ | 1,352,901 | |
| | | | | | | | | | | | | | | | | | | | | | | | | | | | | | | | |
Undistributed net investment income (loss) at the end of the period | | $ | 152 | | | $ | — | | | $ | (38 | ) | | $ | — | | | $ | (295 | ) | | $ | — | | | $ | 84 | | | $ | 84 | |
| | | | | | | | | | | | | | | | | | | | | | | | | | | | | | | | |
| (a) | | For the period from December 1, 2009 (Commencement of Operations) to December 31, 2009. |
See accompanying Notes to Financial Statements.
June 30, 2010 | William Blair Funds 105 |
Notes to Financial Statements
(1) Significant Accounting Policies
The following is a summary of the William Blair Funds’ (the “Fund”) significant accounting policies in effect during the period covered by the financial statements, which are in accordance with U.S. generally accepted accounting principles.
(a) Description of the Fund
William Blair Funds is a diversified mutual fund registered under the Investment Company Act of 1940, as amended, as an open-end management investment company. For each portfolio, the number of shares authorized is unlimited. The Fund currently consists of the following nineteen portfolios (the “Portfolios”), each with its own investment objective and policies.
| | |
Equity Portfolios Growth
Large Cap Growth
Small Cap Growth
Mid Cap Growth
Small-Mid Cap Growth
Small Cap Value (formerly known as
Value Discovery)
Mid Cap Value Global Equity Portfolio Global Growth | | International Equity Portfolios International Growth International Equity Institutional International Growth Institutional International Equity International Small Cap Growth Emerging Markets Growth Emerging Leaders Growth Fixed-Income Portfolios Bond Income Low Duration Money Market Portfolio Ready Reserves |
| |
| |
| |
| |
| |
| |
| |
| |
| |
| |
| |
| |
| |
The investment objectives of the Portfolios are as follows:
| | |
Equity | | Long-term capital appreciation. |
Global Equity | | Long-term capital appreciation. |
International Equity | | Long-term capital appreciation. |
Fixed-Income | | High level of current income with relative stability of principal.
(Maximize total return—Low Duration) |
Money Market | | Current income, a stable share price and daily liquidity. |
The Institutional International Growth Portfolio, the Institutional International Equity Portfolio and the Institutional Class of the International Small Cap Growth Portfolio, the Emerging Markets Growth Portfolio, the Emerging Leaders Growth Portfolio, the Bond Portfolio and the Low Duration Portfolio issue a separate report.
(b) Share Classes
Three different classes of shares currently exist: N, I and Institutional. This report includes financial highlight information for Classes N and I. The table below describes the Class N shares and the Class I shares covered by this report:
| | |
Class | | Description |
| N | | Class N shares are sold to the general public, either directly through the Fund’s distributor or through a select number of financial intermediaries. Class N shares are sold without any sales load, and carry an annual 12b-1 distribution fee (0.25% for the Equity, Global Equity and International Equity Portfolios and 0.15% for the Fixed-Income Portfolios) or a service fee (0.35% for the Money Market Portfolio), transfer agent expense which is not a fixed rate and may vary by Portfolio and class, and an annual shareholder administration fee (0.15% for the Global Growth Portfolio, the International Small Cap Growth Portfolio, the Emerging Markets Growth Portfolio, the Emerging Leaders Growth Portfolio, the Bond Portfolio and the Low Duration Portfolio). |
| I | | Class I shares are sold to a limited group of investors. They do not carry any sales load or distribution fees and generally have lower ongoing expenses than the Class N shares. Class I shares of the Global Growth Portfolio, the International Small Cap Growth Portfolio, the Emerging Markets Growth Portfolio, the Emerging Leaders Growth Portfolio, the Bond Portfolio and the Low Duration Portfolio carry an annual shareholder administration fee of 0.15%. |
106 Semi-Annual Report | June 30, 2010 |
Investment income, realized and unrealized gains and losses, and certain Portfolio level expenses and expense reductions, if any, are allocated based on the relative net assets of each class, except for certain class specific expenses, which are charged directly to the appropriate class. Differences in class expenses may result in the payment of different per share dividends by class. All share classes of the Portfolios have equal rights with respect to voting subject to class specific arrangements.
(c) Investment Valuation
The market value of domestic equity securities is determined by valuing securities traded on national securities markets or in the over-the-counter markets at the last sale price or, if applicable, the official closing price or, in the absence of a recent sale on the date of determination, at the latest bid price.
The value of foreign equity securities is generally determined based upon the last sale price on the foreign exchange or market on which it is primarily traded and in the currency of that market as of the close of the appropriate exchange or, if there have been no sales during that day, at the latest bid price. The Board of Trustees has determined that the passage of time between when the foreign exchanges or markets close and when the Portfolios compute their net asset values could cause the value of foreign equity securities to no longer be representative or accurate and, as a result, may necessitate that such securities be fair valued. Accordingly, for foreign equity securities, the Portfolios may use an independent pricing service to fair value price the security as of the close of regular trading on the New York Stock Exchange. As a result, a Portfolio’s value for a security may be different from the last sale price (or the latest bid price).
Fixed-income securities are valued by using market quotations or independent pricing services that use either prices provided by market-makers or matrixes that produce estimates of market values obtained from yield data relating to instruments or securities with similar characteristics.
Other securities, and all other assets, including securities for which a market price is not available or is deemed unreliable, (e.g., securities affected by unusual or extraordinary events, such as natural disasters or securities affected by market or economic events, such as bankruptcy filings), or the value of which is affected by a significant valuation event, are valued at a fair value as determined in good faith by, or under the direction of, the Board of Trustees and in accordance with the Fund’s Valuation Procedures. The value of fair valued securities may be different from the last sale price (or the latest bid price), and there is no guarantee that a fair valued security will be sold at the price at which a Portfolio is carrying the security.
Investments in other funds are valued at the underlying fund’s net asset value on the date of valuation. Securities held in the Ready Reserves Portfolio are valued at amortized cost, which approximates market value.
As of June 30, 2010, there were securities held in the Small Cap Growth, International Growth, International Small Cap Growth, Emerging Markets Growth, Bond and Income Portfolios requiring fair valuation pursuant to the Fund’s Valuation Procedures.
(d) Investment income and transactions
Dividend income is recorded on the ex-dividend date, except for those dividends from certain foreign securities that are recorded when the information is available.
Interest income is recorded on an accrual basis, adjusted for amortization of premium or discount. Variable rate bonds and floating rate notes earn interest at coupon rates that fluctuate at specific time intervals. The interest rates shown in the Portfolio of Investments for the Bond, Income, Low Duration and Ready Reserves Portfolios were the rates in effect on June 30, 2010. Put bonds may be redeemed at the discretion of the holder on specified dates prior to maturity.
Premiums and discounts are accreted and amortized on a straight-line basis for short-term investments and on an effective interest method for long-term investments.
Paydown gains and losses on mortgage and asset-backed securities are treated as an adjustment to interest income. For the period ended June 30, 2010, the Bond, Income and Low Duration Portfolios recognized a reduction of interest income and a decrease of net realized loss of $(217), $(260) and $(419), respectively (in thousands). This reclassification had no effect on the net asset value of the Portfolios.
The Funds do not isolate that portion of the results of operations resulting from changes in foreign exchange rates on investments from the fluctuations arising from changes in market prices of securities held. Such fluctuations are included with the net realized and unrealized gain or loss from investments.
June 30, 2010 | William Blair Funds 107 |
Reported net realized foreign currency gains or losses arise from disposition of foreign currency, the difference in the foreign exchange rates between the trade and settlement dates on securities transactions, and the difference between the amounts of dividends, interest and foreign withholding taxes recorded on the ex-date or accrual date and the U.S. dollar equivalent of the amounts actually received or paid. Net unrealized foreign exchange gains and losses arise from changes (due to the changes in the exchange rate) in the value of foreign currency and other assets and liabilities denominated in foreign currencies held at period end.
Security and shareholder transactions are accounted for no later than one business day following the trade date. However, for financial reporting purposes, security and shareholder transactions are accounted for on the trade date of the last business day of the reporting period. Realized gains and losses from securities transactions are recognized on a specifically identified cost basis.
Awards from class action litigation may be recorded as a reduction of cost. If the Portfolios no longer own the applicable securities, the proceeds are recorded as realized gains.
(e) Share Valuation and Dividends to Shareholders
Shares are sold and redeemed on a continuous basis at net asset value. The net asset value per share is determined separately for each class by dividing the Portfolio’s net assets attributable to that class by the number of shares of the class outstanding as of the close of regular trading on the New York Stock Exchange, which is generally 4:00 p.m. Eastern time, on each day the Exchange is open. Redemption fees may be applicable to redemptions or exchanges within 60 days of purchase. For both Class N and Class I shares, the William Blair domestic equity portfolios assess a 1% redemption fee on shares sold or exchanged that have been owned 60 days or less and the William Blair international portfolios assess a 2% redemption fee on shares sold or exchanged that have been owned 60 days or less as disclosed within the Fund’s Prospectus. The redemption fees collected by the Portfolio are netted against the amount of redemptions for presentation on the Statement of Changes in Net Assets.
The redemption fees collected by the Portfolios were as follows (in thousands):
| | | | | | |
| | | Period Ended
June 30,
2010 | | Year Ended
December 31,
2009 |
Growth | | $ | 7 | | $ | 3 |
Large Cap Growth | | | 1 | | | — |
Small Cap Growth | | | 48 | | | 59 |
Mid Cap Growth | | | 2 | | | — |
Small-Mid Cap Growth | | | — | | | 1 |
Global Growth | | | — | | | — |
International Growth | | | 82 | | | 130 |
International Equity | | | 6 | | | 7 |
International Small Cap Growth | | | 3 | | | 8 |
Emerging Markets Growth | | | 16 | | | 9 |
Emerging Leaders Growth | | | — | | | — |
Small Cap Value | | | 16 | | | — |
Mid Cap Value | | | — | | | N/A |
Dividends from net investment income, if any, of the Growth, Large Cap Growth, Small Cap Growth, Mid Cap Growth, Small-Mid Cap Growth, Global Growth, International Growth, International Equity, International Small Cap Growth, Emerging Markets Growth, Emerging Leaders Growth, Small Cap Value and Mid Cap Value Portfolios are declared and paid at least annually. Dividends from the Bond and Income Portfolios are declared and paid monthly and dividends from the Ready Reserves Portfolio are declared daily and paid monthly. At June 30, 2010, dividends from the Low Duration Portfolio are declared and paid monthly. Effective September 16, 2010, dividends from the Low Duration Portfolio will be declared daily and paid monthly. Capital gain distributions, if any, are declared and paid at least annually in December. Dividends payable to shareholders are recorded on the ex-dividend date.
(f) Foreign Currency Translation and Forward Foreign Currency Contracts
The Global Growth, International Growth, International Equity, International Small Cap Growth, Emerging Markets Growth and Emerging Leaders Growth Portfolios may invest in securities denominated in foreign currencies. As such, assets and
108 Semi-Annual Report | June 30, 2010 |
liabilities denominated in foreign currencies are translated into U.S. dollar amounts at the current exchange rate on the date of valuation. The values of foreign investments, open forward foreign currency contracts, and cash denominated in foreign currencies are translated into U.S. dollars using a spot market rate of exchange as of the time of the determination of each Portfolio’s Net Asset Value, typically 4:00 p.m. Eastern time on days when there is regular trading on the New York Stock Exchange. Payables and receivables for securities transactions, dividends, interest income and tax reclaims are translated into U.S. dollars using a spot market rate of exchange as of 4:00 p.m. Eastern time. Settlement of purchases and sales and dividend and interest receipts are translated into U.S. dollars using a spot market rate of exchange as of 11:00 a.m. Eastern time.
(g) Income Taxes
Each Portfolio intends to comply with the provisions of Subchapter M of the Internal Revenue Code available to regulated investment companies. Each portfolio intends to make the requisite distributions of income and capital gains to its shareholders sufficient to relieve it from all, or substantially all, federal income and excise taxes. No provision for federal income and excise taxes has been made.
The Global Growth, International Growth, International Equity, International Small Cap Growth, Emerging Markets Growth and Emerging Leaders Growth Portfolios may be subject to a tax imposed on net realized gains on securities of certain foreign countries.
Each Portfolio is subject to the provisions of Accounting Standards Codification (ASC) 740 Income Taxes, formally known as FASB (Financial Accounting Standards Board) Interpretation No. 48, Accounting for Uncertainties in Income Taxes. ASC 740 provides guidance for how uncertain tax positions should be recognized, measured, presented and disclosed in the financial statements. Management has evaluated the implications of ASC 740 and all of the uncertain tax positions of the Portfolios and has determined that no liability is required to be recorded in the financial statements as of December 31, 2009 and December 31, 2008.
The statute of limitations on the Funds’ tax returns for each of the tax years in the four year period ended December 31, 2009, remains open and the returns are subject to examination.
The Global Growth, International Growth, International Equity, International Small Cap Growth, Emerging Markets Growth and Emerging Leaders Growth Portfolios have elected to mark-to-market their investments in Passive Foreign Investment Companies (“PFICs”) for federal income tax purposes. The Portfolios also treat the deferred loss associated with current and prior year wash sales as an adjustment to the cost of investments for tax purposes. The cost of investments for federal income tax purposes and related gross unrealized appreciation/(depreciation) and net unrealized appreciation/(depreciation) at June 30, 2010, were as follows (in thousands):
| | | | | | | | | | | | | |
Portfolio | | Cost of
Investments | | Gross
Unrealized
Appreciation | | Gross
Unrealized
Depreciation | | Net
Unrealized
Appreciation/
(Depreciation) | |
Growth | | $ | 403,082 | | $ | 42,627 | | $ | 24,345 | | $ | 18,282 | |
Large Cap Growth | | | 25,590 | | | 2,569 | | | 1,077 | | | 1,492 | |
Small Cap Growth | | | 765,252 | | | 94,532 | | | 125,034 | | | (30,502 | ) |
Mid Cap Growth | | | 69,064 | | | 8,334 | | | 2,981 | | | 5,353 | |
Small-Mid Cap Growth | | | 135,182 | | | 13,639 | | | 7,068 | | | 6,571 | |
Global Growth | | | 32,119 | | | 3,938 | | | 1,282 | | | 2,656 | |
International Growth | | | 3,919,754 | | | 500,009 | | | 241,140 | | | 258,869 | |
International Equity | | | 260,231 | | | 33,555 | | | 13,161 | | | 20,394 | |
International Small Cap Growth | | | 404,797 | | | 54,293 | | | 17,061 | | | 37,232 | |
Emerging Markets Growth | | | 859,271 | | | 155,003 | | | 19,883 | | | 135,120 | |
Emerging Leaders Growth | | | 65,317 | | | 9,680 | | | 1,460 | | | 8,220 | |
Small Cap Value | | | 90,124 | | | 4,815 | | | 4,794 | | | 21 | |
Mid Cap Value | | | 2,340 | | | 4 | | | 308 | | | (304 | ) |
Bond | | | 178,480 | | | 10,820 | | | 671 | | | 10,149 | |
Income | | | 109,627 | | | 7,808 | | | 1,070 | | | 6,738 | |
Low Duration | | | 139,859 | | | 608 | | | 175 | | | 433 | |
Ready Reserves | | | 1,271,662 | | | — | | | — | | | — | |
June 30, 2010 | William Blair Funds 109 |
The timing and characterization of certain income and capital gain distributions are determined annually in accordance with federal income tax regulations that may differ from U.S. generally accepted accounting principles. As a result, net investment income or loss and net realized gain or loss for a reporting period may differ from the amount distributed during such period. In addition, the Portfolios may periodically record reclassifications among certain capital accounts to reflect differences between financial reporting and income tax basis distributions. The reclassifications were reported in order to reflect the tax treatment for certain permanent differences that exist between income tax regulations and U.S. generally accepted accounting principles. The reclassifications generally relate to net operating losses, Section 988 currency gains and losses, PFICs gains and losses, recharacterization of dividends received from investments in REITs, expired capital loss carryforwards. These reclassifications have no impact on the net asset values of the Portfolios. Accordingly, at December 31, 2009, (the Funds’ most recent fiscal year end) the following reclassifications were recorded (in thousands):
| | | | | | | | | | | | |
Portfolio | | Accumulated Net
Investment
Income (Loss) | | | Accumulated
Net Realized
Gain/(Loss) | | | Capital
Paid in Excess
of Par Value | |
Growth | | $ | — | | | $ | — | | | $ | — | |
Large Cap Growth | | | — | | | | 2,117 | | | | (2,117 | ) |
Small Cap Growth | | | 4,618 | | | | — | | | | (4,618 | ) |
Mid Cap Growth | | | 147 | | | | — | | | | (147 | ) |
Small-Mid Cap Growth | | | 382 | | | | — | | | | (382 | ) |
Global Growth | | | 23 | | | | (23 | ) | | | — | |
International Growth | | | 3,052 | | | | (3,052 | ) | | | — | |
International Equity | | | (508 | ) | | | 508 | | | | — | |
International Small Cap Growth | | | (294 | ) | | | 301 | | | | (7 | ) |
Emerging Markets Growth | | | 741 | | | | (741 | ) | | | — | |
Emerging Leaders Growth | | | 836 | | | | (836 | ) | | | — | |
Small Cap Value | | | (153 | ) | | | 158 | | | | (5 | ) |
Bond | | | 127 | | | | (120 | ) | | | (7 | ) |
Income | | | 524 | | | | (519 | ) | | | (5 | ) |
Low Duration | | | 8 | | | | (1 | ) | | | (7 | ) |
Ready Reserves | | | — | | | | — | | | | — | |
Distributions from net realized gains for book purposes may include short-term capital gains, which are included as ordinary income for tax purposes. The tax character of 2010 distributions will be determined at the end of the fiscal year. The tax character of distributions paid during 2009 and 2008 was as follows (in thousands):
| | | | | | | | | | | | | | | | | | |
| | | Distributions Paid in 2009 | | Distributions Paid in 2008 |
Portfolio | | Ordinary
Income | | Long-Term
Capital
Gains | | Total
Distributions | | Ordinary
Income | | Long-Term
Capital
Gains | | Total
Distributions |
Growth | | $ | 43 | | $ | — | | $ | 43 | | $ | — | | $ | 5,607 | | $ | 5,607 |
Large Cap Growth | | | 16 | | | — | | | 16 | | | — | | | — | | | — |
Small Cap Growth | | | — | | | — | | | — | | | 5,544 | | | 14,989 | | | 20,533 |
Mid Cap Growth | | | — | | | — | | | — | | | — | | | — | | | — |
Small-Mid Cap Growth | | | — | | | — | | | — | | | 3 | | | — | | | 3 |
Global Growth | | | 3 | | | — | | | 3 | | | 391 | | | — | | | 391 |
International Growth | | | 31,541 | | | — | | | 31,541 | | | — | | | 171,159 | | | 171,159 |
International Equity | | | 1,449 | | | — | | | 1,449 | | | 296 | | | 2,938 | | | 3,234 |
International Small Cap Growth | | | 778 | | | — | | | 778 | | | — | | | 4,881 | | | 4,881 |
Emerging Markets Growth | | | 11,127 | | | — | | | 11,127 | | | 10,054 | | | 31,707 | | | 41,761 |
Emerging Leaders Growth | | | 1,588 | | | — | | | 1,588 | | | 87 | | | — | | | 87 |
Small Cap Value | | | 213 | | | — | | | 213 | | | 322 | | | — | | | 322 |
Bond | | | 6,213 | | | — | | | 6,213 | | | 3,517 | | | — | | | 3,517 |
Income | | | 6,533 | | | — | | | 6,533 | | | 8,436 | | | — | | | 8,436 |
Low Duration(a) | | | 86 | | | — | | | 86 | | | — | | | — | | | — |
Ready Reserves | | | 1,639 | | | — | | | 1,639 | | | 33,783 | | | — | | | 33,783 |
| (a) | For the period from December 1, 2009 (commencement of operations) to December 31, 2009. |
110 Semi-Annual Report | June 30, 2010 |
As of December 31, 2009, the components of distributable earnings on a tax basis were as follows (in thousands):
| | | | | | | | | | | | | | |
Portfolio | | Undistributed
Ordinary Income | | Accumulated
Capital and
Other Losses | | | Undistributed
Long-Term
Gain | | Net
Unrealized
Appreciation/
Depreciation | |
Growth | | $ | 13 | | $ | (37,099 | ) | | $ | — | | $ | 65,350 | |
Large Cap Growth | | | 1 | | | (7,905 | ) | | | — | | | 4,218 | |
Small Cap Growth | | | — | | | (153,063 | ) | | | — | | | 63,295 | |
Mid Cap Growth | | | — | | | (11,749 | ) | | | — | | | 12,503 | |
Small-Mid Cap Growth | | | — | | | (20,754 | ) | | | — | | | 23,856 | |
Global Growth | | | 10 | | | (26,300 | ) | | | — | | | 7,068 | |
International Growth | | | 17,572 | | | (2,033,670 | ) | | | — | | | 814,834 | |
International Equity | | | — | | | (143,310 | ) | | | — | | | 57,217 | |
International Small Cap Growth | | | — | | | (168,452 | ) | | | — | | | 67,690 | |
Emerging Markets Growth | | | 2,427 | | | (199,632 | ) | | | — | | | 232,285 | |
Emerging Leaders Growth | | | 130 | | | (29,527 | ) | | | — | | | 30,500 | |
Small Cap Value | | | — | | | (7,592 | ) | | | — | | | 3,972 | |
Bond | | | — | | | (875 | ) | | | — | | | 6,423 | |
Income | | | — | | | (43,467 | ) | | | — | | | 5,402 | |
Low Duration | | | — | | | (1 | ) | | | — | | | (568 | ) |
Ready Reserves | | | 84 | | | (953 | ) | | | — | | | — | |
As of December 31, 2009, the Portfolios have unused capital loss carryforwards available for federal income tax purposes to be applied against future capital gains, if any. If not applied, the carryforwards will expire as follows (in thousands):
| | | | | | | | | | | | | | | | | | | | | | | | | | | |
Portfolio | | 2010 | | 2011 | | 2012 | | 2013 | | 2014 | | 2015 | | 2016 | | 2017 | | Total |
Growth | | $ | — | | $ | — | | $ | — | | $ | — | | $ | — | | $ | — | | $ | 8,153 | | $ | 28,946 | | $ | 37,099 |
Large Cap Growth | | | 1,582 | | | 769 | | | — | | | — | | | — | | | — | | | 1,709 | | | 3,845 | | | 7,905 |
Small Cap Growth | | | — | | | — | | | — | | | — | | | — | | | — | | | 36,185 | | | 116,878 | | | 153,063 |
Mid Cap Growth | | | — | | | — | | | — | | | — | | | — | | | — | | | 4,249 | | | 7,500 | | | 11,749 |
Small-Mid Cap Growth | | | — | | | — | | | — | | | — | | | — | | | — | | | 10,635 | | | 9,806 | | | 20,441 |
Global Growth | | | — | | | — | | | — | | | — | | | — | | | 126 | | | 13,022 | | | 13,125 | | | 26,273 |
International Growth | | | — | | | — | | | — | | | — | | | — | | | — | | | 835,953 | | | 1,198,096 | | | 2,034,049 |
International Equity | | | — | | | — | | | — | | | — | | | — | | | — | | | 61,377 | | | 81,925 | | | 143,302 |
International Small Cap Growth | | | — | | | — | | | — | | | — | | | — | | | — | | | 81,949 | | | 86,330 | | | 168,279 |
Emerging Markets Growth | | | — | | | — | | | — | | | — | | | — | | | — | | | 84,442 | | | 115,253 | | | 199,695 |
Emerging Leaders Growth | | | — | | | — | | | — | | | — | | | — | | | — | | | 21,249 | | | 8,278 | | | 29,527 |
Small Cap Value | | | — | | | — | | | — | | | — | | | — | | | — | | | 2,082 | | | 5,414 | | | 7,496 |
Bond | | | — | | | — | | | — | | | — | | | — | | | 135 | | | 559 | | | 174 | | | 868 |
Income | | | 1,692 | | | 1,582 | | | 4,431 | | | 3,398 | | | 4,138 | | | 9,190 | | | 14,459 | | | 4,577 | | | 43,467 |
Low Duration | | | — | | | — | | | — | | | — | | | — | | | — | | | — | | | 1 | | | 1 |
Ready Reserves | | | 930 | | | — | | | 20 | | | — | | | — | | | 3 | | | — | | | — | | | 953 |
June 30, 2010 | William Blair Funds 111 |
For the period from November 1, 2009 through December 31, 2009, the following Portfolios incurred net realized capital losses, foreign currency losses or PFIC losses. Each Portfolio intends to treat this loss as having occurred in fiscal year 2010 for federal income tax purposes (in thousands):
| | | | | | | | | |
Portfolio | | Capital
Amount | | Currency
Amount | | PFIC
Amount |
Growth | | $ | — | | $ | — | | $ | — |
Large Cap Growth | | | — | | | — | | | — |
Small Cap Growth | | | — | | | — | | | — |
Mid Cap Growth | | | — | | | — | | | — |
Small-Mid Cap Growth | | | 313 | | | — | | | — |
Global Growth | | | 27 | | | — | | | — |
International Growth | | | — | | | — | | | — |
International Equity | | | — | | | 72 | | | — |
International Small Cap Growth | | | — | | | 211 | | | — |
Emerging Markets Growth | | | — | | | — | | | — |
Emerging Leaders Growth | | | — | | | — | | | — |
Small Cap Value | | | 96 | | | — | | | — |
Bond | | | 7 | | | — | | | — |
Income | | | — | | | — | | | — |
Low Duration | | | — | | | — | | | — |
Ready Reserves | | | — | | | — | | | — |
(h) Repurchase Agreements
In a repurchase agreement, a Portfolio buys a security at one price and at the time of sale, the seller agrees to repurchase the obligation at a mutually agreed upon time and price (usually within seven days). The repurchase agreement thereby determines the yield during the purchaser’s holding period, while the seller’s obligation to repurchase is secured by the value of the underlying security. The Advisor will monitor, on an ongoing basis, the value of the underlying securities to ensure that the value always equals or exceeds the repurchase price plus accrued interest. Repurchase agreements could involve certain risks in the event of a default or insolvency of the other party to the agreement, including possible delays or restrictions upon a Portfolio’s ability to dispose of the underlying securities. The risk to a Portfolio is limited to the ability of the seller to pay the agreed upon sum on the delivery date. In the event of default, a repurchase agreement provides that a Portfolio is entitled to sell the underlying collateral. The loss, if any, to a Portfolio will be the difference between the proceeds from the sale and the repurchase price. However, if bankruptcy proceedings are commenced with respect to the seller of the security, disposition of the collateral by the Portfolio may be delayed or limited. Although no definitive creditworthiness criteria are used, the Advisor reviews the creditworthiness of the banks and non-bank dealers with which a Portfolio enters into repurchase agreements to evaluate those risks. The Advisor will review and monitor the creditworthiness of broker dealers and banks with which a Portfolio enters into repurchase agreements. A Portfolio may, under certain circumstances, deem repurchase agreements collateralized by U.S. Government securities to be investments in U.S. Government securities.
(i) Use of Estimates
The preparation of financial statements in conformity with U.S. generally accepted accounting principles requires management to make estimates and assumptions that affect the amounts reported in the financial statements. Actual results may differ from those estimates.
(j) Fair Value Measurements
The Portfolios are subject to ASC 820 Fair Value measurement and Disclosures. In accordance with ASC 820, “Fair value” is defined as the price that a Portfolio would receive upon selling a security in an orderly transaction to an independent buyer in the principal or most advantageous market for the investment. Various inputs are used in determining the value of a Portfolio’s investments. ASC 820 established a three-tier hierarchy of inputs to classify fair value measurements for disclosure purposes. The three-tier hierarchy of inputs is summarized in the three broad levels listed below.
| | • | | Level 1—Quoted prices in active markets for an identical security. |
| | • | | Level 2—Prices determined using other significant observable inputs. Observable inputs are inputs that other market participants would use in pricing a security. These may include quoted prices for similar securities, interest rates, |
112 Semi-Annual Report | June 30, 2010 |
| | prepayment speeds, credit risk, and others. In addition, other observable inputs such as foreign exchange rates, benchmark securities indices and foreign futures contracts may be utilized in the valuation of certain foreign securities when significant events occur between the last sale on the foreign securities exchange and the time the net asset value of the Fund is calculated. |
| | • | | Level 3—Prices determined using significant unobservable inputs. In situations where quoted prices or observable inputs are unavailable (for example, when there is little or no market activity for an investment), unobservable inputs may be used. Unobservable inputs reflect the Fund’s own assumptions about the factors market participants would use in pricing an investment, and would be based on the best information available. |
The inputs or methodology used for valuing an investment are not necessarily an indication of the risk associated with investing in those securities. For example, money market securities are valued using amortized cost, in accordance with rules under the 1940 Act. Generally, amortized cost approximates the current fair value of a security, but since the value is not obtained from a quoted price in an active market, such securities are reflected as Level 2.
The Fund adopted FASB Accounting Standards Update 2010-06 “Fair Value Measurements and Disclosures (ASU 820)” which requires the Fund to disclose details of significant transfers in and out of Level 1 and Level 2 measurements and the reasons for the transfers. Any transfers between Level 1 and Level 2 are disclosed, effective beginning of the period, in the tables below with the reasons for the transfers disclosed in a footnote.
At June 30, 2010, the Portfolios held no other financial instruments, such as, options or futures, that required fair valuation.
As of June 30, 2010, the hierarchical input levels of securities in each Portfolio, segregated by security class, are as follows (in thousands):
| | | | | | | | | | | | | | | | | | |
| | | Growth | | Large Cap
Growth | | Small Cap
Growth | | Mid Cap
Growth | | Small-
Mid Cap
Growth | | Global
Growth |
Investments in securities | | | | | | | | | | | | | | | | | | |
Level 1—Quoted prices | | | | | | | | | | | | | | | | | | |
Common stock | | $ | 410,255 | | $ | 26,279 | | $ | 708,325 | | $ | 71,308 | | $ | 139,621 | | $ | 16,879 |
Preferred stock | | | — | | | — | | | — | | | — | | | — | | | 769 |
Exchange traded fund | | | — | | | — | | | 8,422 | | | — | | | — | | | — |
Short-term investments | | | 1,262 | | | — | | | 3,297 | | | 19 | | | 23 | | | 29 |
Level 2—Other significant observable inputs | | | | | | | | | | | | | | | | | | |
Common stock | | | — | | | — | | | — | | | — | | | — | | | 16,289 |
Preferred stock | | | — | | | — | | | 6,484 | | | — | | | — | | | — |
Short-term investments | | | 9,847 | | | 803 | | | 5,205 | | | 3,090 | | | 2,109 | | | 809 |
Level 3—Significant unobservable inputs | | | | | | | | | | | | | | | | | | |
Common stock | | | — | | | — | | | 3,017 | | | — | | | — | | | — |
| | | | | | | | | | | | | | | | | | |
Total investments in securities | | $ | 421,364 | | $ | 27,082 | | $ | 734,750 | | $ | 74,417 | | $ | 141,753 | | $ | 34,775 |
| | | | | | | | | | | | | | | | | | |
June 30, 2010 | William Blair Funds 113 |
| | | | | | | | | | | | | | | | | | | | | | | |
| | | International
Growth | | | International
Equity | | International
Small Cap
Growth | | | Emerging
Markets
Growth | | Emerging
Leaders
Growth | | Small Cap
Value | | Mid Cap
Value |
Investments in securities | | | | | | | | | | | | | | | | | | | | | | | |
Level 1—Quoted prices | | | | | | | | | | | | | | | | | | | | | | | |
Common stock | | $ | 646,022 | | | $ | 51,596 | | $ | 48,829 | | | $ | 301,497 | | $ | 20,219 | | $ | 88,516 | | $ | 1,971 |
Warrants | | | — | | | | — | | | — | | | | 43 | | | — | | | — | | | — |
Preferred stock | | | — | | | | 2,713 | | | — | | | | 47,239 | | | 1,820 | | | — | | | — |
Exchange traded funds | | | 31,411 | | | | — | | | — | | | | — | | | — | | | — | | | — |
Short-term investments | | | 6,376 | | | | 5 | | | 489 | | | | 66 | | | 440 | | | 4 | | | — |
Level 2—Other significant observable inputs | | | | | | | | | | | | | | | | | | | | | | | |
Common stock | | | 3,402,687 | | | | 216,295 | | | 384,550 | | | | 598,477 | | | 48,347 | | | — | | | — |
Convertible bonds | | | 1,633 | | | | — | | | 545 | | | | 910 | | | — | | | — | | | — |
Short-term investments | | | 90,717 | | | | 10,007 | | | 7,630 | | | | 46,125 | | | 2,709 | | | 1,625 | | | 65 |
Level 3—Significant unobservable inputs | | | | | | | | | | | | | | | | | | | | | | | |
None | | | — | | | | — | | | — | | | | — | | | — | | | — | | | — |
| | | | | | | | | | | | | | | | | | | | | | | |
Total investments in securities | | $ | 4,178,846 | | | $ | 280,616 | | $ | 442,043 | | | $ | 994,357 | | $ | 73,535 | | $ | 90,145 | | $ | 2,036 |
| | | | | | | | | | | | | | | | | | | | | | | |
Level 1 and Level 2 transfers | | | | | | | | | | | | | | | | | | | | | | | |
Transfer from Level 1 to Level 2(a) | | | 12,714 | | | | 1,649 | | | — | | | | — | | | 3,063 | | | — | | | — |
Transfer from Level 2 to Level 1(b) | | | — | | | | — | | | — | | | | — | | | — | | | — | | | — |
Other financial instruments | | | | | | | | | | | | | | | | | | | | | | | |
Level 2—Other significant observable inputs | | | | | | | | | | | | | | | | | | | | | | | |
Forward foreign currency contracts | | $ | (313 | ) | | | | | $ | (26 | ) | | | | | | | | | | | | |
| | | | | | | | | | | | | | | | | | | | | | | |
| | | | | | | |
| | | Bond | | | Income | | Low Duration
Bond | | | Ready
Reserves* | | | | | | |
Investments in securities | | | | | | | | | | | | | | | | | | | | | | | |
Level 1—Quoted prices | | | | | | | | | | | | | | | | | | | | | | | |
None | | $ | — | | | $ | — | | $ | — | | | $ | — | | | | | | | | | |
Level 2—Other significant observable inputs | | | | | | | | | | | | | | | | | | | | | | | |
U.S. government and agency bonds | | | 88,268 | | | | 40,405 | | | 59,323 | | | | 130,240 | | | | | | | | | |
Corporate bonds | | | 86,776 | | | | 68,541 | | | 15,413 | | | | 115,637 | | | | | | | | | |
Asset backed bonds | | | 10,588 | | | | 6,401 | | | 55,118 | | | | — | | | | | | | | | |
Commercial paper | | | — | | | | — | | | — | | | | 833,132 | | | | | | | | | |
Short-term investments | | | 2,878 | | | | 373 | | | 10,438 | | | | 192,653 | | | | | | | | | |
Level 3—Significant unobservable inputs | | | | | | | | | | | | | | | | | | | | | | | |
Asset backed bonds | | | 119 | | | | 645 | | | — | | | | — | | | | | | | | | |
| | | | | | | | | | | | | | | | | | | | | | | |
Total investments in securities | | $ | 188,629 | | | $ | 116,365 | | $ | 140,292 | | | $ | 1,271,662 | | | | | | | | | |
| | | | | | | | | | | | | | | | | | | | | | | |
| * | All of the investments held by the Ready Reserves Fund are short-term investments. |
| (a) | Fair valuation estimates were obtained from the Portfolios’ pricing vendor and applied to certain foreign securities at June 30, 2010 but not on December 31, 2009 resulting in a transfer from Level 1 to Level 2. |
| (b) | Fair valuation estimates were obtained from the Portfolios’ pricing vendor and applied to certain foreign securities at December 31, 2009 but not on June 30, 2010 resulting in a transfer from Level 2 to Level 1. |
Level 1 Common Stocks are exchange traded securities with a quoted price. Typically, Level 2 Common Stocks are non-U.S. exchange traded securities with a quoted price that are fair valued by an independent pricing service approved by the Board of Trustees.
114 Semi-Annual Report | June 30, 2010 |
The following is a reconciliation of Level 3 securities for which significant unobservable inputs were used to determine fair value:
| | | | | | | | | | | | | | | | | | |
| | | Balance
January 1, 2010 | | Net
Purchases/
(Sales) | | Transfers
to/(from)
Level 3 | | Change in
Unrealized
Gain (Loss) | | Realized
Gain (Loss) | | Balance
June 30, 2010 |
Small Cap Growth | | $ | 3,017 | | $ | — | | $ | — | | $ | — | | $ | — | | $ | 3,017 |
Bond | | | — | | | — | | | 119 | | | — | | | — | | | 119 |
Income | | | — | | | — | | | 645 | | | — | | | — | | | 645 |
The fair value estimates for the Level 3 securities in the Small Cap Growth, Bond and Income Portfolios were determined in good faith by the Pricing Committee in consultation with the Valuation Committee, pursuant to the Valuation Procedures adopted by the Board of Trustees. There were various factors considered in reaching this fair value determination, including, but not limited, to the following: the type of security, the extent of public trading of the security, information obtained from a broker-dealer for the security, analysis of the company’s performance, market trends that influence its performance and the potential for adverse outcome in pending litigation. At June 30, 2010, these securities represented 0.40%, 0.06%, 0.55% of the net assets of the Small Cap Growth, Bond and Income Portfolios respectively.
The First Plus bonds held in the Bond and Income Portfolios transferred from level 2 to level 3 during the period due to the lack of significant other observable inputs.
(k) Subsequent Events
On July 27, 2010, the Board of Trustees approved the following changes to the William Blair Funds:
Effective August 16, 2010, the Value Discovery Portfolio changed its name to the Small Cap Value Portfolio. Under normal market conditions, the William Blair Small Cap Value Fund invests at least 80% of its net assets (plus the amount of any borrowings for investment purposes) in equity securities of small capitalized (“small cap”) companies.
Effective September 16, 2010, the Low Duration Portfolio will begin declaring dividends on a daily basis to be paid out monthly.
(2) Transactions with Affiliates
(a) Management and Expense Limitation Agreements
Each Portfolio has a management agreement with William Blair & Company L.L.C. (the “Company”) for investment advisory, clerical, bookkeeping and administrative services. Each Portfolio pays the Company an annual fee, payable monthly, based on a specified percentage of its average daily net assets. A summary of the annual rates expressed as a percentage of average daily net assets is as follows:
| | | | | | | | |
Equity Portfolios | | | | | International Portfolios | | | |
Growth | | 0.75 | % | | International Growth Fund: | | | |
Large Cap Growth Small Cap Growth | | 0.80
1.10 | %
% | | First $250 million | | 1.10 | % |
| | | Next $4.75 billion | | 1.00 | % |
Mid Cap Growth | | 0.95 | % | | Next $5 billion | | 0.95 | % |
Small-Mid Cap Growth | | 1.00 | % | | Next $5 billion | | 0.925 | % |
Small Cap Value | | 1.10 | % | | In excess of $15 billion | | 0.90 | % |
Mid Cap Value | | 0.95 | % | | International Equity | | | |
| | | |
Global Portfolio | | | | | First $250 million | | 1.10 | % |
Global Growth | | 1.00 | % | | In excess of $250 million | | 1.00 | % |
| | | | | International Small Cap Growth | | 1.00 | % |
| | | | | Emerging Markets Growth | | 1.10 | % |
| | | | | Emerging Leaders Growth | | 1.10 | % |
June 30, 2010 | William Blair Funds 115 |
| | | | | | | | |
Fixed-Income Portfolios | | | | | Money Market Portfolio | | | |
Bond Low Duration | | 0.30 | % | | Ready Reserves | | | |
| | 0.30 | % | | First $250 million | | 0.275 | % |
Income* | | | | | Next $250 million | | 0.250 | % |
First $250 million | | 0.25 | % | | Next $2 billion | | 0.225 | % |
In excess of $250 million | | 0.20 | % | | In excess of $2.5 billion | | 0.200 | % |
| | | | | | | | |
*Management fee also includes a charge of 5% of gross income. | | | | | | | | |
Some of the Portfolios have also entered into an Expense Limitation Agreement with the Company. Under the terms of the Agreement, the Company will waive its management fee and/or reimburse the Portfolio for expenses in excess of the agreed upon rate. The amount the Company owes a Portfolio as of the reporting date is recorded as the Receivable from Advisor on the Statement of Assets and Liabilities. The Company reimburses the Portfolios on a monthly basis. Under the terms of the Agreement, the Company has agreed to waive its advisory fees and/or absorb other operating expenses through April 30, 2011, if total expenses for each class of the following Portfolios exceed the following rates (as a percentage of average daily net assets):
| | | | | | | | | | | | |
| | | Class N | | | | | | Class I | | | | |
Portfolio | | Effective
May 1, 2010
through
April 30, 2011 | | | Effective
May 1, 2009
through
April 30, 2010 | | | Effective
May 1, 2010
through
April 30, 2011 | | | Effective
May 1, 2009
through
April 30, 2010 | |
Large Cap Growth | | 1.20 | % | | 1.23 | % | | 0.95 | % | | 0.98 | % |
Small Cap Growth | | 1.50 | % | | 1.50 | % | | 1.25 | % | | 1.25 | % |
Mid Cap Growth | | 1.35 | % | | 1.36 | % | | 1.10 | % | | 1.11 | % |
Small-Mid Cap Growth | | 1.35 | % | | 1.36 | % | | 1.10 | % | | 1.11 | % |
Global Growth | | 1.50 | % | | 1.55 | % | | 1.25 | % | | 1.30 | % |
International Growth | | 1.45 | % | | 1.45 | % | | 1.20 | % | | 1.20 | % |
International Equity | | 1.45 | % | | 1.45 | % | | 1.20 | % | | 1.20 | % |
International Small Cap Growth | | 1.65 | % | | 1.65 | % | | 1.40 | % | | 1.40 | % |
Emerging Markets Growth | | 1.70 | % | | 1.70 | % | | 1.45 | % | | 1.45 | % |
Emerging Leaders Growth | | 1.65 | % | | N/A | | | 1.40 | % | | 1.40 | % |
Small Cap Value | | 1.35 | % | | 1.29 | % | | 1.10 | % | | 1.09 | % |
Mid Cap Value | | 1.35 | % | | N/A | | | 1.10 | % | | N/A | |
Bond | | 0.65 | % | | 0.65 | % | | 0.50 | % | | 0.50 | % |
Income | | 0.85 | % | | 0.85 | % | | 0.70 | % | | 0.70 | % |
Low Duration | | 0.70 | % | | 0.70 | %(a) | | 0.55 | % | | 0.55 | %(a) |
(a) Effective December 1, 2009 through April 30, 2011
For a period of three years subsequent to the commencement of operations of the Global Growth, Emerging Leaders Growth, Mid Cap Value and Low Duration Portfolios, the Company is entitled to reimbursement for previously waived fees and reimbursed expenses to the extent the overall expense ratio remains below the expense limitation in place at the time the fee was waived and/or the expense was reimbursed. The total amount available for recapture at June 30, 2010 was $471 (in thousands) for the Global Growth Portfolio, $209 for the Emerging Leaders Growth Portfolio, $23 for the Mid Cap Value Portfolio and $48 for the Low Duration Portfolio.
The Advisor has agreed to voluntarily waive fees and reimburse expenses incurred for the Ready Reserves Portfolio in order to maintain a minimum yield given the current rate environment.
For the period ended June 30, 2010, the fees incurred by the Portfolios and related fee waivers were as follows (in thousands):
| | | | | | | | | | | | |
Portfolio | | Fund
Level
Waiver | | Class I
Specific
Waiver | | Class N
Specific
Waiver | | Total
Waiver |
Growth | | $ | — | | $ | — | | $ | — | | $ | — |
Large Cap Growth | | | 34 | | | — | | | 3 | | | 37 |
Small Cap Growth | | | 1 | | | — | | | 3 | | | 4 |
Mid Cap Growth | | | 7 | | | 10 | | | 5 | | | 22 |
116 Semi-Annual Report | June 30, 2010 |
| | | | | | | | | | | | |
Portfolio | | Fund
Level
Waiver | | Class N
Specific
Waiver | | Class I
Specific
Waiver | | Total
Waiver |
Small-Mid Cap Growth | | $ | 5 | | $ | 6 | | $ | 7 | | $ | 18 |
Global Growth | | | 69 | | | 2 | | | 1 | | | 72 |
International Growth | | | — | | | — | | | — | | | — |
International Equity | | | — | | | 4 | | | 96 | | | 100 |
International Small Cap Growth | | | — | | | — | | | — | | | — |
Emerging Markets Growth | | | — | | | — | | | — | | | — |
Emerging Leaders Growth | | | 28 | | | — | | | 1 | | | 29 |
Small Cap Value | | | 76 | | | 10 | | | 5 | | | 91 |
Mid Cap Value | | | 23 | | | — | | | — | | | 23 |
Bond | | | 52 | | | — | | | 1 | | | 53 |
Income | | | — | | | 5 | | | — | | | 5 |
Low Duration | | | 34 | | | — | | | — | | | 34 |
Ready Reserves | | | 2,326 | | | — | | | — | | | 2,326 |
(b) Underwriting, Distribution Services and Service Agreement
Each Portfolio, except the Ready Reserves Portfolio, has a Distribution Agreement with the Company for distribution services to the Portfolios’ Class N shares. Each Portfolio pays the Company an annual fee, payable monthly, based on a specified percentage of its average daily net assets of Class N shares. The annual rate expressed as a percentage of average daily net assets for Class N is 0.25% for all Portfolios except the Income, Bond and Low Duration Portfolios, which is 0.15%. Pursuant to the Distribution Agreement, the Company enters into related selling group agreements with various firms at various rates for sales of the Portfolios’ Class N shares.
The Ready Reserves Portfolio has a Service Agreement with the Company to provide shareholder services and automatic sweep services. The Portfolio pays the Company an annual fee, payable monthly, based upon 0.35% of the average daily net assets of Class N shares. The Board of Trustees has determined that the amount payable for “service fees” (as defined by FINRA (Financial Industry Regulatory Authority)) does not exceed 0.25% of the average annual net assets attributable to Class N shares.
The Global Growth, International Small Cap Growth, Emerging Markets Growth, Emerging Leaders Growth, Bond and Low Duration Portfolios have a Shareholder Administration Agreement with the Company to provide shareholder administration services. Class N and Class I shares of the Portfolios pay the Company an annual fee, payable monthly, based upon 0.15% of average daily net assets attributable to each class, respectively. For the period ended June 30, 2010, the following fees were incurred (in thousands):
| | | | | | | | | |
Portfolio | | Class N | | Class I | | Total |
Global Growth | | $ | 3 | | $ | 25 | | $ | 28 |
International Small Cap Growth | | | 12 | | | 172 | | | 184 |
Emerging Markets Growth | | | 19 | | | 129 | | | 148 |
Emerging Leaders Growth | | | — | | | 7 | | | 7 |
Bond | | | 3 | | | 102 | | | 105 |
Low Duration | | | 2 | | | 56 | | | 58 |
(c) Investments in Affiliated Portfolio
Pursuant to the rules of the 1940 Act, each of the Portfolios of the Fund may invest in the William Blair Ready Reserves Portfolio (“Ready Reserves”), an open-end money market portfolio managed by the Company. Ready Reserves Portfolio is used as a cash management option by the other Portfolios in the Fund. The Company waives management fees in an amount equal to the management fee and service fee that Ready Reserves receives based on the Portfolio’s net assets, less any waivers, if applicable. The fees waived with respect to each Portfolio for the period ended June 30, 2010 are listed below. Distributions received from Ready Reserves are reflected as “Dividend income from Affiliated Fund” in each Portfolio’s Statement of Operations. Amounts relating to the Portfolios’ investments in Ready Reserves were as follows for the period ended June 30, 2010 (in thousands):
| | | | | | | | | | | | | | | | | | | | | |
Portfolio | | 12/31/2009
Value | | Purchases | | Sales | | Fees
Waived | | Dividend
Income | | 6/30/2010
Value | | Percent of
Net Assets | |
Growth | | $ | 1,262 | | $ | — | | $ | — | | $ | 1 | | $ | — | | $ | 1,262 | | 0.3 | % |
Small Cap Growth | | | 3,297 | | | — | | | — | | | 4 | | | — | | | 3,297 | | 0.4 | % |
June 30, 2010 | William Blair Funds 117 |
| | | | | | | | | | | | | | | | | | | | | |
Portfolio | | 12/31/2009
Value | | Purchases | | Sales | | Fees
Waived | | Dividend
Income | | 6/30/2010
Value | | Percent of
Net Assets | |
Mid Cap Growth | | $ | 19 | | $ | — | | $ | — | | $ | — | | $ | — | | $ | 19 | | 0.0 | % |
Small-Mid Cap Growth | | | 23 | | | — | | | — | | | — | | | — | | | 23 | | 0.0 | % |
Global Growth | | | 29 | | | — | | | — | | | — | | | — | | | 29 | | 0.1 | % |
International Growth | | | 6,376 | | | — | | | — | | | 7 | | | — | | | 6,376 | | 0.2 | % |
International Equity | | | 5 | | | — | | | — | | | — | | | — | | | 5 | | 0.0 | % |
International Small Cap Growth | | | 489 | | | — | | | — | | | 1 | | | — | | | 489 | | 0.1 | % |
Emerging Markets Growth | | | 66 | | | — | | | — | | | — | | | — | | | 66 | | 0.0 | % |
Emerging Leaders Growth | | | 440 | | | — | | | — | | | — | | | — | | | 440 | | 0.6 | % |
Small Cap Value | | | 4 | | | — | | | — | | | — | | | — | | | 4 | | 0.0 | % |
(3) Investment Transactions
Investment transactions, excluding money market instruments, for the period ended June 30, 2010, were as follows (in thousands):
| | | | | | | |
Portfolio | | Purchases | | Sales | |
Growth | | $ | 153,388 | | $ | (121,290 | ) |
Large Cap Growth | | | 5,273 | | | (6,552 | ) |
Small Cap Growth | | | 455,499 | | | (441,417 | ) |
Mid Cap Growth | | | 37,543 | | | (33,094 | ) |
Small-Mid Cap Growth | | | 81,328 | | | (81,152 | ) |
Global Growth | | | 21,137 | | | (23,049 | ) |
International Growth | | | 1,934,238 | | | (1,920,845 | ) |
International Equity | | | 102,505 | | | (92,922 | ) |
International Small Cap Growth | | | 232,156 | | | (164,521 | ) |
Emerging Markets Growth | | | 571,734 | | | (585,505 | ) |
Emerging Leaders Growth | | | 82,429 | | | (123,187 | ) |
Small Cap Value | | | 66,335 | | | (32,005 | ) |
Mid Cap Value | | | 2,401 | | | (138 | ) |
Bond | | | 71,630 | | | (35,163 | ) |
Income | | | 18,618 | | | (21,332 | ) |
Low Duration | | | 106,303 | | | (50,354 | ) |
(4) Forward Foreign Currency Contracts
The Global Growth, International Growth, International Equity, International Small Cap Growth, Emerging Markets Growth and Emerging Leaders Growth Portfolios from time to time may enter into forward foreign currency contracts with the Fund’s custodian and other counterparties in an attempt to hedge against a decline in the value of foreign currency against the U.S. dollar. The Portfolios bear the market risk that arises from changes in foreign currency rates and bear the credit risk if the counterparty fails to perform under the contract.
For the period ended June 30, 2010, the International Growth, and International Small Cap Portfolios engaged in forward foreign currency contracts with total notional volume (in thousands) of $2,153,072 and $89,804, respectively.
The following table presents the value of open forward foreign currency contracts as of June 30, 2010 and their respective location on the Statement of Assets and Liabilities (values in thousands):
| | | | | | | | | | |
| | | Assets | | Liabilities |
Fund | | Statement of Assets and
Liabilities Location | | Value | | Statement of Assets and
Liabilities Location | | Value |
International Growth | | Unrealized appreciation on foreign forward currency contracts | | $ | — | | Unrealized depreciation on foreign forward currency contracts | | $ | 313 |
| | | | |
International Small Cap Growth | | Unrealized appreciation on foreign forward currency contracts | | | — | | Unrealized depreciation on foreign forward currency contracts | | | 26 |
118 Semi-Annual Report | June 30, 2010 |
The effect of forward contracts on the Statements of Operations for the period ended June 30, 2010 (values in thousands):
| | | |
Realized gain (loss) recognized in foreign currency transactions | | |
Fund | | Value |
International Growth | | $ | 52,676 |
International Small Cap Growth | | | 723 |
| | | | |
Change in unrealized gain (loss) recognized in foreign currency translations | | | |
Fund | | Value | |
International Growth | | $ | (15,357 | ) |
International Small Cap Growth | | | (26 | ) |
The following table presents open forward foreign currency contracts as of June 30, 2010 (values in thousands):
| | | | | | | | | | |
Short Contracts | | Settlement Date | | Local Currency | | Current Value | | Unrealized
Gain/(loss) | |
|
International Growth Fund | |
Japanese Yen | | 9/15/2010 | | 14,774,649 | | 166,687 | | $ | (313 | ) |
|
International Small Cap Growth | |
Japanese Yen | | 9/15/2010 | | 1,610,250 | | 18,182 | | $ | (26 | ) |
(5) Fund Share Transactions
The following table summarizes the activity in capital shares of each Portfolio (in thousands):
| | | | | | | | | | | | | | | | | | |
| | | Sales (Dollars) |
| | | Period Ended June 30, 2010 | | Year Ended December 31, 2009 |
Portfolio | | Class N | | Class I | | Total | | Class N | | Class I | | Total |
Growth | | $ | 46,304 | | $ | 30,185 | | $ | 76,489 | | $ | 67,911 | | $ | 63,683 | | $ | 131,594 |
Large Cap Growth | | | 661 | | | 913 | | | 1,574 | | | 923 | | | 5,311 | | | 6,234 |
Small Cap Growth | | | 82,099 | | | 46,644 | | | 128,743 | | | 225,583 | | | 92,269 | | | 317,852 |
Mid Cap Growth | | | 1,701 | | | 12,065 | | | 13,766 | | | 4,936 | | | 16,887 | | | 21,823 |
Small Mid-Cap Growth | | | 1,635 | | | 12,725 | | | 14,360 | | | 13,361 | | | 39,281 | | | 52,642 |
Global Growth | | | 426 | | | 2,663 | | | 3,089 | | | 465 | | | 3,968 | | | 4,433 |
International Growth | | | 460,610 | | | 261,477 | | | 722,087 | | | 645,844 | | | 715,238 | | | 1,361,082 |
International Equity | | | 580 | | | 43,914 | | | 44,494 | | | 4,147 | | | 83,020 | | | 87,167 |
International Small Cap Growth | | | 5,381 | | | 67,908 | | | 73,289 | | | 5,724 | | | 102,689 | | | 108,413 |
Emerging Markets Growth | | | 1,055 | | | 20,827 | | | 21,882 | | | 5,532 | | | 68,836 | | | 74,368 |
Emerging Leaders Growth | | | — | | | 3,501 | | | 3,501 | | | — | | | 3,863 | | | 3,863 |
Small Cap Value | | | 1,673 | | | 38,416 | | | 40,089 | | | 1,351 | | | 13,550 | | | 14,901 |
Mid Cap Value (a) | | | 4 | | | 2,316 | | | 2,320 | | | — | | | — | | | — |
Bond | | | 836 | | | 42,190 | | | 43,026 | | | 3,270 | | | 69,443 | | | 72,713 |
Income | | | 5,072 | | | 3,610 | | | 8,682 | | | 5,949 | | | 11,021 | | | 16,970 |
Low Duration (b) | | | 3,311 | | | 46,567 | | | 49,878 | | | 1,872 | | | 82,099 | | | 83,971 |
Ready Reserves | | | 357,462 | | | — | | | 357,462 | | | 638,552 | | | — | | | 638,552 |
| (a) | | For the period from May 3, 2010 (Commencement of Operations) to June 30, 2010. |
| (b) | | For the period from December 1, 2009 (Commencement of Operations) to December 31, 2009. |
June 30, 2010 | William Blair Funds 119 |
| | | | | | | | | | | | | | | | | | |
| |
| | | Reinvested Distributions (Dollars) |
| | | Period Ended June 30, 2010 | | Year Ended December 31, 2009 |
Portfolio | | Class N | | Class I | | Total | | Class N | | Class I | | Total |
Growth | | $ | — | | $ | — | | $ | — | | $ | — | | $ | 34 | | $ | 34 |
Large Cap Growth | | | — | | | — | | | — | | | — | | | 14 | | | 14 |
Small Cap Growth | | | — | | | — | | | — | | | — | | | — | | | — |
Mid Cap Growth | | | — | | | — | | | — | | | — | | | — | | | — |
Small Mid-Cap Growth | | | — | | | — | | | — | | | — | | | — | | | — |
Global Growth | | | — | | | — | | | — | | | — | | | 3 | | | 3 |
International Growth | | | — | | | — | | | — | | | 15,272 | | | 13,374 | | | 28,646 |
International Equity | | | — | | | — | | | — | | | 13 | | | 1,374 | | | 1,387 |
International Small Cap Growth | | | — | | | — | | | — | | | — | | �� | 249 | | | 249 |
Emerging Markets Growth | | | — | | | — | | | — | | | 192 | | | 1,432 | | | 1,624 |
Emerging Leaders Growth | | | — | | | — | | | — | | | — | | | 100 | | | 100 |
Small Cap Value | | | — | | | — | | | — | | | 19 | | | 151 | | | 170 |
Mid Cap Value (a) | | | — | | | — | | | — | | | — | | | — | | | — |
Bond | | | 48 | | | 1,856 | | | 1,904 | | | 86 | | | 3,171 | | | 3,257 |
Income | | | 688 | | | 1,350 | | | 2,038 | | | 2,004 | | | 3,427 | | | 5,431 |
Low Duration (b) | | | 14 | | | 476 | | | 490 | | | 1 | | | 36 | | | 37 |
Ready Reserves | | | 62 | | | — | | | 62 | | | 1,710 | | | — | | | 1,710 |
| |
| | | Redemptions (Dollars) |
| | | Period Ended June 30, 2010 | | Year Ended December 31, 2009 |
Portfolio | | Class N | | Class I | | Total | | Class N | | Class I | | Total |
Growth | | $ | 21,331 | | $ | 14,196 | | $ | 35,527 | | $ | 33,393 | | $ | 17,297 | | $ | 50,690 |
Large Cap Growth | | | 394 | | | 1,935 | | | 2,329 | | | 1,360 | | | 5,054 | | | 6,414 |
Small Cap Growth | | | 76,566 | | | 43,940 | | | 120,506 | | | 152,457 | | | 88,376 | | | 240,833 |
Mid Cap Growth | | | 813 | | | 7,098 | | | 7,911 | | | 1,417 | | | 6,314 | | | 7,731 |
Small Mid-Cap Growth | | | 2,712 | | | 12,653 | | | 15,365 | | | 1,450 | | | 28,280 | | | 29,730 |
Global Growth | | | 1,078 | | | 3,399 | | | 4,477 | | | 822 | | | 4,451 | | | 5,273 |
International Growth | | | 527,082 | | | 251,131 | | | 778,213 | | | 839,084 | | | 458,486 | | | 1,297,570 |
International Equity | | | 2,070 | | | 26,173 | | | 28,243 | | | 37,908 | | | 47,320 | | | 85,228 |
International Small Cap Growth | | | 2,692 | | | 43,812 | | | 46,504 | | | 7,257 | | | 36,128 | | | 43,385 |
Emerging Markets Growth | | | 3,268 | | | 47,571 | | | 50,895 | | | 6,566 | | | 29,337 | | | 35,903 |
Emerging Leaders Growth | | | — | | | 1,683 | | | 1,683 | | | — | | | 743 | | | 743 |
Small Cap Value | | | 1,174 | | | 4,442 | | | 5,616 | | | 2,315 | | | 4,882 | | | 7,197 |
Mid Cap Value (a) | | | — | | | 5 | | | 5 | | | — | | | — | | | — |
Bond | | | 534 | | | 25,702 | | | 26,236 | | | 308 | | | 15,214 | | | 15,522 |
Income | | | 6,296 | | | 6,659 | | | 12,955 | | | 19,152 | | | 31,143 | | | 50,295 |
Low Duration (b) | | | 403 | | | 40,161 | | | 40,564 | | | — | | | 1,799 | | | 1,799 |
Ready Reserves | | | 436,708 | | | — | | | 436,708 | | | 1,128,550 | | | — | | | 1,128,550 |
| (a) | | For the period from May 3, 2010 (Commencement of Operations) to June 30, 2010. |
| (b) | | For the period from December 1, 2009 (Commencement of Operations) to December 31, 2009. |
120 Semi-Annual Report | June 30, 2010 |
| | | | | | | | | | | | | | | | | | | | | | | | |
| | | Net Change in Net Assets relating to Fund Share Activity (Dollars) | |
| | | Period Ended June 30, 2010 | | | Year Ended December 31, 2009 | |
Portfolio | | Class N | | | Class I | | | Total | | | Class N | | | Class I | | | Total | |
Growth | | $ | 24,973 | | | $ | 15,989 | | | $ | 40,962 | | | $ | 34,518 | | | $ | 46,420 | | | $ | 80,938 | |
Large Cap Growth | | | 267 | | | | (1,022 | ) | | | (755 | ) | | | (437 | ) | | | 271 | | | | (166 | ) |
Small Cap Growth | | | 5,533 | | | | 2,704 | | | | 8,237 | | | | 73,126 | | | | 3,893 | | | | 77,019 | |
Mid Cap Growth | | | 888 | | | | 4,967 | | | | 5,855 | | | | 3,519 | | | | 10,573 | | | | 14,092 | |
Small Mid-Cap Growth | | | (1,077 | ) | | | 72 | | | | (1,005 | ) | | | 11,911 | | | | 11,001 | | | | 22,912 | |
Global Growth | | | (652 | ) | | | (736 | ) | | | (1,388 | ) | | | (357 | ) | | | (480 | ) | | | (837 | ) |
International Growth | | | (66,472 | ) | | | 10,346 | | | | (56,126 | ) | | | (177,968 | ) | | | 270,126 | | | | 92,158 | |
International Equity | | | (1,490 | ) | | | 17,741 | | | | 16,251 | | | | (33,748 | ) | | | 37,074 | | | | 3,326 | |
International Small Cap Growth | | | 2,689 | | | | 24,096 | | | | 26,785 | | | | (1,533 | ) | | | 66,810 | | | | 65,277 | |
Emerging Markets Growth | | | (2,269 | ) | | | (26,744 | ) | | | (29,013 | ) | | | (842 | ) | | | 40,931 | | | | 40,089 | |
Emerging Leaders Growth | | | — | | | | 1,818 | | | | 1,818 | | | | — | | | | 3,220 | | | | 3,220 | |
Small Cap Value | | | 499 | | | | 33,974 | | | | 34,473 | | | | (945 | ) | | | 8,819 | | | | 7,874 | |
Mid Cap Value (a) | | | 4 | | | | 2,311 | | | | 2,315 | | | | — | | | | — | | | | — | |
Bond | | | 350 | | | | 18,344 | | | | 18,694 | | | | 3,048 | | | | 57,400 | | | | 60,448 | |
Income | | | (536 | ) | | | (1,699 | ) | | | (2,235 | ) | | | (11,199 | ) | | | (16,695 | ) | | | (27,894 | ) |
Low Duration (b) | | | 2,922 | | | | 6,882 | | | | 9,804 | | | | 1,873 | | | | 80,336 | | | | 82,209 | |
Ready Reserves | | | (79,184 | ) | | | — | | | | (79,184 | ) | | | (488,288 | ) | | | — | | | | (488,288 | ) |
| | | | | | | | | | | | |
| | | Sales (Shares) |
| | | Period Ended June 30, 2010 | | Year Ended December 31, 2009 |
Portfolio | | Class N | | Class I | | Total | | Class N | | Class I | | Total |
Growth | | 4,634 | | 2,878 | | 7,512 | | 7,884 | | 7,054 | | 14,938 |
Large Cap Growth | | 108 | | 148 | | 256 | | 181 | | 978 | | 1,159 |
Small Cap Growth | | 3,767 | | 2,109 | | 5,876 | | 14,719 | | 5,427 | | 20,146 |
Mid Cap Growth | | 159 | | 1,147 | | 1,306 | | 551 | | 1,894 | | 2,445 |
Small Mid-Cap Growth | | 133 | | 1,051 | | 1,184 | | 1,183 | | 4,035 | | 5,218 |
Global Growth | | 61 | | 382 | | 443 | | 80 | | 709 | | 789 |
International Growth | | 25,078 | | 13,772 | | 38,850 | | 43,158 | | 45,616 | | 88,774 |
International Equity | | 53 | | 4,006 | | 4,059 | | 474 | | 8,525 | | 8,999 |
International Small Cap Growth | | 519 | | 6,331 | | 6,850 | | 688 | | 11,253 | | 11,941 |
Emerging Markets Growth | | 83 | | 1,635 | | 1,718 | | 571 | | 7,574 | | 8,145 |
Emerging Leaders Growth | | — | | 429 | | 429 | | — | | 548 | | 548 |
Small Cap Value | | 149 | | 3,540 | | 3,689 | | 166 | | 1,517 | | 1,683 |
Mid Cap Value (a) | | — | | 234 | | 234 | | — | | — | | — |
Bond | | 79 | | 4,025 | | 4,104 | | 324 | | 7,009 | | 7,333 |
Income | | 553 | | 397 | | 950 | | 666 | | 1,244 | | 1,910 |
Low Duration (b) | | 331 | | 4,666 | | 4,997 | | 187 | | 8,211 | | 8,398 |
Ready Reserves | | 357,460 | | — | | 357,460 | | 638,552 | | — | | 638,552 |
| (a) | | For the period from May 3, 2010 (Commencement of Operations) to June 30, 2010. |
| (b) | | For the period from December 1, 2009 (Commencement of Operations) to December 31, 2009. |
June 30, 2010 | William Blair Funds 121 |
| | | | | | | | | | | | |
| | | Reinvested Distributions (Shares) |
| | | Period Ended June 30, 2010 | | Year Ended December 31, 2009 |
Portfolio | | Class N | | Class I | | Total | | Class N | | Class I | | Total |
Growth | | — | | — | | — | | — | | 3 | | 3 |
Large Cap Growth | | — | | — | | — | | — | | 2 | | 2 |
Small Cap Growth | | — | | — | | — | | — | | — | | — |
Mid Cap Growth | | — | | — | | — | | — | | — | | — |
Small Mid-Cap Growth | | — | | — | | — | | — | | — | | — |
Global Growth | | — | | — | | — | | — | | — | | — |
International Growth | | — | | — | | — | | 843 | | 722 | | 1,565 |
International Equity | | — | | — | | — | | 2 | | 126 | | 128 |
International Small Cap Growth | | — | | — | | — | | — | | 24 | | 24 |
Emerging Markets Growth | | — | | — | | — | | 15 | | 115 | | 130 |
Emerging Leaders Growth | | — | | — | | — | | — | | 12 | | 12 |
Small Cap Value | | — | | — | | — | | 2 | | 15 | | 17 |
Mid Cap Value (a) | | — | | — | | — | | — | | — | | — |
Bond | | 5 | | 177 | | 182 | | 9 | | 313 | | 322 |
Income | | 75 | | 149 | | 224 | | 225 | | 387 | | 612 |
Low Duration (b) | | 2 | | 48 | | 50 | | — | | 4 | | 4 |
Ready Reserves | | 64 | | — | | 64 | | 1,710 | | — | | 1,710 |
| |
| | | Redemptions (Shares) |
| | | Period Ended June 30, 2010 | | Year Ended December 31, 2009 |
Portfolio | | Class N | | Class I | | Total | | Class N | | Class I | | Total |
Growth | | 2,151 | | 1,366 | | 3,517 | | 4,263 | | 1,994 | | 6,257 |
Large Cap Growth | | 65 | | 310 | | 375 | | 249 | | 973 | | 1,222 |
Small Cap Growth | | 3,675 | | 2,061 | | 5,736 | | 10,272 | | 5,811 | | 16,083 |
Mid Cap Growth | | 78 | | 664 | | 742 | | 169 | | 744 | | 913 |
Small Mid-Cap Growth | | 221 | | 1,034 | | 1,255 | | 148 | | 2,837 | | 2,985 |
Global Growth | | 157 | | 491 | | 648 | | 140 | | 818 | | 958 |
International Growth | | 28,599 | | 13,375 | | 41,974 | | 58,042 | | 30,142 | | 88,184 |
International Equity | | 192 | | 2,410 | | 2,602 | | 4,210 | | 5,321 | | 9,531 |
International Small Cap Growth | | 260 | | 4,321 | | 4,581 | | 976 | | 4,632 | | 5,608 |
Emerging Markets Growth | | 260 | | 3,901 | | 4,161 | | 678 | | 3,007 | | 3,685 |
Emerging Leaders Growth | | — | | 209 | | 209 | | — | | 123 | | 123 |
Small Cap Value | | 103 | | 389 | | 492 | | 278 | | 562 | | 840 |
Mid Cap Value (a) | | — | | 1 | | 1 | | — | | — | | — |
Bond | | 51 | | 2,449 | | 2,500 | | 30 | | 1,505 | | 1,535 |
Income | | 687 | | 732 | | 1,419 | | 2,155 | | 3,558 | | 5,713 |
Low Duration (b) | | 40 | | 4,019 | | 4,059 | | — | | 180 | | 180 |
Ready Reserves | | 436,708 | | — | | 436,708 | | 1,128,550 | | — | | 1,128,550 |
| (a) | | For the period from May 3, 2010 (Commencement of Operations) to June 30, 2010. |
| (b) | | For the period from December 1, 2009 (Commencement of Operations) to December 31, 2009. |
122 Semi-Annual Report | June 30, 2010 |
| | | | | | | | | | | | | | | | | | |
| | | Net Change in Shares Outstanding
relating to Fund Share Activity (Shares) | |
| | | Period Ended June 30, 2010 | | | Year Ended December 31, 2009 | |
Portfolio | | Class N | | | Class I | | | Total | | | Class N | | | Class I | | | Total | |
Growth | | 2,483 | | | 1,512 | | | 3,995 | | | 3,621 | | | 5,063 | | | 8,684 | |
Large Cap Growth | | 43 | | | (162 | ) | | (119 | ) | | (68 | ) | | 7 | | | (61 | ) |
Small Cap Growth | | 92 | | | 48 | | | 140 | | | 4,447 | | | (384 | ) | | 4,063 | |
Mid Cap Growth | | 81 | | | 483 | | | 564 | | | 382 | | | 1,150 | | | 1,532 | |
Small Mid-Cap Growth | | (88 | ) | | 17 | | | (71 | ) | | 1,035 | | | 1,198 | | | 2,233 | |
Global Growth | | (96 | ) | | (109 | ) | | (205 | ) | | (60 | ) | | (109 | ) | | (169 | ) |
International Growth | | (3,521 | ) | | 397 | | | (3,124 | ) | | (14,041 | ) | | 16,196 | | | 2,155 | |
International Equity | | (139 | ) | | 1,596 | | | 1,457 | | | (3,734 | ) | | 3,330 | | | (404 | ) |
International Small Cap Growth | | 259 | | | 2,010 | | | 2,269 | | | (288 | ) | | 6,645 | | | 6,357 | |
Emerging Markets Growth | | (177 | ) | | (2,266 | ) | | (2,443 | ) | | (92 | ) | | 4,682 | | | 4,590 | |
Emerging Leaders Growth | | — | | | 220 | | | 220 | | | — | | | 437 | | | 437 | |
Small Cap Value | | 46 | | | 3,151 | | | 3,197 | | | (110 | ) | | 970 | | | 860 | |
Mid Cap Value (a) | | — | | | 233 | | | 233 | | | — | | | — | | | — | |
Bond | | 33 | | | 1,753 | | | 1,786 | | | 303 | | | 5,817 | | | 6,120 | |
Income | | (59 | ) | | (186 | ) | | (245 | ) | | (1,264 | ) | | (1,927 | ) | | (3,191 | ) |
Low Duration (b) | | 293 | | | 695 | | | 988 | | | 187 | | | 8,035 | | | 8,222 | |
Ready Reserves | | (79,184 | ) | | — | | | (79,184 | ) | | (488,288 | ) | | — | | | (488,288 | ) |
| (a) | | For the period from May 3, 2010 (Commencement of Operations) to June 30, 2010. |
| (b) | | For the period from December 1, 2009 (Commencement of Operations) to December 31, 2009. |
June 30, 2010 | William Blair Funds 123 |
Financial Highlights
Growth Fund
| | | | | | | | | | | | | | | | | | | | | | | | |
| | | Class N | |
| | | Period Ended
June 30, | | | Years Ended December 31, | |
| | | 2010 | | | 2009 | | | 2008 | | | 2007 | | | 2006 | | | 2005 | |
Net asset value, beginning of year | | $ | 9.89 | | | $ | 7.12 | | | $ | 11.70 | | | $ | 11.42 | | | $ | 11.33 | | | $ | 10.70 | |
Income (loss) from investment operations: | | | | | | | | | | | | | | | | | | | | | | | | |
Net investment income (loss) | | | (0.01 | ) | | | (0.02 | ) | | | (0.05 | ) | | | (0.04 | ) | | | (0.06 | ) | | | (0.06 | ) |
Net realized and unrealized gain (loss) on investments | | | (0.79 | ) | | | 2.79 | | | | (4.35 | ) | | | 1.53 | | | | 1.48 | | | | 1.11 | |
| | | | | | | | | | | | | | | | | | | | | | | | |
Total from investment operations | | | (0.80 | ) | | | 2.77 | | | | (4.40 | ) | | | 1.49 | | | | 1.42 | | | | 1.05 | |
Less distributions from: | | | | | | | | | | | | | | | | | | | | | | | | |
Net investment income | | | — | | | | — | | | | — | | | | — | | | | — | | | | — | |
Net realized gain | | | — | | | | — | | | | 0.18 | | | | 1.21 | | | | 1.33 | | | | 0.42 | |
| | | | | | | | | | | | | | | | | | | | | | | | |
Total distributions | | | — | | | | — | | | | 0.18 | | | | 1.21 | | | | 1.33 | | | | 0.42 | |
| | | | | | | | | | | | | | | | | | | | | | | | |
Net asset value, end of year | | $ | 9.09 | | | $ | 9.89 | | | $ | 7.12 | | | $ | 11.70 | | | $ | 11.42 | | | $ | 11.33 | |
| | | | | | | | | | | | | | | | | | | | | | | | |
Total return (%)* | | | (8.09 | ) | | | 38.90 | | | | (37.61 | ) | | | 13.17 | | | | 12.42 | | | | 9.75 | |
Ratios to average daily net assets (%):** | | | | | | | | | | | | | | | | | | | | | | | | |
Expenses | | | 1.14 | | | | 1.23 | | | | 1.17 | | | | 1.22 | | | | 1.17 | | | | 1.15 | |
Net investment income (loss) | | | (0.23 | ) | | | (0.20 | ) | | | (0.54 | ) | | | (0.35 | ) | | | (0.49 | ) | | | (0.60 | ) |
| | | | | | | | | | | | | | | | | | | | | | | | |
| | | Class I | |
| | | Period Ended
June 30, | | | Years Ended December 31, | |
| | | 2010 | | | 2009 | | | 2008 | | | 2007 | | | 2006 | | | 2005 | |
Net asset value, beginning of year | | $ | 10.24 | | | $ | 7.35 | | | $ | 12.02 | | | $ | 11.66 | | | $ | 11.52 | | | $ | 10.84 | |
Income (loss) from investment operations: | | | | | | | | | | | | | | | | | | | | | | | | |
Net investment income (loss) | | | 0.00 | ^ | | | 0.01 | | | | (0.02 | ) | | | 0.00 | ^ | | | (0.02 | ) | | | (0.04 | ) |
Net realized and unrealized gain (loss) on investments | | | (0.82 | ) | | | 2.88 | | | | (4.47 | ) | | | 1.57 | | | | 1.49 | | | | 1.14 | |
| | | | | | | | | | | | | | | | | | | | | | | | |
Total from investment operations | | | (0.82 | ) | | | 2.89 | | | | (4.49 | ) | | | 1.57 | | | | 1.47 | | | | 1.10 | |
Less distributions from: | | | | | | | | | | | | | | | | | | | | | | | | |
Net investment income | | | — | | | | 0.00 | ^ | | | — | | | | — | | | | — | | | | — | |
Net realized gain | | | — | | | | — | | | | 0.18 | | | | 1.21 | | | | 1.33 | | | | 0.42 | |
| | | | | | | | | | | | | | | | | | | | | | | | |
Total distributions | | | — | | | | 0.00 | ^ | | | 0.18 | | | | 1.21 | | | | 1.33 | | | | 0.42 | |
| | | | | | | | | | | | | | | | | | | | | | | | |
Net asset value, end of year | | $ | 9.42 | | | $ | 10.24 | | | $ | 7.35 | | | $ | 12.02 | | | $ | 11.66 | | | $ | 11.52 | |
| | | | | | | | | | | | | | | | | | | | | | | | |
Total return (%)* | | | (8.01 | ) | | | 39.34 | | | | (37.35 | ) | | | 13.59 | | | | 12.64 | | | | 10.08 | |
Ratios to average daily net assets (%):** | | | | | | | | | | | | | | | | | | | | | | | | |
Expenses | | | 0.85 | | | | 0.89 | | | | 0.85 | | | | 0.87 | | | | 0.89 | | | | 0.90 | |
Net investment income (loss) | | | 0.06 | | | | 0.14 | | | | (0.22 | ) | | | 0.00 | | | | (0.20 | ) | | | (0.35 | ) |
| | | | | | | | | | | | | | | | | | |
| | | Period Ended
June 30, | | Years Ended December 31, |
| | | 2010 | | 2009 | | 2008 | | 2007 | | 2006 | | 2005 |
Supplemental data for all classes: | | | | | | | | | | | | | | | | | | |
Net assets at end of year (in thousands) | | $ | 422,811 | | $ | 419,520 | | $ | 238,586 | | $ | 369,644 | | $ | 264,525 | | $ | 253,599 |
Portfolio turnover rate (%)* | | | 28 | | | 67 | | | 60 | | | 72 | | | 61 | | | 54 |
| * | | Rates not annualized for periods that are less than a year. |
| ** | | Rates are annualized for periods that are less than a year. |
| ^ | | Amount is less than $0.005 per share. |
Performance cited represents past performance. Past performance does not guarantee future results and current performance may be lower or higher than the data quoted. Results shown are annual returns, which assume reinvestment of dividends and capital gains. Investment returns and principal will fluctuate and you may have a gain or loss when you sell shares. For the most current month-end performance information, please call 1-800-742-7272 or visit our Web site at www.williamblairfunds.com.
Note: Net investment income (loss) per share is based on the average shares outstanding during the year.
124 Semi-Annual Report | June 30, 2010 |
Financial Highlights
Large Cap Growth Fund
| | | | | | | | | | | | | | | | | | | | | | | | |
| | | Class N | |
| | | Period Ended
June 30, | | | Years Ended December 31, | |
| | | 2010 | | | 2009 | | | 2008 | | | 2007 | | | 2006 | | | 2005 | |
Net asset value, beginning of year | | $ | 6.16 | | | $ | 4.68 | | | $ | 7.52 | | | $ | 6.88 | | | $ | 6.47 | | | $ | 6.24 | |
Income (loss) from investment operations: | | | | | | | | | | | | | | | | | | | | | | | | |
Net investment income (loss) | | | 0.00 | ^ | | | (0.01 | ) | | | (0.02 | ) | | | (0.01 | ) | | | (0.02 | ) | | | (0.02 | ) |
Net realized and unrealized gain (loss) on investments | | | (0.52 | ) | | | 1.49 | | | | (2.82 | ) | | | 0.65 | | | | 0.43 | | | | 0.25 | |
| | | | | | | | | | | | | | | | | | | | | | | | |
Total from investment operations | | | (0.52 | ) | | | 1.48 | | | | (2.84 | ) | | | 0.64 | | | | 0.41 | | | | 0.23 | |
Less distributions from: | | | | | | | | | | | | | | | | | | | | | | | | |
Net investment income | | | — | | | | — | | | | 0.00 | ^ | | | — | | | | — | | | | — | |
Net realized gain | | | — | | | | — | | | | — | | | | — | | | | — | | | | — | |
| | | | | | | | | | | | | | | | | | | | | | | | |
Total distributions | | | — | | | | — | | | | 0.00 | ^ | | | — | | | | — | | | | — | |
| | | | | | | | | | | | | | | | | | | | | | | | |
Net asset value, end of year | | $ | 5.64 | | | $ | 6.16 | | | $ | 4.68 | | | $ | 7.52 | | | $ | 6.88 | | | $ | 6.47 | |
| | | | | | | | | | | | | | | | | | | | | | | | |
Total return (%)* | | | (8.44 | ) | | | 31.62 | | | | (37.76 | ) | | | 9.30 | | | | 6.34 | | | | 3.69 | |
Ratios to average daily net assets (%):** | | | | | | | | | | | | | | | | | | | | | | | | |
Expenses, net of waivers and reimbursements | | | 1.22 | | | | 1.23 | | | | 1.23 | | | | 1.23 | | | | 1.24 | | | | 1.28 | |
Expenses, before waivers and reimbursements | | | 1.56 | | | | 2.28 | | | | 1.85 | | | | 1.50 | | | | 1.63 | | | | 2.08 | |
Net investment income (loss), net of waivers and reimbursements | | | (0.07 | ) | | | (0.13 | ) | | | (0.29 | ) | | | (0.16 | ) | | | (0.29 | ) | | | (0.37 | ) |
Net investment income (loss), before waivers and reimbursements | | | (0.41 | ) | | | (1.18 | ) | | | (0.91 | ) | | | (0.43 | ) | | | (0.68 | ) | | | (1.17 | ) |
| | | | | | | | | | | | | | | | | | | | | | | | |
| | | Class I | |
| | | Period Ended
June 30, | | | Years Ended December 31, | |
| | | 2010 | | | 2009 | | | 2008 | | | 2007 | | | 2006 | | | 2005 | |
Net asset value, beginning of year | | $ | 6.30 | | | $ | 4.77 | | | $ | 7.64 | | | $ | 6.99 | | | $ | 6.56 | | | $ | 6.31 | |
Income (loss) from investment operations: | | | | | | | | | | | | | | | | | | | | | | | | |
Net investment income (loss) | | | 0.01 | | | | 0.01 | | | | 0.00 | ^ | | | 0.01 | | | | 0.00 | ^ | | | (0.01 | ) |
Net realized and unrealized gain (loss) on investments | | | (0.55 | ) | | | 1.52 | | | | (2.87 | ) | | | 0.64 | | | | 0.43 | | | | 0.26 | |
| | | | | | | | | | | | | | | | | | | | | | | | |
Total from investment operations | | | (0.54 | ) | | | 1.53 | | | | (2.87 | ) | | | 0.65 | | | | 0.43 | | | | 0.25 | |
Less distributions from: | | | | | | | | | | | | | | | | | | | | | | | | |
Net investment income | | | — | | | | 0.00 | ^ | | | 0.00 | ^ | | | 0.00 | | | | — | | | | — | |
Net realized gain | | | — | | | | — | | | | — | | | | — | | | | — | | | | — | |
| | | | | | | | | | | | | | | | | | | | | | | | |
Total distributions | | | — | | | | 0.00 | ^ | | | 0.00 | ^ | | | 0.00 | | | | — | | | | — | |
| | | | | | | | | | | | | | | | | | | | | | | | |
Net asset value, end of year | | $ | 5.76 | | | $ | 6.30 | | | $ | 4.77 | | | $ | 7.64 | | | $ | 6.99 | | | $ | 6.56 | |
| | | | | | | | | | | | | | | | | | | | | | | | |
Total return (%)* | | | (8.57 | ) | | | 32.17 | | | | (37.56 | ) | | | 9.36 | | | | 6.55 | | | | 3.96 | |
Ratios to average daily net assets (%):** | | | | | | | | | | | | | | | | | | | | | | | | |
Expenses, net of waivers and reimbursements | | | 0.97 | | | | 0.98 | | | | 0.98 | | | | 0.98 | | | | 0.99 | | | | 1.03 | |
Expenses, before waivers and reimbursements | | | 1.20 | | | | 1.26 | | | | 1.21 | | | | 1.20 | | | | 1.38 | | | | 1.83 | |
Net investment income (loss), net of waivers and reimbursements | | | 0.18 | | | | 0.12 | | | | (0.04 | ) | | | 0.18 | | | | (0.04 | ) | | | (0.12 | ) |
Net investment income (loss), before waivers and reimbursements | | | (0.05 | ) | | | (0.16 | ) | | | (0.27 | ) | | | (0.04 | ) | | | (0.43 | ) | | | (0.92 | ) |
| | | | | | | | | | | | | | | | | | |
| | | Period Ended
June 30, | | Years Ended December 31, |
| | | 2010 | | 2009 | | 2008 | | 2007 | | 2006 | | 2005 |
Supplemental data for all classes: | | | | | | | | | | | | | | | | | | |
Net assets at end of year (in thousands) | | $ | 27,050 | | $ | 30,311 | | $ | 23,279 | | $ | 33,667 | | $ | 20,191 | | $ | 16,888 |
Portfolio turnover rate (%)* | | | 18 | | | 88 | | | 85 | | | 60 | | | 53 | | | 53 |
| * | | Rates not annualized for periods that are less than a year. |
| ** | | Rates are annualized for periods that are less than a year. |
| ^ | | Amount is less than $0.005 per share. |
Performance cited represents past performance. Past performance does not guarantee future results and current performance may be lower or higher than the data quoted. Results shown are annual returns, which assume reinvestment of dividends and capital gains. Investment returns and principal will fluctuate and you may have a gain or loss when you sell shares. For the most current month-end performance information, please call 1-800-742-7272 or visit our Web site at www.williamblairfunds.com.
Note: Net investment income (loss) per share is based on the average shares outstanding during the year.
June 30, 2010 | William Blair Funds 125 |
Financial Highlights
Small Cap Growth Fund
| | | | | | | | | | | | | | | | | | | | | | | | |
| | | Class N | |
| | | Period Ended
June 30, | | | Years Ended December 31, | |
| | | 2010 | | | 2009 | | | 2008 | | | 2007 | | | 2006 | | | 2005 | |
Net asset value, beginning of year | | $ | 19.99 | | | $ | 11.79 | | | $ | 23.30 | | | $ | 25.41 | | | $ | 23.76 | | | $ | 25.72 | |
Income (loss) from investment operations: | | | | | | | | | | | | | | | | | | | | | | | | |
Net investment income (loss) | | | (0.10 | ) | | | (0.15 | ) | | | (0.19 | ) | | | (0.33 | ) | | | (0.29 | ) | | | (0.30 | ) |
Net realized and unrealized gain (loss) on investments | | | (0.63 | ) | | | 8.35 | | | | (10.73 | ) | | | (0.25 | ) | | | 3.65 | | | | 0.64 | |
| | | | | | | | | | | | | | | | | | | | | | | | |
Total from investment operations | | | (0.73 | ) | | | 8.20 | | | | (10.92 | ) | | | (0.58 | ) | | | 3.36 | | | | 0.34 | |
Less distributions from: | | | | | | | | | | | | | | | | | | | | | | | | |
Net investment income | | | — | | | | — | | | | — | | | | — | | | | — | | | | — | |
Net realized gain | | | — | | | | — | | | | 0.59 | | | | 1.53 | | | | 1.71 | | | | 2.30 | |
| | | | | | | | | | | | | | | | | | | | | | | | |
Total distributions | | | — | | | | — | | | | 0.59 | | | | 1.53 | | | | 1.71 | | | | 2.30 | |
| | | | | | | | | | | | | | | | | | | | | | | | |
Net asset value, end of year | | $ | 19.26 | | | $ | 19.99 | | | $ | 11.79 | | | $ | 23.30 | | | $ | 25.41 | | | $ | 23.76 | |
| | | | | | | | | | | | | | | | | | | | | | | | |
Total return (%)* | | | (3.65 | ) | | | 69.55 | | | | (46.85 | ) | | | (2.15 | ) | | | 14.12 | | | | 1.18 | |
Ratios to average daily net assets (%):** | | | | | | | | | | | | | | | | | | | | | | | | |
Expenses, net of waivers and reimbursements | | | 1.49 | | | | 1.50 | | | | 1.50 | | | | 1.49 | | | | 1.48 | | | | 1.49 | |
Expenses, before waivers and reimbursements | | | 1.49 | | | | 1.55 | | | | 1.50 | | | | 1.49 | | | | 1.48 | | | | 1.49 | |
Net investment income (loss), net of waivers and reimbursements | | | (0.99 | ) | | | (0.93 | ) | | | (1.05 | ) | | | (1.24 | ) | | | (1.14 | ) | | | (1.23 | ) |
Net investment income (loss), before waivers and reimbursements | | | (0.99 | ) | | | (0.98 | ) | | | (1.05 | ) | | | (1.24 | ) | | | (1.14 | ) | | | (1.23 | ) |
| | | | | | | | | | | | | | | | | | | | | | | | |
| | | Class I | |
| | | Period Ended
June 30, | | | Years Ended December 31, | |
| | | 2010 | | | 2009 | | | 2008 | | | 2007 | | | 2006 | | | 2005 | |
Net asset value, beginning of year | | $ | 20.64 | | | $ | 12.14 | | | $ | 23.89 | | | $ | 25.94 | | | $ | 24.16 | | | $ | 26.04 | |
Income (loss) from investment operations: | | | | | | | | | | | | | | | | | | | | | | | | |
Net investment income (loss) | | | (0.08 | ) | | | (0.11 | ) | | | (0.14 | ) | | | (0.25 | ) | | | (0.22 | ) | | | (0.25 | ) |
Net realized and unrealized gain (loss) on investments | | | (0.64 | ) | | | 8.61 | | | | (11.02 | ) | | | (0.27 | ) | | | 3.71 | | | | 0.67 | |
| | | | | | | | | | | | | | | | | | | | | | | | |
Total from investment operations | | | (0.72 | ) | | | 8.50 | | | | (11.16 | ) | | | (0.52 | ) | | | 3.49 | | | | 0.42 | |
Less distributions from: | | | | | | | | | | | | | | | | | | | | | | | | |
Net investment income | | | — | | | | — | | | | — | | | | — | | | | — | | | | — | |
Net realized gain | | | — | | | | — | | | | 0.59 | | | | 1.53 | | | | 1.71 | | | | 2.30 | |
| | | | | | | | | | | | | | | | | | | | | | | | |
Total distributions | | | — | | | | — | | | | 0.59 | | | | 1.53 | | | | 1.71 | | | | 2.30 | |
| | | | | | | | | | | | | | | | | | | | | | | | |
Net asset value, end of year | | $ | 19.92 | | | $ | 20.64 | | | $ | 12.14 | | | $ | 23.89 | | | $ | 25.94 | | | $ | 24.16 | |
| | | | | | | | | | | | | | | | | | | | | | | | |
Total return (%)* | | | (3.49 | ) | | | 70.02 | | | | (46.70 | ) | | | (1.88 | ) | | | 14.42 | | | | 1.48 | |
Ratios to average daily net assets (%):** | | | | | | | | | | | | | | | | | | | | | | | | |
Expenses | | | 1.20 | | | | 1.20 | | | | 1.20 | | | | 1.20 | | | | 1.21 | | | | 1.24 | |
Net investment income (loss) | | | (0.70 | ) | | | (0.63 | ) | | | (0.75 | ) | | | (0.94 | ) | | | (0.87 | ) | | | (0.98 | ) |
| | | | | | | | | | | | | | | | | | |
| | | Period Ended
June 30, | | Years Ended December 31, |
| | | 2010 | | 2009 | | 2008 | | 2007 | | 2006 | | 2005 |
Supplemental data for all classes: | | | | | | | | | | | | | | | | | | |
Net assets at end of year (in thousands) | | $ | 738,478 | | $ | 762,798 | | $ | 401,627 | | $ | 1,094,419 | | $ | 1,261,174 | | $ | 831,738 |
Portfolio turnover rate (%)* | | | 58 | | | 122 | | | 135 | | | 97 | | | 105 | | | 80 |
| * | | Rates not annualized for periods that are less than a year. |
| ** | | Rates are annualized for periods that are less than a year. |
Performance cited represents past performance. Past performance does not guarantee future results and current performance may be lower or higher than the data quoted. Results shown are annual returns, which assume reinvestment of dividends and capital gains. Investment returns and principal will fluctuate and you may have a gain or loss when you sell shares. For the most current month-end performance information, please call 1-800-742-7272 or visit our Web site at www.williamblairfunds.com.
Note: Net investment income (loss) per share is based on the average shares outstanding during the year.
126 Semi-Annual Report | June 30, 2010 |
Financial Highlights
Mid Cap Growth Fund
| | | | | | | | | | | | | | | | | | | | |
| | | Class N | |
| | | Period Ended
June 30, | | | Period Ended December 31, | |
| | | 2010 | | | 2009 | | | 2008 | | | 2007 | | | 2006(a) | |
Net asset value, beginning of year | | $ | 10.08 | | | $ | 7.41 | | | $ | 11.35 | | | $ | 10.46 | | | $ | 10.00 | |
Income (loss) from investment operations: | | | | | | | | | | | | | | | | | | | | |
Net investment income (loss) | | | (0.05 | ) | | | (0.04 | ) | | | (0.07 | ) | | | (0.07 | ) | | | (0.07 | ) |
Net realized and unrealized gain (loss) on investments | | | (0.21 | ) | | | 2.71 | | | | (3.87 | ) | | | 1.59 | | | | 0.53 | |
| | | | | | | | | | | | | | | | | | | | |
Total from investment operations | | | (0.26 | ) | | | 2.67 | | | | (3.94 | ) | | | 1.52 | | | | 0.46 | |
Less distributions from: | | | | | | | | | | | | | | | | | | | | |
Net investment income | | | — | | | | — | | | | — | | | | — | | | | — | |
Net realized gain | | | — | | | | — | | | | 0.00 | ^ | | | 0.63 | | | | — | |
| | | | | | | | | | | | | | | | | | | | |
Total distributions | | | — | | | | — | | | | 0.00 | ^ | | | 0.63 | | | | — | |
| | | | | | | | | | | | | | | | | | | | |
Net asset value, end of year | | $ | 9.82 | | | $ | 10.08 | | | $ | 7.41 | | | $ | 11.35 | | | $ | 10.46 | |
| | | | | | | | | | | | | | | | | | | | |
Total return (%)* | | | (2.58 | ) | | | 36.03 | | | | (34.71 | ) | | | 14.62 | | | | 4.60 | |
Ratios to average daily net assets (%):** | | | | | | | | | | | | | | | | | | | | |
Expenses, net of waivers and reimbursements | | | 1.36 | | | | 1.36 | | | | 1.36 | | | | 1.38 | | | | 1.40 | |
Expenses, before waivers and reimbursements | | | 1.46 | | | | 2.13 | | | | 2.03 | | | | 1.67 | | | | 2.35 | |
Net investment income (loss), net of waivers and reimbursements | | | (0.88 | ) | | | (0.51 | ) | | | (0.76 | ) | | | (0.58 | ) | | | (0.70 | ) |
Net investment income (loss), before waivers and reimbursements | | | (0.98 | ) | | | (1.28 | ) | | | (1.43 | ) | | | (0.87 | ) | | | (1.65 | ) |
| | | | | | | | | | | | | | | | | | | | |
| | | Class I | |
| | | Period Ended
June 30, | | | Period Ended December 31, | |
| | | 2010 | | | 2009 | | | 2008 | | | 2007 | | | 2006(a) | |
Net asset value, beginning of year | | $ | 10.20 | | | $ | 7.48 | | | $ | 11.42 | | | $ | 10.49 | | | $ | 10.00 | |
Income (loss) from investment operations: | | | | | | | | | | | | | | | | | | | | |
Net investment income (loss) | | | (0.03 | ) | | | (0.02 | ) | | | (0.05 | ) | | | (0.04 | ) | | | (0.04 | ) |
Net realized and unrealized gain (loss) on investments | | | (0.22 | ) | | | 2.74 | | | | (3.89 | ) | | | 1.60 | | | | 0.53 | |
| | | | | | | | | | | | | | | | | | | | |
Total from investment operations | | | (0.25 | ) | | | 2.72 | | | | (3.94 | ) | | | 1.56 | | | | 0.49 | |
Less distributions from: | | | | | | | | | | | | | | | | | | | | |
Net investment income | | | — | | | | — | | | | — | | | | — | | | | — | |
Net realized gain | | | — | | | | — | | | | 0.00 | ^ | | | 0.63 | | | | — | |
| | | | | | | | | | | | | | | | | | | | |
Total distributions | | | — | | | | — | | | | 0.00 | ^ | | | 0.63 | | | | — | |
| | | | | | | | | | | | | | | | | | | | |
Net asset value, end of year | | $ | 9.95 | | | $ | 10.20 | | | $ | 7.48 | | | $ | 11.42 | | | $ | 10.49 | |
| | | | | | | | | | | | | | | | | | | | |
Total return (%)* | | | (2.45 | ) | | | 36.36 | | | | (34.50 | ) | | | 14.95 | | | | 4.90 | |
Ratios to average daily net assets (%):** | | | | | | | | | | | | | | | | | | | | |
Expenses, net of waivers and reimbursements | | | 1.11 | | | | 1.11 | | | | 1.11 | | | | 1.12 | | | | 1.15 | |
Expenses, before waivers and reimbursements | | | 1.16 | | | | 1.28 | | | | 1.23 | | | | 1.37 | | | | 2.10 | |
Net investment income (loss), net of waivers and reimbursements | | | (0.63 | ) | | | (0.26 | ) | | | (0.51 | ) | | | (0.32 | ) | | | (0.43 | ) |
Net investment income (loss), before waivers and reimbursements | | | (0.68 | ) | | | (0.43 | ) | | | (0.63 | ) | | | (0.57 | ) | | | (1.38 | ) |
| | | | | | | | | | | | | | | |
| | | Period Ended
June 30, | | Period Ended December 31, |
| | | 2010 | | 2009 | | 2008 | | 2007 | | 2006(a) |
Supplemental data for all classes: | | | | | | | | | | | | | | | |
Net assets at end of year (in thousands) | | $ | 74,704 | | $ | 70,834 | | $ | 40,526 | | $ | 45,393 | | $ | 19,639 |
Portfolio turnover rate (%)* | | | 46 | | | 87 | | | 76 | | | 66 | | | 56 |
| (a) | | For the period February 1, 2006 (Commencement of Operations) to December 31, 2006. |
| * | | Rates not annualized for periods that are less than a year. |
| ** | | Rates are annualized for periods that are less than a year. |
| ^ | | Amount is less than $0.005 per share. |
Performance cited represents past performance. Past performance does not guarantee future results and current performance may be lower or higher than the data quoted. Results shown are annual returns, which assume reinvestment of dividends and capital gains. Investment returns and principal will fluctuate and you may have a gain or loss when you sell shares. For the most current month-end performance information, please call 1-800-742-7272 or visit our Web site at www.williamblairfunds.com.
Note: Net investment income (loss) per share is based on the average shares outstanding during the year.
June 30, 2010 | William Blair Funds 127 |
Financial Highlights
Small-Mid Cap Growth Fund
| | | | | | | | | | | | | | | | | | | | | | | | |
| | | Class N | |
| | | Period Ended
June 30, | | | Years Ended December 31, | |
| | | 2010 | | | 2009 | | | 2008 | | | 2007 | | | 2006 | | | 2005 | |
Net asset value, beginning of year | | $ | 11.73 | | | $ | 8.16 | | | $ | 13.10 | | | $ | 12.96 | | | $ | 12.40 | | | $ | 11.28 | |
Income (loss) from investment operations: | | | | | | | | | | | | | | | | | | | | | | | | |
Net investment income (loss) | | | (0.05 | ) | | | (0.06 | ) | | | (0.03 | ) | | | (0.12 | ) | | | (0.11 | ) | | | (0.11 | ) |
Net realized and unrealized gain (loss) on investments | | | (0.31 | ) | | | 3.63 | | | | (4.91 | ) | | | 1.71 | | | | 1.32 | | | | 1.32 | |
| | | | | | | | | | | | | | | | | | | | | | | | |
Total from investment operations | | | (0.36 | ) | | | 3.57 | | | | (4.94 | ) | | | 1.59 | | | | 1.21 | | | | 1.21 | |
Less distributions from: | | | | | | | | | | | | | | | | | | | | | | | | |
Net investment income | | | — | | | | — | | | | — | | | | — | | | | — | | | | — | |
Net realized gain | | | — | | | | — | | | | 0.00 | ^ | | | 1.45 | | | | 0.65 | | | | 0.09 | |
| | | | | | | | | | | | | | | | | | | | | | | | |
Total distributions | | | — | | | | — | | | | 0.00 | ^ | | | 1.45 | | | | 0.65 | | | | 0.09 | |
| | | | | | | | | | | | | | | | | | | | | | | | |
Net asset value, end of year | | $ | 11.37 | | | $ | 11.73 | | | $ | 8.16 | | | $ | 13.10 | | | $ | 12.96 | | | $ | 12.40 | |
| | | | | | | | | | | | | | | | | | | | | | | | |
Total return (%)* | | | (3.07 | ) | | | 43.75 | | | | (37.71 | ) | | | 12.34 | | | | 9.68 | | | | 10.72 | |
Ratios to average daily net assets (%):** | | | | | | | | | | | | | | | | | | | | | | | | |
Expenses, net of waivers and reimbursements | | | 1.36 | | | | 1.36 | | | | 1.36 | | | | 1.36 | | | | 1.38 | | | | 1.45 | |
Expenses, before waivers and reimbursements | | | 1.42 | | | | 1.49 | | | | 1.41 | | | | 1.42 | | | | 1.45 | | | | 1.54 | |
Net investment income (loss), net of waivers and reimbursements | | | (0.82 | ) | | | (0.60 | ) | | | (0.26 | ) | | | (0.79 | ) | | | (0.86 | ) | | | (0.97 | ) |
Net investment income (loss), before waivers and reimbursements | | | (0.88 | ) | | | (0.73 | ) | | | (0.31 | ) | | | (0.85 | ) | | | (0.93 | ) | | | (1.06 | ) |
| | | | | | | | | | | | | | | | | | | | | | | | |
| | | Class I | |
| | | Period Ended
June 30, | | | Years Ended December 31, | |
| | | 2010 | | | 2009 | | | 2008 | | | 2007 | | | 2006 | | | 2005 | |
Net asset value, beginning of year | | $ | 11.93 | | | $ | 8.27 | | | $ | 13.24 | | | $ | 13.06 | | | $ | 12.46 | | | $ | 11.30 | |
Income (loss) from investment operations: | | | | | | | | | | | | | | | | | | | | | | | | |
Net investment income (loss) | | | (0.03 | ) | | | (0.03 | ) | | | 0.00 | ^ | | | (0.08 | ) | | | (0.08 | ) | | | (0.08 | ) |
Net realized and unrealized gain (loss) on investments | | | (0.32 | ) | | | 3.69 | | | | (4.97 | ) | | | 1.71 | | | | 1.33 | | | | 1.33 | |
| | | | | | | | | | | | | | | | | | | | | | | | |
Total from investment operations | | | (0.35 | ) | | | 3.66 | | | | (4.97 | ) | | | 1.63 | | | | 1.25 | | | | 1.25 | |
Less distributions from: | | | | | | | | | | | | | | | | | | | | | | | | |
Net investment income | | | — | | | | 0.00 | ^ | | | — | | | | — | | | | — | | | | — | |
Net realized gain | | | — | | | | — | | | | 0.00 | ^ | | | 1.45 | | | | 0.65 | | | | 0.09 | |
| | | | | | | | | | | | | | | | | | | | | | | | |
Total distributions | | | — | | | | 0.00 | ^ | | | 0.00 | ^ | | | 1.45 | | | | 0.65 | | | | 0.09 | |
| | | | | | | | | | | | | | | | | | | | | | | | |
Net asset value, end of year | | $ | 11.58 | | | $ | 11.93 | | | $ | 8.27 | | | $ | 13.24 | | | $ | 13.06 | | | $ | 12.46 | |
| | | | | | | | | | | | | | | | | | | | | | | | |
Total return (%)* | | | (2.93 | ) | | | 44.26 | | | | (37.54 | ) | | | 12.54 | | | | 9.95 | | | | 11.05 | |
Ratios to average daily net assets (%):** | | | | | | | | | | | | | | | | | | | | | | | | |
Expenses, net of waivers and reimbursements | | | 1.11 | | | | 1.11 | | | | 1.11 | | | | 1.11 | | | | 1.13 | | | | 1.20 | |
Expenses, before waivers and reimbursements | | | 1.12 | | | | 1.18 | | | | 1.17 | | | | 1.17 | | | | 1.20 | | | | 1.29 | |
Net investment income (loss), net of waivers and reimbursements | | | (0.57 | ) | | | (0.33 | ) | | | 0.03 | | | | (0.54 | ) | | | (0.61 | ) | | | (0.72 | ) |
Net investment income (loss), before waivers and reimbursements | | | (0.58 | ) | | | (0.40 | ) | | | (0.03 | ) | | | (0.60 | ) | | | (0.68 | ) | | | (0.81 | ) |
| | | | | | | | | | | | | | | | | | |
| | | Period Ended
June 30, | | Years Ended December 31, |
| | | 2010 | | 2009 | | 2008 | | 2007 | | 2006 | | 2005 |
Supplemental data for all classes: | | | | | | | | | | | | | | | | | | |
Net assets at end of year (in thousands) | | $ | 141,698 | | $ | 146,828 | | $ | 83,479 | | $ | 124,501 | | $ | 92,766 | | $ | 70,211 |
Portfolio turnover rate (%)* | | | 56 | | | 112 | | | 77 | | | 80 | | | 68 | | | 62 |
| * | | Rates not annualized for periods that are less than a year. |
| ** | | Rates are annualized for periods that are less than a year. |
| ^ | | Amount is less than $0.005 per share. |
Performance cited represents past performance. Past performance does not guarantee future results and current performance may be lower or higher than the data quoted. Results shown are annual returns, which assume reinvestment of dividends and capital gains. Investment returns and principal will fluctuate and you may have a gain or loss when you sell shares. For the most current month-end performance information, please call 1-800-742-7272 or visit our Web site at www.williamblairfunds.com.
Note: Net investment income (loss) per share is based on the average shares outstanding during the year.
128 Semi-Annual Report | June 30, 2010 |
Financial Highlights
Global Growth Fund
| | | | | | | | | | | | | | | | |
| | | Class N | |
| | | Period Ended
June 30, | | | Period Ended December 31, | |
| | | 2010 | | | 2009 | | | 2008 | | | 2007(a) | |
Net asset value, beginning of year | | $ | 6.97 | | | $ | 4.96 | | | $ | 9.89 | | | $ | 10.00 | |
Income (loss) from investment operations: | | | | | | | | | | | | | | | | |
Net investment income (loss) (b) | | | 0.01 | | | | (0.01 | ) | | | 0.08 | | | | 0.00 | ^ |
Net realized and unrealized gain (loss) on investments | | | (0.41 | ) | | | 2.02 | | | | (4.98 | ) | | | (0.11 | ) |
| | | | | | | | | | | | | | | | |
Total from investment operations | | | (0.40 | ) | | | 2.01 | | | | (4.90 | ) | | | (0.11 | ) |
Less distributions from: | | | | | | | | | | | | | | | | |
Net investment income | | | — | | | | — | | | | 0.03 | | | | 0.00 | ^ |
Net realized gain | | | — | | | | — | | | | — | | | | — | |
| | | | | | | | | | | | | | | | |
Total distributions | | | — | | | | — | | | | 0.03 | | | | 0.00 | ^ |
| | | | | | | | | | | | | | | | |
Net asset value, end of year | | $ | 6.57 | | | $ | 6.97 | | | $ | 4.96 | | | $ | 9.89 | |
| | | | | | | | | | | | | | | | |
Total return (%)* | | | (5.74 | ) | | | 40.52 | | | | (49.52 | ) | | | (1.10 | ) |
Ratios to average daily net assets (%):** | | | | | | | | | | | | | | | | |
Expenses, net of waivers and reimbursements | | | 1.53 | | | | 1.55 | | | | 1.55 | | | | 1.55 | |
Expenses, before waivers and reimbursements | | | 2.02 | | | | 2.61 | | | | 2.17 | | | | 2.14 | |
Net investment income (loss), net of waivers and reimbursements | | | 0.23 | | | | (0.17 | ) | | | 0.98 | | | | (0.08 | ) |
Net investment income (loss), before waivers and reimbursements | | | (0.26 | ) | | | (1.23 | ) | | | 0.36 | | | | (0.67 | ) |
| | | | | | | | | | | | | | | | |
| | | Class I | |
| | | Period Ended
June 30, | | | Period Ended
December 31, | |
| | | 2010 | | | 2009 | | | 2008 | | | 2007(a) | |
Net asset value, beginning of year | | $ | 6.96 | | | $ | 4.94 | | | $ | 9.91 | | | $ | 10.00 | |
Income (loss) from investment operations: | | | | | | | | | | | | | | | | |
Net investment income (loss) (b) | | | 0.02 | | | | 0.00 | ^ | | | 0.08 | | | | 0.00 | ^ |
Net realized and unrealized gain (loss) on investments | | | (0.41 | ) | | | 2.02 | | | | (4.98 | ) | | | (0.09 | ) |
| | | | | | | | | | | | | | | | |
Total from investment operations | | | (0.39 | ) | | | 2.02 | | | | (4.90 | ) | | | (0.09 | ) |
Less distributions from: | | | | | | | | | | | | | | | | |
Net investment income | | | — | | | | 0.00 | ^ | | | 0.07 | | | | 0.00 | ^ |
Net realized gain | | | — | | | | — | | | | — | | | | — | |
| | | | | | | | | | | | | | | | |
Total distributions | | | — | | | | 0.00 | ^ | | | 0.07 | | | | 0.00 | ^ |
| | | | | | | | | | | | | | | | |
Net asset value, end of year | | $ | 6.57 | | | $ | 6.96 | | | $ | 4.94 | | | $ | 9.91 | |
| | | | | | | | | | | | | | | | |
Total return (%)* | | | (5.60 | ) | | | 40.90 | | | | (49.41 | ) | | | (0.85 | ) |
Ratios to average daily net assets (%):** | | | | | | | | | | | | | | | | |
Expenses, net of waivers and reimbursements | | | 1.28 | | | | 1.30 | | | | 1.30 | | | | 1.30 | |
Expenses, before waivers and reimbursements | | | 1.66 | | | | 1.62 | | | | 1.74 | | | | 1.89 | |
Net investment income (loss), net of waivers and reimbursements | | | 0.51 | | | | 0.05 | | | | 1.05 | | | | 0.14 | |
Net investment income (loss), before waivers and reimbursements | | | 0.13 | | | | (0.27 | ) | | | 0.61 | | | | (0.45 | ) |
| | | | | | | | | | | | |
| | | Period Ended
June 30, | | Period Ended December 31, |
| | | 2010 | | 2009 | | 2008 | | 2007(a) |
Supplemental data for all classes: | | | | | | | | | | | | |
Net assets at end of year (in thousands) | | $ | 34,786 | | $ | 38,287 | | $ | 28,005 | | $ | 45,576 |
Portfolio turnover rate (%)* | | | 58 | | | 133 | | | 124 | | | 63 |
| (a) | | For the period October 15, 2007 (Commencement of Operations) to December 31, 2007. |
| (b) | | Excludes $0.00, $0.00 and $0.00 of PFIC mark to market which is treated as ordinary income for Federal tax purposes for the years 2009, 2008 and 2007, respectively. |
| * | | Rates not annualized for periods that are less than a year. |
| ** | | Rates are annualized for periods that are less than a year. |
| ^ | | Amount is less than $0.005 per share. |
Performance cited represents past performance. Past performance does not guarantee future results and current performance may be lower or higher than the data quoted. Results shown are annual returns, which assume reinvestment of dividends and capital gains. Investment returns and principal will fluctuate and you may have a gain or loss when you sell shares. For the most current month-end performance information, please call 1-800-742-7272 or visit our Web site at www.williamblairfunds.com.
Note: Net investment income (loss) per share is based on the average shares outstanding during the year.
June 30, 2010 | William Blair Funds 129 |
Financial Highlights
International Growth Fund
| | | | | | | | | | | | | | | | | | | | |
| | | Class N |
| | | Period Ended
June 30, | | | Years Ended December 31, |
| | | 2010 | | | 2009 | | 2008 | | | 2007 | | 2006 | | 2005 |
Net asset value, beginning of year | | $ | 18.55 | | | $ | 13.12 | | $ | 29.12 | | | $ | 27.70 | | $ | 25.22 | | $ | 22.09 |
Income (loss) from investment operations: | | | | | | | | | | | | | | | | | | | | |
Net investment income (loss) (a) | | | 0.13 | | | | 0.07 | | | 0.29 | | | | 0.12 | | | 0.05 | | | 0.15 |
Net realized and unrealized gain (loss) on investments | | | (0.91 | ) | | | 5.47 | | | (15.54 | ) | | | 4.77 | | | 5.71 | | | 4.60 |
| | | | | | | | | | | | | | | | | | | | |
Total from investment operations | | | (0.78 | ) | | | 5.54 | | | (15.25 | ) | | | 4.89 | | | 5.76 | | | 4.75 |
Less distributions from: | | | | | | | | | | | | | | | | | | | | |
Net investment income | | | — | | | | 0.11 | | | — | | | | 0.34 | | | 0.37 | | | 0.11 |
Net realized gain | | | — | | | | — | | | 0.75 | | | | 3.13 | | | 2.91 | | | 1.51 |
| | | | | | | | | | | | | | | | | | | | |
Total distributions | | | — | | | | 0.11 | | | 0.75 | | | | 3.47 | | | 3.28 | | | 1.62 |
| | | | | | | | | | | | | | | | | | | | |
Net asset value, end of year | | $ | 17.77 | | | $ | 18.55 | | $ | 13.12 | | | $ | 29.12 | | $ | 27.70 | | $ | 25.22 |
| | | | | | | | | | | | | | | | | | | | |
Total return (%)* | | | (4.20 | ) | | | 42.27 | | | (52.33 | ) | | | 18.13 | | | 23.06 | | | 21.65 |
Ratios to average daily net assets (%):** | | | | | | | | | | | | | | | | | | | | |
Expenses, net of waivers and reimbursements | | | 1.43 | | | | 1.45 | | | 1.39 | | | | 1.40 | | | 1.42 | | | 1.42 |
Expenses, before waivers and reimbursements | | | 1.43 | | | | 1.46 | | | 1.39 | | | | 1.40 | | | 1.42 | | | 1.42 |
Net investment income (loss), net of waivers and reimbursements | | | 1.44 | | | | 0.48 | | | 1.29 | | | | 0.38 | | | 0.19 | | | 0.16 |
Net investment income (loss), before waivers and reimbursements | | | 1.44 | | | | 0.47 | | | 1.29 | | | | 0.38 | | | 0.19 | | | 0.16 |
| | | | | | | | | | | | | | | | | | | | |
| | | Class I |
| | | Period Ended
June 30, | | | Years Ended December 31, |
| | | 2010 | | | 2009 | | 2008 | | | 2007 | | 2006 | | 2005 |
Net asset value, beginning of year | | $ | 18.95 | | | $ | 13.40 | | $ | 29.61 | | | $ | 28.10 | | $ | 25.55 | | $ | 22.34 |
Income (loss) from investment operations: | | | | | | | | | | | | | | | | | | | | |
Net investment income (loss) (a) | | | 0.16 | | | | 0.12 | | | 0.37 | | | | 0.21 | | | 0.13 | | | 0.27 |
Net realized and unrealized gain (loss) on investments | | | (0.92 | ) | | | 5.59 | | | (15.83 | ) | | | 4.86 | | | 5.78 | | | 4.61 |
| | | | | | | | | | | | | | | | | | | | |
Total from investment operations | | | (0.76 | ) | | | 5.71 | | | (15.46 | ) | | | 5.07 | | | 5.91 | | | 4.88 |
Less distributions from: | | | | | | | | | | | | | | | | | | | | |
Net investment income | | | — | | | | 0.16 | | | — | | | | 0.43 | | | 0.45 | | | 0.16 |
Net realized gain | | | — | | | | — | | | 0.75 | | | | 3.13 | | | 2.91 | | | 1.51 |
| | | | | | | | | | | | | | | | | | | | |
Total distributions | | | — | | | | 0.16 | | | 0.75 | | | | 3.56 | | | 3.36 | | | 1.67 |
| | | | | | | | | | | | | | | | | | | | |
Net asset value, end of year | | $ | 18.19 | | | $ | 18.95 | | $ | 13.40 | | | $ | 29.61 | | $ | 28.10 | | $ | 25.55 |
| | | | | | | | | | | | | | | | | | | | |
Total return (%)* | | | (4.01 | ) | | | 42.63 | | | (52.17 | ) | | | 18.53 | | | 23.35 | | | 22.00 |
Ratios to average daily net assets (%):** | | | | | | | | | | | | | | | | | | | | |
Expenses | | | 1.13 | | | | 1.17 | | | 1.08 | | | | 1.09 | | | 1.11 | | | 1.17 |
Net investment income (loss) | | | 1.76 | | | | 0.74 | | | 1.58 | | | | 0.69 | | | 0.45 | | | 0.41 |
| | | | | | | | | | | | | | | | | | |
| | | Period Ended
June 30, | | Years Ended December 31, |
| | | 2010 | | 2009 | | 2008 | | 2007 | | 2006 | | 2005 |
Supplemental data for all classes: | | | | | | | | | | | | | | | | | | |
Net assets at end of year (in thousands) | | $ | 4,233,221 | | $ | 4,473,406 | | $ | 3,130,938 | | $ | 8,048,654 | | $ | 6,267,126 | | $ | 4,551,077 |
Portfolio turnover rate (%) * | | | 46 | | | 121 | | | 91 | | | 56 | | | 72 | | | 70 |
| (a) | | Excludes $0.08, $(0.18), $0.09, $0.42, and $0.37 of PFIC mark to market which is treated as ordinary income for Federal tax purposes for the years 2009, 2008, 2007, 2006 and 2005, respectively. |
| * | | Rates not annualized for periods that are less than a year. |
| ** | | Rates are annualized for periods that are less than a year. |
Performance cited represents past performance. Past performance does not guarantee future results and current performance may be lower or higher than the data quoted. Results shown are annual returns, which assume reinvestment of dividends and capital gains. Investment returns and principal will fluctuate and you may have a gain or loss when you sell shares. For the most current month-end performance information, please call 1-800-742-7272 or visit our Web site at www.williamblairfunds.com.
Note: Net investment income (loss) per share is based on the average shares outstanding during the year.
130 Semi-Annual Report | June 30, 2010 |
Financial Highlights
International Equity Fund
| | | | | | | | | | | | | | | | | | | | | |
| | | Class N | |
| | | Period Ended
June 30, | | | Years Ended December 31, | |
| | | 2010 | | | 2009 | | 2008 | | | 2007 | | 2006 | | 2005 | |
Net asset value, beginning of year | | $ | 11.07 | | | $ | 8.35 | | $ | 16.53 | | | $ | 15.21 | | $ | 12.86 | | $ | 11.33 | |
Income (loss) from investment operations: | | | | | | | | | | | | | | | | | | | | | |
Net investment income (loss) (a) | | | 0.05 | | | | 0.09 | | | 0.10 | | | | 0.09 | | | 0.04 | | | (0.01 | ) |
Net realized and unrealized gain (loss) on investments | | | (1.07 | ) | | | 2.64 | | | (8.16 | ) | | | 2.55 | | | 2.52 | | | 1.54 | |
| | | | | | | | | | | | | | | | | | | | | |
Total from investment operations | | | (1.02 | ) | | | 2.73 | | | (8.06 | ) | | | 2.64 | | | 2.56 | | | 1.53 | |
Less distributions from: | | | | | | | | | | | | | | | | | | | | | |
Net investment income | | | — | | | | 0.01 | | | — | | | | 0.14 | | | 0.19 | | | — | |
Net realized gain | | | — | | | | — | | | 0.12 | | | | 1.18 | | | 0.02 | | | — | |
| | | | | | | | | | | | | | | | | | | | | |
Total distributions | | | — | | | | 0.01 | | | 0.12 | | | | 1.32 | | | 0.21 | | | — | |
| | | | | | | | | | | | | | | | | | | | | |
Net asset value, end of year | | $ | 10.05 | | | $ | 11.07 | | $ | 8.35 | | | $ | 16.53 | | $ | 15.21 | | $ | 12.86 | |
| | | | | | | | | | | | | | | | | | | | | |
Total return (%)* | | | (9.21 | ) | | | 32.69 | | | (48.75 | ) | | | 17.68 | | | 19.96 | | | 13.50 | |
Ratios to average daily net assets (%):** | | | | | | | | | | | | | | | | | | | | | |
Expenses, net of waivers and reimbursements | | | 1.45 | | | | 1.45 | | | 1.45 | | | | 1.45 | | | 1.46 | | | 1.48 | |
Expenses, before waivers and reimbursements | | | 1.51 | | | | 1.59 | | | 1.45 | | | | 1.47 | | | 1.56 | | | 1.81 | |
Net investment income (loss), net of waivers and reimbursements | | | 1.02 | | | | 1.03 | | | 0.80 | | | | 0.52 | | | 0.26 | | | (0.33 | ) |
Net investment income (loss), before waivers and reimbursements | | | 0.96 | | | | 0.89 | | | 0.80 | | | | 0.50 | | | 0.16 | | | (0.66 | ) |
| | | | | | | | | | | | | | | | | | | | | |
| | | Class I | |
| | | Period Ended
June 30, | | | Years Ended December 31, | |
| | | 2010 | | | 2009 | | 2008 | | | 2007 | | 2006 | | 2005 | |
Net asset value, beginning of year | | $ | 11.16 | | | $ | 8.44 | | $ | 16.66 | | | $ | 15.31 | | $ | 12.94 | | $ | 11.37 | |
Income (loss) from investment operations: | | | | | | | | | | | | | | | | | | | | | |
Net investment income (loss) (a) | | | 0.07 | | | | 0.08 | | | 0.15 | | | | 0.13 | | | 0.06 | | | (0.01 | ) |
Net realized and unrealized gain (loss) on investments | | | (1.08 | ) | | | 2.70 | | | (8.25 | ) | | | 2.57 | | | 2.55 | | | 1.58 | |
| | | | | | | | | | | | | | | | | | | | | |
Total from investment operations | | | (1.01 | ) | | | 2.78 | | | (8.10 | ) | | | 2.70 | | | 2.61 | | | 1.57 | |
Less distributions from: | | | | | | | | | | | | | | | | | | | | | |
Net investment income | | | — | | | | 0.06 | | | — | | | | 0.17 | | | 0.22 | | | — | |
Net realized gain | | | — | | | | — | | | 0.12 | | | | 1.18 | | | 0.02 | | | — | |
| | | | | | | | | | | | | | | | | | | | | |
Total distributions | | | — | | | | 0.06 | | | 0.12 | | | | 1.35 | | | 0.24 | | | — | |
| | | | | | | | | | | | | | | | | | | | | |
Net asset value, end of year | | $ | 10.15 | | | $ | 11.16 | | $ | 8.44 | | | $ | 16.66 | | $ | 15.31 | | $ | 12.94 | |
| | | | | | | | | | | | | | | | | | | | | |
Total return (%)* | | | (9.05 | ) | | | 32.93 | | | (48.61 | ) | | | 17.97 | | | 20.22 | | | 13.81 | |
Ratios to average daily net assets (%):** | | | | | | | | | | | | | | | | | | | | | |
Expenses, net of waivers and reimbursements | | | 1.20 | | | | 1.20 | | | 1.20 | | | | 1.20 | | | 1.21 | | | 1.23 | |
Expenses, before waivers and reimbursements | | | 1.27 | | | | 1.39 | | | 1.22 | | | | 1.25 | | | 1.35 | | | 1.56 | |
Net investment income (loss), net of waivers and reimbursements | | | 1.31 | | | | 0.86 | | | 1.12 | | | | 0.76 | | | 0.46 | | | (0.08 | ) |
Net investment income (loss), before waivers and reimbursements | | | 1.24 | | | | 0.67 | | | 1.10 | | | | 0.71 | | | 0.32 | | | (0.41 | ) |
| | | | | | | | | | | | | | | | | | |
| | | Period Ended
June 30, | | Years Ended December 31, |
| | | 2010 | | 2009 | | 2008 | | 2007 | | 2006 | | 2005 |
Supplemental data for all classes: | | | | | | | | | | | | | | | | | | |
Net assets at end of year (in thousands) | | $ | 285,913 | | $ | 298,168 | | $ | 228,486 | | $ | 408,609 | | $ | 297,716 | | $ | 177,710 |
Portfolio turnover rate (%)* | | | 33 | | | 88 | | | 92 | | | 70 | | | 83 | | | 127 |
| (a) | | Excludes $0.00, $(0.07), $0.01, $0.22, and $0.33 of PFIC mark to market which is treated as ordinary income for Federal tax purposes for the years 2009, 2008, 2007, 2006 and 2005, respectively. |
| * | | Rates not annualized for periods that are less than a year. |
| ** | | Rates are annualized for periods that are less than a year. |
Performance cited represents past performance. Past performance does not guarantee future results and current performance may be lower or higher than the data quoted. Results shown are annual returns, which assume reinvestment of dividends and capital gains. Investment returns and principal will fluctuate and you may have a gain or loss when you sell shares. For the most current month-end performance information, please call 1-800-742-7272 or visit our Web site at www.williamblairfunds.com.
Note: Net investment income (loss) per share is based on the average shares outstanding during the year.
June 30, 2010 | William Blair Funds 131 |
Financial Highlights
International Small Cap Growth Fund
| | | | | | | | | | | | | | | | | | | | | | | | |
| | | Class N | |
| | | Period Ended
June 30, | | | Years Ended December 31, | |
| | | 2010 | | | 2009 | | | 2008 | | | 2007 | | | 2006 | | | 2005(a) | |
Net asset value, beginning of year | | $ | 10.40 | | | $ | 6.62 | | | $ | 13.98 | | | $ | 13.37 | | | $ | 11.16 | | | $ | 10.00 | |
Income (loss) from investment operations: | | | | | | | | | | | | | | | | | | | | | | | | |
Net investment income (loss) (b) | | | 0.04 | | | | (0.01 | ) | | | (0.02 | ) | | | (0.02 | ) | | | (0.05 | ) | | | (0.01 | ) |
Net realized and unrealized gain (loss) on investments | | | (0.28 | ) | | | 3.79 | | | | (7.22 | ) | | | 1.72 | | | | 2.32 | | | | 1.17 | |
| | | | | | | | | | | | | | | | | | | | | | | | |
Total from investment operations | | | (0.24 | ) | | | 3.78 | | | | (7.24 | ) | | | 1.70 | | | | 2.27 | | | | 1.16 | |
Less distributions from: | | | | | | | | | | | | | | | | | | | | | | | | |
Net investment income | | | — | | | | — | | | | — | | | | 0.05 | | | | 0.01 | | | | — | |
Net realized gain | | | — | | | | — | | | | 0.12 | | | | 1.04 | | | | 0.05 | | | | — | |
| | | | | | | | | | | | | | | | | | | | | | | | |
Total distributions | | | — | | | | — | | | | 0.12 | | | | 1.09 | | | | 0.06 | | | | — | |
| | | | | | | | | | | | | | | | | | | | | | | | |
Net asset value, end of year | | $ | 10.16 | | | $ | 10.40 | | | $ | 6.62 | | | $ | 13.98 | | | $ | 13.37 | | | $ | 11.16 | |
| | | | | | | | | | | | | | | | | | | | | | | | |
Total return (%)* | | | (2.31 | ) | | | 57.10 | | | | (51.82 | ) | | | 13.06 | | | | 20.32 | | | | 11.60 | |
Ratios to average daily net assets (%):** | | | | | | | | | | | | | | | | | | | | | | | | |
Expenses, net of waivers and reimbursements | | | 1.56 | | | | 1.65 | | | | 1.65 | | | | 1.60 | | | | 1.65 | | | | 1.65 | |
Expenses, before waivers and reimbursements | | | 1.56 | | | | 1.83 | | | | 1.62 | | | | 1.60 | | | | 1.71 | | | | 2.57 | |
Net investment income (loss), net of waivers and reimbursements | | | 0.72 | | | | (0.16 | ) | | | (0.20 | ) | | | (0.16 | ) | | | (0.40 | ) | | | (0.40 | ) |
Net investment income (loss), before waivers and reimbursements | | | 0.72 | | | | (0.34 | ) | | | (0.17 | ) | | | (0.16 | ) | | | (0.46 | ) | | | (1.32 | ) |
| | | | | | | | | | | | | | | | | | | | | | |
| | | Class I | |
| | | Period Ended
June 30, | | | Years Ended December 31, | |
| | | 2010 | | | 2009 | | 2008 | | | 2007 | | 2006 | | | 2005(a) | |
Net asset value, beginning of year | | $ | 10.49 | | | $ | 6.67 | | $ | 14.01 | | | $ | 13.41 | | $ | 11.16 | | | $ | 10.00 | |
Income (loss) from investment operations: | | | | | | | | | | | | | | | | | | | | | | |
Net investment income (loss) (b) | | | 0.06 | | | | 0.01 | | | 0.01 | | | | 0.03 | | | (0.03 | ) | | | 0.00 | ^ |
Net realized and unrealized gain (loss) on investments | | | (0.29 | ) | | | 3.83 | | | (7.23 | ) | | | 1.71 | | | 2.34 | | | | 1.16 | |
| | | | | | | | | | | | | | | | | | | | | | |
Total from investment operations | | | (0.23 | ) | | | 3.84 | | | (7.22 | ) | | | 1.74 | | | 2.31 | | | | 1.16 | |
Less distributions from: | | | | | | | | | | | | | | | | | | | | | | |
Net investment income | | | — | | | | 0.02 | | | — | | | | 0.10 | | | 0.01 | | | | — | |
Net realized gain | | | — | | | | — | | | 0.12 | | | | 1.04 | | | 0.05 | | | | — | |
| | | | | | | | | | | | | | | | | | | | | | |
Total distributions | | | — | | | | 0.02 | | | 0.12 | | | | 1.14 | | | 0.06 | | | | — | |
| | | | | | | | | | | | | | | | | | | | | | |
Net asset value, end of year | | $ | 10.26 | | | $ | 10.49 | | $ | 6.67 | | | $ | 14.01 | | $ | 13.41 | | | $ | 11.16 | |
| | | | | | | | | | | | | | | | | | | | | | |
Total return (%)* | | | (2.19 | ) | | | 57.51 | | | (51.56 | ) | | | 13.34 | | | 20.68 | | | | 11.60 | |
Ratios to average daily net assets (%):** | | | | | | | | | | | | | | | | | | | | | | |
Expenses, net of waivers and reimbursements | | | 1.26 | | | | 1.31 | | | 1.31 | | | | 1.29 | | | 1.40 | | | | 1.40 | |
Expenses, before waivers and reimbursements | | | 1.26 | | | | 1.31 | | | 1.28 | | | | 1.29 | | | 1.46 | | | | 2.32 | |
Net investment income (loss), net of waivers and reimbursements | | | 1.06 | | | | 0.11 | | | 0.11 | | | | 0.18 | | | (0.25 | ) | | | (0.15 | ) |
Net investment income (loss), before waivers and reimbursements | | | 1.06 | | | | 0.11 | | | 0.14 | | | | 0.18 | | | (0.31 | ) | | | (1.07 | ) |
| | | | | | | | | | | | | | | | | | |
| | | Period Ended
June 30, | | Years Ended December 31, |
| | | 2010 | | 2009 | | 2008 | | 2007 | | 2006 | | 2005(a) |
Supplemental data for all classes: | | | | | | | | | | | | | | | | | | |
Net assets at end of year (in thousands) | | $ | 441,589 | | $ | 390,851 | | $ | 291,988 | | $ | 401,459 | | $ | 231,969 | | $ | 50,534 |
Portfolio turnover rate (%)* | | | 40 | | | 136 | | | 78 | | | 88 | | | 109 | | | 127 |
| (a) | | For the period November 1, 2005 (Commencement of Operations) to December 31, 2005. |
| (b) | | Excludes $0.01, $(0.02), $0.05, $0.00, and $0.11 of PFIC mark to market which is treated as ordinary income for Federal tax purposes for the years 2009, 2008, 2007, 2006 and 2005, respectively. |
| * | | Rates not annualized for periods that are less than a year. |
| ** | | Rates are annualized for periods that are less than a year. |
| ^ | | Amount is less than $0.005 per share. |
Performance cited represents past performance. Past performance does not guarantee future results and current performance may be lower or higher than the data quoted. Results shown are annual returns, which assume reinvestment of dividends and capital gains. Investment returns and principal will fluctuate and you may have a gain or loss when you sell shares. For the most current month-end performance information, please call 1-800-742-7272 or visit our Web site at www.williamblairfunds.com.
Note: Net investment income (loss) per share is based on the average shares outstanding during the year.
132 Semi-Annual Report | June 30, 2010 |
Financial Highlights
Emerging Markets Growth Fund
| | | | | | | | | | | | | | | | | | | | | | | | |
| | | Class N | |
| | | Period Ended
June 30, | | | Years Ended December 31, | |
| | | 2010 | | | 2009 | | | 2008 | | | 2007 | | | 2006 | | | 2005(a) | |
Net asset value, beginning of year | | $ | 12.87 | | | $ | 7.46 | | | $ | 21.92 | | | $ | 19.42 | | | $ | 14.17 | | | $ | 10.00 | |
Income (loss) from investment operations: | | | | | | | | | | | | | | | | | | | | | | | | |
Net investment income (loss) (b) | | | 0.02 | | | | 0.00 | ^ | | | 0.11 | | | | (0.10 | ) | | | (0.04 | ) | | | (0.01 | ) |
Net realized and unrealized gain (loss) on investments | | | (0.57 | ) | | | 5.51 | | | | (13.63 | ) | | | 7.23 | | | | 5.41 | | | | 4.26 | |
| | | | | | | | | | | | | | | | | | | | | | | | |
Total from investment operations | | | (0.55 | ) | | | 5.51 | | | | (13.52 | ) | | | 7.13 | | | | 5.37 | | | | 4.25 | |
Less distributions from: | | | | | | | | | | | | | | | | | | | | | | | | |
Net investment income | | | — | | | | 0.10 | | | | — | | | | 0.09 | | | | 0.01 | | | | — | |
Net realized gain | | | — | | | | — | | | | 0.94 | | | | 4.54 | | | | 0.11 | | | | 0.08 | |
| | | | | | | | | | | | | | | | | | | | | | | | |
Total distributions | | | — | | | | 0.10 | | | | 0.94 | | | | 4.63 | | | | 0.12 | | | | 0.08 | |
| | | | | | | | | | | | | | | | | | | | | | | | |
Net asset value, end of year | | $ | 12.32 | | | $ | 12.87 | | | $ | 7.46 | | | $ | 21.92 | | | $ | 19.42 | | | $ | 14.17 | |
| | | | | | | | | | | | | | | | | | | | | | | | |
Total return (%)* | | | (4.27 | ) | | | 73.85 | | | | (61.71 | ) | | | 37.75 | | | | 37.90 | | | | 42.52 | |
Ratios to average daily net assets (%):** | | | | | | | | | | | | | | | | | | | | | | | | |
Expenses, net of waivers and reimbursements | | | 1.67 | | | | 1.70 | | | | 1.67 | | | | 1.65 | | | | 1.65 | | | | 1.55 | |
Expenses, before waivers and reimbursements | | | 1.67 | | | | 1.81 | | | | 1.65 | | | | 1.69 | | | | 1.78 | | | | 1.91 | |
Net investment income (loss), net of waivers and reimbursements | | | 0.24 | | | | 0.04 | | | | 0.65 | | | | (0.45 | ) | | | (0.22 | ) | | | (0.11 | ) |
Net investment income (loss), before waivers and reimbursements | | | 0.24 | | | | (0.07 | ) | | | 0.67 | | | | (0.49 | ) | | | (0.35 | ) | | | (0.47 | ) |
| | | | | | | | | | | | | | | | | | | | | | | |
| | | Class I | |
| | | Period Ended
June 30, | | | Years Ended December 31, | |
| | | 2010 | | | 2009 | | 2008 | | | 2007 | | | 2006 | | | 2005(a) | |
Net asset value, beginning of year | | $ | 12.95 | | | $ | 7.51 | | $ | 21.99 | | | $ | 19.47 | | | $ | 14.19 | | | $ | 10.00 | |
Income (loss) from investment operations: | | | | | | | | | | | | | | | | | | | | | | | |
Net investment income (loss) (b) | | | 0.04 | | | | 0.03 | | | 0.15 | | | | (0.04 | ) | | | (0.01 | ) | | | 0.01 | |
Net realized and unrealized gain (loss) on investments | | | (0.57 | ) | | | 5.54 | | | (13.69 | ) | | | 7.26 | | | | 5.41 | | | | 4.26 | |
| | | | | | | | | | | | | | | | | | | | | | | |
Total from investment operations | | | (0.53 | ) | | | 5.57 | | | (13.54 | ) | | | 7.22 | | | | 5.40 | | | | 4.27 | |
Less distributions from: | | | | | | | | | | | | | | | | | | | | | | | |
Net investment income | | | — | | | | 0.13 | | | — | | | | 0.16 | | | | 0.01 | | | | — | |
Net realized gain | | | — | | | | — | | | 0.94 | | | | 4.54 | | | | 0.11 | | | | 0.08 | |
| | | | | | | | | | | | | | | | | | | | | | | |
Total distributions | | | — | | | | 0.13 | | | 0.94 | | | | 4.70 | | | | 0.12 | | | | 0.08 | |
| | | | | | | | | | | | | | | | | | | | | | | |
Net asset value, end of year | | $ | 12.42 | | | $ | 12.95 | | $ | 7.51 | | | $ | 21.99 | | | $ | 19.47 | | | $ | 14.19 | |
| | | | | | | | | | | | | | | | | | | | | | | |
Total return (%)* | | | (4.09 | ) | | | 74.18 | | | (61.60 | ) | | | 38.13 | | | | 38.07 | | | | 42.72 | |
Ratios to average daily net assets (%):** | | | | | | | | | | | | | | | | | | | | | | | |
Expenses, net of waivers and reimbursements | | | 1.37 | | | | 1.41 | | | 1.41 | | | | 1.40 | | | | 1.40 | | | | 1.40 | |
Expenses, before waivers and reimbursements | | | 1.37 | | | | 1.41 | | | 1.39 | | | | 1.40 | | | | 1.47 | | | | 1.76 | |
Net investment income (loss), net of waivers and reimbursements | | | 0.58 | | | | 0.31 | | | 0.91 | | | | (0.20 | ) | | | (0.06 | ) | | | 0.04 | |
Net investment income (loss), before waivers and reimbursements | | | 0.58 | | | | 0.31 | | | 0.93 | | | | (0.20 | ) | | | (0.13 | ) | | | (0.32 | ) |
| | | | | | | | | | | | | | | | | | |
| | | Period Ended
June 30, | | Years Ended December 31, |
| | | 2010 | | 2009 | | 2008 | | 2007 | | 2006 | | 2005(a) |
Supplemental data for all classes: | | | | | | | | | | | | | | | | | | |
Net assets at end of year (in thousands) | | $ | 1,012,481 | | $ | 1,038,260 | | $ | 385,588 | | $ | 1,165,854 | | $ | 813,649 | | $ | 249,348 |
Portfolio turnover rate (%)* | | | 59 | | | 113 | | | 118 | | | 100 | | | 113 | | | 77 |
| (a) | | For the period June 6, 2005 (Commencement of Operations) to December 31, 2005. |
| (b) | | Excludes $0.15, $(0.09), $0.21, $0.00, and $0.11 of PFIC mark to market which is treated as ordinary income for Federal tax purposes for the years 2009, 2008, 2007, 2006 and 2005, respectively. |
| * | | Rates not annualized for periods that are less than a year. |
| ** | | Rates are annualized for periods that are less than a year. |
| ^ | | Amount is less than $0.005 per share. |
Performance cited represents past performance. Past performance does not guarantee future results and current performance may be lower or higher than the data quoted. Results shown are annual returns, which assume reinvestment of dividends and capital gains. Investment returns and principal will fluctuate and you may have a gain or loss when you sell shares. For the most current month-end performance information, please call 1-800-742-7272 or visit our Web site at www.williamblairfunds.com.
Note: Net investment income (loss) per share is based on the average shares outstanding during the year.
June 30, 2010 | William Blair Funds 133 |
Financial Highlights
Emerging Leaders Growth Fund
| | | | |
| | | Class N | |
| | | Period Ended
June 30, | |
| | | 2010(a) | |
Net asset value, beginning of year | | $ | 8.80 | |
Income (loss) from investment operations: | | | | |
Net investment income (loss) | | | 0.02 | |
Net realized and unrealized gain (loss) on investments | | | (0.56 | ) |
| | | | |
Total from investment operations | | | (0.54 | ) |
Less distributions from: | | | | |
Net investment income | | | — | |
Net realized gain | | | — | |
| | | | |
Total distributions | | | — | |
| | | | |
Net asset value, end of year | | $ | 8.26 | |
| | | | |
Total return (%)* | | | (6.14 | ) |
Ratios to average daily net assets (%):** | | | | |
Expenses, net of waivers and reimbursements | | | 1.65 | |
Expenses, before waivers and reimbursements | | | 1.71 | |
Net investment income (loss), net of waivers and reimbursements | | | 0.51 | |
Net investment income (loss), before waivers and reimbursements | | | 0.45 | |
| | | | | | | | | | | |
| | | Class I | |
| | | Period Ended
June 30, | | | Years Ended
December 31, | |
| | | 2010 | | | 2009 | | 2008(b) | |
Net asset value, beginning of year | | $ | 8.43 | | | $ | 4.79 | | $ | 10.00 | |
Income (loss) from investment operations: | | | | | | | | | | | |
Net investment income (loss) (c) | | | 0.04 | | | | 0.02 | | | 0.04 | |
Net realized and unrealized gain (loss) on investments | | | (0.21 | ) | | | 3.73 | | | (5.25 | ) |
| | | | | | | | | | | |
Total from investment operations | | | (0.17 | ) | | | 3.75 | | | (5.21 | ) |
Less distributions from: | | | | | | | | | | | |
Net investment income (loss) | | | — | | | | 0.11 | | | 0.00 | ^ |
Net realized gain | | | — | | | | — | | | — | |
| | | | | | | | | | | |
Total distributions | | | — | | | | 0.11 | | | 0.00 | ^ |
| | | | | | | | | | | |
Net asset value, end of year | | $ | 8.26 | | | $ | 8.43 | | $ | 4.79 | |
| | | | | | | | | | | |
Total return (%)* | | | (2.02 | ) | | | 78.38 | | | (52.09 | ) |
Ratios to average daily net assets (%):** | | | | | | | | | | | |
Expenses, net of waivers and reimbursements | | | 1.40 | | | | 1.40 | | | 1.40 | |
Expenses, before waivers and reimbursements | | | 1.47 | | | | 1.54 | | | 1.56 | |
Net investment income (loss), net of waivers and reimbursements | | | 0.81 | | | | 0.37 | | | 0.70 | |
Net investment income (loss), before waivers and reimbursements | | | 0.74 | | | | 0.23 | | | 0.54 | |
| | | | | | | | | |
| | | Period Ended
June 30, | | Period Ended
December 31, |
| | | 2010 | | 2009 | | 2008(a) |
Supplemental data for all classes: | | | | | | | | | |
Net assets at end of year (in thousands) | | $ | 75,609 | | $ | 115,136 | | $ | 46,676 |
Portfolio turnover rate (%)* | | | 79 | | | 176 | | | 151 |
| (a) | | For the period May 3, 2010 (Commencement of Operations) to June 30, 2010. |
| (b) | | For the period May 1, 2007 (Commencement of Operations) to December 31, 2007. |
| (c) | | Excludes $1.29 and $0.00 of PFIC mark to market which is treated as ordinary income for Federal tax purposes for the years 2009 and 2008. |
| * | | Rates not annualized for periods that are less than a year. |
| ** | | Rates are annualized for periods that are less than a year. |
| ^ | | Amount is less than $0.005 per share. |
Performance cited represents past performance. Past performance does not guarantee future results and current performance may be lower or higher than the data quoted. Results shown are annual returns, which assume reinvestment of dividends and capital gains. Investment returns and principal will fluctuate and you may have a gain or loss when you sell shares. For the most current month-end performance information, please call 1-800-742-7272 or visit our Web site at www.williamblairfunds.com.
Note: Net investment income (loss) per share is based on the average shares outstanding during the year.
134 Semi-Annual Report | June 30, 2010 |
Financial Highlights
Small Cap Value Fund
| | | | | | | | | | | | | | | | | | | | | | | |
| | | Class N | |
| | | Period Ended
June 30, | | | Years Ended December 31, | |
| | | 2010 | | | 2009 | | 2008 | | | 2007 | | | 2006 | | | 2005 | |
Net asset value, beginning of year | | $ | 10.49 | | | $ | 8.33 | | $ | 11.31 | | | $ | 16.27 | | | $ | 14.95 | | | $ | 22.70 | |
Income (loss) from investment operations: | | | | | | | | | | | | | | | | | | | | | | | |
Net investment income (loss) | | | 0.00 | ^ | | | 0.06 | | | 0.09 | | | | 0.02 | | | | 0.03 | | | | (0.02 | ) |
Net realized and unrealized gain (loss) on investments | | | 0.04 | | | | 2.13 | | | (3.02 | ) | | | (0.96 | ) | | | 3.22 | | | | 0.14 | |
| | | | | | | | | | | | | | | | | | | | | | | |
Total from investment operations | | | 0.04 | | | | 2.19 | | | (2.93 | ) | | | (0.94 | ) | | | 3.25 | | | | 0.12 | |
Less distributions from: | | | | | | | | | | | | | | | | | | | | | | | |
Net investment income | | | — | | | | 0.03 | | | 0.05 | | | | — | | | | 0.01 | | | | — | |
Net realized gain | | | — | | | | — | | | — | | | | 4.02 | | | | 1.92 | | | | 7.87 | |
| | | | | | | | | | | | | | | | | | | | | | | |
Total distributions | | | — | | | | 0.03 | | | 0.05 | | | | 4.02 | | | | 1.93 | | | | 7.87 | |
| | | | | | | | | | | | | | | | | | | | | | | |
Net asset value, end of year | | $ | 10.53 | | | $ | 10.49 | | $ | 8.33 | | | $ | 11.31 | | | $ | 16.27 | | | $ | 14.95 | |
| | | | | | | | | | | | | | | | | | | | | | | |
Total return (%)* | | | 0.38 | | | | 26.24 | | | (25.85 | ) | | | (5.54 | ) | | | 21.78 | | | | 0.49 | |
Ratios to average daily net assets (%):** | | | | | | | | | | | | | | | | | | | | | | | |
Expenses, net of waivers and reimbursements | | | 1.31 | | | | 1.29 | | | 1.29 | | | | 1.33 | | | | 1.34 | | | | 1.34 | |
Expenses, before waivers and reimbursements | | | 1.74 | | | | 1.78 | | | 1.82 | | | | 1.66 | | | | 1.75 | | | | 1.64 | |
Net investment income (loss), net of waivers and reimbursements | | | 0.08 | | | | 0.68 | | | 0.84 | | | | 0.10 | | | | 0.21 | | | | (0.22 | ) |
Net investment income (loss), before waivers and reimbursements | | | (0.35 | ) | | | 0.19 | | | 0.31 | | | | (0.23 | ) | | | (0.20 | ) | | | (0.52 | ) |
| | | | | | | | | | | | | | | | | | | | | | |
| | | Class I | |
| | | Period Ended
June 30, | | Years Ended December 31, | |
| | | 2010 | | 2009 | | 2008 | | | 2007 | | | 2006 | | | 2005 | |
Net asset value, beginning of year | | $ | 10.65 | | $ | 8.45 | | $ | 11.50 | | | $ | 16.51 | | | $ | 15.12 | | | $ | 22.82 | |
Income (loss) from investment operations: | | | | | | | | | | | | | | | | | | | | | | |
Net investment income (loss) | | | 0.02 | | | 0.08 | | | 0.11 | | | | 0.09 | | | | 0.03 | | | | 0.00 | ^ |
Net realized and unrealized gain (loss) on investments | | | 0.03 | | | 2.16 | | | (3.08 | ) | | | (1.01 | ) | | | 3.30 | | | | 0.17 | |
| | | | | | | | | | | | | | | | | | | | | | |
Total from investment operations | | | 0.05 | | | 2.24 | | | (2.97 | ) | | | (0.92 | ) | | | 3.33 | | | | 0.17 | |
Less distributions from: | | | | | | | | | | | | | | | | | | | | | | |
Net investment income | | | — | | | 0.04 | | | 0.08 | | | | 0.07 | | | | 0.02 | | | | — | |
Net realized gain | | | — | | | — | | | — | | | | 4.02 | | | | 1.92 | | | | 7.87 | |
| | | | | | | | | | | | | | | | | | | | | | |
Total distributions | | | — | | | 0.04 | | | 0.08 | | | | 4.09 | | | | 1.94 | | | | 7.87 | |
| | | | | | | | | | | | | | | | | | | | | | |
Net asset value, end of year | | $ | 10.70 | | $ | 10.65 | | $ | 8.45 | | | $ | 11.50 | | | $ | 16.51 | | | $ | 15.12 | |
| | | | | | | | | | | | | | | | | | | | | | |
Total return (%)* | | | 0.47 | | | 26.56 | | | (25.77 | ) | | | (5.31 | ) | | | 22.10 | | | | 0.70 | |
Ratios to average daily net assets (%):** | | | | | | | | | | | | | | | | | | | | | | |
Expenses, net of waivers and reimbursements | | | 1.09 | | | 1.09 | | | 1.09 | | | | 1.09 | | | | 1.09 | | | | 1.14 | |
Expenses, before waivers and reimbursements | | | 1.29 | | | 1.50 | | | 1.57 | | | | 1.37 | | | | 1.50 | | | | 1.39 | |
Net investment income (loss), net of waivers and reimbursements | | | 0.34 | | | 0.86 | | | 1.06 | | | | 0.52 | | | | 0.16 | | | | (0.02 | ) |
Net investment income (loss), before waivers and reimbursements | | | 0.14 | | | 0.45 | | | 0.58 | | | | 0.24 | | | | (0.25 | ) | | | (0.27 | ) |
| | | | | | | | | | | | | | | | | | |
| | | Period Ended
June 30, | | Years Ended December 31, |
| | | 2010 | | 2009 | | 2008 | | 2007 | | 2006 | | 2005 |
Supplemental data for all classes: | | | | | | | | | | | | | | | | | | |
Net assets at end of year (in thousands) | | $ | 89,279 | | $ | 54,859 | | $ | 36,249 | | $ | 47,118 | | $ | 146,777 | | $ | 70,439 |
Portfolio turnover rate (%)* | | | 39 | | | 62 | | | 87 | | | 102 | | | 162 | | | 125 |
| * | | Rates not annualized for periods that are less than a year. |
| ** | | Rates are annualized for periods that are less than a year. |
| ^ | | Amount is less than $0.005 per share. |
Performance cited represents past performance. Past performance does not guarantee future results and current performance may be lower or higher than the data quoted. Results shown are annual returns, which assume reinvestment of dividends and capital gains. Investment returns and principal will fluctuate and you may have a gain or loss when you sell shares. For the most current month-end performance information, please call 1-800-742-7272 or visit our Web site at www.williamblairfunds.com.
Note: Net investment income (loss) per share is based on the average shares outstanding during the year.
June 30, 2010 | William Blair Funds 135 |
Financial Highlights
Mid Cap Value Fund
| | | | |
| | | Class N | |
| | | Period Ended
June 30, | |
| | | 2010(a) | |
Net asset value, beginning of year | | $ | 10.00 | |
Income (loss) from investment operations: | | | | |
Net investment income (loss) | | | 0.01 | |
Net realized and unrealized gain (loss) on investments | | | (1.33 | ) |
| | | | |
Total from investment operations | | | (1.32 | ) |
Less distributions from: | | | | |
Net investment income | | | — | |
Net realized gain | | | — | |
| | | | |
Total distributions | | | — | |
| | | | |
Net asset value, end of year | | $ | 8.68 | |
| | | | |
Total return (%)* | | | (13.20 | ) |
Ratios to average daily net assets (%):** | | | | |
Expenses, net of waivers and reimbursements | | | 1.35 | |
Expenses, before waivers and reimbursements | | | 9.89 | |
Net investment income (loss), net of waivers and reimbursements | | | 0.55 | |
Net investment income (loss), before waivers and reimbursements | | | (7.99 | ) |
| | | | |
| | | Class I | |
| | | Period Ended
June 30, | |
| | | 2010(a) | |
Net asset value, beginning of year | | $ | 10.00 | |
Income (loss) from investment operations: | | | | |
Net investment income (loss) | | | 0.01 | |
Net realized and unrealized gain (loss) on investments | | | (1.32 | ) |
| | | | |
Total from investment operations | | | (1.31 | ) |
Less distributions from: | | | | |
Net investment income | | | — | |
Net realized gain | | | — | |
| | | | |
Total distributions | | | — | |
| | | | |
Net asset value, end of year | | $ | 8.69 | |
| | | | |
Total return (%)* | | | (13.10 | ) |
Ratios to average daily net assets (%):** | | | | |
Expenses, net of waivers and reimbursements | | | 1.10 | |
Expenses, before waivers and reimbursements | | | 8.14 | |
Net investment income (loss), net of waivers and reimbursements | | | 0.80 | |
Net investment income (loss), before waivers and reimbursements | | | (6.24 | ) |
| | | |
| | | Period Ended
June 30, |
| | | 2010(a) |
Supplemental data for all classes: | | | |
Net assets at end of year (in thousands) | | $ | 2,027 |
Portfolio turnover rate (%)* | | | 7 |
| (a) | | For the period May 3, 2010 (Commencement of Operations) to June 30, 2010. |
| * | | Rates not annualized for periods that are less than a year. |
| ** | | Rates are annualized for periods that are less than a year. |
Performance cited represents past performance. Past performance does not guarantee future results and current performance may be lower or higher than the data quoted. Results shown are annual returns, which assume reinvestment of dividends and capital gains. Investment returns and principal will fluctuate and you may have a gain or loss when you sell shares. For the most current month-end performance information, please call 1-800-742-7272 or visit our Web site at www.williamblairfunds.com.
Note: Net investment income (loss) per share is based on the average shares outstanding during the year.
136 Semi-Annual Report | June 30, 2010 |
Financial Highlights
Bond Fund
| | | | | | | | | | | | | |
| | | Class N |
| | | Period Ended
June 30, | | Period Ended December 31, |
| | | 2010 | | 2009 | | 2008 | | | 2007(a) |
Net asset value, beginning of year | | $ | 10.40 | | $ | 9.82 | | $ | 10.07 | | | $ | 10.00 |
Income (loss) from investment operations: | | | | | | | | | | | | | |
Net investment income (loss) | | | 0.24 | | | 0.48 | | | 0.47 | | | | 0.31 |
Net realized and unrealized gain (loss) on investments | | | 0.30 | | | 0.59 | | | (0.31 | ) | | | 0.02 |
| | | | | | | | | | | | | |
Total from investment operations | | | 0.54 | | | 1.07 | | | 0.16 | | | | 0.33 |
Less distributions from: | | | | | | | | | | | | | |
Net investment income | | | 0.22 | | | 0.49 | | | 0.41 | | | | 0.26 |
Net realized gain | | | — | | | — | | | — | | | | — |
| | | | | | | | | | | | | |
Total distributions | | | 0.22 | | | 0.49 | | | 0.41 | | | | 0.26 |
| | | | | | | | | | | | | |
Net asset value, end of year | | $ | 10.72 | | $ | 10.40 | | $ | 9.82 | | | $ | 10.07 |
| | | | | | | | | | | | | |
Total return (%)* | | | 5.27 | | | 11.11 | | | 1.64 | | | | 3.38 |
Ratios to average daily net assets (%):** | | | | | | | | | | | | | |
Expenses, net of waivers and reimbursements | | | 0.65 | | | 0.65 | | | 0.65 | | | | 0.65 |
Expenses, before waivers and reimbursements | | | 0.71 | | | 1.40 | | | 2.47 | | | | 0.81 |
Net investment income (loss), net of waivers and reimbursements | | | 4.49 | | | 4.76 | | | 4.69 | | | | 4.80 |
Net investment income (loss), before waivers and reimbursements | | | 4.43 | | | 4.01 | | | 2.87 | | | | 4.64 |
| | | | | | | | | | | | | |
| | | Class I |
| | | Period Ended
June 30, | | Period Ended December 31, |
| | | 2010 | | 2009 | | 2008 | | | 2007(a) |
Net asset value, beginning of year | | $ | 10.31 | | $ | 9.72 | | $ | 10.04 | | | $ | 10.00 |
Income (loss) from investment operations: | | | | | | | | | | | | | |
Net investment income (loss) | | | 0.24 | | | 0.49 | | | 0.48 | | | | 0.32 |
Net realized and unrealized gain (loss) on investments | | | 0.30 | | | 0.59 | | | (0.31 | ) | | | 0.02 |
| | | | | | | | | | | | | |
Total from investment operations | | | 0.54 | | | 1.08 | | | 0.17 | | | | 0.34 |
Less distributions from: | | | | | | | | | | | | | |
Net investment income | | | 0.23 | | | 0.49 | | | 0.49 | | | | 0.30 |
Net realized gain | | | — | | | — | | | — | | | | — |
| | | | | | | | | | | | | |
Total distributions | | | 0.23 | | | 0.49 | | | 0.49 | | | | 0.30 |
| | | | | | | | | | | | | |
Net asset value, end of year | | $ | 10.62 | | $ | 10.31 | | $ | 9.72 | | | $ | 10.04 |
| | | | | | | | | | | | | |
Total return (%)* | | | 5.29 | | | 11.40 | | | 1.72 | | | | 3.50 |
Ratios to average daily net assets (%):** | | | | | | | | | | | | | |
Expenses, net of waivers and reimbursements | | | 0.50 | | | 0.50 | | | 0.50 | | | | 0.50 |
Expenses, before waivers and reimbursements | | | 0.56 | | | 0.58 | | | 0.71 | | | | 0.67 |
Net investment income (loss), net of waivers and reimbursements | | | 4.64 | | | 4.92 | | | 4.90 | | | | 4.95 |
Net investment income (loss), before waivers and reimbursements | | | 4.58 | | | 4.84 | | | 4.69 | | | | 4.78 |
| | | | | | | | | | | | |
| | | Period Ended
June 30, | | Period Ended December 31, |
| | | 2010 | | 2009 | | 2008 | | 2007(a) |
Supplemental data for all classes: | | | | | | | | | | | | |
Net assets at end of year (in thousands) | | $ | 188,664 | | $ | 147,344 | | $ | 74,613 | | $ | 68,483 |
Portfolio turnover rate (%)* | | | 17 | | | 29 | | | 52 | | | 38 |
| (a) | | For the period May 1, 2007 (Commencement of Operations) to December 31, 2007. |
| * | | Rates not annualized for periods that are less than a year. |
| ** | | Rates are annualized for periods that are less than a year. |
Performance cited represents past performance. Past performance does not guarantee future results and current performance may be lower or higher than the data quoted. Results shown are annual returns, which assume reinvestment of dividends and capital gains. Investment returns and principal will fluctuate and you may have a gain or loss when you sell shares. For the most current month-end performance information, please call 1-800-742-7272 or visit our Web site at www.williamblairfunds.com.
Note: Net investment income (loss) per share is based on the average shares outstanding during the year.
June 30, 2010 | William Blair Funds 137 |
Financial Highlights
Income Fund
| | | | | | | | | | | | | | | | | | | | | | |
| | | Class N | |
| | | Period Ended
June 30, | | Years Ended December 31, | |
| | | 2010 | | 2009 | | 2008 | | | 2007 | | | 2006 | | | 2005 | |
Net asset value, beginning of year | | $ | 9.07 | | $ | 8.69 | | $ | 9.29 | | | $ | 9.74 | | | $ | 9.83 | | | $ | 10.19 | |
Income (loss) from investment operations: | | | | | | | | | | | | | | | | | | | | | | |
Net investment income (loss) | | | 0.20 | | | 0.40 | | | 0.37 | | | | 0.45 | | | | 0.44 | | | | 0.47 | |
Net realized and unrealized gain (loss) on investments | | | 0.15 | | | 0.44 | | | (0.59 | ) | | | (0.35 | ) | | | (0.04 | ) | | | (0.30 | ) |
| | | | | | | | | | | | | | | | | | | | | | |
Total from investment operations | | | 0.35 | | | 0.84 | | | (0.22 | ) | | | 0.10 | | | | 0.40 | | | | 0.17 | |
Less distributions from: | | | | | | | | | | | | | | | | | | | | | | |
Net investment income | | | 0.18 | | | 0.46 | | | 0.38 | | | | 0.55 | | | | 0.49 | | | | 0.53 | |
Net realized gain | | | — | | | — | | | — | | | | — | | | | — | | | | — | |
| | | | | | | | | | | | | | | | | | | | | | |
Total distributions | | | 0.18 | | | 0.46 | | | 0.38 | | | | 0.55 | | | | 0.49 | | | | 0.53 | |
| | | | | | | | | | | | | | | | | | | | | | |
Net asset value, end of year | | $ | 9.24 | | $ | 9.07 | | $ | 8.69 | | | $ | 9.29 | | | $ | 9.74 | | | $ | 9.83 | |
| | | | | | | | | | | | | | | | | | | | | | |
Total return (%)* | | | 3.94 | | | 9.88 | | | (2.46 | ) | | | 1.08 | | | | 4.25 | | | | 1.71 | |
Ratios to average daily net assets (%):** | | | | | | | | | | | | | | | | | | | | | | |
Expenses, net of waivers and reimbursements | | | 0.85 | | | 0.85 | | | 0.90 | | | | 0.79 | | | | 0.74 | | | | 0.73 | |
Expenses, before waivers and reimbursements | | | 0.88 | | | 0.93 | | | 0.93 | | | | 0.81 | | | | 0.80 | | | | 0.73 | |
Net investment income (loss), net of waivers and reimbursements | | | 4.43 | | | 4.48 | | | 4.38 | | | | 4.73 | | | | 4.54 | | | | 4.09 | |
Net investment income (loss), before waivers and reimbursements | | | 4.40 | | | 4.41 | | | 4.35 | | | | 4.71 | | | | 4.48 | | | | 4.09 | |
| | | | | | | | | | | | | | | | | | | | | | |
| | | Class I | |
| | | Period Ended
June 30, | | Years Ended December 31, | |
| | | 2010 | | 2009 | | 2008 | | | 2007 | | | 2006 | | | 2005 | |
Net asset value, beginning of year | | $ | 9.00 | | $ | 8.64 | | $ | 9.30 | | | $ | 9.69 | | | $ | 9.82 | | | $ | 10.15 | |
Income (loss) from investment operations: | | | | | | | | | | | | | | | | | | | | | | |
Net investment income (loss) | | | 0.21 | | | 0.41 | | | 0.39 | | | | 0.47 | | | | 0.45 | | | | 0.52 | |
Net realized and unrealized gain (loss) on investments | | | 0.15 | | | 0.43 | | | (0.59 | ) | | | (0.34 | ) | | | (0.04 | ) | | | (0.33 | ) |
| | | | | | | | | | | | | | | | | | | | | | |
Total from investment operations | | | 0.36 | | | 0.84 | | | (0.20 | ) | | | 0.13 | | | | 0.41 | | | | 0.19 | |
Less distributions from: | | | | | | | | | | | | | | | | | | | | | | |
Net investment income | | | 0.19 | | | 0.48 | | | 0.46 | | | | 0.52 | | | | 0.54 | | | | 0.52 | |
Net realized gain | | | — | | | — | | | — | | | | — | | | | — | | | | — | |
| | | | | | | | | | | | | | | | | | | | | | |
Total distributions | | | 0.19 | | | 0.48 | | | 0.46 | | | | 0.52 | | | | 0.54 | | | | 0.52 | |
| | | | | | | | | | | | | | | | | | | | | | |
Net asset value, end of year | | $ | 9.17 | | $ | 9.00 | | $ | 8.64 | | | $ | 9.30 | | | $ | 9.69 | | | $ | 9.82 | |
| | | | | | | | | | | | | | | | | | | | | | |
Total return (%)* | | | 4.06 | | | 9.89 | | | (2.26 | ) | | | 1.36 | | | | 4.33 | | | | 1.92 | |
Ratios to average daily net assets (%):** | | | | | | | | | | | | | | | | | | | | | | |
Expenses, net of waivers and reimbursements | | | 0.65 | | | 0.66 | | | 0.72 | | | | 0.60 | | | | 0.62 | | | | 0.58 | |
Net investment income (loss), net of waivers and reimbursements | | | 4.62 | | | 4.67 | | | 4.57 | | | | 4.91 | | | | 4.66 | | | | 4.24 | |
| | | | | | | | | | | | | | | | | | |
| | | Period Ended
June 30, | | Years Ended December 31, |
| | | 2010 | | 2009 | | 2008 | | 2007 | | 2006 | | 2005 |
Supplemental data for all classes: | | | | | | | | | | | | | | | | | | |
Net assets at end of year (in thousands) | | $ | 117,613 | | $ | 117,608 | | $ | 140,435 | | $ | 204,630 | | $ | 297,077 | | $ | 310,496 |
Portfolio turnover rate (%)* | | | 13 | | | 40 | | | 38 | | | 34 | | | 33 | | | 41 |
| * | | Rates not annualized for periods that are less than a year. |
| ** | | Rates are annualized for periods that are less than a year. |
Performance cited represents past performance. Past performance does not guarantee future results and current performance may be lower or higher than the data quoted. Results shown are annual returns, which assume reinvestment of dividends and capital gains. Investment returns and principal will fluctuate and you may have a gain or loss when you sell shares. For the most current month-end performance information, please call 1-800-742-7272 or visit our Web site at www.williamblairfunds.com.
Note: Net investment income (loss) per share is based on the average shares outstanding during the year.
138 Semi-Annual Report | June 30, 2010 |
Financial Highlights
Low Duration Bond Fund
| | | | | | | |
| | | Class N | |
| | | Periods Ended | |
| | | June 30, | | December 31, | |
| | | 2010 | | 2009(a) | |
Net asset value, beginning of year | | $ | 9.93 | | $ | 10.00 | |
Income (loss) from investment operations: | | | | | | | |
Net investment income (loss) | | | 0.06 | | | 0.01 | |
Net realized and unrealized gain (loss) on investments | | | 0.08 | | | (0.07 | ) |
| | | | | | | |
Total from investment operations | | | 0.14 | | | (0.06 | ) |
Less distributions from: | | | | | | | |
Net investment income | | | 0.09 | | | 0.01 | |
Net realized gain | | | — | | | — | |
| | | | | | | |
Total distributions | | | 0.09 | | | 0.01 | |
| | | | | | | |
Net asset value, end of year | | $ | 9.98 | | $ | 9.93 | |
| | | | | | | |
Total return (%)* | | | 1.43 | | | (0.60 | ) |
Ratios to average daily net assets (%):** | | | | | | | |
Expenses, net of waivers and reimbursements | | | 0.70 | | | 0.70 | |
Expenses, before waivers and reimbursements | | | 0.76 | | | 0.94 | |
Net investment income (loss), net of waivers and reimbursements | | | 1.30 | | | 1.27 | |
Net investment income (loss), before waivers and reimbursements | | | 1.24 | | | 1.03 | |
| | | | | | | |
| | | Class I | |
| | | Periods Ended | |
| | | June 30, | | December 31, | |
| | | 2010 | | 2009(a) | |
Net asset value, beginning of year | | $ | 9.93 | | $ | 10.00 | |
Income (loss) from investment operations: | | | | | | | |
Net investment income (loss) | | | 0.07 | | | 0.01 | |
Net realized and unrealized gain (loss) on investments | | | 0.08 | | | (0.07 | ) |
| | | | | | | |
Total from investment operations | | | 0.15 | | | (0.06 | ) |
Less distributions from: | | | | | | | |
Net investment income | | | 0.10 | | | 0.01 | |
Net realized gain | | | — | | | — | |
| | | | | | | |
Total distributions | | | 0.10 | | | 0.01 | |
| | | | | | | |
Net asset value, end of year | | $ | 9.98 | | $ | 9.93 | |
| | | | | | | |
Total return (%)* | | | 1.49 | | | (0.59 | ) |
Ratios to average daily net assets (%):** | | | | | | | |
Expenses, net of waivers and reimbursements | | | 0.55 | | | 0.55 | |
Expenses, before waivers and reimbursements | | | 0.61 | | | 0.79 | |
Net investment income (loss), net of waivers and reimbursements | | | 1.45 | | | 1.39 | |
Net investment income (loss), before waivers and reimbursements | | | 1.39 | | | 1.15 | |
| | | | | | |
| | | Periods Ended |
| | | June 30, | | December 31, |
| | | 2010 | | 2009(a) |
Supplemental data for all classes: | | | | | | |
Net assets at end of year (in thousands) | | $ | 132,353 | | $ | 95,134 |
Portfolio turnover rate (%)* | | | 31 | | | — |
| (a) | | For the period December 1, 2009 (Commencement of Operations) to December 31, 2009. |
| * | | Rates not annualized for periods that are less than a year. |
| ** | | Rates are annualized for periods that are less than a year. |
Performance cited represents past performance. Past performance does not guarantee future results and current performance may be lower or higher than the data quoted. Results shown are annual returns, which assume reinvestment of dividends and capital gains. Investment returns and principal will fluctuate and you may have a gain or loss when you sell shares. For the most current month-end performance information, please call 1-800-742-7272 or visit our Web site at www.williamblairfunds.com.
Note: Net investment income (loss) per share is based on the average shares outstanding during the year.
June 30, 2010 | William Blair Funds 139 |
Financial Highlights
Ready Reserve Fund
| | | | | | | | | | | | | | | | | | | | |
| | | Class N |
| | | Period Ended
June 30, | | | Years Ended December 31, |
| | | 2010 | | | 2009 | | | 2008 | | 2007 | | 2006 | | 2005 |
Net asset value, beginning of year | | $ | 1.00 | | | $ | 1.00 | | | $ | 1.00 | | $ | 1.00 | | $ | 1.00 | | $ | 1.00 |
Income (loss) from investment operations: | | | | | | | | | | | | | | | | | | | | |
Net investment income (loss) | | | 0.00^ | | | | 0.00^ | | | | 0.02 | | | 0.05 | | | 0.04 | | | 0.03 |
Net realized and unrealized gain (loss) on investments | | | — | | | | — | | | | — | | | — | | | — | | | — |
| | | | | | | | | | | | | | | | | | | | |
Total from investment operations | | | 0.00^ | | | | 0.00^ | | | | 0.02 | | | 0.05 | | | 0.04 | | | 0.03 |
Less distributions from: | | | | | | | | | | | | | | | | | | | | |
Net investment income | | | 0.00^ | | | | 0.00^ | | | | 0.02 | | | 0.05 | | | 0.04 | | | 0.03 |
Net realized gain | | | — | | | | — | | | | — | | | — | | | — | | | — |
| | | | | | | | | | | | | | | | | | | | |
Total distributions | | | 0.00^ | | | | 0.00^ | | | | 0.02 | | | 0.05 | | | 0.04 | | | 0.03 |
| | | | | | | | | | | | | | | | | | | | |
Net asset value, end of year | | $ | 1.00 | | | $ | 1.00 | | | $ | 1.00 | | $ | 1.00 | | $ | 1.00 | | $ | 1.00 |
| | | | | | | | | | | | | | | | | | | | |
Total return (%)* | | | 0.00 | | | | 0.10 | | | | 2.20 | | | 4.75 | | | 4.47 | | | 2.62 |
Ratios to average daily net assets (%):** | | | | | | | | | | | | | | | | | | | | |
Expenses, net of waivers and reimbursements | | | 0.25 | | | | 0.46 | | | | 0.60 | | | 0.63 | | | 0.63 | | | 0.64 |
Expenses, before waivers and reimbursements | | | 0.62 | | | | 0.66 | | | | 0.60 | | | 0.63 | | | 0.63 | | | 0.64 |
Net investment income (loss), net of waivers and reimbursements | | | 0.01 | | | | 0.11 | | | | 2.12 | | | 4.63 | | | 4.38 | | | 2.57 |
Net investment income (loss), before waivers and reimbursements | | | (0.36 | ) | | | (0.09 | ) | | | 2.12 | | | 4.63 | | | 4.38 | | | 2.57 |
| | | | | | | | | | | | | | | | | | |
| | | Period Ended
June 30, | | Years Ended December 31, |
| | | 2010 | | 2009 | | 2008 | | 2007 | | 2006 | | 2005 |
Supplemental data for all classes: | | | | | | | | | | | | | | | | | | |
Net assets at end of year (in thousands) | | $ | 1,273,717 | | $ | 1,352,901 | | $ | 1,841,189 | | $ | 1,399,537 | | $ | 1,195,593 | | $ | 1,091,854 |
| * | | Rates not annualized for periods that are less than a year. |
| ** | | Rates are annualized for periods that are less than a year. |
| ^ | | Amount is less than $0.005 per share. |
Performance cited represents past performance. Past performance does not guarantee future results and current performance may be lower or higher than the data quoted. Results shown are annual returns, which assume reinvestment of dividends and capital gains. Investment returns and principal will fluctuate and you may have a gain or loss when you sell shares. For the most current month-end performance information, please call 1-800-742-7272 or visit our Web site at www.williamblairfunds.com.
Note: Net investment income (loss) per share is based on the average shares outstanding during the year.
140 Semi-Annual Report | June 30, 2010 |
Trustees and Officers (Unaudited). The trustees and officers of the William Blair Funds, their year of birth, their principal occupations during the last five years, their affiliations, if any, with William Blair & Company, L.L.C., and other significant affiliations are set forth below. The address of each trustee and officer is 222 West Adams Street, Chicago, Illinois 60606.
| | | | | | | | | | |
Name and Year of
Birth | | Position(s)
Held with
Fund | | Term of
Office and
Length of
Time
Served(1) | | Principal Occupation(s) During Past 5 Years | | Number of
Portfolios
in Fund
Complex
Overseen
by Trustee | | Other Directorships Held by Trustee/Officer |
Interested Trustees | | | | | | | | | | |
| | | | | |
Michelle R. Seitz,
1965* | | Chairperson of the Board of Trustees and President | | Since 2010 Since 2007 | | Principal, William Blair & Company, L.L.C.; Limited Partner, WB Holdings, L.P. (since November 2008); Member, WBC GP, L.L.P. (since November 2008) | | 19 | | N/A |
| | | | | |
Richard W. Smirl,
1967 | | Trustee and Senior Vice President | | Trustee Since 2010 and Senior Vice President Since 2008 | | Principal, William Blair & Company, L.L.C. | | 19 | | N/A |
| | | | |
Non-Interested Trustees | | | | | | | | |
Ann P. McDermott,
1939 | | Trustee | | Since 1996 | | Board member and officer for various civic and charitable organizations over the past thirty years; professional experience prior thereto, registered representative for New York Stock Exchange firm | | 19 | | Northwestern University, Women’s Board; Rush Presbyterian St. Luke’s Medical Center, Women’s Board; University of Chicago, Women’s Board; Visiting Nurses Association, Honorary Director |
| | | | | |
Phillip O. Peterson,
1944 | | Trustee | | Since 2007 | | Trustee of Strong Funds Liquidating Trusts since 2005 and President, Strong Mutual Funds, 2004-2005; formerly, Partner, KPMG LLP | | 19 | | The Hartford Group of Mutual Funds (87 portfolios) |
| | | | | |
Donald J. Reaves,
1946 | | Trustee | | Since 2004 | | Chancellor, Winston-Salem State University since 2007; formerly, Vice President for Administration and Chief Financial Officer, University of Chicago 2002-2007. | | 19 | | American Student Assistance Corp., guarantor of student loans; Amica Mutual Insurance Company |
| | | | | |
Donald L. Seeley,
1944 | | Trustee | | Since 2003 | | Retired; formerly, Director, Applied Investment Management Program, University of Arizona Department of Finance, prior thereto, Vice Chairman and Chief Financial Officer, True North Communications, Inc., marketing communications and advertising firm | | 19 | | Warnaco Group, Inc., intimate apparel, sportswear, and swimwear manufacturer; Center for Furniture Craftsmanship (not-for-profit) |
| | | | | |
Thomas J. Skelly,
1951 | | Trustee | | Since 2007 | | Advisory Board Member for various U.S. Companies; Director and Investment Committee Chairman of the US Accenture Foundation, Inc.; prior to 2005, Managing Partner of various divisions at Accenture | | 19 | | First MetLife Investors Insurance Company |
| | | | | |
Robert E. Wood II,
1938 | | Trustee | | Since 1999 | | Retired; formerly, Executive Vice President, Morgan Stanley Dean Witter | | 19 | | Chairman, Add-Vision, Inc., manufacturer of surface animation systems; Chairman Micro-Combustion, LLC |
June 30, 2010 | William Blair Funds 141 |
| | | | | | | | |
Name and Year of Birth | | Position(s)
Held with
Fund | | Term of
Office and
Length of
Time
Served(1) | | Principal Occupation(s) During Past 5 Years(2) | | Other Directorships Held by Trustee/Officer |
Officers | | | | | | | | |
Michael P. Balkin,
1959 | | Senior Vice President Vice President | | Since 2009 2008-2009 | | Principal, William Blair & Company, L.L.C. Associate, William Blair & Company, L.L.C.; former Chief Investment Officer, Magnetar Investment Management | | N/A |
| | | | |
Karl W. Brewer,
1966 | | Senior Vice President | | Since 2000 | | Principal, William Blair & Company, L.L.C. | | N/A |
| | | | |
David C. Fording,
1967 | | Senior Vice President Vice President | | Since 2009 2006-2009 | | Principal, William Blair & Company, L.L.C. Associate, William Blair & Company, L.L.C.; former Portfolio Manager, TIAA-CREF. | | N/A |
| | | | |
James S. Golan,
1961 | | Senior Vice President | | Since 2005 | | Principal, William Blair & Company, L.L.C. | | N/A |
| | | | |
W. George Greig,
1952 | | Senior Vice President | | Since 1996 | | Principal, William Blair & Company, L.L.C. | | N/A |
| | | | |
Michael A. Jancosek,
1959 | | Senior Vice President | | Since 2004 | | Principal, William Blair & Company L.L.C. | | N/A |
| | | | |
John F. Jostrand,
1954 | | Senior Vice President | | Since 1999 | | Principal, William Blair & Company, L.L.C. | | N/A |
| | | | |
Robert C. Lanphier, IV,
1956 | | Senior Vice President | | Since 2003 | | Principal, William Blair & Company, L.L.C. | | Chairman, AG. Med, Inc. |
| | | | |
Mark T. Leslie,
1967 | | Senior Vice President Vice President | | Since 2008 2005-2008 | | Principal, William Blair & Company, L.L.C. Associate, William Blair & Company, L.L.C. formerly, U.S. Bancorp Asset Management | | N/A |
| | | | |
Matthew A. Litfin,
1972 | | Senior Vice President | | Since 2008 | | Principal, William Blair & Company, L.L.C. | | N/A |
| | | | |
Kenneth J. McAtamney
1966 | | Senior Vice President | | Since 2008 | | Principal, William Blair & Company, L.L.C. | | N/A |
| | | | |
Todd M. McClone,
1968 | | Senior Vice President Vice President | | Since 2006 2005-2006 | | Principal, William Blair & Company, L.L.C. Associate, William Blair & Company, L.L.C. | | N/A N/A |
| | | | |
Tracy McCormick,
1954 | | Senior Vice President | | Since 2008 | | Principal, William Blair & Company, L.L.C. | | N/A |
| | | | |
David Merjan,
1960 | | Senior Vice President | | Since 2008 | | Principal, William Blair & Company, L.L.C. | | N/A |
142 Semi-Annual Report | June 30, 2010 |
| | | | | | | | |
Name and Year of Birth | | Position(s)
Held with
Fund | | Term of
Office and
Length of
Time
Served(1) | | Principal Occupation(s) During Past 5 Years(2) | | Other Directorships Held by Trustee/Officer |
David S. Mitchell,
1960 | | Senior Vice President | | Since 2004 | | Principal, William Blair & Company, L.L.C. | | N/A |
| | | | |
David P. Ricci,
1958 | | Senior Vice President | | Since 2006 | | Principal, William Blair & Company, L.L.C. | | N/A |
| | | | |
Jeffrey A. Urbina,
1955 | | Senior Vice President | | Since 1998 | | Principal, William Blair & Company, L.L.C. | | N/A |
| | | | |
Christopher T. Vincent,
1956 | | Senior Vice President | | Since 2004 | | Principal, William Blair & Company, L.L.C. | | N/A |
| | | | |
Chad M. Kilmer,
1975 | | Vice President | | Since 2006 | | Associate, William Blair & Company, L.L.C.; former analyst and Portfolio Manager U.S. Bancorp Asset Management. | | N/A |
| | | | |
Kathleen M. Lynch,
1971 | | Vice President | | Since 2010 | | Associate, William Blair & Company, L.L.C. | | N/A |
| | | | |
Paul J. Sularz,
1967 | | Vice President | | Since 2009 | | Associate, William Blair & Company, L.L.C.; Vice President, J.P. Morgan Securities, Inc. | | N/A |
| | | | |
Walter R. Randall, Jr.,
1960 | | Chief Compliance Officer | | Since 2009 | | Associate, William Blair & Company, L.L.C.; Associate Counsel and Chief Compliance Officer, Calamos Investments; Assistant General Counsel, American Century Investments. | | N/A |
| | | | |
Colette M. Garavalia,
1961 | | Treasurer | | Since 2009 | | Associate, William Blair & Company, L.L.C. | | N/A |
| | | | |
| | Secretary | | 2000-2009 | | Associate, William Blair & Company, L.L.C.; | | N/A |
| | | | |
Andrew T. Pfau,
1970 | | Secretary | | Since 2009 | | Associate, William Blair & Company, L.L.C.; Associate, Bell, Boyd & Lloyd, LLP; Associate, Sidley Austin LLP | | N/A |
| * | | Ms. Seitz and Mr. Smirl are interested persons of the William Blair Funds because each is a principal of William Blair & Company, L.L.C., the Funds’ investment advisor, principal underwriter and distributor. |
| (1) | | Each Trustee serves until the election and qualification of a successor, or until death, resignation or retirement or removal as provided in the Fund’s Declaration of Trust. Retirement for non-interested Trustees occurs no later than at the conclusion of the first regularly scheduled Board meeting of the Fund’s fiscal year that occurs after the Trustee’s 72nd birthday. The Fund’s officers except the Chief Compliance Officer, are elected annually by the Trustees. The Fund’s Chief Compliance Officer is designated by the Board of Trustees and may only be removed by action of the Board of Trustees, including a majority of the non-interested Trustees. |
| (2) | | In November 2008, all current principals of William Blair & Company, L.L.C. also became limited partners in WB Holdings, L.P. |
The Statement of Additional Information for the William Blair Funds includes additional information about the trustees and is available without charge by calling 1-800-635-2886 (in Massachusetts 1-800-635-2840) or by writing the Fund.
June 30, 2010 | William Blair Funds 143 |
Renewal of the Trust’s Management Agreement
On April 27, 2010, the Board of Trustees (the “Board”) of the William Blair Funds (the “Trust”), including the Trustees who are not “interested persons” of the Trust as defined in the Investment Company Act of 1940, as amended (the “Independent Trustees”), approved the renewal for an additional one-year term of the Trust’s Management Agreement with William Blair & Company, L.L.C. (the “Advisor”), on behalf of each of the William Blair Growth Fund, the William Blair Large Cap Growth Fund, the William Blair Small Cap Growth Fund, the William Blair Mid Cap Growth Fund, the William Blair Small-Mid Cap Growth Fund, the William Blair Global Growth Fund, the William Blair International Growth Fund, the William Blair International Equity Fund, the William Blair International Small Cap Growth Fund, the William Blair Emerging Markets Growth Fund, the William Blair Emerging Leaders Growth Fund, the William Blair Value Discovery Fund, the William Blair Bond Fund, the William Blair Income Fund and the William Blair Ready Reserves Fund (each, a “Fund” and collectively, the “Funds”). In deciding to approve the renewal of the Management Agreement, the Board did not identify any single factor or group of factors as all-important or controlling and considered all factors together.
The information in this summary outlines the Board’s considerations associated with its renewal of the Management Agreement. In connection with its deliberations regarding the continuation of the Management Agreement, the Board considered such information and factors as it believed to be relevant. As described below, the Board considered the nature, extent and quality of the services performed by the Advisor under the existing Management Agreement; comparative management fees and expense ratios as prepared by an independent provider (Lipper Inc.); the estimated profits realized by the Advisor; the extent to which the Advisor realizes economies of scale as a Fund grows; and whether any fall-out benefits are being realized by the Advisor. In addition, the Independent Trustees discussed the renewal of the Management Agreement with Fund management and in private sessions with independent legal counsel at which no representatives of the Advisor were present.
The Board, including the Independent Trustees, considered the renewal of the Management Agreement pursuant to a process that concluded at the Board’s April 27, 2010 meeting. In preparation for the review process, the Independent Trustees met with independent legal counsel and discussed the type and nature of information to be requested and independent legal counsel sent a formal request for information to Trust management. The Advisor provided extensive information in response to the request. After reviewing the information received, the Independent Trustees requested supplemental information, which the Advisor provided in writing and/or orally. The Independent Trustees reviewed comparative performance and comparative advisory fees and expense ratios for a peer group and a peer universe of funds provided by Lipper for each Fund. In addition, the Independent Trustees considered: (i) materials describing the nature, quality and extent of services provided by the Advisor; (ii) information comparing the performance of each Fund to one or more relevant securities indexes; (iii) information comparing advisory fees of each Fund to fees charged by the Advisor to other funds and client accounts with similar investment strategies; (iv) the estimated allocated direct or indirect costs of services provided and estimated profits realized by the Advisor for both the Trust as a whole and each Fund individually; and (v) information describing other benefits to the Advisor resulting from its relationship with the Funds. The Independent Trustees also noted that they receive information from the Advisor regarding the Funds throughout the year in connection with regular Board meetings, including presentations from portfolio managers. The Independent Trustees also received a memorandum from independent legal counsel advising them of their duties and responsibilities in connection with the review of the Management Agreement. Finally, the Advisor made an in-person presentation to the Independent Trustees regarding the contract review information, including addressing the supplemental information requests, and answered questions from the Independent Trustees.
On April 14, 26 and 27, 2010, the Independent Trustees met independently of Trust management and of the interested Trustees to review and discuss with independent legal counsel the information provided by the Advisor, Lipper and independent legal counsel. The Independent Trustees noted that in evaluating the Management Agreement, they were taking into account their accumulated experience as Trustees in working with the Advisor on matters relating to the Funds. Based on their review, the Independent Trustees concluded that it was in the best interest of each Fund to renew the Management Agreement and recommended to the Board the renewal of the Management Agreement. The Board considered the recommendation of the Independent Trustees along with the other factors that the Board deemed relevant.
Nature, Quality and Extent of Services. In evaluating the nature, quality and extent of the services provided by the Advisor to the Funds, the Board noted that the Advisor is a quality firm with a reputation for integrity and honesty that employs high-quality people and has a long association with the Funds, in each case other than the Growth Fund, since the inception of the Funds. The Trustees believe that a long-term relationship with a capable, conscientious advisor is in the best interests of shareholders and that shareholders have invested in the Funds knowing that the Advisor managed the Funds and knowing the investment advisory fee. The Board considered biographical information about the Trust’s officers and each Fund’s portfolio
144 Semi-Annual Report | June 30, 2010 |
manager(s), the administrative services performed by the Advisor, financial information regarding the Advisor, the Advisor’s execution quality and use of soft dollars, the compliance regime overseen by the Advisor, and the Advisor’s expense limitations in place for certain Funds. The Board was also provided with information pertaining to the Advisor’s organizational structure and senior management. The Board noted that the Advisor pays the compensation of all of the officers and interested Trustees of the Trust. The Board also noted that the Advisor voluntarily reduces the advisory fees of the Funds by an amount equal to the advisory fee and service fee paid by the Ready Reserves Fund on the cash of the Funds invested in the Ready Reserves Fund.
The Board reviewed information on the annualized total returns of each Fund for the one-, three-, five- and ten-year periods ended December 31, 2009, as applicable, along with annualized total return information for the Lipper performance peer universe of funds and one or more relevant securities indexes. The Lipper performance peer universe for each Fund included all funds with a similar investment style as classified by Lipper regardless of asset size or primary channel of distribution. The Board noted that the information provided indicated that the Growth Fund, the Small Cap Growth Fund, the Mid Cap Growth Fund, the Small-Mid Cap Growth Fund, the Global Growth Fund, the International Growth Fund, the International Small Cap Growth Fund, the Emerging Leaders Growth Fund, the Value Discovery Fund, the Bond Fund and the Ready Reserves Fund generally performed satisfactorily on the whole relative to its Lipper performance peer universe during the periods reviewed. The Board noted that the information provided indicated that the International Equity Fund, the Emerging Markets Growth Fund and the Income Fund each performed satisfactorily relative to its Lipper performance peer universe during the one-year period, but generally lagged the Lipper performance peer universe on a relative basis over the other periods reviewed. The Trustees requested and reviewed with the Advisor additional information regarding the performance of the International Equity Fund, the Emerging Markets Growth Fund and the Income Fund. Finally, the Board noted that the information provided indicated that the Large Cap Growth Fund generally lagged its Lipper performance peer universe on a relative basis during the periods reviewed. The Trustees requested and reviewed with the Advisor additional information regarding the performance of the Large Cap Growth Fund and considered the Advisor’s statements regarding the actions that have been taken and are being considered to address underperformance of the Large Cap Growth Fund, including a change in the management of the Advisor’s research department.
Based on all relevant factors, the Board concluded that the nature, quality and extent of the services provided by the Advisor to each Fund were satisfactory.
Fees and Expenses. The Board reviewed each Fund’s advisory fee and expense ratio and reviewed information comparing the advisory fee and expense ratio to those of a Lipper expense peer group and Lipper expense peer universe for each Fund. The Lipper expense peer group for each Fund consisted of a group of funds with a similar investment style as classified by Lipper, distribution channel and asset size as the Fund. The Lipper expense peer universe for each Fund consisted of all funds with a similar investment style as classified by Lipper and distribution channel as the Fund. The Board considered that the Advisor had proposed to contractually limit total expenses for the Large Cap Growth Fund, the Small Cap Growth Fund, the Mid Cap Growth Fund, the Small-Mid Cap Growth Fund, the Global Growth Fund, the International Growth Fund, the International Equity Fund, the International Small Cap Growth Fund, the Emerging Markets Growth Fund, the Emerging Leaders Growth Fund, the Value Discovery Fund, the Bond Fund and the Income Fund. The Board also considered that the Advisor intended to continue to voluntarily waive or reimburse certain operating expenses of the Ready Reserves Fund to maintain a positive yield for the Fund. For each Fund, the Board also reviewed amounts charged by the Advisor to other registered funds and funds for which the Advisor acts as a sub-advisor, and the Advisor’s fee schedule for institutional separate accounts. With respect to sub-advised funds and institutional separate accounts, the Board considered the Advisor’s view that the advisory fees for institutional separate accounts and sub-advisory services are less relevant to the Board’s consideration of the Funds’ advisory fees because both the mix of services provided to the Funds and the additional regulatory responsibilities associated with registered investment companies were greater as compared to the Advisor’s obligations for sub-advised funds and separate accounts. In addition, the Board considered the Advisor’s statement that institutional separate accounts are distributed differently, operate under different investment and regulatory structures and have different business risks as compared to the Funds.
In considering the information, the Board noted that the advisory fees for the Growth Fund, the Large Cap Growth Fund, the Mid Cap Growth Fund, the Global Growth Fund, the International Growth Fund, the International Small Cap Growth Fund, the Emerging Markets Growth Fund, the Emerging Leaders Growth Fund, the Bond Fund, the Income Fund and the Ready Reserves Fund were below or within an acceptable range of the average advisory fees of their Lipper expense peer group and Lipper expense peer universe. The Board also noted that the advisory fees for the Small-Mid Cap Growth Fund and the Value Discovery Fund were within an acceptable range of the average advisory fees of their Lipper expense peer group and Lipper expense peer universe after giving effect to the expense limitation proposed for 2010. Finally, the Board noted that the advisory fees for the Small Cap Growth Fund and the International Equity Fund were above the average advisory fees of
June 30, 2010 | William Blair Funds 145 |
their Lipper expense peer group and Lipper expense peer universe, but that such advisory fees were within an acceptable range of the average advisory fees of their Lipper expense peer group and Lipper expense peer universe and consistent with reasonable expectations in light of the nature, quality and extent of services provided by the Advisor. With respect to the International Growth Fund, the Board considered that the Advisor had agreed to introduce additional breakpoints into the Fund’s advisory fee schedule. On the basis of the information provided, the Board concluded that each Fund’s advisory fee, coupled with applicable expense limitations, was reasonable in light of the nature, quality and extent of services provided by the Advisor.
Profitability. With respect to the profitability of the Management Agreement to the Advisor, the Board considered the overall fees paid under the Management Agreement, including the estimated allocated costs of the services provided and profits realized by the Advisor from its relationship with the Trust as a whole and each Fund individually. The Board concluded that the estimated profits realized by the Advisor were not unreasonable.
Economies of Scale. The Board considered the extent to which economies of scale would be realized as the Funds grow and whether fee levels reflect these economies of scale for the benefit of investors. The Board noted the Advisor’s representation that certain Fund expenses are relatively fixed and unrelated to asset size and that the Advisor may enjoy some economies of scale as a Fund’s assets grow. In considering whether fee levels reflect economies of scale for the benefit of Fund investors, the Board reviewed each Fund’s asset size, breakpoints for those Funds with breakpoints in the advisory fee schedule where applicable (including the additional breakpoints for the International Growth Fund agreed to by the Advisor), the Fund’s total and net expense ratios and the expense limitations in place and/or proposed, and concluded that in the aggregate they reasonably reflect appropriate recognition of any economies of scale.
Other Benefits to the Advisor. The Board considered benefits derived by the Advisor from its relationship with the Funds, including (i) non-advisory fee revenue from the Funds in the form of shareholder administration fees, service fees and/or distribution fees and the payment of some or all of those revenues to affiliates or third parties, (ii) soft dollars, which pertain primarily to the Funds investing in equity securities, and (iii) favorable media coverage. The Board concluded that, taking into account these benefits, each Fund’s advisory fee was reasonable.
Conclusion. Based on all of the information considered and the conclusions reached, the Board determined that the terms of the Management Agreement continue to be fair and reasonable and that the continuation of the Management Agreement is in the best interests of each Fund.
146 Semi-Annual Report | June 30, 2010 |
Approval of the William Blair Mid Cap Value Fund’s Management Agreement
On April 27, 2010, the Board of Trustees (the “Board”) of the William Blair Funds (the “Trust”), including the Trustees who are not interested persons of the Trust as defined by the Investment Company Act of 1940, as amended (the “Independent Trustees”), approved the Management Agreement between the Trust, on behalf of the William Blair Mid Cap Value Fund (the “Fund”), and William Blair & Company, L.L.C. (the “Advisor”). On February 18, April 26 and 27, 2010, the Board met to consider the approval of the Management Agreement. On April 26 and 27, 2010, the Independent Trustees also met independently of Trust management and the interested Trustees of the Trust to consider the approval of the Management Agreement. The Independent Trustees reviewed materials provided by the Advisor for the approval of the Management Agreement and were assisted by independent legal counsel in making their determination. The Board considered the following factors in making its determination, but did not identify any single factor or group of factors as all-important or controlling and considered all factors together.
Nature, Quality and Extent of Services. In evaluating the nature, quality and extent of services expected to be provided by the Advisor to the Fund, the Board noted that the Advisor is a quality firm with a reputation for integrity and honesty that employs high-quality people. The Board considered biographical information about the Fund’s portfolio managers, financial information regarding the Advisor, the compliance regime created by the Advisor and the proposed financial support of the Fund. The Board considered the Advisor’s past experience managing the William Blair Value Discovery Fund, a small cap value fund, and the Advisor’s experience in managing new funds. Based on all relevant factors, the Board concluded that the nature, quality and extent of the services to be provided by the Advisor to the Fund are expected to be satisfactory.
Fees and Expenses. The Board reviewed the proposed advisory fee for the Fund and reviewed information comparing the advisory fee to a peer universe of funds provided by Lipper Inc. The Lipper peer universe for the Fund consisted of other no-load mid cap value funds. In considering the information, the Board noted that the proposed advisory fee for the Fund was slightly above the median of the Lipper peer universe. The Board also considered that the Advisor has proposed to limit total expenses, including waiving advisory fees, if necessary, for each share class of the Fund. On the basis of the information provided, the Board concluded that the proposed advisory fee was reasonable and appropriate in light of the nature, quality and extent of services expected to be provided by the Advisor.
Profitability. With respect to the estimated profitability of the Management Agreement to the Advisor, the Board considered the proposed advisory fee, that the Fund was newly organized and had no assets and the Advisor’s agreement to limit total expenses. The Board concluded that the expected profits to be realized by the Advisor were not unreasonable.
Economies of Scale. The Board considered the extent to which economies of scale would be realized as the Fund grows and whether fee levels reflect these economies of scale. The Board considered whether the proposed advisory fee was reasonable in relation to the projected asset size of the Fund. In considering whether fee levels reflect economies of scale for the benefit of Fund investors, the Board reviewed the Fund’s advisory fee compared to peer funds, the Fund’s projected asset size, the Fund’s estimated expense ratios and the Advisor’s agreement to limit total expenses, and concluded that the advisory fee was reasonable.
Other Benefits to the Advisor. The Board considered benefits to be derived by the Advisor from its relationship with the Fund. The Board concluded that, after taking into account these benefits, the proposed advisory fee was reasonable.
Conclusion. Based on all of the information considered and the conclusions reached, the Board determined that the terms of the Management Agreement are fair and reasonable and that the approval of the Management Agreement is in the best interests of the Fund.
June 30, 2010 | William Blair Funds 147 |
(unaudited)
Proxy Voting
A description of the policies and procedures that the Fund uses to determine how to vote proxies relating to portfolio securities and information regarding how the Fund voted proxies relating to portfolio securities for the most recent 12-month period ended June 30 are available without charge, upon request, by calling 1-800-635-2886 (in Massachusetts 1-800-635-2840), at www.williamblairfunds.com and on the SEC’s website at http://www.sec.gov.
Quarterly Portfolio Schedules
Each Portfolio files its complete schedule of portfolio holdings with the SEC for the first and third fiscal quarters of each fiscal year (quarters ended March 31 and September 30) on Form N-Q. The Fund’s Forms N-Q are available on the SEC’s website at http://www.sec.gov and may be reviewed and copied at the SEC’s Public Reference Room in Washington, D.C. Information on the operation of the SEC’s Public Reference Room may be obtained by calling 1-800-SEC-0330. The Fund’s Forms N-Q are also available on the Fund’s website at www.williamblairfunds.com.
Additional Federal Income Tax Information: (unaudited)
The following table provides the percentage of the 2009 year-end distributions that qualify for the dividend received deduction, and the qualified dividend income percentage:
| | | | | | |
Portfolio | | Dividend
Received
Deduction% | | | Qualified
Dividend
Income% | |
Growth | | 100.00 | % | | 100.00 | % |
Large Cap Growth | | 100.00 | % | | 100.00 | % |
Small Cap Growth | | 0.00 | % | | 0.00 | % |
Mid Cap Growth | | 0.00 | % | | 0.00 | % |
Small-Mid Cap Growth | | 14.95 | % | | 100.00 | % |
Global Growth | | 100.00 | % | | 100.00 | % |
International Growth | | 0.00 | % | | 100.00 | % |
International Equity | | 1.73 | % | | 100.00 | % |
International Small Cap Growth | | 0.00 | % | | 100.00 | % |
Emerging Markets Growth | | 0.00 | % | | 69.26 | % |
Emerging Leaders Growth | | 0.00 | % | | 57.56 | % |
Small Cap Value | | 100.00 | % | | 100.00 | % |
Bond | | 0.00 | % | | 0.00 | % |
Income | | 0.00 | % | | 0.00 | % |
Low Duration | | 0.00 | % | | 0.00 | % |
Ready Reserves | | 0.00 | % | | 0.00 | % |
In January 2010, you were notified on IRS Form 1099-Div or substitute 1099 DIV as to the Federal tax status of the distributions received by you in the calendar year 2009.
148 Semi-Annual Report | June 30, 2010 |
Useful Information About Your Report (unaudited)
Please refer to this information when reviewing the Expense Example for each Portfolio.
Expense Example
As a shareholder of a Portfolio, you incur two types of costs: (1) transaction costs such as redemption fees and (2) ongoing costs, including management fees, distribution (12b-1) fees (for Class N shares except for the Ready Reserves Portfolio), service fees (for Class N shares of the Ready Reserves Portfolio), shareholder administration fees (for Class N and Class I shares of the Global Growth Portfolio, the International Small Cap Growth Portfolio, the Emerging Markets Growth Portfolio, the Emerging Leaders Growth Portfolio, the Bond Portfolio and the Low Duration Portfolio) and other Portfolio expenses. The example is intended to help you understand your ongoing costs (in dollars) of investing in the Portfolio and to compare these costs with the ongoing costs of investing in other mutual funds. To do so, compare the Portfolio’s 5% hypothetical example with the 5% hypothetical examples that appear in the shareholder reports of other funds. The example is based on an investment of $1,000 invested at the beginning of the period and held for the entire six-month period from January 1, 2010 to June 30, 2010.
Actual Expenses
In each example, the first line for each share class in the table provides information about the actual account values and actual expenses. These expenses reflect the effect of any expense cap applicable to the share class during the period. Without this expense cap, the costs shown in the table would have been higher. You may use the information in this line, together with the amount you invested, to estimate the expenses that you paid over the period. Simply divide your account value by $1,000 (example, an $8,600 account value divided by $1,000 = 8.6), then multiply the result by the number in the first line under the heading entitled “Expenses Paid During the Period” to estimate the expenses you paid on your account during the period.
Hypothetical Example for Comparison Purposes
In each example, the second line for each share class in the table provides information about hypothetical account values and hypothetical expenses based on the Portfolio’s actual expense ratio and an assumed rate of return of 5% per year before expenses. This is not the Portfolio’s actual return. The hypothetical account values and expenses may not be used to estimate the actual ending account balance or expenses you paid for the period. You may use this information to compare the ongoing costs of investing in the Portfolio to other funds. To do so, compare this 5% hypothetical example with the 5% hypothetical examples that appear in the shareholder reports of other funds.
Please note that the expenses shown in both examples are meant to highlight your ongoing costs only and do not reflect any transactional costs or account type fees, such as redemption fees and IRA Fiduciary Administration fees, respectively. These fees are fully described in the prospectus. Therefore, the second line of each share class in the table is useful in comparing ongoing costs only and will not help you determine the relative costs of owning different funds. In addition, if these transactional costs or account fees were included, your costs would have been higher.
June 30, 2010 | William Blair Funds 149 |
Fund Expenses (unaudited)
The examples below show you the ongoing costs (in dollars) of investing in your fund and allows you to compare these costs with those of other mutual funds. Please refer to the previous page for a detailed explanation of the information presented on this chart.
| | | | | | | | | | | | |
Expense Example | | Beginning
Account Value
1/1/2010 | | Ending
Account Value
6/30/2010 | | Expenses Paid
during the
Period(a) | | Annualized
Expense Ratio | |
Growth Fund | | | | | | | | | | | | |
Class N—actual return | | $ | 1,000.00 | | $ | 919.10 | | $ | 5.43 | | 1.14 | % |
Class N—hypothetical 5% return | | | 1,000.00 | | | 1,019.14 | | | 5.71 | | 1.14 | |
Class I—actual return | | | 1,000.00 | | | 919.90 | | | 4.04 | | 0.85 | |
Class I—hypothetical 5% return | | | 1,000.00 | | | 1,020.58 | | | 4.26 | | 0.85 | |
Large Cap Growth Fund | | | | | | | | | | | | |
Class N—actual return | | | 1,000.00 | | | 915.60 | | | 5.79 | | 1.22 | |
Class N—hypothetical 5% return | | | 1,000.00 | | | 1,018.74 | | | 6.11 | | 1.22 | |
Class I—actual return | | | 1,000.00 | | | 914.30 | | | 4.60 | | 0.97 | |
Class I—hypothetical 5% return | | | 1,000.00 | | | 1,019.98 | | | 4.86 | | 0.97 | |
Small Cap Growth Fund | | | | | | | | | | | | |
Class N—actual return | | | 1,000.00 | | | 963.50 | | | 7.25 | | 1.49 | |
Class N—hypothetical 5% return | | | 1,000.00 | | | 1,017.41 | | | 7.45 | | 1.49 | |
Class I—actual return | | | 1,000.00 | | | 965.10 | | | 5.85 | | 1.20 | |
Class I—hypothetical 5% return | | | 1,000.00 | | | 1,018.84 | | | 6.01 | | 1.20 | |
Mid Cap Growth Fund | | | | | | | | | | | | |
Class N—actual return | | | 1,000.00 | | | 974.20 | | | 6.66 | | 1.36 | |
Class N—hypothetical 5% return | | | 1,000.00 | | | 1,018.05 | | | 6.80 | | 1.36 | |
Class I—actual return | | | 1,000.00 | | | 975.50 | | | 5.44 | | 1.11 | |
Class I—hypothetical 5% return | | | 1,000.00 | | | 1,019.29 | | | 5.56 | | 1.11 | |
Small-Mid Cap Growth Fund | | | | | | | | | | | | |
Class N—actual return | | | 1,000.00 | | | 969.30 | | | 6.64 | | 1.36 | |
Class N—hypothetical 5% return | | | 1,000.00 | | | 1,018.05 | | | 6.80 | | 1.36 | |
Class I—actual return | | | 1,000.00 | | | 970.70 | | | 5.42 | | 1.11 | |
Class I—hypothetical 5% return | | | 1,000.00 | | | 1,019.29 | | | 5.56 | | 1.11 | |
Global Growth Fund | | | | | | | | | | | | |
Class N—actual return | | | 1,000.00 | | �� | 942.60 | | | 7.22 | | 1.50 | |
Class N—hypothetical 5% return | | | 1,000.00 | | | 1,017.36 | | | 7.50 | | 1.50 | |
Class I—actual return | | | 1,000.00 | | | 944.00 | | | 6.03 | | 1.25 | |
Class I—hypothetical 5% return | | | 1,000.00 | | | 1,018.60 | | | 6.26 | | 1.25 | |
International Growth Fund | | | | | | | | | | | | |
Class N—actual return | | | 1,000.00 | | | 958.00 | | | 6.94 | | 1.43 | |
Class N—hypothetical 5% return | | | 1,000.00 | | | 1,017.70 | | | 7.15 | | 1.43 | |
Class I—actual return | | | 1,000.00 | | | 959.90 | | | 5.49 | | 1.13 | |
Class I—hypothetical 5% return | | | 1,000.00 | | | 1,019.19 | | | 5.66 | | 1.13 | |
International Equity Fund | | | | | | | | | | | | |
Class N—actual return | | | 1,000.00 | | | 907.90 | | | 6.86 | | 1.45 | |
Class N—hypothetical 5% return | | | 1,000.00 | | | 1,017.60 | | | 7.25 | | 1.45 | |
Class I—actual return | | | 1,000.00 | | | 909.50 | | | 5.68 | | 1.20 | |
Class I—hypothetical 5% return | | | 1,000.00 | | | 1,018.84 | | | 6.01 | | 1.20 | |
International Small Cap Growth Fund | | | | | | | | | | | | |
Class N—actual return | | | 1,000.00 | | | 976.90 | | | 7.65 | | 1.56 | |
Class N—hypothetical 5% return | | | 1,000.00 | | | 1,017.06 | | | 7.80 | | 1.56 | |
Class I—actual return | | | 1,000.00 | | | 978.10 | | | 6.18 | | 1.26 | |
Class I—hypothetical 5% return | | | 1,000.00 | | | 1,018.55 | | | 6.31 | | 1.26 | |
Emerging Markets Growth Fund | | | | | | | | | | | | |
Class N—actual return | | | 1,000.00 | | | 957.30 | | | 8.10 | | 1.67 | |
Class N—hypothetical 5% return | | | 1,000.00 | | | 1,016.51 | | | 8.35 | | 1.67 | |
Class I—actual return | | | 1,000.00 | | | 959.10 | | | 6.65 | | 1.37 | |
Class I—hypothetical 5% return | | | 1,000.00 | | | 1,018.00 | | | 6.85 | | 1.37 | |
150 Semi-Annual Report | June 30, 2010 |
| | | | | | | | | | | | |
Expense Example | | Beginning
Account Value
1/1/2010 | | Ending
Account Value
6/30/2010 | | Expenses Paid
during the
Period(a) | | Annualized
Expense Ratio | |
Emerging Leaders Growth Fund | | | | | | | | | | | | |
Class N—actual return(b) | | $ | 1,000.00 | | $ | 938.60 | | $ | 3.88 | | 1.65 | % |
Class N—hypothetical 5% return (6 month period) | | | 1,000.00 | | | 1,016.61 | | | 8.25 | | 1.65 | |
Class I—actual return | | | 1,000.00 | | | 958.20 | | | 6.80 | | 1.40 | |
Class I—hypothetical 5% return | | | 1,000.00 | | | 1,017.85 | | | 7.00 | | 1.40 | |
Small Cap Value Fund | | | | | | | | | | | | |
Class N—actual return | | | 1,000.00 | | | 1,003.80 | | | 6.51 | | 1.31 | |
Class N—hypothetical 5% return | | | 1,000.00 | | | 1,018.30 | | | 6.56 | | 1.31 | |
Class I—actual return | | | 1,000.00 | | | 1,004.70 | | | 5.42 | | 1.09 | |
Class I—hypothetical 5% return | | | 1,000.00 | | | 1,019.39 | | | 5.46 | | 1.09 | |
Mid Cap Value Fund | | | | | | | | | | | | |
Class N—actual return(b) | | | 1,000.00 | | | 942.50 | | | 3.18 | | 1.35 | |
Class N—hypothetical 5% return (6 month period) | | | 1,000.00 | | | 1,018.10 | | | 6.76 | | 1.35 | |
Class I—actual return(b) | | | 1,000.00 | | | 943.50 | | | 2.59 | | 1.10 | |
Class I—hypothetical 5% return (6 month period) | | | 1,000.00 | | | 1,019.34 | | | 5.51 | | 1.10 | |
Bond Fund | | | | | | | | | | | | |
Class N—actual return | | | 1,000.00 | | | 1,052.70 | | | 3.31 | | 0.65 | |
Class N—hypothetical 5% return | | | 1,000.00 | | | 1,021.57 | | | 3.26 | | 0.65 | |
Class I—actual return | | | 1,000.00 | | | 1,052.90 | | | 2.55 | | 0.50 | |
Class I—hypothetical 5% return | | | 1,000.00 | | | 1,022.32 | | | 2.51 | | 0.50 | |
Income Fund | | | | | | | | | | | | |
Class N—actual return | | | 1,000.00 | | | 1,039.40 | | | 4.30 | | 0.85 | |
Class N—hypothetical 5% return | | | 1,000.00 | | | 1,020.58 | | | 4.26 | | 0.85 | |
Class I—actual return | | | 1,000.00 | | | 1,040.60 | | | 3.29 | | 0.65 | |
Class I—hypothetical 5% return | | | 1,000.00 | | | 1,021.57 | | | 3.26 | | 0.65 | |
Low Duration Fund | | | | | | | | | | | | |
Class N—actual return | | | 1,000.00 | | | 1,014.30 | | | 3.50 | | 0.70 | |
Class N—hypothetical 5% | | | 1,000.00 | | | 1,021.32 | | | 3.51 | | 0.70 | |
Class I—actual return | | | 1,000.00 | | | 1,014.90 | | | 2.75 | | 0.55 | |
Class I—hypothetical 5% | | | 1,000.00 | | | 1,022.07 | | | 2.76 | | 0.55 | |
Ready Reserve Fund | | | | | | | | | | | | |
Class N—actual return | | | 1,000.00 | | | 1,000.00 | | | 1.24 | | 0.25 | |
Class N—hypothetical 5% return | | | 1,000.00 | | | 1,023.55 | | | 1.25 | | 0.25 | |
| (a) | | Expenses are equal to the annualized expense ratio, multiplied by the average account value over the period, multiplied by the number of days in the period 181, and divided by 365 (to reflect the one-half year period). |
| (b) | | For the period May 3, 2010 (Commencement of Operations) to June 30, 2010. |
June 30, 2010 | William Blair Funds 151 |
BOARD OF TRUSTEES
Ann P. McDermott
Director and Trustee
Profit and not-for-profit organizations
Phillip O. Peterson
Retired Partner, KPMG LLP
Donald J. Reaves
Chancellor, Winston-Salem State University
Donald L. Seeley
Retired Adjunct Lecturer and Director, University of Arizona Department of Finance
Michelle R. Seitz, Chairperson and President
Principal, William Blair & Company, L.L.C.,
Thomas J. Skelly
Retired Managing Partner, Accenture U.S.
Richard W. Smirl
Senior Vice President, Principal, William Blair & Company L.L.C.
Robert E. Wood II
Retired Executive Vice President, Morgan Stanley Dean Witter
Officers
Michael P. Balkin, Senior Vice President
Karl W. Brewer, Senior Vice President
David C. Fording, Senior Vice President
James S. Golan, Senior Vice President
W. George Greig, Senior Vice President
Michael A. Jancosek, Senior Vice President
John F. Jostrand, Senior Vice President
Robert C. Lanphier, IV, Senior Vice President
Mark T. Leslie, Senior Vice President
Matthew A. Litfin, Senior Vice President
Kenneth J. McAtamney, Senior Vice President
Todd M. McClone, Senior Vice President
Tracy McCormick, Senior Vice President
David Merjan, Senior Vice President
David S. Mitchell, Senior Vice President
David P. Ricci, Senior Vice President
Jeffrey A. Urbina, Senior Vice President
Christopher T. Vincent, Senior Vice President
Chad M. Kilmer, Vice President
Kathleen M. Lynch, Vice President
Paul J. Sularz, Vice President
Walter R. Randall, Jr., Chief Compliance Officer
Colette M. Garavalia, Treasurer
Andrew T. Pfau, Secretary
Investment Advisor
William Blair & Company, L.L.C.
Legal Counsel
Vedder Price P.C.
Transfer Agent
Boston Financial Data Services, Inc.
P.O. Box 8506
Boston, MA 02266-8506
For customer assistance, call 1-800-635-2886
(Massachusetts 1-800-635-2840)
152 Semi-Annual Report | June 30, 2010 |
| | | | |
EQUITY | | GLOBAL EQUITY | | FIXED-INCOME |
Growth Fund | | Global Growth Fund | | Bond Fund |
Large Cap Growth Fund | | | | Income Fund |
Small Cap Growth Fund | | INTERNATIONAL EQUITY | | Low Duration |
Mid Cap Growth Fund | | International Growth Fund | | |
Small-Mid Cap Growth Fund | | International Equity Fund | | MONEY MARKET |
Small Cap Value Fund | | International Small Cap Growth Fund | | Ready Reserves Fund |
Mid Cap Value Fund | | Emerging Markets Growth Fund | | |
| | Emerging Leaders Growth Fund | | |

222 West Adams Street
Chicago, IL 60606
800.742.7272 Ÿ www.williamblairfunds.com
© William Blair & Company, L.L.C., distributor

INSTITUTIONAL
SEMI-ANNUAL REPORT
JUNE 30, 2010
Table of Contents
This report is submitted for the general information of the shareholders of the William Blair Funds. It is not authorized for distribution to prospective investors unless accompanied or preceded by a prospectus of the William Blair Funds. Please consider the Funds’ investment objectives, risks, charges, and expenses before investing. This and other information is contained in the Funds’ prospectus, which you may obtain by calling 1-800-742-7272. Read it carefully before you invest or send money. William Blair & Company, LLC., distributor.
June 30, 2010 | William Blair Funds 1 |
GLOBAL MARKETS OVERVIEW
Summary
Year to date, the global equity market fell 8.65% as measured by the MSCI AC World IMI (net), with the MSCI World Ex-U.S. Index falling 11.78%. Developed non-U.S. markets underperformed Emerging markets, which fell 5.68%, as measured by the MSCI Emerging Markets IMI (net). The U.S. also underperformed other Developed equity markets, falling 6.28%, as measured by the MSCI US IMI (net), as significant U.S. dollar appreciation particularly hurt European, U.K. and Pacific Ex-Japan returns to U.S. dollar investors. In addition, investor sentiment was hampered by concerns regarding the debt crisis in Europe and the response to it, coupled with concerns about a “double dip” recession. Emerging markets were led by Asia, particularly Indonesia and India, which offset relative weakness from China, while Latin America underperformed, due to weakness in Brazil. Within Emerging Europe, Middle East and Africa (EMEA), South Africa, Egypt and Turkey outperformed Russia and the Central/Eastern European countries. Year to date developed small cap stocks were down 6.31%, as small cap stocks outperformed their larger cap counterparts across most regions. Sectorally, global Consumer and Industrials stocks led relative results, each falling between 3.5% and 4.0%, while Energy fell nearly 16%, and Materials and Utilities were each down approximately 11%. Commodity-related sectors underperformed as the Chinese monetary authorities tightened policy in an attempt to constrain speculation in that market, and the market became concerned about the sustainability of prices amidst potentially softening near term demand.
Outlook
As we enter a more mature phase of recovery, we have seen economic readings begin to weaken throughout the second quarter. Composite leading indicators are rolling over, with the evidence of a potential peak in growth strongest in China. This potential deceleration should not be surprising given the Chinese government’s efforts to restrain real estate markets, but it has become a cause for concern in the markets given China’s important role in global growth. Producer Manufacturing Indices (PMIs) in China and elsewhere are still pointing to growth but are now declining.
Stimulus is fading in the U.S. and employment is stagnant. Sovereign debt concerns have at times threatened to overwhelm Europe and the ECB (European Central Bank) is supporting austerity measures. Fears of a double-dip have re-emerged, and the uncertainties regarding global growth have led to a shift away from risky assets. This risk-off tone has been evidenced by the rally in U.S. Treasuries, the strength of the dollar and the rising price of gold. Despite a fiscal deficit and total debt to GDP ratios that are similar to the worst of the European offenders, the U.S. dollar has appreciated as it is considered to be the best of a dodgy breed.
While the odds of a slowdown have increased and the risks to global growth are now to the downside, double-dips are indeed rare. Indicators are not pointing to negative growth and the reality is that we have likely entered a soft patch as slower growth in the second half will follow the better than expected growth in the first half. We believe that China will avoid a hard landing, the U.S. will maintain positive growth, albeit at a slower rate, and Europe will continue to muddle through.
Earlier this year, with a bubble forming in sections of the residential property market, China put the brakes on lending to moderate prices. While it is possible that they overshoot to the downside, we believe that a hard landing will be averted as policy measures to moderate the housing market are implemented and growth slows from 11.9% in the first quarter to 8-9% in the 2nd half. China’s removal of the U.S. dollar peg was applauded by global leaders and is a
2 Semi-Annual Report | June 30, 2010 |
positive for the Chinese consumer. China’s inflation rose slightly above target but is very moderate at 3.1% especially given its growth and is expected to stay below 4%. Commodity prices (ex-gold) have retreated promoting lower inflation rates.
Economic readings in the U.S. have become more mixed and fears of a double-dip in housing have resurfaced. Data were strong through the quarter spurred by the $8,000 tax credit but starts and sales plummeted after its expiration. But while purchase applications are depressed, record low mortgage rates have stimulated refinancing activity. U.S. employment data disappointed throughout the quarter. At 9.5%, the unemployment rate is now flat versus a year ago but the most recent decline came from lower participation and not job creation. With the small business recovery yet to come, improvements in the NFIB small business optimism index are a promising sign that we can hope to see a new leg of growth and employment gains. The weak outlook for jobs is negatively impacting confidence but has not flowed through to consumer spending as much as expected. Consumers are also less leveraged than they were going into the crisis.
The sovereign debt crisis in Europe has created pressure for countries to set forth fiscal consolidation plans and some austerity measures have already been imposed. While these measures threaten to weaken already subdued growth, a Euro area double-dip is not the consensus view. The southern countries have remained weak but the German recovery remains intact as industrial production has been strong and exports, as well as those of the rest of the Euro-area have been helped by weakness of the Euro. A weaker exchange rate should be broadly expansionary as strong exports will help to boost government tax receipts and will support employment providing a much needed growth driver.
Aggressive fiscal policy around the world was quite effective during the crisis and prevented a prolonged global recession. Policy makers in the developed economies now face difficult decisions as they must face the deficit positions that they have created or exacerbated. A global debate is heating up between proponents of fiscal austerity and continued stimulative spending. The sovereign debt crisis in Europe has shifted the bias towards tightening while the U.S. has not jumped on the austerity bandwagon and is unlikely to do so ahead of the mid-term elections. Emerging markets do not face the same conflict as their debt-to-GDP ratios are considerably lower.
Monetary policy decisions in the developed world are much simpler as high unemployment persists while near-term inflation threats are benign. Additionally, there are no looming asset bubbles because the impairments in the financial system have prevented excess liquidity from flowing into the system. Central banks are expected to err on the side of tightening too late versus too early given the fragility of growth prospects. This “looser for longer” bias is pro-growth and could be a positive for equity markets.
Earnings expectations have rebounded around the globe. New highs in earnings are predicted for the current fiscal year in the emerging markets regions. Estimates for the developed world still remain 10-40% below prior peaks but earnings revisions going forward will likely slow. Of the cyclical sectors, technology has had the strongest rebound especially in the U.S. Multiples have contracted in every region as macro concerns dominated company fundamentals. Dividend yields are above 3% in Europe (including the U.K.) and companies around the world have substantial cash balances which could be used for future buybacks and/or incremental dividends. Uncertainties remain, but attractive valuations and strong balance sheets create an opportunity for solid returns going forward.
June 30, 2010 | William Blair Funds 3 |

W. George Greig
INSTITUTIONAL INTERNATIONAL GROWTH FUND
The Institutional International Growth Fund seeks long-term capital appreciation.
AN OVERVIEW FROM THE PORTFOLIO MANAGER
Please see page 2 for the Global Markets Overview.
The Institutional International Growth Fund posted a 4.34% decrease for the six months ended June 30, 2010. By comparison, the Fund’s benchmark, the MSCI All Country World Ex-U.S. IMI Index (net), declined 10.41%.
Year to date, the Fund’s stock selection was strong in virtually every sector, with the exception of the Fund’s one Utilities holding. In particular, Consumer Discretionary stock selection was strong, added by performance by a number of the Fund’s auto- and transportation-related holdings, coupled with strong performance within the U.K.. Energy stock selection augmented results, as the Fund’s holdings outpaced the Index by nearly 10%. Strong Financials stock selection was driven by the significant underweighting in European Financials stocks, coupled with limited exposure to commercial banks and capital markets companies within the European Union. Moreover, the Fund’s tilt towards Financials with significant Emerging Markets exposure added value. Strong performance in U.K. and Emerging Markets Industrials was also positive. Somewhat detracting from results was performance by EDF Energies Nouvelles S.A., the French alternative Utilities company, which was hampered by concerns about demand and subsidies within the alternative energy space. Regionally, stock selection was strong across most regions, with the exception of Pacific Ex-Japan and Canada. In addition, the Fund’s currency hedging strategy also added just shy of 1% to relative performance.
The Fund’s overall positioning did not substantially change since year end, with its focus remaining in Consumer Discretionary and Industrials at the expense of Materials and Financials. Regionally, the Fund remained underweighted in Developed Market Financials due not only to concerns emanating from the European situation and potential regulatory changes, but also from a growth perspective relative to other opportunities. While the European Financial sector was slightly underweighted versus the Index, the European geographic weighting increased from approximately 23% as of year end, due to the reclassification of Israel (and Teva Pharmaceutical Industries, Ltd.) into Europe from Emerging Europe, Middle East, and Africa (EMEA), coupled with an increase in Consumer Discretionary, Energy and Materials. Emerging Markets exposure was 27.5%, slightly below the 29.3% weighting as of year end, although the complexion of the underlying Emerging Markets regional exposures changed. In particular, we reduced exposure in Emerging Asian Consumer Staples, Industrials, Information Technology and Materials holdings due to concerns about a slowdown in these economies amidst potential overheating concerns, as well as specific valuation concerns. Conversely, exposure in Emerging Latin American Energy, Industrials and Telecommunication Services companies increased. After increasing currency hedges against the Pound Sterling, Euro and Japanese Yen in the first quarter of the year, we began unwinding most exposure following the European debt crisis when the Euro and Sterling significantly depreciated. As a result, as of June 30, the only hedge against U.S. dollar appreciation we maintained in the Fund was a partial hedge against the Japanese Yen. This hedge represented approximately 4% of the Fund’s Net Assets at June 30.
4 Semi-Annual Report | June 30, 2010 |
Institutional International Growth Fund
Performance Highlights (unaudited)
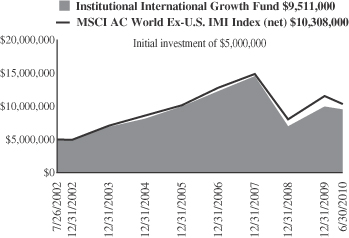
Average Annual Total Return at 6/30/2010
| | | | | | | | | | | | | | | |
| | | Year to
Date | | | 1
Year | | | 3
Year | | | 5
Year | | | Since
Inception(a) | |
Institutional International Growth Fund | | (4.34 | )% | | 16.80 | % | | (11.43 | )% | | 2.99 | % | | 8.42 | % |
MSCI All Country World Ex-U.S. IMI (net) | | (10.41 | ) | | 11.49 | | | (10.50 | ) | | 3.63 | | | 9.52 | |
| | (a) | | For the period July 26, 2002 (Commencement of Operations) to June 30, 2010. |
Performance cited represents past performance. Past performance does not guarantee future results and current performance may be lower or higher than the data quoted. Results shown are average annual returns, which assume reinvestment of dividends and capital gains. Investment returns and principal will fluctuate and you may have a gain or loss when you sell shares. For the most current month-end performance information, please call 1-800-742-7272, or visit our Web site at www.williamblairfunds.com. International investing involves special risk considerations, including currency fluctuations, lower liquidity, economic and political risk.
The performance highlights and graph presented above do not reflect the deduction of taxes that a shareholder would pay on fund distributions or the redemption of fund shares.
The Morgan Stanley Capital International (MSCI) All Country World Ex-U.S. Investable Market Index (IMI) (net) is a free float-adjusted market capitalization weighted index that is designed to measure the equity market performance of developed and emerging markets, excluding the United States. This series approximates the minimum possible dividend reinvestment.
This report identifies the Fund’s investments on June 30, 2010. These holdings are subject to change. Not all stocks in the Fund performed the same, nor is there any guarantee that these stocks will perform as well in the future. Market forecasts provided in this report may not necessarily come to pass.
Sector Diversification (unaudited)
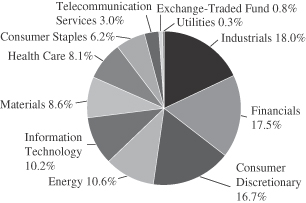
The sector diversification shown is based on the total long-term securities.
June 30, 2010 | William Blair Funds 5 |
Institutional International Growth Fund
Portfolio of Investments, June 30, 2010 (all dollar amounts in thousands) (unaudited)
| | | | | |
Issuer | | Shares | | Value |
| | |
Common Stocks—Europe—29.2%% | | | | | |
Belgium—0.6% | | | | | |
Colruyt S.A. (Food & staples retailing) | | 35,361 | | $ | 8,318 |
| | | | | |
Denmark—2.0% | | | | | |
Coloplast A/S (Health care equipment & supplies) | | 59,537 | | | 5,910 |
FLSmidth & Co. A/S (Construction & engineering) | | 92,574 | | | 5,974 |
Novo Nordisk A/S (Pharmaceuticals) | | 103,850 | | | 8,390 |
Novozymes A/S (Chemicals) | | 50,788 | | | 5,419 |
SimCorp A/S (Software) | | 13,817 | | | 2,201 |
| | | | | |
| | | | | 27,894 |
| | | | | |
Finland—1.1% | | | | | |
Kone Oyj (Machinery) | | 251,899 | | | 10,030 |
Nokian Renkaat Oyj (Auto components) | | 214,077 | | | 5,239 |
| | | | | |
| | | | | 15,269 |
| | | | | |
France—5.4% | | | | | |
Air Liquide S.A. (Chemicals) | | 140,388 | | | 14,177 |
bioMerieux (Health care equipment & supplies) | | 47,019 | | | 4,828 |
Cie Generale des Etablissements Michelin (Auto components) | | 159,092 | | | 11,084 |
EDF Energies Nouvelles S.A. (Independent power producers & energy traders) | | 131,246 | | | 4,440 |
Essilor International S.A. (Health care equipment & supplies) | | 143,563 | | | 8,531 |
Hermes International (Textiles, apparel & luxury goods) | | 52,216 | | | 6,922 |
L’Oreal S.A. (Personal products) | | 139,060 | | | 13,616 |
Schneider Electric S.A. (Electrical equipment) | | 105,875 | | | 10,693 |
| | | | | |
| | | | | 74,291 |
| | | | | |
Germany—4.6% | | | | | |
BASF SE (Chemicals) | | 382,240 | | | 20,886 |
*Daimler AG (Automobiles) | | 237,422 | | | 12,010 |
Fielmann AG (Specialty retail) | | 42,713 | | | 3,233 |
Lanxess AG (Chemicals) | | 86,657 | | | 3,648 |
MAN SE (Machinery) | | 80,411 | | | 6,629 |
SAP AG (Software) | | 323,493 | | | 14,385 |
Wincor Nixdorf AG (Computers & peripherals) | | 30,402 | | | 1,699 |
| | | | | |
| | | | | 62,490 |
| | | | | |
Ireland—0.3% | | | | | |
Paddy Power plc (Hotels, restaurants & leisure) | | 117,546 | | | 3,652 |
| | | | | |
Israel—2.0% | | | | | |
Bezeq Israeli Telecommunication Corp., Ltd. (Diversified telecommunication services) | | 3,127,532 | | | 6,836 |
Israel Chemicals, Ltd. (Chemicals) | | 830,376 | | | 8,651 |
Teva Pharmaceutical Industries, Ltd.—ADR (Pharmaceuticals) | | 218,407 | | | 11,355 |
| | | | | |
| | | | | 26,842 |
| | | | | |
Italy—0.8% | | | | | |
Ansaldo STS SpA (Transportation infrastructure) | | 217,351 | | | 3,489 |
DiaSorin SpA (Health care equipment & supplies) | | 90,547 | | | 3,317 |
| | | | | |
Issuer | | Shares | | Value |
| |
Common Stocks—Europe—29.2%—(continued) | | | |
Italy—(continued) | | | | | |
Saipem SpA (Energy equipment & services) | | 154,166 | | $ | 4,696 |
| | | | | |
| | | | | 11,502 |
| | | | | |
Norway—1.4% | | | | | |
*Norwegian Air Shuttle ASA (Airlines) | | 113,400 | | | 1,813 |
Statoil ASA (Oil, gas & consumable fuels) | | 866,100 | | | 16,685 |
| | | | | |
| | | | | 18,498 |
| | | | | |
Portugal—0.4% | | | | | |
Jeronimo Martins SGPS S.A. (Food & staples retailing) | | 586,442 | | | 5,373 |
| | | | | |
Spain—2.2% | | | | | |
Banco Santander S.A. (Commercial banks) | | 1,753,178 | | | 18,384 |
Inditex S.A. (Specialty retail) | | 124,610 | | | 7,106 |
Tecnicas Reunidas S.A. (Energy equipment & services) | | 102,781 | | | 4,674 |
| | | | | |
| | | | | 30,164 |
| | | | | |
Sweden—0.2% | | | | | |
Elekta AB (Health care equipment & supplies) | | 106,420 | | | 2,693 |
| | | | | |
Switzerland—8.2% | | | | | |
*ABB, Ltd. (Electrical equipment) | | 299,514 | | | 5,215 |
Cie Financiere Richemont S.A. (Textiles, apparel & luxury goods) | | 503,829 | | | 17,590 |
Credit Suisse Group AG (Capital markets) | | 112,384 | | | 4,225 |
Geberit AG (Building products) | | 38,747 | | | 6,029 |
Kuehne + Nagel International AG (Marine) | | 62,258 | | | 6,409 |
Novartis AG (Pharmaceuticals) | | 293,701 | | | 14,234 |
*Orascom Development Holding AG (Hotels, restaurants & leisure) | | 35,102 | | | 1,947 |
Partners Group Holding AG (Capital markets) | | 68,907 | | | 8,314 |
Roche Holding AG (Pharmaceuticals) | | 31,415 | | | 4,564 |
SGS S.A. (Professional services) | | 9,014 | | | 12,166 |
Sika AG (Chemicals) | | 3,188 | | | 5,651 |
Sonova Holding AG (Health care equipment & supplies) | | 62,518 | | | 7,672 |
Zurich Financial Services AG (Insurance) | | 81,289 | | | 17,917 |
| | | | | |
| | | | | 111,933 |
| | | | | |
| | |
United Kingdom—19.9% | | | | | |
Abcam plc (Biotechnology) | | 124,603 | | | 2,276 |
Admiral Group plc (Insurance) | | 454,251 | | | 9,513 |
Aggreko plc (Commercial services & supplies) | | 258,383 | | | 5,424 |
AMEC plc (Energy equipment & services) | | 483,350 | | | 5,922 |
Amlin plc (Insurance) | | 967,136 | | | 5,566 |
Aveva Group plc (Software) | | 200,765 | | | 3,369 |
Babcock International Group plc (Commercial services & supplies) | | 979,515 | | | 8,702 |
Barclays plc (Commercial banks) | | 3,321,008 | | | 13,256 |
BHP Billiton plc (Metals & mining) | | 700,787 | | | 18,170 |
BlueBay Asset Management plc (Capital markets) | | 632,156 | | | 2,707 |
Britvic plc (Beverages) | | 571,851 | | | 4,053 |
Burberry Group plc (Textiles, apparel & luxury goods) | | 372,825 | | | 4,211 |
See accompanying Notes to Financial Statements.
6 Semi-Annual Report | June 30, 2010 |
Institutional International Growth Fund
Portfolio of Investments, June 30, 2010 (all dollar amounts in thousands) (unaudited)
| | | | | |
Issuer | | Shares | | Value |
|
Common Stocks—United Kingdom—19.9%—(continued) |
*Cairn Energy plc (Oil, gas & consumable fuels) | | 962,878 | | $ | 5,915 |
Chemring Group plc (Aerospace & defense) | | 120,944 | | | 5,348 |
Compass Group plc (Hotels, restaurants & leisure) | | 1,083,698 | | | 8,244 |
*Dana Petroleum plc (Oil, gas & consumable fuels) | | 269,502 | | | 4,537 |
Domino’s Pizza UK & IRL plc (Hotels, restaurants & leisure) | | 472,118 | | | 2,667 |
Experian plc (Professional services) | | 630,862 | | | 5,486 |
*Heritage Oil plc (Oil, gas & consumable fuels) | | 591,125 | | | 3,462 |
HSBC Holdings plc (Commercial banks) | | 160,800 | | | 1,474 |
Inmarsat plc (Diversified telecommunication services) | | 377,150 | | | 3,999 |
Intertek Group plc (Professional services) | | 264,293 | | | 5,666 |
Johnson Matthey plc (Chemicals) | | 304,863 | | | 6,773 |
Lancashire Holdings, Ltd. (Insurance) | | 361,540 | | | 2,680 |
Meggitt plc (Aerospace & defense) | | 610,075 | | | 2,843 |
Michael Page International plc (Professional services) | | 793,748 | | | 4,394 |
Micro Focus International plc (Software) | | 259,345 | | | 1,630 |
Mothercare plc (Multiline retail) | | 231,229 | | | 1,962 |
Next plc (Multiline retail) | | 449,983 | | | 13,416 |
Petrofac, Ltd. (Energy equipment & services) | | 475,966 | | | 8,374 |
Rightmove plc (Media) | | 220,224 | | | 2,066 |
*Rolls-Royce Group plc (Aerospace & defense) | | 1,834,171 | | | 15,310 |
Rotork plc (Machinery) | | 331,740 | | | 6,339 |
RPS Group plc (Commercial services & supplies) | | 908,148 | | | 2,528 |
Serco Group plc (Commercial services & supplies) | | 799,937 | | | 6,986 |
Smith & Nephew plc (Health care equipment & supplies) | | 687,499 | | | 6,495 |
Spirax-Sarco Engineering plc (Machinery) | | 169,564 | | | 3,455 |
Standard Chartered plc (Commercial banks) | | 847,148 | | | 20,629 |
*Telecity Group plc (Internet software & services) | | 308,987 | | | 1,841 |
*The Berkeley Group Holdings plc (Household durables) | | 379,541 | | | 4,306 |
The Capita Group plc (Professional services) | | 661,453 | | | 7,287 |
The Weir Group plc (Machinery) | | 370,299 | | | 5,689 |
Ultra Electronics Holdings plc (Aerospace & defense) | | 180,123 | | | 4,114 |
Vedanta Resources plc (Metals & mining) | | 261,214 | | | 8,207 |
Victrex plc (Chemicals) | | 214,804 | | | 3,494 |
VT Group plc (Commercial services & supplies) | | 177,811 | | | 2,046 |
| | | | | |
| | | | | 272,831 |
| | | | | |
| | |
Emerging Asia—14.0% | | | | | |
China—3.7% | | | | | |
China Yurun Food Group, Ltd. (Food products) | | 1,182,000 | | | 3,717 |
China Zhongwang Holdings, Ltd. (Metals & mining) | | 6,908,000 | | | 4,376 |
CNOOC, Ltd. (Oil, gas & consumable fuels) | | 11,870,000 | | | 20,175 |
| | | | | |
Issuer | | Shares | | Value |
|
Common Stocks—Emerging Asia—14.0%—(continued) |
China—(continued) | | | | | |
Dongfeng Motor Group Co., Ltd. (Automobiles) | | 5,062,000 | | $ | 5,872 |
Industrial and Commercial Bank of China (Commercial banks) | | 18,219,000 | | | 13,242 |
Lonking Holdings, Ltd. (Machinery) | | 2,880,000 | | | 1,908 |
Minth Group, Ltd. (Auto components) | | 1,764,000 | | | 2,084 |
| | | | | |
| | | | | 51,374 |
| | | | | |
India—3.8% | | | | | |
Asian Paints, Ltd. (Chemicals) | | 85,251 | | | 4,202 |
Axis Bank, Ltd. (Commercial banks) | | 112,159 | | | 2,973 |
Housing Development Finance Corporation (Thrifts & mortgage finance) | | 122,387 | | | 7,713 |
Infosys Technologies, Ltd. (IT services) | | 206,735 | | | 12,335 |
Jindal Steel & Power, Ltd. (Metals & mining) | | 567,437 | | | 7,577 |
Lupin, Ltd. (Pharmaceuticals) | | 88,009 | | | 3,705 |
Reliance Industries, Ltd. (Oil, gas & consumable fuels) | | 253,324 | | | 5,896 |
Tata Motors, Ltd. (Machinery) | | 339,105 | | | 5,615 |
Yes Bank, Ltd. (Commercial banks) | | 251,217 | | | 1,440 |
| | | | | |
| | | | | 51,456 |
| | | | | |
Indonesia—2.9% | | | | | |
PT Astra International Tbk (Automobiles) | | 2,876,500 | | | 15,198 |
PT Bank Rakyat Indonesia (Commercial banks) | | 12,675,000 | | | 12,868 |
PT Perusahaan Perkebunan London Sumatra Indonesia Tbk (Food products) | | 3,509,500 | | | 3,184 |
PT United Tractors Tbk (Machinery) | | 3,925,500 | | | 8,046 |
| | | | | |
| | | | | 39,296 |
| | | | | |
Malaysia—0.2% | | | | | |
Top Glove Corporation Bhd (Health care equipment & supplies) | | 521,400 | | | 2,204 |
| | | | | |
Papua New Guinea—0.2% | | | | | |
Oil Search, Ltd. (Oil, gas & consumable fuels) | | 672,070 | | | 3,092 |
| | | | | |
South Korea—1.7% | | | | | |
Hyundai Mobis (Auto components) | | 36,316 | | | 6,091 |
Hyundai Motor Co. (Automobiles) | | 142,368 | | | 16,658 |
| | | | | |
| | | | | 22,749 |
| | | | | |
Taiwan—1.3% | | | | | |
Taiwan Semiconductor Manufacturing Co., Ltd. (Semiconductors & semiconductor equipment) | | 7,498,000 | | | 14,014 |
Tripod Technology Corporation (Electronic equipment, instruments & components) | | 590,000 | | | 2,182 |
Wistron Corporation (Computers & peripherals) | | 1,602,000 | | | 2,347 |
| | | | | |
| | | | | 18,543 |
| | | | | |
Thailand—0.2% | | | | | |
CP ALL PCL (Food & staples retailing) | | 3,817,700 | | | 3,389 |
| | | | | |
| | |
Japan—12.9% | | | | | |
ABC-Mart, Inc. (Specialty retail) | | 41,900 | | | 1,644 |
Canon, Inc. (Office electronics) | | 579,500 | | | 21,598 |
See accompanying Notes to Financial Statements.
June 30, 2010 | William Blair Funds 7 |
Institutional International Growth Fund
Portfolio of Investments, June 30, 2010 (all dollar amounts in thousands) (unaudited)
| | | | | |
Issuer | | Shares | | Value |
| |
Common Stocks—Japan—12.9%—(continued) | | | |
Dena Co., Ltd. (Internet & catalog retail) | | 65,300 | | $ | 1,724 |
Exedy Corporation (Auto components) | | 85,100 | | | 2,182 |
F.C.C. Co., Ltd. (Auto components) | | 68,252 | | | 1,275 |
Fanuc, Ltd. (Machinery) | | 151,600 | | | 17,119 |
*Gree, Inc. (Internet software & services) | | 49,800 | | | 3,977 |
Hoya Corporation (Electronic equipment, instruments & components) | | 346,900 | | | 7,381 |
K’s Holdings Corporation (Specialty retail) | | 146,800 | | | 3,001 |
kabu.com Securities Co., Ltd. (Capital markets) | | 399,400 | | | 1,873 |
Kakaku.com, Inc. (Internet software & services) | | 545 | | | 2,251 |
Keyence Corporation (Electronic equipment, instruments & components) | | 45,700 | | | 10,568 |
Komatsu, Ltd. (Machinery) | | 415,400 | | | 7,480 |
Makita Corporation (Machinery) | | 167,200 | | | 4,474 |
Miraca Holdings, Inc. (Health care providers & services) | | 93,900 | | | 2,811 |
MISUMI Group, Inc. (Trading companies & distributors) | | 177,900 | | | 3,285 |
Murata Manufacturing Co., Ltd. (Electronic equipment, instruments & components) | | 132,900 | | | 6,338 |
Nabtesco Corporation (Machinery) | | 149,000 | | | 2,297 |
Nippon Electric Glass Co., Ltd. (Electronic equipment, instruments & components) | | 571,000 | | | 6,540 |
Nitori Co., Ltd. (Specialty retail) | | 62,330 | | | 5,373 |
Osaka Securities Exchange Co., Ltd. (Diversified financial services) | | 482 | | | 2,047 |
Park24 Co., Ltd. (Commercial services & supplies) | | 275,100 | | | 2,951 |
Point, Inc. (Specialty retail) | | 57,560 | | | 3,157 |
Sawai Pharmaceutical Co., Ltd. (Pharmaceuticals) | | 25,600 | | | 2,449 |
Softbank Corporation (Wireless telecommunication services) | | 616,900 | | | 16,362 |
Sony Financial Holdings, Inc. (Insurance) | | 1,125 | | | 3,753 |
Terumo Corporation (Health care equipment & supplies) | | 87,300 | | | 4,181 |
USS Co., Ltd. (Specialty retail) | | 52,960 | | | 3,783 |
Yahoo! Japan Corporation (Internet software & services) | | 44,448 | | | 17,716 |
Yamada Denki Co., Ltd. (Specialty retail) | | 108,000 | | | 7,057 |
| | | | | |
| | | | | 176,647 |
| | | | | |
| | |
Emerging Latin America—9.8% | | | | | |
Brazil—5.4% | | | | | |
Amil Participacoes S.A. (Insurance) | | 180,100 | | | 1,462 |
BR Malls Participacoes S.A. (Real estate management & development) | | 172,300 | | | 2,243 |
BR Properties S.A. (Real estate management & development) | | 415,178 | | | 2,956 |
Cyrela Brazil Realty S.A. (Household durables) | | 500,600 | | | 5,411 |
Diagnosticos da America S.A. (Health care providers & services) | | 294,800 | | | 2,775 |
*GP Investments, Ltd. (Capital markets) | | 454,085 | | | 1,514 |
Localiza Rent a Car S.A. (Road & rail) | | 446,600 | | | 5,184 |
Lojas Renner S.A. (Multiline retail) | | 193,200 | | | 5,245 |
*Mills Estruturas e Servicos de Engenharia S.A. (Trading companies & distributors) | | 314,539 | | | 2,379 |
| | | | | |
Issuer | | Shares | | Value |
|
Common Stocks—Emerging Latin America—9.8%—(continued) |
Brazil—(continued) | | | | | |
MRV Engenharia e Participacoes S.A. (Household durables) | | 346,579 | | $ | 2,440 |
Natura Cosmeticos S.A. (Personal products) | | 491,200 | | | 10,885 |
OdontoPrev S.A. (Health care providers & services) | | 62,600 | | | 2,182 |
*OGX Petroleo e Gas Participacoes S.A. (Oil, gas & consumable fuels) | | 773,700 | | | 7,167 |
PDG Realty S.A. Empreendimentos e Participacoes (Household durables) | | 296,000 | | | 2,499 |
Petroleo Brasileiro S.A. (Oil, gas & consumable fuels) | | 897,752 | | | 15,418 |
SLC Agricola S.A. (Food products) | | 199,200 | | | 1,479 |
Totvs S.A. (Software) | | 29,500 | | | 2,189 |
| | | | | |
| | | | | 73,428 |
| | | | | |
Chile—0.9% | | | | | |
Banco Santander Chile—ADR (Commercial banks) | | 97,775 | | | 6,560 |
Lan Airlines S.A. (Airlines) | | 337,638 | | | 6,307 |
| | | | | |
| | | | | 12,867 |
| | | | | |
Colombia—0.8% | | | | | |
*Pacific Rubiales Energy Corporation (Oil, gas & consumable fuels) | | 474,689 | | | 10,639 |
| | | | | |
Mexico—2.0% | | | | | |
America Movil S.A.B. de C.V.—ADR (Wireless telecommunication services) | | 279,130 | | | 13,259 |
Banco Compartamos S.A. de C.V. (Consumer finance) | | 570,700 | | | 2,966 |
*Genomma Lab Internacional S.A.B. de C.V. (Pharmaceuticals) | | 414,231 | | | 1,376 |
Grupo Mexico S.A.B. de C.V. Series “B” (Metals & mining) | | 834,500 | | | 1,981 |
Wal-Mart de Mexico S.A.B. de C.V. (Food & staples retailing) | | 3,215,200 | | | 7,122 |
| | | | | |
| | | | | 26,704 |
| | | | | |
Panama—0.2% | | | | | |
Copa Holdings S.A. Class “A” (Airlines)† | | 56,981 | | | 2,520 |
| | | | | |
Peru—0.5% | | | | | |
Credicorp, Ltd. (Commercial banks)† | | 82,644 | | | 7,511 |
| | | | | |
| | |
Canada—4.7% | | | | | |
Brookfield Asset Management, Inc. Class “A” (Real estate management & development)† | | 511,670 | | | 11,574 |
Canadian Western Bank (Commercial banks) | | 126,103 | | | 2,800 |
Crescent Point Energy Corporation (Oil, gas & consumable fuels) | | 185,209 | | | 6,465 |
First Quantum Minerals, Ltd. (Metals & mining) | | 58,373 | | | 2,936 |
*Gildan Activewear, Inc. (Textiles, apparel & luxury goods) | | 182,900 | | | 5,254 |
Home Capital Group, Inc. (Thrifts & mortgage finance) | | 34,215 | | | 1,356 |
Niko Resources, Ltd. (Oil, gas & consumable fuels) | | 96,487 | | | 8,974 |
PetroBakken Energy, Ltd. Class “A” (Oil, gas & consumable fuels) | | 299,649 | | | 5,962 |
Petrominerales, Ltd. (Oil, gas & consumable fuels) | | 86,507 | | | 2,019 |
See accompanying Notes to Financial Statements.
8 Semi-Annual Report | June 30, 2010 |
Institutional International Growth Fund
Portfolio of Investments, June 30, 2010 (all dollar amounts in thousands) (unaudited)
| | | | | |
Issuer | | Shares | | Value |
|
Common Stocks—Canada—4.7%—(continued) |
The Toronto-Dominion Bank (Commercial banks) | | 146,040 | | $ | 9,463 |
Tim Hortons, Inc. (Hotels, restaurants & leisure) | | 220,292 | | | 7,052 |
| | | | | |
| | | | | 63,855 |
| | | | | |
|
Emerging Europe, Mid-East, Africa—3.7% |
Egypt—0.4% | | | | | |
Commercial International Bank Egypt S.A.E. (Commercial banks) | | 239,736 | | | 2,806 |
Egyptian Financial Group-Hermes Holding (Capital markets) | | 441,048 | | | 2,225 |
| | | | | |
| | | | | 5,031 |
| | | | | |
South Africa—2.0% | | | | | |
*Aspen Pharmacare Holdings, Ltd. (Pharmaceuticals) | | 598,025 | | | 5,905 |
Clicks Group, Ltd. (Multiline retail) | | 469,128 | | | 2,064 |
Shoprite Holdings, Ltd. (Food & staples retailing) | | 650,166 | | | 6,990 |
Standard Bank Group, Ltd. (Commercial banks) | | 723,431 | | | 9,594 |
Wilson Bayly Holmes-Ovcon, Ltd. (Construction & engineering) | | 231,833 | | | 3,300 |
| | | | | |
| | | | | 27,853 |
| | | | | |
Turkey—1.1% | | | | | |
BIM Birlesik Magazalar A.S. (Food & staples retailing) | | 296,617 | | | 8,221 |
Turkiye Garanti Bankasi A.S. (Commercial banks) | | 1,685,416 | | | 7,014 |
| | | | | |
| | | | | 15,235 |
| | | | | |
United Arab Emirates—0.2% | | | | | |
First Gulf Bank PJSC (Commercial banks) | | 746,620 | | | 3,020 |
| | | | | |
| | |
Asia—3.2% | | | | | |
Australia—0.8% | | | | | |
Seek, Ltd. (Professional services) | | 236,322 | | | 1,376 |
Wesfarmers, Ltd. (Food & staples retailing) | | 283,207 | | | 6,769 |
WorleyParsons, Ltd. (Energy equipment & services) | | 155,191 | | | 2,855 |
| | | | | |
| | | | | 11,000 |
| | | | | |
Hong Kong—1.7% | | | | | |
ASM Pacific Technology, Ltd. (Semiconductors & semiconductor equipment) | | 337,500 | | | 2,622 |
Li & Fung, Ltd. (Distributors) | | 2,956,000 | | | 13,225 |
Noble Group, Ltd. (Trading companies & distributors) | | 6,274,229 | | | 7,584 |
| | | | | |
| | | | | 23,431 |
| | | | | |
Singapore—0.7% | | | | | |
CapitaLand, Ltd. (Real estate management & development) | | 1,854,000 | | | 4,727 |
CapitaMalls Asia, Ltd. (Real estate management & development) | | 3,251,000 | | | 4,861 |
| | | | | |
| | | | | 9,588 |
| | | | | |
Total Common Stocks—97.4%
(cost $1,241,555) | | | 1,333,182 |
| | | | | |
| | | | | | |
Issuer | | Shares or
Principal
Amount | | Value |
| | |
Convertible Bond | | | | | | |
Brazil—0.0% | | | | | | |
Lupatech S.A., 6.500%, due 4/15/18 (Machinery)**§ | | $ | 941 | | $ | 535 |
| | | | | | |
Total Convertible Bond—0.0%
(cost $488) | | | 535 |
| | | | | | |
| | |
Exchange-Traded Fund | | | | | | |
China—0.7% | | | | | | |
iShares FTSE/Xinhua A50 China Index | | | 7,009,700 | | | 10,334 |
| | | | | | |
Total Exchange-Traded Fund—0.7%
(cost $11,287) | | | 10,334 |
| | | | | | |
| | |
Investment in Affiliate | | | | | | |
William Blair Ready Reserves Fund | | | 4,535,679 | | | 4,536 |
| | | | | | |
Total Investment in Affiliate—0.3%
(cost $4,536) | | | 4,536 |
| | | | | | |
| | |
Short-Term Investment | | | | | | |
American Express Credit Corporation Demand Note, VRN, 0.191%, due 7/1/10 | | $ | 1,000 | | | 1,000 |
| | | | | | |
Total Short-Term Investment—0.1%
(cost $1,000) | | | 1,000 |
| | | | | | |
| | |
Repurchase Agreement | | | | | | |
Fixed Income Clearing Corporation, 0.000% dated 6/30/10, due 7/1/10, repurchase price $8,062, collateralized by FFCB, 1.625%, due 3/7/13 | | $ | 8,062 | | | 8,062 |
| | | | | | |
Total Repurchase Agreement—0.6%
(cost $8,062) | | | 8,062 |
| | | | | | |
Total Investments—99.1%
(cost $1,266,928) | | | 1,357,649 |
Cash and other assets, less liabilities—0.9% | | | 11,751 |
| | | | | | |
Net assets—100.0% | | $ | 1,369,400 |
| | | | | | |
ADR = American Depository Receipt
VRN = Variable Rate Note
*Non-income producing securities
† = U.S. listed foreign security
** = Fair valued pursuant to Valuation Procedures adopted by the Board of Trustees. This holding represents 0.04% of the Fund’s net assets at June 30, 2010.
§ = Deemed illiquid pursuant to Liquidity Procedures approved by the Board of Trustees. This holding represents 0.04% of the net assets at June 30, 2010.
For securities primarily traded on exchanges or markets that close before the close of regular trading on the New York Stock Exchange, the Fund may use an independent pricing service to fair value price the securities pursuant to Valuation Procedures approved by the Board of Trustees.
See accompanying Notes to Financial Statements.
June 30, 2010 | William Blair Funds 9 |
Institutional International Growth Fund
Portfolio of Investments, June 30, 2010 (all dollar amounts in thousands) (unaudited)
At June 30, 2010, the Fund’s Portfolio of Investments includes the following industry categories:
| | |
Industrials | | 18.0% |
Financials | | 17.5% |
Consumer Discretionary | | 16.7% |
Energy | | 10.6% |
Information Technology | | 10.2% |
Materials | | 8.6% |
Health Care | | 8.1% |
Consumer Staples | | 6.2% |
Telecommunication Services | | 3.0% |
Exchange-Traded Fund | | 0.8% |
Utilities | | 0.3% |
| | |
Total | | 100.0% |
| | |
At June 30, 2010, the Fund’s Portfolio of Investments includes the following currency categories:
| | |
British Pound Sterling | | 20.2% |
Euro | | 15.7% |
Japanese Yen | | 13.1% |
Swiss Franc | | 8.3% |
Hong Kong Dollar | | 5.9% |
Brazilian Real | | 5.5% |
Canadian Dollar | | 4.7% |
U.S. Dollar | | 3.9% |
Indian Rupee | | 3.8% |
Indonesian Rupiah | | 2.9% |
Danish Krone | | 2.1% |
South African Rand | | 2.1% |
South Korean Won | | 1.7% |
New Taiwan Dollar | | 1.4% |
Norwegian Krone | | 1.4% |
Singapore Dollar | | 1.3% |
Israeli Shekel | | 1.2% |
Turkish Lira | | 1.1% |
Australian Dollar | | 1.0% |
Mexican Peso | | 1.0% |
All Other Currencies | | 1.7% |
| | |
Total | | 100.0% |
| | |
See accompanying Notes to Financial Statements.
10 Semi-Annual Report | June 30, 2010 |
W. George Greig

David Merjan
INSTITUTIONAL INTERNATIONAL EQUITY FUND
The Institutional International Equity Fund seeks long-term capital appreciation.
AN OVERVIEW FROM THE PORTFOLIO MANAGERS
Please see page 2 for the Global Markets Overview.
The Institutional International Equity Fund posted a 9.25% decrease for the six months ended June 30, 2010. By comparison, the Fund’s benchmark, the MSCI All Country World Ex-U.S. IMI Index (net), declined 10.41%.
Year to date stock selection was particularly strong in Discretionary, Energy and Financials. Within Financials, the Fund’s underweighting and stock selection in Europe Ex-U.K. added value, as the Fund eschewed a number of the E.U. commercial banks and capital markets financial institutions, given concerns about debt within the peripheral E.U. economies and ramifications for cross-border financial institutions. Emerging markets Financials performance also augmented results during the first half, as these holdings were not weighed down by slowdown concerns. Regionally, Developed European stock selection added value as did strong performance within Canada and Emerging Asia. The key detractor from performance year to date was Japanese Discretionary and Industrials stock selection.
As of June 30, the Fund maintained its focus in Industrials at 22.6% of the Fund, nearly double that of the MSCI ACWI Ex-U.S. IMI. Financials, while underweighted versus the Index, represented 20.6% of the Fund. Consumer Discretionary and Information Technology each represented approximately 12% of the Fund, above Index weightings. The Fund was most significantly underweighted in Materials, Telecommunication Services and Utilities at quarter end. These exposures did not appreciably change during the six month period. Regionally, the Fund maintained its focus in Developed Europe and Canada at the expense of Developed Asia. Within Europe Ex-U.K., specifically, the Fund was significantly overweighted in Healthcare and Industrials, sectors that generally benefit from a weak euro, and significantly underweighted in Financials, with no exposure in Materials, Telecommunication Services and Utilities. Emerging markets represented 18.7% of the Fund, below the Index weighting of 23.5%, and a decrease since year end, due largely to an underweighting in Emerging Asia, and a reclassification of Israel into Europe Ex-U.K. during the quarter, as one of our largest Emerging Markets Europe, Mid-East and Africa holdings was reclassified.
June 30, 2010 | William Blair Funds 11 |
Institutional International Equity Fund
Performance Highlights (unaudited)
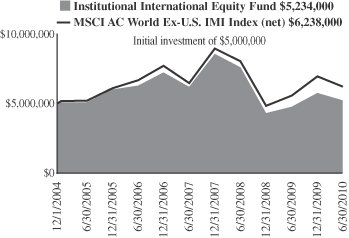
Average Annual Total Return at 6/30/2010
| | | | | | | | | | | | | | | |
| | | Year to
Date | | | 1
Year | | | 3
Year | | | 5
Year | | | Since
Inception(a) | |
Institutional International Equity Fund | | (9.25 | )% | | 9.61 | % | | (13.05 | )% | | 0.48 | % | | 0.82 | % |
MSCI All Country World Ex-U.S. IMI (net) | | (10.41 | ) | | 11.49 | | | (10.50 | ) | | 3.63 | | | 4.03 | |
| | (a) | | For the period May 24, 2004 (Commencement of Operations) to June 30, 2010. |
Performance cited represents past performance. Past performance does not guarantee future results and current performance may be lower or higher than the data quoted. Results shown are average annual returns, which assume reinvestment of dividends and capital gains. Investment returns and principal will fluctuate and you may have a gain or loss when you sell shares. For the most current month-end performance information, please call 1-800-742-7272, or visit our Web site at www.williamblairfunds.com. From time to time, the investment advisor may waive fees or reimburse expenses for the Fund. Without these waivers, performance would be lower. International investing involves special risk considerations, including currency fluctuations, lower liquidity, economic and political risk.
The performance highlights and graph presented above do not reflect the deduction of taxes that a shareholder would pay on fund distributions or the redemption of fund shares.
The Morgan Stanley Capital International (MSCI) All Country World Ex-U.S. Investable Market Index (IMI) (net) is a free float-adjusted market capitalization weighted index that is designed to measure the equity market performance of developed and emerging markets, excluding the United States. This series approximates the minimum possible dividend reinvestment.
This report identifies the Fund’s investments on June 30, 2010. These holdings are subject to change. Not all stocks in the Fund performed the same, nor is there any guarantee that these stocks will perform as well in the future. Market forecasts provided in this report may not necessarily come to pass.
Sector Diversification (unaudited)
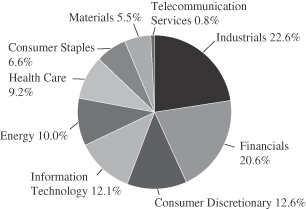
The sector diversification shown is based on the total long-term securities.
12 Semi-Annual Report | June 30, 2010 |
Institutional International Equity Fund
Portfolio of Investments, June 30, 2010 (all dollar amounts in thousands) (unaudited)
| | | | | |
Issuer | | Shares | | Value |
| | |
Common Stocks—Europe—30.1% | | | | | |
Denmark—1.8% | | | | | |
Novo Nordisk A/S (Pharmaceuticals) | | 72,307 | | $ | 5,842 |
| | | | | |
Finland—1.2% | | | | | |
Kone Oyj (Machinery) | | 94,902 | | | 3,779 |
| | | | | |
France—5.2% | | | | | |
AXA S.A. (Insurance) | | 146,476 | | | 2,238 |
Cie Generale des Etablissements Michelin (Auto components) | | 45,867 | | | 3,196 |
L’Oreal S.A. (Personal products) | | 42,676 | | | 4,178 |
Schneider Electric S.A. (Electrical equipment) | | 45,191 | | | 4,564 |
Vinci S.A. (Construction & engineering) | | 61,601 | | | 2,558 |
| | | | | |
| | | | | 16,734 |
| | | | | |
Germany—4.6% | | | | | |
*Infineon Technologies AG (Semiconductors & semiconductor equipment) | | 312,418 | | | 1,811 |
MAN SE (Machinery) | | 60,411 | | | 4,980 |
*QIAGEN N.V. (Life sciences tools & services) | | 164,794 | | | 3,206 |
SAP AG (Software) | | 107,466 | | | 4,779 |
| | | | | |
| | | | | 14,776 |
| | | | | |
Ireland—1.6% | | | | | |
*Ryanair Holdings plc—ADR (Airlines) | | 197,488 | | | 5,350 |
| | | | | |
Israel—2.1% | | | | | |
Teva Pharmaceutical Industries, Ltd.—ADR (Pharmaceuticals) | | 127,781 | | | 6,643 |
| | | | | |
Italy—1.7% | | | | | |
Saipem SpA (Energy equipment & services) | | 176,410 | | | 5,373 |
| | | | | |
Spain—2.4% | | | | | |
Banco Santander S.A. (Commercial banks) | | 260,319 | | | 2,730 |
Inditex S.A. (Specialty retail) | | 87,384 | | | 4,983 |
| | | | | |
| | | | | 7,713 |
| | | | | |
Switzerland—9.5% | | | | | |
*ABB, Ltd. (Electrical equipment) | | 229,047 | | | 3,988 |
*Actelion, Ltd. (Biotechnology) | | 60,529 | | | 2,266 |
Credit Suisse Group AG (Capital markets) | | 115,512 | | | 4,343 |
Julius Baer Group, Ltd. (Capital markets) | | 54,213 | | | 1,546 |
Nestle S.A. (Food products) | | 132,227 | | | 6,376 |
Roche Holding AG (Pharmaceuticals) | | 36,736 | | | 5,056 |
Sonova Holding AG (Health care equipment & supplies) | | 18,671 | | | 2,291 |
Zurich Financial Services AG (Insurance) | | 22,336 | | | 4,923 |
| | | | | |
| | | | | 30,789 |
| | | | | |
| | |
United Kingdom—20.6% | | | | | |
Amlin plc (Insurance) | | 290,149 | | | 1,670 |
*Autonomy Corporation plc (Software) | | 144,498 | | | 3,939 |
Barclays plc (Commercial banks) | | 926,088 | | | 3,696 |
BG Group plc (Oil, gas & consumable fuels) | | 330,358 | | | 4,913 |
British Sky Broadcasting Group plc (Media) | | 483,708 | | | 5,051 |
Burberry Group plc (Textiles, apparel & luxury goods) | | 282,199 | | | 3,187 |
Compass Group plc (Hotels, restaurants & leisure) | | 531,135 | | | 4,041 |
Experian plc (Professional services) | | 306,334 | | | 2,664 |
HSBC Holdings plc (Commercial banks) | | 318,176 | | | 2,917 |
Johnson Matthey plc (Chemicals) | | 113,532 | | | 2,522 |
Petrofac, Ltd. (Energy equipment & services) | | 178,558 | | | 3,141 |
| | | | | |
Issuer | | Shares | | Value |
|
Common Stocks—United Kingdom—20.6%—(continued) |
Reckitt Benckiser Group plc (Household products) | | 148,277 | | $ | 6,897 |
*Rolls-Royce Group plc (Aerospace & defense) | | 537,161 | | | 4,484 |
Rotork plc (Machinery) | | 94,187 | | | 1,800 |
Standard Chartered plc (Commercial banks) | | 211,205 | | | 5,143 |
The Capita Group plc (Professional services) | | 286,336 | | | 3,155 |
Tullow Oil plc (Oil, gas & consumable fuels) | | 259,495 | | | 3,860 |
Vedanta Resources plc (Metals & mining) | | 103,107 | | | 3,239 |
| | | | | |
| | | | | 66,319 |
| | | | | |
| | |
Japan—13.3% | | | | | |
Canon, Inc. (Office electronics) | | 87,300 | | | 3,254 |
Daikin Industries, Ltd. (Building products) | | 86,400 | | | 2,634 |
Fanuc, Ltd. (Machinery) | | 44,600 | | | 5,036 |
Hoya Corporation (Electronic equipment, instruments & components) | | 137,300 | | | 2,921 |
Keyence Corporation (Electronic equipment, instruments & components) | | 18,700 | | | 4,324 |
Komatsu, Ltd. (Machinery) | | 200,800 | | | 3,616 |
Makita Corporation (Machinery) | | 49,900 | | | 1,335 |
Mitsubishi Corporation (Trading companies & distributors) | | 216,400 | | | 4,477 |
Mitsubishi UFJ Financial Group, Inc. (Commercial banks) | | 753,600 | | | 3,422 |
Nippon Electric Glass Co., Ltd. (Electronic equipment, instruments & components) | | 230,000 | | | 2,634 |
Softbank Corporation (Wireless telecommunication services) | | 98,700 | | | 2,618 |
Terumo Corporation (Health care equipment & supplies) | | 47,100 | | | 2,256 |
Yahoo! Japan Corporation (Internet software & services) | | 6,244 | | | 2,489 |
Yamada Denki Co., Ltd. (Specialty retail) | | 28,980 | | | 1,894 |
| | | | | |
| | | | | 42,910 |
| | | | | |
| | |
Emerging Asia—11.4% | | | | | |
China—3.2% | | | | | |
China Life Insurance Co., Ltd. (Insurance) | | 896,000 | | | 3,919 |
CNOOC, Ltd. (Oil, gas & consumable fuels) | | 2,555,000 | | | 4,343 |
Li Ning Co., Ltd. (Textiles, apparel & luxury goods) | | 619,000 | | | 2,028 |
| | | | | |
| | | | | 10,290 |
| | | | | |
India—4.5% | | | | | |
Bharat Heavy Electricals, Ltd. (Electrical equipment) | | 84,678 | | | 4,461 |
*Cairn India, Ltd. (Oil, gas & consumable fuels) | | 434,387 | | | 2,813 |
HDFC Bank, Ltd.—ADR (Commercial banks) | | 17,225 | | | 2,463 |
Infosys Technologies, Ltd. (IT services) | | 77,758 | | | 4,639 |
| | | | | |
| | | | | 14,376 |
| | | | | |
Indonesia—0.8% | | | | | |
PT Bank Rakyat Indonesia (Commercial banks) | | 2,642,500 | | | 2,683 |
| | | | | |
South Korea—1.5% | | | | | |
Hyundai Motor Co. (Automobiles) | | 40,349 | | | 4,721 |
| | | | | |
See accompanying Notes to Financial Statements.
June 30, 2010 | William Blair Funds 13 |
Institutional International Equity Fund
Portfolio of Investments, June 30, 2010 (all dollar amounts in thousands) (unaudited)
| | | | | |
Issuer | | Shares | | Value |
|
Common Stocks—Emerging Asia—11.4%—(continued) |
Taiwan—1.4% | | | | | |
*Hon Hai Precision Industry Co., Ltd. (Electronic equipment, instruments & components) | | 765,000 | | $ | 2,681 |
MediaTek, Inc. (Semiconductors & semiconductor equipment) | | 138,462 | | | 1,933 |
| | | | | |
| | | | | 4,614 |
| | | | | |
| | |
Canada—8.2% | | | | | |
Brookfield Asset Management, Inc. Class “A” (Real estate management & development)† | | 164,368 | | | 3,719 |
Canadian National Railway Co. (Road & rail)† | | 93,872 | | | 5,386 |
Goldcorp, Inc. (Metals & mining)† | | 99,602 | | | 4,368 |
Royal Bank of Canada (Commercial banks) | | 62,444 | | | 2,974 |
The Toronto-Dominion Bank (Commercial banks) | | 55,437 | | | 3,592 |
Thomson Reuters Corporation (Media) | | 73,040 | | | 2,614 |
Tim Hortons, Inc. (Hotels, restaurants & leisure) | | 120,748 | | | 3,866 |
| | | | | |
| | | | | 26,519 |
| | | | | |
| | |
Asia—5.3% | | | | | |
Australia—1.7% | | | | | |
BHP Billiton, Ltd.—ADR (Metals & mining) | | 51,348 | | | 3,183 |
WorleyParsons, Ltd. (Energy equipment & services) | | 115,905 | | | 2,133 |
| | | | | |
| | | | | 5,316 |
| | | | | |
Hong Kong—2.9% | | | | | |
ASM Pacific Technology, Ltd. (Semiconductors & semiconductor equipment) | | 247,700 | | | 1,924 |
Li & Fung, Ltd. (Distributors) | | 1,000,000 | | | 4,474 |
Noble Group, Ltd. (Trading companies & distributors) | | 2,411,090 | | | 2,914 |
| | | | | |
| | | | | 9,312 |
| | | | | |
Singapore—0.7% | | | | | |
CapitaLand, Ltd. (Real estate management & development) | | 931,000 | | | 2,374 |
| | | | | |
| | |
Emerging Latin America—4.7% | | | | | |
Brazil—3.7% | | | | | |
BM&F BOVESPA S.A. (Diversified financial services) | | 592,871 | | | 3,810 |
Petroleo Brasileiro S.A.—ADR (Oil, gas & consumable fuels) | | 40,399 | | | 1,387 |
Vale S.A.—ADR (Metals & mining) | | 153,101 | | | 3,728 |
Weg S.A. (Machinery) | | 327,800 | | | 3,033 |
| | | | | |
| | | | | 11,958 |
| | | | | |
Mexico—1.0% | | | | | |
Wal-Mart de Mexico S.A.B. de C.V. (Food & staples retailing) | | 1,395,900 | | | 3,092 |
| | | | | |
| | |
Emerging Europe, Mid-East, Africa—1.7% | | | | | |
South Africa—0.8% | | | | | |
Standard Bank Group, Ltd. (Commercial banks) | | 196,724 | | | 2,609 |
| | | | | |
| | | | | | |
Issuer | | Shares or
Principal
Amount | | Value |
|
Common Stocks—Emerging Europe, Mid-East, Africa—1.7%—(continued) |
Turkey—0.9% | | | | | | |
Turkiye Garanti Bankasi A.S. (Commercial banks) | | | 722,881 | | $ | 3,008 |
| | | | | | |
Total Common Stocks—95.3%
(cost $272,584) | | | 307,100 |
| | | | | | |
| | |
Preferred Stock | | | | | | |
Brazil—0.9% | | | | | | |
Petroleo Brasileiro S.A. (Oil, gas & consumable fuels) | | | 209,979 | | | 3,124 |
| | | | | | |
Total Preferred Stock—0.9%
(cost $2,179) | | | 3,124 |
| | | | | | |
| | |
Investment in Affiliate | | | | | | |
William Blair Ready Reserves Fund | | | 952,724 | | | 953 |
| | | | | | |
Total Investment in Affiliate—0.3%
(cost $953) | | | 953 |
| | | | | | |
| | |
Repurchase Agreement | | | | | | |
Fixed Income Clearing Corporation, 0.000% dated 6/30/10, due 7/1/10, repurchase price $10,919, collateralized by FHLMC, 2.000%, due 4/15/13 | | $ | 10,919 | | | 10,919 |
| | | | | | |
Total Repurchase Agreement—3.4%
(cost $10,919) | | | 10,919 |
| | | | | | |
Total Investments—99.9%
(cost $286,635) | | | 322,096 |
Cash and other assets, less liabilities—0.1% | | | 221 |
| | | | | | |
Net assets—100.0% | | $ | 322,317 |
| | | | | | |
ADR = American Depository Receipt
*Non-income producing securities
† = U.S. listed foreign security
For securities primarily traded on exchanges or markets that close before the close of regular trading on the New York Stock Exchange, the Fund may use an independent pricing service to fair value price the securities pursuant to Valuation Procedures approved by the Board of Trustees.
At June 30, 2010, the Fund’s Portfolio of Investments includes the following industry categories:
| | |
Industrials | | 22.6% |
Financials | | 20.6% |
Consumer Discretionary | | 12.6% |
Information Technology | | 12.1% |
Energy | | 10.0% |
Health Care | | 9.2% |
Consumer Staples | | 6.6% |
Materials | | 5.5% |
Telecommunication Services | | 0.8% |
| | |
Total | | 100.0% |
| | |
See accompanying Notes to Financial Statements.
14 Semi-Annual Report | June 30, 2010 |
Institutional International Equity Fund
Portfolio of Investments, June 30, 2010 (all dollar amounts in thousands) (unaudited)
At June 30, 2010, the Fund’s Portfolio of Investments includes the following currency categories:
| | |
British Pound Sterling | | 20.4% |
Euro | | 15.6% |
Japanese Yen | | 13.8% |
U.S. Dollar | | 12.0% |
Swiss Franc | | 9.9% |
Hong Kong Dollar | | 6.3% |
Canadian Dollar | | 4.0% |
Indian Rupee | | 3.8% |
Brazilian Real | | 3.2% |
Danish Krone | | 1.9% |
Singapore Dollar | | 1.7% |
South Korean Won | | 1.5% |
New Taiwan Dollar | | 1.5% |
All Other Currencies | | 4.4% |
| | |
Total | | 100.0% |
| | |
See accompanying Notes to Financial Statements.
June 30, 2010 | William Blair Funds 15 |

Jeffery A. Urbina
INTERNATIONAL SMALL CAP GROWTH FUND
The International Small Cap Growth Fund seeks long-term capital appreciation.
AN OVERVIEW FROM THE PORTFOLIO MANAGER
Please see page 2 for the Global Markets Overview.
The International Small Cap Growth Fund decreased 2.09% (Institutional Class) for the six months ended June 30, 2010. By comparison, the Fund’s benchmark, the MSCI All Country Ex-U.S. Small Cap Index (net), declined 5.32%.
Sector stock selection drove year to date outperformance, coupled with good performance across most regions, except for Emerging Asia. Within Consumer Discretionary, Japanese internet website Start Today Co., Ltd. performed well, as did footwear retailer ABC-Mart, Inc. U.K. Consumer Discretionary stock selection was strong, outperforming by nearly 21%, while Emerging Europe, Middle East and Africa (EMEA) and Latin American stocks also added value. Consumer Staples stock selection benefited from good performance by Unicharm Petcare Corporation as its parent company made a tender offer for the remaining outstanding publicly traded shares. Industrials stock selection was bolstered by strong Developed Europe and Emerging Markets stock selection, particularly within the defense, services, and transportation industries. Materials and Energy stock selection was also additive to results for the year to date period, as the Fund’s Materials holdings outperformed by over 31%, and Energy by nearly 13% versus the Index. Somewhat detracting from year to date results was Financials, Information Technology, and Utilities stock selection. Within Financials, the Fund’s underweighting and stock selection in Europe was more than offset by underperformance in Asian Financials holdings and U.K. asset management firms. Information Technology stock selection was hampered by several stock-specific issues, while EDF Energies Nouvelles S.A., the sole Utilities holding, underperformed the sector as a whole, as investors were concerned about the timing of wind farm development in the U.S., coupled with potentially reduced subsidies for alternative energy within Europe as a result of austerity measures.
As of June 30, the Fund maintained its focus in Consumer Discretionary at 26.6% of the Fund, with just over 7% within emerging markets specifically, well above the 16.5% Index weighting, and an increase since year end. Industrials was the second largest sector at 19.1% of the Fund, albeit underweighted versus the Index’s 21.74% weighting. Information Technology and Healthcare represented 15.0% and 13.5% of the Fund, respectively, well above Index weightings. We increased exposure to Emerging Markets and U.K. Healthcare holdings during the period, at the expense of Japanese Industrials. Since year end, we reduced our already underweighted Financials exposure from 12.6% to 9.9%. Materials, representing 4.1% of the Funds remained significantly underweighted versus the market throughout the six month period. Regionally, the Fund was overweighted in Developed European stocks, due largely to Healthcare, Information Technology and Consumer Discretionary weightings within Europe Ex-U.K. and Industrials holdings within the U.K. Emerging markets represented 22.8% of the Fund at June 30, above the 18.8% as of year end, but lower than the Index weighting, due largely to an underweighting in the emerging Asian region.
16 Semi-Annual Report | June 30, 2010 |
International Small Cap Growth Fund
Performance Highlights (unaudited)
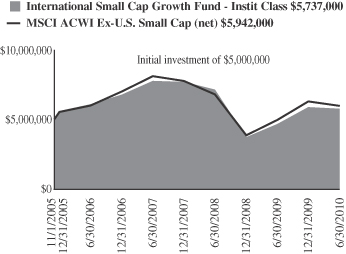
Average Annual Total Return at 6/30/2010
| | | | | | | | | | | | |
| | | Year to
Date | | | 1
Year | | | 3
Year | | | Since
Inception(a) | |
Institutional Class | | (2.09 | )% | | 23.52 | % | | (9.46 | )% | | 2.99 | % |
MSCI All Country World Ex-U.S. Small Cap Index (net) | | (5.32 | ) | | 19.98 | | | (9.68 | ) | | 3.76 | |
| | (a) | | For the period November 1, 2005 (Commencement of Operations) to June 30, 2010. |
Performance cited represents past performance. Past performance does not guarantee future results and current performance may be lower or higher than the data quoted. Results shown are average annual returns, which assume reinvestment of dividends and capital gains. Investment returns and principal will fluctuate and you may have a gain or loss when you sell shares. For the most current month-end performance information, please call 1-800-742-7272, or visit our Web site at www.williamblairfunds.com. From time to time, the investment advisor may waive fees or reimburse expenses for the Fund. Without these waivers, performance would be lower. International investing involves special risk considerations, including currency fluctuations, lower liquidity, economic and political risk.
The performance highlights and graph presented above do not reflect the deduction of taxes that a shareholder would pay on fund distributions or the redemption of fund shares.
The Morgan Stanley Capital International (MSCI) All Country World Ex-U.S. Small Cap Index (net) is a free float-adjusted market capitalization weighted index that is designed to measure the equity market performance of small capitalization developed and emerging markets, excluding the United States. This series approximates the minimum possible dividend reinvestment.
This report identifies the Fund’s investments on June 30, 2010. These holdings are subject to change. Not all stocks in the Fund performed the same, nor is there any guarantee that these stocks will perform as well in the future. Market forecasts provided in this report may not necessarily come to pass.
Sector Diversification (unaudited)
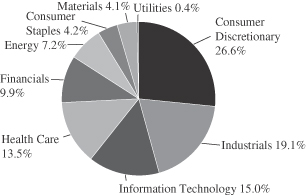
The sector diversification shown is based on the total long-term securities.
June 30, 2010 | William Blair Funds 17 |
International Small Cap Growth Fund
Portfolio of Investments, June 30, 2010 (all dollar amounts in thousands) (unaudited)
| | | | | |
Issuer | | Shares | | Value |
| | |
Common Stocks—Europe—27.1% | | | | | |
Austria—0.4% | | | | | |
Schoeller-Bleckmann Oilfield Equipment AG (Energy equipment & services) | | 40,651 | | $ | 1,843 |
| | | | | |
Denmark—1.7% | | | | | |
FLSmidth & Co. A/S (Construction & engineering) | | 99,420 | | | 6,416 |
SimCorp A/S (Software) | | 5,318 | | | 847 |
| | | | | |
| | | | | 7,263 |
| | | | | |
Finland—2.0% | | | | | |
Nokian Renkaat Oyj (Auto components) | | 361,056 | | | 8,836 |
| | | | | |
France—3.0% | | | | | |
bioMerieux (Health care equipment & supplies) | | 58,739 | | | 6,031 |
*Boursorama (Capital markets) | | 152,766 | | | 1,518 |
EDF Energies Nouvelles S.A. (Independent power producers & energy traders) | | 49,132 | | | 1,662 |
Gemalto N.V. (Computers & peripherals) | | 108,366 | | | 4,078 |
| | | | | |
| | | | | 13,289 |
| | | | | |
Germany—3.9% | | | | | |
Aixtron AG (Semiconductors & semiconductor equipment) | | 247,766 | | | 5,857 |
CTS Eventim AG (Media) | | 43,054 | | | 2,074 |
Fielmann AG (Specialty retail) | | 44,923 | | | 3,401 |
Wincor Nixdorf AG (Computers & peripherals) | | 50,204 | | | 2,806 |
Wirecard AG (IT services) | | 365,197 | | | 3,111 |
| | | | | |
| | | | | 17,249 |
| | | | | |
Ireland—1.5% | | | | | |
*Norkom Group plc (Software) | | 215,133 | | | 347 |
Paddy Power plc (Hotels, restaurants & leisure) | | 195,972 | | | 6,088 |
| | | | | |
| | | | | 6,435 |
| | | | | |
Italy—2.5% | | | | | |
Ansaldo STS SpA (Transportation infrastructure) | | 217,207 | | | 3,487 |
DiaSorin SpA (Health care equipment & supplies) | | 99,945 | | | 3,661 |
Trevi Finanziaria SpA (Construction & engineering) | | 266,974 | | | 3,831 |
| | | | | |
| | | | | 10,979 |
| | | | | |
Luxembourg—1.0% | | | | | |
Oriflame Cosmetics S.A. (Personal products) | | 83,200 | | | 4,321 |
| | | | | |
Netherlands—0.5% | | | | | |
BinckBank N.V. (Capital markets) | | 179,314 | | | 2,231 |
| | | | | |
Norway—0.7% | | | | | |
*Norwegian Air Shuttle ASA (Airlines) | | 95,256 | | | 1,523 |
Opera Software ASA (Internet software & services) | | 171,405 | | | 590 |
*Pronova BioPharma A/S (Pharmaceuticals) | | 510,609 | | | 1,006 |
| | | | | |
| | | | | 3,119 |
| | | | | |
Spain—1.6% | | | | | |
Tecnicas Reunidas S.A. (Energy equipment & services) | | 158,310 | | | 7,200 |
| | | | | |
Sweden—1.6% | | | | | |
Elekta AB (Health care equipment & supplies) | | 283,883 | | | 7,184 |
| | | | | |
| | | | | |
Issuer | | Shares | | Value |
|
Common Stocks—Europe—27.1%—(continued) |
Switzerland—6.7% | | | | | |
*Dufry Group (Specialty retail) | | 55,866 | | $ | 4,178 |
*Orascom Development Holding AG (Hotels, restaurants & leisure) | | 39,856 | | | 2,211 |
Partners Group Holding AG (Capital markets) | | 78,830 | | | 9,512 |
Sika AG (Chemicals) | | 2,919 | | | 5,174 |
*Temenos Group AG (Software) | | 357,555 | | | 8,608 |
| | | | | |
| | | | | 29,683 |
| | | | | |
| | |
United Kingdom—22.1% | | | | | |
Abcam plc (Biotechnology) | | 141,429 | | | 2,583 |
Aggreko plc (Commercial services & supplies) | | 214,055 | | | 4,494 |
Amlin plc (Insurance) | | 1,009,467 | | | 5,810 |
Ashmore Group plc (Capital markets) | | 589,384 | | | 2,127 |
*ASOS plc (Internet & catalog retail) | | 154,303 | | | 1,973 |
Aveva Group plc (Software) | | 201,540 | | | 3,382 |
Babcock International Group plc (Commercial services & supplies) | | 814,504 | | | 7,236 |
*Blinkx plc (Internet software & services) | | 2,006,326 | | | 1,109 |
BlueBay Asset Management plc (Capital markets) | | 199,031 | | | 852 |
Britvic plc (Beverages) | | 735,535 | | | 5,213 |
*Ceres Power Holdings plc (Electrical equipment) | | 262,261 | | | 295 |
Chemring Group plc (Aerospace & defense) | | 75,742 | | | 3,349 |
*Dana Petroleum plc (Oil, gas & consumable fuels) | | 359,274 | | | 6,048 |
Domino’s Pizza UK & IRL plc (Hotels, restaurants & leisure) | | 255,283 | | | 1,442 |
*EnQuest plc (Oil, gas & consumable fuels) | | 299,681 | | | 445 |
Intertek Group plc (Professional services) | | 113,091 | | | 2,424 |
Lancashire Holdings, Ltd. (Insurance) | | 232,960 | | | 1,727 |
Meggitt plc (Aerospace & defense) | | 784,642 | | | 3,657 |
Michael Page International plc (Professional services) | | 799,923 | | | 4,429 |
Micro Focus International plc (Software) | | 544,439 | | | 3,421 |
Mothercare plc (Multiline retail) | | 264,430 | | | 2,244 |
Petrofac, Ltd. (Energy equipment & services) | | 257,082 | | | 4,523 |
*Promethean World plc (Diversified consumer services) | | 350,726 | | | 953 |
Rightmove plc (Media) | | 248,521 | | | 2,331 |
RPS Group plc (Commercial services & supplies) | | 316,754 | | | 882 |
Serco Group plc (Commercial services & supplies) | | 978,331 | | | 8,544 |
Spirax-Sarco Engineering plc (Machinery) | | 158,159 | | | 3,222 |
*Telecity Group plc (Internet software & services) | | 338,559 | | | 2,017 |
The Weir Group plc (Machinery) | | 536,643 | | | 8,244 |
Victrex plc (Chemicals) | | 166,542 | | | 2,709 |
| | | | | |
| | | | | 97,685 |
| | | | | |
| | |
Japan—16.7% | | | | | |
ABC-Mart, Inc. (Specialty retail) | | 232,414 | | | 9,117 |
Aeon Delight Co., Ltd. (Commercial services & supplies) | | 83,700 | | | 1,629 |
CyberAgent, Inc. (Media) | | 1,378 | | | 2,042 |
Dena Co., Ltd. (Internet & catalog retail) | | 173,700 | | | 4,587 |
Disco Corporation (Semiconductors & semiconductor equipment) | | 53,900 | | | 3,410 |
See accompanying Notes to Financial Statements.
18 Semi-Annual Report | June 30, 2010 |
International Small Cap Growth Fund
Portfolio of Investments, June 30, 2010 (all dollar amounts in thousands) (unaudited)
| | | | | |
Issuer | | Shares | | Value |
|
Common Stocks—Japan—16.7%—(continued) |
EPS Co., Ltd. (Life sciences tools & services) | | 560 | | $ | 1,416 |
Exedy Corporation (Auto components) | | 148,800 | | | 3,815 |
F.C.C. Co., Ltd. (Auto components) | | 160,709 | | | 3,003 |
*Gree, Inc. (Internet software & services) | | 60,130 | | | 4,802 |
kabu.com Securities Co., Ltd. (Capital markets) | | 201,900 | | | 947 |
Kakaku.com, Inc. (Internet software & services) | | 614 | | | 2,537 |
Miraca Holdings, Inc. (Health care providers & services) | | 294,500 | | | 8,815 |
Nabtesco Corporation (Machinery) | | 244,000 | | | 3,761 |
Nitori Co., Ltd. (Specialty retail) | | 59,950 | | | 5,168 |
Osaka Securities Exchange Co., Ltd. (Diversified financial services) | | 1,367 | | | 5,805 |
Point, Inc. (Specialty retail) | | 71,440 | | | 3,919 |
Sawai Pharmaceutical Co., Ltd. (Pharmaceuticals) | | 26,300 | | | 2,517 |
Start Today Co., Ltd. (Internet & catalog retail) | | 245 | | | 671 |
USS Co., Ltd. (Specialty retail) | | 82,050 | | | 5,861 |
| | | | | |
| | | | | 73,822 |
| | | | | |
| | |
Emerging Asia—14.6% | | | | | |
China—8.1% | | | | | |
361 Degrees International, Ltd. (Textiles, apparel & luxury goods) | | 6,448,000 | | | 4,594 |
AAC Acoustic Technologies Holdings, Inc. (Communications equipment) | | 2,613,559 | | | 3,736 |
Ajisen China Holdings, Ltd. (Hotels, restaurants & leisure) | | 1,796,429 | | | 2,005 |
China Green (Holdings), Ltd. (Food products) | | 1,754,556 | | | 1,761 |
China High Speed Transmission Equipment Group Co., Ltd. (Electrical equipment) | | 1,056,000 | | | 2,218 |
Comba Telecom Systems Holdings, Ltd. (Communications equipment) | | 1,752,998 | | | 1,932 |
*Concord Medical Services Holdings, Ltd.—ADR (Health care providers & services) | | 99,812 | | | 595 |
Golden Eagle Retail Group, Ltd. (Multiline retail) | | 285,000 | | | 595 |
Haitian International Holdings, Ltd. (Machinery) | | 1,481,496 | | | 1,034 |
Li Ning Co., Ltd. (Textiles, apparel & luxury goods) | | 1,278,373 | | | 4,189 |
Lonking Holdings, Ltd. (Machinery) | | 4,126,000 | | | 2,733 |
Minth Group, Ltd. (Auto components) | | 2,463,384 | | | 2,911 |
Peak Sport Products, Ltd. (Textiles, apparel & luxury goods) | | 5,779,000 | | | 3,806 |
Shandong Weigao Group Medical Polymer Co., Ltd. (Health care equipment & supplies) | | 300,800 | | | 1,310 |
Zhuzhou CSR Times Electric Co., Ltd. (Electrical equipment) | | 1,132,865 | | | 2,398 |
| | | | | |
| | | | | 35,817 |
| | | | | |
India—3.0% | | | | | |
Ipca Laboratories, Ltd. (Pharmaceuticals) | | 378,865 | | | 2,368 |
Lupin, Ltd. (Pharmaceuticals) | | 178,480 | | | 7,514 |
Yes Bank, Ltd. (Commercial banks) | | 598,128 | | | 3,428 |
| | | | | |
| | | | | 13,310 |
| | | | | |
| | | | | |
Issuer | | Shares | | Value |
|
Common Stocks—Emerging Asia—14.6%—(continued) |
Indonesia—1.1% | | | | | |
*PT Ciputra Development Tbk (Real estate management & development) | | 14,294,000 | | $ | 523 |
PT Kalbe Farma Tbk (Pharmaceuticals) | | 10,314,500 | | | 2,368 |
PT Perusahaan Perkebunan London Sumatra Indonesia Tbk (Food products) | | 2,159,000 | | | 1,959 |
| | | | | |
| | | | | 4,850 |
| | | | | |
Taiwan—2.4% | | | | | |
Chicony Electronics Co., Ltd. (Computers & peripherals) | | 1,306,000 | | | 2,895 |
Tripod Technology Corporation (Electronic equipment, instruments & components) | | 1,041,000 | | | 3,849 |
Wistron Corporation (Computers & peripherals) | | 2,441,000 | | | 3,577 |
| | | | | |
| | | | | 10,321 |
| | | | | |
| | |
Canada—6.0% | | | | | |
*Bankers Petroleum, Ltd. (Oil, gas & consumable fuels) | | 191,809 | | | 1,265 |
Canadian Western Bank (Commercial banks) | | 143,600 | | | 3,189 |
*Consolidated Thompson Iron Mines, Ltd. (Metals & mining) | | 403,378 | | | 2,751 |
*Gildan Activewear, Inc. (Textiles, apparel & luxury goods) | | 240,700 | | | 6,914 |
Home Capital Group, Inc. (Thrifts & mortgage finance) | | 54,147 | | | 2,145 |
*Legacy Oil + Gas, Inc. (Oil, gas & consumable fuels) | | 200,562 | | | 2,163 |
Petrominerales, Ltd. (Oil, gas & consumable fuels) | | 121,785 | | | 2,843 |
*Red Back Mining, Inc. (Metals & mining) | | 203,289 | | | 5,138 |
| | | | | |
| | | | | 26,408 |
| | | | | |
| | |
Emerging Latin America—4.6% | | | | | |
Brazil—2.5% | | | | | |
Brasil Brokers Participacoes S.A. (Real estate management & development) | | 319,800 | | | 1,031 |
Localiza Rent a Car S.A. (Road & rail) | | 201,400 | | | 2,338 |
Lojas Renner S.A. (Multiline retail) | | 146,900 | | | 3,988 |
OdontoPrev S.A. (Health care providers & services) | | 38,700 | | | 1,349 |
Positivo Informatica S.A. (Computers & peripherals) | | 213,000 | | | 2,002 |
Tegma Gestao Logistica S.A. (Road & rail) | | 44,455 | | | 376 |
| | | | | |
| | | | | 11,084 |
| | | | | |
Colombia—1.1% | | | | | |
*Pacific Rubiales Energy Corporation (Oil, gas & consumable fuels) | | 225,671 | | | 5,058 |
| | | | | |
Mexico—1.0% | | | | | |
*Genomma Lab Internacional S.A.B. de C.V. (Pharmaceuticals) | | 668,910 | | | 2,221 |
*Grupo Comercial Chedraui S.A. de C.V. (Food & staples retailing) | | 789,787 | | | 2,064 |
| | | | | |
| | | | | 4,285 |
| | | | | |
See accompanying Notes to Financial Statements.
June 30, 2010 | William Blair Funds 19 |
International Small Cap Growth Fund
Portfolio of Investments, June 30, 2010 (all dollar amounts in thousands) (unaudited)
| | | | | | |
Issuer | | Shares or
Principal
Amount | | Value |
|
Common Stocks—Emerging Europe, Mid-East, Africa—3.6% |
South Africa—2.5% | | | | | | |
*Aspen Pharmacare Holdings, Ltd. (Pharmaceuticals) | | | 259,678 | | $ | 2,564 |
Clicks Group, Ltd. (Multiline retail) | | | 1,192,055 | | | 5,244 |
Mr Price Group, Ltd. (Specialty retail) | | | 395,587 | | | 2,297 |
Wilson Bayly Holmes-Ovcon, Ltd. (Construction & engineering) | | | 48,854 | | | 696 |
| | | | | | |
| | | | | | 10,801 |
| | | | | | |
Turkey—1.1% | | | | | | |
Asya Katilim Bankasi A.S. (Commercial banks) | | | 877,427 | | | 2,003 |
BIM Birlesik Magazalar A.S. (Food & staples retailing) | | | 100,074 | | | 2,774 |
| | | | | | |
| | | | | | 4,777 |
| | | | | | |
| | |
Asia—3.5% | | | | | | |
Australia—2.5% | | | | | | |
Cochlear, Ltd. (Health care equipment & supplies) | | | 80,252 | | | 4,999 |
JB Hi-Fi, Ltd. (Specialty retail) | | | 256,719 | | | 4,084 |
Seek, Ltd. (Professional services) | | | 366,928 | | | 2,136 |
| | | | | | |
| | | | | | 11,219 |
| | | | | | |
Singapore—1.0% | | | | | | |
Midas Holdings, Ltd. (Metals & mining) | | | 3,017,000 | | | 1,952 |
Olam International, Ltd. (Food & staples retailing) | | | 1,284,700 | | | 2,358 |
| | | | | | |
| | | | | | 4,310 |
| | | | | | |
Total Common Stocks—98.2%
(cost $392,593) | | | 433,379 |
| | | | | | |
| | |
Convertible Bond | | | | | | |
Brazil—0.1% | | | | | | |
Lupatech S.A., 6.500%, due 4/15/18 (Machinery)**§ | | $ | 959 | | | 545 |
| | | | | | |
Total Convertible Bond—0.1%
(cost $497) | | | 545 |
| | | | | | |
| | |
Investment in Affiliate | | | | | | |
William Blair Ready Reserves Fund | | | 488,907 | | | 489 |
| | | | | | |
Total Investment in Affiliate—0.1%
(cost $489) | | | 489 |
| | | | | | |
| | |
Short-Term Investment | | | | | | |
American Express Credit Corporation Demand Note, VRN, 0.191%, due 7/1/10 | | $ | 500 | | | 500 |
| | | | | | |
Total Short-Term Investment—0.1%
(cost $500) | | | 500 |
| | | | | | |
| | |
Repurchase Agreement | | | | | | |
Fixed Income Clearing Corporation, 0.000% dated 6/30/10, due 7/1/10, repurchase price $7,130, collateralized by FHLMC,
2.000%, due 4/15/13 | | $ | 7,130 | | $ | 7,130 |
| | | | | | |
Total Repurchase Agreement—1.6%
(cost $7,130) | | | 7,130 |
| | | | | | |
| | | | | | |
Issuer | | Value | |
Total Investments—100.1%
(cost $401,209) | | | 442,043 | |
| | | | | | |
Liabilities, plus cash and other assets—(0.1)% | | | (454 | ) |
| | | | | | |
Net assets—100.0% | | $ | 441,589 | |
| | | | | | |
ADR = American Depository Receipt
VRN = Variable Rate Note
* Non-income producing securities
** = Fair valued pursuant to Valuation Procedures adopted by the Board of Trustees. This holding represents 0.12% of the Fund’s net assets at June 30, 2010.
§ = Deemed illiquid pursuant to Liquidity Procedures approved by the Board of Trustees. This holding represents 0.12% of the net assets at June 30, 2010.
For securities primarily traded on exchanges or markets that close before the close of regular trading on the New York Stock Exchange, the Fund may use an independent pricing service to fair value price the securities pursuant to Valuation Procedures approved by the Board of Trustees.
At June 30, 2010, the Fund’s Portfolio of Investments includes the following industry categories:
| | |
Consumer Discretionary | | 26.6% |
Industrials | | 19.1% |
Information Technology | | 15.0% |
Health Care | | 13.5% |
Financials | | 9.9% |
Energy | | 7.2% |
Consumer Staples | | 4.2% |
Materials | | 4.1% |
Utilities | | 0.4% |
| | |
Total | | 100.0% |
| | |
At June 30, 2010, the Fund’s Portfolio of Investments includes the following currency categories:
| | |
British Pound Sterling | | 22.5% |
Japanese Yen | | 17.0% |
Euro | | 15.7% |
Hong Kong Dollar | | 8.1% |
Canadian Dollar | | 7.3% |
Swiss Franc | | 6.8% |
Indian Rupee | | 3.1% |
Brazilian Real | | 2.7% |
Swedish Krona | | 2.6% |
Australian Dollar | | 2.6% |
South African Rand | | 2.5% |
New Taiwan Dollar | | 2.4% |
Danish Krone | | 1.7% |
Indonesian Rupiah | | 1.1% |
Turkish Lira | | 1.1% |
All Other Currencies | | 2.8% |
| | |
Total | | 100.0% |
| | |
See accompanying Notes to Financial Statements.
20 Semi-Annual Report | June 30, 2010 |

Todd M. McClone
Jeffrey A. Urbina
EMERGING MARKETS GROWTH FUND
The Emerging Markets Growth Fund seeks long-term capital appreciation.
AN OVERVIEW FROM THE PORTFOLIO MANAGERS
Please see page 2 for the Global Markets Overview.
The Emerging Markets Growth Fund posted a 4.07% decrease (Institutional Class) for the six months ended June 30, 2010. By comparison, the Fund’s benchmark, the MSCI Emerging Markets IMI Index, declined 5.68%.
The emerging markets growth strategy outpaced the Index year to date as stock selection was strong across most sectors and regions, due largely to second quarter performance. In particular, the Fund added significant value in Consumer, Financials, and Industrials. Within Consumer, the Fund’s focus in Asian auto companies and Consumer Staples added value, as did stock selection within Latin America. Emerging Markets Europe, Mid-East and Africa (EMEA) grocery holdings augmented results, as did Brazilian Consumer Staples performance. Financials stock selection was strong across regions, while transportation and infrastructure-related Asian Industrials added value. The Fund outperformed across each emerging markets region, benefiting largely from individual stock selection, rather than overall sector positioning within regions. Somewhat detracting from performance was Materials stock selection, which was focused on mining and fertilizers, areas which underperformed due to concerns about demand for commodities amidst a slowdown in China property development specifically and a potential global slowdown in general.
As of June 30, the Fund maintained its focus in Consumer stocks with 34.5% of the Fund invested across Consumer Discretionary and Consumer Staples names, a slight increase since year end. Financials was the largest single sector within the portfolio at 25.2%. While Asian Financials represented approximately 10% of the overall exposure, the weighting was significantly lower than the Index. We reduced Information Technology from a 13.7% weighting as of year end to 8.8% during the second quarter, as a result of concerns about near-intermediate term earnings sustainability. Materials and Telecommunication Services were also significantly underweighted versus the Index, and remained relatively stable during the period. Regionally, while 48.2% of the Fund was in Emerging Asian stocks, it remained very underweighted versus the Index, due largely to lower exposure in Korea and Taiwan. Conversely, the Fund was significantly overweighted in Latin America at 26.7% of the Fund, particularly in the Consumer, Energy and Financials sectors.
June 30, 2010 | William Blair Funds 21 |
Emerging Markets Growth Fund
Performance Highlights (unaudited)
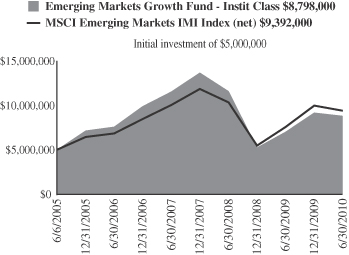
Average Annual Total Return at 6/30/2010
| | | | | | | | | | | | | | | |
| | | Year
To Date | | | 1
Year | | | 3
Year | | | 5
Year | | | Since
Inception(a) | |
Institutional Class | | (4.07 | )% | | 25.68 | % | | (8.67 | )% | | 11.37 | % | | 11.79 | % |
MSCI Emerging Markets IMI (net) | | (5.68 | ) | | 24.57 | | | (2.17 | ) | | 12.98 | | | 13.20 | |
| | (a) | | For the period June 6, 2005 (Commencement of Operations) to June 30, 2010. |
Performance cited represents past performance. Past performance does not guarantee future results and current performance may be lower or higher than the data quoted. Results shown are average annual returns, which assume reinvestment of dividends and capital gains. Investment returns and principal will fluctuate and you may have a gain or loss when you sell shares. For the most current month-end performance information, please call 1-800-742-7272, or visit our Web site at www.williamblairfunds.com. From time to time, the investment advisor may waive fees or reimburse expenses for the Fund. Without these waivers, performance would be lower. International investing involves special risk considerations, including currency fluctuations, lower liquidity, economic and political risk.
The performance highlights and graph presented above do not reflect the deduction of taxes that a shareholder would pay on fund distributions or the redemption of fund shares.
The Morgan Stanley Capital International (MSCI) Emerging Markets Investable Market Index (IMI) (net) is a free float-adjusted market capitalization weighted index that is designed to measure the equity market performance of emerging markets. This series approximates the minimum possible dividend reinvestment.
This report identifies the Fund’s investments on June 30, 2010. These holdings are subject to change. Not all stocks in the Fund performed the same, nor is there any guarantee that these stocks will perform as well in the future. Market forecasts provided in this report may not necessarily come to pass.
Sector Diversification (unaudited)
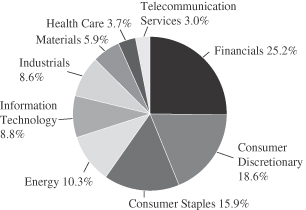
The sector diversification shown is based on the total long-term securities.
22 Semi-Annual Report | June 30, 2010 |
Emerging Markets Growth Fund
Portfolio of Investments, June 30, 2010 (all dollar amounts in thousands) (unaudited)
| | | | | |
Issuer | | Shares | | Value |
| |
Common Stocks—Emerging Asia—48.2% | | | |
China—18.6% | | | | | |
361 Degrees International, Ltd. (Textiles, apparel & luxury goods) | | 3,259,000 | | $ | 2,322 |
AAC Acoustic Technologies Holdings, Inc. (Communications equipment) | | 1,511,949 | | | 2,161 |
Ajisen China Holdings, Ltd. (Hotels, restaurants & leisure) | | 2,175,078 | | | 2,428 |
*Baidu, Inc.—ADR (Internet software & services) | | 177,193 | | | 12,063 |
China Dongxiang Group Co. (Textiles, apparel & luxury goods) | | 4,154,000 | | | 2,769 |
China Green (Holdings), Ltd. (Food products) | | 2,409,000 | | | 2,417 |
China High Speed Transmission Equipment Group Co., Ltd. (Electrical equipment) | | 1,708,000 | | | 3,588 |
China Life Insurance Co., Ltd. (Insurance) | | 4,004,000 | | | 17,510 |
China Shenhua Energy Co., Ltd. (Oil, gas & consumable fuels) | | 3,693,406 | | | 13,325 |
China Vanke Co., Ltd. (Real estate management & development) | | 1,345,426 | | | 1,411 |
China Yurun Food Group, Ltd. (Food products) | | 2,479,000 | | | 7,796 |
CNOOC, Ltd. (Oil, gas & consumable fuels) | | 18,107,000 | | | 30,776 |
Comba Telecom Systems Holdings, Ltd. (Communications equipment) | | 1,964,600 | | | 2,165 |
*Concord Medical Services Holdings, Ltd.—ADR (Health care providers & services) | | 150,368 | | | 896 |
*Ctrip.com International, Ltd.—ADR (Hotels, restaurants & leisure) | | 154,717 | | | 5,811 |
Dongfeng Motor Group Co., Ltd. (Automobiles) | | 13,550,000 | | | 15,717 |
Golden Eagle Retail Group, Ltd. (Multiline retail) | | 1,754,000 | | | 3,662 |
Haitian International Holdings, Ltd. (Machinery) | | 1,960,185 | | | 1,368 |
Hengan International Group Co., Ltd. (Personal products) | | 987,000 | | | 7,992 |
Industrial and Commercial Bank of China (Commercial banks) | | 47,465,000 | | | 34,500 |
Li Ning Co., Ltd. (Textiles, apparel & luxury goods) | | 1,035,000 | | | 3,391 |
Lonking Holdings, Ltd. (Machinery) | | 4,894,000 | | | 3,242 |
Mindray Medical International, Ltd.—ADR (Health care equipment & supplies) | | 108,484 | | | 3,409 |
Minth Group, Ltd. (Auto components) | | 1,004,000 | | | 1,186 |
Peak Sport Products, Ltd. (Textiles, apparel & luxury goods) | | 3,331,000 | | | 2,194 |
Shandong Weigao Group Medical Polymer Co., Ltd. (Health care equipment & supplies) | | 640,700 | | | 2,791 |
Zhuzhou CSR Times Electric Co., Ltd. (Electrical equipment) | | 784,861 | | | 1,662 |
| | | | | |
| | | | | 188,552 |
| | | | | |
India—13.3% | | | | | |
Asian Paints, Ltd. (Chemicals) | | 63,367 | | | 3,123 |
Axis Bank, Ltd. (Commercial banks) | | 391,009 | | | 10,366 |
Bharat Heavy Electricals, Ltd. (Electrical equipment) | | 248,597 | | | 13,098 |
*Cairn India, Ltd. (Oil, gas & consumable fuels) | | 807,585 | | | 5,229 |
| | | | | |
Issuer | | Shares | | Value |
|
Common Stocks—Emerging Asia—48.2%—(continued) |
India—(continued) | | | | | |
Dabur India, Ltd. (Personal products) | | 849,316 | | $ | 3,830 |
Financial Technologies (India), Ltd. (Software) | | 71,919 | | | 2,054 |
Hero Honda Motors, Ltd. (Automobiles) | | 86,847 | | | 3,810 |
Housing Development Finance Corporation (Thrifts & mortgage finance) | | 135,622 | | | 8,547 |
Infosys Technologies, Ltd. (IT services) | | 354,841 | | | 21,171 |
Jindal Steel & Power, Ltd. (Metals & mining) | | 691,867 | | | 9,238 |
Larsen & Toubro, Ltd. (Construction & engineering) | | 439,205 | | | 16,987 |
Lupin, Ltd. (Pharmaceuticals) | | 137,292 | | | 5,780 |
Sterlite Industries India, Ltd. (Metals & mining) | | 4,299,728 | | | 15,518 |
Sun TV Network, Ltd. (Media) | | 277,889 | | | 2,598 |
Tata Motors, Ltd. (Machinery) | | 607,261 | | | 10,056 |
Yes Bank, Ltd. (Commercial banks) | | 619,020 | | | 3,548 |
| | | | | |
| | | | | 134,953 |
| | | | | |
Indonesia—3.9% | | | | | |
PT Astra International Tbk (Automobiles) | | 2,998,500 | | | 15,842 |
PT Bank Rakyat Indonesia (Commercial banks) | | 10,504,000 | | | 10,664 |
*PT Ciputra Development Tbk (Real estate management & development) | | 54,385,456 | | | 1,991 |
PT Unilever Indonesia Tbk (Household products) | | 2,137,500 | | | 3,986 |
PT United Tractors Tbk (Machinery) | | 3,545,000 | | | 7,266 |
| | | | | |
| | | | | 39,749 |
| | | | | |
Malaysia—1.3% | | | | | |
CIMB Group Holdings Bhd (Commercial banks) | | 4,551,200 | | | 9,799 |
Top Glove Corporation Bhd (Health care equipment & supplies) | | 708,900 | | | 2,996 |
| | | | | |
| | | | | 12,795 |
| | | | | |
Papua New Guinea—0.7% | | | | | |
Oil Search, Ltd. (Oil, gas & consumable fuels) | | 1,451,850 | | | 6,680 |
| | | | | |
South Korea—6.8% | | | | | |
Amorepacific Corporation (Personal products) | | 7,331 | | | 6,237 |
Hyundai Mobis (Auto components) | | 106,180 | | | 17,809 |
Hyundai Motor Co. (Automobiles) | | 252,022 | | | 29,489 |
LG Household & Health Care, Ltd. (Household products) | | 19,694 | | | 5,593 |
Samsung Electronics Co., Ltd. (Semiconductors & semiconductor equipment) | | 15,020 | | | 9,421 |
| | | | | |
| | | | | 68,549 |
| | | | | |
Taiwan—2.8% | | | | | |
Chicony Electronics Co., Ltd. (Computers & peripherals) | | 1,056,000 | | | 2,341 |
*Hon Hai Precision Industry Co., Ltd. (Electronic equipment, instruments & components) | | 2,721,100 | | | 9,538 |
MediaTek, Inc. (Semiconductors & semiconductor equipment) | | 627,142 | | | 8,753 |
See accompanying Notes to Financial Statements.
June 30, 2010 | William Blair Funds 23 |
Emerging Markets Growth Fund
Portfolio of Investments, June 30, 2010 (all dollar amounts in thousands) (unaudited)
| | | | | |
Issuer | | Shares | | Value |
|
Common Stocks—Emerging Asia—48.2%—(continued) |
Taiwan—(continued) | | | | | |
Tripod Technology Corporation (Electronic equipment, instruments & components) | | 809,000 | | $ | 2,991 |
Wistron Corporation (Computers & peripherals) | | 2,888,000 | | | 4,232 |
| | | | | |
| | | | | 27,855 |
| | | | | |
Thailand—0.8% | | | | | |
CP ALL PCL (Food & staples retailing) | | 8,734,700 | | | 7,753 |
Minor International PCL (Hotels, restaurants & leisure) | | 2,544,400 | | | 794 |
| | | | | |
| | | | | 8,547 |
| | | | | |
| | |
Emerging Latin America—26.7% | | | | | |
Brazil—14.0% | | | | | |
Amil Participacoes S.A. (Insurance) | | 696,384 | | | 5,652 |
Anhanguera Educacional Participacoes S.A. (Diversified consumer services) | | 162,800 | | | 2,461 |
BR Malls Participacoes S.A. (Real estate management & development) | | 601,900 | | | 7,836 |
BR Properties S.A. (Real estate management & development) | | 305,241 | | | 2,173 |
Brasil Brokers Participacoes S.A. (Real estate management & development) | | 438,200 | | | 1,413 |
Cia de Bebidas das Americas—ADR (Beverages) | | 204,409 | | | 20,647 |
Cyrela Brazil Realty S.A. (Household durables) | | 423,400 | | | 4,577 |
Diagnosticos da America S.A. (Health care providers & services) | | 971,600 | | | 9,145 |
*Hypermarcas S.A. (Personal products) | | 601,228 | | | 7,721 |
Localiza Rent a Car S.A. (Road & rail) | | 677,500 | | | 7,864 |
Lojas Renner S.A. (Multiline retail) | | 334,000 | | | 9,067 |
M Dias Branco S.A. (Food products) | | 112,934 | | | 2,440 |
MRV Engenharia e Participacoes S.A. (Household durables) | | 1,129,880 | | | 7,956 |
Natura Cosmeticos S.A. (Personal products) | | 525,200 | | | 11,639 |
OdontoPrev S.A. (Health care providers & services) | | 61,900 | | | 2,157 |
*OGX Petroleo e Gas Participacoes S.A. (Oil, gas & consumable fuels) | | 987,300 | | | 9,146 |
PDG Realty S.A. Empreendimentos e Participacoes (Household durables) | | 583,500 | | | 4,927 |
Positivo Informatica S.A. (Computers & peripherals) | | 242,700 | | | 2,282 |
Totvs S.A. (Software) | | 62,800 | | | 4,660 |
Vale S.A.—ADR (Metals & mining) | | 747,662 | | | 18,206 |
| | | | | |
| | | | | 141,969 |
| | | | | |
Chile—1.9% | | | | | |
Banco Santander Chile—ADR (Commercial banks) | | 133,920 | | | 8,985 |
Lan Airlines S.A. (Airlines) | | 254,122 | | | 4,747 |
S.A.C.I. Falabella (Multiline retail) | | 912,778 | | | 5,942 |
| | | | | |
| | | | | 19,674 |
| | | | | |
Colombia—0.6% | | | | | |
*Pacific Rubiales Energy Corporation (Oil, gas & consumable fuels) | | 266,540 | | | 5,974 |
| | | | | |
| | | | | |
Issuer | | Shares | | Value |
|
Common Stocks—Emerging Latin America—26.7%—(continued) |
Mexico—8.1% | | | | | |
America Movil S.A.B. de C.V. (Wireless telecommunication services) | | 12,208,300 | | $ | 28,885 |
Banco Compartamos S.A. de C.V. (Consumer finance) | | 884,400 | | | 4,597 |
*Genomma Lab Internacional S.A.B. de C.V. (Pharmaceuticals) | | 748,917 | | | 2,487 |
*Grupo Comercial Chedraui S.A. de C.V. (Food & staples retailing) | | 1,163,002 | | | 3,040 |
Grupo Mexico S.A.B. de C.V. Series “B” (Metals & mining) | | 4,028,428 | | | 9,563 |
Grupo Televisa S.A.—ADR (Media) | | 371,363 | | | 6,465 |
Wal-Mart de Mexico S.A.B. de C.V. (Food & staples retailing) | | 12,396,300 | | | 27,461 |
| | | | | |
| | | | | 82,498 |
| | | | | |
Panama—0.5% | | | | | |
Copa Holdings S.A. Class “A” (Airlines)† | | 102,809 | | | 4,546 |
| | | | | |
Peru—1.6% | | | | | |
Credicorp, Ltd. (Commercial banks)† | | 177,258 | | | 16,111 |
| | | | | |
| |
Emerging Europe, Mid-East, Africa—14.0% | | | |
Egypt—0.6% | | | | | |
Commercial International Bank Egypt S.A.E. (Commercial banks) | | 406,718 | | | 4,761 |
Egyptian Financial Group-Hermes Holding (Capital markets) | | 282,784 | | | 1,427 |
| | | | | |
| | | | | 6,188 |
| | | | | |
Qatar—1.4% | | | | | |
Qatar National Bank S.A.Q. (Commercial banks) | | 386,845 | | | 14,219 |
| | | | | |
Russia—1.8% | | | | | |
Magnit OAO (Food & staples retailing)† | | 120,984 | | | 8,048 |
*X5 Retail Group N.V.—GDR (Food & staples retailing) | | 304,600 | | | 10,222 |
| | | | | |
| | | | | 18,270 |
| | | | | |
South Africa—6.3% | | | | | |
*Aspen Pharmacare Holdings, Ltd. (Pharmaceuticals) | | 516,628 | | | 5,102 |
Clicks Group, Ltd. (Multiline retail) | | 904,081 | | | 3,977 |
Mr Price Group, Ltd. (Specialty retail) | | 538,924 | | | 3,130 |
Naspers, Ltd. (Media) | | 227,587 | | | 7,664 |
Shoprite Holdings, Ltd. (Food & staples retailing) | | 955,130 | | | 10,269 |
Standard Bank Group, Ltd. (Commercial banks) | | 1,758,112 | | | 23,314 |
Truworths International, Ltd. (Specialty retail) | | 1,095,500 | | | 7,625 |
Wilson Bayly Holmes-Ovcon, Ltd. (Construction & engineering) | | 169,068 | | | 2,407 |
| | | | | |
| | | | | 63,488 |
| | | | | |
Turkey—3.4% | | | | | |
Asya Katilim Bankasi A.S. (Commercial banks) | | 2,012,230 | | | 4,594 |
See accompanying Notes to Financial Statements.
24 Semi-Annual Report | June 30, 2010 |
Emerging Markets Growth Fund
Portfolio of Investments, June 30, 2010 (all dollar amounts in thousands) (unaudited)
| | | | | | |
Issuer | | Shares or
Principal
Amount | | Value |
|
Common Stocks—Emerging Europe, Mid-East, Africa—14.0%—(continued) |
Turkey—(continued) | | | | | | |
BIM Birlesik Magazalar A.S. (Food & staples retailing) | | | 240,426 | | $ | 6,664 |
Turkiye Garanti Bankasi A.S. (Commercial banks) | | | 5,611,846 | | | 23,354 |
| | | | | | |
| | | | | | 34,612 |
| | | | | | |
United Arab Emirates—0.5% | | | | | | |
First Gulf Bank PJSC (Commercial banks) | | | 1,173,086 | | | 4,745 |
| | | | | | |
Total Common Stocks—88.9%
(cost $746,081) | | | 899,974 |
| | | | | | |
| | |
Preferred Stocks | | | | | | |
Brazil—4.6% | | | | | | |
Itau Unibanco Holding S.A. (Commercial banks) | | | 955,854 | | | 17,211 |
Petroleo Brasileiro S.A. (Oil, gas & consumable fuels) | | | 1,764,180 | | | 26,252 |
Randon Participacoes S.A. (Machinery) | | | 662,300 | | | 3,776 |
| | | | | | |
| | | | | | 47,239 |
| | | | | | |
Total Preferred Stocks—4.6%
(cost $48,102) | | | 47,239 |
| | | | | | |
| | |
Investment in Warrants | | | | | | |
Thailand—0.0% | | | | | | |
*Minor International PCL 2013, $13.00 (Hotels, restaurants & leisure) | | | 575,650 | | | 43 |
| | | | | | |
Total Warrants—0.0%
(cost $0) | | | 43 |
| | | | | | |
| | |
Convertible Bond | | | | | | |
Brazil—0.1% | | | | | | |
Lupatech S.A., 6.500%, due 4/15/18 (Machinery)**§ | | $ | 1,602 | | | 910 |
| | | | | | |
Total Convertible Bond—0.1%
(cost $831) | | | 910 |
| | | | | | |
| | |
Investment in Affiliate | | | | | | |
William Blair Ready Reserves Fund | | | 66,217 | | | 66 |
| | | | | | |
Total Investment in Affiliate—0.0%
(cost $66) | | | 66 |
| | | | | | |
| | |
Short-Term Investment | | | | | | |
American Express Credit Corporation Demand Note, VRN, 0.191%, due 7/1/10 | | $ | 2,000 | | | 2,000 |
| | | | | | |
Total Short-Term Investment—0.2%
(cost $2,000) | | | 2,000 |
| | | | | | |
| | | | | | |
Issuer | | Principal
Amount | | Value |
| | |
Repurchase Agreement | | | | | | |
Fixed Income Clearing Corporation, 0.000% dated 6/30/10, due 7/1/10, repurchase price $44,125, collateralized by FFCB, 1.625%, due 3/7/13 | | $ | 44,125 | | $ | 44,125 |
| | | | | | |
Total Repurchase Agreement—4.4%
(cost $44,125) | | | 44,125 |
| | | | | | |
Total Investments—98.2%
(cost $841,205) | | | 994,357 |
Cash and other assets, less liabilities—1.8% | | | 18,124 |
| | | | | | |
Net Assets—100.0% | | $ | 1,012,481 |
| | | | | | |
ADR = American Depository Receipt
GDR = Global Depository Receipt
VRN = Variable Rate Note
*Non-income producing securities
† = U.S. listed foreign security
** = Fair valued pursuant to Valuation Procedures adopted by the Board of Trustees. This holding represents 0.09% of the Fund’s net assets at June 30, 2010.
§ = Deemed illiquid pursuant to Liquidity Procedures approved by the Board of Trustees. This holding represents 0.09% of the net assets at June 30, 2010.
For securities primarily traded on exchanges or markets that close before the close of regular trading on the New York Stock Exchange, the Fund may use an independent pricing service to fair value price the securities pursuant to Valuation Procedures approved by the Board of Trustees.
At June 30, 2010, the Fund’s Portfolio of Investments includes the following industry categories:
| | |
Financials | | 25.2% |
Consumer Discretionary | | 18.6% |
Consumer Staples | | 15.9% |
Energy | | 10.3% |
Information Technology | | 8.8% |
Industrials | | 8.6% |
Materials | | 5.9% |
Health Care | | 3.7% |
Telecommunication Services | | 3.0% |
| | |
Total | | 100.0% |
| | |
At June 30, 2010, the Fund’s Portfolio of Investments includes the following currency categories:
| | |
Hong Kong Dollar | | 17.5% |
Brazilian Real | | 16.0% |
Indian Rupee | | 14.2% |
U.S. Dollar | | 12.2% |
Mexican Peso | | 8.0% |
South Korean Won | | 7.2% |
South African Rand | | 6.7% |
Indonesian Rupiah | | 4.2% |
Turkish Lira | | 3.7% |
New Taiwan Dollar | | 2.9% |
Qatari Rial | | 1.5% |
Malaysian Ringgit | | 1.4% |
Chilean Peso | | 1.1% |
All Other Currencies | | 3.4% |
| | |
Total | | 100.0% |
| | |
See accompanying Notes to Financial Statements.
June 30, 2010 | William Blair Funds 25 |
Todd M. McClone
Jeffrey A. Urbina
EMERGING LEADERS GROWTH FUND
The Emerging Leaders Growth Fund seeks long-term capital appreciation.
AN OVERVIEW FROM THE PORTFOLIO MANAGERS
Please see page 2 for the Global Markets Overview.
The Emerging Leaders Growth Fund posted a 2.02% decrease (Institutional Class) for the six months ended June 30, 2010. By comparison, the Fund’s benchmark, the MSCI Emerging Markets Large Cap Index (net) declined 6.11%.
Year to date performance was augmented by the Fund’s significant weighting in Consumer Discretionary and Staples stocks at the expense of Materials and Information Technology (IT). Stock selection was also a key determinant of outperformance during the first half of 2010 across regions and sectors. The Fund’s Staples holdings were up just over 13%, significantly outpacing the Index, due primarily to strong performance in the Fund’s Emerging Asian consumer products and grocery holdings, coupled with strong Emerging Europe, Middle East, and Africa (EMEA) grocery/discount performance. Industrials stock selection was also particularly strong, with infrastructure related holdings driving results. Regionally, the Fund benefited from good performance across most sectors within Emerging Asia, as well as the overweighting in Consumer Discretionary and Staples at the expense of Asian IT and Materials stocks. EMEA value added was largely within the Consumer Staples sector, while Emerging Latin America performance benefited from the underweighting and stock performance within Energy, coupled with strong Financials stock selection.
As of June 30, the Fund maintained its significant exposure in Consumer Discretionary and Staples stocks, with 28.0% in Consumer Staples and another 14.8% in Consumer Discretionary, compared to the 5.94% and 4.36% Index weightings, respectively. Consumer Staples exposure increased by nearly 10% since year end, particularly in Emerging Asia and Emerging Latin America, while Consumer Discretionary decreased by nearly 5%. The Fund maintained its marginal overweighting of Financials at 28.2% of the Fund, with higher weightings in EMEA and Emerging Latin America offset by an underweighting in Asian Financials. The Fund was most significantly underweighted in Energy stocks, which represented 8.0% of the Fund, compared with nearly 16.0% in the Index, and in IT and Materials, which were also significantly underweighted. IT decreased by approximately 9% during the six month period, while Materials decreased by approximately 8%, as we sold holdings in these sectors due to deteriorating short-intermediate term earnings growth in favor of Consumer Staples holdings and, to some extent, cash equivalents.
26 Semi-Annual Report | June 30, 2010 |
Emerging Leaders Growth Fund
Performance Highlights (unaudited)
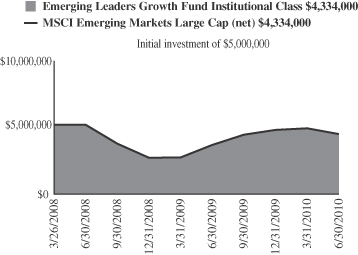
Average Annual Total Return at 6/30/2010
| | | | | | | | | |
| | | Year
To Date | | | 1
Year | | | Since
Inception(a) | |
Institutional Class | | (2.02 | )% | | 28.73 | % | | (7.42 | )% |
MSCI Emerging Markets
Large Cap (net) | | (6.55 | ) | | 21.93 | | | (6.11 | ) |
| | (a) | | For the period March 26, 2008 (Commencement of Operations) to June 30, 2010. |
Performance cited represents past performance. Past performance does not guarantee future results and current performance may be lower or higher than the data quoted. Results shown are average annual total returns, which assume reinvestment of dividends and capital gains. Investment returns and principal will fluctuate and you may have a gain or loss when you sell shares. For the most current month-end performance information, please call 1-800-742-7272, or visit our Web site at www.williamblairfunds.com. International investing includes special risk considerations, including currency fluctuations, lower liquidity, economic and political risk. From time to time, the investment advisor may waive fees or reimburse expenses for the Fund. Without these waivers, performance would be lower.
The performance highlights and graph presented above do not reflect the deduction of taxes that a shareholder would pay on fund distributions or the redemption of fund shares.
The Morgan Stanley Capital International (MSCI) Emerging Markets Large Cap Index (net) is a free float-adjusted market capitalization weighted index that is designed to measure market performance of large capitalization on stocks in emerging markets. This series approximates the minimum possible dividend reinvestment.
This report identifies the Fund’s investments on June 30, 2010. These holdings are subject to change. Not all stocks in the Fund performed the same, nor is there any guarantee that these stocks will perform as well in the future. Market forecasts provided in this report may not necessarily come to pass.
Sector Diversification (unaudited)
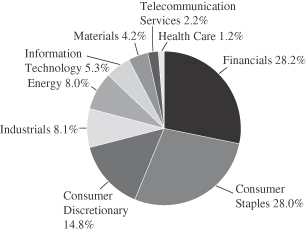
The sector diversification shown is based on the total long-term securities.
June 30, 2010 | William Blair Funds 27 |
Emerging Leaders Growth Fund
Portfolio of Investments, June 30, 2010 (all dollar amounts in thousands) (unaudited)
| | | | | |
Issuer | | Shares | | Value |
|
Common Stocks—Emerging Asia—55.8% |
China—19.7% | | | | | |
*Baidu, Inc.—ADR (Internet software & services) | | 12,159 | | $ | 828 |
Belle International Holdings, Ltd. (Specialty retail) | | 865,000 | | | 1,227 |
China Dongxiang Group Co. (Textiles, apparel & luxury goods) | | 1,304,000 | | | 869 |
China Life Insurance Co., Ltd. (Insurance) | | 270,000 | | | 1,181 |
China Oilfield Services, Ltd. (Energy equipment & services) | | 638,000 | | | 742 |
China Yurun Food Group, Ltd. (Food products) | | 280,000 | | | 880 |
CNOOC, Ltd. (Oil, gas & consumable fuels) | | 1,463,000 | | | 2,487 |
*Ctrip.com International, Ltd.—ADR (Hotels, restaurants & leisure) | | 17,354 | | | 652 |
Dongfeng Motor Group Co., Ltd. (Automobiles) | | 536,000 | | | 622 |
Golden Eagle Retail Group, Ltd. (Multiline retail) | | 470,000 | | | 981 |
Hengan International Group Co., Ltd. (Personal products) | | 116,000 | | | 939 |
Industrial and Commercial Bank of China (Commercial banks) | | 3,181,000 | | | 2,312 |
Want Want China Holdings, Ltd. (Food products) | | 1,410,000 | | | 1,183 |
| | | | | |
| | | | | 14,903 |
| | | | | |
India—17.1% | | | | | |
Axis Bank, Ltd. (Commercial banks) | | 40,528 | | | 1,075 |
Bharat Heavy Electricals, Ltd. (Electrical equipment) | | 18,157 | | | 957 |
*Cairn India, Ltd. (Oil, gas & consumable fuels) | | 153,377 | | | 993 |
Dabur India, Ltd. (Personal products) | | 249,748 | | | 1,126 |
HDFC Bank, Ltd. (Commercial banks) | | 35,862 | | | 1,473 |
Housing Development Finance Corporation (Thrifts & mortgage finance) | | 8,191 | | | 516 |
Infosys Technologies, Ltd. (IT services) | | 22,404 | | | 1,337 |
ITC, Ltd. (Tobacco) | | 140,246 | | | 915 |
Jindal Steel & Power, Ltd. (Metals & mining) | | 85,364 | | | 1,140 |
Larsen & Toubro, Ltd. (Construction & engineering) | | 39,463 | | | 1,526 |
Nestle India, Ltd. (Food products) | | 14,634 | | | 908 |
Tata Motors, Ltd. (Machinery) | | 58,945 | | | 976 |
| | | | | |
| | | | | 12,942 |
| | | | | |
Indonesia—7.1% | | | | | |
PT Astra International Tbk (Automobiles) | | 281,000 | | | 1,485 |
PT Bank Rakyat Indonesia (Commercial banks) | | 1,326,000 | | | 1,346 |
PT Unilever Indonesia Tbk (Household products) | | 667,000 | | | 1,244 |
PT United Tractors Tbk (Machinery) | | 644,000 | | | 1,320 |
| | | | | |
| | | | | 5,395 |
| | | | | |
Malaysia—2.7% | | | | | |
CIMB Group Holdings Bhd (Commercial banks) | | 957,500 | | | 2,062 |
| | | | | |
South Korea—6.4% | | | | | |
Hyundai Mobis (Auto components) | | 7,579 | | | 1,271 |
Hyundai Motor Co. (Automobiles) | | 13,180 | | | 1,542 |
| | | | | |
Issuer | | Shares | | Value |
|
Common Stocks—Emerging Asia—55.8%—(continued) |
South Korea—(continued) | | | | | |
LG Household & Health Care, Ltd. (Household products) | | 4,198 | | $ | 1,192 |
Samsung Electronics Co., Ltd. (Semiconductors & semiconductor equipment) | | 1,280 | | | 803 |
| | | | | |
| | | | | 4,808 |
| | | | | |
Taiwan—1.0% | | | | | |
*Hon Hai Precision Industry Co., Ltd. (Electronic equipment, instruments & components) | | 222,000 | | | 778 |
| | | | | |
Thailand—1.8% | | | | | |
CP ALL PCL (Food & staples retailing) | | 1,504,200 | | | 1,335 |
| | | | | |
| | |
Emerging Latin America—21.2% | | | | | |
Brazil—8.4% | | | | | |
Cia de Bebidas das Americas—ADR (Beverages) | | 14,721 | | | 1,487 |
Cyrela Brazil Realty S.A. (Household durables) | | 14,500 | | | 157 |
*Hypermarcas S.A. (Personal products) | | 123,100 | | | 1,581 |
Natura Cosmeticos S.A. (Personal products) | | 45,800 | | | 1,015 |
*OGX Petroleo e Gas Participacoes S.A. (Oil, gas & consumable fuels) | | 57,000 | | | 528 |
PDG Realty S.A. Empreendimentos e Participacoes (Household durables) | | 55,900 | | | 472 |
Vale S.A.—ADR (Metals & mining) | | 44,252 | | | 1,077 |
| | | | | |
| | | | | 6,317 |
| | | | | |
Chile—3.9% | | | | | |
Banco Santander Chile—ADR (Commercial banks) | | 13,259 | | | 890 |
Lan Airlines S.A. (Airlines) | | 49,913 | | | 932 |
S.A.C.I. Falabella (Multiline retail) | | 172,523 | | | 1,123 |
| | | | | |
| | | | | 2,945 |
| | | | | |
Colombia—1.2% | | | | | |
*Pacific Rubiales Energy Corporation (Oil, gas & consumable fuels) | | 40,415 | | | 906 |
| | | | | |
Mexico—6.1% | | | | | |
America Movil S.A.B. de C.V.—ADR (Wireless telecommunication services) | | 31,637 | | | 1,503 |
Grupo Financiero Banorte S.A.B. de C.V. (Commercial banks) | | 229,400 | | | 869 |
Grupo Mexico S.A.B. de C.V. Series “B” (Metals & mining) | | 317,626 | | | 754 |
Wal-Mart de Mexico S.A.B. de C.V. (Food & staples retailing) | | 664,800 | | | 1,473 |
| | | | | |
| | | | | 4,599 |
| | | | | |
Peru—1.6% | | | | | |
Credicorp, Ltd. (Commercial banks)† | | 13,436 | | | 1,221 |
| | | | | |
|
Emerging Europe, Mid-East, Africa—13.7% |
Egypt—0.9% | | | | | |
Commercial International Bank Egypt S.A.E. (Commercial banks) | | 55,505 | | | 650 |
| | | | | |
Russia—4.0% | | | | | |
*Magnit OJSC—144A—GDR (Food & staples retailing) | | 53,628 | | | 751 |
See accompanying Notes to Financial Statements.
28 Semi-Annual Report | June 30, 2010 |
Emerging Leaders Growth Fund
Portfolio of Investments, June 30, 2010 (all dollar amounts in thousands) (unaudited)
| | | | | | |
Issuer | | Shares or
Principal
Amount | | Value |
|
Common Stocks—Emerging Europe, Mid-East, Africa—13.7%—(continued) |
Russia—(continued) | | | | | | |
Sberbank of Russian Federation (Commercial banks)† | | | 425,545 | | $ | 1,022 |
*X5 Retail Group N.V.—GDR (Food & staples retailing) | | | 36,350 | | | 1,227 |
| | | | | | |
| | | | | | 3,000 |
| | | | | | |
South Africa—4.3% | | | | | | |
*Aspen Pharmacare Holdings, Ltd. (Pharmaceuticals) | | | 86,313 | | | 852 |
Shoprite Holdings, Ltd. (Food & staples retailing) | | | 117,179 | | | 1,260 |
Standard Bank Group, Ltd. (Commercial banks) | | | 88,959 | | | 1,180 |
| | | | | | |
| | | | | | 3,292 |
| | | | | | |
Turkey—4.0% | | | | | | |
BIM Birlesik Magazalar A.S. (Food & staples retailing) | | | 43,371 | | | 1,202 |
Turkiye Garanti Bankasi A.S. (Commercial banks) | | | 435,175 | | | 1,811 |
| | | | | | |
| | | | | | 3,013 |
| | | | | | |
United Arab Emirates—0.5% | | | | | | |
First Gulf Bank PJSC (Commercial banks) | | | 99,024 | | | 400 |
| | | | | | |
Total Common Stocks—90.7%
(cost $59,694) | | | 68,566 |
| | | | | | |
| | |
Preferred Stock | | | | | | |
Brazil—2.4% | | | | | | |
Itau Unibanco Holding S.A. (Commercial banks) | | | 101,085 | | $ | 1,820 |
| | | | | | |
Total Preferred Stock—2.4%
(cost $1,494) | | | 1,820 |
| | | | | | |
| | |
Investment in Affiliate | | | | | | |
William Blair Ready Reserves Fund | | | 440,296 | | | 440 |
| | | | | | |
Total Investment in Affiliate—0.6%
(cost $440) | | | 440 |
| | | | | | |
| | |
Repurchase Agreement | | | | | | |
State Street Bank and Trust Company, 0.000% dated 6/30/10, due 7/1/10, repurchase price $2,709, collateralized by FHLB, 4.375% due 9/17/10 | | $ | 2,709 | | | 2,709 |
| | | | | | |
Total Repurchase Agreement—3.6%
(cost $2,709) | | | 2,709 |
| | | | | | |
Total Investments—97.3%
(cost $64,337) | | | 73,535 |
Cash and other assets, less liabilities—2.7% | | | 2,074 |
| | | | | | |
Net assets—100.0% | | $ | 75,609 |
| | | | | | |
ADR = American Depository Receipt
GDR = Global Depository Receipt
* Non-income producing securities
† = U.S. listed foreign security
For securities primarily traded on exchanges or markets that close before the close of regular trading on the New York Stock Exchange, the Fund may use an independent pricing service to fair value price the securities pursuant to Valuation Procedures approved by the Board of Trustees.
At June 30, 2010, the Fund’s Portfolio of Investments includes the following industry categories:
| | |
Financials | | 28.2% |
Consumer Staples | | 28.0% |
Consumer Discretionary | | 14.8% |
Industrials | | 8.1% |
Energy | | 8.0% |
Information Technology | | 5.3% |
Materials | | 4.2% |
Telecommunication Services | | 2.2% |
Health Care | | 1.2% |
| | |
Total | | 100.0% |
| | |
At June 30, 2010, the Fund’s Portfolio of Investments includes the following currency categories:
| | |
Hong Kong Dollar | | 19.1% |
Indian Rupee | | 18.4% |
U.S. Dollar | | 15.1% |
Brazilian Real | | 7.9% |
Indonesian Rupiah | | 7.7% |
South Korean Won | | 6.8% |
South African Rand | | 4.7% |
Mexican Peso | | 4.4% |
Turkish Lira | | 4.3% |
Malaysian Ringgit | | 2.9% |
Chilean Peso | | 2.9% |
Thai Baht | | 1.9% |
Canadian Dollar | | 1.3% |
New Taiwan Dollar | | 1.1% |
All Other Currencies | | 1.5% |
| | |
Total | | 100.0% |
| | |
See accompanying Notes to Financial Statements.
June 30, 2010 | William Blair Funds 29 |
Fixed-Income Market Overview
Summary
The first half of 2010 was a tale of two quarters for the fixed-income markets.
The first quarter of 2010 reflected investor optimism about economic recovery and growth. Prices of fixed-income securities began to reflect expectations for a healthy rebound in the U.S. economy.
The second quarter was a much more challenging environment. Weaker economic data, stubbornly high unemployment and nervousness about government debt levels in the U.S. and in Europe began to undermine investor confidence. To add to these worries was news on April 16th that the Securities and Exchange Commission (SEC) had filed a civil lawsuit accusing the Wall Street firm Goldman Sachs of securities fraud. All these factors caused investors to turn more bearish towards all “risk” assets.
There were two Federal Market Open Market Committee meetings (FOMC) that were held during the second quarter and both confirmed that the Federal Reserve Board had decided to keep short-term interest rates near zero for “an extended period.” The Fed cited impediments to economic growth, including the effect of new financial problems abroad. In its statement following its most recent meeting on June 23, the Fed said, “financial conditions have become less supportive of economic growth on balance, largely reflecting developments abroad.”
It is worth noting that among the Federal Reserve Board’s arsenal of tools for stimulating growth in the economy is to purchase higher-coupon mortgage-backed securities. The demand created by the Fed’s purchases, in turn, prompts loan originators to lower interest rates, and has driven 30-year mortgages rates to low levels that are unprecedented.
Longer-term interest rates trended lower during the second quarter, with the 10-Year U.S. Treasury Note, which finished at 3.83% at the end of the first quarter, to end the second quarter at 2.93%.
Outlook
In hindsight, during the first quarter investors were probably too optimistic about an economy which was supported by government stimulus. Conversely, this sentiment swung to extreme pessimism during the second quarter. We believe the reality is that the economy is self-sustaining, but serious headwinds remain.
We believe that U.S. GDP growth will likely remain subpar due to structural unemployment in the U.S. economy. We believe this current environment is one that should be favorable for Corporate bonds, and we intend to maintain an overweight position in that sector, as well as higher-coupon Agency Mortgage-backed securities.
It is important to note that the fundamentals for U.S. corporations—for example, corporate balance sheets—remain strong. We believe demand for Corporate bonds will remain robust, and we think Corporate bonds will perform well, based on the prospects for further stabilization in the economy.
We anticipate continued strong fixed-income demand as insurance companies, pension funds, and other investors still carry high cash balances and are looking to invest funds at yields higher than the near zero cash and money market yields offered.
30 Semi-Annual Report | June 30, 2010 |
We remain encouraged that the fixed-income markets have been able to absorb major potential policy changes in the health care and financial services industries with relatively minor changes in risk premiums.
Interest rates are at historic lows. We don’t anticipate any major changes in Federal Reserve policy or interest rates until 2011.
As a firmer root structure emerges to the nascent economic recovery, there is the possibility that upward pressure might be placed on interest rates. While we do not expect this to materially have an impact on the prices of fixed income securities, we nonetheless believe the current structure of the portfolio will help provide protection.
June 30, 2010 | William Blair Funds 31 |

Christopher T. Vincent

Paul J. Sularz
BOND FUND
The Bond Fund seeks to outperform the Barclays Capital U.S. Aggregate Bond Index by maximizing total return through a combination of income and capital appreciation.
AN OVERVIEW FROM THE PORTFOLIO MANAGERS
Please see page 30 for the Fixed Income Market Overview.
How did the Fund preform during the past six months? How did the Fund’s performance compare to its benchmark?
The Bond Fund posted a 5.37% increase on a total return basis (Institutional Class) for the six months ended June 30, 2010. By comparison, the Fund’s benchmark, the Barclays Capital U.S. Aggregate Bond Index, gained 5.33%.
Which sectors enhanced the Fund’s return? What were among the best performing investments for the Fund?
The Fund’s significant overweight in investment grade Corporate securities and its roughly 10% exposure to high yield securities boosted performance during the first quarter. However, these sectors struggled during the second quarter with the paradigm shift of investor sentiment from expectations of economic growth to fears of a double-dip recession.
The Fund nearly doubled its holdings in below investment grade securities (those rated below BBB). Investment grade securities, at almost 50% of the Fund’s portfolio, were double the weight of the Fund’s benchmark Barclays Capital U.S. Aggregate Bond Index.
The Fund’s underweight in Commercial Mortgage-backed securities (which comprise 1% of the Fund and approximately 3% of the benchmark Index), was a slight drag on performance, when compared to the benchmark.
We made a conscious decision to invest in Corporate REITs, which are actively managed rather than the static pools of mortgages typically held in Commercial Mortgage-backed securities. We believe this is more prudent in the event of continued weakness in commercial real estate.
We also avoided owning U.S. Agency debentures, but instead emphasized U.S. Agency Mortgage-backed securities via higher coupon pools that are “seasoned,” as well as low loan balance pools. We believe the above-market coupons in these pools will experience slower amortization and should protect the Fund in a rising rate environment, while still providing an attractive level of current income.
We continue to position the Fund with a significant underweight to U.S. Treasuries, and maintain a very modest allocation to U.S. Treasury securities via TIPs (Treasury Inflation Protected Securities).
While we do not believe inflation is an immediate concern, we think our Fund’s positioning overall is defensive and appropriate in the event that interest rates rise sharply.
32 Semi-Annual Report | June 30, 2010 |
Bond Fund
Performance Highlights (unaudited)
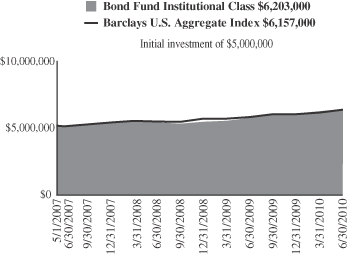
Average Annual Total Return at 6/30/2010
| | | | | | | | | | | | |
| | | Year
To Date | | | 1
Year | | | 3
Year | | | Since
Inception(a) | |
Institutional Class | | 5.37 | % | | 11.70 | % | | 7.85 | % | | 7.04 | % |
Barclays Capital U.S. Aggregate Bond Index | | 5.33 | | | 9.50 | | | 7.55 | | | 6.77 | |
| | (a) | | For the period May 1, 2007 (Commencement of Operations) to June 30, 2010. |
Performance cited represents past performance. Past performance does not guarantee future results and current performance may be lower or higher than the data quoted. Results shown are average annual total returns, which assume reinvestment of dividends and capital gains. Investment returns and principal will fluctuate and you may have a gain or loss when you sell shares. For the most current month-end performance information, please call 1-800-742-7272, or visit our Web site at www.williamblairfunds.com. From time to time, the investment advisor may waive fees or reimburse expenses for the Fund. Without these waivers, performance would be lower.
The performance highlights and graph presented above do not reflect the deduction of taxes that a shareholder would pay on fund distributions or the redemption of fund shares.
The Barclays Capital U.S. Aggregate Bond Index indicates broad intermediate government/corporate bond market performance.
This report identifies the Fund’s investments on June 30, 2010. These holdings are subject to change. Not all investments in the Fund performed the same, nor is there any guarantee that these investments will perform as well in the future. Market forecasts provided in this report may not necessarily come to pass.
Sector Diversification (unaudited)
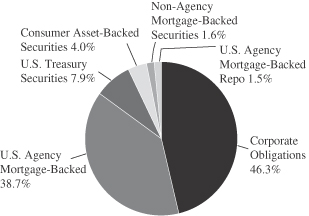
The sector diversification shown is based on the total investments.
June 30, 2010 | William Blair Funds 33 |
Bond Fund
Portfolio of Investments, June 30, 2010 (all amounts in thousands) (unaudited)
| | | | | | | | |
Issuer | | Principal
Amount | | Value |
|
U.S. Government and U.S. Government Agency—46.8% |
U.S. Treasury Inflation Indexed Notes/Bonds—7.9% | | | | | | | | |
U.S. Treasury Inflation Indexed Bond, 3.875%, due 4/15/29 | | | | $ | 7,956 | | $ | 10,677 |
U.S. Treasury Inflation Indexed Note,
1.875%, due 7/15/13 | | | | | 593 | | | 628 |
U.S. Treasury Inflation Indexed Note,
2.375%, due 1/15/17 | | | | | 3,243 | | | 3,580 |
| | | | | | | | |
Total U.S. Treasury Inflation Indexed Notes/Bonds | | | | | | | | 14,885 |
| | | | | | | | |
Government National Mortgage Association (GNMA)—1.0% | | | | | | | | |
GNR 2004-2 M5,
4.891%, due 7/16/34 | | | | | 125 | | | 136 |
GNR 2006-67 GB,
4.324%, due 9/16/34, VRN | | | | | 1,540 | | | 1,666 |
| | | | | | | | |
Total GNMA Mortgage Obligations | | | | | | | | 1,802 |
| | | | | | | | |
Federal Home Loan Mortgage Corp. (FHLMC)—8.9% | | | | | | | | |
#G90024, 7.000%, due 1/20/13 | | | | | 49 | | | 52 |
#G30093, 7.000%, due 12/1/17 | | | | | 41 | | | 45 |
#G30255, 7.000%, due 7/1/21 | | | | | 88 | | | 97 |
#G12792, 4.500%, due 12/1/21 | | | | | 563 | | | 600 |
#D95897, 5.500%, due 3/1/23 | | | | | 292 | | | 317 |
#G30372, 5.000%, due 9/1/27 | | | | | 676 | | | 718 |
#G01728, 7.500%, due 7/1/32 | | | | | 322 | | | 368 |
#C01385, 6.500%, due 8/1/32 | | | | | 439 | | | 488 |
#G02141, 6.000%, due 3/1/36 | | | | | 2,053 | | | 2,275 |
#A62179, 6.000%, due 6/1/37 | | | | | 1,083 | | | 1,198 |
#A63539, 6.000%, due 7/1/37 | | | | | 1,401 | | | 1,542 |
#G03170, 6.500%, due 8/1/37 | | | | | 2,195 | | | 2,413 |
#A66843, 6.500%, due 10/1/37 | | | | | 1,153 | | | 1,281 |
#A78138, 5.500%, due 6/1/38 | | | | | 1,572 | | | 1,711 |
#A81799, 6.500%, due 9/1/38 | | | | | 3,309 | | | 3,682 |
| | | | | | | | |
Total FHLMC Mortgage Obligations | | | | | | | | 16,787 |
| | | | | | | | |
Federal National Mortgage Association (FNMA)—29.0% | | | | | | | | |
#535559, 7.500%, due 9/1/12 | | | | | 126 | | | 128 |
#598453, 7.000%, due 6/1/15 | | | | | 1 | | | 1 |
#689612, 5.000%, due 5/1/18 | | | | | 479 | | | 517 |
#695910, 5.000%, due 5/1/18 | | | | | 845 | | | 915 |
#747903, 4.500%, due 6/1/19 | | | | | 438 | | | 468 |
#745735, 5.000%, due 3/1/21 | | | | | 1,036 | | | 1,112 |
#253847, 6.000%, due 5/1/21 | | | | | 290 | | | 319 |
#900725, 6.000%, due 8/1/21 | | | | | 247 | | | 271 |
#545437, 7.000%, due 2/1/32 | | | | | 227 | | | 257 |
#545759, 6.500%, due 7/1/32 | | | | | 2,495 | | | 2,785 |
#254548, 5.500%, due 12/1/32 | | | | | 1,073 | | | 1,158 |
#684601, 6.000%, due 3/1/33 | | | | | 2,307 | | | 2,591 |
#190340, 5.000%, due 9/1/33 | | | | | 2,216 | | | 2,357 |
#254868, 5.000%, due 9/1/33 | | | | | 1,083 | | | 1,152 |
#555800, 5.500%, due 10/1/33 | | | | | 485 | | | 523 |
#725027, 5.000%, due 11/1/33 | | | | | 874 | | | 930 |
#555880, 5.500%, due 11/1/33 | | | | | 568 | | | 613 |
#555946, 5.500%, due 11/1/33 | | | | | 899 | | | 980 |
#756153, 5.500%, due 11/1/33 | | | | | 2,474 | | | 2,668 |
#725231, 5.000%, due 2/1/34 | | | | | 893 | | | 950 |
#725205, 5.000%, due 3/1/34 | | | | | 1,902 | | | 2,023 |
| | | | | | | | |
Issuer | | NRSRO
Rating | | Principal
Amount | | Value |
Federal National Mortgage Association (FNMA)—(continued) | | | | | | | | |
#725220, 5.000%, due 3/1/34 | | | | $ | 831 | | $ | 884 |
#725232, 5.000%, due 3/1/34 | | | | | 2,692 | | | 2,863 |
#725238, 5.000%, due 3/1/34 | | | | | 1,512 | | | 1,608 |
#725424, 5.500%, due 4/1/34 | | | | | 610 | | | 657 |
#725611, 5.500%, due 6/1/34 | | | | | 543 | | | 586 |
#786546, 6.000%, due 7/1/34 | | | | | 1,031 | | | 1,145 |
#787816, 6.000%, due 7/1/34 | | | | | 979 | | | 1,076 |
#190353, 5.000%, due 8/1/34 | | | | | 644 | | | 684 |
#357883, 5.000%, due 5/1/35 | | | | | 1,320 | | | 1,404 |
#745092, 6.500%, due 7/1/35 | | | | | 677 | | | 756 |
#357944, 6.000%, due 9/1/35 | | | | | 126 | | | 139 |
#829306, 6.000%, due 9/1/35 | | | | | 356 | | | 395 |
#843487, 6.000%, due 10/1/35 | | | | | 302 | | | 333 |
#849191, 6.000%, due 1/1/36 | | | | | 195 | | | 216 |
#848782, 6.500%, due 1/1/36 | | | | | 876 | | | 970 |
#745349, 6.500%, due 2/1/36 | | | | | 1,229 | | | 1,353 |
#831540, 6.000%, due 6/1/36 | | | | | 251 | | | 273 |
#745802, 6.000%, due 7/1/36 | | | | | 719 | | | 792 |
#886220, 6.000%, due 7/1/36 | | | | | 1,225 | | | 1,346 |
#893318, 6.500%, due 8/1/36 | | | | | 287 | | | 317 |
#256859, 5.500%, due 8/1/37 | | | | | 1,119 | | | 1,196 |
#928561, 6.000%, due 8/1/37 | | | | | 883 | | | 969 |
#948689, 6.000%, due 8/1/37 | | | | | 2,570 | | | 2,799 |
#888967, 6.000%, due 12/1/37 | | | | | 1,986 | | | 2,173 |
#962058, 6.500%, due 3/1/38 | | | | | 3,411 | | | 3,815 |
#934006, 6.500%, due 9/1/38 | | | | | 1,812 | | | 2,008 |
#986856, 6.500%, due 9/1/38 | | | | | 1,198 | | | 1,319 |
| | | | | | | | |
Total FNMA Mortgage Obligations | | | | | | | | 54,794 |
| | | | | | | | |
| | | |
Non-Agency Mortgage-Backed Obligations—1.6% | | | | | | | | |
Countrywide Alternative Loan Trust, 2003-11T1, Tranche M, 4.750%, 7/25/18 | | CCC | | | 252 | | | 178 |
Lehman Structured Securities Corp.—144A, 2004-2, Tranche M2, 2.759%, 2/28/33, VRN§ | | CC | | | 162 | | | 21 |
First Horizon Asset Securities, Inc., 2004-AR4, Tranche 3A1, 4.653%, 8/25/34, VRN | | AAA | | | 680 | | | 711 |
Chase Mortgage Finance Corporation, 2006-A1, Tranche 2A3, 6.000%, 9/25/36, VRN | | CCC | | | 2,460 | | | 2,074 |
| | | | | | | | |
Total Non-Agency Mortgage-Backed Obligations | | | | | | | | 2,984 |
| | | | | | | | |
| | | |
Consumer Asset-Backed Securities—4.1% | | | | | | | | |
Avis Budget Rental Car Funding AESOP LLC—144A, 2009-1A, Tranche A, 9.310%, 10/20/13 | | A2 | | | 2,000 | | | 2,225 |
Avis Budget Rental Car Funding AESOP LLC—144A, 2009-2A, Tranche A, 5.680%, 2/20/14 | | Aaa | | | 1,800 | | | 1,919 |
Hertz Vehicle Financing LLC—144A, 2009-2A, Tranche A1, 4.260%, 3/25/14 | | Aaa | | | 2,230 | | | 2,324 |
Centre Point Funding LLC—144A, 2010-1A, Tranche 1, 5.430%, 7/20/16 | | A2 | | | 954 | | | 985 |
First Plus Home Loan Trust, 1997-4, Tranche M1, 7.640%, 9/11/23**§ | | C | | | 199 | | | 119 |
See accompanying Notes to Financial Statements.
34 Semi-Annual Report | June 30, 2010 |
Bond Fund
Portfolio of Investments, June 30, 2010 (all amounts in thousands) (unaudited)
| | | | | | | | |
Issuer | | NRSRO
Rating | | Principal
Amount | | Value |
| |
Consumer Asset-Backed Securities—(continued) | | | |
Renaissance Home Equity Loan Trust, 2004-2, Tranche M5, 6.455%, 7/25/34 | | A2 | | $ | 463 | | $ | 111 |
Soundview Home Equity Loan Trust, 2005-B, Tranche M1, 6.135%, 5/25/35 | | AA+ | | | 40 | | | 40 |
| | | | | | | | |
Total Consumer Asset-Backed Securities | | | | | | | | 7,723 |
| | | | | | | | |
| | | |
Corporate Obligations—46.0% | | | | | | | | |
Morgan Stanley,
6.600%, due 4/1/12 | | A | | | 545 | | | 578 |
Wells Fargo & Co.,
4.375%, due 1/31/13 | | AA- | | | 350 | | | 370 |
Weatherford International, Ltd., 5.150%, due 3/15/13 | | Baa1 | | | 1,425 | | | 1,493 |
John Deere Capital Corporation, 4.500%, due 4/3/13 | | A | | | 700 | | | 754 |
Citigroup, Inc.,
5.500%, due 4/11/13 | | A+ | | | 1,500 | | | 1,559 |
General Electric Capital Corporation, 4.800%, due 5/1/13 | | AA+ | | | 600 | | | 640 |
Kansas City Southern de Mexico S.A. de C.V., 7.625%, due 12/1/13 | | BB- | | | 1,000 | | | 1,020 |
CME Group, Inc.,
5.750%, due 2/15/14 | | AA | | | 700 | | | 779 |
PACCAR, Inc.,
6.875%, due 2/15/14 | | A+ | | | 800 | | | 927 |
America Movil S.A.B. de C.V., 5.500%, due 3/1/14 | | A2 | | | 700 | | | 763 |
Smith International, Inc.,
8.625%, due 3/15/14 | | BBB+ | | | 970 | | | 1,152 |
General Electric Capital Corporation, 5.900%, due 5/13/14 | | AA+ | | | 225 | | | 248 |
Bank of America Corporation,
7.375%, due 5/15/14 | | A+ | | | 700 | | | 785 |
American Express Co.,
7.250%, due 5/20/14 | | A+ | | | 500 | | | 568 |
Capital One Financial Corporation, 7.375%, due 5/23/14 | | A- | | | 1,235 | | | 1,412 |
Hewlett-Packard Co.,
4.750%, due 6/2/14 | | A+ | | | 800 | | | 886 |
Macquarie Group Ltd.—144A,
7.300%, due 8/1/14 | | A2 | | | 1,000 | | | 1,102 |
Petrohawk Energy Corporation, 10.500%, due 8/1/14 | | B | | | 1,000 | | | 1,075 |
AT&T, Inc., 5.100%, due 9/15/14 | | A | | | 1,250 | | | 1,387 |
D.R. Horton, Inc.,
5.625%, due 9/15/14 | | BB | | | 1,000 | | | 980 |
Corporation Nacional del Cobre de Chile—144A,
4.750%, due 10/15/14 | | A1 | | | 1,350 | | | 1,457 |
Boeing Capital Corporation,
3.250%, due 10/27/14 | | A+ | | | 1,400 | | | 1,458 |
Crown Castle International Corporation,
9.000%, due 1/15/15 | | B1 | | | 1,000 | | | 1,058 |
EI du Pont de Nemours & Co.,
3.250%, due 1/15/15 | | A | | | 500 | | | 522 |
Georgia-Pacific LLC—144A,
7.000%, due 1/15/15 | | BB+ | | | 1,000 | | | 1,010 |
| | | | | | | | |
Issuer | | NRSRO
Rating | | Principal
Amount | | Value |
| | |
Corporate Obligations—(continued) | | | | | | |
The Kroger Co.,
4.950%, due 1/15/15 | | BBB | | $ | 1,175 | | $ | 1,266 |
Simon Property Group L.P.,
4.200%, due 2/1/15 | | A- | | | 1,500 | | | 1,541 |
DIRECTV Holdings LLC,
3.550%, due 3/15/15 | | Baa2 | | | 1,600 | | | 1,611 |
Yum! Brands, Inc.,
4.250%, due 9/15/15 | | BBB- | | | 350 | | | 371 |
Cisco Systems, Inc.,
5.500%, due 2/22/16 | | A+ | | | 2,000 | | | 2,304 |
Omnicom Group, Inc.,
5.900%, due 4/15/16 | | A- | | | 750 | | | 853 |
Yum! Brands, Inc.,
6.250%, due 4/15/16 | | BBB- | | | 700 | | | 800 |
Owens-Brockway Glass Container, Inc., 7.375%, due 5/15/16 | | BB+ | | | 1,250 | | | 1,303 |
SABMiller plc—144A,
6.500%, due 7/1/16 | | BBB+ | | | 700 | | | 822 |
Petrobras International Finance Co.,
6.125%, due 10/6/16 | | Baa1 | | | 1,350 | | | 1,433 |
EI du Pont de Nemours & Co.,
5.250%, due 12/15/16 | | A | | | 500 | | | 570 |
Comcast Corporation,
6.500%, due 1/15/17 | | BBB+ | | | 350 | | | 401 |
Corrections Corporation of America,
7.750%, due 6/1/17 | | BB | | | 1,250 | | | 1,297 |
ERP Operating L.P.,
5.750%, due 6/15/17 | | A- | | | 1,100 | | | 1,185 |
JPMorgan Chase & Co.,
6.125%, due 6/27/17 | | A1 | | | 600 | | | 656 |
BB&T Corporation,
4.900%, due 6/30/17 | | A2 | | | 665 | | | 686 |
American Express Co.,
6.150%, due 8/28/17 | | A+ | | | 1,000 | | | 1,096 |
IBM Corporation,
5.700%, due 9/14/17 | | A+ | | | 1,250 | | | 1,453 |
Exelon Generation Co. LLC,
6.200%, due 10/1/17 | | A3 | | | 1,100 | | | 1,250 |
Toll Brothers Finance Corporation,
8.910%, due 10/15/17 | | BBB- | | | 950 | | | 1,059 |
Triumph Group, Inc.,
8.000%, due 11/15/17 | | B+ | | | 1,000 | | | 955 |
Union Pacific Corporation,
5.750%, due 11/15/17 | | BBB | | | 800 | | | 903 |
Wells Fargo & Co.,
5.625%, due 12/11/17 | | AA- | | | 1,000 | | | 1,093 |
Kohl’s Corporation,
6.250%, due 12/15/17 | | BBB+ | | | 350 | | | 408 |
Morgan Stanley,
6.625%, due 4/1/18 | | A | | | 950 | | | 996 |
General Electric Capital Corporation,
5.625%, due 5/1/18 | | AA+ | | | 350 | | | 372 |
Philip Morris International, Inc.,
5.650%, due 5/16/18 | | A | | | 1,000 | | | 1,094 |
Time Warner Cable, Inc.,
6.750%, due 7/1/18 | | BBB | | | 1,000 | | | 1,148 |
Merrill Lynch & Co., Inc.,
6.875%, due 11/15/18 | | A+ | | | 1,075 | | | 1,143 |
Anheuser-Busch InBev Worldwide, Inc.—144A, 7.750%, due 1/15/19 | | BBB+ | | | 700 | | | 850 |
See accompanying Notes to Financial Statements.
June 30, 2010 | William Blair Funds 35 |
Bond Fund
Portfolio of Investments, June 30, 2010 (all amounts in thousands) (unaudited)
| | | | | | | | |
Issuer | | NRSRO
Rating | | Principal
Amount | | Value |
| | |
Corporate Obligations—(continued) | | | | | | |
FedEx Corporation,
8.000%, due 1/15/19 | | BBB | | $ | 750 | | $ | 952 |
CSX Corporation,
7.375%, due 2/1/19 | | BBB- | | | 800 | | | 980 |
Honeywell International, Inc.,
5.000%, due 2/15/19 | | A | | | 925 | | | 1,035 |
Pfizer, Inc.,
6.200%, due 3/15/19 | | AA | | | 1,250 | | | 1,486 |
BHP Billiton Finance USA, Ltd.,
6.500%, due 4/1/19 | | A+ | | | 1,300 | | | 1,559 |
Owens Corning,
9.000%, due 6/15/19 | | BBB- | | | 950 | | | 1,123 |
Jefferies Group, Inc.,
8.500%, due 7/15/19 | | BBB | | | 1,300 | | | 1,460 |
Discovery Communications LLC,
5.625%, due 8/15/19 | | Baa2 | | | 500 | | | 541 |
Roper Industries, Inc.,
6.250%, due 9/1/19 | | BBB- | | | 1,225 | | | 1,358 |
Boston Properties L.P.,
5.875%, due 10/15/19 | | A- | | | 1,500 | | | 1,605 |
Macquarie Group Ltd.—144A,
6.000%, due 1/14/20 | | A2 | | | 250 | | | 253 |
Ford Motor Credit Co. LLC,
8.125%, due 1/15/20 | | Ba3 | | | 1,515 | | | 1,546 |
Jarden Corporation,
7.500%, due 1/15/20 | | B | | | 1,000 | | | 978 |
Motiva Enterprises LLC—144A,
5.750%, due 1/15/20 | | A | | | 1,500 | | | 1,650 |
Johnson Controls, Inc.,
5.000%, due 3/30/20 | | BBB | | | 1,625 | | | 1,708 |
United Technologies Corporation,
4.500%, due 4/15/20 | | A+ | | | 1,500 | | | 1,623 |
Iron Mountain, Inc.,
8.000%, due 6/15/20 | | B+ | | | 1,250 | | | 1,269 |
HCA, Inc.,
7.250%, due 9/15/20 | | BB | | | 1,000 | | | 1,005 |
Ras Laffan Liquefied Natural Gas Co., Ltd. II—144A, 5.298%, due 9/30/20 | | Aa2 | | | 400 | | | 415 |
Southwest Airlines Co. 2007-1 Pass Through Trust, 6.150%, due 8/1/22 | | A | | | 679 | | | 699 |
NRSRO = Nationally Recognized Statistical Rating Organization—The credit quality ratings of the securities in the Fund reflect the highest category rating by either Fitch Ratings, Moody’s Investors Service Inc., or Standard & Poor’s, a division of the McGraw-Hill Companies, Inc. The obligations of certain U. S. Government-sponsored securities are neither issued nor guaranteed by the U. S. Treasury.
VRN = Variable Rate Note
§ = Deemed illiquid pursuant to Liquidity Procedures approved by the Board of Trustees. These holdings represent 0.07% of the net assets at June 30, 2010.
** = Fair valued pursuant to Valuation Procedures adopted by the Board of Trustees. This holding represents 0.06% of the Fund’s net assets at June 30, 2010.
| | | | | | | | |
Issuer | | NRSRO
Rating | | Principal
Amount | | Value |
| | |
Corporate Obligations—(continued) | | | | | | |
The Kroger Co.,
8.000%, due 9/15/29 | | BBB | | $ | 325 | | $ | 419 |
Conoco Funding Co.,
7.250%, due 10/15/31 | | A1 | | | 400 | | | 496 |
Kohl’s Corporation,
6.000%, due 1/15/33 | | BBB+ | | | 1,000 | | | 1,069 |
Pacific Gas & Electric Co.,
6.050%, due 3/1/34 | | A | | | 750 | | | 837 |
Wisconsin Electric Power Co.,
5.700%, due 12/1/36 | | A1 | | | 500 | | | 542 |
Comcast Corporation,
6.450%, due 3/15/37 | | BBB+ | | | 650 | | | 703 |
Yum! Brands, Inc.,
6.875%, due 11/15/37 | | BBB- | | | 600 | | | 689 |
JPMorgan Chase & Co.,
6.400%, due 5/15/38 | | Aa3 | | | 900 | | | 1,042 |
COX Communications, Inc.—144A,
6.950%, due 6/1/38 | | Baa2 | | | 350 | | | 402 |
General Electric Capital Corporation,
6.875%, due 1/10/39 | | AA+ | | | 750 | | | 828 |
Burlington Northern Santa Fe LLC,
5.750%, due 5/1/40 | | A3 | | | 1,515 | | | 1,602 |
| | | | | | | | |
Total Corporate Obligations | | | | | | | | 86,776 |
| | | | | | | | |
Total Long-Term Investments—98.5%
(cost $175,529) | | | 185,751 |
| | | | | | | | |
| | | |
Repurchase Agreement | | | | | | | | |
State Street Bank and Trust Company, 0.000% dated 6/30/10, due 7/1/10, repurchase price $2,878, collateralized by FHLB, 4.375%, due 9/17/10 | | AAA | | | 2,878 | | | 2,878 |
| | | | | | | | |
Total Repurchase Agreement—1.5%
(cost $2,878) | | | 2,878 |
| | | | | | | | |
Total Investments—100.0%
(cost $178,407) | | | 188,629 |
Cash and other assets, less liabilities—0.0% | | | 35 |
| | | | | | | | |
Net assets—100.0% | | $ | 188,664 |
| | | | | | | | |
See accompanying Notes to Financial Statements.
36 Semi-Annual Report | June 30, 2010 |
Christopher T. Vincent
Paul J. Sularz
LOW DURATION FUND
The Low Duration Fund seeks to maximize total return. Total return includes both income and capital appreciation.
AN OVERVIEW FROM THE PORTFOLIO MANAGERS
Please see page 30 for the Fixed Income Market Overview.
The William Blair Low Duration Fund seeks to maximize total return by investing in a diversified portfolio of investment grade low duration debt securities.
The Low Duration Fund posted a 1.66% increase on a total return basis (Institutional Class) for the six months ended June 30, 2010. By comparison, the Fund’s benchmark, the Merrill Lynch 1-Year U.S. Treasury Note Index, gained 0.51%.
What were the most significant factors impacting Fund performance during the first half of 2010? What factors were behind the Fund’s performance versus the benchmark?
Assets in this new Fund continued to build since the Fund’s inception on December 1, 2009, with assets increasing to $132 million by June 30, 2010.
The Fund had a very positive six months, with the Fund outperforming its Merrill Lynch 1-Year U.S. Treasury Note Index benchmark. We believe the Fund has been able to accomplish this objective without sacrificing credit quality. The Fund does not own below-investment grade securities, as mandated by the Prospectus.
We are especially pleased with the way the Fund performed during the first quarter of the year. Short-term interest rate volatility is the worst enemy of a fixed income fund, and the Fund experienced a bout of rising rates at the end of March—which was preceded by a similar episode during the last week of December.
The Fund invested capital as the Fund’s asset flows grew steadily from its inception. We continued to invest in new Consumer Asset-backed securities (such as “top tier” banks and auto receivables) as well as seasoned U.S. Agency Mortgage-backed securities and Corporate Bonds.
We consider the Consumer Asset-backed securities that the Fund invests in to be highly liquid. Nearly a third of these investments are floating rate instruments that reset on monthly basis, which helps offset the negative impact of rising short-term rates on the Fund’s portfolio. The benefits of this strategy are especially evident in a rising rate environment such as the one the Fund experienced in December and March.
Similarly, the Fund’s U.S. Government-guaranteed short duration Mortgage-backed Fannie Mae and Freddie Mac securities pay monthly principal and interest, which we then are able to reinvest.
The Fund kept its exposure to cash and cash equivalents extremely low, given the very low rates currently available from money market instruments.
Finally it is worth noting that the Fund paid a total of $0.09157 per share (Class N Shares) in income distributions to shareholders of record during the first half of 2010.
June 30, 2010 | William Blair Funds 37 |
Low Duration Fund
Performance Highlights (unaudited)
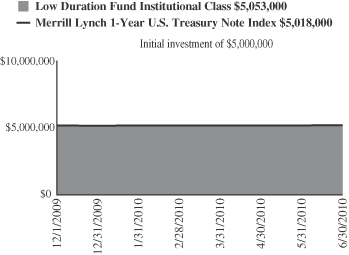
Average Annual Total Return at 6/30/2010
| | | | | | |
| | | Year
To Date | | | Since
Inception(a) | |
Institutional Class | | 1.66 | % | | 1.07 | % |
Merrill Lynch 1-Year U.S. Treasury Note Index | | 0.51 | | | 0.36 | |
| | (a) | | For the period December 1, 2009 (Commencement of Operations to June 30, 2010. |
Performance cited represents past performance. Past performance does not guarantee future results and current performance may be lower or higher than the data quoted. Results shown are average annual total returns, which assume reinvestment of dividends and capital gains. Investment returns and principal will fluctuate and you may have a gain or loss when you sell shares. For the most current month-end performance information, please call 1-800-742-7272, or visit our Web site at www.williamblairfunds.com. From time to time, the investment advisor may waive fees or reimburse expenses for the Fund. Without these waivers, performance would be lower. Class N shares are available to the general public without a sales load. Class I shares are available to certain institutional investors and advisory clients of William Blair & Company, L.L.C., without a sales load or distribution fees (12b-1).
The performance highlights and graph presented above do not reflect the deduction of taxes that a shareholder would pay on fund distributions or the redemption of fund shares.
The Merrill Lynch 1-Year U.S. Treasury Note Index is comprised of a single U.S. Treasury Note issue purchased at the beginning of the month and held for a full month. Each month the index is rebalanced and the issue selected is the outstanding U.S. Treasury Note that matures closest to, but not beyond one year from the rebalancing date.
This report identifies the Fund’s investments on June 30, 2010. These holdings are subject to change. Not all investments in the Fund performed the same, nor is there any guarantee that these investments will perform as well in the future. Market forecasts provided in this report may not necessarily come to pass.
Sector Diversification (unaudited)
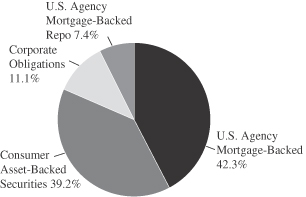
The sector diversification shown is based on the total investments.
38 Semi-Annual Report | June 30, 2010 |
Low Duration Fund
Portfolio of Investments, June 30, 2010 (all dollar amounts in thousands) (unaudited)
| | | | | | | | |
Issuer | | Principal
Amount | | Value |
|
U.S. Government and U.S. Government Agency—44.8% |
Government National Mortgage Association (GNMA)—0.3% | | | | | | | | |
#003438, 4.500%, due 9/20/18 | | | | $ | 363 | | $ | 387 |
| | | | | | | | |
Federal Home Loan Mortgage Corp. (FHLMC)—17.2% | | | | | | | | |
#M80856, 4.500%, due 10/1/10 | | | | | 104 | | | 105 |
#M80898, 4.500%, due 2/1/11 | | | | | 191 | | | 196 |
#M80903, 4.000%, due 3/1/11 | | | | | 369 | | | 374 |
#M80953, 4.000%, due 12/1/11 | | | | | 342 | | | 350 |
#E70847, 5.500%, due 6/1/13 | | | | | 3 | | | 4 |
#G11320, 6.000%, due 4/1/14 | | | | | 761 | | | 826 |
#G11211, 6.000%, due 7/1/16 | | | | | 419 | | | 455 |
#G11187, 5.500%, due 9/1/16 | | | | | 566 | | | 614 |
#E86134, 5.000%, due 11/1/16 | | | | | 308 | | | 331 |
#G11337, 5.500%, due 11/1/17 | | | | | 2,103 | | | 2,283 |
#E96536, 5.000%, due 3/1/18 | | | | | 614 | | | 660 |
#E95355, 5.000%, due 4/1/18 | | | | | 695 | | | 747 |
#E01377, 4.500%, due 5/1/18 | | | | | 707 | | | 749 |
#G11618, 4.500%, due 5/1/18 | | | | | 3,337 | | | 3,560 |
#E01488, 5.000%, due 10/1/18 | | | | | 725 | | | 780 |
#E99895, 5.000%, due 10/1/18 | | | | | 1,483 | | | 1,594 |
#G12093, 4.500%, due 12/1/18 | | | | | 827 | | | 882 |
#B11386, 5.000%, due 12/1/18 | | | | | 324 | | | 348 |
#G11506, 5.500%, due 12/1/18 | | | | | 541 | | | 587 |
#G11567, 5.500%, due 12/1/18 | | | | | 592 | | | 643 |
#E01545, 5.000%, due 1/1/19 | | | | | 410 | | | 440 |
#G11766, 5.000%, due 3/1/19 | | | | | 295 | | | 317 |
#G18001, 4.500%, due 7/1/19 | | | | | 381 | | | 406 |
#G11596, 5.500%, due 8/1/19 | | | | | 300 | | | 326 |
#B16291, 5.000%, due 9/1/19 | | | | | 1,867 | | | 2,006 |
#G18045, 5.000%, due 3/1/20 | | | | | 329 | | | 353 |
#G11892, 4.000%, due 4/1/20 | | | | | 323 | | | 340 |
#G18048, 5.000%, due 4/1/20 | | | | | 234 | | | 251 |
#J08152, 5.000%, due 5/1/20 | | | | | 258 | | | 277 |
#G12827, 5.500%, due 2/1/21 | | | | | 765 | | | 830 |
#G12394, 5.000%, due 5/1/21 | | | | | 433 | | | 465 |
#G12113, 5.500%, due 5/1/21 | | | | | 496 | | | 538 |
#J06402, 5.500%, due 11/1/22 | | | | | 119 | | | 128 |
| | | | | | | | |
Total FHLMC Mortgage Obligations | | | | | | | | 22,765 |
| | | | | | | | |
Federal National Mortgage Association (FNMA)—27.3% | | | | | | | | |
#254956, 4.000%, due 11/1/10 | | | | | 267 | | | 268 |
#255325, 4.500%, due 7/1/11 | | | | | 1,303 | | | 1,337 |
#545898, 5.500%, due 9/1/17 | | | | | 961 | | | 1,041 |
#545899, 5.500%, due 9/1/17 | | | | | 1,102 | | | 1,195 |
#735647, 5.000%, due 12/1/17 | | | | | 2,952 | | | 3,175 |
#254591, 5.500%, due 1/1/18 | | | | | 641 | | | 695 |
#681310, 4.500%, due 2/1/18 | | | | | 668 | | | 714 |
#683100, 5.500%, due 2/1/18 | | | | | 781 | | | 851 |
#675717, 5.000%, due 3/1/18 | | | | | 710 | | | 764 |
#656564, 5.000%, due 4/1/18 | | | | | 3,198 | | | 3,440 |
#555456, 5.500%, due 4/1/18 | | | | | 3,372 | | | 3,655 |
#929388, 4.500%, due 5/1/18 | | | | | 923 | | | 964 |
#704049, 5.500%, due 5/1/18 | | | | | 1,505 | | | 1,635 |
#555622, 4.500%, due 6/1/18 | | | | | 746 | | | 796 |
#656573, 5.000%, due 6/1/18 | | | | | 417 | | | 449 |
#709848, 5.000%, due 6/1/18 | | | | | 393 | | | 423 |
#713807, 4.500%, due 7/1/18 | | | | | 355 | | | 379 |
| | | | | | | | |
Issuer | | NRSRO
Rating | | Principal
Amount | | Value |
Federal National Mortgage Association (FNMA)—(continued) | | | | | | | | |
#711991, 5.000%, due 8/1/18 | | | | $ | 370 | | $ | 398 |
#740444, 4.500%, due 9/1/18 | | | | | 567 | | | 606 |
#743183, 5.000%, due 10/1/18 | | | | | 154 | | | 166 |
#749596, 5.000%, due 11/1/18 | | | | | 512 | | | 550 |
#255233, 4.000%, due 5/1/19 | | | | | 813 | | | 860 |
#725445, 4.500%, due 5/1/19 | | | | | 915 | | | 976 |
#995234, 5.000%, due 7/1/19 | | | | | 3,335 | | | 3,587 |
#785259, 5.000%, due 8/1/19 | | | | | 630 | | | 677 |
#725953, 5.000%, due 10/1/19 | | | | | 182 | | | 196 |
#745240, 4.500%, due 12/1/19 | | | | | 875 | | | 935 |
#735401, 5.500%, due 3/1/20 | | | | | 547 | | | 593 |
#735646, 4.500%, due 7/1/20 | | | | | 1,098 | | | 1,172 |
#836016, 4.500%, due 9/1/20 | | | | | 1,799 | | | 1,916 |
#881284, 4.500%, due 12/1/21 | | | | | 1,652 | | | 1,758 |
| | | | | | | | |
Total FNMA Mortgage Obligations | | | | | | | | 36,171 |
| | | | | | | | |
| | | |
Consumer Asset-Backed Securities—41.6% | | | | | | | | |
BMW Vehicle Lease Trust, 2009-1, Tranche A2, 2.040%, 4/15/11 | | AAA | | | 483 | | | 484 |
Nissan Auto Lease Trust, 2009-A, Tranche A2, 2.010%, 4/15/11 | | AAA | | | 558 | | | 559 |
Nissan Auto Receivables Owner Trust, 2009-1, Tranche A2,
3.920%, 4/15/11 | | AAA | | | 80 | | | 81 |
Mercedes-Benz Auto Receivables Trust, 2010-1, Tranche A1,
0.309%, 5/13/11 | | A-1+ | | | 763 | | | 762 |
Volkswagen Auto Lease Trust, 2009-A, Tranche A2,
2.870%, 7/15/11 | | AAA | | | 364 | | | 365 |
Honda Auto Receivables Owner Trust, 2009-2, Tranche A2,
2.220%, 8/15/11 | | AAA | | | 61 | | | 61 |
Nissan Auto Lease Trust, 2009-B, Tranche A2, 1.220%, 9/15/11 | | AAA | | | 1,568 | | | 1,568 |
Ford Credit Auto Owner Trust, 2009-D, Tranche A2,
1.210%, 1/15/12 | | AAA | | | 1,835 | | | 1,837 |
Honda Auto Receivables Owner Trust, 2008-1, Tranche A3,
4.470%, 1/18/12 | | AAA | | | 771 | | | 779 |
Honda Auto Receivables Owner Trust, 2010-1, Tranche A2,
0.620%, 2/21/12 | | AAA | | | 2,375 | | | 2,373 |
USAA Auto Owner Trust, 2009-2, Tranche A2, 0.740%, 3/15/12 | | AAA | | | 165 | | | 165 |
Ally Auto Receivables Trust, 2010-1, Tranche A2,
0.750%, 4/15/12 | | AAA | | | 1,000 | | | 999 |
Volkswagen Auto Lease Trust, 2009-A, Tranche A3,
3.410%, 4/16/12 | | AAA | | | 1,550 | | | 1,582 |
CNH Equipment Trust, 2008-A, Tranche A3, 4.120%, 5/15/12 | | AAA | | | 555 | | | 559 |
Harley-Davidson Motorcycle Trust, 2009-1, Tranche A2,
2.520%, 5/15/12 | | AAA | | | 45 | | | 45 |
Volkswagen Auto Loan Enhanced Trust, 2010-1, Tranche A2,
0.660%, 5/21/12 | | AAA | | | 2,000 | | | 1,999 |
See accompanying Notes to Financial Statements.
June 30, 2010 | William Blair Funds 39 |
Low Duration Fund
Portfolio of Investments, June 30, 2010 (all dollar amounts in thousands) (unaudited)
| | | | | | | | |
Issuer | | NRSRO
Rating | | Principal
Amount | | Value |
| |
Consumer Asset-Backed Securities—(continued) | | | |
USAA Auto Owner Trust, 2010-1, Tranche A2, 0.630%, 6/15/12 | | AAA | | $ | 1,350 | | $ | 1,349 |
Ford Credit Auto Owner Trust, 2007-B, Tranche A4A,
5.240%, 7/15/12 | | AAA | | | 530 | | | 551 |
Chase Issuance Trust, 2009-A6, Tranche A6, 1.200%, 7/16/12, VRN | | AAA | | | 1,300 | | | 1,300 |
CNH Equipment Trust, 2008-B, Tranche A3A, 4.780%, 7/16/12 | | AAA | | | 442 | | | 447 |
CNH Equipment Trust, 2009-C, Tranche A2, 0.950%, 8/15/12 | | AAA | | | 1,000 | | | 1,001 |
CNH Equipment Trust, 2010-A, Tranche A2, 0.810%, 8/15/12 | | AAA | | | 1,000 | | | 1,000 |
Chase Issuance Trust, 2007-A15, Tranche A, 4.960%, 9/17/12 | | AAA | | | 198 | | | 200 |
BMW Vehicle Owner Trust, 2010-A, Tranche A2,
0.680%, 9/25/12 | | AAA | | | 1,500 | | | 1,499 |
Capital Auto Receivables Asset Trust, 2008-2, Tranche A3B,
1.800%, 10/15/12, VRN | | AAA | | | 840 | | | 847 |
Citibank Credit Card Issuance Trust, 2005-A7, Tranche A7,
4.750%, 10/22/12 | | AAA | | | 200 | | | 202 |
MBNA Credit Card Master Note Trust, 2005-A6, Tranche A6,
4.500%, 1/15/13 | | AAA | | | 150 | | | 151 |
CarMax Auto Owner Trust, 2009-1, Tranche A3, 4.120%, 3/15/13 | | AAA | | | 421 | | | 432 |
Bank of America Credit Card Trust, 2008-A1, Tranche A1,
0.930%, 4/15/13, VRN | | AAA | | | 320 | | | 320 |
Ford Credit Auto Owner Trust, 2009-A, Tranche A3A,
3.960%, 5/15/13 | | AAA | | | 600 | | | 615 |
Bank of America Credit Card Trust, 2007-A2, Tranche A2,
0.370%, 6/17/13, VRN | | AAA | | | 1,283 | | | 1,282 |
USAA Auto Owner Trust, 2009-1, Tranche A3, 3.020%, 6/17/13 | | AAA | | | 1,500 | | | 1,524 |
American Express Issuance Trust, 2007-2, Tranche A, 0.600%, 7/15/13, VRN | | AAA | | | 373 | | | 373 |
Capital One Multi-Asset Execution Trust, 2003-A5, Tranche A5,
0.640%, 7/15/13, VRN | | AAA | | | 1,000 | | | 1,000 |
American Express Credit Account Master Trust, 2008-1, Tranche A,
0.800%, 8/15/13, VRN | | AAA | | | 1,200 | | | 1,202 |
American Express Credit Account Master Trust—144A, 2006-B, Tranche A, 0.390%, 8/15/13, VRN | | AAA | | | 1,070 | | | 1,070 |
American Express Issuance Trust, 2005-2, Tranche A,
0.420%, 8/15/13, VRN | | AAA | | | 730 | | | 727 |
Discover Card Master Trust I, 2006-1, Tranche A2,
0.400%, 8/16/13, VRN | | AAA | | | 354 | | | 353 |
| | | | | | | | |
Issuer | | NRSRO
Rating | | Principal
Amount | | Value |
| |
Consumer Asset-Backed Securities—(continued) | | | |
Ford Credit Auto Owner Trust, 2009-D, Tranche A3,
2.170%, 10/15/13 | | AAA | | $ | 1,160 | | $ | 1,176 |
John Deere Owner Trust, 2009-A, Tranche A3, 2.590%, 10/15/13 | | AAA | | | 1,728 | | | 1,749 |
John Deere Owner Trust, 2009-B, Tranche A3, 1.570%, 10/15/13 | | AAA | | | 865 | | | 866 |
Avis Budget Rental Car Funding AESOP LLC—144A, 2009-1A, Tranche A, 9.310%, 10/20/13 | | A2 | | | 2,000 | | | 2,225 |
Harley-Davidson Motorcycle Trust, 2009-1, Tranche A3, 3.190%, 11/15/13 | | AAA | | | 2,007 | | | 2,049 |
Avis Budget Rental Car Funding AESOP LLC—144A, 2009-2A, Tranche A, 5.680%, 2/20/14 | | Aaa | | | 1,000 | | | 1,066 |
Capital One Multi-Asset Execution Trust, 2006-A7, Tranche A7,
0.380%, 3/17/14, VRN | | AAA | | | 1,000 | | | 998 |
Capital One Multi-Asset Execution Trust, 2008-A6, Tranche A6,
1.450%, 3/17/14, VRN | | AAA | | | 1,610 | | | 1,622 |
Hertz Vehicle Financing LLC—144A, 2009-2A, Tranche A1,
4.260%, 3/25/14 | | Aaa | | | 1,765 | | | 1,839 |
Chase Issuance Trust, 2007-A9, Tranche A, 0.380%, 6/16/14, VRN | | AAA | | | 2,000 | | | 1,990 |
Nissan Auto Receivables Owner Trust, 2008-A, Tranche A4,
4.280%, 6/16/14 | | AAA | | | 150 | | | 155 |
CNH Equipment Trust, 2010-A, Tranche A3, 1.540%, 7/15/14 | | AAA | | | 550 | | | 553 |
Citibank Credit Card Issuance Trust, 2007-A7, Tranche A7,
0.698%, 8/20/14, VRN | | AAA | | | 200 | | | 200 |
American Express Credit Account Master Trust, 2007-5, Tranche A, 0.380%, 12/15/14, VRN | | AAA | | | 1,000 | | | 995 |
Nissan Master Owner Trust Receivables—144A, 2010-AA, Tranche A, 1.500%, 1/15/15, VRN | | AAA | | | 2,000 | | | 2,005 |
Capital One Multi-Asset Execution Trust, 2007-A4, Tranche A4,
0.380%, 3/16/15, VRN | | AAA | | | 620 | | | 616 |
Bank of America Credit Card Trust, 2010-A1, Tranche A1,
0.650%, 9/15/15, VRN | | AAA | | | 1,300 | | | 1,297 |
Chase Issuance Trust, 2008-A3, Tranche A, 1.450%, 3/15/16, VRN | | AAA | | | 2,000 | | | 2,054 |
| | | | | | | | |
Total Consumer Asset-Backed Securities | | | | | | | | 55,118 |
| | | | | | | | |
| | | |
Corporate Obligations—11.7% | | | | | | | | |
Teva Pharmaceutical Finance III LLC, 1.500%, due 6/15/12 | | A- | | | 1,000 | | | 1,004 |
General Electric Capital Corporation, 3.500%, due 8/13/12 | | AA+ | | | 1,000 | | | 1,032 |
See accompanying Notes to Financial Statements.
40 Semi-Annual Report | June 30, 2010 |
Low Duration Fund
Portfolio of Investments, June 30, 2010 (all dollar amounts in thousands) (unaudited)
| | | | | | | | |
Issuer | | NRSRO
Rating | | Principal
Amount | | Value |
| | | |
Corporate Obligations—11.7% | | | | | | | | |
Johnson & Johnson,
5.150%, due 8/15/12 | | AAA | | $ | 1,900 | | $ | 2,071 |
Bank of America Corporation,
5.375%, due 9/11/12 | | A+ | | | 1,000 | | | 1,044 |
ConocoPhillips,
4.750%, due 10/15/12 | | A1 | | | 1,000 | | | 1,074 |
Citigroup, Inc.,
5.300%, due 10/17/12 | | A+ | | | 1,000 | | | 1,036 |
Wells Fargo & Co.,
5.250%, due 10/23/12 | | AA- | | | 1,000 | | | 1,070 |
Morgan Stanley,
5.250%, due 11/2/12 | | A | | | 1,000 | | | 1,040 |
The Walt Disney Co.,
4.700%, due 12/1/12 | | A | | | 1,500 | | | 1,627 |
Hewlett-Packard Co.,
4.500%, due 3/1/13 | | A+ | | | 1,000 | | | 1,079 |
American Honda Finance Corp.—144A, 2.375%, due 3/18/13 | | A+ | | | 1,000 | | | 1,014 |
Novartis Capital Corporation,
1.900%, due 4/24/13 | | Aa2 | | | 1,235 | | | 1,254 |
American Express Co.,
4.875%, due 7/15/13 | | A+ | | | 1,000 | | | 1,068 |
| | | | | | | | |
Total Corporate Obligations | | | | | | | | 15,413 |
| | | | | | | | |
Total Long-Term Investments—98.1%
(cost $129,421) | | | | | | 129,854 |
| | | | | | | | |
NRSRO = Nationally Recognized Statistical Rating Organization—The credit quality ratings of the securities in the Fund reflect the highest category rating by either Fitch Ratings, Moody’s Investors Service Inc., or Standard & Poor’s, a division of the McGraw-Hill Companies, Inc. The obligations of certain U. S. Government-sponsored securities are neither issued nor guaranteed by the U. S. Treasury.
VRN = Variable Rate Note
| | | | | | | | | |
Issuer | | NRSRO
Rating | | Principal
Amount | | Value | |
| | | |
Repurchase Agreement | | | | | | | | | |
State Street Bank and Trust Company, 0.000% dated 6/30/10, due 7/1/10, repurchase price $10,438, collateralized by FHLB,
4.375%, due 9/17/10 | | AAA | | $ | 10,438 | | $ | 10,438 | |
| | | | | | | | | |
Total Repurchase Agreement—7.9%
(cost $10,438) | | | | | | 10,438 | |
| | | | | | | | | |
Total Investments—106.0%
(cost $139,859) | | | | | | 140,292 | |
Liabilities, plus cash and other assets—(6.0)% | | | (7,939 | ) |
| | | | | | | | | |
Net assets—100.0% | | $ | 132,353 | |
| | | | | | | | | |
See accompanying Notes to Financial Statements.
June 30, 2010 | William Blair Funds 41 |
Statements of Assets and Liabilities
June 30, 2010 (dollar amounts in thousands) (unaudited)
| | | | | | | | | | | | |
| | | Institutional
International
Growth
Fund | | | Institutional
International
Equity
Fund | | | International
Small Cap
Growth
Fund | |
Assets | | | | | | | | | | | | |
Investments in securities, at cost | | $ | 1,262,392 | | | $ | 285,682 | | | $ | 400,720 | |
Investments in Affiliated Fund, at cost | | | 4,536 | | | | 953 | | | | 489 | |
| | | | | | | | | | | | |
| | | |
Investments in securities, at value | | $ | 1,353,113 | | | $ | 321,143 | | | $ | 441,554 | |
Investments in Affiliated Fund, at amortized cost | | | 4,536 | | | | 953 | | | | 489 | |
Foreign currency, at value (cost $8,525, $61, and $287) | | | 8,535 | | | | 61 | | | | 283 | |
Receivable for securities sold | | | 21,836 | | | | 2,216 | | | | 1,532 | |
Receivable for fund shares sold | | | — | | | | — | | | | 103 | |
Dividend and interest receivable | | | 4,364 | | | | 927 | | | | 886 | |
| | | | | | | | | | | | |
Total assets | | | 1,392,384 | | | | 325,300 | | | | 444,847 | |
Liabilities | | | | | | | | | | | | |
Payable for investment securities purchased | | | 21,286 | | | | 2,635 | | | | 2,554 | |
Payable for fund shares redeemed | | | 181 | | | | — | | | | 184 | |
Unrealized depreciation on forward foreign currency contracts | | | 103 | | | | — | | | | 26 | |
Management fee payable | | | 1,091 | | | | 271 | | | | 371 | |
Distribution and shareholder administration fee payable | | | — | | | | — | | | | 35 | |
Other payables and accrued expenses | | | 323 | | | | 77 | | | | 88 | |
| | | | | | | | | | | | |
Total liabilities | | | 22,984 | | | | 2,983 | | | | 3,258 | |
| | | | | | | | | | | | |
Net Assets | | $ | 1,369,400 | | | $ | 322,317 | | | $ | 441,589 | |
| | | | | | | | | | | | |
Capital | | | | | | | | | | | | |
Composition of Net Assets | | | | | | | | | | | | |
Par value of shares of beneficial interest | | $ | 117 | | | $ | 36 | | | $ | 43 | |
Capital paid in excess of par value | | | 1,637,346 | | | | 474,490 | | | | 554,469 | |
Accumulated net investment income (loss) | | | 8,903 | | | | 2,406 | | | | 2,169 | |
Accumulated realized gain (loss) | | | (367,595 | ) | | | (190,089 | ) | | | (155,912 | ) |
Net unrealized appreciation (depreciation) of investments and foreign currencies | | | 90,629 | | | | 35,474 | | | | 40,820 | |
| | | | | | | | | | | | |
Net Assets | | $ | 1,369,400 | | | $ | 322,317 | | | $ | 441,589 | |
| | | | | | | | | | | | |
| | | |
Net Assets | | $ | 1,369,400 | | | $ | 322,317 | | | | | |
Shares Outstanding | | | 117,331,769 | | | | 36,091,146 | | | | | |
Net Asset Value Per Share | | $ | 11.67 | | | $ | 8.93 | | | | | |
Institutional Share Class | | | | | | | | | | | | |
Net Assets | | | | | | | | | | $ | 198,001 | |
Shares Outstanding | | | | | | | | | | | 19,208,900 | |
Net Asset Value Per Share | | | | | | | | | | $ | 10.31 | |
See accompanying Notes to Financial Statements.
42 Semi-Annual Report | June 30, 2010 |
Statements of Operations
for the Period Ended June 30, 2010 (all amounts in thousands) (unaudited)
| | | | | | | | | | | | |
| | | Institutional
International
Growth
Fund | | | Institutional
International
Equity
Fund | | | International
Small Cap
Growth
Fund | |
Investment income | | | | | | | | | | | | |
Dividends | | $ | 21,743 | | | $ | 4,639 | | | $ | 5,104 | |
Dividend income from Affiliated Fund | | | 1 | | | | — | | | | — | |
Less foreign tax withheld | | | (1,824 | ) | | | (417 | ) | | | (269 | ) |
Interest | | | 80 | | | | 5 | | | | 72 | |
| | | | | | | | | | | | |
Total income | | | 20,000 | | | | 4,227 | | | | 4,907 | |
Expenses | | | | | | | | | | | | |
Investment advisory fees | | | 6,609 | | | | 1,697 | | | | 2,124 | |
Distribution fees | | | — | | | | — | | | | 20 | |
Shareholder services fees | | | — | | | | — | | | | 184 | |
Custodian fees | | | 181 | | | | 67 | | | | 77 | |
Transfer agent fees | | | 14 | | | | 5 | | | | 49 | |
Professional fees | | | 34 | | | | 20 | | | | 21 | |
Registration fees | | | 23 | | | | 14 | | | | 35 | |
Shareholder reporting fees | | | 10 | | | | 6 | | | | 23 | |
Trustee fees | | | 22 | | | | 6 | | | | 6 | |
Other expenses | | | 22 | | | | 7 | | | | 8 | |
| | | | | | | | | | | | |
Total expenses | | | 6,915 | | | | 1,822 | | | | 2,547 | |
| | | | | | | | | | | | |
Net investment income (loss) | | | 13,085 | | | | 2,405 | | | | 2,360 | |
Realized and unrealized gain (loss) | | | | | | | | | | | | |
Net realized gain (loss) on transactions from: | | | | | | | | | | | | |
Investments | | | 100,484 | | | | 14,577 | | | | 17,578 | |
Foreign currency transactions | | | 13,167 | | | | (314 | ) | | | 113 | |
| | | | | | | | | | | | |
Total net realized gain (loss) | | | 113,651 | | | | 14,263 | | | | 17,691 | |
Change in net unrealized appreciation (depreciation) of: | | | | | | | | | | | | |
Investments | | | (180,780 | ) | | | (48,394 | ) | | | (32,179 | ) |
Foreign currency translations | | | (4,574 | ) | | | (31 | ) | | | (33 | ) |
| | | | | | | | | | | | |
Total change in net unrealized appreciation (depreciation) | | | (185,354 | ) | | | (48,425 | ) | | | (32,212 | ) |
| | | | | | | | | | | | |
| Net increase (decrease) in net assets resulting from operations | | $ | (58,618 | ) | | $ | (31,757 | ) | | $ | (12,161 | ) |
| | | | | | | | | | | | |
See accompanying Notes to Financial Statements.
June 30, 2010 | William Blair Funds 43 |
Statements of Changes in Net Assets
for the Period Ended June 30, 2010 (unaudited) and the Year Ended December 31, 2009 (all amounts in thousands)
| | | | | | | | | | | | | | | | | | | | | | | | |
| | | Institutional
International
Growth
Fund | | | Institutional
International
Equity
Fund | | | International
Small Cap
Growth
Fund | |
| | | 2010 | | | 2009 | | | 2010 | | | 2009 | | | 2010 | | | 2009 | |
Operations | | | | | | | | | | | | | | | | | | | | | | | | |
Net investment income (loss) | | $ | 13,085 | | | $ | 10,704 | | | $ | 2,405 | | | $ | 3,447 | | | $ | 2,360 | | | $ | 1,001 | |
Net realized gain (loss) on investments, foreign currency transactions and other assets and liabilities | | | 113,651 | | | | (117,747 | ) | | | 14,263 | | | | (66,506 | ) | | | 17,691 | | | | (30,308 | ) |
Change in net unrealized appreciation (depreciation) on investments, and other assets and liabilities | | | (185,354 | ) | | | 519,807 | | | | (48,425 | ) | | | 151,206 | | | | (32,212 | ) | | | 174,254 | |
| | | | | | | | | | | | | | | | | | | | | | | | |
Net increase (decrease) in net assets resulting from operations | | | (58,618 | ) | | | 412,764 | | | | (31,757 | ) | | | 88,147 | | | | (12,161 | ) | | | 144,947 | |
Distributions to shareholders from | | | | | | | | | | | | | | | | | | | | | | | | |
Net investment income | | | — | | | | (18,261 | ) | | | — | | | | (2,719 | ) | | | — | | | | (778 | ) |
Net realized gain | | | — | | | | — | | | | — | | | | — | | | | — | | | | — | |
| | | | | | | | | | | | | | | | | | | | | | | | |
| | | — | | | | (18,261 | ) | | | — | | | | (2,719 | ) | | | — | | | | (778 | ) |
Capital stock transactions | | | | | | | | | | | | | | | | | | | | | | | | |
Net proceeds from sale of shares | | | 125,976 | | | | 165,765 | | | | 24,374 | | | | 20,848 | | | | 121,773 | | | | 139,125 | |
Shares issued in reinvestment of income dividends and capital gain distributions | | | — | | | | 16,959 | | | | — | | | | 2,587 | | | | — | | | | 676 | |
Less cost of shares redeemed | | | (73,806 | ) | | | (199,645 | ) | | | (35,571 | ) | | | (104,043 | ) | | | (58,874 | ) | | | (185,107 | ) |
| | | | | | | | | | | | | | | | | | | | | | | | |
Net increase (decrease) in net assets resulting from capital share transactions | | | 52,170 | | | | (16,921 | ) | | | (11,197 | ) | | | (80,608 | ) | | | 62,899 | | | | (45,306 | ) |
| | | | | | | | | | | | | | | | | | | | | | | | |
Increase (decrease) in net assets | | | (6,448 | ) | | | 377,582 | | | | (42,954 | ) | | | 4,820 | | | | 50,738 | | | | 98,863 | |
Net assets | | | | | | | | | | | | | | | | | | | | | | | | |
Beginning of year | | | 1,375,848 | | | | 998,266 | | | | 365,271 | | | | 360,451 | | | | 390,851 | | | | 291,988 | |
| | | | | | | | | | | | | | | | | | | | | | | | |
End of year | | $ | 1,369,400 | | | $ | 1,375,848 | | | $ | 322,317 | | | $ | 365,271 | | | $ | 441,589 | | | $ | 390,851 | |
| | | | | | | | | | | | | | | | | | | | | | | | |
Undistributed net investment income (loss) at the end of the period | | $ | 8,903 | | | $ | (4,182 | ) | | $ | 2,406 | | | $ | 1 | | | $ | 2,169 | | | $ | (191 | ) |
| | | | | | | | | | | | | | | | | | | | | | | | |
See accompanying Notes to Financial Statements.
44 Semi-Annual Report | June 30, 2010 |
Statements of Assets and Liabilities
for the Period Ended June 30, 2010 (all amounts in thousands) (unaudited)
| | | | | | | | | | | | | | | |
| | | Emerging
Markets
Growth
Fund | | | Emerging
Leaders
Growth
Fund | | | Bond
Fund | | Low
Duration
Fund | |
Assets | | | | | | | | | | | | | | | |
Investments in securities, at cost | | $ | 841,139 | | | $ | 63,897 | | | $ | 178,407 | | $ | 139,859 | |
Investments in Affiliated Fund, at cost | | | 66 | | | | 440 | | | | — | | | — | |
| | | | | | | | | | | | | | | |
| | | | |
Investments in securities, at value | | $ | 994,291 | | | $ | 73,095 | | | $ | 188,629 | | $ | 140,292 | |
Investments in Affiliated Fund, at amortized cost | | | 66 | | | | 440 | | | | — | | | — | |
Foreign currency, at value (cost $15,312 and $445) | | | 15,340 | | | | 444 | | | | — | | | — | |
Receivable for securities sold | | | 7,319 | | | | 4,977 | | | | — | | | — | |
Receivable for fund shares sold | | | 139 | | | | 42 | | | | 1,073 | | | 1,527 | |
Receivable from Advisor | | | — | | | | 8 | | | | 5 | | | 46 | |
Dividend and interest receivable | | | 1,866 | | | | 231 | | | | 1,889 | | | 422 | |
| | | | | | | | | | | | | | | |
Total assets | | | 1,019,021 | | | | 79,237 | | | | 191,596 | | | 142,287 | |
Liabilities | | | | | | | | | | | | | | | |
Payable for investment securities purchased | | | 5,170 | | | | 1,106 | | | | 2,478 | | | 8,470 | |
Payable for fund shares redeemed | | | 108 | | | | 2,379 | | | | 372 | | | 1,411 | |
Management fee payable | | | 902 | | | | 88 | | | | 45 | | | 31 | |
Distribution and shareholder administration fee payable | | | 26 | | | | 1 | | | | 18 | | | 11 | |
Other payables and accrued expenses | | | 334 | | | | 54 | | | | 19 | | | 11 | |
| | | | | | | | | | | | | | | |
Total liabilities | | | 6,540 | | | | 3,628 | | | | 2,932 | | | 9,934 | |
| | | | | | | | | | | | | | | |
Net Assets | | $ | 1,012,481 | | | $ | 75,609 | | | $ | 188,664 | | $ | 132,353 | |
| | | | | | | | | | | | | | | |
Capital | | | | | | | | | | | | | | | |
Composition of Net Assets | | | | | | | | | | | | | | | |
Par value of shares of beneficial interest | | $ | 81 | | | $ | 9 | | | $ | 18 | | $ | 13 | |
Capital paid in excess of par value | | | 1,022,262 | | | | 76,172 | | | | 178,222 | | | 132,344 | |
Accumulated net investment income (loss) | | | (4,033 | ) | | | 209 | | | | 152 | | | (295 | ) |
Accumulated realized gain (loss) | | | (159,015 | ) | | | (9,981 | ) | | | 50 | | | (142 | ) |
Net unrealized appreciation (depreciation) of investments and foreign currencies | | | 153,186 | | | | 9,200 | | | | 10,222 | | | 433 | |
| | | | | | | | | | | | | | | |
Net Assets | | $ | 1,012,481 | | | $ | 75,609 | | | $ | 188,664 | | $ | 132,353 | |
| | | | | | | | | | | | | | | |
| | | | |
Institutional Share Class | | | | | | | | | | | | | | | |
Net Assets | | $ | 843,769 | | | $ | 65,154 | | | $ | 34,632 | | $ | 40,410 | |
Shares Outstanding | | | 67,491,564 | | | | 7,882,721 | | | | 3,264,719 | | | 4,046,766 | |
Net Asset Value Per Share | | $ | 12.50 | | | $ | 8.26 | | | $ | 10.61 | | $ | 9.99 | |
See accompanying Notes to Financial Statements.
June 30, 2010 | William Blair Funds 45 |
Statements of Operations
for the Period Ended June 30, 2010 (all amounts in thousands) (unaudited)
| | | | | | | | | | | | | | | | |
| | | Emerging
Markets
Growth
Fund | | | Emerging
Leaders
Growth
Fund | | | Bond
Fund | | | Low
Duration
Fund | |
Investment income | | | | | | | | | | | | | | | | |
Dividends | | $ | 10,396 | | | $ | 1,344 | | | $ | — | | | $ | — | |
Less foreign tax withheld | | | (791 | ) | | | (140 | ) | | | — | | | | — | |
Interest | | | 94 | | | | 1 | | | | 4,208 | | | | 1,143 | |
| | | | | | | | | | | | | | | | |
Total income | | | 9,699 | | | | 1,205 | | | | 4,208 | | | | 1,143 | |
Expenses | | | | | | | | | | | | | | | | |
Investment advisory fees | | | 5,526 | | | | 609 | | | | 246 | | | | 172 | |
Distribution fees | | | 32 | | | | — | | | | 3 | | | | 2 | |
Shareholder services fees | | | 148 | | | | 7 | | | | 105 | | | | 58 | |
Custodian fees | | | 266 | | | | 59 | | | | 29 | | | | 20 | |
Transfer agent fees | | | 69 | | | | 4 | | | | 10 | | | | 7 | |
Professional fees | | | 27 | | | | 16 | | | | 15 | | | | 15 | |
Registration fees | | | 40 | | | | 25 | | | | 29 | | | | 43 | |
Shareholder reporting fees | | | 11 | | | | 2 | | | | 2 | | | | 2 | |
Trustee fees | | | 14 | | | | 2 | | | | 2 | | | | 1 | |
Other expenses | | | 15 | | | | 4 | | | | 6 | | | | 3 | |
| | | | | | | | | | | | | | | | |
Total expenses before waiver | | | 6,148 | | | | 728 | | | | 447 | | | | 323 | |
Expenses reimbursed to (waived or absorbed by) the Advisor | | | — | | | | (29 | ) | | | (53 | ) | | | (34 | ) |
| | | | | | | | | | | | | | | | |
Net expenses | | | 6,148 | | | | 699 | | | | 394 | | | | 289 | |
| | | | | | | | | | | | | | | | |
Net investment income (loss) | | | 3,551 | | | | 506 | | | | 3,814 | | | | 854 | |
Realized and unrealized gain (loss) | | | | | | | | | | | | | | | | |
Net realized gain (loss) on transactions from: | | | | | | | | | | | | | | | | |
Investments | | | 71,759 | | | | 22,851 | | | | 1,015 | | | | (141 | ) |
Foreign currency transactions | | | (2,200 | ) | | | (295 | ) | | | — | | | | — | |
| | | | | | | | | | | | | | | | |
Total net realized gain (loss) | | | 69,559 | | | | 22,556 | | | | 1,015 | | | | (141 | ) |
| | | | |
Change in net unrealized appreciation (depreciation) of: | | | | | | | | | | | | | | | | |
Investments | | | (118,023 | ) | | | (24,739 | ) | | | 3,709 | | | | 1,001 | |
Foreign currency translations | | | (29 | ) | | | 2 | | | | — | | | | — | |
| | | | | | | | | | | | | | | | |
Total change in net unrealized appreciation (depreciation) | | | (118,052 | ) | | | (24,737 | ) | | | 3,709 | | | | 1,001 | |
| | | | | | | | | | | | | | | | |
| Net increase (decrease) in net assets resulting from operations | | $ | (44,942 | ) | | $ | (1,675 | ) | | $ | 8,538 | | | $ | 1,714 | |
| | | | | | | | | | | | | | | | |
See accompanying Notes to Financial Statements.
46 Semi-Annual Report | June 30, 2010 |
Statements of Changes in Net Assets
for the Period Ended June 30, 2010 (unaudited) and the Year Ended December 31, 2009 (all amounts in thousands)
| | | | | | | | | | | | | | | | | | | | | | | | | | | | | | | | |
| | | Emerging
Markets
Growth
Fund | | | Emerging
Leaders
Growth
Fund | | | Bond
Fund
| | | Low
Duration
Fund | |
| | | 2010 | | | 2009 | | | 2010 | | | 2009 | | | 2010 | | | 2009 | | | 2010 | | | 2009(a) | |
Operations | | | | | | | | | | | | | | | | | | | | | | | | | | | | | | | | |
Net investment income (loss) | | $ | 3,551 | | | $ | 3,476 | | | $ | 506 | | | $ | 507 | | | $ | 3,814 | | | $ | 6,076 | | | $ | 854 | | | $ | 78 | |
Net realized gain (loss) on investments, foreign currency transactions and other assets and liabilities | | | 69,559 | | | | (59,561 | ) | | | 22,556 | | | | 3,205 | | | | 1,015 | | | | 284 | | | | (141 | ) | | | — | |
Change in net unrealized appreciation (depreciation) on investments, and other assets and liabilities | | | (118,052 | ) | | | 461,348 | | | | (24,737 | ) | | | 51,098 | | | | 3,709 | | | | 7,229 | | | | 1,001 | | | | (568 | ) |
| | | | | | | | | | | | | | | | | | | | | | | | | | | | | | | | |
Net increase (decrease) in net assets resulting from operations | | | (44,942 | ) | | | 405,263 | | | | (1,675 | ) | | | 54,810 | | | | 8,538 | | | | 13,589 | | | | 1,714 | | | | (490 | ) |
Distributions to shareholders from | | | | | | | | | | | | | | | | | | | | | | | | | | | | | | | | |
Net investment income | | | — | | | | (11,127 | ) | | | — | | | | (1,588 | ) | | | (3,662 | ) | | | (6,213 | ) | | | (1,149 | ) | | | (86 | ) |
Net realized gain | | | — | | | | — | | | | — | | | | — | | | | — | | | | — | | | | — | | | | — | |
| | | | | | | | | | | | | | | | | | | | | | | | | | | | | | | | |
| | | — | | | | (11,127 | ) | | | — | | | | (1,588 | ) | | | (3,662 | ) | | | (6,213 | ) | | | (1,149 | ) | | | (86 | ) |
Capital stock transactions | | | | | | | | | | | | | | | | | | | | | | | | | | | | | | | | |
Net proceeds from sale of shares | | | 162,010 | | | | 422,203 | | | | 3,502 | | | | 42,409 | | | | 60,462 | | | | 77,912 | | | | 93,547 | | | | 97,472 | |
Shares issued in reinvestment of income dividends and capital gain distributions | | | — | | | | 10,336 | | | | — | | | | 1,466 | | | | 2,336 | | | | 4,029 | | | | 882 | | | | 37 | |
Less cost of shares redeemed | | | (142,847 | ) | | | (174,003 | ) | | | (41,354 | ) | | | (28,637 | ) | | | (26,354 | ) | | | (16,586 | ) | | | (57,775 | ) | | | (1,799 | ) |
| | | | | | | | | | | | | | | | | | | | | | | | | | | | | | | | |
Net increase (decrease) in net assets resulting from capital share transactions | | | 19,163 | | | | 258,536 | | | | (37,852 | ) | | | 15,238 | | | | 36,444 | | | | 65,355 | | | | 36,654 | | | | 95,710 | |
| | | | | | | | | | | | | | | | | | | | | | | | | | | | | | | | |
Increase (decrease) in net assets | | | (25,779 | ) | | | 652,672 | | | | (39,527 | ) | | | 68,460 | | | | 41,320 | | | | 72,731 | | | | 37,219 | | | | 95,134 | |
Net assets | | | | | | | | | | | | | | | | | | | | | | | | | | | | | | | | |
Beginning of year | | | 1,038,260 | | | | 385,588 | | | | 115,136 | | | | 46,676 | | | | 147,344 | | | | 74,613 | | | | 95,134 | | | | — | |
| | | | | | | | | | | | | | | | | | | | | | | | | | | | | | | | |
End of year | | $ | 1,012,481 | | | $ | 1,038,260 | | | $ | 75,609 | | | $ | 115,136 | | | $ | 188,664 | | �� | $ | 147,344 | | | $ | 132,353 | | | $ | 95,134 | |
| | | | | | | | | | | | | | | | | | | | | | | | | | | | | | | | |
Undistributed net investment income (loss) at the end of the period | | $ | (4,033 | ) | | $ | (7,584 | ) | | $ | 209 | | | $ | (297 | ) | | $ | 152 | | | $ | — | | | $ | (295 | ) | | $ | — | |
| | | | | | | | | | | | | | | | | | | | | | | | | | | | | | | | |
| (a) | | For the period from December 1, 2009 (Commencement of Operations) to December 31, 2009. |
See accompanying Notes to Financial Statements.
June 30, 2010 | William Blair Funds 47 |
Notes to Financial Statements
(1) Significant Accounting Policies
The following is a summary of the William Blair Funds’ (the “Fund”) significant accounting policies in effect during the period covered by the financial statements, which are in accordance with U.S. generally accepted accounting principles.
(a) Description of the Fund
William Blair Funds is a diversified mutual fund registered under the Investment Company Act of 1940, as amended, as an open-end management investment company. The number of shares authorized for this Fund is unlimited. The Fund currently consists of the following nineteen portfolios (the “Portfolios”), each with its own investment objective and policies.
| | |
Equity Portfolios | | International Equity Portfolios |
Growth Large Cap Growth Small Cap Growth Mid Cap Growth Small-Mid Cap Growth Small Cap Value (formerly known as Value Discovery) Mid Cap Value Global Equity Portfolio Global Growth | | International Growth International Equity Institutional International Growth Institutional International Equity International Small Cap Growth Emerging Markets Growth Emerging Leaders Growth Fixed-Income Portfolios Bond Income Low Duration Money Market Portfolio Ready Reserves |
The investment objectives of the Portfolios are as follows:
| | |
Equity | | Long-term capital appreciation. |
Global Equity | | Long-term capital appreciation. |
International Equity | | Long-term capital appreciation. |
Fixed-Income | | High level of current income with relative stability of principal.
(Maximize total return—Low Duration) |
Money Market | | Current income, a stable share price and daily liquidity. |
The Institutional International Growth Portfolio, the Institutional International Equity Portfolio and the Institutional Share Classes of the International Small Cap Growth Portfolio, the Emerging Markets Growth Portfolio, the Emerging Leaders Growth Portfolio, Bond Portfolio, and the Low Duration Portfolio are the only Portfolios covered in this report.
(b) Share Classes
Three different classes of shares of the International Small Cap Growth Fund, Emerging Markets Growth Fund, Bond Fund and the Low Duration Fund currently exist: N, I and Institutional. Two different classes of shares of the Emerging Leaders Growth Fund currently exist: I and Institutional. This report includes financial information for only the Institutional Class. The Institutional share class is sold to institutional investors, including but not limited to employee benefit plans, endowments, foundations, trusts and corporations, who are able to meet the Fund’s high minimum investment requirement. The minimum initial investment required is $5 million.
Investment income realized and unrealized gains and losses, and certain Portfolio level expenses and expense reductions, if any, are allocated based on the relative net assets of each class, except for certain class specific expenses, which are charged directly to the appropriate class. Differences in class expenses may result in the payment of different per share dividends by class. All share classes of the Portfolios have equal rights with respect to voting subject to class specific arrangements.
48 Semi-Annual Report | June 30, 2010 |
(c) Investment Valuation
The market value of domestic equity securities is determined by valuing securities traded on national securities markets or in the over-the-counter markets at the last sale price or, if applicable, the official closing price or, in the absence of a recent sale on the date of determination, at the latest bid price.
The value of foreign equity securities is generally determined based upon the last sale price on the foreign exchange or market on which it is primarily traded and in the currency of that market as of the close of the appropriate exchange or, if there have been no sales during that day, at the latest bid price. The Board of Trustees has determined that the passage of time between when the foreign exchanges or markets close and when the Portfolios compute their net asset values could cause the value of foreign equity securities to no longer be representative or accurate, and as a result, may necessitate that such securities be fair valued. Accordingly, for foreign equity securities, the Portfolios may use an independent pricing service to fair value price the security as of the close of regular trading on the New York Stock Exchange. As a result, a Portfolio’s value for a security may be different from the last sale price (or the latest bid price).
Fixed-income securities are valued by using market quotations or independent pricing services that use either prices provided by market-makers or matrixes that produce estimates of market values obtained from yield data relating to instruments or securities with similar characteristics.
Other securities, and all other assets, including securities for which a market price is not available or is deemed unreliable, (e.g., securities affected by unusual or extraordinary events, such as natural disasters or securities affected by market or economic events, such as bankruptcy filings), or the value of which is affected by a significant valuation event, are valued at a fair value as determined in good faith by, or under the direction of, the Board of Trustees and in accordance with the Trust’s valuation procedures. The value of fair valued securities may be different from the last sale price (or the latest bid price), and there is no guarantee that a fair valued security will be sold at the price at which a Portfolio is carrying the security.
Investments in other funds are valued at the underlying fund’s net asset value on the date of valuation. Securities held in the Ready Reserves Portfolio are valued at amortized cost, which approximates market value.
Investments in other funds are valued at the underlying fund’s net asset value on the date of valuation. Other securities, and all other assets, including securities for which a market price is not available, or the value of which is affected by a significant valuation event, are valued at fair value as determined in good faith by the Pricing Committee or Valuation Committee, in accordance with the Fund’s Valuation Procedures approved by the Board of Trustees. As of June 30, 2010, there were securities held in the Institutional International Growth, International Small Cap Growth, Emerging Markets Growth and Bond Portfolios requiring fair valuation pursuant to the Fund’s Valuation Procedures.
(d) Investment income and transactions
Dividend income is recorded on the ex-dividend date, except for those dividends from certain foreign securities that are recorded when the information is available.
Interest income is recorded on an accrual basis, adjusted for amortization of premium or discount. Variable rate bonds and floating rate notes earn interest at coupon rates that fluctuate at specific time intervals. The interest rate shown on the Portfolio of Investments for the Bond Fund and Low Duration Fund were the rates in effect on June 30, 2010. Put bonds may be redeemed at the discretion of the holder on specified dates prior to maturity.
Premiums and discounts are accreted and amortized on a straight-line basis for short-term investments and on an effective interest method for long-term investments.
Paydown gains and losses on mortgage and asset-backed securities are treated as an adjustment to interest income. For the period ended June 30, 2010, the Bond and Low Duration Portfolios recognized an increase of interest income and a decrease of net realized loss of $(217) and $(419), respectively (in thousands). This reclassification had no effect on the net asset value of the Portfolios.
The Funds do not isolate that portion of the results of operations resulting from changes in foreign exchange rates on investments from the fluctuations arising from changes in market prices of securities held. Such fluctuations are included with the net realized and unrealized gain or loss from investments.
June 30, 2010 | William Blair Funds 49 |
Reported net realized foreign currency gains or losses arise from disposition of foreign currency, the difference in the foreign exchange rates between the trade and settlement dates on securities transactions, and the difference between the amounts of dividends, interest and foreign withholding taxes recorded on the ex-date or accrual date and the U.S. dollar equivalent of the amounts actually received or paid. Net unrealized foreign exchange gains and losses arise from changes (due to the changes in the exchange rate) in the value of foreign currency and other assets and liabilities denominated in foreign currencies held at period end.
Security and shareholder transactions are accounted for no later than one business day following the trade date. However, for financial reporting purposes, security and shareholder transactions are accounted for on the trade date of the last business day of the reporting period. Realized gains and losses from securities transactions are recognized on a specifically identified cost basis.
Awards from class action litigation may be recorded as a reduction of cost. If the Portfolios no longer own the applicable securities, the proceeds are recorded as realized gains.
(e) Share Valuation and Dividends to Shareholders
Shares are sold and redeemed on a continuous basis at net asset value. The net asset value per share is determined by dividing the Portfolio’s net assets by the number of shares outstanding as of the close of regular trading on the New York Stock Exchange, which is generally 4:00 p.m. Eastern time, on each day the Exchange is open.
Dividends from net investment income, if any, are declared at least annually for all Portfolios covered by this report except the Bond Portfolio and Low Duration Portfolio which is declared monthly. At June 30, 2010, dividends from the Low Duration Portfolio are declared and paid monthly. Effective September 16, 2010 dividends from the Low Duration Portfolio will be declared daily and paid monthly. Capital gain distributions, if any, are declared at least annually in December. Dividends payable to shareholders are recorded on the ex-dividend date.
(f) Foreign Currency Translation and Foreign Currency Forward Contracts
The Portfolios (excluding the Bond Portfolio and the Low Duration Portfolio) may invest in securities denominated in foreign currencies. As such, assets and liabilities denominated in foreign currencies are translated into U.S. dollar amounts at the current exchange rate on the date of valuation. The values of foreign investments, forward open foreign currency contracts, and cash denominated in foreign currencies are translated into U.S. dollars using a spot market rate of exchange as of the time of the determination of each Fund’s net asset value, typically 4:00 p.m. Eastern time on days when there is regular trading on the New York Stock Exchange. Payables and receivables for securities transactions, dividends, interest income and tax reclaims are translated into U.S. dollars using a spot market rate of exchange as of 4:00 p.m. Eastern time. Settlement of purchases and sales and dividend and interest receipts are translated into U.S. dollars using a spot market rate of exchange as of 11:00 a.m. Eastern time.
(g) Income Taxes
Each Portfolio intends to comply with the provisions of Subchapter M of the Internal Revenue Code available to regulated investment companies. Each portfolio intends to make the requisite distributions of income and capital gains to its shareholders sufficient to relieve it from all, or substantially all, federal income and excise taxes. No provision for federal income and excise taxes has been made.
The Institutional International Growth, Institutional International Equity, International Small Cap Growth, Emerging Markets Growth, and Emerging Leaders Growth Portfolios may be subject to a tax imposed on net realized gains on securities of certain foreign countries.
Each Portfolio is subject to the provisions of Accounting Standards Codification (ASC) 740 Income Taxes, formally known as FASB (Financial Accounting Standards Board) Interpretation No. 48, Accounting for Uncertainties in Income Taxes. ASC 740 provides guidance for how uncertain tax positions should be recognized, measured, presented and disclosed in the financial statements. Management has evaluated the implications of ASC 740 and all of the uncertain tax positions of the Portfolios and has determined that no liability is required to be recorded in the financial statements as of December 31, 2009 and December 31, 2008.
The statute of limitations on the Funds’ tax returns for each of the tax years in the four year period ended December 31, 2009, remains open and the returns are subject to examination.
The Portfolios have elected to mark-to-market their investments in Passive Foreign Investment Companies (“PFICs”) for Federal income tax purposes. The Portfolios also treat the deferred loss associated with current and prior year wash sales as
50 Semi-Annual Report | June 30, 2010 |
an adjustment to the cost of investments for tax purposes. The cost of investments for Federal income tax purposes and related gross unrealized appreciation/(depreciation) and net unrealized appreciation/(depreciation) at June 30, 2010 were as follows (in thousands):
| | | | | | | | | | | | |
Portfolio | | Cost of
Investments | | Gross
Unrealized
Appreciation | | Gross
Unrealized
Depreciation | | Net
Unrealized
Appreciation/
Depreciation |
Institutional International Growth | | $ | 1,277,907 | | $ | 157,715 | | $ | 78,065 | | $ | 79,650 |
Institutional International Equity | | | 294,118 | | | 41,675 | | | 13,684 | | | 27,991 |
International Small Cap Growth | | | 404,797 | | | 54,293 | | | 17,061 | | | 37,232 |
Emerging Markets Growth | | | 859,271 | | | 155,003 | | | 19,883 | | | 135,120 |
Emerging Leaders Growth | | | 65,317 | | | 9,680 | | | 1,460 | | | 8,220 |
Bond | | | 178,480 | | | 10,820 | | | 671 | | | 10,149 |
Low Duration | | | 139,859 | | | 608 | | | 175 | | | 433 |
The timing and characterization of certain income and capital gain distributions are determined annually in accordance with federal income tax regulations that may differ from U.S. generally accepted accounting principles. As a result, net investment income or loss and net realized gain or loss for a reporting period may differ from the amount distributed during such period. In addition, the Portfolios may periodically record reclassifications among certain capital accounts to reflect differences between financial reporting and income tax basis distributions. The reclassifications were reported in order to reflect the tax treatment for certain permanent differences that exist between income tax regulations and U.S. generally accepted accounting principles. The reclassifications generally relate to section 988 currency gains and losses, and recharacterization of unrealized appreciation on PFICs (Passive Foreign Investment Corporations). These reclassifications have no impact on the net asset values of the Portfolio. Accordingly, at December 31, 2009 (the Funds’ most recent fiscal year end), the following reclassifications were recorded (in thousands):
| | | | | | | | | | | | |
Portfolio | | Accumulated Net
Investment Income (Loss) | | | Accumulated Net Realized Gain/(Loss) | | | Capital Paid in Excess of Par Value | |
Institutional International Growth | | $ | 1,191 | | | $ | (1,190 | ) | | $ | (1 | ) |
Institutional International Equity | | | (450 | ) | | | 449 | | | | 1 | |
International Small Cap Growth | | | (294 | ) | | | 301 | | | | (7 | ) |
Emerging Markets Growth | | | 741 | | | | (741 | ) | | | — | |
Emerging Leaders Growth | | | 836 | | | | (836 | ) | | | — | |
Bond | | | 127 | | | | (120 | ) | | | (7 | ) |
Low Duration | | | 8 | | | | (1 | ) | | | (7 | ) |
Distributions from net realized gains for book purposes may include short-term capital gains, which are included as ordinary income for tax purposes. The tax character of 2010 distributions will be determined at the end of the fiscal year. The tax character of distributions paid during 2009 and 2008 was as follows (in thousands):
| | | | | | | | | | | | | | | | | | |
| | | Distributions Paid in 2009 | | | | Distributions Paid in 2008 | | |
Portfolio | | Ordinary Income | | Long-Term Capital Gains | | Total Distributions | | Ordinary Income | | Long-Term Capital Gains | | Total
Distributions |
Institutional International Growth | | $ | 18,261 | | $ | — | | $ | 18,261 | | $ | 1,671 | | $ | 58,039 | | $ | 59,710 |
Institutional International Equity | | | 2,719 | | | — | | | 2,719 | | | 1,947 | | | 4,542 | | | 6,489 |
International Small Cap Growth | | | 778 | | | — | | | 778 | | | — | | | 4,881 | | | 4,881 |
Emerging Markets Growth | | | 11,127 | | | — | | | 11,127 | | | 10,054 | | | 31,707 | | | 41,761 |
Emerging Leaders Growth | | | 1,588 | | | — | | | 1,588 | | | 87 | | | — | | | 87 |
Bond | | | 6,213 | | | — | | | 6,213 | | | 3,517 | | | — | | | 3,517 |
Low Duration (a) | | | 86 | | | — | | | 86 | | | — | | | — | | | — |
| (a) | | For the period from December 1, 2009 (commencement of operations) to December 31, 2009. |
As of December 31, 2009, the components of distributable earnings on a tax basis were as follows (in thousands):
| | | | | | | | | | | | | |
Portfolio | | Undistributed Ordinary Income | | Accumulated Capital and Other Losses | | | Undistributed Long-Term Gain | | Net Unrealized Appreciation/ Depreciation |
Institutional International Growth | | $ | 5,359 | | $ | (466,326 | ) | | $ | — | | $ | 251,522 |
Institutional International Equity | | | — | | | (196,577 | ) | | | — | | | 76,125 |
International Small Cap Growth | | | — | | | (168,452 | ) | | | — | | | 67,690 |
June 30, 2010 | William Blair Funds 51 |
| | | | | | | | | | | | | | |
Portfolio | | Undistributed Ordinary Income | | Accumulated Capital and Other Losses | | | Undistributed Long-Term Gain | | Net Unrealized Appreciation/ Depreciation | |
Emerging Markets Growth | | $ | 2,427 | | $ | (199,632 | ) | | $ | — | | $ | 232,285 | |
Emerging Leaders Growth | | | 130 | | | (29,527 | ) | | | — | | | 30,500 | |
Bond | | | — | | | (875 | ) | | | — | | | 6,423 | |
Low Duration | | | — | | | (1 | ) | | | — | | | (568 | ) |
As of December 31, 2009, the Portfolios have unused capital loss carry forwards available for federal income tax purposes to be applied against future gains, if any. If not applied, the carryforward will expire as follows (in thousands):
| | | | | | | | | | | | | | | | | | | | | | | | | | | |
Portfolio | | 2010 | | 2011 | | 2012 | | 2013 | | 2014 | | 2015 | | 2016 | | 2017 | | Total |
Institutional International Growth | | $ | — | | $ | — | | $ | — | | $ | — | | $ | — | | $ | — | | $ | 188,201 | | $ | 278,110 | | $ | 466,311 |
Institutional International Equity | | | — | | | — | | | — | | | — | | | — | | | — | | | 83,536 | | | 113,087 | | | 196,623 |
International Small Cap Growth | | | — | | | — | | | — | | | — | | | — | | | — | | | 81,949 | | | 86,330 | | | 168,279 |
Emerging Markets Growth | | | — | | | — | | | — | | | — | | | — | | | — | | | 84,442 | | | 115,253 | | | 199,695 |
Emerging Leaders Growth | | | — | | | — | | | — | | | — | | | — | | | — | | | 21,249 | | | 8,278 | | | 29,527 |
Bond | | | — | | | — | | | — | | | — | | | — | | | 135 | | | 559 | | | 174 | | | 868 |
Low Duration | | | — | | | — | | | — | | | — | | | — | | | — | | | — | | | 1 | | | 1 |
For the period from November 1, 2009 through December 31, 2009, the following Portfolios incurred net realized capital losses, foreign currency losses or PFIC losses. Each Portfolio intends to treat this loss as having occurred in fiscal year 2010 for federal income tax purposes (in thousands):
| | | | | | | | | |
Portfolio | | Capital
Amount | | Currency
Amount | | PFIC
Amount |
Institutional International Growth | | $ | — | | $ | — | | $ | — |
Institutional International Equity | | | — | | | 41 | | | — |
International Small Cap Growth | | | — | | | 211 | | | — |
Emerging Markets Growth | | | — | | | — | | | — |
Emerging Leaders Growth | | | — | | | — | | | — |
Bond | | | 7 | | | — | | | — |
Low Duration | | | — | | | — | | | — |
(h) Repurchase Agreements
In a repurchase agreement, a Portfolio buys a security at one price and at the time of sale, the seller agrees to repurchase the obligation at a mutually agreed upon time and price (usually within seven days). The repurchase agreement thereby determines the yield during the purchaser’s holding period, while the seller’s obligation to repurchase is secured by the value of the underlying security. The Advisor will monitor, on an ongoing basis, the value of the underlying securities to ensure that the value always equals or exceeds the repurchase price plus accrued interest. Repurchase agreements could involve certain risks in the event of a default or insolvency of the other party to the agreement, including possible delays or restrictions upon a Portfolio’s ability to dispose of the underlying securities. The risk to a Portfolio is limited to the ability of the seller to pay the agreed upon sum on the delivery date. In the event of default, a repurchase agreement provides that a Portfolio is entitled to sell the underlying collateral. The loss, if any, to a Portfolio will be the difference between the proceeds from the sale and the repurchase price. However, if bankruptcy proceedings are commenced with respect to the seller of the security, disposition of the collateral by the Portfolio may be delayed or limited. Although no definitive creditworthiness criteria are used, the Advisor reviews the creditworthiness of the banks and non-bank dealers with which a Portfolio enters into repurchase agreements to evaluate those risks. The Advisor will review and monitor the creditworthiness of broker dealers and banks with which a Portfolio enters into repurchase agreements. A Portfolio may, under certain circumstances, deem repurchase agreements collateralized by U.S. Government securities to be investments in U.S. Government securities.
(i) Use of Estimates
The preparation of financial statements in conformity with U.S. generally accepted accounting principles requires management to make estimates and assumptions that affect the amounts reported in the financial statements. Actual results may differ from those estimates.
52 Semi-Annual Report | June 30, 2010 |
(j) Fair Value Measurements
The Portfolios are subject to ASC 820 Fair Value measurement and Disclosures, formally known as SFAS (Statement of Financial Accounting Standards) No. 157, “Fair Value Measurements”. In accordance with ASC 820, “Fair value” is defined as the price that a Portfolio would receive upon selling a security in an orderly transaction to an independent buyer in the principal or most advantageous market for the investment. Various inputs are used in determining the value of a Portfolio’s investments. ASC 820 established a three-tier hierarchy of inputs to classify fair value measurements for disclosure purposes. The three-tier hierarchy of inputs is summarized in the three broad levels listed below.
| | • | | Level 1—Quoted prices in active markets for an identical security. |
| | • | | Level 2—Prices determined using other significant observable inputs. Observable inputs are inputs that other market participants would use in pricing a security. These may include quoted prices for similar securities, interest rates, prepayment speeds, credit risk, and others. In addition, other observable inputs such as foreign exchange rates, benchmark securities indices and foreign futures contracts may be utilized in the valuation of certain foreign securities when significant events occur between the last sale on the foreign securities exchange and the time the net asset value of the Fund is calculated. |
| | • | | Level 3—Prices determined using significant unobservable inputs. In situations where quoted prices or observable inputs are unavailable (for example, when there is little or no market activity for an investment), unobservable inputs may be used. Unobservable inputs reflect the Fund’s own assumptions about the factors market participants would use in pricing an investment, and would be based on the best information available. |
The inputs or methodology used for valuing an investment are not necessarily an indication of the risk associated with investing in those securities. For example, money market securities are valued using amortized cost, in accordance with rules under the 1940 Act. Generally, amortized cost approximates the current fair value of a security, but since the value is not obtained from a quoted price in an active market, such securities are reflected as Level 2.
The Fund adopted FASB Accounting Standards Update 2010-06 “Fair Value Measurements and Disclosures (ASU 820)” which requires the Fund to disclose details of significant transfers in and out of Level 1 and Level 2 measurements and the reasons for the transfers. Any transfers between Level 1 and Level 2 are disclosed, effective beginning of the period, in the tables below with the reasons for the transfers disclosed in a footnote.
At June 30, 2010, the Portfolios held no other financial instruments, such as options or futures, that required fair valuation.
As of June 30, 2010, the hierarchical input levels of securities in each Portfolio, segregated by security class, are as follows (in thousands):
| | | | | | | | | | | | | | | | | |
| | | Institutional
International
Growth | | | Institutional
International
Equity | | International
Small Cap
Growth | | | Emerging
Markets
Growth | | Emerging
Leaders
Growth |
Investments in securities | | | | | | | | | | | | | | | | | |
Level 1—Quoted prices | | | | | | | | | | | | | | | | | |
Common stock | | $ | 212,267 | | | $ | 59,208 | | $ | 48,829 | | | $ | 301,497 | | $ | 20,219 |
Warrants | | | — | | | | — | | | — | | | | 43 | | | — |
Preferred stock | | | — | | | | 3,124 | | | — | | | | 47,239 | | | 1,820 |
Exchange-traded fund | | | 10,334 | | | | — | | | — | | | | — | | | — |
Short-term investments | | | 4,536 | | | | 953 | | | 489 | | | | 66 | | | 440 |
Level 2—Other significant observable inputs | | | | | | | | | | | | | | | | | |
Common Stock | | | 1,120,915 | | | | 247,892 | | | 384,550 | | | | 598,477 | | | 48,347 |
Convertible bonds | | | 535 | | | | — | | | 545 | | | | 910 | | | — |
Short-term investments | | | 9,062 | | | | 10,919 | | | 7,630 | | | | 46,125 | | | 2,709 |
Level 3—Significant unobservable inputs | | | | | | | | | | | | | | | | | |
None | | | — | | | | — | | | — | | | | — | | | — |
| | | | | | | | | | | | | | | | | |
Total investments in securities | | $ | 1,357,649 | | | $ | 322,096 | | $ | 442,043 | | | $ | 994,357 | | $ | 73,535 |
| | | | | | | | | | | | | | | | | |
Level 1 and Level 2 Transfers | | | | | | | | | | | | | | | | | |
Transfer from Level 1 to Level 2 (a) | | | 3,945 | | | | 2,009 | | | — | | | | — | | | 3,063 |
Transfer from Level 2 to Level 1 (b) | | | — | | | | — | | | — | | | | — | | | — |
Other financial instruments | | | | | | | | | | | | | | | | | |
Level 2—Other significant observable inputs | | | | | | | | | | | | | | | | | |
Forward foreign currency contracts | | $ | (103 | ) | | | | | $ | (26 | ) | | | | | | |
| | | | | | | | | | | | | | | | | |
June 30, 2010 | William Blair Funds 53 |
| | | | | | |
| | | Bond | | Low
Duration
Bond |
Investments in securities | | | | | | |
Level 1—Quoted prices | | | | | | |
None | | $ | — | | $ | — |
Level 2—Other significant observable inputs | | | | | | |
U.S. Government and agency bonds | | | 88,268 | | | 59,323 |
Corporate bonds | | | 86,776 | | | 15,413 |
Asset backed bonds | | | 10,588 | | | 55,118 |
Short-term investments | | | 2,878 | | | 10,438 |
Level 3—Significant unobservable inputs | | | | | | |
Asset backed bonds | | | 119 | | | — |
| | | | | | |
Total investments in securities | | $ | 188,629 | | $ | 140,292 |
| | | | | | |
| (a) | | Fair valuation estimates were obtained from the Portfolio’s pricing vendor and applied to certain foreign securities at June 30, 2010 but not on December 31, 2009 resulting in a transfer from Level 1 to Level 2. |
| (b) | | Fair valuation estimates were obtained from the Portfolio’s pricing vendor and applied to certain foreign securities at December 31, 2009 but not on June 30, 2010 resulting in a transfer from Level 2 to Level 1. |
Level 1 Common Stocks are exchange traded securities with a quoted price. Typically, Level 2 Common Stocks are non-U.S. exchange traded securities with a quoted price that are fair valued by an independent pricing service approved by the Board of Trustees.
The following is a reconciliation of Level 3 securities for which significant unobservable inputs were used to determine fair value:
| | | | | | | | | | | | | | | | | | |
| | | Balance January 1, 2010 | | Net
Purchases/ (Sales) | | Transfers
to/(from) Level 3 | | Change in
Unrealized Gain (Loss) | | Realized Gain (Loss) | | Balance June 30, 2010 |
| | | | | | |
Bond | | $ | — | | $ | — | | $ | 119 | | $ | — | | $ | — | | $ | 119 |
The fair value estimate for the Level 3 security in the Bond Portfolio was determined in good faith by the Pricing Committee in consultation with the Valuation Committee, pursuant to the Valuation Procedures adopted by the Board of Trustees. There were various factors considered in reaching this fair value determination, including, but not limited to, the following: the type of security, the extent of public trading of the security, information obtained from a broker-dealer for the security, analysis of the company’s performance, market trends that influence its performance and the potential for adverse outcome in pending litigation. At June 30, 2010, this security represented 0.06%, of the net assets of the Bond Portfolio.
The First Plus bond held in the Bond Portfolio transferred from level 2 to level 3 during the period due to the lack of significant other observable inputs.
(k) Subsequent Events
On July 27, 2010, the Board of Trustees approved the following change to the William Blair Funds:
Effective September 16, 2010, the Low Duration Portfolio will begin declaring dividends on a daily basis to be paid out monthly.
(2) Transactions with Affiliates
(a) Management and Expense Limitation Agreements
The Institutional International Growth and Institutional International Equity Portfolios have a management agreement with William Blair & Company L.L.C. (the “Company”) for investment advisory, administrative, and other accounting services. The Portfolios pay the Company an annual fee, payable monthly, based on a specified percentage of its average daily net assets. A summary of the annual rates expressed as a percentage of average daily net assets is as follows:
| | | |
First $500 million | | 1.00 | % |
Next $500 million | | 0.95 | % |
In excess of $1 billion | | 0.90 | % |
54 Semi-Annual Report | June 30, 2010 |
The International Small Cap Growth Portfolio pays the Company a 1.00% annual fee payable monthly, based on its average daily net assets. The Emerging Markets Growth Portfolio and Emerging Leaders Growth Portfolio pay the Company a 1.10% annual fee payable monthly, based on its average daily net assets. The Bond and Low Duration Portfolio pays the Company a 0.30% annual fee payable monthly, based on its average daily net assets.
All of the Portfolios, except Institutional International Growth Fund, have also entered into Expense Limitation Agreements with the Company. Under the terms of these agreements, the Advisor will waive its management fee and/or reimburse the Portfolio for expenses in excess of the agreed upon rate. The amount the Advisor owes a Portfolio as of the report date is recorded as the Receivable from Advisor on the Statement of Assets and Liabilities. The Advisor reimburses the Portfolios on an annual basis. Under the terms of these Agreements, the Company has agreed to waive its advisory fees and/or absorb other operating expenses through April 30, 2011, if total expenses of the Portfolios exceed the following rates (as a percentage of average daily net assets):
| | | | | | |
Portfolio | | Effective
May 1, 2010
through
April 30, 2011 | | | Effective
May 1, 2009
through
April 30, 2010 | |
Institutional International Equity | | 1.10 | % | | 1.10 | % |
International Small Cap Growth | | 1.25 | % | | 1.25 | % |
Emerging Markets Growth | | 1.30 | % | | 1.25 | % |
Emerging Leaders Growth | | 1.25 | % | | 1.25 | % |
Bond | | 0.35 | % | | 0.35 | % |
Low Duration | | 0.40 | % | | 0.40 | %(a) |
| (a) | | Effective December 1, 2009 through April 30, 2011. |
For a period of three years subsequent to the Commencement of Operations of the Portfolio, the Company is entitled to reimbursement from the Emerging Leaders Growth and Low Duration Portfolios for previously waived fees and expenses to the extent the overall expense ratio remains below the percentages indicated. The total amount available for recapture at June 30, 2010 is $209 and $48 (in thousands) for the Emerging Leaders Growth and Low Duration Bond Portfolio respectively. As a result, the total expense ratio for a Portfolio during the period the agreement is in effect will not fall below the percentage indicated.
For the period ended June 30, 2010, the fees incurred by the Portfolio and related fee waivers were as follows (in thousands):
| | | | | | | | | |
Portfolio | | Fund
Level
Waiver | | Class I
Specific
Waiver | | Total
Waiver |
Emerging Leaders Growth | | $ | 28 | | $ | 1 | | $ | 29 |
Bond | | | 52 | | | 1 | | | 53 |
Low Duration | | | 34 | | | — | | | 34 |
(b) Investments in Affiliated Portfolio
Pursuant to the rules of the 1940 Act, each of the Portfolios of the Fund may invest in the William Blair Ready Reserves Portfolio (“Ready Reserves”), an open-end money market portfolio managed by the Company. Ready Reserves Portfolio is used as a cash management option by the other Portfolios in the Fund. The Company waives management fees in an amount equal to the management fee and service fee that Ready Reserves receives based on the Portfolio’s net assets, less any waivers if applicable. The fees waived with respect to each Portfolio for the period ended June 30, 2010 are listed below. Distributions received from Ready Reserves are reflected as “Dividend income from Affiliated Fund” in each Portfolio’s Statement of Operations. Amounts relating to the Portfolios’ investments in Ready Reserves were as follows for the period ended June 30, 2010 (in thousands):
| | | | | | | | | | | | | | | | | | | | | |
Portfolio | | 12/31/2009
Value | | Purchases | | Sales | | Fees
Waived | | Dividend
Income | | 6/30/2010
Value | | Percent
of Net
Assets | |
Institutional International Growth | | $ | 4,535 | | $ | — | | $ | — | | $ | 5 | | $ | 1 | | $ | 4,536 | | 0.3 | % |
Institutional International Equity | | | 953 | | | — | | | — | | | 1 | | | — | | | 953 | | 0.3 | % |
International Small Cap Growth | | | 489 | | | — | | | — | | | 1 | | | — | | | 489 | | 0.1 | % |
Emerging Markets Growth | | | 66 | | | — | | | — | | | — | | | — | | | 66 | | 0.0 | % |
Emerging Leaders Growth | | | 440 | | | — | | | — | | | — | | | — | | | 440 | | 0.6 | % |
June 30, 2010 | William Blair Funds 55 |
(3) Investment Transactions
Investment transactions, excluding money market instruments, for the period ended June 30, 2010, were as follows (in thousands):
| | | | | | | |
Portfolio | | Purchases | | Sales | |
Institutional International Growth | | $ | 680,962 | | $ | (582,426 | ) |
Institutional International Equity | | | 128,634 | | | (140,120 | ) |
International Small Cap Growth | | | 232,156 | | | (164,521 | ) |
Emerging Markets Growth | | | 571,734 | | | (585,505 | ) |
Emerging Leaders Growth | | | 82,429 | | | (123,187 | ) |
Bond | | | 71,630 | | | (35,163 | ) |
Low Duration | | | 106,303 | | | (50,354 | ) |
(4) Forward Foreign Currency Contracts
The Portfolios (excluding the Bond and Low Duration Portfolios) from time to time may enter into forward foreign currency contracts with the Fund’s custodian and other counterparties in an attempt to hedge against a decline in the value of foreign currency against the U.S. dollar. The Portfolios bear the market risk that arises from changes in foreign currency rates and bear the credit risk if the counterparty fails to perform under the contract.
For the period ended June 30, 2010, the Institutional International Growth and International Small Cap Growth Portfolios engaged in forward foreign currency contracts with total volume (in thousands) of $680,217 and $89,804, respectively.
The following table presents the value of open forward foreign currency contracts as of June 30, 2010 and their respective location on the Statement of Assets and Liabilities (values in thousands):
| | | | | | | | | | |
| | | Assets | | Liabilities |
Fund | | Statement of Assets and
Liabilities Location | | Value | | Statement of Assets and
Liabilities Location | | Value |
Institutional International Growth | | Unrealized appreciation on foreign
forward currency contracts | | $ | — | | Unrealized depreciation on foreign
forward currency contracts | | $ | 103 |
International Small Cap
Growth | | Unrealized appreciation on foreign
forward currency contracts | | | — | | Unrealized depreciation on foreign
forward currency contracts | | | 26 |
The effect of forward contracts on the Statements of Operations for the period ended June 30, 2010 (values in thousands):
| | | | |
Realized gain (loss) recognized in foreign currency transactions | | | |
Fund | | Value | |
Institutional International Growth | | $ | 16,055 | |
International Small Cap Growth | | | 723 | |
| |
Change in unrealized gain (loss) recognized in foreign currency translations | | | |
Fund | | Value | |
Institutional International Growth | | $ | (4,616 | ) |
International Small Cap Growth | | | (26 | ) |
The following table presents open forward foreign currency contracts as of June 30, 2010 (values in thousands):
| | | | | | | | | | |
Institutional International Growth | |
Short Contracts | | Settlement
Date | | Local
Currency | | Current
Value | | Unrealized
Gain/(loss) | |
Japanese Yen | | 9/15/2010 | | 4,851,260 | | 54,732 | | $ | (103 | ) |
|
International Small Cap Growth | |
Japanese Yen | | 9/15/2010 | | 1,610,250 | | 18,182 | | $ | (26 | ) |
56 Semi-Annual Report | June 30, 2010 |
(5) Fund Share Transactions
The following table summarizes the activity in capital shares of each Portfolio (in thousands):
| | | | | | | | | | | | | |
| | | Dollars | |
| | | For the Period Ended June 30, 2010 | |
Portfolio | | Sales | | Reinvested
Distributions | | Redemptions | | Net change in
Net Assets
relating to fund
share activity | |
Institutional International Growth | | $ | 125,976 | | $ | — | | $ | 73,806 | | $ | 52,170 | |
Institutional International Equity | | | 24,374 | | | — | | | 35,571 | | | (11,197 | ) |
International Small Cap Growth | | | 48,484 | | | — | | | 12,370 | | | 36,114 | |
Emerging Markets Growth | | | 140,128 | | | — | | | 92,008 | | | 48,120 | |
Emerging Leaders Growth | | | 1 | | | — | | | 39,671 | | | (39,670 | ) |
Bond | | | 17,436 | | | 432 | | | 118 | | | 17,750 | |
Low Duration | | | 43,669 | | | 392 | | | 17,211 | | | 26,850 | |
| |
| | | Dollars | |
| | | For the Year Ended December 31, 2009 | |
Portfolio | | Sales | | Reinvested
Distributions | | Redemptions | | Net change in
Net Assets
relating to fund
share activity | |
Institutional International Growth | | $ | 165,765 | | $ | 16,959 | | $ | 199,645 | | $ | (16,921 | ) |
Institutional International Equity | | | 20,848 | | | 2,587 | | | 104,043 | | | (80,608 | ) |
International Small Cap Growth | | | 30,712 | | | 427 | | | 141,722 | | | (110,583 | ) |
Emerging Markets Growth | | | 347,835 | | | 8,712 | | | 138,100 | | | 218,447 | |
Emerging Leaders Growth | | | 38,546 | | | 1,366 | | | 27,894 | | | 12,018 | |
Bond | | | 5,199 | | | 772 | | | 1,064 | | | 4,907 | |
Low Duration (a) | | | 13,501 | | | — | | | — | | | 13,501 | |
| |
| | | Shares | |
| | | For the Period Ended June 30, 2010 | |
Portfolio | | Sales | | Reinvested
Distributions | | Redemptions | | Net change in
Net Assets
relating to fund
share activity | |
Institutional International Growth | | | 10,565 | | | — | | | 6,000 | | | 4,565 | |
Institutional International Equity | | | 2,688 | | | — | | | 3,701 | | | (1,013 | ) |
International Small Cap Growth | | | 4,667 | | | — | | | 1,164 | | | 3,503 | |
Emerging Markets Growth | | | 11,045 | | | — | | | 7,326 | | | 3,719 | |
Emerging Leaders Growth | | | — | | | — | | | 4,725 | | | (4,725 | ) |
Bond | | | 1,659 | | | 41 | | | 11 | | | 1,689 | |
Low Duration | | | 4,373 | | | 39 | | | 1,725 | | | 2,687 | |
| |
| | | Shares | |
| | | For the Year Ended December 31, 2009 | |
Portfolio | | Sales | | Reinvested
Distributions | | Redemptions | | Net change in
Net Assets
relating to fund
share activity | |
Institutional International Growth | | | 16,035 | | | 1,423 | | | 20,023 | | | (2,565 | ) |
Institutional International Equity | | | 2,541 | | | 270 | | | 14,163 | | | (11,352 | ) |
International Small Cap Growth | | | 3,235 | | | 41 | | | 16,155 | | | (12,879 | ) |
Emerging Markets Growth | | | 36,231 | | | 690 | | | 12,815 | | | 24,106 | |
Emerging Leaders Growth | | | 6,962 | | | 167 | | | 3,666 | | | 3,463 | |
Bond | | | 532 | | | 77 | | | 108 | | | 501 | |
Low Duration (a) | | | 1,360 | | | — | | | — | | | 1,360 | |
| (a) | | For the period from December 1, 2009 (Commencement of Operations) to December 31, 2009. |
June 30, 2010 | William Blair Funds 57 |
Financial Highlights
Institutional International Growth Fund
| | | | | | | | | | | | | | | | | | | | |
| | | Institutional Class Shares |
| | | Period Ended
June 30, | | | Years Ended December 31, |
| | | 2010 | | | | | | | | | | | | |
Net asset value, beginning of year | | $ | 12.20 | | | $ | 8.66 | | $ | 19.20 | | | $ | 19.39 | | $ | 18.11 | | $ | 16.06 |
Income (loss) from investment operations: | | | | | | | | | | | | | | | | | | | | |
Net investment income (loss) (a) | | | 0.11 | | | | 0.10 | | | 0.25 | | | | 0.15 | | | 0.11 | | | 0.09 |
Net realized and unrealized gain (loss) on investments | | | (0.64 | ) | | | 3.61 | | | (10.24 | ) | | | 3.30 | | | 4.09 | | | 3.53 |
| | | | | | | | | | | | | | | | | | | | |
Total from investment operations | | | (0.53 | ) | | | 3.71 | | | (9.99 | ) | | | 3.45 | | | 4.20 | | | 3.62 |
Less distributions from: | | | | | | | | | | | | | | | | | | | | |
Net investment income | | | — | | | | 0.17 | | | — | | | | 0.35 | | | 0.38 | | | 0.15 |
Net realized gain | | | — | | | | — | | | 0.55 | | | | 3.29 | | | 2.54 | | | 1.42 |
| | | | | | | | | | | | | | | | | | | | |
Total distributions | | | — | | | | 0.17 | | | 0.55 | | | | 3.64 | | | 2.92 | | | 1.57 |
| | | | | | | | | | | | | | | | | | | | |
Net asset value, end of year | | $ | 11.67 | | | $ | 12.20 | | $ | 8.66 | | | $ | 19.20 | | $ | 19.39 | | $ | 18.11 |
| | | | | | | | | | | | | | | | | | | | |
Total Return (%)* | | | (4.34 | ) | | | 42.83 | | | (51.99 | ) | | | 18.49 | | | 23.45 | | | 22.76 |
Ratios to average daily net assets (%):** | | | | | | | | | | | | | | | | | | | | |
Expenses | | | 1.00 | | | | 1.01 | | | 0.98 | | | | 1.02 | | | 1.03 | | | 1.05 |
Net investment income (loss) | | | 1.89 | | | | 0.95 | | | 1.68 | | | | 0.74 | | | 0.54 | | | 0.52 |
| | | | | | | | | | | | | | | | | | |
| | | Period Ended
June 30, | | Years Ended December 31, |
| | | 2010 | | | | | | | | 2006 | | 2005 |
Supplemental data for all classes: | | | | | | | | | | | | | | | | | | |
Net assets at end of year (in thousands) | | $ | 1,369,400 | | $ | 1,375,848 | | $ | 998,266 | | $ | 2,145,312 | | $ | 1,875,341 | | $ | 1,555,414 |
Portfolio turnover rate (%)* | | | 44 | | | 125 | | | 86 | | | 61 | | | 74 | | | 74 |
| (a) | | Excludes $0.05, $(0.10), $0.06, $0.29, and $0.10 of PFIC mark to market which is treated as ordinary income for Federal tax purposes for the years 2009, 2008, 2007, 2006 and 2005, respectively. |
| * | | Rates not annualized for periods that are less than a year. |
| ** | | Rates are annualized for periods that are less than a year. |
Performance cited represents past performance. Past performance does not guarantee future results and current performance may be lower or higher than the data quoted. Results shown are annual returns, which assume reinvestment of dividends and capital gains. Investment returns and principal will fluctuate and you may have a gain or loss when you sell shares. For the most current month-end performance information, please call 1-800-742-7272 or visit our Web site at www.williamblairfunds.com.
Note: Net investment income (loss) per share is based on the average shares outstanding during the year.
58 Semi-Annual Report | June 30, 2010 |
Financial Highlights
Institutional International Equity Fund
| | | | | | | | | | | | | | | | | | | | | |
| | | Institutional Class Shares | |
| | | Period Ended
June 30, | | | Years Ended December 31, | |
| | | 2010 | | | 2009 | | 2008 | | | 2007 | | 2006 | | 2005 | |
Net asset value, beginning of year | | $ | 9.84 | | | $ | 7.44 | | $ | 15.03 | | | $ | 14.27 | | $ | 12.04 | | $ | 10.20 | |
Income (loss) from investment operations: | | | | | | | | | | | | | | | | | | | | | |
Net investment income (loss) (a) | | | 0.07 | | | | 0.09 | | | 0.15 | | | | 0.13 | | | 0.07 | | | 0.00 | ^ |
Net realized and unrealized gain (loss) on investments | | | (0.98 | ) | | | 2.38 | | | (7.60 | ) | | | 2.42 | | | 2.37 | | | 1.86 | |
| | | | | | | | | | | | | | | | | | | | | |
Total from investment operations | | | (0.91 | ) | | | 2.47 | | | (7.45 | ) | | | 2.55 | | | 2.44 | | | 1.86 | |
Less distributions from: | | | | | | | | | | | | | | | | | | | | | |
Net investment income | | | — | | | | 0.07 | | | — | | | | 0.22 | | | 0.16 | | | 0.02 | |
Net realized gain | | | — | | | | — | | | 0.14 | | | | 1.57 | | | 0.05 | | | — | |
| | | | | | | | | | | | | | | | | | | | | |
Total distributions | | | — | | | | 0.07 | | | 0.14 | | | | 1.79 | | | 0.21 | | | 0.02 | |
| | | | | | | | | | | | | | | | | | | | | |
Net asset value, end of year | | $ | 8.93 | | | $ | 9.84 | | $ | 7.44 | | | $ | 15.03 | | $ | 14.27 | | $ | 12.04 | |
| | | | | | | | | | | | | | | | | | | | | |
Total Return (%)* | | | (9.25 | ) | | | 33.27 | | | (49.57 | ) | | | 18.36 | | | 20.22 | | | 18.26 | |
Ratios to average daily net assets (%):** | | | | | | | | | | | | | | | | | | | | | |
Expenses | | | 1.07 | | | | 1.09 | | | 1.05 | | | | 1.09 | | | 1.10 | | | 1.10 | |
Expenses, before waivers and reimbursements | | | 1.07 | | | | 1.09 | | | 1.05 | | | | 1.06 | | | 1.12 | | | 1.35 | |
Net investment income (loss) | | | 1.42 | | | | 1.04 | | | 1.26 | | | | 0.86 | | | 0.50 | | | 0.31 | |
Net investment income (loss), before waivers and reimbursements | | | 1.42 | | | | 1.04 | | | 1.26 | | | | 0.89 | | | 0.48 | | | 0.06 | |
| | | | | | | | | | | | | | | | | | |
| | | Period Ended
June 30, | | Years Ended December 31, |
| | | 2010 | | 2009 | | 2008 | | 2007 | | 2006 | | 2005 |
Supplemental data for all classes: | | | | | | | | | | | | | | | | | | |
Net assets at end of year (in thousands) | | $ | 322,317 | | $ | 365,271 | | $ | 360,451 | | $ | 618,179 | | $ | 598,375 | | $ | 250,929 |
Portfolio turnover rate (%)* | | | 39 | | | 78 | | | 91 | | | 66 | | | 79 | | | 84 |
| (a) | | Excludes $0.00, $(0.07), $0.01, $0.23, and $0.27 of PFIC mark to market which is treated as ordinary income for Federal tax purposes for the years 2009, 2008, 2007, 2006 and 2005, respectively. |
| * | | Rates not annualized for periods that are less than a year. |
| ** | | Rates are annualized for periods that are less than a year. |
| ^ | | Amount is less than $0.005 per share. |
Performance cited represents past performance. Past performance does not guarantee future results and current performance may be lower or higher than the data quoted. Results shown are annual returns, which assume reinvestment of dividends and capital gains. Investment returns and principal will fluctuate and you may have a gain or loss when you sell shares. For the most current month-end performance information, please call 1-800-742-7272 or visit our Web site at www.williamblairfunds.com.
Note: Net investment income (loss) per share is based on the average shares outstanding during the year.
June 30, 2010 | William Blair Funds 59 |
Financial Highlights
International Small Cap Growth Fund
| | | | | | | | | | | | | | | | | | | | | | |
| | | Institutional Class Shares | |
| | | Period Ended
June 30, | | | Periods Ended December 31, | |
| | | 2010 | | | 2009 | | 2008 | | | 2007 | | 2006 | | | 2005(a) | |
Net asset value, beginning of year | | $ | 10.53 | | | $ | 6.69 | | $ | 14.04 | | | $ | 13.43 | | $ | 11.16 | | | $ | 10.00 | |
Income (loss) from investment operations: | | | | | | | | | | | | | | | | | | | | | | |
Net investment income (loss) (b) | | | 0.06 | | | | 0.04 | | | 0.03 | | | | 0.05 | | | (0.01 | ) | | | 0.00 | ^ |
Net realized and unrealized gain (loss) on investments | | | (0.28 | ) | | | 3.83 | | | (7.26 | ) | | | 1.72 | | | 2.34 | | | | 1.16 | |
| | | | | | | | | | | | | | | | | | | | | | |
Total from investment operations | | | (0.22 | ) | | | 3.87 | | | (7.23 | ) | | | 1.77 | | | 2.33 | | | | 1.16 | |
Less distributions from: | | | | | | | | | | | | | | | | | | | | | | |
Net investment income | | | — | | | | 0.03 | | | — | | | | 0.12 | | | 0.01 | | | | 0.00 | ^ |
Net realized gain | | | — | | | | — | | | 0.12 | | | | 1.04 | | | 0.05 | | | | — | |
| | | | | | | | | | | | | | | | | | | | | | |
Total distributions | | | — | | | | 0.03 | | | 0.12 | | | | 1.16 | | | 0.06 | | | | 0.00 | ^ |
| | | | | | | | | | | | | | | | | | | | | | |
Net asset value, end of year | | $ | 10.31 | | | $ | 10.53 | | $ | 6.69 | | | $ | 14.04 | | $ | 13.43 | | | $ | 11.16 | |
| | | | | | | | | | | | | | | | | | | | | | |
Total Return (%)* | | | (2.09 | ) | | | 57.84 | | | (51.53 | ) | | | 13.53 | | | 20.86 | | | | 11.62 | |
Ratios to average daily net assets (%):** | | | | | | | | | | | | | | | | | | | | | | |
Expenses, net of waivers and reimbursements | | | 1.09 | | | | 1.13 | | | 1.14 | | | | 1.14 | | | 1.25 | | | | 1.25 | |
Expenses, before waivers and reimbursements | | | 1.09 | | | | 1.13 | | | 1.11 | | | | 1.14 | | | 1.31 | | | | 2.17 | |
Net investment income (loss), net of waivers and reimbursements | | | 1.21 | | | | 0.48 | | | 0.28 | | | | 0.32 | | | (0.12 | ) | | | 0.00 | |
Net investment income (loss), before waivers and reimbursements | | | 1.21 | | | | 0.48 | | | 0.32 | | | | 0.32 | | | (0.18 | ) | | | 0.92 | |
| | | | | | | | | | | | | | | | | | |
| | | Period Ended
June 30, | | Periods Ended December 31, |
| | | 2010 | | 2009 | | 2008 | | 2007 | | 2006 | | 2005(a) |
Supplemental data for all classes: | | | | | | | | | | | | | | | | | | |
Net assets at end of year (in thousands) | | $ | 441,589 | | $ | 390,851 | | $ | 291,988 | | $ | 401,459 | | $ | 231,969 | | $ | 50,534 |
Portfolio turnover rate (%)* | | | 40 | | | 136 | | | 78 | | | 88 | | | 109 | | | 127 |
| (a) | | For the period November 1, 2005 (Commencement of Operations) to December 31, 2005. |
| (b) | | Excludes $0.01, $(0.02), $0.05, $0.00, and $0.11 of PFIC mark to market which is treated as ordinary income for Federal tax purposes for the years 2009, 2008, 2007, 2006 and 2005, respectively. |
| * | | Rates not annualized for periods that are less than a year. |
| ** | | Rates are annualized for periods that are less than a year. |
| ^ | | Amount is less than $0.005 per share. |
Performance cited represents past performance. Past performance does not guarantee future results and current performance may be lower or higher than the data quoted. Results shown are annual returns, which assume reinvestment of dividends and capital gains. Investment returns and principal will fluctuate and you may have a gain or loss when you sell shares. For the most current month-end performance information, please call 1-800-742-7272 or visit our Web site at www.williamblairfunds.com.
Note: Net investment income (loss) per share is based on the average shares outstanding during the year.
60 Semi-Annual Report | June 30, 2010 |
Financial Highlights
Emerging Markets Growth Fund
| | | | | | | | | | | | | | | | | | | | | | |
| | | Institutional Class Shares | |
| | | Period Ended
June 30, | | | Periods Ended December 31, | |
| | | 2010 | | | 2009 | | 2008 | | | 2007 | | | 2006 | | 2005(a) | |
Net asset value, beginning of year | | $ | 13.03 | | | $ | 7.56 | | $ | 22.07 | | | $ | 19.54 | | | $ | 14.20 | | $ | 10.00 | |
Income (loss) from investment operations: | | | | | | | | | | | | | | | | | | | | | | |
Net investment income (loss) (b) | | | 0.05 | | | | 0.06 | | | 0.17 | | | | (0.01 | ) | | | 0.02 | | | 0.01 | |
Net realized and unrealized gain (loss) on investments | | | (0.58 | ) | | | 5.55 | | | (13.74 | ) | | | 7.27 | | | | 5.44 | | | 4.27 | |
| | | | | | | | | | | | | | | | | | | | | | |
Total from investment operations | | | (0.53 | ) | | | 5.61 | | | (13.57 | ) | | | 7.26 | | | | 5.46 | | | 4.28 | |
Less distributions from: | | | | | | | | | | | | | | | | | | | | | | |
Net investment income | | | — | | | | 0.14 | | | — | | | | 0.19 | | | | 0.01 | | | — | |
Net realized gain | | | — | | | | — | | | 0.94 | | | | 4.54 | | | | 0.11 | | | 0.08 | |
| | | | | | | | | | | | | | | | | | | | | | |
Total distributions | | | — | | | | 0.14 | | | 0.94 | | | | 4.73 | | | | 0.12 | | | 0.08 | |
| | | | | | | | | | | | | | | | | | | | | | |
Net asset value, end of year | | $ | 12.50 | | | $ | 13.03 | | $ | 7.56 | | | $ | 22.07 | | | $ | 19.54 | | $ | 14.20 | |
| | | | | | | | | | | | | | | | | | | | | | |
Total Return (%)* | | | (4.07 | ) | | | 74.33 | | | (61.51 | ) | | | 38.21 | | | | 38.49 | | | 42.82 | |
Ratios to average daily net assets (%):** | | | | | | | | | | | | | | | | | | | | | | |
Expenses, net of waivers and reimbursements | | | 1.18 | | | | 1.22 | | | 1.22 | | | | 1.25 | | | | 1.25 | | | 1.25 | |
Expenses, before waivers and reimbursements | | | 1.18 | | | | 1.22 | | | 1.20 | | | | 1.25 | | | | 1.32 | | | 1.61 | |
Net investment income (loss), net of waivers and reimbursements | | | 0.75 | | | | 0.54 | | | 1.08 | | | | (0.05 | ) | | | 0.09 | | | 0.19 | |
Net investment income (loss), before waivers and reimbursements | | | 0.75 | | | | 0.54 | | | 1.10 | | | | (0.05 | ) | | | 0.02 | | | (0.17 | ) |
| | | | | | | | | | | | | | | | | | |
| | | Period Ended
June 30, | | Periods Ended December 31, |
| | | 2010 | | 2009 | | 2008 | | 2007 | | 2006 | | 2005(a) |
Supplemental data for all classes: | | | | | | | | | | | | | | | | | | |
Net assets at end of year (in thousands) | | $ | 1,012,481 | | $ | 1,038,260 | | $ | 385,588 | | $ | 1,165,854 | | $ | 813,649 | | $ | 249,348 |
Portfolio turnover rate (%)* | | | 59 | | | 113 | | | 118 | | | 100 | | | 113 | | | 77 |
| (a) | | For the period June 6, 2005 (Commencement of Operations) to December 31, 2005. |
| (b) | | Excludes $0.15, $(0.09), $0.21, $0.00, and $0.11 of PFIC mark to market which is treated as ordinary income for Federal tax purposes for the years 2009, 2008, 2007, 2006 and 2005, respectively. |
| * | | Rates not annualized for periods that are less than a year. |
| ** | | Rates are annualized for periods that are less than a year. |
Performance cited represents past performance. Past performance does not guarantee future results and current performance may be lower or higher than the data quoted. Results shown are annual returns, which assume reinvestment of dividends and capital gains. Investment returns and principal will fluctuate and you may have a gain or loss when you sell shares. For the most current month-end performance information, please call 1-800-742-7272 or visit our Web site at www.williamblairfunds.com.
Note: Net investment income (loss) per share is based on the average shares outstanding during the year.
June 30, 2010 | William Blair Funds 61 |
Financial Highlights
Emerging Leaders Growth Fund
| | | | | | | | | | | |
| | | Institutional Class Shares | |
| | | Period Ended
June 30, | | | Periods Ended
December 31, | |
| | | 2010 | | | 2009 | | 2008(a) | |
Net asset value, beginning of year | | $ | 8.43 | | | $ | 4.78 | | $ | 10.00 | |
Income (loss) from investment operations: | | | | | | | | | | | |
Net investment income (loss) (b) | | | 0.04 | | | | 0.04 | | | 0.04 | |
Net realized and unrealized gain (loss) on investments | | | (0.21 | ) | | | 3.73 | | | (5.26 | ) |
| | | | | | | | | | | |
Total from investment operations | | | (0.17 | ) | | | 3.77 | | | (5.22 | ) |
Less distributions from: | | | | | | | | | | | |
Net investment income | | | — | | | | 0.12 | | | 0.00 | ^ |
Net realized gain | | | — | | | | — | | | — | |
| | | | | | | | | | | |
Total distributions | | | — | | | | 0.12 | | | 0.00 | ^ |
| | | | | | | | | | | |
Net asset value, end of year | | $ | 8.26 | | | $ | 8.43 | | $ | 4.78 | |
| | | | | | | | | | | |
Total Return (%)* | | | (2.02 | ) | | | 78.93 | | | (52.11 | ) |
Ratios to average daily net assets (%):** | | | | | | | | | | | |
Expenses, net of waivers and reimbursements | | | 1.25 | | | | 1.25 | | | 1.25 | |
Expenses, before waivers and reimbursements | | | 1.30 | | | | 1.36 | | | 1.41 | |
Net investment income (loss), net of waivers and reimbursements | | | 0.96 | | | | 0.58 | | | 0.70 | |
Net investment income (loss), before waivers and reimbursements | | | 0.91 | | | | 0.47 | | | 0.54 | |
| | | | | | | | | |
| | | Period Ended
June 30, | | Periods Ended
December 31, |
| | | 2010 | | 2009 | | 2008(a) |
Supplemental data for all classes: | | | | | | | | | |
Net assets at end of year (in thousands) | | $ | 75,609 | | $ | 115,136 | | $ | 46,676 |
Portfolio turnover rate (%)* | | | 79 | | | 176 | | | 151 |
| (a) | | For the period May 1, 2007 (Commencement of Operations) to December 31, 2007. |
| (b) | | Excludes $1.29 and $0.00 of PFIC mark to market which is treated as ordinary income for Federal tax purposes for the years 2009 and 2008. |
| * | | Rates not annualized for periods that are less than a year. |
| ** | | Rates are annualized for periods that are less than a year. |
| ^ | | Amount is less than $0.005 per share. |
Performance cited represents past performance. Past performance does not guarantee future results and current performance may be lower or higher than the data quoted. Results shown are annual returns, which assume reinvestment of dividends and capital gains. Investment returns and principal will fluctuate and you may have a gain or loss when you sell shares. For the most current month-end performance information, please call 1-800-742-7272 or visit our Web site at www.williamblairfunds.com.
Note: Net investment income (loss) per share is based on the average shares outstanding during the year.
62 Semi-Annual Report | June 30, 2010 |
Financial Highlights
Bond Fund
| | | | | | | | | | | | | |
| | | Institutional Class Shares |
| | | Period Ended
June 30, | | Periods Ended December 31, |
| | | 2010 | | 2009 | | 2008 | | | 2007(a) |
Net asset value, beginning of year | | $ | 10.30 | | $ | 9.72 | | $ | 10.00 | | | $ | 10.00 |
Income (loss) from investment operations: | | | | | | | | | | | | | |
Net investment income (loss) | | | 0.25 | | | 0.51 | | | 0.50 | | | | 0.32 |
Net realized and unrealized gain (loss) on investments | | | 0.30 | | | 0.58 | | | (0.31 | ) | | | 0.03 |
| | | | | | | | | | | | | |
Total from investment operations | | | 0.55 | | | 1.09 | | | 0.19 | | | | 0.35 |
Less distributions from: | | | | | | | | | | | | | |
Net investment income | | | 0.24 | | | 0.51 | | | 0.47 | | | | 0.35 |
Net realized gain | | | — | | | — | | | — | | | | 0.00 |
| | | | | | | | | | | | | |
Total distributions | | | 0.24 | | | 0.51 | | | 0.47 | | | | 0.35 |
| | | | | | | | | | | | | |
Net asset value, end of year | | $ | 10.61 | | $ | 10.30 | | $ | 9.72 | | | $ | 10.00 |
| | | | | | | | | | | | | |
Total Return (%)* | | | 5.37 | | | 11.47 | | | 1.95 | | | | 3.57 |
Ratios to average daily net assets (%):** | | | | | | | | | | | | | |
Expenses, net of waivers and reimbursements | | | 0.35 | | | 0.34 | | | 0.35 | | | | 0.35 |
Expenses, before waivers and reimbursements | | | 0.42 | | | 0.43 | | | 0.56 | | | | 0.52 |
Net investment income (loss), net of waivers and reimbursements | | | 4.82 | | | 5.07 | | | 5.04 | | | | 5.09 |
Net investment income (loss), before waivers and reimbursements | | | 4.75 | | | 4.98 | | | 4.83 | | | | 4.92 |
| | | | | | | | | | | | |
| | | Period Ended
June 30, | | Periods Ended December 31, |
| | | 2010 | | 2009 | | 2008 | | 2007(a) |
Supplemental data for all classes: | | | | | | | | | | | | |
Net assets at end of year (in thousands) | | $ | 188,664 | | $ | 147,344 | | $ | 74,613 | | $ | 68,483 |
Portfolio turnover rate (%)* | | | 17 | | | 29 | | | 52 | | | 38 |
| (a) | | For the period May 1, 2007 (Commencement of Operations) to December 31, 2007. |
| * | | Rates not annualized for periods that are less than a year. |
| ** | | Rates are annualized for periods that are less than a year. |
Performance cited represents past performance. Past performance does not guarantee future results and current performance may be lower or higher than the data quoted. Results shown are annual returns, which assume reinvestment of dividends and capital gains. Investment returns and principal will fluctuate and you may have a gain or loss when you sell shares. For the most current month-end performance information, please call 1-800-742-7272 or visit our Web site at www.williamblairfunds.com.
Note: Net investment income (loss) per share is based on the average shares outstanding during the year.
June 30, 2010 | William Blair Funds 63 |
Financial Highlights
Low Duration Bond Fund
| | | | | | | |
| | | Institutional Class Shares | |
| | | Periods Ended | |
| | | June 30, | | December 31, | |
| | | 2010 | | 2009(a) | |
Net asset value, beginning of year | | $ | 9.93 | | $ | 10.00 | |
Income (loss) from investment operations: | | | | | | | |
Net investment income (loss) | | | 0.08 | | | 0.01 | |
Net realized and unrealized gain (loss) on investments | | | 0.08 | | | (0.07 | ) |
| | | | | | | |
Total from investment operations | | | 0.16 | | | (0.06 | ) |
Less distributions from: | | | | | | | |
Net investment income | | | 0.10 | | | 0.01 | |
Net realized gain | | | — | | | — | |
| | | | | | | |
Total distributions | | | 0.10 | | | 0.01 | |
| | | | | | | |
Net asset value, end of year | | $ | 9.99 | | $ | 9.93 | |
| | | | | | | |
Total Return (%)* | | | 1.66 | | | (0.58 | ) |
Ratios to average daily net assets (%):** | | | | | | | |
Expenses, net of waivers and reimbursements | | | 0.40 | | | 0.40 | |
Expenses, before waivers and reimbursements | | | 0.46 | | | 0.64 | |
Net investment income (loss), net of waivers and reimbursements | | | 1.60 | | | 1.54 | |
Net investment income (loss), before waivers and reimbursements | | | 1.54 | | | 1.30 | |
| | | | | | |
| | | Periods Ended |
| | | June 30, | | December 31, |
| | | 2010 | | 2009(a) |
Supplemental data for all classes: | | | | | | |
Net assets at end of year (in thousands) | | $ | 132,353 | | $ | 95,134 |
Portfolio turnover rate (%)* | | | 31 | | | — |
| (a) | | For the period December 1, 2009 (Commencement of Operations) to December 31, 2009. |
| * | | Rates not annualized for periods that are less than a year. |
| ** | | Rates are annualized for periods that are less than a year. |
Performance cited represents past performance. Past performance does not guarantee future results and current performance may be lower or higher than the data quoted. Results shown are annual returns, which assume reinvestment of dividends and capital gains. Investment returns and principal will fluctuate and you may have a gain or loss when you sell shares. For the most current month-end performance information, please call 1-800-742-7272 or visit our Web site at www.williamblairfunds.com.
Note: Net investment income (loss) per share is based on the average shares outstanding during the year.
64 Semi-Annual Report | June 30, 2010 |
Trustees and Officers (Unaudited). The trustees and officers of the William Blair Funds, their year of birth, their principal occupations during the last five years, their affiliations, if any, with William Blair & Company, L.L.C., and other significant affiliations are set forth below. The address of each trustee and officer is 222 West Adams Street, Chicago, Illinois 60606.
| | | | | | | | | | |
Name and Year of Birth | | Position(s)
Held with
Fund | | Term of
Office and
Length of
Time
Served(1) | | Principal Occupation(s) During Past 5 Years | | Number of
Portfolios
in Fund
Complex
Overseen
by Trustee | | Other Directorships Held by Trustee/Officer |
Interested Trustees | | | | | | | | | | |
Michelle R. Seitz,
1965* | | Chairperson of the Board of Trustees and President | | Since 2010 Since 2007 | | Principal, William Blair & Company, L.L.C.; Limited Partner, WB Holdings, L.P. (since November 2008); Member, WBC GP, L.L.P. (since November 2008) | | 19 | | N/A |
| | | | | |
Richard W. Smirl,
1967 | | Trustee and Senior Vice President | | Trustee since 2010 and Senior Vice President since 2008 | | Principal, William Blair & Company, L.L.C. | | 19 | | N/A |
| | | | |
Non-Interested Trustees | | | | | | | | |
Ann P. McDermott,
1939 | | Trustee | | Since 1996 | | Board member and officer for various civic and charitable organizations over the past thirty years; professional experience prior thereto, registered representative for New York Stock Exchange firm | | 19 | | Northwestern University, Women’s Board; Rush Presbyterian St. Luke’s Medical Center, Women’s Board; University of Chicago, Women’s Board; Visiting Nurses Association, Honorary Director |
| | | | | |
Phillip O. Peterson,
1944 | | Trustee | | Since 2007 | | Trustee of Strong Funds Liquidating Trusts since 2005 and President, Strong Mutual Funds, 2004-2005; formerly, Partner, KPMG LLP | | 19 | | The Hartford Group of Mutual Funds (87 portfolios) |
| | | | | |
Donald J. Reaves,
1946 | | Trustee | | Since 2004 | | Chancellor, Winston-Salem State University since 2007; formerly, Vice President for Administration and Chief Financial Officer, University of Chicago 2002-2007. | | 19 | | American Student Assistance Corp., guarantor of student loans; Amica Mutual Insurance Company |
| | | | | |
Donald L. Seeley,
1944 | | Trustee | | Since 2003 | | Retired; formerly, Director, Applied Investment Management Program, University of Arizona Department of Finance, prior there to, Vice Chairman and Chief Financial Officer, True North Communications, Inc., marketing communications and advertising firm | | 19 | | Warnaco Group, Inc., intimate apparel, sportswear, and swimwear manufacturer; Center for Furniture Craftsmanship (not-for-profit) |
June 30, 2010 | William Blair Funds 65 |
| | | | | | | | | | |
Name and Year of Birth | | Position(s)
Held with
Fund | | Term of
Office and
Length of
Time
Served(1) | | Principal Occupation(s) During Past 5 Years | | Number of
Portfolios
in Fund
Complex
Overseen
by Trustee | | Other Directorships Held by Trustee/Officer |
Thomas J. Skelly,
1951 | | Trustee | | Since 2007 | | Advisory Board member for various U.S. companies; Director and Investment Committee Chairman of the US Accenture Foundation, Inc.; prior to 2005, Managing Partner of various divisions at Accenture | | 19 | | First MetLife Investors Insurance Company |
| | | | | |
Robert E. Wood II,
1938 | | Trustee | | Since 1999 | | Retired; formerly, Executive Vice President, Morgan Stanley Dean Witter | | 19 | | Chairman, Add-Vision, Inc., manufacturer of surface animation systems; Chairman Micro-Combustion, LLC |
| | | | | | | | |
Name and Year of Birth | | Position(s)
Held with
Fund | | Term of
Office and
Length of
Time
Served(1) | | Principal
Occupation(s)
During Past 5 Years(2) | | Other Directorships Held by Trustee/Officer |
Officers | | | | | | | | |
Michael P. Balkin,
1959 | | Senior Vice President | | Since 2009 | | Principal, William Blair & Company, L.L.C. | | N/A |
| | | | |
| | Vice President | | 2008-2009 | | Associate, William Blair & Company, L.L.C.; former Chief Investment Officer, Magnetar Investment Management | | |
| | | | |
Karl W. Brewer,
1966 | | Senior Vice President | | Since 2000 | | Principal, William Blair & Company, L.L.C. | | N/A |
| | | | |
David C. Fording,
1967 | | Senior Vice President | | Since 2009 | | Principal, William Blair & Company, L.L.C. | | N/A |
| | | | |
| | Vice President | | 2006-2009 | | Associate, William Blair & Company, L.L.C.; former Portfolio Manager, TIAA-CREF. | | |
| | | | |
James S. Golan,
1961 | | Senior Vice President | | Since 2005 | | Principal, William Blair & Company, L.L.C. | | N/A |
| | | | |
W. George Greig,
1952 | | Senior Vice President | | Since 1996 | | Principal, William Blair & Company, L.L.C. | | N/A |
| | | | |
Michael A. Jancosek,
1959 | | Senior Vice President | | Since 2004 | | Principal, William Blair & Company L.L.C. | | N/A |
| | | | |
John F. Jostrand,
1954 | | Senior Vice President | | Since 1999 | | Principal, William Blair & Company, L.L.C. | | N/A |
| | | | |
Robert C. Lanphier, IV,
1956 | | Senior Vice President | | Since 2003 | | Principal, William Blair & Company, L.L.C. | | Chairman, AG. Med, Inc. |
| | | | |
Mark T. Leslie,
1967 | | Senior Vice President | | Since 2008 | | Principal, William Blair & Company, L.L.C. | | N/A |
| | | | |
| | Vice President | | 2005-2008 | | Associate, William Blair & Company, L.L.C. formerly, U.S. Bancorp Asset Management | | |
66 Semi-Annual Report | June 30, 2010 |
| | | | | | | | |
Name and Year of Birth | | Position(s)
Held with
Fund | | Term of
Office and
Length of
Time
Served(1) | | Principal
Occupation(s)
During Past 5 Years(2) | | Other Directorships Held by Trustee/Officer |
Matthew A. Litfin,
1972 | | Senior Vice President | | Since 2008 | | Principal, William Blair & Company, L.L.C. | | N/A |
| | | | |
Kenneth J. McAtamney
1966 | | Senior Vice President | | Since 2008 | | Principal, William Blair & Company, L.L.C. | | N/A |
| | | | |
Todd M. McClone,
1968 | | Senior Vice President | | Since 2006 | | Principal, William Blair & Company, L.L.C. | | N/A |
| | | | |
| | Vice President | | 2005-2006 | | Associate, William Blair & Company, L.L.C. | | N/A |
| | | | |
Tracy McCormick,
1954 | | Senior Vice President | | Since 2008 | | Principal, William Blair & Company, L.L.C. | | N/A |
| | | | |
David Merjan,
1960 | | Senior Vice President | | Since 2008 | | Principal, William Blair & Company, L.L.C. | | N/A |
| | | | |
David S. Mitchell,
1960 | | Senior Vice President | | Since 2004 | | Principal, William Blair & Company, L.L.C. | | N/A |
| | | | |
David P. Ricci,
1958 | | Senior Vice President | | Since 2006 | | Principal, William Blair & Company, L.L.C. | | N/A |
| | | | |
Richard W. Smirl,
1967 | | Senior Vice President | | Since 2004 | | Principal, William Blair & Company, L.L.C. | | N/A |
| | | | |
Jeffrey A. Urbina,
1955 | | Senior Vice President | | Since 1998 | | Principal, William Blair & Company, L.L.C. | | N/A |
| | | | |
Christopher T. Vincent,
1956 | | Senior Vice President | | Since 2004 | | Principal, William Blair & Company, L.L.C. | | N/A |
| | | | |
Chad M. Kilmer,
1975 | | Vice President | | Since 2006 | | Associate, William Blair & Company, L.L.C.; former analyst and Portfolio Manager U.S. Bancorp Asset Management. | | N/A |
| | | | |
Kathleen M. Lynch,
1971 | | Vice President | | Since 2010 | | Associate, William Blair & Company, L.L.C. | | N/A |
| | | | |
Paul J. Sularz,
1967 | | Vice President | | Since 2009 | | Associate, William Blair & Company, L.L.C.; Vice President, J.P. Morgan Securities, Inc. | | N/A |
| | | | |
Walter R. Randall, Jr.,
1960 | | Chief Compliance Officer | | Since 2009 | | Associate, William Blair & Company, L.L.C.; Associate Counsel and Chief Compliance Officer, Calamos Investments; Assistant General Counsel, American Century Investments. | | N/A |
| | | | |
Colette M. Garavalia,
1961 | | Treasurer | | Since 2009 | | Associate, William Blair & Company, L.L.C. | | N/A |
| | | | |
| | Secretary | | 2000-2009 | | Associate, William Blair & Company, L.L.C.; | | N/A |
June 30, 2010 | William Blair Funds 67 |
| | | | | | | | |
Name and Year of Birth | | Position(s)
Held with
Fund | | Term of
Office and
Length of
Time
Served(1) | | Principal
Occupation(s)
During Past 5 Years(2) | | Other Directorships Held by Trustee/Officer |
Andrew T. Pfau,
1970 | | Secretary | | Since 2009 | | Associate, William Blair & Company, L.L.C.; Associate, Bell, Boyd & Lloyd, LLP; Associate, Sidley Austin LLP | | N/A |
| * | | Ms. Seitz and Mr. Smirl are interested persons of the William Blair Funds because each is a principal of William Blair & Company, L.L.C., the Funds’ investment advisor, principal underwriter and distributor. |
| (1) | | Each Trustee serves until the election and qualification of a successor, or until death, resignation or retirement or removal as provided in the Fund’s Declaration of Trust. Retirement for non-interested Trustees occurs no later than at the conclusion of the first regularly scheduled Board meeting of the Fund’s fiscal year that occurs after the Trustee’s 72nd birthday. The Fund’s officers except the Chief Compliance Officer, are elected annually by the Trustees. The Fund’s Chief Compliance Officer is designated by the Board of Trustees and may only be removed by action of the Board of Trustees, including a majority of the non-interested Trustees. |
| (2) | | In November 2008, all current principals of William Blair & Company, L.L.C. also became limited partners in WB Holdings, L.P. |
The Statement of Additional Information for the William Blair Funds includes additional information about the trustees and is available without charge by calling 1-800-635-2886 (in Massachusetts 1-800-635-2840) or by writing the Fund.
68 Semi-Annual Report | June 30, 2010 |
Renewal of the Trust’s Management Agreement
On April 27, 2010, the Board of Trustees (the “Board”) of the William Blair Funds (the “Trust”), including the Trustees who are not “interested persons” of the Trust as defined in the Investment Company Act of 1940, as amended (the “Independent Trustees”), approved the renewal for an additional one-year term of the Trust’s Management Agreement with William Blair & Company, L.L.C. (the “Advisor”), on behalf of each of the William Blair Global Growth Fund, the William Blair Institutional International Growth Fund, the William Blair Institutional International Equity Fund, the William Blair International Small Cap Growth Fund, the William Blair Emerging Markets Growth Fund, the William Blair Emerging Leaders Growth Fund and the William Blair Bond Fund (each, a “Fund” and collectively, the “Funds”). In deciding to approve the renewal of the Management Agreement, the Board did not identify any single factor or group of factors as all-important or controlling and considered all factors together.
The information in this summary outlines the Board’s considerations associated with its renewal of the Management Agreement. In connection with its deliberations regarding the continuation of the Management Agreement, the Board considered such information and factors as it believed to be relevant. As described below, the Board considered the nature, extent and quality of the services performed by the Advisor under the existing Management Agreement; comparative management fees and expense ratios as prepared by an independent provider (Lipper Inc.); the estimated profits realized by the Advisor; the extent to which the Advisor realizes economies of scale as a Fund grows; and whether any fall-out benefits are being realized by the Advisor. In addition, the Independent Trustees discussed the renewal of the Management Agreement with Fund management and in private sessions with independent legal counsel at which no representatives of the Advisor were present.
The Board, including the Independent Trustees, considered the renewal of the Management Agreement pursuant to a process that concluded at the Board’s April 27, 2010 meeting. In preparation for the review process, the Independent Trustees met with independent legal counsel and discussed the type and nature of information to be requested and independent legal counsel sent a formal request for information to Trust management. The Advisor provided extensive information in response to the request. After reviewing the information received, the Independent Trustees requested supplemental information, which the Advisor provided in writing and/or orally. The Independent Trustees reviewed comparative performance and comparative advisory fees and expense ratios for a peer group and a peer universe of funds provided by Lipper for each Fund. In addition, the Independent Trustees considered: (i) materials describing the nature, quality and extent of services provided by the Advisor; (ii) information comparing the performance of each Fund to one or more relevant securities indexes; (iii) information comparing advisory fees of each Fund to fees charged by the Advisor to other funds and client accounts with similar investment strategies; (iv) the estimated allocated direct or indirect costs of services provided and estimated profits realized by the Advisor for both the Trust as a whole and each Fund individually; and (v) information describing other benefits to the Advisor resulting from its relationship with the Funds. The Independent Trustees also noted that they receive information from the Advisor regarding the Funds throughout the year in connection with regular Board meetings, including presentations from portfolio managers. The Independent Trustees also received a memorandum from independent legal counsel advising them of their duties and responsibilities in connection with the review of the Management Agreement. Finally, the Advisor made an in-person presentation to the Independent Trustees regarding the contract review information, including addressing the supplemental information requests, and answered questions from the Independent Trustees.
On April 14, 26 and 27, 2010, the Independent Trustees met independently of Trust management and of the interested Trustees to review and discuss with independent legal counsel the information provided by the Advisor, Lipper and independent legal counsel. The Independent Trustees noted that in evaluating the Management Agreement, they were taking into account their accumulated experience as Trustees in working with the Advisor on matters relating to the Funds. Based on their review, the Independent Trustees concluded that it was in the best interest of each Fund to renew the Management Agreement and recommended to the Board the renewal of the Management Agreement. The Board considered the recommendation of the Independent Trustees along with the other factors that the Board deemed relevant.
Nature, Quality and Extent of Services. In evaluating the nature, quality and extent of the services provided by the Advisor to the Funds, the Board noted that the Advisor is a quality firm with a reputation for integrity and honesty that employs high-quality people and has been associated with the Funds since their inception. The Trustees believe that a long-term relationship with a capable, conscientious advisor is in the best interests of shareholders and that shareholders have invested in the Funds knowing that the Advisor managed the Funds and knowing the investment advisory fee. The Board considered biographical information about the Trust’s officers and each Fund’s portfolio manager(s), the administrative services performed by the Advisor, financial information regarding the Advisor, the Advisor’s execution quality and use of soft dollars, the compliance regime overseen by the Advisor, and the Advisor’s expense limitations in place for certain Funds.
June 30, 2010 | William Blair Funds 69 |
The Board was also provided with information pertaining to the Advisor’s organizational structure and senior management. The Board noted that the Advisor pays the compensation of all of the officers and interested Trustees of the Trust. The Board also noted that the Advisor voluntarily reduces the advisory fees of the Funds by an amount equal to the advisory fee and service fee paid by the Ready Reserves Fund on the cash of the Funds invested in the Ready Reserves Fund.
The Board reviewed information on the annualized total returns of each Fund for the one-, three-, five- and ten-year periods ended December 31, 2009, as applicable, along with annualized total return information for the Lipper performance peer universe of funds and one or more relevant securities indexes. The Lipper performance peer universe for each Fund included all funds with a similar investment style as classified by Lipper regardless of asset size or primary channel of distribution. The Board noted that the information provided indicated that the Global Growth Fund, the Institutional International Growth Fund, the International Small Cap Growth Fund, the Emerging Leaders Growth Fund and the Bond Fund generally performed satisfactorily on the whole relative to its Lipper performance peer universe during the periods reviewed. The Board noted that the information provided indicated that the Institutional International Equity Fund and the Emerging Markets Growth Fund each performed satisfactorily relative to its Lipper performance peer universe during the one-year period, but generally lagged the Lipper performance peer universe on a relative basis over the other periods reviewed. The Trustees requested and reviewed with the Advisor additional information regarding the performance of the Institutional International Equity Fund and the Emerging Markets Growth Fund.
Based on all relevant factors, the Board concluded that the nature, quality and extent of the services provided by the Advisor to each Fund were satisfactory.
Fees and Expenses. The Board reviewed each Fund’s advisory fee and expense ratio and reviewed information comparing the advisory fee and expense ratio to those of a Lipper expense peer group and Lipper expense peer universe for each Fund. The Lipper expense peer group for each Fund consisted of a group of funds with a similar investment style as classified by Lipper, distribution channel and asset size as the Fund. The Lipper expense peer universe for each Fund consisted of all funds with a similar investment style as classified by Lipper and distribution channel as the Fund. The Board considered that the Advisor had proposed to contractually limit total expenses for the Global Growth Fund, the Institutional International Equity Fund, the International Small Cap Growth Fund, the Emerging Markets Growth Fund, the Emerging Leaders Growth Fund and the Bond Fund. For each Fund, the Board also reviewed amounts charged by the Advisor to other registered funds and funds for which the Advisor acts as a sub-advisor, and the Advisor’s fee schedule for institutional separate accounts. With respect to sub-advised funds and institutional separate accounts, the Board considered the Advisor’s view that the advisory fees for institutional separate accounts and sub-advisory services are less relevant to the Board’s consideration of the Funds’ advisory fees because both the mix of services provided to the Funds and the additional regulatory responsibilities associated with registered investment companies were greater as compared to the Advisor’s obligations for sub-advised funds and separate accounts. In addition, the Board considered the Advisor’s statement that institutional separate accounts are distributed differently, operate under different investment and regulatory structures and have different business risks as compared to the Funds.
In considering the information, the Board noted that the advisory fees for the Global Growth Fund, the International Small Cap Growth Fund, the Emerging Markets Growth Fund, the Emerging Leaders Growth Fund and the Bond Fund were below or within an acceptable range of the average advisory fees of their Lipper expense peer group and Lipper expense peer universe. The Board also noted that the advisory fees for the Institutional International Growth Fund and the Institutional International Equity Fund were above the average advisory fees of their Lipper expense peer group and Lipper expense peer universe, but that such advisory fees were within an acceptable range of the average advisory fees of their Lipper expense peer group and Lipper expense peer universe and consistent with reasonable expectations in light of the nature, quality and extent of services provided by the Advisor. With respect to the Institutional International Growth Fund, the Board considered that the Advisor had agreed to introduce additional breakpoints into the Fund’s advisory fee schedule. On the basis of the information provided, the Board concluded that each Fund’s advisory fee, coupled with applicable expense limitations, was reasonable in light of the nature, quality and extent of services provided by the Advisor.
Profitability. With respect to the profitability of the Management Agreement to the Advisor, the Board considered the overall fees paid under the Management Agreement, including the estimated allocated costs of the services provided and profits realized by the Advisor from its relationship with the Trust as a whole and each Fund individually. The Board concluded that the estimated profits realized by the Advisor were not unreasonable.
Economies of Scale. The Board considered the extent to which economies of scale would be realized as the Funds grow and whether fee levels reflect these economies of scale for the benefit of investors. The Board noted the Advisor’s representation that certain Fund expenses are relatively fixed and unrelated to asset size and that the Advisor may enjoy some economies of
70 Semi-Annual Report | June 30, 2010 |
scale as a Fund’s assets grow. In considering whether fee levels reflect economies of scale for the benefit of Fund investors, the Board reviewed each Fund’s asset size, breakpoints for those Funds with breakpoints in the advisory fee schedule where applicable (including the additional breakpoints for the Institutional International Growth Fund agreed to by the Advisor), the Fund’s total and net expense ratios and the expense limitations in place and/or proposed, and concluded that in the aggregate they reasonably reflect appropriate recognition of any economies of scale.
Other Benefits to the Advisor. The Board considered benefits derived by the Advisor from its relationship with the Funds, including (i) non-advisory fee revenue from the Funds in the form of shareholder administration fees, service fees and/or distribution fees and the payment of some or all of those revenues to affiliates or third parties, (ii) soft dollars, which pertain primarily to the Funds investing in equity securities, and (iii) favorable media coverage. The Board concluded that, taking into account these benefits, each Fund’s advisory fee was reasonable.
Conclusion. Based on all of the information considered and the conclusions reached, the Board determined that the terms of the Management Agreement continue to be fair and reasonable and that the continuation of the Management Agreement is in the best interests of each Fund.
June 30, 2010 | William Blair Funds 71 |
(unaudited)
Proxy Voting
A description of the policies and procedures that the Fund uses to determine how to vote proxies relating to portfolio securities and information regarding how the Fund voted proxies relating to portfolio securities for the most recent 12-month period ended June 30 are available without charge, upon request, by calling 1-800-635-2886 (in Massachusetts 1-800-635-2840), at www.williamblairfunds.com and on the SEC’s website at http://www.sec.gov.
Quarterly Portfolio Schedules
Each Portfolio files its complete schedule of portfolio holdings with the SEC for the first and third fiscal quarters of each fiscal year (quarters ended March 31 and September 30) on Form N-Q. The Fund’s Forms N-Q are available on the SEC’s website at http://www.sec.gov and may be reviewed and copied at the SEC’s Public Reference Room in Washington, D.C. Information on the operation of the SEC’s Public Reference Room may be obtained by calling 1-800-SEC-0330. The Fund’s Forms N-Q are also available on the Fund’s website at www.williamblairfunds.com.
Additional Federal Income Tax Information: (unaudited)
The following table provides the percentage of the 2009 year-end distributions that qualify for the dividend received deduction, and the qualified dividend income percentage:
| | | | | | |
Portfolio | | Dividend
Received
Deduction% | | | Qualified
Dividend
Income% | |
Institutional International Growth | | 0.00 | % | | 100.00 | % |
Institutional International Equity | | 1.30 | % | | 100.00 | % |
International Small Cap Growth | | 0.00 | % | | 100.00 | % |
Emerging Markets Growth | | 0.00 | % | | 69.26 | % |
Emerging Leaders Growth | | 0.00 | % | | 57.56 | % |
Bond | | 0.00 | % | | 0.00 | % |
Low Duration | | 0.00 | % | | 0.00 | % |
In January 2010, you were notified on IRS Form 1099-Div or substitute 1099 DIV as to the Federal tax status of the distributions received by you in the calendar year 2009.
72 Semi-Annual Report | June 30, 2010 |
Useful Information About Your Report (unaudited)
Please refer to this information when reviewing the Expense Example for each Portfolio.
Expense Example
As a shareholder of a Portfolio, you incur ongoing costs, including management fees and other Portfolio expenses. The example is intended to help you understand your ongoing costs (in dollars) of investing in the Portfolio and to compare these costs with the ongoing costs of investing in other mutual funds. To do so, compare the Portfolio’s 5% hypothetical example with the 5% hypothetical examples that appear in the shareholder reports of other funds. The example is based on an investment of $1,000 invested at the beginning of the period and held for the entire six-month period from January 1, 2010 to June 30, 2010.
Actual Expenses
In each example, the first line for each share class in the table provides information about the actual account values and actual expenses. These expenses reflect the effect of any expense cap applicable to the share class during the period. Without this expense cap, the costs shown in the table would have been higher. You may use the information in this line, together with the amount you invested, to estimate the expenses that you paid over the period. Simply divide your account value by $1,000 (example, an $8,600 account value divided by $1,000 = 8.6), then multiply the result by the number in the first line under the heading entitled “Expenses Paid During the Period” to estimate the expenses you paid on your account during the period.
Hypothetical Example for Comparison Purposes
In each example, the second line for each share class in the table provides information about hypothetical account values and hypothetical expenses based on the Portfolio’s actual expense ratio and an assumed rate of return of 5% per year before expenses. This is not the Portfolio’s actual return. The hypothetical account values and expenses may not be used to estimate the actual ending account balance or expenses you paid for the period. You may use this information to compare the ongoing costs of investing in the Portfolio to other funds. To do so, compare this 5% hypothetical example with the 5% hypothetical examples that appear in the shareholder reports of other funds.
Please note that the expenses shown in both examples are meant to highlight your ongoing costs only and do not reflect any transactional costs or account type fees. These fees are fully described in the prospectus. Therefore, the second line of each share class in the table is useful in comparing ongoing costs only and will not help you determine the relative costs of owning different funds.
June 30, 2010 | William Blair Funds 73 |
Fund Expenses (unaudited)
The examples below show you the ongoing costs (in dollars) of investing in your fund and allows you to compare these costs with those of other mutual funds. Please refer to previous page for a detailed explanation of the information presented on this chart.
| | | | | | | | | | | | |
Expense Example | | Beginning
Account Value
1/1/2010 | | Ending
Account Value
6/30/2010 | | Expenses Paid
During
the Period(a) | | Annualized
Expense Ratio | |
Institutional International Growth Fund | | | | | | | | | | | | |
Institutional Class-actual return | | $ | 1,000.00 | | $ | 956.60 | | $ | 4.85 | | 1.00 | % |
Institutional Class-hypothetical 5% return | | | 1,000.00 | | | 1,019.84 | | | 5.01 | | 1.00 | |
Institutional International Equity Fund | | | | | | | | | | | | |
Class I-actual return | | | 1,000.00 | | | 907.50 | | | 5.06 | | 1.07 | |
Institutional Class-hypothetical 5% return | | | 1,000.00 | | | 1,019.49 | | | 5.36 | | 1.07 | |
International Small Cap Growth Fund | | | | | | | | | | | | |
Institutional Class-actual return | | | 1,000.00 | | | 979.10 | | | 5.35 | | 1.09 | |
Institutional Class-hypothetical 5% return | | | 1,000.00 | | | 1,019.39 | | | 5.46 | | 1.09 | |
Emerging Markets Growth Fund | | | | | | | | | | | | |
Institutional Class-actual return | | | 1,000.00 | | | 959.30 | | | 5.73 | | 1.18 | |
Institutional Class-hypothetical 5% return | | | 1,000.00 | | | 1,018.94 | | | 5.91 | | 1.18 | |
Emerging Leaders Growth Fund | | | | | | | | | | | | |
Institutional Class-actual return | | | 1,000.00 | | | 957.10 | | | 6.07 | | 1.25 | |
Institutional Class-hypothetical 5% return | | | 1,000.00 | | | 1,018.60 | | | 6.26 | | 1.25 | |
Bond Fund | | | | | | | | | | | | |
Institutional Class-actual return | | | 1,000.00 | | | 1,053.70 | | | 1.78 | | 0.35 | |
Institutional Class-hypothetical 5% return | | | 1,000.00 | | | 1,023.06 | | | 1.76 | | 0.35 | |
Low Duration Fund | | | | | | | | | | | | |
Institutional Class-actual return | | | 1,000.00 | | | 1,016.60 | | | 2.00 | | 0.40 | |
Institutional Class-hypothetical 5% return | | | 1,000.00 | | | 1,022.81 | | | 2.01 | | 0.40 | |
| (a) | | Expenses are equal to the annualized expense ratio, multiplied by the average account value over the period, multiplied by the number of days in the period 181, and divided by 365 (to reflect the one-half year period). |
74 Semi-Annual Report | June 30, 2010 |
BOARD OF TRUSTEES
Ann P. McDermott
Director and Trustee
Profit and not-for-profit organizations
Phillip O. Peterson
Retired Partner, KPMG LLP
Donald J. Reaves
Chancellor, Winston-Salem State University
Donald L. Seeley
Retired Adjunct Lecturer and Director, University of Arizona Department of Finance
Michelle R. Seitz, Chairperson and President
Principal, William Blair & Company, L.L.C.,
Thomas J. Skelly
Retired Managing Partner, Accenture U.S.
Richard W. Smirl
Senior Vice President, William Blair & Company, L.L.C.,
Robert E. Wood II
Retired Executive Vice President, Morgan Stanley Dean Witter
Officers
Michael P. Balkin, Senior Vice President
Karl W. Brewer, Senior Vice President
David C. Fording, Senior Vice President
James S. Golan, Senior Vice President
W. George Greig, Senior Vice President
Michael A. Jancosek, Senior Vice President
John F. Jostrand, Senior Vice President
Robert C. Lanphier, IV, Senior Vice President
Mark T. Leslie, Senior Vice President
Matthew A. Litfin, Senior Vice President
Kenneth J. McAtamney, Senior Vice President
Todd M. McClone, Senior Vice President
Tracy McCormick, Senior Vice President
David Merjan, Senior Vice President
David S. Mitchell, Senior Vice President
David P. Ricci, Senior Vice President
Jeffrey A. Urbina, Senior Vice President
Christopher T. Vincent, Senior Vice President
Chad M. Kilmer, Vice President
Kathleen M. Lynch, Vice President
Paul J. Sularz, Vice President
Walter R. Randall, Jr., Chief Compliance Officer
Colette M. Garavalia, Treasurer
Andrew T. Pfau, Secretary
Investment Advisor
William Blair & Company, L.L.C.
Legal Counsel
Vedder Price P.C.
Transfer Agent
Boston Financial Data Services, Inc.
P.O. Box 8506
Boston, MA 02266-8506
For customer assistance, call 1-800-635-2886
(Massachusetts 1-800-635-2840)
June 30, 2010 | William Blair Funds 75 |
INSTITUTIONALFUNDS
Institutional International Growth Fund
Institutional International Equity Fund
International Small Cap Growth Fund - Institutional Class Shares
Emerging Markets Growth Fund - Institutional Class Shares
Emerging Leaders Growth Fund - Institutional Class Shares
Bond Fund - Institutional Class Shares
Low Duration - Institutional Class Shares

222 West Adams Street
Chicago, IL 60606
800.742.7272 Ÿ www.williamblairfunds.com
© William Blair & Company, L.L.C., distributor
Not applicable to this filing.
| Item 3. | Audit Committee Financial Expert |
Not applicable to this filing.
| Item 4. | Principal Accountant Fees and Services |
Not applicable to this filing.
| Item 5. | Audit Committee of Listed Registrants |
Not Applicable to this Registrant, insofar as the Registrant is not a listed company.
| Item 6. | Schedule of Investments |
See Schedule of Investments in Item 1
| Item 7. | Disclosure of Proxy Voting Policies and Procedures for Closed-End Management Investment Companies |
Not applicable to this Registrant, insofar as the Registrant is not a closed-end management investment company.
| Item 8. | Portfolio Managers of Closed Investment Companies |
Not applicable to this Registrant, insofar as the Registrant is not a closed-end management investment company.
| Item 9. | Purchase of Equity Securities by Closed-End Management Investment Companies and Affiliated Purchasers |
Not applicable to this Registrant, insofar as the Registrant is not a closed-end management investment company.
| Item 10. | Submission of Matters to a Vote of Security Holders |
There have been no material changes to the procedures by which shareholders may recommend nominees to the Registrant’s Board of Trustees since the Registrant last provided disclosure in response to this item.
Controls and Procedures
(a) The Registrant’s principal executive and principal financial officer, or persons performing similar functions, have concluded that the Registrant’s Disclosure Controls and Procedures (as defined in Rule 30a-3(c) under the Investment Company Act of 1940, as amended (the “1940 Act”) (17 CFR 270.30a-3(c)) are effective, as of a date within 90 days of the filing date of this report that includes the disclosure required by this paragraph, based on their evaluation of these controls and procedures required by Rule 30a-3 (b) under the 1940 Act (17 CFR 270.30a-3(b) and Rules 13a-15(b) or 15d-15(b) under the Exchange Act (17 CFR 240.13a-15(b) or 240.15d-15(b)).
(b) There were no changes in the Registrant’s internal control over financial reporting (as defined in Rule 30a-3(d) under the 1940 Act (17 CFR 270.30a-3(d)) that occurred during the final quarter of the period covered by this report that has materially affected, or is reasonably likely to materially affect, the Registrant’s internal control over financial reporting.
12. (a) (1) Code of Ethics
Not applicable because it is posted on Registrant’s website.
12. (a) (2) (1)
Certification of Principal Executive Officer Required by Rule 30a-2(a) of the Investment Company Act
12. (a) (2) (2)
Certification of Principal Financial Officer Required by Rule 30a-2(a) of the Investment Company Act.
12. (a) (3)
Not applicable to this Registrant.
12. (b)
Certification of Chief Executive Officer and Certification of Chief Financial Officer Required by Rule 30a-2(b) of the Investment Company Act
Signatures
Pursuant to the requirements of the Securities Exchange Act of 1934 and the Investment Company Act of 1940, the Registrant has duly caused this report to be signed on its behalf by the undersigned, thereunto duly authorized.
| | |
| | | William Blair Funds |
| |
| | | /s/ Michelle R. Seitz |
| By: | | Michelle R. Seitz |
| | | President (Chief Executive Officer) |
Date: August 24, 2010
Pursuant to the requirements of the Securities Exchange Act of 1934 and the Investment Company Act of 1940, this report has been signed below by the following persons on behalf of the Registrant and in the capacities and on the dates indicated
| | |
| By: | | Michelle R. Seitz |
| | | President (Chief Executive Officer) |
Date: August 24, 2010
| | |
| By: | | Colette M. Garavalia |
| | | Treasurer (Chief Financial Officer) |
Date: August 24, 2010