UNITED STATES
SECURITIES AND EXCHANGE COMMISSION
Washington, D.C. 20549
Form N-CSR
CERTIFIED SHAREHOLDER REPORT OF REGISTERED
MANAGEMENT INVESTMENT COMPANIES
Investment Company Act File Number 811-5344
William Blair Funds
(Exact name of registrant as specified in charter)
| | |
| 222 West Adams Street, Chicago, IL | | 60606 |
| (Address of principal executive offices) | | (Zip Code) |
Michelle R. Seitz
William Blair Funds
222 West Adams Street, Chicago, IL 60606
(Name and address of agent for service)
Registrant’s telephone number, including area code: 312-236-1600
Date of fiscal year end: December 31
Date of reporting period: June 30, 2007
Form N-CSR is to be used by management investment companies to file reports with the Commission not later than 10 days after the transmission to stockholders of any report that is required to be transmitted to stockholders under Rule 30e-1 under the Investment Company Act of 1940 (17 CFR 270.30e-1). The Commission may use the information provided on Form N-CSR in its regulatory, disclosure review, inspection, and policymaking roles.
A registrant is required to disclose the information specified by Form N-CSR, and the Commission will make this information public. A Registrant is not required to respond to the collection of information contained in Form N-CSR unless the form displays a currently valid Office of Management and Budget (“OMB”) control number. Please direct comments concerning the accuracy of the information collection burden estimates and any suggestions for reducing the burden to Secretary, Securities and Exchange Commission, 450 Fifth Street, NW, Washington, DC 20549-0609. The OMB has reviewed this collection of information under the clearance requirements of 44 U.S.C. (ss) 3507.
June 30, 2007 Semi-Annual Reports transmitted to shareholders.

Table of Contents
This report is submitted for the general information of the shareholders of the William Blair Funds. It is not authorized for distribution to prospective investors unless accompanied or preceded by a prospectus of the William Blair Funds. Please carefully consider the Funds’ investment objectives, risks, charges, and expenses before investing. This and other information is contained in the Funds’ prospectus, which you may obtain by calling 1-800-742-7272. Read it carefully before you invest or send money.
June 30, 2007 | William Blair Funds 1 |
PERFORMANCE AS OF JUNE 30, 2007—CLASS N SHARES (unaudited)
| | | | | | | | | | | | | | |
| | | Year to
Date | | 1 Yr. | | 3 Yr. | | 5 Yr. | | 10 Yr.
(or since
inception) | | Inception
Date | | Overall Morningstar Rating |
| | | | | | | | | | | | | | | |
Growth Fund | | 7.88 | | 18.45 | | 12.66 | | 9.06 | | 5.71 | | 3/20/1946 | | ««« |
Morningstar Large Growth | | 8.13 | | 17.17 | | 9.27 | | 8.96 | | 5.47 | | | | Among 1,426 |
Russell 3000® Growth | | 8.22 | | 18.84 | | 8.97 | | 9.58 | | 4.42 | | | | large growth funds |
Standard & Poor’s 500 | | 6.96 | | 20.59 | | 11.68 | | 10.71 | | 7.13 | | | | |
| | | | | | | |
Tax-Managed Growth Fund | | | | | | | | | | | | | | ««« |
Return before Taxes | | 7.40 | | 14.52 | | 11.40 | | 9.02 | | 2.16 | | 12/27/1999 | | Among 1,426 |
After Taxes on Distributions | | 7.40 | | 14.52 | | 11.40 | | 9.02 | | 2.16 | | | | large growth funds |
After Taxes on distributions and Sale of | | | | | | | | | | | | | | |
Fund Shares | | 4.81 | | 9.44 | | 9.83 | | 7.85 | | 1.86 | | | | |
Morningstar Large Growth | | 8.13 | | 17.17 | | 9.27 | | 8.96 | | — | | | | |
Russell 3000® Growth | | 8.22 | | 18.84 | | 8.97 | | 9.58 | | -3.09 | | | | |
| | | | | | | |
Large Cap Growth Fund | | 5.81 | | 13.57 | | 7.38 | | 6.08 | | -4.13 | | 12/27/1999 | | «« |
Morningstar Large Growth | | 8.13 | | 17.17 | | 9.27 | | 8.96 | | — | | | | Among 1,426 |
Russell 1000® Growth | | 8.13 | | 19.04 | | 8.70 | | 9.28 | | -3.48 | | | | large growth funds |
| | | | | | | |
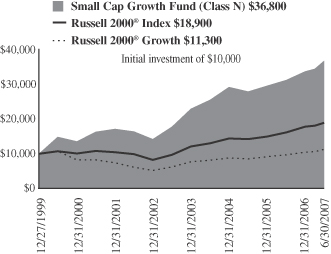
Small Cap Growth Fund | | 8.97 | | 17.49 | | 12.80 | | 17.52 | | 18.88 | | 12/27/1999 | | ««« « |
Morningstar Small Growth | | 10.49 | | 16.28 | | 11.54 | | 12.08 | | — | | | | Among 645 |
Russell 2000® Growth | | 9.33 | | 16.83 | | 11.76 | | 13.08 | | 1.66 | | | | small growth funds |
Russell 2000® | | 6.45 | | 16.43 | | 13.45 | | 13.88 | | 8.83 | | | | |
| The Small Cap Growth Fund’s Performance during 2000 was primarily attributable to investments in initial public offerings (IPOs) during a rising market. Since then, IPOs have had an insignificant effect on the Fund’s performance. | | | | | | |
| | | | | | | |
Mid Cap Growth Fund | | 12.91 | | 18.46 | | — | | — | | 12.51 | | 2/1/2006 | | Not rated. |
Russell Mid Cap Growth® | | 10.97 | | 19.73 | | — | | — | | 10.89 | | | | |
| | | | | | | |
Small-Mid Cap Growth Fund | | 13.27 | | 18.23 | | 13.40 | | — | | 13.31 | | 12/29/2003 | | ««« |
Morningstar Mid-Cap Growth | | 12.33 | | 19.00 | | 13.26 | | — | | — | | | | Among 814 |
Russell 2500™ Growth | | 11.30 | | 19.03 | | 13.60 | | — | | 13.06 | | | | mid cap growth funds |
| | | | | | | |
International Growth Fund | | 11.66 | | 29.69 | | 24.37 | | 18.80 | | 14.55 | | 10/1/1992 | | ««««« |
Morningstar Foreign Large Growth | | 10.65 | | 27.19 | | 21.09 | | 15.80 | | 7.02 | | | | Among 183 |
MSCI All Country World Ex-US | | 12.58 | | 30.15 | | 25.03 | | 19.93 | | 8.58 | | | | foreign large growth funds |
| | | | | | | |
International Equity Fund | | 9.47 | | 25.47 | | 16.94 | | — | | 18.34 | | 5/24/2004 | | « |
Morningstar Foreign Large Growth | | 10.65 | | 27.19 | | 21.09 | | — | | — | | | | Among 183 |
MSCI All Country World Ex-US | | 12.58 | | 30.15 | | 25.03 | | — | | 25.95 | | | | foreign large growth funds |
| | | | | | | |
International Small Cap Growth Fund | | 14.36 | | 26.81 | | — | | — | | 29.38 | | 11/1/2005 | | Not rated. |
Morningstar Foreign Small/Mid Growth | | 14.91 | | 32.70 | | — | | — | | — | | | | |
MSCI World Small Cap ex-US | | 13.06 | | 26.54 | | — | | — | | 27.54 | | | | |
Please see the next page for important disclosure information.
See accompanying Notes to Financial Statements.
2 Semi-Annual Report | June 30, 2007 |
PERFORMANCE AS OF JUNE 30, 2007—CLASS N SHARES—CONTINUED (unaudited)
| | | | | | | | | | | | | | |
| | | Year to
Date | | 1 Yr. | | 3 Yr. | | 5 Yr. | | 10 Yr.
(or since
inception) | | Inception
Date | | Overall Morningstar Rating |
| | | | | | | | | | | | | | | |
| | | | | | | |
Emerging Markets Growth Fund | | 16.53 | | 51.80 | | — | | — | | 49.14 | | 6/6/2005 | | Not rated. |
Morningstar Diversified Emerging Markets | | 17.73 | | 45.91 | | — | | — | | — | | | | |
MSCI Emerging Markets | | 17.75 | | 45.45 | | — | | — | | 40.31 | | | | |
| | | | | | | |
| A portion of the Emerging Markets Growth Fund’s performance since inception is attributable to an investment in an initial public offering. (IPO) | | | | | | | | | | | | | | |
| | | | | | | |
Value Discovery Fund | | 6.45 | | 19.41 | | 11.52 | | 10.11 | | 12.52 | | 12/23/1996 | | «« |
Morningstar Small Value | | 7.07 | | 16.39 | | 13.83 | | 14.11 | | 11.46 | | | | Among 305 small value funds |
Russell 2000® | | 6.45 | | 16.43 | | 13.45 | | 13.88 | | 9.06 | | | |
Russell 2000® Value | | 3.80 | | 16.05 | | 15.02 | | 14.62 | | 12.14 | | | | |
| | | | | | | |
Bond Fund | | — | | — | | — | | — | | -1.15 | | 5/1/2007 | | Not rated. |
Morningstar Short-term Bond | | — | | — | | — | | — | | — | | | | |
Lehman Aggregate Bond Index | | — | | — | | — | | — | | -1.00 | | | | |
| | | | | | | |
Income Fund | | 0.45 | | 4.48 | | 3.16 | | 3.46 | | 4.96 | | 10/1/1990 | | «««« |
Morningstar Short-term Bond | | 1.72 | | 4.96 | | 2.90 | | 3.05 | | 4.47 | | | | Among 364 short-term bond funds |
Lehman Intermediate Govt./Credit Bond Index | | 1.45 | | 5.76 | | 3.41 | | 4.14 | | 5.66 | | | |
Performance cited represents past performance. Past performance does not guarantee future results and current performance may be lower or higher than the data quoted. Returns shown are average annual total returns, which assume reinvestment of dividends and capital gains. Investment returns and principal will fluctuate and you may have a gain or a loss when you sell shares. For the most current month-end performance information, please call 1-800-742-7272, or visit our Web site at www.williamblairfunds.com. From time to time, the investment advisor may waive fees or reimburse expenses for the Fund. Without these waivers, performance would be lower. Investing in smaller companies involves special risks, including higher volatility and lower liquidity. International and emerging markets investing involves special risk considerations, including currency fluctuations, lower liquidity, economic and political risk. As interest rates rise, bond prices will fall and bond funds become more volatile. From time to time, the investment advisor may waive fees or reimburse expenses for certain Funds. Without these waivers, performance would be lower. Class N shares are available to the general public without a sales load.
Tax-Managed Growth Fund’s after-tax returns are calculated using the highest historical individual federal marginal income tax rates, and do not reflect the impact of state and local taxes. Actual after-tax returns depend on the investor’s tax situation and may differ from those shown. After-tax returns shown are not relevant to investors who hold their fund shares through tax-deferred arrangements such as 401(k) plans or individual retirement accounts. After-tax returns are shown only for Class N and the after-tax returns for Class N shares will vary.
Morningstar RatingsTM are as of 6/30/07 and are subject to change every month. The ratings are based on a risk-adjusted return measure that accounts for variation in a fund’s monthly performance, placing more emphasis on downward variations and rewarding consistent performance. The top 10% of funds in each Category receive 5 stars, the next 22.5% receive 4 stars, the middle 35% receive 3 stars, the next 22.5% receive 2 stars, and the bottom 10% receive 1 star. The Overall Morningstar Rating for a fund is derived from a weighted-average of the performance figures associated with its three-, five- and ten-year (if applicable) Morningstar Rating metrics. The 3/5/10 year Morningstar ratings were as follows: Growth Fund ««««/«««/« ««, Tax-Managed Growth Fund ««««/«««/NA, and Large Cap Growth Fund «««/« «/NA, out of 1,426/1,151/471 large growth funds; Small Cap Growth Fund «««/ «««««/NA out of 645/533/NA small growth funds; Small-Mid Cap Growth Fund «««/NA/NA out of 814/NA/NA mid cap growth funds; Value Discovery Fund ««/«/««« out of 305/239/76 small value funds; International Growth Fund ««««/««««/««««« and International Equity Fund «/NA/NA out of 183/155/60 foreign large growth funds; Income Fund «««/ ««««/«««« out of 304/261/158 short-term bond funds.
Please carefully consider the Funds’ investment objectives, risks, charges, and expenses before investing. This and other information is contained in the Funds’ prospectus, which you may obtain by calling 1-800-742-7272. Read it carefully before you invest or send money.
See accompanying Notes to Financial Statements.
June 30, 2007 | William Blair Funds 3 |

David C. Fording

John F. Jostrand
GROWTH FUND
The Growth Fund invests primarily in common stocks of domestic growth companies that the Advisor expects to have sustainable, above-average growth from one business cycle to the next.
AN OVERVIEW FROM THE PORTFOLIO MANAGERS
How did the Fund perform over the first half of the year? How did the Fund’s performance compare to its benchmark?
The Growth Fund posted a 7.88% increase on a total return basis (Class N Shares) for the six month period ended June 30, 2007. By comparison, the Fund’s benchmark, the Russell 3000® Growth Index, posted a gain of 8.22% during the same period.
What were the most significant factors impacting Fund performance?
For the first six months of 2007, domestic equity markets experienced strong gains across the board. As measured by the Russell indices, Midcap growth stocks led the charge, appreciating over 10% during the period. Small Caps and Large Caps trailed behind, respectively, but still posted strong results during the period. Growth overtook value as style leader when the Federal Reserve paused with its interest rate hikes in August of 2006, and the lead was extended in the latter half of the year-to-date period.
There were several noteworthy trends that affected performance, many of which were more prevalent during the last months of the second quarter, which drove most of the performance of the entire period. The credit concerns that arose with respect to subprime lending in February re-emerged later in the period, putting significant pressure on financial stocks, particularly REITs and smaller capitalization banks. Second, although U.S. earnings growth is moderating, growth rates for international companies remains strong. In the first quarter of 2007, stocks with larger non-US exposure experienced twice as much year-over-year earnings growth relative to companies with less significant portions of non-US revenues. Generally speaking, most of these companies, with larger non-U.S. exposure, are ones with larger market capitalizations. Third, liquidity in the market continues to be significant, fueling continued merger and acquisition activity as well as sizeable share-buy backs. The impact of these “liquidity events” is causing price appreciation among primary and ancillary stocks that are moving on speculation that they may be a next candidate. Lastly, higher quality stocks (as measured by S&P quality ratings) continue to under-perform. Typically, higher quality stocks begin to out-perform in periods when earnings growth slows. Although earnings growth has slowed significantly over the last several quarters, overall growth is still at elevated levels compared to historical trends. Investors may not pursue higher quality stocks until earnings growth slows significantly below double-digit levels.
On the positive side, our portfolio does not have any exposure to REITs or banks, and our financial stocks performed well during the period. Conversely, due to our high quality philosophy, our stocks did not benefit significantly from some of these trends. Although larger capitalization stocks generally fared well during the period, ours were not quite as strong. But our stock selection among the smallest cap stocks overcame slight weakness in the other capitalization buckets.
Which sectors enhanced the Fund’s return? What were among the best performing investments for the Fund?
In the first half of 2007, the portfolio benefited the most from stock selection in Information Technology. WebEx Communications Inc. experienced strong price appreciation early in the quarter when the company reported continued robust growth in sales as well as improving margins for its on-line collaboration tools. Toward the end of the period, the company reached an agreement to be acquired by Cisco Systems, causing the stock price to climb
4 Semi-Annual Report | June 30, 2007 |
further. The performance of this stock in particular caused our smallest capitalization sector to have the greatest impact on relative returns. Similarly, j2 Global Communications, Inc., appreciated significantly during the period. The company provides outsourced, value-added messaging and communications services to individuals and businesses. During the last quarter, j2 Global Communications implemented a significant price increase to eFax customers, which is progressing on schedule. In addition, the company has multiple growth initiatives: international growth, expansion of voice services and faster adoption of digital fax services by large enterprises.
Stocks in the Energy sector were also strong contributors during the period, with Smith International Inc. being one of the top performers in the broad portfolio. During May, the company reported an excellent quarter and announced upbeat guidance. Consumer Discretionary placed third in terms of relative contribution for the six months. In January, Laureate Education announced a management-led buyout at a premium to the level at which the stock was trading, which was the basis for significant stock appreciation. Auto components and HVAC systems producer Johnson Controls experienced strong price appreciation as investors began to revalue the underlying earnings power of the company.
Were there any investment strategies or themes that did not measure up to your expectations?
Industrials were the largest detractor from relative performance, due in part to extremely strong performance by Russell 3000® Growth stocks in this sector. Corporate Executive Board stock fell during the period, mainly due to disappointing guidance for 2007 results and concerns about current and future subscriber rates. During February, Danaher Corp. reported an in-line quarter which disappointed overly enthusiastic investors. Following strong price appreciation in 2006, the stock was likely due for a pause to consolidate its recent gains.
Health Care stocks in the portfolio were also relatively weak during the period. Both Amgen Inc. and Genentech Inc. in the biotechnology area suffered, although for different reasons. Amgen has had a significant overhang around its Aranesp franchise, and recent studies show that prospects for its pipeline products are likely less robust than originally thought. As a result the Fund liquidated its position in this holding. For Genentech, although there are some concerns about the growth rate of its core Avastin product, the pipeline is promising and the market, in our view, has overly discounted growth prospects for the company. ResMed, Inc., which manufactures and distributes medical equipment, primarily for treating, diagnosing and managing sleep-disordered breathing, had a significant setback in April as the company initiated a recall of its S8 flow generator product. Although a third party was hired to handle the bulk of this job, we believe that the company’s sales representatives spent more time than expected handling customer issues related to the recall, which led to lost selling time. As a result, investors have lowered revenue and earnings projections for the current quarter, which has negatively affected the stock price.
Although Technology stocks overall contributed to performance, it was in fact a tale of two sides; there were several stocks in this sector that offered disappointing results. Network Appliance Inc. announced weak guidance for the coming quarter as a result of a bookings slowdown. Investors have placed premium valuation on the growth of this company, and the stock has recently struggled to meet expectations. Cognizant Technology Solutions Corp., an offshore provider of application development and management services, modestly raised its utilization rates which in turned reduced its year-end hiring goal. Investors interpreted this lower hiring goal as a sign of decreased demand, although we believe that demand remains solid and that there were other, less concerning factors at play.
What is your current strategy? How is the Fund Positioned?
Impact of credit quality on the broader market, and concerns about the health of the consumer given flat to eroding housing prices and rising fuel costs are looming over the market. Despite these overhangs, significant amounts of global liquidity continue to bolster prices of financial instruments. Merger and acquisition activity is continuing at record levels, and numerous corporate share buybacks have had a sizeable impact on stocks. Additionally, stock valuations remain in a reasonable range, providing additional support for prices. Regardless of the macro issues on the market, we continue to find high quality stocks that offer growth opportunities.
June 30, 2007 | William Blair Funds 5 |
Growth Fund
Performance Highlights (unaudited)

Average Annual Total Return at 6/30/2007
| | | | | | | | | | | | | | | | | | | | |
| | | Year to
Date | | | 1 Year | | | 3 Year | | | 5 Year | | | 10 Year | | | Since Inception | | | |
Growth Fund Class N | | 7.88 | % | | 18.45 | % | | 12.66 | % | | 9.06 | % | | 5.71 | % | | — | % | | |
Growth Fund
Class I | | 8.15 | | | 18.83 | | | 12.98 | | | 9.34 | | | — | | | 3.18 | | | |
Russell 3000® Growth Index | | 8.22 | | | 18.84 | | | 8.97 | | | 9.58 | | | 4.42 | | | (.20 | )(a) | | |
S&P 500 Index | | 6.96 | | | 20.59 | | | 11.68 | | | 10.71 | | | 7.13 | | | 3.72 | (a) | | |
| | (a) | | For the period from October 1, 1999 to June 30, 2007. |
Performance cited represents past performance. Past performance does not guarantee future results and current performance may be lower or higher than the data quoted. Results shown are average annual returns, which assume reinvestment of dividends and capital gains. Investment returns and principal will fluctuate and you may have a gain or loss when you sell shares. For the most current month-end performance information, please call 1-800-742-7272, or visit our Web site at www.williamblairfunds.com. Class N shares are available to the general public without a sales load. Class I shares are available to certain institutional investors and advisory clients of William Blair & Company L.L.C. without a sales load or distribution (12b-1) or service fees.
The performance highlights and graph presented above do not reflect the deduction of taxes that a shareholder would pay on fund distributions or the redemption of fund shares.
The Russell 3000® Growth Index consists of large, medium, and small capitalization companies with above average price-to-book ratios and forecasted growth rates. The index is weighted by market capitalization and large/medium/small companies make up approximately 80%/15%/5% of the index.
The S&P 500 Index indicates broad larger capitalization equity market performance.
This report identifies the Fund’s investments on June 30, 2007. These holdings are subject to change. Not all stocks in the Fund performed the same, nor is there any guarantee that these stocks will perform as well in the future. Market forecasts provided in this report may not necessarily come to pass.
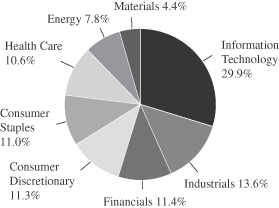
Sector Diversification (unaudited)
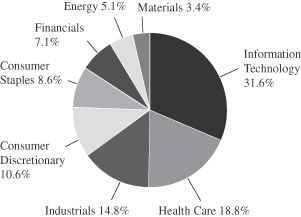
The sector diversification shown is based on the total investment portfolio.
6 Semi-Annual Report | June 30, 2007 |
Growth Fund
Portfolio of Investments, June 30, 2007 (all dollar amounts in thousands) (unaudited)
| | | | | |
Issuer | |
Shares | | Value |
| | |
Common Stocks | | | | | |
Information Technology—30.6% | | | | | |
*Activision, Inc. | | 297,365 | | $ | 5,552 |
*Adobe Systems Incorporated | | 164,385 | | | 6,600 |
Arm Holding plc—ADR | | 501,615 | | | 4,389 |
*Cognizant Technology Solutions Corporation | | 86,105 | | | 6,466 |
*EMC Corporation | | 346,385 | | | 6,270 |
*Euronet Worldwide, Inc. | | 141,655 | | | 4,131 |
*FLIR Systems, Inc. | | 105,205 | | | 4,866 |
*j2 Global Communications, Inc. | | 234,870 | | | 8,197 |
*Network Appliance, Inc. | | 205,250 | | | 5,993 |
*Nuance Communications, Inc. | | 233,900 | | | 3,913 |
Paychex, Inc. | | 218,050 | | | 8,530 |
Qualcomm Incorporated | | 155,695 | | | 6,756 |
*Silicon Laboratories Inc. | | 113,950 | | | 3,944 |
Taiwan Semiconductor Mfg. Co. Ltd.—ADR | | 678,751 | | | 7,555 |
*Verisign Inc. | | 111,450 | | | 3,536 |
*Vistaprint Limited | | 121,528 | | | 4,648 |
*Yahoo!, Inc. | | 242,235 | | | 6,572 |
| | | | | |
| | | | | 97,918 |
| | | | | |
Health Care—18.2% | | | | | |
C.R. Bard, Inc. | | 71,975 | | | 5,947 |
*Genentech, Inc. | | 102,740 | | | 7,773 |
*Gilead Sciences, Inc. | | 224,030 | | | 8,686 |
*Healthways, Inc. | | 136,595 | | | 6,470 |
*Integra Lifesciences Holding Corporation | | 100,745 | | | 4,979 |
*Kyphon, Inc. | | 132,760 | | | 6,392 |
Medtronic, Inc. | | 111,335 | | | 5,774 |
Pharmaceutical Product Development Inc. | | 203,955 | | | 7,805 |
ResMed, Inc. | | 104,740 | | | 4,322 |
| | | | | |
| | | | | 58,148 |
| | | | | |
Industrials & Services—14.3% | | | | | |
Danaher Corporation | | 171,546 | | | 12,952 |
Fastenal Company | | 185,525 | | | 7,766 |
Graco, Inc. | | 115,190 | | | 4,640 |
*InnerWorkings, Inc. | | 270,540 | | | 4,334 |
Knight Transportation, Inc. | | 183,530 | | | 3,557 |
Rockwell Automation, Inc. | | 67,285 | | | 4,672 |
Rockwell Collins, Inc. | | 109,785 | | | 7,755 |
| | | | | |
| | | | | 45,676 |
| | | | | |
Consumer Discretionary—10.2% | | | | | |
*Coinstar, Inc. | | 170,730 | | | 5,375 |
Johnson Controls, Inc. | | 72,917 | | | 8,442 |
*McCormick & Schmick’s Seafood Restaurants, Inc. | | 126,105 | | | 3,271 |
Staples, Inc. | | 293,315 | | | 6,960 |
*Starbucks Corporation | | 151,240 | | | 3,968 |
*Tractor Supply Company | | 89,235 | | | 4,645 |
| | | | | |
| | | | | 32,661 |
| | | | | |
*Non-income producing securities
ADR = American Depository Receipt
† = U.S. listed foreign security
VRN = Variable Rate Note
| | | | | | | |
Issuer | | Shares or
Principal
Amount | | Value | |
| | |
Common Stocks—(continued) | | | | | | | |
Consumer Staples—8.3% | | | | | | | |
PepsiCo, Inc. | | | 243,530 | | $ | 15,793 | |
Wal Mart De Mexico—ADR | | | 126,225 | | | 4,752 | |
Walgreen Co. | | | 139,960 | | | 6,094 | |
| | | | | | | |
| | | | | | 26,639 | |
| | | | | | | |
Financials—6.9% | | | | | | | |
Charles Schwab & Co., Inc. | | | 369,990 | | | 7,592 | |
Goldman Sachs Group, Inc. | | | 44,150 | | | 9,570 | |
*IntercontinentalExchange Inc. | | | 33,580 | | | 4,965 | |
| | | | | | | |
| | | | | | 22,127 | |
| | | | | | | |
Energy—5.0% | | | | | | | |
Smith International, Inc. | | | 157,695 | | | 9,247 | |
Suncor Energy, Inc.† | | | 73,035 | | | 6,567 | |
| | | | | | | |
| | | | | | 15,814 | |
| | | | | | | |
Materials—3.3% | | | | | | | |
Praxair, Inc. | | | 145,130 | | | 10,448 | |
| | | | | | | |
Total Common Stock—96.8%
(cost $240,951) | | | 309,431 | |
| | | | | | | |
| | |
Investment in Affiliate | | | | | | | |
William Blair Ready Reserves Fund | | | 2,634,785 | | | 2,635 | |
| | | | | | | |
Total Investment in Affiliate—0.8%
(cost $2,635) | | | 2,635 | |
| | | | | | | |
| | |
Short-Term Investment | | | | | | | |
Prudential Funding Demand Note,
VRN 5.305%, due 07/02/07 | | $ | 4,330,000 | | | 4,330 | |
| | | | | | | |
Total Short-Term Investment—1.4%
(cost $4,330) | | | 4,330 | |
| | | | | | | |
| | |
Repurchase Agreement | | | | | | | |
Investors Bank & Trust Company,
4.50% dated 6/29/2007, due 7/02/2007, repurchase price $4,204, collateralized by SBA Pool # 506131 | | $ | 4,202,129 | | | 4,202 | |
| | | | | | | |
Total Repurchase Agreement—1.3%
(cost $4,202) | | | 4,202 | |
| | | | | | | |
Total Investments—100.3%
(cost $252,118) | | | 320,598 | |
Liabilities, plus cash and other assets—(0.3)% | | | (1,051 | ) |
| | | | | | | |
Net assets—100.0% | | $ | 319,547 | |
| | | | | | | |
See accompanying Notes to Financial Statements.
June 30, 2007 | William Blair Funds 7 |

Mark A. Fuller III

Gregory J. Pusinelli
TAX-MANAGED GROWTH FUND
The Tax-Managed Growth Fund invests primarily in common stocks of large, medium and small domestic growth companies that the Advisor expects will have sustainable, above-average growth from one business cycle to the next.
AN OVERVIEW FROM THE PORTFOLIO MANAGERS
How did the Fund perform over the first half of the year? How did the Fund’s performance compare to its benchmark?
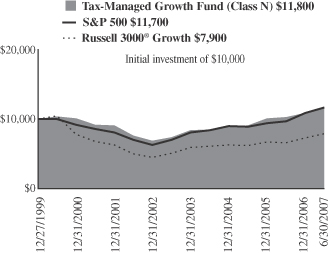
The Tax-Managed Growth Fund posted a 7.40% gain on a total return basis (Class N Shares) for the six-months ended June 30, 2007. By comparison, the Fund’s benchmark, the Russell 3000® Growth Index rose 8.22% while the Standard & Poor’s 500 Stock Index increased 6.96%.
What were the most significant market factors impacting Fund performance?
Although the year started off on a positive note, investors awakened the morning of February 27th to learn that many Asian markets had plummeted overnight, an amounts as great as 9%. This precipitated a decline in global stock markets as markets around the world opened, finally culminating in a sharp slide in U.S. equity prices. Weakness in the U.S. markets was exacerbated by concerns over a series of bankruptcies by issuers of sub-prime mortgage loans. Equity prices finally staged a rally in the final weeks of the first quarter to bring prices off their lows.
Following a relatively flat first quarter, and in spite of some setbacks along the way, the stock market forged ahead in the second quarter to a strong mid-year finish.
Facing strong headwinds from rising interest rates, a slump in housing prices and rising energy prices, the Standard & Poor’s 500-Stock Index set a record high in late May and gained 6.28% in the second quarter.
Boosting the market’s performance was a strong flow of private equity acquisitions, a pickup in manufacturing activity and signs that inflation has moderated.
Our stock selection in the Financials and Consumer Discretionary sectors contributed to the Fund’s strong performance in the first half of the year. On the other hand, the Information Technology (IT) and Health Care sectors were a drag on Fund performance.
What were among the best performing investments for the Fund?
All three of our top-performing investments were involved in acquisitions, which we believe lends credibility to our quality growth philosophy of investing in high quality companies with strong management and durable business franchises.
The best-performing investment, in terms of contribution to the Fund’s return, was Investors Financial Services Company. State Street Bank and Trust Company announced in February it had reached a definitive agreement to acquire Investors Financial Services Company. Investors Financial was up 46.9% for the Fund.
8 Semi-Annual Report | June 30, 2007 |
MedImmune was the second-best performing investment for the Fund, in terms of contribution, up 75.5%. In late April, European drug manufacturer AstraZeneca announced it had entered into a definitive agreement to acquire MedImmune.
The third best-performing investment in terms of contribution to the Fund’s return was WebEx Communications. Cisco Systems announced it would be acquiring WebEx Communications during the first quarter, and WebEx was up 63.1% for the Fund.
What were among the weakest performing investments for the Fund?
The three worst-performing investments, in terms of contribution to return were Network Appliance, Resmed and Santarus.
Network Appliance sells hardware, software, and services for customers to store and manage critical data across their networks. Although Network Appliance’s fourth quarter earnings figures were in line with expectations, the company lowered guidance on earnings for the first quarter. The company experienced weak sales in March and said that many of its customers had put off making capital expenditures until the second quarter. Although April sales rebounded, Network Appliance was down 25.7% for the Fund.
ResMed, Inc., whose major focus is solutions for sleep-disordered breathing, missed its earnings estimates during the first quarter. A rival competitor launched a new product during the period and flooded the market with free product offers. ResMed, which was down 16.2% was a fairly large holding for the Fund, at 2.59%, and was the second worst performer in terms of contribution to return.
Santarus, a pharmaceutical company that makes less expensive versions of drugs made by large cap drug companies to treat gastrointestinal diseases and disorders, was down 34.0% for the Fund. Santarus missed its quarterly earnings due to lower revenues during the March-April period.
What is your current strategy? How is the Fund positioned?
We believe that in the months ahead growth in overseas economies will outpace that of the U.S. One of our current investment themes is to search for companies with a global “footprint,” that do a considerable amount of business outside the U.S. In particular, we are looking at industrial-oriented companies that are well positioned to capitalize on growth in the global economy.
Johnson Controls is a company that epitomizes this investment theme. Johnson Controls operates three distinct business segments: automotive interiors, vehicle batteries, and building controls and services. We chose this well-managed company in part to increase our exposure to the Industrial sector. The company’s interiors segment has experienced strong demand for its products in emerging markets countries.
Starbucks, a recent addition to the Fund’s portfolio, meets the profile of a company with a strong global brand. The company shows potential for good profit growth with a significant “runway” for further growth internationally, in spite of a somewhat slower rate of expansion in the U.S.
Another new addition to the Fund���s portfolio of investments was Allergan, a company we have owned before, and were able to purchase at what we believe was an attractive share price point. Allergan is one of the largest specialty pharmaceutical firms in the world and the maker of Botox. Roughly half of the company’s sales come from its eye care pharmaceutical
June 30, 2007 | William Blair Funds 9 |
division, but last year the company acquired Inamed, and increased its exposure to the cosmetic surgical market, as it now sells breast implants, dermal fillers, and products to treat obesity.
Silicon Laboratories, a designer of integrated circuits and semiconductor chips used in various markets such as communications, industrial, consumer, medical, and power management, was also added to the Fund.
We continue to be selective investors in the Consumer Discretionary sector. The slump in the housing sector and recent problems in the sub-prime lending market are negative factors overhanging the market, and could eventually impact consumer spending.
We believe the environment remains favorable for corporate profit growth in 2007. And we are encouraged by the earnings growth potential of the companies in the Fund’s portfolio, despite what we expect to be a year of tempered economic growth. In such an environment, security selection becomes even more important. We think our high quality growth approach paid off during the first half of the year, and we believe our focus on quality franchise businesses and respect for downside risk is the appropriate time-tested approach as the year progresses.
10 Semi-Annual Report | June 30, 2007 |
Tax-Managed Growth Fund
Performance Highlights (unaudited)
Average Annual Total Return at 6/30/2007
| | | | | | | | | | | | | | | |
| | | Year to
Date | | | 1
Year | | | 3
Year | | | 5
Year | | | Since Inception(a) | |
Tax-Managed Growth Fund
Class N | | 7.40 | % | | 14.52 | % | | 11.40 | % | | 9.02 | % | | 2.16 | % |
Tax-Managed Growth Fund
Class I | | 7.53 | | | 14.85 | | | 11.67 | | | 9.32 | | | 2.44 | |
Russell 3000®
Growth Index | | 8.22 | | | 18.84 | | | 8.97 | | | 9.58 | | | (3.09 | ) |
S&P 500 Index | | 6.96 | | | 20.59 | | | 11.68 | | | 10.71 | | | 2.06 | |
| | (a) | | For the period from December 27, 1999 to June 30, 2007. |
Performance cited represents past performance. Past performance does not guarantee future results and current performance may be lower or higher than the data quoted. Results shown are average annual total returns, which assume reinvestment of dividends and capital gains. Investment returns and principal will fluctuate and you may have a gain or loss when you sell shares. For the most current month-end performance information, please call 1-800-742-7272, or visit our Web site at www.williamblairfunds.com. From time to time, the investment advisor may waive fees or reimburse expenses for the Fund. Without these waivers, performance would be lower. Class N shares are available to the general public without a sales load. Class I shares are available to certain institutional investors and advisory clients of William Blair & Company, L.L.C., without a sales load or distribution (12b-1) or service fees.
The performance highlights and graph presented above do not reflect the deduction of taxes that a shareholder would pay on fund distributions or the redemption of fund shares.
The Russell 3000® Growth Index consists of large, medium, and small-capitalization companies with above average price-to-book ratios and forecasted growth rates. The index is weighted by market capitalization and large/medium/small companies make up approximately 80%/15%/5% of the index.
The S&P 500 Index indicates broad larger capitalization equity market performance.
This report identifies the Fund’s investments on June 30, 2007. These holdings are subject to change. Not all stocks in the Fund performed the same, nor is there any guarantee that these stocks will perform as well in the future. Market forecasts provided in this report may not necessarily come to pass.
Sector Diversification (unaudited)
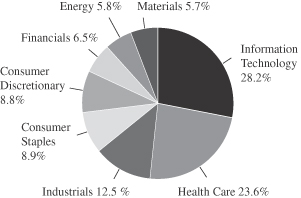
The sector diversification shown is based on the total investment portfolio.
June 30, 2007 | William Blair Funds 11 |
Tax-Managed Growth Fund
Portfolio of Investments, June 30, 2007 (all dollar amounts in thousands) (unaudited)
| | | | | |
Issuer | |
Shares | | Value |
| | |
Common Stocks | | | | | |
Information Technology—27.3% | | | | | |
*Activision, Inc. | | 8,453 | | $ | 158 |
*Adobe Systems Incorporated | | 6,160 | | | 247 |
*Alliance Data Systems Corporation | | 1,610 | | | 124 |
Arm Holdings plc—ADR | | 11,960 | | | 105 |
*Electronic Arts Inc. | | 2,950 | | | 140 |
*EMC Corporation | | 14,140 | | | 256 |
*Euronet Worldwide, Inc. | | 3,770 | | | 110 |
*F5 Networks, Inc. | | 2,580 | | | 208 |
Jabil Circuit Inc. | | 12,590 | | | 278 |
Microchip Technology Incorporated | | 5,250 | | | 194 |
*Network Appliance, Inc. | | 5,650 | | | 165 |
Paychex, Inc. | | 5,950 | | | 233 |
Qualcomm Incorporated | | 5,100 | | | 221 |
*Silicon Laboratories Inc. | | 3,300 | | | 114 |
Taiwan Semiconductor Mfg. Co. Ltd.—ADR | | 10,719 | | | 119 |
*Yahoo!, Inc. | | 6,450 | | | 175 |
| | | | | |
| | | | | 2,847 |
| | | | | |
Health Care—22.8% | | | | | |
Allergan Inc. | | 2,600 | | | 150 |
C.R.Bard, Inc. | | 1,710 | | | 141 |
*Genzyme Corporation | | 1,500 | | | 97 |
*Gilead Sciences, Inc. | | 3,080 | | | 119 |
*Healthways, Inc. | | 5,710 | | | 271 |
IMS Health, Inc. | | 8,820 | | | 283 |
*Kyphon, Inc. | | 2,740 | | | 132 |
Medtronic, Inc. | | 2,730 | | | 142 |
Pharmaceutical Product Development, Inc. | | 5,970 | | | 228 |
*Psychiatric Solutions, Inc. | | 4,820 | | | 175 |
*ResMed, Inc. | | 5,534 | | | 228 |
*Santarus, Inc. | | 36,800 | | | 190 |
Stryker Corporation | | 3,600 | | | 227 |
| | | | | |
| | | | | 2,383 |
| | | | | |
Industrials—12.1% | | | | | |
Danaher Corporation | | 3,810 | | | 288 |
Fastenal Company | | 6,350 | | | 266 |
General Electric Company | | 6,985 | | | 267 |
Knight Transportation, Inc. | | 7,832 | | | 152 |
Rockwell Collins, Inc. | | 4,110 | | | 290 |
| | | | | |
| | | | | 1,263 |
| | | | | |
Consumer Staples—8.6% | | | | | |
Colgate-Palmolive Company | | 3,020 | | | 196 |
CVS/Caremark Corporation | | 3,774 | | | 138 |
PepsiCo, Inc. | | 4,595 | | | 298 |
Wal Mart De Mexico—ADR | | 3,810 | | | 143 |
Walgreen Co. | | 2,975 | | | 130 |
| | | | | |
| | | | | 905 |
| | | | | |
*Non-income producing securities
ADR = American Depository Receipt
† = U.S. listed foreign security
VRN = Variable Rate Note
| | | | | | | |
Issuer | | Shares or
Principal
Amount | | Value | |
| | |
Common Stocks—(continued) | | | | | | | |
Consumer Discretionary—8.5% | | | | | | | |
*CarMax, Inc. | | | 6,840 | | $ | 174 | |
International Game Technology | | | 3,800 | | | 151 | |
Johnson Controls, Inc. | | | 1,890 | | | 219 | |
McGraw-Hill Companies, Inc. | | | 1,460 | | | 99 | |
*Starbucks Corporation | | | 5,190 | | | 136 | |
*Tractor Supply Company | | | 2,030 | | | 106 | |
| | | | | | | |
| | | | | | 885 | |
| | | | | | | |
Financials—6.3% | | | | | | | |
*Affiliated Managers Group, Inc. | | | 1,040 | | | 134 | |
American International Group | | | 2,780 | | | 195 | |
*IntercontinentalExchange, Inc. | | | 930 | | | 138 | |
Moody’s Corporation | | | 3,060 | | | 190 | |
| | | | | | | |
| | | | | | 657 | |
| | | | | | | |
Energy—5.6% | | | | | | | |
Smith International, Inc. | | | 4,360 | | | 256 | |
Suncor Energy, Inc.† | | | 3,630 | | | 326 | |
| | | | | | | |
| | | | | | 582 | |
| | | | | | | |
Materials—5.5% | | | | | | | |
Airgas, Inc. | | | 4,870 | | | 233 | |
Praxair, Inc. | | | 4,750 | | | 342 | |
| | | | | | | |
| | | | | | 575 | |
| | | | | | | |
Total Common Stock—96.7%
(cost $7,816) | | | 10,097 | |
| | | | | | | |
| | |
Investment in Affiliate | | | | | | | |
William Blair Ready Reserves Fund | | | 6,413 | | | 6 | |
| | | | | | | |
Total Investment in Affiliate—0.1%
(cost $6) | | | 6 | |
| | | | | | | |
| | |
Short-Term Investment | | | | | | | |
Prudential Funding Demand Note, VRN 5.305%, due 7/2/07 | | $ | 210,000 | | | 210 | |
| | | | | | | |
Total Short-Term Investment—2.0%
(cost $210) | | | 210 | |
| | | | | | | |
| | |
Repurchase Agreement | | | | | | | |
Investors Bank & Trust Company,
4.50% dated 6/29/2007, due 7/2/2007, repurchase price $141, collateralized by SBA Pool # 505283 | | $ | 140,850 | | | 141 | |
| | | | | | | |
Total Repurchase Agreement—1.3%
(cost $141) | | | 141 | |
| | | | | | | |
Total Investments—100.1%
(cost $8,173) | | | 10,454 | |
Liabilities, plus cash and other assets—( 0.1)% | | | (12 | ) |
| | | | | | | |
Net assets—100.0% | | $ | 10,442 | |
| | | | | | | |
See accompanying Notes to Financial Statements.
12 Semi-Annual Report | June 30, 2007 |

James S. Golan
John F. Jostrand
LARGE CAP GROWTH FUND
The Large Cap Growth Fund invests primarily in common stocks of large domestic growth companies of high quality that the Advisor believes have demonstrated sustained growth over a long period of time.
AN OVERVIEW FROM THE PORTFOLIO MANAGERS
How did the Fund perform over the first half of the year? How did the Fund’s performance compare to its benchmark?
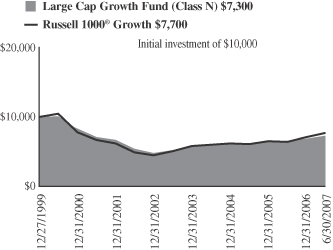
The Large Cap Growth Fund posted a 5.81% increase on a total return basis (Class N Shares) for the six-month period ended June 30, 2007. During the same period, the Fund’s benchmark, the Russell 1000 Growth® Index, gained 8.13%.
What were the most significant factors impacting Fund performance?
For the first six months of 2007, domestic equity markets experienced strong gains across the board. As measured by the Russell indices, Midcap growth stocks led the charge, appreciating over 10% during the period. Small Caps and Large Caps trailed behind, respectively, but still posted strong results during the period. Growth overtook value as style leader when the Federal Reserve paused its interest rate hikes in August of 2006, and the lead was extended in the latter half of the year-to-date period.
There were several noteworthy trends that affected performance, many of which were more prevalent during the last months of the second quarter, which drove most of the performance of the entire period. The credit concerns that arose with respect to sub-prime lending in February re-emerged later in the period, putting significant pressure on financial stocks, particularly REITs and smaller capitalization banks. Second, although U.S. earnings growth is moderating, growth rates for international companies remain strong. In the first quarter of 2007, stocks with larger non-US exposure experienced twice as much year-over-year earnings growth relative to companies with less significant portions of non-US revenues. Generally speaking, most of these companies, with larger non-US exposure, are ones with larger market capitalizations. Third, liquidity in the market continues to be significant, fueling continued merger and acquisition activity as well as sizeable share-buy backs. The impact of these “liquidity events” is causing price appreciation among primary and ancillary stocks that are moving on speculation that they may be a next candidate. Lastly, higher quality stocks (as measured by S&P quality ratings) continue to under-perform. Typically, higher quality stocks begin to out-perform in periods when earnings growth slows. Although earnings growth has slowed significantly over the last several quarters, overall growth is still at elevated levels compared to historical trends. Investors may not pursue higher quality stocks until earnings growth slows significantly below double-digit levels.
On the positive side, our portfolio does not have any exposure to REITs or banks, and our financial stocks performed well during the period. Conversely, due to our high quality philosophy, our stocks did not benefit significantly from these trends.
Which sectors enhanced the Fund’s return? What were among the best performing investments for the Fund?
Financials provided the strongest benefit to relative returns during the first half of the year. The portfolio did not have any direct exposure to the highly interest-rate sensitive companies such as smaller cap banks and REITs, which pulled back in relation to concerns about the subprime lending market and related defaults. Charles Schwab Inc. fared well during the
June 30, 2007 | William Blair Funds 13 |
period, as it continues to grow the asset-based part of its business. Additionally, the company announced a new initiative with respect to gaining additional assets. Similarly, Franklin Resources showed strong asset growth during the period, resulting in a stronger revenue outlook.
Energy stocks provided the second largest contribution to returns during the period. With rising oil prices, most stocks in this sector did well. Companies that produce oilfield services fared particularly well, as the oil companies are seeking to expand production. Schlumberger Ltd. provides project management and information solutions to the oil and gas industry. While the current global demand for oil has benefited Schlumberger tremendously, the company has also experienced strong earnings growth from Eastern Hemisphere markets as well as services from its seismic division. Similarly, Praxair Inc., a company that produces and delivers a variety of gasses for industrial uses, enjoyed strong price appreciation during the quarter. The company continues to exhibit strong earnings growth, not only from its excellence of product and services, but from the strength in the Energy and Industrials areas as well.
Were there any investment strategies or themes that did not measure up to your expectations?
Although Information Technology stocks were the greatest contributors in terms of contribution to portfolio return, this sector was the largest detractor from performance relative to the benchmark during the six months. In part, this was due to the strength in these companies in the Russell 1000® Growth Index, which in aggregate were up nearly 10%. A couple of stocks in the portfolio that had disappointing results during the period include Jabil Circuit Inc. and Network Appliance Inc. Jabil is one of the largest global suppliers of electronic manufacturing services (EMS) used in the communication products, computer peripherals, and automobile industries. Shares sold off after the company announced disappointing revenue guidance during the quarter. Additionally, Jabil lost a contract from one of its biggest customers due to aggressive pricing from an Asian competitor, further eroding growth prospects for the company. Network Appliance Inc. sells data management and storage solutions to corporate customers. Although Network Appliance, Inc. has continued to gain traction and market share in the storage space, the company announced weak guidance for the coming quarter as a result of a bookings slowdown. Investors have placed premium valuation on the growth of this company, and the stock has recently struggled to meet expectations.
Health Care stocks in the portfolio were also relatively weak during the period. Both Amgen Inc. and Genentech Inc. in the biotechnology area suffered, although for different reasons. Amgen has had a significant cloud regarding its Aranesp franchise, and recent studies show that prospects for its pipeline products are likely less robust than originally thought. For Genentech, although there are some concerns about the growth rate of its core Avastin product, the pipeline is promising and the market, in our view, has overly discounted growth prospects for the company.
What is your current strategy? How is the Fund Positioned?
Impact of credit quality on the broader market, and concerns about the health of the consumer given flat to eroding housing prices and rising fuel costs are looming over the market. Despite these overhangs, significant amounts of global liquidity continue to bolster prices of financial instruments. Merger and acquisition activity is continuing at record levels, and numerous corporate share buybacks have had a sizeable impact on stocks. Additionally, stock valuations remain in a reasonable range, providing additional support for prices. Regardless of the macro issues on the market, we continue to find high quality stocks that offer growth opportunities. Although it sounds paradoxical, growth stocks, particularly high quality growth stocks, tend to perform well in a slowing economy, as investors will commonly pay a premium for companies that can sustain earnings during this time. We believe that as overall earnings growth decelerates, investors will pay more attention to earnings multiples, and reward stocks with longer, more sustainable earnings trends.
14 Semi-Annual Report | June 30, 2007 |
Large Cap Growth Fund
Performance Highlights (unaudited)
Average Annual Total Return at 6/30/2007
| | | | | | | | | | | | | | | |
| | | Year to
Date | | | 1
Year | | | 3
Year | | | 5
Year | | | Since
Inception(a) | |
Large Cap Growth Fund Class N | | 5.81 | % | | 13.57 | % | | 7.38 | % | | 6.08 | % | | (4.13 | )% |
Large Cap Growth Fund Class I | | 5.72 | | | 13.69 | | | 7.55 | | | 6.28 | | | (3.93 | ) |
Russell 1000®
Growth Index | | 8.13 | | | 19.04 | | | 8.70 | | | 9.28 | | | -3.48 | |
| | (a) | | For the period from December 27, 1999 to June 30, 2007. |
Performance cited represents past performance. Past performance does not guarantee future results and current performance may be lower or higher than the data quoted. Results shown are average annual total returns, which assume reinvestment of dividends and capital gains. Investment returns and principal will fluctuate and you may have a gain or loss when you sell shares. For the most current month-end performance information, please call 1-800-742-7272, or visit our Web site at www.williamblairfunds.com. From time to time, the investment advisor may waive fees or reimburse expenses for the Fund. Without these waivers, performance would be lower. Class N shares are available to the general public without a sales load. Class I shares are available to certain institutional investors and advisory clients of William Blair & Company, L.L.C., without a sales load or distribution (12b-1) or service fees.
The performance highlights and graph presented above do not reflect the deduction of taxes that a shareholder would pay on fund distributions or the redemption of fund shares.
The Russell 1000® Growth Index consists of large capitalization companies with above average price-to-book ratios and forecasted growth rates.
This report identifies the Fund’s investments on June 30, 2007. These holdings are subject to change. Not all stocks in the Fund performed the same, nor is there any guarantee that these stocks will perform as well in the future. Market forecasts provided in this report may not necessarily come to pass.
Sector Diversification (unaudited)
The sector diversification shown is based on the total investment portfolio.
June 30, 2007 | William Blair Funds 15 |
Large Cap Growth Fund
Portfolio of Investments, June 30, 2007 (all dollar amounts in thousands) (unaudited)
| | | | | |
Issuer | | Shares | | Value |
| | |
Common Stocks | | | | | |
Information Technology—28.5% | | | | | |
*Adobe Systems Incorporated | | 21,115 | | $ | 848 |
*Cisco Systems Incorporated | | 47,729 | | | 1,329 |
*Corning Incorporated | | 22,170 | | | 566 |
*EMC Corporation | | 47,675 | | | 863 |
Infosys Technologies Ltd.—ADR | | 7,985 | | | 402 |
*Network Appliance, Inc. | | 14,380 | | | 420 |
Paychex, Inc. | | 27,325 | | | 1,069 |
Qualcomm Incorporated | | 18,735 | | | 813 |
Taiwan Semiconductor Mfg. Co. Ltd.—ADR | | 59,726 | | | 665 |
*Verisign, Inc. | | 9,700 | | | 308 |
*Yahoo!, Inc. | | 23,925 | | | 649 |
| | | | | |
| | | | | 7,932 |
| | | | | |
Industrials—13.0% | | | | | |
ABB LTD—ADR | | 27,640 | | | 625 |
Danaher Corporation | | 21,237 | | | 1,603 |
Rockwell Automation, Inc. | | 5,990 | | | 416 |
Rockwell Collins, Inc. | | 13,825 | | | 977 |
| | | | | |
| | | | | 3,621 |
| | | | | |
Financials—10.8% | | | | | |
Charles Schwab & Co, Inc. | | 38,205 | | | 784 |
Franklin Resources, Inc. | | 5,835 | | | 773 |
Goldman Sachs Group, Inc. | | 4,740 | | | 1,027 |
*IntercontinentalExchange, Inc. | | 2,920 | | | 432 |
| | | | | |
| | | | | 3,016 |
| | | | | |
Consumer Discretionary—10.7% | | | | | |
*Coach, Inc. | | 8,720 | | | 413 |
Johnson Controls, Inc. | | 8,545 | | | 989 |
Marriott International, Inc., Class “A” | | 11,469 | | | 496 |
Staples, Inc. | | 31,390 | | | 745 |
*Starbucks Corporation | | 13,230 | | | 347 |
| | | | | |
| | | | | 2,990 |
| | | | | |
Consumer Staples—10.5% | | | | | |
PepsiCo, Inc. | | 24,105 | | | 1,563 |
Wal Mart De Mexico—ADR | | 11,160 | | | 420 |
Walgreen Co. | | 21,575 | | | 939 |
| | | | | |
| | | | | 2,922 |
| | | | | |
*Non-income producing securities
ADR = American Depository Receipt
† = U.S. listed foreign security
VRN = Variable Rate Note
| | | | | | | |
Issuer | | Shares or
Principal
Amount | | Value | |
| | |
Common Stocks—(continued) | | | | | | | |
Health Care—10.2% | | | | | | | |
Allergan, Inc. | | | 9,700 | | $ | 559 | |
C. R. Bard, Inc. | | | 6,425 | | | 531 | |
*Genentech, Inc. | | | 12,570 | | | 951 | |
*Gilead Sciences, Inc. | | | 20,310 | | | 787 | |
| | | | | | | |
| | | | | | 2,828 | |
| | | | | | | |
Energy—7.4% | | | | | | | |
Apache Corporation | | | 5,050 | | | 412 | |
Schlumberger Limited† | | | 11,375 | | | 966 | |
Suncor Energy, Inc.† | | | 7,595 | | | 683 | |
| | | | | | | |
| | | | | | 2,061 | |
| | | | | | | |
Materials—4.2% | | | | | | | |
Praxair, Inc. | | | 16,150 | | | 1,163 | |
| | | | | | | |
Total Common Stock—95.3%
(cost $22,800) | | | 26,533 | |
| | | | | | | |
| | |
Investment in Affiliate | | | | | | | |
William Blair Ready Reserves Fund | | | 238,607 | | | 239 | |
| | | | | | | |
Total Investment in Affiliate—0.9%
(cost $239) | | | 239 | |
| | | | | | | |
| | |
Short-Term Investment | | | | | | | |
Prudential Funding Demand Note, VRN 5.305%, due 7/2/07 | | $ | 1,040,000 | | | 1,040 | |
| | | | | | | |
Total Short-Term Investment—3.7%
(cost $1,040) | | | 1,040 | |
| | | | | | | |
| | |
Repurchase Agreement | | | | | | | |
IBT Repurchase Agreement, 4.50% dated 6/29/2007, due 7/2/2007, repurchase price $557, collateralized
by SBA Pool # 503694 | | $ | 556,652 | | | 557 | |
| | | | | | | |
Total Repurchase Agreement—2.0%
(cost $557) | | | 557 | |
| | | | | | | |
Total Investments—101.9%
(cost $24,636) | | | 28,369 | |
Liabilities, plus cash and other assets—(1.9)% | | | (530 | ) |
| | | | | | | |
Net assets—100.0% | | $ | 27,839 | |
| | | | | | | |
See accompanying Notes to Financial Statements.
16 Semi-Annual Report | June 30, 2007 |

Karl W. Brewer

Colin J. Williams
SMALL CAP GROWTH FUND
The Small Cap Growth Fund invests primarily in common stocks of small domestic growth companies that the Advisor expects to have solid growth in earnings.
AN OVERVIEW FROM THE PORTFOLIO MANAGERS
How did the Fund perform in the first six months of 2007? How did the Fund’s performance compare to its benchmark?
The William Blair Small Cap Growth Fund gained 8.97% on a total return basis (Class N shares) during the first six months of 2007. By comparison the Fund’s benchmark, the Russell 2000® Growth Index, increased 9.33%.
What were the most significant factors impacting Fund performance? What factors were behind the Fund’s performance versus the benchmark?
The domestic equity market posted a sizeable return during the first half of 2007. Small caps finished just behind mid caps as the strongest group along the market cap spectrum. Within the small cap market spectrum, while the entire small cap growth universe performed well, the largest quintile of market cap companies performed significantly better than the rest of the space. From a style perspective within the small cap space, growth stocks have outperformed their value peers by over 5% thus far in 2007. This style dynamic has been maintained since the Federal Reserve stopped raising interest rates in August of 2006.
Although the market turned in positive results during the first quarter, the bulk of the year’s return came during the second quarter. The year began relatively slow during January and February as many companies guided Wall Street to lower earnings growth expectations for the coming year. This brief skittishness culminated in a short lived market sell-off prompted by rising sub-prime mortgage defaults, a fall off in housing starts and a correction in the Chinese stock market that made investors question the strength in the global economy and financial markets. However, the domestic market sell-off was relatively modest and short-lived as the market rebounded in March and maintained that momentum throughout the second quarter. This momentum was helped by increasingly encouraging data points about the global economy and the US industrial economy outside of residential real estate. The market strength was also aided by a continued robust environment for mergers and acquisitions and corporate stock repurchase programs.
The Small Cap Growth Fund narrowly underperformed the Russell 2000® Growth Index during the first half of 2007. One of the main reasons for the Fund’s benchmark-like performance was its smaller average market capitalization than the benchmark. We discussed earlier that larger was better within small capitalization stocks. As we have said in the past, we often like to find under-followed and misunderstood companies in our quality growth research process. This typically positions us overweight the smallest market cap quintile within the Russell 2000® Growth Index, and underweight the largest market cap quintile – both of which detracted from relative performance. From a sector perspective, negative stock selection in the Consumer Discretionary and Industrials sectors were the leading detractors. Strong stock selection in the Financials and Consumer Staples sectors was the largest positive contributor to relative performance.
What were among the best performing investments for the Fund?
Two of the best performing stocks during the period were Laureate Education and WebEx Communications.
June 30, 2007 | William Blair Funds 17 |
Laureate Education is a leader in the post secondary education market. The company operates online and campus-based institutions both in the US and abroad. During January, Laureate announced that it would be taken private at a premium to its then current stock price by a consortium of investors led by their CEO, Doug Becker, and several private equity firms.
WebEx is the leading web collaboration services company. The stock experienced two legs of appreciation during the early part of 2007. First, the company released an impressive earnings report in early February and, at the same time, increased forward revenue and earnings expectations. However, the main driver of the stock’s solid first quarter return was Cisco Systems’ announcement that they would be acquiring the company.
What were among the weakest performing investments for the Fund?
Two of the worst performing stocks during the period were Rackable Systems and Santarus.
Rackable Systems sells computer servers and data storage systems to corporate customers. During the quarter, the company pre-announced that revenues and earnings would come in below expectations. This was mainly due to a large competitor in the server market undercutting Rackable on price which caused the company to lose one of their largest customers. We sold the position due to the significant change in the company’s growth outlook.
Santarus is a specialty pharmaceutical company primarily focused on the treatment of acid reflux disease and the associated ailments. Although the number of prescriptions written for their main drug, Zegerid, was encouraging, pricing was worse than expected. Revenue was therefore lower than anticipated and the stock moved lower on the uncertainty of pricing going forward. We continue to own the stock and feel that management’s investment in their direct sales force should improve sales as we look forward a few quarters.
What is your current outlook?
In May as the economy seemed to be stronger than most expected, interest rates began to move higher on fears that the Federal Reserve may have to move interest rates higher to preempt any pick up in inflation. The relatively flat market returns experienced during June would suggest investors are still concerned about the potential inflationary effects of the current economic strength. However, core inflation remains at a reasonable level and we remain—as we have for the past few quarters—in a balance of healthy economic activity and moderate inflation. The consumer remains arguably the largest risk to the economy and equity markets. With higher energy prices, continued weakness in housing activity and rising defaults in the sub-prime mortgage market, pressure on consumer spending remains significant. Fortunately, employment trends remain solid and should help offset weakness related to housing for now. Regardless of the macro issues facing the market, we continue to find high quality stocks that offer attractive growth opportunities. We believe that as overall earnings growth becomes less broad-based, investors will rotate to stocks with more company specific and sustainable growth initiatives.
Is there any other news with respect to the Fund?
With respect to illiquid securities in the Fund, there are five companies for which we hold illiquid securities or warrants. These securities amounted to roughly 2.2% of the Fund as of June 30, 2007. The Fund holds common stock and warrants to buy common stock of Motorcar Parts of America, an auto parts company. The common shares and those shares underlying the warrants are expected to become freely tradable by the end of 2007. Likewise, the Fund’s shares of BancTec are expected to become freely tradable by the end of the year. BancTec provides automation solutions to the retail banking industry. Shares of Kona Grill, a restaurant company, were purchased in two private transactions during 2006 and remain illiquid. The Fund’s Pricing Committee and Valuation Committee are currently pricing these securities at fair value.
18 Semi-Annual Report | June 30, 2007 |
Small Cap Growth Fund
Performance Highlights (unaudited)
Average Annual Total Return at 6/30/2007
| | | | | | | | | | | | | | |
| | | Year
to Date | | | 1 Year | | | 3
Year | | | 5
Year | | | Since Inception(a) |
Small Cap Growth Fund Class N | | 8.97 | % | | 17.49 | % | | 12.80 | % | | 17.52 | % 18.88% | | |
Small Cap Growth Fund Class I | | 9.14 | | | 17.85 | | | 13.12 | | | 17.82 | | | 19.17 |
Russell 2000®
Growth Index | | 9.33 | | | 16.83 | | | 11.76 | | | 13.08 | | | 1.66 |
Russell 2000® Index | | 6.45 | | | 16.43 | | | 13.45 | | | 13.88 | | | 8.83 |
| | (a) | | For the period from December 27, 1999 to June 30, 2007. |
Performance cited represents past performance. Past performance does not guarantee future results and current performance may be lower or higher than the data quoted. Results shown are average annual total returns, which assume reinvestment of dividends and capital gains. Investment returns and principal will fluctuate and you may have a gain or loss when you sell shares. For the most current month-end performance information, please call 1-800-742-7272, or visit our Web site at www.williamblairfunds.com. Investing in smaller companies involves special risks, including higher volatility and lower liquidity. From time to time, the investment advisor may waive fees or reimburse expenses for the Fund. Without these waivers, performance would be lower. Class N shares are available to the general public without a sales load. Class I shares are available to certain institutional investors and advisory clients of William Blair & Company, L.L.C., without a sales load or distribution (12b-1) or service fees.
The performance highlights and graph presented above do not reflect the deduction of taxes that a shareholder would pay on fund distributions or the redemption of fund shares.
The Russell 2000® Growth Index consists of small-capitalization companies with above average price-to-book ratios and forecasted growth rates.
The Russell 2000® Index is an unmanaged composite of the smallest 2000 stocks of the Russell 3000® Index.
This report identifies the Fund’s investments on June 30, 2007. These holdings are subject to change. Not all stocks in the Fund performed the same, nor is there any guarantee that these stocks will perform as well in the future. Market forecasts provided in this report may not necessarily come to pass.
Sector Diversification (unaudited)
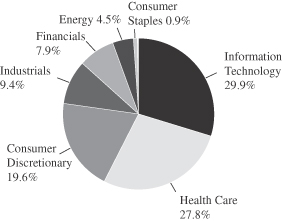
The sector diversification shown is based on the total investment portfolio.
June 30, 2007 | William Blair Funds 19 |
Small Cap Growth Fund
Portfolio of Investments, June 30, 2007 (all dollar amounts in thousands)
| | | | | |
Issuer | | Shares | | Value |
| | |
Common Stocks | | | | | |
Information Technology—29.4% | | | | | |
*Access Integrated Technologies, Inc. | | 2,213,981 | | $ | 17,911 |
*CyberSource Corporation | | 480,100 | | | 5,790 |
*DTS, Inc. | | 956,740 | | | 20,828 |
*EarthLink, Inc. | | 2,053,038 | | | 15,336 |
*Euronet Worldwide, Inc. | | 1,278,782 | | | 37,289 |
*GigaMedia Limited† | | 2,030,547 | | | 27,372 |
*j2 Global Communications, Inc. | | 952,847 | | | 33,254 |
*MathStar, Inc. | | 2,708,904 | | | 4,172 |
*Miva, Inc. | | 1,141,513 | | | 7,420 |
*Monolithic Power Systems | | 744,248 | | | 12,987 |
*Nuance Communications, Inc. | | 1,149,944 | | | 19,238 |
*Optimal Group, Inc.† | | 2,859,908 | | | 21,592 |
Patni Computer Systems Limited—ADR | | 151,453 | | | 3,818 |
*PDF Solutions, Inc. | | 1,283,793 | | | 15,187 |
*Silicon Laboratories, Inc. | | 604,091 | | | 20,908 |
*Skillsoft, plc—ADR | | 1,883,815 | | | 17,501 |
*Think Partnership, Inc. | | 4,626,270 | | | 13,833 |
*Transaction Systems Architect, Inc. | | 416,619 | | | 14,023 |
*Ultimate Software Group, Inc. | | 519,585 | | | 15,032 |
*VistaPrint Limited† | | 250,805 | | | 9,593 |
*Volterra Semiconductor Corporation | | 1,856,618 | | | 26,364 |
*Website Pros, Inc. | | 1,331,800 | | | 12,546 |
*WNS Holdings Limited—ADR | | 773,079 | | | 22,002 |
*Xyratex Ltd† | | 599,973 | | | 13,337 |
| | | | | |
| | | | | 407,333 |
| | | | | |
Health Care—27.3% | | | | | |
*Air Methods Corporation | | 983,803 | | | 36,076 |
*American Medical Systems Holdings, Inc. | | 1,166,917 | | | 21,051 |
*Axcan Pharma, Inc.† | | 1,587,690 | | | 30,690 |
*Capital Senior Living Corporation | | 1,247,946 | | | 11,756 |
*DJO, Inc. | | 360,358 | | | 14,872 |
*Healthways, Inc. | | 506,540 | | | 23,995 |
*Hythiam, Inc. | | 1,802,434 | | | 15,591 |
*Integra Lifesciences Holdings Corporation | | 563,254 | | | 27,836 |
*Iris International, Inc. | | 482,281 | | | 8,122 |
*Kensey Nash Corporation | | 305,400 | | | 8,188 |
*Kyphon, Inc. | | 378,536 | | | 18,226 |
*LifeCell Corporation | | 534,477 | | | 16,323 |
*Lifecore Biomedical, Inc. | | 1,095,112 | | | 17,379 |
*Providence Service Corporation | | 821,861 | | | 21,960 |
*PSS World Medical, Inc. | | 629,099 | | | 11,462 |
*Psychiatric Solutions, Inc. | | 430,078 | | | 15,595 |
*Sangamo Biosciences, Inc. | | 918,074 | | | 7,455 |
*Santarus, Inc. | | 3,631,472 | | | 18,775 |
*Surmodics, Inc. | | 601,437 | | | 30,072 |
*Trinity Biotech plc—ADR | | 1,142,849 | | | 13,268 |
*Zila, Inc. | | 7,237,388 | | | 10,060 |
| | | | | |
| | | | | 378,752 |
| | | | | |
Consumer Discretionary—19.2% | | | | | |
*4 Kids Entertainment, Inc. | | 702,478 | | | 10,537 |
*BUCA, Inc. | | 220,429 | | | 772 |
*Century Casinos, Inc. | | 1,566,233 | | | 14,080 |
*Coinstar, Inc. | | 722,124 | | | 22,732 |
*DG Fastchannel, Inc | | 1,126,830 | | | 22,965 |
*Duckwall-ALCO Stores, Inc. | | 405,838 | | | 15,138 |
*Granite City Food & Brewery Ltd. | | 1,372,423 | | | 7,480 |
*Jarden Corporation | | 568,715 | | | 24,460 |
| | | | | |
Issuer | | Shares | | Value |
| | |
Common Stocks—(continued) | | | | | |
Consumer Discretionary—(continued) | | | | | |
*Jos. A. Bank Clothiers, Inc. | | 304,412 | | $ | 12,624 |
*Kona Grill, Inc. | | 322,795 | | | 5,885 |
*Kona Grill, Inc.** (restricted) | | 435,134 | | | 6,417 |
*Laureate Education, Inc. | | 364,253 | | | 22,460 |
*Lions Gate Entertainment Corporation† | | 1,263,532 | | | 13,937 |
*Mertiage Homes Corporation | | 196,244 | | | 5,250 |
*Motorcar Parts of America,
Inc.** (restricted) | | 743,836 | | | 9,086 |
*Select Comfort Corporation | | 839,318 | | | 13,614 |
*Shuffle Master, Inc. | | 694,768 | | | 11,533 |
*Smith & Wesson Holdings | | 344,725 | | | 5,774 |
Standard Pacific Corporation | | 598,403 | | | 10,490 |
Strayer Education, Inc. | | 116,506 | | | 15,345 |
*ValueVision Media, Inc., Class “A” | | 1,444,377 | | | 16,350 |
| | | | | |
| | | | | 266,929 |
| | | | | |
Industrials—9.2% | | | | | |
*American Reprographics Company | | 433,384 | | | 13,344 |
Frozen Food Express Industries, Inc. | | 902,303 | | | 9,149 |
*GEO Group, Inc. | | 921,246 | | | 26,808 |
*Hudson Highland Group, Inc. | | 301,635 | | | 6,452 |
*InnerWorkings, Inc. | | 1,679,752 | | | 26,910 |
*Kforce, Inc. | | 1,219,650 | | | 19,490 |
*Mobile Mini, Inc. | | 450,564 | | | 13,156 |
*NCI Building Systems, Inc. | | 254,908 | | | 12,575 |
| | | | | |
| | | | | 127,884 |
| | | | | |
Financials—7.7% | | | | | |
*Banctec, Inc.** (restricted) | | 1,809,982 | | | 14,480 |
*First Cash Financial Services, Inc. | | 569,889 | | | 13,358 |
*FirstService Corporation† | | 545,721 | | | 19,657 |
*Marlin Business Services Corporation | | 832,213 | | | 17,734 |
National Financials Partners Corporation | | 468,450 | | | 21,694 |
*Signature Bank New York | | 601,373 | | | 20,507 |
| | | | | |
| | | | | 107,430 |
| | | | | |
Energy—4.4% | | | | | |
*Carrizo Oil & Gas, Inc. | | 86,397 | | | 3,583 |
*Edge Petroleum Corporation | | 699,054 | | | 9,794 |
*Oil States International, Inc. | | 422,192 | | | 17,453 |
*Petrohawk Energy Corporation | | 1,877,867 | | | 29,783 |
| | | | | |
| | | | | 60,613 |
| | | | | |
Consumer Staples—0.9% | | | | | |
*Overhill Farms, Inc. | | 1,903,720 | | | 10,699 |
*Physicians Formula Holdings, Inc. | | 132,220 | | | 2,079 |
| | | | | |
| | | | | 12,778 |
| | | | | |
Total Common Stock—98.1%
(Total Cost $1,169,503) | | | 1,361,719 |
| | | | | |
| | |
Investment in Warrants | | | | | |
*Motorcar Parts of America, Inc.** | | 111,575 | | | — |
*Think Partnership, Inc., 2011, $2.50** | | 1,424,000 | | | 698 |
*Think Partnership, Inc., 2011, $3.05** | | 448,409 | | | — |
*Think Partnership, Inc., 2011, $4.00** | | 224,205 | | | — |
*Zila, Inc., 2011, $2.21** | | 2,271,528 | | | — |
| | | | | |
Total Investment in Warrants—0.1%
(cost $0) | | | 698 |
| | | | | |
See accompanying Notes to Financial Statements.
20 Semi-Annual Report | June 30, 2007 |
Small Cap Growth Fund
Portfolio of Investments, June 30, 2007 (all dollar amounts in thousands) (unaudited)
| | | | | | |
Issuer | | Shares or
Principal
Amount | | Value |
| | |
Investment in Affiliate | | | | | | |
William Blair Ready Reserves Fund | | | 5,496,989 | | $ | 5,497 |
| | | | | | |
Total Investment in Affiliate—0.4%
(cost $5,497) | | | 5,497 |
| | | | | | |
| | |
Short-Term Investments | | | | | | |
American Express Demand Note, VRN
5.170%, due 7/2/07 | | $ | 3,110,000 | | | 3,110 |
Prudential Funding Demand Note, VRN
5.305%, due 7/2/07 | | | 2,702,000 | | | 2,702 |
| | | | | | |
Total Short-Term Investments—0.4%
(cost $5,812) | | | 5,812 |
| | | | | | |
*Non-income producing securities
ADR = American Depository Receipt
† = U.S. listed foreign security
VRN = Variable Rate Note
** = Fair valued pursuant to Valuation Procedures adopted by the Board of Trustees. The holdings represents 2.2% of the Fund’s net assets at June 30, 2007. These securities were also deemed illiquid pursuant to Liquidity Procedures approved by Board of Trustees.
| | | | | | |
Issuer | |
Principal
Amount | | Value |
| | |
Repurchase Agreement | | | | | | |
Investors Bank & Trust Company, 4.50% dated 6/29/2007, due 7/02/2007, repurchase price $8,645, collateralized by SBA Pool #506485 | | $ | 8,641,962 | | $ | 8,642 |
| | | | | | |
Total Repurchase Agreement—0.6%
(cost $8,642) | | | 8,642 |
| | | | | | |
Total Investments—99.6%
(cost $1,189,454) | | | 1,382,368 |
Cash and other assets, less liabilities—0.4% | | | 5,678 |
| | | | | | |
Net assets—100.0% | | $ | 1,388,046 |
| | | | | | |
If a Fund’s portfolio holding represents ownership of 5% or more of the voting securities of a company, the company is deemed to be an affiliate as defined in the Investment Company Act of 1940. The Small Cap Growth Fund had the following transactions during the period ended June 30, 2007 with affiliated companies:
| | | | | | | | | | | | | | |
| | | Share Activity | | Period Ended
June 30, 2007 |
| | | | | | | | | | | (in thousands) |
Security Name | | Balance
12/31/2006 | | Purchases | | Sales | | Balance
6/30/2007 | | Value | | Dividends
Included
in Income |
4 Kids Entertainment, Inc. | | 696,575 | | 23,800 | | 17,897 | | 702,478 | | $ | 10,537 | | $ | — |
Access Integrated Technologies, Inc. | | 1,530,387 | | 740,427 | | 56,833 | | 2,213,981 | | | 17,911 | | | — |
Century Casinos, Inc. | | 1,546,133 | | 75,400 | | 56,300 | | 1,565,233 | | | 14,080 | | | — |
DG Fastchannel, Inc | | 971,150 | | 555,237 | | 399,557 | | 1,126,830 | | | 22,965 | | | — |
Duckwall-ALCO Stores, Inc. | | 325,133 | | 80,705 | | — | | 405,838 | | | 15,138 | | | — |
Frozen Food Express Industries, Inc. | | 894,816 | | 30,400 | | 22,913 | | 902,303 | | | 9,149 | | | 28 |
Granite City Food & Brewery, Ltd. | | — | | 1,372,423 | | — | | 1,372,423 | | | 7,480 | | | — |
Kona Grill, Inc. | | 764,729 | | — | | 6,800 | | 757,929 | | | 12,302 | | | — |
Lifecore Biomedical, Inc. | | 1,117,713 | | 29,700 | | 52,301 | | 1,095,112 | | | 17,379 | | | — |
Marlin Business Services Corp. | | 756,915 | | 96,400 | | 21,102 | | 832,213 | | | 17,734 | | | — |
Optimal Group, Inc. | | 2,150,379 | | 780,542 | | 71,013 | | 2,859,908 | | | 21,592 | | | — |
Overhill Farms, Inc. | | 1,903,720 | | — | | — | | 1,903,720 | | | 10,699 | | | — |
Providence Service Corporation | | 548,734 | | 294,699 | | 21,572 | | 821,861 | | | 21,960 | | | — |
Santarus, Inc. | | 3,588,835 | | 113,500 | | 70,863 | | 3,631,472 | | | 18,775 | | | — |
Stratasys, Inc. | | 590,537 | | 19,400 | | 609,937 | | — | | | — | | | — |
Think Partnership, Inc. | | 4,627,970 | | 125,400 | | 127,100 | | 4,626,270 | | | 13,833 | | | — |
Trinity Biotech plc-ADR | | 95,627 | | 1,074,353 | | 27,131 | | 1,142,849 | | | 13,268 | | | — |
Volterra Semiconductor Corporation | | 1,842,933 | | 57,700 | | 44,015 | | 1,856,618 | | | 26,364 | | | — |
Website Pros, Inc. | | — | | 1,331,800 | | — | | 1,331,800 | | | 12,546 | | | — |
Zila, Inc. | | 7,312,888 | | — | | 75,500 | | 7,237,388 | | | 10,060 | | | — |
| | | | | | | | | | | | | | |
| | | | | | | | | | $ | 293,772 | | | |
| | | | | | | | | | | | | | |
See accompanying Notes to Financial Statements.
June 30, 2007 | William Blair Funds 21 |

Harvey H. Bundy, III

Robert C. Lanphier, IV

David P. Ricci
MID CAP GROWTH FUND
The Mid Cap Growth Fund primarily invests in a diversified portfolio of common stocks of medium-sized domestic growth companies.
AN OVERVIEW FROM THE PORTFOLIO MANAGERS
How did the Fund perform in the first six months of 2007? How did the Fund’s performance compare to its benchmark?
The Mid Cap Growth Fund posted a 12.91% increase on a total return basis (Class N Shares) for the six month period ending June 30, 2007. By comparison, the Fund’s benchmark, the Russell Midcap Growth® Index, gained 10.97% during the period.
What were the most significant factors impacting Fund performance? What factors were behind the Fund’s performance versus the benchmark?
The domestic equity market posted an impressive return during the first half of 2007. The Russell Midcap Growth Index returned 10.97%, more than a full year’s return from a long-term historical perspective. Mid caps finished ahead of their large and small cap counterparts during the period. From a style perspective within the mid cap space, growth stocks have outperformed their value peers by over 2% thus far in 2007. This style dynamic has been maintained since the Federal Reserve stopped raising interest rates in August of 2006.
Although the market turned in positive results during the first quarter, the bulk of the year’s return came during the second quarter. The year began relatively slowly during January and February as many companies guided Wall Street to lower earnings growth expectations for the coming year. This brief skittishness culminated in a short-lived market sell-off prompted by rising sub-prime mortgage defaults, a fall off in housing starts and volatility in the Chinese stock market that made investors question the resiliency of the global financial markets. However, the market rebounded in March and maintained that momentum throughout the second quarter. This momentum was helped by increasingly encouraging data points about the global economy and the US industrial economy outside of residential real estate. The market strength was also aided by a continued robust environment for mergers and acquisitions and corporate stock repurchase programs.
The Mid Cap Growth Fund’s outperformance of the Russell Midcap Growth Index during the first half of 2007 was due to strong stock selection. This was most pronounced in the Financials sector, but it was also a significant contributor in the Health Care and Consumer Discretionary sectors. The Fund’s smaller than benchmark average market capitalization was a positive contributor as well. Stock selection in the Industrials sector was the largest detractor from relative performance. Although hard to measure on a relative basis, the Fund benefited from merger and acquisition activity that also helped the market as a whole. Six of the Fund’s holdings announced either that they were being taken private or being purchased by another public company during the first half of the year.
What were among the best performing investments for the Fund?
Two of the best performing stocks for the Fund were Investors Financial Services Corporation and MedImmune.
Investors Financial is a global trust and custody bank. After reporting solid earnings results during January, the company announced in early February that it was being acquired by State
22 Semi-Annual Report | June 30, 2007 |
Street Bank and Trust Company at a sizeable premium to the then current price. The transaction closed in the third quarter and we liquidated the Fund’s holding prior to that event.
MedImmune is a biotechnology company. Its products are used to prevent and treat infectious diseases, inflammatory diseases and cancer. We had originally purchased the company in large part due to our opinion that the market was undervaluing their significant pipeline of new drugs. During April, AstraZeneca PLC announced it would be acquiring MedImmune for a significant premium to its then market price.
What were among the weakest performing investments for the Fund?
Two of the weakest performing stocks for the Fund were Network Appliance and Corporate Executive Board.
Network Appliance sells data storage and management solutions to corporate customers. The company reported a disappointing quarter during May. The company noted weakness in end market demand which suggests IT buyers are being cautious in the near term. We added to our position on this weakness as the company continues to take market share and we feel the long term growth potential of this company remains intact.
Corporate Executive Board sells subscription-based, best-practices research on a variety of pertinent topics to corporate leaders. During the first quarter, the company had announced a disappointing quarter. We had managed the position down after observing slowing revenue growth and cross selling patterns with existing clients. This was explained by management as a sales force execution issue, and we sought evidence as to whether this was a one-time event, or if the company’s market opportunity was perhaps becoming saturated. After seeing the company’s earnings report in April, we feel this may be a bigger issue from a growth perspective (not enough new products and not enough corporate demand for additional research services). We therefore decided to exit the position.
What is your current outlook?
In May as the economy seemed to be stronger than most expected, interest rates began to move higher on fears that the Federal Reserve may have to move interest rates higher to preempt any pick up in inflation. The relatively flat market returns experienced during June would suggest investors are still concerned about the potential inflationary effects of the current economic strength. However, core inflation remains at a reasonable level and we remain—as we have for the past few quarters—in a balance of healthy economic activity and moderate inflation. The consumer remains arguably the largest risk to the economy and equity markets. With higher energy prices, continued weakness in housing activity and rising defaults in the sub-prime mortgage market, pressure on consumer spending remains significant. Fortunately, employment trends remain solid and continue to offset weakness related to housing. Regardless of the macro issues facing the market, we continue to find high quality stocks that offer above-average growth opportunities. We believe that as overall earnings growth becomes less broad-based, investors will rotate to stocks with more company-specific and sustainable growth initiatives.
June 30, 2007 | William Blair Funds 23 |
Mid Cap Growth Fund
Performance Highlights (unaudited)
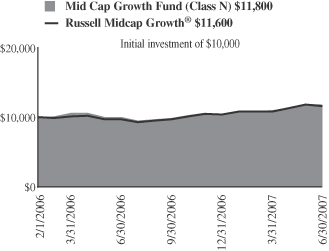
Average Annual Total Return at 6/30/2007
| | | | | | | | | |
| | | Year to
Date | | | 1
year | | | Since Inception(a) | |
Mid Cap Growth Fund
Class N | | 12.91 | % | | 18.46 | % | | 12.51 | % |
Mid Cap Growth Fund
Class I | | 13.16 | | | 18.94 | | | 12.91 | |
Russell Midcap® Growth Index | | 10.97 | | | 19.73 | | | 10.89 | |
| | (a) | | For the period from February 1, 2006 (Commencement of Operations) to June 30, 2007. |
Performance cited represents past performance. Past performance does not guarantee future results and current performance may be lower or higher than the data quoted. Results shown are average annual total returns, which assume reinvestment of dividends and capital gains. Investment returns and principal will fluctuate and you may have a gain or loss when you sell shares. For the most current month-end performance information, please call 1-800-742-7272, or visit our Web site at www.williamblairfunds.com. Investing in smaller and medium capitalization companies involves special risks, including higher volatility and lower liquidity. Mid Cap stocks are also more sensitive to purchase/sale transactions and changes in the issuer’s financial condition. From time to time, the investment advisor may waive fees or reimburse expenses for the Fund. Without these waivers, performance would be lower. Class N shares are available to the general public without a sales load. Class I shares are available to certain institutional investors and advisory clients of William Blair & Company, L.L.C., without a sales load or distribution (12b-1) or service fees.
The performance highlights and graph presented above do not reflect the deduction of taxes that a shareholder would pay on fund distributions or the redemption of fund shares.
The Russell Mid Cap Growth® Index is an index that is constructed to provide a comprehensive and unbiased barometer of the mid-cap growth market.
This report identifies the Fund’s investments on June 30, 2007. These holdings are subject to change. Not all stocks in the Fund performed the same, nor is there any guarantee that these stocks will perform as well in the future. Market forecasts provided in this report may not necessarily come to pass.
Sector Diversification (unaudited)
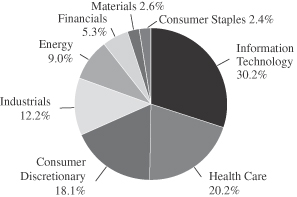
The sector diversification shown is based on the total investment portfolio.
24 Semi-Annual Report | June 30, 2007 |
Mid Cap Growth Fund
Portfolio of Investments, June 30, 2007 (all dollar amounts in thousands) (unaudited)
| | | | | |
| | | |
Issuer | | Shares | | Value |
| | |
Common Stocks | | | | | |
Information Technology—28.8% | | | | | |
*Activision, Inc. | | 55,695 | | $ | 1,040 |
*Autodesk, Inc. | | 8,640 | | | 407 |
*Cognizant Technology Solutions, Class “A” | | 10,165 | | | 763 |
*F5 Networks, Inc. | | 6,779 | | | 546 |
*FLIR Systems, Inc. | | 19,850 | | | 918 |
*Intuit, Inc. | | 25,530 | | | 768 |
*Iron Mountain, Inc. | | 28,567 | | | 747 |
*j2 Global Communications, Inc. | | 24,765 | | | 864 |
Jabil Circuit, Inc. | | 47,395 | | | 1,046 |
Maxim Intergrated Products, Inc. | | 13,920 | | | 465 |
Microchip Technology, Inc. | | 14,985 | | | 555 |
*Network Appliance, Inc. | | 24,256 | | | 708 |
Paychex, Inc. | | 34,815 | | | 1,362 |
*Silicon Laboratories, Inc. | | 22,620 | | | 783 |
*ValueClick, Inc. | | 9,510 | | | 280 |
| | | | | |
| | | | | 11,252 |
| | | | | |
Health Care—19.3% | | | | | |
C.R. Bard, Inc. | | 9,605 | | | 794 |
*Express Scripts, Inc., Class “A” | | 21,724 | | | 1,086 |
*Healthways, Inc. | | 15,015 | | | 711 |
*IDEXX Laboratories, Inc. | | 10,435 | | | 987 |
IMS Health, Incorporated | | 21,405 | | | 688 |
*Integra LifeSciences Holdings Corporation | | 13,505 | | | 667 |
*Kyphon, Inc. | | 14,529 | | | 700 |
Pharmaceutical Product Development, Inc. | | 31,045 | | | 1,188 |
*ResMed, Inc. | | 17,245 | | | 712 |
| | | | | |
| | | | | 7,533 |
| | | | | |
Consumer Discretionary—17.2% | | | | | |
*Dick’s Sporting Goods, Inc. | | 7,195 | | | 419 |
Lamar Advertising Company, Class “A” | | 6,325 | | | 397 |
*Laureate Education, Inc. | | 20,280 | | | 1,250 |
*Life Time Fitness, Inc. | | 23,510 | | | 1,251 |
*O’Reilly Automotive, Inc. | | 21,483 | | | 785 |
PetSmart, Inc. | | 22,785 | | | 739 |
Strayer Education, Inc. | | 6,390 | | | 842 |
*Tractor Supply Company | | 19,876 | | | 1,035 |
| | | | | |
| | | | | 6,718 |
| | | | | |
Industrials — 11.6% | | | | | |
C. H. Robinson Worldwide, Inc. | | 7,565 | | | 397 |
Fastenal Company | | 30,555 | | | 1,279 |
Precision Castparts Corp. | | 4,140 | | | 503 |
Robert Half International, Inc. | | 16,285 | | | 594 |
Rockwell Automation, Inc. | | 8,410 | | | 584 |
Rockwell Collins, Inc. | | 10,985 | | | 776 |
*Stericycle, Inc. | | 9,350 | | | 416 |
| | | | | |
| | | | | 4,549 |
| | | | | |
*Non-income producing securities
VRN = Variable Rate Note
† = U.S. listed foreign security
| | | | | | |
Issuer | | Shares or
Principal
Amount | | Value |
| | |
Common Stocks—(Continued) | | | | | | |
Energy—8.5% | | | | | | |
*Grant Prideco, Inc. | | | 13,350 | | $ | 719 |
Smith International, Inc. | | | 16,230 | | | 952 |
*Southwestern Energy Company | | | 5,630 | | | 250 |
*Ultra Petroleum Corp.† | | | 13,485 | | | 745 |
XTO Energy Corporation | | | 11,300 | | | 679 |
| | | | | | |
| | | | | | 3,345 |
| | | | | | |
Financials—5.0% | | | | | | |
*Affiliated Managers Group, Inc. | | | 8,005 | | | 1,031 |
BOK Financial Corporation | | | 5,590 | | | 299 |
*IntercontinetalExchange, Inc. | | | 4,263 | | | 630 |
| | | | | | |
| | | | | | 1,960 |
| | | | | | |
Materials—2.5% | | | | | | |
Airgas, Inc. | | | 8,920 | | | 427 |
Ecolab Inc. | | | 12,570 | | | 537 |
| | | | | | |
| | | | | | 964 |
| | | | | | |
Consumer Staples—2.3% | | | | | | |
*Hansen Natural Corporation | | | 9,890 | | | 425 |
Whole Foods Market, Inc. | | | 12,360 | | | 474 |
| | | | | | |
| | | | | | 899 |
| | | | | | |
Total Common Stock—95.2%
(cost $33,637) | | | 37,220 |
| | | | | | |
| | |
Investment in Affiliate | | | | | | |
William Blair Ready Reserves Fund | | | 109,861 | | | 110 |
| | | | | | |
Total Investment In Affiliate—0.3%
(cost $110) | | | | | | 110 |
| | | | | | |
| | |
Short-Term Investment | | | | | | |
Prudential Funding Demand Note,
VRN 5.305%, due 7/2/07 | | $ | 324,000 | | | 324 |
| | | | | | |
Total Short-Term Investment—0.8%
(cost $324) | | | 324 |
| | | | | | |
| | |
Repurchase Agreement | | | | | | |
Investors Bank & Trust Company,
4.50% dated 6/29/2007, due 7/2/2007, repurchase price $1,384, collateralized
by SBA Pool # 505656 | | $ | 1,383,259 | | | 1,383 |
| | | | | | |
Total Repurchase Agreement—3.5%
(cost $1,383) | | | 1,383 |
| | | | | | |
Total Investments—99.8%
(cost $35,454) | | | 39,037 |
Cash and other assets, less liabilities—0.2% | | | 74 |
| | | | | | |
Net Assets—100% | | $ | 39,111 |
| | | | | | |
See accompanying Notes to Financial Statements.
June 30, 2007 | William Blair Funds 25 |
Karl W. Brewer
Harvey H. Bundy, III
Robert C. Lanphier, IV
SMALL-MID CAP GROWTH FUND
The Small-Mid Cap Growth Fund primarily invests in a diversified portfolio of common stocks of small and medium-sized domestic growth companies that the Advisor expects to experience solid growth in earnings.
AN OVERVIEW FROM THE PORTFOLIO MANAGERS
How did the Fund perform in the first six months of 2007? How did the Fund’s performance compare to its benchmark?
The Small-Mid Cap Growth Fund gained 13.27% on a total return basis (Class N Shares) for the six month period ending June 30, 2007. By comparison, the Fund’s benchmark, the Russell 2500 Growth™ Index, increased11.30% during the period.
What were the most significant factors impacting Fund performance? What factors were behind the Fund’s performance versus the benchmark?
The domestic equity market posted a substantial return during the first half of 2007. The Russell 2500 Growth™ Index returned 11.30%, more than a full year’s return from a long-term historical perspective. Looking across the entire market cap spectrum, mid caps finished ahead of small caps, and both finished ahead of the large caps. Drilling down further into the Russell benchmarks, the “small-mid” asset class finished ahead of the pure “mid” space as the Russell Midcap Growth Index returned 10.97%. This was due to significant strength in the roughly $2-4 billion market cap range – which constitutes roughly 40% of the Russell 2500 Growth™ Index. The growth investment style outperformed the value style within the small-mid cap space by over 5% in the first half of 2007, continuing a trend that has persisted since the Federal Reserve ceased raising interest rates in August of 2006.
Although the market turned in positive results during the first quarter, the bulk of the year’s return came during the second quarter. The year began relatively slowly during January and February as many companies guided Wall Street to lower earnings growth expectations for the coming year. This brief skittishness culminated in a short-lived market correction prompted by rising sub-prime mortgage defaults, a fall off in housing starts and volatility in the Chinese stock market that tested the resiliency of the global financial markets. Domestic equities rebounded in March and maintained that momentum throughout the second quarter. This momentum was helped by increasingly encouraging data points about the global economy and the US industrial economy outside of residential real estate. The market strength was also aided by a continued robust environment for mergers and acquisitions and corporate stock repurchase programs.
The Small-Mid Cap Growth Fund turned in positive results across all economic sectors during the first half of the year. The most significant factor in the Fund’s outperformance of the Russell 2500 Growth™ Index was strong stock selection in the Financials sector. Information Technology and Energy stock selection produced sizeable relative strength as well. On the downside, Industrials stock selection was the biggest detractor relative to the benchmark. The average market capitalization of the Fund’s holdings was larger than the benchmark’s average, which also detracted from relative performance. This was due to being underweight the aforementioned $2-4 billion market cap range that witnessed significant strength during the quarter. Although hard to measure on a relative basis, the Fund’s absolute performance benefited from the merger and acquisition activity that also helped the market as a whole. Five of the Fund’s holdings announced that they were being acquired during the first half of the year.
26 Semi-Annual Report | June 30, 2007 |
What were among the best performing investments for the Fund?
Two of the best performing stocks during the period were WebEx Communications and SurModics.
WebEx develops and markets various web-based services. The stock experienced two legs of appreciation during the early part of 2007. First, the company released an impressive earnings report in early February and, at the same time, increased forward revenue and earnings expectations. However, the main reason for the stock’s solid return was Cisco Systems’ announcement that they would be acquiring the company.
SurModics is the market leader in surface modification and drug delivery technologies in the healthcare industry. The company’s main exposure currently is in the drug coated stent market but it continues to develop relationships with many of the large medical device and pharmaceutical companies in order to develop additional uses for its proprietary technologies. In June, SurModics announced that it was entering an agreement with Merck to develop and commercialize products using Merck’s drug compounds and SurModics’ I-Vation drug delivery system to treat various retinal diseases in the ophthalmology market.
What were among the weakest performing investments for the Fund?
Two of the weakest performing stocks for the Fund were ResMed and Corporate Executive Board.
ResMed develops, manufactures and distributes medical equipment, primarily for treating, diagnosing and managing sleep apnea. In April, ResMed initiated a recall of its S8 flow generator product, which amounted to replacing 300,000 units. Although a third party was hired to handle the bulk of this job, we believe that the company’s sales representatives spent more time than expected handling customer issues related to the recall, which led to lost selling time. As a result, investors have lowered revenue and earnings projections, which has negatively affected the stock price.
Corporate Executive Board sells subscription-based, best-practices research on a variety of pertinent topics to corporate leaders. During the first quarter, the company had announced a disappointing quarter. We had managed the position down after observing slowing revenue growth and cross selling patterns with existing clients. This was explained by management as a sales force execution issue, and we sought evidence as to whether this was a one-time event, or if the company’s market opportunity was perhaps becoming saturated. After seeing the company’s earnings report in April, we felt this may be a bigger issue from a growth perspective (not enough new products and not enough corporate demand for additional research services). We therefore decided to exit the position.
What is your current outlook?
In May as it became apparent that the U.S. economy was gaining momentum, interest rates began to move higher on the realization that the Federal Reserve may have to move interest rates higher to preempt inflationary pressures. The relatively flat market returns experienced during June would suggest investors are still concerned about the potential inflationary effects of the current economic strength. However, core inflation remains at a reasonable level and the United States remains—as it has for the past few quarters—in a balance of healthy economic activity and moderate inflation. The American consumer remains arguably the “most significant uncertainty” to the economy and equity markets. With higher energy prices, continued weakness in housing activity and rising defaults in the sub-prime mortgage market, pressure on consumer spending remains significant. Fortunately, employment trends remain solid and continue to offset weakness related to housing. Regardless of the macro issues facing the market, we continue to find high quality stocks that offer above-average growth opportunities. We believe that as overall earnings growth becomes less broad-based, investors will rotate to stocks with more company-specific and sustainable growth initiatives.
June 30, 2007 | William Blair Funds 27 |
Small-Mid Cap Growth Fund
Performance Highlights (unaudited)
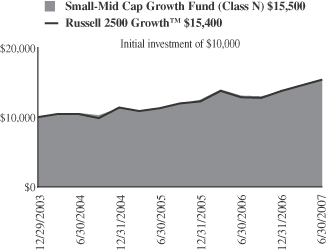
Average Annual Total Return at 6/30/2007
| | | | | | | | | | | | |
| | | Year to
Date | | | 1 Year | | | 3
Year | | | Since Inception(a) | |
Small-Mid Cap Growth Fund Class N | | 13.27 | % | | 18.23 | % | | 13.40 | % | | 13.31 | % |
Small-Mid Cap Growth Fund Class I | | 13.40 | | | 18.59 | | | 13.68 | | | 13.58 | |
Russell 2500™ Growth Index | | 11.30 | | | 19.03 | | | 13.60 | | | 13.06 | |
| | (a) | | For the period from December 29, 2003 to June 30, 2007. | |
Performance cited represents past performance. Past performance does not guarantee future results and current performance may be lower or higher than the data quoted. Results shown are average annual total returns, which assume reinvestment of dividends and capital gains. Investment returns and principal will fluctuate and you may have a gain or loss when you sell shares. For the most current month-end performance information, please call 1-800-742-7272, or visit our Web site at www.williamblairfunds.com. Investing in smaller and medium capitalization companies involves special risks, including higher volatility and lower liquidity. Small and Mid cap stocks are also more sensitive to purchase/sale transactions and changes in the issuer’s financial condition. From time to time, the investment advisor may waive fees or reimburse expenses for the Fund. Without these waivers, performance would be lower. Class N shares are available to the general public without a sales load. Class I shares are available to certain institutional investors and advisory clients of William Blair & Company, L.L.C., without a sales load or distribution (12b-1) or service fees.
The performance highlights and graph presented above do not reflect the deduction of taxes that a shareholder would pay on fund distributions or the redemption of fund shares.
The Russell 2500™ Growth Index measures the performance of those Russell 2500 companies with above average price-to-book ratios and forecasted growth rates.
This report identifies the Fund’s investments on June 30, 2007. These holdings are subject to change. Not all stocks in the Fund performed the same, nor is there any guarantee that these stocks will perform as well in the future. Market forecasts provided in this report may not necessarily come to pass.
Sector Diversification (unaudited)
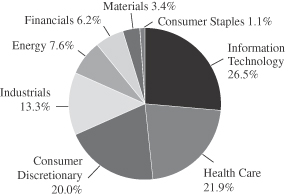
The sector diversification shown is based on the total investment portfolio.
28 Semi-Annual Report | June 30, 2007 |
Small-Mid Cap Growth Fund
Portfolio of Investments, June 30, 2007 (all dollar amounts in thousands) (unaudited)
| | | | | |
Issuer | |
Shares | | Value |
| | |
Common Stocks | | | | | |
Information Technology—25.9% | | | | | |
*Activision, Inc. | | 153,939 | | $ | 2,874 |
*Autodesk, Inc. | | 25,030 | | | 1,178 |
*Cybersource Corporation | | 36,200 | | | 437 |
*Euronet Worldwide, Inc. | | 105,923 | | | 3,089 |
*Intuit, Inc. | | 58,680 | | | 1,765 |
*Iron Mountain, Inc. | | 92,146 | | | 2,408 |
*j2 Global Communications, Inc. | | 83,000 | | | 2,897 |
Jabil Circuit, Inc. | | 123,095 | | | 2,717 |
Microchip Technology, Inc. | | 37,285 | | | 1,381 |
*Nuance Communications, Inc. | | 162,590 | | | 2,720 |
*PDF Solutions, Inc. | | 70,600 | | | 835 |
*Silicon Laboratories, Inc. | | 52,990 | | | 1,834 |
*Transaction Systems Architects, Inc. | | 34,390 | | | 1,157 |
*Ultimate Software Group, Inc. | | 61,410 | | | 1,777 |
United Online, Inc. | | 69,280 | | | 1,142 |
*ValueClick, Inc. | | 29,117 | | | 858 |
*VistaPrint Limited† | | 17,600 | | | 673 |
| | | | | |
| | | | | 29,742 |
| | | | | |
Health Care—21.4% | | | | | |
C.R.Bard, Inc. | | 17,220 | | | 1,423 |
*DJO, Inc. | | 43,880 | | | 1,811 |
*Healthways, Inc. | | 54,065 | | | 2,561 |
*IDEXX Laboratories, Inc. | | 19,310 | | | 1,827 |
IMS Health, Incorporated | | 61,270 | | | 1,969 |
*Integra LifeSciences Holdings Corporation | | 51,825 | | | 2,561 |
*Kyphon, Inc. | | 62,355 | | | 3,002 |
Pharmaceutical Product Development, Inc. | | 86,125 | | | 3,296 |
*PSS World Medical, Inc. | | 85,545 | | | 1,559 |
* ResMed, Inc. | | 42,710 | | | 1,762 |
* Santarus, Inc. | | 93,600 | | | 484 |
*SurModics, Inc. | | 45,570 | | | 2,279 |
| | | | | |
| | | | | 24,534 |
| | | | | |
Consumer Discretionary—19.6% | | | | | |
*Apollo Group, Inc., Class “A” | | 23,270 | | | 1,360 |
*Coinstar, Inc. | | 70,708 | | | 2,226 |
*Jarden Corporation | | 46,980 | | | 2,021 |
Lamar Advertising Company, Class “A” | | 17,905 | | | 1,124 |
*Laureate Education, Inc. | | 60,789 | | | 3,748 |
*Life Time Fitness, Inc. | | 53,870 | | | 2,867 |
*O’Reilly Automotive, Inc. | | 66,735 | | | 2,439 |
PetSmart, Inc. | | 52,035 | | | 1,689 |
*Shuffle Master, Inc. | | 59,470 | | | 987 |
Strayer Education, Inc. | | 13,760 | | | 1,812 |
*Tractor Supply Company | | 42,290 | | | 2,201 |
| | | | | |
| | | | | 22,474 |
| | | | | |
*Non-income producing securities
VRN = Variable Rate Note
† = U.S. listed foreign security
| | | | | | | |
Issuer | | Shares or
Principal
Amount | | Value | |
| | |
Common Stocks—(continued) | | | | | | | |
Industrials—13.0% | | | | | | | |
*Allegiant Travel Company | | | 30,090 | | $ | 925 | |
C.H. Robinson Worldwide, Inc. | | | 24,040 | | | 1,263 | |
*Corrections Corporation of America | | | 40,490 | | | 2,555 | |
Fastenal Company | | | 91,345 | | | 3,824 | |
*Houston Wire & Cable Company | | | 21,180 | | | 602 | |
*InnerWorkings, Inc. | | | 78,920 | | | 1,264 | |
*Kforce, Inc. | | | 100,190 | | | 1,601 | |
Rockwell Collins, Inc. | | | 40,240 | | | 2,842 | |
| | | | | | | |
| | | | | | 14,876 | |
| | | | | | | |
Energy—7.4% | | | | | | | |
*Grant Prideco, Inc. | | | 49,465 | | | 2,663 | |
Smith International, Inc. | | | 41,145 | | | 2,413 | |
*Southwestern Energy Company | | | 41,880 | | | 1,864 | |
*Ultra Petroleum Corp.† | | | 27,725 | | | 1,531 | |
| | | | | | | |
| | | | | | 8,471 | |
| | | | | | | |
Financials—6.1% | | | | | | | |
*Affiliated Managers Group, Inc. | | | 19,735 | | | 2,541 | |
*IntercontinentalExchange, Inc. | | | 11,085 | | | 1,639 | |
*Philadelphia Consolidated Holding Corp. | | | 23,300 | | | 974 | |
*Signature Bank New York | | | 53,010 | | | 1,807 | |
| | | | | | | |
| | | | | | 6,961 | |
| | | | | | | |
Materials—3.3% | | | | | | | |
Airgas, Inc. | | | 59,085 | | | 2,830 | |
The Scotts Miracle-Gro Company | | | 23,930 | | | 1,028 | |
| | | | | | | |
| | | | | | 3,858 | |
| | | | | | | |
Consumer Staples—1.1% | | | | | | | |
*Hansen Natural Corporation | | | 28,780 | | | 1,237 | |
| | | | | | | |
Total Common Stock—97.8%
(cost $92,162) | | | 112,153 | |
| | | | | | | |
| | |
Investment in Affiliate | | | | | | | |
William Blair Ready Reserves Fund | | | 21,341 | | | 21 | |
| | | | | | | |
Total Investment In Affiliate—0.0%
(cost $21) | | | 21 | |
| | | | | | | |
| | |
Short-Term Investment | | | | | | | |
Prudential Funding Demand Note, VRN 5.305%, due 7/2/07 | | $ | 504,000 | | | 504 | |
| | | | | | | |
Total Short-Term Investment—0.4%
(cost $5,04) | | | 504 | |
| | | | | | | |
| | |
Repurchase Agreement | | | | | | | |
Investors Bank & Trust Company, 4.50%
dated 6/29/2007, due 7/2/2007, repurchase price $2,205, collateralized by SBA Pool #505831 | | $ | 2,204,136 | | | 2,204 | |
| | | | | | | |
Total Repurchase Agreement—1.9%
(cost $2,204) | | | 2,204 | |
| | | | | | | |
Total Investments—100.1%
(cost $94,891) | | | 114,882 | |
Liabilities, plus cash and other assets—(0.1)% | | | (147 | ) |
| | | | | | | |
Net Assets—100% | | $ | 114,735 | |
| | | | | | | |
See accompanying Notes to Financial Statements.
June 30, 2007 | William Blair Funds 29 |
INTERNATIONAL MARKETS OVERVIEW
Powerful economic momentum continues to be the driving force behind positive global equity returns. Of the 42 countries whose growth is tracked by the Economist, over two thirds are currently reporting real growth above 3%; the median growth rate for emerging market economies is 6.1%. Among G7 economies, only the US is below its trend rate of growth, held back by the ongoing housing slowdown.
Listed companies outside the US, as represented by the MSCI All Country World ex US Index, have shown remarkable profit gains over the last five years, with 14% annual growth leading to a historically high return on equity of 20%. Strong underlying growth combined with improving productivity and balance sheet management have produced exceptional cash flow and value creation. In turn, with capital costs and inflation subdued, the environment for equity returns overall, and for buyouts and M&A activity in particular, has been consistently strong.
Capital flows to both bonds and equities have followed these growth trends, especially in emerging markets. Corporate bonds and emerging market sovereign debt have strengthened, while historically volatile equity subclasses (small cap and emerging markets) have outperformed.
Since the global recovery began in 2003, there have been three ‘hypotheticals’ that have acted as braking mechanisms on equity returns: concern that a US-led slowdown would stall global growth; concern that commodity price increases and high utilization rates might spill over into wage and price inflation; and worries that either lower growth or higher interest rates could destabilize credit and liquidity and cause a financial accident.
Most recently, in the second quarter, both inflation and financial risk have been in the headlines. In May, US and European rates rose significantly on fears of an inflation/tightening cycle, and in June, the Bear Stearns hedge fund dislocations gave rise to speculation that mortgage-related derivatives might carry the seeds of systemic financial risk.
The market corrections associated with these events seem to have been orderly adjustments to relatively cautious changes in consensus expectations. Risk-awareness seems relatively close to the surface among market participants; there are few if any signs of any kind of asset bubble, in spite of widespread efforts to identify one (or more).
Outlook
For the present, the global economy and financial markets continue to function in relatively stable equilibrium. Anomalies like isolated property booms, errant exchange rates, hedge fund stresses, and weakness in the US mortgage market are relatively minor in the context of a global economy adding nearly $2 trillion a year in output. Global saving seems to be funding a level of real investment activity adequate to sustain non-inflationary growth; consumption growth is reasonably well-balanced across income strata and regions; and capital market activity is well within rational valuation parameters.
Risks and challenges to the sustainability of growth have historically increased with the age of the economic cycle, and the potential for imbalances continues to exist. The conventional end-of-cycle overheating scenario probably remains the key risk to monitor (along with rising tensions in the Middle East), but a more stable phase of expansion may continue to provide a relatively benign market environment for some time to come.
30 Semi-Annual Report | June 30, 2007 |

W. George Greig
INTERNATIONAL GROWTH FUND
The International Growth Fund invests primarily in common stocks of foreign growth companies.
AN OVERVIEW FROM THE PORTFOLIO MANAGER
See page 30 for the International Markets Overview.
How did the Fund perform over the first half of the year? How did the Fund’s performance compare to its benchmark?
The International Growth Fund posted a 11.66% gain (Class N Shares) for the six months ended June 30, 2007. By comparison, the Fund’s benchmark, the Morgan Stanley Capital International (MSCI) All Country World (ACWI) ex-US Index, rose 12.58%.
What were the most significant factors impacting international markets during the first six months of the year?
Non-US markets were strong during the first half of 2007, buoyed by strong results in emerging markets, Canada, Europe and the Pacific Rim. However, the first six months were punctuated by periods of volatility as investors were concerned in the first quarter about the US subprime mortgage market resulting in slowing US consumer demand and its impact on global growth. In the second quarter, investors became concerned about the prospects of a protracted global increasing interest rate environment as the US economy appeared to accelerate and demand for industrial and consumer goods and services remained strong globally. In addition, worries about the impact of US subprime mortgages on the financial industry, including hedge funds, caused apprehension regarding overall financial system risk. Despite these fears, the market returned 12.58% through June 30, as measured by the MSCI ACWI ex-US Index, with most of the performance coming during the second quarter. Emerging markets outpaced their developed counterparts, returning 17.75%, as compared to the MSCI Europe, Asia and Far-East (EAFE) Index, which rose 11.09% in US dollar terms. Materials, Industrials and Energy were the strongest sectors year to date, while Financials and Health Care lagged.
What factors were behind the Fund’s performance versus the benchmark?
Within this environment, the Fund trailed the benchmark during the second quarter, and therefore year to date. The primary detractor to relative results was the Fund’s overall sector positioning during the second quarter despite strong stock selection across most sectors, as it was underweighted in Materials and Energy, which gained and overweighted in the Consumer sectors, which lagged. In addition, Materials and Industrials stock selection, while strong on an absolute basis, trailed comparable Index results. Within Materials, there were several Japanese and UK stocks that dragged on results, while relative Industrials performance was hampered by airline-related companies, coupled with underperformance in Japan. While stock selection was strong across most sectors during the first half of the year, the most significant value added was in Health Care, Energy, and Telecommunication Services. Within Health Care, the focus on diagnostics and medical technology at the expense of pharmaceuticals added value, while energy stock selection benefited from the focus on energy services, engineering, and high production growth exploration and production companies. Telecommunication Services stock selection was bolstered by alternative cable providers in Europe, coupled with emerging markets mobile phone companies, which benefited from strong subscriber growth during the period. The Fund’s
June 30, 2007 | William Blair Funds 31 |
higher weightings in Industrials added value, as did its underweighting in the underperforming Financials sector. Stock selection was strong across most regions, with the most significant value added in Pacific ex-Japan, particularly in Australia and Singapore. At the margin, regional positioning also added value during the period.
How is the Fund positioned?
As of June 30, the Fund was overweighted in Pacific ex-Japan, emerging Asia and Latin America versus the Index, and significantly underweighted in Japan. These weightings were largely the result of relative growth opportunities available in these markets. The Fund maintained its focus on the Consumer area, particularly in European Consumer Staples and emerging markets Consumer Discretionary and Staples companies. In addition, Industrials remained a significant percentage of the Fund, with a concentration on companies exposed to the aircraft, commodity, and energy complexes, coupled with those exposed to additional infrastructure spending globally. Financials, although underweighted versus the Index, was the largest sector at approximately 26% of the Fund, and was focused in companies exposed to capital markets, real estate, and securities exchanges. While the weighting in Materials and Telecommunication Services remained underweighted versus the benchmark, these weightings increased as additional names were added in these sectors during the quarter.
32 Semi-Annual Report | June 30, 2007 |
International Growth Fund
Performance Highlights (unaudited)
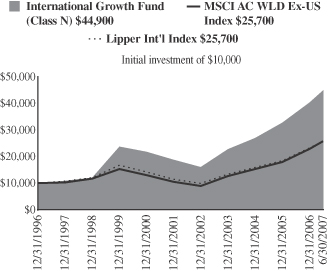
Average Annual Total Return at 6/30/2007
| | | | | | | | | | | | | | | | | | | | |
| | | Year
to Date | | | 1
Year | | | 3
Year | | | 5
Year | | | 10
Year | | | Since Inception | | | |
International Growth Fund Class N | | 11.66 | % | | 29.69 | % | | 24.37 | % | | 18.80 | % | | 14.55 | % | | — | % | | |
International Growth Fund Class I | | 11.85 | | | 30.08 | | | 24.70 | | | 19.12 | | | — | | | 13.96 | (a) | | |
MSCI All Country World Ex-US Index | | 12.58 | | | 30.15 | | | 25.03 | | | 19.93 | | | 8.58 | | | 9.18 | (a) | | |
Lipper International Index | | 10.86 | | | 27.69 | | | 22.61 | | | 17.42 | | | 8.47 | | | — | | | |
| | (a) | | For the period from October 1, 1999 to June 30, 2007. |
Performance cited represents past performance. Past performance does not guarantee future results and current performance may be lower or higher than the data quoted. Results shown are average annual total returns, which assume reinvestment of dividends and capital gains. Investment returns and principal will fluctuate and you may have a gain or loss when you sell shares. For the most current month-end performance information, please call 1-800-742-7272, or visit our Web site at www.williamblairfunds.com. From time to time, the investment advisor may waive fees or reimburse expenses for the Fund. Without these waivers, performance would be lower. International investing involves special risk considerations, including currency fluctuations, lower liquidity, economic and political risk. Class N shares are available to the general public without a sales load. Class I shares are available to certain institutional investors and advisory clients of William Blair & Company, L.L.C., without a sales load or distribution (12b-1) or service fees.
The performance highlights and graph presented above do not reflect the deduction of taxes that a shareholder would pay on fund distributions or the redemption of fund shares.
The Morgan Stanley Capital International (MSCI) All Country World Ex-US Index is an unmanaged index that includes developed and emerging markets and reduced Japanese portion, making it more comparable to the International Growth Fund in terms of investment approach.
The Lipper International Index is a composite of international growth mutual funds.
This report identifies the Fund’s investments on June 30, 2007. These holdings are subject to change. Not all stocks in the Fund performed the same, nor is there any guarantee that these stocks will perform as well in the future. Market forecasts provided in this report may not necessarily come to pass.
Sector Diversification (unaudited)
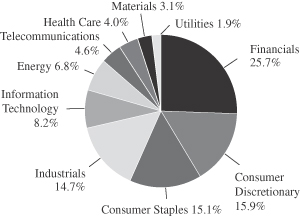
The sector diversification shown is based on the total investment portfolio.
June 30, 2007 | William Blair Funds 33 |
International Growth Fund
Portfolio of Investments, June 30, 2007 (all dollar amounts in thousands) (unaudited)
| | | | | |
Issuer | | Shares | | Value |
| | |
Common Stocks—Europe—33.2% | | | | | |
Austria—1.5% | | | | | |
Erste Bank (Commercial banks) | | 458,592 | | $ | 35,743 |
Raiffeisen International Bank (Commercial banks) | | 470,054 | | | 74,244 |
| | | | | |
| | | | | 109,987 |
| | | | | |
Belgium—1.3% | | | | | |
InBev NV (Beverages) | | 1,229,500 | | | 97,383 |
| | | | | |
Finland—0.5% | | | | | |
Nokian Renkaat OYJ (Auto components) | | 1,062,800 | | | 37,234 |
| | | | | |
France—10.9% | | | | | |
April Group S.A. (Insurance) | | 203,139 | | | 10,675 |
AXA (Insurance) | | 2,682,100 | | | 115,291 |
Capgemini S.A. (IT services) | | 781,400 | | | 57,127 |
EDF Energies Nouvelles S.A. (Electric utilities) | | 469,805 | | | 30,753 |
Essilor International (Health care equipment & supplies) | | 474,900 | | | 56,563 |
Eurazeo (Diversified financial services) | | 339,702 | | | 49,088 |
Group Danone (Food products) | | 1,220,600 | | | 98,583 |
Iliad S.A. (Internet software & services) | | 268,950 | | | 27,091 |
Klepierre (Real estate investment trusts) | | 138,500 | | | 23,453 |
L’Oreal S.A. (Personal products) | | 875,100 | | | 103,437 |
LVMH Moet Hennessey Louis Vuitton SA (Textiles, apparel & luxury goods) | | 732,900 | | | 84,331 |
*Orpea (Health care providers & services) | | 187,312 | | | 19,685 |
*Seloger.com (Media) | | 271,400 | | | 15,068 |
Veolia Environnement (Multi-utilities) | | 1,334,813 | | | 104,837 |
| | | | | |
| | | | | 795,982 |
| | | | | |
Germany—1.6% | | | | | |
*Colonia Real Estate AG (Real estate management & development) | | 227,900 | | | 9,565 |
CTS Eventim AG (Media) | | 242,903 | | | 11,972 |
*Q-Cells AG (Electrical equipment) | | 494,420 | | | 42,649 |
Solarworld AG (Electrical equipment) | | 644,200 | | | 29,739 |
*Wire Card AG (Commercial services & supplies) | | 1,560,400 | | | 20,988 |
| | | | | |
| | | | | 114,913 |
| | | | | |
Greece—1.8% | | | | | |
Coca-Cola Hellenic Bottling S.A. (Beverages) | | 845,571 | | | 38,911 |
EFG Eurobank (Commercial banks) | | 803,760 | | | 26,186 |
Jumbo S.A. (Leisure equipment & products) | | 599,700 | | | 20,739 |
National Bank of Greece (Commercial banks) | | 747,152 | | | 42,542 |
| | | | | |
| | | | | 128,378 |
| | | | | |
Ireland—1.7% | | | | | |
Anglo Irish Bank plc (Commercial banks) | | 3,086,800 | | | 63,352 |
Kingspan Group plc (Building products) | | 1,517,100 | | | 42,552 |
United Drug plc (Health care providers & services) | | 2,625,500 | | | 14,365 |
| | | | | |
| | | | | 120,269 |
| | | | | |
| | | |
Italy—3.0% | | | | | |
Azimut Holding SpA (Capital markets) | | 1,481,600 | | | 25,299 |
Credito Emiliano SpA (Commercial banks) | | 1,379,400 | | | 19,543 |
Luxottica Group SpA (Textiles, apparel & luxury goods) | | 1,049,400 | | | 40,766 |
| | | | | |
Issuer | | Shares | | Value |
| |
Common Stocks—Europe—(continued) | | | |
Italy—(continued) | | | | | |
Saipem SpA (Energy equipment & services) | | 3,308,000 | | $ | 112,870 |
Tod’s SpA (Textiles, apparel & luxury goods) | | 246,700 | | | 22,015 |
| | | | | |
| | | | | 220,493 |
| | | | | |
Netherlands—1.2% | | | | | |
*Qiagen NV (Life science tools & services) | | 1,227,600 | | | 22,055 |
Royal Numico NV (Food products) | | 861,800 | | | 44,784 |
*Tomtom NV (Software) | | 432,500 | | | 22,055 |
| | | | | |
| | | | | 88,894 |
| | | | | |
Norway—0.8% | | | | | |
Acergy S.A. (Energy equipment & services) | | 1,767,700 | | | 39,796 |
*Electromagnetic GeoServices AS (Energy equipment & services) | | 1,033,600 | | | 20,858 |
| | | | | |
| | | | | 60,654 |
| | | | | |
Spain—1.7% | | | | | |
Grifols S.A. (Biotechnology) | | 2,046,412 | | | 44,334 |
Industria De Textile (Specialty retail) | | 849,600 | | | 50,007 |
Tecnicas Reunidas S.A. (Construction & engineering) | | 409,100 | | | 27,498 |
| | | | | |
| | | | | 121,839 |
| | | | | |
Sweden—1.0% | | | | | |
Ericsson (LM) (Communications equipment) | | 11,691,000 | | | 46,634 |
Hemtex AB (Specialty retail) | | 331,300 | | | 6,347 |
Nobia AB (Specialty retail) | | 1,783,950 | | | 22,218 |
| | | | | |
| | | | | 75,199 |
| | | | | |
Switzerland—6.2% | | | | | |
ABB Ltd. (Electrical equipment) | | 5,645,100 | | | 127,284 |
*Barry Callebaut AG (Food products) | | 35,550 | | | 26,911 |
EFG International (Capital markets) | | 789,700 | | | 36,311 |
Geberit AG (Building products) | | 196,280 | | | 33,444 |
Kuehne & Nagel International AG (Marine) | | 670,940 | | | 61,795 |
Nobel Biocare Holdings AG (Health care equipment & supplies) | | 109,950 | | | 35,891 |
Partners Group Global Opporunites, Ltd. (Capital markets) | | 217,278 | | | 29,155 |
Roche Holdings AG (Pharmaceuticals) | | 427,700 | | | 75,783 |
SGS S.A. (Commercial services & supplies) | | 18,710 | | | 22,124 |
| | | | | |
| | | | | 448,698 |
| | | | | |
United Kingdom—17.6% | | | | | |
Amlin plc (Insurance) | | 4,931,800 | | | 27,648 |
Ashmore Group plc (Capital markets) | | 2,382,800 | | | 12,839 |
*Autonomy Corporation plc (Software) | | 2,136,500 | | | 30,646 |
BG Group plc (Oil, gas & consumable fuels) | | 6,209,200 | | | 101,784 |
*Blinkx plc (Internet software & services) | | 3,836,900 | | | 3,352 |
*BlueBay Asset Management plc (Capital markets) | | 1,716,900 | | | 16,967 |
*Cairn Energy plc (Oil, gas & consumable fuels) | | 855,481 | | | 30,154 |
Capita Group plc (Commercial services & supplies) | | 5,613,500 | | | 81,490 |
Carphone Warehouse Group plc (Specialty retail) | | 4,517,180 | | | 29,692 |
See accompanying Notes to Financial Statements.
34 Semi-Annual Report | June 30, 2007 |
International Growth Fund
Portfolio of Investments, June 30, 2007 (all dollar amounts in thousands) (unaudited)
| | | | | |
Issuer | | Shares | | Value |
| |
Common Stocks—Europe—(continued) | | | |
United Kingdom—(continued) | | | | | |
Carter & Carter Group plc (Commercial services & supplies) | | 515,300 | | $ | 4,955 |
Detica Group plc (IT services) | | 2,104,700 | | | 16,208 |
Domino’s Pizza UK & IRL plc (Hotels, restaurants, & leisure) | | 2,850,540 | | | 15,837 |
HBOS plc (Commercial banks) | | 3,167,400 | | | 62,300 |
Homeserve plc (Commercial services & supplies) | | 693,100 | | | 24,856 |
Man Group plc (Capital markets) | | 6,959,600 | | | 84,656 |
Michael Page International (Commercial services & supplies) | | 4,596,500 | | | 48,290 |
Northern Rock plc (Thrifts & mortgage finance) | | 467,850 | | | 8,095 |
Reckitt Benckiser plc (Household products) | | 2,414,300 | | | 132,171 |
Restaurant Group plc (Hotels, restaurants, & leisure) | | 2,252,000 | | | 14,856 |
Rightmove plc (Media) | | 1,574,511 | | | 19,743 |
*Rolls-Royce Group plc (Aerospace & defense) | | 9,003,300 | | | 96,943 |
*Rolls-Royce Group plc, Class “B” (Aerospace & defense) | | 532,995,360 | | | 1,070 |
Rotork plc (Electronic equipment & instruments) | | 1,579,064 | | | 28,849 |
RPS Group plc (Commercial services & supplies) | | 3,545,000 | | | 24,874 |
Serco Group plc (Commercial services & supplies) | | 4,877,209 | | | 43,966 |
Tesco plc (Food & staples retailing) | | 16,116,300 | | | 134,839 |
Tullow Oil plc (Oil, gas & consumable fuels) | | 2,909,190 | | | 28,402 |
Ultra Electronic Holdings plc (Aerospace & defense) | | 879,900 | | | 19,026 |
Victrex plc (Chemicals) | | 611,700 | | | 8,745 |
VT Group plc (Aerospace & defense) | | 2,472,900 | | | 29,080 |
Xstrata plc (Metals & mining) | | 1,662,500 | | | 98,973 |
| | | | | |
| | | | | 1,281,306 |
| | | | | |
| | |
Emerging Asia—10.9% | | | | | |
China—3.8% | | | | | |
*Belle International Holdings Limited (Specialty retail) | | 24,204,000 | | | 26,714 |
China Infrastructure Machinery Holdings, Ltd. (Machinery) | | 9,598,000 | | | 20,987 |
China Mengniu Dairy Co. (Food products) | | 8,825,000 | | | 30,449 |
China Oilfield Services Limited (Energy equipment & services) | | 11,974,000 | | | 12,087 |
China Vanke Company Ltd. (Real estate management & development) | | 18,503,550 | | | 38,300 |
*Focus Media Holding Ltd.—ADR (Media) | | 362,800 | | | 18,321 |
*Foxconn International (Communications equipment) | | 11,594,000 | | | 33,217 |
Fu Ji Food & Catering (Hotels, restaurants & leisure) | | 6,424,000 | | | 22,117 |
Hopson Development Holdings Ltd. (Real estate management & development) | | 1,925,900 | | | 5,416 |
Lee and Man Paper Manufacturing Ltd. (Containers & packaging) | | 6,734,000 | | | 18,646 |
| | | | | |
Issuer | | Shares | | Value |
| |
Common Stocks—Emerging Asia—(continued) | | | |
China—(continued) | | | | | |
Li Ning Co. Ltd. (Leisure equipment & products) | | 9,334,000 | | $ | 22,635 |
Parkson Retail Group Ltd. (Multiline retail) | | 3,268,000 | | | 20,938 |
Wumart Stores, Inc., Class “H” (Food & staples retailing) ** | | 13,480,000 | | | 4,310 |
| | | | | |
| | | | | 274,137 |
| | | | | |
India—2.5% | | | | | |
Bharat Heavy Electricals Ltd. (Electrical equipment) | | 496,800 | | | 18,790 |
*Bharti Airtel Ltd. (Wireless telecommunication services) | | 1,788,200 | | | 36,755 |
Dabur India Ltd. (Personal products) | | 8,037,450 | | | 20,311 |
Financial Technologies (India) Ltd. (Software) | | 396,500 | | | 29,400 |
Housing Development Finance Corp. (Thrifts & mortgage finance) | | 374,800 | | | 18,714 |
Infosys Technologies, Ltd. (IT services) | | 734,348 | | | 34,755 |
Unitech Limited (Construction & engineering) | | 1,620,700 | | | 20,047 |
| | | | | |
| | | | | 178,772 |
| | | | | |
Indonesia—0.9% | | | | | |
PT Bank Rakyat Indonesia (Commercial banks) | | 36,379,500 | | | 23,169 |
PT Telekomunikasi Tbk (Diversified telecommunication services) | | 39,130,600 | | | 42,448 |
| | | | | |
| | | | | 65,617 |
| | | | | |
Malaysia—1.0% | | | | | |
Bumiputra Commerce Holdings Bhd (Commercial banks) | | 14,428,800 | | | 48,891 |
Kuala Lumpur Kepong Bhd (Food products) | | 4,577,550 | | | 17,120 |
Zelan Bhd (Construction & engineering) | | 2,463,300 | | | 8,585 |
| | | | | |
| | | | | 74,596 |
| | | | | |
South Korea—0.8% | | | | | |
*NHN Corp. (Internet software & services) | | 323,320 | | | 58,852 |
| | | | | |
Taiwan—1.9% | | | | | |
Himax Technologies, Inc.— ADR (Semiconductors & semiconductor equipment) | | 927,400 | | | 5,351 |
Hon Hai Precision Industry (Electronic equipment & instrument) | | 8,909,780 | | | 76,959 |
Mediatek Inc. (Semiconductors & semiconductor equipment) | | 3,651,450 | | | 56,811 |
| | | | | |
| | | | | 139,121 |
| | | | | |
| | |
Asia—10.3% | | | | | |
Australia—5.3% | | | | | |
Allco Finance Group, Limited (Capital markets) | | 2,763,604 | | | 24,873 |
Macquarie Bank, Ltd. (Capital markets) | | 1,903,200 | | | 136,697 |
Seek Ltd. (Commercial services & supplies) | | 4,228,163 | | | 26,398 |
United Group Ltd. (Construction & engineering) | | 1,958,500 | | | 27,600 |
Woolworths Limited (Food & staples retailing) | | 5,153,300 | | | 117,768 |
WorleyParsons, Ltd. (Energy equipment & services) | | 1,698,222 | | | 48,850 |
| | | | | |
| | | | | 382,186 |
| | | | | |
See accompanying Notes to Financial Statements.
June 30, 2007 | William Blair Funds 35 |
International Growth Fund
Portfolio of Investments, June 30, 2007 (all dollar amounts in thousands) (unaudited)
| | | | | |
Issuer | | Shares | | Value |
| |
Common Stocks—Asia—(continued) | | | |
Hong Kong—1.6% | | | | | |
Esprit Holdings Ltd. (Specialty retail) | | 6,103,000 | | $ | 77,541 |
Li & Fung Ltd. (Distributors) | | 11,153,200 | | | 40,145 |
| | | | | |
| | | | | 117,686 |
| | | | | |
Singapore—3.4% | | | | | |
Capitaland, Ltd. (Real estate management & development) | | 26,969,000 | | | 142,884 |
Olam International, Ltd. (Food & staples retailing) | | 11,735,000 | | | 23,672 |
Osim International Ltd. (Specialty retail) | | 9,957,240 | | | 4,631 |
Raffles Education Corp. Ltd. (Diversified consumer services) | | 11,779,000 | | | 17,561 |
Singapore Exchange, Ltd. (Diversified financial services) | | 9,054,000 | | | 58,089 |
| | | | | |
| | | | | 246,837 |
| | | | | |
Japan—9.6% | | | | | |
Aeon Mall Co., Ltd. (Real estate management & development) | | 1,003,800 | | | 30,863 |
DeNA Co., Ltd. (Internet & catalog retail) | | 5,283 | | | 18,317 |
Denso Corporation (Auto components) | | 1,479,600 | | | 57,868 |
En-Japan Inc. (Commercial services & supplies) | | 4,504 | | | 16,782 |
Fujimi, Inc. (Chemicals) | | 402,500 | | | 10,585 |
*Fukuoka Financial Group, Inc. (Commercial banks) | | 7,270,000 | | | 48,063 |
Honeys Company, Ltd. (Specialty retail) | | 370,400 | | | 14,938 |
*Jupiter Telecommunications Co., Ltd. (Media) | | 46,518 | | | 38,431 |
*K.K. DaVinci Advisors (Real estate management & development) | | 18,402 | | | 16,065 |
Kenedix, Inc. (Real estate management & development) | | 5,962 | | | 11,097 |
Komatsu Ltd. (Machinery) | | 2,267,800 | | | 65,728 |
Miraial Company, Ltd. (Semiconductors & semiconductor equipment) | | 85,300 | | | 11,788 |
Nakanishi Inc. (Health care equipment & supplies) | | 106,000 | | | 13,255 |
Nintendo Co., Ltd. (Software) | | 231,800 | | | 84,571 |
Nitori Company Ltd. (Specialty retail) | | 409,920 | | | 20,464 |
Orix Corporation (Consumer finance) | | 412,400 | | | 108,703 |
Park 24 Co., Ltd. (Commercial services & supplies) | | 974,900 | | | 9,787 |
Suruga Bank (Commercial banks) | | 4,063,000 | | | 51,204 |
Yamada Denki Company (Specialty retail) | | 532,980 | | | 55,663 |
Zensho Company, Ltd. (Hotels, restaurants, & leisure) | | 1,196,400 | | | 11,373 |
| | | | | |
| | | | | 695,545 |
| | | | | |
| | |
Emerging Latin America—6.8% | | | | | |
Brazil—3.3% | | | | | |
*Anhanguera Eduacional Participacoes S.A. (Diversified consumer services) | | 1,224,600 | | | 17,141 |
*BR Malls Participacoes S.A. (Real estate management & development) | | 1,939,800 | | | 25,240 |
Companhia Vale do Rio Doce .—ADR (Metals & mining) | | 1,941,700 | | | 86,503 |
Cyrela Brazil Realty S.A. (Household durables) | | 1,477,200 | | | 18,333 |
| | | | | |
Issuer | | Shares | | Value |
|
Common Stocks—Emerging Latin America—(continued) |
Brazil—(continued) | | | | | |
Iguatemi Empresa de Shopping Centers S.A. (Commercial services & supplies) | | 844,900 | | $ | 15,251 |
Localiza Rent a Car S.A. (Road & rail) | | 1,509,900 | | | 17,032 |
Lojas Renner S.A. (Multiline retail) | | 1,123,500 | | | 20,851 |
Submarino S.A.(Internet & catalog retail) | | 636,400 | | | 26,475 |
Totvs S.A. (Software) | | 343,900 | | | 11,194 |
| | | | | |
| | | | | 238,020 |
| | | | | |
Chile—0.5% | | | | | |
*Cencosud S.A.—ADR 144A (Specialty retail) | | 620,130 | | | 38,585 |
| | | | | |
Mexico—2.7% | | | | | |
America Movil S.A. (Wireless telecommunication services) | | 21,001,500 | | | 64,850 |
*Banco Compartamos S.A. de C.V. (Commercial banks) | | 2,152,200 | | | 13,447 |
*Desarrolladora Homex S.A.—ADR (Household durables) | | 327,400 | | | 19,837 |
Grupo Aeropuertario Del—ADR (Transportation infrastructure) | | 262,800 | | | 12,962 |
*Urbi Desarrollos Urbanos S.A. (Household durables) | | 8,358,600 | | | 38,491 |
Walmart de Mexico (Food & staples retailing) | | 12,629,600 | | | 47,930 |
| | | | | |
| | | | | 197,517 |
| | | | | |
Panama—0.3% | | | | | |
Copa Holdings S.A., Class “A” (Airlines)† | | 369,900 | | | 24,872 |
| | | | | |
| |
Emerging Europe, Mid-East, Africa—4.4% | | | |
Czech Republic—0.2% | | | | | |
*Central European Media Enterprises Ltd.
Class “A” (Media)† | | 177,000 | | | 17,272 |
| | | | | |
Egypt—0.8% | | | | | |
Egyptian Financial Group- Hermes Holding (Capital markets) | | 2,457,100 | | | 19,808 |
Orascom Construction Industries (Construction & engineering) | | 533,100 | | | 34,849 |
| | | | | |
| | | | | 54,657 |
| | | | | |
Kazakhstan—0.4% | | | | | |
*Kazkommertsbank—GDR 144A (Commercial banks) | | 1,452,951 | | | 31,965 |
| | | | | |
Russia—1.0% | | | | | |
*CTC Media, Inc. (Media)† | | 775,352 | | | 21,043 |
Sberbank—CLS (Commercial banks) | | 8,598 | | | 33,532 |
*X5 Retail Group N.V. (Food & staples retailing) | | 701,300 | | | 20,548 |
| | | | | |
| | | | | 75,123 |
| | | | | |
South Africa—1.6% | | | | | |
MTN Group, Ltd. (Wireless telecommunication services) | | 3,458,200 | | | 47,007 |
Naspers Ltd. (Media) | | 887,590 | | | 22,804 |
The Spar Group Limited (Food & staples retailing) | | 1,924,625 | | | 14,400 |
See accompanying Notes to Financial Statements.
36 Semi-Annual Report | June 30, 2007 |
International Growth Fund
Portfolio of Investments, June 30, 2007 (all dollar amounts in thousands) (unaudited)
| | | | | | |
Issuer | | Shares or
Principal
Amount | | Value |
|
Common Stocks—Emerging Europe, Mid-East, Africa—(continued) |
South Africa—(continued) | | | | | | |
Truworths International Ltd. (Specialty retail) | | | 4,763,400 | | $ | 24,505 |
Wilson Bayly Holmes-Ovcon (Construction & engineering) | | | 737,653 | | | 10,773 |
| | | | | | |
| | | | | | 119,489 |
| | | | | | |
United Arab Emirates—0.4% | | | | | | |
Emaar Properties PJSC (Real estate management & development) | | | 8,849,400 | | | 28,551 |
| | | | | | |
| | |
Canada—3.7% | | | | | | |
Brookfield Asset Management, Inc. Class “A” (Real estate management & development) | | | 1,511,050 | | | 60,442 |
Canadian Western Bank (Commercial banks) | | | 542,300 | | | 14,376 |
*Gildan Activewear, Inc. (Textiles,apparel & luxury goods) | | | 803,200 | | | 27,423 |
Rogers Communications, Inc. Class “B” (Wireless telecommunication services) | | | 2,467,800 | | | 105,222 |
Shoppers Drug Mart Corp. (Food & staples retailing) | | | 1,395,700 | | | 64,646 |
| | | | | | |
| | | | | | 272,109 |
| | | | | | |
Total Common Stock—96.5%
(cost $4,963,702) | | | 7,032,738 |
| | | | | | |
| | |
Preferred Stock | | | | | | |
Brazil—1.3% | | | | | | |
Banco Itau Holding (Commercial banks) | | | 840,600 | | | 37,324 |
*Banco Sofisa S.A. (Commercial banks) | | | 1,775,800 | | | 13,072 |
Petroleo Brasileiro S.A. (Oil, gas & consumable fuels) | | | 1,740,700 | | | 46,473 |
| | | | | | |
| | | | | | 96,869 |
| | | | | | |
Total Preferred Stock—1.3%
(cost $55,410) | | | 96,869 |
| | | | | | |
| | |
Investment in Affiliate | | | | | | |
William Blair Ready Reserves Fund | | | 5,676,235 | | | 5,676 |
| | | | | | |
Total Investment in Affiliate—0.1%
(cost $5,676) | | | 5,676 |
| | | | | | |
| | |
Short-Term Investments | | | | | | |
American Express Demand Note, VRN 5.170% due 07/02/07 | | $ | 49,668,000 | | $ | 49,668 |
Prudential Funding Demand Note, VRN 5.305% due 07/02/07 | | | 45,352,000 | | | 45,352 |
| | | | | | |
Total Short-term Investments—1.3%
(cost $95,020) | | | 95,020 |
| | | | | | |
| | | | | | |
Issuer | |
Principal
Amount | | Value |
| | |
Repurchase Agreement | | | | | | |
Investors Bank & Trust Company, 4.50% dated 06/29/2007, due 07/02/2007, repurchase price $13,139, collateralized by FN, Pool# 820971 | | $ | 13,134,245 | | $ | 13,134 |
| | | | | | |
Total Repurchase Agreement—0.2%
(cost $13,134) | | | 13,134 |
| | | | | | |
Total Investments—99.4%
(cost $5,132,942) | | | 7,243,437 |
Cash and other assets, less liabilities—0.6% | | | 40,964 |
| | | | | | |
Net assets—100.0% | | $ | 7,284,401 |
| | | | | | |
* Non-income producing securities
ADR = American Depository Receipt
GDR = Global Depository Receipt
VRN = Variable Rate Note
† = U.S. listed foreign security
** Fair valued pursuant to Valuation Procedures adopted by Board of Trustees. This holding represents 0.06% of the Fund’s net assets at June 30, 2007. This security was also deemed illiquid pursuant to liquidity procedures securities pursuant to Valuation Procedures adopted by the Board of Trustees.
For securities primarily traded on exchanges or markets that close before the close of regular trading on the New York Stock Exchange, the Fund uses an independent pricing service on a daily basis to fair value price the securities pursuant to Valuation Procedures adopted by the Board of Trustees.
At June 30, 2007 the Fund’s Portfolio of Investments includes the following industry categories:
| | |
Financials | | 25.7% |
Consumer Discretionary | | 15.9% |
Consumer Staples | | 15.1% |
Industrials | | 14.7% |
Information Technology | | 8.2% |
Energy | | 6.8% |
Telecommunication Services | | 4.6% |
Health Care | | 4.0% |
Materials | | 3.1% |
Utilities | | 1.9% |
| | |
| | 100.0% |
| | |
At June 30, 2007 the Fund’s Portfolio of Investments includes the following currency categories:
| | |
Euro | | 25.7% |
British Pound Sterling | | 18.0% |
Japanese Yen | | 9.8% |
Swiss Franc | | 6.3% |
Australian Dollar | | 5.4% |
Hong Kong Dollar | | 5.2% |
United States Dollar | | 4.6% |
Canadian Dollar | | 3.8% |
Singapore Dollar | | 3.5% |
Brazilian Real | | 3.5% |
Indian Rupee | | 2.5% |
Mexico Nuevo Peso | | 2.3% |
Taiwan Dollar | | 1.9% |
South African Rand | | 1.7% |
Swedish Krona | | 1.1% |
All other currencies | | 4.7% |
| | |
| | 100.0% |
| | |
See accompanying Notes to Financial Statements.
June 30, 2007 | William Blair Funds 37 |
W. George Greig
INTERNATIONAL EQUITY FUND
The International Equity Fund invests primarily in common stocks of companies included in the Morgan Stanley Capital International All Country World ex-U.S. Index.
AN OVERVIEW FROM THE PORTFOLIO MANAGER
See page 30 for the International Markets Overview.
How did the Fund perform over the first half of the year? How did the Fund’s performance compare to its benchmark?
The International Equity Fund posted a 9.47% increase for the six months ended June 30, 2007. By comparison, the Fund’s benchmark, the Morgan Stanley Capital International (MSCI) All Country World (ACWI) ex-US Index, rose 12.58%.
What were the most significant factors impacting international markets during the first six months of the year?
Non-US markets were strong during the first half of 2007, buoyed by strong results in emerging markets, Canada, Europe and the Pacific Rim. However, the first six months were punctuated by periods of volatility as investors were concerned in the first quarter about the US subprime mortgage market resulting in slowing US consumer demand and its impact on global growth. In the second quarter, investors became concerned about the prospects of a protracted global increasing interest rate environment as the US economy appeared to accelerate and demand for industrial and consumer goods and services remained strong globally. In addition, worries about the impact of US subprime mortgages on the financial industry, including hedge funds, caused apprehension regarding overall financial system risk. Despite these fears, the market returned 12.58% through June 30, as measured by the MSCI ACWI ex-US Index, with most of the performance coming during the second quarter. Emerging markets outpaced their developed counterparts, returning 17.75%, as measured by the MSCI Emerging Markets Index compared to the MSCI Europe, Asia and Far East (EAFE) Index, which rose 11.09% in US dollar terms. Materials, Industrials and Energy were the strongest sectors year to date, while Financials and Health Care lagged.
What factors were behind the Fund’s performance versus the benchmark?
Within this environment, the Fund trailed the benchmark. The primary detractor to relative results was the Fund’s overall sector positioning during the second quarter despite strong stock selection across a number of sectors. The Fund underweighted in Materials and Energy, which gained and overweighted in the Consumer sectors, which lagged. In addition, Materials and Consumer stock selection, while strong on an absolute basis, trailed comparable Index results. Within Materials, Japanese exposure dragged on results, as did the absence of exposure in Canada and Pacific ex-Japan. Within Consumer, Japanese Consumer Discretionary exposure and stock selection was a primary detractor, as was European stock selection in Consumer Discretionary. While stock selection was strong across a number of sectors during the first half of the year, the most significant value added was in Health Care, Energy, and Telecommunication Services. Within Health Care, the focus on diagnostics and medical technology at the expense of pharmaceuticals added value, while energy stock selection benefited from the focus on energy services and high production growth exploration and production companies. European alternative cable providers and emerging markets mobile phone companies, which have benefited from strong subscriber growth, augmented strong Telecommunication Services stock selection. The Fund’s higher weightings in Industrials added value, as did its underweighting in the underperforming Financials sector. At the margin, regional positioning also added value during the period.
38 Semi-Annual Report | June 30, 2007 |
How is the Fund positioned?
As of June 30, the Fund was overweighted in Pacific ex-Japan, emerging Asia and Latin America versus the Index, and significantly underweighted in Japan. These weightings were largely the result of relative growth opportunities available in these markets. The Fund maintained its focus on the Consumer area, particularly in European and Pacific ex-Japan Consumer Staples companies. In addition, Industrials increased to a larger overweighting in the Fund, with a concentration on companies exposed to the aircraft, commodity, and energy complexes, coupled with those exposed to additional infrastructure spending globally. Financials, although underweighted versus the Index, was the largest sector at approximately 26% of the Fund, and was focused in companies exposed to capital markets, real estate, and securities exchanges. While the weighting in Materials remained underweighted versus the benchmark, this allocation increased as additional names were added in these sectors during the quarter.
June 30, 2007 | William Blair Funds 39 |
International Equity Fund
Performance Highlights (unaudited)
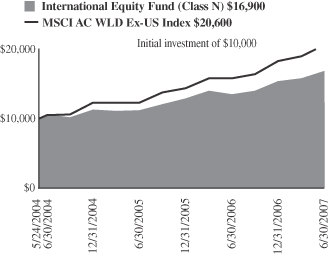
Average Annual Total Return at 6/30/2007
| | | | | | | | | | | | |
| | | Year to
Date | | | 1
Year | | | 3
Year | | | Since Inception(a) | |
International Equity Fund
Class N | | 9.47 | % | | 25.47 | % | | 16.94 | % | | 18.34 | % |
International Equity Fund
Class I | | 9.60 | | | 25.74 | | | 17.32 | | | 18.70 | |
MSCI All Country World Ex-US | | 12.58 | | | 30.15 | | | 25.03 | | | 25.95 | |
| | (a) | | For the period from May 24, 2004 to June 30, 2007. |
Performance cited represents past performance. Past performance does not guarantee future results and current performance may be lower or higher than the data quoted. Results shown are average annual returns, which assume reinvestment of dividends and capital gains. Investment returns and principal will fluctuate and you may have a gain or loss when you sell shares. For the most current month-end performance information, please call 1-800-742-7272, or visit our Web site at www.williamblairfunds.com. From time to time the investment advisor may waive fees or reimburse expenses for the Fund. Without these waivers, performance would be lower. International investing involves special risk considerations, including currency fluctuations, lower liquidity, economic and political risk. Class N shares are available to the general public without a sales load. Class I shares are available to certain institutional investors and advisory clients of William Blair & Company L.L.C. without a sales load or distribution (12b-1) or service fees.
The performance highlights and graph presented above do not reflect the deduction of taxes that a shareholder would pay on fund distributions or the redemption of fund shares.
The Morgan Stanley Capital International (MSCI) All Country World Ex-US Index is an unmanaged index that includes developed and emerging markets and reduced Japanese portion, making it more comparable to the International Equity Fund in terms of investment approach.
The Lipper International Index is a composite of international growth mutual funds.
This report identifies the Fund’s investments on June 30, 2007. These holdings are subject to change. Not all stocks in the Fund performed the same, nor is there any guarantee that these stocks will perform as well in the future. Market forecasts provided in this report may not necessarily come to pass.
Sector Diversification (unaudited)
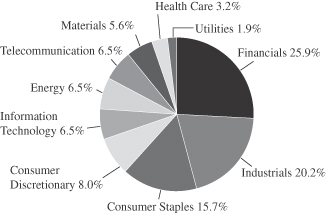
The sector diversification shown is based on the total investment portfolio.
40 Semi-Annual Report | June 30, 2007 |
International Equity Fund
Portfolio of Investments, June 30, 2007 (all dollar amounts in thousands) (unaudited)
| | | | | |
Issuer | | Shares | | Value |
| | |
Common Stocks—Europe—34.6% | | | | | |
Austria—0.7% | | | | | |
Raiffeisen International Bank (Commercial banks) | | 15,700 | | $ | 2,480 |
| | | | | |
Belguim—1.7% | | | | | |
InBev N.V. (Beverages) | | 74,500 | | | 5,901 |
| | | | | |
France—9.7% | | | | | |
AXA (Insurance) | | 144,200 | | | 6,199 |
Essilor International (Health care equipment & supplies) | | 29,600 | | | 3,526 |
Eurazeo (Diversified financial services) | | 20,230 | | | 2,923 |
Iliad S.A. (Diversified telecommunication services) | | 19,100 | | | 1,924 |
L’Oreal S.A. (Personal products) | | 57,700 | | | 6,820 |
Schneider Electric SA (Electrical equipment) | | 49,700 | | | 6,963 |
Veolia Environnement (Multi-utilities) | | 83,588 | | | 6,565 |
| | | | | |
| | | | | 34,920 |
| | | | | |
Germany—4.6% | | | | | |
DaimlerChrysler AG (Automobiles) | | 68,900 | | | 6,374 |
*Q-Cells AG (Electrical equipment) | | 14,000 | | | 1,208 |
Siemens AG (Industrial conglomerates) | | 61,100 | | | 8,793 |
| | | | | |
| | | | | 16,375 |
| | | | | |
Greece—1.0% | | | | | |
National Bank of Greece (Commercial banks) | | 61,660 | | | 3,511 |
| | | | | |
Ireland—1.0% | | | | | |
Anglo Irish Bank plc (Commercial banks) | | 175,600 | | | 3,604 |
| | | | | |
Italy—1.9% | | | | | |
Saipem SpA (Energy equipment & services) | | 203,600 | | | 6,947 |
| | | | | |
Netherlands—1.0% | | | | | |
Randstad N.V. (Commercial services & supplies) | | 44,400 | | | 3,514 |
| | | | | |
Norway—0.5% | | | | | |
Acergy S.A. (Energy equipment & services) | | 74,500 | | | 1,677 |
| | | | | |
Spain—1.4% | | | | | |
Industria De Textile (Specialty retail) | | 84,100 | | | 4,950 |
| | | | | |
Switzerland—9.8% | | | | | |
ABB Ltd. (Electrical equipment) | | 423,000 | | | 9,538 |
EFG International (Capital markets) | | 48,300 | | | 2,221 |
Geberit AG (Building products) | | 9,700 | | | 1,653 |
Julius Baer Holding AG (Capital markets) | | 42,500 | | | 3,041 |
Kuehne & Nagel International AG (Marine) | | 33,700 | | | 3,104 |
Nestle S.A. (Food products) | | 14,660 | | | 5,570 |
Nobel Biocare Holding AG (Health care equipment & supplies) | | 5,740 | | | 1,874 |
Roche Holdings AG (Pharmaceuticals) | | 30,450 | | | 5,395 |
SGS S.A. (Commercial services & supplies) | | 2,181 | | | 2,579 |
| | | | | |
| | | | | 34,975 |
| | | | | |
| | |
United Kingdom—16.6% | | | | | |
BG Group plc (Oil, gas & consumable fuels) | | 536,600 | | | 8,796 |
Capita Group plc (Commercial services & supplies) | | 281,600 | | | 4,088 |
Carphone Warehouse Group plc (Specialty retail) | | 231,600 | | | 1,522 |
HBOS plc (Commercial banks) | | 385,400 | | | 7,581 |
Man Group plc (Capital markets) | | 351,300 | | | 4,273 |
| | | | | |
Issuer | | Shares | | Value |
|
Common Stocks—United Kingdom—15.3%—(continued) |
Reckitt Benckiser plc (Household products) | | 162,500 | | $ | 8,896 |
*Rolls-Royce Group plc (Aerospace & defense) | | 711,300 | | | 7,659 |
*Rolls-Royce Group plc, Class “B” (Aerospace & defense) | | 39,877,120 | | | 80 |
Rotork plc (Electronic equipment & instruments) | | 67,200 | | | 1,228 |
Serco Group plc (Commercial services & supplies) | | 210,700 | | | 1,899 |
Tesco plc (Food & staples retailing) | | 1,063,800 | | | 8,900 |
Xstrata plc (Metal & mining) | | 82,100 | | | 4,888 |
| | | | | |
| | | | | 59,810 |
| | | | | |
| | |
Japan—12.4% | | | | | |
Aeon Mall Co., Ltd. (Real estate management & development) | | 76,200 | | | 2,343 |
FANUC Ltd. (Machinery) | | 52,300 | | | 5,398 |
*Fukuoka Financial Group, Inc. (Commercial banks) | | 642,000 | | | 4,244 |
Honeys Company, Ltd. (Specialty retail) | | 18,200 | | | 734 |
*Jupiter Telecommunications Co., Ltd. (Media) | | 2,503 | | | 2,068 |
*K.K. DaVinci Advisors (Real estate management & development) | | 761 | | | 664 |
Komatsu Ltd. (Machinery) | | 154,900 | | | 4,489 |
NGK Insulators Ltd (Machinery) | | 185,000 | | | 4,543 |
Nintendo Co., Ltd. (Software) | | 17,400 | | | 6,348 |
Orix Corporation (Consumer finance) | | 29,800 | | | 7,855 |
Shin-Etsu Chemical Co., Ltd. (Chemicals) | | 49,500 | | | 3,534 |
Suruga Bank Ltd. (Commercial banks) | | 164,000 | | | 2,067 |
| | | | | |
| | | | | 44,287 |
| | | | | |
| | |
Asia—11.2% | | | | | |
Australia—6.7% | | | | | |
Allco Finance Group Limited (Capital markets) | | 143,800 | | | 1,294 |
Macquarie Bank Ltd. (Capital markets) | | 106,300 | | | 7,635 |
QBE Insurance Group Limited (Insurance) | | 163,100 | | | 4,303 |
Toll Holdings Limited (Air freight & logistics) | | 236,900 | | | 2,903 |
Woolworths Limited (Food & staples retailing) | | 304,600 | | | 6,961 |
WorleyParsons, Ltd. (Energy equipment & services) | | 36,500 | | | 1,050 |
| | | | | |
| | | | | 24,146 |
| | | | | |
Hong Kong—2.2% | | | | | |
Esprit Holdings Ltd. (Specialty retail) | | 310,500 | | | 3,945 |
Li & Fung Ltd. (Distributors) | | 1,103,200 | | | 3,971 |
| | | | | |
| | | | | 7,916 |
| | | | | |
Singapore—2.3% | | | | | |
Capitaland, Ltd. (Real estate management & development) | | 1,537,000 | | | 8,143 |
| | | | | |
| | |
Emerging Asia—10.2% | | | | | |
China—2.2% | | | | | |
China Communications Construction Co. Ltd. (Construction & engineering) | | 1,299,000 | | | 2,328 |
China Merchants Bank Co. Ltd (Commercial banks) | | 840,900 | | | 2,561 |
See accompanying Notes to Financial Statements.
June 30, 2007 | William Blair Funds 41 |
International Equity Fund
Portfolio of Investments, June 30, 2007 (all dollar amounts in thousands) (unaudited)
| | | | | |
Issuer | |
Shares | | Value |
|
Common Stocks—Emerging Asia—10.2%—(continued) |
China—(continued) | | | | | |
*Focus Media Holding Ltd.—ADR (Media) | | 42,400 | | $ | 2,141 |
Hopson Development Holding Ltd. (Real estate management & development) | | 93,100 | | | 262 |
Nine Dragons Papers Hldgs Lt (Paper & forest product) | | 276,000 | | | 644 |
Shandong Weigao Gp Medical (Health care equipment & supplies) | | 25,800 | | | 58 |
| | | | | |
| | | | | 7,994 |
| | | | | |
India—3.0% | | | | | |
*Bharti Airtel Limited (Wireless telecommunication services) | | 168,973 | | | 3,473 |
Infosys Technologies Ltd. (IT services) | | 73,400 | | | 3,474 |
Vedanta Resources Plc (Metals & mining) | | 118,200 | | | 3,810 |
| | | | | |
| | | | | 10,757 |
| | | | | |
Indonesia—1.1% | | | | | |
PT Bank Rakyat Indonesia (Commercial banks) | | 2,629,000 | | | 1,674 |
PT Telekomunikasi Indonesia Tbk (Diversified telecommunication services) | | 2,281,000 | | | 2,474 |
| | | | | |
| | | | | 4,148 |
| | | | | |
South Korea—0.5% | | | | | |
*NHN Corp. (Internet software & services) | | 11,072 | | $ | 2,015 |
| | | | | |
Malaysia—0.8% | | | | | |
Bumiputra Commerce Holdings Bhd (Commercial banks) | | 469,400 | | | 1,591 |
Kuala Lumpur Kepong Bhd (Food product) | | 313,700 | | | 1,173 |
| | | | | |
| | | | | 2,764 |
| | | | | |
Taiwan—2.6% | | | | | |
Hon Hai Precision Industry Corp. (Electronic equipment & instruments) | | 577,117 | | | 4,985 |
Mediatek, Inc. (Semiconductors & semiconductor equipment) | | 170,000 | | | 2,645 |
Taiwan Semiconductor Manufacturing Co. Ltd. (Semiconductors & semiconductor equipment) | | 741,000 | | | 1,599 |
| | | | | |
| | | | | 9,229 |
| | | | | |
| | |
Emerging Latin America—5.4% | | | | | |
Brazil—1.8% | | | | | |
Companhia Vale do Rio Doce—ADR (Metals & mining) | | 146,300 | | | 6,518 |
| | | | | |
Chile—0.5% | | | | | |
*Cencosud S.A.—ADR 144A (Specialty retail) | | 31,000 | | | 1,929 |
| | | | | |
Mexico—3.1% | | | | | |
America Movil S.A. (Wireless telecommunications services) | | 2,052,400 | | | 6,338 |
Walmart de Mexico (Food & staples retailing) | | 1,259,700 | | | 4,781 |
| | | | | |
| | | | | 11,119 |
| | | | | |
| | |
Canada—3.6% | | | | | |
Brookfield Asset Management, Inc. Class “A” (Real estate management & development) | | 112,850 | | | 4,514 |
Rogers Communications, Inc. Class “B” (Wireless telecommunication services) | | 123,200 | | | 5,253 |
| | | | | | |
Issuer | | Shares or
Principal
Amount | | Value |
|
Common Stocks—Canada—3.6%—(continued) |
Shoppers Drug Mart Corporation (Food & staples retailing) | | | 69,200 | | $ | 3,205 |
| | | | | | |
| | | | | | 12,972 |
| | | | | | |
Egypt—0.1% | | | | | | |
Egyptian Financial Group- Hermes Holding (Capital markets) | | | 30,474 | | $ | 246 |
| | | | | | |
South Africa—1.3% | | | | | | |
MTN Group, Ltd. (Wireless telecommunication services) | | | 219,400 | | | 2,982 |
Naspers Ltd. (Media) | | | 67,700 | | | 1,739 |
| | | | | | |
| | | | | | 4,721 |
| | | | | | |
Russia—0.4% | | | | | | |
* PIK Group (Real Estate management & development)** | | | 52,000 | | | 1,300 |
| | | | | | |
United Arab Emirates—0.7% | | | | | | |
Emaar Properties PJSC (Real estate management & development) | | | 805,200 | | | 2,598 |
| | | | | | |
Total Common Stock—95.2%
(cost $273,804) | | | 341,466 |
| | | | | | |
| | |
Preferred Stocks | | | | | | |
Brazil—0.7% | | | | | | |
Petroleo Brasileiro S.A. (Oil, gas & consumable fuels) | | | 91,400 | | | 2,440 |
| | | | | | |
Total Preferred Stocks—0.7%
(cost $1,525) | | | 2,440 |
| | | | | | |
| | |
Investment in Affiliate | | | | | | |
William Blair Ready Reserves Fund | | | 5,159,194 | | | 5,159 |
| | | | | | |
Total Investment in Affiliate—1.4%
(cost $5,159) | | | 5,159 |
| | | | | | |
| | |
Short-Term Investments | | | | | | |
American Express Demand Note, VRN, 5.170%, due 7/02/07 | | $ | 993,000 | | | 993 |
Prudential Funding Demand Note, VRN, 5.305%, due 7/02/07 | | | 1,072,000 | | | 1,072 |
| | | | | | |
Total Short-Term Investments—0.6%
(cost $2,065) | | | 2,065 |
| | | | | | |
Total Investments—97.9%
(cost $282,553) | | | 351,130 |
Cash and other assets, less liabilities—2.1% | | | 7,466 |
| | | | | | |
Net assets—100.0% | | $ | 358,596 |
| | | | | | |
*Non-income producing securities
ADR = American Depository Receipt
VRN = Variable Rate Note
** Fair valued pursuant to Valuation Procedures adopted by the Board of Trustees. This holding represents 0.36% of the Fund’s net assets at June 30, 2007. This security was also deemed illiquid pursuant to Liquidity Procedures adopted by the Board of Trustees.
See accompanying Notes to Financial Statements.
42 Semi-Annual Report | June 30, 2007 |
International Equity Fund
Portfolio of Investments, June 30, 2007 (all dollar amounts in thousands) (unaudited)
For securities primarily traded on exchanges or markets that close before the close of regular trading on the New York Stock Exchange, the Fund uses an independent pricing service on a daily basis to fair value price the securities pursuant to Valuation Procedures adopted by the Board of Trustees.
At June 30, 2007 the Fund’s Portfolio of Investments includes the following industry categories:
| | |
Financials | | 25.9% |
Industrials | | 20.2% |
Consumer Staples | | 15.7% |
Consumer Discretionary | | 8.0% |
Telecommunication Services | | 6.5% |
Information Technology | | 6.5% |
Energy | | 6.5% |
Materials | | 5.6% |
Health Care | | 3.2% |
Utilities | | 1.9% |
| | |
| | 100.0% |
| | |
At June 30, 2007 the Fund’s Portfolio of Investments includes the following currency categories:
| | |
Euro | | 23.9% |
British Pound Sterling | | 18.5% |
Japanese Yen | | 12.9% |
Swiss Franc | | 10.2% |
Australian Dollar | | 7.0% |
Hong Kong Dollar | | 4.0% |
Canadian Dollar | | 3.8% |
United States Dollar | | 3.5% |
Mexico Nuevo Peso | | 3.2% |
Taiwan Dollar | | 2.7% |
Singapore Dollar | | 2.4% |
Indian Rupee | | 2.0% |
South African Rand | | 1.4% |
Indonesian Rupiah | | 1.2% |
Other Currencies | | 3.3% |
| | |
| | 100.0% |
| | |
See accompanying Notes to Financial Statements.
June 30, 2007 | William Blair Funds 43 |

Jeffrey A. Urbina
INTERNATIONAL SMALL CAP GROWTH FUND
The International Small Cap Growth Fund primarily invests in a diversified portfolio of common stocks of small cap companies in developed and emerging markets.
AN OVERVIEW FROM THE PORTFOLIO MANAGER
See page 30 for the International Markets Overview.
How did the Fund perform over the first half of the year? How did the Fund’s performance compare to its benchmark?
The International Small Cap Growth Fund posted a 14.36% increase (Class N Shares) for the six months ended June 30, 2007. By comparison, the Fund’s benchmark, the Morgan Stanley Capital International (MSCI) World Small Cap ex-U.S. Index, gained 13.06%.
What were the most significant factors impacting international markets during the first six months of the year?
Non-US markets were strong during the first half of 2007, buoyed by strong results in emerging markets, Canada, Europe and the Pacific Rim. However, the first six months were punctuated by periods of volatility as investors were concerned in the first quarter about the US subprime mortgage market resulting in slowing US consumer demand and its impact on global growth. In the second quarter, investors became concerned about the prospects of a protracted global increasing interest rate environment as the US economy appeared to accelerate and demand for industrial and consumer goods and services remained strong globally. In addition, worries about the impact of US subprime mortgages on the financial industry, including hedge funds, caused apprehension regarding overall financial system risk. Despite these fears, the market returned 12.58% through June 30, as measured by the MSCI All Country World Index ex-US Index, with most of the performance coming during the second quarter. Emerging markets outpaced their developed counterparts, returning 17.75%, as compared to the EAFE Index, which rose 11.09% in US dollar terms, while developed non-US small cap stocks were also strong, up 13.09%. Within small cap stocks, Pacific ex-Japan and Canada were the strongest regions, up 17.99% and 18.83%, respectively, year to date, while the UK 10.84% and Japan 2.89% trailed. Materials, Industrials and Energy were the strongest sectors year to date, while Financials and Health Care lagged.
What factors were behind the Fund’s performance versus the benchmark?
The Fund outpaced the benchmark year to date, with significant value derived from stock selection in a number of sectors, with most value added in Consumer Discretionary, Energy, Financials and Health Care. In particular, Consumer Discretionary names were strong on a relative basis in Japan and emerging markets, while Energy stock selection benefited from a focus on European and Australian energy services and engineering companies. Financials stock selection contributed by strong relative stock selection in Japan, Europe and emerging markets, with a focus on real estate, asset management, and capital markets stocks. The European weighting and stock selection in Health Care added value in that sector. Regionally, the Fund’s underweighting in Japan and overweighting in Europe ex-UK and emerging markets added value, as did stock selection across most regions. Somewhat mitigating these strong results was general sector positioning, underweighting in Canada, and Materials stock selection.
44 Semi-Annual Report | June 30, 2007 |
How is the Fund positioned?
As of period end, the portfolio was overweighted in emerging markets and Europe ex-UK with corresponding underweightings in developed Asia. From a sector perspective, the portfolio remained focused in Consumer Discretionary, Financials and Industrials holdings, with corresponding underweightings in Information Technology (IT) and Materials. These weightings are largely the result of the team’s bottom up fundamental analysis, in addition to its strategic viewpoint.
June 30, 2007 | William Blair Funds 45 |
International Small Cap Growth Fund
Performance Highlights (unaudited)
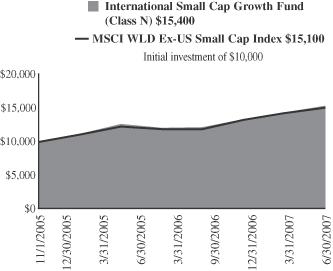
Average Annual Total Return at 6/30/2007
| | | | | | | | | |
| | | Year to
Date | | | 1
Year | | | Since Inception(a) | |
International Small Cap Growth Fund Class N | | 14.36 | % | | 26.81 | % | | 29.38 | % |
International Small Cap Growth Fund Class I | | 14.47 | | | 27.09 | | | 29.68 | |
MSCI World Ex-US Small Cap Index | | 13.06 | | | 26.54 | | | 27.54 | |
| | (a) | | For the period from November 1, 2005 (Commencement of Operations) to June 30, 2007. | |
Performance cited represents past performance. Past performance does not guarantee future results and current performance may be lower or higher than the data quoted. Results shown are average annual returns, which assume reinvestment of dividends and capital gains. Investment returns and principal will fluctuate and you may have a gain or loss when you sell shares. For the most current month-end performance information, please call 1-800-742-7272, or visit our Web site at www.williamblairfunds.com. From time to time, the investment advisor may waive fees or reimburse expenses for the Fund. Without these waivers, performance would be lower. International investing involves special risk considerations, including currency fluctuations, lower liquidity, economic and political risk. Class N shares are available to the general public without a sales load. Class I shares are available to certain institutional investors and advisory clients of William Blair & Company L.L.C. without a sales load or distribution (12b-1) fees.
The performance highlights and graph presented above do not reflect the deduction of taxes that a shareholder would pay on fund distributions or the redemption of fund shares.
The Morgan Stanley Capital International (MSCI) World Ex-US Small Cap Index is an unmanaged index that is designed to measure equity performance of small cap stocks in developed and emerging markets.
This report identifies the Fund’s investments on June 30, 2007. These holdings are subject to change. Not all stocks in the Fund performed the same, nor is there any guarantee that these stocks will perform as well in the future. Market forecasts provided in this report may not necessarily come to pass.
Sector Diversification (unaudited)
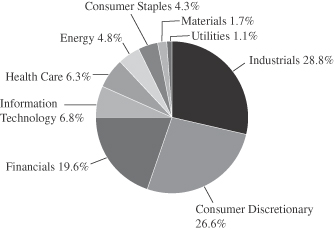
The sector diversification shown is based on the total investment portfolio.
46 Semi-Annual Report | June 30, 2007 |
International Small Cap Growth Fund
Portfolio of Investments, June 30, 2007 (all dollar amounts in thousands) (unaudited)
| | | | | |
Issuer | | Shares | | Value |
| | |
Common Stocks—Europe—44.2% | | | | | |
Finland—6.1% | | | | | |
Konecranes OYJ (Machinery) | | 83,100 | | $ | 3,473 |
Nokian Renkaat OYJ (Auto Components) | | 213,000 | | | 7,462 |
Outotec OYJ (Construction & engineering) | | 83,500 | | | 4,583 |
Ramirent OYJ (Trading companies & distributors) | | 212,900 | | | 5,765 |
| | | | | |
| | | | | 21,283 |
| | | | | |
France—5.5% | | | | | |
*Aufeminin.com SA (Media) | | 21,610 | | | 918 |
April Group S.A. (Insurance) | | 121,582 | | | 6,389 |
EDF Energies Nouvelles S.A. (Electric utilities) | | 60,100 | | | 3,934 |
*Orpea (Heath care providers & services) | | 37,363 | | | 3,927 |
*Seloger.com (Media) | | 73,900 | | | 4,103 |
| | | | | |
| | | | | 19,271 |
| | | | | |
Germany—8.6% | | | | | |
*Colonia Real Estate AG (Real estate management & development) | | 89,960 | | | 3,776 |
CTS Eventim AG (Media) | | 88,800 | | | 4,376 |
MTU Aero Engines Holding AG (Aerospace & defense) | | 112,014 | | | 7,289 |
*Q-Cells AG (Electrical equipment) | | 74,280 | | | 6,408 |
Solarworld AG (Electrical equipment) | | 96,262 | | | 4,444 |
*Wire Card AG (Commercial services & supplies) | | 298,600 | | | 4,016 |
| | | | | |
| | | | | 30,309 |
| | | | | |
Greece—2.1% | | | | | |
Jumbo S.A. (Leisure equipment & products) | | 216,700 | | | 7,494 |
| | | | | |
Ireland—3.1% | | | | | |
Kingspan Group plc (Building products) | | 245,390 | | | 6,883 |
*Norkom Group plc (Software) | | 286,500 | | | 820 |
United Drug plc (Heath care providers & services) | | 610,780 | | | 3,341 |
| | | | | |
| | | | | 11,044 |
| | | | | |
Italy—4.8% | | | | | |
Azimut Holdings SpA (Capital markets) | | 423,317 | | | 7,228 |
Credito Emiliano SpA (Commercial banks) | | 204,872 | | | 2,902 |
Tod’s SpA (Textiles, apparel & luxury goods) | | 35,600 | | | 3,177 |
Trevi Finanziaria SpA (Construction & engineering) | | 199,100 | | | 3,578 |
| | | | | |
| | | | | 16,885 |
| | | | | |
Netherlands—1.3% | | | | | |
*Qiagen NV (Lifesciences tools & services) | | 258,073 | | | 4,637 |
| | | | | |
Norway—2.9% | | | | | |
Acergy S.A. (Energy equipment & services) | | 319,800 | | | 7,200 |
*Electromagnetic GeoServices AS (Energy equipment & services) | | 154,200 | | | 3,112 |
| | | | | |
| | | | | 10,312 |
| | | | | |
Spain—3.4% | | | | | |
Grifols S.A. (Biotechnolgy) | | 366,303 | | | 7,936 |
Tecnicas Reunidas S.A. (Construction & engineering) | | 56,800 | | | 3,818 |
| | | | | |
| | | | | 11,754 |
| | | | | |
| | | | | |
Issuer | | Shares | | Value |
| |
Common Stocks—Europe—(continued) | | | |
Sweden—1.7% | | | | | |
Hemtex AB (Specialty retail) | | 71,900 | | $ | 1,377 |
Nobia AB (Specialty retail) | | 357,700 | | | 4,455 |
| | | | | |
| | | | | 5,832 |
| | | | | |
Switzerland—4.7% | | | | | |
*Barry Callebaut Ag (Food products) | | 8,530 | | | 6,457 |
Partners Group Global Opportunities, Ltd (Capital markets) | | 74,400 | | | 9,983 |
| | | | | |
| | | | | 16,440 |
| | | | | |
| | |
United Kingdom—20.9% | | | | | |
Amlin plc (Insurance) | | 1,057,000 | | | 5,926 |
Ashmore Group plc (Capital markets) | | 579,800 | | | 3,124 |
*Autonomy Corporation plc (Software) | | 348,700 | | | 5,002 |
*Blinkx plc (Internet software & services) | | 1,876,700 | | | 1,639 |
*BlueBay Asset Management plc (Capital markets) | | 365,900 | | | 3,616 |
Carter & Carter Group plc (Commercial services & supplies) | | 126,600 | | | 1,217 |
*Ceres Power Holdings plc (Electrical equipment) | | 684,900 | | | 3,965 |
*Climate Exchage plc (Diversified financial services) | | 64,700 | | | 2,381 |
Detica Group plc (IT services) | | 451,500 | | | 3,477 |
Domino’s Pizza UK & IRL plc (Hotels, restaurants, & leisure) | | 687,780 | | | 3,821 |
Homeserve plc (Commercial services & supplies) | | 137,380 | | | 4,927 |
Mears Group plc (Construction & engineering) | | 449,300 | | | 2,926 |
Michael Page International (Commercial services & supplies) | | 301,970 | | | 3,172 |
Restaurant Group plc (Hotels, restaurants, & leisure) | | 221,500 | | | 1,461 |
Rightmove plc (Media) | | 250,400 | | | 3,140 |
Rotork plc (Electronic equipement & instruments) | | 185,550 | | | 3,390 |
RPS Group plc (Commercial services & supplies) | | 487,000 | | | 3,417 |
Serco Group plc (Commercial services & supplies) | | 758,440 | | | 6,837 |
Ultra Electronic Holdings plc (Aerospace & defense) | | 133,850 | | | 2,894 |
Victrex plc (Chemicals) | | 204,850 | | | 2,929 |
VT Group plc (Aerospace & defense) | | 329,150 | | | 3,871 |
| | | | | |
| | | | | 73,132 |
| | | | | |
| | |
Japan—11.0% | | | | | |
Aeon Mall Co., Ltd. (Real estate management & development) | | 190,900 | | | 5,869 |
DeNA Co., Ltd. (Internet & catalog retail) | | 1,607 | | | 5,572 |
En-Japan Inc. (Commercial services & supplies) | | 611 | | | 2,277 |
Fujimi Inc (Chemicals) | | 111,200 | | | 2,924 |
Honeys Company, Ltd. (Specialty retail) | | 93,630 | | | 3,776 |
*K.K. DaVinci Advisors (Real estate management & development) | | 1,491 | | | 1,302 |
Kenedix, Inc. (Real estate management & development) | | 646 | | | 1,202 |
Miraial Company, Ltd. (Semiconductors & semiconductor equipment) | | 28,700 | | | 3,966 |
See accompanying Notes to Financial Statements.
June 30, 2007 | William Blair Funds 47 |
International Small Cap Growth Fund
Portfolio of Investments, June 30, 2007 (all dollar amounts in thousands) (unaudited)
| | | | | |
Issuer | | Shares | | Value |
| |
Common Stocks—Japan—(continued) | | | |
Nitori Company Ltd. (Specialty retail) | | 63,300 | | $ | 3,160 |
Park 24 Co., Ltd. (Commercial services & supplies) | | 194,600 | | | 1,954 |
Suruga Bank (Commercial banks) | | 296,000 | | | 3,730 |
Zensho Company, Ltd. (Hotels, restaurants, & leisure) | | 285,800 | | | 2,717 |
| | | | | |
| | | | | 38,449 |
| | | | | |
| | |
Emerging Asia—8.2% | | | | | |
China—3.8% | | | | | |
*China High Speed Transmission (Independent power producers & energy traders)** | | 45,000 | | | 41 |
China Infrastructure Machinery Holdings, Ltd. (Machinery) | | 1,836,000 | | | 4,015 |
Ctrip.com International, Ltd.—ADR (Hotels, restaurants & leisure) | | 20,520 | | | 1,613 |
*Focus Media Holdings—ADR (Media) | | 33,200 | | | 1,677 |
Li Ning Co. Ltd. (Leisure equipment & products) | | 836,873 | | | 2,029 |
Ports Design Limited (Textiles, apparel & luxury goods) | | 604,500 | | | 1,700 |
Shandong Weigao GP (Health care equipment & supplies) | | 976,000 | | | 2,200 |
| | | | | |
| | | | | 13,275 |
| | | | | |
India—2.6% | | | | | |
ABB Ltd. India (Electrical equipment) | | 78,500 | | | 2,110 |
Financial Technologies, Ltd. (Diversified financial services) | | 73,900 | | | 5,480 |
*Inox Leisure, Ltd. (Media) | | 436,579 | | | 1,439 |
| | | | | |
| | | | | 9,029 |
| | | | | |
Malaysia—1.1% | | | | | |
Kuala Lumpur Kepong Berhad (Food products) | | 1,046,350 | | | 3,913 |
| | | | | |
Philippines—0.2% | | | | | |
*Paxys Inc. (Commercial services & supplies) | | 1,455,100 | | | 779 |
| | | | | |
South Korea—0.5% | | | | | |
Hana Tour Service Inc. (Hotels, restaurants & leisure) | | 17,400 | | | 1,693 |
| | | | | |
| | |
Asia—6.1% | | | | | |
Australia—3.7.% | | | | | |
Allco Finance Group, Limited (Capital markets) | | 323,265 | | | 2,909 |
Seek Limited (Commercial services & supplies) | | 802,680 | | | 5,011 |
United Group, Ltd. (Construction & engineering) | | 368,470 | | | 5,193 |
| | | | | |
| | | | | 13,113 |
| | | | | |
Singapore—2.4% | | | | | |
Olam International, Ltd. (Food & staples retailing) | | 1,592,000 | | | 3,211 |
Osim International Ltd. (Specialty retail) | | 1,393,700 | | | 648 |
Petra Foods, Ltd. (Food products) | | 1,219,000 | | | 1,259 |
Raffles Education Corp. Ltd. (Diversified consumer services) | | 2,225,000 | | | 3,318 |
| | | | | |
| | | | | 8,436 |
| | | | | |
| | | | | |
Issuer | | Shares | | Value |
| | |
Emerging Latin America—4.5% | | | | | |
Brazil—2.1% | | | | | |
*Anhanguera Educational Parti (Diversified consumer services) | | 162,100 | | $ | 2,269 |
Cyrela Brazil Realty S.A. (Household durables) | | 273,900 | | | 3,399 |
Submarino S.A.(Internet & catalog retail) | | 42,300 | | | 1,760 |
| | | | | |
| | | | | 7,428 |
| | | | | |
| | |
Mexico—1.9% | | | | | |
*Banco Compartamos SA (Commercial banks) | | 491,700 | | | 3,072 |
*Urbi Desarrollos Urbanos S.A. (Household durables) | | 784,900 | | | 3,614 |
| | | | | |
| | | | | 6,686 |
| | | | | |
Panama—0.5% | | | | | |
Copa Holdings S.A., Class “A” (Airlines)† | | 25,400 | | | 1,708 |
| | | | | |
| |
Emerging Europe, Mid-East, Africa—2.1% | | | |
Czech Republic—0.5% | | | | | |
*Central European Media Enterprises Ltd., Class “A” (Media)† | | 16,600 | | | 1,620 |
| | | | | |
Eqypt—0.6% | | | | | |
*Orascom Hotels & Development (Hotels, restaurants & leisure) | | 193,100 | | | 2,026 |
| | | | | |
Poland—0.5% | | | | | |
*Cinema City International N.V. (Media) | | 142,700 | | | 1,793 |
| | | | | |
Russia—0.5% | | | | | |
*CTC Media, Inc. (Media)† | | 63,538 | | | 1,724 |
| | | | | |
| | |
Canada—1.7% | | | | | |
Canadian Western Bank (Commercial banks) | | 102,200 | | | 2,709 |
*Gildan Activewear, Inc. (Textiles, apparel & luxury goods) | | 98,600 | | | 3,367 |
| | | | | |
| | | | | 6,076 |
| | | | | |
Total Common Stock—98.7%
(cost $286,620) | | | 346,141 |
| | | | | |
| | |
Preferred Stock | | | | | |
Brazil—0.5% | | | | | |
*Banco Sofisa S.A. (Commercial banks) | | 248,900 | | | 1,832 |
| | | | | |
Total Preferred Stock—0.5%
(cost $1,532) | | | 1,832 |
| | | | | |
| | |
Investment in Affiliate | | | | | |
William Blair Ready Reserves Fund | | 2,147,561 | | | 2,148 |
| | | | | |
Total Investment in Affiliate—0.6%
(cost $2,148) | | | 2,148 |
| | | | | |
See accompanying Notes to Financial Statements.
48 Semi-Annual Report | June 30, 2007 |
International Small Cap Growth Fund
Portfolio of Investments, June 30, 2007 (all dollar amounts in thousands) (unaudited)
| | | | | | | |
Issuer | | Principal
Amount | | Value | |
| | |
Short-Term Investments | | | | | | | |
American Express Demand Note, VRN 5.170%, due 7/02/07 | | $ | 2,004,000 | | $ | 2,004 | |
Prudential Funding Demand Note, VRN 5.305%, due 7/02/2007 | | | 2,000,000 | | | 2,000 | |
| | | | | | | |
Total Short-term Investments—1.2%
(cost $4,004) | | | 4,004 | |
| | | | | | | |
| | |
Repurchase Agreement | | | | | | | |
Investors Bank & Trust Company, 4.50% dated 6/29/07, due 7/02/07, repurchase price $2,588, collateralized by SBA Pool # 505984 | | $ | 2,586,723 | | $ | 2,587 | |
| | | | | | | |
Total Repurchase Agreement—0.7%
(cost $2,587) | | | 2,587 | |
| | | | | | | |
Total Investments—101.7%
(cost $296,891) | | | 356,712 | |
Liabilities plus, cash and other assets—(1.7)% | | | (5,941 | ) |
| | | | | | | |
Net assets—100.0% | | $ | 350,771 | |
| | | | | | | |
* Non-income producing securities
ADR = American Depository Receipt
GDR = Global Depository Receipt
VRN = Variable Rate Note
† = U.S. listed foreign security
** Fair valued pursuant to Valuation Procedures adopted by the Board of Trustees. This holding represents 0.01% of the Fund’s net assets at June 30, 2007. This security was also deemed illiquid pursuant to Liquidity Procedures adopted by the Board of Trustees.
For securities primarily traded on exchanges or markets that close before the close of regular trading on the New York Stock Exchange the Fund uses an independent pricing service on a daily basis to fair value price the securities pursuant to Valuation Procedures adopted by the Board of Trustees.
At June 30, 2007 the Fund’s Portfolio of Investments includes the following industry categories:
| | |
Industrials | | 28.8% |
Consumer Discretionary | | 26.6% |
Financials | | 19.6% |
Information Technology | | 6.8% |
Health Care | | 6.3% |
Energy | | 4.8% |
Consumer Staples | | 4.3% |
Materials | | 1.7% |
Utilities | | 1.1% |
| | |
| | 100.0% |
| | |
At June 30, 2007 the Fund's Portfolio of Investments includes the following currency categories:
| | |
Euro | | 35.3% |
British Pound Sterling | | 21.0% |
Japanese Yen | | 11.0% |
Swiss Franc | | 4.7% |
Australian Dollar | | 3.8% |
Norwegian Krone | | 3.0% |
Hong Kong Dollar | | 2.9% |
Brazilian Real | | 2.7% |
Indian Rupee | | 2.6% |
Singapore Dollar | | 2.4% |
United States Dollar | | 2.4% |
Mexican Neuvo Peso | | 1.9% |
Canadian Dollar | | 1.7% |
Swedish Krona | | 1.7% |
Malaysian Ringgit | | 1.1% |
All other currencies | | 1.8% |
| | |
| | 100.0% |
| | |
See accompanying Notes to Financial Statements.
June 30, 2007 | William Blair Funds 49 |
W. George Greig

Todd M. McClone
Jeffrey A. Urbina
EMERGING MARKETS GROWTH FUND
The Emerging Markets Growth Fund primarily invests in a diversified portfolio of equity securities issued by growth companies in emerging economies worldwide.
AN OVERVIEW FROM THE PORTFOLIO MANAGERS
See page 30 for the International Markets Overview.
How did the Fund perform over the first half of the year? How did the Fund’s performance compare to its benchmark?
The Emerging Markets Growth Fund posted a 16.53% increase (Class N Shares) for the six months ended June 30, 2007. By comparison, the Fund’s benchmark, the Morgan Stanley Capital International (MSCI) Emerging Markets Index, gained 17.75%.
What were the most significant factors impacting international markets during the first six months of the year?
Non-US markets were strong during the first half of 2007, buoyed by strong results in emerging markets, Canada, Europe and the Pacific Rim. However, the first six months were punctuated by periods of volatility as investors were concerned in the first quarter about the US subprime mortgage market resulting in slowing US consumer demand and its impact on global growth. In the second quarter, investors became concerned about the prospects of a protracted global increasing interest rate environment as the US economy appeared to accelerate and demand for industrial and consumer goods and services remained strong globally. In addition, worries about the impact of US subprime mortgages on the financial industry, including hedge funds, caused apprehension regarding overall financial system risk. Despite these fears, the market returned 12.58% through June 30, as measured by the MSCI All Country World Index ex-US Index, with most of the performance coming during the second quarter. Emerging markets outpaced their developed counterparts, returning 17.75%, as compared to the Europe, Australia and Far East Index, which rose 11.09% in US dollar terms. Latin America was the strongest emerging markets region, up 27.09%, while Asia returned 18.78%. MSCI Emerging Markets Europe, Mid-East and Africa (EMEA) was the relative laggard, returning 9.18% during the first half of the year. In particular, the Latin American markets of Brazil, Chile and Peru performed well as did the Asian markets of Korea, Malaysia and China. Materials, Industrials and Energy were the strongest sectors year to date, while Financials and Healthcare lagged.
What factors were behind the Fund’s performance versus the benchmark?
The Fund’s year-to-date return, trailed the benchmark by approximately 1%, due to first quarter’s relative results. While stock selection across a number of sectors was strong, Energy, Staples and Industrials stock selection hampered relative results, particularly during the first quarter. Specifically, several of the Fund’s Consumer Staples names in Latin America underperformed, while Energy stock selection was hurt by Russian and South African stock selection. Within Industrials, the Fund’s Asian stocks trailed the Index. In addition, the Fund’s underweighting in the strong Materials sector hurt performance, as did stock selection within the sector. Conversely, the Fund’s strong absolute results were bolstered by Consumer Discretionary stock selection across regions, along with the weighting and stock selection in Chinese, Indian, and Malaysian Financials. Moreover, the Fund’s Chinese healthcare stock selection was strong, as was the focus on Asian Information Technology (IT) stocks. In addition, the Fund’s weighting in Latin America at the expense of EMEA augmented performance.
50 Semi-Annual Report | June 30, 2007 |
How is the Fund positioned?
As of quarter end, the Fund remained overweighted in Latin America with corresponding underweightings in EMEA and Asia, due primarily to minimal exposure in Russia and Korea, respectively. From a sector perspective, the Fund remained focused on the emerging markets consumer through Consumer Discretionary, Consumer Staples and Financials, holdings. In addition, the Fund maintained a higher than Index weighting in Industrials, with corresponding underweightings in Energy, IT and Materials. These exposures are largely based upon the team’s bottom up fundamental analysis, in accordance with its strategic viewpoint.
June 30, 2007 | William Blair Funds 51 |
Emerging Markets Growth Fund
Performance Highlights (unaudited)
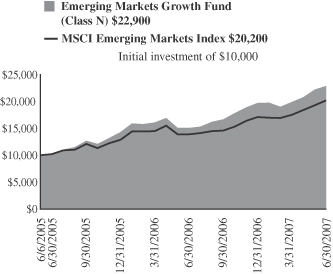
Average Annual Total Return at 6/30/2007
| | | | | | | | | |
| | | Year to
Date | | | 1
Year | | | Since Inception(a) | |
Emerging Markets Growth Fund
Class N | | 16.53 | % | | 51.80 | % | | 49.14 | % |
Emerging Markets Growth Fund
Class I | | 16.74 | | | 52.08 | | | 49.47 | |
MSCI Emerging Markets Index | | 17.75 | | | 45.45 | | | 40.31 | |
| | (a) | | For the period from June 6, 2005 (Commencement of Operations) to June 30, 2007. | |
Performance cited represents past performance. Past performance does not guarantee future results and current performance may be lower or higher than the data quoted. Results shown are average annual returns, which assume reinvestment of dividends and capital gains. Investment returns and principal will fluctuate and you may have a gain or loss when you sell shares. For the most current month-end performance information, please call 1-800-742-7272, or visit our Web site at www.williamblairfunds.com. From time to time, the investment advisor may waive fees or reimburse expenses for the Fund. Without these waivers, performance would be lower. International investing involves special risk considerations, including currency fluctuations, lower liquidity, economic and political risk. Class N shares are available to the general public without a sales load. Class I shares are available to certain institutional investors and advisory clients of William Blair & Company L.L.C. without a sales load or distribution (12b-1) fees.
The performance highlights and graph presented above do not reflect the deduction of taxes that a shareholder would pay on fund distributions or the redemption of fund shares.
The Morgan Stanley Capital International (MSCI) Emerging Markets Index is an index that is designed to measure equity performance in the global emerging markets.
This report identifies the Fund’s investments on June 30, 2007. These holdings are subject to change. Not all stocks in the Fund performed the same, nor is there any guarantee that these stocks will perform as well in the future. Market forecasts provided in this report may not necessarily come to pass.
Sector Diversification (unaudited)
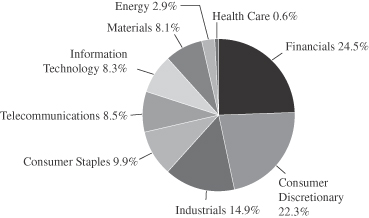
The sector diversification shown is based on the total investment portfolio.
52 Semi-Annual Report | June 30, 2007 |
Emerging Markets Growth Fund
Portfolio of Investments, June 30, 2007 (all dollar amounts in thousands) (unaudited)
| | | | | |
Issuer | | Shares | | Value |
| |
Common Stocks—Emerging Asia—45.4% | | | |
China—16.4% | | | | | |
*Belle International Holdings Limited (Specialty retail) | | 8,546,000 | | $ | 9,432 |
*China High Speed Transmission Equipment Group Co. (Independent power producers & energy traders)** | | 276,000 | | | 250 |
China Infrastructure Machinery Holdings, Ltd. (Machinery) | | 5,188,000 | | | 11,344 |
China Mengniu Dairy Co. Ltd. (Food products) | | 3,054,000 | | | 10,537 |
China Merchants Bank (Commercial banks) | | 3,398,000 | | | 10,348 |
China Mobile Ltd. (Wireless telecommunication services) | | 2,897,800 | | | 31,178 |
China Oilfield Services (Energy equipment & services) | | 2,132,000 | | | 2,152 |
China Vanke Company Ltd. (Real estate management & development) | | 10,707,347 | | | 22,163 |
*China Water Affairs Group (Household durables) | | 7,790,000 | | | 4,547 |
Ctrip.com International Ltd.—ADR (Hotels, restaurants & leisure) | | 67,600 | | | 5,315 |
*Focus Media Holding Ltd.—ADR (Media) | | 219,800 | | | 11,100 |
Fu Ji Food and Catering Services Holdings Ltd (Hotels, restaurants & leisure) | | 1,764,000 | | | 6,073 |
Hopson Development Holdings Ltd. (Real estate management & development) | | 848,800 | | | 2,387 |
Lee and Man Paper Manufacturing Ltd. (Paper & forest products) | | 3,834,000 | | | 10,616 |
Li Ning Co. Ltd (Leisure equipment & products) | | 3,094,000 | | | 7,503 |
Parkson Retail Group Ltd. (Multiline retail) | | 849,900 | | | 5,445 |
Ports Design Ltd. (Textiles, apparel & luxury goods) | | 2,260,000 | | | 6,357 |
Shangdong Weigao GP Medical (Health care equipment & supplies) | | 2,800,000 | | | 6,311 |
Wumart Stores, Inc., Class “H” (Food & staples retailing)** | | 8,680,000 | | | 2,775 |
Xinyu Hengdeli Holdings Ltd. (Distributors) | | 10,920,000 | | | 5,355 |
| | | | | |
| | | | | 171,188 |
| | | | | |
India—12.6% | | | | | |
ABB Ltd. India (Electrical equipment) | | 264,000 | | | 7,097 |
Bharat Heavy Electricals, Ltd. (Electrical equipment) | | 327,800 | | | 12,398 |
*Bharti Airtel Ltd. (Wireless telecommunication services) | | 615,500 | | | 12,651 |
*Carin India Ltd. (Oil, gas & consumable fuels) | | 1,471,300 | | | 5,273 |
Dabur India Ltd. (Personal products) | | 1,862,200 | | | 4,706 |
Financial Technologies, Ltd. (Software) | | 95,410 | | | 7,075 |
Housing Development Finance Corp. (Thrifts & mortgage finance) | | 123,700 | | | 6,176 |
Infosys Technologies, Ltd. (IT services) | | 195,500 | | | 9,252 |
*Inox Leisure Ltd. (Media) | | 1,208,500 | | | 3,983 |
Larsen & Toubro Ltd. (Construction & engineering) | | 315,700 | | | 17,058 |
Shopper’s Stop Ltd. (Multiline retail) | | 280,860 | | | 4,038 |
Unitech Limited (Real estate management & development) | | 715,500 | | | 8,850 |
Vedanta Resources Plc (Metals & mining) | | 1,032,500 | | | 33,281 |
| | | | | |
| | | | | 131,838 |
| | | | | |
| | | | | |
Issuer | | Shares | | Value |
|
Common Stocks—Emerging Asia—45.4%—(continued) |
Indonesia—2.7% | | | | | |
PT Bank Rakyat Indonesia (Commercial banks) | | 16,908,500 | | $ | 10,768 |
PT London Sumatra Indones (Food products) | | 12,863,500 | | | 9,246 |
PT Telekomunikasi Tbk (Diversified telecommunication services) | | 7,867,900 | | | 8,535 |
| | | | | |
| | | | | 28,549 |
| | | | | |
Philippines—1.2% | | | | | |
Bank of Philippine Islands (Commercial banks) | | 6,818,900 | | | 10,095 |
*Paxys Inc. (Commercial services & supplies) | | 4,184,700 | | | 2,239 |
| | | | | |
| | | | | 12,334 |
| | | | | |
Malaysia—4.1% | | | | | |
*Airasia Bhd (Airlines) | | 8,883,600 | | | 4,894 |
Bumiputra Commerce Holding Bhd (Commercial banking) | | 6,429,500 | | | 21,786 |
Kuala Lumpur Kepong Berhad Bhd (Food products) | | 2,845,650 | | | 10,643 |
Zelan Bhd (Construction & engineering) | | 1,424,300 | | | 4,964 |
| | | | | |
| | | | | 42,287 |
| | | | | |
South Korea—3.4% | | | | | |
Hana Tour Service (Hotels, restaurants & leisure) | | 67,800 | | | 6,598 |
*NHN Corporation (Internet software & services) | | 65,500 | | | 11,923 |
Shinsegae Co. Ltd. (Food & staples retailing) | | 14,550 | | | 9,469 |
Taewoong Co Ltd (Machinery) | | 99,500 | | | 6,981 |
| | | | | |
| | | | | 34,971 |
| | | | | |
Taiwan—5.0% | | | | | |
*Himax Technologies, Inc.—ADR (Semiconductors & semiconductor equipment) | | 1,693,315 | | | 9,770 |
Hon Hai Precision Industry (Electronic equipment & instruments) | | 3,527,528 | | | 30,469 |
Mediatek, Inc. (Semiconductors & semiconductor equipment) | | 765,040 | | | 11,903 |
| | | | | |
| | | | | 52,142 |
| | | | | |
| | |
Emerging Latin America—27.6% | | | | | |
Argentina—0.8% | | | | | |
Banco Macro Sa—ADR (Commercial banks) | | 246,900 | | | 8,116 |
| | | | | |
Brazil—11.9% | | | | | |
All America Latin Logistica (Road & rail) | | 709,600 | | | 9,660 |
*Anhanguera Eduacional Participacoes S.A. (Commercial services & supplies) | | 467,000 | | | 6,537 |
*BR Malls Participacoes SA (Real estate management & development) | | 1,177,100 | | | 15,316 |
CIA Vale Do Rio Doce—ADR (Metals & mining) | | 682,400 | | | 30,401 |
Cyrela Brazil Realty S.A. (Household durables) | | 905,200 | | | 11,234 |
Iguatemi Empresa de Shopping Centers S.A. (Commercial services & supplies) | | 581,600 | | | 10,499 |
Localiza Rent a Car S.A. (Road & rail) | | 946,600 | | | 10,678 |
Lojas Renner S.A. (Multiline retail) | | 348,600 | | | 6,470 |
See accompanying Notes to Financial Statements.
June 30, 2007 | William Blair Funds 53 |
Emerging Markets Growth Fund
Portfolio of Investments, June 30, 2007 (all dollar amounts in thousands) (unaudited)
| | | | | |
Issuer | |
Shares | | Value |
|
Common Stocks—Emerging Latin America—27.6%—(continued) |
Brazil—(continued) | | | | | |
Lupatech SA (Machinery) | | 240,300 | | $ | 5,793 |
Rodobens Negocioa Imobiliarios S.A. (Household durables) | | 444,800 | | | 6,051 |
Submarino S.A. (Internet & catalog retail) | | 122,400 | | | 5,092 |
Totvs S.A. (Software) | | 189,500 | | | 6,168 |
| | | | | |
| | | | | 123,899 |
| | | | | |
Chile—2.0% | | | | | |
*Cencosud S.A.—ADR 144A (Specialty retail) | | 163,900 | | | 10,198 |
S.A.C.I. Falabella S.A. (Multiline retail) | | 2,107,954 | | | 10,888 |
| | | | | |
| | | | | 21,086 |
| | | | | |
Mexico—10.7% | | | | | |
Alsea S.A.B. de C.V. (Hotels, restaurants & leisure) | | 3,098,800 | | | 5,450 |
America Movil S.A. (Wireless telecommunication services) | | 7,188,200 | | | 22,196 |
*Banco Compartamos SA (Commercial banks) | | 1,520,700 | | | 9,501 |
*Desarrolladora Homex S.A. de C.V.—ADR (Household durables) | | 160,900 | | | 9,749 |
*Groupo Famsa S.A. (Multiline retail) | | 1,868,700 | | | 10,897 |
Grupo Financiero Banorte S.A. de C.V. (Commercial banks) | | 4,145,500 | | | 18,986 |
Grupo Aeropuertario Del—ADR (Transportation infrastructure) | | 208,200 | | | 10,268 |
*Promotora Ambiental Sab de C.V. (Commercial services & supplies) | | 1,291,350 | | | 3,586 |
*Urbi Desarrollos Urbanos S.A. (Household durables) | | 2,391,400 | | | 11,012 |
Walmart de Mexico (Food & staples retailing) | | 2,670,400 | | | 10,134 |
| | | | | |
| | | | | 111,779 |
| | | | | |
Panama—1.3% | | | | | |
Copa Holdings S.A., Class “A” (Airlines)† | | 205,600 | | | 13,825 |
| | | | | |
Peru—0.9% | | | | | |
Credicorp Ltd. (Commercial banks) | | 157,500 | | | 9,634 |
| | | | | |
|
Emerging Europe, Mid-East, Africa—21.9% |
Czech Republic—1.1% | | | | | |
*Central European Media Enterprises Ltd., Class “A” (Media)† | | 112,300 | | | 10,958 |
| | | | | |
Egypt—3.4% | | | | | |
Egyptian Financial Group—Hermes Holding SAE (Capital markets) | | 1,415,700 | | | 11,413 |
Orascom Construction Industries (Construction & engineering) | | 274,200 | | | 17,925 |
*Orascom Hotels and Development (Hotels, restaurants & leisure) | | 567,500 | | | 5,954 |
| | | | | |
| | | | | 35,292 |
| | | | | |
Kazakhstan—1.0% | | | | | |
*Kazkommertsbank—GDR 144A (Commercial banks) | | 482,226 | | | 10,609 |
| | | | | |
Poland—0.5% | | | | | |
*Cinema City International NV (Media) | | 401,500 | | | 5,045 |
| | | | | |
| | | | | |
Issuer | | Shares or
Principal
Amount | | Value |
|
Common Stocks—Emerging Europe, Mid-East,
Africa—21.9%—(continued) |
Russia—5.9% | | | | | |
*CTC Media, Inc. (Media)† | | 376,645 | | $ | 10,222 |
*Magnit—CLS (Multiline retail)† | | 118,800 | | | 5,221 |
*PIK Group—CLS (Real estate development & management)** | | 597,900 | | | 14,948 |
Sberbank—CLS (Commercial banks)† | | 5,838 | | | 22,768 |
*X5 Retail Group N.V.—GDR (Food & staples retailing) | | 295,300 | | | 8,652 |
| | | | | |
| | | | | 61,811 |
| | | | | |
South Africa— 6.6% | | | | | |
Anglo Platinum Ltd (Metals & mining) | | 61,500 | | | 10,100 |
MTN Group Ltd. (Wireless telecommunication services) | | 1,031,400 | | | 14,020 |
Naspers Ltd. (Media) | | 750,390 | | | 19,279 |
Spar Group Limited (Food & staples retailing) | | 1,444,300 | | | 10,806 |
Truworths International Ltd. (Specialty retail) | | 1,966,300 | | | 10,116 |
Wilson Bayly Holmes-Ovcon (Construction & engineering) | | 318,500 | | | 4,651 |
| | | | | |
| | | | | 68,972 |
| | | | | |
Turkey—1.6% | | | | | |
Bim Birlesik Magazalar A.S. (Food & staples retailing) | | 186,800 | | | 12,382 |
Coca Cola Icecek A.S. (Beverages) | | 500,200 | | | 3,749 |
| | | | | |
| | | | | 16,131 |
| | | | | |
United Arab Emirates—1.8% | | | | | |
Emaar Properties PJSC (Real estate development & management) | | 5,808,100 | | | 18,739 |
| | | | | |
Total Common Stock—94.9%
(cost $743,583) | | | 989,205 |
| | | | | |
| | |
Preferred Stock | | | | | |
Brazil—4.7% | | | | | |
Banco Itau Holding (Commercial banks) | | 221,700 | | | 9,844 |
* Banco Sofisa S.A. (Commercial banks) | | 686,200 | | | 5,051 |
Petroleo Brasileiro S.A. (Oil, gas & consumable fuels) | | 829,300 | | | 22,141 |
* Net Servicos De Counicacao S.A. (Media) | | 704,800 | | | 11,637 |
| | | | | |
| | | | | 48,673 |
| | | | | |
Total Preferred Stock—4.7%
(cost $35,402) | | | 48,673 |
| | | | | |
| | |
Investment in Affiliate | | | | | |
William Blair Ready Reserves Fund | | 1,295,575 | | | 1,296 |
| | | | | |
Total Investment in Affiliate—0.1%
(cost $1,296) | | | 1,296 |
| | | | | |
See accompanying Notes to Financial Statements.
54 Semi-Annual Report | June 30, 2007 |
Emerging Markets Growth Fund
Portfolio of Investments, June 30, 2007 (all dollar amounts in thousands) (unaudited)
| | | | | | | |
Issuer | | Principal
Amount | | Value | |
| | |
Short-Term Investments | | | | | | | |
American Express Demand Note, VRN 5.170% due 7/2/07 | | $ | 6,875,000 | | $ | 6,875 | |
Prudential Funding Demand Note, VRN 5.305% due 7/2/07 | | | 5,983,000 | | | 5,983 | |
| | | | | | | |
Total Short-Term Investments—1.2%
(cost $12,858) | | | 12,858 | |
| | | | | | | |
| | |
Repurchase Agreement | | | | | | | |
Investors Bank & Trust Company, 4.50% dated 6/29/2007, due 7/2/2007, repurchase price $14,646, collateralized by SBA, Pool# 507256 | | $ | 14,640,762 | | | 14,641 | |
| | | | | | | |
Total Repurchase Agreement—1.4%
(cost $14,641) | | | 14,641 | |
| | | | | | | |
Total Investments—102.3%
(cost $807,780) | | | 1,066,673 | |
Liabilities plus cash and other assets—(2.3)% | | | (24,322 | ) |
| | | | | | | |
Net assets—100.0% | | $ | 1,042,351 | |
| | | | | | | |
*Non-income producing securities
ADR = American Depository Receipt
GDR = Global Depository Receipt
VRN = Variable Rate Note
† = U.S. listed Foreign Security
**Fair value pursuant to Valuation Procedures adopted by Board of Trustees. These holdings represent 1.72% of the Fund’s net assets at June 30, 2007. These securities was also deemed illiquid pursuant to Liquidity Procedures securities pursuant to Valuation Procedures adopted by the Board of Trustees.
For securities primarily traded on exchanges or markets that close before the close of regular trading on the New York Stock Exchange the Fund uses an independent pricing service on a daily basis to fair value price the securities pursuant to Valuation Procedures adopted by the Board of Trustees.
At June 30, 2007 the Fund’s Portfolio of Investments includes the following industry categories:
| | |
Finance | | 24.5% |
Consumer Discretionary | | 22.3% |
Industrials | | 14.9% |
Consumer Staples | | 9.9% |
Telecommunication Services | | 8.5% |
Information Technology | | 8.3% |
Materials | | 8.1% |
Energy | | 2.9% |
Health Care | | 0.6% |
| | |
| | 100.0% |
| | |
At June 30, 2007 the Fund’s Portfolio of Investments includes the following currency categories:
| | |
U.S. Dollar | | 19.4% |
Hong Kong Dollar | | 14.9% |
Brazilian Real | | 13.7% |
Indian Rupee | | 9.5% |
Mexican Nuevo Peso | | 8.8% |
South African Rand | | 6.6% |
New Taiwan Dollar | | 4.1% |
Malaysian Ringgit | | 4.1% |
Egyptian Pounds | | 3.4% |
South Korean Won | | 3.4% |
British Pound Sterling | | 3.2% |
Indonesian Rupiah | | 2.8% |
Uae Dirham | | 1.8% |
Turkish Lira | | 1.5% |
Philippine Peso | | 1.2% |
Chilean Peso | | 1.1% |
Polish Zloty | | 0.5% |
| | |
| | 100.0% |
| | |
See accompanying Notes to Financial Statements.
June 30, 2007 | William Blair Funds 55 |

Chad M. Kilmer

Mark T. Leslie

David S. Mitchell
VALUE DISCOVERY FUND
The Value Discovery Fund invests in the equity securities of small companies that we believe offer a long-term investment value seeking to identify undervalued companies with sound business fundamentals.
AN OVERVIEW FROM THE PORTFOLIO MANAGERS
How did the Fund perform over the first half of the year? How did the Fund’s performance compare to its benchmark?
The Value Discovery Fund posted a 6.45% increase on a total return basis (Class N shares) during the six months ended June 30, 2007. By comparison, the Russell 2000® Value Index, gained 3.80%, while the Russell 2000® Index rose 6.45%.
What were the most significant factors impacting Fund performance? What factors were behind the Fund’s performance versus the benchmark?
Strong stock selection in Financials, Health Care, and Energy comprised the majority of the Fund’s relative out performance. In the Financial sector, our holdings of Equity Inns, a real estate investment trust, was the major contributor to performance due to its acquisition by a real estate fund company. Our holdings in Consumer Finance and Insurance, however, slightly detracted from performance. Both industries’ are highly correlated with interest rates and have experienced weakness as a result of increased inflation concerns and deterioration in the subprime marketplace.
What were among the best performing sectors for the Fund? Were there any investment themes that produced the best results?
Energy Reserves has been one of the strongest performing sectors year to date as commodity and oil prices have continued their rally from late 2006. The Fund benefited from both our energy reserves security selection and an over weight position in the energy reserves sector.
What were among the weakest performing sectors for the Fund? Were there any investments that did not measure up to your expectations?
Consumer Staples and Information Technology (IT) sectors detracted from the total return. There were no specific stocks that significantly detracted from performance in Consumer Staples. In general, Consumer sectors have been weak in 2007 as increasing energy prices, hints of rising inflation, and slowing GDP growth led to an unfavorable environment for consumers. IT Services and Semiconductors names were the largest year to date detractors. Semitool is a Semiconductor stock that negatively impacted performance; the market sold off due to some short term events causing a decline in earnings and a subsequent downward revision of earnings guidance. We continue to see opportunity in Semitool and we anticipate a positive long term trend of earnings growth.
What is your current strategy? How is the Fund positioned?
As a bottom up fundamental manager, our portfolio construction is primarily based on identifying stocks with the best potential to add value to our overall returns. We do not make
56 Semi-Annual Report | June 30, 2007 |
sector decisions and then conduct stock selection or portfolio construction based on each sector’s weight in the index. Our portfolio construction has a relative sector neutrality approach that results in our sector weights remaining roughly proportional to those of the benchmark. An over weighted sector position therefore occurs due to finding attractive stocks in that sector.
Calendar year 2007 started with investor concerns that a US-led slowdown would stall growth, commodity price increases and high utilization rates might spill over into wage and price inflation, and either lower growth or higher interest rates could destabilize credit and liquidity and cause a “financial accident.” In May, US interest rates rose significantly on fears that inflation was accelerating and that the “financial accident” was happening as subprime mortgage defaults started to escalate. The highly publicized problems at certain hedge funds further fueled speculation that mortgage-related derivatives were increasing systemic financial risk. The market corrections associated with these events appear to have been orderly adjustments and interest rates have declined from their May levels. Investors however are demanding more compensation for risk as recent leveraged buy-out debt offerings have failed to attract investors and spreads have subsequently widened. While there are few if any signs of an asset bubble, in spite of widespread efforts to identify one, the global economy and financial markets continue to function in relatively stable equilibrium.
While earnings growth has slowed over the last several quarters, we anticipate it will ramp up in late 2007 and through 2008. We anticipate top line revenue and earnings to continue to grow due to indications that companies’ hiring plans are strengthening and many are experiencing bulging order books. Additionally, firms have regained pricing power and strong corporate cash balances are leading to increases in capital spending plans. From a long term perspective, interest rates and employment are still accommodative to economic growth.
June 30, 2007 | William Blair Funds 57 |
Value Discovery Fund
Performance Highlights (unaudited)
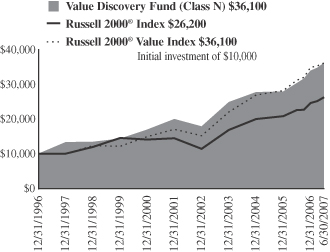
Average Annual Total Return at 6/30/2007
| | | | | | | | | | | | | | | | | | |
| | | Year to
Date | | | 1
Year | | | 3
Year | | | 5
Year | | | 10 Year | | | Since
Inception | |
Value Discovery Fund Class N | | 6.45 | % | | 19.41 | % | | 11.52 | % | | 10.11 | % | | 12.52 | % | | — | |
Value Discovery Fund Class I | | 6.54 | | | 19.64` | | | 11.73 | | | 10.32 | | | — | | | 14.52 | (a) |
Russell 2000® Index | | 6.45 | | | 16.43 | | | 13.45 | | | 13.88 | | | 9.06 | | | 10.34 | (a) |
Russell 2000® Value Index | | 3.80 | | | 16.05 | | | 15.02 | | | 14.62 | | | 12.14 | | | 15.27 | |
| | (a) | | For the period from October 1, 1999 (Commencement of the Class) to June 30, 2007. | |
Performance cited represents past performance. Past performance does not guarantee future results and current performance may be lower or higher than the data quoted. Results shown are average annual total returns, which assume reinvestment of dividends and capital gains. Investment returns and principal will fluctuate and you may have a gain or loss when you sell shares. For the most current month-end performance information, please call 1-800-742-7272, or visit our Web site at www.williamblairfunds.com. Investing in smaller companies involves special risks, including higher volatility and lower liquidity. From time to time, the investment advisor may waive fees or reimburse expenses for the Fund. Without these waivers, performance would be lower. Class N shares are available to the general public without a sales load. Class I shares are available to certain institutional investors and advisory clients of William Blair & Company, L.L.C., without a sales load or distribution (12b-1) or service fees.
The performance highlights and graph presented above do not reflect the deduction of taxes that a shareholder would pay on fund distributions or the redemption of fund shares.
The Russell 2000® Index is the Fund’s primary benchmark. The Russell 2000® Index is an unmanaged composite of the smallest 2000 stocks of the Russell 3000® Index.
The Russell 2000® Value Index consists of small-capitalization companies with below average price-to-book ratios and forecasted growth rates.
This report identifies the Fund’s investments on June 30, 2007. These holdings are subject to change. Not all stocks in the Fund performed the same, nor is there any guarantee that these stocks will perform as well in the future. Market forecasts provided in this report may not necessarily come to pass.
Sector Diversification (unaudited)
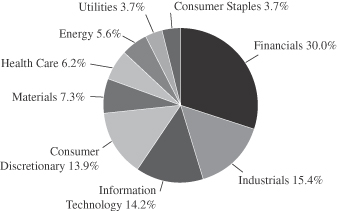
The sector diversification shown is based on the total investment portfolio.
58 Semi-Annual Report | June 30, 2007 |
Value Discovery Fund
Portfolio of Investments, June 30, 2007 (all dollar amounts in thousands) (unaudited)
| | | | | |
Issuer | | Shares | | Value |
| | |
Common Stocks | | | | | |
Financials—30.0% | | | | | |
Argonaut Group, Inc. | | 52,050 | | $ | 1,625 |
Boston Private Financial Holdings, Inc. | | 40,936 | | | 1,100 |
*Care Investment Trust, Inc. | | 48,790 | | | 671 |
Citizens Banking Corporation | | 43,924 | | | 804 |
Cogdell Spencer, Inc. | | 34,775 | | | 716 |
*Community Bancorp | | 31,480 | | | 881 |
*CRM Holdings, Ltd. | | 52,930 | | | 405 |
Employers Holdings, Inc. | | 41,290 | | | 877 |
Equity Inns, Inc. | | 30,009 | | | 672 |
Financial Federal Corporation | | 39,415 | | | 1,175 |
First Midwest Bancorp Incorporated | | 49,121 | | | 1,744 |
First Potimac Realty Trust | | 33,155 | | | 772 |
FirstMerit Corporation | | 45,755 | | | 958 |
Hanover Insurance Group, Inc. | | 16,160 | | | 788 |
Jones Lang LaSalle, Inc | | 7,175 | | | 814 |
Kite Realty Group Trust | | 70,495 | | | 1,341 |
Lasalle Hotel Properties | | 17,635 | | | 766 |
Mid-American Apartment Communities, Inc. | | 28,110 | | | 1,475 |
*PMA Capital Corporation, Class “A” | | 97,803 | | | 1,046 |
*RAM Holdings, Ltd.† | | 83,280 | | | 1,312 |
UCBH Holdings | | 52,345 | | | 956 |
Umpqua Holdings Corporation | | 32,020 | | | 753 |
*Western Alliance Bancorp | | 31,770 | | | 948 |
| | | | | |
| | | | | 22,599 |
| | | | | |
Industrials—15.4% | | | | | |
Barrett Business Services, Inc. | | 30,895 | | | 798 |
CLARCOR, Inc. | | 37,260 | | | 1,395 |
*EMCOR Group, Inc. | | 11,055 | | | 806 |
*Esco Technologies, Inc. | | 14,705 | | | 533 |
Forward Air Corporation | | 35,870 | | | 1,223 |
G & K Services, Inc. | | 20,375 | | | 805 |
*Genlyte Group, Inc. | | 14,860 | | | 1,167 |
Interface Inc., Class “A” | | 69,310 | | | 1,307 |
Kaydon Corporation | | 18,885 | | | 984 |
Tal International Group, Inc. | | 48,460 | | | 1,440 |
Watsco, Inc. | | 20,790 | | | 1,131 |
| | | | | |
| | | | | 11,589 |
| | | | | |
Information Technology—14.2% | | | | | |
Adtran Incorporated | | 30,085 | | | 781 |
*Anixter International, Inc. | | 15,520 | | | 1,167 |
*Avid Technology, Inc. | | 26,121 | | | 923 |
*Entegris, Inc. | | 96,853 | | | 1,151 |
*MICROS Systems, Inc. | | 18,450 | | | 1,004 |
*Parametric Technology Corporation | | 70,130 | | | 1,516 |
*Progress Software Corporation | | 23,570 | | | 749 |
*Semitool, Inc. | | 86,159 | | | 828 |
*SRA International, Inc. | | 14,860 | | | 375 |
*Sybase, Inc. | | 59,880 | | | 1,431 |
*Transaction Systems Architects, Inc. | | 22,110 | | | 744 |
| | | | | |
| | | | | 10,669 |
| | | | | |
Consumer Discretionary—13.9% | | | | | |
*Aftermarket Technology Corp. | | 27,670 | | | 821 |
Ameristar Casinos, Inc. | | 27,670 | | | 961 |
*Cavco Industries, Inc. | | 20,790 | | | 780 |
Christopher & Banks Corporation | | 93,862 | | | 1,610 |
Entercom Communications Corporation | | 35,943 | | | 895 |
*Meritage Homes Corporation | | 14,290 | | | 382 |
*Papa John’s International, Inc. | | 24,245 | | | 697 |
*RC2 Corporation | | 17,715 | | | 709 |
*Non-income producing
† = U.S. listed foreign security
VRN = Variable Rate Note
| | | | | | | |
Issuer | | Shares or
Principal
Amount | | Value | |
| | |
Common Stocks—(continued) | | | | | | | |
Consumer Discretionary—(continued) | | | | | | | |
Ruby Tuesday, Inc. | | | 27,085 | | $ | 713 | |
*Select Comfort Corporation | | | 50,440 | | | 818 | |
*Tractor Supply Company | | | 20,057 | | | 1,044 | |
Wolverine World Wide, Inc. | | | 38,065 | | | 1,055 | |
| | | | | | | |
| | | | | | 10,485 | |
| | | | | | | |
Materials—7.2% | | | | | | | |
Arch Chemicals, Inc. | | | 36,235 | | | 1,273 | |
CF Industries Holdings, Inc. | | | 13,390 | | | 803 | |
Quanex Corporation | | | 17,350 | | | 845 | |
Silgan Holdings, Inc. | | | 23,865 | | | 1,319 | |
Texas Industries, Inc. | | | 15,665 | | | 1,228 | |
| | | | | | | |
| | | | | | 5,468 | |
| | | | | | | |
Health Care—6.2% | | | | | | | |
*Magellan Health Services | | | 27,450 | | | 1,276 | |
*Matrixx Initiatives, Inc. | | | 50,221 | | | 1,051 | |
*Pediatrix Medical Group | | | 22,255 | | | 1,227 | |
*Varian, Inc. | | | 20,939 | | | 1,148 | |
| | | | | | | |
| | | | | | 4,702 | |
| | | | | | | |
Energy—5.6% | | | | | | | |
*Forest Oil Corporation | | | 32,283 | | | 1,364 | |
*Goodrich Petroleum Corporation | | | 19,400 | | | 672 | |
*Horizon Offshore, Inc. | | | 39,590 | | | 760 | |
*Petrohawk Energy Corporation | | | 88,508 | | | 1,404 | |
| | | | | | | |
| | | | | | 4,200 | |
| | | | | | | |
Utilities—3.7% | | | | | | | |
Avista Corpration | | | 32,210 | | | 694 | |
Cleco Corporation | | | 28,845 | | | 707 | |
Northwest Natural Gas Company | | | 14,715 | | | 680 | |
South Jersey Industries, Inc. | | | 19,400 | | | 686 | |
| | | | | | | |
| | | | | | 2,767 | |
| | | | | | | |
Consumer Staples—3.7% | | | | | | | |
Flowers Foods, Inc. | | | 22,180 | | | 740 | |
J&J Snack Foods | | | 18,742 | | | 707 | |
*Playtex Products, Inc. | | | 89,313 | | | 1,323 | |
| | | | | | | |
| | | | | | 2,770 | |
| | | | | | | |
Total Common Stock—99.9%
(cost $66,926) | | | 75,249 | |
| | | | | | | |
| | |
Investment in Affiliate | | | | | | | |
William Blair Ready Reserves Fund | | | 30,226 | | | 30 | |
| | | | | | | |
Total Investment in Affiliate—0.0%
(cost $30) | | | 30 | |
| | | | | | | |
| | |
Short-Term Investment | | | | | | | |
Prudential Funding Demand Note, VRN
5.305%, due 7/2/07 | | $ | 81,000 | | | 81 | |
| | | | | | | |
Total Short-Term Investment—0.1%
(cost $81) | | | 81 | |
| | | | | | | |
Total Investments—100.0%
(cost $67,037) | | | 75,360 | |
Liabilities, plus cash and other assets—(0.0)% | | | (27 | ) |
| | | | | | | |
Net assets—100.0% | | $ | 75,333 | |
| | | | | | | |
See accompanying Notes to Financial Statements.
June 30, 2007 | William Blair Funds 59 |

James S. Kaplan

Christopher T. Vincent

Benjamin J. Armstrong
BOND FUND
The Bond Fund Seeks to outperform the Lehman Aggregate Bond Index by maximizing total return through a combination of income and capital appreciation.
AN OVERVIEW FROM THE PORTFOLIO MANAGERS
We are pleased to have the Bond Fund become the newest addition to the William Blair Fund Family and would like to thank our shareholders for investing with us.
As the managers of the Bond Fund we are enthusiastic about the opportunities available to us. The broad sectors that are represented in the Fund’s portfolio include government securities, corporate debt securities issued by domestic and foreign companies, mortgage-backed securities and asset backed securities. The Fund invests at least 90% in securities rated in the highest four categories by at least one of the following three nationally recognized statistical rating organizations: Fitch Ratings, Moody’s Investors Service Inc. and Standard & Poor’s Corporation. The Fund may also invest no more than 10% of its net assets in below investment grade securities.
How did the Fund perform since its inception? How did the Fund’s performance compare to its benchmark?
The Bond Fund commenced operations on May 1, 2007. Through the two-month period ending June 30, 2007, the Fund posted a decrease of 1.15% (Class N Shares). By comparison, the Fund’s benchmark, the Lehman Aggregate Bond Index, declined 1.00%.
What were the most significant factors impacting Fund performance? What factors were behind the Fund’s performance versus the benchmark?
Rising interest rates and risk aversion weighed on the fixed income markets during the second quarter of 2007.
Interest rates rose sharply during the period. For example, the yield on 2-year Treasury notes increased 0.28% during the second quarter, while the yield on 10-year Treasury securities increased 0.38%. The yield on 2-year Treasury notes was 4.86% on June 30, while the yield on 10-year Treasury securities finished the quarter at 5.02%.
Risk aversion dominated the corporate bond and mortgage markets. Wider spreads resulted in these sectors generally underperforming Treasury securities during the quarter. Concerns about rising subprime mortgage delinquencies and the bankruptcy of several subprime mortgage originators has negatively impacted the residential mortgage market. Mid-year marked the worst six months in the non-Agency Mortgage markets in many years. The highly publicized problems at certain hedge funds heightened fears about the possibility of write-downs of securities backed by subprime mortgages at other institutions.
Reports about the current lackluster housing market added to the negative psychology in the residential mortage-backed market.
Concerns about shareholder-friendly actions by corporate bond issuers contributed to risk aversion in the credit markets. These actions include rising equity dividends and stock repurchases. In addition, the record pace of M&A transactions has negatively impacted the bond market.
60 Semi-Annual Report | June 30, 2007 |
Assets in the Bond Fund reached $51.6 million as of June 30, 2007. We used the months of May and June to deploy these assets into new investments for the Fund.
How is the Fund positioned?
As of June 30, 2007, the three major sector weightings were U.S. Agency Mortgage-Backed securities (43%), Corporate bonds (25%) and U.S. Treasuries (24%). All three sectors represent modest overweights versus the Lehman Aggregate Bond Index.
As previously stated, we are carefully following current market conditions and potential Federal Reserve activity.
June 30, 2007 | William Blair Funds 61 |
Bond Fund
Performance Highlights (unaudited)
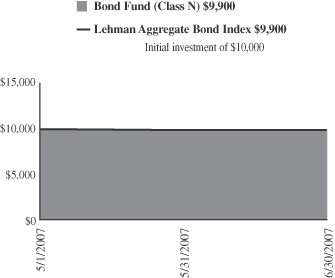
Average Annual Total Return at 6/30/2007
| | | | | |
| | | Since
Inception(a) | | | |
Bond Fund Class N | | (1.15 | )% | | |
Bond Fund Class I | | (1.15 | ) | | |
Lehman Aggregate Bond Index | | (1.00 | ) | | |
| | (a) | | For the period from May 1, 2007 (Commencement of Operations) to June 30, 2007. |
Performance cited represents past performance. Past performance does not guarantee future results and current performance may be lower or higher than the data quoted. Results shown are average annual total returns, which assume reinvestment of dividends and capital gains. Investment returns and principal will fluctuate and you may have a gain or loss when you sell shares. For the most current month-end performance information, please call 1-800-742-7272, or visit our Web site at www.williamblairfunds.com. From time to time, the investment advisor may waive fees or reimburse expenses for the Fund. Without these waivers, performance would be lower. Class N shares are available to the general public without a sales load. Class I shares are available to certain institutional investors and advisory clients of William Blair & Company, L.L.C., without a sales load or distribution (12b-1) or service fees.
The performance highlights and graph presented above do not reflect the deduction of taxes that a shareholder would pay on fund distributions or the redemption of fund shares.
The Lehman Aggregate Bond Index indicates broad intermediate government/corporate bond market performance.
This report identifies the Fund’s investments on June 30, 2007. These holdings are subject to change. Not all investments in the Fund performed the same, nor is there any guarantee that these investments will perform as well in the future. Market forecasts provided in this report may not necessarily come to pass.
Sector Diversification (unaudited)
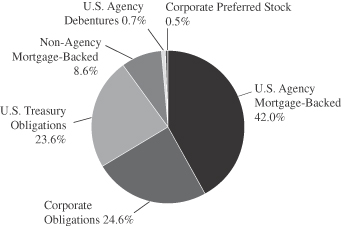
The sector diversification shown is based on the total investment portfolio.
62 Semi-Annual Report | June 30, 2007 |
Bond Fund
Portfolio of Investments, June 30, 2007 (all amounts in thousands) (unaudited)
| | | | | | | | |
Issuer | | Principal
Amount | | Value |
U.S. Government and U.S. Government Agency—64.2% |
U.S. Treasury—22.9% | | | | | | | | |
U.S. Treasury Note,
4.375%, due 12/31/07 | | | | $ | 5,000 | | $ | 4,987 |
U.S. Treasury Note,
4.750%, due 2/15/10 | | | | | 1,450 | | | 1,445 |
U.S. Treasury Note,
4.750%, due 5/15/14 | | | | | 1,300 | | | 1,284 |
U.S. Treasury Note,
5.125%, due 5/15/16 | | | | | 2,250 | | | 2,262 |
U.S. Treasury Note,
7.125%, due 2/15/23 | | | | | 325 | | | 390 |
U.S. Treasury Note,
4.500%, due 2/15/36 | | | | | 1,600 | | | 1,449 |
| | | | | | | | |
Total U.S. Treasury Obligations | | | | | 11,925 | | | 11,817 |
| | | | | | | | |
Government National Mortgage
Association (GNMA)—0.0% |
#357752, 7.000%, due 4/15/09 | | | | | 4 | | | 4 |
| | | | | | | | |
Federal Home Loan Bank (FHLB)—0.6% | | | | | | | | |
4.750%, due 12/16/16 | | | | | 325 | | | 308 |
| | | | | | | | |
Federal Home Loan Mortgage Corp.
(FHLMC)—9.5% | | | |
#G10330, 7.000%, due 1/1/10 | | | | | 30 | | | 31 |
#G90024, 7.000%, due 1/20/13 | | | | | 100 | | | 103 |
#G30093, 7.000%, due 12/1/17 | | | | | 78 | | | 80 |
#G30254, 6.500%, due 5/1/19 | | | | | 124 | | �� | 127 |
#G30255, 7.000%, due 7/1/21 | | | | | 122 | | | 126 |
#G18137, 6.500%, due 8/1/21 | | | | | 541 | | | 551 |
#D95621, 6.500%, due 7/1/22 | | | | | 175 | | | 179 |
#D95897, 5.500%, due 3/1/23 | | | | | 481 | | | 471 |
#C01385, 6.500%, due 8/1/23 | | | | | 709 | | | 722 |
#C90896, 6.500%, due 2/1/25 | | | | | 1,226 | | | 1,250 |
6.750%, due 9/15/29 | | | | | 650 | | | 745 |
#G10728, 7.500%, due 7/1/32 | | | | | 500 | | | 522 |
| | | | | | | | |
Total FHLMC Mortgage Obligations | | | | | 4,736 | | | 4,907 |
| | | | | | | | |
Federal National Mortgage
Association (FNMA)—31.2% | | | |
#598453, 7.000%, due 6/1/15 | | | | | 37 | | | 38 |
#689612, 5.000%, due 5/1/18 | | | | | 968 | | | 939 |
#747903, 4.500%, due 6/1/19 | | | | | 800 | | | 761 |
#791393, 5.500%, due 10/1/19 | | | | | 823 | | | 813 |
#831430, 5.500%, due 3/1/21 | | | | | 987 | | | 973 |
#253847, 6.000%, due 5/1/21 | | | | | 577 | | | 579 |
#900725, 6.000%, due 8/1/21 | | | | | 511 | | | 514 |
#254797, 5.000%, due 6/1/23 | | | | | 528 | | | 504 |
#545437, 7.000%, due 2/1/32 | | | | | 390 | | | 405 |
#555522, 5.000%, due 6/1/33 | | | | | 917 | | | 864 |
#555880, 5.500%, due 11/1/33 | | | | | 978 | | | 948 |
#725027, 5.000%, due 11/1/33 | | | | | 1,295 | | | 1,219 |
#725205, 5.000%, due 3/1/34 | | | | | 1,006 | | | 948 |
#725238, 5.000%, due 3/1/34 | | | | | 1,014 | | | 955 |
#725424, 5.500%, due 4/1/34 | | | | | 1,048 | | | 1,015 |
#725611, 5.500%, due 6/1/34 | | | | | 829 | | | 803 |
#745092, 6.500%, due 7/1/35 | | | | | 1,131 | | | 1,150 |
#845188, 6.000%, due 12/1/35 | | | | | 992 | | | 983 |
#848782, 6.500%, due 1/1/36 | | | | | 1,653 | | | 1,671 |
| | | | | | | | |
Total FNMA Mortgage Obligations | | | | | 16,484 | | | 16,082 |
| | | | | | | | |
| | | | | | | | | |
Issuer | | NRSRO
Rating | | | Principal
Amount | | Value |
Non-Agency Mortgage-Backed Obligations—8.3% | | | |
Countrywide Alternative Loan Trust,
2003-11T1, Tranche M,
4.750%, due 7/25/18 | | AA | + | | $ | 318 | | $ | 307 |
Aames Mortgage Trust,
2001-1, Tranche M2,
7.588%, due 6/25/31 | | A | | | | 133 | | | 131 |
LSSCO, 2004-2, Tranche M2,
6.328%, due 2/28/33, VRN* | | A | | | | 339 | | | 337 |
CWL, 2003-5, Tranche MF2
5.959%, due 11/25/33 | | AA | - | | | 391 | | | 387 |
Renaissance Home Equity Loan Trust, 2004-2, Tranche M5
6.455%, due 7/25/34 | | A | | | | 700 | | | 692 |
FHASI, 2004-AR4, Tranche 3A1,
4.588%, due 8/25/34, VRN | | AAA | | | | 563 | | | 554 |
Security National Mortgage Loan Trust, 2004-2A, Tranche M2,
6.352%, due 11/25/34 | | A | | | | 50 | | | 50 |
GRP Real Estate Asset Trust,
2005-1 Tranche A,
4.850%, due 1/25/35* | | A | | | | 393 | | | 391 |
Security National Mortgage Loan Trust, 2005-1A, Tranche M2,
6.530%, due 2/25/35* | | A | | | | 25 | | | 24 |
Soundview Home Equity Loan Trust, 2005-B, Tranche M1,
5.635%, due 5/25/35 | | AA | + | | | 118 | | | 117 |
Structured Asset Securities Corp.,
2005-9XS, Tranche A2B,
6.500%, due 6/25/35 | | AAA | | | | 200 | | | 200 |
Security National Mortgage Loan Trust, 2005-2A, Tranche M2,
7.321%, due 2/25/36* | | A | | | | 125 | | | 123 |
Chase Mortgage Finance Corporation, 2006-A1, Tranche A3,
6.000%, due 9/25/36 | | AAA | | | | 650 | | | 648 |
La Hipotecaria Panamanian Mortgage Trust, 2007-1GA, Tranche A,
5.750%, due 12/23/36* | | AAA | | | | 80 | | | 79 |
Security National Mortgage Loan Trust, 2006-1A, Tranche M2,
7.500%, due 9/25/36* | | A | | | | 80 | | | 78 |
Statewide Mortgage Loan Trust,
2006-1A, Tranche A2,
7.660%, due 9/25/37* | | AAA | | | | 70 | | | 72 |
ACE, 2005-SN1, Tranche M2,
5.770%, due 11/25/39, VRN | | A | + | | | 50 | | | 48 |
ACE, 2005-SD3, Tranche M2,
7.070%, due 8/25/45, VRN | | A | + | | | 70 | | | 71 |
| | | | | | | | | |
Total Non-Agency Mortgage-Backed Obligations | | | | | | 4,355 | | | 4,309 |
| | | | | | | | | |
| | |
Corporate Obligations—23.8% | | | | | | | |
SLM Corporation,
5.565%, due 7/25/08, VRN | | A | + | | | 500 | | | 496 |
Consolidated Edison Company of
New York, 7.150%, due 12/1/09 | | A | + | | | 500 | | | 520 |
Household Finance Corporation,
8.000%, due 7/15/10 | | AA | - | | | 500 | | | 534 |
Bank of America Corporation,
4.250%, due 10/1/10 | | AA | | | | 500 | | | 483 |
See accompanying Notes to Financial Statements.
June 30, 2007 | William Blair Funds 63 |
Bond Fund
Portfolio of Investments, June 30, 2007 (all amounts in thousands) (unaudited)
| | | | | | | | | |
Issuer | | NRSRO
Rating | | |
Principal
Amount | | Value |
| | |
Corporate Obligations—(continued) | | | | | | | |
National Rural Utilities Cooperative Finance Corporation,
7.250%, due 3/1/12 | | A | | | $ | 500 | | $ | 533 |
Citigroup, Inc. 5.625%, due 8/27/12 | | AA | | | | 400 | | | 400 |
Simon Property Group, Inc.,
6.350%, due 8/28/12 | | A | - | | | 500 | | | 515 |
Cox Communications, Inc.,
7.125%, due 10/1/12 | | BBB | - | | | 400 | | | 423 |
Boeing Capital Corporation,
5.800%, due 1/15/13 | | A | + | | | 400 | | | 406 |
Residential Capital, LLC,
6.500%, due 4/17/13 | | BBB | | | | 350 | | | 338 |
SBC Communications,
5.100%, due 9/15/14 | | A | | | | 400 | | | 381 |
CODELCO, Inc.—144A,
4.750%, due 10/15/14 | | A | | | | 400 | | | 373 |
Johnson Controls, Inc.
5.500%, due 1/15/16 | | A | - | | | 400 | | | 387 |
ProLogis, 5.750%, due 4/1/16 | | BBB | + | | | 400 | | | 395 |
Omnicom Group, Inc.,
5.900%, due 4/15/16 | | A | - | | | 400 | | | 395 |
Yum!, Brands, Inc.,
6.250%, due 4/15/16 | | BBB | | | | 400 | | | 399 |
SAB Miller plc,
6.500%, due 7/1/16 | | BBB | + | | | 400 | | | 411 |
Petrobras International Finance Company, 6.125%, due 10/6/16 | | BBB | - | | | 400 | | | 392 |
Marriott International,
6.375%, due 6/15/17 | | BBB | + | | | 450 | | | 451 |
Ras Laffan Lng II,
5.298%, due 9/30/20 | | A | + | | | 400 | | | 374 |
Kroger Company,
8.00%, due 9/15/29 | | BBB | | | | 400 | | | 431 |
Conoco Funding Company,
7.250%, due 10/15/31 | | A | - | | | 400 | | | 452 |
Kohl’s Corporation,
6.00%, due 1/15/33 | | A | | | | 250 | | | 234 |
Goldman Sachs Group, Inc.,
6.125%, due 2/15/33 | | AA | - | | | 400 | | | 382 |
Pacific Gas and Electric Company,
6.050%, due 3/1/34 | | A | - | | | 250 | | | 242 |
Teva Pharmaceutical Finance LLC,
6.150%, due 2/1/36 | | BBB | | | | 510 | | | 477 |
Wisconsin Electric Power Company,
5.700%, due 12/1/36 | | A | + | | | 500 | | | 471 |
Comcast Corporation,
6.450%, due 3/15/37 | | BBB | + | | | 500 | | | 482 |
Florida Power and Light Group Capital, Inc.
6.650%, due 6/15/67, VRN | | A | - | | | 500 | | | 496 |
| | | | | | | | | |
Total Corporate Obligations | | | | | | 12,310 | | | 12,273 |
| | | | | | | | | |
Total Fixed Income—96.3%
(cost $50,322) | | | | | | 50,139 | | | 49,700 |
| | | | | | | | | |
| | | | | | | | | | |
Issuer | | NRSRO
Rating | | | Principal
Amount/
Shares | | Value | |
| | | |
Preferred Stock—0.5% | | | | | | | | | | |
Public Storage, Inc. | | | | | | 10,000 | | $ | 239 | |
Total Preferred Stock—0.5%
(cost $245) | | | | | | 10,000 | | | 239 | |
| | | | | | | | | | |
Total Long-Term Investments—96.8%
(cost $50,567) | | | 49,939 | |
| | | | | | | | | | |
| | | |
Short-Term Investments | | | | | | | | | | |
American Express Corporation, VRN
5.170%, due 7/2/07 | | A | + | | $ | 2,240 | | | 2,240 | |
Prudential Funding LLC, VRN
5.305%, due 7/2/07 | | A | + | | | 2,240 | | | 2,240 | |
| | | | | | | | | | |
Total Short-Term Investments—8.7%
(cost $4,480) | | | | 4,480 | | | 4,480 | |
| | | | | | | | | | |
| | | |
Repurchase Agreement | | | | | | | | | | |
Investors Bank & Trust Company,
4.50% dated 6/29/2007, due 7/02/2007, repurchase price $1,778, collateralized by SBA #506044 | | A | + | | | 1,777 | | | 1,777 | |
| | | | | | | | | | |
Total Repurchase Agreement—3.4%
(cost $1,777) | | | | 1,777 | | | 1,777 | |
| | | | | | | | | | |
Total Investments—108.9%
(cost $56,824) | | | | | | | 56,196 | |
| | | | | | | | | | |
Liabilities plus cash and other assets—(8.9)% | | | (4,573 | ) |
| | | | | | | | | | |
Net Assets—100% | | $ | 51,623 | |
| | | | | | | | | | |
VRN = Variable Rate Note
NRSRO = Nationally Recognized Statistical Rating Organization, such as
S&P, Moody’s or Fitch (unaudited)
The obligations of certain U. S. Government-sponsored securities are neither issued nor guaranteed by the U. S. Treasury
*Deemed illiquid pursuant to Liquidity Procedures adopted by the Board of Trustees. These holdings represent 2.14% of the net assets at June 30,2007.
See accompanying Notes to Financial Statements.
64 Semi-Annual Report | June 30, 2007 |
James S. Kaplan
Christopher T. Vincent
INCOME FUND
The Income Fund invests in intermediate-term debt securities.
AN OVERVIEW FROM THE PORTFOLIO MANAGERS
How did the Fund perform over the first half of the year? How did the Fund’s performance compare to its benchmark?
The Income Fund posted a 0.45% gain on a total return basis (Class N Shares) for the 6 months ended June 30, 2007. By comparison, the Fund’s benchmark, the Lehman Intermediate Government/Credit Bond Index, rose 1.45%, while the Fund’s peer group, the Morningstar Short-term Bond Category, increased 1.72%.
What were the most significant factors impacting Fund performance? What factors were behind the Fund’s performance versus the benchmark?
During the first half of 2007, the Fund’s return underperformed versus the benchmark. Two non-prime mortgage bonds contributed significantly to the underperformance. The poor performance of these holdings has trimmed approximately 1.1% from the Fund’s return since the beginning of the year.
The Fund has been underweight Treasury securities and overweight the other spread sectors relative to the benchmark. The primary overweight has been in Mortgage and Asset-backed securities including non-agency residential mortgage-backed securities, which also detracted from performance. The Fund has been underweight the credit sector, which marginally benefited performance.
Rising interest rates and risk aversion weighed on the fixed income markets during the first half of 2007.
Interest rates posted slight to modest gains at mid-year. Rates were generally flat during the first quarter of 2007, but spiked during the second quarter. For example, the yield on 2-year Treasury notes increased 0.05% during the first half of the year, while the yield on 10-year Treasury securities increased 0.32%. The yield on 2-year Treasury notes was 4.86% on June 30, while the yield on 10-year Treasury securities finished the quarter at 5.02%.
Risk aversion dominated the corporate bond and mortgage markets. Wider spreads resulted in these sectors generally underperforming Treasury securities during the quarter.
Concerns about rising subprime mortgage delinquencies and the bankruptcy of several subprime mortgage originators has negatively impacted the residential mortgage market. Mid-year marked the worst six months in the non-Agency Mortgage markets in many years. The highly publicized problems at certain hedge funds heightened fears about the possibility of write-downs of securities backed by subprime mortgages at other institutions.
Reports about the current lackluster housing market added to the negative psychology in the residential Mortgage-backed market.
Concerns about shareholder-friendly actions by corporate bond issuers contributed to risk aversion in the credit markets. These actions include rising equity dividends and stock repurchases. In addition, the record pace of M&A transactions has negatively impacted the bond market.
June 30, 2007 | William Blair Funds 65 |
Which investment strategies enhanced the Fund’s return? Were there any investment strategies that produced the best results?
Although it was a very difficult first half of the year for the Mortgage-backed market, and the Fund, in general, the performance of the Fund benefited from its holdings of seasoned premium Agency pass-through mortgages, which have shorter maturities.
The Fund’s duration was shorter than the stated benchmark, the Lehman Intermediate Government Credit Index, which contributed to relative returns.
Within corporate bonds, the Fund has been underweight the finance sector, which has contributed to returns. This sector has been among the worst performers in the credit market due to subprime mortgage problems associated with several firms in this sector. In addition, the Fund has avoided large losses associated with corporate bonds threatened with leveraged buyout concerns. Avoiding these buyouts has also contributed to returns. Finally, the Fund has avoided direct exposure to the Homebuilder sector, which has also been a poor performer.
How is the Fund positioned?
As of June 30th, the three major sector weightings were U.S. Mortgage-backed securities (40%), Non-Agency Mortgage-backed securities (25%) and Corporate bonds (24%). The former two sectors represent overweights while the latter represents an underweight versus the Lehman Intermediate Government/Credit Index.
As previously stated, we are carefully following current market conditions and potential Federal Reserve activity.
66 Semi-Annual Report | June 30, 2007 |
Income Fund
Performance Highlights (unaudited)
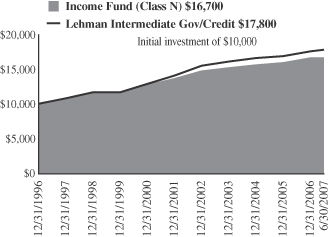
Average Annual Total Return at 6/30/2007
| | | | | | | | | | | | | | | | | | | | |
| | | Year
to
Date | | | 1
Year | | | 3
Year | | | 5
Year | | | 10
Year | | | Since
Inception | | | |
Income Fund Class N | | 0.45 | % | | 4.48 | % | | 3.16 | % | | 3.46 | % | | 4.96 | % | | — | % | | |
Income Fund Class I | | 0.59 | | | 4.70 | | | 3.32 | | | 3.63 | | | — | | | 5.01 | (a) | | |
Lehman Intermediate Government Credit Bond Index | | 1.45 | | | 5.76 | | | 3.41 | | | 4.14 | | | 5.66 | | | 5.53 | (a) | | |
| | (a) | | For the period from October 1, 1999 to June 30, 2007. |
Performance cited represents past performance. Past performance does not guarantee future results and current performance may be lower or higher than the data quoted. Results shown are average annual total returns, which assume reinvestment of dividends and capital gains. Investment returns and principal will fluctuate and you may have a gain or loss when you sell shares. For the most current month-end performance information, please call 1-800-742-7272, or visit our Web site at www.williamblairfunds.com. Class N shares are available to the general public without a sales load. Class I shares are available to certain institutional investors and advisory clients of William Blair & Company, L.L.C., without a sales load or distribution (12b-1) or service fees.
The performance highlights and graph presented above do not reflect the deduction of taxes that a shareholder would pay on fund distributions or the redemption of fund shares.
The Lehman Intermediate Government/Credit Bond Index indicates broad intermediate government/corporate bond market performance.
This report identifies the Fund’s investments on June 30, 2007. These holdings are subject to change. Not all investments in the Fund performed the same, nor is there any guarantee that these investments will perform as well in the future. Market forecasts provided in this report may not necessarily come to pass.
Sector Diversification (unaudited)
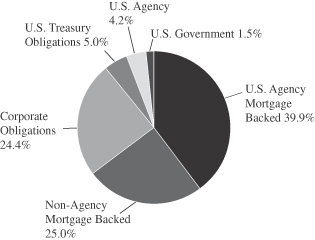
The sector diversification shown is based on the total investment portfolio.
June 30, 2007 | William Blair Funds 67 |
Income Fund
Portfolio of Investments, June 30, 2007 (all amounts in thousands) (unaudited)
| | | | | | | | |
Issuer | | Principal
Amount | | Value |
|
U.S. Government and U.S. Government Agency—49.6% |
U.S. Treasury—4.9% | | | | | | | | |
U.S. Treasury Note,
6.500%, due 2/15/10 | | | | $ | 8,000 | | $ | 8,309 |
U.S. Treasury Note,
4.750%, due 5/15/14 | | | | | 2,000 | | | 1,975 |
U.S. Treasury Note,
5.125%, due 5/15/16 | | | | | 2,060 | | | 2,072 |
| | | | | | | | |
Total U.S. Treasury Obligations | | | | | 12,060 | | | 12,356 |
| | | | | | | | |
Government National Mortgage
Association (GNMA)—1.5% |
#780405, 9.500%, due 11/15/17 | | | | | 469 | | | 500 |
#589335, 6.500%, due 10/15/22 | | | | | 1,877 | | | 1,904 |
#357322, 7.000%, due 9/15/23 | | | | | 142 | | | 148 |
#616250, 6.000%, due 2/15/24 | | | | | 1,286 | | | 1,284 |
| | | | | | | | |
Total Government National Mortgage Association | | | | | 3,774 | | | 3,836 |
| | | | | | | | |
Small Business Administration—0.0% | | | | | | |
Receipt for Multiple Originator Fees,
#3, 0.821%, due 11/01/08 (Interest Only) WAC | | | | | 1,475 | | | 12 |
| | | | | | | | |
Federal Home Loan Mortgage
Corp. (FHLMC)—18.6% | | | |
#1417, Tranche SA,
11.219%, due 11/15/07, VRN | | | | | 94 | | | 94 |
#G10067, 7.000%, due 1/1/08 | | | | | 58 | | | 58 |
#1601, Tranche PJ,
6.000%, due 10/15/08, VRN | | | | | 265 | | | 269 |
#E80050, 6.000%, due 10/1/09 | | | | | 253 | | | 254 |
#G90028, 7.000%, due 5/17/09 | | | | | 147 | | | 147 |
#G90019, 7.500%, due 12/17/09 7.000%, due 3/15/10 | | | |
| 213
4,000 | |
| 215
4,179 |
#E65418, 7.000%, due 8/1/10 | | | | | 107 | | | 107 |
#G10457, 7.000%, due 2/1/11 | | | | | 284 | | | 290 |
#E00436, 7.000%, due 6/1/11 | | | | | 319 | | | 327 |
#G10708, 6.500%, due 8/1/12 | | | | | 189 | | | 193 |
#G11218, 7.000%, due 10/1/12 | | | | | 69 | | | 71 |
#G10839, 5.500%, due 10/1/13 | | | | | 1,011 | | | 1,004 |
#E72924, 7.000%, due 10/1/13 | | | | | 917 | | | 945 |
#J02572, 7.500%, due 6/1/14 | | | | | 1,511 | | | 1,554 |
#E81697, 8.000%, due 5/1/15 | | | | | 1,936 | | | 2,032 |
#E81703, 7.000%, due 5/1/15 | | | | | 829 | | | 853 |
#E81908, 8.500%, due 12/1/15 | | | | | 114 | | | 120 |
#G11688, 7.000%, due 2/1/16 | | | | | 615 | | | 635 |
#J02184, 8.000%, due 4/1/16 | | | | | 1,536 | | | 1,608 |
#G12258, 6.000%, due 8/1/16 | | | | | 2,339 | | | 2,352 |
#G90022, 8.000%, due 9/17/16 | | | | | 578 | | | 603 |
#G11702, 7.500%, due 12/1/16 | | | | | 582 | | | 601 |
#J04096, 6.500%, due 1/1/17 | | | | | 2,443 | | | 2,496 |
#G11486, 7.500%, due 4/1/17 | | | | | 673 | | | 694 |
#E90398, 7.000%, due 5/1/17 | | | | | 1,062 | | | 1,096 |
#M30028, 5.500%, due 5/1/17 | | | | | 262 | | | 263 |
#G11549, 7.000%, due 7/1/17 | | | | | 617 | | | 635 |
#G90027, 6.000%, due 11/17/17 | | | | | 1,152 | | | 1,153 |
#G11756, 7.000%, due 12/1/17 | | | | | 1,026 | | | 1,053 |
#G11725, 5.500%, due 11/1/18 | | | | | 1,904 | | | 1,882 |
#G30254, 6.500%, due 5/1/19 | | | | | 2,341 | | | 2,401 |
#G30255, 7.000%, due 7/1/21 | | | | | 785 | | | 815 |
#G30268, 7.000%, due 7/1/21 | | | | | 1,620 | | | 1,682 |
| | | | | | | | |
Issuer | | Principal
Amount | | Value |
Federal Home Loan Mortgage
Corp. (FHLMC)—(continued) |
#J02986, 6.500%, due 7/1/21 | | | | $ | 2,380 | | $ | 2,424 |
#G30239, 7.000%, due 8/1/21 | | | | | 1,407 | | | 1,460 |
#C67537, 9.500%, due 8/1/21 | | | | | 180 | | | 193 |
#G18137, 6.500%, due 8/1/21 | | | | | 2,756 | | | 2,807 |
#G30243, 6.000%, due 12/1/21 | | | | | 1,599 | | | 1,609 |
#D95621, 6.500%, due 7/1/22 | | | | | 2,976 | | | 3,044 |
#G02183, 6.500%, due 3/1/30 | | | | | 1,822 | | | 1,855 |
#A45790, 7.500%, due 5/1/35 | | | | | 933 | | | 973 |
| | | | | | | | |
Total FHLMC Mortgage Obligations | | | | | 45,904 | | | 47,046 |
| | | | | | | | |
Federal National Mortgage
Association (FNMA)—24.6% | | | |
#1992-192, Tranche SC,
6.329%, due 11/25/07, VRN | | | | | 42 | | | 42 |
#93-196, Tranche SA,
9.794%, due 10/25/08, VRN | | | | | 175 | | | 174 |
#1993-221, Tranche SG,
3.624%, due 12/25/08, VRN | | | | | 149 | | | 147 |
#765396, 5.500%, due 1/1/09 | | | | | 125 | | | 124 |
#2002-27, Tranche SW,
4.327%, due 5/25/2009 VRN | | | | | 1,020 | | | 1,005 |
#695512, 8.000%, due 9/1/10 | | | | | 292 | | | 298 |
#725479, 8.500%, due 10/1/10 | | | | | 463 | | | 471 |
6.250%, due 2/1/11 | | | | | 6,000 | | | 6,201 |
#313816, 6.000%, due 4/1/11 | | | | | 367 | | | 370 |
#577393, 10.000%, due 6/1/11 | | | | | 169 | | | 180 |
#577395, 10.000%, due 8/1/11 | | | | | 675 | | | 720 |
#254705, 5.500%, due 3/1/13 | | | | | 1,372 | | | 1,368 |
#254788, 6.500%, due 4/1/13 | | | | | 469 | | | 477 |
#725315, 8.000%, due 5/1/13 | | | | | 463 | | | 481 |
#190539, 6.000%, due 1/1/14 | | | | | 370 | | | 370 |
#806463, 7.000%, due 3/1/14 | | | | | 557 | | | 574 |
#593561, 9.500%, due 8/1/14 | | | | | 360 | | | 385 |
#535560, 7.000%, due 8/1/14 | | | | | 888 | | | 912 |
#567027, 7.000%, due 9/1/14 | | | | | 1,452 | | | 1,496 |
#567026, 6.500%, due 10/1/14 | | | | | 1,363 | | | 1,394 |
#458124, 7.000%, due 12/15/14 | | | | | 313 | | | 322 |
#576554, 8.000%, due 1/1/16 | | | | | 1,497 | | | 1,566 |
#745459, 7.000%, due 2/1/15 | | | | | 781 | | | 806 |
#598453, 7.000%, due 6/1/15 | | | | | 270 | | | 274 |
#576553, 8.000%, due 2/1/16 | | | | | 2,261 | | | 2,387 |
#555747, 8.000%, due 5/1/16 | | | | | 422 | | | 439 |
#735569, 8.000%, due 10/1/16 | | | | | 2,025 | | | 2,109 |
#725410, 7.500%, due 4/1/17 | | | | | 1,309 | | | 1,352 |
#643217, 6.500%, due 6/1/17 | | | | | 365 | | | 373 |
#679247, 7.000%, due 8/1/17 | | | | | 1,568 | | | 1,631 |
#682075, 5.500%, due 11/1/17 | | | | | 1,029 | | | 1,018 |
#662925, 6.000%, due 12/1/17 | | | | | 1,413 | | | 1,424 |
#740847, 6.000%, due 10/1/18 | | | | | 1,253 | | | 1,260 |
#852864, 7.000%, due 7/1/20 | | | | | 3117 | | | 3220 |
#458147, 10.000%, due 8/15/20 | | | | | 886 | | | 984 |
#835563, 7.000%, due 10/1/20 | | | | | 1,252 | | | 1,297 |
#893325, 7.000%, due 9/1/21 | | | | | 2,962 | | | 3,041 |
#735367, 6.000%, due 3/1/22 | | | | | 2185 | | | 2194 |
#735574, 8.000%, due 3/1/22 | | | | | 852 | | | 902 |
#735104, 7.000%, due 5/1/22 | | | | | 2,172 | | | 2,259 |
#725927, 7.000%, due 8/1/22 | | | | | 1,781 | | | 1,854 |
#679253, 6.000%, 10/1/22 | | | | | 1754 | | | 1761 |
#735137, 6.500%, due 11/1/22 | | | | | 1,184 | | | 1,213 |
#254633, 6.000%, due 1/1/2023 | | | | | 635 | | | 637 |
See accompanying Notes to Financial Statements.
68 Semi-Annual Report | June 30, 2007 |
Income Fund
Portfolio of Investments, June 30, 2007 (all amounts in thousands) (unaudited)
| | | | | | | | |
Issuer | | NRSRO
Rating | | Principal
Amount | | Value |
Federal National Mortgage
Association (FNMA)—(continued) |
#1993-19, Tranche SH,
11.234%, due 4/25/23, VRN | | | | $ | 11 | | $ | 15 |
#745633, 6.500%, due 7/1/24 | | | | | 1,573 | | | 1,610 |
#806458, 8.000%, due 6/1/28 | | | | | 1,164 | | | 1,230 |
#880155, 8.500%, due 7/1/29 | | | | | 1,445 | | | 1,551 |
#797846, 7.000%, due 3/1/32 | | | | | 1,624 | | | 1,679 |
#745519, 8.500%, due 5/1/32 | | | | | 933 | | | 1,002 |
#654674, 6.500%, due 9/1/32 | | | | | 288 | | | 293 |
#733897, 6.500%, due 12/1/32 | | | | | 539 | | | 550 |
#888305, 7.000, due 3/1/36 | | | | | 2,941 | | | 3,049 |
| | | | | | | | |
Total FNMA Mortgage Obligations | | | | | 60,575 | | | 62,491 |
| | | | | | | | |
| |
Non-Agency Mortgage-Backed—24.5% | | | |
ABFS, 2002-2, Tranche A6,
5.850%, due 3/15/19 | | AAA | | | 114 | | | 114 |
RALI, 2004-QS16, Tranche 2M1, 5.000%, due 12/25/19 | | AA | | | 1,629 | | | 1,557 |
RALI, 2004-QS16, Tranche 2M3, 5.000%, due 12/25/19 | | BBB | | | 275 | | | 254 |
RALI, 2005-QS14, Tranche 1M1, 5.250%, due 9/25/20 | | AA | | | 956 | | | 922 |
RALI, 2005-QS14, Tranche 1M2, 5.250%, due 9/25/20 | | A | | | 301 | | | 287 |
RALI, 2006-QS2, Tranche IIM1,
5.500%, due 2/25/21 | | AA | | | 1,057 | | | 1,027 |
RALI, 2006-QS2, Tranche IIM2,
5.500%, due 2/25/21 | | A | | | 494 | | | 475 |
RALI, 2006-QS6, Tranche 2M1,
6.000%, due 6/25/21 | | AA | | | 516 | | | 511 |
RALI, 2006-QS6, Tranche 2M2,
6.000%, due 6/25/21 | | A | | | 408 | | | 400 |
First Plus, 1997-4, Tranche M1,
7.640%, due 9/11/23 | | AA | | | 1,350 | | | 1,345 |
First Plus, 1997-4, Tranche M2,
7.830%, due 9/11/23 | | A | | | 285 | | | 287 |
First Plus, 1997-4, Tranche A8,
7.810%, due 9/11/23 | | AAA | | | 134 | | | 137 |
First Plus, 1998-2, Tranche M2,
8.010%, due 5/10/24 | | A | | | 179 | | | 178 |
First Plus, 1998-3, Tranche M2,
7.920%, due 5/10/24, VRN | | A | | | 474 | | | 478 |
Bear Stearns ABS, 2001-A, Tranche M1, 7.540%, due 2/15/31 | | A | | | 653 | | | 653 |
Delta Funding Home Equity Loan Trust, 2000-4, Tranche M1,
7.650%, due 2/15/31 | | AA | | | 1,554 | | | 1,551 |
Structured Asset Securities Corp.,
2005-SC1, Tranche 1A2,
10.245%, due 5/25/31, VRN* | | AAA | | | 1,921 | | | 2,075 |
Aames Mortgage Trust, 2001-1, Tranche M2,
7.588%, due 6/25/31 | | A | | | 1,216 | | | 1,198 |
Security National Mortgage Loan Trust, 2004-1A, Tranche M2,
6.750%, due 06/25/32 | | A | | | 1,600 | | | 1,566 |
Structured Assets Security Corporation, 2002-13, Tranche B1,
6.750%, due 7/25/32, VRN | | AAA | | | 2,021 | | | 2,014 |
| | | | | | | | | |
Issuer | | NRSRO
Rating | | | Principal
Amount | | Value |
|
Non-Agency Mortgage-Backed Obligations—(continued) |
Structured Assets Security Corporation, 2002-17, Tranche B3,
6.089%, due 9/25/32, VRN | | A | | | $ | 1,811 | | $ | 1,803 |
LSSCO, 2004-2, Tranche M1,
6.326%, due 2/28/33, VRN* | | AA | | | | 884 | | | 885 |
LSSCO, 2004-2, Tranche M2,
6.326%, due 2/28/33, VRN* | | A | | | | 678 | | | 675 |
ABFS, 2002-2, Tranche A-7,
5.215%, due 7/15/33, VRN | | AAA | | | | 16 | | | 16 |
ABFS, 2002-3, Tranche M1,
5.402%, due 9/15/33, VRN | | AA | | | | 1,128 | | | 1,109 |
Residential Asset Mortgage Prouducts, 2003-RS9, Tranche MI1,
5.800%, due 10/25/33 | | AA | | | | 198 | | | 194 |
Residential Asset Mortgage Prouducts, 2003-RS9, Tranche MI2,
6.300%, due 10/25/33 | | A | | | | 1,404 | | | 1,382 |
ACE, 2004-SD1, Tranche M3,
8.070%, due 11/25/33, VRN | | BBB | | | | 2099 | | | 1760 |
Residential Asset Mortgage Products, 2003-RS11, Tranche MI1,
5.597%, due 12/25/33 VRN | | AA | | | | 1,695 | | | 1,675 |
Deutsche Mortgage Securites, Inc., 2004-2, Tranche M1,
5.090%, due 1/25/34 | | AA | | | | 1,332 | | | 1,290 |
RAAC, 2005-SP1, Tranche M1,
5.505%, due 9/25/34, VRN | | AA | | | | 2,571 | | | 2,430 |
Security National Mortgage Loan Trust, 2004-2A, Tranche M2,
6.352%, due 11/25/34 | | A | | | | 2,200 | | | 2,185 |
GRP Real Estate Asset Trust, 2005-1 Tranche A,
4.850%, due 1/25/35* | | A | | | | 224 | | | 223 |
Security National Mortgage Loan Trust, 2005-1A, Tranche M2,
6.530%, due 2/25/35* | | A | | | | 1,475 | | | 1,435 |
Security National Mortgage Loan Trust, 2005-1A, Tranche B1,
7.450%, due 2/25/35* | | BBB | | | | 950 | | | 860 |
Soundview Home Equity Loat Trust, 2005-B, Tranche M1
5.635%, due 5/25/35 | | AA | + | | | 1,578 | | | 1,573 |
Structured Asset Securities Corp., 2005-9XS, Tranche 1A2B,
6.500%, due 6/25/35 | | AAA | | | | 3,435 | | | 3,434 |
SACO, 2005-WM2, Tranche B2,
6.500%, due 7/25/35** | | BBB | | | | 3,017 | | | 714 |
Security National Mortgage Loan Trust, 2005-2A, Tranche B1,
7.750%, due 2/25/36* | | BBB | | | | 1,550 | | | 1,504 |
Security National Mortgage Loan Trust, 2005-2A, Tranche M2,
7.321%, due 2/25/36* | | A | | | | 2,075 | | | 2,043 |
ACE, 2006-SL4, Tranche M6,
6.500%, due 9/25/36** | | A | | | | 2,100 | | | 893 |
Security National Mortgage Loan Trust, 2006-1A, Tranche M2,
7.500%, due 9/25/36* | | A | | | | 2,195 | | | 2,147 |
Security National Mortgage Loan Trust, 2006-2A, Tranche M2,
7.500%, due 10/25/36* | | A | | | | 600 | | | 595 |
See accompanying Notes to Financial Statements.
June 30, 2007 | William Blair Funds 69 |
Income Fund
Portfolio of Investments, June 30, 2007 (all amounts in thousands) (unaudited)
| | | | | | | | | |
Issuer | | NRSRO
Rating | | | Principal
Amount | | Value |
| |
Non-Agency Mortgage-Backed—(continued) | | | |
La Hipotecaria Panamanian Mortgage Trust, 2007-1GA, Tranche A,
5.750%, due 12/23/36* | | AAA | | | $ | 2,923 | | $ | 2,891 |
Security National Mortgage Loan Trust, 2006-3A, Tranche M2,
7.500%, due 1/25/37* | | A | | | | 1,000 | | | 983 |
Blackrock Capital Finance, 1997-R1 WAC, 1.823%, due 3/25/37, VRN* | | AAA | | | | 334 | | | 341 |
Mid-State Trust 2004-1, Tranche A, 6.005%, due 8/15/37 | | AAA | | | | 3,791 | | | 3,786 |
Statewide Mortgage Loan Trust, 2006-1A, Tranche A2,
7.660%, due 9/25/37* | | AAA | | | | 2,638 | | | 2,714 |
ACE, 2005-SN1, Tranche M1,
5.520%, due 11/25/39, VRN | | AA | + | | | 1,075 | | | 1,048 |
ACE, 2005-SN1, Tranche M2,
5.770%, due 11/25/39, VRN | | A | + | | | 625 | | | 604 |
ACE, 2005-SD3, Tranche M2,
7.070%, due 8/25/45, VRN | | A | + | | | 1,895 | | | 1,914 |
| | | | | | | | | |
Total Non-Agency Mortgage-backed Obligations | | | | | | 66,633 | | | 62,135 |
| | | | | | | | | |
| | | |
Corporate Obligations—23.9% | | | | | | | | | |
Philips Petroleum,
8.750%, due 5/25/10 | | A | - | | | 2,500 | | | 2,722 |
HSBC Finance Corporation,
8.000%, due 7/15/10 | | AA | - | | | 2,450 | | | 2,617 |
Boeing Capital Corporation,
7.375%, due 9/27/10 | | A | + | | | 2,549 | | | 2,698 |
Goldman Sachs Group, Inc.,
6.600%, due 1/15/12 | | AA | - | | | 3,050 | | | 3,158 |
Lehman Brothers Holdings, Inc.
6.625%, due 1/18/12 | | A | + | | | 2,650 | | | 2,749 |
National Rural Utility Cooperative, 7.250%, due 3/1/12 | | A | | | | 3,025 | | | 3,223 |
BHP Billiton Finance,
5.125%, due 3/29/12 | | A | + | | | 1,195 | | | 1171 |
General Electric Capital Corporation,
6.000%, due 6/15/12 | | AAA | | | | 2,650 | | | 2,697 |
Citigroup, Inc.,
5.625%, due 8/27/12 | | AA | | | | 2,675 | | | 2,676 |
Cox Communications,Inc.,
7.125%, due 10/1/12 | | BBB- | | | | 2,425 | | | 2,562 |
Kroger Company,
5.500%, due 2/1/13 | | BBB | | | | 3,000 | | | 2,921 |
Ohio Power Company,
5.500%, due 2/15/13 | | A | | | | 1,900 | | | 1,872 |
American Movil SA,
5.500%, due 3/1/14 | | A | | | | 3,000 | | | 2,932 |
Bank of America Corporation,
5.375%, due 6/15/14 | | AA | | | | 2,325 | | | 2,289 |
AT&T, Inc.
5.100%, due 9/15/14 | | A | | | | 3,000 | | | 2,862 |
Codelco, Inc.—144A,
4.750%, due 10/15/14* | | A | | | | 2,815 | | | 2,628 |
Pemex Master Trust,
5.750%, due 12/15/15 | | BBB | | | | 3,000 | | | 2,943 |
| | | | | | | | | |
Issuer | | NRSRO
Rating | | | Principal
Amount | | Value |
| | |
Corporate Obligations—(continued) | | | | | | | |
Johnson Controls, Inc.,
5.500%, due 1/15/16 | | A | - | | $ | 2,925 | | $ | 2,832 |
Omnicom Group, Inc.,
5.900%, due 4/15/16 | | A | - | | | 3,000 | | | 2,963 |
YUM! Brands, Inc.,
6.250%, 4/15/16 | | BBB | | | | 1,939 | | | 1,935 |
Sabmiller PLC,
6.500%, due 7/1/16 | | BBB | + | | | 3,100 | | | 3,185 |
Marriott International,
6.375%, due 6/15/17 | | BBB | + | | | 2,250 | | | 2,256 |
Ras Laffan Lng II,
5.298%, due 9/30/20* | | A | | | | 3,000 | | | 2,803 |
| | | | | | | | | |
Total Corporate Obligations | | | | | | 60,423 | | | 60,694 |
| | | | | | | | | |
Total Long Term Investments—98.0%
(cost $256,687) | | | | 250,844 | | | 248,570 |
| | | | | | | | | |
| | | |
Repurchase Agreement | | | | | | | | | |
Investors Bank & Trust Company, 4.50% dated 6/29/2007, due 7/02/2007, repurchase price $2,537 collateralized by FH Pool #505523 | | | | | | 2,536 | | | 2,536 |
| | | | | | | | | |
Total Repurchase Agreement—1.0%
(cost $2,536) | | | | 2,536 | | | 2,536 |
| | | | | | | | | |
Total Investments—99.0%
(cost $259,223) | | | $ | 253,380 | | | 251,106 |
| | | | | | | | | |
Cash and other assets, less liabilities—1.0% | | | 2,589 |
| | | | | | | | | |
Net Assets—100% | | $ | 253,695 |
| | | | | | | | | |
WAC = Weighted Average Coupon
VRN = Variable Rate Note
NRSRO = Nationally Recognized Statistical Rating Organization, such as
S&P, Moody’s or Fitch (unaudited)
The obligations of certain U. S. Government-sponsored securities are neither issued nor guaranteed by the U. S. Treasury
*Deemed illiquid pursuant to Liquidity Procedures adopted by the Board of Trustees. These holdings represent 10.41% of the net assets at June 30,2006.
**Fair valued pursuant to Valuation Procedures adopted by the Board of Trustees. These holdings represent 0.63% of the Fund’s net assets at June 30, 2007. These securities were also deemed illiquid pursuant to Liquidity Procedures approved by the Board of Trustees.
See accompanying Notes to Financial Statements.
70 Semi-Annual Report | June 30, 2007 |
James S. Kaplan
Christopher T. Vincent
READY RESERVES FUND
The Ready Reserves Fund invests primarily in short-term U.S. dollar-denominated money market instruments, and exclusively in high quality securities that are rated in the top two categories of credit quality.
AN OVERVIEW FROM THE PORTFOLIO MANAGERS
Federal Reserve Board Monetary policy was the focus of the money markets during the first half of 2007.
Federal Reserve Board Chairman Ben Bernanke reached the one-year anniversary of his appointment during the first quarter, a job he has grown into and for which market participants have given him high marks.
At the most recent meeting of the Federal Open Market Committee on June 28, the Federal Reserve said that inflation remained its predominant policy concern. The Fed left its benchmark interest rate unchanged at 5.25% and signaled that it would keep it at that level for some time.
The Fed’s rate decision, which was widely anticipated by most market participants, meant that the Fed’s pause in rate increases was now one year old.
In its statement following the June meeting, the Federal Reserve acknowledged that consumer prices had risen more slowly in recent months. Rather than describing inflation as “elevated,” something it had done after its policy meeting in May, the central bank noted that readings on core inflation “have improved modestly in recent months.” “However, a sustained moderation in inflation pressures has yet to be convincingly demonstrated,” the Fed statement said. The Fed repeated its concern that a tight labor market and a further reduction in available factory capacity had the potential to once again push inflation higher.
Although it is clear that the Fed has adopted a “wait-and-see” approach with regard to their next interest rate move, the biggest question for many investors was how the Fed might modify the nuances in their description of the economy and how they might react to recent signs of slowing inflation.
Unemployment, which has hovered around 4.5 percent for the last several months, remains lower than the Fed had expected—and is at levels that many economists equate with full employment, but the recent decline in housing prices remains a drag on economic growth.
For the last several years, Fed governors, including Chairman Bernanke, have set an unofficial goal of keeping the “core” (excluding food and energy costs) rate of inflation at 1 to 2 percent a year. The Fed’s preferred measure of core inflation, the Commerce Department’s price index for personal consumer expenditures, is just slightly above 2 percent and is down from approximately 2.4 percent in March. However, sustained energy prices and rising food costs could potentially pose a risk to Fed policy if higher prices spark inflationary pressures.
We nonetheless believe that the current Federal Funds rate above 5% will do much of the “heavy lifting” for the Fed with respect to keeping inflationary pressures in check.
We presently intend to maintain our strategy of using commercial paper in the short end of the market, barbelled with fixed-rate obligations with slightly longer maturities, and also will continue to emphasize floating-rate obligations, which price off of LIBOR. (LIBOR is the London Interbank Offered Rate, which is the rate the most credit worthy international banks dealing in Eurodollars—U.S. currency held in banks outside of the U.S.—charge each other for large loans.)
June 30, 2007 | William Blair Funds 71 |
The current inverted shape of the money market yield curve has decreased investment opportunities in the secondary fixed-rate market, but we do not see this as a particularly troubling development. However, at present we do not see attractive investment opportunities in 6-month to 1-year commercial paper. Until the yield curve changes we will stay focused on 30- to 60-day end of the market.
At June 30, 2007, the Fund’s Average Maturity was approximately 53.3 days, compared to 47.0 days at March 31, 2007, and 52.2 days at December 31, 2006.
The return for the 6 months ended June 30, 2007, of the Fund’s Class N Shares was 2.37%, versus the 2.27% return of the Fund’s benchmark, the AAA-Rated Money Market Funds Average. Total assets were $1.18 billion, compared to $1.20 billion at December 31, 2006.
72 Semi-Annual Report | June 30, 2007 |
Ready Reserves Fund
Performance Highlights (unaudited)
The Fund’s 7 day yield on June 30, 2007 was 4.75%.
Average Annual Total Returns—Class N Shares year ending June 30, 2007.
| | | | | | | | | | | | | | | | | |
| | | Year
to
Date | | | 1
Year | | | 3
Year | | | 5
Year | | | 10
Year | | | |
| Ready Reserves Fund | | 2.37 | % | | 4.81 | % | | 3.34 | % | | 2.30 | % | | 3.38 | % | | |
AAA Rated Money Market Funds | | 2.27 | | | 4.54 | | | 3.19 | | | 2.18 | | | 3.36 | | | |
Performance cited represents past performance. Past performance does not guarantee future results and current performance may be lower or higher than the data quoted. For the most current month-end performance information, please call 1-800-742-7272, or visit our Web site at www.williamblairfunds.com. Class N Shares are available to the general public without a sales load. Total return includes reinvestment of income. Yields fluctuate and are not guaranteed. An investment in the Fund is neither insured nor guaranteed by the Federal Deposit Insurance Corp. (FDIC) or any government agency. Although the Fund seeks to preserve the value of your investment at $1.00 per share, it is possible to lose money by investing in the Fund.
The AAA Rated Money Market Funds Average represents the average annual composite performance of all AAA rated First Tier Retail Money Market Funds listed by IBC Financial data.
This report identifies the Fund’s investment’s on June 30, 2007. These holdings are subject to change. Not all fixed-income securities in the Fund performed the same, nor is there any guarantee that these fixed-income securities will perform as well in the future. Market forecasts provided in this report may not necessarily come to pass.
Sector Diversification (unaudited)
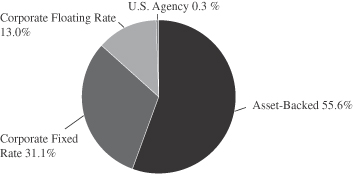
The sector diversification shown is based on the total investment portfolio.
June 30, 2007 | William Blair Funds 73 |
Ready Reserves Fund
Portfolio of Investments, June 30, 2007 (all amounts in thousands) (unaudited)
| | | | | | |
Issuer | | Principal
Amount | | Amortized
Cost |
U.S. Agency Fixed Rate—0.3% | | | | | | |
Federal Home Loan Bank (FHLB),
4.500-4.625%, 10/12/07-10/24/07 | | $ | 3,777 | | $ | 3,783 |
| | | | | | |
Total Agency Backed Securities | | | 3,777 | | | 3,783 |
| | | | | | |
Fixed Rate Notes—29.4% | | | | | | |
Abbott Laboratories, 6.000% , 3/15/08 | | | 2,014 | | | 2,009 |
American General Finance Corp,
4.500%-5.470% , 8/16/07-11/15/07 | | | 19,047 | | | 19,055 |
American Honda Finance Corp,
5.310%-5.470% , 7/10/07-8/23/07 | | | 12,744 | | | 12,741 |
AT&T Corporation, 6.150%, 1/15/08 | | | 2,281 | | | 2,281 |
Berkshire Hathaway, 3.400%, 7/2/07 | | | 16,161 | | | 16,428 |
B.P. Canada Finance, 3.375%, 10/31/07 | | | 12,407 | | | 12,539 |
B.P. Company North America,
6.500%, 8/1/07 | | | 4,144 | | | 4,119 |
Caterpillar Financial Services,
3.625%-5.430%, 8/20/07-2/8/08 | | | 20,418 | | | 20,433 |
Chevron Corporation,
3.375%-3.500%, 9/17/07-2/15/08 | | | 29,737 | | | 30,005 |
Du Pont (E.I.) de Nemours,
3.375%-6.750% , 9/1/07-11/15/07 | | | 14,761 | | | 14,702 |
Eli Lilly & Company, 2.900%, 3/15/08 | | | 6,265 | | | 6,293 |
General Electric Capital Corporation, 3.500%-6.500%, 8/15/07-12/10/07 | | | 11,852 | | | 11,893 |
Gillette Company,
2.500%-4.125%, 8/30/07-6/1/08 | | | 27,203 | | | 27,451 |
IBM Canada Credit, 3.750%, 11/30/07 | | | 5,989 | | | 6,010 |
IBM Corporation, 6.450%, 8/1/07 | | | 2,128 | | | 2,117 |
John Deere Capital Corp,
3.900%-5.428%, 7/20/07-1/15/08 | | | 15,267 | | | 15,272 |
Kimberly-Clark Corp, 7.100%, 8/1/07 | | | 11,384 | | | 11,272 |
National Rural Utility Coop,
3.250%, 10/1/07 | | | 1,865 | | | 1,865 |
PACCAR Financial Corporation,
5.256%, 6/15/07 | | | 14,994 | | | 15,000 |
Southwestern Bell Telephone Company, 6.625%, 7/16/07 | | | 4,014 | | | 4,002 |
Toyota Motor Credit,
5.304%-5.327%, 7/2/07-8/10/07 | | | 16,001 | | | 16,000 |
U.S.A.A. Capital Corporation,
4.000%, 12/10/07 | | | 10,704 | | | 10,737 |
US Bancorp,
3.125%-6.500%, 7/15/07-7/15/08 | | | 29,166 | | | 29,256 |
Verizon Communications,
4.000%, 1/15/08 | | | 14,430 | | | 14,436 |
Wal-Mart Stores, 4.375%, 7/12/07 | | | 15,471 | | | 15,616 |
Wells Fargo Financial,
3.500%-5.420%, 9/28/07-4/4/08 | | | 25,921 | | | 25,936 |
| | | | | | |
Total Fixed Rate Notes | | | 346,368 | | | 347,468 |
| | | | | | |
Variable Rate Notes—13.0% | | | | | | |
American General Finance Corp,
5.479% , 1/18/08 | | | 5,605 | | | 5,604 |
American Honda Finance Corp,
5.465%, 10/22/07 | | | 10,750 | | | 10,745 |
Bellsouth Corporation, 5.485%, 11/15/07 | | | 17,568 | | | 17,565 |
Berkshire Hathaway,
5.400%-5.420%, 1/11/08-5/16/08 | | | 31,055 | | | 31,044 |
General Electric Capital Corporation, 5.406%-5.410%, 1/3/08-5/19/08 | | | 23,446 | | | 23,437 |
| | | | | | |
Issuer | | Principal
Amount | | Amortized
Cost |
Variable Rate Notes—(continued) | | | | | | |
Toyota Motor Credit,
5.326%-5.330%, 10/12/07-6/17/08 | | $ | 32,309 | | $ | 32,305 |
US Bank, 5.379%, 10/1/07 | | | 11,957 | | | 11,952 |
Wal-Mart Stores, 5.260%, 6/16/08 | | | 11,095 | | | 11,095 |
Wells Fargo Financial, 5.400%, 3/10/08 | | | 9,572 | | | 9,570 |
| | | | | | |
Total Variable Rate Notes | | | 153,357 | | | 153,317 |
| | | | | | |
Asset-Backed Commercial Paper—56.1% | | | | | | |
Alpine Securitization, 5.230%, 7/27/07 | | | 10,000 | | | 9,961 |
Amsterdam Funding Corporation,
5.250%-5.275%, 7/5/07-7/31/07 | | | 34,500 | | | 34,406 |
CAFCO, L.L.C.,
5.270%-5.280%, 7/30/07-9/12/07 | | | 37,000 | | | 36,719 |
Chariot Funding, L.L.C.,
5.240%-5.270%, 7/6/07-7/20/07 | | | 28,221 | | | 28,152 |
Ciesco, L.L.C.,
5.250%-5.270%, 8/3/07-8/9/07 | | | 22,500 | | | 22,375 |
CRC Funding, L.L.C.,
5.260%-5.280%, 8/16/07-9/5/07 | | | 40,000 | | | 39,663 |
Daimler Chrysler Revolving Auto,
5.240%-5.260%, 7/11/07-8/7/07 | | | 50,000 | | | 49,809 |
Fairway Finance Co. L.L.C.,
5.270%, 8/23/07 | | | 5,500 | | | 5,456 |
FCAR Owner Trust,
5.250-5.270%, 7/9/07-8/21/07 | | | 50,000 | | | 49,839 |
Govco, Inc.,
5.230%-5.260%, 7/10/07-9/25/07 | | | 40,000 | | | 39,796 |
Jupiter Securitization Co. L.L.C.,
5.260%, 7/11/07 | | | 15,000 | | | 14,976 |
Kittyhawk Funding,
5.250%-5.260%, 8/20/07-9/20/07 | | | 17,257 | | | 17,096 |
Old Line Funding,
5.255%-5.270%, 7/25/07-8/15/07 | | | 50,000 | | | 49,754 |
Park Avenue Receivables,
5.250%-5.270%, 7/6/07-8/10/07 | | | 37,624 | | | 37,488 |
Ranger Funding,
5.240%-5.260%, 7/25/07-8/21/07 | | | 35,000 | | | 34,804 |
Sheffield Receivables,
5.280%-5.290%, 7/13/07-8/2/07 | | | 50,000 | | | 49,824 |
Thames Asset Global Securitization,
5.230%-5.300%, 7/12/07-9/5/07 | | | 45,210 | | | 44,979 |
Thunder Bay Funding,
5.250%-5.270%, 7/3/07-8/8/07 | | | 35,000 | | | 34,886 |
Variable Funding,
5.245%-5.250%, 7/19/07-9/4/07 | | | 24,130 | | | 23,972 |
Wal-Mart Funding,
5.240%, 8/22/07 | | | 10,000 | | | 9,923 |
Windmill Funding Corporation,
5.260%-5.310%, 7/5/07-8/3/07 | | | 30,000 | | | 29,934 |
| | | | | | |
Total Asset-Backed Commercial Paper | | | 666,942 | | | 663,812 |
| | | | | | |
Demand Notes —1.4% | | | | | | |
American Express Corporation, VRN, 5.170%, 7/2/07 | | | 11,367 | | | 11,367 |
Prudential Funding, VRN,
5.305%, 7/2/07 | | | 4,911 | | | 4,911 |
| | | | | | |
Total Demand Notes | | | 16,278 | | | 16,278 |
| | | | | | |
Total Investments—100.2%
(Cost $1,184,658) | | | 1,186,722 | | | 1,184,658 |
| | | | | | |
See accompanying Notes to Financial Statements.
74 Semi-Annual Report | June 30, 2007 |
Ready Reserves Fund
Portfolio of Investments, June 30, 2007 (all amounts in thousands) (unaudited)
| | | | | | |
Issuer | | Principal
Amount | | Amortized
Cost | |
Liabilities plus cash and other assets—(0.2)% | | $ | (2,170 | ) |
| | | | | | |
Net Assets—100.0% | | $ | 1,182,488 | |
| | | | | | |
Portfolio Weighted Average Maturity | | | | | 53 Days | |
VRN = Variable Rate Note
See accompanying Notes to Financial Statements.
June 30, 2007 | William Blair Funds 75 |
Statements of Assets and Liabilities
June 30, 2007 (all dollar amounts in thousands) (unaudited)
| | | | | | | | | | | | |
| | | Growth
Fund | | | Tax-
Managed
Growth
Fund | | | Large Cap
Growth
Fund | |
Assets | | | | | | | | | | | | |
Investments in securities, at cost | | $ | 249,483 | | | $ | 8,167 | | | $ | 24,397 | |
Investments in Affiliated Fund, at cost | | | 2,635 | | | | 6 | | | | 239 | |
| | | | | | | | | | | | |
| | | |
Investments in securities, at value | | $ | 317,963 | | | $ | 10,448 | | | $ | 28,130 | |
Investments in Affiliated Fund, at value | | | 2,635 | | | | 6 | | | | 239 | |
Cash | | | — | | | | — | | | | — | |
Receivable for fund shares sold | | | 663 | | | | — | | | | 74 | |
Receivable from Advisor | | | — | | | | 2 | | | | — | |
Dividend and interest receivable | | | 449 | | | | 12 | | | | 46 | |
| | | | | | | | | | | | |
Total assets | | | 321,710 | | | | 10,468 | | | | 28,489 | |
Liabilities | | | | | | | | | | | | |
Payable for investment securities purchased | | | 1,404 | | | | — | | | | 583 | |
Payable for fund shares redeemed | | | 448 | | | | — | | | | 35 | |
Management fee payable | | | 206 | | | | 7 | | | | 9 | |
Distribution fee payable | | | 18 | | | | — | | | | 2 | |
Other accrued expenses | | | 87 | | | | 19 | | | | 21 | |
| | | | | | | | | | | | |
Total liabilities | | | 2,163 | | | | 26 | | | | 650 | |
| | | | | | | | | | | | |
Net Assets | | $ | 319,547 | | | $ | 10,442 | | | $ | 27,839 | |
| | | | | | | | | | | | |
Capital | | | | | | | | | | | | |
Composition of Net Assets | | | | | | | | | | | | |
Par value of shares of beneficial interest | | $ | 26 | | | $ | 1 | | | $ | 4 | |
Capital paid in excess of par value | | | 228,716 | | | | 8,605 | | | | 28,783 | |
Accumulated net investment income (loss) | | | (6 | ) | | | 7 | | | | 5 | |
Accumulated realized gain (loss) | | | 22,331 | | | | (452 | ) | | | (4,686 | ) |
Net unrealized appreciation (depreciation) of investments and foreign
currencies | | | 68,480 | | | | 2,281 | | | | 3,733 | |
| | | | | | | | | | | | |
Net Assets | | $ | 319,547 | | | $ | 10,442 | | | $ | 27,839 | |
| | | | | | | | | | | | |
| | | |
Class N Shares | | | | | | | | | | | | |
Net Assets | | $ | 89,601 | | | $ | 833 | | | $ | 7,326 | |
Shares Outstanding | | | 7,270,456 | | | | 70,911 | | | | 1,006,885 | |
Net Asset Value Per Share | | $ | 12.32 | | | $ | 11.75 | | | $ | 7.28 | |
Class I Shares | | | | | | | | | | | | |
Net Assets | | $ | 229,946 | | | $ | 9,609 | | | $ | 20,513 | |
Shares Outstanding | | | 18,240,562 | | | | 801,609 | | | | 2,774,162 | |
Net Asset Value Per Share | | $ | 12.61 | | | $ | 11.99 | | | $ | 7.39 | |
See accompanying Notes to Financial Statements.
76 Semi-Annual Report | June 30, 2007 |
Statements of Operations
For the Period Ended June 30, 2007 (all dollar amounts in thousands) (unaudited)
| | | | | | | | | | | | |
| | | Growth
Fund | | | Tax-
Managed
Growth
Fund | | | Large Cap
Growth Fund | |
Investment income | | | | | | | | | | | | |
Dividends | | $ | 1,206 | | | $ | 54 | | | $ | 124 | |
Less foreign tax withheld | | | (62 | ) | | | (1 | ) | | | (5 | ) |
Dividend Income from Affiliated Fund | | | 61 | | | | 1 | | | | 4 | |
Interest | | | 178 | | | | 10 | | | | 19 | |
| | | | | | | | | | | | |
Total income | | | 1,383 | | | | 64 | | | | 142 | |
Expenses | | | | | | | | | | | | |
Investment advisory fees | | | 1,076 | | | | 40 | | | | 98 | |
Distribution fees | | | 96 | | | | 1 | | | | 15 | |
Custodian fees | | | 37 | | | | 19 | | | | 22 | |
Transfer agent fees | | | 113 | | | | 3 | | | | 5 | |
Professional fees | | | 14 | | | | 13 | | | | 13 | |
Registration fees | | | 15 | | | | 14 | | | | 14 | |
Other expenses | | | 38 | | | | 5 | | | | 13 | |
| | | | | | | | | | | | |
Total expenses before waiver | | | 1,389 | | | | 95 | | | | 180 | |
Less expenses waived or absorbed by the Advisor | | | — | | | | (38 | ) | | | (43 | ) |
| | | | | | | | | | | | |
Net expenses | | | 1,389 | | | | 57 | | | | 137 | |
| | | | | | | | | | | | |
Net investment income (loss) | | | (6 | ) | | | 7 | | | | 5 | |
Net realized and unrealized gain (loss) on investments, foreign currency transactions and other assets and liabilities | | | | | | | | | | | | |
Net realized gain (loss) on investments | | | 16,516 | | | | 579 | | | | 461 | |
| | | | | | | | | | | | |
Change in net unrealized appreciation (depreciation) on investments and other assets and liabilities | | | 5,889 | | | | 156 | | | | 1,012 | |
| | | | | | | | | | | | |
Net increase (decrease) in net assets resulting from operations | | $ | 22,399 | | | $ | 742 | | | $ | 1,478 | |
| | | | | | | | | | | | |
See accompanying Notes to Financial Statements.
June 30, 2007 | William Blair Funds 77 |
Statements of Changes in Net Assets
For the Period Ended June 30, 2007 and the Year Ended December 31, 2006 (all amounts in thousands) (unaudited)
| | | | | | | | | | | | | | | | | | | | | | | | |
| | | Growth
Fund | | | Tax-
Managed
Growth
Fund | | | Large Cap
Growth
Fund | |
| | | 2007 | | | 2006 | | | 2007 | | | 2006 | | | 2007 | | | 2006 | |
| | | (unaudited) | | | | | | (unaudited) | | | | | | (unaudited) | | | | |
Operations | | | | | | | | | | | | | | | | | | | | | | | | |
Net investment income (loss) | | $ | (6 | ) | | $ | (652 | ) | | $ | 7 | | | $ | (15 | ) | | $ | 5 | | | $ | (30 | ) |
Net realized gain (loss) on investments, foreign currency transactions and other assets and liabilities | | | 16,516 | | | | 31,916 | | | | 579 | | | | 765 | | | | 461 | | | | 223 | |
Change in net unrealized appreciation (depreciation) on investments, and other assets and liabilities | | | 5,889 | | | | (1,057 | ) | | | 156 | | | | 12 | | | | 1,012 | | | | 1,019 | |
| | | | | | | | | | | | | | | | | | | | | | | | |
Net increase (decrease) in net assets resulting from operations | | | 22,399 | | | | 30,207 | | | | 742 | | | | 762 | | | | 1,478 | | | | 1,212 | |
Distributions to shareholders from | | | | | | | | | | | | | | | | | | | | | | | | |
Net investment income | | | — | | | | — | | | | — | | | | — | | | | — | | | | — | |
Net realized gain | | | — | | | | (27,315 | ) | | | — | | | | — | | | | — | | | | — | |
| | | | | | | | | | | | | | | | | | | | | | | | |
| | | — | | | | (27,315 | ) | | | — | | | | — | | | | — | | | | — | |
Capital stock transactions | | | | | | | | | | | | | | | | | | | | | | | | |
Net proceeds from sale of shares | | | 57,513 | | | | 33,215 | | | | 590 | | | | 1,445 | | | | 16,375 | | | | 4,950 | |
Shares issued in reinvestment of income dividends and capital gain distributions | | | — | | | | 25,204 | | | | — | | | | — | | | | — | | | | — | |
Less cost of shares redeemed | | | (24,890 | ) | | | (50,345 | ) | | | (534 | ) | | | (378 | ) | | | (10,205 | ) | | | (2,859 | ) |
| | | | | | | | | | | | | | | | | | | | | | | | |
Net increase (decrease) in net assets resulting from capital share transactions | | | 32,623 | | | | 8,074 | | | | 56 | | | | 1,067 | | | | 6,170 | | | | 2,091 | |
| | | | | | | | | | | | | | | | | | | | | | | | |
Increase (decrease) in net assets | | | 55,022 | | | | 10,966 | | | | 798 | | | | 1,829 | | | | 7,648 | | | | 3,303 | |
Net assets | | | | | | | | | | | | | | | | | | | | | | | | |
Beginning of period | | | 264,525 | | | | 253,559 | | | | 9,644 | | | | 7,815 | | | | 20,191 | | | | 16,888 | |
| | | | | | | | | | | | | | | | | | | | | | | | |
End of period | | $ | 319,547 | | | $ | 264,525 | | | $ | 10,442 | | | $ | 9,644 | | | $ | 27,839 | | | $ | 20,191 | |
| | | | | | | | | | | | | | | | | | | | | | | | |
Undistributed net investment income (loss) at the end of the period | | $ | (6 | ) | | $ | — | | | $ | 7 | | | $ | — | | | $ | 5 | | | $ | — | |
| | | | | | | | | | | | | | | | | | | | | | | | |
See accompanying Notes to Financial Statements.
78 Semi-Annual Report | June 30, 2007 |
Statements of Assets and Liabilities
June 30, 2007 (all dollar amounts in thousands) (unaudited)
| | | | | | | | | | | | |
| | | Small Cap
Growth
Fund | | | Mid Cap
Growth
Fund | | | Small-Mid
Cap
Growth
Fund | |
Assets | | | | | | | | | | | | |
Investments in securities, at cost | | $ | 891,622 | | | $ | 35,344 | | | $ | 94,870 | |
Investments in Affiliated Companies, at cost | | | 292,335 | | | | — | | | | — | |
Investments in Affiliated Fund, at cost | | | 5,497 | | | | 110 | | | | 21 | |
| | | | | | | | | | | | |
| | | |
Investments in securities, at value | | $ | 1,083,099 | | | $ | 38,927 | | | $ | 114,861 | |
Investments in Affiliated Companies, at value | | | 293,772 | | | | — | | | | — | |
Investments in Affiliated Fund, at value | | | 5,497 | | | | 110 | | | | 21 | |
Receivable for fund shares sold | | | 4,194 | | | | 270 | | | | 111 | |
Receivable for investment securities sold | | | 28,612 | | | | 295 | | | | 179 | |
Dividend and interest receivable | | | 235 | | | | 8 | | | | 17 | |
| | | | | | | | | | | | |
Total assets | | | 1,415,409 | | | | 39,610 | | | | 115,189 | |
Liabilities | | | | | | | | | | | | |
Payable for investment securities purchased | | | 23,048 | | | | 374 | | | | 335 | |
Payable for fund shares redeemed | | | 2,747 | | | | 80 | | | | 1 | |
Management fee payable | | | 1,204 | | | | 11 | | | | 81 | |
Distribution fee payable | | | 90 | | | | 2 | | | | 3 | |
Other accrued expenses | | | 274 | | | | 32 | | | | 34 | |
| | | | | | | | | | | | |
Total liabilities | | | 27,363 | | | | 499 | | | | 454 | |
| | | | | | | | | | | | |
Net Assets | | $ | 1,388,046 | | | $ | 39,111 | | | $ | 114,735 | |
| | | | | | | | | | | | |
Capital | | | | | | | | | | | | |
Composition of Net Assets | | | | | | | | | | | | |
Par value of shares of beneficial interest | | $ | 50 | | | $ | 3 | | | $ | 8 | |
Capital paid in excess of par value | | | 1,094,936 | | | | 34,626 | | | | 88,990 | |
Accumulated net investment income (loss) | | | (7,345 | ) | | | (63 | ) | | | (309 | ) |
Accumulated realized gain (loss) | | | 107,491 | | | | 962 | | | | 6,055 | |
Net unrealized appreciation (depreciation) of investments and foreign currencies | | | 192,914 | | | | 3,583 | | | | 19,991 | |
| | | | | | | | | | | | |
Net Assets | | $ | 1,388,046 | | | $ | 39,111 | | | $ | 114,735 | |
| | | | | | | | | | | | |
| | | |
Class N Shares | | | | | | | | | | | | |
Net Assets | | $ | 725,955 | | | $ | 7,957 | | | $ | 17,556 | |
Shares Outstanding | | | 26,213,089 | | | | 673,633 | | | | 1,195,881 | |
Net Asset Value Per Share | | $ | 27.69 | | | $ | 11.81 | | | $ | 14.68 | |
Class I Shares | | | | | | | | | | | | |
Net Assets | | $ | 662,091 | | | $ | 31,154 | | | $ | 97,179 | |
Shares Outstanding | | | 23,390,271 | | | | 2,625,249 | | | | 6,563,549 | |
Net Asset Value Per Share | | $ | 28.31 | | | $ | 11.87 | | | $ | 14.81 | |
See accompanying Notes to Financial Statements.
June 30, 2007 | William Blair Funds 79 |
Statements of Operations
For the Period Ended June 30, 2007 (all dollar amounts in thousands) (unaudited)
| | | | | | | | | | | | |
| | | Small Cap
Growth Fund | | | Mid Cap
Growth
Fund | | | Small-Mid
Cap
Growth
Fund | |
Investment income | | | | | | | | | | | | |
Dividends | | $ | 570 | | | $ | 80 | | | $ | 210 | |
Less foreign tax withheld | | | — | | | | — | | | | — | |
Dividends from Affiliated Companies | | | 28 | | | | — | | | | — | |
Dividend Income from Affiliated Fund | | | 203 | | | | 5 | | | | 10 | |
Interest | | | 792 | | | | 31 | | | | 71 | |
| | | | | | | | | | | | |
Total income | | | 1,593 | | | | 116 | | | | 291 | |
Expenses | | | | | | | | | | | | |
Investment advisory fees | | | 7,203 | | | | 142 | | | | 520 | |
Distribution fees | | | 883 | | | | 9 | | | | 20 | |
Custodian fees | | | 109 | | | | 31 | | | | 30 | |
Transfer agent fees | | | 588 | | | | 7 | | | | 22 | |
Professional fees | | | 27 | | | | 11 | | | | 14 | |
Registration fees | | | 24 | | | | 19 | | | | 15 | |
Other expenses | | | 104 | | | | 11 | | | | 17 | |
| | | | | | | | | | | | |
Total expenses before waiver | | | 8,938 | | | | 230 | | | | 638 | |
Less expenses waived or absorbed by the Advisor | | | — | | | | (51 | ) | | | (38 | ) |
| | | | | | | | | | | | |
Net expenses | | | 8,938 | | | | 179 | | | | 600 | |
| | | | | | | | | | | | |
Net investment income (loss) | | | (7,345 | ) | | | (63 | ) | | | (309 | ) |
Net realized and unrealized gain (loss) on investments, foreign currency transactions and other assets and liabilities | | | | | | | | | | | | |
Net realized gain (loss) on investments | | | 71,053 | | | | 1,149 | | | | 5,221 | |
Net realized gain (loss) on investments in Affiliated Companies | | | 8,013 | | | | — | | | | — | |
| | | | | | | | | | | | |
| | | 79,066 | | | | 1,149 | | | | 5,221 | |
Change in net unrealized appreciation (depreciation) on investments and other assets and liabilities | | | 45,426 | | | | 2,519 | | | | 8,354 | |
| | | | | | | | | | | | |
Net increase (decrease) in net assets resulting from operations | | $ | 117,147 | | | $ | 3,605 | | | $ | 13,266 | |
| | | | | | | | | | | | |
See accompanying Notes to Financial Statements.
80 Semi-Annual Report | June 30, 2007 |
Statements of Changes in Net Assets
For the Period Ended June 30, 2007 and the Year Ended December 31, 2006 (all amounts in thousands) (unaudited)
| | | | | | | | | | | | | | | | | | | | | | | | |
| | | Small Cap
Growth
Fund | | | Mid Cap
Growth
Fund | | | Small-Mid
Cap
Growth
Fund | |
| | | 2007 | | | 2006 | | | 2007 | | | 2006(a) | | | 2007 | | | 2006 | |
| | | (unaudited) | | | | | | (unaudited) | | | | | | (unaudited) | | | | |
Operations | | | | | | | | | | | | | | | | | | | | | | | | |
Net investment income (loss) | | $ | (7,345 | ) | | $ | (11,401 | ) | | $ | (63 | ) | | $ | (62 | ) | | $ | (309 | ) | | $ | (538 | ) |
Net realized gain (loss) on investments, foreign currency transactions and other assets and liabilities | | | 79,066 | | | | 116,807 | | | | 1,149 | | | | (187 | ) | | | 5,221 | | | | 4,908 | |
Change in net unrealized appreciation (depreciation) on investments, foreign currency transactions and other assets and liabilities | | | 45,426 | | | | 27,043 | | | | 2,519 | | | | 1,064 | | | | 8,354 | | | | 3,169 | |
| | | | | | | | | | | | | | | | | | | | | | | | |
Net increase (decrease) in net assets resulting from operations | | | 117,147 | | | | 132,449 | | | | 3,605 | | | | 815 | | | | 13,266 | | | | 7,539 | |
Distributions to shareholders from | | | | | | | | | | | | | | | | | | | | | | | | |
Net investment income | | | — | | | | — | | | | — | | | | — | | | | — | | | | — | |
Net realized gain | | | — | | | | (78,266 | ) | | | — | | | | — | | | | — | | | | (4,404 | ) |
| | | | | | | | | | | | | | | | | | | | | | | | |
| | | — | | | | (78,266 | ) | | | — | | | | — | | | | — | | | | (4,404 | ) |
Capital stock transactions | | | | | | | | | | | | | | | | | | | | | | | | |
Net proceeds from sale of shares | | | 184,164 | | | | 590,073 | | | | 16,638 | | | | 21,378 | | | | 16,400 | | | | 24,304 | |
Shares issued in reinvestment of income dividends and capital gain distributions | | | — | | | | 73,523 | | | | — | | | | — | | | | — | | | | 3,992 | |
Less cost of shares redeemed | | | (174,439 | ) | | | (288,343 | ) | | | (771 | ) | | | (2,554 | ) | | | (7,697 | ) | | | (8,876 | ) |
| | | | | | | | | | | | | | | | | | | | | | | | |
Net increase (decrease) in net assets resulting from capital stock transactions | | | 9,725 | | | | 375,253 | | | | 15,867 | | | | 18,824 | | | | 8,703 | | | | 19,420 | |
| | | | | | | | | | | | | | | | | | | | | | | | |
Increase (decrease) in net assets | | | 126,872 | | | | 429,436 | | | | 19,472 | | | | 19,639 | | | | 21,969 | | | | 22,555 | |
Net assets | | | | | | | | | | | | | | | | | | | | | | | | |
Beginning of period | | | 1,261,174 | | | | 831,738 | | | | 19,639 | | | | — | | | | 92,766 | | | | 70,211 | |
| | | | | | | | | | | | | | | | | | | | | | | | |
End of period | | $ | 1,388,046 | | | $ | 1,261,174 | | | $ | 39,111 | | | $ | 19,639 | | | $ | 114,735 | | | $ | 92,766 | |
| | | | | | | | | | | | | | | | | | | | | | | | |
Undistributed net investment income (loss) at the end of the period | | $ | (7,345 | ) | | $ | — | | | $ | (63 | ) | | $ | — | | | $ | (309 | ) | | $ | — | |
| | | | | | | | | | | | | | | | | | | | | | | | |
| (a) | | For the period from February 1, 2006 (Commencement of Operations) to December 31, 2006. |
See accompanying Notes to Financial Statements.
June 30, 2007 | William Blair Funds 81 |
Statements of Assets and Liabilities
June 30, 2007 (all dollar amounts in thousands) (unaudited)
| | | | | | | | | | | | | | |
| | | International
Growth
Fund | | | International
Equity Fund | | | International
Small Cap
Growth
Fund | | Emerging
Markets
Growth
Fund |
Assets | | | | | | | | | | | | | | |
Investments in securities, at cost | | $ | 5,127,266 | | | $ | 277,394 | | | $ | 294,743 | | $ | 806,484 |
Investments in Affiliated Fund, at cost | | | 5,676 | | | | 5,159 | | | | 2,148 | | | 1,296 |
| | | | | | | | | | | | | | |
| | | | |
Investments in securities, at value | | $ | 7,237,761 | | | $ | 345,971 | | | $ | 354,564 | | $ | 1,065,377 |
Investments in Affiliated Fund, at value | | | 5,676 | | | | 5,159 | | | | 2,148 | | | 1,296 |
Foreign currency, at value (cost $15,064, $3,921, $99, and $103, respectively) | | | 15,067 | | | | 3,902 | | | | 98 | | | 103 |
Receivable for fund shares sold | | | 27,824 | | | | 1,159 | | | | 1,315 | | | 5,273 |
Receivable for investment securities sold | | | 47,475 | | | | 21,803 | | | | 1,890 | | | 553 |
Dividend and interest receivable | | | 12,703 | | | | 683 | | | | 420 | | | 645 |
| | | | | | | | | | | | | | |
Total assets | | | 7,346,506 | | | | 378,677 | | | | 360,435 | | | 1,073,247 |
Liabilities | | | | | | | | | | | | | | |
Payable for investment securities purchased | | | 30,897 | | | | 19,619 | | | | 9,020 | | | 24,793 |
Payable for fund shares redeemed | | | 22,524 | | | | 139 | | | | 10 | | | 3,994 |
Management fee payable | | | 5,771 | | | | 272 | | | | 271 | | | 825 |
Distribution and shareholder administration fee payable | | | 986 | | | | 10 | | | | 20 | | | 42 |
Other accrued expenses | | | 1,927 | | | | 41 | | | | 343 | | | 1,242 |
| | | | | | | | | | | | | | |
Total liabilities | | | 62,105 | | | | 20,081 | | | | 9,664 | | | 30,896 |
| | | | | | | | | | | | | | |
Net Assets | | $ | 7,284,401 | | | $ | 358,596 | | | $ | 350,771 | | $ | 1,042,351 |
| | | | | | | | | | | | | | |
Capital | | | | | | | | | | | | | | |
Composition of Net Assets | | | | | | | | | | | | | | |
Par value of shares of beneficial interest | | $ | 234 | | | $ | 22 | | | $ | 23 | | $ | 46 |
Capital paid in excess of par value | | | 4,850,461 | | | | 274,907 | | | | 278,606 | | | 701,063 |
Accumulated net investment income (loss) | | | (94,012 | ) | | | (2,436 | ) | | | 676 | | | 293 |
Accumulated realized gain (loss) | | | 418,453 | | | | 17,592 | | | | 11,935 | | | 83,198 |
Net unrealized appreciation (depreciation) of investments and foreign currencies | | | 2,109,265 | | | | 68,511 | | | | 59,531 | | | 257,751 |
| | | | | | | | | | | | | | |
Net Assets | | $ | 7,284,401 | | | $ | 358,596 | | | $ | 350,771 | | $ | 1,042,351 |
| | | | | | | | | | | | | | |
| | | | |
Class N Shares | | | | | | | | | | | | | | |
Net Assets | | $ | 4,774,360 | | | $ | 54,620 | | | $ | 23,061 | | $ | 66,695 |
Shares Outstanding | | | 154,369,024 | | | | 3,280,995 | | | | 1,508,448 | | | 2,946,595 |
Net Asset Value Per Share | | $ | 30.93 | | | $ | 16.65 | | | $ | 15.29 | | $ | 22.63 |
Class I Shares | | | | | | | | | | | | | | |
Net Assets | | $ | 2,510,041 | | | $ | 303,976 | | | $ | 110,164 | | $ | 240,293 |
Shares Outstanding | | | 79,855,952 | | | | 18,117,575 | | | | 7,175,790 | | | 10,573,177 |
Net Asset Value Per Share | | $ | 31.43 | | | $ | 16.78 | | | $ | 15.35 | | $ | 22.73 |
See accompanying Notes to Financial Statements.
82 Semi-Annual Report | June 30, 2007 |
Statements of Operations
For the Period Ended June 30, 2007 (all dollar amounts in thousands) (unaudited)
| | | | | | | | | | | | | | | | |
| | | International
Growth
Fund | | | International
Equity
Fund | | | International
Small Cap
Growth
Fund | | | Emerging
Markets
Growth
Fund | |
Investment income | | | | | | | | | | | | | | | | |
Dividends | | $ | 73,915 | | | $ | 4,210 | | | $ | 2,437 | | | $ | 6,061 | |
Less foreign tax withheld | | | (4,752 | ) | | | (332 | ) | | | (150 | ) | | | (343 | ) |
Income from Affiliated Fund | | | 39 | | | | 101 | | | | 77 | | | | 30 | |
Interest | | | 4,475 | | | | 196 | | | | 279 | | | | 882 | |
| | | | | | | | | | | | | | | | |
Total income | | | 73,677 | | | | 4,175 | | | | 2,643 | | | | 6,630 | |
Expenses | | | | | | | | | | | | | | | | |
Investment advisory fees | | | 33,428 | | | | 1,725 | | | | 1,482 | | | | 4,895 | |
Distribution fees | | | 5,564 | | | | 57 | | | | 25 | | | | 74 | |
Shareholder administration fees | | | — | | | | — | | | | 85 | | | | 207 | |
Custodian fees | | | 1,829 | | | | 153 | | | | 161 | | | | 633 | |
Transfer agent fees | | | 1,867 | | | | 149 | | | | 15 | | | | 46 | |
Professional fees | | | 81 | | | | 23 | | | | 21 | | | | 27 | |
Registration fees | | | 49 | | | | 29 | | | | 30 | | | | 24 | |
Other expenses | | | 503 | | | | 50 | | | | 11 | | | | 19 | |
| | | | | | | | | | | | | | | | |
Total expenses before waiver | | | 43,321 | | | | 2,186 | | | | 1,830 | | | | 5,925 | |
Less expenses waived or absorbed by the Advisor | | | — | | | | (202 | ) | | | — | | | | (80 | ) |
| | | | | | | | | | | | | | | | |
Net expenses | | | 43,321 | | | | 1,984 | | | | 1,830 | | | | 5,845 | |
| | | | | | | | | | | | | | | | |
Net investment income (loss) | | | 30,356 | | | | 2,191 | | | | 813 | | | | 785 | |
Net realized and unrealized gain (loss) on investments, foreign currency transactions and other assets and liabilities | | | | | | | | | | | | | | | | |
Net realized gain (loss) on investments | | | 252,935 | | | | 14,902 | | | | 10,838 | | | | 64,491 | |
Net realized gain (loss) on foreign currency transactions and other assets and liabilities | | | (6,146 | ) | | | (428 | ) | | | (478 | ) | | | (477 | ) |
| | | | | | | | | | | | | | | | |
Total net realized gain (loss) | | | 246,789 | | | | 14,474 | | | | 10,360 | | | | 64,014 | |
Change in net unrealized appreciation (depreciation) on investments and other assets and liabilities | | | 473,369 | | | | 13,273 | | | | 29,094 | | | | 80,279 | |
| | | | | | | | | | | | | | | | |
Net increase (decrease) in net assets resulting from operations | | $ | 750,514 | | | $ | 29,938 | | | $ | 40,267 | | | $ | 145,078 | |
| | | | | | | | | | | | | | | | |
See accompanying Notes to Financial Statements.
June 30, 2007 | William Blair Funds 83 |
Statements of Changes in Net Assets
For the Period Ended June 30, 2007 and the Year Ended December 31, 2006 (all amounts in thousands) (unaudited)
| | | | | | | | | | | | | | | | | | | | | | | | | | | | | | | | |
| | | International Growth Fund | | | International Equity Fund | | | International Small Cap Growth Fund | | | Emerging Markets Growth Fund | |
| | | 2007 | | | 2006 | | | 2007 | | | 2006 | | | 2007 | | | 2006 | | | 2007 | | | 2006 | |
| | | (unaudited) | | | | | | (unaudited) | | | | | | (unaudited) | | | | | | (unaudited) | | | | |
Operations | | | | | | | | | | | | | | | | | | | | | | | | | | | | | | | | |
Net investment income (loss) | | $ | 30,356 | | | $ | 14,830 | | | $ | 2,191 | | | $ | 1,056 | | | $ | 813 | | | $ | (221 | ) | | $ | 785 | | | $ | 211 | |
Net realized gain (loss) on investments, foreign currency transactions and other assets and liabilities | | | 246,789 | | | | 713,203 | | | | 14,474 | | | | 4,871 | | | | 10,360 | | | | 2,299 | | | | 64,014 | | | | 22,993 | |
Change in net unrealized appreciation (depreciation) on investments, foreign currency transactions and other assets and liabilities | | | 473,369 | | | | 398,415 | | | | 13,273 | | | | 38,016 | | | | 29,094 | | | | 26,158 | | | | 80,279 | | | | 147,786 | |
| | | | | | | | | | | | | | | | | | | | | | | | | | | | | | | | |
Net increase (decrease) in net assets resulting from operations | | | 750,514 | | | | 1,126,448 | | | | 29,938 | | | | 43,943 | | | | 40,267 | | | | 28,236 | | | | 145,078 | | | | 170,990 | |
Distributions to shareholders from | | | | | | | | | | | | | | | | | | | | | | | | | | | | | | | | |
Net investment income | | | — | | | | (81,288 | ) | | | — | | | | (4,187 | ) | | | — | | | | (106 | ) | | | — | | | | (405 | ) |
Net realized gain | | | — | | | | (590,410 | ) | | | — | | | | (456 | ) | | | — | | | | (877 | ) | | | — | | | | (4,544 | ) |
| | | | | | | | | | | | | | | | | | | | | | | | | | | | | | | | |
| | | — | | | | (671,698 | ) | | | — | | | | (4,643 | ) | | | — | | | | (983 | ) | | | — | | | | (4,949 | ) |
Capital stock transactions | | | | | | | | | | | | | | | | | | | | | | | | | | | | | | | | |
Net proceeds from sale of shares | | | 867,777 | | | | 1,785,719 | | | | 61,633 | | | | 137,733 | | | | 98,461 | | | | 172,153 | | | | 152,172 | | | | 529,925 | |
Shares issued in reinvestment of income dividends and capital gain distributions | | | — | | | | 633,412 | | | | — | | | | 4,390 | | | | — | | | | 868 | | | | — | | | | 4,687 | |
Less cost of shares redeemed | | | (601,016 | ) | | | (1,157,832 | ) | | | (30,691 | ) | | | (61,417 | ) | | | (19,926 | ) | | | (18,839 | ) | | | (68,548 | ) | | | (136,352 | ) |
| | | | | | | | | | | | | | | | | | | | | | | | | | | | | | | | |
Net increase (decrease) in net assets resulting from capital stock transactions | | | 266,761 | | | | 1,261,299 | | | | 30,942 | | | | 80,706 | | | | 78,535 | | | | 154,182 | | | | 83,624 | | | | 398,260 | |
| | | | | | | | | | | | | | | | | | | | | | | | | | | | | | | | |
Increase (decrease) in net assets | | | 1,017,275 | | | | 1,716,049 | | | | 60,880 | | | | 120,006 | | | | 118,802 | | | | 181,435 | | | | 228,702 | | | | 564,301 | |
Net assets | | | | | | | | | | | | | | | | | | | | | | | | | | | | | | | | |
Beginning of period | | | 6,267,126 | | | | 4,551,077 | | | | 297,716 | | | | 177,710 | | | | 231,969 | | | | 50,534 | | | | 813,649 | | | | 249,348 | |
| | | | | | | | | | | | | | | | | | | | | | | | | | | | | | | | |
End of period | | $ | 7,284,401 | | | $ | 6,267,126 | | | $ | 358,596 | | | $ | 297,716 | | | $ | 350,771 | | | $ | 231,969 | | | $ | 1,042,351 | | | $ | 813,649 | |
| | | | | | | | | | | | | | | | | | | | | | | | | | | | | | | | |
Undistributed net investment income (loss) at the end of the period | | $ | (94,012 | ) | | $ | (124,368 | ) | | $ | (2,436 | ) | | $ | (4,627 | ) | | $ | 676 | | | $ | (137 | ) | | $ | 293 | | | $ | (492 | ) |
| | | | | | | | | | | | | | | | | | | | | | | | | | | | | | | | |
See accompanying Notes to Financial Statements.
84 Semi-Annual Report | June 30, 2007 |
Statements of Assets and Liabilities
June 30, 2007 (all dollar amounts in thousands) (unaudited)
| | | | | | | | | | | | | | | |
| | | Value
Discovery
Fund | | Bond Fund | | | Income Fund | | | Ready Reserves Fund | |
Assets | | | | | | | | | | | | | | | |
Investments in securities, at cost | | $ | 67,007 | | $ | 56,824 | | | $ | 259,223 | | | $ | 1,184,658 | |
Investments in Affiliated Fund, at cost | | | 30 | | | — | | | | — | | | | — | |
| | | | | | | | | | | | | | | |
| | | | |
Investments in securities, at value | | $ | 75,330 | | $ | 56,196 | | | $ | 251,106 | | | $ | 1,184,658 | |
Investments in Affiliated Fund, at value | | | 30 | | | — | | | | — | | | | — | |
Receivable for fund shares sold | | | 138 | | | 438 | | | | 463 | | | | — | |
Receivable for investment securities sold | | | — | | | — | | | | — | | | | — | |
Receivable from Advisor | | | 68 | | | 1 | | | | 12 | | | | — | |
Dividend and interest receivable | | | 163 | | | — | | | | 2,359 | | | | 5,829 | |
| | | | | | | | | | | | | | | |
Total assets | | | 75,729 | | | 56,635 | | | | 253,940 | | | | 1,190,487 | |
Liabilities | | | | | | | | | | | | | | | |
Payable for investment securities purchased | | | 6 | | | 4,989 | | | | — | | | | 7,038 | |
Payable for fund shares redeemed | | | 295 | | | — | | | | 185 | | | | — | |
Management fee payable | | | 17 | | | — | | | | 40 | | | | 206 | |
Distribution fee payable | | | 33 | | | — | | | | 11 | | | | 321 | |
Shareholder services payable | | | — | | | 5 | | | | — | | | | — | |
Dividend payable | | | — | | | — | | | | — | | | | 306 | |
Other accrued expenses | | | 45 | | | 18 | | | | 9 | | | | 128 | |
| | | | | | | | | | | | | | | |
Total liabilities | | | 396 | | | 5,012 | | | | 245 | | | | 7,999 | |
| | | | | | | | | | | | | | | |
Net Assets | | $ | 75,333 | | $ | 51,623 | | | $ | 253,695 | | | $ | 1,182,488 | |
| | | | | | | | | | | | | | | |
Capital | | | | | | | | | | | | | | | |
Composition of Net Assets | | | | | | | | | | | | | | | |
Par value of shares of beneficial interest | | $ | 5 | | $ | 5 | | | $ | 26 | | | $ | 916 | |
Capital paid in excess of par value | | | 52,077 | | | 52,292 | | | | 283,141 | | | | 1,182,517 | |
Accumulated net investment income (loss) | | | 169 | | | 104 | | | | (303 | ) | | | 84 | |
Accumulated realized gain (loss) | | | 14,759 | | | (150 | ) | | | (21,052 | ) | | | (1,029 | ) |
Net unrealized appreciation (depreciation) of investments and foreign currencies | | | 8,323 | | | (628 | ) | | | (8,117 | ) | | | — | |
| | | | | | | | | | | | | | | |
Net Assets | | $ | 75,333 | | $ | 51,623 | | | $ | 253,695 | | | $ | 1,182,488 | |
| | | | | | | | | | | | | | | |
| | | | |
Class N Shares | | | | | | | | | | | | | | | |
Net Assets | | $ | 22,195 | | $ | 690 | | | $ | 93,997 | | | $ | 1,182,488 | |
Shares Outstanding | | | 1,281,758 | | | 70,086 | | | | 9,845,638 | | | | 1,182,542,084 | |
Net Asset Value Per Share | | $ | 17.32 | | $ | 9.84 | | | $ | 9.55 | | | $ | 1.00 | |
Class I Shares | | | | | | | | | | | | | | | |
Net Assets | | $ | 53,138 | | $ | 42,140 | | | $ | 159,698 | | | | | |
Shares Outstanding | | | 3,020,603 | | | 4,281,090 | | | | 16,816,017 | | | | | |
Net Asset Value Per Share | | $ | 17.59 | | $ | 9.84 | | | $ | 9.50 | | | | | |
See accompanying Notes to Financial Statements.
June 30, 2007 | William Blair Funds 85 |
Statements of Operations
For the Period Ended June 30, 2007 (all dollar amounts in thousands) (unaudited)
| | | | | | | | | | | | | | | | |
| | | Value
Discovery
Fund | | | Bond
Fund(a) | | | Income
Fund | | | Ready
Reserves
Fund | |
Investment income | | | | | | | | | | | | | | | | |
Dividends | | $ | 853 | | | $ | 4 | | | $ | — | | | $ | — | |
Income from Affiliated Fund | | | 25 | | | | — | | | | — | | | | — | |
Interest | | | 3 | | | | 370 | | | | 7,796 | | | | 31,501 | |
| | | | | | | | | | | | | | | | |
Total income | | | 881 | | | | 374 | | | | 7,796 | | | | 31,501 | |
Expenses | | | | | | | | | | | | | | | | |
Investment advisory fees | | | 647 | | | | 21 | | | | 710 | | | | 1,416 | |
Distribution fees | | | 83 | | | | — | | | | 69 | | | | — | |
Shareholder administration fees | | | — | | | | 8 | | | | — | | | | 2,059 | |
Custodian fees | | | 71 | | | | 7 | | | | 70 | | | | 90 | |
Transfer agent fees | | | 72 | | | | 2 | | | | 52 | | | | 11 | |
Professional fees | | | 14 | | | | 7 | | | | 18 | | | | 29 | |
Registration fees | | | 22 | | | | 5 | | | | 18 | | | | 13 | |
Other expenses | | | 9 | | | | 4 | | | | 7 | | | | 92 | |
| | | | | | | | | | | | | | | | |
Total expenses before waiver | | | 918 | | | | 54 | | | | 944 | | | | 3,710 | |
Less expenses waived or absorbed by the Advisor | | | (195 | ) | | | (21 | ) | | | (12 | ) | | | — | |
| | | | | | | | | | | | | | | | |
Net expenses | | | 723 | | | | 33 | | | | 932 | | | | 3,710 | |
| | | | | | | | | | | | | | | | |
Net investment income (loss) | | | 158 | | | | 341 | | | | 6,864 | | | | 27,791 | |
Net realized and unrealized gain (loss) on investments, foreign currency transactions and other assets and liabilities | | | | | | | | | | | | | | | | |
Net realized gain (loss) on investments | | | 12,488 | | | | (150 | ) | | | (935 | ) | | | (2 | ) |
| | | | | | | | | | | | | | | | |
Change in net unrealized appreciation (depreciation) on investments and other assets and liabilities | | | (4,657 | ) | | | (628 | ) | | | (4,113 | ) | | | — | |
| | | | | | | | | | | | | | | | |
Net increase (decrease) in net assets resulting from operations | | $ | 7,989 | | | $ | (437 | ) | | $ | 1,816 | | | $ | 27,789 | |
| | | | | | | | | | | | | | | | |
| (a) | | For the period from May 1, 2007 (Commencement of Operations) to June 30, 2007. |
See accompanying Notes to Financial Statements.
86 Semi-Annual Report | June 30, 2007 |
Statements of Changes in Net Assets
For the Period Ended June 30, 2007 and the Year Ended December 31, 2006 (all amounts in thousands) (unaudited)
| | | | | | | | | | | | | | | | | | | | | | | | | | | | |
| | | Value
Discovery
Fund | | | Bond
Fund | | | Income
Fund | | | Ready
Reserves Fund | |
| | | 2007 | | | 2006 | | | 2007(a) | | | 2007 | | | 2006 | | | 2007 | | | 2006 | |
| | | (unaudited) | | | | | | (unaudited) | | | (unaudited) | | | | | | (unaudited) | | | | |
Operations | | | | | | | | | | | | | | | | | | | | | | | | | | | | |
Net investment income (loss) | | $ | 158 | | | $ | 136 | | | $ | 341 | | | $ | 6,864 | | | $ | 14,102 | | | $ | 27,791 | | | $ | 51,297 | |
Net realized gain (loss) on investments, foreign currency transactions and other assets and liabilities | | | 12,488 | | | | 16,215 | | | | (150 | ) | | | (935 | ) | | | (1,052 | ) | | | (2 | ) | | | — | |
Change in net unrealized appreciation (depreciation) on investments, foreign currency transactions and other assets and liabilities | | | (4,657 | ) | | | 760 | | | | (628 | ) | | | (4,113 | ) | | | (202 | ) | | | — | | | | — | |
| | | | | | | | | | | | | | | | | | | | | | | | | | | | |
Net increase (decrease) in net assets resulting from operations | | | 7,989 | | | | 17,111 | | | | (437 | ) | | | 1,816 | | | | 12,848 | | | | 27,789 | | | | 51,297 | |
Distributions to shareholders from | | | | | | | | | | | | | | | | | | | | | | | | | | | | |
Net investment income | | | — | | | | (129 | ) | | | (237 | ) | | | (7,167 | ) | | | (16,500 | ) | | | (27,788 | ) | | | (51,297 | ) |
Net realized gain | | | — | | | | (15,001 | ) | | | — | | | | — | | | | — | | | | — | | | | — | |
| | | | | | | | | | | | | | | | | | | | | | | | | | | | |
| | | — | | | | (15,130 | ) | | | (237 | ) | | | (7,167 | ) | | | (16,500 | ) | | | (27,788 | ) | | | (51,297 | ) |
Capital stock transactions | | | | | | | | | | | | | | | | | | | | | | | | | | | | |
Net proceeds from sale of shares | | | 26,873 | | | | 100,537 | | | | 52,111 | | | | 36,605 | | | | 61,832 | | | | 483,787 | | | | 1,030,633 | |
Shares issued in reinvestment of income dividends and capital gain distributions | | | — | | | | 14,164 | | | | 187 | | | | 5,841 | | | | 13,061 | | | | 28,101 | | | | 51,002 | |
Less cost of shares redeemed | | | (106,306 | ) | | | (40,344 | ) | | | (1 | ) | | | (80,477 | ) | | | (84,660 | ) | | | (524,994 | ) | | | (977,896 | ) |
| | | | | | | | | | | | | | | | | | | | | | | | | | | | |
Net increase (decrease) in net assets resulting from capital stock transactions | | | (79,433 | ) | | | 74,357 | | | | 52,297 | | | | (38,031 | ) | | | (9,767 | ) | | | (13,106 | ) | | | 103,739 | |
| | | | | | | | | | | | | | | | | | | | | | | | | | | | |
Increase (decrease) in net assets | | | (71,444 | ) | | | 76,338 | | | | 51,623 | | | | (43,382 | ) | | | (13,419 | ) | | | (13,105 | ) | | | 103,739 | |
Net assets | | | | | | | | | | | | | | | | | | | | | | | | | | | | |
Beginning of period | | $ | 146,777 | | | $ | 70,439 | | | $ | — | | | $ | 297,077 | | | $ | 310,496 | | | $ | 1,195,593 | | | $ | 1,091,854 | |
| | | | | | | | | | | | | | | | | | | | | | | | | | | | |
End of period | | $ | 75,333 | | | $ | 146,777 | | | $ | 51,623 | | | $ | 253,695 | | | $ | 297,077 | | | $ | 1,182,488 | | | $ | 1,195,593 | |
| | | | | | | | | | | | | | | | | | | | | | | | | | | | |
Undistributed net investment income (loss) at the end of the period | | $ | 169 | | | $ | 11 | | | $ | 104 | | | $ | (303 | ) | | $ | — | | | $ | 84 | | | $ | 81 | |
| | | | | | | | | | | | | | | | | | | | | | | | | | | | |
| (a) | | For the period from May 1, 2007 (Commencement of Operations) to June 30, 2007. |
See accompanying Notes to Financial Statements.
June 30, 2007 | William Blair Funds 87 |
Notes to Financial Statements
(1) Significant Accounting Policies
The following is a summary of the Fund’s significant accounting policies in effect during the period covered by the financial statements, which are in accordance with U.S. generally accepted accounting principles.
(a) Description of the Fund
William Blair Funds (the “Fund”) is a diversified mutual fund registered under the Investment Company Act of 1940, as amended, as an open-end management investment company. For each portfolio, the number of shares authorized is unlimited. The Fund currently consists of the following sixteen portfolios (the “Portfolios”), each with its own investment objectives and policies.
| | |
Equity Portfolios | | International Portfolios |
Growth | | International Growth |
Tax-Managed Growth | | International Equity |
Large Cap Growth | | International Small Cap Growth |
Small Cap Growth | | Institutional International Growth |
Mid Cap Growth | | Institutional International Equity |
Small-Mid Cap Growth | | Emerging Markets Growth |
Value Discovery | | Fixed Income Portfolios |
| | Bond |
| | Income |
| | Money Market Portfolio |
| | Ready Reserves |
The investment objectives of the Portfolios are as follows:
| | |
Equity | | Long-term capital appreciation. |
International | | Long-term capital appreciation. |
Fixed Income | | High level of current income with relative stability of principal. |
Money Market | | Current income, a stable share price and daily liquidity. |
The Institutional International Growth Portfolio, the Institutional International Equity Portfolio and the Institutional Class of the International Small Cap Growth Portfolio, the Emerging Markets Growth Portfolio and the Bond Portfolio issue a separate report.
(b) Share Classes
Three different classes of shares currently exist: N, I and Institutional. This report includes financial highlight information for Classes N and I. The table below describes the Class N shares and the Class I shares covered by this report:
| | |
Class | | Description |
| N | | Class N shares are sold to the general public, either directly through the Fund’s distributor or through a select number of financial intermediaries. Class N shares are sold without any sales load, and carry an annual 12b-1 distribution fee (0.25% for the Equity and International Portfolios and 0.15% for the Fixed Income Portfolios) or a service fee (0.35% for the Money Market Portfolio), and an annual shareholder administration fee (0.15% for the International Small Cap Growth Portfolio, the Emerging Markets Growth Portfolio and the Bond Portfolio). |
| I | | Class I shares are sold to a limited group of investors. They do not carry any sales load or distribution fees and generally have lower ongoing expenses than the other classes. Class I shares of the International Small Cap Growth Portfolio, the Emerging Markets Growth Portfolio and the Bond Portfolio carry an annual shareholder administration fee of 0.15%. |
Investment income, realized and unrealized gains and losses, and certain Portfolio level expenses and expense reductions, if any, are allocated based on the relative net assets of each class, except for certain class specific expenses which are charged directly to the appropriate class. Differences in class expenses may result in the payment of different per share dividends by class. All share classes of the Portfolios have equal rights with respect to voting subject to class specific arrangements.
88 Semi-Annual Report | June 30, 2007 |
(c) Investment Valuation
The market value of domestic equity securities and options is determined by valuing securities traded on national securities exchanges or markets or in the over-the-counter markets at the last sales price or, if applicable, the official closing price or, in the absence of a sale on the date of valuation, at the latest bid price.
For international securities, if the foreign exchange or market on which a security is primarily traded closes before the close of regular trading on the New York Stock Exchange (4:00 p.m. Eastern time), the Portfolios use an independent pricing service on a daily basis to estimate the fair value price as of the close of regular trading on the New York Stock Exchange. The Board of Trustees has determined that the passage of time between when foreign exchanges or markets close and when the Portfolios calculate their net asset values could cause the value of international securities to no longer be representative of their market price or accurate. In addition, quarterly the Board of Trustees receives a report which compares the fair value prices used to calculate the net asset value to the next day’s opening local prices. Otherwise, the value of foreign equity securities is determined based on the last sale price on the foreign exchange or market on which it is primarily traded or, if there have been no sales during that day, at the latest bid price. Foreign currency forward contracts and foreign currencies are valued at the forward and current exchange rates, respectively, prevailing on the date of valuation.
Long-term, fixed-income securities are valued based on market quotations, or by independent pricing services that use prices provided by market makers or by estimates of market values obtained from yield data relating to instruments or securities with similar characteristics.
Investments in other funds are valued at the underlying fund’s net asset value on the date of valuation. Other securities, and all other assets, including securities for which a market price is not available, or the value of which is affected by a significant valuation event, are valued at fair value as determined in good faith by the Pricing or Valuation Committee, in accordance with the Fund’s Valuation Procedures approved by the Board of Trustees. As of June 30, 2007, there were securities held in the Small Cap Growth, International Growth, International Equity, International Small Cap Growth, Emerging Markets Growth and Income Portfolios requiring fair valuation pursuant to the Fund’s valuation procedures. Securities held in the Ready Reserves Fund are valued at amortized cost, which approximates market value.
(d) Investment income and transactions
Dividend income is recorded on the ex-dividend date, except for those dividends from certain foreign securities which are recorded as soon as the information is available. Foreign currency gains and losses associated with fluctuations in the foreign currency rate versus the United States dollar are recorded in the Statement of Operations as a component of the net realized gain (loss) on foreign currency translations and other assets and liabilities.
Premiums and discounts are accreted and amortized on a straight-line basis for short-term investments and on an effective interest method for long-term investments.
Interest income is determined on the basis of the interest accrued, adjusted for amortization of premium or discount. Variable rate bonds and floating rate notes earn interest at coupon rates that fluctuate at specific time intervals. The interest rates shown in the Portfolio of Investments for the Bond, Income, and Ready Reserves Portfolios were the rates in effect on June 30, 2007. Put bonds may be redeemed at the discretion of the holder on specified dates prior to maturity.
Paydown gains and losses on mortgage and asset-backed securities are treated as an adjustment to interest income. For the period ended June 30, 2007, the Bond and Income Portfolios recognized an increase or reduction of interest income and an increase or reduction of net realized gain (loss) of -$1- and ($961) respectively (in thousands). This reclassification has no effect on the net asset value of the Portfolio.
Security and shareholder transactions are accounted for no later than one business day following the trade date. However, for financial reporting purposes, security and shareholder transactions are accounted for on the trade date of the last business day of the reporting period. Realized gains and losses from securities transactions are recognized on the basis of high cost lot sell selection.
Awards from class action litigation may be recorded as a reduction of cost. If the Funds no longer own the applicable securities, the proceeds are recorded as realized gains.
(e) Share Valuation and Dividends to Shareholders
Shares are sold and redeemed on a continuous basis at net asset value. The net asset value per share is determined separately for each class by dividing the Portfolio’s net assets attributable to that class by the number of shares of the class outstanding
June 30, 2007 | William Blair Funds 89 |
as of the close of regular trading on the New York Stock Exchange, which is generally 3:00 p.m. Central time (4:00 p.m. Eastern time), on each day the Exchange is open. Redemption fees may be applicable to redemptions or exchanges within 60 days of purchase. For both Class N and Class I shares, the William Blair domestic equity portfolios assess a 1% redemption fee on shares sold or exchanged that have been owned 60 days or less and the William Blair international portfolios assess a 2% redemption fee on shares sold or exchanged that have been owned 60 days or less as disclosed within the Fund’s Prospectus. The redemption fees collected by the Fund are netted against the amount of Redemptions for presentation on the Statement of Changes in Net Assets.
For the period ended June 30, 2007, the redemption fees collected by the Portfolios were as follows (in thousands):
| | | |
| | | Redemption
Fees |
Growth | | $ | 4 |
Tax-Managed Growth | | | — |
Large Cap Growth | | | — |
Small Cap Growth | | | 31 |
Mid Cap Growth Fund | | | — |
Small Mid-Cap Growth | | | — |
International Growth | | | 71 |
International Equity | | | 13 |
International Small Cap Growth | | | — |
Emerging Markets Growth | | | 5 |
Value Discovery | | | 15 |
Dividends from net investment income, if any, of the Growth, Tax-Managed Growth, Large Cap Growth, Small Cap Growth, Mid Cap Growth, Small-Mid Cap Growth, International Growth, International Equity, International Small Cap Growth, Emerging Markets Growth and Value Discovery Portfolios are declared at least annually. Dividends from the Bond and Income and the Ready Reserves Portfolios are declared monthly and daily, respectively. Capital gain distributions, if any, are declared at least annually in December. Dividends payable to shareholders are recorded on the ex-dividend date.
(f) Foreign Currency Translation and Forward Foreign Currency Contracts
The International Growth, International Equity, International Small Cap Growth and Emerging Markets Growth Portfolios may invest in securities denominated in foreign currencies. As such, assets and liabilities denominated in foreign currencies are translated into U.S. dollar amounts at the current exchange rate on the date of valuation. The values of foreign investments, open foreign currency forward contracts, and cash denominated in foreign currencies are translated into U.S. dollars using a spot market rate of exchange as of the time of the determination of each Portfolio’s NAV, typically 4:00 p.m. Eastern time on days when there is regular trading on the New York Stock Exchange. Payables and receivables for securities transactions, dividends, interest income and tax reclaims are translated into U.S. dollars using a spot market rate of exchange as of 4:00 p.m. Eastern time. Settlement of purchases and sales and dividend and interest receipts are translated into U.S. dollars using a spot market rate of exchange as of 11:00 a.m. Eastern time.
The Portfolios may enter into foreign currency forward contracts (1) as a means of managing the risks associated with changes in the exchange rates for the purchase or sale of a specific amount of a particular foreign currency, and (2) to hedge the value, in U.S. dollars, of portfolio securities. Gains and losses from foreign currency transactions associated with purchases and sales of investments and foreign currency forward contracts are included with the net realized and unrealized gain or loss on investments. For tax purposes these foreign currency gains and losses are treated as ordinary income.
(g) Options
The Portfolios may engage in options transactions on security indices and other financial indices and in doing so achieve similar objectives to what they would achieve through the sale or purchase of options on individual securities or other instruments.
Option writing. When a Portfolio writes an option, an amount equal to the premium received by the Portfolio is recorded as a liability and is subsequently adjusted to the current fair value of the option written. Premiums received from writing options that expire unexercised are treated by the Portfolio on the expiration date as realized gains from investments. The difference between the premium and the amount paid on effecting a closing purchase transaction, including brokerage commissions, is
90 Semi-Annual Report | June 30, 2007 |
also treated as a realized gain, or, if the premium is less than the amount paid for the closing purchase transaction, as a realized loss. If a call option is exercised, the premium is added to the proceeds from the sale of the underlying security or currency in determining whether the Portfolio has realized a gain or loss. If a put option is exercised, the premium reduces the cost basis of the securities purchased by the Portfolio. The Portfolio as writer of an option bears the market risk of an unfavorable change in the price of the security underlying the written option. There were no open options at June 30, 2007.
(h) Income Taxes
Each Portfolio intends to comply with the special provisions of Subchapter M of the Internal Revenue Code available to regulated investment companies and, therefore, no provision for Federal income taxes has been made in the accompanying financial statements since each Portfolio intends to distribute substantially all of its taxable income to its shareholders and be relieved of all Federal income taxes.
The International Growth, International Equity, International Small Cap Growth and Emerging Markets Growth Portfolios have elected to mark-to-market their investments in Passive Foreign Investment Companies (“PFICs”) for Federal income tax purposes. In accordance with this election, the Portfolios recognized net unrealized appreciation/(depreciation) of $83,007 and $3,835, $— and $—, respectively (in thousands) in 2006, all of which has been treated as an adjustment to the cost of investments for tax purposes. The Portfolios also treat the deferred loss associated with current and prior year wash sales as an adjustment to the cost of investments for tax purposes. The cost of investments for Federal income tax purposes and related gross unrealized appreciation/(depreciation) and net unrealized appreciation/(depreciation) at June 30, 2007, were as follows (in thousands):
| | | | | | | | | | | | | |
Portfolio | | Cost of
Investments | | Gross Unrealized Appreciation | | Gross Unrealized Depreciation | | Net Unrealized
Appreciation/ (Depreciation) | |
Growth | | $ | 252,247 | | $ | 71,676 | | $ | 3,325 | | $ | 68,351 | |
Tax-Managed Growth | | | 8,176 | | | 2,419 | | | 141 | | | 2,278 | |
Large Cap Growth | | | 24,664 | | | 4,100 | | | 395 | | | 3,705 | |
Small Cap Growth | | | 1,193,091 | | | 230,418 | | | 41,141 | | | 189,277 | |
Mid Cap Growth | | | 35,531 | | | 4,039 | | | 533 | | | 3,506 | |
Small-Mid Cap Growth | | | 95,165 | | | 20,712 | | | 995 | | | 19,717 | |
International Growth | | | 5,283,243 | | | 2,013,665 | | | 54,701 | | | 1,958,964 | |
International Equity | | | 288,908 | | | 63,836 | | | 1,680 | | | 62,156 | |
International Small Cap Growth | | | 297,811 | | | 67,122 | | | 8,511 | | | 58,611 | |
Emerging Markets Growth | | | 811,577 | | | 263,348 | | | 9,394 | | | 253,954 | |
Value Discovery | | | 67,580 | | | 9,140 | | | 1,360 | | | 7,780 | |
Bond | | | 56,824 | | | 84 | | | 712 | | | (628 | ) |
Income | | | 259,223 | | | 688 | | | 8,805 | | | (8,117 | ) |
Ready Reserves | | | 1,184,658 | | | — | | | — | | | — | |
June 30, 2007 | William Blair Funds 91 |
The timing and characterization of certain income and capital gain distributions are determined annually in accordance with Federal income tax regulations that may differ from U.S. generally accepted accounting principles. As a result, net investment income or loss and net realized gain or loss for a reporting period may differ from the amount distributed during such period. In addition, the Portfolios may periodically record reclassifications among certain capital accounts to reflect differences between financial reporting and income tax basis distributions. The reclassifications were reported in order to reflect the tax treatment for certain permanent differences that exist between income tax regulations and U.S. generally accepted accounting principles. The reclassifications generally relate to net operating losses, Section 988 currency gains and losses, recharacterization of dividends received from investments in REITs, expired capital loss carryforwards, and gain or loss on in-kind transactions. These reclassifications have no impact on the net asset values of the Portfolios. Accordingly, at December 31, 2006, the following reclassifications were recorded (in thousands):
| | | | | | | | | | | | |
Portfolio | | Undistributed Net
Investment Income/(Loss) | | | Accumulated
Undistributed
Net Realized Gain/(Loss) | | | Capital
Paid In Excess
of Par Value | |
Growth | | $ | 653 | | | $ | (653 | ) | | $ | — | |
Tax-Managed Growth | | | 15 | | | | — | | | | (15 | ) |
Large Cap Growth | | | 30 | | | | — | | | | (30 | ) |
Small Cap Growth | | | 11,401 | | | | (11,401 | ) | | | — | |
Mid Cap Growth | | | 62 | | | | — | | | | (62 | ) |
Small-Mid Cap Growth | | | 538 | | | | (538 | ) | | | — | |
International Growth | | | (17,389 | ) | | | 17,389 | | | | — | |
International Equity | | | (896 | ) | | | 896 | | | | — | |
International Small Cap Growth | | | 289 | | | | (289 | ) | | | — | |
Emerging Markets Growth | | | 24 | | | | (22 | ) | | | (2 | ) |
Value Discovery | | | 1 | | | | (1,934 | ) | | | 1,933 | |
Income | | | 2,398 | | | | (2,315 | ) | | | (83 | ) |
Ready Reserves | | | — | | | | 1 | | | | (1 | ) |
Distributions from net realized gains for book purposes may include short-term capital gains, which are included as ordinary income for tax purposes. The tax character of distributions paid during 2006 and 2005 was as follows (in thousands):
| | | | | | | | | | | | |
| | | Distributions Paid In 2006 | | Distributions Paid In 2005 |
Portfolio | | Ordinary
Income | | Long-Term
Capital Gains | | Ordinary
Income | | Long-Term
Capital Gains |
Growth | | $ | 4,799 | | $ | 22,516 | | $ | — | | $ | 8,977 |
Tax-Managed Growth | | | — | | | — | | | — | | | — |
Large Cap Growth | | | — | | | — | | | — | | | — |
Small Cap Growth | | | — | | | 78,266 | | | 11,335 | | | 60,296 |
Mid Cap Growth | | | — | | | — | | | | | | |
Small-Mid Cap Growth | | | 506 | | | 3,898 | | | — | | | 495 |
International Growth | | | 90,245 | | | 581,453 | | | 21,550 | | | 254,334 |
International Equity | | | 4,187 | | | 456 | | | — | | | — |
International Small Cap Growth | | | 983 | | | — | | | 6 | | | — |
Emerging Markets Growth | | | 1,585 | | | 3,364 | | | 1,169 | | | — |
Value Discovery | | | 2,395 | | | 12,735 | | | — | | | 24,647 |
Income | | | 16,500 | | | — | | | 16,070 | | | — |
Ready Reserves | | | 51,297 | | | — | | | 27,823 | | | — |
92 Semi-Annual Report | June 30, 2007 |
As of December 31, 2006, the components of distributable earnings on a tax basis were as follows (in thousands):
| | | | | | | | | | | | | |
Portfolio | | Undistributed
Ordinary
Income | | Accumulated
Capital and
Other Losses | | Undistributed
Long-Term
Gain | | Net Unrealized
Appreciation/ (Depreciation) | |
Growth | | $ | 1,311 | | $ | — | | $ | 4,655 | | $ | 62,440 | |
Tax-Managed Growth | | | — | | | 1,031 | | | — | | | 2,125 | |
Large Cap Growth | | | — | | | 5,106 | | | — | | | 2,680 | |
Small Cap Growth | | | 1,774 | | | — | | | 19,164 | | | 143,574 | |
Mid Cap Growth | | | — | | | 155 | | | — | | | 1,032 | |
Small-Mid Cap Growth | | | 39 | | | — | | | 971 | | | 11,461 | |
International Growth | | | 27,392 | | | — | | | 170,573 | | | 1,485,227 | |
International Equity | | | 1,822 | | | — | | | 3,585 | | | 48,322 | |
International Small Cap Growth | | | 856 | | | 137 | | | 1,730 | | | 29,426 | |
Emerging Markets Growth | | | 5,520 | | | 503 | | | 19,303 | | | 171,844 | |
Value Discovery | | | 1,529 | | | — | | | 999 | | | 12,732 | |
Income | | | — | | | 20,117 | | | — | | | (4,004 | ) |
Ready Reserves | | | 81 | | | 1,026 | | | — | | | — | |
At December 31, 2006, the Portfolios have unused capital loss carryforwards available for Federal income tax purposes to be applied against future capital gains, if any. If not applied, the carryforwards will expire as follows (in thousands):
| | | | | | | | | | | | | | | | | | | | | | | | | | | |
Portfolio | | 2007 | | 2008 | | 2009 | | 2010 | | 2011 | | 2012 | | 2013 | | 2014 | | Total |
Growth | | $ | — | | $ | — | | $ | — | | $ | — | | $ | — | | $ | — | | $ | — | | $ | — | | $ | — |
Tax-Managed Growth | | | — | | | — | | | — | | | 554 | | | 468 | | | — | | | — | | | — | | | 1,022 |
Large Cap Growth | | | — | | | 41 | | | 2,714 | | | 1,582 | | | 769 | | | — | | | — | | | — | | | 5,106 |
Small Cap Growth | | | — | | | — | | | — | | | — | | | — | | | — | | | — | | | — | | | — |
Mid Cap Growth | | | — | | | — | | | — | | | — | | | — | | | — | | | — | | | 155 | | | 155 |
Small-Mid Cap Growth | | | — | | | — | | | — | | | — | | | — | | | — | | | — | | | — | | | — |
International Growth | | | — | | | — | | | — | | | — | | | — | | | — | | | — | | | — | | | — |
International Equity | | | — | | | — | | | — | | | — | | | — | | | — | | | — | | | — | | | — |
International Small Cap Growth | | | — | | | — | | | — | | | — | | | — | | | — | | | — | | | — | | | — |
Emerging Markets Growth | | | — | | | — | | | — | | | — | | | — | | | — | | | — | | | — | | | — |
Value Discovery | | | — | | | — | | | — | | | — | | | — | | | — | | | — | | | — | | | — |
Income | | | 1,249 | | | 3,292 | | | — | | | 1,692 | | | 1,582 | | | 4,431 | | | 3,398 | | | 4,138 | | | 19,782 |
Ready Reserves | | | 51 | | | 24 | | | — | | | 930 | | | — | | | 21 | | | — | | | — | | | 1,026 |
For the period November 1, 2006 through December 31, 2006, the following Portfolios incurred net realized capital or foreign currency losses. Each Portfolio intends to treat this loss as having occurred in fiscal year 2007 for Federal income tax purposes (in thousands):
| | | | | | |
Portfolio | | Capital
Amount | | Currency
Amount |
Growth | | $ | — | | $ | — |
Tax-Managed Growth | | | 9 | | | — |
Large Cap Growth | | | — | | | — |
Small Cap Growth | | | — | | | — |
Mid Cap Growth | | | — | | | — |
Small-Mid Cap Growth | | | — | | | — |
International Growth | | | — | | | — |
International Equity | | | — | | | — |
International Small Cap Growth | | | — | | | 137 |
Emerging Markets Growth | | | — | | | 503 |
Value Discovery | | | — | | | — |
Income | | | 335 | | | — |
Ready Reserves | | | — | | | — |
June 30, 2007 | William Blair Funds 93 |
(i) Repurchase Agreements
The Portfolios may enter into repurchase agreements with its custodian, Investors Bank & Trust Company, whereby the Portfolios acquire ownership of a debt security and the custodian agrees, at the time of sale, to repurchase the debt security from the Portfolios at a mutually agreed upon time and price. The Portfolios’ policy is to take possession of the debt security as collateral under the repurchase agreements. The Portfolios minimize credit risk by monitoring credit exposure to the custodian and by monitoring the collateral value on an ongoing basis.
(j) Use of Estimates
The preparation of financial statements in conformity with U.S. generally accepted accounting principles requires management to make estimates and assumptions that affect the amounts reported in the financial statements. Actual results may differ from those estimates.
(2) New Accounting Pronouncements
In July 2006, the Financial Accounting Standards Board (FASB) released FASB Interpretation No. 48 “Accounting for Uncertainty in Income Taxes” (FIN 48). FIN 48 provides guidance for how uncertain tax positions should be recognized, measured, presented and disclosed in the financial statements. FIN 48 requires the evaluation of tax positions taken or expected to be taken in the course of preparing the Fund’s tax returns to determine whether the tax positions are “more-likely-than-not” of being sustained by the applicable tax authority. Tax positions not deemed to meet the more-likely-than-not threshold would be recorded as a tax benefit or expense in the current year. Adoption of FIN 48 is required for fiscal years beginning after December 15, 2006. Recent SEC guidance allows implementing FIN 48 in portfolio NAV calculations as late as the fund’s last NAV calculation in the first required financial statement reporting period. Management has evaluated the implications of FIN 48 and has determined it does not have an impact on the financial statements as of June 30, 2007.
In September 2006, the Financial Accounting Standards Board (FASB) issued Statement on Financial Accounting Standards No. 157, “Fair Value Measurements” (FAS 157). This standard clarifies the definition of fair value for financial reporting, establishes a framework for measuring fair value and requires additional disclosures about the use of fair value measurements. FAS 157 is effective for financial statements issued for fiscal years beginning after November 15, 2007. Management is currently evaluating the impact that FAS 157 will have on the Funds’ financial statements.
(3) Transactions with Affiliates
(a) Management and Expense Limitation Agreements
Each Portfolio has a management agreement with William Blair & Company L.L.C. (the “Company”) for investment advisory, clerical, bookkeeping and administrative services. Each Portfolio pays the Company an annual fee, payable monthly, based on a specified percentage of its average daily net assets. A summary of the annual rates expressed as a percentage of average daily net assets is as follows:
| | | | | | | | |
Equity Portfolios | | | | | International Portfolios | | | |
Growth | | 0.75 | % | | International Growth and International Equity | | | |
Tax-Managed Growth | | 0.80 | % | | First $250 million | | 1.10 | % |
Large Cap Growth | | 0.80 | % | | In excess of $250 million | | 1.00 | % |
Small Cap Growth | | 1.10 | % | | International Small Cap Growth | | 1.00 | % |
Mid Cap Growth | | 0.95 | % | | Emerging Markets Growth | | 1.10 | % |
Small-Mid Cap Growth | | 1.00 | % | | | | | |
Value Discovery | | 1.10 | % | | | | | |
| | | |
Fixed Income Portfolios | | | | | Money Market Portfolio | | | |
Bond | | 0.30 | % | | Ready Reserves | | | |
Income* | | | | | First $250 million | | 0.275 | % |
First $250 million | | 0.25 | % | | Next $250 million | | 0.250 | % |
In excess of $250 million | | 0.20 | % | | Next $2 billion | | 0.225 | % |
| | | | | In excess of $2.5 billion | | 0.200 | % |
*Management fee also includes a charge of 5% of gross income. | | | | | | | | |
94 Semi-Annual Report | June 30, 2007 |
Some of the Portfolios have also entered into Expense Limitation Agreements with the Company. Under the terms of these Agreements, the Company has agreed to waive its advisory fees and absorb other operating expenses through April 30, 2008, if total expenses for each class of the following Portfolios exceed the following rates (as a percentage of average daily net assets):
| | | | | | | | | | | | |
| | | Class N Shares | | | Class I Shares | |
| | | Through April 30, 2007 | | | Effective
May 1, 2007 | | | Through April 30, 2007 | | | Effective
May 1, 2007 | |
Tax-Managed Growth | | 1.40 | % | | 1.32 | % | | 1.15 | % | | 1.07 | % |
Large Cap Growth | | 1.23 | % | | 1.23 | % | | 0.98 | % | | 0.98 | % |
Small Cap Growth | | 1.50 | % | | 1.50 | % | | 1.25 | % | | 1.25 | % |
Mid Cap Growth Fund | | 1.40 | % | | 1.36 | % | | 1.15 | % | | 1.11 | % |
Small-Mid Cap Growth | | 1.37 | % | | 1.36 | % | | 1.12 | % | | 1.11 | % |
International Growth | | 1.45 | % | | 1.45 | % | | 1.20 | % | | 1.20 | % |
International Equity | | 1.45 | % | | 1.45 | % | | 1.20 | % | | 1.20 | % |
International Small Cap Growth | | 1.65 | % | | 1.65 | % | | 1.40 | % | | 1.40 | % |
Emerging Markets Growth | | 1.65 | % | | 1.65 | % | | 1.40 | % | | 1.40 | % |
Value Discovery | | 1.34 | % | | 1.29 | % | | 1.09 | % | | 1.09 | % |
Bond Fund | | N/A | | | 0.65 | % | | N/A | | | 0.50 | % |
Income Fund | | 0.75 | % | | N/A | | | N/A | | | N/A | |
For a period of three years subsequent to the Commencement of Operations of the Mid Cap Growth, International Small Cap Growth, Emerging Markets Growth and Bond Portfolios, the Company is entitled to reimbursement for previously waived fees and reimbursed expenses to the extent the overall expense ratio remains below the percentages indicated. The total amount available for recapture at June 30, 2007 was $161 (in thousands) for the Mid Cap Growth Portfolio, $134 for the International Small Cap Growth Portfolio, $621 for the Emerging Markets Growth Portfolio and $21 for the Bond Portfolio.
For the period ended June 30, 2007, the investment advisory fees incurred by the Portfolios and related fee waivers were as follows (in thousands):
| | | | | | | | | | | | |
Portfolio | | Gross
Advisory Fee | | Fee Waiver | | Net
Advisory Fee | | Additional Expenses
(Recovered) or
Absorbed
by Advisor |
Growth | | $ | 1,076 | | $ | — | | $ | 1,076 | | $ | — |
Tax-Managed Growth | | | 40 | | | 38 | | | 2 | | | — |
Large Cap Growth | | | 98 | | | 43 | | | 55 | | | — |
Small Cap Growth | | | 7,203 | | | — | | | 7,203 | | | — |
Mid Cap Growth | | | 142 | | | 51 | | | 91 | | | — |
Small-Mid Cap Growth | | | 520 | | | 38 | | | 482 | | | — |
International Growth | | | 33,428 | | | — | | | 33,428 | | | — |
International Equity | | | 1,725 | | | 202 | | | 1,523 | | | — |
International Small Cap Growth | | | 1,482 | | | — | | | 1,482 | | | — |
Emerging Markets Growth | | | 4,895 | | | 80 | | | 4,815 | | | — |
Value Discovery | | | 647 | | | 195 | | | 452 | | | — |
Bond | | | 21 | | | 21 | | | — | | | — |
Income | | | 710 | | | — | | | 710 | | | — |
Ready Reserves | | | 1,416 | | | — | | | 1,416 | | | — |
(b) Underwriting, Distribution Services and Service Agreement
Each Portfolio except the Ready Reserves Portfolio has a Distribution Agreement with the Company for distribution services. Each Portfolio pays the Company an annual fee, payable monthly, based on a specified percentage of its average daily net assets of specified share classes. The annual rates expressed as a percentage of average daily net assets for Class N is 0.25% for all Portfolios except the Income and Bond Portfolios, which is 0.15%. Pursuant to the Distribution Agreement, the Company enters into related selling group agreements with various firms at various rates for sales of the Portfolios’ Class N shares.
June 30, 2007 | William Blair Funds 95 |
Distribution fees incurred by the Portfolios to the Company, for the year ended June 30, 2007, were as follows (in thousands):
| | | | | | | | | |
Portfolio | | Gross Distribution Fees | | Fee Waiver | | Net Distribution Fee |
Growth | | $ | 96 | | $ | — | | $ | 96 |
Tax-Managed Growth | | | 1 | | | — | | | 1 |
Large Cap Growth | |
|
15 | | | — | |
|
15 |
Small Cap Growth | |
|
883 | | | — | |
|
883 |
Mid Cap Growth | |
|
9 | | | — | |
|
9 |
Small-Mid Cap Growth | |
|
20 | | | — | |
|
20 |
International Growth | |
|
5,564 | | | — | |
|
5,564 |
International Equity | |
|
57 | | | — | |
|
57 |
International Small Cap Growth | |
|
25 | | | — | |
|
25 |
Emerging Markets Growth | |
|
74 | |
|
— | | | 74 |
Value Discovery | | | 83 | | | — | | | 83 |
Bond | | | — | | | — | | | — |
Income | |
|
69 | |
|
12 | |
|
57 |
The Ready Reserves Portfolio has a Service Agreement with the Company to provide shareholder services and automatic sweep services. The Portfolio pays the Company an annual fee, payable monthly, based upon 0.35% of the average daily net assets of Class N. For the period ended June 30, 2007, the following fees were incurred (in thousands):
The International Small Cap Growth, Emerging Markets Growth and Bond Portfolios have a Shareholder Administration Agreement with the Company to provide shareholder administration services. Class N and Class I shares of the Portfolios pay the Company an annual fee, payable monthly, based upon 0.15% of average daily net assets attributable to each class, respectively. For the period ended June 30, 2007, the following fees were incurred (in thousands):
| | | |
International Small Cap Growth | | $ | 85 |
Emerging Markets Growth | |
|
207 |
Bond | | | 8 |
(c) Trustees Fees
The Portfolios incurred fees of $167 (in thousands) to non-interested trustees of the Fund for the period ended June 30, 2007. Interested trustees are not compensated by the Fund.
(d) Investments in Affiliated Portfolio
Pursuant to the rules of the 1940 Act, each of the Portfolios of the Fund may invest in the William Blair Ready Reserves Portfolio (“Ready Reserves”), an open-end money market portfolio managed by the Advisor. Ready Reserves Portfolio is used as a cash management option to the other Portfolios in the Fund. The Advisor waives management fees and shareholder service fees earned from the other Portfolios’ investment in the Ready Reserves Fund. The fees waived with respect to each Portfolio for the period ended June 30, 2007 are listed below. Distributions received from Ready Reserves are reflected as “Dividend Income from Affiliated Fund” in each Portfolio’s statement of operations. Amounts relating to the Portfolios’ investments in Ready Reserves were as follows for the period ended June 30, 2007 (in thousands):
| | | | | | | | | | | | | | | | | | |
Portfolio | | Purchases | | Sales
Proceeds | | Fees
Waived | | Dividend
Income | | Value | | Percent
of Net
Assets | |
Growth | | $ | 61 | | $ | — | | $ | 7 | | $ | 61 | | $ | 2,635 | | 0.8 | % |
Tax-Managed Growth | |
|
— | | | 100 | |
|
— | | | 1 | | | 6 | | 0.1 | |
Large Cap Growth | |
|
1,085 | |
|
900 | | | 1 | |
|
4 | |
|
239 | | 0.9 | |
Small Cap Growth | |
|
10,203 | |
|
14,600 | |
|
24 | | | 203 | |
|
5,497 | | 0.4 | |
Mid Cap Growth | |
|
1,506 | |
|
1,500 | | | 1 | | | 5 | | | 110 | | 0.3 | |
Small-Mid Cap Growth | |
|
1,010 | |
|
2,300 | |
|
1 | |
|
10 | | | 21 | |
— |
|
International Growth | |
|
5,039 | |
|
— | |
|
5 | |
|
39 | |
|
5,676 | |
0.1 |
|
International Equity | |
|
6,101 | |
|
6,100 | |
|
12 | | | 101 | | | 5,159 | | 1.4 | |
International Small Cap Growth | |
|
1,078 | |
|
4,158 | |
|
9 | |
|
77 | |
|
2,148 | |
0.6 |
|
Emerging Markets Growth | |
|
31 | |
|
— | | | 4 | |
|
30 | | | 1,296 | | 0.1 | |
Value Discovery | |
|
3 | |
|
475 | |
|
— | |
|
3 | |
|
30 | | — | |
96 Semi-Annual Report | June 30, 2007 |
(4) Investment Transactions
Investment transactions, excluding money market instruments, for the period ended June 30, 2007 were as follows (in thousands):
| | | | | | |
Portfolio | | Purchases | | Sales |
Growth | | $ | 105,378 | | $ | 78,968 |
Tax-Managed Growth | | | 2,858 | | | 2,731 |
Large Cap Growth | | | 12,193 | | | 6,768 |
Small Cap Growth | | | 573,209 | | | 562,103 |
Mid Cap Growth | | | 25,156 | | | 9,454 |
Small-Mid Cap Growth | | | 42,969 | | | 33,859 |
International Growth | | | 2,048,788 | | | 1,800,818 |
International Equity | | | 159,296 | | | 137,310 |
International Small Cap Growth | | | 211,356 | | | 123,259 |
Emerging Markets Growth | | | 532,799 | | | 443,125 |
Value Discovery | | | 72,323 | | | 149,132 |
Bond | | | 57,134 | | | 6,417 |
Income | | | 25,090 | | | 66,290 |
(5) Foreign Currency Forward Contracts
To protect itself against a decline in the value of foreign currency against the U.S. dollar, the International Growth, International Equity, International Small Cap Growth and Emerging Markets Growth Portfolios enter into foreign currency forward contracts with its custodian and others. The Portfolios bear the market risk that arises from changes in foreign currency rates and bears the credit risk if the counterparty fails to perform under the contract. The net realized and unrealized gains and losses associated with foreign currency forward contracts are reflected in the accompanying financial statements.
(6) Fund Share Transactions
The following table summarizes the activity in capital shares of each Portfolio (in thousands):
| | | | | | | | | | | | | | | | | | |
| | | Sales (Dollars) |
| | | Period Ended June 30, 2007 | | Year Ended December 31, 2006 |
Portfolio | | Class N | | Class I | | Total | | Class N | | Class I | | Total |
Growth | |
$ |
35,960 | |
$ |
21,553 | |
$ |
57,513 | | $ | 25,590 | | $ | 7,625 | | $ | 33,215 |
Tax-Managed Growth | |
|
— | |
|
590 | |
|
590 | | | 735 | | | 710 | | | 1,445 |
Large Cap Growth | |
|
5,323 | |
|
11,052 | |
|
16,375 | | | 2,079 | | | 2,871 | | | 4,950 |
Small Cap Growth | |
|
77,213 | |
|
106,951 | |
|
184,164 | | | 327,203 | | | 262,870 | | | 590,073 |
Mid Cap Growth (a) | |
|
2,180 | |
|
14,458 | |
|
16,638 | | | 7,132 | | | 14,246 | | | 21,378 |
Small Mid-Cap Growth | |
|
2,871 | |
|
13,529 | |
|
16,400 | | | 3,522 | | | 20,782 | | | 24,304 |
International Growth | |
|
544,481 | |
|
323,296 | |
|
867,777 | | | 1,221,792 | | | 563,927 | | | 1,785,719 |
International Equity | |
|
17,200 | |
|
44,433 | |
|
61,633 | | | 23,189 | | | 114,544 | | | 137,733 |
International Small Cap Growth | |
|
5,944 | |
|
40,588 | |
|
46,532 | | | 17,783 | | | 51,330 | | | 69,113 |
Emerging Markets Growth | |
|
7,353 | |
|
34,891 | |
|
42,244 | | | 35,769 | | | 147,530 | | | 183,299 |
Value Discovery | |
|
16,987 | |
|
9,886 | |
|
26,873 | | | 88,879 | | | 11,658 | | | 100,537 |
Bond (b) | |
|
697 | |
|
42,535 | |
|
43,232 | | | — | | | — | | | — |
Income | |
|
21,521 | |
|
15,084 | |
|
36,605 | | | 32,007 | | | 29,825 | | | 61,832 |
Ready Reserves | |
|
483,787 | |
|
— | |
|
483,787 | | | 1,030,633 | | | — | | | 1,030,633 |
| (a) | | The information for the year ended December 31, 2006 is for the period from February 1, 2006 (Commencement of Operations) to December 31, 2006. |
| (b) | | For the period from May 1, 2007 (Commencement of Operations) to June 30, 2007. |
June 30, 2007 | William Blair Funds 97 |
| | | | | | | | | | | | | | | | | | | | | | | | |
| | | | | | | | | | | | Reinvested Distributions (Dollars) | |
| | | Period Ended June 30, 2007 | | | Year Ended December 31, 2006 | |
Portfolio | | Class N | | | Class I | | | Total | | | Class N | | | Class I | | | Total | |
Growth | | $ | — | | | $ | — | | | $ | — | | | $ | 5,960 | | | $ | 19,244 | | | $ | 25,204 | |
Tax-Managed Growth | | | — | | | | — | | | | — | | | | — | | | | — | | | | — | |
Large Cap Growth | | | — | | | | — | | | | — | | | | — | | | | — | | | | — | |
Small Cap Growth | | | — | | | | — | | | | — | | | | 43,585 | | | | 29,938 | | | | 73,523 | |
Mid Cap Growth (a) | | | — | | | | — | | | | — | | | | — | | | | — | | | | — | |
Small Mid-Cap Growth | | | — | | | | — | | | | — | | | | 645 | | | | 3,347 | | | | 3,992 | |
International Growth | | | — | | | | — | | | | — | | | | 439,429 | | | | 193,983 | | | | 633,412 | |
International Equity | | | — | | | | — | | | | — | | | | 504 | | | | 3,886 | | | | 4,390 | |
International Small Cap Growth | | | — | | | | — | | | | — | | | | 71 | | | | 204 | | | | 275 | |
Emerging Markets Growth | | | — | | | | — | | | | — | | | | 322 | | | | 1,039 | | | | 1,361 | |
Value Discovery | | | — | | | | — | | | | — | | | | 9,410 | | | | 4,754 | | | | 14,164 | |
Bond (b) | | | 3 | | | | 142 | | | | 145 | | | | — | | | | — | | | | — | |
Income | | | 2,087 | | | | 3,754 | | | | 5,841 | | | | 4,314 | | | | 8,747 | | | | 13,061 | |
Ready Reserves | | | 28,101 | | | | — | | | | 28,101 | | | | 51,002 | | | | — | | | | 51,002 | |
| | | | |
| | | | | | | | | | | | Redemptions (Dollars) | |
| | | Period Ended June 30, 2007 | | | Year Ended December 31, 2006 | |
Portfolio | | Class N | | | Class I | | | Total | | | Class N | | | Class I | | | Total | |
Growth | | $ | 10,970 | | | $ | 13,920 | | | $ | 24,890 | | | $ | 24,102 | | | $ | 26,243 | | | $ | 50,345 | |
Tax-Managed Growth | | | 327 | | | | 207 | | | | 534 | | | | 34 | | | | 344 | | | | 378 | |
Large Cap Growth | | | 9,299 | | | | 906 | | | | 10,205 | | | | 516 | | | | 2,343 | | | | 2,859 | |
Small Cap Growth | | | 120,799 | | | | 53,640 | | | | 174,439 | | | | 193,966 | | | | 94,377 | | | | 288,343 | |
Mid Cap Growth (a) | | | 541 | | | | 230 | | | | 771 | | | | 1,913 | | | | 641 | | | | 2,554 | |
Small Mid-Cap Growth | | | 1,513 | | | | 6,184 | | | | 7,697 | | | | 1,816 | | | | 7,060 | | | | 8,876 | |
International Growth | | | 456,162 | | | | 144,854 | | | | 601,016 | | | | 927,830 | | | | 230,002 | | | | 1,157,832 | |
International Equity | | | 3,839 | | | | 26,852 | | | | 30,691 | | | | 11,966 | | | | 49,451 | | | | 61,417 | |
International Small Cap Growth | | | 2,524 | | | | 11,341 | | | | 13,865 | | | | 5,184 | | | | 1,990 | | | | 7,174 | |
Emerging Markets Growth | | | 7,790 | | | | 32,184 | | | | 39,974 | | | | 11,956 | | | | 14,058 | | | | 26,014 | |
Value Discovery | | | 97,367 | | | | 8,939 | | | | 106,306 | | | | 14,585 | | | | 25,759 | | | | 40,344 | |
Bond (b) | | | 1 | | | | — | | | | 1 | | | | — | | | | — | | | | — | |
Income | | | 17,704 | | | | 62,773 | | | | 80,477 | | | | 46,237 | | | | 38,423 | | | | 84,660 | |
Ready Reserves | | | 524,994 | | | | — | | | | 524,994 | | | | 977,896 | | | | — | | | | 977,896 | |
| | | | |
| | | | | | | | | | | | Net Change in Net Assets relating to
Fund Share Activity (Dollars) | |
| | | Period Ended June 30, 2007 | | | Year Ended December 31, 2006 | |
Portfolio | | Class N | | | Class I | | | Total | | | Class N | | | Class I | | | Total | |
Growth | | $ | 24,990 | | | $ | 7,633 | | | $ | 32,623 | | | $ | 7,448 | | | $ | 626 | | | $ | 8,074 | |
Tax-Managed Growth | | | (327 | ) | | | 383 | | | | 56 | | | | 701 | | | | 366 | | | | 1,067 | |
Large Cap Growth | | | (3,976 | ) | | | 10,146 | | | | 6,170 | | | | 1,563 | | | | 528 | | | | 2,091 | |
Small Cap Growth | | | (43,586 | ) | | | 53,311 | | | | 9,725 | | | | 176,822 | | | | 198,431 | | | | 375,253 | |
Mid Cap Growth (a) | | | 1,639 | | | | 14,228 | | | | 15,867 | | | | 5,219 | | | | 13,605 | | | | 18,824 | |
Small Mid-Cap Growth | | | 1,358 | | | | 7,345 | | | | 8,703 | | | | 2,351 | | | | 17,069 | | | | 19,420 | |
International Growth | | | 88,319 | | | | 178,442 | | | | 266,761 | | | | 733,391 | | | | 527,908 | | | | 1,261,299 | |
International Equity | | | 13,361 | | | | 17,581 | | | | 30,942 | | | | 11,727 | | | | 68,979 | | | | 80,706 | |
International Small Cap Growth | | | 3,420 | | | | 29,247 | | | | 32,667 | | | | 12,670 | | | | 49,544 | | | | 62,214 | |
Emerging Markets Growth | | | (437 | ) | | | 2,707 | | | | 2,270 | | | | 24,135 | | | | 134,511 | | | | 158,646 | |
Value Discovery | | | (80,380 | ) | | | 947 | | | | (79,433 | ) | | | 83,704 | | | | (9,347 | ) | | | 74,357 | |
Bond (b) | | | 699 | | | | 42,675 | | | | 43,376 | | | | — | | | | — | | | | — | |
Income | | | 5,904 | | | | (43,935 | ) | | | (38,031 | ) | | | (9,916 | ) | | | 149 | | | | (9,767 | ) |
Ready Reserves | | | (13,106 | ) | | | — | | | | (13,106 | ) | | | 103,739 | | | | — | | | | 103,739 | |
| (a) | | The information for the year ended December 31, 2006 is for the period from February 1, 2006 (Commencement of Operations) to December 31, 2006. |
| (b) | | For the period from May 1, 2007 (Commencement of Operation) to June 30, 2007. |
98 Semi-Annual Report | June 30, 2007 |
| | | | | | | | | | | | |
| | | | | Sales (Shares) |
| | | Period Ended June 30, 2007 | | Year Ended December 31, 2006 |
Portfolio | | Class N | | Class I | | Total | | Class N | | Class I | | Total |
Growth | | 3,054 | | 1,729 | | 4,783 | | 2,121 | | 632 | | 2,753 |
Tax-Managed Growth | | — | | 52 | | 52 | | 73 | | 67 | | 140 |
Large Cap Growth | | 772 | | 1,512 | | 2,284 | | 314 | | 430 | | 744 |
Small Cap Growth | | 2,968 | | 4,048 | | 7,016 | | 12,763 | | 10,023 | | 22,786 |
Mid Cap Growth (a) | | 199 | | 1,296 | | 1,495 | | 710 | | 1,412 | | 2,122 |
Small Mid-Cap Growth | | 209 | | 985 | | 1,194 | | 267 | | 1,562 | | 1,829 |
International Growth | | 18,687 | | 10,958 | | 29,645 | | 44,607 | | 20,102 | | 64,709 |
International Equity | | 1,094 | | 2,802 | | 3,896 | | 1,691 | | 8,196 | | 9,887 |
International Small Cap Growth | | 414 | | 2,831 | | 3,245 | | 1,449 | | 4,109 | | 5,558 |
Emerging Markets Growth | | 364 | | 1,713 | | 2,077 | | 2,209 | | 8,482 | | 10,691 |
Value Discovery | | 1,037 | | 584 | | 1,621 | | 5,250 | | 689 | | 5,939 |
Bond (b) | | 70 | | 4,266 | | 4,336 | | — | | — | | — |
Income | | 2,216 | | 1,559 | | 3,775 | | 3,289 | | 3,073 | | 6,362 |
Ready Reserves | | 483,788 | | — | | 483,788 | | 1,030,633 | | — | | 1,030,633 |
| | | | |
| | | | | | | | | Reinvested Distributions (Shares) |
| | | Period Ended June 30, 2007 | | Year Ended December 31, 2006 |
Portfolio | | Class N | | Class I | | Total | | Class N | | Class I | | Total |
Growth | | — | | — | | — | | 518 | | 1,639 | | 2,157 |
Tax-Managed Growth | | — | | — | | — | | — | | — | | — |
Large Cap Growth | | — | | — | | — | | — | | — | | — |
Small Cap Growth | | — | | — | | — | | 1,713 | | 1,152 | | 2,865 |
Mid Cap Growth (a) | | — | | — | | — | | — | | — | | — |
Small Mid-Cap Growth | | — | | — | | — | | 49 | | 253 | | 302 |
International Growth | | — | | — | | — | | 16,102 | | 7,005 | | 23,107 |
International Equity | | — | | — | | — | | 34 | | 257 | | 291 |
International Small Cap Growth (b) | | — | | — | | — | | 5 | | 15 | | 20 |
Emerging Markets Growth | | — | | — | | — | | 17 | | 55 | | 72 |
Value Discovery | | — | | — | | — | | 581 | | 289 | | 870 |
Bond (b) | | — | | 15 | | 15 | | — | | — | | — |
Income | | 215 | | 389 | | 604 | | 445 | | 904 | | 1,349 |
Ready Reserves | | 28,101 | | — | | 28,101 | | 51,002 | | — | | 51,002 |
| | | | |
| | | | | | | | | Redemptions (Shares) |
| | | Period Ended June 30, 2007 | | Year Ended December 31, 2006 |
Portfolio | | Class N | | Class I | | Total | | Class N | | Class I | | Total |
Growth | | 916 | | 1,143 | | 2,059 | | 2,024 | | 2,182 | | 4,206 |
Tax-Managed Growth | | 29 | | 17 | | 46 | | 3 | | 32 | | 35 |
Large Cap Growth | | 1,290 | | 125 | | 1,415 | | 76 | | 349 | | 425 |
Small Cap Growth | | 4,619 | | 1,979 | | 6,598 | | 7,637 | | 3,603 | | 11,240 |
Mid Cap Growth (a) | | 49 | | 21 | | 70 | | 186 | | 62 | | 248 |
Small Mid-Cap Growth | | 111 | | 436 | | 547 | | 138 | | 522 | | 660 |
International Growth | | 15,672 | | 4,939 | | 20,611 | | 34,003 | | 8,346 | | 42,349 |
International Equity | | 240 | | 1,715 | | 1,955 | | 909 | | 3,555 | | 4,464 |
International Small Cap Growth (b) | | 178 | | 761 | | 939 | | 417 | | 161 | | 578 |
Emerging Markets Growth | | 398 | | 1,533 | | 1,931 | | 775 | | 840 | | 1,615 |
Value Discovery | | 5,767 | | 531 | | 6,298 | | 900 | | 1,600 | | 2,500 |
Bond (b) | | — | | — | | — | | — | | — | | — |
Income | | 1,824 | | 6,504 | | 8,328 | | 4,755 | | 3,959 | | 8,714 |
Ready Reserves | | 524,994 | | — | | 524,994 | | 977,896 | | — | | 977,896 |
| (a) | | The information for the year ended December 31, 2006 is for the period from February 1, 2006 (Commencement of Operations) to December 31, 2006. |
| (b) | | For the period from May 1, 2007 (Commencement of Operations) to June 30, 2007. |
June 30, 2007 | William Blair Funds 99 |
| | | | | | | | | | | | | | | | | | |
| | | Net Change in Shares Outstanding relating to Fund Share Activity (Shares) | |
| | | Period Ended June 30, 2007 | | | Year Ended December 31, 2006 | |
Portfolio | | Class N | | | Class I | | | Total | | | Class N | | | Class I | | | Total | |
Growth | | 2,138 | | | 586 | | | 2,724 | | | 615 | | | 89 | | | 704 | |
Tax-Managed Growth | | (29 | ) | | 35 | | | 6 | | | 70 | | | 35 | | | 105 | |
Large Cap Growth | | (518 | ) | | 1,387 | | | 869 | | | 238 | | | 81 | | | 319 | |
Small Cap Growth | | (1,651 | ) | | 2,069 | | | 418 | | | 6,839 | | | 7,572 | | | 14,411 | |
Mid Cap Growth (a) | | 150 | | | 1,275 | | | 1,425 | | | 524 | | | 1,350 | | | 1,874 | |
Small Mid-Cap Growth | | 98 | | | 549 | | | 647 | | | 178 | | | 1,293 | | | 1,471 | |
International Growth | | 3,015 | | | 6,019 | | | 9,034 | | | 26,706 | | | 18,761 | | | 45,467 | |
International Equity | | 854 | | | 1,087 | | | 1,941 | | | 816 | | | 4,898 | | | 5,714 | |
International Small Cap Growth | | 236 | | | 2,070 | | | 2,306 | | | 1,037 | | | 3,963 | | | 5,000 | |
Emerging Markets Growth | | (34 | ) | | 180 | | | 146 | | | 1,451 | | | 7,697 | | | 9,148 | |
Value Discovery | | (4,730 | ) | | 53 | | | (4,677 | ) | | 4,931 | | | (622 | ) | | 4,309 | |
Bond (b) | | 70 | | | 4,281 | | | 4,351 | | | — | | | — | | | — | |
Income | | 607 | | | (4,556 | ) | | (3,949 | ) | | (1,021 | ) | | 18 | | | (1,003 | ) |
Ready Reserves | | (13,105 | ) | | — | | | (13,105 | ) | | 103,739 | | | — | | | 103,739 | |
| (a) | | The information for the year ended December 31, 2006 is for the period from February 1, 2006 (Commencement of Operations) to December 31, 2006. |
| (b) | | For the period from May 1, 2007 (Commencement of Operations) to June 30, 2007. |
100 Semi-Annual Report | June 30, 2007 |
Financial Highlights
Growth Fund
| | | | | | | | | | | | | | | | | | | | | | | | |
| | | Class N | |
| | | Period Ended | | | Years Ended December 31, | |
| | | 6/30/2007 | | | 2006 | | | 2005 | | | 2004 | | | 2003 | | | 2002 | |
| | | (unaudited) | | | | | | | | | | | | | | | | |
Net asset value, beginning of year | | $ | 11.42 | | | $ | 11.33 | | | $ | 10.70 | | | $ | 9.97 | | | $ | 8.06 | | | $ | 10.87 | |
Income (loss) from investment operations: | | | | | | | | | | | | | | | | | | | | | | | | |
Net investment income (loss) | | | (0.01 | ) | | | (0.06 | ) | | | (0.06 | ) | | | (0.06 | ) | | | (0.06 | ) | | | (0.07 | ) |
Net realized and unrealized gain (loss) on investments | | | 0.91 | | | | 1.48 | | | | 1.11 | | | | 0.79 | | | | 1.97 | | | | (2.74 | ) |
| | | | | | | | | | | | | | | | | | | | | | | | |
Total from investment operations | | | 0.90 | | | | 1.42 | | | | 1.05 | | | | 0.73 | | | | 1.91 | | | | (2.81 | ) |
Less distributions from: | | | | | | | | | | | | | | | | | | | | | | | | |
Net investment income | | | — | | | | — | | | | — | | | | — | | | | — | | | | — | |
Net realized gain | | | — | | | | 1.33 | | | | 0.42 | | | | — | | | | — | | | | — | |
| | | | | | | | | | | | | | | | | | | | | | | | |
Total distributions | | | — | | | | 1.33 | | | | 0.42 | | | | — | | | | — | | | | — | |
| | | | | | | | | | | | | | | | | | | | | | | | |
Net asset value, end of year | | $ | 12.32 | | | $ | 11.42 | | | $ | 11.33 | | | $ | 10.70 | | | $ | 9.97 | | | $ | 8.06 | |
| | | | | | | | | | | | | | | | | | | | | | | | |
Total return (%) | | | 7.88 | | | | 12.42 | | | | 9.75 | | | | 7.32 | | | | 23.70 | | | | (25.85 | ) |
Ratios to average daily net assets (%): | | | | | | | | | | | | | | | | | | | | | | | | |
Expenses | | | 1.21 | (a) | | | 1.17 | | | | 1.15 | | | | 1.17 | | | | 1.19 | | | | 1.19 | |
Net investment income (loss) | | | (0.23 | )(a) | | | (0.49 | ) | | | (0.60 | ) | | | (0.60 | ) | | | (0.67 | ) | | | (0.73 | ) |
| |
| | | Class I | |
| | | Period Ended | | | Years Ended December 31, | |
| | | 6/30/2007 | | | 2006 | | | 2005 | | | 2004 | | | 2003 | | | 2002 | |
| | | (unaudited) | | | | | | | | | | | | | | | | |
Net asset value, beginning of year | | $ | 11.66 | | | $ | 11.52 | | | $ | 10.84 | | | $ | 10.08 | | | $ | 8.12 | | | $ | 10.93 | |
Income (loss) from investment operations: | | | | | | | | | | | | | | | | | | | | | | | | |
Net investment income (loss) | | | — | | | | (0.02 | ) | | | (0.04 | ) | | | (0.04 | ) | | | (0.04 | ) | | | (0.05 | ) |
Net realized and unrealized gain (loss) on investments | | | 0.95 | | | | 1.49 | | | | 1.14 | | | | 0.80 | | | | 2.00 | | | | (2.76 | ) |
| | | | | | | | | | | | | | | | | | | | | | | | |
Total from investment operations | | | 0.95 | | | | 1.47 | | | | 1.10 | | | | 0.76 | | | | 1.96 | | | | (2.81 | ) |
Less distributions from: | | | | | | | | | | | | | | | | | | | | | | | | |
Net investment income | | | — | | | | — | | | | — | | | | — | | | | — | | | | — | |
Net realized gain | | | — | | | | 1.33 | | | | 0.42 | | | | — | | | | — | | | | — | |
| | | | | | | | | | | | | | | | | | | | | | | | |
Total distributions | | | — | | | | 1.33 | | | | 0.42 | | | | — | | | | — | | | | — | |
| | | | | | | | | | | | | | | | | | | | | | | | |
Net asset value, end of year | | $ | 12.61 | | | $ | 11.66 | | | $ | 11.52 | | | $ | 10.84 | | | $ | 10.08 | | | $ | 8.12 | |
| | | | | | | | | | | | | | | | | | | | | | | | |
Total return (%) | | | 8.15 | | | | 12.64 | | | | 10.08 | | | | 7.54 | | | | 24.14 | | | | (25.71 | ) |
Ratios to average daily net assets (%): | | | | | | | | | | | | | | | | | | | | | | | | |
Expenses | | | 0.87 | (a) | | | 0.89 | | | | 0.90 | | | | 0.92 | | | | 0.94 | | | | 0.94 | |
Net investment income (loss) | | | 0.08 | (a) | | | (0.20 | ) | | | (0.35 | ) | | | (0.35 | ) | | | (0.42 | ) | | | (0.48 | ) |
| | | | | | | | | | | | | | | | | | | |
| |
| | | |
| | | Period Ended | | | Years Ended December 31, |
| | | 6/30/2007 | | | 2006 | | 2005 | | 2004 | | 2003 | | 2002 |
| | | (unaudited) | | | | | | | | | | | |
Supplemental data for all classes: | | | | | | | | | | | | | | | | | | | |
Net assets at end of year (in thousands) | | $ | 319,547 | | | $ | 264,525 | | $ | 253,599 | | $ | 275,506 | | $ | 281,654 | | $ | 255,625 |
Portfolio turnover rate (%) | | | 56 | (a) | | | 61 | | | 54 | | | 35 | | | 45 | | | 29 |
| (a) | | Rates are annualized for periods that are less than a year. |
Performance cited represents past performance. Past performance does not guarantee future results and current performance may be lower or higher than the data quoted. Results shown are annual returns, which assume reinvestment of dividends and capital gains. Investment returns and principal will fluctuate and you may have a gain or loss when you sell shares. For the most current month-end performance information, please call 1-800-742-7272, or visit our Web site at www.williamblairfunds.com.
Note: Net investment income (loss) per share is based on the average shares outstanding during the year.
June 30, 2007 | William Blair Funds 101 |
Financial Highlights
Tax-Managed Growth Fund
| | | | | | | | | | | | | | | | | | | | | | | | |
| | | Class N | |
| | | Period Ended | | | Years Ended December 31, | |
| | | 6/30/07 | | | 2006 | | | 2005 | | | 2004 | | | 2003 | | | 2002 | |
| | | (unaudited) | | | | | | | | | | | | | | | | |
Net asset value, beginning of year | | $ | 10.94 | | | $ | 10.11 | | | $ | 8.99 | | | $ | 8.41 | | | $ | 6.86 | | | $ | 9.07 | |
Income (loss) from investment operations: | | | | | | | | | | | | | | | | | | | | | | | | |
Net investment income (loss) | | | (0.01 | ) | | | (0.04 | ) | | | (0.07 | ) | | | (0.08 | ) | | | (0.07 | ) | | | (0.06 | ) |
Net realized and unrealized gain (loss) on investments | | | 0.82 | | | | 0.87 | | | | 1.19 | | | | 0.66 | | | | 1.62 | | | | (2.15 | ) |
| | | | | | | | | | | | | | | | | | | | | | | | |
Total from investment operations | | | 0.81 | | | | 0.83 | | | | 1.12 | | | | 0.58 | | | | 1.55 | | | | (2.21 | ) |
Less distributions from: | | | | | | | | | | | | | | | | | | | | | | | | |
Net investment income | | | — | | | | — | | | | — | | | | — | | | | — | | | | — | |
Net realized gain | | | — | | | | — | | | | — | | | | — | | | | — | | | | — | |
| | | | | | | | | | | | | | | | | | | | | | | | |
Total distributions | | | — | | | | — | | | | — | | | | — | | | | — | | | | — | |
| | | | | | | | | | | | | | | | | | | | | | | | |
Net asset value, end of year | | $ | 11.75 | | | $ | 10.94 | | | $ | 10.11 | | | $ | 8.99 | | | $ | 8.41 | | | $ | 6.86 | |
| | | | | | | | | | | | | | | | | | | | | | | | |
Total return (%) | | | 7.40 | | | | 8.21 | | | | 12.46 | | | | 6.90 | | | | 22.59 | | | | (24.37 | ) |
Ratios to average daily net assets (%): | | | | | | | | | | | | | | | | | | | | | | | | |
Expenses, net of waivers and reimbursements | | | 1.37 | (a) | | | 1.44 | | | | 1.53 | | | | 1.54 | | | | 1.49 | | | | 1.36 | |
Expenses, before waivers and reimbursements | | | 2.12 | (a) | | | 2.24 | | | | 2.55 | | | | 2.26 | | | | 2.26 | | | | 2.22 | |
Net investment income (loss), net of waivers and reimbursements | | | (0.15 | )(a) | | | (0.41 | ) | | | (0.76 | ) | | | (0.92 | ) | | | (0.91 | ) | | | (0.72 | ) |
Net investment income (loss), before waivers and reimbursements | | | (0.90 | )(a) | | | (1.21 | ) | | | (1.78 | ) | | | (1.64 | ) | | | (1.68 | ) | | | (1.58 | ) |
| |
| | | Class I | |
| | | Period Ended | | | Years Ended December 31, | |
| | | 6/30/07 | | | 2006 | | | 2005 | | | 2004 | | | 2003 | | | 2002 | |
| | | (unaudited) | | | | | | | | | | | | | | | | |
Net asset value, beginning of year | | $ | 11.15 | | | $ | 10.27 | | | $ | 9.10 | | | $ | 8.50 | | | $ | 6.92 | | | $ | 9.12 | |
Income (loss) from investment operations: | | | | | | | | | | | | | | | | | | | | | | | | |
Net investment income (loss) | | | 0.01 | | | | (0.02 | ) | | | (0.05 | ) | | | (0.06 | ) | | | (0.05 | ) | | | (0.04 | ) |
Net realized and unrealized gain (loss) on investments | | | 0.83 | | | | 0.90 | | | | 1.22 | | | | 0.66 | | | | 1.63 | | | | (2.16 | ) |
| | | | | | | | | | | | | | | | | | | | | | | | |
Total from investment operations | | | 0.84 | | | | 0.88 | | | | 1.17 | | | | 0.60 | | | | 1.58 | | | | (2.20 | ) |
Less distributions from: | | | | | | | | | | | | | | | | | | | | | | | | |
Net investment income | | | — | | | | — | | | | — | | | | — | | | | — | | | | — | |
Net realized gain | | | — | | | | — | | | | — | | | | — | | | | — | | | | — | |
| | | | | | | | | | | | | | | | | | | | | | | | |
Total distributions | | | — | | | | — | | | | — | | | | — | | | | — | | | | — | |
| | | | | | | | | | | | | | | | | | | | | | | | |
Net asset value, end of year | | $ | 11.99 | | | $ | 11.15 | | | $ | 10.27 | | | $ | 9.10 | | | $ | 8.50 | | | $ | 6.92 | |
| | | | | | | | | | | | | | | | | | | | | | | | |
Total return (%) | | | 7.53 | | | | 8.57 | | | | 12.86 | | | | 7.06 | | | | 22.83 | | | | (24.12 | ) |
Ratios to average daily net assets (%): | | | | | | | | | | | | | | | | | | | | | | | | |
Expenses, net of waivers and reimbursements | | | 1.12 | (a) | | | 1.19 | | | | 1.28 | | | | 1.29 | | | | 1.24 | | | | 1.11 | |
Expenses, before waivers and reimbursements | | | 1.88 | (a) | | | 1.99 | | | | 2.30 | | | | 2.01 | | | | 2.01 | | | | 1.97 | |
Net investment income (loss), net of waivers and reimbursements | | | 0.16 | (a) | | | (0.16 | ) | | | (0.51 | ) | | | (0.67 | ) | | | (0.66 | ) | | | (0.47 | ) |
Net investment income (loss), before waivers and reimbursements | | | 0.60 | (a) | | | (0.96 | ) | | | (1.53 | ) | | | (1.39 | ) | | | (1.43 | ) | | | (1.33 | ) |
| | | | | | | | | | | | | | | | | | | |
| |
| | | |
| | | Period Ended | | | Years Ended December 31, |
| | | 6/30/07 | | | 2006 | | 2005 | | 2004 | | 2003 | | 2002 |
| | | (unaudited) | | | | | | | | | | | |
Supplemental data for all classes: | | | | | | | | | | | | | | | | | | | |
Net assets at end of year (in thousands) | | $ | 10,442 | | | $ | 9,644 | | $ | 7,815 | | $ | 5,847 | | $ | 6,871 | | $ | 5,303 |
Portfolio turnover rate (%) | | | 56 | (a) | | | 42 | | | 25 | | | 31 | | | 37 | | | 44 |
| (a) | | Rates are annualized for periods that are less than a year. |
Performance cited represents past performance. Past performance does not guarantee future results and current performance may be lower or higher than the data quoted. Results shown are annual returns, which assume reinvestment of dividends and capital gains. Investment returns and principal will fluctuate and you may have a gain or loss when you sell shares. For the most current month-end performance information, please call 1-800-742-7272, or visit our Web site at www.williamblairfunds.com.
Note: Net investment income (loss) per share is based on the average shares outstanding during the year.
102 Semi-Annual Report | June 30, 2007 |
Financial Highlights
Large Cap Growth Fund
| | | | | | | | | | | | | | | | | | | | | | | | |
| | | Class N | |
| | | Period Ended | | | Years Ended December 31, | |
| | | 6/30/2007 | | | 2006 | | | 2005 | | | 2004 | | | 2003 | | | 2002 | |
| | | (unaudited) | | | | | | | | | | | | | | | | |
Net asset value, beginning of year | | $ | 6.88 | | | $ | 6.47 | | | $ | 6.24 | | | $ | 5.93 | | | $ | 4.80 | | | $ | 6.72 | |
Income (loss) from investment operations: | | | | | | | | | | | | | | | | | | | | | | | | |
Net investment income (loss) | | | (0.01 | ) | | | (0.02 | ) | | | (0.02 | ) | | | (0.04 | ) | | | (0.04 | ) | | | (0.04 | ) |
Net realized and unrealized gain (loss) on investments | | | 0.41 | | | | 0.43 | | | | 0.25 | | | | 0.35 | | | | 1.17 | | | | (1.88 | ) |
| | | | | | | | | | | | | | | | | | | | | | | | |
Total from investment operations | | | 0.40 | | | | 0.41 | | | | 0.23 | | | | 0.31 | | | | 1.13 | | | | (1.92 | ) |
Less distributions from: | | | | | | | | | | | | | | | | | | | | | | | | |
Net investment income | | | — | | | | — | | | | — | | | | — | | | | — | | | | — | |
Net realized gain | | | — | | | | — | | | | — | | | | — | | | | — | | | | — | |
| | | | | | | | | | | | | | | | | | | | | | | | |
Total distributions | | | — | | | | — | | | | — | | | | — | | | | — | | | | — | |
| | | | | | | | | | | | | | | | | | | | | | | | |
Net asset value, end of year | | $ | 7.28 | | | $ | 6.88 | | | $ | 6.47 | | | $ | 6.24 | | | $ | 5.93 | | | $ | 4.80 | |
| | | | | | | | | | | | | | | | | | | | | | | | |
Total return (%) | | | 5.81 | | | | 6.34 | | | | 3.69 | | | | 5.23 | | | | 23.54 | | | | (28.57 | ) |
Ratios to average daily net assets (%): | | | | | | | | | | | | | | | | | | | | | | | | |
Expenses, net of waivers and reimbursements | | | 1.23 | (a) | | | 1.24 | | | | 1.28 | | | | 1.38 | | | | 1.42 | | | | 1.36 | |
Expenses, before waivers and reimbursements | | | 1.60 | (a) | | | 1.63 | | | | 2.08 | | | | 2.29 | | | | 2.39 | | | | 2.45 | |
Net investment income (loss), net of waivers and reimbursements | | | (0.18 | )(a) | | | (0.29 | ) | | | (0.37 | ) | | | (0.63 | ) | | | (0.76 | ) | | | (0.71 | ) |
Net investment income (loss), before waivers and reimbursements | | | (0.56 | )(a) | | | (0.68 | ) | | | (1.17 | ) | | | (1.54 | ) | | | (1.73 | ) | | | (1.80 | ) |
| |
| | | Class I | |
| | | Period Ended | | | Years Ended December 31, | |
| | | 6/30/2007 | | | 2006 | | | 2005 | | | 2004 | | | 2003 | | | 2002 | |
| | | (unaudited) | | | | | | | | | | | | | | | | |
Net asset value, beginning of year | | $ | 6.99 | | | $ | 6.56 | | | $ | 6.31 | | | $ | 5.99 | | | $ | 4.82 | | | $ | 6.74 | |
Income (loss) from investment operations: | | | | | | | | | | | | | | | | | | | | | | | | |
Net investment income (loss) | | | 0.01 | | | | — | | | | (0.01 | ) | | | (0.02 | ) | | | (0.03 | ) | | | (0.03 | ) |
Net realized and unrealized gain (loss) on investments | | | 0.39 | | | | 0.43 | | | | 0.26 | | | | 0.34 | | | | 1.20 | | | | (1.89 | ) |
| | | | | | | | | | | | | | | | | | | | | | | | |
Total from investment operations | | | 0.40 | | | | 0.43 | | | | 0.25 | | | | 0.32 | | | | 1.17 | | | | (1.92 | ) |
Less distributions from: | | | | | | | | | | | | | | | | | | | | | | | | |
Net investment income | | | — | | | | — | | | | — | | | | — | | | | — | | | | — | |
Net realized gain | | | — | | | | — | | | | — | | | | — | | | | — | | | | — | |
| | | | | | | | | | | | | | | | | | | | | | | | |
Total distributions | | | — | | | | — | | | | — | | | | — | | | | — | | | | — | |
| | | | | | | | | | | | | | | | | | | | | | | | |
Net asset value, end of year | | $ | 7.39 | | | $ | 6.99 | | | $ | 6.56 | | | $ | 6.31 | | | $ | 5.99 | | | $ | 4.82 | |
| | | | | | | | | | | | | | | | | | | | | | | | |
Total return (%) | | | 5.72 | | | | 6.55 | | | | 3.96 | | | | 5.34 | | | | 24.27 | | | | (28.49 | ) |
Ratios to average daily net assets (%): | | | | | | | | | | | | | | | | | | | | | | | | |
Expenses, net of waivers and reimbursements | | | 0.99 | (a) | | | 0.99 | | | | 1.03 | | | | 1.13 | | | | 1.17 | | | | 1.11 | |
Expenses, before waivers and reimbursements | | | 1.33 | (a) | | | 1.38 | | | | 1.83 | | | | 2.04 | | | | 2.14 | | | | 2.20 | |
Net investment income (loss), net of waivers and reimbursements | | | 0.28 | (a) | | | (0.04 | ) | | | (0.12 | ) | | | (0.38 | ) | | | (0.51 | ) | | | (0.46 | ) |
Net investment income (loss), before waivers and reimbursements | | | (0.07 | )(a) | | | (0.43 | ) | | | (0.92 | ) | | | (1.29 | ) | | | (1.48 | ) | | | (1.55 | ) |
| | | | | | | | | | | | | | | | | | | | | | | | | |
| | | Period Ended
| | | Years Ended December 31, |
| | | 6/30/2007 | | | 2006 | | 2005 | | | | | | | | 2004 | | 2003 | | 2002 |
| | | (unaudited) | | | | | | | | | | | | | | | | | |
Supplemental data for all classes: | | | | | | | | | | | | | | | | | | | | | | | | | |
Net assets at end of year (in thousands) | | $ | 27,839 | | | $ | 20,191 | | $ | 16,888 | | | | | | | | $ | 6,417 | | $ | 5,519 | | $ | 5,469 |
Portfolio turnover rate (%) | | | 57 | (a) | | | 53 | | | 53 | | | | | | | | | 39 | | | 33 | | | 52 |
| (a) | | Rates are annualized for periods less than a year. |
Performance cited represents past performance. Past performance does not guarantee future results and current performance may be lower or higher than the data quoted. Results shown are annual returns, which assume reinvestment of dividends and capital gains. Investment returns and principal will fluctuate and you may have a gain or loss when you sell shares. For the most current month-end performance information, please call 1-800-742-7272, or visit our Web site at www.williamblairfunds.com.
Note: Net investment income (loss) per share is based on the average shares outstanding during the year.
June 30, 2007 | William Blair Funds 103 |
Financial Highlights
Small Cap Growth Fund
| | | | | | | | | | | | | | | | | | | | | | | | |
| | | Class N | |
| | | Period Ended | | | Years Ended December 31, | |
| | | 6/30/2007 | | | 2006 | | | 2005 | | | 2004 | | | 2003 | | | 2002 | |
| | | (unaudited) | | | | | | | | | | | | | | | | |
Net asset value, beginning of year | | $ | 25.41 | | | $ | 23.76 | | | $ | 25.72 | | | $ | 21.83 | | | $ | 13.72 | | | $ | 16.58 | |
Income (loss) from investment operations: | | | | | | | | | | | | | | | | | | | | | | | | |
Net investment income (loss) | | | (0.16 | ) | | | (0.29 | ) | | | (0.30 | ) | | | (0.30 | ) | | | (0.21 | ) | | | (0.19 | ) |
Net realized and unrealized gain (loss) on investments | | | 2.44 | | | | 3.65 | | | | 0.64 | | | | 6.20 | | | | 8.68 | | | | (2.67 | ) |
| | | | | | | | | | | | | | | | | | | | | | | | |
Total from investment operations | | | 2.28 | | | | 3.36 | | | | 0.34 | | | | 5.90 | | | | 8.47 | | | | (2.86 | ) |
Less distributions from: | | | | | | | | | | | | | | | | | | | | | | | | |
Net investment income | | | — | | | | — | | | | — | | | | — | | | | — | | | | — | |
Net realized gain | | | — | | | | 1.71 | | | | 2.30 | | | | 2.01 | | | | 0.36 | | | | — | |
| | | | | | | | | | | | | | | | | | | | | | | | |
Total distributions | | | — | | | | 1.71 | | | | 2.30 | | | | 2.01 | | | | 0.36 | | | | — | |
| | | | | | | | | | | | | | | | | | | | | | | | |
Net asset value, end of year | | $ | 27.69 | | | $ | 25.41 | | | $ | 23.76 | | | $ | 25.72 | | | $ | 21.83 | | | $ | 13.72 | |
| | | | | | | | | | | | | | | | | | | | | | | | |
Total return (%) | | | 8.97 | | | | 14.12 | | | | 1.18 | | | | 27.24 | | | | 61.88 | | | | (17.25 | ) |
Ratios to average daily net assets (%): | | | | | | | | | | | | | | | | | | | | | | | | |
Expenses, net of waivers and reimbursements | | | 1.49(a) | | | | 1.48 | | | | 1.49 | | | | 1.49 | | | | 1.55 | | | | 1.56 | |
Expenses, before waivers and reimbursements | | | 1.49(a) | | | | 1.48 | | | | 1.49 | | | | 1.46 | | | | 1.52 | | | | 1.62 | |
Net investment income (loss), net of waivers and reimbursements | | | (1.25)(a) | | | | (1.14 | ) | | | (1.23 | ) | | | (1.27 | ) | | | (1.22 | ) | | | (1.31 | ) |
Net investment income (loss), before waivers and reimbursements | | | (1.25)(a) | | | | (1.14 | ) | | | (1.23 | ) | | | (1.24 | ) | | | (1.19 | ) | | | (1.37 | ) |
| |
| | | Class I | |
| | | Period Ended | | | Years Ended December 31, | |
| | | 6/30/2007 | | | 2006 | | | 2005 | | | 2004 | | | 2003 | | | 2002 | |
| | | (unaudited) | | | | | | | | | | | | | | | | |
Net asset value, beginning of year | | $ | 25.94 | | | $ | 24.16 | | | $ | 26.04 | | | $ | 22.03 | | | $ | 13.82 | | | $ | 16.65 | |
Income (loss) from investment operations: | | | | | | | | | | | | | | | | | | | | | | | | |
Net investment income (loss) | | | (0.13 | ) | | | (0.22 | ) | | | (0.25 | ) | | | (0.24 | ) | | | (0.18 | ) | | | (0.16 | ) |
Net realized and unrealized gain (loss) on investments | | | 2.50 | | | | 3.71 | | | | 0.67 | | | | 6.26 | | | | 8.75 | | | | (2.67 | ) |
| | | | | | | | | | | | | | | | | | | | | | | | |
Total from investment operations | | | 2.37 | | | | 3.49 | | | | 0.42 | | | | 6.02 | | | | 8.57 | | | | (2.83 | ) |
Less distributions from: | | | | | | | | | | | | | | | | | | | | | | | | |
Net investment income | | | — | | | | — | | | | — | | | | — | | | | — | | | | — | |
Net realized gain | | | — | | | | 1.71 | | | | 2.30 | | | | 2.01 | | | | 0.36 | | | | — | |
| | | | | | | | | | | | | | | | | | | | | | | | |
Total distributions | | | — | | | | 1.71 | | | | 2.30 | | | | 2.01 | | | | 0.36 | | | | — | |
| | | | | | | | | | | | | | | | | | | | | | | | |
Net asset value, end of year | | $ | 28.31 | | | $ | 25.94 | | | $ | 24.16 | | | $ | 26.04 | | | $ | 22.03 | | | $ | 13.82 | |
| | | | | | | | | | | | | | | | | | | | | | | | |
Total return (%) | | | 9.14 | | | | 14.42 | | | | 1.48 | | | | 27.54 | | | | 62.15 | | | | (17.00 | ) |
Ratios to average daily net assets (%): | | | | | | | | | | | | | | | | | | | | | | | | |
Expenses, net of waivers and reimbursements | | | 1.20(a) | | | | 1.21 | | | | 1.24 | | | | 1.24 | | | | 1.35 | | | | 1.31 | |
Expenses, before waivers and reimbursements | | | 1.20(a) | | | | 1.21 | | | | 1.24 | | | | 1.21 | | | | 1.28 | | | | 1.37 | |
Net investment income (loss), net of waivers and reimbursements | | | (0.96)(a) | | | | (0.87 | ) | | | (0.98 | ) | | | (1.02 | ) | | | (1.02 | ) | | | (1.06 | ) |
Net investment income (loss), before waivers and reimbursements | | | (0.96)(a) | | | | (0.87 | ) | | | (0.98 | ) | | | (0.99 | ) | | | (0.95 | ) | | | (1.12 | ) |
| | | | | | | | | | | | | | | | | | | |
| |
| | | |
| | | Period Ended | | | Years Ended December 31, |
| | | 6/30/2007 | | | 2006 | | 2005 | | 2004 | | 2003 | | 2002 |
| | | (unaudited) | | | | | | | | | | | |
Supplemental data for all classes: | | | | | | | | | | | | | | | | | | | |
Net assets at end of year (in thousands) | | $ | 1,388,046 | | | $ | 1,261,174 | | $ | 831,738 | | $ | 771,209 | | $ | 518,824 | | $ | 78,581 |
Portfolio turnover rate (%) | | | 87 | (a) | | | 105 | | | 80 | | | 109 | | | 103 | | | 133 |
| (a) | | Rates are annualized for periods that are less than a year. |
Performance cited represents past performance. Past performance does not guarantee future results and current performance may be lower or higher than the data quoted. Results shown are annual returns, which assume reinvestment of dividends and capital gains. Investment returns and principal will fluctuate and you may have a gain or loss when you sell shares. For the most current month-end performance information, please call 1-800-742-7272, or visit our Web site at www.williamblairfunds.com.
Note: Net investment income (loss) per share is based on the average shares outstanding during the year.
104 Semi-Annual Report | June 30, 2007 |
Financial Highlights
Mid Cap Growth Fund
| | | | | | | | |
| | | Class N | |
| | | Periods Ended | |
| | | 6/30/2007 | | | 12/31/2006(a) | |
| | | (unaudited) | | | | |
Net asset value, beginning of period | | $ | 10.46 | | | $ | 10.00 | |
Income (loss) from investment operations: | | | | | | | | |
Net investment income (loss) | | | (0.03 | ) | | | (0.07 | ) |
Net realized and unrealized gain (loss) on investments | | | 1.38 | | | | 0.53 | |
| | | | | | | | |
Total from investment operations | | | 1.35 | | | | 0.46 | |
Less distributions from: | | | | | | | | |
Net investment income | | | — | | | | — | |
Net realized gain | | | — | | | | — | |
| | | | | | | | |
Total distributions | | | — | | | | — | |
| | | | | | | | |
Net asset value, end of period | | $ | 11.81 | | | $ | 10.46 | |
| | | | | | | | |
Total return (%) (c) | | | 12.91 | | | | 4.60 | |
Ratios to average daily net assets (%) (b): | | | | | | | | |
Expenses, net of waivers and reimbursements | | | 1.39 | | | | 1.40 | |
Expenses, before waivers and reimbursements | | | 1.45 | | | | 2.35 | |
Net investment income (loss), net of waivers and reimbursements | | | (0.61 | ) | | | (0.70 | ) |
Net investment income (loss), before waivers and reimbursements | | | (0.67 | ) | | | (1.65 | ) |
| |
| | | Class I | |
| | | Periods Ended | |
| | | 6/30/2007 | | | 12/31/2006(a) | |
| | | (unaudited) | | | | |
Net asset value, beginning of period | | $ | 10.49 | | | $ | 10.00 | |
Income (loss) from investment operations: | | | | | | | | |
Net investment income (loss) | | | (0.02 | ) | | | (0.04 | ) |
Net realized and unrealized gain (loss) on investments | | | 1.40 | | | | 0.53 | |
| | | | | | | | |
Total from investment operations | | | 1.38 | | | | 0.49 | |
Less distributions from: | | | | | | | | |
Net investment income | | | — | | | | — | |
Net realized gain | | | — | | | | — | |
| | | | | | | | |
Total distributions | | | — | | | | — | |
| | | | | | | | |
Net asset value, end of period | | $ | 11.87 | | | $ | 10.49 | |
| | | | | | | | |
Total return (%) (c) | | | 13.16 | | | | 4.90 | |
Ratios to average daily net assets (%) (b): | | | | | | | | |
Expenses, net of waivers and reimbursements | | | 1.13 | | | | 1.15 | |
Expenses, before waivers and reimbursements | | | 1.55 | | | | 2.10 | |
Net investment income (loss), net of waivers and reimbursements | | | (0.36 | ) | | | (0.43 | ) |
Net investment income (loss), before waivers and reimbursements | | | (0.78 | ) | | | (1.38 | ) |
| |
| | | | |
| | | Periods Ended | |
| | | 6/30/2007 | | | 12/31/2006(a) | |
| | | (unaudited) | | | | |
Supplemental data for all classes: | | | | | | | | |
Net assets at end of period (in thousands) | | $ | 39,111 | | | $ | 19,639 | |
Portfolio turnover rate (%) (b) | | | 65 | | | | 56 | |
| (a) | | For the period from February 1, 2006 (Commencement of Operations) to December 31, 2006. |
| (b) | | Rates are annualized for periods that are less than a year. |
| (c) | | Total return is not annualized for periods that are less than a year. |
Performance cited represents past performance. Past performance does not guarantee future results and current performance may be lower or higher than the data quoted. Results shown are annual returns, which assume reinvestment of dividends and capital gains. Investment returns and principal will fluctuate and you may have a gain or loss when you sell shares. For the most current month-end performance information, please call 1-800-742-7272, or visit our Web site at www.williamblairfunds.com.
Note: Net investment income (loss) per share is based on the average shares outstanding during the period.
June 30, 2007 | William Blair Funds 105 |
Financial Highlights
Small-Mid Cap Growth Fund
| | | | | | | | | | | | | | | | | | | | |
| | | Class N | |
| | | Period Ended | | | Years Ended December 31, | |
| | | 6/30/2007 | | | 2006 | | | 2005 | | | 2004 | | | 2003(a) | |
| | | (unaudited) | | | | | | | | | | | | | |
Net asset value, beginning of year | | $ | 12.96 | | | $ | 12.40 | | | $ | 11.28 | | | $ | 9.94 | | | $ | 10.00 | |
Income (loss) from investment operations: | | | | | | | | | | | | | | | | | | | | |
Net investment income (loss) | | | (0.06 | ) | | | (0.11 | ) | | | (0.11 | ) | | | (0.13 | ) | | | — | |
Net realized and unrealized gain (loss) on investments | | | 1.78 | | | | 1.32 | | | | 1.32 | | | | 1.47 | | | | (0.06 | ) |
| | | | | | | | | | | | | | | | | | | | |
Total from investment operations | | | 1.72 | | | | 1.21 | | | | 1.21 | | | | 1.34 | | | | (0.06 | ) |
Less distributions from: | | | | | | | | | | | | | | | | | | | | |
Net investment income | | | — | | | | — | | | | — | | | | — | | | | — | |
Net realized gain | | | — | | | | 0.65 | | | | 0.09 | | | | — | | | | — | |
| | | | | | | | | | | | | | | | | | | | |
Total distributions | | | — | | | | 0.65 | | | | 0.09 | | | | — | | | | — | |
| | | | | | | | | | | | | | | | | | | | |
Net asset value, end of year | | $ | 14.68 | | | $ | 12.96 | | | $ | 12.40 | | | $ | 11.28 | | | $ | 9.94 | |
| | | | | | | | | | | | | | | | | | | | |
Total return (%) | | | 13.27 | | | | 9.68 | | | | 10.72 | | | | 13.48 | | | | (0.60 | ) |
Ratios to average daily net assets (%): | | | | | | | | | | | | | | | | | | | | |
Expenses, net of waivers and reimbursements | | | 1.36 | (b) | | | 1.38 | | | | 1.45 | | | | 1.54 | | | | 1.54 | (b) |
Expenses, before waivers and reimbursements | | | 1.44 | (b) | | | 1.45 | | | | 1.54 | | | | 2.14 | | | | 1.54 | (b) |
Net investment income (loss), net of waivers and reimbursements | | | (0.80 | )(b) | | | (0.86 | ) | | | (0.97 | ) | | | (1.26 | ) | | | (1.54 | )(b) |
Net investment income (loss), before waivers and reimbursements | | | (0.88 | )(b) | | | (0.93 | ) | | | (1.06 | ) | | | (1.86 | ) | | | (1.54 | )(b) |
| |
| | | Class I | |
| | | Period Ended | | | Years Ended December 31, | |
| | | 6/30/2007 | | | 2006 | | | 2005 | | | 2004 | | | 2003(a) | |
| | | (unaudited) | | | | | | | | | | | | | |
Net asset value, beginning of year | | $ | 13.06 | | | $ | 12.46 | | | $ | 11.30 | | | $ | 9.94 | | | $ | 10.00 | |
Income (loss) from investment operations: | | | | | | | | | | | | | | | | | | | | |
Net investment income (loss) | | | (0.04 | ) | | | (0.08 | ) | | | (0.08 | ) | | | (0.11 | ) | | | — | |
Net realized and unrealized gain (loss) on investments | | | 1.79 | | | | 1.33 | | | | 1.33 | | | | 1.47 | | | | (0.06 | ) |
| | | | | | | | | | | | | | | | | | | | |
Total from investment operations | | | 1.75 | | | | 1.25 | | | | 1.25 | | | | 1.36 | | | | (0.06 | ) |
Less distributions from: | | | | | | | | | | | | | | | | | | | | |
Net investment income | | | — | | | | — | | | | — | | | | — | | | | — | |
Net realized gain | | | — | | | | 0.65 | | | | 0.09 | | | | — | | | | — | |
| | | | | | | | | | | | | | | | | | | | |
Total distributions | | | — | | | | 0.65 | | | | 0.09 | | | | — | | | | — | |
| | | | | | | | | | | | | | | | | | | | |
Net asset value, end of year | | $ | 14.81 | | | $ | 13.06 | | | $ | 12.46 | | | $ | 11.30 | | | $ | 9.94 | |
| | | | | | | | | | | | | | | | | | | | |
Total return (%) | | | 13.40 | | | | 9.95 | | | | 11.05 | | | | 13.68 | | | | (0.60 | ) |
Ratios to average daily net assets (%): | | | | | | | | | | | | | | | | | | | | |
Expenses, net of waivers and reimbursements | | | 1.11 | (b) | | | 1.13 | | | | 1.20 | | | | 1.29 | | | | 1.29 | (b) |
Expenses, before waivers and reimbursements | | | 1.19 | (b) | | | 1.20 | | | | 1.29 | | | | 1.89 | | | | 1.29 | (b) |
Net investment income (loss), net of waivers and reimbursements | | | (0.57 | )(b) | | | (0.61 | ) | | | (0.72 | ) | | | (1.01 | ) | | | (1.29 | )(b) |
Net investment income (loss), before waivers and reimbursements | | | (0.63 | )(b) | | | (0.68 | ) | | | (0.81 | ) | | | (1.61 | ) | | | (1.29 | )(b) |
| | | | | | | | | | | | | | | | | |
| |
| | | | |
| | | Period Ended | | | Years Ended December 31, | |
| | | 6/30/2007 | | | 2006 | | 2005 | | 2004 | | 2003 | |
Supplemental data for all classes: | | | | | | | | | | | | | | | | | |
Net assets at end of year (in thousands) | | $ | 114,735 | | | $ | 92,766 | | $ | 70,211 | | $ | 25,974 | | $ | 3,673 | |
Portfolio turnover rate (%) | | | 66 | (b) | | | 68 | | | 62 | | | 55 | | | — | (b) |
| (a) | | For the period from December 29, 2003 (Commencement of Operations) to December 31, 2003. |
| (b) | | Rates are annualized for periods that are less than a year. |
Performance cited represents past performance. Past performance does not guarantee future results and current performance may be lower or higher than the data quoted. Results shown are annual returns, which assume reinvestment of dividends and capital gains. Investment returns and principal will fluctuate and you may have a gain or loss when you sell shares. For the most current month-end performance information, please call 1-800-742-7272, or visit our Web site at www.williamblairfunds.com.
Note: Net investment income (loss) per share is based on the average shares outstanding during the year.
106 Semi-Annual Report | June 30, 2007 |
Financial Highlights
International Growth Fund
| | | | | | | | | | | | | | | | | | | | | |
| | | Class N | |
| | | Period Ended | | | Years Ended December 31, | |
| | | 6/30/2007 | | | 2006 | | 2005 | | 2004 | | | 2003 | | 2002 | |
| | | (unaudited) | | | | | | | | | | | | | |
Net asset value, beginning of year | | $ | 27.70 | | | $ | 25.22 | | $ | 22.09 | | $ | 18.65 | | | $ | 13.13 | | $ | 15.48 | |
Income (loss) from investment operations: | | | | | | | | | | | | | | | | | | | | | |
Net investment income (loss) (a) | | | 0.12 | | | | 0.05 | | | 0.15 | | | (0.02 | ) | | | 0.02 | | | (0.05 | ) |
Net realized and unrealized gain (loss) on investments | | | 3.11 | | | | 5.71 | | | 4.60 | | | 3.47 | | | | 5.52 | | | (2.30 | ) |
| | | | | | | | | | | | | | | | | | | | | |
Total from investment operations | | | 3.23 | | | | 5.76 | | | 4.75 | | | 3.45 | | | | 5.54 | | | (2.35 | ) |
Less distributions from: | | | | | | | | | | | | | | | | | | | | | |
Net investment income | | | — | | | | 0.37 | | | 0.11 | | | 0.01 | | | | 0.02 | | | — | |
Net realized gain | | | — | | | | 2.91 | | | 1.51 | | | — | | | | — | | | — | |
| | | | | | | | | | | | | | | | | | | | | |
Total distributions | | | — | | | | 3.28 | | | 1.62 | | | 0.01 | | | | 0.02 | | | — | |
| | | | | | | | | | | | | | | | | | | | | |
Net asset value, end of year | | $ | 30.93 | | | $ | 27.70 | | $ | 25.22 | | $ | 22.09 | | | $ | 18.65 | | $ | 13.13 | |
| | | | | | | | | | | | | | | | | | | | | |
Total return (%) | | | 11.66 | | | | 23.06 | | | 21.65 | | | 18.48 | | | | 42.21 | | | (15.18 | ) |
Ratios to average daily net assets (%): | | | | | | | | | | | | | | | | | | | | | |
Expenses | | | 1.40 | (b) | | | 1.42 | | | 1.42 | | | 1.47 | | | | 1.50 | | | 1.51 | |
Net investment income (loss) | | | 0.81 | (b) | | | 0.19 | | | 0.16 | | | (0.16 | ) | | | 0.05 | | | (0.36 | ) |
| | | | | | | | | | | | | | | | | | | | |
| | | Class I | |
| | | Period Ended | | | Years Ended December 31, | |
| | | 6/30/2007 | | | 2006 | | 2005 | | 2004 | | 2003 | | 2002 | |
| | | (unaudited) | | | | | | | | | | | | |
Net asset value, beginning of year | | $ | 28.10 | | | $ | 25.55 | | $ | 22.34 | | $ | 18.85 | | $ | 13.27 | | $ | 15.60 | |
Income (loss) from investment operations: | | | | | | | | | | | | | | | | | | | | |
Net investment income (loss) (a) | | | 0.16 | | | | 0.13 | | | 0.27 | | | 0.01 | | | 0.09 | | | (0.01 | ) |
Net realized and unrealized gain (loss) on investments | | | 3.17 | | | | 5.78 | | | 4.61 | | | 3.53 | | | 5.54 | | | (2.32 | ) |
| | | | | | | | | | | | | | | | | | | | |
Total from investment operations | | | 3.33 | | | | 5.91 | | | 4.88 | | | 3.54 | | | 5.63 | | | (2.33 | ) |
Less distributions from: | | | | | | | | | | | | | | | | | | | | |
Net investment income | | | — | | | | 0.45 | | | 0.16 | | | 0.05 | | | 0.05 | | | — | |
Net realized gain | | | — | | | | 2.91 | | | 1.51 | | | — | | | — | | | — | |
| | | | | | | | | | | | | | | | | | | | |
Total distributions | | | — | | | | 3.36 | | | 1.67 | | | 0.05 | | | 0.05 | | | — | |
| | | | | | | | | | | | | | | | | | | | |
Net asset value, end of year | | $ | 31.43 | | | $ | 28.10 | | $ | 25.55 | | $ | 22.34 | | $ | 18.85 | | $ | 13.27 | |
| | | | | | | | | | | | | | | | | | | | |
Total return (%) | | | 11.85 | | | | 23.35 | | | 22.00 | | | 18.79 | | | 42.42 | | | (14.94 | ) |
Ratios to average daily net assets (%): | | | | | | | | | | | | | | | | | | | | |
Expenses | | | 1.10 | (b) | | | 1.11 | | | 1.17 | | | 1.22 | | | 1.25 | | | 1.26 | |
Net investment income (loss) | | | 1.12 | (b) | | | 0.45 | | | 0.41 | | | 0.09 | | | 0.30 | | | (0.11 | ) |
| | | Period Ended | | | Years Ended December 31, | |
| | | 6/30/2007 | | | 2006 | | 2005 | | 2004 | | 2003 | | 2002 | |
| | | (unaudited) | | | | | | | | | | | | |
Supplemental data for all classes: | | | | | | | | | | | | | | | | | | | | |
Net assets at end of year (in thousands) | | $ | 7,284,401 | | | $ | 6,267,126 | | $ | 4,551,077 | | $ | 3,001,434 | | $ | 1,899,699 | | $ | 778,788 | |
Portfolio turnover rate (%) | | | 55 | (b) | | | 72 | | | 70 | | | 79 | | | 57 | | | 73 | |
| (a) | | Excludes $0.42, $0.37, $0.12, $0.03, $0.00, and $0.00, of PFIC mark to market which are treated as ordinary income for Federal tax purposes for the years 2006, 2005, 2004, 2003 and 2002, respectively. |
| (b) | | Rates are annualized for periods that are less than a year. |
Performance cited represents past performance. Past performance does not guarantee future results and current performance may be lower or higher than the data quoted. Results shown are annual returns, which assume reinvestment of dividends and capital gains. Investment returns and principal will fluctuate and you may have a gain or loss when you sell shares. For the most current month-end performance information, please call 1-800-742-7272, or visit our Web site at www.williamblairfunds.com.
Note: Net investment income (loss) per share is based on the average shares outstanding during the year.
June 30, 2007 | William Blair Funds 107 |
Financial Highlights
International Equity Fund
| | | | | | | | | | | | | | | |
| | | Class N | |
| | | Period Ending | | | Years Ended December 31, | |
| | | 6/30/07 | | | 2006 | | 2005 | | | 2004(a) | |
| | | (unaudited) | | | | | | | | | |
Net asset value, beginning of year | | $ | 15.21 | | | $ | 12.86 | | $ | 11.33 | | | $ | 10.00 | |
Income (loss) from investment operations: | | | | | | | | | | | | | | | |
Net investment income (loss) (b) | | | 0.09 | | | | 0.04 | | | (0.01 | ) | | | (0.04 | ) |
Net realized and unrealized gain (loss) on investments | | | 1.35 | | | | 2.52 | | | 1.54 | | | | 1.37 | |
| | | | | | | | | | | | | | | |
Total from investment operations | | | 1.44 | | | | 2.56 | | | 1.53 | | | | 1.33 | |
Less distributions from: | | | | | | | | | | | | | | | |
Net investment income | | | — | | | | 0.19 | | | — | | | | — | |
Net realized gain | | | — | | | | 0.02 | | | — | | | | — | |
| | | | | | | | | | | | | | | |
Total distributions | | | — | | | | 0.21 | | | — | | | | — | |
| | | | | | | | | | | | | | | |
Net asset value, end of year | | $ | 16.65 | | | $ | 15.21 | | $ | 12.86 | | | $ | 11.33 | |
| | | | | | | | | | | | | | | |
Total return (%) | | | 9.47 | | | | 19.96 | | | 13.50 | | | | 13.30 | |
Ratios to average daily net assets (%): | | | | | | | | | | | | | | | |
Expenses, net of waivers and reimbursements | | | 1.45 | (c) | | | 1.46 | | | 1.48 | | | | 1.50 | (c) |
Expenses, before waivers and reimbursements | | | 1.51 | (c) | | | 1.56 | | | 1.81 | | | | 2.96 | (c) |
Net investment income (loss), net of waivers and reimbursements | | | 1.20 | (c) | | | 0.26 | | | (0.33 | ) | | | (0.77 | )(c) |
Net investment income (loss), before waivers and reimbursements | | | 1.14 | (c) | | | 0.16 | | | (0.66 | ) | | | (2.23 | )(c) |
| | | | | | | | | | | | | | | |
| | | Class I | |
| | | Period Ending | | | Years Ended December 31, | |
| | | 6/30/07 | | | 2006 | | 2005 | | | 2004(a) | |
| | | (unaudited) | | | | | | | | | |
Net asset value, beginning of year | | $ | 15.31 | | | $ | 12.94 | | $ | 11.37 | | | $ | 10.00 | |
Income (loss) from investment operations: | | | | | | | | | | | | | | | |
Net investment income (loss) (b) | | | 0.11 | | | | 0.06 | | | (0.01 | ) | | | (0.01 | ) |
Net realized and unrealized gain (loss) on investments | | | 1.36 | | | | 2.55 | | | 1.58 | | | | 1.38 | |
| | | | | | | | | | | | | | | |
Total from investment operations | | | 1.47 | | | | 2.61 | | | 1.57 | | | | 1.37 | |
Less distributions from: | | | | | | | | | | | | | | | |
Net investment income | | | — | | | | 0.22 | | | — | | | | — | |
Net realized gain | | | — | | | | 0.02 | | | — | | | | — | |
| | | | | | | | | | | | | | | |
Total distributions | | | — | | | | 0.24 | | | — | | | | — | |
| | | | | | | | | | | | | | | |
Net asset value, end of year | | $ | 16.78 | | | $ | 15.31 | | $ | 12.94 | | | $ | 11.37 | |
| | | | | | | | | | | | | | | |
Total return (%) | | | 9.60 | | | | 20.22 | | | 13.81 | | | | 13.70 | |
Ratios to average daily net assets (%): | | | | | | | | | | | | | | | |
Expenses, net of waivers and reimbursements | | | 1.20 | (c) | | | 1.21 | | | 1.23 | | | | 1.25 | (c) |
Expenses, before waivers and reimbursements | | | 1.33 | (c) | | | 1.35 | | | 1.56 | | | | 2.71 | (c) |
Net investment income (loss), net of waivers and reimbursements | | | 1.38 | (c) | | | 0.46 | | | (0.08 | ) | | | (0.52 | )(c) |
Net investment income (loss), before waivers and reimbursements | | | 1.25 | (c) | | | 0.32 | | | (0.41 | ) | | | (1.98 | )(c) |
| | | | | | | | | | | | | | |
| | | Period Ending | | | Years Ended December 31, | |
| | | 6/30/07 | | | 2006 | | 2005 | | 2004 | |
| | | (unaudited) | | | | | | | | |
Supplemental data for all classes: | | | | | | | | | | | | | | |
Net assets at end of year (in thousands) | | $ | 358,596 | | | $ | 297,716 | | $ | 177,710 | | $ | 9,689 | |
Portfolio turnover rate (%) | | | 87 | (c) | | | 83 | | | 127 | | | 108 | (c) |
| (a) | | For the period from May 24, 2004 (Commencement of Operations) to December 31, 2004. |
| (b) | | Excludes $0.22, $0.33 and $0.02 of PFIC mark to market which is treated as ordinary income for Federal tax purposes for the years 2006, 2005 and 2004, respectively. |
| (c) | | Rates are annualized for periods that are less than a year. |
Performance cited represents past performance. Past performance does not guarantee future results and current performance may be lower or higher than the data quoted. Results shown are annual returns, which assume reinvestment of dividends and capital gains. Investment returns and principal will fluctuate and you may have a gain or loss when you sell shares. For the most current month-end performance information, please call 1-800-742-7272, or visit our Web site at www.williamblairfunds.com.
Note: Net investment income (loss) per share is based on the average shares outstanding during the year.
108 Semi-Annual Report | June 30, 2007 |
Financial Highlights
International Small Cap Growth Fund
| | | | | | | | | | | | | | |
| | | Class N | |
| | | Period Ended | | | Years Ended December 31, | |
| | | 6/30/2007 | | | | | 2006 | | | 2005(a) | |
| | | (unaudited) | | | | | | | | | |
Net asset value, beginning of year | | $ | 13.37 | | | | | $ | 11.16 | | | $ | 10.00 | |
Income (loss) from investment operations: | | | | | | | | | | | | | | |
Net investment income (loss) (b) | | | 0.01 | | | | | | (0.05 | ) | | | (0.01 | ) |
Net realized and unrealized gain (loss) on investments | | | 1.91 | | | | | | 2.32 | | | | 1.17 | |
| | | | | | | | | | | | | | |
Total from investment operations | | | 1.92 | | | | | | 2.27 | | | | 1.16 | |
Less distributions from: | | | | | | | | | | | | | | |
Net investment income | | | — | | | | | | 0.01 | | | | — | |
Net realized gain | | | — | | | | | | 0.05 | | | | — | |
| | | | | | | | | | | | | | |
Total distributions | | | — | | | | | | 0.06 | | | | — | |
| | | | | | | | | | | | | | |
Net asset value, end of year | | $ | 15.29 | | | | | $ | 13.37 | | | $ | 11.16 | |
| | | | | | | | | | | | | | |
Total return (%) | | | 14.36 | | | | | | 20.32 | | | | 11.60 | |
Ratios to average daily net assets (%): | | | | | | | | | | | | | | |
Expenses, net of waivers and reimbursements | | | 1.61 | (c) | | | | | 1.65 | | | | 1.65 | (c) |
Expenses, before waivers and reimbursements | | | 1.61 | (c) | | | | | 1.71 | | | | 2.57 | (c) |
Net investment income (loss), net of waivers and reimbursements | | | 0.14 | (c) | | | | | (0.40 | ) | | | (0.40 | )(c) |
Net investment income (loss), before waivers and reimbursements | | | 0.14 | (c) | | | | | (0.46 | ) | | | (1.32 | )(c) |
| |
| | | Class I | |
| | | Period Ended | | | Years Ended December 31, | |
| | | 6/30/2007 | | | | | 2006 | | | 2005(a) | |
| | | (unaudited) | | | | | | | | | |
Net asset value, beginning of year | | $ | 13.41 | | | | | $ | 11.16 | | | $ | 10.00 | |
Income (loss) from investment operations: | | | | | | | | | | | | | | |
Net investment income (loss) (b) | | | 0.04 | | | | | | (0.03 | ) | | | — | |
Net realized and unrealized gain (loss) on investments | | | 1.90 | | | | | | 2.34 | | | | 1.16 | |
| | | | | | | | | | | | | | |
Total from investment operations | | | 1.94 | | | | | | 2.31 | | | | 1.16 | |
Less distributions from: | | | | | | | | | | | | | | |
Net investment income | | | — | | | | | | 0.01 | | | | — | |
Net realized gain | | | — | | | | | | 0.05 | | | | — | |
| | | | | | | | | | | | | | |
Total distributions | | | — | | | | | | 0.06 | | | | — | |
| | | | | | | | | | | | | | |
Net asset value, end of year | | $ | 15.35 | | | | | $ | 13.41 | | | $ | 11.16 | |
| | | | | | | | | | | | | | |
Total return (%) | | | 14.47 | | | | | | 20.68 | | | | 11.60 | |
Ratios to average daily net assets (%): | | | | | | | | | | | | | | |
Expenses, net of waivers and reimbursements | | | 1.30 | (c) | | | | | 1.40 | | | | 1.40 | (c) |
Expenses, before waivers and reimbursements | | | 1.30 | (c) | | | | | 1.46 | | | | 2.32 | (c) |
Net investment income (loss), net of waivers and reimbursements | | | 0.49 | (c) | | | | | (0.25 | ) | | | (0.15 | )(c) |
Net investment income (loss), before waivers and reimbursements | | | 0.49 | (c) | | | | | (0.31 | ) | | | (1.07 | )(c) |
| | | | | | | | | | | | | |
| |
| | | | |
| | | Period Ended | | | Years Ended December 31, | |
| | | 6/30/2007 | | | | | 2006 | | 2005(a) | |
| | | (unaudited) | | | | | | | | |
Supplemental data for all classes: | | | | | | | | | | | | | |
Net assets at end of year (in thousands) | | $ | 350,771 | | | | | $ | 231,969 | | $ | 50,534 | |
Portfolio turnover rate (%) | | | 85 | (c) | | | | | 109 | | | 127 | (c) |
| (a) | | For the period from November 1, 2005 (Commencement of Operations) to December 31, 2005. |
| (b) | | Excludes $0.00 and $0.11 of PFIC mark to market which is treated as ordinary income for Federal tax purposes for the years ended 2006 and 2005, respectively. |
| (c) | | Rates are annualized for periods that are less than a year. |
Performance cited represents past performance. Past performance does not guarantee future results and current performance may be lower or higher than the data quoted. Results shown are annual returns, which assume reinvestment of dividends and capital gains. Investment returns and principal will fluctuate and you may have a gain or loss when you sell shares. For the most current month-end performance information, please call 1-800-742-7272, or visit our Web site at www.williamblairfunds.com.
Note: Net investment income (loss) per share is based on the average shares outstanding during the year.
June 30, 2007 | William Blair Funds 109 |
Financial Highlights
Emerging Markets Growth Fund
| | | | | | | | | | | | |
| | | Class N | |
| | | Periods Ending | | | Years Ended December 31, | |
| | | 6/30/07 | | | 2006 | | | 2005(a) | |
| | | (unaudited) | | | | | | | |
Net asset value, beginning of year | | $ | 19.42 | | | $ | 14.17 | | | $ | 10.00 | |
Income (loss) from investment operations: | | | | | | | | | | | | |
Net investment income (loss) (b) | | | (0.02 | ) | | | (0.04 | ) | | | (0.01 | ) |
Net realized and unrealized gain (loss) on investments | | | 3.23 | | | | 5.41 | | | | 4.26 | |
| | | | | | | | | | | | |
Total from investment operations | | | 3.21 | | | | 5.37 | | | | 4.25 | |
Less distributions from: | | | | | | | | | | | | |
Net investment income | | | — | | | | 0.01 | | | | — | |
Net realized gain | | | — | | | | 0.11 | | | | 0.08 | |
| | | | | | | | | | | | |
Total distributions | | | — | | | | 0.12 | | | | 0.08 | |
| | | | | | | | | | | | |
Net asset value, end of year | | $ | 22.63 | | | $ | 19.42 | | | $ | 14.17 | |
| | | | | | | | | | | | |
Total return (%) | | | 16.53 | | | | 37.90 | | | | 42.52 | |
Ratios to average daily net assets (%): | | | | | | | | | | | | |
Expenses, net of waivers and reimbursements | | | 1.65 | (c) | | | 1.65 | | | | 1.55 | (c) |
Expenses, before waivers and reimbursements | | | 1.72 | (c) | | | 1.78 | | | | 1.91 | (c) |
Net investment income (loss), net of waivers and reimbursements | | | (0.18 | )(c) | | | (0.22 | ) | | | (0.11 | )(c) |
Net investment income (loss), before waivers and reimbursements | | | (0.25 | )(c) | | | (0.35 | ) | | | (0.47 | )(c) |
| | | | | | | | | | | | |
| | | Class I | |
| | | Periods Ending | | | Years Ended December 31, | |
| | | 6/30/07 | | | 2006 | | | 2005(a) | |
| | | (unaudited) | | | | | | | |
Net asset value, beginning of year | | | 19.47 | | | $ | 14.19 | | | $ | 10.00 | |
Income (loss) from investment operations: | | | | | | | | | | | | |
Net investment income (loss) (b) | | | 0.01 | | | | (0.01 | ) | | | 0.01 | |
Net realized and unrealized gain (loss) on investments | | | 3.25 | | | | 5.41 | | | | 4.26 | |
| | | | | | | | | | | | |
Total from investment operations | | | 3.26 | | | | 5.40 | | | | 4.27 | |
Less distributions from: | | | | | | | | | | | | |
Net investment income | | | — | | | | 0.01 | | | | — | |
Net realized gain | | | — | | | | 0.11 | | | | 0.08 | |
| | | | | | | | | | | | |
Total distributions | | | — | | | | 0.12 | | | | 0.08 | |
| | | | | | | | | | | | |
Net asset value, end of year | | $ | 22.73 | | | $ | 19.47 | | | $ | 14.19 | |
| | | | | | | | | | | | |
Total return (%) | | | 16.74 | | | | 38.07 | | | | 42.72 | |
Ratios to average daily net assets (%): | | | | | | | | | | | | |
Expenses, net of waivers and reimbursements | | | 1.40 | (c) | | | 1.40 | | | | 1.40 | (c) |
Expenses, before waivers and reimbursements | | | 1.41 | (c) | | | 1.47 | | | | 1.76 | (c) |
Net investment income (loss), net of waivers and reimbursements | | | 0.09 | (c) | | | (0.06 | ) | | | 0.04 | (c) |
Net investment income (loss), before waivers and reimbursements | | | 0.08 | (c) | | | (0.13 | ) | | | (0.32 | )(c) |
| | | | | | | | | | | |
| |
| | | | |
| | | Periods Ending | | | Years Ended December 31, | |
| | | 6/30/07 | | | 2006 | | 2005(a) | |
| | | (unaudited) | | | | | | |
Supplemental data for all classes: | | | | | | | | | | | |
Net assets at end of year (in thousands) | | $ | 1,042,351 | | | $ | 813,649 | | $ | 249,348 | |
Portfolio turnover rate (%) | | | 102 | (c) | | | 113 | | | 77 | (c) |
| (a) | | For the period from June 6, 2005 (Commencement of Operations) to December 31, 2005. |
| (b) | | Excludes $0.00 and $0.11 of PFIC mark to market which is treated as ordinary income for Federal tax purposes for years ended 2006 and 2005, respectively. |
| (c) | | Rates are annualized for periods that are less than a year. |
Performance cited represents past performance. Past performance does not guarantee future results and current performance may be lower or higher than the data quoted. Results shown are annual returns, which assume reinvestment of dividends and capital gains. Investment returns and principal will fluctuate and you may have a gain or loss when you sell shares. For the most current month-end performance information, please call 1-800-742-7272, or visit our Web site at www.williamblairfunds.com.
Note: Net investment income (loss) per share is based on the average shares outstanding during the year.
110 Semi-Annual Report | June 30, 2007 |
Financial Highlights
Value Discovery Fund
| | | | | | | | | | | | | | | | | | | | | | | | |
| | | Class N | |
| | | Period Ending | | | Years Ended December 31, | |
| | | 6/30/07 | | | 2006 | | | 2005 | | | 2004 | | | 2003 | | | 2002 | |
| | | (unaudited) | | | | | | | | | | | | | | | | |
Net asset value, beginning of year | | $ | 16.27 | | | $ | 14.95 | | | $ | 22.70 | | | $ | 22.68 | | | $ | 16.28 | | | $ | 18.23 | |
Income (loss) from investment operations: | | | | | | | | | | | | | | | | | | | | | | | | |
Net investment income (loss) | | | 0.01 | | | | 0.03 | | | | (0.02 | ) | | | (0.01 | ) | | | (0.06 | ) | | | (0.03 | ) |
Net realized and unrealized gain (loss) on investments | | | 1.04 | | | | 3.22 | | | | 0.14 | | | | 2.68 | | | | 6.46 | | | | (1.92 | ) |
| | | | | | | | | | | | | | | | | | | | | | | | |
Total from investment operations | | | 1.05 | | | | 3.25 | | | | 0.12 | | | | 2.67 | | | | 6.40 | | | | (1.95 | ) |
Less distributions from: | | | | | | | | | | | | | | | | | | | | | | | | |
Net investment income | | | — | | | | 0.01 | | | | — | | | | — | | | | — | | | | — | |
Net realized gain | | | — | | | | 1.92 | | | | 7.87 | | | | 2.65 | | | | — | | | | — | |
| | | | | | | | | | | | | | | | | | | | | | | | |
Total distributions | | | — | | | | 1.93 | | | | 7.87 | | | | 2.65 | | | | — | | | | — | |
| | | | | | | | | | | | | | | | | | | | | | | | |
Net asset value, end of year | | $ | 17.32 | | | $ | 16.27 | | | $ | 14.95 | | | $ | 22.70 | | | $ | 22.68 | | | $ | 16.28 | |
| | | | | | | | | | | | | | | | | | | | | | | | |
Total return (%) | | | 6.45 | | | | 21.78 | | | | 0.49 | | | | 12.05 | | | | 39.31 | | | | (10.70 | ) |
Ratios to average daily net assets (%): | | | | | | | | | | | | | | | | | | | | | | | | |
Expenses, net of waivers and reimbursements | | | 1.34 | (a) | | | 1.34 | | | | 1.34 | | | | 1.34 | | | | 1.49 | | | | 1.53 | |
Expenses, before waivers and reimbursements | | | 1.69 | (a) | | | 1.75 | | | | 1.64 | | | | 1.48 | | | | 1.58 | | | | 1.53 | |
Net investment income (loss), net of waivers and reimbursements | | | 0.06 | (a) | | | 0.21 | | | | (0.22 | ) | | | (0.06 | ) | | | (0.30 | ) | | | (0.16 | ) |
Net investment income (loss), before waivers and reimbursements | | | (0.29 | )(a) | | | (0.20 | ) | | | (0.52 | ) | | | (0.20 | ) | | | (0.39 | ) | | | (0.16 | ) |
| |
| | | Class I | |
| | | Period Ending | | | Years Ended December 31, | |
| | | 6/30/07 | | | 2006 | | | 2005 | | | 2004 | | | 2003 | | | 2002 | |
| | | (unaudited) | | | | | | | | | | | | | | | | |
Net asset value, beginning of year | | $ | 16.51 | | | $ | 15.12 | | | $ | 22.82 | | | $ | 22.76 | | | $ | 16.31 | | | $ | 18.19 | |
Income (loss) from investment operations: | | | | | | | | | | | | | | | | | | | | | | | | |
Net investment income (loss) | | | 0.05 | | | | 0.03 | | | | — | | | | 0.01 | | | | (0.03 | ) | | | 0.01 | |
Net realized and unrealized gain (loss) on investments | | | 1.03 | | | | 3.30 | | | | 0.17 | | | | 2.70 | | | | 6.48 | | | | (1.89 | ) |
| | | | | | | | | | | | | | | | | | | | | | | | |
Total from investment operations | | | 1.08 | | | | 3.33 | | | | 0.17 | | | | 2.71 | | | | 6.45 | | | | (1.88 | ) |
Less distributions from: | | | | | | | | | | | | | | | | | | | | | | | | |
Net investment income | | | — | | | | 0.02 | | | | — | | | | — | | | | — | | | | — | |
Net realized gain | | | — | | | | 1.92 | | | | 7.87 | | | | 2.65 | | | | — | | | | — | |
| | | | | | | | | | | | | | | | | | | | | | | | |
Total distributions | | | — | | | | 1.94 | | | | 7.87 | | | | 2.65 | | | | — | | | | — | |
| | | | | | | | | | | | | | | | | | | | | | | | |
Net asset value, end of year | | $ | 17.59 | | | $ | 16.51 | | | $ | 15.12 | | | $ | 22.82 | | | $ | 22.76 | | | $ | 16.31 | |
| | | | | | | | | | | | | | | | | | | | | | | | |
Total return (%) | | | 6.54 | | | | 22.10 | | | | 0.70 | | | | 12.18 | | | | 39.55 | | | | (10.34 | ) |
Ratios to average daily net assets (%): | | | | | | | | | | | | | | | | | | | | | | | | |
Expenses, net of waivers and reimbursements | | | 1.09 | (a) | | | 1.09 | | | | 1.14 | | | | 1.23 | | | | 1.33 | | | | 1.34 | |
Expenses, before waivers and reimbursements | | | 1.39 | (a) | | | 1.50 | | | | 1.39 | | | | 1.23 | | | | 1.33 | | | | 1.34 | |
Net investment income (loss), net of waivers and reimbursements | | | 0.54 | (a) | | | 0.16 | | | | (0.02 | ) | | | 0.05 | | | | (0.14 | ) | | | 0.03 | |
Net investment income (loss), before waivers and reimbursements | | | 0.24 | (a) | | | (0.25 | ) | | | (0.27 | ) | | | 0.05 | | | | (0.14 | ) | | | 0.03 | |
| | | | | | | | | | | | | | | | | | | |
| | | Period Ending | | | Years Ended December 31, |
| | | 6/30/07 | | | 2006 | | 2005 | | 2004 | | 2003 | | 2002 |
| | | (unaudited) | | | | | | | | | | | |
Supplemental data for all classes: | | | | | | | | | | | | | | | | | | | |
Net assets at end of year (in thousands) | | $ | 75,333 | | | $ | 146,777 | | $ | 70,439 | | $ | 246,176 | | $ | 237,111 | | $ | 190,802 |
Portfolio turnover rate (%) | | | 125 | (a) | | | 162 | | | 125 | | | 50 | | | 51 | | | 20 |
| (a) | | Rates are annualized for periods that are less than a year. |
Performance cited represents past performance. Past performance does not guarantee future results and current performance may be lower or higher than the data quoted. Results shown are annual returns, which assume reinvestment of dividends and capital gains. Investment returns and principal will fluctuate and you may have a gain or loss when you sell shares. For the most current month-end performance information, please call 1-800-742-7272, or visit our Web site at www.williamblairfunds.com.
Note: Net investment income (loss) per share is based on the average shares outstanding during the year.
June 30, 2007 | William Blair Funds 111 |
Financial Highlights
Bond Fund
| | | | |
| | | Class N | |
| | | Period Ended | |
| | | 6/30/2007(a) | |
Net asset value, beginning of period | | $ | 10.00 | |
Income (loss) from investment operations: | | | | |
Net investment income (loss) | |
|
0.10 |
|
Net realized and unrealized gain (loss) on investments | | | (0.22 | ) |
| | | | |
Total from investment operations | | | (0.12 | ) |
Less distributions from: | | | | |
Net investment income | | | (0.04 | ) |
Net realized gain | | | — | |
| | | | |
Total distributions | | | (0.04 | ) |
| | | | |
Net asset value, end of period | | $ | 9.84 | |
| | | | |
Total return (%) (c) | | | (1.15 | ) |
Ratios to average daily net assets (%) (b): | | | | |
Expenses, net of waivers and reimbursements | | | 0.65 | |
Expenses, before waivers and reimbursements | |
|
0.95 |
|
Net investment income (loss), net of waivers and reimbursements | |
|
4.69 |
|
Net investment income (loss), before waivers and reimbursements | |
|
4.39 |
|
| |
| | | Class I | |
| | | Period Ended | |
| | | 6/30/2007(a) | |
Net asset value, beginning of period | | $ | 10.00 | |
Income (loss) from investment operations: | | | | |
Net investment income (loss) | |
|
0.11 |
|
Net realized and unrealized gain (loss) on investments | | | (0.22 | ) |
| | | | |
Total from investment operations | |
|
(0.11 |
) |
Less distributions from: | | | | |
Net investment income | | | (0.05 | ) |
Net realized gain | | | — | |
| | | | |
Total distributions | | | — | |
| | | | |
Net asset value, end of period | | $ | 9.84 | |
| | | | |
Total return (%) (c) | |
|
(1.15 |
) |
Ratios to average daily net assets (%) (b): | | | | |
Expenses, net of waivers and reimbursements | |
|
0.50 |
|
Expenses, before waivers and reimbursements | |
|
0.80 |
|
Net investment income (loss), net of waivers and reimbursements | |
|
4.84 |
|
Net investment income (loss), before waivers and reimbursements | |
|
4.54 |
|
| | | | |
| | | Period Ended | |
| | | 6/30/2007(a) | |
Supplemental data for all classes: | | | | |
Net assets at end of period (in thousands) | | $ | 51,623 | |
Portfolio turnover rate (%) (b) | |
|
88 |
|
| (a) | | For the period from May 1, 2007 (Commencement of Operations) to June 30, 2007. |
| (b) | | Rates are annualized for periods that are less than a year. |
| (c) | | Total return is not annualized for periods that are less than a year. |
Performance cited represents past performance. Past performance does not guarantee future results and current performance may be lower or higher than the data quoted. Results shown are annual returns, which assume reinvestment of dividends and capital gains. Investment returns and principal will fluctuate and you may have a gain or loss when you sell shares. For the most current month-end performance information, please call 1-800-742-7272, or visit our Web site at www.williamblairfunds.com.
Note: Net investment income (loss) per share is based on the average shares outstanding during the period.
112 Semi-Annual Report | June 30, 2007 |
Financial Highlights
Income Fund
| | | | | | | | | | | | | | | | | | | | | | | |
| | | Class N |
| | | Period Ended | | | Years Ended December 31, |
| | | 6/30/2007 | | | 2006 | | | 2005 | | | 2004 | | | 2003 | | | 2002 |
| | | (unaudited) | | | | | | | | | | | | | | | |
Net asset value, beginning of year | | $ | 9.74 | | | $ | 9.83 | | | $ | 10.19 | | | $ | 10.43 | | | $ | 10.62 | | | $ | 10.34 |
Income (loss) from investment operations: | | | | | | | | | | | | | | | | | | | | | | | |
Net investment income (loss) (a) | | | 0.26 | | | | 0.44 | | | | 0.47 | | | | 0.52 | | | | 0.40 | | | | 0.55 |
Net realized and unrealized gain (loss) on investments | | | (0.21 | ) | | | (0.04 | ) | | | (0.30 | ) | | | (0.26 | ) | | | (0.02 | ) | | | 0.25 |
| | | | | | | | | | | | | | | | | | | | | | | |
Total from investment operations | | | 0.05 | | | | 0.40 | | | | 0.17 | | | | 0.26 | | | | 0.38 | | | | 0.80 |
Less distributions from: | | | | | | | | | | | | | | | | | | | | | | | |
Net investment income | | | 0.24 | | | | 0.49 | | | | 0.53 | | | | 0.50 | | | | 0.57 | | | | 0.52 |
Net realized gain | | | — | | | | — | | | | — | | | | — | | | | — | | | | — |
| | | | | | | | | | | | | | | | | | | | | | | |
Total distributions | | | 0.24 | | | | 0.49 | | | | 0.53 | | | | 0.50 | | | | 0.57 | | | | 0.52 |
| | | | | | | | | | | | | | | | | | | | | | | |
Net asset value, end of year | | $ | 9.55 | | | $ | 9.74 | | | $ | 9.83 | | | $ | 10.19 | | | $ | 10.43 | | | $ | 10.62 |
| | | | | | | | | | | | | | | | | | | | | | | |
Total return (%) | | | 0.45 | | | | 4.25 | | | | 1.71 | | | | 2.61 | | | | 3.68 | | | | 7.91 |
Ratios to average daily net assets (%): | | | | | | | | | | | | | | | | | | | | | | | |
Expenses, net of waivers and reimbursements | | | 0.77 | (a) | | | 0.74 | | | | 0.73 | | | | 0.78 | | | | 0.77 | | | | 0.81 |
Expenses, before waivers and reimbursements | | | 0.80 | (a) | | | 0.80 | | | | 0.73 | | | | 0.78 | | | | 0.77 | | | | 0.81 |
Net investment income (loss), net of waivers and reimbursements | | | 5.37 | (a) | | | 4.54 | | | | 4.09 | | | | 4.12 | | | | 4.09 | | | | 5.23 |
Net investment income (loss) before waivers and reimbursements | | | 5.34 | (a) | | | 4.48 | | | | 4.09 | | | | 4.12 | | | | 4.09 | | | | 5.23 |
| |
| | | Class I |
| | | Period Ended | | | Years Ended December 31, |
| | | 6/30/2007 | | | 2006 | | | 2005 | | | 2004 | | | 2003 | | | 2002 |
| | | (unaudited) | | | | | | | | | | | | | | | |
| | | | | | | | | | | | | | | | | | |
Net asset value, beginning of year | | $ | 9.69 | | | $ | 9.82 | | | $ | 10.15 | | | $ | 10.40 | | | $ | 10.62 | | | $ | 10.35 |
Income (loss) from investment operations: | | | | | | | | | | | | | | | | | | | | | | | |
Net investment income (loss) (a) | | | 0.26 | | | | 0.45 | | | | 0.52 | | | | 0.59 | | | | 0.43 | | | | 0.57 |
Net realized and unrealized gain (loss) on investments | | | (0.20 | ) | | | (0.04 | ) | | | (0.33 | ) | | | (0.31 | ) | | | (0.04 | ) | | | 0.24 |
| | | | | | | | | | | | | | | | | | | | | | | |
Total from investment operations | | | 0.06 | | | | 0.41 | | | | 0.19 | | | | 0.28 | | | | 0.39 | | | | 0.81 |
Less distributions from: | | | | | | | | | | | | | | | | | | | | | | | |
Net investment income | | | 0.25 | | | | 0.54 | | | | 0.52 | | | | 0.53 | | | | 0.61 | | | | 0.54 |
Net realized gain | | | — | | | | — | | | | — | | | | — | | | | — | | | | — |
| | | | | | | | | | | | | | | | | | | | | | | |
Total distributions | | | 0.25 | | | | 0.54 | | | | 0.52 | | | | 0.53 | | | | 0.61 | | | | 0.54 |
| | | | | | | | | | | | | | | | | | | | | | | |
Net asset value, end of year | | $ | 9.50 | | | $ | 9.69 | | | $ | 9.82 | | | $ | 10.15 | | | $ | 10.40 | | | $ | 10.62 |
| | | | | | | | | | | | | | | | | | | | | | | |
Total return (%) | | | 0.59 | | | | 4.33 | | | | 1.92 | | | | 2.79 | | | | 3.76 | | | | 8.04 |
Ratios to average daily net assets (%): | | | | | | | | | | | | | | | | | | | | | | | |
Expenses | | | 0.60 | (a) | | | 0.62 | | | | 0.58 | | | | 0.63 | | | | 0.62 | | | | 0.66 |
Net investment income (loss) | | | 5.53 | (a) | | | 4.66 | | | | 4.24 | | | | 4.27 | | | | 4.24 | | | | 5.38 |
| | | | | | | | | | | | | |
| |
| | | |
| | | Period Ended | | | Years Ended December 31, |
| | | 6/30/2007 | | | 2006 | | 2005 | | 2004 | | 2003 | | 2002 |
| | | (unaudited) | | | | | | | | | | | |
Supplemental data for all classes: | | | | | | | | | | | | | |
Net assets at end of year (in thousands) | | $253,695 | | | $297,077 | | $310,496 | | $294,084 | | $265,062 | | $196,136 |
Portfolio turnover rate (%) | | 18 | (a) | | 33 | | 41 | | 43 | | 36 | | 66 |
| (a) | | Rates are annualized for periods that are less than a year. |
Performance cited represents past performance. Past performance does not guarantee future results and current performance may be lower or higher than the data quoted. Results shown are annual returns, which assume reinvestment of dividends and capital gains. Investment returns and principal will fluctuate and you may have a gain or loss when you sell shares. For the most current month-end performance information, please call 1-800-742-7272, or visit our Web site at www.williamblairfunds.com.
Note: Net investment income (loss) per share is based on the average shares outstanding during the year.
June 30, 2007 | William Blair Funds 113 |
Financial Highlights
Ready Reserves Fund
| | | | | | | | | | | | | | | | | | | |
| | | Class N |
| | | Period Ended | | | Years Ended December 31, |
| | | 6/30/2007 | | | 2006 | | 2005 | | 2004 | | 2003 | | 2002 |
| | | (unaudited) | | | | | | | | | | | |
Net asset value, beginning of year | | $ | 1.00 | | | $ | 1.00 | | $ | 1.00 | | $ | 1.00 | | $ | 1.00 | | $ | 1.00 |
Income (loss) from investment operations: | | | | | | | | | | | | | | | | | | | |
Net investment income (loss) | | | 0.02 | | | | 0.04 | | | 0.03 | | | 0.01 | | | 0.01 | | | 0.01 |
| | | | | | | | | | | | | | | | | | | |
Total from investment operations | | | 0.02 | | | | 0.04 | | | 0.03 | | | 0.01 | | | 0.01 | | | 0.01 |
Less distributions from: | | | | | | | | | | | | | | | | | | | |
Net investment income | | | 0.02 | | | | 0.04 | | | 0.03 | | | 0.01 | | | 0.01 | | | 0.01 |
| | | | | | | | | | | | | | | | | | | |
Total distributions | | | 0.02 | | | | 0.04 | | | 0.03 | | | 0.01 | | | 0.01 | | | 0.01 |
| | | | | | | | | | | | | | | | | | | |
Net asset value, end of year | | $ | 1.00 | | | $ | 1.00 | | $ | 1.00 | | $ | 1.00 | | $ | 1.00 | | $ | 1.00 |
| | | | | | | | | | | | | | | | | | | |
Total return (%) | | | 2.37 | | | | 4.47 | | | 2.62 | | | 0.80 | | | 0.66 | | | 1.28 |
Ratios to average daily net assets (%) | | | | | | | | | | | | | | | | | | | |
Expenses | | | 0.63 | (a) | | | 0.63 | | | 0.64 | | | 0.65 | | | 0.66 | | | 0.67 |
Net investment income (loss) | | | 4.72 | (a) | | | 4.38 | | | 2.57 | | | 0.80 | | | 0.66 | | | 1.28 |
Supplemental data: | | | | | | | | | | | | | | | | | | | |
Net assets at end of year (in thousands) | | $ | 1,182,488 | | | $ | 1,195,593 | | $ | 1,091,854 | | $ | 1,092,940 | | $ | 1,153,932 | | $ | 1,324,001 |
| (a) | | Rates are annualized for periods that are less than a year. |
Performance cited represents past performance. Past performance does not guarantee future results and current performance may be lower or higher than the data quoted. Results shown are annual returns, which assume reinvestment of dividends and capital gains. Investment returns and principal will fluctuate and you may have a gain or loss when you sell shares. For the most current month-end performance information, please call 1-800-742-7272, or visit our Web site at www.williamblairfunds.com.
Note: Net investment income (loss) per share is based on the average shares outstanding during the year.
114 Semi-Annual Report | June 30, 2007 |
Trustees and Officers (Unaudited). The trustees and officers of the William Blair Funds as of June 30, 2007, their year of birth, their principal occupations during the last five years, their affiliations, if any, with William Blair & Company, L.L.C., and other significant affiliations are set forth below. The address of each trustee and officer is 222 West Adams Street, Chicago, Illinois 60606.
| | | | | | | | | | |
Name and Year of Birth | | Position(s)
Held with
Fund | | Term of
Office and
Length of
Time
Served(1) | | Principal Occupation(s) During Past 5 Years | | Number of
Portfolios
in Fund
Complex
Overseen
by Trustee | | Other Directorships Held by Trustee/Officer |
Interested Trustees | | | | | | | | | | |
Frederick Conrad Fischer,
1934* | | Chairman of the Board of Trustees | | Since 1987 | | Principal, William Blair & Company, L.L.C.; Partner, APM Limited Partnership | | 16 | | Trustee Emeritus, Chicago Child Care Society, a non-profit organization; Trustee Emeritus Kalamazoo College |
| | | | | |
Michelle R. Seitz,
1965* | | Trustee | | Since 2002 | | Principal, William Blair & Company, L.L.C. | | 16 | | N/A |
Non-Interested Trustees | | | | | | | | |
Ann P. McDermott,
1939 | | Trustee | | Since 1996 | | Board member and officer for various civic and charitable organizations over the past thirty years; professional experience prior thereto, registered representative for New York Stock Exchange firm | | 16 | | Northwestern University, Women’s Board; Rush Presbyterian St. Luke’s Medical Center, Women’s Board; University of Chicago, Women’s Board; Visiting Nurses Association, Honorary Director |
| | | | | |
Phillip O. Peterson,
1944 | | Trustee | | Since 2007 | | Trustee of Strong Funds Liquidating Trusts since 2005 and President, Strong Mutual Funds, 2004-2005; formerly, Partner, KPMG LLP | | 16 | | The Hartford Group of Mutual Funds (87 portfolios) |
| | | | | |
Donald J. Reaves,
1946 | | Trustee | | Since 2004 | | Vice President for Administration and Chief Financial Officer, University of Chicago since 2002. Executive Vice President and Chief Financial Officer, Brown University from 1993 to 2002 | | 16 | | American Student Assistance Corp.; Amica Mutual Insurance Company; guarantor of student loans |
| | | | | |
Donald L. Seeley,
1944 | | Trustee | | Since 2003 | | Director, Applied Investment Management Program, University of Arizona Department of Finance, Formerly Vice Chairman and Chief Financial Officer, True North Communications, Inc., marketing communications and advertising firm | | 16 | | Warnaco Group, Inc. intimate apparel, sportswear, and swimwear manufacturer. Center for Furniture Craftmanship (not-for-profit) |
| | | | | |
Thomas J. Skelly,
1951 | | Trustee | | Since 2007 | | Director and Investment Committee Chairman, U.S. Accenture Foundation Inc.; formerly Managing Partner of various divisions at Accenture | | 16 | | Clayton Holdings, Inc., provider of information-based analytics, consulting and outsourced services to various financial institutions and investors |
| | | | | |
Robert E. Wood II,
1938 | | Trustee | | Since 1999 | | Retired Executive Vice President, Morgan Stanley Dean Witter | | 16 | | Chairman, Add-Vision, Inc. manufacturer of surface animation systems, and Micro-Combustion, LLC |
June 30, 2007 | William Blair Funds 115 |
| | | | | | | | |
Name and Year of Birth | | Position(s)
Held with
Fund | | Term of
Office and
Length of
Time
Served(1) | | Principal Occupation(s) During Past 5 Years | | Other Directorships Held by Trustee/Officer |
Officers | | | | | | | | |
| | | | |
Marco Hanig,
1958 | | President | | Since 1999 | | Principal, William Blair & Company, L.L.C. | | Chicago Scores |
| | | | |
Karl W. Brewer,
1966 | | Senior Vice President | | Since 2000 | | Principal, William Blair & Company, L.L.C. | | N/A |
| | | | |
Harvey H. Bundy, III,
1944 | | Senior Vice President | | Since 2003 | | Principal, William Blair & Company, L.L.C. | | N/A |
| | | | |
Mark A. Fuller, III,
1957 | | Senior Vice President | | Since 1993 | | Principal, William Blair & Company, L.L.C. | | Partner, Fulsen Howney Partners |
| | | | |
James S. Golan,
1961 | | Senior Vice President | | Since 2005 | | Principal, William Blair & Company, L.L.C. | | N/A |
| | | | |
W. George Greig,
1952 | | Senior Vice President | | Since 1996 | | Principal, William Blair & Company, L.L.C. | | N/A |
| | | | |
Michael A. Jancosek,
1959 | | Senior Vice President Vice President | | Since 2004 2000-2004 | | Principal, William Blair & Company L.L.C. Associate, William Blair & Company, L.L.C. | | N/A |
| | | | |
John F. Jostrand,
1954 | | Senior Vice President | | Since 1999 | | Principal, William Blair & Company, L.L.C. | | N/A |
| | | | |
James S. Kaplan,
1960 | | Senior Vice President Vice President | | Since 2004 1995-2004 | | Principal, William Blair & Company, L.L.C. Associate, William Blair & Company, L.L.C. | | N/A |
| | | | |
Robert C. Lanphier, IV,
1956 | | Senior Vice President | | Since 2003 | | Principal, William Blair & Company, L.L.C. | | Chairman, AG. Med, Inc. |
| | | | |
Todd M. McClone,
1968 | | Senior Vice President Vice President | | Since 2006 2005-2006 | | Principal, William Blair & Company, L.L.C. Associate, William Blair & Company, L.L.C. | | N/A N/A |
| | | | |
David S. Mitchell,
1960 | | Senior Vice President Vice President | | Since 2004 2003-2004 | | Principal, William Blair & Company, L.L.C. Associate, William Blair & Company, L.L.C. | | N/A |
| | | | |
Gregory J. Pusinelli,
1958 | | Senior Vice President | | Since 1999 | | Principal, William Blair & Company, L.L.C. | | N/A |
| | | | |
David P. Ricci,
1958 | | Senior Vice President | | Since 2006 | | Principal, William Blair & Company, L.L.C. | | N/A |
| | | | |
Jeffrey A. Urbina,
1955 | | Senior Vice President | | Since 1998 | | Principal, William Blair & Company, L.L.C. | | N/A |
116 Semi-Annual Report | June 30, 2007 |
| | | | | | | | |
Name and Year of Birth | | Position(s)
Held with
Fund | | Term of
Office and
Length of
Time
Served(1) | | Principal Occupation(s) During Past 5 Years | | Other Directorships Held by Trustee/Officer |
Christopher T. Vincent,
1956 | | Senior Vice President Vice President | | Since 2004 2002-2004 | | Principal, William Blair & Company, L.L.C. Associate, William Blair & Company, L.L.C.; former Managing Director/Senior Portfolio Manager, Zurich Scudder Investments | | Uhlich Children’s Home |
| | | | |
Colin J. Williams,
1975 | | Senior Vice President Vice President | | Since 2007 Since 2006 | | Principal, William Blair & Company, L.L.C. Associate William Blair & Company, L.L.C.; formerly, Andersen Consulting; Allegiance Healthcare | | N/A |
| | | | |
Richard W. Smirl,
1967 | | Chief Compliance Officer | | Since 2004 | | Principal, William Blair & Company, L.L.C.; former Chief Legal Officer, Strong Capital Management | | N/A |
| | | | |
Benjamin J. Armstrong
1965 | | Vice President | | Since 2007 | | Associate, William Blair & Company, LLC | | |
| | | | |
David C. Fording,
1967 | | Vice President | | Since 2006 | | Associate, William Blair & Company,; former Portfolio Manager, TIAA-CREF | | N/A |
| | | | |
Chad M. Kilmer,
1975 | | Vice President | | Since 2006 | | Associate, William Blair & Company,; former analyst and Portfolio Manager U.S. Bancorp Asset Management and analyst Gabelli Woodland Partners. | | N/A |
| | | | |
Mark T. Leslie,
1967 | | Vice President | | Since 2005 | | Associate, William Blair & Company, L.L.C. formerly, U.S. Bancorp Asset Management | | N/A |
| | | | |
Terence M. Sullivan,
1944 | | Vice President and Treasurer | | Since 1997 | | Associate, William Blair & Company, L.L.C. | | N/A |
| | | | |
Colette M. Garavalia,
1961 | | Secretary | | Since 2000 | | Associate, William Blair & Company, L.L.C. | | N/A |
| * | | Mr. Fischer and Ms. Seitz are interested persons of the William Blair Funds because each is a principal of William Blair & Company, L.L.C., the Funds’ investment advisor, principal underwriter and distributor. |
| (1) | | Each Trustee serves until the election and qualification of a successor, or until death, resignation or retirement or removal as provided in the Fund’s Declaration of Trust. Retirement for non-interested Trustees occurs no later than at the conclusion of the first regularly scheduled Board meeting of the Fund’s fiscal year that occurs after the Trustee’s 72nd birthday. The Fund’s officers are elected annually by the Trustees. |
The Statement of Additional Information for the William Blair Funds includes additional information about the trustees and is available without charge by calling 1-800-635-2886 (in Massachusetts 1-800-635-2840) or by writing the Fund.
June 30, 2007 | William Blair Funds 117 |
Board Approval of the Fund’s Management Agreement (All Portfolios except the Bond Portfolio)
During the six months ended June 30, 2007, the Board of Trustees (the “Board”) of the Fund approved the renewal for an additional one-year term of the Fund’s Management Agreement with William Blair & Company, L.L.C. (the “Advisor”), on behalf of each Portfolio of the Fund.
The information in this summary outlines the Board’s considerations associated with its renewal of the Management Agreement. In connection with its deliberations regarding the continuation of the Management Agreement, the Board considered such information and factors as it believed to be relevant. As described below, the Board considered the nature, extent and quality of the services performed by the Advisor under the existing Management Agreement; comparative management fees and expense ratios as prepared by an independent provider (Lipper Inc.); the estimated profits realized by the Advisor; the extent to which the Advisor realizes economies of scale as a Portfolio grows; and whether any fall-out benefits are being realized by the Advisor. In addition, the Trustees who are not “interested persons” of the Fund as defined in the Investment Company Act of 1940 (the “Independent Trustees”) discussed the renewal of the Management Agreement with Fund management and in private sessions with independent legal counsel at which no representatives of the Advisor were present.
As required by the Investment Company Act of 1940, the renewal was confirmed by the unanimous separate vote of the Independent Trustees. In deciding to approve the renewal of the Management Agreement, the Board did not identify a single factor as controlling and this summary does not describe all of the matters considered. However, the Board concluded that each of the various factors referred to below favored such approval.
Information Requested and Received
The Board, including all the Independent Trustees, considered the renewal of the Management Agreement pursuant to a process that concluded at the Board’s February 15, 2007 meeting, following an extensive process. In preparation for the review process, the Independent Trustees met with independent legal counsel and discussed the type and nature of information to be requested and directed independent legal counsel to send a formal request for information to Fund management. The Advisor provided extensive information in response to the request. After reviewing the information received, the Independent Trustees requested supplemental information that was provided by the Advisor. Among other information, the Independent Trustees considered: (i) materials describing the nature, quality and extent of services provided by the Advisor; (ii) information comparing the performance of each Portfolio to other mutual funds and relevant indices; (iii) information comparing the advisory fees and expense ratios of each Portfolio to other mutual funds; (iv) information comparing advisory fees of each Portfolio to fees charged by the Advisor to other funds and its similar client accounts; (v) the estimated costs of services provided and estimated profits realized by the Advisor for both the Fund as a whole and each Portfolio individually; (vi) information about potential economies of scale; and (vii) information describing other benefits to the Advisor resulting from its relationship with the Portfolios. The Independent Trustees reviewed comparative performance of peer groups of funds selected by Lipper, comparative advisory fees and expense ratios of peer groups of funds selected by Lipper and the average performance of an applicable Morningstar style category. The Independent Trustees also received a memorandum from independent legal counsel advising them of their duties and responsibilities in connection with the review of the Management Agreement.
On February 12, 14 and 15, 2007, the Independent Trustees met independently of Fund management and of the interested Trustees, to review and discuss with independent legal counsel the information provided by the Advisor, Lipper and independent legal counsel. The Independent Trustees noted that in evaluating the Management Agreement, they were taking into account their accumulated experience as Trustees in working with the Advisor on matters relating to the Portfolios. Based upon their review, the Independent Trustees concluded on February 15, 2007 that it was in the best interest of each Portfolio to renew the Management Agreement and recommended to the Board the renewal of the Management Agreement. At its meeting on February 15, 2007, the Board considered the recommendation of the Independent Trustees along with the other factors that the Board deemed relevant.
Nature, Quality and Extent of Services. In evaluating the nature, quality and extent of the services provided by the Advisor to the Portfolios, the Board noted that the Advisor is a quality firm with a reputation for integrity and honesty that employs high quality people and has a long association with the Portfolios, in each case other than the Growth Portfolio, since the inception of the Portfolios. The Trustees believe that a long-term relationship with a capable, conscientious advisor is in the best interests of shareholders and that shareholders have invested in the Portfolios knowing that the Advisor managed the Portfolios and knowing the investment advisory fee. The Board considered biographical information about each Portfolio’s portfolio manager(s), the administrative services performed by the Advisor, financial information regarding the Advisor,
118 Semi-Annual Report | June 30, 2007 |
brokerage allocation practices, soft dollars and execution, the compliance regime overseen by the Advisor, and the financial support the Advisor provides to certain Portfolios. The Board also noted that the Advisor voluntarily reduces the advisory fees of the Portfolios by an amount equal to the advisory fee charged by the Ready Reserves Portfolio on the cash of the Portfolios invested in the Ready Reserves Portfolio. Based upon all relevant factors, the Board concluded that the nature, quality and extent of the services provided by the Advisor to each Portfolio were satisfactory.
The Board reviewed information on the performance of each Portfolio for one, three, five and ten year periods (or since inception), as applicable, along with performance information of a relevant securities index or indexes and a peer universe of funds from the Lipper database. For all Portfolios (except the Ready Reserves Portfolio which does not have an applicable Morningstar category and the Mid Cap Growth Portfolio for which it was not provided due to its limited operating history), the Board also reviewed performance information provided by the Advisor of the average of the applicable Morningstar style category for the applicable periods. The performance information showed that the Growth Portfolio, the Tax-Managed Growth Portfolio, the Small Cap Growth Portfolio, the Mid Cap Growth Portfolio, the Emerging Markets Growth Portfolio, the Income Portfolio and the Ready Reserves Portfolio performed satisfactorily relative to their Lipper peer universe, Morningstar style category average and benchmark indexes over the applicable periods. The Value Discovery Portfolio performed satisfactorily relative to its Lipper peer universe and Morningstar style category for the one and ten year periods, but underperformed relative to its Lipper peer universe and Morningstar style category for the three and five year periods and to its benchmark indexes over the applicable periods. The International Growth Portfolio and the Small-Mid Cap Growth Portfolio performed satisfactorily relative to their Lipper peer universe and Morningstar style category average, but underperformed relative to their benchmark indexes over the applicable periods. The International Small Cap Growth Portfolio performed satisfactorily relative to its benchmark index, but underperformed relative to its Lipper peer universe and Morningstar style category average. The Board noted the limited operating history of the International Small Cap Growth Portfolio. The International Equity Portfolio underperformed relative to its Lipper peer universe, Morningstar style category and benchmark index over the applicable periods, but the Board noted the positive absolute performance of the Portfolio and its limited operating history. The Large Cap Growth Portfolio underperformed relative to its Lipper peer universe, Morningstar style category and benchmark index over the applicable periods, but the Board noted that the relative performance of the Portfolio compared to the peer funds had improved over the one year period. Based upon the review of the performance information, the Board concluded that the performance of each Portfolio was acceptable and supported continuation of the Management Agreement for each Portfolio.
Fees and Expenses. The Board reviewed each Portfolio’s advisory fee and expense ratio and reviewed information comparing the advisory fee and expense ratio to those of a Lipper peer group and a Lipper peer universe. The Lipper peer group for each Portfolio consists of a group of funds with a similar investment style and asset size as the Portfolio. The Lipper peer universe for each Portfolio includes all funds with a similar investment style regardless of asset size. The Board considered that the Advisor has proposed to limit total expenses, including waiving advisory fees, if necessary, for the Tax-Managed Growth Portfolio, the Large Cap Growth Portfolio, the Small Cap Growth Portfolio, the Mid Cap Growth Portfolio, the Small-Mid Cap Growth Portfolio, the International Growth Portfolio, the International Equity Portfolio, the International Small Cap Growth Portfolio, the Emerging Markets Growth Portfolio and the Value Discovery Portfolio. For each Portfolio, the Board also reviewed amounts paid to the Advisor by other registered funds, including other Portfolios in the Fund and funds for which the Advisor acts as a subadvisor and the Advisor’s fee schedule for separate accounts. With respect to sub-advised funds and separate accounts, the Board noted that (i) both the mix of services provided and the level of responsibility required under the Management Agreement were greater as compared to the Advisor’s obligations for sub-advised funds and separate accounts; and (ii) management’s representation that the management fees of separate accounts are less relevant to the Board’s consideration of the advisory fee because they reflect significantly different competitive forces than those in the mutual fund marketplace.
In considering the information, the Board noted that the advisory fees for the Growth Portfolio, the Tax-Managed Growth Portfolio, the Large Cap Growth Portfolio, the International Small Cap Growth Portfolio, the Emerging Markets Growth Portfolio, the Income Portfolio and the Ready Reserves Portfolio were below or within an acceptable range of the average of their peer group and median of their peer universe. The Board also noted that the advisory fees for the Mid Cap Growth Portfolio, the International Equity Portfolio and the Value Discovery Portfolio were below or within an acceptable range of the average of their peer group and median of their peer universe after giving effect to fee waivers. Finally, the Board noted that the advisory fees for the Small Cap Growth Portfolio, the Small-Mid Cap Growth Portfolio and the International Growth Portfolio were above the average of their peer group and median of their peer universe, but that such advisory fees were within an acceptable range of the peer group and peer universe and consistent with reasonable expectations in light of the nature, quality and extent of services provided by the Advisor. On the basis of the information provided, the Board concluded that each Portfolio’s advisory fee, coupled with any applicable existing or proposed advisory fee waiver and expense cap, was reasonable and appropriate in light of the nature, quality and extent of services provided by the Advisor.
June 30, 2007 | William Blair Funds 119 |
Profitability. With respect to the profitability of the Management Agreement to the Advisor, the Board considered the overall fees paid under the Management Agreement, including the estimated costs of the services provided and profits realized by the Advisor from its relationship with the Fund as a whole and each Portfolio individually. The Board concluded that the estimated profits realized by the Advisor were not unreasonable.
Economies of Scale. The Board considered the extent to which economies of scale would be realized as the Portfolios grow and whether fee levels reflect these economies of scale for the benefit of investors. The Board noted the Advisor’s representation that certain Portfolio expenses are relatively fixed and unrelated to asset size and that the Advisor may enjoy some economies of scale as a Portfolio’s assets grow. The Board also noted the information provided by the Advisor that its costs rise when a Portfolio grows as a result of superior performance because of increased compensation to portfolio managers. In considering whether fee levels reflect economies of scale for the benefit of Portfolio investors, the Board reviewed each Portfolio’s asset size, breakpoints for those Portfolios with breakpoints in the advisory fee schedule, the Portfolio’s total and net expense ratios and the expense caps in place and/or proposed, and concluded that they reasonably reflect appropriate recognition of any economies of scale.
Other Benefits to the Advisor. The Board considered benefits derived by the Advisor from its relationship with the Portfolios, including soft dollars, which pertain primarily to the Portfolios investing in equity securities, and favorable media coverage. The Board concluded that, taking into account these benefits, each Portfolio’s advisory fee was reasonable.
Conclusion. Based upon all of the information considered and the conclusions reached, the Board determined that the terms of the Management Agreement continue to be fair and reasonable and that the continuation of the Management Agreement is in the best interests of each Portfolio.
Board Approval of the Bond Portfolio’s Management Agreement
During the six months ended June 30, 2007, the Board approved the Fund’s Management Agreement with the Advisor, on behalf of the Bond Portfolio of the Fund. The Management Agreement with respect to the Portfolio was approved by the Board of Trustees, including all of the trustees who are not parties to such agreement or interested persons of any such party, on February 15, 2007. The Board, including a majority of the Independent Trustees, determined that approval of the Management Agreement was in the best interests of the Portfolio. The Independent Trustees met separately from the “interested” trustees of the Fund and officers and employees of the Advisor to consider approval of the Management Agreement and were assisted by independent legal counsel in making their determination. The Board, including the Independent Trustees, did not identify any single factor or group of factors as all important or controlling and considered all factors together.
Nature, Quality and Extent of Services. In evaluating the nature, quality and extent of services expected to be provided by the Advisor to the Portfolio, the Board noted that the Advisor is a quality firm with a reputation for integrity and honesty that employs high quality people. The Board considered biographical information about the Portfolio’s portfolio managers, financial information regarding the Advisor, the compliance regime created by the Advisor and the proposed financial support of the Portfolio. The Board considered the Advisor’s past experience managing a core bond strategy and the Advisor’s experience in managing new funds. Based upon all relevant factors, the Board concluded that the nature, quality and extent of the services to be provided by the Advisor to the Portfolio are expected to be satisfactory.
The Board reviewed performance information on the Advisor’s Core Fixed Income composite and the Lehman Brothers U.S. Aggregate Index, the Portfolio’s benchmark (the “Benchmark”), for the one, three, five and ten year periods. The performance information indicated that the Core Fixed Income composite performed satisfactorily relative to the Benchmark for all periods.
Fees and Expenses. The Board reviewed the Portfolio’s proposed advisory fee and estimated expense ratio and reviewed information comparing the advisory fee and expense ratio to a Lipper peer group. The Lipper peer group for the Portfolio consists of a group of funds with a similar investment style as the Portfolio. The Board considered that the Advisor has proposed to cap total expenses, including waiving advisory fees, if necessary, for the Portfolio. The Board also reviewed the Advisor’s fee schedule for separate accounts. With respect to separate accounts, the Board noted that (i) both the mix of services provided and the level of responsibility required under the Management Agreement will be greater as compared to the Advisor’s obligations for separate accounts; and (ii) management’s representation that the management fees of separate accounts are less relevant to the Board’ consideration of the advisory fee because they reflect significantly different competitive forces from those in the mutual fund marketplace.
120 Semi-Annual Report | June 30, 2007 |
In considering the information, the Board noted that the proposed advisory fee for the Portfolio was below the median of the peer group. On the basis of the information provided, the Board concluded that the proposed advisory fee was reasonable and appropriate in light of the nature, quality and extent of services to be provided by the Advisor.
Profitability. With respect to the estimated profitability of the Management Agreement to the Advisor, the Board considered the overall fees expected to be paid under the Management Agreement, the expected size of the Portfolio and the Advisor’s expense limitation agreement. The Board concluded that the expected profits to be realized by the Advisor were not unreasonable.
Economies of Scale. The Board considered the extent to which economies of scale would be realized as the Portfolio grows and whether fee levels reflect these economies of scale. The Board considered whether the proposed advisory fee is reasonable in relation to the projected asset size of the Portfolio. In considering whether fee levels reflect economies of scale for the benefit of Portfolio investors, the Board reviewed the Portfolio’s advisory fee compared to peer funds, the Portfolio’s projected asset size, the Portfolio’s estimated expense ratio and the proposed expense cap, and concluded that the advisory fee was reasonable.
Other Benefits to the Advisor. The Board considered benefits to be derived by the Advisor from its relationship with the Portfolio. The Board concluded that, after taking into account these benefits, the proposed advisory fee was reasonable.
Conclusion. Based upon all of the information considered and the conclusions reached, the Board, determined that the terms of the Management Agreement are fair and reasonable and that the approval of the Management Agreement is in the best interests of the Portfolio.
June 30, 2007 | William Blair Funds 121 |
(unaudited)
Proxy Voting
A description of the policies and procedures that the Fund uses to determine how to vote proxies relating to portfolio securities and information regarding how the Fund voted proxies relating to portfolio securities for the most recent 12-month period ended June 30 are available without charge, upon request, by calling 1-800-635-2886 (in Massachusetts 1-800-635-2840), at www.williamblairfunds.com and on the SEC’s website at http://www.sec.gov.
Quarterly Portfolio Schedules
The Fund files its complete schedule of portfolio holdings with the SEC for the first and third fiscal quarters of each fiscal year (quarters ended March 31 and September 30) on Form N-Q. The Fund’s Forms N-Q are available on the SEC’s website at http://www.sec.gov and may be reviewed and copied at the SEC’s Public Reference Room in Washington, D.C. Information on the operation of the SEC’s Public Reference Room may be obtained by calling 1-800-SEC-0330. The Fund’s Forms N-Q are also available on the Fund’s website at www.williamblairfunds.com.
122 Semi-Annual Report | June 30, 2007 |
Useful Information About Your Report (unaudited)
Please refer to this information when reviewing the Expense Example for each Portfolio.
Expense Example
As a shareholder of a Portfolio, you incur two types of costs: (1) transaction costs such as redemption fees and (2) ongoing costs, including management fees, distribution (12b-1) fees (for Class N shares except for Ready Reserves Portfolio), service fees (for Class N shares of Ready Reserves Portfolio), shareholder administration fees (for Class N and Class I shares of the International Small Cap Growth Portfolio, the Emerging Markets Growth Portfolio and the Bond Portfolio) and other Portfolio expenses. The example is intended to help you understand your ongoing costs (in dollars) of investing in the Portfolio and to compare these costs with the ongoing costs of investing in other mutual funds. To do so, compare the Portfolio’s 5% hypothetical example with the 5% hypothetical examples that appear in the shareholder reports of other funds. The example is based on an investment of $1,000 invested at the beginning of the period and held for the entire six-month period from January 1, 2007 to June 30, 2007.
Actual Expenses
In each example, the first line for each share class in the table provides information about the actual account values and actual expenses. These expenses reflect the effect of any expense cap applicable to the share class during the period. Without this expense cap, the costs shown in the table would have been higher. You may use the information in this line, together with the amount you invested, to estimate the expenses that you paid over the period. Simply divide your account value by $1,000 (example, an $8,600 account value divided by $1,000 = 8.6), then multiply the result by the number in the first line under the heading entitled “Expenses Paid During the Period” to estimate the expenses you paid on your account during the period.
Hypothetical Example for Comparison Purposes
In each example, the second line for each share class in the table provides information about hypothetical account values and hypothetical expenses based on the Portfolio’s actual expense ratio and an assumed rate of return of 5% per year before expenses. This is not the Portfolio’s actual return. The hypothetical account values and expenses may not be used to estimate the actual ending account balance or expenses you paid for the period. You may use this information to compare the ongoing costs of investing in the Portfolio to other funds. To do so, compare this 5% hypothetical example with the 5% hypothetical examples that appear in the shareholder reports of other funds.
Please note that the expenses shown in both examples are meant to highlight your ongoing costs only and do not reflect any transactional costs or account type fees, such as redemption fees and IRA Fiduciary Administration fees, respectively. These fees are fully described in the prospectus. Therefore, the second line of each share class in the table is useful in comparing ongoing costs only and will not help you determine the relative costs of owning different funds. In addition, if these transactional costs or account fees were included, your costs would have been higher.
June 30, 2007 | William Blair Funds 123 |
Fund Expenses (unaudited)
The examples below show you the ongoing costs (in dollars) of investing in your fund and allows you to compare these costs with those of other mutual funds. Please refer to the previous page for a detailed explanation of the information presented on this chart.
| | | | | | | | | | | | |
| | | Beginning
Account Value
1/1/2007 | | Ending
Account Value
6/30/2007 | | Expenses Paid
during Period(a) | | Annualized
Expense Ratio | |
Growth Fund | | | | | | | | | | | | |
Class N—actual return | | $ | 1,000.00 | | $ | 1,078.80 | | $ | 6.24 | | 1.21 | % |
Class N—hypothetical 5% return | | | 1,000.00 | | | 1,018.79 | | | 6.06 | | 1.21 | |
Class I—actual return | | | 1,000.00 | | | 1,081.50 | | | 4.49 | | 0.87 | |
Class I—hypothetical 5% return | | | 1,000.00 | | | 1,020.48 | | | 4.36 | | 0.87 | |
Tax-Managed Growth Fund | | | | | | | | | | | | |
Class N—actual return | | | 1,000.00 | | | 1,074.00 | | | 7.05 | | 1.37 | |
Class N—hypothetical 5% return | | | 1,000.00 | | | 1,018.00 | | | 6.85 | | 1.37 | |
Class I—actual return | | | 1,000.00 | | | 1,075.30 | | | 5.76 | | 1.12 | |
Class I—hypothetical 5% return | | | 1,000.00 | | | 1,019.34 | | | 5.61 | | 1.12 | |
Large Cap Growth Fund | | | | | | | | | | | | |
Class N—actual return | | | 1,000.00 | | | 1,058.10 | | | 6.28 | | 1.23 | |
Class N—hypothetical 5% return | | | 1,000.00 | | | 1,018.60 | | | 6.16 | | 1.23 | |
Class I—actual return | | | 1,000.00 | | | 1,057.20 | | | 5.05 | | 0.99 | |
Class I—hypothetical 5% return | | | 1,000.00 | | | 1,019.89 | | | 4.96 | | 0.99 | |
Small Cap Growth Fund | | | | | | | | | | | | |
Class N—actual return | | | 1,000.00 | | | 1,089.70 | | | 7.72 | | 1.49 | |
Class N—hypothetical 5% return | | | 1,000.00 | | | 1,017.41 | | | 7.45 | | 1.49 | |
Class I—actual return | | | 1,000.00 | | | 1,091.40 | | | 6.22 | | 1.20 | |
Class I—hypothetical 5% return | | | 1,000.00 | | | 1,018.84 | | | 6.01 | | 1.20 | |
Mid Cap Growth Fund | | | | | | | | | | | | |
Class N—actual return | | | 1,000.00 | | | 1,129.10 | | | 7.34 | | 1.39 | |
Class N—hypothetical 5% return | | | 1,000.00 | | | 1,017.90 | | | 6.95 | | 1.39 | |
Class I—actual return | | | 1,000.00 | | | 1,131.60 | | | 5.97 | | 1.13 | |
Class I—hypothetical 5% return | | | 1,000.00 | | | 1,019.19 | | | 5.66 | | 1.13 | |
Small-Mid Cap Growth Fund | | | | | | | | | | | | |
Class N—actual return | | | 1,000.00 | | | 1,132.70 | | | 7.19 | | 1.36 | |
Class N—hypothetical 5% return | | | 1,000.00 | | | 1,018.05 | | | 6.80 | | 1.36 | |
Class I—actual return | | | 1,000.00 | | | 1,134.00 | | | 5.87 | | 1.11 | |
Class I—hypothetical 5% return | | | 1,000.00 | | | 1,019.29 | | | 5.56 | | 1.11 | |
International Growth Fund | | | | | | | | | | | | |
Class N—actual return | | | 1,000.00 | | | 1,116.60 | | | 7.35 | | 1.40 | |
Class N—hypothetical 5% return | | | 1,000.00 | | | 1,017.85 | | | 7.00 | | 1.40 | |
Class I—actual return | | | 1,000.00 | | | 1,118.50 | | | 5.78 | | 1.10 | |
Class I—hypothetical 5% return | | | 1,000.00 | | | 1,019.34 | | | 5.51 | | 1.10 | |
International Equity Fund | | | | | | | | | | | | |
Class N—actual return | | | 1,000.00 | | | 1,094.70 | | | 7.53 | | 1.45 | |
Class N—hypothetical 5% return | | | 1,000.00 | | | 1,017.65 | | | 7.25 | | 1.45 | |
Class I—actual return | | | 1,000.00 | | | 1,096.00 | | | 6.70 | | 1.20 | |
Class I—hypothetical 5% return | | | 1,000.00 | | | 1,018.89 | | | 6.46 | | 1.20 | |
International Small Cap Growth Fund | | | | | | | | | | | | |
Class N—actual return | | | 1,000.00 | | | 1,143.60 | | | 8.56 | | 1.61 | |
Class N—hypothetical 5% return | | | 1,000.00 | | | 1,016.81 | | | 8.05 | | 1.61 | |
Class I—actual return | | | 1,000.00 | | | 1,144.70 | | | 6.91 | | 1.30 | |
Class I—hypothetical 5% return | | | 1,000.00 | | | 1,018.35 | | | 6.51 | | 1.30 | |
124 Semi-Annual Report | June 30, 2007 |
| | | | | | | | |
| | | Beginning
Account Value
1/1/2007 | | Ending
Account Value
6/30/2007 | | Expenses Paid
during Period(a) | | Annualized
Expense Ratio |
Emerging Markets Growth Fund | | | | | | | | |
Class N—actual return | | 1,000.00 | | 1,165.30 | | 8.86 | | 1.65 |
Class N—hypothetical 5% return | | 1,000.00 | | 1,016.61 | | 8.25 | | 1.65 |
Class I—actual return | | 1,000.00 | | 1,167.40 | | 7.52 | | 1.40 |
Class I—hypothetical 5% return | | 1,000.00 | | 1,017.85 | | 7.00 | | 1.40 |
Value Discovery Fund | | | | | | | | |
Class N—actual return | | 1,000.00 | | 1,064.50 | | 6.86 | | 1.34 |
Class N—hypothetical 5% return | | 1,000.00 | | 1,018.15 | | 6.71 | | 1.34 |
Class I—actual return | | 1,000.00 | | 1,065.40 | | 5.58 | | 1.09 |
Class I—hypothetical 5% return | | 1,000.00 | | 1,019.39 | | 5.46 | | 1.09 |
Bond Fund | | | | | | | | |
Class N—actual return (since inception period) (b) | | 1,000.00 | | 988.50 | | 1.08 | | 0.65 |
Class N—hypothetical (6 month period) | | 1,000.00 | | 1,021.57 | | 3.26 | | 0.65 |
Class I—actual return (since inception period) (b) | | 1,000.00 | | 988.50 | | 0.83 | | 0.50 |
Class I—hypothetical (6 month period) | | 1,000.00 | | 1,021.57 | | 2.51 | | 0.50 |
Income Fund | | | | | | | | |
Class N—actual return | | 1,000.00 | | 1,004.50 | | 3.83 | | 0.77 |
Class N—hypothetical 5% return | | 1,000.00 | | 1,020.98 | | 3.86 | | 0.77 |
Class I—actual return | | 1,000.00 | | 1,005.90 | | 2.98 | | 0.60 |
Class I—hypothetical 5% return | | 1,000.00 | | 1,021.82 | | 3.01 | | 0.60 |
Ready Reserves Fund | | | | | | | | |
Class N—actual return | | 1,000.00 | | 1,023.70 | | 3.16 | | 0.63 |
Class N—hypothetical 5% return | | 1,000.00 | | 1,021.67 | | 3.16 | | 0.63 |
| (a) | | Expenses are equal to the annualized expense ratio, multiplied by the average account value over the period, multiplied by the number of days in the period 181, and divided by 365 (to reflect the one-half year period.) |
| (b) | | For the period May 1, 2007 (Commencement of Operations) until June 30, 2007. |
June 30, 2007 | William Blair Funds 125 |
BOARD OF TRUSTEES
Frederick Conrad Fischer, Chairman
Principal, William Blair & Company, L.L.C.
Ann P. McDermott
Director and Trustee
Profit and not-for-profit organizations
Phillip O. Peterson
Retired Partner, KPMG LLP
Donald J. Reaves
Vice President for Administration and Chief Financial Officer, University of Chicago
Donald L. Seeley
Adjunct Lecturer and Director, University of Arizona Department of Finance
Michelle R. Seitz
Principal, William Blair & Company, L.L.C.,
Thomas J. Skelly
Director and Investment Committee Chairman, U.S. Accenture Foundation Inc.
Robert E. Wood II
Retired Executive Vice President, Morgan Stanley Dean Witter
Officers
Marco Hanig, Senior Vice President
Karl W. Brewer, Senior Vice President
Harvey H. Bundy III, Senior Vice President
Mark A. Fuller, III, Senior Vice President
James S. Golan, Senior Vice President
W. George Greig, Senior Vice President
Michael A. Jancosek, Senior Vice President
John F. Jostrand, Senior Vice President
James S. Kaplan, Senior Vice President
Robert C. Lanphier, IV, Senior Vice President
Todd M. McClone, Senior Vice President
David S. Mitchell, Senior Vice President
Gregory J. Pusinelli, Senior Vice President
David P. Ricci, Senior Vice President
Jeffrey A. Urbina, Senior Vice President
Christopher T. Vincent, Senior Vice President
Colin J. Williams, Senior Vice President
Richard W. Smirl, Chief Compliance Officer
Benjamin J. Armstrong, Vice President
David C. Fording, Vice President
Chad M. Kilmer, Vice President
Mark T. Leslie, Vice President
Terence M. Sullivan, Vice President and Treasurer
Colette M. Garavalia, Secretary
Investment Advisor
William Blair & Company, L.L.C.
Independent Registered Public Accounting Firm
Ernst & Young LLP
Legal Counsel
Vedder, Price, Kaufman & Kammholz, P.C.
Transfer Agent
State Street Bank and Trust Company
P.O. Box 8506
Boston, MA 02266-8506
For customer assistance, call 1-800-635-2886
(Massachusetts 1-800-635-2840)
126 Semi-Annual Report | June 30, 2007 |

WILLIAM BLAIR FUNDS
INSTITUTIONAL FUNDS
SEMI-ANNUAL REPORT
JUNE 30 , 2007
Table of Contents
This report is submitted for the general information of the shareholders of the William Blair Funds. It is not authorized for distribution to prospective investors unless accompanied or preceded by a prospectus of the William Blair Funds. Please consider the Funds’ investment objectives, risks, charges, and expenses before investing. This and other information is contained in the Funds’ prospectus, which you may obtain by calling 1-800-742-7272. Read it carefully before you invest or send money. William Blair & Company, LLC., distributor.
June 30, 2007 | William Blair Funds 1 |
International Markets Overview
Powerful economic momentum continues to be the driving force behind positive global equity returns. Of the 42 countries whose growth is tracked by the Economist, over two thirds are currently reporting real growth above 3%; the median growth rate for emerging market economies is 6.1%. Among G7 economies, only the US is below its trend rate of growth, held back by the ongoing housing slowdown.
Listed companies outside the US, as represented by the MSCI All Country World ex US Index, have shown remarkable profit gains over the last five years, with 14% annual growth leading to a historically high return on equity of 20%. Strong underlying growth combined with improving productivity and balance sheet management have produced exceptional cash flow and value creation. In turn, with capital costs and inflation subdued, the environment for equity returns overall, and for buyouts and M&A activity in particular, has been consistently strong.
Capital flows to both bonds and equities have followed these growth trends, especially in emerging markets. Corporate bonds and emerging market sovereign debt have strengthened, while historically volatile equity subclasses (small cap and emerging markets) have outperformed.
Since the global recovery began in 2003, there have been three ‘hypotheticals’ that have acted as braking mechanisms on equity returns: concern that a US-led slowdown would stall global growth; concern that commodity price increases and high utilization rates might spill over into wage and price inflation; and worries that either lower growth or higher interest rates could destabilize credit and liquidity and cause a financial accident.
Most recently, in the second quarter, both inflation and financial risk have been in the headlines. In May, US and European rates rose significantly on fears of an inflation/tightening cycle, and in June, the Bear Stearns hedge fund dislocations gave rise to speculation that mortgage-related derivatives might carry the seeds of systemic financial risk.
The market corrections associated with these events seem to have been orderly adjustments to relatively cautious changes in consensus expectations. Risk-awareness seems relatively close to the surface among market participants; there are few if any signs of any kind of asset bubble, in spite of widespread efforts to identify one (or more).
Outlook
For the present, the global economy and financial markets continue to function in relatively stable equilibrium. Anomalies like isolated property booms, errant exchange rates, hedge fund stresses, and weakness in the US mortgage market are relatively minor in the context of a global economy adding nearly $2 trillion a year in output. Global saving seems to be funding a level of real investment activity adequate to sustain non-inflationary growth; consumption growth is reasonably well-balanced across income strata and regions; and capital market activity is well within rational valuation parameters.
Risks and challenges to the sustainability of growth have historically increased with the age of the economic cycle, and the potential for imbalances continues to exist. The conventional end-of-cycle overheating scenario probably remains the key risk to monitor (along with rising tensions in the Middle East), but a more stable phase of expansion may continue to provide a relatively benign market environment for some time to come.
2 Semi-Annual Report | June 30, 2007 |

W. George Greig
INSTITUTIONAL INTERNATIONAL GROWTH FUND
The Institutional International Growth Fund invests primarily in common stocks of foreign growth companies of all sizes.
AN OVERVIEW FROM THE PORTFOLIO MANAGER
See page 2 for the International Markets Overview.
How did the Fund perform over the first half of the year? How did the Fund’s performance compare to its benchmark?
The Institutional International Growth Fund posted an 11.86% gain for the six months ended June 30, 2007. By comparison, the Fund’s benchmark, the Morgan Stanley Capital International (MSCI) All Country World (ACWI) ex-US Index, rose 12.58%.
What were the most significant factors impacting international markets during the first six months of the year?
Non-US markets were strong during the first half of 2007, buoyed by strong results in emerging markets, Canada, Europe and the Pacific Rim. However, the first six months were punctuated by periods of volatility as investors were concerned in the first quarter about the US subprime mortgage market resulting in slowing US consumer demand and its impact on global growth. In the second quarter, investors became concerned about the prospects of a protracted global increasing interest rate environment as the US economy appeared to accelerate and demand for industrial and consumer goods and services remained strong globally. In addition, worries about the impact of US subprime mortgages on the financial industry, including hedge funds, caused apprehension regarding overall financial system risk. Despite these fears, the market returned 12.58% through June 30, as measured by the MSCI ACWI ex-US Index, with most of the performance coming during the second quarter. Emerging markets outpaced their developed counterparts, returning 17.75%, as compared to the MSCI Europe, Australia, and Far East (EAFE) Index, which rose 11.09% in US dollar terms. Materials, Industrials and Energy were the strongest sectors year to date, while Financials and Health Care lagged.
What factors were behind the Fund’s performance versus the benchmark?
Within this environment, the Fund trailed the benchmark during the second quarter, and therefore year to date. The primary detractor to relative results was the Fund’s overall sector positioning during the second quarter despite strong stock selection across most sectors, as it was underweighted in Materials and Energy and overweighted in the Consumer sectors, which lagged. In addition, Materials and Industrials stock selection, while strong on an absolute basis, trailed comparable Index results. Within Materials, there were several Japanese and UK stocks that dragged on results, while relative Industrials performance was hampered by airline-related companies, coupled with underperformance in Japan. While stock selection was strong across most sectors during the first half of the year, the most significant value added was in Health Care, Energy, and Telecommunication Services. Within Health Care, the focus on diagnostics and medical technology at the expense of pharmaceuticals added value, while energy stock selection benefited from the focus on energy services, engineering, and high production growth exploration and production companies. Telecommunication Services stock selection was bolstered by alternative cable providers in Europe, coupled with emerging markets mobile phone companies, which benefited from strong subscriber growth during the period. The Fund’s higher weightings in Industrials added value, as did its underweighting in the underperforming Financials sector. Stock selection was strong across most regions, with the most significant
June 30, 2007 | William Blair Funds 3 |
value added in Pacific ex-Japan, particularly in Australia and Singapore. At the margin, regional positioning also added value during the period.
How is the Fund positioned?
As of June 30, the Fund was overweighted in Pacific ex-Japan, emerging Asia and Latin America versus the Index, and significantly underweighted in Japan. These weightings were largely the result of relative growth opportunities available in these markets. The Fund maintained its focus on the Consumer area, particularly in European Consumer Staples and emerging markets Consumer Discretionary and Staples companies. In addition, Industrials remained a significant percentage of the Fund, with a concentration on companies exposed to the aircraft, commodity, and energy complexes, coupled with those exposed to additional infrastructure spend globally. Financials, although underweighted versus the Index, was the largest sector at approximately 26% of the Fund, and was focused in companies exposed to capital markets, real estate, and securities exchanges. While the weighting in Materials and Telecommunication Services remained underweighted versus the benchmark, these weightings increased as additional names were added in these sectors during the quarter.
4 Semi-Annual Report | June 30, 2007 |
Institutional International Growth Fund
Performance Highlights (unaudited)
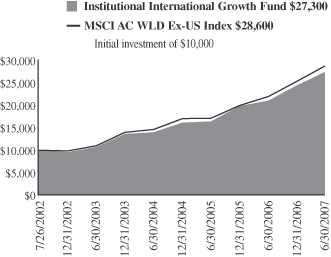
Average Annual Total Return at 6/30/2007
| | | | | | | | | | | | |
| | | Year to
Date | | | 1
Year | | | 3
Year | | | Since Inception(a) | |
Institutional International Growth Fund | | 11.86 | % | | 30.26 | % | | 24.81 | % | | 22.55 | % |
MSCI All Country World Ex-US Index | | 12.58 | | | 30.15 | | | 25.03 | | | 23.62 | |
| | (a) | For the period from July 26, 2002 (Commencement of Operations) to June 30, 2007. |
Performance cited represents past performance. Past performance does not guarantee future results and current performance may be lower or higher than the data quoted. Results shown are average annual returns, which assume reinvestment of dividends and capital gains. Investment returns and principal will fluctuate and you may have a gain or loss when you sell shares. For the most current month-end performance information, please call 1-800-742-7272, or visit our Web site at www.williamblairfunds.com. International investing involves special risk considerations, including currency fluctuations, lower liquidity, economic and political risk.
The performance highlights and graph presented above do not reflect the deduction of taxes that a shareholder would pay on fund distributions or the redemption of fund shares.
The Morgan Stanley Capital International (MSCI) All Country World ex-US Index is an unmanaged index that includes developed and emerging markets and reduced Japanese portion, making it more comparable to the Institutional International Growth Fund in terms of investment approach.
This report identifies the Fund’s investments on June 30, 2007. These holdings are subject to change. Not all stocks in the Fund performed the same, nor is there any guarantee that these stocks will perform as well in the future. Market forecasts provided in this report may not necessarily come to pass.
Sector Diversification (unaudited)
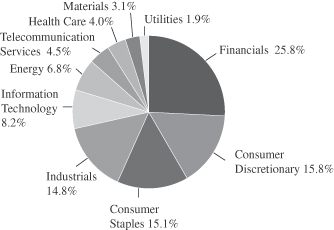
The sector diversification shown is based on the total investment portfolio.
June 30, 2007 | William Blair Funds 5 |
Institutional International Growth Fund
Portfolio of Investments, June 30, 2007 (all dollar amounts in thousands) (unaudited)
| | | | | |
Issuer | | Shares | | Value |
| | | | | |
| | |
Common Stocks—Europe—33.5% | | | | | |
Austria—1.5% | | | | | |
Erste Bank (Commercial banks) | | 138,404 | | $ | 10,787 |
Raiffeisen Interantional Bank (Commercial banks) | | 139,900 | | | 22,097 |
| | | | | |
| | | | | 32,884 |
| | | | | |
Belgium—1.4% | | | | | |
InBev NV (Beverages) | | 366,000 | | | 28,989 |
| | | | | |
Finland—0.5% | | | | | |
Nokian Renkaat OYJ (Auto components) | | 318,200 | | | 11,148 |
| | | | | |
France—11.0% | | | | | |
April Group S.A. (Insurance) | | 56,300 | | | 2,958 |
AXA (Insurance) | | 797,900 | | | 34,298 |
Capgemini S.A. (IT services) | | 232,600 | | | 17,005 |
EDF Energies Nouvelles S.A. (Electric utilities) | | 140,100 | | | 9,171 |
Essilor International (Health care equipment & supplies) | | 141,300 | | | 16,830 |
Eurazeo (Diversified financial services) | | 101,741 | | | 14,702 |
Group Danone (Food products) | | 363,100 | | | 29,326 |
Iliad S.A. (Internet software & services) | | 78,800 | | | 7,937 |
Klepierre (Real estate investment trusts) | | 40,270 | | | 6,819 |
L’Oreal S.A. (Personal products) | | 260,500 | | | 30,791 |
LVMH Moet Hennessey Louis Vuitton SA (Textiles,apparel & luxury goods) | | 218,100 | | | 25,096 |
*Orpea (Health care providers & services) | | 54,533 | | | 5,731 |
*Seloger.com (Media) | | 81,200 | | | 4,508 |
Veolia Environnement (Multi-utilities) | | 397,125 | | | 31,191 |
| | | | | |
| | | | | 236,363 |
| | | | | |
Germany—1.6% | | | | | |
*Colonia Real Estate AG (Real estate management & development) | | 68,200 | | | 2,863 |
CTS Eventim AG (Media) | | 72,700 | | | 3,583 |
*Q-Cells AG (Electrical equipment) | | 149,120 | | | 12,863 |
Solarworld AG (Electrical equipment) | | 192,800 | | | 8,900 |
*Wire Card AG (Commercial services & supplies) | | 467,200 | | | 6,284 |
| | | | | |
| | | | | 34,493 |
| | | | | |
Greece—1.8% | | | | | |
Coca-Cola Hellenic Bottling S.A. (Beverages) | | 255,000 | | | 11,734 |
EFG Eurobank (Commercial banks) | | 243,912 | | | 7,947 |
Jumbo S.A. (Leisure equipment & products) | | 182,100 | | | 6,297 |
National Bank of Greece (Commercial banks) | | 222,426 | | | 12,665 |
| | | | | |
| | | | | 38,643 |
| | | | | |
Ireland—1.7% | | | | | |
Anglo Irish Bank plc (Commercial banks) | | 918,600 | | | 18,853 |
Kingspan Group plc (Building products) | | 453,300 | | | 12,714 |
United Drug plc (Health care providers & services) | | 727,300 | | | 3,979 |
| | | | | |
| | | | | 35,546 |
| | | | | |
Italy—3.0% | | | | | |
Azimut Holding SpA (Capital markets) | | 424,100 | | | 7,242 |
Credito Emiliano SpA (Commercial banks) | | 394,600 | | | 5,591 |
Luxottica Group SpA (Textiles, apparel & luxury goods) | | 306,900 | | | 11,922 |
| | | | | |
Issuer | | Shares | | Value |
| | | | | |
|
Common Stocks—Europe—33.5%—(continued) |
Italy (continued) | | | | | |
Saipem SpA (Energy equipment & services) | | 984,200 | | $ | 33,581 |
Tod’s SpA ( Textiles,apparel & luxury goods) | | 70,900 | | | 6,327 |
| | | | | |
| | | | | 64,663 |
| | | | | |
Netherlands—1.2% | | | | | |
*Qiagen NV (Life science tools & services) | | 351,600 | | | 6,317 |
Royal Numico NV (Food products) | | 256,600 | | | 13,334 |
*Tomtom NV (Software) | | 125,500 | | | 6,400 |
| | | | | |
| | | | | 26,051 |
| | | | | |
Norway—0.9% | | | | | |
Acergy S.A. (Energy equipment & services) | | 530,500 | | | 11,943 |
*Electromagnetic GeoServices AS (Energy equipment & services) | | 309,500 | | | 6,246 |
| | | | | |
| | | | | 18,189 |
| | | | | |
Spain—1.7% | | | | | |
Grifols S.A. (Biotechnology) | | 617,500 | | | 13,378 |
Industria De Textile (Specialty retail) | | 252,900 | | | 14,885 |
Tecnicas Reunidas S.A. (Construction & engineering) | | 122,500 | | | 8,234 |
| | | | | |
| | | | | 36,497 |
| | | | | |
Sweden—1.0% | | | | | |
Ericsson (LM) (Communications equipment) | | 3,479,000 | | | 13,877 |
Hemtex AB (Specialty retail) | | 95,900 | | | 1,837 |
Nobia AB (Specialty retail) | | 510,350 | | | 6,356 |
| | | | | |
| | | | | 22,070 |
| | | | | |
Switzerland—6.2% | | | | | |
ABB Ltd. (Electrical equipment) | | 1,679,600 | | | 37,871 |
*Barry Callebaut AG (Food products) | | 10,600 | | | 8,024 |
EFG International (Capital markets) | | 236,700 | | | 10,884 |
Geberit AG (Building products) | | 59,100 | | | 10,070 |
Kuehne & Nagel International AG (Marine) | | 199,700 | | | 18,393 |
Nobel Biocare Holdings AG (Health care equipment & supplies) | | 33,250 | | | 10,854 |
Partners Group Global Opporunites, Ltd. (Capital markets) | | 63,850 | | | 8,568 |
Roche Holdings AG (Pharmaceuticals) | | 127,200 | | | 22,538 |
SGS S.A. (Commercial services & supplies) | | 5,368 | | | 6,347 |
| | | | | |
| | | | | 133,549 |
| | | | | |
| | |
United Kingdom—17.8% | | | | | |
Amlin plc (Insurance) | | 1,443,900 | | | 8,095 |
Ashmore Group plc (Capital markets) | | 726,700 | | | 3,916 |
*Autonomy Corporation plc (Software) | | 646,300 | | | 9,270 |
BG Group plc (Oil, gas & consumable fuels) | | 1,847,720 | | | 30,289 |
*Blinkx plc (Internet software & services) | | 1,148,700 | | | 1,003 |
*BlueBay Asset Management plc (Capital markets) | | 512,000 | | | 5,060 |
*Cairn Energy plc (Oil, gas & consumable fuels) | | 254,437 | | | 8,968 |
Capita Group plc (Commercial services & supplies) | | 1,670,200 | | | 24,246 |
Carphone Warehouse Group plc (Specialty retail) | | 1,313,200 | | | 8,632 |
Carter & Carter Group plc (Commercial services & supplies) | | 150,500 | | | 1,447 |
Detica Group plc (IT services) | | 624,600 | | | 4,810 |
See accompanying Notes to Financial Statements.
6 Semi-Annual Report | June 30, 2007 |
Institutional International Growth Fund
Portfolio of Investments, June 30, 2007 (all dollar amounts in thousands) (unaudited)
| | | | | |
Issuer | | Shares | | Value |
| | | | | |
|
Common Stocks—United Kingdom—17.8%—(continued) |
Domino’s Pizza UK & IRL plc (Hotels, restaurants, & leisure) | | 865,880 | | $ | 4,811 |
HBOS plc (Commercial banks) | | 942,500 | | | 18,538 |
Homeserve plc (Commercial services & supplies) | | 207,500 | | | 7,441 |
Man Group plc (Capital markets) | | 2,071,000 | | | 25,191 |
Michael Page International (Commercial services & supplies) | | 1,367,600 | | | 14,368 |
Northern Rock plc (Thrifts & mortgage finance) | | 139,200 | | | 2,409 |
Reckitt Benckiser plc (Household products) | | 718,250 | | | 39,321 |
Restaurant Group plc (Hotels, restaurants, & leisure) | | 674,200 | | | 4,447 |
Rightmove plc (Media) | | 465,600 | | | 5,838 |
*Rolls-Royce Group plc (Aerospace & defense) | | 155,317,120 | | | 312 |
*Rolls-Royce Group plc, Class “B” (Aerospace & defense) | | 2,679,000 | | | 28,846 |
Rotork plc (Electronic equipment & instruments) | | 472,700 | | | 8,636 |
RPS Group plc (Commercial services & supplies) | | 1,057,800 | | | 7,422 |
Serco Group (Commercial services & supplies) | | 1,449,100 | | | 13,063 |
Tesco plc (Food & staples retailing) | | 4,795,700 | | | 40,124 |
Tullow Oil plc (Oil, gas & consumable fuels) | | 832,680 | | | 8,129 |
Ultra Electronic Holdings plc (Aerospace & defense) | | 256,000 | | | 5,536 |
Victrex plc (Chemicals) | | 168,100 | | | 2,403 |
VT Group plc (Aerospace & defense) | | 740,400 | | | 8,707 |
Xstrata plc (Metals & mining) | | 496,800 | | | 29,576 |
| | | | | |
| | | | | 380,854 |
| | | | | |
| | |
Emerging Asia—10.9% | | | | | |
China—3.8% | | | | | |
*Belle International Holdings Limited (Specialty retail) | | 7,277,000 | | | 8,032 |
China Infrastructure Machinery Holdings, Ltd. (Machinery) | | 2,942,000 | | | 6,433 |
China Mengniu Dairy Co. (Food products) | | 2,576,000 | | | 8,888 |
China Oilfield Services Limited (Energy equipment & services) | | 3,546,000 | | | 3,579 |
China Vanke Company Ltd. (Real estate management & development) | | 5,582,550 | | | 11,555 |
*Focus Media Holding Ltd.—ADR (Media) | | 108,100 | | | 5,459 |
*Foxconn International (Communications equipment) | | 3,470,800 | | | 9,944 |
Fu Ji Food & Catering (Hotels, restaurants & leisure) | | 1,852,000 | | | 6,376 |
Hopson Development Holdings Ltd. (Real estate management & development) | | 562,200 | | | 1,581 |
Lee and Man Paper Manufacturing Ltd. (Containers & packaging) | | 1,942,000 | | | 5,377 |
Li Ning Co. Ltd. (Leisure equipment & products) | | 2,772,000 | | | 6,722 |
Parkson Retail Group Ltd. (Multiline retail) | | 947,500 | | | 6,071 |
Wumart Stores, Inc., Class “H” (Food & staples retailing)** | | 4,200,000 | | | 1,343 |
| | | | | |
| | | | | 81,360 |
| | | | | |
| | | | | |
Issuer | | Shares | | Value |
| | | | | |
|
Common Stocks—Emerging Asia—10.9%—(continued) |
India—2.5% | | | | | |
Bharat Heavy Electricals Ltd. (Electrical equipment) | | 144,800 | | $ | 5,477 |
*Bharti Airtel Ltd. (Wireless telecommunication services) | | 530,500 | | | 10,904 |
Dabur India Ltd. (Personal products) | | 2,369,750 | | | 5,988 |
Financial Technologies (India) LTD (Software) | | 118,700 | | | 8,802 |
Housing Development Finance Corp. (Thrifts & mortgage finance) | | 108,900 | | | 5,437 |
Infosys Technologies, Ltd. (IT services) | | 214,556 | | | 10,154 |
Unitech Limited (Construction & engineering) | | 470,300 | | | 5,817 |
| | | | | |
| | | | | 52,579 |
| | | | | |
Indonesia—0.9% | | | | | |
PT Bank Rakyat Indonesia (Commercial banks) | | 10,548,500 | | | 6,718 |
PT Telekomunikasi Tbk (Diversified telecommunication services) | | 11,576,100 | | | 12,558 |
| | | | | |
| | | | | 19,276 |
| | | | | |
Malaysia—1.0% | | | | | |
Bumiputra Commerce Holdings Bhd (Commercial banks) | | 4,293,400 | | | 14,548 |
Kuala Lumpur Kepong Bhd (Food products) | | 1,370,500 | | | 5,126 |
Zelan Bhd (Construction & engineering) | | 743,800 | | | 2,592 |
| | | | | |
| | | | | 22,266 |
| | | | | |
South Korea—0.8% | | | | | |
*NHN Corp. (Internet software & services) | | 95,420 | | | 17,369 |
| | | | | |
Taiwan—1.9% | | | | | |
Himax Technologies, Inc.—ADR (Semiconductors & semiconductor equipment)† | | 289,000 | | | 1,667 |
Hon Hai Precision Industry (Electronic equipment & instrument) | | 2,539,506 | | | 21,935 |
Mediatek Inc. (Semiconductors & semiconductor equipment) | | 1,031,120 | | | 16,043 |
| | | | | |
| | | | | 39,645 |
| | | | | |
| | |
Asia—10.3% | | | | | |
Australia—5.3% | | | | | |
Allco Finance Group, Limited (Capital markets) | | 803,472 | | | 7,231 |
Macquarie Bank, Ltd. (Capital markets) | | 565,300 | | | 40,603 |
Seek Ltd. (Commercial services & supplies) | | 1,226,300 | | | 7,656 |
United Group Ltd. (Construction & engineering) | | 569,300 | | | 8,023 |
Woolworths Limited (Food & staples retailing) | | 1,533,600 | | | 35,047 |
WorleyParsons, Ltd. (Energy equipment & services) | | 502,333 | | | 14,450 |
| | | | | |
| | | | | 113,010 |
| | | | | |
Hong Kong—1.6% | | | | | |
Esprit Holdings Ltd. (Specialty retail) | | 1,815,900 | | | 23,072 |
Li & Fung Ltd. (Distributors) | | 3,383,800 | | | 12,180 |
| | | | | |
| | | | | 35,252 |
| | | | | |
See accompanying Notes to Financial Statements.
June 30, 2007 | William Blair Funds 7 |
Institutional International Growth Fund
Portfolio of Investments, June 30, 2007 (all dollar amounts in thousands) (unaudited)
| | | | | |
Issuer | | Shares | | Value |
| | | | | |
|
Common Stocks—Asia—10.3%—(continued) |
Singapore—3.4% | | | | | |
Capitaland, Ltd. (Real estate management & development) | | 8,023,800 | | $ | 42,511 |
Olam International, Ltd. (Food & staples retailing) | | 3,323,000 | | | 6,703 |
Osim International Ltd. (Specialty retail) | | 2,986,540 | | | 1,389 |
Raffles Education Corp. (Diversified consumer services) | | 3,438,000 | | | 5,126 |
Singapore Exchange, Ltd. (Diversified financial services) | | 2,703,000 | | | 17,342 |
| | | | | |
| | | | | 73,071 |
| | | | | |
| | |
Japan—9.6% | | | | | |
Aeon Mall Co., Ltd. (Real estate management & development) | | 298,600 | | | 9,181 |
DeNA Co., Ltd. (Internet & catalog retail) | | 1,478 | | | 5,125 |
Denso Corporation (Auto components) | | 442,800 | | | 17,318 |
En-Japan Inc. (Commercial services & supplies) | | 1,348 | | | 5,023 |
*Fujimi, Inc. (Chemicals) | | 120,500 | | | 3,169 |
Fukuoka Financial Group, Inc. (Commercial banks) | | 2,158,000 | | | 14,267 |
Honeys Company, Ltd. (Specialty retail) | | 102,440 | | | 4,131 |
*Jupiter Telecommunications Co., Ltd. (Media) | | 14,015 | | | 11,579 |
*K.K. DaVinci Advisors (Real estate management & development) | | 5,320 | | | 4,644 |
Kenedix, Inc. (Real estate management & development) | | 1,754 | | | 3,264 |
Komatsu Ltd. (Machinery) | | 674,700 | | | 19,555 |
Miraial Company, Ltd. (Semiconductors & semiconductor equipment) | | 25,500 | | | 3,524 |
Nakanishi Inc. (Health care equipment & supplies) | | 30,100 | | | 3,764 |
Nintendo Co., Ltd. (Software) | | 68,900 | | | 25,138 |
Nitori Company Ltd. (Specialty retail) | | 118,780 | | | 5,930 |
Orix Corporation (Consumer finance) | | 122,800 | | | 32,368 |
Park 24 Co., Ltd. (Commercial services & supplies) | | 284,600 | | | 2,857 |
Suruga Bank (Commercial banks) | | 1,210,000 | | | 15,249 |
Yamada Denki Company (Specialty retail) | | 157,600 | | | 16,459 |
Zensho Company, Ltd. (Hotels, restaurants, & leisure) | | 334,100 | | | 3,176 |
| | | | | |
| | | | | 205,721 |
| | | | | |
| | |
Emerging Latin America—6.9% | | | | | |
Brazil—3.3% | | | | | |
*Anhanguera Eduacional Participacoes S.A. (Diversified consumer services) | | 383,200 | | | 5,364 |
*BR Malls Participacoes S.A. (Real estate management & development) | | 583,200 | | | 7,588 |
Companhia Vale do Rio Doce.—ADR (Metals & mining) | | 577,600 | | | 25,732 |
Cyrela Brazil Realty S.A. (Household durables) | | 430,900 | | | 5,348 |
Iguatemi Empresa de Shopping Centers S.A. (Commercial services & supplies) | | 245,400 | | | 4,430 |
Localiza Rent a Car S.A. (Road & rail) | | 425,300 | | | 4,797 |
Lojas Renner S.A. (Multiline retail) | | 333,000 | | | 6,180 |
Submarino S.A. (Internet & catalog retail) | | 183,700 | | | 7,642 |
Totvs S.A. (Software) | | 102,200 | | | 3,327 |
| | | | | |
| | | | | 70,408 |
| | | | | |
| | | | | |
Issuer | | Shares | | Value |
| | | | | |
| |
Common Stocks—Emerging Latin America—6.9%—(continued) | | | |
Chile—0.5% | | | | | |
*Cencosud S.A.—ADR 144A (Specialty retail) | | 182,300 | | $ | 11,343 |
| | | | | |
Mexico —2.7% | | | | | |
America Movil S.A. (Wireless telecommunication services) | | 6,249,100 | | | 19,296 |
*Banco Compartamos S.A. de C.V. (Commercial banks) | | 654,600 | | | 4,090 |
*Desarrolladora Homex S.A.—ADR (Household durables) | | 94,900 | | | 5,750 |
Grupo Aeropuertario Del—ADR (Transportation infrastructure) | | 76,500 | | | 3,773 |
*Urbi Desarrollos Urbanos S.A. (Household durables) | | 2,479,000 | | | 11,416 |
Walmart de Mexico (Food & staples retailing) | | 3,758,200 | | | 14,263 |
| | | | | |
| | | | | 58,588 |
| | | | | |
Panama—0.4% | | | | | |
Copa Holdings S.A., Class “A” (Airlines)† | | 110,800 | | | 7,450 |
| | | | | |
| |
Emerging Europe, Mid-East, Africa—4.7% | | | |
Czech Republic—0.2% | | | | | |
*Central European Media Enterprises Ltd. Class “A” (Media)† | | 52,500 | | | 5,123 |
| | | | | |
Egypt—0.8% | | | | | |
Egyptian Financial Group—Hermes Holding SAE (Captial markets) | | 735,600 | | | 5,930 |
Orascom Construction Industries (Construction & engineering) | | 163,400 | | | 10,682 |
| | | | | |
| | | | | 16,612 |
| | | | | |
Kazakhstan—0.5% | | | | | |
*Kazkommertsbank—GDR 144A (Commercial banks) | | 437,663 | | | 9,629 |
| | | | | |
Russia—1.1% | | | | | |
*CTC Media, Inc. (Media)† | | 225,702 | | | 6,126 |
Sberbank—CLS (Commercial banks) | | 2,635 | | | 10,276 |
*X5 Retail Group N.V. (Food & staples retailing) | | 208,700 | | | 6,115 |
| | | | | |
| | | | | 22,517 |
| | | | | |
South Africa—1.7% | | | | | |
MTN Group, Ltd. (Wireless telecommunication services) | | 1,025,500 | | | 13,939 |
Naspers Ltd. (Media) | | 260,500 | | | 6,693 |
The Spar Group Limited (Food & staples retailing) | | 576,200 | | | 4,311 |
Truworths International Ltd. (Specialty retail) | | 1,403,800 | | | 7,222 |
Wilson Bayly Holmes-Ovcon (Construction & engineering) | | 225,300 | | | 3,290 |
| | | | | |
| | | | | 35,455 |
| | | | | |
United Arab Emirates—0.4% | | | | | |
Emaar Properties PJSC (Real estate management & development) | | 2,699,700 | | | 8,710 |
| | | | | |
See accompanying Notes to Financial Statements.
8 Semi-Annual Report | June 30, 2007 |
Institutional International Growth Fund
Portfolio of Investments, June 30, 2007 (all dollar amounts in thousands) (unaudited)
| | | | | | |
Issuer | | Shares or
Principal
Amount | | Value |
| | | | | | |
| | |
Canada—3.8% | | | | | | |
Brookfield Asset Management, Inc. Class “A” (Real estate management & development) | | | 453,700 | | $ | 18,148 |
Canadian Western Bank (Commercial banks) | | | 163,900 | | | 4,345 |
*Gildan Activewear, Inc. (Textiles, apparel & luxury goods) | | | 233,400 | | | 7,969 |
Rogers Communications, Inc. Class “B” (Wireless telecommunication services) | | | 734,200 | | | 31,305 |
Shoppers Drug Mart Corp. (Food & staples retailing) | | | 415,600 | | | 19,249 |
| | | | | | |
| | | | | | 81,016 |
| | | | | | |
Total Common Stock—97.5%
(cost $1,468,148) | | | 2,086,339 |
| | | | | | |
| | |
Preferred Stock | | | | | | |
Brazil—1.3% | | | | | | |
Banco Itau Holding (Commercial banks) | | | 251,300 | | | 11,158 |
*Banco Sofisa S.A. (Commercial banks) | | | 538,500 | | | 3,964 |
Petroleo Brasileiro S.A. (Oil, gas & consumable fuels) | | | 517,800 | | | 13,824 |
| | | | | | |
| | | | | | 28,946 |
| | | | | | |
Total Preferred Stock—1.3%
(cost $15,216) | | | 28,946 |
| | | | | | |
| | |
Investment in Affiliate | | | | | | |
William Blair Ready Reserves Fund | | | 53,271 | | | 53 |
| | | | | | |
Total Investment in Affiliate—0.0%
(cost $53) | | | 53 |
| | | | | | |
| | |
Short-Term Investments | | | | | | |
American Express Demand Note, VRN
5.170% due 7/2/2007 | | $ | 12,755,000 | | | 12,755 |
Prudential Funding Demand Note, VRN
5.305% due 7/2/2007 | | | 7,255,000 | | | 7,255 |
| | | | | | |
Total Short-term Investments—0.9%
(cost $20,010) | | | 20,010 |
| | | | | | |
| | |
Repurchase Agreement | | | | | | |
Investors Bank & Trust Company, 4.500% dated 06/29/2007, due 07/02/2007, repurchase price $1,593, collateralized by SBA Pool # 506097 | | $ | 1,592,034 | | | 1,592 |
| | | | | | |
Total Repurchase Agreement—0.1%
(cost $1,592) | | | 1,592 |
| | | | | | |
Total Investments—99.8%
(cost $1,505,019) | | | 2,136,940 |
Cash and other assets, less liabilities—0.2% | | | 3,572 |
| | | | | | |
Net assets—100.0% | | $ | 2,140,512 |
| | | | | | |
*Non-income producing securities
ADR = American Depository Receipt
GDR = Global Depository Receipt
VRN = Variable Rate Note
† = U.S. listed foreign security
**Fair valued pursuant to Valuation Procedures adopted by the Board of Trustees. This holding represents 0.06% of the Fund’s net assets at June 30, 2007. This security was also deemed illiquid pursuant to Liquidity Procedures adopted by the Board of Trustees.
For securities primarily traded on exchanges or markets that close before the close of regular trading on the New York Stock Exchange the Fund uses an independent pricing service on a daily basis to fair value price the securities pursuant to Valuation Procedures adopted by the Board of Trustees.
At June 30, 2007 the Fund’s Portfolio of Investments includes the following industry categories:
| | |
Financials | | 25.8% |
Consumer Discretionary | | 15.8% |
Consumer Staples | | 15.1% |
Industrials | | 14.8% |
Information Technology | | 8.2% |
Energy | | 6.8% |
Telecommunication Services | | 4.5% |
Health Care | | 4.0% |
Materials | | 3.1% |
Utilities | | 1.9% |
| | |
| | 100.0% |
| | |
At June 30, 2007 the Fund’s Portfolio of Investments includes the following currency categories:
| | |
Euro | | 25.7% |
British Pound Sterling | | 18.0% |
Japanese Yen | | 9.7% |
Swiss Franc | | 6.3% |
Australian Dollar | | 5.3% |
Hong Kong Dollar | | 5.3% |
United States Dollar | | 4.7% |
Canadian Dollar | | 3.8% |
Singapore Dollar | | 3.5% |
Brazilian Real | | 3.5% |
Indian Rupee | | 2.5% |
Mexico Nuevo Peso | | 2.3% |
Taiwan Dollar | | 1.8% |
South African Rond | | 1.7% |
Swedish Krona | | 1.1% |
Malaysian Ringgit | | 1.1% |
All other currencies | | 3.7% |
| | |
| | 100.0% |
| | |
See accompanying Notes to Financial Statements.
June 30, 2007 | William Blair Funds 9 |
W. George Greig
INSTITUTIONAL INTERNATIONAL EQUITY FUND
The Institutional International Equity Fund invests primarily in common stocks of companies included in the Morgan Stanley Capital International All Country World ex-U.S. Index.
AN OVERVIEW FROM THE PORTFOLIO MANAGER
See page 2 for the International Markets Overview.
How did the Fund perform over the first half of the year? How did the Fund’s performance compare to its benchmark?
The Institutional International Equity Fund posted a 9.81% increase for the six months ended June 30, 2007. By comparison, the Fund’s benchmark, the Morgan Stanley Capital International (MSCI) All Country World (ACWI) ex-US Index, rose 12.58%.
What were the most significant factors impacting international markets during the first six months of the year?
Non-US markets were strong during the first half of 2007, buoyed by strong results in emerging markets, Canada, Europe and the Pacific Rim. However, the first six months were punctuated by periods of volatility as investors were concerned in the first quarter about the US subprime mortgage market resulting in slowing US consumer demand and its impact on global growth. In the second quarter, investors became concerned about the prospects of a protracted global increasing interest rate environment as the US economy appeared to accelerate and demand for industrial and consumer goods and services remained strong globally. In addition, worries about the impact of US subprime mortgages on the financial industry, including hedge funds, caused apprehension regarding overall financial system risk. Despite these fears, the market returned 12.58% through June 30, as measured by the MSCI ACWI ex-US Index, with most of the performance coming during the second quarter. Emerging markets outpaced their developed counterparts, returning 17.75%, as measured by the MSCI Emerging Markets Index compared to the MSCI Europe, Asia and Far-East (EAFE) Index, which rose 11.09% in US dollar terms. Materials, Industrials and Energy were the strongest sectors year to date, while Financials and Health Care lagged.
What factors were behind the Fund’s performance versus the benchmark?
Within this environment, the Fund trailed the benchmark. The primary detractor to relative results was the Fund’s overall sector positioning during the second quarter despite strong stock selection across a number of sectors. The Fund underweighted in Materials and Energy which gained and overweighted in both the Consumer Discretionary and Consumer Staples sectors, which lagged. In addition, Materials and Consumer stock selection, while strong on an absolute basis, trailed comparable Index results. Within Materials, Japanese exposure dragged on results, as did the absence of exposure in Canada and Pacific ex-Japan. Within Consumer, Japanese Consumer Discretionary exposure and stock selection was a primary detractor, as was European stock selection in Consumer Discretionary. While stock selection was strong across a number of sectors during the first half of the year, the most significant value added was in Health Care, Energy, and Telecommunication Services. Within Health Care, the focus on diagnostics and medical technology at the expense of pharmaceuticals added value, while energy stock selection benefited from the focus on energy services and high production growth exploration and production companies. European alternative cable providers and emerging markets mobile phone companies, which have benefited from strong subscriber growth, augmented strong Telecommunication Services stock selection. The Fund’s higher weightings in Industrials added value, as did its underweighting in the underperforming Financials sector. At the margin, regional positioning also added value during the period.
10 Semi-Annual Report | June 30, 2007 |
How is the Fund positioned?
As of June 30, the Fund was overweighted in Pacific ex-Japan, emerging Asia and Latin America versus the Index, and significantly underweighted in Japan. These weightings were largely the result of relative growth opportunities available in these markets. The Fund maintained its focus on the Consumer area, particularly in European and Pacific ex-Japan Consumer Staples companies. In addition, Industrials increased to a larger overweighting in the Fund, with a concentration on companies exposed to the aircraft, commodity, and energy complexes, coupled with those exposed to additional infrastructure spending globally. Financials, although underweighted versus the Index, was the largest sector at approximately 26% of the Fund, and was focused in companies exposed to capital markets, real estate, and securities exchanges. While the weighting in Materials remained underweighted versus the benchmark, this allocation increased as additional names were added in these sectors during the quarter.
June 30, 2007 | William Blair Funds 11 |
Institutional International Equity Fund
Performance Highlights (unaudited)
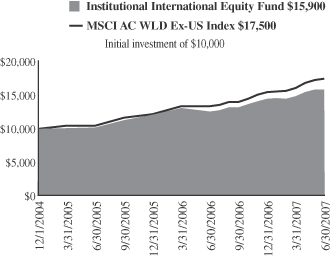
Average Annual Total Return at 6/30/2007
| | | | | | | | | |
| | | Year to
Date | | | 1
Year | | | Since Inception(a) | |
Institutional International Equity Fund | | 9.81 | % | | 26.14 | % | | 19.72 | % |
MSCI All Country World Ex-US Index | | 12.58 | | | 30.15 | | | 23.86 | |
| | (a) | | For the period from December 1, 2004 (Commencement of Operations) to June 30, 2007. |
Performance cited represents past performance. Past performance does not guarantee future results and current performance may be lower or higher than the data quoted. Results shown are average annual returns, which assume reinvestment of dividends and capital gains. Investment returns and principal will fluctuate and you may have a gain or loss when you sell shares. For the most current month-end performance information, please call 1-800-742-7272, or visit our Web site at www.williamblairfunds.com. From time to time, the investment advisor may waive fees or reimburse expenses for the Fund. Without these waivers, performance would be lower. International investing involves special risk considerations, including currency fluctuations, lower liquidity, economic and political risk.
The performance highlights and graph presented above do not reflect the deduction of taxes that a shareholder would pay on fund distributions or the redemption of fund shares.
The Morgan Stanley Capital International (MSCI) All Country World Ex-US Index is an unmanaged index that includes developed and emerging markets and reduced Japanese portion, making it more comparable to the Institutional International Equity Fund in terms of investment approach.
This report identifies the Fund’s investments on June 30, 2007. These holdings are subject to change. Not all stocks in the Fund performed the same, nor is there any guarantee that these stocks will perform as well in the future. Market forecasts provided in this report may not necessarily come to pass.
Sector Diversification (unaudited)
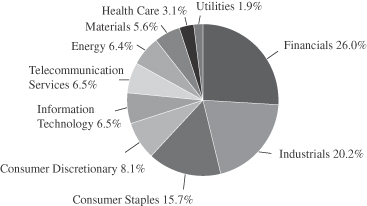
The sector diversification shown is based on the total investment portfolio.
12 Semi-Annual Report | June 30, 2007 |
Institutional International Equity Fund
Portfolio of Investments, June 30, 2007 (all dollar amounts in thousands) (unaudited)
| | | | | |
Issuer | | Shares | | Value |
| | |
Common Stocks—Europe—34.8% | | | | | |
Austria—0.7% | | | | | |
Raiffeisen International Bank (Commercial banks) | | 26,600 | | $ | 4,201 |
| | | | | |
Belguim—1.7% | | | | | |
InBev N.V. (Beverages) | | 126,700 | | | 10,035 |
| | | | | |
France—9.8% | | | | | |
AXA (Insurance) | | 245,600 | | | 10,557 |
Essilor International (Health care equipment & supplies) | | 50,300 | | | 5,991 |
Eurazeo (Diversified financial services) | | 34,417 | | | 4,973 |
Iliad S.A. (Diversified telecommunication services) | | 33,000 | | | 3,324 |
L’Oreal S.A. (Personal products) | | 99,200 | | | 11,725 |
Schneider Electric SA (Electrical equipment) | | 85,400 | | | 11,965 |
Veolia Environnement (Multi-utilities) | | 143,300 | | | 11,255 |
| | | | | |
| | | | | 59,790 |
| | | | | |
Germany—4.6% | | | | | |
DaimlerChrysler AG (Automobiles) | | 117,400 | | | 10,861 |
*Q-Cells AG (Electrical equipment) | | 24,000 | | | 2,070 |
Siemens AG (Industrial conglomerates) | | 104,100 | | | 14,980 |
| | | | | |
| | | | | 27,911 |
| | | | | |
Greece—1.0% | | | | | |
National Bank of Greece (Commercial banks) | | 105,830 | | | 6,026 |
| | | | | |
Ireland—1.0% | | | | | |
Anglo Irish Bank plc (Commercial banks) | | 303,100 | | | 6,221 |
| | | | | |
Italy—1.9% | | | | | |
Saipem SpA (Energy equipment & services) | | 346,800 | | | 11,833 |
| | | | | |
Netherlands—1.0% | | | | | |
Randstad N.V. (Commercial services & supplies) | | 75,700 | | | 5,992 |
| | | | | |
Norway—0.5% | | | | | |
Acergy S.A. (Energy equipment & services) | | 130,300 | | | 2,933 |
| | | | | |
Spain—1.4% | | | | | |
Industria De Textile (Specialty retail) | | 144,400 | | | 8,499 |
| | | | | |
Switzerland—9.8% | | | | | |
ABB Ltd. (Electrical equipment) | | 723,900 | | | 16,322 |
EFG International (Capital markets) | | 82,300 | | | 3,784 |
Geberit AG (Building products) | | 17,100 | | | 2,914 |
Julius Baer Holding AG (Capital markets) | | 72,500 | | | 5,187 |
Kuehne & Nagel International AG (Marine) | | 57,400 | | | 5,287 |
Nestle S.A. (Food products) | | 24,930 | | | 9,473 |
Nobel Biocare Holding AG (Health care equipment & supplies) | | 9,750 | | | 3,183 |
Roche Holdings AG (Pharmaceuticals) | | 51,900 | | | 9,196 |
SGS S.A. (Commercial services & supplies) | | 3,716 | | | 4,394 |
| | | | | |
| | | | | 59,740 |
| | | | | |
| | |
United Kingdom—16.9% | | | | | |
BG Group plc (Oil, gas & consumable fuels) | | 914,200 | | | 14,986 |
Capita Group plc (Commercial services & supplies) | | 486,100 | | | 7,057 |
Carphone Warehouse Group plc (Specialty retail) | | 399,800 | | | 2,628 |
HBOS plc (Commercial banks) | | 659,600 | | | 12,974 |
Man Group plc (Capital markets) | | 606,400 | | | 7,376 |
Reckitt Benckiser plc (Household products) | | 278,100 | | | 15,225 |
| | | | | |
Issuer | | Shares | | Value |
|
Common Stocks—United Kingdom—16.9%—(continued) |
*Rolls-Royce Group plc (Aerospace & defense) | | 1,211,800 | | $ | 13,048 |
*Rolls-Royce Group plc, Class “B” (Aerospace & defense) | | 78,593,920 | | | 158 |
Rotork plc (Electronic equipment & instruments) | | 114,200 | | | 2,086 |
Serco Groupm plc (Commercial services & supplies) | | 362,000 | | | 3,263 |
Tesco plc (Food & staples retailing) | | 1,820,600 | | | 15,232 |
Xstrata plc (Metal & mining) | | 140,500 | | | 8,364 |
| | | | | |
| | | | | 102,397 |
| | | | | |
| | |
Japan—12.6% | | | | | |
Aeon Mall Co., Ltd. (Real Estate management & development) | | 131,300 | | | 4,037 |
FANUC Ltd. (Machinery) | | 89,000 | | | 9,186 |
*Fukuoka Financial Group, Inc. (Commercial banks) | | 1,094,000 | | | 7,233 |
Honeys Company, Ltd. (Specialty retail) | | 36,100 | | | 1,456 |
*Jupiter Telecommunications Co., Ltd. (Media) | | 4,631 | | | 3,826 |
*K.K. DaVinci Advisors (Real Estate management & development) | | 1,507 | | | 1,316 |
Komatsu Ltd. (Machinery) | | 263,900 | | | 7,649 |
NGK Insulators Ltd (Machinery) | | 316,000 | | | 7,761 |
Nintendo Co., Ltd. (Software) | | 30,000 | | | 10,945 |
Orix Corporation (Consumer finance) | | 51,050 | | | 13,456 |
Shin-Etsu Chemical Co., Ltd. (Chemicals) | | 84,300 | | | 6,019 |
Suruga Bank Ltd. (Commercial banks) | | 280,000 | | | 3,529 |
| | | | | |
| | | | | 76,413 |
| | | | | |
| | |
Asia—11.3% | | | | | |
Australia—6.8% | | | | | |
Allco Finance Group Limited (Capital markets) | | 248,300 | | | 2,235 |
Macquarie Bank Ltd. (Capital markets) | | 181,000 | | | 13,000 |
QBE Insurance Group Limited (Insurance) | | 277,800 | | | 7,330 |
Toll Holdings Limited (Air Freight & logistics) | | 403,300 | | | 4,942 |
Woolworths Limited (Food & staples retailing) | | 519,000 | | | 11,861 |
WorleyParsons, Ltd. (Energy equipment & services) | | 62,300 | | | 1,792 |
| | | | | |
| | | | | 41,160 |
| | | | | |
Hong Kong—2.2% | | | | | |
Esprit Holdings Ltd. (Specialty retail) | | 536,000 | | | 6,810 |
Li & Fung Ltd. (Distributors) | | 1,895,100 | | | 6,821 |
| | | | | |
| | | | | 13,631 |
| | | | | |
Singapore—2.3% | | | | | |
Capitaland, Ltd. (Real estate management & development) | | 2,630,900 | | | 13,939 |
| | | | | |
|
Emerging Asia—10.5% |
China—2.3% | | | | | |
China Communications Construction Co. Ltd. (Construction & engineering) | | 2,212,000 | | | 3,964 |
China Merchants Bank Co. Ltd (Commercial banks) | | 1,432,000 | | | 4,361 |
See accompanying Notes to Financial Statements.
June 30, 2007 | William Blair Funds 13 |
Institutional International Equity Fund
Portfolio of Investments, June 30, 2007 (all dollar amounts in thousands) (unaudited)
| | | | | |
Issuer | | Shares | | Value |
| |
Common Stocks—Emerging
Asia—10.5%—(continued) | | | |
China—(continued) | | | | | |
*Focus Media Holding Ltd.—ADR (Media) | | 74,300 | | $ | 3,752 |
Hopson Development Holding Ltd. (Real estate management & development) | | 182,200 | | | 512 |
Nine Dragons Papers Hldgs Lt (Paper & forest product) | | 471,000 | | | 1,098 |
Shandong Weigao Gp Medical (Health care equipment & supplies) | | 43,800 | | | 99 |
| | | | | |
| | | | | 13,786 |
| | | | | |
India—3.0% | | | | | |
*Bharti Airtel Limited (Wireless telecommunication services) | | 287,931 | | | 5,918 |
Infosys Technologies Ltd. (IT services) | | 126,700 | | | 5,996 |
Vedanta Resources Plc (Metals & mining) | | 201,900 | | | 6,508 |
| | | | | |
| | | | | 18,422 |
| | | | | |
Indonesia—1.2% | | | | | |
PT Bank Rakyat Indonesia (Commercial banks) | | 4,598,500 | | | 2,929 |
PT Telekomunikasi Indonesia Tbk (Diversified telecommunication services) | | 3,990,000 | | | 4,328 |
| | | | | |
| | | | | 7,257 |
| | | | | |
South Korea—0.6% | | | | | |
*NHN Corp (Internet software & services) | | 18,777 | | | 3,418 |
| | | | | |
Malaysia—0.8% | | | | | |
Bumiputra Commerce Holdings Bhd (Commercial banks) | | 799,700 | | | 2,710 |
Kuala Lumpur Kepong Bhd (Food product) | | 534,100 | | | 1,998 |
| | | | | |
| | | | | 4,708 |
| | | | | |
Taiwan—2.6% | | | | | |
Hon Hai Precision Industry Corp. (Electronic equipment & instruments) | | 983,880 | | | 8,498 |
Mediatek, Inc. (Semiconductors & semiconductor equipment) | | 290,000 | | | 4,512 |
Taiwan Semiconductor Manufacturing Co. Ltd. (Semiconductors & semiconductor equipment) | | 1,261,000 | | | 2,721 |
| | | | | |
| | | | | 15,731 |
| | | | | |
| | |
Emerging Latin America—5.5% | | | | | |
Brazil—1.8% | | | | | |
Companhia Vale do Rio Doce.—ADR (Metals & mining) | | 249,200 | | | 11,102 |
| | | | | |
Chile—0.6% | | | | | |
*Cencosud S.A.—ADR 144A (Specialty retail) | | 54,500 | | | 3,391 |
| | | | | |
Mexico—3.1% | | | | | |
America Movil S.A. (Wireless telecommunications services) | | 3,496,500 | | | 10,797 |
Walmart de Mexico (Food & staples retailing) | | 2,174,400 | | | 8,252 |
| | | | | |
| | | | | 19,049 |
| | | | | |
| | | | | | |
Issuer | | Shares or
Principal
Amount | | Value |
| | |
Canada—3.6% | | | | | | |
Brookfield Asset Management, Inc. Class “A” (Real estate management & development) | | | 192,200 | | $ | 7,688 |
Rogers Communications, Inc. Class “B” (Wireless telecommunication services) | | | 209,900 | | | 8,950 |
Shoppers Drug Mart Corporation (Food & staples retailing) | | | 117,900 | | | 5,461 |
| | | | | | |
| | | | | | 22,099 |
| | | | | | |
|
Emerging Europe, Mid-East, Africa—2.5% |
Egypt—0.1% | | | | | | |
Egyptian Financial Group—Hermes Holding (Capital markets) | | | 51,894 | | | 418 |
| | | | | | |
South Africa—1.3% | | | | | | |
MTN Group, Ltd. (Wireless telecommunication services) | | | 376,000 | | | 5,111 |
Naspers Ltd. (Media) | | | 115,290 | | | 2,962 |
| | | | | | |
| | | | | | 8,073 |
| | | | | | |
Russia—0.4% | | | | | | |
*PIK Group (Real Estate management & development)** | | | 95,400 | | | 2,385 |
| | | | | | |
United Arab Emirates—0.7% | | | | | | |
Emaar Properties PJSC (Real estate management & development) | | | 1,371,300 | | | 4,424 |
| | | | | | |
Total Common Stock—96.3%
(cost $467,049) | | | 584,984 |
| | | | | | |
| | |
Preferred Stocks | | | | | | |
Brazil—0.7% | | | | | | |
Petroleo Brasileiro S.A. (Oil, gas & consumable fuels) | | | 157,400 | | | 4,202 |
| | | | | | |
Total Preferred Stocks—0.7%
(cost $2,693) | | | 4,202 |
| | | | | | |
| | |
Investment in Affiliate | | | | | | |
William Blair Ready Reserves Fund | | | 3,276,172 | | | 3,276 |
| | | | | | |
Total Investment in Affiliate—0.5%
(cost $3,276) | | | 3,276 |
| | | | | | |
| | |
Short-Term Investments | | | | | | |
American Express Demand Note, VRN, 5.170%, due 7/02/07 | | $ | 4,307,000 | | | 4,307 |
Prudential Funding Demand Note, VRN, 5.305%, due 7/02/07 | | | 4,241,000 | | | 4,241 |
| | | | | | |
Total Short-Term Investments—1.4%
(cost $8,548) | | | 8,548 |
| | | | | | |
Total Investments—98.9%
(cost $481,566) | | | 601,010 |
Cash and other assets, less liabilities—1.1% | | | 6,435 |
| | | | | | |
Net assets—100.0% | | $ | 607,445 |
| | | | | | |
* Non-income producing securities
ADR = American Depository Receipt
VRN = Variable Rate Note
See accompanying Notes to Financial Statements.
14 Semi-Annual Report | June 30, 2007 |
Institutional International Equity Fund
Portfolio of Investments, June 30, 2007 (all dollar amounts in thousands) (unaudited)
** Fair value pursuant to Valuation Procedures adopted by the Board of Trustees. This holding represents 0.39% of the Fund’s net assets at June 30, 2007. This security was also deemed illiquid pursuant to Liquidity Procedures adopted by the Board of Trustees.
For securities, primarily traded on exchanges or markets that close before the close of regular trading on the New York Stock Exchange, the Fund uses an independent pricing service on a daily basis to fair value price the securities pursuant to Valuation Procedures adopted by the Board of Trustees.
At June 30, 2007 the Fund’s Portfolio of Investments includes the following industry categories:
| | |
Financials | | 26.0% |
Industrials | | 20.2% |
Consumer Staples | | 15.7% |
Consumer Discretionary | | 8.1% |
Telecommunication Services | | 6.5% |
Information Technology | | 6.5% |
Energy | | 6.4% |
Materials | | 5.6% |
Health Care | | 3.1% |
Utilities | | 1.9% |
| | |
| | 100.0% |
| | |
At June 30, 2007 the Fund’s Portfolio of Investments includes the following currency categories:
| | |
Euro | | 23.8% |
British Pound Sterling | | 18.5% |
Japanese Yen | | 13.0% |
Swiss Franc | | 10.0% |
Australian Dollar | | 7.0% |
Hong Kong Dollar | | 4.0% |
Canadian Dollar | | 3.8% |
United States Dollar | | 3.5% |
Mexico Nuevo Peso | | 3.2% |
Taiwan Dollar | | 2.7% |
Singapore Dollar | | 2.4% |
Indian Rupee | | 2.0% |
South African Rand | | 1.4% |
Indonesian Rupiah | | 1.2% |
Other Currencies | | 3.5% |
| | |
| | 100.0% |
| | |
See accompanying Notes to Financial Statements.
June 30, 2007 | William Blair Funds 15 |

Jeffery A. Urbina
INTERNATIONAL SMALL CAP GROWTH FUND
The International Small Cap Growth Fund primarily invests in a diversified portfolio of common stocks of small cap companies in developed and emerging markets.
AN OVERVIEW FROM THE PORTFOLIO MANAGER
See page 2 for the International Markets Overview.
How did the Fund perform over the first half of the year? How did the Fund’s performance compare to its benchmark?
The International Small Cap Growth Fund posted a 14.59% increase (Institutional Class) for the six months ended June 30, 2007. By comparison, the Fund’s benchmark, the Morgan Stanley Capital International (MSCI) World Small Cap ex-U.S. Index, gained 13.06%.
What were the most significant factors impacting international markets during the first six months of the year?
Non-US markets were strong during the first half of 2007, buoyed by strong results in emerging markets, Canada, Europe and the Pacific Rim. However, the first six months were punctuated by periods of volatility as investors were concerned in the first quarter about the US subprime mortgage market resulting in slowing US consumer demand and its impact on global growth. In the second quarter, investors became concerned about the prospects of a protracted global increasing interest rate environment as the US economy appeared to accelerate and demand for industrial and consumer goods and services remained strong globally. In addition, worries about the impact of US subprime mortgages on the financial industry, including hedge funds, caused apprehension regarding overall financial system risk. Despite these fears, the market returned 12.58% through June 30, as measured by the MSCI All Country World Index ex-US Index, with most of the performance coming during the second quarter. Emerging markets outpaced their developed counterparts, returning 17.75%, as compared to the MSCI Europe, Asia and Far East (EAFE) Index, which rose 11.09% in US dollar terms, while developed non-US small cap stocks were also strong, up 13.09%. Within small cap stocks, Pacific ex-Japan and Canada were the strongest regions, up 25% and 24%, respectively, year to date, while the UK (7%) and Japan (1%) trailed. Materials, Industrials and Energy were the strongest sectors year to date, while Financials and Health Care lagged.
What factors were behind the Fund’s performance versus the benchmark?
The Fund outpaced the benchmark year to date, with significant value derived from stock selection in a number of sectors, with most value added in Discretionary, Energy, Financials and Health Care. In particular, Consumer Discretionary names were strong on a relative basis in Japan and Emerging Markets, while Energy stock selection benefited from a focus on European and Australian energy services and engineering companies. Financials stock selection was aided by strong relative stock selection in Japan, Europe and Emerging Markets, with a focus on real estate, asset management, and capital markets stocks. The European weighting and stock selection in Health Care added value in that sector. Regionally, the Fund’s underweighting in Japan and overweighting in Europe ex-UK and emerging markets added value, as did stock selection across most regions. Somewhat mitigating these strong results was general sector positioning, underweighting in Canada, and Materials stock selection.
16 Semi-Annual Report | June 30, 2007 |
How is the Fund positioned?
As of period end, the portfolio was overweighted in Emerging Markets and Europe with corresponding underweightings in developed Asia. From a sector perspective, the portfolio remained focused in Consumer Discretionary, Financials and Industrials holdings, with corresponding underweightings in Information Technology (IT) and Materials. These weightings are largely the result of the team’s bottom up fundamental analysis, in addition to its strategic viewpoint.
June 30, 2007 | William Blair Funds 17 |
International Small Cap Growth Fund
Performance Highlights (unaudited)
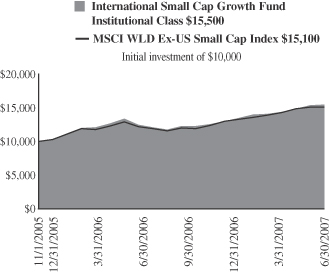
Average Annual Total Return at 6/30/2007
| | | | | | | | | |
| | | Year to
Date | | | 1
Year | | | Since Inception(a) | |
International Small Cap Growth Fund Institutional Class | | 14.59 | % | | 27.32 | % | | 29.90 | % |
MSCI WLD EX-US Small Cap Index | | 13.06 | | | 26.54 | | | 27.54 | |
| | (a) | | For the period from November 1, 2005 (Commencement of Operations) to June 30, 2007. | |
Performance cited represents past performance. Past performance does not guarantee future results and current performance may be lower or higher than the data quoted. Results shown are average annual returns, which assume reinvestment of dividends and capital gains. Investment returns and principal will fluctuate and you may have a gain or loss when you sell shares. For the most current month-end performance information, please call 1-800-742-7272, or visit our Web site at www.williamblairfunds.com. From time to time, the investment advisor may waive fees or reimburse expenses for the Fund. Without these waivers, performance would be lower. International investing involves special risk considerations, including currency fluctuations, lower liquidity, economic and political risk.
The performance highlights and graph presented above do not reflect the deduction of taxes that a shareholder would pay on fund distributions or the redemption of fund shares.
The Morgan Stanley Capital International (MSCI) World Ex-US Small Cap Index is an unmanaged index that is designed to measure equity performance of small cap stocks in developed and emerging markets.
This report identifies the Fund’s investments on June 30, 2007. These holdings are subject to change. Not all stocks in the Fund performed the same, nor is there any guarantee that these stocks will perform as well in the future. Market forecasts provided in this report may not necessarily come to pass.
Sector Diversification (unaudited)
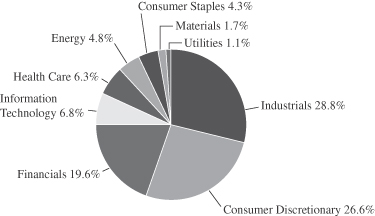
The sector diversification shown is based on the total investment portfolio.
18 Semi-Annual Report | June 30, 2007 |
International Small Cap Growth Fund
Portfolio of Investments, June 30, 2007 (all dollar amounts in thousands) (unaudited)
| | | | | |
Issuer | | Shares | | Value |
| | | | | |
| | |
Common Stocks—Europe—44.2% | | | | | |
Finland—6.1% | | | | | |
Konecranes OYJ (Machinery) | | 83,100 | | $ | 3,473 |
Nokian Renkaat OYJ (Auto Components) | | 213,000 | | | 7,462 |
Outotec OYJ (Construction & engineering) | | 83,500 | | | 4,583 |
Ramirent OYJ (Trading companies & distributors) | | 212,900 | | | 5,765 |
| | | | | |
| | | | | 21,283 |
| | | | | |
France—5.5% | | | | | |
*Aufeminin.com SA (Media) | | 21,610 | | | 918 |
April Group S.A. (Insurance) | | 121,582 | | | 6,389 |
EDF Energies Nouvelles S.A. (Electric utilities) | | 60,100 | | | 3,934 |
*Orpea (Heath care providers & services) | | 37,363 | | | 3,927 |
*Seloger.com (Media) | | 73,900 | | | 4,103 |
| | | | | |
| | | | | 19,271 |
| | | | | |
Germany—8.6% | | | | | |
*Colonia Real Estate AG (Real estate management & development) | | 89,960 | | | 3,776 |
CTS Eventim AG (Media) | | 88,800 | | | 4,376 |
MTU Aero Engines Holding AG (Aerospace & defense) | | 112,014 | | | 7,289 |
*Q-Cells AG (Electrical equipment) | | 74,280 | | | 6,408 |
Solarworld AG (Electrical equipment) | | 96,262 | | | 4,444 |
*Wire Card AG (Commercial services & supplies) | | 298,600 | | | 4,016 |
| | | | | |
| | | | | 30,309 |
| | | | | |
Greece—2.1% | | | | | |
Jumbo S.A. (Leisure equipment & products) | | 216,700 | | | 7,494 |
| | | | | |
Ireland—3.1% | | | | | |
Kingspan Group plc (Building products) | | 245,390 | | | 6,883 |
*Norkom Group plc (Software) | | 286,500 | | | 820 |
United Drug plc (Heath care providers & services) | | 610,780 | | | 3,341 |
| | | | | |
| | | | | 11,044 |
| | | | | |
Italy—4.8% | | | | | |
Azimut Holdings SpA (Capital markets) | | 423,317 | | | 7,228 |
Credito Emiliano SpA (Commercial banks) | | 204,872 | | | 2,902 |
Tod’s SpA (Textiles, apparel & luxury goods) | | 35,600 | | | 3,177 |
Trevi Finanziaria SpA (Construction & engineering) | | 199,100 | | | 3,578 |
| | | | | |
| | | | | 16,885 |
| | | | | |
Netherlands—1.3% | | | | | |
*Qiagen NV (Lifesciences tools & services) | | 258,073 | | | 4,637 |
| | | | | |
Norway—2.9% | | | | | |
Acergy S.A. (Energy equipment & services) | | 319,800 | | | 7,200 |
*Electromagnetic GeoServices AS (Energy equipment & services) | | 154,200 | | | 3,112 |
| | | | | |
| | | | | 10,312 |
| | | | | |
Spain—3.4% | | | | | |
Grifols S.A. (Biotechnology) | | 366,303 | | | 7,936 |
Tecnicas Reunidas S.A. (Construction & engineering) | | 56,800 | | | 3,818 |
| | | | | |
| | | | | 11,754 |
| | | | | |
| | | | | |
Issuer | | Shares | | Value |
| | | | | |
| |
Common Stocks—Europe—44.2%—(continued) | | | |
Sweden—1.7% | | | | | |
Hemtex AB (Specialty retail) | | 71,900 | | $ | 1,377 |
Nobia AB (Specialty retail) | | 357,700 | | | 4,455 |
| | | | | |
| | | | | 5,832 |
| | | | | |
Switzerland—4.7% | | | | | |
*Barry Callebaut Ag (Food products) | | 8,530 | | | 6,457 |
Partners Group Global Opportunities, Ltd (Capital markets) | | 74,400 | | | 9,983 |
| | | | | |
| | | | | 16,440 |
| | | | | |
| |
United Kingdom—20.9% | | | |
Amlin plc (Insurance) | | 1,057,000 | | | 5,926 |
Ashmore Group plc (Capital markets) | | 579,800 | | | 3,124 |
*Autonomy Corporation plc (Software) | | 348,700 | | | 5,002 |
*Blinkx plc (Internet software & services) | | 1,876,700 | | | 1,639 |
*BlueBay Asset Management plc (Capital markets) | | 365,900 | | | 3,616 |
Carter & Carter Group plc (Commercial services & supplies) | | 126,600 | | | 1,217 |
*Ceres Power Holdings plc (Electrical equipment) | | 684,900 | | | 3,965 |
*Climate Exchange plc (Diversified financial services) | | 64,700 | | | 2,381 |
Detica Group plc (IT services) | | 451,500 | | | 3,477 |
Domino’s Pizza UK & IRL plc (Hotels, restaurants, & leisure) | | 687,780 | | | 3,821 |
Homeserve plc (Commercial services & supplies) | | 137,380 | | | 4,927 |
Mears Group plc (Construction & engineering) | | 449,300 | | | 2,926 |
Michael Page International (Commercial services & supplies) | | 301,970 | | | 3,172 |
Restaurant Group plc (Hotels, restaurants, & leisure) | | 221,500 | | | 1,461 |
Rightmove plc (Media) | | 250,400 | | | 3,140 |
Rotork plc (Electronic equipment & instruments) | | 185,550 | | | 3,390 |
RPS Group plc (Commercial services & supplies) | | 487,000 | | | 3,417 |
Serco Group plc (Commercial services & supplies) | | 758,440 | | | 6,837 |
Ultra Electronic Holdings plc (Aerospace & defense) | | 133,850 | | | 2,894 |
Victrex plc (Chemicals) | | 204,850 | | | 2,929 |
VT Group plc (Aerospace & defense) | | 329,150 | | | 3,871 |
| | | | | |
| | | | | 73,132 |
| | | | | |
| | |
Japan—11.0% | | | | | |
Aeon Mall Co., Ltd. (Real estate management & development) | | 190,900 | | | 5,869 |
DeNA Co., Ltd. (Internet & catalog retail) | | 1,607 | | | 5,572 |
En-Japan Inc. (Commercial services & supplies) | | 611 | | | 2,277 |
Fujimi Inc (Chemicals) | | 111,200 | | | 2,924 |
Honeys Company, Ltd. (Specialty retail) | | 93,630 | | | 3,776 |
*K.K. DaVinci Advisors (Real estate management & development) | | 1,491 | | | 1,302 |
Kenedix, Inc. (Real estate management & development) | | 646 | | | 1,202 |
See accompanying Notes to Financial Statements.
June 30, 2007 | William Blair Funds 19 |
International Small Cap Growth Fund
Portfolio of Investments, June 30, 2007 (all dollar amounts in thousands) (unaudited)
| | | | | |
Issuer | | Shares | | Value |
| | | | | |
|
Common Stocks—Japan—11.0%—(continued) |
Miraial Company, Ltd. (Semiconductors & semiconductor equipment) | | 28,700 | | $ | 3,966 |
Nitori Company Ltd. (Specialty retail) | | 63,300 | | | 3,160 |
Park 24 Co., Ltd. (Commercial services & supplies) | | 194,600 | | | 1,954 |
Suruga Bank (Commercial banks) | | 296,000 | | | 3,730 |
Zensho Company, Ltd. (Hotels, restaurants, & leisure) | | 285,800 | | | 2,717 |
| | | | | |
| | | | | 38,449 |
| | | | | |
| | |
Emerging Asia—8.2% | | | | | |
China—3.8% | | | | | |
*China High Speed Transmission (Independent power producers & energy traders)** | | 45,000 | | | 41 |
China Infrastructure Machinery Holdings, Ltd. (Machinery) | | 1,836,000 | | | 4,015 |
Ctrip.com International, Ltd.—ADR (Hotels, restaurants & leisure) | | 20,520 | | | 1,613 |
*Focus Media Holdings—ADR (Media) | | 33,200 | | | 1,677 |
Li Ning Co. Ltd. (Leisure equipment & products) | | 836,873 | | | 2,029 |
Ports Design Limited (Textiles, apparel & luxury goods) | | 604,500 | | | 1,700 |
Shandong Weigao GP (Health care equipment & supplies) | | 976,000 | | | 2,200 |
| | | | | |
| | | | | 13,275 |
| | | | | |
India—2.6% | | | | | |
ABB Ltd. India (Electrical equipment) | | 78,500 | | | 2,110 |
Financial Technologies, Ltd. (Diversified financial services) | | 73,900 | | | 5,480 |
*Inox Leisure, Ltd. (Media) | | 436,579 | | | 1,439 |
| | | | | |
| | | | | 9,029 |
| | | | | |
Malaysia—1.1% | | | | | |
Kuala Lumpur Kepong Berhad (Food products) | | 1,046,350 | | | 3,913 |
| | | | | |
Philippines—0.2% | | | | | |
*Paxys Inc. (Commercial services & supplies) | | 1,455,100 | | | 779 |
| | | | | |
South Korea—0.5% | | | | | |
Hana Tour Service Inc. (Hotels, restaurants & leisure) | | 17,400 | | | 1,693 |
| | | | | |
| | |
Asia—6.1% | | | | | |
Australia—3.7% | | | | | |
Allco Finance Group, Limited (Capital markets) | | 323,265 | | | 2,909 |
Seek Limited (Commercial services & supplies) | | 802,680 | | | 5,011 |
United Group, Ltd. (Construction & engineering) | | 368,470 | | | 5,193 |
| | | | | |
| | | | | 13,113 |
| | | | | |
| | | | | |
Issuer | | Shares | | Value |
| | | | | |
| |
Common Stocks—Asia—6.1%—(continued) | | | |
Singapore—2.4% | | | | | |
Olam International, Ltd. (Food & staples retailing) | | 1,592,000 | | $ | 3,211 |
Osim International Ltd. (Specialty retail) | | 1,393,700 | | | 648 |
Petra Foods, Ltd. (Food products) | | 1,219,000 | | | 1,259 |
Raffles Education Corp. Ltd. (Diversified consumer services) | | 2,225,000 | | | 3,318 |
| | | | | |
| | | | | 8,436 |
| | | | | |
| | |
Emerging Latin America—4.5% | | | | | |
Brazil—2.1% | | | | | |
*Anhanguera Educational Parti (Diversified consumer services) | | 162,100 | | | 2,269 |
Cyrela Brazil Realty S.A. (Household durables) | | 273,900 | | | 3,399 |
Submarino S.A.(Internet & catalog retail) | | 42,300 | | | 1,760 |
| | | | | |
| | | | | 7,428 |
| | | | | |
Mexico—1.9% | | | | | |
*Banco Compartamos SA (Commercial banks) | | 491,700 | | | 3,072 |
*Urbi Desarrollos Urbanos S.A. (Household durables) | | 784,900 | | | 3,614 |
| | | | | |
| | | | | 6,686 |
| | | | | |
Panama—0.5% | | | | | |
Copa Holdings S.A., Class “A” (Airlines)† | | 25,400 | | | 1,708 |
| | | | | |
| |
Emerging Europe, Mid-East, Africa—2.1% | | | |
Czech Republic—0.5% | | | | | |
*Central European Media Enterprises Ltd., Class “A” (Media)† | | 16,600 | | | 1,620 |
| | | | | |
Eqypt—0.6% | | | | | |
*Orascom Hotels & Development (Hotels, restaurants & leisure) | | 193,100 | | | 2,026 |
| | | | | |
Poland—0.5% | | | | | |
*Cinema City International N.V. (Media) | | 142,700 | | | 1,793 |
| | | | | |
Russia—0.5% | | | | | |
*CTC Media, Inc. (Media)† | | 63,538 | | | 1,724 |
| | | | | |
| | |
Canada—1.7% | | | | | |
Canadian Western Bank (Commercial banks) | | 102,200 | | | 2,709 |
*Gildan Activewear, Inc. (Textiles, apparel & luxury goods) | | 98,600 | | | 3,367 |
| | | | | |
| | | | | 6,076 |
| | | | | |
Total Common Stock—98.7%
(cost $286,620) | | | 346,141 |
| | | | | |
| | |
Preferred Stock | | | | | |
Brazil—0.5% | | | | | |
*Banco Sofisa S.A. (Commercial banks) | | 248,900 | | | 1,832 |
| | | | | |
Total Preferred Stock—0.5%
(cost $1,532) | | | 1,832 |
| | | | | |
See accompanying Notes to Financial Statements.
20 Semi-Annual Report | June 30, 2007 |
International Small Cap Growth Fund
Portfolio of Investments, June 30, 2007 (all dollar amounts in thousands) (unaudited)
| | | | | | | |
Issuer | | Shares or
Principal
Amount | | Value | |
| | |
Investment in Affiliate | | | | | | | |
William Blair Ready Reserves Fund | | | 2,147,561 | | $ | 2,148 | |
| | | | | | | |
Total Investment in Affiliate—0.6%
(cost $2,148) | | | 2,148 | |
| | | | | | | |
| | |
Short-Term Investments | | | | | | | |
American Express Demand Note, VRN
5.170%, due 7/02/07 | | $ | 2,004,000 | | | 2,004 | |
Prudential Funding Demand Note, VRN
5.305%, due 7/02/2007 | | | 2,000,000 | | | 2,000 | |
| | | | | | | |
Total Short-term Investments—1.2%
(cost $4,004) | | | 4,004 | |
| | | | | | | |
| | |
Repurchase Agreement | | | | | | | |
Investors Bank & Trust Company, 4.50% dated 6/29/07, due 7/02/07, repurchase price $2,588, collateralized by SBA Pool # 505984 | | $ | 2,586,723 | | | 2,587 | |
| | | | | | | |
Total Repurchase Agreement—0.7%
(cost $2,587) | | | 2,587 | |
| | | | | | | |
Total Investments—101.7%
(cost $296,891) | | | 356,712 | |
Liabilities plus, cash and other assets—(1.7)% | | | (5,941 | ) |
| | | | | | | |
Net assets—100.0% | | $ | 350,771 | |
| | | | | | | |
*Non-income producing securities
ADR = American Depository Receipt
GDR = Global Depository Receipt
VRN = Variable Rate Note
† = U.S. listed foreign security
**Fair valued pursuant to Valuation Procedures adopted by the Board of Trustees. This holding represents 0.01% of the Fund’s net assets at June 30, 2007. This security was also deemed illiquid pursuant to Liquidity Procedures adopted by the Board of Trustees.
For securities primarily traded on exchanges or markets that close before the close of regular trading on the New York Stock Exchange the Fund uses an independent pricing service on a daily basis to fair value price the securities pursuant to Valuation Procedures adopted by the Board of Trustees.
At June 30, 2007 the Fund’s Portfolio of Investments includes the following industry categories:
| | |
Industrials | | 28.8% |
Consumer Discretionary | | 26.6% |
Financials | | 19.6% |
Information Technology | | 6.8% |
Health Care | | 6.3% |
Energy | | 4.8% |
Consumer Staples | | 4.3% |
Materials | | 1.7% |
Utilities | | 1.1% |
| | |
| | 100.0% |
| | |
At June 30, 2007 the Fund’s Portfolio of Investments includes the following currency categories:
| | |
Euro | | 35.3% |
British Pound Sterling | | 21.0% |
Japanese Yen | | 11.0% |
Swiss Franc | | 4.7% |
Australian Dollar | | 3.8% |
Norwegian Krone | | 3.0% |
Hong Kong Dollar | | 2.9% |
Brazilian Real | | 2.7% |
Indian Rupee | | 2.6% |
Singapore Dollar | | 2.4% |
United States Dollar | | 2.4% |
Mexican Neuvo Peso | | 1.9% |
Canadian Dollar | | 1.7% |
Swedish Krona | | 1.7% |
Malaysian Ringgit | | 1.1% |
All other currencies | | 1.8% |
| | |
| | 100.0% |
| | |
See accompanying Notes to Financial Statements.
June 30, 2007 | William Blair Funds 21 |
W. George Greig

Todd M. McClone
Jeffrey A. Urbina
EMERGING MARKETS GROWTH FUND
The Emerging Markets Growth Fund primarily invests in a diversified portfolio of equity securities issued by growth companies in emerging economies worldwide.
AN OVERVIEW FROM THE PORTFOLIO MANAGERS
See page 2 for the International Markets Overview.
How did the Fund perform over the first half of the year? How did the Fund’s performance compare to its benchmark?
The Emerging Markets Growth Fund posted a 16.79% increase (Institutional Class) for the six months ended June 30, 2007. By comparison, the Fund’s benchmark, the Morgan Stanley Capital International (MSCI) Emerging Markets Index, gained 17.75%.
What were the most significant factors impacting international markets during the first six months of the year?
Non-US markets were strong during the first half of 2007, buoyed by strong results in emerging markets, Canada, Europe and the Pacific Rim. However, the first six months were punctuated by periods of volatility as investors were concerned in the first quarter about the US subprime mortgage market resulting in slowing US consumer demand and its impact on global growth. In the second quarter, investors became concerned about the prospects of a protracted global increasing interest rate environment as the US economy appeared to accelerate and demand for industrial and consumer goods and services remained strong globally. In addition, worries about the impact of US subprime mortgages on the financial industry, including hedge funds, caused apprehension regarding overall financial system risk. Despite these fears, the market returned 12.58% through June 30, as measured by the MSCI All Country World Index ex-US Index, with most of the performance coming during the second quarter. Emerging markets outpaced their developed counterparts, returning 17.75%, as compared to the MSCI Europe, Asia and Far-East Index, which rose 11.09% in US dollar terms. Latin America was the strongest emerging markets region, up 27.09%, while Asia returned 18.78%. Emerging Markets Europe, Middle East, and Africa (EMEA) Index was the relative laggard, returning 9.18% during the first half of the year. In particular, the Latin American markets of Brazil, Chile and Peru performed well as did the Asian markets of Korea, Malaysia and China. Materials, Industrials and Energy were the strongest sectors year to date, while Financials and Healthcare lagged.
What factors were behind the Fund’s performance versus the benchmark?
The Fund’s year-to-date return, trailed the benchmark by approximately 1%, due to first quarter’s relative results. While stock selection across a number of sectors was strong, Energy, Consumer Staples and Industrials stock selection hampered relative results, particularly during the first quarter. Specifically, several of the Fund’s Consumer Staples names in Latin America underperformed, while Energy stock selection was hurt by Russian and South African stock selection. Within Industrials, the Fund’s Asian stocks trailed the Index. In addition, the Fund’s underweighting in the strong Materials sector hurt performance, as did stock selection within the sector. Conversely, the Fund’s strong absolute results were bolstered by Consumer Discretionary stock selection across regions, along with the weighting and stock selection in Chinese, Indian, and Malaysian Financials. Moreover, the Fund’s Chinese healthcare stock selection was strong, as was the focus on Asian Information Technology (IT) stocks. In addition, the Fund’s weighting in Latin America at compared to EMEA augmented performance.
22 Semi-Annual Report | June 30, 2007 |
How is the Fund positioned?
As of period end, the Fund remained overweighted in Latin America with corresponding underweightings in EMEA and Asia, due primarily to minimal exposure in Russia and Korea, respectively. From a sector perspective, the Fund remained focused on the emerging markets consumer through Consumer Discretionary, Consumer Staples and Financials, holdings. In addition, the Fund maintained a higher than Index weighting in Industrials, with corresponding underweightings in Energy, IT and Materials. These exposures are largely based upon the team’s bottom up fundamental analysis, in accordance with its strategic viewpoint.
June 30, 2007 | William Blair Funds 23 |
Emerging Markets Growth Fund
Performance Highlights (unaudited)
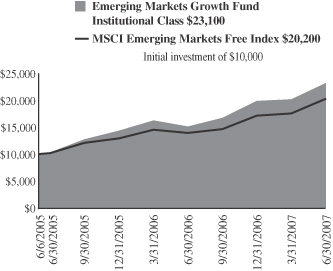
Average Annual Total Return at 6/30/2007
| | | | | | | | | |
| | | Year to
Date | | | 1
Year | | | Since Inception(a) | |
Emerging Markets Growth Fund Institutional Class | | 16.79 | % | | 52.40 | % | | 49.76 | % |
MSCI Emerging Markets Index | | 17.75 | | | 45.45 | | | 40.31 | |
| | (a) | | For the period from June 6, 2005 (Commencement of Operations) to June 30, 2007. | |
Performance cited represents past performance. Past performance does not guarantee future results and current performance may be lower or higher than the data quoted. Results shown are average annual returns, which assume reinvestment of dividends and capital gains. Investment returns and principal will fluctuate and you may have a gain or loss when you sell shares. For the most current month-end performance information, please call 1-800-742-7272, or visit our Web site at www.williamblairfunds.com. From time to time, the investment advisor may waive fees or reimburse expenses for the Fund. Without these waivers, performance would be lower. International investing involves special risk considerations, including currency fluctuations, lower liquidity, economic and political risk.
The performance highlights and graph presented above do not reflect the deduction of taxes that a shareholder would pay on fund distributions or the redemption of fund shares.
The Morgan Stanley Capital International (MSCI) Emerging Markets Index is an index that is designed to measure equity performance in the global emerging markets.
This report identifies the Fund’s investments on June 30, 2007. These holdings are subject to change. Not all stocks in the Fund performed the same, nor is there any guarantee that these stocks will perform as well in the future. Market forecasts provided in this report may not necessarily come to pass.
Sector Diversification (unaudited)
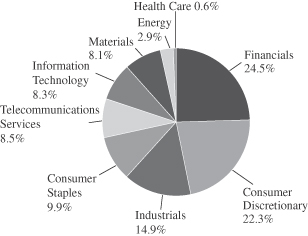
The sector diversification shown is based on the total investment portfolio.
24 Semi-Annual Report | June 30, 2007 |
Emerging Markets Growth Fund
Portfolio of Investments, June 30, 2007 (all dollar amounts in thousands) (unaudited)
| | | | | |
Issuer | | Shares | | Value |
| |
Common Stocks—Emerging Asia—45.4% | | | |
China—16.4% | | | | | |
*Belle International Holdings Limited (Specialty retail) | | 8,546,000 | | $ | 9,432 |
*China High Speed Transmission Equipment Group Co. (Independent power producers & energy traders)** | | 276,000 | | | 250 |
China Infrastructure Machinery Holdings, Ltd. (Machinery) | | 5,188,000 | | | 11,344 |
China Mengniu Dairy Co. Ltd. (Food products) | | 3,054,000 | | | 10,537 |
China Merchants Bank (Commercial banks) | | 3,398,000 | | | 10,348 |
China Mobile Ltd. (Wireless telecommunication services) | | 2,897,800 | | | 31,178 |
China Oilfield Services (Energy equipment & services) | | 2,132,000 | | | 2,152 |
China Vanke Company Ltd. (Real estate management & development) | | 10,707,347 | | | 22,163 |
*China Water Affairs Group (Household durables) | | 7,790,000 | | | 4,547 |
Ctrip.com International Ltd.—ADR (Hotels, restaurants & leisure) | | 67,600 | | | 5,315 |
*Focus Media Holding Ltd.—ADR (Media) | | 219,800 | | | 11,100 |
Fu Ji Food and Catering Services Holdings Ltd (Hotels, restaurants & leisure) | | 1,764,000 | | | 6,073 |
Hopson Development Holdings Ltd. (Real estate management & development) | | 848,800 | | | 2,387 |
Lee and Man Paper Manufacturing Ltd. (Paper & forest products) | | 3,834,000 | | | 10,616 |
Li Ning Co. Ltd (Leisure equipment & products) | | 3,094,000 | | | 7,503 |
Parkson Retail Group Ltd. (Multiline retail) | | 849,900 | | | 5,445 |
Ports Design Ltd. (Textiles, apparel & luxury goods) | | 2,260,000 | | | 6,357 |
Shangdong Weigao GP Medical (Health care equipment & supplies) | | 2,800,000 | | | 6,311 |
Wumart Stores, Inc., Class “H” (Food & staples retailing)** | | 8,680,000 | | | 2,775 |
Xinyu Hengdeli Holdings Ltd. (Distributors) | | 10,920,000 | | | 5,355 |
| | | | | |
| | | | | 171,188 |
| | | | | |
India—12.6% | | | | | |
ABB Ltd. India (Electrical equipment) | | 264,000 | | | 7,097 |
Bharat Heavy Electricals, Ltd. (Electrical equipment) | | 327,800 | | | 12,398 |
*Bharti Airtel Ltd. (Wireless telecommunication services) | | 615,500 | | | 12,651 |
*Cairn India Ltd. (Oil, gas & consumable fuels) | | 1,471,300 | | | 5,273 |
Dabur India Ltd. (Personal products) | | 1,862,200 | | | 4,706 |
Financial Technologies, Ltd. (Software) | | 95,410 | | | 7,075 |
Housing Development Finance Corp. (Thrifts & mortgage finance) | | 123,700 | | | 6,176 |
Infosys Technologies, Ltd. (IT services) | | 195,500 | | | 9,252 |
*Inox Leisure Ltd. (Media) | | 1,208,500 | | | 3,983 |
Larsen & Toubro Ltd. (Construction & engineering) | | 315,700 | | | 17,058 |
Shopper’s Stop Ltd. (Multiline retail) | | 280,860 | | | 4,038 |
Unitech Limited (Real estate management & development) | | 715,500 | | | 8,850 |
Vedanta Resources Plc (Metals & mining) | | 1,032,500 | | | 33,281 |
| | | | | |
| | | | | 131,838 |
| | | | | |
| | | | | |
Issuer | | Shares | | Value |
| |
Common Stocks—Emerging
Asia—45.4%—(continued) | | | |
Indonesia—2.7% | | | | | |
PT Bank Rakyat Indonesia (Commercial banks) | | 16,908,500 | | $ | 10,768 |
PT London Sumatra Indones (Food products) | | 12,863,500 | | | 9,246 |
PT Telekomunikasi Tbk (Diversified telecommunication services) | | 7,867,900 | | | 8,535 |
| | | | | |
| | | | | 28,549 |
| | | | | |
Philippines—1.2% | | | | | |
Bank of Philippine Islands (Commercial banks) | | 6,818,900 | | | 10,095 |
*Paxys Inc. (Commercial services & supplies) | | 4,184,700 | | | 2,239 |
| | | | | |
| | | | | 12,334 |
| | | | | |
Malaysia—4.1% | | | | | |
*Airasia Bhd (Airlines) | | 8,883,600 | | | 4,894 |
Bumiputra Commerce Holding Bhd (Commercial banking) | | 6,429,500 | | | 21,786 |
Kuala Lumpur Kepong Berhad Bhd (Food products) | | 2,845,650 | | | 10,643 |
Zelan Bhd (Construction & engineering) | | 1,424,300 | | | 4,964 |
| | | | | |
| | | | | 42,287 |
| | | | | |
South Korea—3.4% | | | | | |
Hana Tour Service (Hotels, restaurants & leisure) | | 67,800 | | | 6,598 |
*NHN Corporation (Internet software & services) | | 65,500 | | | 11,923 |
Shinsegae Co. Ltd. (Food & staples retailing) | | 14,550 | | | 9,469 |
Taewoong Co Ltd (Machinery) | | 99,500 | | | 6,981 |
| | | | | |
| | | | | 34,971 |
| | | | | |
Taiwan—5.0% | | | | | |
*Himax Technologies, Inc.—ADR (Semiconductors & semiconductor equipment) | | 1,693,315 | | | 9,770 |
Hon Hai Precision Industry (Electronic equipment & instruments) | | 3,527,528 | | | 30,469 |
Mediatek, Inc. (Semiconductors & semiconductor equipment) | | 765,040 | | | 11,903 |
| | | | | |
| | | | | 52,142 |
| | | | | |
| | |
Emerging Latin America—27.6% | | | | | |
Argentina—0.8% | | | | | |
Banco Macro Sa—ADR (Commercial banks) | | 246,900 | | | 8,116 |
| | | | | |
Brazil—11.9% | | | | | |
All America Latin Logistica (Road & rail) | | 709,600 | | | 9,660 |
*Anhanguera Eduacional Participacoes S.A. (Commercial services & supplies) | | 467,000 | | | 6,537 |
*BR Malls Participacoes SA (Real estate management & development) | | 1,177,100 | | | 15,316 |
CIA Vale Do Rio Doce—ADR (Metals & mining) | | 682,400 | | | 30,401 |
Cyrela Brazil Realty S.A. (Household durables) | | 905,200 | | | 11,234 |
See accompanying Notes to Financial Statements.
June 30, 2007 | William Blair Funds 25 |
Emerging Markets Growth Fund
Portfolio of Investments, June 30, 2007 (all dollar amounts in thousands) (unaudited)
| | | | | |
Issuer | | Shares | | Value |
| |
Common Stocks—Emerging Latin America—27.6%—(continued) | | | |
Brazil—(continued) | | | | | |
Iguatemi Empresa de Shopping Centers S.A. (Commercial services & supplies) | | 581,600 | | $ | 10,499 |
Localiza Rent a Car S.A. (Road & rail) | | 946,600 | | | 10,678 |
Lojas Renner S.A. (Multiline retail) | | 348,600 | | | 6,470 |
Lupatech SA (Machinery) | | 240,300 | | | 5,793 |
Rodobens Negocioa Imobiliarios S.A. (Household durables) | | 444,800 | | | 6,051 |
Submarino S.A. (Internet & catalog retail) | | 122,400 | | | 5,092 |
Totvs S.A. (Software) | | 189,500 | | | 6,168 |
| | | | | |
| | | | | 123,899 |
| | | | | |
Chile—2.0% | | | | | |
*Cencosud S.A.—ADR 144A (Specialty retail) | | 163,900 | | | 10,198 |
S.A.C.I. Falabella S.A. (Multiline retail) | | 2,107,954 | | | 10,888 |
| | | | | |
| | | | | 21,086 |
| | | | | |
Mexico—10.7% | | | | | |
Alsea S.A.B. de C.V. (Hotels, restaurants & leisure) | | 3,098,800 | | | 5,450 |
America Movil S.A. (Wireless telecommunication services) | | 7,188,200 | | | 22,196 |
*Banco Compartamos SA (Commercial banks) | | 1,520,700 | | | 9,501 |
*Desarrolladora Homex S.A. de C.V.—ADR (Household durables) | | 160,900 | | | 9,749 |
*Groupo Famsa S.A. (Multiline retail) | | 1,868,700 | | | 10,897 |
Grupo Financiero Banorte S.A. de C.V. (Commercial banks) | | 4,145,500 | | | 18,986 |
Grupo Aeropuertario Del—ADR (Transportation infrastructure) | | 208,200 | | | 10,268 |
*Promotora Ambiental Sab de C.V. (Commercial services & supplies) | | 1,291,350 | | | 3,586 |
*Urbi Desarrollos Urbanos S.A. (Household durables) | | 2,391,400 | | | 11,012 |
Walmart de Mexico (Food & staples retailing) | | 2,670,400 | | | 10,134 |
| | | | | |
| | | | | 111,779 |
| | | | | |
Panama—1.3% | | | | | |
Copa Holdings S.A., Class “A” (Airlines)† | | 205,600 | | | 13,825 |
| | | | | |
Peru—0.9% | | | | | |
Credicorp Ltd. (Commercial banks) | | 157,500 | | | 9,634 |
| | | | | |
| |
Emerging Europe, Mid-East, Africa—21.9% | | | |
Czech Republic—1.1% | | | | | |
*Central European Media Enterprises Ltd., Class “A” (Media)† | | 112,300 | | | 10,958 |
| | | | | |
Egypt—3.4% | | | | | |
Egyptian Financial Group—Hermes Holding SAE (Capital markets) | | 1,415,700 | | | 11,413 |
Orascom Construction Industries (Construction & engineering) | | 274,200 | | | 17,925 |
*Orascom Hotels and Development (Hotels, restaurants & leisure) | | 567,500 | | | 5,954 |
| | | | | |
| | | | | 35,292 |
| | | | | |
Kazakhstan—1.0% | | | | | |
*Kazkommertsbank—GDR 144A (Commercial banks) | | 482,226 | | | 10,609 |
| | | | | |
| | | | | |
Issuer | | Shares | | Value |
| |
Common Stocks—Emerging Europe, Mid-East, Africa—21.9%—(continued) | | | |
Poland—0.5% | | | | | |
*Cinema City International NV (Media) | | 401,500 | | $ | 5,045 |
| | | | | |
Russia—5.9% | | | | | |
*CTC Media, Inc. (Media)† | | 376,645 | | | 10,222 |
*Magnit—CLS (Multiline retail)† | | 118,800 | | | 5,221 |
*PIK Group—CLS (Real estate development & management)** | | 597,900 | | | 14,948 |
Sberbank—CLS (Commercial banks)† | | 5,838 | | | 22,768 |
*X5 Retail Group N.V.—GDR (Food & staples retailing) | | 295,300 | | | 8,652 |
| | | | | |
| | | | | 61,811 |
| | | | | |
South Africa—6.6% | | | | | |
Anglo Platinum Ltd (Metals & mining) | | 61,500 | | | 10,100 |
MTN Group Ltd. (Wireless telecommunication services) | | 1,031,400 | | | 14,020 |
Naspers Ltd. (Media) | | 750,390 | | | 19,279 |
Spar Group Limited (Food & staples retailing) | | 1,444,300 | | | 10,806 |
Truworths International Ltd. (Specialty retail) | | 1,966,300 | | | 10,116 |
Wilson Bayly Holmes-Ovcon (Construction & engineering) | | 318,500 | | | 4,651 |
| | | | | |
| | | | | 68,972 |
| | | | | |
Turkey—1.6% | | | | | |
Bim Birlesik Magazalar A.S. (Food & staples retailing) | | 186,800 | | | 12,382 |
Coca Cola Icecek A.S. (Beverages) | | 500,200 | | | 3,749 |
| | | | | |
| | | | | 16,131 |
| | | | | |
United Arab Emirates—1.8% | | | | | |
Emaar Properties PJSC (Real estate development & management) | | 5,808,100 | | | 18,739 |
| | | | | |
Total Common Stock—94.9%
(cost $743,583) | | | 989,205 |
| | | | | |
| | |
Preferred Stock | | | | | |
Brazil—4.7% | | | | | |
Banco Itau Holding (Commercial banks) | | 221,700 | | | 9,844 |
*Banco Sofisa S.A. (Commercial banks) | | 686,200 | | | 5,051 |
Petroleo Brasileiro S.A. (Oil, gas & consumable fuels) | | 829,300 | | | 22,141 |
*Net Servicos De Counicacao S.A. (Media) | | 704,800 | | | 11,637 |
| | | | | |
| | | | | 48,673 |
| | | | | |
Total Preferred Stock—4.7%
(cost $35,402) | | | 48,673 |
| | | | | |
| | |
Investment in Affiliate | | | | | |
William Blair Ready Reserves Fund | | 1,295,575 | | | 1,296 |
| | | | | |
Total Investment in Affiliate—0.1%
(cost $1,296) | | | 1,296 |
| | | | | |
See accompanying Notes to Financial Statements.
26 Semi-Annual Report | June 30, 2007 |
Emerging Markets Growth Fund
Portfolio of Investments, June 30, 2007 (all dollar amounts in thousands) (unaudited)
| | | | | | | |
Issuer | | Shares or
Principal
Amount | | Value | |
| | |
Short-Term Investments | | | | | | | |
American Express Demand Note,
VRN 5.170% due 7/2/07 | | $ | 6,875,000 | | $ | 6,875 | |
Prudential Funding Demand Note,
VRN 5.305% due7/2/07 | | | 5,983,000 | | | 5,983 | |
| | | | | | | |
Total Short-Term Investments—1.2%
(cost $12,858) | | | 12,858 | |
| | | | | | | |
| | |
Repurchase Agreement | | | | | | | |
Investors Bank & Trust Company, 4.50% dated 6/29/2007, due 7/2/2007, repurchase price $14,646, collateralized by SBA, Pool# 507256 | | $ | 14,640,762 | | | 14,641 | |
| | | | | | | |
Total Repurchase Agreement—1.4%
(cost $14,641) | | | 14,641 | |
| | | | | | | |
Total Investments—102.3%
(cost $807,780) | | | 1,066,673 | |
Liabilities plus cash and other assets—(2.3%) | | | (24,322 | ) |
| | | | | | | |
Net assets—100.0% | | $ | 1,042,351 | |
| | | | | | | |
*Non-income producing securities
ADR = American Depository Receipt
GDR = Global Depository Receipt
VRN = Variable Rate Note
† = U.S. listed Foreign Security
**Fair valued pursuant to Valuation Procedures adopted by the Board of Trustees. These holdings represent 1.72% of the Fund’s net assets at June 30, 2007. These securities were also deemed illiquid pursuant to Liquidity Procedures adopted by the Board of Trustees.
For securities primarily traded on exchanges or markets that close before the close of regular trading on the New York Stock Exchange the Fund uses an independent pricing service on a daily basis to fair value price the securities pursuant to Valuation Procedures adopted by the Board of Trustees.
At June 30, 2007 the Fund’s Portfolio of Investments includes the following industry categories:
| | |
Finance | | 24.5% |
Consumer Discretionary | | 22.3% |
Industrials | | 14.9% |
Consumer Staples | | 9.9% |
Telecommunication Services | | 8.5% |
Information Technology | | 8.3% |
Materials | | 8.1% |
Energy | | 2.9% |
Health Care | | 0.6% |
| | |
| | 100.0% |
| | |
At June 30, 2007 the Fund’s Portfolio of Investments includes the following currency categories:
| | |
U.S. Dollar | | 19.4% |
Hong Kong Dollar | | 14.9% |
Brazilian Real | | 13.7% |
Indian Rupee | | 9.5% |
Mexican Nuevo Peso | | 8.8% |
Rand | | 6.6% |
New Taiwan Dollar | | 4.1% |
Malaysian Ringgit | | 4.1% |
Egyptian Pounds | | 3.4% |
South Korean Won | | 3.4% |
British Pound Sterling | | 3.2% |
Indonesian Rupiah | | 2.8% |
UAE Dirham Spot | | 1.8% |
Turkish Lira Spot | | 1.5% |
Philippine Peso | | 1.2% |
Chilean Peso | | 1.1% |
Polish Zloty | | 0.5% |
| | |
| | 100.0% |
| | |
See accompanying Notes to Financial Statements.
June 30, 2007 | William Blair Funds 27 |

James S. Kaplan

Christopher T. Vincent

Benjamin J. Armstrong
BOND FUND
The Bond Fund seeks to outperform the Lehman Brothers U.S. Aggregate Index by maximizing total return through a combination of income and capital appreciation.
AN OVERVIEW FROM THE PORTFOLIO MANAGERS
We are pleased to have the Bond Fund become the newest addition to the William Blair Fund Family and would like to thank our shareholders for investing with us.
As the managers of the Bond Fund, we are enthusiastic about the opportunities available to us. The broad sectors that are represented in the Fund’s portfolio include government securities, corporate debt securities issued by domestic and foreign companies, mortgage-backed securities and asset backed securities. The Fund invests at least 90% in securities rated in the highest four categories by at least one of the following three nationally recognized statistical rating organizations: Fitch Ratings, Moody’s Investors Service Inc. and Standard & Poor’s Corporation. The Fund may also invest no more than 10% of its net assets in below investment grade securities.
How did the Fund perform since its inception? How did the Fund’s performance compare to its benchmark?
The Bond Fund commenced operations on May 1, 2007. Through the two-month period ending June 30, 2007, the Fund posted a decrease of 1.12% (Institutional Class). By comparison, the Fund’s benchmark, the Lehman Brothers U.S. Aggregate Index, declined 1.00%.
What were the most significant factors impacting Fund performance? What factors were behind the Fund’s performance versus the benchmark?
Rising interest rates and risk aversion weighed on the fixed income markets during the second quarter of 2007.
Interest rates rose sharply during the period. For example, the yield on 2-year Treasury notes increased 0.28% during the second quarter, while the yield on 10-year Treasury securities increased 0.38%. The yield on 2-year Treasury notes was 4.86% on June 30, while the yield on 10-year Treasury securities finished the quarter at 5.02%.
Risk aversion dominated the corporate bond and mortgage markets. Wider spreads resulted in these sectors generally underperforming Treasury securities during the quarter. Concerns about rising subprime mortgage delinquencies and the bankruptcy of several subprime mortgage originators has negatively impacted the residential mortgage market. Mid-year marked the worst six months in the non-Agency Mortgage markets in many years. The highly publicized problems at certain hedge funds heightened fears about the possibility of write-downs of securities backed by subprime mortgages at other institutions.
Reports about the current lackluster housing market added to the negative psychology in the residential Mortgage-backed market.
Concerns about shareholder-friendly actions by corporate bond issuers contributed to risk aversion in the credit markets. These actions include rising equity dividends and stock repurchases. In addition, the record pace of M&A transactions has negatively impacted the bond market.
28 Semi-Annual Report | June 30, 2007 |
The Fund has been close to neutrally weighted in Treasury, mortgage and credit sectors and market volatility has had little impact on Fund returns.
Assets in the Bond Fund reached $51.6 million as of June 30, 2007. We used the months of May and June to deploy these assets into new investments for the Fund.
How is the Fund positioned?
As of June 30, 2007, the three major sector weightings were U.S. Agency Mortgage-Backed securities (43%), Corporate bonds (25%) and U.S. Treasuries (24%). All three sectors represent modest overweights versus the Lehman Aggregate Bond Index.
As previously stated, we are carefully following current market conditions and potential Federal Reserve activity.
June 30, 2007 | William Blair Funds 29 |
Bond Fund
Performance Highlights (unaudited)
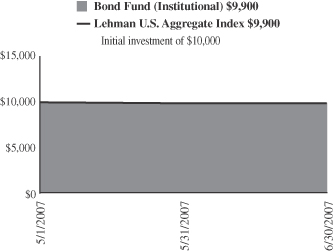
Average Annual Total Return at 6/30/2007
| | | | | |
| | | Since
Inception(a) | | | |
Bond Fund Institutional Class | |
(1.12 |
)% | | |
Lehman Brothers U.S. Aggregate Index | | (1.00 | )% | | |
| | (a) | | For the period from May 1, 2007 (Commencement of Operations) to June 30, 2007. | |
Performance cited represents past performance. Past performance does not guarantee future results and current performance may be lower or higher than the data quoted. Results shown are average annual total returns, which assume reinvestment of dividends and capital gains. Investment returns and principal will fluctuate and you may have a gain or loss when you sell shares. For the most current month-end performance information, please call 1-800-742-7272, or visit our Web site at www.williamblairfunds.com. From time to time, the investment advisor may waive fees or reimburse expenses for the Fund. Without these waivers, performance would be lower.
The performance highlights and graph presented above do not reflect the deduction of taxes that a shareholder would pay on fund distributions or the redemption of fund shares.
The Lehman Brothers U.S. Aggregate Index indicates broad intermediate government/corporate bond market performance.
This report identifies the Fund’s investments on June 30, 2007. These holdings are subject to change. Not all investments in the Fund performed the same, nor is there any guarantee that these investments will perform as well in the future. Market forecasts provided in this report may not necessarily come to pass.
Sector Diversification (unaudited)
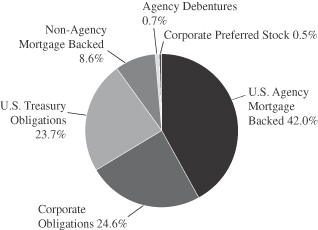
The sector diversification shown is based on the total investment portfolio.
30 Semi-Annual Report | June 30, 2007 |
Bond Fund
Portfolio of Investments, June 30, 2007 (all dollar amounts in thousands) (unaudited)
| | | | | | | | |
| | | | | Principal
Amount | | Value |
|
U.S. Government and U.S. Government Agency—64.2% |
U.S. Treasury—22.9% | | | | | | | | |
U.S. Treasury Note,
4.375%, due 12/31/07 | | | | $ | 5,000 | | $ | 4,987 |
U.S. Treasury Note,
4.750%, due 2/15/10 | | | | | 1,450 | | | 1,445 |
U.S. Treasury Note,
4.750%, due 5/15/14 | | | | | 1,300 | | | 1,284 |
U.S. Treasury Note,
5.125%, due 5/15/16 | | | | | 2,250 | | | 2,262 |
U.S. Treasury Note,
7.125%, due 2/15/23 | | | | | 325 | | | 390 |
U.S. Treasury Note,
4.500%, due 2/15/36 | | | | | 1,600 | | | 1,449 |
| | | | | | | | |
Total U.S. Treasury Obligations | | | | | 11,925 | | | 11,817 |
| | | | | | | | |
Government National Mortgage
Association (GNMA)—0.0% | | | | | | | | |
#357752, 7.000%, due 4/15/09 | | | | | 4 | | | 4 |
| | | | | | | | |
Federal Home Loan Bank (FHLB)—0.6% | | | | | | | | |
4.750%, due 12/16/16 | | | | | 325 | | | 308 |
| | | | | | | | |
Federal Home Loan Mortgage Corp. (FHLMC)—9.5% | | | | | | | | |
#G10330, 7.000%, due 1/1/10 | | | | | 30 | | | 31 |
#G90024, 7.000%, due 1/20/13 | | | | | 100 | | | 103 |
#G30093, 7.000%, due 12/1/17 | | | | | 78 | | | 80 |
#G30254, 6.500%, due 5/1/19 | | | | | 124 | | | 127 |
#G30255, 7.000%, due 7/1/21 | | | | | 122 | | | 126 |
#G18137, 6.500%, due 8/1/21 | | | | | 541 | | | 551 |
#D95621, 6.500%, due 7/1/22 | | | | | 175 | | | 179 |
#D95897, 5.500%, due 3/1/23 | | | | | 481 | | | 471 |
#C01385, 6.500%, due 8/1/23 | | | | | 709 | | | 722 |
#C90896, 6.500%, due 2/1/25 | | | | | 1,226 | | | 1,250 |
6.750%, due 9/15/29 | | | | | 650 | | | 745 |
#G10728, 7.500%, due 7/1/32 | | | | | 500 | | | 522 |
| | | | | | | | |
Total FHLMC Mortgage Obligations | | | | | 4,736 | | | 4,907 |
| | | | | | | | |
Federal National Mortgage
Association (FNMA)—31.2% | | | | | | | | |
#598453, 7.000%, due 6/1/15 | | | | | 37 | | | 38 |
#689612, 5.000%, due 5/1/18 | | | | | 968 | | | 939 |
#747903, 4.500%, due 6/1/19 | | | | | 800 | | | 761 |
#791393, 5.500%, due 10/1/19 | | | | | 823 | | | 813 |
#831430, 5.500%, due 3/1/21 | | | | | 987 | | | 973 |
#253847, 6.000%, due 5/1/21 | | | | | 577 | | | 579 |
#900725, 6.000%, due 8/1/21 | | | | | 511 | | | 514 |
#254797, 5.000%, due 6/1/23 | | | | | 528 | | | 504 |
#545437, 7.000%, due 2/1/32 | | | | | 390 | | | 405 |
#555522, 5.000%, due 6/1/33 | | | | | 917 | | | 864 |
#555880, 5.500%, due 11/1/33 | | | | | 978 | | | 948 |
#725027, 5.000%, due 11/1/33 | | | | | 1,295 | | | 1,219 |
#725205, 5.000%, due 3/1/34 | | | | | 1,006 | | | 948 |
#725238, 5.000%, due 3/1/34 | | | | | 1,014 | | | 955 |
#725424, 5.500%, due 4/1/34 | | | | | 1,048 | | | 1,015 |
#725611, 5.500%, due 6/1/34 | | | | | 829 | | | 803 |
#745092, 6.500%, due 7/1/35 | | | | | 1,131 | | | 1,150 |
#845188, 6.000%, due 12/1/35 | | | | | 992 | | | 983 |
#848782, 6.500%, due 1/1/36 | | | | | 1,653 | | | 1,671 |
| | | | | | | | |
Total FNMA Mortgage Obligations | | | | | 16,484 | | | 16,082 |
| | | | | | | | |
| | | | | | | | | |
| | | NRSRO
Rating | | | Principal
Amount | | Value |
|
Non-Agency Mortgage-Backed Obligations—8.3% |
Countrywide Alternative Loan Trust, 2003-11T1, Tranche M,
4.750%, due 7/25/18 | | AA | + | | $ | 318 | | $ | 307 |
Aames Mortgage Trust, 2001-1, Tranche M2,
7.588%, due 6/25/31 | | A | | | | 133 | | | 131 |
LSSCO, 2004-2, Tranche M2,
6.328%, due 2/28/33, VRN* | | A | | | | 339 | | | 337 |
CWL, 2003-5, Tranche MF2
5.959%, due 11/25/33 | | AA- | | | | 391 | | | 387 |
Renaissance Home Equity Loan Trust, 2004-2, Tranche M5
6.455%, due 7/25/34 | | A | | | | 700 | | | 692 |
FHASI, 2004-AR4, Tranche 3A1,
4.588%, due 8/25/34, VRN | | AAA | | | | 563 | | | 554 |
Security National Mortgage Loan Trust, 2004-2A, Tranche M2,
6.352%, due 11/25/34 | | A | | | | 50 | | | 50 |
GRP Real Estate Asset Trust, 2005-1 Tranche A,
4.850%, due 1/25/35* | | A | | | | 393 | | | 391 |
Security National Mortgage Loan Trust, 2005-1A, Tranche M2,
6.530%, due 2/25/35* | | A | | | | 25 | | | 24 |
Soundview Home Equity Loan Trust, 2005-B, Tranche M1,
5.635%, due 5/25/35 | | AA | + | | | 118 | | | 117 |
Structured Asset Securities Corp., 2005-9XS, Tranche A2B,
6.500%, due 6/25/35 | | AAA | | | | 200 | | | 200 |
Security National Mortgage Loan Trust, 2005-2A, Tranche M2,
7.321%, due 2/25/36* | | A | | | | 125 | | | 123 |
Chase Mortgage Finance Corporation, 2006-A1, Tranche A3,
6.000%, due 9/25/36 | | AAA | | | | 650 | | | 648 |
La Hipotecaria Panamanian Mortgage Trust, 2007-1GA, Tranche A,
5.750%, due 12/23/36* | | AAA | | | | 80 | | | 79 |
Security National Mortgage Loan Trust, 2006-1A, Tranche M2,
7.500%, due 9/25/36* | | A | | | | 80 | | | 78 |
Statewide Mortgage Loan Trust, 2006-1A, Tranche A2,
7.660%, due 9/25/37* | | AAA | | | | 70 | | | 72 |
ACE, 2005-SN1, Tranche M2,
5.770%, due 11/25/39, VRN | | A | + | | | 50 | | | 48 |
ACE, 2005-SD3, Tranche M2,
7.070%, due 8/25/45, VRN | | A | + | | | 70 | | | 71 |
| | | | | | | | | |
Total Non-Agency Mortgage-Backed Obligations | | | | | | 4,355 | | | 4,309 |
| | | | | | | | | |
| | | |
Corporate Obligations—23.8% | | | | | | | | | |
SLM Corporation,
5.565%, due 7/25/08, VRN | | A | + | | | 500 | | | 496 |
Consolidated Edison Company of New York,
7.150%, due 12/1/09 | | A | + | | | 500 | | | 520 |
See accompanying Notes to Financial Statements.
June 30, 2007 | William Blair Funds 31 |
Bond Fund
Portfolio of Investments, June 30, 2007 (all dollar amounts in thousands) (unaudited)
| | | | | | | | |
| | | NRSRO
Rating | | | Principal
Amount | | Value |
| |
Corporate Obligations—(continued) | | | |
Household Finance Corporation,
8.000%, due 7/15/10 | | AA- | | | 500 | | $ | 534 |
Bank of America Corporation,
4.250%, due 10/1/10 | | AA | | | 500 | | | 483 |
National Rural Utilities Cooperative Finance Corporation,
7.250%, due 3/1/12 | | A | | | 500 | | | 533 |
Citigroup, Inc.
5.625%, due 8/27/12 | | AA | | | 400 | | | 400 |
Simon Property Group, Inc.,
6.350%, due 8/28/12 | | A- | | | 500 | | | 515 |
Cox Communications, Inc.,
7.125%, due 10/1/12 | | BBB- | | | 400 | | | 423 |
Boeing Capital Corporation,
5.800%, due 1/15/13 | | A | + | | 400 | | | 406 |
Residential Capital, LLC,
6.500%, due 4/17/13 | | BBB | | | 350 | | | 338 |
SBC Communications,
5.100%, due 9/15/14 | | A | | | 400 | | | 381 |
CODELCO, Inc.—144A,
4.750%, due 10/15/14 | | A | | | 400 | | | 373 |
Johnson Controls, Inc.
5.500%, due 1/15/16 | | A- | | | 400 | | | 387 |
ProLogis,
5.750%, due 4/1/16 | | BBB | + | | 400 | | | 395 |
Omnicom Group, Inc.,
5.900%, due 4/15/16 | | A- | | | 400 | | | 395 |
Yum!, Brands, Inc.,
6.250%, due 4/15/16 | | BBB | | | 400 | | | 399 |
SAB Miller plc,
6.500%, due 7/1/16 | | BBB | + | | 400 | | | 411 |
Petrobras International Finance Company,
6.125%, due 10/6/16 | | BBB- | | | 400 | | | 392 |
Marriott International,
6.375%, due 6/15/17 | | BBB | + | | 450 | | | 451 |
Ras Laffan Lng II,
5.298%, due 9/30/20 | | A | + | | 400 | | | 374 |
Kroger Company,
8.00%, due 9/15/29 | | BBB | | | 400 | | | 431 |
Conoco Funding Company,
7.250%, due 10/15/31 | | A- | | | 400 | | | 452 |
Kohl’s Corporation,
6.00%, due 1/15/33 | | A | | | 250 | | | 234 |
Goldman Sachs Group, Inc.,
6.125%, due 2/15/33 | | AA- | | | 400 | | | 382 |
Pacific Gas and Electric Company,
6.050%, due 3/1/34 | | A- | | | 250 | | | 242 |
Teva Pharmaceutical Finance LLC,
6.150%, due 2/1/36 | | BBB | | | 510 | | | 477 |
Wisconsin Electric Power Company,
5.700%, due 12/1/36 | | A | + | | 500 | | | 471 |
Comcast Corporation,
6.450%, due 3/15/37 | | BBB | + | | 500 | | | 482 |
Florida Power and Light Group Capital, Inc. 6.650%, due 6/15/67, VRN | | A- | | | 500 | | | 496 |
| | | | | | | | |
Total Corporate Obligations | | | | | 12,310 | | | 12,273 |
| | | | | | | | |
Total Fixed Income—96.3%
(Cost $50,322) | | | 50,139 | | | 49,700 |
| | | | | | | | |
| | | | | | | | | | |
| | | NRSRO
Rating | | | Shares or
Principal
Amount | | Value | |
| | | |
Preferred Stock—0.5% | | | | | | | | | | |
Public Storage, Inc. | | | | | | 10,000 | | $ | 239 | |
| | | | | | | | | | |
Total Preferred Stock—0.5%
(Cost $245) | | | | | | 10,000 | | | 239 | |
| | | | | | | | | | |
Total Long-Term Investments—96.8%
(Cost $50,567) | | | 49,939 | |
| | | | | | | | | | |
| | | |
Short-Term Investments | | | | | | | | | | |
American Express Corporation, VRN 5.170%, due 7/2/07 | | A | + | | $ | 2,240 | | | 2,240 | |
Prudential Funding LLC, VRN
5.305%, due 7/2/07 | | A | + | | | 2,240 | | | 2,240 | |
| | | | | | | | | | |
Total Short-Term Investments—8.7%
(Cost $4,480) | | | | 4,480 | | | 4,480 | |
| | | | | | | | | | |
| | | |
Repurchase Agreement | | | | | | | | | | |
Investors Bank & Trust Company,
4.50% dated 6/29/2007, due 7/02/2007, repurchase price $1,778, collateralized by SBA #506044 | | A | + | | | 1,777 | | | 1,777 | |
| | | | | | | | | | |
Total Repurchase Agreement—3.4%
(Cost $1,777) | | | | 1,777 | | | 1,777 | |
| | | | | | | | | | |
Total Investments—108.9%
(Cost $56,824) | | | 56,196 | |
| | | | | | | | |
Cash and other assets, less liabilities—(8.9)% | | | (4,573 | ) |
| | | | | | | | | | |
Net Assets—100% | | $ | 51,623 | |
| | | | |
VRN = Variable Rate Note
NRSRO = Nationally Recognized Statistical Rating Organization, such as
S&P, Moody’s or Fitch (unaudited)
The obligations of certain U.S. Government-sponsored securities are neither issued nor guaranteed by the U. S. Treasury
* Deemed illiquid pursuant to Liquidity Procedures adopted by the Board of Trustees. These holdings represent 2.14% of the net assets at June 30,2007.
See accompanying Notes to Financial Statements.
32 Semi-Annual Report | June 30, 2007 |
Statements of Assets and Liabilities
June 30, 2007 (all dollar amounts in thousands) (unaudited)
| | | | | | | | | | | | | | |
| | | Institutional
International
Growth Fund | | | Institutional
International
Equity Fund | | | International
Small Cap
Growth Fund | | Emerging
Markets
Growth Fund |
Assets | | | | | | | | | | | | | | |
Investments in securities, at cost | | $ | 1,504,966 | | | $ | 478,290 | | | $ | 294,743 | | $ | 806,484 |
Investments in Affiliated Fund, at cost | | | 53 | | | | 3,276 | | | | 2,148 | | | 1,296 |
| | | | | | | | | | | | | | |
| | | | |
Investments in securities, at value | | $ | 2,136,887 | | | $ | 597,734 | | | $ | 354,564 | | $ | 1,065,377 |
Investments in Affiliated Fund, at value | | | 53 | | | | 3,276 | | | | 2,148 | | | 1,296 |
Foreign currency, at value (cost $4,841, $11,466, $99, and $103 respectively) | | | 4,864 | | | | 11,452 | | | | 98 | | | 103 |
Receivable for fund shares sold | | | — | | | | — | | | | 1,315 | | | 5,273 |
Receivable for investment securities sold | | | 14,086 | | | | 35,624 | | | | 1,890 | | | 553 |
Dividend and interest receivable | | | 3,779 | | | | 1,252 | | | | 420 | | | 645 |
| | | | | | | | | | | | | | |
Total assets | | | 2,159,669 | | | | 649,338 | | | | 360,435 | | | 1,073,247 |
Liabilities | | | | | | | | | | | | | | |
Payable for investment securities purchased | | | 9,314 | | | | 41,270 | | | | 9,020 | | | 24,793 |
Payable for fund shares redeemed | | | 7,696 | | | | — | | | | 10 | | | 3,994 |
Management fee payable | | | 1,598 | | | | 452 | | | | 271 | | | 825 |
Distribution and shareholder administration fee payable | | | — | | | | — | | | | 20 | | | 42 |
Other accrued expenses | | | 549 | | | | 171 | | | | 343 | | | 1,242 |
| | | | | | | | | | | | | | |
Total liabilities | | | 19,157 | | | | 41,893 | | | | 9,664 | | | 30,896 |
| | | | | | | | | | | | | | |
Net Assets | | $ | 2,140,512 | | | $ | 607,445 | | | $ | 350,771 | | $ | 1,042,351 |
| | | | | | | | | | | | | | |
Capital | | | | | | | | | | | | | | |
Composition of Net Assets | | | | | | | | | | | | | | |
Par value of shares of beneficial interest | | $ | 99 | | | $ | 39 | | | $ | 23 | | $ | 46 |
Capital paid in excess of par value | | | 1,363,932 | | | | 450,486 | | | | 278,606 | | | 701,063 |
Accumulated net investment income (loss) | | | (29,196 | ) | | | (629 | ) | | | 676 | | | 293 |
Accumulated realized gain (loss) | | | 174,072 | | | | 38,298 | | | | 11,935 | | | 83,198 |
Net unrealized appreciation (depreciation) of investments and foreign currencies | | | 631,605 | | | | 119,251 | | | | 59,531 | | | 257,751 |
| | | | | | | | | | | | | | |
Net Assets | | $ | 2,140,512 | | | $ | 607,445 | | | $ | 350,771 | | $ | 1,042,351 |
| | | | | | | | | | | | | | |
Net Assets | | $ | 2,140,512 | | | $ | 607,445 | | | $ | — | | $ | — |
Shares Outstanding | | | 98,668,177 | | | | 38,776,195 | | | | — | | | — |
Net Asset Value Per Share | | $ | 21.69 | | | $ | 15.67 | | | $ | — | | $ | — |
Institutional Share Class | | | | | | | | | | | | | | |
Net Assets | | $ | — | | | $ | — | | | $ | 217,546 | | $ | 735,363 |
Shares Outstanding | | | — | | | | — | | | | 14,140,046 | | | 32,229,452 |
Net Asset Value Per Share | | $ | — | | | $ | — | | | $ | 15.39 | | $ | 22.82 |
See accompanying Notes to Financial Statements.
June 30, 2007 | William Blair Funds 33 |
Statements of Operations
For the Period Ended June 30, 2007 (all dollar amounts in thousands) (unaudited)
| | | | | | | | | | | | | | | | |
| | | Institutional
International
Growth
Fund | | | Institutional
International
Equity Fund | | | International
Small Cap
Growth
Fund | | | Emerging
Markets
Growth
Fund | |
Investment income | | | | | | | | | | | | | | | | |
Dividends | | $ | 22,208 | | | $ | 7,985 | | | $ | 2,437 | | | $ | 6,061 | |
Less foreign tax withheld | | | (1,434 | ) | | | (625 | ) | | | (150 | ) | | | (343 | ) |
Income from Affiliated Fund | | | 1 | | | | 121 | | | | 77 | | | | 30 | |
Interest | | | 964 | | | | 268 | | | | 279 | | | | 882 | |
| | | | | | | | | | | | | | | | |
Total income | | | 21,739 | | | | 7,749 | | | | 2,643 | | | | 6,630 | |
Expenses | | | | | | | | | | | | | | | | |
Investment advisory fees | | | 9,283 | | | | 3,023 | | | | 1,482 | | | | 4,895 | |
Distribution fees | | | — | | | | — | | | | 25 | | | | 74 | |
Shareholder administration fees | | | — | | | | — | | | | 85 | | | | 207 | |
Custodian fees | | | 662 | | | | 187 | | | | 161 | | | | 633 | |
Transfer agent fees | | | 18 | | | | 8 | | | | 15 | | | | 46 | |
Professional fees | | | 40 | | | | 22 | | | | 21 | | | | 27 | |
Registration fees | | | 21 | | | | 5 | | | | 30 | | | | 24 | |
Other expenses | | | 97 | | | | 30 | | | | 11 | | | | 19 | |
| | | | | | | | | | | | | | | | |
Total expenses before waiver | | | 10,121 | | | | 3,327 | | | | 1,830 | | | | 5,925 | |
Less expenses reimbursed to (waived or absorbed) by the Advisor | | | — | | | | 52 | | | | — | | | | (80 | ) |
| | | | | | | | | | | | | | | | |
Net expenses | | | 10,121 | | | | 3,327 | | | | 1,830 | | | | 5,845 | |
| | | | | | | | | | | | | | | | |
Net investment income (loss) | | | 11,618 | | | | 4,422 | | | | 813 | | | | 785 | |
Net realized and unrealized gain (loss) on investments, foreign currency transactions and other assets and liabilities | | | | | | | | | | | | | | | | |
Net realized gain (loss) on investments | | | 111,150 | | | | 34,371 | | | | 10,838 | | | | 64,491 | |
Net realized gain (loss) on foreign currency transactions and other assets and liabilities | | | (2,368 | ) | | | (826 | ) | | | (478 | ) | | | (477 | ) |
| | | | | | | | | | | | | | | | |
Total net realized gain (loss) | | | 108,782 | | | | 33,545 | | | | 10,360 | | | | 64,014 | |
Change in net unrealized appreciation (depreciation) on investments and other assets and liabilities | | | 108,408 | | | | 20,799 | | | | 29,094 | | | | 80,279 | |
| | | | | | | | | | | | | | | | |
Net increase (decrease) in net assets resulting from operations | | $ | 228,808 | | | $ | 58,766 | | | $ | 40,267 | | | $ | 145,078 | |
| | | | | | | | | | | | | | | | |
See accompanying Notes to Financial Statements.
34 Semi-Annual Report | June 30, 2007 |
Statements of Changes in Net Assets
For the Period Ended June 30, 2007 and the Year Ended December 31, 2006 (all amounts in thousands) (unaudited)
| | | | | | | | | | | | | | | | | | | | | | | | | | | | | | | | |
| | | Institutional
International
Growth
Fund | | | Institutional
International
Equity
Fund | | | International
Small Cap
Growth
Fund | | | Emerging
Markets
Growth
Fund | |
| | | 2007 | | | 2006 | | | 2007 | | | 2006 | | | 2007 | | | 2006 | | | 2007 | | | 2006 | |
| | | (unaudited) | | | | | | (unaudited) | | | | | | (unaudited) | | | | | | (unaudited) | | | | |
Operations | | | | | | | | | | | | | | | | | | | | | | | | | | | | | | | | |
Net investment income (loss) | | $ | 11,618 | | | $ | 9,378 | | | $ | 4,422 | | | $ | 2,025 | | | $ | 813 | | | $ | (221 | ) | | $ | 785 | | | $ | 211 | |
Net realized gain (loss) on investments, foreign currency transactions and other assets and liabilities | | | 108,782 | | | | 267,920 | | | | 33,545 | | | | 7,823 | | | | 10,360 | | | | 2,299 | | | | 64,014 | | | | 22,993 | |
Change in net unrealized appreciation (depreciation) on investments, foreign currency transactions and other assets and liabilities | | | 108,408 | | | | 91,778 | | | | 20,799 | | | | 72,424 | | | | 29,094 | | | | 26,158 | | | | 80,279 | | | | 147,786 | |
| | | | | | | | | | | | | | | | | | | | | | | | | | | | | | | | |
Net increase (decrease) in net assets resulting from operations | | | 228,808 | | | | 369,076 | | | | 58,766 | | | | 82,272 | | | | 40,267 | | | | 28,236 | | | | 145,078 | | | | 170,990 | |
Distributions to shareholders from | | | | | | | | | | | | | | | | | | | | | | | | | | | | | | | | |
Net investment income | | | — | | | | (32,267 | ) | | | — | | | | (6,495 | ) | | | — | | | | (106 | ) | | | — | | | | (405 | ) |
Net realized gain | | | — | | | | (217,683 | ) | | | — | | | | (1,892 | ) | | | — | | | | (877 | ) | | | — | | | | (4,544 | ) |
| | | | | | | | | | | | | | | | | | | | | | | | | | | | | | | | |
| | | — | | | | (249,950 | ) | | | — | | | | (8,387 | ) | | | — | | | | (983 | ) | | | — | | | | (4,949 | ) |
Capital stock transactions | | | | | | | | | | | | | | | | | | | | | | | | | | | | | | | | |
Net proceeds from sale of shares | | | 127,438 | | | | 144,396 | | | | 7,781 | | | | 281,476 | | | | 98,461 | | | | 172,153 | | | | 152,172 | | | | 529,925 | |
Shares issued in reinvestment of income dividends and capital gain distributions | | | — | | | | 244,472 | | | | — | | | | 7,436 | | | | — | | | | 868 | | | | — | | | | 4,687 | |
Less cost of shares redeemed | | | (91,075 | ) | | | (188,067 | ) | | | (57,477 | ) | | | (15,351 | ) | | | (19,926 | ) | | | (18,839 | ) | | | (68,548 | ) | | | (136,352 | ) |
| | | | | | | | | | | | | | | | | | | | | | | | | | | | | | | | |
Net increase (decrease) in net assets resulting from capital stock transactions | | | 36,363 | | | | 200,801 | | | | (49,696 | ) | | | 273,561 | | | | 78,535 | | | | 154,182 | | | | 83,624 | | | | 398,260 | |
| | | | | | | | | | | | | | | | | | | | | | | | | | | | | | | | |
Increase (decrease) in net assets | | | 265,171 | | | | 319,927 | | | | 9,070 | | | | 347,446 | | | | 118,802 | | | | 181,435 | | | | 228,702 | | | | 564,301 | |
Net assets | | | | | | | | | | | | | | | | | | | | | | | | | | | | | | | | |
Beginning of period | | | 1,875,341 | | | | 1,555,414 | | | | 598,375 | | | | 250,929 | | | | 231,969 | | | | 50,534 | | | | 813,649 | | | | 249,348 | |
| | | | | | | | | | | | | | | | | | | | | | | | | | | | | | | | |
End of period | | $ | 2,140,512 | | | $ | 1,875,341 | | | $ | 607,445 | | | $ | 598,375 | | | $ | 350,771 | | | $ | 231,969 | | | $ | 1,042,351 | | | $ | 813,649 | |
| | | | | | | | | | | | | | | | | | | | | | | | | | | | | | | | |
Undistributed net investment income (loss) at the end of the period | | $ | (29,196 | ) | | $ | (40,814 | ) | | $ | (629 | ) | | $ | (6,711 | ) | | $ | 676 | | | $ | (137 | ) | | $ | 293 | | | $ | (492 | ) |
| | | | | | | | | | | | | | | | | | | | | | | | | | | | | | | | |
See accompanying Notes to Financial Statements.
June 30, 2007 | William Blair Funds 35 |
Statements of Assets and Liabilities
June 30, 2007 (all dollar amounts in thousands) (unaudited)
| | | | |
| | | Bond
Fund | |
Assets | | | | |
Investments in securities, at cost | | $ | 56,824 | |
Investments in Affiliated Fund, at cost | | | — | |
| | | | |
| |
Investments in securities, at value | | $ | 56,196 | |
Investments in Affiliated Fund, at value | | | — | |
Receivable for fund shares sold | | | 438 | |
Receivable for investment securities sold | | | — | |
Receivable from Advisor | | | 1 | |
Dividend and interest receivable | | | — | |
| | | | |
Total assets | | | 56,635 | |
| | | | |
Liabilities | | | | |
Payable for investment securities purchased | | | 4,989 | |
Payable for fund shares redeemed | | | — | |
Management fee payable | | | — | |
Distribution and shareholder administration fee payable | | | 5 | |
Other accrued expenses | | | 18 | |
| | | | |
Total liabilities | | | 5,012 | |
| | | | |
Net Assets | | $ | 51,623 | |
| | | | |
Capital | | | | |
Composition of Net Assets | | | | |
Par value of shares of beneficial interest | | $ | 5 | |
Capital paid in excess of par value | | | 52,292 | |
Accumulated net investment income (loss) | | | 104 | |
Accumulated realized gain (loss) | | | (150 | ) |
Net unrealized appreciation (depreciation) of investments and foreign currencies | | | (628 | ) |
| | | | |
Net Assets | | $ | 51,623 | |
| | | | |
| |
Institutional Share Class | | | | |
Net Assets | | $ | 8,793 | |
Shares Outstanding | | | 893,446 | |
Net Asset Value Per Share | | $ | 9.84 | |
See accompanying Notes to Financial Statements.
36 Semi-Annual Report | June 30, 2007 |
Statements of Operations
For the Period Ended June 30, 2007 (all dollar amounts in thousands) (unaudited)
| | | | |
| | | Bond
Fund(a) | |
Investment income | | | | |
Dividends | | $ | 4 | |
Interest | | | 370 | |
| | | | |
Total income | | | 374 | |
Expenses | | | | |
Investment advisory fees | | | 21 | |
Distribution fees | | | — | |
Shareholder administration fees | | | 8 | |
Custodian fees | | | 7 | |
Transfer agent fees | | | 2 | |
Professional fees | | | 7 | |
Registration fees | | | 5 | |
Other expenses | | | 4 | |
| | | | |
Total expenses before waiver | | | 54 | |
Less expenses waived or absorbed by the Advisor | | | (21 | ) |
| | | | |
Net expenses | | | 33 | |
| | | | |
Net investment income (loss) | | | 341 | |
Net realized and unrealized gain (loss) on investments, foreign currency
transactions and other assets and liabilities | | | | |
Net realized gain (loss) on investments | | | (150 | ) |
| | | | |
Change in net unrealized appreciation (depreciation) on investments and other assets and liabilities | | | (628 | ) |
| | | | |
Net increase (decrease) in net assets resulting from operations | | $ | (437 | ) |
| | | | |
| (a) | | For the period from May 1, 2007 (Commencement of Operations) to June 30, 2007. |
See accompanying Notes to Financial Statements.
June 30, 2007 | William Blair Funds 37 |
Statements of Changes in Net Assets
For the Period Ended June 30, 2007 (all amounts in thousands)
| | | | |
| | | Bond Fund(a) | |
| | | 2007 | |
| | | (unaudited) | |
Operations | | | | |
Net investment income (loss) | | $ | 341 | |
Net realized gain (loss) on investments, foreign currency transactions and other assets and liabilities | | | (150 | ) |
Change in net unrealized appreciation (depreciation) on investments, foreign currency transactions and other assets and liabilities | | | (628 | ) |
| | | | |
Net increase (decrease) in net assets resulting from operations | | | (437 | ) |
Distributions to shareholders from | | | | |
Net investment income | | | (237 | ) |
Net realized gain | | | — | |
| | | | |
| | | (237 | ) |
Capital stock transactions | | | | |
Net proceeds from sale of shares | | | 52,111 | |
Shares issued in reinvestment of income dividends and capital gain distributions | | | 187 | |
Less cost of shares redeemed | | | (1 | ) |
| | | | |
Net increase (decrease) in net assets resulting from capital stock transactions | | | 52,297 | |
| | | | |
Increase (decrease) in net assets | | | 51,623 | |
Net assets | | | | |
Beginning of period | | $ | — | |
| | | | |
End of period | | $ | 51,623 | |
| | | | |
Undistributed net investment income (loss) at the end of the period | | $ | 104 | |
| | | | |
| (a) | | For the period from May 1, 2007 (Commencement of Operations) to June 30, 2007. |
See accompanying Notes to Financial Statements.
38 Semi-Annual Report | June 30, 2007 |
Notes to Financial Statements
(1) Significant Accounting Policies
The following is a summary of the Fund’s significant accounting policies in effect during the period covered by the financial statements, which are in accordance with U.S. generally accepted accounting principles.
(a) Description of the Fund
William Blair Funds (the “Fund”) is a diversified mutual fund registered under the Investment Company Act of 1940, as amended, as an open-end management investment company. The number of shares authorized for this Fund is unlimited. The Fund currently consists of the following sixteen portfolios (the “Portfolios”), each with its own investment objectives and policies.
| | |
Equity Portfolios | | International Portfolios |
Growth | | International Growth |
Tax-Managed Growth | | International Equity |
Large Cap Growth | | Institutional International Growth |
Small Cap Growth | | Institutional International Equity |
Mid Cap Growth | | International Small Cap Growth |
Small-Mid Cap Growth | | Emerging Markets Growth |
Value Discovery | | Fixed Income Portfolios |
| | Bond |
| | Income |
| | Money Market Portfolio |
| | Ready Reserves |
The investment objectives of the Portfolios are as follows:
| | |
Equity | | Long-term capital appreciation. |
International | | Long-term capital appreciation. |
Fixed Income | | High level of current income with relative stability of principal. |
Money Market | | Current income, a stable share price and daily liquidity. |
The Institutional International Growth Portfolio, the Institutional International Equity Portfolio and the Institutional Share Classes of the International Small Cap Growth Portfolio, the Emerging Markets Growth Portfolio, and the Bond Portfolio are the only Portfolios covered in this report.
(b) Share Classes
Three different classes of shares of the International Small Cap Growth Fund, Emerging Markets Growth Fund, and the Bond Fund currently exist: N, I and Institutional. This report includes financial information for only the Institutional Class. The Institutional share class is sold to institutional investors, including but not limited to employee benefit plans, endowments, foundations, trusts and corporations, who are able to meet the Fund’s high minimum investment requirement. The minimum initial investment required is $5 million ($2 million for the Bond Portfolio).
Investment income realized and unrealized gains and losses, and certain Portfolio level expenses and expense reductions, if any, are allocated based on the relative net assets of each class, except for certain class specific expenses which are charged directly to the appropriate class. Differences in class expenses may result in the payment of different per share dividends by class. All share classes of the Portfolios have equal rights with respect to voting subject to class specific arrangements.
(c) Investment Valuation
The market value of domestic equity securities and options is determined by valuing securities traded on national securities exchanges or markets or in the over-the-counter markets at the last sales price or, if applicable, the official closing price or, in the absence of a sale on the date of valuation, at the latest bid price.
For international securities, if the foreign exchange or market on which a security is primarily traded closes before the close of regular trading on the New York Stock Exchange (4:00 p.m. Eastern time), the Portfolios use an independent pricing service on a daily basis to estimate the fair value price as of the close of regular trading on the New York Stock Exchange. The Board of Trustees has determined that the passage of time between when foreign exchanges or markets close and when the Portfolios calculate their net asset values could cause the value of international securities to no longer be representative of their market price or accurate. In addition, quarterly the Board of Trustees receives a report which compares the fair value
June 30, 2007 | William Blair Funds 39 |
prices used to calculate the net asset value to the next day’s opening local prices. Otherwise, the value of foreign equity securities is determined based on the last sale price on the foreign exchange or market on which it is primarily traded or, if
there have been no sales during that day, at the latest bid price. Foreign currency forward contracts and foreign currencies are valued at the forward and current exchange rates, respectively, prevailing on the date of valuation.
Long-term, fixed-income securities are valued based on market quotations, or by independent pricing services that use prices provided by market makers or by estimates of market values obtained from yield data relating to instruments or securities with similar characteristics.
Investments in other funds are valued at the underlying fund’s net asset value on the date of valuation. Other securities, and all other assets, including securities for which a market price is not available, or the value of which is affected by a significant valuation event, are valued at fair value as determined in good faith by the Pricing Committee or Valuation Committee, in accordance with the Fund’s Valuation Procedures approved by the Board of Trustees. As of June 30, 2007, there were securities held in the Institutional International Growth, Institutional International Equity, International Small Cap Growth and Emerging Markets Growth Portfolios requiring fair valuation by the Board of Trustees pursuant to the Fund’s valuation procedures.
(d) Investment income and transactions
Dividend income is recorded on the ex-dividend date, except for those dividends from certain foreign securities which are recorded as soon as the information is available. Foreign currency gains and losses associated with fluctuation in the foreign currency rate versus the United States dollar are recorded on the Statement of Operations as a component of net realized gains/(losses) on foreign currency translation and other assets and liabilities.
Premiums and discounts are accreted and amortized on a straight-line basis for short-term investments and on an effective interest method for long-term investments. The interest rate shown on the Portfolio of Investments for the Bond Fund were the rates in effect on June 30, 2007. Put bonds may be redeemed at the discretion of the holder on specified dates prior to maturity.
Interest income is determined on the basis of the interest accrued, adjusted for amortization of premium or discount. Variable rate bonds and floating rate notes earn interest at coupon rates that fluctuate at specific time intervals.
Paydown gains and losses on mortgage and asset-backed securities are treated as an adjustment to interest income. For the period ended June 30, 2007, the Bond Portfolio recognized an increase of interest income and an increase of net realized (loss) of -$1- (in thousands). This reclassification has no effect on the net asset value of the Portfolio.
Security and shareholder transactions are accounted for no later than one business day following the trade date. However, for financial reporting purposes, security and shareholder transactions are accounted for on the trade date of the last business day of the reporting period. Realized gains and losses from securities transactions are recognized on the basis of high cost lot sell selection.
Awards from class action litigation may be recorded as a reduction of cost. If the Funds no longer own the applicable securities, the proceeds are recorded as realized gains.
(e) Share Valuation and Dividends to Shareholders
Shares are sold and redeemed on a continuous basis at net asset value. The net asset value per share is determined by dividing the Portfolio’s net assets by the number of shares outstanding as of the close of regular trading on the New York Stock Exchange, which is generally 3:00 p.m. Central time (4:00 p.m. Eastern time), on each day the Exchange is open.
Dividends from net investment income, if any, are declared at least annually for all Portfolio’s covered by this report except the Bond Portfolio which is declared monthly. Capital gain distributions, if any, are declared at least annually in December. Dividends payable to shareholders are recorded on the ex-dividend date.
(f) Foreign Currency Translation and Foreign Currency Forward Contracts
The Portfolios (excluding the Bond Portfolio) may invest in securities denominated in foreign currencies. As such, assets and liabilities denominated in foreign currencies are translated into U.S. dollar amounts at the current exchange rate on the date of valuation. The values of foreign investments, open foreign currency forward contracts, and cash denominated in foreign currencies are translated into U.S. dollars using a spot market rate of exchange as of the time of the determination of each Fund’s NAV typically 4:00 p.m. Eastern time on days when there is regular trading on the New York Stock Exchange. Payables and receivables for securities transactions, dividends, interest income and tax reclaims are translated into U.S. dollars using a spot market rate of exchange as of 4:00 p.m. Eastern time. Settlement of purchases and sales and dividend and interest receipts are translated into U.S. dollars using a spot market rate of exchange as of 11:00 a.m. Eastern time.
40 Semi-Annual Report | June 30, 2007 |
These Portfolios (excluding the Bond Portfolio) may enter into foreign currency forward contracts (1) as a means of managing the risks associated with changes in the exchange rates for the purchase or sale of a specific amount of a particular foreign currency, and (2) to hedge the value, in U.S. dollars, of portfolio securities. Gains and losses from foreign currency transactions associated with purchases and sales of investments and foreign currency forward contracts are included with the net realized and unrealized gain or loss on investments. For tax purposes, the foreign currency gains and losses are treated as ordinary income.
(g) Income Taxes
The Portfolios intend to comply with the special provisions of Subchapter M of the Internal Revenue Code available to regulated investment companies and, therefore, no provision for Federal income taxes has been made in the accompanying financial statements since each Portfolio intends to distribute substantially all of its taxable income to its shareholders and be relieved of all Federal income taxes.
The Portfolios have elected to mark-to-market their investments in Passive Foreign Investment Companies (“PFICs”) for Federal income tax purposes. In accordance with this election, the Institutional International Growth, Institutional International Equity, International Small Cap Growth and Emerging Markets Growth Portfolios recognized net unrealized appreciation (depreciation) of $25,722, $7,000, $— and $—, respectively (in thousands) in 2006, all of which has been treated as an adjustment to the cost of investments for tax purposes. The Portfolios also treat the deferred loss associated with current and prior year wash sales as an adjustment to the cost of investments for tax purposes. The cost of investments for Federal income tax purposes and related gross unrealized appreciation/(depreciation) and net unrealized appreciation/(depreciation) at June 30, 2007 were as follows (in thousands):
| | | | | | | | | | | | | |
Portfolio | | Cost of
Investments | | Gross Unrealized Appreciation | | Gross Unrealized Depreciation | | Net Unrealized
Appreciation / (Depreciation) | |
Institutional International Growth | | $ | 1,554,078 | | $ | 598,376 | | $ | 15,830 | | $ | 582,546 | |
Institutional International Equity | | | 491,114 | | | 112,794 | | | 3,091 | | | 109,703 | |
International Small Cap Growth | | | 297,811 | | | 67,122 | | | 8,511 | | | 58,611 | |
Emerging Markets Growth | | | 811,577 | | | 263,348 | | | 9,394 | | | 253,954 | |
Bond Fund | | | 56,824 | | | 84 | | | 712 | | | (628 | ) |
The timing and characterization of certain income and capital gain distributions are determined annually in accordance with Federal income tax regulations that may differ from U.S. generally accepted accounting principles. As a result, net investment income or loss and net realized gain or loss for a reporting period may differ from the amount distributed during such period. In addition, the Portfolios may periodically record reclassifications among certain capital accounts to reflect differences between financial reporting and income tax basis distributions. The reclassifications were reported in order to reflect the tax treatment for certain permanent differences that exist between income tax regulations and U.S. generally accepted accounting principles. The reclassifications generally relate to section 988 currency gains and losses, and recharacterization of unrealized appreciation on PFICs (Passive Foreign Investment Corporations). These reclassifications have no impact on the net asset values of the Portfolio. Accordingly, at December 31, 2006, the following reclassifications were recorded (in thousands):
| | | | | | | | | | | | |
Portfolio | | Undistributed Net
Investment Income/(Loss) | | | Accumulated
Undistributed
Net Realized Gain/ (Loss) | | | Capital
Paid In Excess
of Par Value | |
Institutional International Growth | | $ | (3,376 | ) | | $ | 3,376 | | | $ | — | |
Institutional International Equity | | | (1,660 | ) | | | 1,660 | | | | — | |
International Small Cap Growth | | | 289 | | | | (289 | ) | | | — | |
Emerging Markets Growth | | | 24 | | | | (22 | ) | | | (2 | ) |
Distributions from net realized gains for book purposes may include short-term capital gains, which are included as ordinary income for tax purposes. The tax character of distributions paid during 2006 and 2005 was as follows (in thousands):
| | | | | | | | | | | | |
| | | Distributions Paid In 2006 | | Distributions Paid In 2005 |
Portfolio | | Ordinary
Income | | Long-Term
Capital Gains | | Ordinary
Income | | Long-Term
Capital Gains |
Institutional International Growth | | $ | 48,076 | | $ | 201,874 | | $ | 14,610 | | $ | 109,190 |
Institutional International Equity | | | 6,495 | | | 1,892 | | | 445 | | | — |
International Small Cap Growth | | | 983 | | | — | | | 6 | | | — |
Emerging Markets Growth | | | 1,585 | | | 3,364 | | | 1,169 | | | — |
June 30, 2007 | William Blair Funds 41 |
As of December 31, 2006, the components of distributable earnings on a tax basis were as follows (in thousands):
| | | | | | | | | | | | |
Portfolio | | Undistributed
Ordinary
Income | | Accumulated
Capital and
Other Losses | | Undistributed
Long-Term
Gain | | Net Unrealized
Appreciation / (Depreciation) |
Institutional International Growth | | $ | 8,636 | | $ | — | | $ | 64,789 | | $ | 474,248 |
Institutional International Equity | | | 4,100 | | | — | | | 5,519 | | | 88,535 |
International Small Cap Growth | | | 856 | | | 137 | | | 1,730 | | | 29,426 |
Emerging Markets Growth | | | 5,520 | | | 503 | | | 19,303 | | | 171,844 |
At December 31, 2006, the Portfolios, have no unused capital loss carryforwards available for Federal income tax purposes to be applied against future capital gains, if any.
For the period November 1, 2006 through December 31, 2006, the following Portfolios incurred net realized capital or foreign currency losses. Each Portfolio intends to treat this loss as having occurred in fiscal year 2007 for Federal income tax purposes (in thousands):
| | | |
Portfolio | | Currency Loss |
Institutional International Growth | | $ | — |
Institutional International Equity | | | — |
International Small Cap Growth | | | 137 |
Emerging Markets Growth | | | 503 |
(h) Repurchase Agreements
The Portfolios may enter into repurchase agreements with its custodian, Investors Bank & Trust Company, whereby the Portfolios acquire ownership of a debt security and the custodian agrees, at the time of sale, to repurchase the debt security from the Portfolios at a mutually agreed upon time and price. The Portfolios’ policy is to take possession of the debt security as collateral under the repurchase agreements. The Portfolios minimize credit risk by monitoring credit exposure to the custodian and by monitoring the collateral value on an ongoing basis.
(i) Use of Estimates
The preparation of financial statements in conformity with U.S. generally accepted accounting principles requires management to make estimates and assumptions that affect the amounts reported in the financial statements. Actual results may differ from those estimates.
(2) New Accounting Pronouncements
In July 2006, the Financial Accounting Standards Board (FASB) released FASB Interpretation No. 48 “Accounting for Uncertainty in Income Taxes” (FIN 48). FIN 48 provides guidance for how uncertain tax positions should be recognized, measured, presented and disclosed in the financial statements. FIN 48 requires the evaluation of tax positions taken or expected to be taken in the course of preparing the Fund’s tax returns to determine whether the tax positions are “more-likely-than-not” of being sustained by the applicable tax authority. Tax positions not deemed to meet the more-likely-than-not threshold would be recorded as a tax benefit or expense in the current year. Adoption of FIN 48 is required for fiscal years beginning after December 15, 2006. Recent SEC guidance allows implementing FIN 48 in Portfolio’s NAV calculations as late as the fund’s last NAV calculation in the first required financial statement reporting period. Management has evaluated the implications of FIN 48 and has determined it does not have an impact on the financial statements as of June 30, 2007.
In September 2006, the Financial Accounting Standards Board (FASB) issued Statement on Financial Accounting Standards No. 157, “Fair Value Measurements” (FAS 157). This standard clarifies the definition of fair value for financial reporting, establishes a framework for measuring fair value and requires additional disclosures about the use of fair value measurements. FAS 157 is effective for financial statements issued for fiscal years beginning after November 15, 2007. Management is currently evaluating the impact that FAS 157 will have on the Funds’ financial statements.
(3) Transactions with Affiliates
(a) Management and Expense Limitation Agreements
The Institutional International Growth and Institutional International Equity Portfolios have a management agreement with William Blair & Company L.L.C. (the “Company”) for investment advisory, administrative, and other accounting services.
42 Semi-Annual Report | June 30, 2007 |
The Portfolios pay the Company an annual fee, payable monthly, based on a specified percentage of its average daily net assets. A summary of the annual rates expressed as a percentage of average daily net assets is as follows:
| | | |
First $500 million | | 1.00 | % |
Next $500 million | | 0.95 | % |
In excess of $1 billion | | 0.90 | % |
The International Small Cap Growth Portfolio pays the Company a 1.00% annual fee payable monthly, based on its average daily net assets. The Emerging Markets Growth Portfolio pays the Company a 1.10% annual fee payable monthly, based on its average daily net assets. The Bond Portfolio pays the Company a 0.30% annual fee payable monthly, based on its average daily net assets.
All of the Portfolios, except Institutional International Growth Fund, have also entered into Expense Limitation Agreements with the Company. Under the terms of these Agreements, the Company has agreed to waive its advisory fees and absorb other operating expenses through April 30, 2007, if total expenses of the Institutional International Equity Portfolios exceed 1.10% of average daily net assets, 1.25% of average daily net assets for the Institutional Share Classes of the International Small Cap Growth and Emerging Markets Growth Portfolios or 0.35% of average daily net assets for the Institutional Share Class of the Bond Portfolio.
For a period of three years subsequent to the Commencement of Operations of the Portfolio, the Company is entitled to reimbursement from the Institutional International Equity, International Small Cap Growth, Emerging Markets Growth and Bond Portfolios for previously waived fees and expenses to the extent the overall expense ratio remains below the percentages indicated. The total amount available for recapture at June 30, 2007 is $271, $134, $621 and $21 (in thousands) for Institutional International Equity, International Small Cap Growth, Emerging Markets Growth and Bond Portfolios, respectively. As a result, the total expense ratio for a Portfolio during the period the agreement is in effect, will not fall below the percentage indicated.
For the year ended June 30, 2007, the investment advisory fees incurred by the Portfolio and related fee waivers were as follows (in thousands) :
| | | | | | | | | | | | |
Portfolio | | Gross
Advisory Fee | | Fee Waiver | | Net
Advisory Fee | | Expenses
Recovered or
(Absorbed) by
Advisor |
Institutional International Growth | | $ | 9,283 | | $ | — | | $ | 9,283 | | $ | — |
Institutional International Equity | | | 3,023 | | | — | | | 3,023 | | | 52 |
International Small Cap Growth | | | 1,482 | | | — | | | 1,482 | | | — |
Emerging Markets Growth | | | 4,895 | | | 80 | | | 4,815 | | | — |
Bond | | | 21 | | | 21 | | | — | | | — |
(b) Trustees Fees
The Portfolios incurred fees of $54 (in thousands) to non-interested trustees of the Fund for the year ended June 30, 2007. Interested trustees are not compensated by the Fund.
(c) Investments in Affiliated Portfolio
Pursuant to the rules of the 1940 Act, each of the Portfolios of the Fund may invest in the William Blair Ready Reserves Portfolio (“Ready Reserves”), an open-end money market portfolio managed by the Company. Ready Reserves Portfolio is used as a cash management option to the other Portfolios in the Fund. The Company waives management fees and shareholder service fees earned from the other Portfolios investment in the Ready Reserves Fund. The fees waived with respect to the Portfolio for the period ended June 30, 2007 are listed below. Distributions received from Ready Reserves are reflected as “Dividend income from affiliated Fund” in the Portfolio’s statement of operations. Amounts relating to the Portfolio’s investments in Ready Reserves were as follows for the period ended June 30, 2007 (in thousands):
| | | | | | | | | | | | | | | | | | |
Portfolio | | Purchases | | Sales
Proceeds | | Fees
Waived | | Dividend
Income | | Value | | Percent
of Net
Assets | |
Institutional International Growth | | $ | 1 | | $ | — | | $ | — | | $ | 1 | | $ | 53 | | — | % |
Institutional International Equity | | | 8,620 | | | 9,350 | | | 15 | | | 121 | | | 3,276 | | 0.5 | |
International Small Cap Growth | | | 1,078 | | | 4,158 | | | 9 | | | 77 | | | 2,148 | | 0.6 | |
Emerging Markets Growth | | | 31 | | | — | | | 4 | | | 30 | | | 1,926 | | 0.1 | |
June 30, 2007 | William Blair Funds 43 |
(4) Investment Transactions
Investment transactions, excluding money market instruments, for the period ended June 30, 2007, were as follows (in thousands):
| | | | | | |
Portfolio | | Purchases | | Sales |
Institutional International Growth | | $ | 698,178 | | $ | 668,283 |
Institutional International Equity | | | 242,723 | | | 291,367 |
International Small Cap Growth | | | 211,356 | | | 123,259 |
Emerging Markets Growth | | | 532,799 | | | 443,125 |
Bond | | | 57,134 | | | 6,417 |
(5) Foreign Currency Forward Contracts
To protect itself against a decline in the value of foreign currency against the U.S. dollar, each Portfolio enters into foreign currency forward contracts with its custodian and others. The Portfolio bears the market risk that arises from changes in foreign currency rates and bears the credit risk if the counterparty fails to perform under the contract. The net realized and unrealized gains and losses associated with foreign currency forward contracts are reflected in the accompanying financial statements.
(6) Fund Share Transactions
The following table summarizes the activity in capital shares of each Portfolio (in thousands):
| | | | | | | | | | | | | | | | |
| | | Dollars |
| | | For the Period Ended June 30, 2007 |
Portfolio | | Institutional
International
Growth | | Institutional
International
Equity | | �� | International
Small Cap
Growth | | Emerging
Markets
Growth | | Bond(a) |
Sales | | $ | 127,438 | | $ | 7,781 | | | $ | 51,929 | | $ | 109,929 | | $ | 8,879 |
Reinvested Distributions | | | — | | | — | | | | — | | | — | | | 42 |
Redemptions | | | 91,075 | | | 57,477 | | | | 6,061 | | | 28,575 | | | — |
| | | | | | | | | | | | | | | | |
Net change in net assets relating to fund share activity | | | 36,363 | | | (49,696 | ) | | | 45,868 | | | 81,354 | | | 8,921 |
| | | | | | | | | | | | | | | | |
| | |
| | | Dollars | | |
| | | For the Year Ended December 30, 2006 | | |
Portfolio | | Institutional
International
Growth | | Institutional
International
Equity | | | International
Small Cap
Growth | | Emerging
Markets
Growth | | |
Sales | | $ | 144,396 | | $ | 281,476 | | | $ | 103,040 | | $ | 346,626 | | | |
Reinvested Distributions | | | 244,472 | | | 7,436 | | | | 593 | | | 3,326 | | | |
Redemptions | | | 188,067 | | | 15,351 | | | | 11,665 | | | 110,338 | | | |
| | | | | | | | | | | | | | | | |
Net change in net assets relating to fund share activity | | | 200,801 | | | 273,561 | | | | 91,968 | | | 239,614 | | | |
| | | | | | | | | | | | | | | | |
| | | Shares |
| | | For the Period Ended June 30, 2007 |
Portfolio | | Institutional
International
Growth | | Institutional
International
Equity | | | International
Small Cap
Growth | | Emerging
Markets
Growth | | Bond(a) |
Sales | | | 6,324 | | | 560 | | | | 3,644 | | | 5,297 | | | 889 |
Reinvested Distributions | | | — | | | — | | | | — | | | — | | | 4 |
Redemptions | | | 4,390 | | | 3,709 | | | | 414 | | | 1,393 | | | — |
| | | | | | | | | | | | | | | | |
Net change in shares outstanding | | | 1,934 | | | (3,149 | ) | | | 3,230 | | | 3,904 | | | 893 |
| | | | | | | | | | | | | | | | |
| | |
| | | Shares | | |
| | | For the Year Ended December 30, 2006 | | |
Portfolio | | Institutional
International
Growth | | Institutional
International
Equity | | | International
Small Cap
Growth | | Emerging
Markets
Growth | | |
Sales | | | 7,491 | | | 21,737 | | | | 8,638 | | | 13,777 | | | |
Reinvested Distributions | | | 12,799 | | | 527 | | | | 45 | | | 62 | | | |
Redemptions | | | 9,426 | | | 1,172 | | | | 923 | | | 500 | | | |
| | | | | | | | | | | | | | | | |
Net change in shares outstanding | | | 10,864 | | | 21,092 | | | | 7,760 | | | 13,339 | | | |
| | | | | | | | | | | | | | | | |
| (a) | | For the period from May 1, 2007 (Commencement of Operations) to June 30, 2007. |
44 Semi-Annual Report | June 30, 2007 |
Financial Highlights
Institutional International Growth Fund
| | | | | | | | | | | | | | | | | | | | |
| | | | |
| | | Period Ended | | | Years Ended December 31, | |
| | | 6/30/2007 | | | 2006 | | 2005 | | 2004 | | 2003 | | 2002(a) | |
| | | (unaudited) | | | | | | | | | | | | |
Net asset value, beginning of year | | $ | 19.39 | | | $ | 18.11 | | $ | 16.06 | | $ | 13.60 | | $ | 9.57 | | $ | 10.00 | |
Income from investment operations: | | | | | | | | | | | | | | | | | | | | |
Net investment income (b) | | | 0.12 | | | | 0.11 | | | 0.09 | | | 0.03 | | | 0.07 | | | — | |
Net realized and unrealized gain (loss) on investments | | | 2.18 | | | | 4.09 | | | 3.53 | | | 2.44 | | | 3.99 | | | (0.43 | ) |
| | | | | | | | | | | | | | | | | | | | |
Total from investment operations | | | 2.30 | | | | 4.20 | | | 3.62 | | | 2.47 | | | 4.06 | | | (0.43 | ) |
Less distributions from: | | | | | | | | | | | | | | | | | | | | |
Net investment income | | | — | | | | 0.38 | | | 0.15 | | | 0.01 | | | 0.03 | | | — | |
Net realized gain | | | — | | | | 2.54 | | | 1.42 | | | — | | | — | | | — | |
| | | | | | | | | | | | | | | | | | | | |
Total distributions | | | — | | | | 2.92 | | | 1.57 | | | 0.01 | | | 0.03 | | | — | |
| | | | | | | | | | | | | | | | | | | | |
Net asset value, end of year | | $ | 21.69 | | | $ | 19.39 | | $ | 18.11 | | $ | 16.06 | | $ | 13.60 | | $ | 9.57 | |
| | | | | | | | | | | | | | | | | | | | |
Total return (%) | | | 11.86 | | | | 23.45 | | | 22.76 | | | 18.15 | | | 42.47 | | | (4.27 | ) |
Ratios to average daily net assets (%): | | | | | | | | | | | | | | | | | | | | |
Expenses, net of waivers and reimbursements | | | 1.02 | (c) | | | 1.03 | | | 1.05 | | | 1.10 | | | 1.10 | | | 1.10 | (c) |
Expenses, before waivers and reimbursements | | | 1.02 | (c) | | | 1.03 | | | 1.05 | | | 1.11 | | | 1.16 | | | 1.29 | (c) |
Net investment income (loss), net of waivers and reimbursements | | | 1.17 | (c) | | | 0.54 | | | 0.52 | | | 0.18 | | | 0.37 | | | (0.05 | )(c) |
Net investment income (loss), before waivers and reimbursements | | | 1.17 | (c) | | | 0.54 | | | 0.52 | | | 0.17 | | | 0.31 | | | (0.24 | )(c) |
| | | | | | | | | | | | | | | | | | | | |
| | | Period Ended | | | Years Ended December 31, | |
| | | 6/30/2007 | | | 2006 | | 2005 | | 2004 | | 2003 | | 2002 | |
| | | (unaudited) | | | | | | | | | | | | |
Supplemental data: | | | | | | | | | | | | | | | | | | | | |
Net assets at end of year (in thousands) | | $ | 2,140,512 | | | $ | 1,875,341 | | $ | 1,555,414 | | $ | 1,223,436 | | $ | 477,511 | | $ | 149,848 | |
Portfolio turnover rate (%) | | | 68 | (c) | | | 74 | | | 74 | | | 72 | | | 56 | | | 59 | (c) |
| (a) | | For the period from July 26, 2002 (Commencement of Operations) to December 31, 2002. |
| (b) | | Excludes $0.29, $0.25, $0.10, $0.06, and $0.02 of PFIC mark to market which is treated as ordinary income for Federal tax purposes for the years 2006, 2005, 2004, 2003 and 2002, respectively. |
| (c) | | Rates are annualized for periods that are less than a year. |
Performance cited represents past performance. Past performance does not guarantee future results and current performance may be lower or higher that the data quoted. Results shown are annual returns, which assume reinvestment of dividends and capital gains. Investment returns and principal will fluctuate and you may have a gain or loss when you sell shares. For the most current month-end performance information, please call 1-800-742-7272, or visit our Web site at www.williamblairfunds. com.
Note: Net investment income (loss) per share is based on the average shares outstanding during the year.
June 30, 2007 | William Blair Funds 45 |
Financial Highlights
Institutional International Equity Fund
| | | | | | | | | | | | | | |
| | | | |
| | | Period Ended | | | Years Ended December 31, | |
| | | 6/30/2007 | | | 2006 | | 2005 | | 2004(a) | |
| | | (unaudited) | | | | | | | | |
Net asset value, beginning of year | | $ | 14.27 | | | $ | 12.04 | | $ | 10.20 | | $ | 10.00 | |
Income from investment operations: | | | | | | | | | | | | | | |
Net investment income (b) | | | 0.11 | | | | 0.07 | | | — | | | — | |
Net realized and unrealized gain (loss) on investments | | | 1.29 | | | | 2.37 | | | 1.86 | | | 0.20 | |
| | | | | | | | | | | | | | |
Total from investment operations | | | 1.40 | | | | 2.44 | | | 1.86 | | | 0.20 | |
Less distributions from: | | | | | | | | | | | | | | |
Net investment income | | | — | | | | 0.16 | | | 0.02 | | | — | |
Net realized gain | | | — | | | | 0.05 | | | — | | | — | |
| | | | | | | | | | | | | | |
Total distributions | | | — | | | | 0.21 | | | 0.02 | | | — | |
| | | | | | | | | | | | | | |
Net asset value, end of year | | $ | 15.67 | | | $ | 14.27 | | $ | 12.04 | | $ | 10.20 | |
| | | | | | | | | | | | | | |
Total return (%) | | | 9.81 | | | | 20.22 | | | 18.26 | | | 2.00 | |
Ratios to average daily net assets (%): | | | | | | | | | | | | | | |
Expenses, net of waivers and reimbursements | | | 1.08 | (c) | | | 1.10 | | | 1.10 | | | 1.10 | (c) |
Expenses, before waivers and reimbursements | | | 1.08 | (c) | | | 1.12 | | | 1.35 | | | 2.46 | (c) |
Net investment income (loss), net of waivers and reimbursements | | | 1.44 | (c) | | | 0.50 | | | 0.31 | | | (0.21 | )(c) |
Net investment income (loss), before waivers and reimbursements | | | 1.44 | (c) | | | 0.48 | | | 0.06 | | | (1.57 | )(c) |
| |
| | | | |
| | | Period Ended | | | Years Ended December 31, | |
| | | 6/30/2007 | | | 2006 | | 2005 | | 2004 | |
| | | (unaudited) | | | | | | | | |
Supplemental data: | | | | | | | | | | | | | | |
Net assets at end of year (in thousands) | | $ | 607,445 | | | $ | 598,375 | | $ | 250,929 | | $ | 27,384 | |
Portfolio turnover rate (%) | | | 81 | (c) | | | 79 | | | 84 | | | 45 | (c) |
| (a) | | For the period from December 1, 2004 (Commencement of Operations) to December 31, 2004. |
| (b) | | Excludes $0.23, $0.27 and $0.01 of PFIC mark to market which is treated as ordinary income for Federal tax purposes for the years 2006, 2005 and 2004, respectively. |
| (c) | | Rates are annualized for periods that are less than a year. |
Performance cited represents past performance. Past performance does not guarantee future results and current performance may be lower or higher that the data quoted. Results shown are annual returns, which assume reinvestment of dividends and capital gains. Investment returns and principal will fluctuate and you may have a gain or loss when you sell shares. For the most current month-end performance information, please call 1-800-742-7272, or visit our Web site at www.williamblairfunds. com.
Note: Net investment income (loss) per share is based on the average shares outstanding during the year.
46 Semi-Annual Report | June 30, 2007 |
Financial Highlights
International Small Cap Growth Fund
Institutional Share Class
| | | | | | | | | | | | |
| | | | |
| | | Period Ended | | | Years Ended December 31, | |
| | | 6/30/2007 | | | 2006 | | | 2005(a) | |
| | | (unaudited) | | | | | | | |
Net asset value, beginning of year | | $ | 13.43 | | | $ | 11.16 | | | $ | 10.00 | |
Income from investment operations: | | | | | | | | | | | | |
Net investment income (b) | | | 0.04 | | | | (0.01 | ) | | | — | |
Net realized and unrealized gain on investments | | | 1.92 | | | | 2.34 | | | | 1.16 | |
| | | | | | | | | | | | |
Total from investment operations | | | 1.96 | | | | 2.33 | | | | 1.16 | |
Less distributions from: | | | | | | | | | | | | |
Net investment income | | | — | | | | 0.01 | | | | — | (c) |
Net realized gain | | | — | | | | 0.05 | | | | — | |
| | | | | | | | | | | | |
Total distributions | | | — | | | | 0.06 | | | | — | |
| | | | | | | | | | | | |
Net asset value, end of year | | $ | 15.39 | | | $ | 13.43 | | | $ | 11.16 | |
| | | | | | | | | | | | |
Total return (%) | | | 14.59 | | | | 20.86 | | | | 11.62 | |
Ratios to average daily net assets (%): | | | | | | | | | | | | |
Expenses, net of waivers and reimbursements | | | 1.15 | (d) | | | 1.25 | | | | 1.25 | (d) |
Expenses, before waivers and reimbursements | | | 1.15 | (d) | | | 1.31 | | | | 2.17 | (d) |
Net investment income (loss), net of waivers and reimbursements | | | 0.62 | (d) | | | (0.12 | ) | | | 0.00 | (d) |
Net investment income (loss), before waivers and reimbursements | | | 0.62 | (d) | | | (0.18 | ) | | | (0.92 | )(d) |
| |
| | | | |
| | | Period Ended | | | Years Ended December 31, | |
| | | 6/30/2007 | | | 2006 | | | 2005(a) | |
| | | (unaudited) | | | | | | | |
Supplemental data for all classes: | | | | | | | | | | | | |
Net assets at end of year (in thousands) | | $ | 350,771 | | | $ | 231,969 | | | $ | 50,534 | |
Portfolio turnover rate (%) | | | 85 | (d) | | | 109 | | | | 127 | (d) |
| (a) | | For the period from November 1, 2005 (Commencement of Operations) to December 31, 2005. |
| (b) | | Excludes $0.00, $0.11 of PFIC mark to market which is treated as ordinary income for Federal tax purposes, for the years ended 2006 and 2005, respectively. |
| (c) | | Distribution less than $0.01 per share. |
| (d) | | Rates are annualized for periods that are less than a year. |
Performance cited represents past performance. Past performance does not guarantee future results and current performance may be lower or higher that the data quoted. Results shown are annual returns, which assume reinvestment of dividends and capital gains. Investment returns and principal will fluctuate and you may have a gain or loss when you sell shares. For the most current month-end performance information, please call 1-800-742-7272, or visit our Web site at www.williamblairfunds. com.
Note: Net investment income (loss) per share is based on the average shares outstanding during the year.
June 30, 2007 | William Blair Funds 47 |
Financial Highlights
Emerging Markets Growth Fund
Institutional Share Class
| | | | | | | | | | | |
| | | | |
| | | Period Ended | | | Years Ended December 31, | |
| | | 6/30/2007 | | | 2006 | | 2005(a) | |
| | | (unaudited) | | | | | | |
Net asset value, beginning of year | | $ | 19.54 | | | $ | 14.20 | | $ | 10.00 | |
Income from investment operations: | | | | | | | | | | | |
Net investment income (b) | | | 0.02 | | | | 0.02 | | | 0.01 | |
Net realized and unrealized gain on investments | | | 3.26 | | | | 5.44 | | | 4.27 | |
| | | | | | | | | | | |
Total from investment operations | | | 3.28 | | | | 5.46 | | | 4.28 | |
Less distributions from: | | | | | | | | | | | |
Net investment income | | | — | | | | 0.01 | | | — | |
Net realized gain | | | — | | | | 0.11 | | | 0.08 | |
| | | | | | | | | | | |
Total distributions | | | — | | | | 0.12 | | | 0.08 | |
| | | | | | | | | | | |
Net asset value, end of year | | $ | 22.82 | | | $ | 19.54 | | $ | 14.20 | |
| | | | | | | | | | | |
Total return (%) | | | 16.79 | | | | 38.49 | | | 42.82 | |
Ratios to average daily net assets (%): | | | | | | | | | | | |
Expenses, net of waivers and reimbursements | | | 1.25 | (c) | | | 1.25 | | | 1.25 | (c) |
Expenses, before waivers and reimbursements | | | 1.26 | (c) | | | 1.32 | | | 1.61 | (c) |
Net investment income (loss), net of waivers and reimbursements | | | 0.24 | (c) | | | 0.09 | | | 0.19 | (c) |
Net investment income (loss), before waivers and reimbursements | | | 0.23 | (c) | | | 0.02 | | | (0.17 | )(c) |
| |
| | | | |
| | | Period Ended | | | Year Ended December 31, | |
| | | 6/30/2007 | | | 2006 | | 2005(a) | |
| | | (unaudited) | | | | | | |
Supplemental data for all classes: | | | | | | | | | | | |
Net assets at end of year (in thousands) | | $ | 1,042,351 | | | $ | 813,649 | | $ | 249,348 | |
Portfolio turnover rate (%) | | | 102 | (c) | | | 113 | | | 77 | (c) |
| (a) | | For the period from June 6, 2005 (Commencement of Operations) to December 31, 2005. |
| (b) | | Excludes $0.00 and $0.11 of PFIC mark to market which is treated as ordinary income for Federal tax purposes, for the years ended 2006 and 2005, respectively. |
| (c) | | Rates are annualized for periods that are less than a year. |
Performance cited represents past performance. Past performance does not guarantee future results and current performance may be lower or higher that the data quoted. Results shown are annual returns, which assume reinvestment of dividends and capital gains. Investment returns and principal will fluctuate and you may have a gain or loss when you sell shares. For the most current month-end performance information, please call 1-800-742-7272, or visit our Web site at www.williamblairfunds. com.
Note: Net investment income (loss) per share is based on the average shares outstanding during the year.
48 Semi-Annual Report | June 30, 2007 |
Financial Highlights
Bond Fund
Institutional Share Class
| | | | | | |
| | | | |
| | | Period Ended June 30, | |
| | | | | 2007(a) | |
| | | | | | |
Net asset value, beginning of year | | | | $ | 10.00 | |
Income from investment operations: | | | | | | |
Net investment income (b) | | | | | 0.10 | |
Net realized and unrealized gain on investments | | | | | (0.21 | ) |
| | | | | | |
Total from investment operations | | | | | (0.11 | ) |
Less distributions from: | | | | | | |
Net investment income | | | | | 0.05 | |
Net realized gain | | | | | — | |
| | | | | | |
Total distributions | | | | | 0.05 | |
| | | | | | |
Net asset value, end of year | | | | $ | 9.84 | |
| | | | | | |
Total return (%) | | | | | (1.12 | ) |
Ratios to average daily net assets (%): | | | | | | |
Expenses, net of waivers and reimbursements | | | | | 0.35 | (b) |
Expenses, before waivers and reimbursements | | | | | 0.65 | (b) |
Net investment income (loss), net of waivers and reimbursements | | | | | 4.96 | (b) |
Net investment income (loss), before waivers and reimbursements | | | | | 4.66 | (b) |
| |
| | | | |
| | | Year Ended December 31, | |
| | | | | 2005(a) | |
| | | | | | |
Supplemental data for all classes: | | | | | | |
Net assets at end of year (in thousands) | | | | $ | 51,623 | |
Portfolio turnover rate (%) | | | | | 88 | (b) |
| (a) | | For the period from May 1, 2007 (Commencement of Operations) to June 30, 2007. |
| (b) | | Rates are annualized for periods that are less than a year. |
Performance cited represents past performance. Past performance does not guarantee future results and current performance may be lower or higher that the data quoted. Results shown are annual returns, which assume reinvestment of dividends and capital gains. Investment returns and principal will fluctuate and you may have a gain or loss when you sell shares. For the most current month-end performance information, please call 1-800-742-7272, or visit our Web site at www.williamblairfunds. com.
Note: Net investment income (loss) per share is based on the average shares outstanding during the year.
June 30, 2007 | William Blair Funds 49 |
Trustees and Officers. (Unaudited) The trustees and officers of the William Blair Funds as of June 30, 2007, their year of birth, their principal occupations during the last five years, their affiliations, if any, with William Blair & Company, L.L.C., and other significant affiliations are set forth below. The address of each trustee and officer is 222 West Adams Street, Chicago, Illinois 60606.
| | | | | | | | | | |
Name and Year of Birth | | Position(s)
Held with
Fund | | Term of
Office and
Length of
Time
Served(1) | | Principal Occupation(s) During Past 5 Years | | Number of
Portfolios
in Fund
Complex
Overseen
by Trustee | | Other Directorships Held by Trustee/Officer |
Interested Trustees | | | | | | | | | | |
Frederick Conrad Fischer, 1934* | | Chairman of the Board of Trustees | | Since 1987 | | Principal, William Blair & Company, L.L.C.; Partner, APM Limited Partnership | | 16 | | Trustee Emeritus, Chicago Child Care Society, a non-profit organization; Trustee Emeritus, Kalamazoo College |
| | | | | |
Michelle R. Seitz, 1965* | | Trustee | | Since 2002 | | Principal, William Blair & Company, L.L.C. | | 16 | | N/A |
Non-Interested Trustees | | | | | | | | |
| | | | | |
Ann P. McDermott,
1939 | | Trustee | | Since 1996 | | Board member and officer for various civic and charitable organizations over the past thirty years; professional experience prior thereto, registered representative for New York Stock Exchange firm | | 16 | | Northwestern University, Women’s Board; Rush Presbyterian St. Luke’s Medical Center, Women’s Board; University of Chicago, Women’s Board; Visiting Nurses Association, Honorary Director |
| | | | | |
Phillip O. Peterson,
1944 | | Trustee | | Since 2007 | | Trustee of Strong Funds Liquidating Trusts since 2005 and President, Strong Mutual Funds, 2004-2005; formerly, Partner, KPMG LLP | | 16 | | The Hartford Group of Mutual Funds (87 portfolios) |
| | | | | |
Donald J. Reaves,
1946 | | Trustee | | Since 2004 | | Vice President for Administration and Chief Financial Officer, University of Chicago since 2002. Executive Vice President and Chief Financial Officer, Brown University from 1993 to 2002 | | 16 | | American Student Assistance Corp.; Amica Mutual Insurance Company;, guarantor of student loans |
| | | | | |
Donald L. Seeley,
1944 | | Trustee | | Since 2003 | | Director, Applied Investment Management Program, University of Arizona Department of Finance, Formerly Vice Chairman and Chief Financial Officer, True North Communications, Inc., marketing communications and advertising firm | | 16 | | Warnaco, Group Inc., intimate apparel, sportswear and swimwear manufacturer; Center for Furniture Craftmanship (not-for-profit) |
| | | | | |
Thomas J. Skelly,
1951 | | Trustee | | Since 2007 | | Director and Investment Committee Chairman of the U.S. Accenture Foundation Inc.; formerly Managing Partner of various divisions at Accenture | | 16 | | Clayton Holdings, Inc., provider of information-based analytics, consulting and outsourced services to various financial institutions and investors |
| | | | | |
Robert E. Wood II, 1938 | | Trustee | | Since 1999 | | Retired Executive Vice President, Morgan Stanley Dean Witter | | 16 | | Chairman, Add-Vision, Inc. manufacturer of surface animation systems, and Micro-Combustion, LLC |
50 Semi-Annual Report | June 30, 2007 |
| | | | | | | | |
Name and Year of Birth | | Position(s)
Held with
Fund | | Term of
Office and
Length of
Time
Served(1) | | Principal Occupation(s) During Past 5 Years | | Other Directorships Held by Trustee/Officer |
Officers | | | | | | | | |
Marco Hanig, 1958 | | President | | Since 1999 | | Principal, William Blair & Company, L.L.C. | | Chicago Scores |
| | | | |
Karl W. Brewer, 1966 | | Senior Vice President | | Since 2000 | | Principal, William Blair & Company, L.L.C. | | N/A |
| | | | |
Harvey H. Bundy, III, 1944 | | Senior Vice President | | Since 2003 | | Principal, William Blair & Company, L.L.C. | | N/A |
| | | | |
Mark A. Fuller, III, 1957 | | Senior Vice President | | Since 1993 | | Principal, William Blair & Company, L.L.C. | | Partner, Fulsen Howney Partners |
| | | | |
James S. Golan, 1961 | | Senior Vice President | | Since 2005 | | Principal, William Blair & Company, L.L.C. | | N/A |
| | | | |
W. George Greig, 1952 | | Senior Vice President | | Since 1996 | | Principal, William Blair & Company, L.L.C. | | N/A |
| | | | |
Michael A. Jancosek, 1959 | | Senior Vice President Vice President | | Since 2004 2000-2004 | | Principal, William Blair & Company L.L.C. Associate, William Blair & Company, L.L.C. | | N/A |
| | | | |
John F. Jostrand, 1954 | | Senior Vice President | | Since 1999 | | Principal, William Blair & Company, L.L.C. | | N/A |
| | | | |
James S. Kaplan, 1960 | | Senior Vice President Vice President | | Since 2004 1995-2004 | | Principal, William Blair & Company, L.L.C. Associate, William Blair & Company, L.L.C. | | N/A |
| | | | |
Robert C. Lanphier, IV, 1956 | | Senior Vice President | | Since 2003 | | Principal, William Blair & Company, L.L.C. | | Chairman, AG. Med, Inc. |
| | | | |
Todd M. McClone, 1968 | | Senior Vice President Vice President | | Since 2006 2005-2006 | | Principal, William Blair & Company, L.L.C. Associate, William Blair & Company, L.L.C. | | N/A |
| | | | |
David S. Mitchell, 1960 | | Senior Vice President Vice President | | Since 2004 2003-2004 | | Principal, William Blair & Company, L.L.C. Associate, William Blair & Company, L.L.C. | | N/A |
| | | | |
Gregory J. Pusinelli, 1958 | | Senior Vice President | | Since 1999 | | Principal, William Blair & Company, L.L.C. | | N/A |
| | | | |
David P. Ricci, 1958 | | Senior Vice President | | Since 2006 | | Principal, William Blair & Company, L.L.C. | | N/A |
| | | | |
Jeffrey A. Urbina, 1955 | | Senior Vice President | | Since 1998 | | Principal, William Blair & Company, L.L.C. | | N/A |
June 30, 2007 | William Blair Funds 51 |
| | | | | | | | |
Name and Year of Birth | | Position(s)
Held with
Fund | | Term of
Office and
Length of
Time
Served(1) | | Principal Occupation(s) During Past 5 Years | | Other Directorships Held by Trustee/Officer |
| | | | |
Christopher T. Vincent, 1956 | | Senior Vice President Vice President | | Since 2004 2002-2004 | | Principal, William Blair & Company, L.L.C. Associate, William Blair & Company, L.L.C.; former Managing Director/Senior Portfolio Manager, Zurich Scudder Investments | | Uhlich Children’s Home |
| | | | |
Colin J. Williams, 1975 | | Senior Vice President | | Since 2007 | | Principal, William Blair & Company, L.L.C.; formerly Andersen Consulting and Allegiance Healthcare | | N/A |
| | | | |
Richard W. Smirl, 1967 | | Chief Compliance Officer | | Since 2004 | | Principal, William Blair & Company, L.L.C.; former Chief Legal Officer, Strong Capital Management | | N/A |
| | | | |
Benjamin J. Armstrong, 1965 | | Vice President | | Since 2007 | | Associate, William Blair & Company, LLC. | | |
| | | | |
David C. Fording, 1967 | | Vice President | | Since 2006 | | Associate, William Blair & Company, L.L.C.; former Portfolio Manager, TIAA-CREF | | N/A |
| | | | |
Chad M. Kilmer, 1975 | | Vice President | | Since 2006 | | Associate, William Blair & Company, L.L.C.; former analyst and Portfolio Manager, US Bancorp Asset Management, and analyst Gabelli Woodland Partners. | | N/A |
| | | | |
Mark T. Leslie, 1967 | | Vice President | | Since 2005 | | Associate, William Blair & Company, L.L.C.; former Portfolio Manager, U.S. Bancorp Asset Management | | N/A |
| | | | |
Terence M. Sullivan, 1944 | | Vice President and Treasurer | | Since 1997 | | Associate, William Blair & Company, L.L.C. | | N/A |
| | | | |
Colette M. Garavalia, 1961 | | Secretary | | Since 2000 | | Associate, William Blair & Company, L.L.C. | | N/A |
| * | | Mr. Fischer and Ms. Seitz are interested persons of the William Blair Funds because each is a principal of William Blair & Company, L.L.C., the Funds’ investment advisor, principal underwriter and distributor. |
| (1) | | Each Trustee serves until the election and qualification of a successor, or until death, resignation or retirement or removal as provided in the Fund’s Declaration of Trust. Retirement for non-interested Trustees occurs no later than at the conclusion of the first regularly scheduled Board meeting of the Fund’s fiscal year that occurs after the Trustee’s 72nd birthday. The Fund’s officers are elected annually by the Trustees. |
The Statement of Additional Information for the William Blair Funds includes additional information about the trustees and is available without charge by calling 1-800-635-2886 (in Massachusetts 1-800-635-2840) or by writing the Fund.
52 Semi-Annual Report | June 30, 2007 |
Board Approval of the Fund’s Management Agreement (All Portfolios except the Bond Portfolio)
During the six months ended June 30, 2007, the Board of Trustees (the “Board”) of the Fund approved the renewal for an additional one-year term of the Fund’s Management Agreement with William Blair & Company, L.L.C. (the “Advisor”), on behalf of each Portfolio of the Fund.
The information in this summary outlines the Board’s considerations associated with its renewal of the Management Agreement. In connection with its deliberations regarding the continuation of the Management Agreement, the Board considered such information and factors as it believed to be relevant. As described below, the Board considered the nature, extent and quality of the services performed by the Advisor under the existing Management Agreement; comparative management fees and expense ratios as prepared by an independent provider (Lipper Inc.); the estimated profits realized by the Advisor; the extent to which the Advisor realizes economies of scale as a Portfolio grows; and whether any fall-out benefits are being realized by the Advisor. In addition, the Trustees who are not “interested persons” of the Fund as defined in the Investment Company Act of 1940 (the “Independent Trustees”) discussed the renewal of the Management Agreement with Fund management and in private sessions with independent legal counsel at which no representatives of the Advisor were present.
As required by the Investment Company Act of 1940, the renewal was confirmed by the unanimous separate vote of the Independent Trustees. In deciding to approve the renewal of the Management Agreement, the Board did not identify a single factor as controlling and this summary does not describe all of the matters considered. However, the Board concluded that each of the various factors referred to below favored such approval.
Information Requested and Received
The Board, including all the Independent Trustees, considered the renewal of the Management Agreement pursuant to a process that concluded at the Board’s February 15, 2007 meeting, following an extensive process. In preparation for the review process, the Independent Trustees met with independent legal counsel and discussed the type and nature of information to be requested and directed independent legal counsel to send a formal request for information to Fund management. The Advisor provided extensive information in response to the request. After reviewing the information received, the Independent Trustees requested supplemental information that was provided by the Advisor. Among other information, the Independent Trustees considered: (i) materials describing the nature, quality and extent of services provided by the Advisor; (ii) information comparing the performance of each Portfolio to other mutual funds and relevant indices; (iii) information comparing the advisory fees and expense ratios of each Portfolio to other mutual funds; (iv) information comparing advisory fees of each Portfolio to fees charged by the Advisor to other funds and its similar client accounts; (v) the estimated costs of services provided and estimated profits realized by the Advisor for both the Fund as a whole and each Portfolio individually; (vi) information about potential economies of scale; and (vii) information describing other benefits to the Advisor resulting from its relationship with the Portfolios. The Independent Trustees reviewed comparative performance of peer groups of funds selected by Lipper, comparative advisory fees and expense ratios of peer groups of funds selected by Lipper and the average performance of an applicable Morningstar style category. The Independent Trustees also received a memorandum from independent legal counsel advising them of their duties and responsibilities in connection with the review of the Management Agreement.
On February 12, 14 and 15, 2007, the Independent Trustees met independently of Fund management and of the interested Trustees, to review and discuss with independent legal counsel the information provided by the Advisor, Lipper and independent legal counsel. The Independent Trustees noted that in evaluating the Management Agreement, they were taking into account their accumulated experience as Trustees in working with the Advisor on matters relating to the Portfolios. Based upon their review, the Independent Trustees concluded on February 15, 2007 that it was in the best interest of each Portfolio to renew the Management Agreement and recommended to the Board the renewal of the Management Agreement. At its meeting on February 15, 2007, the Board considered the recommendation of the Independent Trustees along with the other factors that the Board deemed relevant.
Nature, Quality and Extent of Services. In evaluating the nature, quality and extent of the services provided by the Advisor to the Portfolios, the Board noted that the Advisor is a quality firm with a reputation for integrity and honesty that employs high quality people and has been associated with the Portfolios since their inception. The Trustees believe that a long-term relationship with a capable, conscientious advisor is in the best interests of shareholders and that shareholders have invested in the Portfolios knowing that the Advisor managed the Portfolios and knowing the investment advisory fee. The Board
June 30, 2007 | William Blair Funds 53 |
considered biographical information about each Portfolio’s portfolio manager(s), the administrative services performed by the Advisor, financial information regarding the Advisor, brokerage allocation practices, soft dollars and execution, the compliance regime overseen by the Advisor, and the financial support the Advisor provides to certain Portfolios. The Board also noted that the Advisor voluntarily reduces the advisory fees of the Portfolios by an amount equal to the advisory fee charged by the Ready Reserves Portfolio on the cash of the Portfolios invested in the Ready Reserves Portfolio. Based upon all relevant factors, the Board concluded that the nature, quality and extent of the services provided by the Advisor to each Portfolio were satisfactory.
The Board reviewed information on the performance of each Portfolio for one-year, three-year and since inception periods, as applicable, along with performance information of a relevant securities index or indexes and a peer universe of funds from the Lipper database. For all Portfolios, the Board also reviewed performance information provided by the Advisor of the average of the applicable Morningstar style category for the applicable periods. The performance information showed that the Emerging Markets Growth Portfolio performed satisfactorily relative to its Lipper peer universe, Morningstar style category average and benchmark index over the applicable periods. The Institutional International Growth Portfolio performed satisfactorily relative to its Lipper peer universe and Morningstar style category average, but underperformed relative to its benchmark index over the applicable periods. The International Small Cap Growth Portfolio performed satisfactorily relative to its benchmark index, but underperformed relative to its Lipper peer universe and Morningstar style category average. The Board noted the limited operating history of the International Small Cap Growth Portfolio. The Institutional International Equity Portfolio underperformed relative to its Lipper peer universe, Morningstar style category and benchmark index over the applicable periods, but the Board noted the positive absolute performance of the Portfolio and its limited operating history. Based upon the review of the performance information, the Board concluded that the performance of each Portfolio was acceptable and supported continuation of the Management Agreement for each Portfolio.
Fees and Expenses. The Board reviewed each Portfolio’s advisory fee and expense ratio and reviewed information comparing the advisory fee and expense ratio to those of a Lipper peer group and a Lipper peer universe. The Lipper peer group for each Portfolio consists of a group of funds with a similar investment style and asset size as the Portfolio. The Lipper peer universe for each Portfolio includes all funds with a similar investment style regardless of asset size. The Board considered that the Advisor has proposed to limit total expenses, including waiving advisory fees, if necessary, for the Institutional International Equity Portfolio, the International Small Cap Growth Portfolio and the Emerging Markets Growth Portfolio. For each Portfolio, the Board also reviewed amounts paid to the Advisor by other registered funds, including other Portfolios in the Fund and funds for which the Advisor acts as a subadvisor and the Advisor’s fee schedule for separate accounts. With respect to sub-advised funds and separate accounts, the Board noted that (i) both the mix of services provided and the level of responsibility required under the Management Agreement were greater as compared to the Advisor’s obligations for sub-advised funds and separate accounts; and (ii) management’s representation that the management fees of separate accounts are less relevant to the Board’s consideration of the advisory fee because they reflect significantly different competitive forces than those in the mutual fund marketplace.
In considering the information, the Board noted that the advisory fees for the International Small Cap Growth Portfolio and the Emerging Markets Growth Portfolio were below or within an acceptable range of the average of their peer group and median of their peer universe. The Board noted that the advisory fees for the Institutional International Growth Portfolio and the Institutional International Equity Portfolio were above the average of their peer group and median of their peer universe, but that such advisory fees were within an acceptable range of the peer group and peer universe and consistent with reasonable expectations in light of the nature, quality and extent of services provided by the Advisor. On the basis of the information provided, the Board concluded that each Portfolio’s advisory fee, coupled with any applicable existing or proposed advisory fee waiver and expense cap, was reasonable and appropriate in light of the nature, quality and extent of services provided by the Advisor.
Profitability. With respect to the profitability of the Management Agreement to the Advisor, the Board considered the overall fees paid under the Management Agreement, including the estimated costs of the services provided and profits realized by the Advisor from its relationship with the Fund as a whole and each Portfolio individually. The Board concluded that the estimated profits realized by the Advisor were not unreasonable.
Economies of Scale. The Board considered the extent to which economies of scale would be realized as the Portfolios grow and whether fee levels reflect these economies of scale for the benefit of investors. The Board noted the Advisor’s representation that certain Portfolio expenses are relatively fixed and unrelated to asset size and that the Advisor may enjoy some economies of scale as a Portfolio’s assets grow. The Board also noted the information provided by the Advisor that its costs rise when a Portfolio grows as a result of superior performance because of increased compensation to portfolio
54 Semi-Annual Report | June 30, 2007 |
managers. In considering whether fee levels reflect economies of scale for the benefit of Portfolio investors, the Board reviewed each Portfolio’s asset size, breakpoints for those Portfolios with breakpoints in the advisory fee schedule, the Portfolio’s total and net expense ratios and the expense caps in place and/or proposed, and concluded that they reasonably reflect appropriate recognition of any economies of scale.
Other Benefits to the Advisor. The Board considered benefits derived by the Advisor from its relationship with the Portfolios, including soft dollars, which pertain primarily to the Portfolios investing in equity securities, and favorable media coverage. The Board concluded that, taking into account these benefits, each Portfolio’s advisory fee was reasonable.
Conclusion. Based upon all of the information considered and the conclusions reached, the Board determined that the terms of the Management Agreement continue to be fair and reasonable and that the continuation of the Management Agreement is in the best interests of each Portfolio.
Board Approval of the Bond Portfolio’s Management Agreement
During the six months ended June 30, 2007, the Board approved the Fund’s Management Agreement with the Advisor, on behalf of the Bond Portfolio of the Fund. The Management Agreement with respect to the Portfolio was approved by the Board of Trustees, including all of the trustees who are not parties to such agreement or interested persons of any such party, on February 15, 2007. The Board, including a majority of the Independent Trustees, determined that approval of the Management Agreement was in the best interests of the Portfolio. The Independent Trustees met separately from the “interested” trustees of the Fund and officers and employees of the Advisor to consider approval of the Management Agreement and were assisted by independent legal counsel in making their determination. The Board, including the Independent Trustees, did not identify any single factor or group of factors as all important or controlling and considered all factors together.
Nature, Quality and Extent of Services. In evaluating the nature, quality and extent of services expected to be provided by the Advisor to the Portfolio, the Board noted that the Advisor is a quality firm with a reputation for integrity and honesty that employs high quality people. The Board considered biographical information about the Portfolio’s portfolio managers, financial information regarding the Advisor, the compliance regime created by the Advisor and the proposed financial support of the Portfolio. The Board considered the Advisor’s past experience managing a core bond strategy and the Advisor’s experience in managing new funds. Based upon all relevant factors, the Board concluded that the nature, quality and extent of the services to be provided by the Advisor to the Portfolio are expected to be satisfactory.
The Board reviewed performance information on the Advisor’s Core Fixed Income composite and the Lehman Brothers U.S. Aggregate Index, the Portfolio’s benchmark (the “Benchmark”), for the one, three, five and ten year periods. The performance information indicated that the Core Fixed Income composite performed satisfactorily relative to the Benchmark for all periods.
Fees and Expenses. The Board reviewed the Portfolio’s proposed advisory fee and estimated expense ratio and reviewed information comparing the advisory fee and expense ratio to a Lipper peer group. The Lipper peer group for the Portfolio consists of a group of funds with a similar investment style as the Portfolio. The Board considered that the Advisor has proposed to cap total expenses, including waiving advisory fees, if necessary, for the Portfolio. The Board also reviewed the Advisor’s fee schedule for separate accounts. With respect to separate accounts, the Board noted that (i) both the mix of services provided and the level of responsibility required under the Management Agreement will be greater as compared to the Advisor’s obligations for separate accounts; and (ii) management’s representation that the management fees of separate accounts are less relevant to the Board’ consideration of the advisory fee because they reflect significantly different competitive forces from those in the mutual fund marketplace.
In considering the information, the Board noted that the proposed advisory fee for the Portfolio was below the median of the peer group. On the basis of the information provided, the Board concluded that the proposed advisory fee was reasonable and appropriate in light of the nature, quality and extent of services to be provided by the Advisor.
Profitability. With respect to the estimated profitability of the Management Agreement to the Advisor, the Board considered the overall fees expected to be paid under the Management Agreement, the expected size of the Portfolio and the Advisor’s expense limitation agreement. The Board concluded that the expected profits to be realized by the Advisor were not unreasonable.
June 30, 2007 | William Blair Funds 55 |
Economies of Scale. The Board considered the extent to which economies of scale would be realized as the Portfolio grows and whether fee levels reflect these economies of scale. The Board considered whether the proposed advisory fee is reasonable in relation to the projected asset size of the Portfolio. In considering whether fee levels reflect economies of scale for the benefit of Portfolio investors, the Board reviewed the Portfolio’s advisory fee compared to peer funds, the Portfolio’s projected asset size, the Portfolio’s estimated expense ratio and the proposed expense cap, and concluded that the advisory fee was reasonable.
Other Benefits to the Advisor. The Board considered benefits to be derived by the Advisor from its relationship with the Portfolio. The Board concluded that, after taking into account these benefits, the proposed advisory fee was reasonable.
Conclusion. Based upon all of the information considered and the conclusions reached, the Board, determined that the terms of the Management Agreement are fair and reasonable and that the approval of the Management Agreement is in the best interests of the Portfolio.
56 Semi-Annual Report | June 30, 2007 |
Additional Information (unaudited)
Proxy Voting
A description of the policies and procedures that the William Blair Institutional International Growth Fund, the William Blair Institutional International Equity Fund, the William Blair International Small Cap Growth Fund and the William Blair Emerging Markets Growth Fund and the William Blair Bond Fund use to determine how to vote proxies relating to portfolio securities and information regarding how the Fund voted proxies relating to portfolio securities for the most recent 12-month period ended June 30 are available without charge, upon request, by calling 1-800-635-2886 (in Massachusetts 1-800-635-2840), at www.williamblairfunds.com and on the SEC’s website at http://www.sec.gov.
Quarterly Portfolio Schedules
The Fund files its complete schedule of portfolio holdings with the SEC for the first and third fiscal quarters of each fiscal year (quarters ended March 31 and September 30) on Form N-Q. The Fund’s Forms N-Q are available on the SEC’s website at http://www.sec.gov and may be reviewed and copied at the SEC’s Public Reference Room in Washington, D.C. Information on the operation of the SEC’s Public Reference Room may be obtained by calling 1-800-SEC-0330. The Fund’s Forms N-Q are also available on the Fund’s website at www.williamblairfunds.com.
June 30, 2007 | William Blair Funds 57 |
Useful Information About Your Report (unaudited)
Please refer to this information when reviewing the Expense Example for each Portfolio.
Expense Example
As a shareholder of a Portfolio, you incur ongoing costs, including management fees and other Portfolio expenses. The example is intended to help you understand your ongoing costs (in dollars) of investing in the Portfolio and to compare these costs with the ongoing costs of investing in other mutual funds. To do so, compare the Portfolio’s 5% hypothetical example with the 5% hypothetical examples that appear in the shareholder reports of other funds. The example is based on an investment of $1,000 invested at the beginning of the period and held for the entire six-month period from January 1, 2007 to June 30, 2007.
Actual Expenses
In each example, the first line for each share class in the table provides information about the actual account values and actual expenses. These expenses reflect the effect of any expense cap applicable to the share class during the period. Without this expense cap, the costs shown in the table would have been higher. You may use the information in this line, together with the amount you invested, to estimate the expenses that you paid over the period. Simply divide your account value by $1,000 (example, an $8,600 account value divided by $1,000 = 8.6), then multiply the result by the number in the first line under the heading entitled “Expenses Paid During the Period” to estimate the expenses you paid on your account during the period.
Hypothetical Example for Comparison Purposes
In each example, the second line for each share class in the table provides information about hypothetical account values and hypothetical expenses based on the Portfolio’s actual expense ratio and an assumed rate of return of 5% per year before expenses. This is not the Portfolio’s actual return. The hypothetical account values and expenses may not be used to estimate the actual ending account balance or expenses you paid for the period. You may use this information to compare the ongoing costs of investing in the Portfolio to other funds. To do so, compare this 5% hypothetical example with the 5% hypothetical examples that appear in the shareholder reports of other funds.
Please note that the expenses shown in both examples are meant to highlight your ongoing costs only and do not reflect any transactional costs or account type fees. These fees are fully described in the prospectus. Therefore, the second line of each share class in the table is useful in comparing ongoing costs only and will not help you determine the relative costs of owning different funds.
58 Semi-Annual Report | June 30, 2007 |
Fund Expenses (Unaudited)
The examples below show you the ongoing costs (in dollars) of investing in your fund and allows you to compare these costs with those of other mutual funds. Please refer to previous page for a detailed explanation of the information presented on this chart.
| | | | | | | | | | | | |
| | | Beginning
Account Value
1/1/2007 | | Ending
Account Value
6/30/2007 | | Expenses Paid
during Period(a) | | Annualized
Expense Ratio | |
| | | | |
Institutional International Growth Fund | | | | | | | | | | | | |
Actual return | | $ | 1,000.00 | | $ | 1,118.60 | | $ | 5.36 | | 1.02 | % |
Hypothetical 5% return | | | 1,000.00 | | | 1,019.74 | | | 5.11 | | 1.02 | |
| | | | | | | | | | | | | |
| | | | |
Institutional International Equity Fund | | | | | | | | | | | | |
Actual return | | | 1,000.00 | | | 1,098.10 | | | 5.62 | | 1.08 | |
Hypothetical 5% return | | | 1,000.00 | | | 1,019.44 | | | 5.41 | | 1.08 | |
| | | | | | | | | | | | | |
| | | | |
International Small Cap Growth Fund Institutional Share Class | | | | | | | | | | | | |
Actual return | | | 1,000.00 | | | 1,145.90 | | | 6.12 | | 1.15 | |
Hypothetical 5% return | | | 1,000.00 | | | 1,019.09 | | | 5.76 | | 1.15 | |
| | | | | | | | | | | | | |
| | | | |
Emerging Markets Growth Fund Institutional Share Class | | | | | | | | | | | | |
Actual return | | | 1,000.00 | | | 1,167.90 | | | 6.72 | | 1.25 | |
Hypothetical 5% return | | | 1,000.00 | | | 1,018.60 | | | 6.26 | | 1.25 | |
| | | | | | | | | | | | | |
| | | | |
Bond Fund Institutional Share Class | | | | | | | | | | | | |
Actual return (since inception period)(b) | | | 1,000.00 | | | 988.80 | | | 0.58 | | 0.35 | |
Hypothetical 5% return (6 month period) | | | 1,000.00 | | | 1,023.06 | | | 0.59 | | 0.35 | |
| | | | | | | | | | | | | |
| (a) | | Expenses are equal to the annualized expense ratio, multiplied by the average account value over the period, multiplied by the number of days in the period 181, and divided by 365 (to reflect the one-half year period). |
| (b) | | For the period May 1, 2007 (Commencement of Operations) until June 30, 2007. |
June 30, 2007 | William Blair Funds 59 |
BOARD OF TRUSTEES
Frederick Conrad Fischer, Chairman
Principal, William Blair & Company, L.L.C.
Phillip O. Peterson
Retired Partner, KPMG LLP
Ann P. McDermott
Director and Trustee
Profit and not-for-profit organizations
Donald J. Reaves
Vice President for Administration and Chief Financial Officer, University of Chicago
Donald L. Seeley
Adjunct Lecturer and Director, University of Arizona Department of Finance
Thomas J. Skelly
Director and Investment Committee Chairman, U.S. Accenture Foundation Inc.
Michelle R. Seitz
Principal, William Blair & Company, L.L.C.
Robert E. Wood II
Retired Executive Vice President, Morgan Stanley Dean Witter
Officers
Marco Hanig, President
Karl W. Brewer, Senior Vice President
Harvey H. Bundy III, Senior Vice President
Mark A. Fuller, III, Senior Vice President
James S. Golan, Senior Vice President
W. George Greig, Senior Vice President
Michael A. Jancosek, Senior Vice President
John F. Jostrand, Senior Vice President
James S. Kaplan, Senior Vice President
Robert C. Lanphier, IV, Senior Vice President
Todd M. McClone, Senior Vice President
David S. Mitchell, Senior Vice President
Gregory J. Pusinelli, Senior Vice President
David P. Ricci, Senior Vice President
Jeffrey A. Urbina, Senior Vice President
Christopher T. Vincent, Senior Vice President
Colin J. Williams, Senior Vice President
Richard W. Smirl, Chief Compliance Officer
Benjamin J. Armstrong, Vice President
David C. Fording, Vice President
Chad M. Kilmer, Vice President
Mark T. Leslie, Vice President
Terence M. Sullivan, Vice President and Treasurer
Colette M. Garavalia, Secretary
Investment Advisor
William Blair & Company, L.L.C.
Legal Counsel
Vedder, Price, Kaufman & Kammholz, P.C.
Transfer Agent
State Street Bank and Trust Company
P.O. Box 8506
Boston, MA 02266-8506
For customer assistance, call 1-800-635-2886
(Massachusetts 1-800-635-2840)
60 Semi-Annual Report | June 30, 2007 |
WILLIAM BLAIR FUNDS
Institutional International Growth Fund
Institutional International Equity Fund
International Small Cap Growth Fund Institutional Share Class
Emerging Markets Growth Fund Institutional Share Class
Bond Fund
Institutional Share Class
222 West Adams Street Chi cago, Illinois 60606 800. 74 2. 7 272 www. wi l liamblairfunds.com
Wil iam Blair & Company, L.L.C., Distributors
Not applicable to this filing.
| Item 3. | Audit Committee Financial Expert |
Not applicable to this filing.
| Item 4. | Principal Accountant Fees and Services |
Not applicable to this filing.
| Item 5. | Audit Committee of Listed Registrants |
Not Applicable to this Registrant, insofar as the Registrant is not a listed company.
| Item 6. | Schedule of Investments |
See Schedule of Investments in Item 1
| Item 7. | Disclosure of Proxy Voting Policies and Procedures for Closed-End Management Investment Companies |
Not applicable to this Registrant, insofar as the Registrant is not a closed-end management investment company.
| Item 8. | Portfolio Managers of Closed-End Management Investment Companies |
Not applicable to this Registrant, insofar as the Registrant is not a closed-end management investment company.
| Item 9. | Purchase of Equity Securities by Closed-End Management Investment Companies and Affiliated Purchasers |
Not applicable to this Registrant, insofar as the Registrant is not a closed-end management investment company.
| Item 10. | Submission of Matters to a Vote of Security Holders |
There have been no material changes to the procedures by which shareholders may recommend nominees to the Registrant’s Board of Trustees since the Registrant last provided disclosure in response to this item.
| Item 11. | Controls and Procedures |
(a) The Registrant’s principal executive and principal financial officer, or persons performing similar functions, have concluded that the Registrant’s Disclosure Controls and Procedures (as defined in Rule 30a-3(c) under the Investment Company Act of 1940, as amended (the “1940 Act”) (17 CFR 270.30a-3(c)) are effective, as of a date within 90 days of the filing date of this report that includes the disclosure required by this paragraph, based on their evaluation of these controls and procedures required by Rule 30a-3 (b) under the 1940 Act (17 CFR 270.30a-3(b) and Rules 13a-15(b) or 15d-15(b) under the Exchange Act (17 CFR 240.13a-15(b) or 240.15d-15(b)).
(b) There were no changes in the Registrant’s internal control over financial reporting (as defined in Rule 30a-3(d) under the 1940 Act (17 CFR 270.30a-3(d)) that occurred during the second fiscal quarter of the period covered by this report that has materially affected, or is reasonably likely to materially affect, the Registrant’s internal control over financial reporting.
12. (a) (1) Code of Ethics
Not applicable because it is posted in the Registrant’s website.
12. (a) (2) (1)
Certification of Principal Executive Officer Required by Rule 30a-2(a) of the Investment Company Act
12. (a) (2) (2)
Certification of Principal Financial Officer Required by Rule 30a-2(a) of the Investment Company Act.
12. (a) (3)
Not applicable to this Registrant.
12. (b)
Certification of Chief Executive Officer and Certification of Chief Financial Officer Required by Rule 30a-2(b) of the Investment Company Act
Signatures
Pursuant to the requirements of the Securities Exchange Act of 1934 and the Investment Company Act of 1940, the Registrant has duly caused this report to be signed on its behalf by the undersigned, thereunto duly authorized.
| | |
| | | William Blair Funds |
| |
| | | /s/ Michelle R. Steitz |
| By: | | Michelle R. Steitz |
| | | President (Chief Executive Officer) |
Date: August 24, 2007
Pursuant to the requirements of the Securities Exchange Act of 1934 and the Investment Company Act of 1940, this Report has been signed below by the following persons on behalf of the Registrant and in the capacities and on the dates indicated
| | |
| By: | | Michelle R. Steitz |
| | | President (Chief Executive Officer) |
Date: August 24, 2007
| | |
| By: | | Terence M. Sullivan |
| | | Treasurer (Chief Financial Officer) |
Date: August 24, 2007