UNITED STATES
SECURITIES AND EXCHANGE COMMISSION
Washington, D.C. 20549
Form N-CSR
CERTIFIED SHAREHOLDER REPORT OF REGISTERED
MANAGEMENT INVESTMENT COMPANIES
Investment Company Act File Number 811-5344
William Blair Funds
(Exact name of registrant as specified in charter)
| | |
| 222 West Adams Street, Chicago, IL | | 60606 |
| (Address of principal executive offices) | | (Zip Code) |
Marco Hanig
William Blair Funds
222 West Adams Street, Chicago, IL 60606
(Name and address of agent for service)
Registrant’s telephone number, including area code: 312-236-1600
Date of fiscal year end: December 31
Date of reporting period: June 30, 2005
Form N-CSR is to be used by management investment companies to file reports with the Commission not later than 10 days after the transmission to stockholders of any report that is required to be transmitted to stockholders under Rule 30e-1 under the Investment Company Act of 1940 (17 CFR 270.30e-1). The Commission may use the information provided on Form N-CSR in its regulatory, disclosure review, inspection, and policymaking roles.
A registrant is required to disclose the information specified by Form N-CSR, and the Commission will make this information public. A Registrant is not required to respond to the collection of information contained in Form N-CSR unless the form displays a currently valid Office of Management and Budget (“OMB”) control number. Please direct comments concerning the accuracy of the information collection burden estimates and any suggestions for reducing the burden to Secretary, Securities and Exchange Commission, 450 Fifth Street, NW, Washington, DC 20549-0609. The OMB has reviewed this collection of information under the clearance requirements of 44 U.S.C. (ss) 3507.
| Item 1. | June 30, 2005 Semi-Annual Reports transmitted to shareholders. |
WILLIAM BLAIR FUNDS
SEMI - ANNUAL REPORT
JUNE 30, 2005
Table of Contents
This report is submitted for the general information of the shareholders of the William Blair Funds. It is not authorized for distribution to prospective investors unless accompanied or preceded by a prospectus of the William Blair Funds. Please carefully consider the Funds’ investment objectives, risks, charges, and expenses before investing. This and other information is contained in the Funds’ prospectus, which you may obtain by calling 1-800-742-7272. Read it carefully before you invest or send money.
June 30, 2005 | William Blair Funds 1 |

Marco Hanig
A LETTER FROM THE PRESIDENT
Dear Shareholders:
After losses in the first quarter, stocks rebounded in the second quarter and were virtually flat for the first half of the year. The S&P 500 Index of large cap stocks closed at -0.81%, the Russell 2000 Index of small cap stocks at -1.25%, and the MSCI World ex-US Index of foreign stocks at 0.32%. Bonds did well, with the Lehman Intermediate Government/Credit Bond index up 1.58% despite rising interest rates.
While the market pretty much drifted sideways, it was not without surprises. International stocks were supposed to outperform US stocks, as the dollar was expected to continue to weaken in light of the chronic trade deficit. But when voters in France and the Netherlands rejected the European constitution, the US dollar strengthened by over 10% versus the Euro, offsetting the good performance of international stocks as measured in their local currencies. Also, three more hikes in short-term interest rates were expected to lead to negative returns for long-term bonds, but in fact long-term rates have actually decreased slightly, resulting in a relatively flat yield curve.
The final surprise was the relative performance of different asset classes. The expectation was that after several years where value had beaten growth and small cap had beaten large cap, the trend would reverse. What actually happened is that the race between the nine Morningstar style boxes was almost too close to call: the best asset class (Mid-cap Value, up 2.25%) was only about 4% ahead of the worst asset class (Large Cap Growth, down 1.78%), which is the smallest performance gap of the last five years. More generally, mid-cap was a modest winner over small and large, and value continued to edge growth.
Total Returns by Morningstar Fund Category
January 1 through June 30, 2005
| | | | | | | | | |
| | | Value
| | | Blend
| | | Growth
| |
Large Cap | | 0.39 | % | | -0.60 | % | | -1.78 | % |
Mid Cap | | 2.25 | % | | 1.65 | % | | 0.05 | % |
Small Cap | | 0.48 | % | | 0.21 | % | | -1.50 | % |
The relative returns for the William Blair Funds were mixed. The Small Cap Growth and Value Discovery Funds trailed their Morningstar peers in the first semester, in part because some large outflows put pressure on the values of their holdings. Details on each fund are provided in the respective portfolio manager discussions. The standout funds were the International Growth Fund, up 1.49% vs. -1.65% for Foreign Large Growth Morningstar peers, Tax-Managed Growth Fund, up 1.00% vs. - -1.78% for Large Growth Morningstar peers, and Income Fund, up 1.33% vs. 0.94% for Short-term Bond Morningstar peers.
As always, we thank you for investing with us!

Marco Hanig
Please see page 4 for important performance disclosure information.
2 Semi-Annual Report | June 30, 2005 |
PERFORMANCE AS OF JUNE 30, 2005—CLASS N SHARES
| | | | | | | | | | | | | | |
| | | Year to
Date
| | 1 Yr
| | 3 Yr
| | 5 Yr
| | 10 Yr (or since
inception)
| | Inception
Date
| | Overall Morningstar Rating
|
Growth Fund | | -0.75 | | 6.63 | | 4.79 | | -5.80 | | 6.38 | | 3/20/46 | | ««« |
Morningstar Large Growth | | -1.78 | | 3.24 | | 6.47 | | -8.27 | | 7.37 | | | | Among 1,074 large growth funds |
Russell 3000® Growth | | -1.88 | | 1.90 | | 7.56 | | -9.93 | | 7.13 | | | |
Standard & Poor’s 500 | | -0.81 | | 6.32 | | 8.28 | | -2.37 | | 9.94 | | | | |
| | | | | | | |
Tax-Managed Growth Fund | | | | | | | | | | | | | | «««« |
Return before Taxes | | 1.00 | | 6.82 | | 5.97 | | -2.62 | | -1.73 | | 12/27/99 | | Among 1,074 large growth funds |
After Taxes on Distributions | | 1.00 | | 6.82 | | 5.97 | | -2.62 | | -1.73 | | | |
After Taxes on Distributions and Sale of
Fund Shares | | 0.65 | | 4.44 | | 5.12 | | -2.21 | | -1.47 | | | | |
Morningstar Large Growth | | -1.78 | | 3.24 | | 6.47 | | -8.27 | | — | | | | |
Russell 3000® Growth | | -1.88 | | 1.90 | | 7.56 | | -9.93 | | -8.17 | | | | |
| | | | | | | |
Large Cap Growth Fund | | -1.76 | | 4.25 | | 4.19 | | -9.54 | | -8.46 | | 12/27/99 | | ««« |
Morningstar Large Growth | | -1.78 | | 3.24 | | 6.47 | | -8.27 | | — | | | | Among 1,074 large growth funds |
Russell 1000® Growth | | -1.72 | | 1.68 | | 7.26 | | -10.36 | | -8.59 | | | |
| | | | | | | |
Small Cap Growth Fund | | -4.16 | | 9.33 | | 19.53 | | 13.44 | | 20.47 | | 12/27/99 | | ««««« |
Morningstar Small Growth | | -1.50 | | 6.10 | | 10.50 | | -2.49 | | — | | | | Among 573 small growth funds |
Russell 2000® Growth | | -3.58 | | 4.29 | | 11.37 | | -4.51 | | -2.86 | | | |
| The Small Cap Growth Fund’s performance during 2000 was primarily attributable to investments in initial public offerings (IPOs) during a rising market. Since then, IPOs have had an insignificant effect on the Fund’s performance. | | | | | | | | |
| | | | | | | |
Small-Mid Cap Growth Fund | | -0.53 | | 5.45 | | — | | — | | 7.89 | | 12/29/03 | | Not rated. |
Morningstar Mid-Cap Growth | | 0.05 | | 7.75 | | — | | — | | — | | | | |
Russell 2500TM Growth | | -0.92 | | 7.46 | | — | | — | | 9.42 | | | | |
| | | | | | | |
International Growth Fund | | 1.49 | | 16.80 | | 12.83 | | 2.43 | | 12.58 | | 10/1/92 | | ««««« |
Morningstar Foreign Large Growth | | -1.65 | | 10.98 | | 8.75 | | -4.56 | | 4.72 | | | | Among 167 foreign large growth funds |
MSCI All Country World Free Ex-US | | 0.32 | | 16.95 | | 14.08 | | 0.76 | | 5.82 | | | |
| | | | | | | |
International Equity Fund | | -1.15 | | 6.06 | | — | | — | | 10.73 | | 5/24/04 | | Not rated. |
Morningstar Foreign Large Growth | | -1.65 | | 10.98 | | — | | — | | — | | | | |
MSCI World Free Ex-US | | 0.32 | | 16.95 | | — | | — | | 20.47 | | | | |
| | | | | | | |
Emerging Markets Growth Fund | | 2.60 | | — | | — | | — | | 2.60 | | 6/6/05 | | Not rated. |
MSCI Emerging Markets Free | | 2.09 | | — | | — | | — | | 2.09 | | | | |
| | | | | | | |
Value Discovery Fund | | -4.67 | | 1.49 | | 5.81 | | 10.65 | | 12.03 | | 12/23/96 | | « |
Morningstar Small Value | | 0.96 | | 12.85 | | 13.94 | | 14.96 | | — | | | | Among 218 small value funds |
Russell 2000® | | -1.25 | | 9.45 | | 12.81 | | 5.71 | | 8.44 | | | |
Russell 2000® Value | | 0.90 | | 14.39 | | 14.15 | | 16.12 | | 12.60 | | | | |
| | | | | | | |
Income Fund | | 1.33 | | 4.43 | | 4.08 | | 5.81 | | 5.61 | | 10/1/90 | | ««««« |
Morningstar Short-Term Bond | | 0.94 | | 2.59 | | 2.91 | | 4.60 | | 4.95 | | | | Among 235 short-term bond funds |
Lehman Intermediate Govt./Credit
Bond Index | | 1.58 | | 4.77 | | 5.08 | | 6.87 | | 6.34 | | | |
Please see the next page for important disclosure information.
June 30, 2005 | William Blair Funds 3 |
Performance cited represents past performance. Past performance does not guarantee future results and current performance may be lower or higher that the data quoted. Returns shown are average annual total returns, which assume reinvestment of dividends and capital gains. Investment returns and principal will fluctuate and you may have a gain or a loss when you sell shares. For the most current month-end performance information, please call 1-800-742-7272, or visit our Web site at www.williamblairfunds.com. Investing in smaller companies involves special risks, including higher volatility and lower liquidity. International and emerging markets investing involves special risk considerations, including currency fluctuations, lower liquidity, economic and political risk. As interest rates rise, bond prices will fall and bond funds become more volatile. From time to time, the investment advisor may waive fees or reimburse expenses for certain Funds. Without these waivers, performance would be lower. Class N shares are available to the general public without a sales load.
Tax-Managed Growth Fund’s after-tax returns are calculated using the highest historical individual federal marginal income tax rates, and do not reflect the impact of state and local taxes. Actual after-tax returns depend on the investor’s tax situation and may differ from those shown. After-tax returns shown are not relevant to investors who hold their fund shares through tax-deferred arrangements such as 401(k) plans or individual retirement accounts. After-tax returns are shown only for Class N and the after-tax returns for other classes will vary.
Morningstar RatingsTM are as of 6/30/05 and are subject to change every month. The ratings are based on a risk-adjusted return measure that accounts for variation in a fund’s monthly performance, placing more emphasis on downward variations and rewarding consistent performance. The top 10% of funds in each Category receive 5 stars, the next 22.5% receive 4 stars, the middle 35% receive 3 stars, the next 22.5% receive 2 stars, and the bottom 10% receive 1 star. The Overall Morningstar Rating for a fund is derived from a weighted-average of the performance figures associated with its three-, five- and ten-year (if applicable) Morningstar Rating metrics. The 3/5/10 year Morningstar ratings were as follows: Growth Fund «««/«««/«««, Tax-Managed Growth Fund «««/««««/NA, and Large Cap Growth Fund ««/«««/NA, out of 1074/817/272 large growth funds; Small Cap Growth Fund «««««/«««««/NA out of 573/409 small growth funds; Value Discovery Fund «/«/NA out of 218/157 small value funds; International Growth Fund «««««/«««««/««««« out of 167/122/44 foreign large growth funds; Income Fund ««««/«««««/««««« out of 235/178/101 short-term bond funds.
Please carefully consider the Funds’ investment objectives, risks, charges, and expenses before investing. This and other information is contained in the Funds prospectus, which you may obtain by calling 1-800-742-7272. Read it carefully before you invest or send money. ©William Blair & Company, L.L.C., distributor. 08/05.
4 Semi-Annual Report | June 30, 2005 |

John F. Jostrand
GROWTH FUND
The Growth Fund invests primarily in common stocks of domestic growth companies that the Advisor expects to have sustainable, above-average growth from one business cycle to the next.
AN OVERVIEW FROM THE PORTFOLIO MANAGER
How did the Fund perform over the first half of the year? How did the Fund’s performance compare to its benchmark?
The Growth Fund posted a 0.75% decrease on a total return basis (Class N Shares) for the six months ended June 30, 2005. By comparison, the Fund’s benchmarks, the Russell 3000® Growth Index decreased 1.88%, while the Standard & Poor’s 500 Index declined 0.81%.
What were the most significant factors impacting Fund performance?
In the first six months of 2005, value stocks outperformed growth stocks, as evidenced by the Russell 3000® Value Index up 1.69%, versus the 1.88% decline of the Russell 3000® Growth Index. Larger cap growth stocks outperformed their smaller cap counterparts, with the Russell 2000® Growth Index decreasing 3.58% and the Russell 1000® Growth Index down 1.72% for the year. Rising oil prices and continued monetary tightening by the Federal Reserve provided headwinds for companies in the first six months of 2005. Crude oil closed the first half of the year near $60 a barrel, which continues to put pressure on stocks reliant on the lower end consumer. Although Energy sector returns were strong, the relatively low weighting of this sector in the Russell 3000® Growth Index had a modest impact on Index’s overall results. Dissecting the period by quarter, growth-oriented issues began to show signs of strength particularly in May, as Technology issues and Biotech stocks took leadership from cyclical stocks that had done well in 2004, such as Materials and Industrial-related stocks.
What were among the best performing investments for the Fund?
One of the largest contributors to portfolio returns for the first half of 2005 was Health Care. Strong stock selection led to good results on both a relative and an absolute return basis for the portfolio. Alcon, Inc., a leader in the eye-care area, showed strong results buoyed particularly by the outlook for its Restor Lens interocular product. United Healthcare, a health care service provider, continued to be a top portfolio performer and a dominant player in its segment.
Technology stocks provided the strongest portfolio returns relative to the Russell 3000® Growth Index. Although overall returns in the portfolio were flat for the six months and negative in the benchmark, strength in the second quarter seems to indicate investors are warming to this sector. Digital Insight Corporation, a provider of outsourced on-line banking services to smaller financial institutions, experienced strong results after reporting double-digit earnings growth with strong margins and cash flows. Taiwan Semiconductor, the world’s largest contract chipmaker, had good stock appreciation after reporting strong results for 2004. Although 2005 will likely see a contraction in shipments due to client inventory issues, the outlook for 2006 remains strong.
What were among the weakest performing investments for the Fund?
Financial stocks suffered significantly during the first quarter, resulting in negative results for the first half of the year. With accounting concerns surrounding insurers such as AIG and
June 30, 2005 | William Blair Funds 5 |
regulatory issues plaguing Fannie Mae, “collision avoidance” was key during the first quarter. In the second quarter, stock selection in certain areas of Financials was the key to success, particularly if spots were picked appropriately. While capital markets firms were leaders in the sector, Goldman Sachs Group, Inc. a portfolio holding, experienced a stock pullback due to lower trading volumes and hence smaller commissions.
Consumer Discretionary and Consumer Staples stocks showed weakness in the portfolio and the benchmark during the first six months, with two of the larger portfolio disappointments coming in these two areas. Harley-Davidson, Inc., a manufacturer of motorcycle equipment and accessories, experienced significantly weak operating earnings during the second quarter. Additionally, the company decreased its earnings outlook and reduced manufacturing plans for the next several quarters. The stock was sold out of the portfolio due to our concern that the motorcycle market is maturing at a rate faster than anticipated. Estee Lauder Companies, Inc. reported quarterly revenues in line with expectations, but fell short on their bottom line results. We continue to think the company will deliver improved longer term results, especially in the latter part of the year with the launch of the new fragrance lines.
What is your current outlook?
We postulated that 2005 would bring a deceleration in earnings growth, as the business cycle is advancing from a recovery stage into a more normalized growth phase. While companies experienced double digit earnings growth in the last several quarters, estimates for the second quarter through the last half of 2005 are closer to the mid to upper single digit range. The Federal Reserve’s posture indicates a likelihood that it will continue to raise interest rates to create a less stimulative monetary environment. Although consumers continue to show resilience, fueled by the strong real estate market and low mortgage rates, the combination of higher oil prices and interest rates will likely take a toll on spending at some point. Investors anticipated that cash-heavy corporations would probably initiate capital spending, but to date corporations have had greater interest in using cash to repurchase shares or increase dividends. All of these trends tend to be harbingers for a lower growth environment.
6 Semi-Annual Report | June 30, 2005 |
Growth Fund
Performance Highlights
Average Annual Total Return at 6/30/2005
| | | | | | | | | | | | | | | | | |
| | | 1 Year
| | | 3 Year
| | | 5 Year
| | | 10 Year
| | | Since Inception(a)
| | | |
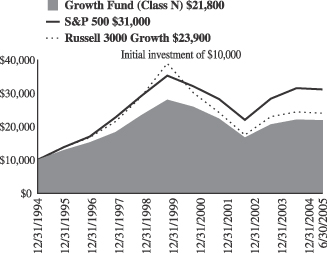
Growth Fund Class N | | 6.63 | % | | 4.79 | % | | (5.80 | )% | | 6.38 | % | | — | % | | |
Growth Fund Class I | | 6.94 | | | 5.05 | | | (5.55 | ) | | — | | | (0.96 | ) | | |
Russell 3000® Growth Index | | 1.90 | | | 7.56 | | | (9.93 | ) | | 7.13 | | | (4.32 | ) | | |
S&P 500 Index | | 6.32 | | | 8.28 | | | (2.37 | ) | | 9.94 | | | 0.25 | | | |
| | (a) | | For the period from October 1, 1999 to June 30, 2005. |
Performance cited represents past performance. Past performance does not guarantee future results and current performance may be lower or higher than the data quoted. Results shown are average annual returns, which assume reinvestment of dividends and capital gains. Investment returns and principal will fluctuate and you may have a gain or loss when you sell shares. For the most current month-end performance information, please call 1-800-742-7272, or visit our Web site at www.williamblairfunds.com. Class N shares are available to the general public without a sales load. Class I shares are available to certain institutional investors and advisory clients of William Blair & Company L.L.C. without a sales load or distribution (12b-1) or service fees.
The performance highlights and graph presented above do not reflect the deduction of taxes that a shareholder would pay on fund distributions or the redemption of fund shares.
The Russell 3000® Growth Index consists of large, medium, and small-capitalization companies with above average price-to-book ratios and forecasted growth rates. The index is weighted by market capitalization and large/medium/small companies make up approximately 80%/15%/5% of the index.
The S&P 500 Index indicates broad larger capitalization equity market performance.
This report identifies the Fund’s investments on June 30, 2005. These holdings are subject to change. Not all stocks in the Fund performed the same, nor is there any guarantee that these stocks will perform as well in the future. Market forecasts provided in this report may not necessarily come to pass.
Sector Diversification
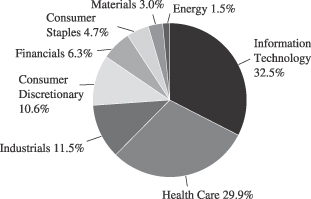
The sector diversification shown is based on the total investment portfolio.
June 30, 2005 | William Blair Funds 7 |
Growth Fund
Portfolio of Investments, June 30, 2005 (all dollar amounts in thousands) (unaudited)
| | | | | |
Issuer
| | Shares
| | Value
|
| | |
Common Stocks | | | | | |
Information Technology—32.0% | | | | | |
*Accenture Ltd.† | | 199,085 | | $ | 4,513 |
Adobe Systems Incorporated | | 125,590 | | | 3,594 |
Arm Holding plc—ADR | | 640,165 | | | 3,931 |
*Dell, Inc. | | 278,630 | | | 11,009 |
*Digital Insight Corporation | | 152,395 | | | 3,645 |
*EMC Corporation | | 451,395 | | | 6,189 |
First Data Corporation | | 203,440 | | | 8,166 |
*Jabil Circuit, Inc. | | 209,975 | | | 6,452 |
Linear Technology Corporation | | 106,035 | | | 3,890 |
Microchip Technology, Inc. | | 90,870 | | | 2,692 |
Paychex, Inc. | | 177,550 | | | 5,777 |
*PDF Solutions, Inc. | | 90,130 | | | 1,183 |
*ScanSoft, Inc. | | 799,620 | | | 3,023 |
Taiwan Semiconductor Mfg. Co. Ltd.—ADR | | 748,812 | | | 6,829 |
*ValueClick, Inc. | | 307,765 | | | 3,795 |
*WebEx Communications, Inc. | | 148,330 | | | 3,917 |
| | | | |
|
|
| | | | | | 78,605 |
| | | | |
|
|
Health Care—29.5% | | | | | |
Alcon, Inc.† | | 60,170 | | | 6,580 |
Allergan, Inc. | | 48,335 | | | 4,120 |
*Amgen, Inc. | | 115,900 | | | 7,007 |
*Axcan Pharma, Inc.† | | 240,325 | | | 3,672 |
Eli Lilly & Company | | 86,310 | | | 4,808 |
*Express Scripts, Inc., Class “A” | | 86,560 | | | 4,326 |
*IDEXX Laboratories, Inc. | | 64,240 | | | 4,004 |
*Integra Lifesciences Holding Corporation | | 99,010 | | | 2,891 |
*Kyphon, Inc. | | 110,670 | | | 3,850 |
Medtronic, Inc. | | 183,615 | | | 9,510 |
*ResMed, Inc. | | 44,510 | | | 2,937 |
Sanofi-Aventis—ADR | | 180,655 | | | 7,405 |
UnitedHealth Group, Inc. | | 177,800 | | | 9,271 |
Valeant Pharmaceuticals International | | 113,310 | | | 1,998 |
| | | | |
|
|
| | | | | | 72,379 |
| | | | |
|
|
Industrials—11.4% | | | | | |
Corporate Executive Board Company | | 48,705 | | | 3,815 |
Danaher Corporation | | 202,331 | | | 10,590 |
*Education Management Corporation | | 151,165 | | | 5,099 |
Graco, Inc. | | 90,610 | | | 3,087 |
Knight Transportation, Inc. | | 218,240 | | | 5,310 |
| | | | |
|
|
| | | | | | 27,901 |
| | | | |
|
|
*Non-income producing securities
ADR = American Depository Receipt
† = U.S. listed foreign security
VRN = Variable Rate Note
| | | | | | |
Issuer
| | Shares or
Principal
Amount
| | Value
|
| | |
Common Stocks—(continued) | | | | | | |
Consumer Discretionary—10.5% | | | | | | |
*Bed, Bath & Beyond, Inc. | | | 218,730 | | $ | 9,138 |
*CarMax, Inc. | | | 110,230 | | | 2,938 |
*Comcast Corporation, Class “A” | | | 216,760 | | | 6,492 |
*Kohl’s Corporation | | | 128,600 | | | 7,190 |
| | | | | |
|
|
| | | | | | | 25,758 |
| | | | | |
|
|
Financials—6.2% | | | | | | |
Goldman Sachs Group, Inc. | | | 46,360 | | | 4,730 |
SEI Investments Company | | | 140,435 | | | 5,245 |
SLM Corporation | | | 102,585 | | | 5,211 |
| | | | | |
|
|
| | | | | | | 15,186 |
| | | | | |
|
|
Consumer Staples—4.6% | | | | | | |
Estee Lauder Companies, Inc. | | | 130,205 | | | 5,095 |
PepsiCo, Inc. | | | 116,215 | | | 6,268 |
| | | | | |
|
|
| | | | | | | 11,363 |
| | | | | |
|
|
Materials—2.9% | | | | | | |
Praxair, Inc. | | | 153,630 | | | 7,159 |
| | | | | |
|
|
Energy—1.5% | | | | | | |
Suncor Energy, Inc.† | | | 77,310 | | | 3,658 |
| | | | | |
|
|
Total Common Stock—98.6%
(cost $192,092) | | | 242,009 |
| | | | | |
|
|
| | |
Investment in Affiliate—0.4% | | | | | | |
William Blair Ready Reserves | | | 921,944 | | | 922 |
| | | | | |
|
|
Total Investment in Affiliate
(cost $922) | | | 922 |
| | | | | |
|
|
| | |
Short-Term Investments—0.3% | | | | | | |
Prudential Funding Demand Note, VRN, 3.368%, due 7/1/05 | | $ | 670,000 | | | 670 |
| | | | | |
|
|
Total Short-Term Investments
(cost $670) | | | 670 |
| | | | | |
|
|
Total Investments—99.3%
(cost $193,684) | | | 243,601 |
Cash and other assets, less liabilities—0.7% | | | 1,699 |
| | | | | |
|
|
Net assets—100.0% | | $ | 245,300 |
| | | | | |
|
|
See accompanying Notes to Financial Statements.
8 Semi-Annual Report | June 30, 2005 |

Mark A. Fuller III

Gregory J. Pusinelli
TAX-MANAGED GROWTH FUND
The Tax-Managed Growth Fund invests primarily in common stocks of large, medium and small domestic growth companies that the Advisor expects will have sustainable, above-average growth from one business cycle to the next.
AN OVERVIEW FROM THE PORTFOLIO MANAGERS
How did the Fund perform over the first half of the year? How did the Fund’s performance compare to its benchmark?
The Tax-Managed Growth Fund posted a 1.00% gain on a total return basis (Class N Shares) for the six-months ended June 30, 2005. By comparison, the Fund’s benchmark, the Russell 3000® Growth Index declined 1.88% and the Standard & Poor’s 500 Stock Index dropped 0.81%.
What were the most significant market factors impacting Fund performance?
Concerns that rising energy prices could dampen economic growth weighed on the equity markets during the first half of the year. In addition, indications early in the year that inflationary pressures had the potential to increase were worrisome to equity market participants.
Amid mounting concerns that corporate profits might slow, investors were also troubled by signs that the Federal Reserve’s campaign to raise short-term interest rates at a “measured” pace was not over. The Federal Reserve raised the federal funds rate on overnight loans once during the first quarter and twice during the second quarter, and investors grew increasingly concerned that the Fed was being overly cautious—and perhaps too restrictive—with its monetary policy.
What were among the best performing investments for the Fund?
Information Technology was the best-performing sector for the Fund for the first six months of 2005. The Fund was underweight the Russell 3000® Growth Index in terms of Information Technology exposure—at 17.1% versus 26.3% for the Index. However, our Information Technology stocks performed better, posting a 2.3% gain, as compared to a 5.6% decline for the stocks in the Russell 3000® Growth.
Energy was the second-best performing sector for the Fund. Our Energy sector exposure at 4.8% was more than double the weighting of the Russell 3000® Growth at 2.1%, and the Fund benefited from the positive performance of its Energy holdings.
Health Care was the third-best performing sector for the Fund during the first half of the year. More specifically, four of the top five-best performing investments for the Fund during the first six months were from the Health Care sector, and three of these companies—Genentech, Inc., Alcon, Inc. and St. Jude Medical, Inc.—deserve mention. Applications for Genentech’s cancer products—and their broader use for different types of cancers—look promising. Increased earnings estimates for the company during the second quarter reinforced our enthusiasm for this company. We especially favor this company because Genentech has an entire portfolio of products, compared to other biotechnology companies which may only have one drug either in test trials or to market. Alcon is a global leader in developing, manufacturing, and selling ophthalmology drugs, supplies, and surgical devices, and also sells consumer eye-care products
June 30, 2005 | William Blair Funds 9 |
such as contact lens-cleaning solution. Alcon has a new drug for age-related macular degeneration, and the company’s stock responded favorably to news that its Phase 3 testing of this product was going well. As the aging segment of the population continues to grow, we expect the growth prospects for Alcon to be strong. St. Jude Medical manufactures cardiovascular medical devices, including the world’s most widely used mechanical heart valve. The firm’s cardiac care business benefited from the misfortune of Boston Scientific Corporation, which had announced a stent recall during the quarter.
What were among the weakest performing investments for the Fund?
Our Financial sector weightings were a material drag on performance during the first half of the year. Investors Financial Service Corporation was a weak performing investment for the Fund. The flattening interest rate yield curve resulting from the Federal Reserve’s short-term interest rate hikes has taken a bite out of Investors Financial’s earnings, as the short-term rates the company pays out have increased relative to the lower long term rates at which the company borrows money.
Another poor performing investment for the Fund was Valeant Pharmaceuticals International. Concerns arose that Phase 2 test trials for Valeant’s Viramidine drug for Hepatitis C were poorly designed by the company’s previous management, which led to speculation regarding the drug’s ability to be approved by the FDA. We nonetheless believe in this company, which has strong new management that has joined the firm from many of the top pharmaceutical companies from around the world. We are willing to withstand the short-term pain with the company’s share price because of this management, and because of Valeant’s promising portfolio of products which is in various stages of testing.
CarMax, Inc. also turned in a disappointing performance. Management lowered expectations for comparable store sales, and the downward guidance caused our investment in CarMax, Inc. to decline. Although we have begun to see greater volatility in comparable store sales from quarter to quarter—which impacts our valuation parameters for the stock—we still believe in this company, its business model and its excellent management.
What is your current strategy? How is the Fund positioned?
As we mentioned last quarter, interest rates have been edging up, turning what had been a favorable tailwind for equity investors into a headwind. We are thoughtfully navigating this market environment. We will continue to maintain our modest underweight in the Financial sector given the likelihood for additional “measured” interest rate increases by the Federal Reserve in the months ahead. Otherwise, we presently intend to maintain reasonable weightings in each sector and we are not currently inclined to significantly over- or under-weight any other particular area.
In addition, rising energy costs are expected to cause a slowdown in earnings growth among companies in the broad market as well as the nation’s Gross Domestic Product (GDP). However, it is also a market environment we believe should favor the type of companies we invest in—companies that demonstrate above-average earnings growth no matter what the economic climate.
As always, we will continue to focus on and emphasize high-quality names that we believe will serve our investors well.
10 Semi-Annual Report | June 30, 2005 |
Tax-Managed Growth Fund
Performance Highlights
Average Annual Total Return at 6/30/2005
| | | | | | | | | | | | |
| | | 1
Year
| | | 3
Year
| | | 5
Year
| | | Since Inception(a)
| |
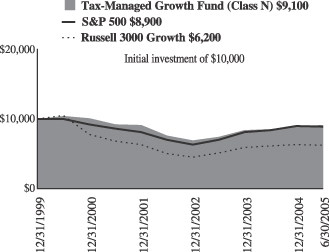
Tax-Managed Growth
Fund Class N | | 6.82 | % | | 5.97 | % | | (2.62 | )% | | (1.73 | )% |
Tax-Managed Growth
Fund Class I | | 6.97 | | | 6.24 | | | (2.38 | ) | | (1.48 | ) |
Russell 3000®
Growth Index | | 1.90 | | | 7.56 | | | (9.93 | ) | | (8.17 | ) |
S&P 500 Index | | 6.32 | | | 8.28 | | | (2.37 | ) | | (2.09 | ) |
| | (a) | | For the period from December 27, 1999 to June 30, 2005. |
Performance cited represents past performance. Past performance does not guarantee future results and current performance may be lower or higher than the data quoted. Results shown are average annual total returns, which assume reinvestment of dividends and capital gains. Investment returns and principal will fluctuate and you may have a gain or loss when you sell shares. For the most current month-end performance information, please call 1-800-742-7272, or visit our Web site at www.williamblairfunds.com. From time to time, the investment adviser may waive fees or reimburse expenses for the Fund. Without these waivers, performance would be lower. Class N shares are available to the general public without a sales load. Class I shares are available to certain institutional investors and advisory clients of William Blair & Company, L.L.C., without a sales load or distribution (12b-1) or service fees.
The performance highlights and graph presented above do not reflect the deduction of taxes that a shareholder would pay on fund distributions or the redemption of fund shares.
The Russell 3000® Growth Index consists of large, medium, and small-capitalization companies with above average price-to-book ratios and forecasted growth rates. The index is weighted by market capitalization and large/medium/small companies make up approximately 80%/15%/5% of the index.
The S&P 500 Index indicates broad larger capitalization equity market performance.
This report identifies the Fund’s investments on June 30, 2005. These holdings are subject to change. Not all stocks in the Fund performed the same, nor is there any guarantee that these stocks will perform as well in the future. Market forecasts provided in this report may not necessarily come to pass.
Sector Diversification

The sector diversification shown is based on the total investment portfolio.
June 30, 2005 | William Blair Funds 11 |
Tax-Managed Growth Fund
Portfolio of Investments, June 30, 2005 (all dollar amounts in thousands) (unaudited)
| | | | | |
Issuer
| | Shares
| | Value
|
| | |
Common Stocks | | | | | |
Health Care—23.8% | | | | | |
Alcon, Inc.† | | 965 | | $ | 106 |
*Amgen, Inc. | | 2,435 | | | 147 |
*Express Scripts, Inc., Class “A” | | 2,470 | | | 123 |
*Genentech, Inc. | | 1,800 | | | 145 |
IMS Health, Inc. | | 4,740 | | | 117 |
Pfizer, Inc. | | 5,325 | | | 147 |
*ResMed, Inc. | | 2,197 | | | 145 |
Sanofi-Aventis—ADR | | 2,480 | | | 102 |
*St. Jude Medical, Inc. | | 2,360 | | | 103 |
Stryker Corporation | | 1,230 | | | 58 |
Valeant Pharmaceuticals International | | 3,420 | | | 60 |
*Zimmer Holdings, Inc. | | 1,910 | | | 145 |
| | | | |
|
|
| | | | | | 1,398 |
| | | | |
|
|
Information Technology—17.4% | | | | | |
Arm Holdings plc—ADR | | 9,500 | | | 58 |
*CACI International, Inc., Class “A” | | 1,360 | | | 86 |
CDW Corporation | | 1,620 | | | 93 |
*EMC Corporation | | 6,590 | | | 90 |
First Data Corporation | | 2,900 | | | 116 |
*Intuit, Inc. | | 2,455 | | | 111 |
*Jabil Circuit, Inc. | | 3,545 | | | 109 |
Microchip Technology, Inc. | | 4,170 | | | 124 |
Paychex, Inc. | | 3,390 | | | 110 |
*ScanSource, Inc. | | 1,230 | | | 53 |
Taiwan Semiconductor Mfg. Co. Ltd.—ADR | | 8,220 | | | 75 |
| | | | |
|
|
| | | | | | 1,025 |
| | | | |
|
|
Industrials—14.9% | | | | | |
*Apollo Group, Inc., Class “A” | | 750 | | | 59 |
C.H. Robinson Worldwide, Inc. | | 2,335 | | | 136 |
Danaher Corporation | | 3,020 | | | 158 |
Expeditors International of Washington | | 2,245 | | | 112 |
Fastenal Company | | 2,520 | | | 154 |
General Electric Company | | 3,355 | | | 116 |
Knight Transportation, Inc. | | 3,255 | | | 79 |
Pentair, Inc. | | 1,400 | | | 60 |
| | | | |
|
|
| | | | | | 874 |
| | | | |
|
|
Consumer Discretionary—13.8% | | | | | |
*Bed, Bath & Beyond, Inc. | | 2,070 | | | 87 |
*CarMax, Inc. | | 2,710 | | | 72 |
Dollar General Corporation | | 4,230 | | | 86 |
*eBAY, Inc. | | 1,720 | | | 57 |
*IAC InterActiveCorp | | 3,240 | | | 78 |
*Laureate Education, Inc. | | 1,250 | | | 60 |
Lowe’s Companies, Inc. | | 1,735 | | | 101 |
Time Warner, Inc. | | 4,530 | | | 76 |
*Univision Communications, Inc. | | 1,820 | | | 50 |
*Williams-Sonoma, Inc. | | 3,645 | | | 144 |
| | | | |
|
|
| | | | | | 811 |
| | | | |
|
|
*Non-income producing securities
ADR = American Depository Receipt
† = U.S. listed foreign security
VRN = Variable Rate Note
| | | | | | | |
Issuer
| | Shares or
Principal
Amount
| | Value
| |
| | |
Common Stocks—(continued) | | | | | | | |
Financials—8.2% | | | | | | | |
AFLAC, Inc. | | | 1,390 | | $ | 60 | |
Ambac Financial Group, Inc. | | | 1,450 | | | 101 | |
American International Group | | | 2,210 | | | 129 | |
Investors Financial Service Corporation | | | 2,240 | | | 85 | |
Moody’s Corporation | | | 2,430 | | | 109 | |
| | | | | |
|
|
|
| | | | | | | 484 | |
| | | | | |
|
|
|
Consumer Staples—6.7% | | | | | | | |
Colgate-Palmolive Company | | | 1,100 | | | 55 | |
PepsiCo, Inc. | | | 2,825 | | | 152 | |
Walgreen Co. | | | 2,365 | | | 109 | |
Whole Foods Market, Inc. | | | 680 | | | 80 | |
| | | | | |
|
|
|
| | | | | | | 396 | |
| | | | | |
|
|
|
Materials—5.6% | | | | | | | |
Airgas, Inc. | | | 5,550 | | | 137 | |
Ecolab, Inc. | | | 2,090 | | | 67 | |
Praxair, Inc. | | | 2,660 | | | 124 | |
| | | | | |
|
|
|
| | | | | | | 328 | |
| | | | | |
|
|
|
Energy—5.5% | | | | | | | |
*Smith International, Inc. | | | 950 | | | 61 | |
Suncor Energy, Inc.† | | | 5,580 | | | 264 | |
| | | | | |
|
|
|
| | | | | | | 325 | |
| | | | | |
|
|
|
Total Common Stock—95.9%
(cost $4,269) | | | 5,641 | |
| | | | | |
|
|
|
| | |
Investment in Affiliate—3.0% | | | | | | | |
William Blair Ready Reserves | | | 177,340 | | | 177 | |
| | | | | |
|
|
|
Total Investment in Affiliate
(cost $177) | | | 177 | |
| | | | | |
|
|
|
| | |
Short-Term Investments—3.4% | | | | | | | |
Prudential Funding Demand Note, VRN,
3.368%, due 7/1/05 | | $ | 200,000 | | | 200 | |
| | | | | |
|
|
|
Total Short-Term Investments
(cost $200) | | | 200 | |
| | | | | |
|
|
|
Total Investments—102.3%
(cost $4,646) | | | 6,018 | |
Liabilities, plus cash and other assets—(2.3)% | | | (134 | ) |
| | | | | |
|
|
|
Net assets—100.0% | | $ | 5,884 | |
| | | | | |
|
|
|
See accompanying Notes to Financial Statements.
12 Semi-Annual Report | June 30, 2005 |
John F. Jostrand

Norbert W. Truderung

James W. Golan
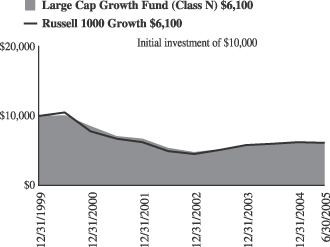
LARGE CAP GROWTH FUND
The Large Cap Growth Fund invests primarily in common stocks of large domestic growth companies of high quality that the Advisor believes have demonstrated sustained growth over a long period of time.
AN OVERVIEW FROM THE PORTFOLIO MANAGERS
How did the Fund perform over the first half of the year? How did the Fund’s performance compare to its benchmark?
The Large Cap Growth Fund posted a 1.76% decrease on a total return basis (Class N Shares) for the six months ended June 30, 2005. By comparison, the Fund’s benchmark, the Russell 1000® Growth Index, declined 1.72%.
What were the most significant factors impacting Fund performance? What factors were behind the Fund’s performance versus the benchmark?
The broad domestic equity market showed mixed results for the first half of the year, with midcap value-oriented stocks having the best overall results, while growth-oriented issues were generally weak. Oil prices marched higher, and the Federal Reserve continued its tightening policy. With concerns about the potential for slowing earnings growth, investors rotated away from more cyclical issues such as Materials and Industrials, and began to show favor to Health Care and some select Technology stocks in the latter part of the second quarter.
What were among the best performing investments for the Fund?
The largest contributor to the portfolio during the year to date period on an absolute and relative basis was the Health Care sector. Alcon, a provider of eye care products, achieved strong results due to favorable outlook for its new Restor Lens product. This interocular device provides improved sight for both near and distance vision, and has proven to be a good option for patients with cataracts as well. The product received additional good news with the approval by Medicare for reimbursements, making the relatively expensive product available to a sizably larger market.
The Energy sector enjoyed the strongest absolute results during the first six months, boosted by oil rising to $60 per barrel. Although the returns were strong, the Energy weighting in both the benchmark and the portfolio was less than two percent. Nevertheless, Energy proved to be the second strongest performer in relative terms for the portfolio during the first six months. Suncor Energy Inc., an integrated energy company which has a proprietary method for extracting oil from the Canadian tar sands, enjoyed particularly strong returns during the quarter.
What were among the weakest performing investments for the Fund?
Industrial stocks detracted from overall portfolio results. This area showed significant weakness during the year to date period, as investors turned to stocks with less orientation to the recovery phase of the economic cycle. The portfolio’s relative overweight position to this area, combined with particularly soft performances by 3M Company and Danaher Corporation, contributed to weakness in overall portfolio returns.
June 30, 2005 | William Blair Funds 13 |
Although stocks in the Consumer Discretionary sector held up well given the potential effects of rising oil prices and increasing interest rates, one of the largest disappointments during the first six months came in this area. Harley-Davidson, Inc., a manufacturer of motorcycle equipment and accessories, experienced significantly weak operating earnings during the second quarter. Additionally, the company decreased its earnings outlook and reduced manufacturing plans for the next several quarters. The stock was sold out of the portfolio due to our concern that the motorcycle market is maturing at a rate faster than anticipated.
What is your current outlook?
We postulated that 2005 would bring a deceleration in earnings growth, as the business cycle is advancing from a recovery stage into a more normalized growth phase. While companies experienced double digit earnings growth in the last several quarters, estimates for the second quarter through the last half of 2005 are closer to the mid to upper single digit range. The Federal Reserve’s posture indicates a likelihood that it will continue to raise interest rates to create a less stimulative monetary environment. Although consumers continue to show resilience, fueled by the strong real estate market and low mortgage rates, the combination of higher oil prices and interest rates will likely take a toll on spending at some point. Investors anticipated that cash-heavy corporations would probably initiate capital spending, but to date corporations have had greater interest in using cash to repurchase shares or increase dividends. All of these trends tend to be harbingers for a lower growth environment.
14 Semi-Annual Report | June 30, 2005 |
Large Cap Growth Fund
Performance Highlights
Average Annual Total Return at 6/30/2005
| | | | | | | | | | | | |
| | | 1
Year
| | | 3
Year
| | | 5
Year
| | | Since
Inception(a)
| |
Large Cap Growth Fund Class N | | 4.25 | % | | 4.19 | % | | (9.54 | )% | | (8.46 | )% |
Large Cap Growth Fund Class I | | 4.38 | | | 4.39 | | | (9.37 | ) | | (8.27 | ) |
Russell 1000®
Growth Index | | 1.68 | | | 7.26 | | | (10.36 | ) | | (8.59 | ) |
| | (a) | | For the period from December 27, 1999 to June 30, 2005. |
Performance cited represents past performance. Past performance does not guarantee future results and current performance may be lower or higher than the data quoted. Results shown are average annual total returns, which assume reinvestment of dividends and capital gains. Investment returns and principal will fluctuate and you may have a gain or loss when you sell shares. For the most current month-end performance information, please call 1-800-742-7272, or visit our Web site at www.williamblairfunds.com. From time to time, the investment adviser may waive fees or reimburse expenses for the Fund. Without these waivers, performance would be lower. Class N shares are available to the general public without a sales load. Class I shares are available to certain institutional investors and advisory clients of William Blair & Company, L.L.C., without a sales load or distribution (12b-1) or service fees.
The performance highlights and graph presented above do not reflect the deduction of taxes that a shareholder would pay on fund distributions or the redemption of fund shares.
The Russell 1000® Growth Index consists of large-capitalization companies with above average-to-book ratios and forecasted growth rates.
This report identifies the Fund’s investments on June 30, 2005. These holdings are subject to change. Not all stocks in the Fund performed the same, nor is there any guarantee that these stocks will perform as well in the future. Market forecasts provided in this report may not necessarily come to pass.
Sector Diversification
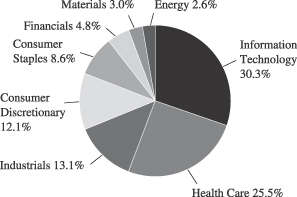
The sector diversification shown is based on the total investment portfolio.
June 30, 2005 | William Blair Funds 15 |
Large Cap Growth Fund
Portfolio of Investments, June 30, 2005 (all dollar amounts in thousands) (unaudited)
| | | | | |
Issuer
| | Shares
| | Value
|
| | |
Common Stocks | | | | | |
Information Technology—29.2% | | | | | |
*Accenture, Ltd.† | | 11,865 | | $ | 269 |
Adobe Systems Incorporated | | 4,570 | | | 131 |
*Dell, Inc. | | 10,890 | | | 430 |
*EMC Corporation | | 18,670 | | | 256 |
First Data Corporation | | 8,790 | | | 353 |
Intel Corporation | | 7,565 | | | 197 |
Linear Technology Corporation | | 7,475 | | | 274 |
Paychex, Inc. | | 6,480 | | | 211 |
Qualcomm Incorporated | | 2,410 | | | 80 |
Taiwan Semiconductor Mfg. Co. Ltd.—ADR | | 33,432 | | | 305 |
*Yahoo!, Inc. | | 4,675 | | | 162 |
| | | | |
|
|
| | | | | | 2,668 |
| | | | |
|
|
Health Care—24.6% | | | | | |
Alcon, Inc.† | | 2,210 | | | 242 |
Allergan, Inc. | | 2,195 | | | 187 |
*Amgen, Inc. | | 4,285 | | | 259 |
*Boston Scientific Corporation | | 2,145 | | | 58 |
*Caremark Rx, Inc. | | 3,655 | | | 163 |
Eli Lilly & Company | | 2,965 | | | 165 |
Medtronic, Inc. | | 8,400 | | | 435 |
Pfizer, Inc. | | 7,200 | | | 198 |
Sanofi-Aventis—ADR | | 4,925 | | | 202 |
UnitedHealth Group, Inc. | | 6,525 | | | 340 |
| | | | |
|
|
| | | | | | 2,249 |
| | | | |
|
|
Industrials—12.6% | | | | | |
3M Company | | 3,680 | | | 266 |
*Apollo Group, Inc., Class “A” | | 2,535 | | | 198 |
Danaher Corporation | | 8,142 | | | 426 |
General Electric Company | | 7,635 | | | 265 |
| | | | |
|
|
| | | | | | 1,155 |
| | | | |
|
|
Consumer Discretionary—11.6% | | | | | |
*Bed, Bath & Beyond, Inc. | | 8,265 | | | 345 |
*Comcast Corporation, Class “A” | | 7,945 | | | 238 |
*Kohl’s Corporation | | 6,563 | | | 367 |
Nike, Inc., Class “B” | | 1,300 | | | 113 |
| | | | |
|
|
| | | | | | 1,063 |
| | | | |
|
|
*Non-income producing securities
ADR = American Depository Receipt
† = U.S. listed foreign security
| | | | | | |
Issuer
| | Shares
| | Value
| |
| | |
Common Stocks—(continued) | | | | | | |
Consumer Staples—8.3% | | | | | | |
Avon Products, Inc. | | 5,320 | | $ | 201 | |
PepsiCo, Inc. | | 4,185 | | | 226 | |
Walgreen Co. | | 7,225 | | | 332 | |
| | | | |
|
|
|
| | | | | | 759 | |
| | | | |
|
|
|
Financials—4.6% | | | | | | |
Goldman Sachs Group, Inc. | | 2,355 | | | 240 | |
SLM Corporation | | 3,565 | | | 181 | |
| | | | |
|
|
|
| | | | | | 421 | |
| | | | |
|
|
|
Materials—2.9% | | | | | | |
Praxair, Inc. | | 5,655 | | | 264 | |
| | | | |
|
|
|
Energy—2.6% | | | | | | |
Schlumberger Limited† | | 1,275 | | | 97 | |
Suncor Energy, Inc.† | | 2,895 | | | 137 | |
| | | | |
|
|
|
| | | | | | 234 | |
| | | | |
|
|
|
Total Common Stock—96.4%
(cost $7,855) | | | 8,813 | |
| | | | |
|
|
|
| | |
Investment in Affiliate—3.6% | | | | | | |
William Blair Ready Reserves | | 329,775 | | | 330 | |
| | | | |
|
|
|
Total Investment in Affiliate
(cost $330) | | | 330 | |
| | | | |
|
|
|
Total Investments—100.0%
(cost $8,185) | | | 9,143 | |
Liabilities, plus cash and other assets—0.0% | | | (1 | ) |
| | | | |
|
|
|
Net assets—100.0% | | $ | 9,142 | |
| | | | |
|
|
|
See accompanying Notes to Financial Statements.
16 Semi-Annual Report | June 30, 2005 |

Karl W. Brewer
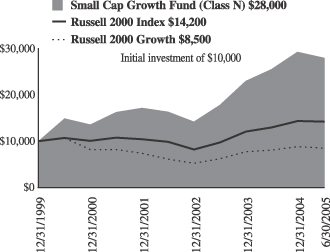
SMALL CAP GROWTH FUND
The Small Cap Growth Fund invests primarily in common stocks of small domestic growth companies that the Advisor expects to have solid growth in earnings.
AN OVERVIEW FROM THE PORTFOLIO MANAGER
How did the Fund perform over the first half of the year? How did the Fund’s performance compare to its benchmark?
The Small Cap Growth Fund posted a 4.16% decrease on a total return basis (Class N Shares) for the six months ended June 30, 2005. By comparison, the Fund’s benchmark, the Russell 2000® Growth Index, declined 3.58% during the period, while the Russell 2000® Index decreased 1.25%.
What were the most significant factors impacting Fund performance? What factors were behind the Fund’s performance versus the benchmark?
Small cap growth stocks underperformed large cap stocks during the first six months of the year, as evidenced by the Russell 2000® Index (of small company stocks) return of -1.25% versus the Russell 1000® Index (of large company stocks) return of 0.11%. From a style perspective within the small cap space, value continued to outperform growth as the Russell 2000® Value Index returned 0.90%.
The financial markets were again faced with the backdrop of a rising interest rate environment and high energy prices during the first half of 2005. The Federal Reserve continued its tightening at a measured pace to take the target Federal Funds interest rate to 3.25% by the end of June. Crude oil closed the first half of the year near $60 a barrel and continues to be a headwind for investors’ outlook on the consumer. With these elevated energy prices, the Energy sector within the Russell 2000® Growth Index has sustained its strong performance in 2005 to date. Consumer Discretionary stocks also turned in positive results. On the other hand, Health Care stocks finished just in negative territory for the Russell 2000® Growth Index. The Information Technology sector once again produced negative results for the Russell 2000® Growth Index as it did in 2004. The Industrials and Materials sectors, after their strong performances in 2004, ended the first half of 2005 with negative returns within the Russell 2000® Growth Index. With respect to the Fund, Health Care, Industrials, Consumer Discretionary and Financials produced negative absolute returns while Information Technology and Energy saw positive results in absolute terms.
On a relative basis, our outperformance during the first quarter was more than offset by our underperformance during the second quarter to end the period down relative to the Russell 2000® Growth Index. There were a few dynamics that contributed to our relative performance during the first six months of the year. First, we had some fundamental disappointments. Stock selection in Health Care was a major detractor from relative performance. In addition to Health Care, stock selection in the Financials and Consumer Discretionary sectors were two other main sources of relative underperformance. Among the positive contributors to the Fund’s relative performance for the first six months of 2005 was stock selection within the Information Technology sector.
Another dynamic that added to the Fund’s underperformance, specifically during the second quarter, was client withdrawals. As a result, we were forced to raise cash in an already difficult small cap market during April and then again in May, which we believe put downward pressure on some of our portfolio holdings. From the end of the first quarter
June 30, 2005 | William Blair Funds 17 |
through May 24, representing roughly the end of the liquidations and the trough in relative performance for the quarter, a substantial amount of the roughly 550 basis point underperformance came from our smaller market capitalization, and typically less liquid stocks. In the period from May 24 through the end of the quarter, after the liquidations were complete, we outperformed compared to the Index by over 300 basis points. While we are not satisfied with our underperformance in the second quarter, and therefore through the first six months of 2005, we feel a portion of this was due to short term dynamics and we remain positive on the positioning of the Fund.
What were among the weakest performing investments for the Fund?
Integra LifeSciences Holdings Corporation and Cell Therapeutics, Inc. were two stocks within Health Care that performed poorly. Integra LifeSciences, a medical products company, reported earnings below expectations and guided future earnings lower during May. We continue to hold the position as we expect Integra’s business momentum to reaccelerate. The small cap biotechnology industry experienced relatively weak returns during the first half of the year. Cell Therapeutics is one of the Fund’s biotechnology holdings that underperformed its peers in the quarter. The company announced negative data from a Phase III trial in the FDA approval process during the first quarter. We have since sold the position after subsequent data points dampened our outlook for the company’s prospects.
What were among the best performing investments for the Fund?
Two stocks that contributed to the Information Technology sector’s positive relative performance were Optimal Group, Inc. and Intermix Media, Inc. Optimal Group was our most significant contributor within our Information Technology holdings and in the Fund overall. Optimal Group, Inc. is an undiscovered transaction processing company. The stock appreciated through the first six months of the year as investors became increasingly aware of the company and its ability to execute fundamentally. Intermix Media, Inc. operates a network of unique websites that allow marketers to target hard-to-reach consumers. The company’s business is accelerating and the stock has responded accordingly.
What is your current outlook?
Looking forward, the markets will continue to face various headwinds. Year over year earnings comparisons are getting tougher after the strong double digit earnings growth rates witnessed in 2004. More companies are reigning in expectations as the ratio of negative to positive preannouncements was significantly higher during the second quarter of 2005 versus the year earlier period. There will be continued debate in regard to near record high energy prices and their effect on overall economic activity. With respect to interest rates, current consensus is for the Federal Reserve to raise rates another 25 basis points at its August meeting but beyond that investors differ on their expectations. Future data points on inflation, economic activity and employment will weigh in on the direction of interest rates so investors will be watching these statistics in anticipation of the Fed’s moves.
With the backdrop of slower yet more sustainable economic and corporate earnings growth rates, we anticipate a stock picker’s market. Our bottom up, fundamental quality growth philosophy of selecting companies with durable business franchises and consistent earnings streams should position the Fund well in this type of environment.
18 Semi-Annual Report | June 30, 2005 |
Small Cap Growth Fund
Performance Highlights
Average Annual Total Return at 6/30/2005
| | | | | | | | | | | | |
| | | 1
Year
| | | 3
Year
| | | 5
Year
| | | Since Inception(a)
| |
Small Cap Growth Fund Class N | | 9.33 | % | | 19.53 | % | | 13.44 | % | | 20.47 | % |
Small Cap Growth Fund Class I | | 9.61 | | | 19.81 | | | 13.70 | | | 20.75 | |
Russell 2000®
Growth Index | | 4.29 | | | 11.37 | | | (4.51 | ) | | (2.86 | ) |
Russell 2000® Index | | 9.45 | | | 12.81 | | | 5.71 | | | 6.59 | |
| | (a) | | For the period from December 27, 1999 to June 30, 2005. |
Performance cited represents past performance. Past performance does not guarantee future results and current performance may be lower or higher than the data quoted. Results shown are average annual total returns, which assume reinvestment of dividends and capital gains. Investment returns and principal will fluctuate and you may have a gain or loss when you sell shares. For the most current month-end performance information, please call 1-800-742-7272, or visit our Web site at www.williamblairfunds.com. Investing in smaller companies involves special risks, including higher volatility and lower liquidity. From time to time, the investment advisor may waive fees or reimburse expenses for the Fund. Without these waivers, performance would be lower. Class N shares are available to the general public without a sales load. Class I shares are available to certain institutional investors and advisory clients of William Blair & Company, L.L.C., without a sales load or distribution (12b-1) or service fees.
The performance highlights and graph presented above do not reflect the deduction of taxes that a shareholder would pay on fund distributions or the redemption of fund shares.
The Russell 2000® Growth Index consists of small-capitalization companies with above average price-to-book ratios and forecasted growth rates.
The Russell 2000® Index is an unmanaged composite of the smallest 2000 stocks of the Russell 3000® Index.
This report identifies the Fund’s investments on June 30, 2005. These holdings are subject to change. Not all stocks in the Fund performed the same, nor is there any guarantee that these stocks will perform as well in the future. Market forecasts provided in this report may not necessarily come to pass.
Sector Diversification
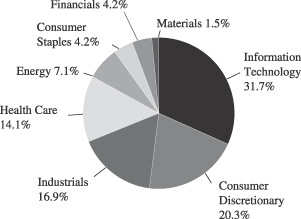
The sector diversification shown is based on the total investment portfolio.
June 30, 2005 | William Blair Funds 19 |
Small Cap Growth Fund
Portfolio of Investments, June 30, 2005 (all dollar amounts in thousands) (unaudited)
| | | | | |
Issuer
| | Shares
| | Value
|
| | |
Common Stocks | | | | | |
Information Technology—30.2% | | | | | |
*AMIS Holdings, Inc. | | 1,126,040 | | $ | 15,021 |
ARM Holdings, plc—ADR | | 1,511,435 | | | 9,280 |
*Blackbaud, Inc. | | 493,782 | | | 6,666 |
*DSP Group, Inc. | | 323,020 | | | 7,711 |
*Euronet Worldwide, Inc. | | 290,184 | | | 8,436 |
*Intermix Media, Inc. | | 558,228 | | | 4,672 |
*Internet Capital Group, Inc. | | 466,363 | | | 3,418 |
*Intrado, Inc. | | 652,664 | | | 9,764 |
*J2 Global Communications, Inc. | | 189,169 | | �� | 6,515 |
*Kanbay International, Inc. | | 494,320 | | | 11,424 |
*Lionbridge Technologies, Inc. | | 1,916,651 | | | 12,995 |
*Macrovision Corporation | | 317,400 | | | 7,154 |
*Open Solutions, Inc. | | 223,442 | | | 4,538 |
*OPNET Technologies, Inc. | | 822,590 | | | 6,663 |
*Optimal Group, Inc.† | | 928,807 | | | 15,000 |
*PDF Solutions, Inc. | | 921,372 | | | 12,088 |
*Plexus Corporation | | 482,606 | | | 6,868 |
*ScanSoft, Inc. | | 2,312,750 | | | 8,742 |
*Ultimate Software Group, Inc. | | 754,863 | | | 12,380 |
*ValueClick, Inc. | | 1,269,797 | | | 15,657 |
*Volterra Semiconductor Corporation | | 525,570 | | | 7,826 |
*WebEx Communications, Inc. | | 520,160 | | | 13,737 |
*Workstream, Inc.† | | 2,736,960 | | | 4,921 |
| | | | |
|
|
| | | | | | 211,476 |
| | | | |
|
|
Consumer Discretionary—19.4% | | | | | |
*4 Kids Entertainment, Inc. | | 464,245 | | | 9,229 |
*Century Casinos, Inc. | | 844,596 | | | 6,351 |
*Cumulus Media, Inc., Class “A” | | 686,895 | | | 8,092 |
*Insight Enterprises, Inc. | | 626,240 | | | 12,637 |
*Jarden Corporation | | 268,650 | | | 14,486 |
*Laureate Education, Inc. | | 406,177 | | | 19,440 |
*Life Time Fitness, Inc. | | 52,900 | | | 1,736 |
*Lions Gate Entertainment Corporation† | | 1,282,915 | | | 13,163 |
Nautilus Group, Inc. | | 238,909 | | | 6,809 |
*Scientific Games Corporation, Class “A” | | 222,507 | | | 5,992 |
*Shuffle Master, Inc. | | 249,376 | | | 6,990 |
Speedway Motorsports, Inc. | | 189,280 | | | 6,920 |
Strayer Education, Inc. | | 72,095 | | | 6,219 |
*ValueVision Media, Inc., Class “A” | | 751,690 | | | 9,028 |
*WMS Industries, Inc. | | 246,585 | | | 8,322 |
| | | | |
|
|
| | | | | | 135,414 |
| | | | |
|
|
Industrials—16.1% | | | | | |
*Coinstar, Inc. | | 552,347 | | | 12,533 |
*Comfort Systems USA, Inc. | | 1,230,365 | | | 8,096 |
*Corrections Corporation of America | | 233,310 | | | 9,157 |
*Educate, Inc. | | 413,818 | | | 5,855 |
*Electronic Clearing House | | 598,262 | | | 5,205 |
*FirstService Corporation† | | 411,025 | | | 8,208 |
*Frozen Food Express Industries, Inc. | | 284,466 | | | 3,220 |
*Hudson Highland Group, Inc. | | 466,235 | | | 7,269 |
*Huron Consulting Group, Inc. | | 341,789 | | | 8,049 |
*Kforce, Inc. | | 1,475,315 | | | 12,481 |
| | | | | |
Issuer
| | Shares
| | Value
|
| | |
Common Stocks—(continued) | | | | | |
Industrials—(continued) | | | | | |
*Labor Ready, Inc. | | 533,241 | | $ | 12,430 |
*Marten Transport, Ltd. | | 235,680 | | | 4,947 |
*Providence Service Corporation | | 283,873 | | | 7,048 |
*TRM Copy Centers Corporation | | 495,191 | | | 8,329 |
| | | | |
|
|
| | | | | | 112,827 |
| | | | |
|
|
Health Care—13.4% | | | | | |
*Allied Healthcare International | | 1,586,937 | | | 11,235 |
*Amicas, Inc. | | 1,576,102 | | | 7,140 |
*Axcan Pharma, Inc.† | | 565,955 | | | 8,648 |
*Barrier Therapeutics, Inc. | | 434,323 | | | 3,444 |
*Connectics Corporation | | 409,500 | | | 7,223 |
*Integra Lifesciences Holdings Corporation | | 368,240 | | | 10,752 |
*Kensey Nash Corporation | | 271,020 | | | 8,196 |
*LifeCell Corporation | | 208,715 | | | 3,300 |
*Martek Biosciences Corporation | | 196,738 | | | 7,466 |
*Matria Healthcare, Inc. | | 275,183 | | | 8,869 |
*Sangamo Biosciences, Inc. | | 531,005 | | | 1,896 |
*Santarus, Inc. | | 848,685 | | | 3,480 |
*Telik, Inc. | | 487,560 | | | 7,928 |
*Zila, Inc. | | 1,530,641 | | | 4,378 |
| | | | |
|
|
| | �� | | | | 93,955 |
| | | | |
|
|
Energy—6.8% | | | | | |
*ATP Oil and Gas Corporation | | 312,481 | | | 7,312 |
*Gasco Energy Inc. | | 2,401,050 | | | 8,884 |
*Grey Wolf, Inc. | | 1,430,573 | | | 10,601 |
*InterOil Corporation† | | 156,075 | | | 4,242 |
OMI Corporation | | 454,770 | | | 8,645 |
*Remington Oil and Gas Corporation | | 218,943 | | | 7,816 |
| | | | |
|
|
| | | | | | 47,500 |
| | | | |
|
|
Consumer Staples—4.0% | | | | | |
*Elizabeth Arden, Inc. | | 459,900 | | | 10,757 |
Nu Skin Enterprises, Inc. | | 341,390 | | | 7,955 |
*Usana Health Services, Inc. | | 214,545 | | | 9,075 |
| | | | |
|
|
| | | | | | 27,787 |
| | | | |
|
|
Financials—4.0% | | | | | |
*Affiliated Managers Group, Inc. | | 186,685 | | | 12,756 |
ECC Capital Corporation | | 1,090,485 | | | 7,262 |
*First Cash Financial Services, Inc. | | 360,309 | | | 7,700 |
| | | | |
|
|
| | | | | | 27,718 |
| | | | |
|
|
Materials—1.5% | | | | | |
Airgas, Inc. | | 413,280 | | | 10,196 |
| | | | |
|
|
Total in Common Stock—95.4%
(Total cost $557,100) | | | 666,873 |
| | | | |
|
|
| | |
Investment in Affiliate—0.9% | | | | | |
William Blair Ready Reserves | | 6,242,722 | | | 6,243 |
| | | | |
|
|
Total Investment in Affiliate
(cost $6,243) | | | 6,243 |
| | | | |
|
|
See accompanying Notes to Financial Statements.
20 Semi-Annual Report | June 30, 2005 |
Small Cap Growth Fund
Portfolio of Investments, June 30, 2005 (all dollar amounts in thousands) (unaudited)
| | | | | | |
Issuer
| | Principal
Amount
| | Value
|
| | |
Short-Term Investments—2.9% | | | | | | |
American Express Demand Note, VRN, 3.164%, due 7/1/05 | | $ | 10,046,000 | | $ | 10,046 |
Prudential Funding Demand Note, VRN, 3.368%, due 4/1/05 | | | 10,046,000 | | | 10,046 |
| | | | | |
|
|
Total Short-Term Investments
(cost $20,092) | | | 20,092 |
| | | | | |
|
|
Total Investments—99.2%
(cost $583,435 ) | | | 693,208 |
Cash and other assets, less liabilities—0.8% | | | 5,911 |
| | | | | |
|
|
Net assets—100.0% | | $ | 699,119 |
| | | | | |
|
|
*Non-income producing securities
ADR = American Depository Receipt
† = U.S. listed foreign security
VRN = Variable Rate Note
See accompanying Notes to Financial Statements.
June 30, 2005 | William Blair Funds 21 |
Karl W. Brewer

Harvey H. Bundy, III

Robert C. Lanphier, IV
SMALL-MID CAP GROWTH FUND
The Small-Mid Cap Growth Fund primarily invests in a diversified portfolio of common stocks of small and medium-sized domestic growth companies that the Advisor expects to experience solid growth in earnings.
AN OVERVIEW FROM THE PORTFOLIO MANAGERS
How did the Fund perform over the first half of the year? How did the Fund’s performance compare to its benchmark?
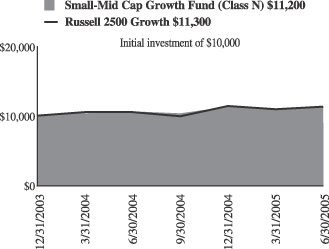
The Small-Mid Cap Growth Fund posted a 0.53% decrease on a total return basis (Class N Shares) for the six months ended June 30, 2005. By comparison, the Fund’s benchmark, the Russell 2500® Growth Index, declined 0.92% during the period.
What were the most significant factors impacting Fund performance? What factors were behind the Fund’s performance versus the benchmark?
Small to mid cap stocks outperformed large cap stocks through the first six months of the year, as evidenced by the Russell 2500® Growth Index’s return of -0.92%, versus the Russell 1000® Growth Index return of -1.72%. From a style perspective within the small to mid cap space, value continued to outperform growth as the Russell 2500® Value Index returned 3.09%.
The financial markets were again faced with the backdrop of a rising interest rate environment and high energy prices during the first half of 2005. The Federal Reserve continued its tightening at a measured pace, taking the target Federal Funds interest rate to 3.25% by the end of June. Crude oil closed the first half of the year near $60 a barrel and continues to be a headwind for investors as they consider the outlook for consumer spending.
With the elevation in energy prices, the Energy sector within the Russell 2500® Growth Index has sustained strong returns in 2005 to date. Consumer Discretionary stocks also turned in positive results while Health Care stocks finished just in positive territory in the Russell 2500® Growth Index. The Information Technology sector once again produced negative returns for the first half of the year in the Russell 2500® Growth Index as it did in 2004. The Industrials and Materials sectors, after their strong performances in 2004, also turned in negative returns within the Russell 2500® Growth Index. With respect to the Fund, Healthcare, Industrials and Financials produced negative absolute returns, while Information Technology, Consumer Discretionary and Energy saw positive results.
A few dynamics occurred during the first six months of the year that affected our relative performance. Stock selection in the Information Technology sector was the largest source of outperformance. Being underweight in the Financials sector during the first six months of the year outweighed poor stock selection in the sector.
What were among the best performing investments for the Fund?
Jabil Circuit, Inc. in the electronics manufacturing services (EMS) business was a strong contributor to the Fund’s performance in the first half of the year. Jabil Circuit, Inc. distinguishes itself with a customer-centric approach that delivers higher service levels and superior financial performance relative to its competition. The stock benefited as earnings estimates were taken up during the first quarter. The stock continued to move higher after the
22 Semi-Annual Report | June 30, 2005 |
company released earnings and guidance in June. We remain positive on the long-term prospects for the company. Ultimate Software Group, Inc. is another company in the Information Technology sector that delivered strong appreciation in the first six months of the year. The company provides innovative web-based payroll services. Customers indicate that the programs are easy to use, flexible in managing complex payroll accounting issues, and competitively priced. The company has gained attention from other growth managers and research analysts as the company transitioned to profitability.
What were among the weakest performing investments for the Fund?
One of the underperformers in the Financials sector was East West Bancorp, a bank focused on the Chinese-American market in California. There was a general market sell off, in the second quarter in part due to increased competition in their region. Finally, negative stock selection in the Consumer Discretionary space was a detractor from relative performance. Strayer Education, a post-secondary educator primarily targeting working adults, was one of the underperformers in the sector. The company’s first quarter earnings disappointed investors as new student enrollment came in below expectations. We feel this was a short term problem that they will resolve.
What is your current outlook?
Looking forward, the markets will continue to face various headwinds. Year over year earnings comparisons are getting tougher after the strong double digit earnings growth rates witnessed in 2004. More companies are reigning in expectations as the ratio of negative to positive pre-announcements was significantly higher during the second quarter of 2005 versus the year earlier period. There will be continued debate in regard to near record high energy prices and their effect on overall economic activity. Future data points on inflation, economic activity and employment will weigh in on the direction of interest rates so investors will be watching these statistics in anticipation of the Fed’s moves in the coming months.
With the backdrop of slower yet more sustainable economic and corporate earnings growth rates, we anticipate a stock picker’s market. We believe that our bottom-up, fundamental quality growth philosophy of selecting companies with durable business franchises and consistent earnings streams should position the Fund well in this type of environment.
June 30, 2005 | William Blair Funds 23 |
Small-Mid Cap Growth Fund
Performance Highlights
Average Annual Total Return at 6/30/2005
| | | | | | |
| | | Year
| | | Since Inception(a)
| |
Small-Mid Cap Growth Fund
Class N | | 5.45 | % | | 7.89 | % |
Small-Mid Cap Growth Fund
Class I | | 5.73 | | | 8.15 | |
Russell 2500® Growth Index | | 7.46 | | | 9.42 | |
| | (a) | | For the period from December 29, 2003 to June 30, 2005. | |
Performance cited represents past performance. Past performance does not guarantee future results and current performance may be lower or higher than the data quoted. Results shown are average annual total returns, which assume reinvestment of dividends and capital gains. Investment returns and principal will fluctuate and you may have a gain or loss when you sell shares. For the most current month-end performance information, please call 1-800-742-7272, or visit our Web site at www.williamblairfunds.com. Investing in smaller companies involves special risks, including higher volatility and lower liquidity. From time to time, the investment advisor may waive fees or reimburse expenses for the Fund. Without these waivers, performance would be lower. Class N shares are available to the general public without a sales load. Class I shares are available to certain institutional investors and advisory clients of William Blair & Company, L.L.C., without a sales load or distribution (12b-1) or service fees.
The performance highlights and graph presented above do not reflect the deduction of taxes that a shareholder would pay on fund distributions or the redemption of fund shares.
The Russell 2500™ Growth Index measures the performance of those Russell 2500 companies with above average price-to-book ratios and forcasted growth rates.
This report identifies the Fund’s investments on June 30, 2005. These holdings are subject to change. Not all stocks in the Fund performed the same, nor is there any guarantee that these stocks will perform as well in the future. Market forecasts provided in this report may not necessarily come to pass.
Sector Diversification

The sector diversification shown is based on the total investment portfolio.
24 Semi-Annual Report | June 30, 2005 |
Small-Mid Cap Growth Fund
Portfolio of Investments, June 30, 2005 (all dollar amounts in thousands) (unaudited)
| | | | | |
Issuer
| | Shares
| | Value
|
| | |
Common Stocks | | | | | |
Information Technology—27.6% | | | | | |
*AMIS Holdings, Inc. | | 60,800 | | $ | 811 |
CDW Corporation | | 21,700 | | | 1,239 |
*Fiserv, Inc. | | 30,200 | | | 1,297 |
*Intrado, Inc. | | 37,170 | | | 556 |
*Intuit, Inc. | | 39,000 | | | 1,759 |
*Iron Mountain, Inc. | | 37,850 | | | 1,174 |
*J2 Global Communications, Inc. | | 31,800 | | | 1,095 |
*Jabil Circuit, Inc. | | 41,900 | | | 1,288 |
Microchip Technology, Inc. | | 49,900 | | | 1,478 |
*OPNET Technologies, Inc. | | 44,900 | | | 364 |
*PDF Solutions, Inc. | | 48,500 | | | 636 |
*Ultimate Software Group, Inc. | | 44,600 | | | 731 |
*ValueClick, Inc. | | 86,500 | | | 1,067 |
*WebEx Communications, Inc. | | 38,800 | | | 1,025 |
Xilinx, Inc. | | 14,200 | | | 362 |
| | | | |
|
|
| | | | | | 14,882 |
| | | | |
|
|
Industrials—22.8% | | | | | |
*Beacon Roofing Supply, Inc. | | 24,603 | | | 647 |
C.H. Robinson Worldwide, Inc. | | 10,000 | | | 582 |
Cintas Corporation | | 16,100 | | | 622 |
*Coinstar, Inc. | | 42,505 | | | 964 |
Corporate Executive Board Company | | 17,700 | | | 1,386 |
*Corrections Corporation of America | | 19,000 | | | 746 |
Expeditors International of Washington | | 24,600 | | | 1,225 |
Fastenal Company | | 32,100 | | | 1,966 |
*Kforce, Inc. | | 54,765 | | | 463 |
Knight Transportation, Inc. | | 44,800 | | | 1,090 |
MSC Industrial Direct Company, Inc., Class “A” | | 17,740 | | | 599 |
Pentair, Inc. | | 29,100 | | | 1,246 |
*Robert Half International, Inc. | | 30,800 | | | 769 |
| | | | |
|
|
| | | | | | 12,305 |
| | | | |
|
|
Consumer Discretionary—20.4% | | | | | |
*Bed, Bath and Beyond, Inc. | | 36,400 | | | 1,521 |
*CarMax, Inc. | | 30,000 | | | 799 |
*Getty Images, Inc. | | 10,600 | | | 787 |
*Jarden Corporation | | 4,100 | | | 221 |
*Lamar Advertising Company, Class “A” | | 20,600 | | | 881 |
*Laureate Education, Inc. | | 38,749 | | | 1,855 |
*Life Time Fitness, Inc. | | 8,400 | | | 276 |
*O’Reilly Automotive, Inc. | | 42,300 | | | 1,261 |
*Shuffle Master, Inc. | | 24,100 | | | 676 |
Strayer Education, Inc. | | 6,300 | | | 543 |
*Tractor Supply Company | | 17,400 | | | 854 |
*Williams-Sonoma, Inc. | | 32,300 | | | 1,278 |
| | | | |
|
|
| | | | | | 10,952 |
| | | | |
|
|
*Non-income producing securities
VRN = Variable Rate Note
| | | | | | | |
Issuer
| | Shares or
Principal
Amount
| | Value
| |
| | |
Common Stocks—(continued) | | | | | | | |
Health Care—16.1% | | | | | | | |
*Connetics Corporation | | | 44,118 | | $ | 778 | |
*Express Scripts, Inc. | | | 29,900 | | | 1,495 | |
*IDEXX Laboratories, Inc. | | | 10,800 | | | 673 | |
*Integra LifeSciences Holdings Corporation | | | 27,840 | | | 813 | |
*Kensey Nash Corporation | | | 20,800 | | | 629 | |
*Kinetic Concepts, Inc. | | | 7,000 | | | 420 | |
*Kyphon, Inc. | | | 32,000 | | | 1,113 | |
*Medicines Company | | | 21,500 | | | 503 | |
*Patterson Companies, Inc. | | | 14,400 | | | 649 | |
*ResMed, Inc. | | | 15,400 | | | 1,016 | |
*Telik, Inc. | | | 37,300 | | | 607 | |
| | | | | |
|
|
|
| | | | | | | 8,696 | |
| | | | | |
|
|
|
Energy—4.4% | | | | | | | |
*Smith International, Inc. | | | 25,200 | | | 1,605 | |
XTO Energy Corporation | | | 21,700 | | | 738 | |
| | | | | |
|
|
|
| | | | | | | 2,343 | |
| | | | | |
|
|
|
Materials—2.1% | | | | | | | |
Airgas, Inc. | | | 45,100 | | | 1,113 | |
| | | | | |
|
|
|
Consumer Staples—1.3% | | | | | | | |
Estee Lauder Companies, Inc. | | | 18,600 | | | 728 | |
| | | | | |
|
|
|
Financials—1.2% | | | | | | | |
East West Bancorp, Inc. | | | 19,600 | | | 658 | |
| | | | | |
|
|
|
Total in Common Stock—95.9%
(Total cost $48,243) | | | 51,677 | |
| | | | | |
|
|
|
| | |
Investment in Afiliate—2.3% | | | | | | | |
William Blair Ready Reserves | | | 1,223,517 | | | 1,224 | |
| | | | | |
|
|
|
Total Investment in Affiliate
(cost $1,224) | | | 1,224 | |
| | | | | |
|
|
|
| | |
Short-Term Investments—2.7% | | | | | | | |
American Express Demand Note, VRN,
3.164%, due 4/1/05 | | $ | 1,468,000 | | | 1,468 | |
| | | | | |
|
|
|
Total Short-Term Investments
(cost $1,468) | | | 1,468 | |
| | | | | |
|
|
|
Total Investments—100.9%
(cost $50,935) | | | 54,369 | |
Liabilities, plus cash and other assets—(0.9)% | | | (488 | ) |
| | | | | |
|
|
|
Net assets—100% | | $ | 53,881 | |
| | | | | |
|
|
|
See accompanying Notes to Financial Statements.
June 30, 2005 | William Blair Funds 25 |

W. George Greig
INTERNATIONAL GROWTH FUND
The International Growth Fund invests primarily in common stocks of foreign growth companies.
AN OVERVIEW FROM THE PORTFOLIO MANAGER
How did the Fund perform over the first half of the year? How did the Fund’s performance compare to its benchmark?
The International Growth Fund posted a 1.49% gain (Class N Shares) for the six months ended June 30, 2005. By comparison, the Fund’s benchmark, the MSCI All Country World (Free) except US Index, rose 0.32%.
What were the most significant factors impacting international markets during the first six months of the year?
The largely flat return of international equity markets during the first six months of 2005 masked volatile monthly results. Emerging markets and small cap stocks were the strongest international equity market performers at the beginning of the year, extending their dominance from 2004. This trend reversed in March and April as inflation fears and concerns about the impact of high energy and commodity prices on global growth resulted in investors reducing their risk positions. After the mid period pause, markets rebounded in May and June, as sectors such as Telecommunication Services underperformed relative to Health Care, Energy and Information Technology. Materials also was a negative performer during the second quarter as concerns about excess supply and falling demand for commodities rippled through the market. Overall, emerging markets were the strongest region during the six month period, returning 6.26% during the period, while small cap stocks outpaced their larger cap counterparts, returning 4.39%. The Europe Australia and Far East Index fell 0.85% during same time period.
During the first six months of 2005, the US dollar appreciated versus most currencies, with the largest appreciation versus the Euro, where it appreciated approximately 10%. Despite this appreciation, international markets extended their gains over the US as the MSCI All Country World (Free) except US Index returned 0.32%, while the S&P 500 Index declined 0.81%.
What factors were behind the Fund’s performance versus the benchmark?
While the Fund slightly lagged the broad index benchmark during the first quarter, it outperformed both broad and growth benchmarks during the six month period, due to strong second quarter results as the market focused on fundamentals. Year to date relative performance was driven by strong stock selection across most regions and sectors, coupled with emerging markets and small cap exposures and stock selection. Somewhat mitigating this performance was stock selection in the Western Hemisphere, in addition to Information Technology and Consumer Discretionary exposures and a lower Energy weighting versus the Index.
What is your current outlook?
The shape of the global economic cycle is shifting. The modest deceleration in growth driven by higher oil prices and a downturn in China’s imports may be receding into the background as other cyclical forces begin to edge growth higher.
26 Semi-Annual Report | June 30, 2005 |
Evidence from a number of sources—including recent purchasing managers’ index releases, indications of temporary help demand, technology demand indicators (in Asia), and credit growth (in Europe)—suggest that the industrial economies may be poised to reaccelerate after a number of sluggish quarters.
On the other hand, rising short term interest rates, higher oil prices and the effects of housing inflation have not had the predicted negative effects on domestic demand, either in the US or elsewhere. Household spending in China and other emerging markets have remained strong, while strong employment and income growth in Japan have steadied the economy there in the face of slowing net exports.
A reacceleration in global growth after the 2004-05 slowdown could be reinforced by stronger investment spending backed by bulging corporate cash and profits, implying cyclical strength in technology and machinery as well as improving growth performance in previous laggards Europe and Japan.
What is your current strategy? How is the Fund positioned?
As of June 30, the Fund maintains its overweighting in emerging markets relative to the Index, and is now near a market weight in Europe ex-UK, largely through the addition of Health Care and Information Technology companies to the portfolio during the quarter. From a sector perspective, the portfolio maintains its largest relative weightings in Consumer Discretionary, Information Technology and Health Care, and has its smallest relative weightings in Energy, Materials, and Financials. These weightings are largely the result of the Advisor’s bottom up, fundamental quality growth discipline, which are also supported by the Advisor’s strategic viewpoint.
June 30, 2005 | William Blair Funds 27 |
International Growth Fund
Performance Highlights
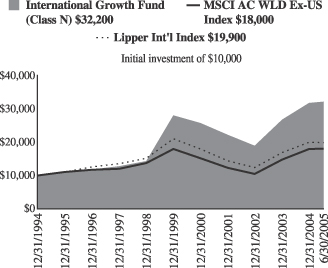
Average Annual Total Return at 6/30/2005
| | | | | | | | | | | | | | | | | |
| | | 1
Year
| | | 3
Year
| | | 5
Year
| | | 10
Year
| | | Since Inception(a)
| | | |
International Growth Fund Class N | | 16.80 | % | | 12.83 | % | | 2.43 | % | | 12.58 | % | | — | | | |
International Growth Fund Class I | | 17.04 | | | 13.12 | | | 2.69 | | | — | | | 9.26 | % | | |
MSCI All Country World Free
Ex-US Index | | 16.95 | | | 14.08 | | | 0.76 | | | 5.82 | | | 2.97 | | | |
Lipper International Index | | 13.45 | | | 11.16 | | | (0.19 | ) | | 6.87 | | | — | | | |
| | (a) | For the period from October 1, 1999 to June 30, 2005. |
Performance cited represents past performance. Past performance does not guarantee future results and current performance may be lower or higher than the data quoted. Results shown are average annual total returns, which assume reinvestment of dividends and capital gains. Investment returns and principal will fluctuate and you may have a gain or loss when you sell shares. For the most current month-end performance information, please call 1-800-742-7272, or visit our Web site at www.williamblairfunds.com. International investing involves special risk considerations, including currency fluctuations, lower liquidity, economic and political risk. Class N shares are available to the general public without a sales load. Class I shares are available to certain institutional investors and advisory clients of William Blair & Company, L.L.C., without a sales load or distribution (12b-1) or service fees.
The performance highlights and graph presented above do not reflect the deduction of taxes that a shareholder would pay on fund distributions or the redemption of fund shares.
The Morgan Stanley Capital International (MSCI) All Country World Free Ex-US Index is an unmanaged index that includes developed and emerging markets and reduced Japanese portion, making it more comparable to the International Growth Fund in terms of investment approach.
The Lipper International Index is a composite of international growth mutual funds.
This report identifies the Fund’s investments on June 30, 2005. These holdings are subject to change. Not all stocks in the Fund performed the same, nor is there any guarantee that these stocks will perform as well in the future. Market forecasts provided in this report may not necessarily come to pass.
Sector Diversification
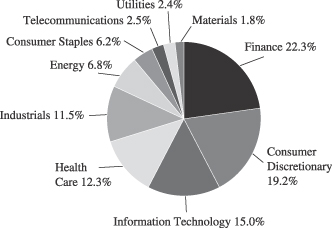
The sector diversification shown is based on the total investment portfolio.
28 Semi-Annual Report | June 30, 2005 |
International Growth Fund
Portfolio of Investments, June 30, 2005 (all dollar amounts in thousands) (unaudited)
| | | | | |
Issuer
| | Shares
| | Value
|
| | |
Common Stocks—Europe—36.6% | | | | | |
Austria—2.0% | | | | | |
Erste Bank Der Oester (Banking) | | 621,500 | | $ | 31,007 |
*Raiffeisen International Bank (Banking) | | 534,500 | | | 33,839 |
| | | | |
|
|
| | | | | | 64,846 |
| | | | |
|
|
Belgium—0.2% | | | | | |
Colruyt S.A.(Mass market distribution) | | 47,800 | | | 6,506 |
| | | | |
|
|
Finland—0.3% | | | | | |
Nokian Renkaat Oyj (Automotive) | | 561,000 | | | 10,214 |
| | | | |
|
|
France—10.5% | | | | | |
April Group S.A. (Insurance brokers) | | 231,643 | | | 7,196 |
BNP Paribas (Banking) | | 889,700 | | | 60,668 |
Essilor International (Health care supplies) | | 430,600 | | | 29,321 |
Hermes International SCA (Apparel and luxury goods) | | 159,500 | | | 32,094 |
*JC Decaux (Media) | | 1,467,660 | | | 37,071 |
Klepierre (Real estate) | | 102,500 | | | 9,744 |
*Nexity (Real estate management) | | 246,100 | | | 9,493 |
*Orpea (Hospital and nursing management) | | 403,853 | | | 17,897 |
Sanofi-Avenits (Pharmaceuticals) | | 998,500 | | | 81,643 |
Technip-Coflexip S.A. (Construction) | | 376,860 | | | 17,456 |
Vinci S.A.(Construction) | | 339,400 | | | 28,160 |
Zodiac S.A. (Aerospace and defense) | | 280,600 | | | 15,030 |
| | | | |
|
|
| | | | | | 345,773 |
| | | | |
|
|
Germany—7.8% | | | | | |
AWD Holdings AG (Financial services) | | 341,500 | | | 14,304 |
Bijou Brigitte (Fashon jewelry accessories) | | 47,422 | | | 8,530 |
Celesio AG (Pharmaceuticals) | | 393,780 | | | 30,845 |
Continental AG (Diversified manufacturing) | | 463,600 | | | 33,188 |
Did Deutscher Industrie Svc (Commercial services) | | 226,461 | | | 9,647 |
E.ON AG (Energy) | | 709,600 | | | 62,892 |
GFK AG (Commercial services) | | 250,948 | | | 9,876 |
Rational AG (Business equipment) | | 56,400 | | | 6,059 |
SAP AG (Software) | | 394,700 | | | 68,173 |
Stada Arzneimittel AG (Pharmaceuticals) | | 356,800 | | | 13,024 |
| | | | |
|
|
| | | | | | 256,538 |
| | | | |
|
|
Greece—1.8% | | | | | |
Coca-Cola Hellenic Bottling S.A. (Beverages) | | 456,671 | | | 12,364 |
EFG Eurobank (Banking) | | 638,400 | | | 19,608 |
National Bank of Greece (Banking) | | 795,420 | | | 26,911 |
| | | | |
|
|
| | | | | | 58,883 |
| | | | |
|
|
Ireland—1.9% | | | | | |
Anglo Irish Bank plc (Finance) | | 2,253,400 | | | 27,852 |
*Grafton Group plc (Wholesale distributors) | | 1,133,900 | | | 13,109 |
Kingspan Group plc (Construction) | | 1,144,000 | | | 13,427 |
United Drug plc (Pharmaceuticals) | | 1,778,300 | | | 7,624 |
| | | | |
|
|
| | | | | | 62,012 |
| | | | |
|
|
Italy—1.0% | | | | | |
Credito Emiliano SpA (Banking) | | 1,167,400 | | | 11,822 |
Hera SpA (Electric services) | | 4,468,176 | | | 12,421 |
Pirelli & C Real Estate SpA (Real estate development) | | 165,752 | | | 9,910 |
| | | | |
|
|
| | | | | | 34,153 |
| | | | |
|
|
| | | | | |
Issuer
| | Shares
| | Value
|
| |
Common Stocks—Europe—36.6%—(continued) | | | |
Netherlands—1.1% | | | | | |
*Axalto (Business equipment) | | 283,200 | | $ | 8,515 |
*Pyaterochka Holdings GDR (Food and retail) | | 859,200 | | | 12,372 |
*Tomtom NV (Computer software) | | 686,300 | | | 15,041 |
| | | | |
|
|
| | | | | | 35,928 |
| | | | |
|
|
Norway—1.1% | | | | | |
Statoil Asa (Oil and gas) | | 1,802,600 | | | 36,661 |
| | | | |
|
|
Spain—1.4% | | | | | |
Grupo Ferrovial S.A. (Industrial services) | | 283,500 | | | 18,212 |
*Industria De Textile (Retail trade) | | 1,043,000 | | | 26,758 |
| | | | |
|
|
| | | | | | 44,970 |
| | | | |
|
|
Sweden—1.3% | | | | | |
*Capio AB (Health care) | | 480,800 | | | 7,071 |
Clas Ohlson AB (Retail) | | 385,400 | | | 6,907 |
*Modern Times Group (Television) | | 53,000 | | | 1,619 |
Scania AB (Vehicles and equipment) | | 753,900 | | | 27,740 |
| | | | |
|
|
| | | | | | 43,337 |
| | | | |
|
|
Switzerland—6.2% | | | | | |
*Actelion (Biotechnology) | | 153,500 | | | 15,918 |
*Kudelski S.A. (Telecommunication equipment) | | 75,200 | | | 2,738 |
Nobel Biocare Holdings AG (Medical equipment and supplies) | | 75,350 | | | 15,238 |
Phonak Holdings AG (Hearing technology) | | 316,300 | | | 11,825 |
Roche Holdings AG (Health care) | | 782,600 | | | 98,600 |
UBS AG (Banking) | | 758,300 | | | 59,026 |
| | | | |
|
|
| | | | | | 203,345 |
| | | | |
|
|
| | |
United Kingdom—11.1% | | | | | |
BG Group plc (Industrial services) | | 8,912,500 | | | 73,143 |
*Burren Energy plc (Energy) | | 1,025,826 | | | 12,262 |
*Cairn Energy plc (Petroleum refining) | | 727,200 | | | 17,512 |
Capita Group plc (Commercial services) | | 4,527,480 | | | 29,757 |
Carnival plc (Hotels, restaurants and leisure activities) | | 711,860 | | | 40,346 |
Intertek Group (Diversified commercial services) | | 879,305 | | | 11,029 |
MAN Group plc (Finance) | | 513,800 | | | 13,270 |
*Michael Page International (Personnel services) | | 3,394,200 | | | 12,264 |
Next plc (Multiline retail) | | 738,400 | | | 19,893 |
Northgate (Vehicles and equipment) | | 551,600 | | | 8,959 |
Reckitt Benckiser plc (Household products) | | 1,017,700 | | | 29,883 |
Standard Chartered plc (Banking) | | 876,300 | | | 15,959 |
Tesco plc (Food retail) | | 12,167,300 | | | 69,290 |
Ultra Electronic Holdings plc (Electronic products) | | 778,000 | | | 11,195 |
| | | | |
|
|
| | | | | | 364,762 |
| | | | |
|
|
| | |
Canada—5.4% | | | | | |
*Alimentation Couche-Tard—Class “B” (Food retail) | | 662,100 | | | 10,094 |
Canadian National Railway Company (Railroads) | | 680,200 | | | 39,176 |
See accompanying Notes to Financial Statements.
June 30, 2005 | William Blair Funds 29 |
International Growth Fund
Portfolio of Investments, June 30, 2005 (all dollar amounts in thousands) (unaudited)
| | | | | |
Issuer
| | Shares
| | Value
|
| |
Common Stocks—Canada—5.4%—(continued) | | | |
Four Seasons Hotel, Inc. (Hotels) | | 462,600 | | $ | 30,503 |
Manulife Financial Corp. (Life and health insurance) | | 676,900 | | | 32,273 |
*Research in Motion Ltd. (Wireless telecommunication) | | 393,400 | | | 28,905 |
Ritchie Brothers Auctioneers, Inc. (Buisness services) | | 133,000 | | | 5,127 |
*Rona, Inc. (Building materials) | | 727,100 | | | 14,623 |
Shoppers Drug Mart Corp. (Retail trade) | | 490,700 | | | 16,994 |
| | | | |
|
|
| | | | | | 177,695 |
| | | | |
|
|
| | |
Japan—17.5% | | | | | |
Aeon Credit Service Co., Ltd. (Consumer finance) | | 272,200 | | | 16,996 |
Aeon Mall Co., Ltd. (Real estate) | | 436,400 | | | 15,307 |
Arnest One Corp. (Real estate) | | 372,900 | | | 8,924 |
Askul Corporation (Retail trade) | | 173,900 | | | 10,173 |
Canon, Inc. (Office electronics) | | 1,213,500 | | | 63,634 |
*Chiyoda Corp. (Construction) | | 1,704,600 | | | 21,031 |
Chugai Pharmaceutical Company (Pharamceuticals) | | 2,648,600 | | | 40,802 |
Honeys Company, Ltd. (Luxury goods) | | 118,500 | | | 3,713 |
Hoya Corporation (Electronic technology) | | 367,000 | | | 42,183 |
ITO EN, Ltd. (Beverages) | | 206,000 | | | 10,566 |
Keyence Corporation (Electronic technology) | | 98,660 | | | 22,004 |
Nakanishi Inc. (Medical specialties) | | 99,400 | | | 10,013 |
Neomax Co., Ltd. (Electronic equipment and instruments) | | 409,400 | | | 9,019 |
Nidec Corporation (Electronic technology) | | 255,000 | | | 26,892 |
Nitori Company Ltd. (Specialty stores) | | 165,260 | | | 11,831 |
Nitto Denko Corporation (Electronic technology) | | 409,800 | | | 23,360 |
NIWS Company, Ltd. (Computer integration) | | 4,300 | | | 5,637 |
Orix Corporation (Consumer finance) | | 315,900 | | | 47,191 |
Park 24 Co., Ltd. (Commercial services) | | 549,200 | | | 10,854 |
Point Inc. Ltd. (Apparel and footwear retail) | | 340,900 | | | 13,349 |
Ryohin Keikaku Co. Ltd. (Retail stores) | | 336,200 | | | 16,564 |
Sharp Corp. (Electronics) | | 5,286,700 | | | 82,299 |
Shimamura Company Ltd. (Retail stores) | | 149,900 | | | 12,627 |
*Shinsei Bank, Ltd. (Banking) | | 3,107,000 | | | 16,682 |
Sparks Asset Management Co. (Financial) | | 3,254 | | | 6,787 |
Sundrug Co., Ltd. (Drug stores) | | 235,900 | | | 9,277 |
Yamada Denki Company (Retail trade) | | 372,800 | | | 21,418 |
| | | | |
|
|
| | | | | | 579,133 |
| | | | |
|
|
| | |
Emerging Asia—8.0% | | | | | |
India—3.1% | | | | | |
Bharat Forge Ltd. (Machinery) | | 404,648 | | | 13,246 |
*Bharti Tele-Ventures (Wireless telecommunication services) | | 4,088,400 | | | 22,815 |
HDFC Bank (Banking) | | 1,240,400 | | | 17,970 |
Housing Development Finance Corp. (Financial services) | | 1,105,900 | | | 22,439 |
Infosys Technologies, Ltd. (Consulting and software services) | | 467,024 | | | 25,309 |
| | | | |
|
|
| | | | | | 101,779 |
| | | | |
|
|
| | | | | |
Issuer
| | Shares
| | Value
|
|
Common Stocks—Emerging Asia—8.0%—(continued) |
Indonesia—0.6% | | | | | |
*Bank Rakyat Indonesia (Banking) | | 35,399,500 | | $ | 10,500 |
Bank Danamon (Commercial banks) | | 15,989,500 | | | 8,265 |
| | | | |
|
|
| | | | | | 18,765 |
| | | | |
|
|
Malaysia—0.3% | | | | | |
*Airasia Bhd (Air transport) | | 22,532,200 | | | 9,709 |
Transmile Group Bhd (Airport development and maintence) | | 328,900 | | | 916 |
| | | | |
|
|
| | | | | | 10,625 |
| | | | |
|
|
South Korea—1.3% | | | | | |
Samsung Electronics Co. (Semiconductors) | | 93,600 | | | 44,350 |
| | | | |
|
|
Taiwan—2.7% | | | | | |
Hon Hai Precision Industry (Computers) | | 9,985,312 | | | 51,765 |
*Mediatek Inc. (Semiconductors and equipment) | | 2,845,000 | | | 24,571 |
Novatek Microelectronics (Semiconductors and equipment) | | 3,051,000 | | | 13,012 |
| | | | |
|
|
| | | | | | 89,348 |
| | | | |
|
|
| | |
Asia—7.8% | | | | | |
Australia—3.9% | | | | | |
BHP Billiton Ltd. (Diversified resources) | | 2,429,200 | | | 33,142 |
Billabong International Ltd. (Apparel and luxury goods) | | 2,097,700 | | | 21,664 |
Macquarie Bank, Ltd. (Financial services) | | 785,800 | | | 35,583 |
Sigma Company, Ltd. (Medical distributors) | | 1,960,633 | | | 13,766 |
Toll Holdings, Ltd. (Trucking) | | 2,341,800 | | | 23,195 |
| | | | |
|
|
| | | | | | 127,350 |
| | | | |
|
|
Hong Kong—3.0% | | | | | |
China Insurance International (Insurance) | | 20,893,438 | | | 7,703 |
Cnooc Ltd. (Oil and gas) | | 34,037,000 | | | 20,172 |
Esprit Holdings Ltd. (Apparel, footwear and retail) | | 3,268,000 | | | 23,566 |
*Foxconn International (Manufacturing services) | | 21,885,000 | | | 16,334 |
*Lifestyle International Holdings Ltd. (Specialty retail) | | 2,850,000 | | | 4,680 |
Techtronic Industries Co. (Consumer durables) | | 10,216,200 | | | 25,749 |
| | | | |
|
|
| | | | | | 98,204 |
| | | | |
|
|
Singapore—0.9% | | | | | |
Capitaland, Ltd. (Real estate operations) | | 17,308,000 | | | 24,395 |
Osim International Ltd. (Consumer sundries) | | 7,746,200 | | | 4,911 |
| | | | |
|
|
| | | | | | 29,306 |
| | | | |
|
|
| | |
Emerging Latin America—5.2% | | | | | |
Brazil—0.7% | | | | | |
Gol Linhas Aereas Int S.P—ADR (Air transport) | | 310,600 | | | 9,337 |
*Natura Cosmeticos S.A. (Cosmetics) | | 474,300 | | | 15,046 |
| | | | |
|
|
| | | | | | 24,383 |
| | | | |
|
|
See accompanying Notes to Financial Statements.
30 Semi-Annual Report | June 30, 2005 |
International Growth Fund
Portfolio of Investments, June 30, 2005 (all dollar amounts in thousands) (unaudited)
| | | | | |
Issuer
| | Shares
| | Value
|
|
Common Stocks—Emerging Latin America—5.2%—(continued) |
Chile—1.4% | | | | | |
Banco Santander SP—ADR (Banking) | | 448,200 | | $ | 14,477 |
Cencosud S.A.—ADR 144A (Retail stores) | | 695,330 | | | 17,487 |
Lan Chile S.A.—ADR (Airlines) | | 426,600 | | | 14,910 |
| | | | |
|
|
| | | | | | 46,874 |
| | | | |
|
|
Columbia—0.2% | | | | | |
Bancolombia S.A.—ADR (Commercial Banks) | | 497,400 | | | 7,953 |
| | | | |
|
|
Mexico—2.9% | | | | | |
America Movil S.A. (Communications) | | 8,178,600 | | | 24,378 |
*Consorcio Ara Sa De Cv (Construction) | | 2,013,300 | | | 6,954 |
*Corporacion Geo Sa De Cv (Real estate) | | 5,963,800 | | | 15,057 |
Grupo Aeroportuario—ADR (Transportation) | | 345,800 | | | 11,014 |
*Urbi Desarrollos Urbanos S.A.
(Household durables) | | 2,697,800 | | | 14,818 |
Walmart de Mexico (Retail trade) | | 6,015,300 | | | 24,432 |
| | | | |
|
|
| | | | | | 96,653 |
| | | | |
|
|
| |
Emerging Europe, Mid-East, Africa—3.1% | | | |
Egypt—1.1% | | | | | |
Orascom Contruction Industry (Construction) | | 649,241 | | | 18,416 |
*Orascom Telecommunication Holding GDR (Telecommunications) | | 367,200 | | | 18,466 |
| | | | |
|
|
| | | | | | 36,882 |
| | | | |
|
|
Hungary—0.6% | | | | | |
OTP Bank (Banking) | | 550,700 | | | 18,626 |
| | | | |
|
|
Romania—0.1% | | | | | |
Romanian Development Bank (Commercial banks) | | 3,036,500 | | | 4,538 |
| | | | |
|
|
South Africa—0.8% | | | | | |
Edgars Consolidated Stores (Apparel, footwear and retail) | | 315,763 | | | 13,707 |
*MTN Group Ltd. (Telecommunication services) | | 2,164,400 | | | 14,339 |
| | | | |
|
|
| | | | | | 28,046 |
| | | | |
|
|
Turkey—0.5% | | | | | |
*Turkiye Garanti Bankasi A.S. (Banking) | | 3,848,500 | | | 16,414 |
| | | | |
|
|
Total Common Stock— 94.7%
(cost $2,486,838) | | | 3,124,852 |
| | | | |
|
|
| | |
Preferred Stock | | | | | |
Brazil—2.1% | | | | | |
Banco Itau Holding (Banking) | | 158,810 | | | 29,409 |
Petroleo Brasileiro S.A. (Oil, gas drilling,
and exploration) | | 897,200 | | | 41,168 |
| | | | |
|
|
Total Preferred Stock—2.1%
(cost $55,493) | | | 70,577 |
| | | | |
|
|
| | |
Investment in Affiliate—0.6% | | | | | |
William Blair Ready Reserves Fund | | 20,000,318 | | | 20,000 |
| | | | |
|
|
Total Investments in Affiliate
(cost $20,000) | | | 20,000 |
| | | | |
|
|
| | | | | | |
Issuer
| | Principal
Amount
| | Value
|
| | |
Short-Term Investments—2.2% | | | | | | |
American Express Demand Note, VRN, 3.164% due 7/1/05 | | $ | 36,110,000 | | $ | 36,110 |
Prudential Funding Demand Note, VRN, 3.368% due 7/1/05 | | | 36,217,000 | | | 36,217 |
| | | | | |
|
|
Total Short-term Investments
(cost $72,327) | | | 72,327 |
| | | | | |
|
|
Total Investments—99.6%
(cost $2,634,658) | | | 3,287,756 |
Cash and other assets, less liabilities—0.4% | | | 12,844 |
| | | | | |
|
|
Net assets—100.0% | | $ | 3,300,600 |
| | | | | |
|
|
* Non-income producing securities
ADR = American Depository Receipt
GDR = Global Depository Receipt
VRN = Variable Rate Note
All securities, excluding those primarily traded on exchanges or markets that close before the close of regular trading on the New York Stock Exchange, are fair valued pursant to Valuation Procedures adopted by the Board of Trustees.
At June 30, 2005 the Fund’s Portfolio of Investments includes the following currency categories:
| | |
Euro | | 28.4% |
Japanese Yen | | 18.1% |
British Pound Sterling | | 11.4% |
Swiss Franc | | 6.4% |
Canadian Dollar | | 5.4% |
Australian Dollar | | 4.0% |
United States Dollar | | 3.5% |
Indian Rupee | | 3.2% |
Hong Kong Dollar | | 3.1% |
Taiwan Dollar | | 2.8% |
Mexico Nuevo Peso | | 2.7% |
Brazilian Real | | 2.7% |
South Korean Won | | 1.4% |
Swedish Krona | | 1.4% |
Norwegian Krone | | 1.2% |
All other currencies | | 4.3% |
| | |
|
| | | 100.0% |
| | |
|
See accompanying Notes to Financial Statements.
June 30, 2005 | William Blair Funds 31 |
W. George Greig
INTERNATIONAL EQUITY FUND
The International Equity Fund invests primarily in common stocks of companies included in the Morgan Stanley Capital International All Country World ex-U.S. Index.
AN OVERVIEW FROM THE PORTFOLIO MANAGER
How did the Fund perform during the first half of the year? How did the Fund’s performance compare to its benchmark?
The International Equity Fund posted a 1.15% decrease (Class N Shares) for the six months ended June 30, 2005. By comparison, the Fund’s benchmark, the MSCI All Country World (Free) except US Index, rose 0.32%.
What were the most significant factors impacting international markets during the first six months of the year?
The largely flat return of international equity markets during the first six months of 2005 masked volatile monthly results. Emerging markets and small cap stocks were the strongest international equity market performers at the beginning of the year, extending their dominance from 2004. This trend reversed in March and April as inflation fears and concerns about the impact of high energy and commodity prices on global growth resulted in investors reducing their risk positions. After the mid period pause, markets rebounded in May and June, as sectors such as Telecommunication Services underperformed relative to Health Care, Energy and Information Technology. Materials also was a negative performer during the second quarter as concerns about excess supply and falling demand for commodities rippled through the market. Overall, emerging markets were the strongest region during the six month period, returning 6.26% during the period, while small cap stocks outpaced their larger cap counterparts, returning 4.39%. The Europe, Australia and Far East Index fell 0.85% during same time period.
During the first six months of 2005, the US dollar appreciated versus most currencies, with the largest appreciation versus the Euro, where it appreciated approximately 10%. Despite this appreciation, international markets extended their gains over the US as the MSCI All Country World (Free) except US Index returned 0.32%, while the S&P 500 Index declined 0.81%.
What factors were behind the Fund’s performance versus the benchmark?
While the Fund significantly outperformed the broad and growth index benchmarks during the second quarter, it lagged the broad benchmark during the six month period, due to first quarter results. The Fund’s quality growth discipline, which manifested itself in the overweighted allocation in Information Technology and Consumer sectors at the expense of Materials and Energy during the first quarter, hampered results. Somewhat mitigating this performance was strong stock selection across sectors and regions during the second quarter, coupled with positive results from emerging markets exposure.
What is your current outlook?
The shape of the global economic cycle is shifting. The modest deceleration in growth driven by higher oil prices and a downturn in China’s imports may be receding into the background as other cyclical forces begin to edge growth higher.
32 Semi-Annual Report | June 30, 2005 |
Evidence from a number of sources—including recent purchasing managers’ index releases, indications of temporary help demand, technology demand indicators (in Asia), and credit growth (in Europe)—suggest that the industrial economies may be poised to reaccelerate after a number of sluggish quarters.
On the other hand, rising short term interest rates, higher oil prices and the effects of housing inflation have not had the predicted negative effects on domestic demand, either in the US or elsewhere. Household spending in China and other emerging markets has remained strong, while strong employment and income growth in Japan have steadied the economy there in the face of slowing net exports.
A reacceleration in global growth after the 2004-05 slowdown could be reinforced by stronger investment spending backed by bulging corporate cash and profits, implying cyclical strength in technology and machinery as well as improving growth performance in previous laggards Europe and Japan.
What is your current strategy? How is the Fund positioned?
As of June 30, the Fund maintains its overweighting in emerging markets relative to the Index, and is now overweighted in Europe ex-UK, largely through the addition of Health Care and Technology companies to the portfolio during the quarter. From a sector perspective, the portfolio maintains its largest relative weightings in Consumer Discretionary, Information Technology and Health Care, and has its smallest relative weightings in Materials, Telecommunication Services and Financials. These weightings are largely the result of the Advisor’s bottom up, fundamental quality growth discipline, which are also supported by the Advisor’s strategic viewpoint.
June 30, 2005 | William Blair Funds 33 |
International Equity Fund
Performance Highlights
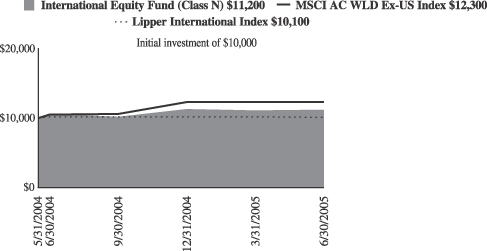
Average Annual Total Return at 6/30/2005
| | | | | | |
| | | 1
Year
| | | Since Inception(a)
| |
International Equity Fund
Class N | | 6.06 | % | | 10.73 | % |
International Equity Fund
Class I | | 6.53 | | | 11.18 | |
MSCI All Country World Free Ex-US | | 16.95 | | | 20.47 | |
Lipper International Index | | 13.45 | | | — | |
| | (a) | | For the period from May 24, 2004 to June 30, 2005. |
Performance cited represents past performance. Past performance does not guarantee future results and current performance may be lower or higher than the data quoted. Results shown are average annual returns, which assume reinvestment of dividends and capital gains. Investment returns and principal will fluctuate and you may have a gain or loss when you sell shares. For the most current month-end performance information, please call 1-800-742-7272, or visit our Web site at www.williamblairfunds.com. Class N shares are available to the general public without a sales load. Class I shares are available to certain institutional investors and advisory clients of William Blair & Company L.L.C. without a sales load or distribution (12b-1) or service fees.
The performance highlights and graph presented above do not reflect the deduction of taxes that a shareholder would pay on fund distributions or the redemption of fund shares.
The Morgan Stanley Capital International (MSCI) All Country World Free Ex-US Index is an unmanaged index that includes developed and emerging markets and reduced Japanese portion, making it more comparable to the International Growth Fund in terms of investment approach.
The Lipper International Index is a composite of international growth mutual funds.
This report identifies the Fund’s investments on June 30, 2005. These holdings are subject to change. Not all stocks in the Fund performed the same, nor is there any guarantee that these stocks will perform as well in the future. Market forecasts provided in this report may not necessarily come to pass.
Sector Diversification
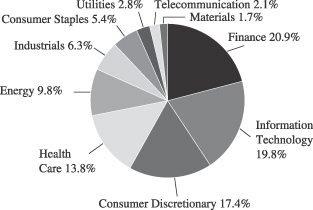
The sector diversification shown is based on the total investment portfolio.
34 Semi-Annual Report | June 30, 2005 |
International Equity Fund
Portfolio of Investments, June 30, 2005 (all dollar amounts in thousands) (unaudited)
| | | | | |
Issuer
| | Shares
| | Value
|
| | |
Common Stocks—Europe—38.5% | | | | | |
Austria—0.8% | | | | | |
Erste Bank Der Oester (Banking) | | 3,975 | | $ | 198 |
| | | | |
|
|
Finland—1.9% | | | | | |
Nokia, Inc. (Electronic technology) | | 26,000 | | | 432 |
| | | | |
|
|
France—10.2% | | | | | |
BNP Paribas (Banking) | | 8,200 | | | 559 |
Essilor International (Health care supplies) | | 2,800 | | | 191 |
Hermes International SCA (Apparel and luxury goods) | | 1,380 | | | 278 |
*JC Decaux (Media) | | 7,250 | | | 183 |
Sanofi-Aventis (Pharmaceuticals) | | 10,515 | | | 860 |
Vinci S.A. (Construction) | | 3,400 | | | 282 |
| | | | |
|
|
| | | | | | 2,353 |
| | | | |
|
|
Germany—9.3% | | | | | |
Celesio AG (Pharmaceuticals) | | 4,905 | | | 384 |
Continental AG (Diversified manufacturing) | | 5,275 | | | 378 |
E.ON AG (Energy) | | 6,680 | | | 592 |
SAP AG (Software) | | 4,600 | | | 794 |
| | | | |
|
|
| | | | | | 2,148 |
| | | | |
|
|
Greece—2.0% | | | | | |
Coca-Cola Hellenic Bottling S.A. (Beverages) | | 2,950 | | | 80 |
EFG Eurobank (Banking) | | 6,120 | | | 188 |
National Bank of Greece (Banking) | | 5,620 | | | 190 |
| | | | |
|
|
| | | | | | 458 |
| | | | |
|
|
Ireland—0.8% | | | | | |
Anglo Irish Bank plc (Finance) | | 15,160 | | | 187 |
| | | | |
|
|
Nethrelands—0.4% | | | | | |
*Qiagen, Inc. (Health care) | | 8,700 | | | 101 |
| | | | |
|
|
Norway—2.0% | | | | | |
Statoil ASA (Oil and gas) | | 22,500 | | | 458 |
| | | | |
|
|
Spain—1.7% | | | | | |
Grupo Ferrovial S.A. (Industrial services) | | 1,800 | | | 116 |
Industria De Textile (Retail trade) | | 10,900 | | | 280 |
| | | | |
|
|
| | | | | | 396 |
| | | | |
|
|
Sweden—0.6% | | | | | |
*Capio AB (Health care) | | 3,400 | | | 50 |
Scania AB (Electronic technology) | | 2,800 | | | 103 |
| | | | |
|
|
| | | | | | 153 |
| | | | |
|
|
Switzerland—8.8% | | | | | |
Nobel Biocare Holding AG (Medical equipment and supplies) | | 490 | | | 99 |
Roche Holdings AG (Health care) | | 7,120 | | | 897 |
SGS SA (Industrials) | | 200 | | | 137 |
Synthes, Inc. (Health care) | | 3,060 | | | 335 |
UBS AG (Banking) | | 7,155 | | | 557 |
| | | | |
|
|
| | | | | | 2,025 |
| | | | |
|
|
| | |
United Kingdom—11.5% | | | | | |
BG Group plc (Industrial services) | | 98,950 | | | 812 |
Capita Group plc (Commercial services) | | 36,600 | | | 241 |
Carnival plc (Hotels, restaurants and leisure activities) | | 6,640 | | | 376 |
MAN Group plc (Finance) | | 3,550 | | | 92 |
| | | | | |
Issuer
| | Shares
| | Value
|
|
Common Stocks—United Kingdom—11.5%—(continued) |
Next plc (Multiline retail) | | 6,880 | | $ | 185 |
Reckitt Benckiser plc (Household products) | | 11,300 | | | 332 |
SAB Miller (Beverages) | | 800 | | | 12 |
Tesco plc (Food retailer) | | 105,200 | | | 599 |
| | | | |
|
|
| | | | | | 2,649 |
| | | | |
|
|
| | |
Japan—15.2% | | | | | |
Askul Corporation (Retail trade) | | 1,200 | | | 70 |
Canon, Inc. (Office electronics) | | 12,800 | | | 671 |
*Chiyoda Corporation (Construction ) | | 11,000 | | | 136 |
Denso Corporation (Auto parts manufacturing) | | 16,000 | | | 363 |
Hoya Corporation (Electronic technology) | | 2,400 | | | 276 |
Keyence Corporation (Electronic technology) | | 900 | | | 201 |
Nidec Corporation (Electronic technology) | | 1,600 | | | 169 |
Nitto Denko Corporation (Electronic technology) | | 2,700 | | | 154 |
Orix Corporation (Consumer finance) | | 3,200 | | | 478 |
Sharp Corporation (Electronics) | | 42,400 | | | 660 |
*Shinsei Bank, Ltd. (Banking) | | 34,500 | | | 185 |
Yamada Denki Co. Ltd. (Retail trade) | | 2,700 | | | 155 |
| | | | |
|
|
| | | | | | 3,518 |
| | | | |
|
|
| | |
Canada—4.1% | | | | | |
Canadian National Railway Co. (Railroads) | | 4,400 | | | 254 |
Manulife Financial Corporation (Life and health insurance) | | 9,800 | | | 467 |
*Research in Motion Ltd. (Wireless telecommunication) | | 1,550 | | | 114 |
Shoppers Drug Mart Corporation (Retail trade) | | 3,100 | | | 107 |
| | | | |
|
|
| | | | | | 942 |
| | | | |
|
|
| | |
Asia—6.6% | | | | | |
Australia—3.8% | | | | | |
BHP Billiton Ltd. (Diversified resources) | | 15,300 | | | 209 |
Macquarie Bank, Ltd. (Financial services) | | 11,200 | | | 507 |
Toll Holdings, Ltd. (Trucking) | | 16,400 | | | 162 |
| | | | |
|
|
| | | | | | 878 |
| | | | |
|
|
Hong Kong—2.8% | | | | | |
Cnooc Ltd. (Oil and gas) | | 226,300 | | | 134 |
Esprit Holdings Ltd. (Apparel, footwear and retail) | | 34,000 | | | 245 |
Techtronic Industries Co. (Consumer durables) | | 106,300 | | | 268 |
| | | | |
|
|
| | | | | | 647 |
| | | | |
|
|
| | |
Emerging Asia—8.2% | | | | | |
India—2.8% | | | | | |
*Bharti Tele-Ventures (Wireless telecommunication services) | | 41,000 | | | 229 |
HDFC Bank (Banking) | | 8,950 | | | 129 |
Infosys Technologies Ltd. (Consulting and software services) | | 5,180 | | | 281 |
| | | | |
|
|
| | | | | | 639 |
| | | | |
|
|
South Korea—2.1% | | | | | |
*Kookmin Bank (Banking) | | 2,500 | | | 113 |
Samsung Electronics Co. (Semiconductors) | | 770 | | | 365 |
| | | | |
|
|
| | | | | | 478 |
| | | | |
|
|
See accompanying Notes to Financial Statements.
June 30, 2005 | William Blair Funds 35 |
International Equity Fund
Portfolio of Investments, June 30, 2005 (all dollar amounts in thousands) (unaudited)
| | | | | | |
Issuer
| | Shares or
Principal
Amount
| | Value
|
|
Common Stocks—Emerging Asia—8.2%—(continued) |
Taiwan—3.3% | | | | | | |
Hon Hai Precision Industry Corp. (Computers) | | | 90,000 | | $ | 467 |
*Mediatek, Inc. (Electronic technology) | | | 35,000 | | | 302 |
| | | | | |
|
|
| | | | | | | 769 |
| | | | | |
|
|
| | |
Emerging Latin America—1.8% | | | | | | |
Mexico—1.8% | | | | | | |
America Movil S.A. (Communications) | | | 70,900 | | | 211 |
Walmart de Mexico (Retail trade) | | | 52,900 | | | 215 |
| | | | | |
|
|
| | | | | | | 426 |
| | | | | |
|
|
| |
Emerging Europe, Mid-East, Africa—2.6% | | | |
Hungary—0.7% | | | | | | |
OTP Bank (Banking) | | | 5,010 | | | 169 |
| | | | | |
|
|
South Africa—1.9% | | | | | | |
Sasol ASA (Energy) | | | 8,499 | | | 230 |
Standard Bank Group Ltd. (Banking) | | | 20,763 | | | 201 |
| | | | | |
|
|
| | | | | | | 431 |
| | | | | |
|
|
Total Common Stock—88.5%
(cost $19,846) | | | 20,455 |
| | | | | |
|
|
| | |
Preferred Stocks | | | | | | |
Brazil—2.7% | | | | | | |
Banco Itau SA (Banking) | | | 1,000 | | | 185 |
Petroleo Brasileiro S.A. (Oil, gas drilling,
and exploration) | | | 9,300 | | | 427 |
| | | | | |
|
|
Total Preferred Stocks—2.7%
(cost $536) | | | 612 |
| | | | | |
|
|
| | |
Investment in Affiliate—3.0% | | | | | | |
William Blair Ready Reserves Fund | | | 689,496 | | | 689 |
| | | | | |
|
|
Total Investment in Affiliate
(cost $689) | | | 689 |
| | | | | |
|
|
| | |
Short-Term Investments—5.6% | | | | | | |
American Express Demand Note, VRN,
3.164%, due 7/1/05 | | $ | 739,000 | | | 739 |
Prudential Funding Demand Note, VRN, 3.368%, due 7/1/05 | | | 563,000 | | | 563 |
| | | | | |
|
|
Total Short-term Investments
(cost $1,302) | | | 1,302 |
| | | | | |
|
|
Total Investments—99.8%
(cost $22,373) | | | 23,058 |
Cash plus other assets, less liabilities—0.2% | | | 46 |
| | | | | |
|
|
Net assets—100.0% | | $ | 23,104 |
| | | | | |
|
|
*Non-income producing securities
VRN = Variable Rate Note
All securities, excluding those primarily traded on exchanges or markets that close before the close of regular trading on the New York Stock Exchange, are fair valued pursuant to Valuation Procedures adopted by the Board of Trustees.
At June 30, 2005 the Fund’s Portfolio of Investments includes the following currency categories:
| | |
Euro | | 29.8% |
Japanese Yen | | 16.7% |
British Pound Sterling | | 12.6% |
Swiss Franc | | 9.6% |
Canadian Dollar | | 4.5% |
Australian Dollar | | 4.2% |
Taiwan Dollar | | 3.7% |
Hong Kong Dollar | | 3.0% |
Indian Rupee | | 3.0% |
Brazilian Real | | 2.9% |
South Korean Won | | 2.3% |
Norwegian Krone | | 2.2% |
Mexico Nuevo Peso | | 2.0% |
South African Rand | | 2.0% |
Hungarian Forint | | 0.8% |
Swedish Krona | | 0.7% |
| | |
|
| | | 100.0% |
| | |
|
See accompanying Notes to Financial Statements.
36 Semi-Annual Report | June 30, 2005 |

Jeffrey A. Urbina
W. George Greig

Todd M. McClone
EMERGING MARKETS GROWTH FUND
The Emerging Markets Growth Fund primarily invests in a diversified portfolio of equity securities issued by growth companies in emerging economies worldwide.
AN OVERVIEW FROM THE PORTFOLIO MANAGERS
We are pleased to have the Emerging Markets Growth Fund become the newest addition to the William Blair Fund Family and would like to thank our shareholders for investing with us.
The Emerging Markets Growth Fund commenced operations on June 6, 2005. Through the period ended June 30, 2005, the Fund posted a gain of 2.60%, ahead of the 2.09% return of the Fund’s benchmark, the MSCI Emerging Markets Index, for this short time period.
We are enthusiastic about opportunities available to us as portfolio managers of the Emerging Markets Growth Fund. The Fund primarily invests in large, mid and small companies located in emerging markets countries.
Our investment process seeks to find high quality growth companies for the Emerging Markets Growth Fund’s investment portfolio. These are companies that historically have exhibited superior growth, profitability and quality relative to local markets and companies within the same industry worldwide, and are expected to continue such performance. Such companies generally will exhibit superior business fundamentals, including leadership in their field, quality products or services, distinctive marketing and distribution, pricing flexibility and revenue from products or services consumed on a steady, recurring basis. We focus on companies with above-average returns on equity, strong balance sheets and consistent, above-average earnings growth.
International Outlook
The shape of the global economic cycle is shifting. The modest deceleration in growth driven by higher oil prices and a downturn in China’s imports may be receding into the background as other cyclical forces begin to edge growth higher.
Evidence from a number of sources—including recent purchasing managers’ index releases, indications of temporary help demand, technology demand indicators (in Asia), and credit growth (in Europe)—suggest that the industrial economies may be poised to reaccelerate after a number of sluggish quarters.
On the other hand, rising short term interest rates, higher oil prices and the effects of housing inflation have not had the predicted negative effects on domestic demand, either in the US or elsewhere. Household spending in China and other emerging markets have remained strong, while strong employment and income growth in Japan have steadied the economy there in the face of slowing net exports.
A reacceleration in global growth after the 2004-05 slowdown could be reinforced by stronger investment spending backed by bulging corporate cash and profits, implying cyclical strength in technology and machinery as well as improving growth performance in previous laggards Europe and Japan.
June 30, 2005 | William Blair Funds 37 |
Emerging Markets Growth Fund
Performance Highlights
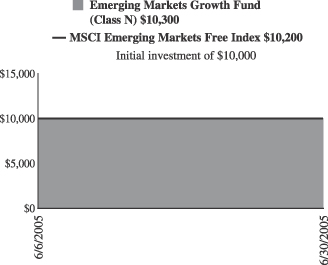
Average Annual Total Return at 6/30/2005
| | | |
| | | Since Inception(a)
| |
Emerging Markets Growth Fund
Class N | | 2.60 | % |
Emerging Markets Growth Fund
Class I | | 2.60 | |
MSCI Emerging Markets Free Index | | 2.09 | |
| | (a) | | For the period from June 6, 2005 (Commencement of Operations) to June 30, 2005. | |
Performance cited represents past performance. Past performance does not guarantee future results and current performance may be lower or higher than the data quoted. Results shown are average annual returns, which assume reinvestment of dividends and capital gains. Investment returns and principal will fluctuate and you may have a gain or loss when you sell shares. For the most current month-end performance information, please call 1-800-742-7272, or visit our Web site at www.williamblairfunds.com. Class N shares are available to the general public without a sales load. Class I shares are available to certain institutional investors and advisory clients of William Blair & Company L.L.C. without a sales load or distribution (12b-1) fees. International investing involves special risk considerations, including currency fluctuations, lower liquidity, economic and political risk.
The performance highlights and graph presented above do not reflect the deduction of taxes that a shareholder would pay on fund distributions or the redemption of fund shares.
The Morgan Stanley Capital International (MSCI) Emerging Markets Free Index is an index that is designated to measure equity performance in the global emerging markets.
This report identifies the Fund’s investments on June 30, 2005. These holdings are subject to change. Not all stocks in the Fund performed the same, nor is there any guarantee that these stocks will perform as well in the future. Market forecasts provided in this report may not necessarily come to pass.
Sector Diversification
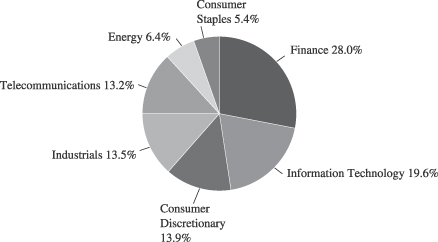
The sector diversification shown is based on the total investment portfolio.
38 Semi-Annual Report | June 30, 2005 |
Emerging Markets Growth Fund
Portfolio of Investments, June 30, 2005 (all dollar amounts in thousands) (unaudited)
| | | | | |
Issuer
| | Shares
| | Value
|
| | |
Common Stocks—Emerging Asia—36.0% | | | | | |
India—14.7% | | | | | |
Bharat Forge Ltd. (Machinery) | | 7,150 | | $ | 238 |
*Bharti Tele-Ventures (Wireless telecommunication services) | | 79,600 | | | 444 |
HDFC Bank (Banking) | | 27,060 | | | 392 |
Housing Development Finance Corp. (Financial services) | | 12,300 | | | 250 |
Infosys Technologies, Ltd. (Consulting and software services) | | 9,050 | | | 491 |
| | | | |
|
|
| | | | | | 1,815 |
| | | | |
|
|
Indonesia—1.9% | | | | | |
*Bank Rakyat Indonesia (Banking) | | 807,000 | | | 239 |
| | | | |
|
|
Malaysia—1.9% | | | | | |
*Airasia Bhd (Air transport) | | 278,700 | | | 120 |
Transmile Group Bhd (Airport development and maintenance) | | 42,800 | | | 119 |
| | | | |
|
|
| | | | | | 239 |
| | | | |
|
|
South Korea—8.9% | | | | | |
Hana Tour Service (Travel service) | | 4,700 | | | 117 |
*Kookmin Bank (Banking) | | 5,100 | | | 230 |
Samsung Electronics Co. (Semiconductors) | | 1,000 | | | 474 |
*Yedang Entertainment (Music entertainment company) | | 17,550 | | | 280 |
| | | | |
|
|
| | | | | | 1,101 |
| | | | |
|
|
Taiwan—7.6% | | | | | |
Hon Hai Precision Industry (Computers) | | 89,000 | | | 461 |
*Mediatek Inc. (Semiconductors and equipment) | | 41,000 | | | 354 |
Novatek Microelectronics (Semiconductors and equipment) | | 29,000 | | | 124 |
| | | | |
|
|
| | | | | | 939 |
| | | | |
|
|
Thailand—1.0% | | | | | |
Aapico Hitech (Auto and truck parts) | | 148,000 | | | 120 |
| | | | |
|
|
| | |
Emerging Latin America—26.2% | | | | | |
Brazil—6.1% | | | | | |
Gol Linhas Aereas Int S.P—ADR (Air transport) | | 12,500 | | | 376 |
*Natura Cosmeticos S.A. (Cosmetics) | | 11,800 | | | 374 |
| | | | |
|
|
| | | | | | 750 |
| | | | |
|
|
Chile—6.3% | | | | | |
Banco Santander SP—ADR (Banking) | | 9,100 | | | 294 |
Cencosud S.A.—ADR 144A (Retail stores) | | 9,500 | | | 239 |
Lan Chile S.A.—ADR (Airlines) | | 6,900 | | | 241 |
| | | | |
|
|
| | | | | | 774 |
| | | | |
|
|
Columbia—2.0% | | | | | |
Bancolombia S.A.—ADR (Commercial banks) | | 15,200 | | | 243 |
| | | | |
|
|
Mexico—11.8% | | | | | |
America Movil S.A. (Communications) | | 123,000 | | | 367 |
*Corporacion Geo Sa De Cv (Real estate) | | 99,000 | | | 250 |
Grupo Aeroportuario—ADR (Transportation) | | 3,800 | | | 121 |
*Urbi Desarrollos Urbanos S.A. (Household durables) | | 44,000 | | | 242 |
Walmart de Mexico (Retail trade) | | 119,000 | | | 483 |
| | | | |
|
|
| | | | | | 1,463 |
| | | | |
|
|
* Non-income producing securities
ADR = American Depository Receipt
GDR = Global Depository Receipt
VRN = Variable Rate Note
| | | | | | | |
Issuer
| | Shares or
Principal
Amount
| | Value
| |
|
Common Stocks—Emerging Europe, Mid-East, Africa—21.1% | |
Egypt—4.9% | | | | | | | |
Orascom Contruction Industry GDR (Construction) | | | 4,300 | | $ | 245 | |
*Orascom Telecommunication Holding GDR (Telecommunications) | | | 7,200 | | | 362 | |
| | | | | |
|
|
|
| | | | | | | 607 | |
| | | | | |
|
|
|
*Hungary—2.6% | | | | | | | |
OTP Bank (Banking) | | | 9,300 | | | 315 | |
| | | | | |
|
|
|
South Africa—10.7% | | | | | | | |
African Bank Investments (Banking) | | | 43,650 | | | 122 | |
Edgars Consolidated Stores (Apparel, footwear and retail) | | | 5,600 | | | 243 | |
*MTN Group Ltd. (Telecommunication services) | | | 55,000 | | | 364 | |
Sasol Ltd. (Oil Company) | | | 13,900 | | | 376 | |
Standard Bank Group Ltd. (Bankings) | | | 22,000 | | | 213 | |
| | | | | |
|
|
|
| | | | | | | 1,318 | |
| | | | | |
|
|
|
Turkey—2.9% | | | | | | | |
*Turkiye Garanti Bankasi A.S. (Banking) | | | 85,000 | | | 363 | |
| | | | | |
|
|
|
| | |
Asia—3.1% | | | | | | | |
Hong Kong—3.1% | | | | | | | |
*Foxconn International (Manufacturing services) | | | 515,000 | | | 384 | |
| | | | | |
|
|
|
| | |
Europe—2.0% | | | | | | | |
Netherlands—2.0% | | | | | | | |
*Pyaterochka Holdings GDR (Food and retail) | | | 17,300 | | | 249 | |
| | | | | |
|
|
|
Total Common Stock—88.4%
(cost $10,645) | | | | | | 10,919 | |
| | | | | |
|
|
|
| | |
Preferred Stock | | | | | | | |
Brazil—5.8% | | | | | | | |
Banco Itau Holding (Banking) | | | 1,900 | | | 352 | |
Petroleo Brasileiro S.A. (Oil, gas drilling,
and exploration) | | | 8,100 | | | 372 | |
| | | | | |
|
|
|
Total Preferred Stock—5.8%
(cost $715) | | | | | | 724 | |
| | | | | |
|
|
|
| | |
Investment in Affiliate—2.1% | | | | | | | |
William Blair Ready Reserves Fund | | | 258,115 | | | 258 | |
| | | | | |
|
|
|
Total Investments in Affiliate
(cost $258) | | | | | | 258 | |
| | | | | |
|
|
|
| | |
Short-Term Investments—7.8% | | | | | | | |
American Express Demand Note, VRN,
3.164% due 7/1/05 | | $ | 491,000 | | | 491 | |
Prudential Funding Demand Note, VRN, 3.368% due 7/1/05 | | | 469,000 | | | 469 | |
| | | | | |
|
|
|
Total Short-term Investments
(cost $960) | | | 960 | |
| | | | | |
|
|
|
Total Investments—104.1%
(cost $12,578) | | | 12,861 | |
| | | | | |
|
|
|
Liabilities, plus cash and other assets—(4.1)% | | | (505 | ) |
| | | | | |
|
|
|
Net assets—100.0% | | $ | 12,356 | |
| | | | | |
|
|
|
See accompanying Notes to Financial Statements.
June 30, 2005 | William Blair Funds 39 |
Emerging Markets Growth Fund
Portfolio of Investments, June 30, 2005 (all dollar amounts in thousands) (unaudited)
All securities, excluding those primarily traded on exchanges or markets that close before the close of regular trading on the New York Stock Exchange, are fair valued pursant to Valuation Procedures adopted by the Board of Trustees.
At June 30, 2005 the Fund’s Portfolio of Investments includes the following currency categories:
| | |
United States Dollar | | 20.4% |
Indian Rupee | | 15.6% |
Mexico Nuevo Peso | | 11.5% |
South African Rand | | 11.3% |
South Korean Won | | 9.4% |
Brazilian Real | | 9.4% |
Taiwan Dollar | | 8.1% |
Hong Kong Dollar | | 3.3% |
Turkish Lira | | 3.1% |
Hungarian Forint | | 2.7% |
Indonesian Rupiah | | 2.1% |
Malaysian Ringgit | | 2.1% |
Thai Baht | | 1.0% |
| | |
|
| | | 100.0% |
| | |
|
See accompanying Notes to Financial Statements.
40 Semi-Annual Report | June 30, 2005 |

David S. Mitchell

Mark T. Leslie
VALUE DISCOVERY FUND
The Value Discovery Fund invests in the equity securities of small companies that we believe offer a long-term investment value seeking to identify undervalued companies with sound business fundamentals—”broken stocks not broken companies.”
PORTFOLIO MANAGER ADDITION
Mark T. Leslie, CFA, joined the firm on July 25, 2005 as Co-Manager of the William Blair Value Discovery Team and separately managed small-cap value accounts. Mark Leslie joins David S. Mitchell, CFA, who has been a Portfolio Manager of Value Discovery Fund since 1996.
A 15-year veteran of the investment industry, Mark has a broad range of experience in the small- and mid-capitalization value equity portfolio management and buy-side research with US Bancorp Asset Management and sell-side research with Dain Bosworth, Inc. (now RBC Capital Markets), prior to joining William Blair & Company.
Mark received his BS from the Whittemore School of Business and Economics at the University of New Hampshire, Durham.
AN OVERVIEW FROM THE PORTFOLIO MANAGER
How did the Fund perform over the first half of the year? How did the Fund’s performance compare to its benchmark?
The Value Discovery Fund posted a 4.67% decrease on a total return basis (Class N shares) during the six months ended June 30, 2005. By comparison, the Russell 2000® Value Index, gained 0.90%, while the Russell 2000® Index declined 1.25%.
What were the most significant factors impacting Fund performance? What factors were behind the Fund’s performance versus the benchmark?
After being the largest contributor to performance during the first quarter, the Financial Services sector was the largest detractor from performance during the second quarter. Conversely, following a tough first quarter, the Producer Durables sector posted solid gains during the second quarter. Additionally, the Consumer Discretionary sector showed signs of improvement.
Generally speaking, Technology stocks have underperformed since their strong showing in 2003. Within the sector, communication-related stocks detracted from both the benchmark and the Fund during the first half of the year.
What were among the best performing sectors for the Fund? Were there any investment themes that produced the best results?
High energy prices drove the Energy sector to lead performance in both the Fund and the benchmark. Good stock selection within the Energy sector contributed to Fund performance during the year to date period as evidenced by Forest Oil Corporation (an oil and gas company) which was the largest single contributor to performance during the first half of the year.
June 30, 2005 | William Blair Funds 41 |
The Consumer Discretionary sector was the second best contributor year to date. Restoration Hardware, Inc., a retailer of home furnishings and decorative products, was the Fund’s top performer in the Consumer Discretionary sector. Restoration Hardware’s stock price advanced as investors gained confidence in the new management team’s ability to execute their business strategy. The shares of Nautilus Group, Inc., a designer and manufacturer of fitness products, were boosted by strong sales, new product development, and continued progress in the retail distribution channel.
What were among the weakest performing sectors for the Fund? Were there any investments that did not measure up to your expectations?
The Technology sector was the most significant detractor from performance during the first six months of 2005. Carrier Access Corporation, a manufacturer of broadband access equipment, was the biggest disappointment turning out weak results due to delays in capital spending within the communications segment of the sector. Borland Software Corporation, a provider of software deployment solutions designed to accelerate the application development lifecycle, missed earnings due to weaker than expected revenues in Europe. Overland Storage, Inc., a provider of data backup and recovery solutions, also detracted from performance citing weak demand for tape backup solutions and increasing competitive pricing pressure.
The Health Care sector also detracted from performance during the first half of the year most of which occurred during the first quarter. Albany Molecular Research and Discovery Partners, both are providers of outsourcing and research solutions to the pharmaceutical industry, posted disappointing results driven by weaker than expected demand and higher than expected costs. Both stocks were sold during the first quarter.
What is your current strategy? How is the Fund positioned?
We remain true to our philosophy and investment discipline. We appreciate your confidence in us and thank you for investing in the Fund.
42 Semi-Annual Report | June 30, 2005 |
Value Discovery Fund
Performance Highlights
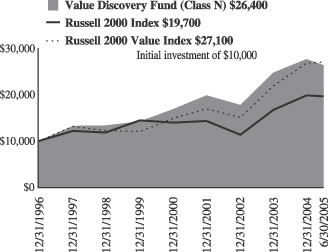
Average Annual Total Return at 6/30/2005
| | | | | | | | | | | | |
| | | 1
Year
| | | 3
Year
| | | 5
Year
| | | Since
Inception
| |
Value Discovery Fund Class N | | 1.49 | % | | 5.81 | % | | 10.65 | % | | 12.03 | %(a) |
Value Discovery Fund Class I | | 1.62 | | | 5.98 | | | 10.91 | | | 13.62 | (b) |
Russell 2000® Index | | 9.45 | | | 12.81 | | | 5.71 | | | 8.44 | (a) |
| | | | | | | | | | | | 8.61 | (b) |
Russell 2000® Value Index | | 14.39 | | | 14.15 | | | 16.12 | | | 12.60 | (a) |
| | | | | | | | | | | | 15.26 | (b) |
| | (a) | | For the period from December 23, 1996 (Commencement of the Class) to June 30, 2005. | |
| | (b) | | For the period from October 1, 1999 (Commencement of the Class) to June 30, 2005. | |
Performance cited represents past performance. Past performance does not guarantee future results and current performance may be lower or higher than the data quoted. Results shown are average annual total returns, which assume reinvestment of dividends and capital gains. Investment returns and principal will fluctuate and you may have a gain or loss when you sell shares. For the most current month-end performance information, please call 1-800-742-7272, or visit our Web site at www.williamblairfunds.com. Investing in smaller companies involves special risks, including higher volatility and lower liquidity. From time to time, the investment adviser may waive fees or reimburse expenses for the Fund. Without these waivers, performance would be lower. Class N shares are available to the general public without a sales load. Class I shares are available to certain institutional investors and advisory clients of William Blair & Company, L.L.C., without a sales load or distribution (12b-1) or service fees.
The performance highlights and graph presented above do not reflect the deduction of taxes that a shareholder would pay on fund distributions or the redemption of fund shares.
The Russell 2000® Index is the Fund’s primary benchmark. The Russell 2000® Index is unmanaged composite of the smallest 2000 stocks of the Russell 3000 Index.
The Russell 2000® Value Index consists of small-capitalization companies with below average price-to-book ratios and forecasted growth rates.
This report identifies the Fund’s investments on June 30, 2005. These holdings are subject to change. Not all stocks in the Fund performed the same, nor is there any guarantee that these stocks will perform as well in the future. Market forecasts provided in this report may not necessarily come to pass.
Sector Diversification
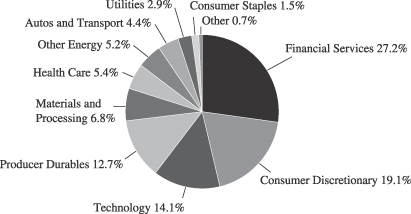
The sector diversification shown is based on the total investment portfolio.
June 30, 2005 | William Blair Funds 43 |
Value Discovery Fund
Portfolio of Investments, June 30, 2005 (all dollar amounts in thousands) (unaudited)
| | | | | |
Issuer
| | Shares
| | Value
|
| | |
Common Stocks | | | | | |
Financial Services—30.3% | | | | | |
*AmericanWest Bancorporation | | 88,895 | | $ | 1,773 |
AmerUs Group, Class “A” | | 62,925 | | | 3,024 |
Astoria Financial Corporation | | 71,390 | | | 2,032 |
Donegal Group, Inc., Class “A” | | 103,651 | | | 2,069 |
Equity Inns, Inc. | | 204,409 | | | 2,719 |
Flagstar Bancorp, Inc. | | 245,438 | | | 4,646 |
*Franklin Bank Corporation | | 151,760 | | | 2,847 |
*Jones Lang LaSalle, Inc | | 47,700 | | | 2,110 |
*KMG America Coporation | | 230,345 | | | 2,290 |
*Meadowbrook Insurance Group, Inc. | | 402,820 | | | 2,111 |
National Financial Partners Corporation | | 52,070 | | | 2,038 |
Ryder System, Inc. | | 52,265 | | | 1,913 |
*Seabright Insurance Holdings, Inc. | | 191,470 | | | 2,188 |
*United Rentals, Inc. | | 139,675 | | | 2,823 |
Winston Hotels, Inc. | | 186,905 | | | 2,104 |
| | | | |
|
|
| | | | | | 36,687 |
| | | | |
|
|
Consumer Discretionary—21.3% | | | | | |
*BJ’s Wholesale Club, Inc. | | 110,025 | | | 3,575 |
*Casual Male Retail Group, Inc. | | 340,600 | | | 2,490 |
*Coinstar, Inc. | | 114,870 | | | 2,606 |
*Elizabeth Arden, Inc. | | 223,145 | | | 5,219 |
*K2, Inc. | | 162,285 | | | 2,058 |
Nautilus Group, Inc. | | 72,865 | | | 2,077 |
*Navigant International, Inc. | | 152,515 | | | 2,241 |
*Restoration Hardware, Inc. | | 409,444 | | | 3,349 |
*Teletech Holdings, Inc. | | 269,600 | | | 2,197 |
| | | | |
|
|
| | | | | | 25,812 |
| | | | |
|
|
Producer Durables—14.1% | | | | | |
*Artesyn Technologies, Inc. | | 378,974 | | | 3,297 |
*Belden, Inc. | | 142,584 | | | 3,023 |
General Cable Corporation | | 332,845 | | | 4,936 |
*LTX Corporation | | 533,575 | | | 2,646 |
*Spatialight, Inc. | | 564,667 | | | 3,202 |
| | | | |
|
|
| | | | | | 17,104 |
| | | | |
|
|
Technology—15.7% | | | | | |
*Anixter International, Inc. | | 92,675 | | | 3,445 |
*Borland Software Corporation | | 453,660 | | | 3,112 |
*Carrier Access Corporation | | 532,770 | | | 2,568 |
*Overland Storage, Inc. | | 159,835 | | | 1,525 |
*Plexus Corporation | | 146,300 | | | 2,082 |
*SPSS, Inc. | | 165,326 | | | 3,176 |
*Tier Technologies, Inc., Class “B” | | 364,587 | | | 3,073 |
| | | | |
|
|
| | | | | | 18,981 |
| | | | |
|
|
Materials and Processing—7.6% | | | | | |
Jacuzzi Brands, Inc. | | 222,348 | | | 2,386 |
Polyone Corporation | | 457,485 | | | 3,028 |
Spartech Corporation | | 105,415 | | | 1,876 |
Watsco, Inc. | | 43,865 | | | 1,869 |
| | | | |
|
|
| | | | | | 9,159 |
| | | | |
|
|
*Non-income producing
**Fair Valued pursuant to Valuation Procedures adopted by the Board of Trustees. The holding represents 0.90% of the Fund’s net assets at June 30, 2005.
VRN = Variable Rate Note
| | | | | | | |
Issuer
| | Shares or
Principal
Amount
| | Value
| |
| | |
Common Stocks—(continued) | | | | | | | |
Other Energy—5.8% | | | | | | | |
*Forest Oil Corporation | | | 92,125 | | $ | 3,869 | |
*Grey Wolf, Inc. | | | 217,460 | | | 1,611 | |
St Mary Land & Exploration Company | | | 54,785 | | | 1,588 | |
| | | | | |
|
|
|
| | | | | | | 7,068 | |
| | | | | |
|
|
|
Autos and Transportation—4.9% | | | | | | | |
BorgWarner, Inc. | | | 52,355 | | | 2,810 | |
*SCS Transportation, Inc. | | | 175,405 | | | 3,122 | |
| | | | | |
|
|
|
| | | | | | | 5,932 | |
| | | | | |
|
|
|
Health Care—6.0% | | | | | | | |
*Encore Medical Corporation | | | 667,440 | | | 3,704 | |
*Par Pharmaceutical Companies, Inc. | | | 111,235 | | | 3,539 | |
| | | | | |
|
|
|
| | | | | | | 7,243 | |
| | | | | |
|
|
|
Utilities—3.3% | | | | | | | |
Atmos Energy Corporation | | | 138,965 | | | 4,002 | |
| | | | | |
|
|
|
Consumer Staples—1.6% | | | | | | | |
*Hain Celestial Group, Inc. | | | 101,743 | | | 1,984 | |
| | | | | |
|
|
|
Total Common Stock—110.6%
(cost $109,459) | | | 133,972 | |
| | | | | |
|
|
|
| | |
Convertible Bonds—0.9% | | | | | | | |
Midwest Express Holdings,
6.750%, due 10/01/08** | | $ | 2,157,000 | | | 1,031 | |
| | | | | |
|
|
|
Total Convertible Bonds
(cost $2,157) | | | 1,031 | |
| | | | | |
|
|
|
| | |
Investment in Affiliate—0.9% | | | | | | | |
William Blair Ready Reserves Fund | | | 1,058,707 | | | 1,059 | |
| | | | | |
|
|
|
Total Investment in Affiliate
(cost $1,059) | | | 1,059 | |
| | | | | |
|
|
|
| | |
Short-Term Investments—0.7% | | | | | | | |
Prudential Funding Demand Note, VRN,
3.368%, due 7/1/05 | | $ | 809,000 | | | 809 | |
| | | | | |
|
|
|
Total Short-Term Investments
(cost $809) | | | 809 | |
| | | | | |
|
|
|
Total Investments—113.1%
(cost $113,484) | | | 136,871 | |
Liabilities, plus cash and other assets—(13.1)% | | | (15,806 | ) |
| | | | | |
|
|
|
Net assets—100.0% | | $ | 121,065 | |
| | | | | |
|
|
|
See accompanying Notes to Financial Statements.
44 Semi-Annual Report | June 30, 2005 |

James S. Kaplan

Christopher T. Vincent
INCOME FUND
The Income Fund invests in high-grade intermediate-term debt securities.
AN OVERVIEW FROM THE PORTFOLIO MANAGERS
How did the Fund perform over the first half of the year? How did the Fund’s performance compare to its benchmark?
The Income Fund posted a 1.33% gain on a total return basis (Class N Shares) for the six months ended June 30, 2005. By comparison, the Fund’s benchmark, the Lehman Intermediate Government/Credit Bond Index, rose 1.58%, while the Fund’s peer group, the Morningstar Short-term Bond Category, increased 0.94%.
What were the most significant factors impacting Fund performance? What factors were behind the Fund’s performance versus the benchmark?
Interest rates were the most significant factor impacting Fund performance during the first half of the year.
The Federal Reserve raised the federal funds rate on overnight loans between banks by 0.25% three times during the first half of the year, on March 22, May 3, and June 30—from 2.50% to 3.25%. The rate increase on the last day of the second quarter was the ninth since June, 2004.
The yield curve flattening trend, which began in 2004, remained in place. The short end of the yield curve continued to underperform, with the yields on 2-year Treasury notes rising 0.57% during the first half of the year. However, the long-end of the yield curve, as indicated by yields on 10-year Treasury securities, declined by 0.30%.
Which investment strategies enhanced the Fund’s return? Were there any investment strategies that produced the best results?
One of our primary strategies during the first quarter was to tilt the Fund toward higher credit quality securities, as we did not believe risk premiums adequately compensated us for investing in corporate bonds—especially in lower-rated securities.
For example, we reduced our holdings in BBB-rated corporate securities from 9.7% at the end of the fourth quarter of 2004 to 6.6% at the end of March, reinvesting proceeds in U.S. Treasury and Agency securities.
However, we generally evaluated risks on a security-by-security basis, and did not believe what was happening in the marketplace was part of a larger industry “contagion,” affecting all corporate issues. By the end of the second quarter, our holdings of BBB-rated securities stood at 7.3%.
And although the mortgage-backed and asset-backed securities sectors have not had an especially noteworthy year, the Fund benefited from its holdings of these defensive income-producing securities.
On balance, we would describe the changes in the portfolio on a year-to-date basis as incremental transactions.
June 30, 2005 | William Blair Funds 45 |
What were among the weakest performing investments for the Fund?
Corporate bonds had a difficult first quarter, which continued into April before conditions finally stabilized somewhat. The majority of the damage in the Corporate Bond market came in late March with a profit warning from General Motors. GM lowered first quarter and full year earnings guidance dramatically. The rating agencies weighed in with either a downgrade or potential action. Given GM’s very large weighting in the corporate bond indexes, the news and rating action created significant concern and concomitant increases in risk premiums in auto credits as well as other BBB names.
We had reduced our holding in GM in early March, as well as our position of Cox Communications (Baa3/BBB-). We further reduced credit exposure in late March with the sale of the remainder of our GM position, and partial sales in Sprint (Baa3/BBB-) and Weyerhaeuser (Baa2/BBB).
What is your current strategy? How is the Fund positioned?
With further interest rate hikes anticipated by the Federal Reserve, we believe that the interest rate yield curve should continue to flatten. We have the Fund positioned defensively, attempting to minimize exposure to interest rates. Although our forecast is for rates to increase, good (modest) longer-term inflation fundamentals and solid foreign demand for U.S. debt securities should keep our domestic rates from rising dramatically.
As we have stated, given our concerns regarding valuations and potential threats to fundamentals, we currently have a bias toward upgrading portfolio credit quality and being judicious in our use of BBB-rated names. In structure, our view on interest rates will likely lead us to continue to emphasize coupon and income-producing securities which produce generous cash flow. These securities should provide “extension” protection, and allow us to reinvest at higher yields of rates move higher during the next stages of the Fed’s tightening cycle.
We continue to favor being defensive and emphasizing non-Treasury sectors. Our enthusiasm for maintaining this strategy will be driven by future changes in valuations and fundamentals.
46 Semi-Annual Report | June 30, 2005 |
Income Fund
Performance Highlights
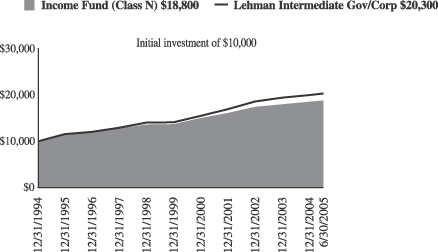
Average Annual Total Return at 6/30/2005
| | | | | | | | | | | | | | | | | |
| | | 1
Year
| | | 3
Year
| | | 5
Year
| | | 10
Year
| | | Since
Inception(a)
| | | |
Income Fund Class N | | 4.43 | % | | 4.08 | % | | 5.81 | % | | 5.61 | % | | — | % | | |
Income Fund Class I | | 4.58 | | | 4.25 | | | 5.97 | | | — | | | 5.82 | | | |
Lehman Intermediate Government Credit Bond Index | | 4.77 | | | 5.08 | | | 6.87 | | | 6.34 | | | 6.52 | | | |
| | (a) | | For the period from October 1, 1999 to June 30, 2005. |
Performance cited represents past performance. Past performance does not guarantee future results and current performance may be lower or higher than the data quoted. Results shown are average annual total returns, which assume reinvestment of dividends and capital gains. Investment returns and principal will fluctuate and you may have a gain or loss when you sell shares. For the most current month-end performance information, please call 1-800-742-7272, or visit our Web site at www.williamblairfunds.com. Class N shares are available to the general public without a sales load. Class I shares are available to certain institutional investors and advisory clients of William Blair & Company, L.L.C., without a sales load or distribution (12b-1) or service fees.
The performance highlights and graph presented above do not reflect the deduction of taxes that a shareholder would pay on fund distributions or the redemption of fund shares.
The Lehman Intermediate Government/Credit Bond Index indicates broad intermediate government/corporate bond market performance.
This report identifies the Fund’s investments on June 30, 2005. These holdings are subject to change. Not all investments in the Fund performed the same, nor is there any guarantee that these investments will perform as well in the future. Market forecasts provided in this report may not necessarily come to pass.
Sector Diversification
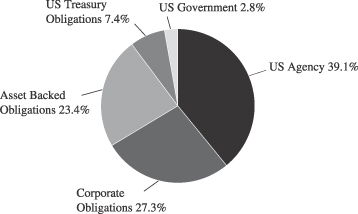
The sector diversification shown is based on the total investment portfolio.
June 30, 2005 | William Blair Funds 47 |
Income Fund
Portfolio of Investments, June 30, 2005 (all amounts in thousands) (unaudited)
| | | | | | |
Issuer
| | Principal
Amount
| | Value
|
|
U.S. Government and U.S. Government Agency—48.8% |
U.S. Treasury—7.3% | | | | | | |
U.S. Treasury Note, 6.500%, due 2/15/10 | | | | $ 12,792 | | $ 14,275 |
U.S. Treasury Note, 4.750%, due 5/15/14 | | | | 7,950 | | 8,436 |
| | | | |
| |
|
Total U.S. Treasury Obligations | | | | 20,742 | | 22,711 |
| | | | |
| |
|
Government National Mortgage Association (GNMA)—2.8% | | | | | | |
#780405, 9.500%, due 11/15/17 | | | | 971 | | 1,060 |
#589335, 6.500%, due 10/15/22 | | | | 2,703 | | 2,837 |
#357322, 7.000%, due 9/15/23 | | | | 247 | | 262 |
#616250, 6.000%, due 2/15/24 | | | | 2,385 | | 2,469 |
#2002-48, Tranche 0B, 6.000%, due 5/16/30 | | | | 1,837 | | 1,868 |
| | | | |
| |
|
Total Government National Mortage Association | | | | 8,143 | | 8,496 |
| | | | |
| |
|
Small Business Administration—0.0% | | | | |
Receipt for Multiple Originator Fees, #3, 0.713%, due 11/01/08 (Interest Only) WAC | | | | — | | 50 |
| | | | | | |
|
Federal Home Loan Mortgage Corp. (FHLMC)—15.4% | | | | | | |
FDIC REMIC Trust, 96-C1, 7.250%, due 5/25/26 | | | | 516 | | 516 |
#1417, Tranche SA, 15.598%, due 11/15/07 | | | | 828 | | 895 |
#G10067, 7.000%, due 1/1/08 | | | | 614 | | 632 |
#G10147, 8.500%, due 2/1/08 | | | | 162 | | 167 |
#1601, Tranche PJ, 6.000%, due 10/15/08, VRN | | | | 2,024 | | 2,064 |
#1612, Tranche SE, 8.100%, due 11/15/08, VRN | | | | 968 | | 1,003 |
# E80050, 6.000%, due 10/1/09 | | | | 905 | | 933 |
#G90028, 7.000%, due 5/15/09 | | | | 604 | | 625 |
#G90019, 7.500%, due 12/15/09 | | | | 714 | | 746 |
7.000%, due 3/15/10 | | | | 5,825 | | 6,570 |
#E65418, 7.000%, due 8/1/10 | | | | 511 | | 526 |
#G10457, 7.000%, due 2/1/11 | | | | 675 | | 707 |
#E00436, 7.000%, due 6/1/11 | | | | 659 | | 690 |
#G10708, 6.500%, due 8/1/12 | | | | 391 | | 407 |
#E91999, 5.000%, due 10/1/12 | | | | 1,317 | | 1,334 |
#G11218, 7.000%, due 10/1/12 | | | | 213 | | 223 |
#E96147, 5.000%, due 5/1/13 | | | | 1,986 | | 2,012 |
#E95846, 4.500%, due 5/1/13 | | | | 1,539 | | 1,535 |
#G10839, 5.500%, due 10/1/13 | | | | 1,788 | | 1,837 |
#E72924, 7.000%, due 10/1/13 | | | | 1,693 | | 1,772 |
#E00639, 5.000%, due 3/1/14 | | | | 2,230 | | 2,270 |
#E81908, 8.500%, due 12/1/15 | | | | 211 | | 228 |
#G11688, 7.00%, due 2/1/16 | | | | 1,191 | | 1,263 |
#G90022, 8.000%, due 9/17/16 | | | | 988 | | 1,054 |
#G11486, 7.500%, due 4/1/17 | | | | 1,605 | | 1,698 |
#E90398, 7.000%, due 5/1/17 | | | | 1,916 | | 2,005 |
#M30028, 5.500%, due 5/1/17 | | | | 538 | | 557 |
#G11549, 7.000%, due 7/1/17 | | | | 1,371 | | 1,435 |
#G30254, 6.500%, due 5/1/19 | | | | 3,612 | | 3,761 |
#G30255, 7.000%, due 7/1/21 | | | | 1,271 | | 1,343 |
#G90027, 6.000%, due 11/15/17 | | | | 2,108 | | 2,177 |
#C67537, 9.500%, due 8/1/21 | | | | 357 | | 389 |
| | | | | | |
Issuer
| | Principal
Amount
| | Value
|
|
U.S. Government and U.S. Government Agency—(continued) |
|
Federal Home Loan Mortgage Corp. (FHLMC)—(continued) |
#G30243, 6.000%, due 12/1/21 | | | | $ 2,636 | | $ 2,721 |
#G21, Tranche J, 6.250%, due 8/25/22 | | | | 15 | | 15 |
#A45790, 7.500%, due 5/1/35 | | | | 1,558 | | 1,669 |
| | | | |
| |
|
Total FHLMC Mortgage Obligations | | | | 45,539 | | 47,779 |
| | | | |
| |
|
Federal National Mortgage Association (FNMA)—23.3% | | | | | | |
#545560, 8.000%, due 5/1/07 | | | | 666 | | 690 |
#1992-192, Tranche SC,
8.641%, due 11/25/07, VRN | | | | 518 | | 530 |
#93-196, Tranche SA,
17.800%, due 10/25/08, VRN | | | | 718 | | 805 |
#1993-221, Tranche SG,
9.030%, due 12/25/08, VRN | | | | 483 | | 496 |
#765396, 5.500%, due 1/1/09 | | | | 506 | | 517 |
#695512, 8.000%, due 9/1/10 | | | | 783 | | 830 |
#725479, 8.5%, due 10/1/10 | | | | 1,345 | | 1,417 |
#255056, 5.000%, due 11/1/10 | | | | 2,563 | | 2,590 |
6.250%, due 2/1/11 | | | | 6,725 | | 7,369 |
#313816, 6.000%, due 4/1/11 | | | | 783 | | 810 |
#577393, 10.000%, due 6/1/11 | | | | 386 | | 421 |
#577395, 10.000%, due 8/1/11 | | | | 1,141 | | 1,247 |
#254705, 5.500%, due 3/1/13 | | | | 2,373 | | 2,442 |
#254788, 6.500%, due 4/1/13 | | | | 796 | | 834 |
#725315, 8.000%, due 5/1/13 | | | | 1,237 | | 1,320 |
#190539, 6.000%, due 1/1/14 | | | | 622 | | 643 |
#806463, 7.000%, due 3/1/14 | | | | 1,424 | | 1,492 |
#593561, 9.500%, due 8/1/14 | | | | 521 | | 567 |
#567027, 7.000%, due 9/1/14 | | | | 2,346 | | 2,458 |
#567026, 6.500%, due 10/1/14 | | | | 2,384 | | 2,483 |
#458124, 7.000%, due 12/15/14 | | | | 722 | | 752 |
#598453, 7.000%, due 6/1/15 | | | | 853 | | 890 |
#555747, 8.000%, due 5/1/16 | | | | 840 | | 897 |
#735569, 8.000%, due 10/1/16 | | | | 4,382 | | 4,677 |
#725410, 7.500%, due 4/1/17 | | | | 1,963 | | 2,077 |
#643217 , 6.500%, due 6/1/17 | | | | 449 | | 467 |
# 682075, 5.500%, due 11/1/17 | | | | 1,379 | | 1,417 |
#251960, 6.000%, due 9/1/18 | | | | 929 | | 959 |
#662925, 6.000%, due 12/1/17 | | | | 2,342 | | 2,431 |
#740847, 6.000%, due 10/1/18 | | | | 1,861 | | 1,925 |
#735367, 6.000%, due 3/1/22 | | | | 3,609 | | 3,723 |
#735574, 8.00%, due 3/1/22 | | | | 1,511 | | 1,643 |
#458147, 10.000%, due 8/15/20 | | | | 1,381 | | 1,552 |
#735104, 7.000%, due 5/1/22 | | | | 3,869 | | 4,097 |
#725927, 7.000%, due 8/1/22 | | | | 3,078 | | 3,255 |
#735137, 6.500%, due 11/1/22 | | | | 2,017 | | 2,100 |
#1993-19, Tranche SH, 11.233%, due 4/25/23, VRN | | | | 11 | | 17 |
#254797, 5.000%, due 6/1/23 | | | | 2,352 | | 2,372 |
#806458, 8.00%, due 6/1/28 | | | | 1,989 | | 2,144 |
#797846, 7.000%, due 3/1/32 | | | | 3,342 | | 3,538 |
#654674, 6.500%, due 9/1/32 | | | | 462 | | 480 |
#733897, 6.500%, due 12/1/32 | | | | 721 | | 754 |
| | | | |
| |
|
Total FNMA Mortgage
Obligations | | | | 68,382 | | 72,128 |
| | | | |
| |
|
See accompanying Notes to Financial Statements.
48 Semi-Annual Report | June 30, 2005 |
Income Fund
Portfolio of Investments, June 30, 2005 (all amounts in thousands) (unaudited)
| | | | | | |
Issuer
| | NRSRO
Rating
| | Principal
Amount
| | Value
|
| |
Collateralized Mortgage Obligations—23.2% | | |
Security National Mortgage Loan Trust, 2002-2, Tranche M2,
6.460%, due 8/25/08* | | A+ | | $ 2,500 | | $ 2,487 |
GRP Real Estate Asset Trust, 2004-1, 3.96%, due 3/25/09* | | A | | 132 | | 133 |
Countrywide Alternative Loan Trust, 2003-11T1, Tranche M,
4.750%, due 7/25/18 | | AA | | 1,935 | | 1,926 |
Cityscape Home Equity Loan Trust, 1997-4, Tranche M2, 8.210%, due 10/25/18 | | A- | | 950 | | 960 |
ABFS, 2002-2, Tranche A6, 5.850%, due 3/15/19 | | AAA | | 1,900 | | 1,968 |
RALI, 2004-QS16, Tranche 2M1, 5.000%, due 12/25/19 | | AA | | 1,806 | | 1,807 |
RALI, 2004-QS16, Tranche 2M3, 5.00%, due 12/15/19 | | BBB | | 305 | | 298 |
Countrywide, 2001-HLV1, Tranche B1, 9.885%, due 5/10/22 | | BBB | | 2,320 | | 2,318 |
First Plus, 1997-4, Tranche M2, 7.830%, due 9/11/23 | | A | | 718 | | 717 |
First Plus, 1997-4, Tranche A8, 7.810%, due 9/11/23 | | AAA | | 531 | | 531 |
First Plus, 1998-2, Tranche M2, 8.010%, due 5/10/24 | | A2 | | 445 | | 444 |
First Plus, 1998-3, Tranche M2, 7.920%, due 5/10/24 | | A2 | | 171 | | 171 |
GMAC Mortgage Corporation Loan Trust, 2000-CL1, Tranche B, 9.000%, due 6/25/26 | | A | | 133 | | 133 |
CIT Group Home Equity Loan Trust, 98-1 M2, 6.720%, due 9/15/27 | | A2 | | 1,135 | | 1,136 |
Green Tree Home Improvement Loan Trust, 1998-E, Tranche HEM2, 7.270%, due 6/15/28 | | A+ | | 5,025 | | 5,055 |
Bear Stearns ABS, 2001-A, Tranche M1, 7.540%, due 2/15/31 | | A | | 2,700 | | 2,787 |
Delta Funding Home Equity Loan Trust, 2000-4, Tranche M1, 7.150%, due 2/15/31 | | AA | | 3,000 | | 3,069 |
Aames Mortgage Trust, 2001-1, Tranche M2, 7.588%, due 2/25/31 | | A | | 1,319 | | 1,369 |
Countrywide, 2000-2, Tranche MF2, 9.000%, due 6/25/31 | | A2 | | 466 | | 469 |
IMSA, 2001-5, Tranche M1, 7.250%, due 8/25/31 | | AAA | | 2,222 | | 2,260 |
Conseco Finance, 2001-B, Tranche 1M1, 7.272%, due 6/15/32 | | AA | | 2,255 | | 2,296 |
Credit Suisse First Boston, 2002-22, Tranche 2M2, 6.500%, due 6/25/32 | | A | | 3,041 | | 3,096 |
Security National Mortgage Loan Trust, 2004-1A, Tranche M2, 6.750%, due 06/25/32* | | A | | 1,600 | | 1,582 |
Credit Suisse First Boston, 2001—HE30, Tranche MF2, 7.760%, due 7/25/32 | | A+ | | 2,557 | | 2,610 |
Structured Assets Security Corporation, 2002-17, Tranche B3, 6.079%, due 9/25/32, VRN | | BBB | | 1,945 | | 1,940 |
| | | | | | |
Issuer
| | NRSRO
Rating
| | Principal
Amount
| | Value
|
| |
Collateralized Mortgage Obligations—(continued) | | |
LSSCO, 2004-2, Tranche M1, 5.578%, due 2/28/33, VRN* | | AA | | $ 2,322 | | $ 2,333 |
LSSCO, 2004-2, Tranche M2, 5.578%, due 2/28/33, VRN* | | A | | 1,780 | | 1,778 |
ABFS, 2002-2, Tranche A-7, 5.215%, due 7/15/33, VRN | | AAA | | 389 | | 396 |
ABFS, 2002-3, Tranche M1, 5.402%, due 9/15/33, VRN | | AA | | 1,500 | | 1,507 |
Residential Asset Mortgage Prouducts, 2003-RS9, Tranche MI2, 6.300%, due 10/25/33 | | A | | 2,200 | | 2,244 |
ACE, 2004-SD1, Tranche M3, 6.064%, due 11/25/33, VRN | | BBB | | 2,099 | | 2,022 |
Residential Asset Mortgage Products, 2003-RS11, Tranche MI1, 5.597%, due 12/25/2033 | | AA | | 2,400 | | 2,449 |
GRP Real Estate Asset Trust, 2004-2, Tranche A, 4.210%, due 7/25/34* | | A | | 2,598 | | 2,598 |
FHASI, 2004-AR4, Tranche 3A1, 4.625%, due 8/25/34 | | AAA | | 1,916 | | 1,911 |
Security National Mortgage Loan Trust, 2004-2A, Tranche M2,
6.352%, due 11/25/34* | | A | | 2,200 | | 2,164 |
GRP Real Estate Asset Trust, 2005-1 Tranche A, 4.850%, due 1/25/35* | | A | | 2,744 | | 2,742 |
Security National Mortgage Loan Trust, 2005-1A, Tranche M2,
6.530%, due 2/25/35* | | A | | 1,475 | | 1,473 |
Security National Mortgage Loan Trust, 2005-1A, Tranche B1,
7.450%, due 2/25/35* | | BBB | | 950 | | 948 |
Structured Asset Securities Corp., 2005-9XS, Tranche 1A2B,
6.500%, due 6/25/35 | | AAA | | 3,385 | | 3,526 |
Blackrock Capital Finance, 1997-R1 WAC, 7.826%, due 3/25/37, VRN* | | AAA | | 523 | | 538 |
ACE, 2005-SN1, Tranche M1,
5.520%, due 11/25/39, VRN | | AA+ | | 1,075 | | 1,086 |
ACE, 2005-SN1, Tranche M2,
5.770%, due 11/25/39, VRN | | A+ | | 625 | | 632 |
| | | | |
| |
|
Total Collateralized Mortgage Obligations | | | | 71,292 | | 71,909 |
| | | | |
| |
|
| | | |
Corporate Obligations—27.0% | | | | | | |
Block Financial Corporation,
8.500%, due 4/15/07 | | BBB+ | | 2,699 | | 2,890 |
Mellon Bank NA,
7.375%, due 5/15/07 | | A+ | | 2,125 | | 2,242 |
Applied Materials, Inc.,
6.750%, due 10/15/07 | | A- | | 2,850 | | 2,992 |
Amgen Inc., 6.500%, due 12/01/07 | | A+ | | 1,000 | | 1,054 |
DaimlerChrysler NA Holdings,
4.750%, due 1/15/08 | | A3 | | 2,650 | | 2,660 |
Wells Fargo Company,
3.500%, due 4/4/08 | | AA- | | 2,425 | | 2,385 |
CIT Group Inc., 3.375%, due 4/1/09 | | A | | 2,550 | | 2,464 |
Philips Petroleum,
8.750%, due 5/25/10 | | A- | | 3,575 | | 4,259 |
See accompanying Notes to Financial Statements.
June 30, 2005 | William Blair Funds 49 |
Income Fund
Portfolio of Investments, June 30, 2005 (all amounts in thousands) (unaudited)
| | | | | | |
Issuer
| | NRSRO
Rating
| | Principal
Amount
| | Value
|
| |
Corporate Obligations—(continued) | | |
Residential Capital Corporation,
6.375%, due 6/30/10 | | BBB | | $ 2,900 | | $ 2,914 |
Household Finance Corporation,
8.000%, due 7/15/10 | | A | | 2,425 | | 2,798 |
Boeing Capital Corporation,
7.375%, due 9/27/10 | | A | | 2,524 | | 2,887 |
Sprint Capital Corp.,
7.625%, due 1/30/11 | | BBB | | 2,000 | | 2,284 |
Countrywide Financial Corp.,
4.000%, due 3/22/11 | | A | | 2,675 | | 2,580 |
Time Warner, Inc.,
6.750%, due 4/15/11 | | BBB+ | | 1,900 | | 2,106 |
Morgan Stanley,
6.750%, due 4/15/11 | | A+ | | 3,350 | | 3,709 |
Goldman Sachs Group, Inc.,
6.600%, due 1/15/12 | | A+ | | 3,025 | | 3,362 |
Lehman Brothers Holdings, Inc.
6.625%, due 1/18/12 | | A | | 2,650 | | 2,960 |
National Rural Utility Cooperative, 7.250%, due 3/1/12 | | A | | 3,000 | | 3,478 |
GE Capital Corporation,
6.000%, due 6/15/12 | | AAA | | 2,625 | | 2,863 |
Citigroup, Inc. 5.625%, due 8/27/12 | | A+ | | 2,650 | | 2,830 |
SLM Corporation,
5.125%, due 8/27/12 | | A | | 2,025 | | 2,094 |
Verizon Global Funding Corporation, 7.375%, due 9/1/12 | | A+ | | 2,650 | | 3,096 |
Cox Communications,Inc.,
7.125%, due 10/1/12 | | BBB- | | 2,425 | | 2,719 |
IBM Corporation, 4.750%, due 11/29/12 | | A+ | | 3,350 | | 3,424 |
Ohio Power Company,
5.500%, due 2/15/13 | | A3 | | 1,900 | | 2,007 |
Comcast Cable Communcations, Inc., 8.375%, due 3/15/13 | | BBB+ | | 2,000 | | 2,439 |
Altria Group, Inc., 7.00%, due 11/4/13 | | BBB | | 2,180 | | 2,440 |
American Movil SA,
5.500%, due 3/1/14 | | A3 | | 2,000 | | 2,000 |
Bank of America Corporation,
5.375%, due 6/15/14 | | AA- | | 2,300 | | 2,444 |
SBC Communications, Inc.,
5.100%, due 9/15/14 | | A | | 2,500 | | 2,556 |
United Technologies Corporation,
4.875%, due 5/1/15 | | A | | 2,700 | | 2,762 |
| | | | |
| |
|
Total Corporate Obligations | | | | 77,628 | | 83,698 |
| | | | |
| |
|
Total Long Term Investments—99.0%
(Cost $305,894) | | 291,726 | | 306,771 |
| | | | |
| |
|
| | | | | | |
Issuer
| | NRSRO
Rating
| | Principal
Amount
| | Value
|
| | |
Short-Term Investments—0.5% | | | | |
American Express Corporation, VRN, 3.164%, due 7/1/05 | | A+ | | $660 | | $660 |
Prudential Funding LLC, VRN,
3.368%, due 7/1/05 | | A+ | | 780 | | 780 |
| | | | |
| |
|
Total Short-Term Investments
(Cost $1,440) | | 1,440 | | 1,440 |
| | | | |
| |
|
Total Investments—99.5%
(Cost $307,334) | | $293,166 | | 308,211 |
| | | | |
| |
|
Cash and other assets, less liabilities—0.5% | | 1,456 |
| | | | | | |
|
Net Assets—100% | | $309,667 |
| | | | | | |
|
WAC = Weighted Average Coupon
VRN = Variable Rate Note
NRSRO = Nationally Recognized Statistical Rating Organization, such as S&P, Moody’s or Fitch
The obligations of certain U. S. Government-sponsored securities are neither issued nor guaranteed by the U. S. Treasury
*Deemed illiquid pursuant to Liquidity Procedures adopted by the Board of Trustees. These holdings represent 6.1% of the net assets at June 30, 2005.
See accompanying Notes to Financial Statements.
50 Semi-Annual Report | June 30, 2005 |
James S. Kaplan
Christopher T. Vincent
READY RESERVES FUND
The Ready Reserves Fund invests primarily in short-term U.S. dollar-denominated money market instruments, and exclusively in high quality securities that are rated in the top two categories of credit quality.
AN OVERVIEW FROM THE PORTFOLIO MANAGERS
Federal Reserve Board Monetary policy was the focus of the money markets during the first half of 2005.
The Federal Reserve raised the federal funds rate on overnight loans between banks by 0.25% three times during the first half of the year, on March 22, May 3, and June 30—from 2.50% to 3.25%. The Federal Reserve has raised this benchmark short-term interest rate nine times since June of 2004.
In a statement that accompanied the announcement of its latest rate increase, the Federal Reserve Board provided no indication as to when they might slow or stop their march to higher rates.
The Federal Reserve repeated previous declarations that monetary policy is “accommodative”—which investors interpret as meaning interest rates are still lower than the Fed officials want—and the Fed again said rates could still rise at a “measured” pace.
Federal Reserve watchers believe the Fed has been using those words as a form of advance guidance that it will continue to raise short-term rates in increments of 0.25% at each policy meeting until it says something different—to indicate it has arrived at a neutral “rate” that will neither stimulate inflationary pressures nor put a brake on economic growth.
With the exception of job growth, which has been choppy, the economy remained on solid footing during the first half of the year. Continued strength in the economy should result in increased issuance of commercial paper by corporations, an affirmation of a healthy economy for the money markets.
We intend to maintain our strategy of using commercial paper in the short end of the market, barbelled with fixed-rate obligations with slightly longer maturities, and also will continue to emphasize floating-rate obligations, which price off of LIBOR. (LIBOR is the London Interbank Offered Rate, which is the rate the creditworthiest international banks dealing in Eurodollars—U.S. currency held in banks outside of the U.S.—charge each other for large loans.)
At June 30, 2005, the Fund’s average maturity was 59 days, compared to 53 days at the end of March 31, 2005, and 55 days at the end of 2004.
The return for the quarter ended June 30, of the Fund’s Class N Shares was 0.58%, versus the 0.55% return of the Fund’s benchmark, the AAA-Rated Money Market Funds Average. Total assets net were $1.08 billion at June 30, 2005, compared to $1.14 billion at March 31, 2005 and $1.09 billion at December 31, 2004.
June 30, 2005 | William Blair Funds 51 |
Ready Reserves Fund
Performance Highlights
The Fund’s 7 day yield on June 30, 2005 was 2.53%.
Average Annual Total Returns—Class N Shares period ending June 30, 2005.
| | | | | | | | | | | | | | |
| | | 1
Year
| | | 3
Year
| | | 5
Year
| | | 10
Year
| | | |
Ready Reserves Fund
AAA Rated Money Market Funds | | 1.58
1.43 | %
% | | 1.03
0.90 | %
% | | 2.09
2.00 | %
% | | 3.53
3.54 | %
% | | |
Performance cited represents past performance. Past Performance does not guarantee future results and current performance may be lower or higher than the data quoted. For the most current month-end performance information, please call 1-800-742-7272, or visit our Web site at www.williamblairfunds.com. Class N Shares are available to the general public without a sales load. Total return includes reinvestment of income. Yields fluctuate and are not guaranteed. An investment in the Fund is neither insured nor guaranteed by the Federal Deposit Insurance Corp. (FDIC) or any government agency. Although the Fund seeks to preserve the value of your investment at $1.00 per share, it is possible to lose money by investing in the Fund.
The AAA Rated Money Market Funds Average represents the average annual composite performance of all AAA rated First Tier Retail Money Market Funds listed by IBC Financial data.
This report identifies the Fund’s investment’s on June 30, 2005. These holdings are subject to change. Not all fixed-income securities in the Fund performed the same, nor is there any guarantee that these fixed-income securities will perform as well in the future. Market forecasts provided in this report may not necessarily come to pass.
Sector Diversification
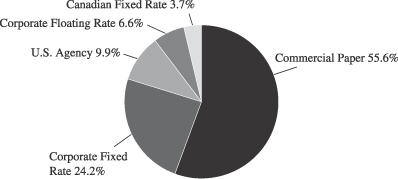
The sector diversification shown is based on the total investment portfolio.
52 Semi-Annual Report | June 30, 2005 |
Ready Reserves Fund
Portfolio of Investments, June 30, 2005 (all amounts in thousands) (unaudited)
| | | | | | |
Issuer
| | Principal
Amount
| | Amortized
Cost
|
Mortage Backed Securities—9.9% | | | | | | |
Federal Home Loan Bank (FHLB),
3.003%-3.363%, 7/5/05-9/28/05 | | $ | 35,229 | | $ | 35,243 |
Federal Home Loan Mortgage Corp. (FHLMC),
3.083%-3.335%, 7/7/05-9/9/05 | | | 24,201 | | | 24,201 |
Federal National Mortgage Assoc. (FNMA), 2.990%-3.310%, 7/3/05-9/19/05 | | | 40,302 | | | 40,315 |
| | |
|
| |
|
|
Total Mortgage Backed Securities | | | 99,732 | | | 99,759 |
| | |
|
| |
|
|
Canadian Fixed Rate Notes—3.7% | | | | | | |
Province of Ontario,
2.625%-7.000%, 8/4/05-2/21/06 | | | 28,295 | | | 27,889 |
Province of Quebec, 5.500%, 4/11/06 | | | 9,775 | | | 9,726 |
| | |
|
| |
|
|
Total Canadian Fixed Rate Notes | | | 38,070 | | | 37,615 |
| | |
|
| |
|
|
Fixed Rate Notes—23.0% | | | | | | |
Abbott Laboratories, 5.625%, 7/1/06 | | | 10,919 | | | 10,906 |
BellSouth Telecomunications,
3.410%, 7/1/05 | | | 10,003 | | | 10,000 |
B.P. plc,
2.350%-10.875%, 7/15/05-6/15/06 | | | 19,058 | | | 18,008 |
Caterpillar Financial Services,
3.100%, 9/19/05 | | | 4,995 | | | 4,996 |
Colgate-Palmolive Corporation,
5.340%, 3/27/06 | | | 7,288 | | | 7,268 |
Dover Corporation, 6.450%, 11/15/05 | | | 2,023 | | | 2,021 |
Eli Lilly & Company, 5.500%, 7/15/06 | | | 5,085 | | | 5,085 |
First Data Corporation,
2.850%-6.800%, 7/15/05-3/30/06 | | | 22,144 | | | 21,991 |
Gillette Company, 5.750%, 10/15/05 | | | 20,004 | | | 19,756 |
Hershey Foods Company,
6.700%, 10/1/05 | | | 1,737 | | | 1,724 |
Kimberly Clark, 4.500%, 7/30/05 | | | 19,042 | | | 18,747 |
Merck & Company, 5.250%, 7/1/06 | | | 1,318 | | | 1,318 |
Paccar Financial, 3.070%, 7/11/05 | | | 9,999 | | | 10,000 |
Pfizer Inc., 5.625%, 2/1/06 | | | 7,688 | | | 7,634 |
Pharmacia Corporation, 5.750%, 12/01/05 | | | 10,591 | | | 10,504 |
SBC Communications, Inc.,
6.250%, 7/7/05 | | | 2,031 | | | 2,001 |
SLM Corporation,
2.900%-3.490%, 7/1/05-8/15/05 | | | 11,012 | | | 11,001 |
Unilever Capital, 6.875%, 11/1/05 | | | 11,551 | | | 11,502 |
US Bancorp,
3.564%-6.750%, 9/16/05-10/15/05 | | | 7,695 | | | 7,687 |
USAA Capital Corporation,
3.130%, 12/15/05 | | | 2,107 | | | 2,103 |
Wal-Mart Stores,
5.580%-5.875%, 10/15/05-5/1/06 | | | 18,738 | | | 18,566 |
Wells Fargo Financial,
4.800%-7.250%, 7/29/05-4/1/06 | | | 29,696 | | | 29,218 |
| | |
|
| |
|
|
Total Fixed Rate Notes | | | 234,724 | | | 232,036 |
| | |
|
| |
|
|
Variable Rate Notes—6.6% | | | | | | |
General Electric Capital Corporation, 3.211%-3.600%, 7/2/05-7/25/05 | | | 12,207 | | | 12,186 |
National Rural Utility Cooperative Finance Corporation, 3.540%, 9/12/05 | | | 6,005 | | | 6,005 |
Paccar Financial Corporation,
3.085%-3.190%, 7/20/05-8/17/05 | | | 17,496 | | | 17,497 |
Pfizer, Inc., 3.150%, 8/4/05 | | | 10,749 | | | 10,750 |
U.S. Bancorp, 3.350%, 9/6/05 | | | 7,726 | | | 7,726 |
Wal-Mart Stores, 3.274%, 9/16/05 | | | 10,989 | | | 10,993 |
Wells Fargo Financial, 3.450%, 9/6/05 | | | 1,692 | | | 1,691 |
| | |
|
| |
|
|
Total Variable Rate Notes | | | 66,864 | | | 66,848 |
| | |
|
| |
|
|
VRN = Variable Rate Note
| | | | | | | |
Issuer
| | Principal
Amount
| | Amortized
Cost
| |
Asset Backed Commercial Paper—54.8% | | | | |
Alpine Securitization Corporation,
3.24%, 9/1/05 | | $ | 13,000 | | $ | 12,927 | |
Amsterdam Funding Corporation,
3.070%-3.190%, 7/8/05-7/27/05 | | | 45,000 | | | 44,923 | |
Blue Ridge Asset Funding,
3.080%-3.170%, 7/12/05-7/28/05 | | | 40,000 | | | 39,936 | |
CAFCO, L.L.C.,
3.070%-3.310%, 7/5/05-8/12/05 | | | 30,000 | | | 29,949 | |
Ciesco, L.L.C., 3.070%, 7/6/05 | | | 10,000 | | | 9,996 | |
CRC Funding, L.L.C.,
3.060%-3.140%, 7/8/05-7/26/05 | | | 35,000 | | | 34,945 | |
Daimler Chrysler Revolving Auto,
3.135%-3.340%, 7/19/05-8/18/05 | | | 25,000 | | | 24,917 | |
Edison Securitization,
3.050%-3.150%, 7/5/05-8/1/05 | | | 15,005 | | | 14,988 | |
FCAR Owner Trust,
3.190%-3.280%, 8/3/05-8/8/05 | | | 45,000 | | | 44,856 | |
Govco, Inc.,
3.170%-3.310%, 8/12/05-8/22/05 | | | 28,500 | | | 28,381 | |
Jupiter Securitization Corporation,
3.26%, 7/28/05 | | | 10,000 | | | 9,976 | |
Kittyhawk Funding,
3.070%, 7/6/05-7/11/05 | | | 20,000 | | | 19,987 | |
Mortgage Interest Networking Trust,
3.230%, 8/2/05 | | | 15,000 | | | 14,957 | |
New Center Asset Trust, 3.100%, 7/18/05 | | | 10,000 | | | 9,985 | |
Old Line Funding,
3.100%-3.170%, 7/12/05-7/25/05 | | | 28,740 | | | 28,687 | |
Park Avenue Receivables,
3.280%, 8/9/05 | | | 10,000 | | | 9,964 | |
Preferred Receivables Funding,
3.140%-3.260%, 7/14/05-7/27/05 | | | 20,000 | | | 19,965 | |
Sheffield Receivables,
3.100%-3.160%, 7/7/05-7/29/05 | | | 23,410 | | | 23,381 | |
Thames Asset Global Securitization,
3.060%-3.250%, 7/14/05-9/6/05 | | | 41,631 | | | 41,499 | |
Thunder Bay Funding,
3.060%-3.200%, 7/7/05-7/25/05 | | | 19,252 | | | 19,227 | |
Variable Funding, 3.130%, 7/18/05-7/19/05 | | | 25,000 | | | 24,962 | |
Windmill Funding Corporation,
3.070%-3.150%, 7/7/05-8/2/05 | | | 43,484 | | | 43,426 | |
| | |
|
| |
|
|
|
Total Asset Backed Commercial Paper | | | 553,022 | | | 551,834 | |
| | |
|
| |
|
|
|
Commercial Paper—1.0% | | | | | | | |
American General Finance Corp,,
3.110%, 7/18/05 | | | 10,000 | | | 9,986 | |
| | |
|
| |
|
|
|
Total Commercial Paper | | | 10,000 | | | 9,986 | |
| | |
|
| |
|
|
|
Demand Notes—1.2% | | | | | | | |
American Express Corporation, VRN, 3.164%, 7/1/05 | | | 7,305 | | | 7,305 | |
Prudential Funding, VRN,
3.368%, 7/1/05 | | | 4,892 | | | 4,892 | |
| | |
|
| |
|
|
|
Total Demand Notes | | | 12,197 | | | 12,197 | |
| | |
|
| |
|
|
|
Total Investments—100.2%
(Cost $1,010,250) | | $ | 1,014,609 | | | 1,010,275 | |
| | |
|
| |
|
|
|
Liabilities, plus cash and other assets—(0.2)% | | | (2,009 | ) |
| | | | | |
|
|
|
Net assets—100.0% | | $ | 1,008,266 | |
| | | | | |
|
|
|
Portfolio Weighted Average Maturity | | | 59 Days | |
See accompanying Notes to Financial Statements.
June 30, 2005 | William Blair Funds 53 |
Statements of Assets and Liabilities
June 30, 2005 (all dollar amounts in thousands) (unaudited)
| | | | | | | | | | | | | | | | |
| | | Growth Fund
| | | Tax-
Managed
Growth
Fund
| | | Large Cap
Growth
Fund
| | | Small Cap
Growth
Fund
| |
Assets | | | | | | | | | | | | | | | | |
Investments in securities, at cost | | $ | 192,762 | | | $ | 4,469 | | | $ | 7,855 | | | $ | 577,192 | |
Investments in Affiliated Fund, at cost | | | 922 | | | | 177 | | | | 330 | | | | 6,243 | |
| | |
|
|
| |
|
|
| |
|
|
| |
|
|
|
| | | | |
Investments in securities, at value | | $ | 242,679 | | | $ | 5,841 | | | $ | 8,813 | | | $ | 686,965 | |
Investments in Affiliated Fund, at value | | | 922 | | | | 177 | | | | 330 | | | | 6,243 | |
Cash | | | — | | | | 1 | | | | — | | | | — | |
Receivable for fund shares sold | | | 58 | | | | 40 | | | | 16 | | | | 1,216 | |
Receivable for investment securities sold | | | 4,506 | | | | 56 | | | | 154 | | | | 8,850 | |
Receivable from Advisor | | | — | | | | 12 | | | | 23 | | | | — | |
Dividend and interest receivable | | | 354 | | | | 8 | | | | 15 | | | | 79 | |
| | |
|
|
| |
|
|
| |
|
|
| |
|
|
|
Total assets | | | 248,519 | | | | 6,135 | | | | 9,351 | | | | 703,353 | |
Liabilities | | | | | | | | | | | | | | | | |
Payable for investment securities purchased | | | 2,196 | | | | 233 | | | | 191 | | | | 3,090 | |
Payable for fund shares redeemed | | | 749 | | | | — | | | | — | | | | 412 | |
Management fee payable | | | 167 | | | | 4 | | | | 6 | | | | 592 | |
Distribution and shareholder services fee payable | | | 10 | | | | — | | | | — | | | | 82 | |
Other accrued expenses | | | 97 | | | | 14 | | | | 12 | | | | 58 | |
| | |
|
|
| |
|
|
| |
|
|
| |
|
|
|
Total liabilities | | | 3,219 | | | | 251 | | | | 209 | | | | 4,234 | |
| | |
|
|
| |
|
|
| |
|
|
| |
|
|
|
Net Assets | | $ | 245,300 | | | $ | 5,884 | | | $ | 9,142 | | | $ | 699,119 | |
| | |
|
|
| |
|
|
| |
|
|
| |
|
|
|
Capital | | | | | | | | | | | | | | | | |
Composition of Net Assets | | | | | | | | | | | | | | | | |
Par value of shares of beneficial interest | | $ | 23 | | | $ | 1 | | | $ | 1 | | | $ | 28 | |
Capital paid in excess of par value | | | 197,246 | | | | 6,295 | | | | 13,586 | | | | 557,551 | |
Accumulated net investment income (loss) | | | (296 | ) | | | (13 | ) | | | 2 | | | | (4,235 | ) |
Accumulated realized gain (loss) | | | (1,590 | ) | | | (1,771 | ) | | | (5,405 | ) | | | 36,002 | |
Net unrealized appreciation (depreciation) of investments and foreign
currencies | | | 49,917 | | | | 1,372 | | | | 958 | | | | 109,773 | |
| | |
|
|
| |
|
|
| |
|
|
| |
|
|
|
Net Assets | | $ | 245,300 | | | $ | 5,884 | | | $ | 9,142 | | | $ | 699,119 | |
| | |
|
|
| |
|
|
| |
|
|
| |
|
|
|
| | | | |
Class N Shares | | | | | | | | | | | | | | | | |
Net Assets | | $ | 47,724 | | | $ | 203 | | | $ | 1,264 | | | $ | 408,974 | |
Shares Outstanding | | | 4,491,773 | | | | 22,396 | | | | 206,286 | | | | 16,592,518 | |
Net Asset Value Per Share | | $ | 10.62 | | | $ | 9.08 | | | $ | 6.13 | | | $ | 24.65 | |
Class I Shares | | | | | | | | | | | | | | | | |
Net Assets | | $ | 197,570 | | | $ | 5,675 | | | $ | 7,875 | | | $ | 290,130 | |
Shares Outstanding | | | 18,328,581 | | | | 615,957 | | | | 1,270,099 | | | | 11,609,889 | |
Net Asset Value Per Share | | $ | 10.78 | | | $ | 9.21 | | | $ | 6.20 | | | $ | 24.99 | |
See accompanying Notes to Financial Statements.
54 Semi-Annual Report | June 30, 2005 |
Statements of Operations
For the Period Ended June 30, 2005 (all dollar amounts in thousands) (unaudited)
| | | | | | | | | | | | | | | | |
| | | Growth Fund
| | | Tax-
Managed
Growth
Fund
| | | Large Cap
Growth Fund
| | | Small Cap
Growth Fund
| |
Investment income | | | | | | | | | | | | | | | | |
Dividends | | $ | 906 | | | $ | 22 | | | $ | 41 | | | $ | 487 | |
Less foreign tax withheld | | | (63 | ) | | | (1 | ) | | | (3 | ) | | | — | |
Income from Affiliated Fund | | | 29 | | | | 2 | | | | 3 | | | | 91 | |
Interest | | | 21 | | | | — | | | | — | | | | 7 | |
| | |
|
|
| |
|
|
| |
|
|
| |
|
|
|
Total income | | | 893 | | | | 23 | | | | 41 | | | | 585 | |
Expenses | | | | | | | | | | | | | | | | |
Investment advisory fees | | | 924 | | | | 21 | | | | 28 | | | | 3,877 | |
Distribution fees | | | 59 | | | | — | | | | 1 | | | | 538 | |
Custodian fees | | | 37 | | | | 17 | | | | 21 | | | | 71 | |
Transfer agent fees | | | 75 | | | | 4 | | | | 7 | | | | 253 | |
Professional fees | | | 19 | | | | 8 | | | | 9 | | | | 28 | |
Registration fees | | | 17 | | | | 14 | | | | 14 | | | | 20 | |
Other expenses | | | 58 | | | | 5 | | | | 4 | | | | 33 | |
| | |
|
|
| |
|
|
| |
|
|
| |
|
|
|
Total expenses before waiver | | | 1,189 | | | | 69 | | | | 84 | | | | 4,820 | |
Less expenses waived or absorbed by the Advisor | | | — | | | | (33 | ) | | | (45 | ) | | | — | |
| | |
|
|
| |
|
|
| |
|
|
| |
|
|
|
Net expenses | | | 1,189 | | | | 36 | | | | 39 | | | | 4,820 | |
| | |
|
|
| |
|
|
| |
|
|
| |
|
|
|
Net investment income (loss) | | | (296 | ) | | | (13 | ) | | | 2 | | | | (4,235 | ) |
Net realized and unrealized gain (loss) on investments, foreign currency transactions and other assets and liabilities | | | | | | | | | | | | | | | | |
Net realized gain (loss) on investments | | | 15,234 | | | | 115 | | | | 44 | | | | 15,092 | |
| | |
|
|
| |
|
|
| |
|
|
| |
|
|
|
Change in net unrealized appreciation (depreciation) on investments and
other assets and liabilities | | | (17,291 | ) | | | (38 | ) | | | (151 | ) | | | (46,037 | ) |
| | |
|
|
| |
|
|
| |
|
|
| |
|
|
|
Net increase (decrease) in net assets resulting from operations | | $ | (2,353 | ) | | $ | 64 | | | $ | (105 | ) | | $ | (35,180 | ) |
| | |
|
|
| |
|
|
| |
|
|
| |
|
|
|
See accompanying Notes to Financial Statements.
June 30, 2005 | William Blair Funds 55 |
Statements of Changes in Net Assets
For the Period Ended June 30, 2005 and the Year Ended December 31, 2004 (all amounts in thousands)
| | | | | | | | | | | | | | | | | | | | | | | | | | | | | | | | |
| | | Growth
Fund
| | | Tax-
Managed
Growth
Fund
| | | Large Cap
Growth
Fund
| | | Small Cap
Growth
Fund
| |
| | | 2005
| | | 2004
| | | 2005
| | | 2004
| | | 2005
| | | 2004
| | | 2005
| | | 2004
| |
| | | (unaudited) | | | | | | (unaudited) | | | | | | (unaudited) | | | | | | (unaudited) | | | | |
Operations | | | | | | | | | | | | | | | | | | | | | | | | | | | | | | | | |
Net investment income (loss) | | $ | (296 | ) | | $ | (1,071 | ) | | $ | (13 | ) | | $ | (41 | ) | | $ | 2 | | | $ | (23 | ) | | $ | (4,235 | ) | | $ | (7,267 | ) |
Net realized gain (loss) on investments, foreign currency transactions and other assets and liabilities | | | 15,234 | | | | 14,917 | | | | 115 | | | | 460 | | | | 44 | | | | 196 | | | | 15,092 | | | | 80,817 | |
Change in net unrealized appreciation (depreciation) on investments, and other assets
and liabilities | | | (17,291 | ) | | | 5,610 | | | | (38 | ) | | | (38 | ) | | | (151 | ) | | | 149 | | | | (46,037 | ) | | | 78,333 | |
| | |
|
|
| |
|
|
| |
|
|
| |
|
|
| |
|
|
| |
|
|
| |
|
|
| |
|
|
|
Net increase (decrease) in net assets resulting from operations | | | (2,353 | ) | | | 19,456 | | | | 64 | | | | 381 | | | | (105 | ) | | | 322 | | | | (35,180 | ) | | | 151,883 | |
Distributions to shareholders from | | | | | | | | | | | | | | | | | | | | | | | | | | | | | | | | |
Net investment income | | | — | | | | — | | | | — | | | | — | | | | — | | | | — | | | | — | | | | — | |
Net realized gain | | | — | | | | — | | | | — | | | | — | | | | — | | | | — | | | | — | | | | (54,782 | ) |
| | |
|
|
| |
|
|
| |
|
|
| |
|
|
| |
|
|
| |
|
|
| |
|
|
| |
|
|
|
| | | | — | | | | — | | | | — | | | | — | | | | — | | | | — | | | | — | | | | (54,782 | ) |
Capital stock transactions | | | | | | | | | | | | | | | | | | | | | | | | | | | | | | | | |
Net proceeds from sale of shares | | | 11,264 | | | | 35,194 | | | | 354 | | | | 246 | | | | 3,534 | | | | 1,655 | | | | 130,438 | | | | 260,030 | |
Shares issued in reinvestment of income dividends and capital gain distributions | | | — | | | | — | | | | — | | | | — | | | | — | | | | — | | | | — | | | | 53,276 | |
Less cost of shares redeemed | | | (39,117 | ) | | | (60,798 | ) | | | (381 | ) | | | (1,651 | ) | | | (704 | ) | | | (1,079 | ) | | | (167,348 | ) | | | (158,022 | ) |
| | |
|
|
| |
|
|
| |
|
|
| |
|
|
| |
|
|
| |
|
|
| |
|
|
| |
|
|
|
Net increase (decrease) in net assets resulting from capital share transactions | | | (27,853 | ) | | | (25,604 | ) | | | (27 | ) | | | (1,405 | ) | | | 2,830 | | | | 576 | | | | (36,910 | ) | | | 155,284 | |
| | |
|
|
| |
|
|
| |
|
|
| |
|
|
| |
|
|
| |
|
|
| |
|
|
| |
|
|
|
Increase (decrease) in net assets | | | (30,206 | ) | | | (6,148 | ) | | | 37 | | | | (1,024 | ) | | | 2,725 | | | | 898 | | | | (72,090 | ) | | | 252,385 | |
Net assets | | | | | | | | | | | | | | | | | | | | | | | | | | | | | | | | |
Beginning of period | | | 275,506 | | | | 281,654 | | | | 5,847 | | | | 6,871 | | | | 6,417 | | | | 5,519 | | | | 771,209 | | | | 518,824 | |
| | |
|
|
| |
|
|
| |
|
|
| |
|
|
| |
|
|
| |
|
|
| |
|
|
| |
|
|
|
End of period | | $ | 245,300 | | | $ | 275,506 | | | $ | 5,884 | | | $ | 5,847 | | | $ | 9,142 | | | $ | 6,417 | | | $ | 699,119 | | | $ | 771,209 | |
| | |
|
|
| |
|
|
| |
|
|
| |
|
|
| |
|
|
| |
|
|
| |
|
|
| |
|
|
|
Undistributed net investment income (loss) at the end of the period | | $ | (296 | ) | | $ | — | | | $ | (13 | ) | | $ | — | | | $ | 2 | | | $ | — | | | $ | (4,235 | ) | | $ | — | |
| | |
|
|
| |
|
|
| |
|
|
| |
|
|
| |
|
|
| |
|
|
| |
|
|
| |
|
|
|
See accompanying Notes to Financial Statements.
56 Semi-Annual Report | June 30, 2005 |
Statements of Assets and Liabilities
June 30, 2005 (all dollar amounts in thousands) (unaudited)
| | | | | | | | | | | | | | | | |
| | | Small-Mid
Cap
Growth
Fund
| | | International
Growth
Fund
| | | International
Equity
Fund
| | | Emerging
Markets
Growth
Fund
| |
Assets | | | | | | | | | | | | | | | | |
Investments in securities, at cost | | $ | 49,711 | | | $ | 2,614,658 | | | $ | 21,684 | | | $ | 12,320 | |
Investments in Affiliated Fund, at cost | | | 1,224 | | | | 20,000 | | | | 689 | | | | 258 | |
| | |
|
|
| |
|
|
| |
|
|
| |
|
|
|
| | | | |
Investments in securities, at value | | $ | 53,145 | | | $ | 3,267,756 | | | $ | 22,369 | | | $ | 12,603 | |
Investments in Affiliated Fund, at value | | | 1,224 | | | | 20,000 | | | | 689 | | | | 258 | |
Cash | | | 1 | | | | — | | | | 1 | | | | 1 | |
Foreign currency, at value (cost $6,488, $27 and $7, respectively) | | | — | | | | 6,324 | | | | 27 | | | | 7 | |
Receivable for fund shares sold | | | 91 | | | | 28,765 | | | | 1,117 | | | | 185 | |
Receivable for investment securities sold | | | 1,378 | | | | 6,847 | | | | — | | | | — | |
Receivable from Advisor | | | — | | | | — | | | | 34 | | | | 2 | |
Dividend and interest receivable | | | 23 | | | | 6,626 | | | | 41 | | | | 30 | |
| | |
|
|
| |
|
|
| |
|
|
| |
|
|
|
Total assets | | | 55,862 | | | | 3,336,318 | | | | 24,278 | | | | 13,086 | |
Liabilities | | | | | | | | | | | | | | | | |
Payable for investment securities purchased | | | 1,914 | | | | 29,499 | | | | 1,141 | | | | 718 | |
Payable for fund shares redeemed | | | 13 | | | | 2,541 | | | | — | | | | — | |
Management fee payable | | | 18 | | | | 2,702 | | | | 19 | | | | 8 | |
Distribution and shareholder services fee payable | | | 2 | | | | 452 | | | | — | | | | — | |
Other accrued expenses | | | 34 | | | | 524 | | | | 14 | | | | 4 | |
| | |
|
|
| |
|
|
| |
|
|
| |
|
|
|
Total liabilities | | | 1,981 | | | | 35,718 | | | | 1,174 | | | | 730 | |
| | |
|
|
| |
|
|
| |
|
|
| |
|
|
|
Net Assets | | $ | 53,881 | | | $ | 3,300,600 | | | $ | 23,104 | | | $ | 12,356 | |
| | |
|
|
| |
|
|
| |
|
|
| |
|
|
|
Capital | | | | | | | | | | | | | | | | |
Composition of Net Assets | | | | | | | | | | | | | | | | |
Par value of shares of beneficial interest | | $ | 5 | | | $ | 147 | | | $ | 2 | | | $ | 1 | |
Capital paid in excess of par value | | | 50,695 | | | | 2,498,483 | | | | 22,792 | | | | 12,064 | |
Accumulated net investment income (loss) | | | (167 | ) | | | (853 | ) | | | (2 | ) | | | 26 | |
Accumulated realized gain (loss) | | | (86 | ) | | | 150,154 | | | | (372 | ) | | | (17 | ) |
Net unrealized appreciation (depreciation) of investments and foreign currencies | | | 3,434 | | | | 652,669 | | | | 684 | | | | 282 | |
| | |
|
|
| |
|
|
| |
|
|
| |
|
|
|
Net Assets | | $ | 53,881 | | | $ | 3,300,600 | | | $ | 23,104 | | | $ | 12,356 | |
| | |
|
|
| |
|
|
| |
|
|
| |
|
|
|
| | | | |
Class N Shares | | | | | | | | | | | | | | | | |
Net Assets | | $ | 9,414 | | | $ | 2,240,772 | | | $ | 6,310 | | | $ | 1,089 | |
Shares Outstanding | | | 838,886 | | | | 99,959,774 | | | | 563,141 | | | | 106,133 | |
Net Asset Value Per Share | | $ | 11.22 | | | $ | 22.42 | | | $ | 11.20 | | | $ | 10.26 | |
Class I Shares | | | | | | | | | | | | | | | | |
Net Assets | | $ | 44,461 | | | $ | 1,059,815 | | | $ | 16,787 | | | $ | 6,134 | |
Shares Outstanding | | | 3,949,492 | | | | 46,686,913 | | | | 1,491,943 | | | | 597,610 | |
Net Asset Value Per Share | | $ | 11.26 | | | $ | 22.70 | | | $ | 11.25 | | | $ | 10.26 | |
See accompanying Notes to Financial Statements.
June 30, 2005 | William Blair Funds 57 |
Statements of Operations
For the Period Ended June 30, 2005 (all dollar amounts in thousands) (unaudited)
| | | | | | | | | | | | | | | | |
| | | Small-Mid
Cap
Growth
Fund
| | | International
Growth
Fund
| | | International
Equity
Fund
| | | Emerging
Markets
Growth
Fund(a)
| |
Investment income | | | | | | | | | | | | | | | | |
Dividends | | $ | 65 | | | $ | 39,788 | | | $ | 170 | | | $ | 35 | |
Less foreign tax withheld | | | — | | | | (4,004 | ) | | | (17 | ) | | | (2 | ) |
Income from Affiliated Fund | | | 18 | | | | 282 | | | | 10 | | | | 1 | |
Interest | | | 7 | | | | 801 | | | | 4 | | | | 2 | |
| | |
|
|
| |
|
|
| |
|
|
| |
|
|
|
Total income | | | 90 | | | | 36,867 | | | | 167 | | | | 36 | |
Expenses | | | | | | | | | | | | | | | | |
Investment advisory fees | | | 193 | | | | 15,582 | | | | 74 | | | | 8 | |
Distribution fees | | | 11 | | | | 2,660 | | | | 5 | | | | — | |
Custodian fees | | | 27 | | | | 853 | | | | 58 | | | | 1 | |
Transfer agent fees | | | 15 | | | | 987 | | | | 5 | | | | 1 | |
Professional fees | | | 10 | | | | 70 | | | | 16 | | | | — | |
Registration fees | | | 15 | | | | 49 | | | | 17 | | | | 1 | |
Other expenses | | | 15 | | | | 413 | | | | 3 | | | | 1 | |
| | |
|
|
| |
|
|
| |
|
|
| |
|
|
|
Total expenses before waiver | | | 286 | | | | 20,614 | | | | 178 | | | | 12 | |
Less expenses waived or absorbed by the Advisor | | | (29 | ) | | | — | | | | (88 | ) | | | (2 | ) |
| | |
|
|
| |
|
|
| |
|
|
| |
|
|
|
Net expenses | | | 257 | | | | 20,614 | | | | 90 | | | | 10 | |
| | |
|
|
| |
|
|
| |
|
|
| |
|
|
|
Net investment income (loss) | | | (167 | ) | | | 16,253 | | | | 77 | | | | 26 | |
Net realized and unrealized gain (loss) on investments, foreign currency transactions and other assets and liabilities | | | | | | | | | | | | | | | | |
Net realized gain (loss) on investments | | | (16 | ) | | | 168,003 | | | | (326 | ) | | | 7 | |
Net realized gain (loss) on foreign currency transactions
and other assets and liabilities | | | — | | | | (6,509 | ) | | | (29 | ) | | | (24 | ) |
| | |
|
|
| |
|
|
| |
|
|
| |
|
|
|
Total net realized gain (loss) | | | (16 | ) | | | 161,494 | | | | (355 | ) | | | (17 | ) |
Change in net unrealized appreciation (depreciation) on investments and other assets and liabilities | | | 1,060 | | | | (127,108 | ) | | | 259 | | | | 282 | |
| | |
|
|
| |
|
|
| |
|
|
| |
|
|
|
Net increase (decrease) in net assets resulting from operations | | $ | 877 | | | $ | 50,639 | | | $ | (19 | ) | | $ | 291 | |
| | |
|
|
| |
|
|
| |
|
|
| |
|
|
|
| (a) | | For the period from June 6, 2005 (Commencement of Operations) to June 30, 2005. |
See accompanying Notes to Financial Statements.
58 Semi-Annual Report | June 30, 2005 |
Statements of Changes in Net Assets
For the Period Ended June 30, 2005 and the Year Ended December 31, 2004 (all amounts in thousands)
| | | | | | | | | | | | | | | | | | | | | | | | | | | | |
| | | Small-Mid
Cap
Growth
Fund
| | | International
Growth
Fund
| | | International Equity Fund
| | | Emerging
Markets
Growth
Fund
| |
| | | 2005
| | | 2004
| | | 2005
| | | 2004
| | | 2005
| | | 2004(a)
| | | 2005(b)
| |
| | | (unaudited) | | | | | | (unaudited) | | | | | | (unaudited) | | | | | | (unaudited) | |
Operations | | | | | | | | | | | | | | | | | | | | | | | | | | | | |
Net investment income (loss) | | $ | (167 | ) | | $ | (152 | ) | | $ | 16,253 | | | $ | (1,748 | ) | | $ | 77 | | | $ | (11 | ) | | $ | 26 | |
Net realized gain (loss) on investments, foreign currency transactions and other assets and liabilities | | | (16 | ) | | | 5 | | | | 161,494 | | | | 106,478 | | | | (355 | ) | | | 641 | | | | (17 | ) |
Change in net unrealized appreciation (depreciation) on investments, foreign currency transactions and other assets and liabilities | | | 1,060 | | | | 2,395 | | | | (127,108 | ) | | | 341,262 | | | | 259 | | | | 425 | | | | 282 | |
| | |
|
|
| |
|
|
| |
|
|
| |
|
|
| |
|
|
| |
|
|
| |
|
|
|
Net increase (decrease) in net assets resulting from operations | | | 877 | | | | 2,248 | | | | 50,639 | | | | 445,992 | | | | (19 | ) | | | 1,055 | | | | 291 | |
Distributions to shareholders from | | | | | | | | | | | | | | | | | | | | | | | | | | | | |
Net investment income | | | — | | | | — | | | | — | | | | (2,616 | ) | | | — | | | | — | | | | — | |
Net realized gain | | | — | | | | — | | | | — | | | | — | | | | — | | | | — | | | | — | |
| | |
|
|
| |
|
|
| |
|
|
| |
|
|
| |
|
|
| |
|
|
| |
|
|
|
| | | | — | | | | — | | | | — | | | | (2,616 | ) | | | — | | | | — | | | | — | |
Capital stock transactions | | | | | | | | | | | | | | | | | | | | | | | | | | | | |
Net proceeds from sale of shares | | | 29,020 | | | | 21,231 | | | | 553,662 | | | | 1,143,395 | | | | 14,067 | | | | 16,380 | | | | 12,090 | |
Shares issued in reinvestment of income dividends and capital gain
distributions | | | — | | | | — | | | | — | | | | 2,161 | | | | — | | | | — | | | | — | |
Less cost of shares redeemed | | | (1,990 | ) | | | (1,178 | ) | | | (305,135 | ) | | | (487,197 | ) | | | (633 | ) | | | (7,746 | ) | | | (25 | ) |
| | |
|
|
| |
|
|
| |
|
|
| |
|
|
| |
|
|
| |
|
|
| |
|
|
|
Net increase (decrease) in net assets resulting from capital stock transactions | | | 27,030 | | | | 20,053 | | | | 248,527 | | | | 658,359 | | | | 13,434 | | | | 8,634 | | | | 12,065 | |
| | |
|
|
| |
|
|
| |
|
|
| |
|
|
| |
|
|
| |
|
|
| |
|
|
|
Increase (decrease) in net assets | | | 27,907 | | | | 22,301 | | | | 299,166 | | | | 1,101,735 | | | | 13,415 | | | | 9,689 | | | | 12,356 | |
Net assets | | | | | | | | | | | | | | | | | | | | | | | | | | | | |
Beginning of period | | | 25,974 | | | | 3,673 | | | | 3,001,434 | | | | 1,899,699 | | | | 9,689 | | | | — | | | | — | |
| | |
|
|
| |
|
|
| |
|
|
| |
|
|
| |
|
|
| |
|
|
| |
|
|
|
End of period | | $ | 53,881 | | | $ | 25,974 | | | $ | 3,300,600 | | | $ | 3,001,434 | | | $ | 23,104 | | | $ | 9,689 | | | $ | 12,356 | |
| | |
|
|
| |
|
|
| |
|
|
| |
|
|
| |
|
|
| |
|
|
| |
|
|
|
Undistributed net investment income (loss) at the end of the period | | $ | (167 | ) | | $ | — | | | $ | (853 | ) | | $ | (17,106 | ) | | $ | (11 | ) | | $ | (79 | ) | | $ | 26 | |
| | |
|
|
| |
|
|
| |
|
|
| |
|
|
| |
|
|
| |
|
|
| |
|
|
|
(a) For the period from May 24, 2004 (Commencement of Operations) to December 31, 2004.
(b) For the period from June 6, 2005 (Commencement of Operations) to June 30, 2005.
See accompanying Notes to Financial Statements.
June 30, 2005 | William Blair Funds 59 |
Statements of Assets and Liabilities
June 30, 2005 (all dollar amounts in thousands) (unaudited)
| | | | | | | | | | | | |
| | | Value
Discovery
Fund
| | | Income
Fund
| | | Ready
Reserves
Fund
| |
Assets | | | | | | | | | | | | |
Investments in securities, at cost | | $ | 112,425 | | | $ | 307,334 | | | $ | 1,010,275 | |
Investments in Affiliated Fund, at cost | | | 1,059 | | | | — | | | | — | |
| | |
|
|
| |
|
|
| |
|
|
|
| | | |
Investments in securities, at value | | $ | 135,812 | | | $ | 308,211 | | | $ | 1,010,275 | |
Investments in Affiliated Fund, at value | | | 1,059 | | | | — | | | | — | |
Cash | | | — | | | | 101 | | | | — | |
Receivable for fund shares sold | | | 26 | | | | 945 | | | | — | |
Receivable for investment securities sold | | | 2,802 | | | | — | | | | — | |
Receivable from Advisor | | | 118 | | | | — | | | | — | |
Dividend and interest receivable | | | 186 | | | | 2,784 | | | | 4,993 | |
| | |
|
|
| |
|
|
| |
|
|
|
Total assets | | | 140,003 | | | | 312,041 | | | | 1,015,268 | |
Liabilities | | | | | | | | | | | | |
Payable for investment securities purchased | | | 1,366 | | | | 1,678 | | | | 6,233 | |
Payable for fund shares redeemed | | | 17,367 | | | | 451 | | | | — | |
Management fee payable | | | 123 | | | | 144 | | | | 191 | |
Distribution and shareholder services fee payable | | | 35 | | | | 11 | | | | 295 | |
Dividend payable | | | — | | | | — | | | | 140 | |
Other accrued expenses | | | 47 | | | | 90 | | | | 143 | |
| | |
|
|
| |
|
|
| |
|
|
|
Total liabilities | | | 18,938 | | | | 2,374 | | | | 7,002 | |
| | |
|
|
| |
|
|
| |
|
|
|
Net Assets | | $ | 121,065 | | | $ | 309,667 | | | $ | 1,008,266 | |
| | |
|
|
| |
|
|
| |
|
|
|
Capital | | | | | | | | | | | | |
Composition of Net Assets | | | | | | | | | | | | |
Par value of shares of beneficial interest | | $ | 5 | | | $ | 31 | | | $ | 1,005 | |
Capital paid in excess of par value | | | 68,031 | | | | 322,421 | | | | 1,008,208 | |
Accumulated net investment income (loss) | | | (200 | ) | | | 1,062 | | | | 81 | |
Accumulated realized gain (loss) | | | 29,842 | | | | (14,724 | ) | | | (1,028 | ) |
Net unrealized appreciation (depreciation) of investments and foreign
currencies | | | 23,387 | | | | 877 | | | | — | |
| | |
|
|
| |
|
|
| |
|
|
|
Net Assets | | $ | 121,065 | | | $ | 309,667 | | | $ | 1,008,266 | |
| | |
|
|
| |
|
|
| |
|
|
|
| | | |
Class N Shares | | | | | | | | | | | | |
Net Assets | | $ | 20,122 | | | $ | 94,466 | | | $ | 1,008,266 | |
Shares Outstanding | | | 930,145 | | | | 9,357,076 | | | | 1,008,320,015 | |
Net Asset Value Per Share | | $ | 21.63 | | | $ | 10.10 | | | $ | 1.00 | |
Class I Shares | | | | | | | | | | | | |
Net Assets | | $ | 100,931 | | | $ | 215,196 | | | | | |
Shares Outstanding | | | 4,635,016 | | | | 21,391,195 | | | | | |
Net Asset Value Per Share | | $ | 21.78 | | | $ | 10.06 | | | | | |
See accompanying Notes to Financial Statements.
60 Semi-Annual Report | June 30, 2005 |
Statements of Operations
For the Period Ended June 30, 2005 (all dollar amounts in thousands) (unaudited)
| | | | | | | | | | | |
| | | Value
Discovery
Fund
| | | Income
Fund
| | | Ready
Reserves
Fund
|
Investment income | | | | | | | | | | | |
Dividends | | $ | 690 | | | $ | — | | | $ | — |
Income from Affiliated Fund | | | 19 | | | | — | | | | — |
Interest | | | 82 | | | | 7,140 | | | | 14,695 |
| | |
|
|
| |
|
|
| |
|
|
Total income | | | 791 | | | | 7,140 | | | | 14,695 |
Expenses | | | | | | | | | | | |
Investment advisory fees | | | 956 | | | | 718 | | | | 1,319 |
Distribution fees | | | 31 | | | | 66 | | | | — |
Shareholder services fees | | | — | | | | — | | | | 1,908 |
Custodian fees | | | 60 | | | | 45 | | | | 90 |
Transfer agent fees | | | 38 | | | | 48 | | | | 21 |
Professional fees | | | 18 | | | | 20 | | | | 35 |
Registration fees | | | 16 | | | | 16 | | | | 12 |
Other expenses | | | 26 | | | | 40 | | | | 103 |
| | |
|
|
| |
|
|
| |
|
|
Total expenses before waiver | | | 1,145 | | | | 953 | | | | 3,488 |
Less expenses waived or absorbed by the Advisor | | | (118 | ) | | | — | | | | — |
| | |
|
|
| |
|
|
| |
|
|
Net expenses | | | 1,027 | | | | 953 | | | | 3,488 |
| | |
|
|
| |
|
|
| |
|
|
Net investment income (loss) | | | (236 | ) | | | 6,187 | | | | 11,207 |
Net realized and unrealized gain (loss) on investments, foreign currency transactions and other assets and liabilities | | | | | | | | | | | |
Net realized gain (loss) on investments | | | 24,622 | | | | (528 | ) | | | — |
| | |
|
|
| |
|
|
| |
|
|
Change in net unrealized appreciation (depreciation) on investments and other assets and liabilities | | | (37,982 | ) | | | (1,472 | ) | | | — |
| | |
|
|
| |
|
|
| |
|
|
Net increase (decrease) in net assets resulting from operations | | $ | (13,596 | ) | | $ | 4,187 | | | $ | 11,207 |
| | |
|
|
| |
|
|
| |
|
|
See accompanying Notes to Financial Statements.
June 30, 2005 | William Blair Funds 61 |
Statements of Changes in Net Assets
For the Period Ended June 30, 2005 and the Year Ended December 31, 2004 (all amounts in thousands)
| | | | | | | | | | | | | | | | | | | | | | | | |
| | | Value
Discovery
Fund
| | | Income
Fund
| | | Ready
Reserves
Fund
| |
| | | 2005
| | | 2004
| | | 2005
| | | 2004
| | | 2005
| | | 2004
| |
| | | (unaudited) | | | | | | (unaudited) | | | | | | (unaudited) | | | | |
Operations | | | | | | | | | | | | | | | | | | | | | | | | |
Net investment income (loss) | | $ | (236 | ) | | $ | 84 | | | $ | 6,187 | | | $ | 11,549 | | | $ | 11,207 | | | $ | 8,967 | |
Net realized gain (loss) on investments, foreign currency transactions and other assets and
liabilities | | | 24,622 | | | | 26,728 | | | | (528 | ) | | | (1,841 | ) | | | — | | | | 13 | |
Change in net unrealized appreciation (depreciation) on investments, foreign currency
transactions and other assets and liabilities | | | (37,982 | ) | | | 240 | | | | (1,472 | ) | | | (2,534 | ) | | | — | | | | — | |
| | |
|
|
| |
|
|
| |
|
|
| |
|
|
| |
|
|
| |
|
|
|
Net increase (decrease) in net assets resulting from operations | | | (13,596 | ) | | | 27,052 | | | | 4,187 | | | | 7,174 | | | | 11,207 | | | | 8,980 | |
Distributions to shareholders from | | | | | | | | | | | | | | | | | | | | | | | | |
Net investment income | | | — | | | | — | | | | (6,786 | ) | | | (14,033 | ) | | | (11,207 | ) | | | (8,967 | ) |
Net realized gain | | | — | | | | (26,037 | ) | | | — | | | | — | | | | — | | | | — | |
| | |
|
|
| |
|
|
| |
|
|
| |
|
|
| |
|
|
| |
|
|
|
| | | | — | | | | (26,037 | ) | | | (6,786 | ) | | | (14,033 | ) | | | (11,207 | ) | | | (8,967 | ) |
Capital stock transactions | | | | | | | | | | | | | | | | | | | | | | | | |
Net proceeds from sale of shares | | | 13,670 | | | | 58,405 | | | | 52,801 | | | | 93,503 | | | | 595,486 | | | | 1,678,077 | |
Shares issued in reinvestment of income dividends and capital gain distributions | | | — | | | | 25,638 | | | | 5,244 | | | | 10,085 | | | | 11,161 | | | | 8,904 | |
Capital contribution by the Advisor | | | — | | | | — | | | | — | | | | — | | | | — | | | | 1,000 | |
Less cost of shares redeemed | | | (125,185 | ) | | | (75,993 | ) | | | (39,863 | ) | | | (67,707 | ) | | | (691,321 | ) | | | (1,748,986 | ) |
| | |
|
|
| |
|
|
| |
|
|
| |
|
|
| |
|
|
| |
|
|
|
Net increase (decrease) in net assets resulting from capital stock transactions | | | (111,515 | ) | | | 8,050 | | | | 18,182 | | | | 35,881 | | | | (84,674 | ) | | | (61,005 | ) |
| | |
|
|
| |
|
|
| |
|
|
| |
|
|
| |
|
|
| |
|
|
|
Increase (decrease) in net assets | | | (125,111 | ) | | | 9,065 | | | | 15,583 | | | | 29,022 | | | | (84,674 | ) | | | (60,992 | ) |
Net assets | | | | | | | | | | | | | | | | | | | | | | | | |
Beginning of period | | | 246,176 | | | | 237,111 | | | | 294,084 | | | | 265,062 | | | | 1,092,940 | | | | 1,153,932 | |
| | |
|
|
| |
|
|
| |
|
|
| |
|
|
| |
|
|
| |
|
|
|
End of period | | $ | 121,065 | | | $ | 246,176 | | | $ | 309,667 | | | $ | 294,084 | | | $ | 1,008,266 | | | $ | 1,092,940 | |
| | |
|
|
| |
|
|
| |
|
|
| |
|
|
| |
|
|
| |
|
|
|
Undistributed net investment income (loss) at the end of the period | | $ | (200 | ) | | $ | 36 | | | $ | 1,062 | | | $ | 173 | | | $ | 81 | | | $ | 81 | |
| | |
|
|
| |
|
|
| |
|
|
| |
|
|
| |
|
|
| |
|
|
|
See accompanying Notes to Financial Statements.
62 Semi-Annual Report | June 30, 2005 |
Notes to Financial Statements
(1) Significant Accounting Policies
(a) Description of the Fund
William Blair Funds (the “Fund”) is a diversified mutual fund registered under the Investment Company Act of 1940, as amended, as an open-end management investment company. For each portfolio, the number of shares authorized is unlimited. The Fund currently consists of the following thirteen portfolios (the “Portfolios”), each with its own investment objectives and policies.
| | |
Equity Portfolios
| | International Portfolios
|
Growth | | International Growth |
Tax-Managed Growth | | International Equity |
Large Cap Growth | | Institutional International Growth |
Small Cap Growth | | Institutional International Equity |
Small-Mid Cap Growth | | Emerging Markets Growth |
Value Discovery | | Fixed Income Portfolio
|
| | | Income |
| | | Money Market Portfolio
|
| | | Ready Reserves |
The investment objectives of the Portfolios are as follows:
| | |
Equity | | Long-term capital appreciation. |
International | | Long-term capital appreciation. |
Fixed Income | | High level of current income with relative stability of principal. |
Money Market | | Current income, a stable share price and daily liquidity. |
The Institutional International Growth Fund, the Institutional International Equity Fund and the Institutional Class of the Emerging Markets Growth Fund issue a separate report.
(b) Share Classes
Six different classes of shares currently exist: A, B, C, N, I and Institutional. This report includes financial highlight information for Classes N and I. The table below describes the Class N shares and the Class I shares covered by this report:
| | |
Class
| | Description
|
| N | | Class N shares are sold to the general public, either directly through the Fund’s distributor or through a select number of financial intermediaries. Class N shares are sold without any sales load, and carry an annual 12b-1 distribution fee (0.25% for the Equity and International Portfolios and 0.15% for the Fixed Income Portfolio) or a service fee (0.35% for the Money Market Portfolio), and a shareholder services fee (0.15% for the Emerging Markets Growth Portfolio). |
| I | | Class I shares are sold to a limited group of investors. They do not carry any sales load or distribution fees and generally have lower ongoing expenses than the other classes. Class I shares of the Emerging Markets Growth Portfolio carry an annual shareholder services fee of 0.15%. |
Investment income, realized and unrealized gains and losses, and certain portfolio level expenses and expense reductions, if any, are allocated based on the relative net assets of each class, except for certain class specific expenses which are charged directly to the appropriate class. Differences in class expenses may result in the payment of different per share dividends by class. All share classes of the Portfolios have equal rights with respect to voting subject to class specific arrangements.
(c) Investment Valuation
The market value of domestic equity securities and options is determined by valuing securities traded on national securities exchanges or markets or in the over-the-counter markets at the last sales price or, if applicable, the official closing price or, in the absence of a sale on the date of valuation, at the latest bid price.
June 30, 2005 | William Blair Funds 63 |
For international securities, if the foreign exchange or market on which a security is primarily traded closes before the close of regular trading on the New York Stock Exchange (4:00 p.m. Eastern time), the Funds use an independent pricing service on a daily basis to estimate the fair value price as of the close of regular trading on the New York Stock Exchange. The Board of Trustees has determined that the passage of time between when foreign exchanges or markets close and when the Funds calculate their net asset values could cause the value of international securities to no longer be representative of their market price or accurate. Otherwise, the value of foreign equity securities is determined based on the last sale price on the foreign exchange or market on which it is primarily traded or, if there have been no sales during that day, at the latest bid price. Foreign currency forward contracts and foreign currencies are valued at the forward and current exchange rates, respectively, prevailing on the date of valuation. In addition, quarterly the Board of Trustees receives a report which tracks the fair value prices used to calculate the net asset value to the next day’s opening local prices.
Long-term, fixed income securities are valued based on market quotations, or by independent pricing services that use prices provided by market makers or by estimates of market values obtained from yield data relating to instruments or securities with similar characteristics.
Investments in other funds are valued at the underlying fund’s net asset value on the date of valuation. Other securities, and all other assets, including securities for which a market price is not available, or the value of which is affected by a significant valuation event, are valued at fair value as determined in good faith by, or under the direction of the Board of Trustees and in accordance with the Fund’s valuation procedures. As of June 30, 2005, there were securities held in International Growth, International Equity, Emerging Markets Growth and Value Discovery Portfolios requiring fair valuation pursuant to the Fund’s valuation procedures. Short-term securities held in the Ready Reserves Fund are valued at amortized cost, which approximates market value.
(d) Investment income and investment transactions
Dividend income is recorded on the ex-dividend date, except for those dividends from certain foreign securities which are recorded as soon as the information is available.
Premiums and discounts are accreted and amortized on a straight-line basis for short-term investments and on an effective interest method for long-term investments.
Interest income is determined on the basis of the interest accrued, adjusted for amortization of premium or discount. Variable rate bonds and floating rate notes earn interest at coupon rates that fluctuate at specific time intervals. The interest rates shown in the Portfolio of Investments for the Income Portfolio and the Ready Reserves Portfolio were the rates in effect on June 30, 2005. Put bonds may be redeemed at the discretion of the holder on specified dates prior to maturity. The Portfolios utilize the straight-line method of amortization of premiums and discounts for short-term securities (maturities less than one year) and the effective interest method for long-term securities (maturities greater than one year).
Paydown gains and losses on mortgage and asset-backed securities are treated as an adjustment to interest income. For the period ended June 30, 2005, the Income Portfolio recognized a reduction of interest income and a reduction of net realized loss of $1,488 (in thousands). For the years ended December 31, 2004 and 2003, the Income Portfolio recognized a reduction in interest income and a reduction in net realized loss of $2,532 and $2,691 (in thousands), respectively. This reclassification has no effect on the net asset value of the Portfolio.
Securities transactions are recorded on the trade date. Realized gains and losses from securities transactions are recognized on the basis of high cost lot sell selection.
(e) Share Valuation and Dividends to Shareholders
Shares are sold and redeemed on a continuous basis at net asset value. The net asset value per share is determined separately for each class by dividing the Portfolio’s net assets attributable to that class by the number of shares of the class outstanding as of the close of regular trading on the New York Stock Exchange, which is generally 3:00 p.m. Central time (4:00 p.m. Eastern time), on each day the Exchange is open. Redemption fees may be applicable to redemptions within 60 days of purchase. The redemption fees collected by the Fund are netted against the amount of Redemptions for presentation on the Statement of Changes in Net Assets.
64 Semi-Annual Report | June 30, 2005 |
For the period ended June 30, 2005, the redemption fees collected by the Portfolios were as follows (in thousands):
| | | |
| | | Redemption Fees
|
Growth | | $ | 2 |
Tax-Managed Growth | | | — |
Large Cap Growth | | | — |
Small Cap Growth | | | 8 |
Small Mid-Cap Growth | | | — |
International Growth | | | 25 |
International Equity | | | — |
Emerging Markets Growth | | | — |
Value Discovery | | | 1 |
Income | | | 1 |
Dividends from net investment income, if any, of the Growth, Tax-Managed Growth, Large Cap Growth, Small Cap Growth, Small-Mid Cap Growth, International Growth, International Equity, Emerging Markets Growth and Value Discovery Portfolios are declared at least annually. Dividends from the Income and the Ready Reserves Portfolios are declared monthly and daily, respectively. Capital gain distributions, if any, are declared at least annually in December. Dividends payable to shareholders are recorded on the ex-dividend date.
The timing and characterization of certain income and capital gain distributions are determined annually in accordance with Federal income tax regulations that may differ from U.S. generally accepted accounting principles. As a result, net investment income or loss and net realized gain or loss for a reporting period may differ from the amount distributed during such period. In addition, the Portfolios may periodically record reclassifications among certain capital accounts to reflect differences between financial reporting and income tax basis distributions. The reclassifications were reported in order to reflect the tax treatment for certain permanent differences that exist between income tax regulations and U.S. generally accepted accounting principles. The reclassifications relate to net operating losses, Section 988 currency gains and losses, mortgage paydown securities gains and losses associated with securities issued before June 8, 1997 and recharacterization of dividends received from investments in REITs, expired capital loss carryforwards, and gain or loss on in-kind transactions. These reclassifications have no impact on the net asset values of the Portfolios. No data relating to these reclassifications is available for the Emerging Markets Growth Fund as it commenced operations on June 6, 2005. Accordingly, at December 31, 2004, the following reclassifications were recorded (in thousands):
| | | | | | | | | | | | |
Portfolio
| | Undistributed Net
Investment Income/(Loss)
| | | Accumulated
Undistributed
Net Realized Gain/(Loss)
| | | Capital
Paid In Excess
of Par Value
| |
Growth | | $ | 1,071 | | | $ | — | | | $ | (1,071 | ) |
Tax-Managed Growth | | | 41 | | | | — | | | | (41 | ) |
Large Cap Growth | | | 23 | | | | — | | | | (23 | ) |
Small Cap Growth | | | 7,267 | | | | (7,267 | ) | | | — | |
Small-Mid Cap Growth | | | 152 | | | | (75 | ) | | | (77 | ) |
International Growth | | | (9,697 | ) | | | 9,697 | | | | — | |
International Equity | | | (67 | ) | | | (658 | ) | | | 725 | |
Value Discovery | | | (48 | ) | | | 84 | | | | (36 | ) |
Income | | | 2,529 | | | | (369 | ) | | | (2,160 | ) |
Ready Reserves | | | — | | | | 108 | | | | (108 | ) |
June 30, 2005 | William Blair Funds 65 |
Distributions from net realized gains for book purposes may include short-term capital gains, which are included as ordinary income for tax purposes. The tax character of distributions paid during 2004 and 2003 was as follows (in thousands):
| | | | | | | | | | | | |
| | | Distributions Paid In 2004
| | Distributions Paid In 2003
|
Portfolio
| | Ordinary
Income
| | Long-Term
Capital Gains
| | Ordinary
Income
| | Long-Term
Capital Gains
|
Growth | | $ | — | | $ | — | | $ | — | | $ | — |
Tax-Managed Growth | | | — | | | — | | | — | | | — |
Large Cap Growth | | | — | | | — | | | — | | | — |
Small Cap Growth | | | 15,332 | | | 39,450 | | | 1,139 | | | 6,304 |
Small-Mid Cap Growth | | | — | | | — | | | — | | | — |
International Growth | | | 2,616 | | | — | | | 2,775 | | | — |
International Equity | | | — | | | — | | | — | | | — |
Value Discovery | | | — | | | — | | | — | | | — |
Income | | | 14,033 | | | — | | | 13,802 | | | — |
Ready Reserves | | | 8,967 | | | — | | | 8,301 | | | — |
As of December 31, 2004, the components of distributable earnings on a tax basis were as follows (in thousands):
| | | | | | | | | | | | |
Portfolio
| | Undistributed
Ordinary
Income
| | Accumulated
Capital and
Other
Losses
| | Undistributed
Long-Term
Gain
| | Net Unrealized
Appreciation / (Depreciation)
|
Growth | | $ | — | | $ | 16,820 | | $ | — | | $ | 67,205 |
Tax-Managed Growth | | | — | | | 1,886 | | | — | | | 1,410 |
Large Cap Growth | | | — | | | 5,421 | | | — | | | 1,082 |
Small Cap Growth | | | 8,679 | | | — | | | 14,322 | | | 153,719 |
Small-Mid Cap Growth | | | — | | | — | | | — | | | 2,304 |
International Growth | | | 1,313 | | | 5,866 | | | — | | | 753,758 |
International Equity | | | — | | | 72 | | | — | | | 402 |
Value Discovery | | | — | | | — | | | 6,625 | | | 59,999 |
Income | | | 173 | | | 12,623 | | | — | | | 2,262 |
Ready Reserves | | | 81 | | | 1,028 | | | — | | | — |
(f) Options
The Portfolios may engage in options transactions on security indices and other financial indices and in doing so achieve similar objectives to what they would achieve through the sale or purchase of options on individual securities or other instruments.
Option writing. When a Portfolio writes an option, an amount equal to the premium received by the Portfolio is recorded as a liability and is subsequently adjusted to the current fair value of the option written. Premiums received from writing options that expire unexercised are treated by the Portfolio on the expiration date as realized gains from investments. The difference between the premium and the amount paid on effecting a closing purchase transaction, including brokerage commissions, is also treated as a realized gain, or, if the premium is less than the amount paid for the closing purchase transaction, as a realized loss. If a call option is exercised, the premium is added to the proceeds from the sale of the underlying security or currency in determining whether the Portfolio has realized a gain or loss. If a put option is exercised, the premium reduces the cost basis of the securities purchased by the Portfolio. The Portfolio as writer of an option bears the market risk of an unfavorable change in the price of the security underlying the written option. There were no open options at June 30, 2005.
(g) Foreign Currency Translation and Forward Foreign Currency Contracts
The International Growth, International Equity and Emerging Markets Growth Portfolios may invest in securities denominated in foreign currencies. As such, assets and liabilities denominated in foreign currencies are translated into U.S. dollar amounts at the current exchange rate on the date of valuation. The Portfolios may enter into foreign currency forward contracts (1) as a means of managing the risks associated with changes in the exchange rates for the purchase or sale of a specific amount of a particular foreign currency, and (2) to hedge the value, in U.S. dollars, of portfolio securities. Gains and losses from foreign currency transactions associated with purchases and sales of investments and foreign currency forward contracts are included with the net realized and unrealized gain or loss on investments.
66 Semi-Annual Report | June 30, 2005 |
(h) Income Taxes
Each Portfolio intends to comply with the special provisions Subchapter M of the Internal Revenue Code available to regulated investment companies and, therefore, no provision for Federal income taxes has been made in the accompanying financial statements since each Portfolio intends to distribute substantially all of its taxable income to its shareholders and be relieved of all Federal income taxes.
The cost of investments for Federal income tax purposes and related gross unrealized appreciation/(depreciation) and net unrealized appreciation/(depreciation) at June 30, 2005, were as follows (in thousands):
| | | | | | | | | | | | |
Portfolio
| | Cost of
Investments
| | Gross Unrealized Appreciation
| | Gross Unrealized Depreciation
| | Net Unrealized
Appreciation / (Depreciation)
|
Growth | | $ | 193,796 | | $ | 55,695 | | $ | 5,890 | | $ | 49,805 |
Tax-Managed Growth | | | 4,646 | | | 1,520 | | | 148 | | | 1,372 |
Large Cap Growth | | | 8,222 | | | 1,123 | | | 202 | | | 921 |
Small Cap Growth | | | 586,762 | | | 136,116 | | | 29,670 | | | 106,446 |
Small-Mid Cap Growth | | | 51,231 | | | 4,205 | | | 1,067 | | | 3,138 |
International Growth | | | 2,640,019 | | | 690,894 | | | 43,586 | | | 647,308 |
International Equity | | | 22,415 | | | 952 | | | 310 | | | 642 |
Emerging Markets Growth | | | 12,579 | | | 369 | | | 88 | | | 281 |
Value Discovery | | | 117,081 | | | 24,505 | | | 4,715 | | | 19,790 |
Income | | | 307,429 | | | 3,902 | | | 3,120 | | | 782 |
Ready Reserves | | | 1,010,275 | | | — | | | — | | | — |
At December 31, 2004, the Portfolios have unused capital loss carryforwards available for Federal income tax purposes to be applied against future capital gains, if any. If not applied, the carryforwards will expire as follows (in thousands):
| | | | | | | | | | | | | | | | | | | | | | | | | | | |
Portfolio
| | 2005
| | 2006
| | 2007
| | 2008
| | 2009
| | 2010
| | 2011
| | 2012
| | Total
|
Growth | | $ | — | | $ | — | | $ | — | | $ | — | | $ | — | | $ | 14,788 | | $ | 2,032 | | $ | — | | $ | 16,820 |
Tax-Managed Growth | | | — | | | — | | | — | | | — | | | 381 | | | 1,037 | | | 468 | | | — | | | 1,886 |
Large Cap Growth | | | — | | | — | | | — | | | 356 | | | 2,714 | | | 1,582 | | | 769 | | | — | | | 5,421 |
Small Cap Growth | | | — | | | — | | | — | | | — | | | — | | | — | | | — | | | — | | | — |
Small-Mid Cap Growth | | | — | | | — | | | — | | | — | | | — | | | — | | | — | | | — | | | — |
International Growth | | | — | | | — | | | — | | | — | | | — | | | — | | | 5,866 | | | — | | | 5,866 |
International Equity | | | — | | | — | | | — | | | — | | | — | | | — | | | — | | | — | | | — |
Value Discovery | | | — | | | — | | | — | | | — | | | — | | | — | | | — | | | — | | | — |
Income | | | — | | | — | | | 1,249 | | | 3,292 | | | — | | | 1,692 | | | 1,582 | | | 4,808 | | | 12,623 |
Ready Reserves | | | 1 | | | 1 | | | 51 | | | 24 | | | — | | | 930 | | | — | | | 21 | | | 1,028 |
The International Growth and International Equity Portfolios have elected to mark-to-market its investments in Passive Foreign Investment Companies (“PFICs”) for Federal income tax purposes. In accordance with this election, the Portfolio recognized net unrealized appreciation (depreciation) of $15,094 and $6, respectively (in thousands) in 2004, all of which has been reclassified from unrealized gain (loss) on investments to undistributed net investment income.
June 30, 2005 | William Blair Funds 67 |
For the period November 1, 2004 through December 31, 2004, the following Portfolios incurred net realized capital or foreign currency losses. Each Portfolio intends to treat this loss as having occurred in fiscal year 2005 for Federal income tax purposes (in thousands):
| | | |
Portfolio
| | Amount
|
Growth | | $ | — |
Tax-Managed Growth | | | — |
Large Cap Growth | | | — |
Small Cap Growth | | | — |
Small-Mid Cap Growth | | | — |
International Growth | | | — |
International Equity | | | 72 |
Value Discovery | | | — |
Income | | | 376 |
Ready Reserves | | | — |
(i) Use of Estimates
The preparation of financial statements in conformity with U.S. generally accepted accounting principles requires management to make estimates and assumptions that affect the amounts reported in the financial statements. Actual results may differ from those estimates.
(2) Transactions with Affiliates
(a) Management and Expense Limitation Agreements
Each Portfolio has a management agreement with William Blair & Company L.L.C. (the “Company”) for investment advisory, administrative, and other accounting services. Each Portfolio pays the Company an annual fee, payable monthly, based on a specified percentage of its average daily net assets. A summary of the annual rates expressed as a percentage of average daily net assets is as follows:
| | | | | | | | |
Equity Portfolios
| | | | | International Portfolios
| | | |
Growth | | 0.75 | % | | International Growth and International Equity | | | |
Tax-Managed Growth | | 0.80 | % | | First $250 million | | 1.10 | % |
Large Cap Growth | | 0.80 | % | | In excess of $250 million | | 1.00 | % |
Small Cap Growth | | 1.10 | % | | Emerging Markets Growth | | 1.10 | % |
Small-Mid Cap Growth | | 1.00 | % | | | | | |
Value Discovery | | 1.15 | % | | | | | |
| | | |
Fixed Income Portfolio
| | | | | Money Market Portfolio
| | | |
Income* | | | | | Ready Reserves | | | |
First $250 million | | 0.25 | % | | First $250 million | | 0.275 | % |
In excess of $250 million | | 0.20 | % | | Next $250 million | | 0.250 | % |
*Management fee also includes a charge of 5% of gross income. | | | | | Next $2 billion In excess of $2.5 billion | | 0.225
0.200 | %
% |
| | | | | | | | |
68 Semi-Annual Report | June 30, 2005 |
Some of the Portfolios have also entered into Expense Limitation Agreements with the Company. Under the terms of these Agreements, the Company has agreed to waive its advisory fees and absorb other operating expenses through April 30, 2006, if total expenses for each class of the following Portfolios exceed the following rates (as a percentage of average daily net assets):
| | | | | | | | | | | | |
| | | Class N Shares
| | | Class I Shares
| |
| | | Through April 30, 2005
| | | Effective
May 1, 2005
| | | Through April 30, 2005
| | | Effective
May 1, 2005
| |
Tax-Managed Growth | | 1.54 | % | | 1.53 | % | | 1.29 | % | | 1.28 | % |
Large Cap Growth | | 1.34 | % | | 1.25 | % | | 1.09 | % | | 1.00 | % |
Small Cap Growth | | 1.53 | % | | 1.50 | % | | 1.40 | % | | 1.25 | % |
Small-Mid Cap Growth | | 1.54 | % | | 1.40 | % | | 1.29 | % | | 1.15 | % |
International Growth | | N/A | | | 1.48 | % | | N/A | | | 1.23 | % |
International Equity | | 1.50 | % | | 1.48 | % | | 1.25 | % | | 1.23 | % |
Emerging Markets Growth | | N/A | | | 1.65 | % | | N/A | | | 1.40 | % |
Value Discovery | | 1.34 | % | | 1.34 | % | | 1.25 | % | | 1.09 | % |
Income Fund | | N/A | | | 0.75 | % | | N/A | | | N/A | |
For a period of five years subsequent to the Commencement of Operations of each Fund, the Company is entitled to reimbursement from the Tax-Managed Growth, Large Cap Growth, and Small Cap Growth Portfolios for previously waived fees and expenses to the extent the overall expense ratio remains below the percentages indicated. As a result, the total expense ratio for the Portfolios during the period the agreement is in effect, will not fall below the percentages indicated. The Company’s right to be reimbursed under these agreements expired December 27, 2004. Under this provision, the Small Cap Growth Portfolio reimbursed the Advisor $164, and $186 for the years ended December 31, 2004 and 2003, respectively (in thousands).
For a period of three years subsequent to the Commencement of Operations of the Small-Mid Cap Growth, the International Equity and the Emerging Markets Growth Portfolios, the Company is entitled to reimbursement for previously waived fees and expenses to the extent the overall expense ratio remains below the percentages indicated. The total amount available for recapture at June 30, 2005 is $162 (in thousands) for the Small-Mid Cap Growth Portfolio, $150 for the International Equity Portfolio and $2 for the Emerging Markets Growth Portfolio.
For the period ended June 30, 2005, the investment advisory fees incurred by the Portfolios and related fee waivers were as follows (in thousands) :
| | | | | | | | | | | | |
Portfolio
| | Gross
Advisory Fee
| | Fee Waiver
| | Net
Advisory Fee
| | Additional Expenses
(Recovered) or
Absorbed
by Advisor
|
Growth | | $ | 924 | | $ | — | | $ | 924 | | $ | — |
Tax-Managed Growth | | | 21 | | | 21 | | | — | | | 12 |
Large Cap Growth | | | 28 | | | 28 | | | — | | | 17 |
Small Cap Growth | | | 3,877 | | | — | | | 3,877 | | | — |
Small-Mid Cap Growth | | | 193 | | | 29 | | | 164 | | | — |
International Growth | | | 15,582 | | | — | | | 15,582 | | | — |
International Equity | | | 74 | | | 74 | | | — | | | 14 |
Emerging Markets Growth | | | 8 | | | 2 | | | 6 | | | — |
Value Discovery | | | 956 | | | 104 | | | 852 | | | — |
Income | | | 718 | | | — | | | 718 | | | — |
Ready Reserves | | | 1,319 | | | — | | | 1,319 | | | — |
(b) Underwriting, Distribution Services and Service Agreement
Each Portfolio except Ready Reserves Portfolio has a Distribution Agreement with the Company for distribution services. Each Portfolio pays the Company an annual fee, payable monthly, based on a specified percentage of its average daily net assets of specified share classes. The annual rates expressed as a percentage of average daily net assets for Class N is 0.25% for all Portfolios except the Income Portfolio, which is 0.15%. Pursuant to the Distribution Agreement, the Company enters into related selling group agreements with various firms at various rates for sales of the Portfolios’ Class N shares.
June 30, 2005 | William Blair Funds 69 |
Distribution fees incurred by the Portfolios to the Company, for the period ended June 30, 2005, were as follows (in thousands):
| | | | | | | | | |
Portfolio
| | Gross Distribution Fees
| | Fee Waiver
| | Net Distribution Fee
|
Growth | | $ | 59 | | $ | — | | $ | 59 |
Tax-Managed Growth | | | — | | | — | | | — |
Large Cap Growth | | | 1 | | | — | | | 1 |
Small Cap Growth | | | 538 | | | — | | | 538 |
Small-Mid Cap Growth | | | 11 | | | — | | | 11 |
International Growth | | | 2,660 | | | — | | | 2,660 |
International Equity | | | 5 | | | — | | | 5 |
Emerging Markets Growth | | | — | | | — | | | — |
Value Discovery | | | 31 | | | 14 | | | 17 |
Income | | | 66 | | | — | | | 66 |
The Ready Reserves Portfolio has a Service Agreement with the Company to provide shareholder services and automatic sweep services. The Portfolio pays the Company an annual fee, payable monthly, based upon 0.35% of the average daily net assets of Class N. For the period ended June 30, 2005, the following fees were incurred (in thousands):
The Emerging Markets Growth Portfolio has a Shareholder Services Agreement with the Company to provide shareholder services. Class N and Class I shares of the Portfolio pay the Company an annual fee, payable monthly, based upon 0.15% of average daily net assets. For the six months ended June 30, 2005, the following fees were incurred (in thousands):
| | | |
Emerging Markets Growth | | $ | — |
(c) Trustees Fees
The Portfolios incurred fees of $150 (in thousands) to non-interested trustees of the Fund for the period ended June 30, 2005. Interested trustees are not compensated.
(d) Investments in Affiliated Portfolio
Pursuant to an Exemptive Order granted by the Securities and Exchange Commission in January, 2001, each of the Portfolios of the Fund may invest in the William Blair Ready Reserves Portfolio (“Ready Reserves”), an open-end money market portfolio managed by the Advisor. Ready Reserves Portfolio is used as a cash management option to the other Portfolios in the Fund. The Advisor waives management fees and shareholder service fees earned from the other Portfolios’ investment in the Ready Reserves Fund. The fees waived with respect to each Portfolio for the period ended June 30, 2005 are listed below. Distributions received from Ready Reserves are reflected as dividend income in each Portfolio’s statement of operations. Amounts relating to the Portfolios’ investments in Ready Reserves were as follows for the period ended June 30, 2005 (in thousands):
| | | | | | | | | | | | | | | | | | |
Portfolio
| | Purchases
| | Sales
Proceeds
| | Fees
Waived
| | Dividend
Income
| | Value
| | Percent
of Net
Assets
| |
Growth | | $ | 37,136 | | $ | 36,352 | | $ | 9 | | $ | 29 | | $ | 922 | | 0.4 | % |
Tax-Managed Growth | | | 989 | | | 859 | | | 1 | | | 2 | | | 177 | | 3.0 | |
Large Cap Growth | | | 3,869 | | | 3,716 | | | 1 | | | 3 | | | 330 | | 3.6 | |
Small Cap Growth | | | 54,115 | | | 69,721 | | | 28 | | | 92 | | | 6,243 | | 0.9 | |
Small-Mid Cap Growth | | | 13,806 | | | 13,558 | | | 5 | | | 18 | | | 1,224 | | 2.3 | |
International Growth | | | 75,134 | | | 95,000 | | | 82 | | | 282 | | | 20,000 | | 0.6 | |
International Equity | | | 5,219 | | | 4,749 | | | 1 | | | 5 | | | 689 | | 3.0 | |
Emerging Markets Growth | | | 1,578 | | | 1,320 | | | — | | | 1 | | | 258 | | 2.1 | |
Value Discovery | | | 28,680 | | | 34,522 | | | 6 | | | 19 | | | 1,059 | | 0.9 | |
(e) Capital Contribution to Affiliated Portfolio
In 2004, the Company voluntarily contributed $1 million dollars to the Ready Reserves Portfolio for which it did not receive any shares. This contribution is reflected on the Statement of Changes in Net Assets.
70 Semi-Annual Report | June 30, 2005 |
(3) Investment Transactions
Investment transactions, excluding money market instruments, for the period ended June 30, 2005 were as follows (in thousands):
| | | | | | |
Portfolio
| | Purchases
| | Sales
|
Growth | | $ | 68,434 | | $ | 100,054 |
Tax-Managed Growth | | | 708 | | | 954 |
Large Cap Growth | | | 4,374 | | | 1,775 |
Small Cap Growth | | | 228,045 | | | 252,489 |
Small-Mid Cap Growth | | | 37,760 | | | 12,008 |
International Growth | | | 1,464,858 | | | 1,216,867 |
International Equity | | | 17,389 | | | 5,274 |
Emerging Markets Growth | | | 11,977 | | | 624 |
Value Discovery | | | 104,961 | | | 197,508 |
Income | | | 85,169 | | | 61,944 |
(4) Foreign Currency Forward Contracts
To protect itself against a decline in the value of foreign currency against the U.S. dollar, the International Growth, International Equity and Emerging Markets Growth Portfolios enter into foreign currency forward contracts with its custodian and others. The Portfolios bear the market risk that arises from changes in foreign currency rates and bears the credit risk if the counterparty fails to perform under the contract. The net realized and unrealized gains and losses associated with foreign currency forward contracts are reflected in the accompanying financial statements. There were no open foreign currency forward contracts at June 30, 2005.
June 30, 2005 | William Blair Funds 71 |
(5) Fund Share Transactions
The following table summarizes the activity in capital shares of each Portfolio (in thousands):
| | | | | | | | | | | | | | | | | | | | | | | | |
| | | Sales (Dollars)
| |
| | | Period Ended June 30, 2005
| | | Year Ended December 31, 2004
| |
Portfolio
| | Class N
| | | Class I
| | | Total
| | | Class N
| | | Class I
| | | Total
| |
Growth | | $ | 4,343 | | | $ | 6,921 | | | $ | 11,264 | | | $ | 19,930 | | | $ | 15,264 | | | $ | 35,194 | |
Tax-Managed Growth | | | 30 | | | | 324 | | | | 354 | | | | — | | | | 246 | | | | 246 | |
Large Cap Growth | | | 1,119 | | | | 2,415 | | | | 3,534 | | | | 99 | | | | 1,556 | | | | 1,655 | |
Small Cap Growth | | | 82,912 | | | | 47,526 | | | | 130,438 | | | | 182,154 | | | | 77,876 | | | | 260,030 | |
Small Mid-Cap Growth | | | 3,296 | | | | 25,724 | | | | 29,020 | | | | 7,409 | | | | 13,822 | | | | 21,231 | |
International Growth | | | 389,848 | | | | 163,814 | | | | 553,662 | | | | 806,487 | | | | 336,908 | | | | 1,143,395 | |
International Equity (a) | | | 4,904 | | | | 9,163 | | | | 14,067 | | | | 1,729 | | | | 14,645 | | | | 16,374 | |
Emerging Markets Growth (b) | | | 1,063 | | | | 6,014 | | | | 7,077 | | | | — | | | | — | | | | — | |
Value Discovery | | | 1,016 | | | | 12,654 | | | | 13,670 | | | | 13,405 | | | | 45,000 | | | | 58,405 | |
Income (c) | | | 30,750 | | | | 22,051 | | | | 52,801 | | | | 50,605 | | | | 42,898 | | | | 93,503 | |
Ready Reserves | | | 595,486 | | | | — | | | | 595,486 | | | | 1,678,077 | | | | — | | | | 1,678,077 | |
| |
| | | Reinvested Distributions (Dollars)
| |
| | | Period Ended June 30, 2005
| | | Year Ended December 31, 2004
| |
Portfolio
| | Class N
| | | Class I
| | | Total
| | | Class N
| | | Class I
| | | Total
| |
Growth | | $ | — | | | $ | — | | | $ | — | | | $ | — | | | $ | — | | | $ | — | |
Tax-Managed Growth | | | — | | | | — | | | | — | | | | — | | | | — | | | | — | |
Large Cap Growth | | | — | | | | — | | | | — | | | | — | | | | — | | | | — | |
Small Cap Growth | | | — | | | | — | | | | — | | | | 33,424 | | | | 19,852 | | | | 53,276 | |
Small Mid-Cap Growth | | | — | | | | — | | | | — | | | | — | | | | — | | | | — | |
International Growth | | | — | | | | — | | | | — | | | | 497 | | | | 1,664 | | | | 2,161 | |
International Equity (a) | | | — | | | | — | | | | — | | | | — | | | | — | | | | — | |
Emerging Markets Growth (b) | | | — | | | | — | | | | — | | | | — | | | | — | | | | — | |
Value Discovery | | | — | | | | — | | | | — | | | | 3,559 | | | | 22,079 | | | | 25,638 | |
Income | | | 1,800 | | | | 3,444 | | | | 5,244 | | | | 2,575 | | | | 7,510 | | | | 10,085 | |
Ready Reserves | | | 11,161 | | | | — | | | | 11,161 | | | | 8,904 | | | | — | | | | 8,904 | |
| |
| | | Redemptions (Dollars)
| |
| | | Period Ended June 30, 2005
| | | Year Ended December 31, 2004
| |
Portfolio
| | Class N
| | | Class I
| | | Total
| | | Class N
| | | Class I
| | | Total
| |
Growth | | $ | 6,325 | | | $ | 32,792 | | | $ | 39,117 | | | $ | 15,081 | | | $ | 45,717 | | | $ | 60,798 | |
Tax-Managed Growth | | | — | | | | 381 | | | | 381 | | | | 41 | | | | 1,610 | | | | 1,651 | |
Large Cap Growth | | | 130 | | | | 574 | | | | 704 | | | | 134 | | | | 945 | | | | 1,079 | |
Small Cap Growth | | | 128,681 | | | | 38,667 | | | | 167,348 | | | | 128,696 | | | | 29,326 | | | | 158,022 | |
Small Mid-Cap Growth | | | 1,746 | | | | 244 | | | | 1,990 | | | | 924 | | | | 254 | | | | 1,178 | |
International Growth | | | 244,893 | | | | 60,242 | | | | 305,135 | | | | 409,543 | | | | 77,654 | | | | 487,197 | |
International Equity (a)(c) | | | 469 | | | | 164 | | | | 633 | | | | 1 | | | | 7,745 | | | | 7,746 | |
Emerging Markets Growth (b) | | | — | | | | 25 | | | | 25 | | | | — | | | | — | | | | — | |
Value Discovery | | | 13,285 | | | | 111,900 | | | | 125,185 | | | | 9,478 | | | | 66,515 | | | | 75,993 | |
Income | | | 19,310 | | | | 20,553 | | | | 39,863 | | | | 16,560 | | | | 51,147 | | | | 67,707 | |
Ready Reserves | | | 691,321 | | | | — | | | | 691,321 | | | | 1,748,986 | | | | — | | | | 1,748,986 | |
| |
| | | Net Change in Net Assets relating to Fund Share Activity (Dollars)
| |
| | | Period Ended June 30, 2005
| | | Year Ended December 31, 2004
| |
Portfolio
| | Class N
| | | Class I
| | | Total
| | | Class N
| | | Class I
| | | Total
| |
Growth | | $ | (1,982 | ) | | $ | (25,871 | ) | | $ | (27,853 | ) | | $ | 4,849 | | | $ | (30,453 | ) | | $ | (25,604 | ) |
Tax-Managed Growth | | | 30 | | | | (57 | ) | | | (27 | ) | | | (41 | ) | | | (1,364 | ) | | | (1,405 | ) |
Large Cap Growth | | | 989 | | | | 1,841 | | | | 2,830 | | | | (35 | ) | | | 611 | | | | 576 | |
Small Cap Growth | | | (45,769 | ) | | | 8,859 | | | | (36,910 | ) | | | 86,882 | | | | 68,402 | | | | 155,284 | |
Small Mid-Cap Growth | | | 1,550 | | | | 25,480 | | | | 27,030 | | | | 6,485 | | | | 13,568 | | | | 20,053 | |
International Growth | | | 144,955 | | | | 103,572 | | | | 248,527 | | | | 397,441 | | | | 260,918 | | | | 658,359 | |
International Equity (a) | | | 4,435 | | | | 8,999 | | | | 14,067 | | | | 1,728 | | | | 6,900 | | | | 8,628 | |
Emerging Markets Growth (b) | | | 1,063 | | | | 5,989 | | | | 7,077 | | | | — | | | | — | | | | — | |
Value Discovery | | | (12,269 | ) | | | (99,246 | ) | | | (111,515 | ) | | | 7,486 | | | | 564 | | | | 8,050 | |
Income | | | 13,240 | | | | 4,942 | | | | 18,182 | | | | 36,620 | | | | (739 | ) | | | 35,881 | |
Ready Reserves | | | (84,674 | ) | | | — | | | | (84,674 | ) | | | (62,005 | ) | | | — | | | | (62,005 | ) |
| (a) | | For the period from May 24, 2004 (Commencement of Operations) to December 31, 2004. |
| (b) | | For the period from June 6, 2005 (Commencement of Operations) to June 30, 2005. |
| (c) | | For 2004, the sales of Class I for Income Fund reflect two in-kind purchases totaling $1.4 million dollars. For 2004, the redemptions for Class I for International Equity Fund reflects an in-kind redemption of $7.7 million. This in-kind redemption resulted in a non-taxable gain of $739 (in thousands). |
72 Semi-Annual Report | June 30, 2005 |
| | | | | | | | | | | | | | | | | | |
| | | Sales (Shares)
| |
| | | Period Ended June 30, 2005
| | | Year Ended December 31, 2004
| |
Portfolio
| | Class N
| | | Class I
| | | Total
| | | Class N
| | | Class I
| | | Total
| |
Growth | | 419 | | | 659 | | | 1,078 | | | 2,031 | | | 1,516 | | | 3,547 | |
Tax-Managed Growth | | 3 | | | 36 | | | 39 | | | — | | | 29 | | | 29 | |
Large Cap Growth | | 183 | | | 391 | | | 574 | | | 16 | | | 259 | | | 275 | |
Small Cap Growth | | 3,404 | | | 1,916 | | | 5,320 | | | 7,573 | | | 3,260 | | | 10,833 | |
Small Mid-Cap Growth | | 301 | | | 2,371 | | | 2,672 | | | 714 | | | 1,328 | | | 2,042 | |
International Growth | | 17,731 | | | 7,367 | | | 25,098 | | | 41,858 | | | 17,229 | | | 59,087 | |
International Equity (a) | | 440 | | | 819 | | | 1,259 | | | 165 | | | 1,392 | | | 1,557 | |
Emerging Markets Growth (b) | | 106 | | | 600 | | | 706 | | | — | | | — | | | — | |
Value Discovery | | 48 | | | 597 | | | 645 | | | 576 | | | 1,900 | | | 2,476 | |
Income | | 3,044 | | | 2,190 | | | 5,234 | | | 4,919 | | | 4,171 | | | 9,090 | |
Ready Reserves | | 595,486 | | | — | | | 595,486 | | | 1,678,077 | | | — | | | 1,678,077 | |
| |
| | | Reinvested Distributions (Shares)
| |
| | | Period Ended June 30, 2005
| | | Year Ended December 31, 2004
| |
Portfolio
| | Class N
| | | Class I
| | | Total
| | | Class N
| | | Class I
| | | Total
| |
Growth | | — | | | — | | | — | | | — | | | — | | | — | |
Tax-Managed Growth | | — | | | — | | | — | | | — | | | — | | | — | |
Large Cap Growth | | — | | | — | | | — | | | — | | | — | | | — | |
Small Cap Growth | | — | | | — | | | — | | | 1,331 | | | 781 | | | 2,112 | |
Small Mid-Cap Growth | | — | | | — | | | — | | | — | | | — | | | — | |
International Growth | | — | | | — | | | — | | | 23 | | | 78 | | | 101 | |
International Equity (a) | | — | | | — | | | — | | | — | | | — | | | — | |
Emerging Markets Growth (b) | | — | | | — | | | — | | | — | | | — | | | — | |
Value Discovery | | — | | | — | | | — | | | 160 | | | 991 | | | 1,151 | |
Income | | 179 | | | 343 | | | 522 | | | 251 | | | 734 | | | 985 | |
Ready Reserves | | 11,161 | | | — | | | 11,161 | | | 8,904 | | | — | | | 8,904 | |
| |
| | | Redemptions (Shares)
| |
| | | Period Ended June 30, 2005
| | | Year Ended December 31, 2004
| |
Portfolio
| | Class N
| | | Class I
| | | Total
| | | Class N
| | | Class I
| | | Total
| |
Growth | | 610 | | | 3,127 | | | 3,737 | | | 1,529 | | | 4,528 | | | 6,057 | |
Tax-Managed Growth | | — | | | 43 | | | 43 | | | 5 | | | 190 | | | 195 | |
Large Cap Growth | | 21 | | | 94 | | | 115 | | | 22 | | | 158 | | | 180 | |
Small Cap Growth | | 5,345 | | | 1,616 | | | 6,961 | | | 5,546 | | | 1,239 | | | 6,785 | |
Small Mid-Cap Growth | | 160 | | | 23 | | | 183 | | | 86 | | | 26 | | | 112 | |
International Growth | | 11,164 | | | 2,706 | | | 13,870 | | | 21,332 | | | 4,005 | | | 25,337 | |
International Equity (a) | | 42 | | | 14 | | | 56 | | | — | | | 705 | | | 705 | |
Emerging Markets Growth (b) | | — | | | 2 | | | 2 | | | — | | | — | | | — | |
Value Discovery | | 623 | | | 5,253 | | | 5,876 | | | 408 | | | 2,844 | | | 3,252 | |
Income | | 1,913 | | | 2,039 | | | 3,952 | | | 1,614 | | | 4,985 | | | 6,599 | |
Ready Reserves | | 691,321 | | | — | | | 691,321 | | | 1,748,986 | | | — | | | 1,748,986 | |
| |
| | | Net Change in Shares Outstanding relating to Fund Share Activity (Shares)
| |
| | | Period Ended June 30, 2005
| | | Year Ended December 31, 2004
| |
Portfolio
| | Class N
| | | Class I
| | | Total
| | | Class N
| | | Class I
| | | Total
| |
Growth | | (191 | ) | | (2,468 | ) | | (2,659 | ) | | 502 | | | (3,012 | ) | | (2,510 | ) |
Tax-Managed Growth | | 3 | | | (7 | ) | | (4 | ) | | (5 | ) | | (161 | ) | | (166 | ) |
Large Cap Growth | | 162 | | | 297 | | | 459 | | | (6 | ) | | 101 | | | 95 | |
Small Cap Growth | | (1,941 | ) | | 300 | | | (1,641 | ) | | 3,358 | | | 2,802 | | | 6,160 | |
Small Mid-Cap Growth | | 141 | | | 2,348 | | | 2,489 | | | 628 | | | 1,302 | | | 1,930 | |
International Growth | | 6,567 | | | 4,661 | | | 11,228 | | | 20,549 | | | 13,302 | | | 33,851 | |
International Equity (a) | | 398 | | | 805 | | | 1,203 | | | 165 | | | 687 | | | 852 | |
Emerging Markets Growth (b) | | 106 | | | 598 | | | 704 | | | — | | | — | | | — | |
Value Discovery | | (575 | ) | | (4,656 | ) | | (5,231 | ) | | 328 | | | 47 | | | 375 | |
Income | | 1,310 | | | 494 | | | 1,804 | | | 3,556 | | | (80 | ) | | 3,476 | |
Ready Reserves | | (84,674 | ) | | — | | | (84,674 | ) | | (62,005 | ) | | — | | | (62,005 | ) |
| (a) | | For the period from May 24, 2004 (Commencement of Operations) to December 31, 2004. |
| (b) | | For the period from June 6, 2005 (Commencement of Operations) to June 30, 2005. |
June 30, 2005 | William Blair Funds 73 |
Financial Highlights
Growth Fund
| | | | | | | | | | | | | | | | | | | | | | | | |
| | | Class N
| |
| | | Period Ended
| | | Years Ended December 31,
| |
| | | 6/30/2005
| | | 2004
| | | 2003
| | | 2002
| | | 2001
| | | 2000
| |
| | | (unaudited) | | | | | | | | | | | | | | | | |
Net asset value, beginning of period | | $ | 10.70 | | | $ | 9.97 | | | $ | 8.06 | | | $ | 10.87 | | | $ | 12.73 | | | $ | 20.10 | |
Income (loss) from investment operations: | | | | | | | | | | | | | | | | | | | | | | | | |
Net investment income (loss) | | | (0.02 | ) | | | (0.06 | ) | | | (0.06 | ) | | | (0.07 | ) | | | (0.06 | ) | | | (0.06 | ) |
Net realized and unrealized gain (loss) on investments | | | (0.06 | ) | | | 0.79 | | | | 1.97 | | | | (2.74 | ) | | | (1.66 | ) | | | (1.52 | ) |
| | |
|
|
| |
|
|
| |
|
|
| |
|
|
| |
|
|
| |
|
|
|
Total from investment operations | | | (0.08 | ) | | | 0.73 | | | | 1.91 | | | | (2.81 | ) | | | (1.72 | ) | | | (1.58 | ) |
Less distributions from: | | | | | | | | | | | | | | | | | | | | | | | | |
Net investment income | | | — | | | | — | | | | — | | | | — | | | | — | | | | — | |
Net realized gain | | | — | | | | — | | | | — | | | | — | | | | 0.14 | | | | 5.79 | |
| | |
|
|
| |
|
|
| |
|
|
| |
|
|
| |
|
|
| |
|
|
|
Total distributions | | | — | | | | — | | | | — | | | | — | | | | 0.14 | | | | 5.79 | |
| | |
|
|
| |
|
|
| |
|
|
| |
|
|
| |
|
|
| |
|
|
|
Net asset value, end of period | | $ | 10.62 | | | $ | 10.70 | | | $ | 9.97 | | | $ | 8.06 | | | $ | 10.87 | | | $ | 12.73 | |
| | |
|
|
| |
|
|
| |
|
|
| |
|
|
| |
|
|
| |
|
|
|
Total return (%) | | | (0.75 | ) | | | 7.32 | | | | 23.70 | | | | (25.85 | ) | | | (13.53 | ) | | | (7.47 | ) |
Ratios to average daily net assets (%) (a): | | | | | | | | | | | | | | | | | | | | | | | | |
Expenses | | | 1.16 | | | | 1.17 | | | | 1.19 | | | | 1.19 | | | | 1.18 | | | | 1.13 | |
Net investment income (loss) | | | (0.44 | ) | | | (0.60 | ) | | | (0.67 | ) | | | (0.73 | ) | | | (0.57 | ) | | | (0.34 | ) |
| |
| | | Class I
| |
| | | Period Ended
| | | Years Ended December 31,
| |
| | | 6/30/2005
| | | 2004
| | | 2003
| | | 2002
| | | 2001
| | | 2000
| |
| | | (unaudited) | | | | | | | | | | | | | | | | |
Net asset value, beginning of period | | $ | 10.84 | | | $ | 10.08 | | | $ | 8.12 | | | $ | 10.93 | | | $ | 12.77 | | | $ | 20.10 | |
Income (loss) from investment operations: | | | | | | | | | | | | | | | | | | | | | | | | |
Net investment income (loss) | | | (0.01 | ) | | | (0.04 | ) | | | (0.04 | ) | | | (0.05 | ) | | | (0.04 | ) | | | (0.01 | ) |
Net realized and unrealized gain (loss) on investments | | | (0.05 | ) | | | 0.80 | | | | 2.00 | | | | (2.76 | ) | | | (1.66 | ) | | | (1.53 | ) |
| | |
|
|
| |
|
|
| |
|
|
| |
|
|
| |
|
|
| |
|
|
|
Total from investment operations | | | (0.06 | ) | | | 0.76 | | | | 1.96 | | | | (2.81 | ) | | | (1.70 | ) | | | (1.54 | ) |
Less distributions from: | | | | | | | | | | | | | | | | | | | | | | | | |
Net investment income | | | — | | | | — | | | | — | | | | — | | | | — | | | | — | |
Net realized gain | | | — | | | | — | | | | — | | | | — | | | | 0.14 | | | | 5.79 | |
| | |
|
|
| |
|
|
| |
|
|
| |
|
|
| |
|
|
| |
|
|
|
Total distributions | | | — | | | | — | | | | — | | | | — | | | | 0.14 | | | | 5.79 | |
| | |
|
|
| �� |
|
|
| |
|
|
| |
|
|
| |
|
|
| |
|
|
|
Net asset value, end of period | | $ | 10.78 | | | $ | 10.84 | | | $ | 10.08 | | | $ | 8.12 | | | $ | 10.93 | | | $ | 12.77 | |
| | |
|
|
| |
|
|
| |
|
|
| |
|
|
| |
|
|
| |
|
|
|
Total return (%) | | | (0.55 | ) | | | 7.54 | | | | 24.14 | | | | (25.71 | ) | | | (13.33 | ) | | | (7.27 | ) |
Ratios to average daily net assets (%) (a): | | | | | | | | | | | | | | | | | | | | | | | | |
Expenses | | | 0.91 | | | | 0.92 | | | | 0.94 | | | | 0.94 | | | | 0.93 | | | | 0.88 | |
Net investment income (loss) | | | (0.19 | ) | | | (0.35 | ) | | | (0.42 | ) | | | (0.48 | ) | | | (0.32 | ) | | | (0.06 | ) |
| | | | | | | | | | | | | | | | | | |
| | | Period Ended
| | Years Ended December 31,
|
| | | 6/30/2005
| | 2004
| | 2003
| | 2002
| | 2001
| | 2000
|
| | | (unaudited) | | | | | | | | | | |
Supplemental data for all classes: | | | | | | | | | | | | | | | | | | |
Net assets at end of period (in thousands) | | $ | 245,300 | | $ | 275,506 | | $ | 281,654 | | $ | 255,625 | | $ | 386,096 | | $ | 550,987 |
Portfolio turnover rate (%) (a) | | | 55 | | | 35 | | | 45 | | | 29 | | | 74 | | | 88 |
| (a) | | Rates are annualized for periods that are less than a year. |
Performance cited represents past performance. Past performance does not guarantee future results and current performance may be lower or higher than the data quoted. Results shown are annual returns, which assume reinvestment of dividends and capital gains. Investment returns and principal will fluctuate and you may have a gain or loss when you sell shares. For the most current month-end performance information, please call 1-800-742-7272, or visit our Web site at www.williamblairfunds.com.
Note: Net investment income (loss) per share is based on the average shares outstanding during the period.
74 Semi-Annual Report | June 30, 2005 |
Financial Highlights
Tax-Managed Growth Fund
| | | | | | | | | | | | | | | | | | | | | | | | |
| | | Class N
| |
| | | Period Ended
| | | Years Ended December 31,
| |
| | | 6/30/2005
| | | 2004
| | | 2003
| | | 2002
| | | 2001
| | | 2000
| |
| | | (unaudited) | | | | | | | | | | | | | | | | |
Net asset value, beginning of period | | $ | 8.99 | | | $ | 8.41 | | | $ | 6.86 | | | $ | 9.07 | | | $ | 10.08 | | | $ | 10.18 | |
Income (loss) from investment operations: | | | | | | | | | | | | | | | | | | | | | | | | |
Net investment income (loss) | | | (.03 | ) | | | (0.08 | ) | | | (0.07 | ) | | | (0.06 | ) | | | (0.05 | ) | | | (0.02 | ) |
Net realized and unrealized gain (loss) on investments | | | 0.12 | | | | 0.66 | | | | 1.62 | | | | (2.15 | ) | | | (0.96 | ) | | | (0.08 | ) |
| | |
|
|
| |
|
|
| |
|
|
| |
|
|
| |
|
|
| |
|
|
|
Total from investment operations | | | 0.09 | | | | 0.58 | | | | 1.55 | | | | (2.21 | ) | | | (1.01 | ) | | | (0.10 | ) |
Less distributions from: | | | | | | | | | | | | | | | | | | | | | | | | |
Net investment income | | | — | | | | — | | | | — | | | | — | | | | — | | | | — | |
Net realized gain | | | — | | | | — | | | | — | | | | — | | | | — | | | | — | |
| | |
|
|
| |
|
|
| |
|
|
| |
|
|
| |
|
|
| |
|
|
|
Total distributions | | | — | | | | — | | | | — | | | | — | | | | — | | | | — | |
| | |
|
|
| |
|
|
| |
|
|
| |
|
|
| |
|
|
| |
|
|
|
Net asset value, end of period | | $ | 9.08 | | | $ | 8.99 | | | $ | 8.41 | | | $ | 6.86 | | | $ | 9.07 | | | $ | 10.08 | |
| | |
|
|
| |
|
|
| |
|
|
| |
|
|
| |
|
|
| |
|
|
|
Total return (%) | | | 1.00 | | | | 6.90 | | | | 22.59 | | | | (24.37 | ) | | | (10.02 | ) | | | (0.98 | ) |
Ratios to average daily net assets (%) (a): | | | | | | | | | | | | | | | | | | | | | | | | |
Expenses, net of waivers and reimbursements | | | 1.54 | | | | 1.54 | | | | 1.49 | | | | 1.36 | | | | 1.36 | | | | 1.36 | |
Expenses, before waivers and reimbursements | | | 2.71 | | | | 2.26 | | | | 2.26 | | | | 2.22 | | | | 3.64 | | | | 11.34 | |
Net investment income (loss), net of waivers and reimbursements | | | (0.70 | ) | | | (0.92 | ) | | | (0.91 | ) | | | (0.72 | ) | | | (0.57 | ) | | | (0.15 | ) |
Net investment income (loss), before waivers and reimbursements | | | (1.84 | ) | | | (1.64 | ) | | | (1.68 | ) | | | (1.58 | ) | | | (2.85 | ) | | | (10.13 | ) |
| |
| | | Class I
| |
| | | Period Ended
| | | Years Ended December 31,
| |
| | | 6/30/2005
| | | 2004
| | | 2003
| | | 2002
| | | 2001
| | | 2000
| |
| | | (unaudited) | | | | | | | | | | | | | | | | |
Net asset value, beginning of period | | $ | 9.10 | | | $ | 8.50 | | | $ | 6.92 | | | $ | 9.12 | | | $ | 10.11 | | | $ | 10.18 | |
Income (loss) from investment operations: | | | | | | | | | | | | | | | | | | | | | | | | |
Net investment income (loss) | | | (0.02 | ) | | | (0.06 | ) | | | (0.05 | ) | | | (0.04 | ) | | | (0.03 | ) | | | — | |
Net realized and unrealized gain (loss) on investments | | | 0.13 | | | | 0.66 | | | | 1.63 | | | | (2.16 | ) | | | (0.96 | ) | | | (0.07 | ) |
| | |
|
|
| |
|
|
| |
|
|
| |
|
|
| |
|
|
| |
|
|
|
Total from investment operations | | | 0.11 | | | | 0.60 | | | | 1.58 | | | | (2.20 | ) | | | (0.99 | ) | | | (0.07 | ) |
Less distributions from: | | | | | | | | | | | | | | | | | | | | | | | | |
Net investment income | | | — | | | | — | | | | — | | | | — | | | | — | | | | — | |
Net realized gain | | | — | | | | — | | | | — | | | | — | | | | — | | | | — | |
| | |
|
|
| |
|
|
| |
|
|
| |
|
|
| |
|
|
| |
|
|
|
Total distributions | | | — | | | | — | | | | — | | | | — | | | | — | | | | — | |
| | |
|
|
| |
|
|
| |
|
|
| |
|
|
| |
|
|
| |
|
|
|
Net asset value, end of period | | $ | 9.21 | | | $ | 9.10 | | | $ | 8.50 | | | $ | 6.92 | | | $ | 9.12 | | | $ | 10.11 | |
| | |
|
|
| |
|
|
| |
|
|
| |
|
|
| |
|
|
| |
|
|
|
Total return (%) | | | 1.21 | | | | 7.06 | | | | 22.83 | | | | (24.12 | ) | | | (9.79 | ) | | | (0.69 | ) |
Ratios to average daily net assets (%) (a): | | | | | | | | | | | | | | | | | | | | | | | | |
Expenses, net of waivers and reimbursements | | | 1.29 | | | | 1.29 | | | | 1.24 | | | | 1.11 | | | | 1.11 | | | | 1.11 | |
Expenses, before waivers and reimbursements | | | 2.46 | | | | 2.01 | | | | 2.01 | | | | 1.97 | | | | 3.39 | | | | 11.09 | |
Net investment income (loss), net of waivers and reimbursements | | | (0.45 | ) | | | (0.67 | ) | | | (0.66 | ) | | | (0.47 | ) | | | (0.32 | ) | | | 0.05 | |
Net investment income (loss), before waivers and reimbursements | | | (1.62 | ) | | | (1.39 | ) | | | (1.43 | ) | | | (1.33 | ) | | | (2.60 | ) | | | (9.93 | ) |
| | | | | | | | | | | | | | | | | | |
| | | Period Ended
| | Years Ended December 31,
|
| | | 6/30/2005
| | 2004
| | 2003
| | 2002
| | 2001
| | 2000
|
| | | (unaudited) | | | | | | | | | | |
Supplemental data for all classes: | | | | | | | | | | | | | | | | | | |
Net assets at end of period (in thousands) | | $ | 5,884 | | $ | 5,847 | | $ | 6,871 | | $ | 5,303 | | $ | 7,211 | | $ | 5,001 |
Portfolio turnover rate (%) (a) | | | 26 | | | 31 | | | 37 | | | 44 | | | 37 | | | 32 |
| (a) | | Rates are annualized for periods that are less than a year. |
Performance cited represents past performance. Past performance does not guarantee future results and current performance may be lower or higher than the data quoted. Results shown are annual returns, which assume reinvestment of dividends and capital gains. Investment returns and principal will fluctuate and you may have a gain or loss when you sell shares. For the most current month-end performance information, please call 1-800-742-7272, or visit our Web site at www.williamblairfunds.com.
Note: Net investment income (loss) per share is based on the average shares outstanding during the period.
June 30, 2005 | William Blair Funds 75 |
Financial Highlights
Large Cap Growth Fund
| | | | | | | | | | | | | | | | | | | | | | | | |
| | | Class N
| |
| | | Period Ended
| | | Years Ended December 31,
| |
| | | 6/30/2005
| | | 2004
| | | 2003
| | | 2002
| | | 2001
| | | 2000
| |
| | | (unaudited) | | | | | | | | | | | | | | | | |
Net asset value, beginning of period | | $ | 6.24 | | | $ | 5.93 | | | $ | 4.80 | | | $ | 6.72 | | | $ | 8.45 | | | $ | 10.14 | |
Income (loss) from investment operations: | | | | | | | | | | | | | | | | | | | | | | | | |
Net investment income (loss) | | | — | | | | (0.04 | ) | | | (0.04 | ) | | | (0.04 | ) | | | (0.05 | ) | | | (0.05 | ) |
Net realized and unrealized gain (loss) on investments | | | (.11 | ) | | | 0.35 | | | | 1.17 | | | | (1.88 | ) | | | (1.68 | ) | | | (1.64 | ) |
| | |
|
|
| |
|
|
| |
|
|
| |
|
|
| |
|
|
| |
|
|
|
Total from investment operations | | | (.11 | ) | | | 0.31 | | | | 1.13 | | | | (1.92 | ) | | | (1.73 | ) | | | (1.69 | ) |
Less distributions from: | | | | | | | | | | | | | | | | | | | | | | | | |
Net investment income | | | — | | | | — | | | | — | | | | — | | | | — | | | | — | |
Net realized gain | | | — | | | | — | | | | — | | | | — | | | | — | | | | — | |
| | |
|
|
| |
|
|
| |
|
|
| |
|
|
| |
|
|
| |
|
|
|
Total distributions | | | — | | | | — | | | | — | | | | — | | | | — | | | | — | |
| | |
|
|
| |
|
|
| |
|
|
| |
|
|
| |
|
|
| |
|
|
|
Net asset value, end of period | | $ | 6.13 | | | $ | 6.24 | | | $ | 5.93 | | | $ | 4.80 | | | $ | 6.72 | | | $ | 8.45 | |
| | |
|
|
| |
|
|
| |
|
|
| |
|
|
| |
|
|
| |
|
|
|
Total return (%) | | | (1.76 | ) | | | 5.23 | | | | 23.54 | | | | (28.57 | ) | | | (20.47 | ) | | | (16.67 | ) |
Ratios to average daily net assets (%) (a): | | | | | | | | | | | | | | | | | | | | | | | | |
Expenses, net of waivers and reimbursements | | | 1.31 | | | | 1.38 | | | | 1.42 | | | | 1.36 | | | | 1.36 | | | | 1.36 | |
Expenses, before waivers and reimbursements | | | 2.64 | | | | 2.29 | | | | 2.39 | | | | 2.45 | | | | 3.01 | | | | 2.84 | |
Net investment income (loss), net of waivers and reimbursements | | | (0.20 | ) | | | (0.63 | ) | | | (0.76 | ) | | | (0.71 | ) | | | (0.79 | ) | | | (0.58 | ) |
Net investment income (loss), before waivers and reimbursements | | | (1.53 | ) | | | (1.54 | ) | | | (1.73 | ) | | | (1.80 | ) | | | (2.44 | ) | | | (2.06 | ) |
| |
| | | Class I
| |
| | | Period Ended
| | | Years Ended December 31,
| |
| | | 6/30/2005
| | | 2004
| | | 2003
| | | 2002
| | | 2001
| | | 2000
| |
| | | (unaudited) | | | | | | | | | | | | | | | | |
Net asset value, beginning of period | | $ | 6.31 | | | $ | 5.99 | | | $ | 4.82 | | | $ | 6.74 | | | $ | 8.47 | | | $ | 10.14 | |
Income (loss) from investment operations: | | | | | | | | | | | | | | | | | | | | | | | | |
Net investment income (loss) | | | — | | | | (0.02 | ) | | | (0.03 | ) | | | (0.03 | ) | | | (0.04 | ) | | | (0.04 | ) |
Net realized and unrealized gain (loss) on investments | | | (0.11 | ) | | | 0.34 | | | | 1.20 | | | | (1.89 | ) | | | (1.69 | ) | | | (1.63 | ) |
| | |
|
|
| |
|
|
| |
|
|
| |
|
|
| |
|
|
| |
|
|
|
Total from investment operations | | | (0.11 | ) | | | 0.32 | | | | 1.17 | | | | (1.92 | ) | | | (1.73 | ) | | | (1.67 | ) |
Less distributions from: | | | | | | | | | | | | | | | | | | | | | | | | |
Net investment income | | | — | | | | — | | | | — | | | | — | | | | — | | | | — | |
Net realized gain | | | — | | | | — | | | | — | | | | — | | | | — | | | | — | |
| | |
|
|
| |
|
|
| |
|
|
| |
|
|
| |
|
|
| |
|
|
|
Total distributions | | | — | | | | — | | | | — | | | | — | | | | — | | | | — | |
| | |
|
|
| |
|
|
| |
|
|
| |
|
|
| |
|
|
| |
|
|
|
Net asset value, end of period | | $ | 6.20 | | | $ | 6.31 | | | $ | 5.99 | | | $ | 4.82 | | | $ | 6.74 | | | $ | 8.47 | |
| | |
|
|
| |
|
|
| |
|
|
| |
|
|
| |
|
|
| |
|
|
|
Total return (%) | | | (1.74 | ) | | | 5.34 | | | | 24.27 | | | | (28.49 | ) | | | (20.43 | ) | | | (16.47 | ) |
Ratios to average daily net assets (%) (a): | | | | | | | | | | | | | | | | | | | | | | | | |
Expenses, net of waivers and reimbursements | | | 1.06 | | | | 1.13 | | | | 1.17 | | | | 1.11 | | | | 1.11 | | | | 1.11 | |
Expenses, before waivers and reimbursements | | | 2.39 | | | | 2.04 | | | | 2.14 | | | | 2.20 | | | | 2.76 | | | | 2.59 | |
Net investment income (loss), net of waivers and reimbursements | | | 0.05 | | | | (0.38 | ) | | | (0.51 | ) | | | (0.46 | ) | | | (0.54 | ) | | | (0.35 | ) |
Net investment income (loss), before waivers and reimbursements | | | (1.28 | ) | | | (1.29 | ) | | | (1.48 | ) | | | (1.55 | ) | | | (2.19 | ) | | | (1.83 | ) |
| | | | | | | | | | | | | | | | | | | | | | | | |
| | | Period Ended
| | | | | | | | Years Ended December 31,
|
| | | 6/30/2005
| | | | | | | | 2004
| | 2003
| | 2002
| | 2001
| | 2000
|
| | | (unaudited) | | | | | | | | | | | | | | | | |
Supplemental data for all classes: | | | | | | | | | | | | | | | | | | | | | | | | |
Net assets at end of period (in thousands) | | $ | 9,142 | | | | | | | | $ | 6,417 | | $ | 5,519 | | $ | 5,469 | | $ | 5,991 | | $ | 10,995 |
Portfolio turnover rate (%) (a) | | | 50 | | | | | | | | | 39 | | | 33 | | | 52 | | | 87 | | | 95 |
| (a) | | Rates are annualized for periods that are less than a year. |
Performance cited represents past performance. Past performance does not guarantee future results and current performance may be lower or higher than the data quoted. Results shown are annual returns, which assume reinvestment of dividends and capital gains. Investment returns and principal will fluctuate and you may have a gain or loss when you sell shares. For the most current month-end performance information, please call 1-800-742-7272, or visit our Web site at www.williamblairfunds.com.
Note: Net investment income (loss) per share is based on the average shares outstanding during the period.
76 Semi-Annual Report | June 30, 2005 |
Financial Highlights
Small Cap Growth Fund
| | | | | | | | | | | | | | | | | | | | | | | | |
| | | Class N
| |
| | | Period Ended
| | | Years Ended December 31,
| |
| | | 6/30/2005
| | | 2004
| | | 2003
| | | 2002
| | | 2001
| | | 2000
| |
| | | (unaudited) | | | | | | | | | | | | | | | | |
Net asset value, beginning of period | | $ | 25.72 | | | $ | 21.83 | | | $ | 13.72 | | | $ | 16.58 | | | $ | 13.16 | | | $ | 10.19 | |
Income (loss) from investment operations: | | | | | | | | | | | | | | | | | | | | | | | | |
Net investment income (loss) | | | (0.16 | ) | | | (0.30 | ) | | | (0.21 | ) | | | (0.19 | ) | | | (0.17 | ) | | | (0.11 | ) |
Net realized and unrealized gain (loss) on investments | | | (0.91 | ) | | | 6.20 | | | | 8.68 | | | | (2.67 | ) | | | 3.59 | | | | 3.51 | |
| | |
|
|
| |
|
|
| |
|
|
| |
|
|
| |
|
|
| |
|
|
|
Total from investment operations | | | (1.07 | ) | | | 5.90 | | | | 8.47 | | | | (2.86 | ) | | | 3.42 | | | | 3.40 | |
Less distributions from: | | | | | | | | | | | | | | | | | | | | | | | | |
Net investment income | | | — | | | | — | | | | — | | | | — | | | | — | | | | — | |
Net realized gain | | | — | | | | 2.01 | | | | 0.36 | | | | — | | | | — | | | | 0.43 | |
| | |
|
|
| |
|
|
| |
|
|
| |
|
|
| |
|
|
| |
|
|
|
Total distributions | | | — | | | | 2.01 | | | | 0.36 | | | | — | | | | — | | | | 0.43 | |
| | |
|
|
| |
|
|
| |
|
|
| |
|
|
| |
|
|
| |
|
|
|
Net asset value, end of period | | $ | 24.65 | | | $ | 25.72 | | | $ | 21.83 | | | $ | 13.72 | | | $ | 16.58 | | | $ | 13.16 | |
| | |
|
|
| |
|
|
| |
|
|
| |
|
|
| |
|
|
| |
|
|
|
Total return (%) | | | (4.16 | ) | | | 27.24 | | | | 61.88 | | | | (17.25 | ) | | | 25.99 | | | | 33.68 | |
Ratios to average daily net assets (%) (a): | | | | | | | | | | | | | | | | | | | | | | | | |
Expenses, net of waivers and reimbursements | | | 1.46 | | | | 1.49 | | | | 1.55 | | | | 1.56 | | | | 1.59 | | | | 1.60 | |
Expenses, before waivers and reimbursements | | | 1.46 | | | | 1.46 | | | | 1.52 | | | | 1.62 | | | | 1.95 | | | | 2.17 | |
Net investment income (loss), net of waivers and reimbursements | | | (1.29 | ) | | | (1.27 | ) | | | (1.22 | ) | | | (1.31 | ) | | | (1.15 | ) | | | (0.75 | ) |
Net investment income (loss), before waivers and reimbursements | | | (1.29 | ) | | | (1.24 | ) | | | (1.19 | ) | | | (1.37 | ) | | | (1.51 | ) | | | (1.32 | ) |
| |
| | | Class I
| |
| | | Period Ended
| | | Years Ended December 31,
| |
| | | 6/30/2005
| | | 2004
| | | 2003
| | | 2002
| | | 2001
| | | 2000
| |
| | | (unaudited) | | | | | | | | | | | | | | | | |
Net asset value, beginning of period | | $ | 26.04 | | | $ | 22.03 | | | $ | 13.82 | | | $ | 16.65 | | | $ | 13.18 | | | $ | 10.19 | |
Income (loss) from investment operations: | | | | | | | | | | | | | | | | | | | | | | | | |
Net investment income (loss) | | | (0.13 | ) | | | (0.24 | ) | | | (0.18 | ) | | | (0.16 | ) | | | (0.13 | ) | | | (0.11 | ) |
Net realized and unrealized gain (loss) on investments | | | (0.92 | ) | | | 6.26 | | | | 8.75 | | | | (2.67 | ) | | | 3.60 | | | | 3.53 | |
| | |
|
|
| |
|
|
| |
|
|
| |
|
|
| |
|
|
| |
|
|
|
Total from investment operations | | | (1.05 | ) | | | 6.02 | | | | 8.57 | | | | (2.83 | ) | | | 3.47 | | | | 3.42 | |
Less distributions from: | | | | | | | | | | | | | | | | | | | | | | | | |
Net investment income | | | — | | | | — | | | | — | | | | — | | | | — | | | | — | |
Net realized gain | | | — | | | | 2.01 | | | | 0.36 | | | | — | | | | — | | | | 0.43 | |
| | |
|
|
| |
|
|
| |
|
|
| |
|
|
| |
|
|
| |
|
|
|
Total distributions | | | — | | | | 2.01 | | | | 0.36 | | | | — | | | | — | | | | 0.43 | |
| | |
|
|
| |
|
|
| |
|
|
| |
|
|
| |
|
|
| |
|
|
|
Net asset value, end of period | | $ | 24.99 | | | $ | 26.04 | | | $ | 22.03 | | | $ | 13.82 | | | $ | 16.65 | | | $ | 13.18 | |
| | |
|
|
| |
|
|
| |
|
|
| |
|
|
| |
|
|
| |
|
|
|
Total return (%) | | | (4.03 | ) | | | 27.54 | | | | 62.15 | | | | (17.00 | ) | | | 26.33 | | | | 33.87 | |
Ratios to average daily net assets (%) (a): | | | | | | | | | | | | | | | | | | | | | | | | |
Expenses, net of waivers and reimbursements | | | 1.21 | | | | 1.24 | | | | 1.35 | | | | 1.31 | | | | 1.34 | | | | 1.35 | |
Expenses, before waivers and reimbursements | | | 1.21 | | | | 1.21 | | | | 1.28 | | | | 1.37 | | | | 1.70 | | | | 1.92 | |
Net investment income (loss), net of waivers and reimbursements | | | (1.04 | ) | | | (1.02 | ) | | | (1.02 | ) | | | (1.06 | ) | | | (0.90 | ) | | | (0.72 | ) |
Net investment income (loss), before waivers and reimbursements | | | (1.04 | ) | | | (0.99 | ) | | | (0.95 | ) | | | (1.12 | ) | | | (1.26 | ) | | | (1.29 | ) |
| | | | | | | | | | | | | | | | | | |
| | | Period Ended
| | Years Ended December 31,
|
| | | 6/30/2005
| | 2004
| | 2003
| | 2002
| | 2001
| | 2000
|
| | | (unaudited) | | | | | | | | | | |
Supplemental data for all classes: | | | | | | | | | | | | | | | | | | |
Net assets at end of period (in thousands) | | $ | 699,119 | | $ | 771,209 | | $ | 518,824 | | $ | 78,581 | | $ | 54,658 | | $ | 28,778 |
Portfolio turnover rate (%) (a) | | | 66 | | | 109 | | | 103 | | | 133 | | | 147 | | | 433 |
| (a) | | Rates are annualized for periods that are less than a year. |
Performance cited represents past performance. Past performance does not guarantee future results and current performance may be lower or higher than the data quoted. Results shown are annual returns, which assume reinvestment of dividends and capital gains. Investment returns and principal will fluctuate and you may have a gain or loss when you sell shares. For the most current month-end performance information, please call 1-800-742-7272, or visit our Web site at www.williamblairfunds.com.
Note: Net investment income (loss) per share is based on the average shares outstanding during the period.
June 30, 2005 | William Blair Funds 77 |
Financial Highlights
Small-Mid Cap Growth Fund
| | | | | | | | | | | | |
| | | Class N
| |
| | | Period Ended
| | | Years Ended December 31,
| |
| | | 6/30/2005
| | | 2004
| | | 2003 (a)
| |
| | | (unaudited) | | | | | | | |
Net asset value, beginning of period | | $ | 11.28 | | | $ | 9.94 | | | $ | 10.00 | |
Income (loss) from investment operations: | | | | | | | | | | | | |
Net investment income (loss) | | | (0.06 | ) | | | (0.13 | ) | | | — | |
Net realized and unrealized gain (loss) on investments | | | — | | | | 1.47 | | | | (0.06 | ) |
| | |
|
|
| |
|
|
| |
|
|
|
Total from investment operations | | | (0.06 | ) | | | 1.34 | | | | (0.06 | ) |
Less distributions from: | | | | | | | | | | | | |
Net investment income | | | — | | | | — | | | | — | |
Net realized gain | | | — | | | | — | | | | — | |
| | |
|
|
| |
|
|
| |
|
|
|
Total distributions | | | — | | | | — | | | | — | |
| | |
|
|
| |
|
|
| |
|
|
|
Net asset value, end of period | | $ | 11.22 | | | $ | 11.28 | | | $ | 9.94 | |
| | |
|
|
| |
|
|
| |
|
|
|
Total return (%) | | | (0.53 | ) | | | 13.48 | | | | (0.60 | ) |
Ratios to average daily net assets (%) (b): | | | | | | | | | | | | |
Expenses, net of waivers and reimbursements | | | 1.49 | | | | 1.54 | | | | 1.54 | |
Expenses, before waivers and reimbursements | | | 1.63 | | | | 2.14 | | | | 1.54 | |
Net investment income (loss), net of waivers and reimbursements | | | (1.05 | ) | | | (1.26 | ) | | | (1.54 | ) |
Net investment income (loss), before waivers and reimbursements | | | (1.19 | ) | | | (1.86 | ) | | | (1.54 | ) |
| |
| | | Class I
| |
| | | Period Ended
| | | Years Ended December 31,
| |
| | | 6/30/2005
| | | 2004
| | | 2003 (a)
| |
| | | (unaudited) | | | | | | | |
Net asset value, beginning of period | | $ | 11.30 | | | $ | 9.94 | | | $ | 10.00 | |
Income (loss) from investment operations: | | | | | | | | | | | | |
Net investment income (loss) | | | (0.04 | ) | | | (0.11 | ) | | | — | |
Net realized and unrealized gain (loss) on investments | | | — | | | | 1.47 | | | | (0.06 | ) |
| | |
|
|
| |
|
|
| |
|
|
|
Total from investment operations | | | (0.04 | ) | | | 1.36 | | | | (0.06 | ) |
Less distributions from: | | | | | | | | | | | | |
Net investment income | | | — | | | | — | | | | — | |
Net realized gain | | | — | | | | — | | | | — | |
| | |
|
|
| |
|
|
| |
|
|
|
Total distributions | | | — | | | | — | | | | — | |
| | |
|
|
| |
|
|
| |
|
|
|
Net asset value, end of period | | $ | 11.26 | | | $ | 11.30 | | | $ | 9.94 | |
| | |
|
|
| |
|
|
| |
|
|
|
Total return (%) | | | (0.35 | ) | | | 13.68 | | | | (0.60 | ) |
Ratios to average daily net assets (%) (b): | | | | | | | | | | | | |
Expenses, net of waivers and reimbursements | | | 1.24 | | | | 1.29 | | | | 1.29 | |
Expenses, before waivers and reimbursements | | | 1.38 | | | | 1.89 | | | | 1.29 | |
Net investment income (loss), net of waivers and reimbursements | | | (0.80 | ) | | | (1.01 | ) | | | (1.29 | ) |
Net investment income (loss), before waivers and reimbursements | | | (0.94 | ) | | | (1.61 | ) | | | (1.29 | ) |
| | | | | | | | | |
| | | Period Ended
| | Years Ended December 31,
|
| | | 6/30/2005
| | 2004
| | 2003
|
| | | (unaudited) | | | | |
Supplemental data for all classes: | | | | | | | | | |
Net assets at end of period (in thousands) | | $ | 53,881 | | $ | 25,974 | | $ | 3,673 |
Portfolio turnover rate (%) (b) | | | 63 | | | 55 | | | — |
| (a) | | For the period from December 29, 2003 (Commencement of Operations) to December 31, 2003. |
| (b) | | Rates are annualized for periods that are less than a year. |
Performance cited represents past performance. Past performance does not guarantee future results and current performance may be lower or higher than the data quoted. Results shown are annual returns, which assume reinvestment of dividends and capital gains. Investment returns and principal will fluctuate and you may have a gain or loss when you sell shares. For the most current month-end performance information, please call 1-800-742-7272, or visit our Web site at www.williamblairfunds.com.
Note: Net investment income (loss) per share is based on the average shares outstanding during the period.
78 Semi-Annual Report | June 30, 2005 |
Financial Highlights
International Growth Fund
| | | | | | | | | | | | | | | | | | | | | | |
| | | Class N
| |
| | | Period Ended
| | Years Ended December 31,
| |
| | | 6/30/2005
| | 2004
| | | 2003
| | 2002
| | | 2001
| | | 2000
| |
| | | (unaudited) | | | | | | | | | | | | | | |
Net asset value, beginning of period | | $ | 22.09 | | $ | 18.65 | | | $ | 13.13 | | $ | 15.48 | | | $ | 17.93 | | | $ | 24.03 | |
Income (loss) from investment operations: | | | | | | | | | | | | | | | | | | | | | | |
Net investment income (loss) (a) | | | 0.10 | | | (0.02 | ) | | | 0.02 | | | (0.05 | ) | | | (0.02 | ) | | | (0.01 | ) |
Net realized and unrealized gain (loss) on investments | | | 0.23 | | | 3.47 | | | | 5.52 | | | (2.30 | ) | | | (2.43 | ) | | | (2.04 | ) |
| | |
|
| |
|
|
| |
|
| |
|
|
| |
|
|
| |
|
|
|
Total from investment operations | | | 0.33 | | | 3.45 | | | | 5.54 | | | (2.35 | ) | | | (2.45 | ) | | | (2.05 | ) |
Less distributions from: | | | | | | | | | | | | | | | | | | | | | | |
Net investment income | | | — | | | 0.01 | | | | 0.02 | | | — | | | | — | | | | 0.08 | |
Net realized gain | | | — | | | — | | | | — | | | — | | | | — | | | | 3.97 | |
| | |
|
| |
|
|
| |
|
| |
|
|
| |
|
|
| |
|
|
|
Total distributions | | | — | | | 0.01 | | | | 0.02 | | | — | | | | — | | | | 4.05 | |
| | |
|
| |
|
|
| |
|
| |
|
|
| |
|
|
| |
|
|
|
Net asset value, end of period | | $ | 22.42 | | $ | 22.09 | | | $ | 18.65 | | $ | 13.13 | | | $ | 15.48 | | | $ | 17.93 | |
| | |
|
| |
|
|
| |
|
| |
|
|
| |
|
|
| |
|
|
|
Total return (%) | | | 1.49 | | | 18.48 | | | | 42.21 | | | (15.18 | ) | | | (13.66 | ) | | | (8.10 | ) |
Ratios to average daily net assets (%) (b): | | | | | | | | | | | | | | | | | | | | | | |
Expenses | | | 1.40 | | | 1.47 | | | | 1.50 | | | 1.51 | | | | 1.60 | | | | 1.59 | |
Net investment income (loss) | | | 0.95 | | | (0.16 | ) | | | 0.05 | | | (0.36 | ) | | | (0.11 | ) | | | (0.44 | ) |
| |
| | | Class I
| |
| | | Period Ended
| | Years Ended December 31,
| |
| | | 6/30/2005
| | 2004
| | | 2003
| | 2002
| | | 2001
| | | 2000
| |
| | | (unaudited) | | | | | | | | | | | | | | |
Net asset value, beginning of period | | $ | 22.34 | | $ | 18.85 | | | $ | 13.27 | | $ | 15.60 | | | $ | 18.02 | | | $ | 24.03 | |
Income (loss) from investment operations: | | | | | | | | | | | | | | | | | | | | | | |
Net investment income (loss) (a) | | | 0.14 | | | 0.01 | | | | 0.09 | | | (0.01 | ) | | | 0.02 | | | | 0.03 | |
Net realized and unrealized gain (loss) on investments | | | 0.22 | | | 3.53 | | | | 5.54 | | | (2.32 | ) | | | (2.44 | ) | | | (2.03 | ) |
| | |
|
| |
|
|
| |
|
| |
|
|
| |
|
|
| |
|
|
|
Total from investment operations | | | 0.36 | | | 3.54 | | | | 5.63 | | | (2.33 | ) | | | (2.42 | ) | | | (2.00 | ) |
Less distributions from: | | | | | | | | | | | | | | | | | | | | | | |
Net investment income | | | — | | | 0.05 | | | | 0.05 | | | — | | | | — | | | | 0.04 | |
Net realized gain | | | — | | | — | | | | — | | | — | | | | — | | | | 3.97 | |
| | |
|
| |
|
|
| |
|
| |
|
|
| |
|
|
| |
|
|
|
Total distributions | | | — | | | 0.05 | | | | 0.05 | | | — | | | | — | | | | 4.01 | |
| | |
|
| |
|
|
| |
|
| |
|
|
| |
|
|
| |
|
|
|
Net asset value, end of period | | $ | 22.70 | | $ | 22.34 | | | $ | 18.85 | | $ | 13.27 | | | $ | 15.60 | | | $ | 18.02 | |
| | |
|
| |
|
|
| |
|
| |
|
|
| |
|
|
| |
|
|
|
Total return (%) | | | 1.61 | | | 18.79 | | | | 42.42 | | | (14.94 | ) | | | (13.43 | ) | | | (7.87 | ) |
Ratios to average daily net assets (%) (b): | | | | | | | | | | | | | | | | | | | | | | |
Expenses | | | 1.15 | | | 1.22 | | | | 1.25 | | | 1.26 | | | | 1.35 | | | | 1.34 | |
Net investment income (loss) | | | 1.20 | | | 0.09 | | | | 0.30 | | | (0.11 | ) | | | 0.14 | | | | (0.16 | ) |
| |
| | |
| |
| | | Period Ended
| | Years Ended December 31,
| |
| | | 6/30/2005
| | 2004
| | | 2003
| | 2002
| | | 2001
| | | 2000
| |
| | | (unaudited) | | | | | | | | | | | | | | |
Supplemental data for all classes: | | | | | | | | | | | | | | | | | | | | | | |
Net assets at end of period (in thousands) | | $ | 3,300,600 | | $ | 3,001,434 | | | $ | 1,899,699 | | $ | 778,788 | | | $ | 454,055 | | | $ | 333,888 | |
Portfolio turnover rate (%) (b) | | | 80 | | | 79 | | | | 57 | | | 73 | | | | 112 | | | | 116 | |
| (a) | | Includes $0.12, $0.03, $0.00, $0.00, and $0.06 in PFIC transactions which are treated as ordinary income for Federal tax purposes for the years 2004, 2003, 2002, 2001, and 2000, respectively. |
| (b) | | Rates are annualized for periods that are less than a year. |
Performance cited represents past performance. Past performance does not guarantee future results and current performance may be lower or higher than the data quoted. Results shown are annual returns, which assume reinvestment of dividends and capital gains. Investment returns and principal will fluctuate and you may have a gain or loss when you sell shares. For the most current month-end performance information, please call 1-800-742-7272, or visit our Web site at www.williamblairfunds.com.
Note: Net investment income (loss) per share is based on the average shares outstanding during the period.
June 30, 2005 | William Blair Funds 79 |
Financial Highlights
International Equity Fund
| | | | | | | | |
| | | Class N
| |
| | | Period Ended
| |
| | | 6/30/2005
| | | December 31, 2004 (a)
| |
| | | (unaudited) | | | | |
Net asset value, beginning of period | | $ | 11.33 | | | $ | 10.00 | |
Income (loss) from investment operations: | | | | | | | | |
Net investment income (loss) | | | 0.06 | | | | (0.04 | ) |
Net realized and unrealized gain (loss) on investments | | | (0.19 | ) | | | 1.37 | |
| | |
|
|
| |
|
|
|
Total from investment operations | | | (0.12 | ) | | | 1.33 | |
Less distributions from: | | | | | | | | |
Net investment income | | | — | | | | — | |
Net realized gain | | | — | | | | — | |
| | |
|
|
| |
|
|
|
Total distributions | | | — | | | | — | |
| | |
|
|
| |
|
|
|
Net asset value, end of period | | $ | 11.20 | | | $ | 11.33 | |
| | |
|
|
| |
|
|
|
Total return (%) | | | (1.15 | ) | | | 13.30 | |
Ratios to average daily net assets (%) (b): | | | | | | | | |
Expenses, net of waivers and reimbursements | | | 1.49 | | | | 1.50 | |
Expenses, before waivers and reimbursements | | | 2.98 | | | | 2.96 | |
Net investment income (loss), net of waivers and reimbursements | | | 0.90 | | | | (0.77 | ) |
Net investment income (loss), before waivers and reimbursements | | | (0.59 | ) | | | (2.23 | ) |
| |
| | | Class I
| |
| | | Period Ended
| |
| | | 6/30/2005
| | | December 31, 2004 (a)
| |
| | | (unaudited) | | | | |
Net asset value, beginning of period | | $ | 11.37 | | | $ | 10.00 | |
Income (loss) from investment operations: | | | | | | | | |
Net investment income (loss) | | | 0.06 | | | | (0.01 | ) |
Net realized and unrealized gain (loss) on investments | | | (0.18 | ) | | | 1.38 | |
| | |
|
|
| |
|
|
|
Total from investment operations | | | (0.12 | ) | | | 1.37 | |
Less distributions from: | | | | | | | | |
Net investment income | | | — | | | | — | |
Net realized gain | | | — | | | | — | |
| | |
|
|
| |
|
|
|
Total distributions | | | — | | | | — | |
| | |
|
|
| |
|
|
|
Net asset value, end of period | | $ | 11.25 | | | $ | 11.37 | |
| | |
|
|
| |
|
|
|
Total return (%) | | | (1.06 | ) | | | 13.70 | |
Ratios to average daily net assets (%) (b): | | | | | | | | |
Expenses, net of waivers and reimbursements | | | 1.24 | | | | 1.25 | |
Expenses, before waivers and reimbursements | | | 2.73 | | | | 2.71 | |
Net investment income (loss), net of waivers and reimbursements | | | 1.15 | | | | (0.52 | ) |
Net investment income (loss), before waivers and reimbursements | | | (0.34 | ) | | | (1.98 | ) |
| | | | | | |
| | |
|
| | | Period Ended
|
| | | 6/30/2005
| | 12/31/2004
|
| | | (unaudited) | | |
Supplemental data for all classes: | | | | | | |
Net assets at end of period (in thousands) | | $ | 23,104 | | $ | 9,689 |
Portfolio turnover rate (%) (b) | | | 81 | | | 108 |
| (a) | | For the period from May 24, 2004 (Commencement of Operations) to December 31, 2004. |
| (b) | | Rates are annualized for periods that are less than a year. |
Performance cited represents past performance. Past performance does not guarantee future results and current performance may be lower or higher than the data quoted. Results shown are annual returns, which assume reinvestment of dividends and capital gains. Investment returns and principal will fluctuate and you may have a gain or loss when you sell shares. For the most current month-end performance information, please call 1-800-742-7272, or visit our Web site at www.williamblairfunds.com.
Note: Net investment income (loss) per share is based on the average shares outstanding during the period.
80 Semi-Annual Report | June 30, 2005 |
Financial Highlights
Emerging Markets Growth Fund
| | | |
| | | Class N
|
| | | Period Ended
|
| | | 6/30/2005
|
| | | (unaudited) |
Net asset value, beginning of period | | $ | 10.00 |
Income (loss) from investment operations: | | | |
Net investment income (loss) | | | 0.04 |
Net realized and unrealized gain (loss) on investments | | | 0.22 |
| | |
|
|
Total from investment operations | | | 0.26 |
Less distributions from: | | | |
Net investment income | | | — |
Net realized gain | | | — |
| | |
|
|
Total distributions | | | — |
| | |
|
|
Net asset value, end of period | | $ | 10.26 |
| | |
|
|
Total return (%) | | | 2.60 |
Ratios to average daily net assets (%) (b): | | | |
Expenses, net of waivers and reimbursements | | | 1.65 |
Expenses, before waivers and reimbursements | | | 1.98 |
Net investment income (loss), net of waivers and reimbursements | | | 3.40 |
Net investment income (loss), before waivers and reimbursements | | | 3.07 |
| |
| | | Class I
|
| | | Period Ended
|
| | | 6/30/2005
|
| | | (unaudited) |
Net asset value, beginning of period | | $ | 10.00 |
Income (loss) from investment operations: | | | |
Net investment income (loss) | | | 0.04 |
Net realized and unrealized gain (loss) on investments | | | 0.22 |
| | |
|
|
Total from investment operations | | | 0.26 |
Less distributions from: | | | |
Net investment income | | | — |
Net realized gain | | | — |
| | |
|
|
Total distributions | | | — |
| | |
|
|
Net asset value, end of period | | $ | 10.26 |
| | |
|
|
Total return (%) | | | 2.60 |
Ratios to average daily net assets (%) (b): | | | |
Expenses, net of waivers and reimbursements | | | 1.40 |
Expenses, before waivers and reimbursements | | | 1.73 |
Net investment income (loss), net of waivers and reimbursements | | | 3.65 |
Net investment income (loss), before waivers and reimbursements | | | 3.32 |
| | | |
| | |
|
| | | Period Ended
|
| | | 6/30/2005
|
| | | (unaudited) |
Supplemental data for all classes: | | | |
Net assets at end of period (in thousands) | | $ | 12,356 |
Portfolio turnover rate (%) (b) | | | 163 |
| (a) | | For the period from June 6, 2005 (Commencement of Operations) to June 30, 2005. |
| (b) | | Rates are annualized for periods that are less than a year. |
Performance cited represents past performance. Past performance does not guarantee future results and current performance may be lower or higher than the data quoted. Results shown are annual returns, which assume reinvestment of dividends and capital gains. Investment returns and principal will fluctuate and you may have a gain or loss when you sell shares. For the most current month-end performance information, please call 1-800-742-7272, or visit our Web site at www.williamblairfunds.com.
Note: Net investment income (loss) per share is based on the average shares outstanding during the period.
June 30, 2005 | William Blair Funds 81 |
Financial Highlights
Value Discovery Fund
| | | | | | | | | | | | | | | | | | | | | | |
| | | Class N
|
| | | Period Ended
| | | Years Ended December 31,
|
| | | 6/30/2005
| | | 2004
| | | 2003
| | | 2002
| | | 2001
| | 2000
|
| | | (unaudited) | | | | | | | | | | | | | | |
Net asset value, beginning of period | | $ | 22.70 | | | $ | 22.68 | | | $ | 16.28 | | | $ | 18.23 | | | $ | 16.20 | | $ | 13.66 |
Income (loss) from investment operations: | | | | | | | | | | | | | | | | | | | | | | |
Net investment income (loss) | | | (0.04 | ) | | | (0.01 | ) | | | (0.06 | ) | | | (0.03 | ) | | | 0.08 | | | 0.05 |
Net realized and unrealized gain (loss) on investments | | | (1.03 | ) | | | 2.68 | | | | 6.46 | | | | (1.92 | ) | | | 2.74 | | | 2.52 |
| | |
|
|
| |
|
|
| |
|
|
| |
|
|
| |
|
| |
|
|
Total from investment operations | | | (1.07 | ) | | | 2.67 | | | | 6.40 | | | | (1.95 | ) | | | 2.82 | | | 2.57 |
Less distributions from: | | | | | | | | | | | | | | | | | | | | | | |
Net investment income | | | — | | | | — | | | | — | | | | — | | | | 0.03 | | | 0.03 |
Net realized gain | | | — | | | | 2.65 | | | | — | | | | — | | | | 0.76 | | | — |
| | |
|
|
| |
|
|
| |
|
|
| |
|
|
| |
|
| |
|
|
Total distributions | | | — | | | | 2.65 | | | | — | | | | — | | | | 0.79 | | | 0.03 |
| | |
|
|
| |
|
|
| |
|
|
| |
|
|
| |
|
| |
|
|
Net asset value, end of period | | $ | 21.63 | | | $ | 22.70 | | | $ | 22.68 | | | $ | 16.28 | | | $ | 18.23 | | $ | 16.20 |
| | |
|
|
| |
|
|
| |
|
|
| |
|
|
| |
|
| |
|
|
Total return (%) | | | (4.67 | ) | | | 12.05 | | | | 39.31 | | | | (10.70 | ) | | | 17.39 | | | 18.85 |
Ratios to average daily net assets (%) (a): | | | | | | | | | | | | | | | | | | | | | | |
Expenses, net of waivers and reimbursements | | | 1.34 | | | | 1.34 | | | | 1.49 | | | | 1.53 | | | | 1.61 | | | 1.64 |
Expenses, before waivers and reimbursements | | | 1.58 | | | | 1.48 | | | | 1.58 | | | | 1.53 | | | | 1.66 | | | 1.88 |
Net investment income (loss), net of waivers and reimbursements | | | (0.40 | ) | | | (0.06 | ) | | | (0.30 | ) | | | (0.16 | ) | | | 0.28 | | | 0.40 |
Net investment income (loss), before waivers and reimbursements | | | (0.64 | ) | | | (0.20 | ) | | | (0.39 | ) | | | (0.16 | ) | | | 0.23 | | | 0.16 |
| |
| | | Class I
|
| | | Period Ended
| | | Years Ended December 31,
|
| | | 6/30/2005
| | | 2004
| | | 2003
| | | 2002
| | | 2001
| | 2000
|
| | | (unaudited) | | | | | | | | | | | | | | |
Net asset value, beginning of period | | $ | 22.82 | | | $ | 22.76 | | | $ | 16.31 | | | $ | 18.19 | | | $ | 16.16 | | $ | 13.64 |
Income (loss) from investment operations: | | | | | | | | | | | | | | | | | | | | | | |
Net investment income (loss) | | | (0.03 | ) | | | 0.01 | | | | (0.03 | ) | | | 0.01 | | | | 0.17 | | | 0.09 |
Net realized and unrealized gain (loss) on investments | | | (1.01 | ) | | | 2.70 | | | | 6.48 | | | | (1.89 | ) | | | 2.70 | | | 2.52 |
| | |
|
|
| |
|
|
| |
|
|
| |
|
|
| |
|
| |
|
|
Total from investment operations | | | (1.04 | ) | | | 2.71 | | | | 6.45 | | | | (1.88 | ) | | | 2.87 | | | 2.61 |
Less distributions from: | | | | | | | | | | | | | | | | | | | | | | |
Net investment income | | | — | | | | — | | | | — | | | | — | | | | 0.08 | | | 0.09 |
Net realized gain | | | — | | | | 2.65 | | | | — | | | | — | | | | 0.76 | | | — |
| | |
|
|
| |
|
|
| |
|
|
| |
|
|
| |
|
| |
|
|
Total distributions | | | — | | | | 2.65 | | | | — | | | | — | | | | 0.84 | | | 0.09 |
| | |
|
|
| |
|
|
| |
|
|
| |
|
|
| |
|
| |
|
|
Net asset value, end of period | | $ | 21.78 | | | $ | 22.82 | | | $ | 22.76 | | | $ | 16.31 | | | $ | 18.19 | | $ | 16.16 |
| | |
|
|
| |
|
|
| |
|
|
| |
|
|
| |
|
| |
|
|
Total return (%) | | | (4.56 | ) | | | 12.18 | | | | 39.55 | | | | (10.34 | ) | | | 17.72 | | | 19.16 |
Ratios to average daily net assets (%) (a): | | | | | | | | | | | | | | | | | | | | | | |
Expenses, net of waivers and reimbursements | | | 1.20 | | | | 1.23 | | | | 1.33 | | | | 1.34 | | | | 1.36 | | | 1.39 |
Expenses, before waivers and reimbursements | | | 1.33 | | | | 1.23 | | | | 1.33 | | | | 1.34 | | | | 1.41 | | | 1.63 |
Net investment income (loss), net of waivers and reimbursements | | | (0.26 | ) | | | 0.05 | | | | (0.14 | ) | | | 0.03 | | | | 0.53 | | | 0.61 |
Net investment income (loss), before waivers and reimbursements | | | (0.39 | ) | | | 0.05 | | | | (0.14 | ) | | | 0.03 | | | | 0.48 | | | 0.37 |
| | | | | | | | | | | | | | | | | | |
| | | Period Ended
| | Years Ended December 31,
|
| | | 6/30/2005
| | 2004
| | 2003
| | 2002
| | 2001
| | 2000
|
| | | (unaudited) | | | | | | | | | | |
Supplemental data for all classes: | | | | | | | | | | | | | | | | | | |
Net assets at end of period (in thousands) | | $ | 121,065 | | $ | 246,176 | | $ | 237,111 | | $ | 190,802 | | $ | 149,292 | | $ | 74,093 |
Portfolio turnover rate (%) (a) | | | 127 | | | 50 | | | 51 | | | 20 | | | 48 | | | 68 |
| (a) | | Rates are annualized for periods that are less than a year. |
Performance cited represents past performance. Past performance does not guarantee future results and current performance may be lower or higher than the data quoted. Results shown are annual returns, which assume reinvestment of dividends and capital gains. Investment returns and principal will fluctuate and you may have a gain or loss when you sell shares. For the most current month-end performance information, please call 1-800-742-7272, or visit our Web site at www.williamblairfunds.com.
Note: Net investment income (loss) per share is based on the average shares outstanding during the period.
82 Semi-Annual Report | June 30, 2005 |
Financial Highlights
Income Fund
| | | | | | | | | | | | | | | | | | | | | |
| | | Class N
|
| | | Period Ended
| | | Years Ended December 31,
|
| | | 6/30/2005
| | | 2004
| | | 2003
| | | 2002
| | 2001
| | 2000
|
| | | (unaudited) | | | | | | | | | | | | | |
Net asset value, beginning of period | | $ | 10.19 | | | $ | 10.43 | | | $ | 10.62 | | | $ | 10.34 | | $ | 10.22 | | $ | 9.92 |
Income (loss) from investment operations: | | | | | | | | | | | | | | | | | | | | | |
Net investment income (loss) (a) | | | 0.27 | | | | 0.52 | | | | 0.40 | | | | 0.55 | | | 0.55 | | | 0.62 |
Net realized and unrealized gain (loss) on investments | | | (0.14 | ) | | | (0.26 | ) | | | (0.02 | ) | | | 0.25 | | | 0.17 | | | 0.33 |
| | |
|
|
| |
|
|
| |
|
|
| |
|
| |
|
| |
|
|
Total from investment operations | | | 0.13 | | | | 0.26 | | | | 0.38 | | | | 0.80 | | | 0.72 | | | 0.95 |
Less distributions from: | | | | | | | | | | | | | | | | | | | | | |
Net investment income | | | 0.22 | | | | 0.50 | | | | 0.57 | | | | 0.52 | | | 0.60 | | | 0.65 |
Net realized gain | | | — | | | | — | | | | — | | | | — | | | — | | | — |
| | |
|
|
| |
|
|
| |
|
|
| |
|
| |
|
| |
|
|
Total distributions | | | 0.22 | | | | 0.50 | | | | 0.57 | | | | 0.52 | | | 0.60 | | | 0.65 |
| | |
|
|
| |
|
|
| |
|
|
| |
|
| |
|
| |
|
|
Net asset value, end of period | | $ | 10.10 | | | $ | 10.19 | | | $ | 10.43 | | | $ | 10.62 | | $ | 10.34 | | $ | 10.22 |
| | |
|
|
| |
|
|
| |
|
|
| |
|
| |
|
| |
|
|
Total return (%) | | | 1.33 | | | | 2.61 | | | | 3.68 | | | | 7.91 | | | 7.18 | | | 9.99 |
Ratios to average daily net assets (%) (b): | | | | | | | | | | | | | | | | | | | | | |
Expenses | | | 0.75 | | | | 0.78 | | | | 0.77 | | | | 0.81 | | | 0.94 | | | 0.92 |
Net investment income (loss) | | | 4.05 | | | | 4.12 | | | | 4.09 | | | | 5.23 | | | 5.38 | | | 6.23 |
| |
| | | Class I
|
| | | Period Ended
| | | Years Ended December 31,
|
| | | 6/30/2005
| | | 2004
| | | 2003
| | | 2002
| | 2001
| | 2000
|
| | | (unaudited) | | | | | | | | | | | | | |
Net asset value, beginning of period | | $ | 10.15 | | | $ | 10.40 | | | $ | 10.62 | | | $ | 10.35 | | $ | 10.24 | | $ | 9.91 |
Income (loss) from investment operations: | | | | | | | | | | | | | | | | | | | | | |
Net investment income (loss) (a) | | | 0.30 | | | | 0.59 | | | | 0.43 | | | | 0.57 | | | 0.58 | | | 0.64 |
Net realized and unrealized gain (loss) on investments | | | (0.16 | ) | | | (0.31 | ) | | | (0.04 | ) | | | 0.24 | | | 0.15 | | | 0.34 |
| | |
|
|
| |
|
|
| |
|
|
| |
|
| |
|
| |
|
|
Total from investment operations | | | 0.14 | | | | 0.28 | | | | 0.39 | | | | 0.81 | | | 0.73 | | | 0.98 |
Less distributions from: | | | | | | | | | | | | | | | | | | | | | |
Net investment income | | | 0.23 | | | | 0.53 | | | | 0.61 | | | | 0.54 | | | 0.62 | | | 0.65 |
Net realized gain | | | — | | | | — | | | | — | | | | — | | | — | | | — |
| | |
|
|
| |
|
|
| |
|
|
| |
|
| |
|
| |
|
|
Total distributions | | | 0.23 | | | | 0.53 | | | | 0.61 | | | | 0.54 | | | 0.62 | | | 0.65 |
| | |
|
|
| |
|
|
| |
|
|
| |
|
| |
|
| |
|
|
Net asset value, end of period | | $ | 10.06 | | | $ | 10.15 | | | $ | 10.40 | | | $ | 10.62 | | $ | 10.35 | | $ | 10.24 |
| | |
|
|
| |
|
|
| |
|
|
| |
|
| |
|
| |
|
|
Total return (%) | | | 1.41 | | | | 2.79 | | | | 3.76 | | | | 8.04 | | | 7.32 | | | 10.28 |
Ratios to average daily net assets (%) (b): | | | | | | | | | | | | | | | | | | | | | |
Expenses | | | 0.60 | | | | 0.63 | | | | 0.62 | | | | 0.66 | | | 0.79 | | | 0.77 |
Net investment income (loss) | | | 4.20 | | | | 4.27 | | | | 4.24 | | | | 5.38 | | | 5.53 | | | 6.39 |
| | | | | | | | | | | | | | |
| | |
|
| | | Period Ended
| | Years Ended December 31,
|
| | | 6/30/2005
| | 2004
| | 2003
| | 2002
| | 2001
| | 2000
|
| | | (unaudited) | | | | | | | | | | |
Supplemental data for all classes: | | | | | | | | | | | | | | |
Net assets at end of period (in thousands) | | $309,667 | | $294,084 | | $265,062 | | $196,136 | | $ | 176,264 | | $ | 167,746 |
Portfolio turnover rate (%) (b) | | 41 | | 43 | | 36 | | 66 | | | 82 | | | 54 |
| (a) | | As required, in 2001, the Fund has adopted the provisions of the AICPA Audit and Accounting Guide for Investment Companies and began treating any paydown gain or losses on mortgage and asset backed securities as an adjustment to income. The effect of this change for the year 2001 was to decrease net investment income per share by $.05 and increase the net realized and unrealized gain and loss per share by $.05. It decreases the Ratio of Net Investment Income to Average Net Assets from 5.87% to 5.38% for Class N for 2001. It decreased the Ratio of Net Investment Income from 6.02% to 5.53% for Class I shares for 2001. |
| (b) | | Rates are annualized for periods that are less than a year. |
Performance cited represents past performance. Past performance does not guarantee future results and current performance may be lower or higher than the data quoted. Results shown are annual returns, which assume reinvestment of dividends and capital gains. Investment returns and principal will fluctuate and you may have a gain or loss when you sell shares. For the most current month-end performance information, please call 1-800-742-7272, or visit our Web site at www.williamblairfunds.com.
Note: Net investment income (loss) per share is based on the average shares outstanding during the period.
June 30, 2005 | William Blair Funds 83 |
Financial Highlights
Ready Reserves Fund
| | | | | | | | | | | | | | | | | | |
| | | Class N
|
| | | Period Ended
| | Years Ended December 31,
|
| | | 6/30/2005
| | 2004
| | 2003
| | 2002
| | 2001
| | 2000
|
| | | (unaudited) | | | | | | | | | | |
Net asset value, beginning of period | | $ | 1.00 | | $ | 1.00 | | $ | 1.00 | | $ | 1.00 | | $ | 1.00 | | $ | 1.00 |
Income (loss) from investment operations: | | | | | | | | | | | | | | | | | | |
Net investment income (loss) | | | 0.01 | | | 0.01 | | | 0.01 | | | 0.01 | | | 0.04 | | | 0.06 |
| | |
|
| |
|
| |
|
| |
|
| |
|
| |
|
|
Total from investment operations | | | 0.01 | | | 0.01 | | | 0.01 | | | 0.01 | | | 0.04 | | | 0.06 |
Less distributions from: | | | | | | | | | | | | | | | | | | |
Net investment income | | | 0.01 | | | 0.01 | | | 0.01 | | | 0.01 | | | 0.04 | | | 0.06 |
| | |
|
| |
|
| |
|
| |
|
| |
|
| |
|
|
Total distributions | | | 0.01 | | | 0.01 | | | 0.01 | | | 0.01 | | | 0.04 | | | 0.06 |
| | |
|
| |
|
| |
|
| |
|
| |
|
| |
|
|
Net asset value, end of period | | $ | 1.00 | | $ | 1.00 | | $ | 1.00 | | $ | 1.00 | | $ | 1.00 | | $ | 1.00 |
| | |
|
| |
|
| |
|
| |
|
| |
|
| |
|
|
Total return (%) | | | 1.03 | | | 0.80 | | | 0.66 | | | 1.28 | | | 3.66 | | | 5.91 |
Ratios to average daily net assets (%) (a) | | | | | | | | | | | | | | | | | | |
Expenses | | | 0.64 | | | 0.65 | | | 0.66 | | | 0.67 | | | 0.67 | | | 0.70 |
Net investment income (loss) | | | 2.06 | | | 0.80 | | | 0.66 | | | 1.28 | | | 3.63 | | | 5.78 |
Supplemental data: | | | | | | | | | | | | | | | | | | |
Net assets at end of period (in thousands) | | $ | 1,008,266 | | $ | 1,092,940 | | $ | 1,153,932 | | $ | 1,324,001 | | $ | 1,403,740 | | $ | 1,339,180 |
| (a) | | Rates are annualized for periods that are less than a year. |
Performance cited represents past performance. Past performance does not guarantee future results and current performance may be lower or higher than the data quoted. Results shown are annual returns, which assume reinvestment of dividends and capital gains. Investment returns and principal will fluctuate and you may have a gain or loss when you sell shares. For the most current month-end performance information, please call 1-800-742-7272, or visit our Web site at www.williamblairfunds.com.
84 Semi-Annual Report | June 30, 2005 |
Trustees and Officers. The trustees and officers of the William Blair Funds, their ages, their principal occupations during the last five years, their affiliations, if any, with William Blair & Company, L.L.C., and other significant affiliations are set forth below. The address of each trustee and officer is 222 West Adams Street, Chicago, Illinois 60606.
| | | | | | | | | | |
Name and Age
| | Position(s)
Held with
Fund
| | Term of
Office and
Length of
Time Served(1)
| | Principal Occupation(s) During Past 5 Years
| | Number of
Portfolios
in Fund
Complex
Overseen
by Trustee
| | Other Directorships Held by Trustee/Officer
|
Interested Trustees | | | | | | | | | | |
Conrad Fischer, 71* | | Chairman of the Board of Trustees | | Since 1987 | | Principal, William Blair & Company, L.L.C.; Partner, APM Limited Partnership | | 13 | | Trustee Emeritus, Chicago Child Care Society, a non-profit organization |
| | | | | |
Michelle Seitz, 39* | | Trustee | | Since 2002 | | Principal, William Blair & Company, L.L.C. | | 13 | | N/A |
Non-Interested Trustees | | | | | | | | |
Theodore A. Bosler, 70 | | Trustee | | Since 1997 | | Retired Principal and Vice President, Lincoln Capital Management | | 13 | | Crystal Lake Watershed Fund, Desert Foothills Land Trust and Institute of Chartered Financial Analysts. |
| | | | | |
Ann P. McDermott, 65 | | Trustee | | Since 1996 | | Board member and officer for various civic and charitable organizations over the past thirty years; professional experience prior thereto, registered representative for New York Stock Exchange firm | | 13 | | Junior League of Chicago, Northwestern University, Women’s Board; Ravinia Festival Women’s Board; Rush Presbyterian St. Luke’s Medical Center, Women’s Board; University of Chicago, Women’s Board; Visiting Nurses Association, Honorary Director |
| | | | | |
Donald J. Reaves, 58 | | Trustee | | Since 2004 | | Vice President for Administration and Chief Financial Officer, University of Chicago since 2002. Executive Vice President and Chief Financial Officer, Brown University from 1993 to 2002 | | 13 | | American Student Assistance Corp.; Amica Mutual Insurance Company; NACUBO (National Association of College and University Business Officers) |
| | | | | |
John B. Schwemm, 71 | | Trustee | | Since 1990 | | Retired Chairman and Chief Executive Officer, R.R. Donnelley & Sons Company | | 13 | | USG Corp., building material manufacturer, and Walgreen Co. |
| | | | | |
Donald L. Seeley, 61 | | Trustee | | Since 2003 | | Director, Applied Investment Management Program, University of Arizona Department of Finance, Formerly Vice Chairman and Chief Financial Officer, True North Communications, Inc., marketing communications and advertising firm | | 13 | | Beverly Enterprises, Inc., provider of eldercare and rehabilitative services; Warnaco Group, Inc. intimate apparel, sportswear, and swimwear manufacturer. |
| | | | | |
Robert E. Wood II, 67 | | Trustee | | Since 1999 | | Retired Executive Vice President, Morgan Stanley Dean Witter | | 13 | | Chairman, Add-Vision, Inc. manufacturer of surface animation systems, and Micro-Combustion, LLC |
June 30, 2005 | William Blair Funds 85 |
| | | | | | | | | | |
Name and Age
| | Position(s)
Held with
Fund
| | Term of
Office and
Length of
Time Served(1)
| | Principal Occupation(s) During Past 5 Years
| | Number of
Portfolios
in Fund
Complex
Overseen
by Trustee
| | Other Directorships Held by Trustee/Officer
|
Officers | | | | | | | | | | |
Marco Hanig, 47 | | President | | Since 1999 | | Principal, William Blair & Company, L.L.C.; former Senior Vice President, First Chicago NBD | | N/A | | Chicago Scores |
| | | | | |
Karl W. Brewer, 39 | | Senior Vice President | | Since 2000 | | Principal, William Blair & Company, L.L.C. | | N/A | | N/A |
| | | | | |
Harvey H. Bundy, III, 61 | | Senior Vice President | | Since 2003 | | Principal, William Blair & Company, L.L.C. | | N/A | | N/A |
| | | | | |
Mark A. Fuller, III, 48 | | Senior Vice President | | Since 1993 | | Principal, William Blair & Company, L.L.C. | | N/A | | Partner, Fulsen Howney Partners |
| | | | | |
James W. Golan , 43 | | Senior Vice President | | Since 2005 | | Principal, William Blair & Company, L.L.C. | | N/A | | N/A |
| | | | | |
W. George Greig, 52 | | Senior Vice President | | Since 1996 | | Principal, William Blair & Company, L.L.C. | | N/A | | N/A |
| | | | | |
Michael A. Jancosek, 46 | | Senior Vice President Vice President | | Since 2004 Since 2000 | | Principal, William Blair & Company L.L.C. Associate, William Blair & Company, L.L.C.; former Vice President, First Chicago NBD | | N/A | | N/A |
| | | | | |
John F. Jostrand, 51 | | Senior Vice President | | Since 1999 | | Principal, William Blair & Company, L.L.C. | | N/A | | N/A |
| | | | | |
James S. Kaplan, 44 | | Senior Vice President Vice President | | Since 2004 Since 1995 | | Principal, William Blair & Company, L.L.C. Associate, William Blair & Company, L.L.C. | | N/A | | N/A |
| | | | | |
Robert C. Lanphier, IV, 49 | | Senior Vice President | | Since 2003 | | Principal, William Blair & Company, L.L.C. | | N/A | | Chairman, AG. Med, Inc. |
| | | | | |
David S. Mitchell, 45 | | Senior Vice President Vice President | | Since 2004 Since 2003 | | Principal, William Blair & Company, L.L.C. Associate, William Blair & Company, L.L.C. | | N/A | | N/A |
| | | | | |
Gregory J. Pusinelli, 46 | | Senior Vice President | | Since 1999 | | Principal, William Blair & Company, L.L.C.; former Principal and Vice President, Stein Roe & Farnham Incorporated | | N/A | | N/A |
| | | | | |
Norbert W. Truderung, 53 | | Senior Vice President | | Since 1992 | | Principal, William Blair & Company, L.L.C. | | N/A | | N/A |
86 Semi-Annual Report | June 30, 2005 |
| | | | | | | | | | |
Name and Age
| | Position(s)
Held with
Fund
| | Term of
Office and
Length of
Time Served(1)
| | Principal Occupation(s) During Past 5 Years
| | Number of
Portfolios
in Fund
Complex
Overseen
by Trustee
| | Other Directorships Held by Trustee/Officer
|
Jeffrey A. Urbina, 50 | | Senior Vice President | | Since 1998 | | Principal, William Blair & Company, L.L.C. | | N/A | | N/A |
| | | | | |
Christopher T. Vincent, 48 | | Senior Vice President Vice President | | Since 2004 Since 2002 | | Principal, William Blair & Company, L.L.C. Associate, William Blair & Company, L.L.C.; former Managing Director/Senior Portfolio Manager, Zurich Scudder Investments | | N/A | | Uhlich Children’s Home |
| | | | | |
Todd M. McClone, 36 | | Vice President | | Since 2005 | | Associate, William Blair & Company, L.L.C. | | N/A | | N/A |
| | | | | |
Terence M. Sullivan, 61 | | Vice President and Treasurer | | Since 1997 | | Associate, William Blair & Company, L.L.C. | | N/A | | N/A |
| | | | | |
Colette M. Garavalia, 44 | | Secretary | | Since 2000 | | Associate, William Blair & Company, L.L.C.; former Assistant Vice President, Scudder Kemper Investments | | N/A | | N/A |
| * | | Mr. Fischer and Ms. Seitz are interested persons of the William Blair Funds because each is a principal of William Blair & Company, L.L.C., the Funds’ investment advisor and principal underwriter. |
| (1) | | Each Trustee serves until the election and qualification of a successor, or until death, resignation or retirement or removal as provided in the Fund’s Declaration of Trust. Retirement for non-interested Trustees occurs no later than at the conclusion of the first regularly scheduled Board meeting of the Fund’s fiscal year that occurs after the Trustee’s 72nd birthday. The Fund’s officers are elected annually by the Trustees. |
The Statement of Additional Information for the William Blair Funds includes additional information about the trustees and is available without charge by calling 1-800-635-2886 (in Massachusetts 1-800-635-2840) or by writing the Fund.
June 30, 2005 | William Blair Funds 87 |
Basis for Board Approval of Advisory Agreement
The advisory agreement was most recently approved, and with respect to the Emerging Markets Growth Fund was initially approved, by the Board of Trustees, including all of the trustees who are not parties to such agreement or interested persons of any such party, on February 18, 2005. The Board of Trustees, including a majority of the independent trustees, determined that continuation of the advisory agreement was in the best interests of the Fund. The independent trustees met separately from the “interested” trustees of the Fund and officers and employees of the Company to consider continuance of the advisory agreement (and approval of the advisory agreement for the Emerging Markets Growth Fund) and were assisted by independent legal counsel in making their determination. The Board of Trustees, including the independent trustees, did not identify any single factor or group of factors as all important or controlling and considered all factors together.
The Board noted that the Company is a quality firm with a reputation for integrity and honesty that employs high quality people and has a long association with the Portfolios, in each case other than the Growth Fund, since the inception of the Portfolios. The Board believes that a long-term relationship with a capable, conscientious advisor is in the best interests of shareholders and that shareholders have invested in the Portfolios knowing that the Company managed the Portfolios and knowing the investment advisory fee schedule. The Board concluded that each existing Portfolio was managed by the Company consistent with its investment objectives and policies and that high quality services were provided. The Board also concluded that it expected the services to be provided by the Company to the Emerging Markets Growth Fund would be high quality.
With respect to the nature, extent and quality of the services provided by the Company to the Portfolios (or to be provided with respect to the Emerging Markets Growth Fund), the Board considered the Company’s Form ADV, biographical information about each Portfolio’s portfolio manager(s), the administrative services performed or to be performed by the Company, financial information regarding the Company, the compliance regime created by the Company, including the fact that the Company has engaged a third party for additional Fund compliance monitoring and, the financial support of the Portfolios, including with respect to the Ready Reserves Fund, the Company’s $1 million voluntary contribution to the Portfolio to ensure that the Portfolio maintains a net asset value of $1.00.
The Board also reviewed and discussed the short- and, where applicable, long-term performance of each of the existing Portfolios, as compared to applicable Morningstar rankings. The Board concluded that as to each Portfolio, the investment performance was at least satisfactory, and in some cases, excellent. With regard to the International Equity Fund, the Board noted that the time period being evaluated was very short and that the Board would continue to monitor the performance. With regard to the Value Discovery Fund, the Board noted that performance was good on an absolute basis but on a relative basis to peers the Company was performing less well, and that the Company was taking steps to address relative performance issues. With respect to the Emerging Markets Growth Fund, the Board reviewed the Company’s performance for managing emerging markets assets as well as the performance of the former Emerging Markets Growth Fund and concluded that the Company’s performance was satisfactory.
With respect to the costs of services provided and profits realized by the Company, the Board considered profitability information provided by the Company and, as applicable, the expense caps in place and/or proposed. Based on this information, the Board concluded for each Portfolio that the Company’s profitability was not unreasonable.
The Board considered the extent to which economies of scale would be realized as the Portfolios grow and considered management’s representation that certain Portfolio expenses are fixed and unrelated to asset size and that for some Portfolios there are little or no economies of scale in the investment process. In considering whether fee levels reflect economies of scale for the benefit of Portfolio investors, the Board reviewed each Portfolio’s asset size (or projected asset size for the Emerging Markets Growth Fund), the Portfolio’s total and net expense ratios (projected for the Emerging Markets Growth Fund), the expense caps in place and/or proposed and whether the investment process produced economies of scale. The Board concluded with respect to each of the Portfolios, that the total expense ratios, after giving effect to the expense caps proposed by the Company, were reasonable.
For each Portfolio, the Board compared the amounts to be paid to the Company for advisory and administrative services with other registered funds included in the Portfolio’s Lipper expense universe. In addition, for each Portfolio (except for the Income and Ready Reserves Funds which are not similar to any other funds advised or subadvised by the Company) the Board compared amounts paid to the Company by other registered funds, including other Portfolios in the Fund and funds for which the Company acts as a subadvisor. For each Portfolio (except for the Ready Reserves Fund because the Company does not manage other money market accounts), the Board compared amounts paid to the Company by the Company’s other clients. The Board also considered that the Company continues to waive advisory fees for the smaller Portfolios, has in place
88 Semi-Annual Report | June 30, 2005 |
and/or proposed expense caps for certain Portfolios and proposed to waive advisory fees for the Emerging Markets Growth Fund. The Board concluded that each Portfolio’s advisory fee was reasonable, and with respect to the Value Discovery Fund, in particular, emphasized the fact that the Company is waiving advisory fees and reimbursing expenses.
The Board considered benefits derived by the Company from its relationship with the Portfolios, including soft dollars and favorable media coverage. The Board concluded that, taking into account these benefits, the fees were reasonable. Based on all of the information considered and the conclusions reached, the Board determined to approve continuance of the advisory agreement for the existing Portfolios and to approve the advisory agreement for the Emerging Markets Growth Fund.
Proxy Voting
A description of the policies and procedures that the Fund uses to determine how to vote proxies relating to portfolio securities and information regarding how the Fund voted proxies relating to portfolio securities for the most recent 12-month period ended June 30 are available without charge, upon request, by calling 1-800-635-2886 (in Massachusetts 1-800-635-2840), at www.williamblairfunds.com and on the SEC’s website at http://www.sec.gov.
Quarterly Portfolio Schedules
The Fund files its complete schedule of portfolio holdings with the SEC for the first and third fiscal quarters of each fiscal year (quarters ended March 31 and September 30) on Form N-Q. The Fund’s Forms N-Q are available on the SEC’s website at http://www.sec.gov and may be reviewed and copied at the SEC’s Public Reference Room in Washington, D.C. Information on the operation of the SEC’s Public Reference Room may be obtained by calling 1-800-SEC-0330.
June 30, 2005 | William Blair Funds 89 |
Useful Information About Your Report (unaudited)
Please refer to this information when reviewing the Expense Example for each Fund.
Expense Example
As a shareholder of a Fund, you incur two types of costs: (1) transaction costs such as redemption fees and (2) ongoing costs, including management fees distribution (12b-1) fees (for Class N shares except for Ready Reserves Fund), service fee (for Class N of Ready Reserves Fund), shareholder services fee (for Emerging Markets Growth Fund) and other Fund expenses. The example is intended to help you understand your ongoing costs (in dollars) of investing in the Fund and to compare these costs with the ongoing costs of investing in other mutual funds. To do so, compare the Fund’s 5% hypothetical example with the 5% hypothetical examples that appear in the shareholder reports of other funds. The example is based on an investment of $1,000 invested at the beginning of the period and held for the entire six-month period from January 1, 2005 to June 30, 2005.
Actual Expenses
In each example, the first line for each share class in the table provides information about the actual account values and actual expenses. These expenses reflect the effect of any expense cap applicable to the share class during the period. Without this expense cap, the costs shown in the table would have been higher. You may use the information in this line, together with the amount you invested, to estimate the expenses that you paid over the period. Simply divide your account value by $1,000 (example, an $8,600 account value divided by $1,000 = 8.6), then multiply the result by the number in the first line under the heading entitled “Expenses Paid During the Period” to estimate the expenses you paid on your account during the period.
Hypothetical Example for Comparison Purposes
In each example, the second line for each share class in the table provides information about hypothetical account values and hypothetical expenses based on the Fund’s actual expense ratio and an assumed rate of return of 5% per year before expenses. This is not the Fund’s actual return. The hypothetical account values and expenses may not be used to estimate the actual ending account balance or expenses you paid for the period. You may use this information to compare the ongoing costs of investing in the Fund to other funds. To do so, compare this 5% hypothetical example with the 5% hypothetical examples that appear in the shareholder reports of other funds.
Please note that the expenses shown in both examples are meant to highlight your ongoing costs only and do not reflect any transactional costs or account type fees, such as redemption fees and IRA Fiduciary Administration fees, respectively. These fees are fully described in the prospectus. Therefore, the second line of each share class in the table is useful in comparing ongoing costs only and will not help you determine the relative costs of owning different funds. In addition, if these transactional costs were included, your costs would have been higher.
90 Semi-Annual Report | June 30, 2005 |
Fund Expenses (unaudited)
The examples below show you the ongoing costs (in dollars) of investing in your fund and allows you to compare these costs with those of other mutual funds. Please refer to the previous page for a detailed explanation of the information presented on this chart.
| | | | | | | | | | | | | |
| | | Beginning
Account Value
1/1/2005
| | Ending
Account Value
6/30/2005
| | Expenses Paid
during
Period(a)
| | | Annualized
Expense Ratio
| |
Growth Fund | | | | | | | | | | | | | |
Class N—actual return | | $ | 1,000.00 | | $ | 992.50 | | $ | 5.73 | | | 1.16 | % |
Class N—hypothetical 5% return | | | 1,000.00 | | | 1,019.04 | | | 5.81 | | | 1.16 | |
Class I—actual return | | | 1,000.00 | | | 994.50 | | | 4.50 | | | 0.91 | |
Class I—hypothetical 5% return | | | 1,000.00 | | | 1,020.28 | | | 4.56 | | | 0.91 | |
Tax-Managed Growth Fund | | | | | | | | | | | | | |
Class N—actual return | | | 1,000.00 | | | 1,010.00 | | | 7.67 | | | 1.54 | |
Class N—hypothetical 5% return | | | 1,000.00 | | | 1,017.16 | | | 7.70 | | | 1.54 | |
Class I—actual return | | | 1,000.00 | | | 1,012.10 | | | 6.44 | | | 1.29 | |
Class I—hypothetical 5% return | | | 1,000.00 | | | 1,018.40 | | | 6.46 | | | 1.29 | |
Large Cap Growth Fund | | | | | | | | | | | | | |
Class N—actual return | | | 1,000.00 | | | 982.40 | | | 6.44 | | | 1.31 | |
Class N—hypothetical 5% return | | | 1,000.00 | | | 1,018.30 | | | 6.56 | | | 1.31 | |
Class I—actual return | | | 1,000.00 | | | 982.60 | | | 5.21 | | | 1.06 | |
Class I—hypothetical 5% return | | | 1,000.00 | | | 1,019.54 | | | 5.31 | | | 1.06 | |
Small Cap Growth Fund | | | | | | | | | | | | | |
Class N—actual return | | | 1,000.00 | | | 958.40 | | | 7.09 | | | 1.46 | |
Class N—hypothetical 5% return | | | 1,000.00 | | | 1,017.55 | | | 7.30 | | | 1.46 | |
Class I—actual return | | | 1,000.00 | | | 959.70 | | | 5.88 | | | 1.21 | |
Class I—hypothetical 5% return | | | 1,000.00 | | | 1,018.79 | | | 6.06 | | | 1.21 | |
Small-Mid Cap Growth Fund | | | | | | | | | | | | | |
Class N—actual return | | | 1,000.00 | | | 994.70 | | | 7.37 | | | 1.49 | |
Class N—hypothetical 5% return | | | 1,000.00 | | | 1,017.41 | | | 7.45 | | | 1.49 | |
Class I—actual return | | | 1,000.00 | | | 996.50 | | | 6.14 | | | 1.24 | |
Class I—hypothetical 5% return | | | 1,000.00 | | | 1,018.65 | | | 6.21 | | | 1.24 | |
International Growth Fund | | | | | | | | | | | | | |
Class N—actual return | | | 1,000.00 | | | 1,014.90 | | | 6.99 | | | 1.40 | |
Class N—hypothetical 5% return | | | 1,000.00 | | | 1,017.85 | | | 7.00 | | | 1.40 | |
Class I—actual return | | | 1,000.00 | | | 1,016.10 | | | 5.75 | | | 1.15 | |
Class I—hypothetical 5% return | | | 1,000.00 | | | 1,019.09 | | | 5.76 | | | 1.15 | |
International Equity Fund | | | | | | | | | | | | | |
Class N—actual return | | | 1,000.00 | | | 988.50 | | | 7.35 | | | 1.49 | |
Class N—hypothetical 5% return | | | 1,000.00 | | | 1,017.41 | | | 7.45 | | | 1.49 | |
Class I—actual return | | | 1,000.00 | | | 989.40 | | | 6.12 | | | 1.24 | |
Class I—hypothetical 5% return | | | 1,000.00 | | | 1,018.65 | | | 6.21 | | | 1.24 | |
Emerging Markets Growth Fund | | | | | | | | | | | | | |
Class N—actual return | | | 1,000.00 | | | 1,026.00 | | | 1.10 | (b) | | 1.65 | |
Class N—hypothetical 5% return | | | 1,000.00 | | | 1,002.20 | | | 1.09 | (b) | | 1.65 | |
Class I—actual return | | | 1,000.00 | | | 1,026.00 | | | 0.93 | (b) | | 1.40 | |
Class I—hypothetical 5% return | | | 1,000.00 | | | 1,002.37 | | | 0.92 | (b) | | 1.40 | |
Value Discovery Fund | | | | | | | | | | | | | |
Class N—actual return | | | 1,000.00 | | | 953.30 | | | 6.49 | | | 1.34 | |
Class N—hypothetical 5% return | | | 1,000.00 | | | 1,018.15 | | | 6.71 | | | 1.34 | |
| | | | | | | | | | | | | | |
Class I—actual return | | | 1,000.00 | | | 954.40 | | | 5.82 | | | 1.20 | |
Class I—hypothetical 5% return | | | 1,000.00 | | | 1,018.84 | | | 6.01 | | | 1.20 | |
June 30, 2005 | William Blair Funds 91 |
| | | | | | | | | | | |
| | | Beginning
Account Value
1/1/2005
| | Ending
Account Value
6/30/2005
| | Expenses Paid
during
Period(a)
| | Annualized
Expense Ratio
|
Income Fund | | | | | | | | | | | |
Class N—actual return | | $ | 1,000.00 | | $ | 1,013.30 | | $ | 3.74 | | 0.75 |
Class N—hypothetical 5% return | | | 1,000.00 | | | 1,021.08 | | | 3.76 | | 0.75 |
Class I—actual return | | | 1,000.00 | | | 1,014.10 | | | 3.00 | | 0.60 |
Class I—hypothetical 5% return | | | 1,000.00 | | | 1,021.82 | | | 3.01 | | 0.60 |
Ready Reserves Fund | | | | | | | | | | | |
Class N—actual return | | | 1,000.00 | | | 1,010.30 | | | 3.19 | | 0.64 |
Class N—hypothetical 5% return | | | 1,000.00 | | | 1,021.62 | | | 3.21 | | 0.64 |
| (a) | | Expenses are equal to the annualized expense ratio, multiplied by the average account value over the period, multiplied by the number of days in the period (181), and divided by 365 (to reflect the one-half-year period.) |
| (b) | | For the period June 6, 2005 (Commencement of Operations) until June 30, 2005. |
92 Semi-Annual Report | June 30, 2005 |
BOARD OF TRUSTEES
Conrad Fischer, Chairman
Principal, William Blair & Company, L.L.C.
Theodore A. Bosler
Retired Principal and Vice President, Lincoln Capital Management Company
Ann P. McDermott
Director and Trustee
Profit and not-for-profit organizations
Donald J. Reaves
Vice President for Administration and Chief Financial Officer, University of Chicago
Donald L. Seeley
Adjunct Lecturer and Director, University of Arizona Department of Finance
John B. Schwemm
Retired Chairman and CEO, R.R. Donnelley & Sons Company
Michelle R. Seitz
Principal, William Blair & Company, L.L.C.,
Robert E. Wood II
Retired Executive Vice President, Morgan Stanley Dean Witter
Officers
Marco Hanig, President
Karl W. Brewer, Senior Vice President
Harvey H. Bundy III, Senior Vice President
Mark A. Fuller, III, Senior Vice President
James W. Golan, Senior Vice President
W. George Greig, Senior Vice President
Michael A. Jancosek, Senior Vice President
John F. Jostrand, Senior Vice President
James S. Kaplan, Senior Vice President
Robert C. Lanphier, IV, Senior Vice President
David S. Mitchell, Senior Vice President
Gregory J. Pusinelli, Senior Vice President
Norbert W. Truderung, Senior Vice President
Jeffrey A. Urbina, Senior Vice President
Christopher T. Vincent, Senior Vice President
Todd M. McClone, Vice President
Terence M. Sullivan, Vice President and Treasurer
Colette M. Garavalia, Secretary
Investment Advisor
William Blair & Company, L.L.C.
Legal Counsel
Vedder, Price, Kaufman & Kammholz, P.C.
Transfer Agent
State Street Bank and Trust Company
P.O. Box 8506
Boston, MA 02266-8506
For customer assistance, call 1-800-635-2886
(Massachusetts 1-800-635-2840)
Date of First Use August, 2005 93
WILLIAM BLAIR FUNDS
GROWTH FUNDS
Growth Fund
Tax-Managed Growth Fund
Large Cap Growth Fund
Small Cap Growth Fund
Small-Mid Cap Growth Fund
International Growth Fund
International Equity Fund
Emerging Markets Growth Fund
OTHER FUNDS
Value Discovery Fund Income Fund Ready Reserves Fund
222 West Adams Street
Chicago, Illinois 60606
800.742.7272
www.williamblairfunds.com
William Blair & Company, L.L.C., Distributors
WILLIAM BLAIR FUNDS
INSTITUTIONAL INTERNATIONAL FUNDS
SEMI-ANNUAL REPORT
JUNE 30, 2005
Table of Contents
This report is submitted for the general information of the shareholders of the William Blair Funds. It is not authorized for distribution to prospective investors unless accompanied or preceded by a prospectus of the William Blair Funds. Please consider the Funds’ investment objectives, risks, charges, and expenses before investing. This and other information is contained in the Funds’ prospectus, which you may obtain by calling 1-800-742-7272. Read it carefully before you invest or send money. ©William Blair & Company, LLC., distributor.
June 30, 2005 | William Blair Funds 1 |

W. George Greig
INSTITUTIONAL INTERNATIONAL GROWTH FUND
The Institutional International Growth Fund invests primarily in common stocks of foreign growth companies of all sizes.
AN OVERVIEW FROM THE PORTFOLIO MANAGER
How did the Fund perform over the first half of the year? How did the Fund’s performance compare to its benchmark?
The Institutional International Growth Fund posted a 1.68% gain for the six months ended June 30, 2005. By comparison, the Fund’s benchmark, the MSCI All Country World (Free) except US Index, rose 0.32%.
What were the most significant factors impacting international markets during the first six months of the year?
The largely flat return of international equity markets during the first six months of 2005 masked volatile monthly results. Emerging markets and small cap stocks were the strongest international equity market performers at the beginning of the year, extending their dominance from 2004. This trend reversed in March and April as inflation fears and concerns about the impact of high energy and commodity prices on global growth resulted in investors reducing their risk positions. After the mid period pause, markets rebounded in May and June, as sectors such as Telecommunication Services underperformed relative to Health Care, Energy and Information Technology. Materials also was a negative performer during the second quarter as concerns about excess supply and falling demand for commodities rippled through the market. Overall, emerging markets were the strongest region during the six month period, returning 6.26% during the period, while small cap stocks outpaced their larger cap counterparts, returning 4.39%. The Europe, Australia and Far East Index fell 0.85% during same time period.
During the first six months of 2005, the US dollar appreciated versus most currencies, with the largest appreciation versus the Euro, where it appreciated approximately 10%. Despite this appreciation, international markets extended their gains over the US as the MSCI All Country World (Free) except US Index returned 0.32%, while the S&P 500 Index declined 0.81%.
What factors were behind the Fund’s performance versus the benchmark?
While the Fund slightly lagged the broad index benchmark during the first quarter, it outperformed both broad and growth benchmarks during the six month period, due to strong second quarter results as the market focused on fundamentals. Year to date relative performance was driven by strong stock selection across most regions and sectors, coupled with emerging markets and small cap exposures and stock selection. Somewhat mitigating this performance was stock selection in the Western Hemisphere, in addition to Information Technology and Consumer Discretionary exposures and a lower Energy weighting versus the Index.
What is your current outlook?
The shape of the global economic cycle is shifting. The modest deceleration in growth driven by higher oil prices and a downturn in China’s imports may be receding into the background as other cyclical forces begin to edge growth higher.
2 Semi-Annual Report | June 30, 2005 |
Evidence from a number of sources—including recent purchasing managers’ index releases, indications of temporary help demand, technology demand indicators (in Asia), and credit growth (in Europe)—suggest that the industrial economies may be poised to reaccelerate after a number of sluggish quarters.
On the other hand, rising short term interest rates, higher oil prices and the effects of housing inflation have not had the predicted negative effects on domestic demand, either in the US or elsewhere. Household spending in China and other emerging markets have remained strong, while strong employment and income growth in Japan have steadied the economy there in the face of slowing net exports.
A reacceleration in global growth after the 2004-05 slowdown could be reinforced by stronger investment spending backed by bulging corporate cash and profits, implying cyclical strength in technology and machinery as well as improving growth performance in previous laggards Europe and Japan.
What is your current strategy? How is the Fund positioned?
As of June 30, the Fund maintains its overweighting in emerging markets relative to the Index, and is now near a market weight in Europe ex-UK, largely through the addition of Health Care and Information Technology companies to the portfolio during the quarter. From a sector perspective, the portfolio maintains its largest relative weightings in Consumer Discretionary, Information Technology and Health Care, and has its smallest relative weightings in Energy, Materials, and Financials. These weightings are largely the result of the Advisor’s bottom up, fundamental quality growth discipline, which are also supported by the Advisor’s strategic viewpoint.
June 30, 2005 | William Blair Funds 3 |
Institutional International Growth Fund
Performance Highlights
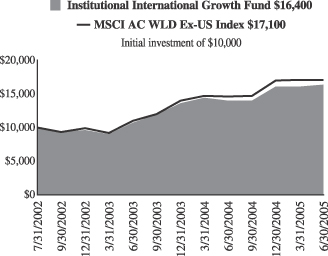
Average Annual Total Return at 6/30/2005
| | | | | | | | |
| | | 1 Year
| | | Since Inception(a)
| | | |
Institutional International Growth Fund | | 16.62 | % | | 18.27 | % | | |
MSCI All Country World Ex-US Index | | 16.95 | | | 19.37 | | | |
| | (a) | For the period from July 26, 2002 (Commencement of Operations) to June 30, 2005. |
Performance cited represents past performance. Past performance does not guarantee future results and current performance may be lower or higher than the data quoted. Results shown are average annual returns, which assume reinvestment of dividends and capital gains. Investment returns and principal will fluctuate and you may have a gain or loss when you sell shares. For the most current month-end performance information, please call 1-800-742-7272, or visit our Web site at www.williamblairfunds.com. International investing involves special risk considerations, including currency fluctuations, lower liquidity, economic and political risk.
The performance highlights and graph presented above do not reflect the deduction of taxes that a shareholder would pay on fund distributions or the redemption of fund shares.
The Morgan Stanley Capital International (MSCI) All Country World Free ex-US Index is an unmanaged index that includes developed and emerging markets and reduced Japanese portion, making it more comparable to the Institutional International Growth Fund in terms of investment approach.
This report identifies the Fund’s investments on June 30, 2005. These holdings are subject to change. Not all stocks in the Fund performed the same, nor is there any guarantee that these stocks will perform as well in the future. Market forecasts provided in this report may not necessarily come to pass.
Sector Diversification
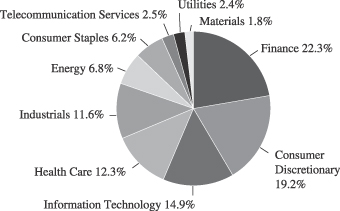
The sector diversification shown is based on the total investment portfolio.
4 Semi-Annual Report | June 30, 2005 |
Institutional International Growth Fund
Portfolio of Investments, June 30, 2005 (all dollar amounts in thousands) (unaudited)
| | | | | |
Issuer
| | Shares
| | Value
|
| | |
Common Stocks—Europe—37.0% | | | | | |
Austria—2.0% | | | | | |
Erste Bank Der Oester (Banking) | | 238,900 | | $ | 11,919 |
*Raiffeisen International Bank (Banking) | | 206,800 | | | 13,092 |
| | | | |
|
|
| | | | | | 25,011 |
| | | | |
|
|
Belgium—0.2% | | | | | |
Colruyt S.A.(Mass market distribution) | | 18,400 | | | 2,504 |
| | | | |
|
|
Finland—0.3% | | | | | |
Nokian Renkaat Oyj (Automotive) | | 217,000 | | | 3,951 |
| | | | |
|
|
France—10.7% | | | | | |
April Group S.A. (Insurance brokers) | | 89,500 | | | 2,780 |
BNP Paribas (Banking) | | 344,200 | | | 23,471 |
Essilor International (Health care supplies) | | 166,300 | | | 11,324 |
Hermes International SCA (Apparel and luxury goods) | | 61,400 | | | 12,355 |
*JC Decaux (Media) | | 579,730 | | | 14,643 |
Klepierre (Real estate) | | 40,270 | | | 3,828 |
*Nexity (Real estate management) | | 94,900 | | | 3,661 |
*Orpea (Hospital and nursing management) | | 159,533 | | | 7,070 |
Sanofi-Avenits (Pharmaceuticals) | | 389,695 | | | 31,864 |
Technip-Coflexip S.A. (Construction) | | 148,480 | | | 6,878 |
Vinci S.A.(Construction) | | 130,400 | | | 10,819 |
Zodiac S.A. (Aerospace and defense) | | 109,000 | | | 5,838 |
| | | | |
|
|
| | | | | | 134,531 |
| | | | |
|
|
Germany—7.9% | | | | | |
AWD Holdings AG (Financial services) | | 132,500 | | | 5,550 |
Bijou Brigitte (Fashion jewelry accessories) | | 18,400 | | | 3,310 |
Celesio AG (Pharmaceuticals) | | 149,350 | | | 11,699 |
Continental AG (Diversified manufacturing) | | 178,500 | | | 12,778 |
Did Deutscher Industrie Svc (Commercial services) | | 87,096 | | | 3,710 |
E.ON AG (Energy) | | 276,580 | | | 24,513 |
GFK AG (Commercial services) | | 93,600 | | | 3,684 |
Rational AG (Business equipment) | | 21,700 | | | 2,331 |
SAP AG (Software) | | 152,200 | | | 26,288 |
Stada Arzneimittel AG (Pharmaceuticals) | | 136,800 | | | 4,993 |
| | | | |
|
|
| | | | | | 98,856 |
| | | | |
|
|
Greece—1.8% | | | | | |
Coca-Cola Hellenic Bottling S.A. (Beverages) | | 176,400 | | | 4,776 |
EFG Eurobank (Banking) | | 246,700 | | | 7,577 |
National Bank of Greece (Banking) | | 304,890 | | | 10,315 |
| | | | |
|
|
| | | | | | 22,668 |
| | | | |
|
|
Ireland—1.9% | | | | | |
Anglo Irish Bank plc (Finance) | | 887,200 | | | 10,966 |
*Grafton Group plc (Wholesale distributors) | | 426,800 | | | 4,934 |
Kingspan Group plc (Construction) | | 446,000 | | | 5,235 |
United Drug plc (Pharmaceuticals) | | 736,700 | | | 3,158 |
| | | | |
|
|
| | | | | | 24,293 |
| | | | |
|
|
Italy—1.0% | | | | | |
Credito Emiliano SpA (Banking) | | 433,000 | | | 4,385 |
Hera SpA (Electric services) | | 1,661,900 | | | 4,620 |
Pirelli & C Real Estate SpA (Real estate development) | | 65,100 | | | 3,892 |
| | | | |
|
|
| | | | | | 12,897 |
| | | | |
|
|
| | | | | |
Issuer
| | Shares
| | Value
|
| |
Common Stocks—Europe—37.0%—(continued) | | | |
Netherlands—1.1% | | | | | |
*Axalto (Business equipment) | | 109,200 | | $ | 3,284 |
*Pyaterochka Holdings GDR (Food and retail) | | 332,500 | | | 4,788 |
*Tomtom NV (Computer software) | | 265,500 | | | 5,819 |
| | | | |
|
|
| | | | | | 13,891 |
| | | | |
|
|
Norway—1.1% | | | | | |
Statoil Asa (Oil and gas) | | 690,900 | | | 14,051 |
| | | | |
|
|
Spain—1.4% | | | | | |
Grupo Ferrovial S.A. (Industrial services) | | 109,500 | | | 7,034 |
*Industria De Textile (Retail trade) | | 400,900 | | | 10,285 |
| | | | |
|
|
| | | | | | 17,319 |
| | | | |
|
|
Sweden—1.3% | | | | | |
*Capio AB (Health care) | | 185,800 | | | 2,732 |
Clas Ohlson AB (Retail) | | 147,900 | | | 2,651 |
*Modern Times Group (Television) | | 20,000 | | | 611 |
Scania AB (Vehicles and equipment) | | 288,900 | | | 10,630 |
| | | | |
|
|
| | | | | | 16,624 |
| | | | |
|
|
Switzerland—6.3% | | | | | |
*Actelion (Biotechnology) | | 59,100 | | | 6,129 |
*Kudelski S.A. (Telecommunication equipment) | | 28,800 | | | 1,048 |
Nobel Biocare Holdings AG (Medical equipment and supplies) | | 29,750 | | | 6,016 |
Phonak Holdings AG (Hearing technology) | | 124,100 | | | 4,640 |
Roche Holdings AG (Health care) | | 299,300 | | | 37,709 |
UBS AG (Banking) | | 293,000 | | | 22,807 |
| | | | |
|
|
| | | | | | 78,349 |
| | | | |
|
|
| | |
United Kingdom—11.4% | | | | | |
BG Group plc (Industrial services) | | 3,440,020 | | | 28,232 |
*Burren Energy plc (Energy) | | 399,400 | | | 4,774 |
*Cairn Energy plc (Petroleum refining) | | 295,800 | | | 7,124 |
Capita Group plc (Commercial services) | | 1,782,400 | | | 11,715 |
Carnival plc (Hotels, restaurants and leisure activities) | | 275,400 | | | 15,609 |
Intertek Group (Diversified commercial services) | | 361,000 | | | 4,528 |
MAN Group plc (Finance) | | 210,500 | | | 5,437 |
*Michael Page International (Personnel services) | | 1,421,000 | | | 5,134 |
Next plc (Multiline retail) | | 287,100 | | | 7,735 |
Northgate (Vehicles and equipment) | | 217,300 | | | 3,529 |
Reckitt Benckiser plc (Household products) | | 393,650 | | | 11,559 |
Standard Chartered plc (Banking) | | 338,200 | | | 6,159 |
Tesco plc (Food retail) | | 4,701,700 | | | 26,775 |
Ultra Electronic Holdings plc (Electronic products) | | 299,000 | | | 4,302 |
| | | | |
|
|
| | | | | | 142,612 |
| | | | |
|
|
| | |
Canada—5.5% | | | | | |
*Alimentation Couche-Tard—Class “B”
(Food retail) | | 254,000 | | | 3,872 |
Canadian National Railway Company (Railroads) | | 264,000 | | | 15,205 |
Four Seasons Hotel, Inc. (Hotels) | | 178,500 | | | 11,770 |
Manulife Financial Corp. (Life and health insurance) | | 260,100 | | | 12,401 |
See accompanying Notes to Financial Statements.
June 30, 2005 | William Blair Funds 5 |
Institutional International Growth Fund
Portfolio of Investments, June 30, 2005 (all dollar amounts in thousands) (unaudited)
| | | | | |
Issuer
| | Shares
| | Value
|
| |
Common Stocks—Canada—5.5%—(continued) | | | |
*Research in Motion Ltd. (Wireless telecommunication) | | 155,800 | | $ | 11,448 |
Ritchie Brothers Auctioneers, Inc. (Business services) | | 50,000 | | | 1,928 |
*Rona, Inc. (Building materials) | | 279,600 | | | 5,623 |
Shoppers Drug Mart Corp. (Retail trade) | | 192,800 | | | 6,677 |
| | | | |
|
|
| | | | | | 68,924 |
| | | | |
|
|
| | |
Japan—17.7% | | | | | |
Aeon Credit Service Co., Ltd.
(Consumer finance) | | 99,200 | | | 6,194 |
Aeon Mall Co., Ltd. (Real estate) | | 168,600 | | | 5,914 |
Arnest One Corp. (Real estate) | | 151,700 | | | 3,631 |
Askul Corporation (Retail trade) | | 65,100 | | | 3,808 |
Canon, Inc. (Office electronics) | | 454,000 | | | 23,807 |
*Chiyoda Corp. (Construction) | | 677,800 | | | 8,363 |
Chugai Pharmaceutical Company (Pharmaceuticals) | | 1,023,000 | | | 15,759 |
Honeys Company, Ltd. (Luxury goods) | | 46,200 | | | 1,448 |
Hoya Corporation (Electronic technology) | | 138,900 | | | 15,965 |
ITO EN, Ltd. (Beverages) | | 75,000 | | | 3,847 |
Keyence Corporation (Electronic technology) | | 37,990 | | | 8,473 |
Nakanishi Inc. (Medical specialties) | | 39,100 | | | 3,939 |
Neomax Co., Ltd. (Electronic equipment and instruments) | | 156,700 | | | 3,452 |
Nidec Corporation (Electronic technology) | | 96,000 | | | 10,124 |
Nitori Company Ltd. (Specialty stores) | | 67,340 | | | 4,821 |
Nitto Denko Corporation (Electronic technology) | | 158,300 | | | 9,024 |
NIWS Company, Ltd. (Computer integration) | | 1,700 | | | 2,228 |
Orix Corporation (Consumer finance) | | 120,900 | | | 18,061 |
Park 24 Co., Ltd. (Commercial services) | | 231,000 | | | 4,565 |
Point Inc. Ltd. (Apparel and footwear retail) | | 119,390 | | | 4,675 |
Ryohin Keikaku Co. Ltd. (Retail stores) | | 129,200 | | | 6,365 |
Sharp Corp. (Electronics) | | 2,034,100 | | | 31,665 |
Shimamura Company Ltd. (Retail stores) | | 59,100 | | | 4,978 |
*Shinsei Bank, Ltd. (Banking) | | 1,233,500 | | | 6,623 |
Sparks Asset Management Co. (Financial) | | 1,266 | | | 2,641 |
Sundrug Co., Ltd. (Drug stores) | | 90,200 | | | 3,547 |
Yamada Denki Company (Retail trade) | | 143,200 | | | 8,227 |
| | | | |
|
|
| | | | | | 222,144 |
| | | | |
|
|
| | |
Emerging Asia—8.2% | | | | | |
India—3.2% | | | | | |
Bharat Forge Ltd. (Machinery) | | 158,760 | | | 5,214 |
*Bharti Tele-Ventures (Telecommunications) | | 1,572,500 | | | 8,775 |
HDFC Bank (Banking) | | 491,000 | | | 7,114 |
Housing Development Finance Corp. (Financial services) | | 427,300 | | | 8,670 |
Infosys Technologies, Ltd. (Consulting and software services) | | 184,028 | | | 9,973 |
| | | | |
|
|
| | | | | | 39,746 |
| | | | |
|
|
Indonesia—0.6% | | | | | |
*Bank Rakyat Indonesia (Banking) | | 14,652,700 | | | 4,346 |
Bank Danamon (Commercial banks) | | 6,170,000 | | | 3,189 |
| | | | |
|
|
| | | | | | 7,535 |
| | | | |
|
|
| | | | | |
Issuer
| | Shares
| | Value
|
|
Common Stocks—Emerging Asia—8.2%—(continued) |
Malaysia—0.3% | | | | | |
*Airasia Bhd (Air transport) | | 8,653,500 | | $ | 3,729 |
Transmile Group Bhd (Airport development and maintenance) | | 130,000 | | | 362 |
| | | | |
|
|
| | | | | | 4,091 |
| | | | |
|
|
South Korea—1.4% | | | | | |
Samsung Electronics Co. (Semiconductors) | | 36,100 | | | 17,105 |
| | | | |
|
|
Taiwan—2.7% | | | | | |
Hon Hai Precision Industry (Computers) | | 3,837,347 | | | 19,893 |
*Mediatek Inc. (Semiconductors and equipment) | | 1,102,000 | | | 9,518 |
Novatek Microelectronics (Semiconductors and equipment) | | 1,173,000 | | | 5,003 |
| | | | |
|
|
| | | | | | 34,414 |
| | | | |
|
|
| | |
Asia—7.8% | | | | | |
Australia—3.9% | | | | | |
BHP Billiton Ltd. (Diversified resources) | | 938,300 | | | 12,801 |
Billabong International Ltd. (Apparel and luxury goods) | | 808,300 | | | 8,348 |
Macquarie Bank, Ltd. (Financial services) | | 303,000 | | | 13,721 |
Sigma Company, Ltd. (Medical distributors) | | 775,800 | | | 5,447 |
Toll Holdings, Ltd. (Trucking) | | 914,500 | | | 9,058 |
| | | | |
|
|
| | | | | | 49,375 |
| | | | |
|
|
Hong Kong—3.0% | | | | | |
China Insurance International (Insurance) | | 8,005,160 | | | 2,951 |
Cnooc Ltd. (Oil and gas) | | 11,789,900 | | | 6,987 |
Esprit Holdings Ltd. (Apparel, footwear
and retail) | | 1,231,000 | | | 8,877 |
*Foxconn International (Manufacturing services) | | 8,381,000 | | | 6,256 |
*Lifestyle International Holdings Ltd. (Specialty retail) | | 1,114,500 | | | 1,830 |
Techtronic Industries Co. (Consumer durables) | | 4,006,400 | | | 10,098 |
| | | | |
|
|
| | | | | | 36,999 |
| | | | |
|
|
Singapore—0.9% | | | | | |
Capitaland, Ltd. (Real estate operations) | | 6,685,000 | | | 9,422 |
Osim International Ltd.
(Consumer sundries) | | 2,997,200 | | | 1,900 |
| | | | |
|
|
| | | | | | 11,322 |
| | | | |
|
|
| | |
Emerging Latin America—5.5% | | | | | |
Brazil—0.8% | | | | | |
Gol Linhas Aereas Int S.P—ADR
(Air transport) | | 119,800 | | | 3,601 |
*Natura Cosmeticos S.A. (Cosmetics) | | 193,300 | | | 6,132 |
| | | | |
|
|
| | | | | | 9,733 |
| | | | |
|
|
Chile—1.4% | | | | | |
Banco Santander SP—ADR (Banking) | | 170,733 | | | 5,515 |
Cencosud S.A.—ADR 144A
(Retail stores) | | 261,300 | | | 6,571 |
Lan Chile S.A.—ADR (Airlines) | | 164,600 | | | 5,753 |
| | | | |
|
|
| | | | | | 17,839 |
| | | | |
|
|
See accompanying Notes to Financial Statements.
6 Semi-Annual Report | June 30, 2005 |
Institutional International Growth Fund
Portfolio of Investments, June 30, 2005 (all dollar amounts in thousands) (unaudited)
| | | | | |
Issuer
| | Shares
| | Value
|
|
Common Stocks—Emerging Latin America—5.5%—(continued) |
Columbia—0.3% | | | | | |
Bancolombia S.A.—ADR (Commercial banks) | | 195,400 | | $ | 3,124 |
| | | | |
|
|
Mexico—3.0% | | | | | |
America Movil S.A. (Communications) | | 3,136,100 | | | 9,348 |
*Consorcio Ara Sa De Cv (Construction) | | 782,300 | | | 2,702 |
*Corporacion Geo Sa De Cv (Real estate) | | 2,250,000 | | | 5,681 |
Grupo Aeroportuario—ADR (Transportation) | | 135,800 | | | 4,325 |
*Urbi Desarrollos Urbanos S.A. (Household durables) | | 1,041,800 | | | 5,722 |
Walmart de Mexico (Retail trade) | | 2,429,400 | | | 9,867 |
| | | | |
|
|
| | | | | | 37,645 |
| | | | |
|
|
| |
Emerging Europe, Mid-East, Africa—3.2% | | | |
Egypt—1.1% | | | | | |
Orascom Contruction Industry (Construction) | | 251,343 | | | 7,129 |
*Orascom Telecommunication Holding GDR (Telecommunications) | | 141,600 | | | 7,121 |
| | | | |
|
|
| | | | | | 14,250 |
| | | | |
|
|
Hungary—0.6% | | | | | |
OTP Bank (Banking) | | 212,400 | | | 7,184 |
| | | | |
|
|
Romania—0.1% | | | | | |
Romanian Development Bank (Commercial banks) | | 1,063,000 | | | 1,589 |
| | | | |
|
|
South Africa—0.9% | | | | | |
Edgars Consolidated Stores (Apparel, footwear and retail) | | 128,500 | | | 5,578 |
*MTN Group Ltd. (Telecommunication
services) | | 828,500 | | | 5,489 |
| | | | |
|
|
| | | | | | 11,067 |
| | | | |
|
|
| | | | | | | |
Issuer
| | Shares or
Principal
Amount
| | Value
| |
| |
Common Stocks—Emerging Europe, Mid-East, Africa—3.2%—(continued) | | | | |
Turkey—0.5% | | | | | | | |
*Turkiye Garanti Bank (Banking) | | | 1,477,400 | | | 6,301 | |
| | | | | |
|
|
|
Total Common Stock—96.3%
(cost $995,294) | | | 1,207,944 | |
| | | | | |
|
|
|
| | |
Preferred Stock | | | | | | | |
Brazil—2.2% | | | | | | | |
Banco Itau Holding (Banking) | | | 61,290 | | $ | 11,350 | |
Petroleo Brasileiro S.A. (Oil, gas drilling, and exploration) | | | 344,400 | | | 15,802 | |
| | | | | |
|
|
|
Total Preferred Stock—2.2%
(cost $21,558) | | | 27,152 | |
| | | | | |
|
|
|
| | |
Investment in Affiliate—0.6% | | | | | | | |
William Blair Ready Reserves Fund | | | 7,862,634 | | | 7,863 | |
| | | | | |
|
|
|
Total Investments in Affiliate
(cost $7,863) | | | 7,863 | |
| | | | | |
|
|
|
| | |
Short-Term Investments—2.1% | | | | | | | |
American Express Demand Note, VRN, 3.164% due 7/1/05 | | $ | 13,802,000 | | | 13,802 | |
Prudential Funding Demand Note, VRN, 3.368% due 7/1/05 | | | 12,712,000 | | | 12,712 | |
| | | | | |
|
|
|
Total Short-term Investments
(cost $26,514) | | | 26,514 | |
| | | | | |
|
|
|
Total Investments—101.2%
(cost $1,051,229) | | | 1,269,473 | |
Liabilities, plus cash and other assets—(1.2)% | | | (15,456 | ) |
| | | | | |
|
|
|
Net assets—100.0% | | $ | 1,254,017 | |
| | | | | |
|
|
|
*Non-income producing securities
ADR = American Depository Receipt
GDR = Global Depository Receipt
VRN = Variable Rate Note
All securities, excluding those primarily traded on exchanges or markets that close before the close of regular trading on the New York Stock Exchange, are fair valued pursuant to Valuation Procedures adopted by the Board of Trustees.
At June 30, 2005 the Fund’s Portfolio of Investments includes the following currency categories:
| | |
Euro | | 28.4% |
Japanese Yen | | 18.0% |
British Pound Sterling | | 11.6% |
Swiss Franc | | 6.3% |
Canadian Dollar | | 5.4% |
Australian Dollar | | 4.0% |
United States Dollar | | 3.5% |
Indian Rupee | | 3.2% |
Hong Kong Dollar | | 3.0% |
Taiwan Dollar | | 2.8% |
Mexico Nuevo Peso | | 2.7% |
Brazilian Real | | 2.7% |
South Korean Won | | 1.4% |
Swedish Krona | | 1.4% |
Norwegian Krone | | 1.1% |
All other currencies | | 4.5% |
| | |
|
| | | 100.0% |
| | |
|
See accompanying Notes to Financial Statements.
June 30, 2005 | William Blair Funds 7 |
W. George Greig
INSTITUTIONAL INTERNATIONAL EQUITY FUND
The Institutional International Equity Fund invests primarily in common stocks of companies included in the Morgan Stanley Capital International All Country World ex-U.S. Index.
AN OVERVIEW FROM THE PORTFOLIO MANAGER
How did the Fund perform over the first half of the year? How did the Fund’s performance compare to its benchmark?
The Institutional International Equity Fund posted a 0.20% increase for the six months ended June 30, 2005. By comparison, the Fund’s benchmark, the MSCI All Country World (Free) except US Index, rose 0.32%.
What were the most significant factors impacting international markets during the first six months of the year?
The largely flat return of international equity markets during the first six months of 2005 masked volatile monthly results. Emerging markets and small cap stocks were the strongest international equity market performers at the beginning of the year, extending their dominance from 2004. This trend reversed in March and April as inflation fears and concerns about the impact of high energy and commodity prices on global growth resulted in investors reducing their risk positions. After the mid period pause, markets rebounded in May and June, as defensive sectors such as Utilities and Telecommunication Services underperformed relative to Health Care, Energy and Information Technology. Materials also was a negative performer during the second quarter as concerns about excess supply and falling demand for commodities rippled through the market. Overall, emerging markets were the strongest region during the six month period, returning 6.26% during the period, while small cap stocks outpaced their larger cap counterparts, returning 4.39%. The Europe, Australia and Far East Index fell 0.85% during same time period.
During the first six months of 2005, the US dollar appreciated versus most currencies, with the largest appreciation versus the Euro, where it appreciated approximately 10%. Despite this appreciation, international markets extended their gains over the US as the MSCI All Country World (Free) except US Index returned 0.32%, while the S&P 500 Index declined 0.81%.
What factors were behind the Fund’s performance versus the benchmark?
While the Fund significantly outperformed the broad and growth index benchmarks during the second quarter, it lagged the broad benchmark during the six month period, due to first quarter results. The Fund’s quality growth discipline, which manifested itself in the overweighted allocation in Information Technology and Consumer sectors at the expense of Materials and Energy during the first quarter, hampered results. Somewhat mitigating this performance was strong stock selection across sectors and regions during the second quarter, coupled with positive results from emerging markets exposure.
What is your current outlook?
The shape of the global economic cycle is shifting. The modest deceleration in growth driven by higher oil prices and a downturn in China’s imports may be receding into the background as other cyclical forces begin to edge growth higher.
8 Semi-Annual Report | June 30, 2005 |
Evidence from a number of sources—including recent purchasing managers’ index releases, indications of temporary help demand, technology demand indicators (in Asia), and credit growth (in Europe)—suggest that the industrial economies may be poised to reaccelerate after a number of sluggish quarters.
On the other hand, rising short term interest rates, higher oil prices and the effects of housing inflation have not had the predicted negative effects on domestic demand, either in the US or elsewhere. Household spending in China and other emerging markets has remained strong, while strong employment and income growth in Japan have steadied the economy there in the face of slowing net exports.
A reacceleration in global growth after the 2004-05 slowdown could be reinforced by stronger investment spending backed by bulging corporate cash and profits, implying cyclical strength in technology and machinery as well as improving growth performance in previous laggards Europe and Japan.
What is your current strategy? How is the Fund positioned?
As of June 30, the Fund maintains its overweighting in emerging markets relative to the Index, and is now near a market weight in Europe ex-UK, largely through the addition of healthcare and technology companies to the portfolio during the quarter. From a sector perspective, the portfolio maintains its largest relative weightings in Consumer Discretionary, Information Technology and Health Care, and has its smallest relative weightings in Materials, Telecommunication Services and Financials. These weightings are largely the result of the Advisor’s bottom up, fundamental quality growth discipline, which are also supported by the Advisor’s strategic viewpoint.
June 30, 2005 | William Blair Funds 9 |
Institutional International Equity Fund
Performance Highlights
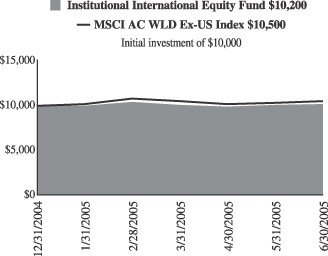
Average Annual Total Return at 6/30/2005
| | | |
| | | Since Inception(a)
| |
Institutional International Equity Fund | | 2.20 | % |
MSCI All Country World Free Ex-US Index | | 4.63 | |
| | (a) | | For the period from December 1, 2004 (Commencement of Operations) to June 30, 2005. | |
Performance cited represents past performance. Past performance does not guarantee future results and current performance may be lower or higher than the data quoted. Results shown are average annual returns, which assume reinvestment of dividends and capital gains. Investment returns and principal will fluctuate and you may have a gain or loss when you sell shares. For the most current month-end performance information, please call 1-800-742-7272, or visit our Web site at www.williamblairfunds.com. International investing involves special risk considerations, including currency fluctuations, lower liquidity, economic and political risk.
The performance highlights and graph presented above do not reflect the deduction of taxes that a shareholder would pay on fund distributions or the redemption of fund shares.
The Morgan Stanley Capital International (MSCI) All Country World Free Ex-US Index is an unmanaged index that includes developed and emerging markets and reduced Japanese portion, making it more comparable to the Institutional International Growth Fund in terms of investment approach.
This report identifies the Fund’s investments on June 30, 2005. These holdings are subject to change. Not all stocks in the Fund performed the same, nor is there any guarantee that these stocks will perform as well in the future. Market forecasts provided in this report may not necessarily come to pass.
Sector Diversification
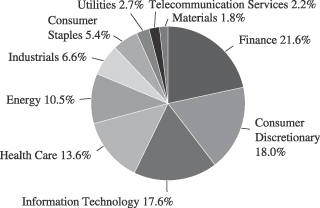
The sector diversification shown is based on the total investment portfolio.
10 Semi-Annual Report | June 30, 2005 |
Institutional International Equity Fund
Portfolio of Investments, June 30, 2005 (all dollar amounts in thousands) (unaudited)
| | | | | |
Issuer
| | Shares
| | Value
|
| | |
Common Stocks—Europe—39.0% | | | | | |
Austria—1.0% | | | | | |
Erste Bank Der Oester (Banking) | | 13,870 | | $ | 692 |
| | | | |
|
|
France—10.7% | | | | | |
BNP Paribas (Banking) | | 25,500 | | | 1,739 |
Essilor International (Health care supplies) | | 9,500 | | | 647 |
Hermes International SCA (Apparel and luxury goods) | | 4,900 | | | 986 |
*JC Decaux (Media) | | 25,400 | | | 642 |
Sanofi-Aventis (Pharmaceuticals) | | 30,600 | | | 2,502 |
Vinci S.A. (Construction) | | 11,700 | | | 971 |
| | | | |
|
|
| | | | | | 7,487 |
| | | | |
|
|
Germany��10.0% | | | | | |
Celesio AG (Pharmaceuticals) | | 16,800 | | | 1,316 |
Continental AG (Diversified manufacturing) | | 17,870 | | | 1,279 |
E.ON AG (Energy) | | 20,900 | | | 1,852 |
SAP AG (Software) | | 14,750 | | | 2,548 |
| | | | |
|
|
| | | | | | 6,995 |
| | | | |
|
|
Greece—2.2% | | | | | |
Coca-Cola Hellenic Bottling S.A. (Beverages) | | 9,950 | | | 269 |
EFG Eurobank (Banking) | | 21,300 | | | 654 |
National Bank of Greece (Banking) | | 18,800 | | | 636 |
| | | | |
|
|
| | | | | | 1,559 |
| | | | |
|
|
Ireland—0.9% | | | | | |
Anglo Irish Bank plc (Finance) | | 53,400 | | | 660 |
| | | | |
|
|
Netherlands—0.5% | | | | | |
*Qiagen, Inc. (Health care) | | 29,700 | | | 345 |
| | | | |
|
|
Norway—2.3% | | | | | |
Statoil ASA (Oil and gas) | | 79,700 | | | 1,621 |
| | | | |
|
|
Spain—1.9% | | | | | |
Grupo Ferrovial S.A. (Industrial services) | | 6,200 | | | 398 |
*Industria De Textile (Retail trade) | | 35,300 | | | 906 |
| | | | |
|
|
| | | | | | 1,304 |
| | | | |
|
|
Sweden—0.2% | | | | | |
Capio AB (Health care) | | 9,800 | | | 144 |
| | | | |
|
|
Switzerland—9.3% | | | | | |
Nobel Biocare Holdings AG (Medical equipment and supplies) | | 1,650 | | | 334 |
Roche Holdings AG (Health care) | | 22,450 | | | 2,828 |
SGS SA (Industrials) | | 710 | | | 486 |
Synthes, Inc. (Health care) | | 10,380 | | | 1,136 |
UBS AG (Banking) | | 22,165 | | | 1,725 |
| | | | |
|
|
| | | | | | 6,509 |
| | | | |
|
|
| | |
United Kingdom—12.6% | | | | | |
BG Group plc (Industrial services) | | 342,300 | | | 2,809 |
Capita Group plc (Commercial services) | | 121,550 | | | 799 |
Carnival plc (Hotels, restaurants and leisure activities) | | 20,700 | | | 1,173 |
MAN Group plc (Finance) | | 12,800 | | | 331 |
Next plc (Multiline retail) | | 23,400 | | | 630 |
Reckitt Benckiser plc (Household products) | | 38,500 | | | 1,131 |
Tesco plc (Food retailer) | | 334,200 | | | 1,903 |
| | | | |
|
|
| | | | | | 8,776 |
| | | | |
|
|
| | | | | |
Issuer
| | Shares
| | Value
|
| | |
Common Stocks—Japan—16.7% | | | | | |
Askul Corporation (Retail trade) | | 4,200 | | $ | 246 |
Canon, Inc. (Office electronics) | | 39,800 | | | 2,087 |
*Chiyoda Corporation (Construction) | | 37,000 | | | 456 |
Denso Corporation (Auto parts manufacturing) | | 54,600 | | | 1,240 |
Hoya Corporation (Electronic technology) | | 8,000 | | | 920 |
Keyence Corporation (Electronic technology) | | 3,300 | | | 736 |
Nidec Corporation (Electronic technology) | | 5,700 | | | 601 |
Nitto Denko Corporation (Electronic technology) | | 9,000 | | | 513 |
Orix Corporation (Consumer finance) | | 10,700 | | | 1,598 |
Sharp Corporation (Electronics) | | 137,000 | | | 2,133 |
*Shinsei Bank, Ltd. (Banking) | | 117,000 | | | 628 |
Yamada Denki Co. Ltd. (Retail trade) | | 9,100 | | | 523 |
| | | | |
|
|
| | | | | | 11,681 |
| | | | |
|
|
| | |
Canada—4.6% | | | | | |
Canadian National Railway Co. (Railroads) | | 14,500 | | | 835 |
Manulife Financial Corporation (Life and health insurance) | | 33,600 | | | 1,602 |
*Research in Motion Ltd. (Wireless telecommunication) | | 5,000 | | | 367 |
Shoppers Drug Mart Corporation (Retail trade) | | 10,800 | | | 374 |
| | | | |
|
|
| | | | | | 3,178 |
| | | | |
|
|
| | |
Asia—7.2% | | | | | |
Australia—4.1% | | | | | |
BHP Billiton Ltd. (Diversified resources) | | 52,500 | | | 716 |
Macquarie Bank, Ltd. (Financial services) | | 35,500 | | | 1,607 |
Toll Holdings, Ltd. (Trucking) | | 56,600 | | | 561 |
| | | | |
|
|
| | | | | | 2,884 |
| | | | |
|
|
Hong Kong—3.1% | | | | | |
Cnooc Ltd. (Oil and gas) | | 729,500 | | | 432 |
Esprit Holdings Ltd. (Apparel, footwear
and retail) | | 109,100 | | | 787 |
Techtronic Industries Co. (Consumer durables) | | 374,900 | | | 945 |
| | | | |
|
|
| | | | | | 2,164 |
| | | | |
|
|
| | |
Emerging Asia—9.0% | | | | | |
India—3.0% | | | | | |
*Bharti Tele-Ventures (Wireless telecommunication services) | | 132,331 | | | 738 |
HDFC Bank (Banking) | | 32,490 | | | 471 |
Infosys Technologies Ltd. (Consulting and software services) | | 16,088 | | | 872 |
| | | | |
|
|
| | | | | | 2,081 |
| | | | |
|
|
South Korea—2.3% | | | | | |
*Kookmin Bank (Banking) | | 8,700 | | | 393 |
Samsung Electronics Co. (Semiconductors) | | 2,612 | | | 1,237 |
| | | | |
|
|
| | | | | | 1,630 |
| | | | |
|
|
Taiwan—3.7% | | | | | |
Hon Hai Precision Industry Corp. (Computers) | | 300,000 | | | 1,555 |
*Mediatek, Inc. (Electronic technology) | | 123,000 | | | 1,063 |
| | | | |
|
|
| | | | | | 2,618 |
| | | | |
|
|
See accompanying Notes to Financial Statements.
June 30, 2005 | William Blair Funds 11 |
Institutional International Equity Fund
Portfolio of Investments, June 30, 2005 (all dollar amounts in thousands) (unaudited)
| | | | | |
Issuer
| | Shares
| | Value
|
| | |
Common Stocks—Latin America—2.1% | | | | | |
Mexico—2.1% | | | | | |
America Movil S.A. (Communications) | | 250,500 | | $ | 747 |
Walmart de Mexico (Retail trade) | | 185,100 | | | 752 |
| | | | |
|
|
| | | | | | 1,499 |
| | | | |
|
|
| |
Emerging Europe, Mid-East, Africa—3.0% | | | |
Hungary—0.9% | | | | | |
OTP Bank (Banking) | | 17,500 | | | 592 |
| | | | |
|
|
South Africa—2.1% | | | | | |
Sasol ASA (Energy) | | 30,000 | | | 811 |
Standard Bank Group Ltd. (Banking) | | 67,400 | | | 652 |
| | | | |
|
|
| | | | | | 1,463 |
| | | | |
|
|
Total Common Stock—94.2%
(cost $64,000) | | | 65,882 |
| | | | |
|
|
| | |
Preferred Stocks | | | | | |
Brazil—3.1% | | | | | |
*Banco Itau Holding (Banking) | | 3,700 | | | 685 |
Petroleo Brasileiro S.A. (Oil, gas drilling, and exploration) | | 31,500 | | | 1,446 |
| | | | |
|
|
Total Preferred Stocks—3.1%
(cost $1,999) | | | 2,131 |
| | | | |
|
|
| | | | | | | |
Issuer
| | Shares or
Principal
Amount
| | Value
| |
| | |
Investment in Affiliate—1.0% | | | | | | | |
William Blair Ready Reserves Fund | | | 705,682 | | $ | 706 | |
| | | | | |
|
|
|
Total Investment in Affiliate
(cost $706) | | | 706 | |
| | | | | |
|
|
|
| | |
Short-Term Investments—2.2% | | | | | | | |
American Express Demand Note, VRN,
3.164% due 7/1/05 | | $ | 685,000 | | | 685 | |
Prudential Funding Demand Note, VRN, 3.368%, due 7/1/05 | | | 839,000 | | | 839 | |
| | | | | |
|
|
|
Total Short-term Investments
(cost $1,524) | | | 1,524 | |
| | | | | |
|
|
|
Total Investments—100.5%
(cost $68,229) | | | 70,243 | |
Liabilities, plus cash and other assets—(0.5)% | | | (325 | ) |
| | | | | |
|
|
|
Net assets—100.0% | | $ | 69,918 | |
| | | | | |
|
|
|
* Non-income producing securities
ADR = American Depository Receipt
+ = U.S. listed foreign security
GDR=Global Depository Receipt
VRN=Variable Rate Note
All securities, excluding those primarily traded on exchanges or markets that close before the close of regular trading on the New York Stock Exchange, are fair valued pursuant to Valuation Procedures adopted by the Board of Trustees.
At June 30, 2005 the Fund’s Portfolio of Investments includes the following currency categories:
| | |
Euro | | 28.0% |
Japanese Yen | | 17.2% |
British Pound Sterling | | 12.9% |
Swiss Franc | | 9.6% |
Canadian Dollar | | 4.7% |
Australian Dollar | | 4.2% |
Hong Kong Dollar | | 3.2% |
Swedish Krona | | 0.2% |
Indian Rupee | | 3.0% |
Mexico Nuevo Peso | | 2.2% |
Norwegian Krone | | 2.4% |
South African Rand | | 2.1% |
South Korean Won | | 2.4% |
Taiwan Dollar | | 3.9% |
Brazilian Real | | 3.1% |
Hungarian Forint | | 0.9% |
| | |
|
| | | 100.0% |
| | |
|
See accompanying Notes to Financial Statements.
12 Semi-Annual Report | June 30, 2005 |

Jeffrey A. Urbina
W. George Greig

Todd M. McClone
EMERGING MARKETS GROWTH FUND
The Emerging Markets Growth Fund primarily invests in a diversified portfolio of equity securities issued by growth companies in emerging economies worldwide.
AN OVERVIEW FROM THE PORTFOLIO MANAGERS
We are pleased to have the Emerging Markets Growth Fund become the newest addition to the William Blair Fund Family and would like to thank our shareholders for investing with us.
The Emerging Markets Growth Fund commenced operations on June 6, 2005. Through the period ended June 30, 2005, the Fund posted a gain of 2.70%, ahead of the 2.09% return of the Fund’s benchmark, the MSCI Emerging Markets Index, for this short time period.
We are enthusiastic about opportunities available to us as portfolio managers of the Emerging Markets Growth Fund. The Fund primarily invests in large, mid and small companies located in emerging markets countries.
Our investment process seeks to find high quality growth companies for the Emerging Markets Growth Fund’s investment portfolio. These are companies that historically have exhibited superior growth, profitability and quality relative to local markets and companies within the same industry worldwide, and are expected to continue such performance. Such companies generally will exhibit superior business fundamentals, including leadership in their field, quality products or services, distinctive marketing and distribution, pricing flexibility and revenue from products or services consumed on a steady, recurring basis. We focus on companies with above-average returns on equity, strong balance sheets and consistent, above-average earnings growth.
International Outlook
The shape of the global economic cycle is shifting. The modest deceleration in growth driven by higher oil prices and a downturn in China’s imports may be receding into the background as other cyclical forces begin to edge growth higher.
Evidence from a number of sources—including recent purchasing managers’ index releases, indications of temporary help demand, technology demand indicators (in Asia), and credit growth (in Europe)—suggest that the industrial economies may be poised to reaccelerate after a number of sluggish quarters.
On the other hand, rising short term interest rates, higher oil prices and the effects of housing inflation have not had the predicted negative effects on domestic demand, either in the US or elsewhere. Household spending in China and other emerging markets have remained strong, while strong employment and income growth in Japan have steadied the economy there in the face of slowing net exports.
A reacceleration in global growth after the 2004-05 slowdown could be reinforced by stronger investment spending backed by bulging corporate cash and profits, implying cyclical strength in technology and machinery as well as improving growth performance in previous laggards Europe and Japan.
June 30, 2005 | William Blair Funds 13 |
Emerging Markets Growth Fund
Performance Highlights
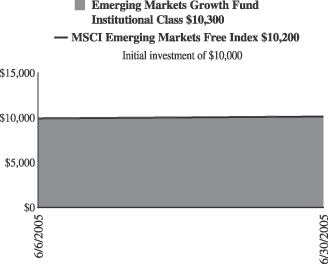
Average Annual Total Return at 6/30/2005
| | | |
| | | Since Inception(a)
| |
Emerging Markets Growth Fund Institutional Class | | 2.70 | % |
MSCI Emerging Markets Free Index | | 2.09 | |
| | (a) | | For the period from June 6, 2005 (Commencement of Operations) to June 30, 2005. | |
Performance cited represents past performance. Past performance does not guarantee future results and current performance may be lower or higher than the data quoted. Results shown are average annual returns, which assume reinvestment of dividends and capital gains. Investment returns and principal will fluctuate and you may have a gain or loss when you sell shares. For the most current month-end performance information, please call 1-800-742-7272, or visit our Web site at www.williamblairfunds.com. International investing involves special risk considerations, including currency fluctuations, lower liquidity, economic and political risk.
The performance highlights and graph presented above do not reflect the deduction of taxes that a shareholder would pay on fund distributions or the redemption of fund shares.
The Morgan Stanley Capital International (MSCI) Emerging Markets Free Index is an index that is designated to measure equity performance in the global emerging markets.
This report identifies the Fund’s investments on June 30, 2005. These holdings are subject to change. Not all stocks in the Fund performed the same, nor is there any guarantee that these stocks will perform as well in the future. Market forecasts provided in this report may not necessarily come to pass.
Sector Diversification
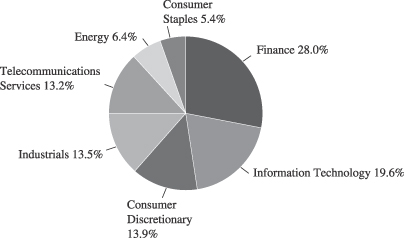
The sector diversification shown is based on the total investment portfolio.
14 Semi-Annual Report | June 30, 2005 |
Emerging Markets Growth Fund
Portfolio of Investments, June 30, 2005 (all dollar amounts in thousands) (unaudited)
| | | | | |
Issuer
| | Shares
| | Value
|
| | |
Common Stocks—Emerging Asia—36.0% | | | | | |
India—14.7% | | | | | |
Bharat Forge Ltd. (Machinery) | | 7,150 | | $ | 238 |
*Bharti Tele-Ventures (Telecommunication services) | | 79,600 | | | 444 |
HDFC Bank (Banking) | | 27,060 | | | 392 |
Housing Development Finance Corp. (Financial services) | | 12,300 | | | 250 |
Infosys Technologies, Ltd. (Consulting and software services) | | 9,050 | | | 491 |
| | | | |
|
|
| | | | | | 1,815 |
| | | | |
|
|
Indonesia—1.9% | | | | | |
*Bank Rakyat Indonesia (Banking) | | 807,000 | | | 239 |
| | | | |
|
|
Malaysia—1.9% | | | | | |
*Airasia Bhd (Air transport) | | 278,700 | | | 120 |
Transmile Group Bhd (Airport development and maintenance) | | 42,800 | | | 119 |
| | | | |
|
|
| | | | | | 239 |
| | | | |
|
|
South Korea —8.9% | | | | | |
Hana Tour Service (Travel service) | | 4,700 | | | 117 |
*Kookmin Bank (Banking) | | 5,100 | | | 230 |
Samsung Electronics Co. (Semiconductors) | | 1,000 | | | 474 |
*Yedang Entertainment (Music entertainment company) | | 17,550 | | | 280 |
| | | | |
|
|
| | | | | | 1,101 |
| | | | |
|
|
Taiwan—7.6% | | | | | |
Hon Hai Precision Industry (Computers) | | 89,000 | | | 461 |
*Mediatek Inc. (Semiconductors and equipment) | | 41,000 | | | 354 |
Novatek Microelectronics (Semiconductors and equipment) | | 29,000 | | | 124 |
| | | | |
|
|
| | | | | | 939 |
| | | | |
|
|
Thailand—1.0% | | | | | |
Aapico Hitech (Auto and truck parts) | | 148,000 | | | 120 |
| | | | |
|
|
| | |
Emerging Latin America—26.2% | | | | | |
Brazil—6.1% | | | | | |
Gol Linhas Aereas Int S.P—ADR (Air transport) | | 12,500 | | | 376 |
*Natura Cosmeticos S.A. (Cosmetics) | | 11,800 | | | 374 |
| | | | |
|
|
| | | | | | 750 |
| | | | |
|
|
Chile—6.3% | | | | | |
Banco Santander SP—ADR (Banking) | | 9,100 | | | 294 |
Cencosud S.A.—ADR 144A (Retail stores) | | 9,500 | | | 239 |
Lan Chile S.A.—ADR (Airlines) | | 6,900 | | | 241 |
| | | | |
|
|
| | | | | | 774 |
| | | | |
|
|
Columbia—2.0% | | | | | |
Bancolombia S.A.—ADR (Commercial banks) | | 15,200 | | | 243 |
| | | | |
|
|
Mexico—11.8% | | | | | |
America Movil S.A. (Communications) | | 123,000 | | | 367 |
*Corporacion Geo Sa De Cv (Real estate) | | 99,000 | | | 250 |
Grupo Aeroportuario—ADR (Transportation) | | 3,800 | | | 121 |
*Urbi Desarrollos Urbanos S.A. (Household durables) | | 44,000 | | | 242 |
Walmart de Mexico (Retail trade) | | 119,000 | | | 483 |
| | | | |
|
|
| | | | | | 1,463 |
| | | | |
|
|
| | | | | | | |
Issuer
| | Shares or
Principal
Amount
| | Value
| |
| |
Common Stocks—Emerging Europe, Mid-East, Africa—21.1% | | | | |
Egypt—4.9% | | | | | | | |
Orascom Contruction Industry GDR (Construction) | | | 4,300 | | $ | 245 | |
*Orascom Telecommunication Holding GDR (Telecommunications) | | | 7,200 | | | 362 | |
| | | | | |
|
|
|
| | | | | | | 607 | |
| | | | | |
|
|
|
*Hungary—2.6% | | | | | | | |
OTP Bank (Banking) | | | 9,300 | | | 315 | |
| | | | | |
|
|
|
South Africa—10.7% | | | | | | | |
African Bank Investments (Banking) | | | 43,650 | | | 122 | |
Edgars Consolidated Stores (Apparel, footwear and retail) | | | 5,600 | | | 243 | |
*MTN Group Ltd. (Telecommunication services) | | | 55,000 | | | 364 | |
Sasol Ltd. (Oil Company) | | | 13,900 | | | 376 | |
Standard Bank Group Ltd. (Banking) | | | 22,000 | | | 213 | |
| | | | | |
|
|
|
| | | | | | | 1,318 | |
| | | | | |
|
|
|
Turkey—2.9% | | | | | | | |
*Turkiye Garanti Bankasi A.S. (Banking) | | | 85,000 | | | 363 | |
| | | | | |
|
|
|
| | |
Asia—3.1% | | | | | | | |
Hong Kong—3.1% | | | | | | | |
*Foxconn International (Manufacturing services) | | | 515,000 | | | 384 | |
| | | | | |
|
|
|
| | |
Europe—2.0% | | | | | | | |
Netherlands—2.0% | | | | | | | |
*Pyaterochka Holdings GDR (Food and retail) | | | 17,300 | | | 249 | |
| | | | | |
|
|
|
Total Common Stock—88.4%
(cost $10,645) | | | 10,919 | |
| | | | | |
|
|
|
| | |
Preferred Stock | | | | | | | |
Brazil—5.8% | | | | | | | |
Banco Itau Holding (Banking) | | | 1,900 | | | 352 | |
Petroleo Brasileiro S.A. (Oil, gas drilling,
and exploration) | | | 8,100 | | | 372 | |
| | | | | |
|
|
|
Total Preferred Stock—5.8%
(cost $715) | | | 724 | |
| | | | | |
|
|
|
| | |
Investment in Affiliate—2.1% | | | | | | | |
William Blair Ready Reserves Fund | | | 258,115 | | | 258 | |
| | | | | |
|
|
|
Total Investments in Affiliate
(cost $258) | | | 258 | |
| | | | | |
|
|
|
| | |
Short-Term Investments—7.8% | | | | | | | |
American Express Demand Note, VRN,
3.164% due 7/1/05 | | $ | 491,000 | | | 491 | |
Prudential Funding Demand Note, VRN,
3.368% due 7/1/05 | | | 469,000 | | | 469 | |
| | | | | |
|
|
|
Total Short-term Investments
(cost $960) | | | 960 | |
| | | | | |
|
|
|
Total Investments—104.1%
(cost $12,578) | | | 12,861 | |
Liabilities, plus cash and other assets—(4.1)% | | | (505 | ) |
| | | | | |
|
|
|
Net assets—100.0% | | $ | 12,356 | |
| | | | | |
|
|
|
See accompanying Notes to Financial Statements.
June 30, 2005 | William Blair Funds 15 |
Emerging Markets Growth Fund
Portfolio of Investments, June 30, 2005 (all dollar amounts in thousands) (unaudited)
* Non-income producing securities
ADR = American Depository Receipt
GDR = Global Depository Receipt
VRN = Variable Rate Note
All securities, excluding those primarily traded on exchanges or markets that close before the close of regular trading on the New York Stock Exchange, are fair valued pursant to Valuation Procedures adopted by the Board of Trustees.
At June 30, 2005 the Fund’s Portfolio of Investments includes the following currency categories:
| | |
United States Dollar | | 20.4% |
Indian Rupee | | 15.6% |
Mexico Nuevo Peso | | 11.5% |
South African Rand | | 11.3% |
South Korean Won | | 9.4% |
Brazilian Real | | 9.4% |
Taiwan Dollar | | 8.1% |
Hong Kong Dollar | | 3.3% |
Turkish Lira | | 3.1% |
Hungarian Forint | | 2.7% |
Indonesian Rupiah | | 2.1% |
Malaysian Ringgit | | 2.1% |
Thai Baht | | 1.0% |
| | |
|
| | | 100.0% |
| | |
|
See accompanying Notes to Financial Statements.
16 Semi-Annual Report | June 30, 2005 |
Statements of Assets and Liabilities
June 30, 2005 (all dollar amounts in thousands) (unaudited)
| | | | | | | | | | | |
| | | Institutional International Growth Fund
| | Institutional International Equity Fund
| | | Emerging
Markets
Growth
Fund
| |
Assets | | | | | | | | | | | |
Investments in securities, at cost | | $ | 1,043,366 | | $ | 67,523 | | | $ | 12,320 | |
Investments in Affiliated Fund, at cost | | | 7,863 | | | 706 | | | | 258 | |
| | |
|
| |
|
|
| |
|
|
|
| | | |
Investments in securities, at value | | $ | 1,261,610 | | $ | 69,537 | | | $ | 12,603 | |
Investments in Affiliated Fund, at value | | | 7,863 | | | 706 | | | | 258 | |
Cash | | | 44 | | | — | | | | 1 | |
Foreign currency, at value (cost $2,215, $0, and $15, respectively) | | | — | | | 29 | | | | 7 | |
Receivable for fund shares sold | | | — | | | — | | | | 185 | |
Receivable for investment securities sold | | | 2,819 | | | — | | | | — | |
Receivable from Advisor | | | — | | | — | | | | 2 | |
Dividend and interest receivable | | | 2,562 | | | 133 | | | | 30 | |
| | |
|
| |
|
|
| |
|
|
|
Total assets | | | 1,274,898 | | | 70,405 | | | | 13,086 | |
Liabilities | | | | | | | | | | | |
Payable for investment securities purchased | | | 19,621 | | | 37 | | | | 718 | |
Payable for fund shares redeemed | | | 63 | | | 363 | | | | — | |
Management fee payable | | | 993 | | | 32 | | | | 8 | |
Other accrued expenses | | | 204 | | | 55 | | | | 4 | |
| | |
|
| |
|
|
| |
|
|
|
Total liabilities | | | 20,881 | | | 487 | | | | 730 | |
| | |
|
| |
|
|
| |
|
|
|
Net Assets | | $ | 1,254,017 | | $ | 69,918 | | | $ | 12,356 | |
| | |
|
| |
|
|
| |
|
|
|
Capital | | | | | | | | | | | |
Composition of Net Assets | | | | | | | | | | | |
Par value of shares of beneficial interest | | $ | 77 | | $ | 7 | | | $ | 1 | |
Capital paid in excess of par value | | | 964,553 | | | 68,655 | | | | 12,064 | |
Accumulated net investment income (loss) | | | 2,228 | | | 141 | | | | 26 | |
Accumulated realized gain (loss) | | | 69,032 | | | (895 | ) | | | (17 | ) |
Net unrealized appreciation (depreciation) of investments and foreign currencies | | | 218,127 | | | 2,010 | | | | 282 | |
| | |
|
| |
|
|
| |
|
|
|
Net Assets | | $ | 1,254,017 | | $ | 69,918 | | | $ | 12,356 | |
| | |
|
| |
|
|
| |
|
|
|
| | | |
Net Assets | | $ | 1,254,017 | | $ | 69,918 | | | $ | — | |
Shares Outstanding | | | 76,776,668 | | | 6,839,228 | | | | — | |
Net Asset Value Per Share | | $ | 16.33 | | $ | 10.22 | | | $ | — | |
Institutional Share Class | | | | | | | | | | | |
Net Assets | | $ | — | | $ | — | | | $ | 5,133 | |
Shares Outstanding | | | — | | | — | | | | 500,000 | |
Net Asset Value Per Share | | $ | — | | $ | — | | | $ | 10.27 | |
See accompanying Notes to Financial Statements.
June 30, 2005 | William Blair Funds 17 |
Statements of Operations
For the Period Ended June 30, 2005 (all dollar amounts in thousands) (unaudited)
| | | | | | | | | | | | |
| | | Institutional
International
Growth
Fund
| | | Institutional International Equity Fund
| | | Emerging
Markets
Growth
Fund(a)
| |
Investment income | | | | | | | | | | | | |
Dividends | | $ | 15,343 | | | $ | 483 | | | $ | 35 | |
Less foreign tax withheld | | | (1,526 | ) | | | (50 | ) | | | (2 | ) |
Income from Affiliated Fund | | | 87 | | | | 10 | | | | 1 | |
Interest | | | 251 | | | | 32 | | | | 2 | |
| | |
|
|
| |
|
|
| |
|
|
|
Total income | | | 14,155 | | | | 475 | | | | 36 | |
Expenses | | | | | | | | | | | | |
Investment advisory fees | | | 5,803 | | | | 188 | | | | 8 | |
Custodian fees | | | 434 | | | | 57 | | | | 1 | |
Transfer agent fees | | | 24 | | | | 2 | | | | 1 | |
Professional fees | | | 54 | | | | 23 | | | | — | |
Registration fees | | | 19 | | | | 5 | | | | 1 | |
Other expenses | | | 109 | | | | 24 | | | | 1 | |
| | |
|
|
| |
|
|
| |
|
|
|
Total expenses before waiver | | | 6,443 | | | | 299 | | | | 12 | |
Less expenses waived or absorbed by the Advisor | | | — | | | | (90 | ) | | | (2 | ) |
| | |
|
|
| |
|
|
| |
|
|
|
Net expenses | | | 6,443 | | | | 209 | | | | 10 | |
| | |
|
|
| |
|
|
| |
|
|
|
Net investment income (loss) | | | 7,712 | | | | 266 | | | | 26 | |
Net realized and unrealized gain (loss) on investments, foreign currency transactions and other assets and liabilities | | | | | | | | | | | | |
Net realized gain (loss) on investments | | | 63,112 | | | | (804 | ) | | | 7 | |
Net realized gain (loss) on foreign currency transactions and other assets and liabilities | | | (3,430 | ) | | | (71 | ) | | | (24 | ) |
| | |
|
|
| |
|
|
| |
|
|
|
Total net realized gain (loss) | | | 59,682 | | | | (875 | ) | | | (17 | ) |
Change in net unrealized appreciation (depreciation) on investments and other assets and liabilities | | | (46,105 | ) | | | 1,481 | | | | 282 | |
| | |
|
|
| |
|
|
| |
|
|
|
Net increase (decrease) in net assets resulting from operations | | $ | 21,289 | | | $ | 872 | | | $ | 291 | |
| | |
|
|
| |
|
|
| |
|
|
|
(a) For the period from June 6, 2005 (Commencement of Operations) to June 30, 2005.
See accompanying Notes to Financial Statements.
18 Semi-Annual Report | June 30, 2005 |
Statements of Changes in Net Assets
For the Period Ended June 30, 2005 and the Year Ended December 31, 2004 (all amounts in thousands)
| | | | | | | | | | | | | | | | | | | | |
| | | Institutional
International
Growth
Fund
| | | Institutional
International
Equity
Fund
| | | Emerging
Markets
Growth
Fund
| |
| | | 2005
| | | 2004
| | | 2005
| | | 2004(a)
| | | 2005(b)
| |
| | | (unaudited) | | | | | | (unaudited) | | | | | | (unaudited) | |
Operations | | | | | | | | | | | | | | | | | | | | |
Net investment income (loss) | | $ | 7,712 | | | $ | 1,475 | | | $ | 266 | | | $ | (3 | ) | | $ | 26 | |
Net realized gain (loss) on investments, foreign currency transactions and other assets and liabilities | | | 59,682 | | | | 6,935 | | | | (875 | ) | | | (142 | ) | | | (17 | ) |
Change in net unrealized appreciation (depreciation) on investments, foreign currency transactions and other assets and liabilities | | | (46,105 | ) | | | 168,587 | | | | 1,481 | | | | 529 | | | | 282 | |
| | |
|
|
| |
|
|
| |
|
|
| |
|
|
| |
|
|
|
Net increase (decrease) in net assets resulting from operations | | | 21,289 | | | | 176,997 | | | | 872 | | | | 384 | | | | 291 | |
Distributions to shareholders from | | | | | | | | | | | | | | | | | | | | |
Net investment income | | | — | | | | (605 | ) | | | — | | | | — | | | | — | |
Net realized gain | | | — | | | | — | | | | — | | | | — | | | | — | |
| | |
|
|
| |
|
|
| |
|
|
| |
|
|
| |
|
|
|
| | | | — | | | | (605 | ) | | | — | | | | — | | | | — | |
Capital stock transactions | | | | | | | | | | | | | | | | | | | | |
Net proceeds from sale of shares | | | 46,774 | | | | 597,277 | (c) | | | 42,046 | | | | 27,000 | | | | 12,090 | |
Shares issued in reinvestment of income dividends and capital gain distributions | | | — | | | | 487 | | | | — | | | | — | | | | — | |
Less cost of shares redeemed | | | (37,482 | ) | | | (28,231 | ) | | | (384 | ) | | | — | | | | (25 | ) |
| | |
|
|
| |
|
|
| |
|
|
| |
|
|
| |
|
|
|
Net increase (decrease) in net assets resulting from capital stock transactions | | | 9,292 | | | | 569,533 | | | | 41,662 | | | | 27,000 | | | | 12,065 | |
| | |
|
|
| |
|
|
| |
|
|
| |
|
|
| |
|
|
|
Increase (decrease) in net assets | | | 30,581 | | | | 745,925 | | | | 42,534 | | | | 27,384 | | | | 12,356 | |
Net assets | | | | | | | | | | | | | | | | | | | | |
Beginning of period | | $ | 1,223,436 | | | $ | 477,511 | | | $ | 27,384 | | | $ | — | | | $ | — | |
| | |
|
|
| |
|
|
| |
|
|
| |
|
|
| |
|
|
|
End of period | | $ | 1,254,017 | | | $ | 1,223,436 | | | $ | 69,918 | | | $ | 27,384 | | | $ | 12,356 | |
| | |
|
|
| |
|
|
| |
|
|
| |
|
|
| |
|
|
|
Undistributed net investment income (loss) at the end of the period | | $ | 2,228 | | | $ | (5,484 | ) | | $ | 141 | | | $ | (125 | ) | | $ | 26 | |
| | |
|
|
| |
|
|
| |
|
|
| |
|
|
| |
|
|
|
Capital stock transactions in shares | | | | | | | | | | | | | | | | | | | | |
Shares sold | | | 2,158 | | | | 43,026 | | | | 4,192 | | | | 2,685 | | | | 500 | |
Shares issued in reinvestment of income dividends and capital gain distributions | | | — | | | | 31 | | | | — | | | | — | | | | — | |
Less shares redeemed | | | (776 | ) | | | (1,991 | ) | | | (37 | ) | | | — | | | | — | |
| | |
|
|
| |
|
|
| |
|
|
| |
|
|
| |
|
|
|
| | | | 1,382 | | | | 41,066 | | | | 4,155 | | | | 2,685 | | | | 500 | |
| | |
|
|
| |
|
|
| |
|
|
| |
|
|
| |
|
|
|
| (a) | | For the period from December 1, 2004 (Commencement of Operations) to December 31, 2004. |
| (b) | | For the period from June 6, 2005 (Commencement of Operations) to June 30, 2005. |
| (c) | | The net proceeds from sale of shares include $73 million dollars in two in-kind purchase transactions completed during 2004. |
See accompanying Notes to Financial Statements.
June 30, 2005 | William Blair Funds 19 |
Notes to Financial Statements
(1) Significant Accounting Policies
(a) Description of the Fund
William Blair Funds (the “Fund”) is a diversified mutual fund registered under the Investment Company Act of 1940, as amended, as an open-end management investment company. The number of shares authorized for this Fund is unlimited. The Fund currently consists of the following thirteen portfolios (the “Portfolios”), each with its own investment objectives and policies.
| | |
Equity Portfolios
| | International Portfolios
|
Growth | | International Growth |
Tax-Managed Growth | | International Equity |
Large Cap Growth | | Institutional International Growth |
Small Cap Growth | | Institutional International Equity |
Small-Mid Cap Growth | | Emerging Markets Growth |
Value Discovery | | Fixed Income Portfolio
|
| | | Income |
| | | Money Market Portfolio
|
| | | Ready Reserves |
The investment objectives of the Portfolios are as follows:
| | |
Equity | | Long-term capital appreciation. |
International | | Long-term capital appreciation. |
Fixed Income | | High level of current income with relative stability of principal. |
Money Market | | Current income, a stable share price and daily liquidity. |
The Institutional International Growth Fund, the Institutional International Equity Fund and the Institutional Share Class of the Emerging Markets Growth Fund are the only Portfolios covered in this report.
(b) Share Classes
Three different classes of shares of the Emerging Markets Growth Fund currently exist: N, I and Institutional. This report includes financial information for the Institutional Class.
(c) Investment Valuation
The market value of domestic equity securities and options is determined by valuing securities traded on national securities exchanges or markets or in the over-the-counter markets at the last sales price or, if applicable, the official closing price or, in the absence of a sale on the date of valuation, at the latest bid price.
For international securities, if the foreign exchange or market on which a security is primarily traded closes before the close of regular trading on the New York Stock Exchange (4:00 p.m. Eastern time), the Funds use an independent pricing service on a daily basis to estimate the fair value price as of the close of regular trading on the New York Stock Exchange. The Board of Trustees has determined that the passage of time between when foreign exchanges or markets close and when the Funds calculate their net asset values could cause the value of international securities to no longer be representative of their market price or accurate. In addition, quarterly the Board of Trustees receives a report which tracks the fair value prices used to calculate the net asset value to the next day’s opening local prices. Otherwise, the value of foreign equity securities is determined based on the last sale price on the foreign exchange or market on which it is primarily traded or, if there have been no sales during that day, at the latest bid price. Foreign currency forward contracts and foreign currencies are valued at the forward and current exchange rates, respectively, prevailing on the date of valuation.
Investments in other funds are valued at the underlying fund’s net asset value on the date of valuation. Other securities, and all other assets, including securities for which a market price is not available, or the value of which is affected by a significant valuation event, are valued at fair value as determined in good faith by, or under the direction of the Board of
20 Semi-Annual Report | June 30, 2005 |
Trustees and in accordance with the Fund’s valuation procedures. As of June 30, 2005, there were securities held in the Institutional International Growth, Institutional International Equity and Emerging Markets Growth Portfolios requiring fair valuation by the Board of Trustees pursuant to the Fund’s valuation procedures.
(d) Investment income and investment transactions
Dividend income is recorded on the ex-dividend date, except for those dividends from certain foreign securities which are recorded as soon as the information is available.
Premiums and discounts are accreted and amortized on a straight-line basis for short-term investments and on an effective interest method for long-term investments.
Interest income is determined on the basis of the interest accrued, adjusted for amortization of premium or discount. Variable rate bonds and floating rate notes earn interest at coupon rates that fluctuate at specific time intervals. The Portfolio utilizes the straight-line method of amortization of premiums and discounts for short-term securities (maturities less than one year) and the effective interest method for long-term securities (maturities greater than one year).
Securities transactions are recorded on the trade date. Realized gains and losses from securities transactions are reported on an identified cost basis.
(e) Share Valuation and Dividends to Shareholders
Shares are sold and redeemed on a continuous basis at net asset value. The net asset value per share is determined by dividing the Portfolio’s net assets by the number of shares outstanding as of the close of regular trading on the New York Stock Exchange, which is generally 3:00 p.m. Central time (4:00 p.m. Eastern time), on each day the Exchange is open.
Dividends from net investment income, if any, are declared at least annually. Capital gain distributions, if any, are declared at least annually in December. Dividends payable to shareholders are recorded on the ex-dividend date.
The timing and characterization of certain income and capital gain distributions are determined annually in accordance with Federal income tax regulations that may differ from U.S. generally accepted accounting principles. As a result, net investment income or loss and net realized gain or loss for a reporting period may differ from the amount distributed during such period. In addition, the Portfolios may periodically record reclassifications among certain capital accounts to reflect differences between financial reporting and income tax basis distributions. The reclassifications were reported in order to reflect the tax treatment for certain permanent differences that exist between income tax regulations and U.S. generally accepted accounting principles. The reclassifications relate to section 988 currency gains and losses, and recharacterization of unrealized appreciation on PFICs. (Passive Foreign Investment Corporations). These reclassifications have no impact on the net asset values of the Portfolio. No data relating to these reclassifications is available for the Emerging Markets Growth Fund Institutional Share Class as it commenced operations on June 6, 2005. Accordingly, at December 31, 2004, the following reclassifications were recorded (in thousands):
| | | | | | | | | | |
Portfolio
| | Undistributed Net
Investment Income/(Loss)
| | | Accumulated
Undistributed
Net Realized Gain/ (Loss)
| | Capital
Paid In Excess
of Par Value
|
Institutional International Growth | | $ | (4,727 | ) | | $ | 4,727 | | $ | — |
Institutional International Equity | | | (121 | ) | | | 121 | | | — |
Distributions from net realized gains for book purposes may include short-term capital gains, which are included as ordinary income for tax purposes. The tax character of distributions paid during 2004 and 2003 was as follows (in thousands):
| | | | | | | | | | | | |
| | | Distributions Paid In 2004
| | Distributions Paid In 2003
|
Portfolio
| | Ordinary
Income
| | Long-Term
Capital Gains
| | Ordinary
Income
| | Long-Term
Capital Gains
|
Institutional International Growth | | $ | 605 | | $ | — | | $ | 1,120 | | $ | — |
Institutional International Equity | | | — | | | — | | | — | | | — |
June 30, 2005 | William Blair Funds 21 |
As of December 31, 2004, the components of distributable earnings on a tax basis were as follows (in thousands):
| | | | | | | | | | | | |
Portfolio
| | Undistributed
Ordinary
Income
| | Accumulated
Capital and
Other Losses
| | Undistributed
Long-Term
Gain
| | Net Unrealized
Appreciation / (Depreciation)
|
Institutional International Growth | | $ | 1,320 | | $ | — | | $ | 12,011 | | $ | 254,767 |
Institutional International Equity | | | 2 | | | 110 | | | — | | | 492 |
(f) Foreign Currency Translation and Foreign Currency Forward Contracts
The Portfolios may invest in securities denominated in foreign currencies. As such, assets and liabilities denominated in foreign currencies are translated into U.S. dollar amounts at the current exchange rate on the date of valuation. These Portfolios may enter into foreign currency forward contracts (1) as a means of managing the risks associated with changes in the exchange rates for the purchase or sale of a specific amount of a particular foreign currency, and (2) to hedge the value, in U.S. dollars, of portfolio securities. Gains and losses from foreign currency transactions associated with purchases and sales of investments and foreign currency forward contracts are included with the net realized and unrealized gain or loss on investments.
(g) Income Taxes
The Portfolios intend to comply with the special provisions Subchapter M of the Internal Revenue Code available to regulated investment companies and, therefore, no provision for Federal income taxes has been made in the accompanying financial statements since each Portfolio intends to distribute substantially all of its taxable income to its shareholders and be relieved of all Federal income taxes.
The Portfolios have elected to mark-to-market its investments in Passive Foreign Investment Companies (“PFICs”) for Federal income tax purposes. In accordance with this election, the Institutional International Growth and Institutional International Equity Portfolios recognized net unrealized appreciation (depreciation) of $5,929 and $15, respectively (in thousands) in 2004 all of which has been treated as an adjustment to the cost of investments for tax purposes. The Portfolios also treat the deferred loss associated with current and prior year wash sales as an adjustment to the cost of investments for tax purposes. The cost of investments for Federal income tax purposes and related gross unrealized appreciation/(depreciation) and net unrealized appreciation/(depreciation) at June 30, 2005 were as follows (in thousands):
| | | | | | | | | | | | |
Portfolio
| | Cost of
Investments
| | Gross Unrealized Appreciation
| | Gross Unrealized Depreciation
| | Net Unrealized
Appreciation / (Depreciation)
|
Institutional International Growth | | $ | 1,053,634 | | $ | 232,075 | | $ | 16,353 | | $ | 215,722 |
Institutional International Equity | | | 68,404 | | | 2,842 | | | 1,007 | | | 1,835 |
Emerging Markets Growth | | | 12,579 | | | 369 | | | 88 | | | 281 |
At December 31, 2004, the Portfolios have no unused capital loss carryforwards available for Federal income tax purposes to be applied against future capital gains, if any.
For the period November 1, 2004 through December 31, 2004, the Institutional International Equity Portfolio incurred net realized capital or foreign currency losses. The Portfolio intends to treat this loss as having occurred in fiscal year 2005 for Federal income tax purposes (in thousands):
| | | | | | |
Portfolio
| | Capital
Loss
| | Currency
Loss
|
Institutional International Growth | | $ | — | | $ | — |
Institutional International Equity | | | — | | | 110 |
(h) Use of Estimates
The preparation of financial statements in conformity with U.S. generally accepted accounting principles requires management to make estimates and assumptions that affect the amounts reported in the financial statements. Actual results may differ from those estimates.
22 Semi-Annual Report | June 30, 2005 |
(2) Transactions with Affiliates
(a) Management and Expense Limitation Agreements
The Institutional International Growth and Institutional International Equity Portfolios have a management agreement with William Blair & Company L.L.C. (the “Company”) for investment advisory, administrative, and other accounting services. The Portfolios pay the Company an annual fee, payable monthly, based on a specified percentage of its average daily net assets. A summary of the annual rates expressed as a percentage of average daily net assets is as follows:
| | | |
First $500 million | | 1.00 | % |
Next $500 million | | 0.95 | % |
In excess of $1 billion | | 0.90 | % |
The Emerging Markets Growth Fund pays the Company a 1.10% annual fee payable monthly, based on its average daily net assets.
The Portfolios have also entered into Expense Limitation Agreements with the Company. Under the terms of these Agreements, the Company has agreed to waive its advisory fees and absorb other operating expenses through April 30, 2006, if total expenses of either the Institutional International Growth or Institutional International Equity Portfolios’ exceeds 1.10% of average daily net assets or 1.25% of average daily net assets for the Institutional Share Class of the Emerging Markets Growth Fund.
For a period of three years subsequent to the Commencement of Operations of the Fund, the Company is entitled to reimbursement from the Institutional International Growth, Institutional International Equity, and Emerging Markets Growth Portfolios for previously waived fees and expenses to the extent the overall expense ratio remains below the percentages indicated. The total amount available for recapture at June 30, 2005 is $320, $111 and $2 (in thousands) for Institutional International Growth, Institutional International Equity, and Emerging Markets Growth Portfolios, respectively. As a result, the total expense ratio for a Portfolio during the period the agreement is in effect, will not fall below the percentage indicated.
For the period ended June 30, 2005, the investment advisory fees incurred by the Portfolio and related fee waivers were as follows (in thousands) :
| | | | | | | | | | | | |
Portfolio
| | Gross
Advisory Fee
| | Fee Waiver
| | Net
Advisory Fee
| | Expenses
(Recovered) or
Absorbed by
Advisor
|
Institutional International Growth | | $ | 5,803 | | $ | — | | $ | 5,803 | | $ | — |
Institutional International Equity | | | 188 | | | 90 | | | 98 | | | — |
Emerging Markets Growth | | | 8 | | | 2 | | | 6 | | | — |
(b) Trustees Fees
The Portfolio incurred fees of $33 (in thousands) to non-interested trustees of the Fund for the period ended June 30, 2005. Interested trustees are not compensated.
(c) Investments in Affiliated Portfolio
Pursuant to an Exemptive Order granted by the Securities and Exchange Commission in January, 2001, each of the Portfolios of the Fund may invest in the William Blair Ready Reserves Portfolio (“Ready Reserves”), an open-end money market portfolio managed by the Advisor. Ready Reserves Portfolio is used as a cash management option to the other Portfolios in the Fund. The Advisor waives management fees and shareholder service fees earned from the other Portfolios investment in the Ready Reserves Fund. The fees waived with respect to the Portfolio for the period ended June 30, 2005 are listed below. Distributions received from Ready Reserves are reflected as dividend income in the Portfolio’s statement of operations. Amounts relating to the Portfolio’s investments in Ready Reserves were as follows for the period ended June 30, 2005 (in thousands):
| | | | | | | | | | | | | | | | | | |
Portfolio
| | Purchases
| | Sales
Proceeds
| | Fees
Waived
| | Dividend
Income
| | Value
| | Percent
of Net
Assets
| |
Institutional International Growth | | $ | 26,546 | | $ | 28,093 | | $ | 24 | | $ | 87 | | $ | 7,863 | | 0.6 | % |
Institutional International Equity | | | 10,245 | | | 9,913 | | | 3 | | | 10 | | | 706 | | 1.0 | |
Emerging Markets Growth | | | 1,578 | | | 1,320 | | | — | | | 1 | | | 258 | | 2.1 | |
June 30, 2005 | William Blair Funds 23 |
(3) Investment Transactions
Investment transactions, excluding money market instruments, for the period ended June 30, 2005 were as follows (in thousands):
| | | | | | |
Portfolio
| | Purchases
| | Sales
|
Institutional International Growth | | $ | 540,824 | | $ | 521,116 |
Institutional International Equity | | | 63,793 | | | 15,283 |
Emerging Markets Growth | | | 11,977 | | | 624 |
(4) Foreign Currency Forward Contracts
To protect itself against a decline in the value of foreign currency against the U.S. dollar, each Portfolio enters into foreign currency forward contracts with its custodian and others. The Portfolio bears the market risk that arises from changes in foreign currency rates and bears the credit risk if the counterparty fails to perform under the contract. The net realized and unrealized gains and losses associated with foreign currency forward contracts are reflected in the accompanying financial statements.
24 Semi-Annual Report | June 30, 2005 |
Financial Highlights
Institutional International Growth Fund
| | | | | | | | | | | | | |
| | |
| |
| | | Period Ended
| | Years Ended
| |
| | | 6/30/2005
| | 12/31/2004
| | 12/31/2003
| | 12/31/2002(a)
| |
| | | (unaudited) | | | | | | | |
Net asset value, beginning of period | | $ | 16.06 | | $ | 13.60 | | $ | 9.567 | | $ | 10.000 | |
Income from investment operations: | | | | | | | | | | | | | |
Net investment income | | | 0.10 | | | 0.03 | | | 0.073 | | | — | |
Net realized and unrealized gain (loss) on investments | | | 0.17 | | | 2.44 | | | 3.993 | | | (0.430 | ) |
| | |
|
| |
|
| |
|
| |
|
|
|
Total from investment operations | | | 0.27 | | | 2.47 | | | 4.066 | | | (0.430 | ) |
Less distributions from: | | | | | | | | | | | | | |
Net investment income | | | — | | | 0.01 | | | 0.033 | | | 0.003 | |
Net realized gain | | | — | | | — | | | — | | | — | |
| | |
|
| |
|
| |
|
| |
|
|
|
Total distributions | | | — | | | 0.01 | | | 0.033 | | | 0.003 | |
| | |
|
| |
|
| |
|
| |
|
|
|
Net asset value, end of period | | $ | 16.33 | | $ | 16.06 | | $ | 13.600 | | $ | 9.567 | |
| | |
|
| |
|
| |
|
| |
|
|
|
Total return (%) | | | 1.68 | | | 18.15 | | | 42.47 | | | (4.27 | ) |
Ratios to average daily net assets (%) (b): | | | | | | | | | | | | | |
Expenses, net of waivers and reimbursements | | | 1.06 | | | 1.10 | | | 1.10 | | | 1.10 | |
Expenses, before waivers and reimbursements | | | 1.06 | | | 1.11 | | | 1.16 | | | 1.29 | |
Net investment income (loss), net of waivers and reimbursements | | | 1.27 | | | 0.18 | | | 0.37 | | | (0.05 | ) |
Net investment income (loss), before waivers and reimbursements | | | 1.27 | | | 0.17 | | | 0.31 | | | (0.24 | ) |
| | | | | | | | | | | | |
| | |
|
| | | Period Ended
| | Years Ended
|
| | | 6/30/2005
| | 12/31/2004
| | 12/31/2003
| | 12/31/2002(a)
|
| | | (unaudited) | | | | | | |
Supplemental data: | | | | | | | | | | | | |
Net assets at end of period (in thousands) | | $ | 1,254,017 | | $ | 1,223,436 | | $ | 477,511 | | $ | 149,848 |
Portfolio turnover rate (%) (b) | | | 87 | | | 72 | | | 56 | | | 59 |
| (a) | | For the period from July 26, 2002 (Commencement of Operations) to December 31, 2002. |
| (b) | | Rates are annualized for periods that are less than a year. |
Performance cited represents past performance. Past performance does not guarantee future results and current performance may be lower or higher that the data quoted. Results shown are annual returns, which assume reinvestment of dividends and capital gains. Investment returns and principal will fluctuate and you may have a gain or loss when you sell shares. For the most current month-end performance information, please call 1-800-742-7272, or visit our Web site at www.williamblairfunds. com.
Note: Net investment income (loss) per share is based on the average shares outstanding during the period.
June 30, 2005 | William Blair Funds 25 |
Financial Highlights
Institutional International Equity Fund
| | | | | | | | |
| | |
| |
| | | Period Ended
| |
| | | 6/30/2005
| | | 12/31/2004(a)
| |
| | | (unaudited) | | | | |
Net asset value, beginning of period | | $ | 10.20 | | | $ | 10.00 | |
Income from investment operations: | | | | | | | | |
Net investment income | | | 0.07 | | | | — | |
Net realized and unrealized gain (loss) on investments | | | (0.05 | ) | | | 0.20 | |
| | |
|
|
| |
|
|
|
Total from investment operations | | | 0.02 | | | | 0.20 | |
Less distributions from: | | | | | | | | |
Net investment income | | | — | | | | — | |
Net realized gain | | | — | | | | — | |
| | |
|
|
| |
|
|
|
Total distributions | | | — | | | | — | |
| | |
|
|
| |
|
|
|
Net asset value, end of period | | $ | 10.22 | | | $ | 10.20 | |
| | |
|
|
| |
|
|
|
Total return (%) | | | 0.20 | | | | 2.00 | |
Ratios to average daily net assets (%) (b): | | | | | | | | |
Expenses, net of waivers and reimbursements | | | 1.10 | | | | 1.10 | |
Expenses, before waivers and reimbursements | | | 1.57 | | | | 2.46 | |
Net investment income (loss), net of waivers and reimbursements | | | 1.40 | | | | (0.21 | ) |
Net investment income (loss), before waivers and reimbursements | | | 0.93 | | | | (1.57 | ) |
| | | | | |
| | |
|
| | | Period Ended
|
| | | 6/30/2005
| | 12/31/2004(a)
|
| | | (unaudited) | | |
Supplemental data: | | | | | |
Net assets at end of period (in thousands) | | 69,918 | | $ | 27,384 |
Portfolio turnover rate (%) (b) | | 85 | | | 45 |
| (a) | | For the period from December 1, 2004 (Commencement of Operations) to December 31, 2004. |
| (b) | | Rates are annualized for periods that are less than a year. |
Performance cited represents past performance. Past performance does not guarantee future results and current performance may be lower or higher that the data quoted. Results shown are annual returns, which assume reinvestment of dividends and capital gains. Investment returns and principal will fluctuate and you may have a gain or loss when you sell shares. For the most current month-end performance information, please call 1-800-742-7272, or visit our Web site at www.williamblairfunds. com.
Note: Net investment income (loss) per share is based on the average shares outstanding during the period.
26 Semi-Annual Report | June 30, 2005 |
Financial Highlights
Emerging Markets Growth Fund
Institutional Share Class
| | | |
| | | Period Ended
|
| | | 6/30/2005(a)
|
| | | (unaudited) |
Net asset value, beginning of period | | $ | 10.00 |
Income from investment operations: | | | |
Net investment income | | | 0.05 |
Net realized and unrealized gain on investments | | | 0.22 |
| | |
|
|
Total from investment operations | | | 0.27 |
Less distributions from: | | | |
Net investment income | | | — |
Net realized gain | | | — |
| | |
|
|
Total distributions | | | — |
| | |
|
|
Net asset value, end of period | | $ | 10.27 |
| | |
|
|
Total return (%) | | | 2.70 |
Ratios to average daily net assets (%) (b): | | | |
Expenses, net of waivers and reimbursements | | | 1.25 |
Expenses, before waivers and reimbursements | | | 1.58 |
Net investment income (loss), net of waivers and reimbursements | | | 3.80 |
Net investment income (loss), before waivers and reimbursements | | | 3.47 |
| | |
|
| | | Period Ended
|
| | | 6/30/2005(a)
|
| | | (unaudited) |
Supplemental data: | | | |
Net assets at end of period (in thousands) | | $ | 12,356 |
Portfolio turnover rate (%) (b) | | | 163 |
| (a) | | For the period from June 6, 2005 (Commencement of Operations) to June 30, 2005. |
| (b) | | Rates are annualized for periods that are less than a year. |
Performance cited represents past performance. Past performance does not guarantee future results and current performance may be lower or higher that the data quoted. Results shown are annual returns, which assume reinvestment of dividends and capital gains. Investment returns and principal will fluctuate and you may have a gain or loss when you sell shares. For the most current month-end performance information, please call 1-800-742-7272, or visit our Web site at www.williamblairfunds. com.
Note: Net investment income (loss) per share is based on the average shares outstanding during the period.
June 30, 2005 | William Blair Funds 27 |
Trustees and Officers. The trustees and officers of the William Blair Funds, their ages, their principal occupations during the last five years, their affiliations, if any, with William Blair & Company, L.L.C., and other significant affiliations are set forth below. The address of each trustee and officer is 222 West Adams Street, Chicago, Illinois 60606.
| | | | | | | | | | |
Name and Age
| | Position(s)
Held with
Fund
| | Term of
Office and
Length of
Time Served(1)
| | Principal Occupation(s) During Past 5 Years
| | Number of
Portfolios
in Fund
Complex
Overseen
by Trustee
| | Other Directorships Held by Trustee/Officer
|
Interested Trustees | | | | | | | | | | |
Conrad Fischer, 71* | | Chairman of the Board of Trustees | | Since 1987 | | Principal, William Blair & Company, L.L.C.; Partner, APM Limited Partnership | | 13 | | Trustee Emeritus, Chicago Child Care Society, a non-profit organization, |
| | | | | |
Michelle Seitz, 39* | | Trustee | | Since 2002 | | Principal, William Blair & Company, L.L.C. | | 13 | | N/A |
Non-Interested Trustees | | | | | | | | |
Theodore A. Bosler, 70 | | Trustee | | Since 1997 | | Retired Principal and Vice President, Lincoln Capital Management | | 13 | | Crystal Lake Watershed Fund, Desert Foothills Land Trust and Institute of Chartered Financial Analysts. |
| | | | | |
Ann P. McDermott, 65 | | Trustee | | Since 1996 | | Board member and officer for various civic and charitable organizations over the past thirty years; professional experience prior thereto, registered representative for New York Stock Exchange firm | | 13 | | Junior League of Chicago, Northwestern University, Women’s Board; Ravinia Festival Women’s Board; Rush Presbyterian St. Luke’s Medical Center, Women’s Board; University of Chicago, Women’s Board; Visiting Nurses Association, Honorary Director |
| | | | | |
Donald J. Reaves, 58 | | Trustee | | Since 2004 | | Vice President for Administration and Chief Financial Officer, University of Chicago since 2002. Executive Vice President and Chief Financial Officer, Brown University from 1993 to 2002 | | 13 | | American Student Assistance Corp.; Amica Mutual Insurance Company; NACUBO (National Association of College and University Business Officers) |
| | | | | |
John B. Schwemm, 71 | | Trustee | | Since 1990 | | Retired Chairman and Chief Executive Officer, R.R. Donnelley & Sons Company | | 13 | | USG Corp., building material manufacturer, and Walgreen Co. |
| | | | | |
Donald L. Seeley, 61 | | Trustee | | Since 2003 | | Director, Applied Investment Management Program, University of Arizona Department of Finance, Formerly Vice Chairman and Chief Financial Officer, True North Communications, Inc., marketing communications and advertising firm | | 13 | | Beverly Enterprises, Inc., provider of eldercare and rehabilitative services; Warnaco, Group Inc., intimate apparel, sportswear and swimwear manufacturer |
28 Semi-Annual Report | June 30, 2005 |
| | | | | | | | | | |
Name and Age
| | Position(s)
Held with
Fund
| | Term of
Office and
Length of
Time Served(1)
| | Principal Occupation(s) During Past 5 Years
| | Number of
Portfolios
in Fund
Complex
Overseen
by Trustee
| | Other Directorships Held by Trustee/Officer
|
Robert E. Wood II, 67 | | Trustee | | Since 1999 | | Retired Executive Vice President, Morgan Stanley Dean Witter | | 13 | | Chairman, Add-Vision, Inc. manufacturer of surface animation systems, and Micro-Combustion, LLC |
Officers | | | | | | | | | | |
Marco Hanig, 47 | | President | | Since 1999 | | Principal, William Blair & Company, L.L.C.; former Senior Vice President, First Chicago NBD | | N/A | | Chicago Scores |
| | | | | |
Karl W. Brewer, 39 | | Senior Vice President | | Since 2000 | | Principal, William Blair & Company, L.L.C. | | N/A | | N/A |
| | | | | |
Harvey H. Bundy, III, 61 | | Senior Vice President | | Since 2003 | | Principal, William Blair & Company, L.L.C. | | N/A | | N/A |
| | | | | |
Mark A. Fuller, III, 48 | | Senior Vice President | | Since 1993 | | Principal, William Blair & Company, L.L.C. | | N/A | | Partner, Fulsen Howney Partners |
| | | | | |
James W. Golan, 43 | | Senior Vice President | | Since 2005 | | Principal, William Blair & Company, L.L.C. | | N/A | | N/A |
| | | | | |
W. George Greig, 52 | | Senior Vice President | | Since 1996 | | Principal, William Blair & Company, L.L.C. | | N/A | | N/A |
| | | | | |
Michael A. Jancosek, 46 | | Senior Vice President Vice President | | Since 2004 Since 2000 | | Principal, William Blair & Company L.L.C. Associate, William Blair & Company, L.L.C.; former Vice President, First Chicago NBD | | N/A | | N/A |
| | | | | |
John F. Jostrand, 51 | | Senior Vice President | | Since 1999 | | Principal, William Blair & Company, L.L.C. | | N/A | | N/A |
| | | | | |
James S. Kaplan, 44 | | Senior Vice President Vice President | | Since 2004 Since 1995 | | Principal, William Blair & Company, L.L.C. Associate, William Blair & Company, L.L.C. | | N/A | | N/A |
| | | | | |
Robert C. Lanphier, IV, 49 | | Senior Vice President | | Since 2003 | | Principal, William Blair & Company, L.L.C. | | N/A | | Chairman, AG. Med, Inc. |
| | | | | |
David S. Mitchell, 45 | | Senior Vice President Vice President | | Since 2004 Since 2003 | | Principal, William Blair & Company, L.L.C. Associate, William Blair & Company, L.L.C. | | N/A | | N/A |
June 30, 2005 | William Blair Funds 29 |
| | | | | | | | | | |
Name and Age
| | Position(s)
Held with
Fund
| | Term of
Office and
Length of
Time Served(1)
| | Principal Occupation(s) During Past 5 Years
| | Number of
Portfolios
in Fund
Complex
Overseen
by Trustee
| | Other Directorships Held by Trustee/Officer
|
Gregory J. Pusinelli, 46 | | Senior Vice President | | Since 1999 | | Principal, William Blair & Company, L.L.C.; former Principal and Vice President, Stein Roe & Farnham Incorporated | | N/A | | N/A |
| | | | | |
Norbert W. Truderung, 53 | | Senior Vice President | | Since 1992 | | Principal, William Blair & Company, L.L.C. | | N/A | | N/A |
| | | | | |
Jeffrey A. Urbina, 50 | | Senior Vice President | | Since 1998 | | Principal, William Blair & Company, L.L.C. | | N/A | | N/A |
| | | | | |
Christopher T. Vincent, 48 | | Senior Vice President Vice President | | Since 2004 Since 2002 | | Principal, William Blair & Company, L.L.C. Associate, William Blair & Company, L.L.C.; former Managing Director/Senior Portfolio Manager, Zurich Scudder Investments | | N/A | | Uhlich Children’s Home |
| | | | | |
Todd M. McClone, 36 | | Vice President | | Since 2005 | | Associate, William Blair & Company, L.L.C. | | N/A | | N/A |
| | | | | |
Terence M. Sullivan, 61 | | Vice President and Treasurer | | Since 1997 | | Associate, William Blair & Company, L.L.C. | | N/A | | N/A |
| | | | | |
Colette M. Garavalia, 44 | | Secretary | | Since 2000 | | Associate, William Blair & Company, L.L.C.; former Assistant Vice President, Scudder Kemper Investments | | N/A | | N/A |
| * | | Mr. Fischer and Ms. Seitz are interested persons of the William Blair Funds because each is a principal of William Blair & Company, L.L.C., the Funds’ investment advisor and principal underwriter. |
| (1) | | Each Trustee serves until the election and qualification of a successor, or until death, resignation or retirement or removal as provided in the Fund’s Declaration of Trust. Retirement for non-interested Trustees occurs no later than at the conclusion of the first regularly scheduled Board meeting of the Fund’s fiscal year that occurs after the Trustee’s 72nd birthday. The Fund’s officers are elected annually by the Trustees. |
The Statement of Additional Information for the William Blair Funds includes additional information about the trustees and is available without charge by calling 1-800-635-2886 (in Massachusetts 1-800-635-2840) or by writing the Fund.
30 Semi-Annual Report | June 30, 2005 |
Basis for Board Approval of Advisory Agreement
The advisory agreement was most recently approved by the Board of Trustees, including all of the trustees who are not parties to such agreement or interested persons of any such party, on February 18, 2005. The Board of Trustees, including a majority of the independent trustees, determined that continuation of the advisory agreement was in the best interests of the Fund. The independent trustees met separately from the “interested” trustees of the Fund and officers and employees of the Company to consider continuance of the advisory agreement (and approval of the advisory agreement for the Emerging Markets Growth Fund) and were assisted by independent legal counsel in making their determination. The Board of Trustees, including the independent trustees, did not identify any single factor or group of factors as all important or controlling and considered all factors together.
The Board noted that the Company is a quality firm with a reputation for integrity and honesty that employs high quality people and has a long association with the Portfolios since the inception of the Portfolios. The Board believes that a long-term relationship with a capable, conscientious advisor is in the best interests of shareholders and that shareholders have invested in the Portfolios knowing that the Company managed the Portfolios and knowing the investment advisory fee schedule. The Board concluded that each existing Portfolio was managed by the Company consistent with its investment objectives and policies and that high quality services were provided. The Board also concluded that it expected the services to be provided by the Company to the Emerging Markets Growth Fund would be high quality.
With respect to the nature, extent and quality of the services provided by the Company to the Portfolios, (or to be provided with respect to the Emerging Markets Growth Fund) the Board considered the Company’s Form ADV, biographical information about each Portfolio’s portfolio manager(s), the administrative services performed or to be performed by the Company, financial information regarding the Company, the compliance regime created by the Company, including the fact that the Company has engaged a third party for additional Fund compliance monitoring and, the financial support of the Portfolios.
The Board also reviewed and discussed the performance of each of the existing Portfolios, as compared to applicable Morningstar rankings. The Board concluded that as to the Institutional International Growth Fund, the investment performance was excellent. With regard to the Institutional International Equity Fund, the Board noted that the time period being evaluated was very short and that the Board would continue to monitor the performance. With respect to the Emerging Markets Growth Fund, the Board reviewed the Company’s performance for managing emerging markets assets as well as the performance of the former Emerging Markets Growth Fund and concluded that the Company’s performance was satisfactory.
With respect to the costs of services provided and profits realized by the Company, the Board considered profitability information provided by the Company and, as applicable, the expense caps in place and/or proposed. Based on this information, the Board concluded for each Portfolio that the Company’s profitability was not unreasonable.
The Board considered the extent to which economies of scale would be realized as the Portfolios grow and considered management’s representation that certain Portfolio expenses are fixed and unrelated to asset size and that for some Portfolios there are little or no economies of scale in the investment process. In considering whether fee levels reflect economies of scale for the benefit of Portfolio investors, the Board reviewed each Portfolio’s asset size, (or projected asset size for the Emerging Markets Growth Fund) the Portfolio’s total and net expense ratios, (projected for the Emerging Markets Growth Fund) the expense caps in place and/or proposed and whether the investment process produced economies of scale. The Board concluded with respect to each of the Portfolios, that the total expense ratios, after giving effect to the expense caps proposed by the Company, were reasonable.
For each Portfolio, the Board compared the amounts to be paid to the Company for advisory and administrative services with other registered funds included in the Portfolio’s Lipper expense universe. In addition, for each Portfolio the Board compared amounts paid to the Company by other registered funds, including other Portfolios in the Fund and funds for which the Company acts as a subadvisor. For each Fund, the Board compared amounts paid to the Company by the Company’s other clients. The Board also considered that the Company continues to waive advisory fees for the existing Portfolios and proposed to waive advisory fees for the Emerging Markets Growth Fund. The Board concluded that each Portfolios advisory fee was reasonable.
The Board considered benefits derived by the Company from its relationship with the Portfolios, including soft dollars and favorable media coverage. The Board concluded that, taking into account these benefits, the fees were reasonable. Based on all of the information considered and the conclusions reached, the Board determined to approve continuance of the advisory agreement for the existing Portfolios and to approve the advisory agreement for the Emerging Markets Growth Fund.
June 30, 2005 | William Blair Funds 31 |
Proxy Voting
A description of the policies and procedures that the William Blair Institutional International Growth Fund, the William Blair Institutional International Equity Fund and the William Blair Emerging Markets Growth Fund use to determine how to vote proxies relating to portfolio securities and information regarding how the Fund voted proxies relating to portfolio securities for the most recent 12-month period ended June 30 are available without charge, upon request, by calling 1-800-635-2886 (in Massachusetts 1-800-635-2840), at www.williamblairfunds.com and on the SEC’s website at http://www.sec.gov.
Quarterly Portfolio Schedules
The Fund files its complete schedule of portfolio holdings with the SEC for the first and third fiscal quarters of each fiscal year (quarters ended March 31 and September 30) on Form N-Q. The Fund’s Forms N-Q are available on the SEC’s website at http://www.sec.gov and may be reviewed and copied at the SEC’s Public Reference Room in Washington, D.C. Information on the operation of the SEC’s Public Reference Room may be obtained by calling 1-800-SEC-0330.
Useful Information About Your Report (Unaudited)
Please refer to this information when reviewing the Expense Example for each Fund.
Expense Example
As a shareholder of a Fund, you incur ongoing costs, including management fees and other Fund expenses. The example is intended to help you understand your ongoing costs (in dollars) of investing in the Fund and to compare these costs with the ongoing costs of investing in other mutual funds. To do so, compare the Fund’s 5% hypothetical example with the 5% hypothetical examples that appear in the shareholder reports of other funds. The example is based on an investment of $1,000 invested at the beginning of the period and held for the entire six-month period from January 1, 2005 to June 30, 2005.
Actual Expenses
In each example, the first line for each share class in the table provides information about the actual account values and actual expenses. These expenses reflect the effect of any expense cap applicable to the share class during the period. Without this expense cap, the costs shown in the table would have been higher. You may use the information in this line, together with the amount you invested, to estimate the expenses that you paid over the period. Simply divide your account value by $1,000 (example, an $8,600 account value divided by $1,000 = 8.6), then multiply the result by the number in the first line under the heading entitled “Expenses Paid During the Period” to estimate the expenses you paid on your account during the period.
Hypothetical Example for Comparison Purposes
In each example, the second line for each share class in the table provides information about hypothetical account values and hypothetical expenses based on the Fund’s actual expense ratio and an assumed rate of return of 5% per year before expenses. This is not the Fund’s actual return. The hypothetical account values and expenses may not be used to estimate the actual ending account balance or expenses you paid for the period. You may use this information to compare the ongoing costs of investing in the Fund to other funds. To do so, compare this 5% hypothetical example with the 5% hypothetical examples that appear in the shareholder reports of other funds.
Please note that the expenses shown in both examples are meant to highlight your ongoing costs only and do not reflect any transactional costs or account type fees. These fees are fully described in the prospectus. Therefore, the second line of each share class in the table is useful in comparing ongoing costs only and will not help you determine the relative costs of owning different funds.
32 Semi-Annual Report | June 30, 2005 |
Fund Expenses (Unaudited)
The examples below show you the ongoing costs (in dollars) of investing in your fund and allows you to compare these costs with those of other mutual funds. Please refer to previous page for a detailed explanation of the information presented on this chart.
| | | | | | | | | | | | | |
| | | Beginning
Account Value
1/1/2005
| | Ending
Account Value
6/30/2005
| | Expenses Paid
during
Period(a)
| | | Annualized
Expense Ratio
| |
| | | | |
Institutional International Growth Fund | | | | | | | | | | | | | |
Actual return | | $ | 1,000.00 | | $ | 1,016.80 | | $ | 5.50 | | | 1.10 | % |
Hypothetical 5% return | | | 1,000.00 | | | 1,019.34 | | | 5.51 | | | 1.10 | |
| | | | | | | | | | | | | | |
| | | | |
Institutional International Equity Fund | | | | | | | | | | | | | |
Actual return | | | 1,000.00 | | | 1,002.00 | | | 5.46 | | | 1.10 | |
Hypothetical 5% return | | | 1,000.00 | | | 1,019.34 | | | 5.51 | | | 1.10 | |
| | | | | | | | | | | | | | |
| | | | |
Emerging Markets Growth Fund Institutional Share Class | | | | | | | | | | | | | |
Actual return | | | 1,000.00 | | | 1,027.00 | | | 0.83 | (b) | | 1.25 | |
Hypothetical 5% return | | | 1,000.00 | | | 1,002.47 | | | 0.82 | (b) | | 1.25 | |
| | | | | | | | | | | | | | |
| (a) | | Expenses are equal to the annualized expense ratio, multiplied by the average account value over the period, multiplied by the number of days in the period (181), and divided by 365 (to reflect the one-half-year period). |
| (b) | | For the period June 6, 2005 (Commencement of Operations) until June 30, 2005. |
June 30, 2005 | William Blair Funds 33 |
BOARD OF TRUSTEES
Conrad Fischer, Chairman
Principal, William Blair & Company, L.L.C.
Theodore A. Bosler
Retired Principal and Vice President, Lincoln Capital Management Company
Ann P. McDermott
Director and Trustee
Profit and not-for-profit organizations
Donald J. Reaves
Vice President for Administration and Chief Financial Officer, University of Chicago
Donald L. Seeley
Adjunct Lecturer and Director, University of Arizona Department of Finance
John B. Schwemm
Retired Chairman and CEO, R.R. Donnelley & Sons Company
Michelle R. Seitz
Principal, William Blair & Company, L.L.C.
Robert E. Wood II
Retired Executive Vice President, Morgan Stanley Dean Witter
Officers
Marco Hanig, President
Karl W. Brewer, Senior Vice President
Harvey H. Bundy III, Senior Vice President
Mark A. Fuller, III, Senior Vice President
James W. Golan, Senior Vice President
W. George Greig, Senior Vice President
Michael A. Jancosek, Senior Vice President
John F. Jostrand, Senior Vice President
James S. Kaplan, Senior Vice President
Robert C. Lanphier, IV, Senior Vice President
David S. Mitchell, Senior Vice President
Gregory J. Pusinelli, Senior Vice President
Norbert W. Truderung, Senior Vice President
Jeffrey A. Urbina, Senior Vice President
Christopher T. Vincent, Senior Vice President
Todd M. McClone, Vice President
Terence M. Sullivan, Vice President and Treasurer
Colette M. Garavalia, Secretary
Investment Advisor
William Blair & Company, L.L.C.
Legal Counsel
Vedder, Price, Kaufman & Kammholz, P.C.
Transfer Agent
State Street Bank and Trust Company
P.O. Box 8506
Boston, MA 02266-8506
For customer assistance, call 1-800-635-2886
(Massachusetts 1-800-635-2840)
34 Date of First Use August 2005

WILLIAM BLAIR FUNDS
Institutional International Growth Fund
Institutional International Equity Fund
Emerging Markets Growth Fund Institutional Share Class
222 West Adams Street
Chicago, Illinois 60606
800.742.7272
www.williamblairfunds.com
William Blair & Company, L.L.C., Distributors

WILLIAM BLAIR FUNDS
SEMI-ANNUAL REPORT CLASS A, CLASS B, CLASS C
JUNE 30, 2005
Table of Contents
This report is submitted for the general information of the shareholders of the William Blair Funds. It is not authorized for distribution to prospective investors unless accompanied or preceded by a prospectus of the William Blair Funds. Please carefully consider the Funds’ investment objectives, risks, charges, and expenses before investing. This and other information is contained in the Funds’ prospectus, which you may obtain by calling 1-800-742-7272. Read it carefully before you invest or send money.
June 30, 2005 | William Blair Funds 1 |

Marco Hanig
A LETTER FROM THE PRESIDENT
Dear Shareholders:
After losses in the first quarter, stocks rebounded in the second quarter and were virtually flat for the first half of the year. The S&P 500 Index of large cap stocks closed at –0.81%, the Russell 2000 Index of small cap stocks at –1.25%, and the MSCI World ex-US Index of foreign stocks at 0.32%. Bonds did well, with the Lehman Intermediate Government/Credit Bond index up 1.58% despite rising interest rates.
While the market pretty much drifted sideways, it was not without surprises. International stocks were supposed to outperform US stocks, as the dollar was expected to continue to weaken in light of the chronic trade deficit. But when voters in France and the Netherlands rejected the European constitution, the US dollar strengthened by over 10% versus the Euro, offsetting the good performance of international stocks as measured in their local currencies. Also, three more hikes in short-term interest rates were expected to lead to negative returns for long-term bonds, but in fact long-term rates have actually decreased slightly, resulting in a relatively flat yield curve.
The final surprise was the relative performance of different asset classes. The expectation was that after several years where value had beaten growth and small cap had beaten large cap, the trend would reverse. What actually happened is that the race between the nine Morningstar style boxes was almost too close to call: the best asset class (Mid-cap Value, up 2.25%) was only about 4% ahead of the worst asset class (Large Cap Growth, down 1.78%), which is the smallest performance gap of the last five years. More generally, mid-cap was a modest winner over small and large, and value continued to edge growth.
Total Returns by Morningstar Fund Category
January 1 through June 30, 2005
| | | | | | | | | |
| | | Value
| | | Blend
| | | Growth
| |
Large Cap | | 0.39 | % | | -0.60 | % | | -1.78 | % |
Mid Cap | | 2.25 | % | | 1.65 | % | | 0.05 | % |
Small Cap | | 0.48 | % | | 0.21 | % | | -1.50 | % |
The relative returns for the William Blair Funds were mixed. The Small Cap Growth and Value Discovery Funds trailed their Morningstar peers in the first semester, in part because some large outflows put pressure on the values of their holdings. Details on each fund are provided in the respective portfolio manager discussions. The standout funds were the International Growth Fund, up 1.50% (Class A Shares) vs. –1.65% for Foreign Large Growth Morningstar peers, Tax-Managed Growth Fund, up 1.11% (Class A Shares) vs. –1.78% for Large Growth Morningstar peers, and Income Fund, up 1.27% (Class A Shares) vs. 0.94% for Short-term Bond Morningstar peers.
As always, we thank you for investing with us!

Marco Hanig
Please see page 3 for important performance disclosure information.
2 Semi-Annual Report | June 30, 2005 |
PERFORMANCE AS OF JUNE 30, 2005—CLASS A SHARES
| | | | | | | | | | | | |
| | | YTD
| | 1 Yr
| | 3 Yr
| | 5 Yr
| | Since
inception
| | Inception
Date
|
Growth Fund | | -6.37 | | 0.59 | | 2.77 | | -6.88 | | -1.64 | | 10/19/99 |
Russell 3000® Growth | | -1.88 | | 1.90 | | 7.56 | | -9.93 | | -4.02 | | |
Standard & Poor’s 500 | | -0.81 | | 6.32 | | 8.28 | | -2.37 | | 0.64 | | |
| | | | | | |
Tax-Managed Growth Fund | | | | | | | | | | | | |
Return before Taxes | | -4.70 | | 0.69 | | 3.91 | | -3.79 | | -2.81 | | 12/27/99 |
After Taxes on Distributions | | -4.70 | | 0.69 | | 3.91 | | -3.79 | | -2.81 | | |
After Taxes on Distributions and Sale of Fund Shares | | -5.07 | | -1.56 | | 3.07 | | -3.38 | | -2.54 | | |
Russell 3000® Growth | | -1.88 | | 1.90 | | 7.56 | | -9.93 | | -8.17 | | |
| | | | | | |
Large Cap Growth Fund | | -7.42 | | -1.90 | | 2.16 | | -10.66 | | -9.53 | | 12/27/99 |
Russell 1000® Growth | | -1.72 | | 1.68 | | 7.26 | | -10.36 | | -8.59 | | |
| | | | | | |
Small Cap Growth Fund | | -9.64 | | 3.09 | | 17.18 | | 12.09 | | 19.27 | | 12/27/99 |
Russell 2000® Growth | | -3.58 | | 4.29 | | 11.37 | | -4.51 | | -2.86 | | |
| The Small Cap Growth Fund’s performance during 2000 was primarily attributable to investments in initial public offerings (IPOs) during a rising market. Since then, IPOs have had an insignificant effect on the Fund’s performance. | | | | |
| | | | | | |
Small-Mid Cap Growth Fund | | -6.25 | | -0.60 | | — | | — | | 3.72 | | 12/29/03 |
Russell 2500TM Growth | | -0.92 | | 7.46 | | — | | — | | 9.42 | | |
| | | | | | |
International Growth Fund | | -4.34 | | 10.02 | | 10.61 | | 1.23 | | 7.50 | | 10/21/99 |
MSCI All Country World Free Ex-US | | 0.32 | | 16.95 | | 14.08 | | 0.76 | | 2.93 | | |
| | | | | | |
International Equity Fund | | -6.83 | | 0.23 | | — | | — | | 5.21 | | 5/24/04 |
MSCI All Country World Free Ex-US. | | 0.32 | | 16.95 | | — | | — | | 20.47 | | |
| | | | | | |
Value Discovery Fund | | -10.18 | | -4.49 | | 3.65 | | 9.37 | | 12.08 | | 11/2/99 |
Russell 2000® | | -1.25 | | 9.45 | | 12.81 | | 5.71 | | 8.53 | | |
Russell 2000® Value | | 0.90 | | 14.39 | | 14.15 | | 16.12 | | 15.82 | | |
| | | | | | |
Income Fund | | -0.75 | | 2.33 | | 3.35 | | 5.38 | | 5.47 | | 10/25/99 |
Lehman Intermediate Govt./Credit Bond | | 1.58 | | 4.77 | | 5.08 | | 6.87 | | 6.70 | | |
Performance cited represents past performance. Past performance does not guarantee future results and current performance may be lower or higher that the data quoted. Returns shown are average annual total returns, which assume reinvestment of dividends and capital gains. Returns shown reflect the effects of maximum sales loads. Investment returns and principal will fluctuate and you may have a gain or a loss when you sell shares. For the most current month-end performance information, please call 1-800-742-7272, or visit our Web site at www.williamblairfunds.com. Investing in smaller companies involves special risks, including higher volatility and lower liquidity. International and emerging markets investing involves special risk considerations, including currency fluctuations, lower liquidity, economic and political risk. As interest rates rise, bond prices will fall and bond funds become more volatile. From time to time, the investment advisor may waive fees or reimburse expenses for certain Funds. Without these waivers, performance would be lower. Class A shares are not available for sale.
Tax-Managed Growth Fund’s after-tax returns are calculated using the highest historical individual federal marginal income tax rates, and do not reflect the impact of state and local taxes. Actual after-tax returns depend on the investor’s tax situation and may differ from those shown. After-tax returns shown are not relevant to investors who hold their fund shares through tax-deferred arrangements such as 401(k) plans or individual retirement accounts. After-tax returns are shown only for Class A and the after-tax returns for other classes will vary.
Please carefully consider the Funds’ investment objectives, risks, charges, and expenses before investing. This and other information is contained in the Funds’ prospectus, which you may obtain by calling 1-800-742-7272. Read it carefully before you invest or send money. ©William Blair & Company, L.L.C., distributor. 08/05.
See accompanying Notes to Financial Statements.
June 30, 2005 | William Blair Funds 3 |

John F. Jostrand
GROWTH FUND
The Growth Fund invests primarily in common stocks of domestic growth companies that the Advisor expects to have sustainable, above-average growth from one business cycle to the next.
AN OVERVIEW FROM THE PORTFOLIO MANAGER
How did the Fund perform over the first half of the year? How did the Fund’s performance compare to its benchmark?
The Growth Fund posted a 6.37% decrease on a total return basis (Class A Shares reflecting the impact of the maximum sales load) for the six months ended June 30, 2005. By comparison, the Fund’s benchmarks, the Russell 3000® Growth Index decreased 1.88%, while the Standard & Poor’s 500 Index declined 0.81%.
What were the most significant factors impacting Fund performance?
In the first six months of 2005, value stocks outperformed growth stocks, as evidenced by the Russell 3000® Value Index up 1.69%, versus the 1.88% decline of the Russell 3000® Growth Index. Larger cap growth stocks outperformed their smaller cap counterparts, with the Russell 2000® Growth Index decreasing 3.58% and the Russell 1000® Growth Index down 1.72% for the year. Rising oil prices and continued monetary tightening by the Federal Reserve provided headwinds for companies in the first six months of 2005. Crude oil closed the first half of the year near $60 a barrel, which continues to put pressure on stocks reliant on the lower end consumer. Although Energy sector returns were strong, the relatively low weighting of this sector in the Russell 3000® Growth Index had a modest impact on Index’s overall results. Dissecting the period by quarter, growth-oriented issues began to show signs of strength particularly in May, as Technology issues and Biotech stocks took leadership from cyclical stocks that had done well in 2004, such as Materials and Industrial-related stocks.
What were among the best performing investments for the Fund?
One of the largest contributors to portfolio returns for the first half of 2005 was Health Care. Strong stock selection led to good results on both a relative and an absolute return basis for the portfolio. Alcon, Inc., a leader in the eye-care area, showed strong results buoyed particularly by the outlook for its Restor Lens interocular product. United Healthcare, a health care service provider, continued to be a top portfolio performer and a dominant player in its segment.
Technology stocks provided the strongest portfolio returns relative to the Russell 3000® Growth Index. Although overall returns in the portfolio were flat for the six months and negative in the benchmark, strength in the second quarter seems to indicate investors are warming to this sector. Digital Insight Corporation, a provider of outsourced on-line banking services to smaller financial institutions, experienced strong results after reporting double-digit earnings growth with strong margins and cash flows. Taiwan Semiconductor, the world’s largest contract chipmaker, had good stock appreciation after reporting strong results for 2004. Although 2005 will likely see a contraction in shipments due to client inventory issues, the outlook for 2006 remains strong.
What were among the weakest performing investments for the Fund?
Financial stocks suffered significantly during the first quarter, resulting in negative results for the first half of the year. With accounting concerns surrounding insurers such as AIG and
4 Semi-Annual Report | June 30, 2005 |
regulatory issues plaguing Fannie Mae, “collision avoidance” was key during the first quarter. In the second quarter, stock selection in certain areas of Financials was the key to success, particularly if spots were picked appropriately. While capital markets firms were leaders in the sector, Goldman Sachs Group, Inc. a portfolio holding, experienced a stock pullback due to lower trading volumes and hence smaller commissions.
Consumer Discretionary and Consumer Staples stocks showed weakness in the portfolio and the benchmark during the first six months, with two of the larger portfolio disappointments coming in these two areas. Harley-Davidson, Inc., a manufacturer of motorcycle equipment and accessories, experienced significantly weak operating earnings during the second quarter. Additionally, the company decreased its earnings outlook and reduced manufacturing plans for the next several quarters. The stock was sold out of the portfolio due to our concern that the motorcycle market is maturing at a rate faster than anticipated. Estee Lauder Companies, Inc. reported quarterly revenues in line with expectations, but fell short on their bottom line results. We continue to think the company will deliver improved longer term results, especially in the latter part of the year with the launch of the new fragrance lines.
What is your current outlook?
We postulated that 2005 would bring a deceleration in earnings growth, as the business cycle is advancing from a recovery stage into a more normalized growth phase. While companies experienced double digit earnings growth in the last several quarters, estimates for the second quarter through the last half of 2005 are closer to the mid to upper single digit range. The Federal Reserve’s posture indicates a likelihood that it will continue to raise interest rates to create a less stimulative monetary environment. Although consumers continue to show resilience, fueled by the strong real estate market and low mortgage rates, the combination of higher oil prices and interest rates will likely take a toll on spending at some point. Investors anticipated that cash-heavy corporations would probably initiate capital spending, but to date corporations have had greater interest in using cash to repurchase shares or increase dividends. All of these trends tend to be harbingers for a lower growth environment.
June 30, 2005 | William Blair Funds 5 |
Growth Fund
Performance Highlights
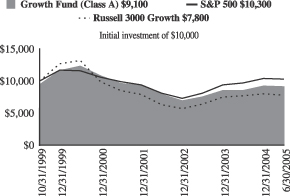
Average Annual Total Return at 6/30/2005 reflecting the maximum sales load
| | | | | | | | | | | | | | |
| | | 1 Year
| | | 3 Year
| | | 5 Year
| | | Since Inception
| | | |
Class A | | 0.59 | % | | 2.77 | % | | (6.88 | )% | | (1.64 | )%(a) | | |
Class B | | 0.96 | | | 3.31 | | | (6.88 | ) | | (3.31 | )(b) | | |
Class C | | 4.97 | | | 4.03 | | | (6.47 | ) | | (2.96 | )(b) | | |
Russell 3000® Growth
Index | | 1.90 | | | 7.56 | | | (9.93 | ) | | (4.02 | )(a) | | |
| | | | | | | | | | | | (5.46 | )(b) | | |
S&P Index | | 6.32 | | | 8.28 | | | (2.37 | ) | | 0.64 | (a) | | |
| | | | | | | | | | | | (0.71 | )(b) | | |
| | (a) | | For the period from October 19, 1999 to June 30, 2005. |
| | (b) | | For the period from November 2, 1999 to June 30, 2005. |
Performance cited represents past performance. Past performance does not guarantee future results and current performance may be lower or higher than the data quoted. Results shown are average annual returns, which assume reinvestment of dividends and capital gains. Investment returns and principal will fluctuate and you may have a gain or loss when you sell shares. For the most current month-end performance information, please call 1-800-742-7272, or visit our Web site at www.williamblairfunds.com. Class A, B, and C shares are not available for sale.
The performance highlights and graph presented above do not reflect the deduction of taxes that a shareholder would pay on fund distributions or the redemption of fund shares.
The Russell 3000® Growth Index consists of large, medium, and small-capitalization companies with above average price-to-book ratios and forecasted growth rates. The index is weighted by market capitalization and large/medium/small companies make up approximately 80%/15%/5% of the index.
The S&P 500 Index indicates broad larger capitalization equity market performance.
This report identifies the Fund’s investments on June 30, 2005. These holdings are subject to change. Not all stocks in the Fund performed the same, nor is there any guarantee that these stocks will perform as well in the future. Market forecasts provided in this report may not necessarily come to pass.
Sector Diversification
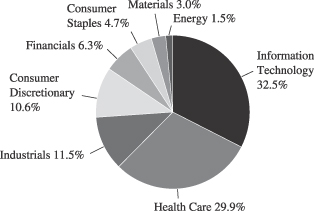
The sector diversification shown is based on the total investment portfolio.
6 Semi-Annual Report | June 30, 2005 |
Growth Fund
Portfolio of Investments, June 30, 2005 (all dollar amounts in thousands) (unaudited)
| | | | | |
Issuer
| | Shares
| | Value
|
| | |
Common Stocks | | | | | |
Information Technology—32.0% | | | | | |
*Accenture Ltd.† | | 199,085 | | $ | 4,513 |
Adobe Systems Incorporated | | 125,590 | | | 3,594 |
Arm Holding plc—ADR | | 640,165 | | | 3,931 |
*Dell, Inc. | | 278,630 | | | 11,009 |
*Digital Insight Corporation | | 152,395 | | | 3,645 |
*EMC Corporation | | 451,395 | | | 6,189 |
First Data Corporation | | 203,440 | | | 8,166 |
*Jabil Circuit, Inc. | | 209,975 | | | 6,452 |
Linear Technology Corporation | | 106,035 | | | 3,890 |
Microchip Technology, Inc. | | 90,870 | | | 2,692 |
Paychex, Inc. | | 177,550 | | | 5,777 |
*PDF Solutions, Inc. | | 90,130 | | | 1,183 |
*ScanSoft, Inc. | | 799,620 | | | 3,023 |
Taiwan Semiconductor Mfg. Co. Ltd.—ADR | | 748,812 | | | 6,829 |
*ValueClick, Inc. | | 307,765 | | | 3,795 |
*WebEx Communications, Inc. | | 148,330 | | | 3,917 |
| | | | |
|
|
| | | | | | 78,605 |
| | | | |
|
|
Health Care—29.5% | | | | | |
Alcon, Inc.† | | 60,170 | | | 6,580 |
Allergan, Inc. | | 48,335 | | | 4,120 |
*Amgen, Inc. | | 115,900 | | | 7,007 |
*Axcan Pharma, Inc.† | | 240,325 | | | 3,672 |
Eli Lilly & Company | | 86,310 | | | 4,808 |
*Express Scripts, Inc., Class “A” | | 86,560 | | | 4,326 |
*IDEXX Laboratories, Inc. | | 64,240 | | | 4,004 |
*Integra Lifesciences Holding Corporation | | 99,010 | | | 2,891 |
*Kyphon, Inc. | | 110,670 | | | 3,850 |
Medtronic, Inc. | | 183,615 | | | 9,510 |
*ResMed, Inc. | | 44,510 | | | 2,937 |
Sanofi-Aventis—ADR | | 180,655 | | | 7,405 |
UnitedHealth Group, Inc. | | 177,800 | | | 9,271 |
Valeant Pharmaceuticals International | | 113,310 | | | 1,998 |
| | | | |
|
|
| | | | | | 72,379 |
| | | | |
|
|
Industrials—11.4% | | | | | |
Corporate Executive Board Company | | 48,705 | | | 3,815 |
Danaher Corporation | | 202,331 | | | 10,590 |
*Education Management Corporation | | 151,165 | | | 5,099 |
Graco, Inc. | | 90,610 | | | 3,087 |
Knight Transportation, Inc. | | 218,240 | | | 5,310 |
| | | | |
|
|
| | | | | | 27,901 |
| | | | |
|
|
*Non-income producing securities
ADR = American Depository Receipt
† = U.S. listed foreign security
VRN = Variable Rate Note
| | | | | | |
Issuer
| | Shares or
Principal
Amount
| | Value
|
| | |
Common Stocks—(continued) | | | | | | |
Consumer Discretionary—10.5% | | | | | | |
*Bed, Bath & Beyond, Inc. | | | 218,730 | | $ | 9,138 |
*CarMax, Inc. | | | 110,230 | | | 2,938 |
*Comcast Corporation, Class “A” | | | 216,760 | | | 6,492 |
*Kohl’s Corporation | | | 128,600 | | | 7,190 |
| | | | | |
|
|
| | | | | | | 25,758 |
| | | | | |
|
|
Financials—6.2% | | | | | | |
Goldman Sachs Group, Inc. | | | 46,360 | | | 4,730 |
SEI Investments Company | | | 140,435 | | | 5,245 |
SLM Corporation | | | 102,585 | | | 5,211 |
| | | | | |
|
|
| | | | | | | 15,186 |
| | | | | |
|
|
Consumer Staples—4.6% | | | | | | |
Estee Lauder Companies, Inc. | | | 130,205 | | | 5,095 |
PepsiCo, Inc. | | | 116,215 | | | 6,268 |
| | | | | |
|
|
| | | | | | | 11,363 |
| | | | | |
|
|
Materials—2.9% | | | | | | |
Praxair, Inc. | | | 153,630 | | | 7,159 |
| | | | | |
|
|
Energy—1.5% | | | | | | |
Suncor Energy, Inc.† | | | 77,310 | | | 3,658 |
| | | | | |
|
|
Total Common Stock—98.6%
(cost $192,092) | | | 242,009 |
| | | | | |
|
|
| | |
Investment in Affiliate—0.4% | | | | | | |
William Blair Ready Reserves | | | 921,944 | | | 922 |
| | | | | |
|
|
Total Investment in Affiliate
(cost $922) | | | 922 |
| | | | | |
|
|
| | |
Short-Term Investments—0.3% | | | | | | |
Prudential Funding Demand Note, VRN, 3.368%, due 7/1/05 | | $ | 670,000 | | | 670 |
| | | | | |
|
|
Total Short-Term Investments
(cost $670) | | | 670 |
| | | | | |
|
|
Total Investments—99.3%
(cost $193,684) | | | 243,601 |
Cash and other assets, less liabilities—0.7% | | | 1,699 |
| | | | | |
|
|
Net assets—100.0% | | $ | 245,300 |
| | | | | |
|
|
See accompanying Notes to Financial Statements.
June 30, 2005 | William Blair Funds 7 |

Mark A. Fuller III

Gregory J. Pusinelli
TAX-MANAGED GROWTH FUND
The Tax-Managed Growth Fund invests primarily in common stocks of large, medium and small domestic growth companies that the Advisor expects to have sustainable, above-average growth from one business cycle to the next.
AN OVERVIEW FROM THE PORTFOLIO MANAGERS
How did the Fund perform over the first half of the year? How did the Fund’s performance compare to its benchmark?
The Tax-Managed Growth Fund posted a –4.70% loss on a total return basis (Class A Shares reflecting the impact of the maximum sales load) for the six-months ended June 30, 2005. By comparison, the Fund’s benchmark, the Russell 3000® Growth Index declined 1.88% and the Standard & Poor’s 500 Stock Index dropped 0.81%.
What were the most significant market factors impacting Fund performance?
Concerns that rising energy prices could dampen economic growth weighed on the equity markets during the first half of the year. In addition, indications early in the year that inflationary pressures had the potential to increase were worrisome to equity market participants.
Amid mounting concerns that corporate profits might slow, investors were also troubled by signs that the Federal Reserve’s campaign to raise short-term interest rates at a “measured” pace was not over. The Federal Reserve raised the federal funds rate on overnight loans once during the first quarter and twice during the second quarter, and investors grew increasingly concerned that the Fed was being overly cautious—and perhaps too restrictive—with its monetary policy.
What were among the best performing investments for the Fund?
Information Technology was the best-performing sector for the Fund for the first six months of 2005. The Fund was underweight the Russell 3000® Growth Index in terms of Information Technology exposure—at 17.1% versus 26.3% for the Index. However, our Information Technology stocks performed better, posting a 2.3% gain, as compared to a 5.6% decline for the stocks in the Russell 3000® Growth.
Energy was the second-best performing sector for the Fund. Our Energy sector exposure at 4.8% was more than double the weighting of the Russell 3000® Growth at 2.1%, and the Fund benefited from the positive performance of its Energy holdings.
Health Care was the third-best performing sector for the Fund during the first half of the year. More specifically, four of the top five-best performing investments for the Fund during the first six months were from the Health Care sector, and three of these companies—Genentech, Inc., Alcon, Inc. and St. Jude Medical, Inc.—deserve mention. Applications for Genentech’s cancer products—and their broader use for different types of cancers—look promising. Increased earnings estimates for the company during the second quarter reinforced our enthusiasm for this company. We especially favor this company because Genentech has an entire portfolio of products, compared to other biotechnology companies which may only have one drug either in test trials or to market. Alcon is a global leader in developing, manufacturing, and selling ophthalmology drugs, supplies, and surgical devices, and also sells consumer eye-care products
8 Semi-Annual Report | June 30, 2005 |
such as contact lens-cleaning solution. Alcon has a new drug for age-related macular degeneration, and the company’s stock responded favorably to news that its Phase 3 testing of this product was going well. As the aging segment of the population continues to grow, we expect the growth prospects for Alcon to be strong. St. Jude Medical manufactures cardiovascular medical devices, including the world’s most widely used mechanical heart valve. The firm’s cardiac care business benefited from the misfortune of Boston Scientific Corporation, which had announced a stent recall during the quarter.
What were among the weakest performing investments for the Fund?
Our Financial sector weightings were a material drag on performance during the first half of the year. Investors Financial Service Corporation was a weak performing investment for the Fund. The flattening interest rate yield curve resulting from the Federal Reserve’s short-term interest rate hikes has taken a bite out of Investors Financial’s earnings, as the short-term rates the company pays out have increased relative to the lower long term rates at which the company borrows money.
Another poor performing investment for the Fund was Valeant Pharmaceuticals International. Concerns arose that Phase 2 test trials for Valeant’s Viramidine drug for Hepatitis C were poorly designed by the company’s previous management, which led to speculation regarding the drug’s ability to be approved by the FDA. We nonetheless believe in this company, which has strong new management that has joined the firm from many of the top pharmaceutical companies from around the world. We are willing to withstand the short-term pain with the company’s share price because of this management, and because of Valeant’s promising portfolio of products which is in various stages of testing.
CarMax, Inc. also turned in a disappointing performance. Management lowered expectations for comparable store sales, and the downward guidance caused our investment in CarMax, Inc. to decline. Although we have begun to see greater volatility in comparable store sales from quarter to quarter—which impacts our valuation parameters for the stock—we still believe in this company, its business model and its excellent management.
What is your current strategy? How is the Fund positioned?
As we mentioned last quarter, interest rates have been edging up, turning what had been a favorable tailwind for equity investors into a headwind. We are thoughtfully navigating this market environment. We will continue to maintain our modest underweight in the Financial sector given the likelihood for additional “measured” interest rate increases by the Federal Reserve in the months ahead. Otherwise, we presently intend to maintain reasonable weightings in each sector and we are not currently inclined to significantly over- or under-weight any other particular area.
In addition, rising energy costs are expected to cause a slowdown in earnings growth among companies in the broad market as well as the nation’s Gross Domestic Product (GDP). However, it is also a market environment we believe should favor the type of companies we invest in—companies that demonstrate above-average earnings growth no matter what the economic climate.
As always, we will continue to focus on and emphasize high-quality names that we believe will serve our investors well.
June 30, 2005 | William Blair Funds 9 |
Tax-Managed Growth Fund
Performance Highlights
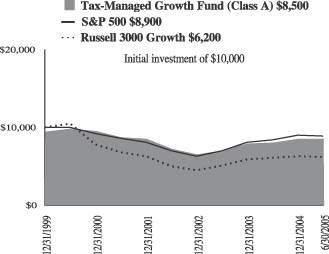
Average Annual Total Return at 6/30/2005 reflecting the maximum sales load
| | | | | | | | | | | | |
| | | 1
Year
| | | 3
Year
| | | 5
Year
| | | Since Inception(a)
| |
Tax-Managed Growth Fund Class A | | 0.69 | % | | 3.91 | % | | (3.79 | )% | | (2.81 | )% |
Tax-Managed Growth Fund Class B | | 0.98 | | | 4.11 | | | (3.79 | ) | | (2.87 | ) |
Tax-Managed Growth Fund Class C | | 4.98 | | | 5.17 | | | (3.40 | ) | | (2.51 | ) |
Russell 3000®
Growth Index | | 1.90 | | | 7.56 | | | (9.93 | ) | | (8.17 | ) |
S&P Index | | 6.32 | | | 8.28 | | | (2.37 | ) | | (2.09 | ) |
| | (a) | | For the period from December 27, 1999 to June 30, 2005. |
Performance cited represents past performance. Past performance does not guarantee future results and current performance may be lower or higher than the data quoted. Results shown are average annual total returns, which assume reinvestment of dividends and capital gains. Investment returns and principal will fluctuate and you may have a gain or loss when you sell shares. For the most current month-end performance information, please call 1-800-742-7272, or visit our Web site at www.williamblairfunds.com. From time to time, the investment adviser may waive fees or reimburse expenses for the Fund. Without these waivers, performance would be lower. Class A, B, and C shares are not available for sale.
The performance highlights and graph presented above do not reflect the deduction of taxes that a shareholder would pay on fund distributions or the redemption of fund shares.
The Russell 3000® Growth Index consists of large, medium, and small-capitalization companies with above average price-to-book ratios and forecasted growth rates. The index is weighted by market capitalization and large/medium/small companies make up approximately 80%/15%/5% of the index.
The S&P 500 Index indicates broad larger capitalization equity market performance.
This report identifies the Fund’s investments on June 30, 2005. These holdings are subject to change. Not all stocks in the Fund performed the same, nor is there any guarantee that these stocks will perform as well in the future. Market forecasts provided in this report may not necessarily come to pass.
Sector Diversification
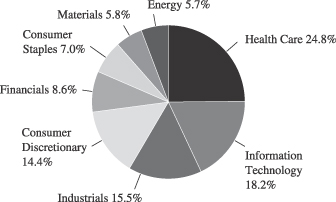
The sector diversification shown is based on the total investment portfolio.
10 Semi-Annual Report | June 30, 2005 |
Tax-Managed Growth Fund
Portfolio of Investments, June 30, 2005 (all dollar amounts in thousands) (unaudited)
| | | | | |
Issuer
| | Shares
| | Value
|
| | |
Common Stocks | | | | | |
Health Care—23.8% | | | | | |
Alcon, Inc.† | | 965 | | $ | 106 |
*Amgen, Inc. | | 2,435 | | | 147 |
*Express Scripts, Inc., Class “A” | | 2,470 | | | 123 |
*Genentech, Inc. | | 1,800 | | | 145 |
IMS Health, Inc. | | 4,740 | | | 117 |
Pfizer, Inc. | | 5,325 | | | 147 |
*ResMed, Inc. | | 2,197 | | | 145 |
Sanofi-Aventis—ADR | | 2,480 | | | 102 |
*St. Jude Medical, Inc. | | 2,360 | | | 103 |
Stryker Corporation | | 1,230 | | | 58 |
Valeant Pharmaceuticals International | | 3,420 | | | 60 |
*Zimmer Holdings, Inc. | | 1,910 | | | 145 |
| | | | |
|
|
| | | | | | 1,398 |
| | | | |
|
|
Information Technology—17.4% | | | | | |
Arm Holdings plc—ADR | | 9,500 | | | 58 |
*CACI International, Inc., Class “A” | | 1,360 | | | 86 |
CDW Corporation | | 1,620 | | | 93 |
*EMC Corporation | | 6,590 | | | 90 |
First Data Corporation | | 2,900 | | | 116 |
*Intuit, Inc. | | 2,455 | | | 111 |
*Jabil Circuit, Inc. | | 3,545 | | | 109 |
Microchip Technology, Inc. | | 4,170 | | | 124 |
Paychex, Inc. | | 3,390 | | | 110 |
*ScanSource, Inc. | | 1,230 | | | 53 |
Taiwan Semiconductor Mfg. Co. Ltd.—ADR | | 8,220 | | | 75 |
| | | | |
|
|
| | | | | | 1,025 |
| | | | |
|
|
Industrials—14.9% | | | | | |
*Apollo Group, Inc., Class “A” | | 750 | | | 59 |
C.H. Robinson Worldwide, Inc. | | 2,335 | | | 136 |
Danaher Corporation | | 3,020 | | | 158 |
Expeditors International of Washington | | 2,245 | | | 112 |
Fastenal Company | | 2,520 | | | 154 |
General Electric Company | | 3,355 | | | 116 |
Knight Transportation, Inc. | | 3,255 | | | 79 |
Pentair, Inc. | | 1,400 | | | 60 |
| | | | |
|
|
| | | | | | 874 |
| | | | |
|
|
Consumer Discretionary—13.8% | | | | | |
*Bed, Bath & Beyond, Inc. | | 2,070 | | | 87 |
*CarMax, Inc. | | 2,710 | | | 72 |
Dollar General Corporation | | 4,230 | | | 86 |
*eBAY, Inc. | | 1,720 | | | 57 |
*IAC InterActiveCorp | | 3,240 | | | 78 |
*Laureate Education, Inc. | | 1,250 | | | 60 |
Lowe’s Companies, Inc. | | 1,735 | | | 101 |
Time Warner, Inc. | | 4,530 | | | 76 |
*Univision Communications, Inc. | | 1,820 | | | 50 |
*Williams-Sonoma, Inc. | | 3,645 | | | 144 |
| | | | |
|
|
| | | | | | 811 |
| | | | |
|
|
*Non-income producing securities
ADR = American Depository Receipt
† = U.S. listed foreign security
VRN = Variable Rate Note
| | | | | | | |
Issuer
| | Shares or
Principal
Amount
| | Value
| |
| | |
Common Stocks—(continued) | | | | | | | |
Financials—8.2% | | | | | | | |
AFLAC, Inc. | | | 1,390 | | $ | 60 | |
Ambac Financial Group, Inc. | | | 1,450 | | | 101 | |
American International Group | | | 2,210 | | | 129 | |
Investors Financial Service Corporation | | | 2,240 | | | 85 | |
Moody’s Corporation | | | 2,430 | | | 109 | |
| | | | | |
|
|
|
| | | | | | | 484 | |
| | | | | |
|
|
|
Consumer Staples—6.7% | | | | | | | |
Colgate-Palmolive Company | | | 1,100 | | | 55 | |
PepsiCo, Inc. | | | 2,825 | | | 152 | |
Walgreen Co. | | | 2,365 | | | 109 | |
Whole Foods Market, Inc. | | | 680 | | | 80 | |
| | | | | |
|
|
|
| | | | | | | 396 | |
| | | | | |
|
|
|
Materials—5.6% | | | | | | | |
Airgas, Inc. | | | 5,550 | | | 137 | |
Ecolab, Inc. | | | 2,090 | | | 67 | |
Praxair, Inc. | | | 2,660 | | | 124 | |
| | | | | |
|
|
|
| | | | | | | 328 | |
| | | | | |
|
|
|
Energy—5.5% | | | | | | | |
*Smith International, Inc. | | | 950 | | | 61 | |
Suncor Energy, Inc.† | | | 5,580 | | | 264 | |
| | | | | |
|
|
|
| | | | | | | 325 | |
| | | | | |
|
|
|
Total Common Stock—95.9%
(cost $4,269) | | | 5,641 | |
| | | | | |
|
|
|
| | |
Investment in Affiliate—3.0% | | | | | | | |
William Blair Ready Reserves | | | 177,340 | | | 177 | |
| | | | | |
|
|
|
Total Investment in Affiliate
(cost $177) | | | 177 | |
| | | | | |
|
|
|
| | |
Short-Term Investments—3.4% | | | | | | | |
Prudential Funding Demand Note, VRN,
3.368%, due 7/1/05 | | $ | 200,000 | | | 200 | |
| | | | | |
|
|
|
Total Short-Term Investments
(cost $200) | | | 200 | |
| | | | | |
|
|
|
Total Investments—102.3%
(cost $4,646) | | | 6,018 | |
Liabilities, plus cash and other assets—(2.3)% | | | (134 | ) |
| | | | | |
|
|
|
Net assets—100.0% | | $ | 5,884 | |
| | | | | |
|
|
|
See accompanying Notes to Financial Statements.
June 30, 2005 | William Blair Funds 11 |
John F. Jostrand

Norbert W. Truderung

James W. Golan
LARGE CAP GROWTH FUND
The Large Cap Growth Fund invests primarily in common stocks of large domestic growth companies of high quality that the Advisor believes have demonstrated sustained growth over a long period of time.
AN OVERVIEW FROM THE PORTFOLIO MANAGERS
How did the Fund perform over the first half of the year? How did the Fund’s performance compare to its benchmark?
The Large Cap Growth Fund posted a –7.42% decrease on a total return basis (Class A Shares reflecting the impact of the maximum sales load) for the six months ended June 30, 2005. By comparison, the Fund’s benchmark, the Russell 1000® Growth Index, declined 1.72%.
What were the most significant factors impacting Fund performance? What factors were behind the Fund’s performance versus the benchmark?
The broad domestic equity market showed mixed results for the first half of the year, with midcap value-oriented stocks having the best overall results, while growth-oriented issues were generally weak. Oil prices marched higher, and the Federal Reserve continued its tightening policy. With concerns about the potential for slowing earnings growth, investors rotated away from more cyclical issues such as Materials and Industrials, and began to show favor to Health Care and some select Technology stocks in the latter part of the second quarter.
What were among the best performing investments for the Fund?
The largest contributor to the portfolio during the year to date period on an absolute and relative basis was the Health Care sector. Alcon, a provider of eye care products, achieved strong results due to favorable outlook for its new Restor Lens product. This interocular device provides improved sight for both near and distance vision, and has proven to be a good option for patients with cataracts as well. The product received additional good news with the approval by Medicare for reimbursements, making the relatively expensive product available to a sizably larger market.
The Energy sector enjoyed the strongest absolute results during the first six months, boosted by oil rising to $60 per barrel. Although the returns were strong, the Energy weighting in both the benchmark and the portfolio was less than two percent. Nevertheless, Energy proved to be the second strongest performer in relative terms for the portfolio during the first six months. Suncor Energy Inc., an integrated energy company which has a proprietary method for extracting oil from the Canadian tar sands, enjoyed particularly strong returns during the quarter.
What were among the weakest performing investments for the Fund?
Industrial stocks detracted from overall portfolio results. This area showed significant weakness during the year to date period, as investors turned to stocks with less orientation to the recovery phase of the economic cycle. The portfolio’s relative overweight position to this area, combined with particularly soft performances by 3M Company and Danaher Corporation, contributed to weakness in overall portfolio returns.
12 Semi-Annual Report | June 30, 2005 |
Although stocks in the Consumer Discretionary sector held up well given the potential effects of rising oil prices and increasing interest rates, one of the largest disappointments during the first six months came in this area. Harley-Davidson, Inc., a manufacturer of motorcycle equipment and accessories, experienced significantly weak operating earnings during the second quarter. Additionally, the company decreased its earnings outlook and reduced manufacturing plans for the next several quarters. The stock was sold out of the portfolio due to our concern that the motorcycle market is maturing at a rate faster than anticipated.
What is your current outlook?
We postulated that 2005 would bring a deceleration in earnings growth, as the business cycle is advancing from a recovery stage into a more normalized growth phase. While companies experienced double digit earnings growth in the last several quarters, estimates for the second quarter through the last half of 2005 are closer to the mid to upper single digit range. The Federal Reserve’s posture indicates a likelihood that it will continue to raise interest rates to create a less stimulative monetary environment. Although consumers continue to show resilience, fueled by the strong real estate market and low mortgage rates, the combination of higher oil prices and interest rates will likely take a toll on spending at some point. Investors anticipated that cash-heavy corporations would probably initiate capital spending, but to date corporations have had greater interest in using cash to repurchase shares or increase dividends. All of these trends tend to be harbingers for a lower growth environment.
June 30, 2005 | William Blair Funds 13 |
Large Cap Growth Fund
Performance Highlights
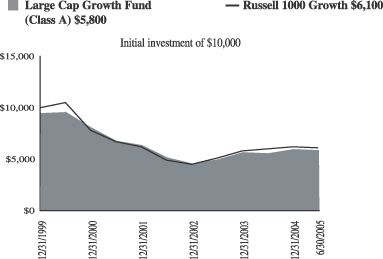
Average Annual Total Return at 6/30/2005 reflecting the maximum sales load
| | | | | | | | | | | | |
| | | 1
Year
| | | 3
Year
| | | 5
Year
| | | Since
Inception(a)
| |
Large Cap Growth Fund Class A | | (1.90 | )% | | 2.16 | % | | (10.66 | )% | | (9.53 | )% |
Large Cap Growth Fund Class B | | (1.64 | ) | | 2.37 | | | (10.67 | ) | | (9.60 | ) |
Large Cap Growth Fund Class C | | 2.36 | | | 3.42 | | | (10.34 | ) | | (9.26 | ) |
Russell 1000®
Growth Index | | 1.68 | | | 7.26 | | | (10.36 | ) | | (8.59 | ) |
| | (a) | | For the period from December 27, 1999 to June 30, 2005. |
Performance cited represents past performance. Past performance does not guarantee future results and current performance may be lower or higher than the data quoted. Results shown are average annual total returns, which assume reinvestment of dividends and capital gains. Investment returns and principal will fluctuate and you may have a gain or loss when you sell shares. For the most current month-end performance information, please call 1-800-742-7272, or visit our Web site at www.williamblairfunds.com. From time to time, the investment adviser may waive fees or reimburse expenses for the Fund. Without these waivers, performance would be lower. Class A, B, and C shares are not available for sale.
The performance highlights and graph presented above do not reflect the deduction of taxes that a shareholder would pay on fund distributions or the redemption of fund shares.
The Russell 1000® Growth Index consists of large-capitalization companies with above average-to-book ratios and forecasted growth rates.
This report identifies the Fund’s investments on June 30, 2005. These holdings are subject to change. Not all stocks in the Fund performed the same, nor is there any guarantee that these stocks will perform as well in the future. Market forecasts provided in this report may not necessarily come to pass.
Sector Diversification

The sector diversification shown is based on the total investment portfolio.
14 Semi-Annual Report | June 30, 2005 |
Large Cap Growth Fund
Portfolio of Investments, June 30, 2005 (all dollar amounts in thousands) (unaudited)
| | | | | |
Issuer
| | Shares
| | Value
|
| | |
Common Stocks | | | | | |
Information Technology—29.2% | | | | | |
*Accenture, Ltd.† | | 11,865 | | $ | 269 |
Adobe Systems Incorporated | | 4,570 | | | 131 |
*Dell, Inc. | | 10,890 | | | 430 |
*EMC Corporation | | 18,670 | | | 256 |
First Data Corporation | | 8,790 | | | 353 |
Intel Corporation | | 7,565 | | | 197 |
Linear Technology Corporation | | 7,475 | | | 274 |
Paychex, Inc. | | 6,480 | | | 211 |
Qualcomm Incorporated | | 2,410 | | | 80 |
Taiwan Semiconductor Mfg. Co. Ltd.—ADR | | 33,432 | | | 305 |
*Yahoo!, Inc. | | 4,675 | | | 162 |
| | | | |
|
|
| | | | | | 2,668 |
| | | | |
|
|
Health Care—24.6% | | | | | |
Alcon, Inc.† | | 2,210 | | | 242 |
Allergan, Inc. | | 2,195 | | | 187 |
*Amgen, Inc. | | 4,285 | | | 259 |
*Boston Scientific Corporation | | 2,145 | | | 58 |
*Caremark Rx, Inc. | | 3,655 | | | 163 |
Eli Lilly & Company | | 2,965 | | | 165 |
Medtronic, Inc. | | 8,400 | | | 435 |
Pfizer, Inc. | | 7,200 | | | 198 |
Sanofi-Aventis—ADR | | 4,925 | | | 202 |
UnitedHealth Group, Inc. | | 6,525 | | | 340 |
| | | | |
|
|
| | | | | | 2,249 |
| | | | |
|
|
Industrials—12.6% | | | | | |
3M Company | | 3,680 | | | 266 |
*Apollo Group, Inc., Class “A” | | 2,535 | | | 198 |
Danaher Corporation | | 8,142 | | | 426 |
General Electric Company | | 7,635 | | | 265 |
| | | | |
|
|
| | | | | | 1,155 |
| | | | |
|
|
Consumer Discretionary—11.6% | | | | | |
*Bed, Bath & Beyond, Inc. | | 8,265 | | | 345 |
*Comcast Corporation, Class “A” | | 7,945 | | | 238 |
*Kohl’s Corporation | | 6,563 | | | 367 |
Nike, Inc., Class “B” | | 1,300 | | | 113 |
| | | | |
|
|
| | | | | | 1,063 |
| | | | |
|
|
*Non-income producing securities
ADR = American Depository Receipt
† = U.S. listed foreign security
| | | | | | |
Issuer
| | Shares
| | Value
| |
| | |
Common Stocks—(continued) | | | | | | |
Consumer Staples—8.3% | | | | | | |
Avon Products, Inc. | | 5,320 | | $ | 201 | |
PepsiCo, Inc. | | 4,185 | | | 226 | |
Walgreen Co. | | 7,225 | | | 332 | |
| | | | |
|
|
|
| | | | | | 759 | |
| | | | |
|
|
|
Financials—4.6% | | | | | | |
Goldman Sachs Group, Inc. | | 2,355 | | | 240 | |
SLM Corporation | | 3,565 | | | 181 | |
| | | | |
|
|
|
| | | | | | 421 | |
| | | | |
|
|
|
Materials—2.9% | | | | | | |
Praxair, Inc. | | 5,655 | | | 264 | |
| | | | |
|
|
|
Energy—2.6% | | | | | | |
Schlumberger Limited† | | 1,275 | | | 97 | |
Suncor Energy, Inc.† | | 2,895 | | | 137 | |
| | | | |
|
|
|
| | | | | | 234 | |
| | | | |
|
|
|
Total Common Stock—96.4%
(cost $7,855) | | | 8,813 | |
| | | | |
|
|
|
| | |
Investment in Affiliate—3.6% | | | | | | |
William Blair Ready Reserves | | 329,775 | | | 330 | |
| | | | |
|
|
|
Total Investment in Affiliate
(cost $330) | | | 330 | |
| | | | |
|
|
|
Total Investments—100.0%
(cost $8,185) | | | 9,143 | |
Liabilities, plus cash and other assets—0.0% | | | (1 | ) |
| | | | |
|
|
|
Net assets—100.0% | | $ | 9,142 | |
| | | | |
|
|
|
See accompanying Notes to Financial Statements.
June 30, 2005 | William Blair Funds 15 |

Karl W. Brewer
SMALL CAP GROWTH FUND
The Small Cap Growth Fund invests primarily in common stocks of small domestic growth companies that the Advisor expects to have solid growth in earnings.
AN OVERVIEW FROM THE PORTFOLIO MANAGER
How did the Fund perform over the first half of the year? How did the Fund’s performance compare to its benchmark?
The Small Cap Growth Fund posted a 9.64% decrease on a total return basis (Class A Shares reflecting the impact of the maximum sales load) for the six months ended June 30, 2005. By comparison, the Fund’s benchmark, the Russell 2000® Growth Index, declined 3.58% during the period, while the Russell 2000® Index decreased 1.25%.
What were the most significant factors impacting Fund performance? What factors were behind the Fund’s performance versus the benchmark?
Small cap growth stocks underperformed large cap stocks during the first six months of the year, as evidenced by the Russell 2000® Index (of small company stocks) return of -1.25% versus the Russell 1000® Index (of large company stocks) return of 0.11%. From a style perspective within the small cap space, value continued to outperform growth as the Russell 2000® Value Index returned 0.90%.
The financial markets were again faced with the backdrop of a rising interest rate environment and high energy prices during the first half of 2005. The Federal Reserve continued its tightening at a measured pace to take the target Federal Funds interest rate to 3.25% by the end of June. Crude oil closed the first half of the year near $60 a barrel and continues to be a headwind for investors’ outlook on the consumer. With these elevated energy prices, the Energy sector within the Russell 2000® Growth Index has sustained its strong performance in 2005 to date. Consumer Discretionary stocks also turned in positive results. On the other hand, Health Care stocks finished just in negative territory for the Russell 2000® Growth Index. The Information Technology sector once again produced negative results for the Russell 2000® Growth Index as it did in 2004. The Industrials and Materials sectors, after their strong performances in 2004, ended the first half of 2005 with negative returns within the Russell 2000® Growth Index. With respect to the Fund, Health Care, Industrials, Consumer Discretionary and Financials produced negative absolute returns while Information Technology and Energy saw positive results in absolute terms.
On a relative basis, our outperformance during the first quarter was more than offset by our underperformance during the second quarter to end the period down relative to the Russell 2000® Growth Index. There were a few dynamics that contributed to our relative performance during the first six months of the year. First, we had some fundamental disappointments. Stock selection in Health Care was a major detractor from relative performance. In addition to Health Care, stock selection in the Financials and Consumer Discretionary sectors were two other main sources of relative underperformance. Among the positive contributors to the Fund’s relative performance for the first six months of 2005 was stock selection within the Information Technology sector.
Another dynamic that added to the Fund’s underperformance, specifically during the second quarter, was client withdrawals. As a result, we were forced to raise cash in an already difficult small cap market during April and then again in May, which we believe put downward pressure on some of our portfolio holdings. From the end of the first quarter
16 Semi-Annual Report | June 30, 2005 |
through May 24, representing roughly the end of the liquidations and the trough in relative performance for the quarter, a substantial amount of the roughly 550 basis point underperformance came from our smaller market capitalization, and typically less liquid stocks. In the period from May 24 through the end of the quarter, after the liquidations were complete, we outperformed compared to the Index by over 300 basis points. While we are not satisfied with our underperformance in the second quarter, and therefore through the first six months of 2005, we feel a portion of this was due to short term dynamics and we remain positive on the positioning of the Fund.
What were among the weakest performing investments for the Fund?
Integra LifeSciences Holdings Corporation and Cell Therapeutics, Inc. were two stocks within Health Care that performed poorly. Integra LifeSciences, a medical products company, reported earnings below expectations and guided future earnings lower during May. We continue to hold the position as we expect Integra’s business momentum to reaccelerate. The small cap biotechnology industry experienced relatively weak returns during the first half of the year. Cell Therapeutics is one of the Fund’s biotechnology holdings that underperformed its peers in the quarter. The company announced negative data from a Phase III trial in the FDA approval process during the first quarter. We have since sold the position after subsequent data points dampened our outlook for the company’s prospects.
What were among the best performing investments for the Fund?
Two stocks that contributed to the Information Technology sector’s positive relative performance were Optimal Group, Inc. and Intermix Media, Inc. Optimal Group was our most significant contributor within our Information Technology holdings and in the Fund overall. Optimal Group, Inc. is an undiscovered transaction processing company. The stock appreciated through the first six months of the year as investors became increasingly aware of the company and its ability to execute fundamentally. Intermix Media, Inc. operates a network of unique websites that allow marketers to target hard-to-reach consumers. The company’s business is accelerating and the stock has responded accordingly.
What is your current outlook?
Looking forward, the markets will continue to face various headwinds. Year over year earnings comparisons are getting tougher after the strong double digit earnings growth rates witnessed in 2004. More companies are reigning in expectations as the ratio of negative to positive preannouncements was significantly higher during the second quarter of 2005 versus the year earlier period. There will be continued debate in regard to near record high energy prices and their effect on overall economic activity. With respect to interest rates, current consensus is for the Federal Reserve to raise rates another 25 basis points at its August meeting but beyond that investors differ on their expectations. Future data points on inflation, economic activity and employment will weigh in on the direction of interest rates so investors will be watching these statistics in anticipation of the Fed’s moves.
With the backdrop of slower yet more sustainable economic and corporate earnings growth rates, we anticipate a stock picker’s market. Our bottom up, fundamental quality growth philosophy of selecting companies with durable business franchises and consistent earnings streams should position the Fund well in this type of environment.
June 30, 2005 | William Blair Funds 17 |
Small Cap Growth Fund
Performance Highlights
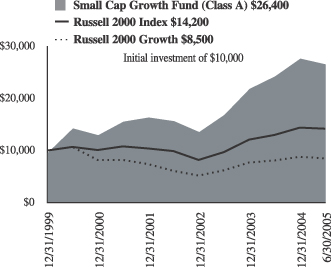
Average Annual Total Return at 6/30/2005 reflecting the maximum sales load
| | | | | | | | | | | | | | |
| | | 1
Year
| | | 3
Year
| | | 5
Year
| | | Since Inception(a)
| | | |
Small Cap Growth Fund Class A | | 3.09 | % | | 17.18 | % | | 12.09 | % | | 19.27 | % | | |
Small Cap Growth Fund Class B | | 3.54 | | | 17.90 | | | 12.31 | | | 19.47 | | | |
Small Cap Growth Fund Class C | | 7.53 | | | 18.62 | | | 12.55 | | | 19.54 | | | |
Russell 2000®
Growth Index | | 4.29 | | | 11.37 | | | (4.51 | ) | | (2.86 | ) | | |
Russell 2000® Index | | 9.45 | | | 12.81 | | | 5.71 | | | 6.59 | | | |
| | (a) | | For the period from December 27, 1999 to June 30, 2005. |
Performance cited represents past performance. Past performance does not guarantee future results and current performance may be lower or higher than the data quoted. Results shown are average annual total returns, which assume reinvestment of dividends and capital gains. Investment returns and principal will fluctuate and you may have a gain or loss when you sell shares. For the most current month-end performance information, please call 1-800-742-7272, or visit our Web site at www.williamblairfunds.com. Investing in smaller companies involves special risks, including higher volatility and lower liquidity. From time to time, the investment advisor may waive fees or reimburse expenses for the Fund. Without these waivers, performance would be lower. Class A, B and C shares are not available for sale.
The performance highlights and graph presented above do not reflect the deduction of taxes that a shareholder would pay on fund distributions or the redemption of fund shares.
The Russell 2000® Growth Index consists of small-capitalization companies with above average price-to-book ratios and forecasted growth rates.
The Russell 2000® Index is an unmanaged composite of the smallest 2000 stocks of the Russell 3000® Index.
This report identifies the Fund’s investments on June 30, 2005. These holdings are subject to change. Not all stocks in the Fund performed the same, nor is there any guarantee that these stocks will perform as well in the future. Market forecasts provided in this report may not necessarily come to pass.
Sector Diversification
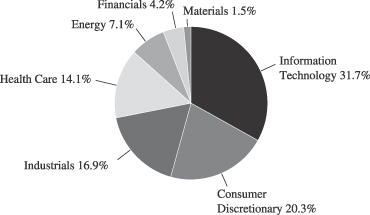
The sector diversification shown is based on the total investment portfolio.
18 Semi-Annual Report | June 30, 2005 |
Small Cap Growth Fund
Portfolio of Investments, June 30, 2005 (all dollar amounts in thousands) (unaudited)
| | | | | |
| |
|
Issuer
| | Shares
| | Value
|
| | |
Common Stocks | | | | | |
Information Technology—30.2% | | | | | |
*AMIS Holdings, Inc. | | 1,126,040 | | $ | 15,021 |
ARM Holdings, plc—ADR | | 1,511,435 | | | 9,280 |
*Blackbaud, Inc. | | 493,782 | | | 6,666 |
*DSP Group, Inc. | | 323,020 | | | 7,711 |
*Euronet Worldwide, Inc. | | 290,184 | | | 8,436 |
*Intermix Media, Inc. | | 558,228 | | | 4,672 |
*Internet Capital Group, Inc. | | 466,363 | | | 3,418 |
*Intrado, Inc. | | 652,664 | | | 9,764 |
*J2 Global Communications, Inc. | | 189,169 | | | 6,515 |
*Kanbay International, Inc. | | 494,320 | | | 11,424 |
*Lionbridge Technologies, Inc. | | 1,916,651 | | | 12,995 |
*Macrovision Corporation | | 317,400 | | | 7,154 |
*Open Solutions, Inc. | | 223,442 | | | 4,538 |
*OPNET Technologies, Inc. | | 822,590 | | | 6,663 |
*Optimal Group, Inc.† | | 928,807 | | | 15,000 |
*PDF Solutions, Inc. | | 921,372 | | | 12,088 |
*Plexus Corporation | | 482,606 | | | 6,868 |
*ScanSoft, Inc. | | 2,312,750 | | | 8,742 |
*Ultimate Software Group, Inc. | | 754,863 | | | 12,380 |
*ValueClick, Inc. | | 1,269,797 | | | 15,657 |
*Volterra Semiconductor Corporation | | 525,570 | | | 7,826 |
*WebEx Communications, Inc. | | 520,160 | | | 13,737 |
*Workstream, Inc.† | | 2,736,960 | | | 4,921 |
| | | | |
|
|
| | | | | | 211,476 |
| | | | |
|
|
Consumer Discretionary—19.4% | | | | | |
*4 Kids Entertainment, Inc. | | 464,245 | | | 9,229 |
*Century Casinos, Inc. | | 844,596 | | | 6,351 |
*Cumulus Media, Inc., Class “A” | | 686,895 | | | 8,092 |
*Insight Enterprises, Inc. | | 626,240 | | | 12,637 |
*Jarden Corporation | | 268,650 | | | 14,486 |
*Laureate Education, Inc. | | 406,177 | | | 19,440 |
*Life Time Fitness, Inc. | | 52,900 | | | 1,736 |
*Lions Gate Entertainment Corporation† | | 1,282,915 | | | 13,163 |
Nautilus Group, Inc. | | 238,909 | | | 6,809 |
*Scientific Games Corporation, Class “A” | | 222,507 | | | 5,992 |
*Shuffle Master, Inc. | | 249,376 | | | 6,990 |
Speedway Motorsports, Inc. | | 189,280 | | | 6,920 |
Strayer Education, Inc. | | 72,095 | | | 6,219 |
*ValueVision Media, Inc., Class “A” | | 751,690 | | | 9,028 |
*WMS Industries, Inc. | | 246,585 | | | 8,322 |
| | | | |
|
|
| | | | | | 135,414 |
| | | | |
|
|
Industrials—16.1% | | | | | |
*Coinstar, Inc. | | 552,347 | | | 12,533 |
*Comfort Systems USA, Inc. | | 1,230,365 | | | 8,096 |
*Corrections Corporation of America | | 233,310 | | | 9,157 |
*Educate, Inc. | | 413,818 | | | 5,855 |
*Electronic Clearing House | | 598,262 | | | 5,205 |
*FirstService Corporation† | | 411,025 | | | 8,208 |
*Frozen Food Express Industries, Inc. | | 284,466 | | | 3,220 |
*Hudson Highland Group, Inc. | | 466,235 | | | 7,269 |
*Huron Consulting Group, Inc. | | 341,789 | | | 8,049 |
*Kforce, Inc. | | 1,475,315 | | | 12,481 |
| | | | | |
| |
|
Issuer
| | Shares
| | Value
|
| | |
Common Stocks—(continued) | | | | | |
Industrials—(continued) | | | | | |
*Labor Ready, Inc. | | 533,241 | | $ | 12,430 |
*Marten Transport, Ltd. | | 235,680 | | | 4,947 |
*Providence Service Corporation | | 283,873 | | | 7,048 |
*TRM Copy Centers Corporation | | 495,191 | | | 8,329 |
| | | | |
|
|
| | | | | | 112,827 |
| | | | |
|
|
Health Care—13.4% | | | | | |
*Allied Healthcare International | | 1,586,937 | | | 11,235 |
*Amicas, Inc. | | 1,576,102 | | | 7,140 |
*Axcan Pharma, Inc.† | | 565,955 | | | 8,648 |
*Barrier Therapeutics, Inc. | | 434,323 | | | 3,444 |
*Connectics Corporation | | 409,500 | | | 7,223 |
*Integra Lifesciences Holdings Corporation | | 368,240 | | | 10,752 |
*Kensey Nash Corporation | | 271,020 | | | 8,196 |
*LifeCell Corporation | | 208,715 | | | 3,300 |
*Martek Biosciences Corporation | | 196,738 | | | 7,466 |
*Matria Healthcare, Inc. | | 275,183 | | | 8,869 |
*Sangamo Biosciences, Inc. | | 531,005 | | | 1,896 |
*Santarus, Inc. | | 848,685 | | | 3,480 |
*Telik, Inc. | | 487,560 | | | 7,928 |
*Zila, Inc. | | 1,530,641 | | | 4,378 |
| | | | |
|
|
| | | | | | 93,955 |
| | | | |
|
|
Energy—6.8% | | | | | |
*ATP Oil and Gas Corporation | | 312,481 | | | 7,312 |
*Gasco Energy Inc. | | 2,401,050 | | | 8,884 |
*Grey Wolf, Inc. | | 1,430,573 | | | 10,601 |
*InterOil Corporation† | | 156,075 | | | 4,242 |
OMI Corporation | | 454,770 | | | 8,645 |
*Remington Oil and Gas Corporation | | 218,943 | | | 7,816 |
| | | | |
|
|
| | | | | | 47,500 |
| | | | |
|
|
Consumer Staples—4.0% | | | | | |
*Elizabeth Arden, Inc. | | 459,900 | | | 10,757 |
Nu Skin Enterprises, Inc. | | 341,390 | | | 7,955 |
*Usana Health Services, Inc. | | 214,545 | | | 9,075 |
| | | | |
|
|
| | | | | | 27,787 |
| | | | |
|
|
Financials—4.0% | | | | | |
*Affiliated Managers Group, Inc. | | 186,685 | | | 12,756 |
ECC Capital Corporation | | 1,090,485 | | | 7,262 |
*First Cash Financial Services, Inc. | | 360,309 | | | 7,700 |
| | | | |
|
|
| | | | | | 27,718 |
| | | | �� |
|
|
Materials—1.5% | | | | | |
Airgas, Inc. | | 413,280 | | | 10,196 |
| | | | |
|
|
Total in Common Stock—95.4%
(Total cost $557,100) | | | 666,873 |
| | | | |
|
|
| | |
Investment in Affiliate—0.9% | | | | | |
William Blair Ready Reserves | | 6,242,722 | | | 6,243 |
| | | | |
|
|
Total Investment in Affiliate
(cost $6,243) | | | 6,243 |
| | | | |
|
|
See accompanying Notes to Financial Statements.
June 30, 2005 | William Blair Funds 19 |
Small Cap Growth Fund
Portfolio of Investments, June 30, 2005 (all dollar amounts in thousands) (unaudited)
| | | | | | |
Issuer
| | Principal
Amount
| | Value
|
| | |
Short-Term Investments—2.9% | | | | | | |
American Express Demand Note, VRN, 3.164%, due 7/1/05 | | $ | 10,046,000 | | $ | 10,046 |
Prudential Funding Demand Note, VRN, 3.368%, due 4/1/05 | | | 10,046,000 | | | 10,046 |
| | | | | |
|
|
Total Short-Term Investments
(cost $20,092) | | | 20,092 |
| | | | | |
|
|
Total Investments—99.2%
(cost $583,435) | | | 693,208 |
Cash and other assets, less liabilities—0.8% | | | 5,911 |
| | | | | |
|
|
Net assets—100.0% | | $ | 699,119 |
| | | | | |
|
|
*Non-income producing securities
ADR = American Depository Receipt
† = U.S. listed foreign security
VRN = Variable Rate Note
See accompanying Notes to Financial Statements.
20 Semi-Annual Report | June 30, 2005 |
Karl W. Brewer

Harvey H. Bundy, III

Robert C. Lanphier, IV
SMALL-MID CAP GROWTH FUND
The Small-Mid Cap Growth Fund primarily invests in a diversified portfolio of common stocks of small and medium-sized domestic growth companies that the Advisor expects to experience solid growth in earnings.
AN OVERVIEW FROM THE PORTFOLIO MANAGERS
How did the Fund perform over the first half of the year? How did the Fund’s performance compare to its benchmark?
The Small-Mid Cap Growth Fund posted a –6.25% decrease on a total return basis (Class A Shares reflecting the impact of the maximum sales load) for the six months ended June 30, 2005. By comparison, the Fund’s benchmark, the Russell 2500® Growth Index, declined 0.92% during the period.
What were the most significant factors impacting Fund performance? What factors were behind the Fund’s performance versus the benchmark?
Small to mid cap stocks outperformed large cap stocks through the first six months of the year, as evidenced by the Russell 2500® Growth Index’s return of –0.92%, versus the Russell 1000® Growth Index return of –1.72%. From a style perspective within the small to mid cap space, value continued to outperform growth as the Russell 2500® Value Index returned 3.09%.
The financial markets were again faced with the backdrop of a rising interest rate environment and high energy prices during the first half of 2005. The Federal Reserve continued its tightening at a measured pace, taking the target Federal Funds interest rate to 3.25% by the end of June. Crude oil closed the first half of the year near $60 a barrel and continues to be a headwind for investors as they consider the outlook for consumer spending.
With the elevation in energy prices, the Energy sector within the Russell 2500® Growth Index has sustained strong returns in 2005 to date. Consumer Discretionary stocks also turned in positive results while Health Care stocks finished just in positive territory in the Russell 2500® Growth Index. The Information Technology sector once again produced negative returns for the first half of the year in the Russell 2500® Growth Index as it did in 2004. The Industrials and Materials sectors, after their strong performances in 2004, also turned in negative returns within the Russell 2500® Growth Index. With respect to the Fund, Healthcare, Industrials and Financials produced negative absolute returns, while Information Technology, Consumer Discretionary and Energy saw positive results.
A few dynamics occurred during the first six months of the year that affected our relative performance. Stock selection in the Information Technology sector was the largest source of outperformance. Being underweight in the Financials sector during the first six months of the year outweighed poor stock selection in the sector.
What were among the best performing investments for the Fund?
Jabil Circuit, Inc. in the electronics manufacturing services (EMS) business was a strong contributor to the Fund’s performance in the first half of the year. Jabil Circuit, Inc. distinguishes itself with a customer-centric approach that delivers higher service levels and superior financial performance relative to its competition. The stock benefited as earnings estimates were taken up during the first quarter. The stock continued to move higher after the
June 30, 2005 | William Blair Funds 21 |
company released earnings and guidance in June. We remain positive on the long-term prospects for the company. Ultimate Software Group, Inc. is another company in the Information Technology sector that delivered strong appreciation in the first six months of the year. The company provides innovative web-based payroll services. Customers indicate that the programs are easy to use, flexible in managing complex payroll accounting issues, and competitively priced. The company has gained attention from other growth managers and research analysts as the company transitioned to profitability.
What were among the weakest performing investments for the Fund?
One of the underperformers in the Financials sector was East West Bancorp, a bank focused on the Chinese-American market in California. There was a general market sell off, in the second quarter in part due to increased competition in their region. Finally, negative stock selection in the Consumer Discretionary space was a detractor from relative performance. Strayer Education, a post-secondary educator primarily targeting working adults, was one of the underperformers in the sector. The company’s first quarter earnings disappointed investors as new student enrollment came in below expectations. We feel this was a short term problem that they will resolve.
What is your current outlook?
Looking forward, the markets will continue to face various headwinds. Year over year earnings comparisons are getting tougher after the strong double digit earnings growth rates witnessed in 2004. More companies are reigning in expectations as the ratio of negative to positive pre-announcements was significantly higher during the second quarter of 2005 versus the year earlier period. There will be continued debate in regard to near record high energy prices and their effect on overall economic activity. Future data points on inflation, economic activity and employment will weigh in on the direction of interest rates so investors will be watching these statistics in anticipation of the Fed’s moves in the coming months.
With the backdrop of slower yet more sustainable economic and corporate earnings growth rates, we anticipate a stock picker��s market. We believe that our bottom-up, fundamental quality growth philosophy of selecting companies with durable business franchises and consistent earnings streams should position the Fund well in this type of environment.
22 Semi-Annual Report | June 30, 2005 |
Small-Mid Cap Growth Fund
Performance Highlights
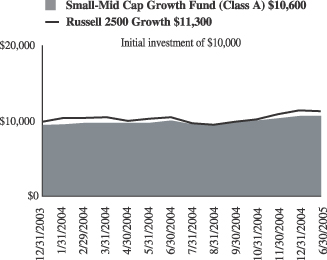
Average Annual Total Return at 6/30/2005 reflecting the maximum sales load
| | | | | | | | |
| | | Year
| | | Since Inception(a)
| | | |
Small-Mid Cap Growth Fund
Class A | | (0.60 | )% | | 3.72 | % | | |
Small-Mid Cap Growth Fund
Class B | | (0.28 | ) | | 4.55 | | | |
Small-Mid Cap Growth Fund
Class C | | 3.72 | | | 7.07 | | | |
Russell 2500® Growth Index | | 7.46 | | | 9.42 | | | |
| | (a) | | For the period from December 29, 2003 to June 30, 2005. |
Performance cited represents past performance. Past performance does not guarantee future results and current performance may be lower or higher than the data quoted. Results shown are average annual total returns, which assume reinvestment of dividends and capital gains. Investment returns and principal will fluctuate and you may have a gain or loss when you sell shares. For the most current month-end performance information, please call 1-800-742-7272, or visit our Web site at www.williamblairfunds.com. Investing in smaller companies involves special risks, including higher volatility and lower liquidity. From time to time, the investment advisor may waive fees or reimburse expenses for the Fund. Without these waivers, performance would be lower. Class A, B, and C shares are not available for sale.
The performance highlights and graph presented above do not reflect the deduction of taxes that a shareholder would pay on fund distributions or the redemption of fund shares.
The Russell 2500™ Growth Index measures the performance of those Russell 2500 companies with above average price-to-book ratios and forecasted growth rates.
This report identifies the Fund’s investments on June 30, 2005. These holdings are subject to change. Not all stocks in the Fund performed the same, nor is there any guarantee that these stocks will perform as well in the future. Market forecasts provided in this report may not necessarily come to pass.
Sector Diversification
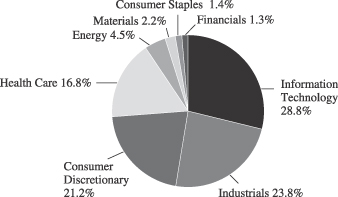
The sector diversification shown is based on the total investment portfolio.
June 30, 2005 | William Blair Funds 23 |
Small-Mid Cap Growth Fund
Portfolio of Investments, June 30, 2005 (all dollar amounts in thousands) (unaudited)
| | | | | |
Issuer
| | Shares
| | Value
|
| | |
Common Stocks | | | | | |
Information Technology—27.6% | | | | | |
*AMIS Holdings, Inc. | | 60,800 | | $ | 811 |
CDW Corporation | | 21,700 | | | 1,239 |
*Fiserv, Inc. | | 30,200 | | | 1,297 |
*Intrado, Inc. | | 37,170 | | | 556 |
*Intuit, Inc. | | 39,000 | | | 1,759 |
*Iron Mountain, Inc. | | 37,850 | | | 1,174 |
*J2 Global Communications, Inc. | | 31,800 | | | 1,095 |
*Jabil Circuit, Inc. | | 41,900 | | | 1,288 |
Microchip Technology, Inc. | | 49,900 | | | 1,478 |
*OPNET Technologies, Inc. | | 44,900 | | | 364 |
*PDF Solutions, Inc. | | 48,500 | | | 636 |
*Ultimate Software Group, Inc. | | 44,600 | | | 731 |
*ValueClick, Inc. | | 86,500 | | | 1,067 |
*WebEx Communications, Inc. | | 38,800 | | | 1,025 |
Xilinx, Inc. | | 14,200 | | | 362 |
| | | | |
|
|
| | | | | | 14,882 |
| | | | |
|
|
Industrials—22.8% | | | | | |
*Beacon Roofing Supply, Inc. | | 24,603 | | | 647 |
C.H. Robinson Worldwide, Inc. | | 10,000 | | | 582 |
Cintas Corporation | | 16,100 | | | 622 |
*Coinstar, Inc. | | 42,505 | | | 964 |
Corporate Executive Board Company | | 17,700 | | | 1,386 |
*Corrections Corporation of America | | 19,000 | | | 746 |
Expeditors International of Washington | | 24,600 | | | 1,225 |
Fastenal Company | | 32,100 | | | 1,966 |
*Kforce, Inc. | | 54,765 | | | 463 |
Knight Transportation, Inc. | | 44,800 | | | 1,090 |
MSC Industrial Direct Company, Inc., Class “A” | | 17,740 | | | 599 |
Pentair, Inc. | | 29,100 | | | 1,246 |
*Robert Half International, Inc. | | 30,800 | | | 769 |
| | | | |
|
|
| | | | | | 12,305 |
| | | | |
|
|
Consumer Discretionary—20.4% | | | | | |
*Bed, Bath and Beyond, Inc. | | 36,400 | | | 1,521 |
*CarMax, Inc. | | 30,000 | | | 799 |
*Getty Images, Inc. | | 10,600 | | | 787 |
*Jarden Corporation | | 4,100 | | | 221 |
*Lamar Advertising Company, Class “A” | | 20,600 | | | 881 |
*Laureate Education, Inc. | | 38,749 | | | 1,855 |
*Life Time Fitness, Inc. | | 8,400 | | | 276 |
*O’Reilly Automotive, Inc. | | 42,300 | | | 1,261 |
*Shuffle Master, Inc. | | 24,100 | | | 676 |
Strayer Education, Inc. | | 6,300 | | | 543 |
*Tractor Supply Company | | 17,400 | | | 854 |
*Williams-Sonoma, Inc. | | 32,300 | | | 1,278 |
| | | | |
|
|
| | | | | | 10,952 |
| | | | |
|
|
*Non-income producing securities
VRN = Variable Rate Note
| | | | | | | |
Issuer
| | Shares or
Principal
Amount
| | Value
| |
| | |
Common Stocks—(continued) | | | | | | | |
Health Care—16.1% | | | | | | | |
*Connetics Corporation | | | 44,118 | | $ | 778 | |
*Express Scripts, Inc. | | | 29,900 | | | 1,495 | |
*IDEXX Laboratories, Inc. | | | 10,800 | | | 673 | |
*Integra LifeSciences Holdings Corporation | | | 27,840 | | | 813 | |
*Kensey Nash Corporation | | | 20,800 | | | 629 | |
*Kinetic Concepts, Inc. | | | 7,000 | | | 420 | |
*Kyphon, Inc. | | | 32,000 | | | 1,113 | |
*Medicines Company | | | 21,500 | | | 503 | |
*Patterson Companies, Inc. | | | 14,400 | | | 649 | |
*ResMed, Inc. | | | 15,400 | | | 1,016 | |
*Telik, Inc. | | | 37,300 | | | 607 | |
| | | | | |
|
|
|
| | | | | | | 8,696 | |
| | | | | |
|
|
|
Energy—4.4% | | | | | | | |
*Smith International, Inc. | | | 25,200 | | | 1,605 | |
XTO Energy Corporation | | | 21,700 | | | 738 | |
| | | | | |
|
|
|
| | | | | | | 2,343 | |
| | | | | |
|
|
|
Materials—2.1% | | | | | | | |
Airgas, Inc. | | | 45,100 | | | 1,113 | |
| | | | | |
|
|
|
Consumer Staples—1.3% | | | | | | | |
Estee Lauder Companies, Inc. | | | 18,600 | | | 728 | |
| | | | | |
|
|
|
Financials—1.2% | | | | | | | |
East West Bancorp, Inc. | | | 19,600 | | | 658 | |
| | | | | |
|
|
|
Total in Common Stock—95.9%
(Total cost $48,243) | | | 51,677 | |
| | | | | |
|
|
|
| | |
Investment in Afiliate—2.3% | | | | | | | |
William Blair Ready Reserves | | | 1,223,517 | | | 1,224 | |
| | | | | |
|
|
|
Total Investment in Affiliate
(cost $1,224) | | | 1,224 | |
| | | | | |
|
|
|
| | |
Short-Term Investments—2.7% | | | | | | | |
American Express Demand Note, VRN,
3.164%, due 4/1/05 | | $ | 1,468,000 | | | 1,468 | |
| | | | | |
|
|
|
Total Short-Term Investments
(cost $1,468) | | | 1,468 | |
| | | | | |
|
|
|
Total Investments—100.9%
(cost $50,935) | | | 54,369 | |
Liabilities, plus cash and other assets—(0.9)% | | | (488 | ) |
| | | | | |
|
|
|
Net assets—100% | | $ | 53,881 | |
| | | | | |
|
|
|
See accompanying Notes to Financial Statements.
24 Semi-Annual Report | June 30, 2005 |

W. George Greig
INTERNATIONAL GROWTH FUND
The International Growth Fund invests primarily in common stocks of foreign growth companies.
AN OVERVIEW FROM THE PORTFOLIO MANAGER
How did the Fund perform over the first half of the year? How did the Fund’s performance compare to its benchmark?
The International Growth Fund posted a –4.34% decline (Class A Shares reflecting the impact of the maximum sales load) for the six months ended June 30, 2005. By comparison, the Fund’s benchmark, the MSCI All Country World (Free) except US Index, rose 0.32%.
What were the most significant factors impacting international markets during the first six months of the year?
The largely flat return of international equity markets during the first six months of 2005 masked volatile monthly results. Emerging markets and small cap stocks were the strongest international equity market performers at the beginning of the year, extending their dominance from 2004. This trend reversed in March and April as inflation fears and concerns about the impact of high energy and commodity prices on global growth resulted in investors reducing their risk positions. After the mid period pause, markets rebounded in May and June, as sectors such as Telecommunication Services underperformed relative to Health Care, Energy and Information Technology. Materials also was a negative performer during the second quarter as concerns about excess supply and falling demand for commodities rippled through the market. Overall, emerging markets were the strongest region during the six month period, returning 6.26% during the period, while small cap stocks outpaced their larger cap counterparts, returning 4.39%. The Europe Australia and Far East Index fell 0.85% during same time period.
During the first six months of 2005, the US dollar appreciated versus most currencies, with the largest appreciation versus the Euro, where it appreciated approximately 10%. Despite this appreciation, international markets extended their gains over the US as the MSCI All Country World (Free) except US Index returned 0.32%, while the S&P 500 Index declined 0.81%.
What factors were behind the Fund’s performance versus the benchmark?
While the Fund slightly lagged the broad index benchmark during the first quarter, it outperformed both broad and growth benchmarks during the six month period, due to strong second quarter results as the market focused on fundamentals. Year to date relative performance was driven by strong stock selection across most regions and sectors, coupled with emerging markets and small cap exposures and stock selection. Somewhat mitigating this performance was stock selection in the Western Hemisphere, in addition to Information Technology and Consumer Discretionary exposures and a lower Energy weighting versus the Index.
What is your current outlook?
The shape of the global economic cycle is shifting. The modest deceleration in growth driven by higher oil prices and a downturn in China’s imports may be receding into the background as other cyclical forces begin to edge growth higher.
June 30, 2005 | William Blair Funds 25 |
Evidence from a number of sources—including recent purchasing managers’ index releases, indications of temporary help demand, technology demand indicators (in Asia), and credit growth (in Europe)—suggest that the industrial economies may be poised to reaccelerate after a number of sluggish quarters.
On the other hand, rising short term interest rates, higher oil prices and the effects of housing inflation have not had the predicted negative effects on domestic demand, either in the US or elsewhere. Household spending in China and other emerging markets have remained strong, while strong employment and income growth in Japan have steadied the economy there in the face of slowing net exports.
A reacceleration in global growth after the 2004-05 slowdown could be reinforced by stronger investment spending backed by bulging corporate cash and profits, implying cyclical strength in technology and machinery as well as improving growth performance in previous laggards Europe and Japan.
What is your current strategy? How is the Fund positioned?
As of June 30, the Fund maintains its overweighting in emerging markets relative to the Index, and is now near a market weight in Europe ex-UK, largely through the addition of Health Care and Information Technology companies to the portfolio during the quarter. From a sector perspective, the portfolio maintains its largest relative weightings in Consumer Discretionary, Information Technology and Health Care, and has its smallest relative weightings in Energy, Materials, and Financials. These weightings are largely the result of the Advisor’s bottom up, fundamental quality growth discipline, which are also supported by the Advisor’s strategic viewpoint.
26 Semi-Annual Report | June 30, 2005 |
International Growth Fund
Performance Highlights
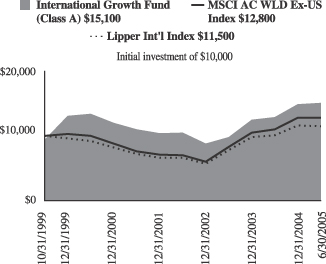
Average Annual Total Return at 6/30/2005 reflecting the maximum sales load
| | | | | | | | | | | | |
| | | 1
Year
| | | 3
Year
| | | 5
Year
| | | Since Inception
| |
International Growth Fund Class A | | 10.02 | % | | 10.61 | % | | 1.23 | % | | 7.50 | %(a) |
International Growth Fund Class B | | 10.91 | | | 11.17 | | | 1.29 | | | 6.94 | (b) |
International Growth Fund Class C | | 14.91 | | | 11.97 | | | 1.66 | | | 7.16 | (b) |
MSCI All Country World Free Ex-US Index | | 16.95 | | | 14.08 | | | 0.76 | | | 2.93 | (a) |
| | | | | | | | | | | | 2.37 | (b) |
Lipper International Index | | 13.45 | | | 11.16 | | | (0.19 | ) | | — | |
| | (a) | | For the period from October 21, 1999 to June 30, 2005. |
| | (b) | | For the period from November 2, 1999 to June 30, 2005. |
Performance cited represents past performance. Past performance does not guarantee future results and current performance may be lower or higher than the data quoted. Results shown are average annual total returns, which assume reinvestment of dividends and capital gains. Investment returns and principal will fluctuate and you may have a gain or loss when you sell shares. For the most current month-end performance information, please call 1-800-742-7272, or visit our Web site at www.williamblairfunds.com. International investing involves special risk considerations, including currency fluctuations, lower liquidity, economic and political risk. Class A, B, and C shares are not available for sale.
The performance highlights and graph presented above do not reflect the deduction of taxes that a shareholder would pay on fund distributions or the redemption of fund shares.
The Morgan Stanley Capital International (MSCI) All Country World Free Ex-U.S. Index is an unmanaged index that includes developed and emerging markets and reduced Japanese portion, making it more comparable to the International Growth Fund in terms of investment approach.
The Lipper International Index is a composite of international growth mutual funds.
This report identifies the Fund’s investments on June 30, 2005. These holdings are subject to change. Not all stocks in the Fund performed the same, nor is there any guarantee that these stocks will perform as well in the future. Market forecasts provided in this report may not necessarily come to pass.
Sector Diversification
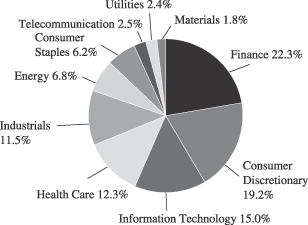
The sector diversification shown is based on the total investment portfolio.
June 30, 2005 | William Blair Funds 27 |
International Growth Fund
Portfolio of Investments, June 30, 2005 (all dollar amounts in thousands) (unaudited)
| | | | | |
| |
|
Issuer
| | Shares
| | Value
|
| | |
Common Stocks—Europe—36.6% | | | | | |
Austria—2.0% | | | | | |
Erste Bank Der Oester (Banking) | | 621,500 | | $ | 31,007 |
*Raiffeisen International Bank (Banking) | | 534,500 | | | 33,839 |
| | | | |
|
|
| | | | | | 64,846 |
| | | | |
|
|
Belgium—0.2% | | | | | |
Colruyt S.A.(Mass market distribution) | | 47,800 | | | 6,506 |
| | | | |
|
|
Finland—0.3% | | | | | |
Nokian Renkaat Oyj (Automotive) | | 561,000 | | | 10,214 |
| | | | |
|
|
France—10.5% | | | | | |
April Group S.A. (Insurance brokers) | | 231,643 | | | 7,196 |
BNP Paribas (Banking) | | 889,700 | | | 60,668 |
Essilor International (Health care supplies) | | 430,600 | | | 29,321 |
Hermes International SCA (Apparel and luxury goods) | | 159,500 | | | 32,094 |
*JC Decaux (Media) | | 1,467,660 | | | 37,071 |
Klepierre (Real estate) | | 102,500 | | | 9,744 |
*Nexity (Real estate management) | | 246,100 | | | 9,493 |
*Orpea (Hospital and nursing management) | | 403,853 | | | 17,897 |
Sanofi-Avenits (Pharmaceuticals) | | 998,500 | | | 81,643 |
Technip-Coflexip S.A. (Construction) | | 376,860 | | | 17,456 |
Vinci S.A.(Construction) | | 339,400 | | | 28,160 |
Zodiac S.A. (Aerospace and defense) | | 280,600 | | | 15,030 |
| | | | |
|
|
| | | | | | 345,773 |
| | | | |
|
|
Germany—7.8% | | | | | |
AWD Holdings AG (Financial services) | | 341,500 | | | 14,304 |
Bijou Brigitte (Fashon jewelry accessories) | | 47,422 | | | 8,530 |
Celesio AG (Pharmaceuticals) | | 393,780 | | | 30,845 |
Continental AG (Diversified manufacturing) | | 463,600 | | | 33,188 |
Did Deutscher Industrie Svc (Commercial services) | | 226,461 | | | 9,647 |
E.ON AG (Energy) | | 709,600 | | | 62,892 |
GFK AG (Commercial services) | | 250,948 | | | 9,876 |
Rational AG (Business equipment) | | 56,400 | | | 6,059 |
SAP AG (Software) | | 394,700 | | | 68,173 |
Stada Arzneimittel AG (Pharmaceuticals) | | 356,800 | | | 13,024 |
| | | | |
|
|
| | | | | | 256,538 |
| | | | |
|
|
Greece—1.8% | | | | | |
Coca-Cola Hellenic Bottling S.A. (Beverages) | | 456,671 | | | 12,364 |
EFG Eurobank (Banking) | | 638,400 | | | 19,608 |
National Bank of Greece (Banking) | | 795,420 | | | 26,911 |
| | | | |
|
|
| | | | | | 58,883 |
| | | | |
|
|
Ireland—1.9% | | | | | |
Anglo Irish Bank plc (Finance) | | 2,253,400 | | | 27,852 |
*Grafton Group plc (Wholesale distributors) | | 1,133,900 | | | 13,109 |
Kingspan Group plc (Construction) | | 1,144,000 | | | 13,427 |
United Drug plc (Pharmaceuticals) | | 1,778,300 | | | 7,624 |
| | | | |
|
|
| | | | | | 62,012 |
| | | | |
|
|
Italy—1.0% | | | | | |
Credito Emiliano SpA (Banking) | | 1,167,400 | | | 11,822 |
Hera SpA (Electric services) | | 4,468,176 | | | 12,421 |
Pirelli & C Real Estate SpA (Real estate development) | | 165,752 | | | 9,910 |
| | | | |
|
|
| | | | | | 34,153 |
| | | | |
|
|
| | | | | |
| |
|
Issuer
| | Shares
| | Value
|
| |
Common Stocks—Europe—36.6%—(continued) | | | |
Netherlands—1.1% | | | �� | | |
*Axalto (Business equipment) | | 283,200 | | $ | 8,515 |
*Pyaterochka Holdings GDR (Food and retail) | | 859,200 | | | 12,372 |
*Tomtom NV (Computer software) | | 686,300 | | | 15,041 |
| | | | |
|
|
| | | | | | 35,928 |
| | | | |
|
|
Norway—1.1% | | | | | |
Statoil Asa (Oil and gas) | | 1,802,600 | | | 36,661 |
| | | | |
|
|
Spain—1.4% | | | | | |
Grupo Ferrovial S.A. (Industrial services) | | 283,500 | | | 18,212 |
*Industria De Textile (Retail trade) | | 1,043,000 | | | 26,758 |
| | | | |
|
|
| | | | | | 44,970 |
| | | | |
|
|
Sweden—1.3% | | | | | |
*Capio AB (Health care) | | 480,800 | | | 7,071 |
Clas Ohlson AB (Retail) | | 385,400 | | | 6,907 |
*Modern Times Group (Television) | | 53,000 | | | 1,619 |
Scania AB (Vehicles and equipment) | | 753,900 | | | 27,740 |
| | | | |
|
|
| | | | | | 43,337 |
| | | | |
|
|
Switzerland—6.2% | | | | | |
*Actelion (Biotechnology) | | 153,500 | | | 15,918 |
*Kudelski S.A. (Telecommunication equipment) | | 75,200 | | | 2,738 |
Nobel Biocare Holdings AG (Medical equipment and supplies) | | 75,350 | | | 15,238 |
Phonak Holdings AG (Hearing technology) | | 316,300 | | | 11,825 |
Roche Holdings AG (Health care) | | 782,600 | | | 98,600 |
UBS AG (Banking) | | 758,300 | | | 59,026 |
| | | | |
|
|
| | | | | | 203,345 |
| | | | |
|
|
| | |
United Kingdom—11.1% | | | | | |
BG Group plc (Industrial services) | | 8,912,500 | | | 73,143 |
*Burren Energy plc (Energy) | | 1,025,826 | | | 12,262 |
*Cairn Energy plc (Petroleum refining) | | 727,200 | | | 17,512 |
Capita Group plc (Commercial services) | | 4,527,480 | | | 29,757 |
Carnival plc (Hotels, restaurants and leisure activities) | | 711,860 | | | 40,346 |
Intertek Group (Diversified commercial services) | | 879,305 | | | 11,029 |
MAN Group plc (Finance) | | 513,800 | | | 13,270 |
*Michael Page International (Personnel services) | | 3,394,200 | | | 12,264 |
Next plc (Multiline retail) | | 738,400 | | | 19,893 |
Northgate (Vehicles and equipment) | | 551,600 | | | 8,959 |
Reckitt Benckiser plc (Household products) | | 1,017,700 | | | 29,883 |
Standard Chartered plc (Banking) | | 876,300 | | | 15,959 |
Tesco plc (Food retail) | | 12,167,300 | | | 69,290 |
Ultra Electronic Holdings plc (Electronic products) | | 778,000 | | | 11,195 |
| | | | |
|
|
| | | | | | 364,762 |
| | | | |
|
|
| | |
Canada—5.4% | | | | | |
*Alimentation Couche-Tard—Class “B” (Food retail) | | 662,100 | | | 10,094 |
Canadian National Railway Company (Railroads) | | 680,200 | | | 39,176 |
See accompanying Notes to Financial Statements.
28 Semi-Annual Report | June 30, 2005 |
International Growth Fund
Portfolio of Investments, June 30, 2005 (all dollar amounts in thousands) (unaudited)
| | | | | |
Issuer
| | Shares
| | Value
|
| |
Common Stocks—Canada—5.4%—(continued) | | | |
Four Seasons Hotel, Inc. (Hotels) | | 462,600 | | $ | 30,503 |
Manulife Financial Corp. (Life and health insurance) | | 676,900 | | | 32,273 |
*Research in Motion Ltd. (Wireless telecommunication) | | 393,400 | | | 28,905 |
Ritchie Brothers Auctioneers, Inc. (Buisness services) | | 133,000 | | | 5,127 |
*Rona, Inc. (Building materials) | | 727,100 | | | 14,623 |
Shoppers Drug Mart Corp. (Retail trade) | | 490,700 | | | 16,994 |
| | | | |
|
|
| | | | | | 177,695 |
| | | | |
|
|
| | |
Japan—17.5% | | | | | |
Aeon Credit Service Co., Ltd. (Consumer finance) | | 272,200 | | | 16,996 |
Aeon Mall Co., Ltd. (Real estate) | | 436,400 | | | 15,307 |
Arnest One Corp. (Real estate) | | 372,900 | | | 8,924 |
Askul Corporation (Retail trade) | | 173,900 | | | 10,173 |
Canon, Inc. (Office electronics) | | 1,213,500 | | | 63,634 |
*Chiyoda Corp. (Construction) | | 1,704,600 | | | 21,031 |
Chugai Pharmaceutical Company (Pharamceuticals) | | 2,648,600 | | | 40,802 |
Honeys Company, Ltd. (Luxury goods) | | 118,500 | | | 3,713 |
Hoya Corporation (Electronic technology) | | 367,000 | | | 42,183 |
ITO EN, Ltd. (Beverages) | | 206,000 | | | 10,566 |
Keyence Corporation (Electronic technology) | | 98,660 | | | 22,004 |
Nakanishi Inc. (Medical specialties) | | 99,400 | | | 10,013 |
Neomax Co., Ltd. (Electronic equipment and instruments) | | 409,400 | | | 9,019 |
Nidec Corporation (Electronic technology) | | 255,000 | | | 26,892 |
Nitori Company Ltd. (Specialty stores) | | 165,260 | | | 11,831 |
Nitto Denko Corporation (Electronic technology) | | 409,800 | | | 23,360 |
NIWS Company, Ltd. (Computer integration) | | 4,300 | | | 5,637 |
Orix Corporation (Consumer finance) | | 315,900 | | | 47,191 |
Park 24 Co., Ltd. (Commercial services) | | 549,200 | | | 10,854 |
Point Inc. Ltd. (Apparel and footwear retail) | | 340,900 | | | 13,349 |
Ryohin Keikaku Co. Ltd. (Retail stores) | | 336,200 | | | 16,564 |
Sharp Corp. (Electronics) | | 5,286,700 | | | 82,299 |
Shimamura Company Ltd. (Retail stores) | | 149,900 | | | 12,627 |
*Shinsei Bank, Ltd. (Banking) | | 3,107,000 | | | 16,682 |
Sparks Asset Management Co. (Financial) | | 3,254 | | | 6,787 |
Sundrug Co., Ltd. (Drug stores) | | 235,900 | | | 9,277 |
Yamada Denki Company (Retail trade) | | 372,800 | | | 21,418 |
| | | | |
|
|
| | | | | | 579,133 |
| | | | |
|
|
| | |
Emerging Asia—8.0% | | | | | |
India—3.1% | | | | | |
Bharat Forge Ltd. (Machinery) | | 404,648 | | | 13,246 |
*Bharti Tele-Ventures (Wireless telecommunication services) | | 4,088,400 | | | 22,815 |
HDFC Bank (Banking) | | 1,240,400 | | | 17,970 |
Housing Development Finance Corp. (Financial services) | | 1,105,900 | | | 22,439 |
Infosys Technologies, Ltd. (Consulting and software services) | | 467,024 | | | 25,309 |
| | | | |
|
|
| | | | | | 101,779 |
| | | | |
|
|
| | | | | |
Issuer
| | Shares
| | Value
|
|
Common Stocks—Emerging Asia—8.0%—(continued) |
Indonesia—0.6% | | | | | |
*Bank Rakyat Indonesia (Banking) | | 35,399,500 | | $ | 10,500 |
Bank Danamon (Commercial banks) | | 15,989,500 | | | 8,265 |
| | | | |
|
|
| | | | | | 18,765 |
| | | | |
|
|
Malaysia—0.3% | | | | | |
*Airasia Bhd (Air transport) | | 22,532,200 | | | 9,709 |
Transmile Group Bhd (Airport development and maintence) | | 328,900 | | | 916 |
| | | | |
|
|
| | | | | | 10,625 |
| | | | |
|
|
South Korea—1.3% | | | | | |
Samsung Electronics Co. (Semiconductors) | | 93,600 | | | 44,350 |
| | | | |
|
|
Taiwan—2.7% | | | | | |
Hon Hai Precision Industry (Computers) | | 9,985,312 | | | 51,765 |
*Mediatek Inc. (Semiconductors and equipment) | | 2,845,000 | | | 24,571 |
Novatek Microelectronics (Semiconductors and equipment) | | 3,051,000 | | | 13,012 |
| | | | |
|
|
| | | | | | 89,348 |
| | | | |
|
|
| | |
Asia—7.8% | | | | | |
Australia—3.9% | | | | | |
BHP Billiton Ltd. (Diversified resources) | | 2,429,200 | | | 33,142 |
Billabong International Ltd. (Apparel and luxury goods) | | 2,097,700 | | | 21,664 |
Macquarie Bank, Ltd. (Financial services) | | 785,800 | | | 35,583 |
Sigma Company, Ltd. (Medical distributors) | | 1,960,633 | | | 13,766 |
Toll Holdings, Ltd. (Trucking) | | 2,341,800 | | | 23,195 |
| | | | |
|
|
| | | | | | 127,350 |
| | | | |
|
|
Hong Kong—3.0% | | | | | |
China Insurance International (Insurance) | | 20,893,438 | | | 7,703 |
Cnooc Ltd. (Oil and gas) | | 34,037,000 | | | 20,172 |
Esprit Holdings Ltd. (Apparel, footwear and retail) | | 3,268,000 | | | 23,566 |
*Foxconn International (Manufacturing services) | | 21,885,000 | | | 16,334 |
*Lifestyle International Holdings Ltd. (Specialty retail) | | 2,850,000 | | | 4,680 |
Techtronic Industries Co. (Consumer durables) | | 10,216,200 | | | 25,749 |
| | | | |
|
|
| | | | | | 98,204 |
| | | | |
|
|
Singapore—0.9% | | | | | |
Capitaland, Ltd. (Real estate operations) | | 17,308,000 | | | 24,395 |
Osim International Ltd. (Consumer sundries) | | 7,746,200 | | | 4,911 |
| | | | |
|
|
| | | | | | 29,306 |
| | | | |
|
|
| | |
Emerging Latin America—5.2% | | | | | |
Brazil—0.7% | | | | | |
Gol Linhas Aereas Int S.P—ADR (Air transport) | | 310,600 | | | 9,337 |
*Natura Cosmeticos S.A. (Cosmetics) | | 474,300 | | | 15,046 |
| | | | |
|
|
| | | | | | 24,383 |
| | | | |
|
|
See accompanying Notes to Financial Statements.
June 30, 2005 | William Blair Funds 29 |
International Growth Fund
Portfolio of Investments, June 30, 2005 (all dollar amounts in thousands) (unaudited)
| | | | | |
Issuer
| | Shares
| | Value
|
|
Common Stocks—Emerging Latin America—5.2%— (continued) |
Chile—1.4% | | | | | |
Banco Santander SP—ADR (Banking) | | 448,200 | | $ | 14,477 |
Cencosud S.A.—ADR 144A (Retail stores) | | 695,330 | | | 17,487 |
Lan Chile S.A.—ADR (Airlines) | | 426,600 | | | 14,910 |
| | | | |
|
|
| | | | | | 46,874 |
| | | | |
|
|
Columbia—0.2% | | | | | |
Bancolombia S.A.—ADR (Commercial Banks) | | 497,400 | | | 7,953 |
| | | | |
|
|
Mexico—2.9% | | | | | |
America Movil S.A. (Communications) | | 8,178,600 | | | 24,378 |
*Consorcio Ara Sa De Cv (Construction) | | 2,013,300 | | | 6,954 |
*Corporacion Geo Sa De Cv (Real estate) | | 5,963,800 | | | 15,057 |
Grupo Aeroportuario—ADR (Transportation) | | 345,800 | | | 11,014 |
*Urbi Desarrollos Urbanos S.A.
(Household durables) | | 2,697,800 | | | 14,818 |
Walmart de Mexico (Retail trade) | | 6,015,300 | | | 24,432 |
| | | | |
|
|
| | | | | | 96,653 |
| | | | |
|
|
| |
Emerging Europe, Mid-East, Africa—3.1% | | | |
Egypt—1.1% | | | | | |
Orascom Contruction Industry (Construction) | | 649,241 | | | 18,416 |
*Orascom Telecommunication Holding GDR (Telecommunications) | | 367,200 | | | 18,466 |
| | | | |
|
|
| | | | | | 36,882 |
| | | | |
|
|
Hungary—0.6% | | | | | |
OTP Bank (Banking) | | 550,700 | | | 18,626 |
| | | | |
|
|
Romania—0.1% | | | | | |
Romanian Development Bank (Commercial banks) | | 3,036,500 | | | 4,538 |
| | | | |
|
|
South Africa—0.8% | | | | | |
Edgars Consolidated Stores (Apparel, footwear and retail) | | 315,763 | | | 13,707 |
*MTN Group Ltd. (Telecommunication services) | | 2,164,400 | | | 14,339 |
| | | | |
|
|
| | | | | | 28,046 |
| | | | |
|
|
Turkey—0.5% | | | | | |
*Turkiye Garanti Bankasi A.S. (Banking) | | 3,848,500 | | | 16,414 |
| | | | |
|
|
Total Common Stock— 94.7%
(cost $2,486,838) | | | 3,124,852 |
| | | | |
|
|
| | |
Preferred Stock | | | | | |
Brazil—2.1% | | | | | |
Banco Itau Holding (Banking) | | 158,810 | | | 29,409 |
Petroleo Brasileiro S.A. (Oil, gas drilling,
and exploration) | | 897,200 | | | 41,168 |
| | | | |
|
|
Total Preferred Stock—2.1%
(cost $55,493) | | | 70,577 |
| | | | |
|
|
| | |
Investment in Affiliate—0.6% | | | | | |
William Blair Ready Reserves Fund | | 20,000,318 | | | 20,000 |
| | | | |
|
|
Total Investments in Affiliate
(cost $20,000) | | | 20,000 |
| | | | |
|
|
| | | | | | |
Issuer
| | Principal
Amount
| | Value
|
| | |
Short-Term Investments—2.2% | | | | | | |
American Express Demand Note, VRN, 3.164% due 7/1/05 | | $ | 36,110,000 | | $ | 36,110 |
Prudential Funding Demand Note, VRN, 3.368% due 7/1/05 | | | 36,217,000 | | | 36,217 |
| | | | | |
|
|
Total Short-term Investments
(cost $72,327) | | | 72,327 |
| | | | | |
|
|
Total Investments—99.6%
(cost $2,634,658) | | | 3,287,756 |
Cash and other assets, less liabilities—0.4% | | | 12,844 |
| | | | | |
|
|
Net assets—100.0% | | $ | 3,300,600 |
| | | | | |
|
|
* Non-income producing securities
ADR = American Depository Receipt
GDR = Global Depository Receipt
VRN = Variable Rate Note
All securities, excluding those primarily traded on exchanges or markets that close before the close of regular trading on the New York Stock Exchange, are fair valued pursant to Valuation Procedures adopted by the Board of Trustees.
At June 30, 2005 the Fund’s Portfolio of Investments includes the following currency categories:
| | |
Euro | | 28.4% |
Japanese Yen | | 18.1% |
British Pound Sterling | | 11.4% |
Swiss Franc | | 6.4% |
Canadian Dollar | | 5.4% |
Australian Dollar | | 4.0% |
United States Dollar | | 3.5% |
Indian Rupee | | 3.2% |
Hong Kong Dollar | | 3.1% |
Taiwan Dollar | | 2.8% |
Mexico Nuevo Peso | | 2.7% |
Brazilian Real | | 2.7% |
South Korean Won | | 1.4% |
Swedish Krona | | 1.4% |
Norwegian Krone | | 1.2% |
All other currencies | | 4.3% |
| | |
|
| | | 100.0% |
| | |
|
See accompanying Notes to Financial Statements.
30 Semi-Annual Report | June 30, 2005 |
W. George Greig
INTERNATIONAL EQUITY FUND
The International Equity Fund invests primarily in common stocks of companies included in the Morgan Stanley Capital International All Country World ex-U.S. Index.
AN OVERVIEW FROM THE PORTFOLIO MANAGER
How did the Fund perform during the first half of the year? How did the Fund’s performance compare to its benchmark?
The International Equity Fund posted a –6.83% decrease (Class A Shares reflecting the impact of the maximum sales load) for the six months ended June 30, 2005. By comparison, the Fund’s benchmark, the MSCI All Country World (Free) except US Index, rose 0.32%.
What were the most significant factors impacting international markets during the first six months of the year?
The largely flat return of international equity markets during the first six months of 2005 masked volatile monthly results. Emerging markets and small cap stocks were the strongest international equity market performers at the beginning of the year, extending their dominance from 2004. This trend reversed in March and April as inflation fears and concerns about the impact of high energy and commodity prices on global growth resulted in investors reducing their risk positions. After the mid period pause, markets rebounded in May and June, as sectors such as Telecommunication Services underperformed relative to Health Care, Energy and Information Technology. Materials also was a negative performer during the second quarter as concerns about excess supply and falling demand for commodities rippled through the market. Overall, emerging markets were the strongest region during the six month period, returning 6.26% during the period, while small cap stocks outpaced their larger cap counterparts, returning 4.39%. The Europe, Australia and Far East Index fell 0.85% during same time period.
During the first six months of 2005, the US dollar appreciated versus most currencies, with the largest appreciation versus the Euro, where it appreciated approximately 10%. Despite this appreciation, international markets extended their gains over the US as the MSCI All Country World (Free) except US Index returned 0.32%, while the S&P 500 Index declined 0.81%.
What factors were behind the Fund’s performance versus the benchmark?
While the Fund significantly outperformed the broad and growth index benchmarks during the second quarter, it lagged the broad benchmark during the six month period, due to first quarter results. The Fund’s quality growth discipline, which manifested itself in the overweighted allocation in Information Technology and Consumer sectors at the expense of Materials and Energy during the first quarter, hampered results. Somewhat mitigating this performance was strong stock selection across sectors and regions during the second quarter, coupled with positive results from emerging markets exposure.
What is your current outlook?
The shape of the global economic cycle is shifting. The modest deceleration in growth driven by higher oil prices and a downturn in China’s imports may be receding into the background as other cyclical forces begin to edge growth higher.
June 30, 2005 | William Blair Funds 31 |
Evidence from a number of sources—including recent purchasing managers’ index releases, indications of temporary help demand, technology demand indicators (in Asia), and credit growth (in Europe)—suggest that the industrial economies may be poised to reaccelerate after a number of sluggish quarters.
On the other hand, rising short term interest rates, higher oil prices and the effects of housing inflation have not had the predicted negative effects on domestic demand, either in the US or elsewhere. Household spending in China and other emerging markets has remained strong, while strong employment and income growth in Japan have steadied the economy there in the face of slowing net exports.
A reacceleration in global growth after the 2004-05 slowdown could be reinforced by stronger investment spending backed by bulging corporate cash and profits, implying cyclical strength in technology and machinery as well as improving growth performance in previous laggards Europe and Japan.
What is your current strategy? How is the Fund positioned?
As of June 30, the Fund maintains its overweighting in emerging markets relative to the Index, and is now overweighted in Europe ex-UK, largely through the addition of Health Care and Technology companies to the portfolio during the quarter. From a sector perspective, the portfolio maintains its largest relative weightings in Consumer Discretionary, Information Technology and Health Care, and has its smallest relative weightings in Materials, Telecommunication Services and Financials. These weightings are largely the result of the Advisor’s bottom up, fundamental quality growth discipline, which are also supported by the Advisor’s strategic viewpoint.
32 Semi-Annual Report | June 30, 2005 |
International Equity Fund
Performance Highlights
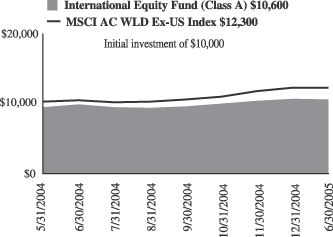
Average Annual Total Return at 6/30/2005 reflecting the maximum sales load
| | | | | | | | |
| | | 1
Year
| | | Since Inception(a)
| | | |
International Equity Fund
Class A | | 0.23 | % | | 5.21 | % | | |
International Equity Fund
Class B | | 0.50 | | | 6.62 | | | |
International Equity Fund
Class C | | 4.50 | | | 10.11 | | | |
MSCI All Country World Free Ex-US | | 16.95 | | | 20.47 | | | |
| | (a) | | For the period from May 24, 2004 to June 30, 2005. |
Performance cited represents past performance. Past performance does not guarantee future results and current performance may be lower or higher than the data quoted. Results shown are average annual returns, which assume reinvestment of dividends and capital gains. Investment returns and principal will fluctuate and you may have a gain or loss when you sell shares. For the most current month-end performance information, please call 1-800-742-7272, or visit our Web site at www.williamblairfunds.com. From time to time, the investment adviser may waive fees or reimburse expenses for the Fund. Without these waivers, performance would be lower. Class A, B, and C shares are not available for sale.
The performance highlights and graph presented above do not reflect the deduction of taxes that a shareholder would pay on fund distributions or the redemption of fund shares.
The Morgan Stanley Capital International (MSCI) All Country World Free ex-U.S. Index is an unmanaged index that includes developed and emerging markets and reduced Japanese portion, making it more comparable to the International Equity Fund in terms of investment approach.
This report identifies the Fund’s investments on June 30, 2005. These holdings are subject to change. Not all stocks in the Fund performed the same, nor is there any guarantee that these stocks will perform as well in the future. Market forecasts provided in this report may not necessarily come to pass.
Sector Diversification
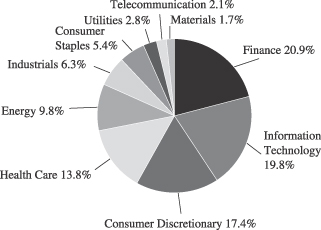
The sector diversification shown is based on the total investment portfolio.
June 30, 2005 | William Blair Funds 33 |
International Equity Fund
Portfolio of Investments, June 30, 2005 (all dollar amounts in thousands) (unaudited)
| | | | | |
Issuer
| | Shares
| | Value
|
| | |
Common Stocks—Europe—38.5% | | | | | |
Austria—0.8% | | | | | |
Erste Bank Der Oester (Banking) | | 3,975 | | $ | 198 |
| | | | |
|
|
Finland—1.9% | | | | | |
Nokia, Inc. (Electronic technology) | | 26,000 | | | 432 |
| | | | |
|
|
France—10.2% | | | | | |
BNP Paribas (Banking) | | 8,200 | | | 559 |
Essilor International (Health care supplies) | | 2,800 | | | 191 |
Hermes International SCA (Apparel and luxury goods) | | 1,380 | | | 278 |
*JC Decaux (Media) | | 7,250 | | | 183 |
Sanofi-Aventis (Pharmaceuticals) | | 10,515 | | | 860 |
Vinci S.A. (Construction) | | 3,400 | | | 282 |
| | | | |
|
|
| | | | | | 2,353 |
| | | | |
|
|
Germany—9.3% | | | | | |
Celesio AG (Pharmaceuticals) | | 4,905 | | | 384 |
Continental AG (Diversified manufacturing) | | 5,275 | | | 378 |
E.ON AG (Energy) | | 6,680 | | | 592 |
SAP AG (Software) | | 4,600 | | | 794 |
| | | | |
|
|
| | | | | | 2,148 |
| | | | |
|
|
Greece—2.0% | | | | | |
Coca-Cola Hellenic Bottling S.A. (Beverages) | | 2,950 | | | 80 |
EFG Eurobank (Banking) | | 6,120 | | | 188 |
National Bank of Greece (Banking) | | 5,620 | | | 190 |
| | | | |
|
|
| | | | | | 458 |
| | | | |
|
|
Ireland—0.8% | | | | | |
Anglo Irish Bank plc (Finance) | | 15,160 | | | 187 |
| | | | |
|
|
Nethrelands—0.4% | | | | | |
*Qiagen, Inc. (Health care) | | 8,700 | | | 101 |
| | | | |
|
|
Norway—2.0% | | | | | |
Statoil ASA (Oil and gas) | | 22,500 | | | 458 |
| | | | |
|
|
Spain—1.7% | | | | | |
Grupo Ferrovial S.A. (Industrial services) | | 1,800 | | | 116 |
Industria De Textile (Retail trade) | | 10,900 | | | 280 |
| | | | |
|
|
| | | | | | 396 |
| | | | |
|
|
Sweden—0.6% | | | | | |
*Capio AB (Health care) | | 3,400 | | | 50 |
Scania AB (Electronic technology) | | 2,800 | | | 103 |
| | | | |
|
|
| | | | | | 153 |
| | | | |
|
|
Switzerland—8.8% | | | | | |
Nobel Biocare Holding AG (Medical equipment and supplies) | | 490 | | | 99 |
Roche Holdings AG (Health care) | | 7,120 | | | 897 |
SGS SA (Industrials) | | 200 | | | 137 |
Synthes, Inc. (Health care) | | 3,060 | | | 335 |
UBS AG (Banking) | | 7,155 | | | 557 |
| | | | |
|
|
| | | | | | 2,025 |
| | | | |
|
|
| | |
United Kingdom—11.5% | | | | | |
BG Group plc (Industrial services) | | 98,950 | | | 812 |
Capita Group plc (Commercial services) | | 36,600 | | | 241 |
Carnival plc (Hotels, restaurants and leisure activities) | | 6,640 | | | 376 |
MAN Group plc (Finance) | | 3,550 | | | 92 |
| | | | | |
Issuer
| | Shares
| | Value
|
|
Common Stocks—United Kingdom—11.5%—(continued) |
Next plc (Multiline retail) | | 6,880 | | $ | 185 |
Reckitt Benckiser plc (Household products) | | 11,300 | | | 332 |
SAB Miller (Beverages) | | 800 | | | 12 |
Tesco plc (Food retailer) | | 105,200 | | | 599 |
| | | | |
|
|
| | | | | | 2,649 |
| | | | |
|
|
| | |
Japan—15.2% | | | | | |
Askul Corporation (Retail trade) | | 1,200 | | | 70 |
Canon, Inc. (Office electronics) | | 12,800 | | | 671 |
*Chiyoda Corporation (Construction ) | | 11,000 | | | 136 |
Denso Corporation (Auto parts manufacturing) | | 16,000 | | | 363 |
Hoya Corporation (Electronic technology) | | 2,400 | | | 276 |
Keyence Corporation (Electronic technology) | | 900 | | | 201 |
Nidec Corporation (Electronic technology) | | 1,600 | | | 169 |
Nitto Denko Corporation (Electronic technology) | | 2,700 | | | 154 |
Orix Corporation (Consumer finance) | | 3,200 | | | 478 |
Sharp Corporation (Electronics) | | 42,400 | | | 660 |
*Shinsei Bank, Ltd. (Banking) | | 34,500 | | | 185 |
Yamada Denki Co. Ltd. (Retail trade) | | 2,700 | | | 155 |
| | | | |
|
|
| | | | | | 3,518 |
| | | | |
|
|
| | |
Canada—4.1% | | | | | |
Canadian National Railway Co. (Railroads) | | 4,400 | | | 254 |
Manulife Financial Corporation (Life and health insurance) | | 9,800 | | | 467 |
*Research in Motion Ltd. (Wireless telecommunication) | | 1,550 | | | 114 |
Shoppers Drug Mart Corporation (Retail trade) | | 3,100 | | | 107 |
| | | | |
|
|
| | | | | | 942 |
| | | | |
|
|
| | |
Asia—6.6% | | | | | |
Australia—3.8% | | | | | |
BHP Billiton Ltd. (Diversified resources) | | 15,300 | | | 209 |
Macquarie Bank, Ltd. (Financial services) | | 11,200 | | | 507 |
Toll Holdings, Ltd. (Trucking) | | 16,400 | | | 162 |
| | | | |
|
|
| | | | | | 878 |
| | | | |
|
|
Hong Kong—2.8% | | | | | |
Cnooc Ltd. (Oil and gas) | | 226,300 | | | 134 |
Esprit Holdings Ltd. (Apparel, footwear and retail) | | 34,000 | | | 245 |
Techtronic Industries Co. (Consumer durables) | | 106,300 | | | 268 |
| | | | |
|
|
| | | | | | 647 |
| | | | |
|
|
| | |
Emerging Asia—8.2% | | | | | |
India—2.8% | | | | | |
*Bharti Tele-Ventures (Wireless telecommunication services) | | 41,000 | | | 229 |
HDFC Bank (Banking) | | 8,950 | | | 129 |
Infosys Technologies Ltd. (Consulting and software services) | | 5,180 | | | 281 |
| | | | |
|
|
| | | | | | 639 |
| | | | |
|
|
South Korea—2.1% | | | | | |
*Kookmin Bank (Banking) | | 2,500 | | | 113 |
Samsung Electronics Co. (Semiconductors) | | 770 | | | 365 |
| | | | |
|
|
| | | | | | 478 |
| | | | |
|
|
See accompanying Notes to Financial Statements.
34 Semi-Annual Report | June 30, 2005 |
International Equity Fund
Portfolio of Investments, June 30, 2005 (all dollar amounts in thousands) (unaudited)
| | | | | | |
Issuer
| | Shares or
Principal
Amount
| | Value
|
|
Common Stocks—Emerging Asia—8.2%—(continued) |
Taiwan—3.3% | | | | | | |
Hon Hai Precision Industry Corp. (Computers) | | | 90,000 | | $ | 467 |
*Mediatek, Inc. (Electronic technology) | | | 35,000 | | | 302 |
| | | | | |
|
|
| | | | | | | 769 |
| | | | | |
|
|
| | |
Emerging Latin America—1.8% | | | | | | |
Mexico—1.8% | | | | | | |
America Movil S.A. (Communications) | | | 70,900 | | | 211 |
Walmart de Mexico (Retail trade) | | | 52,900 | | | 215 |
| | | | | |
|
|
| | | | | | | 426 |
| | | | | |
|
|
| |
Emerging Europe, Mid-East, Africa—2.6% | | | |
Hungary—0.7% | | | | | | |
OTP Bank (Banking) | | | 5,010 | | | 169 |
| | | | | |
|
|
South Africa—1.9% | | | | | | |
Sasol ASA (Energy) | | | 8,499 | | | 230 |
Standard Bank Group Ltd. (Banking) | | | 20,763 | | | 201 |
| | | | | |
|
|
| | | | | | | 431 |
| | | | | |
|
|
Total Common Stock—88.5%
(cost $19,846) | | | 20,455 |
| | | | | |
|
|
| | |
Preferred Stocks | | | | | | |
Brazil—2.7% | | | | | | |
Banco Itau SA (Banking) | | | 1,000 | | | 185 |
Petroleo Brasileiro S.A. (Oil, gas drilling,
and exploration) | | | 9,300 | | | 427 |
| | | | | |
|
|
Total Preferred Stocks—2.7%
(cost $536) | | | 612 |
| | | | | |
|
|
| | |
Investment in Affiliate—3.0% | | | | | | |
William Blair Ready Reserves Fund | | | 689,496 | | | 689 |
| | | | | |
|
|
Total Investment in Affiliate
(cost $689) | | | 689 |
| | | | | |
|
|
| | |
Short-Term Investments—5.6% | | | | | | |
American Express Demand Note, VRN,
3.164%, due 7/1/05 | | $ | 739,000 | | | 739 |
Prudential Funding Demand Note, VRN, 3.368%, due 7/1/05 | | | 563,000 | | | 563 |
| | | | | |
|
|
Total Short-term Investments
(cost $1,302) | | | 1,302 |
| | | | | |
|
|
Total Investments—99.8%
(cost $22,373) | | | 23,058 |
Cash plus other assets, less liabilities—0.2% | | | 46 |
| | | | | |
|
|
Net assets—100.0% | | $ | 23,104 |
| | | | | |
|
|
*Non-income producing securities
VRN = Variable Rate Note
All securities, excluding those primarily traded on exchanges or markets that close before the close of regular trading on the New York Stock Exchange, are fair valued pursuant to Valuation Procedures adopted by the Board of Trustees.
At June 30, 2005 the Fund’s Portfolio of Investments includes the following currency categories:
| | |
Euro | | 29.8% |
Japanese Yen | | 16.7% |
British Pound Sterling | | 12.6% |
Swiss Franc | | 9.6% |
Canadian Dollar | | 4.5% |
Australian Dollar | | 4.2% |
Taiwan Dollar | | 3.7% |
Hong Kong Dollar | | 3.0% |
Indian Rupee | | 3.0% |
Brazilian Real | | 2.9% |
South Korean Won | | 2.3% |
Norwegian Krone | | 2.2% |
Mexico Nuevo Peso | | 2.0% |
South African Rand | | 2.0% |
Hungarian Forint | | 0.8% |
Swedish Krona | | 0.7% |
| | |
|
| | | 100.0% |
| | |
|
See accompanying Notes to Financial Statements.
June 30, 2005 | William Blair Funds 35 |

David S. Mitchell

Mark T. Leslie
VALUE DISCOVERY FUND
The Value Discovery Fund invests in the equity securities of small companies that we believe offer a long-term investment value seeking to identify undervalued companies with sound business fundamentals—”broken stocks not broken companies.”
PORTFOLIO MANAGER ADDITION
Mark T. Leslie, CFA, joined the firm on July 25, 2005 as Co-Manager of the William Blair Value Discovery Team and separately managed small-cap value accounts. Mark Leslie joins David S. Mitchell, CFA, who has been a Portfolio Manager of Value Discovery Fund since 1996.
A 15-year veteran of the investment industry, Mark has a broad range of experience in the small- and mid-capitalization value equity portfolio management and buy-side research with US Bancorp Asset Management and sell-side research with Dain Bosworth, Inc. (now RBC Capital Markets), prior to joining William Blair & Company.
Mark received his BS from the Whittemore School of Business and Economics at the University of New Hampshire, Durham.
AN OVERVIEW FROM THE PORTFOLIO MANAGER
How did the Fund perform over the first half of the year? How did the Fund’s performance compare to its benchmark?
The Value Discovery Fund posted a –10.18% decrease on a total return basis (Class A Shares reflecting the impact of the maximum sales load) during the six months ended June 30, 2005. By comparison, the Russell 2000® Value Index, gained 0.90%, while the Russell 2000® Index declined 1.25%.
What were the most significant factors impacting Fund performance? What factors were behind the Fund’s performance versus the benchmark?
After being the largest contributor to performance during the first quarter, the Financial Services sector was the largest detractor from performance during the second quarter. Conversely, following a tough first quarter, the Producer Durables sector posted solid gains during the second quarter. Additionally, the Consumer Discretionary sector showed signs of improvement.
Generally speaking, Technology stocks have underperformed since their strong showing in 2003. Within the sector, communication-related stocks detracted from both the benchmark and the Fund during the first half of the year.
What were among the best performing sectors for the Fund? Were there any investment themes that produced the best results?
High energy prices drove the Energy sector to lead performance in both the Fund and the benchmark. Good stock selection within the Energy sector contributed to Fund performance during the year to date period as evidenced by Forest Oil Corporation (an oil and gas company) which was the largest single contributor to performance during the first half of the year.
36 Semi-Annual Report | June 30, 2005 |
The Consumer Discretionary sector was the second best contributor year to date. Restoration Hardware, Inc., a retailer of home furnishings and decorative products, was the Fund’s top performer in the Consumer Discretionary sector. Restoration Hardware’s stock price advanced as investors gained confidence in the new management team’s ability to execute their business strategy. The shares of Nautilus Group, Inc., a designer and manufacturer of fitness products, were boosted by strong sales, new product development, and continued progress in the retail distribution channel.
What were among the weakest performing sectors for the Fund? Were there any investments that did not measure up to your expectations?
The Technology sector was the most significant detractor from performance during the first six months of 2005. Carrier Access Corporation, a manufacturer of broadband access equipment, was the biggest disappointment turning out weak results due to delays in capital spending within the communications segment of the sector. Borland Software Corporation, a provider of software deployment solutions designed to accelerate the application development lifecycle, missed earnings due to weaker than expected revenues in Europe. Overland Storage, Inc., a provider of data backup and recovery solutions, also detracted from performance citing weak demand for tape backup solutions and increasing competitive pricing pressure.
The Health Care sector also detracted from performance during the first half of the year most of which occurred during the first quarter. Albany Molecular Research and Discovery Partners, both are providers of outsourcing and research solutions to the pharmaceutical industry, posted disappointing results driven by weaker than expected demand and higher than expected costs. Both stocks were sold during the first quarter.
What is your current strategy? How is the Fund positioned?
We remain true to our philosophy and investment discipline. We appreciate your confidence in us and thank you for investing in the Fund.
June 30, 2005 | William Blair Funds 37 |
Value Discovery Fund
Performance Highlights
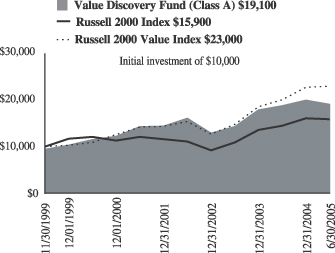
Average Annual Total Return at 6/30/2005 reflecting the maximum sales load
| | | | | | | | | | | | |
| | | 1
Year
| | | 3
Year
| | | 5
Year
| | | Since
Inception
| |
Value Discovery Fund Class A | | (4.49 | )% | | 3.65 | % | | 9.37 | % | | 12.08 | %(a) |
Value Discovery Fund
Class B | | (4.38 | ) | | 4.01 | | | 9.52 | | | 12.17 | (a) |
Value Discovery Fund Class C | | (0.38 | ) | | 4.92 | | | 9.81 | | | 12.24 | (b) |
Russell 2000® Index | | 9.45 | | | 12.81 | | | 5.71 | | | 8.53 | (a) |
| | | | | | | | | | | | 8.51 | (b) |
Russell 2000® Value Index | | 14.39 | | | 14.15 | | | 16.12 | | | 15.82 | (a) |
| | | | | | | | | | | | 15.75 | (b) |
| | (a) | | For the period from November 2, 1999 to June 30, 2005. | |
| | (b) | | For the period from November 3, 1999 to June 30, 2005. | |
Performance cited represents past performance. Past performance does not guarantee future results and current performance may be lower or higher than the data quoted. Results shown are average annual total returns, which assume reinvestment of dividends and capital gains. Investment returns and principal will fluctuate and you may have a gain or loss when you sell shares. For the most current month-end performance information, please call 1-800-742-7272, or visit our Web site at www.williamblairfunds.com. Investing in smaller companies involves special risks, including higher volatility and lower liquidity. From time to time, the investment adviser may waive fees or reimburse expenses for the Fund. Without these waivers, performance would be lower. Class A, B, and C shares are not available for sale.
The performance highlights and graph presented above do not reflect the deduction of taxes that a shareholder would pay on fund distributions or the redemption of fund shares.
The Russell 2000® Index is the Fund’s primary benchmark. The Russell 2000® Index is unmanaged composite of the smallest 2000 stocks of the Russell 3000 Index.
The Russell 2000® Value Index consists of small-capitalization companies with below average price-to-book ratios and forecasted growth rates.
This report identifies the Fund’s investments on June 30, 2005. These holdings are subject to change. Not all stocks in the Fund performed the same, nor is there any guarantee that these stocks will perform as well in the future. Market forecasts provided in this report may not necessarily come to pass.
Sector Diversification
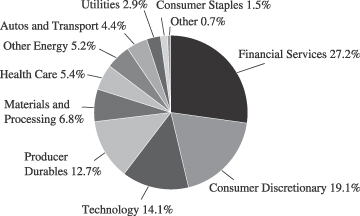
The sector diversification shown is based on the total investment portfolio.
38 Semi-Annual Report | June 30, 2005 |
Value Discovery Fund
Portfolio of Investments, June 30, 2005 (all dollar amounts in thousands) (unaudited)
| | | | | |
Issuer
| | Shares
| | Value
|
| | |
Common Stocks | | | | | |
Financial Services—30.3% | | | | | |
*AmericanWest Bancorporation | | 88,895 | | $ | 1,773 |
AmerUs Group, Class “A” | | 62,925 | | | 3,024 |
Astoria Financial Corporation | | 71,390 | | | 2,032 |
Donegal Group, Inc., Class “A” | | 103,651 | | | 2,069 |
Equity Inns, Inc. | | 204,409 | | | 2,719 |
Flagstar Bancorp, Inc. | | 245,438 | | | 4,646 |
*Franklin Bank Corporation | | 151,760 | | | 2,847 |
*Jones Lang LaSalle, Inc | | 47,700 | | | 2,110 |
*KMG America Coporation | | 230,345 | | | 2,290 |
*Meadowbrook Insurance Group, Inc. | | 402,820 | | | 2,111 |
National Financial Partners Corporation | | 52,070 | | | 2,038 |
Ryder System, Inc. | | 52,265 | | | 1,913 |
*Seabright Insurance Holdings, Inc. | | 191,470 | | | 2,188 |
*United Rentals, Inc. | | 139,675 | | | 2,823 |
Winston Hotels, Inc. | | 186,905 | | | 2,104 |
| | | | |
|
|
| | | | | | 36,687 |
| | | | |
|
|
Consumer Discretionary—21.3% | | | | | |
*BJ’s Wholesale Club, Inc. | | 110,025 | | | 3,575 |
*Casual Male Retail Group, Inc. | | 340,600 | | | 2,490 |
*Coinstar, Inc. | | 114,870 | | | 2,606 |
*Elizabeth Arden, Inc. | | 223,145 | | | 5,219 |
*K2, Inc. | | 162,285 | | | 2,058 |
Nautilus Group, Inc. | | 72,865 | | | 2,077 |
*Navigant International, Inc. | | 152,515 | | | 2,241 |
*Restoration Hardware, Inc. | | 409,444 | | | 3,349 |
*Teletech Holdings, Inc. | | 269,600 | | | 2,197 |
| | | | |
|
|
| | | | | | 25,812 |
| | | | |
|
|
Producer Durables—14.1% | | | | | |
*Artesyn Technologies, Inc. | | 378,974 | | | 3,297 |
*Belden, Inc. | | 142,584 | | | 3,023 |
General Cable Corporation | | 332,845 | | | 4,936 |
*LTX Corporation | | 533,575 | | | 2,646 |
*Spatialight, Inc. | | 564,667 | | | 3,202 |
| | | | |
|
|
| | | | | | 17,104 |
| | | | |
|
|
Technology—15.7% | | | | | |
*Anixter International, Inc. | | 92,675 | | | 3,445 |
*Borland Software Corporation | | 453,660 | | | 3,112 |
*Carrier Access Corporation | | 532,770 | | | 2,568 |
*Overland Storage, Inc. | | 159,835 | | | 1,525 |
*Plexus Corporation | | 146,300 | | | 2,082 |
*SPSS, Inc. | | 165,326 | | | 3,176 |
*Tier Technologies, Inc., Class “B” | | 364,587 | | | 3,073 |
| | | | |
|
|
| | | | | | 18,981 |
| | | | |
|
|
Materials and Processing—7.6% | | | | | |
Jacuzzi Brands, Inc. | | 222,348 | | | 2,386 |
Polyone Corporation | | 457,485 | | | 3,028 |
Spartech Corporation | | 105,415 | | | 1,876 |
Watsco, Inc. | | 43,865 | | | 1,869 |
| | | | |
|
|
| | | | | | 9,159 |
| | | | |
|
|
*Non-income producing
**Fair Valued pursuant to Valuation Procedures adopted by the Board of Trustees. The holding represents 0.90% of the Fund’s net assets at June 30, 2005.
| | | | | | | |
Issuer
| | Shares or
Principal
Amount
| | Value
| |
| | |
Common Stocks—(continued) | | | | | | | |
Other Energy—5.8% | | | | | | | |
*Forest Oil Corporation | | | 92,125 | | $ | 3,869 | |
*Grey Wolf, Inc. | | | 217,460 | | | 1,611 | |
St Mary Land & Exploration Company | | | 54,785 | | | 1,588 | |
| | | | | |
|
|
|
| | | | | | | 7,068 | |
| | | | | |
|
|
|
Autos and Transportation—4.9% | | | | | | | |
BorgWarner, Inc. | | | 52,355 | | | 2,810 | |
*SCS Transportation, Inc. | | | 175,405 | | | 3,122 | |
| | | | | |
|
|
|
| | | | | | | 5,932 | |
| | | | | |
|
|
|
Health Care—6.0% | | | | | | | |
*Encore Medical Corporation | | | 667,440 | | | 3,704 | |
*Par Pharmaceutical Companies, Inc. | | | 111,235 | | | 3,539 | |
| | | | | |
|
|
|
| | | | | | | 7,243 | |
| | | | | |
|
|
|
Utilities—3.3% | | | | | | | |
Atmos Energy Corporation | | | 138,965 | | | 4,002 | |
| | | | | |
|
|
|
Consumer Staples—1.6% | | | | | | | |
*Hain Celestial Group, Inc. | | | 101,743 | | | 1,984 | |
| | | | | |
|
|
|
Total Common Stock—110.6%
(cost $109,459) | | | 133,972 | |
| | | | | |
|
|
|
| | |
Convertible Bonds—0.9% | | | | | | | |
Midwest Express Holdings,
6.750%, due 10/01/08** | | $ | 2,157,000 | | | 1,031 | |
| | | | | |
|
|
|
Total Convertible Bonds
(cost $2,157) | | | 1,031 | |
| | | | | |
|
|
|
| | |
Investment in Affiliate—0.9% | | | | | | | |
William Blair Ready Reserves Fund | | | 1,058,707 | | | 1,059 | |
| | | | | |
|
|
|
Total Investment in Affiliate
(cost $1,059) | | | 1,059 | |
| | | | | |
|
|
|
| | |
Short-Term Investments—0.7% | | | | | | | |
Prudential Funding Demand Note, VRN,
3.368%, due 7/1/05 | | $ | 809,000 | | | 809 | |
| | | | | |
|
|
|
Total Short-Term Investments
(cost $809) | | | 809 | |
| | | | | |
|
|
|
Total Investments—113.1%
(cost $113,484) | | | 136,871 | |
Liabilities, plus cash and other assets—(13.1)% | | | (15,806 | ) |
| | | | | |
|
|
|
Net assets—100.0% | | $ | 121,065 | |
| | | | | |
|
|
|
See accompanying Notes to Financial Statements.
June 30, 2005 | William Blair Funds 39 |

James S. Kaplan

Christopher T. Vincent
INCOME FUND
The Income Fund invests in high-grade intermediate-term debt securities.
AN OVERVIEW FROM THE PORTFOLIO MANAGERS
How did the Fund perform over the first half of the year? How did the Fund’s performance compare to its benchmark?
The Income Fund posted a –0.75% loss on a total return basis (Class A Shares reflecting the impact of the maximum sales load) for the six months ended June 30, 2005. By comparison, the Fund’s benchmark, the Lehman Intermediate Government/Credit Bond Index, rose 1.58%, while the Fund’s peer group, the Morningstar Short-term Bond Category, increased 0.94%.
What were the most significant factors impacting Fund performance? What factors were behind the Fund’s performance versus the benchmark?
Interest rates were the most significant factor impacting Fund performance during the first half of the year.
The Federal Reserve raised the federal funds rate on overnight loans between banks by 0.25% three times during the first half of the year, on March 22, May 3, and June 30—from 2.50% to 3.25%. The rate increase on the last day of the second quarter was the ninth since June, 2004.
The yield curve flattening trend, which began in 2004, remained in place. The short end of the yield curve continued to underperform, with the yields on 2-year Treasury notes rising 0.57% during the first half of the year. However, the long-end of the yield curve, as indicated by yields on 10-year Treasury securities, declined by 0.30%.
Which investment strategies enhanced the Fund’s return? Were there any investment strategies that produced the best results?
One of our primary strategies during the first quarter was to tilt the Fund toward higher credit quality securities, as we did not believe risk premiums adequately compensated us for investing in corporate bonds—especially in lower-rated securities.
For example, we reduced our holdings in BBB-rated corporate securities from 9.7% at the end of the fourth quarter of 2004 to 6.6% at the end of March, reinvesting proceeds in U.S. Treasury and Agency securities.
However, we generally evaluated risks on a security-by-security basis, and did not believe what was happening in the marketplace was part of a larger industry “contagion,” affecting all corporate issues. By the end of the second quarter, our holdings of BBB-rated securities stood at 7.3%.
And although the mortgage-backed and asset-backed securities sectors have not had an especially noteworthy year, the Fund benefited from its holdings of these defensive income-producing securities.
On balance, we would describe the changes in the portfolio on a year-to-date basis as incremental transactions.
40 Semi-Annual Report | June 30, 2005 |
What were among the weakest performing investments for the Fund?
Corporate bonds had a difficult first quarter, which continued into April before conditions finally stabilized somewhat. The majority of the damage in the Corporate Bond market came in late March with a profit warning from General Motors. GM lowered first quarter and full year earnings guidance dramatically. The rating agencies weighed in with either a downgrade or potential action. Given GM’s very large weighting in the corporate bond indexes, the news and rating action created significant concern and concomitant increases in risk premiums in auto credits as well as other BBB names.
We had reduced our holding in GM in early March, as well as our position of Cox Communications (Baa3/BBB-). We further reduced credit exposure in late March with the sale of the remainder of our GM position, and partial sales in Sprint (Baa3/BBB-) and Weyerhaeuser (Baa2/BBB).
What is your current strategy? How is the Fund positioned?
With further interest rate hikes anticipated by the Federal Reserve, we believe that the interest rate yield curve should continue to flatten. We have the Fund positioned defensively, attempting to minimize exposure to interest rates. Although our forecast is for rates to increase, good (modest) longer-term inflation fundamentals and solid foreign demand for U.S. debt securities should keep our domestic rates from rising dramatically.
As we have stated, given our concerns regarding valuations and potential threats to fundamentals, we currently have a bias toward upgrading portfolio credit quality and being judicious in our use of BBB-rated names. In structure, our view on interest rates will likely lead us to continue to emphasize coupon and income-producing securities which produce generous cash flow. These securities should provide “extension” protection, and allow us to reinvest at higher yields of rates move higher during the next stages of the Fed’s tightening cycle.
We continue to favor being defensive and emphasizing non-Treasury sectors. Our enthusiasm for maintaining this strategy will be driven by future changes in valuations and fundamentals.
June 30, 2005 | William Blair Funds 41 |
Income Fund
Performance Highlights
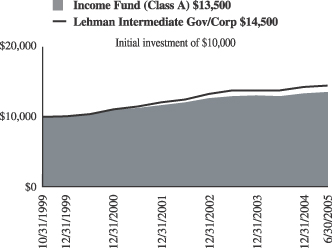
Average Annual Total Return at 6/30/2005 reflecting the maximum sales load
| | | | | | | | | | | | | | |
| | | 1
Year
| | | 3
Year
| | | 5
Year
| | | Since
Inception(a)
| | | |
Income Fund Class A | | 2.33 | % | | 3.35 | % | | 5.38 | % | | 5.47 | (a)% | | |
Income Fund Class B | | 1.62 | | | 3.30 | | | 5.01 | | | 4.88 | (b) | | |
Income Fund Class C | | 2.50 | | | 3.29 | | | 4.99 | | | 4.81 | (c) | | |
Lehman Intermediate Government Credit Bond Index | | 4.77 | | | 5.08 | | | 6.87 | | | 6.70 | (a) | | |
| | | | | | | | | | | | 6.60 | (b) | | |
| | | | | | �� | | | | | | 6.59 | (c) | | |
| | (a) | | For the period from October 25, 1999 to June 30, 2005. |
| | b) | | For the period from November 2, 1999 to June 30, 2005. |
| | (c) | | For the period from November 3, 1999 to June 30, 2005. |
Performance cited represents past performance. Past performance does not guarantee future results and current performance may be lower or higher than the data quoted. Results shown are average annual total returns, which assume reinvestment of dividends and capital gains. Investment returns and principal will fluctuate and you may have a gain or loss when you sell shares. For the most current month-end performance information, please call 1-800-742-7272, or visit our Web site at www.williamblairfunds.com. Class A, B, and C shares are not available for sale.
The performance highlights and graph presented above do not reflect the deduction of taxes that a shareholder would pay on fund distributions or the redemption of fund shares.
The Lehman Intermediate Government/Credit Bond Index indicates broad intermediate government/corporate bond market performance.
This report identifies the Fund’s investments on June 30, 2005. These holdings are subject to change. Not all investments in the Fund performed the same, nor is there any guarantee that these investments will perform as well in the future. Market forecasts provided in this report may not necessarily come to pass.
Sector Diversification
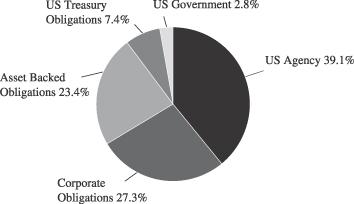
The sector diversification shown is based on the total investment portfolio.
42 Semi-Annual Report | June 30, 2005 |
Income Fund
Portfolio of Investments, June 30, 2005 (all amounts in thousands) (unaudited)
| | | | | | |
Issuer
| | Principal
Amount
| | Value
|
|
U.S. Government and U.S. Government Agency—48.8% |
U.S. Treasury—7.3% | | | | | | |
U.S. Treasury Note, 6.500%, due 2/15/10 | | $ | 12,792 | | $ | 14,275 |
U.S. Treasury Note, 4.750%, due 5/15/14 | | | 7,950 | | | 8,436 |
| | |
|
| |
|
|
Total U.S. Treasury Obligations | | | 20,742 | | | 22,711 |
| | |
|
| |
|
|
Government National Mortgage Association (GNMA)—2.8% | | | | | | |
#780405, 9.500%, due 11/15/17 | | | 971 | | | 1,060 |
#589335, 6.500%, due 10/15/22 | | | 2,703 | | | 2,837 |
#357322, 7.000%, due 9/15/23 | | | 247 | | | 262 |
#616250, 6.000%, due 2/15/24 | | | 2,385 | | | 2,469 |
#2002-48, Tranche 0B, 6.000%, due 5/16/30 | | | 1,837 | | | 1,868 |
| | |
|
| |
|
|
Total Government National Mortage Association | | | 8,143 | | | 8,496 |
| | |
|
| |
|
|
Small Business Administration—0.0% | | | |
Receipt for Multiple Originator Fees,
#3, 0.713%, due 11/01/08 (Interest Only) WAC | | | — | | | 50 |
| | | | | |
|
|
Federal Home Loan Mortgage Corp. (FHLMC)—15.4% | | | | | | |
FDIC REMIC Trust, 96-C1,
7.250%, due 5/25/26 | | | 516 | | | 516 |
#1417, Tranche SA, 15.598%, due 11/15/07 | | | 828 | | | 895 |
#G10067, 7.000%, due 1/1/08 | | | 614 | | | 632 |
#G10147, 8.500%, due 2/1/08 | | | 162 | | | 167 |
#1601, Tranche PJ, 6.000%, due 10/15/08, VRN | | | 2,024 | | | 2,064 |
#1612, Tranche SE, 8.100%, due 11/15/08, VRN | | | 968 | | | 1,003 |
# E80050, 6.000%, due 10/1/09 | | | 905 | | | 933 |
#G90028, 7.000%, due 5/15/09 | | | 604 | | | 625 |
#G90019, 7.500%, due 12/15/09 | | | 714 | | | 746 |
7.000%, due 3/15/10 | | | 5,825 | | | 6,570 |
#E65418, 7.000%, due 8/1/10 | | | 511 | | | 526 |
#G10457, 7.000%, due 2/1/11 | | | 675 | | | 707 |
#E00436, 7.000%, due 6/1/11 | | | 659 | | | 690 |
#G10708, 6.500%, due 8/1/12 | | | 391 | | | 407 |
#E91999, 5.000%, due 10/1/12 | | | 1,317 | | | 1,334 |
#G11218, 7.000%, due 10/1/12 | | | 213 | | | 223 |
#E96147, 5.000%, due 5/1/13 | | | 1,986 | | | 2,012 |
#E95846, 4.500%, due 5/1/13 | | | 1,539 | | | 1,535 |
#G10839, 5.500%, due 10/1/13 | | | 1,788 | | | 1,837 |
#E72924, 7.000%, due 10/1/13 | | | 1,693 | | | 1,772 |
#E00639, 5.000%, due 3/1/14 | | | 2,230 | | | 2,270 |
#E81908, 8.500%, due 12/1/15 | | | 211 | | | 228 |
#G11688, 7.00%, due 2/1/16 | | | 1,191 | | | 1,263 |
#G90022, 8.000%, due 9/17/16 | | | 988 | | | 1,054 |
#G11486, 7.500%, due 4/1/17 | | | 1,605 | | | 1,698 |
#E90398, 7.000%, due 5/1/17 | | | 1,916 | | | 2,005 |
#M30028, 5.500%, due 5/1/17 | | | 538 | | | 557 |
#G11549, 7.000%, due 7/1/17 | | | 1,371 | | | 1,435 |
#G30254, 6.500%, due 5/1/19 | | | 3,612 | | | 3,761 |
#G30255, 7.000%, due 7/1/21 | | | 1,271 | | | 1,343 |
#G90027, 6.000%, due 11/15/17 | | | 2,108 | | | 2,177 |
#C67537, 9.500%, due 8/1/21 | | | 357 | | | 389 |
| | | | | | |
Issuer
| | Principal Amount
| | Value
|
Federal Home Loan Mortgage Corp. (FHLMC)—(continued) | | | |
#G30243, 6.000%, due 12/1/21 | | $ | 2,636 | | $ | 2,721 |
#G21, Tranche J, 6.250%, due 8/25/22 | | | 15 | | | 15 |
#A45790, 7.500%, due 5/1/35 | | | 1,558 | | | 1,669 |
| | |
|
| |
|
|
Total FHLMC Mortgage Obligations | | | 45,539 | | | 47,779 |
| | |
|
| |
|
|
Federal National Mortgage Association (FNMA)—23.3% | | | | | | |
#545560, 8.000%, due 5/1/07 | | | 666 | | | 690 |
#1992-192, Tranche SC,
8.641%, due 11/25/07, VRN | | | 518 | | | 530 |
#93-196, Tranche SA,
17.800%, due 10/25/08, VRN | | | 718 | | | 805 |
#1993-221, Tranche SG,
9.030%, due 12/25/08, VRN | | | 483 | | | 496 |
#765396, 5.500%, due 1/1/09 | | | 506 | | | 517 |
#695512, 8.000%, due 9/1/10 | | | 783 | | | 830 |
#725479, 8.5%, due 10/1/10 | | | 1,345 | | | 1,417 |
#255056, 5.000%, due 11/1/10 | | | 2,563 | | | 2,590 |
6.250%, due 2/1/11 | | | 6,725 | | | 7,369 |
#313816, 6.000%, due 4/1/11 | | | 783 | | | 810 |
#577393, 10.000%, due 6/1/11 | | | 386 | | | 421 |
#577395, 10.000%, due 8/1/11 | | | 1,141 | | | 1,247 |
#254705, 5.500%, due 3/1/13 | | | 2,373 | | | 2,442 |
#254788, 6.500%, due 4/1/13 | | | 796 | | | 834 |
#725315, 8.000%, due 5/1/13 | | | 1,237 | | | 1,320 |
#190539, 6.000%, due 1/1/14 | | | 622 | | | 643 |
#806463, 7.000%, due 3/1/14 | | | 1,424 | | | 1,492 |
#593561, 9.500%, due 8/1/14 | | | 521 | | | 567 |
#567027, 7.000%, due 9/1/14 | | | 2,346 | | | 2,458 |
#567026, 6.500%, due 10/1/14 | | | 2,384 | | | 2,483 |
#458124, 7.000%, due 12/15/14 | | | 722 | | | 752 |
#598453, 7.000%, due 6/1/15 | | | 853 | | | 890 |
#555747, 8.000%, due 5/1/16 | | | 840 | | | 897 |
#735569, 8.000%, due 10/1/16 | | | 4,382 | | | 4,677 |
#725410, 7.500%, due 4/1/17 | | | 1,963 | | | 2,077 |
#643217 , 6.500%, due 6/1/17 | | | 449 | | | 467 |
# 682075, 5.500%, due 11/1/17 | | | 1,379 | | | 1,417 |
#251960, 6.000%, due 9/1/18 | | | 929 | | | 959 |
#662925, 6.000%, due 12/1/17 | | | 2,342 | | | 2,431 |
#740847, 6.000%, due 10/1/18 | | | 1,861 | | | 1,925 |
#735367, 6.000%, due 3/1/22 | | | 3,609 | | | 3,723 |
#735574, 8.00%, due 3/1/22 | | | 1,511 | | | 1,643 |
#458147, 10.000%, due 8/15/20 | | | 1,381 | | | 1,552 |
#735104, 7.000%, due 5/1/22 | | | 3,869 | | | 4,097 |
#725927, 7.000%, due 8/1/22 | | | 3,078 | | | 3,255 |
#735137, 6.500%, due 11/1/22 | | | 2,017 | | | 2,100 |
#1993-19, Tranche SH,
11.233%, due 4/25/23, VRN | | | 11 | | | 17 |
#254797, 5.000%, due 6/1/23 | | | 2,352 | | | 2,372 |
#806458, 8.00%, due 6/1/28 | | | 1,989 | | | 2,144 |
#797846, 7.000%, due 3/1/32 | | | 3,342 | | | 3,538 |
#654674, 6.500%, due 9/1/32 | | | 462 | | | 480 |
#733897, 6.500%, due 12/1/32 | | | 721 | | | 754 |
| | |
|
| |
|
|
Total FNMA Mortgage
Obligations | | | 68,382 | | | 72,128 |
| | |
|
| |
|
|
See accompanying Notes to Financial Statements.
June 30, 2005 | William Blair Funds 43 |
Income Fund
Portfolio of Investments, June 30, 2005 (all amounts in thousands) (unaudited)
| | | | | | |
Issuer
| | NRSRO Rating
| | Principal Amount
| | Value
|
| |
Collateralized Mortgage Obligations—23.2% | | |
Security National Mortgage Loan Trust, 2002-2, Tranche M2,
6.460%, due 8/25/08* | | A+ | | $ 2,500 | | $ 2,487 |
GRP Real Estate Asset Trust, 2004-1, 3.96%, due 3/25/09* | | A | | 132 | | 133 |
Countrywide Alternative Loan Trust, 2003-11T1, Tranche M,
4.750%, due 7/25/18 | | AA | | 1,935 | | 1,926 |
Cityscape Home Equity Loan Trust, 1997-4, Tranche M2, 8.210%, due 10/25/18 | | A- | | 950 | | 960 |
ABFS, 2002-2, Tranche A6, 5.850%, due 3/15/19 | | AAA | | 1,900 | | 1,968 |
RALI, 2004-QS16, Tranche 2M1, 5.000%, due 12/25/19 | | AA | | 1,806 | | 1,807 |
RALI, 2004-QS16, Tranche 2M3, 5.00%, due 12/15/19 | | BBB | | 305 | | 298 |
Countrywide, 2001-HLV1, Tranche B1, 9.885%, due 5/10/22 | | BBB | | 2,320 | | 2,318 |
First Plus, 1997-4, Tranche M2, 7.830%, due 9/11/23 | | A | | 718 | | 717 |
First Plus, 1997-4, Tranche A8, 7.810%, due 9/11/23 | | AAA | | 531 | | 531 |
First Plus, 1998-2, Tranche M2, 8.010%, due 5/10/24 | | A2 | | 445 | | 444 |
First Plus, 1998-3, Tranche M2, 7.920%, due 5/10/24 | | A2 | | 171 | | 171 |
GMAC Mortgage Corporation Loan Trust, 2000-CL1, Tranche B, 9.000%, due 6/25/26 | | A | | 133 | | 133 |
CIT Group Home Equity Loan Trust, 98-1 M2, 6.720%, due 9/15/27 | | A2 | | 1,135 | | 1,136 |
Green Tree Home Improvement Loan Trust, 1998-E, Tranche HEM2, 7.270%, due 6/15/28 | | A+ | | 5,025 | | 5,055 |
Bear Stearns ABS, 2001-A, Tranche M1, 7.540%, due 2/15/31 | | A | | 2,700 | | 2,787 |
Delta Funding Home Equity Loan Trust, 2000-4, Tranche M1, 7.150%, due 2/15/31 | | AA | | 3,000 | | 3,069 |
Aames Mortgage Trust, 2001-1, Tranche M2, 7.588%, due 2/25/31 | | A | | 1,319 | | 1,369 |
Countrywide, 2000-2, Tranche MF2, 9.000%, due 6/25/31 | | A2 | | 466 | | 469 |
IMSA, 2001-5, Tranche M1, 7.250%, due 8/25/31 | | AAA | | 2,222 | | 2,260 |
Conseco Finance, 2001-B, Tranche 1M1, 7.272%, due 6/15/32 | | AA | | 2,255 | | 2,296 |
Credit Suisse First Boston, 2002-22, Tranche 2M2, 6.500%, due 6/25/32 | | A | | 3,041 | | 3,096 |
Security National Mortgage Loan Trust, 2004-1A, Tranche M2,
6.750%, due 06/25/32* | | A | | 1,600 | | 1,582 |
Credit Suisse First Boston, 2001—HE30, Tranche MF2, 7.760%, due 7/25/32 | | A+ | | 2,557 | | 2,610 |
Structured Assets Security Corporation, 2002-17, Tranche B3,
6.079%, due 9/25/32, VRN | | BBB | | 1,945 | | 1,940 |
| | | | | | |
Issuer
| | NRSRO Rating
| | Principal
Amount
| | Value
|
| |
Collateralized Mortgage Obligations—(continued) | | |
LSSCO, 2004-2, Tranche M1, 5.578%, due 2/28/33, VRN* | | AA | | $ 2,322 | | $ 2,333 |
LSSCO, 2004-2, Tranche M2, 5.578%, due 2/28/33, VRN* | | A | | 1,780 | | 1,778 |
ABFS, 2002-2, Tranche A-7, 5.215%, due 7/15/33, VRN | | AAA | | 389 | | 396 |
ABFS, 2002-3, Tranche M1, 5.402%, due 9/15/33, VRN | | AA | | 1,500 | | 1,507 |
Residential Asset Mortgage Prouducts, 2003-RS9, Tranche MI2, 6.300%, due 10/25/33 | | A | | 2,200 | | 2,244 |
ACE, 2004-SD1, Tranche M3, 6.064%, due 11/25/33, VRN | | BBB | | 2,099 | | 2,022 |
Residential Asset Mortgage Products, 2003-RS11, Tranche MI1, 5.597%, due 12/25/2033 | | AA | | 2,400 | | 2,449 |
GRP Real Estate Asset Trust, 2004-2, Tranche A, 4.210%, due 7/25/34* | | A | | 2,598 | | 2,598 |
FHASI, 2004-AR4, Tranche 3A1, 4.625%, due 8/25/34 | | AAA | | 1,916 | | 1,911 |
Security National Mortgage Loan Trust, 2004-2A, Tranche M2,
6.352%, due 11/25/34* | | A | | 2,200 | | 2,164 |
GRP Real Estate Asset Trust, 2005-1 Tranche A, 4.850%, due 1/25/35* | | A | | 2,744 | | 2,742 |
Security National Mortgage Loan Trust, 2005-1A, Tranche M2,
6.530%, due 2/25/35* | | A | | 1,475 | | 1,473 |
Security National Mortgage Loan Trust, 2005-1A, Tranche B1,
7.450%, due 2/25/35* | | BBB | | 950 | | 948 |
Structured Asset Securities Corp.,
2005-9XS, Tranche 1A2B,
6.500%, due 6/25/35 | | AAA | | 3,385 | | 3,526 |
Blackrock Capital Finance, 1997-R1 WAC, 7.826%, due 3/25/37, VRN* | | AAA | | 523 | | 538 |
ACE, 2005-SN1, Tranche M1,
5.520%, due 11/25/39, VRN | | AA+ | | 1,075 | | 1,086 |
ACE, 2005-SN1, Tranche M2,
5.770%, due 11/25/39, VRN | | A+ | | 625 | | 632 |
| | | | |
| |
|
Total Collateralized Mortgage Obligations | | | | 71,292 | | 71,909 |
| | | | |
| |
|
| | | |
Corporate Obligations—27.0% | | | | | | |
Block Financial Corporation,
8.500%, due 4/15/07 | | BBB+ | | 2,699 | | 2,890 |
Mellon Bank NA,
7.375%, due 5/15/07 | | A+ | | 2,125 | | 2,242 |
Applied Materials, Inc.,
6.750%, due 10/15/07 | | A- | | 2,850 | | 2,992 |
Amgen Inc., 6.500%, due 12/01/07 | | A+ | | 1,000 | | 1,054 |
DaimlerChrysler NA Holdings,
4.750%, due 1/15/08 | | A3 | | 2,650 | | 2,660 |
Wells Fargo Company,
3.500%, due 4/4/08 | | AA- | | 2,425 | | 2,385 |
CIT Group Inc., 3.375%, due 4/1/09 | | A | | 2,550 | | 2,464 |
Philips Petroleum,
8.750%, due 5/25/10 | | A- | | 3,575 | | 4,259 |
See accompanying Notes to Financial Statements.
44 Semi-Annual Report | June 30, 2005 |
Income Fund
Portfolio of Investments, June 30, 2005 (all amounts in thousands) (unaudited)
| | | | | | |
Issuer
| | NRSRO Rating
| | Principal
Amount
| | Value
|
| |
Corporate Obligations—(continued) | | |
Residential Capital Corporation,
6.375%, due 6/30/10 | | BBB | | $ 2,900 | | $ 2,914 |
Household Finance Corporation,
8.000%, due 7/15/10 | | A | | 2,425 | | 2,798 |
Boeing Capital Corporation,
7.375%, due 9/27/10 | | A | | 2,524 | | 2,887 |
Sprint Capital Corp.,
7.625%, due 1/30/11 | | BBB | | 2,000 | | 2,284 |
Countrywide Financial Corp.,
4.000%, due 3/22/11 | | A | | 2,675 | | 2,580 |
Time Warner, Inc.,
6.750%, due 4/15/11 | | BBB+ | | 1,900 | | 2,106 |
Morgan Stanley,
6.750%, due 4/15/11 | | A+ | | 3,350 | | 3,709 |
Goldman Sachs Group, Inc.,
6.600%, due 1/15/12 | | A+ | | 3,025 | | 3,362 |
Lehman Brothers Holdings, Inc.
6.625%, due 1/18/12 | | A | | 2,650 | | 2,960 |
National Rural Utility Cooperative, 7.250%, due 3/1/12 | | A | | 3,000 | | 3,478 |
GE Capital Corporation,
6.000%, due 6/15/12 | | AAA | | 2,625 | | 2,863 |
Citigroup, Inc. 5.625%, due 8/27/12 | | A+ | | 2,650 | | 2,830 |
SLM Corporation,
5.125%, due 8/27/12 | | A | | 2,025 | | 2,094 |
Verizon Global Funding Corporation, 7.375%, due 9/1/12 | | A+ | | 2,650 | | 3,096 |
Cox Communications,Inc.,
7.125%, due 10/1/12 | | BBB- | | 2,425 | | 2,719 |
IBM Corporation, 4.750%, due 11/29/12 | | A+ | | 3,350 | | 3,424 |
Ohio Power Company,
5.500%, due 2/15/13 | | A3 | | 1,900 | | 2,007 |
Comcast Cable Communcations, Inc., 8.375%, due 3/15/13 | | BBB+ | | 2,000 | | 2,439 |
Altria Group, Inc., 7.00%, due 11/4/13 | | BBB | | 2,180 | | 2,440 |
American Movil SA,
5.500%, due 3/1/14 | | A3 | | 2,000 | | 2,000 |
Bank of America Corporation,
5.375%, due 6/15/14 | | AA- | | 2,300 | | 2,444 |
SBC Communications, Inc.,
5.100%, due 9/15/14 | | A | | 2,500 | | 2,556 |
United Technologies Corporation,
4.875%, due 5/1/15 | | A | | 2,700 | | 2,762 |
| | | | |
| |
|
Total Corporate Obligations | | | | 77,628 | | 83,698 |
| | | | |
| |
|
Total Long Term Investments—99.0%
(Cost $305,894) | | 291,726 | | 306,771 |
| | | | |
| |
|
| | | | | | |
Issuer
| | NRSRO Rating
| | Principal
Amount
| | Value
|
| | |
Short-Term Investments—0.5% | | | | |
American Express Corporation, VRN, 3.164%, due 7/1/05 | | A+ | | $660 | | $660 |
Prudential Funding LLC, VRN,
3.368%, due 7/1/05 | | A+ | | 780 | | 780 |
| | | | |
| |
|
Total Short-Term Investments
(Cost $1,440) | | 1,440 | | 1,440 |
| | | | |
| |
|
Total Investments—99.5%
(Cost $307,334) | | $293,166 | | 308,211 |
| | | | |
| |
|
Cash and other assets, less liabilities—0.5% | | 1,456 |
| | | | | | |
|
Net Assets—100% | | $309,667 |
| | | | | | |
|
WAC = Weighted Average Coupon
VRN = Variable Rate Note
NRSRO = Nationally Recognized Statistical Rating Organization, such as S&P, Moody’s or Fitch
The obligations of certain U. S. Government-sponsored securities are neither issued nor guaranteed by the U. S. Treasury
*Deemed illiquid pursuant to Liquidity Procedures adopted by the Board of Trustees. These holdings represent 6.1% of the net assets at June 30, 2005.
See accompanying Notes to Financial Statements.
June 30, 2005 | William Blair Funds 45 |
Statements of Assets and Liabilities
June 30, 2005 (all dollar amounts in thousands) (unaudited)
| | | | | | | | | | | | | | | | |
| | | Growth
Fund
| | | Tax-
Managed
Growth
Fund
| | | Large Cap
Growth
Fund
| | | Small Cap
Growth
Fund
| |
Assets | | | | | | | | | | | | | | | | |
Investments in securities, at cost | | $ | 192,762 | | | $ | 4,469 | | | $ | 7,855 | | | $ | 577,192 | |
Investments in Affiliated Fund, at cost | | | 922 | | | | 177 | | | | 330 | | | | 6,243 | |
| | |
|
|
| |
|
|
| |
|
|
| |
|
|
|
| | | | |
Investments in securities, at value | | $ | 242,679 | | | $ | 5,841 | | | $ | 8,813 | | | $ | 686,965 | |
Investments in Affiliated Fund, at value | | | 922 | | | | 177 | | | | 330 | | | | 6,243 | |
Cash | | | — | | | | 1 | | | | — | | | | — | |
Receivable for fund shares sold | | | 58 | | | | 40 | | | | 16 | | | | 1,216 | |
Receivable for investment securities sold | | | 4,506 | | | | 56 | | | | 154 | | | | 8,850 | |
Receivable from Advisor | | | — | | | | 12 | | | | 23 | | | | — | |
Dividend and interest receivable | | | 354 | | | | 8 | | | | 15 | | | | 79 | |
| | |
|
|
| |
|
|
| |
|
|
| |
|
|
|
Total assets | | | 248,519 | | | | 6,135 | | | | 9,351 | | | | 703,353 | |
Liabilities | | | | | | | | | | | | | | | | |
Payable for investment securities purchased | | | 2,196 | | | | 233 | | | | 191 | | | | 3,090 | |
Payable for fund shares redeemed | | | 749 | | | | — | | | | — | | | | 412 | |
Management fee payable | | | 167 | | | | 4 | | | | 6 | | | | 592 | |
Distribution and shareholder services fee payable | | | 10 | | | | — | | | | — | | | | 82 | |
Other accrued expenses | | | 97 | | | | 14 | | | | 12 | | | | 58 | |
| | |
|
|
| |
|
|
| |
|
|
| |
|
|
|
Total liabilities | | | 3,219 | | | | 251 | | | | 209 | | | | 4,234 | |
| | |
|
|
| |
|
|
| |
|
|
| |
|
|
|
Net Assets | | $ | 245,300 | | | $ | 5,884 | | | $ | 9,142 | | | $ | 699,119 | |
| | |
|
|
| |
|
|
| |
|
|
| |
|
|
|
Capital | | | | | | | | | | | | | | | | |
Composition of Net Assets | | | | | | | | | | | | | | | | |
Par value of shares of beneficial interest | | $ | 23 | | | $ | 1 | | | $ | 1 | | | $ | 28 | |
Capital paid in excess of par value | | | 197,246 | | | | 6,295 | | | | 13,586 | | | | 557,551 | |
Accumulated net investment income (loss) | | | (296 | ) | | | (13 | ) | | | 2 | | | | (4,235 | ) |
Accumulated realized gain (loss) | | | (1,590 | ) | | | (1,771 | ) | | | (5,405 | ) | | | 36,002 | |
Net unrealized appreciation (depreciation) of investments and foreign
currencies | | | 49,917 | | | | 1,372 | | | | 958 | | | | 109,773 | |
| | |
|
|
| |
|
|
| |
|
|
| |
|
|
|
Net Assets | | $ | 245,300 | | | $ | 5,884 | | | $ | 9,142 | | | $ | 699,119 | |
| | |
|
|
| |
|
|
| |
|
|
| |
|
|
|
| | | | |
Class A Shares | | | | | | | | | | | | | | | | |
Net Assets | | $ | 2 | | | $ | 2 | | | $ | 1 | | | $ | 5 | |
Shares Outstanding | | | 200 | | | | 200 | | | | 200 | | | | 200 | |
Maximum offering price reflecting 5.75% sales load | | $ | 11.28 | | | $ | 9.62 | | | $ | 6.48 | | | $ | 26.13 | |
Net Asset Value Per Share | | $ | 10.63 | | | $ | 9.07 | | | $ | 6.11 | | | $ | 24.63 | |
Class B Shares | | | | | | | | | | | | | | | | |
Net Assets | | $ | 2 | | | $ | 2 | | | $ | 1 | | | $ | 5 | |
Shares Outstanding | | | 200 | | | | 200 | | | | 200 | | | | 200 | |
Net Asset Value Per Share | | $ | 10.13 | | | $ | 8.69 | | | $ | 5.85 | | | $ | 23.51 | |
Class C Shares | | | | | | | | | | | | | | | | |
Net Assets | | $ | 2 | | | $ | 2 | | | $ | 1 | | | $ | 5 | |
Shares Outstanding | | | 200 | | | | 200 | | | | 200 | | | | 200 | |
Net Asset Value Per Share | | $ | 10.12 | | | $ | 8.69 | | | $ | 5.84 | | | $ | 23.52 | |
See accompanying Notes to Financial Statements.
46 Semi-Annual Report | June 30, 2005 |
Statements of Operations
For the Period Ended June 30, 2005 (all dollar amounts in thousands) (unaudited)
| | | | | | | | | | | | | | | | |
| | | Growth Fund
| | | Tax-Managed
Growth Fund
| | | Large Cap
Growth Fund
| | | Small Cap
Growth Fund
| |
Investment income | | | | | | | | | | | | | | | | |
Dividends | | $ | 906 | | | $ | 22 | | | $ | 41 | | | $ | 487 | |
Less foreign tax withheld | | | (63 | ) | | | (1 | ) | | | (3 | ) | | | — | |
Income from Affiliated Fund | | | 29 | | | | 2 | | | | 3 | | | | 91 | |
Interest | | | 21 | | | | — | | | | — | | | | 7 | |
| | |
|
|
| |
|
|
| |
|
|
| |
|
|
|
Total income | | | 893 | | | | 23 | | | | 41 | | | | 585 | |
Expenses | | | | | | | | | | | | | | | | |
Investment advisory fees | | | 924 | | | | 21 | | | | 28 | | | | 3,877 | |
Distribution fees | | | 59 | | | | — | | | | 1 | | | | 538 | |
Custodian fees | | | 37 | | | | 17 | | | | 21 | | | | 71 | |
Transfer agent fees | | | 75 | | | | 4 | | | | 7 | | | | 253 | |
Professional fees | | | 19 | | | | 8 | | | | 9 | | | | 28 | |
Registration fees | | | 17 | | | | 14 | | | | 14 | | | | 20 | |
Other expenses | | | 58 | | | | 5 | | | | 4 | | | | 33 | |
| | |
|
|
| |
|
|
| |
|
|
| |
|
|
|
Total expenses before waiver | | | 1,189 | | | | 69 | | | | 84 | | | | 4,820 | |
Less expenses waived or absorbed by the Advisor | | | — | | | | (33 | ) | | | (45 | ) | | | — | |
| | |
|
|
| |
|
|
| |
|
|
| |
|
|
|
Net expenses | | | 1,189 | | | | 36 | | | | 39 | | | | 4,820 | |
| | |
|
|
| |
|
|
| |
|
|
| |
|
|
|
Net investment income (loss) | | | (296 | ) | | | (13 | ) | | | 2 | | | | (4,235 | ) |
Net realized and unrealized gain (loss) on investments, foreign currency transactions and other assets and liabilities | | | | | | | | | | | | | | | | |
Net realized gain (loss) on investments | | | 15,234 | | | | 115 | | | | 44 | | | | 15,092 | |
| | |
|
|
| |
|
|
| |
|
|
| |
|
|
|
Change in net unrealized appreciation (depreciation) on investments and other assets and liabilities | | | (17,291 | ) | | | (38 | ) | | | (151 | ) | | | (46,037 | ) |
| | |
|
|
| |
|
|
| |
|
|
| |
|
|
|
Net increase (decrease) in net assets resulting from operations | | $ | (2,353 | ) | | $ | 64 | | | $ | (105 | ) | | $ | (35,180 | ) |
| | |
|
|
| |
|
|
| |
|
|
| |
|
|
|
See accompanying Notes to Financial Statements.
June 30, 2005 | William Blair Funds 47 |
Statements of Changes in Net Assets
For the Period Ended June 30, 2005 and Year Ended December 31, 2004 (all amounts in thousands)
| | | | | | | | | | | | | | | | | | | | | | | | | | | | | | | | |
| | | Growth
Fund
| | | Tax-
Managed
Growth
Fund
| | | Large Cap
Growth
Fund
| | | Small Cap
Growth
Fund
| |
| | | 2005
| | | 2004
| | | 2005
| | | 2004
| | | 2005
| | | 2004
| | | 2005
| | | 2004
| |
| | | (unaudited) | | | | | | (unaudited) | | | | | | (unaudited) | | | | | | (unaudited) | | | | |
Operations | | | | | | | | | | | | | | | | | | | | | | | | | | | | | | | | |
Net investment income (loss) | | $ | (296 | ) | | $ | (1,071 | ) | | $ | (13 | ) | | $ | (41 | ) | | $ | 2 | | | $ | (23 | ) | | $ | (4,235 | ) | | $ | (7,267 | ) |
Net realized gain (loss) on investments, foreign currency transactions and other assets and liabilities | | | 15,234 | | | | 14,917 | | | | 115 | | | | 460 | | | | 44 | | | | 196 | | | | 15,092 | | | | 80,817 | |
Change in net unrealized appreciation (depreciation) on investments, and other assets and liabilities | | | (17,291 | ) | | | 5,610 | | | | (38 | ) | | | (38 | ) | | | (151 | ) | | | 149 | | | | (46,037 | ) | | | 78,333 | |
| | |
|
|
| |
|
|
| |
|
|
| |
|
|
| |
|
|
| |
|
|
| |
|
|
| |
|
|
|
Net increase (decrease) in net assets resulting from operations | | | (2,353 | ) | | | 19,456 | | | | 64 | | | | 381 | | | | (105 | ) | | | 322 | | | | (35,180 | ) | | | 151,883 | |
Distributions to shareholders from | | | | | | | | | | | | | | | | | | | | | | | | | | | | | | | | |
Net investment income | | | — | | | | — | | | | — | | | | — | | | | — | | | | — | | | | — | | | | — | |
Net realized gain | | | — | | | | — | | | | — | | | | — | | | | — | | | | — | | | | — | | | | (54,782 | ) |
| | |
|
|
| |
|
|
| |
|
|
| |
|
|
| |
|
|
| |
|
|
| |
|
|
| |
|
|
|
| | | | — | | | | — | | | | — | | | | — | | | | — | | | | — | | | | — | | | | (54,782 | ) |
Capital stock transactions | | | | | | | | | | | | | | | | | | | | | | | | | | | | | | | | |
Net proceeds from sale of shares | | | 11,264 | | | | 35,194 | | | | 354 | | | | 246 | | | | 3,534 | | | | 1,655 | | | | 130,438 | | | | 260,030 | |
Shares issued in reinvestment of income dividends and capital gain distributions | | | — | | | | — | | | | — | | | | — | | | | — | | | | — | | | | — | | | | 53,276 | |
Less cost of shares redeemed | | | (39,117 | ) | | | (60,798 | ) | | | (381 | ) | | | (1,651 | ) | | | (704 | ) | | | (1,079 | ) | | | (167,348 | ) | | | (158,022 | ) |
| | |
|
|
| |
|
|
| |
|
|
| |
|
|
| |
|
|
| |
|
|
| |
|
|
| |
|
|
|
Net increase (decrease) in net assets resulting from capital share transactions | | | (27,853 | ) | | | (25,604 | ) | | | (27 | ) | | | (1,405 | ) | | | 2,830 | | | | 576 | | | | (36,910 | ) | | | 155,284 | |
| | |
|
|
| |
|
|
| |
|
|
| |
|
|
| |
|
|
| |
|
|
| |
|
|
| |
|
|
|
Increase (decrease) in net assets | | | (30,206 | ) | | | (6,148 | ) | | | 37 | | | | (1,024 | ) | | | 2,725 | | | | 898 | | | | (72,090 | ) | | | 252,385 | |
Net assets | | | | | | | | | | | | | | | | | | | | | | | | | | | | | | | | |
Beginning of period | | | 275,506 | | | | 281,654 | | | | 5,847 | | | | 6,871 | | | | 6,417 | | | | 5,519 | | | | 771,209 | | | | 518,824 | |
| | |
|
|
| |
|
|
| |
|
|
| |
|
|
| |
|
|
| |
|
|
| |
|
|
| |
|
|
|
End of period | | $ | 245,300 | | | $ | 275,506 | | | $ | 5,884 | | | $ | 5,847 | | | $ | 9,142 | | | $ | 6,417 | | | $ | 699,119 | | | $ | 771,209 | |
| | |
|
|
| |
|
|
| |
|
|
| |
|
|
| |
|
|
| |
|
|
| |
|
|
| |
|
|
|
Undistributed net investment income (loss) at the end of the period | | $ | (296 | ) | | $ | — | | | $ | (13 | ) | | $ | — | | | $ | 2 | | | $ | — | | | $ | (4,235 | ) | | $ | — | |
| | |
|
|
| |
|
|
| |
|
|
| |
|
|
| |
|
|
| |
|
|
| |
|
|
| |
|
|
|
See accompanying Notes to Financial Statements
48 Semi-Annual Report | June 30, 2005 |
Statements of Assets and Liabilities
June 30, 2005 (all dollar amounts in thousands) (unaudited)
| | | | | | | | | | | | |
| | | Small-Mid
Cap
Growth
Fund
| | | International
Growth
Fund
| | | International
Equity
Fund
| |
Assets | | | | | | | | | | | | |
Investments in securities, at cost | | $ | 49,711 | | | $ | 2,614,658 | | | $ | 21,684 | |
Investments in Affiliated Fund, at cost | | | 1,224 | | | | 20,000 | | | | 689 | |
| | |
|
|
| |
|
|
| |
|
|
|
| | | |
Investments in securities, at value | | $ | 53,145 | | | $ | 3,267,756 | | | $ | 22,369 | |
Investments in Affiliated Fund, at value | | | 1,224 | | | | 20,000 | | | | 689 | |
Cash | | | 1 | | | | — | | | | 1 | |
Foreign currency, at value (cost $6,488, $27 and $7, respectively) | | | — | | | | 6,324 | | | | 27 | |
Receivable for fund shares sold | | | 91 | | | | 28,765 | | | | 1,117 | |
Receivable for investment securities sold | | | 1,378 | | | | 6,847 | | | | — | |
Receivable from Advisor | | | — | | | | — | | | | 34 | |
Dividend and interest receivable | | | 23 | | | | 6,626 | | | | 41 | |
| | |
|
|
| |
|
|
| |
|
|
|
Total assets | | | 55,862 | | | | 3,336,318 | | | | 24,278 | |
Liabilities | | | | | | | | | | | | |
Payable for investment securities purchased | | | 1,914 | | | | 29,499 | | | | 1,141 | |
Payable for fund shares redeemed | | | 13 | | | | 2,541 | | | | — | |
Management fee payable | | | 18 | | | | 2,702 | | | | 19 | |
Distribution and shareholder services fee payable | | | 2 | | | | 452 | | | | — | |
Other accrued expenses | | | 34 | | | | 524 | | | | 14 | |
| | |
|
|
| |
|
|
| |
|
|
|
Total liabilities | | | 1,981 | | | | 35,718 | | | | 1,174 | |
| | |
|
|
| |
|
|
| |
|
|
|
Net Assets | | $ | 53,881 | | | $ | 3,300,600 | | | $ | 23,104 | |
| | |
|
|
| |
|
|
| |
|
|
|
Capital | | | | | | | | | | | | |
Composition of Net Assets | | | | | | | | | | | | |
Par value of shares of beneficial interest | | $ | 5 | | | $ | 147 | | | $ | 2 | |
Capital paid in excess of par value | | | 50,695 | | | | 2,498,483 | | | | 22,792 | |
Accumulated net investment income (loss) | | | (167 | ) | | | (853 | ) | | | (2 | ) |
Accumulated realized gain (loss) | | | (86 | ) | | | 150,154 | | | | (372 | ) |
Net unrealized appreciation (depreciation) of investments and foreign currencies | | | 3,434 | | | | 652,669 | | | | 684 | |
| | |
|
|
| |
|
|
| |
|
|
|
Net Assets | | $ | 53,881 | | | $ | 3,300,600 | | | $ | 23,104 | |
| | |
|
|
| |
|
|
| |
|
|
|
| | | |
Class A Shares | | | | | | | | | | | | |
Net Assets | | $ | 2 | | | $ | 5 | | | $ | 3 | |
Shares Outstanding | | | 200 | | | | 200 | | | | 200 | |
Maximum offering price reflecting 5.75% sales load | | $ | 11.89 | | | $ | 23.77 | | | $ | 11.92 | |
Net Asset Value Per Share | | $ | 11.21 | | | $ | 22.40 | | | $ | 11.23 | |
Class B Shares | | | | | | | | | | | | |
Net Assets | | $ | 2 | | | $ | 4 | | | $ | 2 | |
Shares Outstanding | | | 200 | | | | 200 | | | | 200 | |
Net Asset Value Per Share | | $ | 11.09 | | | $ | 21.20 | | | $ | 11.13 | |
Class C Shares | | | | | | | | | | | | |
Net Assets | | $ | 2 | | | $ | 4 | | | $ | 2 | |
Shares Outstanding | | | 200 | | | | 200 | | | | 200 | |
Net Asset Value Per Share | | $ | 11.09 | | | $ | 21.20 | | | $ | 11.13 | |
See accompanying Notes to Financial Statements.
June 30, 2005 | William Blair Funds 49 |
Statements of Operations
For the Period Ended June 30, 2005 (all dollar amounts in thousands) (unaudited)
| | | | | | | | | | | | |
| | | Small-Mid
Cap
Growth
Fund
| | | International
Growth
Fund
| | | International
Equity
Fund
| |
Investment income | | | | | | | | | | | | |
Dividends | | $ | 65 | | | $ | 39,788 | | | $ | 170 | |
Less foreign tax withheld | | | — | | | | (4,004 | ) | | | (17 | ) |
Income from Affiliated Fund | | | 18 | | | | 282 | | | | 10 | |
Interest | | | 7 | | | | 801 | | | | 4 | |
| | |
|
|
| |
|
|
| |
|
|
|
Total income | | | 90 | | | | 36,867 | | | | 167 | |
Expenses | | | | | | | | | | | | |
Investment advisory fees | | | 193 | | | | 15,582 | | | | 74 | |
Distribution fees | | | 11 | | | | 2,660 | | | | 5 | |
Custodian fees | | | 27 | | | | 853 | | | | 58 | |
Transfer agent fees | | | 15 | | | | 987 | | | | 5 | |
Professional fees | | | 10 | | | | 70 | | | | 16 | |
Registration fees | | | 15 | | | | 49 | | | | 17 | |
Other expenses | | | 15 | | | | 413 | | | | 3 | |
| | |
|
|
| |
|
|
| |
|
|
|
Total expenses before waiver | | | 286 | | | | 20,614 | | | | 178 | |
Less expenses waived or absorbed by the Advisor | | | (29 | ) | | | — | | | | (88 | ) |
| | |
|
|
| |
|
|
| |
|
|
|
Net expenses | | | 257 | | | | 20,614 | | | | 90 | |
| | |
|
|
| |
|
|
| |
|
|
|
Net investment income (loss) | | | (167 | ) | | | 16,253 | | | | 77 | |
Net realized and unrealized gain (loss) on investments, foreign currency transactions and other assets and liabilities | | | | | | | | | | | | |
Net realized gain (loss) on investments | | | (16 | ) | | | 168,003 | | | | (326 | ) |
Net realized gain (loss) on foreign currency transactions and other assets and liabilities | | | — | | | | (6,509 | ) | | | (29 | ) |
| | |
|
|
| |
|
|
| |
|
|
|
Total net realized gain (loss) | | | (16 | ) | | | 161,494 | | | | (355 | ) |
Change in net unrealized appreciation (depreciation) on investments and other assets and liabilities | | | 1,060 | | | | (127,108 | ) | | | 259 | |
| | |
|
|
| |
|
|
| |
|
|
|
Net increase (decrease) in net assets resulting from operations | | $ | 877 | | | $ | 50,639 | | | $ | (19 | ) |
| | |
|
|
| |
|
|
| |
|
|
|
| (a) | | For the period from June 6, 2005 (Commencement of Operations) to June 30, 2005. |
See accompanying Notes to Financial Statements.
50 Semi-Annual Report | June 30, 2005 |
Statements of Changes in Net Assets
For the Period Ended June 30, 2005 and the Year Ended December 31, 2004 (all amounts in thousands)
| | | | | | | | | | | | | | | | | | | | | | | | |
| | | Small-Mid
Cap
Growth
Fund
| | | International
Growth
Fund
| | | International Equity Fund
| |
| | | 2005
| | | 2004
| | | 2005
| | | 2004
| | | 2005
| | | 2004(a)
| |
| | | (unaudited) | | | | | | (unaudited) | | | | | | (unaudited) | | | | |
Operations | | | | | | | | | | | | | | | | | | | | | | | | |
Net investment income (loss) | | $ | (167 | ) | | $ | (152 | ) | | $ | 16,253 | | | $ | (1,748 | ) | | $ | 77 | | | $ | (11 | ) |
Net realized gain (loss) on investments, foreign currency transactions and other assets and liabilities | | | (16 | ) | | | 5 | | | | 161,494 | | | | 106,478 | | | | (355 | ) | | | 641 | |
Change in net unrealized appreciation (depreciation) on investments, foreign currency transactions and other assets and liabilities | | | 1,060 | | | | 2,395 | | | | (127,108 | ) | | | 341,262 | | | | 259 | | | | 425 | |
| | |
|
|
| |
|
|
| |
|
|
| |
|
|
| |
|
|
| |
|
|
|
Net increase (decrease) in net assets resulting from operations | | | 877 | | | | 2,248 | | | | 50,639 | | | | 445,992 | | | | (19 | ) | | | 1,055 | |
Distributions to shareholders from | | | | | | | | | | | | | | | | | | | | | | | | |
Net investment income | | | — | | | | — | | | | — | | | | (2,616 | ) | | | — | | | | — | |
Net realized gain | | | — | | | | — | | | | — | | | | — | | | | — | | | | — | |
| | |
|
|
| |
|
|
| |
|
|
| |
|
|
| |
|
|
| |
|
|
|
| | | | — | | | | — | | | | — | | | | (2,616 | ) | | | — | | | | — | |
Capital stock transactions | | | | | | | | | | | | | | | | | | | | | | | | |
Net proceeds from sale of shares | | | 29,020 | | | | 21,231 | | | | 553,662 | | | | 1,143,395 | | | | 14,067 | | | | 16,380 | |
Shares issued in reinvestment of income dividends and capital gain distributions | | | — | | | | — | | | | — | | | | 2,161 | | | | — | | | | — | |
Less cost of shares redeemed | | | (1,990 | ) | | | (1,178 | ) | | | (305,135 | ) | | | (487,197 | ) | | | (633 | ) | | | (7,746 | ) |
| | |
|
|
| |
|
|
| |
|
|
| |
|
|
| |
|
|
| |
|
|
|
Net increase (decrease) in net assets resulting from capital stock transactions | | | 27,030 | | | | 20,053 | | | | 248,527 | | | | 658,359 | | | | 13,434 | | | | 8,634 | |
| | |
|
|
| |
|
|
| |
|
|
| |
|
|
| |
|
|
| |
|
|
|
Increase (decrease) in net assets | | | 27,907 | | | | 22,301 | | | | 299,166 | | | | 1,101,735 | | | | 13,415 | | | | 9,689 | |
Net assets | | | | | | | | | | | | | | | | | | | | | | | | |
Beginning of period | | | 25,974 | | | | 3,673 | | | | 3,001,434 | | | | 1,899,699 | | | | 9,689 | | | | — | |
| | |
|
|
| |
|
|
| |
|
|
| |
|
|
| |
|
|
| |
|
|
|
End of period | | $ | 53,881 | | | $ | 25,974 | | | $ | 3,300,600 | | | $ | 3,001,434 | | | $ | 23,104 | | | $ | 9,689 | |
| | |
|
|
| |
|
|
| |
|
|
| |
|
|
| |
|
|
| |
|
|
|
Undistributed net investment income (loss) at the end of the period | | $ | (167 | ) | | $ | — | | | $ | (853 | ) | | $ | (17,106 | ) | | $ | (11 | ) | | $ | (79 | ) |
| | |
|
|
| |
|
|
| |
|
|
| |
|
|
| |
|
|
| |
|
|
|
(a) For the period from May 24, 2004 (Commencement of Operations) to December 31, 2004.
See accompanying Notes to Financial Statements.
June 30, 2005 | William Blair Funds 51 |
Statements of Assets and Liabilities
June 30, 2005 (all dollar amounts in thousands) (unaudited)
| | | | | | | | |
| | | Value
Discovery
Fund
| | | Income
Fund
| |
Assets | | | | | | | | |
Investments in securities, at cost | | $ | 112,425 | | | $ | 307,334 | |
Investments in Affiliated Fund, at cost | | | 1,059 | | | | — | |
| | |
|
|
| |
|
|
|
| | |
Investments in securities, at value | | $ | 135,812 | | | $ | 308,211 | |
Investments in Affiliated Fund, at value | | | 1,059 | | | | — | |
Cash | | | — | | | | 101 | |
Receivable for fund shares sold | | | 26 | | | | 945 | |
Receivable for investment securities sold | | | 2,802 | | | | — | |
Receivable from Advisor | | | 118 | | | | — | |
Dividend and interest receivable | | | 186 | | | | 2,784 | |
| | |
|
|
| |
|
|
|
Total assets | | | 140,003 | | | | 312,041 | |
Liabilities | | | | | | | | |
Payable for investment securities purchased | | | 1,366 | | | | 1,678 | |
Payable for fund shares redeemed | | | 17,367 | | | | 451 | |
Management fee payable | | | 123 | | | | 144 | |
Distribution and shareholder services fee payable | | | 35 | | | | 11 | |
Dividend payable | | | — | | | | — | |
Other accrued expenses | | | 47 | | | | 90 | |
| | |
|
|
| |
|
|
|
Total liabilities | | | 18,938 | | | | 2,374 | |
| | |
|
|
| |
|
|
|
Net Assets | | $ | 121,065 | | | $ | 309,667 | |
| | |
|
|
| |
|
|
|
Capital | | | | | | | | |
Composition of Net Assets | | | | | | | | |
Par value of shares of beneficial interest | | $ | 5 | | | $ | 31 | |
Capital paid in excess of par value | | | 68,031 | | | | 322,421 | |
Accumulated net investment income (loss) | | | (200 | ) | | | 1,062 | |
Accumulated realized gain (loss) | | | 29,842 | | | | (14,724 | ) |
Net unrealized appreciation (depreciation) of investments and foreign currencies | | | 23,387 | | | | 877 | |
| | |
|
|
| |
|
|
|
Net Assets | | $ | 121,065 | | | $ | 309,667 | |
| | |
|
|
| |
|
|
|
| | |
Class A Shares | | | | | | | | |
Net Assets | �� | $ | 4 | | | $ | 1 | |
Shares Outstanding | | | 200 | | | | 200 | |
Maximum offering price reflecting 5.75% sales load | | $ | 21.72 | | | $ | 6.06 | |
Net Asset Value Per Share | | $ | 20.47 | | | $ | 5.94 | |
Class B Shares | | | | | | | | |
Net Assets | | $ | 4 | | | $ | 2 | |
Shares Outstanding | | | 200 | | | | 200 | |
Net Asset Value Per Share | | $ | 20.82 | | | $ | 9.93 | |
Class C Shares | | | | | | | | |
Net Assets | | $ | 4 | | | $ | 2 | |
Shares Outstanding | | | 200 | | | | 200 | |
Net Asset Value Per Share | | $ | 20.83 | | | $ | 10.07 | |
See accompanying Notes to Financial Statements.
52 Semi-Annual Report | June 30, 2005 |
Statements of Operations
For the Period Ended June 30, 2005 (all dollar amounts in thousands) (unaudited)
| | | | | | | | |
| | | Value
Discovery
Fund
| | | Income
Fund
| |
Investment income | | | | | | | | |
Dividends | | $ | 690 | | | $ | — | |
Income from Affiliated Fund | | | 19 | | | | — | |
Interest | | | 82 | | | | 7,140 | |
| | |
|
|
| |
|
|
|
Total income | | | 791 | | | | 7,140 | |
Expenses | | | | | | | | |
Investment advisory fees | | | 956 | | | | 718 | |
Distribution fees | | | 31 | | | | 66 | |
Shareholder services fees | | | — | | | | — | |
Custodian fees | | | 60 | | | | 45 | |
Transfer agent fees | | | 38 | | | | 48 | |
Professional fees | | | 18 | | | | 20 | |
Registration fees | | | 16 | | | | 16 | |
Other expenses | | | 26 | | | | 40 | |
| | |
|
|
| |
|
|
|
Total expenses before waiver | | | 1,145 | | | | 953 | |
Less expenses waived or absorbed by the Advisor | | | (118 | ) | | | — | |
| | |
|
|
| |
|
|
|
Net expenses | | | 1,027 | | | | 953 | |
| | |
|
|
| |
|
|
|
Net investment income (loss) | | | (236 | ) | | | 6,187 | |
Net realized and unrealized gain (loss) on investments, foreign currency transactions and other assets and liabilities | | | | | | | | |
Net realized gain (loss) on investments | | | 24,622 | | | | (528 | ) |
| | |
|
|
| |
|
|
|
Change in net unrealized appreciation (depreciation) on investments and other assets and liabilities | | | (37,982 | ) | | | (1,472 | ) |
| | |
|
|
| |
|
|
|
Net increase (decrease) in net assets resulting from operations | | $ | (13,596 | ) | | $ | 4,187 | |
| | |
|
|
| |
|
|
|
See accompanying Notes to Financial Statements.
June 30, 2005 | William Blair Funds 53 |
Statements of Changes in Net Assets
For the Period Ended June 30, 2005 and the Year Ended December 31, 2004 (all amounts in thousands)
| | | | | | | | | | | | | | | | |
| | | Value
Discovery
Fund
| | | Income
Fund
| |
| | | 2005
| | | 2004
| | | 2005
| | | 2004
| |
| | | (unaudited) | | | | | | (unaudited) | | | | |
Operations | | | | | | | | | | | | | | | | |
Net investment income (loss) | | $ | (236 | ) | | $ | 84 | | | $ | 6,187 | | | $ | 11,549 | |
Net realized gain (loss) on investments, foreign currency transactions and other assets and liabilities | | | 24,622 | | | | 26,728 | | | | (528 | ) | | | (1,841 | ) |
Change in net unrealized appreciation (depreciation) on investments, foreign currency transactions and other assets and liabilities | | | (37,982 | ) | | | 240 | | | | (1,472 | ) | | | (2,534 | ) |
| | |
|
|
| |
|
|
| |
|
|
| |
|
|
|
Net increase (decrease) in net assets resulting from operations | | | (13,596 | ) | | | 27,052 | | | | 4,187 | | | | 7,174 | |
Distributions to shareholders from | | | | | | | | | | | | | | | | |
Net investment income | | | — | | | | — | | | | (6,786 | ) | | | (14,033 | ) |
Net realized gain | | | — | | | | (26,037 | ) | | | — | | | | — | |
| | |
|
|
| |
|
|
| |
|
|
| |
|
|
|
| | | | — | | | | (26,037 | ) | | | (6,786 | ) | | | (14,033 | ) |
Capital stock transactions | | | | | | | | | | | | | | | | |
Net proceeds from sale of shares | | | 13,670 | | | | 58,405 | | | | 52,801 | | | | 93,503 | |
Shares issued in reinvestment of income dividends and capital gain distributions | | | — | | | | 25,638 | | | | 5,244 | | | | 10,085 | |
Capital contribution by the Advisor | | | — | | | | — | | | | — | | | | — | |
Less cost of shares redeemed | | | (125,185 | ) | | | (75,993 | ) | | | (39,863 | ) | | | (67,707 | ) |
| | |
|
|
| |
|
|
| |
|
|
| |
|
|
|
Net increase (decrease) in net assets resulting from capital stock transactions | | | (111,515 | ) | | | 8,050 | | | | 18,182 | | | | 35,881 | |
| | |
|
|
| |
|
|
| |
|
|
| |
|
|
|
Increase (decrease) in net assets | | | (125,111 | ) | | | 9,065 | | | | 15,583 | | | | 29,022 | |
Net assets | | | | | | | | | | | | | | | | |
Beginning of period | | | 246,176 | | | | 237,111 | | | | 294,084 | | | | 265,062 | |
| | |
|
|
| |
|
|
| |
|
|
| |
|
|
|
End of period | | $ | 121,065 | | | $ | 246,176 | | | $ | 309,667 | | | $ | 294,084 | |
| | |
|
|
| |
|
|
| |
|
|
| |
|
|
|
Undistributed net investment income (loss) at the end of the period | | $ | (200 | ) | | $ | 36 | | | $ | 1,062 | | | $ | 173 | |
| | |
|
|
| |
|
|
| |
|
|
| |
|
|
|
See accompanying Notes to Financial Statements.
54 Semi-Annual Report | June 30, 2005 |
Notes to Financial Statements
(1) Significant Accounting Policies
(a) Description of the Fund
William Blair Funds (the “Fund”) is a diversified mutual fund registered under the Investment Company Act of 1940, as amended, as an open-end management investment company. For each portfolio, the number of shares authorized is unlimited. The Fund currently consists of the following thirteen portfolios (the “Portfolios”), each with its own investment objectives and policies.
| | |
Equity Portfolios
| | International Portfolios
|
Growth | | International Growth |
Tax-Managed Growth | | International Equity |
Large Cap Growth | | Institutional International Growth |
Small Cap Growth | | Institutional International Equity |
Small-Mid Cap Growth | | Emerging Markets Growth |
Value Discovery | | Fixed Income Portfolio
|
| | | Income |
| | | Money Market Portfolio
|
| | | Ready Reserves |
The investment objectives of the Portfolios are as follows:
| | |
Equity | | Long-term capital appreciation. |
International | | Long-term capital appreciation. |
Fixed Income | | High level of current income with relative stability of principal. |
Money Market | | Current income, a stable share price and daily liquidity. |
The Institutional International Growth Fund, the Institutional International Equity Fund, the Ready Reserves Fund, and Emerging Markets Growth Fund, which do not offer Class A, B or C shares issue separate reports.
(b) Share Classes
Six different classes of shares currently exist: A, B, C, N, I and Institutional. This report includes financial highlight information for Classes A, B and C. The Class A, Class B and Class C share classes were offered for sale from November 2, 1999 until May 25, 2001. Currently, William Blair and Company, L.L.C., is the only shareholder in Class A, Class B, and Class C. All of the remaining shareholders in these classes exchanged their shares to Class N shares of their respective portfolio as of May 25, 2001. The table below describes the Class A shares, Class B shares and Class C shares covered by this report:
| | |
Class
| | Description
|
| A | | Class A shares are sold to investors subject to an initial sales charge (maximum amount 5.75% for Equity, and International Portfolios, 2.0% for Fixed Income Portfolio) and is subject to ongoing shareholder service fees of 0.25% of average daily net assets of Class A, except the Income Portfolio which is 0.15%. |
| B | | Class B shares are sold without an initial sales charge but are subject to higher ongoing expenses than Class A shares in the form of shareholder service fees of 0.25% and distribution fees under a Rule 12b-1 plan of 0.75% of average daily net assets of Class B and a contingent deferred sales charge payable upon certain redemptions. Class B shares automatically convert to Class A shares seven years after issuance (three years for the Income Portfolio). |
| C | | Class C shares are sold without an initial sales charge but are subject to higher ongoing expenses than Class A shares in the form of shareholder service fees of 0.25% and distribution fees under a Rule 12b-1 plan of 0.75% of average daily net assets of Class B and a contingent deferred sales charge payable upon certain redemptions within one year of purchase. |
Investment income, realized and unrealized gains and losses, and certain portfolio level expenses and expense reductions, if any, are allocated based on the relative net assets of each class, except for certain class specific expenses which are charged directly to the appropriate class. Differences in class expenses may result in the payment of different per share dividends by class. All share classes of the Portfolios have equal rights with respect to voting subject to class specific arrangements.
June 30, 2005 | William Blair Funds 55 |
(c) Investment Valuation
The market value of domestic equity securities and options is determined by valuing securities traded on national securities exchanges or markets or in the over-the-counter markets at the last sales price or, if applicable, the official closing price or, in the absence of a sale on the date of valuation, at the latest bid price.
For international securities, if the foreign exchange or market on which a security is primarily traded closes before the close of regular trading on the New York Stock Exchange (4:00 p.m. Eastern time), the Funds use an independent pricing service on a daily basis to estimate the fair value price as of the close of regular trading on the New York Stock Exchange. The Board of Trustees has determined that the passage of time between when foreign exchanges or markets close and when the Funds compute their net asset values could cause the value of international securities to no longer be representative of their market price or accurate. Otherwise, the value of foreign equity securities is determined based on the last sale price on the foreign exchange or market on which it is primarily traded or, if there have been no sales during that day, at the latest bid price. Foreign currency forward contracts and foreign currencies are valued at the forward and current exchange rates, respectively, prevailing on the date of valuation. In addition, quarterly the Board of Trustees receives a report which tracks the fair value price used to calculate the net asset value to the next day’s opening local prices.
Long-term, fixed income securities are valued based on market quotations, or by independent pricing services that use prices provided by market makers or by estimates of market values obtained from yield data relating to instruments or securities with similar characteristics.
Investments in other funds are valued at the underlying fund’s net asset value on the date of valuation. Other securities, and all other assets, including securities for which a market price is not available, or the value of which is affected by a significant valuation event, are valued at fair value as determined in good faith by, or under the direction of the Board of Trustees and in accordance with the Fund’s valuation procedures. As of June 30, 2005, there were securities held in Value Discovery, International Growth, and International Equity Portfolios requiring fair valuation pursuant to the Fund’s valuation procedures.
(d) Investment income and investment transactions
Dividend income is recorded on the ex-dividend date, except for those dividends from certain foreign securities which are recorded as soon as the information is available.
Premiums and discounts are accreted and amortized on a straight-line basis for short-term investments and on an effective interest method for long-term investments.
Interest income is determined on the basis of the interest accrued, adjusted for amortization of premium or discount. Variable rate bonds and floating rate notes earn interest at coupon rates that fluctuate at specific time intervals. The interest rates shown in the Portfolio of Investments for the Income Portfolio were the rates in effect on June 30, 2005. Put bonds may be redeemed at the discretion of the holder on specified dates prior to maturity. The Portfolios utilize the straight-line method of amortization of premiums and discounts for short-term securities (maturities less than one year) and the effective interest method for long-term securities (maturities greater than one year).
Paydown gains and losses on mortgage and asset-backed securities are treated as an adjustment to interest income. For the period ended June 30, 2005, the Income Portfolio recognized a reduction of interest income and a reduction of net realized loss of $1,488 (in thousands). For the years ended December 31, 2004 and 2003, the Income Portfolio recognized a reduction in interest income and a reduction in net realized loss of $2,532 and $2,691 (in thousands), respectively. This reclassification has no effect on the net asset value of the Portfolio.
Securities transactions are recorded on the trade date. Realized gains and losses from securities transactions are recognized on the basis of high cost lot sell selection.
(e) Share Valuation and Dividends to Shareholders
Shares are sold and redeemed on a continuous basis at net asset value. The net asset value per share is determined separately for each class by dividing the Portfolio’s net assets attributable to that class by the number of shares of the class outstanding as of the close of regular trading on the New York Stock Exchange, which is generally 3:00 p.m. Central time (4:00 p.m. Eastern time), on each day the Exchange is open.
56 Semi-Annual Report | June 30, 2005 |
Dividends from net investment income, if any, of the Growth, Tax-Managed Growth, Large Cap Growth, Small Cap Growth, Small-Mid Cap Growth, International Growth, International Equity, and Value Discovery Portfolios are declared at least annually. Dividends from the Income Portfolio are declared monthly. Capital gain distributions, if any, are declared at least annually in December. Dividends payable to shareholders are recorded on the ex-dividend date.
The timing and characterization of certain income and capital gain distributions are determined annually in accordance with Federal income tax regulations that may differ from U.S. generally accepted accounting principles. As a result, net investment income or loss and net realized gain or loss for a reporting period may differ from the amount distributed during such period. In addition, the Portfolios may periodically record reclassifications among certain capital accounts to reflect differences between financial reporting and income tax basis distributions. The reclassifications were reported in order to reflect the tax treatment for certain permanent differences that exist between income tax regulations and U.S. generally accepted accounting principles. The reclassifications relate to net operating losses, Section 988 currency gains and losses, mortgage paydown securities gains and losses associated with securities issued before June 8, 1997 and recharacterization of dividends received from investments in REITs, expired capital loss carryforwards, and gain or loss on in-kind transactions. These reclassifications have no impact on the net asset values of the Portfolios. Accordingly, at December 31, 2004, the following reclassifications were recorded (in thousands):
| | | | | | | | | | | |
Portfolio
| | Undistributed Net
Investment Income/(Loss)
| | | Accumulated
Undistributed
Net Realized Gain/ (Loss)
| | | Capital
Paid In Excess
of Par Value
| |
Growth | | $ | 1,071 | | | — | | | $ | (1,071 | ) |
Tax-Managed Growth | | | 41 | | | — | | | | (41 | ) |
Large Cap Growth | | | 23 | | | — | | | | (23 | ) |
Small Cap Growth | | | 7,267 | | | (7,267 | ) | | | — | |
Small-Mid Cap Growth | | | 152 | | | (75 | ) | | | (77 | ) |
International Growth | | | (9,697 | ) | | 9,697 | | | | — | |
International Equity | | | (67 | ) | | (658 | ) | | | 725 | |
Value Discovery | | | (48 | ) | | 84 | | | | (36 | ) |
Income | | | 2,529 | | | (369 | ) | | | (2,160 | ) |
Distributions from net realized gains for book purposes may include short-term capital gains, which are included as ordinary income for tax purposes. The tax character of distributions paid during 2004 and 2003 was as follows (in thousands):
| | | | | | | | | | | | |
| | | Distributions Paid In 2004
| | Distributions Paid In 2003
|
Portfolio
| | Ordinary
Income
| | Long-Term
Capital Gains
| | Ordinary
Income
| | Long-Term
Capital Gains
|
Growth | | $ | — | | $ | — | | $ | — | | $ | — |
Tax-Managed Growth | | | — | | | — | | | — | | | — |
Large Cap Growth | | | — | | | — | | | — | | | — |
Small Cap Growth | | | 15,332 | | | 39,450 | | | 1,139 | | | 6,304 |
Small-Mid Cap Growth | | | — | | | — | | | — | | | — |
International Growth | | | 2,616 | | | — | | | 2,775 | | | — |
International Equity | | | — | | | — | | | — | | | — |
Value Discovery | | | — | | | — | | | — | | | — |
Income | | | 14,033 | | | — | | | 13,802 | | | — |
June 30, 2005 | William Blair Funds 57 |
As of December 31, 2004, the components of distributable earnings on a tax basis were as follows (in thousands):
| | | | | | | | | | | | |
Portfolio
| | Undistributed
Ordinary
Income
| | Accumulated
Capital and
Other
Losses
| | Undistributed
Long-Term
Gain
| | Net Unrealized
Appreciation / (Depreciation)
|
Growth | | $ | — | | $ | 16,820 | | $ | — | | $ | 67,205 |
Tax-Managed Growth | | | — | | | 1,886 | | | — | | | 1,410 |
Large Cap Growth | | | — | | | 5,421 | | | — | | | 1,082 |
Small Cap Growth | | | 8,679 | | | — | | | 14,322 | | | 153,719 |
Small-Mid Cap Growth | | | — | | | — | | | — | | | 2,304 |
International Growth | | | 1,313 | | | 5,866 | | | — | | | 753,758 |
International Equity | | | — | | | 72 | | | — | | | 402 |
Value Discovery | | | — | | | — | | | 6,625 | | | 59,999 |
Income | | | 173 | | | 12,623 | | | — | | | 2,262 |
(f) Options
The Portfolios may engage in options transactions on security indices and other financial indices and in doing so achieve similar objectives to what they would achieve through the sale or purchase of options on individual securities or other instruments.
Option writing. When a Portfolio writes an option, an amount equal to the premium received by the Portfolio is recorded as a liability and is subsequently adjusted to the current fair value of the option written. Premiums received from writing options that expire unexercised are treated by the Portfolio on the expiration date as realized gains from investments. The difference between the premium and the amount paid on effecting a closing purchase transaction, including brokerage commissions, is also treated as a realized gain, or, if the premium is less than the amount paid for the closing purchase transaction, as a realized loss. If a call option is exercised, the premium is added to the proceeds from the sale of the underlying security or currency in determining whether the Portfolio has realized a gain or loss. If a put option is exercised, the premium reduces the cost basis of the securities purchased by the Portfolio. The Portfolio as writer of an option bears the market risk of an unfavorable change in the price of the security underlying the written option. There were no open options at June 30, 2005.
(g) Foreign Currency Translation and Forward Foreign Currency Contracts
The International Growth and International Equity Portfolios may invest in securities denominated in foreign currencies. As such, assets and liabilities denominated in foreign currencies are translated into U.S. dollar amounts at the current exchange rate on the date of valuation. The Portfolios may enter into foreign currency forward contracts (1) as a means of managing the risks associated with changes in the exchange rates for the purchase or sale of a specific amount of a particular foreign currency, and (2) to hedge the value, in U.S. dollars, of portfolio securities. Gains and losses from foreign currency transactions associated with purchases and sales of investments and foreign currency forward contracts are included with the net realized and unrealized gain or loss on investments.
(h) Income Taxes
Each Portfolio intends to comply with the special provisions Subchapter M of the Internal Revenue Code available to regulated investment companies and, therefore, no provision for Federal income taxes has been made in the accompanying financial statements since each Portfolio intends to distribute substantially all of its taxable income to its shareholders and be relieved of all Federal income taxes.
The cost of investments for Federal income tax purposes and related gross unrealized appreciation/(depreciation) and net unrealized appreciation/(depreciation) at June 30, 2005, were as follows (in thousands):
| | | | | | | | | | | | |
Portfolio
| | Cost of
Investments
| | Gross Unrealized Appreciation
| | Gross Unrealized Depreciation
| | Net Unrealized
Appreciation / (Depreciation)
|
Growth | | $ | 193,796 | | $ | 55,695 | | $ | 5,890 | | $ | 49,805 |
Tax-Managed Growth | | | 4,646 | | | 1,520 | | | 148 | | | 1,372 |
Large Cap Growth | | | 8,222 | | | 1,123 | | | 202 | | | 921 |
Small Cap Growth | | | 586,762 | | | 136,116 | | | 29,670 | | | 106,446 |
Small-Mid Cap Growth | | | 51,231 | | | 4,205 | | | 1,067 | | | 3,138 |
International Growth | | | 2,640,019 | | | 690,894 | | | 43,586 | | | 647,308 |
International Equity | | | 22,415 | | | 952 | | | 310 | | | 642 |
Value Discovery | | | 117,081 | | | 24,505 | | | 4,715 | | | 19,790 |
Income | | | 307,429 | | | 3,902 | | | 3,120 | | | 782 |
58 Semi-Annual Report | June 30, 2005 |
At December 31, 2004, the Portfolios have unused capital loss carryforwards available for Federal income tax purposes to be applied against future capital gains, if any. If not applied, the carryforwards will expire as follows (in thousands):
| | | | | | | | | | | | | | | | | | | | | | | | | | | |
Portfolio
| | 2005
| | 2006
| | 2007
| | 2008
| | 2009
| | 2010
| | 2011
| | 2012
| | Total
|
Growth | | $ | — | | $ | — | | $ | — | | $ | — | | $ | — | | $ | 14,788 | | $ | 2,032 | | $ | — | | $ | 16,820 |
Tax-Managed Growth | | | — | | | — | | | — | | | — | | | 381 | | | 1,037 | | | 468 | | | — | | | 1,886 |
Large Cap Growth | | | — | | | — | | | — | | | 356 | | | 2,714 | | | 1,582 | | | 769 | | | — | | | 5,421 |
Small Cap Growth | | | — | | | — | | | — | | | — | | | — | | | — | | | — | | | — | | | — |
Small-Mid Cap Growth | | | — | | | — | | | — | | | — | | | — | | | — | | | — | | | — | | | — |
International Growth | | | — | | | — | | | — | | | — | | | — | | | — | | | 5,866 | | | — | | | 5,866 |
International Equity | | | — | | | — | | | — | | | — | | | — | | | — | | | — | | | — | | | — |
Value Discovery | | | — | | | — | | | — | | | — | | | — | | | — | | | — | | | — | | | — |
Income | | | — | | | — | | | 1,249 | | | 3,292 | | | — | | | 1,692 | | | 1,582 | | | 4,808 | | | 12,623 |
The International Growth and International Equity Portfolios have elected to mark-to-market its investments in Passive Foreign Investment Companies (“PFICs”) for Federal income tax purposes. In accordance with this election, the Portfolio recognized net unrealized appreciation (depreciation) of $15,094 and $6, respectively (in thousands) in 2004, all of which has been reclassified from unrealized gain (loss) on investments to undistributed net investment income.
For the period November 1, 2004 through December 31, 2004, the following Portfolios incurred net realized capital or foreign currency losses. Each Portfolio intends to treat this loss as having occurred in fiscal year 2005 for Federal income tax purposes (in thousands):
| | | |
Portfolio
| | Amount
|
Growth | | $ | — |
Tax-Managed Growth | | | — |
Large Cap Growth | | | — |
Small Cap Growth | | | — |
Small-Mid Cap Growth | | | — |
International Growth | | | — |
International Equity | | | 72 |
Value Discovery | | | — |
Income | | | 376 |
(i) Use of Estimates
The preparation of financial statements in conformity with U.S. generally accepted accounting principles requires management to make estimates and assumptions that affect the amounts reported in the financial statements. Actual results may differ from those estimates.
(2) Transactions with Affiliates
(a) Management and Expense Limitation Agreements
Each Portfolio has a management agreement with William Blair & Company L.L.C. (the “Company”) for investment advisory, administrative, and other accounting services. Each Portfolio pays the Company an annual fee, payable monthly, based on a specified percentage of its average daily net assets. A summary of the annual rates expressed as a percentage of average daily net assets is as follows:
| | | | | | |
Equity Portfolios
| | | | International Portfolios
| | |
Growth | | 0.75% | | International Growth and International Equity | | |
Tax-Managed Growth | | 0.80% | | First $250 million | | 1.10% |
Large Cap Growth | | 0.80% | | In excess of $250 million | | 1.00% |
Small Cap Growth | | 1.10% | | | | |
Small-Mid Cap Growth | | 1.00% | | | | |
Value Discovery | | 1.15% | | | | |
Fixed Income Portfolio
| | | | | | |
Income* | | | | | | |
First $250 million | | 0.25% | | | | |
In excess of $250 million | | 0.20% | | | | |
| | | | | | |
*Management fee also includes a charge of 5% of gross income. | | | | | | |
June 30, 2005 | William Blair Funds 59 |
Some of the Portfolios have also entered into Expense Limitation Agreements with the Company. Under the terms of these Agreements, the Company has agreed to waive its advisory fees and absorb other operating expenses through April 30, 2006, if total expenses for each class of the following Portfolios exceed the following rates (as a percentage of average daily net assets):
| | | | | | | | | | | | |
| | | Class A Shares
| | | Class B & C Shares
| |
| | | Through April 30, 2005
| | | Effective
May 1, 2005
| | | Through April 30, 2005
| | | Effective
May 1, 2005
| |
Tax-Managed Growth | | 1.54 | % | | 1.53 | % | | 2.29 | % | | 2.28 | % |
Large Cap Growth | | 1.34 | % | | 1.25 | % | | 2.09 | % | | 2.00 | % |
Small Cap Growth | | 1.65 | % | | 1.50 | % | | 2.40 | % | | 2.25 | % |
Small-Mid Cap Growth | | 1.54 | % | | 1.40 | % | | 2.29 | % | | 2.15 | % |
International Growth | | N/A | | | 1.48 | % | | N/A | | | 2.23 | % |
International Equity | | 1.50 | % | | 1.48 | % | | 2.25 | % | | 2.23 | % |
Value Discovery | | 1.34 | % | | 1.34 | % | | 2.25 | % | | 2.09 | % |
For a period of five years subsequent to the Commencement of Operations of each Fund, the Company is entitled to reimbursement from the Tax-Managed Growth, Large Cap Growth, and Small Cap Growth Portfolios for previously waived fees and expenses to the extent the overall expense ratio remains below the percentages indicated. As a result, the total expense ratio for the Portfolios during the period the agreement is in effect, will not fall below the percentages indicated. The Company’s right to be reimbursed under these agreements expired December 27, 2004. Under this provision, the Small Cap Growth Portfolio reimbursed the Advisor $164, and $186 for the years ended December 31, 2004 and 2003, respectively (in thousands).
For a period of three years subsequent to the Commencement of Operations of the Small-Mid Cap Growth and the International Equity Portfolios, the Company is entitled to reimbursement for previously waived fees and expenses to the extent the overall expense ratio remains below the percentages indicated. The total amount available for recapture at June 30, 2005 is $162 (in thousands) for the Small-Mid Cap Growth Portfolio and $150 for the International Equity Portfolio.
For the period ended June 30, 2005, the investment advisory fees incurred by the Portfolios and related fee waivers were as follows (in thousands) :
| | | | | | | | | | | | |
Portfolio
| | Gross
Advisory Fee
| | Fee Waiver
| | Net
Advisory Fee
| | Additional Expenses
(Recovered) or
Absorbed
by Advisor
|
Growth | | $ | 924 | | $ | — | | $ | 924 | | $ | — |
Tax-Managed Growth | | | 21 | | | 21 | | | — | | | 12 |
Large Cap Growth | | | 28 | | | 28 | | | — | | | 17 |
Small Cap Growth | | | 3,877 | | | — | | | 3,877 | | | — |
Small-Mid Cap Growth | | | 193 | | | 29 | | | 164 | | | — |
International Growth | | | 15,582 | | | — | | | 15,582 | | | — |
International Equity | | | 74 | | | 74 | | | — | | | 14 |
Value Discovery | | | 956 | | | 104 | | | 852 | | | — |
Income | | | 718 | | | — | | | 718 | | | — |
(b) Underwriting, Distribution Services and Shareholder Services Agreement
Each Portfolio has a Distribution Agreement with the Company for distribution services. Each Portfolio pays the Company an annual fee, payable monthly, based on a specified percentage of its average daily net assets of specified share classes. The annual rates for Distribution fees expressed as a percentage of average daily net assets for Class B and Class C is 0.75% for all Portfolios. Each Portfolio also has a Shareholder Services Agreement with the Company. The annual rate for shareholder service fees expressed as a percentage of average daily net assets for Class A, Class B and Class C is 0.25%, except the Income Portfolio, which is 0.15%.
60 Semi-Annual Report | June 30, 2005 |
Distribution and shareholder service fees incurred by Class A, Class B and Class C of the Portfolios to the Company, for the period ended June 30, 2005, were as follows:
| | | | | | |
Portfolio
| | Distribution Fees
| | Shareholder
Service Fee
|
Growth | | $ | 15 | | $ | 6 |
Tax-Managed Growth | | | 12 | | | 6 |
Large Cap Growth | | | 8 | | | 5 |
Small Cap Growth | | | 35 | | | 17 |
Small-Mid Cap Growth | | | 16 | | | 7 |
International Growth | | | 32 | | | 16 |
International Equity | | | 17 | | | 9 |
Value Discovery | | | 30 | | | 16 |
Income | | | 15 | | | 3 |
(c) Trustees Fees
The Fund incurred fees of $123 (in thousands) to non-interested trustees of the Fund for the period ended June 30, 2005. Interested trustees are not compensated.
(d) Investments in Affiliated Portfolio
Pursuant to an Exemptive Order granted by the Securities and Exchange Commission in January, 2001, each of the Portfolios of the Fund may invest in the William Blair Ready Reserves Portfolio (“Ready Reserves”), an open-end money market portfolio managed by the Advisor. Ready Reserves Portfolio is used as a cash management option to the other Portfolios in the Fund. The Advisor waives management fees and shareholder service fees earned from the other Portfolios investment in the Ready Reserves Fund. The fees waived with respect to each Portfolio for the period ended June 30, 2005 are listed below. Distributions received from Ready Reserves are reflected as dividend income in each Portfolio’s statement of operations. Amounts relating to the Portfolios’ investments in Ready Reserves were as follows for the period ended June 30, 2005 (in thousands):
| | | | | | | | | | | | | | | | | | |
Portfolio
| | Purchases
| | Sales
Proceeds
| | Fees
Waived
| | Dividend
Income
| | Value
| | Percent
of Net
Assets
| |
Growth | | $ | 37,136 | | $ | 36,352 | | $ | 9 | | $ | 29 | | $ | 922 | | 0.4 | % |
Tax-Managed Growth | | | 989 | | | 859 | | | 1 | | | 2 | | | 177 | | 3.0 | |
Large Cap Growth | | | 3,869 | | | 3,716 | | | 1 | | | 3 | | | 330 | | 3.6 | |
Small Cap Growth | | | 54,115 | | | 69,721 | | | 28 | | | 92 | | | 6,243 | | 0.9 | |
Small-Mid Cap Growth | | | 13,806 | | | 13,558 | | | 5 | | | 18 | | | 1,224 | | 2.3 | |
International Growth | | | 75,134 | | | 95,000 | | | 82 | | | 282 | | | 20,000 | | 0.6 | |
International Equity | | | 5,219 | | | 4,749 | | | 1 | | | 5 | | | 689 | | 3.0 | |
Value Discovery | | | 28,680 | | | 34,522 | | | 6 | | | 19 | | | 1,059 | | 0.9 | |
(3) Investment Transactions
Investment transactions, excluding money market instruments, for the period ended June 30, 2005 were as follows (in thousands):
| | | | | | |
Portfolio
| | Purchases
| | Sales
|
Growth | | $ | 68,434 | | $ | 100,054 |
Tax-Managed Growth | | | 708 | | | 954 |
Large Cap Growth | | | 4,374 | | | 1,775 |
Small Cap Growth | | | 228,045 | | | 252,489 |
Small-Mid Cap Growth | | | 37,760 | | | 12,008 |
International Growth | | | 1,464,858 | | | 1,216,867 |
International Equity | | | 17,389 | | | 5,274 |
Value Discovery | | | 104,961 | | | 197,508 |
Income | | | 85,169 | | | 61,944 |
June 30, 2005 | William Blair Funds 61 |
(4) Foreign Currency Forward Contracts
To protect itself against a decline in the value of foreign currency against the U.S. dollar, the International Growth and International Equity Portfolios enter into foreign currency forward contracts with its custodian and others. The Portfolios bear the market risk that arises from changes in foreign currency rates and bears the credit risk if the counterparty fails to perform under the contract. The net realized and unrealized gains and losses associated with foreign currency forward contracts are reflected in the accompanying financial statements. There were no open foreign currency forward contracts at June 30, 2005.
(5) Fund Share Transactions
There were no Fund share transactions to report for the Funds’ Class A, Class B, and Class C shares. For all Funds, Class A shares, Class B shares and Class C shares, each have one open account held by William Blair & Company, L.L.C. There have been no purchases, reinvestments of dividends or redemptions in these accounts since they initially opened with 200 shares each on May 25, 2001.
62 Semi-Annual Report | June 30, 2005 |
Financial Highlights
Growth Fund
| | | | | | | | | | | | | | | | | | | | | | | | |
| | | Class A
| |
| | | Period Ended
| | | Years Ended December 31,
| |
| | | 6/30/2005
| | | 2004
| | | 2003
| | | 2002
| | | 2001
| | | 2000
| |
| | | (unaudited) | | | | | | | | | | | | | | | | |
Net asset value, beginning of period | | $ | 10.70 | | | $ | 9.97 | | | $ | 8.05 | | | $ | 10.87 | | | $ | 12.72 | | | $ | 20.09 | |
Income (loss) from investment operations: | | | | | | | | | | | | | | | | | | | | | | | | |
Net investment income (loss) | | | (0.02 | ) | | | (0.06 | ) | | | (0.06 | ) | | | (0.07 | ) | | | (0.05 | ) | | | (0.06 | ) |
Net realized and unrealized gain (loss) on investments | | | (0.05 | ) | | | 0.79 | | | | 1.98 | | | | (2.75 | ) | | | (1.66 | ) | | | (1.52 | ) |
| | |
|
|
| |
|
|
| |
|
|
| |
|
|
| |
|
|
| |
|
|
|
Total from investment operations | | | (0.07 | ) | | | 0.73 | | | | 1.92 | | | | (2.82 | ) | | | (1.71 | ) | | | (1.58 | ) |
Less distributions from: | | | | | | | | | | | | | | | | | | | | | | | | |
Net investment income | | | — | | | | — | | | | — | | | | — | | | | — | | | | — | |
Net realized gain | | | — | | | | — | | | | — | | | | — | | | | 0.14 | | | | 5.79 | |
| | |
|
|
| |
|
|
| |
|
|
| |
|
|
| |
|
|
| |
|
|
|
Total distributions | | | — | | | | — | | | | — | | | | — | | | | 0.14 | | | | 5.79 | |
| | |
|
|
| |
|
|
| |
|
|
| |
|
|
| |
|
|
| |
|
|
|
Net asset value, end of period | | $ | 10.63 | | | $ | 10.70 | | | $ | 9.97 | | | $ | 8.05 | | | $ | 10.87 | | | $ | 12.72 | |
| | |
|
|
| |
|
|
| |
|
|
| |
|
|
| |
|
|
| |
|
|
|
Total return (%) | | | (0.65 | ) | | | 7.32 | | | | 23.85 | | | | (25.94 | ) | | | (13.46 | ) | | | (7.47 | ) |
Ratios to average daily net assets (%) (a): | | | | | | | | | | | | | | | | | | | | | | | | |
Expenses | | | 1.16 | | | | 1.17 | | | | 1.19 | | | | 1.19 | | | | 1.18 | | | | 1.13 | |
Net investment income (loss) | | | (0.44 | ) | | | (0.60 | ) | | | (0.67 | ) | | | (0.73 | ) | | | (0.57 | ) | | | (0.29 | ) |
| | | | | | | | | | | | | | | | | | | | | | | | |
| | | Class B
| |
| | | Period Ended
| | | Years Ended December 31,
| |
| | | 6/30/2005
| | | 2004
| | | 2003
| | | 2002
| | | 2001
| | | 2000
| |
| | | (unaudited) | | | | | | | | | | | | | | | | |
Net asset value, beginning of period | | $ | 10.23 | | | $ | 9.61 | | | $ | 7.82 | | | $ | 10.63 | | | $ | 12.56 | | | $ | 20.07 | |
Income (loss) from investment operations: | | | | | | | | | | | | | | | | | | | | | | | | |
Net investment income (loss) | | | (0.06 | ) | | | (0.13 | ) | | | (0.12 | ) | | | (0.13 | ) | | | (0.14 | ) | | | (0.20 | ) |
Net realized and unrealized gain (loss) on investments | | | (0.04 | ) | | | 0.75 | | | | 1.91 | | | | (2.68 | ) | | | (1.65 | ) | | | (1.52 | ) |
| | |
|
|
| |
|
|
| |
|
|
| |
|
|
| |
|
|
| |
|
|
|
Total from investment operations | | | (0.10 | ) | | | 0.62 | | | | 1.79 | | | | (2.81 | ) | | | (1.79 | ) | | | (1.72 | ) |
Less distributions from: | | | | | | | | | | | | | | | | | | | | | | | | |
Net investment income | | | — | | | | — | | | | — | | | | — | | | | — | | | | — | |
Net realized gain | | | — | | | | — | | | | — | | | | — | | | | 0.14 | | | | 5.79 | |
| | |
|
|
| |
|
|
| |
|
|
| |
|
|
| |
|
|
| |
|
|
|
Total distributions | | | — | | | | — | | | | — | | | | — | | | | 0.14 | | | | 5.79 | |
| | |
|
|
| |
|
|
| |
|
|
| |
|
|
| |
|
|
| |
|
|
|
Net asset value, end of period | | $ | 10.13 | | | $ | 10.23 | | | $ | 9.61 | | | $ | 7.82 | | | $ | 10.63 | | | $ | 12.56 | |
| | |
|
|
| |
|
|
| |
|
|
| |
|
|
| |
|
|
| |
|
|
|
Total return (%) | | | (0.98 | ) | | | 6.45 | | | | 22.89 | | | | (26.43 | ) | | | (14.27 | ) | | | (8.17 | ) |
Ratios to average daily net assets (%) (a): | | | | | | | | | | | | | | | | | | | | | | | | |
Expenses | | | 1.91 | | | | 1.92 | | | | 1.94 | | | | 1.94 | | | | 1.93 | | | | 1.88 | |
Net investment income (loss) | | | (1.19 | ) | | | (1.35 | ) | | | (1.42 | ) | | | (1.48 | ) | | | (1.32 | ) | | | (1.04 | ) |
| | | | | | | | | | | | | | | | | | |
| | | Period Ended
| | Years Ended December 31,
|
| | | 6/30/2005
| | 2004
| | 2003
| | 2002
| | 2001
| | 2000
|
| | | (unaudited) | | | | | | | | | | |
Supplemental data for all classes: | | | | | | | | | | | | | | | | | | |
Net assets at end of period (in thousands) | | $ | 245,300 | | $ | 275,506 | | $ | 281,654 | | $ | 255,625 | | $ | 386,096 | | $ | 550,987 |
Portfolio turnover rate (%) (a) | | | 55 | | | 35 | | | 45 | | | 29 | | | 74 | | | 88 |
| (a) | | Rates are annualized for periods that are less than a year. |
Note: Net investment income (loss) per share is based on the average shares outstanding during the period.
June 30, 2005 | William Blair Funds 63 |
Financial Highlights
Growth Fund
| | | | | | | | | | | | | | | | | | | | | | | | |
| | | Class C
| |
| | | Period Ended
| | | Years Ended December 31,
| |
| | | 6/30/2005
| | | 2004
| | | 2003
| | | 2002
| | | 2001
| | | 2000
| |
| | | (unaudited) | | | | | | | | | | | | | | | | |
Net asset value, beginning of period | | $ | 10.22 | | | $ | 9.60 | | | $ | 7.82 | | | $ | 10.63 | | | $ | 12.54 | | | $ | 20.06 | |
Income (loss) from investment operations: | | | | | | | | | | | | | | | | | | | | | | | | |
Net investment income (loss) | | | (0.06 | ) | | | (0.13 | ) | | | (0.12 | ) | | | (0.13 | ) | | | (0.14 | ) | | | (0.20 | ) |
Net realized and unrealized gain (loss) on investments | | | (0.04 | ) | | | 0.75 | | | | 1.90 | | | | (2.68 | ) | | | (1.63 | ) | | | (1.53 | ) |
| | |
|
|
| |
|
|
| |
|
|
| |
|
|
| |
|
|
| |
|
|
|
Total from investment operations | | | (0.10 | ) | | | 0.62 | | | | 1.78 | | | | (2.81 | ) | | | (1.77 | ) | | | (1.73 | ) |
Less distributions from: | | | | | | | | | | | | | | | | | | | | | | | | |
Net investment income | | | — | | | | — | | | | — | | | | — | | | | — | | | | — | |
Net realized gain | | | — | | | | — | | | | — | | | | — | | | | 0.14 | | | | 5.79 | |
| | |
|
|
| |
|
|
| |
|
|
| |
|
|
| |
|
|
| |
|
|
|
Total distributions | | | — | | | | — | | | | — | | | | — | | | | 0.14 | | | | 5.79 | |
| | |
|
|
| |
|
|
| |
|
|
| |
|
|
| |
|
|
| |
|
|
|
Net asset value, end of period | | $ | 10.12 | | | $ | 10.22 | | | $ | 9.60 | | | $ | 7.82 | | | $ | 10.63 | | | $ | 12.54 | |
| | |
|
|
| |
|
|
| |
|
|
| |
|
|
| |
|
|
| |
|
|
|
Total return (%) | | | (0.98 | ) | | | 6.46 | | | | 22.76 | | | | (26.43 | ) | | | (14.13 | ) | | | (8.22 | ) |
Ratios to average daily net assets (%) (a): | | | | | | | | | | | | | | | | | | | | | | | | |
Expenses | | | 1.91 | | | | 1.92 | | | | 1.94 | | | | 1.94 | | | | 1.93 | | | | 1.88 | |
Net investment income (loss) | | | (1.19 | ) | | | (1.35 | ) | | | (1.42 | ) | | | (1.48 | ) | | | (1.32 | ) | | | (1.01 | ) |
| | | | | | | | | | | | | | | | | | |
| | | Period Ended
| | Years Ended December 31,
|
| | | 6/30/2005
| | 2004
| | 2003
| | 2002
| | 2001
| | 2000
|
| | | (unaudited) | | | | | | | | | | |
Supplemental data for all classes: | | | | | | | | | | | | | | | | | | |
Net assets at end of period (in thousands) | | $ | 245,300 | | $ | 275,506 | | $ | 281,654 | | $ | 255,625 | | $ | 386,096 | | $ | 550,987 |
Portfolio turnover rate (%) (a) | | | 55 | | | 35 | | | 45 | | | 29 | | | 74 | | | 88 |
| (a) | | Rates are annualized for periods that are less than a year. |
Note: Net investment income (loss) per share is based on the average shares outstanding during the period.
64 Semi-Annual Report | June 30, 2005 |
Financial Highlights
Tax-Managed Growth Fund
| | | | | | | | | | | | | | | | | | | | | | | | |
| | | Class A
| |
| | | Period Ended
| | | Years Ended December 31,
| |
| | | 6/30/2005
| | | 2004
| | | 2003
| | | 2002
| | | 2001
| | | 2000
| |
| | | (unaudited) | | | | | | | | | | | | | | | | |
Net asset value, beginning of period | | $ | 8.97 | | | $ | 8.40 | | | $ | 6.85 | | | $ | 9.06 | | | $ | 10.08 | | | $ | 10.18 | |
Income (loss) from investment operations: | | | | | | | | | | | | | | | | | | | | | | | | |
Net investment income (loss) | | | (0.03 | ) | | | (0.08 | ) | | | (0.07 | ) | | | (0.06 | ) | | | (0.04 | ) | | | (0.04 | ) |
Net realized and unrealized gain (loss) on investments | | | 0.13 | | | | 0.65 | | | | 1.62 | | | | (2.15 | ) | | | (0.98 | ) | | | (0.06 | ) |
| | |
|
|
| |
|
|
| |
|
|
| |
|
|
| |
|
|
| |
|
|
|
Total from investment operations | | | 0.10 | | | | 0.57 | | | | 1.55 | | | | (2.21 | ) | | | (1.02 | ) | | | (0.10 | ) |
Less distributions from: | | | | | | | | | | | | | | | | | | | | | | | | |
Net investment income | | | — | | | | — | | | | — | | | | — | | | | — | | | | — | |
Net realized gain | | | — | | | | — | | | | — | | | | — | | | | — | | | | — | |
| | |
|
|
| |
|
|
| |
|
|
| |
|
|
| |
|
|
| |
|
|
|
Total distributions | | | — | | | | — | | | | — | | | | — | | | | — | | | | — | |
| | |
|
|
| |
|
|
| |
|
|
| |
|
|
| |
|
|
| |
|
|
|
Net asset value, end of period | | $ | 9.07 | | | $ | 8.97 | | | $ | 8.40 | | | $ | 6.85 | | | $ | 9.06 | | | $ | 10.08 | |
| | |
|
|
| |
|
|
| |
|
|
| |
|
|
| |
|
|
| |
|
|
|
Total return (%) | | | 1.11 | | | | 6.79 | | | | 22.63 | | | | (24.39 | ) | | | (10.12 | ) | | | (0.98 | ) |
Ratios to average daily net assets (%) (a): | | | | | | | | | | | | | | | | | | | | | | | | |
Expenses, net of waivers and reimbursements | | | 1.54 | | | | 1.54 | | | | 1.49 | | | | 1.36 | | | | 1.36 | | | | 1.36 | |
Expenses, before waivers and reimbursements | | | 2.71 | | | | 2.26 | | | | 2.26 | | | | 2.22 | | | | 3.64 | | | | 11.34 | |
Net investment income (loss), net of waivers and reimbursements | | | (0.70 | ) | | | (0.92 | ) | | | (0.91 | ) | | | (0.72 | ) | | | (0.57 | ) | | | (0.41 | ) |
Net investment income (loss), before waivers and reimbursements | | | (1.87 | ) | | | (1.64 | ) | | | (1.68 | ) | | | (1.58 | ) | | | (2.85 | ) | | | (10.39 | ) |
| | | | | | | | | | | | | | | | | | | | | | | | |
| | | Class B
| |
| | | Period Ended
| | | Years Ended December 31,
| |
| | | 6/30/2005
| | | 2004
| | | 2003
| | | 2002
| | | 2001
| | | 2000
| |
| | | (unaudited) | | | | | | | | | | | | | | | | |
Net asset value, beginning of period | | $ | 8.63 | | | $ | 8.14 | | | $ | 6.69 | | | $ | 8.93 | | | $ | 10.01 | | | $ | 10.18 | |
Income (loss) from investment operations: | | | | | | | | | | | | | | | | | | | | | | | | |
Net investment income (loss) | | | (0.06 | ) | | | (0.14 | ) | | | (0.12 | ) | | | (0.11 | ) | | | (0.11 | ) | | | (0.12 | ) |
Net realized and unrealized gain (loss) on investments | | | 0.12 | | | | 0.63 | | | | 1.57 | | | | (2.13 | ) | | | (0.97 | ) | | | (0.05 | ) |
| | |
|
|
| |
|
|
| |
|
|
| |
|
|
| |
|
|
| |
|
|
|
Total from investment operations | | | 0.06 | | | | 0.49 | | | | 1.45 | | | | (2.24 | ) | | | (1.08 | ) | | | (0.17 | ) |
Less distributions from: | | | | | | | | | | | | | | | | | | | | | | | | |
Net investment income | | | — | | | | — | | | | — | | | | — | | | | — | | | | — | |
Net realized gain | | | — | | | | — | | | | — | | | | — | | | | — | | | | — | |
| | |
|
|
| |
|
|
| |
|
|
| |
|
|
| |
|
|
| |
|
|
|
Total distributions | | | — | | | | — | | | | — | | | | — | | | | — | | | | — | |
| | |
|
|
| |
|
|
| |
|
|
| |
|
|
| |
|
|
| |
|
|
|
Net asset value, end of period | | $ | 8.69 | | | $ | 8.63 | | | $ | 8.14 | | | $ | 6.69 | | | $ | 8.93 | | | $ | 10.01 | |
| | |
|
|
| |
|
|
| |
|
|
| |
|
|
| |
|
|
| |
|
|
|
Total return (%) | | | 0.70 | | | | 6.02 | | | | 21.67 | | | | (25.08 | ) | | | (10.79 | ) | | | (1.67 | ) |
Ratios to average daily net assets (%) (a): | | | | | | | | | | | | | | | | | | | | | | | | |
Expenses, net of waivers and reimbursements | | | 2.29 | | | | 2.29 | | | | 2.24 | | | | 2.11 | | | | 2.11 | | | | 2.11 | |
Expenses, before waivers and reimbursements | | | 3.46 | | | | 3.01 | | | | 3.01 | | | | 2.97 | | | | 4.39 | | | | 12.09 | |
Net investment income (loss), net of waivers and reimbursements | | | (1.45 | ) | | | (1.67 | ) | | | (1.66 | ) | | | (1.47 | ) | | | (1.32 | ) | | | (1.16 | ) |
Net investment income (loss), before waivers and reimbursements | | | (2.62 | ) | | | (2.39 | ) | | | (2.43 | ) | | | (2.33 | ) | | | (3.60 | ) | | | (11.14 | ) |
| | | | | | | | | | | | | | | | | | |
| | |
|
| | | Period Ended
| | Years Ended December 31,
|
| | | 6/30/2005
| | 2004
| | 2003
| | 2002
| | 2001
| | 2000
|
| | | (unaudited) | | | | | | | | | | |
Supplemental data for all classes: | | | | | | | | | | | | | | | | | | |
Net assets at end of period (in thousands) | | $ | 5,884 | | $ | 5,847 | | $ | 6,871 | | $ | 5,303 | | $ | 7,211 | | $ | 5,001 |
Portfolio turnover rate (%) (a) | | | 26 | | | 31 | | | 37 | | | 44 | | | 37 | | | 32 |
| (a) | | Rates are annualized for periods that are less than a year. |
Note: Net investment income (loss) per share is based on the average shares outstanding during the period.
June 30, 2005 | William Blair Funds 65 |
Financial Highlights
Tax-Managed Growth Fund
| | | | | | | | | | | | | | | | | | | | | | | | |
| | | Class C
| |
| | | Period Ended
| | | Years Ended December 31,
| |
| | | 6/30/2005
| | | 2004
| | | 2003
| | | 2002
| | | 2001
| | | 2000
| |
| | | (unaudited) | | | | | | | | | | | | | | | | |
Net asset value, beginning of period | | $ | 8.63 | | | $ | 8.14 | | | $ | 6.69 | | | $ | 8.93 | | | $ | 10.01 | | | $ | 10.18 | |
Income (loss) from investment operations: | | | | | | | | | | | | | | | | | | | | | | | | |
Net investment income (loss) | | | (0.06 | ) | | | (0.14 | ) | | | (0.12 | ) | | | (0.11 | ) | | | (0.11 | ) | | | (0.12 | ) |
Net realized and unrealized gain (loss) on investments | | | 0.12 | | | | 0.63 | | | | 1.57 | | | | (2.13 | ) | | | (0.97 | ) | | | (0.05 | ) |
| | |
|
|
| |
|
|
| |
|
|
| |
|
|
| |
|
|
| |
|
|
|
Total from investment operations | | | 0.06 | | | | 0.49 | | | | 1.45 | | | | (2.24 | ) | | | (1.08 | ) | | | (0.17 | ) |
Less distributions from: | | | | | | | | | | | | | | | | | | | | | | | | |
Net investment income | | | — | | | | — | | | | — | | | | — | | | | — | | | | — | |
Net realized gain | | | — | | | | — | | | | — | | | | — | | | | — | | | | — | |
| | |
|
|
| |
|
|
| |
|
|
| |
|
|
| |
|
|
| |
|
|
|
Total distributions | | | — | | | | — | | | | — | | | | — | | | | — | | | | — | |
| | |
|
|
| |
|
|
| |
|
|
| |
|
|
| |
|
|
| |
|
|
|
Net asset value, end of period | | $ | 8.69 | | | $ | 8.63 | | | $ | 8.14 | | | $ | 6.69 | | | $ | 8.93 | | | $ | 10.01 | |
| | |
|
|
| |
|
|
| |
|
|
| |
|
|
| |
|
|
| |
|
|
|
Total return (%) | | | 0.70 | | | | 6.02 | | | | 21.67 | | | | (25.08 | ) | | | (10.79 | ) | | | (1.67 | ) |
Ratios to average daily net assets (%) (a): | | | | | | | | | | | | | | | | | | | | | | | | |
Expenses, net of waivers and reimbursements | | | 2.29 | | | | 2.29 | | | | 2.24 | | | | 2.11 | | | | 2.11 | | | | 2.11 | |
Expenses, before waivers and reimbursements | | | 3.46 | | | | 3.01 | | | | 3.01 | | | | 2.97 | | | | 4.39 | | | | 12.09 | |
Net investment income (loss), net of waivers and reimbursements | | | (1.45 | ) | | | (1.67 | ) | | | (1.66 | ) | | | (1.47 | ) | | | (1.32 | ) | | | (1.15 | ) |
Net investment income (loss), before waivers and reimbursements | | | (2.62 | ) | | | (2.39 | ) | | | (2.43 | ) | | | (2.33 | ) | | | (3.60 | ) | | | (11.13 | ) |
| | | | | | | | | | | | | | | | | | |
| | | Period Ended
| | Years Ended December 31,
|
| | | 6/30/2005
| | 2004
| | 2003
| | 2002
| | 2001
| | 2000
|
| | | (unaudited) | | | | | | | | | | |
Supplemental data for all classes: | | | | | | | | | | | | | | | | | | |
Net assets at end of period (in thousands) | | $ | 5,884 | | $ | 5,847 | | $ | 6,871 | | $ | 5,303 | | $ | 7,211 | | $ | 5,001 |
Portfolio turnover rate (%) (a) | | | 26 | | | 31 | | | 37 | | | 44 | | | 37 | | | 32 |
| (a) | | Rates are annualized for periods that are less than a year. |
Note: Net investment income (loss) per share is based on the average shares outstanding during the period.
66 Semi-Annual Report | June 30, 2005 |
Financial Highlights
Large Cap Growth Fund
| | | | | | | | | | | | | | | | | | | | | | | | |
| | | Class A
| |
| | | Period Ended
| | | Years Ended December 31,
| |
| | | 6/30/2005
| | | 2004
| | | 2003
| | | 2002
| | | 2001
| | | 2000
| |
| | | (unaudited) | | | | | | | | | | | | | | | | |
Net asset value, beginning of period | | $ | 6.22 | | | $ | 5.92 | | | $ | 4.78 | | | $ | 6.69 | | | $ | 8.45 | | | $ | 10.14 | |
Income (loss) from investment operations: | | | | | | | | | | | | | | | | | | | | | | | | |
Net investment income (loss) | | | (0.01 | ) | | | (0.04 | ) | | | (0.04 | ) | | | (0.04 | ) | | | (0.06 | ) | | | (0.07 | ) |
Net realized and unrealized gain (loss) on investments | | | (0.10 | ) | | | 0.34 | | | | 1.18 | | | | (1.87 | ) | | | (1.70 | ) | | | (1.62 | ) |
| | |
|
|
| |
|
|
| |
|
|
| |
|
|
| |
|
|
| |
|
|
|
Total from investment operations | | | (0.11 | ) | | | 0.30 | | | | 1.14 | | | | (1.91 | ) | | | (1.76 | ) | | | (1.69 | ) |
Less distributions from: | | | | | | | | | | | | | | | | | | | | | | | | |
Net investment income | | | — | | | | — | | | | — | | | | — | | | | — | | | | — | |
Net realized gain | | | — | | | | — | | | | — | | | | — | | | | — | | | | — | |
| | |
|
|
| |
|
|
| |
|
|
| |
|
|
| |
|
|
| |
|
|
|
Total distributions | | | — | | | | — | | | | — | | | | — | | | | — | | | | — | |
| | |
|
|
| |
|
|
| |
|
|
| |
|
|
| |
|
|
| |
|
|
|
Net asset value, end of period | | $ | 6.11 | | | $ | 6.22 | | | $ | 5.92 | | | $ | 4.78 | | | $ | 6.69 | | | $ | 8.45 | |
| | |
|
|
| |
|
|
| |
|
|
| |
|
|
| |
|
|
| |
|
|
|
Total return (%) | | | 1.77 | | | | 5.07 | | | | 23.85 | | | | (28.55 | ) | | | (20.83 | ) | | | (16.67 | ) |
Ratios to average daily net assets (%) (a): | | | | | | | | | | | | | | | | | | | | | | | | |
Expenses, net of waivers and reimbursements | | | 1.31 | | | | 1.38 | | | | 1.42 | | | | 1.36 | | | | 1.36 | | | | 1.36 | |
Expenses, before waivers and reimbursements | | | 2.64 | | | | 2.29 | | | | 2.39 | | | | 2.45 | | | | 3.01 | | | | 2.84 | |
Net investment income (loss), net of waivers and reimbursements | | | (0.20 | ) | | | (0.63 | ) | | | (0.76 | ) | | | (0.71 | ) | | | (0.79 | ) | | | (0.68 | ) |
Net investment income (loss), before waivers and reimbursements | | | (1.53 | ) | | | (1.54 | ) | | | (1.73 | ) | | | (1.80 | ) | | | (2.44 | ) | | | (2.16 | ) |
| | | | | | | | | | | | | | | | | | | | | | | | |
| | | Class B
| |
| | | Period Ended
| | | Years Ended December 31,
| |
| | | 6/30/2005
| | | 2004
| | | 2003
| | | 2002
| | | 2001
| | | 2000
| |
| | | (unaudited) | | | | | | | | | | | | | | | | |
Net asset value, beginning of period | | $ | 5.98 | | | $ | 5.73 | | | $ | 4.67 | | | $ | 6.58 | | | $ | 8.39 | | | $ | 10.14 | |
Income (loss) from investment operations: | | | | | | | | | | | | | | | | | | | | | | | | |
Net investment income (loss) | | | (0.03 | ) | | | (0.08 | ) | | | (0.08 | ) | | | (0.08 | ) | | | (0.11 | ) | | | (0.13 | ) |
Net realized and unrealized gain (loss) on investments | | | (0.10 | ) | | | 0.33 | | | | 1.14 | | | | (1.83 | ) | | | (1.70 | ) | | | (1.62 | ) |
| | |
|
|
| |
|
|
| |
|
|
| |
|
|
| |
|
|
| |
|
|
|
Total from investment operations | | | (0.13 | ) | | | 0.25 | | | | 1.06 | | | | (1.91 | ) | | | (1.81 | ) | | | (1.75 | ) |
Less distributions from: | | | | | | | | | | | | | | | | | | | | | | | | |
Net investment income | | | — | | | | — | | | | — | | | | — | | | | — | | | | — | |
Net realized gain | | | — | | | | — | | | | — | | | | — | | | | — | | | | — | |
| | |
|
|
| |
|
|
| |
|
|
| |
|
|
| |
|
|
| |
|
|
|
Total distributions | | | — | | | | — | | | | — | | | | — | | | | — | | | | — | |
| | |
|
|
| |
|
|
| |
|
|
| |
|
|
| |
|
|
| |
|
|
|
Net asset value, end of period | | $ | 5.85 | | | $ | 5.98 | | | $ | 5.73 | | | $ | 4.67 | | | $ | 6.58 | | | $ | 8.39 | |
| | |
|
|
| |
|
|
| |
|
|
| |
|
|
| |
|
|
| |
|
|
|
Total return (%) | | | 2.17 | | | | 4.36 | | | | 22.70 | | | | (29.03 | ) | | | (21.57 | ) | | | (17.26 | ) |
Ratios to average daily net assets (%) (a): | | | | | | | | | | | | | | | | | | | | | | | | |
Expenses, net of waivers and reimbursements | | | 2.06 | | | | 2.13 | | | | 2.17 | | | | 2.11 | | | | 2.11 | | | | 2.11 | |
Expenses, before waivers and reimbursements | | | 3.39 | | | | 3.04 | | | | 3.14 | | | | 3.20 | | | | 3.76 | | | | 3.59 | |
Net investment income (loss), net of waivers and reimbursements | | | (0.95 | ) | | | (1.38 | ) | | | (1.51 | ) | | | (1.46 | ) | | | (1.54 | ) | | | (1.43 | ) |
Net investment income (loss), before waivers and reimbursements | | | (2.28 | ) | | | (2.29 | ) | | | (2.48 | ) | | | (2.55 | ) | | | (3.19 | ) | | | (2.91 | ) |
| | | | | | | | | | | | | | | | | | |
| | | Period Ended
| | Years Ended December 31,
|
| | | 6/30/2005
| | 2004
| | 2003
| | 2002
| | 2001
| | 2000
|
| | | (unaudited) | | | | | | | | | | |
Supplemental data for all classes: | | | | | | | | | | | | | | | | | | |
Net assets at end of period (in thousands) | | $ | 9,142 | | $ | 6,417 | | $ | 5,519 | | $ | 5,469 | | $ | 5,991 | | $ | 10,995 |
Portfolio turnover rate (%) (a) | | | 50 | | | 39 | | | 33 | | | 52 | | | 87 | | | 95 |
| (a) | | Rates are annualized for periods that are less than a year. |
Note: Net investment income (loss) per share is based on the average shares outstanding during the period.
June 30, 2005 | William Blair Funds 67 |
Financial Highlights
Large Cap Growth Fund
| | | | | | | | | | | | | | | | | | | | | | | | |
| | | Class C
| |
| | | Period Ended
| | | Years Ended December 31,
| |
| | | 6/30/2005
| | | 2004
| | | 2003
| | | 2002
| | | 2001
| | | 2000
| |
| | | (unaudited) | | | | | | | | | | | | | | | | |
Net asset value, beginning of period | | $ | 5.97 | | | $ | 5.72 | | | $ | 4.66 | | | $ | 6.57 | | | $ | 8.39 | | | $ | 10.14 | |
Income (loss) from investment operations: | | | | | | | | | | | | | | | | | | | | | | | | |
Net investment income (loss) | | | (0.03 | ) | | | (0.08 | ) | | | (0.08 | ) | | | (0.08 | ) | | | (0.11 | ) | | | (0.14 | ) |
Net realized and unrealized gain (loss) on investments | | | (0.10 | ) | | | 0.33 | | | | 1.14 | | | | (1.83 | ) | | | (1.71 | ) | | | (1.61 | ) |
| | |
|
|
| |
|
|
| |
|
|
| |
|
|
| |
|
|
| |
|
|
|
Total from investment operations | | | (0.13 | ) | | | 0.25 | | | | 1.06 | | | | (1.91 | ) | | | (1.82 | ) | | | (1.75 | ) |
Less distributions from: | | | | | | | | | | | | | | | | | | | | | | | | |
Net investment income | | | — | | | | — | | | | — | | | | — | | | | — | | | | — | |
Net realized gain | | | — | | | | — | | | | — | | | | — | | | | — | | | | — | |
| | |
|
|
| |
|
|
| |
|
|
| |
|
|
| |
|
|
| |
|
|
|
Total distributions | | | — | | | | — | | | | — | | | | — | | | | — | | | | — | |
| | |
|
|
| |
|
|
| |
|
|
| |
|
|
| |
|
|
| |
|
|
|
Net asset value, end of period | | $ | 5.84 | | | $ | 5.97 | | | $ | 5.72 | | | $ | 4.66 | | | $ | 6.57 | | | $ | 8.39 | |
| | |
|
|
| |
|
|
| |
|
|
| |
|
|
| |
|
|
| |
|
|
|
Total return (%) | | | 2.18 | | | | 4.37 | | | | 22.75 | | | | (29.07 | ) | | | (21.69 | ) | | | (17.26 | ) |
Ratios to average daily net assets (%) (a): | | | | | | | | | | | | | | | | | | | | | | | | |
Expenses, net of waivers and reimbursements | | | 2.06 | | | | 2.13 | | | | 2.17 | | | | 2.11 | | | | 2.11 | | | | 2.11 | |
Expenses, before waivers and reimbursements | | | 3.39 | | | | 3.04 | | | | 3.14 | | | | 3.20 | | | | 3.76 | | | | 3.59 | |
Net investment income (loss), net of waivers and reimbursements | | | (0.95 | ) | | | (1.38 | ) | | | (1.51 | ) | | | (1.46 | ) | | | (1.54 | ) | | | (1.41 | ) |
Net investment income (loss), before waivers and reimbursements | | | (2.28 | ) | | | (2.29 | ) | | | (2.48 | ) | | | (2.55 | ) | | | (3.19 | ) | | | (2.89 | ) |
| | | | | | | | | | | | | | | | | | |
| | | Period Ended
| | Years Ended December 31,
|
| | | 6/30/2005
| | 2004
| | 2003
| | 2002
| | 2001
| | 2000
|
| | | (unaudited) | | | | | | | | | | |
Supplemental data for all classes: | | | | | | | | | | | | | | | | | | |
Net assets at end of period (in thousands) | | $ | 9,142 | | $ | 6,417 | | $ | 5,519 | | $ | 5,469 | | $ | 5,991 | | $ | 10,995 |
Portfolio turnover rate (%) (a) | | | 50 | | | 39 | | | 33 | | | 52 | | | 87 | | | 95 |
| (a) | | Rates are annualized for periods that are less than a year. |
Note: Net investment income (loss) per share is based on the average shares outstanding during the period.
68 Semi-Annual Report | June 30, 2005 |
Financial Highlights
Small Cap Growth Fund
| | | | | | | | | | | | | | | | | | | | | | | | |
| | | Class A
| |
| | | Period Ended
| | | Years Ended December 31,
| |
| | | 6/30/2005
| | | 2004
| | | 2003
| | | 2002
| | | 2001
| | | 2000
| |
| | | (unaudited) | | | | | | | | | | | | | | | | |
Net asset value, beginning of period | | $ | 25.69 | | | $ | 21.82 | | | $ | 13.72 | | | $ | 16.57 | | | $ | 13.16 | | | $ | 10.19 | |
Income (loss) from investment operations: | | | | | | | | | | | | | | | | | | | | | | | | |
Net investment income (loss) | | | (0.15 | ) | | | (0.30 | ) | | | (0.21 | ) | | | (0.19 | ) | | | (0.11 | ) | | | (0.14 | ) |
Net realized and unrealized gain (loss) on investments | | | (0.91 | ) | | | 6.18 | | | | 8.67 | | | | (2.66 | ) | | | 3.52 | | | | 3.54 | |
| | |
|
|
| |
|
|
| |
|
|
| |
|
|
| |
|
|
| |
|
|
|
Total from investment operations | | | (1.06 | ) | | | 5.88 | | | | 8.46 | | | | (2.85 | ) | | | 3.41 | | | | 3.40 | |
Less distributions from: | | | | | | | | | | | | | | | | | | | | | | | | |
Net investment income | | | — | | | | — | | | | — | | | | — | | | | — | | | | — | |
Net realized gain | | | — | | | | 2.01 | | | | 0.36 | | | | — | | | | — | | | | 0.43 | |
| | |
|
|
| |
|
|
| |
|
|
| |
|
|
| |
|
|
| |
|
|
|
Total distributions | | | — | | | | 2.01 | | | | 0.36 | | | | — | | | | — | | | | 0.43 | |
| | |
|
|
| |
|
|
| |
|
|
| |
|
|
| |
|
|
| |
|
|
|
Net asset value, end of period | | $ | 24.63 | | | $ | 25.69 | | | $ | 21.82 | | | $ | 13.72 | | | $ | 16.57 | | | $ | 13.16 | |
| | |
|
|
| |
|
|
| |
|
|
| |
|
|
| |
|
|
| |
|
|
|
Total return (%) | | | (4.13 | ) | | | 27.16 | | | | 61.81 | | | | (17.20 | ) | | | 25.91 | | | | 33.68 | |
Ratios to average daily net assets (%) (a): | | | | | | | | | | | | | | | | | | | | | | | | |
Expenses, net of waivers, reimbursements or recovery by Advisor | | | 1.46 | | | | 1.49 | | | | 1.60 | | | | 1.56 | | | | 1.59 | | | | 1.60 | |
Expenses, before waivers, reimbursements or recovery by Advisor | | | 1.46 | | | | 1.46 | | | | 1.53 | | | | 1.62 | | | | 1.95 | | | | 2.17 | |
Net investment income (loss), net of waivers, reimbursements or
recovery by Advisor | | | (1.29 | ) | | | (1.27 | ) | | | (1.27 | ) | | | (1.31 | ) | | | (1.15 | ) | | | (0.85 | ) |
Net investment income (loss), before waivers, reimbursements or
recovery by Advisor | | | (1.29 | ) | | | (1.24 | ) | | | (1.20 | ) | | | (1.37 | ) | | | (1.51 | ) | | | (1.42 | ) |
| | | | | | | | | | | | | | | | | | | | | | | | |
| | | Class B
| |
| | | Period Ended
| | | Years Ended December 31,
| |
| | | 6/30/2005
| | | 2004
| | | 2003
| | | 2002
| | | 2001
| | | 2000
| |
| | | (unaudited) | | | | | | | | | | | | | | | | |
Net asset value, beginning of period | | $ | 24.62 | | | $ | 21.13 | | | $ | 13.40 | | | $ | 16.31 | | | $ | 13.05 | | | $ | 10.19 | |
Income (loss) from investment operations: | | | | | | | | | | | | | | | | | | | | | | | | |
Net investment income (loss) | | | (0.23 | ) | | | (0.46 | ) | | | (0.34 | ) | | | (0.30 | ) | | | (0.22 | ) | | | (0.24 | ) |
Net realized and unrealized gain (loss) on investments | | | (0.88 | ) | | | 5.96 | | | | 8.43 | | | | (2.61 | ) | | | 3.48 | | | | 3.53 | |
| | |
|
|
| |
|
|
| |
|
|
| |
|
|
| |
|
|
| |
|
|
|
Total from investment operations | | | (1.11 | ) | | | 5.50 | | | | 8.09 | | | | (2.91 | ) | | | 3.26 | | | | 3.29 | |
Less distributions from: | | | | | | | | | | | | | | | | | | | | | | | | |
Net investment income | | | — | | | | — | | | | — | | | | — | | | | — | | | | — | |
Net realized gain | | | — | | | | 2.01 | | | | 0.36 | | | | — | | | | — | | | | 0.43 | |
| | |
|
|
| |
|
|
| |
|
|
| |
|
|
| |
|
|
| |
|
|
|
Total distributions | | | — | | | | 2.01 | | | | 0.36 | | | | — | | | | — | | | | 0.43 | |
| | |
|
|
| |
|
|
| |
|
|
| |
|
|
| |
|
|
| |
|
|
|
Net asset value, end of period | | $ | 23.51 | | | $ | 24.62 | | | $ | 21.13 | | | $ | 13.40 | | | $ | 16.31 | | | $ | 13.05 | |
| | |
|
|
| |
|
|
| |
|
|
| |
|
|
| |
|
|
| |
|
|
|
Total return (%) | | | (4.51 | ) | | | 26.25 | | | | 60.51 | | | | (17.84 | ) | | | 24.98 | | | | 32.60 | |
Ratios to average daily net assets (%) (a): | | | | | | | | | | | | | | | | | | | | | | | | |
Expenses, net of waivers, reimbursements or recovery by Advisor | | | 2.21 | | | | 2.24 | | | | 2.35 | | | | 2.31 | | | | 2.34 | | | | 2.35 | |
Expenses, before waivers, reimbursements or recovery by Advisor | | | 2.21 | | | | 2.21 | | | | 2.28 | | | | 2.37 | | | | 2.70 | | | | 2.92 | |
Net investment income (loss), net of waivers, reimbursements or
recovery by Advisor | | | (2.04 | ) | | | (2.02 | ) | | | (2.02 | ) | | | (2.06 | ) | | | (1.90 | ) | | | (1.70 | ) |
Net investment income (loss), before waivers, reimbursements or
recovery by Advisor | | | (2.04 | ) | | | (1.99 | ) | | | (1.95 | ) | | | (2.12 | ) | | | (2.26 | ) | | | (2.27 | ) |
| | | | | | | | | | | | | | | | | | |
| | | Period Ended
| | Years Ended December 31,
|
| | | 6/30/2005
| | 2004
| | 2003
| | 2002
| | 2001
| | 2000
|
| | | (unaudited) | | | | | | | | | | |
Supplemental data for all classes: | | | | | | | | | | | | | | | | | | |
Net assets at end of period (in thousands) | | $ | 699,119 | | $ | 771,209 | | $ | 518,824 | | $ | 78,581 | | $ | 54,658 | | $ | 28,778 |
Portfolio turnover rate (%) (a) | | | 66 | | | 109 | | | 103 | | | 133 | | | 147 | | | 433 |
| (a) | | Rates are annualized for periods that are less than a year. |
Note: Net investment income (loss) per share is based on the average shares outstanding during the period.
June 30, 2005 | William Blair Funds 69 |
Financial Highlights
Small Cap Growth Fund
| | | | | | | | | | | | | | | | | | | | | | | | |
| | | Class C
| |
| | | Period Ended
| | | Years Ended December 31,
| |
| | | 6/30/2005
| | | 2004
| | | 2003
| | | 2002
| | | 2001
| | | 2000
| |
| | | (unaudited) | | | | | | | | | | | | | | | | |
Net asset value, beginning of period | | $ | 24.63 | | | $ | 21.14 | | | $ | 13.40 | | | $ | 16.32 | | | $ | 13.05 | | | $ | 10.19 | |
Income (loss) from investment operations: | | | | | | | | | | | | | | | | | | | | | | | | |
Net investment income (loss) | | | (0.23 | ) | | | (0.46 | ) | | | (0.34 | ) | | | (0.30 | ) | | | (0.22 | ) | | | (0.25 | ) |
Net realized and unrealized gain (loss) on investments | | | (0.88 | ) | | | 5.96 | | | | 8.44 | | | | (2.62 | ) | | | 3.49 | | | | 3.54 | |
| | |
|
|
| |
|
|
| |
|
|
| |
|
|
| |
|
|
| |
|
|
|
Total from investment operations | | | (1.11 | ) | | | 5.50 | | | | 8.10 | | | | (2.92 | ) | | | 3.27 | | | | 3.29 | |
Less distributions from: | | | | | | | | | | | | | | | | | | | | | | | | |
Net investment income | | | — | | | | — | | | | — | | | | — | | | | — | | | | — | |
Net realized gain | | | — | | | | 2.01 | | | | 0.36 | | | | — | | | | — | | | | 0.43 | |
| | |
|
|
| |
|
|
| |
|
|
| |
|
|
| |
|
|
| |
|
|
|
Total distributions | | | — | | | | 2.01 | | | | 0.36 | | | | — | | | | — | | | | 0.43 | |
| | |
|
|
| |
|
|
| |
|
|
| |
|
|
| |
|
|
| |
|
|
|
Net asset value, end of period | | $ | 23.52 | | | $ | 24.63 | | | $ | 21.14 | | | $ | 13.40 | | | $ | 16.32 | | | $ | 13.05 | |
| | |
|
|
| |
|
|
| |
|
|
| |
|
|
| |
|
|
| |
|
|
|
Total return (%) | | | (4.51 | ) | | | 26.24 | | | | 60.59 | | | | (17.89 | ) | | | 25.06 | | | | 32.60 | |
Ratios to average daily net assets (%) (a): | | | | | | | | | | | | | | | | | | | | | | | | |
Expenses, net of waivers, reimbursements or recovery by Advisor | | | 2.21 | | | | 2.24 | | | | 2.35 | | | | 2.31 | | | | 2.34 | | | | 2.35 | |
Expenses, before waivers, reimbursements or recovery by Advisor | | | 2.21 | | | | 2.21 | | | | 2.28 | | | | 2.37 | | | | 2.70 | | | | 2.92 | |
Net investment income (loss), net of waivers, reimbursements or
recovery by Advisor | | | (2.04 | ) | | | (2.02 | ) | | | (2.02 | ) | | | (2.06 | ) | | | (1.90 | ) | | | (1.70 | ) |
Net investment income (loss), before waivers, reimbursements or
recovery by Advisor | | | (2.04 | ) | | | (1.99 | ) | | | (1.95 | ) | | | (2.12 | ) | | | (2.26 | ) | | | (2.27 | ) |
| | | | | | | | | | | | | | | | | | |
| | | Period Ended
| | Years Ended December 31,
|
| | | 6/30/2005
| | 2004
| | 2003
| | 2002
| | 2001
| | 2000
|
| | | (unaudited) | | | | | | | | | | |
Supplemental data for all classes: | | | | | | | | | | | | | | | | | | |
Net assets at end of period (in thousands) | | $ | 699,119 | | $ | 771,209 | | $ | 518,824 | | $ | 78,581 | | $ | 54,658 | | $ | 28,778 |
Portfolio turnover rate (%) (a) | | | 66 | | | 109 | | | 103 | | | 133 | | | 147 | | | 433 |
| (a) | | Rates are annualized for periods that are less than a year. |
Note: Net investment income (loss) per share is based on the average shares outstanding during the period.
70 Semi-Annual Report | June 30, 2005 |
Financial Highlights
Small-Mid Cap Growth Fund
| | | | | | | | | | | | |
| | | | | | | |
| | | Class A
| |
| | | Period Ended
| | | Periods Ended December 31,
| |
| | | 6/30/2005
| | | 2004
| | | 2003(a)
| |
| | | (unaudited) | | | | | | | |
Net asset value, beginning of period | | $ | 11.27 | | | $ | 9.94 | | | $ | 10.00 | |
Income (loss) from investment operations: | | | | | | | | | | | | |
Net investment income (loss) | | | (0.06 | ) | | | (0.13 | ) | | | — | |
Net realized and unrealized gain (loss) on investments | | | — | | | | 1.46 | | | | (0.06 | ) |
| | |
|
|
| |
|
|
| |
|
|
|
Total from investment operations | | | (0.06 | ) | | | 1.33 | | | | (0.06 | ) |
Less distributions from: | | | | | | | | | | | | |
Net investment income | | | — | | | | — | | | | — | |
Net realized gain | | | — | | | | — | | | | — | |
| | |
|
|
| |
|
|
| |
|
|
|
Total distributions | | | — | | | | — | | | | — | |
| | |
|
|
| |
|
|
| |
|
|
|
Net asset value, end of period | | $ | 11.21 | | | $ | 11.27 | | | $ | 9.94 | |
| | |
|
|
| |
|
|
| |
|
|
|
Total return (%) | | | (0.53 | ) | | | 13.38 | | | | (0.60 | ) |
Ratios to average daily net assets (%) (b): | | | | | | | | | | | | |
Expenses, net of waivers and reimbursements | | | 1.49 | | | | 1.54 | | | | 1.54 | |
Expenses, before waivers and reimbursements | | | 1.63 | | | | 2.14 | | | | 1.54 | |
Net investment income (loss), net of waivers and reimbursements | | | (1.05 | ) | | | (1.26 | ) | | | (1.54 | ) |
Net investment income (loss), before waivers and reimbursements | | | (1.19 | ) | | | (1.86 | ) | | | (1.54 | ) |
| | | | | | | | | | | | |
| | | | | | | |
| | | Class B
| |
| | | Period Ended
| | | Periods Ended December 31,
| |
| | | 6/30/2005
| | | 2004
| | | 2003(a)
| |
| | | (unaudited) | | | | | | | |
Net asset value, beginning of period | | $ | 11.19 | | | $ | 9.94 | | | $ | 10.00 | |
Income (loss) from investment operations: | | | | | | | | | | | | |
Net investment income (loss) | | | (0.10 | ) | | | (0.21 | ) | | | — | |
Net realized and unrealized gain (loss) on investments | | | — | | | | 1.46 | | | | (0.06 | ) |
| | |
|
|
| |
|
|
| |
|
|
|
Total from investment operations | | | (0.10 | ) | | | 1.25 | | | | (0.06 | ) |
Less distributions from: | | | | | | | | | | | | |
Net investment income | | | — | | | | — | | | | — | |
Net realized gain | | | — | | | | — | | | | — | |
| | |
|
|
| |
|
|
| |
|
|
|
Total distributions | | | — | | | | — | | | | — | |
| | |
|
|
| |
|
|
| |
|
|
|
Net asset value, end of period | | $ | 11.09 | | | $ | 11.19 | | | $ | 9.94 | |
| | |
|
|
| |
|
|
| |
|
|
|
Total return (%) | | | (0.89 | ) | | | 12.58 | | | | (0.60 | ) |
Ratios to average daily net assets (%) (b): | | | | | | | | | | | | |
Expenses, net of waivers and reimbursements | | | 2.24 | | | | 2.29 | | | | 2.29 | |
Expenses, before waivers and reimbursements | | | 2.38 | | | | 2.89 | | | | 2.29 | |
Net investment income (loss), net of waivers and reimbursements | | | (1.80 | ) | | | (2.01 | ) | | | (2.29 | ) |
Net investment income (loss), before waivers and reimbursements | | | (1.94 | ) | | | (2.61 | ) | | | (2.29 | ) |
| | | | | | | | | |
| | | | | |
| | | Period Ended
| | Periods Ended December 31,
|
| | | 6/30/2005
| | 2004
| | 2003
|
| | | (unaudited) | | | | |
Supplemental data for all classes: | | | | | | | | | |
Net assets at end of period (in thousands) | | $ | 53,881 | | $ | 25,974 | | $ | 3,673 |
Portfolio turnover rate (%) (b) | | | 63 | | | 55 | | | — |
| (a) | | For the period from December 29, 2003 (Commencement of Operations) to December 31, 2003. |
| (b) | | Rates are annualized for periods that are less than a year. |
Note: Net investment income (loss) per share is based on the average shares outstanding during the period.
June 30, 2005 | William Blair Funds 71 |
Financial Highlights
Small-Mid Cap Growth Fund
| | | | | | | | | | | | |
| | | | | | | |
| | | Class C
| |
| | | Period Ended
| | | Periods Ended December 31,
| |
| | | 6/30/2005
| | | 2004
| | | 2003(a)
| |
| | | (unaudited) | | | | | | | |
Net asset value, beginning of period | | $ | 11.19 | | | $ | 9.94 | | | $ | 10.00 | |
Income (loss) from investment operations: | | | | | | | | | | | | |
Net investment income (loss) | | | (0.10 | ) | | | (0.21 | ) | | | — | |
Net realized and unrealized gain (loss) on investments | | | — | | | | 1.46 | | | | (0.06 | ) |
| | |
|
|
| |
|
|
| |
|
|
|
Total from investment operations | | | (0.10 | ) | | | 1.25 | | | | (0.06 | ) |
Less distributions from: | | | | | | | | | | | | |
Net investment income | | | — | | | | — | | | | — | |
Net realized gain | | | — | | | | — | | | | — | |
| | |
|
|
| |
|
|
| |
|
|
|
Total distributions | | | — | | | | — | | | | — | |
| | |
|
|
| |
|
|
| |
|
|
|
Net asset value, end of period | | $ | 11.09 | | | $ | 11.19 | | | $ | 9.94 | |
| | |
|
|
| |
|
|
| |
|
|
|
Total return (%) | | | (0.89 | ) | | | 12.58 | | | | (0.60 | ) |
Ratios to average daily net assets (%) (b): | | | | | | | | | | | | |
Expenses, net of waivers and reimbursements | | | 2.24 | | | | 2.29 | | | | 2.29 | |
Expenses, before waivers and reimbursements | | | 2.38 | | | | 2.89 | | | | 2.29 | |
Net investment income (loss), net of waivers and reimbursements | | | (1.80 | ) | | | (2.01 | ) | | | (2.29 | ) |
Net investment income (loss), before waivers and reimbursements | | | (1.94 | ) | | | (2.61 | ) | | | (2.29 | ) |
| | | | | | | | | |
| | | | | |
| | | Period Ended
| | Periods Ended December 31,
|
| | | 6/30/2005
| | 2004
| | 2003
|
| | | (unaudited) | | | | |
Supplemental data for all classes: | | | | | | | | | |
Net assets at end of period (in thousands) | | $ | 53,881 | | $ | 25,974 | | $ | 3,673 |
Portfolio turnover rate (%) (b) | | | 63 | | | 55 | | | — |
| (a) | | For the period from December 29, 2003 (Commencement of Operations) to December 31, 2003. |
| (b) | | Rates are annualized for periods that are less than a year. |
Note: Net investment income (loss) per share is based on the average shares outstanding during the period.
72 Semi-Annual Report | June 30, 2005 |
Financial Highlights
International Growth Fund
| | | | | | | | | | | | | | | | | | | | | | |
| | | Class A
| |
| | | Period Ended
| | Years Ended December 31,
| |
| | | 6/30/2005
| | 2004
| | | 2003
| | 2002
| | | 2001
| | | 2000
| |
| | | (unaudited) | | | | | | | | | | | | | | |
Net asset value, beginning of period | | $ | 22.07 | | $ | 18.63 | | | $ | 13.12 | | $ | 15.46 | | | $ | 17.90 | | | $ | 24.01 | |
Income (loss) from investment operations: | | | | | | | | | | | | | | | | | | | | | | |
Net investment income (loss) (a) | | | 0.10 | | | (0.03 | ) | | | 0.03 | | | (0.05 | ) | | | 0.07 | | | | (0.04 | ) |
Net realized and unrealized gain (loss) on investments | | | 0.23 | | | 3.47 | | | | 5.49 | | | (2.29 | ) | | | (2.51 | ) | | | (2.01 | ) |
| | |
|
| |
|
|
| |
|
| |
|
|
| |
|
|
| |
|
|
|
Total from investment operations | | | 0.33 | | | 3.44 | | | | 5.52 | | | (2.34 | ) | | | (2.44 | ) | | | (2.05 | ) |
Less distributions from: | | | | | | | | | | | | | | | | | | | | | | |
Net investment income | | | — | | | — | | | | — | | | — | | | | — | | | | 0.09 | |
Net realized gain | | | — | | | — | | | | 0.01 | | | — | | | | — | | | | 3.97 | |
| | |
|
| |
|
|
| |
|
| |
|
|
| |
|
|
| |
|
|
|
Total distributions | | | — | | | — | | | | 0.01 | | | — | | | | — | | | | 4.06 | |
| | |
|
| |
|
|
| |
|
| |
|
|
| |
|
|
| |
|
|
|
Net asset value, end of period | | $ | 22.40 | | $ | 22.07 | | | $ | 18.63 | | $ | 13.12 | | | $ | 15.46 | | | $ | 17.90 | |
| | |
|
| |
|
|
| |
|
| |
|
|
| |
|
|
| |
|
|
|
Total return (%) | | | 1.50 | | | 18.46 | | | | 42.10 | | | (15.14 | ) | | | (13.63 | ) | | | (8.11 | ) |
Ratios to average daily net assets (%) (b): | | | | | | | | | | | | | | | | | | | | | | |
Expenses | | | 1.40 | | | 1.47 | | | | 1.50 | | | 1.51 | | | | 1.60 | | | | 1.59 | |
Net investment income (loss) | | | 0.95 | | | (0.16 | ) | | | 0.05 | | | (0.36 | ) | | | (0.11 | ) | | | (0.37 | ) |
| | | | | | | | | | | | | | | | | | | | | | | |
| | | Class B
| |
| | | Period Ended
| | Years Ended December 31,
| |
| | | 6/30/2005
| | 2004
| | | 2003
| | | 2002
| | | 2001
| | | 2000
| |
| | | (unaudited) | | | | | | | | | | | | | | | |
Net asset value, beginning of period | | $ | 20.97 | | $ | 17.83 | | | $ | 12.64 | | | $ | 15.01 | | | $ | 17.52 | | | $ | 23.98 | |
Income (loss) from investment operations: | | | | | | | | | | | | | | | | | | | | | | | |
Net investment income (loss) (a) | | | 0.02 | | | (0.17 | ) | | | (0.09 | ) | | | (0.15 | ) | | | (0.07 | ) | | | (0.23 | ) |
Net realized and unrealized gain (loss) on investments | | | 0.21 | | | 3.31 | | | | 5.28 | | | | (2.22 | ) | | | (2.44 | ) | | | (1.99 | ) |
| | |
|
| |
|
|
| |
|
|
| |
|
|
| |
|
|
| |
|
|
|
Total from investment operations | | | 0.23 | | | 3.14 | | | | 5.19 | | | | (2.37 | ) | | | (2.51 | ) | | | (2.22 | ) |
Less distributions from: | | | | | | | | | | | | | | | | | | | | | | | |
Net investment income | | | — | | | — | | | | — | | | | — | | | | — | | | | 0.27 | |
Net realized gain | | | — | | | — | | | | — | | | | — | | | | — | | | | 3.97 | |
| | |
|
| |
|
|
| |
|
|
| |
|
|
| |
|
|
| |
|
|
|
Total distributions | | | — | | | — | | | | — | | | | — | | | | — | | | | 4.24 | |
| | |
|
| |
|
|
| |
|
|
| |
|
|
| |
|
|
| |
|
|
|
Net asset value, end of period | | $ | 21.20 | | $ | 20.97 | | | $ | 17.83 | | | $ | 12.64 | | | $ | 15.01 | | | $ | 17.52 | |
| | |
|
| |
|
|
| |
|
|
| |
|
|
| |
|
|
| |
|
|
|
Total return (%) | | | 1.10 | | | 17.61 | | | | 41.06 | | | | (15.79 | ) | | | (14.33 | ) | | | (8.79 | ) |
Ratios to average daily net assets (%) (b): | | | | | | | | | | | | | | | | | | | | | | | |
Expenses | | | 2.15 | | | 2.22 | | | | 2.25 | | | | 2.26 | | | | 2.35 | | | | 2.34 | |
Net investment income (loss) | | | 0.20 | | | (0.91 | ) | | | (0.70 | ) | | | (1.11 | ) | | | (0.86 | ) | | | (1.16 | ) |
| | | | | | | | | | | | | | | | | | |
| | | Period Ended
| | Years Ended December 31,
|
| | | 6/30/2005
| | 2004
| | 2003
| | 2002
| | 2001
| | 2000
|
| | | (unaudited) | | | | | | | | | | |
Supplemental data for all classes: | | | | | | | | | | | | | | | | | | |
Net assets at end of period (in thousands) | | $ | 3,300,600 | | $ | 3,001,434 | | $ | 1,899,699 | | $ | 778,788 | | $ | 454,055 | | $ | 333,888 |
Portfolio turnover rate (%) (b) | | | 80 | | | 79 | | | 57 | | | 73 | | | 112 | | | 116 |
| (a) | | Includes $0.12, $0.03, $0.00, $0.00 and $0.06 in PFIC transactions which are treated as ordinary income for Federal tax purposes for the years 2004, 2003, 2002, 2001 and 2000, respectively. |
| (b) | | Rates are annualized for periods that are less than a year. |
Note: Net investment income (loss) per share is based on the average shares outstanding during the period.
June 30, 2005 | William Blair Funds 73 |
Financial Highlights
International Growth Fund
| | | | | | | | | | | | | | | | | | | | | | | |
| | | Class C
| |
| | | Period Ended
| | Years Ended December 31,
| |
| | 6/30/2005
| | 2004
| | | 2003
| | | 2002
| | | 2001
| | | 2000
| |
| | | (unaudited) | | | | | | | | | | | | | | | |
Net asset value, beginning of period | | $ | 20.97 | | $ | 17.83 | | | $ | 12.64 | | | $ | 15.01 | | | $ | 17.52 | | | $ | 23.98 | |
Income (loss) from investment operations: | | | | | | | | | | | | | | | | | | | | | | | |
Net investment income (loss) (a) | | | 0.02 | | | (0.17 | ) | | | (0.09 | ) | | | (0.15 | ) | | | (0.07 | ) | | | (0.23 | ) |
Net realized and unrealized gain (loss) on investments | | | 0.21 | | | 3.31 | | | | 5.28 | | | | (2.22 | ) | | | (2.44 | ) | | | (1.99 | ) |
| | |
|
| |
|
|
| |
|
|
| |
|
|
| |
|
|
| |
|
|
|
Total from investment operations | | | 0.23 | | | 3.14 | | | | 5.19 | | | | (2.37 | ) | | | (2.51 | ) | | | (2.22 | ) |
Less distributions from: | | | | | | | | | | | | | | | | | | | | | | | |
Net investment income | | | — | | | — | | | | — | | | | — | | | | — | | | | 0.27 | |
Net realized gain | | | — | | | — | | | | — | | | | — | | | | — | | | | 3.97 | |
| | |
|
| |
|
|
| |
|
|
| |
|
|
| |
|
|
| |
|
|
|
Total distributions | | | — | | | — | | | | — | | | | — | | | | — | | | | 4.24 | |
| | |
|
| |
|
|
| |
|
|
| |
|
|
| |
|
|
| |
|
|
|
Net asset value, end of period | | $ | 21.20 | | $ | 20.97 | | | $ | 17.83 | | | $ | 12.64 | | | $ | 15.01 | | | $ | 17.52 | |
| | |
|
| |
|
|
| |
|
|
| |
|
|
| |
|
|
| |
|
|
|
Total return (%) | | | 1.10 | | | 17.61 | | | | 41.06 | | | | (15.79 | ) | | | (14.33 | ) | | | (8.81 | ) |
Ratios to average daily net assets (%) (b): | | | | | | | | | | | | | | | | | | | | | | | |
Expenses | | | 2.15 | | | 2.22 | | | | 2.25 | | | | 2.26 | | | | 2.35 | | | | 2.34 | |
Net investment income (loss) | | | 0.20 | | | (0.91 | ) | | | (0.70 | ) | | | (1.11 | ) | | | (0.86 | ) | | | (1.10 | ) |
| | | | | | | | | | | | | | | | | | |
| | | Period Ended
| | Years Ended December 31,
|
| | | 6/30/2005
| | 2004
| | 2003
| | 2002
| | 2001
| | 2000
|
| | | (unaudited) | | | | | | | | | | |
Supplemental data for all classes: | | | | | | | | | | | | | | | | | | |
Net assets at end of period (in thousands) | | $ | 3,300,600 | | $ | 3,001,434 | | $ | 1,899,699 | | $ | 778,788 | | $ | 454,055 | | $ | 333,888 |
Portfolio turnover rate (%) (b) | | | 80 | | | 79 | | | 57 | | | 73 | | | 112 | | | 116 |
| (a) | | Includes $0.12, $0.03, $0.00, $0.00 and $0.06 in PFIC transactions which are treated as ordinary income for Federal tax purposes for the years 2004, 2003, 2002, 2001 and 2000, respectively. |
| (b) | | Rates are annualized for periods that are less than a year. |
Note: Net investment income (loss) per share is based on the average shares outstanding during the period.
74 Semi-Annual Report | June 30, 2005 |
Financial Highlights
International Equity Fund
| | | | | | | | |
| | | Class A
| |
| | | Period Ended
| | | Period Ended December 31,
| |
| | | 6/30/2005
| | | 2004(a)
| |
| | | (unaudited) | | | | |
Net asset value, beginning of period | | $ | 11.35 | | | $ | 10.00 | |
Income (loss) from investment operations: | | | | | | | | |
Net investment income (loss) | | | 0.05 | | | | (0.03 | ) |
Net realized and unrealized gain (loss) on investments | | | (0.17 | ) | | | 1.38 | |
| | |
|
|
| |
|
|
|
Total from investment operations | | | (0.12 | ) | | | 1.35 | |
Less distributions from: | | | | | | | | |
Net investment income | | | — | | | | — | |
Net realized gain | | | — | | | | — | |
| | |
|
|
| |
|
|
|
Total distributions | | | — | | | | — | |
| | |
|
|
| |
|
|
|
Net asset value, end of period | | $ | 11.23 | | | $ | 11.35 | |
| | |
|
|
| |
|
|
|
Total return (%) | | | 1.15 | | | | 13.50 | |
Ratios to average daily net assets (%) (b): | | | | | | | | |
Expenses, net of waivers and reimbursements | | | 1.49 | | | | 1.50 | |
Expenses, before waivers and reimbursements | | | 2.98 | | | | 2.96 | |
Net investment income (loss), net of waivers and reimbursements | | | 0.90 | | | | (0.77 | ) |
Net investment income (loss), before waivers and reimbursements | | | (0.59 | ) | | | (2.23 | ) |
| | | | | | | | |
| | | Class B
| |
| | | Period Ended
| | | Period Ended December 31,
| |
| | | 6/30/2005
| | | 2004(a)
| |
| | | (unaudited) | | | | |
Net asset value, beginning of period | | $ | 11.30 | | | $ | 10.00 | |
Income (loss) from investment operations: | | | | | | | | |
Net investment income (loss) | | | 0.00 | | | | (0.08 | ) |
Net realized and unrealized gain (loss) on investments | | | (0.17 | ) | | | 1.38 | |
| | |
|
|
| |
|
|
|
Total from investment operations | | | (0.17 | ) | | | 1.30 | |
Less distributions from: | | | | | | | | |
Net investment income | | | — | | | | — | |
Net realized gain | | | — | | | | — | |
| | |
|
|
| |
|
|
|
Total distributions | | | — | | | | — | |
| | |
|
|
| |
|
|
|
Net asset value, end of period | | $ | 11.13 | | | $ | 11.30 | |
| | |
|
|
| |
|
|
|
Total return (%) | | | 1.50 | | | | 13.00 | |
Ratios to average daily net assets (%) (b): | | | | | | | | |
Expenses, net of waivers and reimbursements | | | 2.24 | | | | 2.25 | |
Expenses, before waivers and reimbursements | | | 3.73 | | | | 3.71 | |
Net investment income (loss), net of waivers and reimbursements | | | 0.15 | | | | (1.52 | ) |
Net investment income (loss), before waivers and reimbursements | | | (1.34 | ) | | | (2.98 | ) |
| | | | | | |
| | | Period Ended
| | Period Ended December 31,
|
| | | 6/30/2005
| | 2004(a)
|
| | | (unaudited) | | |
Supplemental data for all classes: | | | | | | |
Net assets at end of period (in thousands) | | $ | 23,104 | | $ | 9,689 |
Portfolio turnover rate (%) (b) | | | 81 | | | 108 |
| (a) | | For the period from May 24, 2004 (Commencement of Operations) to December 31, 2004. |
| (b) | | Rates are annualized for periods that are less than a year. |
Note: Net investment income (loss) per share is based on the average shares outstanding during the period.
June 30, 2005 | William Blair Funds 75 |
Financial Highlights
International Equity Fund
| | | | | | | | |
| | | Class C
| |
| | | Period Ended
| | | Period Ended December 31,
| |
| | | 6/30/2005
| | | 2004(a)
| |
| | | (unaudited) | | | | |
Net asset value, beginning of period | | $ | 11.30 | | | $ | 10.00 | |
Income (loss) from investment operations: | | | | | | | | |
Net investment income (loss) | | | 0.00 | | | | (0.08 | ) |
Net realized and unrealized gain (loss) on investments | | | (0.17 | ) | | | 1.38 | |
| | |
|
|
| |
|
|
|
Total from investment operations | | | (0.17 | ) | | | 1.30 | |
Less distributions from: | | | | | | | | |
Net investment income | | | — | | | | — | |
Net realized gain | | | — | | | | — | |
| | |
|
|
| |
|
|
|
Total distributions | | | — | | | | — | |
| | |
|
|
| |
|
|
|
Net asset value, end of period | | $ | 11.13 | | | $ | 11.30 | |
| | |
|
|
| |
|
|
|
Total return (%) | | | 1.50 | | | | 13.00 | |
Ratios to average daily net assets (%) (b): | | | | | | | | |
Expenses, net of waivers and reimbursements | | | 2.24 | | | | 2.25 | |
Expenses, before waivers and reimbursements | | | 3.73 | | | | 3.71 | |
Net investment income (loss), net of waivers and reimbursements | | | 0.15 | | | | (1.52 | ) |
Net investment income (loss), before waivers and reimbursements | | | (1.34 | ) | | | (2.98 | ) |
| | | | | | |
| | | Period Ended
| | Period Ended December 31,
|
| | | 6/30/2005
| | 2004(a)
|
| | | (unaudited) | | |
Supplemental data for all classes: | | | | | | |
Net assets at end of period (in thousands) | | $ | 23,104 | | $ | 9,689 |
Portfolio turnover rate (%) (b) | | | 81 | | | 108 |
| (a) | | For the period from May 24, 2004 (Commencement of Operations) to December 31, 2004. |
| (b) | | Rates are annualized for periods that are less than a year. |
Note: Net investment income (loss) per share is based on the average shares outstanding during the period.
76 Semi-Annual Report | June 30, 2005 |
Financial Highlights
Value Discovery Fund
| | | | | | | | | | | | | | | | | | | | | | |
| | | Class A
|
| | | Period Ended
| | | Years Ended December 31,
|
| | | 6/30/2005
| | | 2004
| | | 2003
| | | 2002
| | | 2001
| | 2000
|
| | | (unaudited) | | | | | | | | | | | | | | |
Net asset value, beginning of period | | $ | 21.48 | | | $ | 21.62 | | | $ | 15.54 | | | $ | 17.37 | | | $ | 16.25 | | $ | 13.72 |
Income (loss) from investment operations: | | | | | | | | | | | | | | | | | | | | | | |
Net investment income (loss) | | | (0.04 | ) | | | (0.04 | ) | | | (0.07 | ) | | | (0.04 | ) | | | 0.09 | | | 0.09 |
Net realized and unrealized gain (loss) on investments | | | (0.97 | ) | | | 2.55 | | | | 6.15 | | | | (1.79 | ) | | | 2.75 | | | 2.53 |
| | |
|
|
| |
|
|
| |
|
|
| |
|
|
| |
|
| |
|
|
Total from investment operations | | | (1.01 | ) | | | 2.51 | | | | 6.08 | | | | (1.83 | ) | | | 2.84 | | | 2.62 |
Less distributions from: | | | | | | | | | | | | | | | | | | | | | | |
Net investment income | | | — | | | | — | | | | — | | | | — | | | | 0.96 | | | 0.09 |
Net realized gain | | | — | | | | 2.65 | | | | — | | | | — | | | | 0.76 | | | — |
| | |
|
|
| |
|
|
| |
|
|
| |
|
|
| |
|
| |
|
|
Total distributions | | | — | | | | 2.65 | | | | — | | | | — | | | | 1.72 | | | 0.09 |
| | |
|
|
| |
|
|
| |
|
|
| |
|
|
| |
|
| |
|
|
Net asset value, end of period | | $ | 20.47 | | | $ | 21.48 | | | $ | 21.62 | | | $ | 15.54 | | | $ | 17.37 | | $ | 16.25 |
| | |
|
|
| |
|
|
| |
|
|
| |
|
|
| |
|
| |
|
|
Total return (%) | | | (4.70 | ) | | | 11.89 | | | | 39.12 | | | | (10.54 | ) | | | 17.42 | | | 19.09 |
Ratios to average daily net assets (%) (a): | | | | | | | | | | | | | | | | | | | | | | |
Expenses, net of waivers and reimbursements | | | 1.45 | | | | 1.48 | | | | 1.58 | | | | 1.59 | | | | 1.61 | | | 1.64 |
Expenses, before waivers and reimbursements | | | 1.58 | | | | 1.48 | | | | 1.58 | | | | 1.59 | | | | 1.66 | | | 1.88 |
Net investment income (loss), net of waivers and reimbursements | | | (0.51 | ) | | | (0.20 | ) | | | (0.39 | ) | | | (0.22 | ) | | | 0.28 | | | 0.47 |
Net investment income (loss), before waivers and reimbursements | | | (0.64 | ) | | | (0.20 | ) | | | (0.39 | ) | | | (0.22 | ) | | | 0.23 | | | 0.23 |
| | | | | | | | | | | | | | | | | | | | | | | | |
| | | Class B
| |
| | | Period Ended
| | | Years Ended December 31,
| |
| | | 6/30/2005
| | | 2004
| | | 2003
| | | 2002
| | | 2001
| | | 2000
| |
| | | (unaudited) | | | | | | | | | | | | | | | | |
Net asset value, beginning of period | | $ | 21.94 | | | $ | 22.20 | | | $ | 16.07 | | | $ | 18.10 | | | $ | 16.18 | | | $ | 13.72 | |
Income (loss) from investment operations: | | | | | | | | | | | | | | | | | | | | | | | | |
Net investment income (loss) | | | (0.12 | ) | | | (0.22 | ) | | | (0.20 | ) | | | (0.18 | ) | | | (0.06 | ) | | | (0.07 | ) |
Net realized and unrealized gain (loss) on investments | | | (1.00 | ) | | | 2.61 | | | | 6.33 | | | | (1.85 | ) | | | 2.74 | | | | 2.53 | |
| | |
|
|
| |
|
|
| |
|
|
| |
|
|
| |
|
|
| |
|
|
|
Total from investment operations | | | (1.12 | ) | | | 2.39 | | | | 6.13 | | | | (2.03 | ) | | | 2.68 | | | | 2.46 | |
Less distributions from: | | | | | | | | | | | | | | | | | | | | | | | | |
Net investment income | | | — | | | | — | | | | — | | | | — | | | | — | | | | — | |
Net realized gain | | | — | | | | 2.65 | | | | — | | | | — | | | | 0.76 | | | | — | |
| | |
|
|
| |
|
|
| |
|
|
| |
|
|
| |
|
|
| |
|
|
|
Total distributions | | | — | | | | 2.65 | | | | — | | | | — | | | | 0.76 | | | | — | |
| | |
|
|
| |
|
|
| |
|
|
| |
|
|
| |
|
|
| |
|
|
|
Net asset value, end of period | | $ | 20.82 | | | $ | 21.94 | | | $ | 22.20 | | | $ | 16.07 | | | $ | 18.10 | | | $ | 16.18 | |
| | |
|
|
| |
|
|
| |
|
|
| |
|
|
| |
|
|
| |
|
|
|
Total return (%) | | | (5.06 | ) | | | 11.04 | | | | 38.15 | | | | (11.22 | ) | | | 16.54 | | | | 17.93 | |
Ratios to average daily net assets (%) (a): | | | | | | | | | | | | | | | | | | | | | | | | |
Expenses, net of waivers and reimbursements | | | 2.20 | | | | 2.23 | | | | 2.33 | | | | 2.34 | | | | 2.36 | | | | 2.39 | |
Expenses, before waivers and reimbursements | | | 2.33 | | | | 2.23 | | | | 2.33 | | | | 2.34 | | | | 2.41 | | | | 2.63 | |
Net investment income (loss), net of waivers and reimbursements | | | (1.26 | ) | | | (0.95 | ) | | | (1.14 | ) | | | (0.97 | ) | | | (0.47 | ) | | | (0.27 | ) |
Net investment income (loss), before waivers and reimbursements | | | (1.39 | ) | | | (0.95 | ) | | | (1.14 | ) | | | (0.97 | ) | | | (0.52 | ) | | | (0.51 | ) |
| | | | | | | | | | | | | | | | | | |
| | | Period Ended
| | Years Ended December 31,
|
| | | 6/30/2005
| | 2004
| | 2003
| | 2002
| | 2001
| | 2000
|
| | | (unaudited) | | | | | | | | | | |
Supplemental data for all classes: | | | | | | | | | | | | | | | | | | |
Net assets at end of period (in thousands) | | $ | 121,065 | | $ | 246,176 | | $ | 237,111 | | $ | 190,802 | | $ | 149,292 | | $ | 74,093 |
Portfolio turnover rate (%) (a) | | | 127 | | | 50 | | | 51 | | | 20 | | | 48 | | | 68 |
| (a) | | Rates are annualized for periods that are less than a year. |
Note: Net investment income (loss) per share is based on the average shares outstanding during the period.
June 30, 2005 | William Blair Funds 77 |
Financial Highlights
Value Discovery Fund
| | | | | | | | | | | | | | | | | | | | | | | | |
| | | Class C
| |
| | | Period Ended
| | | Years Ended December 31,
| |
| | | 6/30/2005
| | | 2004
| | | 2003
| | | 2002
| | | 2001
| | | 2000
| |
| | | (unaudited) | | | | | | | | | | | | | | | | |
Net asset value, beginning of period | | $ | 21.95 | | | $ | 22.20 | | | $ | 16.07 | | | $ | 18.11 | | | $ | 16.19 | | | $ | 13.72 | |
Income (loss) from investment operations: | | | | | | | | | | | | | | | | | | | | | | | | |
Net investment income (loss) | | | (0.12 | ) | | | (0.22 | ) | | | (0.20 | ) | | | (0.18 | ) | | | (0.06 | ) | | | (0.06 | ) |
Net realized and unrealized gain (loss) on investments | | | (1.00 | ) | | | 2.62 | | | | 6.33 | | | | (1.86 | ) | | | 2.74 | | | | 2.53 | |
| | |
|
|
| |
|
|
| |
|
|
| |
|
|
| |
|
|
| |
|
|
|
Total from investment operations | | | (1.12 | ) | | | 2.40 | | | | 6.13 | | | | (2.04 | ) | | | 2.68 | | | | 2.47 | |
Less distributions from: | | | | | | | | | | | | | | | | | | | | | | | | |
Net investment income | | | — | | | | — | | | | — | | | | — | | | | — | | | | — | |
Net realized gain | | | — | | | | 2.65 | | | | — | | | | — | | | | 0.76 | | | | — | |
| | |
|
|
| |
|
|
| |
|
|
| |
|
|
| |
|
|
| |
|
|
|
Total distributions | | | — | | | | 2.65 | | | | — | | | | — | | | | 0.76 | | | | — | |
| | |
|
|
| |
|
|
| |
|
|
| |
|
|
| |
|
|
| |
|
|
|
Net asset value, end of period | | $ | 20.83 | | | $ | 21.95 | | | $ | 22.20 | | | $ | 16.07 | | | $ | 18.11 | | | $ | 16.19 | |
| | |
|
|
| |
|
|
| |
|
|
| |
|
|
| |
|
|
| |
|
|
|
Total return (%) | | | (5.06 | ) | | | 11.08 | | | | 38.15 | | | | (11.26 | ) | | | 16.53 | | | | 18.00 | |
Ratios to average daily net assets (%) (a): | | | | | | | | | | | | | | | | | | | | | | | | |
Expenses, net of waivers and reimbursements | | | 2.20 | | | | 2.23 | | | | 2.33 | | | | 2.34 | | | | 2.36 | | | | 2.39 | |
Expenses, before waivers and reimbursements | | | 2.33 | | | | 2.23 | | | | 2.33 | | | | 2.34 | | | | 2.41 | | | | 2.63 | |
Net investment income (loss), net of waivers and reimbursements | | | (1.26 | ) | | | (0.95 | ) | | | (1.14 | ) | | | (0.97 | ) | | | (0.47 | ) | | | (0.37 | ) |
Net investment income (loss), before waivers and reimbursements | | | (1.39 | ) | | | (0.95 | ) | | | (1.14 | ) | | | (0.97 | ) | | | (0.52 | ) | | | (0.61 | ) |
| | | | | | | | | | | | | | | | | | | | | | |
| | | | | | | Period Ended
| | Years Ended December 31,
|
| | | | | | | 6/30/2005
| | 2004
| | 2003
| | 2002
| | 2001
| | 2000
|
| | | | | | | (unaudited) | | | | | | | | | | |
Supplemental data for all classes: | | | | | | | | | | | | | | | | | | | | | | |
Net assets at end of period (in thousands) | | | | | | $ | 121,065 | | $ | 246,176 | | $ | 237,111 | | $ | 190,802 | | $ | 149,292 | | $ | 74,093 |
Portfolio turnover rate (%) (a) | | | | | | | 127 | | | 50 | | | 51 | | | 20 | | | 48 | | | 68 |
| (a) | | Rates are annualized for the periods that are less than one year. |
Note: Net investment income (loss) per share is based on the average shares outstanding during the period.
78 Semi-Annual Report | June 30, 2005 |
Financial Highlights
Income Fund
| | | | | | | | | | | | | | | | | | | | | |
| | | Class A
|
| | | Period Ended
| | | Years Ended December 31,
|
| | | 6/30/2005
| | | 2004
| | | 2003
| | 2002
| | 2001
| | | 2000
|
| | | (unaudited) | | | | | | | | | | | | | |
Net asset value, beginning of period | | $ | 6.07 | | | $ | 6.23 | | | $ | 6.40 | | $ | 6.21 | | $ | 10.37 | | | $ | 9.94 |
Income (loss) from investment operations: | | | | | | | | | | | | | | | | | | | | | |
Net investment income (loss) (a) | | | 0.19 | | | | 0.39 | | | | 0.22 | | | 0.32 | | | 4.80 | | | | 0.63 |
Net realized and unrealized gain (loss) on investments | | | (0.11 | ) | | | (0.23 | ) | | | — | | | 0.16 | | | (4.16 | ) | | | 0.35 |
| | |
|
|
| |
|
|
| |
|
| |
|
| |
|
|
| |
|
|
Total from investment operations | | | 0.08 | | | | 0.16 | | | | 0.22 | | | 0.48 | | | 0.64 | | | | 0.98 |
Less distributions from: | | | | | | | | | | | | | | | | | | | | | |
Net investment income | | | 0.21 | | | | 0.32 | | | | 0.39 | | | 0.29 | | | 4.80 | | | | 0.55 |
Net realized gain | | | — | | | | — | | | | — | | | — | | | — | | | | — |
| | |
|
|
| |
|
|
| |
|
| |
|
| |
|
|
| |
|
|
Total distributions | | | 0.21 | | | | 0.32 | | | | 0.39 | | | 0.29 | | | 4.80 | | | | 0.55 |
| | |
|
|
| |
|
|
| |
|
| |
|
| |
|
|
| |
|
|
Net asset value, end of period | | $ | 5.94 | | | $ | 6.07 | | | $ | 6.23 | | $ | 6.40 | | $ | 6.21 | | | $ | 10.37 |
| | |
|
|
| |
|
|
| |
|
| |
|
| |
|
|
| |
|
|
Total return (%) | | | 1.27 | | | | 2.59 | | | | 3.56 | | | 7.86 | | | 7.26 | | | | 10.20 |
Ratios to average daily net assets (%) (b): | | | | | | | | | | | | | | | | | | | | | |
Expenses | | | 0.75 | | | | 0.78 | | | | 0.77 | | | 0.81 | | | 0.94 | | | | 1.02 |
Net investment income (loss) | | | 4.05 | | | | 4.12 | | | | 4.09 | | | 5.23 | | | 5.38 | | | | 6.25 |
| | | | | | | | | | | | | | | | | | | | | |
| | | Class B
|
| | | Period Ended
| | | Years Ended December 31,
|
| | | 6/30/2005
| | | 2004
| | | 2003
| | | 2002
| | 2001
| | 2000
|
| | | (unaudited) | | | | | | | | | | | | | |
Net asset value, beginning of period | | $ | 10.03 | | | $ | 10.28 | | | $ | 10.51 | | | $ | 10.24 | | $ | 10.23 | | $ | 9.94 |
Income (loss) from investment operations: | | | | | | | | | | | | | | | | | | | | | |
Net investment income (loss) (a) | | | 0.26 | | | | 0.52 | | | | 0.33 | | | | 0.47 | | | 0.63 | | | 0.57 |
Net realized and unrealized gain (loss) on investments | | | (0.17 | ) | | | (0.33 | ) | | | (0.04 | ) | | | 0.24 | | | 0.01 | | | 0.32 |
| | |
|
|
| |
|
|
| |
|
|
| |
|
| |
|
| |
|
|
Total from investment operations | | | 0.09 | | | | 0.19 | | | | 0.29 | | | | 0.71 | | | 0.64 | | | 0.89 |
Less distributions from: | | | | | | | | | | | | | | | | | | | | | |
Net investment income | | | 0.19 | | | | 0.44 | | | | 0.52 | | | | 0.44 | | | 0.63 | | | 0.60 |
Net realized gain | | | — | | | | — | | | | — | | | | — | | �� | — | | | — |
| | |
|
|
| |
|
|
| |
|
|
| |
|
| |
|
| |
|
|
Total distributions | | | 0.19 | | | | 0.44 | | | | 0.52 | | | | 0.44 | | | 0.63 | | | 0.60 |
| | |
|
|
| |
|
|
| |
|
|
| |
|
| |
|
| |
|
|
Net asset value, end of period | | $ | 9.93 | | | $ | 10.03 | | | $ | 10.28 | | | $ | 10.51 | | $ | 10.24 | | $ | 10.23 |
| | |
|
|
| |
|
|
| |
|
|
| |
|
| |
|
| |
|
|
Total return (%) | | | 0.89 | | | | 1.91 | | | | 2.82 | | | | 7.15 | | | 6.37 | | | 9.25 |
Ratios to average daily net assets (%) (b): | | | | | | | | | | | | | | | | | | | | | |
Expenses | | | 1.50 | | | | 1.53 | | | | 1.52 | | | | 1.56 | | | 1.69 | | | 1.77 |
Net investment income (loss) | | | 3.30 | | | | 3.37 | | | | 3.34 | | | | 4.48 | | | 4.63 | | | 5.38 |
| | | | | | | | | | | | | | | | | | |
| | | Period Ended
| | Years Ended December 31,
|
| | | 6/30/2005
| | 2004
| | 2003
| | 2002
| | 2001
| | 2000
|
| | | (unaudited) | | | | | | | | | | |
Supplemental data for all classes: | | | | | | | | | | | | | | | | | | |
Net assets at end of period (in thousands) | | $ | 309,667 | | $ | 294,084 | | $ | 265,062 | | $ | 196,136 | | $ | 176,264 | | $ | 167,746 |
Portfolio turnover rate (%) (b) | | | 41 | | | 43 | | | 36 | | | 66 | | | 82 | | | 54 |
| (a) | | As required, in 2001, the Fund has adopted the provisions of the AICPA Audit and Accounting Guide for Investment Companies and began treating any paydown gain or losses on mortgage and asset backed securities as an adjustment to income. The effect of this change for the year 2001 was to decrease net investment income per share by $.05 and increase the net realized and unrealized gain and loss per share by $.05. It decreases the Ratio of Net Investment Income to Average Net Assets from 5.87% to 5.38% for Class A for 2001. It decreased the Ratio of Net Investment Income 5.12% to 4.63% for Class B and C shares for 2001. Per share amounts and the Ratio of Net Investment Income to Average Net Assets for periods prior to December 31, 2001 have not been restated to reflect this change in presentation. |
| (b) | | Rates are annualized for periods that are less than a year. |
Note: Net investment income (loss) per share is based on the average shares outstanding during the period.
June 30, 2005 | William Blair Funds 79 |
Financial Highlights
Income Fund
| | | | | | | | | | | | | | | | | | | | | |
| | | Class C
|
| | | Period Ended
| | | Years Ended December 31,
|
| | 6/30/2005
| | | 2004
| | | 2003
| | | 2002
| | 2001
| | 2000
|
| | | (unaudited) | | | | | | | | | | | | | |
Net asset value, beginning of period | | $ | 10.17 | | | $ | 10.43 | | | $ | 10.66 | | | $ | 10.39 | | $ | 10.27 | | $ | 9.93 |
Income (loss) from investment operations: | | | | | | | | | | | | | | | | | | | | | |
Net investment income (loss) (a) | | | 0.26 | | | | 0.52 | | | | 0.33 | | | | 0.47 | | | 0.53 | | | 0.53 |
Net realized and unrealized gain (loss) on investments | | | (0.17 | ) | | | (0.34 | ) | | | (0.03 | ) | | | 0.25 | | | 0.12 | | | 0.34 |
| | |
|
|
| |
|
|
| |
|
|
| |
|
| |
|
| |
|
|
Total from investment operations | | | 0.09 | | | | 0.18 | | | | 0.30 | | | | 0.72 | | | 0.65 | | | 0.87 |
Less distributions from: | | | | | | | | | | | | | | | | | | | | | |
Net investment income | | | 0.19 | | | | 0.44 | | | | 0.53 | | | | 0.45 | | | 0.53 | | | 0.53 |
Net realized gain | | | — | | | | — | | | | — | | | | — | | | — | | | — |
| | |
|
|
| |
|
|
| |
|
|
| |
|
| |
|
| |
|
|
Total distributions | | | 0.19 | | | | 0.44 | | | | 0.53 | | | | 0.45 | | | 0.53 | | | 0.53 |
| | |
|
|
| |
|
|
| |
|
|
| |
|
| |
|
| |
|
|
Net asset value, end of period | | $ | 10.07 | | | $ | 10.17 | | | $ | 10.43 | | | $ | 10.66 | | $ | 10.39 | | $ | 10.27 |
| | |
|
|
| |
|
|
| |
|
|
| |
|
| |
|
| |
|
|
Total return (%) | | | 0.90 | | | | 1.80 | | | | 2.85 | | | | 7.09 | | | 6.41 | | | 9.05 |
Ratios to average daily net assets (%) (b): | | | | | | | | | | | | | | | | | | | | | |
Expenses | | | 1.50 | | | | 1.53 | | | | 1.52 | | | | 1.56 | | | 1.69 | | | 1.77 |
Net investment income (loss) | | | 3.30 | | | | 3.37 | | | | 3.34 | | | | 4.48 | | | 4.63 | | | 5.35 |
| | | | | | | | | | | | | | | | | | |
| | | Period Ended
| | Years Ended December 31,
|
| | | 6/30/2005
| | 2004
| | 2003
| | 2002
| | 2001
| | 2000
|
| | | (unaudited) | | | | | | | | | | |
Supplemental data for all classes: | | | | | | | | | | | | | | | | | | |
Net assets at end of period (in thousands) | | $ | 309,667 | | $ | 294,084 | | $ | 265,062 | | $ | 196,136 | | $ | 176,264 | | $ | 167,746 |
Portfolio turnover rate (%) (b) | | | 41 | | | 43 | | | 36 | | | 66 | | | 82 | | | 54 |
| (a) | | As required, in 2001, the Fund has adopted the provisions of the AICPA Audit and Accounting Guide for Investment Companies and began treating any paydown gain or losses on mortgage and asset backed securities as an adjustment to income. The effect of this change for the year 2001 was to decrease net investment income per share by $.05 and increase the net realized and unrealized gain and loss per share by $.05. It decreases the Ratio of Net Investment Income to Average Net Assets from 5.87% to 5.38% for Class A for 2001. It decreased the Ratio of Net Investment Income from 5.12% to 4.63% for Class B and C shares for 2001. Per share amounts and the Ratio of Net Investment Income to Average Net Assets for periods prior to December 31, 2001 have not been restated to reflect this change in presentation. |
| (b) | | Rates are annualized for periods that are less than a year. |
Note: Net investment income (loss) per share is based on the average shares outstanding during the period.
80 Semi-Annual Report | June 30, 2005 |
Trustees and Officers. The trustees and officers of the William Blair Funds, their ages, their principal occupations during the last five years, their affiliations, if any, with William Blair & Company, L.L.C., and other significant affiliations are set forth below. The address of each trustee and officer is 222 West Adams Street, Chicago, Illinois 60606.
| | | | | | | | | | |
Name and Age
| | Position(s)
Held with
Fund
| | Term of
Office and
Length
of Time
Served(1)
| | Principal Occupation(s) During Past 5 Years
| | Number of
Portfolios
in Fund
Complex
Overseen
by Trustee
| | Other Directorships Held by Trustee/Officer
|
Interested Trustees | | | | | | | | | | |
Conrad Fischer, 71* | | Chairman of the Board of Trustees | | Since 1987 | | Principal, William Blair & Company, L.L.C.; Partner, APM Limited Partnership | | 13 | | Trustee Emeritus, Chicago Child Care Society, a non-profit organization, and Partner, APM Limited Partnership |
| | | | | |
Michelle Seitz, 39* | | Trustee | | Since 2002 | | Principal, William Blair & Company, L.L.C. | | 13 | | N/A |
Non-Interested Trustees | | | | | | | | |
Theodore A. Bosler, 70 | | Trustee | | Since 1997 | | Retired Principal and Vice President, Lincoln Capital Management | | 13 | | Crystal Lake Watershed Fund, Desert Foothills Land Trust and Institute of Chartered Financial Analysts. |
| | | | | |
Ann P. McDermott, 65 | | Trustee | | Since 1996 | | Board member and officer for various civic and charitable organizations over the past thirty years; professional experience prior thereto, registered representative for New York Stock Exchange firm | | 13 | | Junior League of Chicago, Northwestern University, Women’s Board; Ravinia Festival Women’s Board; Rush Presbyterian St. Luke’s Medical Center, Women’s Board; University of Chicago, Women’s Board; Visiting Nurses Association, Honorary Director |
| | | | | |
Donald J. Reaves, 58 | | Trustee | | Since 2004 | | Vice President for Administration and Chief Financial Officer, University of Chicago since 2002. Executive Vice President and Chief Financial Officer, Brown University from 1993 to 2002 | | 13 | | American Student Assistance Corp.; Amica Mutual Insurance Company; NACUBO (National Association of College and University Business Officers) |
| | | | | |
John B. Schwemm, 71 | | Trustee | | Since 1990 | | Retired Chairman and Chief Executive Officer, R.R. Donnelley & Sons Company | | 13 | | USG Corp., building material manufacturer, and Walgreen Co. |
| | | | | |
Donald L. Seeley, 61 | | Trustee | | Since 2003 | | Director, Applied Investment Management Program, University of Arizona Department of Finance, Formerly Vice Chairman and Chief Financial Officer, True North Communications, Inc., marketing communications and advertising firm | | 13 | | Beverly Enterprises, Inc., provider of eldercare and rehabilitative services; Warnaco Group, Inc., intimate apparel, sportswear, and swimwear manufacturer. |
June 30, 2005 | William Blair Funds 81 |
| | | | | | | | | | |
Name and Age
| | Position(s)
Held with
Fund
| | Term of
Office and
Length of
Time
Served(1)
| | Principal Occupation(s) During Past 5 Years
| | Number of
Portfolios
in Fund
Complex
Overseen
by Trustee
| | Other Directorships Held by Trustee/Officer
|
Robert E. Wood II, 67 | | Trustee | | Since 1999 | | Retired Executive Vice President, Morgan Stanley Dean Witter | | 13 | | Chairman, Add-Vision, Inc. manufacturer of surface animation systems, and Micro-Combustion, LLC |
Officers | | | | | | | | | | |
Marco Hanig, 47 | | President | | Since 1999 | | Principal, William Blair & Company, L.L.C.; former Senior Vice President, First Chicago NBD | | N/A | | Chicago Scores |
| | | | | |
Karl W. Brewer, 39 | | Senior Vice President | | Since 2000 | | Principal, William Blair & Company, L.L.C. | | N/A | | N/A |
| | | | | |
Harvey H. Bundy, III, 61 | | Senior Vice President | | Since 2003 | | Principal, William Blair & Company, L.L.C. | | N/A | | N/A |
| | | | | |
Mark A. Fuller, III, 48 | | Senior Vice President | | Since 1993 | | Principal, William Blair & Company, L.L.C. | | N/A | | Partner, Fulsen Howney Partners |
| | | | | |
James W. Golan, 43 | | Senior Vice President | | Since 2005 | | Principal, William Blair & Company, L.L.C. | | N/A | | N/A |
| | | | | |
W. George Greig, 52 | | Senior Vice President | | Since 1996 | | Principal, William Blair & Company, L.L.C. | | N/A | | N/A |
| | | | | |
Michael A. Jancosek, 46 | | Senior Vice President | | Since 2004 | | Principal, William Blair & Company L.L.C. | | N/A | | N/A |
| | | | | |
| | | Vice President | | Since 2000 | | Associate, William Blair & Company, L.L.C.; former Vice President, First Chicago NBD | | | | |
| | | | | |
John F. Jostrand, 51 | | Senior Vice President | | Since 1999 | | Principal, William Blair & Company, L.L.C. | | N/A | | N/A |
| | | | | |
James S. Kaplan, 44 | | Senior Vice President | | Since 2004 | | Principal, William Blair & Company, L.L.C. | | N/A | | N/A |
| | | | | |
| | | Vice President | | Since 1995 | | Associate, William Blair & Company, L.L.C. | | | | |
| | | | | |
Robert C. Lanphier, IV, 49 | | Senior Vice President | | Since 2003 | | Principal, William Blair & Company, L.L.C. | | N/A | | Chairman, AG. Med, Inc. |
| | | | | |
David S. Mitchell, 45 | | Senior Vice President Vice President | | Since 2004 Since 2003 | | Principal, William Blair & Company, L.L.C. Associate, William Blair & Company, L.L.C. | | N/A | | N/A |
| | | | | |
Gregory J. Pusinelli, 46 | | Senior Vice President | | Since 1999 | | Principal, William Blair & Company, L.L.C.; former Principal and Vice President, Stein Roe & Farnham Incorporated | | N/A | | N/A |
| | | | | |
Norbert W. Truderung, 53 | | Senior Vice President | | Since 1992 | | Principal, William Blair & Company, L.L.C. | | N/A | | N/A |
82 Semi-Annual Report | June 30, 2005 |
| | | | | | | | | | |
Name and Age
| | Position(s)
Held with
Fund
| | Term of
Office and
Length of
Time
Served(1)
| | Principal Occupation(s) During Past 5 Years
| | Number of
Portfolios
in Fund
Complex
Overseen
by Trustee
| | Other Directorships Held by Trustee/Officer
|
| | | | | |
Jeffrey A. Urbina, 50 | | Senior Vice President | | Since 1998 | | Principal, William Blair & Company, L.L.C. | | N/A | | N/A |
| | | | | |
Christopher T. Vincent, 48 | | Senior Vice President Vice President | | Since 2004 Since 2002 | | Principal, William Blair & Company, L.L.C. Associate, William Blair & Company, L.L.C.; former Managing Director/Senior Portfolio Manager, Zurich Scudder Investments | | N/A | | Uhlich Children’s Home |
| | | | | |
Todd M. McClone, 36 | | Vice President | | Since 2005 | | Associate, William Blair & Company, L.L.C. | | N/A | | N/A |
| | | | | |
Terence M. Sullivan, 61 | | Vice President and Treasurer | | Since 1997 | | Associate, William Blair & Company, L.L.C. | | N/A | | N/A |
| | | | | |
Colette M. Garavalia, 44 | | Secretary | | Since 2000 | | Associate, William Blair & Company, L.L.C.; former Assistant Vice President, Scudder Kemper Investments | | N/A | | N/A |
| * | | Mr. Fischer and Ms. Seitz are interested persons of the William Blair Funds because each is a principal of William Blair & Company, L.L.C., the Funds’ investment advisor and principal underwriter. |
| (1) | | Each Trustee serves until the election and qualification of a successor, or until death, resignation or retirement or removal as provided in the Fund’s Declaration of Trust. Retirement for non-interested Trustees occurs no later than at the conclusion of the first regularly scheduled Board meeting of the Fund’s fiscal year that occurs after the Trustee’s 72nd birthday. The Fund’s officers are elected annually by the Trustees. |
The Statement of Additional Information for the William Blair Funds includes additional information about the trustees and is available without charge by calling 1-800-635-2886 (in Massachusetts 1-800-635-2840) or by writing the Fund.
June 30, 2005 | William Blair Funds 83 |
Basis for Board Approval of Advisory Agreement
The advisory agreement was most recently approved by the Board of Trustees, including all of the trustees who are not parties to such agreement or interested persons of any such party, on February 18, 2005. The Board of Trustees, including a majority of the independent trustees, determined that continuation of the advisory agreement was in the best interests of the Fund. The independent trustees met separately from the “interested” trustees of the Fund and officers and employees of the Company to consider continuance of the advisory agreement and were assisted by independent legal counsel in making their determination. The Board of Trustees, including the independent trustees, did not identify any single factor or group of factors as all important or controlling and considered all factors together.
The Board noted that the Company is a quality firm with a reputation for integrity and honesty that employs high quality people and has a long association with the Portfolios, in each case other than the Growth Fund, since the inception of the Portfolios. The Board believes that a long-term relationship with a capable, conscientious advisor is in the best interests of shareholders and that shareholders have invested in the Portfolios knowing that the Company managed the Portfolios and knowing the investment advisory fee schedule. The Board concluded that each existing Portfolio was managed by the Company consistent with its investment objectives and policies and that high quality services were provided.
With respect to the nature, extent and quality of the services provided by the Company to the Portfolios (or to be provided with respect to the Emerging Markets Growth Fund), the Board considered the Company’s Form ADV, biographical information about each Portfolio’s portfolio manager(s), the administrative services performed or to be performed by the Company, financial information regarding the Company, the compliance regime created by the Company, including the fact that the Company has engaged a third party for additional Fund compliance monitoring and the financial support of the Portfolios.
The Board also reviewed and discussed the short- and, where applicable, long-term performance of each of the Portfolios, as compared to applicable Morningstar rankings. The Board concluded that as to each Portfolio, the investment performance was at least satisfactory, and in some cases, excellent. With regard to the International Equity Fund, the Board noted that the time period being evaluated was very short and that the Board would continue to monitor the performance. With regard to the Value Discovery Fund, the Board noted that performance was good on an absolute basis but on a relative basis to peers the Company was performing less well, and that the Company was taking steps to address relative performance issues.
With respect to the costs of services provided and profits realized by the Company, the Board considered profitability information provided by the Company and, as applicable, the expense caps in place and/or proposed. Based on this information, the Board concluded for each Portfolio that the Company’s profitability was not unreasonable.
The Board considered the extent to which economies of scale would be realized as the Portfolios grow and considered management’s representation that certain Portfolio expenses are fixed and unrelated to asset size and that for some Portfolios there are little or no economies of scale in the investment process. In considering whether fee levels reflect economies of scale for the benefit of Portfolio investors, the Board reviewed each Portfolio’s asset size, the Portfolio’s total and net expense ratios, the expense caps in place and/or proposed and whether the investment process produced economies of scale. The Board concluded with respect to each of the Portfolios, that the total expense ratios, after giving effect to the expense caps proposed by the Company, were reasonable.
For each Portfolio, the Board compared the amounts to be paid to the Company for advisory and administrative services with other registered funds included in the Portfolio’s Lipper expense universe. In addition, for each Portfolio (except for the Income Fund which are not similar to any other funds advised or subadvised by the Company) the Board compared amounts paid to the Company by other registered funds, including other Portfolios in the Fund and funds for which the Company acts as a subadvisor. For each Portfolio, the Board compared amounts paid to the Company by the Company’s other clients. The Board also considered that the Company continues to waive advisory fees for the smaller Portfolios and has in place and/or proposed expense caps for certain Portfolios. The Board concluded that each Portfolio’s advisory fee was reasonable, and with respect to the Value Discovery Fund, in particular, emphasized the fact that the Company is waiving advisory fees and reimbursing expenses.
The Board considered benefits derived by the Company from its relationship with the Portfolios, including soft dollars and favorable media coverage. The Board concluded that, taking into account these benefits, the fees were reasonable. Based on all of the information considered and the conclusions reached, the Board determined to approve continuance of the advisory agreement for the existing Portfolios.
84 Semi-Annual Report | June 30, 2005 |
Proxy Voting
A description of the policies and procedures that the Fund uses to determine how to vote proxies relating to portfolio securities and information regarding how the Fund voted proxies relating to portfolio securities for the most recent 12-month period ended June 30 are available without charge, upon request, by calling 1-800-635-2886 (in Massachusetts 1-800-635-2840), at www.williamblairfunds.com and on the SEC’s website at http://www.sec.gov.
Quarterly Portfolio Schedules
The Fund files its complete schedule of portfolio holdings with the SEC for the first and third fiscal quarters of each fiscal year (quarters ended March 31 and September 30) on Form N-Q. The Fund’s Forms N-Q are available on the SEC’s website at http://www.sec.gov and may be reviewed and copied at the SEC’s Public Reference Room in Washington, D.C. Information on the operation of the SEC’s Public Reference Room may be obtained by calling 1-800-SEC-0330.
June 30, 2005 | William Blair Funds 85 |
Useful Information About Your Report (unaudited)
Please refer to this information when reviewing the Expense Example for each Fund.
Expense Example
As a shareholder of a Fund, you incur two types of costs: (1) transaction costs such sales charges (loads) or purchase payments for Class A shares and (2) ongoing costs, including management fees, distribution (12b-1) fees for Class B and Class C shares, shareholder services fees and other Fund expenses. The example is intended to help you understand your ongoing costs (in dollars) of investing in the Fund and to compare these costs with the ongoing costs of investing in other mutual funds. To do so, compare the Fund’s 5% hypothetical example with the 5% hypothetical examples that appear in the shareholder reports of other funds. The example is based on an investment of $1,000 invested at the beginning of the period and held for the entire six-month period from January 1, 2005 to June 30, 2005.
Actual Expenses
In each example, the first line for each share class in the table provides information about the actual account values and actual expenses. These expenses reflect the effect of any expense cap applicable to the share class during the period. Without this expense cap, the costs shown in the table would have been higher. You may use the information in this line, together with the amount you invested, to estimate the expenses that you paid over the period. Simply divide your account value by $1,000 (example, an $8,600 account value divided by $1,000 = 8.6), then multiply the result by the number in the first line under the heading entitled “Expenses Paid During the Period” to estimate the expenses you paid on your account during the period.
Hypothetical Example for Comparison Purposes
In each example, the second line for each share class in the table provides information about hypothetical account values and hypothetical expenses based on the Fund’s actual expense ratio and an assumed rate of return of 5% per year before expenses. This is not the Fund’s actual return. The hypothetical account values and expenses may not be used to estimate the actual ending account balance or expenses you paid for the period. You may use this information to compare the ongoing costs of investing in the Fund to other funds. To do so, compare this 5% hypothetical example with the 5% hypothetical examples that appear in the shareholder reports of other funds.
Please note that the expenses shown in both examples are meant to highlight your ongoing costs only and do not reflect any transactional costs or account type fees, such as sales charges (loads) for Class A shares and IRA Fiduciary Administration fees, respectively. These fees are fully described in the prospectus. Therefore, the second line of each share class in the table is useful in comparing ongoing costs only and will not help you determine the relative costs of owning different funds. In addition, if these transactional costs were included, your costs would have been higher.
86 Semi-Annual Report | June 30, 2005 |
Fund Expenses (unaudited)
The examples below show you the ongoing costs (in dollars) of investing in your fund and allows you to compare these costs with those of other mutual funds. Please refer to the previous page for a detailed explanation of the information presented on this chart.
| | | | | | | | | | | | |
| | | Beginning
Account Value
1/1/2005
| | Ending
Account Value
6/30/2005
| | Expenses Paid
during
Period(a)
| | Annualized
Expense Ratio
| |
Growth Fund | | | | | | | | | | | | |
Class A—actual return | | $ | 1,000.00 | | $ | 993.50 | | $ | 5.73 | | 1.16 | % |
Class A—hypothetical 5% return | | | 1,000.00 | | | 1,019.04 | | | 5.81 | | 1.16 | |
Class B—actual return | | | 1,000.00 | | | 990.20 | | | 9.43 | | 1.91 | |
Class B—hypothetical 5% return | | | 1,000.00 | | | 1,015.32 | | | 9.54 | | 1.91 | |
Class C—actual return | | | 1,000.00 | | | 990.20 | | | 9.43 | | 1.91 | |
Class C—hypothetical 5% return | | | 1,000.00 | | | 1,015.32 | | | 9.54 | | 1.91 | |
Tax-Managed Growth Fund | | | | | | | | | | | | |
Class A—actual return | | | 1,000.00 | | | 1,011.10 | | | 7.68 | | 1.54 | |
Class A—hypothetical 5% return | | | 1,000.00 | | | 1,017.16 | | | 7.70 | | 1.54 | |
Class B—actual return | | | 1,000.00 | | | 1,007.00 | | | 11.40 | | 2.29 | |
Class B—hypothetical 5% return | | | 1,000.00 | | | 1,013.44 | | | 11.43 | | 2.29 | |
Class C—actual return | | | 1,000.00 | | | 1,007.00 | | | 11.40 | | 2.29 | |
Class C—hypothetical 5% return | | | 1,000.00 | | | 1,013.44 | | | 11.43 | | 2.29 | |
Large Cap Growth Fund | | | | | | | | | | | | |
Class A—actual return | | | 1,000.00 | | | 982.30 | | | 6.44 | | 1.31 | |
Class A—hypothetical 5% return | | | 1,000.00 | | | 1,018.30 | | | 6.56 | | 1.31 | |
Class B—actual return | | | 1,000.00 | | | 978.30 | | | 10.10 | | 2.06 | |
Class B—hypothetical 5% return | | | 1,000.00 | | | 1,014.58 | | | 10.29 | | 2.06 | |
Class C—actual return | | | 1,000.00 | | | 978.20 | | | 10.10 | | 2.06 | |
Class C—hypothetical 5% return | | | 1,000.00 | | | 1,014.58 | | | 10.29 | | 2.06 | |
Small Cap Growth Fund | | | | | | | | | | | | |
Class A—actual return | | | 1,000.00 | | | 958.70 | | | 7.09 | | 1.46 | |
Class A—hypothetical 5% return | | | 1,000.00 | | | 1,017.55 | | | 7.30 | | 1.46 | |
Class B—actual return | | | 1,000.00 | | | 954.90 | | | 10.71 | | 2.21 | |
Class B—hypothetical 5% return | | | 1,000.00 | | | 1,013.84 | | | 11.03 | | 2.21 | |
Class C—actual return | | | 1,000.00 | | | 954.90 | | | 10.71 | | 2.21 | |
Class C—hypothetical 5% return | | | 1,000.00 | | | 1,013.84 | | | 11.03 | | 2.21 | |
Small-Mid Cap Growth Fund | | | | | | | | | | | | |
Class A—actual return | | | 1,000.00 | | | 994.70 | | | 7.37 | | 1.49 | |
Class A—hypothetical 5% return | | | 1,000.00 | | | 1,017.41 | | | 7.45 | | 1.49 | |
Class B—actual return | | | 1,000.00 | | | 991.10 | | | 11.06 | | 2.24 | |
Class B—hypothetical 5% return | | | 1,000.00 | | | 1,013.69 | | | 11.18 | | 2.24 | |
Class C—actual return | | | 1,000.00 | | | 991.10 | | | 11.06 | | 2.24 | |
Class C—hypothetical 5% return | | | 1,000.00 | | | 1,013.69 | | | 11.18 | | 2.24 | |
International Growth Fund | | | | | | | | | | | | |
Class A—actual return | | | 1,000.00 | | | 1,015.00 | | | 6.99 | | 1.40 | |
Class A—hypothetical 5% return | | | 1,000.00 | | | 1,017.85 | | | 7.00 | | 1.40 | |
Class B—actual return | | | 1,000.00 | | | 1,011.00 | | | 10.72 | | 2.15 | |
Class B—hypothetical 5% return | | | 1,000.00 | | | 1,014.13 | | | 10.74 | | 2.15 | |
Class C—actual return | | | 1,000.00 | | | 1,011.00 | | | 10.72 | | 2.15 | |
Class C—hypothetical 5% return | | | 1,000.00 | | | 1,014.13 | | | 10.74 | | 2.15 | |
June 30, 2005 | William Blair Funds 87 |
Fund Expenses (unaudited)—continued
| | | | | | | | | | | | |
| | | Beginning
Account Value
1/1/2005
| | Ending
Account Value
6/30/2005
| | Expenses Paid
during
Period(a)
| | Annualized
Expense Ratio
| |
International Equity Fund | | | | | | | | | | | | |
Class A—actual return | | $ | 1,000.00 | | $ | 988.50 | | $ | 7.35 | | 1.49 | % |
Class A—hypothetical 5% return | | | 1,000.00 | | | 1,017.41 | | | 7.45 | | 1.49 | |
Class B—actual return | | | 1,000.00 | | | 985.00 | | | 11.02 | | 2.24 | |
Class B—hypothetical 5% return | | | 1,000.00 | | | 1,013.69 | | | 11.18 | | 2.24 | |
Class C—actual return | | | 1,000.00 | | | 985.00 | | | 11.02 | | 2.24 | |
Class C—hypothetical 5% return | | | 1,000.00 | | | 1,013.69 | | | 11.18 | | 2.24 | |
Value Discovery Fund | | | | | | | | | | | | |
Class A—actual return | | | 1,000.00 | | | 953.00 | | | 7.02 | | 1.45 | |
Class A—hypothetical 5% return | | | 1,000.00 | | | 1,017.60 | | | 7.25 | | 1.45 | |
Class B—actual return | | | 1,000.00 | | | 949.40 | | | 10.63 | | 2.20 | |
Class B—hypothetical 5% return | | | 1,000.00 | | | 1,013.88 | | | 10.99 | | 2.20 | |
Class C—actual return | | | 1,000.00 | | | 949.40 | | | 10.63 | | 2.20 | |
Class C—hypothetical 5% return | | | 1,000.00 | | | 1,013.88 | | | 10.99 | | 2.20 | |
Income Fund | | | | | | | | | | | | |
Class A—actual return | | | 1,000.00 | | | 1,012.70 | | | 3.74 | | 0.75 | |
Class A—hypothetical 5% return | | | 1,000.00 | | | 1,021.08 | | | 3.76 | | 0.75 | |
Class B—actual return | | | 1,000.00 | | | 1,008.90 | | | 7.47 | | 1.50 | |
Class B—hypothetical 5% return | | | 1,000.00 | | | 1,017.36 | | | 7.50 | | 1.50 | |
Class C—actual return | | | 1,000.00 | | | 1,009.00 | | | 7.47 | | 1.50 | |
Class C—hypothetical 5% return | | | 1,000.00 | | | 1,017.36 | | | 7.50 | | 1.50 | |
| (a) | | Expenses are equal to the annualized expense ratio, multiplied by the average account value over the period, multiplied by the number of days in the period (181), and divided by 365 (to reflect the one-half-year period.) |
88 Semi-Annual Report | June 30, 2005 |
BOARD OF TRUSTEES
Conrad Fischer, Chairman
Principal, William Blair & Company, L.L.C.
Theodore A. Bosler
Retired Principal and Vice President, Lincoln Capital Management Company
Ann P. McDermott
Director and Trustee
Profit and not-for-profit organizations
Donald J. Reaves
Vice President for Administration and Chief Financial Officer, University of Chicago
Donald L. Seeley
Adjunct Lecturer and Director, University of Arizona Department of Finance
John B. Schwemm
Retired Chairman and CEO, R.R. Donnelley & Sons Company
Michelle R. Seitz
Principal, William Blair & Company, L.L.C.,
Robert E. Wood II
Retired Executive Vice President, Morgan Stanley Dean Witter
Officers
Marco Hanig, President
Karl W. Brewer, Senior Vice President
Harvey H. Bundy III, Senior Vice President
Mark A. Fuller, III, Senior Vice President
James M. Golan, Senior Vice President
W. George Greig, Senior Vice President
Michael A. Jancosek, Senior Vice President
John F. Jostrand, Senior Vice President
James S. Kaplan, Senior Vice President
Robert C. Lanphier, IV, Senior Vice President
David S. Mitchell, Senior Vice President
Gregory J. Pusinelli, Senior Vice President
Norbert W. Truderung, Senior Vice President
Jeffrey A. Urbina, Senior Vice President
Christopher T. Vincent, Senior Vice President
Todd M. McClone, Vice President
Terence M. Sullivan, Vice President and Treasurer
Colette M. Garavalia, Secretary
Investment Advisor
William Blair & Company, L.L.C.
Legal Counsel
Vedder, Price, Kaufman & Kammholz, P.C.
Transfer Agent
State Street Bank and Trust Company
P.O. Box 8506
Boston, MA 02266-8506
For customer assistance, call 1-800-635-2886
(Massachusetts 1-800-635-2840)
| | Date of First Use August 2005 89 |

WILLIAM BLAIR FUNDS
GROWTH FUNDS
Growth Fund
Tax-Managed Growth Fund
Large Cap Growth Fund
Small Cap Growth Fund
Small-Mid Cap Growth Fund
International Growth Fund
International Equity Fund
Emerging Markets Growth Fund
OTHER FUNDS
Value Discovery Fund Income Fund
222 West Adams Street
Chicago, Illinois 60606
800.742.7272
www.williamblairfunds.com
William Blair & Company, L. L. C., Distributors
Not applicable to this filing.
| Item 3. | Audit Committee Financial Expert |
Not applicable to this filing.
| Item 4. | Principal Accountant Fees and Services |
Not applicable to this filing.
| Item 5. | Audit Committee of Listed Registrants |
Not Applicable to this Registrant, insofar as the Registrant is not a listed company.
| Item 6. | Schedule of Investments |
See Schedule of Investments in Item 1
| Item 7. | Disclosure of Proxy Voting Policies and Procedures for Closed-End Management Investment Companies |
Not applicable to this Registrant, insofar as the Registrant is not a closed-end management investment company.
| Item 8. | Portfolio Managers of Closed-End Management Investment Companies |
Not applicable to this Registrant, insofar as the Registrant is not a closed-end management investment company.
| Item 9. | Purchase of Equity Securities by Closed-End Management Investment Companies and Affiliated Purchasers |
Not applicable to this Registrant, insofar as the Registrant is not a closed-end management investment company.
| Item 10. | Submission of Matters to a Vote of Security Holders |
There have been no material changes to the procedures by which shareholders may recommend nominees to the Registrant’s Board of Trustees since the Registrant last provided disclosure in response to this item.
Controls and Procedures
(a) The Registrant’s principal executive and principal financial officer, or persons performing similar functions, have concluded that the Registrant’s Disclosure Controls and Procedures (as defined in Rule 30-a-3( c ) under the Investment Company Act of 1940, as amended (the “1940 Act”) (17 CFR 270.30a-3 ( c )) are effective, as of a date within 90 days of the filing date of this report that includes the disclosure required by this paragraph, based on their evaluation of these controls and procedures required by Rule 30a-3 (b) under the 1940 Act (17 CFR 270.30a-3( b ) and Rules 13a-15( b ) or 15d-15(b) under the Exchange Act (17 CFR 240.13a-15(b) or 240.15d-15(b)).
(b) There were no changes in the Registrant’s internal controls over financial reporting (as defined in Rule 30a-3(d) under the 1940 Act (17 CFR 270.30a-3(d)) that occurred during the final quarter of the period covered by this report that has materially affected, or is reasonably likely to materially affect, the Registrant’s internal control over financial reporting.
12. (a) (1) Code of Ethics
Not applicable to this filing.
12. (a) (2) (1)
Certification of Principal Executive Officer Required by Rule 30a-2(a) of the Investment Company Act
12. (a) (2) (2)
Certification of Principal Financial Officer Required by Rule 30a-2(a) of the Investment Company Act.
12. (a) (3)
Not applicable to this Registrant.
12. (b)
Certification of Chief Executive Officer and Certification of Chief Financial Officer Required by Rule 30a-2(b) of the Investment Company Act
Signatures
Pursuant to the requirements of the Securities Exchange Act of 1934 and the Investment Company Act of 1940, the Registrant has duly caused this report to be signed on its behalf by the undersigned, thereunto duly authorized.
| | |
| | | William Blair Funds |
| |
| | | /s/ Marco Hanig |
| By: | | Marco Hanig |
| | | President (Chief Executive Officer) |
Date: August 29, 2005
Pursuant to the requirements of the Securities Exchange Act of 1934 and the Investment Company Act of 1940, this Report has been signed below by the following persons on behalf of the Registrant and in the capacities and on the dates indicated
| | |
| By: | | Marco Hanig |
| | | President (Chief Executive Officer) |
Date: August 29, 2005
| | |
| By: | | Terence M. Sullivan |
| | | Treasurer (Chief Financial Officer) |
Date: August 29, 2005