UNITED STATES
SECURITIES AND EXCHANGE COMMISSION
Washington, D.C. 20549
Form N-CSR
CERTIFIED SHAREHOLDER REPORT OF REGISTERED
MANAGEMENT INVESTMENT COMPANIES
Investment Company Act File Number 811-5344
William Blair Funds
(Exact name of registrant as specified in charter)
| | |
| 222 West Adams Street, Chicago, IL | | 60606 |
| (Address of principal executive offices) | | (Zip Code) |
Marco Hanig
William Blair Funds
222 West Adams Street, Chicago, IL 60606
(Name and address of agent for service)
Registrant’s telephone number, including area code: 312-236-1600
Date of fiscal year end: December 31
Date of reporting period: June 30, 2006
Form N-CSR is to be used by management investment companies to file reports with the Commission not later than 10 days after the transmission to stockholders of any report that is required to be transmitted to stockholders under Rule 30e-1 under the Investment Company Act of 1940 (17 CFR 270.30e-1). The Commission may use the information provided on Form N-CSR in its regulatory, disclosure review, inspection, and policymaking roles.
A registrant is required to disclose the information specified by Form N-CSR, and the Commission will make this information public. A Registrant is not required to respond to the collection of information contained in Form N-CSR unless the form displays a currently valid Office of Management and Budget (“OMB”) control number. Please direct comments concerning the accuracy of the information collection burden estimates and any suggestions for reducing the burden to Secretary, Securities and Exchange Commission, 450 Fifth Street, NW, Washington, DC 20549-0609. The OMB has reviewed this collection of information under the clearance requirements of 44 U.S.C. (ss) 3507.
June 30, 2006 Semi-Annual Reports transmitted to shareholders.

Table of Contents
This report is submitted for the general information of the shareholders of the William Blair Funds. It is not authorized for distribution to prospective investors unless accompanied or preceded by a prospectus of the William Blair Funds. Please carefully consider the Funds’ investment objectives, risks, charges, and expenses before investing. This and other information is contained in the Funds’ prospectus, which you may obtain by calling 1-800-742-7272. Read it carefully before you invest or send money.
June 30, 2006 | William Blair Funds 1 |

Marco Hanig
A LETTER FROM THE PRESIDENT
Dear Shareholders:
In the first half of 2006, the U.S. stock market got off to a great start in the first quarter, and then pulled back in the second quarter to end up with modestly positive returns. The Standard and Poor’s 500 Index of large cap stocks posted a 2.71% return, and the Russell 2000 Index of small cap stocks was up 8.21%. Rising interest rates led to slightly negative bond returns, with the Lehman Aggregate Bond Index declining -0.72%. Foreign stocks continued to outperform the U.S., with the MSCI All Country World ex-US Index up 9.99%.
The first quarter rally was fueled by strong corporate earnings and the hope that the Fed would soon end its tightening cycle. In mid-May, the Fed’s hawkish comments about inflation signaled that the end to interest rate hikes would likely be delayed. In addition, concern about high energy prices and a soft housing market led to worries about the strength of the consumer sector. On the bright side, the U.S. economy is still growing robustly, and after the recent market correction valuations have become more reasonable, so the outlook for stock returns in the second half of the year is generally flat to moderately positive.
Differences in style were fairly pronounced, with value continuing its five-year winning streak over growth, and small caps outperforming large caps. While many observers continue to expect large caps and growth stocks to outperform, this change in tide has yet to materialize.
Total Returns by Russell Style Index
January 1 through June 30, 2006
| | | | | | | | | |
| | | Value
| | | Blend
| | | Growth
| |
Large Cap (Russell 1000) | | 6.56 | % | | 2.76 | % | | -0.93 | % |
Mid Cap (Russell MidCap) | | 7.02 | % | | 4.84 | % | | 2.56 | % |
Small Cap (Russell 2000) | | 10.44 | % | | 8.21 | % | | 6.07 | % |
The relative returns of the William Blair Funds were mixed. Year-to-date, all the domestic equity funds beat their respective Morningstar peer groups, with the standout funds being the Growth Fund, up 2.38% vs. a decline of -1.34% for the Morningstar Large Growth universe, and the Small-Mid Cap Growth Fund, up 5.08% vs. 2.88% for the Morningstar Mid-Cap Growth universe. Our foreign funds all lagged in the first half, with our largest fund, International Growth Fund, posting a return of 5.95% vs. 8.20% for the Morningstar Foreign Large Growth peers. The Fund managers’ letters discuss the reasons for their respective over- or under-performance in greater detail.
As always, thank you for investing with us!

Marco Hanig
2 Semi-Annual Report | June 30, 2006 |
PERFORMANCE AS OF JUNE 30, 2006—CLASS N SHARES
| | | | | | | | | | | | | | |
| | | Year to
Date
| | 1 Yr
| | 3 Yr
| | 5 Yr
| | 10 Yr (or since
inception)
| | Inception
Date
| | Overall Morningstar Rating
|
| | | (unaudited) | | | | | | | | | | | | |
Growth Fund | | 2.38 | | 13.21 | | 10.88 | | 1.31 | | 5.50 | | 3/20/1946 | | «««« |
Morningstar Large Growth | | -1.34 | | 6.83 | | 8.83 | | -0.56 | | 5.68 | | | | Among 1,361 large growth funds |
Russell 3000® Growth | | -0.32 | | 6.84 | | 8.96 | | -0.43 | | 5.24 | | | |
Standard & Poor’s 500 | | 2.71 | | 8.63 | | 11.22 | | 2.49 | | 8.32 | | | | |
| | | | | | | |
Tax-Managed Growth Fund | | | | | | | | | | | | | | «««« |
Return before Taxes | | 1.48 | | 13.00 | | 11.36 | | 2.25 | | 0.39 | | 12/27/1999 | | Among 1,361 large growth funds |
After Taxes on Distributions | | 1.48 | | 13.00 | | 11.36 | | 2.25 | | 0.39 | | | |
After Taxes on Distributions and Sale of Fund Shares | | 0.96 | | 8.45 | | 9.80 | | 1.92 | | 0.34 | | | | |
Morningstar Large Growth | | -1.34 | | 6.83 | | 8.83 | | -0.56 | | — | | | | |
Russell 3000® Growth | | -0.32 | | 6.84 | | 8.96 | | -0.43 | | -6.07 | | | | |
| | | | | | | |
Large Cap Growth Fund | | -0.93 | | 4.57 | | 6.95 | | -2.00 | | -6.58 | | 12/27/1999 | | ««« |
Morningstar Large Growth | | -1.34 | | 6.83 | | 8.83 | | -0.56 | | — | | | | Among 1,361 large growth funds |
Russell 1000® Growth | | -0.93 | | 6.12 | | 8.35 | | -0.76 | | -6.53 | | | |
| | | | | | | |
Small Cap Growth Fund | | 5.85 | | 11.75 | | 20.82 | | 13.95 | | 19.09 | | 12/27/1999 | | ««««« |
Morningstar Small Growth | | 4.89 | | 12.73 | | 15.23 | | 3.70 | | — | | | | Among 646 small growth funds |
Russell 2000® Growth | | 6.07 | | 14.58 | | 16.27 | | 3.49 | | -0.48 | | | |
The Small Cap Growth Fund’s Performance during 2000 was primarily attributable to investments in initial public offerings (IPOs) during a rising market. Since then, IPOs have had an insignificant effect on the Fund’s performance. | | | | | | |
| | | | | | | |
Mid Cap Growth Fund | | — | | — | | — | | — | | -0.30 | | 2/1/2006 | | Not rated. |
Russell Mid Cap Growth Index | | — | | — | | — | | — | | -3.36 | | | | |
| | | | | | | |
Small-Mid Cap Growth Fund | | 5.08 | | 16.97 | | — | | — | | 11.41 | | 12/29/2003 | | Not rated. |
Morningstar Mid-Cap Growth | | 2.88 | | 12.66 | | — | | — | | — | | | | |
Russell 2500TM Growth | | 4.98 | | 14.62 | | — | | — | | 10.77 | | | | |
| | | | | | | |
International Growth Fund | | 5.95 | | 26.99 | | 25.02 | | 11.66 | | 13.44 | | 10/1/1992 | | ««««« |
Morningstar Foreign Large Growth | | 8.20 | | 26.99 | | 21.10 | | 7.64 | | 5.63 | | | | Among 195 foreign large growth funds |
MSCI World Ex-US | | 9.99 | | 28.40 | | 25.78 | | 11.85 | | 7.16 | | | |
| | | | | | | |
International Equity Fund | | 4.67 | | 20.18 | | — | | — | | 15.11 | | 5/24/2004 | | Not rated. |
Morningstar Foreign Large Growth | | 8.20 | | 26.99 | | — | | — | | — | | | | |
MSCI World Ex-US | | 9.99 | | 28.40 | | — | | — | | 24.01 | | | | |
| | | | | | | |
International Small Cap Growth Fund | | 8.51 | | — | | — | | — | | 21.10 | | 11/1/2005 | | Not rated. |
Morningstar Foreign Small/Mid Growth | | 9.44 | | — | | — | | — | | — | | | | |
MSCI World Small Cap Ex-US | | 7.06 | | — | | — | | — | | 18.49 | | | | |
Please see the next page for important disclosure information.
June 30, 2006 | William Blair Funds 3 |
| | | | | | | | | | | | | | |
| | | Year to
Date
| | 1 Yr
| | 3 Yr
| | 5 Yr
| | 10 Yr (or since
inception)
| | Inception
Date
| | Overall Morningstar Rating
|
| | | | | | | |
Emerging Markets Growth Fund | | 5.86 | | 47.05 | | — | | — | | 46.71 | | 6/6/2005 | | Not rated. |
Morningstar Diversified Emerging Markets | | 6.74 | | 34.14 | | — | | — | | — | | | | |
MSCI Emerging Markets | | 7.33 | | 35.91 | | — | | — | | 35.68 | | | | |
| A portion of the Emerging Markets Growth Funds performance since inception was attributable to an investment in an initial public offering (IPO). | | | | | | |
| | | | | | | |
Value Discovery Fund | | 8.56 | | 14.43 | | 15.23 | | 8.92 | | 12.28 | | 12/23/1996 | | « |
Morningstar Small Value | | 7.13 | | 12.64 | | 19.35 | | 12.34 | | — | | | | Among 291 small value funds |
Russell 2000® | | 8.21 | | 14.58 | | 18.70 | | 8.50 | | 9.11 | | | |
Russell 2000® Value | | 10.44 | | 14.61 | | 21.01 | | 13.09 | | 12.82 | | | | |
| | | | | | | |
Income Fund | | 0.23 | | 0.61 | | 1.74 | | 3.92 | | 5.16 | | 10/1/1990 | | «««« |
Morningstar Short-Term Bond | | 0.84 | | 1.38 | | 1.45 | | 3.17 | | 4.64 | | | | Among 335 short-term bond funds |
Lehman Intermediate Govt./Credit Bond Index | | -0.18 | | -0.19 | | 1.48 | | 4.61 | | 5.80 | | | |
Performance cited represents past performance. Past performance does not guarantee future results and current performance may be lower or higher that the data quoted. Returns shown are average annual total returns, which assume reinvestment of dividends and capital gains. Investment returns and principal will fluctuate and you may have a gain or a loss when you sell shares. For the most current month-end performance information, please call 1-800-742-7272, or visit our Web site at www.williamblairfunds.com. Investing in smaller companies involves special risks, including higher volatility and lower liquidity. International and emerging markets investing involves special risk considerations, including currency fluctuations, lower liquidity, economic and political risk. As interest rates rise, bond prices will fall and bond funds become more volatile. From time to time, the investment advisor may waive fees or reimburse expenses for certain Funds. Without these waivers, performance would be lower. Class N shares are available to the general public without a sales load.
Tax-Managed Growth Fund’s after-tax returns are calculated using the highest historical individual federal marginal income tax rates, and do not reflect the impact of state and local taxes. Actual after-tax returns depend on the investor’s tax situation and may differ from those shown. After-tax returns shown are not relevant to investors who hold their fund shares through tax-deferred arrangements such as 401(k) plans or individual retirement accounts. After-tax returns are shown only for Class N and the after-tax returns for Class N shares will vary.
Morningstar RatingsTM are as of 6/30/06 and are subject to change every month. The ratings are based on a risk-adjusted return measure that accounts for variation in a fund’s monthly performance, placing more emphasis on downward variations and rewarding consistent performance. The top 10% of funds in each Category receive 5 stars, the next 22.5% receive 4 stars, the middle 35% receive 3 stars, the next 22.5% receive 2 stars, and the bottom 10% receive 1 star. The Overall Morningstar Rating for a fund is derived from a weighted-average of the performance figures associated with its three-, five- and ten-year (if applicable) Morningstar Rating metrics. The 3/5/10 year Morningstar ratings were as follows: Growth Fund ««««/««««/«««, Tax-Managed Growth Fund ««««/««««/NA, and Large Cap Growth Fund «««/«««/NA, out of 1361/1081/402 large growth funds; Small Cap Growth Fund «««««/«««««/NA out of 646/509/NA small growth funds; Value Discovery Fund «/«/NA out of 291/205/NA small value funds; International Growth Fund ««««/««««/««««« out of 195/153/66 foreign large growth funds; Income Fund ««««/««««/«««« out of 335/239/141 short-term bond funds.
Please carefully consider the Funds’ investment objectives, risks, charges, and expenses before investing. This and other information is contained in the Funds’ prospectus, which you may obtain by calling 1-800-742-7272. Read it carefully before you invest or send money.
4 Semi-Annual Report | June 30, 2006 |

David C. Fording

John F. Jostrand
GROWTH FUND
The Growth Fund invests primarily in common stocks of domestic growth companies that the Advisor expects to have sustainable, above-average growth from one business cycle to the next.
AN OVERVIEW FROM THE PORTFOLIO MANAGERS
How did the Fund perform over the first half of the year? How did the Fund’s performance compare to its benchmark?
The Growth Fund posted a 2.38% increase on a total return basis (Class N Shares) for the six month period ended June 30, 2006. By comparison, the Fund’s benchmark, the Russell 3000 Growth® Index, posted a loss of 0.32% during the same period.
What were the most significant factors impacting Fund performance?
For the six months ended June 30, 2006, the domestic equity markets were flat to modestly positive. The first few months of the year witnessed relatively strong gains, due to fourth quarter earnings reports that generally exceeded market expectations. Smaller capitalization stocks significantly outperformed in the early months, achieving double-digit gains in the first three months of the year. The optimism in the market held until mid-May, when hawkish language from the Federal Reserve regarding inflation concerns sent the domestic and international markets into a tailspin. Most of the early gains were given back, and investors shunned the higher beta stocks such as technology issues in favor of more defensive stocks such as consumer staples and utilities. Smaller capitalization stocks fell more significantly than larger caps, but still maintain a healthy lead on the year-to-date basis. Value stocks were also more heavily favored than growth, with a 400 basis point lead in the small cap area, and a 7.50% lead in large cap, as measured by the Russell indices.
The Growth Fund outpaced the Russell 3000 Growth Index for the six month period ended June 30, 2006, primarily due to strong stock selection, especially among the smallest capitalization stocks in the portfolio. With smaller capitalization issues continuing to lead larger counterparts on a year-to-date basis, our relative overweight in this area was a modest benefit, but by far the largest contributing factor to relative returns was our stock selection amongst the smallest cap stocks.
A couple of the strongest leaders during the period were small cap software-related stocks WebEx Communications and Nuance Communications. As a provider of on-demand, web-enabled collaboration services, WebEx continue to grow rapidly and surpass Street expectations. Moreover, it is effectively executing the transition to a new pricing model, and thus experienced significant price/earnings multiple expansion in the first quarter as the market’s perception of business risk receded. Nuance announced the acquisition of a major competitor in the voice recognition software business, Dictaphone, thus further securing its leadership position in this high growth area.
After the significant gains posted in the first quarter, valuations in certain areas of the market appeared relatively lofty, particularly in areas that are traditionally a little more volatile, like semiconductors. We took the opportunity to trim some stocks in Information Technology, and also repositioned some of our Health Care holdings to take advantage of gains in some issues and pursue new stocks with better product pipelines and longer-term growth outlooks. While we did not specifically anticipate the market slide in May and June, our repositioning due to valuation concerns helped our portfolio weather the turbulent environment.
June 30, 2006 | William Blair Funds 5 |
Which sectors enhanced the Fund’s return? What were among the best performing investments for the Fund?
Stocks in the Information Technology sector were the largest contributors to absolute and relative returns in the first six months. The primary contributors to portfolio results were the smaller capitalization stocks in this sector, such as WebEx Communications Inc. and Nuance Communications Inc., mentioned in the previous section. J2 Global Communications Inc., a leader in providing communication and messaging services such as fax, e-mail, and call options, was also one of the top performers during the period.
Consumer Discretionary stocks were generally flat during the period, but stock selection in the portfolio provided better returns. Shuffle Master Inc. and Kohl’s Corp. were two of the top performers in this sector during the six-month period. Shuffle Master’s stock appreciated significantly as its revenues and earnings continued to accelerate, and investor expectations regarding its potential growth in the Macao gaming market pushed the stock higher. Kohl’s is beginning to benefit from its new management team’s initiatives, including new and broadened product lines, improved inventory management systems and enhanced store displays. These factors are leading to relatively robust same store sales gains and corresponding improvements in margins.
Were there any investment strategies or themes that did not measure up to your expectations?
On both a relative and absolute basis, portfolio stocks in the Health Care sector were particularly weak during the first six months. After witnessing relatively robust returns in 2005, some of the portfolio’s large cap Health Care holdings came under some selling pressure in the first quarter. This was especially true in the medical technology area, where concerns about pricing and Medicare reimbursement cast a pall over the sector. This, in turn, put some pressure on several portfolio holdings, notably Medtronic, although we remain optimistic about the company’s future growth prospects. UnitedHealth Group Inc. continued to experience weakness, as Medicare providers continued to come under valuation pressure and subscriber rates are likely to decelerate. Medimmune Inc. also experienced significant weakness relative to the group during the quarter, as its primary earnings driver, Synagis (for respiratory ailments), experienced weaker than expected revenue growth. The falloff was due primarily to a distribution agreement issue, which has since been resolved. We anticipate that growth should improve, and pipeline products should benefit the company as well in coming quarters.
Although technology stocks broadly served as contributors to relative return, there were a few stocks in this area that experienced significant weakness during the six-month period. EMC Corp. is a global provider of systems and software that are used primarily for the management and storage of data. During the quarter the stock experienced significant price declines due to the company’s reporting lower than expected earnings and revenues reflecting, in our opinion, a tougher than anticipated competitive environment and intensified pricing pressures with respect to new products. Furthermore, EMC has made several acquisitions, the most recent of which caused investor concern regarding the company’s ability to gain synergies from such activities. Jabil Circuit Inc. provides services and solutions through the design, development, and manufacture of electronic equipment primarily to the telecommunications, technology and manufacturing industries. The stock experienced a relatively large loss during the quarter, after reporting lower earnings due to problems at a specific manufacturing plant.
The portfolio’s relatively low allocation to Consumer Staples stocks was also a detractor during the year-to-date period. In the volatile investment backdrop of the second quarter, investors sought refuge in more defensive issues, such as Consumer Staples. PepsiCo Inc., the portfolio’s primary holding in this sector, performed well versus other index stocks in this group, as unit volumes continued to do well, and the outlook, particularly for non-carbonated beverage sales abroad, looks robust. Our relative sector weights are based on fundamental,
6 Semi-Annual Report | June 30, 2006 |
bottom-up stock evaluation rather than a macro thematic position. While there are several companies in the Consumer Staples area that would score relatively well on our quality metrics, we do not think that most of them offer significant growth opportunities, which is why we have relatively low representation in this group.
What is your current strategy? How is the Fund Positioned?
The sell-off in May and June re-priced the market, bringing actual price/earnings multiples down to levels more appropriate to those implied by the current intermediate interest rates. We think it likely that stocks will remain in the new valuation band for the next nine months to a year until new or different information regarding market direction becomes apparent. The economic environment during the prior three calendar years provided an exceptional opportunity for strong earnings growth and historically high corporate profitability, which resulted in little delineation between a mediocre company and a great one. This tenor is changing in the market, as growth rates are decelerating and investors are beginning to adopt more conservative risk postures.
Given this environment, we believe favorable conditions exist for high quality growth investing to regain leadership in the stock market, and we continue to find investment ideas that fit within our “quality growth” framework. While our fundamental analysis and valuation discipline led us to reduce positions in select small cap names during the second quarter (thus modestly reducing our small cap exposure), we continue to seek out opportunities across the full spectrum of market capitalizations. Furthermore, we remain overweight both the Information Technology and Health Care sectors, largely at the expense of the consumer sectors, though we remain vigilant about continually assessing the risk-reward framework for individual companies within all sectors.
June 30, 2006 | William Blair Funds 7 |
Growth Fund
Performance Highlights (unaudited)
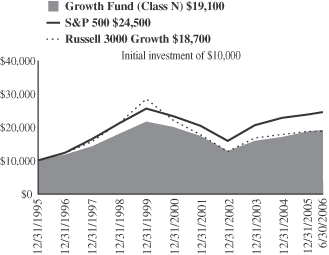
Average Annual Total Return at 6/30/2006
| | | | | | | | | | | | | | | | | |
| | | 1 Year
| | | 3 Year
| | | 5 Year
| | | 10 Year
| | | Since Inception
| | | |
Growth Fund Class N | | 13.21 | % | | 10.88 | % | | 1.31 | % | | 5.50 | % | | — | % | | |
Growth Fund
Class I | | 13.48 | | | 11.19 | | | 1.57 | | | — | | | 1.05 | (a) | | |
Russell 3000® Growth Index | | 6.84 | | | 8.96 | | | (0.43 | ) | | 5.24 | | | (2.75 | )(a) | | |
S&P 500 Index | | 8.63 | | | 11.22 | | | 2.49 | | | 8.32 | | | 1.44 | (a) | | |
| | (a) | | For the period from October 1, 1999 to June 30, 2006. |
Performance cited represents past performance. Past performance does not guarantee future results and current performance may be lower or higher than the data quoted. Results shown are average annual returns, which assume reinvestment of dividends and capital gains. Investment returns and principal will fluctuate and you may have a gain or loss when you sell shares. For the most current month-end performance information, please call 1-800-742-7272, or visit our Web site at www.williamblairfunds.com. Class N shares are available to the general public without a sales load. Class I shares are available to certain institutional investors and advisory clients of William Blair & Company L.L.C. without a sales load or distribution (12b-1) or service fees.
The performance highlights and graph presented above do not reflect the deduction of taxes that a shareholder would pay on fund distributions or the redemption of fund shares.
The Russell 3000® Growth Index consists of large, medium, and small-capitalization companies with above average price-to-book ratios and forecasted growth rates. The index is weighted by market capitalization and large/medium/small companies make up approximately 80%/15%/5% of the index.
The S&P 500 Index indicates broad larger capitalization equity market performance.
This report identifies the Fund’s investments on June 30, 2006. These holdings are subject to change. Not all stocks in the Fund performed the same, nor is there any guarantee that these stocks will perform as well in the future. Market forecasts provided in this report may not necessarily come to pass.
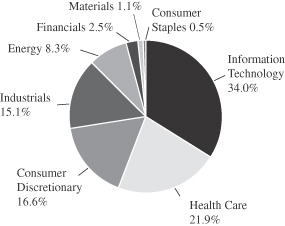
Sector Diversification (unaudited)
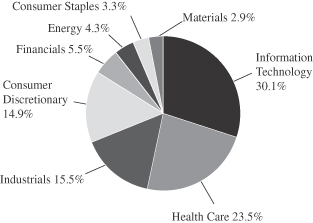
The sector diversification shown is based on the total investment portfolio.
8 William Blair Funds | June 30, 2006 |
Growth Fund
Portfolio of Investments, June 30, 2006 (all dollar amounts in thousands) (unaudited)
| | | | | |
Issuer
| | Shares
| | Value
|
| | |
Common Stocks | | | | | |
Information Technology—29.9% | | | | | |
*Activision, Inc. | | 208,515 | | $ | 2,373 |
*Adobe Systems Incorporated | | 92,440 | | | 2,807 |
Arm Holding plc—ADR | | 457,605 | | | 2,865 |
*Cognizant Technology Solutions Corporation | | 60,705 | | | 4,090 |
*Cognos, Inc.† | | 132,900 | | | 3,781 |
*EMC Corporation | | 511,710 | | | 5,614 |
*F5 Networks, Inc. | | 50,475 | | | 2,699 |
*J2 Global Communications, Inc. | | 200,000 | | | 6,244 |
Jabil Circuit, Inc. | | 179,760 | | | 4,602 |
*Kanbay International, Inc. | | 169,970 | | | 2,471 |
Linear Technology Corporation | | 91,590 | | | 3,067 |
*Network Appliance, Inc. | | 110,435 | | | 3,898 |
*Nuance Communications, Inc. | | 213,735 | | | 2,150 |
Paychex, Inc. | | 198,825 | | | 7,750 |
Taiwan Semiconductor Mfg. Co. Ltd.—ADR | | 497,485 | | | 4,567 |
*WebEx Communications, Inc. | | 248,345 | | | 8,826 |
*Yahoo!, Inc. | | 153,260 | | | 5,058 |
| | | | |
|
|
| | | | | | 72,862 |
| | | | |
|
|
Health Care—23.4% | | | | | |
Allergan, Inc. | | 25,455 | | | 2,730 |
*Amgen, Inc. | | 130,665 | | | 8,523 |
C. R. Bard, Inc. | | 34,930 | | | 2,559 |
Eli Lilly and Company | | 73,690 | | | 4,073 |
*IDEXX Laboratories, Inc. | | 37,380 | | | 2,808 |
*Integra Lifesciences Holding Corporation | | 134,820 | | | 5,232 |
*Kyphon, Inc. | | 107,520 | | | 4,125 |
*MedImmune, Inc. | | 88,395 | | | 2,396 |
Medtronic, Inc. | | 194,585 | | | 9,130 |
Pharmaceutical Product Development, Incorporated | | 109,370 | | | 3,841 |
*ResMed, Inc. | | 63,155 | | | 2,965 |
Sanofi-Aventis—ADR | | 82,535 | | | 4,020 |
UnitedHealth Group, Inc. | | 100,535 | | | 4,502 |
| | | | |
|
|
| | | | | | 56,904 |
| | | | |
|
|
Industrials—15.4% | | | | | |
*Coinstar, Inc. | | 155,910 | | | 3,733 |
Corporate Executive Board Company | | 42,070 | | | 4,215 |
Danaher Corporation | | 174,756 | | | 11,240 |
Graco, Inc. | | 105,000 | | | 4,828 |
Knight Transportation, Inc. | | 234,610 | | | 4,739 |
Rockwell Automation, Inc. | | 61,550 | | | 4,432 |
Rockwell Collins, Inc. | | 79,230 | | | 4,427 |
| | | | |
|
|
| | | | | | 37,614 |
| | | | |
|
|
Consumer Discretionary—14.8% | | | | | |
*Bed, Bath & Beyond, Inc. | | 164,005 | | | 5,440 |
*CarMax, Inc. | | 95,210 | | | 3,376 |
*Non-income producing securities
ADR = American Depository Receipt
† = U.S. listed foreign security
VRN = Variable Rate Note
| | | | | | |
Issuer
| | Shares or
Principal
Amount
| | Value
|
| | |
Common Stocks—(continued) | | | | | | |
Consumer Discretionary—(continued) | | | | | | |
*Guitar Center, Inc. | | | 70,710 | | $ | 3,144 |
Johnson Controls, Inc. | | | 49,625 | | | 4,080 |
*Kohl’s Corporation | | | 111,070 | | | 6,567 |
*Laureate Education, Inc. | | | 81,790 | | | 3,487 |
Marriott International, Inc., Class “A” | | | 143,130 | | | 5,456 |
Nike, Inc., Class “B” | | | 56,760 | | | 4,598 |
| | | | | |
|
|
| | | | | | | 36,148 |
| | | | | |
|
|
Financials—5.4% | | | | | | |
Goldman Sachs Group, Inc. | | | 40,040 | | | 6,023 |
Charles Schwab & Co., Inc. | | | 159,635 | | | 2,551 |
SLM Corporation | | | 88,600 | | | 4,689 |
| | | | | |
|
|
| | | | | | | 13,263 |
| | | | | |
|
|
Energy—4.3% | | | | | | |
Smith International, Inc. | | | 112,310 | | | 4,994 |
Suncor Energy, Inc.† | | | 66,775 | | | 5,410 |
| | | | | |
|
|
| | | | | | | 10,404 |
| | | | | |
|
|
Consumer Staples—3.3% | | | | | | |
PepsiCo, Inc. | | | 133,120 | | | 7,992 |
| | | | | |
|
|
Materials—2.9% | | | | | | |
Praxair, Inc. | | | 132,695 | | | 7,165 |
| | | | | |
|
|
Total Common Stock—99.4%
(cost $187,995) | | | 242,352 |
| | | | | |
|
|
| | |
Investment in Affiliate | | | | | | |
William Blair Ready Reserves Fund | | | 122,216 | | | 122 |
| | | | | |
|
|
Total Investment in Affiliate—0.1%
(cost $122) | | | 122 |
| | | | | |
|
|
| | |
Short-Term Investment | | | | | | |
Prudential Funding Demand Note, VRN 5.055%, due 7/03/06 | | $ | 1,287,000 | | | 1,287 |
| | | | | |
|
|
Total Short-Term Investment—0.5%
(cost $1,287) | | | 1,287 |
| | | | | |
|
|
Total Investments—100.0%
(cost $189,404) | | | 243,761 |
Cash and other assets, less liabilities—0.0% | | | 53 |
| | | | | |
|
|
Net assets—100.0% | | $ | 243,814 |
| | | | | |
|
|
See accompanying Notes to Financial Statements.
June 30, 2006 | William Blair Funds 9 |

Mark A. Fuller III

Gregory J. Pusinelli
TAX-MANAGED GROWTH FUND
The Tax-Managed Growth Fund invests primarily in common stocks of large, medium and small domestic growth companies that the Advisor expects will have sustainable, above-average growth from one business cycle to the next.
AN OVERVIEW FROM THE PORTFOLIO MANAGERS
How did the Fund perform over the first half of the year? How did the Fund’s performance compare to its benchmark?
The Tax-Managed Growth Fund posted a 1.48% gain on a total return basis (Class N Shares) for the six-months ended June 30, 2006. By comparison, the Fund’s benchmark, the Russell 3000® Growth Index declined 0.32% while the Standard & Poor’s 500 Stock Index rose 2.71%.
What were the most significant market factors impacting Fund performance?
Despite stubbornly high energy prices, economic uncertainty and the Federal Reserve’s ongoing campaign to raise short-term interest rates, the equity markets continued to forge ahead during the first quarter of 2006.
However, concerns about inflation and the sustainability of corporate profits led to a market sell-off late during the second quarter. By the end of June, the Fed had conducted its fourth interest rate increase of the year, and investors began to worry if the Fed was not being too heavy-handed in their administration of monetary policy.
What were among the best performing investments for the Fund?
The Fund’s top three contributors to return in the first half of the year were Suncor Energy, CH Robinson and Expeditors International of Washington.
Suncor Energy’s strong performance reflected the strength throughout the Energy sector, which was the second strongest sector in terms of overall contribution to return. Suncor Energy produces and refines oil from the Alberta oil sands in Canada and is a pioneer in oil sands production.
The next two biggest contributors were both from the Industrial sector, which provided the greatest contribution to the Fund’s return. CH Robinson Worldwide, provides transportation and logistics services through a network of more than 170 offices across North America, Europe, and South America. Expeditors International is primarily a consolidator and secondarily a forwarder of international air and ocean freight.
What were among the weakest performing investments for the Fund?
The weakest performing sector for the Fund during the first half of the year was Health Care. This lackluster showing was reflected in the poor performance of two stocks, which were the second and third greatest detractors to the Fund’s return: St. Jude Medical, and Alcon.
Mounting concerns over slowing sales of St Jude’s cardiac devices, began to weigh on the company’s share price during the first quarter. Generally speaking, investors grew concerned about the less-than-friendly competitive market environment the company was facing.
10 Semi-Annual Report | June 30, 2006 |
After appreciating to very high price levels, the price of Alcon declined as investors realized the company was unlikely to exceed growth targets.
Jabil Circuit, a company that provides customized electronic conductivity services and solutions to manufacturing clients, experienced a loss during the second quarter after reporting lower earnings due to problems with higher than expected start up costs in their new facilities. The ramp up was not as quick as expected so costs were greater then anticipated.
What is your current strategy? How is the Fund positioned?
We would describe our investment approach as somewhat less aggressive than it has been as we head into the second half of the year, especially in what we expect to be an environment of moderating economic growth.
We have trimmed or sold a number of positions in companies we own. For example, we scaled back our position in Suncor. We also reduced our position in Intercontinental Exchange, an electronic marketplace for trading of energy futures, options and over-the-counter contracts. Intercontinental Exchange has had a tremendous run up in price this year, and our concerns about valuation caused us to cut our position.
We also sold our entire positions in Expeditors, Alcon, Ebay, and Dollar General. In the case of Dollar General, we grew concerned about the impact of rising interest rates and higher energy prices on lower-income consumers. Similarly, we eliminated our position in D.R. Horton based on the expected slowdown in the housing market.
We added to our position in Smith International, the oil drilling company, and increased our stake in Rockwell Collins, the maker of avionics, as its share price dipped.
Reflecting our desire to increase exposure to larger cap high quality names, we established a new position in 3M, which we had owned previously, and we added to our positions in GE and Qualcomm.
We also established new positions in Psychiatric Solutions and WebEx. Psychiatric Solutions owns and operates 58 psychiatric facilities with more than 6,600 beds in 27 states, operating in an underserved area of health care with sizable barriers to entry. Lastly, WebEx provides multimedia communications services.
As we have stated, we believe the environment remains favorable for corporate profit growth in 2006. And we are encouraged by the earnings growth potential of the companies in the Fund’s portfolio, despite the potential for higher interest rates and slower growth in the economy this year. In such an environment, security selection becomes even more important. We believe our focus on quality franchise businesses and a respect for downside risk will serve us well as the year progresses.
June 30, 2006 | William Blair Funds 11 |
Tax-Managed Growth Fund
Performance Highlights (unaudited)
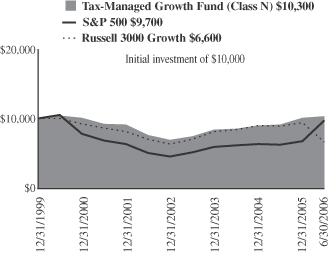
Average Annual Total Return at 6/30/2006
| | | | | | | | | | | | |
| | | 1
Year
| | | 3
Year
| | | 5
Year
| | | Since Inception(a)
| |
Tax-Managed Growth
Fund Class N | | 13.00 | % | | 11.36 | % | | 2.25 | % | | 0.39 | % |
Tax-Managed Growth
Fund Class I | | 13.36 | | | 11.66 | | | 2.52 | | | 0.66 | |
Russell 3000®
Growth Index | | 6.84 | | | 8.96 | | | (0.43 | ) | | (6.07 | ) |
S&P 500 Index | | 8.63 | | | 11.22 | | | 2.49 | | | (0.51 | ) |
| | (a) | | For the period from December 27, 1999 to June 30, 2006. |
Performance cited represents past performance. Past performance does not guarantee future results and current performance may be lower or higher than the data quoted. Results shown are average annual total returns, which assume reinvestment of dividends and capital gains. Investment returns and principal will fluctuate and you may have a gain or loss when you sell shares. For the most current month-end performance information, please call 1-800-742-7272, or visit our Web site at www.williamblairfunds.com. From time to time, the investment adviser may waive fees or reimburse expenses for the Fund. Without these waivers, performance would be lower. Class N shares are available to the general public without a sales load. Class I shares are available to certain institutional investors and advisory clients of William Blair & Company, L.L.C., without a sales load or distribution (12b-1) or service fees.
The performance highlights and graph presented above do not reflect the deduction of taxes that a shareholder would pay on fund distributions or the redemption of fund shares.
The Russell 3000® Growth Index consists of large, medium, and small-capitalization companies with above average price-to-book ratios and forecasted growth rates. The index is weighted by market capitalization and large/medium/small companies make up approximately 80%/15%/5% of the index.
The S&P 500 Index indicates broad larger capitalization equity market performance.
This report identifies the Fund’s investments on June 30, 2006. These holdings are subject to change. Not all stocks in the Fund performed the same, nor is there any guarantee that these stocks will perform as well in the future. Market forecasts provided in this report may not necessarily come to pass.
Sector Diversification (unaudited)
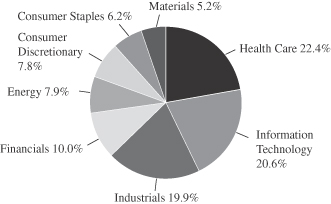
The sector diversification shown is based on the total investment portfolio.
12 Semi-Annual Report | June 30, 2006 |
Tax-Managed Growth Fund
Portfolio of Investments, June 30, 2006 (all dollar amounts in thousands) (unaudited)
| | | | | |
Issuer
| | Shares
| | Value
|
| | |
Common Stocks | | | | | |
Health Care—21.0% | | | | | |
*Amgen, Inc. | | 2,825 | | $ | 184 |
*Genentech, Inc. | | 2,090 | | | 171 |
*American Healthways, Inc. | | 1,720 | | | 90 |
IMS Health, Inc. | | 8,120 | | | 218 |
*MedImmune, Inc. | | 2,270 | | | 62 |
*Patterson Companies, Inc. | | 3,660 | | | 128 |
*Psychiatric Solutions, Inc. | | 4,480 | | | 128 |
*ResMed, Inc. | | 5,104 | | | 240 |
Sanofi-Aventis—ADR | | 2,870 | | | 140 |
*St. Jude Medical, Inc. | | 2,740 | | | 89 |
Stryker Corporation | | 1,430 | | | 60 |
Valeant Pharmaceuticals International | | 6,870 | | | 116 |
*Zimmer Holdings, Inc. | | 2,220 | | | 126 |
| | | | |
|
|
| | | | | | 1,752 |
| | | | |
|
|
Information Technology—19.3% | | | | | |
*Activision, Inc. | | 4,613 | | | 53 |
*Adobe Systems Incorporated | | 3,730 | | | 113 |
Arm Holdings plc—ADR | | 11,020 | | | 69 |
*CACI International, Inc., Class “A” | | 1,580 | | | 92 |
CDW Corporation | | 1,880 | | | 103 |
*EMC Corporation | | 7,650 | | | 84 |
First Data Corporation | | 3,370 | | | 152 |
Jabil Circuit, Inc. | | 4,115 | | | 105 |
Microchip Technology, Inc. | | 4,840 | | | 162 |
*Network Appliance, Inc. | | 5,210 | | | 184 |
Paychex, Inc. | | 3,930 | | | 153 |
Qualcomm Incorporated | | 1,880 | | | 75 |
*ScanSource, Inc. | | 2,860 | | | 84 |
Taiwan Semiconductor Mfg. Co. Ltd.—ADR | | 9,826 | | | 90 |
*WebEx Communications, Inc. | | 2,670 | | | 95 |
| | | | |
|
|
| | | | | | 1,614 |
| | | | |
|
|
Industrials—18.7% | | | | | |
3M Company | | 1,500 | | | 121 |
C.H. Robinson Worldwide, Inc. | | 2,700 | | | 144 |
Danaher Corporation | | 3,510 | | | 226 |
Fastenal Company | | 5,850 | | | 236 |
General Electric Company | | 6,465 | | | 213 |
Knight Transportation, Inc. | | 5,662 | | | 114 |
Pentair, Inc. | | 4,740 | | | 162 |
Rockwell Automation, Inc. | | 1,830 | | | 132 |
Rockwell Collins, Inc. | | 3,790 | | | 212 |
| | | | |
|
|
| | | | | | 1,560 |
| | | | |
|
|
Financials—9.3% | | | | | |
Ambac Financial Group, Inc. | | 1,680 | | | 136 |
American International Group | | 2,560 | | | 151 |
Capital One Financial Corporation | | 1,450 | | | 124 |
*IntercontinentalExchange, Inc. | | 1,690 | | | 98 |
Investors Financial Services Corporation | | 2,600 | | | 117 |
Moody’s Corporation | | 2,820 | | | 153 |
| | | | |
|
|
| | | | | | 779 |
| | | | |
|
|
*Non-income producing securities
ADR = American Depository Receipt
† = U.S. listed foreign security
VRN = Variable Rate Note
| | | | | | | |
Issuer
| | Shares or
Principal
Amount
| | Value
| |
| | |
Common Stocks—(continued) | | | | | | | |
Energy—7.4% | | | | | | | |
EOG Resources, Inc. | | | 1,090 | | $ | 76 | |
Smith International, Inc. | | | 4,010 | | | 178 | |
Suncor Energy, Inc.† | | | 4,490 | | | 364 | |
| | | | | |
|
|
|
| | | | | | | 618 | |
| | | | | |
|
|
|
Consumer Discretionary—7.3% | | | | | | | |
*Bed, Bath & Beyond, Inc. | | | 2,400 | | | 79 | |
*CarMax, Inc. | | | 3,150 | | | 112 | |
Johnson Controls, Inc. | | | 1,740 | | | 143 | |
*Laureate Education, Inc. | | | 3,120 | | | 133 | |
Williams-Sonoma, Inc. | | | 4,225 | | | 144 | |
| | | | | |
|
|
|
| | | | | | | 611 | |
| | | | | |
|
|
|
Consumer Staples—5.9% | | | | | | | |
Colgate-Palmolive Company | | | 2,780 | | | 167 | |
PepsiCo, Inc. | | | 3,285 | | | 197 | |
Walgreen Co. | | | 2,745 | | | 123 | |
| | | | | |
|
|
|
| | | | | | | 487 | |
| | | | | |
|
|
|
Materials—4.9% | | | | | | | |
Airgas, Inc. | | | 6,440 | | | 240 | |
Praxair, Inc. | | | 3,090 | | | 167 | |
| | | | | |
|
|
|
| | | | | | | 407 | |
| | | | | |
|
|
|
Total Common Stock—93.8%
(cost $6,224) | | | 7,828 | |
| | | | | |
|
|
|
| | |
Investment in Affiliate | | | | | | | |
William Blair Ready Reserves Fund | | | 144,958 | | | 145 | |
| | | | | |
|
|
|
Total Investment in Affiliate—1.7%
(cost $145) | | | 145 | |
| | | | | |
|
|
|
| | |
Short-Term Investment | | | | | | | |
Prudential Funding Demand Note, VRN 5.055%, due 7/03/06 | | $ | 406,000 | | | 406 | |
| | | | | |
|
|
|
Total Short-Term Investment—4.9%
(cost $406) | | | 406 | |
| | | | | |
|
|
|
Total Investments—100.4%
(cost $6,775) | | | 8,379 | |
Liabilities, plus cash and other assets—(0.4)% | | | (33 | ) |
| | | | | |
|
|
|
Net assets—100.0% | | $ | 8,346 | |
| | | | | |
|
|
|
See accompanying Notes to Financial Statements.
June 30, 2006 | William Blair Funds 13 |

James S. Golan
John F. Jostrand

Norbert W. Truderung
LARGE CAP GROWTH FUND
The Large Cap Growth Fund invests primarily in common stocks of large domestic growth companies of high quality that the Advisor believes have demonstrated sustained growth over a long period of time.
AN OVERVIEW FROM THE PORTFOLIO MANAGERS
How did the Fund perform over the first half of the year? How did the Fund’s performance compare to its benchmark?
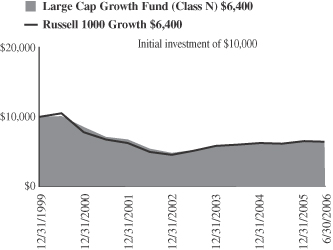
The Large Cap Growth Fund posted a 0.93% decrease on a total return basis (Class N Shares) for the six-month period ended June 30, 2006. During the same period, the Fund’s benchmark, the Russell 1000 Growth® Index, declined 0.93%
What were the most significant factors impacting Fund performance?
For the six months ended June 30, 2006, the domestic equity markets were flat to modestly positive. The first few months of the year witnessed relatively strong gains, due to fourth quarter earnings reports that generally exceeded market expectations. Smaller capitalization stocks significantly outperformed in the early months, achieving double-digit gains in the first three months of the year. The optimism in the market held until mid-May, when hawkish language from the Federal Reserve regarding inflation concerns sent the domestic and international markets into a tailspin. Most of the early gains were given back, and investors shunned the higher beta stocks such as technology issues in favor of more defensive stocks such as consumer staples and utilities. Smaller capitalization stocks were beaten down more significantly than larger caps, but still maintain a healthy lead on the year-to-date basis. Value stocks were also more heavily favored than growth, with a 400 basis point lead in the small cap area, and a 7.50% lead in large cap, as measured by the Russell indices.
Valuations in certain areas of the market appeared particularly lofty shortly after the first quarter, particularly in areas that are traditionally a little more volatile, like semiconductors. We took the opportunity to trim some stocks in Information Technology, and also repositioned some of our Health Care holdings to take advantage of gains in some issues and pursue new stocks with better product pipelines and longer-term growth outlooks. In the past six months, we have found more interesting opportunities in Financial stocks and select Consumer Discretionary issues as well. While we did not specifically anticipate the market slide in May and June, our repositioning due to valuation concerns helped our portfolio weather the turbulent environment.
Which sectors enhanced the Fund’s return? What were among the best performing investments for the Fund?
On an absolute basis, Energy sector stocks were among the strongest performers in the portfolio. Schlumberger Ltd. in the oilfield drilling and services area, appreciated significantly due to both increased demand for its services and more favorable pricing. Technological advances helped improve profitability as well. Suncor Energy Inc. reported results that were generally in-line, but continues to have a favorable outlook with respect to current and future production expectations. Investor sentiment also reflects that higher oil prices are likely to have some sustainability in the market.
14 Semi-Annual Report | June 30, 2006 |
On a relative basis, the largest contributor to returns was the Information Technology sector. Although technology stocks were broadly weaker during the quarter, the portfolio held several stocks that performed very well versus the group. Network Appliance Inc., a company that provides network software and data storage, experienced strong revenue and earnings growth, and was a significant leader in its industry during the period. Corning, Inc., with its patented technology for the manufacture of LCD glass, continues to have a significant edge over competitors. Investor expectations for relatively strong growth in the flat panel television market, combined with larger units (more glass per television), contributed to stock appreciation in the first six months.
Consumer Discretionary stocks were generally flat during the period, but stock selection in the portfolio provided better returns. Marriott International Inc. and Kohl’s Corp. were two of the top performers in this sector during the period. As we surmised, Marriott is benefiting from strong trends among business travelers, resulting in high occupancy rates and higher room prices, particularly for hotels in bigger metropolitan areas. Kohl’s is beginning to benefit from its new management team’s initiatives, including new and broadened product lines, improved inventory management systems and enhanced store displays. These factors are leading to relatively robust same store sales gains and corresponding improvements in margins.
Were there any investment strategies or themes that did not measure up to your expectations?
On both a relative and absolute basis, portfolio stocks in the Health Care sector were particularly weak during the first six months. After witnessing relatively robust returns in 2005, some of the portfolio’s large cap Health Care holdings came under some selling pressure in the first quarter. This was especially true in the medical technology area, where concerns about pricing and Medicare reimbursement cast a pall over the sector. This, in turn, put some pressure on several portfolio holdings, notably Medtronic Inc., although we remain optimistic about the company’s future growth prospects. UnitedHealth Group Inc. continued to experience weakness, as Medicare providers continued to come under valuation pressure and subscriber rates are likely to decelerate. Medimmune Inc. also experienced significant weakness relative to the group during the quarter, as its primary earnings driver, Synagis (for respiratory ailments), experienced weaker than expected revenue growth. The falloff was due primarily to a distribution agreement issue, which has since been resolved. We anticipate that growth should improve and pipeline products should benefit the company as well in coming quarters.
Although technology stocks broadly served as contributors to relative return, there were a few stocks in this area that experienced significant weakness during the six-month period. EMC Corp. in particular detracted from returns. This company is a global provider of systems and software that are used primarily for the management and storage of data. During the quarter the stock experienced significant price declines due to the company’s reporting lower than expected earnings and revenues reflecting, in our opinion, a tougher than anticipated competitive environment and intensified pricing pressures with respect to new products. Furthermore, EMC has made several acquisitions, the most recent of which caused investor concern regarding the company’s ability to gain synergies from such activities.
The portfolio’s relatively low allocation to Consumer Staples stocks was also a detractor during the year-to-date period. In the volatile investment backdrop of the second quarter, investors sought refuge in more defensive issues, such as Consumer Staples. PepsiCo Inc., the portfolio’s primary holding in this sector, performed well versus other index stocks in this group, as unit volumes continued to do well, and the outlook, particularly for non-carbonated beverage sales abroad, looks robust. Our relative sector weights are based on fundamental, bottom-up stock evaluation rather than a macro thematic position. While there are several companies in the Consumer Staples area that would score relatively well on our quality metrics, we do not think that most of them offer significant growth opportunities, which is why we have relatively low representation in this group.
June 30, 2006 | William Blair Funds 15 |
What is your current strategy? How is the Fund positioned?
The sell-off in May and June re-priced the market, bringing actual price/earnings multiples down to levels more appropriate to those implied by the current intermediate interest rates. The economic environment during the prior three calendar years provided an exceptional opportunity for strong earnings growth and historically high corporate profitability, which resulted in little delineation between a mediocre company and a great one. This tenor is changing in the market, as growth rates are decelerating and investors are beginning to adopt more conservative risk postures. As a result, we believe higher quality larger capitalization stocks are well positioned to resume a leadership role. We continue to find some of the best opportunities for quality growth investing in the Health Care and Information Technology sectors. In more recent periods, we have added some new issues to our Financial sector holdings, particularly among asset managers and consumer finance. We have also repositioned our Consumer Discretionary sector to have less exposure to retail oriented names in favor of ones that tend to be more reliant on business related expenditures. We continue to find excellent opportunities for quality growth companies in the market.
16 Semi-Annual Report | June 30, 2006 |
Large Cap Growth Fund
Performance Highlights (unaudited)
Average Annual Total Return at 6/30/2006
| | | | | | | | | | | | |
| | | 1
Year
| | | 3
Year
| | | 5
Year
| | | Since
Inception(a)
| |
Large Cap Growth Fund Class N | | 4.57 | % | | 6.95 | % | | (2.00 | )% | | (6.58 | )% |
Large Cap Growth Fund Class I | | 4.84 | | | 7.17 | | | (1.81 | ) | | (6.38 | ) |
Russell 1000®
Growth Index | | 6.12 | | | 8.35 | | | (0.76 | ) | | (6.53 | ) |
| | (a) | | For the period from December 27, 1999 to June 30, 2006. |
Performance cited represents past performance. Past performance does not guarantee future results and current performance may be lower or higher than the data quoted. Results shown are average annual total returns, which assume reinvestment of dividends and capital gains. Investment returns and principal will fluctuate and you may have a gain or loss when you sell shares. For the most current month-end performance information, please call 1-800-742-7272, or visit our Web site at www.williamblairfunds.com. From time to time, the investment adviser may waive fees or reimburse expenses for the Fund. Without these waivers, performance would be lower. Class N shares are available to the general public without a sales load. Class I shares are available to certain institutional investors and advisory clients of William Blair & Company, L.L.C., without a sales load or distribution (12b-1) or service fees.
The performance highlights and graph presented above do not reflect the deduction of taxes that a shareholder would pay on fund distributions or the redemption of fund shares.
The Russell 1000® Growth Index consists of large-capitalization companies with above average-to-book ratios and forecasted growth rates.
This report identifies the Fund’s investments on June 30, 2006. These holdings are subject to change. Not all stocks in the Fund performed the same, nor is there any guarantee that these stocks will perform as well in the future. Market forecasts provided in this report may not necessarily come to pass.
Sector Diversification (unaudited)
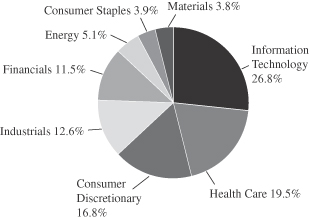
The sector diversification shown is based on the total investment portfolio.
June 30, 2006 | Semi-Annual Report 17 |
Large Cap Growth Fund
Portfolio of Investments, June 30, 2006 (all dollar amounts in thousands) (unaudited)
| | | | | |
Issuer
| | Shares
| | Value
|
| | |
Common Stocks | | | | | |
Information Technology—26.1% | | | | | |
*Adobe Systems Incorporated | | 15,770 | | $ | 479 |
*Cisco Systems Incorporated | | 22,714 | | | 444 |
*Corning Incorporated | | 20,810 | | | 503 |
*EMC Corporation | | 35,540 | | | 390 |
Infosys Technologies Ltd.—ADR | | 2,965 | | | 227 |
Linear Technology Corporation | | 11,800 | | | 395 |
*Network Appliance, Inc. | | 10,690 | | | 377 |
Paychex, Inc. | | 14,790 | | | 577 |
Qualcomm Incorporated | | 8,715 | | | 349 |
Taiwan Semiconductor Mfg. Co. Ltd.—ADR | | 47,649 | | | 437 |
*Yahoo!, Inc. | | 17,490 | | | 577 |
| | | | |
|
|
| | | | | | 4,755 |
| | | | |
|
|
Health Care—19.0% | | | | | |
Allergan, Inc. | | 2,260 | | | 243 |
*Amgen, Inc. | | 8,340 | | | 544 |
C. R. Bard, Inc. | | 2,550 | | | 187 |
Caremark Rx, Inc. | | 11,330 | | | 565 |
Eli Lilly and Company | | 4,150 | | | 229 |
*MedImmune, Inc. | | 6,910 | | | 187 |
Medtronic, Inc. | | 18,545 | | | 870 |
Sanofi-Aventis—ADR | | 6,085 | | | 296 |
UnitedHealth Group, Inc. | | 7,630 | | | 342 |
| | | | |
|
|
| | | | | | 3,463 |
| | | | |
|
|
Consumer Discretionary—16.3% | | | | | |
*Bed, Bath & Beyond, Inc. | | 12,475 | | | 414 |
Johnson Controls, Inc. | | 4,920 | | | 404 |
*Kohl’s Corporation | | 8,248 | | | 488 |
Marriott International, Inc., Class “A” | | 15,934 | | | 607 |
Nike, Inc., Class “B” | | 8,390 | | | 680 |
Staples, Inc. | | 15,665 | | | 381 |
| | | | |
|
|
| | | | | | 2,974 |
| | | | |
|
|
Industrials—12.3% | | | | | |
3M Company | | 4,625 | | | 373 |
Danaher Corporation | | 15,512 | | | 998 |
Rockwell Automation, Inc. | | 4,330 | | | 312 |
Rockwell Collins, Inc. | | 10,020 | | | 560 |
| | | | |
|
|
| | | | | | 2,243 |
| | | | |
|
|
*Non-income producing securities
ADR = American Depository Receipt
† = U.S. listed foreign security
| | | | | | |
Issuer
| | Shares or
Principal
Amount
| | Value
|
| | |
Common Stocks—(continued) | | | | | | |
Financials—11.3% | | | | | | |
Capital One Financial Corporation | | | 6,520 | | $ | 557 |
Franklin Resources, Inc. | | | 2,130 | | | 185 |
Goldman Sachs Group, Inc. | | | 3,910 | | | 588 |
Charles Schwab & Co, Inc. | | | 17,380 | | | 278 |
SLM Corporation | | | 8,370 | | | 443 |
| | | | | |
|
|
| | | | | | | 2,051 |
| | | | | |
|
|
Energy—5.0% | | | | | | |
Schlumberger Limited† | | | 7,090 | | | 462 |
Suncor Energy, Inc.† | | | 5,510 | | | 446 |
| | | | | |
|
|
| | | | | | | 908 |
| | | | | |
|
|
Consumer Staples—3.8% | | | | | | |
PepsiCo, Inc. | | | 11,390 | | | 684 |
| | | | | |
|
|
Materials—3.7% | | | | | | |
Praxair, Inc. | | | 12,415 | | | 670 |
| | | | | |
|
|
Total Common Stock—97.5%
(cost $16,308) | | | 17,748 |
| | | | | |
|
|
Investment in Affiliate | | | | | | |
William Blair Ready Reserves Fund | | | 73,566 | | | 74 |
| | | | | |
|
|
Total Investment in Affiliate—0.4%
(cost $74) | | | 74 |
| | | | | |
|
|
| | |
Short-Term Investment | | | | | | |
Prudential Funding Demand Note, VRN 5.055%, due 7/03/06 | | $ | 315,000 | | | 315 |
| | | | | |
|
|
Total Short-Term Investment—1.7%
(cost $315) | | | 315 |
| | | | | |
|
|
Total Investments—99.6%
(cost $16,697) | | | 18,137 |
Cash plus other assets less liabilities—0.4% | | | 65 |
| | | | | |
|
|
Net assets—100.0% | | $ | 18,202 |
| | | | | |
|
|
See accompanying Notes to Financial Statements.
18 Semi-Annual Report | June 30, 2006 |

Karl W. Brewer

Colin J. Williams
SMALL CAP GROWTH FUND
The Small Cap Growth Fund invests primarily in common stocks of small domestic growth companies that the Advisor expects to have solid growth in earnings.
AN OVERVIEW FROM THE PORTFOLIO MANAGERS
How did the Fund perform in the first half of 2006? How did the Fund’s performance compare to its benchmark?
The William Blair Small Cap Growth Fund gained 5.85% on a total return basis (Class N shares) during the first half of 2006. By comparison the Fund’s benchmark, the Russell 2000® Growth Index, increased 6.07%.
What were the most significant factors impacting Fund performance? What factors were behind the Fund’s performance versus the benchmark?
The Fund’s total return finished just behind the benchmark during the first half of the year. Looking across sectors, there were two main factors that influenced our relative performance. Stock selection in the Information Technology sector was superior to the Russell 2000 Growth Index while the Fund’s Consumer Discretionary holdings lagged their peers in the benchmark.
Small capitalization stocks outpaced their large cap counterparts during the first half of the year with the Russell 2000 Growth Index return of 6.07% as compared to the Russell 1000 Growth Index return of –0.93%. From a style perspective, value outperformed growth as the Russell 2000 Value Index returned 10.44% during the six month period.
The first half of 2006 saw explosive small cap returns during the first quarter before losing a great deal of that return in the second quarter. The first quarter brought strength across all major sectors. The broad based nature of small cap returns during the first quarter was due to corporate and economic health and in part due to expectations that an end to the Federal Reserve’s tightening cycle was in sight. However, during the second quarter inflationary data points indicated that the end to interest rate hikes may be delayed. Stocks with higher valuation risk turned south as investors discounted higher inflation going forward. Soft housing market data in the last few months also increased investor skepticism on the outlook for consumer spending. Across the entire six month period, energy stocks have led all other sectors in the Russell 2000 Growth Index after crude oil prices increased during the beginning of the year and remained at elevated levels throughout the period. The Industrials sector turned in the second best return among the six major sectors as global growth, despite recent pessimism, continues. With the aforementioned negative sentiment about consumer spending, the Consumer Discretionary sector finished barely in positive territory and therefore underperformed the broader market. It was joined by Information Technology and Health Care as investors took money out of some of the riskier stocks within these two sectors.
What were among the best performing investments for the Fund?
Two of the top performing stocks for the Fund were J2 Global Communications and Nuance Communications. J2 Global Communications offers messaging and communication services to individuals and businesses, including fax to email services. The stock performed extremely well despite a tough environment for technology stocks particularly in the second quarter. Concerns regarding possible government surcharges diminished during the first half of the
June 30, 2006 | William Blair Funds 19 |
year. In addition, investors began to anticipate the company’s potential price increases later this year. Nuance Communications is a leader in speech recognition and transcription software solutions. The continued evolution of speech recognition technology and increased coverage of the stock by Wall Street have helped drive growth in the stock price. The stock has continued its strength in part due to the company’s acquisition of Dictaphone, a leader in speech transcription software for the medical field, in early February. This accretive acquisition in a growth industry adds to its existing market leadership in other areas of speech recognition.
What were among the weakest performing investments for the Fund?
Laureate Education and Nautilus were two of the biggest detractors from the Fund’s return. Laureate Education is a for-profit educational institution operating online degree programs and primarily campus-based programs overseas. The stock is one of the Fund’s largest holdings but came under pressure in the second quarter after the company projected a temporary decline in enrollments for its U.S. online programs, which represent only 20% of its business. Management is making strategic adjustments to offset these headwinds. In addition, the majority of its business and the segment central to our investment thesis, is its international campus-based unit. This business is strong and our expectation for long term earnings growth remains robust. Nautilus designs and markets fitness apparel and equipment under various brand names. Some of the company’s most well known brands include Nautilus, Bowflex and Schwinn. Company management guided forward earnings guidance down for the second straight quarter during January. This reoccurrence was due to operational issues and we therefore liquidated the position.
What is your current outlook?
After the first quarter’s strong performance, we discussed the likelihood of a more sustainable level of stock market returns over the balance of 2006. Unfortunately, a great deal of the market’s early 2006 gain was negated by the second quarter’s weak performance. We had also discussed that the Federal Reserve’s effort to balance fighting inflation while maintaining economic growth had been on track. However, recent data points suggest inflation has been climbing while a housing market slowdown is underway—which could impact consumer spending and overall economic growth. This presents a bigger challenge for the Federal Reserve and along with it, greater uncertainty about what the future holds for interest rates. Investors’ aversion to this uncertainty has played out in the market’s decline over the past couple of months. That being said, we focus our time on finding quality growth companies with sustainable growth prospects despite the macro environment of the day. We feel such a portfolio better serves our clients over time.
Is there any other news with respect to the Fund?
As previously disclosed, Colin Williams was promoted to co-portfolio manager of the Fund. Colin has worked on the Fund as a research analyst for the past four years. Colin joins Karl Brewer who has been a portfolio manager for the Fund since its inception. Also, with respect to illiquid securities in the Fund, Think Partnership Inc. is a portfolio holding that we acquired through a Private Investment in Public Equity (PIPE) transaction during the first half of 2006. Think Partnership is a company that offers online services and solutions. We were able to purchase convertible preferred shares in the transaction that pay a preferred dividend. We expect these shares, if converted, to become freely tradable during the third quarter. The Fund’s Pricing Committee and Valuation Committee are currently pricing the security at fair value.
20 Semi-Annual Report | June 30, 2006 |
Small Cap Growth Fund
Performance Highlights (unaudited)

Average Annual Total Return at 6/30/2006
| | | | | | | | | | | | |
| | | 1
Year
| | | 3
Year
| | | 5
Year
| | | Since Inception(a)
| |
Small Cap Growth Fund Class N | | 11.75 | % | | 20.82 | % | | 13.95 | % | | 19.09 | % |
Small Cap Growth Fund Class I | | 12.04 | | | 21.11 | | | 14.25 | | | 19.37 | |
Russell 2000®
Growth Index | | 14.58 | | | 16.27 | | | 3.49 | | | (0.48 | ) |
Russell 2000® Index | | 14.58 | | | 18.70 | | | 8.50 | | | 7.71 | |
| | (a) | | For the period from December 27, 1999 to June 30, 2006. |
Performance cited represents past performance. Past performance does not guarantee future results and current performance may be lower or higher than the data quoted. Results shown are average annual total returns, which assume reinvestment of dividends and capital gains. Investment returns and principal will fluctuate and you may have a gain or loss when you sell shares. For the most current month-end performance information, please call 1-800-742-7272, or visit our Web site at www.williamblairfunds.com. Investing in smaller companies involves special risks, including higher volatility and lower liquidity. From time to time, the investment advisor may waive fees or reimburse expenses for the Fund. Without these waivers, performance would be lower. Class N shares are available to the general public without a sales load. Class I shares are available to certain institutional investors and advisory clients of William Blair & Company, L.L.C., without a sales load or distribution (12b-1) or service fees.
The performance highlights and graph presented above do not reflect the deduction of taxes that a shareholder would pay on fund distributions or the redemption of fund shares.
The Russell 2000® Growth Index consists of small-capitalization companies with above average price-to-book ratios and forecasted growth rates.
The Russell 2000® Index is an unmanaged composite of the smallest 2000 stocks of the Russell 3000® Index.
This report identifies the Fund’s investments on June 30, 2006. These holdings are subject to change. Not all stocks in the Fund performed the same, nor is there any guarantee that these stocks will perform as well in the future. Market forecasts provided in this report may not necessarily come to pass.
Sector Diversification (unaudited)
The sector diversification shown is based on the total investment portfolio.
June 30, 2006 | William Blair Funds 21 |
Small Cap Growth Fund
Portfolio of Investments, June 30, 2006 (all dollar amounts in thousands) (unaudited)
| | | | | |
Issuer
| | Shares
| | Value
|
| | |
Common Stocks | | | | | |
Information Technology—32.4% | | | | | |
*Access Integrated Technologies, Inc. | | 1,229,947 | | $ | 12,066 |
*BISYS Group, Inc. (The) | | 1,110,354 | | | 15,212 |
*Cogent, Inc. | | 770,546 | | | 11,612 |
*CyberSource Corporation | | 976,789 | | | 11,428 |
*DealerTrack Holdings, Inc. | | 272,908 | | | 6,034 |
*Digital Insight Corporation | | 300,115 | | | 10,291 |
*DTS, Inc. | | 791,976 | | | 15,428 |
*Electronic Clearing House | | 851,387 | | | 11,460 |
*Euronet Worldwide, Inc. | | 511,059 | | | 19,609 |
*F5 Networks, Inc. | | 303,072 | | | 16,208 |
*Heartland Payment Systems, Inc. | | 566,770 | | | 15,802 |
*J2 Global Communications, Inc. | | 782,846 | | | 24,440 |
*Kanbay International, Inc. | | 1,580,199 | | | 22,976 |
*Lionbridge Technologies, Inc. | | 1,182,962 | | | 6,542 |
*Nuance Communications, Inc. | | 1,616,430 | | | 16,261 |
*Optimal Group, Inc.† | | 1,318,631 | | | 17,815 |
*PDF Solutions, Inc. | | 763,013 | | | 9,469 |
*Silicon Labratories, Inc. | | 498,365 | | | 17,518 |
*Skillsoft, plc—ADR | | 1,625,107 | | | 9,946 |
*Ultimate Software Group, Inc. | | 842,403 | | | 16,140 |
*ValueClick, Inc. | | 1,745,686 | | | 26,796 |
*Volterra Semiconductor Corporation | | 1,714,989 | | | 26,171 |
*WebEx Communications, Inc. | | 708,044 | | | 25,164 |
*Workstream, Inc.† | | 4,365,092 | | | 6,460 |
| | | | |
|
|
| | | | | | 370,848 |
| | | | |
|
|
Health Care—21.3% | | | | | |
*American Medical Systems Holdings, Inc. | | 880,695 | | | 14,664 |
*Axcan Pharma, Inc.† | | 932,421 | | | 12,235 |
*CryoLife, Inc. | | 191,327 | | | 1,033 |
*Encore Medical Corporation | | 2,419,329 | | | 11,637 |
*Hythiam, Inc. | | 1,615,702 | | | 11,262 |
*Integra Lifesciences Holdings Corporation | | 421,808 | | | 16,370 |
*Kensey Nash Corporation | | 496,554 | | | 14,648 |
LCA-Vision, Inc. | | 287,909 | | | 15,233 |
*Lifecore Biomedical, Inc. | | 919,323 | | | 14,433 |
*Matria Healthcare, Inc. | | 525,475 | | | 11,256 |
PolyMedical Corporation | | 402,446 | | | 14,472 |
*PSS World Medical, Inc. | | 937,344 | | | 16,544 |
*Psychiatric Solutions, Inc. | | 665,400 | | | 19,070 |
*Sangamo Biosciences, Inc. | | 791,773 | | | 4,672 |
*Santarus, Inc. | | 3,397,305 | | | 22,592 |
*Surmodics, Inc. | | 481,572 | | | 17,390 |
*Telik, Inc. | | 588,818 | | | 9,716 |
*United Surgical Partners International, Inc. | | 254,885 | | | 7,664 |
*Zila, Inc. | | 2,552,677 | | | 8,271 |
| | | | |
|
|
| | | | | | 243,162 |
| | | | |
|
|
Consumer Discretionary—16.1% | | | | | |
*4 Kids Entertainment, Inc. | | 606,245 | | | 9,827 |
*AFC Enterprises, Inc. | | 874,311 | | | 11,148 |
*Century Casinos, Inc. | | 1,242,121 | | | 13,303 |
*Dick’s Sporting Goods, Inc. | | 302,751 | | | 11,989 |
*Duckwall-ALCO Stores, Inc. | | 107,555 | | | 3,228 |
*Guitar Center, Inc. | | 275,733 | | | 12,262 |
*Jarden Corporation | | 813,922 | | | 24,784 |
*Laureate Education, Inc. | | 647,879 | | | 27,619 |
*Lions Gate Entertainment Corporation† | | 1,231,842 | | | 10,532 |
*Shuffle Master, Inc. | | 396,696 | | | 13,004 |
Strayer Education, Inc. | | 142,950 | | | 13,883 |
| | | | | |
Issuer
| | Shares
| | Value
|
| | |
Common Stocks—(continued) | | | | | |
Consumer Discretionary—(continued) | | | | | |
*ValueVision Media, Inc., Class “A” | | 1,742,433 | | $ | 19,219 |
*VistaPrint Limited † | | 503,630 | | | 13,467 |
| | | | |
|
|
| | | | | | 184,265 |
| | | | |
|
|
Industrials—14.7% | | | | | |
*American Reprographics Company | | 326,052 | | | 11,820 |
*Coinstar, Inc. | | 589,820 | | | 14,120 |
Comfort Systems USA, Inc. | | 1,124,098 | | | 16,063 |
*Corrections Corporation of America | | 321,614 | | | 17,026 |
*FirstService Corporation † | | 701,995 | | | 18,701 |
*Frozen Food Express Industries, Inc. | | 628,125 | | | 6,922 |
*Huron Consulting Group, Inc. | | 418,702 | | | 14,692 |
*Kforce, Inc. | | 933,839 | | | 14,465 |
*Labor Ready, Inc. | | 727,185 | | | 16,471 |
*Luna Innovations, Inc. | | 759,300 | | | 4,556 |
*NCI Building Systems, Inc. | | 348,228 | | | 18,515 |
*SIRVA, Inc. | | 2,185,070 | | | 14,138 |
| | | | |
|
|
| | | | | | 167,489 |
| | | | |
|
|
Energy—8.0% | | | | | |
*Carrizo Oil & Gas, Inc. | | 435,876 | | | 13,647 |
*Hornbeck Offshore Services, Inc. | | 489,042 | | | 17,371 |
*Oil States International, Inc. | | 344,259 | | | 11,801 |
*Petrohawk Energy Corporation | | 1,223,554 | | | 15,417 |
*TETRA Technologies, Inc. | | 609,360 | | | 18,458 |
*W-H Energy Services, Inc. | | 297,978 | | | 15,146 |
| | | | |
|
|
| | | | | | 91,840 |
| | | | |
|
|
Financials—2.5% | | | | | |
Highland Hospitality Corporation | | 1,159,379 | | | 16,324 |
*Signature Bank New York | | 360,884 | | | 11,685 |
| | | | |
|
|
| | | | | | 28,009 |
| | | | |
|
|
Materials—1.0% | | | | | |
Airgas, Inc. | | 318,632 | | | 11,869 |
| | | | |
|
|
Consumer Staples—0.5% | | | | | |
*Overhill Farms, Inc. | | 1,903,720 | | | 5,920 |
| | | | |
|
|
Total Common Stock—96.5%
(Total cost $990,105) | | | 1,103,402 |
| | | | |
|
|
| | |
Preferred Stock | | | | | |
Think Partnership, Inc.** | | 7,120 | | | 6,057 |
| | | | |
|
|
Total Preferred Stock—0.5%
cost ($7,120) | | | 6,057 |
| | | | |
|
|
| | |
Investment in Warrants | | | | | |
*Think Partnership, Inc.** | | 1,424,000 | | | — |
| | | | |
|
|
Total Investment in Warrants—0.0%
(cost $0) | | | — |
| | | | |
|
|
| | |
Investment in Affiliate | | | | | |
William Blair Ready Reserves Fund | | 7,233,213 | | | 7,233 |
| | | | |
|
|
Total Investment in Affiliate—0.7%
(cost $7,233) | | | 7,233 |
| | | | |
|
|
See accompanying Notes to Financial Statements.
22 Semi-Annual Report | June 30, 2006 |
Small Cap Growth Fund
Portfolio of Investments, June 30, 2006 (all dollar amounts in thousands) (unaudited)
| | | | | | |
Issuer
| | Principal
Amount
| | Value
|
| | |
Short-Term Investments | | | | | | |
American Express Demand Note, VRN 5.200%, due 7/3/06 | | $ | 8,604,000 | | $ | 8,604 |
Prudential Funding Demand Note, VRN 5.055%, due 7/3/06 | | | 7,411,000 | | | 7,411 |
| | | | | |
|
|
Total Short-Term Investments—1.4%
(cost $16,015) | | | 16,015 |
| | | | | |
|
|
Total Investments—99.1%
(cost $1,020,473) | | | 1,132,707 |
Cash and other assets, less liabilities—0.9% | | | 10,387 |
| | | | | |
|
|
Net assets—100.0% | | $ | 1,143,094 |
| | | | | |
|
|
*Non-income producing securities
ADR = American Depository Receipt
† = U.S. listed foreign security
VRN = Variable Rate Note
**Fair Valued pursuant to Valuation Procedures adopted by the Board of Trustees. The holding represents 0.53% of the Fund’s net assets at June 30, 2006. This security was also deemed illiquid pursuant to Liquidity Procedures approved by the Board of Trustees.
See accompanying Notes to Financial Statements.
June 30, 2006 | William Blair Funds 23 |

Harvey H. Bundy, III

Robert C. Lanphier, IV

David P. Ricci
MID CAP GROWTH FUND
The Mid Cap Growth Fund primarily invests in a diversified portfolio of common stocks of medium-sized domestic growth companies.
AN OVERVIEW FROM THE PORTFOLIO MANAGERS
We are pleased to have the Mid Cap Growth Fund become the newest addition to the William Blair Fund Family and would like to thank our shareholders for investing with us.
We are enthusiastic about the opportunities available to us as the managers of the Mid Cap Fund. The Mid Cap Growth Fund will invest at least 80% of its assets in companies with market capitalizations between $1.5 billion and $14 billion at the time of the Fund’s investment, and will seek stocks of companies that are expected to experience solid growth in earnings. Such companies generally will exhibit superior business fundamentals, including leadership in their field, distinctive attributes that cannot easily be duplicated by competitors, quality products or services, distinctive marketing and distribution, value to customer, conservative financial policies and accounting practices and strong management.
How did the Fund perform since its inception? How did the Fund’s performance compare to its benchmark?
The Mid Cap Growth Fund commenced operations on February 1, 2006. Through the five-month period ending June 30, 2006, the Fund posted a decrease of 0.30% (Class N Shares), ahead of the 3.36% decline of the Russell Mid Cap Growth Index.
What were the most significant factors impacting Fund performance? What factors were behind the Fund’s performance versus the benchmark?
From a market capitalization perspective, there was only a slight disparity between small, mid and large cap stock performance during the 5-month period since the Fund’s inception. Mid caps finished just behind large caps and just ahead of small during this period. However, the value outperformed growth stocks within the mid cap space over the period.
The peak in the market in 2006 occurred in early May but softness ensued after the Federal Reserve suggested the end to interest rate hikes may be later than investors expected. During the second quarter, inflationary data points became more prevalent and stocks with higher valuation risk turned south as investors discounted higher inflation going forward. Soft housing market data in the last few months also increased investor skepticism on the outlook for consumer spending. These housing market and inflation dynamics have combined to cool the market in recent months.
From a sector perspective over the 5-month period, the Industrials sector was the strongest performer among the six major sectors in the Russell Mid Cap Growth Index. The sector outperformed during the period as global economic growth and corporate earnings growth remained healthy despite recent concerns. Dragging the market down over the period was the Information Technology and Consumer Discretionary sectors. The heightened concern over a decline in consumer spending is to blame for a weak Consumer Discretionary sector. The Information Technology sector sold off as investors steered clear of some of the more risky areas in the sector.
The Fund’s outperformance of the Russell Mid Cap Growth Index since its inception is attributable to strong stock picking across most of the major sectors. Stock selection in
24 Semi-Annual Report | June 30, 2006 |
Information Technology and Consumer Discretionary had the largest positive effect on relative performance while the Fund’s Health Care and Industrials holdings also outperformed their peers in the benchmark. Detracting slightly from performance during the five-month period was stock selection in the Energy and Materials sectors.
What were among the weakest performing investments for the Fund?
Among the largest individual stock detractors from absolute performance for the Fund were Jabil Circuit and Laureate Education. Jabil Circuit operates in the electronic manufacturing services industry. It is the outsourced manufacturer of choice for various technology, industrial, medical and consumer companies around the globe. The company has had a proven track record of meeting earnings expectations. However, in June the company announced some operational issues that would affect earnings negatively. With revenue growth on target, we feel that management will make the necessary adjustments to move past this uncharacteristic earnings shortfall. Laureate Education is a for-profit educational institution operating online degree programs and primarily campus-based programs overseas. The stock is one of the Fund’s largest holdings but came under pressure in the second quarter after the company projected a temporary decline in enrollments for its U.S. online programs, which represent only 20% of its business. Management is making strategic adjustments to offset these headwinds. In addition, the majority of its business and the segment central to our investment thesis is its international campus-based unit. This business is strong and our expectation for long term earnings growth remains robust.
What were among the best performing investments for the Fund?
CarMax and J2 Global Communication were two of the biggest contributors to the Fund’s performance since inception. CarMax operates 70 used car superstores across the nation. In addition to its used car retailing, the company also sells used cars on the wholesale market and is a new car dealer. The stock was a large contributor in the first quarter for the Fund and followed through with a strong second quarter performance as well. Pure fundamental strength, accelerating sales and earnings growth, have been responsible for the stock performance through the first half of 2006. J2 Global Communications offers messaging and communication services to individuals and businesses, including fax to email services. The stock performed extremely well in a tough environment for technology stocks, particularly in the second quarter. Concerns regarding possible government surcharges diminished during the quarter. In addition, investors began to anticipate the company’s potential price increases later this year.
What is your current outlook?
After the first quarter’s strong performance, we discussed the likelihood of a more sustainable level of stock market returns over the balance of 2006. Unfortunately, a great deal of the market’s early 2006 gain was negated by the second quarter’s weak performance. We had also discussed that the Federal Reserve’s effort to balance fighting inflation while maintaining economic growth had been on track. However, recent data points suggest inflation is climbing and a housing market slowdown is underway—which could impact consumer spending and overall economic growth. This presents a bigger challenge for the Federal Reserve and along with it, greater uncertainty about what the future holds for interest rates. The market’s aversion to this uncertainty has played out in the returns over the past couple of months. That being said, we focus our time on finding quality growth companies with growth prospects despite the macro environment of the day. We feel such a portfolio better serves our clients over time.
June 30, 2006 | William Blair Funds 25 |
Mid Cap Growth Fund
Performance Highlights (unaudited)
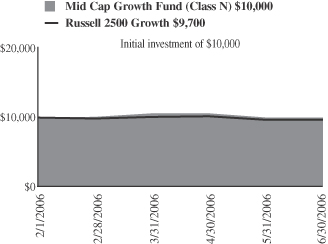
Average Annual Total Return at 6/30/2006
| | | |
| | | Since Inception(a)
| |
Small-Mid Cap Growth Fund
Class N | | (0.30 | )% |
Small-Mid Cap Growth Fund
Class I | | (0.20 | ) |
Russell Mid Cap Growth Index | | (3.36 | ) |
| | (a) | | For the period from February 1, 2006 (Commencement of Operations) to June 30, 2006. | |
Performance cited represents past performance. Past performance does not guarantee future results and current performance may be lower or higher than the data quoted. Results shown are average annual total returns, which assume reinvestment of dividends and capital gains. Investment returns and principal will fluctuate and you may have a gain or loss when you sell shares. For the most current month-end performance information, please call 1-800-742-7272, or visit our Web site at www.williamblairfunds.com. Investing in smaller companies involves special risks, including higher volatility and lower liquidity. From time to time, the investment advisor may waive fees or reimburse expenses for the Fund. Without these waivers, performance would be lower. Class N shares are available to the general public without a sales load. Class I shares are available to certain institutional investors and advisory clients of William Blair & Company, L.L.C., without a sales load or distribution (12b-1) or service fees.
The performance highlights and graph presented above do not reflect the deduction of taxes that a shareholder would pay on fund distributions or the redemption of fund shares.
The Russell Mid Cap Growth Index is an index that is constructed to provide a comprehensive and unbiased barometer of the mid-cap growth market.
This report identifies the Fund’s investments on June 30, 2006. These holdings are subject to change. Not all stocks in the Fund performed the same, nor is there any guarantee that these stocks will perform as well in the future. Market forecasts provided in this report may not necessarily come to pass.
Sector Diversification (unaudited)
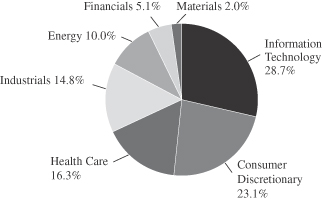
The sector diversification shown is based on the total investment portfolio.
26 Semi-Annual Report | June 30, 2006 |
Mid Cap Growth Fund
Portfolio of Investments, June 30, 2006 (all dollar amounts in thousands) (unaudited)
| | | | | |
Issuer
| | Shares
| | Value
|
| | |
Common Stocks | | | | | |
Information Technology—27.8% | | | | | |
*Activision, Inc. | | 18,320 | | $ | 208 |
*Cognizant Technology Solutions, Class “A” | | 1,900 | | | 128 |
*F5 Networks, Inc. | | 3,864 | | | 207 |
*Intuit, Inc. | | 4,155 | | | 251 |
*Iron Mountain, Inc. | | 6,175 | | | 231 |
*J2 Global Communications, Inc. | | 10,665 | | | 333 |
Jabil Circuit, Inc. | | 12,695 | | | 325 |
Maxim Intergrated Products, Inc. | | 5,935 | | | 191 |
Microchip Technology, Inc. | | 8,720 | | | 293 |
*Network Appliance, Inc. | | 6,786 | | | 239 |
Paychex, Inc. | | 9,815 | | | 383 |
*Trimble Navigation, Ltd. | | 3,265 | | | 146 |
*ValueClick, Inc. | | 13,125 | | | 201 |
*WebEx Communications, Inc. | | 5,915 | | | 210 |
| | | | |
|
|
| | | | | | 3,346 |
| | | | |
|
|
Consumer Discretionary—22.5% | | | | | |
*Bed, Bath and Beyond, Inc. | | 9,775 | | | 324 |
*CarMax, Inc. | | 11,100 | | | 394 |
*Cheesecake Factory, Inc. | | 3,755 | | | 101 |
*Dick’s Sporting Goods, Inc. | | 4,010 | | | 159 |
*Getty Images, Inc. | | 1,890 | | | 120 |
*Lamar Advertising Company, Class “A” | | 3,860 | | | 208 |
*Laureate Education, Inc. | | 6,960 | | | 297 |
*Life Time Fitness, Inc. | | 5,435 | | | 251 |
*O’Reilly Automotive, Inc. | | 7,153 | | | 223 |
*Sonic Corporation | | 11,487 | | | 239 |
Strayer Education, Inc. | | 1,575 | | | 153 |
*Tractor Supply Company | | 3,121 | | | 172 |
*XM Satellite Radio Holdings, Inc., Class “A” | | 3,930 | | | 58 |
| | | | |
|
|
| | | | | | 2,699 |
| | | | |
|
|
Health Care—15.8% | | | | | |
C.R. Bard, Inc. | | 2,565 | | | 188 |
*Healthways, Inc. | | 3,025 | | | 159 |
*IDEXX Laboratories, Inc. | | 1,575 | | | 118 |
*Integra LifeSciences Holdings Corporation | | 4,540 | | | 176 |
*Kinetic Concepts, Inc. | | 2,220 | | | 98 |
*Kyphon, Inc. | | 5,689 | | | 218 |
*MedImmune, Inc. | | 7,210 | | | 195 |
*Patterson Companies, Inc. | | 4,985 | | | 174 |
Pharmaceutical Product Development, Inc. | | 8,525 | | | 300 |
*ResMed, Inc. | | 4,445 | | | 209 |
Valeant Pharmaceuticals International | | 3,635 | | | 62 |
| | | | |
|
|
| | | | | | 1,897 |
| | | | |
|
|
*Non-income producing securities
VRN = Variable Rate Note
| | | | | | |
Issuer
| | Shares or
Principal
Amount
| | Value
|
| | |
Common Stocks—(continued) | | | | | | |
Industrials—14.3% | | | | | | |
Corporate Executive Board Company | | | 1,175 | | $ | 118 |
Fastenal Company | | | 9,375 | | | 378 |
Graco Inc. | | | 5,130 | | | 236 |
Knight Transportation, Inc. | | | 7,645 | | | 154 |
*Monster Worldwide, Inc. | | | 3,065 | | | 131 |
MSC Industrial Direct Company, Inc., Class “A” | | | 5,140 | | | 244 |
Pentair, Inc. | | | 4,761 | | | 163 |
Rockwell Collins, Inc. | | | 5,345 | | | 298 |
| | | | | |
|
|
| | | | | | | 1,722 |
| | | | | |
|
|
Energy—9.7% | | | | | | |
*Grant Prideco, Inc. | | | 3,590 | | | 161 |
Rowan Companies, Inc. | | | 5,548 | | | 198 |
Smith International, Inc. | | | 7,960 | | | 354 |
*Southwestern Energy Company | | | 5,850 | | | 182 |
XTO Energy Corporation | | | 6,150 | | | 272 |
| | | | | |
|
|
| | | | | | | 1,167 |
| | | | | |
|
|
Financials—5.0% | | | | | | |
*E*Trade Financial Corporation | | | 5,170 | | | 118 |
*IntercontinetalExchange, Inc. | | | 3,238 | | | 188 |
Investors Financial Services Corporation | | | 6,515 | | | 292 |
| | | | | |
|
|
| | | | | | | 598 |
| | | | | |
|
|
Materials—1.9% | | | | | | |
Airgas, Inc. | | | 6,265 | | | 233 |
| | | | | |
|
|
Total Common Stock—97.0%
(cost $11,715) | | | 11,662 |
| | | | | |
|
|
| | |
Investment in Affiliate | | | | | | |
William Blair Ready Reserves Fund | | | 100,315 | | | 100 |
| | | | | |
|
|
Total Investment In Affiliate—0.8%
(cost $100) | | | 100 |
| | | | | |
|
|
| | |
Short-Term Investment | | | | | | |
Prudential Funding Demand Note, VRN 5.055%, due 7/3/06 | | $ | 26,000 | | | 26 |
| | | | | |
|
|
Total Short-Term Investment—0.2%
(cost $26) | | | 26 |
| | | | | |
|
|
Total Investments—98.0%
(cost $11,841) | | | 11,788 |
Cash and other assets, less liabilities—2.0% | | | 240 |
| | | | | |
|
|
Net Assets—100% | | $ | 12,028 |
| | | | | |
|
|
See accompanying Notes to Financial Statements.
June 30, 2006 | William Blair Funds 27 |
Karl W. Brewer
Harvey H. Bundy, III
Robert C. Lanphier, IV
SMALL-MID CAP GROWTH FUND
The Small-Mid Cap Growth Fund primarily invests in a diversified portfolio of common stocks of small and medium-sized domestic growth companies that the Advisor expects to experience solid growth in earnings.
AN OVERVIEW FROM THE PORTFOLIO MANAGERS
How did the Fund perform in the first half of 2006? How did the Fund’s performance compare to its benchmark?
The Small-Mid Cap Growth Fund posted a 5.08% total return (Class N Shares) for the six month period ending June 30, 2006. By comparison, the Fund’s benchmark, the Russell 2500TM Growth Index, returned 4.98% during the period.
What were the most significant factors impacting Fund performance? What factors were behind the Fund’s performance versus the benchmark?
Small and mid capitalization stocks outperformed large cap stocks during the six month period with the Russell 2500TM Growth Index return of 4.98% compared to the Russell 1000® Growth Index return of –0.93%. From a style perspective, value outperformed growth as the Russell 2500TM Value Index returned 7.67%.
Small and mid cap stocks started the year off strong but pulled in during the second quarter. The strength during the first quarter was due to corporate and economic health and in part due to expectations that an end to the Federal Reserve’s tightening cycle was in sight. However, during the second quarter, inflationary data points indicated that the end to interest rate hikes may be delayed. Stocks with higher valuation risk turned south as investors discounted higher inflation going forward. Soft housing market data in the last few months also increased investor skepticism on the outlook for consumer spending. These housing market and inflation dynamics have combined to cool the market over the past couple of months in particular. From a sector perspective over the entire six month period, the Energy sector was the strongest performer when compared to the six major sectors in the benchmark. The elevated crude oil prices are partly responsible for the strength in these stocks. Industrial stocks were quite strong during the period as global economic growth and corporate earnings growth remained healthy despite recent concerns. On the downside, the heightened concern over a decline in consumer spending is to blame for a weak Consumer Discretionary sector. The Health Care sector also underperformed the broader market due to particular weakness in the more risky biotechnology and pharmaceutical stocks.
The Fund narrowly outpaced the Russell 2500TM Growth Index during the first half of the year. From a sector perspective compared to the benchmark, the disparity in returns is explained by superior stock selection in the Health Care and Industrial sectors and negative stock selection in the Consumer Discretionary sector.
What were among the weakest performing investments for the Fund?
Among the detractors from the Fund’s performance relative to the benchmark were Laureate Education and Jabil Circuit. Laureate Education is a for-profit educational institution operating online degree programs and primarily campus-based programs overseas. The stock is one of the Fund’s largest holdings but came under pressure in the second quarter after the company projected a temporary decline in enrollments for its U.S. online programs, which
28 Semi-Annual Report | June 30, 2006 |
represent only 20% of its business. Management is making strategic adjustments to offset these headwinds. In addition, the majority of its business and the segment central to our investment thesis is its international campus-based unit. This business is strong and our expectation for long term earnings growth remains robust. Jabil Circuit was another detractor from the Fund’s performance. The company operates in the electronic manufacturing services industry. It is the outsourced manufacturer of choice for various technology, industrial, medical and consumer companies around the globe. The company has had a proven track record of meeting earnings expectations. However, in June the company announced some operational issues that affected earnings negatively. With revenue growth on target, we feel that management will make the necessary adjustments to move past this uncharacteristic earnings shortfall.
What were among the best performing investments for the Fund?
Two of the best performing issues for the Fund were Webex Communications and J2 Global Communications. WebEx develops and markets web-based services. Its products allow a group of users to simultaneously view and edit documents and presentations, all online, regardless of their geographic location. The stock appreciated during the quarter after turning in positive earnings results in February that reiterated the fundamental strength in the business, and also, as investor concerns over the transition to a new pricing model subsided. J2 Global Communications offers messaging and communication services to individuals and businesses, including fax to email services. The stock performed extremely well in a tough environment for technology stocks. Concerns regarding possible government surcharges diminished during the quarter. In addition, investors began to anticipate the company’s potential price increases later this year.
What is your current outlook?
After the first quarter’s strong performance, we discussed the likelihood of a more sustainable level of stock market returns over the balance of 2006. Unfortunately, a great deal of the market’s early 2006 gain was negated by the second quarter’s weak performance. We had also discussed that the Federal Reserve’s effort to balance fighting inflation while maintaining economic growth had been on track. However, recent data points suggest inflation is climbing and a housing market slowdown is underway—which could impact consumer spending and overall economic growth. This presents a bigger challenge for the Federal Reserve and along with it, greater uncertainty about what the future holds for interest rates. The market’s aversion to this uncertainty has played out in the returns over the past couple of months. That being said, we focus our time on finding quality growth companies with growth prospects despite the macro environment of the day. We feel such a portfolio better serves our clients over time.
June 30, 2006 | William Blair Funds 29 |
Small-Mid Cap Growth Fund
Performance Highlights (unaudited)
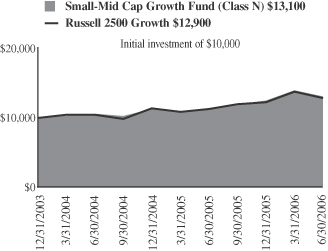
Average Annual Total Return at 6/30/2006
| | | | | | |
| | | 1 Year
| | | Since Inception(a)
| |
Small-Mid Cap Growth Fund
Class N | | 16.97 | % | | 11.41 | % |
Small-Mid Cap Growth Fund
Class I | | 17.17 | | | 11.65 | |
Russell 2500® Growth Index | | 14.62 | | | 10.77 | |
| | (a) | | For the period from December 29, 2003 to June 30, 2006. | |
Performance cited represents past performance. Past performance does not guarantee future results and current performance may be lower or higher than the data quoted. Results shown are average annual total returns, which assume reinvestment of dividends and capital gains. Investment returns and principal will fluctuate and you may have a gain or loss when you sell shares. For the most current month-end performance information, please call 1-800-742-7272, or visit our Web site at www.williamblairfunds.com. Investing in smaller companies involves special risks, including higher volatility and lower liquidity. From time to time, the investment advisor may waive fees or reimburse expenses for the Fund. Without these waivers, performance would be lower. Class N shares are available to the general public without a sales load. Class I shares are available to certain institutional investors and advisory clients of William Blair & Company, L.L.C., without a sales load or distribution (12b-1) or service fees.
The performance highlights and graph presented above do not reflect the deduction of taxes that a shareholder would pay on fund distributions or the redemption of fund shares.
The Russell 2500™ Growth Index measures the performance of those Russell 2500 companies with above average price-to-book ratios and forecasted growth rates.
This report identifies the Fund’s investments on June 30, 2006. These holdings are subject to change. Not all stocks in the Fund performed the same, nor is there any guarantee that these stocks will perform as well in the future. Market forecasts provided in this report may not necessarily come to pass.
Sector Diversification (unaudited)
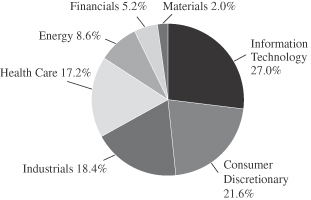
The sector diversification shown is based on the total investment portfolio.
30 Semi-Annual Report | June 30, 2006 |
Small-Mid Cap Growth Fund
Portfolio of Investments, June 30, 2006 (all dollar amounts in thousands) (unaudited)
| | | | | |
Issuer
| | Shares
| | Value
|
| | |
Common Stocks | | | | | |
Information Technology—26.5% | | | | | |
*Activision, Inc. | | 109,889 | | $ | 1,251 |
*Cogent, Inc. | | 43,400 | | | 654 |
*Euronet Worldwide, Inc. | | 51,300 | | | 1,968 |
*F5 Networks, Inc. | | 27,525 | | | 1,472 |
*Intuit, Inc. | | 22,260 | | | 1,344 |
*Iron Mountain, Inc. | | 43,914 | | | 1,642 |
*J2 Global Communications, Inc. | | 74,000 | | | 2,310 |
Jabil Circuit, Inc. | | 76,700 | | | 1,964 |
*Kanbay International, Inc. | | 84,200 | | | 1,224 |
Microchip Technology, Inc. | | 54,300 | | | 1,822 |
*Nuance Communications, Inc. | | 74,600 | | | 751 |
*PDF Solutions, Inc. | | 64,800 | | | 804 |
*Ultimate Software Group, Inc. | | 56,000 | | | 1,073 |
*ValueClick, Inc. | | 128,812 | | | 1,977 |
*WebEx Communications, Inc. | | 54,740 | | | 1,945 |
| | | | |
|
|
| | | | | | 22,201 |
| | | | |
|
|
Consumer Discretionary—21.2% | | | | | |
*Bed, Bath and Beyond, Inc. | | 41,900 | | | 1,390 |
*CarMax, Inc. | | 48,300 | | | 1,713 |
*Cheesecake Factory, Inc. | | 26,700 | | | 719 |
*Getty Images, Inc. | | 13,900 | | | 883 |
*Guitar Center, Inc. | | 20,200 | | | 898 |
*Jarden Corporation | | 44,950 | | | 1,369 |
*Lamar Advertising Company, Class “A” | | 18,360 | | | 989 |
*Laureate Education, Inc. | | 44,349 | | | 1,891 |
*Life Time Fitness, Inc. | | 38,460 | | | 1,779 |
*O’Reilly Automotive, Inc. | | 47,600 | | | 1,485 |
*Shuffle Master, Inc. | | 32,900 | | | 1,078 |
*Sonic Corporation | | 53,050 | | | 1,103 |
Strayer Education, Inc. | | 11,800 | | | 1,146 |
*Tractor Supply Company | | 13,300 | | | 735 |
*XM Satellite Radio Holdings, Class “A” | | 38,700 | | | 567 |
| | | | |
|
|
| | | | | | 17,745 |
| | | | |
|
|
Industrials—18.0% | | | | | |
*Beacon Roofing Supply, Inc. | | 48,105 | | | 1,059 |
*Coinstar, Inc. | | 42,133 | | | 1,009 |
Corporate Executive Board Company | | 6,100 | | | 611 |
*Corrections Corporation of America | | 24,700 | | | 1,308 |
Fastenal Company | | 56,800 | | | 2,288 |
Graco Inc. | | 22,900 | | | 1,053 |
*Kforce, Inc. | | 71,565 | | | 1,108 |
Knight Transportation, Inc. | | 57,950 | | | 1,171 |
*Monster Worldwide, Inc. | | 27,200 | | | 1,160 |
MSC Industrial Direct Company, Inc., Class “A” | | 23,140 | | | 1,101 |
Pentair, Inc. | | 43,760 | | | 1,496 |
Rockwell Collins, Inc. | | 31,300 | | | 1,749 |
| | | | |
|
|
| | | | | | 15,113 |
| | | | |
|
|
Health Care—17.0% | | | | | |
C.R.Bard, Inc. | | 12,300 | | | 901 |
*Healthways, Inc. | | 19,400 | | | 1,021 |
*Non-income producing securities
VRN = Variable Rate Note
| | | | | | |
Issuer
| | Shares or
Principal
Amount
| | Value
|
| | |
Common Stocks—(continued) | | | | | | |
Health Care—(continued) | | | | | | |
*IDEXX Laboratories, Inc. | | | 12,000 | | $ | 902 |
*Integra LifeSciences Holdings Corporation | | | 37,040 | | | 1,437 |
*Kinetic Concepts, Inc. | | | 15,800 | | | 698 |
*Kyphon, Inc. | | | 43,259 | | | 1,659 |
*Patterson Companies, Inc. | | | 34,400 | | | 1,202 |
Pharmaceutical Product Development, Inc. | | | 48,000 | | | 1,686 |
*PSS World Medical, Inc. | | | 61,100 | | | 1,078 |
*ResMed, Inc. | | | 30,400 | | | 1,427 |
*Surmodics, Inc. | | | 32,600 | | | 1,177 |
*Telik, Inc. | | | 44,661 | | | 737 |
Valeant Pharmaceuticals International | | | 16,000 | | | 271 |
| | | | | |
|
|
| | | | | | | 14,196 |
| | | | | |
|
|
Energy—8.4% | | | | | | |
*Grant Prideco, Inc. | | | 25,100 | | | 1,123 |
Rowan Companies, Inc. | | | 30,700 | | | 1,093 |
Smith International, Inc. | | | 45,100 | | | 2,005 |
*Southwestern Energy Company | | | 27,500 | | | 857 |
*Toreador Resources Corporation | | | 28,800 | | | 810 |
XTO Energy Corporation | | | 26,000 | | | 1,151 |
| | | | | |
|
|
| | | | | | | 7,039 |
| | | | | |
|
|
Financials—5.2% | | | | | | |
*E*Trade Financial Corporation | | | 37,468 | | | 855 |
*IntercontinentalExchange, Inc. | | | 16,500 | | | 956 |
Investors Financial Services Corporation | | | 36,970 | | | 1,660 |
*Signature Bank New York | | | 26,500 | | | 858 |
| | | | | |
|
|
| | | | | | | 4,329 |
| | | | | |
|
|
Materials—2.0% | | | | | | |
Airgas, Inc. | | | 44,610 | | | 1,662 |
| | | | | |
|
|
Total Common Stock—98.3%
(cost $73,539) | | | 82,285 |
| | | | | |
|
|
| | |
Investment in Affiliate | | | | | | |
William Blair Ready Reserves Fund | | | 640,075 | | | 640 |
| | | | | |
|
|
Total Investment In Affiliate—0.7%
(cost $640) | | | 640 |
| | | | | |
|
|
| | |
Short-Term Investment | | | | | | |
Prudential Funding Demand Note, VRN 5.055%, due 7/3/06 | | $ | 255,000 | | | 255 |
| | | | | |
|
|
Total Short-Term Investment—0.3%
(cost $255) | | | 255 |
| | | | | |
|
|
Total Investments—99.3%
(cost $74,434) | | | 83,180 |
Cash and other assets, less liabilities—0.7% | | | 556 |
| | | | | |
|
|
Net Assets—100% | | $ | 83,736 |
| | | | | |
|
|
See accompanying Notes to Financial Statements.
June 30, 2006 | William Blair Funds 31 |

W. George Greig
INTERNATIONAL GROWTH FUND
The International Growth Fund invests primarily in common stocks of foreign growth companies.
AN OVERVIEW FROM THE PORTFOLIO MANAGER
How did the Fund perform over the first half of the year? How did the Fund’s performance compare to its benchmark?
The International Growth Fund posted a 5.95% gain (Class N Shares) for the six months ended June 30, 2006. By comparison, the Fund’s benchmark, the Morgan Stanley Capital International (MSCI) All Country World (ACWI) ex-US Index, rose 9.99%.
What were the most significant factors impacting international markets during the first six months of the year?
Following first quarter’s strong equity market, when international equities were up 9.76%, as reflected by the MSCI ACWI ex-US Index, markets retreated during the second quarter as concerns about potential global inflationary pressures, monetary policy tightening (and uncertainty as to the duration and size of further tightening moves and their impact on the US consumer in particular), and higher valuations in a number of the recent strong markets such as emerging markets and small cap came to the forefront of investor psychology. As a result, investors significantly reduced risk positions and emerging markets, which were up approximately 12% in the first quarter, fell sharply beginning in May through mid-June, while developed markets’ small cap stocks, up 10.8% during the first quarter, fell significantly as well. In addition, commodities and energy stocks, which were the strongest sectors globally through April, declined.
The correction in equity markets during May and most of June was broad based and non-discriminatory, although the stocks that were the prime beneficiaries of the strong global growth trends over the past several years did suffer more than their more defensive-oriented counterparts. In addition, the US remained the safe haven for investors as its equity and bond markets outperformed other regions of the world. The increased uncertainty surrounding monetary policy, inflationary pressures, rumored intervention by the Chinese government to slow investment and housing in certain parts of its market, record profits by corporations, significant outperformance of “riskier” assets, coupled with higher valuations and concerns about a slower growth environment, created the perfect storm for a liquidity driven market correction. However, within this environment, unit labor costs remained constrained as productivity enhancements offset higher wages, company fundamentals and earnings prospects remained strong, and managements continued to be focused on enhancing shareholder value. At the same time, emerging markets governments significantly improved monetary and fiscal policies and current account positions, and are now more immune to economic downdrafts such as those that occurred in 1997 and 1998.
Markets began to stabilize in mid June and rebounded sharply near the end of the quarter, however, as the severity and broadness of the equity market downdraft appeared overdone, and investors began to believe that central banks would in fact engineer a “soft landing” to a more sustainable growth environment. During the second quarter, the MSCI ACWI ex-US Index was up 0.21%, led by the UK and Pacific ex-Japan, while emerging markets fell 4.27% and developed markets’ small cap companies fell 3.41%, as measured by the MSCI World ex-US Small Cap Index. As a result, over the first six months of 2006, the MSCI ACWI ex-US Index returned 9.99%, led by Europe ex-UK and the UK, while Japan was the largest
32 Semi-Annual Report | June 30, 2006 |
developed markets detractor. Emerging markets and developed small cap returned just over 7% each. From a global sector perspective, Materials, Energy and Utilities were the strongest sectors with double digit returns year to date, while Information Technology (IT) and Telecommunication Services trailed.
What factors were behind the Fund’s performance versus the benchmark?
Within this environment, the Fund returned 5.95% (N Shares), underperforming the MSCI ACWI ex-US Index year to date, due solely to second quarter underperformance, as it led the Index benchmark during the first quarter. While stock selection was strong across most regions and sectors during the first quarter, during the second quarter the Fund’s pro growth strategy as evidenced by higher weightings in Consumer Cyclical and IT holdings at the expense of Materials, Energy and Utilities was the primary detractor from results. In addition, sector positioning in Japan was a drag on year to date performance, as the Fund’s focus on specialty retailing and smaller asset management firms, hurt performance as these areas underperformed the Japanese market as a whole. While there were no particular earnings disappointments or negative news regarding individual portfolio holdings, these companies suffered with the general decline in smaller capitalization stocks, coupled with investor concerns about ongoing consumer demand in Japan and the prospects of an increasing interest rate environment. Offsetting these negative results on a year to date basis was the Fund’s Europe ex-UK and Latin America weightings at the expense of Developed Asia and Emerging Markets Europe, Mid-East and Africa (EMEA). In addition, Consumer Staples, Energy and IT stock selection was strong. Within Consumer Staples, the Fund added value due to regional positioning and stock selection in Japan, Emerging Asia and Latin America, while Energy stock selection was bolstered by stock selection in Continental Europe and the UK. Within IT the Fund’s stock selection in Canada, as well as the higher weighting and stock selection in Emerging Asia added value during the first half of the year.
What is your current strategy? How is the Fund positioned?
We have used the second quarter market activity to add to positions in strong companies with good fundamentals, which now have significantly more compelling valuations. As of quarter end, the Fund maintained its higher Consumer and Health Care weightings at the expense of Materials, Telecom Services, Energy and Utilities. At the margin, IT was decreased, while Industrials weightings were increased. Financials, while the largest sector in the portfolio from an absolute perspective, remained underweighted versus the Index. From a regional perspective, the Fund maintained its underweighting in developed Asia and the UK, and overweightings in Europe ex-UK and emerging markets versus the Index. These weightings are largely based upon the team’s bottom up, fundamental research efforts, which are also supported by the team’s top down view.
What is your outlook for the international markets?
The key cyclical drivers of the world economy are generally seen to be US household spending growth and China’s industrial and infrastructure investment boom. Both of these trends have been expected to decelerate for some time, but, ironically, a great deal of the increase in economic anxiety that unfolded in the first half of 2006 relates to the fact that both of the expected slowdowns have so far largely failed to materialize.
For the US consumer, the areas of concern are the sharp slowdown in housing activity and the negative fallout of house price weakness, and the hit to discretionary spending power from higher energy costs and interest payments. Coupled with the persistent upward pressure on reported inflation and its uncertain impact on monetary policy, these unknowns are increasingly tipping the odds in favor of a significant (1 percentage point or more) reduction in growth expectations for next year.
June 30, 2006 | William Blair Funds 33 |
In China, the government has targeted a growth slowdown in selected industrial sectors as well as speculative segments of the housing market. But economists have very little confidence in the degree to which the government’s intentions can be translated into actual changes in growth expectations. Similarly, there is no consensus about the effect of a potential export slowdown on the overall economy. Although there are obviously a great number of unknowns in both the numbers and the mechanisms of growth in China, aggregate GDP growth often seems only mildly affected by local and sector-specific cycles, and we would not anticipate more than a moderate downshift back to trend growth.
Japan and Europe, on the other hand, have been seeing steady improvement in growth indicators and economic news flow. Will this quickening expansion be sustained in the face of deceleration in the US and China, as well as some early-stage monetary tightening? Our view is that the cycles in Japan and Europe remain at a relatively early stage, and that growth may be sustained by continued strength in global capital spending, improving employment prospects, high savings balances, and pent-up demand in both the corporate and household sectors.
In the context of this reasonably balanced but still somewhat slower growth scenario, the key policy and market risk issue will be the degree of persistence of rising inflation and the potential broadening of price inflation into more core spending-related measures. This aspect of inflation makes itself known as a severely lagging indicator, and presents the US in particular with the policy problem of whether to prioritize visible growth trends or price trends in setting monetary conditions. This dilemma may well get worse before being resolved in favor of ending the tightening cycle.
In the first half of 2006, valuation and risk issues topped the equity market agenda—concerns about relative risk appetite and relative levels of real rates. To a degree, as growth and inflation issues come to the fore, the market’s principal concern will shift toward the outlook for sales and earnings growth.
Global corporate profitability is at or near record levels, spurred on by the strong secular forces of improved corporate performance and strong labor productivity growth. But while these forces remain in place, there are signs that cyclical pressures may push cost growth ahead of revenue growth—at least in some sectors—regardless of whether the global cycle is stronger or weaker than consensus expectations.
Our view is that changes in relative earnings growth and growth expectations will be an important factor governing market and sector leadership over the next several quarters. At the same time, it is likely that trends in profitability in place for the last year or two may be disrupted by shifts in global demand and relative pricing patterns.
We will be focusing particularly for signs of (negative) change in the commodity and industrial sectors, for changes in margins within the highly diverse financial sector, and for indications of the sustainability of profit growth on a regional basis, particularly with respect to the strong growth advantage enjoyed by emerging markets in the last several years.
In the near term, though, the market’s view of these prospective growth issues will be set by high frequency economic releases and especially by any visible trends that emerge from second and third (calendar) quarter earnings reports. Investment strategy, like economic policy, is at least cyclically becoming more and more ‘data-dependent’.
34 Semi-Annual Report | June 30, 2006 |
International Growth Fund
Performance Highlights (unaudited)
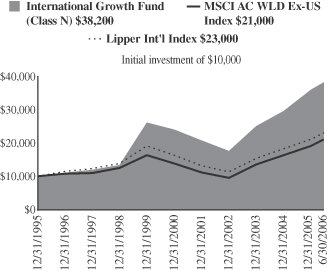
Average Annual Total Return at 6/30/2006
| | | | | | | | | | | | | | | | | |
| | | 1
Year
| | | 3
Year
| | | 5
Year
| | | 10
Year
| | | Since Inception
| | | |
International Growth Fund Class N | | 26.99 | % | | 25.02 | % | | 11.66 | % | | 13.44 | % | | — | % | | |
International Growth Fund Class I | | 27.35 | | | 25.35 | | | 11.94 | | | — | | | 11.75 | (a) | | |
MSCI All Country World Ex-US Index | | 28.40 | | | 25.78 | | | 11.85 | | | 7.16 | | | 6.38 | (a) | | |
Lipper International Index | | 27.25 | | | 23.15 | | | 10.13 | | | 7.80 | | | — | | | |
| | (a) | | For the period from October 1, 1999 to June 30, 2006. |
Performance cited represents past performance. Past performance does not guarantee future results and current performance may be lower or higher than the data quoted. Results shown are average annual total returns, which assume reinvestment of dividends and capital gains. Investment returns and principal will fluctuate and you may have a gain or loss when you sell shares. For the most current month-end performance information, please call 1-800-742-7272, or visit our Web site at www.williamblairfunds.com. International investing involves special risk considerations, including currency fluctuations, lower liquidity, economic and political risk. Class N shares are available to the general public without a sales load. Class I shares are available to certain institutional investors and advisory clients of William Blair & Company, L.L.C., without a sales load or distribution (12b-1) or service fees.
The performance highlights and graph presented above do not reflect the deduction of taxes that a shareholder would pay on fund distributions or the redemption of fund shares.
The Morgan Stanley Capital International (MSCI) All Country World Ex-US Index is an unmanaged index that includes developed and emerging markets and reduced Japanese portion, making it more comparable to the International Growth Fund in terms of investment approach.
The Lipper International Index is a composite of international growth mutual funds.
This report identifies the Fund’s investments on June 30, 2006. These holdings are subject to change. Not all stocks in the Fund performed the same, nor is there any guarantee that these stocks will perform as well in the future. Market forecasts provided in this report may not necessarily come to pass.
Sector Diversification (unaudited)
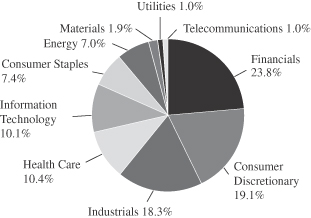
The sector diversification shown is based on the total investment portfolio.
June 30, 2006 | William Blair Funds 35 |
International Growth Fund
Portfolio of Investments, June 30, 2006 (all dollar amounts in thousands) (unaudited)
| | | | | |
Issuer
| | Shares
| | Value
|
| | |
Common Stocks—Europe—36.2% | | | | | |
Austria—1.2% | | | | | |
Erste Bank (Banking) | | 725,192 | | $ | 40,769 |
Raiffeisen International Bank (Banking) | | 289,554 | | | 25,089 |
| | | | |
|
|
| | | | | | 65,858 |
| | | | |
|
|
France—8.6% | | | | | |
April Group S.A. (Insurance brokers) | | 159,339 | | | 8,588 |
BNP Paribas (Banking) | | 663,630 | | | 63,459 |
Essilor International (Health care supplies) | | 449,200 | | | 45,182 |
Eurazeo (Diversified financial services) | | 221,340 | | | 21,901 |
Iliad S.A. (Internet software and services) | | 259,450 | | | 21,684 |
Klepierre (Real estate) | | 130,500 | | | 15,111 |
L’Oreal S.A. (Cosmetics) | | 1,341,100 | | | 126,595 |
LVMH Moet Hennessey Louis Vuitton SA (Luxury goods) | | 551,052 | | | 54,618 |
Nexity (Real estate management) | | 17,016 | | | 987 |
*Orpea (Hospital and nursing management) | | 184,912 | | | 12,761 |
Technip-Coflexip S.A. (Construction) | | 708,060 | | | 39,014 |
Vinci S.A.(Construction) | | 429,500 | | | 44,168 |
| | | | |
|
|
| | | | | | 454,068 |
| | | | |
|
|
Germany—8.3% | | | | | |
AWD Holdings AG (Financial services) | | 376,000 | | | 12,587 |
Bijou Brigitte (Fashon jewelry accessories) | | 64,250 | | | 17,368 |
Celesio AG (Pharmaceuticals) | | 300,080 | | | 27,233 |
Continental AG (Diversified manufacturing) | | 501,800 | | | 51,205 |
CTS Eventim AG (Leisure and recreation products) | | 165,703 | | | 5,083 |
E.ON AG (Energy) | | 460,400 | | | 52,923 |
GFK AG (Commercial services) | | 252,468 | | | 9,194 |
*Q-Cells AG (Alternative energy sources) | | 196,110 | | | 16,405 |
*Qiagen NV (Biomedical) | | 1,128,800 | | | 15,216 |
Rational AG (Business equipment) | | 56,200 | | | 9,186 |
SAP AG (Software) | | 495,350 | | | 104,145 |
Siemens AG (Manufacturing) | | 1,026,200 | | | 89,144 |
Solarworld AG (Alternative energy sources) | | 200,000 | | | 12,525 |
Stada Arzneimittel AG (Pharmaceuticals) | | 480,300 | | | 19,143 |
| | | | |
|
|
| | | | | | 441,357 |
| | | | |
|
|
Greece—1.5% | | | | | |
Coca-Cola Hellenic Bottling S.A. (Beverages) | | 835,571 | | | 24,880 |
EFG Eurobank (Banking) | | 954,480 | | | 26,577 |
National Bank of Greece (Banking) | | 756,952 | | | 29,214 |
| | | | |
|
|
| | | | | | 80,671 |
| | | | |
|
|
Ireland—2.0% | | | | | |
Anglo Irish Bank plc (Finance) | | 2,965,300 | | | 46,209 |
Kingspan Group plc (Construction) | | 1,500,700 | | | 26,206 |
*Ryanair Holdings plc—ADR (Airlines) | | 403,700 | | | 21,283 |
United Drug plc (Pharmaceuticals) | | 2,325,900 | | | 9,959 |
| | | | |
|
|
| | | | | | 103,657 |
| | | | |
|
|
Italy—2.4% | | | | | |
Azimut Holding SpA (Investment management services) | | 1,413,300 | | | 14,716 |
Credito Emiliano SpA (Banking) | | 909,400 | | | 11,211 |
Luxottica Group SpA (Apparel and luxury goods) | | 1,839,500 | | | 49,859 |
Pirelli & C Real Estate SpA (Real estate development) | | 233,952 | | | 15,700 |
| | | | | |
Issuer
| | Shares
| | Value
|
| |
Common Stocks—Europe—36.2%—(continued) | | | |
Italy—(continued) | | | | | |
Saipem SpA (Energy equipment and services) | | 1,617,900 | | $ | 36,724 |
| | | | |
|
|
| | | | | | 128,210 |
| | | | |
|
|
Luxembourg—0.1% | | | | | |
*Transcom Worldwide S.A. (E-services/consulting) | | 446,600 | | | 4,932 |
| | | | |
|
|
Netherlands—0.6% | | | | | |
*Tomtom NV (Computer software) | | 760,700 | | | 29,568 |
| | | | |
|
|
Norway—0.7% | | | | | |
Statoil Asa (Oil and gas) | | 1,324,700 | | | 37,761 |
| | | | |
|
|
Spain—1.6% | | | | | |
Grupo Ferrovial S.A. (Industrial services) | | 347,400 | | | 26,494 |
Industria De Textile (Retail trade) | | 1,405,600 | | | 59,257 |
| | | | |
|
|
| | | | | | 85,751 |
| | | | |
|
|
Sweden—1.3% | | | | | |
*Capio AB (Health care) | | 672,960 | | | 12,074 |
*Ericsson (LM) (Wireless equipment) | | 8,171,000 | | | 26,966 |
*Modern Times Group (Television) | | 752,800 | | | 21,072 |
*Tradedoubler AB (E-services and consulting) | | 379,600 | | | 6,931 |
| | | | |
|
|
| | | | | | 67,043 |
| | | | |
|
|
Switzerland—7.9% | | | | | |
*EFG International (Commercial banking) | | 786,500 | | | 21,808 |
Kuehne & Nagel International AG (Air freight and logistics) | | 635,040 | | | 46,318 |
Nobel Biocare Holdings AG (Medical equipment and supplies) | | 100,400 | | | 23,798 |
Phonak Holdings AG (Hearing technology) | | 180,100 | | | 11,250 |
Roche Holdings AG (Health care) | | 661,200 | | | 109,106 |
SGS S.A. (Industrials) | | 39,910 | | | 37,879 |
Synthes, Inc. (Health care) | | 628,489 | | | 75,676 |
UBS AG (Banking) | | 855,100 | | | 93,604 |
| | | | |
|
|
| | | | | | 419,439 |
| | | | |
|
|
| | |
Japan—17.1% | | | | | |
Aeon Credit Service Co., Ltd. (Consumer finance) | | 764,900 | | | 18,624 |
Aeon Mall Co., Ltd. (Real estate) | | 478,400 | | | 20,189 |
Chiyoda Corp. (Construction) | | 1,062,600 | | | 21,740 |
Denso Corporation (Auto parts manufacturing) | | 2,670,500 | | | 87,425 |
Honeys Company, Ltd. (Luxury goods) | | 353,600 | | | 15,170 |
Hoya Corporation (Electronic technology) | | 729,500 | | | 25,970 |
ITO EN, Ltd. (Beverages) | | 493,600 | | | 18,045 |
Joint Corporation (Real estate operations/development) | | 542,000 | | | 17,686 |
*K.K. DaVinci Advisors (Consulting services) | | 15,387 | | | 15,233 |
Keyence Corporation (Electronic technology) | | 205,006 | | | 52,309 |
Komatsu Ltd. (Machinery) | | 3,664,000 | | | 72,910 |
MISUMI Group, Inc. (Metal production) | | 773,600 | | | 14,494 |
Mitsubishi Tokyo Financial (Financial services) | | 7,993 | | | 112,045 |
Nakanishi Inc. (Medical specialties) | | 125,300 | | | 11,776 |
See accompanying Notes to Financial Statements.
36 Semi-Annual Report | June 30, 2006 |
International Growth Fund
Portfolio of Investments, June 30, 2006 (all dollar amounts in thousands) (unaudited)
| | | | | |
Issuer
| | Shares
| | Value
|
| |
Common Stocks—Japan—17.1%—(continued) | | | |
Nitori Company Ltd. (Specialty stores) | | 374,120 | | $ | 18,207 |
Nitto Denko Corporation (Electronic technology) | | 366,100 | | | 26,083 |
Orix Corporation (Consumer finance) | | 396,500 | | | 96,751 |
Park 24 Co., Ltd. (Commercial services) | | 322,600 | | | 9,528 |
Point Inc. Ltd. (Apparel and footwear retail) | | 261,600 | | | 14,810 |
Ryohin Keikaku Co. Ltd. (Retail stores) | | 312,400 | | | 25,687 |
Sharp Corp. (Electronics) | | 1,677,700 | | | 26,522 |
Shimamura Company Ltd. (Retail stores) | | 216,800 | | | 23,787 |
Sparx Asset Management Co. (Financial services) | | 11,482 | | | 12,086 |
Suruga Bank (Banking) | | 1,874,000 | | | 25,375 |
Toyota Motor Corporation (Automobiles) | | 1,521,800 | | | 79,536 |
Yamada Denki Company (Retail trade) | | 422,500 | | | 43,047 |
| | | | |
|
|
| | | | | | 905,035 |
| | | | |
|
|
| | |
United Kingdom—13.9% | | | | | |
BG Group plc (Industrial services) | | 9,720,500 | | | 129,746 |
*Cairn Energy plc (Petroleum refining) | | 789,800 | | | 31,984 |
Carphone Warehouse Group plc (Consumer electronics) | | 4,360,180 | | | 25,543 |
*CSR plc (Electronic technology) | | 842,200 | | | 19,584 |
HBOS plc (Commercial banking) | | 5,712,000 | | | 99,126 |
Homeserve plc (Extended service contracts) | | 271,600 | | | 7,778 |
Michael Page International (Personnel services) | | 4,350,700 | | | 28,172 |
Northern Rock plc (Commercial banking) | | 3,300,800 | | | 61,031 |
Reckitt Benckiser plc (Household products) | | 2,316,400 | | | 86,432 |
Rolls-Royce Group plc (Aerospace) | | 13,488,300 | | | 103,162 |
Rotork plc (Control insturments) | | 1,259,964 | | | 15,967 |
Serco Group (Consulting services) | | 4,719,009 | | | 27,887 |
Standard Chartered plc (Banking) | | 1,954,000 | | | 47,677 |
Tullow Oil plc (Oil, gas drilling, and exploration) | | 2,762,190 | | | 19,486 |
Ultra Electronic Holdings plc (Electronic products) | | 970,700 | | | 17,367 |
VT Group plc (Shipbuilding) | | 1,945,500 | | | 17,501 |
| | | | |
|
|
| | | | | | 738,443 |
| | | | |
|
|
| | |
Emerging Asia—12.5% | | | | | |
China—4.2% | | | | | |
China Life Insurance Co. (Life/Health insurance) | | 29,823,000 | | | 47,243 |
China Mengniu Dairy Co. (Food products) | | 13,788,000 | | | 17,310 |
China Vanke Company Ltd. (Real estate operations/development) | | 11,570,500 | | | 9,821 |
*Ctrip.com International Ltd.—ADR (E-commerce/services) | | 438,800 | | | 22,401 |
*Focus Media Holding Ltd.—ADR (Advertising) | | 366,500 | | | 23,881 |
*Foxconn International (Manufacturing services) | | 9,604,000 | | | 20,580 |
Fu Ji Food & Catering (Hotels, restaurants and leisure) | | 5,905,000 | | | 9,760 |
Hopson Development Holdings (Real estate operations /development) | | 3,849,000 | | | 7,971 |
Lee and Man Paper Manufacturing Ltd. (Paper and related products) | | 4,904,000 | | | 7,179 |
| | | | | |
Issuer
| | Shares
| | Value
|
|
Common Stocks—Emerging Asia—12.5%—continued |
China—continued | | | | | |
Li Ning Co. Ltd. (Leisure equipment and products) | | 17,312,000 | | $ | 16,976 |
Parkson Retail Group Ltd. (Retail stores) | | 1,767,000 | | | 5,033 |
Ports Design Limited (Apparel and luxury goods) | | 5,864,500 | | | 9,456 |
*Suntech Power Holdings Co. Ltd—ADR (Alternative energy sources) | | 426,400 | | | 12,046 |
Wumart Stores, Inc., Class “H” (Retail) | | 3,287,000 | | | 11,341 |
| | | | |
|
|
| | | | | | 220,998 |
| | | | |
|
|
India—3.2% | | | | | |
Bharat Forge Ltd. (Metal processors) | | 1,901,900 | | | 12,990 |
Bharat Heavy Electricals Ltd. (Supply equipment) | | 627,800 | | | 26,650 |
*Bharti Airtel Ltd. (Wireless telecommunication services) | | 1,877,700 | | | 15,118 |
Dabur India Ltd. (Cosmetics and toiletries) | | 3,983,300 | | | 12,330 |
HDFC Bank (Banking) | | 1,029,500 | | | 17,834 |
Hindustan Lever Ltd. (Soap and cleaning preparation) | | 846,200 | | | 4,210 |
Housing Development Finance Corp. (Financial services) | | 652,300 | | | 16,188 |
Infosys Technologies, Ltd. (Consulting and software services) | | 493,724 | | | 33,035 |
Maruti Udyog Ltd. (Automobiles) | | 903,500 | | | 15,649 |
Pantaloon Retail India Ltd. (Department stores) | | 55,164 | | | 1,621 |
Suzlon Energy Ltd. (Power conversion equipment) | | 665,600 | | | 15,163 |
| | | | |
|
|
| | | | | | 170,788 |
| | | | |
|
|
Indonesia—0.2% | | | | | |
PT Kalbe Farma Tbk (Pharmaceuticals) | | 66,617,200 | | | 8,995 |
| | | | |
|
|
Malaysia—0.6% | | | | | |
Bumiputra Commerce Holdings Bhd (Banking) | | 13,700,600 | | | 22,150 |
Transmile Group Bhd (Airport development and maintence) | | 2,358,000 | | | 8,215 |
| | | | |
|
|
| | | | | | 30,365 |
| | | | |
|
|
South Korea—2.5% | | | | | |
Kookmin Bank (Banking) | | 325,290 | | | 26,801 |
Korea Investment Holdings Co. Ltd. (Diversified financial services) | | 307,400 | | | 10,009 |
*NHN Corp. (Internet software and services) | | 104,940 | | | 36,395 |
Samsung Electronics Co. (Semiconductors) | | 58,120 | | | 36,889 |
Shinsegae Co. Ltd. (Discount retail) | | 40,850 | | | 20,451 |
| | | | |
|
|
| | | | | | 130,545 |
| | | | |
|
|
Taiwan—1.8% | | | | | |
High Tech Computer Corporation (Computers) | | 752,000 | | | 20,671 |
*Himax Technologies, Inc.—ADR (Computers) | | 1,170,200 | | | 6,694 |
Hon Hai Precision Industry (Computers) | | 6,331,150 | | | 39,089 |
Largan Precision Co. Ltd. (Photo equipment and supplies) | | 769,000 | | | 16,438 |
See accompanying Notes to Financial Statements.
June 30, 2006 | William Blair Funds 37 |
International Growth Fund
Portfolio of Investments, June 30, 006 (all dollar amounts in thousands) (unaudited)
| | | | | |
Issuer
| | Shares
| | Value
|
|
Common Stocks—Emerging Asia—12.5%—continued |
Taiwan—continued | | | | | |
Mediatek Inc. (Semiconductors and equipment) | | 1,649,500 | | $ | 15,268 |
| | | | |
|
|
| | | | | | 98,160 |
| | | | |
|
|
| | |
Asia—6.8% | | | | | |
Australia—3.2% | | | | | |
BHP Billiton Ltd. (Diversified resources) | | 2,981,600 | | | 64,489 |
Macquarie Bank, Ltd. (Financial services) | | 977,800 | | | 50,052 |
Seek Ltd. (Internet (advertising)) | | 3,560,200 | | | 14,159 |
Sigma Company, Ltd. (Medical distributors) | | 6,501,211 | | | 12,562 |
United Group Ltd. (Building and construction) | | 556,438 | | | 5,956 |
WorleyParsons, Ltd. (Engineering) | | 1,432,400 | | | 21,419 |
| | | | |
|
|
| | | | | | 168,637 |
| | | | |
|
|
Hong Kong—1.7% | | | | | |
*China Insurance International (Insurance) | | 22,015,438 | | | 14,178 |
Esprit Holdings Ltd. (Apparel, footwear and retail) | | 3,998,500 | | | 32,680 |
Li & Fung Ltd. (Distribution) | | 21,977,200 | | | 44,542 |
| | | | |
|
|
| | | | | | 91,400 |
| | | | |
|
|
Singapore—1.9% | | | | | |
Capitaland, Ltd. (Real estate operations) | | 26,009,000 | | | 74,215 |
Goodpack Ltd. (Air freight and logistics) | | 6,968,000 | | | 7,193 |
Osim International Ltd. (Consumer sundries) | | 12,972,240 | | | 12,667 |
Raffles Education Corporation Ltd. (Schools) | | 3,524,000 | | | 5,411 |
| | | | |
|
|
| | | | | | 99,486 |
| | | | |
|
|
| | |
Emerging Latin America—5.5% | | | | | |
Brazil—1.8% | | | | | |
Companhia de Concessoes Rodoviarias (Public thoroughfares) | | 1,900,700 | | | 15,357 |
Cyrela Brazil Realty S.A. (Real estate operations/development) | | 785,400 | | | 13,054 |
Gol Linhas Aereas Int S.P—ADR (Air transport) | | 776,300 | | | 27,559 |
Localiza Rent a Car S.A. (Automobile rental) | | 435,000 | | | 8,235 |
Natura Cosmeticos S.A. (Cosmetics) | | 1,153,500 | | | 11,797 |
*Submarino S.A.(E-commerce) | | 612,000 | | | 12,291 |
*Totvs S.A. (Computer software) | | 552,100 | | | 8,218 |
| | | | |
|
|
| | | | | | 96,511 |
| | | | |
|
|
Chile—1.0% | | | | | |
Cencosud S.A.—ADR 144A (Retail stores) | | 807,530 | | | 29,626 |
S.A.C.I. Falabella (Department stores) | | 7,060,400 | | | 21,538 |
| | | | |
|
|
| | | | | | 51,164 |
| | | | |
|
|
Columbia—0.3% | | | | | |
Bancolombia S.A.—ADR (Banking) | | 681,600 | | | 16,427 |
| | | | |
|
|
Mexico—2.2% | | | | | |
America Movil S.A. (Communications) | | 20,332,200 | | | 33,973 |
Consorcio Ara Sa De Cv (Construction) | | 2,383,300 | | | 9,814 |
*Corporacion Geo Sa De Cv (Real estate) | | 2,971,700 | | | 9,847 |
*Desarrolladora Homex S.A.—ADR (Household durables) | | 327,400 | | | 10,742 |
| | | | | |
Issuer
| | Shares
| | Value
|
|
Common Stocks—Emerging Latin America—5.5%—continued |
Mexico—continued | | | | | |
Grupo Aeropuertario Del ADR (Airport development and maintenance) | | 241,700 | | $ | 7,698 |
*Urbi Desarrollos Urbanos S.A. (Household durables) | | 4,167,300 | | | 9,664 |
Walmart de Mexico (Retail trade) | | 12,215,800 | | | 34,144 |
| | | | |
|
|
| | | | | | 115,882 |
| | | | |
|
|
Panama—0.2% | | | | | |
Copa Holdings S.A., Class “A” (Airlines)† | | 597,500 | | | 13,533 |
| | | | |
|
|
| | |
Canada—3.1% | | | | | |
Canadian National Railway Company (Railroads) | | 1,189,000 | | | 51,936 |
*Gildan Activewear, Inc. (Apparel and luxury goods) | | 385,600 | | | 18,235 |
Manulife Financial Corp. (Life and health insurance) | | 2,152,200 | | | 68,192 |
Ritchie Brothers Auctioneers, Inc. (Buisness services)† | | 276,400 | | | 14,699 |
Shoppers Drug Mart Corp. (Retail trade) | | 378,300 | | | 13,725 |
| | | | |
|
|
| | | | | | 166,787 |
| | | | |
|
|
| |
Emerging Europe, Mid-East, Africa—1.7% | | | |
Czech Republic—0.2% | | | | | |
*Central European Media Enterprises Ltd. Class “A” (Television)† | | 177,000 | | | 11,185 |
| | | | |
|
|
Israel—0.5% | | | | | |
Teva Pharmaceutical Industries, Ltd.—ADR (Pharmaceuticals) | | 922,400 | | | 29,139 |
| | | | |
|
|
Russia—0.3% | | | | | |
*CTC Media, Inc. (Television)† | | 775,352 | | | 14,158 |
| | | | |
|
|
South Africa—0.7% | | | | | |
Aspen Pharmacare (Pharmaceuticals) | | 1,392,000 | | | 7,072 |
*MTN Group Ltd. (Telecommunication services) | | 626,800 | | | 4,610 |
Naspers (Media) | | 732,290 | | | 12,446 |
Sasol ASA (Energy) | | 280,100 | | | 10,755 |
Truworths International Ltd. (Retail-apparel) | | 737,653 | | | 2,211 |
| | | | |
|
|
| | | | | | 37,094 |
| | | | |
|
|
Total Common Stock—96.8%
(cost $4,059,264 ) | | | 5,133,047 |
| | | | |
|
|
| | |
Preferred Stock | | | | | |
Brazil—1.1% | | | | | |
Banco Itau Holding (Banking) | | 799,300 | | | 23,194 |
Petroleo Brasileiro S.A. (Oil, gas drilling, and exploration) | | 1,859,200 | | | 36,954 |
| | | | |
|
|
| | | | | | 60,148 |
| | | | |
|
|
Total Preferred Stock—1.1%
(cost $37,429) | | | 60,148 |
| | | | |
|
|
See accompanying Notes to Financial Statements.
38 Semi-Annual Report | June 30, 2006 |
International Growth Fund
Portfolio of Investments, June 30, 006 (all dollar amounts in thousands) (unaudited)
| | | | | | | |
Issuer
| | Shares or Principal Amount
| | Value
| |
| | |
Investment in Affiliate | | | | | | | |
William Blair Ready Reserves Fund | | | 27,813,956 | | $ | 27,814 | |
| | | | | |
|
|
|
Total Investment in Affiliate—0.5%
(cost $27,814) | | | | |
| | |
Short-Term Investments | | | | | | | |
American Express Demand Note, VRN 5.200% due 7/3/06 | | $ | 43,985,000 | | | 43,985 | |
Prudential Funding Demand Note, VRN 5.055% due 7/3/06 | | | 43,985,000 | | | 43,985 | |
| | | | | |
|
|
|
Total Short-Term Investments—1.7%
(cost $87,970) | | | 87,970 | |
| | | | | |
|
|
|
Total Investments—100.1%
(cost $4,212,477) | | | 5,308,979 | |
Liabilities, plus cash and other assets—(0.1)% | | | (3,575 | ) |
| | | | | |
|
|
|
Net assets—100.0% | | $ | 5,305,404 | |
| | | | | |
|
|
|
*Non-income producing securities
ADR = American Depository Receipt
GDR = Global Depository Receipt
VRN = Variable Rate Note
† = U.S. listed foreign security
All securities, primarily traded on exchanges or markets that close before the close of regular trading on the New York Stock Exchange, are fair valued pursant to Valuation Procedures adopted by the Board of Trustees.
At June 30, 2006 the Fund’s Portfolio of Investments includes the following industry categories:
| | |
Financials | | 23.8% |
Consumer Discretionary | | 19.1% |
Industrials and Services | | 18.3% |
Healthcare | | 10.4% |
Information Technology | | 10.1% |
Consumer Staples | | 7.4% |
Energy | | 7.0% |
Materials | | 1.9% |
Telecommunication Services | | 1.0% |
Utilities | | 1.0% |
| | |
|
| | | 100.0% |
| | |
|
At June 30, 2006 the Fund’s Portfolio of Investments includes the following currency categories:
| | |
Euro | | 26.3% |
Japanese Yen | | 17.4% |
British Pound Sterling | | 14.2% |
Swiss Franc | | 8.1% |
United States Dollar | | 5.0% |
Hong Kong Dollar | | 4.9% |
Indian Rupee | | 3.3% |
Australian Dollar | | 3.3% |
Canadian Dollar | | 2.9% |
South Korean Won | | 2.5% |
Brazilian Real | | 2.5% |
Mexico Nuevo Peso | | 1.9% |
Singapore Dollar | | 1.9% |
Taiwan Dollar | | 1.8% |
Swedish Krona | | 1.4% |
All other currencies | | 2.6% |
| | |
|
| | | 100.0% |
| | |
|
See accompanying Notes to Financial Statements.
June 30, 2006 | William Blair Funds 39 |
W. George Greig
INTERNATIONAL EQUITY FUND
The International Equity Fund invests primarily in common stocks of companies included in the Morgan Stanley Capital International All Country World ex-U.S. Index.
AN OVERVIEW FROM THE PORTFOLIO MANAGER
How did the Fund perform over the first half of the year? How did the Fund’s performance compare to its benchmark?
The International Equity Fund posted a 4.67% increase for the six months ended June 30, 2006. By comparison, the Fund’s benchmark, the Morgan Stanley Capital International (MSCI) All Country World (ACWI) ex-US Index, rose 9.99%.
What were the most significant factors impacting international markets during the first six months of the year?
Following first quarter’s strong equity market, when international equities were up 9.76%, as reflected by the MSCI ACWI ex-US Index, markets retreated during the second quarter as concerns about potential global inflationary pressures, monetary policy tightening (and uncertainty as to the duration and size of further tightening moves and their impact on the US consumer in particular), and higher valuations in a number of the recent strong markets such as emerging markets and small cap came to the forefront of investor psychology. As a result, investors significantly reduced risk positions and emerging markets, which were up approximately 12% in the first quarter, fell sharply beginning in May through mid-June, while developed markets’ small cap stocks, up 10.8% during the first quarter, fell significantly as well. In addition, commodities and energy stocks, which were the strongest sectors globally through April, declined.
The correction in equity markets during May and most of June was broad based and non-discriminatory, although the stocks that were the prime beneficiaries of the strong global growth trends over the past several years did suffer more than their more defensive-oriented counterparts. In addition, the US remained the safe haven for investors as its equity and bond markets outperformed other regions of the world. The increased uncertainty surrounding monetary policy, inflationary pressures, rumored intervention by the Chinese government to slow investment and housing in certain parts of its market, record profits by corporations, significant outperformance of “riskier” assets, coupled with higher valuations and concerns about a slower growth environment, created the perfect storm for a liquidity driven market correction. However, within this environment, unit labor costs remained constrained as productivity enhancements offset higher wages, company fundamentals and earnings prospects remained strong, and managements continued to be focused on enhancing shareholder value. At the same time, emerging markets governments significantly improved monetary and fiscal policies and current account positions, and are now more immune to economic downdrafts such as those that occurred in 1997 and 1998.
Markets began to stabilize in mid June and rebounded sharply near the end of the quarter, however, as the severity and broadness of the equity market downdraft appeared overdone, and investors began to believe that central banks would in fact engineer a “soft landing” to a more sustainable growth environment. During the second quarter, the MSCI ACWI ex-US Index was up 0.21%, led by the UK and Pacific ex-Japan, while emerging markets fell 4.27% and developed markets’ small cap companies fell 3.41%, as measured by the MSCI World ex-US Small Cap Index. For the first six months of 2006, the MSCI ACWI ex-US Index returned 9.99%, led by Europe ex-UK and the UK, while Japan was the largest developed markets
40 Semi-Annual Report | June 30, 2006 |
detractor. Emerging markets and developed small cap returned just over 7% each. From a global sector perspective, Materials, Energy and Utilities were the strongest sectors with double digit returns year to date, while Information Technology (IT) and Telecommunication Services trailed.
What factors were behind the Fund’s performance versus the benchmark?
Within this environment, the Fund returned 4.67% (Class N), underperforming the MSCI ACWI ex-US Index year to date. While stock selection was strong across several regions and sectors during the first quarter, the Fund’s pro growth strategy as evidenced by higher weightings in consumer cyclical and IT holdings at the expense of the Materials, Energy and Utilities sectors was the primary detractor from results year to date. In addition, sector positioning in Japan was a drag on year to date performance, as the Fund’s focus on specialty retailing, asset management firms, and large financial institutions hurt performance as these areas underperformed the Japanese market as a whole. While there were no particular earnings disappointments in general regarding individual portfolio holdings, the specialty retailing and asset management firms suffered with the general decline in smaller capitalization stocks, coupled with investor concerns about ongoing consumer demand in Japan, while the large financial institutions were hurt by the prospects of an increasing interest rate environment. Offsetting these negative results on a year to date basis was the Fund’s Europe ex-UK and Latin America weightings at the expense of Developed Asia and Emerging Markets Europe, Mid-East and Africa (EMEA). In addition, Energy, IT and Utilities stock selection was strong. Energy stock selection was bolstered by stock selection in Continental Europe and the UK, coupled with a higher weighting in Latin America. Within IT the Fund’s weighting and stock selection in Continental Europe and Canada, as well as the higher weighting and stock selection in Emerging Asia added value during the first half of the year. The Fund’s only Utilities holding, E.ON, located in Germany, outperformed the Utilities sector as a whole.
What is your current strategy? How is the Fund positioned?
We have used the second quarter market activity to add to positions in strong companies with good fundamentals, which now have significantly more compelling valuations. As of quarter end, the Fund maintained its higher Consumer and Health Care weightings at the expense of Materials, Telecom Services, Energy and Utilities. At the margin, IT was decreased, while Industrials and Energy weightings were increased since year end. Financials, while the largest sector in the portfolio from an absolute perspective, approximated the Index weighting. From a regional perspective, the Fund maintained its underweighting in developed Asia and the UK and overweighting in Europe ex-UK versus the Index. These weightings are largely based upon the team’s bottom up, fundamental research efforts, which are also supported by the team’s top down view.
What is your outlook for the international markets?
The key cyclical drivers of the world economy are generally seen to be US household spending growth and China’s industrial and infrastructure investment boom. Both of these trends have been expected to decelerate for some time, but, ironically, a great deal of the increase in economic anxiety that unfolded in the first half of 2006 relates to the fact that both of the expected slowdowns have so far largely failed to materialize.
For the US consumer, the areas of concern are the sharp slowdown in housing activity and the negative fallout of house price weakness, and the hit to discretionary spending power from higher energy costs and interest payments. Coupled with the persistent upward pressure on reported inflation and its uncertain impact on monetary policy, these unknowns are increasingly tipping the odds in favor of a significant (1 percentage point or more) reduction in growth expectations for next year.
June 30, 2006 | William Blair Funds 41 |
In China, the government has targeted a growth slowdown in selected industrial sectors as well as speculative segments of the housing market. But economists have very little confidence in the degree to which the government’s intentions can be translated into actual changes in growth expectations. Similarly, there is no consensus about the effect of a potential export slowdown on the overall economy. Although there are obviously a great number of unknowns in both the numbers and the mechanisms of growth in China, aggregate GDP growth often seems only mildly affected by local and sector-specific cycles, and we would not anticipate more than a moderate downshift back to trend growth.
Japan and Europe, on the other hand, have been seeing steady improvement in growth indicators and economic news flow. Will this quickening expansion be sustained in the face of deceleration in the US and China, as well as some early-stage monetary tightening? Our view is that the cycles in Japan and Europe remain at a relatively early stage, and that growth may be sustained by continued strength in global capital spending, improving employment prospects, high savings balances, and pent-up demand in both the corporate and household sectors.
In the context of this reasonably balanced but still somewhat slower growth scenario, the key policy and market risk issue will be the degree of persistence of rising inflation and the potential broadening of price inflation into more core spending-related measures. This aspect of inflation makes itself known as a severely lagging indicator, and presents the US in particular with the policy problem of whether to prioritize visible growth trends or price trends in setting monetary conditions. This dilemma may well get worse before being resolved in favor of ending the tightening cycle.
In the first half of 2006, valuation and risk issues topped the equity market agenda—concerns about relative risk appetite and relative levels of real rates. To a degree, as growth and inflation issues come to the fore, the market’s principal concern will shift toward the outlook for sales and earnings growth.
Global corporate profitability is at or near record levels, spurred on by the strong secular forces of improved corporate performance and strong labor productivity growth. But while these forces remain in place, there are signs that cyclical pressures may push cost growth ahead of revenue growth—at least in some sectors—regardless of whether the global cycle is stronger or weaker than consensus expectations.
Our view is that changes in relative earnings growth and growth expectations will be an important factor governing market and sector leadership over the next several quarters. At the same time, it is likely that trends in profitability in place for the last year or two may be disrupted by shifts in global demand and relative pricing patterns.
We will be focusing particularly for signs of (negative) change in the commodity and industrial sectors, for changes in margins within the highly diverse financial sector, and for indications of the sustainability of profit growth on a regional basis, particularly with respect to the strong growth advantage enjoyed by emerging markets in the last several years.
In the near term, though, the market’s view of these prospective growth issues will be set by high frequency economic releases and especially by any visible trends that emerge from second and third (calendar) quarter earnings reports. Investment strategy, like economic policy, is at least cyclically becoming more and more ‘data-dependent’.
42 Semi-Annual Report | June 30, 2006 |
International Equity Fund
Performance Highlights (unaudited)
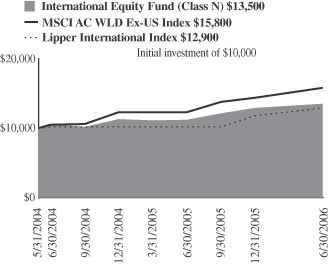
Average Annual Total Return at 6/30/2006
| | | | | | |
| | | 1
Year
| | | Since Inception(a)
| |
International Equity Fund
Class N | | 20.18 | % | | 15.11 | % |
International Equity Fund
Class I | | 20.53 | | | 15.51 | |
MSCI All Country World Ex-US | | 28.40 | | | 24.01 | |
Lipper International Index | | 27.25 | | | — | |
| | (a) | | For the period from May 24, 2004 to June 30, 2006. |
Performance cited represents past performance. Past performance does not guarantee future results and current performance may be lower or higher than the data quoted. Results shown are average annual returns, which assume reinvestment of dividends and capital gains. Investment returns and principal will fluctuate and you may have a gain or loss when you sell shares. For the most current month-end performance information, please call 1-800-742-7272, or visit our Web site at www.williamblairfunds.com. From time to time the investment adviser may waive fees or reimburse expenses for the Fund. Without these waivers, performance would be lower. International investing involves special risk considerations, including currency fluctuations, lower liquidity, economic and political risk. Class N shares are available to the general public without a sales load. Class I shares are available to certain institutional investors and advisory clients of William Blair & Company L.L.C. without a sales load or distribution (12b-1) or service fees.
The performance highlights and graph presented above do not reflect the deduction of taxes that a shareholder would pay on fund distributions or the redemption of fund shares.
The Morgan Stanley Capital International (MSCI) All Country World Ex-US Index is an unmanaged index that includes developed and emerging markets and reduced Japanese portion, making it more comparable to the International Growth Fund in terms of investment approach.
The Lipper International Index is a composite of international growth mutual funds.
This report identifies the Fund’s investments on June 30, 2006. These holdings are subject to change. Not all stocks in the Fund performed the same, nor is there any guarantee that these stocks will perform as well in the future. Market forecasts provided in this report may not necessarily come to pass.
Sector Diversification (unaudited)
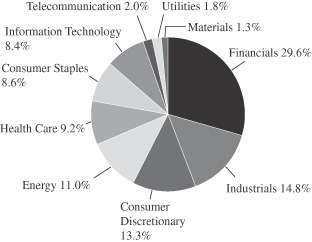
The sector diversification shown is based on the total investment portfolio.
June 30, 2006 | William Blair Funds 43 |
International Equity Fund
Portfolio of Investments, June 30, 2006 (all dollar amounts in thousands) (unaudited)
| | | | | |
Issuer
| | Shares
| | Value
|
|
Common Stocks—Europe—41.3% |
Austria—1.3% | | | | | |
Erste Bank (Banking) | | 35,332 | | $ | 1,986 |
Raiffeisen International Bank (Banking) | | 13,200 | | | 1,144 |
| | | | |
|
|
| | | | | | 3,130 |
| | | | |
|
|
France—10.2% | | | | | |
BNP Paribas (Banking) | | 41,770 | | | 3,995 |
Essilor International (Health care supplies) | | 24,500 | | | 2,464 |
Eurazeo (Diversified financial services) | | 10,710 | | | 1,060 |
Iliad S.A. (Internet software and services) | | 11,200 | | | 936 |
L’Oreal S.A. (Cosmetics) | | 75,900 | | | 7,165 |
LVMH Moet Hennessey Louis Vuitton SA (Luxury goods) | | 42,700 | | | 4,232 |
Technip-Coflexip S.A. (Construction) | | 30,600 | | | 1,686 |
Vinci S.A. (Construction) | | 25,000 | | | 2,571 |
| | | | |
|
|
| | | | | | 24,109 |
| | | | |
|
|
Germany—8.5% | | | | | |
Bijou Brigitte (Fashion jewelry accessories) | | 2,000 | | | 541 |
Celesio AG (Pharmaceuticals) | | 13,100 | | | 1,189 |
Continental AG (Diversified manufacturing) | | 22,450 | | | 2,291 |
E.ON AG (Energy) | | 34,600 | | | 3,977 |
*Qiagen, NV. (Biomedical) | | 78,000 | | | 1,051 |
SAP AG (Software) | | 22,000 | | | 4,625 |
Siemens AG (Manufacturing) | | 65,500 | | | 5,690 |
Solarworld AG (Alternate energy sources) | | 11,200 | | | 702 |
| | | | |
|
|
| | | | | | 20,066 |
| | | | |
|
|
Greece—2.2% | | | | | |
Coca-Cola Hellenic Bottling S.A. (Beverages) | | 59,100 | | | 1,760 |
EFG Eurobank (Banking) | | 39,960 | | | 1,113 |
National Bank of Greece (Banking) | | 57,460 | | | 2,217 |
| | | | |
|
|
| | | | | | 5,090 |
| | | | |
|
|
Ireland—1.2% | | | | | |
Anglo Irish Bank plc (Finance) | | 146,100 | | | 2,277 |
IAWS Group plc (Food products) | | 34,700 | | | 613 |
| | | | |
|
|
| | | | | | 2,890 |
| | | | |
|
|
Italy—3.1% | | | | | |
Azimut Holding SpA (Investment management services) | | 49,900 | | | 520 |
Luxottica Group SpA (Apparel and luxury goods) | | 147,300 | | | 3,992 |
Saipem SpA (Energy equipment and services) | | 127,700 | | | 2,898 |
| | | | |
|
|
| | | | | | 7,410 |
| | | | |
|
|
Netherlands—0.5% | | | | | |
*Tomtom NV (Computer software) | | 27,600 | | | 1,073 |
| | | | |
|
|
Norway—1.0% | | | | | |
Statoil ASA (Oil and gas) | | 82,900 | | | 2,363 |
| | | | |
|
|
Spain—2.6% | | | | | |
Grupo Ferrovial S.A. (Industrial services) | | 30,500 | | | 2,326 |
Industria De Textile (Retail trade) | | 93,800 | | | 3,954 |
| | | | |
|
|
| | | | | | 6,280 |
| | | | |
|
|
Sweden—0.6% | | | | | |
*Capio AB (Health care) | | 30,240 | | | 543 |
*Modern Times Group (Television) | | 27,600 | | | 772 |
| | | | |
|
|
| | | | | | 1,315 |
| | | | |
|
|
| | | | | |
Issuer
| | Shares
| | Value
|
|
Common Stocks—Europe—41.3%—(continued) |
Switzerland—10.1% | | | | | |
*EFG International (Commercial banking) | | 39,400 | | $ | 1,092 |
Kuehne & Nagel International AG (Air freight and logistics) | | 27,500 | | | 2,006 |
Nobel Biocare Holding AG (Medical equipment and supplies) | | 4,840 | | | 1,147 |
Roche Holdings AG (Health care) | | 50,800 | | | 8,383 |
SGS S.A. (Industrials) | | 1,750 | | | 1,661 |
Synthes, Inc. (Health care) | | 28,000 | | | 3,372 |
UBS AG (Banking) | | 57,300 | | | 6,272 |
| | | | |
|
|
| | | | | | 23,933 |
| | | | |
|
|
Japan—15.3% | | | | | |
Aeon Credit Service Co., Ltd. (Consumer finance) | | 45,400 | | | 1,105 |
Aeon Mall Co., Ltd. (Real estate) | | 25,400 | | | 1,072 |
Chiyoda Corporation (Industrial construction) | | 53,000 | | | 1,084 |
Denso Corporation (Auto parts manufacturing) | | 115,100 | | | 3,768 |
Honeys Company, Ltd. (Retail) | | 15,200 | | | 652 |
Hoya Corporation (Electronic technology) | | 61,300 | | | 2,182 |
*K.K. DaVinci Advisors (Consulting services) | | 746 | | | 739 |
Keyence Corporation (Electronic technology) | | 10,280 | | | 2,623 |
Komatsu Ltd. (Machinery) | | 250,000 | | | 4,975 |
MISUMI Group, Inc. (Metal production) | | 35,300 | | | 661 |
Mitsubishi Tokyo Financial (Financial services) | | 494 | | | 6,925 |
Nitto Denko Corporation (Electronic technology) | | 16,900 | | | 1,204 |
Orix Corporation (Consumer finance) | | 24,500 | | | 5,978 |
Point Inc. Ltd. (Apparel and footwear retail) | | 11,000 | | | 623 |
Ryohin Keikaku Co. Ltd. (Retail stores) | | 10,100 | | | 831 |
Yamada Denki Co., Ltd. (Retail trade) | | 18,300 | | | 1,865 |
| | | | |
|
|
| | | | | | 36,287 |
| | | | |
|
|
United Kingdom—14.1% | | | | | |
BG Group plc (Industrial services) | | 542,200 | | | 7,237 |
*Cairn Energy plc (Petroleum refining) | | 43,100 | | | 1,745 |
Carphone Warehouse Group plc (Consumer electronics) | | 197,100 | | | 1,155 |
*CSR plc (Electronic technology) | | 46,600 | | | 1,084 |
HBOS plc (Commercial banking) | | 326,400 | | | 5,664 |
Northern Rock plc (Commercial banking) | | 144,600 | | | 2,674 |
Reckitt Benckiser plc (Household products) | | 137,100 | | | 5,116 |
Rolls-Royce Group plc (Aerospace) | | 599,400 | | | 4,584 |
Rotork plc (Control instruments) | | 55,200 | | | 700 |
Standard Chartered plc (Banking) | | 110,100 | | | 2,686 |
Tullow Oil plc (Oil, gas drilling, and exploration) | | 97,800 | | | 690 |
| | | | |
|
|
| | | | | | 33,335 |
| | | | |
|
|
| |
Emerging Asia—6.7% | | | |
China—1.4% | | | | | |
China Life Insurance Co. (Life/Health insurance) | | 1,243,000 | | | 1,969 |
*Focus Media Holding Ltd.—ADR (Advertising) | | 13,700 | | | 893 |
Hopson Development Holding Ltd. (Real estate operations/development) | | 236,000 | | | 489 |
| | | | |
|
|
| | | | | | 3,351 |
| | | | |
|
|
See accompanying Notes to Financial Statements.
44 Semi-Annual Report | June 30, 2006 |
International Equity Fund
Portfolio of Investments, June 30, 2006 (all dollar amounts in thousands) (unaudited)
| | | | | |
Issuer
| | Shares
| | Value
|
|
Common Stocks—Emerging Asia—6.7%—(continued) |
India—3.5% | | | | | |
Bharat Heavy Electricals Ltd. (Supply equiptment) | | 36,400 | | $ | 1,545 |
*Bharti Airtel Limited (Wireless telecommunication services) | | 138,373 | | | 1,114 |
HDFC Bank (Banking) | | 78,600 | | | 1,361 |
Infosys Technologies Ltd. (Consulting software and services) | | 29,700 | | | 1,987 |
Suzlon Energy Ltd. (Power conversion equipment) | | 30,100 | | | 686 |
Vedanta Resources Plc (Mining) | | 62,600 | | | 1,588 |
| | | | |
|
|
| | | | | | 8,281 |
| | | | |
|
|
Indonesia—0.3% | | | | | |
PT Bank Rakyat Indonesia (Banking) | | 1,732,000 | | | 768 |
| | | | |
|
|
Taiwan—1.5% | | | | | |
High Tech Computer Corp. (Computers) | | 49,000 | | | 1,347 |
*Himax Technologies, Inc.—ADR (Computers) | | 70,000 | | | 400 |
Hon Hai Precision Industry Corp. (Computers) | | 290,931 | | | 1,796 |
| | | | |
|
|
| | | | | | 3,543 |
| | | | |
|
|
Canada—4.9% | | | | | |
Cameco Corporation (Metals) | | 56,000 | | | 2,231 |
Canadian National Railway Co. (Railroads) | | 51,500 | | | 2,249 |
Manulife Financial Corporation (Life and health insurance) | | 119,000 | | | 3,771 |
Shoppers Drug Mart Corporation (Retail trade) | | 27,900 | | | 1,012 |
Suncor Energy, Inc. (Oil, gas drilling and exploration) | | 29,300 | | | 2,371 |
| | | | |
|
|
| | | | | | 11,634 |
| | | | |
|
|
| | |
Asia—4.2% | | | | | |
Australia—1.2% | | | | | |
Macquarie Bank Ltd. (Financial services) | | 57,500 | | | 2,943 |
| | | | |
|
|
Hong Kong—1.5% | | | | | |
Esprit Holdings Ltd. (Apparel, footwear and retail) | | 152,500 | | | 1,246 |
Li & Fung Ltd. (Distribution) | | 1,107,200 | | | 2,244 |
| | | | |
|
|
| | | | | | 3,490 |
| | | | |
|
|
Singapore—1.5% | | | | | |
Capitaland, Ltd. (Real estate operations) | | 1,264,000 | | | 3,607 |
| | | | |
|
|
| | |
Emerging Europe, Mid-East, Africa—1.7% | | | | | |
Isreal—0.9% | | | | | |
Teva Pharmaceutical Industries Ltd.—ADR (Health care) | | 69,500 | | | 2,196 |
| | | | |
|
|
South Africa—0.8% | | | | | |
MTN Group Limited (Wireless telecommunications) | | 55,100 | | | 405 |
Naspers Ltd. (Media) | | 25,800 | | | 439 |
Sasol ASA (Energy) | | 24,599 | | | 944 |
| | | | |
|
|
| | | | | | 1,788 |
| | | | |
|
|
| | | | | | | |
Issuer
| | Shares or
Principal
Amount
| | Value
| |
|
Common Stocks—Emerging Latin America—3.9% | |
Brazil—1.1% | | | | | | | |
Companhia de Concessoes Rodoviarias (Public thoroughfares) | | | 89,600 | | $ | 724 | |
Gol-Linhas Aereas Inteligentes S.A.—ADR (Airlines) | | | 30,300 | | | 1,076 | |
Localiza Rent a Car S.A. (Automobile rental) | | | 18,900 | | | 358 | |
Natura Cosmeticos S.A. (Cosmetics) | | | 48,500 | | | 496 | |
| | | | | |
|
|
|
| | | | | | | 2,654 | |
| | | | | |
|
|
|
Columbia—0.3% | | | | | | | |
Bancolumbia S.A.—ADR (Banking) | | | 26,500 | | | 639 | |
| | | | | |
|
|
|
Mexico—2.5% | | | | | | | |
America Movil S.A. (Communications) | | | 1,726,900 | | | 2,885 | |
Walmart de Mexico (Retail trade) | | | 1,058,000 | | | 2,957 | |
| | | | | |
|
|
|
| | | | | | | 5,842 | |
| | | | | |
|
|
|
Total Common Stock — 92.1%
(cost $198,425) | | | 218,017 | |
| | | | | |
|
|
|
| | |
Preferred Stocks | | | | | | | |
Brazil—1.5% | | | | | | | |
Banco Itau S.A. (Banking) | | | 51,900 | | | 1,506 | |
Petroleo Brasileiro S.A. (Oil, gas drilling, and exploration) | | | 110,600 | | | 2,198 | |
| | | | | |
|
|
|
| | | | | | | 3,704 | |
| | | | | |
|
|
|
Total Preferred Stocks—1.5%
(cost $2,927) | | | 3,704 | |
| | | | | |
|
|
|
| | |
Investment in Affiliate | | | | | | | |
William Blair Ready Reserves Fund | | | 13,028 | | | 13 | |
| | | | | |
|
|
|
Total Investment in Affiliate—0.0%
(cost $13) | | | 13 | |
| | | | | |
|
|
|
| | |
Short-Term Investments | | | | | | | |
American Express Demand Note, VRN, 5.200%, due 7/03/06 | | $ | 7,823,000 | | | 7,823 | |
Prudential Funding Demand Note, VRN, 5.055%, due 7/03/06 | | | 7,509,000 | | | 7,509 | |
| | | | | |
|
|
|
Total Short-Term Investments—6.5%
(cost $15,332) | | | 15,332 | |
| | | | | |
|
|
|
Total Investments—100.1%
(cost $216,697) | | | | | | 237,066 | |
Liabilities plus cash and other assets—(0.1%) | | | (283 | ) |
| | | | | |
|
|
|
Net assets—100.0% | | $ | 236,783 | |
| | | | | |
|
|
|
*Non-income producing securities
ADR = American Depository Receipt
VRN = Variable Rate Note
See accompanying Notes to Financial Statements.
June 30, 2006 | William Blair Funds 45 |
International Equity Fund
Portfolio of Investments, June 30, 2006 (all dollar amounts in thousands) (unaudited)
For securities, primarily traded on exchanges or markets that close before the close of regular trading on the New York Stock Exchange, the Fund uses an independent pricing service on a daily basis to fair value price the securities pursuant to Valuation Procedures adopted by the Board of Trustees.
At June 30, 2006 the Fund’s Portfolio of Investments includes the following industry categories:
| | |
Financials | | 29.6% |
Industrials and Services | | 14.8% |
Consumer Discretionary | | 13.3% |
Energy | | 11.0% |
Healthcare | | 9.2% |
Consumer Staples | | 8.6% |
Information Technology | | 8.4% |
Telecommunication Services | | 2.0% |
Utilities . | | 1.8% |
Materials . | | 1.3% |
| | |
|
| | | 100.0% |
| | |
|
At June 30, 2006 the Fund’s Portfolio of Investments includes the following currency categories:
| | |
Euro | | 31.6% |
Japanese Yen | | 16.4% |
British Pound Sterling | | 15.8% |
Swiss Franc | | 10.8% |
Canadian Dollar | | 5.2% |
Indian Rupee | | 3.0% |
Hong Kong Dollar | | 2.7% |
Mexico Nuevo Peso | | 2.7% |
Brazilian Real | | 2.4% |
United States Dollar | | 2.3% |
Singapore Dollar | | 1.6% |
Taiwan Dollar | | 1.4% |
Australian Dollar | | 1.3% |
Norwegian Krone | | 1.1% |
All other currencies | | 1.7% |
| | |
|
| | | 100.0% |
| | |
|
See accompanying Notes to Financial Statements.
46 Semi-Annual Report | June 30, 2006 |

Jeffrey A. Urbina
INTERNATIONAL SMALL CAP GROWTH FUND
The International Small Cap Growth Fund primarily invests in a diversified portfolio of common stocks of small cap companies in developed and emerging markets.
AN OVERVIEW FROM THE PORTFOLIO MANAGER
How did the Fund perform over the first half of the year? How did the Fund’s performance compare to its benchmark?
The International Small Cap Growth Fund posted an 8.51% increase (Class N Shares) for the six months ended June 30, 2006. By comparison, the Fund’s benchmark, the Morgan Stanley Capital International (MSCI) World Small Cap ex-U.S. Index gained 7.06%.
What were the most significant factors impacting international markets during the first six months of the year?
Following first quarter’s strong equity market, when international equities were up 9.76%, as reflected by the Morgan Stanley (MSCI) All Country World ex-US (ACWI) Index, markets retreated during the second quarter as concerns about potential global inflationary pressures, monetary policy tightening (and uncertainty as to the duration and size of further tightening moves and their impact on the US consumer in particular), and higher valuations in a number of the recent strong markets such as emerging markets and small cap came to the forefront of investor psychology. As a result, investors significantly reduced risk positions and emerging markets, which were up approximately 12% in the first quarter, fell sharply beginning in May through mid-June, while developed markets’ small cap stocks, up 10.8% during the first quarter, fell significantly as well. In addition, commodities and energy stocks, which were the strongest sectors globally through April, declined.
The correction in equity markets during May and most of June was broad based and non-discriminatory, although the stocks that were the prime beneficiaries of the strong global growth trends over the past several years did suffer more than their more defensive-oriented counterparts. In addition, the US remained the safe haven for investors as its equity and bond markets outperformed other regions of the world. The increased uncertainty surrounding monetary policy, inflationary pressures, rumored intervention by the Chinese government to slow investment and housing in certain parts of its market, record profits by corporations, significant outperformance of “riskier” assets, coupled with higher valuations and concerns about a slower growth environment, created the perfect storm for a liquidity driven market correction. However, within this environment, unit labor costs remained constrained as productivity enhancements offset higher wages, company fundamentals and earnings prospects remained strong, and managements continued to be focused on enhancing shareholder value. At the same time, emerging markets governments significantly improved monetary and fiscal policies and current account positions, and are now more immune to economic downdrafts such as those that occurred in 1997 and 1998.
Markets began to stabilize in mid June and rebounded sharply near the end of the quarter, however, as the severity and broadness of the equity market downdraft appeared overdone, and investors began to believe that central banks would in fact engineer a “soft landing” to a more sustainable growth environment. During the second quarter, the MSCI ACWI ex-US Index was up 0.21%, led by the UK and Pacific ex-Japan, while emerging markets fell 4.27% and developed markets’ small cap companies fell 3.41%, as measured by the MSCI World ex-US Small Cap Index. For the first six months of 2006, the MSCI ACWI ex-US Index returned 9.99%, led by Europe ex-UK and the UK, while Japan was the largest developed
June 30, 2006 | William Blair Funds 47 |
markets detractor. Emerging markets and developed small cap returned just over 7% each. From a global sector perspective, Materials, Energy and Utilities were the strongest sectors with double digit returns year to date, while Information Technology (IT) and Telecommunication Services trailed.
What factors were behind the Fund’s performance versus the benchmark?
Within this environment, the Fund returned 8.51% (Class N), outpacing the MSCI World ex-US Small Cap Index year to date, due to strong relative performance during the first quarter, which was somewhat mitigated by second quarter performance. Stock selection across most sectors augmented results year to date, in particular in Consumer and IT. Within Consumer, Pacific Free ex-Japan , UK and Emerging Markets stock selection added value, while UK and Emerging Asia stock selection augmented IT results. The Fund’s focus on Europe ex-UK Emerging Asia and Emerging Markets Europe, Mid-East and Africa (EMEA) at the expense of Japan was also additive to results. Conversely, sector positioning was a drag on results year to date, as the Fund’s focus on Consumer Cyclicals at the expense of Materials hurt performance. In addition, sector positioning in Japan was a drag on year to date performance, as the Fund’s focus on specialty retailing, and small capitalization asset management firms hurt performance as these areas underperformed the Japanese market as a whole. While there were no earnings disappointments in general regarding individual portfolio holdings, the specialty retailing and asset management firms suffered with the general decline in smaller capitalization stocks, coupled with investor concerns about ongoing consumer demand in Japan and the prospects of an increasing interest rate environment.
What is your current strategy? How is the Fund positioned?
We have used the second quarter market activity to add to positions in strong companies with good fundamentals, which now have significantly more compelling valuations. As of quarter end, the Fund maintained its higher Consumer, Industrials and Health Care weightings at the expense of Materials, Telecom Services, Energy, IT and Utilities. From a regional perspective, the Fund maintained its underweighting in developed Asia and the UK and overweighting in Europe ex-UK versus the Index. In addition, emerging markets were decreased during the first quarter on valuation by nearly 8% and then increased on weakness by approximately 8% during the second quarter, focused largely on Emerging Asia. These weightings are largely based upon the team’s bottom up, fundamental research efforts, which are also supported by the team’s top down view.
What is your outlook for the international markets?
The key cyclical drivers of the world economy are generally seen to be US household spending growth and China’s industrial and infrastructure investment boom. Both of these trends have been expected to decelerate for some time, but, ironically, a great deal of the increase in economic anxiety that unfolded in the first half of 2006 relates to the fact that both of the expected slowdowns have so far largely failed to materialize.
For the US consumer, the areas of concern are the sharp slowdown in housing activity and the negative fallout of house price weakness, and the hit to discretionary spending power from higher energy costs and interest payments. Coupled with the persistent upward pressure on reported inflation and its uncertain impact on monetary policy, these unknowns are increasingly tipping the odds in favor of a significant (1 percentage point or more) reduction in growth expectations for next year.
In China, the government has targeted a growth slowdown in selected industrial sectors as well as speculative segments of the housing market. But economists have very little confidence in the degree to which the government’s intentions can be translated into actual
48 Semi-Annual Report | June 30, 2006 |
changes in growth expectations. Similarly, there is no consensus about the effect of a potential export slowdown on the overall economy. Although there are obviously a great number of unknowns in both the numbers and the mechanisms of growth in China, aggregate GDP growth often seems only mildly affected by local and sector-specific cycles, and we would not anticipate more than a moderate downshift back to trend growth.
Japan and Europe, on the other hand, have been seeing steady improvement in growth indicators and economic news flow. Will this quickening expansion be sustained in the face of deceleration in the US and China, as well as some early-stage monetary tightening? Our view is that the cycles in Japan and Europe remain at a relatively early stage, and that growth may be sustained by continued strength in global capital spending, improving employment prospects, high savings balances, and pent-up demand in both the corporate and household sectors.
In the context of this reasonably balanced but still somewhat slower growth scenario, the key policy and market risk issue will be the degree of persistence of rising inflation and the potential broadening of price inflation into more core spending-related measures. This aspect of inflation makes itself known as a severely lagging indicator, and presents the US in particular with the policy problem of whether to prioritize visible growth trends or price trends in setting monetary conditions. This dilemma may well get worse before being resolved in favor of ending the tightening cycle.
In the first half of 2006, valuation and risk issues topped the equity market agenda—concerns about relative risk appetite and relative levels of real rates. To a degree, as growth and inflation issues come to the fore, the market’s principal concern will shift toward the outlook for sales and earnings growth.
Global corporate profitability is at or near record levels, spurred on by the strong secular forces of improved corporate performance and strong labor productivity growth. But while these forces remain in place, there are signs that cyclical pressures may push cost growth ahead of revenue growth—at least in some sectors—regardless of whether the global cycle is stronger or weaker than consensus expectations.
Our view is that changes in relative earnings growth and growth expectations will be an important factor governing market and sector leadership over the next several quarters. At the same time, it is likely that trends in profitability in place for the last year or two may be disrupted by shifts in global demand and relative pricing patterns.
We will be focusing particularly for signs of (negative) change in the commodity and industrial sectors, for changes in margins within the highly diverse financial sector, and for indications of the sustainability of profit growth on a regional basis, particularly with respect to the strong growth advantage enjoyed by emerging markets in the last several years.
In the near term, though, the market’s view of these prospective growth issues will be set by high frequency economic releases and especially by any visible trends that emerge from second and third (calendar) quarter earnings reports. Investment strategy, like economic policy, is at least cyclically becoming more and more ‘data-dependent’.
June 30, 2006 | William Blair Funds 49 |
International Small Cap Growth Fund
Performance Highlights (unaudited)
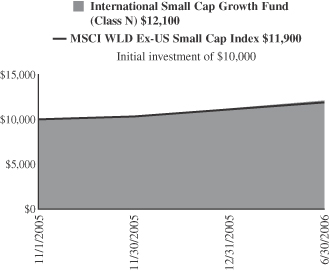
Average Annual Total Return at 6/30/2006
| | | |
| | | Since Inception(a)
| |
International Small Cap Growth Fund
Class N | | 21.10 | % |
International Small Cap Growth Fund
Class I | | 21.30 | |
MSCI World Ex-US Small Cap Index | | 18.49 | |
| | (a) | | For the period from November 1, 2005 (Commencement of Operations) to June 30, 2006. | |
Performance cited represents past performance. Past performance does not guarantee future results and current performance may be lower or higher than the data quoted. Results shown are average annual returns, which assume reinvestment of dividends and capital gains. Investment returns and principal will fluctuate and you may have a gain or loss when you sell shares. For the most current month-end performance information, please call 1-800-742-7272, or visit our Web site at www.williamblairfunds.com. From time to time, the investment adviser may waive fees or reimburse expenses for the Fund. Without these waivers, performance would be lower. Class N shares are available to the general public without a sales load. Class I shares are available to certain institutional investors and advisory clients of William Blair & Company L.L.C. without a sales load or distribution (12b-1) fees. International investing involves special risk considerations, including currency fluctuations, lower liquidity, economic and political risk.
The performance highlights and graph presented above do not reflect the deduction of taxes that a shareholder would pay on fund distributions or the redemption of fund shares.
The Morgan Stanley Capital International (MSCI) World Ex-US Small Cap Index is an unmanaged index that is designated to measure equity performance of small cap stocks in developed and emerging markets.
This report identifies the Fund’s investments on June 30, 2006. These holdings are subject to change. Not all stocks in the Fund performed the same, nor is there any guarantee that these stocks will perform as well in the future. Market forecasts provided in this report may not necessarily come to pass.
Sector Diversification (unaudited)
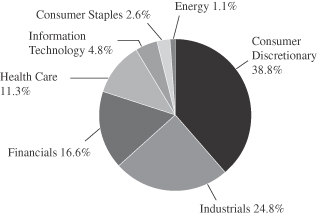
The sector diversification shown is based on the total investment portfolio.
50 Semi-Annual Report | June 30, 2006 |
International Small Cap Growth Fund
Portfolio of Investments, June 30, 2006 (all dollar amounts in thousands) (unaudited)
| | | | | |
Issuer
| | Shares
| | Value
|
| | |
Common Stocks—Europe—30.8% | | | | | |
France—2.9% | | | | | |
April Group S.A. (Insurance brokers) | | 43,600 | | $ | 2,350 |
*Orpea (Hospital and nursing management) | | 16,800 | | | 1,159 |
| | | | |
|
|
| | | | | | 3,509 |
| | | | |
|
|
Germany—8.9% | | | | | |
Bijou Brigitte (Fashion jewelry accessories) | | 4,500 | | | 1,216 |
CTS Eventim (Leisure and recreation products) | | 39,500 | | | 1,212 |
GFK AG (Commercial services) | | 21,400 | | | 779 |
*Q-Cells AG (Alternative energy sources) | | 23,200 | | | 1,941 |
*Qiagen NV (Biomedical) | | 132,400 | | | 1,785 |
Rational AG (Business equipment) | | 3,500 | | | 572 |
Solarworld AG (Alternative energy sources) | | 26,300 | | | 1,647 |
Stada Arzneimittel AG (Pharmaceuticals) | | 43,700 | | | 1,742 |
| | | | |
|
|
| | | | | | 10,894 |
| | | | |
|
|
Ireland—5.2% | | | | | |
IAWS Group plc (Food distribution) | | 99,400 | | | 1,756 |
Kingspan Group plc (Construction) | | 174,400 | | | 3,046 |
United Drug plc (Pharmaceuticals) | | 383,400 | | | 1,642 |
| | | | |
|
|
| | | | | | 6,444 |
| | | | |
|
|
Italy—4.9% | | | | | |
Amplifon SpA (Retail) | | 132,300 | | | 1,125 |
Azimut Holdings SpA (Investment management services) | | 112,000 | | | 1,166 |
Credito Emiliano SpA (Banking) | | 97,200 | | | 1,198 |
Pirelli & C Real Estate SpA (Real estate development) | | 9,400 | | | 631 |
Tod’s SpA (Footwear apparel) | | 25,300 | | | 1,895 |
| | | | |
|
|
| | | | | | 6,015 |
| | | | |
|
|
Luxembourg—1.0% | | | | | |
*Transcom Worldwide S.A. (E-services and consulting) | | 109,200 | | | 1,206 |
| | | | |
|
|
Sweden—5.5% | | | | | |
*Capio AB (Health care) | | 97,240 | | | 1,745 |
HIQ International AB (Computer services) | | 116,000 | | | 631 |
*Modern Times Group (Television) | | 107,800 | | | 3,268 |
*Tradedoubler AB (E-services and consulting) | | 61,700 | | | 1,127 |
| | | | |
|
|
| | | | | | 6,771 |
| | | | |
|
|
Switzerland—2.4% | | | | | |
*EFG International (Banking) | | 62,750 | | | 1,740 |
Phonak Holdings AG (Hearing technology) | | 18,900 | | | 1,181 |
| | | | |
|
|
| | | | | | 2,921 |
| | | | |
|
|
| | |
Japan—24.0% | | | | | |
Aeon Credit Service Co., Ltd. (Consumer finance) | | 112,300 | | | 2,735 |
Aeon Mall Co., Ltd. (Real estate) | | 53,000 | | | 2,237 |
Chiyoda Corp. (Construction) | | 92,000 | | | 1,882 |
Honeys Company, Ltd. (Luxury goods) | | 25,800 | | | 1,107 |
ITO EN, Ltd. (Beverages) | | 34,500 | | | 1,261 |
Joint Corporation (Real estate operations/development) | | 65,100 | | | 2,124 |
*K.K. DaVinci Advisors (Consulting services) | | 2,230 | | | 2,208 |
MISUMI Group, Inc. (Metal production) | | 90,000 | | | 1,686 |
| | | | | |
Issuer
| | Shares
| | Value
|
| |
Common Stocks—Japan—24.0%—(continued) | | | |
Nakanishi Inc. (Medical specialties) | | 15,900 | | $ | 1,494 |
Nitori Company Ltd. (Specialty stores) | | 35,000 | | | 1,703 |
Park 24 Co., Ltd. (Commercial services) | | 36,000 | | | 1,063 |
Point Inc. Ltd. (Apparel and footwear retail) | | 19,500 | | | 1,104 |
Ryohin Keikaku Co. Ltd. (Retail stores) | | 28,200 | | | 2,319 |
Shimamura Company Ltd. (Retail stores) | | 15,500 | | | 1,701 |
Sparx Asset Management Co. Ltd. (Financial) | | 2,890 | | | 3,042 |
Suruga Bank (Banking) | | 133,000 | | | 1,801 |
| | | | |
|
|
| | | | | | 29,467 |
| | | | |
|
|
| | |
United Kingdom—12.3% | | | | | |
Accident Exchange Group plc (Auto rental) | | 96,400 | | | 623 |
*Ceres Power Holdings plc (Alternative energy sources) | | 226,000 | | | 991 |
*CSR plc (Electronic technology) | | 93,100 | | | 2,165 |
Homeserve plc (Extended service contracts) | | 59,500 | | | 1,704 |
Mears Group plc (Building maintenace and services) | | 216,250 | | | 1,085 |
Michael Page International (Personnel services) | | 397,400 | | | 2,573 |
Rotork plc (Control insturments) | | 91,100 | | | 1,154 |
Serco Group plc (Consulting services) | | 403,200 | | | 2,383 |
Ultra Electronic Holdings plc (Electronic products) | | 64,300 | | | 1,150 |
VT Group plc (Shipbuilding) | | 143,000 | | | 1,286 |
| | | | |
|
|
| | | | | | 15,114 |
| | | | |
|
|
| | |
Emerging Asia—11.3% | | | | | |
China—5.6% | | | | | |
*Ctrip.com International, Ltd.—ADR (E-commerce/services) | | 36,700 | | $ | 1,874 |
*Focus Media Holdings—ADR (Advertising sales) | | 28,100 | | | 1,831 |
Li Ning Co. Ltd. (Leisure equipment and products) | | 1,268,873 | | | 1,244 |
Ports Design Limited (Apparel and luxury goods) | | 355,000 | | | 572 |
*Suntech Power Holdings Co. Ltd—ADR (Alternative energy sources) | | 46,900 | | | 1,325 |
| | | | |
|
|
| | | | | | 6,846 |
| | | | |
|
|
India—2.3% | | | | | |
Bharat Forge Ltd. (Metal processors) | | 252,300 | | | 1,723 |
*Inox Leisure, Ltd. (Movie theaters) | | 226,400 | | | 621 |
Pantaloon Retail India, Ltd. (Department stores) | | 15,700 | | | 461 |
| | | | |
|
|
| | | | | | 2,805 |
| | | | |
|
|
Malaysia—0.4% | | | | | |
Transmile Group Bhd (Airport development and maintenance) | | 143,200 | | | 499 |
| | | | |
|
|
Taiwan—2.0% | | | | | |
Largan Precision Company, Ltd. (Photo equipment and supplies) | | 114,000 | | | 2,437 |
| | | | |
|
|
South Korea—1.0% | | | | | |
Hana Tour Service Inc. (Travel services) | | 16,400 | | | 1,237 |
| | | | |
|
|
See accompanying Notes to Financial Statements.
June 30, 2006 | William Blair Funds 51 |
International Small Cap Growth Fund
Portfolio of Investments, June 30, 2006 (all dollar amounts in thousands) (unaudited)
| | | | | |
Issuer
| | Shares
| | Value
|
| | |
Emerging Latin America—5.9% | | | | | |
Brazil—4.0% | | | | | |
Cyrela Brazil Realty S.A. (Real estate operations/development) | | 79,500 | | $ | 1,321 |
*Submarino S.A.(E-commerce) | | 96,100 | | | 1,930 |
*Totvs S.A. (Computer software) | | 109,700 | | | 1,633 |
| | | | |
|
|
| | | | | | 4,884 |
| | | | |
|
|
Chile—1.0% | | | | | |
Cencosud S.A.—ADR 144A (Retail stores) | | 32,900 | | | 1,207 |
| | | | |
|
|
Mexico—0.9% | | | | | |
*Urbi Desarrollos Urbanos S.A. (Household durables) | | 490,200 | | | 1,137 |
| | | | |
|
|
| | |
Asia—5.3% | | | | | |
Australia—3.0% | | | | | |
Seek Limited (Internet advertising) | | 512,300 | | | 2,037 |
Sigma Company, Ltd. (Medical distributors) | | 67,700 | | | 131 |
United Group, Ltd. (Building and construction) | | 27,600 | | | 296 |
WorleyParsons, Ltd. (Engineering) | | 80,800 | | | 1,208 |
| | | | |
|
|
| | | | | | 3,672 |
| | | | |
|
|
Singapore—2.3% | | | | | |
Goodpack Ltd. (Air freight and logistics) | | 884,000 | | | 912 |
Osim International Ltd. (Consumer sundries) | | 1,141,400 | | | 1,115 |
Raffles Education Corp. Ltd. (Schools) | | 558,000 | | | 857 |
| | | | |
|
|
| | | | | | 2,884 |
| | | | |
|
|
| | |
Emerging Europe, Mid-East, Africa—2.9% | | | | | |
Czech Republic—1.0% | | | | | |
*Central European Media Enterprises Ltd., Class “A” (Television)† | | 19,900 | | | 1,257 |
| | | | |
|
|
Russia—1.0% | | | | | |
*CTC Media, Inc. (Television)† | | 68,438 | | | 1,249 |
| | | | |
|
|
| | | | | | |
Issuer
| | Shares or
Principal
Amount
| | Value
|
|
Common Stocks—Emerging Europe, Mid-East, Africa—2.9%—(continued) |
South Africa—0.9% | | | | | | |
Aspen Pharmacare (Pharmaceuticals) | | | 206,500 | | $ | 1,049 |
| | | | | |
|
|
| | |
Canada—1.5% | | | | | | |
*Gildan Activewear, Inc. (Apparel and luxury goods) | | | 28,100 | | | 1,329 |
Ritchie Brothers Auctioneers, Inc. (Business services)† | | | 10,600 | | | 564 |
| | | | | |
|
|
| | | | | | | 1,893 |
| | | | | |
|
|
Total Common Stock—94.0%
(cost $109,778) | | | 115,397 |
| | | | | |
|
|
| | |
Investment in Affiliate | | | | | | |
William Blair Ready Reserves Fund | | | 221,938 | | | 222 |
| | | | | |
|
|
Total Investment in Affiliate—0.2%
(cost $222) | | | 222 |
| | | | | |
|
|
| | |
Short-Term Investments | | | | | | |
American Express Demand Note, VRN
5.200% due 7/3/06 | | $ | 540,000 | | | 540 |
Prudential Funding Demand Note, VRN
5.055% due 7/3/06 | | | 301,000 | | | 301 |
| | | | | |
|
|
Total Short-Term Investments—0.7%
(cost $841) | | | 841 |
| | | | | |
|
|
Total Investments—94.9%
(cost $110,841) | | | 116,460 |
Cash and other assets, less liabilities—5.1% | | | 6,245 |
| | | | | |
|
|
Net assets—100.0% | | $ | 122,705 |
| | | | | |
|
|
*Non-income producing securities
ADR = American Depository Receipt
GDR = Global Depository Receipt
VRN = Variable Rate Note
† = U.S. listed foreign security
For securities, primarily traded on exchanges or markets that close before the close of regular trading on the New York Stock Exchange the Fund uses an independent pricing service on a daily basis to fair value price the securities pursuant to Valuation Procedures adopted by the Board of Trustees.
At June 30, 2006 the Fund’s Portfolio of Investments includes the following industry categories:
| | |
Consumer Discretionary | | 38.8% |
Industrials and Services | | 24.8% |
Financials | | 16.6% |
Healthcare | | 11.3% |
Information Technology | | 4.8% |
Consumer Staples | | 2.6% |
Energy | | 1.1% |
| | |
|
| | | 100.0% |
| | |
|
At June 30, 2006 the Fund’s Portfolio of Investments includes the following currency categories:
| | |
Japanese Yen | | 25.5% |
Euro | | 23.3% |
British Pound Sterling | | 13.1% |
United States Dollar | | 8.1% |
Swedish Krona | | 6.9% |
Brazilian Real | | 4.2% |
Australian Dollar | | 3.2% |
Swiss Franc | | 2.5% |
Signapore Dollar | | 2.5% |
Indian Rupee | | 2.4% |
New Taiwan Dollar | | 2.1% |
Hong Kong Dollar | | 1.6% |
Canadian Dollar | | 1.2% |
South Korean Won | | 1.1% |
All other currencies | | 2.3% |
| | |
|
| | | 100.0% |
| | |
|
See accompanying Notes to Financial Statements.
52 Semi-Annual Report | June 30, 2006 |
W. George Greig

Todd M. McClone
Jeffrey A. Urbina
EMERGING MARKETS GROWTH FUND
The Emerging Markets Growth Fund primarily invests in a diversified portfolio of equity securities issued by growth companies in emerging economies worldwide.
AN OVERVIEW FROM THE PORTFOLIO MANAGERS
How did the Fund perform over the first half of the year? How did the Fund’s performance compare to its benchmark?
The Emerging Markets Growth Fund posted a 5.86% increase (Class N Shares) for the six months ended June 30, 2006. By comparison, the Fund’s benchmark, the Morgan Stanley Capital International (MSCI) Emerging Markets Index, gained 7.33%.
What were the most significant factors impacting international markets during the first six months of the year?
Following first quarter’s strong equity market, when international equities were up 9.76%, as reflected by the Morgan Stanley Capital International (MSCI) all Country World (ACWI) ex-US Index, markets retreated during the second quarter as concerns about potential global inflationary pressures, monetary policy tightening (and uncertainty as to the duration and size of further tightening moves and their impact on the US consumer in particular), and higher valuations in a number of the recent strong markets such as emerging markets and small cap came to the forefront of investor psychology. As a result, investors significantly reduced risk positions and emerging markets, which were up approximately 12% in the first quarter, fell sharply beginning in May through mid-June, while developed small cap stocks, up 10.8% during the first quarter, fell significantly as well. In addition, commodities and energy stocks, which were the strongest sectors globally through April, declined.
The correction in equity markets during May and most of June was broad based and non-discriminatory, although the stocks that were the prime beneficiaries of the strong global growth trends over the past several years did suffer more than their more defensive-oriented counterparts. In addition, the US remained the safe haven for investors as its equity and bond markets outperformed other regions of the world. The increased uncertainty surrounding monetary policy, inflationary pressures, rumored intervention by the Chinese government to slow investment and housing in certain parts of its market, record profits by corporations, significant outperformance of “riskier” assets, coupled with higher valuations and concerns about a slower growth environment, created the perfect storm for a liquidity driven market correction. However, within this environment, unit labor costs remained constrained as productivity enhancements offset higher wages, company fundamentals and earnings prospects remained strong, and managements continued to be focused on enhancing shareholder value. At the same time, emerging markets governments significantly improved monetary and fiscal policies and current account positions, and are now more immune to economic downdrafts such as those that occurred in 1997 and 1998.
Markets began to stabilize in mid June and rebounded sharply near the end of the quarter, however, as the severity and broadness of the equity market downdraft appeared overdone, and investors began to believe that central banks would in fact engineer a “soft landing” to a more sustainable growth environment. During the second quarter, the MSCI ACWI ex-US Index was up 0.21%, led by the UK, Australia and Hong Kong, while emerging markets fell 4.27% and developed small cap companies fell 3.41%, as measured by the MSCI World ex-US Small Cap Index. Within emerging markets, Emerging Markets Europe, Mid-East and Africa (EMEA) was the weakest performer, due to Turkey and South Africa and concerns
June 30, 2006 | William Blair Funds 53 |
about their current account deficits, while Emerging Asia was the strongest. As a result, over the first six months of 2006, the MSCI ACWI ex-US Index returned 9.99%, led by Europe ex-UK and the UK, while Japan was the largest developed markets detractor. Emerging markets and developed small cap returned just over 7% each. From a global sector perspective, Materials, Energy and Utilities were the strongest sectors with double digit returns year to date, while Information Technology (IT) and Telecommunication Services trailed.
What factors were behind the Fund’s performance versus the benchmark?
Within this environment, the Fund returned 5.86% (Class N), trailing the MSCI Emerging Markets Index year to date, due to underperformance during the second quarter, which more than offset first quarter 2006 outperformance. Lagging performance was due largely to the portfolio’s emphasis on a pro growth strategy, as evidenced by the portfolio’s higher weightings in Consumer Cyclicals at the expense of Materials, Energy and Utilities. In particular, the Fund underperformed during April due to its lack of Materials exposure and underweighted Energy holdings versus the Index, as commodities prices soared. The Fund’s pro growth sector positioning was also negative in the significant risk aversion environment during the remainder of the second quarter, favoring the more defensive sectors, as well as, the most defensive stocks within sectors. Mitigating this factor was the Fund’s higher weighting in Latin America at the expense of EMEA was also positive during the six month period, as Latin America was the strongest performing region and EMEA trailed. Moreover stock selection across most sectors was strong. In Energy, the Fund’s stock selection in EMEA was strong, while Materials benefited from Emerging Asia exposures. The Fund also benefited from higher weightings in and stock selection in Emerging Asia and Latin America.
What is your current strategy? How is the Fund positioned?
We have used the second quarter market activity to add to positions in strong companies with good fundamentals, which now have significantly more compelling valuations. As of quarter end, the portfolio maintained its higher Consumer and Industrials weightings at the expense of Materials, Telecom Services, Energy, and Utilities. From a regional perspective, the portfolio’s weighting in EMEA was reduced, on sales from South Africa in particular in favor of Emerging Asian companies, which now approximate the weighting of the Index. These weightings are largely based upon the team’s bottom up, fundamental research efforts, which are also supported by the team’s top down view.
What is your outlook for the international markets?
The key cyclical drivers of the world economy are generally seen to be US household spending growth and China’s industrial and infrastructure investment boom. Both of these trends have been expected to decelerate for some time, but, ironically, a great deal of the increase in economic anxiety that unfolded in the first half of 2006 relates to the fact that both of the expected slowdowns have so far largely failed to materialize.
For the US consumer, the areas of concern are the sharp slowdown in housing activity and the negative fallout of house price weakness, and the hit to discretionary spending power from higher energy costs and interest payments. Coupled with the persistent upward pressure on reported inflation and its uncertain impact on monetary policy, these unknowns are increasingly tipping the odds in favor of a significant (1 percentage point or more) reduction in growth expectations for next year.
In China, the government has targeted a growth slowdown in selected industrial sectors as well as speculative segments of the housing market. But economists have very little confidence in the degree to which the government’s intentions can be translated into actual changes in growth expectations. Similarly, there is no consensus about the effect of a
54 Semi-Annual Report | June 30, 2006 |
potential export slowdown on the overall economy. Although there are obviously a great number of unknowns in both the numbers and the mechanisms of growth in China, aggregate GDP growth often seems only mildly affected by local and sector-specific cycles, and we would not anticipate more than a moderate downshift back to trend growth.
Japan and Europe, on the other hand, have been seeing steady improvement in growth indicators and economic news flow. Will this quickening expansion be sustained in the face of deceleration in the US and China, as well as some early-stage monetary tightening? Our view is that the cycles in Japan and Europe remain at a relatively early stage, and that growth may be sustained by continued strength in global capital spending, improving employment prospects, high savings balances, and pent-up demand in both the corporate and household sectors.
In the context of this reasonably balanced but still somewhat slower growth scenario, the key policy and market risk issue will be the degree of persistence of rising inflation and the potential broadening of price inflation into more core spending-related measures. This aspect of inflation makes itself known as a severely lagging indicator, and presents the US in particular with the policy problem of whether to prioritize visible growth trends or price trends in setting monetary conditions. This dilemma may well get worse before being resolved in favor of ending the tightening cycle.
In the first half of 2006, valuation and risk issues topped the equity market agenda—concerns about relative risk appetite and relative levels of real rates. To a degree, as growth and inflation issues come to the fore, the market’s principal concern will shift toward the outlook for sales and earnings growth.
Global corporate profitability is at or near record levels, spurred on by the strong secular forces of improved corporate performance and strong labor productivity growth. But while these forces remain in place, there are signs that cyclical pressures may push cost growth ahead of revenue growth—at least in some sectors—regardless of whether the global cycle is stronger or weaker than consensus expectations.
Our view is that changes in relative earnings growth and growth expectations will be an important factor governing market and sector leadership over the next several quarters. At the same time, it is likely that trends in profitability in place for the last year or two may be disrupted by shifts in global demand and relative pricing patterns.
We will be focusing particularly for signs of (negative) change in the commodity and industrial sectors, for changes in margins within the highly diverse financial sector, and for indications of the sustainability of profit growth on a regional basis, particularly with respect to the strong growth advantage enjoyed by emerging markets in the last several years.
In the near term, though, the market’s view of these prospective growth issues will be set by high frequency economic releases and especially by any visible trends that emerge from second and third (calendar) quarter earnings reports. Investment strategy, like economic policy, is at least cyclically becoming more and more ‘data-dependent’.
June 30, 2006 | William Blair Funds 55 |
Emerging Markets Growth Fund
Performance Highlights (unaudited)
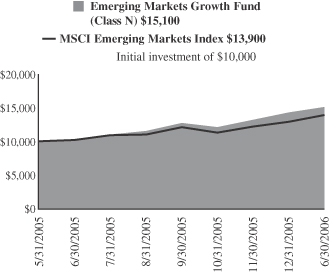
Average Annual Total Return at 6/30/2006
| | | | | | |
| | | 1
Year
| | | Since Inception(a)
| |
Emerging Markets Growth Fund
Class N | | 47.05 | % | | 46.71 | % |
Emerging Markets Growth Fund
Class I | | 47.44 | | | 47.07 | |
MSCI Emerging Markets Index | | 35.91 | | | 35.68 | |
| | (a) | | For the period from June 6, 2005 (Commencement of Operations) to June 30, 2006. | |
Performance cited represents past performance. Past performance does not guarantee future results and current performance may be lower or higher than the data quoted. Results shown are average annual returns, which assume reinvestment of dividends and capital gains. Investment returns and principal will fluctuate and you may have a gain or loss when you sell shares. For the most current month-end performance information, please call 1-800-742-7272, or visit our Web site at www.williamblairfunds.com. From time to time, the investment adviser may waive fees or reimburse expenses for the Fund. Without these waivers, performance would be lower. Class N shares are available to the general public without a sales load. Class I shares are available to certain institutional investors and advisory clients of William Blair & Company L.L.C. without a sales load or distribution (12b-1) fees. International investing involves special risk considerations, including currency fluctuations, lower liquidity, economic and political risk.
The performance highlights and graph presented above do not reflect the deduction of taxes that a shareholder would pay on fund distributions or the redemption of fund shares.
The Morgan Stanley Capital International (MSCI) Emerging Markets Index is an index that is designated to measure equity performance in the global emerging markets.
This report identifies the Fund’s investments on June 30, 2006. These holdings are subject to change. Not all stocks in the Fund performed the same, nor is there any guarantee that these stocks will perform as well in the future. Market forecasts provided in this report may not necessarily come to pass.
Sector Diversification (unaudited)
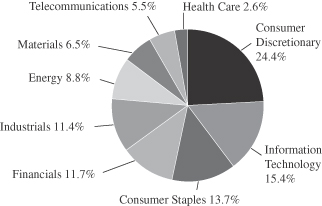
The sector diversification shown is based on the total investment portfolio.
56 Semi-Annual Report | June 30, 2006 |
Emerging Markets Growth Fund
Portfolio of Investments, June 30, 2006 (all dollar amounts in thousands) (unaudited)
| | | | | |
Issuer
| | Shares
| | Value
|
| |
Common Stocks—Emerging Asia—53.4% | | | |
China—16.6% | | | | | |
China Life Insurance Co. (Life/Health Insurance) | | 8,430,100 | | $ | 13,354 |
China Mengniu Dairy Co. Ltd. (Food products) | | 5,340,000 | | | 6,704 |
China Vanke Company Ltd. (Real estate operations/development) | | 4,816,625 | | | 4,088 |
*Ctrip.com International Ltd.—ADR (E-commerce/services) | | 86,500 | | | 4,416 |
*Focus Media Holding Ltd.—ADR (Advertising sales) | | 66,800 | | | 4,353 |
*Foxconn International (Manufacturing services) | | 4,996,000 | | | 10,706 |
Fu Ji Food and Catering Services Holdings Ltd (Hotels, restaurants, and leisure) | | 1,243,000 | | | 2,054 |
Hopson Development Holdings Ltd. (Real estate operations/development) | | 930,000 | | | 1,926 |
Lee and Man Paper Manufacturing Ltd. (Paper and related products) | | 4,090,000 | | | 5,987 |
Li Ning Co. Ltd (Leisure equipment and products) | | 4,800,000 | | | 4,707 |
Parkson Retail Group Ltd. (Retail stores) | | 1,467,900 | | | 4,181 |
Ports Design Ltd. (Apparel and luxury goods) | | 1,367,000 | | | 2,204 |
*Suntech Power Holdings Co. Ltd—ADR (Alternate energy sources) | | 175,100 | | | 4,947 |
Wumart Stores, Inc., Class “H” (Retail stores) | | 2,005,000 | | | 6,918 |
| | | | |
|
|
| | | | | | 76,545 |
| | | | |
|
|
India—18.5% | | | | | |
Bharat Forge Ltd. (Metal processors) | | 1,245,300 | | | 8,506 |
Bharat Heavy Electricals, Ltd. (Power conversion equipment) | | 313,100 | | | 13,291 |
*Bharti Airtel Ltd. (Wireless telecommunication services) | | 1,359,200 | | | 10,943 |
Dabur India Ltd. (Cosmetics and toiletries) | | 729,000 | | | 2,257 |
HDFC Bank (Banking) | | 132,000 | | | 2,287 |
Hindustan Lever Ltd. (Soap and cleaning preparation) | | 120,900 | | | 601 |
Housing Development Finance Corp. (Financial services) | | 81,700 | | | 2,028 |
Infosys Technologies, Ltd. (Consulting and software services) | | 200,900 | | | 13,442 |
*Inox Leisure Ltd. (Movie theaters) | | 800,300 | | | 2,195 |
Maruti Udyog Ltd. (Automobiles) | | 411,400 | | | 7,126 |
Pantaloon Retail India Ltd. (Department stores) | | 61,300 | | | 1,801 |
*Shopper’s Stop Ltd. (Retail stores) | | 175,545 | | | 1,883 |
Suzlon Energy Ltd. (Power conversion equipment) | | 232,000 | | | 5,285 |
Vedanta Resources Plc (Mining) | | 542,400 | | | 13,756 |
| | | | |
|
|
| | | | | | 85,401 |
| | | | |
|
|
Indonesia—1.4% | | | | | |
PT Bank Rakyat Indonesia (Banking) | | 10,083,500 | | | 4,471 |
PT Kalbe Farma Tbk (Pharmaceuticals) | | 14,837,000 | | | 2,003 |
| | | | |
|
|
| | | | | | 6,474 |
| | | | |
|
|
| | | | | |
Issuer
| | Shares
| | Value
|
|
Common Stocks—Emerging Asia—53.4%—(continued) |
Malaysia—1.8% | | | | | |
Bumiputra Commerce Holding Bhd (Banking) | | 2,562,200 | | $ | 4,142 |
Transmile Group Bhd (Airport development and maintenance) | | 1,189,700 | | | 4,145 |
| | | | |
|
|
| | | | | | 8,287 |
| | | | |
|
|
South Korea—6.3% | | | | | |
Hana Tour Service (Travel service) | | 61,200 | | | 4,618 |
Kookmin Bank (Banking) | | 52,800 | | | 4,350 |
Korea Investment Holdings Co. Ltd. (Diversified financial services) | | 49,300 | | | 1,605 |
*NHN Corporation (Internet software and services) | | 13,500 | | | 4,682 |
Samsung Electronics Co. (Semiconductors) | | 7,100 | | | 4,506 |
Shinsegae Co. Ltd. (Discount retail) | | 18,300 | | | 9,162 |
| | | | |
|
|
| | | | | | 28,923 |
| | | | |
|
|
Taiwan—8.8% | | | | | |
High Tech Computer Corporation (Computers) | | 294,000 | | | 8,081 |
Hon Hai Precision Industry (Computers) | | 1,984,107 | | | 12,250 |
*Himax Technologies, Inc.—ADR (Semiconductors) | | 1,174,400 | | | 6,718 |
Largan Precision Co. Ltd. (Photo equipment and supplies) | | 439,000 | | | 9,384 |
Mediatek Inc. (Semiconductors and equipment) | | 466,400 | | | 4,317 |
| | | | |
|
|
| | | | | | 40,750 |
| | | | |
|
|
|
Emerging Europe, Mid-East, Africa—13.9% |
Czech Republic—1.1% | | | | | |
*Central European Media Enterprises Ltd., Class “A” (Television)† | | 77,100 | | | 4,872 |
| | | | |
|
|
Israel—0.7% | | | | | |
Teva Pharmaceutical Industries, Ltd.—ADR (Pharmaceuticals) | | 108,000 | | | 3,412 |
| | | | |
|
|
Russia—4.3% | | | | | |
*CTC Media, Inc. (Television) | | 261,145 | | | 4,768 |
*Novatek OAO—GDR 144A (Oil, gas drilling, and exploration) | | 335,500 | | | 14,762 |
| | | | |
|
|
| | | | | | 19,530 |
| | | | |
|
|
South Africa—6.8% | | | | | |
Aspen Pharmacare Holdings Ltd. (Pharmaceuticals) | | 788,600 | | | 4,007 |
BHP Billiton Plc (Diversified minerals) | | 472,600 | | | 9,135 |
MTN Group Ltd. (Telecommunication services) | | 524,900 | | | 3,861 |
Naspers Ltd. (Media) | | 244,890 | | | 4,162 |
Sasol Ltd. (Oil company) | | 246,100 | | | 9,449 |
Truworths International Ltd. (Retail-apparel) | | 276,700 | | | 829 |
| | | | |
|
|
| | | | | | 31,443 |
| | | | |
|
|
Turkey—1.0% | | | | | |
*Bim Birlesik Magazalar A.S. (Retail stores) | | 161,600 | | | 4,723 |
| | | | |
|
|
See accompanying Notes to Financial Statements.
June 30, 2006 | William Blair Funds 57 |
Emerging Markets Growth Fund
Portfolio of Investments, June 30, 2006 (all dollar amounts in thousands) (unaudited)
| | | | | |
Issuer
| | Shares
| | Value
|
|
Common Stocks—Emerging Latin America—24.1% |
Brazil—9.0% | | | | | |
Companhia de Concessoes Rodoviarias (Public thoroughfares) | | 252,700 | | $ | 2,042 |
Cyrela Brazil Realty S.A. (Real estate operations/development) | | 544,700 | | | 9,054 |
*Diagnosticos da America S.A. (Health care services) | | 102,300 | | | 1,969 |
Gol Linhas Aereas Int S.P—ADR (Air transport) | | 138,400 | | | 4,913 |
Localiza Rent a Car S.A. (Automobile rental) | | 401,600 | | | 7,602 |
Lojas Renner S.A. (Retail-apparel) | | 46,600 | | | 2,474 |
Natura Cosmeticos S.A. (Cosmetics) | | 430,400 | | | 4,402 |
*Submarino S.A. (Internet and catalog retail) | | 239,400 | | | 4,808 |
*Totvs S.A. (Computer software) | | 279,800 | | | 4,165 |
| | | | |
|
|
| | | | | | 41,429 |
| | | | |
|
|
Chile—4.9% | | | | | |
Cencosud S.A.—ADR 144A (Retail stores) | | 317,800 | | | 11,659 |
S.A.C.I. Falabella S.A. (Retail stores) | | 3,616,100 | | | 11,031 |
| | | | |
|
|
| | | | | | 22,690 |
| | | | |
|
|
Columbia—1.0% | | | | | |
Bancolombia S.A.—ADR (Banking) | | 189,200 | | | 4,559 |
| | | | |
|
|
Mexico—8.3% | | | | | |
America Movil S.A. (Communications) | | 5,862,800 | | | 9,796 |
*Corporacion Geo Sa De Cv (Real estate) | | 1,470,000 | | | 4,871 |
Grupo Aeropuertario Del ADR (Airport development and maintenance) | | 141,700 | | | 4,513 |
*Urbi Desarrollos Urbanos S.A. (Household durables) | | 1,903,300 | | | 4,414 |
Walmart de Mexico (Retail trade) | | 5,276,300 | | | 14,748 |
| | | | |
|
|
| | | | | | 38,342 |
| | | | |
|
|
Panama—0.9% | | | | | |
Copa Holdings S.A., Class “A” (Airlines)† | | 178,800 | | | 4,050 |
| | | | |
|
|
Total Common Stock—91.4%
(cost $394,124) | | | 421,430 |
| | | | |
|
|
| | |
Preferred Stock | | | | | |
Brazil—5.3% | | | | | |
Banco Itau Holding (Banking) | | 323,300 | | | 9,382 |
Petroleo Brasileiro S.A. (Oil, gas drilling, and exploration) | | 764,700 | | | 15,199 |
| | | | |
|
|
Total Preferred Stock—5.3%
(cost $20,722) | | | 24,581 |
| | | | |
|
|
| | | | | | |
Issuer
| | Shares or
Principal
Amount
| | Value
|
| | |
Investment in Affiliate | | | | | | |
William Blair Ready Reserves Fund | | | 5,762,120 | | $ | 5,762 |
| | | | | |
|
|
Total Investment in Affiliate—1.3%
(cost $5,762) | | | 5,762 |
| | | | | |
|
|
| | |
Short-Term Investments | | | | | | |
American Express Demand Note, VRN 5.200% due 7/3/06 | | $ | 1,985,000 | | | 1,985 |
Prudential Funding Demand Note, VRN 5.055% due 7/3/06 | | | 732,000 | | | 732 |
| | | | | |
|
|
Total Short-Term Investments—0.6%
(cost $2,717) | | | 2,717 |
| | | | | |
|
|
Total Investments—98.6%
(cost $423,325) | | | 454,490 |
Cash and other assets, less liabilities—1.4% | | | 6,352 |
| | | | | |
|
|
Net assets—100.0% | | $ | 460,842 |
| | | | | |
|
|
* Non-income producing securities
ADR = American Depository Receipt
GDR = Global Depository Receipt
VRN = Variable Rate Note
† = U.S. listed foreign security
For securities, primarily traded on exchanges or markets that close before the close of regular trading on the New York Stock Exchange, the Fund uses an independent pricing service on a daily basis to fair value price the securities pursant to Valuation Procedures adopted by the Board of Trustees.
At June 30, 2006 the Fund’s Portfolio of Investments includes the following currency categories:
| | |
United States Dollar | | 17.5% |
Indian Rupee | | 16.1% |
Hong Kong Dollar | | 14.1% |
Brazilian Real | | 13.7% |
Taiwan Dollar | | 7.6% |
Mexico Nuevo Peso | | 7.6% |
South African Rand | | 7.0% |
South Korean Won | | 6.5% |
British Pound Sterling | | 3.1% |
Chilean Peso | | 2.5% |
Malaysian Ringgit | | 1.9% |
Indonesian Rupiah | | 1.4% |
Turkish Lira | | 1.0% |
| | |
|
| | | 100.0% |
| | |
|
At June 30, 2006 the Fund’s Portfolio of Investments includes the following industry categories:
| | |
Consumer Discretionary | | 24.4% |
Information Technology | | 15.4% |
Consumer Staples | | 13.7% |
Finance | | 11.7% |
Industrials | | 11.4% |
Energy | | 8.8% |
Materials | | 6.5% |
Telecommunication Services | | 5.5% |
Health Care | | 2.6% |
| | |
|
| | | 100.0% |
| | |
|
See accompanying Notes to Financial Statements.
58 Semi-Annual Report | June 30, 2006 |

Chad M. Kilmer

Mark T. Leslie

David S. Mitchell
VALUE DISCOVERY FUND
The Value Discovery Fund invests in the equity securities of small companies that we believe offer a long-term investment value seeking to identify undervalued companies with sound business fundamentals.
AN OVERVIEW FROM THE PORTFOLIO MANAGERS
How did the Fund perform over the first half of the year? How did the Fund’s performance compare to its benchmark?
The Value Discovery Fund posted an 8.56% increase on a total return basis (Class N shares) during the six months ended June 30, 2006. By comparison, the Russell 2000® Value Index, gained 10.44%, while the Russell 2000® Index rose 8.21%.
What were the most significant factors impacting Fund performance? What factors were behind the Fund’s performance versus the benchmark?
Excellent performance in the Consumer Discretionary and Health Care sectors combined with disappointing results in Technology and Materials were the primary drivers of performance in the first half of 2006.
What were among the best performing sectors for the Fund? Were there any investment themes that produced the best results?
As mentioned above, the Consumer Discretionary and Health Care sectors were the best performers during the first half. Casual Male Retail Group saw improved earnings and comparable store sales favorable to expectations. Navigant International announced it was being acquired by a private competitor. Both stocks were meaningful contributors to the Consumer Discretionary sector’s +145 basis points relative contribution. The Health Care sector, which provided a +58 basis points relative contribution, was driven by strong performances from Magellan Health and CNS, Inc.
Other significantly positive stocks included General Cable and Jones Lang LaSalle. Both stocks increased due to earnings that were meaningfully better than expectations.
What were among the weakest performing sectors for the Fund? Were there any investments that did not measure up to your expectations?
The Technology and Materials sectors were the most significant detractors from performance during the first six months of 2006. Plantronics experienced an abrupt turn in its fundamentals resulting from increased competition and a disadvantageous mix shift from wired to wireless head sets. This was particularly disappointing as the company was coming off a strong quarter during which they raised their financial guidance. Overall, the Technology sector detracted 133 basis points of return relative to the benchmark.
The Materials sector detracted 71 basis points of relative return during the first half. Metals & Mining stocks returned 46.5% during the period and lack of representation cost the fund 85 basis points as a result. Offsetting that to a certain extent was a strong showing by Arch Chemicals.
June 30, 2006 | William Blair Funds 59 |
Our investment in Quanta Capital proved unrewarding. Despite a significant equity capital raise, the specialty reinsurer lost its A- rating from A.M. Best after further adverse developments from Hurricanes Katrina and Rita. Playtex declined as management chose to increase spending in support of current brands and new product launches.
What is your current strategy? How is the Fund positioned?
Our underweight position in Financials has and continues to be due to a combination of lofty valuations and mixed fundamentals. However, with the Russell rebalancing, the Financials sector is now over 35% of our primary benchmark and we have taken steps to selectively increase our representation in the sector. The most dramatic change in the benchmark was a 400-500 basis point reduction in the Industrial sector weight. This abrupt change caused us to enter the third quarter with a significant overweight position in Industrials. Early in the quarter we have opportunistically taken steps to narrow this overweight.
During the second quarter we added a third Co-Manager, Chad Kilmer, to the team. Like Mark Leslie before him, Chad was previously the Lead Manager of the First American Small Cap Value Fund at US Bancorp. Chad was originally hired by Mark at US Bancorp and subsequently replaced him as Lead Manager when Mark joined William Blair. With the addition of Mark in July 2005 and now Chad, the team is fully constituted and looking forward to proving ourselves to shareholders over the long term. We remain encouraged by our performance over the first three full quarters since Mark’s arrival and believe we have a put together a solid foundation for the future. We appreciate your confidence in us and thank you for investing in the Fund.
60 Semi-Annual Report | June 30, 2006 |
Value Discovery Fund
Performance Highlights (unaudited)
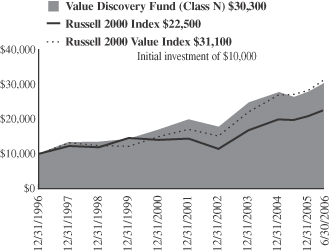
Average Annual Total Return at 6/30/2006
| | | | | | | | | | | | |
| | | 1
Year
| | | 3
Year
| | | 5
Year
| | | Since
Inception
| |
Value Discovery Fund Class N | | 14.43 | % | | 15.23 | % | | 8.92 | % | | 12.28 | %(a) |
Value Discovery Fund Class I | | 14.72 | | | 15.45 | | | 9.16 | | | 13.78 | (b) |
Russell 2000® Index | | 14.58 | | | 18.70 | | | 8.50 | | | 9.11 | (a) |
| | | | | | | | | | | | 9.47 | (b) |
Russell 2000® Value Index | | 14.61 | | | 21.01 | | | 13.09 | | | 12.82 | (a) |
| | | | | | | | | | | | 15.15 | (b) |
| | (a) | | For the period from December 23, 1996 (Commencement of the Class) to June 30, 2006. | |
| | (b) | | For the period from October 1, 1999 (Commencement of the Class) to June 30, 2006. | |
Performance cited represents past performance. Past performance does not guarantee future results and current performance may be lower or higher than the data quoted. Results shown are average annual total returns, which assume reinvestment of dividends and capital gains. Investment returns and principal will fluctuate and you may have a gain or loss when you sell shares. For the most current month-end performance information, please call 1-800-742-7272, or visit our Web site at www.williamblairfunds.com. Investing in smaller companies involves special risks, including higher volatility and lower liquidity. From time to time, the investment adviser may waive fees or reimburse expenses for the Fund. Without these waivers, performance would be lower. Class N shares are available to the general public without a sales load. Class I shares are available to certain institutional investors and advisory clients of William Blair & Company, L.L.C., without a sales load or distribution (12b-1) or service fees.
The performance highlights and graph presented above do not reflect the deduction of taxes that a shareholder would pay on fund distributions or the redemption of fund shares.
The Russell 2000® Index is the Fund’s primary benchmark. The Russell 2000® Index is an unmanaged composite of the smallest 2000 stocks of the Russell 3000 Index.
The Russell 2000® Value Index consists of small-capitalization companies with below average price-to-book ratios and forecasted growth rates.
This report identifies the Fund’s investments on June 30, 2006. These holdings are subject to change. Not all stocks in the Fund performed the same, nor is there any guarantee that these stocks will perform as well in the future. Market forecasts provided in this report may not necessarily come to pass.
Sector Diversification (unaudited)
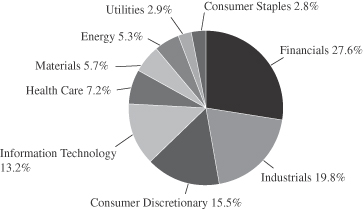
The sector diversification shown is based on the total investment portfolio.
June 30, 2006 | William Blair Funds 61 |
Value Discovery Fund
Portfolio of Investments, June 30, 2006 (all dollar amounts in thousands) (unaudited)
| | | | | |
Issuer
| | Shares
| | Value
|
| | |
Common Stocks | | | | | |
Financials—27.7% | | | | | |
AmericanWest Bancorporation | | 22,005 | | $ | 499 |
*Argonaut Group, Inc. | | 26,645 | | | 801 |
Astoria Financial Corporation | | 21,390 | | | 651 |
Chittenden Corporation | | 28,050 | | | 725 |
Cogdell Spencer, Inc. | | 32,635 | | | 637 |
*Community Bancorp | | 15,700 | | | 488 |
*CompuCredit Corporation | | 12,720 | | | 489 |
Donegal Group, Inc., Class “A” | | 25,936 | | | 504 |
Equity Inns, Inc. | | 70,339 | | | 1,165 |
First Midwest Bancorp Incorporated | | 27,730 | | | 1,028 |
Horizon Financial Corp | | 24,075 | | | 660 |
Jones Lang LaSalle, Inc | | 8,765 | | | 767 |
Kite Realty Group Trust | | 31,775 | | | 495 |
Mid-American Apartment Communities, Inc. | | 8,670 | | | 483 |
Midwest Banc Holdings, Inc. | | 47,072 | | | 1,047 |
*RAM Holdings, Ltd.+ | | 58,645 | | | 737 |
Scottish Re Group, Ltd. | | 28,050 | | | 468 |
*Trammell Crow Company | | 14,525 | | | 511 |
*Western Alliance Bancorp | | 15,035 | | | 523 |
Winston Hotels, Inc. | | 69,175 | | | 847 |
| | | | |
|
|
| | | | | | 13,525 |
| | | | |
|
|
Industrials—20.0% | | | | | |
Acuity Brands, Inc. | | 18,215 | | | 709 |
Clarcor, Inc. | | 22,925 | | | 683 |
*Coinstar, Inc. | | 21,145 | | | 506 |
*EMCOR Group, Inc. | | 17,855 | | | 869 |
*Esco Technologies, Inc. | | 25,000 | | | 1,336 |
G & K Services, Inc. | | 17,175 | | | 589 |
*General Cable Corporation | | 21,200 | | | 742 |
*Genlyte Group, Inc. | | 10,695 | | | 775 |
*Goodman Global, Inc. | | 32,880 | | | 499 |
*SCS Transportation, Inc. | | 20,415 | | | 562 |
*Tal International Group, Inc. | | 28,085 | | | 677 |
*Teletech Holdings, Inc. | | 48,265 | | | 611 |
Toro Company | | 14,565 | | | 680 |
Watsco, Inc. | | 7,735 | | | 463 |
| | | | |
|
|
| | | | | | 9,701 |
| | | | |
|
|
Consumer Discretionary—15.5% | | | | | |
*Aeropostale, Inc. | | 28,585 | | | 826 |
*AFC Enterprises, Inc. | | 37,190 | | | 474 |
BorgWarner, Inc. | | 9,085 | | | 591 |
*Casual Male Retail Group, Inc. | | 52,435 | | | 527 |
Christopher & Banks Corporation | | 21,485 | | | 623 |
Entercom Communications Corporation | | 17,490 | | | 458 |
*Interface Incorporated, Class “A” | | 118,640 | | | 1,359 |
Polaris Industries, Inc. | | 18,240 | | | 790 |
*Rent A Center, Inc. | | 19,840 | | | 493 |
Ruby Tuesday, Inc. | | 20,120 | | | 491 |
Wolverine World Wide, Inc. | | 41,445 | | | 967 |
| | | | |
|
|
| | | | | | 7,599 |
| | | | |
|
|
Information Technology—13.3% | | | | | |
*Anixter International, Inc. | | 15,040 | | | 714 |
*Bisys Group, Inc. | | 95,865 | | | 1,313 |
*Entegris, Inc. | | 85,560 | | | 816 |
*Mastec Incorporated | | 61,015 | | | 806 |
*MICROS Systems, Inc. | | 12,230 | | | 534 |
*Parametric Technology Corporation | | 55,330 | | | 703 |
*Semitool, Inc. | | 67,614 | | | 610 |
*Sybase, Inc. | | 51,555 | | | 1,000 |
| | | | |
|
|
| | | | | | 6,496 |
| | | | |
|
|
| | | | | | | |
Issuer
| | Shares or
Principal
Amount
| | Value
| |
|
Common Stocks—(continued) | |
Health Care—7.2% | | | | | | | |
CNS, Inc. | | | 32,110 | | $ | 787 | |
*Encore Medical Corporation | | | 178,053 | | | 856 | |
*Magellan Health Services | | | 14,960 | | | 678 | |
*Pediatrix Medical Group | | | 13,590 | | | 616 | |
Vital Signs, Inc. | | | 12,105 | | | 599 | |
| | | | | |
|
|
|
| | | | | | | 3,536 | |
| | | | | |
|
|
|
Materials—5.7% | | | | | | | |
Arch Chemicals, Inc. | | | 21,720 | | | 783 | |
Silgan Holdings, Inc. | | | 20,080 | | | 743 | |
Spartech Corporation | | | 33,340 | | | 753 | |
Texas Industries, Inc. | | | 9,750 | | | 518 | |
| | | | | |
|
|
|
| | | | | | | 2,797 | |
| | | | | |
|
|
|
Energy—5.3% | | | | | | | |
*Forest Oil Corporation | | | 16,155 | | | 536 | |
*Goodrich Petroleum Corporation | | | 9,300 | | | 264 | |
*KCS Energy, Inc. | | | 21,975 | | | 653 | |
RPC, Inc. | | | 23,010 | | | 559 | |
St. Mary Land & Exploration Company | | | 14,270 | | | 574 | |
| | | | | |
|
|
|
| | | | | | | 2,586 | |
| | | | | |
|
|
|
Utilities—2.9% | | | | | | | |
Northwest Natural Gas Company | | | 19,535 | | | 723 | |
South Jersey Industries, Inc. | | | 26,145 | | | 716 | |
| | | | | |
|
|
|
| | | | | | | 1,439 | |
| | | | | |
|
|
|
Consumer Staples—2.8% | | | | | | | |
Longs Drug Stores Corporation | | | 11,115 | | | 507 | |
*Playtex Products, Inc. | | | 80,650 | | | 841 | |
| | | | | |
|
|
|
| | | | | | | 1,348 | |
| | | | | |
|
|
|
Total Common Stock—100.4%
(cost $43,135) | | | 49,027 | |
| | | | | |
|
|
|
| | |
Investment in Affiliate | | | | | | | |
William Blair Ready Reserves Fund | | | 101,110 | | | 101 | |
| | | | | |
|
|
|
Total Investment in Affiliate—0.2%
(cost $101) | | | 101 | |
| | | | | |
|
|
|
| | |
Short-Term Investment | | | | | | | |
Prudential Funding Demand Note, VRN 5.055%, due 7/3/06 | | $ | 94,000 | | | 94 | |
| | | | | |
|
|
|
Total Short-Term Investment—0.2%
(cost $94) | | | 94 | |
| | | | | |
|
|
|
Total Investments—100.8%
(cost $43,330) | | | 49,222 | |
Liabilities, plus cash and other assets—(0.8)% | | | (381 | ) |
| | | | | |
|
|
|
Net assets—100.0% | | $ | 48,841 | |
| | | | | |
|
|
|
*Non-income producing
VRN = Variable Rate Note
+ = U.S. listed foreign security
See accompanying Notes to Financial Statements.
62 Semi-Annual Report | June 30, 2006 |

James S. Kaplan

Christopher T. Vincent
INCOME FUND
The Income Fund invests in high-grade intermediate-term debt securities.
AN OVERVIEW FROM THE PORTFOLIO MANAGERS
How did the Fund perform over the first half of the year? How did the Fund’s performance compare to its benchmark?
The Income Fund posted a 0.23% gain on a total return basis (Class N Shares) for the 6 months ended June 30, 2006. By comparison, the Fund’s benchmark, the Lehman Intermediate Government/Credit Bond Index, decreased 0.18%, while the Fund’s peer group, the Morningstar Short-Term Bond Category, increased 0.84%.
What were the most significant factors impacting Fund performance? What factors were behind the Fund’s performance versus the benchmark?
During the first half of the year, Federal Reserve Monetary Policy was the dominant factor impacting Fund performance.
The Federal Reserve Board raised short-term interest rates four times during the first half of the year, each time by 0.25%. The fourth rate hike on June 29th was the seventeenth consecutive meeting at which the Fed had raised rates. At the end of the quarter, the Fed Funds rate stood at 5.25%.
Interest rates across the yield curve rose by roughly 0.75%. For example, the yield on 2-year Treasury notes increased 0.42% to finish the quarter at 4.82%, while the yield on 10-year Treasury securities rose 0.46% to 4.85%. The interest rate yield curve flattened as the year began, steepened slightly in March, and then continued to flatten again in the second quarter.
Which investment strategies enhanced the Fund’s return? Were there any investment strategies that produced the best results?
In general, corporate bonds contributed positive excess returns in the first two months of the year, but gave back some of their gains during March. We believe much of the weakness during March was related to profit-taking, as well as ideas that corporate bonds had become somewhat overvalued.
The Mortgage- and Asset-backed sectors were strong performers during the first two months of the year, but then lagged in March. There has been a consistent demand on the part of investors for these instruments, which continue to provide a safe haven for those investors seeking excess returns versus U.S. Treasury securities. Some of this demand reflects the continued strong appetite for U.S. securities on the part of foreign investors.
The Mortgage- and Asset-backed sectors of the bond market provided positive excess returns in the second quarter, although not to the extent that they had during the first quarter. Corporate bonds were responsible for somewhat flat to slightly positive excess returns in the second quarter.
What were among the weakest performing investments for the Fund?
The first half of the year was a relatively uneventful period for the Fund, and one in which no one security stands out as particularly noteworthy for its performance—on the upside, or the downside for that matter.
June 30, 2006 | William Blair Funds 63 |
What is your current strategy? How is the Fund positioned?
Within the Mortgage-, and Asset-backed sectors of the fixed-income markets, it has become a very security-specific trading environment.
Relying on an investment strategy of merely selecting bonds based on such criteria as type and ratings is not enough to ensure success. The current environment requires an analysis of each bond’s individual structure—because some lower-rated bonds look more attractive and creditworthy as investment candidates than higher-rated bonds.
We are being particularly judicious in monitoring the Asset-backed and Mortgage-backed positions in our portfolio, making sure the assumptions about each bond remain the same as when they were first purchased. The housing market is not as strong as it was, and some borrowers may experience stress, but we do not see the market collapsing. We sold some Asset-backed positions where the bond’s creditworthiness no longer met our original assumptions.
One trade that we executed within our Corporate holdings emphasizes our investment philosophy and process, and analysis of individual securities. We sold Altria (Phillip Morris), a bond we had held about two years, capturing excess return as the risk premium for this issue shrank as a result of recent positive legal decisions for cigarette manufacturers. Tobacco issues were tainted for a long period of time, with a great deal of risk priced into these securities because of the litigation threats hanging over companies. As those threats have been mitigated somewhat, the issues have been priced to reflect less risk.
We took the proceeds from our sale and purchased a new issue, SAB Miller, a company with a global brand that manufactures a product (beer) that is a consumer staple, demand for which should remain strong regardless of the economic environment. This new issue also reflects how many international companies have looked to the U.S. Corporate bond market—the most liquid in the world—to provide financing.
On an absolute basis, the Fund has held its own in spite of the fact that rates are up 0.75% since the beginning of the year. If interest rates stabilize over the second half of the year, as we expect them to, we believe the securities in the Fund’s portfolio should provide attractive returns.
The real issue facing the fixed-income markets is whether or not the Federal Reserve has completed its campaign to engineer a gradual slowing of economic growth that does not cause undue damage, triggering a recession, for example. We do not expect that to be the case.
It is fair to say that it has been quite a rocky honeymoon period for the new Fed Chairman, Ben Bernanke, with the fixed-income markets hanging on his every word, and the interpretation and communication of those words responsible for periods of sharp market volatility, something even the shortest-term bond funds are not able to overcome.
We will remain patient investors during this period, and do not expect the Fund’s sector allocations to change much. As we stated, we intend to focus on the structure and characteristics of individual issues, and evaluate opportunities as they arise on a security-by-security basis.
64 Semi-Annual Report | June 30, 2006 |
Income Fund
Performance Highlights (unaudited)
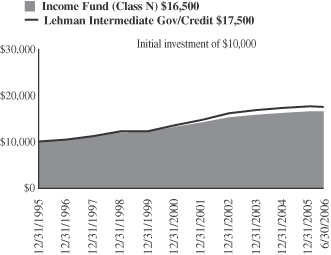
Average Annual Total Return at 6/30/2006
| | | | | | | | | | | | | | | | | |
| | | 1
Year
| | | 3
Year
| | | 5
Year
| | | 10
Year
| | | Since
Inception
| | | |
Income Fund Class N | | 0.61 | % | | 1.74 | % | | 3.92 | % | | 5.16 | % | | — | % | | |
Income Fund Class I | | 0.74 | | | 1.87 | | | 4.07 | | | — | | | 5.05 | (a) | | |
Lehman Intermediate Government Credit Bond Index | | (0.19 | ) | | 1.48 | | | 4.61 | | | 5.80 | | | 5.50 | (a) | | |
| | (a) | | For the period from October 1, 1999 to June 30, 2006. |
Performance cited represents past performance. Past performance does not guarantee future results and current performance may be lower or higher than the data quoted. Results shown are average annual total returns, which assume reinvestment of dividends and capital gains. Investment returns and principal will fluctuate and you may have a gain or loss when you sell shares. For the most current month-end performance information, please call 1-800-742-7272, or visit our Web site at www.williamblairfunds.com. Class N shares are available to the general public without a sales load. Class I shares are available to certain institutional investors and advisory clients of William Blair & Company, L.L.C., without a sales load or distribution (12b-1) or service fees.
The performance highlights and graph presented above do not reflect the deduction of taxes that a shareholder would pay on fund distributions or the redemption of fund shares.
The Lehman Intermediate Government/Credit Bond Index indicates broad intermediate government/corporate bond market performance.
This report identifies the Fund’s investments on June 30, 2006. These holdings are subject to change. Not all investments in the Fund performed the same, nor is there any guarantee that these investments will perform as well in the future. Market forecasts provided in this report may not necessarily come to pass.
Sector Diversification (unaudited)
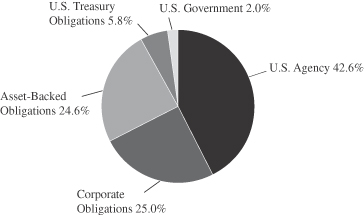
The sector diversification shown is based on the total investment portfolio.
June 30, 2006 | William Blair Funds 65 |
Income Fund
Portfolio of Investments, June 30, 2006 (all amounts in thousands) (unaudited)
| | | | | | |
Issuer
| | Principal
Amount
| | Value
|
|
U.S. Government and U.S. Government Agency—49.1% |
U.S. Treasury—5.7% | | | | | | |
U.S. Treasury Note, 6.500%, due 2/15/10 | | | | $12,000 | | $12,538 |
U.S. Treasury Note, 4.750%, due 5/15/14 | | | | 4,550 | | 4,438 |
| | | | |
| |
|
Total U.S. Treasury Obligations | | | | 16,550 | | 16,976 |
| | | | |
| |
|
Government National Mortgage Association (GNMA)—1.9% | | | | | | |
#780405, 9.500%, due 11/15/17 | | | | 694 | | 741 |
#589335, 6.500%, due 10/15/22 | | | | 2,174 | | 2,203 |
#357322, 7.000%, due 9/15/23 | | | | 185 | | 191 |
#616250, 6.000%, due 2/15/24 | | | | 1,740 | | 1,734 |
#2002-48, Tranche 0B, 6.000%, due 5/16/30 | | | | 891 | | 891 |
| | | | |
| |
|
Total Government National Mortage Association | | | | 5,684 | | 5,760 |
| | | | |
| |
|
Small Business Administration—0.0% | | | | | | |
Receipt for Multiple Originator Fees, #3, 0.821%, due 11/01/08 (Interest Only) WAC* | | | | — | | 28 |
| | | | |
| |
|
Federal Home Loan Mortgage Corp. (FHLMC)—17.7% | | | | | | |
#1417, Tranche SA, 12.695%, due 11/15/07, VRN | | | | 526 | | 537 |
#G10067, 7.000%, due 1/1/08 | | | | 272 | | 274 |
#G10147, 8.500%, due 2/1/08 | | | | 43 | | 43 |
#1601, Tranche PJ, 6.000%, due 10/15/08, VRN | | | | 1,124 | | 1,125 |
#1612, Tranche SE, 8.100%, due 11/15/08, VRN | | | | 558 | | 568 |
#G90028, 7.000%, due 5/17/09 | | | | 339 | | 340 |
#E80050, 6.000%, due 10/1/09 | | | | 580 | | 580 |
#G90019, 7.500%, due 12/17/09 | | | | 417 | | 421 |
7.000%, due 3/15/10 | | | | 5,950 | | 6,250 |
#E65418, 7.000%, due 8/1/10 | | | | 270 | | 271 |
#G10457, 7.000%, due 2/1/11 | | | | 467 | | 474 |
#E00436, 7.000%, due 6/1/11 | | | | 454 | | 463 |
#G10708, 6.500%, due 8/1/12 | | | | 273 | | 277 |
#E91999, 5.000%, due 10/1/12 | | | | 1,140 | | 1,118 |
#G11218, 7.000%, due 10/1/12 | | | | 125 | | 127 |
#E96147, 5.000%, due 5/1/13 | | | | 1,460 | | 1,431 |
#E95846, 4.500%, due 5/1/13 | | | | 1,294 | | 1,249 |
#G10839, 5.500%, due 10/1/13 | | | | 1,375 | | 1,351 |
#E72924, 7.000%, due 10/1/13 | | | | 1,172 | | 1,199 |
#E00639, 5.000%, due 3/1/14 | | | | 1,815 | | 1,750 |
#J02572, 7.500%, due 6/1/14 | | | | 2,123 | | 2,197 |
#E81697, 8.000%, due 5/1/15 | | | | 2,548 | | 2,686 |
#E81908, 8.500%, due 12/1/15 | | | | 123 | | 129 |
#G11688, 7.000%, due 2/1/16 | | | | 853 | | 875 |
#J02184, 8.000%, due 4/1/16 | | | | 1,935 | | 2,032 |
#G90022, 8.000%, due 9/17/16 | | | | 726 | | 761 |
#G11702, 7.500%, due 12/1/16 | | | | 826 | | 858 |
#G11486, 7.500%, due 4/1/17 | | | | 1,026 | | 1,066 |
#E90398, 7.000%, due 5/1/17 | | | | 1,346 | | 1,380 |
#M30028, 5.500%, due 5/1/17 | | | | 382 | | 378 |
#G11549, 7.000%, due 7/1/17 | | | | 897 | | 920 |
#G90027, 6.000%, due 11/17/17 | | | | 1,385 | | 1,388 |
#G11756, 7.000%, due 12/1/17 | | | | 1,584 | | 1,615 |
| | | | | | |
Issuer
| | Principal
Amount
| | Value
|
Federal Home Loan Mortgage Corp. (FHLMC)—(continued) |
#G30254, 6.500%, due 5/1/19 | | | | $2,734 | | $2,771 |
#G30255, 7.000%, due 7/1/21 | | | | 1,012 | | 1,040 |
#G30268, 7.000%, due 7/1/21 | | | | 2,030 | | 2,087 |
#G30239, 7.000%, due 8/1/21 | | | | 1,767 | | 1,815 |
#C67537, 9.500%, due 8/1/21 | | | | 220 | | 236 |
#G30243, 6.000%, due 12/1/21 | | | | 1,963 | | 1,958 |
#D95621, 6.500%, due 7/1/22 | | | | 3,542 | | 3,586 |
#G02183, 6.500%, due 3/1/30 | | | | 2,176 | | 2,198 |
#A45790, 7.500%, due 5/1/35 | | | | 1,149 | | 1,189 |
| | | | |
| |
|
Total FHLMC Mortgage Obligations | | | | 52,001 | | 53,013 |
| | | | |
| |
|
Federal National Mortgage Association (FNMA)—23.8% | | | | | | |
#545560, 8.000%, due 5/1/07 | | | | 237 | | 239 |
#1992-192, Tranche SC, 8.641%, due 11/25/07, VRN | | | | 230 | | 230 |
#93-196, Tranche SA, 12.083%, due 10/25/08, VRN | | | | 405 | | 423 |
#1993-221, Tranche SG, 3.624%, due 12/25/08, VRN | | | | 311 | | 302 |
#765396, 5.500%, due 1/1/09 | | | | 261 | | 259 |
#695512, 8.000%, due 9/1/10 | | | | 434 | | 445 |
#725479, 8.500%, due 10/1/10 | | | | 780 | | 797 |
#255056, 5.000%, due 12/1/10 | | | | 1,903 | | 1,858 |
6.250%, due 2/1/11 | | | | 6,775 | | 6,939 |
#313816, 6.000%, due 4/1/11 | | | | 549 | | 550 |
#577393, 10.000%, due 6/1/11 | | | | 253 | | 269 |
#577395, 10.000%, due 8/1/11 | | | | 896 | | 954 |
#254705, 5.500%, due 2/1/13 | | | | 1,839 | | 1,823 |
#254788, 6.500%, due 4/1/13 | | | | 660 | | 668 |
#725315, 8.000%, due 5/1/13 | | | | 818 | | 852 |
#190539, 6.000%, due 1/1/14 | | | | 490 | | 488 |
#806463, 7.000%, due 3/1/14 | | | | 834 | | 852 |
#593561, 9.500%, due 8/1/14 | | | | 406 | | 435 |
#567027, 7.000%, due 9/1/14 | | | | 1,895 | | 1,945 |
#567026, 6.500%, due 10/1/14 | | | | 1,760 | | 1,784 |
#458124, 7.000%, due 12/15/14 | | | | 491 | | 502 |
#745459, 7.000%, due 2/1/15 | | | | 1,084 | | 1,108 |
#598453, 7.000%, due 6/1/15 | | | | 586 | | 593 |
#576554, 8.000%, due 1/1/16 | | | | 1,794 | | 1,888 |
#576553, 8.000%, due 2/1/16 | | | | 2,757 | | 2,925 |
#555747, 8.000%, due 5/1/16 | | | | 591 | | 615 |
#735569, 8.000%, due 10/1/16 | | | | 2,978 | | 3,101 |
#725410, 7.500%, due 4/1/17 | | | | 1,311 | | 1,352 |
#643217, 6.500%, due 6/1/17 | | | | 390 | | 396 |
#682075, 5.500%, due 11/1/17 | | | | 1,228 | | 1,207 |
#662925, 6.000%, due 12/1/17 | | | | 1,638 | | 1,647 |
#251960, 6.000%, due 9/1/18 | | | | 683 | | 681 |
#740847, 6.000%, due 10/1/18 | | | | 1,434 | | 1,439 |
#852864, 7.000%, due 7/1/20 | | | | 3,824 | | 3,911 |
#458147, 10.000%, due 8/15/20 | | | | 1,084 | | 1,188 |
#835563, 7.000%, due 10/1/20 | | | | 1,461 | | 1,513 |
#735367, 6.000%, due 3/1/22 | | | | 2,758 | | 2,749 |
#735574, 8.000%, due 3/1/22 | | | | 1,062 | | 1,123 |
#735104, 7.000%, due 5/1/22 | | | | 2,816 | | 2,896 |
#725927, 7.000%, due 8/1/22 | | | | 2,271 | | 2,335 |
#735137, 6.500%, due 11/1/22 | | | | 1,453 | | 1,472 |
#1993-19, Tranche SH, 11.234%, due 4/25/23, VRN | | | | 11 | | 14 |
#254797, 5.000%, due 6/1/23 | | | | 2,677 | | 2,545 |
#745633, 6.500%, due 7/1/24 | | | | 3,308 | | 3,361 |
See accompanying Notes to Financial Statements.
66 Semi-Annual Report | June 30, 2006 |
Income Fund
Portfolio of Investments, June 30, 2006 (all amounts in thousands) (unaudited)
| | | | | | | |
Issuer
| | NRSRO
Rating
| | | Principal
Amount
| | Value
|
Federal National Mortgage Association (FNMA)—(continued) |
#806458, 8.000%, due 6/1/28 | | | | | $1,519 | | $1,605 |
#880155, 8.500%, due 7/1/29 | | | | | 2,309 | | 2,481 |
#797846, 7.000%, due 3/1/32 | | | | | 2,295 | | 2,349 |
#745519, 8.500%, due 5/1/32 | | | | | 1,246 | | 1,338 |
#654674, 6.500%, due 9/1/32 | | | | | 349 | | 352 |
#733897, 6.500%, due 12/1/32 | | | | | 548 | | 555 |
| | | | | |
| |
|
Total FNMA Mortgage Obligations | | | | | 69,692 | | 71,353 |
| | | | | |
| |
|
| |
Collateralized Mortgage Obligations—24.0% | | |
Security National Mortgage Loan Trust, 2002-2, Tranche M2, 6.460%, due 8/25/08 | | A | + | | 197 | | 197 |
Countrywide Alternative Loan Trust, 2003-11T1, Tranche M, 4.750%, due 7/25/18 | | AA | + | | 1,824 | | 1,733 |
ABFS, 2002-2, Tranche A6, 5.850%, due 3/15/19 | | AAA | | | 1,062 | | 1,057 |
RALI, 2004-QS16, Tranche 2M1, 5.000%, due 12/25/19 | | AA | | | 1,720 | | 1,628 |
RALI, 2004-QS16, Tranche 2M3, 5.000%, due 12/25/19 | | BBB | | | 291 | | 265 |
RALI, 2005-QS14, Tranche 1M1, 5.250%, due 9/25/20 | | AA | | | 1,006 | | 960 |
RALI, 2005-QS14, Tranche 1M2, 5.250%, due 9/25/20 | | A | | | 316 | | 297 |
RALI, 2006-QS2, Tranche 2M1, 5.500%, due 2/25/21 | | AA | | | 1,109 | | 1,070 |
RALI, 2006-QS2, Tranche 2M2, 5.500%, due 2/25/21 | | A | | | 518 | | 491 |
RALI, 2006-QS6, Tranche 2M1, 6.000%, due 6/25/21 | | AA | | | 540 | | 523 |
RALI, 2006-QS6, Tranche 2M2, 6.000%, due 6/25/21 | | A | | | 427 | | 408 |
First Plus, 1997-4, Tranche M1, 7.640%, due 9/11/23 | | AA | | | 2,058 | | 2,087 |
First Plus, 1997-4, Tranche M2, 7.830%, due 9/11/23 | | A | | | 434 | | 438 |
First Plus, 1997-4, Tranche A8, 7.810%, due 9/11/23 | | AAA | | | 271 | | 278 |
First Plus, 1998-2, Tranche M2, 8.010%, due 5/10/24 | | A | | | 260 | | 262 |
First Plus, 1998-3, Tranche M2, 7.920%, due 5/10/24, VRN | | A | | | 729 | | 736 |
Bear Stearns ABS, 2001-A, Tranche M1, 7.540%, due 2/15/31 | | AA | | | 1,882 | | 1,892 |
Delta Funding Home Equity Loan Trust, 2000-4, Tranche M1, 7.150%, due 2/15/31 | | AA | | | 2,940 | | 2,938 |
Structured Asset Securities Corp., 2005-SC1, Tranche 1A2, 9.843%, due 5/25/31, VRN* | | AAA | | | 2,729 | | 2,862 |
Aames Mortgage Trust, 2001-1, Tranche M2, 7.588%, due 6/25/31 | | A | | | 1,216 | | 1,224 |
Conseco Finance, 2001-B, Tranche 1M1 7.272%, due 6/15/32 | | AA | | | 961 | | 966 |
Security National Mortgage Loan Trust, 2004-1A, Tranche M2, 6.750%, due 06/25/32* | | A | | | 1,600 | | 1,596 |
| | | | | | | |
Issuer
| | NRSRO
Rating
| | | Principal
Amount
| | Value
|
| |
Collateralized Mortgage Obligations—(continued) | | |
Structured Assets Security Corporation, 2002-13, Tranche B1, 6.750%, due 7/25/32, VRN | | AAA | | | $2,738 | | $2,738 |
Structured Assets Security Corporation, 2002-17, Tranche B3, 6.085%, due 9/25/32, VRN | | A | | | 1,881 | | 1,859 |
LSSCO, 2004-2, Tranche M1, 6.179%, due 2/28/33, VRN* | | AA | | | 1,460 | | 1,457 |
LSSCO, 2004-2, Tranche M2, 6.179%, due 2/28/33, VRN* | | A | | | 1,119 | | 1,109 |
ABFS, 2002-2, Tranche A-7, 5.215%, due 7/15/33, VRN | | AAA | | | 148 | | 147 |
ABFS, 2002-3, Tranche M1, 5.402%, due 9/15/33, VRN | | AA | | | 1,500 | | 1,483 |
Residential Asset Mortgage Prouducts, 2003-RS9, Tranche MI1, 5.800%, due 10/25/33 | | AA | | | 310 | | 305 |
Residential Asset Mortgage Prouducts, 2003-RS9, Tranche MI2, 6.300%, due 10/25/33 | | A | | | 2,200 | | 2,177 |
ACE, 2004-SD1, Tranche M3, 8.073%, due 11/25/33, VRN | | BBB | | | 2,099 | | 2,046 |
Residential Asset Mortgage Products, 2003-RS11, Tranche MI1, 5.597%, due 12/25/33 | | AA | | | 2,400 | | 2,374 |
Deutsche Mortgage Securites, Inc., 2004-2, Tranche M1, 5.090%, due 1/25/34 | | AA | | | 2,055 | | 2,006 |
GRP Real Estate Asset Trust, 2004-2, Tranche A, 4.207%, due 7/25/34* | | A | | | 501 | | 499 |
FHASI, 2004-AR4, Tranche 3A1, 4.586%, due 8/25/34, VRN | | AAA | | | 1,618 | | 1,568 |
RAAC, 2005-SP1, Tranche M1, 5.505%, due 9/25/34, VRN | | AA | | | 2,614 | | 2,436 |
Security National Mortgage Loan Trust, 2004-2A, Tranche M2, 6.352%, due 11/25/34* | | A | | | 2,200 | | 2,113 |
GRP Real Estate Asset Trust, 2005-1 Tranche A, 4.850%, due 1/25/35* | | A | | | 814 | | 808 |
Security National Mortgage Loan Trust, 2005-1A, Tranche M2, 6.530%, due 2/25/35* | | A | | | 1,475 | | 1,441 |
Security National Mortgage Loan Trust, 2005-1A, Tranche B1, 7.450%, due 2/25/35* | | BBB | | | 950 | | 916 |
Structured Asset Securities Corp., 2005-9XS, Tranche 1A2B, 6.500%, due 5/25/35 | | AAA | | | 3,435 | | 3,424 |
ACE, 2005-SL1, Tranche M6, 6.360%, due 6/25/35 | | BBB | | | 1,843 | | 1,796 |
SACO, 2005-WM2, Tranche B2, 6.500%, due 7/25/35 | | BBB | | | 3,017 | | 2,922 |
ACE, 2006-SL2, Tranche M6A, 6.530%, due 1/25/36 | | A | - | | 2,355 | | 2,327 |
Security National Mortgage Loan Trust, 2005-2A, Tranche B1, 7.750%, due 2/25/36* | | BBB | | | 1,550 | | 1,481 |
Security National Mortgage Loan Trust, 2005-2A, Tranche M2, 7.321%, due 2/25/36* | | A | | | 2,075 | | 2,004 |
See accompanying Notes to Financial Statements.
June 30, 2006 | William Blair Funds 67 |
Income Fund
Portfolio of Investments, June 30, 2006 (all amounts in thousands) (unaudited)
| | | | | | | |
Issuer
| | NRSRO
Rating
| | | Principal
Amount
| | Value
|
| |
Collateralized Mortgage Obligations—(continued) | | |
Blackrock Capital Finance, 1997-R1 WAC, 1.809%, due 3/25/37, VRN* | | AAA | | | $413 | | $394 |
Statewide Mortgage Loan Trust, 2006-1A, Tranche A2, 7.660%, due 7/25/37* | | AAA | | | 2,638 | | 2,638 |
ACE, 2005-SN1, Tranche M1, 5.520%, due 11/25/39, VRN | | AA | + | | 1,075 | | 1,040 |
ACE, 2005-SN1, Tranche M2, 5.770%, due 11/25/39, VRN | | A | + | | 625 | | 607 |
ACE, 2005-SD3, Tranche M2, 7.073%, due 8/25/45, VRN | | A | + | | 1,895 | | 1,909 |
| | | | | |
| |
|
Total Collateralized Mortgage Obligations | | | | | 73,093 | | 71,932 |
| | | | | |
| |
|
| |
Corporate Obligations—24.3% | | |
Block Financial Corporation, 8.500%, due 4/15/07 | | A | | | 2,724 | | 2,773 |
Applied Materials, Inc., 6.750%, due 10/15/07 | | A | - | | 2,875 | | 2,905 |
DaimlerChrysler, NA Holdings, 4.750%, due 1/15/08 | | A3 | | | 2,675 | | 2,631 |
Philips Petroleum, 8.750%, due 5/25/10 | | A | - | | 3,600 | | 3,979 |
Residential Capital Corporation, 6.375%, due 6/30/10 | | BBB | - | | 3,000 | | 2,959 |
Household Finance Corporation, 8.000%, due 7/15/10 | | AA | - | | 2,450 | | 2,641 |
Boeing Capital Corporation, 7.375%, due 9/27/10 | | A | | | 2,549 | | 2,708 |
Sprint Capital Corporation, 7.625%, due 1/30/11 | | A | - | | 2,000 | | 2,129 |
Goldman Sachs Group, Inc., 6.600%, due 1/15/12 | | A | + | | 3,050 | | 3,148 |
Lehman Brothers Holdings, Inc. 6.625%, due 1/18/12 | | A | + | | 2,650 | | 2,743 |
National Rural Utility Cooperative, 7.250%, due 3/1/12 | | A | | | 3,025 | | 3,223 |
Valero Energy Corporation, 6.875%, due 4/15/12 | | BBB | | | 2,065 | | 2,141 |
General Electric Capital Corporation, 6.000%, due 6/15/12 | | AAA | | | 2,650 | | 2,680 |
Citigroup, Inc., 5.625%, due 8/27/12 | | A | + | | 2,675 | | 2,643 |
SLM Corporation, 5.125%, due 8/27/12 | | A | | | 2,050 | | 1,969 |
Cox Communications,Inc., 7.125%, due 10/1/12 | | BBB | - | | 2,425 | | 2,508 |
Kroger Company, 5.500%, due 2/1/13 | | BBB | | | 3,000 | | 2,880 |
| | | | | | | |
Issuer
| | NRSRO
Rating
| | | Principal
Amount
| | Value
|
| | |
Corporate Obligations—(continued) | | | | | |
Ohio Power Company, 5.500%, due 2/15/13 | | A3 | | | $1,900 | | $1,846 |
American Movil SA, 5.500%, due 3/1/14 | | A3 | | | 2,000 | | 1,848 |
Bank of America Corporation, 5.375%, due 6/15/14 | | AA | - | | 2,325 | | 2,251 |
SBC Communications, Inc., 5.100%, due 9/15/14 | | A | | | 2,500 | | 2,319 |
Codelco, Inc.—144A, 4.750%, due 10/15/14* | | A | | | 2,815 | | 2,573 |
United Technologies Corporation, 4.875%, due 5/1/15 | | A | + | | 2,725 | | 2,543 |
Telecom Italia Capital, 5.250%, due 10/1/15 | | BBB | + | | 3,000 | | 2,715 |
Forutne Brands, Inc., 5.375%, due 1/15/16 | | BBB | | | 2,060 | | 1,906 |
Johnson Controls, Inc., 5.500%, due 1/15/16 | | A | - | | 1,975 | | 1,874 |
Omnicom Group, Inc., 5.900%, due 4/15/16 | | A | - | | 3,000 | | 2,873 |
Sabmiller PLC, 6.500%, due 7/1/16 | | BBB | + | | 2,100 | | 2,117 |
Ras Laffan Lng II, 5.298%, due 9/30/20* | | A | + | | 1,500 | | 1,398 |
| | | | | |
| |
|
Total Corporate Obligations | | | | | 73,363 | | 72,923 |
| | | | | |
| |
|
Total Long Term Investments—97.4%
(Cost $301,220) | | | 290,383 | | 291,985 |
| | | | | |
| |
|
| | | |
Short-Term Investments | | | | | | | |
American Express Corporation, VRN 5.200%, due 7/3/06 | | A | + | | 3,319 | | 3,319 |
Prudential Funding LLC, VRN 5.055%, due 7/3/06 | | A | + | | 4,450 | | 4,450 |
| | | | | |
| |
|
Total Short-Term Investments—2.6%
(Cost $7,769) | | | 7,769 | | 7,769 |
| | | | | |
| |
|
Total Investments—100.0%
(Cost $308,989) | | | $298,152 | | 299,754 |
| | | | | |
| |
|
Cash and other assets, less liabilities—0.0% | | 140 |
| | | | | | | |
|
Net Assets—100% | | $299,894 |
| | | | | | | |
|
WAC = Weighted Average Coupon
VRN = Variable Rate Note
NRSRO = Nationally Recognized Statistical Rating Organization, such as S&P, Moody’s or Fitch
The obligations of certain U. S. Government-sponsored securities are neither issued nor guaranteed by the U. S. Treasury
*Deemed illiquid pursuant to Liquidity Procedures adopted by the Board of Trustees. These holdings represent 7.7% of the net assets at June 30, 2006.
See accompanying Notes to Financial Statements.
68 Semi-Annual Report | June 30, 2006 |
James S. Kaplan
Christopher T. Vincent
READY RESERVES FUND
The Ready Reserves Fund invests primarily in short-term U.S. dollar-denominated money market instruments, and exclusively in high quality securities that are rated in the top two categories of credit quality.
AN OVERVIEW FROM THE PORTFOLIO MANAGERS
Federal Reserve Board Monetary policy continued to be the focus of the money markets during the first half of 2006.
The Federal Reserve raised the federal funds rate on overnight loans between banks by 0.25% four times during the first half of the year; on January 31—which was also Federal Reserve Board Chairman Alan Greenspan’s last day as chairman—and subsequently on March 28, May 10 and June 29. The last rate increase was the seventeenth consecutive rate hike by the Federal Reserve, and brought the federal funds rate to 5.25%.
For the first time since the Federal Reserve began raising rates two years ago, the Fed stopped short of signaling that additional interest rate increases were a foregone conclusion. In a statement that accompanied the announcement of its latest rate increase, the Federal Reserve Board stated that recent price trends had been “elevated” and that “inflation pressures remain,” but also said that economic growth appeared to be slowing, which in turn should ease inflation. “Recent indicators suggest that economic growth is moderating from its quite strong pace,” the Fed’s policy-making committee said.
The Fed said that slowing growth resulted from a “gradual cooling” of the housing market, the lagged effects of previous rate hikes and elevated energy prices.
However, investors were especially encouraged by a change in the Fed’s language that hinted at the possibility that further interest rate increases may no longer be needed. The Fed spoke hypothetically as to the course of action it would take if interest rate increases were necessary. “The extent and timing of any additional firming that may be needed to address risks will depend on the evolution of the outlook for inflation and economic growth,” the Fed said. By comparison, in May the Fed simply stated that “some additional firming may be necessary.”
It’s been a rough start for the new Fed Chairman, Ben Bernanke. Unfortunately, as market participants attempted to interpret the exact meaning of his early statements on the economy and Fed policy, market volatility ensued. The biggest concern on the part of investors is Mr. Bernanke’s ability to engineer a “soft landing”—like his predecessor before him—from a period of strong economic growth and rising inflation to one where underlying inflation slows, and without sparking a recession.
We presently intend to maintain our strategy of using commercial paper in the short end of the market, barbelled with fixed-rate obligations with slightly longer maturities, and also will continue to emphasize floating-rate obligations, which price off of LIBOR. (LIBOR is the London Interbank Offered Rate, which is the rate the creditworthiest international banks dealing in Eurodollars—U.S. currency held in banks outside of the U.S.—charge each other for large loans.)
At June 30, 2006, the Fund’s Average Maturity was 59.4 days, compared to 55.5 days at March 31, 2006, and 58.6 days at December 31, 2005.
The return for the six months ended June 30, 2006, of the Fund’s Class N Shares was 2.04%, versus the 1.95% return of the Fund’s benchmark, the AAA-Rated Money Market Funds Average. Total assets were $1.16 billion, compared to $1.14 billion at March 31, 2006, and $1.09 billion at December 31, 2005.
June 30, 2006 | William Blair Funds 69 |
Ready Reserves Fund
Performance Highlights (unaudited)
The Fund’s 7 day yield on June 30, 2006 was 4.47%.
Average Annual Total Returns—Class N Shares year ending June 30, 2006.
| | | | | | | | | | | | | | |
| | | 1
Year
| | | 3
Year
| | | 5
Year
| | | 10
Year
| | | |
| Ready Reserves Fund | | 3.65 | % | | 1.90 | % | | 1.74 | % | | 3.39 | % | | |
AAA Rated Money Market Funds | | 3.43 | | | 1.78 | | | 1.64 | | | 3.40 | | | |
Performance cited represents past performance. Past performance does not guarantee future results and current performance may be lower or higher than the data quoted. For the most current month-end performance information, please call 1-800-742-7272, or visit our Web site at www.williamblairfunds.com. Class N Shares are available to the general public without a sales load. Total return includes reinvestment of income. Yields fluctuate and are not guaranteed. An investment in the Fund is neither insured nor guaranteed by the Federal Deposit Insurance Corp. (FDIC) or any government agency. Although the Fund seeks to preserve the value of your investment at $1.00 per share, it is possible to lose money by investing in the Fund.
The AAA Rated Money Market Funds Average represents the average annual composite performance of all AAA rated First Tier Retail Money Market Funds listed by IBC Financial data.
This report identifies the Fund’s investment’s on June 30, 2006. These holdings are subject to change. Not all fixed-income securities in the Fund performed the same, nor is there any guarantee that these fixed-income securities will perform as well in the future. Market forecasts provided in this report may not necessarily come to pass.
Sector Diversification (unaudited)
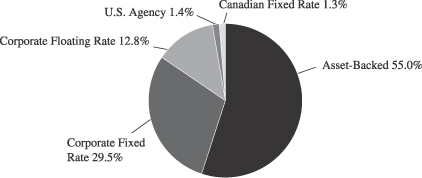
The sector diversification shown is based on the total investment portfolio.
70 Semi-Annual Report | June 30, 2006 |
Ready Reserves Fund
Portfolio of Investments, June 30, 2006 (all amounts in thousands) (unaudited)
| | | | | | |
Issuer
| | Principal
Amount
| | Amortized
Cost
|
Mortage-Backed Securities—1.5% | | | | | | |
Federal Home Loan Bank (FHLB),
2.600%, 3/30/07 | | $ | 978 | | $ | 980 |
Federal Home Loan Mortgage Corp. (FHLMC), 4.125%-5.375%,
2/20/07-6/18/07 | | | 15,990 | | | 15,991 |
| | |
|
| |
|
|
Total Mortgage Backed Securities | | | 16,968 | | | 16,971 |
| | |
|
| |
|
|
Canadian Fixed Rate Notes—1.3% | | | | | | |
Province of Manitoba, 4.250%, 11/20/06 | | | 10,940 | | | 10,958 |
Province of Ontario, 2.650%, 12/15/06 | | | 2,434 | | | 2,459 |
Province of Quebec, 7.000%, 1/30/07 | | | 2,058 | | | 2,045 |
| | |
|
| |
|
|
Total Canadian Fixed Rate Notes | | | 15,432 | | | 15,462 |
| | |
|
| |
|
|
Fixed Rate Notes—24.8% | | | | | | |
Abbott Laboratories, 5.625%-6.400%, 7/1/06-12/1/06 | | | 30,508 | | | 30,167 |
American General Finance Corp,
3.000%-5.875% , 7/14/06-11/15/06 | | | 21,260 | | | 21,216 |
Anheuser Busch Company,
5.600%, 7/06/06 | | | 5,060 | | | 5,001 |
B.P. Argentina 6.750%, 2/1/07 | | | 1,321 | | | 1,313 |
B.P. Capital PLC, 2.625%-6.950%,
11/08/06-3/15/07 | | | 24,337 | | | 24,484 |
Caterpillar Financial Services,
2.350%-2.625%, 7/15/06-1/30/07 | | | 19,080 | | | 19,207 |
Chevron Corporation, 7.090%-8.250%, 10/1/06-2/1/07 | | | 2,895 | | | 2,877 |
Coca-Cola Enterprises, Inc.
2.500%-5.375%, 8/15/06-9/15/06 | | | 16,913 | | | 16,918 |
Du Pont (E.I) De Numours
8.250%, 9/15/06 | | | 10,243 | | | 9,934 |
Eli Lilly & Company, 5.500%, 7/15/06 | | | 16,027 | | | 15,873 |
GE Capital Corp 2.750%-6.500%,
9/25/06-6/15/07 | | | 13,630 | | | 13,689 |
IBM Corporation, 2.375%-4.875%,
10/1/06-11/1/06 | | | 22,233 | | | 22,329 |
Merck & Company, 5.250%, 7/1/06 | | | 7,748 | | | 7,670 |
Paccar Financial, 2.500%, 8/1/06 | | | 1,311 | | | 1,328 |
Pfizer, Inc. 2.500%, 3/15/07 | | | 14,413 | | | 14,490 |
Procter and Gamble Corporation,
4.750%, 6/15/07 | | | 12,327 | | | 12,330 |
SLM Corporation, 3.500, 9/30/06 | | | 15,258 | | | 15,308 |
Toyota Motor Credit, 2.700%-5.650%, 1/15/07-1/30/07 | | | 10,398 | | | 10,394 |
US Bancorp, 2.400%-5.100%,
11/15/06-7/15/07 | | | 13,779 | | | 13,842 |
USAA Capital Corporation,
7.050%, 11/8/06 | | | 2,680 | | | 2,651 |
Wal-Mart Stores, 4.375%-8.000%,
8/1/06-7/12/07 | | | 15,435 | | | 15,330 |
Wells Fargo Financial, 5.125%-7.125%, 8/15/06-6/15/07 | | | 10,957 | | | 10,919 |
| | |
|
| |
|
|
Total Fixed Rate Notes | | | 287,813 | | | 287,270 |
| | |
|
| |
|
|
Variable Rate Notes—12.8% | | | | | | |
American General Finance Corp,
5.330% , 11/15/06 | | | 3,503 | | | 3,502 |
General Electric Capital Corporation, 5.080%-5.526%, 9/18/06-3/9/07 | | | 23,294 | | | 23,285 |
| | | | | | |
Issuer
| | Principal
Amount
| | Amortized
Cost
|
Variable Rate Notes—(continued) | | | | | | |
Paccar Financial Corporation,
4.988%-5.334%, 9/20/06-1/16/07 | | $ | 22,206 | | $ | 22,211 |
SLM Corp, 5.220%-5.529%,
9/15/06-1/25/07 | | | 9,100 | | | 9,095 |
Toyota Motor Credit, 4.945%-5.274%, 8/25/06-7/2/07 | | | 24,992 | | | 24,991 |
US Bank, 5.060%-5.470%, 7/28/06-3/16/07 | | | 28,283 | | | 28,278 |
Wal-Mart Stores, 5.388%, 3/28/07 | | | 15,992 | | | 15,993 |
Wells Fargo Financial, 5.419%-5.009%, 9/15/06-3/23/07 | | | 24,191 | | | 24,178 |
| | |
|
| |
|
|
Total Variable Rate Notes | | | 151,561 | | | 151,533 |
| | |
|
| |
|
|
Asset-Backed Commercial Paper—54.6% | | | |
Alpine Securitization Corporation,
5.020%%, 7/7/06 | | | 10,000 | | | 9,992 |
Amsterdam Funding Corporation,
5.110%-5.120%, 7/24/06-7/25/06 | | | 25,000 | | | 24,917 |
CAFCO, L.L.C., 5.030%-5.290%,
7/5/06-8/9/06 | | | 35,000 | | | 34,873 |
Ciesco, L.L.C., 5.090%-5.290%,
7/19/06-8/7/06 | | | 50,000 | | | 49,819 |
CRC Funding, L.L.C., 5.080%-5.340%, 7/19/06-8/17/06 | | | 25,000 | | | 24,870 |
Daimler Chrysler Revolving Auto,
5.030%-5.120%, 7/5/06-8/1/06 | | | 45,000 | | | 44,897 |
FCAR Owner Trust, 5.230-5.330%,
8/3/06-8/16/06 | | | 50,000 | | | 49,717 |
Govco, Inc., 5.110%-5.140%,
8/1/06-8/22/06 | | | 30,364 | | | 30,172 |
Mortgage Interest Networking Trust, 5.020%-5.250%, 7/6/06-7/31/06 | | | 35,000 | | | 34,891 |
New Center Asset Trust, 5.090%-5.280%, 7/18/06-8/4/06 | | | 40,000 | | | 39,849 |
Old Line Funding, 5.030%-5.250%, 7/6/06-8/2/06 | | | 50,000 | | | 49,896 |
Preferred Receivables Funding,
5.050%, 7/18/06 | | | 10,000 | | | 9,976 |
Ranger Funding, 5.140%-5.300%, 7/24/06-8/11/06 | | | 25,000 | | | 24,877 |
Sheffield Receivables, 5.060%-5.280%, 7/13/06-8/2/06 | | | 35,000 | | | 34,884 |
Thames Asset Global Securitization, 5.060%-5.090%, 7/13/06-8/18/06 | | | 49,220 | | | 49,007 |
Thunder Bay Funding, 5.030%-5.050%, 7/11/06-7/15/06 | | | 47,002 | | | 46,946 |
Variable Funding,
5.14%, 7/26/06-7/27/06 | | | 30,000 | | | 29,891 |
Wal-Mart Funding, 5.070%, 7/25/06 | | | 8,500 | | | 8,471 |
Windmill Funding Corporation,
5.070%-5.120%, 7/14/06-7/27/06 | | | 35,000 | | | 34,902 |
| | |
|
| |
|
|
Total Asset Backed Commercial Paper | | | 635,086 | | | 632,847 |
| | |
|
| |
|
|
Commercial Paper—1.6% | | | | | | |
National Rural Utility Coop,
5.300%, 8/10/06 | | | 15,000 | | | 14,912 |
Private Export Funding, 5.060%, 7/20/06 | | | 4,050 | | | 4,039 |
| | |
|
| |
|
|
Total Commercial Paper | | | 19,050 | | | 18,951 |
| | |
|
| |
|
|
See accompanying Notes to Financial Statements.
June 30, 2006 | William Blair Funds 71 |
Ready Reserves Fund
Portfolio of Investments, June 30, 2006 (all amounts in thousands) (unaudited)
| | | | | | | |
Issuer
| | Principal
Amount
| | Amortized
Cost
| |
Demand Notes—5.4% | | | | | | | |
American Express Corporation, VRN, 5.200%, 7/3/06 | | $ | 30,953 | | $ | 30,953 | |
Prudential Funding, VRN,
5.055%, 7/3/06 | | | 30,897 | | | 30,897 | |
| | |
|
| |
|
|
|
Total Demand Notes | | | 61,850 | | | 61,850 | |
| | |
|
| |
|
|
|
Total Investments—102.0%
(cost $1,184,884) | | $ | 1,187,760 | | | 1,184,884 | |
| | |
|
| |
|
|
|
Liabilities plus cash and other assets—(2.0)% | | | (25,835 | ) |
| | | | | |
|
|
|
Net assets—100.0% | | $ | 1,159,049 | |
| | | | | |
|
|
|
Portfolio Weighted Average Maturity | | | 59 Days | |
VRN = Variable Rate Note
See accompanying Notes to Financial Statements.
72 Semi-Annual Report | June 30, 2006 |
Statements of Assets and Liabilities
June 30, 2006 (all dollar amounts in thousands) (unaudited)
| | | | | | | | | | | | |
| | | Growth
Fund
| | | Tax-
Managed
Growth
Fund
| | | Large Cap
Growth
Fund
| |
Assets | | | | | | | | | | | | |
Investments in securities, at cost | | $ | 189,282 | | | $ | 6,630 | | | $ | 16,623 | |
Investments in Affiliated Fund, at cost | | | 122 | | | | 145 | | | | 74 | |
| | |
|
|
| |
|
|
| |
|
|
|
| | | |
Investments in securities, at value | | $ | 243,639 | | | $ | 8,234 | | | $ | 18,063 | |
Investments in Affiliated Fund, at value | | | 122 | | | | 145 | | | | 74 | |
Cash | | | 1 | | | | 1 | | | | — | |
Receivable for fund shares sold | | | 82 | | | | 20 | | | | 1 | |
Receivable for investment securities sold | | | — | | | | — | | | | 343 | |
Receivable from Advisor | | | — | | | | 12 | | | | 7 | |
Dividend and interest receivable | | | 345 | | | | 12 | | | | 32 | |
| | |
|
|
| |
|
|
| |
|
|
|
Total assets | | | 244,189 | | | | 8,424 | | | | 18,520 | |
Liabilities | | | | | | | | | | | | |
Payable for investment securities purchased | | | — | | | | — | | | | 293 | |
Payable for fund shares redeemed | | | 139 | | | | 65 | | | | 2 | |
Management fee payable | | | 163 | | | | — | | | | 6 | |
Distribution fee payable | | | 9 | | | | — | | | | 2 | |
Other accrued expenses | | | 64 | | | | 13 | | | | 15 | |
| | |
|
|
| |
|
|
| |
|
|
|
Total liabilities | | | 375 | | | | 78 | | | | 318 | |
| | |
|
|
| |
|
|
| |
|
|
|
Net Assets | | $ | 243,814 | | | $ | 8,346 | | | $ | 18,202 | |
| | |
|
|
| |
|
|
| |
|
|
|
Capital | | | | | | | | | | | | |
Composition of Net Assets | | | | | | | | | | | | |
Par value of shares of beneficial interest | | $ | 22 | | | $ | 1 | | | $ | 3 | |
Capital paid in excess of par value | | | 171,660 | | | | 7,899 | | | | 22,048 | |
Accumulated net investment income (loss) | | | (268 | ) | | | (8 | ) | | | (9 | ) |
Accumulated realized gain (loss) | | | 18,043 | | | | (1,150 | ) | | | (5,280 | ) |
Net unrealized appreciation (depreciation) of investments and foreign
currencies | | | 54,357 | | | | 1,604 | | | | 1,440 | |
| | |
|
|
| |
|
|
| |
|
|
|
Net Assets | | $ | 243,814 | | | $ | 8,346 | | | $ | 18,202 | |
| | |
|
|
| |
|
|
| |
|
|
|
| | | |
Class N Shares | | | | | | | | | | | | |
Net Assets | | $ | 44,929 | | | $ | 283 | | | $ | 9,285 | |
Shares Outstanding | | | 3,871,821 | | | | 27,633 | | | | 1,449,392 | |
Net Asset Value Per Share | | $ | 11.60 | | | $ | 10.26 | | | $ | 6.41 | |
Class I Shares | | | | | | | | | | | | |
Net Assets | | $ | 198,885 | | | $ | 8,063 | | | $ | 8,917 | |
Shares Outstanding | | | 16,840,883 | | | | 772,542 | | | | 1,372,090 | |
Net Asset Value Per Share | | $ | 11.81 | | | $ | 10.44 | | | $ | 6.50 | |
See accompanying Notes to Financial Statements.
June 30, 2006 | William Blair Funds 73 |
Statements of Operations
For the Period Ended June 30, 2006 (all dollar amounts in thousands) (unaudited)
| | | | | | | | | | | | |
| | | Growth
Fund
| | | Tax-
Managed
Growth
Fund
| | | Large Cap
Growth Fund
| |
Investment income | | | | | | | | | | | | |
Dividends | | $ | 849 | | | $ | 32 | | | $ | 84 | |
Less foreign tax withheld | | | (49 | ) | | | (1 | ) | | | (5 | ) |
Income from Affiliated Fund | | | 17 | | | | 5 | | | | 6 | |
Interest | | | 116 | | | | 9 | | | | 7 | |
| | |
|
|
| |
|
|
| |
|
|
|
Total income | | | 933 | | | | 45 | | | | 92 | |
Expenses | | | | | | | | | | | | |
Investment advisory fees | | | 960 | | | | 33 | | | | 71 | |
Distribution fees | | | 64 | | | | — | | | | 12 | |
Custodian fees | | | 40 | | | | 19 | | | | 23 | |
Transfer agent fees | | | 70 | | | | 4 | | | | 6 | |
Professional fees | | | 18 | | | | 13 | | | | 12 | |
Registration fees | | | 16 | | | | 10 | | | | 15 | |
Other expenses | | | 32 | | | | 4 | | | | 1 | |
| | |
|
|
| |
|
|
| |
|
|
|
Total expenses before waiver | | | 1,200 | | | | 83 | | | | 140 | |
Less expenses waived or absorbed by the Advisor | | | — | | | | (30 | ) | | | (39 | ) |
| | |
|
|
| |
|
|
| |
|
|
|
Net expenses | | | 1,200 | | | | 53 | | | | 101 | |
| | |
|
|
| |
|
|
| |
|
|
|
Net investment income (loss) | | | (267 | ) | | | (8 | ) | | | (9 | ) |
Net realized and unrealized gain (loss) on investments, foreign currency transactions and other assets and liabilities | | | | | | | | | | | | |
Net realized gain (loss) on investments | | | 16,176 | | | | 646 | | | | 90 | |
| | |
|
|
| |
|
|
| |
|
|
|
Change in net unrealized appreciation (depreciation) on investments and other assets and liabilities | | | (9,291 | ) | | | (509 | ) | | | (262 | ) |
| | |
|
|
| |
|
|
| |
|
|
|
Net increase (decrease) in net assets resulting from operations | | $ | 6,618 | | | $ | 129 | | | $ | (181 | ) |
| | |
|
|
| |
|
|
| |
|
|
|
See accompanying Notes to Financial Statements.
74 Semi-Annual Report | June 30, 2006 |
Statements of Changes in Net Assets
For the Period Ended June 30, 2006 and the Year Ended December 31, 2005 (all amounts in thousands)
| | | | | | | | | | | | | | | | | | | | | | | | |
| | | Growth
Fund
| | | Tax-
Managed
Growth
Fund
| | | Large Cap
Growth
Fund
| |
| | | 2006
| | | 2005
| | | 2006
| | | 2005
| | | 2006
| | | 2005
| |
| | | (unaudited) | | | | | | (unaudited) | | | | | | (unaudited) | | | | |
Operations | | | | | | | | | | | | | | | | | | | | | | | | |
Net investment income (loss) | | $ | (267 | ) | | $ | (987 | ) | | $ | (8 | ) | | $ | (32 | ) | | $ | (9 | ) | | $ | (21 | ) |
Net realized gain (loss) on investments, foreign currency transactions and other assets and liabilities | | | 16,176 | | | | 27,667 | | | | 646 | | | | 90 | | | | 90 | | | | 79 | |
Change in net unrealized appreciation (depreciation) on investments, and other assets and liabilities | | | (9,291 | ) | | | (3,560 | ) | | | (509 | ) | | | 703 | | | | (262 | ) | | | 593 | |
| | |
|
|
| |
|
|
| |
|
|
| |
|
|
| |
|
|
| |
|
|
|
Net increase (decrease) in net assets resulting from operations | | | 6,618 | | | | 23,120 | | | | 129 | | | | 761 | | | | (181 | ) | | | 651 | |
Distributions to shareholders from | | | | | | | | | | | | | | | | | | | | | | | | |
Net investment income | | | — | | | | — | | | | — | | | | — | | | | — | | | | — | |
Net realized gain | | | — | | | | (8,977 | ) | | | — | | | | — | | | | — | | | | — | |
| | |
|
|
| |
|
|
| |
|
|
| |
|
|
| |
|
|
| |
|
|
|
| | | | — | | | | (8,977 | ) | | | — | | | | — | | | | — | | | | — | |
Capital stock transactions | | | | | | | | | | | | | | | | | | | | | | | | |
Net proceeds from sale of shares | | | 11,736 | | | | 19,807 | | | | 617 | | | | 1,775 | | | | 3,261 | | | | 11,656 | |
Shares issued in reinvestment of income dividends and capital gain distributions | | | — | | | | 8,262 | | | | — | | | | — | | | | — | | | | — | |
Less cost of shares redeemed | | | (28,099 | ) | | | (64,159 | ) | | | (215 | ) | | | (568 | ) | | | (1,766 | ) | | | (1,836 | ) |
| | |
|
|
| |
|
|
| |
|
|
| |
|
|
| |
|
|
| |
|
|
|
Net increase (decrease) in net assets resulting from capital share transactions | | | (16,363 | ) | | | (36,090 | ) | | | 402 | | | | 1,207 | | | | 1,495 | | | | 9,820 | |
| | |
|
|
| |
|
|
| |
|
|
| |
|
|
| |
|
|
| |
|
|
|
Increase (decrease) in net assets | | | (9,745 | ) | | | (21,947 | ) | | | 531 | | | | 1,968 | | | | 1,314 | | | | 10,471 | |
Net assets | | | | | | | | | | | | | | | | | | | | | | | | |
Beginning of period | | | 253,559 | | | | 275,506 | | | | 7,815 | | | | 5,847 | | | | 16,888 | | | | 6,417 | |
| | |
|
|
| |
|
|
| |
|
|
| |
|
|
| |
|
|
| |
|
|
|
End of period | | $ | 243,814 | | | $ | 253,559 | | | $ | 8,346 | | | $ | 7,815 | | | $ | 18,202 | | | $ | 16,888 | |
| | |
|
|
| |
|
|
| |
|
|
| |
|
|
| |
|
|
| |
|
|
|
Undistributed net investment income (loss) at the end of the period | | $ | (268 | ) | | $ | (1 | ) | | $ | (8 | ) | | $ | — | | | $ | (9 | ) | | $ | — | |
| | |
|
|
| |
|
|
| |
|
|
| |
|
|
| |
|
|
| |
|
|
|
See accompanying Notes to Financial Statements.
June 30, 2006 | William Blair Funds 75 |
Statements of Assets and Liabilities
June 30, 2006 (all dollar amounts in thousands) (unaudited)
| | | | | | | | | | | | |
| | | Small Cap
Growth
Fund
| | | Mid Cap
Growth
Fund
| | | Small-Mid
Cap
Growth
Fund
| |
Assets | | | | | | | | | | | | |
Investments in securities, at cost | | $ | 1,013,240 | | | $ | 11,741 | | | $ | 73,794 | |
Investments in Affiliated Fund, at cost | | | 7,233 | | | | 100 | | | | 640 | |
| | |
|
|
| |
|
|
| |
|
|
|
| | | |
Investments in securities, at value | | $ | 1,125,474 | | | $ | 11,688 | | | $ | 82,540 | |
Investments in Affiliated Fund, at value | | | 7,233 | | | | 100 | | | | 640 | |
Cash | | | — | | | | 62 | | | | — | |
Receivable for fund shares sold | | | 3,802 | | | | 88 | | | | 288 | |
Receivable for investment securities sold | | | 11,389 | | | | 104 | | | | 557 | |
Receivable from Advisor | | | — | | | | 23 | | | | — | |
Dividend and interest receivable | | | 293 | | | | 3 | | | | 21 | |
| | |
|
|
| |
|
|
| |
|
|
|
Total assets | | | 1,148,191 | | | | 12,068 | | | | 84,046 | |
Liabilities | | | | | | | | | | | | |
Payable for investment securities purchased | | | 2,386 | | | | 17 | | | | 177 | |
Payable for fund shares redeemed | | | 1,407 | | | | — | | | | 40 | |
Management fee payable | | | 1,010 | | | | — | | | | 64 | |
Distribution fee payable | | | 132 | | | | 1 | | | | 2 | |
Other accrued expenses | | | 162 | | | | 22 | | | | 27 | |
| | |
|
|
| |
|
|
| |
|
|
|
Total liabilities | | | 5,097 | | | | 40 | | | | 310 | |
| | |
|
|
| |
|
|
| |
|
|
|
Net Assets | | $ | 1,143,094 | | | $ | 12,028 | | | $ | 83,736 | |
| | |
|
|
| |
|
|
| |
|
|
|
Capital | | | | | | | | | | | | |
Composition of Net Assets | | | | | | | | | | | | |
Par value of shares of beneficial interest | | $ | 45 | | | $ | 1 | | | $ | 7 | |
Capital paid in excess of par value | | | 991,061 | | | | 12,114 | | | | 70,598 | |
Accumulated net investment income (loss) | | | (5,352 | ) | | | (18 | ) | | | (244 | ) |
Accumulated realized gain (loss) | | | 45,106 | | | | (16 | ) | | | 4,629 | |
Net unrealized appreciation (depreciation) of investments and foreign currencies | | | 112,234 | | | | (53 | ) | | | 8,746 | |
| | |
|
|
| |
|
|
| |
|
|
|
Net Assets | | $ | 1,143,094 | | | $ | 12,028 | | | $ | 83,736 | |
| | |
|
|
| |
|
|
| |
|
|
|
| | | |
Class N Shares | | | | | | | | | | | | |
Net Assets | | $ | 658,102 | | | $ | 5,862 | | | $ | 12,526 | |
Shares Outstanding | | | 26,169,507 | | | | 587,849 | | | | 961,380 | |
Net Asset Value Per Share | | $ | 25.15 | | | $ | 9.97 | | | $ | 13.03 | |
Class I Shares | | | | | | | | | | | | |
Net Assets | | $ | 484,992 | | | $ | 6,166 | | | $ | 71,210 | |
Shares Outstanding | | | 18,946,258 | | | | 617,704 | | | | 5,434,339 | |
Net Asset Value Per Share | | $ | 25.60 | | | $ | 9.98 | | | $ | 13.10 | |
See accompanying Notes to Financial Statements.
76 Semi-Annual Report | June 30, 2006 |
Statements of Operations
For the Period Ended June 30, 2006 (all dollar amounts in thousands) (unaudited)
| | | | | | | | | | | | |
| | | Small Cap
Growth Fund
| | | Mid Cap
Growth
Fund(a)
| | | Small-Mid
Cap
Growth
Fund
| |
Investment income | | | | | | | | | | | | |
Dividends | | $ | 696 | | | $ | 24 | | | $ | 175 | |
Income from Affiliated Fund | | | 212 | | | | 1 | | | | 14 | |
Interest | | | 824 | | | | 6 | | | | 39 | |
| | |
|
|
| |
|
|
| |
|
|
|
Total income | | | 1,732 | | | | 31 | | | | 228 | |
Expenses | | | | | | | | | | | | |
Investment advisory fees | | | 5,749 | | | | 37 | | | | 397 | |
Distribution fees | | | 772 | | | | 4 | | | | 16 | |
Custodian fees | | | 100 | | | | 30 | | | | 30 | |
Transfer agent fees | | | 346 | | | | 8 | | | | 16 | |
Professional fees | | | 29 | | | | 11 | | | | 14 | |
Registration fees | | | 37 | | | | 12 | | | | 16 | |
Other expenses | | | 51 | | | | 6 | | | | 5 | |
| | |
|
|
| |
|
|
| |
|
|
|
Total expenses before waiver | | | 7,084 | | | | 108 | | | | 494 | |
Less expenses waived or absorbed by the Advisor | | | — | | | | (59 | ) | | | (22 | ) |
| | |
|
|
| |
|
|
| |
|
|
|
Net expenses | | | 7,084 | | | | 49 | | | | 472 | |
| | |
|
|
| |
|
|
| |
|
|
|
Net investment income (loss) | | | (5,352 | ) | | | (18 | ) | | | (244 | ) |
Net realized and unrealized gain (loss) on investments, foreign currency transactions and other assets and liabilities | | | | | | | | | | | | |
Net realized gain (loss) on investments | | | 55,222 | | | | (16 | ) | | | 3,761 | |
| | |
|
|
| |
|
|
| |
|
|
|
Change in net unrealized appreciation (depreciation) on investments and other assets and liabilities | | | (8,211 | ) | | | (53 | ) | | | 278 | |
| | |
|
|
| |
|
|
| |
|
|
|
Net increase (decrease) in net assets resulting from operations | | $ | 41,659 | | | $ | (87 | ) | | $ | 3,795 | |
| | |
|
|
| |
|
|
| |
|
|
|
| (a) | | For the period from February 1, 2006 (Commencement of Operations) to June 30, 2006. |
See accompanying Notes to Financial Statements.
June 30, 2006 | William Blair Funds 77 |
Statements of Changes in Net Assets
For the Period Ended June 30, 2006 and the Year Ended December 31, 2005 (all amounts in thousands)
| | | | | | | | | | | | | | | | | | | | |
| | | Small Cap
Growth
Fund
| | | Mid Cap
Growth
Fund(a)
| | | Small-Mid
Cap
Growth
Fund
| |
| | | 2006
| | | 2005
| | | 2006
| | | 2006
| | | 2005
| |
| | | (unaudited) | | | | | | (unaudited) | | | (unaudited) | | | | |
Operations | | | | | | | | | | | | | | | | | | | | |
Net investment income (loss) | | $ | (5,352 | ) | | $ | (8,349 | ) | | $ | (18 | ) | | $ | (244 | ) | | $ | (382 | ) |
Net realized gain (loss) on investments, foreign currency transactions and other assets and liabilities | | | 55,222 | | | | 48,921 | | | | (16 | ) | | | 3,761 | | | | 1,453 | |
Change in net unrealized appreciation (depreciation) on investments, foreign currency transactions and other assets and liabilities | | | (8,211 | ) | | | (35,365 | ) | | | (53 | ) | | | 278 | | | | 6,094 | |
| | |
|
|
| |
|
|
| |
|
|
| |
|
|
| |
|
|
|
Net increase (decrease) in net assets resulting from operations | | | 41,659 | | | | 5,207 | | | | (87 | ) | | | 3,795 | | | | 7,165 | |
Distributions to shareholders from | | | | | | | | | | | | | | | | | | | | |
Net investment income | | | — | | | | — | | | | — | | | | — | | | | — | |
Net realized gain | | | — | | | | (71,631 | ) | | | — | | | | — | | | | (495 | ) |
| | |
|
|
| |
|
|
| |
|
|
| |
|
|
| |
|
|
|
| | | | — | | | | (71,631 | ) | | | — | | | | — | | | | (495 | ) |
Capital stock transactions | | | | | | | | | | | | | | | | | | | | |
Net proceeds from sale of shares | | | 401,442 | | | | 345,073 | | | | 12,307 | | | | 14,256 | | | | 43,370 | |
Shares issued in reinvestment of income dividends and capital gain
distributions | | | — | | | | 69,879 | | | | — | | | | — | | | | 457 | |
Less cost of shares redeemed | | | (131,745 | ) | | | (287,999 | ) | | | (192 | ) | | | (4,526 | ) | | | (6,260 | ) |
| | |
|
|
| |
|
|
| |
|
|
| |
|
|
| |
|
|
|
Net increase (decrease) in net assets resulting from capital stock transactions | | | 269,697 | | | | 126,953 | | | | 12,115 | | | | 9,730 | | | | 37,567 | |
| | |
|
|
| |
|
|
| |
|
|
| |
|
|
| |
|
|
|
Increase (decrease) in net assets | | | 311,356 | | | | 60,529 | | | | 12,028 | | | | 13,525 | | | | 44,237 | |
Net assets | | | | | | | | | | | | | | | | | | | | |
Beginning of period | | | 831,738 | | | | 771,209 | | | | — | | | | 70,211 | | | | 25,974 | |
| | |
|
|
| |
|
|
| |
|
|
| |
|
|
| |
|
|
|
End of period | | $ | 1,143,094 | | | $ | 831,738 | | | $ | 12,028 | | | $ | 83,736 | | | $ | 70,211 | |
| | |
|
|
| |
|
|
| |
|
|
| |
|
|
| |
|
|
|
Undistributed net investment income (loss) at the end of the period | | $ | (5,352 | ) | | $ | — | | | $ | (18 | ) | | $ | (244 | ) | | $ | — | |
| | |
|
|
| |
|
|
| |
|
|
| |
|
|
| |
|
|
|
| (a) | | For the period from February 1, 2006 (Commencement of Operations) to June 30, 2006. |
See accompanying Notes to Financial Statements.
78 Semi-Annual Report | June 30, 2006 |
Statements of Assets and Liabilities
June 30, 2006 (all dollar amounts in thousands) (unaudited)
| | | | | | | | | | | | | | | |
| | | International
Growth
Fund
| | | International
Equity
Fund
| | International
Small Cap
Growth
Fund
| | | Emerging
Markets
Growth
Fund
| |
Assets | | | | | | | | | | | | | | | |
Investments in securities, at cost | | $ | 4,184,663 | | | $ | 216,684 | | $ | 110,619 | | | $ | 417,563 | |
Investments in Affiliated Fund, at cost | | | 27,814 | | | | 13 | | | 222 | | | | 5,762 | |
| | |
|
|
| |
|
| |
|
|
| |
|
|
|
| | | | |
Investments in securities, at value | | $ | 5,281,165 | | | $ | 237,053 | | $ | 116,238 | | | $ | 448,728 | |
Investments in Affiliated Fund, at value | | | 27,814 | | | | 13 | | | 222 | | | | 5,762 | |
Cash | | | 328 | | | | 43 | | | 74 | | | | — | |
Foreign currency, at value (cost $5,132, $17, $1,086, and $2,662, respectively) | | | 5,173 | | | | 15 | | | 1,096 | | | | 2,684 | |
Receivable for fund shares sold | | | 12,676 | | | | 3,562 | | | 24,530 | | | | 4,428 | |
Receivable for investment securities sold | | | 41,289 | | | | 1,283 | | | 3,015 | | | | 6,612 | |
Dividend and interest receivable | | | 6,603 | | | | 261 | | | 132 | | | | 462 | |
| | |
|
|
| |
|
| |
|
|
| |
|
|
|
Total assets | | | 5,375,048 | | | | 242,230 | | | 145,307 | | | | 468,676 | |
Liabilities | | | | | | | | | | | | | | | |
Payable for investment securities purchased | | | 59,292 | | | | 5,064 | | | 22,386 | | | | 7,430 | |
Payable for fund shares redeemed | | | 4,570 | | | | 215 | | | 57 | | | | 23 | |
Management fee payable | | | 4,255 | | | | 157 | | | 117 | | | | 306 | |
Distribution and shareholder administration fee payable | | | 775 | | | | 6 | | | 7 | | | | 22 | |
Other accrued expenses | | | 752 | | | | 5 | | | 35 | | | | 53 | |
| | |
|
|
| |
|
| |
|
|
| |
|
|
|
Total liabilities | | | 69,644 | | | | 5,447 | | | 22,602 | | | | 7,834 | |
| | |
|
|
| |
|
| |
|
|
| |
|
|
|
Net Assets | | $ | 5,305,404 | | | $ | 236,783 | | $ | 122,705 | | | $ | 460,842 | |
| | |
|
|
| |
|
| |
|
|
| |
|
|
|
Capital | | | | | | | | | | | | | | | |
Composition of Net Assets | | | | | | | | | | | | | | | |
Par value of shares of beneficial interest | | $ | 198 | | | $ | 17 | | $ | 10 | | | $ | 31 | |
Capital paid in excess of par value | | | 3,817,828 | | | | 215,439 | | | 112,783 | | | | 435,616 | |
Accumulated net investment income (loss) | | | (18,430 | ) | | | 720 | | | (24 | ) | | | 519 | |
Accumulated realized gain (loss) | | | 409,204 | | | | 200 | | | 4,456 | | | | (6,489 | ) |
Net unrealized appreciation (depreciation) of investments and foreign
currencies | | | 1,096,604 | | | | 20,407 | | | 5,480 | | | | 31,165 | |
| | |
|
|
| |
|
| |
|
|
| |
|
|
|
Net Assets | | $ | 5,305,404 | | | $ | 236,783 | | $ | 122,705 | | | $ | 460,842 | |
| | |
|
|
| |
|
| |
|
|
| |
|
|
|
| | | | |
Class N Shares | | | | | | | | | | | | | | | |
Net Assets | | $ | 3,669,407 | | | $ | 27,559 | | $ | 13,524 | | | $ | 35,157 | |
Shares Outstanding | | | 137,353,465 | | | | 2,047,483 | | | 1,116,318 | | | | 2,343,541 | |
Net Asset Value Per Share | | $ | 26.72 | | | $ | 13.46 | | $ | 12.11 | | | $ | 15.00 | |
Class I Shares | | | | | | | | | | | | | | | |
Net Assets | | $ | 1,635,997 | | | $ | 209,224 | | $ | 25,757 | | | $ | 68,394 | |
Shares Outstanding | | | 60,376,078 | | | | 15,431,738 | | | 2,123,129 | | | | 4,548,879 | |
Net Asset Value Per Share | | $ | 27.10 | | | $ | 13.56 | | $ | 12.13 | | | $ | 15.04 | |
See accompanying Notes to Financial Statements.
June 30, 2006 | William Blair Funds 79 |
Statements of Operations
For the Period Ended June 30, 2006 (all dollar amounts in thousands) (unaudited)
| | | | | | | | | | | | | | | | |
| | | International
Growth
Fund
| | | International
Equity
Fund
| | | International
Small Cap
Growth
Fund
| | | Emerging
Markets
Growth
Fund
| |
Investment income | | | | | | | | | | | | | | | | |
Dividends | | $ | 57,955 | | | $ | 2,778 | | | $ | 502 | | | $ | 2,836 | |
Less foreign tax withheld | | | (5,512 | ) | | | (294 | ) | | | (50 | ) | | | (194 | ) |
Income from Affiliated Fund | | | 636 | | | | 26 | | | | 14 | | | | 44 | |
Interest | | | 2,847 | | | | 201 | | | | 92 | | | | 373 | |
| | |
|
|
| |
|
|
| |
|
|
| |
|
|
|
Total income | | | 55,926 | | | | 2,711 | | | | 558 | | | | 3,059 | |
Expenses | | | | | | | | | | | | | | | | |
Investment advisory fees | | | 25,963 | | | | 1,224 | | | | 361 | | | | 1,859 | |
Distribution fees | | | 4,499 | | | | 37 | | | | 11 | | | | 44 | |
Shareholder administration fees | | | — | | | | — | | | | 20 | | | | 67 | |
Custodian fees | | | 1,386 | | | | 126 | | | | 77 | | | | 290 | |
Transfer agent fees | | | 1,384 | | | | 63 | | | | 8 | | | | 29 | |
Professional fees | | | 84 | | | | 18 | | | | 17 | | | | 19 | |
Registration fees | | | 85 | | | | 26 | | | | 23 | | | | 42 | |
Other expenses | | | 434 | | | | 8 | | | | 4 | | | | 6 | |
| | |
|
|
| |
|
|
| |
|
|
| |
|
|
|
Total expenses before waiver | | | 33,835 | | | | 1,502 | | | | 521 | | | | 2,356 | |
Less expenses waived or absorbed by the Advisor | | | — | | | | (111 | ) | | | (38 | ) | | | (138 | ) |
| | |
|
|
| |
|
|
| |
|
|
| |
|
|
|
Net expenses | | | 33,835 | | | | 1,391 | | | | 483 | | | | 2,218 | |
| | |
|
|
| |
|
|
| |
|
|
| |
|
|
|
Net investment income (loss) | | | 22,091 | | | | 1,320 | | | | 75 | | | | 841 | |
Net realized and unrealized gain (loss) on investments, foreign currency transactions and other assets and liabilities | | | | | | | | | | | | | | | | |
Net realized gain (loss) on investments | | | 386,801 | | | | 2,962 | | | | 4,125 | | | | (5,347 | ) |
Net realized gain (loss) on foreign currency transactions and other assets and liabilities | | | (9,079 | ) | | | (569 | ) | | | (111 | ) | | | (1,899 | ) |
| | |
|
|
| |
|
|
| |
|
|
| |
|
|
|
Total net realized gain (loss) | | | 377,722 | | | | 2,393 | | | | 4,014 | | | | (7,246 | ) |
Change in net unrealized appreciation (depreciation) on investments and other assets and liabilities | | | (140,877 | ) | | | 3,185 | | | | 1,201 | | | | 1,479 | |
| | |
|
|
| |
|
|
| |
|
|
| |
|
|
|
Net increase (decrease) in net assets resulting from operations | | $ | 258,936 | | | $ | 6,898 | | | $ | 5,290 | | | $ | (4,926 | ) |
| | |
|
|
| |
|
|
| |
|
|
| |
|
|
|
See accompanying Notes to Financial Statements.
80 Semi-Annual Report | June 30, 2006 |
Statements of Changes in Net Assets
For the Period Ended June 30, 2006 and the Year Ended December 31, 2005 (all amounts in thousands) (unaudited)
| | | | | | | | | | | | | | | | | | | | | | | | | | | | | | | | |
| | | International
Growth
Fund
| | | International Equity Fund
| | |
| | | International
Small Cap
Growth
Fund
| | |
| | | Emerging
Markets
Growth
Fund
| |
| | | 2006
| | | 2005
| | | 2006
| | | 2005
| | | 2006
| | | 2005(a)
| | | 2006
| | | 2005(b)
| |
| | | (unaudited) | | | | | | (unaudited) | | | | | | (unaudited) | | | | | | (unaudited) | | | | |
Operations | | | | | | | | | | | | | | | | | | | | | | | | | | | | | | | | |
Net investment income (loss) | | $ | 22,091 | | | $ | 8,479 | | | $ | 1,320 | | | $ | (46 | ) | | $ | 75 | | | $ | (6 | ) | | $ | 841 | | | $ | 69 | |
Net realized gain (loss) on investments, foreign currency transactions and other assets and liabilities | | | 377,722 | | | | 286,812 | | | | 2,393 | | | | (2,648 | ) | | | 4,014 | | | | 355 | | | | (7,246 | ) | | | 1,535 | |
Change in net unrealized appreciation (depreciation) on investments, foreign currency transactions and other assets and liabilities | | | (140,877 | ) | | | 457,704 | | | | 3,185 | | | | 16,797 | | | | 1,201 | | | | 4,279 | | | | 1,479 | | | | 29,686 | |
| | |
|
|
| |
|
|
| |
|
|
| |
|
|
| |
|
|
| |
|
|
| |
|
|
| |
|
|
|
Net increase (decrease) in net assets resulting from operations | | | 258,936 | | | | 752,995 | | | | 6,898 | | | | 14,103 | | | | 5,290 | | | | 4,628 | | | | (4,926 | ) | | | 31,290 | |
Distributions to shareholders from | | | | | | | | | | | | | | | | | | | | | | | | | | | | | | | | |
Net investment income | | | — | | | | (21,550 | ) | | | — | | | | — | | | | — | | | | (6 | ) | | | — | | | | — | |
Net realized gain | | | — | | | | (254,334 | ) | | | — | | | | — | | | | — | | | | — | | | | — | | | | (1,169 | ) |
| | |
|
|
| |
|
|
| |
|
|
| |
|
|
| |
|
|
| |
|
|
| |
|
|
| |
|
|
|
| | | | — | | | | (275,884 | ) | | | — | | | | — | | | | — | | | | (6 | ) | | | — | | | | (1,169 | ) |
Capital stock transactions | | | | | | | | | | | | | | | | | | | | | | | | | | | | | | | | |
Net proceeds from sale of shares | | | 1,040,842 | | | | 1,424,671 | | | | 88,133 | | | | 196,067 | | | | 68,746 | | | | 46,006 | | | | 245,273 | | | | 224,893 | |
Shares issued in reinvestment of income dividends and capital gain distributions | | | — | | | | 246,145 | | | | — | | | | — | | | | — | | | | 6 | | | | — | | | | 1,122 | |
Less cost of shares redeemed | | | (545,451 | ) | | | (598,284 | ) | | | (35,958 | ) | | | (42,149 | ) | | | (1,865 | ) | | | (100 | ) | | | (28,853 | ) | | | (6,788 | ) |
| | |
|
|
| |
|
|
| |
|
|
| |
|
|
| |
|
|
| |
|
|
| |
|
|
| |
|
|
|
Net increase (decrease) in net assets resulting from capital stock transactions | | | 495,391 | | | | 1,072,532 | | | | 52,175 | | | | 153,918 | | | | 66,881 | | | | 45,912 | | | | 216,420 | | | | 219,227 | |
| | |
|
|
| |
|
|
| |
|
|
| |
|
|
| |
|
|
| |
|
|
| |
|
|
| |
|
|
|
Increase (decrease) in net assets | | | 754,327 | | | | 1,549,643 | | | | 59,073 | | | | 168,021 | | | | 72,171 | | | | 50,534 | | | | 211,494 | | | | 249,348 | |
Net assets | | | | | | | | | | | | | | | | | | | | | | | | | | | | | | | | |
Beginning of period | | | 4,551,077 | | | | 3,001,434 | | | | 177,710 | | | | 9,689 | | | | 50,534 | | | | — | | | | 249,348 | | | | — | |
| | |
|
|
| |
|
|
| |
|
|
| |
|
|
| |
|
|
| |
|
|
| |
|
|
| |
|
|
|
End of period | | $ | 5,305,404 | | | $ | 4,551,077 | | | $ | 236,783 | | | $ | 177,710 | | | $ | 122,705 | | | $ | 50,534 | | | $ | 460,842 | | | $ | 249,348 | |
| | |
|
|
| |
|
|
| |
|
|
| |
|
|
| |
|
|
| |
|
|
| |
|
|
| |
|
|
|
Undistributed net investment income (loss) at the end of the period | | $ | (18,430 | ) | | $ | (40,521 | ) | | $ | 720 | | | $ | (600 | ) | | $ | (24 | ) | | $ | (99 | ) | | $ | 519 | | | $ | (322 | ) |
| | |
|
|
| |
|
|
| |
|
|
| |
|
|
| |
|
|
| |
|
|
| |
|
|
| |
|
|
|
(a) For the period from November 1, 2005 (Commencement of Operations) to December 31, 2005.
| (b) | | For the period from June 6, 2005 (Commencement of Operations) to December 31, 2005. |
See accompanying Notes to Financial Statements.
June 30, 2006 | William Blair Funds 81 |
Statements of Assets and Liabilities
June 30, 2006 (all dollar amounts in thousands) (unaudited)
| | | | | | | | | | | | |
| | | Value
Discovery
Fund
| | | Income
Fund
| | | Ready
Reserves
Fund
| |
Assets | | | | | | | | | | | | |
Investments in securities, at cost | | $ | 43,229 | | | $ | 308,989 | | | $ | 1,184,884 | |
Investments in Affiliated Fund, at cost | | | 101 | | | | — | | | | — | |
| | |
|
|
| |
|
|
| |
|
|
|
| | | |
Investments in securities, at value | | $ | 49,121 | | | $ | 299,754 | | | $ | 1,184,884 | |
Investments in Affiliated Fund, at value | | | 101 | | | | — | | | | — | |
Cash | | | 57 | | | | 4 | | | | — | |
Receivable for fund shares sold | | | 30 | | | | 169 | | | | — | |
Receivable for investment securities sold | | | 882 | | | | — | | | | — | |
Receivable from Advisor | | | — | | | | 13 | | | | — | |
Dividend and interest receivable | | | 63 | | | | 2,873 | | | | 4,932 | |
| | |
|
|
| |
|
|
| |
|
|
|
Total assets | | | 50,254 | | | | 302,813 | | | | 1,189,816 | |
Liabilities | | | | | | | | | | | | |
Payable for investment securities purchased | | | 852 | | | | 2,096 | | | | 29,834 | |
Payable for fund shares redeemed | | | 474 | | | | 734 | | | | — | |
Management fee payable | | | 23 | | | | 36 | | | | 217 | |
Distribution fee payable | | | 30 | | | | 11 | | | | — | |
Shareholder services fee payable | | | — | | | | — | | | | 337 | |
Dividend payable | | | — | | | | — | | | | 286 | |
Other accrued expenses | | | 34 | | | | 42 | | | | 93 | |
| | |
|
|
| |
|
|
| |
|
|
|
Total liabilities | | | 1,413 | | | | 2,919 | | | | 30,767 | |
| | |
|
|
| |
|
|
| |
|
|
|
Net Assets | | $ | 48,841 | | | $ | 299,894 | | | $ | 1,159,049 | |
| | |
|
|
| |
|
|
| |
|
|
|
Capital | | | | | | | | | | | | |
Composition of Net Assets | | | | | | | | | | | | |
Par value of shares of beneficial interest | | $ | 3 | | | $ | 31 | | | $ | 793 | |
Capital paid in excess of par value | | | 28,401 | | | | 327,102 | | | | 1,159,202 | |
Accumulated net investment income (loss) | | | (56 | ) | | | (513 | ) | | | 81 | |
Accumulated realized gain (loss) | | | 14,601 | | | | (17,491 | ) | | | (1,027 | ) |
Net unrealized appreciation (depreciation) of investments and foreign currencies | | | 5,892 | | | | (9,235 | ) | | | — | |
| | |
|
|
| |
|
|
| |
|
|
|
Net Assets | | $ | 48,841 | | | $ | 299,894 | | | $ | 1,159,049 | |
| | |
|
|
| |
|
|
| |
|
|
|
| | | |
Class N Shares | | | | | | | | | | | | |
Net Assets | | $ | 8,633 | | | $ | 92,310 | | | $ | 1,159,049 | |
Shares Outstanding | | | 531,995 | | | | 9,598,288 | | | | 1,159,103,311 | |
Net Asset Value Per Share | | $ | 16.23 | | | $ | 9.62 | | | $ | 1.00 | |
Class I Shares | | | | | | | | | | | | |
Net Assets | | $ | 40,208 | | | $ | 207,584 | | | | | |
Shares Outstanding | | | 2,446,045 | | | | 21,612,876 | | | | | |
Net Asset Value Per Share | | $ | 16.44 | | | $ | 9.60 | | | | | |
See accompanying Notes to Financial Statements.
82 Semi-Annual Report | June 30, 2006 |
Statements of Operations
For the Period Ended June 30, 2006 (all dollar amounts in thousands) (unaudited)
| | | | | | | | | | | |
| | | Value
Discovery
Fund
| | | Income
Fund
| | | Ready
Reserves
Fund
|
Investment income | | | | | | | | | | | |
Dividends | | $ | 230 | | | $ | — | | | $ | — |
Income from Affiliated Fund | | | 3 | | | | — | | | | — |
Interest | | | 11 | | | | 7,943 | | | | 26,909 |
| | |
|
|
| |
|
|
| |
|
|
Total income | | | 244 | | | | 7,943 | | | | 26,909 |
Expenses | | | | | | | | | | | |
Investment advisory fees | | | 302 | | | | 717 | | | | 1,380 |
Distribution fees | | | 13 | | | | 73 | | | | — |
Shareholder services fees | | | — | | | | — | | | | 2,003 |
Custodian fees | | | 52 | | | | 62 | | | | 86 |
Transfer agent fees | | | 16 | | | | 53 | | | | 17 |
Professional fees | | | 19 | | | | 19 | | | | 36 |
Registration fees | | | 15 | | | | 18 | | | | 15 |
Other expenses | | | 16 | | | | 12 | | | | 74 |
| | |
|
|
| |
|
|
| |
|
|
Total expenses before waiver | | | 433 | | | | 954 | | | | 3,611 |
Less expenses waived or absorbed by the Advisor | | | (130 | ) | | | (13 | ) | | | — |
| | |
|
|
| |
|
|
| |
|
|
Net expenses | | | 303 | | | | 941 | | | | 3,611 |
| | |
|
|
| |
|
|
| |
|
|
Net investment income (loss) | | | (59 | ) | | | 7,002 | | | | 23,298 |
Net realized and unrealized gain (loss) on investments, foreign currency transactions and other assets and liabilities | | | | | | | | | | | |
Net realized gain (loss) on investments | | | 11,610 | | | | (741 | ) | | | — |
| | |
|
|
| |
|
|
| |
|
|
Change in net unrealized appreciation (depreciation) on investments and other assets and liabilities | | | (6,327 | ) | | | (5,433 | ) | | | — |
| | |
|
|
| |
|
|
| |
|
|
Net increase (decrease) in net assets resulting from operations | | $ | 5,224 | | | $ | 828 | | | $ | 23,298 |
| | |
|
|
| |
|
|
| |
|
|
See accompanying Notes to Financial Statements.
June 30, 2006 | William Blair Funds 83 |
Statements of Changes in Net Assets
For the Period Ended June 30, 2006 and the Year Ended December 31, 2005 (all amounts in thousands)
| | | | | | | | | | | | | | | | | | | | | | | | |
| | | Value
Discovery
Fund
| | | Income
Fund
| | | Ready
Reserves
Fund
| |
| | | 2006
| | | 2005
| | | 2006
| | | 2005
| | | 2006
| | | 2005
| |
Operations | | | (unaudited | ) | | | | | | | (unaudited | ) | | | | | | | (unaudited | ) | | | | |
Net investment income (loss) | | $ | (59 | ) | | $ | (48 | ) | | $ | 7,002 | | | $ | 12,852 | | | $ | 23,298 | | | $ | 27,823 | |
Net realized gain (loss) on investments, foreign currency transactions and other assets and liabilities | | | 11,610 | | | | 39,004 | | | | (741 | ) | | | (1,052 | ) | | | — | | | | — | |
Change in net unrealized appreciation (depreciation) on investments, foreign currency transactions and other assets and liabilities | | | (6,327 | ) | | | (49,149 | ) | | | (5,433 | ) | | | (6,151 | ) | | | — | | | | — | |
| | |
|
|
| |
|
|
| |
|
|
| |
|
|
| |
|
|
| |
|
|
|
Net increase (decrease) in net assets resulting from operations | | | 5,224 | | | | (10,193 | ) | | | 828 | | | | 5,649 | | | | 23,298 | | | | 27,823 | |
Distributions to shareholders from | | | | | | | | | | | | | | | | | | | | | | | | |
Net investment income | | | — | | | | — | | | | (7,515 | ) | | | (16,070 | ) | | | (23,298 | ) | | | (27,823 | ) |
Net realized gain | | | — | | | | (24,647 | ) | | | — | | | | — | | | | — | | | | — | |
| | |
|
|
| |
|
|
| |
|
|
| |
|
|
| |
|
|
| |
|
|
|
| | | | — | | | | (24,647 | ) | | | (7,515 | ) | | | (16,070 | ) | | | (23,298 | ) | | | (27,823 | ) |
Capital stock transactions | | | | | | | | | | | | | | | | | | | | | | | | |
Net proceeds from sale of shares | | | 4,991 | | | | 19,288 | | | | 33,182 | | | | 95,102 | | | | 531,027 | | | | 1,131,031 | |
Shares issued in reinvestment of income dividends and capital gain distributions | | | — | | | | 24,267 | | | | 5,933 | | | | 12,541 | | | | 23,337 | | | | 27,698 | |
Less cost of shares redeemed | | | (31,813 | ) | | | (184,452 | ) | | | (43,030 | ) | | | (80,810 | ) | | | (487,169 | ) | | | (1,159,815 | ) |
| | |
|
|
| |
|
|
| |
|
|
| |
|
|
| |
|
|
| |
|
|
|
Net increase (decrease) in net assets resulting from capital stock transactions | | | (26,822 | ) | | | (140,897 | ) | | | (3,915 | ) | | | 26,833 | | | | 67,195 | | | | (1,086 | ) |
| | |
|
|
| |
|
|
| |
|
|
| |
|
|
| |
|
|
| |
|
|
|
Increase (decrease) in net assets | | | (21,598 | ) | | | (175,737 | ) | | | (10,602 | ) | | | 16,412 | | | | 67,195 | | | | (1,086 | ) |
Net assets | | | | | | | | | | | | | | | | | | | | | | | | |
Beginning of period | | | 70,439 | | | | 246,176 | | | | 310,496 | | | | 294,084 | | | | 1,091,854 | | | | 1,092,940 | |
| | |
|
|
| |
|
|
| |
|
|
| |
|
|
| |
|
|
| |
|
|
|
End of period | | $ | 48,841 | | | $ | 70,439 | | | $ | 299,894 | | | $ | 310,496 | | | $ | 1,159,049 | | | $ | 1,091,854 | |
| | |
|
|
| |
|
|
| |
|
|
| |
|
|
| |
|
|
| |
|
|
|
Undistributed net investment income (loss) at the end of the period | | $ | (56 | ) | | $ | 3 | | | $ | (513 | ) | | $ | — | | | $ | 81 | | | $ | 81 | |
| | |
|
|
| |
|
|
| |
|
|
| |
|
|
| |
|
|
| |
|
|
|
See accompanying Notes to Financial Statements.
84 Semi-Annual Report | June 30, 2006 |
Notes to Financial Statements (unaudited)
(1) Significant Accounting Policies
The following is a summary of the Funds’ significant accounting policies in effect during the period covered by the financial statements, which are in accordance with U.S. generally accepted accounting principles.
(a) Description of the Fund
William Blair Funds (the “Fund”) is a diversified mutual fund registered under the Investment Company Act of 1940, as amended, as an open-end management investment company. For each portfolio, the number of shares authorized is unlimited. The Fund currently consists of the following fifteen portfolios (the “Portfolios”), each with its own investment objectives and policies.
| | |
Equity Portfolios
| | International Portfolios
|
Growth | | International Growth |
Tax-Managed Growth | | International Equity |
Large Cap Growth | | International Small Cap Growth |
Small Cap Growth | | Institutional International Growth |
Mid Cap Growth | | Institutional International Equity |
Small-Mid Cap Growth | | Emerging Markets Growth |
Value Discovery | | Fixed Income Portfolio
|
| | | Income |
| | | Money Market Portfolio
|
| | | Ready Reserves |
The investment objectives of the Portfolios are as follows:
| | |
Equity | | Long-term capital appreciation. |
International | | Long-term capital appreciation. |
Fixed Income | | High level of current income with relative stability of principal. |
Money Market | | Current income, a stable share price and daily liquidity. |
The Institutional International Growth Fund, the Institutional International Equity Fund and the Institutional Class of the International Small Cap Growth Fund and Emerging Markets Growth Fund issue a separate report.
(b) Share Classes
Three different classes of shares currently exist: N, I and Institutional. This report includes financial highlight information for Classes N and I. The table below describes the Class N shares and the Class I shares covered by this report:
| | |
Class
| | Description
|
| N | | Class N shares are sold to the general public, either directly through the Fund’s distributor or through a select number of financial intermediaries. Class N shares are sold without any sales load, and carry an annual 12b-1 distribution fee (0.25% for the Equity and International Portfolios and 0.15% for the Fixed Income Portfolio) or a service fee (0.35% for the Money Market Portfolio), and an annual shareholder administration fee (0.15% for the International Small Cap Growth Portfolio and Emerging Markets Growth Portfolio). |
| I | | Class I shares are sold to a limited group of investors. They do not carry any sales load or distribution fees and generally have lower ongoing expenses than the other classes. Class I shares of the International Small Cap Growth Portfolio and Emerging Markets Growth Portfolio carry an annual shareholder administration fee of 0.15%. |
Investment income, realized and unrealized gains and losses, and certain portfolio level expenses and expense reductions, if any, are allocated based on the relative net assets of each class, except for certain class specific expenses which are charged directly to the appropriate class. Differences in class expenses may result in the payment of different per share dividends by class. All share classes of the Portfolios have equal rights with respect to voting subject to class specific arrangements.
June 30, 2006 | William Blair Funds 85 |
(c) Investment Valuation
The market value of domestic equity securities and options is determined by valuing securities traded on national securities exchanges or markets or in the over-the-counter markets at the last sales price or, if applicable, the official closing price or, in the absence of a sale on the date of valuation, at the latest bid price.
For international securities, if the foreign exchange or market on which a security is primarily traded closes before the close of regular trading on the New York Stock Exchange (4:00 p.m. Eastern time), the Funds use an independent pricing service on a daily basis to estimate the fair value price as of the close of regular trading on the New York Stock Exchange. The Board of Trustees has determined that the passage of time between when foreign exchanges or markets close and when the Funds calculate their net asset values could cause the value of international securities to no longer be representative of their market price or accurate. In addition, quarterly the Board of Trustees receives a report which tracks the fair value prices used to calculate the net asset value to the next day’s opening local prices. Otherwise, the value of foreign equity securities is determined based on the last sale price on the foreign exchange or market on which it is primarily traded or, if there have been no sales during that day, at the latest bid price. Foreign currency forward contracts and foreign currencies are valued at the forward and current exchange rates, respectively, prevailing on the date of valuation.
Long-term, fixed income securities are valued based on market quotations, or by independent pricing services that use prices provided by market makers or by estimates of market values obtained from yield data relating to instruments or securities with similar characteristics.
Investments in other funds are valued at the underlying fund’s net asset value on the date of valuation. Other securities, and all other assets, including securities for which a market price is not available, or the value of which is affected by a significant valuation event, are valued at fair value as determined in good faith by the Valuation Committee, in accordance with the Fund’s valuation procedures approved by the Board of Trustees. As of June 30, 2006, there were securities held in Small Cap Growth, International Growth, International Equity, International Small Cap Growth and the Emerging Markets Growth Portfolios requiring fair valuation pursuant to the Fund’s valuation procedures. Short-term securities held in the Ready Reserves Fund are valued at amortized cost, which approximates market value.
(d) Investment income and transactions
Dividend income is recorded on the ex-dividend date, except for those dividends from certain foreign securities which are recorded as soon as the information is available. Foreign currency gains and losses associated with fluctuations in the foreign currency rate versus the United States dollar are recorded in the Statement of Operations as a component of the net realized gain (loss) on foreign currency transactions and other assets and liabilities.
Premiums and discounts are accreted and amortized on a straight-line basis for short-term investments and on an effective interest method for long-term investments.
Interest income is determined on the basis of the interest accrued, adjusted for amortization of premium or discount. Variable rate bonds and floating rate notes earn interest at coupon rates that fluctuate at specific time intervals. The interest rates shown in the Portfolio of Investments for the Income Portfolio and the Ready Reserves Portfolio were the rates in effect on June 30, 2006. Put bonds may be redeemed at the discretion of the holder on specified dates prior to maturity.
Paydown gains and losses on mortgage and asset-backed securities are treated as an adjustment to interest income. For the period ended June 30, 2006, the Income Portfolio recognized a reduction of interest income and a reduction of net realized loss of $1,255 (in thousands). This reclassification has no effect on the net asset value of the Portfolio.
Security and shareholder transactions are accounted for no later than one business day following the trade date. However, for financial reporting purposes, security and shareholder transactions are accounted for on the trade date of the last business day of the reporting period. Realized gains and losses from securities transactions are recognized on the basis of high cost lot sell selection.
Awards from class action litigation may be recorded as a reduction of cost. If the Funds no longer own the applicable securities, the proceeds are recorded as realized gains.
(e) Share Valuation and Dividends to Shareholders
Shares are sold and redeemed on a continuous basis at net asset value. The net asset value per share is determined separately for each class by dividing the Portfolio’s net assets attributable to that class by the number of shares of the class outstanding
86 Semi-Annual Report | June 30, 2006 |
as of the close of regular trading on the New York Stock Exchange, which is generally 3:00 p.m. Central time (4:00 p.m. Eastern time), on each day the Exchange is open. Redemption fees may be applicable to redemptions or exchanges within 60 days of purchase. For both Class N and Class I shares, the William Blair domestic equity funds assess a 1% redemption fees on shares sold or exchanged that have been owned 60 days or less and the William Blair international funds assess a 2% redemption fees on shares sold or exchanged that have been owned 60 days or less as disclosed within the Funds’ Prospectus. The redemption fees collected by the Fund are netted against the amount of Redemptions for presentation on the Statement of Changes in Net Assets.
For the period ended June 30, 2006, the redemption fees collected by the Portfolios were as follows (in thousands):
| | | |
| | | Redemption
Fees
|
Growth | | $ | 1 |
Tax-Managed Growth | | | — |
Large Cap Growth | | | — |
Small Cap Growth | | | 42 |
Mid Cap Growth Fund | | | — |
Small Mid-Cap Growth | | | 3 |
International Growth | | | 92 |
International Equity | | | 16 |
International Small Cap Growth | | | 3 |
Emerging Markets Growth | | | 19 |
Value Discovery | | | — |
Dividends from net investment income, if any, of the Growth, Tax-Managed Growth, Large Cap Growth, Small Cap Growth, Mid Cap Growth, Small-Mid Cap Growth, International Growth, International Equity, International Small Cap Growth, Emerging Markets Growth and Value Discovery Portfolios are declared at least annually. Dividends from the Income and the Ready Reserves Portfolios are declared monthly and daily, respectively. Capital gain distributions, if any, are declared at least annually in December. Dividends payable to shareholders are recorded on the ex-dividend date.
(f) Foreign Currency Translation and Forward Foreign Currency Contracts
The International Growth, International Equity, International Small Cap Growth and Emerging Markets Growth Portfolios may invest in securities denominated in foreign currencies. As such, assets and liabilities denominated in foreign currencies are translated into U.S. dollar amounts at the current exchange rate on the date of valuation. The values of foreign investments, open foreign currency forward contracts, and cash denominated in foreign currencies are translated into U.S. dollars using a spot market rate of exchange as of the time of the determination of each Fund’s NAV, typically 4:00 p.m. Eastern time on days when there is regular trading on the New York Stock Exchange. Payables and receivables for securities transactions, dividends, interest income and tax reclaims are translated into U.S. dollars using a spot market rate of exchange as of 4:00 p.m. Eastern time. Settlement of purchases and sales and dividend and interest receipts are translated into U.S. dollars using a spot market rate of exchange as of 11:00 a.m. Eastern time.
The Portfolios may enter into foreign currency forward contracts (1) as a means of managing the risks associated with changes in the exchange rates for the purchase or sale of a specific amount of a particular foreign currency, and (2) to hedge the value, in U.S. dollars, of portfolio securities. Gains and losses from foreign currency transactions associated with purchases and sales of investments and foreign currency forward contracts are included with the net realized and unrealized gain or loss on investments. For tax purposes these foreign currency gains and losses are treated as ordinary income.
(g) Options
The Portfolios may engage in options transactions on security indices and other financial indices and in doing so achieve similar objectives to what they would achieve through the sale or purchase of options on individual securities or other instruments.
Option writing. When a Portfolio writes an option, an amount equal to the premium received by the Portfolio is recorded as a liability and is subsequently adjusted to the current fair value of the option written. Premiums received from writing options that expire unexercised are treated by the Portfolio on the expiration date as realized gains from investments. The difference between the premium and the amount paid on effecting a closing purchase transaction, including brokerage commissions, is
June 30, 2006 | William Blair Funds 87 |
also treated as a realized gain, or, if the premium is less than the amount paid for the closing purchase transaction, as a realized loss. If a call option is exercised, the premium is added to the proceeds from the sale of the underlying security or currency in determining whether the Portfolio has realized a gain or loss. If a put option is exercised, the premium reduces the cost basis of the securities purchased by the Portfolio. The Portfolio as writer of an option bears the market risk of an unfavorable change in the price of the security underlying the written option. There were no open options at June 30, 2006.
(h) Income Taxes
Each Portfolio intends to comply with the special provisions of Subchapter M of the Internal Revenue Code available to regulated investment companies and, therefore, no provision for Federal income taxes has been made in the accompanying financial statements since each Portfolio intends to distribute substantially all of its taxable income to its shareholders and be relieved of all Federal income taxes.
On July 13, 2006, the Financial Accounting Standards Board (FASB) released FASB Interpretation No. 48 “Accounting for Uncertainty in Income Taxes” (FIN 48). FIN 48 provides guidance for how uncertain tax positions should be recognized, measured, presented and disclosed in the financial statements. FIN 48 requires the evaluation of tax positions taken or expected to be taken in the course of preparing the Fund’s tax returns to determine whether the tax positions are “more-likely-than-not” of being sustained by the applicable tax authority. Tax positions not deemed to meet the more-likely-than-not threshold would be recorded as a tax benefit or expense in the current year. Adoption of FIN 48 is required for fiscal years beginning after December 15, 2006 and is to be applied to all open tax years as of the effective date. At this time, management is evaluating the implications of FIN 48 and its impact in the financial statements has not yet been determined.
The cost of investments for Federal income tax purposes and related gross unrealized appreciation/(depreciation) and net unrealized appreciation/(depreciation) at June 30, 2006, were as follows (in thousands):
| | | | | | | | | | | | | |
Portfolio
| | Cost of
Investments
| | Gross Unrealized Appreciation
| | Gross Unrealized Depreciation
| | Net Unrealized
Appreciation/ (Depreciation)
| |
Growth | | $ | 189,558 | | $ | 58,333 | | $ | 4,130 | | $ | 54,203 | |
Tax-Managed Growth | | | 6,775 | | | 1,765 | | | 161 | | | 1,604 | |
Large Cap Growth | | | 16,757 | | | 1,754 | | | 374 | | | 1,380 | |
Small Cap Growth | | | 1,023,759 | | | 147,003 | | | 38,055 | | | 108,948 | |
Mid Cap Growth | | | 11,852 | | | 510 | | | 574 | | | (64 | ) |
Small-Mid Cap Growth | | | 74,708 | | | 10,947 | | | 2,475 | | | 8,472 | |
International Growth | | | 4,278,376 | | | 1,118,621 | | | 87,916 | | | 1,030,705 | |
International Equity | | | 220,270 | | | 20,720 | | | 3,886 | | | 16,834 | |
International Small Cap Growth | | | 111,107 | | | 7,731 | | | 2,517 | | | 5,214 | |
Emerging Markets Growth | | | 428,175 | | | 41,653 | | | 15,338 | | | 26,315 | |
Value Discovery | | | 43,612 | | | 6,778 | | | 1,168 | | | 5,610 | |
Income | | | 309,072 | | | 409 | | | 9,727 | | | (9,318 | ) |
Ready Reserves | | | 1,184,884 | | | — | | | — | | | — | |
88 Semi-Annual Report | June 30, 2006 |
The timing and characterization of certain income and capital gain distributions are determined annually in accordance with Federal income tax regulations that may differ from U.S. generally accepted accounting principles. As a result, net investment income or loss and net realized gain or loss for a reporting period may differ from the amount distributed during such period. In addition, the Portfolios may periodically record reclassifications among certain capital accounts to reflect differences between financial reporting and income tax basis distributions. The reclassifications were reported in order to reflect the tax treatment for certain permanent differences that exist between income tax regulations and U.S. generally accepted accounting principles. The reclassifications relate to net operating losses, Section 988 currency gains and losses, recharacterization of dividends received from investments in REITs, expired capital loss carryforwards, and gain or loss on in-kind transactions. These reclassifications have no impact on the net asset values of the Portfolios. Accordingly, at December 31, 2005, the following reclassifications were recorded (in thousands):
| | | | | | | | | | | | |
Portfolio
| | Undistributed Net
Investment Income/(Loss)
| | | Accumulated
Undistributed
Net Realized Gain/(Loss)
| | | Capital
Paid In Excess
of Par Value
| |
Growth | | $ | 986 | | | $ | 1 | | | $ | (987 | ) |
Tax-Managed Growth | | | 32 | | | | — | | | | (32 | ) |
Large Cap Growth | | | 21 | | | | — | | | | (21 | ) |
Small Cap Growth | | | 8,349 | | | | (8,316 | ) | | | (33 | ) |
Small-Mid Cap Growth | | | 382 | | | | (20 | ) | | | (362 | ) |
International Growth | | | (10,344 | ) | | | 10,344 | | | | — | |
International Equity | | | (475 | ) | | | 472 | | | | 3 | |
International Small Cap Growth | | | (87 | ) | | | 87 | | | | — | |
Emerging Markets Growth | | | (391 | ) | | | 391 | | | | — | |
Value Discovery | | | 15 | | | | (16,587 | ) | | | 16,572 | |
Income | | | 3,045 | | | | (2,990 | ) | | | (55 | ) |
Ready Reserves | | | — | | | | 1 | | | | (1 | ) |
Distributions from net realized gains for book purposes may include short-term capital gains, which are included as ordinary income for tax purposes. The tax character of distributions paid during 2005 and 2004 was as follows (in thousands):
| | | | | | | | | | | | |
| | | Distributions Paid In 2005
| | Distributions Paid In 2004
|
Portfolio
| | Ordinary
Income
| | Long-Term
Capital Gains
| | Ordinary
Income
| | Long-Term
Capital Gains
|
Growth | | $ | — | | $ | 8,977 | | $ | — | | $ | — |
Tax-Managed Growth | | | — | | | — | | | — | | | — |
Large Cap Growth | | | — | | | — | | | — | | | — |
Small Cap Growth | | | 11,335 | | | 60,296 | | | 15,332 | | | 39,450 |
Small-Mid Cap Growth | | | — | | | 495 | | | — | | | — |
International Growth | | | 21,550 | | | 254,334 | | | 2,616 | | | — |
International Equity | | | — | | | — | | | — | | | — |
International Small Cap Growth | | | 6 | | | — | | | — | | | — |
Emerging Markets Growth | | | 1,169 | | | — | | | — | | | — |
Value Discovery | | | — | | | 24,647 | | | — | | | 26,037 |
Income | | | 16,070 | | | — | | | 14,033 | | | — |
Ready Reserves | | | 27,823 | | | — | | | 8,967 | | | — |
June 30, 2006 | William Blair Funds 89 |
As of December 31, 2005, the components of distributable earnings on a tax basis were as follows (in thousands):
| | | | | | | | | | | | | |
Portfolio
| | Undistributed
Ordinary
Income
| | Accumulated
Capital and
Other Losses
| | Undistributed
Long-Term
Gain
| | Net Unrealized
Appreciation/ (Depreciation)
| |
Growth | | $ | — | | $ | — | | $ | 2,034 | | $ | 63,480 | |
Tax-Managed Growth | | | — | | | 1,796 | | | — | | | 2,113 | |
Large Cap Growth | | | — | | | 5,327 | | | — | | | 1,659 | |
Small Cap Growth | | | — | | | 7,540 | | | — | | | 117,869 | |
Small-Mid Cap Growth | | | — | | | — | | | 1,113 | | | 8,223 | |
International Growth | | | 24,244 | | | — | | | 34,770 | | | 1,169,428 | |
International Equity | | | 1,109 | | | 1,042 | | | — | | | 14,362 | |
International Small Cap Growth | | | 511 | | | — | | | — | | | 4,111 | |
Emerging Markets Growth | | | 404 | | | — | | | 1,158 | | | 28,559 | |
Value Discovery | | | — | | | — | | | 4,318 | | | 10,896 | |
Income | | | — | | | 16,667 | | | — | | | (3,885 | ) |
Ready Reserves | | | 81 | | | 1,027 | | | — | | | — | |
At December 31, 2005, the Portfolios have unused capital loss carryforwards available for Federal income tax purposes to be applied against future capital gains, if any. If not applied, the carryforwards will expire as follows (in thousands):
| | | | | | | | | | | | | | | | | | | | | | | | | | | |
Portfolio
| | 2006
| | 2007
| | 2008
| | 2009
| | 2010
| | 2011
| | 2012
| | 2013
| | Total
|
Growth | | $ | — | | $ | — | | $ | — | | $ | — | | $ | — | | $ | — | | $ | — | | $ | — | | $ | — |
Tax-Managed Growth | | | — | | | — | | | — | | | 273 | | | 1,037 | | | 468 | | | — | | | — | | | 1,778 |
Large Cap Growth | | | — | | | — | | | 246 | | | 2,714 | | | 1,582 | | | 769 | | | — | | | — | | | 5,311 |
Small Cap Growth | | | — | | | — | | | — | | | — | | | — | | | — | | | — | | | — | | | — |
Small-Mid Cap Growth | | | — | | | — | | | — | | | — | | | — | | | — | | | — | | | — | | | — |
International Growth | | | — | | | — | | | — | | | — | | | — | | | — | | | — | | | — | | | — |
International Equity | | | — | | | — | | | — | | | — | | | — | | | — | | | — | | | 1,042 | | | 1,042 |
International Small Cap Growth | | | — | | | — | | | — | | | — | | | — | | | — | | | — | | | — | | | — |
Emerging Markets Growth | | | — | | | — | | | — | | | — | | | — | | | — | | | — | | | — | | | — |
Value Discovery | | | — | | | — | | | — | | | — | | | — | | | — | | | — | | | — | | | — |
Income | | | — | | | 1,249 | | | 3,292 | | | — | | | 1,692 | | | 1,582 | | | 4,431 | | | 3,398 | | | 15,644 |
Ready Reserves | | | 1 | | | 51 | | | 24 | | | — | | | 930 | | | — | | | 21 | | | — | | | 1,027 |
The International Growth, International Equity, International Small Cap Growth and Emerging Markets Growth Portfolios have elected to mark-to-market their investments in Passive Foreign Investment Companies (“PFICs”) for Federal income tax purposes. In accordance with this election, the Portfolios recognized net unrealized appreciation/(depreciation) of $51,869, $1,706, $117 and $726, respectively (in thousands) in 2005, all of which has been reclassified from unrealized gain/(loss) on investments to undistributed net investment income.
For the period November 1, 2005 through December 31, 2005, the following Portfolios incurred net realized capital or foreign currency losses. Each Portfolios intends to treat this loss as having occurred in fiscal year 2006 for Federal income tax purposes (in thousands):
| | | |
Portfolio
| | Capital
Loss
|
Growth | | $ | — |
Tax-Managed Growth | | | 18 |
Large Cap Growth | | | 16 |
Small Cap Growth | | | 7,540 |
Small-Mid Cap Growth | | | — |
International Growth | | | — |
International Equity | | | — |
International Small Cap Growth | | | — |
Emerging Markets Growth | | | — |
Value Discovery | | | — |
Income | | | 1,023 |
Ready Reserves | | | — |
90 Semi-Annual Report | June 30, 2006 |
(i) Use of Estimates
The preparation of financial statements in conformity with U.S. generally accepted accounting principles requires management to make estimates and assumptions that affect the amounts reported in the financial statements. Actual results may differ from those estimates.
(2) Transactions with Affiliates
(a) Management and Expense Limitation Agreements
Each Portfolio has a management agreement with William Blair & Company L.L.C. (the “Company”) for investment advisory, clerical, bookkeeping and administrative services. Each Portfolio pays the Company an annual fee, payable monthly, based on a specified percentage of its average daily net assets. A summary of the annual rates expressed as a percentage of average daily net assets is as follows:
| | | | | | | | |
Equity Portfolios
| | | | | International Portfolios
| | | |
Growth | | 0.75 | % | | International Growth and International Equity | | | |
Tax-Managed Growth | | 0.80 | % | | First $250 million | | 1.10 | % |
Large Cap Growth | | 0.80 | % | | In excess of $250 million | | 1.00 | % |
Small Cap Growth | | 1.10 | % | | International Small Cap Growth | | 1.00 | % |
Mid Cap Growth | | 0.95 | % | | Emerging Markets Growth | | 1.10 | % |
Small-Mid Cap Growth | | 1.00 | % | | | | | |
Value Discovery | | 1.10 | % | | | | | |
| | | |
Fixed Income Portfolio
| | | | | Money Market Portfolio
| | | |
Income* | | | | | Ready Reserves | | | |
First $250 million | | 0.25 | % | | First $250 million | | 0.275 | % |
In excess of $250 million | | 0.20 | % | | Next $250 million | | 0.250 | % |
| | | | | Next $2 billion | | 0.225 | % |
*Management fee also includes a charge of 5% of gross income. | | | | | In excess of $2.5 billion | | 0.200 | % |
Some of the Portfolios have also entered into Expense Limitation Agreements with the Company. Under the terms of these Agreements, the Company has agreed to waive its advisory fees and absorb other operating expenses through April 30, 2007, if total expenses for each class of the following Portfolios exceed the following rates (as a percentage of average daily net assets):
| | | | | | | | | | | | |
| | | Class N Shares
| | | Class I Shares
| |
| | | Through April 30, 2006
| | | Effective
May 1, 2006
| | | Through April 30, 2006
| | | Effective
May 1, 2006
| |
Tax-Managed Growth | | 1.53 | % | | 1.40 | % | | 1.28 | % | | 1.15 | % |
Large Cap Growth | | 1.25 | % | | 1.23 | % | | 1.00 | % | | 0.98 | % |
Small Cap Growth | | 1.50 | % | | 1.50 | % | | 1.25 | % | | 1.25 | % |
Mid Cap Growth Fund | | 1.40 | % | | 1.40 | % | | 1.15 | % | | 1.15 | % |
Small-Mid Cap Growth | | 1.40 | % | | 1.37 | % | | 1.15 | % | | 1.12 | % |
International Growth | | 1.48 | % | | 1.45 | % | | 1.23 | % | | 1.20 | % |
International Equity | | 1.48 | % | | 1.45 | % | | 1.23 | % | | 1.20 | % |
International Small Cap Growth | | 1.65 | % | | 1.65 | % | | 1.40 | % | | 1.40 | % |
Emerging Markets Growth | | 1.65 | % | | 1.65 | % | | 1.40 | % | | 1.40 | % |
Value Discovery | | 1.34 | % | | 1.34 | % | | 1.09 | % | | 1.09 | % |
Income Fund | | 0.75 | % | | 0.75 | % | | N/A | | | N/A | |
For a period of three years subsequent to the Commencement of Operations of the Mid Cap Growth, Small-Mid Cap Growth, the International Equity, International Small Cap Growth and the Emerging Markets Growth Portfolios, the Company is entitled to reimbursement for previously waived fees and expenses to the extent the overall expense ratio remains below the percentages indicated. The total amount available for recapture at June 30, 2006 is $59 (in thousands) for the Mid Cap Growth Portfolio, $153 for the Small-Mid Cap Growth Portfolio, $355 for the International Equity Portfolio, $92 for the International Small Cap Growth Portfolio and $299 for the Emerging Markets Growth Portfolio.
June 30, 2006 | William Blair Funds 91 |
For the period ended June 30, 2006, the investment advisory fees incurred by the Portfolios and related fee waivers were as follows (in thousands):
| | | | | | | | | | | | |
Portfolio
| | Gross
Advisory Fee
| | Fee Waiver
| | Net
Advisory Fee
| | Additional Expenses
(Recovered) or
Absorbed
by Advisor
|
Growth | | $ | 960 | | $ | — | | $ | 960 | | $ | — |
Tax-Managed Growth | | | 33 | | | 30 | | | 3 | | | — |
Large Cap Growth | | | 71 | | | 39 | | | 32 | | | — |
Small Cap Growth | | | 5,749 | | | — | | | 5,749 | | | — |
Mid Cap Growth | | | 37 | | | 37 | | | — | | | 22 |
Small-Mid Cap Growth | | | 397 | | | 22 | | | 375 | | | — |
International Growth | | | 25,963 | | | — | | | 25,963 | | | — |
International Equity | | | 1,224 | | | 111 | | | 1,113 | | | — |
International Small Cap Growth | | | 361 | | | 38 | | | 323 | | | — |
Emerging Markets Growth | | | 1,859 | | | 138 | | | 1,721 | | | — |
Value Discovery | | | 302 | | | 130 | | | 172 | | | — |
Income | | | 717 | | | — | | | 717 | | | — |
Ready Reserves | | | 1,380 | | | — | | | 1,380 | | | — |
(b) Underwriting, Distribution Services and Service Agreement
Each Portfolio except Ready Reserves Portfolio has a Distribution Agreement with the Company for distribution services. Each Portfolio pays the Company an annual fee, payable monthly, based on a specified percentage of its average daily net assets of specified share classes. The annual rates expressed as a percentage of average daily net assets for Class N is 0.25% for all Portfolios except the Income Portfolio, which is 0.15%. Pursuant to the Distribution Agreement, the Company enters into related selling group agreements with various firms at various rates for sales of the Portfolios’ Class N shares.
Distribution fees incurred by the Portfolios to the Company, for the period ended June 30, 2006, were as follows (in thousands):
| | | | | | | | | |
Portfolio
| | Gross Distribution Fees
| | Fee Waiver
| | Net Distribution Fee
|
Growth | | $ | 64 | | $ | — | | $ | 64 |
Tax-Managed Growth | | | — | | | — | | | — |
Large Cap Growth | | | 12 | | | — | | | 12 |
Small Cap Growth | | | 772 | | | — | | | 772 |
Mid Cap Growth | | | 4 | | | — | | | 4 |
Small-Mid Cap Growth | | | 16 | | | — | | | 16 |
International Growth | | | 4,499 | | | — | | | 4,499 |
International Equity | | | 37 | | | — | | | 37 |
International Small Cap Growth | | | 11 | | | — | | | 11 |
Emerging Markets Growth | | | 44 | | | — | | | 44 |
Value Discovery | | | 13 | | | — | | | 13 |
Income | | | 73 | | | 13 | | | 60 |
The Ready Reserves Portfolio has a Service Agreement with the Company to provide shareholder services and automatic sweep services. The Portfolio pays the Company an annual fee, payable monthly, based upon 0.35% of the average daily net assets of Class N. For the period ended June 30, 2006, the following fees were incurred (in thousands):
The International Small Cap Growth and the Emerging Markets Growth Portfolios have a Shareholder Administration Agreement with the Company to provide shareholder administration services. Class N and Class I shares of the Portfolios pay the Company an annual fee, payable monthly, based upon 0.15% of average daily net assets attributable to each class, respectively. For the period ended June 30, 2006, the following fees were incurred (in thousands):
| | | |
International Small Cap Growth | | $ | 20 |
Emerging Markets Growth | | | 67 |
92 Semi-Annual Report | June 30, 2006 |
(c) Trustees Fees
The Portfolios incurred fees of $136 (in thousands) to non-interested trustees of the Fund for the period ended June 30, 2006. Interested trustees are not compensated.
(d) Investments in Affiliated Portfolio
Pursuant to an Exemptive Order granted by the Securities and Exchange Commission in January, 2001, each of the Portfolios of the Fund may invest in the William Blair Ready Reserves Portfolio (“Ready Reserves”), an open-end money market portfolio managed by the Advisor. Ready Reserves Portfolio is used as a cash management option to the other Portfolios in the Fund. The Advisor waives management fees and shareholder service fees earned from the other Portfolios’ investment in the Ready Reserves Fund. The fees waived with respect to each Portfolio for the period ended June 30, 2006 are listed below. Distributions received from Ready Reserves are reflected as dividend income from affiliated Fund in each Portfolio’s statement of operations. Amounts relating to the Portfolios’ investments in Ready Reserves were as follows for the period ended June 30, 2006 (in thousands):
| | | | | | | | | | | | | | | | | | |
Portfolio
| | Purchases
| | Sales
Proceeds
| | Fees
Waived
| | Dividend
Income
| | Value
| | Percent
of Net
Assets
| |
Growth | | $ | 2,955 | | $ | 3,557 | | $ | 2 | | $ | 17 | | $ | 122 | | 0.1 | % |
Tax-Managed Growth | | | 978 | | | 1,196 | | | 1 | | | 5 | | | 145 | | 1.7 | |
Large Cap Growth | | | 3,680 | | | 4,030 | | | 1 | | | 6 | | | 74 | | 0.4 | |
Small Cap Growth | | | 1,352 | | | 5,121 | | | 30 | | | 212 | | | 7,233 | | 0.7 | |
Mid Cap Growth | | | 619 | | | 519 | | | — | | | 1 | | | 100 | | 0.8 | |
Small-Mid Cap Growth | | | 2,109 | | | 3,481 | | | 2 | | | 14 | | | 640 | | 0.7 | |
International Growth | | | 58,136 | | | 59,000 | | | 90 | | | 636 | | | 27,814 | | 0.5 | |
International Equity | | | 1,919 | | | 3,466 | | | 4 | | | 26 | | | 13 | | 0.0 | |
International Small Cap Growth | | | 2,467 | | | 2,655 | | | 2 | | | 14 | | | 222 | | 0.2 | |
Emerging Markets Growth | | | 6,458 | | | 4,517 | | | 6 | | | 44 | | | 5,762 | | 1.3 | |
Value Discovery | | | 413 | | | 385 | | | — | | | 3 | | | 101 | | 0.2 | |
(3) Investment Transactions
Investment transactions, excluding money market instruments, for the period ended June 30, 2006 were as follows (in thousands):
| | | | | | |
Portfolio
| | Purchases
| | Sales
|
Growth | | $ | 88,144 | | $ | 100,473 |
Tax-Managed Growth | | | 2,059 | | | 1,593 |
Large Cap Growth | | | 6,508 | | | 4,875 |
Small Cap Growth | | | 795,525 | | | 524,278 |
Mid Cap Growth | | | 13,958 | | | 2,227 |
Small-Mid Cap Growth | | | 38,100 | | | 26,933 |
International Growth | | | 2,154,110 | | | 1,624,528 |
International Equity | | | 152,901 | | | 107,205 |
International Small Cap Growth | | | 107,921 | | | 45,697 |
Emerging Markets Growth | | | 450,224 | | | 232,037 |
Value Discovery | | | 39,511 | | | 63,361 |
Income | | | 50,375 | | | 58,841 |
(4) Foreign Currency Forward Contracts
To protect itself against a decline in the value of foreign currency against the U.S. dollar, the International Growth, International Equity, International Small Cap Growth and Emerging Markets Growth Portfolios enter into foreign currency forward contracts with its custodian and others. The Portfolios bear the market risk that arises from changes in foreign currency rates and bears the credit risk if the counterparty fails to perform under the contract. The net realized and unrealized gains and losses associated with foreign currency forward contracts are reflected in the accompanying financial statements. There were no open foreign currency forward contracts at June 30, 2006.
June 30, 2006 | William Blair Funds 93 |
(5) Fund Share Transactions
The following table summarizes the activity in capital shares of each Portfolio (in thousands):
| | | | | | | | | | | | | | | | | | |
| | | Sales (Dollars)
|
| | | Period Ended June 30, 2006
| | Year Ended December 31, 2005
|
Portfolio
| | Class N
| | Class I
| | Total
| | Class N
| | Class I
| | Total
|
Growth | | $ | 6,828 | | $ | 4,908 | | $ | 11,736 | | $ | 10,753 | | $ | 9,054 | | $ | 19,807 |
Tax-Managed Growth | | | 7 | | | 610 | | | 617 | | | 113 | | | 1,662 | | | 1,775 |
Large Cap Growth | | | 1,171 | | | 2,090 | | | 3,261 | | | 7,918 | | | 3,738 | | | 11,656 |
Small Cap Growth | | | 229,046 | | | 172,396 | | | 401,442 | | | 236,433 | | | 108,640 | | | 345,073 |
Mid Cap Growth (a) | | | 5,948 | | | 6,359 | | | 12,307 | | | — | | | — | | | — |
Small Mid-Cap Growth | | | 1,769 | | | 12,487 | | | 14,256 | | | 5,104 | | | 38,266 | | | 43,370 |
International Growth | | | 764,066 | | | 276,776 | | | 1,040,842 | | | 1,066,440 | | | 358,231 | | | 1,424,671 |
International Equity | | | 16,729 | | | 71,404 | | | 88,133 | | | 18,044 | | | 178,024 | | | 196,068 |
International Small Cap
Growth (b) | | | 11,693 | | | 13,202 | | | 24,895 | | | 2,422 | | | 11,684 | | | 14,106 |
Emerging Markets Growth (c) | | | 22,031 | | | 34,126 | | | 56,157 | | | 20,123 | | | 31,981 | | | 52,104 |
Value Discovery | | | 1,135 | | | 3,856 | | | 4,991 | | | 1,656 | | | 17,632 | | | 19,288 |
Income (d) | | | 17,879 | | | 15,303 | | | 33,182 | | | 57,943 | | | 37,159 | | | 95,102 |
Ready Reserves | | | 531,027 | | | — | | | 531,027 | | | 1,131,031 | | | — | | | 1,131,031 |
| |
| | | Reinvested Distributions (Dollars)
|
| | | Period Ended June 30, 2006
| | Year Ended December 31, 2005
|
Portfolio
| | Class N
| | Class I
| | Total
| | Class N
| | Class I
| | Total
|
Growth | | $ | — | | $ | — | | $ | — | | $ | 1,778 | | $ | 6,484 | | $ | 8,262 |
Tax-Managed Growth | | | — | | | — | | | — | | | — | | | — | | | — |
Large Cap Growth | | | — | | | — | | | — | | | — | | | — | | | — |
Small Cap Growth | | | — | | | — | | | — | | | 42,338 | | | 27,541 | | | 69,879 |
Mid Cap Growth (a) | | | — | | | — | | | — | | | — | | | — | | | — |
Small Mid-Cap Growth | | | — | | | — | | | — | | | 77 | | | 380 | | | 457 |
International Growth | | | — | | | — | | | — | | | 170,874 | | | 75,271 | | | 246,145 |
International Equity | | | — | | | — | | | — | | | — | | | — | | | — |
International Small Cap
Growth (b) | | | — | | | — | | | — | | | — | | | — | | | — |
Emerging Markets Growth (c) | | | — | | | — | | | — | | | 104 | | | 160 | | | 264 |
Value Discovery | | | — | | | — | | | — | | | 5,835 | | | 18,431 | | | 24,266 |
Income | | | 2,089 | | | 3,844 | | | 5,933 | | | 4,620 | | | 7,921 | | | 12,541 |
Ready Reserves | | | 23,337 | | | — | | | 23,337 | | | 27,698 | | | — | | | 27,698 |
| |
| | | Redemptions (Dollars)
|
| | | Period Ended June 30, 2006
| | Year Ended December 31, 2005
|
Portfolio
| | Class N
| | Class I
| | Total
| | Class N
| | Class I
| | Total
|
Growth | | $ | 14,495 | | $ | 13,604 | | $ | 28,099 | | $ | 14,242 | | $ | 49,911 | | $ | 64,153 |
Tax-Managed Growth | | | 34 | | | 181 | | | 215 | | | 8 | | | 554 | | | 562 |
Large Cap Growth | | | 105 | | | 1,661 | | | 1,766 | | | 185 | | | 1,647 | | | 1,832 |
Small Cap Growth | | | 95,814 | | | 35,931 | | | 131,745 | | | 214,257 | | | 73,727 | | | 287,984 |
Mid Cap Growth (a) | | | 42 | | | 150 | | | 192 | | | — | | | — | | | — |
Small Mid-Cap Growth | | | 1,221 | | | 3,305 | | | 4,526 | | | 2,617 | | | 3,636 | | | 6,253 |
International Growth | | | 416,179 | | | 129,272 | | | 545,451 | | | 477,866 | | | 120,404 | | | 598,270 |
International Equity | | | 10,270 | | | 25,688 | | | 35,958 | | | 1,207 | | | 40,936 | | | 42,143 |
International Small Cap
Growth (b) | | | 871 | | | 994 | | | 1,865 | | | — | | | 100 | | | 100 |
Emerging Markets Growth (c) | | | 8,879 | | | 5,491 | | | 14,370 | | | 1,024 | | | 605 | | | 1,629 |
Value Discovery | | | 9,835 | | | 21,978 | | | 31,813 | | | 18,736 | | | 165,704 | | | 184,440 |
Income | | | 26,401 | | | 16,629 | | | 43,030 | | | 40,325 | | | 40,480 | | | 80,805 |
Ready Reserves | | | 487,169 | | | — | | | 487,169 | | | 1,159,815 | | | — | | | 1,159,815 |
| (a) | | For the period from February 1, 2006 (Commencement of Operations) to June 30, 2006. |
| (b) | | For the period from November 1, 2005 (Commencement of Operation) to December 31, 2005. |
| (c) | | For the period from June 6, 2005 (Commencement of Operations) to December 31, 2005. |
| (d) | | For 2005, the sales of Class I shares for Income Fund reflect two in-kind purchases totaling $4.2 million dollars. |
94 Semi-Annual Report | June 30, 2006 |
| | | | | | | | | | | | | | | | | | | | | | | | |
| |
| | | Net Change in Net Assets relating to Fund Share Activity (Dollars)
| |
| | | Period Ended June 30, 2006
| | | Year Ended December 31, 2005
| |
Portfolio
| | Class N
| | | Class I
| | | Total
| | | Class N
| | | Class I
| | | Total
| |
Growth | | $ | (7,667 | ) | | $ | (8,696 | ) | | $ | (16,363 | ) | | $ | (1,711 | ) | | $ | (34,373 | ) | | $ | (36,084 | ) |
Tax-Managed Growth | | | (27 | ) | | | 429 | | | | 402 | | | | 105 | | | | 1,108 | | | | 1,213 | |
Large Cap Growth | | | 1,066 | | | | 429 | | | | 1,495 | | | | 7,733 | | | | 2,091 | | | | 9,824 | |
Small Cap Growth | | | 133,232 | | | | 136,465 | | | | 269,697 | | | | 64,514 | | | | 62,454 | | | | 126,968 | |
Mid Cap Growth (a) | | | 5,906 | | | | 6,209 | | | | 12,115 | | | | — | | | | — | | | | — | |
Small Mid-Cap Growth | | | 548 | | | | 9,182 | | | | 9,730 | | | | 2,564 | | | | 35,010 | | | | 37,574 | |
International Growth | | | 347,887 | | | | 147,504 | | | | 495,391 | | | | 759,448 | | | | 313,098 | | | | 1,072,546 | |
International Equity | | | 6,459 | | | | 45,716 | | | | 52,175 | | | | 16,837 | | | | 137,088 | | | | 153,925 | |
International Small Cap
Growth (b) | | | 10,822 | | | | 12,208 | | | | 23,030 | | | | 2,422 | | | | 11,584 | | | | 14,006 | |
Emerging Markets Growth (c) | | | 13,152 | | | | 28,635 | | | | 41,787 | | | | 19,203 | | | | 31,536 | | | | 50,739 | |
Value Discovery | | | (8,700 | ) | | | (18,122 | ) | | | (26,822 | ) | | | (11,245 | ) | | | (129,641 | ) | | | (140,886 | ) |
Income | | | (6,433 | ) | | | 2,518 | | | | (3,915 | ) | | | 22,238 | | | | 4,600 | | | | 26,838 | |
Ready Reserves | | | 67,195 | | | | — | | | | 67,195 | | | | (1,086 | ) | | | — | | | | (1,086 | ) |
| |
| | | Sales (Shares)
| |
| | | Period Ended June 30, 2006
| | | Year Ended December 31, 2005
| |
Portfolio
| | Class N
| | | Class I
| | | Total
| | | Class N
| | | Class I
| | | Total
| |
Growth | | | 578 | | | | 409 | | | | 987 | | | | 992 | | | | 846 | | | | 1,838 | |
Tax-Managed Growth | | | 1 | | | | 58 | | | | 59 | | | | 11 | | | | 168 | | | | 179 | |
Large Cap Growth | | | 178 | | | | 314 | | | | 492 | | | | 1,273 | | | | 597 | | | | 1,870 | |
Small Cap Growth | | | 8,922 | | | | 6,592 | | | | 15,514 | | | | 9,448 | | | | 4,272 | | | | 13,720 | |
Mid Cap Growth (a) | | | 592 | | | | 633 | | | | 1,225 | | | | — | | | | — | | | | — | |
Small Mid-Cap Growth | | | 134 | | | | 955 | | | | 1,089 | | | | 450 | | | | 3,393 | | | | 3,843 | |
International Growth | | | 28,226 | | | | 10,086 | | | | 38,312 | | | | 45,004 | | | | 15,184 | | | | 60,188 | |
International Equity | | | 1,227 | | | | 5,210 | | | | 6,437 | | | | 1,550 | | | | 14,844 | | | | 16,394 | |
International Small Cap
Growth (b) | | | 953 | | | | 1,061 | | | | 2,014 | | | | 235 | | | | 1,153 | | | | 1,388 | |
Emerging Markets Growth (c) | | | 1,401 | | | | 2,219 | | | | 3,620 | | | | 1,604 | | | | 2,731 | | | | 4,335 | |
Value Discovery | | | 70 | | | | 234 | | | | 304 | | | | 78 | | | | 829 | | | | 907 | |
Income | | | 1,837 | | | | 1,575 | | | | 3,412 | | | | 5,777 | | | | 3,717 | | | | 9,494 | |
Ready Reserves | | | 531,027 | | | | — | | | | 531,027 | | | | 1,131,031 | | | | — | | | | 1,131,031 | |
| |
| | | Reinvested Distributions (Shares)
| |
| | | Period Ended June 30, 2006
| | | Year Ended December 31, 2005
| |
Portfolio
| | Class N
| | | Class I
| | | Total
| | | Class N
| | | Class I
| | | Total
| |
Growth | | | — | | | | — | | | | — | | | | 155 | | | | 555 | | | | 710 | |
Tax-Managed Growth | | | — | | | | — | | | | — | | | | — | | | | — | | | | — | |
Large Cap Growth | | | — | | | | — | | | | — | | | | — | | | | — | | | | — | |
Small Cap Growth | | | — | | | | — | | | | — | | | | 1,752 | | | | 1,121 | | | | 2,873 | |
Mid Cap Growth (a) | | | — | | | | — | | | | — | | | | — | | | | — | | | | — | |
Small Mid-Cap Growth | | | — | | | | — | | | | — | | | | 6 | | | | 30 | | | | 36 | |
International Growth | | | — | | | | — | | | | — | | | | 6,912 | | | | 3,007 | | | | 9,919 | |
International Equity | | | — | | | | — | | | | — | | | | — | | | | — | | | | — | |
International Small Cap
Growth (b) | | | — | | | | — | | | | — | | | | — | | | | — | | | | — | |
Emerging Markets Growth (c) | | | — | | | | — | | | | — | | | | 7 | | | | 12 | | | | 19 | |
Value Discovery | | | — | | | | — | | | | — | | | | 390 | | | | 1,218 | | | | 1,608 | |
Income | | | 215 | | | | 397 | | | | 612 | | | | 464 | | | | 796 | | | | 1,260 | |
Ready Reserves | | | 23,337 | | | | — | | | | 23,337 | | | | 27,698 | | | | — | | | | 27,698 | |
| (a) | | For the period from February 1, 2006 (Commencement of Operations) to June 30, 2006. |
| (b) | | For the period from November 1, 2005 (Commencement of Operation) to December 31, 2005. |
| (c) | | For the period from June 6, 2005 (Commencement of Operations) to December 31, 2005. |
June 30, 2006 | William Blair Funds 95 |
| | | | | | | | | | | | | | | | | | |
| |
| | | Redemptions (Shares)
| |
| | | Period Ended June 30, 2006
| | | Year Ended December 31, 2005
| |
Portfolio
| | Class N
| | | Class I
| | | Total
| | | Class N
| | | Class I
| | | Total
| |
Growth | | 1,223 | | | 1,134 | | | 2,357 | | | 1,313 | | | 4,632 | | | 5,945 | |
Tax-Managed Growth | | 3 | | | 17 | | | 20 | | | — | | | 59 | | | 59 | |
Large Cap Growth | | 16 | | | 248 | | | 264 | | | 30 | | | 264 | | | 294 | |
Small Cap Growth | | 3,777 | | | 1,395 | | | 5,172 | | | 8,709 | | | 2,954 | | | 11,663 | |
Mid Cap Growth (a) | | 4 | | | 15 | | | 19 | | | — | | | — | | | — | |
Small Mid-Cap Growth | | 93 | | | 242 | | | 335 | | | 234 | | | 303 | | | 537 | |
International Growth | | 15,521 | | | 4,785 | | | 20,306 | | | 20,661 | | | 5,142 | | | 25,803 | |
International Equity | | 791 | | | 1,911 | | | 2,702 | | | 104 | | | 3,398 | | | 3,502 | |
International Small Cap
Growth (b) | | 72 | | | 81 | | | 153 | | | — | | | 10 | | | 10 | |
Emerging Markets Growth (c) | | 587 | | | 366 | | | 953 | | | 81 | | | 47 | | | 128 | |
Value Discovery | | 619 | | | 1,378 | | | 1,997 | | | 892 | | | 7,748 | | | 8,640 | |
Income | | 2,714 | | | 1,713 | | | 4,427 | | | 4,028 | | | 4,056 | | | 8,084 | |
Ready Reserves | | 487,169 | | | — | | | 487,169 | | | 1,159,815 | | | — | | | 1,159,815 | |
| |
| | | Net Change in Shares Outstanding relating to Fund Share Activity (Shares)
| |
| | | Period Ended June 30, 2006
| | | Year Ended December 31, 2005
| |
Portfolio
| | Class N
| | | Class I
| | | Total
| | | Class N
| | | Class I
| | | Total
| |
Growth | | (645 | ) | | (725 | ) | | (1,370 | ) | | (166 | ) | | (3,231 | ) | | (3,397 | ) |
Tax-Managed Growth | | (2 | ) | | 41 | | | 39 | | | 11 | | | 109 | | | 120 | |
Large Cap Growth | | 162 | | | 66 | | | 228 | | | 1,243 | | | 333 | | | 1,576 | |
Small Cap Growth | | 5,145 | | | 5,197 | | | 10,342 | | | 2,491 | | | 2,439 | | | 4,930 | |
Mid Cap Growth (a) | | 588 | | | 618 | | | 1,206 | | | — | | | — | | | — | |
Small Mid-Cap Growth | | 41 | | | 713 | | | 754 | | | 222 | | | 3,120 | | | 3,342 | |
International Growth | | 12,705 | | | 5,301 | | | 18,006 | | | 31,255 | | | 13,049 | | | 44,304 | |
International Equity | | 436 | | | 3,299 | | | 3,735 | | | 1,446 | | | 11,446 | | | 12,892 | |
International Small Cap Growth (b) | | 881 | | | 980 | | | 1,861 | | | 235 | | | 1,143 | | | 1,378 | |
Emerging Markets Growth (c) | | 814 | | | 1,853 | | | 2,667 | | | 1,530 | | | 2,696 | | | 4,226 | |
Value Discovery | | (549 | ) | | (1,144 | ) | | (1,693 | ) | | (424 | ) | | (5,701 | ) | | (6,125 | ) |
Income | | (662 | ) | | 259 | | | (403 | ) | | 2,213 | | | 457 | | | 2,670 | |
Ready Reserves | | 67,195 | | | — | | | 67,195 | | | (1,086 | ) | | — | | | (1,086 | ) |
| (a) | | For the period from February 1, 2006 (Commencement of Operations) to June 30, 2006. |
| (b) | | For the period from November 1, 2005 (Commencement of Operations) to December 31, 2005. |
| (c) | | For the period from June 6, 2005 (Commencement of Operations) to December 31, 2005. |
96 Semi-Annual Report | June 30, 2006 |
Financial Highlights
Growth Fund
| | | | | | | | | | | | | | | | | | | | | | | | |
| | | Class N
| |
| | | Period Ended
| | | Years Ended December 31,
| |
| | | 6/30/2006
| | | 2005
| | | 2004
| | | 2003
| | | 2002
| | | 2001
| |
| | | (unaudited) | | | | | | | | | | | | | | | | |
Net asset value, beginning of year | | $ | 11.33 | | | $ | 10.70 | | | $ | 9.97 | | | $ | 8.06 | | | $ | 10.87 | | | $ | 12.73 | |
Income (loss) from investment operations: | | | | | | | | | | | | | | | | | | | | | | | | |
Net investment income (loss) | | | (0.03 | ) | | | (0.06 | ) | | | (0.06 | ) | | | (0.06 | ) | | | (0.07 | ) | | | (0.06 | ) |
Net realized and unrealized gain (loss) on investments | | | 0.30 | | | | 1.11 | | | | 0.79 | | | | 1.97 | | | | (2.74 | ) | | | (1.66 | ) |
| | |
|
|
| |
|
|
| |
|
|
| |
|
|
| |
|
|
| |
|
|
|
Total from investment operations | | | 0.27 | | | | 1.05 | | | | 0.73 | | | | 1.91 | | | | (2.81 | ) | | | (1.72 | ) |
Less distributions from: | | | | | | | | | | | | | | | | | | | | | | | | |
Net investment income | | | — | | | | — | | | | — | | | | — | | | | — | | | | — | |
Net realized gain | | | — | | | | 0.42 | | | | — | | | | — | | | | — | | | | 0.14 | |
| | |
|
|
| |
|
|
| |
|
|
| |
|
|
| |
|
|
| |
|
|
|
Total distributions | | | — | | | | 0.42 | | | | — | | | | — | | | | — | | | | 0.14 | |
| | |
|
|
| |
|
|
| |
|
|
| |
|
|
| |
|
|
| |
|
|
|
Net asset value, end of period | | $ | 11.60 | | | $ | 11.33 | | | $ | 10.70 | | | $ | 9.97 | | | $ | 8.06 | | | $ | 10.87 | |
| | |
|
|
| |
|
|
| |
|
|
| |
|
|
| |
|
|
| |
|
|
|
Total return (%) | | | 2.38 | | | | 9.75 | | | | 7.32 | | | | 23.70 | | | | (25.85 | ) | | | (13.53 | ) |
Ratios to average daily net assets (%): | | | | | | | | | | | | | | | | | | | | | | | | |
Expenses | | | 1.15 | (a) | | | 1.15 | | | | 1.17 | | | | 1.19 | | | | 1.19 | | | | 1.18 | |
Net investment income (loss) | | | (0.42 | )(a) | | | (0.60 | ) | | | (0.60 | ) | | | (0.67 | ) | | | (0.73 | ) | | | (0.57 | ) |
| |
| | | Class I
| |
| | | Period Ended
| | | Years Ended December 31,
| |
| | | 6/30/2006
| | | 2005
| | | 2004
| | | 2003
| | | 2002
| | | 2001
| |
| | | (unaudited) | | | | | | | | | | | | | | | | |
Net asset value, beginning of year | | $ | 11.52 | | | $ | 10.84 | | | $ | 10.08 | | | $ | 8.12 | | | $ | 10.93 | | | $ | 12.77 | |
Income (loss) from investment operations: | | | | | | | | | | | | | | | | | | | | | | | | |
Net investment income (loss) | | | (0.01 | ) | | | (0.04 | ) | | | (0.04 | ) | | | (0.04 | ) | | | (0.05 | ) | | | (0.04 | ) |
Net realized and unrealized gain (loss) on investments | | | 0.30 | | | | 1.14 | | | | 0.80 | | | | 2.00 | | | | (2.76 | ) | | | (1.66 | ) |
| | |
|
|
| |
|
|
| |
|
|
| |
|
|
| |
|
|
| |
|
|
|
Total from investment operations | | | 0.29 | | | | 1.10 | | | | 0.76 | | | | 1.96 | | | | (2.81 | ) | | | (1.70 | ) |
Less distributions from: | | | | | | | | | | | | | | | | | | | | | | | | |
Net investment income | | | — | | | | — | | | | — | | | | — | | | | — | | | | — | |
Net realized gain | | | — | | | | 0.42 | | | | — | | | | — | | | | — | | | | 0.14 | |
| | |
|
|
| |
|
|
| |
|
|
| |
|
|
| |
|
|
| |
|
|
|
Total distributions | | | — | | | | 0.42 | | | | — | | | | — | | | | — | | | | 0.14 | |
| | |
|
|
| |
|
|
| |
|
|
| |
|
|
| |
|
|
| |
|
|
|
Net asset value, end of period | | $ | 11.81 | | | $ | 11.52 | | | $ | 10.84 | | | $ | 10.08 | | | $ | 8.12 | | | $ | 10.93 | |
| | |
|
|
| |
|
|
| |
|
|
| |
|
|
| |
|
|
| |
|
|
|
Total return (%) | | | 2.52 | | | | 10.08 | | | | 7.54 | | | | 24.14 | | | | (25.71 | ) | | | (13.33 | ) |
Ratios to average daily net assets (%): | | | | | | | | | | | | | | | | | | | | | | | | |
Expenses | | | 0.89 | (a) | | | 0.90 | | | | 0.92 | | | | 0.94 | | | | 0.94 | | | | 0.93 | |
Net investment income (loss) | | | (0.16 | )(a) | | | (0.35 | ) | | | (0.35 | ) | | | (0.42 | ) | | | (0.48 | ) | | | (0.32 | ) |
| | | | | | | | | | | | | | | | | | | |
| | | Period Ended
| | | Years Ended December 31,
|
| | | 6/30/2006
| | | 2005
| | 2004
| | 2003
| | 2002
| | 2001
|
| | | (unaudited) | | | | | | | | | | | |
Supplemental data for all classes: | | | | | | | | | | | | | | | | | | | |
Net assets at end of period (in thousands) | | $ | 243,814 | | | $ | 253,599 | | $ | 275,506 | | $ | 281,654 | | $ | 255,625 | | $ | 386,096 |
Portfolio turnover rate (%) | | | 70 | (a) | | | 54 | | | 35 | | | 45 | | | 29 | | | 74 |
| (a) | | Rates are annualized for periods that are less than a year. |
Performance cited represents past performance. Past performance does not guarantee future results and current performance may be lower or higher than the data quoted. Results shown are annual returns, which assume reinvestment of dividends and capital gains. Investment returns and principal will fluctuate and you may have a gain or loss when you sell shares. For the most current month-end performance information, please call 1-800-742-7272, or visit our Web site at www.williamblairfunds.com.
Note: Net investment income (loss) per share is based on the average shares outstanding during the year.
June 30, 2006 | William Blair Funds 97 |
Financial Highlights
Tax-Managed Growth Fund
| | | | | | | | | | | | | | | | | | | | | | | | |
| | | Class N
| |
| | | Period Ended
| | | Years Ended December 31,
| |
| | | 6/30/2006
| | | 2005
| | | 2004
| | | 2003
| | | 2002
| | | 2001
| |
| | | (unaudited) | | | | | | | | | | | | | | | | |
Net asset value, beginning of year | | $ | 10.11 | | | $ | 8.99 | | | $ | 8.41 | | | $ | 6.86 | | | $ | 9.07 | | | $ | 10.08 | |
Income (loss) from investment operations: | | | | | | | | | | | | | | | | | | | | | | | | |
Net investment income (loss) | | | (0.02 | ) | | | (0.07 | ) | | | (0.08 | ) | | | (0.07 | ) | | | (0.06 | ) | | | (0.05 | ) |
Net realized and unrealized gain (loss) on investments | | | 0.17 | | | | 1.19 | | | | 0.66 | | | | 1.62 | | | | (2.15 | ) | | | (0.96 | ) |
| | |
|
|
| |
|
|
| |
|
|
| |
|
|
| |
|
|
| |
|
|
|
Total from investment operations | | | 0.15 | | | | 1.12 | | | | 0.58 | | | | 1.55 | | | | (2.21 | ) | | | (1.01 | ) |
Less distributions from: | | | | | | | | | | | | | | | | | | | | | | | | |
Net investment income | | | — | | | | — | | | | — | | | | — | | | | — | | | | — | |
Net realized gain | | | — | | | | — | | | | — | | | | — | | | | — | | | | — | |
| | |
|
|
| |
|
|
| |
|
|
| |
|
|
| |
|
|
| |
|
|
|
Total distributions | | | — | | | | — | | | | — | | | | — | | | | — | | | | — | |
| | |
|
|
| |
|
|
| |
|
|
| |
|
|
| |
|
|
| |
|
|
|
Net asset value, end of period | | $ | 10.26 | | | $ | 10.11 | | | $ | 8.99 | | | $ | 8.41 | | | $ | 6.86 | | | $ | 9.07 | |
| | |
|
|
| |
|
|
| |
|
|
| |
|
|
| |
|
|
| |
|
|
|
Total return (%) | | | 1.48 | | | | 12.46 | | | | 6.90 | | | | 22.59 | | | | (24.37 | ) | | | (10.02 | ) |
Ratios to average daily net assets (%): | | | | | | | | | | | | | | | | | | | | | | | | |
Expenses, net of waivers and reimbursements | | | 1.49 | (a) | | | 1.53 | | | | 1.54 | | | | 1.49 | | | | 1.36 | | | | 1.36 | |
Expenses, before waivers and reimbursements | | | 2.21 | (a) | | | 2.55 | | | | 2.26 | | | | 2.26 | | | | 2.22 | | | | 3.64 | |
Net investment income (loss), net of waivers and reimbursements | | | (0.42 | )(a) | | | (0.76 | ) | | | (0.92 | ) | | | (0.91 | ) | | | (0.72 | ) | | | (0.57 | ) |
Net investment income (loss), before waivers and reimbursements | | | (1.14 | )(a) | | | (1.78 | ) | | | (1.64 | ) | | | (1.68 | ) | | | (1.58 | ) | | | (2.85 | ) |
| |
| | | Class I
| |
| | | Period Ended
| | | Years Ended December 31,
| |
| | | 6/30/2006
| | | 2005
| | | 2004
| | | 2003
| | | 2002
| | | 2001
| |
| | | (unaudited) | | | | | | | | | | | | | | | | |
Net asset value, beginning of year | | $ | 10.27 | | | $ | 9.10 | | | $ | 8.50 | | | $ | 6.92 | | | $ | 9.12 | | | $ | 10.11 | |
Income (loss) from investment operations: | | | | | | | | | | | | | | | | | | | | | | | | |
Net investment income (loss) | | | (0.01 | ) | | | (0.05 | ) | | | (0.06 | ) | | | (0.05 | ) | | | (0.04 | ) | | | (0.03 | ) |
Net realized and unrealized gain (loss) on investments | | | 0.18 | | | | 1.22 | | | | 0.66 | | | | 1.63 | | | | (2.16 | ) | | | (0.96 | ) |
| | |
|
|
| |
|
|
| |
|
|
| |
|
|
| |
|
|
| |
|
|
|
Total from investment operations | | | 0.17 | | | | 1.17 | | | | 0.60 | | | | 1.58 | | | | (2.20 | ) | | | (0.99 | ) |
Less distributions from: | | | | | | | | | | | | | | | | | | | | | | | | |
Net investment income | | | — | | | | — | | | | — | | | | — | | | | — | | | | — | |
Net realized gain | | | — | | | | — | | | | — | | | | — | | | | — | | | | — | |
| | |
|
|
| |
|
|
| |
|
|
| |
|
|
| |
|
|
| |
|
|
|
Total distributions | | | — | | | | — | | | | — | | | | — | | | | — | | | | — | |
| | |
|
|
| |
|
|
| |
|
|
| |
|
|
| |
|
|
| |
|
|
|
Net asset value, end of period | | $ | 10.44 | | | $ | 10.27 | | | $ | 9.10 | | | $ | 8.50 | | | $ | 6.92 | | | $ | 9.12 | |
| | |
|
|
| |
|
|
| |
|
|
| |
|
|
| |
|
|
| |
|
|
|
Total return (%) | | | 1.66 | | | | 12.86 | | | | 7.06 | | | | 22.83 | | | | (24.12 | ) | | | (9.79 | ) |
Ratios to average daily net assets (%): | | | | | | | | | | | | | | | | | | | | | | | | |
Expenses, net of waivers and reimbursements | | | 1.24 | (a) | | | 1.28 | | | | 1.29 | | | | 1.24 | | | | 1.11 | | | | 1.11 | |
Expenses, before waivers and reimbursements | | | 1.96 | (a) | | | 2.30 | | | | 2.01 | | | | 2.01 | | | | 1.97 | | | | 3.39 | |
Net investment income (loss), net of waivers and reimbursements | | | (0.17 | )(a) | | | (0.51 | ) | | | (0.67 | ) | | | (0.66 | ) | | | (0.47 | ) | | | (0.32 | ) |
Net investment income (loss), before waivers and reimbursements | | | (0.89 | )(a) | | | (1.53 | ) | | | (1.39 | ) | | | (1.43 | ) | | | (1.33 | ) | | | (2.60 | ) |
| | | | | | | | | | | | | | | | | | | |
| | | Period Ended
| | | Years Ended December 31,
|
| | | 6/30/2006
| | | 2005
| | 2004
| | 2003
| | 2002
| | 2001
|
| | | (unaudited) | | | | | | | | | | | |
Supplemental data for all classes: | | | | | | | | | | | | | | | | | | | |
Net assets at end of period (in thousands) | | $ | 8,346 | | | $ | 7,815 | | $ | 5,847 | | $ | 6,871 | | $ | 5,303 | | $ | 7,211 |
Portfolio turnover rate (%) | | | 40 | (a) | | | 25 | | | 31 | | | 37 | | | 44 | | | 37 |
| (a) | | Rates are annualized for periods that are less than a year. |
Performance cited represents past performance. Past performance does not guarantee future results and current performance may be lower or higher than the data quoted. Results shown are annual returns, which assume reinvestment of dividends and capital gains. Investment returns and principal will fluctuate and you may have a gain or loss when you sell shares. For the most current month-end performance information, please call 1-800-742-7272, or visit our Web site at www.williamblairfunds.com.
Note: Net investment income (loss) per share is based on the average shares outstanding during the year.
98 Semi-Annual Report | June 30, 2006 |
Financial Highlights
Large Cap Growth Fund
| | | | | | | | | | | | | | | | | | | | | | | | |
| | | Class N
| |
| | | Period Ended
| | | Years Ended December 31,
| |
| | | 6/30/2006
| | | 2005
| | | 2004
| | | 2003
| | | 2002
| | | 2001
| |
| | | (unaudited) | | | | | | | | | | | | | | | | |
Net asset value, beginning of year | | $ | 6.47 | | | $ | 6.24 | | | $ | 5.93 | | | $ | 4.80 | | | $ | 6.72 | | | $ | 8.45 | |
Income (loss) from investment operations: | | | | | | | | | | | | | | | | | | | | | | | | |
Net investment income (loss) | | | (0.01 | ) | | | (0.02 | ) | | | (0.04 | ) | | | (0.04 | ) | | | (0.04 | ) | | | (0.05 | ) |
Net realized and unrealized gain (loss) on investments | | | (0.05 | ) | | | 0.25 | | | | 0.35 | | | | 1.17 | | | | (1.88 | ) | | | (1.68 | ) |
| | |
|
|
| |
|
|
| |
|
|
| |
|
|
| |
|
|
| |
|
|
|
Total from investment operations | | | (0.06 | ) | | | 0.23 | | | | 0.31 | | | | 1.13 | | | | (1.92 | ) | | | (1.73 | ) |
Less distributions from: | | | | | | | | | | | | | | | | | | | | | | | | |
Net investment income | | | — | | | | — | | | | — | | | | — | | | | — | | | | — | |
Net realized gain | | | — | | | | — | | | | — | | | | — | | | | — | | | | — | |
| | |
|
|
| |
|
|
| |
|
|
| |
|
|
| |
|
|
| |
|
|
|
Total distributions | | | — | | | | — | | | | — | | | | — | | | | — | | | | — | |
| | |
|
|
| |
|
|
| |
|
|
| |
|
|
| |
|
|
| |
|
|
|
Net asset value, end of period | | $ | 6.41 | | | $ | 6.47 | | | $ | 6.24 | | | $ | 5.93 | | | $ | 4.80 | | | $ | 6.72 | |
| | |
|
|
| |
|
|
| |
|
|
| |
|
|
| |
|
|
| |
|
|
|
Total return (%) | | | (0.93 | ) | | | 3.69 | | | | 5.23 | | | | 23.54 | | | | (28.57 | ) | | | (20.47 | ) |
Ratios to average daily net assets (%): | | | | | | | | | | | | | | | | | | | | | | | | |
Expenses, net of waivers and reimbursements | | | 1.25 | (a) | | | 1.28 | | | | 1.38 | | | | 1.42 | | | | 1.36 | | | | 1.36 | |
Expenses, before waivers and reimbursements | | | 1.68 | (a) | | | 2.08 | | | | 2.29 | | | | 2.39 | | | | 2.45 | | | | 3.01 | |
Net investment income (loss), net of waivers and reimbursements | | | (0.23 | )(a) | | | (0.37 | ) | | | (0.63 | ) | | | (0.76 | ) | | | (0.71 | ) | | | (0.79 | ) |
Net investment income (loss), before waivers and reimbursements | | | (0.66 | )(a) | | | (1.17 | ) | | | (1.54 | ) | | | (1.73 | ) | | | (1.80 | ) | | | (2.44 | ) |
| |
| | | Class I
| |
| | | Period Ended
| | | Years Ended December 31,
| |
| | | 6/30/2006
| | | 2005
| | | 2004
| | | 2003
| | | 2002
| | | 2001
| |
| | | (unaudited) | | | | | | | | | | | | | | | | |
Net asset value, beginning of year | | $ | 6.56 | | | $ | 6.31 | | | $ | 5.99 | | | $ | 4.82 | | | $ | 6.74 | | | $ | 8.47 | |
Income (loss) from investment operations: | | | | | | | | | | | | | | | | | | | | | | | | |
Net investment income (loss) | | | — | | | | (0.01 | ) | | | (0.02 | ) | | | (0.03 | ) | | | (0.03 | ) | | | (0.04 | ) |
Net realized and unrealized gain (loss) on investments | | | (0.06 | ) | | | 0.26 | | | | 0.34 | | | | 1.20 | | | | (1.89 | ) | | | (1.69 | ) |
| | |
|
|
| |
|
|
| |
|
|
| |
|
|
| |
|
|
| |
|
|
|
Total from investment operations | | | (0.06 | ) | | | 0.25 | | | | 0.32 | | | | 1.17 | | | | (1.92 | ) | | | (1.73 | ) |
Less distributions from: | | | | | | | | | | | | | | | | | | | | | | | | |
Net investment income | | | — | | | | — | | | | — | | | | — | | | | — | | | | — | |
Net realized gain | | | — | | | | — | | | | — | | | | — | | | | — | | | | — | |
| | |
|
|
| |
|
|
| |
|
|
| |
|
|
| |
|
|
| |
|
|
|
Total distributions | | | — | | | | — | | | | — | | | | — | | | | — | | | | — | |
| | |
|
|
| |
|
|
| |
|
|
| |
|
|
| |
|
|
| |
|
|
|
Net asset value, end of period | | $ | 6.50 | | | $ | 6.56 | | | $ | 6.31 | | | $ | 5.99 | | | $ | 4.82 | | | $ | 6.74 | |
| | |
|
|
| |
|
|
| |
|
|
| |
|
|
| |
|
|
| |
|
|
|
Total return (%) | | | (0.91 | ) | | | 3.96 | | | | 5.34 | | | | 24.27 | | | | (28.49 | ) | | | (20.43 | ) |
Ratios to average daily net assets (%): | | | | | | | | | | | | | | | | | | | | | | | | |
Expenses, net of waivers and reimbursements | | | 1.00 | (a) | | | 1.03 | | | | 1.13 | | | | 1.17 | | | | 1.11 | | | | 1.11 | |
Expenses, before waivers and reimbursements | | | 1.43 | (a) | | | 1.83 | | | | 2.04 | | | | 2.14 | | | | 2.20 | | | | 2.76 | |
Net investment income (loss), net of waivers and reimbursements | | | 0.02 | (a) | | | (0.12 | ) | | | (0.38 | ) | | | (0.51 | ) | | | (0.46 | ) | | | (0.54 | ) |
Net investment income (loss), before waivers and reimbursements | | | (0.41 | )(a) | | | (0.92 | ) | | | (1.29 | ) | | | (1.48 | ) | | | (1.55 | ) | | | (2.19 | ) |
| | | | | | | | | | | | | | | | | | | | | | | | |
| | | Period Ended
| | | Years Ended December 31,
|
| | | 6/30/2006
| | | 2005
| | | | | | | | 2004
| | 2003
| | 2002
| | 2001
|
| | | (unaudited) | | | | | | | | | | | | | | | | | |
Supplemental data for all classes: | | | | | | | | | | | | | | | | | | | | | | | | |
Net assets at end of period (in thousands) | | 18,202 | | | $ | 16,888 | | | | | | | | $ | 6,417 | | $ | 5,519 | | $ | 5,469 | | $ | 5,991 |
Portfolio turnover rate (%) | | 55 | (a) | | | 53 | | | | | | | | | 39 | | | 33 | | | 52 | | | 87 |
| (a) | | Rates are annualized for periods that are less than a year. |
Performance cited represents past performance. Past performance does not guarantee future results and current performance may be lower or higher than the data quoted. Results shown are annual returns, which assume reinvestment of dividends and capital gains. Investment returns and principal will fluctuate and you may have a gain or loss when you sell shares. For the most current month-end performance information, please call 1-800-742-7272, or visit our Web site at www.williamblairfunds.com.
Note: Net investment income (loss) per share is based on the average shares outstanding during the year.
June 30, 2006 | William Blair Funds 99 |
Financial Highlights
Small Cap Growth Fund
| | | | | | | | | | | | | | | | | | | | | | | | |
| | | Class N
| |
| | | Period Ended
| | | Years Ended December 31,
| |
| | | 6/30/2006
| | | 2005
| | | 2004
| | | 2003
| | | 2002
| | | 2001
| |
| | | (unaudited) | | | | | | | | | | | | | | | | |
Net asset value, beginning of year | | $ | 23.76 | | | $ | 25.72 | | | $ | 21.83 | | | $ | 13.72 | | | $ | 16.58 | | | $ | 13.16 | |
Income (loss) from investment operations: | | | | | | | | | | | | | | | | | | | | | | | | |
Net investment income (loss) | | | (0.14 | ) | | | (0.30 | ) | | | (0.30 | ) | | | (0.21 | ) | | | (0.19 | ) | | | (0.17 | ) |
Net realized and unrealized gain (loss) on investments | | | 1.53 | | | | 0.64 | | | | 6.20 | | | | 8.68 | | | | (2.67 | ) | | | 3.59 | |
| | |
|
|
| |
|
|
| |
|
|
| |
|
|
| |
|
|
| |
|
|
|
Total from investment operations | | | 1.39 | | | | 0.34 | | | | 5.90 | | | | 8.47 | | | | (2.86 | ) | | | 3.42 | |
Less distributions from: | | | | | | | | | | | | | | | | | | | | | | | | |
Net investment income | | | — | | | | — | | | | — | | | | — | | | | — | | | | — | |
Net realized gain | | | — | | | | 2.30 | | | | 2.01 | | | | 0.36 | | | | — | | | | — | |
| | |
|
|
| |
|
|
| |
|
|
| |
|
|
| |
|
|
| |
|
|
|
Total distributions | | | — | | | | 2.30 | | | | 2.01 | | | | 0.36 | | | | — | | | | — | |
| | |
|
|
| |
|
|
| |
|
|
| |
|
|
| |
|
|
| |
|
|
|
Net asset value, end of period | | $ | 25.15 | | | $ | 23.76 | | | $ | 25.72 | | | $ | 21.83 | | | $ | 13.72 | | | $ | 16.58 | |
| | |
|
|
| |
|
|
| |
|
|
| |
|
|
| |
|
|
| |
|
|
|
Total return (%) | | | 5.85 | | | | 1.18 | | | | 27.24 | | | | 61.88 | | | | (17.25 | ) | | | 25.99 | |
Ratios to average daily net assets (%): | | | | | | | | | | | | | | | | | | | | | | | | |
Expenses, net of waivers and reimbursements | | | 1.47 | (a) | | | 1.49 | | | | 1.49 | | | | 1.55 | | | | 1.56 | | | | 1.59 | |
Expenses, before waivers and reimbursements | | | 1.47 | (a) | | | 1.49 | | �� | | 1.46 | | | | 1.52 | | | | 1.62 | | | | 1.95 | |
Net investment income (loss), net of waivers and reimbursements | | | (1.14 | )(a) | | | (1.23 | ) | | | (1.27 | ) | | | (1.22 | ) | | | (1.31 | ) | | | (1.15 | ) |
Net investment income (loss), before waivers and reimbursements | | | (1.14 | )(a) | | | (1.23 | ) | | | (1.24 | ) | | | (1.19 | ) | | | (1.37 | ) | | | (1.51 | ) |
| |
| | | Class I
| |
| | | Period Ended
| | | Years Ended December 31,
| |
| | | 6/30/2006
| | | 2005
| | | 2004
| | | 2003
| | | 2002
| | | 2001
| |
| | | (unaudited) | | | | | | | | | | | | | | | | |
Net asset value, beginning of year | | $ | 24.16 | | | $ | 26.04 | | | $ | 22.03 | | | $ | 13.82 | | | $ | 16.65 | | | $ | 13.18 | |
Income (loss) from investment operations: | | | | | | | | | | | | | | | | | | | | | | | | |
Net investment income (loss) | | | (0.11 | ) | | | (0.25 | ) | | | (0.24 | ) | | | (0.18 | ) | | | (0.16 | ) | | | (0.13 | ) |
Net realized and unrealized gain (loss) on investments | | | 1.55 | | | | 0.67 | | | | 6.26 | | | | 8.75 | | | | (2.67 | ) | | | 3.60 | |
| | |
|
|
| |
|
|
| |
|
|
| |
|
|
| |
|
|
| |
|
|
|
Total from investment operations | | | 1.44 | | | | 0.42 | | | | 6.02 | | | | 8.57 | | | | (2.83 | ) | | | 3.47 | |
Less distributions from: | | | | | | | | | | | | | | | | | | | | | | | | |
Net investment income | | | — | | | | — | | | | — | | | | — | | | | — | | | | — | |
Net realized gain | | | — | | | | 2.30 | | | | 2.01 | | | | 0.36 | | | | — | | | | — | |
| | |
|
|
| |
|
|
| |
|
|
| |
|
|
| |
|
|
| |
|
|
|
Total distributions | | | — | | | | 2.30 | | | | 2.01 | | | | 0.36 | | | | — | | | | — | |
| | |
|
|
| |
|
|
| |
|
|
| |
|
|
| |
|
|
| |
|
|
|
Net asset value, end of period | | $ | 25.60 | | | $ | 24.16 | | | $ | 26.04 | | | $ | 22.03 | | | $ | 13.82 | | | $ | 16.65 | |
| | |
|
|
| |
|
|
| |
|
|
| |
|
|
| |
|
|
| |
|
|
|
Total return (%) | | | 5.96 | | | | 1.48 | | | | 27.54 | | | | 62.15 | | | | (17.00 | ) | | | 26.33 | |
Ratios to average daily net assets (%): | | | | | | | | | | | | | | | | | | | | | | | | |
Expenses, net of waivers and reimbursements | | | 1.20 | (a) | | | 1.24 | | | | 1.24 | | | | 1.35 | | | | 1.31 | | | | 1.34 | |
Expenses, before waivers and reimbursements | | | 1.20 | (a) | | | 1.24 | | | | 1.21 | | | | 1.28 | | | | 1.37 | | | | 1.70 | |
Net investment income (loss), net of waivers and reimbursements | | | (0.87 | )(a) | | | (0.98 | ) | | | (1.02 | ) | | | (1.02 | ) | | | (1.06 | ) | | | (0.90 | ) |
Net investment income (loss), before waivers and reimbursements | | | (0.87 | )(a) | | | (0.98 | ) | | | (0.99 | ) | | | (0.95 | ) | | | (1.12 | ) | | | (1.26 | ) |
| | | | | | | | | | | | | | | | | | | |
| | | Period Ended
| | | Years Ended December 31,
|
| | | 6/30/2006
| | | 2005
| | 2004
| | 2003
| | 2002
| | 2001
|
| | | (unaudited) | | | | | | | | | | | |
Supplemental data for all classes: | | | | | | | | | | | | | | | | | | | |
Net assets at end of period (in thousands) | | $ | 1,143,094 | | | $ | 831,738 | | $ | 771,209 | | $ | 518,824 | | $ | 78,581 | | $ | 54,658 |
Portfolio turnover rate (%) | | | 104 | (a) | | | 80 | | | 109 | | | 103 | | | 133 | | | 147 |
| (a) | | Rates are annualized for periods that are less than a year. |
Performance cited represents past performance. Past performance does not guarantee future results and current performance may be lower or higher than the data quoted. Results shown are annual returns, which assume reinvestment of dividends and capital gains. Investment returns and principal will fluctuate and you may have a gain or loss when you sell shares. For the most current month-end performance information, please call 1-800-742-7272, or visit our Web site at www.williamblairfunds.com.
Note: Net investment income (loss) per share is based on the average shares outstanding during the year.
100 Semi-Annual Report | June 30, 2006 |
Financial Highlights
Mid Cap Growth Fund
| | | | |
| | | Class N
| |
| | | Period Ended
| |
| | | 6/30/2006(a)
| |
Net asset value, beginning of period | | $ | 10.00 | |
Income (loss) from investment operations: | | | | |
Net investment income (loss) | | | (0.03 | ) |
Net realized and unrealized gain (loss) on investments | | | — | |
| | |
|
|
|
Total from investment operations | | | (0.03 | ) |
Less distributions from: | | | | |
Net investment income | | | — | |
Net realized gain | | | — | |
| | |
|
|
|
Total distributions | | | — | |
| | |
|
|
|
Net asset value, end of period | | $ | 9.97 | |
| | |
|
|
|
Total return (%) | | | (0.30 | ) |
Ratios to average daily net assets (%) (b): | | | | |
Expenses, net of waivers and reimbursements | | | 1.40 | |
Expenses, before waivers and reimbursements | | | 2.84 | |
Net investment income (loss), net of waivers and reimbursements | | | (0.62 | ) |
Net investment income (loss), before waivers and reimbursements | | | 2.06 | |
| |
| | | Class I
| |
| | | Period Ended
| |
| | | 6/30/2006(a)
| |
Net asset value, beginning of period | | $ | 10.00 | |
Income (loss) from investment operations: | | | | |
Net investment income (loss) | | | (0.02 | ) |
Net realized and unrealized gain (loss) on investments | | | — | |
| | |
|
|
|
Total from investment operations | | | (0.02 | ) |
Less distributions from: | | | | |
Net investment income | | | — | |
Net realized gain | | | — | |
| | |
|
|
|
Total distributions | | | — | |
| | |
|
|
|
Net asset value, end of period | | $ | 9.98 | |
| | |
|
|
|
Total return (%) | | | (0.20 | ) |
Ratios to average daily net assets (%) (b): | | | | |
Expenses, net of waivers and reimbursements | | | 1.15 | |
Expenses, before waivers and reimbursements | | | 2.59 | |
Net investment income (loss), net of waivers and reimbursements | | | (0.37 | ) |
Net investment income (loss), before waivers and reimbursements | | | (1.81 | ) |
| | |
| |
| | | Period Ended
| |
| | | 6/30/2006(a)
| |
Supplemental data for all classes: | | | | |
Net assets at end of period (in thousands) | | $ | 12,028 | |
Portfolio turnover rate (%) (b) | | | 66 | |
| (a) | | For the period from February 1, 2006 (Commencement of Operations) to June 30, 2006. |
| (b) | | Rates are annualized for periods that are less than a year. |
Performance cited represents past performance. Past performance does not guarantee future results and current performance may be lower or higher than the data quoted. Results shown are annual returns, which assume reinvestment of dividends and capital gains. Investment returns and principal will fluctuate and you may have a gain or loss when you sell shares. For the most current month-end performance information, please call 1-800-742-7272, or visit our Web site at www.williamblairfunds.com.
Note: Net investment income (loss) per share is based on the average shares outstanding during the period.
June 30, 2006 | William Blair Funds 101 |
Financial Highlights
Small-Mid Cap Growth Fund
| | | | | | | | | | | | | | | | |
| | | Class N
| |
| | | Period Ended
| | | Years Ended December 31,
| |
| | | 6/30/2006
| | | 2005
| | | 2004
| | | 2003(a)
| |
| | | (unaudited) | | | | | | | | | | |
Net asset value, beginning of year | | $ | 12.40 | | | $ | 11.28 | | | $ | 9.94 | | | $ | 10.00 | |
Income (loss) from investment operations: | | | | | | | | | | | | | | | | |
Net investment income (loss) | | | (0.05 | ) | | | (0.11 | ) | | | (0.13 | ) | | | — | |
Net realized and unrealized gain (loss) on investments | | | 0.68 | | | | 1.32 | | | | 1.47 | | | | (0.06 | ) |
| | |
|
|
| |
|
|
| |
|
|
| |
|
|
|
Total from investment operations | | | 0.63 | | | | 1.21 | | | | 1.34 | | | | (0.06 | ) |
Less distributions from: | | | | | | | | | | | | | | | | |
Net investment income | | | — | | | | — | | | | — | | | | — | |
Net realized gain | | | — | | | | 0.09 | | | | — | | | | — | |
| | |
|
|
| |
|
|
| |
|
|
| |
|
|
|
Total distributions | | | — | | | | 0.09 | | | | — | | | | — | |
| | |
|
|
| |
|
|
| |
|
|
| |
|
|
|
Net asset value, end of period | | $ | 13.03 | | | $ | 12.40 | | | $ | 11.28 | | | $ | 9.94 | |
| | |
|
|
| |
|
|
| |
|
|
| |
|
|
|
Total return (%) | | | 5.08 | | | | 10.72 | | | | 13.48 | | | | (0.60 | ) |
Ratios to average daily net assets (%): | | | | | | | | | | | | | | | | |
Expenses, net of waivers and reimbursements | | | 1.39 | (b) | | | 1.45 | | | | 1.54 | | | | 1.54 | (b) |
Expenses, before waivers and reimbursements | | | 1.45 | (b) | | | 1.54 | | | | 2.14 | | | | 1.54 | (b) |
Net investment income (loss), net of waivers and reimbursements | | | (0.82 | )(b) | | | (0.97 | ) | | | (1.26 | ) | | | (1.54 | )(b) |
Net investment income (loss), before waivers and reimbursements | | | (0.88 | )(b) | | | (1.06 | ) | | | (1.86 | ) | | | (1.54 | )(b) |
| |
| | | Class I
| |
| | | Period Ended
| | | Years Ended December 31,
| |
| | | 6/30/2006
| | | 2005
| | | 2004
| | | 2003(a)
| |
| | | (unaudited) | | | | | | | | | | |
Net asset value, beginning of year | | $ | 12.46 | | | $ | 11.30 | | | $ | 9.94 | | | $ | 10.00 | |
Income (loss) from investment operations: | | | | | | | | | | | | | | | | |
Net investment income (loss) | | | (0.04 | ) | | | (0.08 | ) | | | (0.11 | ) | | | — | |
Net realized and unrealized gain (loss) on investments | | | 0.68 | | | | 1.33 | | | | 1.47 | | | | (0.06 | ) |
| | |
|
|
| |
|
|
| |
|
|
| |
|
|
|
Total from investment operations | | | 0.64 | | | | 1.25 | | | | 1.36 | | | | (0.06 | ) |
Less distributions from: | | | | | | | | | | | | | | | | |
Net investment income | | | — | | | | — | | | | — | | | | — | |
Net realized gain | | | — | | | | 0.09 | | | | — | | | | — | |
| | |
|
|
| |
|
|
| |
|
|
| |
|
|
|
Total distributions | | | — | | | | 0.09 | | | | — | | | | — | |
| | | | | | |
|
|
| |
|
|
| |
|
|
|
Net asset value, end of period | | $ | 13.10 | | | $ | 12.46 | | | $ | 11.30 | | | $ | 9.94 | |
| | |
|
|
| |
|
|
| |
|
|
| |
|
|
|
Total return (%) | | | 5.14 | | | | 11.05 | | | | 13.68 | | | | (0.60 | ) |
Ratios to average daily net assets (%): | | | | | | | | | | | | | | | | |
Expenses, net of waivers and reimbursements | | | 1.14 | (b) | | | 1.20 | | | | 1.29 | | | | 1.29 | (b) |
Expenses, before waivers and reimbursements | | | 1.20 | (b) | | | 1.29 | | | | 1.89 | | | | 1.29 | (b) |
Net investment income (loss), net of waivers and reimbursements | | | (0.57 | )(b) | | | (0.72 | ) | | | (1.01 | ) | | | (1.29 | )(b) |
Net investment income (loss), before waivers and reimbursements | | | (0.63 | )(b) | | | (0.81 | ) | | | (1.61 | ) | | | (1.29 | )(b) |
| | | | | | | | | | | | | | |
| | | Period Ended
| | | Years Ended December 31,
| |
| | | 6/30/2006
| | | 2005
| | 2004
| | 2003
| |
| | | (unaudited) | | | | | | | | |
Supplemental data for all classes: | | | | | | | | | | | | | | |
Net assets at end of period (in thousands) | | $ | 83,736 | | | $ | 70,211 | | $ | 25,974 | | $ | 3,673 | |
Portfolio turnover rate (%) | | | 69 | (b) | | | 62 | | | 55 | | | — | (b) |
| (a) | | For the period from December 29, 2003 (Commencement of Operations) to December 31, 2003. |
| (b) | | Rates are annualized for periods that are less than a year. |
Performance cited represents past performance. Past performance does not guarantee future results and current performance may be lower or higher than the data quoted. Results shown are annual returns, which assume reinvestment of dividends and capital gains. Investment returns and principal will fluctuate and you may have a gain or loss when you sell shares. For the most current month-end performance information, please call 1-800-742-7272, or visit our Web site at www.williamblairfunds.com.
Note: Net investment income (loss) per share is based on the average shares outstanding during the year.
102 Semi-Annual Report | June 30, 2006 |
Financial Highlights
International Growth Fund
| | | | | | | | | | | | | | | | | | | | | | |
| | | Class N
| |
| | | Period Ended
| | | Years Ended December 31,
| |
| | | 6/30/2006
| | | 2005
| | 2004
| | | 2003
| | 2002
| | | 2001
| |
| | | (unaudited) | | | | | | | | | | | | | | |
Net asset value, beginning of year | | $ | 25.22 | | | $ | 22.09 | | $ | 18.65 | | | $ | 13.13 | | $ | 15.48 | | | $ | 17.93 | |
Income (loss) from investment operations: | | | | | | | | | | | | | | | | | | | | | | |
Net investment income (loss) (a) | | | 0.10 | | | | 0.15 | | | (0.02 | ) | | | 0.02 | | | (0.05 | ) | | | (0.02 | ) |
Net realized and unrealized gain (loss) on investments | | | 1.40 | | | | 4.60 | | | 3.47 | | | | 5.52 | | | (2.30 | ) | | | (2.43 | ) |
| | |
|
|
| |
|
| |
|
|
| |
|
| |
|
|
| |
|
|
|
Total from investment operations | | | 1.50 | | | | 4.75 | | | 3.45 | | | | 5.54 | | | (2.35 | ) | | | (2.45 | ) |
Less distributions from: | | | | | | | | | | | | | | | | | | | | | | |
Net investment income | | | — | | | | 0.11 | | | 0.01 | | | | 0.02 | | | — | | | | — | |
Net realized gain | | | — | | | | 1.51 | | | — | | | | — | | | — | | | | — | |
| | |
|
|
| |
|
| |
|
|
| |
|
| |
|
|
| |
|
|
|
Total distributions | | | — | | | | 1.62 | | | 0.01 | | | | 0.02 | | | — | | | | — | |
| | |
|
|
| |
|
| |
|
|
| |
|
| |
|
|
| |
|
|
|
Net asset value, end of period | | $ | 26.72 | | | $ | 25.22 | | $ | 22.09 | | | $ | 18.65 | | $ | 13.13 | | | $ | 15.48 | |
| | |
|
|
| |
|
| |
|
|
| |
|
| |
|
|
| |
|
|
|
Total return (%) | | | 5.95 | | | | 21.65 | | | 18.48 | | | | 42.21 | | | (15.18 | ) | | | (13.66 | ) |
Ratios to average daily net assets (%): | | | | | | | | | | | | | | | | | | | | | | |
Expenses | | | 1.41 | (b) | | | 1.42 | | | 1.47 | | | | 1.50 | | | 1.51 | | | | 1.60 | |
Net investment income (loss) | | | 0.75 | (b) | | | 0.16 | | | (0.16 | ) | | | 0.05 | | | (0.36 | ) | | | (0.11 | ) |
| | | | | | | | | | | | | | | | | | | | | |
| | | Class I
| |
| | | Period Ended
| | | Years Ended December 31,
| |
| | | 6/30/2006
| | | 2005
| | 2004
| | 2003
| | 2002
| | | 2001
| |
| | | (unaudited) | | | | | | | | | | | | | |
Net asset value, beginning of year | | $ | 25.55 | | | $ | 22.34 | | $ | 18.85 | | $ | 13.27 | | $ | 15.60 | | | $ | 18.02 | |
Income (loss) from investment operations: | | | | | | | | | | | | | | | | | | | | | |
Net investment income (loss) (a) | | | 0.14 | | | | 0.27 | | | 0.01 | | | 0.09 | | | (0.01 | ) | | | 0.02 | |
Net realized and unrealized gain (loss) on investments | | | 1.41 | | | | 4.61 | | | 3.53 | | | 5.54 | | | (2.32 | ) | | | (2.44 | ) |
| | |
|
|
| |
|
| |
|
| |
|
| |
|
|
| |
|
|
|
Total from investment operations | | | 1.55 | | | | 4.88 | | | 3.54 | | | 5.63 | | | (2.33 | ) | | | (2.42 | ) |
Less distributions from: | | | | | | | | | | | | | | | | | | | | | |
Net investment income | | | — | | | | 0.16 | | | 0.05 | | | 0.05 | | | — | | | | — | |
Net realized gain | | | — | | | | 1.51 | | | — | | | — | | | — | | | | — | |
| | |
|
|
| |
|
| |
|
| |
|
| |
|
|
| |
|
|
|
Total distributions | | | — | | | | 1.67 | | | 0.05 | | | 0.05 | | | — | | | | — | |
| | |
|
|
| |
|
| |
|
| |
|
| |
|
|
| |
|
|
|
Net asset value, end of period | | $ | 27.10 | | | $ | 25.55 | | $ | 22.34 | | $ | 18.85 | | $ | 13.27 | | | $ | 15.60 | |
| | |
|
|
| |
|
| |
|
| |
|
| |
|
|
| |
|
|
|
Total return (%) | | | 6.07 | | | | 22.00 | | | 18.79 | | | 42.42 | | | (14.94 | ) | | | (13.43 | ) |
Ratios to average daily net assets (%): | | | | | | | | | | | | | | | | | | | | | |
Expenses | | | 1.08 | (b) | | | 1.17 | | | 1.22 | | | 1.25 | | | 1.26 | | | | 1.35 | |
Net investment income (loss) | | | 1.08 | (b) | | | 0.41 | | | 0.09 | | | 0.30 | | | (0.11 | ) | | | 0.14 | |
| | | | | | | | | | | | | | | | | | | |
| | | Period Ended
| | | Years Ended December 31,
|
| | | 6/30/2006
| | | 2005
| | 2004
| | 2003
| | 2002
| | 2001
|
| | | (unaudited) | | | | | | | | | | | |
Supplemental data for all classes: | | | | | | | | | | | | | | | | | | | |
Net assets at end of period (in thousands) | | $ | 5,305,404 | | | $ | 4,551,077 | | $ | 3,001,434 | | $ | 1,899,699 | | $ | 778,788 | | $ | 454,055 |
Portfolio turnover rate (%) | | | 65 | (b) | | | 70 | | | 79 | | | 57 | | | 73 | | | 112 |
| (a) | | Excludes $0.37, $0.12, $0.03, $0.00, and $0.00, of PFIC mark to market which are treated as ordinary income for Federal tax purposes for the years 2005, 2004, 2003, 2002, and 2001, respectively. |
| (b) | | Rates are annualized for periods that are less than a year. |
Performance cited represents past performance. Past performance does not guarantee future results and current performance may be lower or higher than the data quoted. Results shown are annual returns, which assume reinvestment of dividends and capital gains. Investment returns and principal will fluctuate and you may have a gain or loss when you sell shares. For the most current month-end performance information, please call 1-800-742-7272, or visit our Web site at www.williamblairfunds.com.
Note: Net investment income (loss) per share is based on the average shares outstanding during the year.
June 30, 2006 | William Blair Funds 103 |
Financial Highlights
International Equity Fund
| | | | | | | | | | | | |
| | | Class N
| |
| | | Period Ended
| | | Years Ended December 31,
| |
| | | 6/30/2006
| | | 2005
| | | 2004(a)
| |
| | | (unaudited) | | | | | | | |
Net asset value, beginning of year | | $ | 12.86 | | | $ | 11.33 | �� | | $ | 10.00 | |
Income (loss) from investment operations: | | | | | | | | | | | | |
Net investment income (loss) (b) | | | 0.07 | | | | (0.01 | ) | | | (0.04 | ) |
Net realized and unrealized gain (loss) on investments | | | 0.53 | | | | 1.54 | | | | 1.37 | |
| | |
|
|
| |
|
|
| |
|
|
|
Total from investment operations | | | 0.60 | | | | 1.53 | | | | 1.33 | |
Less distributions from: | | | | | | | | | | | | |
Net investment income | | | — | | | | — | | | | — | |
Net realized gain | | | — | | | | — | | | | — | |
| | |
|
|
| |
|
|
| |
|
|
|
Total distributions | | | — | | | | — | | | | — | |
| | |
|
|
| |
|
|
| |
|
|
|
Net asset value, end of period | | $ | 13.46 | | | $ | 12.86 | | | $ | 11.33 | |
| | |
|
|
| |
|
|
| |
|
|
|
Total return (%) | | | 4.67 | | | | 13.50 | | | | 13.30 | |
Ratios to average daily net assets (%): | | | | | | | | | | | | |
Expenses, net of waivers and reimbursements | | | 1.47 | (c) | | | 1.48 | | | | 1.50 | (c) |
Expenses, before waivers and reimbursements | | | 1.57 | (c) | | | 1.81 | | | | 2.96 | (c) |
Net investment income (loss), net of waivers and reimbursements | | | 0.96 | (c) | | | (0.33 | ) | | | (0.77 | )(c) |
Net investment income (loss), before waivers and reimbursements | | | 0.86 | (c) | | | (0.66 | ) | | | (2.23 | )(c) |
| | | | | | | | | | | | |
| | | Class I
| |
| | | Period Ended
| | | Years Ended December 31,
| |
| | | 6/30/2006
| | | 2005
| | | 2004(a)
| |
| | | (unaudited) | | | | | | | |
Net asset value, beginning of year | | $ | 12.94 | | | $ | 11.37 | | | $ | 10.00 | |
Income (loss) from investment operations: | | | | | | | | | | | | |
Net investment income (loss) (b) | | | 0.08 | | | | (0.01 | ) | | | (0.01 | ) |
Net realized and unrealized gain (loss) on investments | | | 0.54 | | | | 1.58 | | | | 1.38 | |
| | |
|
|
| |
|
|
| |
|
|
|
Total from investment operations | | | 0.62 | | | | 1.57 | | | | 1.37 | |
Less distributions from: | | | | | | | | | | | | |
Net investment income | | | — | | | | — | | | | — | |
Net realized gain | | | — | | | | — | | | | — | |
| | |
|
|
| |
|
|
| |
|
|
|
Total distributions | | | — | | | | — | | | | — | |
| | |
|
|
| |
|
|
| |
|
|
|
Net asset value, end of period | | $ | 13.56 | | | $ | 12.94 | | | $ | 11.37 | |
| | |
|
|
| |
|
|
| |
|
|
|
Total return (%) | | | 4.79 | | | | 13.81 | | | | 13.70 | |
Ratios to average daily net assets (%): | | | | | | | | | | | | |
Expenses, net of waivers and reimbursements | | | 1.22 | (c) | | | 1.23 | | | | 1.25 | (c) |
Expenses, before waivers and reimbursements | | | 1.32 | (c) | | | 1.56 | | | | 2.71 | (c) |
Net investment income (loss), net of waivers and reimbursements | | | 1.21 | (c) | | | (0.08 | ) | | | (0.52 | )(c) |
Net investment income (loss), before waivers and reimbursements | | | 1.11 | (c) | | | (0.41 | ) | | | (1.98 | )(c) |
| | | | | | | | | | | |
| | | Period Ended
| | | Years Ended December 31,
| |
| | | 6/30/2006
| | | 2005
| | 2004
| |
| | | (unaudited) | | | | | | |
Supplemental data for all classes: | | | | | | | | | | | |
Net assets at end of period (in thousands) | | $ | 236,783 | | | $ | 177,710 | | $ | 9,689 | |
Portfolio turnover rate (%) | | | 101 | (c) | | | 127 | | | 108 | (c) |
| (a) | | For the period from May 24, 2004 (Commencement of Operations) to December 31, 2004. |
| (b) | | Excludes $0.33 and $0.02 of PFIC mark to market which is treated as ordinary income for Federal tax purposes for the years 2005 and 2004, respectively. |
| (c) | | Rates are annualized for periods that are less than a year. |
Performance cited represents past performance. Past performance does not guarantee future results and current performance may be lower or higher than the data quoted. Results shown are annual returns, which assume reinvestment of dividends and capital gains. Investment returns and principal will fluctuate and you may have a gain or loss when you sell shares. For the most current month-end performance information, please call 1-800-742-7272, or visit our Web site at www.williamblairfunds.com.
Note: Net investment income (loss) per share is based on the average shares outstanding during the year.
104 Semi-Annual Report | June 30, 2006 |
Financial Highlights
International Small Cap Growth Fund
| | | | | | | | |
| | | Class N
| |
| | | Period Ended
| |
| | | 6/30/2006
| | | 12/31/2005(a)
| |
| | | (unaudited) | | | | |
Net asset value, beginning of period | | $ | 11.16 | | | $ | 10.00 | |
Income (loss) from investment operations: | | | | | | | | |
Net investment income (loss) (b) | | | — | | | | (0.01 | ) |
Net realized and unrealized gain (loss) on investments | | | 0.95 | | | | 1.17 | |
| | |
|
|
| |
|
|
|
Total from investment operations | | | 0.95 | | | | 1.16 | |
Less distributions from: | | | | | | | | |
Net investment income | | | — | | | | — | |
Net realized gain | | | — | | | | — | |
| | |
|
|
| |
|
|
|
Total distributions | | | — | | | | — | |
| | |
|
|
| |
|
|
|
Net asset value, end of period | | $ | 12.11 | | | $ | 11.16 | |
| | |
|
|
| |
|
|
|
Total return (%) | | | 8.51 | | | | 11.60 | |
Ratios to average daily net assets (%) (c): | | | | | | | | |
Expenses, net of waivers and reimbursements | | | 1.65 | | | | 1.65 | |
Expenses, before waivers and reimbursements | | | 1.78 | | | | 2.57 | |
Net investment income (loss), net of waivers and reimbursements | | | (0.10 | ) | | | (0.40 | ) |
Net investment income (loss), before waivers and reimbursements | | | (0.23 | ) | | | (1.32 | ) |
| |
| | | Class I
| |
| | | Period Ended
| |
| | | 6/30/2006
| | | 12/31/2005(a)
| |
| | | (unaudited) | | | | |
Net asset value, beginning of period | | $ | 11.16 | | | $ | 10.00 | |
Income (loss) from investment operations: | | | | | | | | |
Net investment income (loss) (b) | | | 0.01 | | | | — | |
Net realized and unrealized gain (loss) on investments | | | 0.96 | | | | 1.16 | |
| | |
|
|
| |
|
|
|
Total from investment operations | | | 0.97 | | | | 1.16 | |
Less distributions from: | | | | | | | | |
Net investment income | | | — | | | | — | |
Net realized gain | | | — | | | | — | |
| | |
|
|
| |
|
|
|
Total distributions | | | — | | | | — | |
| | |
|
|
| |
|
|
|
Net asset value, end of period | | $ | 12.13 | | | $ | 11.16 | |
| | |
|
|
| |
|
|
|
Total return (%) | | | 8.69 | | | | 11.60 | |
Ratios to average daily net assets (%) (c): | | | | | | | | |
Expenses, net of waivers and reimbursements | | | 1.40 | | | | 1.40 | |
Expenses, before waivers and reimbursements | | | 1.53 | | | | 2.32 | |
Net investment income (loss), net of waivers and reimbursements | | | 0.15 | | | | (0.15 | ) |
Net investment income (loss), before waivers and reimbursements | | | 0.02 | | | | (1.07 | ) |
| | | | | | |
| | |
|
| | | Period Ended
|
| | | 6/30/2006
| | 12/31/2005(a)
|
| | | (unaudited) | | |
Supplemental data for all classes: | | | | | | |
Net assets at end of period (in thousands) | | $ | 122,705 | | $ | 50,534 |
Portfolio turnover rate (%) (c) | | | 132 | | | 127 |
| (a) | | For the period from November 1, 2005 (Commencement of Operations) to December 31, 2005. |
| (b) | | Excludes $0.11 of PFIC mark to market which is treated as ordinary income for Federal tax purposes. |
| (c) | | Rates are annualized for periods that are less than a year. |
Performance cited represents past performance. Past performance does not guarantee future results and current performance may be lower or higher than the data quoted. Results shown are annual returns, which assume reinvestment of dividends and capital gains. Investment returns and principal will fluctuate and you may have a gain or loss when you sell shares. For the most current month-end performance information, please call 1-800-742-7272, or visit our Web site at www.williamblairfunds.com.
Note: Net investment income (loss) per share is based on the average shares outstanding during the period.
June 30, 2006 | William Blair Funds 105 |
Financial Highlights
Emerging Markets Growth Fund
| | | | | | | |
| | | Class N
| |
| | | Period Ended
| |
| | | 6/30/2006
| | 12/31/2005(a)
| |
| | | (unaudited) | | | |
Net asset value, beginning of period | | $ | 14.17 | | $ | 10.00 | |
Income (loss) from investment operations: | | | | | | | |
Net investment income (loss) (b) | | | 0.02 | | | (0.01 | ) |
Net realized and unrealized gain (loss) on investments | | | 0.81 | | | 4.26 | |
| | |
|
| |
|
|
|
Total from investment operations | | | 0.83 | | | 4.25 | |
Less distributions from: | | | | | | | |
Net investment income | | | — | | | — | |
Net realized gain | | | — | | | 0.08 | �� |
| | |
|
| |
|
|
|
Total distributions | | | — | | | 0.08 | |
| | |
|
| |
|
|
|
Net asset value, end of period | | $ | 15.00 | | $ | 14.17 | |
| | |
|
| |
|
|
|
Total return (%) | | | 5.86 | | | 42.52 | |
Ratios to average daily net assets (%) (c): | | | | | | | |
Expenses, net of waivers and reimbursements | | | 1.65 | | | 1.55 | |
Expenses, before waivers and reimbursements | | | 1.74 | | | 1.91 | |
Net investment income (loss), net of waivers and reimbursements | | | 0.15 | | | (0.11 | ) |
Net investment income (loss), before waivers and reimbursements | | | 0.06 | | | (0.47 | ) |
| | | | | | | |
| | | Class I
| |
| | | Period Ended
| |
| | | 6/30/2006
| | 12/31/2005(a)
| |
| | | (unaudited) | | | |
Net asset value, beginning of period | | $ | 14.19 | | $ | 10.00 | |
Income (loss) from investment operations: | | | | | | | |
Net investment income (loss) (b) | | | 0.03 | | | 0.01 | |
Net realized and unrealized gain (loss) on investments | | | 0.82 | | | 4.26 | |
| | |
|
| |
|
|
|
Total from investment operations | | | 0.85 | | | 4.27 | |
Less distributions from: | | | | | | | |
Net investment income | | | — | | | — | |
Net realized gain | | | — | | | 0.08 | |
| | |
|
| |
|
|
|
Total distributions | | | — | | | 0.08 | |
| | |
|
| |
|
|
|
Net asset value, end of period | | $ | 15.04 | | $ | 14.19 | |
| | |
|
| |
|
|
|
Total return (%) | | | 5.99 | | | 42.72 | |
Ratios to average daily net assets (%) (c): | | | | | | | |
Expenses, net of waivers and reimbursements | | | 1.40 | | | 1.40 | |
Expenses, before waivers and reimbursements | | | 1.49 | | | 1.76 | |
Net investment income (loss), net of waivers and reimbursements | | | 0.40 | | | 0.04 | |
Net investment income (loss), before waivers and reimbursements | | | 0.31 | | | (0.32 | ) |
| | | | | | |
| | | Period Ended
|
| | | 6/30/2006
| | 12/31/2005(a)
|
| | | (unaudited) | | |
Supplemental data for all classes: | | | | | | |
Net assets at end of period (in thousands) | | $ | 460,842 | | $ | 249,348 |
Portfolio turnover rate (%) (c) | | | 144 | | | 77 |
| (a) | | For the period from June 6, 2005 (Commencement of Operations) to December 31, 2005. |
| (b) | | Excludes $0.11 of PFIC mark to market which is treated as ordinary income for Federal tax purposes. |
| (c) | | Rates are annualized for periods that are less than a year. |
Performance cited represents past performance. Past performance does not guarantee future results and current performance may be lower or higher than the data quoted. Results shown are annual returns, which assume reinvestment of dividends and capital gains. Investment returns and principal will fluctuate and you may have a gain or loss when you sell shares. For the most current month-end performance information, please call 1-800-742-7272, or visit our Web site at www.williamblairfunds.com.
Note: Net investment income (loss) per share is based on the average shares outstanding during the period.
106 Semi-Annual Report | June 30, 2006 |
Financial Highlights
Value Discovery Fund
| | | | | | | | | | | | | | | | | | | | | | | |
| | | Class N
|
| | | Period Ended
| | | Years Ended December 31,
|
| | | 6/30/2006
| | | 2005
| | | 2004
| | | 2003
| | | 2002
| | | 2001
|
| | | (unaudited) | | | | | | | | | | | | | | | |
Net asset value, beginning of year | | $ | 14.95 | | | $ | 22.70 | | | $ | 22.68 | | | $ | 16.28 | | | $ | 18.23 | | | $ | 16.20 |
Income (loss) from investment operations: | | | | | | | | | | | | | | | | | | | | | | | |
Net investment income (loss) | | | (0.03 | ) | | | (0.02 | ) | | | (0.01 | ) | | | (0.06 | ) | | | (0.03 | ) | | | 0.08 |
Net realized and unrealized gain (loss) on investments | | | 1.31 | | | | 0.14 | | | | 2.68 | | | | 6.46 | | | | (1.92 | ) | | | 2.74 |
| | |
|
|
| |
|
|
| |
|
|
| |
|
|
| |
|
|
| |
|
|
Total from investment operations | | | 1.28 | | | | 0.12 | | | | 2.67 | | | | 6.40 | | | | (1.95 | ) | | | 2.82 |
Less distributions from: | | | | | | | | | | | | | | | | | | | | | | | |
Net investment income | | | — | | | | — | | | | — | | | | — | | | | — | | | | 0.03 |
Net realized gain | | | — | | | | 7.87 | | | | 2.65 | | | | — | | | | — | | | | 0.76 |
| | |
|
|
| |
|
|
| |
|
|
| |
|
|
| |
|
|
| |
|
|
Total distributions | | | — | | | | 7.87 | | | | 2.65 | | | | — | | | | — | | | | 0.79 |
| | |
|
|
| |
|
|
| |
|
|
| |
|
|
| |
|
|
| |
|
|
Net asset value, end of period | | $ | 16.23 | | | $ | 14.95 | | | $ | 22.70 | | | $ | 22.68 | | | $ | 16.28 | | | $ | 18.23 |
| | |
|
|
| |
|
|
| |
|
|
| |
|
|
| |
|
|
| |
|
|
Total return (%) | | | 8.56 | | | | 0.49 | | | | 12.05 | | | | 39.31 | | | | (10.70 | ) | | | 17.39 |
Ratios to average daily net assets (%): | | | | | | | | | | | | | | | | | | | | | | | |
Expenses, net of waivers and reimbursements | | | 1.34 | (a) | | | 1.34 | | | | 1.34 | | | | 1.49 | | | | 1.53 | | | | 1.61 |
Expenses, before waivers and reimbursements | | | 1.83 | (a) | | | 1.64 | | | | 1.48 | | | | 1.58 | | | | 1.53 | | | | 1.66 |
Net investment income (loss), net of waivers and reimbursements | | | (0.42 | )(a) | | | (0.22 | ) | | | (0.06 | ) | | | (0.30 | ) | | | (0.16 | ) | | | 0.28 |
Net investment income (loss), before waivers and reimbursements | | | (0.91 | )(a) | | | (0.52 | ) | | | (0.20 | ) | | | (0.39 | ) | | | (0.16 | ) | | | 0.23 |
| |
| | | Class I
|
| | | Period Ended
| | | Years Ended December 31,
|
| | | 6/30/2006
| | | 2005
| | | 2004
| | | 2003
| | | 2002
| | | 2001
|
| | | (unaudited) | | | | | | | | | | | | | | | |
Net asset value, beginning of year | | $ | 15.12 | | | $ | 22.82 | | | $ | 22.76 | | | $ | 16.31 | | | $ | 18.19 | | | $ | 16.16 |
Income (loss) from investment operations: | | | | | | | | | | | | | | | | | | | | | | | |
Net investment income (loss) | | | (0.01 | ) | | | — | | | | 0.01 | | | | (0.03 | ) | | | 0.01 | | | | 0.17 |
Net realized and unrealized gain (loss) on investments | | | 1.33 | | | | 0.17 | | | | 2.70 | | | | 6.48 | | | | (1.89 | ) | | | 2.70 |
| | |
|
|
| |
|
|
| |
|
|
| |
|
|
| |
|
|
| |
|
|
Total from investment operations | | | 1.32 | | | | 0.17 | | | | 2.71 | | | | 6.45 | | | | (1.88 | ) | | | 2.87 |
Less distributions from: | | | | | | | | | | | | | | | | | | | | | | | |
Net investment income | | | — | | | | — | | | | — | | | | — | | | | — | | | | 0.08 |
Net realized gain | | | — | | | | 7.87 | | | | 2.65 | | | | — | | | | — | | | | 0.76 |
| | |
|
|
| |
|
|
| |
|
|
| |
|
|
| |
|
|
| |
|
|
Total distributions | | | — | | | | 7.87 | | | | 2.65 | | | | — | | | | — | | | | 0.84 |
| | |
|
|
| |
|
|
| |
|
|
| |
|
|
| |
|
|
| |
|
|
Net asset value, end of period | | $ | 16.44 | | | $ | 15.12 | | | $ | 22.82 | | | $ | 22.76 | | | $ | 16.31 | | | $ | 18.19 |
| | |
|
|
| |
|
|
| |
|
|
| |
|
|
| |
|
|
| |
|
|
Total return (%) | | | 8.73 | | | | 0.70 | | | | 12.18 | | | | 39.55 | | | | (10.34 | ) | | | 17.72 |
Ratios to average daily net assets (%): | | | | | | | | | | | | | | | | | | | | | | | |
Expenses, net of waivers and reimbursements | | | 1.09 | (a) | | | 1.14 | | | | 1.23 | | | | 1.33 | | | | 1.34 | | | | 1.36 |
Expenses, before waivers and reimbursements | | | 1.58 | (a) | | | 1.39 | | | | 1.23 | | | | 1.33 | | | | 1.34 | | | | 1.41 |
Net investment income (loss), net of waivers and reimbursements | | | (0.17 | )(a) | | | (0.02 | ) | | | 0.05 | | | | (0.14 | ) | | | 0.03 | | | | 0.53 |
Net investment income (loss), before waivers and reimbursements | | | (0.66 | )(a) | | | (0.27 | ) | | | 0.05 | | | | (0.14 | ) | | | 0.03 | | | | 0.48 |
| | | | | | | | | | | | | | | | | | | |
| | | Period Ended
| | | Years Ended December 31,
|
| | | 6/30/2006
| | | 2005
| | 2004
| | 2003
| | 2002
| | 2001
|
| | | (unaudited) | | | | | | | | | | | |
Supplemental data for all classes: | | | | | | | | | | | | | | | | | | | |
Net assets at end of period (in thousands) | | $ | 48,841 | | | $ | 70,439 | | $ | 246,176 | | $ | 237,111 | | $ | 190,802 | | $ | 149,292 |
Portfolio turnover rate (%) | | | 146 | (a) | | | 125 | | | 50 | | | 51 | | | 20 | | | 48 |
| (a) | | Rates are annualized for periods that are less than a year. |
Performance cited represents past performance. Past performance does not guarantee future results and current performance may be lower or higher than the data quoted. Results shown are annual returns, which assume reinvestment of dividends and capital gains. Investment returns and principal will fluctuate and you may have a gain or loss when you sell shares. For the most current month-end performance information, please call 1-800-742-7272, or visit our Web site at www.williamblairfunds.com.
Note: Net investment income (loss) per share is based on the average shares outstanding during the year.
June 30, 2006 | William Blair Funds 107 |
Financial Highlights
Income Fund
| | | | | | | | | | | | | | | | | | | | | | |
| | | Class N
|
| | | Period Ended
| | | Years Ended December 31,
|
| | | 6/30/2006
| | | 2005
| | | 2004
| | | 2003
| | | 2002
| | 2001
|
| | | (unaudited) | | | | | | | | | | | | | | |
Net asset value, beginning of year | | $ | 9.83 | | | $ | 10.19 | | | $ | 10.43 | | | $ | 10.62 | | | $ | 10.34 | | $ | 10.22 |
Income (loss) from investment operations: | | | | | | | | | | | | | | | | | | | | | | |
Net investment income (loss) (a) | | | 0.22 | | | | 0.47 | | | | 0.52 | | | | 0.40 | | | | 0.55 | | | 0.55 |
Net realized and unrealized gain (loss) on investments | | | (0.20 | ) | | | (0.30 | ) | | | (0.26 | ) | | | (0.02 | ) | | | 0.25 | | | 0.17 |
| | |
|
|
| |
|
|
| |
|
|
| |
|
|
| |
|
| |
|
|
Total from investment operations | | | 0.02 | | | | 0.17 | | | | 0.26 | | | | 0.38 | | | | 0.80 | | | 0.72 |
Less distributions from: | | | | | | | | | | | | | | | | | | | | | | |
Net investment income | | | 0.23 | | | | 0.53 | | | | 0.50 | | | | 0.57 | | | | 0.52 | | | 0.60 |
Net realized gain | | | — | | | | — | | | | — | | | | — | | | | — | | | — |
| | |
|
|
| |
|
|
| |
|
|
| |
|
|
| |
|
| |
|
|
Total distributions | | | 0.23 | | | | 0.53 | | | | 0.50 | | | | 0.57 | | | | 0.52 | | | 0.60 |
| | |
|
|
| |
|
|
| |
|
|
| |
|
|
| |
|
| |
|
|
Net asset value, end of period | | $ | 9.62 | | | $ | 9.83 | | | $ | 10.19 | | | $ | 10.43 | | | $ | 10.62 | | $ | 10.34 |
| | |
|
|
| |
|
|
| |
|
|
| |
|
|
| |
|
| |
|
|
Total return (%) | | | 0.23 | | | | 1.71 | | | | 2.61 | | | | 3.68 | | | | 7.91 | | | 7.18 |
Ratios to average daily net assets (%): | | | | | | | | | | | | | | | | | | | | | | |
Expenses | | | 0.73 | (b) | | | 0.73 | | | | 0.78 | | | | 0.77 | | | | 0.81 | | | 0.94 |
Net investment income (loss) | | | 4.51 | (b) | | | 4.09 | | | | 4.12 | | | | 4.09 | | | | 5.23 | | | 5.38 |
| | | Class I
|
| | | Period Ended
| | | Years Ended December 31,
|
| | | 6/30/2006
| | | 2005
| | | 2004
| | | 2003
| | | 2002
| | 2001
|
| | | (unaudited) | | | | | | | | | | | | | | |
Net asset value, beginning of year | | $ | 9.82 | | | $ | 10.15 | | | $ | 10.40 | | | $ | 10.62 | | | $ | 10.35 | | $ | 10.24 |
Income (loss) from investment operations: | | | | | | | | | | | | | | | | | | | | | | |
Net investment income (loss) (a) | | | 0.23 | | | | 0.52 | | | | 0.59 | | | | 0.43 | | | | 0.57 | | | 0.58 |
Net realized and unrealized gain (loss) on investments | | | (0.21 | ) | | | (0.33 | ) | | | (0.31 | ) | | | (0.04 | ) | | | 0.24 | | | 0.15 |
| | |
|
|
| |
|
|
| |
|
|
| |
|
|
| |
|
| |
|
|
Total from investment operations | | | 0.02 | | | | 0.19 | | | | 0.28 | | | | 0.39 | | | | 0.81 | | | 0.73 |
Less distributions from: | | | | | | | | | | | | | | | | | | | | | | |
Net investment income | | | 0.24 | | | | 0.52 | | | | 0.53 | | | | 0.61 | | | | 0.54 | | | 0.62 |
Net realized gain | | | — | | | | — | | | | — | | | | — | | | | — | | | — |
| | |
|
|
| |
|
|
| |
|
|
| |
|
|
| |
|
| |
|
|
Total distributions | | | 0.24 | | | | 0.52 | | | | 0.53 | | | | 0.61 | | | | 0.54 | | | 0.62 |
| | |
|
|
| |
|
|
| |
|
|
| |
|
|
| |
|
| |
|
|
Net asset value, end of period | | $ | 9.60 | | | $ | 9.82 | | | $ | 10.15 | | | $ | 10.40 | | | $ | 10.62 | | $ | 10.35 |
| | |
|
|
| |
|
|
| |
|
|
| |
|
|
| |
|
| |
|
|
Total return (%) | | | 0.23 | | | | 1.92 | | | | 2.79 | | | | 3.76 | | | | 8.04 | | | 7.32 |
Ratios to average daily net assets (%): | | | | | | | | | | | | | | | | | | | | | | |
Expenses | | | 0.57 | (b) | | | 0.58 | | | | 0.63 | | | | 0.62 | | | | 0.66 | | | 0.79 |
Net investment income (loss) | | | 4.67 | (b) | | | 4.24 | | | | 4.27 | | | | 4.24 | | | | 5.38 | | | 5.53 |
| | | | | | | | | | | | | | |
| | | Period Ended
| | | Years Ended December 31,
|
| | | 6/30/2006
| | | 2005
| | 2004
| | 2003
| | 2002
| | 2001
|
| | | (unaudited) | | | | | | | | | | | |
Supplemental data for all classes: | | | | | | | | | | | | | | |
Net assets at end of period (in thousands) | | $299,894 | | | $310,496 | | $294,084 | | $265,062 | | $196,136 | | $ | 176,264 |
Portfolio turnover rate (%) | | 33 | (b) | | 41 | | 43 | | 36 | | 66 | | | 82 |
| (a) | | As required, in 2001, the Fund has adopted the provisions of the AICPA Audit and Accounting Guide for Investment Companies and began treating any paydown gain or losses on mortgage and asset backed securities as an adjustment to income. The effect of this change for the year 2001 was to decrease net investment income per share by $.05 and increase the net realized and unrealized gain and loss per share by $.05. It decreases the Ratio of Net Investment Income to Average Net Assets from 5.87% to 5.38% for Class N for 2001. It decreased the Ratio of Net Investment Income from 6.02% to 5.53% for Class I shares for 2001. |
| (b) | | Rates are annualized for periods that are less than a year. |
Performance cited represents past performance. Past performance does not guarantee future results and current performance may be lower or higher than the data quoted. Results shown are annual returns, which assume reinvestment of dividends and capital gains. Investment returns and principal will fluctuate and you may have a gain or loss when you sell shares. For the most current month-end performance information, please call 1-800-742-7272, or visit our Web site at www.williamblairfunds.com.
Note: Net investment income (loss) per share is based on the average shares outstanding during the year.
108 Semi-Annual Report | June 30, 2006 |
Financial Highlights
Ready Reserves Fund
| | | | | | | | | | | | | | | | | | | |
| | | Class N
|
| | | Period Ended
| | | Years Ended December 31,
|
| | | 6/30/2006
| | | 2005
| | 2004
| | 2003
| | 2002
| | 2001
|
| | | (unaudited) | | | | | | | | | | | |
Net asset value, beginning of year | | $ | 1.00 | | | $ | 1.00 | | $ | 1.00 | | $ | 1.00 | | $ | 1.00 | | $ | 1.00 |
Income (loss) from investment operations: | | | | | | | | | | | | | | | | | | | |
Net investment income (loss) | | | 0.02 | | | | 0.03 | | | 0.01 | | | 0.01 | | | 0.01 | | | 0.04 |
| | |
|
|
| |
|
| |
|
| |
|
| |
|
| |
|
|
Total from investment operations | | | 0.02 | | | | 0.03 | | | 0.01 | | | 0.01 | | | 0.01 | | | 0.04 |
Less distributions from: | | | | | | | | | | | | | | | | | | | |
Net investment income | | | 0.02 | | | | 0.03 | | | 0.01 | | | 0.01 | | | 0.01 | | | 0.04 |
| | |
|
|
| |
|
| |
|
| |
|
| |
|
| |
|
|
Total distributions | | | 0.02 | | | | 0.03 | | | 0.01 | | | 0.01 | | | 0.01 | | | 0.04 |
| | |
|
|
| |
|
| |
|
| |
|
| |
|
| |
|
|
Net asset value, end of period | | $ | 1.00 | | | $ | 1.00 | | $ | 1.00 | | $ | 1.00 | | $ | 1.00 | | $ | 1.00 |
| | |
|
|
| |
|
| |
|
| |
|
| |
|
| |
|
|
Total return (%) | | | 2.04 | | | | 2.62 | | | 0.80 | | | 0.66 | | | 1.28 | | | 3.66 |
Ratios to average daily net assets (%) | | | | | | | | | | | | | | | | | | | |
Expenses | | | 0.63 | (a) | | | 0.64 | | | 0.65 | | | 0.66 | | | 0.67 | | | 0.67 |
Net investment income (loss) | | | 4.07 | (a) | | | 2.57 | | | 0.80 | | | 0.66 | | | 1.28 | | | 3.63 |
Supplemental data: | | | | | | | | | | | | | | | | | | | |
Net assets at end of period (in thousands) | | $ | 1,159,049 | | | $ | 1,091,854 | | $ | 1,092,940 | | $ | 1,153,932 | | $ | 1,324,001 | | $ | 1,403,740 |
| (a) | | Rates are annualized for periods that are less than a year. |
Performance cited represents past performance. Past performance does not guarantee future results and current performance may be lower or higher than the data quoted. Results shown are annual returns, which assume reinvestment of dividends and capital gains. Investment returns and principal will fluctuate and you may have a gain or loss when you sell shares. For the most current month-end performance information, please call 1-800-742-7272, or visit our Web site at www.williamblairfunds.com.
June 30, 2006 | William Blair Funds 109 |
Trustees and Officers (Unaudited). The trustees and officers of the William Blair Funds, their year of birth, their principal occupations during the last five years, their affiliations, if any, with William Blair & Company, L.L.C., and other significant affiliations are set forth below. The address of each trustee and officer is 222 West Adams Street, Chicago, Illinois 60606.
| | | | | | | | | | |
Name and Year of Birth
| | Position(s)
Held with
Fund
| | Term of
Office and
Length of
Time
Served(1)
| | Principal Occupation(s) During Past 5 Years
| | Number of
Portfolios
in Fund
Complex
Overseen
by Trustee
| | Other Directorships Held by Trustee/Officer
|
Interested Trustees | | | | | | | | | | |
Frederick Conrad Fischer,
1934* | | Chairman of the Board of Trustees | | Since 1987 | | Principal, William Blair & Company, L.L.C.; Partner, APM Limited Partnership | | 15 | | Trustee Emeritus, Chicago Child Care Society, a non-profit organization; Trustee Emeritus Kalamazoo College |
| | | | | |
Michelle Seitz,
1965* | | Trustee | | Since 2002 | | Principal, William Blair & Company, L.L.C. | | 15 | | N/A |
Non-Interested Trustees | | | | | | | | |
Theodore A. Bosler,
1934 | | Trustee | | Since 1997 | | Retired Principal and Vice President, Lincoln Capital Management | | 15 | | Desert Foothills Land Trust, Institute of Chartered Financial Analysts, and Thresholds. |
| | | | | |
Ann P. McDermott,
1939 | | Trustee | | Since 1996 | | Board member and officer for various civic and charitable organizations over the past thirty years; professional experience prior thereto, registered representative for New York Stock Exchange firm | | 15 | | Northwestern University, Women’s Board; Rush Presbyterian St. Luke’s Medical Center, Women’s Board; University of Chicago, Women’s Board; Visiting Nurses Association, Honorary Director |
| | | | | |
Donald J. Reaves,
1946 | | Trustee | | Since 2004 | | Vice President for Administration and Chief Financial Officer, University of Chicago since 2002. Executive Vice President and Chief Financial Officer, Brown University from 1993 to 2002 | | 15 | | American Student Assistance Corp.; Amica Mutual Insurance Company; NACUBO (National Association of College and University Business Officers) |
| | | | | |
John B. Schwemm,
1934 | | Trustee | | Since 1990 | | Retired Chairman and Chief Executive Officer, R.R. Donnelley & Sons Company | | 15 | | USG Corp., building material manufacturer, and Walgreen Co. |
| | | | | |
Donald L. Seeley,
1944 | | Trustee | | Since 2003 | | Director, Applied Investment Management Program, University of Arizona Department of Finance, Formerly Vice Chairman and Chief Financial Officer, True North Communications, Inc., marketing communications and advertising firm | | 15 | | Warnaco Group, Inc. intimate apparel, sportswear, and swimwear manufacturer. |
| | | | | |
Robert E. Wood II,
1938 | | Trustee | | Since 1999 | | Retired Executive Vice President, Morgan Stanley Dean Witter | | 15 | | Chairman, Add-Vision, Inc. manufacturer of surface animation systems, and Micro-Combustion, LLC |
110 Semi-Annual Report | June 30, 2006 |
| | | | | | | | | | |
Name and Year of Birth
| | Position(s)
Held with
Fund
| | Term of
Office and
Length of
Time
Served(1)
| | Principal Occupation(s) During Past 5 Years
| | Number of
Portfolios
in Fund
Complex
Overseen
by Trustee
| | Other Directorships Held by Trustee/Officer
|
Officers | | | | | | | | | | |
Marco Hanig,
1958 | | President | | Since 1999 | | Principal, William Blair & Company, L.L.C. | | N/A | | Chicago Scores |
| | | | | |
Karl W. Brewer,
1966 | | Senior Vice President | | Since 2000 | | Principal, William Blair & Company, L.L.C. | | N/A | | N/A |
| | | | | |
Harvey H. Bundy, III,
1944 | | Senior Vice President | | Since 2003 | | Principal, William Blair & Company, L.L.C. | | N/A | | N/A |
| | | | | |
Mark A. Fuller, III,
1957 | | Senior Vice President | | Since 1993 | | Principal, William Blair & Company, L.L.C. | | N/A | | Partner, Fulsen Howney Partners |
| | | | | |
James S. Golan,
1961 | | Senior Vice President | | Since 2005 | | Principal, William Blair & Company, L.L.C. | | N/A | | N/A |
| | | | | |
W. George Greig,
1952 | | Senior Vice President | | Since 1996 | | Principal, William Blair & Company, L.L.C. | | N/A | | N/A |
| | | | | |
Michael A. Jancosek,
1959 | | Senior Vice President Vice President | | Since 2004 Since 2000 | | Principal, William Blair & Company L.L.C. Associate, William Blair & Company, L.L.C. | | N/A | | N/A |
| | | | | |
John F. Jostrand,
1954 | | Senior Vice President | | Since 1999 | | Principal, William Blair & Company, L.L.C. | | N/A | | N/A |
| | | | | |
James S. Kaplan,
1960 | | Senior Vice President Vice President | | Since 2004 Since 1995 | | Principal, William Blair & Company, L.L.C. Associate, William Blair & Company, L.L.C. | | N/A | | N/A |
| | | | | |
Robert C. Lanphier, IV,
1956 | | Senior Vice President | | Since 2003 | | Principal, William Blair & Company, L.L.C. | | N/A | | Chairman, AG. Med, Inc. |
| | | | | |
Todd M. McClone,
1968 | | Senior Vice President Vice President | | Since 2006 Since 2005 | | Principal, William Blair & Company, L.L.C. Associate, William Blair & Company, L.L.C. | | N/A N/A | | N/A N/A |
| | | | | |
David S. Mitchell,
1960 | | Senior Vice President Vice President | | Since 2004 Since 2003 | | Principal, William Blair & Company, L.L.C. Associate, William Blair & Company, L.L.C. | | N/A | | N/A |
| | | | | |
Gregory J. Pusinelli,
1958 | | Senior Vice President | | Since 1999 | | Principal, William Blair & Company, L.L.C. | | N/A | | N/A |
| | | | | |
David P. Ricci,
1958 | | Senior Vice President | | Since 2006 | | Principal, William Blair & Company, L.L.C. | | N/A | | N/A |
| | | | | |
Norbert W. Truderung,
1952 | | Senior Vice President | | Since 1992 | | Principal, William Blair & Company, L.L.C. | | N/A | | N/A |
| | | | | |
Jeffrey A. Urbina,
1955 | | Senior Vice President | | Since 1998 | | Principal, William Blair & Company, L.L.C. | | N/A | | N/A |
June 30, 2006 | William Blair Funds 111 |
| | | | | | | | | | |
Name and Year of Birth
| | Position(s)
Held with
Fund
| | Term of
Office and
Length of
Time
Served(1)
| | Principal Occupation(s) During Past 5 Years
| | Number of
Portfolios
in Fund
Complex
Overseen
by Trustee
| | Other Directorships Held by Trustee/Officer
|
Christopher T. Vincent,
1956 | | Senior Vice President Vice President | | Since 2004 Since 2002 | | Principal, William Blair & Company, L.L.C. Associate, William Blair & Company, L.L.C.; former Managing Director/Senior Portfolio Manager, Zurich Scudder Investments | | N/A | | Uhlich Children’s Home |
| | | | | |
David C. Fording,
1967 | | Vice President | | Since 2006 | | Associate, William Blair & Company,; former Portfolio Manager, TIAA-CREF | | N/A | | N/A |
| | | | | |
Chad M. Kilmer,
1975 | | Vice President | | Since 2006 | | Associate, William Blair & Company,; former analyst and Portfolio Manager U.S. Bancorp Asset Management and analyst Gabelli Woodland Partners. | | N/A | | N/A |
| | | | | |
Mark T. Leslie,
1967 | | Vice President | | Since 2005 | | Associate, William Blair & Company, L.L.C. formerly, U.S. Bancorp Asset Management | | N/A | | N/A |
| | | | | |
Colin J. Williams,
1975 | | Vice President | | Since 2006 | | Associate William Blair & Company, L.L.C.; formerly, Andersen Consulting; Allegiance Healthcare | | N/A | | N/A |
| | | | | |
Terence M. Sullivan,
1944 | | Vice President and Treasurer | | Since 1997 | | Associate, William Blair & Company, L.L.C. | | N/A | | N/A |
| | | | | |
Colette M. Garavalia,
1961 | | Secretary | | Since 2000 | | Associate, William Blair & Company, L.L.C. | | N/A | | N/A |
| * | | Mr. Fischer and Ms. Seitz are interested persons of the William Blair Funds because each is a principal of William Blair & Company, L.L.C., the Funds’ investment advisor and principal underwriter. |
| (1) | | Each Trustee serves until the election and qualification of a successor, or until death, resignation or retirement or removal as provided in the Fund’s Declaration of Trust. Retirement for non-interested Trustees occurs no later than at the conclusion of the first regularly scheduled Board meeting of the Fund’s fiscal year that occurs after the Trustee’s 72nd birthday. The Fund’s officers are elected annually by the Trustees. |
The Statement of Additional Information for the William Blair Funds includes additional information about the trustees and is available without charge by calling 1-800-635-2886 (in Massachusetts 1-800-635-2840) or by writing the Fund.
112 Semi-Annual Report | June 30, 2006 |
Board Approval of Fund’s Advisory Agreement (unaudited)
During the six months ended June 30, 2006, the Board of Trustees (the “Board”) of William Blair Funds (the “Trust”) approved the renewal for an additional one-year term of the Trust’s Management Agreement with William Blair & Company, L.L.C. (the “Advisor”), on behalf of each series of the Trust, (except the Mid Cap Growth Fund, the International Small Cap Growth Fund and the Emerging Markets Growth Fund which are effective until April, 30, 2007).
The information in this summary outlines the Board’s considerations associated with its renewal of the Management Agreement. In connection with its deliberations regarding the continuation of the Management Agreement, the Board considered such information and factors as it believed to be relevant. As described below, the Board considered the nature, extent and quality of the services performed by the Advisor under the existing Management Agreement; comparative fees and expense ratios as prepared by an independent provider (Lipper Inc.); the profits to be realized by the Advisor; the extent to which the Advisor realizes economies of scale as a Fund grows; and whether any fall-out benefits are being realized by the Advisor. In addition, the Trustees who are not “interested persons” of the Trust as defined in the Investment Company Act of 1940 (the “Independent Trustees”) discussed the renewal of the Management Agreement with Trust management and in private sessions with independent legal counsel at which no representatives of the Advisor were present.
As required by the Investment Company Act of 1940, the renewal was confirmed by the unanimous separate vote of the Independent Trustees. In deciding to approve the renewal of the Management Agreement, the Board did not identify a single factor as controlling and this summary does not describe all of the matters considered. However, the Board concluded that each of the various factors referred to below favored such approval.
Information Requested and Received
The Board, including all the Independent Trustees, considered the renewal of the Management Agreement pursuant to a extensive process that concluded at the Board’s February 16, 2006 meeting. In preparation for the review process, the Independent Trustees met with independent legal counsel several months prior to February 16, 2006 and discussed the type and nature of information to be requested and directed independent legal counsel to send a formal request for information to Trust management. The Advisor provided extensive information in response to the request. Among other information, the Independent Trustees considered: (i) materials describing the nature, quality and extent of services provided by the Advisor; (ii) information comparing the performance of each Fund to other mutual funds and relevant indices; (iii) information comparing the advisory fees and expense ratios of each Fund to other mutual funds; (iv) information comparing advisory fees of each Fund to fees charged by the Advisor to other funds and its similar client accounts; (v) the costs of services provided and estimated profits realized by the Advisor; (vi) information about economies of scale; and (vii) information describing other benefits to the Advisor resulting from its relationship with the Funds. The Independent Trustees reviewed comparative performance of peer groups of funds selected by Lipper, comparative advisory fees and expense ratios of peer groups of funds selected by Lipper and the average performance of an applicable Morningstar style category. The Independent Trustees also received a memorandum from independent legal counsel advising them of their duties and responsibilities in connection with the review of the Management Agreement.
On February 15 and 16, 2006, the Independent Trustees met independently of Trust management and of the interested Trustees, to review and discuss with independent legal counsel the information provided by the Advisor, Lipper and independent legal counsel. The Independent Trustees noted that the Board has also taken into account their accumulated experience as Trustees in working with the Advisor on matters relating to the Funds. Based upon their review, the Independent Trustees concluded on February 16, 2006 that it was in the best interest of each Fund to renew the Management Agreement and recommended to the Board the renewal of the Management Agreement. At its meeting on February 16, 2006, the Board considered the recommendation of the Independent Trustees along with the other factors that the Board deemed relevant.
Nature, Quality and Extent of Services. In evaluating the nature, quality and extent of the services provided by the Advisor to the Funds, the Board noted that the Advisor is a quality firm with a reputation for integrity and honesty that employs high quality people and has a long association with the Funds, since the inception of the Funds. The Trustees believe that a long-term relationship with a capable, conscientious advisor is in the best interests of shareholders and that shareholders have invested in the Funds knowing that the Advisor managed the Funds and knowing the investment advisory fee. The Board considered biographical information about each Fund’s portfolio manager(s), the administrative services performed by the Advisor, financial information regarding the Advisor, brokerage allocation practices, soft dollars and execution, the compliance regime overseen by the Advisor, including the fact that the Advisor has engaged an independent third party for additional Fund compliance monitoring, and the financial support of certain Funds. The Board also noted that the Advisor voluntarily reduces the advisory fees of the Funds by an amount equal to the advisory fee charged by the Ready Reserves Fund on the cash of the Funds invested in the Ready Reserves Fund. Based upon all relevant factors, the Board concluded that the nature, quality and extent of the services provided by the Advisor to each Fund were satisfactory.
June 30, 2006 | William Blair Funds 113 |
The Board reviewed information on the performance of each Fund for one, three, five and ten year periods (or since inception), as applicable, along with performance information of a relevant securities index or indexes and a peer universe of funds from the Lipper database. For all Funds, except the Ready Reserves Fund, the Board also reviewed performance information of the average of the applicable Morningstar style category. There is no applicable Morningstar category for the Ready Reserves Fund. Based upon the review of the performance information, the Board concluded that the performance for the Small-Mid Cap Growth Fund, the International Growth Fund, the Ready Reserves Fund, the Tax-Managed Growth Fund, the Income Fund, the Growth Fund and the Small Cap Growth Fund was satisfactory. Although the Small Cap Growth Fund underperformed over the most recent one year period, it has outperformed for all other periods and as a result the Board concluded that the Small Cap Growth Fund’s overall performance was satisfactory. For the International Equity Fund, while the Fund had underperformed relative to its Lipper peer universe, Morningstar style category average and benchmark index, the Board concluded that the International Equity Fund’s performance was acceptable. The Board noted the actions that have been taken or are being considered to address the investment performance of the Large Cap Growth Fund and the Value Discovery Fund.
Fees and Expenses. The Board reviewed each Fund’s advisory fee and expense ratio and reviewed information comparing the advisory fee and expense ratio to those of a Lipper peer group and a Lipper peer universe. The Lipper peer group for each Fund consists of a group of funds with a similar investment style and asset size as the Fund. The Lipper peer universe for each Fund includes all funds with a similar investment style regardless of asset size. The Board considered that the Advisor has proposed to cap total expenses, including waiving advisory fees, if necessary, for any Fund whose total expense ratio may not be within an appropriate range of the peer universe without expense caps. For each Fund, the Board also reviewed amounts paid to the Advisor by other registered funds, including other Funds in the Trust and funds for which the Advisor acts as a subadvisor and the Advisor’s fee schedule for separate accounts.
In considering the information, the Board noted that the advisory fees for the Growth Fund, the Tax-Managed Growth Fund, the Large Cap Growth Fund, the Income Fund and the Ready Reserves Fund were below their peer group and peer universe. The Board also noted that the advisory fees for the Small-Mid Cap Growth Fund, the International Equity Fund, the Institutional International Equity Fund and the Value Discovery Fund were within an acceptable range of their peer group and peer universe after giving effect to fee waivers. For the Value Discovery Fund, the Board further considered that the Advisor voluntarily had agreed to lower its contractual advisory fee. Finally, the Board noted that the advisory fees for the Small Cap Growth Fund, International Growth Fund and Institutional International Growth Fund were above their peer group and peer universe. On the basis of the information provided, the Board concluded that each Fund’s advisory fee, coupled with any applicable existing or proposed advisory fee waiver and expense cap, was reasonable and appropriate in light of the nature, quality and extent of services provided by the Advisor. The Board noted that, although advisory fees for the International Small Cap Growth Fund were above the median of their peer group and peer universe, such advisory fees were within an acceptable range of the peer group and peer universe and consistent with reasonable expectations in light of the nature, quality and extent of services provided by the Advisor.
Profitability. With respect to the profitability of the Management Agreement to the Advisor, the Board considered the overall fees paid under the Management Agreement, including the costs of the services provided and the profits realized by the Advisor from its relationship with the Funds. The Board concluded that the profits realized by the Advisor were not unreasonable.
Economies of Scale. The Board considered whether there are economies of scale with respect to the management of the Funds and whether the Funds benefit from any economies of scale. The Board considered whether the advisory fees are reasonable in relation to the asset size of the Funds. The Board noted the Advisor’s representation that certain Fund expenses are relatively fixed and unrelated to asset size and that the Advisor may enjoy some economies of scale as a Fund’s assets grow. In considering whether fee levels reflect economies of scale for the benefit of Fund investors, the Board reviewed each Fund’s asset size, breakpoints for those Funds with breakpoints in the advisory fee schedule, the Fund’s total and net expense ratios and the expense caps in place and/or proposed. The Board concluded with respect to each of the Funds, that the expense ratios, after giving effect to the expense caps proposed by the Advisor, as applicable, were reasonable.
Other Benefits to the Advisor. The Board considered benefits derived by the Advisor from its relationship with the Funds, including soft dollars, which pertain primarily to the Funds investing in equity securities, and favorable media coverage. The Board concluded that, taking into account these benefits, each Fund’s advisory fee was reasonable.
Conclusion. Based upon all of the information considered and the conclusions reached, the Board of Trustees, including all of the Independent Trustees, determined that the terms of the Management Agreement continue to be fair and reasonable and that the continuation of the Management Agreement is in the best interests of each Fund.
114 Semi-Annual Report | June 30, 2006 |
(unaudited)
Proxy Voting
A description of the policies and procedures that the Fund uses to determine how to vote proxies relating to portfolio securities and information regarding how the Fund voted proxies relating to portfolio securities for the most recent 12-month period ended June 30 are available without charge, upon request, by calling 1-800-635-2886 (in Massachusetts 1-800-635-2840), at www.williamblairfunds.com and on the SEC’s website at http://www.sec.gov.
Quarterly Portfolio Schedules
The Fund files its complete schedule of portfolio holdings with the SEC for the first and third fiscal quarters of each fiscal year (quarters ended March 31 and September 30) on Form N-Q. The Fund’s Forms N-Q are available on the SEC’s website at http://www.sec.gov and may be reviewed and copied at the SEC’s Public Reference Room in Washington, D.C. Information on the operation of the SEC’s Public Reference Room may be obtained by calling 1-800-SEC-0330.
June 30, 2006 | William Blair Funds 115 |
Useful Information About Your Report (unaudited)
Please refer to this information when reviewing the Expense Example for each Fund.
Expense Example
As a shareholder of a Fund, you incur two types of costs: (1) transaction costs such as redemption fees and (2) ongoing costs, including management fees, distribution (12b-1) fees (for Class N shares except for Ready Reserves Fund), service fees (for Class N of Ready Reserves Fund), shareholder administration fees (for Class N and Class I shares of International Small Cap Growth Fund and Emerging Markets Growth Fund) and other Fund expenses. The example is intended to help you understand your ongoing costs (in dollars) of investing in the Fund and to compare these costs with the ongoing costs of investing in other mutual funds. To do so, compare the Fund’s 5% hypothetical example with the 5% hypothetical examples that appear in the shareholder reports of other funds. The example is based on an investment of $1,000 invested at the beginning of the period and held for the entire six-month period from January 1, 2006 to June 30, 2006.
Actual Expenses
In each example, the first line for each share class in the table provides information about the actual account values and actual expenses. These expenses reflect the effect of any expense cap applicable to the share class during the period. Without this expense cap, the costs shown in the table would have been higher. You may use the information in this line, together with the amount you invested, to estimate the expenses that you paid over the period. Simply divide your account value by $1,000 (example, an $8,600 account value divided by $1,000 = 8.6), then multiply the result by the number in the first line under the heading entitled “Expenses Paid During the Period” to estimate the expenses you paid on your account during the period.
Hypothetical Example for Comparison Purposes
In each example, the second line for each share class in the table provides information about hypothetical account values and hypothetical expenses based on the Fund’s actual expense ratio and an assumed rate of return of 5% per year before expenses. This is not the Fund’s actual return. The hypothetical account values and expenses may not be used to estimate the actual ending account balance or expenses you paid for the period. You may use this information to compare the ongoing costs of investing in the Fund to other funds. To do so, compare this 5% hypothetical example with the 5% hypothetical examples that appear in the shareholder reports of other funds.
Please note that the expenses shown in both examples are meant to highlight your ongoing costs only and do not reflect any transactional costs or account type fees, such as redemption fees and IRA Fiduciary Administration fees, respectively. These fees are fully described in the prospectus. Therefore, the second line of each share class in the table is useful in comparing ongoing costs only and will not help you determine the relative costs of owning different funds. In addition, if these transactional costs or account fees were included, your costs would have been higher.
116 Semi-Annual Report | June 30, 2006 |
Fund Expenses (unaudited)
The examples below show you the ongoing costs (in dollars) of investing in your fund and allows you to compare these costs with those of other mutual funds. Please refer to the previous page for a detailed explanation of the information presented on this chart.
| | | | | | | | | | | | | |
| | | Beginning
Account Value
1/1/2006
| | Ending
Account Value
6/30/2006
| | Expenses Paid
during
Period(a)
| | | Annualized
Expense Ratio
| |
Growth Fund | | | | | | | | | | | | | |
Class N—actual return | | $ | 1,000.00 | | $ | 1,023.80 | | $ | 5.77 | | | 1.15 | % |
Class N—hypothetical 5% return | | | 1,000.00 | | | 1,019.09 | | | 5.76 | | | 1.15 | |
Class I—actual return | | | 1,000.00 | | | 1,025.20 | | | 4.47 | | | 0.89 | |
Class I—hypothetical 5% return | | | 1,000.00 | | | 1,020.38 | | | 4.46 | | | 0.89 | |
Tax-Managed Growth Fund | | | | | | | | | | | | | |
Class N—actual return | | | 1,000.00 | | | 1,014.80 | | | 7.44 | | | 1.49 | |
Class N—hypothetical 5% return | | | 1,000.00 | | | 1,017.41 | | | 7.45 | | | 1.49 | |
Class I—actual return | | | 1,000.00 | | | 1,016.60 | | | 6.20 | | | 1.24 | |
Class I—hypothetical 5% return | | | 1,000.00 | | | 1,018.65 | | | 6.21 | | | 1.24 | |
Large Cap Growth Fund | | | | | | | | | | | | | |
Class N—actual return | | | 1,000.00 | | | 990.70 | | | 6.17 | | | 1.25 | |
Class N—hypothetical 5% return | | | 1,000.00 | | | 1,018.60 | | | 6.26 | | | 1.25 | |
Class I—actual return | | | 1,000.00 | | | 990.90 | | | 4.94 | | | 1.00 | |
Class I—hypothetical 5% return | | | 1,000.00 | | | 1,019.84 | | | 5.01 | | | 1.00 | |
Small Cap Growth Fund | | | | | | | | | | | | | |
Class N—actual return | | | 1,000.00 | | | 1,058.50 | | | 7.50 | | | 1.47 | |
Class N—hypothetical 5% return | | | 1,000.00 | | | 1,017.50 | | | 7.35 | | | 1.47 | |
Class I—actual return | | | 1,000.00 | | | 1,059.60 | | | 6.13 | | | 1.20 | |
Class I—hypothetical 5% return | | | 1,000.00 | | | 1,018.84 | | | 6.01 | | | 1.20 | |
Mid Cap Growth Fund | | | | | | | | | | | | | |
Class N—actual return (since inception period) (b) | | | 1,000.00 | | | 997.00 | | | 5.67 | (b) | | 1.40 | |
Class N—hypothetical 5% return (6 month period) | | | 1,000.00 | | | 1014.60 | | | 6.99 | | | 1.40 | |
Class I—actual return (since inception period) (b) | | | 1,000.00 | | | 998.00 | | | 4.66 | (b) | | 1.15 | |
Class I—hypothetical 5% return (6 month period) | | | 1,000.00 | | | 1015.61 | | | 5.75 | | | 1.15 | |
Small-Mid Cap Growth Fund | | | | | | | | | | | | | |
Class N—actual return | | | 1,000.00 | | | 1,050.80 | | | 7.07 | | | 1.39 | |
Class N—hypothetical 5% return | | | 1,000.00 | | | 1,017.90 | | | 6.95 | | | 1.39 | |
Class I—actual return | | | 1,000.00 | | | 1,051.40 | | | 5.80 | | | 1.14 | |
Class I—hypothetical 5% return | | | 1,000.00 | | | 1,019.14 | | | 5.71 | | | 1.14 | |
International Growth Fund | | | | | | | | | | | | | |
Class N—actual return | | | 1,000.00 | | | 1,059.50 | | | 7.20 | | | 1.41 | |
Class N—hypothetical 5% return | | | 1,000.00 | | | 1,017.80 | | | 7.05 | | | 1.41 | |
Class I—actual return | | | 1,000.00 | | | 1,060.70 | | | 5.52 | | | 1.08 | |
Class I—hypothetical 5% return | | | 1,000.00 | | | 1,019.44 | | | 5.41 | | | 1.08 | |
International Equity Fund | | | | | | | | | | | | | |
Class N—actual return | | | 1,000.00 | | | 1,046.40 | | | 7.46 | | | 1.47 | |
Class N—hypothetical 5% return | | | 1,000.00 | | | 1,017.50 | | | 7.35 | | | 1.47 | |
Class I—actual return | | | 1,000.00 | | | 1,047.90 | | | 6.19 | | | 1.22 | |
Class I—hypothetical 5% return | | | 1,000.00 | | | 1,018.74 | | | 6.11 | | | 1.22 | |
International Small Cap Growth Fund | | | | | | | | | | | | | |
Class N—actual return | | | 1,000.00 | | | 1,085.10 | | | 8.53 | | | 1.65 | |
Class N—hypothetical 5% return | | | 1,000.00 | | | 1,016.89 | | | 8.25 | | | 1.65 | |
Class I—actual return | | | 1,000.00 | | | 1,086.90 | | | 7.24 | | | 1.40 | |
Class I—hypothetical 5% return | | | 1,000.00 | | | 1,018.15 | | | 7.01 | | | 1.40 | |
June 30, 2006 | William Blair Funds 117 |
| | | | | | | | | | | | |
| | | Beginning
Account Value
1/1/2006
| | Ending
Account Value
6/30/2006
| | Expenses Paid
during
Period(a)
| | Annualized
Expense Ratio
| |
Emerging Markets Growth Fund | | | | | | | | | | | | |
Class N—actual return | | $ | 1,000.00 | | $ | 1,058.60 | | $ | 8.42 | | 1.65 | % |
Class N—hypothetical 5% return | | | 1,000.00 | | | 1,016.61 | | | 8.25 | | 1.65 | |
Class I—actual return | | | 1,000.00 | | | 1,059.90 | | | 7.15 | | 1.40 | |
Class I—hypothetical 5% return | | | 1,000.00 | | | 1,017.85 | | | 7.00 | | 1.40 | |
Value Discovery Fund | | | | | | | | | | | | |
Class N—actual return | | | 1,000.00 | | | 1,085.60 | | | 6.93 | | 1.34 | |
Class N—hypothetical 5% return | | | 1,000.00 | | | 1,018.15 | | | 6.71 | | 1.34 | |
Class I—actual return | | | 1,000.00 | | | 1,087.30 | | | 5.64 | | 1.09 | |
Class I—hypothetical 5% return | | | 1,000.00 | | | 1,019.39 | | | 5.46 | | 1.09 | |
Income Fund | | | | | | | | | | | | |
Class N—actual return | | | 1,000.00 | | | 1,002.30 | | | 3.62 | | 0.73 | |
Class N—hypothetical 5% return | | | 1,000.00 | | | 1,021.17 | | | 3.66 | | 0.73 | |
Class I—actual return | | | 1,000.00 | | | 1,002.30 | | | 2.83 | | 0.57 | |
Class I—hypothetical 5% return | | | 1,000.00 | | | 1,021.97 | | | 2.86 | | 0.57 | |
Ready Reserves Fund | | | | | | | | | | | | |
Class N—actual return | | | 1,000.00 | | | 1,020.40 | | | 3.16 | | 0.63 | |
Class N—hypothetical 5% return | | | 1,000.00 | | | 1,021.67 | | | 3.16 | | 0.63 | |
| (a) | | Expenses are equal to the annualized expense ratio, multiplied by the average account value over the period, multiplied by the number of days in the period (181), and divided by 365 (to reflect the one-half-year period.) |
| (b) | | For the period February 1, 2006 (Commencement of Operations) until June 30, 2006. |
118 Semi-Annual Report | June 30, 2006 |
BOARD OF TRUSTEES
Frederick Conrad Fischer, Chairman
Principal, William Blair & Company, L.L.C.
Theodore A. Bosler
Retired Principal and Vice President, Lincoln Capital Management Company
Ann P. McDermott
Director and Trustee
Profit and not-for-profit organizations
Donald J. Reaves
Vice President for Administration and Chief Financial Officer, University of Chicago
Donald L. Seeley
Adjunct Lecturer and Director, University of Arizona Department of Finance
John B. Schwemm
Retired Chairman and CEO, R.R. Donnelley & Sons Company
Michelle R. Seitz
Principal, William Blair & Company, L.L.C.,
Robert E. Wood II
Retired Executive Vice President, Morgan Stanley Dean Witter
Officers
Marco Hanig, President
Karl W. Brewer, Senior Vice President
Harvey H. Bundy III, Senior Vice President
Mark A. Fuller, III, Senior Vice President
James S. Golan, Senior Vice President
W. George Greig, Senior Vice President
Michael A. Jancosek, Senior Vice President
John F. Jostrand, Senior Vice President
James S. Kaplan, Senior Vice President
Robert C. Lanphier, IV, Senior Vice President
Todd M. McClone, Senior Vice President
David S. Mitchell, Senior Vice President
Gregory J. Pusinelli, Senior Vice President
David P. Ricci, Senior Vice President
Norbert W. Truderung, Senior Vice President
Jeffrey A. Urbina, Senior Vice President
Christopher T. Vincent, Senior Vice President
David C. Fording, Vice President
Chad M. Kilmer, Vice President
Mark T. Leslie, Vice President
Colin J. Williams, Vice President
Terence M. Sullivan, Vice President and Treasurer
Colette M. Garavalia, Secretary
Investment Advisor
William Blair & Company, L.L.C.
Legal Counsel
Vedder, Price, Kaufman & Kammholz, P.C.
Transfer Agent
State Street Bank and Trust Company
P.O. Box 8506
Boston, MA 02266-8506
For customer assistance, call 1-800-635-2886
(Massachusetts 1-800-635-2840)
Date of First Use August, 2006 119

Table of Contents
This report is submitted for the general information of the shareholders of the William Blair Funds. It is not authorized for distribution to prospective investors unless accompanied or preceded by a prospectus of the William Blair Funds. Please consider the Funds’ investment objectives, risks, charges, and expenses before investing. This and other information is contained in the Funds’ prospectus, which you may obtain by calling 1-800-742-7272. Read it carefully before you invest or send money. William Blair & Company, LLC., distributor.
June 30, 2006 | William Blair Funds 1 |

W. George Greig
INSTITUTIONAL INTERNATIONAL GROWTH FUND
The Institutional International Growth Fund invests primarily in common stocks of foreign growth companies of all sizes.
AN OVERVIEW FROM THE PORTFOLIO MANAGER
How did the Fund perform over the first half of the year? How did the Fund’s performance compare to its benchmark?
The Institutional International Growth Fund posted a 6.02% gain (Class N Shares) for the six months ended June 30, 2006. By comparison, the Fund’s benchmark, the Morgan Stanley Capital International (MSCI) All Country World (ACWI) ex-US Index, rose 9.99%.
What were the most significant factors impacting international markets during the first six months of the year?
Following first quarter’s strong equity market, when international equities were up 9.76%, as reflected by the MSCI ACWI ex-US Index, markets retreated during the second quarter as concerns about potential global inflationary pressures, monetary policy tightening (and uncertainty as to the duration and size of further tightening moves and their impact on the US consumer in particular), and higher valuations in a number of the recent strong markets such as emerging markets and small cap came to the forefront of investor psychology. As a result, investors significantly reduced risk positions and emerging markets, which were up approximately 12% in the first quarter, fell sharply beginning in May through mid-June, while developed small cap stocks, up 10.8% during the first quarter, fell significantly as well. In addition, commodities and energy stocks, which were the strongest sectors globally through April, declined.
The correction in equity markets during May and most of June was broad based and non-discriminatory, although the stocks that were the prime beneficiaries of the strong global growth trends over the past several years did suffer more than their more defensive-oriented counterparts. In addition, the US remained the safe haven for investors as its equity and bond markets outperformed other regions of the world. The increased uncertainty surrounding monetary policy, inflationary pressures, rumored intervention by the Chinese government to slow investment and housing in certain parts of its market, record profits by corporations, significant outperformance of “riskier” assets, coupled with higher valuations and concerns about a slower growth environment, created the perfect storm for a liquidity driven market correction. However, within this environment, unit labor costs remained constrained as productivity enhancements offset higher wages, company fundamentals and earnings prospects remained strong, and managements continued to be focused on enhancing shareholder value. At the same time, emerging markets governments significantly improved monetary and fiscal policies and current account positions, and are now more immune to economic downdrafts such as those that occurred in 1997 and 1998.
Markets began to stabilize in mid June and rebounded sharply near the end of the quarter, however, as the severity and broadness of the equity market downdraft appeared overdone, and investors began to believe that central banks would in fact engineer a “soft landing” to a more sustainable growth environment. During the second quarter, the MSCI ACWI ex-US Index was up 0.21%, led by the UK and Pacific ex-Japan, while emerging markets fell 4.27% and developed small cap companies fell 3.41%, as measured by the MSCI World ex-US Small Cap Index. As a result, over the first six months of 2006, the MSCI ACWI ex-US Index returned 9.99%, led by Europe ex-UK and the UK, while Japan was the largest developed
2 Semi-Annual Report | June 30, 2006 |
markets detractor. Emerging markets and developed small cap returned just over 7% each. From a global sector perspective, Materials, Energy and Utilities were the strongest sectors with double digit returns year to date, while Information Technology (IT) and Telecommunication Services trailed.
What factors were behind the Fund’s performance versus the benchmark?
Within this environment, the Fund returned 6.02%, underperforming the MSCI ACWI ex-US Index year to date, due solely to second quarter underperformance, as it led the Index benchmark during the first quarter. While stock selection was strong across most regions and sectors during the first quarter, during the second quarter the Fund’s pro growth strategy as evidenced by higher weightings in Consumer Cyclical and IT holdings at the expense of Materials, Energy and Utilities was the primary detractor from results. In addition, sector positioning in Japan was a drag on year to date performance, as the Fund’s focus on specialty retailing and smaller asset management firms, hurt performance as these areas underperformed the Japanese market as a whole. While there were no particular earnings disappointments or negative news regarding individual portfolio holdings, these companies suffered with the general decline in smaller capitalization stocks, coupled with investor concerns about ongoing consumer demand in Japan and the prospects of an increasing interest rate environment. Offsetting these negative results on a year to date basis was the Fund’s Europe ex-UK and Latin America weightings at the expense of Developed Asia and Emerging Markets Europe, Mid-East and Africa (EMEA). In addition, Consumer Staples, Energy and IT stock selection was strong. Within Consumer Staples, the Fund added value due to regional positioning and stock selection in Japan, Emerging Asia and Latin America, while Energy stock selection was bolstered by stock selection in Continental Europe and the UK. Within IT the Fund’s stock selection in Canada, as well as the higher weighting and stock selection in Emerging Asia added value during the first half of the year.
What is your current strategy? How is the Fund positioned?
We have used the second quarter market activity to add to positions in strong companies with good fundamentals, which now have significantly more compelling valuations. As of quarter end, the Fund maintained its higher Consumer and Health Care weightings at the expense of Materials, Telecom Services, Energy and Utilities. At the margin, IT was decreased, while Industrials weightings were increased. Financials, while the largest sector in the portfolio from an absolute perspective, remained underweighted versus the Index. From a regional perspective, the Fund maintained its underweighting in developed Asia and the UK, and overweightings in Europe ex-UK and emerging markets versus the Index. These weightings are largely based upon the team’s bottom up, fundamental research efforts, which are also supported by the team’s top down view.
What is your outlook for the international markets?
The key cyclical drivers of the world economy are generally seen to be US household spending growth and China’s industrial and infrastructure investment boom. Both of these trends have been expected to decelerate for some time, but, ironically, a great deal of the increase in economic anxiety that unfolded in the first half of 2006 relates to the fact that both of the expected slowdowns have so far largely failed to materialize.
For the US consumer, the areas of concern are the sharp slowdown in housing activity and the negative fallout of house price weakness, and the hit to discretionary spending power from higher energy costs and interest payments. Coupled with the persistent upward pressure on reported inflation and its uncertain impact on monetary policy, these unknowns are increasingly tipping the odds in favor of a significant (1 percentage point or more) reduction in growth expectations for next year.
June 30, 2006 | William Blair Funds 3 |
In China, the government has targeted a growth slowdown in selected industrial sectors as well as speculative segments of the housing market. But economists have very little confidence in the degree to which the government’s intentions can be translated into actual changes in growth expectations. Similarly, there is no consensus about the effect of a potential export slowdown on the overall economy. Although there are obviously a great number of unknowns in both the numbers and the mechanisms of growth in China, aggregate GDP growth often seems only mildly affected by local and sector-specific cycles, and we would not anticipate more than a moderate downshift back to trend growth.
Japan and Europe, on the other hand, have been seeing steady improvement in growth indicators and economic news flow. Will this quickening expansion be sustained in the face of deceleration in the US and China, as well as some early-stage monetary tightening? Our view is that the cycles in Japan and Europe remain at a relatively early stage, and that growth may be sustained by continued strength in global capital spending, improving employment prospects, high savings balances, and pent-up demand in both the corporate and household sectors.
In the context of this reasonably balanced but still somewhat slower growth scenario, the key policy and market risk issue will be the degree of persistence of rising inflation and the potential broadening of price inflation into more core spending-related measures. This aspect of inflation makes itself known as a severely lagging indicator, and presents the US in particular with the policy problem of whether to prioritize visible growth trends or price trends in setting monetary conditions. This dilemma may well get worse before being resolved in favor of ending the tightening cycle.
In the first half of 2006, valuation and risk issues topped the equity market agenda—concerns about relative risk appetite and relative levels of real rates. To a degree, as growth and inflation issues come to the fore, the market’s principal concern will shift toward the outlook for sales and earnings growth.
Global corporate profitability is at or near record levels, spurred on by the strong secular forces of improved corporate performance and strong labor productivity growth. But while these forces remain in place, there are signs that cyclical pressures may push cost growth ahead of revenue growth—at least in some sectors—regardless of whether the global cycle is stronger or weaker than consensus expectations.
Our view is that changes in relative earnings growth and growth expectations will be an important factor governing market and sector leadership over the next several quarters. At the same time, it is likely that trends in profitability in place for the last year or two may be disrupted by shifts in global demand and relative pricing patterns.
We will be focusing particularly for signs of (negative) change in the commodity and industrial sectors, for changes in margins within the highly diverse financial sector, and for indications of the sustainability of profit growth on a regional basis, particularly with respect to the strong growth advantage enjoyed by emerging markets in the last several years.
In the near term, though, the market’s view of these prospective growth issues will be set by high frequency economic releases and especially by any visible trends that emerge from second and third (calendar) quarter earnings reports. Investment strategy, like economic policy, is at least cyclically becoming more and more ‘data-dependent’.
4 Semi-Annual Report | June 30, 2006 |
Institutional International Growth Fund
Performance Highlights (unaudited)
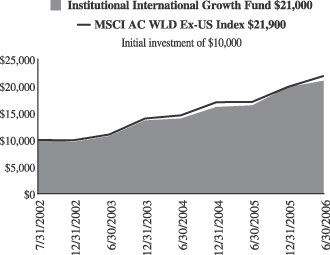
Average Annual Total Return at 6/30/2006
| | | | | | | | | |
| | | 1
Year
| | | 3
Year
| | | Since Inception(a)
| |
Institutional International Growth Fund | | 28.00 | % | | 25.25 | % | | 20.67 | % |
MSCI All Country World Ex-US Index | | 28.40 | | | 25.78 | | | 22.02 | |
| | (a) | For the period from July 26, 2002 (Commencement of Operations) to June 30, 2006. |
Performance cited represents past performance. Past performance does not guarantee future results and current performance may be lower or higher than the data quoted. Results shown are average annual returns, which assume reinvestment of dividends and capital gains. Investment returns and principal will fluctuate and you may have a gain or loss when you sell shares. For the most current month-end performance information, please call 1-800-742-7272, or visit our Web site at www.williamblairfunds.com. International investing involves special risk considerations, including currency fluctuations, lower liquidity, economic and political risk.
The performance highlights and graph presented above do not reflect the deduction of taxes that a shareholder would pay on fund distributions or the redemption of fund shares.
The Morgan Stanley Capital International (MSCI) All Country World ex-US Index is an unmanaged index that includes developed and emerging markets and reduced Japanese portion, making it more comparable to the Institutional International Growth Fund in terms of investment approach.
This report identifies the Fund’s investments on June 30, 2006. These holdings are subject to change. Not all stocks in the Fund performed the same, nor is there any guarantee that these stocks will perform as well in the future. Market forecasts provided in this report may not necessarily come to pass.
Sector Diversification (unaudited)
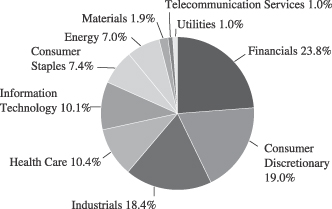
The sector diversification shown is based on the total investment portfolio.
June 30, 2006 | William Blair Funds 5 |
Institutional International Growth Fund
Portfolio of Investments, June 30, 2006 (all dollar amounts in thousands) (unaudited)
| | | | | |
Issuer
| | Shares
| | Value
|
| | | | | | |
| | |
Common Stocks—Europe—36.3% | | | | | |
Austria—1.3% | | | | | |
Erste Bank (Banking) | | 232,704 | | $ | 13,082 |
Raiffeisen Interantional Bank (Banking) | | 91,400 | | | 7,920 |
| | | | |
|
|
| | | | | | 21,002 |
| | | | |
|
|
France—8.6% | | | | | |
April Group S.A. (Insurance brokers) | | 51,300 | | | 2,765 |
BNP Paribas (Banking) | | 205,260 | | | 19,628 |
Essilor International (Health care supplies) | | 141,600 | | | 14,243 |
Eurazeo (Diversified financial services) | | 71,725 | | | 7,097 |
Iliad S.A. (Internet software and services) | | 83,500 | | | 6,979 |
Klepierre (Real estate) | | 42,670 | | | 4,941 |
L'Oreal S.A. (Cosmetics) | | 424,100 | | | 40,033 |
LVMH Moet Hennessey Louis Vuitton SA (Luxury goods) | | 172,600 | | | 17,107 |
Nexity (Real estate management) | | 4,800 | | | 278 |
*Orpea (Hospital and nursing management) | | 57,933 | | | 3,998 |
Technip-Coflexip S.A. (Construction) | | 221,880 | | | 12,226 |
Vinci S.A.(Construction) | | 134,900 | | | 13,872 |
| | | | |
|
|
| | | | | | 143,167 |
| | | | |
|
|
Germany—8.4% | | | | | |
AWD Holdings AG (Financial services) | | 126,900 | | | 4,248 |
Bijou Brigitte (Fashion jewelry accessories) | | 21,150 | | | 5,717 |
Celesio AG (Pharmaceuticals) | | 95,450 | | | 8,662 |
Continental AG (Diversified manufacturing) | | 153,600 | | | 15,674 |
CTS Eventim (Leisure and recreation products) | | 55,700 | | | 1,708 |
E.ON AG (Energy) | | 148,180 | | | 17,033 |
GFK AG (Commercial services) | | 82,400 | | | 3,001 |
Q-Cells AG (Alternative energy sources) | | 61,660 | | | 5,158 |
*Qiagen NV (Biomedical) | | 381,200 | | | 5,139 |
Rational AG (Business equipment) | | 17,590 | | | 2,875 |
SAP AG (Software) | | 155,850 | | | 32,767 |
Siemens AG (Manufacturing) | | 327,400 | | | 28,441 |
Solarworld AG (Alternative energy sources) | | 68,200 | | | 4,271 |
Stada Arzneimittel AG (Pharmaceuticals) | | 154,600 | | | 6,162 |
| | | | |
|
|
| | | | | | 140,856 |
| | | | |
|
|
Greece—1.5% | | | | | |
Coca-Cola Hellenic Bottling S.A. (Beverages) | | 262,200 | | | 7,807 |
EFG Eurobank (Banking) | | 311,160 | | | 8,664 |
National Bank of Greece (Banking) | | 243,726 | | | 9,407 |
| | | | |
|
|
| | | | | | 25,878 |
| | | | |
|
|
Ireland—1.9% | | | | | |
Anglo Irish Bank plc (Finance) | | 927,500 | | | 14,453 |
Kingspan Group plc (Construction) | | 466,000 | | | 8,137 |
*Ryanair Holdings plc—ADR (Airlines) | | 126,400 | | | 6,664 |
United Drug plc (Pharmaceuticals) | | 736,700 | | | 3,155 |
| | | | |
|
|
| | | | | | 32,409 |
| | | | |
|
|
Italy—2.4% | | | | | |
Azimut Holding SpA (Investment management services) | | 449,700 | | | 4,683 |
Credito Emiliano SpA (Banking) | | 285,400 | | | 3,518 |
Luxottica Group SpA (Apparel and luxury goods) | | 563,400 | | | 15,271 |
Pirelli & C Real Estate SpA (Real estate development) | | 74,200 | | | 4,979 |
Saipem SpA (Energy equipment and services) | | 518,400 | | | 11,767 |
| | | | |
|
|
| | | | | | 40,218 |
| | | | |
|
|
| | | | | |
Issuer
| | Shares
| | Value
|
| | | | | | |
| |
Common Stocks—Europe—36.3%—(continued) | | | |
Luxembourg—0.1% | | | | | |
*Transcom Worldwide S.A. (E-services/consulting) | | 145,600 | | $ | 1,608 |
| | | | |
|
|
Netherlands—0.6% | | | | | |
*Tomtom NV (Computer software) | | 243,600 | | | 9,469 |
| | | | |
|
|
Norway—0.7% | | | | | |
Statoil Asa (Oil and gas) | | 418,800 | | | 11,938 |
| | | | |
|
|
Spain—1.6% | | | | | |
Grupo Ferrovial S.A. (Industrial services) | | 110,900 | | | 8,457 |
Industria De Textile (Retail trade) | | 430,000 | | | 18,128 |
| | | | |
|
|
| | | | | | 26,585 |
| | | | |
|
|
Sweden—1.3% | | | | | |
*Capio AB (Health care) | | 222,960 | | | 4,001 |
*Ericsson (LM) (Wireless equipment) | | 2,558,000 | | | 8,442 |
*Modern Times Group (Television) | | 235,900 | | | 6,603 |
*Tradedoubler AB (E-services and consulting) | | 121,500 | | | 2,218 |
| | | | |
|
|
| | | | | | 21,264 |
| | | | |
|
|
Switzerland—7.9% | | | | | |
*EFG International (Commercial banking) | | 243,500 | | | 6,752 |
Kuehne & Nagel International AG (Air freight and logistics) | | 203,600 | | | 14,850 |
Nobel Biocare Holdings AG (Medical equipment and supplies) | | 32,310 | | | 7,659 |
Phonak Holdings AG (Hearing technology) | | 56,400 | | | 3,523 |
Roche Holdings AG (Health care) | | 207,500 | | | 34,240 |
SGS S.A. (Industrials) | | 12,740 | | | 12,092 |
Synthes, Inc. (Health care) | | 197,800 | | | 23,817 |
UBS AG (Banking) | | 270,400 | | | 29,599 |
| | | | |
|
|
| | | | | | 132,532 |
| | | | |
|
|
| | |
Japan—17.2% | | | | | |
Aeon Credit Service Co., Ltd. (Consumer finance) | | 249,500 | | | 6,075 |
Aeon Mall Co., Ltd. (Real estate) | | 146,100 | | | 6,166 |
Chiyoda Corp. (Construction) | | 341,800 | | | 6,993 |
Denso Corporation (Auto parts manufacturing) | | 827,900 | | | 27,103 |
Honeys Company, Ltd. (Luxury goods) | | 115,000 | | | 4,934 |
Hoya Corporation (Electronic technology) | | 228,400 | | | 8,131 |
ITO EN, Ltd. (Beverages) | | 158,900 | | | 5,809 |
Joint Corporation (Real estate operations/development) | | 170,400 | | | 5,560 |
*K.K. DaVinci Advisors (Consulting services) | | 4,904 | | | 4,855 |
Keyence Corporation (Electronic technology) | | 62,589 | | | 15,970 |
Komatsu Ltd. (Machinery) | | 1,152,000 | | | 22,924 |
MISUMI Group, Inc. (Metal production) | | 261,200 | | | 4,894 |
Mitsubishi Tokyo Financial (Financial services) | | 2,513 | | | 35,227 |
Nakanishi Inc. (Medical specialties) | | 42,500 | | | 3,994 |
Nitori Company Ltd. (Specialty stores) | | 122,880 | | | 5,980 |
Nitto Denko Corporation (Electronic technology) | | 115,000 | | | 8,193 |
Orix Corporation (Consumer finance) | | 124,400 | | | 30,355 |
Park 24 Co., Ltd. (Commercial services) | | 109,200 | | | 3,225 |
Point Inc. Ltd. (Apparel and footwear retail) | | 86,190 | | | 4,880 |
See accompanying Notes to Financial Statements.
6 Semi-Annual Report | June 30, 2006 |
Institutional International Growth Fund
Portfolio of Investments, June 30, 2006 (all dollar amounts in thousands) (unaudited)
| | | | | |
Issuer
| | Shares
| | Value
|
| | | | | | |
| |
Common Stocks—Japan—17.2%—(continued) | | | |
Japan—(continued) | | | | | |
Ryohin Keikaku Co. Ltd. (Retail stores) | | 100,600 | | $ | 8,272 |
Sharp Corp. (Electronics) | | 525,100 | | | 8,301 |
Shimamura Company Ltd. (Retail stores) | | 69,800 | | | 7,658 |
Sparx Asset Management Co. (Financial services) | | 3,728 | | | 3,924 |
Suruga Bank (Banking) | | 600,000 | | | 8,124 |
Toyota Motor Corporation (Automobiles) | | 478,200 | | | 24,993 |
Yamada Denki Company (Retail trade) | | 133,600 | | | 13,612 |
| | | | |
|
|
| | | | | | 286,152 |
| | | | |
|
|
| | |
United Kingdom—13.9% | | | | | |
BG Group plc (Industrial services) | | 3,056,720 | | | 40,800 |
*Cairn Energy plc (Petroleum refining) | | 253,200 | | | 10,254 |
Carphone Warehouse Group plc (Consumer electronics) | | 1,365,600 | | | 8,000 |
*CSR plc (Electronic technology) | | 270,200 | | | 6,283 |
HBOS plc (Commercial banking) | | 1,780,100 | | | 30,892 |
Homeserve plc (Extended service contracts) | | 85,000 | | | 2,434 |
Michael Page International (Personnel services) | | 1,388,300 | | | 8,990 |
Northern Rock plc (Commercial banking) | | 1,034,100 | | | 19,120 |
Reckitt Benckiser plc (Household products) | | 728,350 | | | 27,177 |
Rolls-Royce Group plc (Aerospace) | | 4,222,500 | | | 32,295 |
Rotork plc (Control instruments) | | 404,100 | | | 5,121 |
Serco Group (Consulting services) | | 1,505,100 | | | 8,894 |
Standard Chartered plc (Banking) | | 597,900 | | | 14,589 |
Tullow Oil plc (Oil, gas drilling, and exploration) | | 903,080 | | | 6,371 |
Ultra Electronic Holdings plc (Electronic products) | | 304,200 | | | 5,442 |
VT Group plc (Shipbuilding) | | 620,300 | | | 5,580 |
| | | | |
|
|
| | | | | | 232,242 |
| | | | |
|
|
| | |
Emerging Asia—12.6% | | | | | |
China—4.2% | | | | | |
China Life Insurance Co. (Life/Health insurance) | | 9,386,000 | | | 14,869 |
China Mengniu Dairy Co. (Food products) | | 4,495,000 | | | 5,643 |
China Vanke Company Ltd. (Real estate operations/development) | | 4,090,200 | | | 3,472 |
*Ctrip.com International Ltd.—ADR
(E-commerce/services) | | 134,900 | | | 6,887 |
*Focus Media Holding Ltd.—ADR (Advertising) | | 116,100 | | | 7,565 |
*Foxconn International (Manufacturing services) | | 3,019,800 | | | 6,471 |
Fu Ji Food & Catering (Hotels, restaurants and leisure) | | 1,819,000 | | | 3,006 |
Hopson Development Holdings (Real estate operations/development) | | 1,237,000 | | | 2,562 |
Lee and Man Paper Manufacturing Ltd. (Paper and related products) | | 1,542,000 | | | 2,257 |
Li Ning Co. Ltd. (Leisure equipment and products) | | 5,440,000 | | | 5,334 |
Parkson Retail Group Ltd. (Retail stores) | | 554,000 | | | 1,578 |
Ports Design Limited (Apparel and luxury goods) | | 1,890,500 | | | 3,048 |
| | | | | |
Issuer
| | Shares
| | Value
|
| | | | | | |
|
Common Stocks—Emerging Asia—12.6%—(continued) |
China—(continued) | | | | | |
*Suntech Power Holdings Co. Ltd—ADR (Alternative energy sources) | | 136,600 | | $ | 3,859 |
Wumart Stores, Inc., Class “H” (Retail) | | 1,050,000 | | | 3,623 |
| | | | |
|
|
| | | | | | 70,174 |
| | | | |
|
|
India—3.3% | | | | | |
Bharat Forge Ltd. (Metal processors) | | 642,100 | | | 4,386 |
Bharat Heavy Electricals Ltd. (Supply equipment) | | 202,100 | | | 8,579 |
*Bharti Airtel Ltd. (Wireless telecommunication services) | | 585,900 | | | 4,717 |
Dabur India Ltd. (Cosmetics and toiletries) | | 1,276,900 | | | 3,953 |
HDFC Bank (Banking) | | 347,700 | | | 6,023 |
Hindustan Lever Ltd. (Soap and cleaning preparation) | | 266,000 | | | 1,323 |
Housing Development Finance Corp. (Financial services) | | 213,500 | | | 5,299 |
Infosys Technologies, Ltd. (Consulting and software services) | | 156,128 | | | 10,447 |
Maruti Udyog Ltd. (Automobiles) | | 295,200 | | | 5,113 |
Pantaloon Retail India Ltd. (Department stores) | | 16,000 | | | 470 |
Suzlon Energy Ltd. (Power conversion equipment) | | 218,400 | | | 4,975 |
| | | | |
|
|
| | | | | | 55,285 |
| | | | |
|
|
Indonesia—0.2% | | | | | |
PT Kalbe Farma Tbk (Pharmaceuticals) | | 21,475,400 | | | 2,900 |
| | | | |
|
|
Malaysia—0.6% | | | | | |
Bumiputra Commerce Holdings Bhd (Banking) | | 4,412,100 | | | 7,133 |
Transmile Group Bhd (Airport development and maintenance) | | 796,300 | | | 2,774 |
| | | | |
|
|
| | | | | | 9,907 |
| | | | |
|
|
South Korea—2.5% | | | | | |
Kookmin Bank (Banking) | | 104,750 | | | 8,631 |
Korea Investment Holdings Co. Ltd. (Diversified financial services) | | 96,800 | | | 3,152 |
*NHN Corp. (Internet software and services) | | 32,940 | | | 11,424 |
Samsung Electronics Co. (Semiconductors) | | 18,710 | | | 11,875 |
Shinsegae Co. Ltd. (Discount retail) | | 13,110 | | | 6,563 |
| | | | |
|
|
| | | | | | 41,645 |
| | | | |
|
|
Taiwan—1.8% | | | | | |
High Tech Computer Corporation (Computers) | | 238,000 | | | 6,542 |
*Himax Technologies, Inc.—ADR (Computers) | | 386,000 | | | 2,208 |
Hon Hai Precision Industry (Computers) | | 1,972,589 | | | 12,179 |
Largan Precision Co. Ltd. (Photo equipment and supplies) | | 242,000 | | | 5,173 |
Mediatek Inc. (Semiconductors and equipment) | | 519,200 | | | 4,806 |
| | | | |
|
|
| | | | | | 30,908 |
| | | | |
|
|
See accompanying Notes to Financial Statements.
June 30, 2006 | William Blair Funds 7 |
Institutional International Growth Fund
Portfolio of Investments, June 30, 2006 (all dollar amounts in thousands) (unaudited)
| | | | | |
Issuer
| | Shares
| | Value
|
| | | | | | |
| | |
Common Stocks—(continued) | | | | | |
Asia—6.8% | | | | | |
Australia—3.2% | | | | | |
BHP Billiton Ltd. (Diversified resources) | | 934,100 | | $ | 20,203 |
Macquarie Bank, Ltd. (Financial services) | | 309,400 | | | 15,838 |
Seek Ltd. (Internet advertising) | | 1,119,100 | | | 4,451 |
Sigma Company, Ltd. (Medical distributors) | | 1,989,873 | | | 3,845 |
United Group Ltd. (Building and construction) | | 176,000 | | | 1,884 |
WorleyParsons, Ltd. (Engineering) | | 465,300 | | | 6,957 |
| | | | |
|
|
| | | | | | 53,178 |
| | | | |
|
|
Hong Kong—1.7% | | | | | |
*China Insurance International (Insurance) | | 7,087,160 | | | 4,564 |
Esprit Holdings Ltd. (Apparel, footwear and retail) | | 1,251,000 | | | 10,225 |
Li & Fung Ltd. (Distribution) | | 6,675,800 | | | 13,530 |
| | | | |
|
|
| | | | | | 28,319 |
| | | | |
|
|
Singapore—1.9% | | | | | |
Capitaland, Ltd. (Real estate operations) | | 8,142,800 | | | 23,235 |
Goodpack Ltd. (Air freight and logistics) | | 2,168,000 | | | 2,238 |
Osim International Ltd. (Consumer sundries) | | 4,334,640 | | | 4,233 |
Raffles Education Corporation Ltd. (Schools) | | 1,157,000 | | | 1,776 |
| | | | |
|
|
| | | | | | 31,482 |
| | | | |
|
|
| | |
Emerging Latin America—5.7% | | | | | |
Brazil—1.9% | | | | | |
Companhia de Concessoes Rodoviarias (Public thoroughfares) | | 598,200 | | | 4,833 |
Cyrela Brazil Realty S.A. (Real estate operations/development) | | 234,100 | | | 3,891 |
Gol Linhas Aereas Int S.P—ADR (Air transport) | | 252,600 | | | 8,967 |
Localiza Rent a Car S.A. (Automobile rental) | | 142,400 | | | 2,696 |
Natura Cosmeticos S.A. (Cosmetics) | | 389,500 | | | 3,983 |
*Submarino S.A.(E-commerce) | | 198,300 | | | 3,983 |
*Totvs S.A. (Computer software) | | 178,500 | | | 2,657 |
| | | | |
|
|
| | | | | | 31,010 |
| | | | |
|
|
Chile—1.0% | | | | | |
Cencosud S.A.—ADR 144A (Retail stores) | | 253,200 | | | 9,289 |
S.A.C.I. Falabella (Department stores) | | 2,310,500 | | | 7,048 |
| | | | |
|
|
| | | | | | 16,337 |
| | | | |
|
|
Columbia—0.3% | | | | | |
Bancolombia S.A.—ADR (Banking) | | 210,500 | | | 5,073 |
| | | | |
|
|
Mexico—2.2% | | | | | |
America Movil S.A. (Communications) | | 6,393,400 | | | 10,683 |
Consorcio Ara Sa De Cv (Construction) | | 717,700 | | | 2,955 |
*Corporacion Geo Sa De Cv (Real estate) | | 947,900 | | | 3,141 |
*Desarrolladora Homex S.A.—ADR (Household durables) | | 103,900 | | | 3,409 |
Grupo Aeropuertario Del ADR (Airport development and maintenance) | | 81,900 | | | 2,608 |
*Urbi Desarrollos Urbanos S.A. (Household durables) | | 1,314,000 | | | 3,047 |
| | | | | |
Issuer
| | Shares
| | Value
|
| | | | | | |
| | |
Common Stocks—Emerging Latin
America—5.7%—(continued) | | | | | |
Mexico—(continued) | | | | | |
Walmart de Mexico (Retail trade) | | 3,844,800 | | $ | 10,747 |
| | | | |
|
|
| | | | | | 36,590 |
| | | | |
|
|
Panama—0.3% | | | | | |
Copa Holdings S.A. Class “A” (Airlines)† | | 191,400 | | | 4,335 |
| | | | |
|
|
| | |
Canada—3.1% | | | | | |
Canadian National Railway Company (Railroads) | | 372,200 | | | 16,258 |
*Gildan Activewear, Inc. (Apparel and luxury goods) | | 119,100 | | | 5,632 |
Manulife Financial Corporation (Life/health insurance) | | 669,800 | | | 21,223 |
Ritchie Brothers Auctioneers, Inc. (Business services) † | | 90,700 | | | 4,823 |
Shoppers Drug Mart Corp. (Retail trade) | | 123,400 | | | 4,477 |
| | | | |
|
|
| | | | | | 52,413 |
| | | | |
|
|
| |
Emerging Europe, Mid-East, Africa—1.8% | | | |
Czech Republic—0.2% | | | | | |
*Central European Media Enterprises Ltd. Class “A” (Television)† | | 55,400 | | | 3,501 |
| | | | |
|
|
Israel—0.6% | | | | | |
Teva Pharmaceutical Industries, Ltd.—ADR (Pharmaceuticals) | | 294,400 | | | 9,300 |
| | | | |
|
|
Russia—0.3% | | | | | |
*CTC Media, Inc. (Television)† | | 243,102 | | | 4,439 |
| | | | |
|
|
South Africa—0.7% | | | | | |
Aspen Pharmacare (Pharmaceuticals) | | 444,200 | | | 2,257 |
*MTN Group Ltd. (Telecommunication services) | | 200,000 | | | 1,471 |
Naspers (Media) | | 233,700 | | | 3,972 |
Sasol ASA (Energy) | | 89,400 | | | 3,433 |
Truworths International Ltd. (Retail-apparel) | | 234,300 | | | 702 |
| | | | |
|
|
| | | | | | 11,835 |
| | | | |
|
|
Total Common Stock — 97.4%
(cost $1,259,522) | | | 1,623,951 |
| | | | |
|
|
| | |
Preferred Stocks | | | | | |
Brazil—1.1% | | | | | |
Banco Itau Holding (Banking) | | 251,700 | | | 7,304 |
Petroleo Brasileiro S.A. (Oil, gas drilling, and exploration) | | 584,400 | | | 11,616 |
| | | | |
|
|
| | | | | | 18,920 |
| | | | |
|
|
Total Preferred Stocks—1.1%
(cost $9,992) | | | 18,920 |
| | | | |
|
|
| | |
Investment in Affiliate | | | | | |
William Blair Ready Reserves Fund | | 3,385,737 | | | 3,386 |
| | | | |
|
|
Total Investment in Affiliate—0.2%
(cost $3,386) | | | 3,386 |
| | | | |
|
|
See accompanying Notes to Financial Statements.
8 Semi-Annual Report | June 30, 2006 |
Institutional International Growth Fund
Portfolio of Investments, June 30, 2006 (all dollar amounts in thousands) (unaudited)
| | | | | | | |
| | | |
Issuer
| |
| Shares or
Principal
Amount
| |
| Value
|
|
| | |
Short-Term Investments | | | | | | | |
American Express Demand Note, VRN 5.200% due 7/3/06 | | $ | 11,718,000 | | $ | 11,718 | |
Prudential Funding Demand Note, VRN 5.055% due 7/3/06 | | | 12,106,000 | | | 12,106 | |
| | | | | |
|
|
|
Total Short-Term Investments—1.4%
(cost $23,824) | | | 23,824 | |
| | | | | |
|
|
|
Total Investments—100.1%
(cost $1,296,724) | | | 1,670,081 | |
| | | | | |
|
|
|
Liabilities, plus cash and other assets—(0.1)% | | | (2,846 | ) |
| | | | | |
|
|
|
Net assets—100.0% | | $ | 1,667,235 | |
| | | | | |
|
|
|
* Non-income producing securities
ADR = American Depository Receipt
GDR = Global Depository Receipt
VRN = Variable Rate Note
† = U.S. listed foreign security
For securities, primarily traded on exchanges or markets that close before the close of regular trading on the New York Stock Exchange the Fund uses an independent pricing service on a daily basis to fair value price the securities pursuant to Valuation Procedures adopted by the Board of Trustees.
At June 30, 2006 the Fund’s Portfolio of Investments includes the following industry categories:
| | |
Financials | | 23.8% |
Consumer Discretionary | | 19.0% |
Industrials | | 18.4% |
Health Care | | 10.4% |
Information Technology | | 10.1% |
Consumer Staples | | 7.4% |
Energy | | 7.0% |
Materials | | 1.9% |
Telecommunication Services | | 1.0% |
Utilities | | 1.0% |
| | |
|
| | | 100.0% |
| | |
|
At June 30, 2006 the Fund’s Portfolio of Investments includes the following currency categories:
| | |
Euro | | 26.4% |
Japanese Yen | | 17.4% |
British Pound Sterling | | 14.1% |
Swiss Franc | | 8.1% |
United States Dollar | | 5.0% |
Hong Kong Dollar | | 4.9% |
Indian Rupee | | 3.4% |
Australian Dollar | | 3.2% |
Canadian Dollar | | 2.9% |
South Korean Won | | 2.5% |
Brazilian Real | | 2.5% |
Singapore Dollar | | 1.9% |
Mexico Nuevo Peso | | 1.8% |
Taiwan Dollar | | 1.7% |
Swedish Krone | | 1.4% |
All other currencies | | 2.8% |
| | |
|
| | | 100.0% |
| | |
|
See accompanying Notes to Financial Statements.
June 30, 2006 | William Blair Funds 9 |
W. George Greig
INSTITUTIONAL INTERNATIONAL EQUITY FUND
The Institutional International Equity Fund invests primarily in common stocks of companies included in the Morgan Stanley Capital International All Country World ex-U.S. Index.
AN OVERVIEW FROM THE PORTFOLIO MANAGER
How did the Fund perform over the first half of the year? How did the Fund’s performance compare to its benchmark?
The Institutional International Equity Fund posted a 4.65% increase for the six months ended June 30, 2006. By comparison, the Fund’s benchmark, the Morgan Stanley Capital International (MSCI) All Country World (ACWI) ex-US Index, rose 9.99%.
What were the most significant factors impacting international markets during the first six months of the year?
Following first quarter’s strong equity market, when international equities were up 9.76%, as reflected by the MSCI ACWI ex-US Index, markets retreated during the second quarter as concerns about potential global inflationary pressures, monetary policy tightening (and uncertainty as to the duration and size of further tightening moves and their impact on the US consumer in particular), and higher valuations in a number of the recent strong markets such as emerging markets and small cap came to the forefront of investor psychology. As a result, investors significantly reduced risk positions and emerging markets, which were up approximately 12% in the first quarter, fell sharply beginning in May through mid-June, while developed small cap stocks, up 10.8% during the first quarter, fell significantly as well. In addition, commodities and energy stocks, which were the strongest sectors globally through April, declined.
The correction in equity markets during May and most of June was broad based and non-discriminatory, although the stocks that were the prime beneficiaries of the strong global growth trends over the past several years did suffer more than their more defensive-oriented counterparts. In addition, the US remained the safe haven for investors as its equity and bond markets outperformed other regions of the world. The increased uncertainty surrounding monetary policy, inflationary pressures, rumored intervention by the Chinese government to slow investment and housing in certain parts of its market, record profits by corporations, significant outperformance of “riskier” assets, coupled with higher valuations and concerns about a slower growth environment, created the perfect storm for a liquidity driven market correction. However, within this environment, unit labor costs remained constrained as productivity enhancements offset higher wages, company fundamentals and earnings prospects remained strong, and managements continued to be focused on enhancing shareholder value. At the same time, emerging markets governments significantly improved monetary and fiscal policies and current account positions, and are now more immune to economic downdrafts such as those that occurred in 1997 and 1998.
Markets began to stabilize in mid June and rebounded sharply near the end of the quarter, however, as the severity and broadness of the equity market downdraft appeared overdone, and investors began to believe that central banks would in fact engineer a “soft landing” to a more sustainable growth environment. During the second quarter, the MSCI ACWI ex-US Index was up 0.21%, led by the UK and Pacific ex-Japan, while emerging markets fell 4.27% and developed small cap companies fell 3.41%, as measured by the MSCI World ex-US Small Cap Index. As a result, over the first six months of 2006, the MSCI ACWI ex-US Index returned 9.99%, led by Europe ex-UK and the UK, while Japan was the largest developed
10 Semi-Annual Report | June 30, 2006 |
markets detractor. Emerging markets and developed small cap returned just over 7% each. From a global sector perspective, Materials, Energy and Utilities were the strongest sectors with double digit returns year to date, while Information Technology (IT) and Telecommunication Services trailed.
What factors were behind the Fund’s performance versus the benchmark?
Within this environment, the Fund returned 4.65%, underperforming the MSCI ACWI ex-US Index year to date. While stock selection was strong across several regions and sectors during the first quarter, the Fund’s pro growth strategy as evidenced by higher weightings in Consumer Cyclical and IT holdings at the expense of Materials, Energy and Utilities was the primary detractor from results year to date. In addition, sector positioning in Japan was a drag on year to date performance, as the Fund’s focus on specialty retailing, asset management firms, and large financial institutions hurt performance as these areas underperformed the Japanese market as a whole. While there were no particular earnings disappointments in general regarding individual portfolio holdings, the specialty retailing and asset management firms suffered with the general decline in smaller capitalization stocks, coupled with investor concerns about ongoing consumer demand in Japan, while the large financial institutions were hurt by the prospects of an increasing interest rate environment. Offsetting these negative results on a year to date basis was the Fund’s Europe ex-UK and Latin America weightings at the expense of Developed Asia and Emerging Markets Europe, Mid-East and Africa (EMEA). In addition, Energy , IT and Utilities stock selection was strong. Energy stock selection was bolstered by stock selection in Continental Europe and the UK, coupled with a higher weighting in Latin America. Within IT the Fund’s weighting and stock selection in Continental Europe and Canada, as well as the higher weighting and stock selection in Emerging Asia added value during the first half of the year. The Fund’s only Utilities holding, E.ON, located in Germany, outperformed the Utilities sector as a whole.
What is your current strategy? How is the Fund positioned?
We have used the second quarter market activity to add to positions in strong companies with good fundamentals, which now have significantly more compelling valuations. As of quarter end, the Fund maintained its higher Consumer and Health Care weightings at the expense of Materials, Telecom Services, Energy and Utilities. At the margin, IT was decreased, while Industrials and Energy weightings were increased since year end. Financials, while the largest sector in the portfolio from an absolute perspective, approximated the Index weighting. From a regional perspective, the Fund maintained its underweighting in developed Asia and the UK and overweighting in Europe ex-UK versus the Index. These weightings are largely based upon the team’s bottom up, fundamental research efforts, which are also supported by the team’s top down view.
What is your outlook for the international markets?
The key cyclical drivers of the world economy are generally seen to be US household spending growth and China’s industrial and infrastructure investment boom. Both of these trends have been expected to decelerate for some time, but, ironically, a great deal of the increase in economic anxiety that unfolded in the first half of 2006 relates to the fact that both of the expected slowdowns have so far largely failed to materialize.
For the US consumer, the areas of concern are the sharp slowdown in housing activity and the negative fallout of house price weakness, and the hit to discretionary spending power from higher energy costs and interest payments. Coupled with the persistent upward pressure on reported inflation and its uncertain impact on monetary policy, these unknowns are increasingly tipping the odds in favor of a significant (1 percentage point or more) reduction in growth expectations for next year.
June 30, 2006 | William Blair Funds 11 |
In China, the government has targeted a growth slowdown in selected industrial sectors as well as speculative segments of the housing market. But economists have very little confidence in the degree to which the government’s intentions can be translated into actual changes in growth expectations. Similarly, there is no consensus about the effect of a potential export slowdown on the overall economy. Although there are obviously a great number of unknowns in both the numbers and the mechanisms of growth in China, aggregate GDP growth often seems only mildly affected by local and sector-specific cycles, and we would not anticipate more than a moderate downshift back to trend growth.
Japan and Europe, on the other hand, have been seeing steady improvement in growth indicators and economic news flow. Will this quickening expansion be sustained in the face of deceleration in the US and China, as well as some early-stage monetary tightening? Our view is that the cycles in Japan and Europe remain at a relatively early stage, and that growth may be sustained by continued strength in global capital spending, improving employment prospects, high savings balances, and pent-up demand in both the corporate and household sectors.
In the context of this reasonably balanced but still somewhat slower growth scenario, the key policy and market risk issue will be the degree of persistence of rising inflation and the potential broadening of price inflation into more core spending-related measures. This aspect of inflation makes itself known as a severely lagging indicator, and presents the US in particular with the policy problem of whether to prioritize visible growth trends or price trends in setting monetary conditions. This dilemma may well get worse before being resolved in favor of ending the tightening cycle.
In the first half of 2006, valuation and risk issues topped the equity market agenda—concerns about relative risk appetite and relative levels of real rates. To a degree, as growth and inflation issues come to the fore, the market’s principal concern will shift toward the outlook for sales and earnings growth.
Global corporate profitability is at or near record levels, spurred on by the strong secular forces of improved corporate performance and strong labor productivity growth. But while these forces remain in place, there are signs that cyclical pressures may push cost growth ahead of revenue growth—at least in some sectors—regardless of whether the global cycle is stronger or weaker than consensus expectations.
Our view is that changes in relative earnings growth and growth expectations will be an important factor governing market and sector leadership over the next several quarters. At the same time, it is likely that trends in profitability in place for the last year or two may be disrupted by shifts in global demand and relative pricing patterns.
We will be focusing particularly for signs of (negative) change in the commodity and industrial sectors, for changes in margins within the highly diverse financial sector, and for indications of the sustainability of profit growth on a regional basis, particularly with respect to the strong growth advantage enjoyed by emerging markets in the last several years.
In the near term, though, the market’s view of these prospective growth issues will be set by high frequency economic releases and especially by any visible trends that emerge from second and third (calendar) quarter earnings reports. Investment strategy, like economic policy, is at least cyclically becoming more and more ‘data-dependent’.
12 Semi-Annual Report | June 30, 2006 |
Institutional International Equity Fund
Performance Highlights (unaudited)
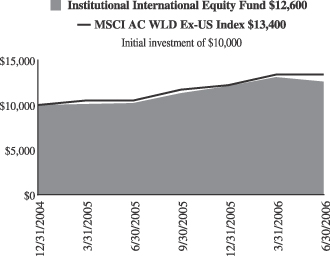
Average Annual Total Return at 6/30/2006
| | | | | | |
| | | 1
Year
| | | Since Inception(a)
| |
Institutional International Equity Fund | | 23.52 | % | | 15.84 | % |
MSCI All Country World Ex-US Index | | 28.40 | | | 20.05 | |
| | (a) | | For the period from December 1, 2004 (Commencement of Operations) to June 30, 2006. | |
Performance cited represents past performance. Past performance does not guarantee future results and current performance may be lower or higher than the data quoted. Results shown are average annual returns, which assume reinvestment of dividends and capital gains. Investment returns and principal will fluctuate and you may have a gain or loss when you sell shares. For the most current month-end performance information, please call 1-800-742-7272, or visit our Web site at www.williamblairfunds.com. From time to time, the investment adviser may waive fees or reimburse expenses for the Fund. Without these waivers, performance would be lower. International investing involves special risk considerations, including currency fluctuations, lower liquidity, economic and political risk.
The performance highlights and graph presented above do not reflect the deduction of taxes that a shareholder would pay on fund distributions or the redemption of fund shares.
The Morgan Stanley Capital International (MSCI) All Country World Ex-US Index is an unmanaged index that includes developed and emerging markets and reduced Japanese portion, making it more comparable to the Institutional International Equity Fund in terms of investment approach.
This report identifies the Fund’s investments on June 30, 2006. These holdings are subject to change. Not all stocks in the Fund performed the same, nor is there any guarantee that these stocks will perform as well in the future. Market forecasts provided in this report may not necessarily come to pass.
Sector Diversification (unaudited)
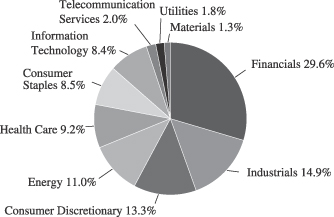
The sector diversification shown is based on the total investment portfolio.
June 30, 2006 | William Blair Funds 13 |
Institutional International Equity Fund
Portfolio of Investments, June 30, 2006 (all dollar amounts in thousands) (unaudited)
| | | | | |
Issuer
| | Shares
| | Value
|
| | | | | | |
| | |
Common Stocks—Europe—40.4% | | | | | |
Austria—1.3% | | | | | |
Erste Bank (Banking) | | 52,866 | | $ | 2,972 |
Raiffeisen International Bank (Banking) | | 18,600 | | | 1,612 |
| | | | |
|
|
| | | | | | 4,584 |
| | | | |
|
|
France—9.9% | | | | | |
BNP Paribas (Banking) | | 61,360 | | | 5,867 |
Essilor International (Health care supplies) | | 36,900 | | | 3,711 |
Eurazeo (Diversified financial services) | | 15,015 | | | 1,486 |
Iliad S.A. (Internet software and services) | | 16,000 | | | 1,337 |
L’Oreal S.A. (Cosmetics) | | 111,600 | | | 10,535 |
LVMH Moet Hennessey Louis Vuitton S.A. (Luxury goods) | | 62,800 | | | 6,225 |
Technip-Coflexip S.A. (Construction) | | 44,500 | | | 2,452 |
Vinci S.A. (Construction) | | 37,700 | | | 3,877 |
| | | | |
|
|
| | | | | | 35,490 |
| | | | |
|
|
Germany—8.3% | | | | | |
Bijou Brigitte (Fashion jewelry accessories) | | 3,000 | | | 811 |
Celesio AG (Pharmaceuticals) | | 19,000 | | | 1,724 |
Continental AG (Diversified manufacturing) | | 33,870 | | | 3,456 |
E.ON AG (Energy) | | 50,900 | | | 5,851 |
*Qiagen, NV (Biomedical) | | 114,700 | | | 1,546 |
SAP AG (Software) | | 32,350 | | | 6,802 |
Siemens AG (Manufacturing) | | 96,300 | | | 8,365 |
Solarworld AG (Alternative energy sources) | | 16,000 | | | 1,002 |
| | | | |
|
|
| | | | | | 29,557 |
| | | | |
|
|
Greece—2.1% | | | | | |
Coca-Cola Hellenic Bottling S.A. (Beverages) | | 85,940 | | | 2,559 |
EFG Eurobank (Banking) | | 59,792 | | | 1,665 |
National Bank of Greece (Banking) | | 86,630 | | | 3,343 |
| | | | |
|
|
| | | | | | 7,567 |
| | | | |
|
|
Ireland—1.2% | | | | | |
Anglo Irish Bank plc (Finance) | | 220,200 | | | 3,431 |
IAWS Group plc (Food products) | | 50,000 | | | 884 |
| | | | |
|
|
| | | | | | 4,315 |
| | | | |
|
|
Italy—3.1% | | | | | |
Azimut Holding SpA (Investment management services) | | 71,900 | | | 749 |
Luxottica Group SpA (Apparel and luxury goods) | | 216,400 | | | 5,865 |
Saipem SpA (Energy equipment and services) | | 187,700 | | | 4,261 |
| | | | |
|
|
| | | | | | 10,875 |
| | | | |
|
|
Netherlands—0.4% | | | | | |
*Tomtom NV (Computer software) | | 38,400 | | | 1,492 |
| | | | |
|
|
Norway—1.0% | | | | | |
Statoil ASA (Oil and gas) | | 124,910 | | | 3,561 |
| | | | |
|
|
Spain—2.6.% | | | | | |
Grupo Ferrovial S.A. (Industrial services) | | 45,900 | | | 3,500 |
Industria De Textile (Retail trade) | | 137,900 | | | 5,814 |
| | | | |
|
|
| | | | | | 9,314 |
| | | | |
|
|
| | | | | |
Issuer
| | Shares
| | Value
|
| | | | | | |
| |
Common Stocks—Europe—40.4%—(continued) | | | |
Sweden—0.6% | | | | | |
*Capio AB (Health care) | | 45,360 | | $ | 814 |
*Modern Times Group (Television) | | 41,200 | | | 1,153 |
| | | | |
|
|
| | | | | | 1,967 |
| | | | |
|
|
Switzerland—9.9% | | | | | |
*EFG International (Commercial banking) | | 59,600 | | | 1,653 |
Kuehne & Nagel International AG (Air freight and logistics) | | 41,500 | | | 3,027 |
Nobel Biocare Holding AG (Medical equipment and supplies) | | 6,700 | | | 1,588 |
Roche Holdings AG (Health care) | | 74,600 | | | 12,310 |
SGS S.A. (Industrials) | | 2,650 | | | 2,515 |
Synthes, Inc. (Health care) | | 41,100 | | | 4,949 |
UBS AG (Banking) | | 84,255 | | | 9,223 |
| | | | |
|
|
| | | | | | 35,265 |
| | | | |
|
|
| | |
Japan—15.1% | | | | | |
Aeon Credit Service Co., Ltd. (Consumer finance) | | 64,400 | | | 1,568 |
Aeon Mall Co., Ltd. (Real estate) | | 37,700 | | | 1,591 |
Chiyoda Corporation (Construction) | | 74,000 | | | 1,514 |
Denso Corporation (Auto parts manufacturing) | | 173,400 | | | 5,677 |
Honeys Co., Ltd. (Retail) | | 22,700 | | | 974 |
Hoya Corporation (Electronic technology) | | 89,700 | | | 3,193 |
*K.K. DaVinci Advisors (Consulting services) | | 1,060 | | | 1,049 |
Keyence Corporation (Electronic technology) | | 15,510 | | | 3,957 |
Komatsu Ltd. (Machinery) | | 376,000 | | | 7,482 |
MISUMI Group, Inc. (Metal production) | | 48,200 | | | 903 |
Mitsubishi Tokyo Financial (Financial services) | | 735 | | | 10,303 |
Nitto Denko Corporation (Electronic technology) | | 24,000 | | | 1,710 |
Orix Corporation (Consumer finance) | | 36,900 | | | 9,004 |
Point Inc. Ltd. (Apparel and footwear retail) | | 14,300 | | | 810 |
Ryohin Keikaku Co. Ltd. (Retail stores) | | 13,900 | | | 1,143 |
Yamada Denki Co., Ltd. (Retail trade) | | 27,600 | | | 2,812 |
| | | | |
|
|
| | | | | | 53,690 |
| | | | |
|
|
| | |
United Kingdom—13.8% | | | | | |
BG Group plc (Industrial services) | | 796,700 | | | 10,634 |
*Cairn Energy plc (Petroleum refining) | | 62,300 | | | 2,523 |
Carphone Warehouse Group plc (Consumer electronics) | | 285,500 | | | 1,672 |
*CSR plc (Electronic technology) | | 70,100 | | | 1,630 |
HBOS plc (Commercial banking) | | 479,600 | | | 8,323 |
Northern Rock plc (Commercial banking) | | 217,900 | | | 4,029 |
Reckitt Benckiser plc (Household products) | | 201,400 | | | 7,515 |
Rolls-Royce Group plc (Aerospace) | | 880,800 | | | 6,737 |
Rotork plc (Control instruments) | | 79,300 | | | 1,005 |
Standard Chartered plc (Banking) | | 165,900 | | | 4,048 |
Tullow Oil plc (Oil, gas drilling, and exploration) | | 140,800 | | | 993 |
| | | | |
|
|
| | | | | | 49,109 |
| | | | |
|
|
See accompanying Notes to Financial Statements.
14 Semi-Annual Report | June 30, 2006 |
Institutional International Equity Fund
Portfolio of Investments, June 30, 2006 (all dollar amounts in thousands) (unaudited)
| | | | | |
Issuer
| | Shares
| | Value
|
| | | | | | |
| |
Common Stocks—Emerging Asia—6.6% | | | |
China—1.4% | | | | | |
China Life Insurance Co. (Life/Health insurance) | | 1,871,000 | | $ | 2,964 |
*Focus Media Holding Ltd.—ADR (Advertising) | | 19,500 | | | 1,270 |
Hopson Development Holding Ltd. (Real estate operations/development) | | 336,000 | | | 696 |
| | | | |
|
|
| | | | | | 4,930 |
| | | | |
|
|
India—3.4% | | | | | |
Bharat Heavy Electricals Ltd. (Supply equipment) | | 54,800 | | | 2,326 |
*Bharti Airtel Limited (Wireless telecommunication services) | | 208,331 | | | 1,677 |
HDFC Bank (Banking) | | 113,310 | | | 1,963 |
Infosys Technologies Ltd. (Consulting software and services) | | 44,600 | | | 2,984 |
Suzlon Energy Ltd. (Power conversion equipment) | | 43,300 | | | 987 |
Vedanta Resources Plc (Mining) | | 94,200 | | | 2,389 |
| | | | |
|
|
| | | | | | 12,326 |
| | | | |
|
|
Indonesia—0.3% | | | | | |
PT Bank Rakyat Indonesia (Banking) | | 2,460,000 | | | 1,091 |
| | | | |
|
|
Taiwan—1.5% | | | | | |
High Tech Computer Corp. (Computers) | | 71,000 | | | 1,951 |
*Himax Technologies, Inc.—ADR (Computers) | | 101,400 | | | 580 |
Hon Hai Precision Industry (Computers) | | 438,234 | | | 2,706 |
| | | | |
|
|
| | | | | | 5,237 |
| | | | |
|
|
| | |
Canada—4.8% | | | | | |
Cameco Corporation (Metals) | | 84,300 | | | 3,358 |
Canadian National Railway Co. (Railroads) | | 77,600 | | | 3,390 |
Manulife Financial Corporation (Life and health insurance) | | 174,900 | | | 5,542 |
Shoppers Drug Mart Corporation (Retail trade) | | 37,500 | | | 1,360 |
Suncor Energy, Inc. (Oil, gas drilling and exploration) | | 43,800 | | | 3,545 |
| | | | |
|
|
| | | | | | 17,195 |
| | | | |
|
|
| | |
Asia—4.2% | | | | | |
Australia—1.2% | | | | | |
Macquarie Bank Ltd. (Financial services) | | 86,600 | | | 4,433 |
| | | | |
|
|
Hong Kong—1.5% | | | | | |
Esprit Holdings Ltd. (Apparel, footwear and retail) | | 226,000 | | | 1,847 |
Li & Fung Ltd. (Distribution) | | 1,667,100 | | | 3,379 |
| | | | |
|
|
| | | | | | 5,226 |
| | | | |
|
|
Singapore—1.5% | | | | | |
Capitaland, Ltd. (Real estate operations) | | 1,903,900 | | | 5,433 |
| | | | |
|
|
| | |
Emerging Latin America—3.8% | | | | | |
Brazil—1.1% | | | | | |
Companhia de Concessoes Rodoviarias (Public thoroughfares) | | 126,400 | | | 1,021 |
| | | | | | |
Issuer
| |
| Shares or
Principal
Amount
| |
| Value
|
| | | | | | | |
|
Common Stocks—Emerging Latin
America—3.8%—(continued) |
Brazil—(continued) | | | | | | |
Gol-Linhas Aereas Inteligentes S.A.—ADR (Airlines) | | | 43,000 | | $ | 1,526 |
Localiza Rent a Car S.A. (Automobile rental) | | | 27,500 | | | 521 |
Natura Cosmeticos S.A. (Cosmetics) | | | 73,500 | | | 752 |
| | | | | |
|
|
| | | | | | | 3,820 |
| | | | | |
|
|
Columbia—0.3% | | | | | | |
Bancolumbia S.A.—ADR (Banking) | | | 39,100 | | | 942 |
| | | | | |
|
|
Mexico—2.4% | | | | | | |
America Movil S.A. (Communications) | | | 2,568,900 | | | 4,292 |
Walmart de Mexico (Retail trade) | | | 1,576,400 | | | 4,406 |
| | | | | |
|
|
| | | | | | | 8,698 |
| | | | | |
|
|
| |
Emerging Europe, Mid-East, Africa—1.7% | | | |
Israel—0.9% | | | | | | |
Teva Pharmaceutical Industries Ltd.—ADR (Health care) | | | 104,800 | | | 3,311 |
| | | | | |
|
|
South Africa—0.8% | | | | | | |
MTN Group Limited (Wireless telecommunications) | | | 78,300 | | | 576 |
Naspers Ltd. (Media) | | | 36,590 | | | 622 |
Sasol ASA (Energy) | | | 35,000 | | | 1,344 |
| | | | | |
|
|
| | | | | | | 2,542 |
| | | | | |
|
|
Total Common Stock—90.4%
(cost $293,617) | | | 321,970 |
| | | | | |
|
|
| | |
Preferred Stocks | | | | | | |
Brazil—1.5% | | | | | | |
Banco Itau S.A. (Banking) | | | 75,400 | | | 2,188 |
Petroleo Brasileiro S.A. (Oil, gas drilling, and exploration) | | | 166,600 | | | 3,311 |
| | | | | |
|
|
| | | | | | | 5,499 |
| | | | | |
|
|
Total Preferred Stocks—1.5%
(cost $4,449) | | | 5,499 |
| | | | | |
|
|
| | |
Investment in Affiliate | | | | | | |
William Blair Ready Reserves Fund | | | 1,370,534 | | | 1,371 |
| | | | | |
|
|
Total Investment in Affiliate—0.4%
(cost $1,371) | | | 1,371 |
| | | | | |
|
|
| | |
Short-Term Investments | | | | | | |
American Express Demand Note,
VRN, 5.200%, due 7/03/06 | | $ | 9,155,000 | | | 9,155 |
Prudential Funding Demand Note,
VRN, 5.055%, due 7/03/06 | | | 10,754,000 | | | 10,754 |
| | | | | |
|
|
Total Short-Term Investments—5.6%
(cost $19,909) | | | 19,909 |
| | | | | |
|
|
Total Investments—97.9%
(cost $319,346) | | | 348,749 |
Cash plus other assets, less liabilities—2.1% | | | 7,602 |
| | | | | |
|
|
Net assets—100.0% | | $ | 356,351 |
| | | | | |
|
|
See accompanying Notes to Financial Statements.
June 30, 2006 | William Blair Funds 15 |
Institutional International Equity Fund
Portfolio of Investments, June 30, 2006 (all dollar amounts in thousands) (unaudited)
* Non-income producing securities
ADR = American Depository Receipt
VRN = Variable Rate Note
For securities primarily traded on exchanges or markets that close before the close of regular trading on the New York Stock Exchange, the Fund uses an independent pricing service on a daily basis to fair value price the securities pursuant to Valuation Procedures adopted by the Board of Trustees.
At June 30, 2006 the Fund’s Portfolio of Investments includes the following industry categories:
| | |
Financials | | 29.6% |
Industrials and Services | | 14.9% |
Consumer Discretionary | | 13.3% |
Energy | | 11.0% |
Healthcare | | 9.2% |
Consumer Staples | | 8.5% |
Information Technology | | 8.4% |
Telecommunication Services | | 2.0% |
Utilities | | 1.8% |
Materials | | 1.3% |
| | |
|
| | | 100.0% |
| | |
|
At June 30, 2006 the Fund’s Portfolio of Investments includes the following currency categories:
| | |
Euro | | 31.5% |
Japanese Yen | | 16.4% |
British Pound Sterling | | 15.7% |
Swiss Franc | | 10.8% |
Canadian Dollar | | 5.3% |
Indian Rupee | | 3.0% |
Hong Kong Dollar | | 2.7% |
Mexico Nuevo Peso | | 2.7% |
Brazilian Real | | 2.4% |
United States Dollar | | 2.3% |
Singapore Dollar | | 1.7% |
Taiwan Dollar | | 1.4% |
Australian Dollar | | 1.3% |
Norwegian Krone | | 1.1% |
All other currencies | | 1.7% |
| | |
|
| | | 100.0% |
| | |
|
See accompanying Notes to Financial Statements.
16 Semi-Annual Report June 30, 2006 | -- |

Jeffery A. Urbina
INTERNATIONAL SMALL CAP GROWTH FUND
The International Small Cap Growth Fund primarily invests in a diversified portfolio of common stocks of small cap companies in developed and emerging markets.
AN OVERVIEW FROM THE PORTFOLIO MANAGER
How did the Fund perform over the first half of the year? How did the Fund’s performance compare to its benchmark?
The International Small Cap Growth Fund posted an 8.78% increase (Institutional Class Shares) for the six months ended June 30, 2006. By comparison, the Fund’s benchmark, the Morgan Stanley Capital International (MSCI) World Small Cap ex-U.S. Index gained 7.06%.
What were the most significant factors impacting international markets during the first six months of the year?
Following first quarter’s strong equity market, when international equities were up 9.76%, as reflected by the Morgan Stanley (MSCI) All Country World ex-US (ACWI) Index, markets retreated during the second quarter as concerns about potential global inflationary pressures, monetary policy tightening (and uncertainty as to the duration and size of further tightening moves and their impact on the US consumer in particular), and higher valuations in a number of the recent strong markets such as emerging markets and small cap came to the forefront of investor psychology. As a result, investors significantly reduced risk positions and emerging markets, which were up approximately 12% in the first quarter, fell sharply beginning in May through mid-June, while developed small cap stocks, up 10.8% during the first quarter, fell significantly as well. In addition, commodities and energy stocks, which were the strongest sectors globally through April, declined.
The correction in equity markets during May and most of June was broad based and non-discriminatory, although the stocks that were the prime beneficiaries of the strong global growth trends over the past several years did suffer more than their more defensive-oriented counterparts. In addition, the US remained the safe haven for investors as its equity and bond markets outperformed other regions of the world. The increased uncertainty surrounding monetary policy, inflationary pressures, rumored intervention by the Chinese government to slow investment and housing in certain parts of its market, record profits by corporations, significant outperformance of “riskier” assets, coupled with higher valuations and concerns about a slower growth environment, created the perfect storm for a liquidity driven market correction. However, within this environment, unit labor costs remained constrained as productivity enhancements offset higher wages, company fundamentals and earnings prospects remained strong, and managements continued to be focused on enhancing shareholder value. At the same time, emerging markets governments significantly improved monetary and fiscal policies and current account positions, and are now more immune to economic downdrafts such as those that occurred in 1997 and 1998.
Markets began to stabilize in mid June and rebounded sharply near the end of the quarter, however, as the severity and broadness of the equity market downdraft appeared overdone, and investors began to believe that central banks would in fact engineer a “soft landing” to a more sustainable growth environment. During the second quarter, the MSCI ACWI ex-US Index was up 0.21%, led by the UK and Pacific ex-Japan, while emerging markets fell 4.27% and developed small cap companies fell 3.41%, as measured by the MSCI World ex-US Small Cap Index. As a result, over the first six months of 2006, the MSCI ACWI ex-US Index returned 9.99%, led by Europe ex-UK and the UK, while Japan was the largest developed
June 30, 2006 | William Blair Funds 17 |
markets detractor. Emerging markets and developed small cap returned just over 7% each. From a global sector perspective, Materials, Energy and Utilities were the strongest sectors with double digit returns year to date, while Information Technology (IT) and Telecommunication Services trailed.
What factors were behind the Fund’s performance versus the benchmark?
Within this environment, the Fund returned 8.78% (Institutional Class Shares), outpacing the MSCI World ex-US Small Cap Index year to date, due to strong relative performance during the first quarter, which was somewhat mitigated by second quarter performance. Stock selection across most sectors augmented results year to date, in particular in Consumer and IT. Within Consumer, Pacific Free ex-Japan , UK and Emerging Markets stock selection added value, while UK and Emerging Asia stock selection augmented IT results. The Fund’s focus on Europe ex-UK, Emerging Asia and Emerging Markets Europe, Mid-East and Africa (EMEA). at the expense of Japan was also additive to results. Conversely, sector positioning was a drag on results year to date, as the Fund’s focus on Consumer Cyclicals at the expense of Materials hurt performance. In addition, sector positioning in Japan was a drag on year to date performance, as the Fund’s focus on specialty retailing, and small capitalization asset management firms hurt performance as these areas underperformed the Japanese market as a whole. While there were no earnings disappointments in general regarding individual portfolio holdings, the specialty retailing and asset management firms suffered with the general decline in smaller capitalization stocks, coupled with investor concerns about ongoing consumer demand in Japan and the prospects of an increasing interest rate environment.
What is your current strategy? How is the Fund positioned?
We have used the second quarter market activity to add to positions in strong companies with good fundamentals, which now have significantly more compelling valuations. As of quarter end, the Fund maintained its higher Consumer, Industrials and Health Care weightings at the expense of Materials, Telecom Services, Energy, IT and Utilities. From a regional perspective, the Fund maintained its underweighting in developed Asia and the UK and overweighting in Europe ex-UK versus the Index. In addition, emerging markets were decreased during the first quarter on valuation by nearly 8% and then increased on weakness by approximately 8% during the second quarter, focused largely on Emerging Asia. These weightings are largely based upon the team’s bottom up, fundamental research efforts, which are also supported by the team’s top down view.
What is your outlook for the international markets?
The key cyclical drivers of the world economy are generally seen to be US household spending growth and China’s industrial and infrastructure investment boom. Both of these trends have been expected to decelerate for some time, but, ironically, a great deal of the increase in economic anxiety that unfolded in the first half of 2006 relates to the fact that both of the expected slowdowns have so far largely failed to materialize.
For the US consumer, the areas of concern are the sharp slowdown in housing activity and the negative fallout of house price weakness, and the hit to discretionary spending power from higher energy costs and interest payments. Coupled with the persistent upward pressure on reported inflation and its uncertain impact on monetary policy, these unknowns are increasingly tipping the odds in favor of a significant (1 percentage point or more) reduction in growth expectations for next year.
In China, the government has targeted a growth slowdown in selected industrial sectors as well as speculative segments of the housing market. But economists have very little confidence in the degree to which the government’s intentions can be translated into actual
18 Semi-Annual Report | June 30, 2006 |
changes in growth expectations. Similarly, there is no consensus about the effect of a potential export slowdown on the overall economy. Although there are obviously a great number of unknowns in both the numbers and the mechanisms of growth in China, aggregate GDP growth often seems only mildly affected by local and sector-specific cycles, and we would not anticipate more than a moderate downshift back to trend growth.
Japan and Europe, on the other hand, have been seeing steady improvement in growth indicators and economic news flow. Will this quickening expansion be sustained in the face of deceleration in the US and China, as well as some early-stage monetary tightening? Our view is that the cycles in Japan and Europe remain at a relatively early stage, and that growth may be sustained by continued strength in global capital spending, improving employment prospects, high savings balances, and pent-up demand in both the corporate and household sectors.
In the context of this reasonably balanced but still somewhat slower growth scenario, the key policy and market risk issue will be the degree of persistence of rising inflation and the potential broadening of price inflation into more core spending-related measures. This aspect of inflation makes itself known as a severely lagging indicator, and presents the US in particular with the policy problem of whether to prioritize visible growth trends or price trends in setting monetary conditions. This dilemma may well get worse before being resolved in favor of ending the tightening cycle.
In the first half of 2006, valuation and risk issues topped the equity market agenda—concerns about relative risk appetite and relative levels of real rates. To a degree, as growth and inflation issues come to the fore, the market’s principal concern will shift toward the outlook for sales and earnings growth.
Global corporate profitability is at or near record levels, spurred on by the strong secular forces of improved corporate performance and strong labor productivity growth. But while these forces remain in place, there are signs that cyclical pressures may push cost growth ahead of revenue growth—at least in some sectors—regardless of whether the global cycle is stronger or weaker than consensus expectations.
Our view is that changes in relative earnings growth and growth expectations will be an important factor governing market and sector leadership over the next several quarters. At the same time, it is likely that trends in profitability in place for the last year or two may be disrupted by shifts in global demand and relative pricing patterns.
We will be focusing particularly for signs of (negative) change in the commodity and industrial sectors, for changes in margins within the highly diverse financial sector, and for indications of the sustainability of profit growth on a regional basis, particularly with respect to the strong growth advantage enjoyed by emerging markets in the last several years.
In the near term, though, the market’s view of these prospective growth issues will be set by high frequency economic releases and especially by any visible trends that emerge from second and third (calendar) quarter earnings reports. Investment strategy, like economic policy, is at least cyclically becoming more and more ‘data-dependent’.
June 30, 2006 | William Blair Funds 19 |
International Small Cap Growth Fund
Performance Highlights (unaudited)
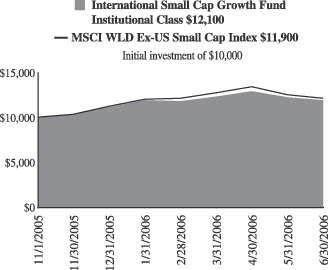
Average Annual Total Return at 6/30/2006
| | | |
| | | Since Inception(a)
| |
International Small Cap Growth Fund
Institutional Class | | 21.42 | % |
MSCI WLD EX-US Small Cap Index | | 18.49 | |
| | (a) | | For the period from November 1, 2005 (Commencement of Operations) to June 30, 2006. | |
Performance cited represents past performance. Past performance does not guarantee future results and current performance may be lower or higher than the data quoted. Results shown are average annual returns, which assume reinvestment of dividends and capital gains. Investment returns and principal will fluctuate and you may have a gain or loss when you sell shares. For the most current month-end performance information, please call 1-800-742-7272, or visit our Web site at www.williamblairfunds.com. From time to time, the investment adviser may waive fees or reimburse expenses for the Fund. Without these waivers, performance would be lower. International investing involves special risk considerations, including currency fluctuations, lower liquidity, economic and political risk.
The performance highlights and graph presented above do not reflect the deduction of taxes that a shareholder would pay on fund distributions or the redemption of fund shares.
The Morgan Stanley Capital International (MSCI) World Ex-US Small Cap Index is an unmanaged index that is designated to measure equity performance of small cap stocks in developed and emerging markets.
This report identifies the Fund’s investments on June 30, 2006. These holdings are subject to change. Not all stocks in the Fund performed the same, nor is there any guarantee that these stocks will perform as well in the future. Market forecasts provided in this report may not necessarily come to pass.
Sector Diversification (unaudited)
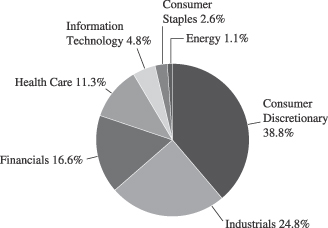
The sector diversification shown is based on the total investment portfolio.
20 Semi-Annual Report | June 30, 2006 |
International Small Cap Growth Fund
Portfolio of Investments, June 30, 2006 (all dollar amounts in thousands) (unaudited)
| | | | | |
Issuer
| | Shares
| | Value
|
| | |
Common Stocks—Europe—30.8% | | | | | |
France—2.9% | | | | | |
April Group S.A. (Insurance brokers) | | 43,600 | | $ | 2,350 |
*Orpea (Hospital and nursing management) | | 16,800 | | | 1,159 |
| | | | |
|
|
| | | | | | 3,509 |
| | | | |
|
|
Germany—8.9% | | | | | |
Bijou Brigitte (Fashion jewelry accessories) | | 4,500 | | | 1,216 |
CTS Eventim (Leisure and recreation products) | | 39,500 | | | 1,212 |
GFK AG (Commercial services) | | 21,400 | | | 779 |
*Q-Cells AG (Alternative energy sources) | | 23,200 | | | 1,941 |
*Qiagen NV (Biomedical) | | 132,400 | | | 1,785 |
Rational AG (Business equipment) | | 3,500 | | | 572 |
Solarworld AG (Alternative energy sources) | | 26,300 | | | 1,647 |
Stada Arzneimittel AG (Pharmaceuticals) | | 43,700 | | | 1,742 |
| | | | |
|
|
| | | | | | 10,894 |
| | | | |
|
|
Ireland—5.2% | | | | | |
IAWS Group plc (Food distribution) | | 99,400 | | | 1,756 |
Kingspan Group plc (Construction) | | 174,400 | | | 3,046 |
United Drug plc (Pharmaceuticals) | | 383,400 | | | 1,642 |
| | | | |
|
|
| | | | | | 6,444 |
| | | | |
|
|
Italy—4.9% | | | | | |
Amplifon SpA (Retail) | | 132,300 | | | 1,125 |
Azimut Holdings SpA (Investment management services) | | 112,000 | | | 1,166 |
Credito Emiliano SpA (Banking) | | 97,200 | | | 1,198 |
Pirelli & C Real Estate SpA (Real estate development) | | 9,400 | | | 631 |
Tod’s SpA (Footwear apparel) | | 25,300 | | | 1,895 |
| | | | |
|
|
| | | | | | 6,015 |
| | | | |
|
|
Luxembourg—1.0% | | | | | |
*Transcom Worldwide S.A. (E-services and consulting) | | 109,200 | | | 1,206 |
| | | | |
|
|
Sweden—5.5% | | | | | |
*Capio AB (Health care) | | 97,240 | | | 1,745 |
HIQ International AB (Computer services) | | 116,000 | | | 631 |
*Modern Times Group (Television) | | 107,800 | | | 3,268 |
*Tradedoubler AB (E-services and consulting) | | 61,700 | | | 1,127 |
| | | | |
|
|
| | | | | | 6,771 |
| | | | |
|
|
Switzerland—2.4% | | | | | |
*EFG International (Banking) | | 62,750 | | | 1,740 |
Phonak Holdings AG (Hearing technology) | | 18,900 | | | 1,181 |
| | | | |
|
|
| | | | | | 2,921 |
| | | | |
|
|
| | |
Japan—24.0% | | | | | |
Aeon Credit Service Co., Ltd. (Consumer finance) | | 112,300 | | | 2,735 |
Aeon Mall Co., Ltd. (Real estate) | | 53,000 | | | 2,237 |
Chiyoda Corp. (Construction) | | 92,000 | | | 1,882 |
Honeys Company, Ltd. (Luxury goods) | | 25,800 | | | 1,107 |
ITO EN, Ltd. (Beverages) | | 34,500 | | | 1,261 |
Joint Corporation (Real estate operations/development) | | 65,100 | | | 2,124 |
*K.K. DaVinci Advisors (Consulting services) | | 2,230 | | | 2,208 |
MISUMI Group, Inc. (Metal production) | | 90,000 | | | 1,686 |
Nakanishi Inc. (Medical specialties) | | 15,900 | | | 1,494 |
Nitori Company Ltd. (Specialty stores) | | 35,000 | | | 1,703 |
| | | | | |
Issuer
| | Shares
| | Value
|
|
Common Stocks—Japan—24.0%—(continued) |
Park 24 Co., Ltd. (Commercial services) | | 36,000 | | $ | 1,063 |
Point Inc. Ltd. (Apparel and footwear retail) | | 19,500 | | | 1,104 |
Ryohin Keikaku Co. Ltd. (Retail stores) | | 28,200 | | | 2,319 |
Shimamura Company Ltd. (Retail stores) | | 15,500 | | | 1,701 |
Sparx Asset Management Co. Ltd. (Financial) | | 2,890 | | | 3,042 |
Suruga Bank (Banking) | | 133,000 | | | 1,801 |
| | | | |
|
|
| | | | | | 29,467 |
| | | | |
|
|
| | |
United Kingdom—12.3% | | | | | |
Accident Exchange Group plc (Auto rental) | | 96,400 | | | 623 |
*Ceres Power Holdings plc (Alternative energy sources) | | 226,000 | | | 991 |
*CSR plc (Electronic technology) | | 93,100 | | | 2,165 |
Homeserve plc (Extended service contracts) | | 59,500 | | | 1,704 |
Mears Group plc (Building maintenace and services) | | 216,250 | | | 1,085 |
Michael Page International (Personnel services) | | 397,400 | | | 2,573 |
Rotork plc (Control insturments) | | 91,100 | | | 1,154 |
Serco Group plc (Consulting services) | | 403,200 | | | 2,383 |
Ultra Electronic Holdings plc (Electronic products) | | 64,300 | | | 1,150 |
VT Group plc (Shipbuilding) | | 143,000 | | | 1,286 |
| | | | |
|
|
| | | | | | 15,114 |
| | | | |
|
|
| | |
Emerging Asia—11.3% | | | | | |
China—5.6% | | | | | |
*Ctrip.com International, Ltd.—ADR (E-commerce/services) | | 36,700 | | | 1,874 |
*Focus Media Holdings—ADR (Advertising sales) | | 28,100 | | | 1,831 |
Li Ning Co. Ltd. (Leisure equipment and products) | | 1,268,873 | | | 1,244 |
Ports Design Limited (Apparel and luxury goods) | | 355,000 | | | 572 |
*Suntech Power Holdings Co. Ltd—ADR (Alternative energy sources) | | 46,900 | | | 1,325 |
| | | | |
|
|
| | | | | | 6,846 |
| | | | |
|
|
India—2.3% | | | | | |
Bharat Forge Ltd. (Metal processors) | | 252,300 | | | 1,723 |
*Inox Leisure, Ltd. (Movie theaters) | | 226,400 | | | 621 |
Pantaloon Retail India, Ltd. (Department stores) | | 15,700 | | | 461 |
| | | | |
|
|
| | | | | | 2,805 |
| | | | |
|
|
Malaysia—0.4% | | | | | |
Transmile Group Bhd (Airport development and maintenance) | | 143,200 | | | 499 |
| | | | |
|
|
Taiwan—2.0% | | | | | |
Largan Precision Company, Ltd. (Photo equipment and supplies) | | 114,000 | | | 2,437 |
| | | | |
|
|
South Korea—1.0% | | | | | |
Hana Tour Service Inc. (Travel services) | | 16,400 | | | 1,237 |
| | | | |
|
|
See accompanying Notes to Financial Statements.
June 30, 2006 | William Blair Funds 21 |
International Small Cap Growth Fund
Portfolio of Investments, June 30, 2006 (all dollar amounts in thousands) (unaudited)
| | | | | |
Issuer
| | Shares
| | Value
|
|
Common Stocks—Emerging Latin America—5.9% |
Brazil—4.0% | | | | | |
Cyrela Brazil Realty S.A. (Real estate operations/development) | | 79,500 | | $ | 1,321 |
*Submarino S.A.(E-commerce) | | 96,100 | | | 1,930 |
*Totvs S.A. (Computer software) | | 109,700 | | | 1,633 |
| | | | |
|
|
| | | | | | 4,884 |
| | | | |
|
|
Chile—1.0% | | | | | |
Cencosud S.A.—ADR 144A (Retail stores) | | 32,900 | | | 1,207 |
| | | | |
|
|
Mexico—0.9% | | | | | |
*Urbi Desarrollos Urbanos S.A. (Household durables) | | 490,200 | | | 1,137 |
| | | | |
|
|
| | |
Asia—5.3% | | | | | |
Australia—3.0% | | | | | |
Seek Limited (Internet advertising) | | 512,300 | | | 2,037 |
Sigma Company, Ltd. (Medical distributors) | | 67,700 | | | 131 |
United Group, Ltd. (Building and construction) | | 27,600 | | | 296 |
WorleyParsons, Ltd. (Engineering) | | 80,800 | | | 1,208 |
| | | | |
|
|
| | | | | | 3,672 |
| | | | |
|
|
Singapore—2.3% | | | | | |
Goodpack Ltd. (Air freight and logistics) | | 884,000 | | | 912 |
Osim International Ltd. (Consumer sundries) | | 1,141,400 | | | 1,115 |
Raffles Education Corp. Ltd. (Schools) | | 558,000 | | | 857 |
| | | | |
|
|
| | | | | | 2,884 |
| | | | |
|
|
| | |
Emerging Europe, Mid-East, Africa—2.9% | | | | | |
Czech Republic—1.0% | | | | | |
*Central European Media Enterprises Ltd., Class “A” (Television)† | | 19,900 | | | 1,257 |
| | | | |
|
|
Russia—1.0% | | | | | |
*CTC Media, Inc. (Television)† | | 68,438 | | | 1,249 |
| | | | |
|
|
South Africa—0.9% | | | | | |
Aspen Pharmacare (Pharmaceuticals) | | 206,500 | | | 1,049 |
| | | | |
|
|
| | | | | | |
Issuer
| | Shares or
Principal
Amount
| | Value
|
| | |
Common Stocks—Canada—1.5% | | | | | | |
*Gildan Activewear, Inc. (Apparel and luxury goods) | | | 28,100 | | $ | 1,329 |
Ritchie Brothers Auctioneers, Inc. (Business services)† | | | 10,600 | | | 564 |
| | | | | |
|
|
| | | | | | | 1,893 |
| | | | | |
|
|
Total Common Stock—94.0%
(cost $109,778) | | | 115,397 |
| | | | | |
|
|
| | |
Investment in Affiliate | | | | | | |
William Blair Ready Reserves Fund | | | 221,938 | | | 222 |
| | | | | |
|
|
Total Investment in Affiliate—0.2%
(cost $222) | | | 222 |
| | | | | |
|
|
| | |
Short-Term Investments | | | | | | |
American Express Demand Note,
VRN 5.200% due 7/3/06 | | $ | 540,000 | | | 540 |
Prudential Funding Demand Note,
VRN 5.055% due 7/3/06 | | | 301,000 | | | 301 |
| | | | | |
|
|
Total Short-Term Investments—0.7%
(cost $841) | | | 841 |
| | | | | |
|
|
Total Investments—94.9%
(cost $110,841) | | | 116,460 |
Cash and other assets, less liabilities—5.1% | | | 6,245 |
| | | | | |
|
|
Net assets—100.0% | | $ | 122,705 |
| | | | | |
|
|
* Non-income producing securities
ADR = American Depository Receipt
GDR = Global Depository Receipt
VRN = Variable Rate Note
† = U.S. listed foreign security
For securities, primarily traded on exchanges or markets that close before the close of regular trading on the New York Stock Exchange the Fund uses an independent pricing service on a daily basis to fair value price the securities pursuant to Valuation Procedures adopted by the Board of Trustees.
See accompanying Notes to Financial Statements.
22 Semi-Annual Report | June 30, 2006 |
International Small Cap Growth Fund
Portfolio of Investments, June 30, 2006 (all dollar amounts in thousands) (unaudited)
At June 30, 2006 the Fund’s Portfolio of Investments includes the following industry categories:
| | |
Consumer Discretionary | | 38.8% |
Industrials and Services | | 24.8% |
Financials | | 16.6% |
Healthcare | | 11.3% |
Information Technology | | 4.8% |
Consumer Staples | | 2.6% |
Energy | | 1.1% |
| | |
|
| | | 100.0% |
| | |
|
At June 30, 2006 the Fund’s Portfolio of Investments includes the following currency categories:
| | |
Japanese Yen | | 25.5% |
Euro | | 23.3% |
British Pound Sterling | | 13.1% |
United States Dollar | | 8.1% |
Swedish Krona | | 6.9% |
Brazilian Real | | 4.2% |
Australian Dollar | | 3.2% |
Swiss Franc | | 2.5% |
Singapore Dollar | | 2.5% |
Indian Rupee | | 2.4% |
New Taiwan Dollar | | 2.1% |
Hong Kong Dollar | | 1.6% |
Canadian Dollar | | 1.2% |
South Korean Won | | 1.1% |
All other currencies | | 2.3% |
| | |
|
| | | 100.0% |
| | |
|
See accompanying Notes to Financial Statements.
June 30, 2006 | William Blair Funds 23 |
W. George Greig

Todd M. McClone
Jeffrey A. Urbina
EMERGING MARKETS GROWTH FUND
The Emerging Markets Growth Fund primarily invests in a diversified portfolio of equity securities issued by growth companies in emerging economies worldwide.
AN OVERVIEW FROM THE PORTFOLIO MANAGERS
How did the Fund perform over the first half of the year? How did the Fund’s performance compare to its benchmark?
The Emerging Markets Growth Fund posted a 6.13% increase (Institutional Class Shares) for the six months ended June 30, 2006. By comparison, the Fund’s benchmark, the Morgan Stanley Capital International (MSCI) Emerging Markets Index, gained 7.33%.
What were the most significant factors impacting international markets during the first six months of the year?
Following first quarter’s strong equity market, when international equities were up 9.76%, as reflected by the Morgan Stanley Capital International (MSCI) all Country World (ACWI) ex-US Index, markets retreated during the second quarter as concerns about potential global inflationary pressures, monetary policy tightening (and uncertainty as to the duration and size of further tightening moves and their impact on the US consumer in particular), and higher valuations in a number of the recent strong markets such as emerging markets and small cap came to the forefront of investor psychology. As a result, investors significantly reduced risk positions and emerging markets, which were up approximately 12% in the first quarter, fell sharply beginning in May through mid-June, while developed small cap stocks, up 10.8% during the first quarter, fell significantly as well. In addition, commodities and energy stocks, which were the strongest sectors globally through April, declined.
The correction in equity markets during May and most of June was broad based and non-discriminatory, although the stocks that were the prime beneficiaries of the strong global growth trends over the past several years did suffer more than their more defensive-oriented counterparts. In addition, the US remained the safe haven for investors as its equity and bond markets outperformed other regions of the world. The increased uncertainty surrounding monetary policy, inflationary pressures, rumored intervention by the Chinese government to slow investment and housing in certain parts of its market, record profits by corporations, significant outperformance of “riskier” assets, coupled with higher valuations and concerns about a slower growth environment, created the perfect storm for a liquidity driven market correction. However, within this environment, unit labor costs remained constrained as productivity enhancements offset higher wages, company fundamentals and earnings prospects remained strong, and managements continued to be focused on enhancing shareholder value. At the same time, emerging markets governments significantly improved monetary and fiscal policies and current account positions, and are now more immune to economic downdrafts such as those that occurred in 1997 and 1998.
Markets began to stabilize in mid June and rebounded sharply near the end of the quarter, however, as the severity and broadness of the equity market downdraft appeared overdone, and investors began to believe that central banks would in fact engineer a “soft landing” to a more sustainable growth environment. During the second quarter, the MSCI ACWI ex-US Index was up 0.21%, led by the UK, Australia and Hong Kong, while emerging markets fell 4.27% and developed small cap companies fell 3.41%, as measured by the MSCI World ex-US Small Cap Index. Within emerging markets, Emerging Markets Europe, Mid-East and Africa (EMEA) was the weakest performer, due to Turkey and South Africa and concerns about their current account deficits, while Emerging Asia was the strongest. As a result, over
24 Semi-Annual Report | June 30, 2006 |
the first six months of 2006, the MSCI ACWI ex-US Index returned 9.99%, led by Europe ex-UK and the UK, while Japan was the largest developed markets detractor. Emerging markets and developed small cap returned just over 7% each. From a global sector perspective, Materials, Energy and Utilities were the strongest sectors with double digit returns year to date, while Information Technology (IT) and Telecommunication Services trailed.
What factors were behind the Fund’s performance versus the benchmark?
Within this environment, the Fund returned 6.13% (Institutional Share Class), trailing the MSCI Emerging Markets Index year to date, due to underperformance during the second quarter, which more than offset first quarter 2006 outperformance. Lagging performance was due largely to the portfolio’s emphasis on a pro growth strategy, as evidenced by the portfolio’s higher weightings in Consumer Cyclicals at the expense of Materials, Energy and Utilities. In particular, the Fund underperformed during April due to its lack of Materials exposure and underweighted Energy holdings versus the Index, as commodities prices soared. The Fund’s pro growth sector positioning was also negative in the significant risk aversion environment during the remainder of the second quarter, favoring the more defensive sectors, as well as, the most defensive stocks within sectors. Mitigating this factor was the Fund’s higher weighting in Latin America at the expense of EMEA was also positive during the six month period, as Latin America was the strongest performing region and EMEA trailed. Moreover stock selection across most sectors was strong. In Energy, the Fund’s stock selection in EMEA was strong, while Materials benefited from Emerging Asia exposures. The Fund also benefited from higher weightings in and stock selection in Emerging Asia and Latin America.
What is your current strategy? How is the Fund positioned?
We have used the second quarter market activity to add to positions in strong companies with good fundamentals, which now have significantly more compelling valuations. As of quarter end, the portfolio maintained its higher Consumer and Industrials weightings at the expense of Materials, Telecom Services, Energy, and Utilities. From a regional perspective, the portfolio’s weighting in EMEA was reduced, on sales from South Africa in particular in favor of Emerging Asian companies, which now approximate the weighting of the Index. These weightings are largely based upon the team’s bottom up, fundamental research efforts, which are also supported by the team’s top down view.
What is your outlook for the international markets?
The key cyclical drivers of the world economy are generally seen to be US household spending growth and China’s industrial and infrastructure investment boom. Both of these trends have been expected to decelerate for some time, but, ironically, a great deal of the increase in economic anxiety that unfolded in the first half of 2006 relates to the fact that both of the expected slowdowns have so far largely failed to materialize.
For the US consumer, the areas of concern are the sharp slowdown in housing activity and the negative fallout of house price weakness, and the hit to discretionary spending power from higher energy costs and interest payments. Coupled with the persistent upward pressure on reported inflation and its uncertain impact on monetary policy, these unknowns are increasingly tipping the odds in favor of a significant (1 percentage point or more) reduction in growth expectations for next year.
In China, the government has targeted a growth slowdown in selected industrial sectors as well as speculative segments of the housing market. But economists have very little confidence in the degree to which the government’s intentions can be translated into actual changes in growth expectations. Similarly, there is no consensus about the effect of a potential export slowdown on the overall economy. Although there are obviously a great number of unknowns in both the numbers and the mechanisms of growth in China, aggregate
June 30, 2006 | William Blair Funds 25 |
GDP growth often seems only mildly affected by local and sector-specific cycles, and we would not anticipate more than a moderate downshift back to trend growth.
Japan and Europe, on the other hand, have been seeing steady improvement in growth indicators and economic news flow. Will this quickening expansion be sustained in the face of deceleration in the US and China, as well as some early-stage monetary tightening? Our view is that the cycles in Japan and Europe remain at a relatively early stage, and that growth may be sustained by continued strength in global capital spending, improving employment prospects, high savings balances, and pent-up demand in both the corporate and household sectors.
In the context of this reasonably balanced but still somewhat slower growth scenario, the key policy and market risk issue will be the degree of persistence of rising inflation and the potential broadening of price inflation into more core spending-related measures. This aspect of inflation makes itself known as a severely lagging indicator, and presents the US in particular with the policy problem of whether to prioritize visible growth trends or price trends in setting monetary conditions. This dilemma may well get worse before being resolved in favor of ending the tightening cycle.
In the first half of 2006, valuation and risk issues topped the equity market agenda—concerns about relative risk appetite and relative levels of real rates. To a degree, as growth and inflation issues come to the fore, the market’s principal concern will shift toward the outlook for sales and earnings growth.
Global corporate profitability is at or near record levels, spurred on by the strong secular forces of improved corporate performance and strong labor productivity growth. But while these forces remain in place, there are signs that cyclical pressures may push cost growth ahead of revenue growth—at least in some sectors—regardless of whether the global cycle is stronger or weaker than consensus expectations.
Our view is that changes in relative earnings growth and growth expectations will be an important factor governing market and sector leadership over the next several quarters. At the same time, it is likely that trends in profitability in place for the last year or two may be disrupted by shifts in global demand and relative pricing patterns.
We will be focusing particularly for signs of (negative) change in the commodity and industrial sectors, for changes in margins within the highly diverse financial sector, and for indications of the sustainability of profit growth on a regional basis, particularly with respect to the strong growth advantage enjoyed by emerging markets in the last several years.
In the near term, though, the market’s view of these prospective growth issues will be set by high frequency economic releases and especially by any visible trends that emerge from second and third (calendar) quarter earnings reports. Investment strategy, like economic policy, is at least cyclically becoming more and more ‘data-dependent’.
26 Semi-Annual Report | June 30, 2006 |
Emerging Markets Growth Fund
Performance Highlights (unaudited)
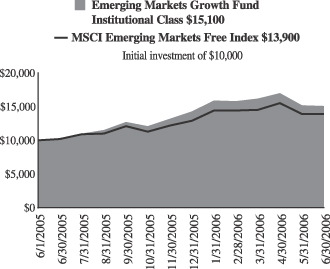
Average Annual Total Return at 6/30/2006
| | | | | | |
| | | 1
Year
| | | Since Inception(a)
| |
Emerging Markets Growth Fund Institutional Class | | 47.59 | % | | 47.34 | % |
MSCI Emerging Markets Index | | 35.91 | | | 35.68 | |
| | (a) | | For the period from June 6, 2005 (Commencement of Operations) to June 30, 2006. | |
Performance cited represents past performance. Past performance does not guarantee future results and current performance may be lower or higher than the data quoted. Results shown are average annual returns, which assume reinvestment of dividends and capital gains. Investment returns and principal will fluctuate and you may have a gain or loss when you sell shares. For the most current month-end performance information, please call 1-800-742-7272, or visit our Web site at www.williamblairfunds.com. From time to time, the investment adviser may waive fees or reimburse expenses for the Fund. Without these waivers, performance would be lower. International investing involves special risk considerations, including currency fluctuations, lower liquidity, economic and political risk.
The performance highlights and graph presented above do not reflect the deduction of taxes that a shareholder would pay on fund distributions or the redemption of fund shares.
The Morgan Stanley Capital International (MSCI) Emerging Markets Index is an index that is designated to measure equity performance in the global emerging markets.
This report identifies the Fund’s investments on June 30, 2006. These holdings are subject to change. Not all stocks in the Fund performed the same, nor is there any guarantee that these stocks will perform as well in the future. Market forecasts provided in this report may not necessarily come to pass.
Sector Diversification (unaudited)

The sector diversification shown is based on the total investment portfolio.
June 30, 2006 | William Blair Funds 27 |
Emerging Markets Growth Fund
Portfolio of Investments, June 30, 2006 (all dollar amounts in thousands) (unaudited)
| | | | | |
Issuer
| | Shares
| | Value
|
| |
Common Stocks—Emerging Asia—53.4% | | | |
China—16.6% | | | | | |
China Life Insurance Co. (Life/Health Insurance) | | 8,430,100 | | $ | 13,354 |
China Mengniu Dairy Co. Ltd. (Food products) | | 5,340,000 | | | 6,704 |
China Vanke Company Ltd. (Real estate operations/development) | | 4,816,625 | | | 4,088 |
*Ctrip.com International Ltd.—ADR
(E-commerce/services) | | 86,500 | | | 4,416 |
*Focus Media Holding Ltd.—ADR (Advertising sales) | | 66,800 | | | 4,353 |
*Foxconn International (Manufacturing services) | | 4,996,000 | | | 10,706 |
Fu Ji Food and Catering Services Holdings Ltd (Hotels, restaurants, and leisure) | | 1,243,000 | | | 2,054 |
Hopson Development Holdings Ltd. (Real estate operations/development) | | 930,000 | | | 1,926 |
Lee and Man Paper Manufacturing Ltd. (Paper and related products) | | 4,090,000 | | | 5,987 |
Li Ning Co. Ltd (Leisure equipment and products) | | 4,800,000 | | | 4,707 |
Parkson Retail Group Ltd. (Retail stores) | | 1,467,900 | | | 4,181 |
Ports Design Ltd. (Apparel and luxury goods) | | 1,367,000 | | | 2,204 |
*Suntech Power Holdings Co. Ltd—ADR (Alternate energy sources) | | 175,100 | | | 4,947 |
Wumart Stores, Inc., Class “H” (Retail stores) | | 2,005,000 | | | 6,918 |
| | | | |
|
|
| | | | | | 76,545 |
| | | | |
|
|
India—18.5% | | | | | |
Bharat Forge Ltd. (Metal processors) | | 1,245,300 | | | 8,506 |
Bharat Heavy Electricals, Ltd. (Power conversion equipment) | | 313,100 | | | 13,291 |
*Bharti Airtel Ltd. (Wireless telecommunication services) | | 1,359,200 | | | 10,943 |
Dabur India Ltd. (Cosmetics and toiletries) | | 729,000 | | | 2,257 |
HDFC Bank (Banking) | | 132,000 | | | 2,287 |
Hindustan Lever Ltd. (Soap and cleaning preparation) | | 120,900 | | | 601 |
Housing Development Finance Corp. (Financial services) | | 81,700 | | | 2,028 |
Infosys Technologies, Ltd. (Consulting and software services) | | 200,900 | | | 13,442 |
*Inox Leisure Ltd. (Movie theaters) | | 800,300 | | | 2,195 |
Maruti Udyog Ltd. (Automobiles) | | 411,400 | | | 7,126 |
Pantaloon Retail India Ltd. (Department stores) | | 61,300 | | | 1,801 |
*Shopper’s Stop Ltd. (Retail stores) | | 175,545 | | | 1,883 |
Suzlon Energy Ltd. (Power conversion equipment) | | 232,000 | | | 5,285 |
Vedanta Resources Plc (Mining) | | 542,400 | | | 13,756 |
| | | | |
|
|
| | | | | | 85,401 |
| | | | |
|
|
Indonesia—1.4% | | | | | |
PT Bank Rakyat Indonesia (Banking) | | 10,083,500 | | | 4,471 |
PT Kalbe Farma Tbk (Pharmaceuticals) | | 14,837,000 | | | 2,003 |
| | | | |
|
|
| | | | | | 6,474 |
| | | | |
|
|
| | | | | |
Issuer
| | Shares
| | Value
|
|
Common Stocks—Emerging Asia—53.4%—(continued) |
Malaysia—1.8% | | | | | |
Bumiputra Commerce Holding Bhd (Banking) | | 2,562,200 | | $ | 4,142 |
Transmile Group Bhd (Airport development and maintenance) | | 1,189,700 | | | 4,145 |
| | | | |
|
|
| | | | | | 8,287 |
| | | | |
|
|
South Korea—6.3% | | | | | |
Hana Tour Service (Travel service) | | 61,200 | | | 4,618 |
Kookmin Bank (Banking) | | 52,800 | | | 4,350 |
Korea Investment Holdings Co. Ltd. (Diversified financial services) | | 49,300 | | | 1,605 |
*NHN Corporation (Internet software and services) | | 13,500 | | | 4,682 |
Samsung Electronics Co. (Semiconductors) | | 7,100 | | | 4,506 |
Shinsegae Co. Ltd. (Discount retail) | | 18,300 | | | 9,162 |
| | | | |
|
|
| | | | | | 28,923 |
| | | | |
|
|
Taiwan—8.8% | | | | | |
High Tech Computer Corporation (Computers) | | 294,000 | | | 8,081 |
Hon Hai Precision Industry (Computers) | | 1,984,107 | | | 12,250 |
*Himax Technologies, Inc.—ADR (Semiconductors) | | 1,174,400 | | | 6,718 |
Largan Precision Co. Ltd. (Photo equipment and supplies) | | 439,000 | | | 9,384 |
Mediatek Inc. (Semiconductors and equipment) | | 466,400 | | | 4,317 |
| | | | |
|
|
| | | | | | 40,750 |
| | | | |
|
|
|
Emerging Europe, Mid-East, Africa—13.9% |
Czech Republic—1.1% | | | | | |
*Central European Media Enterprises Ltd., Class “A” (Television)+ | | 77,100 | | | 4,872 |
| | | | |
|
|
Israel—0.7% | | | | | |
Teva Pharmaceutical Industries, Ltd.—ADR (Pharmaceuticals) | | 108,000 | | | 3,412 |
| | | | |
|
|
Russia—4.3% | | | | | |
*CTC Media, Inc. (Television) | | 261,145 | | | 4,768 |
*Novatek OAO—GDR 144A (Oil, gas drilling, and exploration) | | 335,500 | | | 14,762 |
| | | | |
|
|
| | | | | | 19,530 |
| | | | |
|
|
South Africa—6.8% | | | | | |
Aspen Pharmacare Holdings Ltd. (Pharmaceuticals) | | 788,600 | | | 4,007 |
BHP Billiton Plc (Diversified minerals) | | 472,600 | | | 9,135 |
MTN Group Ltd. (Telecommunication services) | | 524,900 | | | 3,861 |
Naspers Ltd. (Media) | | 244,890 | | | 4,162 |
Sasol Ltd. (Oil company) | | 246,100 | | | 9,449 |
Truworths International Ltd. (Retail-apparel) | | 276,700 | | | 829 |
| | | | |
|
|
| | | | | | 31,443 |
| | | | |
|
|
Turkey—1.0% | | | | | |
*Bim Birlesik Magazalar A.S. (Retail stores) | | 161,600 | | | 4,723 |
| | | | |
|
|
See accompanying Notes to Financial Statements.
28 Semi-Annual Report | June 30, 2006 |
Emerging Markets Growth Fund
Portfolio of Investments, June 30, 2006 (all dollar amounts in thousands) (unaudited)
| | | | | |
Issuer
| | Shares
| | Value
|
|
Common Stocks—Emerging Latin America—24.1% |
Brazil—9.0% | | | | | |
Companhia de Concessoes Rodoviarias (Public thoroughfares) | | 252,700 | | $ | 2,042 |
Cyrela Brazil Realty S.A. (Real estate operations/development) | | 544,700 | | | 9,054 |
*Diagnosticos da America S.A. (Health care services) | | 102,300 | | | 1,969 |
Gol Linhas Aereas Int S.P—ADR (Air transport) | | 138,400 | | | 4,913 |
Localiza Rent a Car S.A. (Automobile rental) | | 401,600 | | | 7,602 |
Lojas Renner S.A. (Retail-apparel) | | 46,600 | | | 2,474 |
Natura Cosmeticos S.A. (Cosmetics) | | 430,400 | | | 4,402 |
*Submarino S.A. (Internet and catalog retail) | | 239,400 | | | 4,808 |
*Totvs S.A. (Computer software) | | 279,800 | | | 4,165 |
| | | | |
|
|
| | | | | | 41,429 |
| | | | |
|
|
Chile—4.9% | | | | | |
Cencosud S.A.—ADR 144A (Retail stores) | | 317,800 | | | 11,659 |
S.A.C.I. Falabella S.A. (Retail stores) | | 3,616,100 | | | 11,031 |
| | | | |
|
|
| | | | | | 22,690 |
| | | | |
|
|
Columbia—1.0% | | | | | |
Bancolombia S.A.—ADR (Banking) | | 189,200 | | | 4,559 |
| | | | |
|
|
Mexico—8.3% | | | | | |
America Movil S.A. (Communications) | | 5,862,800 | | | 9,796 |
*Corporacion Geo Sa De Cv (Real estate) | | 1,470,000 | | | 4,871 |
Grupo Aeropuertario Del ADR (Airport development and maintenance) | | 141,700 | | | 4,513 |
*Urbi Desarrollos Urbanos S.A. (Household durables) | | 1,903,300 | | | 4,414 |
Walmart de Mexico (Retail trade) | | 5,276,300 | | | 14,748 |
| | | | |
|
|
| | | | | | 38,342 |
| | | | |
|
|
Panama—0.9% | | | | | |
Copa Holdings S.A., Class “A” (Airlines)+ | | 178,800 | | | 4,050 |
| | | | |
|
|
Total Common Stock—91.4%
(cost $394,124) | | | 421,430 |
| | | | |
|
|
| | |
Preferred Stock | | | | | |
Brazil—5.3% | | | | | |
Banco Itau Holding (Banking) | | 323,300 | | | 9,382 |
Petroleo Brasileiro S.A. (Oil, gas drilling, and exploration) | | 764,700 | | | 15,199 |
| | | | |
|
|
Total Preferred Stock—5.3%
(cost $20,722) | | | 24,581 |
| | | | |
|
|
| | | | | | |
Issuer
| | Shares or
Principal
Amount
| | Value
|
| | |
Investment in Affiliate | | | | | | |
William Blair Ready Reserves Fund | | | 5,762,120 | | $ | 5,762 |
| | | | | |
|
|
Total Investment in Affiliate—1.3%
(cost $5,762) | | | 5,762 |
| | | | | |
|
|
| | |
Short-Term Investments | | | | | | |
American Express Demand Note, VRN 5.200% due 7/3/06 | | $ | 1,985,000 | | | 1,985 |
Prudential Funding Demand Note, VRN 5.055% due 7/3/06 | | | 732,000 | | | 732 |
| | | | | |
|
|
Total Short-Term Investments—0.6%
(cost $2,717) | | | 2,717 |
| | | | | |
|
|
Total Investments—98.6%
(cost $423,325) | | | 454,490 |
Cash and other assets, less liabilities—1.4% | | | 6,352 |
| | | | | |
|
|
Net assets—100.0% | | $ | 460,842 |
| | | | | |
|
|
* Non-income producing securities
ADR = American Depository Receipt
GDR = Global Depository Receipt
VRN = Variable Rate Note
† = U.S. listed foreign security
For securities, primarily traded on exchanges or markets that close before the close of regular trading on the New York Stock Exchange, the Fund uses an independent pricing service on a daily basis to fair value price the securities pursant to Valuation Procedures adopted by the Board of Trustees.
At June 30, 2006 the Fund’s Portfolio of Investments includes the following currency categories:
| | |
United States Dollar | | 17.5% |
Indian Rupee | | 16.1% |
Hong Kong Dollar | | 14.1% |
Brazilian Real | | 13.7% |
Taiwan Dollar | | 7.6% |
Mexico Nuevo Peso | | 7.6% |
South African Rand | | 7.0% |
South Korean Won | | 6.5% |
British Pound Sterling | | 3.1% |
Chilean Peso | | 2.5% |
Malaysian Ringgit | | 1.9% |
Indonesian Rupiah | | 1.4% |
Turkish Lira | | 1.0% |
| | |
|
| | | 100.0% |
| | |
|
At June 30, 2006 the Fund’s Portfolio of Investments includes the following industry categories:
| | |
Consumer Discretionary | | 24.4% |
Information Technology | | 15.4% |
Consumer Staples | | 13.7% |
Finance | | 11.7% |
Industrials | | 11.4% |
Energy | | 8.8% |
Materials | | 6.5% |
Telecommunication Services | | 5.5% |
Health Care | | 2.6% |
| | |
|
| | | 100.0% |
| | |
|
See accompanying Notes to Financial Statements.
June 30, 2006 | William Blair Funds 29 |
Statements of Assets and Liabilities
June 30, 2006 (all dollar amounts in thousands) (unaudited)
| | | | | | | | | | | | | | | |
| | | Institutional International Growth Fund
| | | Institutional International Equity Fund
| | International
Small Cap
Growth
Fund
| | | Emerging
Markets
Growth Fund
| |
Assets | | | | | | | | | | | | | | | |
Investments in securities, at cost | | $ | 1,293,338 | | | $ | 317,975 | | $ | 110,619 | | | $ | 417,563 | |
Investments in Affiliated Fund, at cost | | | 3,386 | | | | 1,371 | | | 222 | | | | 5,762 | |
| | |
|
|
| |
|
| |
|
|
| |
|
|
|
| | | | |
Investments in securities, at value | | $ | 1,666,695 | | | $ | 347,378 | | $ | 116,238 | | | $ | 448,728 | |
Investments in Affiliated Fund, at value | | | 3,386 | | | | 1,371 | | | 222 | | | | 5,762 | |
Cash | | | 172 | | | | 60 | | | 74 | | | | — | |
Foreign currency, at value (cost $—, $536, $1,086, and $2,662, respectively) | | | — | | | | 538 | | | 1,096 | | | | 2,684 | |
Receivable for fund shares sold | | | 381 | | | | 9,203 | | | 24,530 | | | | 4,428 | |
Receivable for investment securities sold | | | 13,530 | | | | 1,922 | | | 3,015 | | | | 6,612 | |
Dividend and interest receivable | | | 2,168 | | | | 398 | | | 132 | | | | 462 | |
| | |
|
|
| |
|
| |
|
|
| |
|
|
|
Total assets | | | 1,686,332 | | | | 360,870 | | | 145,307 | | | | 468,676 | |
Liabilities | | | | | | | | | | | | | | | |
Payable for investment securities purchased | | | 17,674 | | | | 4,170 | | | 22,386 | | | | 7,430 | |
Payable for fund shares redeemed | | | — | | | | 41 | | | 57 | | | | 23 | |
Management fee payable | | | 1,275 | | | | 235 | | | 117 | | | | 306 | |
Distribution and shareholder administration fee payable | | | — | | | | — | | | 7 | | | | 22 | |
Other accrued expenses | | | 148 | | | | 73 | | | 35 | | | | 53 | |
| | |
|
|
| |
|
| |
|
|
| |
|
|
|
Total liabilities | | | 19,097 | | | | 4,519 | | | 22,602 | | | | 7,834 | |
| | |
|
|
| |
|
| |
|
|
| |
|
|
|
Net Assets | | $ | 1,667,235 | | | $ | 356,351 | | $ | 122,705 | | | $ | 460,842 | |
| | |
|
|
| |
|
| |
|
|
| |
|
|
|
Capital | | | | | | | | | | | | | | | |
Composition of Net Assets | | | | | | | | | | | | | | | |
Par value of shares of beneficial interest | | $ | 87 | | | $ | 28 | | $ | 10 | | | $ | 31 | |
Capital paid in excess of par value | | | 1,141,757 | | | | 320,949 | | | 112,783 | | | | 435,616 | |
Accumulated net investment income (loss) | | | (5,258 | ) | | | 1,585 | | | (24 | ) | | | 519 | |
Accumulated realized gain (loss) | | | 157,262 | | | | 4,321 | | | 4,456 | | | | (6,489 | ) |
Net unrealized appreciation (depreciation) of investments and foreign currencies | | | 373,387 | | | | 29,468 | | | 5,480 | | | | 31,165 | |
| | |
|
|
| |
|
| |
|
|
| |
|
|
|
Net Assets | | $ | 1,667,235 | | | $ | 356,351 | | $ | 122,705 | | | $ | 460,842 | |
| | |
|
|
| |
|
| |
|
|
| |
|
|
|
| | | | |
Net Assets | | $ | 1,667,235 | | | $ | 356,351 | | $ | — | | | $ | — | |
Shares Outstanding | | | 86,841,746 | | | | 28,288,096 | | | — | | | | — | |
Net Asset Value Per Share | | $ | 19.20 | | | $ | 12.60 | | $ | — | | | $ | — | |
Institutional Share Class | | | | | | | | | | | | | | | |
Net Assets | | $ | — | | | $ | — | | $ | 83,424 | | | $ | 357,291 | |
Shares Outstanding | | | — | | | | — | | | 6,871,339 | | | | 23,715,858 | |
Net Asset Value Per Share | | $ | — | | | $ | — | | $ | 12.14 | | | $ | 15.07 | |
See accompanying Notes to Financial Statements.
30 Semi-Annual Report | June 30, 2006 |
Statements of Operations
For the Period Ended June 30, 2006 (all dollar amounts in thousands) (unaudited)
| | | | | | | | | | | | | | | | |
| | | Institutional
International
Growth
Fund
| | | Institutional
International
Equity Fund
| | | International
Small Cap
Growth
Fund
| | | Emerging
Markets
Growth
Fund
| |
Investment income | | | | | | | | | | | | | | | | |
Dividends | | $ | 19,100 | | | $ | 4,047 | | | $ | 502 | | | $ | 2,836 | |
Less foreign tax withheld | | | (1,818 | ) | | | (430 | ) | | | (50 | ) | | | (194 | ) |
Income from Affiliated Fund | | | 94 | | | | 17 | | | | 14 | | | | 44 | |
Interest | | | 609 | | | | 317 | | | | 92 | | | | 373 | |
| | |
|
|
| |
|
|
| |
|
|
| |
|
|
|
Total income | | | 17,985 | | | | 3,951 | | | | 558 | | | | 3,059 | |
Expenses | | | | | | | | | | | | | | | | |
Investment advisory fees | | | 8,032 | | | | 1,628 | | | | 361 | | | | 1,859 | |
Distribution fees | | | — | | | | — | | | | 11 | | | | 44 | |
Shareholder administration fees | | | — | | | | — | | | | 20 | | | | 67 | |
Custodian fees | | | 556 | | | | 158 | | | | 77 | | | | 290 | |
Transfer agent fees | | | 22 | | | | 5 | | | | 8 | | | | 29 | |
Professional fees | | | 39 | | | | 21 | | | | 17 | | | | 19 | |
Registration fees | | | 16 | | | | 28 | | | | 23 | | | | 42 | |
Other expenses | | | 29 | | | | 5 | | | | 4 | | | | 6 | |
| | |
|
|
| |
|
|
| |
|
|
| |
|
|
|
Total expenses before waiver | | | 8,694 | | | | 1,845 | | | | 521 | | | | 2,356 | |
Less expenses waived or absorbed by the Advisor | | | — | | | | (60 | ) | | | (38 | ) | | | (138 | ) |
| | |
|
|
| |
|
|
| |
|
|
| |
|
|
|
Net expenses | | | 8,694 | | | | 1,785 | | | | 483 | | | | 2,218 | |
| | |
|
|
| |
|
|
| |
|
|
| |
|
|
|
Net investment income (loss) | | | 9,291 | | | | 2,166 | | | | 75 | | | | 841 | |
Net realized and unrealized gain (loss) on investments, foreign currency transactions and other assets and liabilities | | | | | | | | | | | | | | | | |
Net realized gain (loss) on investments | | | 148,659 | | | | 6,224 | | | | 4,125 | | | | (5,347 | ) |
Net realized gain (loss) on foreign currency transactions and other assets and liabilities | | | (3,074 | ) | | | (725 | ) | | | (111 | ) | | | (1,899 | ) |
| | |
|
|
| |
|
|
| |
|
|
| |
|
|
|
Total net realized gain (loss) | | | 145,585 | | | | 5,499 | | | | 4,014 | | | | (7,246 | ) |
Change in net unrealized appreciation (depreciation) on investments, foreign currency transactions and other assets and liabilities | | | (58,032 | ) | | | 3,440 | | | | 1,201 | | | | 1,479 | |
| | |
|
|
| |
|
|
| |
|
|
| |
|
|
|
Net increase (decrease) in net assets resulting from operations | | $ | 96,844 | | | $ | 11,105 | | | $ | 5,290 | | | $ | (4,926 | ) |
| | |
|
|
| |
|
|
| |
|
|
| |
|
|
|
See accompanying Notes to Financial Statements.
June 30, 2006 | William Blair Funds 31 |
Statements of Changes in Net Assets
For the Periods Ended June 30, 2006 and December 31, 2005 (all amounts in thousands)
| | | | | | | | | | | | | | | | | | | | | | | | | | | | | | | | |
| | | Institutional
International
Growth
Fund
| | | Institutional
International
Equity
Fund
| | | International
Small Cap
Growth
Fund
| | | Emerging
Markets
Growth
Fund
| |
| | | 2006
| | | 2005
| | | 2006
| | | 2005
| | | 2006
| | | 2005(a)
| | | 2006
| | | 2005(b)
| |
| | | (unaudited) | | | | | | (unaudited) | | | | | | (unaudited) | | | | | | (unaudited) | | | | |
Operations | | | | | | | | | | | | | | | | | | | | | | | | | | | | | | | | |
Net investment income (loss) | | $ | 9,291 | | | $ | 6,765 | | | $ | 2,166 | | | $ | 257 | | | $ | 75 | | | $ | (6 | ) | | $ | 841 | | | $ | 69 | |
Net realized gain (loss) on investments, foreign currency transactions and other assets and liabilities | | | 145,585 | | | | 110,297 | | | | 5,499 | | | | (1,426 | ) | | | 4,014 | | | | 355 | | | | (7,246 | ) | | | 1,535 | |
Change in net unrealized appreciation (depreciation) on investments, foreign currency transactions and other assets and liabilities | | | (58,032 | ) | | | 167,187 | | | | 3,440 | | | | 25,499 | | | | 1,201 | | | | 4,279 | | | | 1,479 | | | | 29,686 | |
| | |
|
|
| |
|
|
| |
|
|
| |
|
|
| |
|
|
| |
|
|
| |
|
|
| |
|
|
|
Net increase (decrease) in net assets resulting from operations | | | 96,844 | | | | 284,249 | | | | 11,105 | | | | 24,330 | | | | 5,290 | | | | 4,628 | | | | (4,926 | ) | | | 31,290 | |
Distributions to shareholders from | | | | | | | | | | | | | | | | | | | | | | | | | | | | | | | | |
Net investment income | | | — | | | | (11,444 | ) | | | — | | | | (442 | ) | | | — | | | | (6 | ) | | | — | | | | — | |
Net realized gain | | | — | | | | (112,356 | ) | | | — | | | | (3 | ) | | | — | | | | — | | | | — | | | | (1,169 | ) |
| | |
|
|
| |
|
|
| |
|
|
| |
|
|
| |
|
|
| |
|
|
| |
|
|
| |
|
|
|
| | | | — | | | | (123,800 | ) | | | — | | | | (445 | ) | | | — | | | | (6 | ) | | | — | | | | (1,169 | ) |
Capital stock transactions | | | | | | | | | | | | | | | | | | | | | | | | | | | | | | | | |
Net proceeds from sale of shares | | | 93,619 | | | | 114,081 | | | | 98,322 | | | | 201,804 | | | | 68,746 | | | | 46,006 | | | | 245,273 | | | | 224,893 | |
Shares issued in reinvestment of income dividends and capital gain distributions | | | — | | | | 120,609 | | | | — | | | | 383 | | | | — | | | | 6 | | | | — | | | | 1,122 | |
Less cost of shares redeemed | | | (78,642 | ) | | | (63,161 | ) | | | (4,005 | ) | | | (2,527 | ) | | | (1,865 | ) | | | (100 | ) | | | (28,853 | ) | | | (6,788 | ) |
| | |
|
|
| |
|
|
| |
|
|
| |
|
|
| |
|
|
| |
|
|
| |
|
|
| |
|
|
|
Net increase (decrease) in net assets resulting from capital stock transactions | | | 14,977 | | | | 171,529 | | | | 94,317 | | | | 199,660 | | | | 66,881 | | | | 45,912 | | | | 216,420 | | | | 219,227 | |
| | |
|
|
| |
|
|
| |
|
|
| |
|
|
| |
|
|
| |
|
|
| |
|
|
| |
|
|
|
Increase (decrease) in net assets | | | 111,821 | | | | 331,978 | | | | 105,422 | | | | 223,545 | | | | 72,171 | | | | 50,534 | | | | 211,494 | | | | 249,348 | |
Net assets | | | | | | | | | | | | | | | | | | | | | | | | | | | | | | | | |
Beginning of period | | $ | 1,555,414 | | | $ | 1,223,436 | | | $ | 250,929 | | | $ | 27,384 | | | $ | 50,534 | | | $ | — | | | $ | 249,348 | | | $ | — | |
| | |
|
|
| |
|
|
| |
|
|
| |
|
|
| |
|
|
| |
|
|
| |
|
|
| |
|
|
|
End of period | | $ | 1,667,235 | | | $ | 1,555,414 | | | $ | 356,351 | | | $ | 250,929 | | | $ | 122,705 | | | $ | 50,534 | | | $ | 460,842 | | | $ | 249,348 | |
| | |
|
|
| |
|
|
| |
|
|
| |
|
|
| |
|
|
| |
|
|
| |
|
|
| |
|
|
|
Undistributed net investment income (loss) at the end of the period | | $ | (5,258 | ) | | $ | (14,549 | ) | | $ | 1,585 | | | $ | (581 | ) | | $ | (24 | ) | | $ | (99 | ) | | $ | 519 | | | $ | (322 | ) |
| | |
|
|
| |
|
|
| |
|
|
| |
|
|
| |
|
|
| |
|
|
| |
|
|
| |
|
|
|
Capital stock transactions in dollars | | | | | | | | | | | | | | | | | | | | | | | | | | | | | | | | |
Institutional Share Class (only) | | | | | | | | | | | | | | | | | | | | | | | | | | | | | | | | |
Sales | | | | | | | | | | | | | | | | | | $ | 43,851 | | | $ | 31,900 | | | $ | 189,116 | | | $ | 172,789 | |
Reinvested distributions | | | | | | | | | | | | | | | | | | | — | | | | 6 | | | | — | | | | 858 | |
Redemptions | | | | | | | | | | | | | | | | | | | — | | | | — | | | | 14,483 | | | | 5,159 | |
| | | | | | | | | | | | | | | | | | |
|
|
| |
|
|
| |
|
|
| |
|
|
|
Net change in net assets relating to fund share activity | | | | | | | | | | | | | | | | | | $ | 43,851 | | | $ | 31,906 | | | $ | 174,633 | | | $ | 168,488 | |
| | | | | | | | | | | | | | | | | | |
|
|
| |
|
|
| |
|
|
| |
|
|
|
Capital stock transactions in shares | | | | | | | | | | | | | | | | | | | | | | | | | | | | | | | | |
Shares sold | | | 4,923 | | | | 6,656 | | | | 7,765 | | | | 18,357 | | | | 3,721 | | | | 3,150 | | | | 11,297 | | | | 13,777 | |
Shares issued in reinvestment of income dividends or capital gain distributions | | | — | | | | 6,798 | | | | — | | | | 32 | | | | — | | | | — | | | | — | | | | 62 | |
Less shares redeemed | | | (3,950 | ) | | | (3,750 | ) | | | (310 | ) | | | (240 | ) | | | — | | | | — | | | | (920 | ) | | | (500 | ) |
| | |
|
|
| |
|
|
| |
|
|
| |
|
|
| |
|
|
| |
|
|
| |
|
|
| |
|
|
|
Net change in shares outstanding | | | 973 | | | | 9,704 | | | | 7,455 | | | | 18,149 | | | | 3,721 | | | | 3,150 | | | | 10,377 | | | | 13,339 | |
| | |
|
|
| |
|
|
| |
|
|
| |
|
|
| |
|
|
| |
|
|
| |
|
|
| |
|
|
|
| (a) | | For the period from November 1, 2005 (Commencement of Operations) to December 31, 2005. |
| (b) | | For the period from June 6, 2005 (Commencement of Operations) to December 31, 2005. |
See accompanying Notes to Financial Statements.
32 Semi-Annual Report | June 30, 2006 |
Notes to Financial Statements
(1) Significant Accounting Policies
The following is a summary of the Funds’ significant accounting policies in effect during the period covered by the financial statements, which are in accordance with U.S. generally accepted accounting principles.
(a) Description of the Fund
William Blair Funds (the “Fund”) is a diversified mutual fund registered under the Investment Company Act of 1940, as amended, as an open-end management investment company. The number of shares authorized for this Fund is unlimited. The Fund currently consists of the following fifteen portfolios (the “Portfolios”), each with its own investment objectives and policies.
| | |
Equity Portfolios
| | International Portfolios
|
Growth | | International Growth |
Tax-Managed Growth | | International Equity |
Large Cap Growth | | Institutional International Growth |
Small Cap Growth | | Institutional International Equity |
Mid Cap Growth | | International Small Cap Growth |
Small-Mid Cap Growth | | Emerging Markets Growth |
Value Discovery | | Fixed Income Portfolio
|
| | | Income |
| | | Money Market Portfolio
|
| | | Ready Reserves |
The investment objectives of the Portfolios are as follows:
| | |
Equity | | Long-term capital appreciation. |
International | | Long-term capital appreciation. |
Fixed Income | | High level of current income with relative stability of principal. |
Money Market | | Current income, a stable share price and daily liquidity. |
The Institutional International Growth Fund, the Institutional International Equity Fund and the Institutional Share Class of the International Small Cap Growth Fund and the Emerging Markets Growth Fund are the only Portfolios covered in this report.
(b) Share Classes
Three different classes of shares of the International Small Cap Growth Fund and Emerging Markets Growth Fund currently exist: N, I and Institutional. This report includes financial information for only the Institutional Class. The Institutional share class is sold to institutional investors, including but not limited to employee benefit plans, endowments, foundations, trusts and corporations, who are able to meet the Fund’s high minimum investment requirement. The minimum initial investment required is $5 million.
(c) Investment Valuation
The market value of domestic equity securities and options is determined by valuing securities traded on national securities exchanges or markets or in the over-the-counter markets at the last sales price or, if applicable, the official closing price or, in the absence of a sale on the date of valuation, at the latest bid price.
For international securities, if the foreign exchange or market on which a security is primarily traded closes before the close of regular trading on the New York Stock Exchange (4:00 p.m. Eastern time), the Funds use an independent pricing service on a daily basis to estimate the fair value price as of the close of regular trading on the New York Stock Exchange. The Board of Trustees has determined that the passage of time between when foreign exchanges or markets close and when the Funds calculate their net asset values could cause the value of international securities to no longer be representative of their
June 30, 2006 | William Blair Funds 33 |
market price or accurate. In addition, quarterly the Board of Trustees receives a report which tracks the fair value prices used to calculate the net asset value to the next day’s opening local prices. Otherwise, the value of foreign equity securities is determined based on the last sale price on the foreign exchange or market on which it is primarily traded or, if there have been no sales during that day, at the latest bid price. Foreign currency forward contracts and foreign currencies are valued at the forward and current exchange rates, respectively, prevailing on the date of valuation.
Investments in other funds are valued at the underlying fund’s net asset value on the date of valuation. Other securities, and all other assets, including securities for which a market price is not available, or the value of which is affected by a significant valuation event, are valued at fair value as determined in good faith by, or under the direction of the Board of Trustees and in accordance with the Fund’s valuation procedures. As of June 30, 2006, there were securities held in the Institutional International Growth, Institutional International Equity, International Small Cap Growth and Emerging Markets Growth Portfolios requiring fair valuation by the Board of Trustees pursuant to the Fund’s valuation procedures.
(d) Investment income and transactions
Dividend income is recorded on the ex-dividend date, except for those dividends from certain foreign securities which are recorded as soon as the information is available. Foreign currency gains and losses associated with fluctuation in the foreign currency rate versus the United States dollar are recorded on the Statement of Operations as a component of net realized gains/(losses) on foreign currency transactions and other assets and liabilities.
Premiums and discounts are accreted and amortized on a straight-line basis for short-term investments and on an effective interest method for long-term investments.
Interest income is determined on the basis of the interest accrued, adjusted for amortization of premium or discount. Variable rate bonds and floating rate notes earn interest at coupon rates that fluctuate at specific time intervals.
Security and shareholder transactions are accounted for no later than one business day following the trade date. However, for financial reporting purposes, security and shareholder transactions are accounted for on the trade date of the last business day of the reporting period. Realized gains and losses from securities transactions are recognized on the basis of high cost lot sell selection.
Awards from class action litigation may be recorded as a reduction of cost. If the Funds no longer own the applicable securities, the proceeds are recorded as realized gains.
(e) Share Valuation and Dividends to Shareholders
Shares are sold and redeemed on a continuous basis at net asset value. The net asset value per share is determined by dividing the Portfolio’s net assets by the number of shares outstanding as of the close of regular trading on the New York Stock Exchange, which is generally 3:00 p.m. Central time (4:00 p.m. Eastern time), on each day the Exchange is open.
Dividends from net investment income, if any, are declared at least annually. Capital gain distributions, if any, are declared at least annually in December. Dividends payable to shareholders are recorded on the ex-dividend date.
(f) Foreign Currency Translation and Foreign Currency Forward Contracts
The Portfolios may invest in securities denominated in foreign currencies. As such, assets and liabilities denominated in foreign currencies are translated into U.S. dollar amounts at the current exchange rate on the date of valuation. The values of foreign investments, open foreign currency forward contracts, and cash denominated in foreign currencies are translated into U.S. dollars using a spot market rate of exchange as of the time of the determination of each Fund’s NAV typically 4:00 p.m. Eastern time on days when there is regular trading on the New York Stock Exchange. Payables and receivables for securities transactions, dividends, interest income and tax reclaims are translated into U.S. dollars using a spot market rate of exchange as of 4:00 p.m. Eastern time. Settlement of purchases and sales and dividend and interest receipts are translated into U.S. dollars using a spot market rate of exchange as of 11:00 a.m. Eastern time.
These Portfolios may enter into foreign currency forward contracts (1) as a means of managing the risks associated with changes in the exchange rates for the purchase or sale of a specific amount of a particular foreign currency, and (2) to hedge the value, in U.S. dollars, of portfolio securities. Gains and losses from foreign currency transactions associated with purchases and sales of investments and foreign currency forward contracts are included with the net realized and unrealized gain or loss on investments. For tax purposes, the foreign currency gains and losses are treated as ordinary income.
34 Semi-Annual Report | June 30, 2006 |
(g) Income Taxes
The Portfolios intend to comply with the special provisions of Subchapter M of the Internal Revenue Code available to regulated investment companies and, therefore, no provision for Federal income taxes has been made in the accompanying financial statements since each Portfolio intends to distribute substantially all of its taxable income to its shareholders and be relieved of all Federal income taxes.
On July 13, 2006, the Financial Accounting Standards Board (FASB) released FASB Interpretation No. 48 “Accounting for Uncertainty in Income Taxes” (FIN 48). FIN 48 provides guidance for how uncertain tax positions should be recognized, measured, presented and disclosed in the financial statements. FIN 48 requires the evaluation of tax positions taken or expected to be taken in the course of preparing the Fund’s tax returns to determine whether the tax positions are “more-likely-than-not” of being sustained by the applicable tax authority. Tax positions not deemed to meet the more-likely-than-not threshold would be recorded as a tax benefit or expense in the current year. Adoption of FIN 48 is required for fiscal years beginning after December 15, 2006 and is to be applied to all open tax years as of the effective date. At this time, management is evaluating the implications of FIN 48 and its impact in the financial statements has not yet been determined.
The Portfolios have elected to mark-to-market their investments in Passive Foreign Investment Companies (“PFICs”) for Federal income tax purposes. In accordance with this election, the Institutional International Growth, Institutional International Equity, International Small Cap Growth and Emerging Markets Growth Portfolios recognized net unrealized appreciation (depreciation) of $19,062, $2,034, $117 and $726, respectively (in thousands) in 2005, all of which has been treated as an adjustment to the cost of investments for tax purposes. The Portfolios also treat the deferred loss associated with current and prior year wash sales as an adjustment to the cost of investments for tax purposes. The cost of investments for Federal income tax purposes and related gross unrealized appreciation/(depreciation) and net unrealized appreciation/(depreciation) at June 30, 2006 were as follows (in thousands):
| | | | | | | | | | | | |
Portfolio
| | Cost of
Investments
| | Gross Unrealized Appreciation
| | Gross Unrealized Depreciation
| | Net Unrealized
Appreciation / (Depreciation)
|
Institutional International Growth | | $ | 1,321,060 | | $ | 376,926 | | $ | 27,875 | | $ | 349,051 |
Institutional International Equity | | | 321,936 | | | 32,336 | | | 5,458 | | | 26,878 |
International Small Cap Growth | | | 111,107 | | | 7,731 | | | 2,517 | | | 5,214 |
Emerging Markets Growth | | | 428,175 | | | 41,653 | | | 15,338 | | | 26,315 |
The timing and characterization of certain income and capital gain distributions are determined annually in accordance with Federal income tax regulations that may differ from U.S. generally accepted accounting principles. As a result, net investment income or loss and net realized gain or loss for a reporting period may differ from the amount distributed during such period. In addition, the Portfolios may periodically record reclassifications among certain capital accounts to reflect differences between financial reporting and income tax basis distributions. The reclassifications were reported in order to reflect the tax treatment for certain permanent differences that exist between income tax regulations and U.S. generally accepted accounting principles. The reclassifications relate to section 988 currency gains and losses, and recharacterization of unrealized appreciation on PFICs (Passive Foreign Investment Corporations). These reclassifications have no impact on the net asset values of the Portfolio. Accordingly, at December 31, 2005, the following reclassifications were recorded (in thousands):
| | | | | | | | | | |
Portfolio
| | Undistributed Net
Investment Income/(Loss)
| | | Accumulated
Undistributed
Net Realized Gain/ (Loss)
| | Capital
Paid In Excess
of Par Value
|
Institutional International Growth | | $ | (4,386 | ) | | $ | 4,386 | | $ | — |
Institutional International Equity | | | (271 | ) | | | 271 | | | — |
International Small Cap Growth | | | (87 | ) | | | 87 | | | — |
Emerging Markets Growth | | | (391 | ) | | | 391 | | | — |
June 30, 2006 | William Blair Funds 35 |
Distributions from net realized gains for book purposes may include short-term capital gains, which are included as ordinary income for tax purposes. The tax character of distributions paid during 2005 and 2004 was as follows (in thousands):
| | | | | | | | | | | | |
| | | Distributions Paid In 2005
| | Distributions Paid In 2004
|
Portfolio
| | Ordinary
Income
| | Long-Term
Capital Gains
| | Ordinary
Income
| | Long-Term
Capital Gains
|
Institutional International Growth | | $ | 14,610 | | $ | 109,190 | | $ | 605 | | $ | — |
Institutional International Equity | | | 445 | | | — | | | — | | | — |
International Small Cap Growth | | | 6 | | | — | | | — | | | — |
Emerging Markets Growth | | | 1,169 | | | — | | | — | | | — |
As of December 31, 2005, the components of distributable earnings on a tax basis were as follows (in thousands):
| | | | | | | | | | | | |
Portfolio
| | Undistributed
Ordinary
Income
| | Accumulated
Capital and
Other Losses
| | Undistributed
Long-Term
Gain
| | Net Unrealized
Appreciation / (Depreciation)
|
Institutional International Growth | | $ | 12,597 | | $ | — | | $ | 9,285 | | $ | 406,665 |
Institutional International Equity | | | 1,453 | | | 493 | | | — | | | 23,309 |
International Small Cap Growth | | | 511 | | | — | | | — | | | 4,111 |
Emerging Markets Growth | | | 404 | | | — | | | 1,158 | | | 28,559 |
At December 31, 2005, the Portfolios, with the exception of Institutional International Equity, have no unused capital loss carryforwards available for Federal income tax purposes to be applied against future capital gains, if any. Institutional International Equity Portfolio has an unused capital loss carryforward of $383 (in thousands) that will not expire until 2013.
For the period November 1, 2005 through December 31, 2005, the Institutional International Equity Portfolio incurred net realized capital or foreign currency losses. The Portfolio intends to treat this loss as having occurred in fiscal year 2006 for Federal income tax purposes (in thousands):
| | | |
Portfolio
| | Capital
Loss
|
Institutional International Growth | | $ | — |
Institutional International Equity | | | 110 |
International Small Cap Growth | | | — |
Emerging Markets Growth | | | — |
(h) Use of Estimates
The preparation of financial statements in conformity with U.S. generally accepted accounting principles requires management to make estimates and assumptions that affect the amounts reported in the financial statements. Actual results may differ from those estimates.
(2) Transactions with Affiliates
(a) Management and Expense Limitation Agreements
The Institutional International Growth and Institutional International Equity Portfolios have a management agreement with William Blair & Company L.L.C. (the “Company”) for investment advisory, administrative, and other accounting services. The Portfolios pay the Company an annual fee, payable monthly, based on a specified percentage of its average daily net assets. A summary of the annual rates expressed as a percentage of average daily net assets is as follows:
| | | |
First $500 million | | 1.00 | % |
Next $500 million | | 0.95 | % |
In excess of $1 billion | | 0.90 | % |
The Emerging Markets Growth Portfolio pays the Company a 1.10% annual fee payable monthly, based on its average daily net assets. The International Small Cap Growth Portfolio pays the Company a 1.00% annual fee payable monthly, based on its average daily net assets.
Some of the Portfolios have also entered into Expense Limitation Agreements with the Company. Under the terms of these Agreements, the Company has agreed to waive its advisory fees and absorb other operating expenses through April 30, 2007, if total expenses of the Institutional International Equity Portfolios exceed 1.10% of average daily net assets or 1.25% of average daily net assets for the Institutional Share Class of the International Small Cap Growth and Emerging Markets Growth Portfolios.
36 Semi-Annual Report | June 30, 2006 |
For a period of three years subsequent to the Commencement of Operations of the Fund, the Company is entitled to reimbursement from the Institutional International Growth, Institutional International Equity, International Small Cap Growth and Emerging Markets Growth Portfolios for previously waived fees and expenses to the extent the overall expense ratio remains below the percentages indicated. The total amount available for recapture at June 30, 2006 is $289, $92 and $299 (in thousands) for Institutional International Equity, International Small Cap Growth and Emerging Markets Growth Portfolios, respectively. As a result, the total expense ratio for a Portfolio during the period the agreement is in effect, will not fall below the percentage indicated.
For the period ended June 30, 2006, the investment advisory fees incurred by the Portfolio and related fee waivers were as follows (in thousands) :
| | | | | | | | | | | | |
Portfolio
| | Gross
Advisory Fee
| | Fee Waiver
| | Net
Advisory Fee
| | Expenses
(Recovered) or
Absorbed by
Advisor
|
Institutional International Growth | | $ | 8,032 | | $ | — | | $ | 8,032 | | $ | — |
Institutional International Equity | | | 1,628 | | | 60 | | | 1,568 | | | — |
International Small Cap Growth | | | 361 | | | 38 | | | 323 | | | — |
Emerging Markets Growth | | | 1,859 | | | 138 | | | 1,721 | | | — |
(b) Trustees Fees
The Portfolio incurred fees of $38 (in thousands) to non-interested trustees of the Fund for the period ended June 30, 2006. Interested trustees are not compensated.
(c) Investments in Affiliated Portfolio
Pursuant to an Exemptive Order granted by the Securities and Exchange Commission in January, 2001, each of the Portfolios of the Fund may invest in the William Blair Ready Reserves Portfolio (“Ready Reserves”), an open-end money market portfolio managed by the Advisor. Ready Reserves Portfolio is used as a cash management option to the other Portfolios in the Fund. The Advisor waives management fees and shareholder service fees earned from the other Portfolios investment in the Ready Reserves Fund. The fees waived with respect to the Portfolio for the period ended June 30, 2006 are listed below. Distributions received from Ready Reserves are reflected as dividend income from affiliated Fund in the Portfolio’s statement of operations. Amounts relating to the Portfolio’s investments in Ready Reserves were as follows for the period ended June 30, 2006 (in thousands):
| | | | | | | | | | | | | | | | | | |
Portfolio
| | Purchases
| | Sales
Proceeds
| | Fees
Waived
| | Dividend
Income
| | Value
| | Percent
of Net
Assets
| |
Institutional International Growth | | $ | 15,715 | | $ | 13,408 | | $ | 13 | | $ | 94 | | $ | 3,386 | | 0.2 | % |
Institutional International Equity | | | 2,102 | | | 824 | | | 2 | | | 17 | | | 1,371 | | 0.4 | |
International Small Cap Growth | | | 2,467 | | | 2,655 | | | 2 | | | 14 | | | 222 | | 0.2 | |
Emerging Markets Growth | | | 6,458 | | | 4,517 | | | 6 | | | 44 | | | 5,762 | | 1.3 | |
(3) Investment Transactions
Investment transactions, excluding money market instruments, for the period ended June 30, 2006 were as follows (in thousands):
| | | | | | |
Portfolio
| | Purchases
| | Sales
|
Institutional International Growth | | $ | 624,796 | | $ | 606,164 |
Institutional International Equity | | | 226,521 | | | 145,617 |
International Small Cap Growth | | | 107,921 | | | 45,697 |
Emerging Markets Growth | | | 450,224 | | | 232,037 |
(4) Foreign Currency Forward Contracts
To protect itself against a decline in the value of foreign currency against the U.S. dollar, each Portfolio enters into foreign currency forward contracts with its custodian and others. The Portfolio bears the market risk that arises from changes in foreign currency rates and bears the credit risk if the counterparty fails to perform under the contract. The net realized and unrealized gains and losses associated with foreign currency forward contracts are reflected in the accompanying financial statements. There were no open foreign forward contracts at June 30, 2006.
June 30, 2006 | William Blair Funds 37 |
Financial Highlights
Institutional International Growth Fund
| | | | | | | | | | | | | | | | | |
| | |
| |
| | | Period Ended
| | | Years Ended December 31,
| |
| | | 6/30/2006
| | | 2005
| | 2004
| | 2003
| | 2002(a)
| |
| | | (unaudited) | | | | | | | | | | |
Net asset value, beginning of year | | $ | 18.11 | | | $ | 16.06 | | $ | 13.60 | | $ | 9.567 | | $ | 10.000 | |
Income from investment operations: | | | | | | | | | | | | | | | | | |
Net investment income (b) | | | 0.11 | | | | 0.09 | | | 0.03 | | | 0.073 | | | — | |
Net realized and unrealized gain (loss) on investments | | | 0.98 | | | | 3.53 | | | 2.44 | | | 3.993 | | | (0.430 | ) |
| | |
|
|
| |
|
| |
|
| |
|
| |
|
|
|
Total from investment operations | | | 1.09 | | | | 3.62 | | | 2.47 | | | 4.066 | | | (0.430 | ) |
Less distributions from: | | | | | | | | | | | | | | | | | |
Net investment income | | | — | | | | 0.15 | | | 0.01 | | | 0.033 | | | 0.003 | |
Net realized gain | | | — | | | | 1.42 | | | — | | | — | | | — | |
| | |
|
|
| |
|
| |
|
| |
|
| |
|
|
|
Total distributions | | | — | | | | 1.57 | | | 0.01 | | | 0.033 | | | 0.003 | |
| | |
|
|
| |
|
| |
|
| |
|
| |
|
|
|
Net asset value, end of period | | $ | 19.20 | | | $ | 18.11 | | $ | 16.06 | | $ | 13.600 | | $ | 9.567 | |
| | |
|
|
| |
|
| |
|
| |
|
| |
|
|
|
Total return (%) | | | 6.02 | | | | 22.76 | | | 18.15 | | | 42.47 | | | (4.27 | ) |
Ratios to average daily net assets (%): | | | | | | | | | | | | | | | | | |
Expenses, net of waivers and reimbursements | | | 1.03 | (c) | | | 1.05 | | | 1.10 | | | 1.10 | | | 1.10 | (c) |
Expenses, before waivers and reimbursements | | | 1.03 | (c) | | | 1.05 | | | 1.11 | | | 1.16 | | | 1.29 | (c) |
Net investment income (loss), net of waivers and reimbursements | | | 1.10 | (c) | | | 0.52 | | | 0.18 | | | 0.37 | | | (0.05 | )(c) |
Net investment income (loss), before waivers and reimbursements | | | 1.10 | (c) | | | 0.52 | | | 0.17 | | | 0.31 | | | (0.24 | )(c) |
| | | | | | | | | | | | | | | | | |
| | | Period Ended
| | | Years Ended December 31,
| |
| | | 6/30/2006
| | | 2005
| | 2004
| | 2003
| | 2002
| |
| | | (unaudited) | | | | | | | | | | |
Supplemental data: | | | | | | | | | | | | | | | | | |
Net assets at end of period (in thousands) | | $ | 1,667,235 | | | $ | 1,555,414 | | $ | 1,223,436 | | $ | 477,511 | | $ | 149,848 | |
Portfolio turnover rate (%) | | | 72 | (c) | | | 74 | | | 72 | | | 56 | | | 59 | (c) |
| (a) | | For the period from July 26, 2002 (Commencement of Operations) to December 31, 2002. |
| (b) | | Excludes $0.25, $0.10, $0.06, and $0.02 of PFIC mark to market which is treated as ordinary income for Federal tax purposes for the years 2005, 2004, 2003 and 2002, respectively. |
| (c) | | Rates are annualized for periods that are less than a year. |
Performance cited represents past performance. Past performance does not guarantee future results and current performance may be lower or higher that the data quoted. Results shown are annual returns, which assume reinvestment of dividends and capital gains. Investment returns and principal will fluctuate and you may have a gain or loss when you sell shares. For the most current month-end performance information, please call 1-800-742-7272, or visit our Web site at www.williamblairfunds. com.
Note: Net investment income (loss) per share is based on the average shares outstanding during the year.
38 Semi-Annual Report | June 30, 2006 |
Financial Highlights
Institutional International Equity Fund
| | | | | | | | | | | |
| | |
| |
| | | Period Ended
| | | Years Ended
December 31,
| |
| | | 6/30/2006
| | | 2005
| | 2004(a)
| |
| | | (unaudited) | | | | | | |
Net asset value, beginning of year | | $ | 12.04 | | | $ | 10.20 | | $ | 10.00 | |
Income from investment operations: | | | | | | | | | | | |
Net investment income (b) | | | 0.08 | | | | — | | | — | |
Net realized and unrealized gain (loss) on investments | | | 0.48 | | | | 1.86 | | | 0.20 | |
| | |
|
|
| |
|
| |
|
|
|
Total from investment operations | | | 0.56 | | | | 1.86 | | | 0.20 | |
Less distributions from: | | | | | | | | | | | |
Net investment income | | | — | | | | 0.02 | | | — | |
Net realized gain | | | — | | | | — | | | — | |
| | |
|
|
| |
|
| |
|
|
|
Total distributions | | | — | | | | 0.02 | | | — | |
| | |
|
|
| |
|
| |
|
|
|
Net asset value, end of period | | $ | 12.60 | | | $ | 12.04 | | $ | 10.20 | |
| | |
|
|
| |
|
| |
|
|
|
Total return (%) | | | 4.65 | | | | 18.26 | | | 2.00 | |
Ratios to average daily net assets (%): | | | | | | | | | | | |
Expenses, net of waivers and reimbursements | | | 1.10 | (c) | | | 1.10 | | | 1.10 | (c) |
Expenses, before waivers and reimbursements | | | 1.14 | (c) | | | 1.35 | | | 2.46 | (c) |
Net investment income (loss), net of waivers and reimbursements | | | 1.34 | (c) | | | 0.31 | | | (0.21 | )(c) |
Net investment income (loss), before waivers and reimbursements | | | 1.30 | (c) | | | 0.06 | | | (1.57 | )(c) |
| |
| | |
| |
| | | Period Ended
| | | Years Ended
December 31,
| |
| | | 6/30/2006
| | | 2005
| | 2004
| |
| | | (unaudited) | | | | | | |
Supplemental data: | | | | | | | | | | | |
Net assets at end of period (in thousands) | | $ | 356,351 | | | $ | 250,929 | | $ | 27,384 | |
Portfolio turnover rate (%) | | | 94 | (c) | | | 84 | | | 45 | (c) |
| (a) | | For the period from December 1, 2004 (Commencement of Operations) to December 31, 2004. |
| (b) | | Excludes $0.27 and $0.01 of PFIC mark to market which is treated as ordinary income for Federal tax purposes for the years 2005 and 2004, respectively. |
| (c) | | Rates are annualized for periods that are less than a year. |
Performance cited represents past performance. Past performance does not guarantee future results and current performance may be lower or higher that the data quoted. Results shown are annual returns, which assume reinvestment of dividends and capital gains. Investment returns and principal will fluctuate and you may have a gain or loss when you sell shares. For the most current month-end performance information, please call 1-800-742-7272, or visit our Web site at www.williamblairfunds. com.
Note: Net investment income (loss) per share is based on the average shares outstanding during the year.
June 30, 2006 | William Blair Funds 39 |
Financial Highlights
International Small Cap Growth Fund
Institutional Share Class
| | | | | | | |
| | |
| |
| | | Periods Ended
| |
| | | 6/30/2006
| | 12/31/2005(a)
| |
| | | (unaudited) | | | |
Net asset value, beginning of period | | $ | 11.16 | | $ | 10.00 | |
Income from investment operations: | | | | | | | |
Net investment income (b) | | | 0.01 | | | — | |
Net realized and unrealized gain on investments | | | 0.97 | | | 1.16 | |
| | |
|
| |
|
|
|
Total from investment operations | | | 0.98 | | | 1.16 | |
Less distributions from: | | | | | | | |
Net investment income (c) | | | — | | | — | |
Net realized gain | | | — | | | — | |
| | |
|
| |
|
|
|
Total distributions | | | — | | | — | |
| | |
|
| |
|
|
|
Net asset value, end of period | | $ | 12.14 | | $ | 11.16 | |
| | |
|
| |
|
|
|
Total return (%) | | | 8.78 | | | 11.62 | |
Ratios to average daily net assets (%) (d): | | | | | | | |
Expenses, net of waivers and reimbursements | | | 1.25 | | | 1.25 | |
Expenses, before waivers and reimbursements | | | 1.38 | | | 2.17 | |
Net investment income (loss), net of waivers and reimbursements | | | 0.30 | | | 0.00 | |
Net investment income (loss), before waivers and reimbursements | | | 0.17 | | | (0.92 | ) |
| | |
| |
| | | Periods Ended
| |
| | | 6/30/2006
| | 12/31/2005(a)
| |
| | | (unaudited) | | | |
Supplemental data for all classes: | | | | | | | |
Net assets at end of period (in thousands) | | $ | 122,705 | | $ | 50,534 | |
Portfolio turnover rate (%) (d) | | | 132 | | | 127 | |
| (a) | | For the period from November 1, 2005 (Commencement of Operations) to December 31, 2005. |
| (b) | | Excludes $0.11 of PFIC mark to market which is treated as ordinary income for Federal tax purposes. |
| (c) | | Distribution less than $0.01 per share. |
| (d) | | Rates are annualized for periods that are less than a year. |
Performance cited represents past performance. Past performance does not guarantee future results and current performance may be lower or higher that the data quoted. Results shown are annual returns, which assume reinvestment of dividends and capital gains. Investment returns and principal will fluctuate and you may have a gain or loss when you sell shares. For the most current month-end performance information, please call 1-800-742-7272, or visit our Web site at www.williamblairfunds. com.
Note: Net investment income (loss) per share is based on the average shares outstanding during the period.
40 Semi-Annual Report | June 30, 2006 |
Financial Highlights
Emerging Markets Growth Fund
Institutional Share Class
| | | | | | | |
| | |
| |
| | | Periods Ended
| |
| | | 6/30/2006
| | 12/31/2005(a)
| |
| | | (unaudited) | | | |
Net asset value, beginning of period | | $ | 14.20 | | $ | 10.00 | |
Income from investment operations: | | | | | | | |
Net investment income (b) | | | 0.04 | | | 0.01 | |
Net realized and unrealized gain on investments | | | 0.83 | | | 4.27 | |
| | |
|
| |
|
|
|
Total from investment operations | | | 0.87 | | | 4.28 | |
Less distributions from: | | | | | | | |
Net investment income | | | — | | | — | |
Net realized gain | | | — | | | 0.08 | |
| | |
|
| |
|
|
|
Total distributions | | | — | | | 0.08 | |
| | |
|
| |
|
|
|
Net asset value, end of period | | $ | 15.07 | | $ | 14.20 | |
| | |
|
| |
|
|
|
Total return (%) | | | 6.13 | | | 42.82 | |
Ratios to average daily net assets (%) (c): | | | | | | | |
Expenses, net of waivers and reimbursements | | | 1.25 | | | 1.25 | |
Expenses, before waivers and reimbursements | | | 1.34 | | | 1.61 | |
Net investment income (loss), net of waivers and reimbursements | | | 0.55 | | | 0.19 | |
Net investment income (loss), before waivers and reimbursements | | | 0.46 | | | (0.17 | ) |
| | |
| |
| | | Periods Ended
| |
| | | 6/30/2006
| | 12/31/2005(a)
| |
| | | (unaudited) | | | |
Supplemental data for all classes: | | | | | | | |
Net assets at end of period (in thousands) | | $ | 460,842 | | $ | 249,348 | |
Portfolio turnover rate (%) (c) | | | 144 | | | 77 | |
| (a) | | For the period from June 6, 2005 (Commencement of Operations) to December 31, 2005. |
| (b) | | Excludes $0.11 of PFIC mark to market which is treated as ordinary income for Federal tax purposes. |
| (c) | | Rates are annualized for periods that are less than a year. |
Performance cited represents past performance. Past performance does not guarantee future results and current performance may be lower or higher that the data quoted. Results shown are annual returns, which assume reinvestment of dividends and capital gains. Investment returns and principal will fluctuate and you may have a gain or loss when you sell shares. For the most current month-end performance information, please call 1-800-742-7272, or visit our Web site at www.williamblairfunds. com.
Note: Net investment income (loss) per share is based on the average shares outstanding during the period.
June 30, 2006 | William Blair Funds 41 |
Trustees and Officers. (Unaudited) The trustees and officers of the William Blair Funds, their year of birth, their principal occupations during the last five years, their affiliations, if any, with William Blair & Company, L.L.C., and other significant affiliations are set forth below. The address of each trustee and officer is 222 West Adams Street, Chicago, Illinois 60606.
| | | | | | | | | | |
Name and Year of Birth
| | Position(s)
Held with
Fund
| | Term of
Office and
Length of
Time
Served(1)
| | Principal Occupation(s) During Past 5 Years
| | Number of
Portfolios
in Fund
Complex
Overseen
by Trustee
| | Other Directorships Held by Trustee/Officer
|
Interested Trustees | | | | | | | | | | |
Frederick Conrad Fischer, 1934* | | Chairman of the Board of Trustees | | Since 1987 | | Principal, William Blair & Company, L.L.C.; Partner, APM Limited Partnership | | 15 | | Trustee Emeritus, Chicago Child Care Society, a non-profit organization; Trustee Emeritus Kalamazoo College |
| | | | | |
Michelle Seitz, 1965* | | Trustee | | Since 2002 | | Principal, William Blair & Company, L.L.C. | | 15 | | N/A |
Non-Interested Trustees | | | | | | | | |
Theodore A. Bosler,
1934 | | Trustee | | Since 1997 | | Retired Principal and Vice President, Lincoln Capital Management | | 15 | | Desert Foothills Land Trust; Institute of Chartered Financial Analysts; and Thresholds |
| | | | | |
Ann P. McDermott,
1939 | | Trustee | | Since 1996 | | Board member and officer for various civic and charitable organizations over the past thirty years; professional experience prior thereto, registered representative for New York Stock Exchange firm | | 15 | | Northwestern University, Women’s Board; Rush Presbyterian St. Luke’s Medical Center, Women’s Board; University of Chicago, Women’s Board; Visiting Nurses Association, Honorary Director |
| | | | | |
Donald J. Reaves,
1946 | | Trustee | | Since 2004 | | Vice President for Administration and Chief Financial Officer, University of Chicago since 2002. Executive Vice President and Chief Financial Officer, Brown University from 1993 to 2002 | | 15 | | American Student Assistance Corp.; Amica Mutual Insurance Company; NACUBO (National Association of College and University Business Officers) |
| | | | | |
John B. Schwemm,
1934 | | Trustee | | Since 1990 | | Retired Chairman and Chief Executive Officer, R.R. Donnelley & Sons Company | | 15 | | USG Corp., building material manufacturer, and Walgreen Co. (retail drugstores) |
| | | | | |
Donald L. Seeley,
1944 | | Trustee | | Since 2003 | | Director, Applied Investment Management Program, University of Arizona Department of Finance, Formerly Vice Chairman and Chief Financial Officer, True North Communications, Inc., marketing communications and advertising firm | | 15 | | Warnaco, Group Inc., intimate apparel, sportswear and swimwear manufacturer |
42 Semi-Annual Report | June 30, 2006 |
| | | | | | | | | | |
Name and Year of Birth
| | Position(s)
Held with
Fund
| | Term of
Office and
Length of
Time
Served(1)
| | Principal Occupation(s) During Past 5 Years
| | Number of
Portfolios
in Fund
Complex
Overseen
by Trustee
| | Other Directorships Held by Trustee/Officer
|
Robert E. Wood II, 1938 | | Trustee | | Since 1999 | | Retired Executive Vice President, Morgan Stanley Dean Witter | | 15 | | Chairman, Add-Vision, Inc. manufacturer of surface animation systems, and Micro-Combustion, LLC |
Officers | | | | | | | | | | |
Marco Hanig, 1958 | | President | | Since 1999 | | Principal, William Blair & Company, L.L.C. | | N/A | | Chicago Scores |
| | | | | |
Karl W. Brewer, 1966 | | Senior Vice President | | Since 2000 | | Principal, William Blair & Company, L.L.C. | | N/A | | N/A |
| | | | | |
Harvey H. Bundy, III, 1944 | | Senior Vice President | | Since 2003 | | Principal, William Blair & Company, L.L.C. | | N/A | | N/A |
| | | | | |
Mark A. Fuller, III, 1957 | | Senior Vice President | | Since 1993 | | Principal, William Blair & Company, L.L.C. | | N/A | | Partner, Fulsen Howney Partners |
| | | | | |
James S. Golan, 1961 | | Senior Vice President | | Since 2005 | | Principal, William Blair & Company, L.L.C. | | N/A | | N/A |
| | | | | |
W. George Greig, 1952 | | Senior Vice President | | Since 1996 | | Principal, William Blair & Company, L.L.C. | | N/A | | N/A |
| | | | | |
Michael A. Jancosek, 1959 | | Senior Vice President Vice President | | Since 2004 Since 2000 | | Principal, William Blair & Company L.L.C. Associate, William Blair & Company, L.L.C. | | N/A | | N/A |
| | | | | |
John F. Jostrand, 1954 | | Senior Vice President | | Since 1999 | | Principal, William Blair & Company, L.L.C. | | N/A | | N/A |
| | | | | |
James S. Kaplan, 1960 | | Senior Vice President Vice President | | Since 2004 Since 1995 | | Principal, William Blair & Company, L.L.C. Associate, William Blair & Company, L.L.C. | | N/A | | N/A |
| | | | | |
Robert C. Lanphier, IV, 1956 | | Senior Vice President | | Since 2003 | | Principal, William Blair & Company, L.L.C. | | N/A | | Chairman, AG. Med, Inc. |
| | | | | |
Todd M. McClone, 1968 | | Senior Vice President Vice President | | Since 2006 Since 2005 | | Principal, William Blair & Company, L.L.C. Associate, William Blair & Company, L.L.C. | | N/A
| | N/A |
| | | | | |
David S. Mitchell, 1960 | | Senior Vice President Vice President | | Since 2004 Since 2003 | | Principal, William Blair & Company, L.L.C. Associate, William Blair & Company, L.L.C. | | N/A | | N/A |
| | | | | |
Gregory J. Pusinelli, 1958 | | Senior Vice President | | Since 1999 | | Principal, William Blair & Company, L.L.C. | | N/A | | N/A |
| | | | | |
David P. Ricci, 1958 | | Senior Vice President | | Since 2006 | | Principal, William Blair & Company, L.L.C. | | N/A | | N/A |
June 30, 2006 | William Blair Funds 43 |
| | | | | | | | | | |
Name and Year of Birth
| | Position(s)
Held with
Fund
| | Term of
Office and
Length of
Time
Served(1)
| | Principal Occupation(s) During Past 5 Years
| | Number of
Portfolios
in Fund
Complex
Overseen
by Trustee
| | Other Directorships Held by Trustee/Officer
|
| | | | | |
Norbert W. Truderung, 1952 | | Senior Vice President | | Since 1992 | | Principal, William Blair & Company, L.L.C. | | N/A | | N/A |
| | | | | |
Jeffrey A. Urbina, 1955 | | Senior Vice President | | Since 1998 | | Principal, William Blair & Company, L.L.C. | | N/A | | N/A |
| | | | | |
Christopher T. Vincent, 1956 | | Senior Vice President Vice President | | Since 2004 Since 2002 | | Principal, William Blair & Company, L.L.C. Associate, William Blair & Company, L.L.C.; former Managing Director/Senior Portfolio Manager, Zurich Scudder Investments | | N/A | | Uhlich Children’s Home |
| | | | | |
David C. Fording, 1967 | | Vice President | | Since 2006 | | Associate, William Blair & Company, L.L.C.; former Portfolio Manager, TIAA-CREF | | N/A | | N/A |
| | | | | |
Chad M. Kilmer, 1975 | | Vice President | | Since 2006 | | Associate, William Blair & Company, L.L.C.; former analyst and Portfolio Manager, US Bancorp Asset Management, and analyst Gabelli Woodland Partners. | | N/A | | N/A |
| | | | | |
Mark T. Leslie, 1967 | | Vice President | | Since 2005 | | Associate, William Blair & Company, L.L.C.; former Portfolio Manager, U.S. Bancorp Asset Management | | N/A | | N/A |
| | | | | |
Colin J. Williams, 1975 | | Vice President | | Since 2006 | | Associate, William Blair & Company, L.L.C.; formerly Andersen Consulting and Allegiance Healthcare | | N/A | | N/A |
| | | | | |
Terence M. Sullivan, 1944 | | Vice President and Treasurer | | Since 1997 | | Associate, William Blair & Company, L.L.C. | | N/A | | N/A |
| | | | | |
Colette M. Garavalia, 1961 | | Secretary | | Since 2000 | | Associate, William Blair & Company, L.L.C. | | N/A | | N/A |
| * | | Mr. Fischer and Ms. Seitz are interested persons of the William Blair Funds because each is a principal of William Blair & Company, L.L.C., the Funds’ investment advisor and principal underwriter. |
| (1) | | Each Trustee serves until the election and qualification of a successor, or until death, resignation or retirement or removal as provided in the Fund’s Declaration of Trust. Retirement for non-interested Trustees occurs no later than at the conclusion of the first regularly scheduled Board meeting of the Fund’s fiscal year that occurs after the Trustee’s 72nd birthday. The Fund’s officers are elected annually by the Trustees. |
The Statement of Additional Information for the William Blair Funds includes additional information about the trustees and is available without charge by calling 1-800-635-2886 (in Massachusetts 1-800-635-2840) or by writing the Fund.
44 Semi-Annual Report | June 30, 2006 |
Board Approval of the Management Agreement (unaudited)
During the six months ended June 30, 2006, the Board of Trustees (the “Board”) of William Blair Funds (the “Trust”) approved the renewal for an additional one-year term of the Trust’s Management Agreement with William Blair & Company, L.L.C. (the “Advisor”), on behalf of each series of the Trust, except the International Small Cap Growth Fund and the Emerging Markets Growth Fund.
The information in this summary outlines the Board’s considerations associated with its renewal of the Management Agreement. In connection with its deliberations regarding the continuation of the Management Agreement, the Board considered such information and factors as it believed to be relevant. As described below, the Board considered the nature, extent and quality of the services performed by the Advisor under the existing Management Agreement; comparative fees and expense ratios as prepared by an independent provider (Lipper Inc.); the profits to be realized by the Advisor; the extent to which the Advisor realizes economies of scale as a Fund grows; and whether any fall-out benefits are being realized by the Advisor. In addition, the Trustees who are not “interested persons” of the Trust as defined in the Investment Company Act of 1940 (the “Independent Trustees”) discussed the renewal of the Management Agreement with Trust management and in private sessions with independent legal counsel at which no representatives of the Advisor were present.
As required by the Investment Company Act of 1940, the renewal was confirmed by the unanimous separate vote of the Independent Trustees. In deciding to approve the renewal of the Management Agreement, the Board did not identify a single factor as controlling and this summary does not describe all of the matters considered. However, the Board concluded that each of the various factors referred to below favored such approval.
Information Requested and Received
The Board, including all the Independent Trustees, considered the renewal of the Management Agreement pursuant to a extensive process that concluded at the Board’s February 16, 2006 meeting. In preparation for the review process, the Independent Trustees met with independent legal counsel several months prior to February 16, 2006 and discussed the type and nature of information to be requested and directed independent legal counsel to send a formal request for information to Trust management. The Advisor provided extensive information in response to the request. Among other information, the Independent Trustees considered: (i) materials describing the nature, quality and extent of services provided by the Advisor; (ii) information comparing the performance of each Fund to other mutual funds and relevant indices; (iii) information comparing the advisory fees and expense ratios of each Fund to other mutual funds; (iv) information comparing advisory fees of each Fund to fees charged by the Advisor to other funds and its similar client accounts; (v) the costs of services provided and estimated profits realized by the Advisor; (vi) information about economies of scale; and (vii) information describing other benefits to the Advisor resulting from its relationship with the Funds. The Independent Trustees reviewed comparative performance of peer groups of funds selected by Lipper, and comparative advisory fees and expense ratios of peer groups of funds selected by Lipper. The Independent Trustees also received a memorandum from independent legal counsel advising them of their duties and responsibilities in connection with the review of the Management Agreement.
On February 15 and 16, 2006, the Independent Trustees met independently of Trust management and of the interested Trustees, to review and discuss with independent legal counsel the information provided by the Advisor, Lipper and independent legal counsel. The Independent Trustees noted that the Board also received regular information throughout the year regarding the performance and operating results and compliance matters of each Fund and that in evaluating the Management Agreement, they were taking into account their accumulated experience as Trustees in working with the Advisor on matters relating to the Funds. Based upon their review, the Independent Trustees concluded on February 16, 2006 that it was in the best interest of each Fund to renew the Management Agreement and recommended to the Board the renewal of the Management Agreement. At its meeting on February 16, 2006, the Board considered the recommendation of the Independent Trustees along with the other factors that the Board deemed relevant.
Nature, Quality and Extent of Services. In evaluating the nature, quality and extent of the services provided by the Advisor to the Funds, the Board noted that the Advisor is a quality firm with a reputation for integrity and honesty that employs high quality people and has a long association with the Funds, since the inception of the Funds. The Trustees believe that a long-term relationship with a capable, conscientious advisor is in the best interests of shareholders and that shareholders have invested in the Funds knowing that the Advisor managed the Funds and knowing the investment advisory fee. The Board considered biographical information about each Fund’s portfolio manager(s), the administrative services performed by the Advisor, financial information regarding the Advisor, brokerage allocation practices, soft dollars and execution, the
June 30, 2006 | William Blair Funds 45 |
compliance regime overseen by the Advisor, including the fact that the Advisor has engaged an independent third party for additional Fund compliance monitoring, and the financial support of certain Funds. The Board also noted that the Advisor voluntarily reduces the advisory fees of the Funds by an amount equal to the advisory fee charged by the Ready Reserves Fund on the cash of the Funds invested in the Ready Reserves Fund. Based upon all relevant factors, the Board concluded that the nature, quality and extent of the services provided by the Advisor to each Fund were satisfactory.
The Board reviewed information on the performance of each Fund for one, three, five and since inception periods, as applicable, along with performance information of a relevant securities index or indexes and a peer universe of funds from the Lipper database. Based upon the review of the performance information, the Board concluded that the performance of the Institutional International Growth Fund, and the Institutional International Equity Fund, was satisfactory.
Fees and Expenses. The Board reviewed each Fund’s advisory fee and expense ratio and reviewed information comparing the advisory fee and expense ratio to those of a Lipper peer group and a Lipper peer universe. The Lipper peer group for each Fund consists of a group of funds with a similar investment style and asset size as the Fund. The Lipper peer universe for each Fund includes all funds with a similar investment style regardless of asset size. The Board considered that the Advisor has proposed to cap total expenses, including waiving advisory fees, if necessary, for any Fund whose total expense ratio may not be within an appropriate range of the peer universe without expense caps. For each Fund, the Board also reviewed amounts paid to the Advisor by other registered funds, including other Funds in the Trust and funds for which the Advisor acts as a subadvisor and the Advisor’s fee schedule for separate accounts.
In considering the information, the Board noted that the advisory fees for the Institutional International Equity Fund was within an acceptable range of its peer group and peer universe after giving effect to fee waivers. The Board noted that the advisory fees for the Institutional International Growth Fund was above its peer group and peer universe. On the basis of the information provided, the Board concluded that each Fund’s advisory fee, coupled with any applicable existing or proposed advisory fee waiver and expense cap, was reasonable and appropriate in light of the nature, quality and extent of services provided by the Advisor. The Board noted that, although advisory fees for the Institutional International Growth Fund were above the median of its peer group and peer universe, such advisory fees were within an acceptable range of the peer group and peer universe and consistent with reasonable expectations in light of the nature, quality and extent of services provided by the Advisor.
Profitability. With respect to the profitability of the Management Agreement to the Advisor, the Board considered the overall fees paid under the Management Agreement, including the costs of the services provided and the profits realized by the Advisor from its relationship with the Funds. The Board concluded that the profits realized by the Advisor were not unreasonable.
Economies of Scale. The Board considered whether there are economies of scale with respect to the management of the Funds and whether the Funds benefit from any economies of scale. The Board considered whether the advisory fees are reasonable in relation to the asset size of the Funds. The Board noted the Advisor’s representation that certain Fund expenses are relatively fixed and unrelated to asset size and that the Advisor may enjoy some economies of scale as a Fund’s assets grow. In considering whether fee levels reflect economies of scale for the benefit of Fund investors, the Board reviewed each Fund’s asset size, breakpoints for those Funds with breakpoints in the advisory fee schedule, the Fund’s total and net expense ratios and the expense caps in place and/or proposed. The Board concluded with respect to each of the Funds, that the expense ratios, after giving effect to the expense caps proposed by the Advisor, as applicable, were reasonable.
Other Benefits to the Advisor. The Board considered benefits derived by the Advisor from its relationship with the Funds, including soft dollars, and favorable media coverage. The Board concluded that, taking into account these benefits, each Fund’s advisory fee was reasonable.
Conclusion. Based upon all of the information considered and the conclusions reached, the Board of Trustees, including all of the Independent Trustees, determined that the terms of the Management Agreement continue to be fair and reasonable and that the continuation of the Management Agreement is in the best interests of each Fund.
46 Semi-Annual Report | June 30, 2006 |
Additional Information (unaudited)
Proxy Voting
A description of the policies and procedures that the William Blair Institutional International Growth Fund, the William Blair Institutional International Equity Fund and the William Blair Emerging Markets Growth Fund use to determine how to vote proxies relating to portfolio securities and information regarding how the Fund voted proxies relating to portfolio securities for the most recent 12-month period ended June 30 are available without charge, upon request, by calling 1-800-635-2886 (in Massachusetts 1-800-635-2840), at www.williamblairfunds.com and on the SEC’s website at http://www.sec.gov.
Quarterly Portfolio Schedules
The Fund files its complete schedule of portfolio holdings with the SEC for the first and third fiscal quarters of each fiscal year (quarters ended March 31 and September 30) on Form N-Q. The Fund’s Forms N-Q are available on the SEC’s website at http://www.sec.gov and may be reviewed and copied at the SEC’s Public Reference Room in Washington, D.C. Information on the operation of the SEC’s Public Reference Room may be obtained by calling 1-800-SEC-0330.
June 30, 2006 | William Blair Funds 47 |
Useful Information About Your Report (unaudited)
Please refer to this information when reviewing the Expense Example for each Fund.
Expense Example
As a shareholder of a Fund, you incur ongoing costs, including management fees and other Fund expenses. The example is intended to help you understand your ongoing costs (in dollars) of investing in the Fund and to compare these costs with the ongoing costs of investing in other mutual funds. To do so, compare the Fund’s 5% hypothetical example with the 5% hypothetical examples that appear in the shareholder reports of other funds. The example is based on an investment of $1,000 invested at the beginning of the period and held for the entire six-month period from January 1, 2006 to June 30, 2006.
Actual Expenses
In each example, the first line for each share class in the table provides information about the actual account values and actual expenses. These expenses reflect the effect of any expense cap applicable to the share class during the period. Without this expense cap, the costs shown in the table would have been higher. You may use the information in this line, together with the amount you invested, to estimate the expenses that you paid over the period. Simply divide your account value by $1,000 (example, an $8,600 account value divided by $1,000 = 8.6), then multiply the result by the number in the first line under the heading entitled “Expenses Paid During the Period” to estimate the expenses you paid on your account during the period.
Hypothetical Example for Comparison Purposes
In each example, the second line for each share class in the table provides information about hypothetical account values and hypothetical expenses based on the Fund’s actual expense ratio and an assumed rate of return of 5% per year before expenses. This is not the Fund’s actual return. The hypothetical account values and expenses may not be used to estimate the actual ending account balance or expenses you paid for the period. You may use this information to compare the ongoing costs of investing in the Fund to other funds. To do so, compare this 5% hypothetical example with the 5% hypothetical examples that appear in the shareholder reports of other funds.
Please note that the expenses shown in both examples are meant to highlight your ongoing costs only and do not reflect any transactional costs or account type fees. These fees are fully described in the prospectus. Therefore, the second line of each share class in the table is useful in comparing ongoing costs only and will not help you determine the relative costs of owning different funds.
48 Semi-Annual Report Report | June 30, 2006 |
Fund Expenses (Unaudited)
The examples below show you the ongoing costs (in dollars) of investing in your fund and allows you to compare these costs with those of other mutual funds. Please refer to previous page for a detailed explanation of the information presented on this chart.
| | | | | | | | | | | | |
| | | Beginning
Account Value
1/1/2006
| | Ending
Account Value
6/30/2006
| | Expenses Paid
during
Period(a)
| | Annualized
Expense Ratio
| |
| | | | |
Institutional International Growth Fund | | | | | | | | | | | | |
Actual return | | $ | 1,000.00 | | $ | 1,060.20 | | $ | 5.26 | | 1.03 | % |
Hypothetical 5% return | | | 1,000.00 | | | 1,019.69 | | | 5.16 | | 1.03 | |
| | | | | | | | | | | | | |
| | | | |
Institutional International Equity Fund | | | | | | | | | | | | |
Actual return | | | 1,000.00 | | | 1,046.50 | | | 5.58 | | 1.10 | |
Hypothetical 5% return | | | 1,000.00 | | | 1,019.34 | | | 5.51 | | 1.10 | |
| | | | | | | | | | | | | |
| | | | |
International Small Cap Growth Fund Institutional Share Class | | | | | | | | | | | | |
Actual return | | | 1,000.00 | | | 1,087.80 | | | 6.47 | | 1.25 | |
Hypothetical 5% return | | | 1,000.00 | | | 1,018.90 | | | 6.26 | | 1.25 | |
| | | | | | | | | | | | | |
| | | | |
Emerging Markets Growth Fund Institutional Share Class | | | | | | | | | | | | |
Actual return | | | 1,000.00 | | | 1,061.30 | | | 6.39 | | 1.25 | |
Hypothetical 5% return | | | 1,000.00 | | | 1,018.60 | | | 6.26 | | 1.25 | |
| | | | | | | | | | | | | |
| (a) | | Expenses are equal to the annualized expense ratio, multiplied by the average account value over the period, multiplied by the number of days in the period 181, and divided by 365 (to reflect the one-half-year period). |
June 30, 2006 | William Blair Funds 49 |
BOARD OF TRUSTEES
Frederick Conrad Fischer, Chairman
Principal, William Blair & Company, L.L.C.
Theodore A. Bosler
Retired Principal and Vice President, Lincoln Capital Management Company
Ann P. McDermott
Director and Trustee
Profit and not-for-profit organizations
Donald J. Reaves
Vice President for Administration and Chief Financial Officer, University of Chicago
Donald L. Seeley
Adjunct Lecturer and Director, University of Arizona Department of Finance
John B. Schwemm
Retired Chairman and CEO, R.R. Donnelley & Sons Company
Michelle R. Seitz
Principal, William Blair & Company, L.L.C.
Robert E. Wood II
Retired Executive Vice President, Morgan Stanley Dean Witter
Officers
Marco Hanig, President
Karl W. Brewer, Senior Vice President
Harvey H. Bundy III, Senior Vice President
Mark A. Fuller, III, Senior Vice President
James S. Golan, Senior Vice President
W. George Greig, Senior Vice President
Michael A. Jancosek, Senior Vice President
John F. Jostrand, Senior Vice President
James S. Kaplan, Senior Vice President
Robert C. Lanphier, IV, Senior Vice President
Todd M. McClone, Senior Vice President
David S. Mitchell, Senior Vice President
Gregory J. Pusinelli, Senior Vice President
David P. Ricci, Senior Vice President
Norbert W. Truderung, Senior Vice President
Jeffrey A. Urbina, Senior Vice President
Christopher T. Vincent, Senior Vice President
David C. Fording, Vice President
Chad M. Kilmer, Vice President
Mark T. Leslie, Vice President
Colin J. Williams, Vice President
Terence M. Sullivan, Vice President and Treasurer
Colette M. Garavalia, Secretary
Investment Advisor
William Blair & Company, L.L.C.
Legal Counsel
Vedder, Price, Kaufman & Kammholz, P.C.
Transfer Agent
State Street Bank and Trust Company
P.O. Box 8506
Boston, MA 02266-8506
For customer assistance, call 1-800-635-2886
(Massachusetts 1-800-635-2840)
50 Date of First Use August 2006 | |
Not applicable to this filing.
| Item 3. | Audit Committee Financial Expert |
Not applicable to this filing.
| Item 4. | Principal Accountant Fees and Services |
Not applicable to this filing.
| Item 5. | Audit Committee of Listed Registrants |
Not Applicable to this Registrant, insofar as the Registrant is not a listed company.
| Item 6. | Schedule of Investments |
See Schedule of Investments in Item 1
| Item 7. | Disclosure of Proxy Voting Policies and Procedures for Closed-End Management Investment Companies |
Not applicable to this Registrant, insofar as the Registrant is not a closed-end management investment company.
| Item 8. | Portfolio Managers of Closed-End Management Investment Companies |
Not applicable to this Registrant, insofar as the Registrant is not a closed-end management investment company.
| Item 9. | Purchase of Equity Securities by Closed-End Management Investment Companies and Affiliated Purchasers |
Not applicable to this Registrant, insofar as the Registrant is not a closed-end management investment company.
| Item 10. | Submission of Matters to a Vote of Security Holders |
There have been no material changes to the procedures by which shareholders may recommend nominees to the Registrant’s Board of Trustees since the Registrant last provided disclosure in response to this item.
| Item 11. | Controls and Procedures |
(a) The Registrant’s principal executive and principal financial officer, or persons performing similar functions, have concluded that the Registrant’s Disclosure Controls and Procedures (as defined in Rule 30-a-3( c ) under the Investment Company Act of 1940, as amended (the “1940 Act”) (17 CFR 270.30a-3 ( c )) are effective, as of a date within 90 days of the filing date of this report that includes the disclosure required by this paragraph, based on their evaluation of these controls and procedures required by Rule 30a-3 (b) under the 1940 Act (17 CFR 270.30a-3( b ) and Rules 13a-15( b ) or 15d-15(b) under the Exchange Act (17 CFR 240.13a-15(b) or 240.15d-15(b)).
(b) There were no changes in the Registrant’s internal control over financial reporting (as defined in Rule 30a-3(d) under the 1940 Act (17 CFR 270.30a-3(d)) that occurred during the second fiscal quarter of the period covered by this report that has materially affected, or is reasonably likely to materially affect, the Registrant’s internal control over financial reporting.
12. (a) (1) Code of Ethics
Not applicable to this filing.
12. (a) (2) (1)
Certification of Principal Executive Officer Required by Rule 30a-2(a) of the Investment Company Act
12. (a) (2) (2)
Certification of Principal Financial Officer Required by Rule 30a-2(a) of the Investment Company Act.
12. (a) (3)
Not applicable to this Registrant.
12. (b)
Certification of Chief Executive Officer and Certification of Chief Financial Officer Required by Rule 30a-2(b) of the Investment Company Act
Signatures
Pursuant to the requirements of the Securities Exchange Act of 1934 and the Investment Company Act of 1940, the Registrant has duly caused this report to be signed on its behalf by the undersigned, thereunto duly authorized.
| | |
| | | William Blair Funds |
| |
| | | /s/ Marco Hanig |
| By: | | Marco Hanig |
| | | President (Chief Executive Officer) |
Date: August 23, 2006
Pursuant to the requirements of the Securities Exchange Act of 1934 and the Investment Company Act of 1940, this Report has been signed below by the following persons on behalf of the Registrant and in the capacities and on the dates indicated
| | |
| By: | | Marco Hanig |
| | | President (Chief Executive Officer) |
Date: August 23, 2006
| | |
| By: | | Terence M. Sullivan |
| | | Treasurer (Chief Financial Officer) |
Date: August 23, 2006