UNITED STATES
SECURITIES AND EXCHANGE COMMISSION
Washington, D.C. 20549
Form N-CSR/A
CERTIFIED SHAREHOLDER REPORT OF REGISTERED
MANAGEMENT INVESTMENT COMPANIES
Investment Company Act File Number 811-5344
William Blair Funds
(Exact name of registrant as specified in charter)
| | |
| 222 West Adams Street, Chicago, IL | | 60606 |
| (Address of principal executive offices) | | (Zip Code) |
Michelle R. Seitz
William Blair Funds
222 West Adams Street, Chicago, IL 60606
(Name and address of agent for service)
Registrant’s telephone number, including area code: 312-236-1600
Date of fiscal year end: December 31
Date of reporting period: December 31, 2012
EXPLANATORY NOTE: The Registrant is filing this amendment to its Form N-CSR for fiscal year ended December 31, 2012 to correct typographical errors in the Financial Highlights for periods prior to 2012. Other than the corrections to the Financial Highlights, the Form N-CSR/A does not reflect events occurring after the filing of the original Form N-CSR or modify or update the disclosures in any way.
Form N-CSR is to be used by management investment companies to file reports with the Commission not later than 10 days after the transmission to stockholders of any report that is required to be transmitted to stockholders under Rule 30e-1 under the Investment Company Act of 1940 (17 CFR 270.30e-1). The Commission may use the information provided on Form N-CSR in its regulatory, disclosure review, inspection, and policymaking roles.
A registrant is required to disclose the information specified by Form N-CSR, and the Commission will make this information public. A Registrant is not required to respond to the collection of information contained in Form N-CSR unless the form displays a currently valid Office of Management and Budget (“OMB”) control number. Please direct comments concerning the accuracy of the information collection burden estimates and any suggestions for reducing the burden to Secretary, Securities and Exchange Commission, 450 Fifth Street, NW, Washington, DC 20549-0609. The OMB has reviewed this collection of information under the clearance requirements of 44 U.S.C. (ss) 3507.
| Item 1. | December 31, 2012 Annual Reports transmitted to shareholders. |

William Blair Funds
Annual Report
December 31, 2012
Table of Contents
December 31, 2012 | William Blair Funds 1 |
The views expressed in the commentary for each Fund reflect those of the portfolio management team only through the end of the period of the report as stated on the cover. The portfolio management team’s views are subject to change at any time based on market and other conditions and should not be construed as a recommendation. Statements involving predictions, assessments, analyses, or outlook for individual securities, industries, market sectors, and/or markets involve risks and uncertainties, and there is no guarantee they will come to pass.
This report is submitted for the general information of the shareholders of the William Blair Funds. It is not authorized for distribution to prospective investors unless accompanied or preceded by a prospectus of the William Blair Funds. Please carefully consider the Funds’ investment objectives, risks, charges, and expenses before investing. This and other information is contained in the Funds’ prospectus, which you may obtain by calling 1-800-742-7272. Read it carefully before you invest or send money.
2 Annual Report | December 31, 2012 |
PERFORMANCE AS OF DECEMBER 31, 2012—CLASS N SHARES (Unaudited)
| | | | | | | | | | | | | | | | | | | | |
| | | 1 yr | | | 3 yr | | | 5 yr | | | 10 yr
(or since
inception) | | | Inception
Date | | Overall
Morningstar
Rating |
Growth Fund | | | | | | | | | | | | | | | | | | | | |
Class N | | | 15.67 | | | | 8.97 | | | | 2.32 | | | | 7.59 | | | 3/20/1946 | | «««
Among 1,503 Large Growth Funds |
Morningstar Large Growth | | | 15.34 | | | | 9.30 | | | | 1.12 | | | | 7.12 | | | | |
Russell 3000® Growth | | | 15.21 | | | | 11.46 | | | | 3.15 | | | | 7.69 | | | | |
S&Ps 500 | | | 16.00 | | | | 10.87 | | | | 1.66 | | | | 7.10 | | | | | |
| | | | | | |
Large Cap Growth Fund | | | | | | | | | | | | | | | | | | | | |
Class N | | | 18.31 | | | | 9.74 | | | | 1.60 | | | | 5.42 | | | 12/27/1999 | | «««
Among 1,503 Large Growth Funds |
Morningstar Large Growth | | | 15.34 | | | | 9.30 | | | | 1.12 | | | | 7.12 | | | | |
Russell 1000® Growth | | | 15.26 | | | | 11.35 | | | | 3.12 | | | | 7.52 | | | | |
| | | | | | |
Small Cap Growth Fund | | | | | | | | | | | | | | | | | | | | |
Class N | | | 18.15 | | | | 5.96 | | | | 1.40 | | | | 9.57 | | | 12/27/1999 | | ««
Among 658 Small Growth Funds |
Morningstar Small Growth | | | 13.15 | | | | 11.74 | | | | 2.55 | | | | 9.14 | | | | |
Russell 2000® Growth | | | 14.59 | | | | 12.82 | | | | 3.49 | | | | 9.80 | | | | |
| | | | | | |
Mid Cap Growth Fund | | | | | | | | | | | | | | | | | | | | |
Class N | | | 10.90 | | | | 11.81 | | | | 4.42 | | | | 5.92 | | | 2/1/2006 | | ««««
Among 671 Mid-Cap Growth Funds |
Morningstar Mid-Cap Growth | | | 14.07 | | | | 11.08 | | | | 1.73 | | | | — | | | | |
Russell MidCap® Growth | | | 15.81 | | | | 12.91 | | | | 3.23 | | | | 4.57 | | | | |
| | | | | | |
Small-Mid Cap Growth Fund | | | | | | | | | | | | | | | | | | | | |
Class N | | | 12.20 | | | | 11.16 | | | | 4.23 | | | | 7.34 | | | 12/29/2003 | | ««««
Among 671 Mid-Cap Growth Funds |
Morningstar Mid-Cap Growth | | | 14.07 | | | | 11.08 | | | | 1.73 | | | | — | | | | |
Russell 2500TM Growth | | | 16.13 | | | | 13.78 | | | | 4.07 | | | | 7.07 | | | | |
| | | | | | |
Global Leaders Fund | | | | | | | | | | | | | | | | | | | | |
Class N | | | 17.25 | | | | 10.90 | | | | (0.66 | ) | | | (0.84 | ) | | 10/15/2007 | | ««««
Among 736 World Stock Funds |
Morningstar World Stock | | | 15.84 | | | | 6.66 | | | | (0.76 | ) | | | — | | | | |
MSCI All Country World IMI (net) | | | 16.38 | | | | 7.02 | | | | (0.73 | ) | | | (1.56 | ) | | | |
| | | | | | |
International Growth Fund | | | | | | | | | | | | | | | | | | | | |
Class N | | | 23.67 | | | | 8.28 | | | | (2.95 | ) | | | 9.88 | | | 10/1/1992 | | «««
Among 223 Foreign Large Growth Funds |
Morningstar Foreign Large Growth | | | 17.70 | | | | 5.77 | | | | (2.26 | ) | | | 8.99 | | | | |
MSCI All Country World Ex-U.S. IMI (net) | | | 17.04 | | | | 4.18 | | | | (2.59 | ) | | | 10.16 | | | | |
| | | | | | |
International Equity Fund | | | | | | | | | | | | | | | | | | | | |
Class N | | | 17.57 | | | | 4.35 | | | | (5.03 | ) | | | 4.01 | | | 5/24/2004 | | ««
Among 223 Foreign Large Growth Funds |
Morningstar Foreign Large Growth | | | 17.70 | | | | 5.77 | | | | (2.26 | ) | | | — | | | | |
MSCI World Ex-U.S. (net) | | | 16.41 | | | | 3.65 | | | | (3.43 | ) | | | 5.98 | | | | |
| | | | | | |
International Leaders Fund | | | | | | | | | | | | | | | | | | | | |
Class N | | | — | | | | — | | | | — | | | | 8.16 | | | 8/16/2012 | | Not rated. |
MSCI All Country World Ex-U.S. IMI (net) | | | — | | | | — | | | | — | | | | 9.61 | | | | | |
| | | | | | |
International Small Cap Growth Fund | | | | | | | | | | | | | | | | | | | | |
Class N | | | 20.73 | | | | 10.11 | | | | 0.21 | | | | 6.15 | | | 11/1/2005 | | «««
Among 109 Foreign Small/Mid Growth Funds |
Morningstar Foreign Small/Mid Growth | | | 22.20 | | | | 9.70 | | | | (0.49 | ) | | | — | | | | |
MSCI All Country World Small Cap
Ex-U.S. (net) | | | 18.52 | | | | 6.54 | | | | (0.39 | ) | | | 5.99 | | | | |
| | | | | | |
Emerging Markets Growth Fund | | | | | | | | | | | | | | | | | | | | |
Class N | | | 20.70 | | | | 7.21 | | | | (3.88 | ) | | | 11.11 | | | 6/6/2005 | | «««
Among 358 Diversified Emerging Markets Funds |
Morningstar Diversified Emerging Markets | | | 18.15 | | | | 4.26 | | | | (2.16 | ) | | | — | | | | |
MSCI Emerging Markets IMI (net) | | | 18.68 | | | | 4.64 | | | | (0.70 | ) | | | 11.50 | | | | |
Please see the next page for important disclosure information.
December 31, 2012 | William Blair Funds 3 |
PERFORMANCE AS OF DECEMBER 31, 2012—CLASS N SHARES (Unaudited)—CONTINUED
| | | | | | | | | | | | | | | | | | | | |
| | | 1 yr | | | 3 yr | | | 5 yr | | | 10 yr
(or since
inception) | | | Inception
Date | | Overall
Morningstar
Rating |
Emerging Markets Leaders Fund | | | | | | | | | | | | | | | | | | | | |
Class N | | | 20.37 | | | | — | | | | — | | | | 5.27 | | | 5/3/2010 | | ««««
Among 358 Diversified Emerging Markets Funds |
Morningstar Diversified Emerging Markets | | | 18.15 | | | | — | | | | — | | | | — | | | | |
MSCI Emerging Markets (net) | | | 18.22 | | | | — | | | | — | | | | 4.29 | | | | |
| | | | | | |
Emerging Markets Small Cap Growth Fund | | | | | | | | | | | | | | | | | | | | |
Class N | | | 34.23 | | | | — | | | | — | | | | 25.19 | | | 10/24/2011 | | Not rated. |
Morningstar Diversified Emerging Markets | | | 18.15 | | | | — | | | | — | | | | — | | | | | |
MSCI Emerging Markets Small Cap (net) | | | 22.22 | | | | — | | | | — | | | | 12.05 | | | | | |
| | | | | | |
Large Cap Value Fund | | | | | | | | | | | | | | | | | | | | |
Class N | | | 16.92 | | | | — | | | | — | | | | 13.87 | | | 10/24/2011 | | Not rated. |
Morningstar Large Value | | | 14.57 | | | | — | | | | — | | | | — | | | | | |
Russell 1000® Value | | | 17.51 | | | | — | | | | — | | | | 16.13 | | | | | |
| | | | | | |
Small Cap Value Fund | | | | | | | | | | | | | | | | | | | | |
Class N | | | 12.49 | | | | 11.08 | | | | 5.11 | | | | 8.76 | | | 12/23/1996 | | «««
Among 279 Small Value Funds |
Morningstar Small Value | | | 16.00 | | | | 11.04 | | | | 4.20 | | | | 9.96 | | | | |
Russell 2000® Value | | | 18.05 | | | | 11.57 | | | | 3.55 | | | | 9.50 | | | | |
| | | | | | |
Mid Cap Value Fund | | | | | | | | | | | | | | | | | | | | |
Class N | | | 13.54 | | | | — | | | | — | | | | 7.93 | | | 5/3/2010 | | Not rated. |
Morningstar Mid-Cap Value | | | 16.60 | | | | — | | | | — | | | | — | | | | | |
Russell Midcap® Value | | | 18.51 | | | | — | | | | — | | | | 8.81 | | | | | |
| | | | | | |
Small-Mid Cap Value Fund | | | | | | | | | | | | | | | | | | | | |
Class N | | | 11.95 | | | | — | | | | — | | | | 16.18 | | | 12/15/2011 | | Not rated. |
Morningstar Small Value | | | 16.00 | | | | — | | | | — | | | | — | | | | | |
Russell 2500® Value | | | 19.21 | | | | — | | | | — | | | | 23.03 | | | | | |
| | | | | | |
Bond Fund | | | | | | | | | | | | | | | | | | | | |
Class N | | | 8.33 | | | | 7.87 | | | | 7.23 | | | | 6.97 | | | 5/1/2007 | | ««««
Among 1,001 Intermediate-Term Bond Funds |
Morningstar Intermediate-Term Bond | | | 7.01 | | | | 6.96 | | | | 6.07 | | | | — | | | | |
Barclays Capital U.S. Aggregate Bond | | | 4.21 | | | | 6.19 | | | | 5.95 | | | | 6.11 | | | | |
| | | | | | |
Income Fund | | | | | | | | | | | | | | | | | | | | |
Class N | | | 6.00 | | | | 5.75 | | | | 4.85 | | | | 3.75 | | | 10/1/1990 | | ««««
Among 357 Short-Term Bond Funds |
Morningstar Short-term Bond | | | 3.67 | | | | 3.21 | | | | 3.30 | | | | 3.20 | | | | |
Barclays Capital U.S. Intermediate | | | 3.89 | | | | 5.19 | | | | 5.18 | | | | 4.62 | | | | |
Govt./Credit Bond | | | | | | | | | | | | | | | | | | | | |
| | | | | | |
Low Duration Fund | | | | | | | | | | | | | | | | | | | | |
Class N | | | 2.80 | | | | 2.13 | | | | — | | | | 1.87 | | | 12/1/2009 | | ««««
Among 87 Ultrashort Bond Funds |
Morningstar Ultra Short Bond | | | 1.99 | | | | 1.52 | | | | — | | | | — | | | | |
Bank of America Merrill Lynch 1-Year U.S. Treasury Note | | | 0.24 | | | | 0.54 | | | | — | | | | 0.48 | | | | |
Performance cited represents past performance. Past performance does not guarantee future results and current performance may be lower or higher than the data quoted. Results shown are average annual total returns, which assume reinvestment of dividends and capital gains. Investment returns and principal will fluctuate and you may have a gain or a loss when you sell shares. For the most current month-end performance information, please call 1-800-742-7272, or visit our Web site at www.williamblairfunds.com. From time to time, the investment advisor may waive fees or reimburse expenses for the Fund. Without these waivers, performance would be lower. Investing in smaller companies involves special risks, including higher volatility and lower liquidity. International and emerging markets investing involves special risk considerations, including currency fluctuations, lower liquidity, economic and political risk. As interest rates rise, bond prices will fall and bond funds may become more volatile. Class N shares are available to the general public without a sales load.
4 Annual Report | December 31, 2012 |
PERFORMANCE AS OF DECEMBER 31, 2012—CLASS N SHARES (Unaudited)—CONTINUED
Morningstar Ratings™ are as of 12/31/2012 and are subject to change every month. The ratings are based on a risk-adjusted return measure that accounts for variation in a fund’s monthly performance, placing more emphasis on downward variations and rewarding consistent performance. The top 10% of funds in each Category receive 5 stars, the next 22.5% receive 4 stars, the middle 35% receive 3 stars, the next 22.5% receive 2 stars, and the bottom 10% receive 1 star. The Overall Morningstar Rating for a fund is derived from a weighted-average of the performance figures associated with its three-, five- and ten-year (if applicable) Morningstar Rating metrics. The 3/5/10 year Morningstar ratings were as follows: Growth Fund «««/««««/««« and Large Cap Growth Fund «««/«««/««, out of 1,503/1,301/863 large growth funds; Small Cap Growth Fund «/««/«««, out of 658/570/384 small growth funds; Mid Cap Growth Fund «««/««««/NA and Small-Mid Cap Growth Fund «««/««««/NA out of 671/591/NA mid cap growth funds; Global Leaders Fund «««««/«««/NA out of 736/549/NA world stocks; International Growth Fund ««««/«««/««« and International Equity Fund ««/««/NA out of 223/182/105 foreign large growth funds; International Small Cap Growth Fund «««/«««/NA out of 109/96/NA foreign small/mid growth funds; Emerging Markets Growth Fund ««««/««/NA and Emerging Markets Leaders Fund ««««/NA/NA, out of 358/250/NA diversified emerging markets growth funds; Small Cap Value Fund «««/««««/««« out of 279/247/144 small value funds; Income Fund «««««/««««/«««« out of 357/319/206 short-term bond funds; Bond Fund ««««/««««/NA out of 1,001/874/NA intermediate-term bond funds; Low Duration Fund ««««/NA/NA out of 87/NA/NA ultrashort bond funds.
Please carefully consider the Funds’ investment objectives, risks, charges, and expenses before investing. This and other information is contained in the Funds’ prospectus, which you may obtain by calling 1-800-742-7272. Read it carefully before you invest or send money.
See accompanying Notes to Financial Statements.
December 31, 2012 | William Blair Funds 5 |

David C. Fording

John F. Jostrand
GROWTH FUND
The Growth Fund seeks long-term capital appreciation.
AN OVERVIEW FROM THE PORTFOLIO MANAGERS
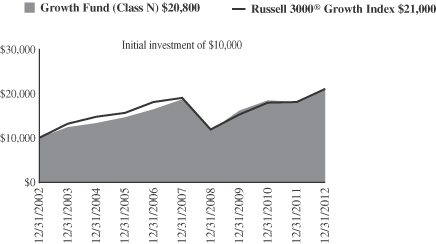
The William Blair Growth Fund posted a 15.67% increase (Class N shares) for the year ended December 31, 2012. By comparison, the Fund’s benchmark, the Russell 3000® Growth Index, increased by 15.21%.
In the year, investors continued to fluctuate between optimism and pessimism based on macroeconomic or political announcements. Market volatility remained, but less than recent years as there were fewer unknowns in the marketplace. In this environment, the Russell 3000® Growth Index rose 15.21%, and climbed the proverbial “wall of worry.” In general, by the fourth quarter there was evidence that the global economy, ex-Europe, had stabilized after a slowing in the middle of the year. From a sector perspective, cyclical sectors such as Financials and Consumer Discretionary as well as Health Care performed best. Energy stocks were a drag as were more defensive Utilities and Consumer Staples sectors.
Technology stock selection stood out due to a top ten position in eBay, as well as SolarWinds. eBay benefited from strong revenue growth from its Marketplace and PayPal divisions. We believe PayPal is a key strategic asset and it should continue to see market share gains in the fast growing mobile payments arena. SolarWinds, a seller of licensed software for corporate and storage networks, had solid execution from new products and geographies. In our view, it has a unique strategy as the low cost, low touch, high performance provider of network management software using a telesales model, which should enable it to continue to take market share. Outside of Technology, Gilead Sciences in the Health Care sector, and TransDigm Group in Industrials were also key contributors. Gilead Sciences rallied on news that a major competitor put its HCV (hepatisis C virus) pipeline product on hold due to safety concerns, placing Gilead Sciences in a strong position with its own HCV product. Also, the U.S. FDA approved Gilead’s Quad pill (branded Stribild); it is the first four drug, single tablet, once-a-day, regimen for HIV. Lastly, aerospace/defense provider, TransDigm Group, gained ground due to strong revenue and margin trends, as well as continued execution of its acquisition strategy. We believe the firm has an attractive business model that focuses on the design of complex, low volume, low dollar value parts within an aircraft; it is the sole provider for the life of the aircraft (30 to 40 years) and typically generates close to 50% margins on these parts. Importantly, as the aforementioned stock positions rose during the year, we trimmed them, which is typical of our investment discipline. Other ancillary contributors were our sector underweights in Energy and Consumer Staples.
Conversely, Consumer stock selection for the year was disappointing. In Consumer Discretionary, Gentex announced pricing pressures, order volatility and lower industry volumes for its products. Our investment thesis was based on new products driving organic growth and higher average selling prices (ASPs) over the longer term. As a result, we eliminated the stock in July over the slowing product demand and stalled ASPs. In Consumer Staples, Mead Johnson Nutrition, a recent addition to the portfolio in June, trailed its sector peers. The stock lost ground given the firm’s recent performance related to a slowdown in Chinese consumer spending, and in hindsight, an ill timed price increase, which was met with temporary consumer resistance and market share loss. We believe these are near-term issues and the long-term investment thesis remains intact; we added to our existing position in the fourth quarter. In our view, it should benefit from the secular growth in emerging markets with the rising middle class and their desire for premium Western branded infant formula. Beyond the consumer group, NxStage Medical and Occidental Petroleum detracted from results. In Health Care, NxStage Medical reported weaker-than-expected patient additions for
6 Annual Report | December 31, 2012 |
home hemodialysis (HHD) reflecting a deceleration from last year. Despite these results, we remain confident in our long-term secular thesis; HHD improves the quality of life of patients through faster recovery times and we believe it will benefit from increased patient usage over time. Consequently, we increased our position in the fourth quarter. In Energy, Occidental Petroleum has been an absolute and relative underperformer this year. The company modified its strategy three years ago to place a greater focus on production growth. At the time, we found this strategy shift compelling; however, the company has struggled to achieve production growth in a cost and capital efficient manner. We sold the stock because we believe it will take an extended period to resolve these strategy issues.
In terms of changes over 2012, there were no major shifts in sector positioning for the year. In regards to market capitalization, our exposure to large cap stocks has increased from 40% to 53% based on our bottom up, fundamental work, and our mid and small cap weights declined about equally.
Going forward, many positive factors remain for the U.S. economy. The Federal Reserve’s accommodative policies continue, while the labor and housing markets recover albeit at a slow pace. That said, macro issues remain in the headlines, most notably the government debt ceiling and decisions regarding government deficits. The need to trim deficits may cause an intermediate-term headwind to growth, given likely spending cuts. Overseas, while Europe has stabilized with the announcement of OMT (Outright Monetary Transactions), uncertainties remain on implementation and economic growth has ground to a halt. For emerging market countries, the level of growth remains debatable; however, economies, particularly China, appear to be stabilizing.
In our view, stocks remain reasonably valued, especially in relation to bonds. While many investors continue to seek the safety of fixed income securities, stocks have continued to rise despite a substantial asset flow headwind. That said, a critical issue for the market remains peak operating margins. Those companies that can produce positive operating leverage in 2013 should be rewarded. We focus—as always—on fundamental analysis in an attempt to identify quality growth companies that sustain and improve upon their competitive position and earnings versus peers. Long-term, we believe investors differentiate between average companies and those with superior growth and quality characteristics in which we invest. In 2012, we began to see this distinguishing behavior take place again, which assisted performance results for our strategy.
December 31, 2012 | William Blair Funds 7 |
Growth Fund
Performance Highlights (Unaudited)
Average Annual Total Return at 12/31/2012
| | | | | | | | | | | | | | | | |
| | | 1
Year | | | 3
Year | | | 5
Year | | | 10
Year | |
Class N | | | 15.67 | % | | | 8.97 | % | | | 2.32 | % | | | 7.59 | % |
Class I | | | 16.03 | | | | 9.30 | | | | 2.65 | | | | 7.92 | |
Russell 3000® Growth | | | 15.21 | | | | 11.46 | | | | 3.15 | | | | 7.69 | |
S&P 500 | | | 16.00 | | | | 10.87 | | | | 1.66 | | | | 7.10 | |
Performance cited represents past performance. Past performance does not guarantee future results and current performance may be lower or higher than the data quoted. Results shown are average annual returns, which assume reinvestment of dividends and capital gains. Investment returns and principal will fluctuate and you may have a gain or loss when you sell shares. For the most current month-end performance information, please call 1-800-742-7272, or visit our Web site at www.williamblairfunds.com. Class N shares are available to the general public without a sales load. Class I shares are available to certain institutional investors and advisory clients of William Blair & Company L.L.C. without a sales load or distribution (12b-1) or service fees.
The performance highlights and graph presented above do not reflect the deduction of taxes that a shareholder would pay on fund distributions or the redemption of fund shares.
The Russell 3000® Growth Index consists of large, medium, and small capitalization companies with above average price-to-book ratios and forecasted growth rates. The index is weighted by market capitalization and large/medium/small companies make up approximately 80%/15%/5% of the index.
The S&P 500 Index indicates broad larger capitalization equity market performance.
This report identifies the Fund’s investments on December 31, 2012. These holdings are subject to change. Not all stocks in the Fund performed the same, nor is there any guarantee that these stocks will perform as well in the future. Market forecasts provided in this report may not necessarily come to pass.
Sector Diversification (Unaudited)
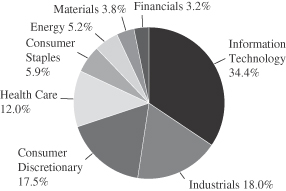
The sector diversification shown is based on the total long-term securities.
8 Annual Report | December 31, 2012 |
Growth Fund
Portfolio of Investments, December 31, 2012 (all dollar amounts in thousands)
| | | | | | | | |
Issuer | | Shares | | | Value | |
| | |
Common Stocks | | | | | | | | |
Information Technology—33.8% | | | | | | | | |
Apple, Inc. | | | 92,185 | | | $ | 49,137 | |
*Citrix Systems, Inc. | | | 267,800 | | | | 17,608 | |
*Cognizant Technology Solutions Corporation | | | 162,800 | | | | 12,055 | |
*eBay, Inc. | | | 500,100 | | | | 25,515 | |
*F5 Networks, Inc. | | | 98,600 | | | | 9,579 | |
Genpact, Ltd.† | | | 1,065,805 | | | | 16,520 | |
*Google, Inc. | | | 51,705 | | | | 36,678 | |
Mastercard, Inc. | | | 57,500 | | | | 28,249 | |
QUALCOMM, Inc. | | | 465,040 | | | | 28,842 | |
*RealPage, Inc. | | | 451,361 | | | | 9,736 | |
*SolarWinds, Inc. | | | 157,500 | | | | 8,261 | |
| | | | | | | | |
| | | | | | | 242,180 | |
| | | | | | | | |
Industrials—17.7% | | | | | | | | |
*B/E Aerospace, Inc. | | | 193,100 | | | | 9,539 | |
*Encore Capital Group, Inc. | | | 75,872 | | | | 2,323 | |
Fastenal Co. | | | 377,558 | | | | 17,628 | |
*IHS, Inc. | | | 78,931 | | | | 7,577 | |
*Jacobs Engineering Group, Inc. | | | 396,800 | | | | 16,892 | |
Precision Castparts Corporation | | | 102,400 | | | | 19,397 | |
*Stericycle, Inc. | | | 143,200 | | | | 13,356 | |
TransDigm Group, Inc. | | | 77,580 | | | | 10,579 | |
*Trimas Corporation | | | 342,023 | | | | 9,563 | |
Union Pacific Corporation | | | 160,500 | | | | 20,178 | |
| | | | | | | | |
| | | | | | | 127,032 | |
| | | | | | | | |
Consumer Discretionary—17.3% | | | | | | | | |
*Amazon.com, Inc. | | | 74,400 | | | | 18,685 | |
*Discovery Communications, Inc. | | | 190,800 | | | | 12,112 | |
Harley-Davidson, Inc. | | | 338,999 | | | | 16,557 | |
*K12, Inc. | | | 284,942 | | | | 5,824 | |
McDonald’s Corporation | | | 238,164 | | | | 21,008 | |
*Pandora Media, Inc. | | | 973,783 | | | | 8,939 | |
*Sally Beauty Holdings, Inc. | | | 296,900 | | | | 6,998 | |
Tractor Supply Co. | | | 121,500 | | | | 10,736 | |
*Vera Bradley, Inc. | | | 332,100 | | | | 8,336 | |
Yum! Brands, Inc. | | | 215,900 | | | | 14,336 | |
| | | | | | | | |
| | | | | | | 123,531 | |
| | | | | | | | |
Health Care—11.8% | | | | | | | | |
Allergan, Inc. | | | 210,600 | | | | 19,318 | |
*Gilead Sciences, Inc. | | | 225,635 | | | | 16,573 | |
*Haemonetics Corporation | | | 339,600 | | | | 13,869 | |
*HMS Holdings Corporation | | | 435,862 | | | | 11,297 | |
Issuer | | Shares or
Principal
Amount | | | Value | |
| | |
Common Stocks—(continued) | | | | | | | | |
Health Care—(continued) | | | | | | | | |
*IDEXX Laboratories, Inc. | | | 98,618 | | | $ | 9,152 | |
*Illumina, Inc. | | | 130,700 | | | | 7,266 | |
*NxStage Medical, Inc. | | | 632,900 | | | | 7,120 | |
| | | | | | | | |
| | | | | | | 84,595 | |
| | | | | | | | |
Consumer Staples—5.8% | | | | | | | | |
Costco Wholesale Corporation | | | 182,100 | | | | 17,986 | |
*Green Mountain Coffee Roasters, Inc. | | | 224,100 | | | | 9,269 | |
Mead Johnson Nutrition Co. | | | 221,800 | | | | 14,614 | |
| | | | | | | | |
| | | | | | | 41,869 | |
| | | | | | | | |
Energy—5.1% | | | | | | | | |
*Cameron International Corporation | | | 229,947 | | | | 12,983 | |
Schlumberger, Ltd.† | | | 340,200 | | | | 23,572 | |
| | | | | | | | |
| | | | | | | 36,555 | |
| | | | | | | | |
Materials—3.8% | | | | | | | | |
Airgas, Inc. | | | 162,800 | | | | 14,862 | |
Ecolab, Inc. | | | 170,120 | | | | 12,232 | |
| | | | | | | | |
| | | | | | | 27,094 | |
| | | | | | | | |
Financials—3.2% | | | | | | | | |
*IntercontinentalExchange, Inc. | | | 140,600 | | | | 17,408 | |
LPL Financial Holdings, Inc. | | | 194,800 | | | | 5,485 | |
| | | | | | | | |
| | | | | | | 22,893 | |
| | | | | | | | |
Total Common Stocks—98.5%
(cost $581,999) | | | | 705,749 | |
| | | | | | | | |
| | |
Repurchase Agreement | | | | | | | | |
Fixed Income Clearing Corporation, 0.110% dated 12/31/12, due 1/2/13, repurchase price $11,407, collateralized by US Treasury Note, 2.125%, due 12/31/2015 | | $ | 11,407 | | | | 11,407 | |
| | | | | | | | |
Total Repurchase Agreement—1.6%
(cost $11,407) | | | | 11,407 | |
| | | | | | | | |
Total Investments—100.1%
(cost $593,406) | | | | 717,156 | |
Liabilities, plus cash and other assets—(0.1)% | | | | (911 | ) |
| | | | | | | | |
Net assets—100.0% | | | $ | 716,245 | |
| | | | | | | | |
* Non-income producing securities
† = U.S. listed foreign security
See accompanying Notes to Portfolio of Investments.
December 31, 2012 | William Blair Funds 9 |

James S. Golan

David P. Ricci
LARGE CAP GROWTH FUND
The Large Cap Growth Fund seeks long-term capital appreciation.
AN OVERVIEW FROM THE PORTFOLIO MANAGERS
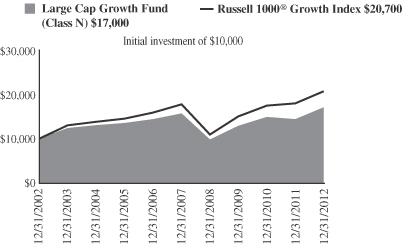
The William Blair Large Cap Growth Fund posted a 18.31% increase (Class N shares) for the year ended December 31, 2012. By comparison, the Fund’s benchmark, the Russell 1000® Growth Index, increased by 15.26%.
In 2012, investors continued to fluctuate between optimism and pessimism based on macroeconomic or political announcements. Market volatility remained, but less than recent years as there were fewer unknowns in the marketplace. In this environment, the Russell 1000® Growth Index rose 15.26%, and climbed the proverbial “wall of worry.” In general by the fourth quarter, there was evidence that the global economy, ex-Europe, had stabilized after a slowing in the middle of the year. From a sector perspective, cyclical sectors such as Financials and Consumer Discretionary as well as Health Care performed best. Energy stocks were a drag as were more defensive Utilities and Consumer Staples sectors.
The primary driver of our results within the Fund was strong stock selection across multiple sectors, as is our goal from our fundamentally driven investment process. Technology stock positioning stood out due a large weight in eBay. The company reported strong revenue growth from both its Marketplace and PayPal divisions. We believe PayPal is a key strategic asset and it should continue to see market share gains in the fast growing mobile payments arena. Within Health Care, Gilead Sciences rallied on news that a major competitor put its HCV (hepatitis C virus) pipeline product on hold due to safety concerns, placing Gilead Sciences in a strong position with its own HCV product. Also, the U.S. FDA approved Gilead’s Quad pill (branded Stribild); it is the first four drug, single tablet, once-a-day, regimen for HIV. In the Telecommunications sector, SBA Communications notably contributed; it reported better than expected revenues and cash flows. Additionally, investors were optimistic on AT&T’s announcement for a significant ramp in capital expenditures in order to build out its 4G network, which we believe should be a positive for the tower industry and SBA Communications. Lastly, in Consumer Discretionary, Discovery Communications benefited from strong revenues and operating profits; international growth was particularly impressive. Over the long-term, the company’s earnings growth should be driven by higher affiliate fees with broader distribution and higher prices per subscriber as the company reformats existing networks. We believe it should also experience market share gains in advertising with viewership growth, as well as margin expansion through scale efficiency, cost controls and ramping its international advertising sales effort. Importantly, as these stock positions mentioned above rose during the year, we trimmed them, which is typical of our investment discipline. Other ancillary contributors were our sector underweight in Energy and overweight in Technology.
Despite the success in stock selection, there were a few modest detractors in the year. In the consumer group, both Mead Johnson and Dollar General lagged peers. In Consumer Staples, Mead Johnson Nutrition lost ground given the firm’s recent performance in China related to a slowdown in Chinese consumer spending, and in hindsight, an ill timed price increase, which was met with temporary consumer resistance and market share loss. We believe these are near-term issues and the long-term investment thesis remains intact. Mead Johnson should benefit from the secular growth in emerging markets with the rising middle class and their desire for premium branded Western infant formula. Within Consumer Discretionary, Dollar General declined on slowing store sales growth. In general, dollar stores have come under pressure recently given reduced spending by lower end consumers as worries over government debt and tax policies flared up at a time when government assistance programs
are leveling. In our view, the company offers an attractive combination of consumer value
10 Annual Report | December 31, 2012 |
and convenience, which should facilitate further store expansion and market share gains over time. Outside of consumer groups, select Energy holdings trailed, particularly Occidental Petroleum and Schlumberger. Occidental Petroleum modified its strategy three years ago to place a greater focus on production growth. At the time, we found this strategy shift compelling; however, the company has struggled to achieve production growth in a cost and capital efficient manner. We sold the stock because we believe it will take an extended period to resolve these strategy issues. Schlumberger remains one of our top ten positions, and in the long-term, it should benefit from increased deepwater exploration in international markets. Lastly, there were no major shifts in sector or market cap positioning for the year.
Going forward, many positive factors remain for the U.S. economy. The Federal Reserve’s accommodative policies continue, while the labor and housing markets recover albeit at a slow pace. That said, macro issues remain in the headlines, most notably the government debt ceiling and decisions regarding government deficits. The need to trim deficits may cause an intermediate-term headwind to growth, given likely spending cuts. Overseas, while Europe has stabilized with the announcement of OMT (Outright Monetary Transactions), uncertainties remain on implementation and economic growth has ground to a halt. For emerging market countries, the level of growth remains debatable; however, economies, particularly China, appear to be stabilizing.
In our view, stocks remain reasonably valued, especially in relation to bonds. While many investors continue to seek the safety of fixed income securities, stocks have continued to rise despite a substantial asset flow headwind. That said, a critical issue for the market remains peak operating margins. Those companies that can produce positive operating leverage in 2013 should be rewarded. We focus—as always—on fundamental analysis in an attempt to identify quality growth companies that sustain and improve upon their competitive position and earnings versus peers. Long-term, we believe investors differentiate between average companies and those with superior growth and quality characteristics in which we invest. In 2012, we began to see this distinguishing behavior take place again, which assisted performance results for our strategy.
December 31, 2012 | William Blair Funds 11 |
Large Cap Growth Fund
Performance Highlights (Unaudited)
Average Annual Total Return 12/31/2012
| | | | | | | | | | | | | | | | |
| | | 1
Year | | | 3
Year | | | 5
Year | | | 10
Year | |
Class N | | | 18.31 | % | | | 9.74 | % | | | 1.60 | % | | | 5.42 | % |
Class I | | | 18.78 | | | | 9.96 | | | | 1.87 | | | | 5.69 | |
Russell 1000® Growth | | | 15.26 | | | | 11.35 | | | | 3.12 | | | | 7.52 | |
Performance cited represents past performance. Past performance does not guarantee future results and current performance may be lower or higher than the data quoted. Results shown are average annual total returns, which assume reinvestment of dividends and capital gains. Investment returns and principal will fluctuate and you may have a gain or loss when you sell shares. For the most current month-end performance information, please call 1-800-742-7272, or visit our Web site at www.williamblairfunds.com. From time to time, the investment advisor may waive fees or reimburse expenses for the Fund. Without these waivers, performance would be lower. Class N shares are available to the general public without a sales load. Class I shares are available to certain institutional investors and advisory clients of William Blair & Company, L.L.C., without a sales load or distribution (12b-1) or service fees.
The performance highlights and graph presented above do not reflect the deduction of taxes that a shareholder would pay on fund distributions or the redemption of fund shares.
The Russell 1000® Growth Index consists of large capitalization companies with above average price-to-book ratios and forecasted growth rates.
This report identifies the Fund’s investments on December 31, 2012. These holdings are subject to change. Not all stocks in the Fund performed the same, nor is there any guarantee that these stocks will perform as well in the future. Market forecasts provided in this report may not necessarily come to pass.
Sector Diversification (Unaudited)
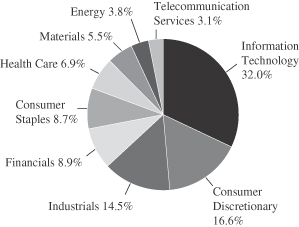
The sector diversification shown is based on the total long-term securities.
12 Annual Report | December 31, 2012 |
Large Cap Growth Fund
Portfolio of Investments, December 31, 2012 (all dollar amounts in thousands)
| | | | | | | | |
Issuer | | Shares | | | Value | |
| | |
Common Stocks | | | | | | | | |
Information Technology—31.6% | | | | | | | | |
Apple, Inc. | | | 5,275 | | | $ | 2,812 | |
*Citrix Systems, Inc. | | | 12,840 | | | | 844 | |
*Cognizant Technology Solutions Corporation Class “A” | | | 11,780 | | | | 872 | |
*eBay, Inc. | | | 16,490 | | | | 842 | |
*Google, Inc. Class “A” | | | 1,858 | | | | 1,318 | |
Mastercard, Inc. Class “A” | | | 2,085 | | | | 1,024 | |
QUALCOMM, Inc. | | | 15,025 | | | | 932 | |
*Trimble Navigation, Ltd. | | | 5,440 | | | | 325 | |
| | | | | | | | |
| | | | | | | 8,969 | |
| | | | | | | | |
Consumer Discretionary—16.4% | | | | | | | | |
*Amazon.com, Inc. | | | 1,500 | | | | 377 | |
*Discovery Communications, Inc. Class “A” | | | 12,810 | | | | 813 | |
*Dollar General Corporation | | | 12,660 | | | | 558 | |
Harley-Davidson, Inc. | | | 14,640 | | | | 715 | |
*priceline.com, Inc. | | | 1,051 | | | | 653 | |
Starbucks Corporation | | | 18,740 | | | | 1,005 | |
Yum! Brands, Inc. | | | 8,390 | | | | 557 | |
| | | | | | | | |
| | | | | | | 4,678 | |
| | | | | | | | |
Industrials—14.3% | | | | | | | | |
Donaldson Co., Inc. | | | 20,590 | | | | 676 | |
Precision Castparts Corporation | | | 6,730 | | | | 1,275 | |
*Stericycle, Inc. | | | 8,100 | | | | 755 | |
Union Pacific Corporation | | | 8,190 | | | | 1,030 | |
W.W. Grainger, Inc. | | | 1,610 | | | | 326 | |
| | | | | | | | |
| | | | | | | 4,062 | |
| | | | | | | | |
Financials—8.8% | | | | | | | | |
*Affiliated Managers Group, Inc. | | | 5,200 | | | | 677 | |
JPMorgan Chase & Co. | | | 29,350 | | | | 1,290 | |
T Rowe Price Group, Inc. | | | 8,350 | | | | 544 | |
| | | | | | | | |
| | | | | | | 2,511 | |
| | | | | | | | |
Consumer Staples—8.6% | | | | | | | | |
Colgate-Palmolive Co. | | | 8,850 | | | | 925 | |
*Green Mountain Coffee Roasters, Inc. | | | 12,530 | | | | 518 | |
Mead Johnson Nutrition Co. | | | 11,960 | | | | 788 | |
Whole Foods Market, Inc. | | | 2,220 | | | | 203 | |
| | | | | | | | |
| | | | | | | 2,434 | |
| | | | | | | | |
| | | | | | | | |
Issuer | | Shares or
Principal
Amount | | | Value | |
| | |
Common Stocks—(continued) | | | | | | | | |
Health Care—6.9% | | | | | | | | |
Allergan, Inc. | | | 8,085 | | | $ | 741 | |
*Gilead Sciences, Inc. | | | 11,010 | | | | 809 | |
*IDEXX Laboratories, Inc. | | | 4,340 | | | | 403 | |
| | | | | | | | |
| | | | | | | 1,953 | |
| | | | | | | | |
Materials—5.4% | | | | | | | | |
Monsanto Co. | | | 10,970 | | | | 1,038 | |
Praxair, Inc. | | | 4,645 | | | | 509 | |
| | | | | | | | |
| | | | | | | 1,547 | |
| | | | | | | | |
Energy—3.8% | | | | | | | | |
Schlumberger, Ltd.† | | | 15,490 | | | | 1,073 | |
| | | | | | | | |
Telecommunication Services—3.1% | | | | | | | | |
*SBA Communications Corporation
Class “A” | | | 12,330 | | | | 876 | |
| | | | | | | | |
Total Common Stocks—98.9%
(cost $22,083) | | | | 28,103 | |
| | | | | | | | |
| | |
Repurchase Agreement | | | | | | | | |
Fixed Income Clearing Corporation, 0.110% dated 12/31/12, due 1/2/13, repurchase price $265, collateralized by U.S. Treasury Note, 2.125%, due 12/31/15 | | $ | 265 | | | | 265 | |
| | | | | | | | |
Total Repurchase Agreement—0.9%
(cost $265) | | | | 265 | |
| | | | | | | | |
Total Investments—99.8%
(cost $22,348) | | | | 28,368 | |
Cash and other assets, less liabilities—0.2% | | | | 45 | |
| | | | | | | | |
Net assets—100.0% | | | $ | 28,413 | |
| | | | | | | | |
See accompanying Notes to Portfolio of Investments.
December 31, 2012 | William Blair Funds 13 |
* Non-income producing securities
† = U.S. listed foreign security

Michael P. Balkin

Karl W. Brewer
SMALL CAP GROWTH FUND
The Small Cap Growth Fund seeks long-term capital appreciation.
AN OVERVIEW FROM THE PORTFOLIO MANAGERS
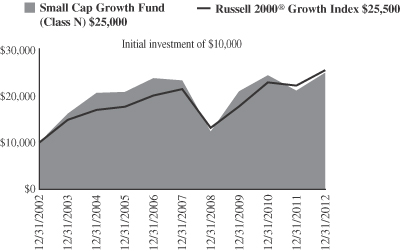
After another above-average total return for 2012 we now stand nearly four years into the current bull market, which began in early 2009. The William Blair Small Cap Growth Fund posted an 18.15% increase (Class N Shares) for the twelve months ended December 31, 2012. By comparison, the Fund’s benchmark, the Russell 2000® Growth Index, increased by 14.59%.
Improving US economic data points, especially housing-related, and global central bank actions were the primary drivers of equity market returns in 2012. Despite a brief correction mid-year due to elevated fears regarding Euro zone financial stability, emerging market growth and a pause in the US economic recovery, most small and mid cap indices finished the year near all-time highs. Propelling the market higher in the back half of the year was European Central Bank messaging and actions, which restored confidence in Spanish and Italian borrowing capacity and the overall sustainability of the currency bloc. In the US, the Federal Reserve announced new quantitative easing programs aimed to maintain low government and consumer borrowing rates. Finally, investors cheered further improvements in the housing industry. Rebounding home prices and homebuilding activity positively impacts housing-related employment and overall consumer confidence. Thus, the market digested the possibility of a more sustainable domestic economic recovery.
The William Blair Small Cap Growth Fund’s 2012 outperformance is attributable to positive stock picks and a modest style benefit. While style factors were mostly muted this year for our strategy, our valuation sensitivity was a modest tailwind, primarily driven by fourth quarter market forces. From a stock selection front, Kensey Nash was the top performer during the year after being one of the largest underperformers in the Fund the previous year. On Assignment, SolarWinds and TriMas were other notable winners in the strategy this year. On the other hand, NxStage Medical, U.S. Auto Parts and Polypore International were detractors from return. Our typical lack of ownership in the outperforming Biotechnology and Real Estate Investment Trusts (REITs) industries detracted as well, despite the overall outperformance.
Despite progress on certain fronts in the US and abroad during 2012, there remain several uncertainties the market will grapple with in 2013. In the US, the late 2012 “fiscal cliff” negotiations produced some clarity on tax policy, but government spending policy remains in flux. These discussions will take center stage in the coming months along with a renewed debt-ceiling debate. On the other hand, the improving housing market and overall economy in the US provides some ballast to these downside risks. Outside the US, European Central Bank activities have suppressed fears of draconian scenarios but financial stability, government budget and economic risks continue to exist in the region. Finally, while there are signs the Chinese economy has shown some improvement, investors will keep a close eye on this important global economic engine.
Equity valuations expanded in 2012, but they begin the year near long-term averages and thus should be neither a tailwind nor headwind to equity returns. Profit margins are elevated and therefore a premium should be placed on companies with above-average revenue growth opportunities, such as the companies in which we seek to invest. Corporate balance sheets remain strong and should provide companies the ability to invest or increase merger and acquisition activities, both of which would be a tailwind for the stock market.
We continue to find good ideas across sectors and are confident the Fund’s portfolio consists of well-managed companies with solid competitive positions whose stocks are at reasonable valuations compared to the expected growth and consistency of their business.
14 Annual Report | December 31, 2012 |
Small Cap Growth Fund
Performance Highlights (Unaudited)
Average Annual Total Return at 12/31/2012
| | | | | | | | | | | | | | | | |
| | | 1
Year | | | 3
Year | | | 5
Year | | | 10
Year | |
Class N | | | 18.15 | % | | | 5.96 | % | | | 1.40 | % | | | 9.57 | % |
Class I | | | 18.43 | | | | 6.26 | | | | 1.69 | | | | 9.86 | |
Russell 2000® Growth | | | 14.59 | | | | 12.82 | | | | 3.49 | | | | 9.80 | |
Performance cited represents past performance. Past performance does not guarantee future results and current performance may be lower or higher than the data quoted. Results shown are average annual total returns, which assume reinvestment of dividends and capital gains. Investment returns and principal will fluctuate and you may have a gain or loss when you sell shares. For the most current month-end performance information, please call 1-800-742-7272, or visit our Web site at www.williamblairfunds.com. Investing in smaller companies involves special risks, including higher volatility and lower liquidity. Smaller Capitalization stocks are also more sensitive to purchase/sale transactions and changes in the issuer’s financial condition. From time to time, the investment advisor may waive fees or reimburse expenses for the Fund. Without these waivers, performance would be lower. Class N shares are available to the general public without a sales load. Class I shares are available to certain institutional investors and advisory clients of William Blair & Company, L.L.C., without a sales load or distribution (12b-1) or service fees.
The performance highlights and graph presented above do not reflect the deduction of taxes that a shareholder would pay on fund distributions or the redemption of fund shares.
The Russell 2000® Growth Index is an unmanaged composite of the smallest 2000 stocks of the Russell 3000® Growth Index.
This report identifies the Fund’s investments on December 31, 2012. These holdings are subject to change. Not all stocks in the Fund performed the same, nor is there any guarantee that these stocks will perform as well in the future. Market forecasts provided in this report may not necessarily come to pass.
Sector Diversification (Unaudited)
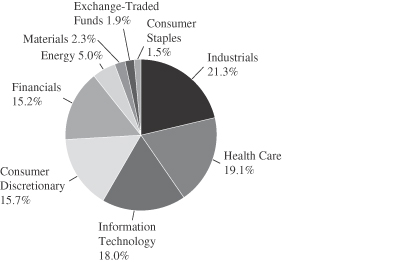
The sector diversification shown is based on the total long-term securities.
December 31, 2012 | William Blair Funds 15 |
Small Cap Growth Fund
Portfolio of Investments, December 31, 2012 (all dollar amounts in thousands)
| | | | | | | | |
Issuer | | Shares | | | Value | |
| | |
Common Stocks | | | | | | | | |
Industrials—20.5% | | | | | | | | |
Acorn Energy, Inc. | | | 425,352 | | | $ | 3,322 | |
Barrett Business Services, Inc. | | | 70,561 | | | | 2,688 | |
*CAI International, Inc. | | | 570,283 | | | | 12,518 | |
*Clean Harbors, Inc. | | | 78,150 | | | | 4,299 | |
*Encore Capital Group, Inc. | | | 235,122 | | | | 7,199 | |
*Franklin Covey Co. | | | 584,703 | | | | 7,543 | |
*Furmanite Corporation | | | 536,272 | | | | 2,880 | |
Healthcare Services Group, Inc. | | | 157,768 | | | | 3,665 | |
*Heritage-Crystal Clean, Inc. | | | 209,999 | | | | 3,152 | |
*Huron Consulting Group, Inc. | | | 174,307 | | | | 5,872 | |
*ICF International, Inc. | | | 191,054 | | | | 4,478 | |
*Navigant Consulting, Inc. | | | 263,525 | | | | 2,941 | |
*Old Dominion Freight Line, Inc. | | | 68,520 | | | | 2,349 | |
*On Assignment, Inc. | | | 142,965 | | | | 2,899 | |
*Performant Financial Corporation | | | 255,490 | | | | 2,580 | |
*Trimas Corporation | | | 280,932 | | | | 7,855 | |
US Ecology, Inc. | | | 209,799 | | | | 4,939 | |
| | | | | | | | |
| | | | | | | 81,179 | |
| | | | | | | | |
Health Care—18.3% | | | | | | | | |
*ABIOMED, Inc. | | | 133,080 | | | | 1,791 | |
Air Methods Corporation | | | 134,406 | | | | 4,958 | |
*Brookdale Senior Living, Inc. | | | 151,872 | | | | 3,845 | |
*Conceptus, Inc. | | | 167,279 | | | | 3,514 | |
*Cyberonics, Inc. | | | 101,521 | | | | 5,333 | |
*ExamWorks Group, Inc. | | | 486,851 | | | | 6,811 | |
*Haemonetics Corporation | | | 172,052 | | | | 7,027 | |
*HealthSouth Corporation | | | 168,345 | | | | 3,554 | |
*HMS Holdings Corporation | | | 179,157 | | | | 4,644 | |
*Novadaq Technologies, Inc.† | | | 364,631 | | | | 3,238 | |
*NxStage Medical, Inc. | | | 483,182 | | | | 5,436 | |
*Quidel Corporation | | | 251,469 | | | | 4,695 | |
*Spectranetics Corporation | | | 334,767 | | | | 4,944 | |
*TearLab Corporation | | | 536,909 | | | | 2,201 | |
*The Providence Service Corporation | | | 339,643 | | | | 5,771 | |
Trinity Biotech plc—ADR | | | 347,010 | | | | 5,004 | |
| | | | | | | | |
| | | | | | | 72,766 | |
| | | | | | | | |
Information Technology—17.4% | | | | | | | | |
*Audience, Inc. | | | 335,151 | | | | 3,482 | |
*Bottomline Technologies, Inc. | | | 292,927 | | | | 7,730 | |
*Cardtronics, Inc. | | | 161,234 | | | | 3,828 | |
*Envestnet, Inc. | | | 158,725 | | | | 2,214 | |
*Exar Corporation | | | 387,541 | | | | 3,449 | |
*Guidewire Software, Inc. | | | 29,840 | | | | 887 | |
*Inuvo, Inc. | | | 1,886,947 | | | | 1,755 | |
*Liquidity Services, Inc. | | | 177,616 | | | | 7,258 | |
*OSI Systems, Inc. | | | 62,240 | | | | 3,986 | |
*RealPage, Inc. | | | 215,770 | | | | 4,654 | |
Syntel, Inc. | | | 61,417 | | | | 3,291 | |
*Tangoe, Inc. | | | 461,037 | | | | 5,473 | |
| | | | | | | | |
Issuer | | Shares | | | Value | |
| | |
Common Stocks—(continued) | | | | | | | | |
Information Technology—(continued) | | | | | | | | |
*TeleTech Holdings, Inc. | | | 215,730 | | | $ | 3,840 | |
*Ultimate Software Group, Inc. | | | 30,452 | | | | 2,875 | |
*ValueClick, Inc. | | | 190,875 | | | | 3,705 | |
*WEX, Inc. | | | 48,151 | | | | 3,629 | |
*WNS Holdings, Ltd.—ADR | | | 663,088 | | | | 6,909 | |
| | | | | | | | |
| | | | | | | 68,965 | |
| | | | | | | | |
Consumer Discretionary—15.1% | | | | | | | | |
Dorman Products, Inc. | | | 127,100 | | | | 4,492 | |
*Genesco, Inc. | | | 80,147 | | | | 4,408 | |
*Gentherm, Inc. | | | 546,474 | | | | 7,268 | |
*Jarden Corporation | | | 70,104 | | | | 3,624 | |
*K12, Inc. | | | 229,144 | | | | 4,684 | |
*Mattress Firm Holding Corporation | | | 139,100 | | | | 3,412 | |
MDC Partners, Inc.† | | | 234,912 | | | | 2,655 | |
*Pandora Media, Inc. | | | 847,728 | | | | 7,782 | |
*Select Comfort Corporation | | | 119,989 | | | | 3,140 | |
*SHFL Entertainment, Inc. | | | 255,923 | | | | 3,711 | |
Six Flags Entertainment Corporation | | | 144,091 | | | | 8,818 | |
*U.S. Auto Parts Network, Inc. | | | 1,091,812 | | | | 1,998 | |
*Vera Bradley, Inc. | | | 157,258 | | | | 3,947 | |
| | | | | | | | |
| | | | | | | 59,939 | |
| | | | | | | | |
Financials—14.7% | | | | | | | | |
*Cowen Group, Inc. | | | 2,171,714 | | | | 5,321 | |
*First Cash Financial Services, Inc. | | | 242,742 | | | | 12,045 | |
*FirstService Corporation† | | | 133,408 | | | | 3,770 | |
GFI Group, Inc. | | | 1,519,291 | | | | 4,922 | |
*ICG Group, Inc. | | | 749,921 | | | | 8,572 | |
Jones Lang LaSalle, Inc. | | | 63,744 | | | | 5,351 | |
Manning & Napier, Inc. | | | 357,011 | | | | 4,498 | |
Marlin Business Services Corporation | | | 197,161 | | | | 3,955 | |
*National Financial Partners Corporation | | | 573,551 | | | | 9,831 | |
| | | | | | | | |
| | | | | | | 58,265 | |
| | | | | | | | |
Energy—4.8% | | | | | | | | |
*Atwood Oceanics, Inc. | | | 84,052 | | | | 3,849 | |
*Dril-Quip, Inc. | | | 49,476 | | | | 3,614 | |
Gulfmark Offshore, Inc. | | | 70,430 | | | | 2,426 | |
*Hornbeck Offshore Services, Inc. | | | 95,069 | | | | 3,265 | |
*Oil States International, Inc. | | | 44,972 | | | | 3,217 | |
*PDC Energy, Inc. | | | 85,618 | | | | 2,844 | |
| | | | | | | | |
| | | | | | | 19,215 | |
| | | | | | | | |
Materials—2.2% | | | | | | | | |
*Horsehead Holding Corporation | | | 348,151 | | | | 3,555 | |
*Stillwater Mining Co. | | | 416,076 | | | | 5,317 | |
| | | | | | | | |
| | | | | | | 8,872 | |
| | | | | | | | |
Consumer Staples—1.4% | | | | | | | | |
Nu Skin Enterprises, Inc. | | | 150,253 | | | | 5,567 | |
| | | | | | | | |
See accompanying Notes to Portfolio of Investments.
16 Annual Report | December 31, 2012 |
Small Cap Growth Fund
Portfolio of Investments, December 31, 2012 (all dollar amounts in thousands)
| | | | | | | | |
Issuer | | Shares or
Principal
Amount | | | Value | |
| | |
Common Stocks—(continued) | | | | | | | | |
Total Common Stocks—94.4%
(cost $335,034) | | | $ | 374,768 | |
| | | | | | | | |
| | |
Exchange-Traded Fund | | | | | | | | |
iShares Russell 2000 Growth Index Fund | | | 77,993 | | | | 7,433 | |
| | | | | | | | |
Total Exchange-Traded Fund—1.9%
(cost $7,257) | | | | 7,433 | |
| | | | | | | | |
| | |
Repurchase Agreement | | | | | | | | |
Fixed Income Clearing Corporation, 0.110% dated 12/31/12, due 1/2/13, repurchase price $13,843, collateralized by U.S. Treasury Notes, 1.375%—2.125%, due 11/30/15—12/31/15 | | | 13,843 | | | | 13,843 | |
| | | | | | | | |
Total Repurchase Agreement—3.5%
(cost $13,843) | | | | 13,843 | |
| | | | | | | | |
Total Investments—99.8%
(cost $356,134) | | | | 396,044 | |
Cash and other assets, less liabilities—0.2% | | | | 769 | |
| | | | | | | | |
Net assets—100.0% | | | $ | 396,813 | |
| | | | | | | | |
ADR = American Depository Receipt
* Non-income producing securities
† = U.S. listed foreign security
If the Fund’s portfolio holdings represent ownership of 5% or more of the voting securities of a company, the company is deemed to be an affiliate as defined in the Investment Company Act of 1940. The Small Cap Growth Fund had the following transactions during the year ended December 31, 2012 with companies deemed affiliated during the year or at December 31, 2012.
| | | | | | | | | | | | | | | | | | | | | | | | | | |
| | | | | Share Activity | | | Year Ended
December 31, 2012 | |
| | | | | | | | | | | | | | | | | (in thousands) | |
Security Name | | Balance
12/31/2011 | | | Purchases | | | Sales | | | Balance
12/31/2012 | | | Value | | | Dividends
Included
in Income | |
| | Dreams, Inc. | | | 2,671,926 | | | | 119,643 | | | | 2,791,569 | | | | — | | | $ | — | | | $ | — | |
p | | Inuvo, Inc. | | | 861,747 | | | | 1,309,992 | | | | 284,792 | | | | 1,886,947 | | | | 1,755 | | | | — | |
| | Kensey Nash Corporation | | | 483,937 | | | | 44,009 | | | | 527,946 | | | | — | | | | — | | | | 217 | |
* | | Vertro, Inc. | | | 847,343 | | | | — | | | | 847,343 | | | | — | | | | — | | | | — | |
| | | | | | | | | | | | | | | | | | | | | | | | | | |
| | | | | | | | | | | | | | | | | | | | $ | 1,755 | | | $ | 217 | |
| | | | | | | | | | | | | | | | | | | | | | | | | | |
p Affiliated company at December 31, 2012. The Small Cap Growth Fund’s total value in companies deemed to be affiliated at December 31, 2012 was $ 1,755 ( in thousands).
* Vertro, Inc. was acquired by Inuvo, Inc. at a rate of 1.546 per share of Inuvo, Inc. for each share of Vetro, Inc. on March 2, 2012.
Affiliate companies accounted for $(15,309) of the net realized loss on investments and $(21,044) of the change in net unrealized (depreciation) on investments during the year.
See accompanying Notes to Portfolio of Investments.
December 31, 2012 | William Blair Funds 17 |

Robert C. Lanphier, IV
David P. Ricci
MID CAP GROWTH FUND
The Mid Cap Growth Fund seeks long-term capital appreciation.
AN OVERVIEW FROM THE PORTFOLIO MANAGERS
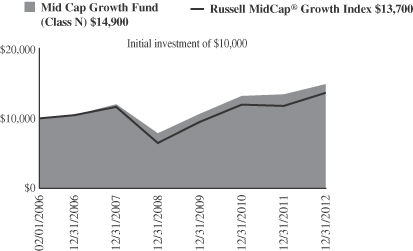
After another above-average total return for 2012 we now stand nearly four years into the current bull market, which began in early 2009. The William Blair Mid Cap Growth Fund posted a 10.90% increase (Class N Shares) for the twelve months ended December 31, 2012. By comparison, the Fund’s benchmark, the Russell Midcap® Growth Index, increased by 15.81%.
While this review is focused on 2012, we believe it is appropriate to add a brief perspective on our intermediate term performance. Our five-year relative performance, which includes nearly a full market cycle, remains well above benchmark. However, our Fund’s subdued relative performance over the past three years is partially the result of the market’s unsustainably strong returns in three of the last four calendar years, producing a 110% benchmark four-year cumulative return. Looking forward, while not overly bearish, we believe the market environment over the next three to five years will be more normalized (and therefore more conducive to our style of investing) and remain confident in our ability to produce the level of outperformance our shareholders expect over the long run.
Improving US economic data points, especially housing-related, and global central bank actions were the primary drivers of equity market returns in 2012. Despite a brief correction mid-year due to elevated fears regarding Euro zone financial stability, emerging market growth and a pause in the US economic recovery, most small and mid cap indices finished the year near all-time highs. Propelling the market higher in the back half of the year was European Central Bank messaging and actions, which restored confidence in Spanish and Italian borrowing capacity and the overall sustainability of the currency bloc. In the US, the Federal Reserve announced new quantitative easing programs aimed to maintain low government and consumer borrowing rates. Finally, investors cheered further improvements in the housing industry. Rebounding home prices and homebuilding activity positively impacts housing-related employment and overall consumer confidence. Thus, the market digested the possibility of a more sustainable domestic economic recovery.
The William Blair Mid Cap Growth Fund’s 2012 underperformance is attributable to style and industry headwinds and negative stock selection. Given the strong market return, our more conservative investment style (typical lower portfolio beta) was a headwind during the year. Our lack of ownership in outperforming industries such as Biotechnology and Real Estate Investment Trusts (REITs) detracted from relative performance as well. We have historically not invested in these areas due to lack of quality (Biotechnology) or lack of growth (REITs). From a stock specific perspective, Gentex, HMS Holdings, Gardner Denver and Clean Harbors all detracted from relative performance. We liquidated Gentex and Gardner Denver, but continue to believe HMS Holdings and Clean Harbors will be good investments. On the other hand, Illumina, SBA Communications and SolarWinds were stock picks that helped partially offset the overall underperformance during the year.
Despite progress on certain fronts in the US and abroad during 2012, there remain several uncertainties the market will grapple with in 2013. In the US, the late 2012 “fiscal cliff” negotiations produced some clarity on tax policy, but government spending policy remains in flux. These discussions will take center stage in the coming months along with a renewed debt-ceiling debate. In addition, the increase in payroll taxes will likely be a headwind for consumer spending and could potentially shift market leadership away from the consumer discretionary sector. On the other hand, the improving housing market and overall economy in the US provides some ballast to these downside risks. Outside the US, European Central
18 Annual Report | December 31, 2012 |
Bank activities have suppressed fears of draconian scenarios but financial stability, government budget and economic risks remain. And while the Chinese economy has improved, investors will keep a close eye on this important global economic engine.
Equity valuations expanded in 2012, but they begin the year near long-term averages. Profit margins are elevated and therefore a premium should be placed on companies with above-average revenue growth opportunities, such as the companies in which we seek to invest. Corporate balance sheets remain strong, providing companies the ability to invest or increase merger and acquisition activities, both of which would be a tailwind for the stock market.
We continue to find good ideas across sectors, and are confident the Fund’s portfolio consists of well-managed companies with solid competitive positions whose stocks are at reasonable valuations compared to the expected growth and consistency of their business.
December 31, 2012 | William Blair Funds 19 |
Mid Cap Growth Fund
Performance Highlights (Unaudited)
Average Annual Total Return at 12/31/2012
| | | | | | | | | | | | | | | | |
| | | 1
Year | | | 3
Year | | | 5
Year | | | Since
Inception(a) | |
Class N | | | 10.90 | % | | | 11.81 | % | | | 4.42 | % | | | 5.92 | % |
Class I | | | 11.30 | | | | 12.12 | | | | 4.71 | | | | 6.22 | |
Russell Midcap®
Growth | | | 15.81 | | | | 12.91 | | | | 3.23 | | | | 4.57 | |
| | (a) | | For the period from February 1, 2006 (Commencement of Operations) to December 31, 2012. |
Performance cited represents past performance. Past performance does not guarantee future results and current performance may be lower or higher than the data quoted. Results shown are average annual total returns, which assume reinvestment of dividends and capital gains. Investment returns and principal will fluctuate and you may have a gain or loss when you sell shares. For the most current month-end performance information, please call 1-800-742-7272, or visit our Web site at www.williamblairfunds.com. Investing in medium capitalization companies involves special risks, including higher volatility and lower liquidity. Medium Capitalization stocks are also more sensitive to purchase/sale transactions and changes in the issuer’s financial condition. From time to time, the investment advisor may waive fees or reimburse expenses for the Fund. Without these waivers, performance would be lower. Class N shares are available to the general public without a sales load. Class I shares are available to certain institutional investors and advisory clients of William Blair & Company, L.L.C., without a sales load or distribution (12b-1) or service fees.
The performance highlights and graph presented above do not reflect the deduction of taxes that a shareholder would pay on fund distributions or the redemption of fund shares.
The Russell MidCap® Growth Index is an index that is constructed to provide a comprehensive and unbiased barometer of the mid-cap growth market.
This report identifies the Fund’s investments on December 31, 2012. These holdings are subject to change. Not all stocks in the Fund performed the same, nor is there any guarantee that these stocks will perform as well in the future. Market forecasts provided in this report may not necessarily come to pass.
Sector Diversification (Unaudited)
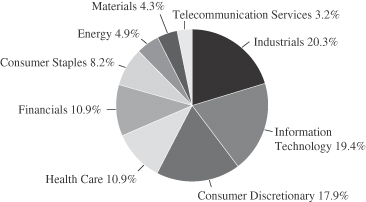
The sector diversification shown is based on the total long-term securities.
20 Annual Report | December 31, 2012 |
Mid Cap Growth Fund
Portfolio of Investments, December 31, 2012 (all dollar amounts in thousands)
| | | | | | | | |
Issuer | | Shares | | | Value | |
| | |
Common Stocks | | | | | | | | |
Industrials—19.7% | | | | | | | | |
AMETEK, Inc. | | | 146,500 | | | $ | 5,504 | |
*B/E Aerospace, Inc. | | | 76,700 | | | | 3,789 | |
*Clean Harbors, Inc. | | | 127,600 | | | | 7,019 | |
Donaldson Co., Inc. | | | 250,300 | | | | 8,220 | |
Fastenal Co. | | | 213,962 | | | | 9,990 | |
J.B. Hunt Transport Services, Inc. | | | 151,500 | | | | 9,046 | |
*Jacobs Engineering Group, Inc. | | | 131,000 | | | | 5,577 | |
*Polypore International, Inc. | | | 105,400 | | | | 4,901 | |
*Stericycle, Inc. | | | 100,230 | | | | 9,348 | |
TransDigm Group, Inc. | | | 68,950 | | | | 9,402 | |
| | | | | | | | |
| | | | | | | 72,796 | |
| | | | | | | | |
Information Technology—18.7% | | | | | | | | |
Amphenol Corporation | | | 154,100 | | | | 9,970 | |
*Cavium, Inc. | | | 122,702 | | | | 3,830 | |
*Citrix Systems, Inc. | | | 181,500 | | | | 11,934 | |
*Concur Technologies, Inc. | | | 28,230 | | | | 1,906 | |
*F5 Networks, Inc. | | | 38,600 | | | | 3,750 | |
Genpact, Ltd.† | | | 348,212 | | | | 5,397 | |
*Guidewire Software, Inc. | | | 121,700 | | | | 3,617 | |
*RealPage, Inc. | | | 213,800 | | | | 4,612 | |
*Silicon Laboratories, Inc. | | | 175,469 | | | | 7,336 | |
*SolarWinds, Inc. | | | 155,400 | | | | 8,151 | |
*Trimble Navigation, Ltd. | | | 77,204 | | | | 4,615 | |
*VeriSign, Inc. | | | 109,300 | | | | 4,243 | |
| | | | | | | | |
| | | | | | | 69,361 | |
| | | | | | | | |
Consumer Discretionary—17.3% | | | | | | | | |
*Bed Bath & Beyond, Inc. | | | 158,160 | | | | 8,843 | |
*Chipotle Mexican Grill, Inc. | | | 18,590 | | | | 5,530 | |
Dick’s Sporting Goods, Inc. | | | 277,429 | | | | 12,620 | |
Harley-Davidson, Inc. | | | 174,800 | | | | 8,537 | |
Harman International Industries, Inc. | | | 83,306 | | | | 3,719 | |
*Lululemon Athletica, Inc. | | | 106,700 | | | | 8,134 | |
*O’Reilly Automotive, Inc. | | | 116,780 | | | | 10,442 | |
*Select Comfort Corporation | | | 174,378 | | | | 4,564 | |
Tractor Supply Co. | | | 18,700 | | | | 1,652 | |
| | | | | | | | |
| | | | | | | 64,041 | |
| | | | | | | | |
Health Care—10.5% | | | | | | | | |
*Cerner Corporation | | | 34,700 | | | | 2,694 | |
*HealthSouth Corporation | | | 331,524 | | | | 6,999 | |
*HMS Holdings Corporation | | | 478,000 | | | | 12,390 | |
*IDEXX Laboratories, Inc. | | | 103,872 | | | | 9,639 | |
*Mettler-Toledo International, Inc. | | | 10,000 | | | | 1,933 | |
Perrigo Co. | | | 51,600 | | | | 5,368 | |
| | | | | | | | |
| | | | | | | 39,023 | |
| | | | | | | | |
Financials—10.5% | | | | | | | | |
*Affiliated Managers Group, Inc. | | | 55,875 | | | | 7,272 | |
First Republic Bank | | | 178,100 | | | | 5,838 | |
LPL Financial Holdings, Inc. | | | 301,379 | | | | 8,487 | |
*Signature Bank | | | 127,600 | | | | 9,103 | |
T Rowe Price Group, Inc. | | | 126,200 | | | | 8,219 | |
| | | | | | | | |
| | | | | | | 38,919 | |
| | | | | | | | |
Issuer | | Shares or
Principal
Amount | | | Value | |
| | |
Common Stocks—(continued) | | | | | | | | |
Consumer Staples—7.9% | | | | | | | | |
*Green Mountain Coffee Roasters, Inc. | | | 225,146 | | | $ | 9,312 | |
McCormick & Co., Inc. | | | 143,200 | | | | 9,098 | |
Mead Johnson Nutrition Co. | | | 165,900 | | | | 10,931 | |
| | | | | | | | |
| | | | | | | 29,341 | |
| | | | | | | | |
Energy—4.8% | | | | | | | | |
*Cameron International Corporation | | | 107,100 | | | | 6,046 | |
*Denbury Resources, Inc. | | | 272,770 | | | | 4,419 | |
Helmerich & Payne, Inc. | | | 70,200 | | | | 3,932 | |
Range Resources Corporation | | | 51,900 | | | | 3,261 | |
| | | | | | | | |
| | | | | | | 17,658 | |
| | | | | | | | |
Materials—4.2% | | | | | | | | |
Airgas, Inc. | | | 90,100 | | | | 8,225 | |
Ecolab, Inc. | | | 101,500 | | | | 7,298 | |
| | | | | | | | |
| | | | | | | 15,523 | |
| | | | | | | | |
Telecommunication Services—3.1% | | | | | | | | |
*SBA Communications Corporation Class “A” | | | 159,600 | | | | 11,335 | |
| | | | | | | | |
Total Common Stocks—96.7%
(cost $331,273) | | | | | | | 357,997 | |
| | | | | | | | |
| | |
Repurchase Agreement | | | | | | | | |
Fixed Income Clearing Corporation, 0.110% dated 12/31/12, due 1/2/13, repurchase price $11,791, collateralized by US Treasury Note, 2.125%, due 12/31/15 | | $ | 11,791 | | | | 11,791 | |
| | | | | | | | |
Total Repurchase Agreement—3.2%
(cost $11,791) | | | | 11,791 | |
| | | | | | | | |
Total Investments—99.9%
(cost $343,064) | | | | 369,788 | |
Cash and other assets, less liabilities—0.1% | | | | 447 | |
| | | | | | | | |
Net assets—100.0% | | | $ | 370,235 | |
| | | | | | | | |
See accompanying Notes to Portfolio of Investments.
December 31, 2012 | William Blair Funds 21 |
* Non-income producing securities
† = U.S. listed foreign security
Karl W. Brewer
Robert C. Lanphier, IV

Matthew A. Litfin
SMALL-MID CAP GROWTH FUND
The Small-Mid Cap Growth Fund seeks long-term capital appreciation.
AN OVERVIEW FROM THE PORTFOLIO MANAGERS
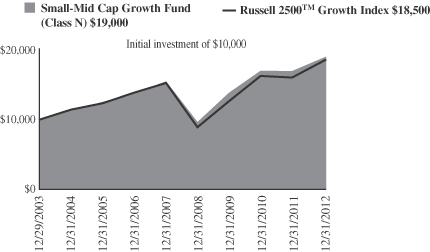
After another above-average total return for 2012 we now stand nearly four years into the current bull market, which began in early 2009. The William Blair Small-Mid Cap Growth Fund posted a 12.20% increase (Class N Shares) for the twelve months ended December 31, 2012. By comparison, the Fund’s benchmark, the Russell 2500™ Growth Index, increased by 16.13%.
While this review is focused on 2012, we believe it is appropriate to add a brief perspective on our intermediate term performance. Our Fund’s subdued relative performance over the intermediate term is partially the result of the market’s unsustainably strong returns in three of the last four calendar years, producing a 108% benchmark four-year cumulative return. However, while not overly bearish, we believe the market environment over the next three to five years will be more normalized (and therefore more conducive to our style of investing) and remain confident in our ability to produce the level of outperformance our clients expect over the long run.
Improving US economic data points, especially housing-related, and global central bank actions were the primary drivers of equity market returns in 2012. Despite a brief correction mid-year due to elevated fears regarding Euro zone financial stability, emerging market growth and a pause in the US economic recovery, most small and mid cap indices finished the year near all-time highs. Propelling the market higher in the back half of the year was European Central Bank messaging and actions, which restored confidence in Spanish and Italian borrowing capacity and the overall sustainability of the currency bloc. In the US, the Federal Reserve announced new quantitative easing programs aimed to maintain low government and consumer borrowing rates. Finally, investors cheered further improvements in the housing industry. Rebounding home prices and homebuilding activity positively impacts housing-related employment and overall consumer confidence. Thus, the market digested the possibility of a more sustainable domestic economic recovery.
The William Blair Small-Mid Cap Growth Fund’s 2012 underperformance is attributable to style and industry headwinds and negative stock selection. Given the strong market return, our more conservative investment style (typical lower portfolio beta) was a headwind during the year. In addition, both our traditional overweight to the highest growth stocks and our underweight to cheaper stocks were disadvantageous for the year, driven mostly by fourth quarter market dynamics. Our underweight or lack of ownership in outperforming industries such as Biotechnology and Real Estate Investment Trusts (REITs) detracted from relative performance as well. We have historically been significantly underweight in these areas due to lack of quality (Biotechnology) or lack of growth (REITs). From a stock specific perspective, Constant Contact, Tempur-Pedic, Gentex and Fossil were the largest detractors for the year. On the other hand, SBA Communications, Catamaran and Fortune Brands Home & Security helped partially offset the overall underperformance during the year.
Despite progress on certain fronts in the US and abroad during 2012, there remain several uncertainties the market will grapple with in 2013. In the US, the late 2012 “fiscal cliff” negotiations produced some clarity on tax policy, but government spending policy remains in flux. These discussions will take center stage in the coming months along with a renewed debt-ceiling debate. On the other hand, the improving housing market and overall economy in the US provides some ballast to these downside risks. Outside the US, European Central Bank activities have suppressed fears of draconian scenarios but financial stability, government budget and economic risks continue to exist in the region. And while the Chinese economy has improved, investors will keep a close eye on this important global economic engine.
22 Annual Report | December 31, 2012 |
Equity valuations expanded in 2012, but they begin the year near long-term averages and thus should be neither a tailwind nor headwind to equity returns. Profit margins are elevated and therefore a premium should be placed on companies with above-average revenue growth opportunities, such as the companies in which we seek to invest. Corporate balance sheets remain strong and should provide companies the ability to invest or increase merger and acquisition activities, both of which would be a tailwind for the stock market.
We continue to find good ideas across sectors, and are confident the Fund’s portfolio consists of well-managed companies with solid competitive positions whose stocks are at reasonable valuations compared to the expected growth and consistency of their business.
December 31, 2012 | William Blair Funds 23 |
Small-Mid Cap Growth Fund
Performance Highlights (Unaudited)
Average Annual Total Return at 12/31/2012
| | | | | | | | | | | | | | | | |
| | | 1
Year | | | 3
Year | | | 5
Year | | | Since
Inception(a) | |
Class N | | | 12.20 | % | | | 11.16 | % | | | 4.23 | % | | | 7.34 | % |
Class I | | | 12.36 | | | | 11.41 | | | | 4.50 | | | | 7.60 | |
Russell 2500™ Growth | | | 16.13 | | | | 13.78 | | | | 4.07 | | | | 7.07 | |
| | (a) | | For the period from December 29, 2003 (Commencement of Operations) to December 31, 2012. | |
Performance cited represents past performance. Past performance does not guarantee future results and current performance may be lower or higher than the data quoted. Results shown are average annual total returns, which assume reinvestment of dividends and capital gains. Investment returns and principal will fluctuate and you may have a gain or loss when you sell shares. For the most current month-end performance information, please call 1-800-742-7272, or visit our Web site at www.williamblairfunds.com. Investing in smaller and medium capitalization companies involves special risks, including higher volatility and lower liquidity. Smaller and medium capitalization stocks are also more sensitive to purchase/sale transactions and changes in the issuer’s financial condition. From time to time, the investment advisor may waive fees or reimburse expenses for the Fund. Without these waivers, performance would be lower. Class N shares are available to the general public without a sales load. Class I shares are available to certain institutional investors and advisory clients of William Blair & Company, L.L.C., without a sales load or distribution (12b-1) or service fees.
The performance highlights and graph presented above do not reflect the deduction of taxes that a shareholder would pay on fund distributions or the redemption of fund shares.
The Russell 2500™ Growth Index measures the performance of those Russell 2500 companies with above average price-to-book ratios and forecasted growth rates.
This report identifies the Fund’s investments on December 31, 2012. These holdings are subject to change. Not all stocks in the Fund performed the same, nor is there any guarantee that these stocks will perform as well in the future. Market forecasts provided in this report may not necessarily come to pass.
Sector Diversification (Unaudited)
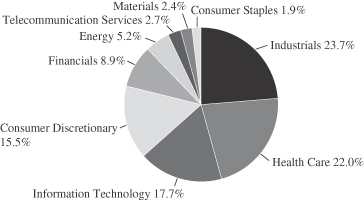
The sector diversification shown is based on the total long-term securities.
24 Annual Report | December 31, 2012 |
Small-Mid Cap Growth Fund
Portfolio of Investments, December 31, 2012 (all dollar amounts in thousands)
| | | | | | | | |
Issuer | | Shares | | | Value | |
| | |
Common Stocks | | | | | | | | |
Industrials—23.3% | | | | | | | | |
Allegiant Travel Co. | | | 60,065 | | | $ | 4,409 | |
*B/E Aerospace, Inc. | | | 181,053 | | | | 8,944 | |
*Fortune Brands Home & Security, Inc. | | | 225,200 | | | | 6,580 | |
Healthcare Services Group, Inc. | | | 225,932 | | | | 5,248 | |
*Huron Consulting Group, Inc. | | | 144,285 | | | | 4,861 | |
*ICF International, Inc. | | | 240,125 | | | | 5,629 | |
Manpower, Inc. | | | 97,950 | | | | 4,157 | |
*Old Dominion Freight Line, Inc. | | | 113,900 | | | | 3,905 | |
*Portfolio Recovery Associates, Inc. | | | 72,400 | | | | 7,737 | |
Robert Half International, Inc. | | | 308,800 | | | | 9,826 | |
*Standard Parking Corporation | | | 161,418 | | | | 3,550 | |
*Stericycle, Inc. | | | 140,870 | | | | 13,139 | |
The Corporate Executive Board Co. | | | 115,135 | | | | 5,464 | |
TransDigm Group, Inc. | | | 9,475 | | | | 1,292 | |
*Trimas Corporation | | | 231,010 | | | | 6,459 | |
| | | | | | | | |
| | | | | | | 91,200 | |
| | | | | | | | |
Health Care—21.8% | | | | | | | | |
*ABIOMED, Inc. | | | 223,938 | | | | 3,014 | |
*Align Technology, Inc. | | | 160,903 | | | | 4,465 | |
*BioMarin Pharmaceutical, Inc. | | | 135,000 | | | | 6,649 | |
*Brookdale Senior Living, Inc. | | | 191,476 | | | | 4,848 | |
*Catamaran Corporation† | | | 177,932 | | | | 8,382 | |
*Conceptus, Inc. | | | 146,534 | | | | 3,079 | |
*Cyberonics, Inc. | | | 83,700 | | | | 4,397 | |
*Haemonetics Corporation | | | 113,500 | | | | 4,635 | |
*HealthSouth Corporation | | | 211,184 | | | | 4,458 | |
*HMS Holdings Corporation | | | 311,792 | | | | 8,081 | |
*Hologic, Inc. | | | 323,500 | | | | 6,480 | |
*Mettler-Toledo International, Inc. | | | 20,500 | | | | 3,963 | |
*Myriad Genetics, Inc. | | | 64,000 | | | | 1,744 | |
Perrigo Co. | | | 84,800 | | | | 8,822 | |
*Sirona Dental Systems, Inc. | | | 94,683 | | | | 6,103 | |
*Team Health Holdings, Inc. | | | 215,811 | | | | 6,209 | |
| | | | | | | | |
| | | | | | | 85,329 | |
| | | | | | | | |
Information Technology—17.5% | | | | | | | | |
*Akamai Technologies, Inc. | | | 86,600 | | | | 3,543 | |
*ANSYS, Inc. | | | 46,400 | | | | 3,125 | |
*Aruba Networks, Inc. | | | 230,700 | | | | 4,787 | |
*Concur Technologies, Inc. | | | 56,100 | | | | 3,788 | |
*CoStar Group, Inc. | | | 44,500 | | | | 3,977 | |
*Envestnet, Inc. | | | 157,119 | | | | 2,192 | |
*Gartner, Inc. | | | 133,800 | | | | 6,157 | |
Genpact, Ltd.† | | | 342,000 | | | | 5,301 | |
*Guidewire Software, Inc. | | | 176,300 | | | | 5,240 | |
*Liquidity Services, Inc. | | | 101,600 | | | | 4,151 | |
NIC, Inc. | | | 215,770 | | | | 3,526 | |
*RealPage, Inc. | | | 290,960 | | | | 6,276 | |
*Riverbed Technology, Inc. | | | 206,500 | | | | 4,072 | |
*SolarWinds, Inc. | | | 75,300 | | | | 3,949 | |
*Ultimate Software Group, Inc. | | | 32,925 | | | | 3,108 | |
*WEX, Inc. | | | 70,400 | | | | 5,306 | |
| | | | | | | | |
| | | | | | | 68,498 | |
| | | | | | | | |
* Non-income producing securities
† = U.S. listed foreign security
| | | | | | | | |
Issuer | | Shares or
Principal
Amount | | | Value | |
Consumer Discretionary—15.4% | | | | | | | | |
Dick’s Sporting Goods, Inc. | | | 232,790 | | | $ | 10,590 | |
*Grand Canyon Education, Inc. | | | 200,400 | | | | 4,703 | |
*Jarden Corporation | | | 71,600 | | | | 3,702 | |
*K12, Inc. | | | 296,914 | | | | 6,069 | |
*LKQ Corporation | | | 303,600 | | | | 6,406 | |
*Pandora Media, Inc. | | | 309,202 | | | | 2,838 | |
Polaris Industries, Inc. | | | 50,000 | | | | 4,208 | |
*Sally Beauty Holdings, Inc. | | | 245,400 | | | | 5,784 | |
Texas Roadhouse, Inc. | | | 200,143 | | | | 3,362 | |
Tractor Supply Co. | | | 78,600 | | | | 6,945 | |
*Under Armour, Inc. | | | 114,820 | | | | 5,572 | |
| | | | | | | | |
| | | | | | | 60,179 | |
| | | | | | | | |
Financials—8.8% | | | | | | | | |
*Affiliated Managers Group, Inc. | | | 69,909 | | | | 9,099 | |
CBOE Holdings, Inc. | | | 146,900 | | | | 4,328 | |
*First Cash Financial Services, Inc. | | | 61,143 | | | | 3,034 | |
First Republic Bank | | | 152,500 | | | | 4,999 | |
*FirstService Corporation† | | | 107,741 | | | | 3,045 | |
Jones Lang LaSalle, Inc. | | | 76,900 | | | | 6,455 | |
*National Financial Partners Corporation | | | 199,624 | | | | 3,421 | |
| | | | | | | | |
| | | | | | | 34,381 | |
| | | | | | | | |
Energy—5.2% | | | | | | | | |
Cabot Oil & Gas Corporation | | | 54,400 | | | | 2,706 | |
Core Laboratories N.V.† | | | 37,700 | | | | 4,121 | |
Helmerich & Payne, Inc. | | | 85,100 | | | | 4,766 | |
*KiOR, Inc. | | | 258,797 | | | | 1,659 | |
Oceaneering International, Inc. | | | 78,900 | | | | 4,244 | |
*Oil States International, Inc. | | | 39,000 | | | | 2,790 | |
| | | | | | | | |
| | | | | | | 20,286 | |
| | | | | | | | |
Telecommunication Services—2.6% | | | | | | | | |
*SBA Communications Corporation | | | 147,000 | | | | 10,440 | |
| | | | | | | | |
Materials—2.4% | | | | | | | | |
Celanese Corporation | | | 114,500 | | | | 5,099 | |
Rockwood Holdings, Inc. | | | 85,000 | | | | 4,204 | |
| | | | | | | | |
| | | | | | | 9,303 | |
| | | | | | | | |
Consumer Staples—1.9% | | | | | | | | |
*Green Mountain Coffee Roasters, Inc. | | | 118,723 | | | | 4,910 | |
Nu Skin Enterprises, Inc. | | | 68,900 | | | | 2,553 | |
| | | | | | | | |
| | | | | | | 7,463 | |
| | | | | | | | |
Total Common Stocks—98.9%
(cost $347,882) | | | | | | | 387,079 | |
| | | | | | | | |
| | |
Repurchase Agreement | | | | | | | | |
Fixed Income Clearing Corporation, 0.110% dated 12/31/12, due 1/2/13, repurchase price $729 collateralized by US Treasury Note, 2.125%, due 12/31/15 | | $ | 729 | | | | 729 | |
| | | | | | | | |
Total Repurchase Agreement—0.2%
(cost $729) | | | | | | | 729 | |
| | | | | | | | |
Total Investments—99.1%
(cost $348,611) | | | | | | | 387,808 | |
Cash and other assets, less liabilities—0.9% | | | | | | | 3,552 | |
| | | | | | | | |
Net assets—100.0% | | | | | | $ | 391,360 | |
| | | | | | | | |
See accompanying Notes to Financial Statements.
December 31, 2012 | William Blair Funds 25 |
GLOBAL MARKETS OVERVIEW
In a year beset by concerns about macroeconomic policies, debt and global growth, where most investors generally maintained a cautious stance, risk assets produced a stealth rally. The global equity market, as reflected by the MSCI ACWI IMI rose 16.38% during the period, while high yield fixed income and real estate also performed well. Financials was the strongest performing sector during 2012, rising nearly 28%, followed by a 24% Discretionary return, as Utilities and Energy lagged, each returning below 3%. The strong 2012 double digit equity return, however, masks the volatility that occurred during the year, as the market moved from expectations of reinvigorated China-led global growth in the first quarter, to second quarter concerns about a European Union collapse, to third quarter improved European sentiment and stabilizing Chinese economic indicators. The fourth quarter of 2012 ended with a bang despite US “fiscal cliff” concerns as equity markets rallied on the expectations of a stabilizing Chinese economy, continued progress in Europe, and as a reform-minded Shinzo Abe was re-elected as prime minister of Japan. High quality stocks with good earnings trends and growth prospects outpaced their lower quality counterparts during 2012; although this varied during the period. In particular, as the market rallied in the first and fourth quarters on expectations of improving global growth, companies with low valuations and lower quality characteristics rallied the strongest.
The MSCI EM IMI rose 18.68% during the year, outpacing the developed world, due largely to a strong fourth quarter, when the Index rose 5.52%. EMEA and Asia were particularly strong, rising 22.55% and 20.72%, respectively. Within Asia, Southeast Asia countries Thailand and Philippines led the rally, while Indonesia lagged, up just 4.2%. Within EMEA, Turkey rose over 63%, while Egypt was up nearly 50%; conversely, the Czech Republic and Russia trailed. Latin America was the worst performing emerging markets region, up 9.88%, as Brazil was the key laggard, rising only 1.61% on a slowing economy and concerns about the interventionist government. The MSCI World Index was up 16.06% during the year, led by Pacific ex-Japan, which rose by 23.88% on strength in Singapore and New Zealand. Despite market angst about the viability of the European Union during the second quarter, Europe ex-UK rose 21.63% in USD terms, led by Core Europe and the Nordic Region, as well as Greece, which was up 24.60%, due largely to December’s results. Conversely, Spain and Portugal lagged notably during the period, up just 3.17% and 8.17%, respectively, as concerns about the banking system continued to plague the markets. Conversely, Japan and Canada were notable laggards, rising 7.54% and 8.10%, respectively, as the USD appreciated approximately 11% versus the Japanese Yen during the period. Small cap stocks generally outpaced their larger cap counterparts during 2012, particularly in Europe, Emerging Markets and the US, while Developed Asian and Canadian small cap stocks lagged.
26 Annual Report | December 31, 2012 |

W. George Greig

Kenneth J. McAtamney
GLOBAL LEADERS FUND (FORMERLY KNOWN AS GLOBAL GROWTH FUND)
The Global Leaders Fund seeks long-term capital appreciation.
AN OVERVIEW FROM THE PORTFOLIO MANAGERS
The Global Leaders Fund (formerly the Global Growth Fund) posted a 17.25% increase (Class N Shares) for the twelve months ended December 31, 2012. By comparison, the Fund’s benchmark, the MSCI All Country World IMI Index (net) increased 16.38%.
Year to date Fund outperformance was driven by good stock selection in Consumer Staples, Health Care, Industrials, and Information Technology (IT), which more than offset weakness in Consumer Discretionary, Energy and Financials. Consumer Staples stock selection was bolstered by strong performance by Monster Beverage in the first half of the year, Diageo, a beverage company, on continued emerging markets demand and solid North American results and McCormick & Company, the US food company, on solid operating performance throughout the year. Pharmaceuticals performed particularly well during the year, while Industrials benefited from strong Aerospace performance, coupled with solid operating results by a number of holdings. Despite underperforming in the fourth quarter, Apple was a full year contributor to IT performance, along with ARM Holdings, a semiconductors company, and Samsung Electronics. Offsetting these positive results were Autos and Luxury performance, while Energy was hampered by weakness in Oil/Gas, due largely to BG Group, oil & gas company’s production cuts. Financials stock selection was hurt by limited exposure in Commercial Banks, which accelerated beginning in mid-year, along with limited real estate-related holdings. Regionally the US and Europe performed well, offsetting weakness in Japan and Emerging Asia.
The Fund’s Financials weighting increased from approximately 15% of the Fund as of year-end 2011 to 21%, due to an increase in Commercial Banks. Funding this increase was a decrease in Consumer Staples, IT and Energy. Regionally, the US remained underweighted during the period, ending the year at 41.9% of the Fund, with the biggest weighting in Consumer Discretionary. Developed Europe was overweighted versus the Index, while Developed Asia and Emerging Markets largely approximated the Index.
December 31, 2012 | William Blair Funds 27 |
Global Leaders Fund
Performance Highlights (Unaudited)
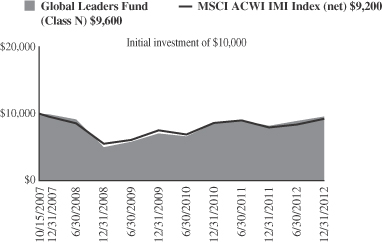
Average Annual Total Return at 12/31/2012
| | | | | | | | | | | | | | | | |
| | | 1
Year | | | 3
Year | | | 5
Year | | | Since
Inception(a) | |
Class N | | | 17.25 | % | | | 10.90 | % | | | (0.66 | )% | | | (0.84 | )% |
Class I | | | 17.64 | | | | 11.17 | | | | (0.41 | ) | | | (0.56 | ) |
MSCI AC World IMI - Net | | | 16.38 | | | | 7.02 | | | | (0.73 | ) | | | (1.56 | ) |
| | (a) | | For the period from October 15, 2007 (Commencement of Operations) to December 31, 2012. |
Performance cited represents past performance. Past performance does not guarantee future results and current performance may be lower or higher than the data quoted. Results shown are average annual total returns, which assume reinvestment of dividends and capital gains. Investment returns and principal will fluctuate and you may have a gain or loss when you sell shares. For the most current month-end performance information, please call 1-800-742-7272, or visit our Web site at www.williamblairfunds.com. Investing in smaller and medium capitalization companies involves special risks, including higher volatility and lower liquidity. Smaller and medium capitalization stocks are also more sensitive to purchase/sale transactions and changes in the issuer’s financial condition. International investing involves special risk considerations, including currency fluctuations, lower liquidity, economic and political risk. From time to time, the investment advisor may waive fees or reimburse expenses for the Fund. Without these waivers, performance would be lower. Class N shares are available to the general public without a sales load. Class I shares are available to certain institutional investors and advisory clients of William Blair & Company, L.L.C., without a sales load or distribution fees (12b-1).
The performance highlights and graph presented above do not reflect the deduction of taxes that a shareholder would pay on fund distributions or the redemption of fund shares.
The Morgan Stanley Capital International (MSCI) All Country World Investable Market Index (IMI) (net) is a free float-adjusted market capitalization weighted index that is designed to measure the equity market of developed and emerging markets. This series approximates the minimum possible dividend reinvestment.
This report identifies the Fund’s investments on December 31, 2012. These holdings are subject to change. Not all stocks in the Fund performed the same, nor is there any guarantee that these stocks will perform as well in the future. Market forecasts provided in this report may not necessarily come to pass.
Sector Diversification (Unaudited)
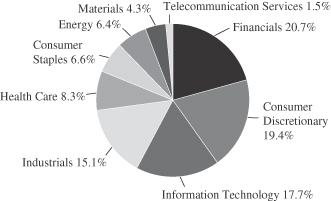
The sector diversification shown is based on the total long-term securities.
28 Annual Report | December 31, 2012 |
Global Leaders Fund
Portfolio of Investments, December 31, 2012 (all dollar amounts in thousands)
| | | | | | | | |
Issuer | | Shares | | | Value | |
| | |
Common Stocks | | | | | | | | |
| | |
Western Hemisphere—45.0% | | | | | | | | |
Canada—3.1% | | | | | | | | |
Brookfield Asset Management, Inc.
(Real estate management & development)† | | | 27,755 | | | $ | 1,017 | |
The Toronto-Dominion Bank (Commercial banks) | | | 12,657 | | | | 1,066 | |
| | | | | | | | |
| | | | | | | 2,083 | |
| | | | | | | | |
United States—41.9% | | | | | | | | |
*Affiliated Managers Group, Inc. (Capital markets) | | | 6,298 | | | | 820 | |
American Express Co. (Consumer finance) | | | 16,739 | | | | 962 | |
AMETEK, Inc. (Electrical equipment) | | | 20,843 | | | | 783 | |
Apple, Inc. (Computers & peripherals) | | | 2,859 | | | | 1,524 | |
*Citrix Systems, Inc. (Software) | | | 12,481 | | | | 821 | |
Colgate-Palmolive Co. (Household products) | | | 7,150 | | | | 747 | |
Costco Wholesale Corporation (Food & staples retailing) | | | 9,914 | | | | 979 | |
*Discovery Communications, Inc. (Media) | | | 16,667 | | | | 1,058 | |
*Express Scripts Holding Co. (Health care providers & services) | | | 19,257 | | | | 1,040 | |
Exxon Mobil Corporation (Oil, gas & consumable fuels) | | | 14,071 | | | | 1,218 | |
*Fortune Brands Home & Security, Inc. (Building products) | | | 26,545 | | | | 776 | |
Harley-Davidson, Inc. (Automobiles) | | | 21,962 | | | | 1,072 | |
*IDEXX Laboratories, Inc. (Health care equipment & supplies) | | | 6,102 | | | | 566 | |
Jones Lang LaSalle, Inc. (Real estate management & development) | | | 10,376 | | | | 871 | |
JPMorgan Chase & Co. (Diversified financial services) | | | 33,820 | | | | 1,487 | |
Marriott International, Inc. (Hotels, restaurants & leisure) | | | 25,678 | | | | 957 | |
Mastercard, Inc. Class “A” (IT services) | | | 2,477 | | | | 1,217 | |
McCormick & Co., Inc. (Food products) | | | 10,395 | | | | 660 | |
*O’Reilly Automotive, Inc. (Specialty retail) | | | 7,973 | | | | 713 | |
*priceline.com, Inc. (Internet & catalog retail) | | | 1,579 | | | | 981 | |
QUALCOMM, Inc. (Communications equipment) | | | 17,836 | | | | 1,106 | |
Schlumberger, Ltd. (Energy equipment & services)† | | | 20,623 | | | | 1,429 | |
*SolarWinds, Inc. (Software) | | | 9,873 | | | | 518 | |
Starbucks Corporation (Hotels, restaurants & leisure) | | | 19,091 | | | | 1,024 | |
The Walt Disney Co. (Media) | | | 22,640 | | | | 1,127 | |
Union Pacific Corporation (Road & rail) | | | 9,858 | | | | 1,239 | |
W.W. Grainger, Inc. (Trading companies & distributors) | | | 1,872 | | | | 379 | |
Williams-Sonoma, Inc. (Specialty retail) | | | 22,508 | | | | 985 | |
Yum! Brands, Inc. (Hotels, restaurants & leisure) | | | 15,116 | | | | 1,004 | |
| | | | | | | | |
| | | | | | | 28,063 | |
| | | | | | | | |
| | |
Europe, Mid-East—19.2% | | | | | | | | |
Denmark—2.8% | | | | | | | | |
CHR Hansen Holding A/S (Chemicals) | | | 9,194 | | | | 300 | |
Coloplast A/S Class “B” (Health care equipment & supplies) | | | 8,185 | | | | 401 | |
Novo Nordisk A/S Class “B” (Pharmaceuticals) | | | 7,285 | | | | 1,186 | |
| | | | | | | | |
| | | | | | | 1,887 | |
| | | | | | | | |
|
Common Stocks—Europe, Mid-East—19.2%—(continued) | |
France—4.0% | | | | | | | | |
BNP Paribas S.A. (Commercial banks) | | | 24,001 | | | $ | 1,366 | |
Essilor International S.A. (Health care equipment & supplies) | | | 3,726 | | | | 376 | |
Technip S.A. (Energy equipment & services) | | | 8,078 | | | | 934 | |
| | | | | | | | |
| | | | | | | 2,676 | |
| | | | | | | | |
Germany—5.4% | | | | | | | | |
Bayerische Motoren Werke AG (Automobiles) | | | 10,923 | | | | 1,063 | |
Brenntag AG (Trading companies & distributors) | | | 4,078 | | | | 537 | |
Fresenius SE & Co. KGaA (Health care providers & services) | | | 6,241 | | | | 718 | |
MTU Aero Engines Holding AG (Aerospace & defense) | | | 3,653 | | | | 334 | |
SAP AG (Software) | | | 11,804 | | | | 949 | |
| | | | | | | | |
| | | | | | | 3,601 | |
| | | | | | | | |
Ireland—0.7% | | | | | | | | |
Paddy Power plc (Hotels, restaurants & leisure) | | | 5,311 | | | | 439 | |
| | | | | | | | |
Israel—1.1% | | | | | | | | |
*Check Point Software Technologies, Ltd. (Software)† | | | 15,704 | | | | 748 | |
| | | | | | | | |
Sweden—1.4% | | | | | | | | |
Atlas Copco AB (Machinery) | | | 34,197 | | | | 948 | |
| | | | | | | | |
Switzerland—3.8% | | | | | | | | |
Nestle S.A. (Food products) | | | 10,123 | | | | 660 | |
Partners Group Holding AG (Capital markets) | | | 3,434 | | | | 794 | |
Syngenta AG (Chemicals) | | | 2,737 | | | | 1,106 | |
| | | | | | | | |
| | | | | | | 2,560 | |
| | | | | | | | |
| | |
United Kingdom—13.8% | | | | | | | | |
Abcam plc (Biotechnology) | | | 42,503 | | | | 268 | |
AMEC plc (Energy equipment & services) | | | 29,001 | | | | 479 | |
ARM Holdings plc (Semiconductors & semiconductor equipment) | | | 69,599 | | | | 879 | |
Ashmore Group plc (Capital markets) | | | 85,961 | | | | 508 | |
Babcock International Group plc (Commercial services & supplies) | | | 26,705 | | | | 422 | |
BHP Billiton plc (Metals & mining) | | | 38,069 | | | | 1,343 | |
Compass Group plc (Hotels, restaurants & leisure) | | | 84,563 | | | | 1,004 | |
Diageo plc (Beverages) | | | 39,426 | | | | 1,148 | |
Experian plc (Professional services) | | | 63,378 | | | | 1,021 | |
Hargreaves Lansdown plc (Capital markets) | | | 36,243 | | | | 405 | |
Lancashire Holdings, Ltd. (Insurance) | | | 14,531 | | | | 185 | |
*Rolls-Royce Holdings plc (Aerospace & defense) | | | 68,186 | | | | 978 | |
The Weir Group plc (Machinery) | | | 18,668 | | | | 577 | |
| | | | | | | | |
| | | | | | | 9,217 | |
| | | | | | | | |
| | |
Emerging Asia—7.0% | | | | | | | | |
China—2.6% | | | | | | | | |
*Baidu, Inc.—ADR (Internet software & services) | | | 6,586 | | | | 661 | |
China Mobile, Ltd. (Wireless telecommunication services) | | | 80,000 | | | | 941 | |
*WuXi PharmaTech Cayman, Inc.—ADR (Life sciences tools & services) | | | 9,897 | | | | 156 | |
| | | | | | | | |
| | | | | | | 1,758 | |
| | | | | | | | |
See accompanying Notes to Portfolio of Investments.
December 31, 2012 | William Blair Funds 29 |
Global Leaders Fund
Portfolio of Investments, December 31, 2012 (all dollar amounts in thousands)
| | | | | | | | |
Issuer | | Shares or
Principal
Amount | | | Value | |
|
Common Stocks—Emerging Asia—7.0%—(continued) | |
Indonesia—1.2% | | | | | | | | |
PT Bank Rakyat Indonesia (Commercial banks) | | | 1,071,500 | | | $ | 777 | |
| | | | | | | | |
South Korea—3.2% | | | | | | | | |
*Hyundai Motor Co. (Automobiles) | | | 4,125 | | | | 850 | |
Samsung Electronics Co., Ltd. (Semiconductors & semiconductor equipment) | | | 903 | | | | 1,298 | |
| | | | | | | | |
| | | | | | | 2,148 | |
| | | | | | | | |
| | |
Japan—3.2% | | | | | | | | |
Fanuc Corporation (Machinery) | | | 5,800 | | | | 1,079 | |
Sumitomo Mitsui Financial Group, Inc. (Commercial banks) | | | 28,600 | | | | 1,040 | |
| | | | | | | | |
| | | | | | | 2,119 | |
| | | | | | | | |
| |
Emerging Europe, Mid-East, Africa—2.8% | | | | | |
South Africa—1.5% | | | | | | | | |
*Aspen Pharmacare Holdings, Ltd. (Pharmaceuticals) | | | 27,661 | | | | 554 | |
Bidvest Group, Ltd. (Industrial conglomerates) | | | 17,601 | | | | 450 | |
| | | | | | | | |
| | | | | | | 1,004 | |
| | | | | | | | |
Turkey—1.3% | | | | | | | | |
Turkiye Halk Bankasi A.S. (Commercial banks) | | | 88,141 | | | | 869 | |
| | | | | | | | |
| | |
Asia—1.8% | | | | | | | | |
Hong Kong—1.8% | | | | | | | | |
AIA Group, Ltd. (Insurance) | | | 311,400 | | | | 1,235 | |
| | | | | | | | |
| | |
Emerging Latin America—1.6% | | | | | | | | |
Argentina—0.6% | | | | | | | | |
MercadoLibre, Inc. (Internet software & services) | | | 5,651 | | | | 444 | |
| | | | | | | | |
Brazil—1.0% | | | | | | | | |
BR Malls Participacoes S.A. (Real estate management & development) | | | 49,300 | | | | 651 | |
| | | | | | | | |
Total Common Stocks—94.4%
(cost $54,930) | | | | | | | 63,227 | |
| | | | | | | | |
| | |
Repurchase Agreement | | | | | | | | |
Fixed Income Clearing Corporation, 0.110% dated 12/31/12, due 1/2/13, repurchase price $338, collateralized by U.S. Treasury Note, 2.125%, due 12/31/15 | | $ | 338 | | | | 338 | |
| | | | | | | | |
Total Repurchase Agreement—0.5%
(cost $338) | | | | | | | 338 | |
| | | | | | | | |
Total Investments—94.9%
(cost $55,268) | | | | | | | 63,565 | |
Cash and other assets, less liabilities—5.1% | | | | | | | 3,429 | |
| | | | | | | | |
Net assets—100.0% | | | | | | $ | 66,994 | |
| | | | | | | | |
ADR = American Depository Receipt
† = U.S. listed foreign security
* Non-income producing securities
For securities primarily traded on exchanges or markets that close before the close of regular trading on the New York Stock Exchange, the Fund may use an independent pricing service to fair value price the securities pursuant to Valuation Procedures approved by the Board of Trustees.
At December 31, 2012, the Fund’s Portfolio of Investments includes the following sector categories (as a percentage of long-term investments):
| | | | |
Financials | | | 20.7% | |
Consumer Discretionary | | | 19.4% | |
Information Technology | | | 17.7% | |
Industrials | | | 15.1% | |
Health Care | | | 8.3% | |
Consumer Staples | | | 6.6% | |
Energy | | | 6.4% | |
Materials | | | 4.3% | |
Telecommunication Services | | | 1.5% | |
| | | | |
Total | | | 100.0% | |
| | | | |
At December 31, 2012, the Fund’s Portfolio of Investments includes the following currency categories (as a percentage of long-term investments):
| | | | |
U.S. Dollar | | | 48.9% | |
British Pound Sterling | | | 14.6% | |
Euro | | | 10.6% | |
Swiss Franc | | | 4.0% | |
Hong Kong Dollar | | | 3.7% | |
South Korean Won | | | 3.4% | |
Japanese Yen | | | 3.4% | |
Danish Krone | | | 3.0% | |
Canadian Dollar | | | 1.7% | |
South African Rand | | | 1.6% | |
Swedish Krona | | | 1.5% | |
Turkish Lira | | | 1.4% | |
Indonesian Rupiah | | | 1.2% | |
Brazilian Real | | | 1.0% | |
| | | | |
Total | | | 100.0% | |
| | | | |
See accompanying Notes to Portfolio of Investments.
30 Annual Report | December 31, 2012 |
W. George Greig
INTERNATIONAL GROWTH FUND
The International Growth Fund seeks long-term capital appreciation.
AN OVERVIEW FROM THE PORTFOLIO MANAGER
The International Growth Fund posted a 23.67% increase (Class N Shares) for the twelve months ended December 31, 2012. By comparison, the Fund’s benchmark, the MSCI All Country World ex-U.S. IMI Index (net) increased 17.04%.
Year to date, the Fund outperformed the Index by 6.63% as stock selection was strong across most sectors and currency hedging added approximately 75 basis points to relative performance. The Fund’s Financials holdings were up over 34% during the period, well ahead of the 29% Index return, on strong Commercial Banks performance, both within developed and emerging markets. In addition, the strategy’s higher weighting in Real Estate Management and Development holdings, which rallied nearly 45%, added value. The Fund’s Healthcare stocks were up nearly 31% during the year, significantly outpacing the 18.59% index sector return, led by strong performance in European Pharmaceuticals Bayer and Sanofi, while the Fund’s Industrial holdings outperformed by 10% as stock selection was strong across industries. The Fund’s Materials stocks also outperformed by 10%, as Chemicals added value, as did the underweighting in Metals and Mining. Somewhat detracting from relative full year results was Energy stock selection as Oil/Gas holdings underperformed.
As of year-end, the Fund remained focused on Europe at the expense of Developed Asia and Canada. Japan represented 13.6% of the Fund, an increase since December 2011. Emerging markets totaled 20.4% of the Fund as of December 31, and shifted towards Emerging Asia at the expense of Latin America. From a sector perspective, Financials was the largest weighting at 25.3% of the Fund, just above the 25.2% Index weighting, increasing throughout the year. The Fund remained overweighted in Discretionary, Healthcare and Industrials at the expense of Energy and Materials.
December 31, 2012 | William Blair Funds 31 |
International Growth Fund
Performance Highlights (Unaudited)
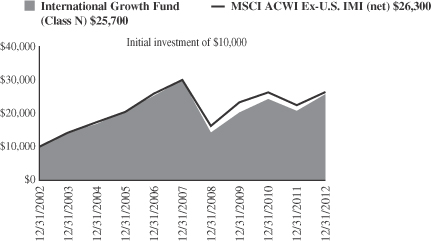
Average Annual Total Return 12/31/2012
| | | | | | | | | | | | | | | | |
| | | 1
Year | | | 3
Year | | | 5
Year | | | 10
Year | |
Class N | | | 23.67 | % | | | 8.28 | % | | | (2.95 | )% | | | 9.88 | % |
Class I | | | 23.96 | | | | 8.60 | | | | (2.67 | ) | | | 10.18 | |
MSCI AC World ex USA IMI - Net | | | 17.04 | | | | 4.18 | | | | (2.59 | ) | | | 10.16 | |
Performance cited represents past performance. Past performance does not guarantee future results and current performance may be lower or higher than the data quoted. Results shown are average annual total returns, which assume reinvestment of dividends and capital gains. Investment returns and principal will fluctuate and you may have a gain or loss when you sell shares. For the most current month-end performance information, please call 1-800-742-7272, or visit our Web site at www.williamblairfunds.com. From time to time, the investment advisor may waive fees or reimburse expenses for the Fund. Without these waivers, performance would be lower. International investing involves special risk considerations, including currency fluctuations, lower liquidity, economic and political risk. Class N shares are available to the general public without a sales load. Class I shares are available to certain institutional investors and advisory clients of William Blair & Company, L.L.C., without a sales load or distribution (12b-1) or service fees.
The performance highlights and graph presented above do not reflect the deduction of taxes that a shareholder would pay on fund distributions or the redemption of fund shares.
The Morgan Stanley Capital International (MSCI) All Country World Ex-U.S. Investable Market Index (IMI) (net) is a free float-adjusted market capitalization weighted index that is designed to measure the equity market performance of developed and emerging markets, excluding the United States. This series approximates the minimum possible dividend reinvestment.
This report identifies the Fund’s investments on December 31, 2012. These holdings are subject to change. Not all stocks in the Fund performed the same, nor is there any guarantee that these stocks will perform as well in the future. Market forecasts provided in this report may not necessarily come to pass.
Sector Diversification (Unaudited)
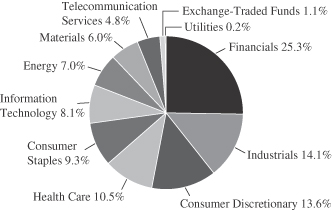
The sector diversification shown is based on the total long-term securities.
32 Annual Report | December 31, 2012 |
International Growth Fund
Portfolio of Investments, December 31, 2012 (all dollar amounts in thousands)
| | | | | | | | |
Issuer | | Shares | | | Value | |
|
Common Stocks | |
| |
Europe—32.9% | | | | | |
Austria—0.8% | |
Andritz AG (Machinery) | | | 361,521 | | | $ | 23,231 | |
Schoeller-Bleckmann Oilfield Equipment AG (Energy equipment & services) | | | 66,551 | | | | 6,974 | |
| | | | | | | | |
| | | | | | | 30,205 | |
| | | | | | | | |
Belgium—0.3% | | | | | | | | |
Colruyt S.A. (Food & staples retailing) | | | 218,571 | | | | 10,838 | |
| | | | | | | | |
Denmark—1.2% | | | | | | | | |
Coloplast A/S Class “B” (Health care equipment & supplies) | | | 576,930 | | | | 28,293 | |
GN Store Nord A/S (Health care equipment & supplies) | | | 688,070 | | | | 10,000 | |
SimCorp A/S (Software) | | | 27,340 | | | | 6,099 | |
| | | | | | | | |
| | | | | | | 44,392 | |
| | | | | | | | |
Finland—1.0% | | | | | | | | |
Kone Oyj (Machinery) | | | 344,705 | | | | 25,494 | |
Nokian Renkaat Oyj (Auto components) | | | 318,913 | | | | 12,775 | |
| | | | | | | | |
| | | | | | | 38,269 | |
| | | | | | | | |
France—9.9% | | | | | | | | |
Arkema S.A. (Chemicals) | | | 375,252 | | | | 39,401 | |
BNP Paribas S.A. (Commercial banks) | | | 1,755,170 | | | | 99,922 | |
Christian Dior S.A. (Textiles, apparel & luxury goods) | | | 176,154 | | | | 30,026 | |
Hermes International (Textiles, apparel & luxury goods) | | | 42,683 | | | | 12,761 | |
Sanofi (Pharmaceuticals) | | | 776,171 | | | | 73,604 | |
Societe BIC S.A. (Commercial services & supplies) | | | 110,463 | | | | 13,241 | |
Unibail-Rodamco SE (Real estate investment trusts (REITs)) | | | 197,589 | | | | 47,916 | |
Vivendi S.A. (Diversified telecommunication services) | | | 1,524,540 | | | | 34,479 | |
Zodiac Aerospace (Aerospace & defense) | | | 100,906 | | | | 11,171 | |
| | | | | | | | |
| | | | | | | 362,521 | |
| | | | | | | | |
Germany—3.9% | | | | | | | | |
Aixtron AG (Semiconductors & semiconductor equipment) | | | 94,263 | | | | 1,124 | |
Bayer AG (Pharmaceuticals) | | | 495,064 | | | | 47,210 | |
Bertrandt AG (Professional services) | | | 30,087 | | | | 3,021 | |
Brenntag AG (Trading companies & distributors) | | | 104,500 | | | | 13,767 | |
Deutsche Bank AG (Capital markets) | | | 317,317 | | | | 13,960 | |
Deutsche Wohnen AG (Real estate management & development) | | | 593,081 | | | | 11,011 | |
Fresenius SE & Co. KGaA (Health care providers & services) | | | 217,585 | | | | 25,037 | |
Gerry Weber International AG (Textiles, apparel & luxury goods) | | | 198,113 | | | | 9,596 | |
MTU Aero Engines Holding AG (Aerospace & defense) | | | 200,063 | | | | 18,258 | |
| | | | | | | | |
| | | | | | | 142,984 | |
| | | | | | | | |
Ireland—0.2% | | | | | | | | |
Paddy Power plc (Hotels, restaurants & leisure) | | | 103,881 | | | | 8,575 | |
| | | | | | | | |
|
Common Stocks—Europe—32.9%—(continued) | |
| | |
Italy—0.9% | | | | | | | | |
Azimut Holding SpA (Capital markets) | | | 444,394 | | | $ | 6,395 | |
Intesa Sanpaolo SpA (Commercial banks) | | | 7,396,197 | | | | 12,790 | |
Pirelli & C. SpA (Auto components) | | | 485,411 | | | | 5,593 | |
Tod’s SpA (Textiles, apparel & luxury goods) | | | 74,809 | | | | 9,499 | |
| | | | | | | | |
| | | | | | | 34,277 | |
| | | | | | | | |
Netherlands—3.7% | | | | | | | | |
ASML Holding N.V. (Semiconductors & semiconductor equipment) | | | 190,662 | | | | 12,228 | |
Royal Dutch Shell plc Class “B” (Oil, gas & consumable fuels) | | | 1,801,374 | | | | 64,266 | |
Unilever N.V. (Food products) | | | 1,546,193 | | | | 59,163 | |
| | | | | | | | |
| | | | | | | 135,657 | |
| | | | | | | | |
Norway—3.0% | | | | | | | | |
Fred Olsen Energy ASA (Energy equipment & services) | | | 150,866 | | | | 6,624 | |
Schibsted ASA (Media) | | | 241,070 | | | | 10,309 | |
Statoil ASA (Oil, gas & consumable fuels) | | | 2,245,712 | | | | 56,602 | |
Telenor ASA (Diversified telecommunication services) | | | 1,810,226 | | | | 36,860 | |
| | | | | | | | |
| | | | | | | 110,395 | |
| | | | | | | | |
Spain—1.4% | | | | | | | | |
Inditex S.A. (Specialty retail) | | | 298,903 | | | | 41,998 | |
Viscofan S.A. (Food products) | | | 142,213 | | | | 8,055 | |
| | | | | | | | |
| | | | | | | 50,053 | |
| | | | | | | | |
Sweden—2.0% | | | | | | | | |
Atlas Copco AB Class “A” (Machinery) | | | 1,429,293 | | | | 39,635 | |
Getinge AB (Health care equipment & supplies) | | | 701,597 | | | | 23,849 | |
Hexpol AB (Chemicals) | | | 165,901 | | | | 8,803 | |
| | | | | | | | |
| | | | | | | 72,287 | |
| | | | | | | | |
Switzerland—4.6% | | | | | | | | |
Burckhardt Compression Holding AG (Machinery) | | | 9,859 | | | | 3,240 | |
*Credit Suisse Group AG (Capital markets) | | | 754,741 | | | | 18,420 | |
*Geberit AG (Building products) | | | 107,677 | | | | 23,869 | |
Glencore International plc (Metals & mining) | | | 9,224,636 | | | | 53,289 | |
Partners Group Holding AG (Capital markets) | | | 86,049 | | | | 19,893 | |
SGS S.A. (Professional services) | | | 9,686 | | | | 21,513 | |
Syngenta AG (Chemicals) | | | 70,281 | | | | 28,393 | |
| | | | | | | | |
| | | | | | | 168,617 | |
| | | | | | | | |
United Kingdom—18.1% | | | | | | | | |
Abcam plc (Biotechnology) | | | 1,032,007 | | | | 6,500 | |
Aberdeen Asset Management plc (Capital markets) | | | 1,639,890 | | | | 9,868 | |
AMEC plc (Energy equipment & services) | | | 1,008,806 | | | | 16,677 | |
Amlin plc (Insurance) | | | 1,898,424 | | | | 11,802 | |
ARM Holdings plc (Semiconductors & semiconductor equipment) | | | 1,473,463 | | | | 18,608 | |
Ashmore Group plc (Capital markets) | | | 2,697,495 | | | | 15,928 | |
Babcock International Group plc (Commercial services & supplies) | | | 1,882,905 | | | | 29,722 | |
See accompanying Notes to Portfolio of Investments.
December 31, 2012 | William Blair Funds 33 |
International Growth Fund
Portfolio of Investments, December 31, 2012 (all dollar amounts in thousands)
| | | | | | | | |
Issuer | | Shares | | | Value | |
|
Common Stocks—United Kingdom—18.1%—(continued) | |
Bunzl plc (Trading companies & distributors) | | | 710,378 | | | $ | 11,758 | |
Croda International plc (Chemicals) | | | 173,582 | | | | 6,784 | |
Debenhams plc (Multiline retail) | | | 527,553 | | | | 985 | |
Derwent London plc (Real estate investment trusts (REITs)) | | | 346,263 | | | | 11,984 | |
Diageo plc (Beverages) | | | 2,231,381 | | | | 64,993 | |
Dunelm Group plc (Specialty retail) | | | 1,032,488 | | | | 11,841 | |
Elementis plc (Chemicals) | | | 2,209,133 | | | | 8,435 | |
Experian plc (Professional services) | | | 1,106,470 | | | | 17,833 | |
Halma plc (Electronic equipment, instruments
& components) | | | 1,365,998 | | | | 10,279 | |
Hargreaves Lansdown plc (Capital
markets) | | | 218,368 | | | | 2,442 | |
Hiscox, Ltd. (Insurance) | | | 932,283 | | | | 6,940 | |
IG Group Holdings plc (Diversified financial
services) | | | 1,280,360 | | | | 9,423 | |
InterContinental Hotels Group plc (Hotels,
restaurants & leisure) | | | 1,097,734 | | | | 30,781 | |
ITV plc (Media) | | | 18,892,162 | | | | 32,773 | |
John Wood Group plc (Energy equipment &
services) | | | 1,607,261 | | | | 19,214 | |
Johnson Matthey plc (Chemicals) | | | 547,655 | | | | 21,514 | |
Jupiter Fund Management plc (Capital
markets) | | | 1,528,336 | | | | 6,995 | |
Lancashire Holdings, Ltd. (Insurance) | | | 1,081,998 | | | | 13,776 | |
Meggitt plc (Aerospace & defense) | | | 1,907,774 | | | | 11,946 | |
Moneysupermarket.com Group plc (Internet
software & services) | | | 3,081,548 | | | | 7,901 | |
*Ocado Group plc (Internet & catalog
retail) | | | 1,923,504 | | | | 2,748 | |
Oxford Instruments plc (Electronic
equipment, instruments & components) | | | 169,907 | | | | 3,971 | |
Prudential plc (Insurance) | | | 3,093,495 | | | | 44,136 | |
Reckitt Benckiser Group plc (Household
products) | | | 658,498 | | | | 41,801 | |
Rightmove plc (Media) | | | 275,322 | | | | 6,473 | |
*Rolls-Royce Holdings plc (Aerospace &
defense) | | | 2,483,004 | | | | 35,615 | |
Rotork plc (Machinery) | | | 285,126 | | | | 11,902 | |
RPS Group plc (Commercial services &
supplies) | | | 1,049,791 | | | | 3,629 | |
Spirax-Sarco Engineering plc (Machinery) | | | 200,592 | | | | 7,511 | |
St James’s Place plc (Insurance) | | | 905,796 | | | | 6,262 | |
*The Berkeley Group Holdings plc (Household durables) | | | 874,528 | | | | 25,158 | |
Tullow Oil plc (Oil, gas & consumable
fuels) | | | 1,792,496 | | | | 37,369 | |
Victrex plc (Chemicals) | | | 376,308 | | | | 10,029 | |
Wolseley plc (Trading companies &
distributors) | | | 232,075 | | | | 11,098 | |
| | | | | | | | |
| | | | 665,404 | |
| | | | | | | | |
|
Japan—13.6% | |
ABC-Mart, Inc. (Specialty retail) | | | 151,700 | | | | 6,604 | |
Ain Pharmaciez, Inc. (Food & staples
retailing) | | | 62,500 | | | | 3,419 | |
Arnest One Corporation (Household
durables) | | | 357,800 | | | | 5,861 | |
|
Common Stocks—Japan—13.6% —(continued) | |
Astellas Pharma, Inc. (Pharmaceuticals) | | | 537,200 | | | $ | 24,153 | |
Chiyoda Corporation (Construction &
engineering) | | | 993,000 | | | | 14,225 | |
Cosmos Pharmaceutical Corporation (Food &
staples retailing) | | | 35,900 | | | | 3,568 | |
Daito Trust Construction Co., Ltd. (Real
estate management & development) | | | 166,500 | | | | 15,736 | |
FamilyMart Co., Ltd. (Food & staples retailing) | | | 346,600 | | | | 14,279 | |
Fast Retailing Co., Ltd. (Specialty retail) | | | 92,500 | | | | 23,607 | |
Fuji Heavy Industries, Ltd. (Automobiles) | | | 1,906,000 | | | | 24,035 | |
Japan Tobacco, Inc. (Tobacco) | | | 1,208,900 | | | | 34,151 | |
Keyence Corporation (Electronic equipment,
instruments & components) | | | 82,000 | | | | 22,741 | |
Lawson, Inc. (Food & staples retailing) | | | 290,700 | | | | 19,720 | |
M3, Inc. (Health care technology) | | | 3,730 | | | | 5,953 | |
Miraca Holdings, Inc. (Health care providers & services) | | | 140,600 | | | | 5,669 | |
MISUMI Group, Inc. (Trading companies &
distributors) | | | 212,900 | | | | 5,819 | |
MonotaRO Co., Ltd. (Trading companies &
distributors) | | | 103,800 | | | | 3,344 | |
Nitori Co., Ltd. (Specialty retail) | | | 117,920 | | | | 8,640 | |
ORIX Corporation (Diversified financial
services) | | | 570,880 | | | | 64,486 | |
Ryohin Keikaku Co., Ltd. (Multiline
retail) | | | 85,900 | | | | 4,804 | |
Shimamura Co., Ltd. (Specialty retail) | | | 100,400 | | | | 9,756 | |
Ship Healthcare Holdings, Inc.
(Health care providers & services) | | | 201,700 | | | | 5,361 | |
Sumitomo Mitsui Financial Group, Inc.
(Commercial banks) | | | 2,202,900 | | | | 80,057 | |
Sumitomo Realty & Development Co.,
Ltd. (Real estate management &
development) | | | 1,286,000 | | | | 42,842 | |
Sundrug Co., Ltd. (Food & staples
retailing) | | | 198,700 | | | | 6,796 | |
Suruga Bank, Ltd. (Commercial banks) | | | 888,000 | | | | 10,922 | |
Tsuruha Holdings, Inc. (Food & staples
retailing) | | | 71,100 | | | | 5,607 | |
United Arrows, Ltd. (Specialty retail) | | | 154,300 | | | | 3,553 | |
Yahoo! Japan Corporation
(Internet software & services) | | | 74,387 | | | | 24,086 | |
| | | | | | | | |
| | | | | | | 499,794 | |
| | | | | | | | |
| | |
Emerging Asia—11.2% | | | | | | | | |
China—2.6% | | | | | | | | |
*Brilliance China Automotive
Holdings, Ltd. (Automobiles) | | | 11,342,000 | | | | 14,253 | |
China Overseas Land & Investment, Ltd.
(Real estate management & development) | | | 12,084,000 | | | | 36,741 | |
Great Wall Motor Co., Ltd. Class “H”
(Automobiles) | | | 5,227,000 | | | | 16,812 | |
*Hollysys Automation Technologies, Ltd.
(Electronic equipment, instruments &
components)† | | | 403,494 | | | | 4,789 | |
Lenovo Group, Ltd.
(Computers & peripherals) | | | 17,024,000 | | | | 15,697 | |
See accompanying Notes to Portfolio of Investments.
34 Annual Report | December 31, 2012 |
International Growth Fund
Portfolio of Investments, December 31, 2012 (all dollar amounts in thousands)
| | | | | | | | |
Issuer | | Shares | | | Value | |
|
Common Stocks—Emerging Asia—11.2%—(continued) | |
| | |
China—(continued) | | | | | | | | |
Spreadtrum Communications, Inc.—ADR
(Semiconductors & semiconductor
equipment) | | | 250,119 | | | $ | 4,402 | |
*WuXi PharmaTech Cayman, Inc.—ADR
(Life sciences tools & services) | | | 233,977 | | | | 3,685 | |
| | | | | | | | |
| | | | | | | 96,379 | |
| | | | | | | | |
India—2.1% | | | | | | | | |
CRISIL, Ltd. (Diversified financial
services) | | | 175,788 | | | | 3,486 | |
Gruh Finance, Ltd. (Thrifts & mortgage
finance) | | | 574,950 | | | | 2,497 | |
IndusInd Bank, Ltd. (Commercial banks) | | | 611,736 | | | | 4,722 | |
Ipca Laboratories, Ltd. (Pharmaceuticals) | | | 601,557 | | | | 5,697 | |
Lupin, Ltd. (Pharmaceuticals) | | | 744,202 | | | | 8,405 | |
Oberoi Realty, Ltd. (Real estate
management & development) | | | 850,309 | | | | 4,513 | |
Sun Pharmaceutical Industries, Ltd.
(Pharmaceuticals) | | | 1,047,751 | | | | 14,172 | |
Tata Motors, Ltd. (Automobiles) | | | 4,526,391 | | | | 26,018 | |
Yes Bank, Ltd. (Commercial banks) | | | 906,173 | | | | 7,718 | |
| | | | | | | | |
| | | | | | | 77,228 | |
| | | | | | | | |
|
Indonesia—1.0% | |
PT Alam Sutera Realty Tbk (Real estate
management & development) | | | 89,256,000 | | | | 5,585 | |
PT Bank Rakyat Indonesia (Commercial
banks) | | | 17,443,000 | | | | 12,651 | |
PT Kalbe Farma Tbk (Pharmaceuticals) | | | 103,961,000 | | | | 11,457 | |
PT Media Nusantara Citra Tbk (Media) | | | 22,070,000 | | | | 5,734 | |
| | | | | | | | |
| | | | | | | 35,427 | |
| | | | | | | | |
| | |
Philippines—0.4% | | | | | | | | |
International Container Terminal Services, Inc. (Transportation infrastructure) | | | 2,063,320 | | | | 3,728 | |
Puregold Price Club, Inc. (Food & staples
retailing) | | | 4,613,700 | | | | 3,711 | |
SM Prime Holdings, Inc. (Real estate
management & development) | | | 20,256,350 | | | | 8,165 | |
| | | | | | | | |
| | | | | | | 15,604 | |
| | | | | | | | |
South Korea—3.5% | | | | | | | | |
*Hyundai Motor Co.
(Automobiles) | | | 183,207 | | | | 37,767 | |
Samsung Electronics Co., Ltd.
(Semiconductors & semiconductor
equipment) | | | 55,234 | | | | 79,360 | |
Samsung Fire & Marine Insurance Co., Ltd.
(Insurance) | | | 51,851 | | | | 10,534 | |
| | | | | | | | |
| | | | | | | 127,661 | |
| | | | | | | | |
Taiwan—0.4% | | | | | | | | |
Asustek Computer, Inc.
(Computers & peripherals) | | | 1,089,000 | | | | 12,332 | |
| | | | | | | | |
Thailand—1.2% | | | | | | | | |
Advanced Info Service PCL
(Wireless telecommunication services) | | | 2,565,300 | | | | 17,643 | |
BEC World PCL (Media) | | | 3,101,400 | | | | 7,229 | |
Kasikornbank PCL (Commercial banks) | | | 3,136,500 | | | | 19,938 | |
| | | | | | | | |
| | | | | | | 44,810 | |
| | | | | | | | |
| | | | | | | | |
Issuer | | Shares | | | Value | |
|
Common Stocks—(continued) | |
| | |
Asia—6.7% | | | | | | | | |
Australia—2.5% | | | | | | | | |
Cochlear, Ltd. (Health care equipment &
supplies) | | | 144,978 | | | $ | 12,018 | |
CSL, Ltd. (Biotechnology) | | | 495,308 | | | | 27,964 | |
Telstra Corporation, Ltd. (Diversified
telecommunication services) | | | 11,588,351 | | | | 52,805 | |
| | | | | | | | |
| | | | | | | 92,787 | |
| | | | | | | | |
Hong Kong—2.2% | | | | | | | | |
AIA Group, Ltd. (Insurance) | | | 11,780,600 | | | | 46,726 | |
China High Precision Automation Group,
Ltd. (Electronic equipment,
instruments & components)**§ | | | 6,597,000 | | | | 1,055 | |
Hutchison Telecommunications
Hong Kong Holdings, Ltd.
(Diversified telecommunication services) | | | 19,412,000 | | | | 8,981 | |
Sa Sa International Holdings, Ltd.
(Specialty retail) | | | 10,214,000 | | | | 8,482 | |
SmarTone Telecommunications Holdings,
Ltd. (Wireless telecommunication
services) | | | 4,764,500 | | | | 8,735 | |
Value Partners Group, Ltd.
(Capital markets) | | | 7,266,000 | | | | 4,896 | |
| | | | | | | | |
| | | | | | | 78,875 | |
| | | | | | | | |
Singapore—2.0% | | | | | | | | |
First Resources, Ltd. (Food products) | | | 3,932,000 | | | | 6,557 | |
Global Logistic Properties, Ltd. (Real estate
management & development) | | | 13,141,000 | | | | 30,391 | |
Keppel Corporation, Ltd.
(Industrial conglomerates) | | | 4,138,300 | | | | 37,789 | |
| �� | | | | | | | |
| | | | | | | 74,737 | |
| | | | | | | | |
| | |
Emerging Latin America—5.6% | | | | | | | | |
Brazil—2.1% | | | | | | | | |
BR Malls Participacoes S.A. (Real estate
management & development) | | | 952,400 | | | | 12,568 | |
Cia de Concessoes Rodoviarias
(Transportation infrastructure) | | | 1,813,200 | | | | 17,224 | |
Cia Hering (Specialty retail) | | | 600,400 | | | | 12,313 | |
Cielo S.A. (IT services) | | | 447,000 | | | | 12,442 | |
*Lupatech S.A. (Energy equipment &
services) | | | 756,125 | | | | 609 | |
Mills Estruturas e Servicos de Engenharia
S.A. (Trading companies & distributors) | | | 361,800 | | | | 6,008 | |
*Qualicorp S.A. (Health care providers &
services) | | | 382,100 | | | | 3,958 | |
T4F Entretenimento S.A. (Media) | | | 206,100 | | | | 789 | |
Tractebel Energia S.A. (Independent power
producers & energy traders) | | | 504,200 | | | | 8,213 | |
Valid Solucoes e Servicos de Seguranca em Meios de Pagamento e Identificacao S.A.
(Commercial services & supplies) | | | 223,100 | | | | 4,958 | |
| | | | | | | | |
| | | | | | | 79,082 | |
| | | | | | | | |
Chile—1.5% | | | | | | | | |
CFR Pharmaceuticals S.A. (Pharmaceuticals) | | | 24,273,928 | | | | 6,135 | |
ENTEL Chile S.A. (Wireless telecommunication services) | | | 610,835 | | | | 12,631 | |
See accompanying Notes to Portfolio of Investments.
December 31, 2012 | William Blair Funds 35 |
International Growth Fund
Portfolio of Investments, December 31, 2012 (all dollar amounts in thousands)
| | | | | | | | |
Issuer | | Shares | | | Value | |
| |
Common Stocks—Emerging
Latin America—5.6%—(continued) | | | | | |
Chile—(continued) | | | | | |
Inversiones La Construccion S.A. (Diversified financial services) | | | 210,385 | | | $ | 4,131 | |
Parque Arauco S.A. (Real estate management & development) | | | 5,220,316 | | | | 12,964 | |
Sociedad Quimica y Minera de Chile S.A.—ADR (Chemicals) | | | 222,810 | | | | 12,842 | |
Sonda S.A. (IT services) | | | 1,750,122 | | | | 5,575 | |
| | | | | | | | |
| | | | | | | 54,278 | |
| | | | | | | | |
Colombia—0.8% | | | | | | | | |
Ecopetrol S.A. (Oil, gas & consumable fuels) | | | 9,188,901 | | | | 28,394 | |
| | | | | | | | |
Mexico—0.9% | | | | | | | | |
Banregio Grupo Financiero S.A.B. de C.V. (Commercial banks) | | | 1,121,900 | | | | 5,112 | |
Grupo Financiero Banorte S.A.B. de C.V. (Commercial banks) | | | 604,600 | | | | 3,904 | |
Grupo Mexico S.A.B. de C.V. Series “B” (Metals & mining) | | | 6,532,100 | | | | 23,564 | |
| | | | | | | | |
| | | | | | | 32,580 | |
| | | | | | | | |
Panama—0.3% | | | | | | | | |
Copa Holdings S.A. (Airlines)† | | | 119,362 | | | | 11,871 | |
| | | | | | | | |
| | |
Western Hemisphere—4.7% | | | | | | | | |
Bermuda—0.3% | | | | | | | | |
RenaissanceRe Holdings, Ltd. (Insurance)† | | | 152,797 | | | | 12,416 | |
| | | | | | | | |
Canada—4.4% | | | | | | | | |
Alimentation Couche Tard, Inc. (Food & staples retailing) | | | 364,351 | | | | 17,923 | |
Brookfield Asset Management, Inc. Class “A” (Real estate management & development)† | | | 1,318,135 | | | | 48,310 | |
Canadian National Railway Co. (Road & rail)† | | | 480,185 | | | | 43,702 | |
CI Financial Corporation (Capital markets) | | | 621,838 | | | | 15,585 | |
Metro, Inc. (Food & staples retailing) | | | 315,282 | | | | 20,073 | |
Peyto Exploration & Development Corporation (Oil, gas & consumable fuels) | | | 668,491 | | | | 15,450 | |
| | | | | | | | |
| | | | | | | 161,043 | |
| | | | | | | | |
| |
Emerging Europe, Mid-East, Africa—3.6% | | | | | |
Nigeria—0.3% | | | | | | | | |
Guaranty Trust Bank plc (Commercial banks) | | | 70,554,411 | | | | 10,431 | |
| | | | | | | | |
South Africa—2.7% | | | | | | | | |
*Aspen Pharmacare Holdings, Ltd. (Pharmaceuticals) | | | 956,263 | | | | 19,146 | |
Bidvest Group, Ltd. (Industrial conglomerates) | | | 713,574 | | | | 18,256 | |
FirstRand, Ltd. (Diversified financial services) | | | 5,890,170 | | | | 21,674 | |
Life Healthcare Group Holdings Pte, Ltd. (Health care providers & services) | | | 1,970,581 | | | | 7,919 | |
Naspers, Ltd. (Media) | | | 315,673 | | | | 20,389 | |
Tiger Brands, Ltd. (Food products) | | | 318,913 | | | | 12,298 | |
| | | | | | | | |
| | | | | | | 99,682 | |
| | | | | | | | |
| |
Common Stocks—Emerging Europe, Mid-East, Africa—3.6%—(continued) | | | | | |
Turkey—0.4% | | | | | | | | |
Turkiye Halk Bankasi A.S. (Commercial banks) | | | 1,588,316 | | | $ | 15,657 | |
| | | | | | | | |
United Arab Emirates—0.2% | | | | | | | | |
First Gulf Bank PJSC (Commercial banks) | | | 1,899,878 | | | | 6,099 | |
| | | | | | | | |
Total Common Stocks—96.4%
(cost $2,909,418) | | | | 3,541,641 | |
| | | | | | | | |
| | |
Exchange-Traded Fund | | | | | | | | |
China—1.0% | | | | | | | | |
iShares FTSE A50 China Index | | | 26,431,410 | | | | 37,989 | |
| | | | | | | | |
Total Exchange-Traded Fund—1.0% (cost $35,050) | | | | | | | 37,989 | |
| | | | | | | | |
| | |
Affiliated Fund | | | | | | | | |
China—0.6% | | | | | | | | |
William Blair China A-Share Fund, LLC | | | 2,202,200 | | | | 22,022 | |
| | | | | | | | |
Total Affiliated Fund—0.6%
(cost $22,022) | | | | 22,022 | |
| | | | | | | | |
| | |
Repurchase Agreement | | | | | | | | |
Fixed Income Clearing Corporation, 0.110% dated 12/31/12, due 1/2/13, repurchase price $61,402, collateralized by U.S. Treasury Note, 2.125%, due 12/31/15 | | $ | 61,401 | | | | 61,401 | |
| | | | | | | | |
Total Repurchase Agreement—1.7%
(cost $61,401) | | | | 61,401 | |
| | | | | | | | |
Total Investments—99.7%
(cost $3,027,891) | | | | 3,663,053 | |
Cash and other assets, less liabilities—0.3% | | | | 9,580 | |
| | | | | | | | |
Net assets—100.0% | | | $ | 3,672,633 | |
| | | | | | | | |
ADR = American Depository Receipt
* Non-income producing securities
† = U.S. listed foreign security
** = Fair valued pursuant to Valuation Procedures adopted by the Board of Trustees. This holding represents 0.03% of the Fund’s net assets at December 31, 2012.
§ = Deemed illiquid pursuant to Liquidity Procedures approved by the Board of Trustees. This holding represents 0.03% of the net assets at December 31, 2012.
For securities primarily traded on exchanges or markets that close before the close of regular trading on the New York Stock Exchange, the Fund may use an independent pricing service to fair value price the securities pursuant to Valuation Procedures approved by the Board of Trustees.
See accompanying Notes to Portfolio of Investments.
36 Annual Report | December 31, 2012 |
International Growth Fund
Portfolio of Investments, December 31, 2012 (all dollar amounts in thousands)
The International Growth Fund invested in the following affiliated fund. There are no unfunded commitments to the affiliated fund and the Fund may redeem its investment monthly.
| | | | | | | | | | | | | | | | | | | | | | | | | | |
| | | | | Share Activity | | | Year Ended
December 31, 2012 | |
| | | | | | | | | | | | | | | | | (in thousands) | |
Fund Name | | Balance
12/31/2011 | | | Purchases | | | Sales | | | Balance
12/31/2012 | | | Value | | | Dividends
Included
in Income | |
William Blair China-A Share Fund, LLC | | | — | | | | 2,202,200 | | | | — | | | | 2,202,200 | | | $ | 22,022 | | | | — | |
As of December 31, 2012 the Fund invested in William Blair China A Share Fund, LLC, an Affiliated Fund. There was no realized or unrealized gain/(loss) from investments in the affiliated fund.
At December 31, 2012, the Fund’s Portfolio of Investments includes the following sector categories (as a percentage of long-term investments):
| | | | |
Financials | | | 25.3% | |
Industrials | | | 14.1% | |
Consumer Discretionary | | | 13.6% | |
Health Care | | | 10.5% | |
Consumer Staples | | | 9.3% | |
Information Technology | | | 8.1% | |
Energy | | | 7.0% | |
Materials | | | 6.0% | |
Telecommunication Services | | | 4.8% | |
Exchange-Traded Funds | | | 1.1% | |
Utilities | | | 0.2% | |
| | | | |
Total | | | 100.0% | |
| | | | |
At December 31, 2012, the Fund’s Portfolio of Investments includes the following currency categories (as a percentage of long-term investments):
| | | | |
British Pound Sterling | | | 21.7% | |
Euro | | | 20.8% | |
Japanese Yen | | | 13.9% | |
Hong Kong Dollar | | | 5.8% | |
U.S. Dollar | | | 4.3% | |
South Korean Won | | | 3.5% | |
Swiss Franc | | | 3.2% | |
Norwegian Krone | | | 3.1% | |
South African Rand | | | 2.8% | |
Australian Dollar | | | 2.6% | |
Brazilian Real | | | 2.2% | |
Indian Rupee | | | 2.1% | |
Singapore Dollar | | | 2.1% | |
Swedish Krona | | | 2.0% | |
Canadian Dollar | | | 1.9% | |
Thai Baht | | | 1.2% | |
Danish Krone | | | 1.2% | |
Chilean Peso | | | 1.2% | |
All Other Currencies | | | 4.4% | |
| | | | |
Total | | | 100.0% | |
| | | | |
See accompanying Notes to Financial Statements.
December 31, 2012 | William Blair Funds 37 |

David Merjan
INTERNATIONAL EQUITY FUND
The International Equity Fund seeks long-term capital appreciation.
AN OVERVIEW FROM THE PORTFOLIO MANAGER
The International Equity Fund posted a 17.57% increase (Class N Shares) for the twelve months ended December 31, 2012. By comparison, the Fund’s benchmark, the MSCI World ex-US Index (net) increased 16.41%.
In 2012, the Fund outpaced the MSCI World ex-US Index (net) on strong Health Care, Information Technology (IT), Materials and Telecom Services stock selection. Essilor, the contact lens manufacturer, was a strong contributor as it continued to perform well fundamentally and benefited from its defensive nature mid-year, while the Fund’s Pharmaceutical companies also performed well, led by Novo Nordisk and Bayer. IT stock selection benefited from the overweighting and performance in Semiconductors and Semiconductor Equipment, particularly due to strong performance by Samsung Electronics and Arm Holdings. Materials added value given the Fund’s underweighting in the underperforming Metals/Mining industry, coupled with good Chemicals stock selection. Somewhat mitigating these positive results were the Fund’s Discretionary, Energy and Financials stock selection. Discretionary underperformance was largely the result of Automobiles performance, coupled with underperformance in Japanese holdings. Energy’s underperformance was due largely to BG Group’s production guidance in the fourth quarter, along with broader Oil/Gas stock selection. Financials stock selection was hampered by conservative positioning in Commercial Banks during the latter part of 2012, as the market accelerated.
During the year, we increased the weighting in European and Emerging Markets commercial banks, thereby increasing the Financials weighting from approximately 19.9% to just over 21%, although it remained underweighted relative to the 25.7% benchmark Index weighting. IT also increased from approximately 11.2% to 13.5% well ahead of the 4% benchmark Index weighting, which was funded by reduced Discretionary and Energy weightings. Regionally, emerging markets totaled approximately 13%. The Fund ended the year overweighted in Developed Europe and underweighted in Developed Asia.
38 Annual Report | December 31, 2012 |
International Equity Fund
Performance Highlights (Unaudited)
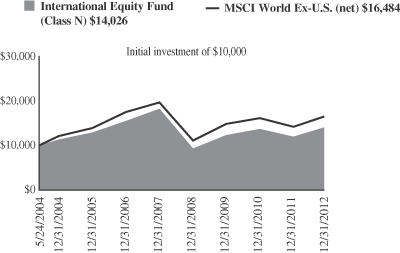
Average Annual Total Return at 12/31/2012
| | | | | | | | | | | | | | | | |
| | | 1
Year | | | 3
Year | | | 5
Year | | | Since
Inception(a) | |
Class N | | | 17.57 | % | | | 4.35 | % | | | (5.03 | )% | | | 4.01 | % |
Class I | | | 17.89 | | | | 4.60 | | | | (4.80 | ) | | | 4.28 | |
MSCI World Ex-U.S. (net) | | | 16.41 | | | | 3.65 | | | | (3.43 | ) | | | 5.98 | |
| | (a) | | For the period from May 24, 2004 (Commencement of Operations) to December 31, 2012. | |
Performance cited represents past performance. Past performance does not guarantee future results and current performance may be lower or higher than the data quoted. Results shown are average annual returns, which assume reinvestment of dividends and capital gains. Investment returns and principal will fluctuate and you may have a gain or loss when you sell shares. For the most current month-end performance information, please call 1-800-742-7272, or visit our Web site at www.williamblairfunds.com. From time to time the investment advisor may waive fees or reimburse expenses for the Fund. Without these waivers, performance would be lower. International investing involves special risk considerations, including currency fluctuations, lower liquidity, economic and political risk. Class N shares are available to the general public without a sales load. Class I shares are available to certain institutional investors and advisory clients of William Blair & Company L.L.C. without a sales load or distribution (12b-1) or service fees.
The performance highlights and graph presented above do not reflect the deduction of taxes that a shareholder would pay on fund distributions or the redemption of fund shares.
The Morgan Stanley Capital International (MSCI) World Ex-U.S. (net) is a free float-adjusted market capitalization weighted index that is designed to measure the equity market performance of developed markets, excluding the United States. This series approximates the minimum possible dividend reinvestment.
This report identifies the Fund’s investments on December 31, 2012. These holdings are subject to change. Not all stocks in the Fund performed the same, nor is there any guarantee that these stocks will perform as well in the future. Market forecasts provided in this report may not necessarily come to pass.
Sector Diversification (Unaudited)
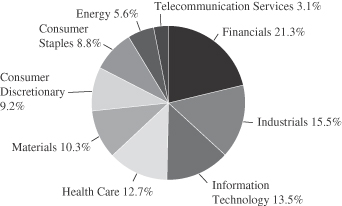
The sector diversification shown is based on the total long-term securities.
December 31, 2012 | William Blair Funds 39 |
International Equity Fund
Portfolio of Investments, December 31, 2012 (all dollar amounts in thousands)
| | | | | | | | |
Issuer | | Shares | | | Value | |
| | |
Common Stocks | | | | | | | | |
| | |
Europe—42.2% | | | | | | | | |
Denmark—2.4% | | | | | | | | |
Coloplast A/S Class “B” (Health care equipment & supplies) | | | 11,727 | | | $ | 575 | |
Novo Nordisk A/S Class “B” (Pharmaceuticals) | | | 6,815 | | | | 1,110 | |
| | | | | | | | |
| | | | | | | 1,685 | |
| | | | | | | | |
France—13.4% | | | | | | | | |
Arkema S.A. (Chemicals) | | | 7,963 | | | | 836 | |
BNP Paribas S.A. (Commercial banks) | | | 24,801 | | | | 1,412 | |
Christian Dior S.A. (Textiles, apparel & luxury goods) | | | 5,973 | | | | 1,018 | |
Dassault Systemes S.A. (Software) | | | 11,152 | | | | 1,247 | |
Essilor International S.A. (Health care equipment & supplies) | | | 8,618 | | | | 869 | |
L’Oreal S.A. (Personal products) | | | 4,034 | | | | 561 | |
Sanofi (Pharmaceuticals) | | | 16,912 | | | | 1,604 | |
Technip S.A. (Energy equipment & services) | | | 9,532 | | | | 1,102 | |
Unibail-Rodamco SE (Real estate investment trusts (REITs)) | | | 3,282 | | | | 796 | |
| | | | | | | | |
| | | | | | | 9,445 | |
| | | | | | | | |
Germany—8.4% | | | | | | | | |
BASF SE (Chemicals) | | | 14,736 | | | | 1,394 | |
Bayer AG (Pharmaceuticals) | | | 13,122 | | | | 1,251 | |
Fresenius SE & Co. KGaA (Health care providers & services) | | | 10,596 | | | | 1,219 | |
MTU Aero Engines Holding AG (Aerospace & defense) | | | 5,318 | | | | 485 | |
SAP AG (Software) | | | 19,286 | | | | 1,551 | |
| | | | | | | | |
| | | | | | | 5,900 | |
| | | | | | | | |
Ireland—4.5% | | | | | | | | |
Accenture plc Class “A” (IT services)† | | | 16,362 | | | | 1,088 | |
Ryanair Holdings plc—ADR (Airlines) | | | 25,537 | | | | 875 | |
Shire plc (Pharmaceuticals) | | | 38,521 | | | | 1,185 | |
| | | | | | | | |
| | | | | | | 3,148 | |
| | | | | | | | |
Netherlands—2.0% | | | | | | | | |
Unilever N.V. (Food products) | | | 36,123 | | | | 1,382 | |
| | | | | | | | |
Norway—1.6% | | | | | | | | |
Telenor ASA (Diversified telecommunication services) | | | 53,922 | | | | 1,098 | |
| | | | | | | | |
Spain—1.9% | | | | | | | | |
Inditex S.A. (Specialty retail) | | | 9,579 | | | | 1,346 | |
| | | | | | | | |
Sweden—1.5% | | | | | | | | |
Atlas Copco AB Class “A” (Machinery) | | | 38,795 | | | | 1,076 | |
| | | | | | | | |
Switzerland—6.5% | | | | | | | | |
*Geberit AG (Building products) | | | 4,641 | | | | 1,029 | |
Nestle S.A. (Food products) | | | 12,790 | | | | 834 | |
Roche Holding AG (Pharmaceuticals) | | | 5,005 | | | | 1,012 | |
Syngenta AG (Chemicals) | | | 4,135 | | | | 1,671 | |
| | | | | | | | |
| | | | | | | 4,546 | |
| | | | | | | | |
| | |
United Kingdom—20.9% | | | | | | | | |
ARM Holdings plc (Semiconductors & semiconductor equipment) | | | 78,445 | | | | 991 | |
Babcock International Group plc (Commercial services & supplies) | | | 52,393 | | | | 827 | |
Issuer | | Shares | | | Value | |
|
Common Stocks—United Kingdom—20.9%—(continued) | |
Burberry Group plc (Textiles, apparel & luxury goods) | | | 42,718 | | | $ | 859 | |
Compass Group plc (Hotels, restaurants & leisure) | | | 135,961 | | | | 1,614 | |
Diageo plc (Beverages) | | | 49,228 | | | | 1,434 | |
Experian plc (Professional services) | | | 47,732 | | | | 769 | |
HSBC Holdings plc (Commercial banks) | | | 100,766 | | | | 1,068 | |
InterContinental Hotels Group plc (Hotels, restaurants & leisure) | | | 26,064 | | | | 731 | |
John Wood Group plc (Energy equipment & services) | | | 75,992 | | | | 908 | |
Johnson Matthey plc (Chemicals) | | | 27,057 | | | | 1,063 | |
Prudential plc (Insurance) | | | 84,529 | | | | 1,206 | |
*Rolls-Royce Holdings plc (Aerospace & defense) | | | 87,953 | | | | 1,261 | |
Tullow Oil plc (Oil, gas & consumable fuels) | | | 28,437 | | | | 593 | |
Wolseley plc (Trading companies & distributors) | | | 27,501 | | | | 1,315 | |
| | | | | | | | |
| | | | | | | 14,639 | |
| | | | | | | | |
| | |
Japan—11.3% | | | | | | | | |
Chiyoda Corporation (Construction & engineering) | | | 29,000 | | | | 415 | |
Daito Trust Construction Co., Ltd. (Real estate management & development) | | | 11,700 | | | | 1,106 | |
Fuji Heavy Industries, Ltd. (Automobiles) | | | 69,000 | | | | 870 | |
Keyence Corporation (Electronic equipment, instruments & components) | | | 3,300 | | | | 915 | |
Murata Manufacturing Co., Ltd. (Electronic equipment, instruments & components) | | | 15,900 | | | | 938 | |
ORIX Corporation (Diversified financial services) | | | 10,770 | | | | 1,217 | |
Sumitomo Mitsui Financial Group, Inc. (Commercial banks) | | | 34,700 | | | | 1,261 | |
Suruga Bank, Ltd. (Commercial banks) | | | 52,000 | | | | 639 | |
Yahoo! Japan Corporation (Internet software & services) | | | 1,688 | | | | 547 | |
| | | | | | | | |
| | | | | | | 7,908 | |
| | | | | | | | |
| | |
Emerging Asia—8.6% | | | | | | | | |
China—4.1% | | | | | | | | |
China Mobile, Ltd. (Wireless telecommunication services) | | | 87,000 | | | | 1,024 | |
CNOOC, Ltd. (Oil, gas & consumable fuels) | | | 359,000 | | | | 791 | |
Sun Art Retail Group, Ltd. (Food & staples retailing) | | | 684,500 | | | | 1,058 | |
| | | | | | | | |
| | | | | | | 2,873 | |
| | | | | | | | |
India—0.8% | | | | | | | | |
Tata Consultancy Services, Ltd. (IT services) | | | 22,747 | | | | 524 | |
| | | | | | | | |
Papua New Guinea—0.7% | | | | | | | | |
Oil Search, Ltd. (Oil, gas & consumable fuels) | | | 70,771 | | | | 523 | |
| | | | | | | | |
South Korea—2.3% | | | | | | | | |
Samsung Electronics Co., Ltd. (Semiconductors & semiconductor equipment) | | | 1,114 | | | | 1,601 | |
| | | | | | | | |
Thailand—0.7% | | | | | | | | |
Kasikornbank PCL (Commercial banks) | | | 78,100 | | | | 496 | |
| | | | | | | | |
| | |
Canada—6.3% | | | | | | | | |
Brookfield Asset Management, Inc. Class “A” (Real estate management & development)† | | | 39,656 | | | | 1,453 | |
See accompanying Notes to Portfolio of Investments.
40 Annual Report | December 31, 2012 |
International Equity Fund
Portfolio of Investments, December 31, 2012 (all dollar amounts in thousands)
| | | | | | | | |
Issuer | | Shares | | | Value | |
| |
Common Stocks—Canada—6.3%—(continued) | | | | | |
Canadian National Railway Co. (Road & rail)† | | | 10,814 | | | $ | 984 | |
Goldcorp, Inc. (Metals & mining)† | | | 26,196 | | | | 962 | |
The Toronto-Dominion Bank (Commercial banks) | | | 12,399 | | | | 1,044 | |
| | | | | | | | |
| | | | | | | 4,443 | |
| | | | | | | | |
| | |
Asia—5.3% | | | | | | | | |
Australia—1.7% | | | | | | | | |
BHP Billiton, Ltd.—ADR (Metals & mining) | | | 15,574 | | | | 1,222 | |
| | | | | | | | |
Hong Kong—2.2% | | | | | | | | |
AIA Group, Ltd. (Insurance) | | | 389,000 | | | | 1,543 | |
| | | | | | | | |
Singapore—1.4% | | | | | | | | |
Keppel Corporation, Ltd. (Industrial conglomerates) | | | 107,000 | | | | 977 | |
| | | | | | | | |
| | |
Emerging Latin America—2.3% | | | | | | | | |
Mexico—1.2% | | | | | | | | |
Fomento Economico Mexicano S.A.B. de C.V—ADR (Beverages) | | | 8,308 | | | | 837 | |
| | | | | | | | |
Panama—1.1% | | | | | | | | |
Copa Holdings S.A. (Airlines)† | | | 7,869 | | | | 782 | |
| | | | | | | | |
|
Emerging Europe, Mid-East, Africa—2.3% | |
South Africa—1.7% | | | | | | | | |
FirstRand, Ltd. (Diversified financial services) | | | 322,679 | | | | 1,188 | |
| | | | | | | | |
Turkey—0.6% | | | | | | | | |
Turkiye Garanti Bankasi A.S. (Commercial banks) | | | 79,366 | | | | 414 | |
| | | | | | | | |
Total Common Stocks—99.2%
(cost $57,147) | | | | 69,596 | |
| | | | | | | | |
Total Investments—99.2%
(cost $57,147) | | | | 69,596 | |
Cash and other assets, less liabilities—0.8% | | | | 588 | |
| | | | | | | | |
Net assets—100.0% | | | $ | 70,184 | |
| | | | | | | | |
ADR = American Depository Receipt
† = U.S. listed foreign security
* Non-income producing securities
For securities primarily traded on exchanges or markets that close before the close of regular trading on the New York Stock Exchange, the Fund may use an independent pricing service to fair value price the securities pursuant to Valuation Procedures approved by the Board of Trustees.
At December 31, 2012, the Fund’s Portfolio of Investments includes the following sector categories (as a percentage of long-term investments):
| | | | |
Financials | | | 21.3% | |
Industrials | | | 15.5% | |
Information Technology | | | 13.5% | |
Health Care | | | 12.7% | |
Materials | | | 10.3% | |
Consumer Discretionary | | | 9.2% | |
Consumer Staples | | | 8.8% | |
Energy | | | 5.6% | |
Telecommunication Services | | | 3.1% | |
| | | | |
Total | | | 100.0% | |
| | | | |
At December 31, 2012, the Fund’s Portfolio of Investments includes the following currency categories (as a percentage of long-term investments):
| | | | |
Euro | | | 26.0% | |
British Pound Sterling | | | 22.7% | |
U.S. Dollar | | | 11.8% | |
Japanese Yen | | | 11.4% | |
Swiss Franc | | | 6.5% | |
Hong Kong Dollar | | | 6.3% | |
Danish Krone | | | 2.4% | |
South Korean Won | | | 2.3% | |
South African Rand | | | 1.7% | |
Norwegian Krone | | | 1.6% | |
Swedish Krona | | | 1.6% | |
Canadian Dollar | | | 1.5% | |
Singapore Dollar | | | 1.4% | |
All Other Currencies | | | 2.8% | |
| | | | |
Total | | | 100.0% | |
| | | | |
See accompanying Notes to Portfolio of Investments.
December 31, 2012 | William Blair Funds 41 |
W. George Greig
Kenneth J. McAtamney
INTERNATIONAL LEADERS FUND
The International Leaders Fund seeks long-term capital appreciation.
AN OVERVIEW FROM THE PORTFOLIO MANAGERS
The International Leaders Fund posted an 8.16% increase (Class N Shares) since its inception date of August 16, 2012 through December 31, 2012. By comparison, the Fund’s benchmark, the MSCI All Country World ex-U.S. IMI Index (net) increased 9.61% over the same period.
The International Leaders Fund underperformed the Index since its August 2012 inception, due largely to Energy, Information Technology (IT) and Materials stock selection, which was only somewhat mitigated by strong stock selection in Health Care, Industrials and Consumer Discretionary. Within Energy, Oil/Gas underperformed, due primarily to weakness in BG Group, as it reported production growth targets below market expectations. Chinese internet-related names were the key detractors from IT performance due to increased competition and potential valuation concerns. As a result of these company-specific issues, we sold both companies. Metals/Mining stock selection was the primary detractor from Materials outperformance, but was somewhat mitigated by strong Chemicals results and an underweighting in the Metals/Mining segment. Conversely, Auto companies bolstered Discretionary results, while Pharmaceuticals stock selection was also particularly strong. Within Industrials, the overweighting in the outperforming Machinery industry added value, as did stock selection in Trading Companies.
The market’s increased confidence in a positive resolution to the European sovereign crisis and related banking system has highlighted the attractive valuations in Financials, not only in Europe but globally as well. As a result, during the course of the period Financials increased to approximately 25% of the Fund, due largely to an increase in Developed Market Commercial Banks. Industrials increased to 17% of the Fund on an improved outlook and good valuations. Conversely, IT, Telecommunication Services and Consumer Staples decreased, as we reduced valuation risk in the Fund and on company-specific concerns. Regionally, the Fund maintained its significant overweighting in Europe, due largely to Health Care and IT, while the UK was also significantly overweighted in Consumer Discretionary and Industrials. Conversely, Emerging Markets and Developed Asia remained underweighted versus the Index.
42 Annual Report | December 31, 2012 |
International Leaders Fund
Performance Highlights (Unaudited)
Average Annual Total Return at 12/31/2012
| | | | |
| | | Since
Inception(a) | |
Class N | | | 8.16 | % |
Class I | | | 8.26 | |
MSCI AC World Ex-U.S. IMI (net) | | | 9.61 | |
| | (a) | | For the period from August 16, 2012 (Commencement of Operations) to December 31, 2012. | |
Performance cited represents past performance. Past performance does not guarantee future results and current performance may be lower or higher than the data quoted. Results shown are average annual returns, which assume reinvestment of dividends and capital gains. Investment returns and principal will fluctuate and you may have a gain or loss when you sell shares. For the most current month-end performance information, please call 1-800-742-7272, or visit our Web site at www.williamblairfunds.com. From time to time the investment advisor may waive fees or reimburse expenses for the Fund. Without these waivers, performance would be lower. International investing involves special risk considerations, including currency fluctuations, lower liquidity, economic and political risk. Class N shares are available to the general public without a sales load. Class I shares are available to certain institutional investors and advisory clients of William Blair & Company L.L.C. without a sales load or distribution (12b-1) fees.
The performance highlights presented above do not reflect the deduction of taxes that a shareholder would pay on fund distributions or the redemption of fund shares.
The Morgan Stanley Capital International (MSCI) All Country World Ex-U.S. Investable Market Index (IMI) (net) is a free float-adjusted market capitalization weighted index that is designed to measure the equity market performance of developed and emerging markets, excluding the United States. This series approximates the minimum possible dividend reinvestment.
This report identifies the Fund’s investments on December 31, 2012. These holdings are subject to change. Not all stocks in the Fund performed the same, nor is there any guarantee that these stocks will perform as well in the future. Market forecasts provided in this report may not necessarily come to pass.
Sector Diversification (Unaudited)
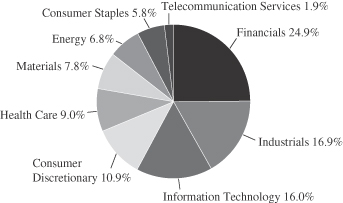
The sector diversification shown is based on the total long-term securities.
December 31, 2012 | William Blair Funds 43 |
International Leaders Fund
Portfolio of Investments, December 31, 2012 (all dollar amounts in thousands)
| | | | | | | | |
Issuer | | Shares | | | Value | |
|
Common Stocks | |
|
Europe, Mid-East—41.4% | |
Denmark—3.7% | |
Coloplast A/S Class “B” (Health care equipment & supplies) | | | 2,795 | | | $ | 137 | |
Novo Nordisk A/S Class “B” (Pharmaceuticals) | | | 1,502 | | | | 245 | |
| | | | | | | | |
| | | | | | | 382 | |
| | | | | | | | |
France—10.7% | | | | | | | | |
Arkema S.A. (Chemicals) | | | 1,633 | | | | 171 | |
BNP Paribas S.A. (Commercial banks) | | | 5,569 | | | | 317 | |
Dassault Systemes S.A. (Software) | | | 1,633 | | | | 182 | |
Sanofi (Pharmaceuticals) | | | 2,380 | | | | 226 | |
Technip S.A. (Energy equipment & services) | | | 1,623 | | | | 188 | |
| | | | | | | | |
| | | | | | | 1,084 | |
| | | | | | | | |
Germany—7.6% | | | | | | | | |
Bayerische Motoren Werke AG (Automobiles) | | | 2,451 | | | | 238 | |
Brenntag AG (Trading companies & distributors) | | | 834 | | | | 110 | |
Fresenius SE & Co. KGaA (Health care providers & services) | | | 1,816 | | | | 209 | |
SAP AG (Software) | | | 2,645 | | | | 213 | |
| | | | | | | | |
| | | | | | | 770 | |
| | | | | | | | |
Israel—1.4% | | | | | | | | |
*Check Point Software Technologies, Ltd. (Software)† | | | 2,951 | | | | 141 | |
| | | | | | | | |
Netherlands—3.8% | |
Royal Dutch Shell plc Class “B” (Oil, gas & consumable fuels) | | | 5,940 | | | | 212 | |
Unilever N.V. (Food products) | | | 4,583 | | | | 175 | |
| | | | | | | | |
| | | | | | | 387 | |
| | | | | | | | |
Norway—1.7% | | | | | | | | |
Statoil ASA (Oil, gas & consumable fuels) | | | 6,722 | | | | 169 | |
| | | | | | | | |
Spain—2.4% | | | | | | | | |
Inditex S.A. (Specialty retail) | | | 1,719 | | | | 242 | |
| | | | | | | | |
Sweden—2.1% | | | | | | | | |
Atlas Copco AB Class “A” (Machinery) | | | 7,605 | | | | 211 | |
| | | | | | | | |
Switzerland—8.0% | | | | | | | | |
*Geberit AG (Building products) | | | 631 | | | | 140 | |
Glencore International plc (Metals & mining) | | | 34,532 | | | | 199 | |
*Lindt & Spruengli AG (Food products) | | | 2 | | | | 76 | |
Partners Group Holding AG (Capital markets) | | | 693 | | | | 160 | |
Syngenta AG (Chemicals) | | | 604 | | | | 244 | |
| | | | | | | | |
| | | | | | | 819 | |
| | | | | | | | |
| | |
United Kingdom—22.1% | | | | | | | | |
ARM Holdings plc (Semiconductors & semiconductor equipment) | | | 15,539 | | | | 196 | |
Babcock International Group plc (Commercial services & supplies) | | | 7,982 | | | | 126 | |
Compass Group plc (Hotels, restaurants & leisure) | | | 16,940 | | | | 201 | |
Diageo plc (Beverages) | | | 6,181 | | | | 180 | |
Experian plc (Professional services) | | | 7,720 | | | | 125 | |
HSBC Holdings plc (Commercial banks) | | | 21,600 | | | | 229 | |
| | | | | | | | |
Issuer | | Shares | | | Value | |
|
Common Stocks—United Kingdom—22.1%—(continued) | |
InterContinental Hotels Group plc (Hotels, restaurants & leisure) | | | 6,025 | | | $ | 169 | |
Intertek Group plc (Professional services) | | | 3,025 | | | | 154 | |
John Wood Group plc (Energy equipment & services) | | | 9,330 | | | | 112 | |
Johnson Matthey plc (Chemicals) | | | 4,221 | | | | 166 | |
*Rolls-Royce Holdings plc (Aerospace & defense) | | | 7,130 | | | | 102 | |
*The Berkeley Group Holdings plc (Household durables) | | | 4,737 | | | | 136 | |
The Weir Group plc (Machinery) | | | 4,686 | | | | 145 | |
Wolseley plc (Trading companies & distributors) | | | 4,212 | | | | 201 | |
| | | | | | | | |
| | | | | | | 2,242 | |
| | | | | | | | |
| | |
Japan—10.0% | | | | | | | | |
Daito Trust Construction Co., Ltd. (Real estate management & development) | | | 800 | | | | 76 | |
Fanuc Corporation (Machinery) | | | 1,100 | | | | 205 | |
Fuji Heavy Industries, Ltd. (Automobiles) | | | 8,000 | | | | 101 | |
Makita Corporation (Machinery) | | | 3,400 | | | | 158 | |
ORIX Corporation (Diversified financial services) | | | 2,410 | | | | 272 | |
Sumitomo Mitsui Financial Group, Inc. (Commercial banks) | | | 5,700 | | | | 207 | |
| | | | | | | | |
| | | | | | | 1,019 | |
| | | | | | | | |
| | |
Emerging Asia—6.9% | | | | | | | | |
China—3.3% | |
*Baidu, Inc.—ADR (Internet software & services) | | | 1,417 | | | | 142 | |
China Mobile, Ltd. (Wireless telecommunication services) | | | 16,000 | | | | 188 | |
| | | | | | | | |
| | | | | | | 330 | |
| | | | | | | | |
Indonesia—1.2% | | | | | | | | |
PT Bank Rakyat Indonesia (Commercial banks) | | | 170,000 | | | | 123 | |
| | | | | | | | |
South Korea—2.4% | | | | | | | | |
Samsung Electronics Co., Ltd. (Semiconductors & semiconductor equipment) | | | 173 | | | | 249 | |
| | | | | | | | |
|
Emerging Latin America—5.4% | |
Argentina—1.1% | | | | | | | | |
MercadoLibre, Inc. (Internet software & services) | | | 1,418 | | | | 111 | |
| | | | | | | | |
Brazil—1.0% | | | | | | | | |
BR Malls Participacoes S.A. (Real estate management & development) | | | 7,500 | | | | 99 | |
| | | | | | | | |
Mexico—1.5% | | | | | | | | |
Fomento Economico Mexicano S.A.B. de C.V.—ADR (Beverages) | | | 1,506 | | | | 152 | |
| | | | | | | | |
Peru—1.8% | | | | | | | | |
Credicorp, Ltd. (Commercial banks)† | | | 1,290 | | | | 189 | |
| | | | | | | | |
|
Asia—4.3% | |
Hong Kong—4.3% | |
AIA Group, Ltd. (Insurance) | | | 70,600 | | | | 280 | |
ASM Pacific Technology, Ltd. (Semiconductors & semiconductor equipment) | | | 12,500 | | | | 154 | |
| | | | | | | | |
| | | | | | | 434 | |
| | | | | | | | |
See accompanying Notes to Portfolio of Investments.
44 Annual Report | December 31, 2012 |
International Leaders Fund
Portfolio of Investments, December 31, 2012 (all dollar amounts in thousands)
| | | | | | | | |
Issuer | | Shares or
Principal
Amount | | | Value | |
|
Common Stocks—(continued) | |
| | |
Canada—4.2% | | | | | | | | |
Brookfield Asset Management, Inc. Class “A” (Real estate management & development)† | | | 5,720 | | | $ | 209 | |
The Toronto-Dominion Bank (Commercial banks) | | | 2,622 | | | | 221 | |
| | | | | | | | |
| | | | | | | 430 | |
| | | | | | | | |
| |
Emerging Europe, Mid-East, Africa—3.8% | | | | | |
South Africa—3.8% | |
*Aspen Pharmacare Holdings, Ltd. (Pharmaceuticals) | | | 4,198 | | | | 84 | |
Discovery Holdings, Ltd. (Insurance) | | | 19,787 | | | | 146 | |
FirstRand, Ltd. (Diversified financial services) | | | 41,624 | | | | 153 | |
| | | | | | | | |
| | | | | | | 383 | |
| | | | | | | | |
Total Common Stocks—98.1%
(cost $9,254) | | | | 9,966 | |
| | | | | | | | |
| | |
Repurchase Agreement | | | | | | | | |
Fixed Income Clearing Corporation, 0.110% dated 12/31/12, due 1/2/13, repurchase price $166, collateralized by U.S. Treasury Note, 2.125%, due 12/31/15 | | $ | 166 | | | | 166 | |
| | | | | | | | |
Total Repurchase Agreement—1.6%
(cost $166) | | | | 166 | |
| | | | | | | | |
Total Investments—99.7%
(cost $9,420) | | | | 10,132 | |
Cash and other assets, less liabilities—0.3% | | | | 32 | |
| | | | | | | | |
Net assets—100.0% | | | $ | 10,164 | |
| | | | | | | | |
ADR = American Depository Receipt
* Non-income producing securities
† = U.S. listed foreign security
For securities primarily traded on exchanges or markets that close before the close of regular trading on the New York Stock Exchange, the Fund may use an independent pricing service to fair value price the securities pursuant to Valuation Procedures approved by the Board of Trustees.
At December 31, 2012, the Fund’s Portfolio of Investments includes the following sector categories (as a percentage of long-term investments):
| | | | |
Financials | | | 24.9% | |
Industrials | | | 16.9% | |
Information Technology | | | 16.0% | |
Consumer Discretionary | | | 10.9% | |
Health Care | | | 9.0% | |
Materials | | | 7.8% | |
Energy | | | 6.8% | |
Consumer Staples | | | 5.8% | |
Telecommunication Services | | | 1.9% | |
| | | | |
Total | | | 100.0% | |
| | | | |
At December 31, 2012, the Fund’s Portfolio of Investments includes the following currency categories (as a percentage of long-term investments):
| | | | |
British Pound Sterling | | | 24.3% | |
Euro | | | 22.8% | |
Japanese Yen | | | 10.2% | |
U.S. Dollar | | | 9.5% | |
Hong Kong Dollar | | | 8.6% | |
Swiss Franc | | | 6.2% | |
South African Rand | | | 3.9% | |
Danish Krone | | | 3.8% | |
South Korean Won | | | 2.5% | |
Canadian Dollar | | | 2.2% | |
Swedish Krona | | | 2.1% | |
Norwegian Krone | | | 1.7% | |
Indonesian Rupiah | | | 1.2% | |
All Other Currencies | | | 1.0% | |
| | | | |
Total | | | 100.0% | |
| | | | |
See accompanying Notes to Financial Statements.
December 31, 2012 | William Blair Funds 45 |

Jeffrey A. Urbina
INTERNATIONAL SMALL CAP GROWTH FUND
The International Small Cap Growth Fund seeks long-term capital appreciation.
AN OVERVIEW FROM THE PORTFOLIO MANAGER
The International Small Cap Growth Fund posted a 20.73% increase (Class N Shares) for the twelve months ended December 31, 2012. By comparison, the Fund’s benchmark, the MSCI All Country World ex-U.S. Small Cap Index (net) increased 18.52%.
2012 performance was bolstered by particularly strong Discretionary stock selection, coupled with the significant overweighting, as well as strong performance in Materials and Industrials. Discretionary performance was driven by strong Auto-related company performance, in addition to strength in Hotels/Restaurants, Household Durables and Luxury holdings, which more than offset weakness in Japanese internet-related holdings. The Fund’s Materials stocks were up over 34%, as compared to the 5.25% Index return in the benchmark index, led by strength in Chemicals, and benefitting from the underweighting in the underperforming Metals/Mining industry. Industrials stock selection was also additive, as MTU Aero Engines, the German aerospace engine company, benefited from strong sales and earnings growth during the period. Babcock International, the UK engineering outsourcing company, also benefited from strong results that exceeded market expectations. Somewhat offsetting these positive results were the Fund’s underweighting in Materials and Financials, coupled with Energy and Information Technology (IT) stock selection.
Overall sector positioning did not substantially change during the year, although Consumer Discretionary was marginally increased to 26.9%, and remained overweighted versus the 17.4% Index weighting. While Financials increased to 13.2% of the Fund during the period, it remained significantly underweighted versus the 19.7% benchmark Index weighting. Industrials and Materials remained significantly underweighted as well, with a corresponding overweighting in Healthcare, which totaled 13.6% of the Fund as of year-end, well ahead of the 5.2% benchmark Index weighting, due to significant holdings in Healthcare Providers and Pharmaceuticals. Regionally, the Fund remained focused on Developed Europe at the expense of Developed Asia, particularly Pacific ex-Japan. Emerging markets totaled 15.2% of the Fund, below the 23.3% Index weighting, due largely to a significant underweighting in Emerging Asia.
46 Annual Report | December 31, 2012 |
International Small Cap Growth Fund
Performance Highlights (Unaudited)
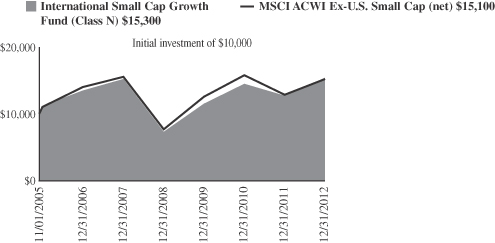
Average Annual Total Return at 12/31/2012
| | | | | | | | | | | | | | | | |
| | | 1
Year | | | 3
Year | | | 5
Year | | | Since
Inception(a) | |
Class N | | | 20.73 | % | | | 10.11 | % | | | 0.21 | % | | | 6.15 | % |
Class I | | | 21.10 | | | | 10.46 | | | | 0.56 | | | | 6.49 | |
MSCI AC World ex-U.S. Small Cap - Net | | | 18.52 | | | | 6.54 | | | | (0.39 | ) | | | 5.99 | |
| | (a) | | For the period from November 1, 2005 (Commencement of Operations) to December 31, 2012. |
Performance cited represents past performance. Past performance does not guarantee future results and current performance may be lower or higher than the data quoted. Results shown are average annual returns, which assume reinvestment of dividends and capital gains. Investment returns and principal will fluctuate and you may have a gain or loss when you sell shares. For the most current month-end performance information, please call 1-800-742-7272, or visit our Web site at www.williamblairfunds.com. Smaller capitalization stock are also more sensitive to purchase/sale transactions and changes in the issuer’s financial condition. From time to time, the investment advisor may waive fees or reimburse expenses for the Fund. Without these waivers, performance would be lower. International investing involves special risk considerations, including currency fluctuations, lower liquidity, economic and political risk. Class N shares are available to the general public without a sales load. Class I shares are available to certain institutional investors and advisory clients of William Blair & Company L.L.C. without a sales load or distribution (12b-1) fees.
The performance highlights and graph presented above do not reflect the deduction of taxes that a shareholder would pay on fund distributions or the redemption of fund shares.
The Morgan Stanley Capital International (MSCI) All Country World Ex-U.S. Small Cap Index (net) is a free float-adjusted market capitalization weighted index that is designed to measure the equity market performance of small capitalization developed and emerging markets, excluding the United States. This series approximates the minimum possible dividend reinvestment.
This report identifies the Fund’s investments on December 31, 2012. These holdings are subject to change. Not all stocks in the Fund performed the same, nor is there any guarantee that these stocks will perform as well in the future. Market forecasts provided in this report may not necessarily come to pass.
Sector Diversification (Unaudited)
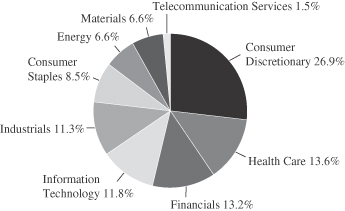
The sector diversification shown is based on the total long-term securities.
December 31, 2012 | William Blair Funds 47 |
International Small Cap Growth Fund
Portfolio of Investments, December 31, 2012 (all dollar amounts in thousands)
| | | | | | | | |
Issuer | | Shares | | | Value | |
|
Common Stocks | |
|
Europe—28.5% | |
Austria—0.3% | |
AMS AG (Semiconductors & semiconductor equipment) | | | 22,333 | | | $ | 2,405 | |
| | | | | | | | |
Belgium—0.4% | |
*ThromboGenics N.V. (Biotechnology) | | | 52,627 | | | | 2,929 | |
| | | | | | | | |
Denmark—1.0% | |
CHR Hansen Holding A/S (Chemicals) | | | 70,769 | | | | 2,305 | |
GN Store Nord A/S (Health care equipment & supplies) | | | 318,173 | | | | 4,624 | |
| | | | | | | | |
| | | | 6,929 | |
| | | | | | | | |
Finland—0.7% | |
Tikkurila Oyj (Chemicals) | | | 259,406 | | | | 5,067 | |
| | | | | | | | |
France—0.1% | |
*GameLoft SE (Software) | | | 150,004 | | | | 1,055 | |
| | | | | | | | |
Germany—9.2% | |
Aixtron AG (Semiconductors & semiconductor equipment) | | | 29,277 | | | | 349 | |
Bertrandt AG (Professional services) | | | 20,097 | | | | 2,018 | |
ElringKlinger AG (Auto components) | | | 331,992 | | | | 11,260 | |
Gerry Weber International AG (Textiles, apparel & luxury goods) | | | 141,348 | | | | 6,846 | |
MTU Aero Engines Holding AG (Aerospace & defense) | | | 116,389 | | | | 10,621 | |
Pfeiffer Vacuum Technology AG (Machinery) | | | 42,530 | | | | 5,183 | |
Symrise AG (Chemicals) | | | 215,847 | | | | 7,755 | |
Wincor Nixdorf AG (Computers & peripherals) | | | 297,749 | | | | 14,042 | |
Wirecard AG (IT services) | | | 320,351 | | | | 7,909 | |
| | | | | | | | |
| | | | 65,983 | |
| | | | | | | | |
Ireland—2.1% | |
Paddy Power plc (Hotels, restaurants & leisure) | | | 181,117 | | | | 14,952 | |
| | | | | | | | |
Italy—5.4% | |
Azimut Holding SpA (Capital markets) | | | 733,543 | | | | 10,556 | |
De’Longhi SpA (Household durables) | | | 544,103 | | | | 7,819 | |
Recordati SpA (Pharmaceuticals) | | | 863,611 | | | | 7,897 | |
Salvatore Ferragamo Italia SpA (Textiles, apparel & luxury goods) | | | 76,084 | | | | 1,684 | |
Tod’s SpA (Textiles, apparel & luxury goods) | | | 51,896 | | | | 6,589 | |
*Yoox SpA (Internet & catalog retail) | | | 257,471 | | | | 4,078 | |
| | | | | | | | |
| | | | 38,623 | |
| | | | | | | | |
Norway—2.8% | |
Fred Olsen Energy ASA (Energy equipment & services) | | | 153,966 | | | | 6,760 | |
Opera Software ASA (Internet software & services) | | | 676,617 | | | | 3,876 | |
Schibsted ASA (Media) | | | 222,219 | | | | 9,503 | |
| | | | | | | | |
| | | | 20,139 | |
| | | | | | | | |
Spain—2.6% | |
Viscofan S.A. (Food products) | | | 331,071 | | | | 18,753 | |
| | | | | | | | |
| | | | | | | | |
Issuer | | Shares | | | Value | |
|
Common Stocks—Europe—28.5%—(continued) | |
Sweden—3.2% | |
Axis Communications AB (Communications equipment) | | | 341,012 | | | $ | 9,392 | |
Hexpol AB (Chemicals) | | | 171,111 | | | | 9,080 | |
JM AB (Household durables) | | | 234,915 | | | | 4,213 | |
NIBE Industrier AB (Building products) | | | 39,408 | | | | 571 | |
| | | | | | | | |
| | | | 23,256 | |
| | | | | | | | |
Switzerland—0.7% | |
Burckhardt Compression Holding AG (Machinery) | | | 15,674 | | | | 5,150 | |
| | | | | | | | |
|
United Kingdom—26.2% | |
Abcam plc (Biotechnology) | | | 932,027 | | | | 5,870 | |
Ashmore Group plc (Capital markets) | | | 1,736,586 | | | | 10,254 | |
*ASOS plc (Internet & catalog retail) | | | 253,510 | | | | 11,182 | |
Aveva Group plc (Software) | | | 321,425 | | | | 11,535 | |
AZ Electronic Materials S.A. (Chemicals) | | | 903,483 | | | | 5,198 | |
Booker Group plc (Food & staples retailing) | | | 8,108,578 | | | | 12,940 | |
Debenhams plc (Multiline retail) | | | 4,908,407 | | | | 9,164 | |
Domino’s Pizza Group plc (Hotels, restaurants & leisure) | | | 653,589 | | | | 5,336 | |
Dunelm Group plc (Specialty retail) | | | 582,726 | | | | 6,683 | |
Elementis plc (Chemicals) | | | 904,915 | | | | 3,455 | |
Fidessa Group plc (Software) | | | 119,591 | | | | 2,975 | |
Halma plc (Electronic equipment, instruments & components) | | | 850,474 | | | | 6,400 | |
Hiscox, Ltd. (Insurance) | | | 470,236 | | | | 3,501 | |
IG Group Holdings plc (Diversified financial services) | | | 1,232,896 | | | | 9,074 | |
*Imagination Technologies Group plc (Computers & peripherals) | | | 187,732 | | | | 1,224 | |
Lancashire Holdings, Ltd. (Insurance) | | | 897,939 | | | | 11,433 | |
Moneysupermarket.com Group plc (Internet software & services) | | | 2,922,139 | | | | 7,492 | |
Oxford Instruments plc (Electronic equipment, instruments & components) | | | 240,759 | | | | 5,627 | |
Rotork plc (Machinery) | | | 347,388 | | | | 14,501 | |
RPS Group plc (Commercial services & supplies) | | | 872,849 | | | | 3,018 | |
*Salamander Energy plc (Oil, gas & consumable fuels) | | | 1,617,863 | | | | 5,009 | |
*Sports Direct International plc (Specialty retail) | | | 873,033 | | | | 5,524 | |
St James’s Place plc (Insurance) | | | 613,072 | | | | 4,238 | |
Synergy Health plc (Health care providers & services) | | | 201,939 | | | | 3,582 | |
Telecity Group plc (Internet software & services) | | | 260,085 | | | | 3,359 | |
*The Berkeley Group Holdings plc (Household durables) | | | 432,957 | | | | 12,455 | |
Victrex plc (Chemicals) | | | 268,463 | | | | 7,155 | |
| | | | | | | | |
| | | | 188,184 | |
| | | | | | | | |
See accompanying Notes to Portfolio of Investments.
48 Annual Report | December 31, 2012 |
International Small Cap Growth Fund
Portfolio of Investments, December 31, 2012 (all dollar amounts in thousands)
| | | | | | | | |
Issuer | | Shares | | | Value | |
|
Common Stocks—(continued) | |
|
Japan—16.4% | |
Ain Pharmaciez, Inc. (Food & staples retailing) | | | 109,000 | | | $ | 5,962 | |
Chiyoda Corporation (Construction & engineering) | | | 885,000 | | | | 12,678 | |
Cosmos Pharmaceutical Corporation (Food & staples retailing) | | | 77,000 | | | | 7,652 | |
CyberAgent, Inc. (Media) | | | 2,170 | | | | 4,459 | |
F.C.C. Co., Ltd. (Auto components) | | | 365,509 | | | | 7,592 | |
FamilyMart Co., Ltd. (Food & staples retailing) | | | 165,500 | | | | 6,818 | |
Kakaku.com, Inc. (Internet software & services) | | | 89,600 | | | | 2,958 | |
M3, Inc. (Health care technology) | | | 3,791 | | | | 6,051 | |
Miraca Holdings, Inc. (Health care providers & services) | | | 254,200 | | | | 10,250 | |
MISUMI Group, Inc. (Trading companies & distributors) | | | 269,500 | | | | 7,365 | |
MonotaRO Co., Ltd. (Trading companies & distributors) | | | 126,000 | | | | 4,059 | |
Park24 Co., Ltd. (Commercial services & supplies) | | | 116,000 | | | | 1,832 | |
Ryohin Keikaku Co., Ltd. (Multiline retail) | | | 164,900 | | | | 9,222 | |
Sawai Pharmaceutical Co., Ltd. (Pharmaceuticals) | | | 64,800 | | | | 6,505 | |
Ship Healthcare Holdings, Inc. (Health care providers & services) | | | 301,200 | | | | 8,005 | |
Suruga Bank, Ltd. (Commercial banks) | | | 985,000 | | | | 12,115 | |
United Arrows, Ltd. (Specialty retail) | | | 197,800 | | | | 4,555 | |
| | | | | | | | |
| | | | 118,078 | |
| | | | | | | | |
|
Emerging Asia—7.8% | |
China—4.9% | |
China Medical System Holdings, Ltd. (Pharmaceuticals) | | | 5,891,000 | | | | 4,598 | |
Dongyue Group (Chemicals) | | | 8,759,000 | | | | 5,922 | |
*Haier Electronics Group Co., Ltd. (Household durables) | | | 7,758,000 | | | | 11,507 | |
Haitian International Holdings, Ltd. (Machinery) | | | 3,933,496 | | | | 4,714 | |
Minth Group, Ltd. (Auto components) | | | 1,580,000 | | | | 1,836 | |
Sino Biopharmaceutical (Pharmaceuticals) | | | 7,808,000 | | | | 3,765 | |
*WuXi PharmaTech Cayman, Inc.—ADR (Life sciences tools & services)† | | | 176,359 | | | | 2,778 | |
| | | | | | | | |
| | | | 35,120 | |
| | | | | | | | |
India—2.9% | |
CRISIL, Ltd. (Diversified financial services) | | | 174,919 | | | | 3,469 | |
eClerx Services, Ltd. (Professional services) | | | 100,070 | | | | 1,251 | |
Ipca Laboratories, Ltd. (Pharmaceuticals) | | | 429,511 | | | | 4,068 | |
*Jubilant Foodworks, Ltd. (Hotels, restaurants & leisure) | | | 146,216 | | | | 3,471 | |
Motherson Sumi Systems, Ltd. (Auto components) | | | 1,957,109 | | | | 7,126 | |
Oberoi Realty, Ltd. (Real estate management & development) | | | 337,316 | | | | 1,790 | |
| | | | | | | | |
| | | | 21,175 | |
| | | | | | | | |
|
Common Stocks—(continued) | |
|
Emerging Europe, Mid-East, Africa—5.7% | |
Russia—0.1% | |
*Etalon Group Ltd.—144A—GDR (Real estate management & development)† | | | 154,616 | | | $ | 845 | |
| | | | | | | | |
South Africa—2.9% | |
Capitec Bank Holdings, Ltd. (Commercial banks) | | | 227,238 | | | | 4,917 | |
Coronation Fund Managers, Ltd. (Capital markets) | | | 998,657 | | | | 4,676 | |
Life Healthcare Group Holdings Pte, Ltd. (Health care providers & services) | | | 2,746,547 | | | | 11,038 | |
| | | | | | | | |
| | | | 20,631 | |
| | | | | | | | |
Turkey—2.7% | |
Tofas Turk Otomobil Fabrikasi A.S. (Automobiles) | | | 1,196,176 | | | | 7,042 | |
Turkiye Sinai Kalkinma Bankasi A.S. (Commercial banks) | | | 9,869,085 | | | | 12,728 | |
| | | | | | | | |
| | | | 19,770 | |
| | | | | | | | |
|
Asia—5.7% | |
Australia—1.4% | |
Domino’s Pizza Enterprises, Ltd. (Hotels, restaurants & leisure) | | | 327,274 | | | | 3,588 | |
Seek, Ltd. (Professional services) | | | 900,328 | | | | 6,653 | |
| | | | | | | | |
| | | | 10,241 | |
| | | | | | | | |
Hong Kong—2.9% | |
Sa Sa International Holdings, Ltd. (Specialty retail) | | | 11,950,000 | | | | 9,923 | |
SmarTone Telecommunications Holdings, Ltd. (Wireless telecommunication services) | | | 5,804,000 | | | | 10,641 | |
| | | | | | | | |
| | | | 20,564 | |
| | | | | | | | |
Singapore—1.4% | |
ARA Asset Management Ltd.—144A (Capital markets) | | | 343,000 | | | | 459 | |
*Biosensors International Group, Ltd. (Health care equipment & supplies) | | | 2,932,000 | | | | 2,927 | |
First Resources, Ltd. (Food products) | | | 4,203,000 | | | | 7,008 | |
| | | | | | | | |
| | | | 10,394 | |
| | | | | | | | |
|
Canada—4.8% | |
Canadian Energy Services & Technology Corporation (Energy equipment & services) | | | 312,295 | | | | 3,328 | |
*Legacy Oil + Gas, Inc. (Oil, gas & consumable fuels) | | | 1,326,320 | | | | 9,147 | |
Peyto Exploration & Development Corporation (Oil, gas & consumable fuels) | | | 261,923 | | | | 6,054 | |
Precision Drilling Corporation (Energy equipment & services) | | | 745,292 | | | | 6,159 | |
Total Energy Services, Inc. (Energy equipment & services) | | | 222,362 | | | | 3,351 | |
Trilogy Energy Corporation (Oil, gas & consumable fuels) | | | 214,885 | | | | 6,288 | |
| | | | | | | | |
| | | | 34,327 | |
| | | | | | | | |
See accompanying Notes to Portfolio of Investments.
December 31, 2012 | William Blair Funds 49 |
International Small Cap Growth Fund
Portfolio of Investments, December 31, 2012 (all dollar amounts in thousands)
| | | | | | | | |
Issuer | | Shares or
Principal
Amount | | | Value | |
|
Common Stocks—(continued) | |
|
Emerging Latin America—1.7% | |
Brazil—0.9% | |
*Lupatech S.A. (Energy equipment & services) | | | 252,217 | | | $ | 203 | |
OdontoPrev S.A. (Health care providers & services) | | | 472,000 | | | | 2,473 | |
*Qualicorp S.A. (Health care providers & services) | | | 359,100 | | | | 3,720 | |
T4F Entretenimento S.A. (Media) | | | 88,500 | | | | 339 | |
| | | | | | | | |
| | | | 6,735 | |
| | | | | | | | |
Chile—0.5% | |
CFR Pharmaceuticals S.A. (Pharmaceuticals) | | | 13,645,276 | | | | 3,449 | |
| | | | | | | | |
Mexico—0.3% | |
*Macquarie Mexico Real Estate Management S.A. de C.V.—144A (Real estate investment trusts (REITs)) | | | 906,973 | | | | 1,796 | |
| | | | | | | | |
Total Common Stocks—96.8%
(cost $590,782) | | | | 696,550 | |
| | | | | | | | |
|
Repurchase Agreement | |
Fixed Income Clearing Corporation, 0.110% dated 12/31/12, due 1/2/13, repurchase price $20,374, collateralized by U.S. Treasury Note, 2.125%, due 12/31/15 | | $ | 20,374 | | | | 20,374 | |
| | | | | | | | |
Total Repurchase Agreement—2.8%
(cost $20,374) | | | | 20,374 | |
| | | | | | | | |
Total Investments—99.6%
(cost $611,156) | | | | 716,924 | |
Cash and other assets, less liabilities—0.4% | | | | 2,584 | |
| | | | | | | | |
Net assets—100.0% | | | $ | 719,508 | |
| | | | | | | | |
ADR = American Depository Receipt
GDR = Global Depository Receipt
* Non-income producing securities
† = U.S. listed foreign security
For securities primarily traded on exchanges or markets that close before the close of regular trading on the New York Stock Exchange, the Fund may use an independent pricing service to fair value price the securities pursuant to Valuation Procedures approved by the Board of Trustees.
At December 31, 2012, the Fund’s Portfolio of Investments includes the following sector categories (as a percentage of long-term investments):
| | | | |
Consumer Discretionary | | | 26.9% | |
Health Care | | | 13.6% | |
Financials | | | 13.2% | |
Information Technology | | | 11.8% | |
Industrials | | | 11.3% | |
Consumer Staples | | | 8.5% | |
Energy | | | 6.6% | |
Materials | | | 6.6% | |
Telecommunication Services | | | 1.5% | |
| | | | |
Total | | | 100.0% | |
| | | | |
At December 31, 2012, the Fund’s Portfolio of Investments includes the following currency categories (as a percentage of long-term investments):
| | | | |
British Pound Sterling | | | 27.0% | |
Euro | | | 21.2% | |
Japanese Yen | | | 17.0% | |
Hong Kong Dollar | | | 8.0% | |
Canadian Dollar | | | 4.9% | |
Swedish Krona | | | 3.3% | |
Indian Rupee | | | 3.0% | |
South African Rand | | | 3.0% | |
Norwegian Krone | | | 2.9% | |
Turkish Lira | | | 2.8% | |
Singapore Dollar | | | 1.5% | |
Australian Dollar | | | 1.5% | |
Swiss Franc | | | 1.1% | |
All Other Currencies | | | 2.8% | |
| | | | |
Total | | | 100.0% | |
| | | | |
See accompanying Notes to Portfolio of Investments.
50 Annual Report | December 31, 2012 |

Todd M. McClone
Jeffrey A. Urbina
EMERGING MARKETS GROWTH FUND
The Emerging Markets Growth Fund seeks long-term capital appreciation.
AN OVERVIEW FROM THE PORTFOLIO MANAGERS
The Emerging Markets Growth Fund posted a 20.70% increase (Class N Shares) for the twelve months ended December 31, 2012. By comparison, the Fund’s benchmark, the MSCI Emerging Markets IMI Index (net) increased 18.68%.
2012 outperformance was driven by strong stock selection across most sectors, with particular value added in the overweighted Consumer sectors, coupled with strong results in Materials and Energy. The Fund’s Discretionary stocks were up over 25%, compared to the 17.6% return in the benchmark Index due to broad strength across industries. Staples was up over 38%, due largely to strong outperformance in overweighted Food/Staples Retailing. Energy benefited from strong performance by CNOOC on a recovering production growth profile and Ecopetrol on strong results during the first half. In addition, limited exposure to Petrobras, a Brazil oil company, during the year was positive, given operational disappointments and continued concerns about governmental intervention. Materials benefited from good operational results from Grupo Mexico, the Fund’s sole Metals/Mining holding during the period. The key detractor from 2012 results was Information Technology (IT) stock selection, due largely to Chinese internet-related performance coupled with operational weakness at Comba Telecom and HTC, which we sold during the year.
As of year-end, Consumer Discretionary and Staples remained overweighted at a combined 27.1% of the Fund, compared to the 17.7% Index weighting, with a tilt towards Discretionary. Financials increased during the year to 24.7% from 15.9% as of year-end 2012 primarily due to an increase in Commercial Banks and real estate-related weightings, but remained underweighted versus the 25.7% benchmark Index weighting. IT and Energy marginally decreased to fund this increase. Regionally, the Fund was underweighted in Emerging Asia, despite above-market weightings in China, India and the ASEAN countries, due to a significant underweighting in Korea and Taiwan. Latin America totaled 21.1% of the Fund at year-end, a significant decrease since year-end 2011 due to lower exposure in Brazil on economic slowdown and governmental intervention concerns.
December 31, 2012 | William Blair Funds 51 |
Emerging Markets Growth Fund
Performance Highlights (Unaudited)
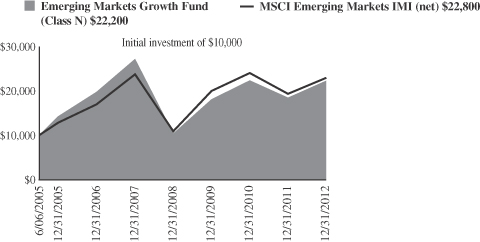
Average Annual Total Return at 12/31/2012
| | | | | | | | | | | | | | | | |
| | | 1
Year | | | 3
Year | | | 5
Year | | | Since
Inception(a) | |
Class N | | | 20.70 | % | | | 7.21 | % | | | (3.88 | )% | | | 11.11 | % |
Class I | | | 21.01 | | | | 7.52 | | | | (3.63 | ) | | | 11.39 | |
MSCI Emerging Markets IMI (net) | | | 18.68 | | | | 4.64 | | | | (0.70 | ) | | | 11.50 | |
| | (a) | | For the period from June 6, 2005 (Commencement of Operations) to December 31, 2012. | |
Performance cited represents past performance. Past performance does not guarantee future results and current performance may be lower or higher than the data quoted. Results shown are average annual returns, which assume reinvestment of dividends and capital gains. Investment returns and principal will fluctuate and you may have a gain or loss when you sell shares. For the most current month-end performance information, please call 1-800-742-7272, or visit our Web site at www.williamblairfunds.com. From time to time, the investment advisor may waive fees or reimburse expenses for the Fund. Without these waivers, performance would be lower. International investing involves special risk considerations, including currency fluctuations, lower liquidity, economic and political risk. Class N shares are available to the general public without a sales load. Class I shares are available to certain institutional investors and advisory clients of William Blair & Company L.L.C. without a sales load or distribution (12b-1) fees.
The performance highlights and graph presented above do not reflect the deduction of taxes that a shareholder would pay on fund distributions or the redemption of fund shares.
The Morgan Stanley Capital International (MSCI) Emerging Markets Investable Market Index (IMI) (net) is a free float-adjusted market capitalization weighted index that is designed to measure the equity market performance of emerging markets. This series approximates the minimum possible dividend reinvestment.
This report identifies the Fund’s investments on December 31, 2012. These holdings are subject to change. Not all stocks in the Fund performed the same, nor is there any guarantee that these stocks will perform as well in the future. Market forecasts provided in this report may not necessarily come to pass.
Sector Diversification (Unaudited)
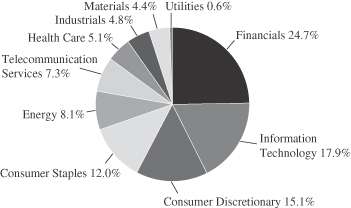
The sector diversification shown is based on the total long-term securities.
52 Annual Report | December 31, 2012 |
Emerging Markets Growth Fund
Portfolio of Investments, December 31, 2012 (all dollar amounts in thousands)
| | | | | | | | |
Issuer | | Shares | | | Value | |
|
Common Stocks | |
|
Emerging Asia—55.5% | |
China—19.8% | |
AAC Technologies Holdings, Inc. (Communications equipment) | | | 875,959 | | | $ | 3,106 | |
*Baidu, Inc.—ADR (Internet software & services) | | | 47,987 | | | | 4,813 | |
Belle International Holdings, Ltd. (Specialty retail) | | | 2,346,610 | | | | 5,190 | |
*Brilliance China Automotive Holdings, Ltd. (Automobiles) | | | 8,818,000 | | | | 11,081 | |
China BlueChemical, Ltd. (Chemicals) | | | 3,610,609 | | | | 2,463 | |
China Mobile, Ltd. (Wireless telecommunication services) | | | 3,274,755 | | | | 38,536 | |
China Overseas Land & Investment, Ltd. (Real estate management & development) | | | 3,456,000 | | | | 10,508 | |
China Shenhua Energy Co., Ltd. (Oil, gas & consumable fuels) | | | 2,233,304 | | | | 10,004 | |
CNOOC, Ltd. (Oil, gas & consumable fuels) | | | 10,840,601 | | | | 23,882 | |
Dongyue Group (Chemicals) | | | 5,456,287 | | | | 3,689 | |
Golden Eagle Retail Group, Ltd. (Multiline retail) | | | 956,547 | | | | 2,382 | |
*Haier Electronics Group Co., Ltd. (Household durables) | | | 4,822,000 | | | | 7,152 | |
Haitian International Holdings, Ltd. (Machinery) | | | 2,334,870 | | | | 2,798 | |
Industrial and Commercial Bank of China, Ltd. Class “H” (Commercial banks) | | | 19,945,000 | | | | 14,396 | |
Lenovo Group, Ltd. (Computers & peripherals) | | | 15,575,014 | | | | 14,361 | |
Sino Biopharmaceutical (Pharmaceuticals) | | | 1,548,000 | | | | 746 | |
Sun Art Retail Group, Ltd. (Food & staples retailing) | | | 5,414,745 | | | | 8,371 | |
Tencent Holdings, Ltd. (Internet software & services) | | | 446,835 | | | | 14,655 | |
Want Want China Holdings, Ltd. (Food products) | | | 6,291,217 | | | | 8,817 | |
*WuXi PharmaTech Cayman, Inc.—ADR (Life sciences tools & services) | | | 144,501 | | | | 2,276 | |
Yingde Gases (Chemicals) | | | 2,062,981 | | | | 2,114 | |
| | | | | | | | |
| | | | 191,340 | |
| | | | | | | | |
India—9.5% | |
Asian Paints, Ltd. (Chemicals) | | | 40,286 | | | | 3,282 | |
Bajaj Auto, Ltd. (Automobiles) | | | 217,835 | | | | 8,522 | |
HDFC Bank, Ltd. (Commercial banks) | | | 614,440 | | | | 7,660 | |
Housing Development Finance Corporation (Thrifts & mortgage finance) | | | 648,245 | | | | 9,903 | |
IndusInd Bank, Ltd. (Commercial banks) | | | 370,437 | | | | 2,859 | |
ITC, Ltd. (Tobacco) | | | 2,622,889 | | | | 13,812 | |
*Jubilant Foodworks, Ltd. (Hotels, restaurants & leisure) | | | 107,827 | | | | 2,559 | |
Lupin, Ltd. (Pharmaceuticals) | | | 208,913 | | | | 2,359 | |
Motherson Sumi Systems, Ltd. (Auto components) | | | 1,019,801 | | | | 3,713 | |
Sun Pharmaceutical Industries, Ltd. (Pharmaceuticals) | | | 560,729 | | | | 7,585 | |
Tata Consultancy Services, Ltd. (IT services) | | | 416,320 | | | | 9,592 | |
Tata Motors, Ltd. (Automobiles) | | | 3,400,953 | | | | 19,549 | |
| | | | | | | | |
| | | | 91,395 | |
| | | | | | | | |
|
Common Stocks—Emerging Asia—55.5%—(continued) | |
Indonesia—4.4% | |
PT Astra International Tbk (Automobiles) | | | 17,263,240 | | | $ | 13,675 | |
PT Bank Rakyat Indonesia (Commercial banks) | | | 18,996,821 | | | | 13,778 | |
PT Indo Tambangraya Megah (Oil, gas & consumable fuels) | | | 876,724 | | | | 3,795 | |
PT Jasa Marga Persero Tbk (Transportation infrastructure) | | | 7,091,000 | | | | 4,017 | |
PT Kalbe Farma Tbk (Pharmaceuticals) | | | 28,249,415 | | | | 3,113 | |
PT XL Axiata Tbk (Diversified telecommunication services) | | | 6,536,500 | | | | 3,879 | |
| | | | | | | | |
| | | | 42,257 | |
| | | | | | | | |
Malaysia—2.1% | |
CIMB Group Holdings Bhd (Commercial banks) | | | 5,420,087 | | | | 13,567 | |
*IHH Healthcare Bhd (Health care providers & services) | | | 5,739,800 | | | | 6,358 | |
| | | | | | | | |
| | | | 19,925 | |
| | | | | | | | |
Papua New Guinea—1.0% | |
Oil Search, Ltd. (Oil, gas & consumable fuels) | | | 1,306,597 | | | | 9,662 | |
| | | | | | | | |
Philippines—0.4% | |
SM Prime Holdings, Inc. (Real estate management & development) | | | 9,556,100 | | | | 3,852 | |
| | | | | | | | |
South Korea—8.3% | |
Celltrion, Inc. (Pharmaceuticals) | | | 175,399 | | | | 4,283 | |
*Hyundai Motor Co. (Automobiles) | | | 87,825 | | | | 18,105 | |
*LG Household & Health Care, Ltd. (Household products) | | | 5,802 | | | | 3,554 | |
Samsung Electronics Co., Ltd. (Semiconductors & semiconductor equipment) | | | 27,900 | | | | 40,087 | |
Samsung Engineering Co., Ltd. (Construction & engineering) | | | 15,089 | | | | 2,351 | |
Samsung Fire & Marine Insurance Co., Ltd. (Insurance) | | | 34,088 | | | | 6,925 | |
Samsung Heavy Industries Co., Ltd. (Machinery) | | | 135,964 | | | | 4,968 | |
| | | | | | | | |
| | | | 80,273 | |
| | | | | | | | |
Taiwan—5.6% | |
Asustek Computer, Inc. (Computers & peripherals) | | | 1,341,000 | | | | 15,186 | |
Catcher Technology Co., Ltd. (Computers & peripherals) | | | 464,064 | | | | 2,330 | |
Hiwin Technologies Corporation (Machinery) | | | 239,429 | | | | 1,770 | |
Hon Hai Precision Industry Co., Ltd. (Electronic equipment, instruments & components) | | | 5,845,893 | | | | 18,095 | |
MediaTek, Inc. (Semiconductors & semiconductor equipment) | | | 851,064 | | | | 9,521 | |
TPK Holding Co., Ltd. (Electronic equipment, instruments & components) | | | 383,979 | | | | 6,876 | |
| | | | | | | | |
| | | | 53,778 | |
| | | | | | | | |
Thailand—4.4% | |
Advanced Info Service PCL (Wireless telecommunication services) | | | 1,168,362 | | | | 8,036 | |
BEC World PCL (Media) | | | 3,646,100 | | | | 8,498 | |
CP ALL PCL (Food & staples retailing) | | | 5,417,518 | | | | 8,146 | |
See accompanying Notes to Portfolio of Investments.
December 31, 2012 | William Blair Funds 53 |
Emerging Markets Growth Fund
Portfolio of Investments, December 31, 2012 (all dollar amounts in thousands)
| | | | | | | | |
Issuer | | Shares | | | Value | |
|
Common Stocks—Emerging Asia—55.5%—(continued) | |
Thailand—(continued) | |
Kasikornbank PCL (Commercial banks) | | | 2,248,482 | | | $ | 14,293 | |
Siam Makro PCL (Food & staples retailing) | | | 226,932 | | | | 3,319 | |
| | | | | | | | |
| | | | 42,292 | |
| | | | | | | | |
|
Emerging Latin America—21.1% | |
Argentina—0.5% | |
MercadoLibre, Inc. (Internet software & services) | | | 56,934 | | | | 4,473 | |
| | | | | | | | |
Brazil—7.9% | |
BR Malls Participacoes S.A. (Real estate management & development) | | | 858,690 | | | | 11,332 | |
BR Properties S.A. (Real estate management & development) | | | 275,997 | | | | 3,437 | |
Cia de Bebidas das Americas—ADR (Beverages) | | | 590,382 | | | | 24,790 | |
Cia de Concessoes Rodoviarias (Transportation infrastructure) | | | 750,389 | | | | 7,128 | |
Cia Hering (Specialty retail) | | | 201,116 | | | | 4,125 | |
Cielo S.A. (IT services) | | | 201,100 | | | | 5,598 | |
CPFL Energia S.A.—ADR (Electric utilities) | | | 25,717 | | | | 539 | |
Iochpe-Maxion S.A. (Machinery) | | | 167,600 | | | | 2,239 | |
Lojas Renner S.A. (Multiline retail) | | | 67,222 | | | | 2,618 | |
*Lupatech S.A. (Energy equipment & services) | | | 421,326 | | | | 340 | |
OdontoPrev S.A. (Health care providers & services) | | | 448,666 | | | | 2,351 | |
*Qualicorp S.A. (Health care providers & services) | | | 234,300 | | | | 2,427 | |
Raia Drogasil S.A. (Food & staples retailing) | | | 219,145 | | | | 2,469 | |
Totvs S.A. (Software) | | | 110,832 | | | | 2,186 | |
Tractebel Energia S.A. (Independent power producers & energy traders) | | | 296,538 | | | | 4,830 | |
| | | | | | | | |
| | | | 76,409 | |
| | | | | | | | |
Chile—2.9% | |
Banco Santander Chile—ADR (Commercial banks) | | | 166,393 | | | | 4,740 | |
CFR Pharmaceuticals S.A. (Pharmaceuticals) | | | 9,228,150 | | | | 2,332 | |
ENTEL Chile S.A. (Wireless telecommunication services) | | | 334,333 | | | | 6,914 | |
Inversiones La Construccion S.A. (Diversified financial services) | | | 102,017 | | | | 2,003 | |
S.A.C.I. Falabella (Multiline retail) | | | 446,216 | | | | 4,586 | |
Sociedad Quimica y Minera de Chile S.A.—ADR (Chemicals) | | | 84,509 | | | | 4,871 | |
Sonda S.A. (IT services) | | | 907,561 | | | | 2,891 | |
| | | | | | | | |
| | | | 28,337 | |
| | | | | | | | |
Colombia—2.8% | |
Ecopetrol S.A. (Oil, gas & consumable fuels) | | | 6,054,150 | | | | 18,707 | |
Pacific Rubiales Energy Corporation (Oil, gas & consumable fuels) | | | 369,891 | | | | 8,594 | |
| | | | | | | | |
| | | | 27,301 | |
| | | | | | | | |
Mexico—5.7% | |
Fibra Uno Administracion S.A. de C.V. (Real estate investment trusts (REITs)) | | | 192,369 | | | | 581 | |
Fomento Economico Mexicano S.A.B. de
C.V.—ADR (Beverages) | | | 93,678 | | | | 9,433 | |
|
Common Stocks—Emerging Latin
America—21.1%—(continued) | |
Mexico—(continued) | |
Grupo Financiero Banorte S.A.B. de C.V. (Commercial banks) | | | 3,230,910 | | | $ | 20,863 | |
Grupo Mexico S.A.B. de C.V. Series “B” (Metals & mining) | | | 6,740,267 | | | | 24,315 | |
| | | | | | | | |
| | | | 55,192 | |
| | | | | | | | |
Panama—0.2% | |
Copa Holdings S.A. Class “A” (Airlines)† | | | 16,927 | | | | 1,683 | |
| | | | | | | | |
Peru—1.1% | |
Credicorp, Ltd. (Commercial banks)† | | | 69,363 | | | | 10,166 | |
| | | | | | | | |
|
Emerging Europe, Mid-East, Africa—16.8% | |
Nigeria—0.7% | |
Guaranty Trust Bank plc (Commercial banks) | | | 28,471,188 | | | | 4,209 | |
Nigerian Breweries plc (Beverages) | | | 2,388,036 | | | | 2,257 | |
| | | | | | | | |
| | | | 6,466 | |
| | | | | | | | |
Poland—0.2% | |
Eurocash S.A. (Food & staples retailing) | | | 166,187 | | | | 2,351 | |
| | | | | | | | |
Qatar—1.2% | |
Industries Qatar QSC (Industrial conglomerates) | | | 271,417 | | | | 11,604 | |
| | | | | | | | |
Russia—2.5% | |
*Etalon Group Ltd.—144A—GDR (Real estate management & development) | | | 408,600 | | | | 2,235 | |
M Video OJSC (Specialty retail) | | | 193,600 | | | | 1,543 | |
Magnit OAO (Food & staples retailing)† | | | 64,463 | | | | 10,227 | |
Mail.ru Group, Ltd.—GDR (Internet software & services) | | | 69,724 | | | | 2,435 | |
*Yandex N.V. Class “A” (Internet software & services)† | | | 381,211 | | | | 8,223 | |
| | | | | | | | |
| | | | 24,663 | |
| | | | | | | | |
South Africa—7.8% | |
*Aspen Pharmacare Holdings, Ltd. (Pharmaceuticals) | | | 283,871 | | | | 5,683 | |
AVI, Ltd. (Food products) | | | 316,748 | | | | 2,244 | |
Bidvest Group, Ltd. (Industrial conglomerates) | | | 189,187 | | | | 4,840 | |
Discovery Holdings, Ltd. (Insurance) | | | 439,270 | | | | 3,240 | |
FirstRand, Ltd. (Diversified financial services) | | | 4,241,154 | | | | 15,606 | |
Life Healthcare Group Holdings Pte, Ltd. (Health care providers & services) | | | 1,827,565 | | | | 7,345 | |
Mr Price Group, Ltd. (Specialty retail) | | | 134,316 | | | | 2,226 | |
MTN Group, Ltd. (Wireless telecommunication services) | | | 519,782 | | | | 10,941 | |
Naspers, Ltd. (Media) | | | 228,562 | | | | 14,763 | |
Shoprite Holdings, Ltd. (Food & staples retailing) | | | 224,152 | | | | 5,438 | |
Tiger Brands, Ltd. (Food products) | | | 65,572 | | | | 2,529 | |
| | | | | | | | |
| | | | 74,855 | |
| | | | | | | | |
Turkey—3.8% | |
Arcelik A.S. (Household durables) | | | 735,219 | | | | 4,835 | |
BIM Birlesik Magazalar A.S. (Food & staples retailing) | | | 49,474 | | | | 2,426 | |
See accompanying Notes to Portfolio of Investments.
54 Annual Report | December 31, 2012 |
Emerging Markets Growth Fund
Portfolio of Investments, December 31, 2012 (all dollar amounts in thousands)
| | | | | | | | |
Issuer | | Shares | | | Value | |
|
Common Stocks—Emerging Europe, Mid-East,
Africa—16.8%—(continued) | |
Turkey—(continued) | |
Tofas Turk Otomobil Fabrikasi A.S. (Automobiles) | | | 639,220 | | | $ | 3,763 | |
Turkiye Halk Bankasi A.S. (Commercial banks) | | | 2,586,661 | | | | 25,498 | |
| | | | | | | | |
| | | | 36,522 | |
| | | | | | | | |
United Arab Emirates—0.6% | |
First Gulf Bank PJSC (Commercial banks) | | | 1,905,256 | | | | 6,116 | |
| | | | | | | | |
Total Common Stocks—93.4%
(cost $749,631) | | | | 900,912 | |
| | | | | | | | |
|
Preferred Stock | |
Brazil—2.0% | |
Itau Unibanco Holding S.A. (Commercial banks) | | | 1,211,941 | | | | 19,764 | |
| | | | | | | | |
Total Preferred Stock—2.0%
(cost $18,035) | | | | 19,764 | |
| | | | | | | | |
|
Affiliated Fund | |
China—2.5% | |
William Blair China A-Share Fund, LLC | | | 2,362,400 | | | | 23,624 | |
| | | | | | | | |
Total Affiliated Fund—2.5%
(cost $23,624) | | | | 23,624 | |
| | | | | | | | |
|
Repurchase Agreement | |
Fixed Income Clearing Corporation, 0.110% dated 12/31/12, due 1/2/13, repurchase price $13,524, collateralized by U.S. Treasury Note, 2.125%, due 12/31/15 | | $ | 13,524 | | | $ | 13,524 | |
| | | | | | | | |
Total Repurchase Agreement—1.4%
(cost $13,524) | | | | 13,524 | |
| | | | | | | | |
Total Investments—99.3%
(cost $804,814) | | | | 957,824 | |
Cash and other assets, less liabilities—0.7% | | | | 6,413 | |
| | | | | | | | |
Net assets—100.0% | | | $ | 964,237 | |
| | | | | | | | |
ADR = American Depository Receipt
GDR = Global Depository Receipt
* Non-income producing securities
† = U.S. listed foreign security
For securities primarily traded on exchanges or markets that close before the close of regular trading on the New York Stock Exchange, the Fund may use an independent pricing service to fair value price the securities pursuant to Valuation Procedures approved by the Board of Trustees.
The Emerging Markets Growth Fund invested in the following affiliated fund. There are no unfunded commitments to the affiliated fund and the Fund may redeem its investment monthly.
| | | | | | | | | | | | | | | | | | | | | | | | | | |
| | | | | Share Activity | | | Year Ended
December 31, 2012 | |
| | | | | | | | | | | | | | | | | (in thousands) | |
Fund Name | | Balance
12/31/2011 | | | Purchases | | | Sales | | | Balance
12/31/2012 | | | Value | | | Dividends
Included
in Income | |
William Blair China-A Share Fund, LLC | | | — | | | | 2,362,400 | | | | — | | | | 2,362,400 | | | $ | 23,624 | | | | — | |
As of December 31, 2012 the Fund invested in William Blair China A Share Fund, LLC, an Affiliated Fund. There was no realized or unrealized gain/(loss) from investments in the affiliated fund.
At December 31, 2012, the Fund’s Portfolio of Investments includes the following sector categories (as a percentage of long-term investments):
| | | | |
Financials | | | 24.7% | |
Information Technology | | | 17.9% | |
Consumer Discretionary | | | 15.1% | |
Consumer Staples | | | 12.0% | |
Energy | | | 8.1% | |
Telecommunication Services | | | 7.3% | |
Health Care | | | 5.1% | |
Industrials | | | 4.8% | |
Materials | | | 4.4% | |
Utilities | | | 0.6% | |
| | | | |
Total | | | 100.0% | |
| | | | |
At December 31, 2012, the Fund’s Portfolio of Investments includes the following currency categories (as a percentage of long-term investments):
| | | | |
Hong Kong Dollar | | | 19.8% | |
U.S. Dollar | | | 11.8% | |
Indian Rupee | | | 9.7% | |
South Korean Won | | | 8.5% | |
South African Rand | | | 7.9% | |
Brazilian Real | | | 7.5% | |
New Taiwan Dollar | | | 5.7% | |
Mexican Peso | | | 4.8% | |
Thai Baht | | | 4.5% | |
Indonesian Rupiah | | | 4.5% | |
Turkish Lira | | | 3.9% | |
Malaysian Ringgit | | | 2.1% | |
Chilean Peso | | | 2.0% | |
Colombian Peso | | | 2.0% | |
Qatari Rial | | | 1.2% | |
Australian Dollar | | | 1.0% | |
All Other Currencies | | | 3.1% | |
| | | | |
Total | | | 100.0% | |
| | | | |
See accompanying Notes to Portfolio of Investments.
December 31, 2012 | William Blair Funds 55 |
Todd M. McClone
Jeffrey A. Urbina
EMERGING MARKETS LEADERS FUND (FORMERLY KNOWN AS EMERGING LEADERS GROWTH FUND)
The Emerging Markets Leaders Fund seeks long-term capital appreciation.
AN OVERVIEW FROM THE PORTFOLIO MANAGERS
The Emerging Markets Leaders Fund posted a 20.37% increase (Class N Shares) for the twelve months ended December 31, 2012. By comparison, the Fund’s benchmark, the MSCI Emerging Markets Index (net) increased 18.22%.
2012 to date performance surpassed the MSCI Emerging Markets Index (net), on strong outperformance across a number of sectors. The overweighted Consumer Staples sector added approximately 2% to outperformance, as the overweighted Food/Staples Retailing segment was up over 52% with broad strength across names. Energy stock selection was bolstered by limited exposure in Petrobras, a Brazil oil company, during the year, given operational disappointments and continued concerns about governmental intervention. It also benefited from strong performance by CNOOC, a Chinese energy company, on a recovering production growth profile and Ecopetrol on strong results during the first half. Commercial Banks were up nearly 29% during the year and were the most significant contributor to Financials outperformance, while Materials benefited from good operational results from Grupo Mexico, the Fund’s sole Metals/Mining holding during the period. The key detractor from 2012 results was Information Technology (IT) stock selection, due largely to Chinese internet-related performance coupled with concerns about revenue trends at Cielo, the Brazilian card processing company.
During the year as valuations expanded, the Fund’s weighting in Consumer Discretionary and Staples decreased substantially from approximately 36% of the Fund to approximately 28%, but remained above the 16.7% benchmark Index weighting. Conversely, Financials increased from 19.8% to 30.6%, as we added to Commercial Banks and Real Estate-related holdings. Conversely, Industrials decreased from an index weighting of approximately 6.5% to 3.1% on deteriorating demand trends, while IT marginally increased. Regionally, the Fund was underweighted in Emerging Asia, despite above-market weightings in China, India and the Southeast Asia countries, due to a significant underweighting in Korea and Taiwan. Europe, Middle East and Africa decreased slightly during the year, due to a reduction in South African holdings on valuation concerns. Latin America totaled 21.3% of the Fund at year-end, approximately 3% above the Index weighting, due to holdings in Chile, Colombia, Mexico and Peru, which more than offset the lower Brazil weighting.
56 Annual Report | December 31, 2012 |
Emerging Markets Leaders Fund
Performance Highlights (Unaudited)

Average Annual Total Return at 12/31/2012
| | | | | | | | | | | | |
| | | 1
Year | | | 3
Year | | | Since
Inception | |
Class N(a) | | | 20.37 | % | | | N/A | | | | 5.27 | % |
MSCI Emerging Markets (net)(a) | | | 18.22 | | | | N/A | | | | 4.29 | |
MSCI Emerging Markets Large Cap (net)(a) | | | 17.79 | | | | N/A | | | | 4.40 | |
Class I(b) | | | 20.64 | | | | 6.37 | | | | 0.60 | |
MSCI Emerging Markets (net)(b) | | | 18.22 | | | | 4.66 | | | | 1.43 | |
MSCI Emerging Markets Large Cap (net)(b) | | | 17.79 | | | | 4.71 | | | | 1.32 | |
| | (a) | | Since Inception is for the period from May 3, 2010 (Commencement of Operations) to December 31, 2012. | |
| | (b) | | Since Inception is for the period from March 26, 2008 (Commencement of Operations) to December 31, 2012. | |
Performance cited represents past performance. Past performance does not guarantee future results and current performance may be lower or higher than the data quoted. Results shown are average annual total returns, which assume reinvestment of dividends and capital gains. Investment returns and principal will fluctuate and you may have a gain or loss when you sell shares. For the most current month-end performance information, please call 1-800-742-7272, or visit our Web site at www.williamblairfunds.com. International investing involves special risk considerations, including currency fluctuations, lower liquidity, economic and political risk. From time to time, the investment advisor may waive fees or reimburse expenses for the Fund. Without these waivers, performance would be lower. Class N shares are available to the general public without a sales load. Class I shares are available to certain institutional investors and advisory clients of William Blair & Company, L.L.C., without a sales load or distribution (12b-1) fees.
The performance highlights and graph presented above do not reflect the deduction of taxes that a shareholder would pay on fund distributions or the redemption of fund shares.
The Morgan Stanley Capital International (MSCI) Emerging Markets Index (net) is a free float-adjusted market-capitalization-weighted index that is designed to measure equity market performance of emerging markets. This series approximates the minimum possible dividend reinvestment.
The Morgan Stanley Capital International (MSCI) Emerging Markets Large Cap Index (net) is a free float-adjusted market capitalization weighted index that is designed to measure market performance of large capitalization stocks in emerging markets. This series approximates the minimum possible dividend reinvestment.
On December 31, 2012, the Fund’s Benchmark changed from the Morgan Stanley Capital International (MSCI) Emerging Markets Large Cap Index (net) to the Morgan Stanley Capital International (MSCI) Emerging Markets Index (net). The primary reason for this change is to compare the Fund to a benchmark that more closely reflects the market capitalization focus the Fund uses in its investment strategy.
This report identifies the Fund’s investments on December 31, 2012. These holdings are subject to change. Not all stocks in the Fund performed the same, nor is there any guarantee that these stocks will perform as well in the future. Market forecasts provided in this report may not necessarily come to pass.
Sector Diversification (Unaudited)
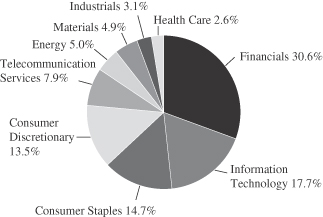
The sector diversification shown is based on the total long-term securities.
December 31, 2012 | William Blair Funds 57 |
Emerging Markets Leaders Fund
Portfolio of Investments, December 31, 2012 (all dollar amounts in thousands)
| | | | | | | | |
Issuer | | Shares | | | Value | |
| | |
Common Stocks | | | | | | | | |
| | |
Emerging Asia—56.6% | | | | | | | | |
China—20.0% | | | | | | | | |
Belle International Holdings, Ltd. (Specialty retail) | | | 449,000 | | | $ | 993 | |
* Brilliance China Automotive Holdings, Ltd. (Automobiles) | | | 938,000 | | | | 1,179 | |
China Mobile, Ltd. (Wireless telecommunication services) | | | 260,500 | | | | 3,066 | |
China Overseas Land & Investment, Ltd. (Real estate management & development) | | | 546,000 | | | | 1,660 | |
CNOOC, Ltd. (Oil, gas & consumable fuels) | | | 618,000 | | | | 1,361 | |
Lenovo Group, Ltd. (Computers & peripherals) | | | 1,506,000 | | | | 1,389 | |
Ping An Insurance Group Co. of China, Ltd. Class “H” (Insurance) | | | 87,500 | | | | 746 | |
Sun Art Retail Group, Ltd. (Food & staples retailing) | | | 484,000 | | | | 748 | |
Tencent Holdings, Ltd. (Internet software & services) | | | 59,700 | | | | 1,958 | |
Want Want China Holdings, Ltd. (Food products) | | | 521,000 | | | | 730 | |
| | | | | | | | |
| | | | | | | 13,830 | |
| | | | | | | | |
India—10.1% | | | | | | | | |
Bajaj Auto, Ltd. (Automobiles) | | | 26,380 | | | | 1,032 | |
HDFC Bank, Ltd. (Commercial banks) | | | 59,521 | | | | 742 | |
Housing Development Finance Corporation (Thrifts & mortgage finance) | | | 50,310 | | | | 769 | |
ITC, Ltd. (Tobacco) | | | 210,623 | | | | 1,109 | |
Sun Pharmaceutical Industries, Ltd. (Pharmaceuticals) | | | 77,316 | | | | 1,046 | |
Tata Consultancy Services, Ltd. (IT services) | | | 30,914 | | | | 712 | |
Tata Motors, Ltd. (Automobiles) | | | 271,948 | | | | 1,563 | |
| | | | | | | | |
| | | | | | | 6,973 | |
| | | | | | | | |
Indonesia—3.1% | | | | | | | | |
PT Astra International Tbk (Automobiles) | | | 1,155,000 | | | | 915 | |
PT Bank Rakyat Indonesia (Commercial banks) | | | 1,656,500 | | | | 1,201 | |
| | | | | | | | |
| | | | | | | 2,116 | |
| | | | | | | | |
Malaysia—2.9% | | | | | | | | |
CIMB Group Holdings Bhd (Commercial banks) | | | 514,800 | | | | 1,289 | |
* IHH Healthcare Bhd (Health care providers & services) | | | 630,600 | | | | 698 | |
| | | | | | | | |
| | | | | | | 1,987 | |
| | | | | | | | |
South Korea—7.9% | | | | | | | | |
* Hyundai Motor Co. (Automobiles) | | | 8,070 | | | | 1,664 | |
* LG Household & Health Care, Ltd. (Household products) | | | 582 | | | | 356 | |
Samsung Electronics Co., Ltd. (Semiconductors & semiconductor equipment) | | | 2,383 | | | | 3,424 | |
| | | | | | | | |
| | | | | | | 5,444 | |
| | | | | | | | |
|
Common Stocks—Emerging Asia—56.6%—(continued) | |
Taiwan—6.5% | | | | | | | | |
Asustek Computer, Inc. (Computers & peripherals) | | | 124,000 | | | $ | 1,404 | |
Hon Hai Precision Industry Co., Ltd. (Electronic equipment, instruments & components) | | | 552,770 | | | | 1,711 | |
MediaTek, Inc. (Semiconductors & semiconductor equipment) | | | 61,000 | | | | 683 | |
Taiwan Semiconductor Manufacturing Co., Ltd.—ADR (Semiconductors & semiconductor equipment) | | | 40,175 | | | | 689 | |
| | | | | | | | |
| | | | | | | 4,487 | |
| | | | | | | | |
Thailand—6.1% | | | | | | | | |
Advanced Info Service PCL (Wireless telecommunication services) | | | 222,500 | | | | 1,530 | |
CP ALL PCL (Food & staples retailing) | | | 881,400 | | | | 1,326 | |
Kasikornbank PCL (Commercial banks) | | | 210,200 | | | | 1,336 | |
| | | | | | | | |
| | | | | | | 4,192 | |
| | | | | | | | |
| |
Emerging Latin America—21.3% | | | | | |
Brazil—4.6% | | | | | | | | |
BR Malls Participacoes S.A. (Real estate management & development) | | | 104,600 | | | | 1,381 | |
Cia de Bebidas das Americas—ADR (Beverages) | | | 43,016 | | | | 1,806 | |
| | | | | | | | |
| | | | | | | 3,187 | |
| | | | | | | | |
Chile—3.3% | | | | | | | | |
Banco Santander Chile—ADR (Commercial banks) | | | 24,273 | | | | 691 | |
S.A.C.I. Falabella (Multiline retail) | | | 70,614 | | | | 726 | |
Sociedad Quimica y Minera de Chile S.A.—ADR (Chemicals) | | | 15,429 | | | | 889 | |
| | | | | | | | |
| | | | | | | 2,306 | |
| | | | | | | | |
Colombia—2.9% | | | | | | | | |
Ecopetrol S.A. (Oil, gas & consumable fuels) | | | 654,079 | | | | 2,021 | |
| | | | | | | | |
Mexico—8.9% | | | | | | | | |
Fomento Economico Mexicano S.A.B. de C.V.—ADR (Beverages) | | | 13,452 | | | | 1,355 | |
Grupo Financiero Banorte S.A.B. de C.V. (Commercial banks) | | | 358,800 | | | | 2,317 | |
Grupo Mexico S.A.B. de C.V. Series “B” (Metals & mining) | | | 676,400 | | | | 2,440 | |
| | | | | | | | |
| | | | | | | 6,112 | |
| | | | | | | | |
Peru—1.6% | | | | | | | | |
Credicorp, Ltd. (Commercial banks)† | | | 7,284 | | | | 1,067 | |
| | | | | | | | |
| |
Emerging Europe, Mid-East, Africa—17.3% | | | | | |
Qatar—2.0% | | | | | | | | |
Industries Qatar QSC (Industrial conglomerates) | | | 33,058 | | | | 1,414 | |
| | | | | | | | |
Russia—4.8% | | | | | | | | |
Magnit OAO (Food & staples retailing)† | | | 902 | | | | 143 | |
Magnit OJSC—144A—GDR (Food & staples retailing) | | | 30,146 | | | | 1,226 | |
Sberbank of Russian Federation (Commercial banks)† | | | 628,838 | | | | 1,922 | |
| | | | | | | | |
| | | | | | | 3,291 | |
| | | | | | | | |
See accompanying Notes to Portfolio of Investments.
58 Annual Report | December 31, 2012 |
Emerging Markets Leaders Fund
Portfolio of Investments, December 31, 2012 (all dollar amounts in thousands)
| | | | | | | | |
Issuer | | Shares or
Principal
Amount | | | Value | |
| |
Common Stocks—Emerging Europe, Mid-East, Africa—17.3%—(continued) | | | | | |
South Africa—7.0% | | | | | | | | |
Bidvest Group, Ltd. (Industrial conglomerates) | | | 27,569 | | | $ | 705 | |
FirstRand, Ltd. (Diversified financial services) | | | 304,841 | | | | 1,122 | |
MTN Group, Ltd. (Wireless telecommunication services) | | | 37,013 | | | | 779 | |
Naspers, Ltd. (Media) | | | 16,375 | | | | 1,058 | |
Shoprite Holdings, Ltd. (Food & staples retailing) | | | 32,125 | | | | 779 | |
Tiger Brands, Ltd. (Food products) | | | 9,106 | | | | 351 | |
| | | | | | | | |
| | | | | | | 4,794 | |
| | | | | | | | |
Turkey—3.5% | | | | | | | | |
Turkiye Garanti Bankasi A.S. (Commercial banks) | | | 461,388 | | | | 2,408 | |
| | | | | | | | |
Total Common Stocks—95.2%
(cost $55,595) | | | | 65,629 | |
| | | | | | | | |
| | |
Preferred Stock | | | | | | | | |
Brazil—3.0% | | | | | | | | |
Itau Unibanco Holding S.A. (Commercial banks) | | | 127,900 | | | | 2,086 | |
| | | | | | | | |
Total Preferred Stock—3.0%
(cost $1,986) | | | | 2,086 | |
| | | | | | | | |
| | |
Repurchase Agreement | | | | | | | | |
Fixed Income Clearing Corporation, 0.110% dated 12/31/12, due 1/2/13, repurchase price $2,909, collateralized by U.S. Treasury Note, 2.125%, due 12/31/15 | | $ | 2,909 | | | | 2,909 | |
| | | | | | | | |
Total Repurchase Agreement—4.2%
(cost $2,909) | | | | 2,909 | |
| | | | | | | | |
Total Investments—102.4%
(cost $60,490) | | | | 70,624 | |
Liabilities, plus cash and other assets—(2.4)% | | | | (1,645 | ) |
| | | | | | | | |
Net assets—100.0% | | | $ | 68,979 | |
| | | | | | | | |
ADR = American Depository Receipt
GDR = Global Depository Receipt
* Non-income producing securities
† = U.S. listed foreign security
For securities primarily traded on exchanges or markets that close before the close of regular trading on the New York Stock Exchange, the Fund may use an independent pricing service to fair value price the securities pursuant to Valuation Procedures approved by the Board of Trustees.
At December 31, 2012, the Fund’s Portfolio of Investments includes the following sector categories (as a percentage of total long-term investments):
| | | | |
Financials | | | 30.6% | |
Information Technology | | | 17.7% | |
Consumer Staples | | | 14.7% | |
Consumer Discretionary | | | 13.5% | |
Telecommunication Services | | | 7.9% | |
Energy | | | 5.0% | |
Materials | | | 4.9% | |
Industrials | | | 3.1% | |
Health Care | | | 2.6% | |
| | | | |
Total | | | 100.0% | |
| | | | |
At December 31, 2012, the Fund’s Portfolio of Investments includes the following currency categories (as a percentage of total long-term investments):
| | | | |
Hong Kong Dollar | | | 20.4% | |
U.S. Dollar | | | 14.5% | |
Indian Rupee | | | 10.3% | |
South Korean Won | | | 8.0% | |
South African Rand | | | 7.1% | |
Mexican Peso | | | 7.0% | |
Thai Baht | | | 6.2% | |
New Taiwan Dollar | | | 5.6% | |
Brazilian Real | | | 5.1% | |
Turkish Lira | | | 3.6% | |
Indonesian Rupiah | | | 3.1% | |
Colombian Peso | | | 3.0% | |
Malaysian Ringgit | | | 2.9% | |
Qatari Rial | | | 2.1% | |
Chilean Peso | | | 1.1% | |
| | | | |
Total | | | 100.0% | |
| | | | |
See accompanying Notes to Portfolio of Investments.
December 31, 2012 | William Blair Funds 59 |
Todd M. McClone
Jeffrey A. Urbina
EMERGING MARKETS SMALL CAP GROWTH FUND
The Emerging Markets Small Cap Growth Fund seeks long-term capital appreciation.
AN OVERVIEW FROM THE PORTFOLIO MANAGERS
The Emerging Markets Small Cap Growth Fund posted a 34.23% increase (Class N Shares) for the twelve months ended December 31, 2012. By comparison, the Fund’s benchmark, the MSCI Emerging Markets Small Cap Index (net) increased 22.22%.
Year to date, the Fund outpaced the Index by over 12%, led by significant outperformance in the overweighted Consumer sectors. Discretionary stocks were up over 41% for the year, well ahead of the 22% Index return, due largely to outperformance in Latin American and Asian Hotels/Restaurants, coupled with strong results in Household Durables and in Asian Media companies. The Fund’s Staples stocks were up approximately 57%, well ahead of the 27% Index return, on strength in the overweighted Food/Staples Retailing industry, in addition to outperformance in Asian Food products companies. The Fund’s Industrials stocks were up over 35%, with broad-based strength across industries except Transportation Infrastructure. In addition, the lack of Construction/Engineering holdings somewhat detracted from results. While the underweighting in Materials added significant value during the year, stock selection was negative, as all industries underperformed. Regionally, Asian stock selection was particularly strong as a focus on Southeast Asian Nation (ASEAN) countries at the expense of South Korea and Taiwan added value, as did strong stock selection across a number of countries.
The Fund maintained its significant focus on Consumer, which represented a combined 46% of the Fund as of year end, compared with the 26% Index weighting. Financials was also overweighted at 23% of the Fund versus the 20% Index weighting, an increase since year-end 2011. Conversely, Industrials, Information Technology (IT) and Telecommunication Services were the most underweighted. Regionally, the Fund’s Asian holdings totalled 57.2%, well below the 74.5% Index weighting due primarily to significant underweightings in South Korea and Taiwan, which were only somewhat mitigated by higher India and ASEAN exposures. Conversely, Latin America totalled 22.8%, well above the 11.3% Index weighting, due to significant exposure in Brazil and Mexico and a higher weighting in Chile.
60 Annual Report | December 31, 2012 |
Emerging Markets Small Cap Growth Fund
Performance Highlights (Unaudited)
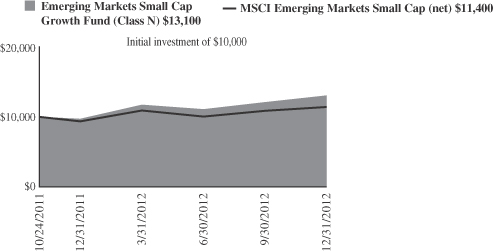
Average Annual Total Return at 12/31/2012
| | | | | | | | |
| | | Year
To Date | | | Since
Inception(a) | |
Class N | | | 34.23 | % | | | 25.19 | % |
Class I | | | 34.62 | | | | 25.49 | |
MSCI Emerging Markets Small Cap (net) | | | 22.22 | | | | 12.05 | |
| | (a) | | For the period from October 24, 2011 (Commencement of Operations) to December 31, 2012. |
Performance cited represents past performance. Past performance does not guarantee future results and current performance may be lower or higher than the data quoted. Results shown are average annual returns, which assume reinvestment of dividends and capital gains. Investment returns and principal will fluctuate and you may have a gain or loss when you sell shares. For the most current month-end performance information, please call 1-800-742-7272, or visit our Web site at www.williamblairfunds.com. From time to time, the investment advisor may waive fees or reimburse expenses for the Fund. Without these waivers, performance would be lower. International investing involves special risk considerations, including currency fluctuations, lower liquidity, economic and political risk. Class N shares are available to the general public without a sales load. Class I shares are available to certain institutional investors and advisory clients of William Blair & Company L.L.C. without a sales load or distribution (12b-1) fees.
The performance highlights and graph presented above do not reflect the deduction of taxes that a shareholder would pay on fund distributions or the redemption of fund shares.
The Morgan Stanley Capital International (MSCI) Emerging Markets Small Cap Index (net) is a free float-adjusted market capitalization weighted index that is designed to measure the equity market performance of emerging markets. This series approximates the minimum possible dividend reinvestment.
This report identifies the Fund’s investments on December 31, 2012. These holdings are subject to change. Not all stocks in the Fund performed the same, nor is there any guarantee that these stocks will perform as well in the future. Market forecasts provided in this report may not necessarily come to pass.
Sector Diversification (Unaudited)
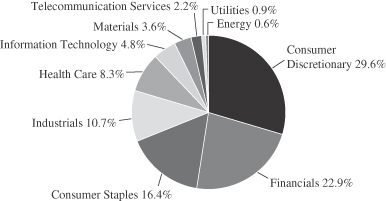
The sector diversification shown is based on the total long-term securities.
December 31, 2012 | William Blair Funds 61 |
Emerging Markets Small Cap Growth Fund
Portfolio of Investments, December 31, 2012 (all dollar amounts in thousands)
| | | | | | | | |
Issuer | | Shares | | | Value | |
| | |
Common Stocks | | | | | | | | |
| | |
Emerging Asia—57.2% | | | | | | | | |
Cambodia—1.6% | | | | | | | | |
NagaCorp, Ltd. (Hotels, restaurants & leisure) | | | 710,000 | | | $ | 434 | |
| | | | | |
China—12.1% | | | | | | | | |
AAC Technologies Holdings, Inc. (Communications equipment) | | | 73,000 | | | | 259 | |
China Medical System Holdings, Ltd. (Pharmaceuticals) | | | 240,000 | | | | 187 | |
China Overseas Grand Oceans Group, Ltd. (Real estate management & development) | | | 428,000 | | | | 523 | |
Dongyue Group (Chemicals) | | | 500,000 | | | | 338 | |
Golden Eagle Retail Group, Ltd. (Multiline retail) | | | 130,000 | | | | 324 | |
*Haier Electronics Group Co., Ltd. (Household durables) | | | 255,000 | | | | 378 | |
Haitian International Holdings, Ltd. (Machinery) | | | 250,000 | | | | 300 | |
*Hollysys Automation Technologies, Ltd. (Electronic equipment, instruments & components)† | | | 11,059 | | | | 131 | |
Minth Group, Ltd. (Auto components) | | | 108,000 | | | | 125 | |
Prince Frog International Holdings, Ltd. (Personal products) | | | 571,000 | | | | 243 | |
Sino Biopharmaceutical Ltd. (Pharmaceuticals) | | | 580,000 | | | | 280 | |
Tiangong International Co., Ltd. (Metals & mining) | | | 776,000 | | | | 189 | |
| | | | | | | | |
| | | | | | | 3,277 | |
| | | | | | | | |
India—12.7% | | | | | | | | |
Bata India, Ltd. (Textiles, apparel & luxury goods) | | | 11,797 | | | | 188 | |
Colgate-Palmolive India, Ltd. (Personal products) | | | 7,779 | | | | 225 | |
CRISIL, Ltd. (Diversified financial services) | | | 5,146 | | | | 102 | |
Eicher Motors, Ltd. (Machinery) | | | 3,304 | | | | 176 | |
GlaxoSmithKline Consumer Healthcare, Ltd. (Food products) | | | 4,041 | | | | 284 | |
Godrej Consumer Products, Ltd. (Personal products) | | | 13,706 | | | | 182 | |
Gruh Finance, Ltd. (Thrifts & mortgage finance) | | | 54,158 | | | | 235 | |
Havells India, Ltd. (Electrical equipment) | | | 2,075 | | | | 24 | |
IndusInd Bank, Ltd. (Commercial banks) | | | 38,858 | | | | 300 | |
Ipca Laboratories, Ltd. (Pharmaceuticals) | | | 22,423 | | | | 212 | |
*Jubilant Foodworks, Ltd. (Hotels, restaurants & leisure) | | | 7,314 | | | | 174 | |
Lupin, Ltd. (Pharmaceuticals) | | | 24,125 | | | | 272 | |
Marico, Ltd. (Personal products) | | | 63,017 | | | | 252 | |
Motherson Sumi Systems, Ltd. (Auto components) | | | 38,643 | | | | 141 | |
Page Industries, Ltd. (Textiles, apparel & luxury goods) | | | 2,464 | | | | 154 | |
Pidilite Industries, Ltd. (Chemicals) | | | 54,818 | | | | 219 | |
Yes Bank, Ltd. (Commercial banks) | | | 32,711 | | | | 279 | |
| | | | | | | | |
| | | | | | | 3,419 | |
| | | | | | | | |
Indonesia—6.4% | | | | | | | | |
PT Ace Hardware Indonesia Tbk (Specialty retail) | | | 5,295,500 | | | | 453 | |
PT Alam Sutera Realty Tbk (Real estate management & development) | | | 1,792,000 | | | | 112 | |
|
Common Stocks—Emerging Asia—57.2%—(continued) | |
Indonesia—(continued) | | | | | | | | |
*PT Bank Tabungan Pensiunan Nasional Tbk (Commercial banks) | | | 227,000 | | | $ | 124 | |
PT Ciputra Development Tbk (Real estate management & development) | | | 2,034,500 | | | | 169 | |
PT Holcim Indonesia Tbk (Construction materials) | | | 584,000 | | | | 176 | |
PT Jasa Marga (Transportation infrastructure) | | | 87,000 | | | | 49 | |
PT Kalbe Farma Tbk (Pharmaceuticals) | | | 1,349,500 | | | | 149 | |
PT Media Nusantara Citra Tbk (Media) | | | 234,500 | | | | 61 | |
*PT MNC Sky Vision Tbk (Media) | | | 311,000 | | | | 77 | |
PT Sumber Alfaria Trijaya Tbk (Food & staples retailing) | | | 133,000 | | | | 73 | |
*PT Tower Bersama Infrastructure Tbk (Wireless telecommunication services) | | | 492,500 | | | | 292 | |
| | | | | | | | |
| | | | | | | 1,735 | |
| | | | | | | | |
Malaysia—3.5% | | | | | | | | |
Aeon Co. M Bhd (Multiline retail) | | | 44,200 | | | | 204 | |
Dayang Enterprise Holdings Bhd (Energy equipment & services) | | | 207,200 | | | | 162 | |
Guinness Anchor Bhd (Beverages) | | | 69,400 | | | | 377 | |
Nestle Malaysia Bhd (Food products) | | | 9,000 | | | | 186 | |
Padini Holdings Bhd (Specialty retail) | | | 45,400 | | | | 28 | |
| | | | | | | | |
| | | | | | | 957 | |
| | | | | | | | |
Philippines—6.1% | | | | | | | | |
Alliance Global Group, Inc. (Industrial conglomerates) | | | 787,000 | | | | 322 | |
*East West Banking Corporation (Commercial banks) | | | 13,900 | | | | 10 | |
Puregold Price Club, Inc. (Food & staples retailing) | | | 673,000 | | | | 541 | |
Security Bank Corporation (Commercial banks) | | | 88,450 | | | | 337 | |
SM Prime Holdings, Inc. (Real estate management & development) | | | 264,375 | | | | 107 | |
Universal Robina Corporation (Food products) | | | 160,700 | | | | 328 | |
| | | | | | | | |
| | | | | | | 1,645 | |
| | | | | | | | |
South Korea—2.5% | | | | | | | | |
*Able C&C Co., Ltd. (Personal products) | | | 2,351 | | | | 175 | |
*Gamevil, Inc. (Software) | | | 2,051 | | | | 193 | |
*Kolao Holdings (Automobiles) | | | 10,328 | | | | 178 | |
*Paradise Co., Ltd. (Hotels, restaurants & leisure) | | | 8,360 | | | | 135 | |
| | | | | | | | |
| | | | | | | 681 | |
| | | | | | | | |
Sri Lanka—1.0% | | | | | | | | |
Commercial Bank of Ceylon plc (Commercial banks) | | | 148,872 | | | | 120 | |
John Keells Holdings plc (Industrial conglomerates) | | | 84,914 | | | | 147 | |
| | | | | | | | |
| | | | | | | 267 | |
| | | | | | | | |
Taiwan—3.4% | | | | | | | | |
Eclat Textile Co., Ltd. (Textiles, apparel & luxury goods) | | | 54,000 | | | | 199 | |
Ginko International Co., Ltd. (Health care equipment & supplies) | | | 12,000 | | | | 134 | |
Hiwin Technologies Corporation (Machinery) | | | 3,300 | | | | 24 | |
Largan Precision Co., Ltd. (Electronic equipment, instruments & components) | | | 5,000 | | | | 135 | |
See accompanying Notes to Portfolio of Investments.
62 Annual Report | December 31, 2012 |
Emerging Markets Small Cap Growth Fund
Portfolio of Investments, December 31, 2012 (all dollar amounts in thousands)
| | | | | | | | |
Issuer | | Shares | | | Value | |
|
Common Stocks—Emerging Asia—57.2%—(continued) | |
Taiwan—(continued) | | | | | | | | |
Merida Industry Co., Ltd. (Leisure equipment & products) | | | 43,000 | | | $ | 193 | |
St Shine Optical Co., Ltd. (Health care equipment & supplies) | | | 15,000 | | | | 230 | |
| | | | | | | | |
| | | | | | | 915 | |
| | | | | | | | |
Thailand—7.9% | | | | | | | | |
Bangkok Dusit Medical Services PCL (Health care providers & services) | | | 52,100 | | | | 194 | |
BEC World PCL (Media) | | | 146,300 | | | | 341 | |
Home Product Center PCL (Specialty retail) | | | 652,040 | | | | 271 | |
LPN Development PCL (Real estate management & development) | | | 266,600 | | | | 161 | |
Minor International PCL (Hotels, restaurants & leisure) | | | 474,810 | | | | 306 | |
Robinson Department Store PCL (Multiline retail) | | | 123,700 | | | | 271 | |
Siam Makro PCL (Food & staples retailing) | | | 13,650 | | | | 200 | |
Thai Tap Water Supply PCL (Water utilities) | | | 795,500 | | | | 240 | |
Tisco Financial Group PCL (Commercial banks) | | | 80,700 | | | | 138 | |
| | | | | | | | |
| | | | | | | 2,122 | |
| | | | | | | | |
| | |
Emerging Latin America—22.8% | | | | | | | | |
Brazil—12.4% | | | | | | | | |
Arezzo Industria e Comercio S.A. (Textiles, apparel & luxury goods) | | | 12,800 | | | | 247 | |
BR Properties S.A. (Real estate management & development) | | | 10,500 | | | | 131 | |
Cia Hering (Specialty retail) | | | 10,200 | | | | 209 | |
Ez Tec Empreendimentos e Participacoes S.A. (Household durables) | | | 14,500 | | | | 182 | |
Iguatemi Empresa de Shopping Centers S.A. (Real estate management & development) | | | 20,400 | | | | 271 | |
*Kroton Educacional S.A. (Diversified consumer services) | | | 17,790 | | | | 402 | |
Localiza Rent a Car S.A. (Road & rail) | | | 10,700 | | | | 196 | |
Lojas Renner S.A. (Multiline retail) | | | 6,600 | | | | 257 | |
Mills Estruturas e Servicos de Engenharia S.A. (Trading companies & distributors) | | | 21,586 | | | | 359 | |
*Qualicorp S.A. (Professional services) | | | 23,300 | | | | 241 | |
Raia Drogasil S.A. (Food & staples retailing) | | | 9,700 | | | | 109 | |
Tegma Gestao Logistica S.A. (Road & rail) | | | 10,700 | | | | 183 | |
Totvs S.A. (Software) | | | 9,200 | | | | 182 | |
Valid Solucoes e Servicos de Seguranca em Meios de Pagamento e Identificacao S.A (Commercial services & supplies) | | | 16,900 | | | | 376 | |
| | | | | | | | |
| | | | | | | 3,345 | |
| | | | | | | | |
Chile—3.1% | | | | | | | | |
Inversiones La Construccion S.A. (Diversified financial services) | | | 15,590 | | | | 306 | |
Parque Arauco S.A. (Real estate management & development) | | | 77,460 | | | | 192 | |
Sonda S.A. (IT services) | | | 103,879 | | | | 331 | |
| | | | | | | | |
| | | | | | | 829 | |
| | | | | | | | |
Mexico—5.4% | | | | | | | | |
*Alsea S.A.B. de C.V. (Hotels, restaurants & leisure) | | | 189,869 | | | | 379 | |
Banregio Grupo Financiero S.A.B. de C.V. (Commercial banks) | | | 87,838 | | | | 400 | |
|
Common Stocks—Emerging Latin
America—22.8%—(continued) | |
Mexico—(Continued) | | | | | | | | |
Compartamos S.A.B. de C.V. (Consumer finance) | | | 105,200 | | | $ | 150 | |
Fibra Uno Administracion S.A. de C.V. (Real estate investment trusts (REITs)) | | | 88,500 | | | | 267 | |
*Macquarie Mexico Real Estate Management S.A. de C.V.—144A (Real estate investment trusts (REITs)) | | | 140,965 | | | | 279 | |
| | | | | | | | |
| | | | | | | 1,475 | |
| | | | | | | | |
Panama—1.0% | | | | | | | | |
Copa Holdings S.A. (Airlines)† | | | 2,648 | | | | 263 | |
| | | | | | | | |
Peru—0.9% | | | | | | | | |
*Inretail Peru Corporation (Food & staples retailing) | | | 4,077 | | | | 86 | |
*Inretail Peru Corporation—144A (Food & staples retailing)† | | | 1,346 | | | | 28 | |
Intercorp Financial Services, Inc. (Diversified financial services) | | | 3,529 | | | | 126 | |
| | | | | | | | |
| | | | | | | 240 | |
| | | | | | | | |
| |
Emerging Europe, Mid-East, Africa—13.5% | | | | | |
Kenya—1.0% | | | | | | | | |
Safaricom, Ltd. (Wireless telecommunication services) | | | 4,588,400 | | | | 267 | |
| | | | | | | | |
Nigeria—1.7% | | | | | | | | |
Guaranty Trust Bank plc (Commercial banks) | | | 1,908,274 | | | | 282 | |
Nestle Nigeria plc (Food products) | | | 40,090 | | | | 180 | |
| | | | | | | | |
| | | | | | | 462 | |
| | | | | | | | |
Poland—2.9% | | | | | | | | |
*Alior Bank S.A. (Commercial banks) | | | 7,026 | | | | 142 | |
Eurocash S.A. (Food & staples retailing) | | | 18,191 | | | | 258 | |
LPP S.A. (Textiles, apparel & luxury goods) | | | 257 | | | | 379 | |
| | | | | | | | |
| | | | | | | 779 | |
| | | | | | | | |
Russia—0.5% | | | | | | | | |
*Etalon Group Ltd.—144A—GDR (Real estate management & development) | | | 4,868 | | | | 27 | |
*MD Medical Group Investments plc—144A—GDR (Health care providers & services) | | | 9,432 | | | | 117 | |
| | | | | | | | |
| | | | | | | 144 | |
| | | | | | | | |
South Africa—4.2% | | | | | | | | |
AVI, Ltd. (Food products) | | | 23,285 | | | | 165 | |
Coronation Fund Managers, Ltd. (Capital markets) | | | 59,162 | | | | 277 | |
Discovery Holdings, Ltd. (Insurance) | | | 19,818 | | | | 146 | |
Life Healthcare Group Holdings Pte, Ltd. (Health care providers & services) | | | 24,717 | | | | 99 | |
Mr Price Group, Ltd. (Specialty retail) | | | 12,072 | | | | 200 | |
The Foschini Group, Ltd. (Specialty retail) | | | 7,077 | | | | 118 | |
Tsogo Sun Holdings, Ltd. (Hotels, restaurants & leisure) | | | 48,096 | | | | 135 | |
| | | | | | | | |
| | | | | | | 1,140 | |
| | | | | | | | |
Turkey—3.2% | | | | | | | | |
Arcelik A.S. (Household durables) | | | 26,925 | | | | 177 | |
See accompanying Notes to Portfolio of Investments.
December 31, 2012 | William Blair Funds 63 |
Emerging Markets Small Cap Growth Fund
Portfolio of Investments, December 31, 2012 (all dollar amounts in thousands)
| | | | | | | | |
Issuer | | Shares | | | Value | |
|
Common Stocks—Emerging Europe, Mid-East, Africa—13.5%—(continued) | |
Turkey—(continued) | | | | | | | | |
Bizim Toptan Satis Magazalari A.S. (Food & staples retailing) | | | 19,285 | | | $ | 301 | |
Tofas Turk Otomobil Fabrikasi A.S. (Automobiles) | | | 41,406 | | | | 244 | |
Turkiye Sinai Kalkinma Bankasi A.S. (Commercial banks) | | | 108,970 | | | | 141 | |
| | | | | | | | |
| | | | | | | 863 | |
| | | | | | | | |
Total Common Stocks—93.5%
(cost $23,445) | | | | 25,259 | |
| | | | | | | | |
| | |
Preferred Stock | | | | | | | | |
Brazil—1.2% | | | | | | | | |
Marcopolo S.A. (Machinery) | | | 49,000 | | | | 309 | |
| | | | | | | | |
Total Preferred Stock—1.2%
(cost $284) | | | | 309 | |
| | | | | | | | |
| | | | | | | | |
Issuer | | Principal
Amount | | | Value | |
| | |
Repurchase Agreement | | | | | | | | |
Fixed Income Clearing Corporation, 0.110% dated 12/31/12, due 1/2/13, repurchase price $2,088, collateralized by U.S. Treasury Note, 2.125%, due 12/31/15 | | $ | 2,088 | | | $ | 2,088 | |
| | | | | | | | |
Total Repurchase Agreement—7.7%
(cost $2,088) | | | | 2,088 | |
| | | | | | | | |
Total Investments—102.4%
(cost $25,817) | | | | 27,656 | |
Liabilities, plus cash and other assets—(2.4)% | | | | (635 | ) |
| | | | | | | | |
Net assets—100.0% | | | $ | 27,021 | |
| | | | | | | | |
GDR = Global Depository Receipt
* Non-income producing securities
† = U.S. listed foreign security
For securities primarily traded on exchanges or markets that close before the close of regular trading on the New York Stock Exchange, the Fund may use an independent pricing service to fair value price the securities pursuant to Valuation Procedures approved by the Board of Trustees.
At December 31, 2012, the Fund’s Portfolio of Investments includes the following sector categories as a percentage of total long-term investments:
| | | | |
Consumer Discretionary | | | 29.6% | |
Financials | | | 22.9% | |
Consumer Staples | | | 16.4% | |
Industrials | | | 10.7% | |
Health Care | | | 8.3% | |
Information Technology | | | 4.8% | |
Materials | | | 3.6% | |
Telecommunication Services | | | 2.2% | |
Utilities | | | 0.9% | |
Energy | | | 0.6% | |
| | | | |
Total | | | 100.0% | |
| | | | |
At December 31, 2012, the Fund’s Portfolio of Investments includes the following currency categories as a percentage of total long-term investments:
| | | | |
Brazilian Real | | | 14.3% | |
Hong Kong Dollar | | | 14.0% | |
Indian Rupee | | | 13.4% | |
Thai Baht | | | 8.3% | |
Indonesian Rupiah | | | 6.8% | |
Philippine Peso | | | 6.4% | |
Mexican Peso | | | 5.8% | |
South African Rand | | | 4.5% | |
Malaysian Ringgit | | | 3.7% | |
New Taiwan Dollar | | | 3.6% | |
Turkish Lira | | | 3.4% | |
Chilean Peso | | | 3.2% | |
U.S. Dollar | | | 3.0% | |
South Korean Won | | | 2.7% | |
Euro | | | 2.5% | |
Nigerian Naira | | | 1.8% | |
Kenyan Shilling | | | 1.0% | |
Sri Lanka Rupee | | | 1.0% | |
All Other Currencies | | | 0.6% | |
| | | | |
Total | | | 100.0% | |
| | | | |
See accompanying Notes to Portfolio of Investments.
64 Annual Report | December 31, 2012 |

David F. Hone
LARGE CAP VALUE FUND
The Large Cap Value Fund seeks long-term capital appreciation.
AN OVERVIEW FROM THE PORTFOLIO MANAGER
The William Blair Large Cap Value Fund posted a 16.92% increase (Class N Shares) for the twelve months ended December 31, 2012. By comparison, the Fund’s benchmark, the Russell 1000® Value Index, increased by 17.51%.
In 2012, investors continued to fluctuate between optimism and pessimism based on macroeconomic or political announcements. Market volatility remained, but less than recent years as there were fewer unknowns in the marketplace. In this environment, the Russell 1000® Value Index rose 17.51%, and climbed the proverbial “wall of worry.” In general, by the fourth quarter, there was evidence that the global economy, ex-Europe, had stabilized after a slowing in the middle of the year. From a sector perspective, cyclical sectors such as Consumer Discretionary, Financials and Industrials performed best. Technology and Energy stocks were a drag as was the more defensive Utilities sector.
Performance results of certain holdings across a variety of sectors were weaker than our expectation. Hewlett-Packard’s stock price declined considerably and was our largest relative underperformer. This Technology company is in the midst of a multi-year turnaround; it disappointed investors with a weaker than expected outlook on the overall IT demand environment. We believe the firm should benefit from its efforts to cut costs and restructure its business. Within Consumer Discretionary, Big Lots lost ground due to softness in same store sales, weakness in merchandising, and the departure of key management such as the Chief Merchandising Officer and Chief Financial Officer. Over time, we believe Big Lots should benefit from a turnaround in merchandising as well as a re-imaging of its stores; as we wait for progress toward the investment thesis, the company has solid cash flows and a good balance sheet. In Financials, Bank of America’s underweight relative to the benchmark detracted for the year. The stock gained ground significantly in the first quarter; however, we added it to the portfolio in June on its attractive risk/reward combination after its substantial decline beginning in April over concerns on the global economic slowdown and weakness in capital markets. Lastly, cash was a drag on relative results in the strong upward market; on average, it was 2.3%.
Stock contributors to results were primarily in the Financials and Consumer Discretionary sectors. Financial stocks were strong benchmark performers and our positions in Discover Financial Services and SunTrust Banks stood out above their peers. Discover Financial gained ground from rising demand for credit and improving credit cards trends as both losses and delinquencies declined. We believe this company will benefit from an improving domestic economy and consumer credit environment. With improvements in the U.S. housing market, SunTrust Banks was well positioned due to its significant mortgage business especially relative to other regional banks. For the Consumer Discretionary sector, Time Warner Cable and Brunswick performed best. Time Warner Cable’s management provided strong execution on its high speed data and voice businesses as well as an attractive return of capital through dividends and stock buybacks. Brunswick, a leading manufacturer and marketer of marine and leisure products, reported healthy retail sales and continues to draw down inventory. Its marine engine business continues to do well, and demand remains solid in its fiberglass outboard and aluminum boating businesses. We believe Brunswick should continue to benefit from an improving economy as well as market share gains.
December 31, 2012 | William Blair Funds 65 |
In terms of changes over 2012, there were no major shifts in sector or market cap positioning for the year. The Financials sector rose with the addition of Allstate, Morgan Stanley and Bank of America. (Note: American Tower was reclassified by Russell to Financials from Telecommunications). Energy stock exposure also grew; we added new positions in Baker Hughes, Southwestern Energy and Chevron. Health care declined as we trimmed select existing holdings on share price strength.
Going forward, many positive factors remain for the U.S. economy. The Federal Reserve’s accommodative policies continue, while the labor and housing markets recover albeit at a slow pace. That said, macro issues remain in the headlines, most notably the government debt ceiling and decisions regarding government deficits. The need to trim deficits may cause an intermediate-term headwind to growth, given likely spending cuts. Overseas, while Europe has stabilized with the announcement of OMT (Outright Monetary Transactions), uncertainties remain on implementation and economic growth has ground to a halt. For emerging market countries, the level of growth remains debatable; however, economies, particularly China, appear to be stabilizing.
For the Large Cap Value Fund, we continue to find attractive opportunities on a valuation basis across most sectors. As always, our focus remains on fundamental analysis to identify quality companies that are temporarily out-of-favor with investors. Over time, we believe investors will benefit from the attractive value creation as the company returns towards its historical growth trends. In 2012, we found it promising that investors began to distinguish underlying company fundamentals instead of being influenced by macro events; this behavior assisted performance results for our strategy.
66 Annual Report | December 31, 2012 |
Large Cap Value Fund
Performance Highlights (Unaudited)
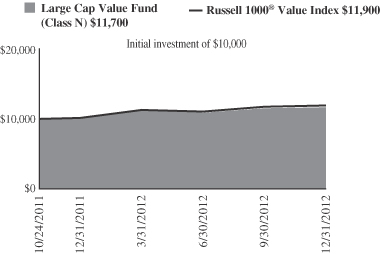
Average Annual Total Return at 12/31/2012
| | | | | | | | |
| | | 1
Year | | | Since
Inception(a) | |
Class N | | | 16.92 | % | | | 13.87 | % |
Class I | | | 17.28 | % | | | 14.17 | |
Russell 1000® Value | | | 17.51 | % | | | 16.13 | |
| | (a) | | For the period from October 24, 2011 (Commencement of Operations) to December 31, 2012. |
Performance cited represents past performance. Past performance does not guarantee future results and current performance may be lower or higher than the data quoted. Results shown are average annual total returns, which assume reinvestment of dividends and capital gains. Investment returns and principal will fluctuate and you may have a gain or loss when you sell shares. For the most current month-end performance information, please call 1-800-742-7272, or visit our Web site at www.williamblairfunds.com. From time to time, the investment advisor may waive fees or reimburse expenses for the Fund. Without these waivers, performance would be lower. Class N shares are available to the general public without a sales load. Class I shares are available to certain institutional investors and advisory clients of William Blair & Company, L.L.C., without a sales load or distribution (12b-1) or service fees.
The performance highlights and graph presented above do not reflect the deduction of taxes that a shareholder would pay on fund distributions or the redemption of fund shares.
The Russell 1000® Value Index consists of large capitalization companies with above average price-to-book ratios and forecasted growth rates.
This report identifies the Fund’s investments on December 31, 2012. These holdings are subject to change. Not all stocks in the Fund performed the same, nor is there any guarantee that these stocks will perform as well in the future. Market forecasts provided in this report may not necessarily come to pass.
Sector Diversification (Unaudited)
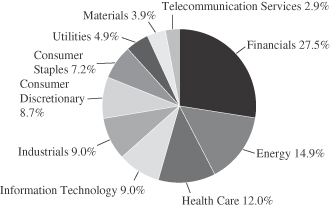
The sector diversification shown is based on the total long-term securities.
December 31, 2012 | William Blair Funds 67 |
Large Cap Value Fund
Portfolio of Investments, December 31, 2012 (all dollar amounts in thousands)
| | | | | | | | |
Issuer | | Shares | | | Value | |
| | |
Common Stocks | | | | | | | | |
Financials—27.2% | | | | | | | | |
American Tower Corporation | | | 869 | | | $ | 67 | |
Bank of America Corporation | | | 5,938 | | | | 69 | |
*CBRE Group, Inc. | | | 1,599 | | | | 32 | |
Citigroup, Inc. | | | 2,233 | | | | 88 | |
CNA Financial Corporation | | | 860 | | | | 24 | |
Discover Financial Services | | | 1,288 | | | | 50 | |
JPMorgan Chase & Co. | | | 2,637 | | | | 116 | |
Lazard, Ltd.† | | | 2,197 | | | | 65 | |
Lincoln National Corporation | | | 1,025 | | | | 26 | |
Morgan Stanley | | | 2,397 | | | | 46 | |
Prudential Financial, Inc. | | | 691 | | | | 37 | |
Regions Financial Corporation | | | 5,122 | | | | 36 | |
State Street Corporation | | | 991 | | | | 47 | |
SunTrust Banks, Inc. | | | 1,929 | | | | 55 | |
The Allstate Corporation | | | 1,342 | | | | 54 | |
The Goldman Sachs Group, Inc. | | | 297 | | | | 38 | |
US Bancorp | | | 1,567 | | | | 50 | |
Wells Fargo & Co. | | | 2,897 | | | | 99 | |
Zions Bancorporation | | | 2,236 | | | | 48 | |
| | | | | | | | |
| | | | | | | 1,047 | |
| | | | | | | | |
Energy—14.7% | | | | | | | | |
Anadarko Petroleum Corporation | | | 731 | | | | 54 | |
Baker Hughes, Inc. | | | 1,112 | | | | 45 | |
Chevron Corporation | | | 802 | | | | 87 | |
Devon Energy Corporation | | | 829 | | | | 43 | |
Exxon Mobil Corporation | | | 1,738 | | | | 151 | |
Hess Corporation | | | 1,095 | | | | 58 | |
Occidental Petroleum Corporation | | | 877 | | | | 67 | |
Schlumberger, Ltd.† | | | 442 | | | | 31 | |
*Southwestern Energy Co. | | | 932 | | | | 31 | |
| | | | | | | | |
| | | | | | | 567 | |
| | | | | | | | |
Health Care—11.9% | | | | | | | | |
Amgen, Inc. | | | 380 | | | | 33 | |
Baxter International, Inc. | | | 726 | | | | 48 | |
Cardinal Health, Inc. | | | 1,267 | | | | 52 | |
*Express Scripts Holding Co. | | | 750 | | | | 41 | |
Merck & Co., Inc. | | | 1,701 | | | | 70 | |
Pfizer, Inc. | | | 4,431 | | | | 111 | |
UnitedHealth Group, Inc. | | | 807 | | | | 44 | |
Zimmer Holdings, Inc. | | | 855 | | | | 57 | |
| | | | | | | | |
| | | | | | | 456 | |
| | | | | | | | |
Information Technology—8.9% | | | | | | | | |
*Adobe Systems, Inc. | | | 1,576 | | | | 59 | |
*BMC Software, Inc. | | | 851 | | | | 34 | |
*Broadcom Corporation | | | 1,053 | | | | 35 | |
Corning, Inc. | | | 2,425 | | | | 31 | |
Hewlett-Packard Co. | | | 2,041 | | | | 29 | |
Intel Corporation | | | 624 | | | | 13 | |
Microsoft Corporation | | | 1,083 | | | | 29 | |
*NetApp, Inc. | | | 1,143 | | | | 38 | |
*Symantec Corporation | | | 2,375 | | | | 45 | |
*VeriFone Systems, Inc. | | | 1,029 | | | | 30 | |
| | | | | | | | |
| | | | | | | 343 | |
| | | | | | | | |
* Non-income producing securities
† = U.S. listed foreign security
| | | | | | | | |
Issuer | | Shares | | | Value | |
| | |
Common Stocks—(continued) | | | | | | | | |
Industrials—8.9% | | | | | | | | |
Gardner Denver, Inc. | | | 172 | | | $ | 12 | |
General Electric Co. | | | 4,981 | | | | 105 | |
Honeywell International, Inc. | | | 293 | | | | 19 | |
Kansas City Southern | | | 665 | | | | 55 | |
SPX Corporation | | | 507 | | | | 36 | |
Textron, Inc. | | | 2,561 | | | | 63 | |
The Boeing Co. | | | 375 | | | | 28 | |
Union Pacific Corporation | | | 187 | | | | 23 | |
| | | | | | | | |
| | | | | | | 341 | |
| | | | | | | | |
Consumer Discretionary—8.6% | | | | | | | | |
*Big Lots, Inc. | | | 1,218 | | | | 35 | |
Brunswick Corporation | | | 1,452 | | | | 42 | |
*General Motors Co. | | | 1,895 | | | | 55 | |
Lear Corporation | | | 915 | | | | 43 | |
Marriott International, Inc. | | | 409 | | | | 15 | |
*MGM Resorts International | | | 2,206 | | | | 26 | |
*Saks, Inc. | | | 1,953 | | | | 20 | |
The Walt Disney Co. | | | 807 | | | | 40 | |
Time Warner Cable, Inc. | | | 558 | | | | 54 | |
| | | | | | | | |
| | | | | | | 330 | |
| | | | | | | | |
Consumer Staples—7.1% | | | | | | | | |
General Mills, Inc. | | | 1,350 | | | | 55 | |
Kimberly-Clark Corporation | | | 428 | | | | 36 | |
Molson Coors Brewing Co. | | | 570 | | | | 24 | |
Philip Morris International, Inc. | | | 671 | | | | 56 | |
The Procter & Gamble Co. | | | 1,148 | | | | 78 | |
Walgreen Co. | | | 625 | | | | 23 | |
| | | | | | | | |
| | | | | | | 272 | |
| | | | | | | | |
Utilities—4.8% | | | | | | | | |
CMS Energy Corporation | | | 2,461 | | | | 60 | |
NextEra Energy, Inc. | | | 893 | | | | 62 | |
Wisconsin Energy Corporation | | | 1,721 | | | | 63 | |
| | | | | | | | |
| | | | | | | 185 | |
| | | | | | | | |
Materials—3.8% | | | | | | | | |
Alcoa, Inc. | | | 3,518 | | | | 31 | |
Freeport-McMoRan Copper & Gold, Inc. | | | 1,679 | | | | 57 | |
Rockwood Holdings, Inc. | | | 738 | | | | 37 | |
The Dow Chemical Co. | | | 688 | | | | 22 | |
| | | | | | | | |
| | | | | | | 147 | |
| | | | | | | | |
Telecommunication Services—2.9% | | | | | | | | |
AT&T, Inc. | | | 1,279 | | | | 43 | |
CenturyLink, Inc. | | | 1,213 | | | | 48 | |
Verizon Communications, Inc. | | | 489 | | | | 21 | |
| | | | | | | | |
| | | | | | | 112 | |
| | | | | | | | |
Total Common Stocks—98.8%
(cost $3,392) | | | | 3,800 | |
| | | | | | | | |
Total Investments—98.8%
(cost $3,392) | | | | 3,800 | |
Cash and other assets, less liabilities—1.2% | | | | 45 | |
| | | | | | | | |
Net assets—100.0% | | | $ | 3,845 | |
| | | | | | | | |
See accompanying Notes to Portfolio of Investments.
68 Annual Report | December 31, 2012 |

Chad M. Kilmer

Mark T. Leslie

David S. Mitchell
SMALL CAP VALUE FUND
The Small Cap Value Fund seeks long-term capital appreciation.
AN OVERVIEW FROM THE PORTFOLIO MANAGERS
The William Blair Small Cap Value Fund (Class N shares) posted a 12.49% increase for the twelve months ended December 31, 2012. By comparison, the Fund’s benchmark, the Russell 2000® Value Index, returned 18.05%.
Improving U.S. economic data points, especially housing-related, and global central bank actions were the primary drivers of equity market returns in 2012. Despite a brief correction mid-year due to elevated fears regarding Euro zone financial stability, emerging market growth and a pause in the U.S. economic recovery, most small and mid cap indices finished the year near all-time highs. Propelling the market higher in the back half of the year was European Central Bank messaging and actions, which restored confidence in Spanish and Italian borrowing capacity and the overall sustainability of the currency bloc. In the U.S., the Federal Reserve announced new quantitative easing programs aimed to maintain low government and consumer borrowing rates. Finally, investors cheered further improvements in the housing industry. Rebounding home prices and homebuilding activity positively impacts housing-related employment and overall consumer confidence. Thus, the market digested the possibility of a more sustainable domestic economic recovery.
The William Blair Small Cap Value Fund’s 2012 underperformance is attributable to style and industry headwinds and negative stock selection. Quality was out of favor for the year, which negatively impacted relative performance due to our strategy’s high quality bias. Size was another significant style factor for the year in the small cap value space. Stocks with market capitalizations of $2 billion and above lagged the market, hurting relative returns for our portfolio, which tends to have more exposure to the $2B to $3B range as compared to the Russell 2000® Value Index. Another notable trend was the sustained outperformance of homebuilding stocks along with other stocks tied to the housing resurgence. While we had some exposure, we exited our one homebuilder position early in the year due to what was already an elevated valuation. Even though we’ve seen encouraging data points in 2012 that suggest signs of a housing recovery, the multiples being applied to the homebuilding stocks implied housing growth at levels which to us seemed unrealistically optimistic. Our underweight to what we consider to be an overvalued segment of the market also detracted from relative returns. Looking at stock selection, Key Energy Services Inc. and Adtran Inc. detracted from relative performance, both of which are stocks we continue to own, while partially offsetting the underperformance were investments in PolyOne Corp., AFC Enterprises Inc., and Western Alliance Bancorp.
Despite progress on certain fronts in the U.S. and abroad during 2012, there remain several uncertainties the market will grapple with in 2013. In the US, the late 2012 “fiscal cliff” negotiations produced some clarity on tax policy, but government spending policy remains in flux. These discussions will take center stage in the coming months along with a new debt-ceiling debate. On the other hand, the improving housing market and overall economy in the U.S. provides some ballast to these downside risks. Outside the US, European Central Bank activities have suppressed fears of draconian scenarios but financial stability, government budget and economic risks continue to exist in the region. And while the Chinese economy has improved, investors will keep a close eye on this important global economic engine.
Equity valuations expanded in 2012, but they begin the year near long-term averages and thus should be neither a tailwind nor headwind to equity returns. Profit margins are elevated and therefore we believe a premium should be placed on companies with above-average revenue
December 31, 2012 | William Blair Funds 69 |
growth opportunities, such as the companies in which we seek to invest. Corporate balance sheets remain strong and should provide companies the ability to invest or increase merger and acquisition activities, both of which would be a tailwind for the stock market.
In the end, while we factor various economic scenarios into our stock picking, we focus our time on constructing the portfolio from a bottom-up perspective. As always, we remain focused on finding quality companies at discount prices and corporate transformation opportunities, and we continue to find good ideas across sectors. We believe building a fund with these types of companies should produce solid investment results over the long term.
70 Annual Report | December 31, 2012 |
Small Cap Value Fund
Performance Highlights (Unaudited)
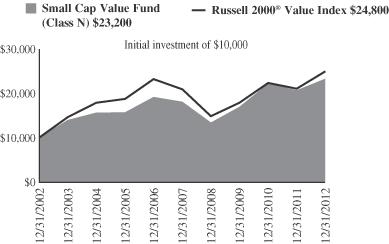
Average Annual Total Return at 12/31/2012
| | | | | | | | | | | | | | | | |
| | | 1
Year | | | 3
Year | | | 5
Year | | | 10
Year | |
Class N | | | 12.49 | % | | | 11.08 | % | | | 5.11 | % | | | 8.76 | % |
Class I | | | 12.73 | | | | 11.33 | | | | 5.32 | | | | 8.98 | |
Russell 2000® Value | | | 18.05 | | | | 11.57 | | | | 3.55 | | | | 9.50 | |
Performance cited represents past performance. Past performance does not guarantee future results and current performance may be lower or higher than the data quoted. Results shown are average annual total returns, which assume reinvestment of dividends and capital gains. Investment returns and principal will fluctuate and you may have a gain or loss when you sell shares. For the most current month-end performance information, please call 1-800-742-7272, or visit our Web site at www.williamblairfunds.com. Investing in smaller companies involves special risks, including higher volatility and lower liquidity. Smaller Capitalization stocks are also more sensitive to purchase/sale transactions and changes in the issuer’s financial condition. From time to time, the investment advisor may waive fees or reimburse expenses for the Fund. Without these waivers, performance would be lower. Class N shares are available to the general public without a sales load. Class I shares are available to certain institutional investors and advisory clients of William Blair & Company, L.L.C., without a sales load or distribution (12b-1) or service fees.
The performance highlights and graph presented above do not reflect the deduction of taxes that a shareholder would pay on fund distributions or the redemption of fund shares.
The Russell 2000® Value Index consists of small-capitalization companies with below average price-to-book ratios and forecasted growth rates.
This report identifies the Fund’s investments on December 31, 2012. These holdings are subject to change. Not all stocks in the Fund performed the same, nor is there any guarantee that these stocks will perform as well in the future. Market forecasts provided in this report may not necessarily come to pass.
Sector Diversification (Unaudited)
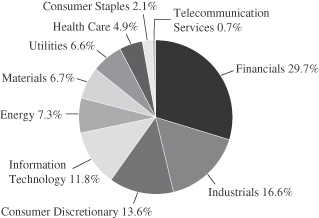
The sector diversification shown is based on the total long-term securities.
December 31, 2012 | William Blair Funds 71 |
Small Cap Value Fund
Portfolio of Investments, December 31, 2012 (all dollar amounts in thousands)
| | | | | | | | |
Issuer | | Shares | | | Value | |
| | |
Common Stocks | | | | | | | | |
Financials—29.5% | | | | | | | | |
Acadia Realty Trust | | | 94,640 | | | $ | 2,374 | |
Alterra Capital Holdings, Ltd.† | | | 103,155 | | | | 2,908 | |
American Assets Trust, Inc. | | | 61,540 | | | | 1,719 | |
Bank of the Ozarks, Inc. | | | 90,710 | | | | 3,036 | |
Berkshire Hills Bancorp, Inc. | | | 112,970 | | | | 2,695 | |
CoBiz Financial, Inc. | | | 272,445 | | | | 2,035 | |
Coresite Realty Corporation | | | 54,770 | | | | 1,515 | |
*Eagle Bancorp, Inc. | | | 150,122 | | | | 2,998 | |
East West Bancorp, Inc. | | | 108,545 | | | | 2,333 | |
EastGroup Properties, Inc. | | | 43,390 | | | | 2,335 | |
Education Realty Trust, Inc. | | | 210,140 | | | | 2,236 | |
First Horizon National Corporation | | | 248,880 | | | | 2,466 | |
*Forest City Enterprises, Inc. | | | 139,835 | | | | 2,258 | |
*Genworth Financial, Inc. | | | 168,010 | | | | 1,262 | |
Highwoods Properties, Inc. | | | 53,865 | | | | 1,802 | |
LaSalle Hotel Properties | | | 70,329 | | | | 1,786 | |
Mid-America Apartment Communities, Inc. | | | 36,665 | | | | 2,374 | |
*National Financial Partners Corporation | | | 144,850 | | | | 2,483 | |
National Retail Properties, Inc. | | | 54,365 | | | | 1,696 | |
Old National Bancorp | | | 171,866 | | | | 2,040 | |
PacWest Bancorp | | | 123,493 | | | | 3,060 | |
Pebblebrook Hotel Trust | | | 97,889 | | | | 2,261 | |
ProAssurance Corporation | | | 50,750 | | | | 2,141 | |
Prosperity Bancshares, Inc. | | | 61,995 | | | | 2,604 | |
*Safeguard Scientifics, Inc. | | | 209,101 | | | | 3,084 | |
Susquehanna Bancshares, Inc. | | | 214,155 | | | | 2,244 | |
The Hanover Insurance Group, Inc. | | | 68,405 | | | | 2,650 | |
Webster Financial Corporation | | | 139,520 | | | | 2,867 | |
West Coast Bancorp | | | 74,635 | | | | 1,653 | |
*Western Alliance Bancorp | | | 224,315 | | | | 2,362 | |
| | | | | | | | |
| | | | | | | 69,277 | |
| | | | | | | | |
Industrials—16.5% | | | | | | | | |
Actuant Corporation | | | 76,993 | | | | 2,149 | |
Belden, Inc. | | | 86,330 | | | | 3,884 | |
Cubic Corporation | | | 49,395 | | | | 2,369 | |
EMCOR Group, Inc. | | | 107,181 | | | | 3,709 | |
ESCO Technologies, Inc. | | | 83,107 | | | | 3,109 | |
*FTI Consulting, Inc. | | | 72,453 | | | | 2,391 | |
G&K Services, Inc. | | | 73,433 | | | | 2,508 | |
Interface, Inc. | | | 130,940 | | | | 2,105 | |
*Kadant, Inc. | | | 92,094 | | | | 2,441 | |
*Moog, Inc. | | | 90,809 | | | | 3,726 | |
*Northwest Pipe Co. | | | 87,415 | | | | 2,086 | |
*Old Dominion Freight Line, Inc. | | | 67,140 | | | | 2,302 | |
Quanex Building Products Corporation | | | 98,430 | | | | 2,009 | |
TAL International Group, Inc. | | | 41,675 | | | | 1,516 | |
*Tetra Tech, Inc. | | | 90,837 | | | | 2,403 | |
| | | | | | | | |
| | | | | | | 38,707 | |
| | | | | | | | |
Consumer Discretionary—13.5% | | | | | | | | |
Core-Mark Holding Co., Inc. | | | 40,185 | | | | 1,903 | |
*Krispy Kreme Doughnuts, Inc. | | | 337,645 | | | | 3,167 | |
*Life Time Fitness, Inc. | | | 51,200 | | | | 2,519 | |
Meredith Corporation | | | 66,870 | | | | 2,304 | |
Pier 1 Imports, Inc. | | | 168,460 | | | | 3,369 | |
*Pinnacle Entertainment, Inc. | | | 238,635 | | | | 3,778 | |
Regis Corporation | | | 154,735 | | | | 2,618 | |
| | |
Common Stocks—(continued) | | | | | | | | |
Consumer Discretionary—(continued) | | | | | | | | |
*The Children’s Place Retail Stores, Inc. | | | 44,475 | | | $ | 1,970 | |
The Men’s Wearhouse, Inc. | | | 95,975 | | | | 2,991 | |
The PEP Boys-Manny, Moe & Jack | | | 185,260 | | | | 1,821 | |
*The Warnaco Group, Inc. | | | 40,500 | | | | 2,899 | |
*WMS Industries, Inc. | | | 144,080 | | | | 2,521 | |
| | | | | | | | |
| | | | | | | 31,860 | |
| | | | | | | | |
Information Technology—11.8% | | | | | | | | |
ADTRAN, Inc. | | | 137,860 | | | | 2,694 | |
*Cadence Design Systems, Inc. | | | 179,930 | | | | 2,431 | |
*Digital River, Inc. | | | 103,535 | | | | 1,490 | |
Earthlink, Inc. | | | 465,425 | | | | 3,007 | |
Genpact, Ltd.† | | | 146,245 | | | | 2,267 | |
*Integrated Device Technology, Inc. | | | 500,347 | | | | 3,652 | |
j2 Global Communications, Inc. | | | 75,225 | | | | 2,300 | |
Monolithic Power Systems, Inc. | | | 87,704 | | | | 1,954 | |
*ON Semiconductor Corporation | | | 353,835 | | | | 2,495 | |
*Parametric Technology Corporation | | | 110,440 | | | | 2,486 | |
*Silicon Laboratories, Inc. | | | 42,605 | | | | 1,781 | |
*Ultra Clean Holdings | | | 231,312 | | | | 1,136 | |
| | | | | | | | |
| | | | | | | 27,693 | |
| | | | | | | | |
Energy—7.3% | | | | | | | | |
*Bonanza Creek Energy, Inc. | | | 57,255 | | | | 1,591 | |
Bristow Group, Inc. | | | 26,775 | | | | 1,437 | |
Gulfmark Offshore, Inc. | | | 59,919 | | | | 2,064 | |
*Gulfport Energy Corporation | | | 57,029 | | | | 2,180 | |
*Helix Energy Solutions Group, Inc. | | | 112,475 | | | | 2,321 | |
*Key Energy Services, Inc. | | | 211,085 | | | | 1,467 | |
*Magnum Hunter Resources Corporation | | | 291,111 | | | | 1,162 | |
*Swift Energy Co. | | | 147,375 | | | | 2,268 | |
*TETRA Technologies, Inc. | | | 349,565 | | | | 2,653 | |
| | | | | | | | |
| | | | | | | 17,143 | |
| | | | | | | | |
Materials—6.6% | | | | | | | | |
Minerals Technologies, Inc. | | | 84,525 | | | | 3,374 | |
PolyOne Corporation | | | 204,225 | | | | 4,170 | |
*RTI International Metals, Inc. | | | 93,825 | | | | 2,586 | |
Sensient Technologies Corporation | | | 76,305 | | | | 2,713 | |
Silgan Holdings, Inc. | | | 65,245 | | | | 2,714 | |
| | | | | | | | |
| | | | | | | 15,557 | |
| | | | | | | | |
Utilities—6.5% | | | | | | | | |
ALLETE, Inc. | | | 66,600 | | | | 2,729 | |
Chesapeake Utilities Corporation | | | 42,080 | | | | 1,910 | |
Cleco Corporation | | | 68,180 | | | | 2,728 | |
PNM Resources, Inc. | | | 115,590 | | | | 2,371 | |
Southwest Gas Corporation | | | 64,295 | | | | 2,727 | |
WGL Holdings, Inc. | | | 73,145 | | | | 2,867 | |
| | | | | | | | |
| | | | | | | 15,332 | |
| | | | | | | | |
Health Care—4.9% | | | | | | | | |
CONMED Corporation | | | 83,620 | | | | 2,337 | |
*Greatbatch, Inc. | | | 96,445 | | | | 2,241 | |
*HealthSouth Corporation | | | 97,210 | | | | 2,052 | |
*Magellan Health Services, Inc. | | | 39,235 | | | | 1,923 | |
*Mednax, Inc. | | | 37,113 | | | | 2,951 | |
| | | | | | | | |
| | | | | | | 11,504 | |
| | | | | | | | |
See accompanying Notes to Portfolio of Investments.
72 Annual Report | December 31, 2012 |
Small Cap Value Fund
Portfolio of Investments, December 31, 2012 (all dollar amounts in thousands)
| | | | | | | | |
Issuer | | Shares or
Principal
Amount | | | Value | |
| | |
Common Stocks—(continued) | | | | | | | | |
Consumer Staples—2.1% | | | | | | | | |
J&J Snack Foods Corporation | | | 40,727 | | | $ | 2,604 | |
Spartan Stores, Inc. | | | 157,019 | | | | 2,412 | |
| | | | | | | | |
| | | | | | | 5,016 | |
| | | | | | | | |
Telecommunication Services—0.7% | | | | | | | | |
*tw telecom, Inc. | | | 64,475 | | | | 1,642 | |
| | | | | | | | |
Total Common Stocks—99.4%
(cost $204,594) | | | | | | | 233,731 | |
| | | | | | | | |
| | |
Repurchase Agreement | | | | | | | | |
Fixed Income Clearing Corporation, 0.110% dated 12/31/12, due 1/2/13, repurchase price $4,519, collateralized by U.S. Treasury Note, 2.125%, due 12/31/2015 | | $ | 4,519 | | | | 4,519 | |
| | | | | | | | |
Total Repurchase Agreement—1.9%
(cost $4,519) | | | | 4,519 | |
| | | | | | | | |
Total Investments—101.3%
(cost $209,113) | | | | 238,250 | |
Liabilities, plus cash and other assets—(1.3)% | | | | (2,982 | ) |
| | | | | | | | |
Net assets—100.0% | | | $ | 235,268 | |
| | | | | | | | |
† = U.S. listed foreign security
* Non-income producing securities
See accompanying Notes to Portfolio of Investments.
December 31, 2012 | William Blair Funds 73 |
Chad M. Kilmer
Mark T. Leslie
David S. Mitchell
MID CAP VALUE FUND
The Mid Cap Value Fund seeks long-term capital appreciation.
AN OVERVIEW FROM THE PORTFOLIO MANAGERS
The William Blair Mid Cap Value Fund (Class N shares) posted a 13.54% increase for the twelve months ended December 31, 2012. By comparison, the Fund’s benchmark, the Russell Midcap® Value Index, returned 18.51%.
Improving U.S. economic data points, especially housing-related, and global central bank actions were the primary drivers of equity market returns in 2012. Despite a brief correction mid-year due to elevated fears regarding Euro zone financial stability, emerging market growth and a pause in the U.S. economic recovery, most small and mid cap indices finished the year near all-time highs. Propelling the market higher in the back half of the year was European Central Bank messaging and actions which restored confidence in Spanish and Italian borrowing capacity and the overall sustainability of the currency bloc. In the U.S., the Federal Reserve announced new quantitative easing programs aimed to maintain low government and consumer borrowing rates. Finally, investors cheered further improvements in the housing industry. Rebounding home prices and homebuilding activity positively impacts housing-related employment and overall consumer confidence. Thus, the market digested the possibility of a more sustainable domestic economic recovery.
The William Blair Mid Cap Value Fund’s 2012 underperformance is attributable to style headwinds and negative stock selection. Quality was out of favor for the year, which negatively impacted relative performance due to our strategy’s high quality bias. In terms of stock selection, SM Energy Co., Hill-Rom Holdings Inc., and Atmel Corp. detracted from relative performance. Partially offsetting this was outperformance by Discover Financial Services, Wyndham Worldwide Corp. and Snap-On Inc.
Despite progress on certain fronts in the U.S. and abroad during 2012, there remain several uncertainties the market will grapple with in 2013. In the U.S., the late 2012 “fiscal cliff” negotiations produced some clarity on tax policy, but government spending policy remains in flux. These discussions will take center stage in the coming months along with a new debt-ceiling debate. On the other hand, the improving housing market and overall economy in the U.S. provides some ballast to these downside risks. Outside the U.S., European Central Bank activities have suppressed fears of draconian scenarios but financial stability, government budget and economic risks continue to exist in the region. And while the Chinese economy has improved, investors will keep a close eye on this important global economic engine.
Equity valuations expanded in 2012, but they begin the year near long-term averages and thus should be neither a tailwind nor headwind to equity returns. Profit margins are elevated and therefore we believe a premium should be placed on companies with above-average revenue growth opportunities, such as the companies in which we seek to invest. Corporate balance sheets remain strong and should provide companies the ability to invest or increase merger and acquisition activities, both of which would be a tailwind for the stock market.
In the end, while we factor various economic scenarios into our stock picking, we focus our time on constructing the portfolio from a bottom-up perspective. As always, we remain focused on finding quality companies at discount prices and corporate transformation opportunities, and we continue to find good ideas across sectors. We believe building a fund with these types of companies should produce solid investment results over the long term.
74 Annual Report | December 31, 2012 |
Mid Cap Value Fund
Performance Highlights (Unaudited)
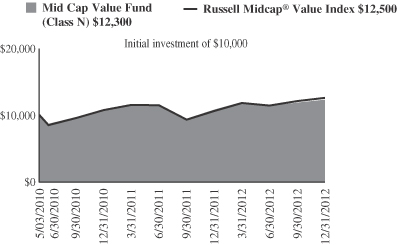
Average Annual Total Return at 12/31/2012
| | | | | | | | |
| | | 1
Year | | | Since
Inception(a) | |
Class N | | | 13.54 | % | | | 7.93 | % |
Class I | | | 13.77 | | | | 8.17 | |
Russell Midcap® Value | | | 18.51 | | | | 8.81 | |
| | (a) | | For the period from May 3, 2010 (Commencement of Operations) to December 31, 2012. | |
Performance cited represents past performance. Past performance does not guarantee future results and current performance may be lower or higher than the data quoted. Results shown are average annual total returns, which assume reinvestment of dividends and capital gains. Investment returns and principal will fluctuate and you may have a gain or loss when you sell shares. For the most current month-end performance information, please call 1-800-742-7272, or visit our Web site at www.williamblairfunds.com. Investing in smaller and medium capitalization companies involves special risks, including higher volatility and lower liquidity. Medium Capitalization stocks are also more sensitive to purchase/sale transactions and changes in the issuer’s financial condition. From time to time, the investment advisor may waive fees or reimburse expenses for the Fund. Without these waivers, performance would be lower. Class N shares are available to the general public without a sales load. Class I shares are available to certain institutional investors and advisory clients of William Blair & Company, L.L.C., without a sales load or distribution (12b-1) or service fees.
The performance highlights and graph presented above do not reflect the deduction of taxes that a shareholder would pay on fund distributions or the redemption of fund shares.
The Russell Midcap® Value Index consists of Midcap-capitalization companies with below average price-to-book ratios and forecasted growth rates.
This report identifies the Fund’s investments on December 31, 2012. These holdings are subject to change. Not all stocks in the Fund performed the same, nor is there any guarantee that these stocks will perform as well in the future. Market forecasts provided in this report may not necessarily come to pass.
Sector Diversification (Unaudited)
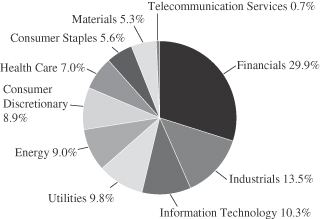
The sector diversification shown is based on the total long-term securities.
December 31, 2012 | William Blair Funds 75 |
Mid Cap Value Fund
Portfolio of Investments, December 31, 2012 (all dollar amounts in thousands)
| | | | | | | | |
Issuer | | Shares | | | Value | |
| | |
Common Stocks | | | | | | | | |
Financials—29.8% | | | | | | | | |
Alexandria Real Estate Equities, Inc. | | | 725 | | | $ | 50 | |
Allied World Assurance Co. Holdings, Ltd.† | | | 535 | | | | 42 | |
American Campus Communities, Inc. | | | 905 | | | | 42 | |
Ameriprise Financial, Inc. | | | 1,465 | | | | 92 | |
Comerica, Inc. | | | 1,410 | | | | 43 | |
Digital Realty Trust, Inc. | | | 565 | | | | 38 | |
Discover Financial Services | | | 1,670 | | | | 64 | |
East West Bancorp, Inc. | | | 1,890 | | | | 41 | |
Essex Property Trust, Inc. | | | 245 | | | | 36 | |
Fifth Third Bancorp | | | 3,310 | | | | 50 | |
First Horizon National Corporation | | | 4,315 | | | | 43 | |
*Forest City Enterprises, Inc. | | | 2,745 | | | | 44 | |
*Genworth Financial, Inc. | | | 3,735 | | | | 28 | |
Host Hotels & Resorts, Inc. | | | 3,095 | | | | 49 | |
Marsh & McLennan Cos., Inc. | | | 1,825 | | | | 63 | |
People’s United Financial, Inc. | | | 3,280 | | | | 40 | |
Realty Income Corporation | | | 1,075 | | | | 43 | |
SL Green Realty Corporation | | | 745 | | | | 57 | |
SunTrust Banks, Inc. | | | 2,270 | | | | 64 | |
Taubman Centers, Inc. | | | 500 | | | | 39 | |
The Hanover Insurance Group, Inc. | | | 1,195 | | | | 46 | |
The Hartford Financial Services Group, Inc. | | | 2,925 | | | | 66 | |
Validus Holdings, Ltd.† | | | 1,695 | | | | 59 | |
Ventas, Inc. | | | 1,020 | | | | 66 | |
Zions Bancorporation | | | 1,260 | | | | 27 | |
| | | | | | | | |
| | | | | | | 1,232 | |
| | | | | | | | |
Industrials—13.4% | | | | | | | | |
Dover Corporation | | | 810 | | | | 53 | |
Eaton Corporation plc† | | | 1,200 | | | | 65 | |
Hubbell, Inc. | | | 550 | | | | 47 | |
Joy Global, Inc. | | | 895 | | | | 57 | |
*Old Dominion Freight Line, Inc. | | | 1,160 | | | | 40 | |
Pall Corporation | | | 870 | | | | 52 | |
Parker Hannifin Corporation | | | 650 | | | | 55 | |
Pentair, Ltd.† | | | 955 | | | | 47 | |
Rockwell Automation, Inc. | | | 580 | | | | 49 | |
Rockwell Collins, Inc. | | | 775 | | | | 45 | |
Snap-On, Inc. | | | 565 | | | | 45 | |
| | | | | | | | |
| | | | | | | 555 | |
| | | | | | | | |
Information Technology—10.2% | | | | | | | | |
*Atmel Corporation | | | 5,140 | | | | 34 | |
Genpact, Ltd.† | | | 2,595 | | | | 40 | |
*Ingram Micro, Inc. | | | 2,790 | | | | 47 | |
*Juniper Networks, Inc. | | | 2,500 | | | | 49 | |
Linear Technology Corporation | | | 1,325 | | | | 45 | |
*ON Semiconductor Corporation | | | 4,635 | | | | 33 | |
*Parametric Technology Corporation | | | 2,030 | | | | 46 | |
TE Connectivity, Ltd.† | | | 1,890 | | | | 70 | |
Xerox Corporation | | | 8,640 | | | | 59 | |
| | | | | | | | |
| | | | | | | 423 | |
| | | | | | | | |
Utilities—9.7% | | | | | | | | |
American Water Works Co., Inc. | | | 1,485 | | | | 55 | |
Cleco Corporation | | | 920 | | | | 37 | |
DTE Energy Co. | | | 900 | | | | 54 | |
Northeast Utilities | | | 1,510 | | | | 59 | |
NV Energy, Inc. | | | 2,815 | | | | 51 | |
† = U.S. listed foreign security
* Non-income producing securities
| | | | | | | | |
Issuer | | Shares | | | Value | |
| | |
Common Stocks—(continued) | | | | | | | | |
Utilities—(continued) | | | | | | | | |
Pinnacle West Capital Corporation | | | 935 | | | $ | 48 | |
Wisconsin Energy Corporation | | | 1,055 | | | | 39 | |
Xcel Energy, Inc. | | | 2,170 | | | | 58 | |
| | | | | | | | |
| | | | | | | 401 | |
| | | | | | | | |
Energy—8.9% | | | | | | | | |
Noble Energy, Inc. | | | 415 | | | | 42 | |
Pioneer Natural Resources Co. | | | 630 | | | | 67 | |
*Rowan Cos. plc† | | | 1,575 | | | | 49 | |
SM Energy Co. | | | 995 | | | | 52 | |
*Superior Energy Services, Inc. | | | 1,745 | | | | 36 | |
Valero Energy Corporation | | | 2,095 | | | | 72 | |
*Whiting Petroleum Corporation | | | 1,160 | | | | 50 | |
| | | | | | | | |
| | | | | | | 368 | |
| | | | | | | | |
Consumer Discretionary—8.9% | | | | | | | | |
Autoliv, Inc. | | | 525 | | | | 35 | |
*Bed Bath & Beyond, Inc. | | | 670 | | | | 38 | |
Coach, Inc. | | | 920 | | | | 51 | |
DISH Network Corporation | | | 1,610 | | | | 59 | |
H&R Block, Inc. | | | 2,415 | | | | 45 | |
Kohl’s Corporation | | | 960 | | | | 41 | |
Newell Rubbermaid, Inc. | | | 2,605 | | | | 58 | |
VF Corporation | | | 265 | | | | 40 | |
| | | | | | | | |
| | | | | | | 367 | |
| | | | | | | | |
Health Care—7.0% | | | | | | | | |
*CareFusion Corporation | | | 1,880 | | | | 54 | |
CIGNA Corporation | | | 1,365 | | | | 73 | |
*Laboratory Corporation of America Holdings | | | 515 | | | | 44 | |
*Mettler-Toledo International, Inc. | | | 310 | | | | 60 | |
Zimmer Holdings, Inc. | | | 865 | | | | 58 | |
| | | | | | | | |
| | | | | | | 289 | |
| | | | | | | | |
Consumer Staples—5.5% | | | | | | | | |
ConAgra Foods, Inc. | | | 2,385 | | | | 70 | |
HJ Heinz Co. | | | 715 | | | | 41 | |
Ingredion, Inc. | | | 1,015 | | | | 66 | |
The Kroger Co. | | | 1,965 | | | | 51 | |
| | | | | | | | |
| | | | | | | 228 | |
| | | | | | | | |
Materials—5.2% | | | | | | | | |
Airgas, Inc. | | | 640 | | | | 59 | |
Carpenter Technology Corporation | | | 855 | | | | 44 | |
FMC Corporation | | | 1,150 | | | | 67 | |
Steel Dynamics, Inc. | | | 3,350 | | | | 46 | |
| | | | | | | | |
| | | | | | | 216 | |
| | | | | | | | |
Telecommunication Services—0.7% | | | | | | | | |
*tw telecom, Inc. | | | 1,110 | | | | 28 | |
| | | | | | | | |
Total Common Stocks—99.3%
(cost $3,632) | | | | | | | 4,107 | |
| | | | | | | | |
Total Investments—99.3%
(cost $3,632) | | | | | | | 4,107 | |
Cash and other assets, less liabilities—0.7% | | | | | | | 30 | |
| | | | | | | | |
Net assets—100.0% | | | | | | $ | 4,137 | |
| | | | | | | | |
See accompanying Notes to Portfolio of Investments.
76 Annual Report | December 31, 2012 |
Chad M. Kilmer
Mark T. Leslie
David S. Mitchell
SMALL-MID CAP VALUE FUND
The Small-Mid Cap Value Fund seeks long-term capital appreciation.
AN OVERVIEW FROM THE PORTFOLIO MANAGERS
The William Blair Small-Mid Cap Value Fund (Class N shares) posted an 11.95% increase for the twelve month period ended December 31, 2012. By comparison, the Fund’s benchmark, the Russell 2500® Value Index, returned 19.21%.
Improving U.S. economic data points, especially housing-related, and global central bank actions were the primary drivers of equity market returns in 2012. Despite a brief correction mid-year due to elevated fears regarding Euro zone financial stability, emerging market growth and a pause in the U.S. economic recovery, most small and mid cap indices finished the year near all-time highs. Propelling the market higher in the back half of the year was European Central Bank messaging and actions, which restored confidence in Spanish and Italian borrowing capacity and the overall sustainability of the currency bloc. In the U.S., the Federal Reserve announced new quantitative easing programs aimed to maintain low government and consumer borrowing rates. Finally, investors cheered further improvements in the housing industry. Rebounding home prices and homebuilding activity positively impacts housing-related employment and overall consumer confidence. Thus, the market digested the possibility of a more sustainable domestic economic recovery.
The William Blair Small-Mid Value Fund’s 2012 underperformance is attributable to style and industry headwinds and negative stock selection. Quality was out of favor for the year, which negatively impacted relative performance due to our strategy’s high quality bias. Another notable trend was the sustained outperformance of homebuilding stocks along with other stocks tied to the housing resurgence. While we had some exposure, we exited our one homebuilder position early in the year due to what was already an elevated valuation. Even though we’ve seen encouraging data points in 2012 that suggest signs of a housing recovery, the multiples being applied to the homebuilding stocks implied housing growth at levels which to us seemed unrealistically optimistic. Our underweight to what we consider to be an overvalued segment of the market also detracted from relative returns. Looking at stock selection, Key Energy Services Inc. and Adtran Inc. detracted from relative performance, both of which are stocks we continue to own, while partially offsetting the underperformance were investments in PolyOne Corp., Pinnacle Entertainment Inc., and Monolithic Power Systems Inc.
Despite progress on certain fronts in the U.S. and abroad during 2012, there remain several uncertainties the market will grapple with in 2013. In the U.S., the late 2012 “fiscal cliff” negotiations produced some clarity on tax policy, but government spending policy remains in flux. These discussions will take center stage in the coming months along with a new debt-ceiling debate. On the other hand, the improving housing market and overall economy in the US provides some ballast to these downside risks. Outside the U.S., European Central Bank activities have suppressed fears of draconian scenarios but financial stability, government budget and economic risks continue to exist in the region. And while the Chinese economy has improved, investors will keep a close eye on this important global economic engine.
Equity valuations expanded in 2012, but they begin the year near long-term averages and thus should be neither a tailwind nor headwind to equity returns. Profit margins are elevated and therefore we believe a premium should be placed on companies with above-average revenue growth opportunities, such as the companies in which we seek to invest. Corporate balance sheets remain strong and should provide companies the ability to invest or increase merger and acquisition activities, both of which would be a tailwind for the stock market.
December 31, 2012 | William Blair Funds 77 |
In the end, while we factor various economic scenarios into our stock picking, we focus our time on constructing the portfolio from a bottom-up perspective. As always, we remain focused on finding quality companies at discount prices and corporate transformation opportunities, and we continue to find good ideas across sectors. We believe building a fund with these types of companies should produce solid investment results over the long term.
78 Annual Report | December 31, 2012 |
Small-Mid Cap Value Fund
Performance Highlights (Unaudited)
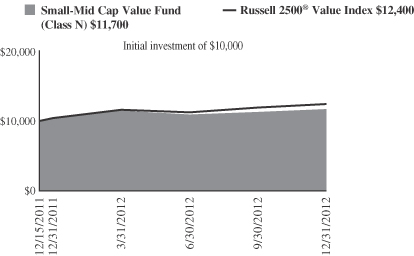
Average Annual Total Return at 12/31/2012
| | | | | | | | |
| | | 1
Year | | | Since
Inception(a) | |
Class N | | | 11.95 | % | | | 16.18 | % |
Class I | | | 12.22 | | | | 16.44 | |
Russell 2500® Value | | | 19.21 | | | | 23.03 | |
| | (a) | | For the period from December 15, 2011 (Commencement of Operations) to December 31, 2012. | |
Performance cited represents past performance. Past performance does not guarantee future results and current performance may be lower or higher than the data quoted. Results shown are average annual total returns, which assume reinvestment of dividends and capital gains. Investment returns and principal will fluctuate and you may have a gain or loss when you sell shares. For the most current month-end performance information, please call 1-800-742-7272, or visit our Web site at www.williamblairfunds.com. Investing in smaller and medium capitalization companies involves special risks, including higher volatility and lower liquidity. Smaller and medium capitalization stocks are also more sensitive to purchase/sale transactions and changes in the issuer’s financial condition. From time to time, the investment advisor may waive fees or reimburse expenses for the Fund. Without these waivers, performance would be lower. Class N shares are available to the general public without a sales load. Class I shares are available to certain institutional investors and advisory clients of William Blair & Company, L.L.C., without a sales load or distribution (12b-1) or service fees.
The performance highlights and graph presented above do not reflect the deduction of taxes that a shareholder would pay on fund distributions or the redemption of fund shares.
Russell 2500® Value Index consists of Midcap-capitalization companies with below average price-to-book ratios and forecasted growth rates.
This report identifies the Fund’s investments on December 31, 2012. These holdings are subject to change. Not all stocks in the Fund performed the same, nor is there any guarantee that these stocks will perform as well in the future. Market forecasts provided in this report may not necessarily come to pass.
Sector Diversification (Unaudited)
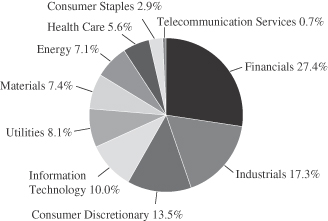
The sector diversification shown is based on the total long-term securities.
December 31, 2012 | William Blair Funds 79 |
Small-Mid Cap Value Fund
Portfolio of Investments, December 31, 2012 (all dollar amounts in thousands)
| | | | | | | | |
Issuer | | Shares | | | Value | |
| | |
Common Stocks | | | | | | | | |
Financials—27.3% | | | | | | | | |
Alexandria Real Estate Equities, Inc. | | | 317 | | | $ | 22 | |
Allied World Assurance Co. Holdings, Ltd.† | | | 220 | | | | 17 | |
Alterra Capital Holdings, Ltd.† | | | 685 | | | | 19 | |
American Assets Trust, Inc. | | | 410 | | | | 11 | |
Bank of the Ozarks, Inc. | | | 590 | | | | 20 | |
Comerica, Inc. | | | 805 | | | | 24 | |
East West Bancorp, Inc. | | | 740 | | | | 16 | |
EastGroup Properties, Inc. | | | 325 | | | | 18 | |
Education Realty Trust, Inc. | | | 1,605 | | | | 17 | |
Essex Property Trust, Inc. | | | 100 | | | | 15 | |
First Horizon National Corporation | | | 2,460 | | | | 24 | |
*Forest City Enterprises, Inc. | | | 1,290 | | | | 21 | |
*Genworth Financial, Inc. | | | 2,510 | | | | 19 | |
Highwoods Properties, Inc. | | | 465 | | | | 16 | |
LaSalle Hotel Properties | | | 428 | | | | 11 | |
Mid-America Apartment Communities, Inc. | | | 235 | | | | 15 | |
*National Financial Partners Corporation | | | 1,180 | | | | 20 | |
National Retail Properties, Inc. | | | 540 | | | | 17 | |
Old National Bancorp | | | 1,370 | | | | 16 | |
PacWest Bancorp | | | 894 | | | | 22 | |
Pebblebrook Hotel Trust | | | 728 | | | | 17 | |
People’s United Financial, Inc. | | | 1,860 | | | | 22 | |
ProAssurance Corporation | | | 504 | | | | 21 | |
Prosperity Bancshares, Inc. | | | 505 | | | | 21 | |
Realty Income Corporation | | | 430 | | | | 17 | |
SL Green Realty Corporation | | | 350 | | | | 27 | |
Susquehanna Bancshares, Inc. | | | 1,580 | | | | 17 | |
Taubman Centers, Inc. | | | 210 | | | | 17 | |
The Hanover Insurance Group, Inc. | | | 495 | | | | 19 | |
The Hartford Financial Services Group, Inc. | | | 1,200 | | | | 27 | |
Validus Holdings, Ltd.† | | | 830 | | | | 29 | |
Webster Financial Corporation | | | 1,055 | | | | 22 | |
*Western Alliance Bancorp | | | 1,280 | | | | 13 | |
Zions Bancorporation | | | 1,065 | | | | 23 | |
| | | | | | | | |
| | | | | | | 652 | |
| | | | | | | | |
Industrials—17.2% | | | | | | | | |
Actuant Corporation | | | 762 | | | | 21 | |
Belden, Inc. | | | 790 | | | | 36 | |
Cubic Corporation | | | 370 | | | | 18 | |
EMCOR Group, Inc. | | | 870 | | | | 30 | |
ESCO Technologies, Inc. | | | 760 | | | | 28 | |
*FTI Consulting, Inc. | | | 405 | | | | 13 | |
G&K Services, Inc. | | | 635 | | | | 22 | |
Hubbell, Inc. | | | 205 | | | | 17 | |
Interface, Inc. | | | 1,170 | | | | 19 | |
Joy Global, Inc. | | | 395 | | | | 25 | |
*Moog, Inc. | | | 770 | | | | 32 | |
*Old Dominion Freight Line, Inc. | | | 665 | | | | 23 | |
Pall Corporation | | | 450 | | | | 27 | |
Pentair, Ltd.† | | | 540 | | | | 26 | |
Quanex Building Products Corporation | | | 865 | | | | 18 | |
Snap-On, Inc. | | | 245 | | | | 19 | |
TAL International Group, Inc. | | | 345 | | | | 13 | |
*Tetra Tech, Inc. | | | 899 | | | | 24 | |
| | | | | | | | |
| | | | | | | 411 | |
| | | | | | | | |
Consumer Discretionary—13.4% | | | | | | | | |
Autoliv, Inc. | | | 360 | | | | 24 | |
Core-Mark Holding Co., Inc. | | | 320 | | | | 15 | |
| | |
Common Stocks—(continued) | | | | | | | | |
Consumer Discretionary—(continued) | | | | | | | | |
H&R Block, Inc. | | | 1,365 | | | $ | 25 | |
*Krispy Kreme Doughnuts, Inc. | | | 2,875 | | | | 27 | |
*Life Time Fitness, Inc. | | | 510 | | | | 25 | |
Meredith Corporation | | | 565 | | | | 19 | |
Newell Rubbermaid, Inc. | | | 1,240 | | | | 28 | |
Pier 1 Imports, Inc. | | | 1,290 | | | | 26 | |
*Pinnacle Entertainment, Inc. | | | 1,760 | | | | 28 | |
Regis Corporation | | | 1,230 | | | | 21 | |
*The Children’s Place Retail Stores, Inc. | | | 350 | | | | 16 | |
The Men’s Wearhouse, Inc. | | | 880 | | | | 27 | |
The PEP Boys-Manny, Moe & Jack | | | 1,485 | | | | 15 | |
*WMS Industries, Inc. | | | 1,350 | | | | 24 | |
| | | | | | | | |
| | | | | | | 320 | |
| | | | | | | | |
Information Technology—9.9% | | | | | | | | |
ADTRAN, Inc. | | | 1,093 | | | | 21 | |
*Atmel Corporation | | | 2,245 | | | | 15 | |
*Cadence Design Systems, Inc. | | | 1,350 | | | | 18 | |
*Digital River, Inc. | | | 770 | | | | 11 | |
Earthlink, Inc. | | | 3,655 | | | | 24 | |
Genpact, Ltd.† | | | 1,460 | | | | 23 | |
*Ingram Micro, Inc. Class “A” | | | 1,175 | | | | 20 | |
*Integrated Device Technology, Inc. | | | 4,420 | | | | 32 | |
j2 Global Communications, Inc. | | | 560 | | | | 17 | |
Monolithic Power Systems, Inc. | | | 693 | | | | 16 | |
*ON Semiconductor Corporation | | | 2,610 | | | | 18 | |
*Parametric Technology Corporation | | | 995 | | | | 22 | |
| | | | | | | | |
| | | | | | | 237 | |
| | | | | | | | |
Utilities—8.0% | | | | | | | | |
ALLETE, Inc. | | | 515 | | | | 21 | |
American Water Works Co., Inc. | | | 815 | | | | 30 | |
Cleco Corporation | | | 530 | | | | 21 | |
NV Energy, Inc. | | | 1,490 | | | | 27 | |
Pinnacle West Capital Corporation | | | 495 | | | | 25 | |
PNM Resources, Inc. | | | 880 | | | | 18 | |
Southwest Gas Corporation | | | 555 | | | | 24 | |
WGL Holdings, Inc. | | | 635 | | | | 25 | |
| | | | | | | | |
| | | | | | | 191 | |
| | | | | | | | |
Materials—7.3% | | | | | | | | |
Airgas, Inc. | | | 245 | | | | 22 | |
Carpenter Technology Corporation | | | 265 | | | | 14 | |
FMC Corporation | | | 400 | | | | 23 | |
Minerals Technologies, Inc. | | | 520 | | | | 21 | |
PolyOne Corporation | | | 1,190 | | | | 24 | |
*RTI International Metals, Inc. | | | 685 | | | | 19 | |
Sensient Technologies Corporation | | | 415 | | | | 15 | |
Silgan Holdings, Inc. | | | 475 | | | | 20 | |
Steel Dynamics, Inc. | | | 1,225 | | | | 17 | |
| | | | | | | | |
| | | | | | | 175 | |
| | | | | | | | |
Energy—7.0% | | | | | | | | |
*Bonanza Creek Energy, Inc. | | | 460 | | | | 13 | |
Gulfmark Offshore, Inc. | | | 525 | | | | 18 | |
*Gulfport Energy Corporation | | | 370 | | | | 14 | |
*Helix Energy Solutions Group, Inc. | | | 915 | | | | 19 | |
*Key Energy Services, Inc. | | | 2,085 | | | | 14 | |
*Magnum Hunter Resources Corporation | | | 3,206 | | | | 13 | |
*Rowan Cos. plc† | | | 700 | | | | 22 | |
See accompanying Notes to Portfolio of Investments.
80 Annual Report | December 31, 2012 |
Small-Mid Cap Value Fund
Portfolio of Investments, December 31, 2012 (all dollar amounts in thousands)
| | | | | | | | |
Issuer | | Shares | | | Value | |
| | |
Common Stocks—(continued) | | | | | | | | |
Energy—(continued) | | | | | | | | |
SM Energy Co. | | | 350 | | | $ | 18 | |
*Swift Energy Co. | | | 1,140 | | | | 17 | |
*TETRA Technologies, Inc. | | | 2,455 | | | | 19 | |
| | | | | | | | |
| | | | | | | 167 | |
| | | | | | | | |
Health Care—5.5% | | | | | | | | |
*CareFusion Corporation | | | 830 | | | | 24 | |
CONMED Corporation | | | 415 | | | | 12 | |
*Greatbatch, Inc. | | | 530 | | | | 12 | |
*HealthSouth Corporation | | | 860 | | | | 18 | |
*Magellan Health Services, Inc. | | | 290 | | | | 14 | |
*Mednax, Inc. | | | 360 | | | | 29 | |
*Mettler-Toledo International, Inc. | | | 125 | | | | 24 | |
| | | | | | | | |
| | | | | | | 133 | |
| | | | | | | | |
Consumer Staples—2.8% | | | | | | | | |
Ingredion, Inc. | | | 530 | | | | 34 | |
J&J Snack Foods Corporation | | | 255 | | | | 16 | |
Spartan Stores, Inc. | | | 1,135 | | | | 18 | |
| | | | | | | | |
| | | | | | | 68 | |
| | | | | | | | |
Telecommunication Services—0.7% | | | | | | | | |
*tw telecom, Inc. | | | 640 | | | | 16 | |
| | | | | | | | |
Total Common Stocks—99.1%
(cost $2,126) | | | | 2,370 | |
| | | | | | | | |
† = U.S. listed foreign security
* Non-income producing securities
| | | | | | | | |
Issuer | | Principal
Amount | | | Value | |
| | |
Repurchase Agreement | | | | | | | | |
State Street Bank and Trust Company, 0.110% dated 12/31/12, due 1/2/13, repurchase price $37, collateralized by FHLMC, 2.000% due 1/30/2023 | | $ | 37 | | | $ | 37 | |
| | | | | |
Total Repurchase Agreement—1.5%
(cost $37) | | | | 37 | |
| | | | | | | | |
Total Investments—100.6%
(cost $2,163) | | | | 2,407 | |
Liabilities, plus cash and other assets—(0.6)% | | | | (15 | ) |
| | | | | | | | |
Net assets—100.0% | | | $ | 2,392 | |
| | | | | | | | |
See accompanying Notes to Portfolio of Investments.
December 31, 2012 | William Blair Funds 81 |

Christopher T. Vincent

Paul J. Sularz
BOND FUND
The Bond Fund seeks to outperform the Barclays Capital U.S. Aggregate Bond Index by maximizing total return through a combination of income and capital appreciation.
AN OVERVIEW FROM THE PORTFOLIO MANAGERS
The William Blair Bond Fund posted an 8.33% increase (Class N shares) for the year ended December 31, 2012. By comparison, the Fund’s benchmark, the Barclays Capital U.S. Aggregate Index, increased by 4.21%.
Several factors contributed to the outperformance of the William Blair Bond Fund versus its benchmark during 2012. Security selection within the Fund had the largest positive impact on performance, with results particularly strong among the Fund’s corporate and mortgage-backed securities. The Fund benefitted from several security selection themes in the corporate sector, including its overweight of U.S. banks and financial services, positioning within investment-grade industrials, and its allocation to high yield corporate bonds. In the mortgage-backed sector, the Fund’s emphasis on higher-coupon pools comprised of low loan balance borrowers continued to add value relative to comparable duration alternatives. Finally, sector positioning contributed to performance, as the Fund eschewed nominal fixed-rate Treasuries in favor of corporate bonds, mortgage-backed securities, and Treasury Inflation-Protected Securities (TIPS).
Some factors detracted from the William Blair Bond Fund’s performance on a relative basis during 2012. An underweight allocation to Commercial Mortgage-Backed Securities (CMBS) had a marginal negative impact on relative performance. However, the Fund was overweight to REITs to account for that underweight, and that positioning offset the relative underperformance. The Fund’s cash holdings detracted from performance as bonds posted solid performance. We attempt to minimize the amount of cash in the Fund at any time and to keep the Fund fully invested.
The major sectors of the U.S. fixed income market generated positive total returns during 2012. The primary drivers of returns have been income and narrowing risk spreads as investors’ demand for incremental yield has been insatiable. The 10-year Treasury note yielded 1.76% at year-end.
We believe that the threat of any rapid rise in interest rates is subdued. The Federal Open Market Committee’s (FOMC’s) stance towards monetary policy has become increasingly accommodative due to concerns over the pace of economic growth, job growth, and inflation. The FOMC announced several unconventional easing policies this year, and the FOMC remains committed to maintaining rates at low levels until the unemployment rate declines below 6.5%.
We expect economic growth to be low in the short-to-intermediate term (two to three years), with continued high levels of unemployment and a depressed real estate market constraining growth. However, we do not believe that the economy is at imminent risk of a “double-dip” recession.
Corporate bond issuance was robust in 2012. Corporations sought to secure longer-term financing at low all-in yields. Net issuance ended the year slightly lower than the record levels experienced in 2009. We expect that issuance will decline modestly from this pace in 2013.
We believe that spread sectors are poised to lead the market. Risk premiums across all spread sectors remain elevated versus long-term averages but not approaching the historically cheap levels experienced in prior years. These valuations, coupled with the strength of corporate balance sheets, make us bullish on spread product relative to Treasuries.
82 Annual Report | December 31, 2012 |
Bond Fund
Performance Highlights (Unaudited)
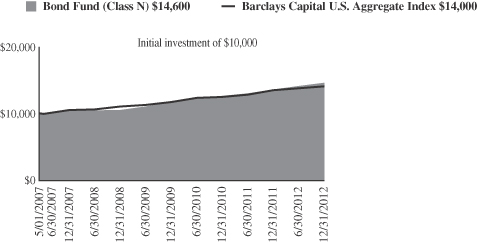
Average Annual Total Return at 12/31/2012
| | | | | | | | | | | | | | | | |
| | | 1
year | | | 3
year | | | 5
year | | | Since
Inception(a) | |
Class N | | | 8.33 | % | | | 7.87 | % | | | 7.23 | % | | | 6.97 | % |
Class I | | | 8.54 | | | | 8.02 | | | | 7.39 | | | | 7.14 | |
Barclays Capital
U.S. Aggregate Index | | | 4.21 | | | | 6.19 | | | | 5.95 | | | | 6.11 | |
| | (a) | | For the period from May 1, 2007 (Commencement of Operations) to December 31, 2012. | |
Performance cited represents past performance. Past performance does not guarantee future results and current performance may be lower or higher than the data quoted. Results shown are average annual total returns, which assume reinvestment of dividends and capital gains. Investment returns and principal will fluctuate and you may have a gain or loss when you sell shares. For the most current month-end performance information, please call 1-800-742-7272, or visit our Web site at www.williamblairfunds.com. From time to time, the investment advisor may waive fees or reimburse expenses for the Fund. Without these waivers, performance would be lower. Class N shares are available to the general public without a sales load. Class I shares are available to certain institutional investors and advisory clients of William Blair & Company, L.L.C., without a sales load or distribution (12b-1) fees.
The performance highlights and graph presented above do not reflect the deduction of taxes that a shareholder would pay on fund distributions or the redemption of fund shares.
The Barclays Capital U.S. Aggregate Bond Index indicates broad intermediate government/corporate bond market performance.
This report identifies the Fund’s investments on December 31, 2012. These holdings are subject to change. Not all investments in the Fund performed the same, nor is there any guarantee that these investments will perform as well in the future. Market forecasts provided in this report may not necessarily come to pass.
Sector Diversification (Unaudited)
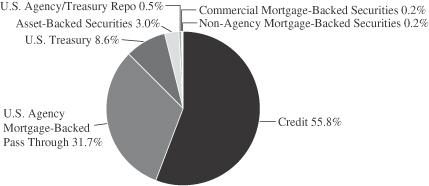
The sector diversification shown is based on the total investments.
December 31, 2012 | William Blair Funds 83 |
Bond Fund
Portfolio of Investments, December 31, 2012 (all amounts in thousands)
| | | | | | | | |
Issuer | | Principal
Amount | | | Value | |
|
U.S. Government and U.S. Government Agency—40.3% | |
U.S. Treasury Inflation Indexed Notes/Bonds—7.5% | | | | | | | | |
U.S. Treasury Inflation Indexed Note,
2.375%, due 1/15/17 | | $ | 5,913 | | | $ | 6,872 | |
U.S. Treasury Inflation Indexed Bond,
3.875%, due 4/15/29 | | | 9,287 | | | | 15,393 | |
| | | | | | | | |
Total U.S. Treasury Inflation Indexed Notes/Bonds | | | | | | | 22,265 | |
| | | | | | | | |
U.S. Treasury—1.1% | | | | | | | | |
U.S. Treasury Bond,
3.125%, due 2/15/42 | | | 525 | | | | 549 | |
U.S. Treasury Strip Principal,
0.000%, due 5/15/20 | | | 2,900 | | | | 2,641 | |
| | | | | | | | |
Total U.S. Treasury Obligations | | | | | | | 3,190 | |
| | | | | | | | |
Government National Mortgage Association (GNMA)—2.3% | | | | | | | | |
#344834, 6.250%, due 7/15/13 | | | 2 | | | | 2 | |
#344902, 6.250%, due 3/15/14 | | | 4 | | | | 4 | |
#623162, 6.500%, due 7/15/18 | | | 35 | | | | 40 | |
#616250, 6.000%, due 2/15/24 | | | 10 | | | | 11 | |
#422470, 7.500%, due 3/15/26 | | | 1 | | | | 1 | |
#509405, 7.500%, due 8/15/29 | | | 1 | | | | 1 | |
GNR 2004-2 M5,
4.891%, due 7/16/34 | | | 125 | | | | 130 | |
GNR 2006-67 GB,
4.775%, due 9/16/34, VRN | | | 517 | | | | 526 | |
#699118, 6.000%, due 9/15/38 | | | 5,488 | | | | 6,171 | |
| | | | | | | | |
Total GNMA Mortgage Obligations | | | | | | | 6,886 | |
| | | | | | | | |
Federal Home Loan Mortgage Corp. (FHLMC)—6.3% | | | | | | | | |
#J16051, 4.500%, due 7/1/26 | | | 1,198 | | | | 1,306 | |
#G01728, 7.500%, due 7/1/32 | | | 252 | | | | 309 | |
#C01385, 6.500%, due 8/1/32 | | | 245 | | | | 283 | |
#A13303, 5.000%, due 9/1/33 | | | 474 | | | | 534 | |
#C01623, 5.500%, due 9/1/33 | | | 339 | | | | 369 | |
#A15039, 5.500%, due 10/1/33 | | | 6 | | | | 7 | |
#G01843, 6.000%, due 6/1/35 | | | 65 | | | | 72 | |
#G02141, 6.000%, due 3/1/36 | | | 1,372 | | | | 1,522 | |
#A62179, 6.000%, due 6/1/37 | | | 685 | | | | 759 | |
#A63539, 6.000%, due 7/1/37 | | | 888 | | | | 986 | |
#A62858, 6.500%, due 7/1/37 | | | 473 | | | | 532 | |
#G03170, 6.500%, due 8/1/37 | | | 1,138 | | | | 1,281 | |
#A66843, 6.500%, due 10/1/37 | | | 1,680 | | | | 1,907 | |
#A78138, 5.500%, due 6/1/38 | | | 1,001 | | | | 1,129 | |
#G04544, 6.000%, due 8/1/38 | | | 2,893 | | | | 3,179 | |
#A81799, 6.500%, due 9/1/38 | | | 1,960 | | | | 2,225 | |
#A86143, 5.000%, due 5/1/39 | | | 120 | | | | 133 | |
#C03665, 9.000%, due 4/1/41 | | | 1,583 | | | | 1,966 | |
| | | | | | | | |
Total FHLMC Mortgage Obligations | | | | | | | 18,499 | |
| | | | | | | | |
Federal National Mortgage Association (FNMA)—23.1% | | | | | | | | |
#576553, 8.000%, due 2/1/16 | | | 8 | | | | 9 | |
#580793, 6.000%, due 4/1/16 | | | 2 | | | | 2 | |
#624506, 6.000%, due 1/1/17 | | | 2 | | | | 2 | |
#679247, 7.000%, due 8/1/17 | | | 8 | | | | 8 | |
#689612, 5.000%, due 5/1/18 | | | 224 | | | | 241 | |
#695910, 5.000%, due 5/1/18 | | | 455 | | | | 489 | |
#697593, 5.000%, due 5/1/18 | | | 408 | | | | 439 | |
| | | | | | | | |
Issuer | | Principal
Amount | | | Value | |
|
U.S. Government and U.S. Government Agency—40.3%—(continued) | |
Federal National Mortgage Association (FNMA)—(continued) | | | | | | | | |
#770395, 5.000%, due 4/1/19 | | $ | 8 | | | $ | 9 | |
#900725, 6.000%, due 8/1/21 | | | 109 | | | | 121 | |
#893325, 7.000%, due 9/1/21 | | | 9 | | | | 9 | |
#AA2924, 4.500%, due 4/1/24 | | | 791 | | | | 872 | |
#255956, 5.500%, due 10/1/25 | | | 52 | | | | 57 | |
#AB2256, 3.500%, due 2/1/26 | | | 1,179 | | | | 1,283 | |
#890329, 4.000%, due 4/1/26 | | | 465 | | | | 510 | |
#AI9811, 4.500%, due 8/1/26 | | | 505 | | | | 556 | |
#AH9564, 3.500%, due 9/1/26 | | | 1,031 | | | | 1,121 | |
#AJ8149, 3.500%, due 12/1/26 | | | 1,299 | | | | 1,413 | |
#AJ9402, 4.000%, due 12/1/26 | | | 2,200 | | | | 2,422 | |
#AB4818, 4.000%, due 4/1/27 | | | 1,211 | | | | 1,334 | |
#AP0446, 3.500%, due 7/1/27 | | | 3,377 | | | | 3,674 | |
#AL2590, 4.000%, due 7/1/27 | | | 2,344 | | | | 2,581 | |
#252925, 7.500%, due 12/1/29 | | | 3 | | | | 3 | |
#535977, 6.500%, due 4/1/31 | | | 22 | | | | 26 | |
#253907, 7.000%, due 7/1/31 | | | 3 | | | | 4 | |
#587849, 6.500%, due 11/1/31 | | | 32 | | | | 37 | |
#545437, 7.000%, due 2/1/32 | | | 122 | | | | 143 | |
#545759, 6.500%, due 7/1/32 | | | 1,282 | | | | 1,460 | |
#678007, 6.000%, due 9/1/32 | | | 24 | | | | 27 | |
#254548, 5.500%, due 12/1/32 | | | 56 | | | | 62 | |
#684601, 6.000%, due 3/1/33 | | | 1,213 | | | | 1,361 | |
#703391, 5.000%, due 5/1/33 | | | 198 | | | | 214 | |
#708993, 5.000%, due 6/1/33 | | | 74 | | | | 83 | |
#190340, 5.000%, due 9/1/33 | | | 170 | | | | 186 | |
#254868, 5.000%, due 9/1/33 | | | 18 | | | | 20 | |
#727056, 5.000%, due 9/1/33 | | | 911 | | | | 1,032 | |
#739243, 6.000%, due 9/1/33 | | | 1,506 | | | | 1,720 | |
#739331, 6.000%, due 9/1/33 | | | 718 | | | | 820 | |
#555800, 5.500%, due 10/1/33 | | | 189 | | | | 208 | |
#555946, 5.500%, due 11/1/33 | | | 645 | | | | 739 | |
#756153, 5.500%, due 11/1/33 | | | 1,521 | | | | 1,729 | |
#725017, 5.500%, due 12/1/33 | | | 75 | | | | 86 | |
#725205, 5.000%, due 3/1/34 | | | 2,231 | | | | 2,426 | |
#725232, 5.000%, due 3/1/34 | | | 2,397 | | | | 2,612 | |
#725238, 5.000%, due 3/1/34 | | | 844 | | | | 920 | |
#763798, 5.500%, due 3/1/34 | | | 244 | | | | 276 | |
#776964, 5.000%, due 4/1/34 | | | 619 | | | | 698 | |
#725611, 5.500%, due 6/1/34 | | | 308 | | | | 338 | |
#783786, 5.500%, due 7/1/34 | | | 241 | | | | 277 | |
#786546, 6.000%, due 7/1/34 | | | 656 | | | | 736 | |
#787816, 6.000%, due 7/1/34 | | | 730 | | | | 833 | |
#190353, 5.000%, due 8/1/34 | | | 253 | | | | 275 | |
#794474, 6.000%, due 10/1/34 | | | 127 | | | | 142 | |
#745092, 6.500%, due 7/1/35 | | | 920 | | | | 1,047 | |
#357944, 6.000%, due 9/1/35 | | | 79 | | | | 89 | |
#829306, 6.000%, due 9/1/35 | | | 959 | | | | 1,075 | |
#836140, 5.500%, due 10/1/35 | | | 109 | | | | 118 | |
#843487, 6.000%, due 10/1/35 | | | 206 | | | | 235 | |
#849191, 6.000%, due 1/1/36 | | | 421 | | | | 472 | |
#848782, 6.500%, due 1/1/36 | | | 559 | | | | 632 | |
#745349, 6.500%, due 2/1/36 | | | 834 | | | | 943 | |
#888305, 7.000%, due 3/1/36 | | | 22 | | | | 26 | |
#895637, 6.500%, due 5/1/36 | | | 320 | | | | 361 | |
#831540, 6.000%, due 6/1/36 | | | 114 | | | | 128 | |
#745802, 6.000%, due 7/1/36 | | | 434 | | | | 496 | |
See accompanying Notes to Portfolio of Investments.
84 Annual Report | December 31, 2012 |
Bond Fund
Portfolio of Investments, December 31, 2012 (all amounts in thousands)
| | | | | | | | | | | | |
Issuer | | NRSRO
Rating
(unaudited) | | | Principal
Amount | | | Value | |
|
U.S. Government and U.S. Government Agency—40.3%—(continued) | |
Federal National Mortgage Association (FNMA)—(continued) | | | | | | | | | |
#886220, 6.000%, due 7/1/36 | | | | | | $ | 957 | | | $ | 1,093 | |
#893318, 6.500%, due 8/1/36 | | | | | | | 135 | | | | 152 | |
#902974, 6.000%, due 12/1/36 | | | | | | | 921 | | | | 1,029 | |
#909480, 6.000%, due 2/1/37 | | | | | | | 919 | | | | 1,030 | |
#938440, 6.000%, due 7/1/37 | | | | | | | 430 | | | | 480 | |
#928561, 6.000%, due 8/1/37 | | | | | | | 538 | | | | 614 | |
#948689, 6.000%, due 8/1/37 | | | | | | | 863 | | | | 964 | |
#946646, 6.000%, due 9/1/37 | | | | | | | 277 | | | | 310 | |
#888967, 6.000%, due 12/1/37 | | | | | | | 1,770 | | | | 2,022 | |
#889385, 6.000%, due 2/1/38 | | | | | | | 525 | | | | 589 | |
#962058, 6.500%, due 3/1/38 | | | | | | | 3,647 | | | | 4,132 | |
#934006, 6.500%, due 9/1/38 | | | | | | | 1,189 | | | | 1,347 | |
#986856, 6.500%, due 9/1/38 | | | | | | | 906 | | | | 1,018 | |
#991911, 7.000%, due 11/1/38 | | | | | | | 664 | | | | 756 | |
#AA8443, 5.000%, due 6/1/39 | | | | | | | 484 | | | | 548 | |
#931492, 6.000%, due 7/1/39 | | | | | | | 329 | | | | 376 | |
#AA6898, 6.000%, due 7/1/39 | | | | | | | 1,710 | �� | | | 1,952 | |
#932279, 5.000%, due 12/1/39 | | | | | | | 213 | | | | 236 | |
#AE0082, 5.000%, due 5/1/40 | | | | | | | 1,213 | | | | 1,347 | |
#AL0913, 6.000%, due 7/1/41 | | | | | | | 2,371 | | | | 2,642 | |
#AK2733, 5.000%, due 2/1/42 | | | | | | | 3,286 | | | | 3,721 | |
| | | | | | | | | | | | |
Total FNMA Mortgage Obligations | | | | | | | | | | | 68,625 | |
| | | | | | | | | | | | |
| | | |
Non-Agency Mortgage-Backed Obligations—0.2% | | | | | | | | | | | | |
*First Plus Home Loan Trust, 1997-4, Tranche M1,
7.640%, 9/11/23§** | | | D | | | | 199 | | | | 166 | |
First Horizon Asset Securities, Inc., 2004-AR4, Tranche 3A1,
2.587%, 8/25/34, VRN | | | Aaa | | | | 382 | | | | 382 | |
| | | | | | | | | | | | |
Total Non-Agency Mortgage-Backed Obligations | | | | | | | | | | | 548 | |
| | | | | | | | | | | | |
| | |
Asset-Backed Securities—3.0% | | | | | | | | | |
Hertz Vehicle Financing LLC—144A, 2009-2A, Tranche A1,
4.260%, 3/25/14 | | | Aaa | | | | 1,140 | | | | 1,146 | |
Hertz Vehicle Financing
LLC—144A, 2009-2A, Tranche A2,
5.290%, 3/25/16 | | | Aaa | | | | 600 | | | | 653 | |
Avis Budget Rental Car Funding AESOP LLC—144A, 2010-3A, Tranche A,
4.640%, 5/20/16 | | | Aaa | | | | 100 | | | | 108 | |
Centre Point Funding LLC—144A, 2010-1A, Tranche 1,
5.430%, 7/20/16 | | | A2 | | | | 1,935 | | | | 2,084 | |
GE Capital Credit Card Master Note Trust, 2012-6, Tranche B,
1.830%, 8/17/20 | | | AA- | | | | 2,800 | | | | 2,843 | |
Centre Point Funding LLC—144A, 2012-2A, Tranche 1,
2.610%, 8/20/21 | | | Baa2 | | | | 1,979 | | | | 1,978 | |
| | | | | | | | | | | | |
Total Asset-Backed Securities | | | | | | | | | | | 8,812 | |
| | | | | | | | | | | | |
| | |
Corporate Obligations—55.0% | | | | | | | | | |
Petrobras International Finance Co., 6.125%, due 10/6/16 | | | A3 | | | $ | 1,400 | | | $ | 1,582 | |
Ally Financial, Inc.,
5.500%, due 2/15/17 | | | BB- | | | | 1,788 | | | | 1,913 | |
American International Group, Inc., 3.800%, due 3/22/17 | | | A- | | | | 2,375 | | | | 2,571 | |
Penske Truck Leasing Co. L.P.—144A,
3.750%, due 5/11/17 | | | BBB+ | | | | 2,000 | | | | 2,093 | |
ERP Operating L.P.,
5.750%, due 6/15/17 | | | BBB+ | | | | 2,075 | | | | 2,448 | |
JPMorgan Chase & Co.,
6.125%, due 6/27/17 | | | A | | | | 1,600 | | | | 1,869 | |
General Motors Financial Co.,
Inc.—144A,
4.750%, due 8/15/17 | | | BB | | | | 1,000 | | | | 1,051 | |
American Express Co.,
6.150%, due 8/28/17 | | | A+ | | | | 2,050 | | | | 2,470 | |
Capital One Financial Corporation, 6.750%, due 9/15/17 | | | A- | | | | 1,900 | | | | 2,320 | |
Exelon Generation Co. LLC,
6.200%, due 10/1/17 | | | Baa1 | | | | 1,160 | | | | 1,370 | |
Toll Brothers Finance Corporation, 8.910%, due 10/15/17 | | | BBB- | | | | 1,050 | | | | 1,326 | |
Triumph Group, Inc.,
8.000%, due 11/15/17 | | | B+ | | | | 1,550 | | | | 1,674 | |
American Tower Corporation, 4.500%, due 1/15/18 | | | Baa3 | | | | 1,200 | | | | 1,315 | |
Morgan Stanley,
6.625%, due 4/1/18 | | | A | | | | 2,575 | | | | 3,035 | |
Simon Property Group L.P.,
6.125%, due 5/30/18 | | | A- | | | | 2,500 | | | | 3,045 | |
Petrohawk Energy Corporation, 7.250%, due 8/15/18 | | | A | | | | 1,050 | | | | 1,185 | |
Merrill Lynch & Co., Inc.,
6.875%, due 11/15/18 | | | A | | | | 1,100 | | | | 1,347 | |
CSX Corporation,
7.375%, due 2/1/19 | | | BBB | | | | 870 | | | | 1,106 | |
BHP Billiton Finance USA, Ltd., 6.500%, due 4/1/19 | | | A+ | | | | 1,300 | | | | 1,658 | |
Citigroup, Inc.,
8.500%, due 5/22/19 | | | A | | | | 2,050 | | | | 2,757 | |
Discovery Communications LLC, 5.625%, due 8/15/19 | | | BBB | | | | 550 | | | | 657 | |
Roper Industries, Inc.,
6.250%, due 9/1/19 | | | BBB | | | | 1,850 | | | | 2,211 | |
Continental Rubber Of America Corp.—144A,
4.500%, due 9/15/19 | | | BB- | | | | 250 | | | | 256 | |
Republic Services, Inc.,
5.500%, due 9/15/19 | | | BBB | | | | 1,725 | | | | 2,043 | |
SBA Communications Corp.—144A, 5.625%, due 10/1/19 | | | B2 | | | | 1,250 | | | | 1,313 | |
Boston Properties L.P.,
5.875%, due 10/15/19 | | | A- | | | | 1,575 | | | | 1,878 | |
Crown Castle International Corporation,
7.125%, due 11/1/19 | | | BB- | | | | 1,550 | | | | 1,713 | |
See accompanying Notes to Portfolio of Investments.
December 31, 2012 | William Blair Funds 85 |
Bond Fund
Portfolio of Investments, December 31, 2012 (all amounts in thousands)
| | | | | | | | | | | | |
Issuer | | NRSRO
Rating
(unaudited) | | | Principal
Amount | | | Value | |
| | |
Corporate Obligations—(continued) | | | | | | | | | |
Toll Brothers Finance Corporation, 6.750%, due 11/1/19 | | | BBB- | | | $ | 500 | | | $ | 594 | |
Ford Motor Credit Co. LLC,
8.125%, due 1/15/20 | | | Baa3 | | | | 3,050 | | | | 3,908 | |
Jarden Corporation,
7.500%, due 1/15/20 | | | B | | | | 1,550 | | | | 1,701 | |
Johnson Controls, Inc.,
5.000%, due 3/30/20 | | | BBB+ | | | | 1,675 | | | | 1,904 | |
The Goldman Sachs Group, Inc., 6.000%, due 6/15/20 | | | A | | | | 2,575 | | | | 3,060 | |
Hologic, Inc.—144A,
6.250%, due 8/1/20 | | | BB | | | | 1,100 | | | | 1,185 | |
Alcoa, Inc.,
6.150%, due 8/15/20 | | | BBB- | | | | 2,050 | | | | 2,239 | |
Omnicom Group, Inc.,
4.450%, due 8/15/20 | | | BBB+ | | | | 2,075 | | | | 2,309 | |
The Goodyear Tire & Rubber Co., 8.250%, due 8/15/20 | | | B+ | | | | 1,500 | | | | 1,646 | |
Georgia-Pacific LLC—144A, 5.400%, due 11/1/20 | | | A | | | | 1,500 | | | | 1,784 | |
Progress Energy, Inc.,
4.400%, due 1/15/21 | | | BBB | | | | 1,675 | | | | 1,867 | |
Standard Pacific Corporation, 8.375%, due 1/15/21 | | | B | | | | 1,750 | | | | 2,030 | |
Petrobras International Finance Co., 5.375%, due 1/27/21 | | | A3 | | | | 1,200 | | | | 1,351 | |
L-3 Communications Corporation, 4.950%, due 2/15/21 | | | BBB- | | | | 2,430 | | | | 2,742 | |
Wyndham Worldwide Corporation, 5.625%, due 3/1/21 | | | BBB- | | | | 1,000 | | | | 1,116 | |
Ball Corporation,
5.750%, due 5/15/21 | | | BB+ | | | | 1,550 | | | | 1,678 | |
Energizer Holdings, Inc.,
4.700%, due 5/19/21 | | | BBB- | | | | 2,050 | | | | 2,197 | |
Discovery Communications LLC, 4.375%, due 6/15/21 | | | BBB | | | | 2,000 | | | | 2,233 | |
O’Reilly Automotive, Inc.,
4.625%, due 9/15/21 | | | BBB | | | | 2,275 | | | | 2,491 | |
Corporation Nacional del Cobre de Chile—144A,
3.875%, due 11/3/21 | | | A1 | | | | 1,900 | | | | 2,070 | |
Itau Unibanco Holding S.A.—144A, 6.200%, due 12/21/21 | | | Baa2 | | | | 2,500 | | | | 2,763 | |
SABMiller Holdings, Inc.—144A, 3.750%, due 1/15/22 | | | BBB+ | | | | 2,000 | | | | 2,160 | |
SLM Corporation,
7.250%, due 1/25/22 | | | BBB- | | | | 2,075 | | | | 2,288 | |
Fresenius Medical Care US Finance II, Inc.—144A,
5.875%, due 1/31/22 | | | BB+ | | | | 1,000 | | | | 1,085 | |
Lamar Media Corporation,
5.875%, due 2/1/22 | | | BB- | | | | 1,550 | | | | 1,682 | |
Masco Corporation,
5.950%, due 3/15/22 | | | BBB- | | | | 1,675 | | | | 1,857 | |
BE Aerospace, Inc.,
5.250%, due 4/1/22 | | | BB | | | | 1,550 | | | | 1,643 | |
Pinnacle Entertainment, Inc.,
7.750%, due 4/1/22 | | | B | | | | 1,315 | | | | 1,400 | |
| | |
Corporate Obligations—(continued) | | | | | | | | | |
Discover Financial Services,
5.200%, due 4/27/22 | | | BBB- | | | $ | 2,150 | | | $ | 2,448 | |
Kraft Foods Group, Inc.—144A, 3.500%, due 6/6/22 | | | BBB | | | | 1,900 | | | | 2,028 | |
Embraer S.A.,
5.150%, due 6/15/22 | | | BBB- | | | | 2,500 | | | | 2,738 | |
Comcast Corporation,
3.125%, due 7/15/22 | | | BBB+ | | | | 2,000 | | | | 2,084 | |
America Movil S.A.B. de C.V., 3.125%, due 7/16/22 | | | A2 | | | | 2,850 | | | | 2,897 | |
PPG Industries, Inc.,
2.700%, due 8/15/22 | | | A- | | | | 1,000 | | | | 990 | |
DR Horton, Inc.,
4.375%, due 9/15/22 | | | Ba2 | | | | 2,350 | | | | 2,397 | |
Mexichem S.A.B. de C.V.—144A, 4.875%, due 9/19/22 | | | BBB- | | | | 1,500 | | | | 1,616 | |
WEA Finance LLC—144A,
3.375%, due 10/3/22 | | | A2 | | | | 2,650 | | | | 2,723 | |
American Axle & Manufacturing, Inc.,
6.625%, due 10/15/22 | | | B | | | | 1,550 | | | | 1,573 | |
Southern Copper Corporation, 3.500%, due 11/8/22 | | | BBB+ | | | | 2,500 | | | | 2,553 | |
Jones Lang LaSalle, Inc.,
4.400%, due 11/15/22 | | | Baa2 | | | | 1,650 | | | | 1,686 | |
Camden Property Trust,
2.950%, due 12/15/22 | | | Baa1 | | | | 2,325 | | | | 2,267 | |
Owens Corning, Inc.,
4.200%, due 12/15/22 | | | BBB- | | | | 500 | | | | 509 | |
Royal Bank of Scotland Group plc, 6.125%, due 12/15/22 | | | BB+ | | | | 2,325 | | | | 2,454 | |
CC Holdings GS V LLC—144A, 3.849%, due 4/15/23 | | | Baa3 | | | | 400 | | | | 407 | |
The Kroger Co.,
8.000%, due 9/15/29 | | | BBB | | | | 450 | | | | 601 | |
Conoco Funding Co.,
7.250%, due 10/15/31 | | | A1 | | | | 450 | | | | 663 | |
Kohl’s Corporation,
6.000%, due 1/15/33 | | | BBB+ | | | | 1,065 | | | | 1,228 | |
Wisconsin Electric Power Co., 5.700%, due 12/1/36 | | | A+ | | | | 525 | | | | 669 | |
Comcast Corporation,
6.450%, due 3/15/37 | | | BBB+ | | | | 650 | | | | 834 | |
Yum! Brands, Inc.,
6.875%, due 11/15/37 | | | BBB | | | | 625 | | | | 853 | |
JPMorgan Chase & Co.,
6.400%, due 5/15/38 | | | A+ | | | | 1,470 | | | | 1,971 | |
Philip Morris International, Inc., 6.375%, due 5/16/38 | | | A | | | | 2,175 | | | | 2,962 | |
COX Communications, Inc.—144A, 6.950%, due 6/1/38 | | | BBB+ | | | | 370 | | | | 486 | |
General Electric Capital Corporation, 6.875%, due 1/10/39 | | | AA+ | | | | 750 | | | | 1,019 | |
Burlington Northern Santa Fe LLC, 5.750%, due 5/1/40 | | | A3 | | | | 1,565 | | | | 1,929 | |
Illinois Tool Works, Inc.,
4.875%, due 9/15/41 | | | A+ | | | | 900 | | | | 1,055 | |
Union Pacific Corporation,
4.750%, due 9/15/41 | | | A- | | | | 1,450 | | | | 1,626 | |
See accompanying Notes to Portfolio of Investments.
86 Annual Report | December 31, 2012 |
Bond Fund
Portfolio of Investments, December 31, 2012 (all dollar amounts in thousands)
| | | | | | | | | | | | |
Issuer | | NRSRO
Rating
(unaudited) | | | Principal
Amount | | | Value | |
| | |
Corporate Obligations—(continued) | | | | | | | | | |
Aristotle Holding, Inc.—144A, 6.125%, due 11/15/41 | | | BBB+ | | | $ | 2,500 | | | $ | 3,189 | |
Gilead Sciences, Inc.,
5.650%, due 12/1/41 | | | A- | | | | 1,775 | | | | 2,205 | |
Citigroup, Inc.,
5.875%, due 1/30/42 | | | A | | | | 750 | | | | 926 | |
Bank of America Corporation, 5.875%, due 2/7/42 | | | A | | | | 2,375 | | | | 2,963 | |
CSX Corporation,
4.750%, due 5/30/42 | | | BBB | | | | 1,225 | | | | 1,319 | |
Odebrecht Finance Ltd.—144A, 7.125%, due 6/26/42 | | | BBB- | | | | 2,000 | | | | 2,320 | |
| | | | | | | | | | | | |
Total Corporate Obligations | | | | | | | | | | | 163,377 | |
| | | | | | | | | | | | |
Total Long-Term Investments—98.5%
(cost $270,789) | | | | 292,202 | |
| | | | | | | | | | | | |
| | | |
Repurchase Agreement | | | | | | | | | | | | |
Fixed Income Clearing Corporation, 0.110% dated 12/31/12, due 1/2/13, repurchase price $1,622, collateralized by FHLMC, 3.720%,
due 2/27/32 | | | Aaa | | | $ | 1,622 | | | | 1,622 | |
| | | | | | | | | | | | |
Total Repurchase Agreement—0.5%
(cost $1,622) | | | | 1,622 | |
| | | | | | | | | | | | |
Total Investments—99.0%
(cost $272,411) | | | | 293,824 | |
| | | | | | | | | | | | |
Cash and other assets, less liabilities—1.0% | | | | 2,918 | |
| | | | | | | | | | | | |
Net assets—100.0% | | | $ | 296,742 | |
| | | | | | | | | | | | |
NRSRO = Nationally Recognized Statistical Rating Organization—The credit quality ratings of the securities in the Fund reflect the highest category rating by either Fitch Ratings, Moody’s Investors Service Inc., or Standard & Poor’s, a division of the McGraw-Hill Companies, Inc.
The obligations of certain U.S. Government-sponsored securities are neither issued nor guaranteed by the U.S. Treasury.
VRN = Variable Rate Note
§ = Deemed illiquid pursuant to Liquidity Procedures approved by the Board of Trustees. This holding represents 0.06% of the net assets at December 31, 2012.
* = Non-income producing security
** = Fair valued pursuant to Valuation Procedures adopted by the Board of Trustees. This holding represents 0.06% of the Fund’s net assets at December 31, 2012.
See accompanying Notes to Portfolio of Investments.
December 31, 2012 | William Blair Funds 87 |
Christopher T. Vincent
INCOME FUND
The Income Fund seeks a high level of current income with relative stability of principal.
AN OVERVIEW FROM THE PORTFOLIO MANAGER
The William Blair Income Fund posted a 6.00% increase (Class N shares) for the year ended December 31, 2012. By comparison, the Fund’s benchmark, the Barclays Capital Intermediate Government/Credit Bond Index, increased by 3.89%.
Several factors contributed to the outperformance of the William Blair Income Fund versus its benchmark during 2012. Security selection within the Fund had the largest positive impact on performance, with results particularly strong among the Fund’s corporate and mortgage-backed securities. The Fund benefited from several security selection themes in the corporate sector, including its overweight of U.S. banks and financial services and positioning within investment-grade industrials. In the mortgage-backed sector, the Fund’s emphasis on higher-coupon pools comprised of low loan balance borrowers continued to add value relative to comparable duration alternatives. Finally, sector positioning contributed to performance, as the Fund eschewed nominal fixed-rate Treasuries in favor of corporate bonds, mortgage-backed securities, and Treasury Inflation—Protected Securities (TIPS).
Some factors detracted from the William Blair Income Fund’s performance on a relative basis during 2012. The Fund was underweight compared to its benchmark in BBB-rated corporate bonds as a result of its limitation of investing no more than 10% of its total assets in BBB-rated debt securities. This positioning detracted as lower-quality bonds outperformed their higher-quality counterparts in 2012. The Fund’s cash holdings also detracted from performance as bonds posted solid performance. We attempt to minimize the amount of cash in the Fund at any time and to keep the Fund fully invested.
The major sectors of the U.S. fixed income market generated positive total returns during 2012. The primary drivers of returns have been income and narrowing risk spreads as investors’ demand for incremental yield has been insatiable. The 10-year Treasury note yielded 1.76% at year-end.
We believe that the threat of any rapid rise in interest rates is subdued. The Federal Open Market Committee’s (FOMC’s) stance towards monetary policy has become increasingly accommodative due to concerns over the pace of economic growth, job growth, and inflation. The FOMC announced several unconventional easing policies this year, and the FOMC remains committed to maintaining interest rates at low levels until the unemployment rate declines below 6.5%.
We expect economic growth to be low in the short-to-intermediate term (2—3 years), with continued high levels of unemployment and a depressed real estate market constraining growth. However, we do not believe that the economy is at imminent risk of a “double-dip” recession.
Corporate bond issuance was robust in 2012. Corporations sought to secure longer-term financing at low all-in yields. Net issuance ended the year slightly lower than the record levels experienced in 2009. We expect that issuance will decline modestly from this pace in 2013.
We believe that spread sectors are poised to lead the market. Risk premiums across all spreads sectors remain elevated versus long-term averages but not approaching the historically cheap levels experienced in prior years. These valuations, coupled with the strength of corporate balance sheets, make us bullish on spread product relative to Treasuries.
88 Annual Report | December 31, 2012 |
Income Fund
Performance Highlights (Unaudited)
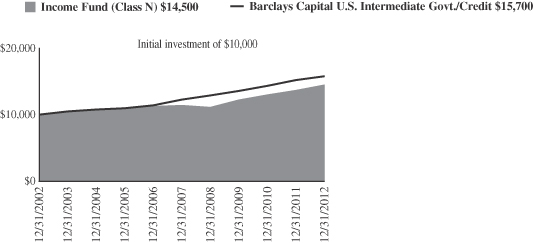
Average Annual Total Return at 12/31/2012
| | | | | | | | | | | | | | | | |
| | | 1
year | | | 3
year | | | 5
year | | | 10
year | |
Class N | | | 6.00 | % | | | 5.75 | % | | | 4.85 | % | | | 3.75 | % |
Class I | | | 6.28 | | | | 6.02 | | | | 5.06 | | | | 3.94 | |
Barclays Capital U.S. Intermediate Government/Credit | | | 3.89 | | | | 5.19 | | | | 5.18 | | | | 4.62 | |
Performance cited represents past performance. Past performance does not guarantee future results and current performance may be lower or higher than the data quoted. Results shown are average annual total returns, which assume reinvestment of dividends and capital gains. Investment returns and principal will fluctuate and you may have a gain or loss when you sell shares. For the most current month-end performance information, please call 1-800-742-7272, or visit our Web site at www.williamblairfunds.com. From time to time, the investment advisor may waive fees or reimburse expenses for the Fund. Without these waivers, performance would be lower. Class N shares are available to the general public without a sales load. Class I shares are available to certain institutional investors and advisory clients of William Blair & Company, L.L.C., without a sales load or distribution (12b-1) or service fees.
The performance highlights and graph presented above do not reflect the deduction of taxes that a shareholder would pay on fund distributions or the redemption of fund shares.
The Barclays Capital U.S. Intermediate Government/Credit Bond Index indicates broad intermediate government/corporate bond market performance.
This report identifies the Fund’s investments on December 31, 2012. These holdings are subject to change. Not all investments in the Fund performed the same, nor is there any guarantee that these investments will perform as well in the future. Market forecasts provided in this report may not necessarily come to pass.
Sector Diversification (Unaudited)
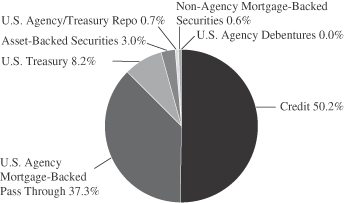
The sector diversification shown is based on the total investments.
December 31, 2012 | William Blair Funds 89 |
Income Fund
Portfolio of Investments, December 31, 2012 (all dollar amounts in thousands)
| | | | | | | | |
| | | | |
Issuer | |
Principal
Amount
| | | Value | |
|
U.S. Government and U.S. Government Agency—45.1% | |
U.S. Treasury Inflation Indexed Notes/Bonds—7.5% | |
U.S. Treasury Inflation Indexed Note,
2.375%, due 1/15/17 | | $ | 4,158 | | | $ | 4,833 | |
U.S. Treasury Inflation Indexed Note,
1.125%, due 1/15/21 | | | 4,917 | | | | 5,775 | |
| | | | | | | | |
Total U.S. Treasury Inflation Indexed Notes/Bonds | | | | | | | 10,608 | |
| | | | | | | | |
U.S. Treasury—0.6% | | | | | | | | |
U.S. Treasury Strip Principal,
0.000%, due 5/15/20 | | | 1,000 | | | | 911 | |
| | | | | | | | |
Government National Mortgage Association (GNMA)—0.1% | |
#780405, 9.500%, due 11/15/17 | | | 79 | | | | 84 | |
#357322, 7.000%, due 9/15/23 | | | 57 | | | | 67 | |
| | | | | | | | |
Total GNMA Mortgage Obligations | | | | | | | 151 | |
| | | | | | | | |
Federal Home Loan Mortgage Corp. (FHLMC)—7.7% | |
#E72924, 7.000%, due 10/1/13 | | | 46 | | | | 46 | |
#E81703, 7.000%, due 5/1/15 | | | 104 | | | | 106 | |
#E81697, 8.000%, due 5/1/15 | | | 317 | | | | 336 | |
#E81908, 8.500%, due 12/1/15 | | | 23 | | | | 24 | |
#J02184, 8.000%, due 4/1/16 | | | 172 | | | | 180 | |
#G90022, 8.000%, due 9/17/16 | | | 94 | | | | 95 | |
#M30028, 5.500%, due 5/1/17 | | | 11 | | | | 11 | |
#E90398, 7.000%, due 5/1/17 | | | 330 | | | | 354 | |
#E97112, 4.000%, due 5/1/18 | | | 161 | | | | 169 | |
#D95621, 6.500%, due 7/1/22 | | | 1,344 | | | | 1,499 | |
#J16051, 4.500%, due 7/1/26 | | | 2,220 | | | | 2,420 | |
#J19032, 3.500%, due 5/1/27 | | | 1,401 | | | | 1,519 | |
#A45790, 7.500%, due 5/1/35 | | | 220 | | | | 270 | |
#G02141, 6.000%, due 3/1/36 | | | 687 | | | | 762 | |
#A66843, 6.500%, due 10/1/37 | | | 760 | | | | 863 | |
#A81799, 6.500%, due 9/1/38 | | | 1,099 | | | | 1,248 | |
#C03665, 9.000%, due 4/1/41 | | | 768 | | | | 953 | |
| | | | | | | | |
Total FHLMC Mortgage Obligations | | | | | | | 10,855 | |
| | | | | | | | |
Federal National Mortgage Association (FNMA)—29.2% | | | | | |
#725315, 8.000%, due 5/1/13 | | | 2 | | | | 2 | |
#593561, 9.500%, due 8/1/14 | | | 32 | | | | 34 | |
#567027, 7.000%, due 9/1/14 | | | 153 | | | | 155 | |
#567026, 6.500%, due 10/1/14 | | | 92 | | | | 93 | |
#458124, 7.000%, due 12/15/14 | | | 26 | | | | 27 | |
#576554, 8.000%, due 1/1/16 | | | 345 | | | | 369 | |
#576553, 8.000%, due 2/1/16 | | | 496 | | | | 532 | |
#555747, 8.000%, due 5/1/16 | | | 35 | | | | 37 | |
#735569, 8.000%, due 10/1/16 | | | 240 | | | | 257 | |
#725410, 7.500%, due 4/1/17 | | | 82 | | | | 87 | |
#643217, 6.500%, due 6/1/17 | | | 126 | | | | 138 | |
#679247, 7.000%, due 8/1/17 | | | 457 | | | | 505 | |
#695910, 5.000%, due 5/1/18 | | | 473 | | | | 509 | |
#740847, 6.000%, due 10/1/18 | | | 270 | | | | 297 | |
#323501, 6.500%, due 1/1/19 | | | 89 | | | | 99 | |
#751313, 5.000%, due 3/1/19 | | | 400 | | | | 441 | |
#852864, 7.000%, due 7/1/20 | | | 1,024 | | | | 1,135 | |
#458147, 10.000%, due 8/15/20 | | | 236 | | | | 271 | |
#835563, 7.000%, due 10/1/20 | | | 391 | | | | 430 | |
#735574, 8.000%, due 3/1/22 | | | 255 | | | | 295 | |
#679253, 6.000%, due 10/1/22 | | | 649 | | | | 720 | |
FNR G93-19 SH,
11.234%, due 4/25/23, VRN | | | 11 | | | | 17 | |
Issuer | | NRSRO
Rating
(unaudited) | | | Principal
Amount | | | Value | |
|
U.S. Government and U.S. Government Agency—(continued) | |
Federal National Mortgage Association (FNMA)—(continued) | |
#982878, 4.500%, due 5/1/23 | | | | | | $ | 658 | | | $ | 725 | |
#AC5124, 4.000%, due 11/1/24 | | | | | | | 628 | | | | 692 | |
#AD8164, 4.000%, due 8/1/25 | | | | | | | 797 | | | | 877 | |
#AE1176, 4.000%, due 8/1/25 | | | | | | | 743 | | | | 818 | |
#255956, 5.500%, due 10/1/25 | | | | | | | 157 | | | | 172 | |
#AB2256, 3.500%, due 2/1/26 | | | | | | | 1,179 | | | | 1,283 | |
#890329, 4.000%, due 4/1/26 | | | | | | | 2,326 | | | | 2,548 | |
#AI9811, 4.500%, due 8/1/26 | | | | | | | 757 | | | | 834 | |
#AJ2322, 3.500%, due 10/1/26 | | | | | | | 889 | | | | 967 | |
#AJ3203, 4.000%, due 10/1/26 | | | | | | | 1,837 | | | | 2,022 | |
#AJ8149, 3.500%, due 12/1/26 | | | | | | | 2,572 | | | | 2,798 | |
#AJ7724, 4.000%, due 12/1/26 | | | | | | | 892 | | | | 982 | |
#AK0498, 3.500%, due 1/1/27 | | | | | | | 543 | | | | 591 | |
#256639, 5.000%, due 2/1/27 | | | | | | | 40 | | | | 43 | |
#AB4818, 4.000%, due 4/1/27 | | | | | | | 937 | | | | 1,032 | |
#AP0446, 3.500%, due 7/1/27 | | | | | | | 3,377 | | | | 3,674 | |
#AL2590, 4.000%, due 7/1/27 | | | | | | | 2,910 | | | | 3,204 | |
#806458, 8.000%, due 6/1/28 | | | | | | | 211 | | | | 258 | |
#880155, 8.500%, due 7/1/29 | | | | | | | 377 | | | | 471 | |
#797846, 7.000%, due 3/1/32 | | | | | | | 595 | | | | 668 | |
#745519, 8.500%, due 5/1/32 | | | | | | | 186 | | | | 233 | |
#654674, 6.500%, due 9/1/32 | | | | | | | 125 | | | | 142 | |
#733897, 6.500%, due 12/1/32 | | | | | | | 266 | | | | 306 | |
#254693, 5.500%, due 4/1/33 | | | | | | | 26 | | | | 28 | |
#555531, 5.500%, due 6/1/33 | | | | | | | 71 | | | | 78 | |
#555591, 5.500%, due 7/1/33 | | | | | | | 43 | | | | 47 | |
#725231, 5.000%, due 2/1/34 | | | | | | | 535 | | | | 583 | |
#725220, 5.000%, due 3/1/34 | | | | | | | 523 | | | | 570 | |
#725232, 5.000%, due 3/1/34 | | | | | | | 517 | | | | 564 | |
#725238, 5.000%, due 3/1/34 | | | | | | | 291 | | | | 317 | |
#776964, 5.000%, due 4/1/34 | | | | | | | 929 | | | | 1,047 | |
#725424, 5.500%, due 4/1/34 | | | | | | | 278 | | | | 306 | |
#255630, 5.000%, due 3/1/35 | | | | | | | 31 | | | | 34 | |
#886220, 6.000%, due 7/1/36 | | | | | | | 681 | | | | 778 | |
#928658, 6.500%, due 9/1/37 | | | | | | | 88 | | | | 98 | |
#889385, 6.000%, due 2/1/38 | | | | | | | 1,225 | | | | 1,374 | |
#962058, 6.500%, due 3/1/38 | | | | | | | 1,278 | | | | 1,448 | |
#991911, 7.000%, due 11/1/38 | | | | | | | 424 | | | | 483 | |
#AL0913, 6.000%, due 7/1/41 | | | | | | | 1,694 | | | | 1,887 | |
| | | | | | | | | | | | |
Total FNMA Mortgage Obligations | | | | | | | | | | | 41,432 | |
| | | | | | | | | | | | |
| |
Non-Agency Mortgage-Backed Obligations—0.7% | | | | | |
*First Plus Home Loan Trust, 1997-4, Tranche M1,
7.640%, 9/11/23§** | | | D | | | | 676 | | | | 566 | |
*First Plus Home Loan Trust, 1997-4, Tranche M2,
7.830%, 9/11/23§** | | | D | | | | 143 | | | | 104 | |
*First Plus Home Loan Trust, 1998-3, Tranche M2,
7.920%, 5/10/24§** | | | Caa1ø | | | | 256 | | | | 247 | |
*Lehman Structured Securities Corp.—144A, 2004-2, Tranche M1,
2.991%, 2/28/33, VRN§ | | | CCC | | | | 312 | | | | 150 | |
| | | | | | | | | | | | |
Total Non-Agency Mortgage-Backed Obligations | | | | | | | | | | | 1,067 | |
| | | | | | | | | | | | |
See accompanying Notes to Portfolio of Investments.
90 Annual Report | December 31, 2012 |
Income Fund
Portfolio of Investments, December 31, 2012 (all dollar amounts in thousands)
| | | | | | | | | | | | |
Issuer | | NRSRO
Rating
(unaudited) | | | Principal
Amount | | | Value | |
| | |
Asset-Backed Securities—3.0% | | | | | | | | | |
Hertz Vehicle Financing LLC—144A, 2009-2A, Tranche A1,
4.260%, 3/25/14 | | | Aaa | | | $ | 750 | | | $ | 754 | |
Centre Point Funding LLC—144A, 2010-1A, Tranche
1,5.430%, 7/20/16 | | | A2 | | | | 991 | | | | 1,067 | |
Citibank Omni Master Trust—144A, 2009-A14A, Tranche A14,
2.959%, 8/15/18, VRN | | | Aaa | | | | 1,000 | | | | 1,040 | |
GE Capital Credit Card Master Note Trust, 2012-6, Tranche B,
1.830%, 8/17/20 | | | AA- | | | | 1,350 | | | | 1,371 | |
| | | | | | | | | | | | |
Total Asset-Backed Securities | | | | | | | | | | | 4,232 | |
| | | | | | | | | | | | |
| | | |
Corporate Obligations—49.7% | | | | | | | | | | | | |
Bank of America Corporation,
7.375%, due 5/15/14 | | | A | | | | 715 | | | | 774 | |
American International Group, Inc., 3.000%, due 3/20/15 | | | A- | | | | 1,000 | | | | 1,041 | |
The Goldman Sachs Group, Inc.,
3.300%, due 5/3/15 | | | A | | | | 600 | | | | 625 | |
Royal Bank of Scotland Group plc, 2.550%, due 9/18/15 | | | A | | | | 750 | | | | 768 | |
PepsiCo, Inc.,
2.500%, due 5/10/16 | | | Aa3 | | | | 700 | | | | 737 | |
Petrobras International Finance Co., 6.125%, due 10/6/16 | | | A3 | | | | 1,250 | | | | 1,413 | |
PACCAR Financial Corporation,
1.600%, due 3/15/17 | | | A+ | | | | 1,000 | | | | 1,016 | |
BHP Billiton Finance USA, Ltd.,
5.400%, due 3/29/17 | | | A+ | | | | 1,000 | | | | 1,172 | |
Penske Truck Leasing Co. L.P.—144A, 3.750%, due 5/11/17 | | | BBB+ | | | | 500 | | | | 523 | |
JPMorgan Chase & Co.,
6.125%, due 6/27/17 | | | A | | | | 1,750 | | | | 2,044 | |
Kimberly-Clark Corporation,
6.125%, due 8/1/17 | | | A | | | | 1,250 | | | | 1,533 | |
American Express Co.,
6.150%, due 8/28/17 | | | A+ | | | | 1,500 | | | | 1,807 | |
IBM Corporation,
5.700%, due 9/14/17 | | | AA- | | | | 900 | | | | 1,087 | |
Capital One Financial Corporation, 6.750%, due 9/15/17 | | | A- | | | | 1,000 | | | | 1,221 | |
Standard Chartered Bank—144A,
6.400%, due 9/26/17 | | | A+ | | | | 1,000 | | | | 1,164 | |
Baidu, Inc., 2.250%, due 11/28/17 | | | A | | | | 1,250 | | | | 1,258 | |
Wells Fargo & Co.,
5.625%, due 12/11/17 | | | AA- | | | | 1,250 | | | | 1,491 | |
Morgan Stanley,
6.625%, due 4/1/18 | | | A | | | | 1,250 | | | | 1,473 | |
General Electric Capital Corporation, 5.625%, due 5/1/18 | | | AA+ | | | | 1,725 | | | | 2,049 | |
Philip Morris International, Inc.,
5.650%, due 5/16/18 | | | A | | | | 1,250 | | | | 1,515 | |
Simon Property Group L.P.,
6.125%, due 5/30/18 | | | A- | | | | 1,250 | | | | 1,523 | |
John Deere Capital Corporation,
5.750%, due 9/10/18 | | | A | | | | 1,300 | | | | 1,585 | |
| |
Corporate Obligations—(continued) | | | | | |
Honeywell International, Inc., 5.000%, due 2/15/19 | | | A | | | $ | 1,280 | | | $ | 1,522 | |
The Procter & Gamble Co.,
4.700%, due 2/15/19 | | | AA- | | | | 500 | | | | 591 | |
Citigroup, Inc.,
8.500%, due 5/22/19 | | | A | | | | 1,250 | | | | 1,681 | |
Burlington Northern Santa Fe LLC, 4.700%, due 10/1/19 | | | A3 | | | | 1,000 | | | | 1,153 | |
Boston Properties L.P.,
5.875%, due 10/15/19 | | | A- | | | | 1,350 | | | | 1,610 | |
The Goldman Sachs Group, Inc., 6.000%, due 6/15/20 | | | A | | | | 1,250 | | | | 1,485 | |
Alcoa, Inc., 6.150%, due 8/15/20 | | | BBB- | | | | 750 | | | | 819 | |
Georgia-Pacific LLC—144A, 5.400%, due 11/1/20 | | | A | | | | 1,000 | | | | 1,190 | |
L-3 Communications Corporation, 4.950%, due 2/15/21 | | | BBB- | | | | 250 | | | | 282 | |
E.I. du Pont de Nemours & Co., 4.250%, due 4/1/21 | | | A | | | | 1,000 | | | | 1,148 | |
Ford Motor Credit Co. LLC,
5.875%, due 8/2/21 | | | Baa3 | | | | 750 | | | | 873 | |
Praxair, Inc.,
3.000%, due 9/1/21 | | | A | | | | 1,000 | | | | 1,049 | |
Verizon Communications, Inc., 3.500%, due 11/1/21 | | | A | | | | 1,000 | | | | 1,094 | |
Corporation Nacional del Cobre de Chile—144A,
3.875%, due 11/3/21 | | | A1 | | | | 1,000 | | | | 1,090 | |
Gilead Sciences, Inc.,
4.400%, due 12/1/21 | | | A- | | | | 1,425 | | | | 1,624 | |
Itau Unibanco Holding S.A.—144A, 6.200%, due 12/21/21 | | | Baa2 | | | | 1,000 | | | | 1,105 | |
McDonald’s Corporation,
2.625%, due 1/15/22 | | | A | | | | 1,250 | | | | 1,283 | |
SLM Corporation,
7.250%, due 1/25/22 | | | BBB- | | | | 1,000 | | | | 1,103 | |
AT&T, Inc.,
3.000%, due 2/15/22 | | | A2 | | | | 1,500 | | | | 1,560 | |
Masco Corporation,
5.950%, due 3/15/22 | | | BBB- | | | | 1,000 | | | | 1,108 | |
Potomac Electric Power Co.,
3.050%, due 4/1/22 | | | A | | | | 1,000 | | | | 1,045 | |
Discover Financial Services,
5.200%, due 4/27/22 | | | BBB- | | | | 750 | | | | 854 | |
Caterpillar Financial Services Corporation,
2.850%, due 6/1/22 | | | A | | | | 1,000 | | | | 1,023 | |
United Technologies Corporation, 3.100%, due 6/1/22 | | | A | | | | 1,500 | | | | 1,588 | |
Embraer S.A.,
5.150%, due 6/15/22 | | | BBB- | | | | 1,000 | | | | 1,095 | |
Odebrecht Finance Ltd.—144A, 5.125%, due 6/26/22 | | | BBB- | | | | 1,000 | | | | 1,085 | |
Anheuser-Busch InBev Worldwide, Inc., 2.500%, due 7/15/22 | | | A | | | | 1,000 | | | | 1,006 | |
America Movil S.A.B. de C.V., 3.125%, due 7/16/22 | | | A2 | | | | 1,500 | | | | 1,525 | |
PPG Industries, Inc.,
2.700%, due 8/15/22 | | | A- | | | | 550 | | | | 545 | |
Dominion Resources, Inc.,
2.750%, due 9/15/22 | | | A- | | | | 1,000 | | | | 1,009 | |
See accompanying Notes to Portfolio of Investments
December 31, 2012 | William Blair Funds 91 |
Income Fund
Portfolio of Investments, December 31, 2012 (all dollar amounts in thousands)
| | | | | | | | | | | | |
Issuer | | NRSRO
Rating
(unaudited) | | | Principal
Amount | | | Value | |
| |
Corporate Obligations—(continued) | | | | | |
Mexichem S.A.B. de C.V.—144A, 4.875%, due 9/19/22 | | | BBB- | | | $ | 1,000 | | | $ | 1,078 | |
WEA Finance LLC—144A, 3.375%, due 10/3/22 | | | A2 | | | | 1,000 | | | | 1,028 | |
Southern Copper Corporation, 3.500%, due 11/8/22 | | | BBB+ | | | | 200 | | | | 204 | |
Jones Lang LaSalle, Inc.,
4.400%, due 11/15/22 | | | Baa2 | | | | 600 | | | | 613 | |
National Oilwell Varco, Inc., 2.600%, due 12/1/22 | | | A2 | | | | 1,300 | | | | 1,318 | |
Camden Property Trust,
2.950%, due 12/15/22 | | | Baa1 | | | | 600 | | | | 585 | |
Royal Bank of Scotland Group plc, 6.125%, due 12/15/22 | | | BBB- | | | | 800 | | | | 844 | |
Teva Pharmaceutical Finance Co. BV, 2.950%, due 12/18/22 | | | A- | | | | 1,300 | | | | 1,315 | |
Union Pacific Corporation, 2.950%, due 1/15/23 | | | A- | | | | 1,000 | | | | 1,034 | |
CC Holdings GS V LLC—144A, 3.849%, due 4/15/23 | | | Baa3 | | | | 500 | | | | 509 | |
| | | | | | | | | | | | |
Total Corporate Obligations | | | | | | | | | | | 70,492 | |
| | | | | | | | | | | | |
Total Long-Term Investments—98.5%
(cost $133,438) | | | | 139,748 | |
| | | | | | | | | | | | |
| | | |
Repurchase Agreement | | | | | | | | | | | | |
Fixed Income Clearing Corporation, 0.110% dated 12/31/12, due 1/2/13, repurchase price $938, collateralized by FNMA, 3.250%, due 12/27/32 | | | Aaa | | | | 938 | | | | 938 | |
| | | | | | | | | | | | |
Total Repurchase Agreement—0.7%
(cost $938) | | | | 938 | |
| | | | | | | | | | | | |
Total Investments—99.2%
(cost $134,376) | | | | 140,686 | |
Cash and other assets, less liabilities—0.8% | | | | 1,091 | |
| | | | | | | | | | | | |
Net assets—100.0% | | | $ | 141,777 | |
| | | | | | | | | | | | |
NRSRO = Nationally Recognized Statistical Rating Organization—The credit quality ratings of the securities in the Fund reflect the highest category rating by either Fitch Ratings, Moody’s Investors Service Inc., or Standard & Poor’s, a division of the McGraw-Hill Companies, Inc.
The obligations of certain U. S. Government-sponsored securities are neither issued nor guaranteed by the U. S. Treasury.
VRN = Variable Rate Note
§ = Deemed illiquid pursuant to Liquidity Procedures approved by the Board of Trustees. These holdings represent 0.75% of the net assets at December 31, 2012.
* = Non-income producing securities
** = Fair valued pursuant to Valuation Procedures adopted by the Board of Trustees. These holdings represent 0.65% of the Fund’s net assets at December 31, 2012.
ø = Moody’s withdrew its rating as of July 29, 2011. The rating shown represents the last issued. The bond is currently not rated by a NRSRO.
See accompanying Notes to Portfolio of Investments.
92 Annual Report | December 31, 2012 |
Christopher T. Vincent
Paul J. Sularz
LOW DURATION FUND
The Low Duration Fund seeks to maximize total return. Total return includes both income and capital appreciation.
AN OVERVIEW FROM THE PORTFOLIO MANAGERS
The William Blair Low Duration Fund posted a 2.80% increase (Class N shares) for the year ended December 31, 2012. By comparison, the Fund’s benchmark, the Bank of America Merrill Lynch 1-Year Treasury Note Index (net), increased by 0.24%.
Several factors contributed to the outperformance of the William Blair Low Duration Fund versus its benchmark during 2012. Security selection within the Fund had the largest positive impact on performance, with results particularly strong among the Fund’s mortgage-backed, asset-backed, and corporate securities. In the mortgage-backed sector, the Fund’s emphasis on higher-coupon pools comprised of low loan balance borrowers continued to add value relative to comparable duration alternatives. The Fund’s asset-backed security positions were also a source of value, as the Fund’s holdings generated incremental income throughout the year. The Fund benefitted from several security selection themes in the corporate sector, including its overweight of U.S. banks and financial services and positioning within investment-grade industrials. Finally, sector positioning contributed to performance, as the Fund eschewed nominal fixed-rate Treasuries in favor of mortgage-backed securities, asset-backed securities, and corporate bonds.
Some factors detracted from the William Blair Low Duration Fund’s performance on a relative basis during 2012. The Fund held some floating-rate instruments in its effort to protect against a rise in interest rate rates. However, floating-rate instruments lagged fixed-rate alternatives during the year, as the interest rate environment was fairly benign. The Fund’s cash holdings detracted from performance as bonds posted solid performance. We attempt to minimize the amount of cash in the Fund at any time and to keep the Fund fully invested.
The major sectors of the U.S. fixed income market generated positive total returns during 2012. The primary drivers of returns have been income and narrowing risk spreads as investors’ demand for incremental yield has been insatiable. The 10-year Treasury note yielded 1.76% at year-end.
We believe that the threat of any rapid rise in interest rates is subdued. The Federal Open Market Committee’s (FOMC’s) stance towards monetary policy has become increasingly accommodative due to concerns over the pace of economic growth, job growth, and inflation. The FOMC announced several unconventional easing policies this year, and the FOMC remains committed to maintaining interest rates at low levels until the unemployment rate declines below 6.5%.
We expect economic growth to be low in the short-to-intermediate term (two to three years), with continued high levels of unemployment and a depressed real estate market constraining growth. However, we do not believe that the economy is at imminent risk of a “double-dip” recession.
Corporate bond issuance was robust in 2012. Corporations sought to secure longer-term financing at low all-in yields. Net issuance ended the year slightly lower than the record levels experienced in 2009. We expect that issuance will decline modestly from this pace in 2013.
We believe that spread sectors are poised to lead the market. Risk premiums across all spread sectors remain elevated versus long-term averages but not approaching the historically cheap levels experienced in prior years. These valuations, coupled with the strength of corporate balance sheets, make us bullish on spread product relative to Treasuries.
December 31, 2012 | William Blair Funds 93 |
Low Duration Fund
Performance Highlights (Unaudited)
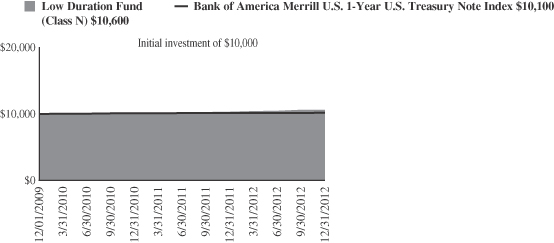
Average Annual Total Return at 12/31/2012
| | | | | | | | | | | | |
| | | 1 Year | | | 3 Year | | | Since
Inception(a) | |
Class N | | | 2.80 | % | | | 2.13 | % | | | 1.87 | % |
Class I | | | 2.96 | | | | 2.28 | | | | 2.02 | |
Bank of America Merrill Lynch 1-Year U.S. Treasury Note Index | | | 0.24 | | | | 0.54 | | | | 0.48 | |
| | (a) | | For the period from December 1, 2009 (Commencement of Operations) to December 31, 2012. | |
Performance cited represents past performance. Past performance does not guarantee future results and current performance may be lower or higher than the data quoted. Results shown are average annual total returns, which assume reinvestment of dividends and capital gains. Investment returns and principal will fluctuate and you may have a gain or loss when you sell shares. For the most current month-end performance information, please call 1-800-742-7272, or visit our Web site at www.williamblairfunds.com. From time to time, the investment advisor may waive fees or reimburse expenses for the Fund. Without these waivers, performance would be lower. Class N shares are available to the general public without a sales load. Class I shares are available to certain institutional investors and advisory clients of William Blair & Company, L.L.C., without a sales load or distribution (12b-1) fees.
The performance highlights and graph presented above do not reflect the deduction of taxes that a shareholder would pay on fund distributions or the redemption of fund shares.
The Bank of America Merrill Lynch 1-Year U.S. Treasury Note Index is comprised of a single U.S. Treasury Note issue purchased at the beginning of the month and held for a full month. Each month the index is rebalanced and the issue selected is the outstanding U.S. Treasury Note that matures closest to, but not beyond one year from the rebalancing date.
This report identifies the Fund’s investments on December 31, 2012. These holdings are subject to change. Not all investments in the Fund performed the same, nor is there any guarantee that these investments will perform as well in the future. Market forecasts provided in this report may not necessarily come to pass.
Sector Diversification (Unaudited)
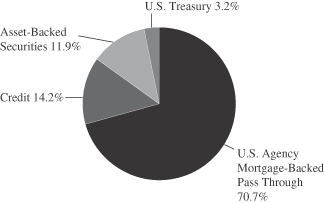
The sector diversification shown is based on the total investments.
94 Annual Report | December 31, 2012 |
Low Duration Fund
Portfolio of Investments, December 31, 2012 (all dollar amounts in thousands)
| | | | | | | | |
Issuer | | Principal
Amount | | | Value | |
|
U.S. Government and U.S. Government Agency—67.4% | |
U.S. Treasury Inflation Indexed Notes/Bonds—2.9% | |
U.S. Treasury Inflation Indexed Note, 2.375%, due 1/15/17 | | $ | 3,728 | | | $ | 4,333 | |
U.S. Treasury Inflation Indexed Note, 1.625%, due 1/15/18 | | | 3,478 | | | | 4,034 | |
| | | | | | | | |
Total U.S. Treasury Inflation Indexed Notes/Bonds | | | | | | | 8,367 | |
| | | | | | | | |
Government National Mortgage Association (GNMA)—1.1% | |
#002584, 6.000%, due 4/20/13 | | | 3 | | | | 3 | |
#623159, 5.000%, due 11/15/13 | | | 26 | | | | 28 | |
#628400, 6.000%, due 11/15/13 | | | 43 | | | | 44 | |
#002682, 6.500%, due 11/20/13 | | | 13 | | | | 14 | |
#623182, 5.000%, due 12/15/13 | | | 36 | | | | 39 | |
#781010, 6.500%, due 4/15/14 | | | 31 | | | | 32 | |
#002761, 6.000%, due 5/20/14 | | | 21 | | | | 23 | |
#002787, 5.500%, due 7/20/14 | | | 3 | | | | 3 | |
#781275, 6.000%, due 10/15/14 | | | 77 | | | | 80 | |
GNR 2011-24 VA, 3.500%, due 2/20/16 | | | 1,242 | | | | 1,305 | |
#561031, 5.500%, due 9/15/16 | | | 196 | | | | 212 | |
#003180, 6.000%, due 1/20/17 | | | 30 | | | | 33 | |
#781567, 5.000%, due 2/15/18 | | | 72 | | | | 77 | |
#606406, 5.000%, due 4/15/18 | | | 99 | | | | 109 | |
#003438, 4.500%, due 9/20/18 | | | 179 | | | | 196 | |
#003465, 4.500%, due 11/20/18 | | | 60 | | | | 65 | |
#004430, 4.500%, due 5/20/24 | | | 895 | | | | 977 | |
| | | | | | | | |
Total GNMA Mortgage Obligations | | | | | | | 3,240 | |
| | | | | | | | |
Federal Home Loan Mortgage Corp. (FHLMC)—16.9% | |
#B18053, 5.000%, due 3/1/15 | | | 34 | | | | 35 | |
#G11885, 5.000%, due 1/1/16 | | | 119 | | | | 127 | |
#E86134, 5.000%, due 11/1/16 | | | 126 | | | | 135 | |
#G12631, 5.500%, due 4/1/17 | | | 259 | | | | 278 | |
#G13127, 4.500%, due 4/1/18 | | | 74 | | | | 78 | |
#E95355, 5.000%, due 4/1/18 | | | 273 | | | | 294 | |
#G11606, 4.500%, due 5/1/18 | | | 29 | | | | 30 | |
#E96700, 5.000%, due 5/1/18 | | | 738 | | | | 794 | |
#E96962, 4.000%, due 6/1/18 | | | 123 | | | | 133 | |
#E01418, 4.000%, due 7/1/18 | | | 28 | | | | 30 | |
#E01411, 5.000%, due 7/1/18 | | | 143 | | | | 153 | |
#E01424, 4.000%, due 8/1/18 | | | 14 | | | | 15 | |
#E99160, 4.500%, due 9/1/18 | | | 139 | | | | 152 | |
#E99582, 5.000%, due 9/1/18 | | | 34 | | | | 37 | |
#E99659, 4.500%, due 10/1/18 | | | 192 | | | | 209 | |
#E01488, 5.000%, due 10/1/18 | | | 312 | | | | 334 | |
#E99895, 5.000%, due 10/1/18 | | | 637 | | | | 685 | |
#B11386, 5.000%, due 12/1/18 | | | 135 | | | | 145 | |
#B11362, 5.500%, due 12/1/18 | | | 20 | | | | 22 | |
#G13367, 5.500%, due 12/1/18 | | | 478 | | | | 515 | |
#E01545, 5.000%, due 1/1/19 | | | 169 | | | | 181 | |
#B12826, 4.500%, due 3/1/19 | | | 818 | | | | 880 | |
#G11766, 5.000%, due 3/1/19 | | | 119 | | | | 128 | |
#B13051, 4.500%, due 4/1/19 | | | 101 | | | | 110 | |
#B13143, 4.500%, due 4/1/19 | | | 495 | | | | 539 | |
#B14961, 4.500%, due 6/1/19 | | | 100 | | | | 109 | |
#B15141, 4.500%, due 6/1/19 | | | 107 | | | | 114 | |
#G11596, 5.500%, due 8/1/19 | | | 165 | | | | 179 | |
#G11605, 5.500%, due 9/1/19 | | | 79 | | | | 86 | |
#B17142, 4.500%, due 11/1/19 | | | 1,247 | | | | 1,355 | |
#B17161, 4.500%, due 11/1/19 | | | 36 | | | | 39 | |
|
U.S. Government and U.S. Government Agency—67.4%—(continued) | |
Federal Home Loan Mortgage Corp. (FHLMC)—(continued) | |
#G18045, 5.000%, due 3/1/20 | | $ | 133 | | | $ | 144 | |
#B19078, 5.000%, due 4/1/20 | | | 97 | | | | 105 | |
#G18048, 5.000%, due 4/1/20 | | | 92 | | | | 99 | |
#G11697, 5.500%, due 4/1/20 | | | 1,308 | | | | 1,423 | |
#J08152, 5.000%, due 5/1/20 | | | 105 | | | | 113 | |
#J02537, 5.000%, due 9/1/20 | | | 83 | | | | 90 | |
#G12394, 5.000%, due 5/1/21 | | | 171 | | | | 184 | |
#G13296, 5.000%, due 5/1/21 | | | 459 | | | | 494 | |
#G12113, 5.500%, due 5/1/21 | | | 234 | | | | 255 | |
#G12286, 5.000%, due 7/1/21 | | | 91 | | | | 98 | |
#G12432, 5.000%, due 12/1/21 | | | 77 | | | | 83 | |
#E02322, 5.500%, due 5/1/22 | | | 67 | | | | 73 | |
#J06484, 5.500%, due 11/1/22 | | | 525 | | | | 571 | |
#J06871, 5.500%, due 1/1/23 | | | 214 | | | | 233 | |
#J08703, 5.500%, due 9/1/23 | | | 91 | | | | 99 | |
#C00351, 8.000%, due 7/1/24 | | | 108 | | | | 129 | |
#G13695, 4.000%, due 9/1/24 | | | 1,530 | | | | 1,661 | |
#G00363, 8.000%, due 6/1/25 | | | 146 | | | | 176 | |
#J12853, 4.000%, due 8/1/25 | | | 224 | | | | 243 | |
#C80329, 8.000%, due 8/1/25 | | | 31 | | | | 38 | |
#J13022, 4.000%, due 9/1/25 | | | 2,837 | | | | 3,080 | |
#J14491, 4.000%, due 2/1/26 | | | 7,617 | | | | 8,357 | |
#G14150, 4.500%, due 4/1/26 | | | 3,677 | | | | 4,009 | |
#E02912, 5.000%, due 6/1/26 | | | 1,183 | | | | 1,278 | |
#J16051, 4.500%, due 7/1/26 | | | 4,488 | | | | 4,893 | |
#J19032, 3.500%, due 5/1/27 | | | 1,658 | | | | 1,798 | |
#G04053, 5.500%, due 3/1/38 | | | 3,194 | | | | 3,581 | |
#G04424, 6.000%, due 6/1/38 | | | 247 | | | | 273 | |
#G04778, 6.000%, due 7/1/38 | | | 225 | | | | 250 | |
#A81372, 6.000%, due 8/1/38 | | | 94 | | | | 103 | |
#G04544, 6.000%, due 8/1/38 | | | 1,446 | | | | 1,589 | |
#G04687, 6.000%, due 9/1/38 | | | 331 | | | | 365 | |
#G04745, 6.000%, due 9/1/38 | | | 180 | | | | 199 | |
#A81799, 6.500%, due 9/1/38 | | | 1,031 | | | | 1,171 | |
#G06017, 5.500%, due 6/1/40 | | | 2,785 | | | | 3,123 | |
| | | | | | | | |
Total FHLMC Mortgage Obligations | | | | | | | 48,301 | |
| | | | | | | | |
Federal National Mortgage Association (FNMA)—46.5% | |
#679220, 6.000%, due 12/1/14 | | | 14 | | | | 15 | |
#256224, 5.500%, due 4/1/16 | | | 22 | | | | 24 | |
#254181, 5.000%, due 1/1/17 | | | 68 | | | | 74 | |
#256559, 5.500%, due 1/1/17 | | | 12 | | | | 13 | |
#256606, 5.500%, due 2/1/17 | | | 16 | | | | 17 | |
#256646, 5.500%, due 3/1/17 | | | 13 | | | | 14 | |
#545862, 5.000%, due 8/1/17 | | | 68 | | | | 74 | |
#545898, 5.500%, due 9/1/17 | | | 369 | | | | 397 | |
#545899, 5.500%, due 9/1/17 | | | 413 | | | | 445 | |
#254510, 5.000%, due 11/1/17 | | | 63 | | | | 68 | |
#555029, 5.000%, due 11/1/17 | | | 50 | | | | 55 | |
#254545, 5.000%, due 12/1/17 | | | 28 | | | | 30 | |
#254590, 5.000%, due 1/1/18 | | | 32 | | | | 34 | |
#257067, 5.000%, due 1/1/18 | | | 72 | | | | 78 | |
#663692, 5.000%, due 1/1/18 | | | 154 | | | | 167 | |
#674713, 5.000%, due 1/1/18 | | | 12 | | | | 13 | |
#679305, 5.000%, due 1/1/18 | | | 56 | | | | 60 | |
#254591, 5.500%, due 1/1/18 | | | 281 | | | | 303 | |
#678938, 5.500%, due 2/1/18 | | | 28 | | | | 30 | |
#683100, 5.500%, due 2/1/18 | | | 366 | | | | 395 | |
#254684, 5.000%, due 3/1/18 | | | 20 | | | | 21 | |
See accompanying Notes to Portfolio of Investments.
December 31, 2012 | William Blair Funds 95 |
Low Duration Fund
Portfolio of Investments, December 31, 2012 (all dollar amounts in thousands)
| | | | | | | | |
Issuer | | Principal
Amount | | | Value | |
|
U.S. Government and U.S. Government Agency—67.4%—(continued) | |
Federal National Mortgage Association (FNMA)—(continued) | |
#675717, 5.000%, due 3/1/18 | | $ | 237 | | | $ | 258 | |
#681361, 5.000%, due 3/1/18 | | | 86 | | | | 94 | |
#656564, 5.000%, due 4/1/18 | | | 1,343 | | | | 1,459 | |
#696677, 5.000%, due 4/1/18 | | | 87 | | | | 95 | |
#702888, 5.000%, due 4/1/18 | | | 138 | | | | 150 | |
#695838, 5.500%, due 4/1/18 | | | 84 | | | | 90 | |
#254721, 5.000%, due 5/1/18 | | | 221 | | | | 240 | |
#697593, 5.000%, due 5/1/18 | | | 218 | | | | 234 | |
#702332, 5.000%, due 5/1/18 | | | 47 | | | | 51 | |
#704049, 5.500%, due 5/1/18 | | | 832 | | | | 895 | |
#735357, 5.500%, due 5/1/18 | | | 1,164 | | | | 1,253 | |
#656573, 5.000%, due 6/1/18 | | | 222 | | | | 245 | |
#709838, 5.000%, due 6/1/18 | | | 2,760 | | | | 3,008 | |
#709848, 5.000%, due 6/1/18 | | | 196 | | | | 216 | |
#728715, 5.000%, due 7/1/18 | | | 329 | | | | 359 | |
#735003, 5.500%, due 7/1/18 | | | 1,250 | | | | 1,346 | |
#711991, 5.000%, due 8/1/18 | | | 180 | | | | 199 | |
#190341, 5.000%, due 9/1/18 | | | 51 | | | | 56 | |
#743183, 5.000%, due 10/1/18 | | | 81 | | | | 89 | |
#555872, 5.000%, due 11/1/18 | | | 197 | | | | 214 | |
#749596, 5.000%, due 11/1/18 | | | 288 | | | | 317 | |
#745237, 5.000%, due 12/1/18 | | | 58 | | | | 63 | |
#753866, 6.000%, due 12/1/18 | | | 378 | | | | 416 | |
#761246, 5.000%, due 1/1/19 | | | 406 | | | | 448 | |
#761267, 4.500%, due 2/1/19 | | | 660 | | | | 727 | |
#255079, 5.000%, due 2/1/19 | | | 51 | | | | 56 | |
#766059, 5.500%, due 2/1/19 | | | 284 | | | | 311 | |
#766276, 5.000%, due 3/1/19 | | | 431 | | | | 471 | |
#742086, 4.500%, due 4/1/19 | | | 2,424 | | | | 2,671 | |
#779363, 5.000%, due 6/1/19 | | | 81 | | | | 89 | |
#785259, 5.000%, due 8/1/19 | | | 344 | | | | 376 | |
#788424, 5.500%, due 9/1/19 | | | 83 | | | | 91 | |
#725953, 5.000%, due 10/1/19 | | | 102 | | | | 112 | |
#735401, 5.500%, due 3/1/20 | | | 233 | | | | 251 | |
#357865, 5.000%, due 7/1/20 | | | 241 | | | | 263 | |
#357978, 5.000%, due 9/1/20 | | | 239 | | | | 263 | |
#745735, 5.000%, due 3/1/21 | | | 757 | | | | 827 | |
#879607, 5.500%, due 4/1/21 | | | 121 | | | | 133 | |
#831497, 6.000%, due 4/1/21 | | | 455 | | | | 501 | |
#880993, 6.000%, due 1/1/22 | | | 32 | | | | 36 | |
#972934, 5.500%, due 2/1/23 | | | 375 | | | | 406 | |
#889342, 5.000%, due 3/1/23 | | | 146 | | | | 159 | |
#982878, 4.500%, due 5/1/23 | | | 595 | | | | 655 | |
#254908, 5.000%, due 9/1/23 | | | 68 | | | | 74 | |
#AE0011, 5.500%, due 9/1/23 | | | 200 | | | | 216 | |
#255165, 4.500%, due 3/1/24 | | | 97 | | | | 106 | |
#934808, 4.500%, due 3/1/24 | | | 298 | | | | 325 | |
#AA4519, 4.500%, due 3/1/24 | | | 2,069 | | | | 2,280 | |
#AA2922, 4.000%, due 4/1/24 | | | 1,103 | | | | 1,215 | |
#AA5028, 4.500%, due 4/1/24 | | | 406 | | | | 447 | |
#190988, 9.000%, due 6/1/24 | | | 164 | | | | 191 | |
#993231, 4.000%, due 7/1/24 | | | 1,402 | | | | 1,544 | |
#AC1520, 4.000%, due 9/1/24 | | | 167 | | | | 183 | |
#AC3674, 4.500%, due 10/1/24 | | | 1,865 | | | | 2,054 | |
#AC5124, 4.000%, due 11/1/24 | | | 1,256 | | | | 1,383 | |
#AC6600, 4.500%, due 11/1/24 | | | 90 | | | | 99 | |
#AC6257, 4.000%, due 12/1/24 | | | 1,246 | | | | 1,372 | |
#AC8857, 4.500%, due 12/1/24 | | | 81 | | | | 88 | |
#AC9560, 5.000%, due 1/1/25 | | | 4,072 | | | | 4,485 | |
Issuer | | NRSRO
Rating
(unaudited) | | | Principal
Amount | | | Value | |
Federal National Mortgage Association (FNMA)—(continued) | |
#932449, 4.000%, due 2/1/25 | | | | | | $ | 498 | | | $ | 548 | |
#932629, 4.000%, due 3/1/25 | | | | | | | 544 | | | | 599 | |
#AD0855, 4.000%, due 3/1/25 | | | | | | | 411 | | | | 451 | |
#932723, 4.000%, due 4/1/25 | | | | | | | 600 | | | | 661 | |
#AD4073, 4.000%, due 5/1/25 | | | | | | | 206 | | | | 227 | |
#935995, 4.000%, due 6/1/25 | | | | | | | 202 | | | | 222 | |
#AD4677, 4.000%, due 6/1/25 | | | | | | | 2,059 | | | | 2,267 | |
#AD8164, 4.000%, due 8/1/25 | | | | | | | 4,363 | | | | 4,804 | |
#AE1176, 4.000%, due 8/1/25 | | | | | | | 835 | | | | 920 | |
#AB1459, 4.000%, due 9/1/25 | | | | | | | 413 | | | | 454 | |
#AD8190, 4.000%, due 9/1/25 | | | | | | | 1,856 | | | | 2,033 | |
#AH2671, 4.000%, due 1/1/26 | | | | | | | 1,559 | | | | 1,717 | |
#890329, 4.000%, due 4/1/26 | | | | | | | 3,489 | | | | 3,822 | |
#AI4856, 4.500%, due 6/1/26 | | | | | | | 3,325 | | | | 3,664 | |
#AI9811, 4.500%, due 8/1/26 | | | | | | | 2,869 | | | | 3,161 | |
#AH9564, 3.500%, due 9/1/26 | | | | | | | 4,647 | | | | 5,056 | |
#AB3497, 4.000%, due 9/1/26 | | | | | | | 2,045 | | | | 2,240 | |
#AB3608, 3.500%, due 10/1/26 | | | | | | | 4,735 | | | | 5,152 | |
#AI7363, 3.500%, due 10/1/26 | | | | | | | 1,208 | | | | 1,314 | |
#AJ2322, 3.500%, due 10/1/26 | | | | | | | 4,162 | | | | 4,528 | |
#AB3975, 3.500%, due 12/1/26 | | | | | | | 1,662 | | | | 1,808 | |
#AJ8149, 3.500%, due 12/1/26 | | | | | | | 3,362 | | | | 3,657 | |
#AJ7724, 4.000%, due 12/1/26 | | | | | | | 2,676 | | | | 2,946 | |
#AK0498, 3.500%, due 1/1/27 | | | | | | | 897 | | | | 976 | |
#AK2768, 3.500%, due 3/1/27 | | | | | | | 2,876 | | | | 3,129 | |
#AK7384, 4.000%, due 3/1/27 | | | | | | | 3,718 | | | | 4,094 | |
#AB4818, 4.000%, due 4/1/27 | | | | | | | 2,810 | | | | 3,095 | |
#AL2223, 3.000%, due 6/1/27 | | | | | | | 3,151 | | | | 3,385 | |
#AP0446, 3.500%, due 7/1/27 | | | | | | | 7,201 | | | | 7,835 | |
#AP0462, 3.500%, due 7/1/27 | | | | | | | 1,138 | | | | 1,238 | |
#AL2590, 4.000%, due 7/1/27 | | | | | | | 6,814 | | | | 7,503 | |
#AQ8404, 3.000%, due 12/1/27 | | | | | | | 3,112 | | | | 3,344 | |
#809926, 5.500%, due 2/1/35 | | | | | | | 237 | | | | 269 | |
#829306, 6.000%, due 9/1/35 | | | | | | | 144 | | | | 162 | |
#928574, 6.000%, due 7/1/37 | | | | | | | 282 | | | | 315 | |
#889385, 6.000%, due 2/1/38 | | | | | | | 1,750 | | | | 1,963 | |
#975649, 6.000%, due 7/1/38 | | | | | | | 381 | | | | 417 | |
#935532, 4.500%, due 8/1/39 | | | | | | | 108 | | | | 122 | |
#AC6651, 4.500%, due 12/1/39 | | | | | | | 136 | | | | 154 | |
#AL0913, 6.000%, due 7/1/41 | | | | | | | 4,065 | | | | 4,529 | |
| | | | | | | | | | | | |
Total FNMA Mortgage Obligations | | | | | | | | | | | 133,363 | |
| | | | | | | | | | | | |
| |
Asset-Backed Securities—10.9% | | | | | |
Mercedes-Benz Auto Receivables Trust, 2009-1, Tranche A3, 1.670%, 1/15/14 | | | AAA | | | | 19 | | | | 19 | |
Honda Auto Receivables Owner Trust, 2010-2, Tranche A3, 1.340%, 3/18/14 | | | Aaa | | | | 17 | | | | 17 | |
Hertz Vehicle Financing LLC—144A, 2009-2A, Tranche A1,
4.260%, 3/25/14 | | | Aaa | | | | 883 | | | | 887 | |
BMW Vehicle Owner Trust, 2010-A, Tranche A3, 1.390%, 4/25/14 | | | AAA | | | | 30 | | | | 30 | |
Ford Credit Auto Owner Trust, 2010-A, Tranche A3, 1.320%, 6/15/14 | | | AAA | | | | 50 | | | | 50 | |
See accompanying Notes to Portfolio of Investments.
96 Annual Report | December 31, 2012 |
Low Duration Fund
Portfolio of Investments, December 31, 2012 (all dollar amounts in thousands)
| | | | | | | | | | | | |
Issuer | | NRSRO
Rating
(unaudited) | | | Principal
Amount | | | Value | |
| |
Asset-Backed Securities—10.9%—(continued) | | | | | |
Nissan Auto Receivables Owner Trust, 2010-A, Tranche A3, 0.870%, 7/15/14 | | | Aaa | | | $ | 236 | | | $ | 236 | |
Nissan Master Owner Trust Receivables—144A, 2010-AA, Tranche A,
1.359%, 1/15/15, VRN | | | AAA | | | | 2,300 | | | | 2,301 | |
CarMax Auto Owner Trust, 2012-1, Tranche A2,
0.590%, 3/16/15 | | | AAA | | | | 675 | | | | 676 | |
CNH Equipment Trust, 2010-C, Tranche A3,
1.170%, 5/15/15 | | | AAA | | | | 194 | | | | 195 | |
Harley-Davidson Motorcycle Trust, 2011-2, Tranche A2,
0.710%, 5/15/15 | | | Aaa | | | | 863 | | | | 864 | |
FPL Recovery Funding LLC, 2007-A, Tranche A2,
5.044%, 8/1/15 | | | AAA | | | | 354 | | | | 359 | |
Bank of America Credit Card Trust, 2010-A1, Tranche A1,
0.509%, 9/15/15, VRN | | | AAA | | | | 2,215 | | | | 2,217 | |
Chase Issuance Trust, 2008-A13, Tranche A13,
1.808%, 9/15/15, VRN | | | AAA | | | | 100 | | | | 101 | |
Discover Card Master Trust I, 2010-A1, Tranche A1,
0.859%, 9/15/15, VRN | | | Aaa | | | | 447 | | | | 448 | |
Honda Auto Receivables Owner Trust, 2012-1, Tranche A3,
0.770%, 1/15/16 | | | AAA | | | | 1,000 | | | | 1,005 | |
Ford Credit Floorplan Master Owner Trust, 2011-1, Tranche A2,
0.809%, 2/15/16, VRN | | | AAA | | | | 1,250 | | | | 1,255 | |
Hertz Vehicle Financing LLC—144A, 2009-2A, Tranche A2,
5.290%, 3/25/16 | | | Aaa | | | | 2,350 | | | | 2,556 | |
CNH Equipment Trust, 2010-C, Tranche A4,
1.750%, 5/16/16 | | | AAA | | | | 60 | | | | 61 | |
Avis Budget Rental Car Funding AESOP LLC—144A, 2010-3A, Tranche A,
4.640%, 5/20/16 | | | Aaa | | | | 1,400 | | | | 1,514 | |
Centre Point Funding LLC—144A, 2010-1A, Tranche 1,
5.430%, 7/20/16 | | | A2 | | | | 1,352 | | | | 1,456 | |
CNH Equipment Trust, 2011-B,
Tranche A3,
0.910%, 8/15/16 | | | AAA | | | | 700 | | | | 703 | |
Discover Card Master Trust, 2011-A1, Tranche A1,
0.559%, 8/15/16, VRN | | | Aaa | | | | 1,400 | | | | 1,404 | |
Bank of America Credit Card Trust, 2007-A6, Tranche A6, 0.269%, 9/15/16, VRN | | | AAA | | | | 20 | | | | 20 | |
Enterprise Fleet Financing LLC—144A, 2011-2, Tranche A2,
1.430%, 10/20/16 | | | AAA | | | | 1,236 | | | | 1,239 | |
GE Capital Credit Card Master Note Trust, 2011-1, Tranche A, 0.759%, 1/15/17, VRN | | | Aaa | | | | 500 | | | | 503 | |
| |
Asset-Backed Securities—10.9%—(continued) | | | | | |
GE Dealer Floorplan Master Note Trust, 2012-1, Tranche A,
0.781%, 2/20/17, VRN | | | Aaa | | | $ | 1,250 | | | $ | 1, 256 | |
Bank of America Credit Card Trust, 2007-A15, Tranche A15, 0.559%, 4/17/17, VRN | | | AAA | | | | 100 | | | | 100 | |
Citibank Credit Card Issuance Trust, 2008-A6, Tranche A6, 1.411%, 5/22/17, VRN | | | AAA | | | | 200 | | | | 205 | |
Discover Card Master Trust, 2010-A2, Tranche A2, 0.789%, 3/15/18, VRN | | | AAA | | | | 350 | | | | 355 | |
Citibank Omni Master Trust—144A, 2009-A14A, Tranche A14, 2.959%, 8/15/18, VRN | | | Aaa | | | | 2,000 | | | | 2,081 | |
Capital One Multi-Asset Execution Trust, 2007-A2, Tranche A2, 0.289%, 12/16/19, VRN | | | AAA | | | | 215 | | | | 214 | |
MBNA Credit Card Master Note Trust, 2004-A3, Tranche A3, 0.469%, 8/16/21, VRN | | | AAA | | | | 475 | | | | 471 | |
SLM Student Loan Trust, 2008-5, Tranche A4, 2.015%, 7/25/23, VRN | | | Aaa | | | | 4,000 | | | | 4,222 | |
SLM Student Loan Trust—144A, 2011-A, Tranche A3,
2.709%, 1/15/43, VRN | | | AAA | | | | 2,000 | | | | 2,085 | |
| | | | | | | | | | | | |
Total Asset-Backed Securities | | | | | | | | | | | 31,105 | |
| | | | | | | | | | | | |
| | | |
Corporate Obligations—12.9% | | | | | | | | | | | | |
JPMorgan Chase & Co.,
1.116%, due 1/24/14, VRN | | | A+ | | | | 1,100 | | | | 1,107 | |
Morgan Stanley,
1.916%, due 1/24/14, VRN | | | A | | | | 1,000 | | | | 1,007 | |
Bank of America Corporation, 1.733%, due 1/30/14, VRN | | | A | | | | 1,000 | | | | 1,008 | |
Citigroup, Inc., 1.290%, due 4/1/14, VRN | | | A | | | | 1,000 | | | | 1,001 | |
Morgan Stanley, 6.000%, due 5/13/14 | | | A | | | | 1,300 | | | | 1,377 | |
The Goldman Sachs Group, Inc., 0.843%, due 1/12/15, VRN | | | A | | | | 1,000 | | | | 986 | |
General Dynamics Corporation, 1.375%, due 1/15/15 | | | A | | | | 1,325 | | | | 1,346 | |
The Goldman Sachs Group, Inc., 5.125%, due 1/15/15 | | | A | | | | 1,000 | | | | 1,074 | |
AT&T, Inc.,
0.875%, due 2/13/15 | | | A2 | | | | 1,000 | | | | 1,005 | |
Wells Fargo & Co., 1.250%, due 2/13/15 | | | AA- | | | | 2,250 | | | | 2,271 | |
Toyota Motor Credit Corporation, 1.000%, due 2/17/15 | | | AA- | | | | 1,000 | | | | 1,007 | |
The Bank of New York Mellon Corporation, 1.200%, due 2/20/15 | | | Aa3 | | | | 1,000 | | | | 1,011 | |
American International Group, Inc., 3.000%, due 3/20/15 | | | A- | | | | 1,150 | | | | 1,197 | |
JPMorgan Chase & Co.,
1.875%, due 3/20/15 | | | A+ | | | | 1,525 | | | | 1,552 | |
Bank of America Corporation, 4.500%, due 4/1/15 | | | A | | | | 2,000 | | | | 2,132 | |
The Goldman Sachs Group, Inc., 3.300%, due 5/3/15 | | | A | | | | 800 | | | | 834 | |
See accompanying Notes to Portfolio of Investments.
December 31, 2012 | William Blair Funds 97 |
Low Duration Fund
Portfolio of Investments, December 31, 2012 (all dollar amounts in thousands)
| | | | | | | | | | | | |
Issuer | | NRSRO
Rating
(unaudited) | | | Principal
Amount | | | Value | |
| |
Corporate Obligations—12.9%—(continued) | | | | | |
Citigroup, Inc., 4.700%, due 5/29/15 | | | A | | | $ | 1,300 | | | $ | 1,400 | |
John Deere Capital Corporation, 0.950%, due 6/29/15 | | | A | | | | 1,000 | | | | 1,006 | |
General Electric Capital Corporation, 1.625%, due 7/2/15 | | | AA+ | | | | 1,650 | | | | 1,677 | |
Anheuser-Busch InBev Worldwide, Inc., 0.800%, due 7/15/15 | | | A | | | | 300 | | | | 301 | |
Royal Bank of Scotland Group plc, 2.550%, due 9/18/15 | | | A | | | | 3,000 | | | | 3,070 | |
AbbVie, Inc.—144A, 1.200%, due 11/6/15 | | | A | | | | 1,250 | | | | 1,258 | |
Capital One Financial Corporation,
1.000%, due 11/6/15 | | | A- | | | | 3,000 | | | | 2,990 | |
American Express Centurion Bank, 0.875%, due 11/13/15 | | | A+ | | | | 1,000 | | | | 999 | |
Volkswagen International Finance N.V.—144A, 1.150%, due 11/20/15 | | | A- | | | | 1,500 | | | | 1,502 | |
AT&T, Inc., 0.800%, due 12/1/15 | | | A2 | | | | 2,000 | | | | 2,000 | |
McKesson Corporation,
0.950%, due 12/4/15 | | | A- | | | | 1,000 | | | | 1,001 | |
| | | | | | | | | | | | |
Total Corporate Obligations | | | | | | | | | | | 37,119 | |
| | | | | | | | | | | | |
Total Long-Term Investments—91.2%
(cost $259,259) | | | | 261,495 | |
| | | | | | | | | | | | |
Total Investments—91.2%
(cost $259,259) | | | | 261,495 | |
Cash and other assets, less liabilities—8.8% | | | | 25,335 | |
| | | | | | | | | | | | |
Net assets—100.0% | | | $ | 286,830 | |
| | | | | | | | | | | | |
NRSRO = Nationally Recognized Statistical Rating Organization—The credit quality ratings of the securities in the Fund reflect the highest category rating by either Fitch Ratings, Moody’s Investors Service Inc., or Standard & Poor’s, a division of the McGraw-Hill Companies, Inc. The obligations of certain U. S. Government-sponsored securities are neither issued nor guaranteed by the U. S. Treasury.
VRN = Variable Rate Note
See accompanying Notes to Portfolio of Investments.
98 Annual Report | December 31, 2012 |
Christopher T. Vincent

Kathleen M. Lynch
READY RESERVES FUND
AN OVERVIEW FROM THE PORTFOLIO MANAGERS
The William Blair Ready Reserves Fund posted a 0.01% return (Class N shares) for the year ended December 31, 2012. The Fund’s benchmark, the AAAm Rated Money Market Funds Average, also posted a 0.01% return.
The William Blair Ready Reserves Fund is managed with a focus on liquidity, quality and yield. The Fund manages overnight liquidity and one week liquidity in excess of the SEC’s Rule 2a-7 mandate, which requires 10% and 30% of total assets to be convertible into cash in one and five business days, respectively. We favor overnight repurchase agreements as these instruments are highly liquid and are backed by Treasuries, government agency debentures and government agency mortgage-backed securities. Furthermore, the offered yields on these instruments, although volatile, tend to be more attractive than other longer dated money market eligible securities. The Fund is also invested in individual securities such as Treasuries, government agency discount notes and bonds as well as high-quality corporate bonds and commercial paper. The Fund continues to maintain a relatively short average maturity. As of December 31, 2012, the Fund’s average maturity was 31 days, shorter than the maximum allowable average maturity of 60 days as specified by the SEC’s Rule 2a-7.
The Federal Open Market Committee’s (FOMC’s) position on monetary policy has become increasingly accommodative due to concerns over the pace of economic growth, job growth, and inflation. The FOMC announced several unconventional easing policies this year, and the FOMC remains committed to maintaining interest rates at low levels until the unemployment rate declines below 6.5%. As such, the target Fed Funds rate remains unchanged in the range of 0-0.25%, where it has been since December 2008. Therefore, we expect to continue to navigate through low interest rates as we believe that there is minimal probability that there will be a shift in monetary policy in the near-term. These conditions have a direct impact on yields of money market funds. Due to the extended low interest rate environment, many money market funds continue to waive fees in order to offer a positive return.
Our expectations for limited economic growth in the short to intermediate time frame is supported by our belief that unemployment levels are likely to remain high and the real estate market is likely to remain depressed. That said, we do not believe that the economy is at imminent risk of a “double-dip” recession.
On the regulatory front, money market fund reform continues to be aggressively debated. In August 2012, SEC Chairman Mary Schapiro announced that the SEC would not vote on money market fund reform proposals due to a lack of support from a majority of the SEC commissioners. Chairman Schapiro urged other policymakers, including the Financial Stability Oversight Council (FSOC), to consider addressing money market fund issues. In response to Chairman Schapiro’s failed attempt to implement additional money market fund reform, FSOC, under the authority of The Dodd-Frank Wall Street Reform and Consumer Protection Act (Dodd-Frank), put forth several reform proposals and requested comments from various market participants. Money market fund sponsors and investors have been extremely outspoken against additional reform. Participants are anxious for a resolution but the timing is unclear.
December 31, 2012 | William Blair Funds 99 |
Ready Reserves Fund
Performance Highlights (Unaudited)
The Fund’s 7 day yield on December 31, 2012 was 0.01%.
Average Annual Total Returns—Class N Shares year ended December 31, 2012.
| | | | | | | | | | | | | | | | |
| | | 1
year | | | 3
year | | | 5
year | | | 10
year | |
Class N | | | 0.01 | % | | | 0.01 | % | | | 0.47 | % | | | 1.55 | % |
AAA Rated Money Market Funds | | | 0.01 | | | | 0.02 | | | | 0.49 | | | | 1.52 | |
30 Day Treasury Bills | | | 0.05 | | | | 0.08 | | | | 0.33 | | | | 1.60 | |
Performance cited represents past performance. Past performance does not guarantee future results and current performance may be lower or higher than the data quoted. For the most current month-end performance information, please call 1-800-742-7272, or visit our Web site at www.williamblairfunds.com. Class N Shares are available to the general public without a sales load. Total return includes reinvestment of income. Yields fluctuate and are not guaranteed. An investment in the Fund is neither insured nor guaranteed by the Federal Deposit Insurance Corp. (FDIC) or any government agency. Although the Fund seeks to preserve the value of your investment at $1.00 per share, it is possible to lose money by investing in the Fund.
The AAA Rated Money Market Funds Average represents the average annual composite performance of all AAA rated First Tier Retail Money Market Funds listed by iMoneyNet data.
This report identifies the Fund’s investments on December 31, 2012. These holdings are subject to change. Not all fixed-income securities in the Fund performed the same, nor is there any guarantee that these fixed-income securities will perform as well in the future. Market forecasts provided in this report may not necessarily come to pass.
Sector Diversification (Unaudited)
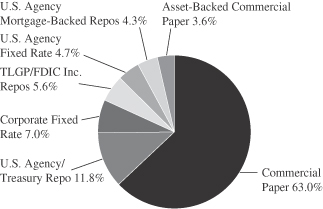
The sector diversification shown is based on the total Investments.
100 Annual Report | December 31, 2012 |
Ready Reserves Fund
Portfolio of Investments, December 31, 2012 (all dollar amounts in thousands)
| | | | | | | | |
Issuer | | Principal
Amount | | | Amortized
Cost | |
|
U.S. Government and U.S. Government Agency—7.6% | |
Federal Home Loan Mortgage Corp. (FHLMC)—0.9% | | | | | | | | |
Federal Home Loan Mortgage Corporation, 0.750%-4.500%, 1/9/13-6/12/13 | | $ | 14,041 | | | $ | 14,076 | |
| | | | | | | | |
Total Federal Home Loan Mortgage Corp. (FHLMC) | | | | | | | 14,076 | |
| | | | | | | | |
Federal National Mortgage Association (FNMA)—3.7% | | | | | | | | |
Federal National Mortgage Association, 0.500%-4.000%, 2/12/13-9/17/13 | | | 55,790 | | | | 56,047 | |
| | | | | | | | |
Total Federal National Mortgage Association (FNMA) | | | | | | | 56,047 | |
| | | | | | | | |
U.S. Treasury—3.0% | | | | | | | | |
U.S. Treasury Bill,
0.100%-0.110%, 5/30/13-6/6/13 | | | 30,000 | | | | 29,987 | |
U.S. Treasury Note,
0.625%-3.875%, 1/31/13-5/15/13 | | | 15,000 | | | | 15,088 | |
| | | | | | | | |
Total U.S. Treasury | | | | | | | 45,075 | |
| | | | | | | | |
| | |
Corporate Notes—5.9% | | | | | | | | |
Boeing Capital Corporation,
5.800%, 1/15/13 | | | 15,613 | | | | 15,645 | |
Boeing Co. (The),
5.125%, 2/15/13 | | | 1,975 | | | | 1,987 | |
Caterpillar Financial Services Corporation, 2.000%-4.900%, 2/8/13-8/15/13 | | | 13,203 | | | | 13,305 | |
General Electric Capital Corporation, 1.875%-5.450%, 1/15/13-9/16/13 | | | 11,949 | | | | 12,063 | |
International Business Machines Corporation, 1.000%-2.100%, 5/6/13-8/5/13 | | | 16,132 | | | | 16,213 | |
John Deere Capital Corporation,
1.875%-5.100%, 1/15/13-9/9/13 | | | 12,410 | | | | 12,625 | |
Merck & Co., Inc.,
4.375%, 2/15/13 | | | 2,000 | | | | 2,010 | |
Oracle Corporation,
4.950%, 4/15/13 | | | 300 | | | | 304 | |
PepsiCo, Inc.,
4.650%, 2/15/13 | | | 6,940 | | | | 6,977 | |
Praxair, Inc.,
3.950%, 6/1/13 | | | 775 | | | | 787 | |
Wal-Mart Stores, Inc.,
4.250%-4.550%, 4/15/13-5/1/13 | | | 7,506 | | | | 7,593 | |
| | | | | | | | |
Total Corporate Notes | | | | | | | 89,509 | |
| | | | | | | | |
| | |
Commercial Paper—64.9% | | | | | | | | |
Abbott Laboratories,
0.090%, 1/3/13 | | | 11,700 | | | | 11,700 | |
American Honda Finance Corporation, 0.120%-0.150%, 1/7/13-1/25/13 | | | 51,000 | | | | 50,997 | |
Caterpillar Financial Services Corporation, 0.150%-0.190%, 1/14/13-3/25/13 | | | 36,020 | | | | 36,012 | |
Chariot Funding LLC,
0.140%-0.190%, 1/3/13-2/14/13 | | | 55,200 | | | | 55,195 | |
Chevron Corporation,
0.100%-0.120%, 1/8/13-1/14/13 | | | 37,000 | | | | 36,999 | |
Coca-Cola Co.,
0.140%-0.200%, 1/9/13-4/17/13 | | | 39,000 | | | | 38,993 | |
| | |
Commercial Paper—(continued) | | | | | | | | |
Colgate Palmolive Co.,
0.080%-0.090%, 1/3/13-1/4/13 | | $ | 35,000 | | | $ | 35,000 | |
ConocoPhillips Qatar Funding, Ltd., 0.150%-0.160%, 1/18/13-3/19/13 | | | 40,000 | | | | 39,993 | |
Deere & Co.,
0.130%, 1/15/13 | | | 8,924 | | | | 8,923 | |
Dover Corporation,
0.100%-0.120%, 1/3/13-1/7/13 | | | 45,000 | | | | 45,000 | |
General Electric Capital Corporation, 0.030%-0.090%, 1/2/13-2/22/13 | | | 34,000 | | | | 33,999 | |
Illinois Tool Works, Inc.,
0.120%, 1/3/13-1/8/13 | | | 25,000 | | | | 24,999 | |
International Business Machines Corporation, 0.070%, 1/2/13-1/7/13 | | | 46,000 | | | | 46,000 | |
John Deere Credit, Ltd.,
0.120%-0.150%, 1/9/13-2/19/13 | | | 21,950 | | | | 21,948 | |
Johnson & Johnson,
0.060%, 1/7/13-1/11/13 | | | 35,000 | | | | 35,000 | |
Kimberly-Clark Corporation,
0.080%-0.100%, 1/7/13-1/14/13 | | | 55,700 | | | | 55,699 | |
Merck & Co., Inc.,
0.100%-0.130%, 1/9/13-1/17/13 | | | 47,000 | | | | 46,999 | |
PACCAR Financial Corporation,
0.130%-0.170%, 1/2/13-2/8/13 | | | 52,000 | | | | 51,997 | |
PepsiCo, Inc.,
0.050%-0.070%, 1/3/13-1/28/13 | | | 17,000 | | | | 16,999 | |
Pfizer, Inc.,
0.070%-0.080%, 1/10/13-1/11/13 | | | 20,000 | | | | 20,000 | |
Praxair, Inc.,
0.090%-0.110%, 1/3/13-1/10/13 | | | 15,000 | | | | 15,000 | |
Private Export Funding,
0.110%-0.160%, 1/22/13-1/30/13 | | | 22,300 | | | | 22,298 | |
Procter & Gamble Co. (The),
0.100%-0.160%, 1/17/13-3/7/13 | | | 50,000 | | | | 49,990 | |
Roche Holdings, Inc.,
0.100%, 1/7/13-1/15/13 | | | 40,000 | | | | 40,000 | |
Toyota Credit de Puerto Rico Corporation, 0.090%-0.200%, 1/2/13-2/22/13 | | | 35,000 | | | | 34,998 | |
Toyota Motor Credit Corporation,
0.110%, 1/2/13 | | | 10,000 | | | | 10,000 | |
Unilever Capital Corporation,
0.160%-0.330%, 1/17/13-2/4/13 | | | 15,000 | | | | 14,997 | |
Wal-Mart Stores, Inc.,
0.090%-0.100%, 1/4/13-2/5/13 | | | 44,000 | | | | 43,996 | |
Walt Disney Co. (The),
0.110%-0.150%, 1/18/13-3/28/13 | | | 39,000 | | | | 38,991 | |
| | | | | | | | |
Total Commercial Paper | | | | | | | 982,722 | |
| | | | | | | | |
| | |
Repurchase Agreements—21.7% | | | | | | | | |
Bank of America, 0.150% dated 12/31/12, due 1/2/13, repurchase price $65,001, Collateralized by FNMA, 4.000%, due 1/1/42 | | | 65,000 | | | | 65,000 | |
Barclays Capital, 0.200% dated 12/31/12, due 1/2/13, repurchase price $20,000, collateralized by U.S. Treasury Note, 2.125%, due 5/31/15 | | | 20,000 | | | | 20,000 | |
See accompanying Notes to Portfolio of Investments.
December 31, 2012 | William Blair Funds 101 |
Ready Reserves Fund
Portfolio of Investments, December 31, 2012 (all dollar amounts in thousands)
| | | | | | | | |
Issuer | | Principal
Amount | | | Amortized
Cost | |
| | |
Repurchase Agreements—(continued) | | | | | | | | |
Fixed Income Clearing Corporation, 0.110% dated 12/31/12, due 1/2/13, repurchase price $179,305, collateralized by FHLB, 5.500%, due 7/15/36, and FHLMC, 3.720%, due 2/27/32, and FNMA, 3.250%-3.300%, due 8/27/32-12/27/32 | | $ | 179,304 | | | $ | 179,304 | |
Goldman Sachs,
0.250% dated 12/31/12, due 1/2/13, repurchase price $65,001, Collateralized by FNMA, 3.500%-4.000%, due 2/1/18-10/1/40 | | | 65,000 | | | | 65,000 | |
| | | | | | | | |
Total Repurchase Agreements | | | | | | | 329,304 | |
| | | | | | | | |
Total Investments—100.1%
(cost $1,516,733) | | | | | | | 1,516,733 | |
Liabilities, plus cash and other
assets—(0.1)% | | | | | | | (1,403 | ) |
| | | | | | | | |
Net assets—100.0% | | | | | | $ | 1,515,330 | |
| | | | | | | | |
Portfolio Weighted Average Maturity | | | | | | | 31 days | |
VRN = Variable Rate Note
See accompanying Notes to Portfolio of Investments.
102 Annual Report | December 31, 2012 |
Statements of Assets and Liabilities
December 31, 2012 (all dollar amounts in thousands)
| | | | | | | | | | | | | | | | |
| | | Growth
Fund | | | Large Cap
Growth
Fund | | | Small Cap
Growth
Fund | | | Mid Cap
Growth
Fund | |
Assets | | | | | | | | | | | | | | | | |
Investments in securities, at cost | | $ | 593,406 | | | $ | 22,348 | | | $ | 356,134 | | | $ | 343,064 | |
| | | | | | | | | | | | | | | | |
Investments in securities, at value | | $ | 717,156 | | | $ | 28,368 | | | $ | 396,044 | | | $ | 369,788 | |
Receivable for securities sold | | | 3,370 | | | | — | | | | 5,294 | | | | 1,039 | |
Receivable for fund shares sold | | | 892 | | | | 77 | | | | 373 | | | | 429 | |
Receivable from Advisor | | | — | | | | 5 | | | | — | | | | 9 | |
Dividend and interest receivable | | | 183 | | | | 14 | | | | — | | | | 115 | |
| | | | | | | | | | | | | | | | |
Total assets | | | 721,601 | | | | 28,464 | | | | 401,711 | | | | 371,380 | |
Liabilities | | | | | | | | | | | | | | | | |
Payable for investment securities purchased | | | 3,626 | | | | — | | | | 2,850 | | | | — | |
Payable for fund shares redeemed | | | 1,048 | | | | — | | | | 1,250 | | | | 760 | |
Management fee payable | | | 433 | | | | 19 | | | | 535 | | | | 296 | |
Distribution and shareholder administration fees payable | | | 48 | | | | 1 | | | | 28 | | | | 9 | |
Other payables and accrued expenses | | | 201 | | | | 31 | | | | 235 | | | | 80 | |
| | | | | | | | | | | | | | | | |
Total liabilities | | | 5,356 | | | | 51 | | | | 4,898 | | | | 1,145 | |
| | | | | | | | | | | | | | | | |
Net Assets | | $ | 716,245 | | | $ | 28,413 | | | $ | 396,813 | | | $ | 370,235 | |
| | | | | | | | | | | | | | | | |
Capital | | | | | | | | | | | | | | | | |
Composition of Net Assets | | | | | | | | | | | | | | | | |
Par value of shares of beneficial interest | | | 58 | | | | 3 | | | | 16 | | | | 30 | |
Capital paid in excess of par value | | | 580,540 | | | | 23,473 | | | | 356,267 | | | | 344,328 | |
Accumulated net investment income (loss) | | | 8 | | | | — | | | | — | | | | — | |
Accumulated net realized gain (loss) | | | 11,889 | | | | (1,083 | ) | | | 620 | | | | (847 | ) |
Net unrealized appreciation (depreciation) of investments and foreign currencies . . . . . . . . . . . . . . . . . . . . .. | | | 123,750 | | | | 6,020 | | | | 39,910 | | | | 26,724 | |
| | | | | | | | | | | | | | | | |
Net Assets | | | 716,245 | | | | 28,413 | | | | 396,813 | | | | 370,235 | |
| | | | | | | | | | | | | | | | |
| | | | |
Class N Shares | | | | | | | | | | | | | | | | |
Net Assets | | $ | 248,121 | | | $ | 4,238 | | | $ | 130,382 | | | $ | 40,940 | |
Shares Outstanding | | | 20,593,188 | | | | 520,825 | | | | 5,507,405 | | | | 3,235,187 | |
Net Asset Value Per Share | | $ | 12.05 | | | $ | 8.14 | | | $ | 23.68 | | | $ | 12.65 | |
Class I Shares | | | | | | | | | | | | | | | | |
Net Assets | | $ | 468,124 | | | $ | 24,175 | | | $ | 266,431 | | | $ | 329,295 | |
Shares Outstanding | | | 37,199,616 | | | | 2,896,680 | | | | 10,806,479 | | | | 25,500,033 | |
Net Asset Value Per Share | | $ | 12.58 | | | $ | 8.35 | | | $ | 24.66 | | | $ | 12.91 | |
See accompanying Notes to Financial Statements.
December 31, 2012 | William Blair Funds 103 |
Statements of Operations
for the Year Ended December 31, 2012 (all dollar amounts in thousands)
| | | | | | | | | | | | | | | | |
| | | Growth
Fund | | | Large Cap
Growth
Fund | | | Small Cap
Growth
Fund | | | Mid Cap
Growth
Fund | |
Investment income | | | | | | | | | | | | | | | | |
Dividends | | $ | 7,344 | | | $ | 271 | | | $ | 2,741 | | | $ | 4,019 | |
Less foreign tax withheld | | | — | | | | (2 | ) | | | (10 | ) | | | — | |
Interest | | | 11 | | | | — | | | | 11 | | | | 9 | |
| | | | | | | | | | | | | | | | |
Total income | | | 7,355 | | | | 269 | | | | 2,742 | | | | 4,028 | |
Expenses | | | | | | | | | | | | | | | | |
Investment advisory fees | | | 4,727 | | | | 219 | | | | 5,538 | | | | 3,046 | |
Distribution fees | | | 521 | | | | 10 | | | | 416 | | | | 103 | |
Custodian fees | | | 21 | | | | 32 | | | | 39 | | | | 38 | |
Transfer agent fees | | | 162 | | | | 11 | | | | 112 | | | | 38 | |
Sub-transfer agent fees | | | | | | | | | | | | | | | | |
Class N | | | 282 | | | | 5 | | | | 214 | | | | 61 | |
Class I | | | 319 | | | | 10 | | | | 491 | | | | 137 | |
Professional fees | | | 58 | | | | 22 | | | | 54 | | | | 40 | |
Registration fees | | | 35 | | | | 32 | | | | 35 | | | | 32 | |
Shareholder reporting fees | | | 48 | | | | 4 | | | | 276 | | | | 64 | |
Trustee fees | | | 31 | | | | 1 | | | | 32 | | | | 10 | |
Other expenses | | | 28 | | | | 5 | | | | 27 | | | | 9 | |
| | | | | | | | | | | | | | | | |
Total expenses before waiver and reimbursements | | | 6,232 | | | | 351 | | | | 7,234 | | | | 3,578 | |
Expenses reimbursed to (waived or absorbed by) the Advisor | | | — | | | | (81 | ) | | | (508 | ) | | | (34 | ) |
| | | | | | | | | | | | | | | | |
Net expenses | | | 6,232 | | | | 270 | | | | 6,726 | | | | 3,544 | |
| | | | | | | | | | | | | | | | |
Net investment income (loss) | | | 1,123 | | | | (1 | ) | | | (3,984 | ) | | | 484 | |
Realized and unrealized gain (loss) | | | | | | | | | | | | | | | | |
Net realized gain (loss) on transactions from: | | | | | | | | | | | | | | | | |
Investments in securities | | | 29,181 | | | | 2,407 | | | | 71,506 | | | | 7,689 | |
| | | | | | | | | | | | | | | | |
Total net realized gain (loss) | | | 29,181 | | | | 2,407 | | | | 71,506 | | | | 7,689 | |
Change in net unrealized appreciation (depreciation) of: | | | | | | | | | | | | | | | | |
Investments | | | 60,237 | | | | 2,131 | | | | 18,864 | | | | 15,618 | |
| | | | | | | | | | | | | | | | |
Change in net unrealized appreciation (depreciation) | | | 60,237 | | | | 2,131 | | | | 18,864 | | | | 15,618 | |
| | | | | | | | | | | | | | | | |
Net increase (decrease) in net assets resulting from operations | | $ | 90,541 | | | $ | 4,537 | | | $ | 86,386 | | | $ | 23,791 | |
| | | | | | | | | | | | | | | | |
See accompanying Notes to Financial Statements.
104 Annual Report | December 31, 2012 |
Statements of Changes in Net Assets
for the Years Ended December 31, 2012 and 2011 (all dollar amounts in thousands)
| | | | | | | | | | | | | | | | | | | | | | | | | | | | | | | | |
| | | Growth
Fund | | | Large Cap
Growth
Fund | | | Small Cap
Growth
Fund | | | Mid Cap
Growth
Fund | |
| | | 2012 | | | 2011 | | | 2012 | | | 2011 | | | 2012 | | | 2011 | | | 2012 | | | 2011 | |
Operations | | | | | | | | | | | | | | | | | | | | | | | | | | | | | | | | |
Net investment income (loss) | | $ | 1,123 | | | $ | (886 | ) | | $ | (1 | ) | | $ | 21 | | | $ | (3,984 | ) | | $ | (7,875 | ) | | $ | 484 | | | $ | (573 | ) |
Net realized gain (loss) on investments | | | 29,181 | | | | 27,540 | | | | 2,407 | | | | 3,351 | | | | 71,506 | | | | 27,224 | | | | 7,689 | | | | 13,458 | |
Change in net unrealized appreciation (depreciation) on investments | | | 60,237 | | | | (38,002 | ) | | | 2,131 | | | | (4,038 | ) | | | 18,864 | | | | (110,707 | ) | | | 15,618 | | | | (12,060 | ) |
| | | | | | | | | | | | | | | | | | | | | | | | | | | | | | | | |
Net increase (decrease) in net assets resulting from operations | | | 90,541 | | | | (11,348 | ) | | | 4,537 | | | | (666 | ) | | | 86,386 | | | | (91,358 | ) | | | 23,791 | | | | 825 | |
Distributions to shareholders from | | | | | | | | | | | | | | | | | | | | | | | | | | | | | | | | |
Net investment income | | | | | | | | | | | | | | | | | | | | | | | | | | | | | | | | |
Class N | | | (10 | ) | | | — | | | | — | | | | — | | | | — | | | | — | | | | — | | | | — | |
Class I | | | (1,133 | ) | | | (329 | ) | | | — | | | | (37 | ) | | | — | | | | — | | | | (488 | ) | | | — | |
Net realized gain | | | | | | | | | | | | | | | | | | | | | | | | | | | | | | | | |
Class N | | | (7,281 | ) | | | (5,882 | ) | | | — | | | | — | | | | (564 | ) | | | — | | | | (905 | ) | | | (2,378 | ) |
Class I | | | (12,939 | ) | | | (10,199 | ) | | | — | | | | — | | | | (1,107 | ) | | | — | | | | (7,042 | ) | | | (8,679 | ) |
| | | | | | | | | | | | | | | | | | | | | | | | | | | | | | | | |
Total Distributions | | | (21,363 | ) | | | (16,410 | ) | | | — | | | | (37 | ) | | | (1,671 | ) | | | — | | | | (8,435 | ) | | | (11,057 | ) |
Capital stock transactions | | | | | | | | | | | | | | | | | | | | | | | | | | | | | | | | |
Net proceeds from sale of shares | | | 178,095 | | | | 134,130 | | | | 3,967 | | | | 4,139 | | | | 93,413 | | | | 123,447 | | | | 273,232 | | | | 88,823 | |
Shares issued in reinvestment of income dividends and capital gain distributions | | | 19,820 | | | | 14,916 | | | | — | | | | 32 | | | | 1,627 | | | | — | | | | 8,342 | | | | 10,898 | |
Less cost of shares redeemed | | | (117,590 | ) | | | (130,159 | ) | | | (5,040 | ) | | | (10,554 | ) | | | (337,680 | ) | | | (368,940 | ) | | | (72,449 | ) | | | (44,983 | ) |
| | | | | | | | | | | | | | | | | | | | | | | | | | | | | | | | |
Net increase (decrease) in net assets resulting from capital share transactions | | | 80,325 | | | | 18,887 | | | | (1,073 | ) | | | (6,383 | ) | | | (242,640 | ) | | | (245,493 | ) | | | 209,125 | | | | 54,738 | |
| | | | | | | | | | | | | | | | | | | | | | | | | | | | | | | | |
Increase (decrease) in net assets | | | 149,503 | | | | (8,871 | ) | | | 3,464 | | | | (7,086 | ) | | | (157,925 | ) | | | (336,851 | ) | | | 224,481 | | | | 44,506 | |
Net assets | | | | | | | | | | | | | | | | | | | | | | | | | | | | | | | | |
Beginning of year | | | 566,742 | | | | 575,613 | | | | 24,949 | | | | 32,035 | | | | 554,738 | | | | 891,589 | | | | 145,754 | | | | 101,248 | |
| | | | | | | | | | | | | | | | | | | | | | | | | | | | | | | | |
End of year | | $ | 716,245 | | | $ | 566,742 | | | $ | 28,413 | | | $ | 24,949 | | | $ | 396,813 | | | $ | 554,738 | | | $ | 370,235 | | | $ | 145,754 | |
| | | | | | | | | | | | | | | | | | | | | | | | | | | | | | | | |
Accumulated net investment income (loss) at the end of the year | | $ | 8 | | | $ | — | | | $ | — | | | $ | — | | | $ | — | | | $ | — | | | $ | — | | | $ | — | |
| | | | | | | | | | | | | | | | | | | | | | | | | | | | | | | | |
See accompanying Notes to Financial Statements.
December 31, 2012 | William Blair Funds 105 |
Statements of Assets and Liabilities
December 31, 2012 (all dollar amounts in thousands)
| | | | | | | | | | | | |
| | | Small-Mid Cap
Growth
Fund | | | Global
Leaders
Fund | | | International
Growth
Fund | |
Assets | | | | | | | | | | | | |
Investments in securities, at cost | | $ | 348,611 | | | $ | 55,268 | | | $ | 3,005,869 | |
Investment in affiliate, at cost | | | — | | | | — | | | | 22,022 | |
| | | | | | | | | | | | |
Investments in securities, at value | | $ | 387,808 | | | $ | 63,565 | | | $ | 3,641,031 | |
Investment in affiliate, at value | | | — | | | | — | | | | 22,022 | |
Cash | | | — | | | | — | | | | 886 | |
Foreign currency, at value (Cost $—; $—; $3,171) | | | — | | | | — | | | | 3,202 | |
Receivable for securities sold | | | 888 | | | | 7 | | | | 5,294 | |
Receivable for fund shares sold | | | 8,495 | | | | 10,023 | | | | 16,250 | |
Receivable from Advisor | | | 9 | | | | 12 | | | | — | |
Dividend and interest receivable | | | — | | | | 42 | | | | 4,308 | |
| | | | | | | | | | | | |
Total assets | | | 397,200 | | | | 73,649 | | | | 3,692,993 | |
Liabilities | | | | | | | | | | | | |
Payable for investment securities purchased | | | 4,813 | | | | 6,496 | | | | 8,833 | |
Payable for fund shares redeemed | | | 294 | | | | 39 | | | | 6,785 | |
Management fee payable | | | 433 | | | | 49 | | | | 3,103 | |
Distribution and shareholder administration fees payable | | | 9 | | | | 8 | | | | 268 | |
Other payables and accrued expenses | | | 291 | | | | 63 | | | | 1,371 | |
| | | | | | | | | | | | |
Total liabilities | | | 5,840 | | | | 6,655 | | | | 20,360 | |
| | | | | | | | | | | | |
Net Assets | | $ | 391,360 | | | $ | 66,994 | | | $ | 3,672,633 | |
| | | | | | | | | | | | |
Capital | | | | | | | | | | | | |
Composition of Net Assets | | | | | | | | | | | | |
Par value of shares of beneficial interest | | $ | 27 | | | $ | 7 | | | $ | 161 | |
Capital paid in excess of par value | | | 348,572 | | | | 72,738 | | | | 4,173,696 | |
Accumulated net investment income (loss) | | | — | | | | (7 | ) | | | (14,690 | ) |
Accumulated net realized gain (loss) | | | 3,564 | | | | (14,041 | ) | | | (1,122,026 | ) |
Net unrealized appreciation (depreciation) of investments and foreign currencies | | | 39,197 | | | | 8,297 | | | | 635,492 | |
| | | | | | | | | | | | |
Net Assets | | $ | 391,360 | | | $ | 66,994 | | | $ | 3,672,633 | |
| | | | | | | | | | | | |
| | | |
Class N Shares | | | | | | | | | | | | |
Net Assets | | $ | 42,015 | | | $ | 5,215 | | | $ | 1,269,736 | |
Shares Outstanding | | | 2,956,963 | | | | 549,967 | | | | 56,608,236 | |
Net Asset Value Per Share | | $ | 14.21 | | | $ | 9.47 | | | $ | 22.43 | |
Class I Shares | | | | | | | | | | | | |
Net Assets | | $ | 349,345 | | | $ | 45,757 | | | $ | 2,402,897 | |
Shares Outstanding | | | 24,001,491 | | | | 4,828,543 | | | | 104,730,039 | |
Net Asset Value Per Share | | $ | 14.55 | | | $ | 9.47 | | | $ | 22.94 | |
See accompanying Notes to Financial Statements.
106 Annual Report | December 31, 2012 |
Statements of Operations
for the Year Ended December 31, 2012 (all dollar amounts in thousands)
| | | | | | | | | | | | |
| | | Small-Mid Cap
Growth
Fund | | | Global
Leaders
Fund | | | International
Growth
Fund | |
Investment income | | | | | | | | | | | | |
Dividends | | $ | 5,410 | | | $ | 947 | | | $ | 100,432 | |
Less foreign tax withheld | | | (5 | ) | | | (52 | ) | | | (7,817 | ) |
Interest | | | 10 | | | | 1 | | | | 387 | |
| | | | | | | | | | | | |
Total income | | | 5,415 | | | | 896 | | | | 93,002 | |
Expenses | | | | | | | | | | | | |
Investment advisory fees | | | 3,462 | | | | 501 | | | | 35,031 | |
Distribution fees | | | 114 | | | | 12 | | | | 3,160 | |
Shareholder administration fees | | | — | | | | 75 | | | | — | |
Custodian fees | | | 43 | | | | 72 | | | | 599 | |
Transfer agent fees | | | 52 | | | | 19 | | | | 404 | |
Sub-transfer agent fees | | | | | | | | | | | | |
Class N | | | 69 | | | | 3 | | | | 1,466 | |
Class I | | | 375 | | | | 15 | | | | 1,885 | |
Professional fees | | | 35 | | | | 41 | | | | 300 | |
Registration fees | | | 47 | | | | 42 | | | | 75 | |
Shareholder reporting fees | | | 44 | | | | 7 | | | | 448 | |
Trustee fees | | | 14 | | | | 2 | | | | 196 | |
Other expenses | | | 14 | | | | 6 | | | | 163 | |
| | | | | | | | | | | | |
Total expenses before waiver | | | 4,269 | �� | | | 795 | | | | 43,727 | |
Expenses reimbursed to (waived or absorbed by) the Advisor | | | (334 | ) | | | (157 | ) | | | — | |
| | | | | | | | | | | | |
Net expenses | | | 3,935 | | | | 638 | | | | 43,727 | |
| | | | | | | | | | | | |
Net investment income (loss) | | | 1,480 | | | | 258 | | | | 49,275 | |
Realized and unrealized gain (loss) | | | | | | | | | | | | |
Net Realized gain (loss) on transactions from: | | | | | | | | | | | | |
Investments in securities | | | 11,592 | | | | 3,726 | | | | 89,404 | |
Forward foreign currency contracts | | | — | | | | — | | | | 20,690 | |
Foreign currency transactions | | | — | | | | (22 | ) | | | (4,674 | ) |
| | | | | | | | | | | | |
Total net realized gain (loss) | | | 11,592 | | | | 3,704 | | | | 105,420 | |
Change in net unrealized appreciation (depreciation) of: | | | | | | | | | | | | |
Investments | | | 22,741 | | | | 3,879 | | | | 578,479 | |
Forward foreign currency contracts | | | — | | | | — | | | | 1,799 | |
Foreign currency translations | | | — | | | | — | | | | 397 | |
| | | | | | | | | | | | |
Change in net unrealized appreciation (depreciation) | | | 22,741 | | | | 3,879 | | | | 580,675 | |
| | | | | | | | | | | | |
Net increase (decrease) in net assets resulting from operations | | $ | 35,813 | | | $ | 7,841 | | | $ | 735,370 | |
| | | | | | | | | | | | |
See accompanying Notes to Financial Statements.
December 31, 2012 | William Blair Funds 107 |
Statements of Changes in Net Assets
for the Years Ended December 31, 2012 and 2011 (all dollar amounts in thousands)
| | | | | | | | | | | | | | | | | | | | | | | | |
| | | Small-Mid Cap
Growth
Fund | | | Global
Leaders
Fund | | | International
Growth
Fund | |
| | | 2012 | | | 2011 | | | 2012 | | | 2011 | | | 2012 | | | 2011 | |
Operations | | | | | | | | | | | | | | | | | | | | | | | | |
Net investment income (loss) | | $ | 1,480 | | | $ | (1,387 | ) | | $ | 258 | | | $ | 225 | | | $ | 49,275 | | | $ | 56,294 | |
Net realized gain (loss) on investments, forwards, and foreign currency | | | 11,592 | | | | 27,339 | | | | 3,704 | | | | 4,570 | | | | 105,420 | | | | 347,948 | |
Change in net unrealized appreciation (depreciation) on investments, forwards, and foreign currency | | | 22,741 | | | | (27,537 | ) | | | 3,879 | | | | (6,320 | ) | | | 580,675 | | | | (971,769 | ) |
| | | | | | | | | | | | | | | | | | | | | | | | |
Net increase (decrease) in net assets resulting from operations | | | 35,813 | | | | (1,585 | ) | | | 7,841 | | | | (1,525 | ) | | | 735,370 | | | | (567,527 | ) |
Distributions to shareholders from | | | | | | | | | | | | | | | | | | | | | | | | |
Net investment income | | | | | | | | | | | | | | | | | | | | | | | | |
Class N | | | (61 | ) | | | — | | | | (15 | ) | | | (4 | ) | | | (37,353 | ) | | | — | |
Class I | | | (1,426 | ) | | | — | | | | (227 | ) | | | (170 | ) | | | (74,977 | ) | | | (6,046 | ) |
Net realized gain | | | | | | | | | | | | | | | | | | | | | | | | |
Class N | | | (1,028 | ) | | | (3,138 | ) | | | — | | | | — | | | | — | | | | — | |
Class I | | | (8,102 | ) | | | (19,875 | ) | | | — | | | | — | | | | — | | | | — | |
| | | | | | | | | | | | | | | | | | | | | | | | |
Total Distributions | | | (10,617 | ) | | | (23,013 | ) | | | (242 | ) | | | (174 | ) | | | (112,330 | ) | | | (6,046 | ) |
Capital stock transactions | | | | | | | | | | | | | | | | | | | | | | | | |
Net proceeds from sale of shares | | | 188,047 | | | | 85,339 | | | | 32,763 | | | | 3,738 | | | | 673,026 | | | | 756,415 | |
Shares issued in reinvestment of income dividends and capital gain distributions | | | 9,387 | | | | 20,564 | | | | 234 | | | | 166 | | | | 103,180 | | | | 5,030 | |
Less cost of shares redeemed | | | (84,867 | ) | | | (35,773 | ) | | | (16,176 | ) | | | (4,508 | ) | | | (955,515 | ) | | | (2,041,149 | ) |
| | | | | | | | | | | | | | | | | | | | | | | | |
Net increase (decrease) in net assets resulting from capital share transactions | | | 112,567 | | | | 70,130 | | | | 16,821 | | | | (604 | ) | | | (179,309 | ) | | | (1,279,704 | ) |
| | | | | | | | | | | | | | | | | | | | | | | | |
Increase (decrease) in net assets | | | 137,763 | | | | 45,532 | | | | 24,420 | | | | (2,303 | ) | | | 443,731 | | | | (1,853,277 | ) |
Net assets | | | | | | | | | | | | | | | | | | | | | | | | |
Beginning of year | | | 253,597 | | | | 208,065 | | | | 42,574 | | | | 44,877 | | | | 3,228,902 | | | | 5,082,179 | |
| | | | | | | | | | | | | | | | | | | | | | | | |
End of year | | $ | 391,360 | | | $ | 253,597 | | | $ | 66,994 | | | $ | 42,574 | | | $ | 3,672,633 | | | $ | 3,228,902 | |
| | | | | | | | | | | | | | | | | | | | | | | | |
Accumulated net investment income (loss) at the end of the year | | $ | — | | | $ | — | | | $ | (7 | ) | | $ | (3 | ) | | $ | (14,690 | ) | | $ | 27,949 | |
| | | | | | | | | | | | | | | | | | | | | | | | |
See accompanying Notes to Financial Statements.
108 Annual Report | December 31, 2012 |
Statements of Assets and Liabilities
December 31, 2012 (all dollar amounts in thousands)
| | | | | | | | | | | | |
| | | International
Equity Fund | | | International
Leaders Fund | | | International
Small Cap
Growth Fund | |
Assets | | | | | | | | | | | | |
Investments in securities, at cost | | $ | 57,147 | | | $ | 9,420 | | | $ | 611,156 | |
| | | | | | | | | | | | |
| | | |
Investments in securities, at value | | $ | 69,596 | | | $ | 10,132 | | | $ | 716,924 | |
Foreign currency, at value (Cost $63 ; $8 ;$2,085) | | | 63 | | | | 8 | | | | 2,086 | |
Receivable for securities sold | | | 843 | | | | 1 | | | | 4,361 | |
Receivable for fund shares sold | | | 1 | | | | 305 | | | | 774 | |
Receivable from Advisor | | | 4 | | | | 7 | | | | — | |
Dividend and interest receivable | | | 59 | | | | 2 | | | | 401 | |
| | | | | | | | | | | | |
Total assets | | | 70,566 | | | | 10,455 | | | | 724,546 | |
Liabilities | | | | | | | | | | | | |
Payable for investment securities purchased | | | — | | | | 241 | | | | 3,141 | |
Payable for fund shares redeemed | | | 2 | | | | — | | | | 1,064 | |
Payable to custodian | | | 239 | | | | — | | | | — | |
Management fee payable | | | 65 | | | | 8 | | | | 605 | |
Distribution and shareholder administration fees payable | | | 1 | | | | 1 | | | | 50 | |
Other payables and accrued expenses | | | 75 | | | | 41 | | | | 178 | |
| | | | | | | | | | | | |
Total liabilities | | | 382 | | | | 291 | | | | 5,038 | |
| | | | | | | | | | | | |
Net Assets | | $ | 70,184 | | | $ | 10,164 | | | $ | 719,508 | |
| | | | | | | | | | | | |
Capital | | | | | | | | | | | | |
Composition of Net Assets | | | | | | | | | | | | |
Par value of shares of beneficial interest | | $ | 6 | | | $ | 1 | | | $ | 53 | |
Capital paid in excess of par value | | | 150,126 | | | | 9,558 | | | | 673,078 | |
Accumulated net investment income (loss) | | | (126 | ) | | | (3 | ) | | | (1,792 | ) |
Accumulated net realized gain (loss) | | | (92,267 | ) | | | (104 | ) | | | (57,594 | ) |
Net unrealized appreciation (depreciation) of investments and foreign currencies | | | 12,445 | | | | 712 | | | | 105,763 | |
| | | | | | | | | | | | |
Net Assets | | $ | 70,184 | | | $ | 10,164 | | | $ | 719,508 | |
| | | | | | | | | | | | |
| | | |
Class N Shares | | | | | | | | | | | | |
Net Assets | | $ | 5,648 | | | $ | 542 | | | $ | 14,771 | |
Shares Outstanding | | | 468,835 | | | | 50,101 | | | | 1,097,146 | |
Net Asset Value Per Share | | $ | 12.05 | | | $ | 10.81 | | | $ | 13.46 | |
Class I Shares | | | | | | | | | | | | |
Net Assets | | $ | 64,536 | | | $ | 4,336 | | | $ | 359,557 | |
Shares Outstanding | | | 5,299,357 | | | | 401,086 | | | | 26,470,513 | |
Net Asset Value Per Share | | $ | 12.18 | | | $ | 10.81 | | | $ | 13.58 | |
See accompanying Notes to Financial Statements.
December 31, 2012 | William Blair Funds 109 |
Statements of Operations
for the Year Ended December 31, 2012 (all dollar amounts in thousands)
| | | | | | | | | | | | |
| | | International
Equity Fund | | | International
Leaders
Fund (a) | | | International
Small Cap
Growth
Fund | |
Investment income | | | | | | | | | | | | |
Dividends | | $ | 1,778 | | | $ | 30 | | | $ | 16,759 | |
Less foreign tax withheld | | | (131 | ) | | | (1 | ) | | | (1,245 | ) |
Interest | | | 1 | | | | — | | | | 128 | |
| | | | | | | | | | | | |
Total income | | | 1,648 | | | | 29 | | | | 15,642 | |
Expenses | | | | | | | | | | | | |
Investment advisory fees | | | 763 | | | | 22 | | | | 6,995 | |
Distribution fees | | | 16 | | | | — | | | | 38 | |
Shareholder administration fees | | | — | | | | 2 | | | | 566 | |
Custodian fees | | | 77 | | | | 22 | | | | 201 | |
Transfer agent fees | | | 6 | | | | 5 | | | | 38 | |
Sub-transfer agent fee | | | | | | | | | | | | |
Class N | | | 7 | | | | — | | | | 20 | |
Class I | | | 50 | | | | — | | | | 266 | |
Professional fees | | | 54 | | | | 27 | | | | 98 | |
Registration fees | | | 32 | | | | 4 | | | | 41 | |
Shareholder reporting fees | | | — | | | | — | | | | 99 | |
Trustee fees | | | 5 | | | | — | | | | 36 | |
Other expenses | | | 5 | | | | 1 | | | | 27 | |
| | | | | | | | | | | | |
Total expenses before waiver | | | 1,015 | | | | 83 | | | | 8,425 | |
Expenses reimbursed to (waived or absorbed by) the Advisor | | | (166 | ) | | | (57 | ) | | | — | |
| | | | | | | | | | | | |
Net expenses | | | 849 | | | | 26 | | | | 8,425 | |
| | | | | | | | | | | | |
Net investment income (loss) | | | 799 | | | | 3 | | | | 7,217 | |
Realized and unrealized gain (loss) | | | | | | | | | | | | |
Net realized gain (loss) on transactions from: | | | | | | | | | | | | |
Investments in securities | | | 2,124 | | | | (104 | ) | | | 7,787 | |
Forward foreign currency contracts | | | (46 | ) | | | 9 | | | | 1,901 | |
Foreign currency transactions | | | (37 | ) | | | 1 | | | | (397 | ) |
| | | | | | | | | | | | |
Total net realized gain (loss) | | | 2,041 | | | | (94 | ) | | | 9,291 | |
Change in net unrealized appreciation (depreciation) of: | | | | | | | | | | | | |
Investments | | | 8,566 | | | | 712 | | | | 125,451 | |
Forward foreign currency contracts | | | — | | | | — | | | | 311 | |
Foreign currency translations | | | 3 | | | | — | | | | 231 | |
| | | | | | | | | | | | |
Change in net unrealized appreciation (depreciation) | | | 8,569 | | | | 712 | | | | 125,993 | |
| | | | | | | | | | | | |
Net increase (decrease) in net assets resulting from operations | | $ | 11,409 | | | $ | 621 | | | $ | 142,501 | |
| | | | | | | | | | | | |
| (a) | | For the period from August 16, 2012 (Commencement of Operations) to December 31, 2012. |
See accompanying Notes to Financial Statements.
110 Annual Report | December 31, 2012 |
Statements of Changes in Net Assets
for the Years Ended December 31, 2012 and 2011 (all dollar amounts in thousands)
| | | | | | | | | | | | | | | | | | | | |
| | | International
Equity Fund | | | International
Leaders Fund | | | International
Small Cap
Growth Fund | |
| | | 2012 | | | 2011 | | | 2012(a) | | | 2012 | | | 2011 | |
Operations | | | | | | | | | | | | | | | | | | | | |
Net investment income (loss) | | $ | 799 | | | $ | 1,890 | | | $ | 3 | | | $ | 7,217 | | | $ | 6,857 | |
Net realized gain (loss) on investments, forwards, and foreign currency | | | 2,041 | | | | 22,846 | | | | (94 | ) | | | 9,291 | | | | 60,435 | |
Change in net unrealized appreciation (depreciation) on investments, forwards, and foreign currency | | | 8,569 | | | | (36,134 | ) | | | 712 | | | | 125,993 | | | | (155,577 | ) |
| | | | | | | | | | | | | | | | | | | | |
Net increase (decrease) in net assets resulting from operations | | | 11,409 | | | | (11,398 | ) | | | 621 | | | | 142,501 | | | | (88,285 | ) |
Distributions to shareholders from | | | | | | | | | | | | | | | | | | | | |
Net investment income | | | | | | | | | | | | | | | | | | | | |
Class N | | | (172 | ) | | | — | | | | — | | | | (274 | ) | | | (193 | ) |
Class I | | | (2,061 | ) | | | — | | | | (6 | ) | | | (7,774 | ) | | | (5,147 | ) |
Class Institutional | | | — | | | | — | | | | (10 | ) | | | (8,146 | ) | | | (5,384 | ) |
| | | | | | | | | | | | | | | | | | | | |
Total Distributions | | | (2,233 | ) | | | — | | | | (16 | ) | | | (16,194 | ) | | | (10,724 | ) |
Capital stock transactions | | | | | | | | | | | | | | | | | | | | |
Net proceeds from sale of shares | | | 3,288 | | | | 26,832 | | | | 9,543 | | | | 122,084 | | | | 313,989 | |
Shares issued in reinvestment of income dividends and capital gain distributions | | | 1,945 | | | | — | | | | 16 | | | | 14,490 | | | | 8,514 | |
Less cost of shares redeemed | | | (19,882 | ) | | | (117,832 | ) | | | — | | | | (261,594 | ) | | | (152,224 | ) |
| | | | | | | | | | | | | | | | | | | | |
Net increase (decrease) in net assets resulting from capital share transactions | | | (14,649 | ) | | | (91,000 | ) | | | 9,559 | | | | (125,020 | ) | | | 170,279 | |
| | | | | |
| | | | | | | | | | | | | | | | | | | | |
Increase (decrease) in net assets | | | (5,473 | ) | | | (102,398 | ) | | | 10,164 | | | | 1,287 | | | | 71,270 | |
Net assets | | | | | | | | | | | | | | | | | | | | |
Beginning of year | | | 75,657 | | | | 178,055 | | | | — | | | | 718,221 | | | | 646,951 | |
| | | | | | | | | | | | | | | | | | | | |
End of year | | $ | 70,184 | | | $ | 75,657 | | | $ | 10,164 | | | $ | 719,508 | | | $ | 718,221 | |
| | | | | | | | | | | | | | | | | | | | |
Accumulated net investment income (loss) at the end of the year | | $ | (126 | ) | | $ | 1,379 | | | $ | (3 | ) | | $ | (1,792 | ) | | $ | 4,542 | |
| | | | | | | | | | | | | | | | | | | | |
| (a) | For the period from August 16, 2012 (Commencement of Operations) to December 31, 2012. |
See accompanying Notes to Financial Statements.
December 31, 2012 | William Blair Funds 111 |
Statements of Assets and Liabilities
December 31, 2012 (all dollar amounts in thousands)
| | | | | | | | | | | | |
| | | Emerging
Markets
Growth
Fund | | | Emerging
Markets
Leaders
Fund | | | Emerging
Markets
Small Cap
Growth Fund | |
Assets | | | | | | | | | | | | |
Investments in securities, at cost . . . . . . . . . . . . . . . . . . . . . . . . . . . . . . . | | $ | 781,190 | | | $ | 60,490 | | | $ | 25,817 | |
Investments in affiliate, at cost | | | 23,624 | | | | — | | | | — | |
| | | | | | | | | | | | |
| | | |
Investments in securities, at value . . . . . . . . . . . . . . . . . . . . . . . . . . . . . . | | $ | 934,200 | | | $ | 70,624 | | | $ | 27,656 | |
Investments in affiliate, at value | | | 23,624 | | | | — | | | | — | |
Cash . . . . . . . . . . . . . . . . . . . . . . . . . . . . . . . . . . . . . . . . . . . . . . . . . . . | | | — | | | | — | | | | 12 | |
Foreign currency, at value (cost $1,679; $5; $93) | | | 1,680 | | | | 5 | | | | 93 | |
Receivable for securities sold . . . . . . . . . . . . . . . . . . . . . . . . . . . . . . . . . | | | 9,380 | | | | — | | | | 311 | |
Receivable for fund shares sold . . . . . . . . . . . . . . . . . . . . . . . . . . . . . . . . . . . . . . | | | 5,660 | | | | 13 | | | | 1,239 | |
Receivable from Advisor . . . . . . . . . . . . . . . . . . . . . . . . . . . . . . . . . . . . . . . . | | | — | | | | 11 | | | | 25 | |
Dividend and interest receivable . . . . . . . . . . . . . . . . . . . . . . . . . . . . . . . . . | | | 662 | | | | 40 | | | | 10 | |
| | | | | | | | | | | | |
Total assets . . . . . . . . . . . . . . . . . . . . . . . . . . . . . . . . . . . . . . . . | | | 975,206 | | | | 70,693 | | | | 29,346 | |
Liabilities | | | | | | | | | | | | |
Payable for investment securities purchased . . . . . . . . . . . . . . . . . . . . . | | | 7,788 | | | | 1,563 | | | | 2,214 | |
Payable for fund shares redeemed . . . . . . . . . . . . . . . . . . . . . . . . . . . . . | | | 242 | | | | — | | | | — | |
Management fee payable . . . . . . . . . . . . . . . . . . . . . . . . . . . . . . . . . . . . . . . . | | | 870 | | | | 60 | | | | 14 | |
Distribution and shareholder administration fees payable. . . . . . . . . . | | | 24 | | | | 3 | | | | 2 | |
Foreign income tax payable | | | 1,738 | | | | — | | | | 29 | |
Other payables and accrued expenses . . . . . . . . . . . . . . . . . . . . . . . . . . . . . . . . . . . . . . . .. | | | 307 | | | | 88 | | | | 66 | |
| | | | | | | | | | | | |
Total liabilities . . . . . . . . . . . . . . . . . . . . . . . . . . . . . . . . . . . . . . . . | | | 10,969 | | | | 1,714 | | | | 2,325 | |
| | | | | | | | | | | | |
Net Assets . . . . . . . . . . . . . . . . . . . . . . . . . . . . . . . . . . . . . . . . | | $ | 964,237 | | | $ | 68,979 | | | $ | 27,021 | |
| | | | | | | | | | | | |
Capital | | | | | | | | | | | | |
Composition of Net Assets | | | | | | | | | | | | |
Par value of shares of beneficial interest . . . . . . . . . . . . . . . . . . . . . . . . | | $ | 71 | | | $ | 8 | | | $ | 2 | |
Capital paid in excess of par value . . . . . . . . . . . . . . . . . . . . . . . . . . . . | | | 852,556 | | | | 63,868 | | | | 25,269 | |
Accumulated net investment income (loss) . . . . . . . . . . . . . . . . . . . . . | | | (2,280 | ) | | | (44 | ) | | | (59 | ) |
Accumulated realized gain (loss) . . . . . . . . . . . . . . . . . . . . . . . . . . . . . | | | (37,394 | ) | | | (4,987 | ) | | | (4 | ) |
Net unrealized appreciation (depreciation) of investments and foreign currencies | | | 151,284 | | | | 10,134 | | | | 1,813 | |
| | | | | | | | | | | | |
Net Assets . . . . . . . . . . . . . . . . . . . . . . . . . . . . . . . . . . . . . . . . | | $ | 964,237 | | | $ | 68,979 | | | $ | 27,021 | |
| | | | | | | | | | | | |
| | | |
Class N Shares | | | | | | | | | | | | |
Net Assets . . . . . . . . . . . . . . . . . . . . . . . . . . . . . . . . . . . . . . . . . . . . . . . | | $ | 16,724 | | | $ | 249 | | | $ | 3,016 | |
Shares Outstanding . . . . . . . . . . . . . . . . . . . . . . . . . . . . . . . . . . . . . . . . . . | | | 1,248,048 | | | | 27,027 | | | | 232,133 | |
Net Asset Value Per Share . . . . . . . . . . . . . . . . . . . . . . . . . . . . . . . . . . . . . . . . . | | $ | 13.40 | | | $ | 9.20 | | | $ | 12.99 | |
Class I Shares | | | | | | | | | | | | |
Net Assets . . . . . . . . . . . . . . . . . . . . . . . . . . . . . . . . . . . . . . . . . . . . . . . | | $ | 144,942 | | | $ | 25,628 | | | $ | 8,763 | |
Shares Outstanding . . . . . . . . . . . . . . . . . . . . . . . . . . . . . . . . . . . . . . . . . . | | | 10,733,551 | | | | 2,791,568 | | | | 674,405 | |
Net Asset Value Per Share . . . . . . . . . . . . . . . . . . . . . . . . . . . . . . . . . . . . . . . . . | | $ | 13.50 | | | $ | 9.18 | | | $ | 12.99 | |
See accompanying Notes to Financial Statements.
112 Annual Report | December 31, 2012 |
Statements of Operations
for the Year Ended December 31, 2012 (all dollar amounts in thousands)
| | | | | | | | | | | | |
| | | Emerging
Markets
Growth Fund | | | Emerging
Markets
Leaders Fund | | | Emerging
Markets
Small Cap
Growth Fund | |
Investment income | | | | | | | | | | | | |
Dividends . . . . . . . . . . . . . . . . . . . . . . . . . . . . . . . . . . . . . . . . . | | | 24,475 | | | | 1,364 | | | | 160 | |
Less foreign tax withheld . | | | (2,200 | ) | | | (113 | ) | | | (17 | ) |
Interest . . . . . . . . . . . . . . . . . . . . . . . . . . . . . . . . . . . . . . . . . . . . . . . . . . . . . . . . . . .. | | | 208 | | | | 1 | | | | — | |
| | | | | | | | | | | | |
Total income | | | 22,483 | | | | 1,252 | | | | 143 | |
Expenses | | | | | | | | | | | | |
Investment advisory fees | | | 10,670 | | | | 631 | | | | 78 | |
Distribution fees | | | 44 | | | | — | | | | 5 | |
Shareholder administration fees | | | 232 | | | | 37 | | | | 10 | |
Custodian fees | | | 578 | | | | 121 | | | | 105 | |
Transfer agent fees | | | 49 | | | | 21 | | | | 7 | |
Sub-transfer agent fee | | | | | | | | | | | | |
Class N | | | 15 | | | | — | | | | — | |
Class I | | | 70 | | | | 1 | | | | — | |
Professional fees | | | 165 | | | | 71 | | | | 55 | |
Registration fees | | | 50 | | | | 52 | | | | 38 | |
Shareholder reporting fees | | | 72 | | | | 4 | | | | 5 | |
Trustee fees | | | 50 | | | | 4 | | | | — | |
Other expenses | | | 42 | | | | 12 | | | | 6 | |
| | | | | | | | | | | | |
Total expenses before waiver and reimbursements | | | 12,037 | | | | 954 | | | | 309 | |
Expenses reimbursed to (waived or absorbed by) the Advisor | | | — | | | | (198 | ) | | | (205 | ) |
| | | | | | | | | | | | |
Net expenses | | | 12,037 | | | | 756 | | | | 104 | |
| | | | | | | | | | | | |
Net investment income (loss) | | | 10,446 | | | | 496 | | | | 39 | |
Realized and unrealized gain (loss) | | | | | | | | | | | | |
Net realized gain (loss) on transactions from: | | | | | | | | | | | | |
Investments in securities. | | | (9,098 | ) | | | (2,337 | ) | | | 54 | |
Foreign currency transactions . . . . . . . . . . . . . . . . . . . . . . . . . . . . . . . . | | | (1,371 | ) | | | (53 | ) | | | (6 | ) |
| | | | | | | | | | | | |
Total net realized gain (loss). . . . . . . . . . . . . . . . . . . . . . . . . . . . . . . . . . . | | | (10,469 | ) | | | (2,390 | ) | | | 48 | |
Change in net unrealized appreciation (depreciation) of: | | | | | | | | | | | | |
Investments . . . . . . . . . . . . . . . . . . . . . . . . . . . . . . . . . . . . . . . . . . . . . | | | 172,004 | | | | 12,648 | | | | 1,856 | |
Foreign currency translations . . . . . . . . . . . . . . . . . . . . . . . . . . . . . . . . | | | (1,409 | ) | | | 45 | | | | (25 | ) |
| | | | | | | | | | | | |
Change in net unrealized appreciation (depreciation) | | | 170,595 | | | | 12,693 | | | | 1,831 | |
| | | | | | | | | | | | |
Net increase (decrease) in net assets resulting from operations | | | 170,572 | | | | 10,799 | | | | 1,918 | |
| | | | | | | | | | | | |
See accompanying Notes to Financial Statements.
December 31, 2012 | William Blair Funds 113 |
Statements of Changes in Net Assets
for the Years Ended December 31, 2012 and 2011 (all dollar amounts in thousands)
| | | | | | | | | | | | | | | | | | | | | | | | |
| | | Emerging Markets
Growth Fund | | | Emerging Markets
Leaders Fund | | | Emerging
Markets Small
Cap
Growth Fund | |
| | | 2012 | | | 2011 | | | 2012 | | | 2011 | | | 2012 | | | 2011(a) | |
Operations | | | | | | | | | | | | | | | | | | | | | | | | |
Net investment income (loss) | | $ | 10,446 | | | $ | 8,885 | | | $ | 496 | | | $ | 701 | | | $ | 39 | | | $ | 2 | |
Net realized gain (loss) on investments and foreign currency | | | (10,469 | ) | | | 127,536 | | | | (2,390 | ) | | | 112 | | | | 48 | | | | (75 | ) |
Change in net unrealized appreciation (depreciation) on investments, and foreign currency | | | 170,595 | | | | (304,105 | ) | | | 12,693 | | | | (20,181 | ) | | | 1,831 | | | | (17 | ) |
| | | | | | | | | | | | | | | | | | | | | | | | |
Net increase (decrease) in net assets resulting from operations | | | 170,572 | | | | (167,684 | ) | | | 10,799 | | | | (19,368 | ) | | | 1,918 | | | | (90 | ) |
Distributions to shareholders from | | | | | | | | | | | | | | | | | | | | | | | | |
Net investment income | | | | | | | | | | | | | | | | | | | | | | | | |
Class N | | | (88 | ) | | | — | | | | (1 | ) | | | — | | | | (13 | ) | | | — | |
Class I | | | (1,209 | ) | | | (466 | ) | | | (169 | ) | | | (126 | ) | | | (65 | ) | | | — | |
Class Institutional | | | (7,965 | ) | | | (3,984 | ) | | | (303 | ) | | | (181 | ) | | | — | | | | — | |
Net realized gain | | | | | | | | | | | | | | | | | | | | | | | | |
Class N | | | — | | | | (2,577 | ) | | | — | | | | (3 | ) | | | — | | | | — | |
Class I | | | — | | | | (18,690 | ) | | | — | | | | (1,745 | ) | | | — | | | | — | |
Class Institutional | | | — | | | | (93,763 | ) | | | — | | | | (1,956 | ) | | | — | | | | — | |
Return of capital | | | | | | | | | | | | | | | | | | | | | | | | |
Class I | | | — | | | | — | | | | — | | | | (11 | ) | | | — | | | | — | |
Class Institutional | | | — | | | | — | | | | — | | | | (14 | ) | | | — | | | | — | |
| | | | | | | | | | | | | | | | | | | | | | | | |
Total Distributions | | | (9,262 | ) | | | (119,480 | ) | | | (473 | ) | | | (4,036 | ) | | | (78 | ) | | | — | |
Capital stock transactions | | | | | | | | | | | | | | | | | | | | | | | | |
Net proceeds from sale of shares | | | 260,741 | | | | 352,369 | | | | 29,723 | | | | 19,857 | | | | 25,035 | | | | 3,362 | |
Shares issued in reinvestment of income dividends and capital gain distributions | | | 8,174 | | | | 100,061 | | | | 413 | | | | 3,491 | | | | 52 | | | | — | |
Less cost of shares redeemed | | | (283,834 | ) | | | (597,963 | ) | | | (19,305 | ) | | | (47,023 | ) | | | (3,178 | ) | | | — | |
| | | | | | | | | | | | | | | | | | | | | | | | |
Net increase (decrease) in net assets resulting from capital share transactions | | | (14,919 | ) | | | (145,533 | ) | | | 10,831 | | | | (23,675 | ) | | | 21,909 | | | | 3,362 | |
| | | | | | | | | | | | | | | | | | | | | | | | |
Increase (decrease) in net assets | | | 146,391 | | | | (432,697 | ) | | | 21,157 | | | | (47,079 | ) | | | 23,749 | | | | 3,272 | |
Net assets | | | | | | | | | | | | | | | | | | | | | | | | |
Beginning of year | | | 817,846 | | | | 1,250,543 | | | | 47,822 | | | | 94,901 | | | | 3,272 | | | | — | |
| | | | | | | | | | | | | | | | | | | | | | | | |
End of year | | $ | 964,237 | | | $ | 817,846 | | | $ | 68,979 | | | $ | 47,822 | | | $ | 27,021 | | | $ | 3,272 | |
| | | | | | | | | | | | | | | | | | | | | | | | |
Accumulated net investment income (loss) at the end of the year | | $ | (2,280 | ) | | $ | (1,953 | ) | | $ | (44 | ) | | $ | (14 | ) | | $ | (59 | ) | | $ | (13 | ) |
| | | | | | | | | | | | | | | | | | | | | | | | |
| (a) | | For the period ended from October 24, 2011 (Commencement of Operations) to December 31, 2011. |
See accompanying Notes to Financial Statements.
114 Annual Report | December 31, 2012 |
Statements of Assets and Liabilities
December 31, 2012 (all dollar amounts in thousands)
| | | | | | | | | | | | | | | | |
| | | Large Cap
Value
Fund | | | Small Cap
Value
Fund | | | Mid Cap
Value
Fund | | | Small-Mid Cap
Value
Fund | |
Assets | | | | | | | | | | | | | | | | |
Investments in securities, at cost | | $ | 3,392 | | | $ | 209,113 | | | $ | 3,633 | | | $ | 2,163 | |
| | | | | | | | | | | | | | | | |
| | | | |
Investments in securities, at value | | $ | 3,800 | | | $ | 238,250 | | | $ | 4,107 | | | $ | 2,407 | |
Cash | | | 56 | | | | — | | | | 53 | | | | — | |
Receivable for fund shares sold | | | — | | | | 399 | | | | — | | | | — | |
Receivable from Advisor | | | 15 | | | | 32 | | | | 9 | | | | 21 | |
Dividend and interest receivable | | | 5 | | | | 99 | | | | 5 | | | | 2 | |
| | | | | | | | | | | | | | | | |
Total assets | | | 3,876 | | | | 238,780 | | | | 4,174 | | | | 2,430 | |
Liabilities | | | | | | | | | | | | | | | | |
Payable for fund shares redeemed | | | — | | | | 3,162 | | | | 10 | | | | — | |
Management fee payable | | | 3 | | | | 220 | | | | 3 | | | | 2 | |
Distribution and shareholder administration fees payable | | | — | | | | 9 | | | | — | | | | — | |
Other payables and accrued expenses | | | 28 | | | | 121 | | | | 24 | | | | 36 | |
| | | | | | | | | | | | | | | | |
Total liabilities | | | 31 | | | | 3,512 | | | | 37 | | | | 38 | |
| | | | | | | | | | | | | | | | |
Net Assets | | $ | 3,845 | | | $ | 235,268 | | | $ | 4,137 | | | $ | 2,392 | |
| | | | | | | | | | | | | | | | |
Capital | | | | | | | | | | | | | | | | |
Composition of Net Assets | | | | | | | | | | | | | | | | |
Par value of shares of beneficial interest | | $ | — | | | $ | 17 | | | $ | — | | | $ | — | |
Capital paid in excess of par value | | | 3,436 | | | | 206,849 | | | | 3,652 | | | | 2,126 | |
Accumulated net investment income (loss) | | | — | | | | 97 | | | | 1 | | | | — | |
Accumulated net realized gain (loss) | | | 1 | | | | (832 | ) | | | 10 | | | | 22 | |
Net unrealized appreciation (depreciation) of investments and foreign currencies | | | 408 | | | | 29,137 | | | | 474 | | | | 244 | |
| | | | | | | | | | | | | | | | |
Net Assets | | $ | 3,845 | | | $ | 235,268 | | | $ | 4,137 | | | $ | 2,392 | |
| | | | | | | | | | | | | | | | |
| | | | |
Class N Shares | | | | | | | | | | | | | | | | |
Net Assets | | $ | 1,416 | | | $ | 39,084 | | | $ | 79 | | | $ | 950 | |
Shares Outstanding | | | 122,651 | | | | 2,863,527 | | | | 6,948 | | | | 84,173 | |
Net Asset Value Per Share | | $ | 11.54 | | | $ | 13.65 | | | $ | 11.39 | | | $ | 11.29 | |
Class I Shares | | | | | | | | | | | | | | | | |
Net Assets | | $ | 2,429 | | | $ | 196,184 | | | $ | 4,058 | | | $ | 1,442 | |
Shares Outstanding | | | 210,312 | | | | 14,130,986 | | | | 356,231 | | | | 127,705 | |
Net Asset Value Per Share | | $ | 11.55 | | | $ | 13.88 | | | $ | 11.39 | | | $ | 11.29 | |
See accompanying Notes to Financial Statements.
December 31, 2012 | William Blair Funds 115 |
Statements of Operations
for the Year Ended December 31, 2012 (all dollar amounts in thousands)
| | | | | | | | | | | | | | | | |
| | | Large Cap
Value
Fund | | | Small Cap
Value
Fund | | | Mid Cap
Value
Fund | | | Small-Mid
Cap Value
Fund | |
Investment income | | | | | | | | | | | | | | | | |
Dividends | | | 70 | | | | 5,041 | | | | 92 | | | | 50 | |
Interest | | | — | | | | 4 | | | | — | | | | — | |
| | | | | | | | | | | | | | | | |
Total income | | | 70 | | | | 5,045 | | | | 92 | | | | 50 | |
Expenses | | | | | | | | | | | | | | | | |
Investment advisory fees | | | 26 | | | | 2,663 | | | | 45 | | | | 23 | |
Distribution fees | | | 3 | | | | 107 | | | | — | | | | 2 | |
Custodian fees | | | 39 | | | | 36 | | | | 36 | | | | 47 | |
Transfer agent fees | | | 6 | | | | 46 | | | | 7 | | | | 7 | |
Sub-transfer agent fee | | | | | | | | | | | | | | | | |
Class N | | | — | | | | 66 | | | | — | | | | 3 | |
Class I | | | — | | | | 198 | | | | — | | | | 2 | |
Professional fees | | | 24 | | | | 38 | | | | 25 | | | | 24 | |
Registration fees | | | 28 | | | | 41 | | | | 29 | | | | 23 | |
Shareholder reporting fees | | | 3 | | | | 46 | | | | 1 | | | | — | |
Trustee fees | | | — | | | | 12 | | | | — | | | | — | |
Other expenses | | | 5 | | | | 13 | | | | 8 | | | | 11 | |
| | | | | | | | | | | | | | | | |
Total expenses before waiver and reimbursements | | | 134 | | | | 3,266 | | | | 151 | | | | 142 | |
Expenses reimbursed to (waived or absorbed by) the Advisor | | | (101 | ) | | | (294 | ) | | | (98 | ) | | | (112 | ) |
| | | | | | | | | | | | | | | | |
Net expenses | | | 33 | | | | 2,972 | | | | 53 | | | | 30 | |
| | | | | | | | | | | | | | | | |
Net investment income (loss) | | | 37 | | | | 2,073 | | | | 39 | | | | 20 | |
Realized and unrealized gain (loss) | | | | | | | | | | | | | | | | |
Net realized gain (loss) on transactions from: | | | | | | | | | | | | | | | | |
Investments in securities | | | 5 | | | | 6,771 | | | | 186 | | | | 93 | |
| | | | | | | | | | | | | | | | |
Total net realized gain (loss) | | | 5 | | | | 6,771 | | | | 186 | | | | 93 | |
Change in net unrealized appreciation (depreciation) of: | | | | | | | | | | | | | | | | |
Investments | | | 415 | | | | 19,569 | | | | 377 | | | | 150 | |
| | | | | | | | | | | | | | | | |
Change in net unrealized appreciation (depreciation) | | | 415 | | | | 19,569 | | | | 377 | | | | 150 | |
| | | | | | | | | | | | | | | | |
Net increase (decrease) in net assets resulting from operations | | | 457 | | | | 28,413 | | | | 602 | | | | 263 | |
| | | | | | | | | | | | | | | | |
See accompanying Notes to Financial Statements.
116 Annual Report | December 31, 2012 |
Statements of Changes in Net Assets
for the Years Ended December 31, 2012 and 2011 (all dollar amounts in thousands)
| | | | | | | | | | | | | | | | | | | | | | | | | | | | | | | | |
| | | Large Cap
Value
Fund | | | Small Cap
Value
Fund | | | Mid Cap
Value
Fund | | | Small-Mid
Cap Value
Fund | |
| | | 2012 | | | 2011 (a) | | | 2012 | | | 2011 | | | 2012 | | | 2011 | | | 2012 | | | 2011 (b) | |
Operations | | | | | | | | | | | | | | | | | | | | | | | | | | | | | | | | |
Net investment income (loss) | | $ | 37 | | | $ | 7 | | | $ | 2,073 | | | $ | 440 | | | $ | 39 | | | $ | 46 | | | $ | 20 | | | $ | 1 | |
Net realized gain (loss) on investments | | | 5 | | | | (4 | ) | | | 6,771 | | | | 890 | | | | 186 | | | | 40 | | | | 93 | | | | (3 | ) |
Change in net unrealized appreciation (depreciation) on investments | | | 415 | | | | (7 | ) | | | 19,569 | | | | (16,890 | ) | | | 377 | | | | (92 | ) | | | 150 | | | | 94 | |
| | | | | | | | | | | | | | | | | | | | | | | | | | | | | | | | |
Net increase (decrease) in net assets resulting from operations | | | 457 | | | | (4 | ) | | | 28,413 | | | | (15,560 | ) | | | 602 | | | | (6 | ) | | | 263 | | | | 92 | |
Distributions to shareholders from | | | | | | | | | | | | | | | | | | | | | | | | | | | | | | | | |
Net investment income | | | | | | | | | | | | | | | | | | | | | | | | | | | | | | | | |
Class N | | | (12 | ) | | | (3 | ) | | | (256 | ) | | | (23 | ) | | | (1 | ) | | | (1 | ) | | | (7 | ) | | | — | |
Class I | | | (25 | ) | | | (4 | ) | | | (1,734 | ) | | | (466 | ) | | | (35 | ) | | | (47 | ) | | | (14 | ) | | | — | |
Net realized gain | | | | | | | | | | | | | | | | | | | | | | | | | | | | | | | | |
Class N | | | — | | | | — | | | | (164 | ) | | | (1,471 | ) | | | (3 | ) | | | (1 | ) | | | (27 | ) | | | — | |
Class I | | | — | | | | — | | | | (782 | ) | | | (6,717 | ) | | | (148 | ) | | | (50 | ) | | | (41 | ) | | | — | |
Return of capital | | | | | | | | | | | | | | | | | | | | | | | | | | | | | | | | |
Class N | | | — | | | | — | | | | — | | | | (60 | ) | | | — | | | | — | | | | — | | | | — | |
Class I | | | — | | | | — | | | | — | | | | (273 | ) | | | — | | | | — | | | | — | | | | — | |
| | | | | | | | | | | | | | | | | | | | | | | | | | | | | | | | |
Total Distributions | | | (37 | ) | | | (7 | ) | | | (2,936 | ) | | | (9,010 | ) | | | (187 | ) | | | (99 | ) | | | (89 | ) | | | — | |
Capital stock transactions | | | | | | | | | | | | | | | | | | | | | | | | | | | | | | | | |
Net proceeds from sale of shares | | | 957 | | | | 2,457 | | | | 47,641 | | | | 162,792 | | | | 303 | | | | 1,698 | | | | 72 | | | | 2,064 | |
Shares issued in reinvestment of income dividends and capital gain distributions | | | 15 | | | | 7 | | | | 2,750 | | | | 8,075 | | | | 158 | | | | 85 | | | | 20 | | | | — | |
Less cost of shares redeemed | | | — | | | | — | | | | (71,998 | ) | | | (79,398 | ) | | | (1,312 | ) | | | (498 | ) | | | (30 | ) | | | — | |
| | | | | | | | | | | | | | | | | | | | | | | | | | | | | | | | |
Net increase (decrease) in net assets resulting from capital share transactions | | | 972 | | | | 2,464 | | | | (21,607 | ) | | | 91,469 | | | | (851 | ) | | | 1,285 | | | | 62 | | | | 2,064 | |
| | | | | | | | | | | | | | | | | | | | | | | | | | | | | | | | |
Increase (decrease) in net assets | | | 1,392 | | | | 2,453 | | | | 3,870 | | | | 66,899 | | | | (436 | ) | | | 1,180 | | | | 236 | | | | 2,156 | |
Net assets | | | | | | | | | | | | | | | | | | | | | | | | | | | | | | | | |
Beginning of year | | | 2,453 | | | | — | | | | 231,398 | | | | 164,499 | | | | 4,573 | | | | 3,393 | | | | 2,156 | | | | — | |
| | | | | | | | | | | | | | | | | | | | | | | | | | | | | | | | |
End of year | | $ | 3,845 | | | $ | 2,453 | | | $ | 235,268 | | | $ | 231,398 | | | $ | 4,137 | | | $ | 4,573 | | | $ | 2,392 | | | $ | 2,156 | |
| | | | | | | | | | | | | | | | | | | | | | | | | | | | | | | | |
Accumulated net investment income (loss) at the end of the year | | $ | — | | | $ | — | | | $ | 97 | | | $ | 25 | | | $ | 1 | | | $ | — | | | $ | — | | | $ | 1 | |
| | | | | | | | | | | | | | | | | | | | | | | | | | | | | | | | |
| (a) | | For the period from October 24, 2011 (Commencement of Operations) to December 31, 2011. |
| (b) | | For the period from December 15, 2011 (Commencement of Operations) to December 31, 2011. |
See accompanying Notes to Financial Statements.
December 31, 2012 | William Blair Funds 117 |
Statements of Assets and Liabilities
December 31, 2012 (all dollar amounts in thousands)
| | | | | | | | | | | | | | | | |
| | | Bond Fund | | | Income
Fund | | | Low
Duration
Fund | | | Ready
Reserves
Fund | |
Assets | | | | | | | | | | | | | | | | |
Investments in securities, at cost | | $ | 272,411 | | | $ | 134,376 | | | $ | 259,259 | | | $ | 1,187,429 | |
Repurchase agreements, at cost | | | — | | | | — | | | | — | | | | 329,304 | |
| | | | | | | | | | | | | | | | |
| | | | |
Investments in securities, at value | | $ | 293,824 | | | $ | 140,686 | | | $ | 261,495 | | | $ | 1,187,429 | |
Repurchase agreements, at value | | | — | | | | — | | | | — | | | | 329,304 | |
Cash | | | — | | | | 6 | | | | — | | | | — | |
Receivable for fund shares sold | | | 733 | | | | 596 | | | | 26,188 | | | | — | |
Receivable from Advisor | | | 21 | | | | — | | | | 20 | | | | 717 | |
Dividend and interest receivable | | | 2,588 | | | | 910 | | | | 896 | | | | 1,730 | |
| | | | | | | | | | | | | | | | |
Total assets | | | 297,166 | | | | 142,198 | | | | 288,599 | | | | 1,519,180 | |
Liabilities | | | | | | | | | | | | | | | | |
Payable for investment securities purchased | | | — | | | | — | | | | 1,213 | | | | 3,087 | |
Payable for fund shares redeemed | | | 141 | | | | 257 | | | | 30 | | | | 3 | |
Payable to custodian | | | — | | | | — | | | | 323 | | | | — | |
Management fee payable | | | 71 | | | | 48 | | | | 60 | | | | 286 | |
Distribution and shareholder administration fees payable | | | 28 | | | | 8 | | | | 19 | | | | 409 | |
Shareholder distributions payable | | | 121 | | | | 44 | | | | 76 | | | | 2 | |
Other payables and accrued expenses | | | 63 | | | | 64 | | | | 48 | | | | 63 | |
| | | | | | | | | | | | | | | | |
Total liabilities | | | 424 | | | | 421 | | | | 1,769 | | | | 3,850 | |
| | | | | | | | | | | | | | | | |
Net Assets | | $ | 296,742 | | | $ | 141,777 | | | $ | 286,830 | | | $ | 1,515,330 | |
| | | | | | | | | | | | | | | | |
Capital | | | | | | | | | | | | | | | | |
Composition of Net Assets | | | | | | | | | | | | | | | | |
Par value of shares of beneficial interest | | | 27 | | | | 15 | | | | 29 | | | | 1,515 | |
Capital paid in excess of par value | | | 273,907 | | | | 171,215 | | | | 289,373 | | | | 1,513,724 | |
Accumulated net investment income (loss) | | | 2 | | | | — | | | | — | | | | 112 | |
Accumulated net realized gain (loss) | | | 1,393 | | | | (35,763 | ) | | | (4,808 | ) | | | (21 | ) |
Net unrealized appreciation (depreciation) of investments and foreign currencies | | | 21,413 | | | | 6,310 | | | | 2,236 | | | | — | |
| | | | | | | | | | | | | | | | |
Net Assets | | | 296,742 | | | | 141,777 | | | | 286,830 | | | | 1,515,330 | |
| | | | | | | | | | | | | | | | |
| | | | |
Class N Shares | | | | | | | | | | | | | | | | |
Net Assets | | $ | 32,867 | | | $ | 68,947 | | | $ | 11,216 | | | $ | 1,515,330 | |
Shares Outstanding | | | 2,912,746 | | | | 7,219,490 | | | | 1,141,105 | | | | 1,515,330,408 | |
Net Asset Value Per Share | | $ | 11.28 | | | $ | 9.55 | | | $ | 9.83 | | | $ | 1.00 | |
Class I Shares | | | | | | | | | | | | | | | | |
Net Assets | | $ | 172,836 | | | $ | 72,830 | | | $ | 157,213 | | | | | |
Shares Outstanding | | | 15,468,274 | | | | 7,683,605 | | | | 15,997,262 | | | | | |
Net Asset Value Per Share | | $ | 11.17 | | | $ | 9.48 | | | $ | 9.83 | | | | | |
See accompanying Notes to Financial Statements.
118 Annual Report | December 31, 2012 |
Statements of Operations
for the Year Ended December 31, 2012 (all dollar amounts in thousands)
| | | | | | | | | | | | | | | | |
| | | Bond
Fund | | | Income
Fund | | | Low
Duration
Fund | | | Ready
Reserves
Fund | |
Investment income | | | | | | | | | | | | | | | | |
Interest | | $ | 10,566 | | | $ | 4,277 | | | $ | 4,030 | | | $ | 1,915 | |
| | | | | | | | | | | | | | | | |
Total income | | | 10,566 | | | | 4,277 | | | | 4,030 | | | | 1,915 | |
Expenses | | | | | | | | | | | | | | | | |
Investment advisory fees | | | 803 | | | | 533 | | | | 583 | | | | 3,131 | |
Distribution fees | | | 36 | | | | 85 | | | | 13 | | | | — | |
Shareholder administration fees | | | 280 | | | | — | | | | 170 | | | | 4,579 | |
Custodian fees | | | 59 | | | | 55 | | | | 71 | | | | 43 | |
Transfer agent fees | | | 35 | | | | 40 | | | | 27 | | | | 37 | |
Sub-transfer agent fee | | | | | | | | | | | | | | | | |
Class N | | | 32 | | | | 72 | | | | 2 | | | | — | |
Class I | | | 53 | | | | 16 | | | | 4 | | | | — | |
Professional fees | | | 33 | | | | 16 | | | | 38 | | | | 108 | |
Registration fees | | | 44 | | | | 37 | | | | 57 | | | | 22 | |
Shareholder reporting fees | | | 14 | | | | 17 | | | | 5 | | | | 87 | |
Trustee fees | | | 12 | | | | 6 | | | | 8 | | | | 64 | |
Other expenses | | | 15 | | | | 7 | | | | 12 | | | | 56 | |
| | | | | | | | | | | | | | | | |
Total expenses before waiver | | | 1,416 | | | | 884 | | | | 990 | | | | 8,127 | |
Expenses reimbursed to (waived or absorbed by) the Advisor | | | (162 | ) | | | — | | | | (31 | ) | | | (6,343 | ) |
| | | | | | | | | | | | | | | | |
Net expenses | | | 1,254 | | | | 884 | | | | 959 | | | | 1,784 | |
| | | | | | | | | | | | | | | | |
Net investment income (loss) | | | 9,312 | | | | 3,393 | | | | 3,071 | | | | 131 | |
Realized and unrealized gain (loss) | | | | | | | | | | | | | | | | |
Net realized gain (loss) on transactions from: | | | | | | | | | | | | | | | | |
Investments in securities | | | 4,348 | | | | 2,712 | | | | 192 | | | | — | |
| | | | | | | | | | | | | | | | |
Total net realized gain (loss) | | | 4,348 | | | | 2,712 | | | | 192 | | | | — | |
Change in net unrealized appreciation (depreciation) of: | | | | | | | | | | | | | | | | |
Investments | | | 8,020 | | | | 1,352 | | | | 1,977 | | | | — | |
| | | | | | | | | | | | | | | | |
Change in net unrealized appreciation (depreciation) | | | 8,020 | | | | 1,352 | | | | 1,977 | | | | — | |
| | | | | | | | | | | | | | | | |
Net increase (decrease) in net assets resulting from operations | | $ | 21,680 | | | $ | 7,457 | | | $ | 5,240 | | | $ | 131 | |
| | | | | | | | | | | | | | | | |
See accompanying Notes to Financial Statements.
December 31, 2012 | William Blair Funds 119 |
Statements of Changes in Net Assets
for the Years Ended December 31, 2012 and 2011 (all amounts in thousands)
| | | | | | | | | | | | | | | | | | | | | | | | | | | | | | | | |
| | | Bond
Fund | | | Income
Fund | | | Low
Duration
Fund | | | Ready
Reserves
Fund | |
| | | 2012 | | | 2011 | | | 2012 | | | 2011 | | | 2012 | | | 2011 | | | 2012 | | | 2011 | |
Operations | | | | | | | | | | | | | | | | | | | | | | | | | | | | | | | | |
Net investment income (loss) | | $ | 9,312 | | | $ | 8,820 | | | $ | 3,393 | | | $ | 3,627 | | | $ | 3,071 | | | $ | 2,586 | | | $ | 131 | | | $ | 125 | |
Net realized gain (loss) on investments | | | 4,348 | | | | 3,325 | | | | 2,712 | | | | 2,582 | | | | 192 | | | | 59 | | | | — | | | | — | |
Change in net unrealized appreciation (depreciation) on investments | | | 8,020 | | | | 3,590 | | | | 1,352 | | | | (897 | ) | | | 1,977 | | | | 360 | | | | — | | | | — | |
| | | | | | | | | | | | | | | | | | | | | | | | | | | | | | | | |
Net increase (decrease) in net assets resulting from operations | | | 21,680 | | | | 15,735 | | | | 7,457 | | | | 5,312 | | | | 5,240 | | | | 3,005 | | | | 131 | | | | 125 | |
Distributions to shareholders from | | | | | | | | | | | | | | | | | | | | | | | | | | | | | | | | |
Net investment income | | | | | | | | | | | | | | | | | | | | | | | | | | | | | | | | |
Class N | | | (961 | ) | | | (229 | ) | | | (1,884 | ) | | | (1,377 | ) | | | (219 | ) | | | (152 | ) | | | (131 | ) | | | (125 | ) |
Class I | | | (6,754 | ) | | | (6,707 | ) | | | (2,587 | ) | | | (2,800 | ) | | | (2,909 | ) | | | (2,098 | ) | | | — | | | | — | |
Class Institutional | | | (3,467 | ) | | | (2,764 | ) | | | — | | | | — | | | | (2,382 | ) | | | (1,853 | ) | | | — | | | | — | |
Net realized gain | | | | | | | | | | | | | | | | | | | | | | | | | | | | | | | | |
Class N | | | (211 | ) | | | (66 | ) | | | — | | | | — | | | | — | | | | — | | | | — | | | | — | |
Class I | | | (1,126 | ) | | | (1,188 | ) | | | — | | | | — | | | | — | | | | — | | | | — | | | | — | |
Class Institutional | | | (597 | ) | | | (577 | ) | | | — | | | | — | | | | — | | | | — | | | | — | | | | — | |
| | | | | | | | | | | | | | | | | | | | | | | | | | | | | | | | |
Total Distributions | | | (13,116 | ) | | | (11,531 | ) | | | (4,471 | ) | | | (4,177 | ) | | | (5,510 | ) | | | (4,103 | ) | | | (131 | ) | | | (125 | ) |
Capital stock transactions | | | | | | | | | | | | | | | | | | | | | | | | | | | | | | | | |
Net proceeds from sale of shares | | | 82,419 | | | | 100,839 | | | | 71,248 | | | | 34,055 | | | | 191,001 | | | | 121,427 | | | | 867,610 | | | | 838,997 | |
Shares issued in reinvestment of income dividends and capital gain distributions | | | 10,216 | | | | 8,489 | | | | 3,667 | | | | 3,514 | | | | 4,275 | | | | 3,322 | | | | 131 | | | | 125 | |
Less cost of shares redeemed | | | (36,473 | ) | | | (74,292 | ) | | | (48,109 | ) | | | (39,996 | ) | | | (65,323 | ) | | | (109,974 | ) | | | (624,157 | ) | | | (783,919 | ) |
| | | | | | | | | | | | | | | | | | | | | | | | | | | | | | | | |
Net increase (decrease) in net assets resulting from capital share transactions | | | 56,162 | | | | 35,036 | | | | 26,806 | | | | (2,427 | ) | | | 129,953 | | | | 14,775 | | | | 243,584 | | | | 55,203 | |
| | | | | | | | | | | | | | | | | | | | | | | | | | | | | | | | |
Increase (decrease) in net assets | | | 64,726 | | | | 39,240 | | | | 29,792 | | | | (1,292 | ) | | | 129,683 | | | | 13,677 | | | | 243,584 | | | | 55,203 | |
Net assets | | | | | | | | | | | | | | | | | | | | | | | | | | | | | | | | |
Beginning of year | | | 232,016 | | | | 192,776 | | | | 111,985 | | | | 113,277 | | | | 157,147 | | | | 143,470 | | | | 1,271,746 | | | | 1,216,543 | |
| | | | | | | | | | | | | | | | | | | | | | | | | | | | | | | | |
End of year | | $ | 296,742 | | | $ | 232,016 | | | $ | 141,777 | | | $ | 111,985 | | | $ | 286,830 | | | $ | 157,147 | | | $ | 1,515,330 | | | $ | 1,271,746 | |
| | | | | | | | | | | | | | | | | | | | | | | | | | | | | | | | |
Accumulated net investment income (loss) at the end of the year | | $ | 2 | | | $ | 2 | | | $ | — | | | $ | — | | | $ | — | | | $ | — | | | $ | 112 | | | $ | 108 | |
| | | | | | | | | | | | | | | | | | | | | | | | | | | | | | | | |
See accompanying Notes to Financial Statements.
120 Annual Report | December 31, 2012 |
Notes to Financial Statements
(1) Significant Accounting Policies
The following is a summary of William Blair Funds’ (the “Trust”) significant accounting policies in effect during the period covered by the financial statements, which are in accordance with U.S. generally accepted accounting principles.
(a) Description of the Trust
The Trust is a mutual fund registered under the Investment Company Act of 1940 (the “1940 Act”), as amended, as an open-end management investment company. The Trust currently consists of the following twenty-five funds (the “Funds”), each with its own investment objective and policies. For each Fund, the number of shares authorized is unlimited.
| | |
Domestic Equity Funds Growth Large Cap Growth Small Cap Growth Mid Cap Growth Small-Mid Cap Growth Large Cap Value Small Cap Value Mid Cap Value Small-Mid Cap Value Global Equity Fund Global Leaders (formerly known as
Global Growth) Multi-Asset and Alternative Funds Macro Allocation Commodity Strategy Long/Short | | International Equity Funds International Growth International Equity International Leaders Institutional International Growth Institutional International Equity International Small Cap Growth Emerging Markets Growth Emerging Markets Leaders (formerly known as
Emerging Leaders Growth) Emerging Markets Small Cap Growth Fixed-Income Funds Bond Income Low Duration Money Market Fund Ready Reserves |
| |
| |
| |
| |
| |
| |
| |
| |
| |
| |
| |
| |
| |
The Macro Allocation Fund and the Commodity Strategy Long/Short Fund have a fiscal year-end of October 31, and issue a separate report.
The investment objectives of the Funds are as follows:
| | |
Equity | | Long-term capital appreciation. |
Global Equity | | Long-term capital appreciation. |
International Equity | | Long-term capital appreciation. |
Fixed-Income | | High level of current income with relative stability of principal.
(Maximize total return—Low Duration) |
Money Market | | Current income, a stable share price and daily liquidity. |
The Institutional International Growth Fund, the Institutional International Equity Fund and the Institutional Class of each of the Global Leaders Fund, the International Leaders Fund, the International Small Cap Growth Fund, the Emerging Markets Growth Fund, the Emerging Markets Leaders Fund, the Emerging Markets Small Cap Growth Fund, the Bond Fund and the Low Duration Fund issue a separate report.
(b) Share Classes
Three different classes of shares currently exist: N, I and Institutional. This report includes financial highlight information for Classes N and I. The table below describes the Class N shares and the Class I shares covered by this report:
| | |
Class | | Description |
| N | | Class N shares are sold to the general public, either directly through the Trust’s distributor or through a select number of financial intermediaries. Class N shares are sold without any sales load, and carry an annual 12b-1 distribution fee (0.25% for the Equity, Global Equity and International Equity Funds and 0.15% for the Fixed-Income Funds) or a service fee (0.35% for the Money Market Fund), a sub-transfer agent fee that is not a fixed rate and may vary by Fund and class, and an annual shareholder administration fee (0.15% for the Global Leaders, the International Leaders, the International Small Cap Growth, the Emerging Markets Growth, the Emerging Markets Leaders, the Emerging Markets Small Cap Growth, the Bond and the Low Duration) |
December 31, 2012 | William Blair Funds 121 |
| | |
Class | | Description |
| I | | Class I shares are sold to a limited group of investors. They do not carry any sales load or distribution fees and generally have lower ongoing expenses than the Class N shares. Class I shares have a sub-transfer agent fee that is not a fixed rate and may vary by Fund and class and the Global Leaders, the International Leaders, the International Small Cap Growth, the Emerging Markets Growth, the Emerging Markets Leaders, the Emerging Markets Small Cap Growth, the Bond and the Low Duration carry an annual shareholder administration fee of 0.15%. |
Sub-transfer agent fees: The Funds may reimburse the Advisor for fees paid to intermediaries such as banks, broker-dealers, financial advisors or other financial institutions for sub-transfer agency, sub-administration and other services provided to investors whose shares of record are held in omnibus, other group accounts, retirement plans or accounts traded through registered securities clearing agents. These fees may vary based on, for example, the nature of services provided, but generally range up to 0.15% of the assets of the class serviced or maintained by the intermediary or up to $15 per sub-account maintained by the intermediary.
Investment income, realized and unrealized gains and losses, and certain Fund level expenses and expense reductions, if any, are allocated based on the relative net assets of each class, except for certain class specific expenses, which are charged directly to the appropriate class. Differences in class expenses may result in the payment of different per share dividends by class. All share classes of the Funds have equal rights with respect to voting subject to class specific arrangements.
(c) Investment Valuation
The market value of domestic equity securities is determined by valuing securities traded on national securities markets or in the over-the-counter markets at the last sale price or, if applicable, the official closing price or, in the absence of a recent sale on the date of determination, at the latest bid price.
The value of foreign equity securities is generally determined based upon the last sale price on the foreign exchange or market on which it is primarily traded and in the currency of that market as of the close of the appropriate exchange or, if there have been no sales during that day, at the latest bid price. The Board of Trustees has determined that the passage of time between when the foreign exchanges or markets close and when the Funds compute their net asset values could cause the value of foreign equity securities to no longer be representative or accurate and, as a result, may necessitate that such securities be fair valued. Accordingly, for foreign equity securities, the Funds may use an independent pricing service to fair value the security as of the close of regular trading on the New York Stock Exchange. As a result, a Fund’s value for a security may be different from the last sale price (or the latest bid price).
Fixed-income securities are valued using evaluated prices provided by an independent pricing service. The evaluated prices are formed using various market inputs the pricing vendor believes accurately represents the market value of a security at a particular point in time. The pricing service determines evaluated prices for fixed-income securities using inputs including, but not limited to, recent transaction prices, dealer quotes, transaction prices for securities with similar characteristics, collateral characteristics, credit quality, payment history, liquidity and market conditions.
Securities, and other assets, for which a market price is not available or is deemed unreliable, (e.g., securities affected by unusual or extraordinary events, such as natural disasters or securities affected by market or economic events, such as bankruptcy filings), or the value of which is affected by a significant valuation event, are valued at a fair value as determined in good faith by, or under the direction of, the Board of Trustees and in accordance with the Trust’s Valuation Procedures. The value of fair valued securities may be different from the last sale price (or the latest bid price), and there is no guarantee that a fair valued security will be sold at the price at which a Fund is carrying the security.
Investments in other funds that are not exchange-traded funds are valued at the underlying fund’s net asset value on the date of valuation. Securities held in the Ready Reserves Fund are valued at amortized cost, which approximates fair value.
As of December 31, 2012, there were securities held in the International Growth, Bond and Income Funds requiring fair valuation pursuant to the Trust’s Valuation Procedures.
(d) Investment income and transactions
Dividend income is recorded on the ex-dividend date, except for those dividends from certain foreign securities that are recorded when the information is available.
122 Annual Report | December 31, 2012 |
Interest income is recorded on an accrual basis, adjusted for amortization of premium or accretion of discount. Variable rate bonds and floating rate notes earn interest at coupon rates that fluctuate at specific time intervals. The interest rates shown in the Portfolio of Investments for the Bond, Income, Low Duration and Ready Reserves Funds were the rates in effect on December 31, 2012. Put bonds may be redeemed at the discretion of the holder on specified dates prior to maturity.
Premiums and discounts are accreted and amortized on a straight-line basis for short-term investments and on an effective interest method for long-term investments.
Paydown gains and losses on mortgage-backed and asset-backed securities are treated as an adjustment to interest income. For the period ended December 31, 2012, the Bond, Income and Low Duration Funds recognized a reduction of interest income and a decrease of net realized loss of $(1,870), $(1,073) and $(2,439), respectively (in thousands). This reclassification had no effect on the net asset value or the net assets of the Funds.
The Funds do not isolate that portion of the results of operations resulting from changes in foreign exchange rates on investments from the fluctuations arising from changes in market prices of securities held. Such fluctuations are included with the net realized and unrealized gain or loss from investments.
Reported net realized foreign currency gains or losses arise from disposition of foreign currency, the difference in the foreign exchange rates between the trade and settlement dates on securities transactions, and the difference between the amounts of dividends, interest and foreign withholding taxes recorded on the ex-date or accrual date and the U.S. dollar equivalent of the amounts actually received or paid. Net unrealized foreign exchange gains and losses arise from changes (due to the changes in the exchange rate) in the value of foreign currency and other assets and liabilities denominated in foreign currencies held at year end.
Security and shareholder transactions are accounted for no later than one business day following the trade date. However, for financial reporting purposes, security and shareholder transactions are accounted for on the trade date of the last business day of the reporting year. Realized gains and losses from securities transactions are recognized on a specifically identified cost basis.
Awards from class action litigation may be recorded as a reduction of cost. If the Funds no longer own the applicable securities, the proceeds are recorded as realized gains.
(e) Share Valuation and Distributions to Shareholders
Shares are sold and redeemed on a continuous basis at net asset value. The net asset value per share is determined separately for each class by dividing the Fund’s net assets attributable to that class by the number of shares of the class outstanding as of the close of regular trading on the New York Stock Exchange (the “Exchange”), which is generally 4:00 p.m. Eastern time, on each day the Exchange is open. Redemption fees may be applicable to redemptions or exchanges within 60 days of purchase. For both Class N and Class I shares, the Equity Funds assess a 1% redemption fee on shares sold or exchanged that have been owned 60 days or less and the Global Equity and International Equity Funds assess a 2% redemption fee on shares sold or exchanged that have been owned 60 days or less as disclosed within the Fund’s Prospectus. The redemption fees collected by the Fund are netted against the amount of redemptions for presentation on the Statements of Changes in Net Assets.
The redemption fees collected by the Funds were as follows (in thousands):
| | | | | | | | |
Fund | | Year Ended
December 31,
2012 | | | Year Ended
December 31,
2011 | |
Growth | | $ | 7 | | | $ | 11 | |
Large Cap Growth | | | — | | | | — | |
Small Cap Growth | | | 4 | | | | 15 | |
Mid Cap Growth | | | 12 | | | | 13 | |
Small-Mid Cap Growth | | | 9 | | | | 8 | |
Global Leaders | | | 1 | | | | 1 | |
International Growth | | | 38 | | | | 107 | |
International Equity | | | 7 | | | | 4 | |
International Leaders | | | — | | | | — | |
International Small Cap Growth | | | 19 | | | | 18 | |
December 31, 2012 | William Blair Funds 123 |
| | | | | | | | |
Fund | | Year Ended
December 31,
2012 | | | Year Ended
December 31,
2011 | |
Emerging Markets Growth | | | 1 | | | | 4 | |
Emerging Markets Leaders | | | 1 | | | | 1 | |
Emerging Markets Small Cap Growth | | | 3 | | | | — | |
Large Cap Value | | | — | | | | — | |
Small Cap Value | | | 8 | | | | 48 | |
Mid Cap Value | | | — | | | | — | |
Small-Mid Cap Value | | | 1 | | | | — | |
Distributions from net investment income, if any, of all Equity Funds are declared and paid at least annually. Distributions from the Bond, Income, Low Duration and Ready Reserves Funds are declared daily and paid monthly. Capital gain distributions, if any, are declared and paid at least annually in December. Distributions payable to shareholders are recorded on the ex-dividend date.
(f) Foreign Currency Translation and Forward Foreign Currency Contracts
The Global Equity and International Equity Funds may invest in securities denominated in foreign currencies. As such, assets and liabilities denominated in foreign currencies are translated into U.S. dollar amounts at the current exchange rate on the date of valuation. The values of foreign investments, open forward foreign currency contracts, and cash denominated in foreign currencies are translated into U.S. dollars using a spot market rate of exchange as of the time of the determination of each Fund’s Net Asset Value, typically 4:00 p.m. Eastern time on days when there is regular trading on the New York Stock Exchange. Payables and receivables for securities transactions, dividends, interest income and tax reclaims are translated into U.S. dollars using a spot market rate of exchange as of 4:00 p.m. Eastern time. Settlement of purchases and sales and dividend and interest receipts are translated into U.S. dollars using a spot market rate of exchange as of 11:00 a.m. Eastern time.
(g) Income Taxes
Each Fund intends to comply with the provisions of Subchapter M of the Internal Revenue Code available to regulated investment companies. Each Fund intends to make the requisite distributions of income and capital gains to its shareholders sufficient to relieve it from all, or substantially all, federal income and excise taxes. No provision for federal income and excise taxes has been made.
Certain Funds may be subject to foreign income taxes imposed on realized gains on securities of issuers from certain foreign countries.
Management has evaluated all of the uncertain tax positions of the Funds and has determined that no liability is required to be recorded in the financial statements.
The statute of limitations on the Funds’ tax returns for each of the tax years in the four year period ended December 31, 2012, remains open and the returns are subject to examination.
The Funds have elected to mark-to-market their investments in Passive Foreign Investment Companies (“PFICs”) for federal income tax purposes. The Funds also treat the deferred loss associated with current and prior year wash sales as an adjustment to the cost of investments for tax purposes. The cost of investments for federal income tax purposes and related gross unrealized appreciation/(depreciation) and net unrealized appreciation (depreciation) at December 31, 2012, were as follows (in thousands):
| | | | | | | | | | | | | | | | |
Fund | | Cost of
Investments | | | Gross
Unrealized
Appreciation | | | Gross
Unrealized
Depreciation | | | Net
Unrealized
Appreciation/
Depreciation | |
Growth | | $ | 595,000 | | | $ | 127,495 | | | $ | 5,339 | | | $ | 122,156 | |
Large Cap Growth | | | 22,544 | | | | 6,017 | | | | 193 | | | | 5,824 | |
Small Cap Growth | | | 362,402 | | | | 68,182 | | | | 34,540 | | | | 33,642 | |
Mid Cap Growth | | | 347,001 | | | | 29,795 | | | | 7,008 | | | | 22,787 | |
Small-Mid Cap Growth | | | 351,999 | | | | 44,202 | | | | 8,393 | | | | 35,809 | |
Global Leaders | | | 55,537 | | | | 8,332 | | | | 304 | | | | 8,028 | |
124 Annual Report | December 31, 2012 |
| | | | | | | | | | | | | | | | |
Fund | | Cost of
Investments | | | Gross
Unrealized
Appreciation | | | Gross
Unrealized
Depreciation | | | Net
Unrealized
Appreciation/
Depreciation | |
International Growth | | $ | 3,075,534 | | | $ | 607,683 | | | $ | 20,164 | | | $ | 587,519 | |
International Equity | | | 57,693 | | | | 12,081 | | | | 178 | | | | 11,903 | |
International Leaders | | | 9,453 | | | | 737 | | | | 58 | | | | 679 | |
International Small Cap Growth | | | 618,210 | | | | 108,461 | | | | 9,747 | | | | 98,714 | |
Emerging Markets Growth | | | 818,359 | | | | 146,056 | | | | 6,591 | | | | 139,465 | |
Emerging Markets Leaders | | | 62,365 | | | | 8,388 | | | | 129 | | | | 8,259 | |
Emerging Markets Small Cap Growth | | | 25,961 | | | | 1,736 | | | | 41 | | | | 1,695 | |
Large Cap Value | | | 3,397 | | | | 469 | | | | 66 | | | | 403 | |
Small Cap Value | | | 211,372 | | | | 33,216 | | | | 6,338 | | | | 26,878 | |
Mid Cap Value | | | 3,644 | | | | 553 | | | | 90 | | | | 463 | |
Small-Mid Cap Value | | | 2,163 | | | | 297 | | | | 53 | | | | 244 | |
Bond | | | 272,412 | | | | 21,690 | | | | 278 | | | | 21,412 | |
Income | | | 134,376 | | | | 6,772 | | | | 462 | | | | 6,310 | |
Low Duration | | | 259,260 | | | | 2,595 | | | | 360 | | | | 2,235 | |
Ready Reserves | | | 1,516,733 | | | | — | | | | — | | | | — | |
In addition, the Funds may periodically record reclassifications among certain capital accounts to reflect differences between financial reporting and income tax basis distributions. The reclassifications were reported in order to reflect the tax treatment for certain permanent differences that exist between income tax regulations and U.S. generally accepted accounting principles. The reclassifications generally relate to net operating losses, Section 988 currency gains and losses, PFICs gains and losses, expiration of capital loss carryforward, recharacterization of dividends received from investments in Real Estate Investment Trust, paydown gains and losses, and redemptions in-kind. These reclassifications have no impact on the net asset values of the Funds. Accordingly, at December 31, 2012, the following reclassifications were recorded (in thousands):
| | | | | | | | | | | | |
Fund | | Undistributed Net
Investment
Income (Loss) | | | Accumulated
Undistributed
Net Realized
Gain/(Loss) | | | Capital
Paid in Excess
of Par Value | |
Growth | | $ | 28 | | | $ | (28 | ) | | $ | — | |
Large Cap Growth | | | 1 | | | | (1 | ) | | | — | |
Small Cap Growth | | | 3,984 | | | | — | | | | (3,984 | ) |
Mid Cap Growth | | | 4 | | | | — | | | | (4 | ) |
Small-Mid Cap Growth | | | 7 | | | | (7 | ) | | | — | |
Global Leaders | | | (20 | ) | | | 20 | | | | — | |
International Growth | | | 20,416 | | | | (20,416 | ) | | | — | |
International Equity | | | (71 | ) | | | 71 | | | | — | |
International Leaders | | | 10 | | | | (10 | ) | | | — | |
International Small Cap Growth | | | 2,643 | | | | (2,665 | ) | | | 22 | |
Emerging Markets Growth | | | (1,511 | ) | | | 1,511 | | | | — | |
Emerging Markets Leaders | | | (53 | ) | | | 53 | | | | — | |
Emerging Markets Small Cap Growth | | | (7 | ) | | | 6 | | | | 1 | |
Large Cap Value | | | — | | | | — | | | | — | |
Small Cap Value | | | (12 | ) | | | 12 | | | | — | |
Mid Cap Value | | | (2 | ) | | | (32 | ) | | | 34 | |
Small-Mid Cap Value | | | — | | | | — | | | | — | |
Bond | | | 1,870 | | | | (1,870 | ) | | | — | |
Income | | | 1,078 | | | | 1,412 | | | | (2,490 | ) |
Low Duration | | | 2,439 | | | | (2,439 | ) | | | — | |
Ready Reserves | | | 4 | | | | 20 | | | | (24 | ) |
The timing and characterization of certain income and capital gain distributions are determined annually in accordance with federal income tax regulations that may differ from U.S. generally accepted accounting principles. As a result, net investment income or loss and net realized gain or loss for a reporting period may differ from the amount distributed during such period.
December 31, 2012 | William Blair Funds 125 |
Distributions from net realized gains for book purposes may include short-term capital gains, which are included as ordinary income for tax purposes. The tax character of distributions paid during 2012 and 2011 was as follows (in thousands):
| | | | | | | | | | | | | | | | | | | | | | | | | | | | | | | | | | | | | | | | |
| | | Distributions Paid in 2012 | | | Distributions Paid in 2011 | |
| | | Ordinary
Income | | | Long-Term
Capital Gains | | | Return of
Capital | | | Ordinary
Income | | | Long-Term
Capital Gains | |
Fund | | Class N | | | Class I | | | Class N | | | Class I | | | Class N | | | Class I | | | Class N | | | Class I | | | Class N | | | Class I | |
Growth | | $ | 10 | | | $ | 1,133 | | | $ | 7,281 | | | $ | 12,939 | | | $ | — | | | $ | — | | | $ | — | | | $ | 329 | | | $ | 5,882 | | | $ | 10,199 | |
Large Cap Growth | | | — | | | | — | | | | — | | | | — | | | | — | | | | — | | | | — | | | | 37 | | | | — | | | | — | |
Small Cap Growth | | | — | | | | — | | | | 564 | | | | 1,107 | | | | — | | | | — | | | | — | | | | — | | | | — | | | | — | |
Mid Cap Growth | | | — | | | | 488 | | | | 905 | | | | 7,042 | | | | — | | | | — | | | | — | | | | — | | | | 2,378 | | | | 8,679 | |
Small-Mid Cap Growth | | | 63 | | | | 1,436 | | | | 1,026 | | | | 8,092 | | | | — | | | | — | | | | 595 | | | | 3,772 | | | | 2,542 | | | | 16,104 | |
Global Leaders | | | 15 | | | | 227 | | | | — | | | | — | | | | — | | | | — | | | | 4 | | | | 170 | | | | — | | | | — | |
International Growth | | | 37,353 | | | | 74,977 | | | | — | | | | — | | | | — | | | | — | | | | — | | | | 6,046 | | | | — | | | | — | |
International Equity | | | 172 | | | | 2,061 | | | | — | | | | — | | | | — | | | | — | | | | — | | | | — | | | | — | | | | — | |
International Leaders | | | — | | | | 6 | | | | — | | | | — | | | | — | | | | — | | | | — | | | | — | | | | — | | | | — | |
International Small Cap Growth | | | 274 | | | | 7,774 | | | | — | | | | — | | | | — | | | | — | | | | 193 | | | | 5,147 | | | | — | | | | — | |
Emerging Markets Growth | | | 88 | | | | 1,209 | | | | — | | | | — | | | | — | | | | — | | | | — | | | | 466 | | | | 2,577 | | | | 18,690 | |
Emerging Markets Leaders | | | 1 | | | | 169 | | | | — | | | | — | | | | — | | | | 11 | | | | 1 | | | | 582 | | | | 3 | | | | 1,287 | |
Emerging Markets Small Cap Growth | | | 13 | | | | 65 | | | | — | | | | — | | | | — | | | | — | | | | — | | | | — | | | | — | | | | — | |
Large Cap Value | | | 12 | | | | 25 | | | | — | | | | — | | | | — | | | | — | | | | 3 | | | | 4 | | | | — | | | | — | |
Small Cap Value | | | 256 | | | | 1,734 | | | | 164 | | | | 782 | | | | 60 | | | | 273 | | | | 6 | | | | 483 | | | | 1,471 | | | | 6,717 | |
Mid Cap Value | | | 1 | | | | 62 | | | | 3 | | | | 121 | | | | — | | | | — | | | | 1 | | | | 64 | | | | — | | | | 34 | |
Small-Mid Cap Value | | | 34 | | | | 55 | | | | — | | | | — | | | | — | | | | — | | | | — | | | | — | | | | — | | | | — | |
Bond | | | 961 | | | | 6,754 | | | | 211 | | | | 1,126 | | | | — | | | | — | | | | 229 | | | | 6,707 | | | | 66 | | | | 1,188 | |
Income | | | 1,884 | | | | 2,587 | | | | — | | | | — | | | | — | | | | — | | | | 1,377 | | | | 2,800 | | | | — | | | | — | |
Low Duration | | | 219 | | | | 2,909 | | | | — | | | | — | | | | — | | | | — | | | | 152 | | | | 2,098 | | | | — | | | | — | |
Ready Reserves | | | 131 | | | | — | | | | — | | | | — | | | | — | | | | — | | | | 125 | | | | — | | | | — | | | | — | |
As of December 31, 2012, the components of distributable earnings on a tax basis were as follows (in thousands):
| | | | | | | | | | | | | | | | |
Fund | | Undistributed
Ordinary
Income | | | Accumulated
Capital and
Other Losses | | | Undistributed
Long-Term
Capital Gain | | | Net
Unrealized
Appreciation/
Depreciation | |
Growth | | $ | 10 | | | $ | — | | | $ | 13,481 | | | $ | 122,156 | |
Large Cap Growth | | | — | | | | (887 | ) | | | — | | | | 5,824 | |
Small Cap Growth | | | — | | | | — | | | | 6,887 | | | | 33,642 | |
Mid Cap Growth | | | — | | | | (168 | ) | | | 3,258 | | | | 22,787 | |
Small-Mid Cap Growth | | | — | | | | 1 | | | | 6,952 | | | | 35,809 | |
Global Leaders | | | 2 | | | | (13,781 | ) | | | — | | | | 8,028 | |
International Growth | | | 16,303 | | | | (1,105,046 | ) | | | — | | | | 587,519 | |
International Equity | | | 120 | | | | (91,971 | ) | | | — | | | | 11,903 | |
International Leaders | | | 30 | | | | (104 | ) | | | — | | | | 679 | |
International Small Cap Growth | | | 1,592 | | | | (53,929 | ) | | | — | | | | 98,714 | |
Emerging Markets Growth | | | 155 | | | | (28,010 | ) | | | — | | | | 139,465 | |
Emerging Markets Leaders | | | 57 | | | | (3,213 | ) | | | — | | | | 8,259 | |
Emerging Markets Small Cap Growth | | | 56 | | | | (37 | ) | | | 36 | | | | 1,695 | |
Large Cap Value | | | 1 | | | | — | | | | 5 | | | | 403 | |
Small Cap Value | | | 83 | | | | — | | | | 1,441 | | | | 26,878 | |
Mid Cap Value | | | 8 | | | | — | | | | 14 | | | | 463 | |
Small-Mid Cap Value | | | 14 | | | | — | | | | 8 | | | | 244 | |
Bond | | | 2 | | | | (104 | ) | | | 1,498 | | | | 21,412 | |
Income | | | — | | | | (35,763 | ) | | | — | | | | 6,310 | |
Low Duration | | | — | | | | (4,807 | ) | | | — | | | | 2,235 | |
Ready Reserves | | | 113 | | | | (22 | ) | | | — | | | | — | |
126 Annual Report | December 31, 2012 |
As of December 31, 2012, the Funds have unused capital loss carryforwards available for federal income tax purposes to be applied against future capital gains, if any. If not applied, the carryforwards will expire as follows (in thousands):
| | | | | | | | | | | | | | | | | | | | | | | | | | | | |
Fund | | 2013 | | | 2014 | | | 2015 | | | 2016 | | | 2017 | | | 2018 | | | Total | |
Large Cap Growth | | $ | — | | | $ | — | | | $ | — | | | $ | — | | | $ | 887 | | | $ | — | | | $ | 887 | |
Global Leaders | | | — | | | | — | | | | — | | | | 644 | | | | 13,127 | | | | — | | | | 13,771 | |
International Growth | | | — | | | | — | | | | — | | | | — | | | | 1,101,382 | | | | — | | | | 1,101,382 | |
International Equity | | | — | | | | — | | | | — | | | | 10,048 | | | | 81,926 | | | | — | | | | 91,974 | |
International Small Cap Growth | | | — | | | | — | | | | — | | | | — | | | | 53,954 | | | | — | | | | 53,954 | |
Income | | | 3,398 | | | | 4,138 | | | | 9,190 | | | | 14,459 | | | | 4,577 | | | | — | | | | 35,762 | |
Low Duration | | | — | | | | — | | | | — | | | | — | | | | — | | | | 955 | | | | 955 | |
Ready Reserves | | | — | | | | — | | | | 2 | | | | — | | | | — | | | | — | | | | 2 | |
Under current law, the Funds may carry forward net capital losses indefinitely to use to offset capital gains realized in future years. Previous law limited the carry forward of capital losses to the eight tax years following the year the capital loss was realized. If a Fund has capital losses that are subject to current law and also has capital losses subject to prior law, the losses realized under current law will be utilized to offset capital gains before any of the losses governed by prior law can be used. As a result of these ordering rules, capital losses realized under previous law may be more likely to expire unused. Capital losses realized under current law will carry forward retaining their classification as long-term or short-term losses; as compared to under prior law in which all capital losses were carried forward as short term capital losses.
As of December 31, 2012, the Funds incurred the following capital losses which will not expire (in thousands):
| | | | | | | | |
Fund | | Short-
Term | | | Long-
Term | |
International Leaders | | $ | 33 | | | $ | — | |
Emerging Markets Growth | | | 23,905 | | | | — | |
Emerging Markets Leaders | | | 2,240 | | | | — | |
Low Duration | | | 2,054 | | | | 1,296 | |
Ready Reserves | | | 19 | | | | — | |
In order to meet certain excise tax distribution requirements, the Funds are required to measure and distribute annually, net capital gains realized during a twelve month period ending October 31 and net investment income earned during a twelve month period ending December 31. In connection with this, the Funds are permitted for tax purposes to defer into their next fiscal year qualified late year losses. Qualified late year capital losses are any net capital losses incurred between November 1 and the end of their fiscal year, December 31, 2012. Qualified late year ordinary losses are comprised of losses related to foreign currency and PFICs, incurred between November 1 and the end of their fiscal year, December 31, 2012.
At December 31, 2012, the following Funds deferred, on a tax basis, qualified late year losses of:
| | | | | | | | | | | | |
| | | Qualified Late Year Losses | |
Fund | | Ordinary
Loss | | | Short-Term
Capital | | | Long-Term
Capital | |
Mid Cap Growth | | $ | — | | | $ | 168 | | | $ | — | |
Global Leaders | | | 10 | | | | — | | | | — | |
International Growth | | | — | | | | 4,050 | | | | — | |
International Leaders | | | — | | | | 71 | | | | — | |
Emerging Markets Growth | | | — | | | | 2,380 | | | | — | |
Emerging Markets Leaders | | | — | | | | 464 | | | | 507 | |
Emerging Markets Small Cap Growth | | | — | | | | 7 | | | | — | |
Bond | | | — | | | | 104 | | | | — | |
Low Duration | | | — | | | | 291 | | | | 210 | |
(h) Repurchase Agreements
In a repurchase agreement, a Fund buys a security at one price and at the time of sale, the seller agrees to repurchase the security at a mutually agreed upon time and price (usually within seven days). The repurchase agreement thereby determines the yield during the purchaser’s holding period, while the seller’s obligation to repurchase is secured by the value of the underlying security. William Blair & Company, L.L.C. (“William Blair” or the “Advisor”) will monitor, on an ongoing basis, the value of the underlying securities to ensure that the value always equals or exceeds the repurchase price
December 31, 2012 | William Blair Funds 127 |
plus accrued interest. Repurchase agreements could involve certain risks in the event of a default or insolvency of the other party to the agreement, including possible delays or restrictions upon a Fund’s ability to dispose of the underlying securities. The risk to a Fund is limited to the ability of the seller to pay the agreed upon sum on the delivery date. In the event of default, a repurchase agreement provides that a Fund is entitled to sell the underlying collateral. The loss, if any, to a Fund will be the difference between the proceeds from the sale and the repurchase price. However, if bankruptcy proceedings are commenced with respect to the seller of the security, disposition of the collateral by the Fund may be delayed or limited. Although no definitive creditworthiness criteria are used, the Advisor reviews the creditworthiness of the banks and non-bank dealers with which a Fund enters into repurchase agreements to evaluate those risks. A Fund may, for tax purposes, deem repurchase agreements collateralized by U.S. Government securities to be investments in U.S. Government securities.
(i) Use of Estimates
The preparation of financial statements in conformity with U.S. generally accepted accounting principles requires management to make estimates and assumptions that affect the amounts reported in the financial statements. Actual results may differ from those estimates.
(j) Indemnification
In the normal course of business, the Funds have entered into contracts in which the Funds agree to indemnify the other party or parties against various potential costs or liabilities. The Funds’ maximum exposure under these arrangements is unknown. No claim has been made for indemnification pursuant to any such agreement of the Funds.
(k) Fair Value Measurements
Fair value is defined as the price that a Fund would receive upon selling a security in an orderly transaction to an independent buyer in the principal or most advantageous market for the investment. Various inputs are used in determining the value of a Fund’s investments. A three-tier hierarchy of inputs is used to classify fair value measurements for disclosure purposes. The three-tier hierarchy of inputs is summarized in the three broad levels listed below:
| | • | | Level 1—Quoted prices (unadjusted) in active markets for an identical security. |
| | • | | Level 2—Prices determined using other significant observable inputs. Observable inputs are inputs that other market participants would use in pricing a security. These may include quoted prices for similar securities, interest rates, prepayment speeds, credit risk, and others. In addition, other observable inputs such as foreign exchange rates, benchmark securities indices and foreign futures contracts may be utilized in the valuation of certain foreign securities when significant events occur between the last sale on the foreign securities exchange and the time the net asset value of the Fund is calculated. |
| | • | | Level 3—Prices determined using significant unobservable inputs. In situations where quoted prices or observable inputs are unavailable (for example, when there is little or no market activity for an investment), unobservable inputs may be used. Unobservable inputs reflect the Fund’s own assumptions about the factors market participants would use in pricing an investment, and would be based on the best information available. |
The inputs or methodology used for valuing an investment are not necessarily an indication of the risk associated with investing in those securities. For example, money market securities are valued using amortized cost, in accordance with rules under the 1940 Act. Generally, amortized cost approximates the current fair value of a security, but since the value is not obtained from a quoted price in an active market, such securities are reflected as Level 2.
Any transfers between Level 1 and Level 2 are disclosed, effective as of the beginning of the period, in the following tables with the reasons for the transfers disclosed in a note to the tables, if applicable.
As of December 31, 2012, the hierarchical input levels of securities in each Fund, segregated by security class, are as follows (in thousands):
| | | | | | | | | | | | | | | | | | | | | | | | |
Investments in securities | | Growth | | | Large Cap
Growth | | | Small Cap
Growth | | | Mid Cap
Growth | | | Small-Mid Cap
Growth | | | Global
Leaders | |
Level 1—Quoted prices | | | | | | | | | | | | | | | | | | | | | | | | |
Common Stocks | | $ | 705,749 | | | $ | 28,103 | | | $ | 374,768 | | | $ | 357,997 | | | $ | 387,079 | | | $ | 32,806 | |
Exchange Traded Funds | | | — | | | | — | | | | 7,433 | | | | — | | | | — | | | | — | |
128 Annual Report | December 31, 2012 |
| | | | | | | | | | | | | | | | | | | | | | | | |
Investments in securities | | Growth | | | Large Cap
Growth | | | Small Cap
Growth | | | Mid Cap
Growth | | | Small-Mid Cap
Growth | | | Global
Leaders | |
Level 2—Other significant observable inputs | | | | | | | | | | | | | | | | | | | | | | | | |
Common Stocks | | | — | | | | — | | | | — | | | | — | | | | — | | | | 30,421 | |
Short-Term Investments | | | 11,407 | | | | 265 | | | | 13,843 | | | | 11,791 | | | | 729 | | | | 338 | |
Level 3—Significant unobservable inputs | | | | | | | | | | | | | | | | | | | | | | | | |
None | | | — | | | | — | | | | — | | | | — | | | | — | | | | — | |
| | | | | | | | | | | | | | | | | | | | | | | | |
Total investments in securities | | $ | 717,156 | | | $ | 28,368 | | | $ | 396,044 | | | $ | 369,788 | | | $ | 387,808 | | | $ | 63,565 | |
| | | | | | | | | | | | | | | | | | | | | | | | |
Level 1 and Level 2 transfers | | | | | | | | | | | | | | | | | | | | | | | | |
Transfers from Level 1 to Level 2 (a) | | | — | | | | — | | | | — | | | | — | | | | — | | | | 11,929 | |
Transfers from Level 2 to Level 1 | | | — | | | | — | | | | — | | | | — | | | | — | | | | — | |
| | | | | | | | | | | | | | | | | | | | | | | | | | | | |
Investments in securities | | International
Growth | | | International
Equity | | | International
Leaders | | | International
Small Cap
Growth | | | Emerging
Markets
Growth | | | Emerging
Markets
Leaders | | | Emerging
Markets
Small Cap
Growth | |
Level 1—Quoted prices | | | | | | | | | | | | | | | | | | | | | | | | | | | | |
Common Stocks | | $ | 392,541 | | | $ | 9,247 | | | $ | 1,265 | | | $ | 50,335 | | | $ | 218,872 | | | $ | 16,608 | | | $ | 6,809 | |
Preferred Stocks | | | — | | | | — | | | | — | | | | — | | | | 19,764 | | | | 2,086 | | | | 309 | |
Exchange Traded Funds | | | 37,989 | | | | — | | | | — | | | | — | | | | — | | | | — | | | | — | |
Level 2—Other significant observable inputs | | | | | | | | | | | | | | | | | | | | | | | | | | | | |
Common Stocks | | | 3,148,045 | | | | 60,349 | | | | 8,701 | | | | 646,215 | | | | 682,040 | | | | 49,021 | | | | 18,450 | |
Affiliated Funds | | | 22,022 | | | | — | | | | — | | | | — | | | | 23,624 | | | | — | | | | — | |
Short-Term Investments | | | 61,401 | | | | — | | | | 166 | | | | 20,374 | | | | 13,524 | | | | 2,909 | | | | 2,088 | |
Level 3—Significant unobservable inputs | | | | | | | | | | | | | | | | | | | | | | | | | | | | |
Common Stock | | | 1,055 | | | | — | | | | — | | | | — | | | | — | | | | — | | | | — | |
| | | | | | | | | | | | | | | | | | | | | | | | | | | | |
Total investments in securities | | $ | 3,663,053 | | | $ | 69,596 | | | $ | 10,132 | | | $ | 716,924 | | | $ | 957,824 | | | $ | 70,624 | | | $ | 27,656 | |
| | | | | | | | | | | | | | | | | | | | | | | | | | | | |
Level 1 and Level 2 transfers | | | | | | | | | | | | | | | | | | | | | | | | | | | | |
Transfers from Level 1 to Level 2 (a) | | | 1,422,279 | | | | 25,925 | | | | — | | | | 352,290 | | | | 388,205 | | | | 26,326 | | | | 1,325 | |
Transfers from Level 2 to
Level 1 | | | — | | | | — | | | | — | | | | — | | | | — | | | | — | | | | — | |
| | | | | | | | | | | | | | | | |
Investments in securities | | Large Cap
Value | | | Small Cap
Value | | | Mid Cap
Value | | | Small-Mid Cap
Value | |
Level 1—Quoted prices | | | | | | | | | | | | | | | | |
Common Stocks | | $ | 3,800 | | | $ | 233,731 | | | $ | 4,107 | | | $ | 2,370 | |
Level 2—Other significant observable inputs | | | | | | | | | | | | | | | | |
Short-Term Investments | | | — | | | | 4,519 | | | | — | | | | 37 | |
Level 3—Significant unobservable inputs | | | | | | | | | | | | | | | | |
None | | | — | | | | — | | | | — | | | | — | |
| | | | | | | | | | | | | | | | |
Total investments in securities | | $ | 3,800 | | | $ | 238,250 | | | $ | 4,107 | | | $ | 2,407 | |
| | | | | | | | | | | | | | | | |
| | | | | | | | | | | | | | | | |
Investments in securities | | Bond | | | Income | | | Low Duration
Fund | | | Ready
Reserves | |
Level 1—Quoted Prices | | | | | | | | | | | | | | | | |
Short-Term Investments | | $ | — | | | $ | — | | | $ | — | | | $ | — | |
Level 2—Other significant observable inputs | | | | | | | | | | | | | | | | |
US Government and Agency Bonds | | | 119,464 | | | | 63,957 | | | | 193,271 | | | | 115,198 | |
Corporate Bonds | | | 163,377 | | | | 70,492 | | | | 37,119 | | | | 89,509 | |
Asset-Backed Bonds | | | 9,194 | | | | 4,382 | | | | 31,105 | | | | — | |
Commercial Paper | | | — | | | | — | | | | — | | | | 982,722 | |
Short-Term Investments | | | 1,622 | | | | 938 | | | | — | | | | 329,304 | |
Level 3—Significant unobservable inputs | | | | | | | | | | | | | | | | |
Asset-Backed Bonds | | | 167 | | | | 917 | | | | — | | | | — | |
| | | | | | | | | | | | | | | | |
Total investments in securities | | $ | 293,824 | | | $ | 140,686 | | | $ | 261,495 | | | $ | 1,516,733 | |
| | | | | | | | | | | | | | | | |
December 31, 2012 | William Blair Funds 129 |
Fair Valuation Transfers
| (a) | | Fair valuation estimates were obtained from the Funds’ pricing vendor and applied to certain foreign securities at December 31, 2012 but not on December 31, 2011, resulting in a transfer from Level 1 to Level 2. |
Level 1 Common Stocks are exchange-traded securities with a quoted price. See Portfolio of Investments for Sector Classification.
The fair value estimates for the Level 3 securities in the International Growth, Bond and Income Funds were determined in good faith by the Pricing Committee in consultation with the Valuation Committee, pursuant to the Valuation Procedures adopted by the Board of Trustees. There were various factors considered in reaching this fair value determination, including, but not limited to, the following: the type of security, the extent of public trading of the security, information obtained from a broker-dealer for the security, analysis of the issuer market trends that influence its performance and the potential for an adverse outcome in pending litigation. Level 3 securities represented 0.03%, 0.06%, and 0.65% as a percentage of Net Assets in the International Growth, Bond, and Income Funds, respectively. The change in net unrealized gain (loss) related to those securities held at December 31, 2012 is included in the change in net unrealized appreciation (depreciation) of investments on the Statement of Operations. There were no transfers from or to Level 3 during the period.
(l) Redemptions In-Kind
In accordance with the Trust’s prospectus, the Funds may distribute portfolio securities rather than cash as payment for a redemption of fund shares (in-kind redemption). For financial reporting purposes, the Fund recognizes a gain or loss on the transfer of securities depending on the value of those securities on the date of redemption. Gains and losses realized on in-kind redemptions are not recognized for tax purposes and are reclassified from undistributed realized gain (loss) to paid-in capital. During the year ended December 31, 2012, the International Small Cap Growth Fund redeemed in-kind $62,716 (in thousands) with realized gains of $464.
(2) Recent Accounting Pronouncement
In December 2011, the Financial Accounting Standards Board (“FASB”) issued Accounting Standard Update (“ASU”) No. 2011-11 “Disclosures about Offsetting Assets and Liabilities.” These common disclosure requirements are intended to help investors and other financial statement users to better assess the effect or potential effect of offsetting arrangements on a Fund’s financial position. They also improve transparency in the reporting of how companies mitigate credit risk, including disclosure of related collateral pledged or received. In addition, ASU 2011-11 facilitates comparison between those entities that prepare their financial statements on the basis of U.S. generally accepted accounting principles and those entities that prepare their financial statements on the basis of International Financial Reporting Standards. ASU 2011-11 requires entities to disclose both gross and net information about both instruments and transactions eligible for offset in the financial position; and disclose instruments and transactions subject to an agreement similar to a master netting agreement. ASU 2011-11 is effective for fiscal years beginning on or after January 1, 2013, and interim periods within those annual periods. The Trust is currently evaluating the implications of ASU 2011-11 and its impact on financial statement disclosures.
130 Annual Report | December 31, 2012 |
(3) Transactions with Affiliates
(a) Management and Expense Limitation Agreements
Each Fund has a management agreement with the Advisor for investment advisory, clerical, bookkeeping and administrative services. Each Fund pays the Advisor an annual fee, payable monthly, based on a specified percentage of its average daily net assets. A summary of the annual rates expressed as a percentage of average daily net assets is as follows:
| | | | | | | | | | |
Domestic Equity Funds | | | | | International Equity Funds | | | |
Growth | | | 0.75 | % | | International Growth: | | | | |
Large Cap Growth | | | 0.80 | % | | First $250 million | | | 1.10 | % |
Small Cap Growth | | | 1.10 | % | | Next $4.75 billion | | | 1.00 | % |
Mid Cap Growth | | | 0.95 | % | | Next $5 billion | | | 0.95 | % |
Small-Mid Cap Growth | | | 1.00 | % | | Next $5 billion | | | 0.925 | % |
Large Cap Value | | | 0.80 | % | | In excess of $15 billion | | | 0.90 | % |
Small Cap Value | | | 1.10 | % | | International Equity: | | | | |
Mid Cap Value | | | 0.95 | % | | First $250 million | | | 1.10 | % |
Small-Mid Cap Value | | | 1.00 | % | | In excess of $250 million | | | 1.00 | % |
| | | | | | International Leaders | | | 0.95 | % |
| | | | | | International Small Cap Growth | | | 1.00 | % |
Global Equity Fund | | | | | | Emerging Markets Growth | | | 1.10 | % |
Global Leaders | | | 1.00 | % | | Emerging Markets Leaders | | | 1.10 | % |
| | | | | | Emerging Markets Small Cap Growth | | | 1.10 | % |
| | | |
Fixed-Income Funds | | | | | Money Market Fund | | | |
Bond | | | 0.30 | % | | Ready Reserves: | | | | |
Low Duration | | | 0.30 | % | | First $250 million | | | 0.275 | % |
Income* | | | | | | Next $250 million | | | 0.250 | % |
First $250 million | | | 0.25 | % | | Next $2 billion | | | 0.225 | % |
In excess of $250 million | | | 0.20 | % | | In excess of $2.5 billion | | | 0.200 | % |
| | | | | | | | | | |
*Management fee also includes a charge of 5% of gross income. | | | | | | | |
Some of the Funds have also entered into an Expense Limitation Agreement with the Advisor. Under the terms of the agreement, the Advisor will waive its management fee and/or reimburse the Fund for expenses in excess of the agreed upon rate. The amount the Advisor owes a Fund as of the reporting date is recorded as the Receivable from Advisor on the Statement of Assets and Liabilities. The Advisor reimburses the Funds on a monthly basis. Under the terms of the agreement, the Advisor has agreed to waive its advisory fees and/or absorb other operating expenses through April 30, 2013, if total expenses for each class of the following Funds exceed the following rates (as a percentage of average daily net assets):
| | | | | | | | | | | | | | | | |
| | | Class N | | | Class I | |
Fund | | Effective
May 1, 2012
through
April 30, 2013 | | | Effective
May 1, 2011
through
April 30, 2012 | | | Effective
May 1, 2012
through
April 30, 2013 | | | Effective
May 1, 2011
through
April 30, 2012 | |
Large Cap Growth | | | 1.20 | % | | | 1.20 | % | | | 0.95 | % | | | 0.95 | % |
Small Cap Growth | | | 1.50 | % | | | 1.50 | % | | | 1.25 | % | | | 1.25 | % |
Mid Cap Growth | | | 1.35 | % | | | 1.35 | % | | | 1.10 | % | | | 1.10 | % |
Small-Mid Cap Growth | | | 1.35 | % | | | 1.35 | % | | | 1.10 | % | | | 1.10 | % |
Global Leaders | | | 1.50 | % | | | 1.50 | % | | | 1.25 | % | | | 1.25 | % |
International Growth | | | 1.45 | % | | | 1.45 | % | | | 1.20 | % | | | 1.20 | % |
International Equity | | | 1.45 | % | | | 1.45 | % | | | 1.20 | % | | | 1.20 | % |
International Leaders | | | 1.45 | % (a) | | | N/A | | | | 1.20 | % (a) | | | N/A | |
International Small Cap Growth | | | 1.65 | % | | | 1.65 | % | | | 1.40 | % | | | 1.40 | % |
Emerging Markets Growth | | | 1.70 | % | | | 1.70 | % | | | 1.45 | % | | | 1.45 | % |
Emerging Markets Leaders | | | 1.65 | % | | | 1.65 | % | | | 1.40 | % | | | 1.40 | % |
Emerging Markets Small Cap Growth | | | 1.65 | % | | | 1.65 | % | | | 1.40 | % | | | 1.40 | % |
Large Cap Value | | | 1.20 | % | | | 1.20 | % | | | 0.95 | % | | | 0.95 | % |
Small Cap Value | | | 1.45 | % | | | 1.40 | % | | | 1.20 | % | | | 1.15 | % |
Mid Cap Value | | | 1.35 | % | | | 1.35 | % | | | 1.10 | % | | | 1.10 | % |
December 31, 2012 | William Blair Funds 131 |
| | | | | | | | | | | | | | | | |
| | | Class N | | | Class I | |
Fund | | Effective
May 1, 2012
through
April 30, 2013 | | | Effective
May 1, 2011
through
April 30, 2012 | | | Effective
May 1, 2012
through
April 30, 2013 | | | Effective
May 1, 2011
through
April 30, 2012 | |
Small—Mid Cap Value | | | 1.40 | % | | | 1.40 | % | | | 1.15 | % | | | 1.15 | % |
Bond | | | 0.65 | % | | | 0.65 | % | | | 0.50 | % | | | 0.50 | % |
Income | | | 0.85 | % | | | 0.85 | % | | | 0.70 | % | | | 0.70 | % |
Low Duration | | | 0.70 | % | | | 0.70 | % | | | 0.55 | % | | | 0.55 | % |
| (a) | Effective August 16, 2012 through April 30, 2014 |
For a period of three years subsequent to the commencement of operations, the Advisor is entitled to reimbursement for previously waived fees and reimbursed expenses to the extent the overall expense ratio remains below the expense limitation in place at the time the fee was waived and/or the expense was reimbursed. The total amount available for recapture at December 31, 2012 was (in thousands):
| | | | |
Fund | | Available for
Recapture | |
International Leaders | | $ | 57 | |
Emerging Markets Small Cap Growth | | | 253 | |
Large Cap Value | | | 130 | |
Mid Cap Value | | | 279 | |
Small-Mid Cap Value | | | 128 | |
The Advisor has agreed to voluntarily waive fees and reimburse expenses incurred for the Ready Reserves Fund in order to maintain a minimum yield given the current interest rate environment.
For the year ended December 31, 2012, the fee waivers and/or reimbursements for each Fund were as follows (in thousands):
| | | | | | | | | | | | | | | | |
Fund | | Fund
Level
Waiver | | | Class I
Specific
Waiver | | | Class N
Specific
Waiver | | | Total
Waiver | |
Growth | | $ | — | | | $ | — | | | $ | — | | | $ | — | |
Large Cap Growth | | | 66 | | | | 10 | | | | 5 | | | | 81 | |
Small Cap Growth | | | — | | | | 360 | | | | 148 | | | | 508 | |
Mid Cap Growth | | | — | | | | — | | | | 34 | | | | 34 | |
Small-Mid Cap Growth | | | 9 | | | | 267 | | | | 58 | | | | 334 | |
Global Leaders | | | 140 | | | | 14 | | | | 3 | | | | 157 | |
International Growth | | | — | | | | — | | | | — | | | | — | |
International Equity | | | 112 | | | | 47 | | | | 7 | | | | 166 | |
International Leaders | | | 57 | | | | — | | | | — | | | | 57 | |
International Small Cap Growth | | | — | | | | — | | | | — | | | | — | |
Emerging Markets Growth | | | — | | | | — | | | | — | | | | — | |
Emerging Markets Leaders | | | 196 | | | | 1 | | | | 1 | | | | 198 | |
Emerging Markets Small Cap Growth | | | 205 | | | | — | | | | — | | | | 205 | |
Large Cap Value | | | 101 | | | | — | | | | — | | | | 101 | |
Small Cap Value | | | 36 | | | | 193 | | | | 65 | | | | 294 | |
Mid Cap Value | | | 98 | | | | — | | | | — | | | | 98 | |
Small-Mid Cap Value | | | 112 | | | | — | | | | — | | | | 112 | |
Bond | | | 77 | | | | 53 | | | | 32 | | | | 162 | |
Income | | | — | | | | — | | | | — | | | | — | |
Low Duration | | | 25 | | | | 4 | | | | 2 | | | | 31 | |
Ready Reserves | | | 6,343 | | | | — | | | | — | | | | 6,343 | |
(b) Underwriting, Distribution Services and Service Agreements
Each Fund, except the Ready Reserves Fund, has a Distribution Agreement with William Blair for distribution services to the Funds’ Class N shares. Each Fund pays William Blair an annual fee, payable monthly, based on a specified percentage of its average daily net assets of Class N shares. The annual rate expressed as a percentage of average daily net assets for Class N is 0.25% for all Funds except the Income, Bond and Low Duration Funds, which is 0.15%. Pursuant to the Distribution
132 Annual Report | December 31, 2012 |
Agreement, William Blair enters into related selling group agreements with various firms at various rates for sales of the Funds’ Class N shares.
The Ready Reserves Fund has entered into a Service Agreement with the Advisor under which the Advisor agrees to provide certain support services to Class N shareholders, including shareholder services and automatic sweep services, for a fee of 0.35% of the Fund’s average daily net assets attributable to Class N shares. The Board of Trustees has determined that the amount payable for “service fee” (as defined by FINRA, Financial Industry Regulatory Authority) does not exceed 0.25% of the average annual net assets attributable to the Class N shares of the Ready Reserves Fund.
The Global Leaders, International Leaders, International Small Cap Growth, Emerging Markets Growth, Emerging Markets Small Cap Growth, Bond and Low Duration Funds have a Shareholder Administration Agreement with William Blair to provide shareholder administration services. Class N and Class I shares of the Funds pay William Blair an annual fee, payable monthly, based upon 0.15% of average daily net assets attributable to each class, respectively. For the year ended December 31, 2012, the following fees were incurred (in thousands):
| | | | | | | | | | | | |
Fund | | Class N | | | Class I | | | Total | |
Global Leaders | | $ | 7 | | | $ | 68 | | | $ | 75 | |
International Leaders | | | — | | | | 2 | | | | 2 | |
International Small Cap Growth | | | 23 | | | | 543 | | | | 566 | |
Emerging Markets Growth | | | 26 | | | | 206 | | | | 232 | |
Emerging Markets Leaders | | | — | | | | 37 | | | | 37 | |
Emerging Markets Small Cap Growth | | | 3 | | | | 7 | | | | 10 | |
Bond | | | 36 | | | | 244 | | | | 280 | |
Low Duration | | | 13 | | | | 157 | | | | 170 | |
Ready Reserves | | | 4,579 | | | | — | | | | 4,579 | |
(4) Investment Transactions
Investment transactions, excluding money market instruments, repurchase agreements and demand notes for the year ended December 31, 2012, were as follows (in thousands):
| | | | | | | | |
Fund | | Purchases | | | Sales | |
Growth | | $ | 517,771 | | | $ | (453,240 | ) |
Large Cap Growth | | | 13,602 | | | | (14,813 | ) |
Small Cap Growth | | | 433,203 | | | | (688,431 | ) |
Mid Cap Growth | | | 381,110 | | | | (189,676 | ) |
Small-Mid Cap Growth | | | 383,753 | | | | (272,728 | ) |
Global Leaders | | | 49,749 | | | | (36,269 | ) |
International Growth | | | 2,776,011 | | | | (3,044,611 | ) |
International Equity | | | 54,762 | | | | (70,050 | ) |
International Leaders | | | 10,340 | | | | (982 | ) |
International Small Cap Growth | | | 522,503 | | | | (661,617 | ) |
Emerging Markets Growth | | | 847,110 | | | | (869,517 | ) |
Emerging Markets Leaders | | | 61,689 | | | | (52,654 | ) |
Emerging Markets Small Cap Growth | | | 26,387 | | | | (5,999 | ) |
Large Cap Value | | | 1,608 | | | | (644 | ) |
Small Cap Value | | | 121,348 | | | | (142,014 | ) |
Mid Cap Value | | | 2,843 | | | | (3,813 | ) |
Small-Mid Cap Value | | | 1,273 | | | | (1,264 | ) |
Bond | | | 148,553 | | | | (92,844 | ) |
Income | | | 82,791 | | | | (56,684 | ) |
Low Duration | | | 186,371 | | | | (78,475 | ) |
December 31, 2012 | William Blair Funds 133 |
(5) Forward Foreign Currency Contracts
The Global and International Equity Funds from time to time may enter into forward foreign currency contracts with the Fund's custodian and other counterparties in an attempt to hedge against a decline in the value of foreign currency against the U.S. dollar. The Funds bear the market risk that arises from changes in foreign currency rates and bear the credit risk if the counterparty fails to perform under the contract.
For the year ended December 31, 2012, the International Growth, International Equity, International Leaders, and International Small Cap Growth Funds engaged in forward foreign currency contracts with average notional volume (in thousands) of:
| | | | |
Fund | | Average
Notional
Value | |
International Growth | | $ | 310,013 | |
International Equity | | | 2,510 | |
International Leaders | | | 351 | |
International Small Cap Growth | | | 7,102 | |
The effect of forward foreign currency contracts on the Statements of Operations for the year ended December 31, 2012 (values in thousands):
| | | | |
Net realized gain (loss) on transactions from forward foreign currency contracts | |
Fund | | Value | |
International Growth | | $ | 20,690 | |
International Equity | | | (46 | ) |
International Leaders | | | 9 | |
International Small Cap Growth | | | 1,901 | |
|
Change in net unrealized appreciation (depreciation) of forward foreign currency contracts | |
Fund | | Value | |
International Growth | | $ | 1,799 | |
International Equity | | | — | |
International Leaders | | | — | |
International Small Cap Growth | | | 311 | |
There were no open Forward Foreign Currency Contracts as of December 31, 2012.
134 Annual Report | December 31, 2012 |
(6) Fund Share Transactions
The following table summarizes the activity in capital shares of each Fund (in thousands):
| | | | | | | | | | | | | | | | | | | | | | | | |
| | | Sales (Dollars) | |
| | | Year Ended December 31, 2012 | | | Year Ended December 31, 2011 | |
Fund | | Class N | | | Class I | | | Total | | | Class N | | | Class I | | | Total | |
Growth | | $ | 78,696 | | | $ | 99,399 | | | $ | 178,095 | | | $ | 71,261 | | | $ | 62,869 | | | $ | 134,130 | |
Large Cap Growth | | | 910 | | | | 3,057 | | | | 3,967 | | | | 900 | | | | 3,239 | | | | 4,139 | |
Small Cap Growth | | | 11,395 | | | | 82,018 | | | | 93,413 | | | | 30,204 | | | | 93,243 | | | | 123,447 | |
Mid Cap Growth | | | 23,163 | | | | 250,069 | | | | 273,232 | | | | 21,824 | | | | 66,999 | | | | 88,823 | |
Small Mid-Cap Growth | | | 21,591 | | | | 166,456 | | | | 188,047 | | | | 14,552 | | | | 70,787 | | | | 85,339 | |
Global Leaders | | | 2,165 | | | | 14,574 | | | | 16,739 | | | | 475 | | | | 3,263 | | | | 3,738 | |
International Growth | | | 201,960 | | | | 471,066 | | | | 673,026 | | | | 280,122 | | | | 476,293 | | | | 756,415 | |
International Equity | | | 230 | | | | 3,058 | | | | 3,288 | | | | 693 | | | | 26,139 | | | | 26,832 | |
International Leaders (a) | | | 501 | | | | 4,042 | | | | 4,543 | | | | — | | | | — | | | | — | |
International Small Cap Growth | | | 1,764 | | | | 70,906 | | | | 72,670 | | | | 5,220 | | | | 163,897 | | | | 169,117 | |
Emerging Markets Growth | | | 439 | | | | 14,379 | | | | 14,818 | | | | 1,576 | | | | 24,982 | | | | 26,558 | |
Emerging Markets Leaders | | | 182 | | | | 5,784 | | | | 29,541 | | | | 34 | | | | 19,823 | | | | 19,857 | |
Emerging Markets Small Cap Growth (b) | | | 3,152 | | | | 6,883 | | | | 10,035 | | | | 1,040 | | | | 2,322 | | | | 3,362 | |
Large Cap Value (b) | | | 247 | | | | 710 | | | | 957 | | | | 1,000 | | | | 1,457 | | | | 2,457 | |
Small Cap Value | | | 13,727 | | | | 33,914 | | | | 47,641 | | | | 42,726 | | | | 120,066 | | | | 162,792 | |
Mid Cap Value | | | 27 | | | | 276 | | | | 303 | | | | 81 | | | | 1,617 | | | | 1,698 | |
Small-Mid Cap Value (c) | | | 22 | | | | 50 | | | | 72 | | | | 823 | | | | 1,241 | | | | 2,064 | |
Bond | | | 29,217 | | | | 30,744 | | | | 59,961 | | | | 4,585 | | | | 41,430 | | | | 46,015 | |
Income | | | 46,878 | | | | 24,370 | | | | 71,248 | | | | 25,156 | | | | 8,899 | | | | 34,055 | |
Low Duration | | | 13,181 | | | | 106,781 | | | | 119,962 | | | | 2,975 | | | | 56,988 | | | | 59,963 | |
Ready Reserves | | | 867,610 | | | | — | | | | 867,610 | | | | 838,997 | | | | — | | | | 838,997 | |
| | | | | | | | | | | | | | | | | | | | | | | | |
| | | Reinvested Distributions (Dollars) | |
| | | Year Ended December 31, 2012 | | | Year Ended December 31, 2011 | |
Fund | | Class N | | | Class I | | | Total | | | Class N | | | Class I | | | Total | |
Growth | | $ | 7,021 | | | $ | 12,799 | | | $ | 19,820 | | | $ | 5,705 | | | $ | 9,211 | | | $ | 14,916 | |
Large Cap Growth | | | — | | | | — | | | | — | | | | — | | | | 32 | | | | 32 | |
Small Cap Growth | | | 558 | | | | 1,069 | | | | 1,627 | | | | — | | | | — | | | | — | |
Mid Cap Growth | | | 883 | | | | 7,459 | | | | 8,342 | | | | 2,354 | | | | 8,544 | | | | 10,898 | |
Small Mid-Cap Growth | | | 1,057 | | | | 8,330 | | | | 9,387 | | | | 3,020 | | | | 17,544 | | | | 20,564 | |
Global Leaders | | | 14 | | | | 220 | | | | 234 | | | | 4 | | | | 162 | | | | 166 | |
International Growth | | | 36,834 | | | | 66,346 | | | | 103,180 | | | | — | | | | 5,030 | | | | 5,030 | |
International Equity | | | 172 | | | | 1,773 | | | | 1,945 | | | | — | | | | — | | | | — | |
International Leaders (a) | | | — | | | | 6 | | | | 6 | | | | — | | | | — | | | | — | |
International Small Cap Growth | | | 249 | | | | 6,537 | | | | 6,786 | | | | 182 | | | | 3,176 | | | | 3,358 | |
Emerging Markets Growth | | | 71 | | | | 863 | | | | 934 | | | | 2,055 | | | | 13,471 | | | | 15,526 | |
Emerging Markets Leaders | | | 1 | | | | 109 | | | | 110 | | | | 3 | | | | 1,336 | | | | 1,339 | |
Emerging Markets Small Cap Growth (b) | | | 12 | | | | 40 | | | | 52 | | | | — | | | | — | | | | — | |
Large Cap Value (b) | | | 2 | | | | 13 | | | | 15 | | | | 3 | | | | 4 | | | | 7 | |
Small Cap Value | | | 412 | | | | 2,338 | | | | 2,750 | | | | 1,502 | | | | 6,573 | | | | 8,075 | |
Mid Cap Value | | | 4 | | | | 154 | | | | 158 | | | | 1 | | | | 84 | | | | 85 | |
Small-Mid Cap Value (c) | | | 1 | | | | 19 | | | | 20 | | | | — | | | | — | | | | — | |
Bond | | | 1,107 | | | | 5,895 | | | | 7,002 | | | | 219 | | | | 5,706 | | | | 5,925 | |
Income | | | 1,690 | | | | 1,977 | | | | 3,667 | | | | 1,249 | | | | 2,265 | | | | 3,514 | |
Low Duration | | | 97 | | | | 1,897 | | | | 1,994 | | | | 80 | | | | 1,426 | | | | 1,506 | |
Ready Reserves | | | 131 | | | | — | | | | 131 | | | | 125 | | | | — | | | | 125 | |
December 31, 2012 | William Blair Funds 135 |
| | | | | | | | | | | | | | | | | | | | | | | | |
| | | Redemptions (Dollars) | |
| | | Year Ended December 31, 2012 | | | Year Ended December 31, 2011 | |
Fund | | Class N | | | Class I | | | Total | | | Class N | | | Class I | | | Total | |
Growth | | $ | 66,403 | | | $ | 51,187 | | | $ | 117,590 | | | $ | 61,036 | | | $ | 69,123 | | | $ | 130,159 | |
Large Cap Growth | | | 679 | | | | 4,361 | | | | 5,040 | | | | 4,715 | | | | 5,839 | | | | 10,554 | |
Small Cap Growth | | | 114,495 | | | | 223,185 | | | | 337,680 | | | | 188,253 | | | | 180,687 | | | | 368,940 | |
Mid Cap Growth | | | 15,631 | | | | 56,818 | | | | 72,449 | | | | 6,014 | | | | 38,969 | | | | 44,983 | |
Small Mid-Cap Growth | | | 18,344 | | | | 66,523 | | | | 84,867 | | | | 7,153 | | | | 28,620 | | | | 35,773 | |
Global Leaders | | | 1,342 | | | | 14,834 | | | | 16,176 | | | | 1,725 | | | | 2,783 | | | | 4,508 | |
International Growth | | | 478,336 | | | | 477,179 | | | | 955,515 | | | | 1,472,224 | | | | 568,925 | | | | 2,041,149 | |
International Equity | | | 2,397 | | | | 17,485 | | | | 19,882 | | | | 6,340 | | | | 111,492 | | | | 117,832 | |
International Leaders (a) | | | — | | | | — | | | | — | | | | — | | | | — | | | | — | |
International Small Cap Growth | | | 8,879 | | | | 146,425 | | | | 155,304 | | | | 5,634 | | | | 95,320 | | | | 100,954 | |
Emerging Markets Growth | | | 4,491 | | | | 19,348 | | | | 23,839 | | | | 12,534 | | | | 59,984 | | | | 72,518 | |
Emerging Markets Leaders | | | 10 | | | | 6,173 | | | | 6,183 | | | | 30 | | | | 8,683 | | | | 8,713 | |
Emerging Markets Small Cap Growth (b) | | | 1,607 | | | | 1,571 | | | | 3,178 | | | | — | | | | — | | | | — | |
Large Cap Value (b) | | | — | | | | — | | | | — | | | | — | | | | — | | | | — | |
Small Cap Value | | | 20,304 | | | | 51,694 | | | | 71,998 | | | | 33,678 | | | | 45,720 | | | | 79,398 | |
Mid Cap Value | | | 16 | | | | 1,296 | | | | 1,312 | | | | 24 | | | | 474 | | | | 498 | |
Small-Mid Cap Value (c) | | | 2 | | | | 28 | | | | 30 | | | | — | | | | — | | | | — | |
Bond | | | 6,469 | | | | 23,329 | | | | 29,798 | | | | 1,033 | | | | 43,605 | | | | 44,638 | |
Income | | | 25,694 | | | | 22,415 | | | | 48,109 | | | | 17,730 | | | | 22,266 | | | | 39,996 | |
Low Duration | | | 8,314 | | | | 34,142 | | | | 42,456 | | | | 3,689 | | | | 63,525 | | | | 67,214 | |
Ready Reserves | | | 624,157 | | | | — | | | | 624,157 | | | | 783,918 | | | | — | | | | 783,918 | |
| | | | | | | | | | | | | | | | | | | | | | | | |
| | | Net Change in Net Assets relating to Fund Share Activity (Dollars) | |
| | | Year Ended December 31, 2012 | | | Year Ended December 31, 2011 | |
Fund | | Class N | | | Class I | | | Total | | | Class N | | | Class I | | | Total | |
Growth | | $ | 19,314 | | | $ | 61,011 | | | $ | 80,325 | | | $ | 15,930 | | | $ | 2,957 | | | $ | 18,887 | |
Large Cap Growth | | | 231 | | | | (1,304 | ) | | | (1,073 | ) | | | (3,815 | ) | | | (2,568 | ) | | | (6,383 | ) |
Small Cap Growth | | | (102,542 | ) | | | (140,098 | ) | | | (242,640 | ) | | | (158,049 | ) | | | (87,444 | ) | | | (245,493 | ) |
Mid Cap Growth | | | 8,415 | | | | 200,710 | | | | 209,125 | | | | 18,164 | | | | 36,574 | | | | 54,738 | |
Small Mid-Cap Growth | | | 4,304 | | | | 108,263 | | | | 112,567 | | | | 10,419 | | | | 59,711 | | | | 70,130 | |
Global Leaders | | | 837 | | | | (40 | ) | | | 797 | | | | (1,246 | ) | | | 642 | | | | (604 | ) |
International Growth | | | (239,542 | ) | | | 60,233 | | | | (179,309 | ) | | | (1,192,102 | ) | | | (87,602 | ) | | | (1,279,704 | ) |
International Equity | | | (1,995 | ) | | | (12,654 | ) | | | (14,649 | ) | | | (5,647 | ) | | | (85,353 | ) | | | (91,000 | ) |
International Leaders (a) | | | 501 | | | | 4,048 | | | | 4,549 | | | | — | | | | — | | | | — | |
International Small Cap Growth | | | (6,866 | ) | | | (68,982 | ) | | | (75,848 | ) | | | (232 | ) | | | 71,753 | | | | 71,521 | |
Emerging Markets Growth | | | (3,981 | ) | | | (4,106 | ) | | | (8,087 | ) | | | (8,903 | ) | | | (21,531 | ) | | | (30,434 | ) |
Emerging Markets Leaders | | | 23,748 | | | | (280 | ) | | | 23,468 | | | | 7 | | | | 12,476 | | | | 12,483 | |
Emerging Markets Small Cap Growth (b) | | | 1,557 | | | | 5,352 | | | | 6,909 | | | | 1,040 | | | | 2,322 | | | | 3,362 | |
Large Cap Value (b) | | | 249 | | | | 723 | | | | 972 | | | | 1,003 | | | | 1,461 | | | | 2,464 | |
Small Cap Value | | | (6,165 | ) | | | (15,442 | ) | | | (21,607 | ) | | | 10,550 | | | | 80,919 | | | | 91,469 | |
Mid Cap Value | | | 15 | | | | (866 | ) | | | (851 | ) | | | 58 | | | | 1,227 | | | | 1,285 | |
Small-Mid Cap Value (c) | | | 21 | | | | 41 | | | | 62 | | | | 823 | | | | 1,241 | | | | 2,064 | |
Bond | | | 23,855 | | | | 13,310 | | | | 37,165 | | | | 3,771 | | | | 3,531 | | | | 7,302 | |
Income | | | 22,874 | | | | 3,932 | | | | 26,806 | | | | 8,675 | | | | (11,102 | ) | | | (2,427 | ) |
Low Duration | | | 4,964 | | | | 74,536 | | | | 79,500 | | | | (634 | ) | | | (5,111 | ) | | | (5,745 | ) |
Ready Reserves | | | 243,584 | | | | — | | | | 243,584 | | | | 55,204 | | | | — | | | | 55,204 | |
| (a) | | For the period from August 16, 2012 (Commencement of Operations) to December 31, 2012. |
| (b) | | For the period from October 24, 2011 (Commencement of Operations) to December 31, 2011. |
| (c) | | For the period from December 15, 2011 (Commencement of Operations) to December 31, 2011. |
136 Annual Report | December 31, 2012 |
| | | | | | | | | | | | | | | | | | | | | | | | |
| | | Sales (Shares) | |
| | | Year Ended December 31, 2012 | | | Year Ended December 31, 2011 | |
Fund | | Class N | | | Class I | | | Total | | | Class N | | | Class I | | | Total | |
Growth | | | 6,511 | | | | 7,918 | | | | 14,429 | | | | 6,242 | | | | 5,321 | | | | 11,563 | |
Large Cap Growth | | | 117 | | | | 382 | | | | 499 | | | | 125 | | | | 451 | | | | 576 | |
Small Cap Growth | | | 507 | | | | 3,541 | | | | 4,048 | | | | 1,396 | | | | 4,242 | | | | 5,638 | |
Mid Cap Growth | | | 1,835 | | | | 19,576 | | | | 21,411 | | | | 1,734 | | | | 5,091 | | | | 6,825 | |
Small Mid-Cap Growth | | | 1,549 | | | | 11,543 | | | | 13,092 | | | | 997 | | | | 4,690 | | | | 5,687 | |
Global Leaders | | | 237 | | | | 1,589 | | | | 1,826 | | | | 59 | | | | 378 | | | | 437 | |
International Growth | | | 9,747 | | | | 22,026 | | | | 31,773 | | | | 13,859 | | | | 22,239 | | | | 36,098 | |
International Equity | | | 20 | | | | 266 | | | | 286 | | | | 58 | | | | 2,177 | | | | 2,235 | |
International Leaders (a) | | | 50 | | | | 401 | | | | 451 | | | | — | | | | — | | | | — | |
International Small Cap Growth | | | 140 | | | | 5,547 | | | | 5,687 | | | | 409 | | | | 12,634 | | | | 13,043 | |
Emerging Markets Growth | | | 35 | | | | 1,140 | | | | 1,175 | | | | 110 | | | | 1,744 | | | | 1,854 | |
Emerging Markets Leaders | | | 22 | | | | 702 | | | | 724 | | | | 3 | | | | 2,073 | | | | 2,076 | |
Emerging Markets Small Cap Growth (b) | | | 261 | | | | 568 | | | | 829 | | | | 104 | | | | 232 | | | | 336 | |
Large Cap Value (b) | | | 23 | | | | 63 | | | | 86 | | | | 100 | | | | 145 | | | | 245 | |
Small Cap Value | | | 1,057 | | | | 2,556 | | | | 3,613 | | | | 3,200 | | | | 8,897 | | | | 12,097 | |
Mid Cap Value | | | 2 | | | | 24 | | | | 26 | | | | 8 | | | | 151 | | | | 159 | |
Small-Mid Cap Value (c) | | | 2 | | | | 5 | | | | 7 | | | | 82 | | | | 124 | | | | 206 | |
Bond | | | 2,628 | | | | 2,776 | | | | 5,404 | | | | 421 | | | | 3,871 | | | | 4,292 | |
Income | | | 4,948 | | | | 2,595 | | | | 7,543 | | | | 2,705 | | | | 967 | | | | 3,672 | |
Low Duration | | | 1,337 | | | | 10,837 | | | | 12,174 | | | | 301 | | | | 5,769 | | | | 6,070 | |
Ready Reserves | | | 867,610 | | | | — | | | | 867,610 | | | | 838,996 | | | | — | | | | 838,996 | |
| | | | | | | | | | | | | | | | | | | | | | | | |
| | | Reinvested Distributions (Shares) | |
| | | Year Ended December 31, 2012 | | | Year Ended December 31, 2011 | |
Fund | | Class N | | | Class I | | | Total | | | Class N | | | Class I | | | Total | |
Growth | | | 581 | | | | 1,014 | | | | 1,595 | | | | 552 | | | | 854 | | | | 1,406 | |
Large Cap Growth | | | — | | | | — | | | | — | | | | — | | | | 5 | | | | 5 | |
Small Cap Growth | | | 24 | | | | 44 | | | | 68 | | | | — | | | | — | | | | — | |
Mid Cap Growth | | | 70 | | | | 576 | | | | 646 | | | | 208 | | | | 742 | | | | 950 | |
Small Mid-Cap Growth | | | 74 | | | | 570 | | | | 644 | | | | 239 | | | | 1,356 | | | | 1,595 | |
Global Leaders | | | 1 | | | | 24 | | | | 25 | | | | — | | | | 21 | | | | 21 | |
International Growth | | | 1,647 | | | | 2,899 | | | | 4,546 | | | | — | | | | 271 | | | | 271 | |
International Equity | | | 14 | | | | 146 | | | | 160 | | | | — | | | | — | | | | — | |
International Leaders (a) | | | — | | | | — | | | | — | | | | — | | | | — | | | | — | |
International Small Cap Growth | | | 19 | | | | 483 | | | | 502 | | | | 17 | | | | 286 | | | | 303 | |
Emerging Markets Growth | | | 5 | | | | 64 | | | | 69 | | | | 188 | | | | 1,225 | | | | 1,413 | |
Emerging Markets Leaders | | | — | | | | 12 | | | | 12 | | | | 1 | | | | 178 | | | | 179 | |
Emerging Markets Small Cap Growth (b) | | | 1 | | | | 3 | | | | 4 | | | | — | | | | — | | | | — | |
Large Cap Value (b) | | | — | | | | 1 | | | | 1 | | | | — | | | | 1 | | | | 1 | |
Small Cap Value | | | 30 | | | | 169 | | | | 199 | | | | 128 | | | | 550 | | | | 678 | |
Mid Cap Value | | | — | | | | 14 | | | | 14 | | | | — | | | | 8 | | | | 8 | |
Small-Mid Cap Value (c) | | | — | | | | 2 | | | | 2 | | | | — | | | | — | | | | — | |
Bond | | | 99 | | | | 531 | | | | 630 | | | | 20 | | | | 533 | | | | 553 | |
Income | | | 178 | | | | 210 | | | | 388 | | | | 135 | | | | 246 | | | | 381 | |
Low Duration | | | 10 | | | | 192 | | | | 202 | | | | 8 | | | | 145 | | | | 153 | |
Ready Reserves | | | 131 | | | | — | | | | 131 | | | | 125 | | | | — | | | | 125 | |
December 31, 2012 | William Blair Funds 137 |
| | | | | | | | | | | | | | | | | | | | | | | | |
| | | Redemptions (Shares) | |
| | | Year Ended December 31, 2012 | | | Year Ended December 31, 2011 | |
Fund | | Class N | | | Class I | | | Total | | | Class N | | | Class I | | | Total | |
Growth | | | 5,556 | | | | 4,123 | | | | 9,679 | | | | 5,345 | | | | 5,968 | | | | 11,313 | |
Large Cap Growth | | | 88 | | | | 550 | | | | 638 | | | | 633 | | | | 802 | | | | 1,435 | |
Small Cap Growth | | | 5,073 | | | | 9,629 | | | | 14,702 | | | | 8,432 | | | | 7,958 | | | | 16,390 | |
Mid Cap Growth | | | 1,251 | | | | 4,392 | | | | 5,643 | | | | 465 | | | | 2,990 | | | | 3,455 | |
Small Mid-Cap Growth | | | 1,290 | | | | 4,593 | | | | 5,883 | | | | 478 | | | | 1,908 | | | | 2,386 | |
Global Leaders | | | 150 | | | | 1,585 | | | | 1,735 | | | | 204 | | | | 334 | | | | 538 | |
International Growth | | | 23,161 | | | | 22,367 | | | | 45,528 | | | | 68,547 | | | | 27,431 | | | | 95,978 | |
International Equity | | | 207 | | | | 1,569 | | | | 1,776 | | | | 549 | | | | 9,168 | | | | 9,717 | |
International Leaders (a) | | | — | | | | — | | | | — | | | | — | | | | — | | | | — | |
International Small Cap Growth | | | 734 | | | | 11,369 | | | | 12,103 | | | | 431 | | | | 7,627 | | | | 8,058 | |
Emerging Markets Growth | | | 358 | | | | 1,558 | | | | 1,916 | | | | 911 | | | | 4,152 | | | | 5,063 | |
Emerging Markets Leaders | | | 1 | | | | 745 | | | | 746 | | | | 3 | | | | 1,006 | | | | 1,009 | |
Emerging Markets Small Cap Growth (b) | | | 134 | | | | 129 | | | | 263 | | | | — | | | | — | | | | — | |
Large Cap Value (b) | | | — | | | | — | | | | — | | | | — | | | | — | | | | — | |
Small Cap Value | | | 1,543 | | | | 3,881 | | | | 5,424 | | | | 2,509 | | | | 3,505 | | | | 6,014 | |
Mid Cap Value | | | 1 | | | | 113 | | | | 114 | | | | 2 | | | | 43 | | | | 45 | |
Small-Mid Cap Value (c) | | | — | | | | 3 | | | | 3 | | | | — | | | | — | | | | — | |
Bond | | | 579 | | | | 2,114 | | | | 2,693 | | | | 95 | | | | 4,083 | | | | 4,178 | |
Income | | | 2,712 | | | | 2,382 | | | | 5,094 | | | | 1,913 | | | | 2,423 | | | | 4,336 | |
Low Duration | | | 843 | | | | 3,465 | | | | 4,308 | | | | 373 | | | | 6,432 | | | | 6,805 | |
Ready Reserves | | | 624,157 | | | | — | | | | 624,157 | | | | 783,918 | | | | — | | | | 783,918 | |
| | | | | | | | | | | | | | | | | | | | | | | | |
| | | Net Change in Shares Outstanding relating to Fund Share Activity (Shares) | |
| | | Year Ended December 31, 2012 | | | Year Ended December 31, 2011 | |
Fund | | Class N | | | Class I | | | Total | | | Class N | | | Class I | | | Total | |
Growth | | | 1,536 | | | | 4,809 | | | | 6,345 | | | | 1,449 | | | | 207 | | | | 1,656 | |
Large Cap Growth | | | 29 | | | | (168 | ) | | | (139 | ) | | | (508 | ) | | | (346 | ) | | | (854 | ) |
Small Cap Growth | | | (4,542 | ) | | | (6,044 | ) | | | (10,586 | ) | | | (7,036 | ) | | | (3,716 | ) | | | (10,752 | ) |
Mid Cap Growth | | | 654 | | | | 15,760 | | | | 16,414 | | | | 1,477 | | | | 2,843 | | | | 4,320 | |
Small Mid-Cap Growth | | | 333 | | | | 7,520 | | | | 7,853 | | | | 758 | | | | 4,138 | | | | 4,896 | |
Global Leaders | | | 88 | | | | 28 | | | | 116 | | | | (145 | ) | | | 65 | | | | (80 | ) |
International Growth | | | (11,767 | ) | | | 2,558 | | | | (9,209 | ) | | | (54,688 | ) | | | (4,921 | ) | | | (59,609 | ) |
International Equity | | | (173 | ) | | | (1,157 | ) | | | (1,330 | ) | | | (491 | ) | | | (6,991 | ) | | | (7,482 | ) |
International Leaders (a) | | | 50 | | | | 401 | | | | 451 | | | | — | | | | — | | | | — | |
International Small Cap Growth | | | (575 | ) | | | (5,339 | ) | | | (5,914 | ) | | | (5 | ) | | | 5,293 | | | | 5,288 | |
Emerging Markets Growth | | | (318 | ) | | | (354 | ) | | | (672 | ) | | | (613 | ) | | | (1,183 | ) | | | (1,796 | ) |
Emerging Markets Leaders | | | 21 | | | | (31 | ) | | | (10 | ) | | | 1 | | | | 1,245 | | | | 1,246 | |
Emerging Markets Small Cap Growth (b) | | | 128 | | | | 442 | | | | 570 | | | | 104 | | | | 232 | | | | 336 | |
Large Cap Value (b) | | | 23 | | | | 64 | | | | 87 | | | | 100 | | | | 146 | | | | 246 | |
Small Cap Value | | | (456 | ) | | | (1,156 | ) | | | (1,612 | ) | | | 819 | | | | 5,942 | | | | 6,761 | |
Mid Cap Value | | | 1 | | | | (75 | ) | | | (74 | ) | | | 6 | | | | 116 | | | | 122 | |
Small-Mid Cap Value (c) | | | 2 | | | | 4 | | | | 6 | | | | 82 | | | | 124 | | | | 206 | |
Bond | | | 2,148 | | | | 1,193 | | | | 3,341 | | | | 346 | | | | 321 | | | | 667 | |
Income | | | 2,414 | | | | 423 | | | | 2,837 | | | | 927 | | | | (1,210 | ) | | | (283 | ) |
Low Duration | | | 504 | | | | 7,564 | | | | 8,068 | | | | (64 | ) | | | (518 | ) | | | (582 | ) |
Ready Reserves | | | 243,584 | | | | — | | | | 243,584 | | | | 55,203 | | | | — | | | | 55,203 | |
| (a) | | For the period from August 16, 2012 (Commencement of Operations) to December 31, 2012. |
| (b) | | For the period from October 24, 2011 (Commencement of Operations) to December 31, 2011. |
| (c) | | For the period from December 15, 2011 (Commencement of Operations) to December 31, 2011. |
138 Annual Report | December 31, 2012 |
Financial Highlights
Growth Fund
| | | | | | | | | | | | | | | | | | | | |
| | | Class N | |
| | | Years Ended December 31, | |
| | | 2012 | | | 2011 | | | 2010 | | | 2009 | | | 2008 | |
Net asset value, beginning of year | | $ | 10.73 | | | $ | 11.28 | | | $ | 9.89 | | | $ | 7.12 | | | $ | 11.70 | |
Income (loss) from investment operations: | | | | | | | | | | | | | | | | | | | | |
Net investment income (loss) | | | (0.01 | ) | | | (0.04 | ) | | | (0.01 | ) | | | (0.02 | ) | | | (0.05 | ) |
Net realized and unrealized gain (loss) on investments | | | 1.69 | | | | (0.19 | ) | | | 1.40 | | | | 2.79 | | | | (4.35 | ) |
| | | | | | | | | | | | | | | | | | | | |
Total from investment operations | | | 1.68 | | | | (0.23 | ) | | | 1.39 | | | | 2.77 | | | | (4.40 | ) |
Less distributions from: | | | | | | | | | | | | | | | | | | | | |
Net investment income | | | 0.00 | ^ | | | — | | | | — | | | | — | | | | — | |
Net realized gain | | | 0.36 | | | | 0.32 | | | | — | | | | — | | | | 0.18 | |
| | | | | | | | | | | | | | | | | | | | |
Total distributions | | | 0.36 | | | | 0.32 | | | | — | | | | — | | | | 0.18 | |
| | | | | | | | | | | | | | | | | | | | |
Net asset value, end of year | | $ | 12.05 | | | $ | 10.73 | | | $ | 11.28 | | | $ | 9.89 | | | $ | 7.12 | |
| | | | | | | | | | | | | | | | | | | | |
Total Return (%) | | | 15.67 | | | | (1.93 | ) | | | 14.05 | | | | 38.90 | | | | (37.61 | ) |
Ratios to average daily net assets (%): | | | | | | | | | | | | | | | | | | | | |
Expenses | | | 1.20 | | | | 1.21 | | | | 1.16 | | | | 1.23 | | | | 1.17 | |
Net investment income (loss) | | | (0.06 | ) | | | (0.37 | ) | | | (0.13 | ) | | | (0.20 | ) | | | (0.54 | ) |
Net assets at end of year (in thousands) | | $ | 248,121 | | | $ | 204,476 | | | $ | 198,622 | | | $ | 153,987 | | | $ | 85,142 | |
Portfolio turnover rate (%) | | | 73 | | | | 59 | | | | 66 | | | | 67 | | | | 60 | |
| |
| | | Class I | |
| | | Years Ended December 31, | |
| | | 2012 | | | 2011 | | | 2010 | | | 2009 | | | 2008 | |
Net asset value, beginning of year | | $ | 11.18 | | | $ | 11.71 | | | $ | 10.24 | | | $ | 7.35 | | | $ | 12.02 | |
Income (loss) from investment operations: | | | | | | | | | | | | | | | | | | | | |
Net investment income (loss) | | | 0.04 | | | | 0.00 | ^ | | | 0.02 | | | | 0.01 | | | | (0.02 | ) |
Net realized and unrealized gain (loss) on investments | | | 1.75 | | | | (0.20 | ) | | | 1.45 | | | | 2.88 | | | | (4.47 | ) |
| | | | | | | | | | | | | | | | | | | | |
Total from investment operations | | | 1.79 | | | | (0.20 | ) | | | 1.47 | | | | 2.89 | | | | (4.49 | ) |
Less distributions from: | | | | | | | | | | | | | | | | | | | | |
Net investment income | | | 0.03 | | | | 0.01 | | | | 0.00 | ^ | | | 0.00 | ^ | | | — | |
Net realized gain | | | 0.36 | | | | 0.32 | | | | — | | | | — | | | | 0.18 | |
| | | | | | | | | | | | | | | | | | | | |
Total distributions | | | 0.39 | | | | 0.33 | | | | 0.00 | ^ | | | 0.00 | ^ | | | 0.18 | |
| | | | | | | | | | | | | | | | | | | | |
Net asset value, end of year | | $ | 12.58 | | | $ | 11.18 | | | $ | 11.71 | | | $ | 10.24 | | | $ | 7.35 | |
| | | | | | | | | | | | | | | | | | | | |
Total Return (%) | | | 16.03 | | | | (1.60 | ) | | | 14.36 | | | | 39.34 | | | | (37.35 | ) |
Ratios to average daily net assets (%): | | | | | | | | | | | | | | | | | | | | |
Expenses | | | 0.89 | | | | 0.86 | | | | 0.84 | | | | 0.89 | | | | 0.85 | |
Net investment income (loss) | | | 0.30 | | | | (0.03 | ) | | | 0.20 | | | | 0.14 | | | | (0.22 | ) |
Net assets at end of year (in thousands) | | $ | 468,124 | | | $ | 362,266 | | | $ | 376,991 | | | $ | 265,533 | | | $ | 153,444 | |
Portfolio turnover rate (%) | | | 73 | | | | 59 | | | | 66 | | | | 67 | | | | 60 | |
| ^ | | Amount is less than $0.005 per share. |
Note: Net investment income (loss) per share is based on the average shares outstanding during the year.
Performance cited represents past performance. Past performance does not guarantee future results and current performance may be lower or higher than the data quoted. Results shown are annual returns, which assume reinvestment of dividends and capital gains. Investment returns and principal will fluctuate and you may have a gain or loss when you sell shares. For the most current month-end performance information, please call 1-800-742-7272 or visit our Web site at www.williamblairfunds.com.
December 31, 2012 | William Blair Funds 139 |
Financial Highlights
Large Cap Growth Fund
| | | | | | | | | | | | | | | | | | | | |
| | | Class N | |
| | | Years Ended December 31, | |
| | | 2012 | | | 2011 | | | 2010 | | | 2009 | | | 2008 | |
Net asset value, beginning of year | | $ | 6.88 | | | $ | 7.14 | | | $ | 6.16 | | | $ | 4.68 | | | $ | 7.52 | |
Income (loss) from investment operations: | | | | | | | | | | | | | | | | | | | | |
Net investment income (loss) | | | (0.02 | ) | | | (0.01 | ) | | | (0.00 | )^ | | | (0.01 | ) | | | (0.02 | ) |
Net realized and unrealized gain (loss) on investments | | | 1.28 | | | | (0.25 | ) | | | 0.98 | | | | 1.49 | | | | (2.82 | ) |
| | | | | | | | | | | | | | | | | | | | |
Total from investment operations | | | 1.26 | | | | (0.26 | ) | | | 0.98 | | | | 1.48 | | | | (2.84 | ) |
Less distributions from: | | | | | | | | | | | | | | | | | | | | |
Net investment income | | | — | | | | — | | | | — | | | | — | | | | 0.00 | ^ |
Net realized gain | | | — | | | | — | | | | — | | | | — | | | | — | |
| | | | | | | | | | | | | | | | | | | | |
Total distributions | | | — | | | | — | | | | — | | | | — | | | | 0.00 | ^ |
| | | | | | | | | | | | | | | | | | | | |
Net asset value, end of year | | $ | 8.14 | | | $ | 6.88 | | | $ | 7.14 | | | $ | 6.16 | | | $ | 4.68 | |
| | | | | | | | | | | | | | | | | | | | |
Total Return (%) | | | 18.31 | | | | (3.64 | ) | | | 15.91 | | | | 31.62 | | | | (37.76 | ) |
Ratios to average daily net assets (%): | | | | | | | | | | | | | | | | | | | | |
Expenses, net of waivers and reimbursements | | | 1.20 | | | | 1.20 | | | | 1.21 | | | | 1.23 | | | | 1.23 | |
Expenses, before waivers and reimbursements | | | 1.57 | | | | 1.51 | | | | 1.53 | | | | 2.28 | | | | 1.85 | |
Net investment income (loss), net of waivers and reimbursements | | | (0.21 | ) | | | (0.13 | ) | | | (0.08 | ) | | | (0.13 | ) | | | (0.29 | ) |
Net investment income (loss), before waivers and reimbursements | | | (0.58 | ) | | | (0.44 | ) | | | (0.40 | ) | | | (1.18 | ) | | | (0.91 | ) |
Net assets at end of year (in thousands) | | $ | 4,238 | | | $ | 3,387 | | | $ | 7,135 | | | $ | 5,952 | | | $ | 4,842 | |
Portfolio turnover rate (%) | | | 50 | | | | 67 | | | | 54 | | | | 88 | | | | 85 | |
| |
| | | Class I | |
| | | Years Ended December 31, | |
| | | 2012 | | | 2011 | | | 2010 | | | 2009 | | | 2008 | |
Net asset value, beginning of year | | $ | 7.03 | | | $ | 7.30 | | | $ | 6.30 | | | $ | 4.77 | | | $ | 7.64 | |
Income (loss) from investment operations: | | | | | | | | | | | | | | | | | | | | |
Net investment income (loss) | | | 0.00 | ^ | | | 0.01 | | | | 0.01 | | | | 0.01 | | | | 0.00 | ^ |
Net realized and unrealized gain (loss) on investments | | | 1.32 | | | | (0.27 | ) | | | 1.00 | | | | 1.52 | | | | (2.87 | ) |
| | | | | | | | | | | | | | | | | | | | |
Total from investment operations | | | 1.32 | | | | (0.26 | ) | | | 1.01 | | | | 1.53 | | | | (2.87 | ) |
Less distributions from: | | | | | | | | | | | | | | | | | | | | |
Net investment income | | | — | | | | 0.01 | | | | 0.01 | | | | 0.00 | ^ | | | 0.00 | ^ |
Net realized gain | | | — | | | | — | | | | — | | | | — | | | | — | |
| | | | | | | | | | | | | | | | | | | | |
Total distributions | | | — | | | | 0.01 | | | | 0.01 | | | | 0.00 | ^ | | | 0.00 | ^ |
| | | | | | | | | | | | | | | | | | | | |
Net asset value, end of year | | $ | 8.35 | | | $ | 7.03 | | | $ | 7.30 | | | $ | 6.30 | | | $ | 4.77 | |
| | | | | | | | | | | | | | | | | | | | |
Total Return (%) | | | 18.78 | | | | (3.54 | ) | | | 16.03 | | | | 32.17 | | | | (37.56 | ) |
Ratios to average daily net assets (%): | | | | | | | | | | | | | | | | | | | | |
Expenses, net of waivers and reimbursements | | | 0.95 | | | | 0.95 | | | | 0.96 | | | | 0.98 | | | | 0.98 | |
Expenses, before waivers and reimbursements | | | 1.23 | | | | 1.16 | | | | 1.16 | | | | 1.26 | | | | 1.21 | |
Net investment income (loss), net of waivers and reimbursements | | | 0.03 | | | | 0.11 | | | | 0.16 | | | | 0.12 | | | | (0.04 | ) |
Net investment income (loss), before waivers and reimbursements | | | (0.25 | ) | | | (0.10 | ) | | | (0.04 | ) | | | (0.16 | ) | | | (0.27 | ) |
Net assets at end of year (in thousands) | | $ | 24,175 | | | $ | 21,562 | | | $ | 24,900 | | | $ | 24,359 | | | $ | 18,437 | |
Portfolio turnover rate (%) | | | 50 | | | | 67 | | | | 54 | | | | 88 | | | | 85 | |
| ^ | | Amount is less than $0.005 per share. |
Note: Net investment income (loss) per share is based on the average shares outstanding during the year.
Performance cited represents past performance. Past performance does not guarantee future results and current performance may be lower or higher than the data quoted. Results shown are annual returns, which assume reinvestment of dividends and capital gains. Investment returns and principal will fluctuate and you may have a gain or loss when you sell shares. For the most current month-end performance information, please call 1-800-742-7272 or visit our Web site at www.williamblairfunds.com.
140 Annual Report | December 31, 2012 |
Financial Highlights
Small Cap Growth Fund
| | | | | | | | | | | | | | | | | | | | |
| | | Class N | |
| | | Years Ended December 31, | |
| | | 2012 | | | 2011 | | | 2010 | | | 2009 | | | 2008 | |
Net asset value, beginning of year | | $ | 20.13 | | | $ | 23.22 | | | $ | 19.99 | | | $ | 11.79 | | | $ | 23.30 | |
Income (loss) from investment operations: | | | | | | | | | | | | | | | | | | | | |
Net investment income (loss) | | | (0.22 | ) | | | (0.28 | ) | | | (0.21 | ) | | | (0.15 | ) | | | (0.19 | ) |
Net realized and unrealized gain (loss) on investments | | | 3.87 | | | | (2.81 | ) | | | 3.44 | | | | 8.35 | | | | (10.73 | ) |
| | | | | | | | | | | | | | | | | | | | |
Total from investment operations | | | 3.65 | | | | (3.09 | ) | | | 3.23 | | | | 8.20 | | | | (10.92 | ) |
Less distributions from: | | | | | | | | | | | | | | | | | | | | |
Net investment income | | | — | | | | — | | | | — | | | | — | | | | — | |
Net realized gain | | | 0.10 | | | | — | | | | — | | | | — | | | | 0.59 | |
| | | | | | | | | | | | | | | | | | | | |
Total distributions | | | 0.10 | | | | — | | | | — | | | | — | | | | 0.59 | |
| | | | | | | | | | | | | | | | | | | | |
Net asset value, end of year | | $ | 23.68 | | | $ | 20.13 | | | $ | 23.22 | | | $ | 19.99 | | | $ | 11.79 | |
| | | | | | | | | | | | | | | | | | | | |
Total Return (%) | | | 18.15 | | | | (13.31 | ) | | | 16.16 | | | | 69.55 | | | | (46.85 | ) |
Ratios to average daily net assets (%): | | | | | | | | | | | | | | | | | | | | |
Expenses, net of waivers and reimbursements | | | 1.50 | | | | 1.50 | | | | 1.50 | | | | 1.50 | | | | 1.50 | |
Expenses, before waivers and reimbursements | | | 1.59 | | | | 1.59 | | | | 1.52 | | | | 1.55 | | | | 1.50 | |
Net investment income (loss), net of waivers and reimbursements | | | (0.96 | ) | | | (1.25 | ) | | | (1.03 | ) | | | (0.93 | ) | | | (1.05 | ) |
Net investment income (loss), before waivers and reimbursements | | | (1.05 | ) | | | (1.34 | ) | | | (1.05 | ) | | | (0.98 | ) | | | (1.05 | ) |
Net assets at end of year (in thousands) | | $ | 130,382 | | | $ | 202,341 | | | $ | 396,767 | | | $ | 469,746 | | | $ | 224,612 | |
Portfolio turnover rate (%) | | | 89 | | | | 97 | | | | 117 | | | | 122 | | | | 135 | |
| |
| | | Class I | |
| | | Years Ended December 31, | |
| | | 2012 | | | 2011 | | | 2010 | | | 2009 | | | 2008 | |
Net asset value, beginning of year | | $ | 20.91 | | | $ | 24.07 | | | $ | 20.64 | | | $ | 12.14 | | | $ | 23.89 | |
Income (loss) from investment operations: | | | | | | | | | | | | | | | | | | | | |
Net investment income (loss) | | | (0.16 | ) | | | (0.23 | ) | | | (0.16 | ) | | | (0.11 | ) | | | (0.14 | ) |
Net realized and unrealized gain (loss) on investments | | | 4.01 | | | | (2.93 | ) | | | 3.59 | | | | 8.61 | | | | (11.02 | ) |
| | | | | | | | | | | | | | | | | | | | |
Total from investment operations | | | 3.85 | | | | (3.16 | ) | | | 3.43 | | | | 8.50 | | | | (11.16 | ) |
Less distributions from: | | | | | | | | | | | | | | | | | | | | |
Net investment income | | | — | | | | — | | | | — | | | | — | | | | — | |
Net realized gain | | | 0.10 | | | | — | | | | — | | | | — | | | | 0.59 | |
| | | | | | | | | | | | | | | | | | | | |
Total distributions | | | 0.10 | | | | — | | | | — | | | | — | | | | 0.59 | |
| | | | | | | | | | | | | | | | | | | | |
Net asset value, end of year | | $ | 24.66 | | | $ | 20.91 | | | $ | 24.07 | | | $ | 20.64 | | | $ | 12.14 | |
| | | | | | | | | | | | | | | | | | | | |
Total Return (%) | | | 18.43 | | | | (13.13 | ) | | | 16.62 | | | | 70.02 | | | | (46.70 | ) |
Ratios to average daily net assets (%): | | | | | | | | | | | | | | | | | | | | |
Expenses, net of waivers and reimbursements | | | 1.25 | | | | 1.25 | | | | 1.25 | | | | 1.20 | | | | 1.20 | |
Expenses, before waivers and reimbursements | | | 1.35 | | | | 1.35 | | | | 1.25 | | | | 1.20 | | | | 1.20 | |
Net investment income (loss), net of waivers and reimbursements | | | (0.71 | ) | | | (1.00 | ) | | | (0.76 | ) | | | (0.63 | ) | | | (0.75 | ) |
Net investment income (loss), before waivers and reimbursements | | | (0.81 | ) | | | (1.10 | ) | | | (0.76 | ) | | | (0.63 | ) | | | (0.75 | ) |
Net assets at end of year (in thousands) | | $ | 266,431 | | | $ | 352,397 | | | $ | 494,822 | | | $ | 293,052 | | | $ | 177,015 | |
Portfolio turnover rate (%) | | | 89 | | | | 97 | | | | 117 | | | | 122 | | | | 135 | |
Note: Net investment income (loss) per share is based on the average shares outstanding during the year.
Performance cited represents past performance. Past performance does not guarantee future results and current performance may be lower or higher than the data quoted. Results shown are annual returns, which assume reinvestment of dividends and capital gains. Investment returns and principal will fluctuate and you may have a gain or loss when you sell shares. For the most current month-end performance information, please call 1-800-742-7272 or visit our Web site at www.williamblairfunds.com.
December 31, 2012 | William Blair Funds 141 |
Financial Highlights
Mid Cap Growth Fund
| | | | | | | | | | | | | | | | | | | | |
| | | Class N | |
| | | Years Ended December 31, | |
| | | 2012 | | | 2011 | | | 2010 | | | 2009 | | | 2008 | |
Net asset value, beginning of year | | $ | 11.66 | | | $ | 12.50 | | | $ | 10.08 | | | $ | 7.41 | | | $ | 11.35 | |
Income (loss) from investment operations: | | | | | | | | | | | | | | | | | | | | |
Net investment income (loss) | | | (0.02 | ) | | | (0.08 | ) | | | (0.05 | ) | | | (0.04 | ) | | | (0.07 | ) |
Net realized and unrealized gain (loss) on investments | | | 1.29 | | | | 0.25 | | | | 2.47 | | | | 2.71 | | | | (3.87 | ) |
| | | | | | | | | | | | | | | | | | | | |
Total from investment operations | | | 1.27 | | | | 0.17 | | | | 2.42 | | | | 2.67 | | | | (3.94 | ) |
Less distributions from: | | | | | | | | | | | | | | | | | | | | |
Net investment income | | | — | | | | — | | | | — | | | | — | | | | — | |
Net realized gain | | | 0.28 | | | | 1.01 | | | | — | | | | — | | | | 0.00 | ^ |
| | | | | | | | | | | | | | | | | | | | |
Total distributions | | | 0.28 | | | | 1.01 | | | | — | | | | — | | | | 0.00 | ^ |
| | | | | | | | | | | | | | | | | | | | |
Net asset value, end of year | | $ | 12.65 | | | $ | 11.66 | | | $ | 12.50 | | | $ | 10.08 | | | $ | 7.41 | |
| | | | | | | | | | | | | | | | | | | | |
Total Return (%) | | | 10.90 | | | | 1.65 | | | | 24.01 | | | | 36.03 | | | | (34.71 | ) |
Ratios to average daily net assets (%): | | | | | | | | | | | | | | | | | | | | |
Expenses, net of waivers and reimbursements | | | 1.35 | | | | 1.35 | | | | 1.35 | | | | 1.36 | | | | 1.36 | |
Expenses, before waivers and reimbursements | | | 1.42 | | | | 1.43 | | | | 1.42 | | | | 2.13 | | | | 2.03 | |
Net investment income (loss), net of waivers and reimbursements | | | (0.15 | ) | | | (0.65 | ) | | | (0.42 | ) | | | (0.51 | ) | | | (0.76 | ) |
Net investment income (loss), before waivers and reimbursements | | | (0.22 | ) | | | (0.73 | ) | | | (0.49 | ) | | | (1.28 | ) | | | (1.43 | ) |
Net assets at end of year (in thousands) | | $ | 40,940 | | | $ | 30,093 | | | $ | 13,802 | | | $ | 10,379 | | | $ | 4,803 | |
Portfolio turnover rate (%) | | | 62 | | | | 70 | | | | 73 | | | | 87 | | | | 76 | |
| |
| | | Class I | |
| | | Years Ended December 31, | |
| | | 2012 | | | 2011 | | | 2010 | | | 2009 | | | 2008 | |
Net asset value, beginning of year | | $ | 11.87 | | | $ | 12.68 | | | $ | 10.20 | | | $ | 7.48 | | | $ | 11.42 | |
Income (loss) from investment operations: | | | | | | | | | | | | | | | | | | | | |
Net investment income (loss) | | | 0.03 | | | | (0.05 | ) | | | (0.02 | ) | | | (0.02 | ) | | | (0.05 | ) |
Net realized and unrealized gain (loss) on investments | | | 1.31 | | | | 0.25 | | | | 2.50 | | | | 2.74 | | | | (3.89 | ) |
| | | | | | | | | | | | | | | | | | | | |
Total from investment operations | | | 1.34 | | | | 0.20 | | | | 2.48 | | | | 2.72 | | | | (3.94 | ) |
Less distributions from: | | | | | | | | | | | | | | | | | | | | |
Net investment income | | | 0.02 | | | | — | | | | — | | | | — | | | | — | |
Net realized gain | | | 0.28 | | | | 1.01 | | | | — | | | | — | | | | 0.00 | ^ |
| | | | | | | | | | | | | | | | | | | | |
Total distributions | | | 0.30 | | | | 1.01 | | | | — | | | | — | | | | 0.00 | ^ |
| | | | | | | | | | | | | | | | | | | | |
Net asset value, end of year | | $ | 12.91 | | | $ | 11.87 | | | $ | 12.68 | | | $ | 10.20 | | | $ | 7.48 | |
| | | | | | | | | | | | | | | | | | | | |
Total Return (%) | | | 11.30 | | | | 1.86 | | | | 24.31 | | | | 36.36 | | | | (34.50 | ) |
Ratios to average daily net assets (%): | | | | | | | | | | | | | | | | | | | | |
Expenses, net of waivers and reimbursements | | | 1.07 | | | | 1.10 | | | | 1.10 | | | | 1.11 | | | | 1.11 | |
Expenses, before waivers and reimbursements | | | 1.07 | | | | 1.13 | | | | 1.15 | | | | 1.28 | | | | 1.23 | |
Net investment income (loss), net of waivers and reimbursements | | | 0.19 | | | | (0.42 | ) | | | (0.14 | ) | | | (0.26 | ) | | | (0.51 | ) |
Net investment income (loss), before waivers and reimbursements | | | 0.19 | | | | (0.45 | ) | | | (0.19 | ) | | | (0.43 | ) | | | (0.63 | ) |
Net assets at end of year (in thousands) | | $ | 329,295 | | | $ | 115,661 | | | $ | 87,446 | | | $ | 60,455 | | | $ | 35,723 | |
Portfolio turnover rate (%) | | | 62 | | | | 70 | | | | 73 | | | | 87 | | | | 76 | |
| ^ | | Amount is less than $0.005 per share. |
Note: Net investment income (loss) per share is based on the average shares outstanding during the year.
Performance cited represents past performance. Past performance does not guarantee future results and current performance may be lower or higher than the data quoted. Results shown are annual returns, which assume reinvestment of dividends and capital gains. Investment returns and principal will fluctuate and you may have a gain or loss when you sell shares. For the most current month-end performance information, please call 1-800-742-7272 or visit our Web site at www.williamblairfunds.com.
142 Annual Report | December 31, 2012 |
Financial Highlights
Small-Mid Cap Growth Fund
| | | | | | | | | | | | | | | | | | | | |
| | | Class N | |
| | | Years Ended December 31, | |
| | | 2012 | | | 2011 | | | 2010 | | | 2009 | | | 2008 | |
Net asset value, beginning of year | | $ | 13.00 | | | $ | 14.40 | | | $ | 11.73 | | | $ | 8.16 | | | $ | 13.10 | |
Income (loss) from investment operations: | | | | | | | | | | | | | | | | | | | | |
Net investment income (loss) | | | 0.02 | | | | (0.11 | ) | | | (0.09 | ) | | | (0.06 | ) | | | (0.03 | ) |
Net realized and unrealized gain (loss) on investments | | | 1.57 | | | | 0.03 | | | | 2.76 | | | | 3.63 | | | | (4.91 | ) |
| | | | | | | | | | | | | | | | | | | | |
Total from investment operations | | | 1.59 | | | | (0.08 | ) | | | 2.67 | | | | 3.57 | | | | (4.94 | ) |
Less distributions from: | | | | | | | | | | | | | | | | | | | | |
Net investment income | | | 0.02 | | | | — | | | | — | | | | — | | | | — | |
Net realized gain | | | 0.36 | | | | 1.32 | | | | — | | | | — | | | | 0.00 | ^ |
| | | | | | | | | | | | | | | | | | | | |
Total distributions | | | 0.38 | | | | 1.32 | | | | — | | | | — | | | | 0.00 | ^ |
| | | | | | | | | | | | | | | | | | | | |
Net asset value, end of year | | $ | 14.21 | | | $ | 13.00 | | | $ | 14.40 | | | $ | 11.73 | | | $ | 8.16 | |
| | | | | | | | | | | | | | | | | | | | |
Total Return (%) | | | 12.20 | | | | (0.27 | ) | | | 22.76 | | | | 43.75 | | | | (37.71 | ) |
Ratios to average daily net assets (%): | | | | | | | | | | | | | | | | | | | | |
Expenses, net of waivers and reimbursements | | | 1.35 | | | | 1.35 | | | | 1.35 | | | | 1.36 | | | | 1.36 | |
Expenses, before waivers and reimbursements | | | 1.47 | | | | 1.46 | | | | 1.46 | | | | 1.49 | | | | 1.41 | |
Net investment income (loss), net of waivers and reimbursements | | | 0.16 | | | | (0.77 | ) | | | (0.76 | ) | | | (0.60 | ) | | | (0.26 | ) |
Net investment income (loss), before waivers and reimbursements | | | 0.04 | | | | (0.88 | ) | | | (0.87 | ) | | | (0.73 | ) | | | (0.31 | ) |
Net assets at end of year (in thousands) | | $ | 42,015 | | | $ | 34,123 | | | $ | 26,876 | | | $ | 23,576 | | | $ | 7,954 | |
Portfolio turnover rate (%) | | | 82 | | | | 76 | | | | 93 | | | | 112 | | | | 77 | |
| |
| | | Class I | |
| | | Years Ended December 31, | |
| | | 2012 | | | 2011 | | | 2010 | | | 2009 | | | 2008 | |
Net asset value, beginning of year | | $ | 13.32 | | | $ | 14.68 | | | $ | 11.93 | | | $ | 8.27 | | | $ | 13.24 | |
Income (loss) from investment operations: | | | | | | | | | | | | | | | | | | | | |
Net investment income (loss) | | | 0.07 | | | | (0.08 | ) | | | (0.06 | ) | | | (0.03 | ) | | | 0.00 | ^ |
Net realized and unrealized gain (loss) on investments | | | 1.58 | | | | 0.04 | | | | 2.81 | | | | 3.69 | | | | (4.97 | ) |
| | | | | | | | | | | | | | | | | | | | |
Total from investment operations | | | 1.65 | | | | (0.04 | ) | | | 2.75 | | | | 3.66 | | | | (4.97 | ) |
Less distributions from: | | | | | | | | | | | | | | | | | | | | |
Net investment income | | | 0.06 | | | | — | | | | — | | | | 0.00 | ^ | | | — | |
Net realized gain | | | 0.36 | | | | 1.32 | | | | — | | | | — | | | | 0.00 | ^ |
| | | | | | | | | | | | | | | | | | | | |
Total distributions | | | 0.42 | | | | 1.32 | | | | — | | | | 0.00 | ^ | | | 0.00 | ^ |
| | | | | | | | | | | | | | | | | | | | |
Net asset value, end of year | | $ | 14.55 | | | $ | 13.32 | | | $ | 14.68 | | | $ | 11.93 | | | $ | 8.27 | |
| | | | | | | | | | | | | | | | | | | | |
Total Return (%) | | | 12.36 | | | | 0.01 | | | | 23.05 | | | | 44.26 | | | | (37.54 | ) |
Ratios to average daily net assets (%): | | | | | | | | | | | | | | | | | | | | |
Expenses, net of waivers and reimbursements | | | 1.10 | | | | 1.10 | | | | 1.10 | | | | 1.11 | | | | 1.11 | |
Expenses, before waivers and reimbursements | | | 1.20 | | | | 1.12 | | | | 1.11 | | | | 1.18 | | | | 1.17 | |
Net investment income (loss), net of waivers and reimbursements | | | 0.48 | | | | (0.54 | ) | | | (0.50 | ) | | | (0.33 | ) | | | 0.03 | |
Net investment income (loss), before waivers and reimbursements | | | 0.38 | | | | (0.56 | ) | | | (0.51 | ) | | | (0.40 | ) | | | (0.03 | ) |
Net assets at end of year (in thousands) | | $ | 349,345 | | | $ | 219,474 | | | $ | 181,189 | | | $ | 123,252 | | | $ | 75,525 | |
Portfolio turnover rate (%) | | | 82 | | | | 76 | | | | 93 | | | | 112 | | | | 77 | |
| ^ | | Amount is less than $0.005 per share. |
Note: Net investment income (loss) per share is based on the average shares outstanding during the year.
Performance cited represents past performance. Past performance does not guarantee future results and current performance may be lower or higher than the data quoted. Results shown are annual returns, which assume reinvestment of dividends and capital gains. Investment returns and principal will fluctuate and you may have a gain or loss when you sell shares. For the most current month-end performance information, please call 1-800-742-7272 or visit our Web site at www.williamblairfunds.com.
December 31, 2012 | William Blair Funds 143 |
Financial Highlights
Global Leaders Fund
| | | | | | | | | | | | | | | | | | | | |
| | | Class N | |
| | | Years Ended December 31, | |
| | | 2012 | | | 2011 | | | 2010 | | | 2009 | | | 2008 | |
Net asset value, beginning of year | | $ | 8.10 | | | $ | 8.40 | | | $ | 6.97 | | | $ | 4.96 | | | $ | 9.89 | |
Income (loss) from investment operations: | | | | | | | | | | | | | | | | | | | | |
Net investment income (loss) (a) | | | 0.03 | | | | 0.02 | | | | (0.01 | ) | | | (0.01 | ) | | | 0.08 | |
Net realized and unrealized gain (loss) on investments | | | 1.37 | | | | (0.31 | ) | | | 1.44 | | | | 2.02 | | | | (4.98 | ) |
| | | | | | | | | | | | | | | | | | | | |
Total from investment operations | | | 1.40 | | | | (0.29 | ) | | | 1.43 | | | | 2.01 | | | | (4.90 | ) |
Less distributions from: | | | | | | | | | | | | | | | | | | | | |
Net investment income | | | 0.03 | | | | 0.01 | | | | — | | | | — | | | | 0.03 | |
Net realized gain | | | — | | | | — | | | | — | | | | — | | | | — | |
| | | | | | | | | | | | | | | | | | | | |
Total distributions | | | 0.03 | | | | 0.01 | | | | — | | | | — | | | | 0.03 | |
| | | | | | | | | | | | | | | | | | | | |
Net asset value, end of year | | $ | 9.47 | | | $ | 8.10 | | | $ | 8.40 | | | $ | 6.97 | | | $ | 4.96 | |
| | | | | | | | | | | | | | | | | | | | |
Total Return (%) | | | 17.25 | | | | (3.47 | ) | | | 20.52 | | | | 40.52 | | | | (49.52 | ) |
Ratios to average daily net assets (%): | | | | | | | | | | | | | | | | | | | | |
Expenses, net of waivers and reimbursements | | | 1.50 | | | | 1.50 | | | | 1.52 | | | | 1.55 | | | | 1.55 | |
Expenses, before waivers and reimbursements | | | 1.84 | | | | 1.82 | | | | 1.93 | | | | 2.61 | | | | 2.17 | |
Net investment income (loss), net of waivers and reimbursements | | | 0.29 | | | | 0.29 | | | | (0.09 | ) | | | (0.17 | ) | | | 0.98 | |
Net investment income (loss), before waivers and reimbursements | | | (0.05 | ) | | | (0.03 | ) | | | (0.50 | ) | | | (1.23 | ) | | | 0.36 | |
Net assets at end of year (in thousands) | | $ | 5,215 | | | $ | 3,740 | | | $ | 5,101 | | | $ | 4,721 | | | $ | 3,652 | |
Portfolio turnover rate (%) | | | 73 | | | | 75 | | | | 96 | | | | 133 | | | | 124 | |
| |
| | | Class I | |
| | | Years Ended December 31, | |
| | | 2012 | | | 2011 | | | 2010 | | | 2009 | | | 2008 | |
Net asset value, beginning of year | | $ | 8.09 | | | $ | 8.40 | | | $ | 6.96 | | | $ | 4.94 | | | $ | 9.91 | |
Income (loss) from investment operations: | | | | | | | | | | | | | | | | | | | | |
Net investment income (loss) (a) | | | 0.05 | | | | 0.04 | | | | 0.01 | | | | 0.00 | ^ | | | 0.08 | |
Net realized and unrealized gain (loss) on investments | | | 1.38 | | | | (0.31 | ) | | | 1.43 | | | | 2.02 | | | | (4.98 | ) |
| | | | | | | | | | | | | | | | | | | | |
Total from investment operations | | | 1.43 | | | | (0.27 | ) | | | 1.44 | | | | 2.02 | | | | (4.90 | ) |
Less distributions from: | | | | | | | | | | | | | | | | | | | | |
Net investment income | | | 0.05 | | | | 0.04 | | | | 0.00 | ^ | | | 0.00 | ^ | | | 0.07 | |
Net realized gain | | | — | | | | — | | | | — | | | | — | | | | — | |
| | | | | | | | | | | | | | | | | | | | |
Total distributions | | | 0.05 | | | | 0.04 | | | | 0.00 | ^ | | | 0.00 | ^ | | | 0.07 | |
| | | | | | | | | | | | | | | | | | | | |
Net asset value, end of year | | $ | 9.47 | | | $ | 8.09 | | | $ | 8.40 | | | $ | 6.96 | | | $ | 4.94 | |
| | | | | | | | | | | | | | | | | | | | |
Total Return (%) | | | 17.64 | | | | (3.26 | ) | | | 20.73 | | | | 40.90 | | | | (49.41 | ) |
Ratios to average daily net assets (%): | | | | | | | | | | | | | | | | | | | | |
Expenses, net of waivers and reimbursements | | | 1.25 | | | | 1.25 | | | | 1.27 | | | | 1.30 | | | | 1.30 | |
Expenses, before waivers and reimbursements | | | 1.56 | | | | 1.55 | | | | 1.62 | | | | 1.62 | | | | 1.74 | |
Net investment income (loss), net of waivers and reimbursements | | | 0.54 | | | | 0.52 | | | | 0.16 | | | | 0.05 | | | | 1.05 | |
Net investment income (loss), before waivers and reimbursements | | | 0.23 | | | | 0.22 | | | | (0.19 | ) | | | (0.27 | ) | | | 0.61 | |
Net assets at end of year (in thousands) | | $ | 45,757 | | | $ | 38,834 | | | $ | 39,776 | | | $ | 33,566 | | | $ | 24,353 | |
Portfolio turnover rate (%) | | | 73 | | | | 75 | | | | 96 | | | | 133 | | | | 124 | |
| (a) | | Excludes $0.00, $0.00, $0.00, $0.00 and $0.00 of PFIC mark to market, which is treated as ordinary income for Federal tax purposes for the years 2012, 2011, 2010, 2009 and 2008, respectively. |
| ^ | | Amount is less than $0.005 per share. |
Note: Net investment income (loss) per share is based on the average shares outstanding during the year.
Performance cited represents past performance. Past performance does not guarantee future results and current performance may be lower or higher than the data quoted. Results shown are annual returns, which assume reinvestment of dividends and capital gains. Investment returns and principal will fluctuate and you may have a gain or loss when you sell shares. For the most current month-end performance information, please call 1-800-742-7272 or visit our Web site at www.williamblairfunds.com.
144 Annual Report | December 31, 2012 |
Financial Highlights
International Growth Fund
| | | | | | | | | | | | | | | | | | | | |
| | | Class N | |
| | | Years Ended December 31, | |
| | | 2012 | | | 2011 | | | 2010 | | | 2009 | | | 2008 | |
Net asset value, beginning of year | | $ | 18.68 | | | $ | 21.85 | | | $ | 18.55 | | | $ | 13.12 | | | $ | 29.12 | |
Income (loss) from investment operations: | | | | | | | | | | | | | | | | | | | | |
Net investment income (loss) (a) | | | 0.26 | | | | 0.26 | | | | 0.14 | | | | 0.07 | | | | 0.29 | |
Net realized and unrealized gain (loss) on investments | | | 4.16 | | | | (3.43 | ) | | | 3.58 | | | | 5.47 | | | | (15.54 | ) |
| | | | | | | | | | | | | | | | | | | | |
Total from investment operations | | | 4.42 | | | | (3.17 | ) | | | 3.72 | | | | 5.54 | | | | (15.25 | ) |
Less distributions from: | | | | | | | | | | | | | | | | | | | | |
Net investment income | | | 0.67 | | | | — | | | | 0.42 | | | | 0.11 | | | | — | |
Net realized gain | | | — | | | | — | | | | — | | | | — | | | | 0.75 | |
| | | | | | | | | | | | | | | | | | | | |
Total distributions | | | 0.67 | | | | — | | | | 0.42 | | | | 0.11 | | | | 0.75 | |
| | | | | | | | | | | | | | | | | | | | |
Net asset value, end of year | | $ | 22.43 | | | $ | 18.68 | | | $ | 21.85 | | | $ | 18.55 | | | $ | 13.12 | |
| | | | | | | | | | | | | | | | | | | | |
Total Return (%) | | | 23.67 | | | | (14.51 | ) | | | 20.09 | | | | 42.27 | | | | (52.33 | ) |
Ratios to average daily net assets (%): | | | | | | | | | | | | | | | | | | | | |
Expenses, net of waivers and reimbursements | | | 1.44 | | | | 1.45 | | | | 1.43 | | | | 1.45 | | | | 1.39 | |
Expenses, before waivers and reimbursements | | | 1.44 | | | | 1.46 | | | | 1.43 | | | | 1.46 | | | | 1.39 | |
Net investment income (loss), net of waivers and reimbursements | | | 1.25 | | | | 1.22 | | | | 0.73 | | | | 0.48 | | | | 1.29 | |
Net investment income (loss), before waivers and reimbursements | | | 1.25 | | | | 1.21 | | | | 0.73 | | | | 0.47 | | | | 1.29 | |
Net assets at end of year (in thousands) | | $ | 1,269,736 | | | $ | 1,277,534 | | | $ | 2,689,417 | | | $ | 2,539,596 | | | $ | 1,980,750 | |
Portfolio turnover rate (%) | | | 81 | | | | 103 | | | | 99 | | | | 121 | | | | 91 | |
| |
| | | Class I | |
| | | Years Ended December 31, | |
| | | 2012 | | | 2011 | | | 2010 | | | 2009 | | | 2008 | |
Net asset value, beginning of year | | $ | 19.10 | | | $ | 22.34 | | | $ | 18.95 | | | $ | 13.40 | | | $ | 29.61 | |
Income (loss) from investment operations: | | | | | | | | | | | | | | | | | | | | |
Net investment income (loss) (a) | | | 0.32 | | | | 0.30 | | | | 0.20 | | | | 0.12 | | | | 0.37 | |
Net realized and unrealized gain (loss) on investments | | | 4.25 | | | | (3.48 | ) | | | 3.67 | | | | 5.59 | | | | (15.83 | ) |
| | | | | | | | | | | | | | | | | | | | |
Total from investment operations | | | 4.57 | | | | (3.18 | ) | | | 3.87 | | | | 5.71 | | | | (15.46 | ) |
Less distributions from: | | | | | | | | | | | | | | | | | | | | |
Net investment income | | | 0.73 | | | | 0.06 | | | | 0.48 | | | | 0.16 | | | | — | |
Net realized gain | | | — | | | | — | | | | — | | | | — | | | | 0.75 | |
| | | | | | | | | | | | | | | | | | | | |
Total distributions | | | 0.73 | | | | 0.06 | | | | 0.48 | | | | 0.16 | | | | 0.75 | |
| | | | | | | | | | | | | | | | | | | | |
Net asset value, end of year | | $ | 22.94 | | | $ | 19.10 | | | $ | 22.34 | | | $ | 18.95 | | | $ | 13.40 | |
| | | | | | | | | | | | | | | | | | | | |
Total Return (%) | | | 23.96 | | | | (14.23 | ) | | | 20.47 | | | | 42.63 | | | | (52.17 | ) |
Ratios to average daily net assets (%): | | | | | | | | | | | | | | | | | | | | |
Expenses | | | 1.15 | | | | 1.15 | | | | 1.14 | | | | 1.17 | | | | 1.08 | |
Net investment income (loss) | | | 1.51 | | | | 1.40 | | | | 0.99 | | | | 0.74 | | | | 1.58 | |
Net assets at end of year (in thousands) | | $ | 2,402,897 | | | $ | 1,951,368 | | | $ | 2,392,762 | | | $ | 1,933,812 | | | $ | 1,150,188 | |
Portfolio turnover rate (%) | | | 81 | | | | 103 | | | | 99 | | | | 121 | | | | 91 | |
| (a) | | Excludes $0.10, $0.00, $0.13, $0.08 and $(0.18) of PFIC mark to market, which is treated as ordinary income for Federal tax purposes for the years 2012, 2011, 2010, 2009, and 2008, respectively. |
Note: Net investment income (loss) per share is based on the average shares outstanding during the year.
Performance cited represents past performance. Past performance does not guarantee future results and current performance may be lower or higher than the data quoted. Results shown are annual returns, which assume reinvestment of dividends and capital gains. Investment returns and principal will fluctuate and you may have a gain or loss when you sell shares. For the most current month-end performance information, please call 1-800-742-7272 or visit our Web site at www.williamblairfunds.com.
December 31, 2012 | William Blair Funds 145 |
Financial Highlights
International Equity Fund
| | | | | | | | | | | | | | | | | | | | |
| | | Class N | |
| | | Years Ended December 31, | |
| | | 2012 | | | 2011 | | | 2010 | | | 2009 | | | 2008 | |
Net asset value, beginning of year | | $ | 10.56 | | | $ | 12.12 | | | $ | 11.07 | | | $ | 8.35 | | | $ | 16.53 | |
Income (loss) from investment operations: | | | | | | | | | | | | | | | | | | | | |
Net investment income (loss) (a) | | | 0.11 | | | | 0.13 | | | | 0.06 | | | | 0.09 | | | | 0.10 | |
Net realized and unrealized gain (loss) on investments | | | 1.75 | | | | (1.69 | ) | | | 1.15 | | | | 2.64 | | | | (8.16 | ) |
| | | | | | | | | | | | | | | | | | | | |
Total from investment operations | | | 1.86 | | | | (1.56 | ) | | | 1.21 | | | | 2.73 | | | | (8.06 | ) |
Less distributions from: | | | | | | | | | | | | | | | | | | | | |
Net investment income | | | 0.37 | | | | — | | | | 0.16 | | | | 0.01 | | | | — | |
Net realized gain | | | — | | | | — | | | | — | | | | — | | | | 0.12 | |
| | | | | | | | | | | | | | | | | | | | |
Total distributions | | | 0.37 | | | | — | | | | 0.16 | | | | 0.01 | | | | 0.12 | |
| | | | | | | | | | | | | | | | | | | | |
Net asset value, end of year | | $ | 12.05 | | | $ | 10.56 | | | $ | 12.12 | | | $ | 11.07 | | | $ | 8.35 | |
| | | | | | | | | | | | | | | | | | | | |
Total Return (%) | | | 17.57 | | | | (12.87 | ) | | | 10.92 | | | | 32.69 | | | | (48.75 | ) |
Ratios to average daily net assets (%): | | | | | | | | | | | | | | | | | | | | |
Expenses, net of waivers and reimbursements | | | 1.45 | | | | 1.45 | | | | 1.45 | | | | 1.45 | | | | 1.45 | |
Expenses, before waivers and reimbursements | | | 1.71 | | | | 1.60 | | | | 1.66 | | | | 1.59 | | | | 1.45 | |
Net investment income (loss), net of waivers and reimbursements | | | 0.95 | | | | 1.09 | | | | 0.55 | | | | 1.03 | | | | 0.80 | |
Net investment income (loss), before waivers and reimbursements | | | 0.69 | | | | 0.94 | | | | 0.34 | | | | 0.89 | | | | 0.80 | |
Net assets at end of year (in thousands) | | $ | 5,648 | | | $ | 6,773 | | | $ | 13,733 | | | $ | 15,436 | | | $ | 42,824 | |
Portfolio turnover rate (%) | | | 80 | | | | 99 | | | | 71 | | | | 88 | | | | 92 | |
| |
| | | Class I | |
| | | Years Ended December 31, | |
| | | 2012 | | | 2011 | | | 2010 | | | 2009 | | | 2008 | |
Net asset value, beginning of year | | $ | 10.67 | | | $ | 12.22 | | | $ | 11.16 | | | $ | 8.44 | | | $ | 16.66 | |
Income (loss) from investment operations: | | | | | | | | | | | | | | | | | | | | |
Net investment income (loss) (a) | | | 0.14 | | | | 0.17 | | | | 0.10 | | | | 0.08 | | | | 0.15 | |
Net realized and unrealized gain (loss) on investments | | | 1.77 | | | | (1.72 | ) | | | 1.15 | | | | 2.70 | | | | (8.25 | ) |
| | | | | | | | | | | | | | | | | | | | |
Total from investment operations | | | 1.91 | | | | (1.55 | ) | | | 1.25 | | | | 2.78 | | | | (8.10 | ) |
Less distributions from: | | | | | | | | | | | | | | | | | | | | |
Net investment income | | | 0.40 | | | | — | | | | 0.19 | | | | 0.06 | | | | — | |
Net realized gain | | | — | | | | — | | | | — | | | | — | | | | 0.12 | |
| | | | | | | | | | | | | | | | | | | | |
Total distributions | | | 0.40 | | | | — | | | | 0.19 | | | | 0.06 | | | | 0.12 | |
| | | | | | | | | | | | | | | | | | | | |
Net asset value, end of year | | $ | 12.18 | | | $ | 10.67 | | | $ | 12.22 | | | $ | 11.16 | | | $ | 8.44 | |
| | | | | | | | | | | | | | | | | | | | |
Total Return (%) | | | 17.89 | | | | (12.68 | ) | | | 11.19 | | | | 32.93 | | | | (48.61 | ) |
Ratios to average daily net assets (%): | | | | | | | | | | | | | | | | | | | | |
Expenses, net of waivers and reimbursements | | | 1.20 | | | | 1.20 | | | | 1.20 | | | | 1.20 | | | | 1.20 | |
Expenses, before waivers and reimbursements | | | 1.44 | | | | 1.33 | | | | 1.28 | | | | 1.39 | | | | 1.22 | |
Net investment income (loss), net of waivers and reimbursements | | | 1.17 | | | | 1.43 | | | | 0.88 | | | | 0.86 | | | | 1.12 | |
Net investment income (loss), before waivers and reimbursements | | | 0.93 | | | | 1.30 | | | | 0.80 | | | | 0.67 | | | | 1.10 | |
Net assets at end of year (in thousands) | | $ | 64,536 | | | $ | 68,884 | | | $ | 164,322 | | | $ | 282,732 | | | $ | 185,662 | |
Portfolio turnover rate (%) | | | 80 | | | | 99 | | | | 71 | | | | 88 | | | | 92 | |
| (a) | | Excludes $0.01, $0.00, $0.04, $0.00 and $0.00 of PFIC mark to market, which is treated as ordinary income for Federal tax purposes for the years 2012, 011, 2010, 2009, and 2008, respectively. |
Note: Net investment income (loss) per share is based on the average shares outstanding during the year.
Performance cited represents past performance. Past performance does not guarantee future results and current performance may be lower or higher than the data quoted. Results shown are annual returns, which assume reinvestment of dividends and capital gains. Investment returns and principal will fluctuate and you may have a gain or loss when you sell shares. For the most current month-end performance information, please call 1-800-742-7272 or visit our Web site at www.williamblairfunds.com.
146 Annual Report | December 31, 2012 |
Financial Highlights
International Leaders Fund
| | | | |
| | | Class N | |
| | | Period Ended December 31, | |
| | | 2012 (a) | |
Net asset value, beginning of year | | $ | 10.00 | |
Income (loss) from investment operations: | | | | |
Net investment income (loss) (b) | | | 0.00 | ^ |
Net realized and unrealized gain (loss) on investments | | | 0.82 | |
| | | | |
Total from investment operations | | | 0.82 | |
Less distributions from: | | | | |
Net investment income | | | 0.01 | |
Net realized gain | | | — | |
| | | | |
Total distributions | | | 0.01 | |
| | | | |
Net asset value, end of year | | $ | 10.81 | |
| | | | |
Total Return (%)* | | | 8.16 | |
Ratios to average daily net assets (%):** | | | | |
Expenses, net of waivers and reimbursements | | | 1.45 | |
Expenses, before waivers and reimbursements | | | 4.98 | |
Net investment income (loss), net of waivers and reimbursements | | | — | |
Net investment income (loss), before waivers and reimbursements | | | (3.53 | ) |
Net assets at end of year (in thousands) | | $ | 542 | |
Portfolio turnover rate (%)* | | | 16 | |
| |
| | | Class I | |
| | | Period Ended December 31, | |
| | | 2012 (a) | |
Net asset value, beginning of year | | $ | 10.00 | |
Income (loss) from investment operations: | | | | |
Net investment income (loss) (b) | | | 0.01 | |
Net realized and unrealized gain (loss) on investments | | | 0.82 | |
| | | | |
Total from investment operations | | | 0.83 | |
Less distributions from: | | | | |
Net investment income | | | 0.02 | |
Net realized gain | | | — | |
| | | | |
Total distributions | | | 0.02 | |
| | | | |
Net asset value, end of year | | $ | 10.81 | |
| | | | |
Total Return (%)* | | | 8.26 | |
Ratios to average daily net assets (%):** | | | | |
Expenses, net of waivers and reimbursements | | | 1.20 | |
Expenses, before waivers and reimbursements | | | 4.56 | |
Net investment income (loss), net of waivers and reimbursements | | | 0.22 | |
Net investment income (loss), before waivers and reimbursements | | | (3.14 | ) |
Net assets at end of year (in thousands) | | $ | 4,336 | |
Portfolio turnover rate (%)* | | | 16 | |
| (a) | | For the period from August 16, 2012 (Commencement of Operations) to December 31, 2012. |
| (b) | | Excludes $0.01 of PFIC mark to market, which is treated as ordinary income for Federal tax purposes for 2012. |
| * | | Rates not annualized for periods that are less than a year. |
| ** | | Rates are annualized for periods that are less than a year. |
| ^ | | Amount is less than $0.005 per share. |
Note: Net investment income (loss) per share is based on the average shares outstanding during the year.
Performance cited represents past performance. Past performance does not guarantee future results and current performance may be lower or higher than the data quoted. Results shown are annual returns, which assume reinvestment of dividends and capital gains. Investment returns and principal will fluctuate and you may have a gain or loss when you sell shares. For the most current month-end performance information, please call 1-800-742-7272 or visit our Web site at www.williamblairfunds.com.
December 31, 2012 | William Blair Funds 147 |
Financial Highlights
International Small Cap Growth Fund
| | | | | | | | | | | | | | | | | | | | |
| | | Class N | |
| | | Years Ended December 31, | |
| | | 2012 | | | 2011 | | | 2010 | | | 2009 | | | 2008 | |
Net asset value, beginning of year | | $ | 11.36 | | | $ | 13.07 | | | $ | 10.40 | | | $ | 6.62 | | | $ | 13.98 | |
Income (loss) from investment operations: | | | | | | | | | | | | | | | | | | | | |
Net investment income (loss) (a) | | | 0.08 | | | | 0.07 | | | | 0.03 | | | | (0.01 | ) | | | (0.02 | ) |
Net realized and unrealized gain (loss) on investments | | | 2.27 | | | | (1.66 | ) | | | 2.66 | | | | 3.79 | | | | (7.22 | ) |
| | | | | | | | | | | | | | | | | | | | |
Total from investment operations | | | 2.35 | | | | (1.59 | ) | | | 2.69 | | | | 3.78 | | | | (7.24 | ) |
Less distributions from: | | | | | | | | | | | | | | | | | | | | |
Net investment income | | | 0.25 | | | | 0.12 | | | | 0.02 | | | | — | | | | — | |
Net realized gain | | | — | | | | — | | | | — | | | | — | | | | 0.12 | |
| | | | | | | | | | | | | | | | | | | | |
Total distributions | | | 0.25 | | | | 0.12 | | | | 0.02 | | | | — | | | | 0.12 | |
| | | | | | | | | | | | | | | | | | | | |
Net asset value, end of year | | $ | 13.46 | | | $ | 11.36 | | | $ | 13.07 | | | $ | 10.40 | | | $ | 6.62 | |
| | | | | | | | | | | | | | | | | | | | |
Total Return (%) | | | 20.73 | | | | (12.16 | ) | | | 25.88 | | | | 57.10 | | | | (51.82 | ) |
Ratios to average daily net assets (%): | | | | | | | | | | | | | | | | | | | | |
Expenses, net of waivers and reimbursements | | | 1.61 | | | | 1.64 | | | | 1.55 | | | | 1.65 | | | | 1.65 | |
Expenses, before waivers and reimbursements | | | 1.61 | | | | 1.64 | | | | 1.55 | | | | 1.83 | | | | 1.62 | |
Net investment income (loss), net of waivers and reimbursements | | | 0.65 | | | | 0.55 | | | | 0.30 | | | | (0.16 | ) | | | (0.20 | ) |
Net investment income (loss), before waivers and reimbursements | | | 0.65 | | | | 0.55 | | | | 0.30 | | | | (0.34 | ) | | | (0.17 | ) |
Net assets at end of year (in thousands) | | $ | 14,771 | | | $ | 18,991 | | | $ | 21,916 | | | $ | 14,854 | | | $ | 11,363 | |
Portfolio turnover rate (%) | | | 76 | | | | 85 | | | | 85 | | | | 136 | | | | 78 | |
| |
| | | Class I | |
| | | Years Ended December 31, | |
| | | 2012 | | | 2011 | | | 2010 | | | 2009 | | | 2008 | |
Net asset value, beginning of year | | $ | 11.46 | | | $ | 13.19 | | | $ | 10.49 | | | $ | 6.67 | | | $ | 14.01 | |
Income (loss) from investment operations: | | | | | | | | | | | | | | | | | | | | |
Net investment income (loss) (a) | | | 0.12 | | | | 0.12 | | | | 0.07 | | | | 0.01 | | | | 0.01 | |
Net realized and unrealized gain (loss) on investments | | | 2.30 | | | | (1.69 | ) | | | 2.68 | | | | 3.83 | | | | (7.23 | ) |
| | | | | | | | | | | | | | | | | | | | |
Total from investment operations | | | 2.42 | | | | (1.57 | ) | | | 2.75 | | | | 3.84 | | | | (7.22 | ) |
Less distributions from: | | | | | | | | | | | | | | | | | | | | |
Net investment income | | | 0.30 | | | | 0.16 | | | | 0.05 | | | | 0.02 | | | | — | |
Net realized gain | | | — | | | | — | | | | — | | | | — | | | | 0.12 | |
| | | | | | | | | | | | | | | | | | | | |
Total distributions | | | 0.30 | | | | 0.16 | | | | 0.05 | | | | 0.02 | | | | 0.12 | |
| | | | | | | | | | | | | | | | | | | | |
Net asset value, end of year | | $ | 13.58 | | | $ | 11.46 | | | $ | 13.19 | | | $ | 10.49 | | | $ | 6.67 | |
| | | | | | | | | | | | | | | | | | | | |
Total Return (%) | | | 21.10 | | | | (11.84 | ) | | | 26.24 | | | | 57.51 | | | | (51.56 | ) |
Ratios to average daily net assets (%): | | | | | | | | | | | | | | | | | | | | |
Expenses, net of waivers and reimbursements | | | 1.30 | | | | 1.28 | | | | 1.25 | | | | 1.31 | | | | 1.31 | |
Expenses, before waivers and reimbursements | | | 1.30 | | | | 1.28 | | | | 1.25 | | | | 1.31 | | | | 1.28 | |
Net investment income (loss), net of waivers and reimbursements | | | 0.95 | | | | 0.92 | | | | 0.61 | | | | 0.11 | | | | 0.11 | |
Net investment income (loss), before waivers and reimbursements | | | 0.95 | | | | 0.92 | | | | 0.61 | | | | 0.11 | | | | 0.14 | |
Net assets at end of year (in thousands) | | $ | 359,557 | | | $ | 364,574 | | | $ | 349,679 | | | $ | 210,561 | | | $ | 89,452 | |
Portfolio turnover rate (%) | | | 76 | | | | 85 | | | | 85 | | | | 136 | | | | 78 | |
| (a) | | Excludes $0.04, $0.00, $0.15, $0.01 and $(0.02) of PFIC mark to market, which is treated as ordinary income for Federal tax purposes for the years 2012, 2011, 2010, 2009 and 2008, respectively. |
Note: Net investment income (loss) per share is based on the average shares outstanding during the year.
Performance cited represents past performance. Past performance does not guarantee future results and current performance may be lower or higher than the data quoted. Results shown are annual returns, which assume reinvestment of dividends and capital gains. Investment returns and principal will fluctuate and you may have a gain or loss when you sell shares. For the most current month-end performance information, please call 1-800-742-7272 or visit our Web site at www.williamblairfunds.com.
148 Annual Report | December 31, 2012 |
Financial Highlights
Emerging Markets Growth Fund
| | | | | | | | | | | | | | | | | | | | |
| | | Class N | |
| | | Years Ended December 31, | |
| | | 2012 | | | 2011 | | | 2010 | | | 2009 | | | 2008 | |
Net asset value, beginning of year | | $ | 11.16 | | | $ | 15.76 | | | $ | 12.87 | | | $ | 7.46 | | | $ | 21.92 | |
Income (loss) from investment operations: | | | | | | | | | | | | | | | | | | | | |
Net investment income (loss) (a) | | | 0.07 | | | | 0.07 | | | | (0.01 | ) | | | 0.00 | ^ | | | 0.11 | |
Net realized and unrealized gain (loss) on investments | | | 2.24 | | | | (2.84 | ) | | | 3.02 | | | | 5.51 | | | | (13.63 | ) |
| | | | | | | | | | | | | | | | | | | | |
Total from investment operations | | | 2.31 | | | | (2.77 | ) | | | 3.01 | | | | 5.51 | | | | (13.52 | ) |
Less distributions from: | | | | | | | | | | | | | | | | | | | | |
Net investment income | | | 0.07 | | | | — | | | | 0.12 | | | | 0.10 | | | | — | |
Net realized gain | | | — | | | | 1.83 | | | | — | | | | — | | | | 0.94 | |
| | | | | | | | | | | | | | | | | | | | |
Total distributions | | | 0.07 | | | | 1.83 | | | | 0.12 | | | | 0.10 | | | | 0.94 | |
| | | | | | | | | | | | | | | | | | | | |
Net asset value, end of year | | $ | 13.40 | | | $ | 11.16 | | | $ | 15.76 | | | $ | 12.87 | | | $ | 7.46 | |
| | | | | | | | | | | | | | | | | | | | |
Total Return (%) | | | 20.70 | | | | (17.29 | ) | | | 23.44 | | | | 73.85 | | | | (61.71 | ) |
Ratios to average daily net assets (%): | | | | | | | | | | | | | | | | | | | | |
Expenses, net of waivers and reimbursements | | | 1.69 | | | | 1.68 | | | | 1.63 | | | | 1.70 | | | | 1.67 | |
Expenses, before waivers and reimbursements | | | 1.69 | | | | 1.68 | | | | 1.63 | | | | 1.81 | | | | 1.65 | |
Net investment income (loss), net of waivers and reimbursements | | | 0.59 | | | | 0.48 | | | | (0.05 | ) | | | 0.04 | | | | 0.65 | |
Net investment income (loss), before waivers and reimbursements | | | 0.59 | | | | 0.48 | | | | (0.05 | ) | | | (0.07 | ) | | | 0.67 | |
Net assets at end of year (in thousands) | | $ | 16,724 | | | $ | 17,474 | | | $ | 34,324 | | | $ | 27,271 | | | $ | 16,486 | |
Portfolio turnover rate (%) | | | 90 | | | | 104 | | | | 121 | | | | 113 | | | | 118 | |
| |
| | | Class I | |
| | | Years Ended December 31, | |
| | | 2012 | | | 2011 | | | 2010 | | | 2009 | | | 2008 | |
Net asset value, beginning of year | | $ | 11.25 | | | $ | 15.87 | | | $ | 12.95 | | | $ | 7.51 | | | $ | 21.99 | |
Income (loss) from investment operations: | | | | | | | | | | | | | | | | | | | | |
Net investment income (loss) (a) | | | 0.11 | | | | 0.11 | | | | 0.04 | | | | 0.03 | | | | 0.15 | |
Net realized and unrealized gain (loss) on investments | | | 2.25 | | | | (2.85 | ) | | | 3.03 | | | | 5.54 | | | | (13.69 | ) |
| | | | | | | | | | | | | | | | | | | | |
Total from investment operations | | | 2.36 | | | | (2.74 | ) | | | 3.07 | | | | 5.57 | | | | (13.54 | ) |
Less distributions from: | | | | | | | | | | | | | | | | | | | | |
Net investment income | | | 0.11 | | | | 0.05 | | | | 0.15 | | | | 0.13 | | | | — | |
Net realized gain | | | — | | | | 1.83 | | | | — | | | | — | | | | 0.94 | |
| | | | | | | | | | | | | | | | | | | | |
Total distributions | | | 0.11 | | | | 1.88 | | | | 0.15 | | | | 0.13 | | | | 0.94 | |
| | | | | | | | | | | | | | | | | | | | |
Net asset value, end of year | | $ | 13.50 | | | $ | 11.25 | | | $ | 15.87 | | | $ | 12.95 | | | $ | 7.51 | |
| | | | | | | | | | | | | | | | | | | | |
Total Return (%) | | | 21.01 | | | | (17.00 | ) | | | 23.77 | | | | 74.18 | | | | (61.60 | ) |
Ratios to average daily net assets (%): | | | | | | | | | | | | | | | | | | | | |
Expenses, net of waivers and reimbursements | | | 1.41 | | | | 1.38 | | | | 1.36 | | | | 1.41 | | | | 1.41 | |
Expenses, before waivers and reimbursements | | | 1.41 | | | | 1.38 | | | | 1.36 | | | | 1.41 | | | | 1.39 | |
Net investment income (loss), net of waivers and reimbursements | | | 0.86 | | | | 0.77 | | | | 0.26 | | | | 0.31 | | | | 0.91 | |
Net investment income (loss), before waivers and reimbursements | | | 0.86 | | | | 0.77 | | | | 0.26 | | | | 0.31 | | | | 0.93 | |
Net assets at end of year (in thousands) | | $ | 144,942 | | | $ | 124,739 | | | $ | 194,763 | | | $ | 180,329 | | | $ | 69,363 | |
Portfolio turnover rate (%) | | | 90 | | | | 104 | | | | 121 | | | | 113 | | | | 118 | |
| (a) | | Excludes $0.00, $0.01, $0.11, $0.15 and $(0.09) of PFIC mark to market, which is treated as ordinary income for Federal tax purposes for the years 2012, 2011, 2010, 2009 and 2008, respectively. |
| ^ | | Amount is less than $0.005 per share. |
Note: Net investment income (loss) per share is based on the average shares outstanding during the year.
Performance cited represents past performance. Past performance does not guarantee future results and current performance may be lower or higher than the data quoted. Results shown are annual returns, which assume reinvestment of dividends and capital gains. Investment returns and principal will fluctuate and you may have a gain or loss when you sell shares. For the most current month-end performance information, please call 1-800-742-7272 or visit our Web site at www.williamblairfunds.com.
December 31, 2012 | William Blair Funds 149 |
Financial Highlights
Emerging Markets Leaders Fund
| | | | | | | | | | | | |
| | | Class N | |
| | | Periods Ended December 31, | |
| | | 2012 | | | 2011 | | | 2010(a) | |
Net asset value, beginning of year | | $ | 7.68 | | | $ | 10.34 | | | $ | 8.80 | |
Income (loss) from investment operations: | | | | | | | | | | | | |
Net investment income (loss) (c) | | | 0.02 | | | | 0.04 | | | | (0.02 | ) |
Net realized and unrealized gain (loss) on investments | | | 1.54 | | | | (2.08 | ) | | | 1.64 | |
| | | | | | | | | | | | |
Total from investment operations | | | 1.56 | | | | (2.04 | ) | | | 1.62 | |
Less distributions from: | | | | | | | | | | | | |
Net investment income | | | 0.04 | | | | — | | | | 0.02 | |
Net realized gain | | | — | | | | 0.62 | | | | 0.06 | |
| | | | | | | | | | | | |
Total distributions | | | 0.04 | | | | 0.62 | | | | 0.08 | |
| | | | | | | | | | | | |
Net asset value, end of year | | $ | 9.20 | | | $ | 7.68 | | | $ | 10.34 | |
| | | | | | | | | | | | |
Total Return (%)* | | | 20.37 | | | | (19.55 | ) | | | 18.43 | |
Ratios to average daily net assets (%):** | | | | | | | | | | | | |
Expenses, net of waivers and reimbursements | | | 1.65 | | | | 1.65 | | | | 1.65 | |
Expenses, before waivers and reimbursements | | | 2.10 | | | | 1.83 | | | | 1.71 | |
Net investment income (loss), net of waivers and reimbursements | | | 0.26 | | | | 0.44 | | | | (0.38 | ) |
Net investment income (loss), before waivers and reimbursements | | | (0.19 | ) | | | 0.26 | | | | (0.44 | ) |
Net assets at end of year (in thousands) | | $ | 249 | | | $ | 46 | | | $ | 53 | |
Portfolio turnover rate (%)* | | | 94 | | | | 142 | | | | 176 | |
| | | | | | | | | | | | | | | | | | | | |
| | | Class I | |
| | | Periods Ended December 31, | |
| | | 2012 | | | 2011 | | | 2010 | | | 2009 | | | 2008(b) | |
Net asset value, beginning of year | | $ | 7.66 | | | $ | 10.35 | | | $ | 8.43 | | | $ | 4.79 | | | $ | 10.00 | |
Income (loss) from investment operations: | | | | | | | | | | | | | | | | | | | | |
Net investment income (loss) (c) | | | 0.07 | | | | 0.06 | | | | 0.02 | | | | 0.02 | | | | 0.04 | |
Net realized and unrealized gain (loss) on investments | | | 1.51 | | | | (2.08 | ) | | | 1.98 | | | | 3.73 | | | | (5.25 | ) |
| | | | | | | | | | | | | | | | | | | | |
Total from investment operations | | | 1.58 | | | | (2.02 | ) | | | 2.00 | | | | 3.75 | | | | (5.21 | ) |
Less distributions from: | | | | | | | | | | | | | | | | | | | | |
Net investment income | | | 0.06 | | | | 0.05 | | | | 0.02 | | | | 0.11 | | | | 0.00 | ^ |
Net realized gain | | | — | | | | 0.62 | | | | 0.06 | | | | — | | | | — | |
Return of capital | | | — | | | | 0.00 | ^ | | | — | | | | — | | | | — | |
| | | | | | | | | | | | | | | | | | | | |
Total distributions | | | 0.06 | | | | 0.67 | | | | 0.08 | | | | 0.11 | | | | 0.00 | ^ |
| | | | | | | | | | | | | | | | | | | | |
Net asset value, end of year | | $ | 9.18 | | | $ | 7.66 | | | $ | 10.35 | | | $ | 8.43 | | | $ | 4.79 | |
| | | | | | | | | | | | | | | | | | | | |
Total Return (%)* | | | 20.64 | | | | (19.34 | ) | | | 23.70 | | | | 78.38 | | | | (52.09 | ) |
Ratios to average daily net assets (%):** | | | | | | | | | | | | | | | | | | | | |
Expenses, net of waivers and reimbursements | | | 1.40 | | | | 1.40 | | | | 1.40 | | | | 1.40 | | | | 1.40 | |
Expenses, before waivers and reimbursements | | | 1.75 | | | | 1.58 | | | | 1.52 | | | | 1.54 | | | | 1.56 | |
Net investment income (loss), net of waivers and reimbursements | | | 0.83 | | | | 0.69 | | | | 0.25 | | | | 0.37 | | | | 0.70 | |
Net investment income (loss), before waivers and reimbursements | | | 0.48 | | | | 0.51 | | | | 0.13 | | | | 0.23 | | | | 0.54 | |
Net assets at end of year (in thousands) | | $ | 25,628 | | | $ | 21,610 | | | $ | 16,332 | | | $ | 8,823 | | | $ | 2,914 | |
Portfolio turnover rate (%)* | | | 94 | | | | 142 | | | | 176 | | | | 176 | | | | 151 | |
| (a) | | For the period from May 3, 2010 (Commencement of Operations) to December 31, 2010. |
| (b) | | For the period from March 26, 2008 (Commencement of Operations) to December 31, 2008. |
| (c) | | Excludes $0.00, $0.00, $0.96, $1.29, and $0.00 of PFIC mark to market, which is treated as ordinary income for Federal tax purposes for the years 2012, 2011, 2010, 2009, and 2008, respectively. |
| * | | Rates not annualized for periods that are less than a year. |
| ** | | Rates are annualized for periods that are less than a year. |
| ^ | | Amount is less than $0.005 per share. |
Note: Net investment income (loss) per share is based on the average shares outstanding during the year.
Performance cited represents past performance. Past performance does not guarantee future results and current performance may be lower or higher than the data quoted. Results shown are annual returns, which assume reinvestment of dividends and capital gains. Investment returns and principal will fluctuate and you may have a gain or loss when you sell shares. For the most current month-end performance information, please call 1-800-742-7272 or visit our Web site at www.williamblairfunds.com.
150 Annual Report | December 31, 2012 |
Financial Highlights
Emerging Markets Small Cap Growth Fund
| | | | | | | | |
| | | Class N | |
| | | Periods Ended
December 31, | |
| | | 2012 | | | 2011(a) | |
Net asset value, beginning of year | | $ | 9.73 | | | $ | 10.00 | |
Income (loss) from investment operations: | | | | | | | | |
Net investment income (loss) | | | 0.06 | | | | 0.00 | ^ |
Net realized and unrealized gain (loss) on investments | | | 3.27 | | | | (0.27 | ) |
| | | | | | | | |
Total from investment operations | | | 3.33 | | | | (0.27 | ) |
Less distributions from: | | | | | | | | |
Net investment income | | | 0.07 | | | | — | |
Net realized gain | | | — | | | | — | |
| | | | | | | | |
Total distributions | | | 0.07 | | | | — | |
| | | | | | | | |
Net asset value, end of year | | $ | 12.99 | | | $ | 9.73 | |
| | | | | | | | |
Total Return (%)* | | | 34.23 | | | | (2.70 | ) |
Ratios to average daily net assets (%):** | | | | | | | | |
Expenses, net of waivers and reimbursements | | | 1.65 | | | | 1.65 | |
Expenses, before waivers and reimbursements | | | 4.76 | | | | 9.53 | |
Net investment income (loss), net of waivers and reimbursements | | | 0.56 | | | | 0.08 | |
Net investment income (loss), before waivers and reimbursements | | | (2.54 | ) | | | (7.80 | ) |
| Net assets at end of year (in thousands) | | $ | 3,016 | | | $ | 1,012 | |
| Portfolio turnover rate (%)* | | | 78 | | | | 17 | |
| |
| | | Class I | |
| | | Periods Ended
December 31, | |
| | | 2012 | | | 2011(a) | |
Net asset value, beginning of year | | $ | 9.73 | | | $ | 10.00 | |
Income (loss) from investment operations: | | | | | | | | |
Net investment income (loss) | | | 0.08 | | | | 0.01 | |
Net realized and unrealized gain (loss) on investments | | | 3.29 | | | | (0.28 | ) |
| | | | | | | | |
Total from investment operations | | | 3.37 | | | | (0.27 | ) |
Less distributions from: | | | | | | | | |
Net investment income | | | 0.11 | | | | — | |
Net realized gain | | | — | | | | — | |
| | | | | | | | |
Total distributions | | | 0.11 | | | | — | |
| | | | | | | | |
Net asset value, end of year | | $ | 12.99 | | | $ | 9.73 | |
| | | | | | | | |
Total Return (%)* | | | 34.62 | | | | (2.70 | ) |
Ratios to average daily net assets (%):** | | | | | | | | |
Expenses, net of waivers and reimbursements | | | 1.40 | | | | 1.40 | |
Expenses, before waivers and reimbursements | | | 4.40 | | | | 9.28 | |
Net investment income (loss), net of waivers and reimbursements | | | 0.70 | | | | 0.33 | |
Net investment income (loss), before waivers and reimbursements | | | (2.30 | ) | | | (7.55 | ) |
| Net assets at end of year (in thousands) | | $ | 8,763 | | | $ | 2,260 | |
| Portfolio turnover rate (%)* | | | 78 | | | | 17 | |
| (a) | | For the period from October 24, 2011 (Commencement of Operations) to December 31, 2011. |
| (b) | | Excludes $0.05 and $0.00, of PFIC mark to market, which is treated as ordinary income for Federal tax purposes for the year 2012 and 2011 respectively. |
| * | | Rates not annualized for periods that are less than a year. |
| ** | | Rates are annualized for periods that are less than a year. |
| ^ | | Amount is less than $0.005 per share. |
Note: Net investment income (loss) per share is based on the average shares outstanding during the year.
Performance cited represents past performance. Past performance does not guarantee future results and current performance may be lower or higher than the data quoted. Results shown are annual returns, which assume reinvestment of dividends and capital gains. Investment returns and principal will fluctuate and you may have a gain or loss when you sell shares. For the most current month-end performance information, please call 1-800-742-7272 or visit our Web site at www.williamblairfunds.com.
December 31, 2012 | William Blair Funds 151 |
Financial Highlights
Large Cap Value Fund
| | | | | | | | |
| | | Class N | |
| | | Periods Ended December 31, | |
| | | 2012 | | | 2011(a) | |
Net asset value, beginning of year | | $ | 9.95 | | | $ | 10.00 | |
Income (loss) from investment operations: | | | | | | | | |
Net investment income (loss) | | | 0.11 | | | | 0.03 | |
Net realized and unrealized gain (loss) on investments | | | 1.57 | | | | (0.05 | ) |
| | | | | | | | |
Total from investment operations | | | 1.68 | | | | (0.02 | ) |
Less distributions from: | | | | | | | | |
Net investment income | | | 0.09 | | | | 0.03 | |
Net realized gain | | | — | | | | 0.00 | ^ |
| | | | | | | | |
Total distributions | | | 0.09 | | | | 0.03 | |
| | | | | | | | |
Net asset value, end of year | | $ | 11.54 | | | $ | 9.95 | |
| | | | | | | | |
Total Return (%)* | | | 16.92 | | | | (0.19 | ) |
Ratios to average daily net assets (%):** | | | | | | | | |
Expenses, net of waivers and reimbursements | | | 1.20 | | | | 1.20 | |
Expenses, before waivers and reimbursements | | | 4.25 | | | | 7.83 | |
Net investment income (loss), net of waivers and reimbursements | | | 0.96 | | | | 1.41 | |
Net investment income (loss), before waivers and reimbursements | | | (2.09 | ) | | | (5.22 | ) |
| Net assets at end of year (in thousands) | | $ | 1,416 | | | $ | 998 | |
| Portfolio turnover rate (%)* | | | 20 | | | | 5 | |
| |
| | | Class I | |
| | | Periods Ended December 31, | |
| | | 2012 | | | 2011(a) | |
Net asset value, beginning of year | | $ | 9.95 | | | $ | 10.00 | |
Income (loss) from investment operations: | | | | | | | | |
Net investment income (loss) | | | 0.14 | | | | 0.03 | |
Net realized and unrealized gain (loss) on investments | | | 1.58 | | | | (0.05 | ) |
| | | | | | | | |
Total from investment operations | | | 1.72 | | | | (0.02 | ) |
Less distributions from: | | | | | | | | |
Net investment income | | | 0.12 | | | | 0.03 | |
Net realized gain | | | — | | | | 0.00 | ^ |
| | | | | | | | |
Total distributions | | | 0.12 | | | | 0.03 | |
| | | | | | | | |
Net asset value, end of year | | $ | 11.55 | | | $ | 9.95 | |
| | | | | | | | |
Total Return (%)* | | | 17.28 | | | | (0.19 | ) |
Ratios to average daily net assets (%):** | | | | | | | | |
Expenses, net of waivers and reimbursements | | | 0.95 | | | | 0.95 | |
Expenses, before waivers and reimbursements | | | 4.06 | | | | 7.58 | |
Net investment income (loss), net of waivers and reimbursements | | | 1.22 | | | | 1.66 | |
Net investment income (loss), before waivers and reimbursements | | | (1.89 | ) | | | (4.97 | ) |
| Net assets at end of year (in thousands) | | $ | 2,429 | | | $ | 1,455 | |
| Portfolio turnover rate (%)* | | | 20 | | | | 5 | |
| (a) | | For the period from October 24, 2011 (Commencement of Operations) to December 31, 2011. |
| * | | Rates not annualized for periods that are less than a year. |
| ** | | Rates are annualized for periods that are less than a year. |
| ^ | | Amount is less than $0.005 per share. |
Note: Net investment income (loss) per share is based on the average shares outstanding during the year.
Performance cited represents past performance. Past performance does not guarantee future results and current performance may be lower or higher than the data quoted. Results shown are annual returns, which assume reinvestment of dividends and capital gains. Investment returns and principal will fluctuate and you may have a gain or loss when you sell shares. For the most current month-end performance information, please call 1-800-742-7272 or visit our Web site at www.williamblairfunds.com.
152 Annual Report | December 31, 2012 |
Financial Highlights
Small Cap Value Fund
| | | | | | | | | | | | | | | | | | | | |
| | | Class N | |
| | | Years Ended December 31, | |
| | | 2012 | | | 2011 | | | 2010 | | | 2009 | | | 2008 | |
Net asset value, beginning of year | | $ | 12.26 | | | $ | 13.71 | | | $ | 10.49 | | | $ | 8.33 | | | $ | 11.31 | |
Income (loss) from investment operations: | | | | | | | | | | | | | | | | | | | | |
Net investment income (loss) | | | 0.10 | | | | 0.00 | ^ | | | 0.03 | | | | 0.06 | | | | 0.09 | |
Net realized and unrealized gain (loss) on investments | | | 1.43 | | | | (0.97 | ) | | | 3.22 | | | | 2.13 | | | | (3.02 | ) |
| | | | | | | | | | | | | | | | | | | | |
Total from investment operations | | | 1.53 | | | | (0.97 | ) | | | 3.25 | | | | 2.19 | | | | (2.93 | ) |
Less distributions from: | | | | | | | | | | | | | | | | | | | | |
Net investment income | | | 0.08 | | | | 0.02 | | | | 0.03 | | | | 0.03 | | | | 0.05 | |
Net realized gain | | | 0.06 | | | | 0.46 | | | | — | | | | — | | | | — | |
Return of capital | | | — | | | | 0.00 | ^ | | | — | | | | — | | | | — | |
| | | | | | | | | | | | | | | | | | | | |
Total distributions | | | 0.14 | | | | 0.48 | | | | 0.03 | | | | 0.03 | | | | 0.05 | |
| | | | | | | | | | | | | | | | | | | | |
Net asset value, end of year | | $ | 13.65 | | | $ | 12.26 | | | $ | 13.71 | | | $ | 10.49 | | | $ | 8.33 | |
| | | | | | | | | | | | | | | | | | | | |
Total Return (%) | | | 12.49 | | | | (6.95 | ) | | | 30.94 | | | | 26.24 | | | | (25.85 | ) |
Ratios to average daily net assets (%): | | | | | | | | | | | | | | | | | | | | |
Expenses, net of waivers and reimbursements | | | 1.43 | | | | 1.38 | | | | 1.33 | | | | 1.29 | | | | 1.29 | |
Expenses, before waivers and reimbursements | | | 1.60 | | | | 1.60 | | | | 1.57 | | | | 1.78 | | | | 1.82 | |
Net investment income (loss), net of waivers and reimbursements | | | 0.78 | | | | (0.01 | ) | | | 0.25 | | | | 0.68 | | | | 0.84 | |
Net investment income (loss), before waivers and reimbursements | | | 0.61 | | | | (0.23 | ) | | | 0.01 | | | | 0.19 | | | | 0.31 | |
Net assets at end of year (in thousands) | | $ | 39,084 | | | $ | 40,712 | | | $ | 34,285 | | | $ | 7,745 | | | $ | 7,061 | |
Portfolio turnover rate (%) | | | 51 | | | | 65 | | | | 71 | | | | 62 | | | | 87 | |
| |
| | | Class I | |
| | | Years Ended December 31, | |
| | | 2012 | | | 2011 | | | 2010 | | | 2009 | | | 2008 | |
Net asset value, beginning of year | | $ | 12.47 | | | $ | 13.93 | | | $ | 10.65 | | | $ | 8.45 | | | $ | 11.50 | |
Income (loss) from investment operations: | | | | | | | | | | | | | | | | | | | | |
Net investment income (loss) | | | 0.14 | | | | 0.03 | | | | 0.05 | | | | 0.08 | | | | 0.11 | |
Net realized and unrealized gain (loss) on investments | | | 1.45 | | | | (0.98 | ) | | | 3.27 | | | | 2.16 | | | | (3.08 | ) |
| | | | | | | | | | | | | | | | | | | | |
Total from investment operations | | | 1.59 | | | | (0.95 | ) | | | 3.32 | | | | 2.24 | | | | (2.97 | ) |
Less distributions from: | | | | | | | | | | | | | | | | | | | | |
Net investment income | | | 0.12 | | | | 0.03 | | | | 0.04 | | | | 0.04 | | | | 0.08 | |
Net realized gain | | | 0.06 | | | | 0.46 | | | | — | | | | — | | | | — | |
Return of capital | | | — | | | | 0.02 | | | | — | | | | — | | | | — | |
| | | | | | | | | | | | | | | | | | | | |
Total distributions | | | 0.18 | | | | 0.51 | | | | 0.04 | | | | 0.04 | | | | 0.08 | |
| | | | | | | | | | | | | | | | | | | | |
Net asset value, end of year | | $ | 13.88 | | | $ | 12.47 | | | $ | 13.93 | | | $ | 10.65 | | | $ | 8.45 | |
| | | | | | | | | | | | | | | | | | | | |
Total Return (%) | | | 12.73 | | | | (6.68 | ) | | | 31.16 | | | | 26.56 | | | | (25.77 | ) |
Ratios to average daily net assets (%): | | | | | | | | | | | | | | | | | | | | |
Expenses, net of waivers and reimbursements | | | 1.18 | | | | 1.14 | | | | 1.10 | | | | 1.09 | | | | 1.09 | |
Expenses, before waivers and reimbursements | | | 1.29 | | | | 1.30 | | | | 1.29 | | | | 1.50 | | | | 1.57 | |
Net investment income (loss), net of waivers and reimbursements | | | 1.02 | | | | 0.26 | | | | 0.43 | | | | 0.86 | | | | 1.06 | |
Net investment income (loss), before waivers and reimbursements | | | 0.91 | | | | 0.10 | | | | 0.24 | | | | 0.45 | | | | 0.58 | |
Net assets at end of year (in thousands) | | $ | 196,184 | | | $ | 190,686 | | | $ | 130,214 | | | $ | 47,114 | | | $ | 29,188 | |
Portfolio turnover rate (%) | | | 51 | | | | 65 | | | | 71 | | | | 62 | | | | 87 | |
| ^ | | Amount is less than $0.005 per share. |
Note: Net investment income (loss) per share is based on the average shares outstanding during the year.
Performance cited represents past performance. Past performance does not guarantee future results and current performance may be lower or higher than the data quoted. Results shown are annual returns, which assume reinvestment of dividends and capital gains. Investment returns and principal will fluctuate and you may have a gain or loss when you sell shares. For the most current month-end performance information, please call 1-800-742-7272 or visit our Web site at www.williamblairfunds.com.
December 31, 2012 | William Blair Funds 153 |
Financial Highlights
Mid Cap Value Fund
| | | | | | | | | | | | |
| | | Class N | |
| | | Periods Ended December 31, | |
| | | 2012 | | | 2011 | | | 2010(a) | |
Net asset value, beginning of year | | $ | 10.48 | | | $ | 10.75 | | | $ | 10.00 | |
Income (loss) from investment operations: | | | | | | | | | | | | |
Net investment income (loss) | | | 0.08 | | | | 0.12 | | | | 0.09 | |
Net realized and unrealized gain (loss) on investments | | | 1.34 | | | | (0.17 | ) | | | 0.74 | |
| | | | | | | | | | | | |
Total from investment operations | | | 1.42 | | | | (0.05 | ) | | | 0.83 | |
Less distributions from: | | | | | | | | | | | | |
Net investment income | | | 0.08 | | | | 0.09 | | | | 0.06 | |
Net realized gain | | | 0.43 | | | | 0.13 | | | | 0.02 | |
| | | | | | | | | | | | |
Total distributions | | | 0.51 | | | | 0.22 | | | | 0.08 | |
| | | | | | | | | | | | |
Net asset value, end of year | | $ | 11.39 | | | $ | 10.48 | | | $ | 10.75 | |
| | | | | | | | | | | | |
Total Return (%)* | | | 13.54 | | | | (0.34 | ) | | | 8.36 | |
Ratios to average daily net assets (%):** | | | | | | | | | | | | |
Expenses, net of waivers and reimbursements | | | 1.35 | | | | 1.35 | | | | 1.35 | |
Expenses, before waivers and reimbursements | | | 3.40 | | | | 3.85 | | | | 5.09 | |
Net investment income (loss), net of waivers and reimbursements | | | 0.70 | | | | 1.15 | | | | 0.92 | |
Net investment income (loss), before waivers and reimbursements | | | (1.35 | ) | | | (1.35 | ) | | | (2.82 | ) |
Net assets at end of year (in thousands) | | $ | 79 | | | $ | 58 | | | $ | 4 | |
Portfolio turnover rate (%)* | | | 63 | | | | 69 | | | | 35 | |
| |
| | | Class I | |
| | | Periods Ended December 31, | |
| | | 2012 | | | 2011 | | | 2010(a) | |
Net asset value, beginning of year | | $ | 10.48 | | | $ | 10.76 | | | $ | 10.00 | |
Income (loss) from investment operations: | | | | | | | | | | | | |
Net investment income (loss) | | | 0.10 | | | | 0.13 | | | | 0.11 | |
Net realized and unrealized gain (loss) on investments | | | 1.35 | | | | (0.17 | ) | | | 0.75 | |
| | | | | | | | | | | | |
Total from investment operations | | | 1.45 | | | | (0.04 | ) | | | 0.86 | |
Less distributions from: | | | | | | | | | | | | |
Net investment income | | | 0.11 | | | | 0.11 | | | | 0.08 | |
Net realized gain | | | 0.43 | | | | 0.13 | | | | 0.02 | |
| | | | | | | | | | | | |
Total distributions | | | 0.54 | | | | 0.24 | | | | 0.10 | |
| | | | | | | | | | | | |
Net asset value, end of year | | $ | 11.39 | | | $ | 10.48 | | | $ | 10.76 | |
| | | | | | | | | | | | |
Total Return (%)* | | | 13.77 | | | | (0.25 | ) | | | 8.66 | |
Ratios to average daily net assets (%):** | | | | | | | | | | | | |
Expenses, net of waivers and reimbursements | | | 1.10 | | | | 1.10 | | | | 1.10 | |
Expenses, before waivers and reimbursements | | | 3.13 | | | | 3.60 | | | | 4.92 | |
Net investment income (loss), net of waivers and reimbursements | | | 0.92 | | | | 1.20 | | | | 1.10 | |
Net investment income (loss), before waivers and reimbursements | | | (1.11 | ) | | | (1.30 | ) | | | (2.72 | ) |
Net assets at end of year (in thousands) | | $ | 4,058 | | | $ | 4,515 | | | $ | 3,389 | |
Portfolio turnover rate (%)* | | | 63 | | | | 69 | | | | 35 | |
| (a) | | For the period from May 3, 2010 (Commencement of Operations) to December 31, 2010. |
| * | | Rates not annualized for periods that are less than a year. |
| ** | | Rates are annualized for periods that are less than a year. |
Note: Net investment income (loss) per share is based on the average shares outstanding during the year.
Performance cited represents past performance. Past performance does not guarantee future results and current performance may be lower or higher than the data quoted. Results shown are annual returns, which assume reinvestment of dividends and capital gains. Investment returns and principal will fluctuate and you may have a gain or loss when you sell shares. For the most current month-end performance information, please call 1-800-742-7272 or visit our Web site at www.williamblairfunds.com.
154 Annual Report | December 31, 2012 |
Financial Highlights
Small-Mid Cap Value Fund
| | | | | | | | |
| | | Class N | |
| | | Periods Ended December 31, | |
| | | 2012 | | | 2011(a) | |
Net asset value, beginning of year | | $ | 10.45 | | | $ | 10.00 | |
Income (loss) from investment operations: | | | | | | | | |
Net investment income (loss) | | | 0.10 | | | | 0.00 | ^ |
Net realized and unrealized gain (loss) on investments | | | 1.15 | | | | 0.45 | |
| | | | | | | | |
Total from investment operations | | | 1.25 | | | | 0.45 | |
Less distributions from: | | | | | | | | |
Net investment income | | | 0.09 | | | | — | |
Net realized gain | | | 0.32 | | | | — | |
| | | | | | | | |
Total distributions | | | 0.41 | | | | — | |
| | | | | | | | |
Net asset value, end of year | | $ | 11.29 | | | $ | 10.45 | |
| | | | | | | | |
Total Return (%)* | | | 11.95 | | | | 4.50 | |
Ratios to average daily net assets (%):** | | | | | | | | |
Expenses, net of waivers and reimbursements | | | 1.40 | | | | 1.40 | |
Expenses, before waivers and reimbursements | | | 6.34 | | | | 18.68 | |
Net investment income (loss), net of waivers and reimbursements | | | 0.87 | | | | 0.53 | |
Net investment income (loss), before waivers and reimbursements | | | (4.07 | ) | | | (16.75 | ) |
Net assets at end of year (in thousands) | | $ | 950 | | | $ | 860 | |
Portfolio turnover rate (%)* | | | 56 | | | | 1 | |
| |
| | | Class I | |
| | | Periods Ended December 31, | |
| | | 2012 | | | 2011(a) | |
Net asset value, beginning of year | | $ | 10.45 | | | $ | 10.00 | |
Income (loss) from investment operations: | | | | | | | | |
Net investment income (loss) | | | 0.13 | | | | 0.00 | ^ |
Net realized and unrealized gain (loss) on investments | | | 1.15 | | | | 0.45 | |
| | | | | | | | |
Total from investment operations | | | 1.28 | | | | 0.45 | |
Less distributions from: | | | | | | | | |
Net investment income | | | 0.12 | | | | — | |
Net realized gain | | | 0.32 | | | | — | |
| | | | | | | | |
Total distributions | | | 0.44 | | | | — | |
| | | | | | | | |
Net asset value, end of year | | $ | 11.29 | | | $ | 10.45 | |
| | | | | | | | |
Total Return (%)* | | | 12.22 | | | | 4.50 | |
Ratios to average daily net assets (%):** | | | | | | | | |
Expenses, net of waivers and reimbursements | | | 1.15 | | | | 1.15 | |
Expenses, before waivers and reimbursements | | | 5.88 | | | | 18.43 | |
Net investment income (loss), net of waivers and reimbursements | | | 1.12 | | | | 0.79 | |
Net investment income (loss), before waivers and reimbursements | | | (3.61 | ) | | | (16.49 | ) |
Net assets at end of year (in thousands) | | $ | 1,442 | | | $ | 1,296 | |
Portfolio turnover rate (%)* | | | 56 | | | | 1 | |
| (a) | | For the period from December 15, 2011 (Commencement of Operations) to December 31, 2011. |
| * | | Rates not annualized for periods that are less than a year. |
| ** | | Rates are annualized for periods that are less than a year. |
| ^ | | Amount is less than $0.005 per share. |
Note: Net investment income (loss) per share is based on the average shares outstanding during the year.
Performance cited represents past performance. Past performance does not guarantee future results and current performance may be lower or higher than the data quoted. Results shown are annual returns, which assume reinvestment of dividends and capital gains. Investment returns and principal will fluctuate and you may have a gain or loss when you sell shares. For the most current month-end performance information, please call 1-800-742-7272 or visit our Web site at www.williamblairfunds.com.
December 31, 2012 | William Blair Funds 155 |
Financial Highlights
Bond Fund
| | | | | | | | | | | | | | | | | | | | |
| | | Class N | |
| | | Years Ended December 31, | |
| | | 2012 | | | 2011 | | | 2010 | | | 2009 | | | 2008 | |
Net asset value, beginning of year | | $ | 10.91 | | | $ | 10.70 | | | $ | 10.40 | | | $ | 9.82 | | | $ | 10.07 | |
Income (loss) from investment operations: | | | | | | | | | | | | | | | | | | | | |
Net investment income (loss) | | | 0.36 | | | | 0.43 | | | | 0.46 | | | | 0.48 | | | | 0.47 | |
Net realized and unrealized gain (loss) on investments | | | 0.53 | | | | 0.34 | | | | 0.35 | | | | 0.59 | | | | (0.31 | ) |
| | | | | | | | | | | | | | | | | | | | |
Total from investment operations | | | 0.89 | | | | 0.77 | | | | 0.81 | | | | 1.07 | | | | 0.16 | |
Less distributions from: | | | | | | | | | | | | | | | | | | | | |
Net investment income | | | 0.45 | | | | 0.47 | | | | 0.48 | | | | 0.49 | | | | 0.41 | |
Net realized gain | | | 0.07 | | | | 0.09 | | | | 0.03 | | | | — | | | | — | |
| | | | | | | | | | | | | | | | | | | | |
Total distributions | | | 0.52 | | | | 0.56 | | | | 0.51 | | | | 0.49 | | | | 0.41 | |
| | | | | | | | | | | | | | | | | | | | |
Net asset value, end of year | | $ | 11.28 | | | $ | 10.91 | | | $ | 10.70 | | | $ | 10.40 | | | $ | 9.82 | |
| | | | | | | | | | | | | | | | | | | | |
Total Return (%) | | | 8.33 | | | | 7.41 | | | | 7.86 | | | | 11.11 | | | | 1.64 | |
Ratios to average daily net assets (%): | | | | | | | | | | | | | | | | | | | | |
Expenses, net of waivers and reimbursements | | | 0.65 | | | | 0.65 | | | | 0.65 | | | | 0.65 | | | | 0.65 | |
Expenses, before waivers and reimbursements | | | 0.81 | | | | 0.76 | | | | 0.70 | | | | 1.40 | | | | 2.47 | |
Net investment income (loss), net of waivers and reimbursements | | | 3.25 | | | | 3.97 | | | | 4.25 | | | | 4.76 | | | | 4.69 | |
Net investment income (loss), before waivers and reimbursements | | | 3.09 | | | | 3.86 | | | | 4.20 | | | | 4.01 | | | | 2.87 | |
Net assets at end of year (in thousands) | | $ | 32,867 | | | $ | 8,345 | | | $ | 4,479 | | | $ | 3,580 | | | $ | 407 | |
Portfolio turnover rate (%) | | | 25 | | | | 28 | | | | 25 | | | | 29 | | | | 52 | |
| |
| | | Class I | |
| | | Years Ended December 31, | |
| | | 2012 | | | 2011 | | | 2010 | | | 2009 | | | 2008 | |
Net asset value, beginning of year | | $ | 10.80 | | | $ | 10.59 | | | $ | 10.31 | | | $ | 9.72 | | | $ | 10.04 | |
Income (loss) from investment operations: | | | | | | | | | | | | | | | | | | | | |
Net investment income (loss) | | | 0.38 | | | | 0.45 | | | | 0.47 | | | | 0.49 | | | | 0.48 | |
Net realized and unrealized gain (loss) on investments | | | 0.52 | | | | 0.33 | | | | 0.33 | | | | 0.59 | | | | (0.31 | ) |
| | | | | | | | | | | | | | | | | | | | |
Total from investment operations | | | 0.90 | | | | 0.78 | | | | 0.80 | | | | 1.08 | | | | 0.17 | |
Less distributions from: | | | | | | | | | | | | | | | | | | | | |
Net investment income | | | 0.46 | | | | 0.48 | | | | 0.49 | | | | 0.49 | | | | 0.49 | |
Net realized gain | | | 0.07 | | | | 0.09 | | | | 0.03 | | | | — | | | | — | |
| | | | | | | | | | | | | | | | | | | | |
Total distributions | | | 0.53 | | | | 0.57 | | | | 0.52 | | | | 0.49 | | | | 0.49 | |
| | | | | | | | | | | | | | | | | | | | |
Net asset value, end of year | | $ | 11.17 | | | $ | 10.80 | | | $ | 10.59 | | | $ | 10.31 | | | $ | 9.72 | |
| | | | | | | | | | | | | | | | | | | | |
Total Return (%) | | | 8.54 | | | | 7.62 | | | | 7.89 | | | | 11.40 | | | | 1.72 | |
Ratios to average daily net assets (%): | | | | | | | | | | | | | | | | | | | | |
Expenses, net of waivers and reimbursements | | | 0.50 | | | | 0.50 | | | | 0.50 | | | | 0.50 | | | | 0.50 | |
Expenses, before waivers and reimbursements | | | 0.56 | | | | 0.55 | | | | 0.55 | | | | 0.58 | | | | 0.71 | |
Net investment income (loss), net of waivers and reimbursements | | | 3.45 | | | | 4.17 | | | | 4.41 | | | | 4.92 | | | | 4.90 | |
Net investment income (loss), before waivers and reimbursements | | | 3.39 | | | | 4.12 | | | | 4.36 | | | | 4.84 | | | | 4.69 | |
Net assets at end of year (in thousands) | | $ | 172,836 | | | $ | 154,224 | | | $ | 147,807 | | | $ | 127,538 | | | $ | 63,763 | |
Portfolio turnover rate (%) | | | 25 | | | | 28 | | | | 25 | | | | 29 | | | | 52 | |
Note: Net investment income (loss) per share is based on the average shares outstanding during the year.
Performance cited represents past performance. Past performance does not guarantee future results and current performance may be lower or higher than the data quoted. Results shown are annual returns, which assume reinvestment of dividends and capital gains. Investment returns and principal will fluctuate and you may have a gain or loss when you sell shares. For the most current month-end performance information, please call 1-800-742-7272 or visit our Web site at www.williamblairfunds.com.
156 Annual Report | December 31, 2012 |
Financial Highlights
Income Fund
| | | | | | | | | | | | | | | | | | | | |
| | | Class N | |
| | | Years Ended December 31, | |
| | | 2012 | | | 2011 | | | 2010 | | | 2009 | | | 2008 | |
Net asset value, beginning of year | | $ | 9.32 | | | $ | 9.22 | | | $ | 9.07 | | | $ | 8.69 | | | $ | 9.29 | |
Income (loss) from investment operations: | | | | | | | | | | | | | | | | | | | | |
Net investment income (loss) | | | 0.24 | | | | 0.32 | | | | 0.35 | | | | 0.40 | | | | 0.37 | |
Net realized and unrealized gain (loss) on investments | | | 0.31 | | | | 0.15 | | | | 0.19 | | | | 0.44 | | | | (0.59 | ) |
| | | | | | | | | | | | | | | | | | | | |
Total from investment operations | | | 0.55 | | | | 0.47 | | | | 0.54 | | | | 0.84 | | | | (0.22 | ) |
Less distributions from: | | | | | | | | | | | | | | | | | | | | |
Net investment income | | | 0.32 | | | | 0.37 | | | | 0.39 | | | | 0.46 | | | | 0.38 | |
Net realized gain | | | — | | | | — | | | | — | | | | — | | | | — | |
| | | | | | | | | | | | | | | | | | | | |
Total distributions | | | 0.32 | | | | 0.37 | | | | 0.39 | | | | 0.46 | | | | 0.38 | |
| | | | | | | | | | | | | | | | | | | | |
Net asset value, end of year | | $ | 9.55 | | | $ | 9.32 | | | $ | 9.22 | | | $ | 9.07 | | | $ | 8.69 | |
| | | | | | | | | | | | | | | | | | | | |
Total Return (%) | | | 6.00 | | | | 5.21 | | | | 6.04 | | | | 9.88 | | | | (2.46 | ) |
Ratios to average daily net assets (%): | | | | | | | | | | | | | | | | | | | | |
Expenses, net of waivers and reimbursements | | | 0.83 | | | | 0.85 | | | | 0.85 | | | | 0.85 | | | | 0.90 | |
Expenses, before waivers and reimbursements | | | 0.83 | | | | 0.91 | | | | 0.85 | | | | 0.93 | | | | 0.93 | |
Net investment income (loss), net of waivers and reimbursements | | | 2.49 | | | | 3.40 | | | | 3.79 | | | | 4.48 | | | | 4.38 | |
Net investment income (loss), before waivers and reimbursements | | | 2.49 | | | | 3.34 | | | | 3.79 | | | | 4.41 | | | | 4.35 | |
| Net assets at end of year (in thousands) | | $ | 68,947 | | | $ | 44,802 | | | $ | 35,755 | | | $ | 37,567 | | | $ | 47,009 | |
| Portfolio turnover rate (%) | | | 33 | | | | 39 | | | | 29 | | | | 40 | | | | 38 | |
| |
| | | Class I | |
| | | Years Ended December 31, | |
| | | 2012 | | | 2011 | | | 2010 | | | 2009 | | | 2008 | |
Net asset value, beginning of year | | $ | 9.25 | | | $ | 9.15 | | | $ | 9.00 | | | $ | 8.64 | | | $ | 9.30 | |
Income (loss) from investment operations: | | | | | | | | | | | | | | | | | | | | |
Net investment income (loss) | | | 0.26 | | | | 0.34 | | | | 0.37 | | | | 0.41 | | | | 0.39 | |
Net realized and unrealized gain (loss) on investments | | | 0.31 | | | | 0.15 | | | | 0.19 | | | | 0.43 | | | | (0.59 | ) |
| | | | | | | | | | | | | | | | | | | | |
Total from investment operations | | | 0.57 | | | | 0.49 | | | | 0.56 | | | | 0.84 | | | | (0.20 | ) |
Less distributions from: | | | | | | | | | | | | | | | | | | | | |
Net investment income | | | 0.34 | | | | 0.39 | | | | 0.41 | | | | 0.48 | | | | 0.46 | |
Net realized gain | | | — | | | | — | | | | — | | | | — | | | | — | |
| | | | | | | | | | | | | | | | | | | | |
Total distributions | | | 0.34 | | | | 0.39 | | | | 0.41 | | | | 0.48 | | | | 0.46 | |
| | | | | | | | | | | | | | | | | | | | |
Net asset value, end of year | | $ | 9.48 | | | $ | 9.25 | | | $ | 9.15 | | | $ | 9.00 | | | $ | 8.64 | |
| | | | | | | | | | | | | | | | | | | | |
Total Return (%) | | | 6.28 | | | | 5.46 | | | | 6.33 | | | | 9.89 | | | | (2.26 | ) |
Ratios to average daily net assets (%): | | | | | | | | | | | | | | | | | | | | |
Expenses | | | 0.58 | | | | 0.64 | | | | 0.63 | | | | 0.66 | | | | 0.72 | |
Net investment income (loss) | | | 2.78 | | | | 3.66 | | | | 4.01 | | | | 4.67 | | | | 4.57 | |
| Net assets at end of year (in thousands) | | $ | 72,830 | | | $ | 67,183 | | | $ | 77,522 | | | $ | 80,041 | | | $ | 93,426 | |
| Portfolio turnover rate (%) | | | 33 | | | | 39 | | | | 29 | | | | 40 | | | | 38 | |
Note: Net investment income (loss) per share is based on the average shares outstanding during the year.
Performance cited represents past performance. Past performance does not guarantee future results and current performance may be lower or higher than the data quoted. Results shown are annual returns, which assume reinvestment of dividends and capital gains. Investment returns and principal will fluctuate and you may have a gain or loss when you sell shares. For the most current month-end performance information, please call 1-800-742-7272 or visit our Web site at www.williamblairfunds.com.
December 31, 2012 | William Blair Funds 157 |
Financial Highlights
Low Duration Bond Fund
| | | | | | | | | | | | | | | | |
| | | Class N | |
| | | Periods Ended December 31, | |
| | | 2012 | | | 2011 | | | 2010 | | | 2009(a) | |
Net asset value, beginning of year | | $ | 9.82 | | | $ | 9.90 | | | $ | 9.93 | | | $ | 10.00 | |
Income (loss) from investment operations: | | | | | | | | | | | | | | | | |
Net investment income (loss) | | | 0.13 | | | | 0.15 | | | | 0.13 | | | | 0.01 | |
Net realized and unrealized gain (loss) on investments | | | 0.14 | | | | 0.02 | | | | 0.05 | | | | (0.07 | ) |
| | | | | | | | | | | | | | | | |
Total from investment operations | | | 0.27 | | | | 0.17 | | | | 0.18 | | | | (0.06 | ) |
Less distributions from: | | | | | | | | | | | | | | | | |
Net investment income | | | 0.26 | | | | 0.25 | | | | 0.21 | | | | 0.01 | |
Net realized gain | | | — | | | | — | | | | — | | | | — | |
| | | | | | | | | | | | | | | | |
Total distributions | | | 0.26 | | | | 0.25 | | | | 0.21 | | | | 0.01 | |
| | | | | | | | | | | | | | | | |
Net asset value, end of year | | $ | 9.83 | | | $ | 9.82 | | | $ | 9.90 | | | $ | 9.93 | |
| | | | | | | | | | | | | | | | |
Total Return (%)* | | | 2.80 | | | | 1.73 | | | | 1.86 | | | | (0.60 | ) |
Ratios to average daily net assets (%): ** | | | | | | | | | | | | | | | | |
Expenses, net of waivers and reimbursements | | | 0.70 | | | | 0.70 | | | | 0.70 | | | | 0.70 | |
Expenses, before waivers and reimbursements | | | 0.74 | | | | 0.73 | | | | 0.78 | | | | 0.94 | |
Net investment income (loss), net of waivers and reimbursements | | | 1.37 | | | | 1.52 | | | | 1.33 | | | | 1.27 | |
Net investment income (loss), before waivers and reimbursements | | | 1.33 | | | | 1.49 | | | | 1.25 | | | | 1.03 | |
| Net assets at end of year (in thousands) | | $ | 11,216 | | | $ | 6,260 | | | $ | 6,937 | | | $ | 1,861 | |
| Portfolio turnover rate (%)* | | | 20 | | | | 43 | | | | 51 | | | | — | |
| |
| | | Class I | |
| | | Periods Ended December 31, | |
| | | 2012 | | | 2011 | | | 2010 | | | 2009(a) | |
Net asset value, beginning of year | | $ | 9.82 | | | $ | 9.89 | | | $ | 9.93 | | | $ | 10.00 | |
Income (loss) from investment operations: | | | | | | | | | | | | | | | | |
Net investment income (loss) | | | 0.15 | | | | 0.17 | | | | 0.15 | | | | 0.01 | |
Net realized and unrealized gain (loss) on investments | | | 0.14 | | | | 0.02 | | | | 0.04 | | | | (0.07 | ) |
| | | | | | | | | | | | | | | | |
Total from investment operations | | | 0.29 | | | | 0.19 | | | | 0.19 | | | | (0.06 | ) |
Less distributions from: | | | | | | | | | | | | | | | | |
Net investment income | | | 0.28 | | | | 0.26 | | | | 0.23 | | | | 0.01 | |
Net realized gain | | | — | | | | — | | | | — | | | | — | |
| | | | | | | | | | | | | | | | |
Total distributions | | | 0.28 | | | | 0.26 | | | | 0.23 | | | | 0.01 | |
| | | | | | | | | | | | | | | | |
Net asset value, end of year | | $ | 9.83 | | | $ | 9.82 | | | $ | 9.89 | | | $ | 9.93 | |
| | | | | | | | | | | | | | | | |
Total Return (%)* | | | 2.96 | | | | 1.99 | | | | 1.89 | | | | (0.59 | ) |
Ratios to average daily net assets (%): ** | | | | | | | | | | | | | | | | |
Expenses, net of waivers and reimbursements | | | 0.55 | | | | 0.55 | | | | 0.55 | | | | 0.55 | |
Expenses, before waivers and reimbursements | | | 0.57 | | | | 0.58 | | | | 0.63 | | | | 0.79 | |
Net investment income (loss), net of waivers and reimbursements | | | 1.52 | | | | 1.67 | | | | 1.46 | | | | 1.39 | |
Net investment income (loss), before waivers and reimbursements | | | 1.50 | | | | 1.64 | | | | 1.38 | | | | 1.15 | |
| Net assets at end of year (in thousands) | | $ | 157,213 | | | $ | 82,828 | | | $ | 88,568 | | | $ | 79,773 | |
| Portfolio turnover rate (%)* | | | 20 | | | | 43 | | | | 51 | | | | — | |
| (a) | | For the period from December 1, 2009 (Commencement of Operations) to December 31, 2009. |
| * | | Rates not annualized for periods that are less than a year. |
| ** | | Rates are annualized for periods that are less than a year. |
Note: Net investment income (loss) per share is based on the average shares outstanding during the year.
Performance cited represents past performance. Past performance does not guarantee future results and current performance may be lower or higher than the data quoted. Results shown are annual returns, which assume reinvestment of dividends and capital gains. Investment returns and principal will fluctuate and you may have a gain or loss when you sell shares. For the most current month-end performance information, please call 1-800-742-7272 or visit our Web site at www.williamblairfunds.com.
158 Annual Report | December 31, 2012 |
Financial Highlights
Ready Reserves Fund
| | | | | | | | | | | | | | | | | | | | |
| | | Class N | |
| | | Years Ended December 31, | |
| | | 2012 | | | 2011 | | | 2010 | | | 2009 | | | 2008 | |
Net asset value, beginning of year | | $ | 1.00 | | | $ | 1.00 | | | $ | 1.00 | | | $ | 1.00 | | | $ | 1.00 | |
Income (loss) from investment operations: | | | | | | | | | | | | | | | | | | | | |
Net investment income (loss) | | | 0.00 | ^ | | | 0.00 | ^ | | | 0.00 | ^ | | | 0.00 | ^ | | | 0.02 | |
Net realized and unrealized gain (loss) on investments | | | — | | | | — | | | | — | | | | — | | | | — | |
| | | | | | | | | | | | | | | | | | | | |
Total from investment operations | | | 0.00 | ^ | | | 0.00 | ^ | | | 0.00 | ^ | | | 0.00 | ^ | | | 0.02 | |
Less distributions from: | | | | | | | | | | | | | | | | | | | | |
Net investment income | | | 0.00 | ^ | | | 0.00 | ^ | | | 0.00 | ^ | | | 0.00 | ^ | | | 0.02 | |
Net realized gain | | | — | | | | — | | | | — | | | | — | | | | — | |
| | | | | | | | | | | | | | | | | | | | |
Total distributions | | | 0.00 | ^ | | | 0.00 | ^ | | | 0.00 | ^ | | | 0.00 | ^ | | | 0.02 | |
| | | | | | | | | | | | | | | | | | | | |
Net asset value, end of year | | $ | 1.00 | | | $ | 1.00 | | | $ | 1.00 | | | $ | 1.00 | | | $ | 1.00 | |
| | | | | | | | | | | | | | | | | | | | |
Total Return (%) | | | 0.01 | | | | 0.01 | | | | 0.01 | | | | 0.10 | | | | 2.20 | |
Ratios to average daily net assets (%): | | | | | | | | | | | | | | | | | | | | |
Expenses, net of waivers and reimbursements | | | 0.14 | | | | 0.14 | | | | 0.24 | | | | 0.46 | | | | 0.60 | |
Expenses, before waivers and reimbursements | | | 0.62 | | | | 0.62 | | | | 0.61 | | | | 0.66 | | | | 0.60 | |
Net investment income (loss), net of waivers and reimbursements | | | 0.01 | | | | 0.01 | | | | 0.01 | | | | 0.11 | | | | 2.12 | |
Net investment income (loss), before waivers and reimbursements | | | (0.47 | ) | | | (0.47 | ) | | | (0.36 | ) | | | (0.09 | ) | | | 2.12 | |
Net assets at end of year (in thousands) | | $ | 1,515,330 | | | $ | 1,271,746 | | | $ | 1,216,543 | | | $ | 1,352,901 | | | $ | 1,841,189 | |
| ^ | | Amount is less than $0.005 per share. |
Note: Net investment income (loss) per share is based on the average shares outstanding during the year.
Performance cited represents past performance. Past performance does not guarantee future results and current performance may be lower or higher than the data quoted. Results shown are annual returns, which assume reinvestment of dividends and capital gains. Investment returns and principal will fluctuate and you may have a gain or loss when you sell shares. For the most current month-end performance information, please call 1-800-742-7272 or visit our Web site at www.williamblairfunds.com.
December 31, 2012 | William Blair Funds 159 |
REPORT OF INDEPENDENT REGISTERED PUBLIC ACCOUNTING FIRM
To the Board of Trustees and Shareholders of
William Blair Funds
We have audited the accompanying statements of assets and liabilities, including the portfolios of investments, of the Growth Fund, Large Cap Growth Fund, Small Cap Growth Fund, Mid Cap Growth Fund, Small-Mid Cap Growth Fund, Global Leaders Fund (formerly known as Global Growth Fund), International Growth Fund, International Equity Fund, International Leaders Fund, International Small Cap Growth Fund, Emerging Markets Growth Fund, Emerging Markets Leaders Fund (formerly known as Emerging Leaders Growth Fund), Emerging Markets Small Cap Growth Fund, Large Cap Value Fund, Small Cap Value Fund, Mid Cap Value Fund, Small-Mid Cap Value Fund, Bond Fund, Income Fund, Low Duration Fund and Ready Reserves Fund (collectively, the “Funds”) (twenty-one of the Funds constituting William Blair Funds) as of December 31, 2012, and the related statements of operations, statements of changes in net assets, and the financial highlights for the periods indicated therein. These financial statements and financial highlights are the responsibility of the Funds’ management. Our responsibility is to express an opinion on these financial statements and financial highlights based on our audits.
We conducted our audits in accordance with the standards of the Public Company Accounting Oversight Board (United States). Those standards require that we plan and perform the audit to obtain reasonable assurance about whether the financial statements and financial highlights are free of material misstatement. We were not engaged to perform an audit of the Funds’ internal control over financial reporting. Our audits included consideration of internal control over financial reporting as a basis for designing audit procedures that are appropriate in the circumstances, but not for the purpose of expressing an opinion on the effectiveness of the Funds’ internal control over financial reporting. Accordingly, we express no such opinion. An audit also includes examining, on a test basis, evidence supporting the amounts and disclosures in the financial statements and financial highlights, assessing the accounting principles used and significant estimates made by management, and evaluating the overall financial statement presentation. Our procedures included confirmation of securities owned as of December 31, 2012 by correspondence with the custodian and brokers or by other appropriate auditing procedures where replies from brokers were not received. We believe that our audits provide a reasonable basis for our opinion.
In our opinion, the financial statements and financial highlights referred to above present fairly, in all material respects, the financial position of the above mentioned Funds of William Blair Funds at December 31, 2012, the results of their operations, the changes in their net assets, and the financial highlights for the periods indicated therein in conformity with U.S. generally accepted accounting principles.

Chicago, Illinois
April 22, 2013
160 Annual Report | December 31, 2012 |
Trustees and Officers (Unaudited). The trustees and officers of the William Blair Funds, their year of birth, their principal occupations during the last five years, their affiliations, if any, with William Blair & Company, L.L.C., and other significant affiliations are set forth below. The address of each trustee and officer is 222 West Adams Street, Chicago, Illinois 60606.
| | | | | | | | | | |
Name and Year of Birth | | Position(s)
Held with
Fund | | Term of
Office and
Length of
Time
Served(1) | | Principal Occupation(s) During Past 5 Years(2) | | Number of
Portfolios
in Fund
Complex
Overseen
by Trustee | | Other Directorships Held by Trustee/Officer |
Interested Trustees | | | | | | | | | | |
Michelle R. Seitz,
1965* | | Chairman of the Board of Trustees and President | | Trustee since 2002; Chairman since 2010 Since 2007 | | Partner, William Blair & Company, L.L.C.; Limited Partner, WBC Holdings, L.P. (since November 2008); Member, WBC GP, L.L.P. (since November 2008); Director, William Blair International, Ltd. (U.K.) (since 2012) | | 25 | | Chairman, William Blair SICAV; Director, William Blair CLS Ltd.; Director, William Blair MAS Ltd.; Financial Accounting Foundation (FAF) |
| | | | | |
Richard W. Smirl,
1967* | | Trustee and Senior Vice President | | Trustee since 2010 and Senior Vice President Since 2007 | | Partner, William Blair & Company, L.L.C.; Limited Partner, WBC Holdings, L.P. (since November 2008); Director, William Blair International, Ltd. (U.K.) (since 2012) | | 25 | | Director, William Blair SICAV Director, William Blair CLS Ltd.; Director, William Blair MAS Ltd.; |
| | | | |
Non-Interested Trustees | | | | | | | | |
Vann A. Avedisian,
1964 | | Trustee | | Since 2012 | | Principal, Highgate Holdings since 2009; formerly, co-founder and Managing Director, Oxford Capital Partners, Inc. from 1994 to 2006 | | 25 | | Potbelly Sandwich Works, LLC |
| | | | | |
Phillip O. Peterson,
1944 | | Trustee | | Since 2007 | | Retired; formerly, President, Strong Mutual Funds, 2004 to 2005; formerly, Partner, KPMG LLP | | 25 | | The Hartford Group of Mutual Funds (87 portfolios); Symetra Mutual Funds Trust (variable annuity funds) (14 portfolios) |
| | | | | |
Donald J. Reaves,
1946 | | Trustee | | Since 2004 | | Chancellor, Winston-Salem State University since 2007; formerly, Vice President for Administration and Chief Financial Officer, University of Chicago 2002 to 2007. | | 25 | | American Student Assistance Corp., guarantor of student loans; Amica Mutual Insurance Company |
| | | | | |
Donald L. Seeley,
1944 | | Trustee | | Since 2003 | | Retired; formerly, Director, Applied Investment Management Program, University of Arizona Department of Finance, prior thereto, Vice Chairman and Chief Financial Officer, True North Communications, Inc., marketing communications and advertising firm | | 25 | | Warnaco Group, Inc., intimate apparel, sportswear, and swimwear manufacturer; Center for Furniture Craftsmanship (not-for-profit) |
| | | | | |
Thomas J. Skelly,
1951 | | Trustee | | Since 2007 | | Advisory Board Member for various U.S. Companies; Director and Investment Committee Chairman of the US Accenture Foundation, Inc.; prior to 2005, Managing Partner of various divisions at Accenture | | 25 | | Mutual Trust Financial Group, provider of insurance and investment products; Board Member, First MetLife Investors Insurance Company, NY Chartered Company for Metropolitan Life Insurance |
December 31, 2012 | William Blair Funds 161 |
| | | | | | | | | | |
Name and Year of Birth | | Position(s)
Held with
Fund | | Term of
Office and
Length of
Time
Served(1) | | Principal Occupation(s) During Past 5 Years(2) | | Number of
Portfolios
in Fund
Complex
Overseen
by Trustee | | Other Directorships Held by Trustee/Officer |
Officers | | | | | | | | | | |
Michael P. Balkin,
1959 | | Senior Vice President Vice President | | Since 2009 2008-2009 | | Partner, William Blair & Company, L.L.C. Associate, William Blair & Company, L.L.C.; former Partner, Magnetar Capital (2005-2009) | | | | N/A |
| | | | | |
Karl W. Brewer,
1966 | | Senior Vice President | | Since 2000 | | Partner, William Blair & Company, L.L.C. | | | | N/A |
| | | | | |
David C. Fording,
1967 | | Senior Vice President Vice President | | Since 2009 2006-2009 | | Partner, William Blair & Company, L.L.C. Associate, William Blair & Company, L.L.C.; former Portfolio Manager, TIAA-CREF. | | | | N/A |
| | | | | |
James S. Golan,
1961 | | Senior Vice President | | Since 2005 | | Partner, William Blair & Company, L.L.C. | | | | N/A |
| | | | | |
W. George Greig,
1952 | | Senior Vice President | | Since 1996 | | Partner, William Blair & Company, L.L.C. | | | | N/A |
| | | | | |
Michael A. Jancosek,
1959 | | Senior Vice President | | Since 2004 | | Partner, William Blair & Company L.L.C. | | | | N/A |
| | | | | |
John F. Jostrand,
1954 | | Senior Vice President | | Since 1999 | | Partner, William Blair & Company, L.L.C. | | | | N/A |
| | | | | |
Chad M. Kilmer,
1975 | | Senior Vice President Vice President | | Since 2011 2006-2011 | | Partner, William Blair & Company, L.L.C. Associate, William Blair & Company, L.L.C.; former analyst and Portfolio Manager U.S. Bancorp Asset Management. | | | | N/A |
| | | | | |
Robert C. Lanphier, IV,
1956 | | Senior Vice President | | Since 2003 | | Partner, William Blair & Company, L.L.C. | | | | Chairman, AG. Med, Inc. |
| | | | | |
Mark T. Leslie,
1967 | | Senior Vice President Vice President | | Since 2008 2005-2008 | | Partner, William Blair & Company, L.L.C. Associate, William Blair & Company, L.L.C. | | | | N/A |
| | | | | |
Matthew A. Litfin,
1972 | | Senior Vice President | | Since 2008 | | Partner, William Blair & Company, L.L.C. | | | | N/A |
| | | | | |
Kenneth J. McAtamney
1966 | | Senior Vice President | | Since 2008 | | Partner, William Blair & Company, L.L.C. | | | | N/A |
162 Annual Report | December 31, 2012 |
| | | | | | | | |
Name and Year of Birth | | Position(s) Held with Fund | | Term of
Office and
Length of Time
Served(1) | | Principal Occupation(s) During Past 5 Years(2) | | Other Directorships Held by Trustee/Officer |
Todd M. McClone,
1968 | | Senior Vice President Vice President | | Since 2006 2005-2006 | | Partner, William Blair & Company, L.L.C. Associate, William Blair & Company, L.L.C. | | N/A N/A |
| | | | |
David Merjan,
1960 | | Senior Vice President | | Since 2008 | | Partner, William Blair & Company, L.L.C. | | N/A |
| | | | |
David S. Mitchell,
1960 | | Senior Vice President | | Since 2004 | | Partner, William Blair & Company, L.L.C. | | N/A |
| | | | |
David P. Ricci,
1958 | | Senior Vice President | | Since 2006 | | Partner, William Blair & Company, L.L.C. | | N/A |
| | | | |
Brian D. Singer,
1960 | | Senior Vice President Vice President | | Since 2012 2011-2012 | | Partner, William Blair & Company, L.L.C. Associate, William Blair & Company, L.L.C. (since 2011); prior thereto, Managing Partner, Singer Partners, LLC (2009-2011); prior thereto, UBS Global Asset Management (Americas) Inc. (2003-2007) | | N/A |
| | | | |
Paul J. Sularz,
1967 | | Senior Vice President Vice President | | Since 2012 2009-2012 | | Partner, William Blair & Company, L.L.C. Associate, William Blair & Company, L.L.C.; Vice President, J.P. Morgan Securities, Inc. | | N/A |
| | | | |
Jeffrey A. Urbina,
1955 | | Senior Vice President | | Since 1998 | | Partner, William Blair & Company, L.L.C. | | N/A |
| | | | |
Christopher T. Vincent,
1956 | | Senior Vice President | | Since 2004 | | Partner, William Blair & Company, L.L.C. | | N/A |
| | | | |
Kathleen M. Lynch,
1971 | | Vice President | | Since 2010 | | Associate, William Blair & Company, L.L.C. | | N/A |
| | | | |
David F. Hone,
1967 | | Vice President | | Since 2011 | | Associate, William Blair & Company, L.L.C. (since 2011); prior thereto, Portfolio Manager Large Cap Value, Deutsche Asset Management (2002-2010) | | N/A |
| | | | |
John Abunassar,
1967 | | Vice President | | Since 2011 | | Associate, William Blair & Company, L.L.C. (since 2011); prior thereto, Principal, Guidance Capital LLC (2009-2011); prior thereto, President and CEO of Allegiant Asset Management (2004-2009) | | N/A |
| | | | |
Peter Carl,
1967 | | Vice President | | Since 2011 | | Associate, William Blair & Company L.L.C. (since 2011); prior thereto, Portfolio Manager, Guidance Capital LLC (2006-2011) | | N/A |
| | | | |
D. Trowbridge Elliman III, 1957 | | Vice President | | Since 2011 | | Associate, William Blair & Company L.L.C. (since 2011); prior thereto, Principal, Guidance Capital LLC (2001-2011) | | N/A |
December 31, 2012 | William Blair Funds 163 |
| | | | | | | | |
Name and Year of Birth | | Position(s) Held with Fund | | Term of
Office and
Length of Time
Served(1) | | Principal Occupation(s) During Past 5 Years(2) | | Other Directorships Held by Trustee/Officer |
Christopher Walvoord,
1966 | | Vice President | | Since 2011 | | Associate, William Blair & Company, L.L.C. (since 2011); prior thereto, Principal, Guidance Capital LLC (2002-2011) | | N/A |
| | | | |
Brian Ziv,
1957 | | Vice President | | Since 2011 | | Associate, William Blair & Company, L.L.C. (since 2011); prior thereto, Principal, Guidance Capital LLC (2001-2011) | | N/A |
| | | | |
Edwin Denson,
1967 | | Vice President | | Since 2011 | | Associate, William Blair & Company, L.L.C. (since 2011); prior thereto, Managing Partner, Singer Partners, LLC (2009-2011); prior thereto, UBS Global Asset Management (Americas) Inc. (2001-2009) | | N/A |
| | | | |
Thomas Clarke,
1968 | | Vice President | | Since 2011 | | Associate, William Blair & Company, L.L.C. (since 2011); prior thereto, Managing Partner, Singer Partners, LLC (2009-2011); prior thereto, UBS Global Asset Management (Americas) Inc. (2000-2009) | | N/A |
| | | | |
Walter R. Randall, Jr.,
1960 | | Chief Compliance Officer and Assistant Secretary | | Since 2009 | | Associate, William Blair & Company, L.L.C. (since 2008); prior thereto, Associate Counsel and Chief Compliance Officer, Calamos Investments (2006-2008) | | N/A |
| | | | |
Colette M. Garavalia,
1961 | | Treasurer | | Since 2009 | | Associate, William Blair & Company, L.L.C. | | N/A |
| | | | |
| | Secretary | | 2000-2009 | | Associate, William Blair & Company, L.L.C. | | N/A |
| | | | |
Andrew T. Pfau,
1970 | | Secretary | | Since 2009 | | Associate, William Blair & Company, L.L.C. (since 2008); prior thereto, Associate, Bell, Boyd & Lloyd, LLP (2006-2008) | | N/A |
| | | | |
John M. Raczek,
1970 | | Assistant Treasurer | | Since 2010 | | Associate, William Blair & Company, L.L.C. (since 2009); prior thereto, Manager, Calamos Investments (2003-2009) | | N/A |
| * | | Ms. Seitz and Mr. Smirl are interested persons of the William Blair Funds because each is a partner of William Blair & Company, L.L.C., the Fund’s investment advisor, principal underwriter and distributor. |
| (1) | | Each Trustee serves until the election and qualification of a successor, or until death, resignation or retirement or removal as provided in the Fund’s Declaration of Trust. Retirement for non-interested Trustees occurs no later than at the conclusion of the first regularly scheduled Board meeting of the Fund’s fiscal year that occurs after the earlier of (a) the non-interested Trustee’s 72nd birthday or (b) the 15th anniversary of the date that the non-interested Trustee was first elected or appointed as a member of the Board of Trustees. The Fund’s officers, except the Chief Compliance Officer, are elected annually by the Trustees. The Fund’s Chief Compliance Officer is designated by the Board of Trustees and may only be removed by action of the Board of Trustees, including a majority of the non-interested Trustees. |
| (2) | | In November 2008, all partners of William Blair & Company, L.L.C. also became limited partners in WBC Holdings, L.P. |
The Statement of Additional Information for the William Blair Funds includes additional information about the trustees and is available without charge by calling 1-800-635-2886 (in Massachusetts 1-800-635-2840) or by writing the Fund.
164 Annual Report | December 31, 2012 |
Approval of the Management Agreement for the William Blair International Leaders Fund
On April 24, 2012 and August 3, 2012, the Board of Trustees (the “Board”) of William Blair Funds (the “Trust”), including the Trustees who are not interested persons of the Trust as defined by the Investment Company Act of 1940, as amended (the “Independent Trustees”), approved the Management Agreement between the Trust, on behalf of the William Blair International Leaders Fund (the “Fund”), and William Blair & Company, L.L.C. (the “Advisor”). On April 23 and 24, 2012 and August 3, 2012, the Board met to consider the approval of the Management Agreement. On April 23 and 24, 2012 and August 2, 2012, the Independent Trustees also met independently of Trust management and the interested Trustees of the Trust to consider the approval of the Management Agreement. The Independent Trustees reviewed materials provided by the Advisor for the approval of the Management Agreement and were assisted by independent legal counsel in making their determination. The Board considered the following factors in making its determination, but did not identify any single factor or group of factors as all important or controlling and considered all factors together.
Nature, Quality and Extent of Services. In evaluating the nature, quality and extent of services expected to be provided by the Advisor to the Fund, the Board noted that the Advisor is a quality firm with a reputation for integrity and honesty that employs high quality people. The Board considered biographical information about the Fund’s portfolio managers, financial information regarding the Advisor, the compliance regime created by the Advisor and the proposed financial support of the Fund. The Board considered that the proposed portfolio management team currently co-manages the William Blair Global Growth Fund and that a member of the portfolio management team currently manages the William Blair International Growth Fund and the William Blair Institutional International Growth Fund. The Board also considered the Advisor’s experience in managing new funds. Based upon all relevant factors, the Board concluded that the nature, quality and extent of the services to be provided by the Advisor to the Fund were expected to be satisfactory.
Fees and Expenses. The Board reviewed the proposed advisory fee for the Fund and reviewed information comparing the advisory fee to a peer group of funds provided by Lipper Inc. The Lipper peer group for the Fund consisted of other no-load international large-cap growth funds. In considering the information, the Board noted that the proposed advisory fee for the Fund was slightly above the median of the Lipper peer group. The Board also considered that the Advisor had proposed to limit total operating expenses, including waiving advisory fees, if necessary, for each share class of the Fund until April 30, 2014. On the basis of the information provided, the Board concluded that the proposed advisory fee was reasonable in light of the nature, quality and extent of services expected to be provided by the Advisor.
Profitability. With respect to the estimated profitability of the Management Agreement to the Advisor, the Board considered the proposed advisory fee, that the Fund was newly organized and had no assets and the Advisor’s agreement to limit total expenses until April 30, 2014. The Board concluded that the expected profits to be realized by the Advisor were not expected to be unreasonable.
Economies of Scale. The Board considered the extent to which economies of scale would be realized as the Fund grows and whether fee levels reflect these economies of scale. In considering whether fee levels reflect economies of scale for the benefit of Fund investors, the Board reviewed the Fund’s advisory fee compared to peer funds and the Fund’s estimated expense ratios giving effect to the Advisor’s agreement to limit total expenses until April 30, 2014, and concluded that the advisory fee was reasonable.
Other Benefits to the Advisor. The Board considered benefits to be derived by the Advisor from its relationship with the Fund. The Board concluded that, after taking into account these benefits, the proposed advisory fee was reasonable.
Conclusion. Based upon all of the information considered and the conclusions reached, the Board determined that the terms of the Management Agreement are fair and reasonable and that the approval of the Management Agreement is in the best interests of the Fund.
December 31, 2012 | William Blair Funds 165 |
(unaudited)
Proxy Voting
A description of the policies and procedures that the Funds use to determine how to vote proxies relating to portfolio securities and information regarding how the Funds voted proxies relating to portfolio securities for the most recent 12-month period ended June 30 are available without charge, upon request, by calling 1-800-635-2886 (in Massachusetts 1-800-635-2840), at www.williamblairfunds.com and on the SEC’s website at http://www.sec.gov.
Quarterly Portfolio Schedules
Each Fund files its complete schedule of portfolio holdings with the SEC for the first and third fiscal quarters of each fiscal year (quarters ended January 31 and July 31) on Form N-Q. The Fund’s Forms N-Q are available on the SEC’s website at http://www.sec.gov and may be reviewed and copied at the SEC’s Public Reference Room in Washington, D.C. Information on the operation of the SEC’s Public Reference Room may be obtained by calling 1-800-SEC-0330. The Fund’s Forms N-Q are also available on the Fund’s website at www.williamblairfunds.com.
Shareholder Meeting Results
A Special Meeting of Shareholders (the “Meeting”) of William Blair Funds (the “Trust”) was held on August 2, 2012 in the 2nd Floor Conference Room at 222 West Adams Street, Chicago, Illinois 60606. At the Meeting, the following matter was voted upon by shareholders (the resulting votes are presented below).
| 1. | Election of Trustees to the Board of Trustees of the Trust. (“Number of Votes” represents all series of the Trust.) |
| | | | |
| | | Number of Votes: |
Trustee | | For | | Withhold |
Vann A. Avedisian | | 1,644,687,158.154 | | 12,090,164.011 |
Phillip O. Peterson | | 1,644,159,693.572 | | 12,617,628.593 |
Lisa A. Pollina* | | 1,644,478,204.339 | | 12,299,117.826 |
Donald J. Reaves | | 1,642,694,755.277 | | 14,082,566.888 |
Donald L. Seeley | | 1,644,312,102.168 | | 12,465,219.997 |
Michelle R. Seitz | | 1,640,209,136.710 | | 16,568,185.455 |
Thomas J. Skelly | | 1,643,851,882.961 | | 12,925,439.204 |
Richard W. Smirl | | 1,640,721,918.768 | | 16,055,403.397 |
| * | | Ms. Pollina resigned from the Board of Trustees on October 23, 2012. |
Additional Federal Income Tax Information: (unaudited)
Under Section 852(b)(3)(C) of the Code, the Funds hereby designate the following amounts as capital gain dividends for the fiscal year ended December 31, 2012:
| | | | | | |
| | | |
Growth Fund | | Small Cap Growth | | Mid Cap Growth | | Small Mid Cap Growth |
20,221,469 | | 1,671,239 | | 7,948,197 | | 9,118,849 |
| | | |
Small Cap Value | | Mid Cap Value | | Small Mid Cap Value | | Bond Fund |
946,031 | | 145,618 | | 123 | | 1,934,272 |
166 Annual Report | December 31, 2012 |
The following table provides the percentage of the 2012 year-end distributions that qualify for the dividend received deduction, and the qualified dividend income percentage:
| | | | | | | | |
Fund | | Dividend
Received
Deduction% | | | Qualified
Dividend
Income% | |
Growth | | | 100.00 | % | | | 100.00 | % |
Large Cap Growth | | | 0.00 | % | | | 0.00 | % |
Small Cap Growth | | | 0.00 | % | | | 0.00 | % |
Mid Cap Growth | | | 100.00 | % | | | 100.00 | % |
Small Mid-Cap Growth | | | 99.13 | % | | | 100.00 | % |
Global Leaders | | | 100.00 | % | | | 100.00 | % |
International Growth | | | 0.00 | % | | | 72.82 | % |
International Equity | | | 0.00 | % | | | 70.29 | % |
International Leaders | | | 0.42 | % | | | 92.76 | % |
International Small Cap Growth | | | 0.00 | % | | | 78.98 | % |
Emerging Markets Growth | | | 0.27 | % | | | 100.00 | % |
Emerging Markets Leaders | | | 0.00 | % | | | 100.00 | % |
Emerging Markets Small Cap Growth | | | 0.21 | % | | | 100.00 | % |
Large Cap Value | | | 100.00 | % | | | 100.00 | % |
Small Cap Value | | | 100.00 | % | | | 100.00 | % |
Mid Cap Value | | | 89.10 | % | | | 100.00 | % |
Small-Mid Cap Value | | | 38.86 | % | | | 47.73 | % |
Bond | | | 0.00 | % | | | 0.00 | % |
Income | | | 0.00 | % | | | 0.00 | % |
Low Duration | | | 0.00 | % | | | 0.00 | % |
Ready Reserves. . . . . . . . . . . . . . . . . . . . . . . . . . . . . . . . . . . . . . . . . . . . . . . | | | 0.00 | % | | | 0.00 | % |
In January 2013, investors were notified on IRS Form 1099-Div or substitute 1099 DIV as to the Federal tax status of the distributions received by investors in the calendar year 2012.
December 31, 2012 | William Blair Funds 167 |
Useful Information About Your Report (unaudited)
Please refer to this information when reviewing the Expense Example for each Fund.
Expense Example
As a shareholder of a Fund, you incur two types of costs: (1) transaction costs such as redemption fees and (2) ongoing costs, including management fees, distribution (12b-1) fees (for Class N shares except for the Ready Reserves Fund), service fees (for Class N shares of the Ready Reserves Fund), shareholder administration fees (for Class N and Class I shares of the Global Leaders Fund, the International Small Cap Growth Fund, the Emerging Markets Growth Fund, the Emerging Markets Leaders Fund, the Emerging Markets Small Cap Growth Fund, the Bond Fund and the Low Duration Fund) and other Fund expenses. The example is intended to help you understand your ongoing costs (in dollars) of investing in the Fund and to compare these costs with the ongoing costs of investing in other mutual funds. To do so, compare the Fund’s 5% hypothetical example with the 5% hypothetical examples that appear in the shareholder reports of other funds. The example is based on an investment of $1,000 invested at the beginning of the period and held for the entire six-month period from July 1, 2012 to December 30, 2012.
Actual Expenses
In each example, the first line for each share class in the table provides information about the actual account values and actual expenses. These expenses reflect the effect of any expense cap applicable to the share class during the period. Without this expense cap, the costs shown in the table would have been higher. You may use the information in this line, together with the amount you invested, to estimate the expenses that you paid over the period. Simply divide your account value by $1,000 (example, an $8,600 account value divided by $1,000 = 8.6), then multiply the result by the number in the first line under the heading entitled “Expenses Paid During the Period” to estimate the expenses you paid on your account during the period.
Hypothetical Example for Comparison Purposes
In each example, the second line for each share class in the table provides information about hypothetical account values and hypothetical expenses based on the Fund’s actual expense ratio and an assumed rate of return of 5% per year before expenses. This is not the Fund’s actual return. The hypothetical account values and expenses may not be used to estimate the actual ending account balance or expenses you paid for the period. You may use this information to compare the ongoing costs of investing in the Fund to other funds. To do so, compare this 5% hypothetical example with the 5% hypothetical examples that appear in the shareholder reports of other funds.
Please note that the expenses shown in both examples are meant to highlight your ongoing costs only and do not reflect any transactional costs or account type fees, such as redemption fees and IRA Fiduciary Administration fees, respectively. These fees are fully described in the prospectus. Therefore, the second line of each share class in the table is useful in comparing ongoing costs only and will not help you determine the relative costs of owning different funds. In addition, if these transactional costs or account fees were included, your costs would have been higher.
168 Annual Report | December 31, 2012 |
Fund Expenses (unaudited)
The examples below show you the ongoing costs (in dollars) of investing in your fund and allows you to compare these costs with those of other mutual funds. Please refer to the previous page for a detailed explanation of the information presented on this chart.
| | | | | | | | | | | | | | | | |
Expense Example | | Beginning
Account Value
7/1/2012 | | | Ending
Account Value
12/31/2012 | | | Expenses Paid
During
the Period(a) | | | Annualized
Expense Ratio | |
Growth Fund | | | | | | | | | | | | | | | | |
Class N—actual return | | $ | 1,000.00 | | | $ | 1,061.71 | | | $ | 6.17 | | | | 1.19 | % |
Class N—hypothetical 5% return | | | 1,000.00 | | | | 1,019.15 | | | | 6.04 | | | | 1.19 | |
Class I—actual return | | | 1,000.00 | | | | 1,063.30 | | | | 4.66 | | | | 0.90 | |
Class I—hypothetical 5% return | | | 1,000.00 | | | | 1,020.62 | | | | 4.56 | | | | 0.90 | |
Large Cap Growth Fund | | | | | | | | | | | | | | | | |
Class N—actual return | | | 1,000.00 | | | | 1,055.77 | | | | 6.20 | | | | 1.20 | |
Class N—hypothetical 5% return | | | 1,000.00 | | | | 1,019.10 | | | | 6.09 | | | | 1.20 | |
Class I—actual return | | | 1,000.00 | | | | 1,056.96 | | | | 4.91 | | | | 0.95 | |
Class I—hypothetical 5% return | | | 1,000.00 | | | | 1,020.36 | | | | 4.82 | | | | 0.95 | |
Small Cap Growth Fund | | | | | | | | | | | | | | | | |
Class N—actual return | | | 1,000.00 | | | | 1,082.02 | | | | 7.85 | | | | 1.50 | |
Class N—hypothetical 5% return | | | 1,000.00 | | | | 1,017.60 | | | | 7.61 | | | | 1.50 | |
Class I—actual return | | | 1,000.00 | | | | 1,083.23 | | | | 6.55 | | | | 1.25 | |
Class I—hypothetical 5% return | | | 1,000.00 | | | | 1,018.85 | | | | 6.34 | | | | 1.25 | |
Mid Cap Growth Fund | | | | | | | | | | | | | | | | |
Class N—actual return | | | 1,000.00 | | | | 1,036.18 | | | | 6.91 | | | | 1.35 | |
Class N—hypothetical 5% return | | | 1,000.00 | | | | 1,018.35 | | | | 6.85 | | | | 1.35 | |
Class I—actual return | | | 1,000.00 | | | | 1,037.81 | | | | 5.53 | | | | 1.08 | |
Class I—hypothetical 5% return | | | 1,000.00 | | | | 1,019.71 | | | | 5.48 | | | | 1.08 | |
Small-Mid Cap Growth Fund | | | | | | | | | | | | | | | | |
Class N—actual return | | | 1,000.00 | | | | 1,068.54 | | | | 6.95 | | | | 1.34 | |
Class N—hypothetical 5% return | | | 1,000.00 | | | | 1,018.42 | | | | 6.78 | | | | 1.34 | |
Class I—actual return | | | 1,000.00 | | | | 1,069.04 | | | | 5.72 | | | | 1.10 | |
Class I—hypothetical 5% return | | | 1,000.00 | | | | 1,019.61 | | | | 5.58 | | | | 1.10 | |
Global Leaders Fund | | | | | | | | | | | | | | | | |
Class N—actual return | | | 1,000.00 | | | | 1,079.20 | | | | 7.84 | | | | 1.50 | |
Class N—hypothetical 5% return | | | 1,000.00 | | | | 1,017.60 | | | | 7.61 | | | | 1.50 | |
Class I—actual return | | | 1,000.00 | | | | 1,081.49 | | | | 6.54 | | | | 1.25 | |
Class I—hypothetical 5% return | | | 1,000.00 | | | | 1,018.85 | | | | 6.34 | | | | 1.25 | |
International Growth Fund | | | | | | | | | | | | | | | | |
Class N—actual return | | | 1,000.00 | | | | 1,148.74 | | | | 7.62 | | | | 1.41 | |
Class N—hypothetical 5% return | | | 1,000.00 | | | | 1,018.04 | | | | 7.16 | | | | 1.41 | |
Class I—actual return | | | 1,000.00 | | | | 1,149.89 | | | | 6.17 | | | | 1.14 | |
Class I—hypothetical 5% return | | | 1,000.00 | | | | 1,019.40 | | | | 5.79 | | | | 1.14 | |
International Equity Fund | | | | | | | | | | | | | | | | |
Class N—actual return | | | 1,000.00 | | | | 1,124.54 | | | | 7.74 | | | | 1.45 | |
Class N—hypothetical 5% return | | | 1,000.00 | | | | 1,017.85 | | | | 7.35 | | | | 1.45 | |
Class I—actual return | | | 1,000.00 | | | | 1,126.16 | | | | 6.41 | | | | 1.20 | |
Class I—hypothetical 5% return | | | 1,000.00 | | | | 1,019.10 | | | | 6.09 | | | | 1.20 | |
International Leaders Fund | | | | | | | | | | | | | | | | |
Class N—actual return(b) | | | 1,000.00 | | | | 1,106.60 | | | | 7.68 | | | | 1.45 | |
Class N—hypothetical 5% return (6 month period) | | | 1,000.00 | | | | 1,017.85 | | | | 7.35 | | | | 1.45 | |
Class I—actual return(b) | | | 1,000.00 | | | | 1,108.60 | | | | 6.36 | | | | 1.20 | |
Class I—hypothetical 5% return (6 month period) | | | 1,000.00 | | | | 1,019.10 | | | | 6.09 | | | | 1.20 | |
International Small Cap Growth Fund | | | | | | | | | | | | | | | | |
Class N—actual return | | | 1,000.00 | | | | 1,137.22 | | | | 8.48 | | | | 1.58 | |
Class N—hypothetical 5% return | | | 1,000.00 | | | | 1,017.20 | | | | 8.01 | | | | 1.58 | |
Class I—actual return | | | 1,000.00 | | | | 1,139.40 | | | | 7.01 | | | | 1.30 | |
Class I—hypothetical 5% return | | | 1,000.00 | | | | 1,018.59 | | | | 6.61 | | | | 1.30 | |
| (a) | | Expenses are equal to the annualized expense ratio, multiplied by the average account value over the period, multiplied by the number of days in the period 184, and divided by 366 (to reflect the one-half year period). |
| (b) | | For the period August 16, 2012 (Commencement of Operations) to December 31, 2012. |
December 31, 2012 | William Blair Funds 169 |
| | | | | | | | | | | | | | | | |
Expense Example | | Beginning
Account Value
7/1/2012 | | | Ending
Account Value
12/31/2012 | | | Expenses Paid
During
the Period(a) | | | Annualized
Expense Ratio | |
Emerging Markets Growth Fund | | | | | | | | | | | | | | | | |
Class N—actual return | | $ | 1,000.00 | | | $ | 1,127.25 | | | $ | 8.98 | | | | 1.68 | % |
Class N—hypothetical 5% return | | | 1,000.00 | | | | 1,016.70 | | | | 8.51 | | | | 1.68 | |
Class I—actual return | | | 1,000.00 | | | | 1,127.85 | | | | 7.55 | | | | 1.41 | |
Class I—hypothetical 5% return | | | 1,000.00 | | | | 1,018.04 | | | | 7.16 | | | | 1.41 | |
Emerging Markets Leaders Fund | | | | | | | | | | | | | | | | |
Class N—actual return | | | 1,000.00 | | | | 1,125.97 | | | | 8.82 | | | | 1.65 | |
Class N—hypothetical 5% return | | | 1,000.00 | | | | 1,016.84 | | | | 8.36 | | | | 1.65 | |
Class I—actual return | | | 1,000.00 | | | | 1,128.32 | | | | 7.49 | | | | 1.40 | |
Class I—hypothetical 5% return | | | 1,000.00 | | | | 1,018.10 | | | | 7.10 | | | | 1.40 | |
Emerging Markets Small Cap Growth Fund | | | | | | | | | | | | | | | | |
Class N—actual return | | | 1,000.00 | | | | 1,174.55 | | | | 9.02 | | | | 1.65 | |
Class N—hypothetical 5% return | | | 1,000.00 | | | | 1,016.84 | | | | 8.36 | | | | 1.65 | |
Class I—actual return | | | 1,000.00 | | | | 1,175.79 | | | | 7.66 | | | | 1.40 | |
Class I—hypothetical 5% return | | | 1,000.00 | | | | 1,018.10 | | | | 7.10 | | | | 1.40 | |
Large Cap Value Fund | | | | | | | | | | | | | | | | |
Class N—actual return | | | 1,000.00 | | | | 1,071.23 | | | | 6.25 | | | | 1.20 | |
Class N—hypothetical 5% return | | | 1,000.00 | | | | 1,019.10 | | | | 6.09 | | | | 1.20 | |
Class I—actual return | | | 1,000.00 | | | | 1,072.56 | | | | 4.95 | | | | 0.95 | |
Class I—hypothetical 5% return | | | 1,000.00 | | | | 1,020.36 | | | | 4.82 | | | | 0.95 | |
Small Cap Value Fund | | | | | | | | | | | | | | | | |
Class N—actual return | | | 1,000.00 | | | | 1,066.59 | | | | 7.53 | | | | 1.45 | |
Class N—hypothetical 5% return | | | 1,000.00 | | | | 1,017.85 | | | | 7.35 | | | | 1.45 | |
Class I—actual return | | | 1,000.00 | | | | 1,068.16 | | | | 6.24 | | | | 1.20 | |
Class I—hypothetical 5% return | | | 1,000.00 | | | | 1,019.10 | | | | 6.09 | | | | 1.20 | |
Mid Cap Value Fund | | | | | | | | | | | | | | | | |
Class N—actual return | | | 1,000.00 | | | | 1,084.71 | | | | 7.07 | | | | 1.35 | |
Class N—hypothetical 5% return . | | | 1,000.00 | | | | 1,018.35 | | | | 6.85 | | | | 1.35 | |
Class I—actual return | | | 1,000.00 | | | | 1,085.88 | | | | 5.77 | | | | 1.10 | |
Class I—hypothetical 5% return | | | 1,000.00 | | | | 1,019.61 | | | | 5.58 | | | | 1.10 | |
Small-Mid Cap Value Fund | | | | | | | | | | | | | | | | |
Class N—actual return | | | 1,000.00 | | | | 1,070.36 | | | | 7.29 | | | | 1.40 | |
Class N—hypothetical 5% return | | | 1,000.00 | | | | 1,018.10 | | | | 7.10 | | | | 1.40 | |
Class I—actual return | | | 1,000.00 | | | | 1,071.92 | | | | 5.99 | | | | 1.15 | |
Class I—hypothetical 5% return | | | 1,000.00 | | | | 1,019.36 | | | | 5.84 | | | | 1.15 | |
Bond Fund | | | | | | | | | | | | | | | | |
Class N—actual return | | | 1,000.00 | | | | 1,042.40 | | | | 3.34 | | | | 0.65 | |
Class N—hypothetical 5% return | | | 1,000.00 | | | | 1,021.87 | | | | 3.30 | | | | 0.65 | |
Class I—actual return | | | 1,000.00 | | | | 1,043.43 | | | | 2.57 | | | | 0.50 | |
Class I—hypothetical 5% return | | | 1,000.00 | | | | 1,022.62 | | | | 2.54 | | | | 0.50 | |
Income Fund | | | | | | | | | | | | | | | | |
Class N—actual return | | | 1,000.00 | | | | 1,029.70 | | | | 4.29 | | | | 0.84 | |
Class N—hypothetical 5% return | | | 1,000.00 | | | | 1,020.91 | | | | 4.27 | | | | 0.84 | |
Class I—actual return | | | 1,000.00 | | | | 1,031.08 | | | | 2.97 | | | | 0.58 | |
Class I—hypothetical 5% return | | | 1,000.00 | | | | 1,022.22 | | | | 2.95 | | | | 0.58 | |
Low Duration Fund | | | | | | | | | | | | | | | | |
Class N—actual return | | | 1,000.00 | | | | 1,011.91 | | | | 3.54 | | | | 0.70 | |
Class N—hypothetical 5% | | | 1,000.00 | | | | 1,021.62 | | | | 3.56 | | | | 0.70 | |
Class I—actual return | | | 1,000.00 | | | | 1,012.69 | | | | 2.78 | | | | 0.55 | |
Class I—hypothetical 5% | | | 1,000.00 | | | | 1,022.37 | | | | 2.80 | | | | 0.55 | |
Ready Reserves Fund | | | | | | | | | | | | | | | | |
Class N—actual return | | | 1,000.00 | | | | 1,000.23 | | | | 0.50 | | | | 0.10 | |
Class N—hypothetical 5% return | | | 1,000.00 | | | | 1,024.63 | | | | 0.51 | | | | 0.10 | |
| (a) | | Expenses are equal to the annualized expense ratio, multiplied by the average account value over the period, multiplied by the number of days in the period 184, and divided by 366 (to reflect the one-half year period). |
170 Annual Report | December 31, 2012 |
BOARD OF TRUSTEES
Vann A. Avedisian
Principal, Highgate Holdings
Phillip O. Peterson
Retired Partner, KPMG LLP
Donald J. Reaves
Chancellor, Winston-Salem State University
Donald L. Seeley
Retired Adjunct Lecturer and Director, University of Arizona Department of Finance
Michelle R. Seitz, Chairman and President
Partner, William Blair & Company, L.L.C.,
Thomas J. Skelly
Retired Managing Partner, Accenture U.S.
Richard W. Smirl, Senior Vice President
Partner, William Blair & Company L.L.C.
Officers
Michael P. Balkin, Senior Vice President
Karl W. Brewer, Senior Vice President
David C. Fording, Senior Vice President
James S. Golan, Senior Vice President
W. George Greig, Senior Vice President
Michael A. Jancosek, Senior Vice President
John F. Jostrand, Senior Vice President
Chad M. Kilmer, Senior Vice President
Robert C. Lanphier, IV, Senior Vice President
Mark T. Leslie, Senior Vice President
Matthew A. Litfin, Senior Vice President
Kenneth J. McAtamney, Senior Vice President
Todd M. McClone, Senior Vice President
David Merjan, Senior Vice President
David S. Mitchell, Senior Vice President
David P. Ricci, Senior Vice President
Brian D. Singer, Senior Vice President
Paul J. Sularz, Senior Vice President
Jeffrey A. Urbina, Senior Vice President
Christopher T. Vincent, Senior Vice President
Kathleen M. Lynch, Vice President
David F. Hone, Vice President
John Abunassar, Vice President
Peter Carl, Vice President
D. Trowbridge Elliman III, Vice President
Christopher Walvoord, Vice President
Brian Ziv, Vice President
Edwin Denson, Vice President
Thomas Clarke, Vice President
Walter R. Randall, Jr., Chief Compliance Officer and Assistant Secretary
Colette M. Garavalia, Treasurer
Andrew T. Pfau, Secretary
John M. Raczek, Assistant Treasurer
Investment Advisor
William Blair & Company, L.L.C.
Independent Registered Public Accounting Firm
Ernst & Young LLP
Legal Counsel
Vedder Price P.C.
Transfer Agent
Boston Financial Data Services, Inc.
P.O. Box 8506
Boston, MA 02266-8506
For customer assistance, call 1-800-635-2886
(Massachusetts 1-800-635-2840)
December 31, 2012 | William Blair Funds 171 |
William Blair Funds
| | | | |
DOMESTIC EQUITY | | GLOBAL EQUITY | | FIXED-INCOME |
Growth Fund | | Global Leaders Fund | | Bond Fund |
Large Cap Growth Fund | | | | Income Fund |
Small Cap Growth Fund | | INTERNATIONAL EQUITY | | Low Duration Fund |
Mid Cap Growth Fund | | International Growth Fund | | |
Small-Mid Cap Growth Fund | | International Equity Fund | | MONEY MARKET |
| | International Leaders Fund | | |
Large Cap Value Fund | | International Small Cap Growth Fund | | Ready Reserves Fund |
Small Cap Value Fund | | Emerging Markets Growth Fund | | |
Mid Cap Value Fund | | Emerging Markets Leaders Fund | | |
Small-Mid Cap Value Fund | | Emerging Markets Small Cap Growth Fund | | |
| | | | | | |
| | | | ©William Blair & Company, L.L.C., distributor | | |
 | | +1 800 742 7272 williamblairfunds.com | | 222 West Adams Street Chicago, Illinois 60606 | | 00093586 |

William Blair Funds
Institutional
Annual Report
December 31, 2012
Table of Contents
The views expressed in the commentary for each Fund reflect those of the portfolio management team only through the end of the period of the report as stated on the cover. The portfolio management team’s views are subject to change at any time based on market and other conditions and should not be construed as a recommendation. Statements involving predictions, assessments, analyses, or outlook for individual securities, industries, market sectors, and/or markets involve risks and uncertainties, and there is no guarantee they will come to pass.
This report is submitted for the general information of the shareholders of the William Blair Funds. It is not authorized for distribution to prospective investors unless accompanied or preceded by a prospectus of the William Blair Funds. Please consider the Funds’ investment objectives, risks, charges, and expenses before investing. This and other information is contained in the Funds’ prospectus, which you may obtain by calling 1-800-742-7272. Read it carefully before you invest or send money. William Blair & Company, LLC., distributor.
December 31, 2012 | William Blair Funds 1 |
GLOBAL MARKETS OVERVIEW
In a year beset by concerns about macroeconomic policies, debt and global growth, where most investors generally maintained a cautious stance, risk assets produced a stealth rally. The global equity market, as reflected by the MSCI ACWI IMI rose 16.38% during the period, while high yield fixed income and real estate also performed well. Financials was the strongest performing sector during 2012, rising nearly 28%, followed by a 24% Discretionary return, as Utilities and Energy lagged, each returning below 3%. The strong 2012 double digit equity return, however, masks the volatility that occurred during the year, as the market moved from expectations of reinvigorated China-led global growth in the first quarter, to second quarter concerns about a European Union collapse, to third quarter improved European sentiment and stabilizing Chinese economic indicators. The fourth quarter of 2012 ended with a bang despite US Fiscal Cliff concerns as equity markets rallied on the expectations of a stabilizing Chinese economy, continued progress in Europe, and as a reform-minded Shinzo Abe was re-elected as prime minister of Japan. High quality stocks with good earnings trends and growth prospects outpaced their lower quality counterparts during 2012; although this varied during the period. In particular, as the market rallied in the first and fourth quarters on expectations of improving global growth, companies with low valuations and lower quality characteristics rallied the strongest.
The MSCI EM IMI rose 18.68% during the year, outpacing the developed world, due largely to a strong fourth quarter, when the Index rose 5.52%. EMEA and Asia were particularly strong, rising 22.55% and 20.72%, respectively. Within Asia, Southeast Asia countries Thailand and Philippines led the rally, while Indonesia lagged, up just 4.2%. Within EMEA, Turkey rose over 63%, while Egypt was up nearly 50%; conversely, the Czech Republic and Russia trailed. Latin America was the worst performing emerging markets region, up 9.88%, as Brazil was the key laggard, rising only 1.61% on a slowing economy and concerns about the interventionist government. The MSCI World Index was up 16.06% during the year, led by Pacific ex-Japan, which rose by 23.88% on strength in Singapore and New Zealand. Despite market angst about the viability of the European Union during the second quarter, Europe ex-UK rose 21.63% in USD terms, led by Core Europe and the Nordic Region, as well as Greece, which was up 24.60%, due largely to December’s results. Conversely, Spain and Portugal lagged notably during the period, up just 3.17% and 8.17%, respectively, as concerns about the banking system continued to plague the markets. Conversely, Japan and Canada were notable laggards, rising 7.54% and 8.10%, respectively, as the USD appreciated approximately 11% versus the Japanese Yen during the period. Small cap stocks generally outpaced their larger cap counterparts during 2012, particularly in Europe, Emerging Markets and the US, while Developed Asian and Canadian small cap stocks lagged.
2 Annual Report | December 31, 2012 |

W. George Greig

Kenneth J. McAtamney
GLOBAL LEADERS FUND (FORMERLY KNOWN AS GLOBAL GROWTH FUND)
The Global Leaders Fund seeks long-term capital appreciation.
AN OVERVIEW FROM THE PORTFOLIO MANAGER
The Global Leaders Fund (formerly the Global Growth Fund) posted a 0.32% decrease (Institutional Class Shares) since its inception date of December 19, 2012 through December 31, 2012. By comparison, the Fund’s benchmark, the MSCI All Country World IMI Index (net) increased 0.59%.
Year to date Fund outperformance was driven by good stock selection in Consumer Staples, Health Care, Industrials, and Information Technology (IT), which more than offset weakness in Consumer Discretionary, Energy and Financials. Consumer Staples stock selection was bolstered by strong performance by Monster Beverage in the first half of the year, Diageo, a beverage company, on continued emerging markets demand and solid North American results and McCormick & Company, the US food company, on solid operating performance throughout the year. Pharmaceuticals performed particularly well during the year, while Industrials benefited from strong Aerospace performance, coupled with solid operating results by a number of holdings. Despite underperforming in the fourth quarter, Apple was a full year contributor to IT performance, along with ARM Holdings, a semiconductors company, and Samsung Electronics. Offsetting these positive results were Autos and Luxury performance, while Energy was hampered by weakness in Oil/Gas, due largely to BG Group, oil & gas company’s production cuts. Financials stock selection was hurt by limited exposure in Commercial Banks, which accelerated beginning in mid-year, along with limited real estate-related holdings. Regionally the US and Europe performed well, offsetting weakness in Japan and Emerging Asia.
The Fund’s Financials weighting increased from approximately 15% of the fund as of year-end 2011 to 21%, due to an increase in Commercial Banks. Funding this increase was a decrease in Consumer Staples, IT and Energy. Regionally, the US remained underweighted during the period, ending the year at 41.9% of the Fund, with the biggest weighting in Consumer Discretionary. Developed Europe was overweighted versus the Index, while Developed Asia and Emerging Markets largely approximated the Index.
December 31, 2012 | William Blair Funds 3 |
Global Leaders Fund
Performance Highlights (Unaudited)
Average Annual Total Return at 12/31/2012
| | | | |
| | | Since
Inception(a) | |
Institutional Class | | | (0.32 | )% |
MSCI All Country World IMI (net) | | | 0.59 | |
| | (a) | | For the period from December 19, 2012 (Commencement of Operations) |
Performance cited represents past performance. Past performance does not guarantee future results and current performance may be lower or higher than the data quoted. Results shown are average annual total returns, which assume reinvestment of dividends and capital gains. Investment returns and principal will fluctuate and you may have a gain or loss when you sell shares. For the most current month-end performance information, please call 1-800-742-7272, or visit our Web site at www.williamblairfunds.com. Investing in smaller and medium capitalization companies involves special risks, including higher volatility and lower liquidity. Smaller and medium capitalization stocks are also more sensitive to purchase/sale transactions and changes in the issuer’s financial condition. International investing involves special risk considerations, including currency fluctuations, lower liquidity, economic and political risk.
The performance highlights and graph presented above do not reflect the deduction of taxes that a shareholder would pay on fund distributions or the redemption of fund shares.
The Morgan Stanley Capital International (MSCI) All Country World Investable Market Index (IMI) (net) is a free float-adjusted market capitalization weighted index that is designed to measure the equity market of developed and emerging markets. This series approximates the minimum possible dividend reinvestment.
This report identifies the Fund’s investments on December 31, 2012. These holdings are subject to change. Not all stocks in the Fund performed the same, nor is there any guarantee that these stocks will perform as well in the future. Market forecasts provided in this report may not necessarily come to pass.
Sector Diversification (Unaudited)
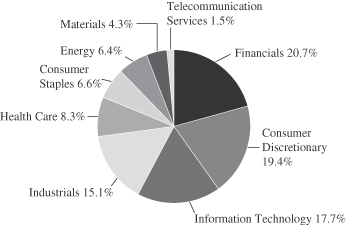
The sector diversification shown is based on the total long-term securities.
4 Annual Report | December 31, 2012 |
Global Leaders Fund
Portfolio of Investments, December 31, 2012 (all dollar amounts in thousands)
| | | | | | | | |
Issuer | | Shares | | | Value | |
|
Common Stocks—Western Hemisphere—45.0% | |
Canada—3.1% | | | | | | | | |
Brookfield Asset Management, Inc. Class “A” (Real estate management & development)† | | | 27,755 | | | $ | 1,017 | |
The Toronto-Dominion Bank (Commercial banks) | | | 12,657 | | | | 1,066 | |
| | | | | | | | |
| | | | | | | 2,083 | |
| | | | | | | | |
United States—41.9% | | | | | | | | |
*Affiliated Managers Group, Inc. (Capital markets) | | | 6,298 | | | | 820 | |
American Express Co. (Consumer finance) | | | 16,739 | | | | 962 | |
AMETEK, Inc. (Electrical equipment) | | | 20,843 | | | | 783 | |
Apple, Inc. (Computers & peripherals) | | | 2,859 | | | | 1,524 | |
*Citrix Systems, Inc. (Software) | | | 12,481 | | | | 821 | |
Colgate-Palmolive Co. (Household products) | | | 7,150 | | | | 747 | |
Costco Wholesale Corporation (Food & staples retailing) | | | 9,914 | | | | 979 | |
*Discovery Communications, Inc. Class “A” (Media) | | | 16,667 | | | | 1,058 | |
*Express Scripts Holding Co. (Health care providers & services) | | | 19,257 | | | | 1,040 | |
Exxon Mobil Corporation (Oil, gas & consumable fuels) | | | 14,071 | | | | 1,218 | |
*Fortune Brands Home & Security, Inc. (Building products) | | | 26,545 | | | | 776 | |
Harley-Davidson, Inc. (Automobiles) | | | 21,962 | | | | 1,072 | |
*IDEXX Laboratories, Inc. (Health care equipment & supplies) | | | 6,102 | | | | 566 | |
Jones Lang LaSalle, Inc. (Real estate management & development) | | | 10,376 | | | | 871 | |
JPMorgan Chase & Co. (Diversified financial services) | | | 33,820 | | | | 1,487 | |
Marriott International, Inc. Class “A” (Hotels, restaurants & leisure) | | | 25,678 | | | | 957 | |
Mastercard, Inc. Class “A” (IT services) | | | 2,477 | | | | 1,217 | |
McCormick & Co., Inc. (Food products) | | | 10,395 | | | | 660 | |
*O’Reilly Automotive, Inc. (Specialty retail) | | | 7,973 | | | | 713 | |
*priceline.com, Inc. (Internet & catalog retail) | | | 1,579 | | | | 981 | |
QUALCOMM, Inc. (Communications equipment) | | | 17,836 | | | | 1,106 | |
Schlumberger, Ltd. (Energy equipment & services)† | | | 20,623 | | | | 1,429 | |
*SolarWinds, Inc. (Software) | | | 9,873 | | | | 518 | |
Starbucks Corporation (Hotels, restaurants & leisure) | | | 19,091 | | | | 1,024 | |
The Walt Disney Co. (Media) | | | 22,640 | | | | 1,127 | |
Union Pacific Corporation (Road & rail) | | | 9,858 | | | | 1,239 | |
W.W. Grainger, Inc. (Trading companies & distributors) | | | 1,872 | | | | 379 | |
Williams-Sonoma, Inc. (Specialty retail) | | | 22,508 | | | | 985 | |
Yum! Brands, Inc. (Hotels, restaurants & leisure) | | | 15,116 | | | | 1,004 | |
| | | | | | | | |
| | | | | | | 28,063 | |
| | | | | | | | |
| | |
Europe, Mid-East—19.2% | | | | | | | | |
Denmark—2.8% | | | | | | | | |
CHR Hansen Holding A/S (Chemicals) | | | 9,194 | | | | 300 | |
Coloplast A/S Class “B” (Health care equipment & supplies) | | | 8,185 | | | | 401 | |
Novo Nordisk A/S Class “B” (Pharmaceuticals) | | | 7,285 | | | | 1,186 | |
| | | | | | | | |
| | | | | | | 1,887 | |
| | | | | | | | |
|
Common Stocks—Europe, Mid-East—19.2%—(continued) | |
France—4.0% | | | | | | | | |
BNP Paribas S.A. (Commercial banks) | | | 24,001 | | | $ | 1,366 | |
Essilor International S.A. (Health care equipment & supplies) | | | 3,726 | | | | 376 | |
Technip S.A. (Energy equipment & services) | | | 8,078 | | | | 934 | |
| | | | | | | | |
| | | | | | | 2,676 | |
| | | | | | | | |
Germany—5.4% | | | | | | | | |
Bayerische Motoren Werke AG (Automobiles) | | | 10,923 | | | | 1,063 | |
Brenntag AG (Trading companies & distributors) | | | 4,078 | | | | 537 | |
Fresenius SE & Co. KGaA (Health care providers & services) | | | 6,241 | | | | 718 | |
MTU Aero Engines Holding AG (Aerospace & defense) | | | 3,653 | | | | 334 | |
SAP AG (Software) | | | 11,804 | | | | 949 | |
| | | | | | | | |
| | | | | | | 3,601 | |
| | | | | | | | |
Ireland—0.7% | | | | | | | | |
Paddy Power plc (Hotels, restaurants & leisure) | | | 5,311 | | | | 439 | |
| | | | | | | | |
Israel—1.1% | | | | | | | | |
*Check Point Software Technologies, Ltd. (Software)† | | | 15,704 | | | | 748 | |
| | | | | | | | |
Sweden—1.4% | | | | | | | | |
Atlas Copco AB Class “A” (Machinery) | | | 34,197 | | | | 948 | |
| | | | | | | | |
Switzerland—3.8% | | | | | | | | |
Nestle S.A. (Food products) | | | 10,123 | | | | 660 | |
Partners Group Holding AG (Capital markets) | | | 3,434 | | | | 794 | |
Syngenta AG (Chemicals) | | | 2,737 | | | | 1,106 | |
| | | | | | | | |
| | | | | | | 2,560 | |
| | | | | | | | |
| | |
United Kingdom—13.8% | | | | | | | | |
Abcam plc (Biotechnology) | | | 42,503 | | | | 268 | |
AMEC plc (Energy equipment & services) | | | 29,001 | | | | 479 | |
ARM Holdings plc (Semiconductors & semiconductor equipment) | | | 69,599 | | | | 879 | |
Ashmore Group plc (Capital markets) | | | 85,961 | | | | 508 | |
Babcock International Group plc (Commercial services & supplies) | | | 26,705 | | | | 422 | |
BHP Billiton plc (Metals & mining) | | | 38,069 | | | | 1,343 | |
Compass Group plc (Hotels, restaurants & leisure) | | | 84,563 | | | | 1,004 | |
Diageo plc (Beverages) | | | 39,426 | | | | 1,148 | |
Experian plc (Professional services) | | | 63,378 | | | | 1,021 | |
Hargreaves Lansdown plc (Capital markets) | | | 36,243 | | | | 405 | |
Lancashire Holdings, Ltd. (Insurance) | | | 14,531 | | | | 185 | |
*Rolls-Royce Holdings plc (Aerospace & defense) | | | 68,186 | | | | 978 | |
The Weir Group plc (Machinery) | | | 18,668 | | | | 577 | |
| | | | | | | | |
| | | | | | | 9,217 | |
| | | | | | | | |
| | |
Emerging Asia—7.0% | | | | | | | | |
China—2.6% | | | | | | | | |
*Baidu, Inc.—ADR (Internet software & services) | | | 6,586 | | | | 661 | |
China Mobile, Ltd. (Wireless telecommunication services) | | | 80,000 | | | | 941 | |
See accompanying Notes to Financial Statements.
December 31, 2012 | William Blair Funds 5 |
Global Leaders Fund
Portfolio of Investments, December 31, 2012 (all dollar amounts in thousands)
| | | | | | | | |
Issuer | | Shares or
Principal
Amount | | | Value | |
|
Common Stocks—Emerging Asia—7.0%—(continued) | |
China—(continued) | | | | | | | | |
*WuXi PharmaTech Cayman, Inc.—ADR (Life sciences tools & services) | | | 9,897 | | | $ | 156 | |
| | | | | | | | |
| | | | | | | 1,758 | |
| | | | | | | | |
Indonesia—1.2% | | | | | | | | |
PT Bank Rakyat Indonesia (Commercial banks) | | | 1,071,500 | | | | 777 | |
| | | | | | | | |
South Korea—3.2% | | | | | | | | |
*Hyundai Motor Co. (Automobiles) | | | 4,125 | | | | 850 | |
Samsung Electronics Co., Ltd. (Semiconductors & semiconductor equipment) | | | 903 | | | | 1,298 | |
| | | | | | | | |
| | | | | | | 2,148 | |
| | | | | | | | |
| | |
Japan—3.2% | | | | | | | | |
Fanuc Corporation (Machinery) | | | 5,800 | | | | 1,079 | |
Sumitomo Mitsui Financial Group, Inc. (Commercial banks) | | | 28,600 | | | | 1,040 | |
| | | | | | | | |
| | | | | | | 2,119 | |
| | | | | | | | |
|
Emerging Europe, Mid-East, Africa—2.8% | |
South Africa—1.5% | | | | | | | | |
*Aspen Pharmacare Holdings, Ltd. (Pharmaceuticals) | | | 27,661 | | | | 554 | |
Bidvest Group, Ltd. (Industrial conglomerates) | | | 17,601 | | | | 450 | |
| | | | | | | | |
| | | | | | | 1,004 | |
| | | | | | | | |
Turkey—1.3% | | | | | | | | |
Turkiye Halk Bankasi A.S. (Commercial banks) | | | 88,141 | | | | 869 | |
| | | | | | | | |
| | |
Asia—1.8% | | | | | | | | |
Hong Kong—1.8% | | | | | | | | |
AIA Group, Ltd. (Insurance) | | | 311,400 | | | | 1,235 | |
| | | | | | | | |
| | |
Emerging Latin America—1.6% | | | | | | | | |
Argentina—0.6% | | | | | | | | |
MercadoLibre, Inc. (Internet software & services) | | | 5,651 | | | | 444 | |
| | | | | | | | |
Brazil—1.0% | | | | | | | | |
BR Malls Participacoes S.A. (Real estate management & development) | | | 49,300 | | | | 651 | |
| | | | | | | | |
Total Common Stocks—94.4%
(cost $54,930) | | | | 63,227 | |
| | | | | | | | |
| | |
Repurchase Agreement | | | | | | | | |
Fixed Income Clearing Corporation, 0.110% dated 12/31/12, due 1/2/13, repurchase price $338, collateralized by U.S. Treasury Note, 2.125%, due 12/31/15 | | $ | 338 | | | | 338 | |
| | | | | | | | |
Total Repurchase Agreement—0.5%
(cost $338) | | | | 338 | |
| | | | | | | | |
Total Investments—94.9%
(cost $55,268) | | $ | 63,565 | |
Cash and other assets, less liabilities—5.1% | | | 3,429 | |
| | | | | | |
Net assets—100.0% | | $ | 66,994 | |
| | | | | | |
ADR = American Depository Receipt
† = U.S. listed foreign security
*Non-income producing securities
For securities primarily traded on exchanges or markets that close before the close of regular trading on the New York Stock Exchange, the Fund may use an independent pricing service to fair value price the securities pursuant to Valuation Procedures approved by the Board of Trustees.
At December 31, 2012, the Fund’s Portfolio of Investments includes the following sector categories (as a percentage of long-term investments):
| | | | |
Financials | | | 20.7% | |
Consumer Discretionary | | | 19.4% | |
Information Technology | | | 17.7% | |
Industrials | | | 15.1% | |
Health Care | | | 8.3% | |
Consumer Staples | | | 6.6% | |
Energy | | | 6.4% | |
Materials | | | 4.3% | |
Telecommunication Services | | | 1.5% | |
| | | | |
Total | | | 100.0% | |
| | | | |
At December 31, 2012, the Fund’s Portfolio of Investments includes the following currency categories (as a percentage of long-term investments):
| | | | |
U.S. Dollar | | | 48.9% | |
British Pound Sterling | | | 14.6% | |
Euro | | | 10.6% | |
Swiss Franc | | | 4.0% | |
Hong Kong Dollar | | | 3.7% | |
South Korean Won | | | 3.4% | |
Japanese Yen | | | 3.4% | |
Danish Krone | | | 3.0% | |
Canadian Dollar | | | 1.7% | |
South African Rand | | | 1.6% | |
Swedish Krona | | | 1.5% | |
Turkish Lira | | | 1.4% | |
Indonesian Rupiah | | | 1.2% | |
Brazilian Real | | | 1.0% | |
| | | | |
Total | | | 100.0% | |
| | | | |
See accompanying Notes to Financial Statements.
6 Annual Report | December 31, 2012 |
W. George Greig
INSTITUTIONAL INTERNATIONAL GROWTH FUND
The Institutional International Growth Fund seeks long-term capital appreciation.
AN OVERVIEW FROM THE PORTFOLIO MANAGER
The Institutional International Growth Fund posted a 24.11% increase for the twelve months ended December 31, 2012. By comparison, the Fund’s benchmark, the MSCI All Country World ex-U.S. IMI Index (net) increased 17.04%.
The Fund slightly outpaced the Index during the fourth quarter, but added significant alpha during 2012. Fourth quarter performance was bolstered by positive stock selection across a number of sectors, more than offsetting Consumer and Energy underperformance. In particular, Financials stock selection was strong, particularly within Commercial Banks, while REITs also added value. The Fund’s Health Care stocks outperformed the Index by over 3% during the period, given strong results in Pharmaceuticals, while Samsung Electronics, the South Korean Semiconductors & semiconductor equipment company and ARM Holdings, the UK Semiconductors & semiconductor equipment company reported good results during the period, bolstering Information Technology (IT ) performance. Discretionary results were hampered by underperformance by Hyundai Motor, the South Korean Automobiles company, along with Nitori Holdings, the Japanese Specialty retail company, on weak sales results and a price cutting initiative, while both Services and Oil/Gas underperformed within Energy during the period. Stock selection was strong across regions during the fourth quarter, with the notable exception of Japan, while currency hedging added approximately 20 basis points to performance, as we hedged Japanese Yen exposure and the USD rallied.
As of year end, the Fund remained focused on Europe at the expense of Developed Asia and Canada. Japan represented 13.6% of the Fund, an increase since December 2011. Emerging Markets totaled 20.4% of the Fund as of December 31, and shifted towards Emerging Asia at the expense of Latin America. From a sector perspective, Financials was the largest weighting at nearly 26% of the Fund, just above the 25.2% Index weighting, increasing throughout the year. The Fund remained overweighted in Discretionary, Healthcare and Industrials at the expense of Energy and Materials.
December 31, 2012 | William Blair Funds 7 |
Institutional International Growth Fund
Performance Highlights (unaudited)
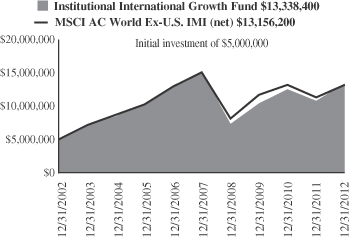
Average Annual Total Return at 12/31/2012
| | | | | | | | | | | | | | | | |
| | | 1
Year | | | 3
Year | | | 5
Year | | | 10
Year | |
Institutional International Growth Fund | | | 24.11 | % | | | 8.77 | % | | | (2.47 | )% | | | 10.31 | % |
MSCI All Country World Ex-US IMI (net) | | | 17.04 | | | | 4.18 | | | | (2.59 | ) | | | 10.16 | |
Performance cited represents past performance. Past performance does not guarantee future results and current performance may be lower or higher than the data quoted. Results shown are average annual returns, which assume reinvestment of dividends and capital gains. Investment returns and principal will fluctuate and you may have a gain or loss when you sell shares. For the most current month-end performance information, please call 1-800-742-7272, or visit our Web site at www.williamblairfunds.com. International investing involves special risk considerations, including currency fluctuations, lower liquidity, economic and political risk.
The performance highlights and graph presented above do not reflect the deduction of taxes that a shareholder would pay on fund distributions or the redemption of fund shares.
The Morgan Stanley Capital International (MSCI) All Country World Ex-U.S. Investable Market Index (IMI) (net) is a free float-adjusted market capitalization weighted index that is designed to measure the equity market performance of developed and emerging markets, excluding the United States. This series approximates the minimum possible dividend reinvestment.
This report identifies the Fund’s investments on December 31, 2012. These holdings are subject to change. Not all stocks in the Fund performed the same, nor is there any guarantee that these stocks will perform as well in the future. Market forecasts provided in this report may not necessarily come to pass.
Sector Diversification (unaudited)
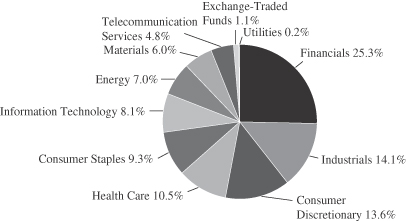
The sector diversification shown is based on the total long-term securities.
8 Annual Report | December 31, 2012 |
Institutional International Growth Fund
Portfolio of Investments, December 31, 2012 (all dollar amounts in thousands)
| | | | | | | | |
Issuer | | Shares | | | Value | |
| | |
Common Stocks—Europe—33.0% | | | | | | | | |
Austria—0.8% | | | | | | | | |
Andritz AG (Machinery) | | | 194,576 | | | $ | 12,503 | |
Schoeller-Bleckmann Oilfield Equipment AG (Energy equipment & services) | | | 35,819 | | | | 3,754 | |
| | | | | | | | |
| | | | | | | 16,257 | |
| | | | | | | | |
Belgium—0.3% | | | | | | | | |
Colruyt S.A. (Food & staples retailing) | | | 117,882 | | | | 5,845 | |
| | | | | | | | |
Denmark—1.2% | | | | | | | | |
Coloplast A/S Class “B” (Health care equipment & supplies) | | | 310,515 | | | | 15,228 | |
GN Store Nord A/S (Health care equipment & supplies) | | | 369,812 | | | | 5,374 | |
SimCorp A/S (Software) | | | 14,716 | | | | 3,283 | |
| | | | | | | | |
| | | | | | | 23,885 | |
| | | | | | | | |
Finland—1.1% | | | | | | | | |
Kone Oyj (Machinery) | | | 185,526 | | | | 13,721 | |
Nokian Renkaat Oyj (Auto components) | | | 171,094 | | | | 6,854 | |
| | | | | | | | |
| | | | | | | 20,575 | |
| | | | | | | | |
France—9.9% | | | | | | | | |
Arkema S.A. (Chemicals) | | | 202,193 | | | | 21,230 | |
BNP Paribas S.A. (Commercial banks) | | | 944,659 | | | | 53,779 | |
Christian Dior S.A. (Textiles, apparel & luxury goods) | | | 94,916 | | | | 16,179 | |
Hermes International (Textiles, apparel & luxury goods) | | | 22,941 | | | | 6,859 | |
Sanofi (Pharmaceuticals) | | | 417,747 | | | | 39,615 | |
Societe BIC S.A. (Commercial services & supplies) | | | 59,323 | | | | 7,111 | |
Unibail-Rodamco SE (Real estate investment trusts (REITs)) | | | 106,346 | | | | 25,789 | |
Vivendi S.A. (Diversified telecommunication services) | | | 820,530 | | | | 18,557 | |
Zodiac Aerospace (Aerospace & defense) | | | 54,135 | | | | 5,993 | |
| | | | | | | | |
| | | | | | | 195,112 | |
| | | | | | | | |
Germany—3.9% | | | | | | | | |
Aixtron AG (Semiconductors & semiconductor equipment) | | | 50,114 | | | | 598 | |
Bayer AG (Pharmaceuticals) | | | 266,450 | | | | 25,409 | |
Bertrandt AG (Professional services) | | | 16,168 | | | | 1,623 | |
Brenntag AG (Trading companies & distributors) | | | 56,064 | | | | 7,386 | |
Deutsche Bank AG (Capital markets) | | | 170,238 | | | | 7,490 | |
Deutsche Wohnen AG (Real estate management & development) | | | 329,116 | | | | 6,110 | |
Fresenius SE & Co. KGaA (Health care providers & services) | | | 117,109 | | | | 13,475 | |
Gerry Weber International AG (Textiles, apparel & luxury goods) | | | 106,286 | | | | 5,148 | |
MTU Aero Engines Holding AG (Aerospace & defense) | | | 107,678 | | | | 9,827 | |
| | | | | | | | |
| | | | | | | 77,066 | |
| | | | | | | | |
Ireland—0.2% | | | | | | | | |
Paddy Power plc (Hotels, restaurants & leisure) | | | 55,910 | | | | 4,616 | |
| | | | | | | | |
|
Common Stocks—Europe—33.0%—(continued) | |
Italy—0.9% | | | | | | | | |
Azimut Holding SpA (Capital markets) | | | 238,414 | | | $ | 3,431 | |
Intesa Sanpaolo SpA (Commercial banks) | | | 3,967,997 | | | | 6,862 | |
Pirelli & C. SpA (Auto components) | | | 260,418 | | | | 3,000 | |
Tod’s SpA (Textiles, apparel & luxury goods) | | | 40,134 | | | | 5,096 | |
| | | | | | | | |
| | | | | | | 18,389 | |
| | | | | | | | |
Netherlands—3.7% | | | | | | | | |
ASML Holding N.V. (Semiconductors & semiconductor equipment) | | | 102,288 | | | | 6,560 | |
Royal Dutch Shell plc Class “B” (Oil, gas & consumable fuels) | | | 969,528 | | | | 34,589 | |
Unilever N.V. (Food products) | | | 832,186 | | | | 31,843 | |
| | | | | | | | |
| | | | | | | 72,992 | |
| | | | | | | | |
Norway—3.0% | | | | | | | | |
Fred Olsen Energy ASA (Energy equipment & services) | | | 80,938 | | | | 3,554 | |
Schibsted ASA (Media) | | | 129,332 | | | | 5,531 | |
Statoil ASA (Oil, gas & consumable fuels) | | | 1,208,676 | | | | 30,464 | |
Telenor ASA (Diversified telecommunication services) | | | 974,291 | | | | 19,838 | |
| | | | | | | | |
| | | | | | | 59,387 | |
| | | | | | | | |
Spain—1.4% | | | | | | | | |
Inditex S.A. (Specialty retail) | | | 160,875 | | | | 22,604 | |
Viscofan S.A. (Food products) | | | 76,567 | | | | 4,337 | |
| | | | | | | | |
| | | | | | | 26,941 | |
| | | | | | | | |
Sweden—2.0% | | | | | | | | |
Atlas Copco AB Class “A” (Machinery) | | | 769,266 | | | | 21,332 | |
Getinge AB (Health care equipment & supplies) | | | 379,333 | | | | 12,894 | |
Hexpol AB (Chemicals) | | | 89,005 | | | | 4,723 | |
| | | | | | | | |
| | | | | | | 38,949 | |
| | | | | | | | |
Switzerland—4.6% | | | | | | | | |
Burckhardt Compression Holding AG (Machinery) | | | 5,223 | | | | 1,717 | |
*Credit Suisse Group AG (Capital markets) | | | 406,213 | | | | 9,914 | |
*Geberit AG (Building products) | | | 57,955 | | | | 12,847 | |
Glencore International plc (Metals & mining) | | | 4,985,620 | | | | 28,801 | |
Partners Group Holding AG (Capital markets) | | | 46,350 | | | | 10,715 | |
SGS S.A. (Professional services) | | | 5,214 | | | | 11,581 | |
Syngenta AG (Chemicals) | | | 37,826 | | | | 15,281 | |
| | | | | | | | |
| | | | | | | 90,856 | |
| | | | | | | | |
| | |
United Kingdom—18.2% | | | | | | | | |
Abcam plc (Biotechnology) | | | 555,441 | | | | 3,498 | |
Aberdeen Asset Management plc (Capital markets) | | | 882,711 | | | | 5,312 | |
AMEC plc (Energy equipment & services) | | | 541,215 | | | | 8,947 | |
Amlin plc (Insurance) | | | 1,018,489 | | | | 6,332 | |
ARM Holdings plc (Semiconductors & semiconductor equipment) | | | 793,041 | | | | 10,015 | |
Ashmore Group plc (Capital markets) | | | 1,447,183 | | | | 8,545 | |
Babcock International Group plc (Commercial services & supplies) | | | 1,013,408 | | | | 15,997 | |
See accompanying Notes to Financial Statements.
December 31, 2012 | William Blair Funds 9 |
Institutional International Growth Fund
Portfolio of Investments, December 31, 2012 (all dollar amounts in thousands)
| | | | | | | | |
Issuer | | Shares | | | Value | |
|
Common Stocks—United Kingdom—18.2%—(continued) | |
Bunzl plc (Trading companies & distributors) | | | 381,112 | | | $ | 6,308 | |
Croda International plc (Chemicals) | | | 93,425 | | | | 3,652 | |
Debenhams plc (Multiline retail) | | | 334,010 | | | | 624 | |
Derwent London plc (Real estate investment trusts (REITs)) | | | 185,767 | | | | 6,429 | |
Diageo plc (Beverages) | | | 1,200,964 | | | | 34,980 | |
Dunelm Group plc (Specialty retail) | | | 553,921 | | | | 6,352 | |
Elementis plc (Chemicals) | | | 1,194,458 | | | | 4,561 | |
Experian plc (Professional services) | | | 595,519 | | | | 9,598 | |
Halma plc (Electronic equipment, instruments & components) | | | 732,846 | | | | 5,515 | |
Hargreaves Lansdown plc (Capital markets) | | | 119,752 | | | | 1,339 | |
Hiscox, Ltd. (Insurance) | | | 501,767 | | | | 3,735 | |
IG Group Holdings plc (Diversified financial services) | | | 686,902 | | | | 5,055 | |
InterContinental Hotels Group plc (Hotels, restaurants & leisure) | | | 590,818 | | | | 16,567 | |
ITV plc (Media) | | | 10,168,053 | | | | 17,639 | |
John Wood Group plc (Energy equipment & services) | | | 868,086 | | | | 10,378 | |
Johnson Matthey plc (Chemicals) | | | 294,755 | | | | 11,579 | |
Jupiter Fund Management plc (Capital markets) | | | 822,574 | | | | 3,765 | |
Lancashire Holdings, Ltd. (Insurance) | | | 580,483 | | | | 7,391 | |
Meggitt plc (Aerospace & defense) | | | 1,023,504 | | | | 6,409 | |
Moneysupermarket.com Group plc (Internet software & services) | | | 1,658,536 | | | | 4,252 | |
*Ocado Group plc (Internet & catalog retail) | | | 1,026,644 | | | | 1,467 | |
Oxford Instruments plc (Electronic equipment, instruments & components) | | | 91,517 | | | | 2,139 | |
Prudential plc (Insurance) | | | 1,672,556 | | | | 23,863 | |
Reckitt Benckiser Group plc (Household products) | | | 357,445 | | | | 22,690 | |
Rightmove plc (Media) | | | 147,708 | | | | 3,473 | |
*Rolls-Royce Holdings plc (Aerospace & defense) | | | 1,336,392 | | | | 19,168 | |
Rotork plc (Machinery) | | | 152,968 | | | | 6,385 | |
RPS Group plc (Commercial services & supplies) | | | 552,726 | | | | 1,911 | |
Spirax-Sarco Engineering plc (Machinery) | | | 107,962 | | | | 4,042 | |
St James’s Place plc (Insurance) | | | 487,514 | | | | 3,370 | |
*The Berkeley Group Holdings plc (Household durables) | | | 470,683 | | | | 13,541 | |
Tullow Oil plc (Oil, gas & consumable fuels) | | | 969,148 | | | | 20,204 | |
Victrex plc (Chemicals) | | | 201,886 | | | | 5,381 | |
Wolseley plc (Trading companies & distributors) | | | 124,506 | | | | 5,954 | |
| | | | | | | | |
| | | | | | | 358,362 | |
| | | | | | | | |
| | |
Japan—13.6% | | | | | | | | |
ABC-Mart, Inc. (Specialty retail) | | | 82,200 | | | | 3,579 | |
Ain Pharmaciez, Inc. (Food & staples retailing) | | | 33,800 | | | | 1,849 | |
Arnest One Corporation (Household durables) | | | 192,500 | | | | 3,153 | |
Astellas Pharma, Inc. (Pharmaceuticals) | | | 288,300 | | | | 12,962 | |
|
Common Stocks—Japan—13.6%—(continued) | |
Chiyoda Corporation (Construction & engineering) | | | 538,000 | | | $ | 7,707 | |
Cosmos Pharmaceutical Corporation (Food & staples retailing) | | | 19,200 | | | | 1,908 | |
Daito Trust Construction Co., Ltd. (Real estate management & development) | | | 89,300 | | | | 8,440 | |
FamilyMart Co., Ltd. (Food & staples retailing) | | | 186,600 | | | | 7,688 | |
Fast Retailing Co., Ltd. (Specialty retail) | | | 49,900 | | | | 12,735 | |
Fuji Heavy Industries, Ltd. (Automobiles) | | | 1,031,000 | | | | 13,001 | |
Japan Tobacco, Inc. (Tobacco) | | | 650,700 | | | | 18,382 | |
Keyence Corporation (Electronic equipment, instruments & components) | | | 44,500 | | | | 12,341 | |
Lawson, Inc. (Food & staples retailing) | | | 156,500 | | | | 10,616 | |
M3, Inc. (Health care technology) | | | 2,007 | | | | 3,203 | |
Miraca Holdings, Inc. (Health care providers & services) | | | 75,400 | | | | 3,040 | |
MISUMI Group, Inc. (Trading companies & distributors) | | | 114,300 | | | | 3,124 | |
MonotaRO Co., Ltd. (Trading companies & distributors) | | | 56,300 | | | | 1,814 | |
Nitori Co., Ltd. (Specialty retail) | | | 62,430 | | | | 4,574 | |
ORIX Corporation (Diversified financial services) | | | 307,270 | | | | 34,709 | |
Ryohin Keikaku Co., Ltd. (Multiline retail) | | | 46,200 | | | | 2,584 | |
Shimamura Co., Ltd. (Specialty retail) | | | 53,900 | | | | 5,238 | |
Ship Healthcare Holdings, Inc. (Health care providers & services) | | | 108,600 | | | | 2,886 | |
Sumitomo Mitsui Financial Group, Inc. (Commercial banks) | | | 1,185,700 | | | | 43,090 | |
Sumitomo Realty & Development Co., Ltd. (Real estate management & development) | | | 692,000 | | | | 23,053 | |
Sundrug Co., Ltd. (Food & staples retailing) | | | 106,900 | | | | 3,656 | |
Suruga Bank, Ltd. (Commercial banks) | | | 476,000 | | | | 5,854 | |
Tsuruha Holdings, Inc. (Food & staples retailing) | | | 38,300 | | | | 3,021 | |
United Arrows, Ltd. (Specialty retail) | | | 81,100 | | | | 1,868 | |
Yahoo! Japan Corporation (Internet software & services) | | | 40,299 | | | | 13,049 | |
| | | | | | | | |
| | | | | | | 269,124 | |
| | | | | | | | |
| | |
Emerging Asia—11.2% | | | | | | | | |
China—2.6% | | | | | | | | |
*Brilliance China Automotive Holdings, Ltd. (Automobiles) | | | 6,108,000 | | | | 7,676 | |
China Overseas Land & Investment, Ltd. (Real estate management & development) | | | 6,532,000 | | | | 19,860 | |
Great Wall Motor Co., Ltd. Class “H” (Automobiles) | | | 2,804,000 | | | | 9,018 | |
*Hollysys Automation Technologies, Ltd. (Electronic equipment, instruments & components)† | | | 214,215 | | | | 2,543 | |
Lenovo Group, Ltd. (Computers & peripherals) | | | 9,164,000 | | | | 8,450 | |
Spreadtrum Communications, Inc.—ADR (Semiconductors & semiconductor equipment) | | | 134,617 | | | | 2,369 | |
See accompanying Notes to Financial Statements.
10 Annual Report | December 31, 2012 |
Institutional International Growth Fund
Portfolio of Investments, December 31, 2012 (all dollar amounts in thousands)
| | | | | | | | |
Issuer | | Shares | | | Value | |
|
Common Stocks—Emerging Asia—11.2%—(continued) | |
China—(continued) | | | | | | | | |
*WuXi PharmaTech Cayman, Inc.—ADR (Life sciences tools & services) | | | 124,883 | | | $ | 1,967 | |
| | | | | | | | |
| | | | | | | 51,883 | |
| | | | | | | | |
India—2.1% | | | | | | | | |
CRISIL, Ltd. (Diversified financial services) | | | 93,643 | | | | 1,857 | |
Gruh Finance, Ltd. (Thrifts & mortgage finance) | | | 308,895 | | | | 1,342 | |
IndusInd Bank, Ltd. (Commercial banks) | | | 327,111 | | | | 2,525 | |
Ipca Laboratories, Ltd. (Pharmaceuticals) | | | 323,767 | | | | 3,066 | |
Lupin, Ltd. (Pharmaceuticals) | | | 399,258 | | | | 4,509 | |
Oberoi Realty, Ltd. (Real estate management & development) | | | 457,649 | | | | 2,429 | |
Sun Pharmaceutical Industries, Ltd. (Pharmaceuticals) | | | 562,110 | | | | 7,603 | |
Tata Motors, Ltd. (Automobiles) | | | 2,436,173 | | | | 14,003 | |
Yes Bank, Ltd. (Commercial banks) | | | 487,715 | | | | 4,154 | |
| | | | | | | | |
| | | | | | | 41,488 | |
| | | | | | | | |
Indonesia—1.0% | | | | | | | | |
PT Alam Sutera Realty Tbk (Real estate management & development) | | | 48,039,500 | | | | 3,006 | |
PT Bank Rakyat Indonesia (Commercial banks) | | | 9,358,000 | | | | 6,787 | |
PT Kalbe Farma Tbk (Pharmaceuticals) | | | 55,774,500 | | | | 6,147 | |
PT Media Nusantara Citra Tbk (Media) | | | 11,878,500 | | | | 3,086 | |
| | | | | | | | |
| | | | | | | 19,026 | |
| | | | | | | | |
Philippines—0.4% | | | | | | | | |
International Container Terminal Services, Inc. (Transportation infrastructure) | | | 1,101,280 | | | | 1,989 | |
Puregold Price Club, Inc. (Food & staples retailing) | | | 2,466,100 | | | | 1,984 | |
SM Prime Holdings, Inc. (Real estate management & development) | | | 10,867,375 | | | | 4,381 | |
| | | | | | | | |
| | | | | | | 8,354 | |
| | | | | | | | |
South Korea—3.5% | | | | | | | | |
*Hyundai Motor Co. (Automobiles) | | | 98,605 | | | | 20,327 | |
Samsung Electronics Co., Ltd. (Semiconductors & semiconductor equipment) | | | 29,729 | | | | 42,715 | |
Samsung Fire & Marine Insurance Co., Ltd. (Insurance) | | | 27,818 | | | | 5,651 | |
| | | | | | | | |
| | | | | | | 68,693 | |
| | | | | | | | |
Taiwan—0.4% | | | | | | | | |
Asustek Computer, Inc. (Computers & peripherals) | | | 584,000 | | | | 6,613 | |
| | | | | | | | |
Thailand—1.2% | | | | | | | | |
Advanced Info Service PCL (Wireless telecommunication services) | | | 1,380,500 | | | | 9,495 | |
BEC World PCL (Media) | | | 1,669,200 | | | | 3,891 | |
Kasikornbank PCL (Commercial banks) | | | 1,688,200 | | | | 10,731 | |
| | | | | | | | |
| | | | | | | 24,117 | |
| | | | | | | | |
| | |
Common Stocks—Asia—6.7% | | | | | | | | |
Australia—2.5% | | | | | | | | |
Cochlear, Ltd. (Health care equipment & supplies) | | | 77,780 | | | $ | 6,448 | |
CSL, Ltd. (Biotechnology) | | | 268,263 | | | | 15,145 | |
Telstra Corporation, Ltd. (Diversified telecommunication services) | | | 6,237,029 | | | | 28,421 | |
| | | | | | | | |
| | | | | | | 50,014 | |
| | | | | | | | |
Hong Kong—2.2% | | | | | | | | |
AIA Group, Ltd. (Insurance) | | | 6,340,400 | | | | 25,148 | |
China High Precision Automation Group, Ltd. (Electronic equipment, instruments & components)**§ | | | 3,373,000 | | | | 540 | |
Hutchison Telecommunications Hong Kong Holdings, Ltd. (Diversified telecommunication services) | | | 10,414,000 | | | | 4,818 | |
Sa Sa International Holdings, Ltd. (Specialty retail) | | | 5,494,000 | | | | 4,562 | |
SmarTone Telecommunications Holdings, Ltd. (Wireless telecommunication services) | | | 2,556,000 | | | | 4,686 | |
Value Partners Group, Ltd. (Capital markets) | | | 3,920,000 | | | | 2,641 | |
| | | | | | | | |
| | | | | | | 42,395 | |
| | | | | | | | |
Singapore—2.0% | | | | | | | | |
First Resources, Ltd. (Food products) | | | 2,110,000 | | | | 3,518 | |
Global Logistic Properties, Ltd. (Real estate management & development) | | | 7,074,000 | | | | 16,360 | |
Keppel Corporation, Ltd. (Industrial conglomerates) | | | 2,226,300 | | | | 20,330 | |
| | | | | | | | |
| | | | | | | 40,208 | |
| | | | | | | | |
| | |
Emerging Latin America—5.6% | | | | | | | | |
Brazil—2.1% | | | | | | | | |
BR Malls Participacoes S.A. (Real estate management & development) | | | 510,900 | | | | 6,742 | |
Cia de Concessoes Rodoviarias (Transportation infrastructure) | | | 975,900 | | | | 9,270 | |
Cia Hering (Specialty retail) | | | 322,100 | | | | 6,606 | |
Cielo S.A. (IT services) | | | 239,800 | | | | 6,675 | |
*Lupatech S.A. (Energy equipment & services) | | | 247,483 | | | | 199 | |
Mills Estruturas e Servicos de Engenharia S.A. (Trading companies & distributors) | | | 194,500 | | | | 3,230 | |
*Qualicorp S.A. (Health care providers & services) | | | 203,900 | | | | 2,112 | |
T4F Entretenimento S.A. (Media) | | | 104,900 | | | | 402 | |
Tractebel Energia S.A. (Independent power producers & energy traders) | | | 270,500 | | | | 4,406 | |
Valid Solucoes e Servicos de Seguranca em Meios de Pagamento e Identificacao S.A. (Commercial services & supplies) | | | 117,700 | | | | 2,615 | |
| | | | | | | | |
| | | | | | | 42,257 | |
| | | | | | | | |
Chile—1.5% | | | | | | | | |
CFR Pharmaceuticals S.A. (Pharmaceuticals) | | | 13,064,602 | | | | 3,302 | |
ENTEL Chile S.A. (Wireless telecommunication services) | | | 327,708 | | | | 6,777 | |
See accompanying Notes to Financial Statements.
December 31, 2012 | William Blair Funds 11 |
Institutional International Growth Fund
Portfolio of Investments, December 31, 2012 (all dollar amounts in thousands)
| | | | | | | | |
Issuer | | Shares | | | Value | |
|
Common Stocks—Emerging Latin America—5.6%—(continued) | |
Chile—(continued) | | | | | | | | |
Inversiones La Construccion S.A. (Diversified financial services) | | | 112,289 | | | $ | 2,205 | |
Parque Arauco S.A. (Real estate management & development) | | | 2,800,655 | | | | 6,955 | |
Sociedad Quimica y Minera de Chile S.A.—ADR (Chemicals) | | | 119,536 | | | | 6,890 | |
Sonda S.A. (IT services) | | | 922,766 | | | | 2,939 | |
| | | | | | | | |
| | | | | | | 29,068 | |
| | | | | | | | |
Colombia—0.8% | | | | | | | | |
Ecopetrol S.A. (Oil, gas & consumable fuels) | | | 4,945,608 | | | | 15,282 | |
| | | | | | | | |
Mexico—0.9% | | | | | | | | |
Banregio Grupo Financiero S.A.B. de C.V. (Commercial banks) | | | 602,900 | | | | 2,747 | |
Grupo Financiero Banorte S.A.B. de C.V. (Commercial banks) | | | 325,400 | | | | 2,101 | |
Grupo Mexico S.A.B. de C.V. Series “B” (Metals & mining) | | | 3,519,600 | | | | 12,697 | |
| | | | | | | | |
| | | | | | | 17,545 | |
| | | | | | | | |
Panama—0.3% | | | | | | | | |
Copa Holdings S.A. (Airlines)† | | | 64,037 | | | | 6,368 | |
| | | | | | | | |
| | |
Western Hemisphere—4.7% | | | | | | | | |
Bermuda—0.3% | | | | | | | | |
RenaissanceRe Holdings, Ltd. (Insurance)† | | | 81,975 | | | | 6,661 | |
| | | | | | | | |
Canada—4.4% | | | | | | | | |
Alimentation Couche Tard, Inc. (Food & staples retailing) | | | 196,099 | | | | 9,646 | |
Brookfield Asset Management, Inc. Class “A” (Real estate management & development)† | | | 709,440 | | | | 26,001 | |
Canadian National Railway Co. (Road & rail)† | | | 258,736 | | | | 23,548 | |
CI Financial Corporation (Capital markets) | | | 333,611 | | | | 8,361 | |
Metro, Inc. (Food & staples retailing) | | | 169,690 | | | | 10,804 | |
Peyto Exploration & Development Corporation (Oil, gas & consumable fuels) | | | 358,639 | | | | 8,289 | |
| | | | | | | | |
| | | | | | | 86,649 | |
| | | | | | | | |
|
Emerging Europe, Mid-East, Africa—3.6% | |
Nigeria—0.3% | | | | | | | | |
Guaranty Trust Bank plc (Commercial banks) | | | 37,969,896 | | | | 5,613 | |
| | | | | | | | |
South Africa—2.7% | | | | | | | | |
*Aspen Pharmacare Holdings, Ltd. (Pharmaceuticals) | | | 514,677 | | | | 10,304 | |
Bidvest Group, Ltd. (Industrial conglomerates) | | | 384,058 | | | | 9,826 | |
FirstRand, Ltd. (Diversified financial services) | | | 3,170,179 | | | | 11,665 | |
Life Healthcare Group Holdings Pte, Ltd. (Health care providers & services) | | | 1,060,597 | | | | 4,262 | |
|
Common Stocks—Emerging Europe, Mid-East, Africa—3.6%—(continued) | |
Naspers, Ltd. (Media) | | | 169,900 | | | $ | 10,974 | |
Tiger Brands, Ltd. (Food products) | | | 171,094 | | | | 6,598 | |
| | | | | | | | |
| | | | | | | 53,629 | |
| | | | | | | | |
Turkey—0.4% | | | | | | | | |
Turkiye Halk Bankasi A.S. (Commercial banks) | | | 855,961 | | | | 8,438 | |
| | | | | | | | |
United Arab Emirates—0.2% | | | | | | | | |
First Gulf Bank PJSC (Commercial banks) | | | 1,019,268 | | | | 3,272 | |
| | | | | | | | |
Total Common Stocks—96.6%
(cost $1,577,573) | | | | 1,905,929 | |
| | | | | | | | |
| | |
Exchange-Traded Fund | | | | | | | | |
China—1.0% | | | | | | | | |
iShares FTSE A50 China Index | | | 14,221,840 | | | | 20,441 | |
| | | | | | | | |
Total Exchange-Traded Fund—1.0%
(cost $18,862) | | | | 20,441 | |
| | | | | | | | |
| | |
Affiliated Fund | | | | | | | | |
China—0.6% | | | | | | | | |
William Blair China A—Share Fund, LLC | | | 1,183,400 | | | | 11,834 | |
| | | | | | | | |
Total Affiliated Fund—0.6% (cost $11,834) | | | | 11,834 | |
| | | | | | | | |
| | |
Repurchase Agreement | | | | | | | | |
Fixed Income Clearing Corporation, 0.110% dated 12/31/12, due 1/2/13, repurchase price $37,717, collateralized by U.S. Treasury Note, 1.375%, due 11/30/15 | | $ | 37,717 | | | | 37,717 | |
| | | | | | | | |
Total Repurchase Agreement—1.9%
(cost $37,717) | | | | 37,717 | |
| | | | | | | | |
Total Investments—100.1%
(cost $1,645,986) | | | | 1,975,921 | |
Liabilities, plus cash and other assets—(0.1)% | | | | (1,791 | ) |
| | | | | | | | |
Net assets—100.0% | | | $ | 1,974,130 | |
| | | | | | | | |
ADR = American Depository Receipt
*Non-income producing securities
† = U.S. listed foreign security
** = Fair valued pursuant to Valuation Procedures adopted by the Board of Trustees. This holding represents 0.03% of the Fund’s net assets at December 31, 2012.
§ = Deemed illiquid pursuant to Liquidity Procedures approved by the Board of Trustees. This holding represents 0.03% of the net assets at December 31, 2012.
For securities primarily traded on exchanges or markets that close before the close of regular trading on the New York Stock Exchange, the Fund may use an independent pricing service to fair value price the securities pursuant to Valuation Procedures approved by the Board of Trustees.
See accompanying Notes to Financial Statements.
12 Annual Report | December 31, 2012 |
Institutional International Growth Fund
Portfolio of Investments, December 31, 2012 (all dollar amounts in thousands)
At December 31, 2012, the Fund’s Portfolio of Investments includes the following sector categories (as a percentage of long-term investments):
| | | | |
Financials | | | 25.3% | |
Industrials | | | 14.1% | |
Consumer Discretionary | | | 13.6% | |
Health Care | | | 10.5% | |
Consumer Staples | | | 9.3% | |
Information Technology | | | 8.1% | |
Energy | | | 7.0% | |
Materials | | | 6.0% | |
Telecommunication Services | | | 4.8% | |
Exchange-Traded Funds | | | 1.1% | |
Utilities | | | 0.2% | |
| | | | |
Total | | | 100.0% | |
| | | | |
At December 31, 2012, the Fund’s Portfolio of Investments includes the following currency categories (as a percentage of long-term investments):
| | | | |
British Pound Sterling | | | 21.8% | |
Euro | | | 20.8% | |
Japanese Yen | | | 13.9% | |
Hong Kong Dollar | | | 5.8% | |
U.S. Dollar | | | 4.3% | |
South Korean Won | | | 3.5% | |
Swiss Franc | | | 3.2% | |
Norwegian Krone | | | 3.1% | |
South African Rand | | | 2.8% | |
Australian Dollar | | | 2.6% | |
Brazilian Real | | | 2.2% | |
Indian Rupee | | | 2.1% | |
Singapore Dollar | | | 2.1% | |
Swedish Krona | | | 2.0% | |
Canadian Dollar | | | 1.9% | |
Thai Baht | | | 1.3% | |
Danish Krone | | | 1.2% | |
Chilean Peso | | | 1.1% | |
All Other Currencies | | | 4.3% | |
| | | | |
Total | | | 100.0% | |
| | | | |
The Institutional International Growth Fund invested in the following affiliated fund. There are no unfunded commitments to the affiliated fund and the Fund may redeem its investment monthly.
| | | | | | | | | | | | | | | | | | | | | | | | |
| | | Share Activity | | | Year Ended
December 31, 2012 | |
| | | | | | | | | | | | | | | (in thousands) | |
Fund Name | | Balance
12/31/2011 | | | Purchases | | | Sales | | | Balance
12/31/2012 | | | Value | | | Dividends
Included
in Income | |
William Blair China A—Share Fund, LLC | | | — | | | | 1,183,400 | | | | — | | | | 1,183,400 | | | $ | 11,834 | | | | — | |
As of December 31, 2012, the Fund invested in the William Blair China A—Share Fund, LLC, an affiliated fund. There was no realized or unrealized gain/ (loss) from investments in the affiliated fund.
See accompanying Notes to Financial Statements.
December 31, 2012 | William Blair Funds 13 |

David Merjan
INSTITUTIONAL INTERNATIONAL EQUITY FUND
The Institutional International Equity Fund seeks long-term capital appreciation.
AN OVERVIEW FROM THE PORTFOLIO MANAGER
The Institutional International Equity Fund posted an 18.31% increase for the twelve months ended December 31, 2012. By comparison, the Fund’s benchmark, the MSCI World ex-US Index (net) increased 16.41%.
In 2012, the Fund outpaced the MSCI World ex-US Index (net) on strong Healthcare, Information Technology (IT), Materials and Telecom Services stock selection. Essilor, the contact lens manufacturer, was a strong contributor as it continued to perform well fundamentally and benefited from its defensive nature mid-year, while the Fund’s Pharmaceutical companies also performed well, led by Novo Nordisk and Bayer. IT stock selection benefited from the overweighting and performance in Semiconductors and Semiconductor Equipment, particularly due to strong performance by Samsung Electronics and Arm Holdings. Materials added value given the Fund’s underweighting in the underperforming Metals/Mining industry, coupled with good Chemicals stock selection. Somewhat mitigating these positive results were the Fund’s Discretionary, Energy and Financials stock selection. Discretionary underperformance was largely the result of Automobiles performance, coupled with underperformance in Japanese holdings. Energy’s underperformance was due largely to BG Group’s production guidance in the fourth quarter, along with broader Oil/Gas stock selection. Financials stock selection was hampered by conservative positioning in Commercial Banks during the latter part of 2012, as the market accelerated.
During the year, we increased the weighting in European and Emerging Markets commercial banks, thereby increasing the Financials weighting from approximately 19.9% to just over 21%, although it remained underweighted relative to the 25.7% Index weighting. IT also increased from approximately 11.2% to 13.5%, well ahead of the 4% Index weighting, which was funded by reduced Discretionary and Energy weightings. Regionally, emerging markets totaled approximately 13%. The Fund ended the year overweighted in Developed Europe and underweighted in Developed Asia.
14 Annual Report | December 31, 2012 |
Institutional International Equity Fund
Performance Highlights (unaudited)
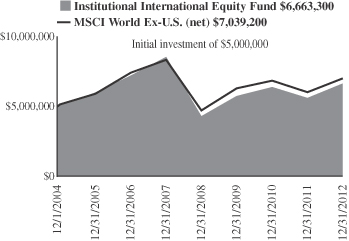
Average Annual Total Return 12/31/2012
| | | | | | | | | | | | | | | | |
| | | 1
Year | | | 3
Year | | | 5
Year | | | Since
Inception(a) | |
Institutional International Equity Fund | | | 18.31 | % | | | 4.93 | % | | | (4.93 | )% | | | 3.62 | % |
MSCI World Ex-U.S. (net) | | | 16.41 | | | | 3.65 | | | | (3.43 | ) | | | 4.32 | |
| | (a) | | For the period December 1, 2004 (Commencement of Operations) to December 31, 2012. |
Performance cited represents past performance. Past performance does not guarantee future results and current performance may be lower or higher than the data quoted. Results shown are average annual returns, which assume reinvestment of dividends and capital gains. Investment returns and principal will fluctuate and you may have a gain or loss when you sell shares. For the most current month-end performance information, please call 1-800-742-7272, or visit our Web site at www.williamblairfunds.com. From time to time, the investment advisor may waive fees or reimburse expenses for the Fund. Without these waivers, performance would be lower. International investing involves special risk considerations, including currency fluctuations, lower liquidity, economic and political risk.
The performance highlights and graph presented above do not reflect the deduction of taxes that a shareholder would pay on fund distributions or the redemption of fund shares.
The Morgan Stanley Capital International (MSCI) World Ex-U.S. (net) is a free float-adjusted market capitalization weighted index that is designed to measure the equity market performance of developed markets, excluding the United States. This series approximates the minimum possible dividend reinvestment.
This report identifies the Fund’s investments on December 31, 2012. These holdings are subject to change. Not all stocks in the Fund performed the same, nor is there any guarantee that these stocks will perform as well in the future. Market forecasts provided in this report may not necessarily come to pass.
Sector Diversification (unaudited)
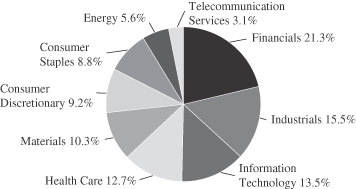
The sector diversification shown is based on the total long-term securities.
December 31, 2012 | William Blair Funds 15 |
Institutional International Equity Fund
Portfolio of Investments, December 31, 2012 (all dollar amounts in thousands)
| | | | | | | | |
Issuer | | Shares | | | Value | |
| | |
Common Stocks—Europe—42.2% | | | | | | | | |
Denmark—2.4% | | | | | | | | |
Coloplast A/S Class “B” (Health care equipment & supplies) | | | 18,300 | | | $ | 898 | |
Novo Nordisk A/S Class “B” (Pharmaceuticals) | | | 10,631 | | | | 1,731 | |
| | | | | | | | |
| | | | | | | 2,629 | |
| | | | | | | | |
France—13.4% | |
Arkema S.A. (Chemicals) | | | 12,431 | | | | 1,305 | |
BNP Paribas S.A. (Commercial banks) | | | 38,756 | | | | 2,206 | |
Christian Dior S.A. (Textiles, apparel & luxury goods) | | | 9,324 | | | | 1,589 | |
Dassault Systemes S.A. (Software) | | | 17,400 | | | | 1,946 | |
Essilor International S.A. (Health care equipment & supplies) | | | 13,449 | | | | 1,357 | |
L’Oreal S.A. (Personal products) | | | 6,326 | | | | 880 | |
Sanofi (Pharmaceuticals) | | | 26,394 | | | | 2,503 | |
Technip S.A. (Energy equipment & services) | | | 14,884 | | | | 1,721 | |
Unibail-Rodamco SE (Real estate investment trusts (REITs)) | | | 5,124 | | | | 1,243 | |
| | | | | | | | |
| | | | | | | 14,750 | |
| | | | | | | | |
Germany—8.4% | |
BASF SE (Chemicals) | | | 23,014 | | | | 2,176 | |
Bayer AG (Pharmaceuticals) | | | 20,491 | | | | 1,954 | |
Fresenius SE & Co. KGaA (Health care providers & services) | | | 16,552 | | | | 1,905 | |
MTU Aero Engines Holding AG (Aerospace & defense) | | | 8,343 | | | | 761 | |
SAP AG (Software) | | | 30,112 | | | | 2,422 | |
| | | | | | | | |
| | | | | | | 9,218 | |
| | | | | | | | |
Ireland—4.5% | |
Accenture plc Class “A” (IT services)† | | | 25,540 | | | | 1,698 | |
Ryanair Holdings plc—ADR (Airlines) | | | 39,838 | | | | 1,366 | |
Shire plc (Pharmaceuticals) | | | 60,114 | | | | 1,849 | |
| | | | | | | | |
| | | | | | | 4,913 | |
| | | | | | | | |
Netherlands—2.0% | |
Unilever N.V. (Food products) | | | 56,374 | | | | 2,157 | |
| | | | | | | | |
Norway—1.6% | |
Telenor ASA (Diversified telecommunication services) | | | 84,131 | | | | 1,713 | |
| | | | | | | | |
Spain—1.9% | |
Inditex S.A. (Specialty retail) | | | 14,956 | | | | 2,101 | |
| | | | | | | | |
Sweden—1.5% | |
Atlas Copco AB Class “A” (Machinery) | | | 60,522 | | | | 1,678 | |
| | | | | | | | |
Switzerland—6.5% | |
*Geberit AG (Building products) | | | 7,240 | | | | 1,605 | |
Nestle S.A. (Food products) | | | 19,953 | | | | 1,302 | |
Roche Holding AG (Pharmaceuticals) | | | 7,808 | | | | 1,578 | |
Syngenta AG (Chemicals) | | | 6,453 | | | | 2,607 | |
| | | | | | | | |
| | | | | | | 7,092 | |
| | | | | | | | |
| | |
United Kingdom—20.8% | | | | | | | | |
ARM Holdings plc (Semiconductors & semiconductor equipment) | | | 122,394 | | | | 1,546 | |
|
Common Stocks—United Kingdom—20.8%—(continued) | |
Babcock International Group plc (Commercial services & supplies) | | | 81,755 | | | $ | 1,290 | |
Burberry Group plc (Textiles, apparel & luxury goods) | | | 66,664 | | | | 1,340 | |
Compass Group plc (Hotels, restaurants & leisure) | | | 212,105 | | | | 2,518 | |
Diageo plc (Beverages) | | | 76,798 | | | | 2,237 | |
Experian plc (Professional services) | | | 74,463 | | | | 1,200 | |
HSBC Holdings plc (Commercial banks) | | | 157,199 | | | | 1,666 | |
InterContinental Hotels Group plc (Hotels, restaurants & leisure) | | | 40,662 | | | | 1,140 | |
John Wood Group plc (Energy equipment & services) | | | 118,551 | | | | 1,417 | |
Johnson Matthey plc (Chemicals) | | | 42,209 | | | | 1,658 | |
Prudential plc (Insurance) | | | 131,868 | | | | 1,881 | |
*Rolls-Royce Holdings plc (Aerospace & defense) | | | 137,211 | | | | 1,968 | |
Tullow Oil plc (Oil, gas & consumable fuels) | | | 44,567 | | | | 929 | |
Wolseley plc (Trading companies & distributors) | | | 42,902 | | | | 2,052 | |
| | | | | | | | |
| | | | | | | 22,842 | |
| | | | | | | | |
| | |
Japan—11.3% | | | | | | | | |
Chiyoda Corporation (Construction & engineering) | | | 46,000 | | | | 659 | |
Daito Trust Construction Co., Ltd. (Real estate management & development) | | | 18,200 | | | | 1,720 | |
Fuji Heavy Industries, Ltd. (Automobiles) | | | 107,000 | | | | 1,349 | |
Keyence Corporation (Electronic equipment, instruments & components) | | | 5,200 | | | | 1,442 | |
Murata Manufacturing Co., Ltd. (Electronic equipment, instruments & components) | | | 24,800 | | | | 1,463 | |
ORIX Corporation (Diversified financial services) | | | 16,790 | | | | 1,897 | |
Sumitomo Mitsui Financial Group, Inc. (Commercial banks) | | | 54,100 | | | | 1,966 | |
Suruga Bank, Ltd. (Commercial banks) | | | 81,000 | | | | 996 | |
Yahoo! Japan Corporation (Internet software & services) | | | 2,645 | | | | 857 | |
| | | | | | | | |
| | | | | | | 12,349 | |
| | | | | | | | |
| | |
Emerging Asia—8.5% | | | | | | | | |
China—4.1% | | | | | | | | |
China Mobile, Ltd. (Wireless telecommunication services) | | | 135,500 | | | | 1,595 | |
CNOOC, Ltd. (Oil, gas & consumable fuels) | | | 559,000 | | | | 1,231 | |
Sun Art Retail Group, Ltd. (Food & staples retailing) | | | 1,061,000 | | | | 1,640 | |
| | | | | | | | |
| | | | | | | 4,466 | |
| | | | | | | | |
India—0.7% | | | | | | | | |
Tata Consultancy Services, Ltd. (IT services) | | | 35,652 | | | | 822 | |
| | | | | | | | |
Papua New Guinea—0.7% | | | | | | | | |
Oil Search, Ltd. (Oil, gas & consumable fuels) | | | 110,906 | | | | 820 | |
| | | | | | | | |
South Korea—2.3% | | | | | | | | |
Samsung Electronics Co., Ltd. (Semiconductors & semiconductor equipment) | | | 1,738 | | | | 2,497 | |
| | | | | | | | |
See accompanying Notes to Financial Statements.
16 Annual Report | December 31, 2012 |
Institutional International Equity Fund
Portfolio of Investments, December 31, 2012 (all dollar amounts in thousands)
| | | | | | | | |
Issuer | | Shares | | | Value | |
|
Common Stocks—Emerging Asia—8.5%—(continued) | |
Thailand—0.7% | | | | | | | | |
Kasikornbank PCL (Commercial banks) | | | 121,800 | | | $ | 774 | |
| | | | | | | | |
Canada—6.3% | | | | | | | | |
Brookfield Asset Management, Inc. Class “A” (Real estate management & development)† | | | 61,865 | | | | 2,267 | |
Canadian National Railway Co. (Road & rail)† | | | 16,870 | | | | 1,535 | |
Goldcorp, Inc. (Metals & mining)† | | | 40,868 | | | | 1,500 | |
The Toronto-Dominion Bank (Commercial banks) | | | 19,353 | | | | 1,630 | |
| | | | | | | | |
| | | | | | | 6,932 | |
| | | | | | | | |
| | |
Asia—5.3% | | | | | | | | |
Australia—1.7% | | | | | | | | |
BHP Billiton, Ltd.—ADR (Metals & mining) | | | 24,301 | | | | 1,906 | |
| | | | | | | | |
Hong Kong—2.2% | | | | | | | | |
AIA Group, Ltd. (Insurance) | | | 607,000 | | | | 2,408 | |
| | | | | | | | |
Singapore—1.4% | | | | | | | | |
Keppel Corporation, Ltd. (Industrial conglomerates) | | | 166,000 | | | | 1,516 | |
| | | | | | | | |
| | |
Emerging Latin America—2.3% | | | | | | | | |
Mexico—1.2% | | | | | | | | |
Fomento Economico Mexicano S.A.B. de C.V.—ADR (Beverages) | | | 12,967 | | | | 1,306 | |
| | | | | | | | |
Panama—1.1% | | | | | | | | |
Copa Holdings S.A. (Airlines)† | | | 12,286 | | | | 1,222 | |
| | | | | | | | |
| | |
Emerging Europe, Mid-East, Africa—2.3% | | | | | | | | |
South Africa—1.7% | | | | | | | | |
FirstRand, Ltd. (Diversified financial services) | | | 503,396 | | | | 1,852 | |
| | | | | | | | |
Turkey—0.6% | | | | | | | | |
Turkiye Garanti Bankasi A.S. (Commercial banks) | | | 124,423 | | | | 650 | |
| | | | | | | | |
Total Common Stocks—99.0%
(cost $88,597) | | | | 108,613 | |
| | | | | | | | |
Total Investments—99.0%
(cost $88,597) | | | | 108,613 | |
Cash and other assets, less liabilities—1.0% | | | | 1,077 | |
| | | | | | | | |
Net assets—100.0% | | | $ | 109,690 | |
| | | | | | | | |
ADR = American Depository Receipt
† = U.S. listed foreign security
*Non-income producing securities
For securities primarily traded on exchanges or markets that close before the close of regular trading on the New York Stock Exchange, the Fund may use an independent pricing service to fair value price the securities pursuant to Valuation Procedures approved by the Board of Trustees.
At December 31, 2012, the Fund’s Portfolio of Investments includes the following sector categories (as a percentage of long-term investments):
| | | | |
Financials | | | 21.3% | |
Industrials | | | 15.5% | |
Information Technology | | | 13.5% | |
Health Care | | | 12.7% | |
Materials | | | 10.3% | |
Consumer Discretionary | | | 9.2% | |
Consumer Staples | | | 8.8% | |
Energy | | | 5.6% | |
Telecommunication Services | | | 3.1% | |
| | | | |
Total | | | 100.0% | |
| | | | |
At December 31, 2012, the Fund’s Portfolio of Investments includes the following currency categories (as a percentage of long-term investments):
| | | | |
Euro | | | 26.0% | |
British Pound Sterling | | | 22.7% | |
U.S. Dollar | | | 11.8% | |
Japanese Yen | | | 11.4% | |
Swiss Franc | | | 6.5% | |
Hong Kong Dollar | | | 6.3% | |
Danish Krone | | | 2.4% | |
South Korean Won | | | 2.3% | |
South African Rand | | | 1.7% | |
Norwegian Krone | | | 1.6% | |
Swedish Krona | | | 1.6% | |
Canadian Dollar | | | 1.5% | |
Singapore Dollar | | | 1.4% | |
All Other Currencies | | | 2.8% | |
| | | | |
Total | | | 100.0% | |
| | | | |
See accompanying Notes to Financial Statements.
December 31, 2012 | William Blair Funds 17 |

W. George Greig
Kenneth J. McAtamney
INTERNATIONAL LEADERS FUND
The International Leaders Fund seeks long-term capital appreciation.
AN OVERVIEW FROM THE PORTFOLIO MANAGERS
The International Leaders Fund posted a 5.67% increase (Institutional Class Shares) since its inception date of December 2, 2012 through December 31, 2012. By comparison, the Fund’s benchmark, the MSCI All Country World ex-U.S. IMI Index (net) increased 4.74% over the same period.
The International Leaders Fund outperformed the Index since its December 2012 inception. Auto companies bolstered Discretionary results, while Pharmaceuticals stock selection was also particularly strong. Within Industrials, the overweighting in the outperforming Machinery industry added value, as did stock selection in Trading Companies.
The market’s increased confidence in a positive resolution to the European sovereign crisis and related banking system has highlighted the attractive valuations in Financials, not only in Europe but globally as well. As a result, during the course of the period Financials increased to approximately 25% of the fund, due largely to an increase in Developed Market Commercial Banks. Industrials increased to 17% of the fund on an improved outlook and good valuations. Conversely, IT, Telecommunication Services and Consumer Staples decreased, as we reduced valuation risk in the Fund and on company-specific concerns. Regionally, the Fund maintained its significant overweighting in Europe, due largely to Health Care and IT, while the UK was also significantly overweighted in Consumer Discretionary and Industrials. Conversely, emerging markets and Developed Asia remained underweighted versus the Index.
18 Annual Report | December 31, 2012 |
International Leaders Fund
Performance Highlights (Unaudited)
Performance cited represents past performance. Past performance does not guarantee future results and current performance may be lower or higher than the data quoted. Results shown are average annual returns, which assume reinvestment of dividends and capital gains. Investment returns and principal will fluctuate and you may have a gain or loss when you sell shares. For the most current month-end performance information, please call 1-800-742-7272, or visit our Web site at www.williamblairfunds.com. From time to time the investment advisor may waive fees or reimburse expenses for the Fund. Without these waivers, performance would be lower. International investing involves special risk considerations, including currency fluctuations, lower liquidity, economic and political risk.
The performance highlights presented above do not reflect the deduction of taxes that a shareholder would pay on fund distributions or the redemption of fund shares.
The Morgan Stanley Capital International (MSCI) All Country World Ex-U.S. Investable Market Index (IMI) (net) is a free float-adjusted market capitalization weighted index that is designed to measure the equity market performance of developed and emerging markets, excluding the United States. This series approximates the minimum possible dividend reinvestment.
This report identifies the Fund’s investments on December 31, 2012. These holdings are subject to change. Not all stocks in the Fund performed the same, nor is there any guarantee that these stocks will perform as well in the future. Market forecasts provided in this report may not necessarily come to pass.
Sector Diversification (Unaudited)
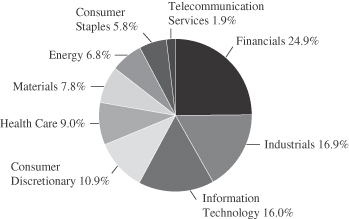
The sector diversification shown is based on the total long-term securities.
Average Annual Total Return at 12/31/2012
| | | | |
| | | Since
Inception(a) | |
Institutional Class | | | 5.67 | % |
MSCI All Country World Ex-US IMI (net) | | | 4.74 | |
| | (a) | | For the period from November 2, 2012 (Commencement of Operations) to December 31, 2012. | |
December 31, 2012 | William Blair Funds 19 |
International Leaders Fund
Portfolio of Investments, December 31, 2012 (all dollar amounts in thousands)
| | | | | | | | |
Issuer | | Shares | | | Value | |
| | |
Common Stocks—Europe, Mid-East—41.4% | | | | | | | | |
Denmark—3.7% | | | | | | | | |
Coloplast A/S Class “B” (Health care equipment & supplies) | | | 2,795 | | | $ | 137 | |
Novo Nordisk A/S Class “B” (Pharmaceuticals) | | | 1,502 | | | | 245 | |
| | | | | | | | |
| | | | | | | 382 | |
| | | | | | | | |
France—10.7% | | | | | | | | |
Arkema S.A. (Chemicals) | | | 1,633 | | | | 171 | |
BNP Paribas S.A. (Commercial banks) | | | 5,569 | | | | 317 | |
Dassault Systemes S.A. (Software) | | | 1,633 | | | | 182 | |
Sanofi (Pharmaceuticals) | | | 2,380 | | | | 226 | |
Technip S.A. (Energy equipment & services) | | | 1,623 | | | | 188 | |
| | | | | | | | |
| | | | | | | 1,084 | |
| | | | | | | | |
Germany—7.6% | | | | | | | | |
Bayerische Motoren Werke AG (Automobiles) | | | 2,451 | | | | 238 | |
Brenntag AG (Trading companies & distributors) | | | 834 | | | | 110 | |
Fresenius SE & Co. KGaA (Health care providers & services) | | | 1,816 | | | | 209 | |
SAP AG (Software) | | | 2,645 | | | | 213 | |
| | | | | | | | |
| | | | | | | 770 | |
| | | | | | | | |
Israel—1.4% | | | | | | | | |
*Check Point Software Technologies, Ltd. (Software)† | | | 2,951 | | | | 141 | |
| | | | | | | | |
Netherlands—3.8% | | | | | | | | |
Royal Dutch Shell plc Class “B” (Oil, gas & consumable fuels) | | | 5,940 | | | | 212 | |
Unilever N.V. (Food products) | | | 4,583 | | | | 175 | |
| | | | | | | | |
| | | | | | | 387 | |
| | | | | | | | |
Norway—1.7% | | | | | | | | |
Statoil ASA (Oil, gas & consumable fuels) | | | 6,722 | | | | 169 | |
| | | | | | | | |
Spain—2.4% | | | | | | | | |
Inditex S.A. (Specialty retail) | | | 1,719 | | | | 242 | |
| | | | | | | | |
Sweden—2.1% | | | | | | | | |
Atlas Copco AB Class “A” (Machinery) | | | 7,605 | | | | 211 | |
| | | | | | | | |
Switzerland—8.0% | | | | | | | | |
*Geberit AG (Building products) | | | 631 | | | | 140 | |
Glencore International plc (Metals & mining) | | | 34,532 | | | | 199 | |
*Lindt & Spruengli AG (Food products) | | | 2 | | | | 76 | |
Partners Group Holding AG (Capital markets) | | | 693 | | | | 160 | |
Syngenta AG (Chemicals) | | | 604 | | | | 244 | |
| | | | | | | | |
| | | | | | | 819 | |
| | | | | | | | |
| | |
United Kingdom—22.1% | | | | | | | | |
ARM Holdings plc (Semiconductors & semiconductor equipment) | | | 15,539 | | | | 196 | |
Babcock International Group plc (Commercial services & supplies) | | | 7,982 | | | | 126 | |
Compass Group plc (Hotels, restaurants & leisure) | | | 16,940 | | | | 201 | |
Diageo plc (Beverages) | | | 6,181 | | | | 180 | |
Experian plc (Professional services) | | | 7,720 | | | | 125 | |
HSBC Holdings plc (Commercial banks) | | | 21,600 | | | | 229 | |
InterContinental Hotels Group plc (Hotels, restaurants & leisure) | | | 6,025 | | | | 169 | |
|
Common Stocks—United Kingdom—22.1%—(continued) | |
Intertek Group plc (Professional services) | | | 3,025 | | | $ | 154 | |
John Wood Group plc (Energy equipment & services) | | | 9,330 | | | | 112 | |
Johnson Matthey plc (Chemicals) | | | 4,221 | | | | 166 | |
*Rolls-Royce Holdings plc (Aerospace & defense) | | | 7,130 | | | | 102 | |
*The Berkeley Group Holdings plc (Household durables) | | | 4,737 | | | | 136 | |
The Weir Group plc (Machinery) | | | 4,686 | | | | 145 | |
Wolseley plc (Trading companies & distributors) | | | 4,212 | | | | 201 | |
| | | | | | | | |
| | | | | | | 2,242 | |
| | | | | | | | |
| | |
Japan—10.0% | | | | | | | | |
Daito Trust Construction Co., Ltd. (Real estate management & development) | | | 800 | | | | 76 | |
Fanuc Corporation (Machinery) | | | 1,100 | | | | 205 | |
Fuji Heavy Industries, Ltd. (Automobiles) | | | 8,000 | | | | 101 | |
Makita Corporation (Machinery) | | | 3,400 | | | | 158 | |
ORIX Corporation (Diversified financial services) | | | 2,410 | | | | 272 | |
Sumitomo Mitsui Financial Group, Inc. (Commercial banks) | | | 5,700 | | | | 207 | |
| | | | | | | | |
| | | | | | | 1,019 | |
| | | | | | | | |
| | |
Emerging Asia—6.9% | | | | | | | | |
China—3.3% | | | | | | | | |
*Baidu, Inc.—ADR (Internet software & services) | | | 1,417 | | | | 142 | |
China Mobile, Ltd. (Wireless telecommunication services) | | | 16,000 | | | | 188 | |
| | | | | | | | |
| | | | | | | 330 | |
| | | | | | | | |
Indonesia—1.2% | | | | | | | | |
PT Bank Rakyat Indonesia (Commercial banks) | | | 170,000 | | | | 123 | |
| | | | | | | | |
South Korea—2.4% | | | | | | | | |
Samsung Electronics Co., Ltd. (Semiconductors & semiconductor equipment) | | | 173 | | | | 249 | |
| | | | | | | | |
| | |
Emerging Latin America—5.4% | | | | | | | | |
Argentina—1.1% | | | | | | | | |
MercadoLibre, Inc. (Internet software & services) | | | 1,418 | | | | 111 | |
| | | | | | | | |
Brazil—1.0% | | | | | | | | |
BR Malls Participacoes S.A. (Real estate management & development) | | | 7,500 | | | | 99 | |
| | | | | | | | |
Mexico—1.5% | | | | | | | | |
Fomento Economico Mexicano S.A.B. de C.V.—ADR (Beverages) | | | 1,506 | | | | 152 | |
| | | | | | | | |
Peru—1.8% | | | | | | | | |
Credicorp, Ltd. (Commercial banks)† | | | 1,290 | | | | 189 | |
| | | | | | | | |
| | |
Asia—4.3% | | | | | | | | |
Hong Kong—4.3% | | | | | | | | |
AIA Group, Ltd. (Insurance) | | | 70,600 | | | | 280 | |
ASM Pacific Technology, Ltd. (Semiconductors & semiconductor equipment) | | | 12,500 | | | | 154 | |
| | | | | | | | |
| | | | | | | 434 | |
| | | | | | | | |
See accompanying Notes to Financial Statements.
20 Annual Report | December 31, 2012 |
International Leaders Fund
Portfolio of Investments, December 31, 2012 (all dollar amounts in thousands)
| | | | | | | | |
Issuer | | Shares or
Principal
Amount | | | Value | |
|
Common Stocks—Asia—4.3%—(continued) | |
Canada—4.2% | | | | | | | | |
Brookfield Asset Management, Inc. Class “A” (Real estate management & development)† | | | 5,720 | | | $ | 209 | |
The Toronto-Dominion Bank (Commercial banks) | | | 2,622 | | | | 221 | |
| | | | | | | | |
| | | | | | | 430 | |
| | | | | | | | |
| |
Emerging Europe, Mid-East, Africa—3.8% | | | | | |
South Africa—3.8% | | | | | | | | |
*Aspen Pharmacare Holdings, Ltd. (Pharmaceuticals) | | | 4,198 | | | | 84 | |
Discovery Holdings, Ltd. (Insurance) | | | 19,787 | | | | 146 | |
FirstRand, Ltd. (Diversified financial services) | | | 41,624 | | | | 153 | |
| | | | | | | | |
| | | | | | | 383 | |
| | | | | | | | |
Total Common Stocks—98.1%
(cost $9,254) | | | | 9,966 | |
| | | | | | | | |
| | |
Repurchase Agreement | | | | | | | | |
Fixed Income Clearing Corporation, 0.110% dated 12/31/12, due 1/2/13, repurchase price $166, collateralized by U.S. Treasury Note, 2.125%, due 12/31/15 | | $ | 166 | | | | 166 | |
| | | | | | | | |
Total Repurchase Agreement—1.6%
(cost $166) | | | | 166 | |
| | | | | | | | |
Total Investments—99.7%
(cost $9,420) | | | | 10,132 | |
Cash and other assets, less liabilities—0.3% | | | | 32 | |
| | | | | | | | |
Net assets—100.0% | | | $ | 10,164 | |
| | | | | | | | |
ADR = American Depository Receipt
*Non-income producing securities
† = U.S. listed foreign security
For securities primarily traded on exchanges or markets that close before the close of regular trading on the New York Stock Exchange, the Fund may use an independent pricing service to fair value price the securities pursuant to Valuation Procedures approved by the Board of Trustees.
At December 31, 2012, the Fund’s Portfolio of Investments includes the following sector categories (as a percentage of long-term investments):
| | | | |
Financials | | | 24.9% | |
Industrials | | | 16.9% | |
Information Technology | | | 16.0% | |
Consumer Discretionary | | | 10.9% | |
Health Care | | | 9.0% | |
Materials | | | 7.8% | |
Energy | | | 6.8% | |
Consumer Staples | | | 5.8% | |
Telecommunication Services | | | 1.9% | |
| | | | |
Total | | | 100.0% | |
| | | | |
At December 31, 2012, the Fund’s Portfolio of Investments includes the following currency categories (as a percentage of long-term investments):
| | | | |
British Pound Sterling | | | 24.3% | |
Euro | | | 22.8% | |
Japanese Yen | | | 10.2% | |
U.S. Dollar | | | 9.5% | |
Hong Kong Dollar | | | 8.6% | |
Swiss Franc | | | 6.2% | |
South African Rand | | | 3.9% | |
Danish Krone | | | 3.8% | |
South Korean Won | | | 2.5% | |
Canadian Dollar | | | 2.2% | |
Swedish Krona | | | 2.1% | |
Norwegian Krone | | | 1.7% | |
Indonesian Rupiah | | | 1.2% | |
All Other Currencies | | | 1.0% | |
| | | | |
Total | | | 100.0% | |
| | | | |
See accompanying Notes to Financial Statements.
December 31, 2012 | William Blair Funds 21 |

Jeffrey A. Urbina
INTERNATIONAL SMALL CAP GROWTH FUND
The International Small Cap Growth Fund seeks long-term capital appreciation.
AN OVERVIEW FROM THE PORTFOLIO MANAGER
The International Small Cap Growth Fund posted a 21.36% increase (Institutional Class Shares) for the twelve months ended December 31, 2012. By comparison, the Fund’s benchmark, the MSCI All Country World ex-U.S. Small Cap Index (net) increased 18.52%.
2012 performance was bolstered by particularly strong Discretionary stock selection, coupled with the significant overweighting, as well as strong performance in Materials and Industrials. Discretionary performance was driven by strong Auto-related company performance, in addition to strength in Hotels/Restaurants, Household Durables and Luxury holdings, which more than offset weakness in Japanese internet-related holdings. The Fund’s Materials stocks were up over 34%, as compared to the 5.25% Index return in the benchmark index, led by strength in Chemicals, and benefiting from the underweighting in the underperforming Metals/Mining industry. Industrials stock selection was also additive, as MTU Aero Engines, the German aerospace engine company, benefited from strong sales and earnings growth during the period. Babcock International, the UK engineering outsourcing company, also benefited from strong results that exceeded market expectations. Somewhat offsetting these positive results were the Fund’s underweighting in Materials and Financials, coupled with Energy and Information Technology (IT) stock selection.
Overall sector positioning did not substantially change during the year, although Discretionary was marginally increased to 26.9%, and remained overweighted versus the 17.4% Index weighting. While Financials increased to 13.2% of the Fund during the period, it remained significantly underweighted versus the 19.7% benchmark Index weighting. Industrials and Materials remained significantly underweighted as well, with a corresponding overweighting in Healthcare, which totaled 13.6% of the Fund as of year end, well ahead of the 5.2% benchmark Index weighting, due to significant holdings in Healthcare Providers and Pharmaceuticals. Regionally, the Fund remained focused on Developed Europe at the expense of Developed Asia, particularly Pacific ex-Japan. Emerging markets totaled 15.2% of the Fund, below the 23.3% Index weighting, due largely to a significant underweighting in Emerging Asia.
22 Annual Report | December 31, 2012 |
International Small Cap Growth Fund
Performance Highlights (unaudited)
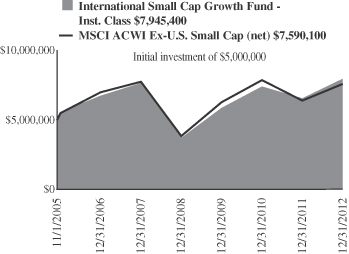
Average Annual Total Return at 12/31/2012
| | | | | | | | | | | | | | | | |
| | | 1
Year | | | 3
Year | | | 5
Year | | | Since
Inception(a) | |
Institutional Class | | | 21.36 | % | | | 10.69 | % | | | 0.74 | % | | | 6.68 | % |
MSCI ACWI Ex-U.S. Small Cap (net) | | | 18.52 | | | | 6.54 | | | | (0.39 | ) | | | 5.99 | |
| | (a) | | For the period November 1, 2005 (Commencement of Operations) to December 31, 2012. |
Performance cited represents past performance. Past performance does not guarantee future results and current performance may be lower or higher than the data quoted. Results shown are average annual returns, which assume reinvestment of dividends and capital gains. Investment returns and principal will fluctuate and you may have a gain or loss when you sell shares. For the most current month-end performance information, please call 1-800-742-7272, or visit our Web site at www.williamblairfunds.com. Investing in smaller companies involves special risks, including higher volatility and lower liquidity. Smaller capitalization stocks are also more sensitive to purchase/sale transactions and changes in the issuer’s financial condition. From time to time, the investment advisor may waive fees or reimburse expenses for the Fund. Without these waivers, performance would be lower. International investing involves special risk considerations, including currency fluctuations, lower liquidity, economic and political risk.
The performance highlights and graph presented above do not reflect the deduction of taxes that a shareholder would pay on fund distributions or the redemption of fund shares.
The Morgan Stanley Capital International (MSCI) All Country World Ex-U.S. Small Cap Index (net) is a free float-adjusted market capitalization weighted index that is designed to measure the equity market performance of small capitalization developed and emerging markets, excluding the United States. This series approximates the minimum possible dividend reinvestment.
This report identifies the Fund’s investments on December 31, 2012. These holdings are subject to change. Not all stocks in the Fund performed the same, nor is there any guarantee that these stocks will perform as well in the future. Market forecasts provided in this report may not necessarily come to pass.
Sector Diversification (unaudited)
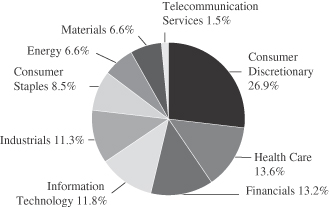
The sector diversification shown is based on the total long-term securities.
December 31, 2012 | William Blair Funds 23 |
International Small Cap Growth Fund
Portfolio of Investments, December 31, 2012 (all dollar amounts in thousands)
| | | | | | | | |
Issuer | | Shares | | | Value | |
| | |
Common Stocks—Europe—28.5% | | | | | | | | |
Austria—0.3% | | | | | | | | |
AMS AG (Semiconductors & semiconductor equipment) | | | 22,333 | | | $ | 2,405 | |
| | | | | | | | |
Belgium—0.4% | | | | | | | | |
*ThromboGenics N.V. (Biotechnology) | | | 52,627 | | | | 2,929 | |
| | | | | | | | |
Denmark—1.0% | | | | | | | | |
CHR Hansen Holding A/S (Chemicals) | | | 70,769 | | | | 2,305 | |
GN Store Nord A/S (Health care equipment & supplies) | | | 318,173 | | | | 4,624 | |
| | | | | | | | |
| | | | | | | 6,929 | |
| | | | | | | | |
Finland—0.7% | | | | | | | | |
Tikkurila Oyj (Chemicals) | | | 259,406 | | | | 5,067 | |
| | | | | | | | |
France—0.1% | | | | | | | | |
*GameLoft SE (Software) | | | 150,004 | | | | 1,055 | |
| | | | | | | | |
Germany—9.2% | | | | | | | | |
Aixtron AG (Semiconductors & semiconductor equipment) | | | 29,277 | | | | 349 | |
Bertrandt AG (Professional services) | | | 20,097 | | | | 2,018 | |
ElringKlinger AG (Auto components) | | | 331,992 | | | | 11,260 | |
Gerry Weber International AG (Textiles, apparel & luxury goods) | | | 141,348 | | | | 6,846 | |
MTU Aero Engines Holding AG (Aerospace & defense) | | | 116,389 | | | | 10,621 | |
Pfeiffer Vacuum Technology AG (Machinery) | | | 42,530 | | | | 5,183 | |
Symrise AG (Chemicals) | | | 215,847 | | | | 7,755 | |
Wincor Nixdorf AG (Computers & peripherals) | | | 297,749 | | | | 14,042 | |
Wirecard AG (IT services) | | | 320,351 | | | | 7,909 | |
| | | | | | | | |
| | | | | | | 65,983 | |
| | | | | | | | |
Ireland—2.1% | | | | | | | | |
Paddy Power plc (Hotels, restaurants & leisure) | | | 181,117 | | | | 14,952 | |
| | | | | | | | |
Italy—5.4% | | | | | | | | |
Azimut Holding SpA (Capital markets) | | | 733,543 | | | | 10,556 | |
De’Longhi SpA (Household durables) | | | 544,103 | | | | 7,819 | |
Recordati SpA (Pharmaceuticals) | | | 863,611 | | | | 7,897 | |
Salvatore Ferragamo Italia SpA (Textiles, apparel & luxury goods) | | | 76,084 | | | | 1,684 | |
Tod’s SpA (Textiles, apparel & luxury goods) | | | 51,896 | | | | 6,589 | |
*Yoox SpA (Internet & catalog retail) | | | 257,471 | | | | 4,078 | |
| | | | | | | | |
| | | | | | | 38,623 | |
| | | | | | | | |
Norway—2.8% | | | | | | | | |
Fred Olsen Energy ASA (Energy equipment & services) | | | 153,966 | | | | 6,760 | |
Opera Software ASA (Internet software & services) | | | 676,617 | | | | 3,876 | |
Schibsted ASA (Media) | | | 222,219 | | | | 9,503 | |
| | | | | | | | |
| | | | | | | 20,139 | |
| | | | | | | | |
Spain—2.6% | | | | | | | | |
Viscofan S.A. (Food products) | | | 331,071 | | | | 18,753 | |
| | | | | | | | |
|
Common Stocks—Europe—28.5%—(continued) | |
Sweden—3.2% | | | | | | | | |
Axis Communications AB (Communications equipment) | | | 341,012 | | | $ | 9,392 | |
Hexpol AB (Chemicals) | | | 171,111 | | | | 9,080 | |
JM AB (Household durables) | | | 234,915 | | | | 4,213 | |
NIBE Industrier AB (Building products) | | | 39,408 | | | | 571 | |
| | | | | | | | |
| | | | | | | 23,256 | |
| | | | | | | | |
Switzerland—0.7% | | | | | | | | |
Burckhardt Compression Holding AG (Machinery) | | | 15,674 | | | | 5,150 | |
| | | | | | | | |
| | |
United Kingdom—26.2% | | | | | | | | |
Abcam plc (Biotechnology) | | | 932,027 | | | | 5,870 | |
Ashmore Group plc (Capital markets) | | | 1,736,586 | | | | 10,254 | |
*ASOS plc (Internet & catalog retail) | | | 253,510 | | | | 11,182 | |
Aveva Group plc (Software) | | | 321,425 | | | | 11,535 | |
AZ Electronic Materials S.A. (Chemicals) | | | 903,483 | | | | 5,198 | |
Booker Group plc (Food & staples retailing) | | | 8,108,578 | | | | 12,940 | |
Debenhams plc (Multiline retail) | | | 4,908,407 | | | | 9,164 | |
Domino’s Pizza Group plc (Hotels, restaurants & leisure) | | | 653,589 | | | | 5,336 | |
Dunelm Group plc (Specialty retail) | | | 582,726 | | | | 6,683 | |
Elementis plc (Chemicals) | | | 904,915 | | | | 3,455 | |
Fidessa Group plc (Software) | | | 119,591 | | | | 2,975 | |
Halma plc (Electronic equipment, instruments & components) | | | 850,474 | | | | 6,400 | |
Hiscox, Ltd. (Insurance) | | | 470,236 | | | | 3,501 | |
IG Group Holdings plc (Diversified financial services) | | | 1,232,896 | | | | 9,074 | |
*Imagination Technologies Group plc (Computers & peripherals) | | | 187,732 | | | | 1,224 | |
Lancashire Holdings, Ltd. (Insurance) | | | 897,939 | | | | 11,433 | |
Moneysupermarket.com Group plc (Internet software & services) | | | 2,922,139 | | | | 7,492 | |
Oxford Instruments plc (Electronic equipment, instruments & components) | | | 240,759 | | | | 5,627 | |
Rotork plc (Machinery) | | | 347,388 | | | | 14,501 | |
RPS Group plc (Commercial services & supplies) | | | 872,849 | | | | 3,018 | |
*Salamander Energy plc (Oil, gas & consumable fuels) | | | 1,617,863 | | | | 5,009 | |
*Sports Direct International plc (Specialty retail) | | | 873,033 | | | | 5,524 | |
St James’s Place plc (Insurance) | | | 613,072 | | | | 4,238 | |
Synergy Health plc (Health care providers & services) | | | 201,939 | | | | 3,582 | |
Telecity Group plc (Internet software & services) | | | 260,085 | | | | 3,359 | |
*The Berkeley Group Holdings plc (Household durables) | | | 432,957 | | | | 12,455 | |
Victrex plc (Chemicals) | | | 268,463 | | | | 7,155 | |
| | | | | | | | |
| | | | | | | 188,184 | |
| | | | | | | | |
| | |
Japan—16.4% | | | | | | | | |
Ain Pharmaciez, Inc. (Food & staples retailing) | | | 109,000 | | | | 5,962 | |
Chiyoda Corporation (Construction & engineering) | | | 885,000 | | | | 12,678 | |
Cosmos Pharmaceutical Corporation (Food & staples retailing) | | | 77,000 | | | | 7,652 | |
See accompanying Notes to Financial Statements.
24 Annual Report | December 31, 2012 |
International Small Cap Growth Fund
Portfolio of Investments, December 31, 2012 (all dollar amounts in thousands)
| | | | | | | | |
Issuer | | Shares | | | Value | |
|
Common Stocks—Japan—16.4%—(continued) | |
CyberAgent, Inc. (Media) | | | 2,170 | | | $ | 4,459 | |
F.C.C. Co., Ltd. (Auto components) | | | 365,509 | | | | 7,592 | |
FamilyMart Co., Ltd. (Food & staples retailing) | | | 165,500 | | | | 6,818 | |
Kakaku.com, Inc. (Internet software & services) | | | 89,600 | | | | 2,958 | |
M3, Inc. (Health care technology) | | | 3,791 | | | | 6,051 | |
Miraca Holdings, Inc. (Health care providers & services) | | | 254,200 | | | | 10,250 | |
MISUMI Group, Inc. (Trading companies & distributors) | | | 269,500 | | | | 7,365 | |
MonotaRO Co., Ltd. (Trading companies & distributors) | | | 126,000 | | | | 4,059 | |
Park24 Co., Ltd. (Commercial services & supplies) | | | 116,000 | | | | 1,832 | |
Ryohin Keikaku Co., Ltd. (Multiline retail) | | | 164,900 | | | | 9,222 | |
Sawai Pharmaceutical Co., Ltd. (Pharmaceuticals) | | | 64,800 | | | | 6,505 | |
Ship Healthcare Holdings, Inc. (Health care providers & services) | | | 301,200 | | | | 8,005 | |
Suruga Bank, Ltd. (Commercial banks) | | | 985,000 | | | | 12,115 | |
United Arrows, Ltd. (Specialty retail) | | | 197,800 | | | | 4,555 | |
| | | | | | | | |
| | | | | | | 118,078 | |
| | | | | | | | |
| | |
Emerging Asia—7.8% | | | | | | | | |
China—4.9% | | | | | | | | |
China Medical System Holdings, Ltd. (Pharmaceuticals) | | | 5,891,000 | | | | 4,598 | |
Dongyue Group (Chemicals) | | | 8,759,000 | | | | 5,922 | |
*Haier Electronics Group Co., Ltd. (Household durables) | | | 7,758,000 | | | | 11,507 | |
Haitian International Holdings, Ltd. (Machinery) | | | 3,933,496 | | | | 4,714 | |
Minth Group, Ltd. (Auto components) | | | 1,580,000 | | | | 1,836 | |
Sino Biopharmaceutical (Pharmaceuticals) | | | 7,808,000 | | | | 3,765 | |
*WuXi PharmaTech Cayman, Inc.—ADR (Life sciences tools & services)† | | | 176,359 | | | | 2,778 | |
| | | | | | | | |
| | | | | | | 35,120 | |
| | | | | | | | |
India—2.9% | | | | | | | | |
CRISIL, Ltd. (Diversified financial services) | | | 174,919 | | | | 3,469 | |
eClerx Services, Ltd. (Professional services) | | | 100,070 | | | | 1,251 | |
Ipca Laboratories, Ltd. (Pharmaceuticals) | | | 429,511 | | | | 4,068 | |
*Jubilant Foodworks, Ltd. (Hotels, restaurants & leisure) | | | 146,216 | | | | 3,471 | |
Motherson Sumi Systems, Ltd. (Auto components) | | | 1,957,109 | | | | 7,126 | |
Oberoi Realty, Ltd. (Real estate management & development) | | | 337,316 | | | | 1,790 | |
| | | | | | | | |
| | | | | | | 21,175 | |
| | | | | | | | |
|
Emerging Europe, Mid-East, Africa—5.7% | |
Russia—0.1% | | | | | | | | |
*Etalon Group Ltd.—144A—GDR (Real estate management & development)† | | | 154,616 | | | | 845 | |
| | | | | | | | |
South Africa—2.9% | | | | | | | | |
Capitec Bank Holdings, Ltd. (Commercial banks) | | | 227,238 | | | | 4,917 | |
Coronation Fund Managers, Ltd. (Capital markets) | | | 998,657 | | | | 4,676 | |
|
Common Stocks—Emerging Europe, Mid-East, Africa—5.7%—(continued) | |
South Africa—(continued) | | | | | | | | |
Life Healthcare Group Holdings Pte, Ltd. (Health care providers & services) | | | 2,746,547 | | | $ | 11,038 | |
| | | | | | | | |
| | | | | | | 20,631 | |
| | | | | | | | |
Turkey—2.7% | | | | | | | | |
Tofas Turk Otomobil Fabrikasi A.S. (Automobiles) | | | 1,196,176 | | | | 7,042 | |
Turkiye Sinai Kalkinma Bankasi A.S. (Commercial banks) | | | 9,869,085 | | | | 12,728 | |
| | | | | | | | |
| | | | | | | 19,770 | |
| | | | | | | | |
| | |
Asia—5.7% | | | | | | | | |
Australia—1.4% | | | | | | | | |
Domino’s Pizza Enterprises, Ltd. (Hotels, restaurants & leisure) | | | 327,274 | | | | 3,588 | |
Seek, Ltd. (Professional services) | | | 900,328 | | | | 6,653 | |
| | | | | | | | |
| | | | | | | 10,241 | |
| | | | | | | | |
Hong Kong—2.9% | | | | | | | | |
Sa Sa International Holdings, Ltd. (Specialty retail) | | | 11,950,000 | | | | 9,923 | |
SmarTone Telecommunications Holdings, Ltd. (Wireless telecommunication services) | | | 5,804,000 | | | | 10,641 | |
| | | | | | | | |
| | | | | | | 20,564 | |
| | | | | | | | |
Singapore—1.4% | | | | | | | | |
ARA Asset Management Ltd.—144A (Capital markets) | | | 343,000 | | | | 459 | |
*Biosensors International Group, Ltd. (Health care equipment & supplies) | | | 2,932,000 | | | | 2,927 | |
First Resources, Ltd. (Food products) | | | 4,203,000 | | | | 7,008 | |
| | | | | | | | |
| | | | | | | 10,394 | |
| | | | | | | | |
Canada—4.8% | | | | | | | | |
Canadian Energy Services & Technology Corporation (Energy equipment & services) | | | 312,295 | | | | 3,328 | |
*Legacy Oil + Gas, Inc. (Oil, gas & consumable fuels) | | | 1,326,320 | | | | 9,147 | |
Peyto Exploration & Development Corporation (Oil, gas & consumable fuels) | | | 261,923 | | | | 6,054 | |
Precision Drilling Corporation (Energy equipment & services) | | | 745,292 | | | | 6,159 | |
Total Energy Services, Inc. (Energy equipment & services) | | | 222,362 | | | | 3,351 | |
Trilogy Energy Corporation (Oil, gas & consumable fuels) | | | 214,885 | | | | 6,288 | |
| | | | | | | | |
| | | | | | | 34,327 | |
| | | | | | | | |
| | |
Emerging Latin America—1.7% | | | | | | | | |
Brazil—0.9% | | | | | | | | |
*Lupatech S.A. (Energy equipment & services) | | | 252,217 | | | | 203 | |
OdontoPrev S.A. (Health care providers & services) | | | 472,000 | | | | 2,473 | |
*Qualicorp S.A. (Health care providers & services) | | | 359,100 | | | | 3,720 | |
T4F Entretenimento S.A. (Media) | | | 88,500 | | | | 339 | |
| | | | | | | | |
| | | | | | | 6,735 | |
| | | | | | | | |
See accompanying Notes to Financial Statements.
December 31, 2012 | William Blair Funds 25 |
International Small Cap Growth Fund
Portfolio of Investments, December 31, 2012 (all dollar amounts in thousands)
| | | | | | | | |
Issuer | | Shares or
Principal
Amount | | | Value | |
|
Common Stocks—Emerging Latin America—1.7%—(continued) | |
Chile—0.5% | | | | | | | | |
CFR Pharmaceuticals S.A. (Pharmaceuticals) | | | 13,645,276 | | | $ | 3,449 | |
| | | | | | | | |
Mexico—0.3% | | | | | | | | |
*Macquarie Mexico Real Estate Management S.A. de C.V.—144A (Real estate investment trusts (REITs)) | | | 906,973 | | | | 1,796 | |
| | | | | | | | |
Total Common Stocks—96.8%
(cost $590,782) | | | | 696,550 | |
| | | | | | | | |
| | |
Repurchase Agreement | | | | | | | | |
Fixed Income Clearing Corporation, 0.110% dated 12/31/12, due 1/2/13, repurchase price $20,374, collateralized by U.S. Treasury Note, 2.125%, due 12/31/15 | | $ | 20,374 | | | | 20,374 | |
| | | | | | | | |
Total Repurchase Agreement—2.8%
(cost $20,374) | | | | 20,374 | |
| | | | | | | | |
Total Investments—99.6%
(cost $611,156) | | | | 716,924 | |
Cash and other assets, less liabilities—0.4% | | | | 2,584 | |
| | | | | | | | |
Net assets—100.0% | | | $ | 719,508 | |
| | | | | | | | |
ADR = American Depository Receipt
GDR = Global Depository Receipt
*Non-income producing securities
† = U.S. listed foreign security
For securities primarily traded on exchanges or markets that close before the close of regular trading on the New York Stock Exchange, the Fund may use an independent pricing service to fair value price the securities pursuant to Valuation Procedures approved by the Board of Trustees.
At December 31, 2012, the Fund’s Portfolio of Investments includes the following sector categories (as a percentage of long-term investments):
| | | | |
Consumer Discretionary | | | 26.9% | |
Health Care | | | 13.6% | |
Financials | | | 13.2% | |
Information Technology | | | 11.8% | |
Industrials | | | 11.3% | |
Consumer Staples | | | 8.5% | |
Energy | | | 6.6% | |
Materials | | | 6.6% | |
Telecommunication Services | | | 1.5% | |
| | | | |
Total | | | 100.0% | |
| | | | |
At December 31, 2012, the Fund’s Portfolio of Investments includes the following currency categories (as a percentage of long-term investments):
| | | | |
British Pound Sterling | | | 27.0% | |
Euro | | | 21.2% | |
Japanese Yen | | | 17.0% | |
Hong Kong Dollar | | | 8.0% | |
Canadian Dollar | | | 4.9% | |
Swedish Krona | | | 3.3% | |
Indian Rupee | | | 3.0% | |
South African Rand | | | 3.0% | |
Norwegian Krone | | | 2.9% | |
Turkish Lira | | | 2.8% | |
Singapore Dollar | | | 1.5% | |
Australian Dollar | | | 1.5% | |
Swiss Franc | | | 1.1% | |
All Other Currencies | | | 2.8% | |
| | | | |
Total | | | 100.0% | |
| | | | |
See accompanying Notes to Financial Statements.
26 Annual Report | December 31, 2012 |

Todd M. McClone
Jeffrey A. Urbina
EMERGING MARKETS GROWTH FUND
The Emerging Markets Growth Fund seeks long-term capital appreciation.
AN OVERVIEW FROM THE PORTFOLIO MANAGERS
The Emerging Markets Growth Fund posted a 21.28% increase (Institutional Class Shares) for the twelve months ended December 31, 2012. By comparison, the Fund’s benchmark, the MSCI Emerging Markets IMI Index (net) increased 18.68%.
2012 outperformance was driven by strong stock selection across most sectors, with particular value added in the overweighted Consumer sectors, coupled with strong results in Materials and Energy. The Fund’s Discretionary stocks were up over 25%, compared to the 17.6% return in the benchmark Index due to broad strength across industries. Staples was up over 38%, due largely to strong outperformance in overweighted Food/Staples Retailing. Energy benefited from strong performance by CNOOC on a recovering production growth profile and Ecopetrol on strong results during the first half. In addition, limited exposure to Petrobras, a Brazil oil company, during the year was positive, given operational disappointments and continued concerns about governmental intervention. Materials benefited from good operational results from Grupo Mexico, the Fund’s sole Metals/Mining holding during the period. The key detractor from 2012 results was Information Technology (IT) stock selection, due largely to Chinese internet-related performance coupled with operational weakness at Comba Telecom and HTC, which we sold during the year.
As of year end, Consumer Discretionary and Staples remained overweighted at a combined 27.1% of the Fund, compared to the 17.7% Index weighting, with a tilt towards Discretionary. Financials increased during the year to 24.7% from 15.9% as of year-end 2012 primarily due to an increase in Commercial Banks and real estate-related weightings, but remained underweighted versus the 25.7% benchmark Index weighting. IT and Energy marginally decreased to fund this increase. Regionally, the Fund was underweighted in Emerging Asia, despite above-market weightings in China, India and the ASEAN countries, due to significantly underweighted Korea and Taiwan. Latin America totaled 21.1% of the Fund at year-end, a significant decrease since year-end 2011 due to lower exposure in Brazil on economic slowdown and governmental intervention concerns.
December 31, 2012 | William Blair Funds 27 |
Emerging Markets Growth Fund
Performance Highlights (unaudited)
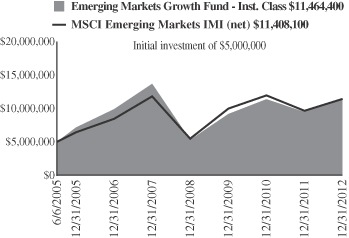
Average Annual Total Return at 12/31/2012
| | | | | | | | | | | | | | | | |
| | | 1
Year | | | 3
Year | | | 5
Year | | | Since
Inception(a) | |
Institutional Class | | | 21.28 | % | | | 7.72 | % | | | (3.46 | )% | | | 11.58 | % |
MSCI Emerging
Markets IMI (net) | | | 18.68 | | | | 4.64 | | | | (0.70 | ) | | | 11.50 | |
| | (a) | | For the period June 6, 2005 (Commencement of Operations) to December 31, 2012. |
Performance cited represents past performance. Past performance does not guarantee future results and current performance may be lower or higher than the data quoted. Results shown are average annual returns, which assume reinvestment of dividends and capital gains. Investment returns and principal will fluctuate and you may have a gain or loss when you sell shares. For the most current month-end performance information, please call 1-800-742-7272, or visit our Web site at www.williamblairfunds.com. From time to time, the investment advisor may waive fees or reimburse expenses for the Fund. Without these waivers, performance would be lower. International investing involves special risk considerations, including currency fluctuations, lower liquidity, economic and political risk.
The performance highlights and graph presented above do not reflect the deduction of taxes that a shareholder would pay on fund distributions or the redemption of fund shares.
The Morgan Stanley Capital International (MSCI) Emerging Markets Investable Market Index (IMI) (net) is a free float-adjusted market capitalization weighted index that is designed to measure the equity market performance of emerging markets. This series approximates the minimum possible dividend reinvestment.
This report identifies the Fund’s investments on December 31, 2012. These holdings are subject to change. Not all stocks in the Fund performed the same, nor is there any guarantee that these stocks will perform as well in the future. Market forecasts provided in this report may not necessarily come to pass.
Sector Diversification (unaudited)
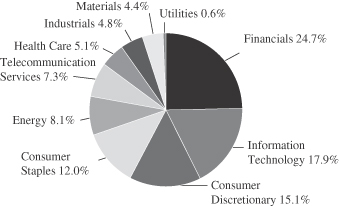
The sector diversification shown is based on the total long-term securities.
28 Annual Report | December 31, 2012 |
Emerging Markets Growth Fund
Portfolio of Investments, December 31, 2012 (all dollar amounts in thousands)
| | | | | | | | |
Issuer | | Shares | | | Value | |
|
Common Stocks—Emerging Asia—55.5% | |
China—19.8% | | | | | | | | |
AAC Technologies Holdings, Inc. (Communications equipment) | | | 875,959 | | | $ | 3,106 | |
*Baidu, Inc.—ADR (Internet software & services) | | | 47,987 | | | | 4,813 | |
Belle International Holdings, Ltd. (Specialty retail) | | | 2,346,610 | | | | 5,190 | |
*Brilliance China Automotive Holdings, Ltd. (Automobiles) | | | 8,818,000 | | | | 11,081 | |
China BlueChemical, Ltd. (Chemicals) | | | 3,610,609 | | | | 2,463 | |
China Mobile, Ltd. (Wireless telecommunication services) | | | 3,274,755 | | | | 38,536 | |
China Overseas Land & Investment, Ltd. (Real estate management & development) | | | 3,456,000 | | | | 10,508 | |
China Shenhua Energy Co., Ltd. (Oil, gas & consumable fuels) | | | 2,233,304 | | | | 10,004 | |
CNOOC, Ltd. (Oil, gas & consumable fuels) | | | 10,840,601 | | | | 23,882 | |
Dongyue Group (Chemicals) | | | 5,456,287 | | | | 3,689 | |
Golden Eagle Retail Group, Ltd. (Multiline retail) | | | 956,547 | | | | 2,382 | |
*Haier Electronics Group Co., Ltd. (Household durables) | | | 4,822,000 | | | | 7,152 | |
Haitian International Holdings, Ltd. (Machinery) | | | 2,334,870 | | | | 2,798 | |
Industrial and Commercial Bank of China, Ltd. Class “H” (Commercial banks) | | | 19,945,000 | | | | 14,396 | |
Lenovo Group, Ltd. (Computers & peripherals) | | | 15,575,014 | | | | 14,361 | |
Sino Biopharmaceutical (Pharmaceuticals) | | | 1,548,000 | | | | 746 | |
Sun Art Retail Group, Ltd. (Food & staples retailing) | | | 5,414,745 | | | | 8,371 | |
Tencent Holdings, Ltd. (Internet software & services) | | | 446,835 | | | | 14,655 | |
Want Want China Holdings, Ltd. (Food products) | | | 6,291,217 | | | | 8,817 | |
*WuXi PharmaTech Cayman, Inc.—ADR (Life sciences tools & services) | | | 144,501 | | | | 2,276 | |
Yingde Gases (Chemicals) | | | 2,062,981 | | | | 2,114 | |
| | | | | | | | |
| | | | | | | 191,340 | |
| | | | | | | | |
India—9.5% | | | | | | | | |
Asian Paints, Ltd. (Chemicals) | | | 40,286 | | | | 3,282 | |
Bajaj Auto, Ltd. (Automobiles) | | | 217,835 | | | | 8,522 | |
HDFC Bank, Ltd. (Commercial banks) | | | 614,440 | | | | 7,660 | |
Housing Development Finance Corporation (Thrifts & mortgage finance) | | | 648,245 | | | | 9,903 | |
IndusInd Bank, Ltd. (Commercial banks) | | | 370,437 | | | | 2,859 | |
ITC, Ltd. (Tobacco) | | | 2,622,889 | | | | 13,812 | |
*Jubilant Foodworks, Ltd. (Hotels, restaurants & leisure) | | | 107,827 | | | | 2,559 | |
Lupin, Ltd. (Pharmaceuticals) | | | 208,913 | | | | 2,359 | |
Motherson Sumi Systems, Ltd. (Auto components) | | | 1,019,801 | | | | 3,713 | |
Sun Pharmaceutical Industries, Ltd. (Pharmaceuticals) | | | 560,729 | | | | 7,585 | |
Tata Consultancy Services, Ltd. (IT services) | | | 416,320 | | | | 9,592 | |
Tata Motors, Ltd. (Automobiles) | | | 3,400,953 | | | | 19,549 | |
| | | | | | | | |
| | | | | | | 91,395 | |
| | | | | | | | |
|
Common Stocks—Emerging Asia—55.5%—(continued) | |
Indonesia—4.4% | | | | | | | | |
PT Astra International Tbk (Automobiles) | | | 17,263,240 | | | $ | 13,675 | |
PT Bank Rakyat Indonesia (Commercial banks) | | | 18,996,821 | | | | 13,778 | |
PT Indo Tambangraya Megah (Oil, gas & consumable fuels) | | | 876,724 | | | | 3,795 | |
PT Jasa Marga Persero Tbk (Transportation infrastructure) | | | 7,091,000 | | | | 4,017 | |
PT Kalbe Farma Tbk (Pharmaceuticals) | | | 28,249,415 | | | | 3,113 | |
PT XL Axiata Tbk (Diversified telecommunication services) | | | 6,536,500 | | | | 3,879 | |
| | | | | | | | |
| | | | | | | 42,257 | |
| | | | | | | | |
Malaysia—2.1% | | | | | | | | |
CIMB Group Holdings Bhd (Commercial banks) | | | 5,420,087 | | | | 13,567 | |
*IHH Healthcare Bhd (Health care providers & services) | | | 5,739,800 | | | | 6,358 | |
| | | | | | | | |
| | | | | | | 19,925 | |
| | | | | | | | |
Papua New Guinea—1.0% | | | | | | | | |
Oil Search, Ltd. (Oil, gas & consumable fuels) | | | 1,306,597 | | | | 9,662 | |
| | | | | | | | |
Philippines—0.4% | | | | | | | | |
SM Prime Holdings, Inc. (Real estate management & development) | | | 9,556,100 | | | | 3,852 | |
| | | | | | | | |
South Korea—8.3% | | | | | | | | |
Celltrion, Inc. (Pharmaceuticals) | | | 175,399 | | | | 4,283 | |
*Hyundai Motor Co. (Automobiles) | | | 87,825 | | | | 18,105 | |
*LG Household & Health Care, Ltd. (Household products) | | | 5,802 | | | | 3,554 | |
Samsung Electronics Co., Ltd. (Semiconductors & semiconductor equipment) | | | 27,900 | | | | 40,087 | |
Samsung Engineering Co., Ltd. (Construction & engineering) | | | 15,089 | | | | 2,351 | |
Samsung Fire & Marine Insurance Co., Ltd. (Insurance) | | | 34,088 | | | | 6,925 | |
Samsung Heavy Industries Co., Ltd. (Machinery) | | | 135,964 | | | | 4,968 | |
| | | | | | | | |
| | | | | | | 80,273 | |
| | | | | | | | |
Taiwan—5.6% | | | | | | | | |
Asustek Computer, Inc. (Computers & peripherals) | | | 1,341,000 | | | | 15,186 | |
Catcher Technology Co., Ltd. (Computers & peripherals) | | | 464,064 | | | | 2,330 | |
Hiwin Technologies Corporation (Machinery) | | | 239,429 | | | | 1,770 | |
Hon Hai Precision Industry Co., Ltd. (Electronic equipment, instruments & components) | | | 5,845,893 | | | | 18,095 | |
MediaTek, Inc. (Semiconductors & semiconductor equipment) | | | 851,064 | | | | 9,521 | |
TPK Holding Co., Ltd. (Electronic equipment, instruments & components) | | | 383,979 | | | | 6,876 | |
| | | | | | | | |
| | | | | | | 53,778 | |
| | | | | | | | |
Thailand—4.4% | | | | | | | | |
Advanced Info Service PCL (Wireless telecommunication services) | | | 1,168,362 | | | | 8,036 | |
BEC World PCL (Media) | | | 3,646,100 | | | | 8,498 | |
See accompanying Notes to Financial Statements.
December 31, 2012 | William Blair Funds 29 |
Emerging Markets Growth Fund
Portfolio of Investments, December 31, 2012 (all dollar amounts in thousands)
| | | | | | | | |
Issuer | | Shares | | | Value | |
|
Common Stocks—Emerging Asia—55.5%—(continued) | |
Thailand—(continued) | | | | | | | | |
CP ALL PCL (Food & staples retailing) | | | 5,417,518 | | | $ | 8,146 | |
Kasikornbank PCL (Commercial banks) | | | 2,248,482 | | | | 14,293 | |
Siam Makro PCL (Food & staples retailing) | | | 226,932 | | | | 3,319 | |
| | | | | | | | |
| | | | | | | 42,292 | |
| | | | | | | | |
| | |
Emerging Latin America—21.1% | | | | | | | | |
Argentina—0.5% | | | | | | | | |
MercadoLibre, Inc. (Internet software & services) | | | 56,934 | | | | 4,473 | |
| | | | | | | | |
Brazil—7.9% | | | | | | | | |
BR Malls Participacoes S.A. (Real estate management & development) | | | 858,690 | | | | 11,332 | |
BR Properties S.A. (Real estate management & development) | | | 275,997 | | | | 3,437 | |
Cia de Bebidas das Americas—ADR (Beverages) | | | 590,382 | | | | 24,790 | |
Cia de Concessoes Rodoviarias (Transportation infrastructure) | | | 750,389 | | | | 7,128 | |
Cia Hering (Specialty retail) | | | 201,116 | | | | 4,125 | |
Cielo S.A. (IT services) | | | 201,100 | | | | 5,598 | |
CPFL Energia S.A.—ADR (Electric utilities) | | | 25,717 | | | | 539 | |
Iochpe-Maxion S.A. (Machinery) | | | 167,600 | | | | 2,239 | |
Lojas Renner S.A. (Multiline retail) | | | 67,222 | | | | 2,618 | |
*Lupatech S.A. (Energy equipment & services) | | | 421,326 | | | | 340 | |
OdontoPrev S.A. (Health care providers & services) | | | 448,666 | | | | 2,351 | |
*Qualicorp S.A. (Health care providers & services) | | | 234,300 | | | | 2,427 | |
Raia Drogasil S.A. (Food & staples retailing) | | | 219,145 | | | | 2,469 | |
Totvs S.A. (Software) | | | 110,832 | | | | 2,186 | |
Tractebel Energia S.A. (Independent power producers & energy traders) | | | 296,538 | | | | 4,830 | |
| | | | | | | | |
| | | | | | | 76,409 | |
| | | | | | | | |
Chile—2.9% | | | | | | | | |
Banco Santander Chile—ADR (Commercial banks) | | | 166,393 | | | | 4,740 | |
CFR Pharmaceuticals S.A. (Pharmaceuticals) | | | 9,228,150 | | | | 2,332 | |
ENTEL Chile S.A. (Wireless telecommunication services) | | | 334,333 | | | | 6,914 | |
Inversiones La Construccion S.A. (Diversified financial services) | | | 102,017 | | | | 2,003 | |
S.A.C.I. Falabella (Multiline retail) | | | 446,216 | | | | 4,586 | |
Sociedad Quimica y Minera de Chile S.A.—ADR (Chemicals) | | | 84,509 | | | | 4,871 | |
Sonda S.A. (IT services) | | | 907,561 | | | | 2,891 | |
| | | | | | | | |
| | | | | | | 28,337 | |
| | | | | | | | |
Colombia—2.8% | | | | | | | | |
Ecopetrol S.A. (Oil, gas & consumable fuels) | | | 6,054,150 | | | | 18,707 | |
Pacific Rubiales Energy Corporation (Oil, gas & consumable fuels) | | | 369,891 | | | | 8,594 | |
| | | | | | | | |
| | | | | | | 27,301 | |
| | | | | | | | |
|
Common Stocks—Emerging Latin America—21.1%—(continued) | |
Mexico—5.7% | | | | | | | | |
Fibra Uno Administracion S.A. de C.V. (Real estate investment trusts (REITs)) | | | 192,369 | | | $ | 581 | |
Fomento Economico Mexicano S.A.B. de C.V.—ADR (Beverages) | | | 93,678 | | | | 9,433 | |
Grupo Financiero Banorte S.A.B. de C.V. (Commercial banks) | | | 3,230,910 | | | | 20,863 | |
Grupo Mexico S.A.B. de C.V. Series “B” (Metals & mining) | | | 6,740,267 | | | | 24,315 | |
| | | | | | | | |
| | | | | | | 55,192 | |
| | | | | | | | |
Panama—0.2% | | | | | | | | |
Copa Holdings S.A. Class “A” (Airlines)† | | | 16,927 | | | | 1,683 | |
| | | | | | | | |
Peru—1.1% | | | | | | | | |
Credicorp, Ltd. (Commercial banks)† | | | 69,363 | | | | 10,166 | |
| | | | | | | | |
|
Emerging Europe, Mid-East, Africa—16.8% | |
Nigeria—0.7% | | | | | | | | |
Guaranty Trust Bank plc (Commercial banks) | | | 28,471,188 | | | | 4,209 | |
Nigerian Breweries plc (Beverages) | | | 2,388,036 | | | | 2,257 | |
| | | | | | | | |
| | | | | | | 6,466 | |
| | | | | | | | |
Poland—0.2% | | | | | | | | |
Eurocash S.A. (Food & staples retailing) | | | 166,187 | | | | 2,351 | |
| | | | | | | | |
Qatar—1.2% | | | | | | | | |
Industries Qatar QSC (Industrial conglomerates) | | | 271,417 | | | | 11,604 | |
| | | | | | | | |
Russia—2.5% | | | | | | | | |
*Etalon Group Ltd.—144A—GDR (Real estate management & development) | | | 408,600 | | | | 2,235 | |
M Video OJSC (Specialty retail) | | | 193,600 | | | | 1,543 | |
Magnit OAO (Food & staples retailing)† | | | 64,463 | | | | 10,227 | |
Mail.ru Group, Ltd.—GDR (Internet software & services) | | | 69,724 | | | | 2,435 | |
*Yandex N.V. Class “A” (Internet software & services)† | | | 381,211 | | | | 8,223 | |
| | | | | | | | |
| | | | | | | 24,663 | |
| | | | | | | | |
South Africa—7.8% | | | | | | | | |
*Aspen Pharmacare Holdings, Ltd. (Pharmaceuticals) | | | 283,871 | | | | 5,683 | |
AVI, Ltd. (Food products) | | | 316,748 | | | | 2,244 | |
Bidvest Group, Ltd. (Industrial conglomerates) | | | 189,187 | | | | 4,840 | |
Discovery Holdings, Ltd. (Insurance) | | | 439,270 | | | | 3,240 | |
FirstRand, Ltd. (Diversified financial services) | | | 4,241,154 | | | | 15,606 | |
Life Healthcare Group Holdings Pte, Ltd. (Health care providers & services) | | | 1,827,565 | | | | 7,345 | |
Mr Price Group, Ltd. (Specialty retail) | | | 134,316 | | | | 2,226 | |
MTN Group, Ltd. (Wireless telecommunication services) | | | 519,782 | | | | 10,941 | |
Naspers, Ltd. (Media) | | | 228,562 | | | | 14,763 | |
Shoprite Holdings, Ltd. (Food & staples retailing) | | | 224,152 | | | | 5,438 | |
Tiger Brands, Ltd. (Food products) | | | 65,572 | | | | 2,529 | |
| | | | | | | | |
| | | | | | | 74,855 | |
| | | | | | | | |
See accompanying Notes to Financial Statements.
30 Annual Report | December 31, 2012 |
Emerging Markets Growth Fund
Portfolio of Investments, December 31, 2012 (all dollar amounts in thousands)
| | | | | | | | |
Issuer | | Shares or
Principal
Amount | | | Value | |
|
Common Stocks—Emerging Europe, Mid-East, Africa—16.8%—(continued) | |
Turkey—3.8% | | | | | | | | |
Arcelik A.S. (Household durables) | | | 735,219 | | | $ | 4,835 | |
BIM Birlesik Magazalar A.S. (Food & staples retailing) | | | 49,474 | | | | 2,426 | |
Tofas Turk Otomobil Fabrikasi A.S. (Automobiles) | | | 639,220 | | | | 3,763 | |
Turkiye Halk Bankasi A.S. (Commercial banks) | | | 2,586,661 | | | | 25,498 | |
| | | | | | | | |
| | | | | | | 36,522 | |
| | | | | | | | |
United Arab Emirates—0.6% | | | | | | | | |
First Gulf Bank PJSC (Commercial banks) | | | 1,905,256 | | | | 6,116 | |
| | | | | | | | |
Total Common Stocks—93.4%
(cost $749,631) | | | | 900,912 | |
| | | | | | | | |
| | |
Preferred Stock | | | | | | | | |
Brazil—2.0% | | | | | | | | |
Itau Unibanco Holding S.A. (Commercial banks) | | | 1,211,941 | | | | 19,764 | |
| | | | | | | | |
Total Preferred Stock—2.0%
(cost $18,035) | | | | 19,764 | |
| | | | | | | | |
| | |
Affiliated Fund | | | | | | | | |
China—2.5% | | | | | | | | |
William Blair China A—Share Fund, LLC | | | 2,362,400 | | | | 23,624 | |
| | | | | | | | |
Total Affiliated Fund—2.5%
(cost $23,624) | | | | 23,624 | |
| | | | | | | | |
| | |
Repurchase Agreement | | | | | | | | |
Fixed Income Clearing Corporation, 0.110% dated 12/31/12, due 1/2/13, repurchase price $13,524, collateralized by U.S. Treasury Note, 2.125%, due 12/31/15 | | $ | 13,524 | | | | 13,524 | |
| | | | | | | | |
Total Repurchase Agreement—1.4%
(cost $13,524) | | | | 13,524 | |
| | | | | | | | |
Total Investments—99.3%
(cost $804,814) | | | | 957,824 | |
Cash and other assets, less liabilities—0.7% | | | | 6,413 | |
| | | | | | | | |
Net assets—100.0% | | | $ | 964,237 | |
| | | | | | | | |
ADR = American Depository Receipt
GDR = Global Depository Receipt
*Non-income producing securities
† = U.S. listed foreign security
The Emerging Markets Growth Fund invested in the following affiliated fund. There are no unfunded commitments to the affiliated fund and the Fund may redeem its investment monthly.
| | | | | | | | | | | | | | | | | | | | | | | | |
| | | Share Activity | | | Year Ended
December 31, 2012 | |
| | | | | | | | | | | | | | | (in thousands) | |
Fund Name | | Balance
12/31/2011 | | | Purchases | | | Sales | | | Balance
12/31/2012 | | | Value | | | Dividends
Included
in Income | |
William Blair China A—Share Fund, LLC | | | — | | | | 2,362,400 | | | | — | | | | 2,362,400 | | | $ | 23,624 | | | | — | |
As of December 31, 2012, the Fund invested in the William Blair China A—Share Fund, LLC, an affiliated fund. There was no realized or unrealized gain/(loss) from investments in the affiliated fund.
For securities primarily traded on exchanges or markets that close before the close of regular trading on the New York Stock Exchange, the Fund may use an independent pricing service to fair value price the securities pursuant to Valuation Procedures approved by the Board of Trustees.
At December 31, 2012, the Fund’s Portfolio of Investments includes the following sector categories (as a percentage of long-term investments):
| | | | |
Financials | | | 24.7% | |
Information Technology | | | 17.9% | |
Consumer Discretionary | | | 15.1% | |
Consumer Staples | | | 12.0% | |
Energy | | | 8.1% | |
Telecommunication Services | | | 7.3% | |
Health Care | | | 5.1% | |
Industrials | | | 4.8% | |
Materials | | | 4.4% | |
Utilities | | | 0.6% | |
| | | | |
Total | | | 100.0% | |
| | | | |
At December 31, 2012, the Fund’s Portfolio of Investments includes the following currency categories (as a percentage of long-term investments):
| | | | |
Hong Kong Dollar | | | 19.8% | |
U.S. Dollar | | | 11.8% | |
Indian Rupee | | | 9.7% | |
South Korean Won | | | 8.5% | |
South African Rand | | | 7.9% | |
Brazilian Real | | | 7.5% | |
New Taiwan Dollar | | | 5.7% | |
Mexican Peso | | | 4.8% | |
Thai Baht | | | 4.5% | |
Indonesian Rupiah | | | 4.5% | |
Turkish Lira | | | 3.9% | |
Malaysian Ringgit | | | 2.1% | |
Chilean Peso | | | 2.0% | |
Colombian Peso | | | 2.0% | |
Qatari Rial | | | 1.2% | |
Australian Dollar | | | 1.0% | |
All Other Currencies | | | 3.1% | |
| | | | |
Total | | | 100.0% | |
| | | | |
See accompanying Notes to Financial Statements.
December 31, 2012 | William Blair Funds 31 |
Todd M. McClone
Jeffrey A. Urbina
EMERGING MARKETS LEADERS FUND
The Emerging Markets Leaders Fund seeks long-term capital appreciation.
AN OVERVIEW FROM THE PORTFOLIO MANAGERS
The Emerging Markets Leaders Fund (formerly the Emerging Leaders Growth Fund Institutional Class Shares) posted a 20.97% increase (Institutional Class Shares) for the twelve months ended December 31, 2012. By comparison, the Fund’s benchmark, the MSCI Emerging Markets Index (net) increased 18.22%.
2012 to date performance surpassed the MSCI Emerging Markets Index (net), on strong outperformance across a number of sectors. The overweighted Consumer Staples sector added approximately 2% to outperformance, as the overweighted Food/Staples Retailing segment was up over 52% with broad strength across names. Energy stock selection was bolstered by limited exposure in Petrobras , a Brazil oil company, during the year, given operational disappointments and continued concerns about governmental intervention. It also benefited from strong performance by CNOOC, a Chinese energy company, on a recovering production growth profile and Ecopetrol on strong results during the first half. Commercial Banks were up nearly 29% during the year and were the most significant contributor to Financials outperformance, while Materials benefited from good operational results from Grupo Mexico, the Fund’s sole Metals/Mining holding during the period. The key detractor from 2012 results was Information Technology (IT) stock selection, due largely to Chinese internet-related performance coupled with concerns about revenue trends at Cielo, the Brazilian card processing company.
During the year as valuations expanded, the Fund’s weighting in Consumer Discretionary and Staples decreased substantially from approximately 36% of the Fund to approximately 28%, but remained above the 16.7% benchmark Index weighting. Conversely, Financials increased from 19.8% to 30.6%, as we added to Commercial Banks and Real Estate-related holdings. Conversely, Industrials decreased from a index weighting of approximately 6.5% to 3.1% on deteriorating demand trends, while IT marginally increased. Regionally, the Fund was underweighted in Emerging Asia, despite above-market weightings in China, India and the Southeast Asia countries, due to significantly underweighted Korea and Taiwan. Europe, Middle East and Africa decreased slightly during the year, due to a reduction in South African holdings on valuation concerns. Latin America totaled 21.3% of the Fund at year end, approximately 3% above the Index weighting, due to holdings in Chile, Colombia, Mexico and Peru, which more than offset the lower Brazil weighting.
32 Annual Report | December 31, 2012 |
Emerging Markets Leaders Fund
Performance Highlights (unaudited)
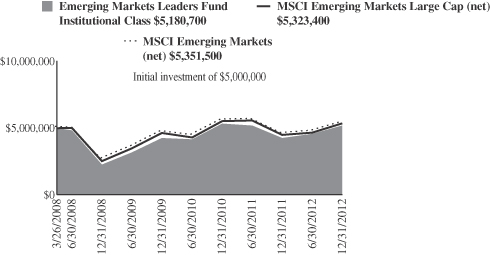
Average Annual Total Return at 12/31/2012
| | | | | | | | | | | | |
| | | 1
Year | | | 3
Year | | | Since
Inception(a) | |
Institutional Class | | | 20.97 | % | | | 6.53 | % | | | 0.75 | % |
MSCI Emerging Markets
Large Cap (net) | | | 17.79 | | | | 4.71 | | | | 1.32 | |
MSCI Emerging Markets (net) | | | 18.22 | | | | 4.66 | | | | 1.43 | |
| | (a) | | For the period March 26, 2008 (Commencement of Operations) to December 31, 2012. |
Performance cited represents past performance. Past performance does not guarantee future results and current performance may be lower or higher than the data quoted. Results shown are average annual total returns, which assume reinvestment of dividends and capital gains. Investment returns and principal will fluctuate and you may have a gain or loss when you sell shares. For the most current month-end performance information, please call 1-800-742-7272, or visit our Web site at www.williamblairfunds.com. International investing includes special risk considerations, including currency fluctuations, lower liquidity, economic and political risk. From time to time, the investment advisor may waive fees or reimburse expenses for the Fund. Without these waivers, performance would be lower.
The performance highlights and graph presented above do not reflect the deduction of taxes that a shareholder would pay on fund distributions or the redemption of fund shares.
The Morgan Stanley Capital International (MSCI) Emerging Markets Index (net) is a free float-adjusted market-capitalization-weighted index that is designed to measure equity market performance of emerging markets. This series approximates the minimum possible dividend reinvestment.
The Morgan Stanley Capital International (MSCI) Emerging Markets Large Cap Index (net) is a free float-adjusted market capitalization weighted index that is designed to measure market performance of large capitalization on stocks in emerging markets. This series approximates the minimum possible dividend reinvestment.
On December 31, 2012, the Fund’s Benchmark changed from the Morgan Stanley Capital International (MSCI) Emerging Markets Large Cap Index (net) to the Morgan Stanley Capital International (MSCI) Emerging Markets Index (net). The primary reason for this change is to compare the Fund to a benchmark that more closely reflects the market capitalization focus the Fund uses in its investment strategy.
This report identifies the Fund’s investments on December 31, 2012. These holdings are subject to change. Not all stocks in the Fund performed the same, nor is there any guarantee that these stocks will perform as well in the future. Market forecasts provided in this report may not necessarily come to pass.
Sector Diversification (unaudited)
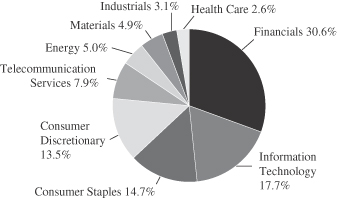
The sector diversification shown is based on the total long-term securities.
December 31, 2012 | William Blair Funds 33 |
Emerging Markets Leaders Fund
Portfolio of Investments, December 31, 2012 (all dollar amounts in thousands)
| | | | | | | | |
Issuer | | Shares | | | Value | |
|
Common Stocks—Emerging Asia—56.6% | |
China—20.0% | | | | | | | | |
Belle International Holdings, Ltd. (Specialty retail) | | | 449,000 | | | $ | 993 | |
*Brilliance China Automotive Holdings, Ltd. (Automobiles) | | | 938,000 | | | | 1,179 | |
China Mobile, Ltd. (Wireless telecommunication services) | | | 260,500 | | | | 3,066 | |
China Overseas Land & Investment, Ltd. (Real estate management & development) | | | 546,000 | | | | 1,660 | |
CNOOC, Ltd. (Oil, gas & consumable fuels) | | | 618,000 | | | | 1,361 | |
Lenovo Group, Ltd. (Computers & peripherals) | | | 1,506,000 | | | | 1,389 | |
Ping An Insurance Group Co. of China, Ltd. Class “H” (Insurance) | | | 87,500 | | | | 746 | |
Sun Art Retail Group, Ltd. (Food & staples retailing) | | | 484,000 | | | | 748 | |
Tencent Holdings, Ltd. (Internet software & services) | | | 59,700 | | | | 1,958 | |
Want Want China Holdings, Ltd. (Food products) | | | 521,000 | | | | 730 | |
| | | | | | | | |
| | | | | | | 13,830 | |
| | | | | | | | |
India—10.1% | | | | | | | | |
Bajaj Auto, Ltd. (Automobiles) | | | 26,380 | | | | 1,032 | |
HDFC Bank, Ltd. (Commercial banks) | | | 59,521 | | | | 742 | |
Housing Development Finance Corporation (Thrifts & mortgage finance) | | | 50,310 | | | | 769 | |
ITC, Ltd. (Tobacco) | | | 210,623 | | | | 1,109 | |
Sun Pharmaceutical Industries, Ltd. (Pharmaceuticals) | | | 77,316 | | | | 1,046 | |
Tata Consultancy Services, Ltd. (IT services) | | | 30,914 | | | | 712 | |
Tata Motors, Ltd. (Automobiles) | | | 271,948 | | | | 1,563 | |
| | | | | | | | |
| | | | | | | 6,973 | |
| | | | | | | | |
Indonesia—3.1% | | | | | | | | |
PT Astra International Tbk (Automobiles) | | | 1,155,000 | | | | 915 | |
PT Bank Rakyat Indonesia (Commercial banks) | | | 1,656,500 | | | | 1,201 | |
| | | | | | | | |
| | | | | | | 2,116 | |
| | | | | | | | |
Malaysia—2.9% | | | | | | | | |
CIMB Group Holdings Bhd (Commercial banks) | | | 514,800 | | | | 1,289 | |
*IHH Healthcare Bhd (Health care providers & services) | | | 630,600 | | | | 698 | |
| | | | | | | | |
| | | | | | | 1,987 | |
| | | | | | | | |
South Korea—7.9% | | | | | | | | |
*Hyundai Motor Co. (Automobiles) | | | 8,070 | | | | 1,664 | |
*LG Household & Health Care, Ltd. (Household products) | | | 582 | | | | 356 | |
Samsung Electronics Co., Ltd. (Semiconductors & semiconductor equipment) | | | 2,383 | | | | 3,424 | |
| | | | | | | | |
| | | | | | | 5,444 | |
| | | | | | | | |
Taiwan—6.5% | | | | | | | | |
Asustek Computer, Inc. (Computers & peripherals) | | | 124,000 | | | | 1,404 | |
Hon Hai Precision Industry Co., Ltd. (Electronic equipment, instruments & components) | | | 552,770 | | | | 1,711 | |
MediaTek, Inc. (Semiconductors & semiconductor equipment) | | | 61,000 | | | | 683 | |
|
Common Stocks—Emerging Asia—56.6%—(continued) | |
Taiwan—(continued) | | | | | | | | |
Taiwan Semiconductor Manufacturing Co., Ltd.—ADR (Semiconductors & semiconductor equipment) | | | 40,175 | | | $ | 689 | |
| | | | | | | | |
| | | | | | | 4,487 | |
| | | | | | | | |
Thailand—6.1% | | | | | | | | |
Advanced Info Service PCL (Wireless telecommunication services) | | | 222,500 | | | | 1,530 | |
CP ALL PCL (Food & staples retailing) | | | 881,400 | | | | 1,326 | |
Kasikornbank PCL (Commercial banks) | | | 210,200 | | | | 1,336 | |
| | | | | | | | |
| | | | | | | 4,192 | |
| | | | | | | | |
| | |
Emerging Latin America—21.3% | | | | | | | | |
Brazil—4.6% | | | | | | | | |
BR Malls Participacoes S.A. (Real estate management & development) | | | 104,600 | | | | 1,381 | |
Cia de Bebidas das Americas—ADR (Beverages) | | | 43,016 | | | | 1,806 | |
| | | | | | | | |
| | | | | | | 3,187 | |
| | | | | | | | |
Chile—3.3% | | | | | | | | |
Banco Santander Chile—ADR (Commercial banks) | | | 24,273 | | | | 691 | |
S.A.C.I. Falabella (Multiline retail) | | | 70,614 | | | | 726 | |
Sociedad Quimica y Minera de Chile S.A.—ADR (Chemicals) | | | 15,429 | | | | 889 | |
| | | | | | | | |
| | | | | | | 2,306 | |
| | | | | | | | |
Colombia—2.9% | | | | | | | | |
Ecopetrol S.A. (Oil, gas & consumable fuels) | | | 654,079 | | | | 2,021 | |
| | | | | | | | |
Mexico—8.9% | | | | | | | | |
Fomento Economico Mexicano S.A.B. de C.V.—ADR (Beverages) | | | 13,452 | | | | 1,355 | |
Grupo Financiero Banorte S.A.B. de C.V. (Commercial banks) | | | 358,800 | | | | 2,317 | |
Grupo Mexico S.A.B. de C.V. Series “B” (Metals & mining) | | | 676,400 | | | | 2,440 | |
| | | | | | | | |
| | | | | | | 6,112 | |
| | | | | | | | |
Peru—1.6% | | | | | | | | |
Credicorp, Ltd. (Commercial banks)† | | | 7,284 | | | | 1,067 | |
| | | | | | | | |
|
Emerging Europe, Mid-East, Africa—17.3% | |
Qatar—2.0% | | | | | | | | |
Industries Qatar QSC (Industrial conglomerates) | | | 33,058 | | | | 1,414 | |
| | | | | | | | |
Russia—4.8% | | | | | | | | |
Magnit OAO (Food & staples retailing)† | | | 902 | | | | 143 | |
Magnit OJSC—144A—GDR (Food & staples retailing) | | | 30,146 | | | | 1,226 | |
Sberbank of Russian Federation (Commercial banks)† | | | 628,838 | | | | 1,922 | |
| | | | | | | | |
| | | | | | | 3,291 | |
| | | | | | | | |
South Africa—7.0% | | | | | | | | |
Bidvest Group, Ltd. (Industrial conglomerates) | | | 27,569 | | | | 705 | |
FirstRand, Ltd. (Diversified financial services) | | | 304,841 | | | | 1,122 | |
MTN Group, Ltd. (Wireless telecommunication services) | | | 37,013 | | | | 779 | |
See accompanying Notes to Financial Statements.
34 Annual Report | December 31, 2012 |
Emerging Markets Leaders Fund
Portfolio of Investments, December 31, 2012 (all dollar amounts in thousands)
| | | | | | | | |
Issuer | | Shares or
Principal
Amount | | | Value | |
|
Common Stocks—Emerging Europe, Mid-East, Africa—17.3%—(continued) | |
South Africa—(continued) | | | | | | | | |
Naspers, Ltd. (Media) | | | 16,375 | | | $ | 1,058 | |
Shoprite Holdings, Ltd. (Food & staples retailing) | | | 32,125 | | | | 779 | |
Tiger Brands, Ltd. (Food products) | | | 9,106 | | | | 351 | |
| | | | | | | | |
| | | | | | | 4,794 | |
| | | | | | | | |
Turkey—3.5% | | | | | | | | |
Turkiye Garanti Bankasi A.S. (Commercial banks) | | | 461,388 | | | | 2,408 | |
| | | | | | | | |
Total Common Stocks—95.2%
(cost $55,595) | | | | 65,629 | |
| | | | | | | | |
| | |
Preferred Stock | | | | | | | | |
Brazil—3.0% | | | | | | | | |
Itau Unibanco Holding S.A. (Commercial banks) | | | 127,900 | | | | 2,086 | |
| | | | | | | | |
Total Preferred Stock—3.0%
(cost $1,986) | | | | 2,086 | |
| | | | | | | | |
| | |
Repurchase Agreement | | | | | | | | |
Fixed Income Clearing Corporation, 0.110% dated 12/31/12, due 1/2/13, repurchase price $2,909, collateralized by U.S.Treasury Note, 2.125%, due 12/31/15 | | $ | 2,909 | | | | 2,909 | |
| | | | | | | | |
Total Repurchase Agreement—4.2%
(cost $2,909) | | | | 2,909 | |
| | | | | | | | |
Total Investments—102.4%
(cost $60,490) | | | | 70,624 | |
Liabilities, plus cash and other assets—(2.4)% | | | | (1,645 | ) |
| | | | | | | | |
Net assets—100.0% | | | $ | 68,979 | |
| | | | | | | | |
ADR = American Depository Receipt
GDR = Global Depository Receipt
*Non-income producing securities
† = U.S. listed foreign security
For securities primarily traded on exchanges or markets that close before the close of regular trading on the New York Stock Exchange, the Fund may use an independent pricing service to fair value price the securities pursuant to Valuation Procedures approved by the Board of Trustees.
At December 31, 2012, the Fund’s Portfolio of Investments includes the following sector categories (as a percentage of long-term investments):
| | | | |
Financials | | | 30.6% | |
Information Technology | | | 17.7% | |
Consumer Staples | | | 14.7% | |
Consumer Discretionary | | | 13.5% | |
Telecommunication Services | | | 7.9% | |
Energy | | | 5.0% | |
Materials | | | 4.9% | |
Industrials | | | 3.1% | |
Health Care | | | 2.6% | |
| | | | |
Total | | | 100.0% | |
| | | | |
At December 31, 2012, the Fund’s Portfolio of Investments includes the following currency categories (as a percentage of long-term investments):
| | | | |
Hong Kong Dollar | | | 20.4% | |
U.S. Dollar | | | 14.5% | |
Indian Rupee | | | 10.3% | |
South Korean Won | | | 8.0% | |
South African Rand | | | 7.1% | |
Mexican Peso | | | 7.0% | |
Thai Baht | | | 6.2% | |
New Taiwan Dollar | | | 5.6% | |
Brazilian Real | | | 5.1% | |
Turkish Lira | | | 3.6% | |
Indonesian Rupiah | | | 3.1% | |
Colombian Peso | | | 3.0% | |
Malaysian Ringgit | | | 2.9% | |
Qatari Rial | | | 2.1% | |
Chilean Peso | | | 1.1% | |
| | | | |
Total | | | 100.0% | |
| | | | |
See accompanying Notes to Financial Statements.
December 31, 2012 | William Blair Funds 35 |
Todd M. McClone
Jeffrey A. Urbina
EMERGING MARKETS SMALL CAP GROWTH FUND
The Emerging Markets Small Cap Growth Fund seeks long-term capital appreciation.
AN OVERVIEW FROM THE PORTFOLIO MANAGERS
The Emerging Markets Small Cap Growth Fund posted a 1.64% increase (Institutional Class Shares) for the period ended December 31, 2012. By comparison, the Fund’s benchmark, the MSCI Emerging Markets Small Cap Index (net) increased 1.43%.
The Fund outpaced the Index, led by outperformance in the overweighted Consumer sectors. Discretionary stocks were up over 41% for the year, well ahead of the 22% Index return, due largely to outperformance in Latin American and Asian Hotels/Restaurants, coupled with strong results in Household Durables and in Asian Media companies. The Fund’s Staples stocks were up approximately 57%, well ahead of the 27% Index return, on strength in the overweighted Food/Staples Retailing industry, in addition to outperformance in Asian Food products companies. The Fund’s Industrials stocks were up over 35%, with broad-based strength across industries except Transportation Infrastructure. In addition, the lack of Construction/Engineering holdings somewhat detracted from results. While the underweighting in Materials added significant value during the year, stock selection was negative, as all industries underperformed. Regionally, Asian stock selection was particularly strong as a focus on Southeast Asian Nation (ASEAN) countries at the expense of South Korea and Taiwan added value, as did strong stock selection across a number of countries.
The Fund maintained its significant focus on Consumer, which represented a combined 46% of the Fund as of year end, compared with the 26% Index weighting. Financials was also overweighted at 23% of the Fund versus the 20% Index weighting, an increase since year-end 2011. Conversely, Industrials, Information Technology (IT) and Telecommunication Services were the most underweighted. Regionally, the Fund’s Asian holdings totalled 57.2%, well below the 74.5% Index weighting due primarily to significant underweightings in South Korea and Taiwan, which were only somewhat mitigated by higher India and ASEAN exposures. Conversely, Latin America totalled 22.8%, well above the 11.3% Index weighting, due to significant exposure in Brazil and Mexico and a higher weighting in Chile.
36 Annual Report | December 31, 2012 |
Emerging Markets Small Cap Growth Fund
Performance Highlights (Unaudited)
Average Annual Total Return at 12/31/2012
| | | | |
| | | Since
Inception(a) | |
Institutional Class | | | 1.64 | % |
MSCI Emerging Markets Small Cap (net) | | | 1.43 | |
| | (a) | | For the period from December 20, 2012 (Commencement of Operations) to December 31, 2012. | |
Performance cited represents past performance. Past performance does not guarantee future results and current performance may be lower or higher than the data quoted. Results shown are average annual returns, which assume reinvestment of dividends and capital gains. Investment returns and principal will fluctuate and you may have a gain or loss when you sell shares. For the most current month-end performance information, please call 1-800-742-7272, or visit our Web site at www.williamblairfunds.com. From time to time, the investment advisor may waive fees or reimburse expenses for the Fund. Without these waivers, performance would be lower. International investing involves special risk considerations, including currency fluctuations, lower liquidity, economic and political risk.
The performance highlights and graph presented above do not reflect the deduction of taxes that a shareholder would pay on fund distributions or the redemption of fund shares.
The Morgan Stanley Capital International (MSCI) Emerging Markets Small Cap Index (net) is a free float-adjusted market capitalization weighted index that is designed to measure the equity market performance of emerging markets. This series approximates the minimum possible dividend reinvestment.
This report identifies the Fund’s investments on December 31, 2012. These holdings are subject to change. Not all stocks in the Fund performed the same, nor is there any guarantee that these stocks will perform as well in the future. Market forecasts provided in this report may not necessarily come to pass.
Sector Diversification (Unaudited)
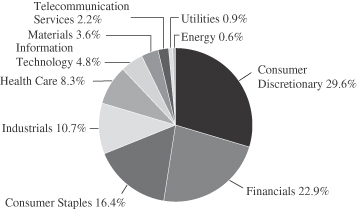
The sector diversification shown is based on the total long-term securities.
December 31, 2012 | William Blair Funds 37 |
Emerging Markets Small Cap Growth Fund
Portfolio of Investments, December 31, 2012 (all dollar amounts in thousands)
| | | | | | | | |
Issuer | | Shares | | | Value | |
|
Common Stocks—Emerging Asia—57.2% | |
Cambodia—1.6% | | | | | | | | |
NagaCorp, Ltd. (Hotels, restaurants & leisure) | | | 710,000 | | | $ | 434 | |
| | | | | | | | |
China—12.1% | | | | | | | | |
AAC Technologies Holdings, Inc. (Communications equipment) | | | 73,000 | | | | 259 | |
China Medical System Holdings, Ltd. (Pharmaceuticals) | | | 240,000 | | | | 187 | |
China Overseas Grand Oceans Group, Ltd. (Real estate management & development) | | | 428,000 | | | | 523 | |
Dongyue Group (Chemicals) | | | 500,000 | | | | 338 | |
Golden Eagle Retail Group, Ltd. (Multiline retail) | | | 130,000 | | | | 324 | |
*Haier Electronics Group Co., Ltd. (Household durables) | | | 255,000 | | | | 378 | |
Haitian International Holdings, Ltd. (Machinery) | | | 250,000 | | | | 300 | |
*Hollysys Automation Technologies, Ltd. (Electronic equipment, instruments & components)† | | | 11,059 | | | | 131 | |
Minth Group, Ltd. (Auto components) | | | 108,000 | | | | 125 | |
Prince Frog International Holdings, Ltd. (Personal products) | | | 571,000 | | | | 243 | |
Sino Biopharmaceutical Ltd. (Pharmaceuticals) | | | 580,000 | | | | 280 | |
Tiangong International Co., Ltd. (Metals & mining) | | | 776,000 | | | | 189 | |
| | | | | | | | |
| | | | | | | 3,277 | |
| | | | | | | | |
India—12.7% | | | | | | | | |
Bata India, Ltd. (Textiles, apparel & luxury goods) | | | 11,797 | | | | 188 | |
Colgate-Palmolive India, Ltd. (Personal products) | | | 7,779 | | | | 225 | |
CRISIL, Ltd. (Diversified financial services) | | | 5,146 | | | | 102 | |
Eicher Motors, Ltd. (Machinery) | | | 3,304 | | | | 176 | |
GlaxoSmithKline Consumer Healthcare, Ltd. (Food products) | | | 4,041 | | | | 284 | |
Godrej Consumer Products, Ltd. (Personal products) | | | 13,706 | | | | 182 | |
Gruh Finance, Ltd. (Thrifts & mortgage finance) | | | 54,158 | | | | 235 | |
Havells India, Ltd. (Electrical equipment) | | | 2,075 | | | | 24 | |
IndusInd Bank, Ltd. (Commercial banks) | | | 38,858 | | | | 300 | |
Ipca Laboratories, Ltd. (Pharmaceuticals) | | | 22,423 | | | | 212 | |
*Jubilant Foodworks, Ltd. (Hotels, restaurants & leisure) | | | 7,314 | | | | 174 | |
Lupin, Ltd. (Pharmaceuticals) | | | 24,125 | | | | 272 | |
Marico, Ltd. (Personal products) | | | 63,017 | | | | 252 | |
Motherson Sumi Systems, Ltd. (Auto components) | | | 38,643 | | | | 141 | |
Page Industries, Ltd. (Textiles, apparel & luxury goods) | | | 2,464 | | | | 154 | |
Pidilite Industries, Ltd. (Chemicals) | | | 54,818 | | | | 219 | |
Yes Bank, Ltd. (Commercial banks) | | | 32,711 | | | | 279 | |
| | | | | | | | |
| | | | | | | 3,419 | |
| | | | | | | | |
Indonesia—6.4% | | | | | | | | |
PT Ace Hardware Indonesia Tbk (Specialty retail) | | | 5,295,500 | | | | 453 | |
PT Alam Sutera Realty Tbk (Real estate management & development) | | | 1,792,000 | | | | 112 | |
*PT Bank Tabungan Pensiunan Nasional Tbk (Commercial banks) | | | 227,000 | | | | 124 | |
|
Common Stocks—Emerging Asia—57.2%—(continued) | |
Indonesia—(continued) | | | | | | | | |
PT Ciputra Development Tbk (Real estate management & development) | | | 2,034,500 | | | $ | 169 | |
PT Holcim Indonesia Tbk (Construction materials) | | | 584,000 | | | | 176 | |
PT Jasa Marga (Transportation infrastructure) | | | 87,000 | | | | 49 | |
PT Kalbe Farma Tbk (Pharmaceuticals) | | | 1,349,500 | | | | 149 | |
PT Media Nusantara Citra Tbk (Media) | | | 234,500 | | | | 61 | |
*PT MNC Sky Vision Tbk (Media) | | | 311,000 | | | | 77 | |
PT Sumber Alfaria Trijaya Tbk (Food & staples retailing) | | | 133,000 | | | | 73 | |
*PT Tower Bersama Infrastructure Tbk (Wireless telecommunication services) | | | 492,500 | | | | 292 | |
| | | | | | | | |
| | | | | | | 1,735 | |
| | | | | | | | |
Malaysia—3.5% | | | | | | | | |
Aeon Co. M Bhd (Multiline retail) | | | 44,200 | | | | 204 | |
Dayang Enterprise Holdings Bhd (Energy equipment & services) | | | 207,200 | | | | 162 | |
Guinness Anchor Bhd (Beverages) | | | 69,400 | | | | 377 | |
Nestle Malaysia Bhd (Food products) | | | 9,000 | | | | 186 | |
Padini Holdings Bhd (Specialty retail) | | | 45,400 | | | | 28 | |
| | | | | | | | |
| | | | | | | 957 | |
| | | | | | | | |
Philippines—6.1% | | | | | | | | |
Alliance Global Group, Inc. (Industrial conglomerates) | | | 787,000 | | | | 322 | |
*East West Banking Corporation (Commercial banks) | | | 13,900 | | | | 10 | |
Puregold Price Club, Inc. (Food & staples retailing) | | | 673,000 | | | | 541 | |
Security Bank Corporation (Commercial banks) | | | 88,450 | | | | 337 | |
SM Prime Holdings, Inc. (Real estate management & development) | | | 264,375 | | | | 107 | |
Universal Robina Corporation (Food products) | | | 160,700 | | | | 328 | |
| | | | | | | | |
| | | | | | | 1,645 | |
| | | | | | | | |
South Korea—2.5% | | | | | | | | |
*Able C&C Co., Ltd. (Personal products) | | | 2,351 | | | | 175 | |
*Gamevil, Inc. (Software) | | | 2,051 | | | | 193 | |
*Kolao Holdings (Automobiles) | | | 10,328 | | | | 178 | |
*Paradise Co., Ltd. (Hotels, restaurants & leisure) | | | 8,360 | | | | 135 | |
| | | | | | | | |
| | | | | | | 681 | |
| | | | | | | | |
Sri Lanka—1.0% | | | | | | | | |
Commercial Bank of Ceylon plc (Commercial banks) | | | 148,872 | | | | 120 | |
John Keells Holdings plc (Industrial conglomerates) | | | 84,914 | | | | 147 | |
| | | | | | | | |
| | | | | | | 267 | |
| | | | | | | | |
Taiwan—3.4% | | | | | | | | |
Eclat Textile Co., Ltd. (Textiles, apparel & luxury goods) | | | 54,000 | | | | 199 | |
Ginko International Co., Ltd. (Health care equipment & supplies) | | | 12,000 | | | | 134 | |
Hiwin Technologies Corporation (Machinery) | | | 3,300 | | | | 24 | |
Largan Precision Co., Ltd. (Electronic equipment, instruments & components) | | | 5,000 | | | | 135 | |
Merida Industry Co., Ltd. (Leisure equipment & products) | | | 43,000 | | | | 193 | |
See accompanying Notes to Financial Statements.
38 Annual Report | December 31, 2012 |
Emerging Markets Small Cap Growth Fund
Portfolio of Investments, December 31, 2012 (all dollar amounts in thousands)
| | | | | | | | |
Issuer | | Shares | | | Value | |
|
Common Stocks—Emerging Asia—57.2%—(continued) | |
Taiwan—(continued) | | | | | | | | |
St Shine Optical Co., Ltd. (Health care equipment & supplies) | | | 15,000 | | | $ | 230 | |
| | | | | | | | |
| | | | | | | 915 | |
| | | | | | | | |
Thailand—7.9% | | | | | | | | |
Bangkok Dusit Medical Services PCL (Health care providers & services) | | | 52,100 | | | | 194 | |
BEC World PCL (Media) | | | 146,300 | | | | 341 | |
Home Product Center PCL (Specialty retail) | | | 652,040 | | | | 271 | |
LPN Development PCL (Real estate management & development) | | | 266,600 | | | | 161 | |
Minor International PCL (Hotels, restaurants & leisure) | | | 474,810 | | | | 306 | |
Robinson Department Store PCL (Multiline retail) | | | 123,700 | | | | 271 | |
Siam Makro PCL (Food & staples retailing) | | | 13,650 | | | | 200 | |
Thai Tap Water Supply PCL (Water utilities) | | | 795,500 | | | | 240 | |
Tisco Financial Group PCL (Commercial banks) | | | 80,700 | | | | 138 | |
| | | | | | | | |
| | | | | | | 2,122 | |
| | | | | | | | |
| | |
Emerging Latin America—22.8% | | | | | | | | |
Brazil—12.4% | | | | | | | | |
Arezzo Industria e Comercio S.A. (Textiles, apparel & luxury goods) | | | 12,800 | | | | 247 | |
BR Properties S.A. (Real estate management & development) | | | 10,500 | | | | 131 | |
Cia Hering (Specialty retail) | | | 10,200 | | | | 209 | |
Ez Tec Empreendimentos e Participacoes S.A. (Household durables) | | | 14,500 | | | | 182 | |
Iguatemi Empresa de Shopping Centers S.A. (Real estate management & development) | | | 20,400 | | | | 271 | |
*Kroton Educacional S.A. (Diversified consumer services) | | | 17,790 | | | | 402 | |
Localiza Rent a Car S.A. (Road & rail) | | | 10,700 | | | | 196 | |
Lojas Renner S.A. (Multiline retail) | | | 6,600 | | | | 257 | |
Mills Estruturas e Servicos de Engenharia S.A. (Trading companies & distributors) | | | 21,586 | | | | 359 | |
*Qualicorp S.A. (Professional services) | | | 23,300 | | | | 241 | |
Raia Drogasil S.A. (Food & staples retailing) | | | 9,700 | | | | 109 | |
Tegma Gestao Logistica S.A. (Road & rail) | | | 10,700 | | | | 183 | |
Totvs S.A. (Software) | | | 9,200 | | | | 182 | |
Valid Solucoes e Servicos de Seguranca em Meios de Pagamento e Identificacao S.A (Commercial services & supplies) | | | 16,900 | | | | 376 | |
| | | | | | | | |
| | | | | | | 3,345 | |
| | | | | | | | |
Chile—3.1% | | | | | | | | |
Inversiones La Construccion S.A. (Diversified financial services) | | | 15,590 | | | | 306 | |
Parque Arauco S.A. (Real estate management & development) | | | 77,460 | | | | 192 | |
Sonda S.A. (IT services) | | | 103,879 | | | | 331 | |
| | | | | | | | |
| | | | | | | 829 | |
| | | | | | | | |
Mexico—5.4% | | | | | | | | |
*Alsea S.A.B. de C.V. (Hotels, restaurants & leisure) | | | 189,869 | | | | 379 | |
Banregio Grupo Financiero S.A.B. de C.V. (Commercial banks) | | | 87,838 | | | | 400 | |
|
Common Stocks—Emerging Latin America—22.8%—(continued) | |
Mexico—(continued) | | | | | | | | |
Compartamos S.A.B. de C.V. (Consumer finance) | | | 105,200 | | | $ | 150 | |
Fibra Uno Administracion S.A. de C.V. (Real estate investment trusts (REITs)) | | | 88,500 | | | | 267 | |
*Macquarie Mexico Real Estate Management S.A. de C.V.—144A (Real estate investment trusts (REITs)) | | | 140,965 | | | | 279 | |
| | | | | | | | |
| | | | | | | 1,475 | |
| | | | | | | | |
Panama—1.0% | | | | | | | | |
Copa Holdings S.A. (Airlines)† | | | 2,648 | | | | 263 | |
| | | | | | | | |
Peru—0.9% | | | | | | | | |
*Inretail Peru Corporation (Food & staples retailing) | | | 4,077 | | | | 86 | |
*Inretail Peru Corporation—144A (Food & staples retailing)† | | | 1,346 | | | | 28 | |
Intercorp Financial Services, Inc. (Diversified financial services) | | | 3,529 | | | | 126 | |
| | | | | | | | |
| | | | | | | 240 | |
| | | | | | | | |
|
Emerging Europe, Mid-East, Africa—13.5% | |
Kenya—1.0% | | | | | | | | |
Safaricom, Ltd. (Wireless telecommunication services) | | | 4,588,400 | | | | 267 | |
| | | | | | | | |
Nigeria—1.7% | | | | | | | | |
Guaranty Trust Bank plc (Commercial banks) | | | 1,908,274 | | | | 282 | |
Nestle Nigeria plc (Food products) | | | 40,090 | | | | 180 | |
| | | | | | | | |
| | | | | | | 462 | |
| | | | | | | | |
Poland—2.9% | | | | | | | | |
*Alior Bank S.A. (Commercial banks) | | | 7,026 | | | | 142 | |
Eurocash S.A. (Food & staples retailing) | | | 18,191 | | | | 258 | |
LPP S.A. (Textiles, apparel & luxury goods) | | | 257 | | | | 379 | |
| | | | | | | | |
| | | | | | | 779 | |
| | | | | | | | |
Russia—0.5% | | | | | | | | |
*Etalon Group Ltd.—144A—GDR (Real estate management & development) | | | 4,868 | | | | 27 | |
*MD Medical Group Investments plc—144A—GDR (Health care providers & services) | | | 9,432 | | | | 117 | |
| | | | | | | | |
| | | | | | | 144 | |
| | | | | | | | |
South Africa—4.2% | | | | | | | | |
AVI, Ltd. (Food products) | | | 23,285 | | | | 165 | |
Coronation Fund Managers, Ltd. (Capital markets) | | | 59,162 | | | | 277 | |
Discovery Holdings, Ltd. (Insurance) | | | 19,818 | | | | 146 | |
Life Healthcare Group Holdings Pte, Ltd. (Health care providers & services) | | | 24,717 | | | | 99 | |
Mr Price Group, Ltd. (Specialty retail) | | | 12,072 | | | | 200 | |
The Foschini Group, Ltd. (Specialty retail) | | | 7,077 | | | | 118 | |
Tsogo Sun Holdings, Ltd. (Hotels, restaurants & leisure) | | | 48,096 | | | | 135 | |
| | | | | | | | |
| | | | | | | 1,140 | |
| | | | | | | | |
Turkey—3.2% | | | | | | | | |
Arcelik A.S. (Household durables) | | | 26,925 | | | | 177 | |
Bizim Toptan Satis Magazalari A.S. (Food & staples retailing) | | | 19,285 | | | | 301 | |
See accompanying Notes to Financial Statements.
December 31, 2012 | William Blair Funds 39 |
Emerging Markets Small Cap Growth Fund
Portfolio of Investments, December 31, 2012 (all dollar amounts in thousands)
| | | | | | | | |
Issuer | | Shares or
Principal
Amount | | | Value | |
|
Common Stocks—Emerging Europe, Mid-East, Africa—13.5%—(continued) | |
Turkey—(continued) | | | | | | | | |
Tofas Turk Otomobil Fabrikasi A.S. (Automobiles) | | | 41,406 | | | $ | 244 | |
Turkiye Sinai Kalkinma Bankasi A.S. (Commercial banks) | | | 108,970 | | | | 141 | |
| | | | | | | | |
| | | | | | | 863 | |
| | | | | | | | |
Total Common Stocks—93.5%
(cost $23,445) | | | | 25,259 | |
| | | | | | | | |
| | |
Preferred Stock | | | | | | | | |
Brazil—1.2% | | | | | | | | |
Marcopolo S.A. (Machinery) | | | 49,000 | | | | 309 | |
| | | | | | | | |
Total Preferred Stock—1.2%
(cost $284) | | | | 309 | |
| | | | | | | | |
| | |
Repurchase Agreement | | | | | | | | |
Fixed Income Clearing Corporation, 0.110% dated 12/31/12, due 1/2/13, repurchase price $2,088, collateralized by U.S. Treasury Note, 2.125%, due 12/31/15 | | $ | 2,088 | | | | 2,088 | |
| | | | | | | | |
Total Repurchase Agreement—7.7%
(cost $2,088) | | | | 2,088 | |
| | | | | | | | |
Total Investments—102.4%
(cost $25,817) | | | | 27,656 | |
Liabilities, plus cash and other assets—(2.4)% | | | | (635 | ) |
| | | | | | | | |
Net assets—100.0% | | | $ | 27,021 | |
| | | | | | | | |
GDR = Global Depository Receipt
*Non-income producing securities
† = U.S. listed foreign security
For securities primarily traded on exchanges or markets that close before the close of regular trading on the New York Stock Exchange, the Fund may use an independent pricing service to fair value price the securities pursuant to Valuation Procedures approved by the Board of Trustees.
At December 31, 2012, the Fund’s Portfolio of Investments includes the following sector categories (as a percentage of long-term investments):
| | | | |
Consumer Discretionary | | | 29.6% | |
Financials | | | 22.9% | |
Consumer Staples | | | 16.4% | |
Industrials | | | 10.7% | |
Health Care | | | 8.3% | |
Information Technology | | | 4.8% | |
Materials | | | 3.6% | |
Telecommunication Services | | | 2.2% | |
Utilities | | | 0.9% | |
Energy | | | 0.6% | |
| | | | |
Total | | | 100.0% | |
| | | | |
At December 31, 2012, the Fund’s Portfolio of Investments includes the following currency categories (as a percentage of long-term investments):
| | | | |
Brazilian Real | | | 14.3% | |
Hong Kong Dollar | | | 14.0% | |
Indian Rupee | | | 13.4% | |
Thai Baht | | | 8.3% | |
Indonesian Rupiah | | | 6.8% | |
Philippine Peso | | | 6.4% | |
Mexican Peso | | | 5.8% | |
South African Rand | | | 4.5% | |
Malaysian Ringgit | | | 3.7% | |
New Taiwan Dollar | | | 3.6% | |
Turkish Lira | | | 3.4% | |
Chilean Peso | | | 3.2% | |
U.S. Dollar | | | 3.0% | |
South Korean Won | | | 2.7% | |
Euro | | | 2.5% | |
Nigerian Naira | | | 1.8% | |
Kenyan Shilling | | | 1.0% | |
Sri Lanka Rupee | | | 1.0% | |
All Other Currencies | | | 0.6% | |
| | | | |
Total | | | 100.0% | |
| | | | |
See accompanying Notes to Financial Statements.
40 Annual Report | December 31, 2012 |

Christopher T. Vincent

Paul J. Sularz
BOND FUND
The Bond Fund seeks to outperform the Barclays Capital U.S. Aggregate Bond Index by maximizing total return through a combination of income and capital appreciation.
AN OVERVIEW FROM THE PORTFOLIO MANAGERS
The William Blair Bond Fund posted an 8.61% increase (Institutional Class Shares) for the year ended December 31, 2012. By comparison, the Fund’s benchmark, the Barclays Capital U.S. Aggregate Index, increased by 4.21%.
Several factors contributed to the outperformance of the William Blair Bond Fund versus its benchmark during 2012. Security selection within the Fund had the largest positive impact on performance, with results particularly strong among the Fund’s corporate and mortgage-backed securities. The Fund benefited from several security selection themes in the corporate sector, including its overweight of U.S. banks and financial services, positioning within investment-grade industrials, and its allocation to high yield corporate bonds. In the mortgage-backed sector, the Fund’s emphasis on higher-coupon pools comprised of low loan balance borrowers continued to add value relative to comparable duration alternatives. Finally, sector positioning contributed to performance, as the Fund eschewed nominal fixed-rate Treasuries in favor of corporate bonds, mortgage-backed securities, and Treasury Inflation-Protected Securities (TIPS).
Some factors detracted from the William Blair Bond Fund’s performance on a relative basis during 2012. An underweight allocation to Commercial Mortgage-Backed Securities (CMBS) had a marginal negative impact on relative performance. However, the Fund was overweight to REITs to account for that underweight, and that positioning offset the relative underperformance. The Fund’s cash holdings detracted from performance as bonds have posted solid performance. We attempt to minimize the amount of cash in the Fund at any time and to keep the Fund’s Fund fully invested.
The major sectors of the U.S. fixed income market generated positive total returns during 2012. The primary drivers of returns have been income and narrowing risk spreads as investors’ demand for incremental yield has been insatiable. The 10-year Treasury note yielded 1.76% at year-end.
We believe that the threat of any rapid rise in interest rates is subdued. The Federal Open Market Committee’s) (FOMC’s) stance towards monetary policy has become increasingly accommodative due to concerns over the pace of economic growth, job growth, and inflation. The FOMC announced several unconventional easing policies this year, and the FOMC remains committed to maintaining rates at low levels until the unemployment rate declines below 6.5%.
We expect economic growth to be low in the short-to-intermediate term (two to three years), with continued high levels of unemployment and a depressed real estate market constraining growth. However, we do not believe that the economy is at imminent risk of a “double-dip” recession.
Corporate bond issuance was robust in 2012. Corporations sought to secure longer-term financing at low all-in yields. Net issuance ended the year slightly lower than the record levels experienced in 2009. We expect that issuance will decline modestly from this pace in 2013.
We believe that spread sectors are poised to lead the market. Risk premiums across all spreads sectors remain elevated versus long-term averages but not approaching the historically cheap levels experienced in prior years. These valuations, coupled with the strength of corporate balance sheets, make us bullish on spread product relative to Treasuries.
December 31, 2012 | William Blair Funds 41 |
Bond Fund
Performance Highlights (unaudited)
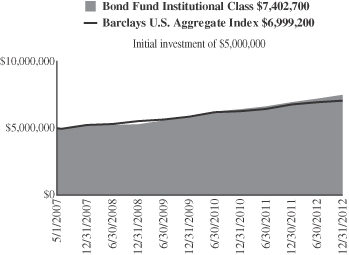
Average Annual Total Return at 12/31/2012
| | | | | | | | | | | | | | | | |
| | | 1
Year | | | 3
Year | | | 5
Year | | | Since
Inception(a) | |
Institutional Class | | | 8.61 | % | | | 8.19 | % | | | 7.55 | % | | | 7.29 | % |
Barclays Capital U.S. Aggregate Index | | | 4.21 | | | | 6.19 | | | | 5.95 | | | | 6.11 | |
| | (a) | | For the period May 1, 2007 (Commencement of Operations) to December 31, 2012. | |
Performance cited represents past performance. Past performance does not guarantee future results and current performance may be lower or higher than the data quoted. Results shown are average annual total returns, which assume reinvestment of dividends and capital gains. Investment returns and principal will fluctuate and you may have a gain or loss when you sell shares. For the most current month-end performance information, please call 1-800-742-7272, or visit our Web site at www.williamblairfunds.com. From time to time, the investment advisor may waive fees or reimburse expenses for the Fund. Without these waivers, performance would be lower.
The performance highlights and graph presented above do not reflect the deduction of taxes that a shareholder would pay on fund distributions or the redemption of fund shares.
The Barclays Capital U.S. Aggregate Bond Index indicates broad intermediate government/corporate bond market performance.
This report identifies the Fund’s investments on December 31, 2012. These holdings are subject to change. Not all investments in the Fund performed the same, nor is there any guarantee that these investments will perform as well in the future. Market forecasts provided in this report may not necessarily come to pass.
Sector Diversification (unaudited)
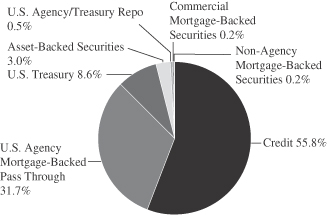
The sector diversification shown is based on the total investments.
42 Annual Report | December 31, 2012 |
Bond Fund
Portfolio of Investments, December 31, 2012 (all amounts in thousands)
| | | | | | | | |
Issuer | | Principal
Amount | | | Value | |
|
U.S. Government and U.S. Government Agency—40.3% | |
U.S. Treasury Inflation Indexed Notes/Bonds—7.5% | |
U.S. Treasury Inflation Indexed Note,
2.375%, due 1/15/17 | | $ | 5,913 | | | $ | 6,872 | |
U.S. Treasury Inflation Indexed Bond,
3.875%, due 4/15/29 | | | 9,287 | | | | 15,393 | |
| | | | | | | | |
Total U.S. Treasury Inflation Indexed Notes/Bonds | | | | | | | 22,265 | |
| | | | | | | | |
U.S. Treasury—1.1% | |
U.S. Treasury Bond,
3.125%, due 2/15/42 | | | 525 | | | | 549 | |
U.S. Treasury Strip Principal,
0.000%, due 5/15/20 | | | 2,900 | | | | 2,641 | |
| | | | | | | | |
Total U.S. Treasury Obligations | | | | | | | 3,190 | |
| | | | | | | | |
Government National Mortgage Association (GNMA)—2.3% | |
#344834, 6.250%, due 7/15/13 | | | 2 | | | | 2 | |
#344902, 6.250%, due 3/15/14 | | | 4 | | | | 4 | |
#623162, 6.500%, due 7/15/18 | | | 35 | | | | 40 | |
#616250, 6.000%, due 2/15/24 | | | 10 | | | | 11 | |
#422470, 7.500%, due 3/15/26 | | | 1 | | | | 1 | |
#509405, 7.500%, due 8/15/29 | | | 1 | | | | 1 | |
GNR 2004-2 M5, 4.891%, due 7/16/34 | | | 125 | | | | 130 | |
GNR 2006-67 GB, 4.775%, due 9/16/34, VRN | | | 517 | | | | 526 | |
#699118, 6.000%, due 9/15/38 | | | 5,488 | | | | 6,171 | |
| | | | | | | | |
Total GNMA Mortgage Obligations | | | | | | | 6,886 | |
| | | | | | | | |
Federal Home Loan Mortgage Corp. (FHLMC)—6.3% | |
#J16051, 4.500%, due 7/1/26 | | | 1,198 | | | | 1,306 | |
#G01728, 7.500%, due 7/1/32 | | | 252 | | | | 309 | |
#C01385, 6.500%, due 8/1/32 | | | 245 | | | | 283 | |
#A13303, 5.000%, due 9/1/33 | | | 474 | | | | 534 | |
#C01623, 5.500%, due 9/1/33 | | | 339 | | | | 369 | |
#A15039, 5.500%, due 10/1/33 | | | 6 | | | | 7 | |
#G01843, 6.000%, due 6/1/35 | | | 65 | | | | 72 | |
#G02141, 6.000%, due 3/1/36 | | | 1,372 | | | | 1,522 | |
#A62179, 6.000%, due 6/1/37 | | | 685 | | | | 759 | |
#A63539, 6.000%, due 7/1/37 | | | 888 | | | | 986 | |
#A62858, 6.500%, due 7/1/37 | | | 473 | | | | 532 | |
#G03170, 6.500%, due 8/1/37 | | | 1,138 | | | | 1,281 | |
#A66843, 6.500%, due 10/1/37 | | | 1,680 | | | | 1,907 | |
#A78138, 5.500%, due 6/1/38 | | | 1,001 | | | | 1,129 | |
#G04544, 6.000%, due 8/1/38 | | | 2,893 | | | | 3,179 | |
#A81799, 6.500%, due 9/1/38 | | | 1,960 | | | | 2,225 | |
#A86143, 5.000%, due 5/1/39 | | | 120 | | | | 133 | |
#C03665, 9.000%, due 4/1/41 | | | 1,583 | | | | 1,966 | |
| | | | | | | | |
Total FHLMC Mortgage Obligations | | | | | | | 18,499 | |
| | | | | | | | |
Federal National Mortgage Association (FNMA)—23.1% | |
#576553, 8.000%, due 2/1/16 | | | 8 | | | | 9 | |
#580793, 6.000%, due 4/1/16 | | | 2 | | | | 2 | |
#624506, 6.000%, due 1/1/17 | | | 2 | | | | 2 | |
#679247, 7.000%, due 8/1/17 | | | 8 | | | | 8 | |
#689612, 5.000%, due 5/1/18 | | | 224 | | | | 241 | |
#695910, 5.000%, due 5/1/18 | | | 455 | | | | 489 | |
#697593, 5.000%, due 5/1/18 | | | 408 | | | | 439 | |
#770395, 5.000%, due 4/1/19 | | | 8 | | | | 9 | |
#900725, 6.000%, due 8/1/21 | | | 109 | | | | 121 | |
#893325, 7.000%, due 9/1/21 | | | 9 | | | | 9 | |
#AA2924, 4.500%, due 4/1/24 | | | 791 | | | | 872 | |
#255956, 5.500%, due 10/1/25 | | | 52 | | | | 57 | |
| | | | | | | | |
Issuer | | Principal
Amount | | | Value | |
|
U.S. Government and U.S. Government Agency—(continued) | |
Federal National Mortgage Association (FNMA)—(continued) | |
#AB2256, 3.500%, due 2/1/26 | | $ | 1,179 | | | $ | 1,283 | |
#890329, 4.000%, due 4/1/26 | | | 465 | | | | 510 | |
#AI9811, 4.500%, due 8/1/26 | | | 505 | | | | 556 | �� |
#AH9564, 3.500%, due 9/1/26 | | | 1,031 | | | | 1,121 | |
#AJ8149, 3.500%, due 12/1/26 | | | 1,299 | | | | 1,413 | |
#AJ9402, 4.000%, due 12/1/26 | | | 2,200 | | | | 2,422 | |
#AB4818, 4.000%, due 4/1/27 | | | 1,211 | | | | 1,334 | |
#AP0446, 3.500%, due 7/1/27 | | | 3,377 | | | | 3,674 | |
#AL2590, 4.000%, due 7/1/27 | | | 2,344 | | | | 2,581 | |
#252925, 7.500%, due 12/1/29 | | | 3 | | | | 3 | |
#535977, 6.500%, due 4/1/31 | | | 22 | | | | 26 | |
#253907, 7.000%, due 7/1/31 | | | 3 | | | | 4 | |
#587849, 6.500%, due 11/1/31 | | | 32 | | | | 37 | |
#545437, 7.000%, due 2/1/32 | | | 122 | | | | 143 | |
#545759, 6.500%, due 7/1/32 | | | 1,282 | | | | 1,460 | |
#678007, 6.000%, due 9/1/32 | | | 24 | | | | 27 | |
#254548, 5.500%, due 12/1/32 | | | 56 | | | | 62 | |
#684601, 6.000%, due 3/1/33 | | | 1,213 | | | | 1,361 | |
#703391, 5.000%, due 5/1/33 | | | 198 | | | | 214 | |
#708993, 5.000%, due 6/1/33 | | | 74 | | | | 83 | |
#190340, 5.000%, due 9/1/33 | | | 170 | | | | 186 | |
#254868, 5.000%, due 9/1/33 | | | 18 | | | | 20 | |
#727056, 5.000%, due 9/1/33 | | | 911 | | | | 1,032 | |
#739243, 6.000%, due 9/1/33 | | | 1,506 | | | | 1,720 | |
#739331, 6.000%, due 9/1/33 | | | 718 | | | | 820 | |
#555800, 5.500%, due 10/1/33 | | | 189 | | | | 208 | |
#555946, 5.500%, due 11/1/33 | | | 645 | | | | 739 | |
#756153, 5.500%, due 11/1/33 | | | 1,521 | | | | 1,729 | |
#725017, 5.500%, due 12/1/33 | | | 75 | | | | 86 | |
#725205, 5.000%, due 3/1/34 | | | 2,231 | | | | 2,426 | |
#725232, 5.000%, due 3/1/34 | | | 2,397 | | | | 2,612 | |
#725238, 5.000%, due 3/1/34 | | | 844 | | | | 920 | |
#763798, 5.500%, due 3/1/34 | | | 244 | | | | 276 | |
#776964, 5.000%, due 4/1/34 | | | 619 | | | | 698 | |
#725611, 5.500%, due 6/1/34 | | | 308 | | | | 338 | |
#783786, 5.500%, due 7/1/34 | | | 241 | | | | 277 | |
#786546, 6.000%, due 7/1/34 | | | 656 | | | | 736 | |
#787816, 6.000%, due 7/1/34 | | | 730 | | | | 833 | |
#190353, 5.000%, due 8/1/34 | | | 253 | | | | 275 | |
#794474, 6.000%, due 10/1/34 | | | 127 | | | | 142 | |
#745092, 6.500%, due 7/1/35 | | | 920 | | | | 1,047 | |
#357944, 6.000%, due 9/1/35 | | | 79 | | | | 89 | |
#829306, 6.000%, due 9/1/35 | | | 959 | | | | 1,075 | |
#836140, 5.500%, due 10/1/35 | | | 109 | | | | 118 | |
#843487, 6.000%, due 10/1/35 | | | 206 | | | | 235 | |
#849191, 6.000%, due 1/1/36 | | | 421 | | | | 472 | |
#848782, 6.500%, due 1/1/36 | | | 559 | | | | 632 | |
#745349, 6.500%, due 2/1/36 | | | 834 | | | | 943 | |
#888305, 7.000%, due 3/1/36 | | | 22 | | | | 26 | |
#895637, 6.500%, due 5/1/36 | | | 320 | | | | 361 | |
#831540, 6.000%, due 6/1/36 | | | 114 | | | | 128 | |
#745802, 6.000%, due 7/1/36 | | | 434 | | | | 496 | |
#886220, 6.000%, due 7/1/36 | | | 957 | | | | 1,093 | |
#893318, 6.500%, due 8/1/36 | | | 135 | | | | 152 | |
#902974, 6.000%, due 12/1/36 | | | 921 | | | | 1,029 | |
#909480, 6.000%, due 2/1/37 | | | 919 | | | | 1,030 | |
#938440, 6.000%, due 7/1/37 | | | 430 | | | | 480 | |
#928561, 6.000%, due 8/1/37 | | | 538 | | | | 614 | |
#948689, 6.000%, due 8/1/37 | | | 863 | | | | 964 | |
#946646, 6.000%, due 9/1/37 | | | 277 | | | | 310 | |
See accompanying Notes to Portfolio of Investments.
December 31, 2012 | William Blair Funds 43 |
Bond Fund
Portfolio of Investments, December 31, 2012 (all amounts in thousands)
| | | | | | | | | | | | |
Issuer | | NRSRO
Rating
(unaudited) | | | Principal
Amount | | | Value | |
|
U.S. Government and U.S. Government Agency—(continued) | |
Federal National Mortgage Association (FNMA)—(continued) | |
#888967, 6.000%, due 12/1/37 | | | | | | $ | 1,770 | | | $ | 2,022 | |
#889385, 6.000%, due 2/1/38 | | | | | | | 525 | | | | 589 | |
#962058, 6.500%, due 3/1/38 | | | | | | | 3,647 | | | | 4,132 | |
#934006, 6.500%, due 9/1/38 | | | | | | | 1,189 | | | | 1,347 | |
#986856, 6.500%, due 9/1/38 | | | | | | | 906 | | | | 1,018 | |
#991911, 7.000%, due 11/1/38 | | | | | | | 664 | | | | 756 | |
#AA8443, 5.000%, due 6/1/39 | | | | | | | 484 | | | | 548 | |
#931492, 6.000%, due 7/1/39 | | | | | | | 329 | | | | 376 | |
#AA6898, 6.000%, due 7/1/39 | | | | | | | 1,710 | | | | 1,952 | |
#932279, 5.000%, due 12/1/39 | | | | | | | 213 | | | | 236 | |
#AE0082, 5.000%, due 5/1/40 | | | | | | | 1,213 | | | | 1,347 | |
#AL0913, 6.000%, due 7/1/41 | | | | | | | 2,371 | | | | 2,642 | |
#AK2733, 5.000%, due 2/1/42 | | | | | | | 3,286 | | | | 3,721 | |
| | | | | | | | | | | | |
Total FNMA Mortgage Obligations | | | | | | | | | | | 68,625 | |
| | | | | | | | | | | | |
|
Non-Agency Mortgage-Backed Obligations—0.2% | |
*First Plus Home Loan Trust, 1997-4, Tranche M1,
7.640%, 9/11/23§** | | | D | | | | 199 | | | | 166 | |
First Horizon Asset Securities, Inc., 2004-AR4, Tranche 3A1,
2.587%, 8/25/34, VRN | | | Aaa | | | | 382 | | | | 382 | |
| | | | | | | | | | | | |
Total Non-Agency Mortgage-Backed Obligations | | | | | | | | | | | 548 | |
| | | | | | | | | | | | |
|
Asset-Backed Securities—3.0% | |
Hertz Vehicle Financing LLC—144A, 2009-2A, Tranche A1, 4.260%, 3/25/14 | | | Aaa | | | | 1,140 | | | | 1,146 | |
Hertz Vehicle Financing LLC—144A, 2009-2A, Tranche A2, 5.290%, 3/25/16 | | | Aaa | | | | 600 | | | | 653 | |
Avis Budget Rental Car Funding AESOP LLC—144A, 2010-3A, Tranche A, 4.640%, 5/20/16 | | | Aaa | | | | 100 | | | | 108 | |
Centre Point Funding LLC—144A, 2010-1A, Tranche 1,
5.430%, 7/20/16 | | | A2 | | | | 1,935 | | | | 2,084 | |
GE Capital Credit Card Master Note Trust, 2012-6, Tranche B, 1.830%, 8/17/20 | | | AA- | | | | 2,800 | | | | 2,843 | |
Centre Point Funding LLC—144A, 2012-2A, Tranche 1,
2.610%, 8/20/21 | | | Baa2 | | | | 1,979 | | | | 1,978 | |
| | | | | | | | | | | | |
Total Asset-Backed Securities | | | | | | | | | | | 8,812 | |
| | | | | | | | | | | | |
|
Corporate Obligations—55.0% | |
Petrobras International Finance Co., 6.125%, due 10/6/16 | | | A3 | | | | 1,400 | | | | 1,582 | |
Ally Financial, Inc.,
5.500%, due 2/15/17 | | | BB- | | | | 1,788 | | | | 1,913 | |
American International Group, Inc., 3.800%, due 3/22/17 | | | A- | | | | 2,375 | | | | 2,571 | |
Penske Truck Leasing Co. L.P.—144A, 3.750%, due 5/11/17 | | | BBB | + | | | 2,000 | | | | 2,093 | |
ERP Operating L.P.,
5.750%, due 6/15/17 | | | BBB | + | | | 2,075 | | | | 2,448 | |
|
Corporate Obligations—(continued) | |
JPMorgan Chase & Co.,
6.125%, due 6/27/17 | | | A | | | $ | 1,600 | | | $ | 1,869 | |
General Motors Financial Co., Inc.—144A,
4.750%, due 8/15/17 | | | BB | | | | 1,000 | | | | 1,051 | |
American Express Co.,
6.150%, due 8/28/17 | | | A | + | | | 2,050 | | | | 2,470 | |
Capital One Financial Corporation, 6.750%, due 9/15/17 | | | A- | | | | 1,900 | | | | 2,320 | |
Exelon Generation Co. LLC, 6.200%, due 10/1/17 | | | Baa1 | | | | 1,160 | | | | 1,370 | |
Toll Brothers Finance Corporation, 8.910%, due 10/15/17 | | | BBB- | | | | 1,050 | | | | 1,326 | |
Triumph Group, Inc.,
8.000%, due 11/15/17 | | | B | + | | | 1,550 | | | | 1,674 | |
American Tower Corporation, 4.500%, due 1/15/18 | | | Baa3 | | | | 1,200 | | | | 1,315 | |
Morgan Stanley,
6.625%, due 4/1/18 | | | A | | | | 2,575 | | | | 3,035 | |
Simon Property Group L.P., 6.125%, due 5/30/18 | | | A- | | | | 2,500 | | | | 3,045 | |
Petrohawk Energy Corporation, 7.250%, due 8/15/18 | | | A | | | | 1,050 | | | | 1,185 | |
Merrill Lynch & Co., Inc.,
6.875%, due 11/15/18 | | | A | | | | 1,100 | | | | 1,347 | |
CSX Corporation,
7.375%, due 2/1/19 | | | BBB | | | | 870 | | | | 1,106 | |
BHP Billiton Finance USA, Ltd., 6.500%, due 4/1/19 | | | A | + | | | 1,300 | | | | 1,658 | |
Citigroup, Inc.,
8.500%, due 5/22/19 | | | A | | | | 2,050 | | | | 2,757 | |
Discovery Communications LLC, 5.625%, due 8/15/19 | | | BBB | | | | 550 | | | | 657 | |
Roper Industries, Inc.,
6.250%, due 9/1/19 | | | BBB | | | | 1,850 | | | | 2,211 | |
Continental Rubber Of America Corp.—144A,
4.500%, due 9/15/19 | | | BB- | | | | 250 | | | | 256 | |
Republic Services, Inc.,
5.500%, due 9/15/19 | | | BBB | | | | 1,725 | | | | 2,043 | |
SBA Communications Corp.—144A, 5.625%, due 10/1/19 | | | B2 | | | | 1,250 | | | | 1,313 | |
Boston Properties L.P.,
5.875%, due 10/15/19 | | | A- | | | | 1,575 | | | | 1,878 | |
Crown Castle International Corporation,
7.125%, due 11/1/19 | | | BB- | | | | 1,550 | | | | 1,713 | |
Toll Brothers Finance Corporation, 6.750%, due 11/1/19 | | | BBB- | | | | 500 | | | | 594 | |
Ford Motor Credit Co. LLC, 8.125%, due 1/15/20 | | | Baa3 | | | | 3,050 | | | | 3,908 | |
Jarden Corporation,
7.500%, due 1/15/20 | | | B | | | | 1,550 | | | | 1,701 | |
Johnson Controls, Inc.,
5.000%, due 3/30/20 | | | BBB | + | | | 1,675 | | | | 1,904 | |
The Goldman Sachs Group, Inc., 6.000%, due 6/15/20 | | | A | | | | 2,575 | | | | 3,060 | |
Hologic, Inc.—144A,
6.250%, due 8/1/20 | | | BB | | | | 1,100 | | | | 1,185 | |
See accompanying Notes to Portfolio of Investments.
44 Annual Report | December 31, 2012 |
Bond Fund
Portfolio of Investments, December 31, 2012 (all amounts in thousands)
| | | | | | | | | | | | |
Issuer | | NRSRO
Rating
(unaudited) | | | Principal
Amount | | | Value | |
|
Corporate Obligations—(continued) | |
Alcoa, Inc.,
6.150%, due 8/15/20 | | | BBB- | | | $ | 2,050 | | | $ | 2,239 | |
Omnicom Group, Inc.,
4.450%, due 8/15/20 | | | BBB | + | | | 2,075 | | | | 2,309 | |
The Goodyear Tire & Rubber Co., 8.250%, due 8/15/20 | | | B | + | | | 1,500 | | | | 1,646 | |
Georgia-Pacific LLC—144A, 5.400%, due 11/1/20 | | | A | | | | 1,500 | | | | 1,784 | |
Progress Energy, Inc.,
4.400%, due 1/15/21 | | | BBB | | | | 1,675 | | | | 1,867 | |
Standard Pacific Corporation, 8.375%, due 1/15/21 | | | B | | | | 1,750 | | | | 2,030 | |
Petrobras International Finance Co., 5.375%, due 1/27/21 | | | A3 | | | | 1,200 | | | | 1,351 | |
L-3 Communications Corporation, 4.950%, due 2/15/21 | | | BBB- | | | | 2,430 | | | | 2,742 | |
Wyndham Worldwide Corporation, 5.625%, due 3/1/21 | | | BBB- | | | | 1,000 | | | | 1,116 | |
Ball Corporation,
5.750%, due 5/15/21 | | | BB | + | | | 1,550 | | | | 1,678 | |
Energizer Holdings, Inc.,
4.700%, due 5/19/21 | | | BBB- | | | | 2,050 | | | | 2,197 | |
Discovery Communications LLC, 4.375%, due 6/15/21 | | | BBB | | | | 2,000 | | | | 2,233 | |
O’Reilly Automotive, Inc., 4.625%, due 9/15/21 | | | BBB | | | | 2,275 | | | | 2,491 | |
Corporation Nacional del Cobre de Chile—144A,
3.875%, due 11/3/21 | | | A1 | | | | 1,900 | | | | 2,070 | |
Itau Unibanco Holding S.A.—144A, 6.200%, due 12/21/21 | | | Baa2 | | | | 2,500 | | | | 2,763 | |
SABMiller Holdings, Inc.—144A, 3.750%, due 1/15/22 | | | BBB | + | | | 2,000 | | | | 2,160 | |
SLM Corporation,
7.250%, due 1/25/22 | | | BBB- | | | | 2,075 | | | | 2,288 | |
Fresenius Medical Care US Finance II, Inc.—144A,
5.875%, due 1/31/22 | | | BB | + | | | 1,000 | | | | 1,085 | |
Lamar Media Corporation,
5.875%, due 2/1/22 | | | BB- | | | | 1,550 | | | | 1,682 | |
Masco Corporation,
5.950%, due 3/15/22 | | | BBB- | | | | 1,675 | | | | 1,857 | |
BE Aerospace, Inc.,
5.250%, due 4/1/22 | | | BB | | | | 1,550 | | | | 1,643 | |
Pinnacle Entertainment, Inc., 7.750%, due 4/1/22 | | | B | | | | 1,315 | | | | 1,400 | |
Discover Financial Services, 5.200%, due 4/27/22 | | | BBB- | | | | 2,150 | | | | 2,448 | |
Kraft Foods Group, Inc.—144A, 3.500%, due 6/6/22 | | | BBB | | | | 1,900 | | | | 2,028 | |
Embraer S.A.,
5.150%, due 6/15/22 | | | BBB- | | | | 2,500 | | | | 2,738 | |
Comcast Corporation,
3.125%, due 7/15/22 | | | BBB | + | | | 2,000 | | | | 2,084 | |
America Movil S.A.B. de C.V., 3.125%, due 7/16/22 | | | A2 | | | | 2,850 | | | | 2,897 | |
PPG Industries, Inc.,
2.700%, due 8/15/22 | | | A- | | | | 1,000 | | | | 990 | |
DR Horton, Inc.,
4.375%, due 9/15/22 | | | Ba2 | | | | 2,350 | | | | 2,397 | |
|
Corporate Obligations—(continued) | |
Mexichem S.A.B. de C.V.—144A, 4.875%, due 9/19/22 | | | BBB- | | | $ | 1,500 | | | $ | 1,616 | |
WEA Finance LLC—144A, 3.375%, due 10/3/22 | | | A2 | | | | 2,650 | | | | 2,723 | |
American Axle & Manufacturing, Inc., 6.625%, due 10/15/22 | | | B | | | | 1,550 | | | | 1,573 | |
Southern Copper Corporation, 3.500%, due 11/8/22 | | | BBB | + | | | 2,500 | | | | 2,553 | |
Jones Lang LaSalle, Inc.,
4.400%, due 11/15/22 | | | Baa2 | | | | 1,650 | | | | 1,686 | |
Camden Property Trust,
2.950%, due 12/15/22 | | | Baa1 | | | | 2,325 | | | | 2,267 | |
Owens Corning, Inc.,
4.200%, due 12/15/22 | | | BBB- | | | | 500 | | | | 509 | |
Royal Bank of Scotland Group plc, 6.125%, due 12/15/22 | | | BB+ | | | | 2,325 | | | | 2,454 | |
CC Holdings GS V LLC—144A, 3.849%, due 4/15/23 | | | Baa3 | | | | 400 | | | | 407 | |
The Kroger Co.,
8.000%, due 9/15/29 | | | BBB | | | | 450 | | | | 601 | |
Conoco Funding Co.,
7.250%, due 10/15/31 | | | A1 | | | | 450 | | | | 663 | |
Kohl’s Corporation,
6.000%, due 1/15/33 | | | BBB | + | | | 1,065 | | | | 1,228 | |
Wisconsin Electric Power Co., 5.700%, due 12/1/36 | | | A | + | | | 525 | | | | 669 | |
Comcast Corporation,
6.450%, due 3/15/37 | | | BBB | + | | | 650 | | | | 834 | |
Yum! Brands, Inc.,
6.875%, due 11/15/37 | | | BBB | | | | 625 | | | | 853 | |
JPMorgan Chase & Co.,
6.400%, due 5/15/38 | | | A | + | | | 1,470 | | | | 1,971 | |
Philip Morris International, Inc., 6.375%, due 5/16/38 | | | A | | | | 2,175 | | | | 2,962 | |
COX Communications, Inc.—144A, 6.950%, due 6/1/38 | | | BBB | + | | | 370 | | | | 486 | |
General Electric Capital Corporation,
6.875%, due 1/10/39 | | | AA | + | | | 750 | | | | 1,019 | |
Burlington Northern Santa Fe LLC, 5.750%, due 5/1/40 | | | A3 | | | | 1,565 | | | | 1,929 | |
Illinois Tool Works, Inc.,
4.875%, due 9/15/41 | | | A | + | | | 900 | | | | 1,055 | |
Union Pacific Corporation, 4.750%, due 9/15/41 | | | A- | | | | 1,450 | | | | 1,626 | |
Aristotle Holding, Inc.—144A, 6.125%, due 11/15/41 | | | BBB | + | | | 2,500 | | | | 3,189 | |
Gilead Sciences, Inc.,
5.650%, due 12/1/41 | | | A- | | | | 1,775 | | | | 2,205 | |
Citigroup, Inc.,
5.875%, due 1/30/42 | | | A | | | | 750 | | | | 926 | |
Bank of America Corporation, 5.875%, due 2/7/42 | | | A | | | | 2,375 | | | | 2,963 | |
CSX Corporation,
4.750%, due 5/30/42 | | | BBB | | | | 1,225 | | | | 1,319 | |
Odebrecht Finance Ltd.—144A, 7.125%, due 6/26/42 | | | BBB- | | | | 2,000 | | | | 2,320 | |
| | | | | | | | | | | | |
Total Corporate Obligations | | | | 163,377 | |
| | | | | | | | | | | | |
Total Long-Term Investments—98.5%
(cost $270,789) | | | | 292,202 | |
| | | | | | | | | | | | |
See accompanying Notes to Portfolio of Investments.
December 31, 2012 | William Blair Funds 45 |
Bond Fund
Portfolio of Investments, December 31, 2012 (all amounts in thousands)
| | | | | | | | | | | | |
Issuer | | NRSRO
Rating
(unaudited) | | | Principal
Amount | | | Value | |
|
Repurchase Agreement | |
Fixed Income Clearing Corporation, 0.110% dated 12/31/12, due 1/2/13, repurchase price $1,622, collateralized by FHLMC,
3.720%, due 2/27/32 | | | Aaa | | | $ | 1,622 | | | $ | 1,622 | |
| | | | | | | | | | | | |
Total Repurchase Agreement—0.5%
(cost $1,622) | | | | 1,622 | |
| | | | | | | | | | | | |
Total Investments—99.0%
(cost $272,411) | | | | 293,824 | |
Cash and other assets, less liabilities—1.0% | | | | 2,918 | |
| | | | | | | | | | | | |
Net assets—100.0% | | | $ | 296,742 | |
| | | | | | | | | | | | |
NRSRO = Nationally Recognized Statistical Rating Organization—
The credit quality ratings of the securities in the Fund reflect the highest category rating by either Fitch Ratings, Moody’s Investors Service Inc., or Standard & Poor’s, a division of the McGraw-Hill Companies, Inc.
The obligations of certain U. S. Government-sponsored securities are neither issued nor guaranteed by the U. S. Treasury.
VRN = Variable Rate Note
§ = Deemed illiquid pursuant to Liquidity Procedures approved by the Board of Trustees. This holding represents 0.06% of the net assets at December 31, 2012.
* = Non-income producing security
** = Fair valued pursuant to Valuation Procedures adopted by the Board of Trustees. This holding represents 0.06% of the Fund’s net assets at December 31, 2012.
See accompanying Notes to Portfolio of Investments.
46 Annual Report | December 31, 2012 |
Christopher T. Vincent
Paul J. Sularz
LOW DURATION FUND
The Low Duration Fund seeks to maximize total return. Total return includes both income and capital appreciation.
AN OVERVIEW FROM THE PORTFOLIO MANAGERS
The William Blair Low Duration Fund posted a 3.01% increase (Institutional Class Shares) for the year ended December 31, 2012. By comparison, the Fund’s benchmark, the Bank of America Merrill Lynch 1-Year Treasury Note Index (net), increased by 0.24%.
Several factors contributed to the outperformance of the William Blair Low Duration Fund versus its benchmark during 2012. Security selection within the Fund had the largest positive impact on performance, with results particularly strong among the Fund’s mortgage-backed, asset-backed, and corporate securities. In the mortgage-backed sector, the Fund’s emphasis on higher-coupon pools comprised of low loan balance borrowers continued to add value relative to comparable duration alternatives. The Fund’s asset-backed security positions were also a source of value, as the Fund’s holdings generated incremental income throughout the year. The Fund benefited from several security selection themes in the corporate sector, including its overweight of U.S. banks and financial services and positioning within investment-grade industrials. Finally, sector positioning contributed to performance, as the Fund eschewed nominal fixed-rate Treasuries in favor of mortgage-backed securities, asset-backed securities, and corporate bonds.
Some factors detracted from the William Blair Low Duration Fund’s performance on a relative basis during 2012. The Fund held some floating-rate instruments in its effort to protect against a rise in interest rate rates. However, floating-rate instruments lagged fixed-rate alternatives during the year, as the interest rate environment was fairly benign. The Fund’s cash holdings detracted from performance as bonds posted solid performance. We attempt to minimize the amount of cash in the Fund at any time and to keep the Fund fully invested.
The major sectors of the U.S. fixed income market generated positive total returns during 2012. The primary drivers of returns have been income and narrowing risk spreads as investors’ demand for incremental yield has been insatiable. The 10-year Treasury note yielded 1.76% at year-end.
We believe that the threat of any rapid rise in interest rates is subdued. The Federal Open Market Committee’s (FOMC’s) stance towards monetary policy has become increasingly accommodative due to concerns over the pace of economic growth, job growth, and inflation. The FOMC announced several unconventional easing policies this year, and the FOMC remains committed to maintaining interest rates at low levels until the unemployment rate declines below 6.5%.
We expect economic growth to be low in the short-to-intermediate term (two to three years), with continued high levels of unemployment and a depressed real estate market constraining growth. However, we do not believe that the economy is at imminent risk of a “double-dip” recession.
Corporate bond issuance was robust in 2012. Corporations sought to secure longer-term financing at low all-in yields. Net issuance ended the year slightly lower than the record levels experienced in 2009. We expect that issuance will decline modestly from this pace in 2013.
We believe that spread sectors are poised to lead the market. Risk premiums across all spread sectors remain elevated versus long-term averages but not approaching the historically cheap levels experienced in prior years. These valuations, coupled with the strength of corporate balance sheets, make us bullish on spread product relative to Treasuries.
December 31, 2012 | William Blair Funds 47 |
Low Duration Fund
Performance Highlights (unaudited)
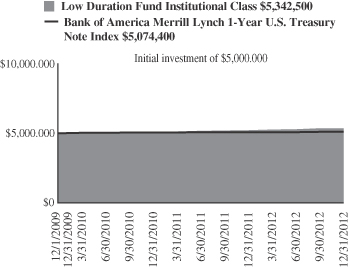
Average Annual Total Return at 12/31/2012
| | | | | | | | | | | | |
| | | 1
Year | | | 3
Year | | | Since
Inception(a) | |
Institutional Class | | | 3.01 | % | | | 2.43 | % | | | 2.17 | % |
Bank of America Merrill Lynch 1-Year U.S. Treasury Note Index | | | 0.24 | | | | 0.54 | | | | 0.48 | |
| | (a) | | For the period December 1, 2009 (Commencement of Operations) to December 31, 2012. |
Performance cited represents past performance. Past performance does not guarantee future results and current performance may be lower or higher than the data quoted. Results shown are average annual total returns, which assume reinvestment of dividends and capital gains. Investment returns and principal will fluctuate and you may have a gain or loss when you sell shares. For the most current month-end performance information, please call 1-800-742-7272, or visit our Web site at www.williamblairfunds.com. From time to time, the investment advisor may waive fees or reimburse expenses for the Fund. Without these waivers, performance would be lower.
The performance highlights and graph presented above do not reflect the deduction of taxes that a shareholder would pay on fund distributions or the redemption of fund shares.
The Bank of America Merrill Lynch 1-Year U.S. Treasury Note Index is comprised of a single U.S. Treasury Note issue purchased at the beginning of the month and held for a full month. Each month the index is rebalanced and the issue selected is the outstanding U.S. Treasury Note that matures closest to, but not beyond one year from the rebalancing date.
This report identifies the Fund’s investments on December 31, 2012. These holdings are subject to change. Not all investments in the Fund performed the same, nor is there any guarantee that these investments will perform as well in the future. Market forecasts provided in this report may not necessarily come to pass.
Sector Diversification (unaudited)
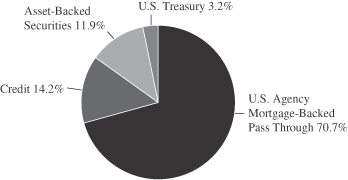
The sector diversification shown is based on the total investments.
48 Annual Report | December 31, 2012 |
Low Duration Fund
Portfolio of Investments, December 31, 2012 (all dollar amounts in thousands)
| | | | | | | | |
Issuer | | Principal
Amount | | | Value | |
|
U.S. Government and U.S. Government Agency—67.4% | |
U.S. Treasury Inflation Indexed Notes/Bonds—2.9% | | | | | | | | |
U.S. Treasury Inflation Indexed Note,
2.375%, due 1/15/17 | | $ | 3,728 | | | $ | 4,333 | |
U.S. Treasury Inflation Indexed Note,
1.625%, due 1/15/18 | | | 3,478 | | | | 4,034 | |
| | | | | | | | |
Total U.S. Treasury Inflation Indexed Notes/Bonds | | | | | | | 8,367 | |
| | | | | | | | |
Government National Mortgage Association (GNMA)—1.1% | | | | | | | | |
#002584, 6.000%, due 4/20/13 | | | 3 | | | | 3 | |
#623159, 5.000%, due 11/15/13 | | | 26 | | | | 28 | |
#628400, 6.000%, due 11/15/13 | | | 43 | | | | 44 | |
#002682, 6.500%, due 11/20/13 | | | 13 | | | | 14 | |
#623182, 5.000%, due 12/15/13 | | | 36 | | | | 39 | |
#781010, 6.500%, due 4/15/14 | | | 31 | | | | 32 | |
#002761, 6.000%, due 5/20/14 | | | 21 | | | | 23 | |
#002787, 5.500%, due 7/20/14 | | | 3 | | | | 3 | |
#781275, 6.000%, due 10/15/14 | | | 77 | | | | 80 | |
GNR 2011-24 VA, 3.500%, due 2/20/16 | | | 1,242 | | | | 1,305 | |
#561031, 5.500%, due 9/15/16 | | | 196 | | | | 212 | |
#003180, 6.000%, due 1/20/17 | | | 30 | | | | 33 | |
#781567, 5.000%, due 2/15/18 | | | 72 | | | | 77 | |
#606406, 5.000%, due 4/15/18 | | | 99 | | | | 109 | |
#003438, 4.500%, due 9/20/18 | | | 179 | | | | 196 | |
#003465, 4.500%, due 11/20/18 | | | 60 | | | | 65 | |
#004430, 4.500%, due 5/20/24 | | | 895 | | | | 977 | |
| | | | | | | | |
Total GNMA Mortgage Obligations | | | | | | | 3,240 | |
| | | | | | | | |
Federal Home Loan Mortgage Corp. (FHLMC)—16.9% | | | | | | | | |
#B18053, 5.000%, due 3/1/15 | | | 34 | | | | 35 | |
#G11885, 5.000%, due 1/1/16 | | | 119 | | | | 127 | |
#E86134, 5.000%, due 11/1/16 | | | 126 | | | | 135 | |
#G12631, 5.500%, due 4/1/17 | | | 259 | | | | 278 | |
#G13127, 4.500%, due 4/1/18 | | | 74 | | | | 78 | |
#E95355, 5.000%, due 4/1/18 | | | 273 | | | | 294 | |
#G11606, 4.500%, due 5/1/18 | | | 29 | | | | 30 | |
#E96700, 5.000%, due 5/1/18 | | | 738 | | | | 794 | |
#E96962, 4.000%, due 6/1/18 | | | 123 | | | | 133 | |
#E01418, 4.000%, due 7/1/18 | | | 28 | | | | 30 | |
#E01411, 5.000%, due 7/1/18 | | | 143 | | | | 153 | |
#E01424, 4.000%, due 8/1/18 | | | 14 | | | | 15 | |
#E99160, 4.500%, due 9/1/18 | | | 139 | | | | 152 | |
#E99582, 5.000%, due 9/1/18 | | | 34 | | | | 37 | |
#E99659, 4.500%, due 10/1/18 | | | 192 | | | | 209 | |
#E01488, 5.000%, due 10/1/18 | | | 312 | | | | 334 | |
#E99895, 5.000%, due 10/1/18 | | | 637 | | | | 685 | |
#B11386, 5.000%, due 12/1/18 | | | 135 | | | | 145 | |
#B11362, 5.500%, due 12/1/18 | | | 20 | | | | 22 | |
#G13367, 5.500%, due 12/1/18 | | | 478 | | | | 515 | |
#E01545, 5.000%, due 1/1/19 | | | 169 | | | | 181 | |
#B12826, 4.500%, due 3/1/19 | | | 818 | | | | 880 | |
#G11766, 5.000%, due 3/1/19 | | | 119 | | | | 128 | |
#B13051, 4.500%, due 4/1/19 | | | 101 | | | | 110 | |
#B13143, 4.500%, due 4/1/19 | | | 495 | | | | 539 | |
#B14961, 4.500%, due 6/1/19 | | | 100 | | | | 109 | |
#B15141, 4.500%, due 6/1/19 | | | 107 | | | | 114 | |
#G11596, 5.500%, due 8/1/19 | | | 165 | | | | 179 | |
#G11605, 5.500%, due 9/1/19 | | | 79 | | | | 86 | |
#B17142, 4.500%, due 11/1/19 | | | 1,247 | | | | 1,355 | |
#B17161, 4.500%, due 11/1/19 | | | 36 | | | | 39 | |
#G18045, 5.000%, due 3/1/20 | | | 133 | | | | 144 | |
|
U.S. Government and U.S. Government Agency—(continued) | |
Federal Home Loan Mortgage Corp. (FHLMC)—(continued) | | | | | | | | |
#B19078, 5.000%, due 4/1/20 | | $ | 97 | | | $ | 105 | |
#G18048, 5.000%, due 4/1/20 | | | 92 | | | | 99 | |
#G11697, 5.500%, due 4/1/20 | | | 1,308 | | | | 1,423 | |
#J08152, 5.000%, due 5/1/20 | | | 105 | | | | 113 | |
#J02537, 5.000%, due 9/1/20 | | | 83 | | | | 90 | |
#G12394, 5.000%, due 5/1/21 | | | 171 | | | | 184 | |
#G13296, 5.000%, due 5/1/21 | | | 459 | | | | 494 | |
#G12113, 5.500%, due 5/1/21 | | | 234 | | | | 255 | |
#G12286, 5.000%, due 7/1/21 | | | 91 | | | | 98 | |
#G12432, 5.000%, due 12/1/21 | | | 77 | | | | 83 | |
#E02322, 5.500%, due 5/1/22 | | | 67 | | | | 73 | |
#J06484, 5.500%, due 11/1/22 | | | 525 | | | | 571 | |
#J06871, 5.500%, due 1/1/23 | | | 214 | | | | 233 | |
#J08703, 5.500%, due 9/1/23 | | | 91 | | | | 99 | |
#C00351, 8.000%, due 7/1/24 | | | 108 | | | | 129 | |
#G13695, 4.000%, due 9/1/24 | | | 1,530 | | | | 1,661 | |
#G00363, 8.000%, due 6/1/25 | | | 146 | | | | 176 | |
#J12853, 4.000%, due 8/1/25 | | | 224 | | | | 243 | |
#C80329, 8.000%, due 8/1/25 | | | 31 | | | | 38 | |
#J13022, 4.000%, due 9/1/25 | | | 2,837 | | | | 3,080 | |
#J14491, 4.000%, due 2/1/26 | | | 7,617 | | | | 8,357 | |
#G14150, 4.500%, due 4/1/26 | | | 3,677 | | | | 4,009 | |
#E02912, 5.000%, due 6/1/26 | | | 1,183 | | | | 1,278 | |
#J16051, 4.500%, due 7/1/26 | | | 4,488 | | | | 4,893 | |
#J19032, 3.500%, due 5/1/27 | | | 1,658 | | | | 1,798 | |
#G04053, 5.500%, due 3/1/38 | | | 3,194 | | | | 3,581 | |
#G04424, 6.000%, due 6/1/38 | | | 247 | | | | 273 | |
#G04778, 6.000%, due 7/1/38 | | | 225 | | | | 250 | |
#A81372, 6.000%, due 8/1/38 | | | 94 | | | | 103 | |
#G04544, 6.000%, due 8/1/38 | | | 1,446 | | | | 1,589 | |
#G04687, 6.000%, due 9/1/38 | | | 331 | | | | 365 | |
#G04745, 6.000%, due 9/1/38 | | | 180 | | | | 199 | |
#A81799, 6.500%, due 9/1/38 | | | 1,031 | | | | 1,171 | |
#G06017, 5.500%, due 6/1/40 | | | 2,785 | | | | 3,123 | |
| | | | | | | | |
Total FHLMC Mortgage Obligations | | | | | | | 48,301 | |
| | | | | | | | |
Federal National Mortgage Association (FNMA)—46.5% | | | | | | | | |
#679220, 6.000%, due 12/1/14 | | | 14 | | | | 15 | |
#256224, 5.500%, due 4/1/16 | | | 22 | | | | 24 | |
#254181, 5.000%, due 1/1/17 | | | 68 | | | | 74 | |
#256559, 5.500%, due 1/1/17 | | | 12 | | | | 13 | |
#256606, 5.500%, due 2/1/17 | | | 16 | | | | 17 | |
#256646, 5.500%, due 3/1/17 | | | 13 | | | | 14 | |
#545862, 5.000%, due 8/1/17 | | | 68 | | | | 74 | |
#545898, 5.500%, due 9/1/17 | | | 369 | | | | 397 | |
#545899, 5.500%, due 9/1/17 | | | 413 | | | | 445 | |
#254510, 5.000%, due 11/1/17 | | | 63 | | | | 68 | |
#555029, 5.000%, due 11/1/17 | | | 50 | | | | 55 | |
#254545, 5.000%, due 12/1/17 | | | 28 | | | | 30 | |
#254590, 5.000%, due 1/1/18 | | | 32 | | | | 34 | |
#257067, 5.000%, due 1/1/18 | | | 72 | | | | 78 | |
#663692, 5.000%, due 1/1/18 | | | 154 | | | | 167 | |
#674713, 5.000%, due 1/1/18 | | | 12 | | | | 13 | |
#679305, 5.000%, due 1/1/18 | | | 56 | | | | 60 | |
#254591, 5.500%, due 1/1/18 | | | 281 | | | | 303 | |
#678938, 5.500%, due 2/1/18 | | | 28 | | | | 30 | |
#683100, 5.500%, due 2/1/18 | | | 366 | | | | 395 | |
#254684, 5.000%, due 3/1/18 | | | 20 | | | | 21 | |
#675717, 5.000%, due 3/1/18 | | | 237 | | | | 258 | |
See accompanying Notes to Financial Statements.
December 31, 2012 | William Blair Funds 49 |
Low Duration Fund
Portfolio of Investments, December 31, 2012 (all dollar amounts in thousands)
| | | | | | | | |
Issuer | | Principal
Amount | | | Value | |
|
U.S. Government and U.S. Government Agency—(continued) | |
Federal National Mortgage Association (FNMA)—(continued) | | | | | | | | |
#681361, 5.000%, due 3/1/18 | | $ | 86 | | | $ | 94 | |
#656564, 5.000%, due 4/1/18 | | | 1,343 | | | | 1,459 | |
#696677, 5.000%, due 4/1/18 | | | 87 | | | | 95 | |
#702888, 5.000%, due 4/1/18 | | | 138 | | | | 150 | |
#695838, 5.500%, due 4/1/18 | | | 84 | | | | 90 | |
#254721, 5.000%, due 5/1/18 | | | 221 | | | | 240 | |
#697593, 5.000%, due 5/1/18 | | | 218 | | | | 234 | |
#702332, 5.000%, due 5/1/18 | | | 47 | | | | 51 | |
#704049, 5.500%, due 5/1/18 | | | 832 | | | | 895 | |
#735357, 5.500%, due 5/1/18 | | | 1,164 | | | | 1,253 | |
#656573, 5.000%, due 6/1/18 | | | 222 | | | | 245 | |
#709838, 5.000%, due 6/1/18 | | | 2,760 | | | | 3,008 | |
#709848, 5.000%, due 6/1/18 | | | 196 | | | | 216 | |
#728715, 5.000%, due 7/1/18 | | | 329 | | | | 359 | |
#735003, 5.500%, due 7/1/18 | | | 1,250 | | | | 1,346 | |
#711991, 5.000%, due 8/1/18 | | | 180 | | | | 199 | |
#190341, 5.000%, due 9/1/18 | | | 51 | | | | 56 | |
#743183, 5.000%, due 10/1/18 | | | 81 | | | | 89 | |
#555872, 5.000%, due 11/1/18 | | | 197 | | | | 214 | |
#749596, 5.000%, due 11/1/18 | | | 288 | | | | 317 | |
#745237, 5.000%, due 12/1/18 | | | 58 | | | | 63 | |
#753866, 6.000%, due 12/1/18 | | | 378 | | | | 416 | |
#761246, 5.000%, due 1/1/19 | | | 406 | | | | 448 | |
#761267, 4.500%, due 2/1/19 | | | 660 | | | | 727 | |
#255079, 5.000%, due 2/1/19 | | | 51 | | | | 56 | |
#766059, 5.500%, due 2/1/19 | | | 284 | | | | 311 | |
#766276, 5.000%, due 3/1/19 | | | 431 | | | | 471 | |
#742086, 4.500%, due 4/1/19 | | | 2,424 | | | | 2,671 | |
#779363, 5.000%, due 6/1/19 | | | 81 | | | | 89 | |
#785259, 5.000%, due 8/1/19 | | | 344 | | | | 376 | |
#788424, 5.500%, due 9/1/19 | | | 83 | | | | 91 | |
#725953, 5.000%, due 10/1/19 | | | 102 | | | | 112 | |
#735401, 5.500%, due 3/1/20 | | | 233 | | | | 251 | |
#357865, 5.000%, due 7/1/20 | | | 241 | | | | 263 | |
#357978, 5.000%, due 9/1/20 | | | 239 | | | | 263 | |
#745735, 5.000%, due 3/1/21 | | | 757 | | | | 827 | |
#879607, 5.500%, due 4/1/21 | | | 121 | | | | 133 | |
#831497, 6.000%, due 4/1/21 | | | 455 | | | | 501 | |
#880993, 6.000%, due 1/1/22 | | | 32 | | | | 36 | |
#972934, 5.500%, due 2/1/23 | | | 375 | | | | 406 | |
#889342, 5.000%, due 3/1/23 | | | 146 | | | | 159 | |
#982878, 4.500%, due 5/1/23 | | | 595 | | | | 655 | |
#254908, 5.000%, due 9/1/23 | | | 68 | | | | 74 | |
#AE0011, 5.500%, due 9/1/23 | | | 200 | | | | 216 | |
#255165, 4.500%, due 3/1/24 | | | 97 | | | | 106 | |
#934808, 4.500%, due 3/1/24 | | | 298 | | | | 325 | |
#AA4519, 4.500%, due 3/1/24 | | | 2,069 | | | | 2,280 | |
#AA2922, 4.000%, due 4/1/24 | | | 1,103 | | | | 1,215 | |
#AA5028, 4.500%, due 4/1/24 | | | 406 | | | | 447 | |
#190988, 9.000%, due 6/1/24 | | | 164 | | | | 191 | |
#993231, 4.000%, due 7/1/24 | | | 1,402 | | | | 1,544 | |
#AC1520, 4.000%, due 9/1/24 | | | 167 | | | | 183 | |
#AC3674, 4.500%, due 10/1/24 | | | 1,865 | | | | 2,054 | |
#AC5124, 4.000%, due 11/1/24 | | | 1,256 | | | | 1,383 | |
#AC6600, 4.500%, due 11/1/24 | | | 90 | | | | 99 | |
#AC6257, 4.000%, due 12/1/24 | | | 1,246 | | | | 1,372 | |
#AC8857, 4.500%, due 12/1/24 | | | 81 | | | | 88 | |
#AC9560, 5.000%, due 1/1/25 | | | 4,072 | | | | 4,485 | |
#932449, 4.000%, due 2/1/25 | | | 498 | | | | 548 | |
| | | | | | | | | | | | |
Issuer | | NRSRO
Rating
(unaudited) | | | Principal
Amount | | | Value | |
|
U.S. Government and U.S. Government Agency—(continued) | |
Federal National Mortgage Association (FNMA)—(continued) | | | | | | | | | |
#932629, 4.000%, due 3/1/25 | | | | | | $ | 544 | | | $ | 599 | |
#AD0855, 4.000%, due 3/1/25 | | | | | | | 411 | | | | 451 | |
#932723, 4.000%, due 4/1/25 | | | | | | | 600 | | | | 661 | |
#AD4073, 4.000%, due 5/1/25 | | | | | | | 206 | | | | 227 | |
#935995, 4.000%, due 6/1/25 | | | | | | | 202 | | | | 222 | |
#AD4677, 4.000%, due 6/1/25 | | | | | | | 2,059 | | | | 2,267 | |
#AD8164, 4.000%, due 8/1/25 | | | | | | | 4,363 | | | | 4,804 | |
#AE1176, 4.000%, due 8/1/25 | | | | | | | 835 | | | | 920 | |
#AB1459, 4.000%, due 9/1/25 | | | | | | | 413 | | | | 454 | |
#AD8190, 4.000%, due 9/1/25 | | | | | | | 1,856 | | | | 2,033 | |
#AH2671, 4.000%, due 1/1/26 | | | | | | | 1,559 | | | | 1,717 | |
#890329, 4.000%, due 4/1/26 | | | | | | | 3,489 | | | | 3,822 | |
#AI4856, 4.500%, due 6/1/26 | | | | | | | 3,325 | | | | 3,664 | |
#AI9811, 4.500%, due 8/1/26 | | | | | | | 2,869 | | | | 3,161 | |
#AH9564, 3.500%, due 9/1/26 | | | | | | | 4,647 | | | | 5,056 | |
#AB3497, 4.000%, due 9/1/26 | | | | | | | 2,045 | | | | 2,240 | |
#AB3608, 3.500%, due 10/1/26 | | | | | | | 4,735 | | | | 5,152 | |
#AI7363, 3.500%, due 10/1/26 | | | | | | | 1,208 | | | | 1,314 | |
#AJ2322, 3.500%, due 10/1/26 | | | | | | | 4,162 | | | | 4,528 | |
#AB3975, 3.500%, due 12/1/26 | | | | | | | 1,662 | | | | 1,808 | |
#AJ8149, 3.500%, due 12/1/26 | | | | | | | 3,362 | | | | 3,657 | |
#AJ7724, 4.000%, due 12/1/26 | | | | | | | 2,676 | | | | 2,946 | |
#AK0498, 3.500%, due 1/1/27 | | | | | | | 897 | | | | 976 | |
#AK2768, 3.500%, due 3/1/27 | | | | | | | 2,876 | | | | 3,129 | |
#AK7384, 4.000%, due 3/1/27 | | | | | | | 3,718 | | | | 4,094 | |
#AB4818, 4.000%, due 4/1/27 | | | | | | | 2,810 | | | | 3,095 | |
#AL2223, 3.000%, due 6/1/27 | | | | | | | 3,151 | | | | 3,385 | |
#AP0446, 3.500%, due 7/1/27 | | | | | | | 7,201 | | | | 7,835 | |
#AP0462, 3.500%, due 7/1/27 | | | | | | | 1,138 | | | | 1,238 | |
#AL2590, 4.000%, due 7/1/27 | | | | | | | 6,814 | | | | 7,503 | |
#AQ8404, 3.000%, due 12/1/27 | | | | | | | 3,112 | | | | 3,344 | |
#809926, 5.500%, due 2/1/35 | | | | | | | 237 | | | | 269 | |
#829306, 6.000%, due 9/1/35 | | | | | | | 144 | | | | 162 | |
#928574, 6.000%, due 7/1/37 | | | | | | | 282 | | | | 315 | |
#889385, 6.000%, due 2/1/38 | | | | | | | 1,750 | | | | 1,963 | |
#975649, 6.000%, due 7/1/38 | | | | | | | 381 | | | | 417 | |
#935532, 4.500%, due 8/1/39 | | | | | | | 108 | | | | 122 | |
#AC6651, 4.500%, due 12/1/39 | | | | | | | 136 | | | | 154 | |
#AL0913, 6.000%, due 7/1/41 | | | | | | | 4,065 | | | | 4,529 | |
| | | | | | | | | | | | |
Total FNMA Mortgage Obligations | | | | | | | | | | | 133,363 | |
| | | | | | | | | | | | |
| |
Asset-Backed Securities—10.9% | | | | | |
Mercedes-Benz Auto Receivables Trust, 2009-1, Tranche A3,
1.670%, 1/15/14 | | | AAA | | | | 19 | | | | 19 | |
Honda Auto Receivables Owner Trust, 2010-2, Tranche A3,
1.340%, 3/18/14 | | | Aaa | | | | 17 | | | | 17 | |
Hertz Vehicle Financing LLC—144A, 2009-2A, Tranche A1,
4.260%, 3/25/14 | | | Aaa | | | | 883 | | | | 887 | |
BMW Vehicle Owner Trust, 2010-A, Tranche A3,
1.390%, 4/25/14 | | | AAA | | | | 30 | | | | 30 | |
Ford Credit Auto Owner Trust, 2010-A, Tranche A3,
1.320%, 6/15/14 | | | AAA | | | | 50 | | | | 50 | |
See accompanying Notes to Financial Statements.
50 Annual Report | December 31, 2012 |
Low Duration Fund
Portfolio of Investments, December 31, 2012 (all dollar amounts in thousands)
| | | | | | | | | | | | |
Issuer | | NRSRO
Rating
(unaudited) | | | Principal
Amount | | | Value | |
| |
Asset-Backed Securities—(continued) | | | | | |
Nissan Auto Receivables Owner Trust, 2010-A, Tranche A3,
0.870%, 7/15/14 | | | Aaa | | | $ | 236 | | | $ | 236 | |
Nissan Master Owner Trust Receivables—144A, 2010-AA, Tranche A,
1.359%, 1/15/15, VRN | | | AAA | | | | 2,300 | | | | 2,301 | |
CarMax Auto Owner Trust, 2012-1, Tranche A2,
0.590%, 3/16/15 | | | AAA | | | | 675 | | | | 676 | |
CNH Equipment Trust, 2010-C, Tranche A3,
1.170%, 5/15/15 | | | AAA | | | | 194 | | | | 195 | |
Harley-Davidson Motorcycle Trust, 2011-2, Tranche A2,
0.710%, 5/15/15 | | | Aaa | | | | 863 | | | | 864 | |
FPL Recovery Funding LLC, 2007-A, Tranche A2,
5.044%, 8/1/15 | | | AAA | | | | 354 | | | | 359 | |
Bank of America Credit Card Trust, 2010-A1, Tranche A1,
0.509%, 9/15/15, VRN | | | AAA | | | | 2,215 | | | | 2,217 | |
Chase Issuance Trust, 2008-A13, Tranche A13,
1.808%, 9/15/15, VRN | | | AAA | | | | 100 | | | | 101 | |
Discover Card Master Trust I, 2010-A1, Tranche A1,
0.859%, 9/15/15, VRN | | | Aaa | | | | 447 | | | | 448 | |
Honda Auto Receivables Owner Trust, 2012-1, Tranche A3,
0.770%, 1/15/16 | | | AAA | | | | 1,000 | | | | 1,005 | |
Ford Credit Floorplan Master Owner Trust, 2011-1,
Tranche A2,
0.809%, 2/15/16, VRN | | | AAA | | | | 1,250 | | | | 1,255 | |
Hertz Vehicle Financing LLC—144A, 2009-2A, Tranche A2, 5.290%, 3/25/16 | | | Aaa | | | | 2,350 | | | | 2,556 | |
CNH Equipment Trust, 2010-C, Tranche A4,
1.750%, 5/16/16 | | | AAA | | | | 60 | | | | 61 | |
Avis Budget Rental Car Funding AESOP LLC—144A, 2010-3A, Tranche A,
4.640%, 5/20/16 | | | Aaa | | | | 1,400 | | | | 1,514 | |
Centre Point Funding LLC—144A, 2010-1A, Tranche 1,
5.430%, 7/20/16 | | | A2 | | | | 1,352 | | | | 1,456 | |
CNH Equipment Trust, 2011-B, Tranche A3,
0.910%, 8/15/16 | | | AAA | | | | 700 | | | | 703 | |
Discover Card Master Trust, 2011-A1, Tranche A1,
0.559%, 8/15/16, VRN | | | Aaa | | | | 1,400 | | | | 1,404 | |
BA Credit Card Trust, 2007-A6, Tranche A6,
0.269%, 9/15/16, VRN | | | AAA | | | | 20 | | | | 20 | |
Enterprise Fleet Financing LLC—144A, 2011-2, Tranche A2, 1.430%, 10/20/16 | | | AAA | | | | 1,236 | | | | 1,239 | |
| |
Asset-Backed Securities—(continued) | | | | | |
GE Capital Credit Card Master Note Trust, 2011-1, Tranche A, 0.759%, 1/15/17, VRN | | | Aaa | | | $ | 500 | | | $ | 503 | |
GE Dealer Floorplan Master Note Trust, 2012-1, Tranche A, 0.781%, 2/20/17, VRN | | | Aaa | | | | 1,250 | | | | 1,256 | |
BA Credit Card Trust, 2007-A15, Tranche A15,
0.559%, 4/17/17, VRN | | | AAA | | | | 100 | | | | 100 | |
Citibank Credit Card Issuance Trust, 2008-A6, Tranche A6, 1.411%, 5/22/17, VRN | | | AAA | | | | 200 | | | | 205 | |
Discover Card Master Trust, 2010-A2, Tranche A2,
0.789%, 3/15/18, VRN | | | AAA | | | | 350 | | | | 355 | |
Citibank Omni Master Trust—144A, 2009-A14A, Tranche A14,
2.959%, 8/15/18, VRN | | | Aaa | | | | 2,000 | | | | 2,081 | |
Capital One Multi-Asset Execution Trust, 2007-A2, Tranche A2, 0.289%, 12/16/19, VRN | | | AAA | | | | 215 | | | | 214 | |
MBNA Credit Card Master Note Trust, 2004-A3, Tranche A3, 0.469%, 8/16/21, VRN | | | AAA | | | | 475 | | | | 471 | |
SLM Student Loan Trust, 2008-5, Tranche A4,
2.015%, 7/25/23, VRN | | | Aaa | | | | 4,000 | | | | 4,222 | |
SLM Student Loan Trust—144A, 2011-A, Tranche A3,
2.709%, 1/15/43, VRN | | | AAA | | | | 2,000 | | | | 2,085 | |
| | | | | | | | | | | | |
Total Asset-Backed Securities | | | | | | | | | | | 31,105 | |
| | | | | | | | | | | | |
|
Corporate Obligations—12.9% | |
JPMorgan Chase & Co.,
1.116%, due 1/24/14, VRN | | | A | + | | | 1,100 | | | | 1,107 | |
Morgan Stanley,
1.916%, due 1/24/14, VRN | | | A | | | | 1,000 | | | | 1,007 | |
Bank of America Corporation,
1.733%, due 1/30/14, VRN | | | A | | | | 1,000 | | | | 1,008 | |
Citigroup, Inc.,
1.290%, due 4/1/14, VRN | | | A | | | | 1,000 | | | | 1,001 | |
Morgan Stanley,
6.000%, due 5/13/14 | | | A | | | | 1,300 | | | | 1,377 | |
The Goldman Sachs Group, Inc.,
0.843%, due 1/12/15, VRN | | | A | | | | 1,000 | | | | 986 | |
General Dynamics Corporation,
1.375%, due 1/15/15 | | | A | | | | 1,325 | | | | 1,346 | |
The Goldman Sachs Group, Inc.,
5.125%, due 1/15/15 | | | A | | | | 1,000 | | | | 1,074 | |
AT&T, Inc.,
0.875%, due 2/13/15 | | | A2 | | | | 1,000 | | | | 1,005 | |
Wells Fargo & Co.,
1.250%, due 2/13/15 | | | AA | - | | | 2,250 | | | | 2,271 | |
Toyota Motor Credit Corporation,
1.000%, due 2/17/15 | | | AA | - | | | 1,000 | | | | 1,007 | |
The Bank of New York Mellon Corporation,
1.200%, due 2/20/15 | | | Aa3 | | | | 1,000 | | | | 1,011 | |
See accompanying Notes to Financial Statements.
December 31, 2012 | William Blair Funds 51 |
Low Duration Fund
Portfolio of Investments, December 31, 2012 (all dollar amounts in thousands)
| | | | | | | | | | | | |
Issuer | | NRSRO
Rating
(unaudited) | | | Principal
Amount | | | Value | |
|
Corporate Obligations—(continued) | |
American International Group, Inc.,
3.000%, due 3/20/15 | | | A | - | | $ | 1,150 | | | $ | 1,197 | |
JPMorgan Chase & Co.,
1.875%, due 3/20/15 | | | A | + | | | 1,525 | | | | 1,552 | |
Bank of America Corporation,
4.500%, due 4/1/15 | | | A | | | | 2,000 | | | | 2,132 | |
The Goldman Sachs Group, Inc.,
3.300%, due 5/3/15 | | | A | | | | 800 | | | | 834 | |
Citigroup, Inc.,
4.700%, due 5/29/15 | | | A | | | | 1,300 | | | | 1,400 | |
John Deere Capital Corporation,
0.950%, due 6/29/15 | | | A | | | | 1,000 | | | | 1,006 | |
General Electric Capital Corporation,
1.625%, due 7/2/15 | | | AA | + | | | 1,650 | | | | 1,677 | |
Anheuser-Busch InBev Worldwide, Inc.,
0.800%, due 7/15/15 | | | A | | | | 300 | | | | 301 | |
Royal Bank of Scotland Group plc,
2.550%, due 9/18/15 | | | A | | | | 3,000 | | | | 3,070 | |
AbbVie, Inc.—144A,
1.200%, due 11/6/15 | | | A | | | | 1,250 | | | | 1,258 | |
NRSRO = Nationally Recognized Statistical Rating Organization—
The credit quality ratings of the securities in the Fund reflect the highest category rating by either Fitch Ratings, Moody’s Investors Service Inc., or Standard & Poor’s, a division of the McGraw-Hill Companies, Inc.
The obligations of certain U. S. Government-sponsored securities are neither issued nor guaranteed by the U. S. Treasury.
VRN = Variable Rate Note
| | | | | | | | | | | | |
Issuer | | NRSRO
Rating
(unaudited) | | | Principal
Amount | | | Value | |
|
Corporate Obligations—(continued) | |
Capital One Financial Corporation,
1.000%, due 11/6/15 | | | A | - | | $ | 3,000 | | | $ | 2,990 | |
American Express Centurion Bank,
0.875%, due 11/13/15 | | | A | + | | | 1,000 | | | | 999 | |
Volkswagen International Finance N.V.—144A,
1.150%, due 11/20/15 | | | A | - | | | 1,500 | | | | 1,502 | |
AT&T, Inc.,
0.800%, due 12/1/15 | | | A2 | | | | 2,000 | | | | 2,000 | |
McKesson Corporation,
0.950%, due 12/4/15 | | | A | - | | | 1,000 | | | | 1,001 | |
| | | | | | | | | | | | |
Total Corporate Obligations | | | | | | | | | | | 37,119 | |
| | | | | | | | | | | | |
Total Long-Term Investments—91.2%
(cost $259,259) | | | | 261,495 | |
| | | | | | | | | | | | |
Total Investments—91.2%
(cost $259,259) | | | | 261,495 | |
Cash and other assets, less liabilities—8.8% | | | | 25,335 | |
| | | | | | | | | | | | |
Net assets—100.0% | | | $ | 286,830 | |
| | | | | | | | | | | | |
See accompanying Notes to Financial Statements.
52 Annual Report | December 31, 2012 |
Statements of Assets and Liabilities
December 31, 2012 (all dollar amounts in thousands)
| | | | | | | | | | | | | | | | |
| | | Global
Leaders
Fund | | | Institutional
International
Growth
Fund | | | Institutional
International
Equity
Fund | | | International
Leaders
Fund | |
Assets | | | | | | | | | | | | | | | | |
Investments in securities, at cost | | $ | 55,268 | | | $ | 1,634,152 | | | $ | 88,597 | | | $ | 9,420 | |
Investments in affiliated companies, at cost | | | — | | | | 11,834 | | | | — | | | | — | |
| | | | | | | | | | | | | | | | |
| | | | |
Investments in securities, at value | | $ | 63,565 | | | $ | 1,964,087 | | | $ | 108,613 | | | $ | 10,132 | |
Investments in affiliated companies, at cost | | | — | | | | 11,834 | | | | — | | | | — | |
Cash | | | — | | | | 476 | | | | — | | | | — | |
Foreign currency, at value (cost $- ; $1,544 ;$98 ; $8) | | | — | | | | 1,561 | | | | 98 | | | | 8 | |
Receivable for securities sold | | | 7 | | | | 2,834 | | | | 1,404 | | | | 1 | |
Receivable for fund shares sold | | | 10,023 | | | | 1,520 | | | | — | | | | 305 | |
Receivable from Advisor | | | 12 | | | | — | | | | 37 | | | | 7 | |
Dividend and interest receivable | | | 42 | | | | 1,708 | | | | 96 | | | | 2 | |
| | | | | | | | | | | | | | | | |
Total assets | | | 73,649 | | | | 1,984,020 | | | | 110,248 | | | | 10,455 | |
Liabilities | | | | | | | | | | | | | | | | |
Payable for investment securities purchased | | | 6,496 | | | | 4,793 | | | | — | | | | 241 | |
Payable for fund shares redeemed | | | 39 | | | | 2,651 | | | | — | | | | — | |
Payable to custodian | | | — | | | | — | | | | 400 | | | | — | |
Management fee payable | | | 49 | | | | 1,557 | | | | 92 | | | | 8 | |
Distribution and shareholder administration fees payable | | | 8 | | | | — | | | | — | | | | 1 | |
Foreign income tax payable | | | — | | | | 654 | | | | — | | | | — | |
Other payables and accrued expenses | | | 63 | | | | 235 | | | | 66 | | | | 41 | |
| | | | | | | | | | | | | | | | |
Total liabilities | | | 6,655 | | | | 9,890 | | | | 558 | | | | 291 | |
| | | | | | | | | | | | | | | | |
Net Assets | | $ | 66,994 | | | $ | 1,974,130 | | | $ | 109,690 | | | $ | 10,164 | |
| | | | | | | | | | | | | | | | |
Capital | | | | | | | | | | | | | | | | |
Composition of Net Assets | | | | | | | | | | | | | | | | |
Par value of shares of beneficial interest | | | 7 | | | | 133 | | | | 10 | | | | 1 | |
Capital paid in excess of par value | | | 72,738 | | | | 1,834,210 | | | | 213,309 | | | | 9,558 | |
Accumulated net investment income (loss) | | | (7 | ) | | | (8,076 | ) | | | (196 | ) | | | (3 | ) |
Accumulated realized gain (loss) | | | (14,041 | ) | | | (181,425 | ) | | | (123,444 | ) | | | (104 | ) |
Net unrealized appreciation (depreciation) of investments and foreign currencies | | | 8,297 | | | | 329,288 | | | | 20,011 | | | | 712 | |
| | | | | | | | | | | | | | | | |
Net Assets | | $ | 66,994 | | | $ | 1,974,130 | | | $ | 109,690 | | | $ | 10,164 | |
| | | | | | | | | | | | | | | | |
| | | | |
Net Assets | | $ | 16,022 | | | $ | 1,974,130 | | | $ | 109,690 | | | $ | 5,286 | |
Shares Outstanding—Institutional Class | | | 1,690,007 | | | | 132,588,054 | | | | 10,134,638 | | | | 489,229 | |
Net Asset Value Per Share | | $ | 9.47 | | | $ | 14.89 | | | $ | 10.82 | | | $ | 10.80 | |
See accompanying Notes to Financial Statements.
December 31, 2012 | William Blair Funds 53 |
Statements of Operations
for the Year Ended December 31, 2012 (all dollar amounts in thousands)
| | | | | | | | | | | | | | | | |
| | | Global
Leaders
Fund | | | Institutional
International
Growth
Fund | | | Institutional
International
Equity
Fund | | | International
Leaders
Fund(a) | |
Investment income | | | | | | | | | | | | | | | | |
Dividends | | $ | 947 | | | $ | 50,411 | | | $ | 2,931 | | | $ | 30 | |
Less foreign tax withheld | | | (52 | ) | | | (3,906 | ) | | | (215 | ) | | | (1 | ) |
Interest | | | 1 | | | | 143 | | | | 2 | | | | — | |
| | | | | | | | | | | | | | | | |
Total income | | | 896 | | | | 46,648 | | | | 2,718 | | | | 29 | |
Expenses | | | | | | | | | | | | | | | | |
Investment advisory fees | | | 501 | | | | 16,682 | | | | 1,139 | | | | 22 | |
Distribution fees | | | 12 | | | | — | | | | — | | | | — | |
Shareholder administration fees | | | 75 | | | | — | | | | — | | | | 2 | |
Custodian fees | | | 72 | | | | 382 | | | | 74 | | | | 22 | |
Transfer agent fees | | | 19 | | | | 41 | | | | 4 | | | | 5 | |
Sub-transfer agent fees | | | | | | | | | | | | | | | | |
Class N | | | 3 | | | | — | | | | — | | | | — | |
Class I | | | 15 | | | | — | | | | — | | | | — | |
Professional fees | | | 41 | | | | 173 | | | | 62 | | | | 27 | |
Registration fees | | | 42 | | | | 44 | | | | 21 | | | | 4 | |
Shareholder reporting fees | | | 7 | | | | 3 | | | | — | | | | — | |
Trustee fees | | | 2 | | | | 86 | | | | 9 | | | | — | |
Other expenses | | | 6 | | | | 68 | | | | 13 | | | | 1 | |
| | | | | | | | | | | | | | | | |
Total expenses before waiver | | | 795 | | | | 17,479 | | | | 1,322 | | | | 83 | |
Expenses reimbursed to (waived or absorbed by) the Advisor | | | (157 | ) | | | — | | | | (69 | ) | | | (57 | ) |
| | | | | | | | | | | | | | | | |
Net expenses | | | 638 | | | | 17,479 | | | | 1,253 | | | | 26 | |
| | | | | | | | | | | | | | | | |
Net investment income (loss) | | | 258 | | | | 29,169 | | | | 1,465 | | | | 3 | |
Realized and unrealized gain (loss) | | | | | | | | | | | | | | | | |
Net Realized gain (loss) on transactions from: | | | | | | | | | | | | | | | | |
Investments in securities | | | 3,726 | | | | 27,285 | | | | 5,965 | | | | (104 | ) |
Forward foreign currency contracts | | | — | | | | 10,281 | | | | (85 | ) | | | 9 | |
Foreign currency transactions | | | (22 | ) | | | (2,430 | ) | | | (87 | ) | | | 1 | |
| | | | | | | | | | | | | | | | |
Total net realized gain (loss) | | | 3,704 | | | | 35,136 | | | | 5,793 | | | | (94 | ) |
Change in net unrealized appreciation (depreciation) of: | | | | | | | | | | | | | | | | |
Investments | | | 3,879 | | | | 314,012 | | | | 11,757 | | | | 712 | |
Forward foreign currency contracts | | | — | | | | 837 | | | | — | | | | — | |
Foreign currency translations | | | — | | | | (410 | ) | | | 5 | | | | — | |
| | | | | | | | | | | | | | | | |
Change in net unrealized appreciation (depreciation) | | | 3,879 | | | | 314,439 | | | | 11,762 | | | | 712 | |
| | | | | | | | | | | | | | | | |
Net increase (decrease) in net assets resulting from operations | | $ | 7,841 | | | $ | 378,744 | | | $ | 19,020 | | | $ | 621 | |
| | | | | | | | | | | | | | | | |
| (a) | | For the period from August 16, 2012 (commencement of operations) to December 31, 2012. |
See accompanying Notes to Financial Statements.
54 Annual Report | December 31, 2012 |
Statements of Changes in Net Assets
for the Years Ended December 31, 2012 and 2011 (all dollar amounts in thousands)
| | | | | | | | | | | | | | | | | | | | | | | | | | | | |
| | | Global
Leaders
Fund | | | Institutional
International
Growth
Fund | | | Institutional
International
Equity
Fund | | | International
Leaders
Fund | |
| | | 2012 | | | 2011 | | | 2012 | | | 2011 | | | 2012 | | | 2011 | | | 2012(a) | |
Operations | | | | | | | | | | | | | | | | | | | | | | | | | | | | |
Net investment income (loss) | | $ | 258 | | | $ | 225 | | | $ | 29,169 | | | $ | 25,588 | | | $ | 1,465 | | | $ | 3,338 | | | $ | 3 | |
Net realized gain (loss) on investments, forwards and foreign currency | | | 3,704 | | | | 4,570 | | | | 35,136 | | | | 68,491 | | | | 5,793 | | | | 29,945 | | | | (94 | ) |
Change in net unrealized appreciation (depreciation) on investments, forwards and foreign currency | | | 3,879 | | | | (6,320 | ) | | | 314,439 | | | | (329,733 | ) | | | 11,762 | | | | (61,430 | ) | | | 712 | |
| | | | | | | | | | | | | | | | | | | | | | | | | | | | |
Net increase (decrease) in net assets resulting from operations | | | 7,841 | | | | (1,525 | ) | | | 378,744 | | | | (235,654 | ) | | | 19,020 | | | | (28,147 | ) | | | 621 | |
Distributions to shareholders from | | | | | | | | | | | | | | | | | | | | | | | | | | | | |
Net investment income | | | | | | | | | | | | | | | | | | | | | | | | | | | | |
Class N | | | (15 | ) | | | (4 | ) | | | — | | | | — | | | | — | | | | — | | | | — | |
Class I | | | (227 | ) | | | (170 | ) | | | — | | | | — | | | | — | | | | — | | | | (6 | ) |
Class Institutional | | | — | | | | — | | | | (62,889 | ) | | | (1,997 | ) | | | (1,482 | ) | | | (2,326 | ) | | | (10 | ) |
| | | | | | | | | | | | | | | | | | | | | | | | | | | | |
Total Distributions | | | (242 | ) | | | (174 | ) | | | (62,889 | ) | | | (1,997 | ) | | | (1,482 | ) | | | (2,326 | ) | | | (16 | ) |
Capital stock transactions | | | | | | | | | | | | | | | | | | | | | | | | | | | | |
Net proceeds from sale of shares | | | 32,763 | | | | 3,738 | | | | 283,364 | | | | 357,122 | | | | 9,705 | | | | 12,843 | | | | 9,543 | |
Shares issued in reinvestment of income dividends and capital gain distributions | | | 234 | | | | 166 | | | | 58,949 | | | | 1,885 | | | | 1,482 | | | | 2,328 | | | | 16 | |
Less cost of shares redeemed | | | (16,176 | ) | | | (4,508 | ) | | | (226,632 | ) | | | (464,979 | ) | | | (30,509 | ) | | | (164,692 | ) | | | — | |
| | | | | | | | | | | | | | | | | | | | | | | | | | | | |
Net increase (decrease) in net assets resulting from capital share transactions | | | 16,821 | | | | (604 | ) | | | 115,681 | | | | (105,972 | ) | | | (19,322 | ) | | | (149,521 | ) | | | 9,559 | |
| | | | | | | | | | | | | | | | | | | | | | | | | | | | |
Increase (decrease) in net assets | | | 24,420 | | | | (2,303 | ) | | | 431,536 | | | | (343,623 | ) | | | (1,784 | ) | | | (179,994 | ) | | | 10,164 | |
Net assets | | | | | | | | | | | | | | | | | | | | | | | | | | | | |
Beginning of year | | | 42,574 | | | | 44,877 | | | | 1,542,594 | | | | 1,886,217 | | | | 111,474 | | | | 291,468 | | | | — | |
| | | | | | | | | | | | | | | | | | | | | | | | | | | | |
End of year | | $ | 66,994 | | | $ | 42,574 | | | $ | 1,974,130 | | | $ | 1,542,594 | | | $ | 109,690 | | | $ | 111,474 | | | $ | 10,164 | |
| | | | | | | | | | | | | | | | | | | | | | | | | | | | |
Accumulated net investment income (loss) at the end of the year | | $ | (7 | ) | | $ | (3 | ) | | $ | (8,076 | ) | | $ | 16,015 | | | $ | (196 | ) | | $ | (25 | ) | | $ | (3 | ) |
| | | | | | | | | | | | | | | | | | | | | | | | | | | | |
| (a) | | For the period from August 16, 2012 (commencement of operations) to December 31, 2012. |
See accompanying Notes to Financial Statements.
December 31, 2012 | William Blair Funds 55 |
Statements of Assets and Liabilities
December 31, 2012 (all dollar amounts in thousands)
| | | | | | | | | | | | | | | | |
| | | International
Small Cap
Growth
Fund | | | Emerging
Markets
Growth
Fund | | | Emerging
Markets
Leaders
Fund | | | Emerging
Markets
Small Cap
Growth
Fund | |
Assets | | | | | | | | | | | | | | | | |
Investments in securities, at cost | | $ | 611,156 | | | $ | 781,190 | | | $ | 60,490 | | | $ | 25,817 | |
Investments in affiliated companies, at cost | | | — | | | | 23,624 | | | | — | | | | — | |
| | | | | | | | | | | | | | | | |
| | | | |
Investments in securities, at value | | $ | 716,924 | | | $ | 934,200 | | | $ | 70,624 | | | $ | 27,656 | |
Investments in affiliated companies, at cost | | | — | | | | 23,624 | | | | — | | | | — | |
Cash | | | — | | | | — | | | | — | | | | 12 | |
Foreign currency, at value (cost $2,085 ; $1,679 ;$5 ; $93) | | | 2,086 | | | | 1,680 | | | | 5 | | | | 93 | |
Receivable for securities sold | | | 4,361 | | | | 9,380 | | | | — | | | | 311 | |
Receivable for fund shares sold | | | 774 | | | | 5,660 | | | | 13 | | | | 1,239 | |
Receivable from Advisor | | | — | | | | — | | | | 11 | | | | 25 | |
Dividend and interest receivable | | | 401 | | | | 662 | | | | 40 | | | | 10 | |
| | | | | | | | | | | | | | | | |
Total assets | | | 724,546 | | | | 975,206 | | | | 70,693 | | | | 29,346 | |
Liabilities | | | | | | | | | | | | | | | | |
Payable for investment securities purchased | | | 3,141 | | | | 7,788 | | | | 1,563 | | | | 2,214 | |
Payable for fund shares redeemed | | | 1,064 | | | | 242 | | | | — | | | | — | |
Management fee payable | | | 605 | | | | 870 | | | | 60 | | | | 14 | |
Distribution and shareholder administration fees payable | | | 50 | | | | 24 | | | | 3 | | | | 2 | |
Foreign income tax payable | | | — | | | | 1,738 | | | | — | | | | 29 | |
Other payables and accrued expenses | | | 178 | | | | 307 | | | | 88 | | | | 66 | |
| | | | | | | | | | | | | | | | |
Total liabilities | | | 5,038 | | | | 10,969 | | | | 1,714 | | | | 2,325 | |
| | | | | | | | | | | | | | | | |
Net Assets | | $ | 719,508 | | | $ | 964,237 | | | $ | 68,979 | | | $ | 27,021 | |
| | | | | | | | | | | | | | | | |
Capital | | | | | | | | | | | | | | | | |
Composition of Net Assets | | | | | | | | | | | | | | | | |
Par value of shares of beneficial interest | | | 53 | | | | 71 | | | | 8 | | | | 2 | |
Capital paid in excess of par value | | | 673,078 | | | | 852,556 | | | | 63,868 | | | | 25,269 | |
Accumulated net investment income (loss) | | | (1,792 | ) | | | (2,280 | ) | | | (44 | ) | | | (59 | ) |
Accumulated realized gain (loss) | | | (57,594 | ) | | | (37,394 | ) | | | (4,987 | ) | | | (4 | ) |
Net unrealized appreciation (depreciation) of investments and foreign currencies | | | 105,763 | | | | 151,284 | | | | 10,134 | | | | 1,813 | |
| | | | | | | | | | | | | | | | |
Net Assets | | $ | 719,508 | | | $ | 964,237 | | | $ | 68,979 | | | $ | 27,021 | |
| | | | | | | | | | | | | | | | |
| | | | |
Net Assets | | $ | 345,180 | | | $ | 802,571 | | | $ | 43,102 | | | $ | 15,242 | |
Shares Outstanding—Institutional Class | | | 25,301,236 | | | | 59,076,898 | | | | 4,697,641 | | | | 1,172,791 | |
Net Asset Value Per Share | | $ | 13.64 | | | $ | 13.59 | | | $ | 9.18 | | | $ | 13.00 | |
See accompanying Notes to Financial Statements.
56 Annual Report | December 31, 2012 |
Statements of Operations
for the Year Ended December 31, 2012 (all dollar amounts in thousands)
| | | | | | | | | | | | | | | | |
| | | International
Small Cap
Growth
Fund | | | Emerging
Markets
Growth
Fund | | | Emerging
Markets
Leaders
Fund | | | Emerging
Markets
Small Cap
Growth
Fund | |
Investment income | | | | | | | | | | | | | | | | |
Dividends | | $ | 16,759 | | | $ | 24,475 | | | $ | 1,364 | | | $ | 160 | |
Less foreign tax withheld | | | (1,245 | ) | | | (2,200 | ) | | | (113 | ) | | | (17 | ) |
Interest | | | 128 | | | | 208 | | | | 1 | | | | — | |
| | | | | | | | | | | | | | | | |
Total income | | | 15,642 | | | | 22,483 | | | | 1,252 | | | | 143 | |
Expenses | | | | | | | | | | | | | | | | |
Investment advisory fees | | | 6,995 | | | | 10,670 | | | | 631 | | | | 78 | |
Distribution fees | | | 38 | | | | 44 | | | | — | | | | 5 | |
Shareholder administration fees | | | 566 | | | | 232 | | | | 37 | | | | 10 | |
Custodian fees | | | 201 | | | | 578 | | | | 121 | | | | 105 | |
Transfer agent fees | | | 38 | | | | 49 | | | | 21 | | | | 7 | |
Sub transfer agent fees | | | | | | | | | | | | | | | | |
Class N | | | 20 | | | | 15 | | | | — | | | | — | |
Class I | | | 266 | | | | 70 | | | | 1 | | | | — | |
Professional fees | | | 98 | | | | 165 | | | | 71 | | | | 55 | |
Registration fees | | | 41 | | | | 50 | | | | 52 | | | | 38 | |
Shareholder reporting fees | | | 99 | | | | 72 | | | | 4 | | | | 5 | |
Trustee fees | | | 36 | | | | 50 | | | | 4 | | | | — | |
Other expenses | | | 27 | | | | 42 | | | | 12 | | | | 6 | |
| | | | | | | | | | | | | | | | |
Total expenses before waiver | | | 8,425 | | | | 12,037 | | | | 954 | | | | 309 | |
Expenses reimbursed to (waived or absorbed by) the Advisor | | | — | | | | — | | | | (198 | ) | | | (205 | ) |
| | | | | | | | | | | | | | | | |
Net expenses | | | 8,425 | | | | 12,037 | | | | 756 | | | | 104 | |
| | | | | | | | | | | | | | | | |
Net investment income (loss) | | | 7,217 | | | | 10,446 | | | | 496 | | | | 39 | |
Realized and unrealized gain (loss) | | | | | | | | | | | | | | | | |
Net Realized gain (loss) on transactions from: | | | | | | | | | | | | | | | | |
Investments in securities | | | 7,787 | | | | (9,098 | ) | | | (2,337 | ) | | | 54 | |
Forward foreign currency contracts | | | 1,901 | | | | — | | | | — | | | | — | |
Foreign currency transactions | | | (397 | ) | | | (1,371 | ) | | | (53 | ) | | | (6 | ) |
| | | | | | | | | | | | | | | | |
Total net realized gain (loss) | | | 9,291 | | | | (10,469 | ) | | | (2,390 | ) | | | 48 | |
Change in net unrealized appreciation (depreciation) of: | | | | | | | | | | | | | | | | |
Investments | | | 125,451 | | | | 172,004 | | | | 12,648 | | | | 1,856 | |
Forward foreign currency contracts | | | 311 | | | | — | | | | — | | | | — | |
Foreign currency translations | | | 231 | | | | (1,409 | ) | | | 45 | | | | (25 | ) |
| | | | | | | | | | | | | | | | |
Change in net unrealized appreciation (depreciation) | | | 125,993 | | | | 170,595 | | | | 12,693 | | | | 1,831 | |
| | | | | | | | | | | | | | | | |
Net increase (decrease) in net assets resulting from operations | | $ | 142,501 | | | $ | 170,572 | | | $ | 10,799 | | | $ | 1,918 | |
| | | | | | | | | | | | | | | | |
See accompanying Notes to Financial Statements.
December 31, 2012 | William Blair Funds 57 |
Statements of Changes in Net Assets
for the Years Ended December 31, 2012 and 2011 (all dollar amounts in thousands)
| | | | | | | | | | | | | | | | | | | | | | | | | | | | | | | | |
| | | International
Small Cap
Growth
Fund | | | Emerging
Markets
Growth
Fund | | | Emerging
Markets
Leaders
Fund | | | Emerging
Markets
Small Cap
Growth
Fund | |
| | | 2012 | | | 2011 | | | 2012 | | | 2011 | | | 2012 | | | 2011 | | | 2012 | | | 2011(a) | |
Operations | | | | | | | | | | | | | | | | | | | | | | | | | | | | | | | | |
Net investment income (loss) | | $ | 7,217 | | | $ | 6,857 | | | $ | 10,446 | | | $ | 8,885 | | | $ | 496 | | | $ | 701 | | | $ | 39 | | | $ | 2 | |
Net realized gain (loss) on investments, forwards and foreign currency | | | 9,291 | | | | 60,435 | | | | (10,469 | ) | | | 127,536 | | | | (2,390 | ) | | | 112 | | | | 48 | | | | (75 | ) |
Change in net unrealized appreciation (depreciation) on investments, forwards and foreign currency | | | 125,993 | | | | (155,577 | ) | | | 170,595 | | | | (304,105 | ) | | | 12,693 | | | | (20,181 | ) | | | 1,831 | | | | (17 | ) |
| | | | | | | | | | | | | | | | | | | | | | | | | | | | | | | | |
Net increase (decrease) in net assets resulting from operations | | | 142,501 | | | | (88,285 | ) | | | 170,572 | | | | (167,684 | ) | | | 10,799 | | | | (19,368 | ) | | | 1,918 | | | | (90 | ) |
Distributions to shareholders from | | | | | | | | | | | | | | | | | | | | | | | | | | | | | | | | |
Net investment income | | | | | | | | | | | | | | | | | | | | | | | | | | | | | | | | |
Class N | | | (274 | ) | | | (193 | ) | | | (88 | ) | | | — | | | | (1 | ) | | | — | | | | (13 | ) | | | — | |
Class I | | | (7,774 | ) | | | (5,147 | ) | | | (1,209 | ) | | | (466 | ) | | | (169 | ) | | | (126 | ) | | | (65 | ) | | | — | |
Class Institutional | | | (8,146 | ) | | | (5,384 | ) | | | (7,965 | ) | | | (3,984 | ) | | | (303 | ) | | | (181 | ) | | | — | | | | — | |
Net realized gain | | | | | | | | | | | | | | | | | | | | | | | | | | | | | | | | |
Class N | | | — | | | | — | | | | — | | | | (2,577 | ) | | | — | | | | (3 | ) | | | — | | | | — | |
Class I | | | — | | | | — | | | | — | | | | (18,690 | ) | | | — | | | | (1,745 | ) | | | — | | | | — | |
Class Institutional | | | — | | | | — | | | | — | | | | (93,763 | ) | | | — | | | | (1,956 | ) | | | — | | | | — | |
Return of capital | | | | | | | | | | | | | | | | | | | | | | | | | | | | | | | | |
Class I | | | — | | | | — | | | | — | | | | — | | | | — | | | | (11 | ) | | | — | | | | — | |
Class Institutional | | | — | | | | — | | | | — | | | | — | | | | — | | | | (14 | ) | | | — | | | | — | |
| | | | | | | | | | | | | | | | | | | | | | | | | | | | | | | | |
Total Distributions | | | (16,194 | ) | | | (10,724 | ) | | | (9,262 | ) | | | (119,480 | ) | | | (473 | ) | | | (4,036 | ) | | | (78 | ) | | | — | |
Capital stock transactions | | | | | | | | | | | | | | | | | | | | | | | | | | | | | | | | |
Net proceeds from sale of shares | | | 122,084 | | | | 313,989 | | | | 260,741 | | | | 352,369 | | | | 29,723 | | | | 19,857 | | | | 25,035 | | | | 3,362 | |
Shares issued in reinvestment of income dividends and capital gain distributions | | | 14,490 | | | | 8,514 | | | | 8,174 | | | | 100,061 | | | | 413 | | | | 3,491 | | | | 52 | | | | — | |
Less cost of shares redeemed | | | (261,594 | ) | | | (152,224 | ) | | | (283,834 | ) | | | (597,963 | ) | | | (19,305 | ) | | | (47,023 | ) | | | (3,178 | ) | | | — | |
| | | | | | | | | | | | | | | | | | | | | | | | | | | | | | | | |
Net increase (decrease) in net assets resulting from capital share transactions | | | (125,020 | ) | | | 170,279 | | | | (14,919 | ) | | | (145,533 | ) | | | 10,831 | | | | (23,675 | ) | | | 21,909 | | | | 3,362 | |
| | | | | | | | | | | | | | | | | | | | | | | | | | | | | | | | |
Increase (decrease) in net assets | | | 1,287 | | | | 71,270 | | | | 146,391 | | | | (432,697 | ) | | | 21,157 | | | | (47,079 | ) | | | 23,749 | | | | 3,272 | |
Net assets | | | | | | | | | | | | | | | | | | | | | | | | | | | | | | | | |
Beginning of year | | | 718,221 | | | | 646,951 | | | | 817,846 | | | | 1,250,543 | | | | 47,822 | | | | 94,901 | | | | 3,272 | | | | — | |
| | | | | | | | | | | | | | | | | | | | | | | | | | | | | | | | |
End of year | | $ | 719,508 | | | $ | 718,221 | | | $ | 964,237 | | | $ | 817,846 | | | $ | 68,979 | | | $ | 47,822 | | | $ | 27,021 | | | $ | 3,272 | |
| | | | | | | | | | | | | | | | | | | | | | | | | | | | | | | | |
Accumulated net investment income (loss) at the end of the year | | $ | (1,792 | ) | | $ | 4,542 | | | $ | (2,280 | ) | | $ | (1,953 | ) | | $ | (44 | ) | | $ | (14 | ) | | $ | (59 | ) | | $ | (13) | |
| | | | | | | | | | | | | | | | | | | | | | | | | | | | | | | | |
| (a) | | For the period ended from October 24, 2011 (commencement of operations) to December 31, 2011 |
See accompanying Notes to Financial Statements.
58 Annual Report | December 31, 2012 |
Statements of Assets and Liabilities
December 31, 2012 (all dollar amounts in thousands)
| | | | | | | | |
| | | Bond
Fund | | | Low
Duration
Fund | |
Assets | | | | | | | | |
Investments in securities, at cost | | $ | 272,411 | | | $ | 259,259 | |
| | | | | | | | |
| | |
Investments in securities, at value | | $ | 293,824 | | | $ | 261,495 | |
Receivable for fund shares sold | | | 733 | | | | 26,188 | |
Receivable from Advisor | | | 21 | | | | 20 | |
Dividend and interest receivable | | | 2,588 | | | | 896 | |
| | | | | | | | |
Total assets | | | 297,166 | | | | 288,599 | |
Liabilities | | | | | | | | |
Payable for investment securities purchased | | | — | | | | 1,213 | |
Payable for fund shares redeemed | | | 141 | | | | 30 | |
Payable to custodian | | | — | | | | 323 | |
Management fee payable | | | 71 | | | | 60 | |
Distribution and shareholder administration fees payable | | | 28 | | | | 19 | |
Shareholders distribution payable | | | 121 | | | | 76 | |
Other payables and accrued expenses | | | 63 | | | | 48 | |
| | | | | | | | |
Total liabilities | | | 424 | | | | 1,769 | |
| | | | | | | | |
Net Assets | | $ | 296,742 | | | $ | 286,830 | |
| | | | | | | | |
Capital | | | | | | | | |
Composition of Net Assets | | | | | | | | |
Par value of shares of beneficial interest | | $ | 27 | | | $ | 29 | |
Capital paid in excess of par value | | | 273,907 | | | | 289,373 | |
Accumulated net investment income (loss) | | | 2 | | | | — | |
Accumulated realized gain (loss) | | | 1,393 | | | | (4,808 | ) |
Net unrealized appreciation (depreciation) of investments and foreign currencies | | | 21,413 | | | | 2,236 | |
| | | | | | | | |
Net Assets | | $ | 296,742 | | | $ | 286,830 | |
| | | | | | | | |
| | |
Net Assets | | $ | 91,039 | | | $ | 118,401 | |
Shares Outstanding—Institutional Class | | | 8,154,261 | | | | 12,043,624 | |
Net Asset Value Per Share | | $ | 11.16 | | | $ | 9.83 | |
See accompanying Notes to Financial Statements.
December 31, 2012 | William Blair Funds 59 |
Statements of Operations
for the Year Ended December 31, 2012 (all dollar amounts in thousands)
| | | | | | | | |
| | | Bond
Fund | | | Low Duration
Fund | |
Investment income | | | | | | | | |
Interest | | $ | 10,566 | | | $ | 4,030 | |
| | | | | | | | |
Total income | | | 10,566 | | | | 4,030 | |
Expenses | | | | | | | | |
Investment advisory fees | | | 803 | | | | 583 | |
Distribution fees | | | 36 | | | | 13 | |
Shareholder administration fees | | | 280 | | | | 170 | |
Custodian fees | | | 59 | | | | 71 | |
Transfer agent fees | | | 35 | | | | 27 | |
Sub transfer agent fees | | | | | | | | |
Class N | | | 32 | | | | 2 | |
Class I | | | 53 | | | | 4 | |
Professional fees | | | 33 | | | | 38 | |
Registration fees | | | 44 | | | | 57 | |
Shareholder reporting fees | | | 14 | | | | 5 | |
Trustee fees | | | 12 | | | | 8 | |
Other expenses | | | 15 | | | | 12 | |
| | | | | | | | |
Total expenses before waiver | | | 1,416 | | | | 990 | |
Expenses reimbursed to (waived or absorbed by) the Advisor | | | (162 | ) | | | (31 | ) |
| | | | | | | | |
Net expenses | | | 1,254 | | | | 959 | |
| | | | | | | | |
Net investment income (loss) | | | 9,312 | | | | 3,071 | |
Realized and unrealized gain (loss) | | | | | | | | |
Net Realized gain (loss) on transactions from: | | | | | | | | |
Investments in securities | | | 4,348 | | | | 192 | |
| | | | | | | | |
Total net realized gain (loss) | | | 4,348 | | | | 192 | |
Change in net unrealized appreciation (depreciation) of: | | | | | | | | |
Investments | | | 8,020 | | | | 1,977 | |
| | | | | | | | |
Change in net unrealized appreciation (depreciation) | | | 8,020 | | | | 1,977 | |
| | | | | | | | |
Net increase (decrease) in net assets resulting from operations | | $ | 21,680 | | | $ | 5,240 | |
| | | | | | | | |
See accompanying Notes to Financial Statements.
60 Annual Report | December 31, 2012 |
Statements of Changes in Net Assets
for the Years Ended December 31, 2012 and 2011 (all dollar amounts in thousands)
| | | | | | | | | | | | | | | | |
| | | Bond
Fund | | | Low Duration
Fund | |
| | | 2012 | | | 2011 | | | 2012 | | | 2011 | |
Operations | | | | | | | | | | | | | | | | |
Net investment income (loss) | | $ | 9,312 | | | $ | 8,820 | | | $ | 3,071 | | | $ | 2,586 | |
Net realized gain (loss) on investments | | | 4,348 | | | | 3,325 | | | | 192 | | | | 59 | |
Change in net unrealized appreciation (depreciation) on investments | | | 8,020 | | | | 3,590 | | | | 1,977 | | | | 360 | |
| | | | | | | | | | | | | | | | |
Net increase (decrease) in net assets resulting from operations | | | 21,680 | | | | 15,735 | | | | 5,240 | | | | 3,005 | |
Distributions to shareholders from | | | | | | | | | | | | | | | | |
Net investment income | | | | | | | | | | | | | | | | |
Class N | | | (961 | ) | | | (229 | ) | | | (219 | ) | | | (152 | ) |
Class I | | | (6,754 | ) | | | (6,707 | ) | | | (2,909 | ) | | | (2,098 | ) |
Class Institutional | | | (3,467 | ) | | | (2,764 | ) | | | (2,382 | ) | | | (1,853 | ) |
Net realized gain | | | | | | | | | | | | | | | | |
Class N | | | (211 | ) | | | (66 | ) | | | — | | | | — | |
Class I | | | (1,126 | ) | | | (1,188 | ) | | | — | | | | — | |
Class Institutional | | | (597 | ) | | | (577 | ) | | | — | | | | — | |
| | | | | | | | | | | | | | | | |
Total Distributions | | | (13,116 | ) | | | (11,531 | ) | | | (5,510 | ) | | | (4,103 | ) |
Capital stock transactions | | | | | | | | | | | | | | | | |
Net proceeds from sale of shares | | | 82,419 | | | | 100,839 | | | | 191,001 | | | | 121,427 | |
Shares issued in reinvestment of income dividends and capital gain distributions | | | 10,216 | | | | 8,489 | | | | 4,275 | | | | 3,322 | |
Less cost of shares redeemed | | | (36,473 | ) | | | (74,292 | ) | | | (65,323 | ) | | | (109,974 | ) |
| | | | | | | | | | | | | | | | |
Net increase (decrease) in net assets resulting from capital share transactions | | | 56,162 | | | | 35,036 | | | | 129,953 | | | | 14,775 | |
| | | | | | | | | | | | | | | | |
Increase (decrease) in net assets | | | 64,726 | | | | 39,240 | | | | 129,683 | | | | 13,677 | |
Net assets | | | | | | | | | | | | | | | | |
Beginning of year | | | 232,016 | | | | 192,776 | | | | 157,147 | | | | 143,470 | |
| | | | | | | | | | | | | | | | |
End of year | | $ | 296,742 | | | $ | 232,016 | | | $ | 286,830 | | | $ | 157,147 | |
| | | | | | | | | | | | | | | | |
Accumulated net investment income (loss) at the end of the year | | $ | 2 | | | $ | 2 | | | $ | — | | | $ | — | |
| | | | | | | | | | | | | | | | |
See accompanying Notes to Financial Statements.
December 31, 2012 | William Blair Funds 61 |
Notes to Financial Statements
(1) Significant Accounting Policies
The following is a summary of William Blair Funds’ (the “Trust”) significant accounting policies in effect during the year covered by the financial statements, which are in accordance with U.S. generally accepted accounting principles.
(a) Description of the Fund
The Fund is a mutual fund registered under the Investment Company Act of 1940 (the “1940 Act”), as amended, as an open-end management investment company. The number of shares authorized for this Trust is unlimited. The Trust currently consists of the following twenty-five funds (the “Funds”), each with its own investment objective and policies. For each Fund, the number of shares authorized is unlimited.
| | |
Domestic Equity Funds | | International Equity Funds |
Growth Large Cap Growth Small Cap Growth Mid Cap Growth Small-Mid Cap Growth Large Cap Value Small Cap Value Mid Cap Value Small-Mid Cap Value Global Equity Fund Global Leaders (formerly known as Global Growth) Multi-Asset and Alternative Funds Macro Allocation Commodity Strategy Long/Short | | International Growth International Equity International Leaders Institutional International Growth Institutional International Equity International Small Cap Growth Emerging Markets Growth Emerging Markets Leaders (formerly
known as Emerging Leaders Growth) Emerging Markets Small Cap Growth Fixed-Income Funds Bond Income Low Duration Money Market Fund Ready Reserves |
The Macro Allocation Fund and the Commodity Strategy Long/Short Fund have a fiscal year-end of October 31, and issue a separate report.
The investment objectives of the Funds are as follows:
| | |
Equity | | Long-term capital appreciation. |
Global Equity | | Long-term capital appreciation. |
International Equity | | Long-term capital appreciation. |
Fixed-Income | | High level of current income with relative stability of principal.
(Maximize total return—Low Duration) |
Money Market | | Current income, a stable share price and daily liquidity. |
The Institutional International Growth Fund, the Institutional International Equity Fund and the Institutional Share Classes of the Global Leaders Fund, the International Leaders Fund, the International Small Cap Growth Fund, the Emerging Markets Growth Fund, the Emerging Markets Leaders Fund, the Emerging Markets Small Cap Growth Fund, the Bond Fund and the Low Duration Fund are the only Funds covered in this report.
(b) Share Classes
Three different classes of shares of the Global Leaders, International Leaders, International Small Cap Growth, Emerging Markets Growth, Emerging Markets Leaders, Emerging Markets Small Cap Growth, Bond and the Low Duration Funds currently exist: N, I and Institutional. This report includes financial information for only the Institutional Class. The Institutional share class is sold to institutional investors, including but not limited to employee benefit plans, endowments, foundations, trusts and corporations, who are able to meet the Fund’s high minimum investment requirement. The minimum initial investment required is $5 million.
62 Annual Report | December 31, 2012 |
Investment income realized and unrealized gains and losses, and certain Fund level expenses and expense reductions, if any, are allocated based on the relative net assets of each class, except for certain class specific expenses, which are charged directly to the appropriate class. Differences in class expenses may result in the payment of different per share dividends by class. All share classes of the Funds have equal rights with respect to voting subject to class specific arrangements.
(c) Investment Valuation
The market value of domestic equity securities is determined by valuing securities traded on national securities markets or in the over-the-counter markets at the last sale price or, if applicable, the official closing price or, in the absence of a recent sale on the date of determination, at the latest bid price.
The value of foreign equity securities is generally determined based upon the last sale price on the foreign exchange or market on which it is primarily traded and in the currency of that market as of the close of the appropriate exchange or, if there have been no sales during that day, at the latest bid price. The Board of Trustees has determined that the passage of time between when the foreign exchanges or markets close and when the Funds compute their net asset values could cause the value of foreign equity securities to no longer be representative or accurate, and as a result, may necessitate that such securities be fair valued. Accordingly, for foreign equity securities, the Funds may use an independent pricing service to fair value the security as of the close of regular trading on the New York Stock Exchange. As a result, a Fund’s value for a security may be different from the last sale price (or the latest bid price).
Fixed-income securities are valued using evaluated prices provided by an independent pricing service. The evaluated prices are formed using various market inputs the pricing vendor believes accurately represents the market value of a security at a particular point in time. The pricing service determines evaluated prices for fixed-income securities using inputs including, but not limited to, recent transaction prices, dealer quotes, transaction prices for securities with similar characteristics, collateral characteristics, credit quality, payment history, liquidity and market conditions.
Securities, and other assets, for which a market price is not available or is deemed unreliable, (e.g., securities affected by unusual or extraordinary events, such as natural disasters or securities affected by market or economic events, such as bankruptcy filings), or the value of which is affected by a significant valuation event, are valued at a fair value as determined in good faith by, or under the direction of, the Board of Trustees and in accordance with the Trust’s valuation procedures. The value of fair valued securities may be different from the last sale price (or the latest bid price), and there is no guarantee that a fair valued security will be sold at the price at which a Fund is carrying the security.
Investments in other funds that are not exchange traded funds are valued at the underlying fund’s net asset value on the date of valuation.
As of December 31, 2012, there were securities held in the Institutional International Growth and Bond Funds requiring fair valuation pursuant to the Trust’s Valuation Procedures.
(d) Investment income and transactions
Dividend income is recorded on the ex-dividend date, except for those dividends from certain foreign securities that are recorded when the information is available.
Interest income is recorded on an accrual basis, adjusted for amortization of premium or discount. Variable rate bonds and floating rate notes earn interest at coupon rates that fluctuate at specific time intervals. The interest rate shown on the Portfolio of Investments for the Bond Fund and Low Duration Fund were the rates in effect on December 31, 2012. Put bonds may be redeemed at the discretion of the holder on specified dates prior to maturity.
Premiums and discounts are accreted and amortized on a straight-line basis for short-term investments and on an effective interest method for long-term investments.
Paydown gains and losses on mortgage and asset-backed securities are treated as an adjustment to interest income. For the period ended December 31, 2012, the Bond and Low Duration Funds recognized an increase of interest income and a decrease of net realized loss of $(1,870) and $(2,439), respectively (in thousands). This reclassification had no effect on the net asset value or the net assets of the Funds.
The Funds do not isolate that portion of the results of operations resulting from changes in foreign exchange rates on investments from the fluctuations arising from changes in market prices of securities held. Such fluctuations are included with the net realized and unrealized gain or loss from investments.
December 31, 2012 | William Blair Funds 63 |
Reported net realized foreign currency gains or losses arise from disposition of foreign currency, the difference in the foreign exchange rates between the trade and settlement dates on securities transactions, and the difference between the amounts of dividends, interest and foreign withholding taxes recorded on the ex-date or accrual date and the U.S. dollar equivalent of the amounts actually received or paid. Net unrealized foreign exchange gains and losses arise from changes (due to the changes in the exchange rate) in the value of foreign currency and other assets and liabilities denominated in foreign currencies held at year end.
Security and shareholder transactions are accounted for no later than one business day following the trade date. However, for financial reporting purposes, security and shareholder transactions are accounted for on the trade date of the last business day of the reporting period. Realized gains and losses from securities transactions are recognized on a specifically identified cost basis.
Awards from class action litigation may be recorded as a reduction of cost. If the Funds no longer own the applicable securities, the proceeds are recorded as realized gains.
(e) Share Valuation and Dividends to Shareholders
Shares are sold and redeemed on a continuous basis at net asset value. The net asset value per share is determined by dividing the Fund’s net assets by the number of shares outstanding as of the close of regular trading on the New York Stock Exchange, which is generally 4:00 p.m. Eastern time, on each day the Exchange is open.
Dividends from net investment income, if any, are declared at least annually for the Global Leaders, Institutional International Growth, Institutional International Equity, International Leaders, International Small Cap Growth, Emerging Markets Growth, Emerging Markets Leaders, and Emerging Markets Small Cap Growth Funds. Dividends from the Bond and Low Duration Funds are declared daily and paid monthly. Dividends payable to shareholders are recorded on the ex-dividend date.
(f) Foreign Currency Translation and Foreign Currency Forward Contracts
The Funds (excluding the Bond and Low Duration Funds) may invest in securities denominated in foreign currencies. As such, assets and liabilities denominated in foreign currencies are translated into U.S. dollar amounts at the current exchange rate on the date of valuation. The values of foreign investments, forward open foreign currency contracts, and cash denominated in foreign currencies are translated into U.S. dollars using a spot market rate of exchange as of the time of the determination of each Fund’s net asset value, typically 4:00 p.m. Eastern time on days when there is regular trading on the New York Stock Exchange (the “Exchange”). Payables and receivables for securities transactions, dividends, interest income and tax reclaims are translated into U.S. dollars using a spot market rate of exchange as of 4:00 p.m. Eastern time. Settlement of purchases and sales and dividend and interest receipts are translated into U.S. dollars using a spot market rate of exchange as of 11:00 a.m. Eastern time.
(g) Income Taxes
Each Fund intends to comply with the provisions of Subchapter M of the Internal Revenue Code available to regulated investment companies. Each Fund intends to make the requisite distributions of income and capital gains to its shareholders sufficient to relieve it from all, or substantially all, federal income and excise taxes. No provision for federal income and excise taxes has been made.
Certain Funds may be subject to a tax imposed on net realized and unrealized gains on securities of certain foreign countries.
Management has evaluated all of the uncertain tax positions of the Funds and has determined that no liability is required to be recorded in the financial statements.
The statute of limitations on the Funds’ tax returns for each of the tax years in the four year period ended December 31, 2012 remains open and the returns are subject to examination.
64 Annual Report | December 31, 2012 |
The Funds have elected to mark-to-market their investments in Passive Foreign Investment Companies (“PFICs”) for federal income tax purposes. The Funds also treat the deferred loss associated with current and prior year wash sales as an adjustment to the cost of investments for tax purposes. The cost of investments for federal income tax purposes and related gross unrealized appreciation (depreciation) and net unrealized appreciation (depreciation) at December 31, 2012 were as follows (in thousands):
| | | | | | | | | | | | | | | | |
Fund | | Cost of
Investments | | | Gross
Unrealized
Appreciation | | | Gross
Unrealized
Depreciation | | | Net
Unrealized
Appreciation/
Depreciation | |
Global Leaders | | $ | 55,537 | | | $ | 8,332 | | | $ | 304 | | | $ | 8,028 | |
Institutional International Growth | | | 1,669,697 | | | | 315,921 | | | | 9,697 | | | | 306,224 | |
Institutional International Equity | | | 89,646 | | | | 19,150 | | | | 183 | | | | 18,967 | |
International Leaders | | | 9,453 | | | | 737 | | | | 58 | | | | 679 | |
International Small Cap Growth | | | 618,210 | | | | 108,461 | | | | 9,747 | | | | 98,714 | |
Emerging Markets Growth | | | 818,359 | | | | 146,056 | | | | 6,591 | | | | 139,465 | |
Emerging Markets Leaders | | | 62,365 | | | | 8,388 | | | | 129 | | | | 8,259 | |
Emerging Markets Small Cap Growth | | | 25,961 | | | | 1,736 | | | | 41 | | | | 1,695 | |
Bond | | | 272,412 | | | | 21,690 | | | | 278 | | | | 21,412 | |
Low Duration | | | 259,260 | | | | 2,595 | | | | 360 | | | | 2,235 | |
In addition, the Funds may periodically record reclassifications among certain capital accounts to reflect differences between financial reporting and income tax basis distributions. The reclassifications were reported in order to reflect the tax treatment for certain permanent differences that exist between income tax regulations and U.S. generally accepted accounting principles. The reclassifications generally relate to Section 988 currency gains and losses, PFIC gains and losses, expiration of capital loss carryforward, paydown gains and losses and redemptions in-kind. These reclassifications have no impact on the net asset values of the Funds. Accordingly, at December 31, 2012, the following reclassifications were recorded (in thousands):
| | | | | | | | | | | | |
Fund | | Undistributed Net
Investment Income (Loss) | | | Accumulated
Undistributed
Net Realized
Gain/(Loss) | | | Capital
Paid In Excess
of Par Value | |
Global Leaders | | $ | (20 | ) | | $ | 20 | | | $ | — | |
Institutional International Growth | | | 9,629 | | | | (9,629 | ) | | | — | |
Institutional International Equity | | | (154 | ) | | | 154 | | | | — | |
International Leaders | | | 10 | | | | (10 | ) | | | — | |
International Small Cap Growth | | | 2,643 | | | | (2,665 | ) | | | 22 | |
Emerging Markets Growth | | | (1,511 | ) | | | 1,511 | | | | — | |
Emerging Markets Leaders | | | (53 | ) | | | 53 | | | | — | |
Emerging Markets Small Cap Growth | | | (7 | ) | | | 6 | | | | 1 | |
Bond | | | 1,870 | | | | (1,870 | ) | | | — | |
Low Duration | | | 2,439 | | | | (2,439 | ) | | | — | |
The timing and characterization of certain income and capital gain distributions are determined annually in accordance with federal income tax regulations that may differ from U.S. generally accepted accounting principles. As a result, net investment income or loss and net realized gain or loss for a reporting period may differ from the amount distributed during such period.
Distributions from net realized gains for book purposes may include short-term capital gains, which are included as ordinary income for tax purposes. The tax character of distributions paid to the Institutional Class during 2012 and 2011 was as follows (in thousands):
| | | | | | | | | | | | | | | | | | | | |
| | | Distributions Paid in 2012 | | | Distributions Paid in 2011 | |
Fund | | Ordinary
Income | | | Long-Term
Capital Gains | | | Return of
Capital | | | Ordinary
Income | | | Long-Term
Capital Gains | |
Institutional International Growth | | $ | 62,889 | | | $ | — | | | $ | — | | | $ | 1,997 | | | $ | — | |
Institutional International Equity | | | 1,482 | | | | — | | | | — | | | | 2,326 | | | | — | |
International Leaders | | | 10 | | | | — | | | | — | | | | — | | | | — | |
International Small Cap Growth | | | 8,146 | | | | — | | | | — | | | | 5,384 | | | | — | |
Emerging Markets Growth | | | 7,965 | | | | — | | | | — | | | | 3,984 | | | | 93,763 | |
Emerging Markets Leaders | | | 303 | | | | — | | | | 14 | | | | 695 | | | | 1,443 | |
Bond | | | 3,467 | | | | 597 | | | | — | | | | 2,764 | | | | 577 | |
Low Duration | | | 2,382 | | | | — | | | | — | | | | 1,853 | | | | — | |
December 31, 2012 | William Blair Funds 65 |
As of December 31, 2012, the components of distributable earnings on a tax basis were as follows (in thousands):
| | | | | | | | | | | | | | | | |
Fund | | Undistributed
Ordinary
Income | | | Accumulated
Capital and
Other Losses | | | Undistributed
Long-Term
Capital Gain | | | Net
Unrealized
Appreciation/
Depreciation | |
Global Leaders | | $ | 2 | | | $ | (13,781 | ) | | $ | — | | | $ | 8,028 | |
Institutional International Growth | | | 8,836 | | | | (175,273 | ) | | | — | | | | 306,224 | |
Institutional International Equity | | | 191 | | | | (122,787 | ) | | | — | | | | 18,967 | |
International Leaders | | | 30 | | | | (104 | ) | | | — | | | | 679 | |
International Small Cap Growth | | | 1,592 | | | | (53,929 | ) | | | — | | | | 98,714 | |
Emerging Markets Growth | | | 155 | | | | (28,010 | ) | | | — | | | | 139,465 | |
Emerging Markets Leaders | | | 57 | | | | (3,213 | ) | | | — | | | | 8,259 | |
Emerging Markets Small Cap Growth | | | 56 | | | | (37 | ) | | | 36 | | | | 1,695 | |
Bond | | | 2 | | | | (104 | ) | | | 1,498 | | | | 21,412 | |
Low Duration | | | — | | | | (4,807 | ) | | | — | | | | 2,235 | |
As of December 31, 2012, the Funds have unused capital loss carry forwards available for federal income tax purposes to be applied against future gains, if any. If not applied, the carryforward will expire as follows (in thousands):
| | | | | | | | | | | | | | | | |
Fund | | 2016 | | | 2017 | | | 2018 | | | Total | |
Global Leaders | | $ | 644 | | | $ | 13,127 | | | $ | — | | | $ | 13,771 | |
Institutional International Growth | | | — | | | | 172,315 | | | | — | | | | 172,315 | |
Institutional International Equity | | | 9,705 | | | | 113,087 | | | | — | | | | 122,792 | |
International Small Cap Growth | | | — | | | | 53,954 | | | | — | | | | 53,954 | |
Low Duration | | | — | | | | — | | | | 955 | | | | 955 | |
Under current law, the Funds may carry forward net capital losses indefinitely to use to offset capital gains realized in future years. Previous law limited the carry forward of capital losses to the eight tax years following the year the capital loss was realized. If a Fund has capital losses that are subject to current law and also has capital losses subject to prior law, the losses realized under current law will be utilized to offset capital gains before any of the losses governed by prior law can be used. As a result of these ordering rules, capital losses realized under previous law may be more likely to expire unused. Capital losses realized under current law will carry forward retaining their classification as long-term or short-term losses; as compared to under prior law in which all capital losses were carried forward as short term capital losses.
As of December 31, 2012 the Funds incurred the following capital losses which will not expire (in thousands):
| | | | | | | | |
Fund | | Short
Term | | | Long
Term | |
International Leaders | | $ | 33 | | | $ | — | |
Emerging Market Growth | | | 23,905 | | | | — | |
Emerging Market Leaders | | | 2,240 | | | | — | |
Low Duration | | | 2,054 | | | | 1,296 | |
In order to meet certain excise tax distribution requirements, the Funds are required to measure and distribute annually, net capital gains realized during a twelve month period ending October 31 and net investment income earned during a twelve month period ending December 31. In connection with this, the Funds are permitted for tax purposes to defer into their next fiscal year qualified late year losses. Qualified late year capital losses are any net capital losses incurred between November 1 and the end of their fiscal year, December 31, 2012. Qualified late year ordinary losses are comprised of losses related to foreign currency and PFICs, incurred between November 1 and the end of their fiscal year, December 31, 2012.
66 Annual Report | December 31, 2012 |
At December 31, 2012, the following Funds deferred, on a tax basis, qualified late year losses of:
| | | | | | | | | | | | |
| | | Qualified Late Year Losses | |
Fund | | Ordinary
Income | | | Short-Term
Capital | | | Long-Term
Capital | |
Global Leaders | | $ | 10 | | | $ | — | | | $ | — | |
Institutional International Growth | | | — | | | | 2,341 | | | | — | |
International Leaders | | | — | | | | 71 | | | | — | |
Emerging Markets Growth | | | — | | | | 2,380 | | | | — | |
Emerging Markets Leaders | | | — | | | | 464 | | | | 507 | |
Emerging Markets Small Cap Growth | | | — | | | | 7 | | | | — | |
Bond | | | — | | | | 104 | | | | — | |
Low Duration | | | — | | | | 291 | | | | 210 | |
(h) Repurchase Agreements
In a repurchase agreement, a Fund buys a security at one price and at the time of sale, the seller agrees to repurchase the security at a mutually agreed upon time and price (usually within seven days). The repurchase agreement thereby determines the yield during the purchaser’s holding period, while the seller’s obligation to repurchase is secured by the value of the underlying security. William Blair & Company, L.L.C. (the “Advisor”) will monitor, on an ongoing basis, the value of the underlying securities to ensure that the value always equals or exceeds the repurchase price plus accrued interest. Repurchase agreements could involve certain risks in the event of a default or insolvency of the other party to the agreement, including possible delays or restrictions upon a Fund’s ability to dispose of the underlying securities. The risk to a Fund is limited to the ability of the seller to pay the agreed upon sum on the delivery date. In the event of default, a repurchase agreement provides that a Fund is entitled to sell the underlying collateral. The loss, if any, to a Fund will be the difference between the proceeds from the sale and the repurchase price. However, if bankruptcy proceedings are commenced with respect to the seller of the security, disposition of the collateral by the Fund may be delayed or limited. Although no definitive creditworthiness criteria are used, the Advisor reviews the creditworthiness of the banks and non-bank dealers with which a Fund enters into repurchase agreements to evaluate those risks. A Fund may, for tax purposes, deem repurchase agreements collateralized by U.S. Government securities to be investments in U.S. Government securities.
(i) Use of Estimates
The preparation of financial statements in conformity with U.S. generally accepted accounting principles requires management to make estimates and assumptions that affect the amounts reported in the financial statements. Actual results may differ from those estimates.
(j) Indemnification
In the normal course of business, the Funds have entered into contracts in which the Funds agree to indemnify the other party or parties against various potential costs or liabilities. The Fund’s maximum exposure under these arrangements is unknown. No claim has been made for indemnification pursuant to any such agreement of the Funds.
(k) Fair Value Measurements
Fair value is defined as the price that a Fund would receive upon selling a security in an orderly transaction to an independent buyer in the principal or most advantageous market for the investment. Various inputs are used in determining the value of a Fund’s investments. A three-tier hierarchy of inputs is used to classify fair value measurements for disclosure purposes. The three-tier hierarchy of inputs is summarized in the three broad levels listed below.
| | • | | Level 1—Quoted prices (unadjusted) in active markets for an identical security. |
| | • | | Level 2—Prices determined using other significant observable inputs. Observable inputs are inputs that other market participants would use in pricing a security. These may include quoted prices for similar securities, interest rates, prepayment speeds, credit risk, and others. In addition, other observable inputs such as foreign exchange rates, benchmark securities indices and foreign futures contracts may be utilized in the valuation of certain foreign securities when significant events occur between the last sale on the foreign securities exchange and the time the net asset value of the Fund is calculated. |
December 31, 2012 | William Blair Funds 67 |
| | • | | Level 3—Prices determined using significant unobservable inputs. In situations where quoted prices or observable inputs are unavailable (for example, when there is little or no market activity for an investment), unobservable inputs may be used. Unobservable inputs reflect the Fund’s own assumptions about the factors market participants would use in pricing an investment, and would be based on the best information available. |
The inputs or methodology used for valuing an investment are not necessarily an indication of the risk associated with investing in those securities. For example, money market securities are valued using amortized cost, in accordance with rules under the 1940 Act. Generally, amortized cost approximates the current fair value of a security, but since the value is not obtained from a quoted price in an active market, such securities are reflected as Level 2.
Any transfers between Level 1 and Level 2 are disclosed, effective as of the beginning of the year, in the tables below with the reasons for the transfers disclosed in a note to the tables, if applicable.
As of December 31, 2012, the hierarchical input levels of securities in each Fund, segregated by security class, are as follows (in thousands):
| | | | | | | | | | | | | | | | | | | | | | | | | | | | | | | | |
| | | Global
Leaders | | | Institutional
International
Growth | | | Institutional
International
Equity | | | International
Leaders | | | International
Small Cap
Growth | | | Emerging
Markets
Growth | | | Emerging
Markets
Leaders | | | Emerging
Markets
Small Cap
Growth | |
Investments in securities | | | | | | | | | | | | | | | | | | | | | | | | | | | | | | | | |
Level 1—Quoted prices | | | | | | | | | | | | | | | | | | | | | | | | | | | | | | | | |
Common Stock | | $ | 32,806 | | | $ | 210,709 | | | $ | 14,430 | | | $ | 1,265 | | | $ | 50,335 | | | $ | 218,872 | | | $ | 16,608 | | | $ | 6,809 | |
Preferred Stock | | | — | | | | — | | | | — | | | | — | | | | — | | | | 19,764 | | | | 2,086 | | | | 309 | |
Exchange traded funds | | | — | | | | 20,441 | | | | — | | | | — | | | | — | | | | — | | | | — | | | | — | |
Level 2—Other significant observable inputs | | | | | | | | | | | | | | | | | | | | | | | | | | | | | | | | |
Common Stock | | | 30,421 | | | | 1,694,680 | | | | 94,183 | | | | 8,701 | | | | 646,215 | | | | 682,040 | | | | 49,021 | | | | 18,450 | |
Affiliated Funds | | | — | | | | 11,834 | | | | — | | | | — | | | | — | | | | 23,624 | | | | — | | | | — | |
Short-Term Investments | | | 338 | | | | 37,717 | | | | — | | | | 166 | | | | 20,374 | | | | 13,524 | | | | 2,909 | | | | 2,088 | |
Level 3—Significant unobservable inputs | | | | | | | | | | | | | | | | | | | | | | | | | | | | | | | | |
Common Stock | | | — | | | | 540 | | | | — | | | | — | | | | — | | | | — | | | | — | | | | — | |
| | | | | | | | | | | | | | | | | | | | | | | | | | | | | | | | |
Total investments in securities | | $ | 63,565 | | | $ | 1,975,921 | | | $ | 108,613 | | | $ | 10,132 | | | $ | 716,924 | | | $ | 957,824 | | | $ | 70,624 | | | $ | 27,656 | |
| | | | | | | | | | | | | | | | | �� | | | | | | | | | | | | | | | |
Level 1 and Level 2 transfers | | | | | | | | | | | | | | | | | | | | | | | | | | | | | | | | |
Transfers from Level 1 to Level 2 | | | 11,929 | | | | 672,388 | | | | 38,181 | | | | — | | | | 352,290 | | | | 386,205 | | | | 26,326 | | | | 1,325 | |
Transfers from Level 2 to Level 1 | | | — | | | | — | | | | — | | | | — | | | | — | | | | — | | | | — | | | | — | |
| | | | | | | | |
| | | Bond | | | Low Duration
Fund | |
Investments in securities | | | | | | | | |
Level 1—Quoted Prices | | | | | | | | |
None | | $ | — | | | $ | — | |
Level 2—Other significant observable inputs | | | | | | | | |
US Government and Agency Bonds | | | 119,464 | | | | 193,271 | |
Corporate Bonds | | | 163,377 | | | | 37,119 | |
Asset Backed Bonds | | | 9,194 | | | | 31,105 | |
Short-Term Investments | | | 1,622 | | | | — | |
Level 3—Significant unobservable inputs | | | | | | | | |
Asset Backed Bonds | | | 167 | | | | — | |
| | | | | | | | |
Total investments in securities | | $ | 293,824 | | | $ | 261,495 | |
| | | | | | | | |
Fair Valuation Transfers
| | (a) | Fair valuation estimates were obtained from the Funds’ pricing vendor and applied to certain foreign securities at December 31, 2012 but not on December 31, 2011, resulting in a transfer from Level 1 to Level 2. |
68 Annual Report | December 31, 2012 |
Level 1 Common Stocks are exchange-traded securities with a quoted price. See Portfolio of Investments for Sector Classification.
The fair value estimates for the Level 3 securities in the Institutional International Growth and Bond Funds were determined in good faith by the Pricing Committee in consultation with the Valuation Committee, pursuant to the Valuation Procedures adopted by the Board of Trustees. There were various factors considered in reaching this fair value determination, including, but not limited to, the following: the type of security, the extent of public trading of the security, information obtained from a broker-dealer for the security, analysis of the company’s performance, market trends that influence its performance and the potential for an adverse outcome in pending litigation. Level 3 securities represented 0.03% and 0.06% as a percentage of Net Assets in the Institutional International Growth and Bond Funds, respectively. The change in net unrealized gain (loss) related to those securities held at December 31, 2012 is included in the change in net unrealized appreciation (depreciation) of investments on the Statement of Operations. There were no transfers from or to Level 3 during the period.
(l) Redemptions In-Kind
In accordance with the Trust’s prospectus, the Funds may distribute portfolio securities rather than cash as payment for a redemption of fund shares (in-kind redemption). For financial reporting purposes, the Fund recognizes a gain or loss on the transfer of securities depending on the value of those securities on the date of redemption. Gains and losses realized on in-kind redemptions are not recognized for tax purposes and are reclassified from undistributed realized gain (loss) to paid-in capital. During the year ended December 31, 2012, the International Small Cap Growth Fund redeemed in-kind $62,716 (in thousands) with realized gains of $464.
(2) Transactions with Affiliates
(a) Management and Expense Limitation Agreements
Each Fund has a management agreement with the Advisor for investment advisory, clerical, bookkeeping and administrative services. Each Fund pays the Advisor an annual fee, payable monthly, based on a specified percentage of its average daily net assets. A summary of the annual rates expressed as a percentage of average daily net assets is as follows:
| | | | | | | | | | |
Global Equity Fund | | | | | Fixed-Income Funds | | | |
Global Leaders | | | 1.00% | | | Bond | | | 0.30% | |
International Funds | | | | | | Low Duration | | | 0.30% | |
Institutional International Growth: | | | | | | | | | | |
First $500 million | | | 1.00% | | | | | | | |
Next $500 million | | | 0.95% | | | | | | | |
Next $1.5 billion | | | 0.90% | | | | | | | |
Next $2.5 billion | | | 0.875% | | | | | | | |
Next $5 billion | | | 0.85% | | | | | | | |
Next $5 billion | | | 0.825% | | | | | | | |
In excess of $15 billion | | | 0.80% | | | | | | | |
Institutional International Equity: | | | | | | | | | | |
First $500 million | | | 1.000% | | | | | | | |
Next $500 million | | | 0.950% | | | | | | | |
In excess of $1 billion | | | 0.900% | | | | | | | |
International Leaders | | | 0.95% | | | | | | | |
International Small Cap Growth | | | 1.00% | | | | | | | |
Emerging Markets Growth | | | 1.10% | | | | | | | |
Emerging Markets Leaders | | | 1.10% | | | | | | | |
Emerging Markets Small Cap Growth | | | 1.10% | | | | | | | |
All of the Funds, except Institutional International Growth, have also entered into Expense Limitation Agreements with the Advisor. Under the terms of these agreements, the Advisor will waive its management fee and/or reimburse the Fund for expenses in excess of the agreed upon rate. The amount the Advisor owes a Fund as of the report date is recorded as the Receivable from Advisor on the Statement of Assets and Liabilities. The Advisor reimburses the Funds on an monthly basis.
December 31, 2012 | William Blair Funds 69 |
Under the terms of these agreements, the Advisor has agreed to waive its advisory fees and/or absorb other operating expenses through April 30, 2013, if total expenses of the Funds exceed the following rates (as a percentage of average daily net assets):
| | | | | | | | |
Fund | | Effective
May 1, 2012
through
April 30, 2013 | | | Effective
May 1, 2011
through
April 30, 2012 | |
Global Leaders | | | 1.10 | % | | | N/A | |
Institutional International Equity | | | 1.10 | % | | | 1.10 | % |
International Leaders | | | 1.05 | %(a) | | | N/A | |
International Small Cap Growth | | | 1.25 | % | | | 1.25 | % |
Emerging Markets Growth | | | 1.30 | % | | | 1.30 | % |
Emerging Markets Leaders | | | 1.25 | % | | | 1.25 | % |
Emerging Markets Small Cap Growth | | | 1.25 | % | | | N/A | |
Bond | | | 0.35 | % | | | 0.35 | % |
Low Duration | | | 0.40 | % | | | 0.40 | % |
| (a) | | Effective August 16, 2012 through April 30, 2014 |
For a period of three years subsequent to the commencement of operations, the Advisor is entitled to reimbursement for previously waived fees and reimbursed expenses to the extent the overall expense ratio remains below the expense limitation in place at the time the fee was waived and/or the expense was reimbursed. The total amount available for recapture at December 31, 2012 was (in thousands):
| | | | |
Fund | | Available for
Recapture | |
International Leaders | | $ | 57 | |
Emerging Markets Small Cap Growth | | | 253 | |
For the year ended December 31, 2012, the fees waivers and/or reimbursements for each Fund were as follows (in thousands):
| | | | | | | | | | | | | | | | |
Fund | | Fund
Level
Waiver | | | Class I
Specific
Waiver | | | Class N
Specific
Waiver | | | Total
Waiver | |
Global Leaders | | $ | 140 | | | $ | 14 | | | $ | 3 | | | $ | 157 | |
Institutional International Equity | | | 69 | | | | — | | | | — | | | | 69 | |
International Leaders | | | 57 | | | | — | | | | — | | | | 57 | |
Emerging Markets Leaders | | | 196 | | | | 1 | | | | 1 | | | | 198 | |
Emerging Markets Small Cap Growth | | | 205 | | | | — | | | | — | | | | 205 | |
Bond | | | 77 | | | | 53 | | | | 32 | | | | 162 | |
Low Duration | | | 25 | | | | 4 | | | | 2 | | | | 30 | |
(3) Investment Transactions
Investment transactions, excluding money market instruments, repurchase agreements and demand notes for the year ended December 31, 2012 were as follows (in thousands):
| | | | | | | | |
Fund | | Purchases | | | Sales | |
Global Leaders | | $ | 49,749 | | | $ | (36,269 | ) |
Institutional International Growth | | | 1,520,125 | | | | (1,435,964 | ) |
Institutional International Equity | | | 95,866 | | | | (114,216 | ) |
International Leaders | | | 10,340 | | | | (982 | ) |
International Small Cap Growth | | | 522,503 | | | | (661,617 | ) |
Emerging Markets Growth | | | 847,110 | | | | (869,517 | ) |
Emerging Markets Leaders | | | 61,689 | | | | (52,654 | ) |
Emerging Markets Small Cap Growth | | | 26,387 | | | | (5,999 | ) |
Bond | | | 148,553 | | | | (92,844 | ) |
Low Duration | | | 186,371 | | | | (78,475 | ) |
70 Annual Report | December 31, 2012 |
(4) Forward Foreign Currency Contracts
The Funds (excluding the Bond and Low Duration Funds) from time to time may enter into forward foreign currency contracts with the Fund’s custodian and other counterparties in an attempt to hedge against a decline in the value of foreign currency against the U.S. dollar. The Funds bear the market risk that arises from changes in foreign currency rates and bear the credit risk if the counterparty fails to perform under the contract.
For the year ended December 31, 2012, the Institutional International Growth, Institutional International Equity, International Leaders and International Small Cap Growth Funds engaged in forward foreign currency contracts with average notional volume (in thousands) of:
| | | | |
Fund | | Average
Notional
Value | |
Institutional International Growth | | $ | 153,791 | |
Institutional International Equity | | | 4,056 | |
International Leaders | | | 351 | |
International Small Cap Growth | | | 7,102 | |
The effect of forward contracts on the Statements of Operations for the year ended December 31, 2012 (values in thousands):
| | | | |
Net realized gain (loss) on transactions from forward foreign currency contracts | |
Fund | | Value | |
Institutional International Growth | | $ | 10,281 | |
Institutional International Equity | | | (85 | ) |
International Leaders | | | 9 | |
International Small Cap Growth | | | 1,901 | |
| | | | |
Change in net unrealized appreciation (depreciation) of forward foreign currency contracts | |
Fund | | Value | |
Institutional International Growth | | | $837 | |
Institutional International Equity | | | — | |
International Leaders | | | — | |
International Small Cap Growth | | | 311 | |
There were no open Forward Foreign Currency Contracts as of December 31, 2012.
(5) Fund Share Transactions
The following table summarizes the activity in capital shares for Institutional Classes of each Fund (in thousands):
| | | | | | | | | | | | | | | | |
| | | Dollars | |
| | | For the Year Ended December 31, 2012 | |
Fund | | Sales | | | Reinvested
Distributions | | | Redemptions | | | Net change in Net
Assets relating to
fund share activity | |
Global Leaders (a) | | $ | 16,024 | | | $ | — | | | $ | — | | | $ | 16,024 | |
Institutional International Growth | | | 283,364 | | | | 58,949 | | | | 226,632 | | | | 115,681 | |
Institutional International Equity | | | 9,705 | | | | 1,482 | | | | 30,509 | | | | (19,322 | ) |
International Leaders (b) | | | 5,000 | | | | 10 | | | | — | | | | 5,010 | |
International Small Cap Growth | | | 49,414 | | | | 7,704 | | | | 106,290 | | | | (49,172 | ) |
Emerging Markets Growth | | | 245,923 | | | | 7,240 | | | | 259,995 | | | | (6,832 | ) |
Emerging Markets Leaders | | | 23,757 | | | | 303 | | | | 13,122 | | | | (12,637 | ) |
Emerging Markets Small Cap Growth (c) | | | 15,000 | | | | — | | | | — | | | | 15,000 | |
Bond | | | 22,458 | | | | 3,214 | | | | 6,675 | | | | 18,995 | |
Low Duration | | | 71,039 | | | | 2,281 | | | | 22,867 | | | | 50,453 | |
December 31, 2012 | William Blair Funds 71 |
| | | | | | | | | | | | | | | | |
| | | Dollars | |
| | | For the Year Ended December 31, 2011 | |
Fund | | Sales | | | Reinvested
Distributions | | | Redemptions | | | Net change in Net
Assets relating to
fund share activity | |
Global Leaders (a) | | $ | — | | | $ | — | | | $ | — | | | $ | — | |
Institutional International Growth | | | 357,122 | | | | 1,885 | | | | 464,979 | | | | (105,972 | ) |
Institutional International Equity | | | 12,843 | | | | 2,328 | | | | 164,692 | | | | (149,521 | ) |
International Leaders (b) | | | — | | | | — | | | | — | | | | — | |
International Small Cap Growth | | | 144,872 | | | | 5,156 | | | | 51,270 | | | | 98,758 | |
Emerging Markets Growth | | | 325,811 | | | | 84,535 | | | | 525,445 | | | | (115,099 | ) |
Emerging Markets Leaders | | | — | | | | 2,152 | | | | 38,310 | | | | (36,158 | ) |
Emerging Markets Small Cap Growth (c) | | | — | | | | — | | | | — | | | | — | |
Bond | | | 54,824 | | | | 2,564 | | | | 29,654 | | | | 27,734 | |
Low Duration | | | 61,464 | | | | 1,816 | | | | 42,760 | | | | 20,520 | |
| |
| | | Shares | |
| | | For the Year Ended December 31, 2012 | |
Fund | | Sales | | | Reinvested
Distributions | | | Redemptions | | | Net change in Net
Assets relating to
fund share activity | |
Global Leaders (a) | | | 1,690 | | | | — | | | | — | | | | 1,690 | |
Institutional International Growth | | | 20,453 | | | | 3,970 | | | | 16,310 | | | | 8,113 | |
Institutional International Equity | | | 987 | | | | 137 | | | | 3,013 | | | | (1,889 | ) |
International Leaders (b) | | | 488 | | | | 1 | | | | — | | | | 489 | |
International Small Cap Growth | | | 3,936 | | | | 567 | | | | 8,279 | | | | (3,776 | ) |
Emerging Markets Growth | | | 19,326 | | | | 537 | | | | 20,495 | | | | (632 | ) |
Emerging Markets Leaders | | | 2,826 | | | | 33 | | | | 1,581 | | | | 1,278 | |
Emerging Markets Small Cap Growth (c) | | | 1,173 | | | | — | | | | — | | | | 1,173 | |
Bond | | | 2,035 | | | | 290 | | | | 604 | | | | 1,721 | |
Low Duration | | | 7,207 | | | | 231 | | | | 2,321 | | | | 5,117 | |
| |
| | | Shares | |
| | | For the Year Ended December 31, 2011 | |
Fund | | Sales | | | Reinvested
Distributions | | | Redemptions | | | Net change in Net
Assets relating to
fund share activity | |
Global Leaders (a) | | | — | | | | — | | | | — | | | | — | |
Institutional International Growth | | | 26,212 | | | | 156 | | | | 33,111 | | | | (6,743 | ) |
Institutional International Equity | | | 1,239 | | | | 259 | | | | 16,514 | | | | (15,016 | ) |
International Leaders (b) | | | — | | | | — | | | | — | | | | — | |
International Small Cap Growth | | | 11,931 | | | | 463 | | | | 4,109 | | | | 8,285 | |
Emerging Markets Growth | | | 22,569 | | | | 7,644 | | | | 34,501 | | | | (4,288 | ) |
Emerging Markets Leaders | | | — | | | | 288 | | | | 4,453 | | | | (4,165 | ) |
Emerging Markets Small Cap Growth (c) | | | — | | | | — | | | | — | | | | — | |
Bond | | | 5,142 | | | | 239 | | | | 2,774 | | | | 2,607 | |
Low Duration | | | 6,225 | | | | 184 | | | | 4,328 | | | | 2,081 | |
| (a) | | For the period from December 18, 2012 (Commencement of Operations) to December 31, 2012. |
| (b) | | For the period from November 2, 2012 (Commencement of Operations) to December 31, 2012. |
| (c) | | For the period from December 20, 2012 (Commencement of Operations) to December 31, 2012. |
72 Annual Report | December 31, 2012 |
Financial Highlights
Global Leaders Fund
| | | | |
| | | Period Ended
December 31, | |
| | | 2012(a) | |
Net asset value, beginning of year | | $ | 9.50 | |
Income (loss) from investment operations: | | | | |
Net investment income (loss) (b) | | | 0.00 | ^ |
Net realized and unrealized gain (loss) on investments | | | (0.03 | ) |
| | | | |
Total from investment operations | | | (0.03 | ) |
Less distributions from: | | | | |
Net investment income | | | — | |
Net realized gain | | | — | |
| | | | |
Total distributions | | | — | |
| | | | |
Net asset value, end of year | | $ | 9.47 | |
| | | | |
Total Return (%) * | | | (0.32 | ) |
Ratios to average daily net assets (%): ** | | | | |
Expenses, net of waivers and reimbursements | | | 1.10 | |
Expenses, before waivers and reimbursements | | | 1.26 | |
Net investment income (loss), net of waivers and reimbursements | | | (0.91 | ) |
Net investment income (loss), before waivers and reimbursements | | | (1.07 | ) |
| |
Net assets at end of year (in thousands) | | $ | 16,022 | |
Portfolio turnover rate (%) | | | 73 | |
| (a) | | For the period December 19, 2012 (Commencement of Operations) to December 31, 2012. |
| (b) | | Excludes $0.00 of PFIC mark-to-market which is treated as ordinary income for Federal tax purposes for 2012. |
| * | | Rates not annualized for periods that are less than a year. |
| ** | | Rates are annualized for periods that are less than a year. |
| ^ | | Amount is less than $0.005 per share. |
Note: Net investment income (loss) per share is based on the average shares outstanding during the year.
Performance cited represents past performance. Past performance does not guarantee future results and current performance may be lower or higher than the data quoted. Results shown are annual returns, which assume reinvestment of dividends and capital gains. Investment returns and principal will fluctuate and you may have a gain or loss when you sell shares. For the most current month-end performance information, please call 1-800-742-7272 or visit our Web site at www.williamblairfunds.com.
December 31, 2012 | William Blair Funds 73 |
Financial Highlights
Institutional International Growth Fund
| | | | | | | | | | | | | | | | | | | | |
| | | Years Ended December 31, | |
| | | 2012 | | | 2011 | | | 2010 | | | 2009 | | | 2008 | |
Net asset value, beginning of year | | $ | 12.39 | | | $ | 14.37 | | | $ | 12.20 | | | $ | 8.66 | | | $ | 19.20 | |
Income (loss) from investment operations: | | | | | | | | | | | | | | | | | | | | |
Net investment income (loss) (a) | | | 0.23 | | | | 0.21 | | | | 0.14 | | | | 0.10 | | | | 0.25 | |
Net realized and unrealized gain (loss) on investments | | | 2.76 | | | | (2.17 | ) | | | 2.31 | | | | 3.61 | | | | (10.24 | ) |
| | | | | | | | | | | | | | | | | | | | |
Total from investment operations | | | 2.99 | | | | (1.96 | ) | | | 2.45 | | | | 3.71 | | | | (9.99 | ) |
Less distributions from: | | | | | | | | | | | | | | | | | | | | |
Net investment income | | | 0.49 | | | | 0.02 | | | | 0.28 | | | | 0.17 | | | | — | |
Net realized gain | | | — | | | | — | | | | — | | | | — | | | | 0.55 | |
| | | | | | | | | | | | | | | | | | | | |
Total distributions | | | 0.49 | | | | 0.02 | | | | 0.28 | | | | 0.17 | | | | 0.55 | |
| | | | | | | | | | | | | | | | | | | | |
Net asset value, end of year | | $ | 14.89 | | | $ | 12.39 | | | $ | 14.37 | | | $ | 12.20 | | | $ | 8.66 | |
| | | | | | | | | | | | | | | | | | | | |
Total Return (%) | | | 24.11 | | | | (13.66 | ) | | | 20.10 | | | | 42.83 | | | | (51.99 | ) |
Ratios to average daily net assets (%): | | | | | | | | | | | | | | | | | | | | |
Expenses | | | 0.98 | �� | | | 0.99 | | | | 0.99 | | | | 1.01 | | | | 0.98 | |
Net investment income (loss) | | | 1.64 | | | | 1.51 | | | | 1.12 | | | | 0.95 | | | | 1.68 | |
| | | | | |
Net assets at end of year (in thousands) | | $ | 1,974,130 | | | $ | 1,542,594 | | | $ | 1,886,217 | | | $ | 1,375,848 | | | $ | 998,266 | |
Portfolio turnover rate (%) | | | 83 | | | | 111 | | | | 99 | | | | 125 | | | | 86 | |
| (a) | | Excludes $0.00, $0.09, $0.05, $(0.10), and $0.06 of PFIC mark-to-market which is treated as ordinary income for Federal tax purposes for the years 2012, 2011, 2010, 2009, and 2008 respectively. |
Note: Net investment income (loss) per share is based on the average shares outstanding during the year.
Performance cited represents past performance. Past performance does not guarantee future results and current performance may be lower or higher than the data quoted. Results shown are annual returns, which assume reinvestment of dividends and capital gains. Investment returns and principal will fluctuate and you may have a gain or loss when you sell shares. For the most current month-end performance information, please call 1-800-742-7272 or visit our Web site at www.williamblairfunds.com.
74 Annual Report | December 31, 2012 |
Financial Highlights
Institutional International Equity Fund
| | | | | | | | | | | | | | | | | | | | |
| | | Years Ended December 31, | |
| | | 2012 | | | 2011 | | | 2010 | | | 2009 | | | 2008 | |
Net asset value, beginning of year | | $ | 9.27 | | | $ | 10.78 | | | $ | 9.84 | | | $ | 7.44 | | | $ | 15.03 | |
Income (loss) from investment operations: | | | | | | | | | | | | | | | | | | | | |
Net investment income (loss) (a) | | | 0.13 | | | | 0.16 | | | | 0.10 | | | | 0.09 | | | | 0.15 | |
Net realized and unrealized gain (loss) on investments | | | 1.57 | | | | (1.47 | ) | | | 0.99 | | | | 2.38 | | | | (7.60 | ) |
| | | | | | | | | | | | | | | | | | | | |
Total from investment operations | | | 1.70 | | | | (1.31 | ) | | | 1.09 | | | | 2.47 | | | | (7.45 | ) |
Less distributions from: | | | | | | | | | | | | | | | | | | | | |
Net investment income | | | 0.15 | | | | 0.20 | | | | 0.15 | | | | 0.07 | | | | — | |
Net realized gain | | | — | | | | — | | | | — | | | | — | | | | 0.14 | |
| | | | | | | | | | | | | | | | | | | | |
Total distributions | | | 0.15 | | | | 0.20 | | | | 0.15 | | | | 0.07 | | | | 0.14 | |
| | | | | | | | | | | | | | | | | | | | |
Net asset value, end of year | | $ | 10.82 | | | $ | 9.27 | | | $ | 10.78 | | | $ | 9.84 | | | $ | 7.44 | |
| | | | | | | | | | | | | | | | | | | | |
Total Return (%) | | | 18.31 | | | | (12.12 | ) | | | 11.12 | | | | 33.27 | | | | (49.57 | ) |
Ratios to average daily net assets (%): | | | | | | | | | | | | | | | | | | | | |
Expenses, net of waivers and reimbursements | | | 1.10 | | | | 1.10 | | | | 1.07 | | | | 1.09 | | | | 1.05 | |
Expenses, before waivers and reimbursements | | | 1.16 | | | | 1.10 | | | | 1.07 | | | | 1.09 | | | | 1.05 | |
Net investment income (loss), net of waivers and reimbursements | | | 1.28 | | | | 1.48 | | | | 0.97 | | | | 1.04 | | | | 1.26 | |
Net investment income (loss), before waivers and reimbursements | | | 1.22 | | | | 1.48 | | | | 0.97 | | | | 1.04 | | | | 1.26 | |
| | | | | |
Net assets at end of year (in thousands) | | $ | 109,690 | | | $ | 111,474 | | | $ | 291,468 | | | $ | 365,271 | | | $ | 360,451 | |
Portfolio turnover rate (%) | | | 86 | | | | 91 | | | | 73 | | | | 78 | | | | 91 | |
| (a) | | Excludes $0.00, $0.04, $0.00, $0.00, and $(0.07) of PFIC mark-to-market which is treated as ordinary income for Federal tax purposes for the years 2012, 2011, 2010, 2009, and 2008 respectively. |
Note: Net investment income (loss) per share is based on the average shares outstanding during the year.
Performance cited represents past performance. Past performance does not guarantee future results and current performance may be lower or higher than the data quoted. Results shown are annual returns, which assume reinvestment of dividends and capital gains. Investment returns and principal will fluctuate and you may have a gain or loss when you sell shares. For the most current month-end performance information, please call 1-800-742-7272 or visit our Web site at www.williamblairfunds.com.
December 31, 2012 | William Blair Funds 75 |
Financial Highlights
International Leaders Fund
| | | | |
| | | Period Ended
December 31, | |
| | | 2012(a) | |
Net asset value, beginning of year | | $ | 10.24 | |
Income (loss) from investment operations: | | | | |
Net investment income (loss) (b) | | | 0.00 | ^ |
Net realized and unrealized gain (loss) on investments | | | 0.58 | |
| | | | |
Total from investment operations | | | 0.58 | |
Less distributions from: | | | | |
Net investment income | | | 0.02 | |
Net realized gain | | | — | |
| | | | |
Total distributions | | | 0.02 | |
| | | | |
Net asset value, end of year | | $ | 10.80 | |
| | | | |
Total Return (%) * | | | 5.67 | |
Ratios to average daily net assets (%): ** | | | | |
Expenses, net of waivers and reimbursements | | | 1.05 | |
Expenses, before waivers and reimbursements | | | 1.84 | |
Net investment income (loss), net of waivers and reimbursements | | | 0.01 | |
Net investment income (loss), before waivers and reimbursements | | | (0.78 | ) |
| |
Net assets at end of year (in thousands) | | $ | 5,286 | |
Portfolio turnover rate (%) * | | | 16 | |
| (a) | | For the period November 2, 2012 (Commencement of Operations) to December 31, 2012. |
| (b) | | Excludes $0.00 of PFIC mark-to-market which is treated as ordinary income for Federal tax purposes for the year 2012. |
| * | | Rates not annualized for periods that are less than a year. |
| ** | | Rates are annualized for periods that are less than a year. |
| ^ | | Amount is less than $0.005 per share. |
Note: Net investment income (loss) per share is based on the average shares outstanding during the year.
Performance cited represents past performance. Past performance does not guarantee future results and current performance may be lower or higher than the data quoted. Results shown are annual returns, which assume reinvestment of dividends and capital gains. Investment returns and principal will fluctuate and you may have a gain or loss when you sell shares. For the most current month-end performance information, please call 1-800-742-7272 or visit our Web site at www.williamblairfunds.com.
76 Annual Report | December 31, 2012 |
Financial Highlights
International Small Cap Growth Fund
| | | | | | | | | | | | | | | | | | | | |
| | | Years Ended December 31, | |
| | | 2012 | | | 2011 | | | 2010 | | | 2009 | | | 2008 | |
Net asset value, beginning of year | | $ | 11.51 | | | $ | 13.24 | | | $ | 10.53 | | | $ | 6.69 | | | $ | 14.04 | |
Income (loss) from investment operations: | | | | | | | | | | | | | | | | | | | | |
Net investment income (loss) (a) | | | 0.15 | | | | 0.14 | | | | 0.09 | | | | 0.04 | | | | 0.03 | |
Net realized and unrealized gain (loss) on investments | | | 2.31 | | | | (1.68 | ) | | | 2.69 | | | | 3.83 | | | | (7.26 | ) |
| | | | | | | | | | | | | | | | | | | | |
Total from investment operations | | | 2.46 | | | | (1.54 | ) | | | 2.78 | | | | 3.87 | | | | (7.23 | ) |
Less distributions from: | | | | | | | | | | | | | | | | | | | | |
Net investment income | | | 0.33 | | | | 0.19 | | | | 0.07 | | | | 0.03 | | | | — | |
Net realized gain | | | — | | | | — | | | | — | | | | — | | | | 0.12 | |
| | | | | | | | | | | | | | | | | | | | |
Total distributions | | | 0.33 | | | | 0.19 | | | | 0.07 | | | | 0.03 | | | | 0.12 | |
| | | | | | | | | | | | | | | | | | | | |
Net asset value, end of year | | $ | 13.64 | | | $ | 11.51 | | | $ | 13.24 | | | $ | 10.53 | | | $ | 6.69 | |
| | | | | | | | | | | | | | | | | | | | |
Total Return (%) | | | 21.36 | | | | (11.60 | ) | | | 26.40 | | | | 57.84 | | | | (51.53 | ) |
Ratios to average daily net assets (%): | | | | | | | | | | | | | | | | | | | | |
Expenses, net of waivers and reimbursements | | | 1.08 | | | | 1.08 | | | | 1.08 | | | | 1.13 | | | | 1.14 | |
Expenses, before waivers and reimbursements | | | 1.08 | | | | 1.08 | | | | 1.08 | | | | 1.13 | | | | 1.11 | |
Net investment income (loss), net of waivers and reimbursements | | | 1.14 | | | | 1.10 | | | | 0.77 | | | | 0.48 | | | | 0.28 | |
Net investment income (loss), before waivers and reimbursements | | | 1.14 | | | | 1.10 | | | | 0.77 | | | | 0.48 | | | | 0.31 | |
| | | | | |
Net assets at end of year (in thousands) | | $ | 345,180 | | | $ | 334,656 | | | $ | 275,356 | | | $ | 165,436 | | | $ | 191,173 | |
Portfolio turnover rate (%) | | | 76 | | | | 85 | | | | 85 | | | | 136 | | | | 78 | |
| (a) | | Excludes $0.00, $0.15, $0.01, $(0.02), and $0.05 of PFIC mark-to-market which is treated as ordinary income for Federal tax purposes for the years 2012, 2011, 2010, 2009, and 2008 respectively. |
Note: Net investment income (loss) per share is based on the average shares outstanding during the year.
Performance cited represents past performance. Past performance does not guarantee future results and current performance may be lower or higher than the data quoted. Results shown are annual returns, which assume reinvestment of dividends and capital gains. Investment returns and principal will fluctuate and you may have a gain or loss when you sell shares. For the most current month-end performance information, please call 1-800-742-7272 or visit our Web site at www.williamblairfunds.com.
December 31, 2012 | William Blair Funds 77 |
Financial Highlights
Emerging Markets Growth Fund
| | | | | | | | | | | | | | | | | | | | |
| | | Years Ended December 31, | |
| | | 2012 | | | 2011 | | | 2010 | | | 2009 | | | 2008 | |
Net asset value, beginning of year | | $ | 11.32 | | | $ | 15.96 | | | $ | 13.03 | | | $ | 7.56 | | | $ | 22.07 | |
Income (loss) from investment operations: | | | | | | | | | | | | | | | | | | | | |
Net investment income (loss) (a) | | | 0.14 | | | | 0.14 | | | | 0.06 | | | | 0.06 | | | | 0.17 | |
Net realized and unrealized gain (loss) on investments | | | 2.27 | | | | (2.87 | ) | | | 3.05 | | | | 5.55 | | | | (13.74 | ) |
| | | | | | | | | | | | | | | | | | | | |
Total from investment operations | | | 2.41 | | | | (2.73 | ) | | | 3.11 | | | | 5.61 | | | | (13.57 | ) |
Less distributions from: | | | | | | | | | | | | | | | | | | | | |
Net investment income | | | 0.14 | | | | 0.08 | | | | 0.18 | | | | 0.14 | | | | — | |
Net realized gain | | | — | | | | 1.83 | | | | — | | | | — | | | | 0.94 | |
| | | | | | | | | | | | | | | | | | | | |
Total distributions | | | 0.14 | | | | 1.91 | | | | 0.18 | | | | 0.14 | | | | 0.94 | |
| | | | | | | | | | | | | | | | | | | | |
Net asset value, end of year | | $ | 13.59 | | | $ | 11.32 | | | $ | 15.96 | | | $ | 13.03 | | | $ | 7.56 | |
| | | | | | | | | | | | | | | | | | | | |
Total Return (%) | | | 21.28 | | | | (16.82 | ) | | | 23.91 | | | | 74.33 | | | | (61.51 | ) |
Ratios to average daily net assets (%): | | | | | | | | | | | | | | | | | | | | |
Expenses, net of waivers and reimbursements | | | 1.20 | | | | 1.19 | | | | 1.17 | | | | 1.22 | | | | 1.22 | |
Expenses, before waivers and reimbursements | | | 1.20 | | | | 1.19 | | | | 1.17 | | | | 1.22 | | | | 1.20 | |
Net investment income (loss), net of waivers and reimbursements | | | 1.12 | | | | 0.93 | | | | 0.43 | | | | 0.54 | | | | 1.08 | |
Net investment income (loss), before waivers and reimbursements | | | 1.12 | | | | 0.93 | | | | 0.43 | | | | 0.54 | | | | 1.10 | |
| | | | | |
Net assets at end of year (in thousands) | | $ | 802,571 | | | $ | 675,633 | | | $ | 1,021,456 | | | $ | 830,660 | | | $ | 299,739 | |
Portfolio turnover rate (%) | | | 90 | | | | 104 | | | | 121 | | | | 113 | | | | 118 | |
| (a) | | Excludes $0.00, $0.11, $0.15, $(0.09), and $0.21 of PFIC mark-to-market which is treated as ordinary income for Federal tax purposes for the years 2012, 2011, 2010, 2009, and 2008 respectively. |
Note: Net investment income (loss) per share is based on the average shares outstanding during the year.
Performance cited represents past performance. Past performance does not guarantee future results and current performance may be lower or higher than the data quoted. Results shown are annual returns, which assume reinvestment of dividends and capital gains. Investment returns and principal will fluctuate and you may have a gain or loss when you sell shares. For the most current month-end performance information, please call 1-800-742-7272 or visit our Web site at www.williamblairfunds.com.
78 Annual Report | December 31, 2012 |
Financial Highlights
Emerging Markets Leaders Fund
| | | | | | | | | | | | | | | | | | | | |
| | | Periods Ended December 31, | |
| | | 2012 | | | 2011 | | | 2010 | | | 2009 | | | 2008(a) | |
Net asset value, beginning of year | | $ | 7.65 | | | $ | 10.35 | | | $ | 8.43 | | | $ | 4.78 | | | $ | 10.00 | |
Income (loss) from investment operations: | | | | | | | | | | | | | | | | | | | | |
Net investment income (loss) (c) | | | 0.08 | | | | 0.09 | | | | 0.04 | | | | 0.04 | | | | 0.04 | |
Net realized and unrealized gain (loss) on investments | | | 1.52 | | | | (2.10 | ) | | | 1.97 | | | | 3.73 | | | | (5.26 | ) |
| | | | | | | | | | | | | | | | | | | | |
Total from investment operations | | | 1.60 | | | | (2.01 | ) | | | 2.01 | | | | 3.77 | | | | (5.22 | ) |
Less distributions from: | | | | | | | | | | | | | | | | | | | | |
Net investment income | | | 0.07 | | | | 0.06 | | | | 0.03 | | | | 0.12 | | | | 0.00 | ^ |
Net realized gain | | | — | | | | 0.63 | | | | 0.06 | | | | — | | | | — | |
Return of capital | | | — | | | | 0.00 | ^ | | | — | | | | — | | | | — | |
| | | | | | | | | | | | | | | | | | | | |
Total distributions | | | 0.07 | | | | 0.69 | | | | 0.09 | | | | 0.12 | | | | 0.00 | ^ |
| | | | | | | | | | | | | | | | | | | | |
Net asset value, end of year | | $ | 9.18 | | | $ | 7.65 | | | $ | 10.35 | | | $ | 8.43 | | | $ | 4.78 | |
| | | | | | | | | | | | | | | | | | | | |
Total Return (%) * | | | 20.97 | | | | (19.30 | ) | | | 23.84 | | | | 78.93 | | | | (52.11 | ) |
Ratios to average daily net assets (%): ** | | | | | | | | | | | | | | | | | | | | |
Expenses, net of waivers and reimbursements | | | 1.25 | | | | 1.25 | | | | 1.26 | | | | 1.25 | | | | 1.25 | |
Expenses, before waivers and reimbursements | | | 1.59 | | | | 1.41 | | | | 1.35 | | | | 1.36 | | | | 1.41 | |
Net investment income (loss), net of waivers and reimbursements | | | 0.90 | | | | 0.90 | | | | 0.50 | | | | 0.58 | | | | 0.70 | |
Net investment income (loss), before waivers and reimbursements | | | 0.56 | | | | 0.74 | | | | 0.41 | | | | 0.47 | | | | 0.54 | |
| | | | | |
Net assets at end of year (in thousands) | | $ | 43,102 | | | $ | 26,166 | | | $ | 78,516 | | | $ | 106,313 | | | $ | 43,762 | |
Portfolio turnover rate (%) * | | | 94 | | | | 142 | | | | 176 | | | | 176 | | | | 151 | |
| (a) | | For the period March 26, 2008 (Commencement of Operations) to December 31, 2008. |
| (b) | | Excludes $0.00, $0.00, $0.96, $1.29, and $0.00 of PFIC mark-to-market which is treated as ordinary income for Federal tax purposes for the years 2012, 2011, 2010, 2009, and 2008 respectively. |
| * | | Rates not annualized for periods that are less than a year. |
| ** | | Rates are annualized for periods that are less than a year. |
| ^ | | Amount is less than $0.005 per share. |
Note: Net investment income (loss) per share is based on the average shares outstanding during the year.
Performance cited represents past performance. Past performance does not guarantee future results and current performance may be lower or higher than the data quoted. Results shown are annual returns, which assume reinvestment of dividends and capital gains. Investment returns and principal will fluctuate and you may have a gain or loss when you sell shares. For the most current month-end performance information, please call 1-800-742-7272 or visit our Web site at www.williamblairfunds.com.
December 31, 2012 | William Blair Funds 79 |
Financial Highlights
Emerging Markets Small Cap Growth Fund
| | | | |
| | | Period Ended
December 31, | |
| | | 2012(a) | |
Net asset value, beginning of year | | $ | 12.79 | |
Income (loss) from investment operations: | | | | |
Net investment income (loss) | | | 0.00 | ^ |
Net realized and unrealized gain (loss) on investments | | | 0.21 | |
| | | | |
Total from investment operations | | | 0.21 | |
Less distributions from: | | | | |
Net investment income | | | — | |
Net realized gain | | | — | |
Return of capital | | | — | |
| | | | |
Total distributions | | | — | |
| | | | |
Net asset value, end of year | | $ | 13.00 | |
| | | | |
Total Return (%) * | | | 1.64 | |
Ratios to average daily net assets (%): ** | | | | |
Expenses, net of waivers and reimbursements | | | 1.25 | |
Expenses, before waivers and reimbursements | | | 2.32 | |
Net investment income (loss), net of waivers and reimbursements | | | (0.87 | ) |
Net investment income (loss), before waivers and reimbursements | | | (1.93 | ) |
| |
Net assets at end of year (in thousands) | | $ | 15,242 | |
Portfolio turnover rate (%) * | | | 78 | |
| (a) | | For the period December 20, 2012 (Commencement of Operations) to December 31, 2012. |
| (b) | | Excludes $0.00 of PFIC mark-to-market which is treated as ordinary income for Federal tax purposes for the year 2012. |
| * | | Rates not annualized for periods that are less than a year. |
| ** | | Rates are annualized for periods that are less than a year. |
| ^ | | Amount is less than $0.005 per share. |
Note: Net investment income (loss) per share is based on the average shares outstanding during the year.
Performance cited represents past performance. Past performance does not guarantee future results and current performance may be lower or higher than the data quoted. Results shown are annual returns, which assume reinvestment of dividends and capital gains. Investment returns and principal will fluctuate and you may have a gain or loss when you sell shares. For the most current month-end performance information, please call 1-800-742-7272 or visit our Web site at www.williamblairfunds.com.
80 Annual Report | December 31, 2012 |
Financial Highlights
Bond Fund
| | | | | | | | | | | | | | | | | | | | |
| | | Years Ended December 31, | |
| | | 2012 | | | 2011 | | | 2010 | | | 2009 | | | 2008 | |
Net asset value, beginning of year | | $ | 10.80 | | | $ | 10.58 | | | $ | 10.30 | | | $ | 9.72 | | | $ | 10.00 | |
Income (loss) from investment operations: | | | | | | | | | | | | | | | | | | | | |
Net investment income (loss) | | | 0.40 | | | | 0.45 | | | | 0.48 | | | | 0.51 | | | | 0.50 | |
Net realized and unrealized gain (loss) on investments | | | 0.51 | | | | 0.36 | | | | 0.34 | | | | 0.58 | | | | (0.31 | ) |
| | | | | | | | | | | | | | | | | | | | |
Total from investment operations | | | 0.91 | | | | 0.81 | | | | 0.82 | | | | 1.09 | | | | 0.19 | |
Less distributions from: | | | | | | | | | | | | | | | | | | | | |
Net investment income | | | 0.48 | | | | 0.50 | | | | 0.51 | | | | 0.51 | | | | 0.47 | |
Net realized gain | | | 0.07 | | | | 0.09 | | | | 0.03 | | | | — | | | | — | |
| | | | | | | | | | | | | | | | | | | | |
Total distributions | | | 0.55 | | | | 0.59 | | | | 0.54 | | | | 0.51 | | | | 0.47 | |
| | | | | | | | | | | | | | | | | | | | |
Net asset value, end of year | | $ | 11.16 | | | $ | 10.80 | | | $ | 10.58 | | | $ | 10.30 | | | $ | 9.72 | |
| | | | | | | | | | | | | | | | | | | | |
Total Return (%) | | | 8.61 | | | | 7.88 | | | | 8.06 | | | | 11.47 | | | | 1.95 | |
Ratios to average daily net assets (%): | | | | | | | | | | | | | | | | | | | | |
Expenses, net of waivers and reimbursements | | | 0.35 | | | | 0.35 | | | | 0.35 | | | | 0.34 | | | | 0.35 | |
Expenses, before waivers and reimbursements | | | 0.38 | | | | 0.39 | | | | 0.40 | | | | 0.43 | | | | 0.56 | |
Net investment income (loss), net of waivers and reimbursements | | | 3.60 | | | | 4.24 | | | | 4.54 | | | | 5.07 | | | | 5.04 | |
Net investment income (loss), before waivers and reimbursements | | | 3.57 | | | | 4.20 | | | | 4.49 | | | | 4.98 | | | | 4.83 | |
| | | | | |
Net assets at end of year (in thousands) | | $ | 91,039 | | | $ | 69,447 | | | $ | 40,490 | | | $ | 16,226 | | | $ | 10,443 | |
Portfolio turnover rate (%) | | | 25 | | | | 28 | | | | 25 | | | | 29 | | | | 52 | |
Note: Net investment income (loss) per share is based on the average shares outstanding during the year.
Performance cited represents past performance. Past performance does not guarantee future results and current performance may be lower or higher than the data quoted. Results shown are annual returns, which assume reinvestment of dividends and capital gains. Investment returns and principal will fluctuate and you may have a gain or loss when you sell shares. For the most current month-end performance information, please call 1-800-742-7272 or visit our Web site at www.williamblairfunds.com.
December 31, 2012 | William Blair Funds 81 |
Financial Highlights
Low Duration Fund
| | | | | | | | | | | | | | | | |
| | | Periods Ended December 31, | |
| | | 2012 | | | 2011 | | | 2010 | | | 2009(a) | |
Net asset value, beginning of year | | $ | 9.83 | | | $ | 9.90 | | | $ | 9.93 | | | $ | 10.00 | |
Income (loss) from investment operations: | | | | | | | | | | | | | | | | |
Net investment income (loss) | | | 0.17 | | | | 0.18 | | | | 0.16 | | | | 0.01 | |
Net realized and unrealized gain (loss) on investments | | | 0.12 | | | | 0.03 | | | | 0.05 | | | | (0.07 | ) |
| | | | | | | | | | | | | | | | |
Total from investment operations | | | 0.29 | | | | 0.21 | | | | 0.21 | | | | (0.06 | ) |
Less distributions from: | | | | | | | | | | | | | | | | |
Net investment income | | | 0.29 | | | | 0.28 | | | | 0.24 | | | | 0.01 | |
Net realized gain | | | — | | | | — | | | | — | | | | — | |
| | | | | | | | | | | | | | | | |
Total distributions | | | 0.29 | | | | 0.28 | | | | 0.24 | | | | 0.01 | |
| | | | | | | | | | | | | | | | |
Net asset value, end of year | | $ | 9.83 | | | $ | 9.83 | | | $ | 9.90 | | | $ | 9.93 | |
| | | | | | | | | | | | | | | | |
Total Return (%) * | | | 3.01 | | | | 2.14 | | | | 2.15 | | | | (0.58 | ) |
Ratios to average daily net assets (%): ** | | | | | | | | | | | | | | | | |
Expenses, net of waivers and reimbursements | | | 0.40 | | | | 0.40 | | | | 0.40 | | | | 0.40 | |
Expenses, before waivers and reimbursements | | | 0.41 | | | | 0.42 | | | | 0.48 | | | | 0.64 | |
Net investment income (loss), net of waivers and reimbursements | | | 1.68 | | | | 1.81 | | | | 1.61 | | | | 1.54 | |
Net investment income (loss), before waivers and reimbursements | | | 1.67 | | | | 1.79 | | | | 1.53 | | | | 1.30 | |
| | | | |
Net assets at end of year (in thousands) | | $ | 118,401 | | | $ | 68,059 | | | $ | 47,965 | | | $ | 13,500 | |
Portfolio turnover rate (%) * | | | 20 | | | | 43 | | | | 51 | | | | — | |
| (a) | | For the period December 1, 2009 (Commencement of Operations) to December 31, 2009. |
| * | | Rates not annualized for periods that are less than a year. |
| ** | | Rates are annualized for periods that are less than a year. |
Note: Net investment income (loss) per share is based on the average shares outstanding during the year.
Performance cited represents past performance. Past performance does not guarantee future results and current performance may be lower or higher than the data quoted. Results shown are annual returns, which assume reinvestment of dividends and capital gains. Investment returns and principal will fluctuate and you may have a gain or loss when you sell shares. For the most current month-end performance information, please call 1-800-742-7272 or visit our Web site at www.williamblairfunds.com.
82 Annual Report | December 31, 2012 |
REPORT OF INDEPENDENT REGISTERED PUBLIC ACCOUNTING FIRM
To the Board of Trustees and Shareholders of
William Blair Funds
We have audited the accompanying statements of assets and liabilities, including the portfolios of investments, of the Global Leaders Fund (formerly known as Global Growth Fund), Institutional International Growth Fund, Institutional International Equity Fund, International Leaders Fund, International Small Cap Growth Fund, Emerging Markets Growth Fund, Emerging Markets Leaders Fund (formerly known as Emerging Leaders Growth Fund), Emerging Markets Small Cap Growth Fund, Bond Fund, and Low Duration Fund (collectively, the “Funds”) (ten of the Funds constituting William Blair Funds) as of December 31, 2012, and the related statements of operations, statements of changes in net assets, and the financial highlights for the periods indicated therein. These financial statements and financial highlights are the responsibility of the Funds’ management. Our responsibility is to express an opinion on these financial statements and financial highlights based on our audits.
We conducted our audits in accordance with the standards of the Public Company Accounting Oversight Board (United States). Those standards require that we plan and perform the audit to obtain reasonable assurance about whether the financial statements and financial highlights are free of material misstatement. We were not engaged to perform an audit of the Funds’ internal control over financial reporting. Our audits included consideration of internal control over financial reporting as a basis for designing audit procedures that are appropriate in the circumstances, but not for the purpose of expressing an opinion on the effectiveness of the Funds’ internal control over financial reporting. Accordingly, we express no such opinion. An audit also includes examining, on a test basis, evidence supporting the amounts and disclosures in the financial statements and financial highlights, assessing the accounting principles used and significant estimates made by management, and evaluating the overall financial statement presentation. Our procedures included confirmation of securities owned as of December 31, 2012 by correspondence with the custodian and brokers or by other appropriate auditing procedures where replies from brokers were not received. We believe that our audits provide a reasonable basis for our opinion.
In our opinion, the financial statements and financial highlights referred to above present fairly, in all material respects, the financial position of the above mentioned Funds of William Blair Funds at December 31, 2012, the results of their operations, the changes in their net assets, and the financial highlights for the periods indicated therein in conformity with U.S. generally accepted accounting principles.

Chicago, Illinois
April 22, 2013
December 31, 2012 | William Blair Funds 83 |
Trustees and Officers (Unaudited). The trustees and officers of the William Blair Funds, their year of birth, their principal occupations during the last five years, their affiliations, if any, with William Blair & Company, L.L.C., and other significant affiliations are set forth below. The address of each trustee and officer is 222 West Adams Street, Chicago, Illinois 60606.
| | | | | | | | | | |
Name and Year of Birth | | Position(s)
Held with
Fund | | Term of
Office and
Length of
Time
Served(1) | | Principal Occupation(s) During Past 5 Years(2) | | Number of
Portfolios
in Fund
Complex
Overseen
by Trustee | | Other Directorships Held by Trustee/Officer |
Interested Trustees | | | | | | | | | | |
Michelle R. Seitz,
1965* | | Chairman of the Board of Trustees and President | | Trustee since 2002; Chairman since 2010 Since 2007 | | Partner, William Blair & Company, L.L.C.; Limited Partner, WBC Holdings, L.P. (since November 2008); Member, WBC GP, L.L.P. (since November 2008); Director, William Blair International, Ltd. (U.K.) (since 2012) | | 25 | | Chairman, William Blair SICAV; Director, William Blair CLS Ltd.; Director, William Blair MAS Ltd.; Financial Accounting Foundation (FAF) |
| | | | | |
Richard W. Smirl,
1967* | | Trustee and Senior Vice President | | Trustee since 2010 and Senior Vice President Since 2007 | | Partner, William Blair & Company, L.L.C.; Limited Partner, WBC Holdings, L.P. (since November 2008); Director, William Blair International, Ltd. (U.K.) (since 2012) | | 25 | | Director, William Blair SICAV; Director, William Blair CLS Ltd.; Director, William Blair MAS Ltd.; |
Non-Interested Trustees | | | | | | | | |
Vann A. Avedisian,
1964 | | Trustee | | Since 2012 | | Principal, Highgate Holdings since 2009; formerly, co-founder and Managing Director, Oxford Capital Partners, Inc. from 1994 to 2006 | | 25 | | Potbelly Sandwich Works, LLC |
| | | | | |
Phillip O. Peterson,
1944 | | Trustee | | Since 2007 | | Retired; formerly, President, Strong Mutual Funds, 2004 to 2005; formerly, Partner, KPMG LLP | | 25 | | The Hartford Group of Mutual Funds (87 portfolios); Symetra Mutual Funds Trust (variable annuity funds) (14 portfolios) |
| | | | | |
Donald J. Reaves,
1946 | | Trustee | | Since 2004 | | Chancellor, Winston-Salem State University since 2007; formerly, Vice President for Administration and Chief Financial Officer, University of Chicago 2002 to 2007. | | 25 | | American Student Assistance Corp., guarantor of student loans; Amica Mutual Insurance Company |
| | | | | |
Donald L. Seeley,
1944 | | Trustee | | Since 2003 | | Retired; formerly, Director, Applied Investment Management Program, University of Arizona Department of Finance, prior thereto, Vice Chairman and Chief Financial Officer, True North Communications, Inc., marketing communications and advertising firm | | 25 | | Warnaco Group, Inc., intimate apparel, sportswear, and swimwear manufacturer; Center for Furniture Craftsmanship (not-for-profit) |
84 Annual Report | December 31, 2012 |
| | | | | | | | | | |
Name and Year of Birth | | Position(s)
Held with
Fund | | Term of
Office and
Length of
Time
Served(1) | | Principal Occupation(s) During Past 5 Years(2) | | Number of
Portfolios
in Fund
Complex
Overseen
by Trustee | | Other Directorships Held by Trustee/Officer |
Thomas J. Skelly,
1951 | | Trustee | | Since 2007 | | Advisory Board Member for various U.S. Companies; Director and Investment Committee Chairman of the US Accenture Foundation, Inc.; prior to 2005, Managing Partner of various divisions at Accenture | | 25 | | Mutual Trust Financial Group, provider of insurance and investment products; Board Member, First MetLife Investors Insurance Company, NY Chartered Company for Metropolitan Life Insurance |
Officers | | | | | | | | | | |
Michael P. Balkin,
1959 | | Senior Vice President Vice President | | Since 2009 2008-2009 | | Partner, William Blair & Company, L.L.C. Associate, William Blair & Company, L.L.C.; former Partner, Magnetar Capital (2005-2009) | | | | N/A |
| | | | | |
Karl W. Brewer,
1966 | | Senior Vice President | | Since 2000 | | Partner, William Blair & Company, L.L.C. | | | | N/A |
| | | | | |
David C. Fording,
1967 | | Senior Vice President Vice President | | Since 2009 2006-2009 | | Partner, William Blair & Company, L.L.C. Associate, William Blair & Company, L.L.C.; former Portfolio Manager, TIAA-CREF. | | | | N/A |
| | | | | |
James S. Golan,
1961 | | Senior Vice President | | Since 2005 | | Partner, William Blair & Company, L.L.C. | | | | N/A |
| | | | | |
W. George Greig,
1952 | | Senior Vice President | | Since 1996 | | Partner, William Blair & Company, L.L.C. | | | | N/A |
| | | | | |
Michael A. Jancosek,
1959 | | Senior Vice President | | Since 2004 | | Partner, William Blair & Company L.L.C. | | | | N/A |
| | | | | |
John F. Jostrand,
1954 | | Senior Vice President | | Since 1999 | | Partner, William Blair & Company, L.L.C. | | | | N/A |
| | | | | |
Chad M. Kilmer,
1975 | | Senior Vice President Vice President | | Since 2011 2006-2011 | | Partner, William Blair & Company, L.L.C. Associate, William Blair & Company, L.L.C.; former analyst and Portfolio Manager U.S. Bancorp Asset Management. | | | | N/A |
| | | | | |
Robert C. Lanphier, IV,
1956 | | Senior Vice President | | Since 2003 | | Partner, William Blair & Company, L.L.C. | | | | Chairman, AG. Med, Inc. |
| | | | | |
Mark T. Leslie,
1967 | | Senior Vice President Vice President | | Since 2008 2005-2008 | | Partner, William Blair & Company, L.L.C. Associate, William Blair & Company, L.L.C. | | | | N/A |
| | | | | |
Matthew A. Litfin,
1972 | | Senior Vice President | | Since 2008 | | Partner, William Blair & Company, L.L.C. | | | | N/A |
| | | | | |
Kenneth J. McAtamney
1966 | | Senior Vice President | | Since 2008 | | Partner, William Blair & Company, L.L.C. | | | | N/A |
December 31, 2012 | William Blair Funds 85 |
| | | | | | | | |
Name and Year of Birth | | Position(s) Held with Fund | | Term of
Office and
Length of Time
Served(1) | | Principal Occupation(s) During Past 5 Years(2) | | Other Directorships Held by Trustee/Officer |
Todd M. McClone,
1968 | | Senior Vice President Vice President | | Since 2006 2005-2006 | | Partner, William Blair & Company, L.L.C. Associate, William Blair & Company, L.L.C. | | N/A N/A |
| | | | |
David Merjan,
1960 | | Senior Vice President | | Since 2008 | | Partner, William Blair & Company, L.L.C. | | N/A |
| | | | |
David S. Mitchell,
1960 | | Senior Vice President | | Since 2004 | | Partner, William Blair & Company, L.L.C. | | N/A |
| | | | |
David P. Ricci,
1958 | | Senior Vice President | | Since 2006 | | Partner, William Blair & Company, L.L.C. | | N/A |
| | | | |
Brian D. Singer,
1960 | | Senior Vice President Vice President | | Since 2012 2011-2012 | | Partner, William Blair & Company, L.L.C. Associate, William Blair & Company, L.L.C. (since 2011); prior thereto, Managing Partner, Singer Partners, LLC (2009-2011); prior thereto, UBS Global Asset Management (Americas) Inc. (2003-2007) | | N/A |
| | | | |
Paul J. Sularz,
1967 | | Senior Vice President Vice President | | Since 2012 2009-2012 | | Partner, William Blair & Company, L.L.C. Associate, William Blair & Company, L.L.C.; Vice President, J.P. Morgan Securities, Inc. | | N/A |
| | | | |
Jeffrey A. Urbina,
1955 | | Senior Vice President | | Since 1998 | | Partner, William Blair & Company, L.L.C. | | N/A |
| | | | |
Christopher T. Vincent,
1956 | | Senior Vice President | | Since 2004 | | Partner, William Blair & Company, L.L.C. | | N/A |
| | | | |
Kathleen M. Lynch,
1971 | | Vice President | | Since 2010 | | Associate, William Blair & Company, L.L.C. | | N/A |
| | | | |
David F. Hone,
1967 | | Vice President | | Since 2011 | | Associate, William Blair & Company, L.L.C. (since 2011); prior thereto, Portfolio Manager Large Cap Value, Deutsche Asset Management (2002-2010) | | N/A |
| | | | |
John Abunassar,
1967 | | Vice President | | Since 2011 | | Associate, William Blair & Company, L.L.C. (since 2011); prior thereto, Principal, Guidance Capital LLC (2009-2011); prior thereto, President and CEO of Allegiant Asset Management (2004-2009) | | N/A |
| | | | |
Peter Carl,
1967 | | Vice President | | Since 2011 | | Associate, William Blair & Company L.L.C. (since 2011); prior thereto, Portfolio Manager, Guidance Capital LLC (2006-2011) | | N/A |
| | | | |
D. Trowbridge Elliman III, 1957 | | Vice President | | Since 2011 | | Associate, William Blair & Company L.L.C. (since 2011); prior thereto, Principal, Guidance Capital LLC (2001-2011) | | N/A |
86 Annual Report | December 31, 2012 |
| | | | | | | | |
Name and Year of Birth | | Position(s) Held with Fund | | Term of
Office and
Length of Time
Served(1) | | Principal Occupation(s) During Past 5 Years(2) | | Other Directorships Held by Trustee/Officer |
Christopher Walvoord,
1966 | | Vice President | | Since 2011 | | Associate, William Blair & Company, L.L.C. (since 2011); prior thereto, Principal, Guidance Capital LLC (2002-2011) | | N/A |
| | | | |
Brian Ziv,
1957 | | Vice President | | Since 2011 | | Associate, William Blair & Company, L.L.C. (since 2011); prior thereto, Principal, Guidance Capital LLC (2001-2011) | | N/A |
| | | | |
Edwin Denson,
1967 | | Vice President | | Since 2011 | | Associate, William Blair & Company, L.L.C. (since 2011); prior thereto, Managing Partner, Singer Partners, LLC (2009-2011); prior thereto, UBS Global Asset Management (Americas) Inc. (2001-2009) | | N/A |
| | | | |
Thomas Clarke,
1968 | | Vice President | | Since 2011 | | Associate, William Blair & Company, L.L.C. (since 2011); prior thereto, Managing Partner, Singer Partners, LLC (2009-2011); prior thereto, UBS Global Asset Management (Americas) Inc. (2000-2009) | | N/A |
| | | | |
Walter R. Randall, Jr.,
1960 | | Chief Compliance Officer and Assistant Secretary | | Since 2009 | | Associate, William Blair & Company, L.L.C. (since 2008); prior thereto, Associate Counsel and Chief Compliance Officer, Calamos Investments (2006-2008) | | N/A |
| | | | |
Colette M. Garavalia,
1961 | | Treasurer | | Since 2009 | | Associate, William Blair & Company, L.L.C. | | N/A |
| | | | |
| | Secretary | | 2000-2009 | | Associate, William Blair & Company, L.L.C. | | N/A |
| | | | |
Andrew T. Pfau,
1970 | | Secretary | | Since 2009 | | Associate, William Blair & Company, L.L.C. (since 2008); prior thereto, Associate, Bell, Boyd & Lloyd, LLP (2006-2008) | | N/A |
| | | | |
John M. Raczek,
1970 | | Assistant Treasurer | | Since 2010 | | Associate, William Blair & Company, L.L.C. (since 2009); prior thereto, Manager, Calamos Investments (2003-2009) | | N/A |
| * | | Ms. Seitz and Mr. Smirl are interested persons of the William Blair Funds because each is a partner of William Blair & Company, L.L.C., the Fund’s investment advisor, principal underwriter and distributor. |
| (1) | | Each Trustee serves until the election and qualification of a successor, or until death, resignation or retirement or removal as provided in the Fund’s Declaration of Trust. Retirement for non-interested Trustees occurs no later than at the conclusion of the first regularly scheduled Board meeting of the Fund’s fiscal year that occurs after the earlier of (a) the non-interested Trustee’s 72nd birthday or (b) the 15th anniversary of the date that the non-interested Trustee was first elected or appointed as a member of the Board of Trustees. The Fund’s officers, except the Chief Compliance Officer, are elected annually by the Trustees. The Fund’s Chief Compliance Officer is designated by the Board of Trustees and may only be removed by action of the Board of Trustees, including a majority of the non-interested Trustees. |
| (2) | | In November 2008, all partners of William Blair & Company, L.L.C. also became limited partners in WBC Holdings, L.P. |
The Statement of Additional Information for the William Blair Funds includes additional information about the trustees and is available without charge by calling 1-800-635-2886 (in Massachusetts 1-800-635-2840) or by writing the Fund.
December 31, 2012 | William Blair Funds 87 |
Approval of the Management Agreement for the William Blair International Leaders Fund
On April 24, 2012 and August 3, 2012, the Board of Trustees (the “Board”) of William Blair Funds (the “Trust”), including the Trustees who are not interested persons of the Trust as defined by the Investment Company Act of 1940, as amended (the “Independent Trustees”), approved the Management Agreement between the Trust, on behalf of the William Blair International Leaders Fund (the “Fund”), and William Blair & Company, L.L.C. (the “Advisor”). On April 23 and 24, 2012 and August 3, 2012, the Board met to consider the approval of the Management Agreement. On April 23 and 24, 2012 and August 2, 2012, the Independent Trustees also met independently of Trust management and the interested Trustees of the Trust to consider the approval of the Management Agreement. The Independent Trustees reviewed materials provided by the Advisor for the approval of the Management Agreement and were assisted by independent legal counsel in making their determination. The Board considered the following factors in making its determination, but did not identify any single factor or group of factors as all important or controlling and considered all factors together.
Nature, Quality and Extent of Services. In evaluating the nature, quality and extent of services expected to be provided by the Advisor to the Fund, the Board noted that the Advisor is a quality firm with a reputation for integrity and honesty that employs high quality people. The Board considered biographical information about the Fund’s portfolio managers, financial information regarding the Advisor, the compliance regime created by the Advisor and the proposed financial support of the Fund. The Board considered that the proposed portfolio management team currently co-manages the William Blair Global Growth Fund and that a member of the portfolio management team currently manages the William Blair International Growth Fund and the William Blair Institutional International Growth Fund. The Board also considered the Advisor’s experience in managing new funds. Based upon all relevant factors, the Board concluded that the nature, quality and extent of the services to be provided by the Advisor to the Fund were expected to be satisfactory.
Fees and Expenses. The Board reviewed the proposed advisory fee for the Fund and reviewed information comparing the advisory fee to a peer group of funds provided by Lipper Inc. The Lipper peer group for the Fund consisted of other no-load international large-cap growth funds. In considering the information, the Board noted that the proposed advisory fee for the Fund was slightly above the median of the Lipper peer group. The Board also considered that the Advisor had proposed to limit total operating expenses, including waiving advisory fees, if necessary, for each share class of the Fund until April 30, 2014. On the basis of the information provided, the Board concluded that the proposed advisory fee was reasonable in light of the nature, quality and extent of services expected to be provided by the Advisor.
Profitability. With respect to the estimated profitability of the Management Agreement to the Advisor, the Board considered the proposed advisory fee, that the Fund was newly organized and had no assets and the Advisor’s agreement to limit total expenses until April 30, 2014. The Board concluded that the expected profits to be realized by the Advisor were not expected to be unreasonable.
Economies of Scale. The Board considered the extent to which economies of scale would be realized as the Fund grows and whether fee levels reflect these economies of scale. In considering whether fee levels reflect economies of scale for the benefit of Fund investors, the Board reviewed the Fund’s advisory fee compared to peer funds and the Fund’s estimated expense ratios giving effect to the Advisor’s agreement to limit total expenses until April 30, 2014, and concluded that the advisory fee was reasonable.
Other Benefits to the Advisor. The Board considered benefits to be derived by the Advisor from its relationship with the Fund. The Board concluded that, after taking into account these benefits, the proposed advisory fee was reasonable.
Conclusion. Based upon all of the information considered and the conclusions reached, the Board determined that the terms of the Management Agreement are fair and reasonable and that the approval of the Management Agreement is in the best interests of the Fund.
88 Annual Report | December 31, 2012 |
(unaudited)
Proxy Voting
A description of the policies and procedures that the Funds use to determine how to vote proxies relating to portfolio securities and information regarding how the Funds voted proxies relating to portfolio securities for the most recent 12-month period ended December 31 are available without charge, upon request, by calling 1-800-635-2886 (in Massachusetts 1-800-635-2840), at www.williamblairfunds.com and on the SEC’s website at http://www.sec.gov.
Shareholder Meeting Results
A Special Meeting of Shareholders (the “Meeting”) of William Blair Funds (the “Trust”) was held on August 2, 2012 in the 2nd Floor Conference Room at 222 West Adams Street, Chicago, Illinois 60606. At the Meeting, the following matter was voted upon by shareholders (the resulting votes are presented below).
| 1. | Election of Trustees to the Board of Trustees of the Trust. (“Number of Votes” represents all series of the Trust.) |
| | | | |
| | | Number of Votes: |
Trustee | | For | | Withhold |
Vann A. Avedisian | | 1,644,687,158.154 | | 12,090,164.011 |
Phillip O. Peterson | | 1,644,159,693.572 | | 12,617,628.593 |
Lisa A. Pollina* | | 1,644,478,204.339 | | 12,299,117.826 |
Donald J. Reaves | | 1,642,694,755.277 | | 14,082,566.888 |
Donald L. Seeley | | 1,644,312,102.168 | | 12,465,219.997 |
Michelle R. Seitz | | 1,640,209,136.710 | | 16,568,185.455 |
Thomas J. Skelly | | 1,643,851,882.961 | | 12,925,439.204 |
Richard W. Smirl | | 1,640,721,918.768 | | 16,055,403.397 |
| * | | Ms. Pollina resigned from the Board of Trustees on October 23, 2012. |
Quarterly Portfolio Schedules
Each Portfolio files its complete schedule of portfolio holdings with the SEC for the first and third fiscal quarters of each fiscal year (quarters ended March 31 and September 30) on Form N-Q. The Fund’s Forms N-Q are available on the SEC’s website at http://www.sec.gov and may be reviewed and copied at the SEC’s Public Reference Room in Washington, D.C. Information on the operation of the SEC’s Public Reference Room may be obtained by calling 1-800-SEC-0330. The Fund’s Forms N-Q are also available on the Fund’s website at www.williamblairfunds.com.
Additional Federal Income Tax Information: (unaudited)
Under Section 852(b)(3)(C) of the Code, the Funds hereby designate the following amounts as capital gain dividends for the fiscal year ended December 31, 2012:
The following table provides the percentage of the 2012 year-end distributions that qualify for the dividend received deduction, and the qualified dividend income percentage:
| | | | | | | | |
Fund | | Dividend
Received
Deduction% | | | Qualified
Dividend
Income% | |
Institutional International Growth | | | 0.00 | % | | | 65.16 | % |
Institutional International Equity | | | 0.00 | % | | | 100.00 | % |
International Leaders | | | 0.42 | % | | | 92.76 | % |
International Small Cap Growth | | | 0.00 | % | | | 78.98 | % |
Emerging Markets Growth | | | 0.27 | % | | | 100.00 | % |
Emerging Markets Leaders | | | 0.00 | % | | | 100.00 | % |
Bond | | | 0.00 | % | | | 0.00 | % |
Low Duration . . . . . . . . . . . . . . . . . . | | | 0.00 | % | | | 0.00 | % |
In January 2013, you were notified on IRS Form 1099-Div or substitute 1099 DIV as to the Federal tax status of the distributions received by you in the calendar year 2012.
December 31, 2012 | William Blair Funds 89 |
Useful Information About Your Report (unaudited)
Please refer to this information when reviewing the Expense Example for each Portfolio.
Expense Example
As a shareholder of a Fund, you incur ongoing costs, including management fees and other Portfolio expenses. The example is intended to help you understand your ongoing costs (in dollars) of investing in the Portfolio and to compare these costs with the ongoing costs of investing in other mutual funds. To do so, compare the Fund’s 5% hypothetical example with the 5% hypothetical examples that appear in the shareholder reports of other funds. The example is based on an investment of $1,000 invested at the beginning of the period and held for the entire six-month period from January 1, 2012 to June 30, 2012.
Actual Expenses
In each example, the first line for each share class in the table provides information about the actual account values and actual expenses. These expenses reflect the effect of any expense cap applicable to the share class during the period. Without this expense cap, the costs shown in the table would have been higher. You may use the information in this line, together with the amount you invested, to estimate the expenses that you paid over the period. Simply divide your account value by $1,000 (example, an $8,600 account value divided by $1,000 = 8.6), then multiply the result by the number in the first line under the heading entitled “Expenses Paid During the Period” to estimate the expenses you paid on your account during the period.
Hypothetical Example for Comparison Purposes
In each example, the second line for each share class in the table provides information about hypothetical account values and hypothetical expenses based on the Portfolio’s actual expense ratio and an assumed rate of return of 5% per year before expenses. This is not the Portfolio’s actual return. The hypothetical account values and expenses may not be used to estimate the actual ending account balance or expenses you paid for the period. You may use this information to compare the ongoing costs of investing in the to other funds. To do so, compare this 5% hypothetical example with the 5% hypothetical examples that appear in the shareholder reports of other funds.
Please note that the expenses shown in both examples are meant to highlight your ongoing costs only and do not reflect any transactional costs or account type fees. These fees are fully described in the prospectus. Therefore, the second line of each share class in the table is useful in comparing ongoing costs only and will not help you determine the relative costs of owning different funds.
90 Annual Report | December 31, 2012 |
Fund Expenses (Unaudited)
The example below shows you the ongoing costs (in dollars) of investing in your fund and allows you to compare these costs with those of other mutual funds. Please refer to Page 89 for a detailed explanation of the information presented in these charts.
| | | | | | | | | | | | | | | | |
Expense Example | | Beginning
Account Value
7/1/2012 | | | Ending
Account Value
12/31/2012 | | | Expenses Paid
During the
Period(a) | | | Annualized
Expense Ratio | |
Global Leaders Fund | | | | | | | | | | | | | | | | |
Institutional Class—actual return (b) | | $ | 1,000.00 | | | $ | 990.60 | | | $ | 5.50 | | | | 1.10 | % |
Institutional Class—hypothetical 5% return (6 month period) | | | 1,000.00 | | | | 1,019.61 | | | | 5.58 | | | | 1.10 | |
Institutional International Growth Fund | | | | | | | | | | | | | | | | |
Institutional Class—actual return | | | 1,000.00 | | | | 1,149.23 | | | | 5.37 | | | | 0.99 | |
Institutional Class—hypothetical 5% return | | | 1,000.00 | | | | 1,020.14 | | | | 5.05 | | | | 0.99 | |
Institutional International Equity Fund | | | | | | | | | | | | | | | | |
Class I—actual return | | | 1,000.00 | | | | 1,127.14 | | | | 5.88 | | | | 1.10 | |
Institutional Class—hypothetical 5% return | | | 1,000.00 | | | | 1,019.61 | | | | 5.58 | | | | 1.10 | |
International Leaders Fund | | | | | | | | | | | | | | | | |
Class I—actual return (c) | | | 1,000.00 | | | | 1,056.70 | | | | 5.43 | | | | 1.05 | |
Institutional Class—hypothetical 5% return (6 month period) | | | 1,000.00 | | | | 1,019.86 | | | | 5.33 | | | | 1.05 | |
International Small Cap Growth Fund | | | | | | | | | | | | | | | | |
Institutional Class—actual return | | | 1,000.00 | | | | 1,140.31 | | | | 5.78 | | | | 1.08 | |
Institutional Class—hypothetical 5% return | | | 1,000.00 | | | | 1,019.73 | | | | 5.46 | | | | 1.08 | |
Emerging Markets Growth Fund | | | | | | | | | | | | | | | | |
Institutional Class—actual return | | | 1,000.00 | | | | 1,129.97 | | | | 6.48 | | | | 1.21 | |
Institutional Class—hypothetical 5% return | | | 1,000.00 | | | | 1,019.05 | | | | 6.14 | | | | 1.21 | |
Emerging Markets Leaders Fund | | | | | | | | | | | | | | | | |
Institutional Class—actual return | | | 1,000.00 | | | | 1,129.96 | | | | 6.69 | | | | 1.25 | |
Institutional Class—hypothetical 5% return | | | 1,000.00 | | | | 1,018.85 | | | | 6.34 | | | | 1.25 | |
Emerging Markets Small Cap Growth Fund | | | | | | | | | | | | | | | | |
Institutional Class—actual return (d) | | | 1,000.00 | | | | 1,016.40 | | | | 6.34 | | | | 1.25 | |
Institutional Class—hypothetical 5% return (6 month period) | | | 1,000.00 | | | | 1,018.85 | | | | 6.34 | | | | 1.25 | |
Bond Fund | | | | | | | | | | | | | | | | |
Institutional Class—actual return | | | 1,000.00 | | | | 1,044.23 | | | | 1.80 | | | | 0.35 | |
Institutional Class—hypothetical 5% return | | | 1,000.00 | | | | 1,023.38 | | | | 1.78 | | | | 0.35 | |
Low Duration Fund | | | | | | | | | | | | | | | | |
Institutional Class—actual return | | | 1,000.00 | | | | 1,000.00 | | | | 2.01 | | | | 0.40 | |
Institutional Class—hypothetical 5% return | | | 1,000.00 | | | | 1,023.13 | | | | 2.03 | | | | 0.40 | |
| (a) | | Expenses are equal to the annualized expense ratio, multiplied by the average account value over the period, multiplied by the number of days in the period 184, and divided by 366 (to reflect the one-half year period). |
| (b) | | For the period December 18, 2012 (Commencement of Operations) to December 31, 2012. |
| (c) | | For the period November 2, 2012 (Commencement of Operations) to December 31, 2012. |
| (d) | | For the period December 20, 2012 (Commencement of Operations) to December 31, 2012. |
December 31, 2012 | William Blair Funds 91 |
BOARD OF TRUSTEES
Vann A. Avedisian
Principal, Highgate Holdings
Phillip O. Peterson
Retired Partner, KPMG LLP
Donald J. Reaves
Chancellor, Winston-Salem State University
Donald L. Seeley
Retired Adjunct Lecturer and Director, University of Arizona Department of Finance
Michelle R. Seitz, Chairman and President
Partner, William Blair & Company, L.L.C.,
Thomas J. Skelly
Retired Managing Partner, Accenture U.S.
Richard W. Smirl, Senior Vice President
Partner, William Blair & Company L.L.C.
Officers
Michael P. Balkin, Senior Vice President
Karl W. Brewer, Senior Vice President
David C. Fording, Senior Vice President
James S. Golan, Senior Vice President
W. George Greig, Senior Vice President
Michael A. Jancosek, Senior Vice President
John F. Jostrand, Senior Vice President
Chad M. Kilmer, Senior Vice President
Robert C. Lanphier, IV, Senior Vice President
Mark T. Leslie, Senior Vice President
Matthew A. Litfin, Senior Vice President
Kenneth J. McAtamney, Senior Vice President
Todd M. McClone, Senior Vice President
David Merjan, Senior Vice President
David S. Mitchell, Senior Vice President
David P. Ricci, Senior Vice President
Brian D. Singer, Senior Vice President
Paul J. Sularz, Senior Vice President
Jeffrey A. Urbina, Senior Vice President
Christopher T. Vincent, Senior Vice President
Kathleen M. Lynch, Vice President
David F. Hone, Vice President
John Abunassar, Vice President
Peter Carl, Vice President
D. Trowbridge Elliman III, Vice President
Christopher Walvoord, Vice President
Brian Ziv, Vice President
Edwin Denson, Vice President
Thomas Clarke, Vice President
Walter R. Randall, Jr., Chief Compliance Officer and Assistant Secretary
Colette M. Garavalia, Treasurer
Andrew T. Pfau, Secretary
John M. Raczek, Assistant Treasurer
Investment Advisor
William Blair & Company, L.L.C.
Independent Registered Public Accounting Firm
Ernst & Young LLP
Legal Counsel
Vedder Price P.C.
Transfer Agent
Boston Financial Data Services, Inc.
P.O. Box 8506
Boston, MA 02266-8506
For customer assistance, call 1-800-635-2886
(Massachusetts 1-800-635-2840)
92 Annual Report | December 31, 2012 |
William Blair Funds
| | |
GLOBAL EQUITY | | FIXED-INCOME |
Global Leaders Fund - Institutional Class Shares | | Bond Fund - Institutional Class Shares |
INTERNATIONAL EQUITY | | Low Duration Fund - Institutional Class Shares |
Institutional International Growth Fund | | |
Institutional International Equity Fund | | |
International Leaders Fund - Institutional Class Shares | | |
International Small Cap Growth Fund - Institutional Class Shares | | |
Emerging Markets Growth Fund - Institutional Class Shares | | |
Emerging Markets Leaders Fund - Institutional Class Shares | | |
Emerging Markets Small Cap Growth Fund - Institutional Class Shares | | |
| | | | | | |
| | | | ©William Blair & Company, L.L.C., distributor | | |
 | | +1 800 742 7272 williamblairfunds.com | | 222 West Adams Street Chicago, Illinois 60606 | | 00093591 |
As of the end of the period covered by this Form N-CSR, the Registrant has adopted a code of ethics that applies to its principal executive officer and principal financial officer. Such code of ethics is posted on the Registrant’s website: www.williamblairfunds.com. There were no amendments to or waivers of the code of ethics during the period covered by this report.
| Item 3. | Audit Committee Financial Expert |
The Registrant’s Board of Trustees has determined that the Registrant has at least one “audit committee financial expert” (as defined in Item 3 of Form N-CSR) serving on its Audit Committee. Mr. Phillip O. Peterson, the Registrant’s audit committee financial expert, is “independent” for purposes of Item 3 to Form N-CSR.
An “audit committee financial expert” is not an “expert” for any purpose, including for purposes of Section 11 of the Securities Act of 1933, as a result of being designated as an “audit committee financial expert.” Further, the designation of a person as an “audit committee financial expert” does not mean that the person has any greater duties, obligations, or liability than those imposed on the person without the “audit committee financial expert” designation. Similarly, the designation of a person as an “audit committee financial expert” does not affect the duties, obligations, or liability of any other member of the audit committee or Board of Trustees.
| Item 4. | Principal Accountant Fees and Services |
Audit Fees
For the fiscal years ended December 31, 2011 and 2012, Ernst & Young, LLP, the Registrant’s principal accountant (“E&Y”), billed the Registrant $559,500 and $693,000, respectively, for professional services rendered for the audit of the Registrant’s annual financial statements or services that are normally provided in connection with statutory and regulatory filings.
Audit-Related Fees
For the fiscal years ended December 31, 2011 and 2012, E&Y billed the Registrant $8,000 and $30,000, respectively, for assurance and related services that are reasonably related to the performance of the audit of the Registrant’s financial statements and that are not reported above, such as reviewing prospectuses and SEC filings. For the fiscal years ended December 31, 2011 and 2012, E&Y provided no audit-related services to William Blair & Company L.L.C., the Registrant’s investment advisor (“William Blair”) or any of its control affiliates that were for engagements directly related to the Registrant’s operations and financial reporting.
Tax Fees
For the fiscal years ended December 31, 2011 and 2012, E&Y billed the Registrant $138,500 and $176,400, respectively, for professional services rendered for tax compliance, tax advice and tax planning. Such services consisted of preparation of tax returns, year-end distribution review, qualifying dividend income analysis and computation of foreign tax credit pass-through. For the fiscal years ended December 31, 2011 and 2012, E&Y did not bill William Blair and its control affiliates for any services that were for engagements directly related to the Registrant’s operations and financial reporting.
All Other Fees
For the fiscal years ended December 31, 2011 and 2012, E&Y did not bill the Registrant for products and services other than the services reported above. For the fiscal years ended December 31, 2011 and 2012, E&Y provided no other services to William Blair or any of its control affiliates that were for engagements directly related to the Registrant’s operations and financial reporting.
Audit Committee Pre-Approval Policies and Procedures
Pursuant to Registrant’s Audit Committee Charter (the “Charter”), the Audit Committee is responsible for pre-approving any engagement of the principal accountant to provide non-prohibited services to the Registrant, including the fees and other compensation to be paid to the principal accountant, to the extent required by Rule 2-01(c)(7) of Regulation S-X. Pursuant to the Charter, the Audit Committee is also responsible for pre-approving any engagement of the principal accountant, including the fees and other compensation to be paid to the principal accountant, to provide non-audit services to the Registrant’s investment advisor (or any entity controlling, controlled by, or under common control with the adviser that provides ongoing services to the Registrant), if the engagement relates directly to the operations and financial reporting of the Registrant, to the extent required by Rule 2-01(c)(7) of Regulation S-X. The Chair of the Audit Committee may grant the pre-approval referenced above for non-prohibited and non-audit services. All such delegated pre-approvals will be presented to the Audit Committee no later than the next Audit Committee meeting.
Non-Audit Fees
For the fiscal years ended December 31, 2011 and 2012, E&Y billed the Registrant $138,500 and $176,400, respectively, in non-audit fees (tax services). For the same periods, E&Y billed William Blair and its control affiliates $119,000 and $115,000 (Custodian SSAE 16 Report), respectively, in non-audit fees. The Registrant’s Audit Committee has considered whether the provision of non-audit services that were rendered to William Blair or any of its control affiliates that were not pre-approved pursuant to Rule 2-01(c)(7)(ii) of Regulation S-X is compatible with maintaining E&Y’s independence.
| Item 5. | Audit Committee of Listed Registrants |
Not Applicable to this Registrant, insofar as the Registrant is not a listed company.
| Item 6. | Schedule of Investments |
See Schedule of Investments in Item 1
| Item 7. | Disclosure of Proxy Voting Policies and Procedures for Closed-End Management Investment Companies |
Not applicable to this Registrant, insofar as the Registrant is not a closed-end management investment company.
| Item 8. | Portfolio Managers of Closed Investment Companies |
Not applicable to this Registrant, insofar as the Registrant is not a closed-end management investment company.
| Item 9. | Purchase of Equity Securities by Closed-End Management Investment Companies and Affiliated Purchasers |
Not applicable to this Registrant, insofar as the Registrant is not a closed-end management investment company.
| Item 10. | Submission of Matters to a Vote of Security Holders |
There have been no material changes to the procedures by which shareholders may recommend nominees to the Registrant’s Board of Trustees since the Registrant last provided disclosure in response to this item.
Controls and Procedures
(a) The Registrant’s principal executive and principal financial officer, or persons performing similar functions, have concluded that the Registrant’s Disclosure Controls and Procedures (as defined in Rule 30a-3(c) under the Investment Company Act of 1940, as amended (the “1940 Act”) (17 CFR 270.30a-3(c)) are effective, as of a date within 90 days of the filing date of this report that includes the disclosure required by this paragraph, based on their evaluation of these controls and procedures required by Rule 30a-3 (b) under the 1940 Act (17 CFR 270.30a-3(b) and Rules 13a-15(b) or 15d-15(b) under the Exchange Act (17 CFR 240.13a-15(b) or 240.15d-15(b)).
(b) There were no changes in the Registrant’s internal control over financial reporting (as defined in Rule 30a-3(d) under the 1940 Act (17 CFR 270.30a-3(d)) that occurred during the final quarter of the period covered by this report that has materially affected, or is reasonably likely to materially affect, the Registrant’s internal control over financial reporting.
12. (a) (1) Code of Ethics
Not applicable because it is posted on Registrant’s website.
12. (a) (2) (1)
Certification of Principal Executive Officer Required by Rule 30a-2(a) of the Investment Company Act
12. (a) (2) (2)
Certification of Principal Financial Officer Required by Rule 30a-2(a) of the Investment Company Act.
12. (a) (3)
Not applicable to this Registrant.
12. (b)
Certification of Chief Executive Officer and Certification of Chief Financial Officer Required by Rule 30a-2(b) of the Investment Company Act
Signatures
Pursuant to the requirements of the Securities Exchange Act of 1934 and the Investment Company Act of 1940, the Registrant has duly caused this report to be signed on its behalf by the undersigned, thereunto duly authorized.
| | |
| | | William Blair Funds |
| |
| | | /s/ Michelle R. Seitz |
| By: | | Michelle R. Seitz |
| | | President (Chief Executive Officer) |
Date: April 22, 2013
Pursuant to the requirements of the Securities Exchange Act of 1934 and the Investment Company Act of 1940, this report has been signed below by the following persons on behalf of the Registrant and in the capacities and on the dates indicated
| | |
| By: | | Michelle R. Seitz |
| | | President (Chief Executive Officer) |
Date: April 22, 2013
| | |
| By: | | Colette M. Garavalia |
| | | Treasurer (Chief Financial Officer) |
Date: April 22, 2013