UNITED STATES
SECURITIES AND EXCHANGE COMMISSION
Washington, D.C. 20549
Form N-CSR
CERTIFIED SHAREHOLDER REPORT OF REGISTERED
MANAGEMENT INVESTMENT COMPANIES
Investment Company Act File Number 811-5344
William Blair Funds
(Exact name of registrant as specified in charter)
| | |
| 222 West Adams Street, Chicago, IL | | 60606 |
| (Address of principal executive offices) | | (Zip Code) |
Michelle R. Seitz
William Blair Funds
222 West Adams Street, Chicago, IL 60606
(Name and address of agent for service)
Registrant’s telephone number, including area code: 312-236-1600
Date of fiscal year end: October 31
Date of reporting period: October 31, 2012
Form N-CSR is to be used by management investment companies to file reports with the Commission not later than 10 days after the transmission to stockholders of any report that is required to be transmitted to stockholders under Rule 30e-1 under the Investment Company Act of 1940 (17 CFR 270.30e-1). The Commission may use the information provided on Form N-CSR in its regulatory, disclosure review, inspection, and policymaking roles.
A registrant is required to disclose the information specified by Form N-CSR, and the Commission will make this information public. A Registrant is not required to respond to the collection of information contained in Form N-CSR unless the form displays a currently valid Office of Management and Budget (“OMB”) control number. Please direct comments concerning the accuracy of the information collection burden estimates and any suggestions for reducing the burden to Secretary, Securities and Exchange Commission, 450 Fifth Street, NW, Washington, DC 20549-0609. The OMB has reviewed this collection of information under the clearance requirements of 44 U.S.C. (ss) 3507.
| Item 1. | December 20, 2012 Annual Reports transmitted to shareholders. |

William Blair Funds
Annual Report
October 31, 2012
Multi-Asset and Alternatives Funds
Table of Contents
October 31, 2012 | William Blair Funds 1 |

Brian D. Singer

Edwin Denson

Thomas Clarke
MACRO ALLOCATION FUND
AN OVERVIEW FROM THE PORTFOLIO MANAGERS
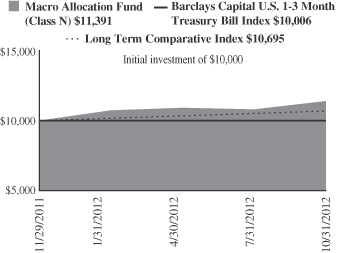
The Macro Allocation Fund (Class N shares) returned 13.61%, net of fees, for the period from November 29, 2011 (commencement of operations) to October 31, 2012, outperforming the Barclays Capital U.S. 1-3 Month Treasury Bill Index and its Long-Term Comparative Index, which returned 0.06% and 6.95%, respectively, for the same period. The Long-Term Comparative Index return is comprised of the following indices: 40% Barclays Capital U.S. Aggregate Index, 30% MSCI All Country World Index (net), and 30% Bank of America/Merrill Lynch 3-month US Treasury Bill Index.
The Fund benefited from positive contributions from both its market-oriented strategies and its currency-oriented strategies during this time period. Market performance benefited from an aggregate long exposure to equities, particularly within Europe and the U.S., as well as from long exposures to both U.S. high yield and investment grade credit. Market performance suffered due to short exposures to safe-haven sovereign bond markets such as Germany, Japan, Switzerland, and the U.S. Currency performance benefited from short exposures to the Euro and Japanese yen, as well as from an aggregate long exposure to emerging markets currencies, particularly within Asia. Currency performance was hurt by short exposures to the Australian dollar and the New Zealand dollar.
Long exposure to Financials, particularly within Europe, was the best performing sector exposure. Two other positively performing sectors for the Fund during this time period resulted from short exposures to both U.S. Utilities and U.S. Telecoms.
As the Fund’s long exposure to Financials was a prevalent theme in the Fund during this time period, the Fund’s investment in emerging market currencies was a large positive contributor. Further, the Fund’s broad exposure to the equity markets with long positions in Europe and emerging markets, as well as a general long position in U.S. credit, helped generate positive performance during this time period.
Long exposure to the global energy sector was the weakest performing sector exposure.
The Fund remains positioned consistent with an elevated level of long-term opportunity, with an anticipation of further clarity emanating within Europe, and also with an eye toward the end of 2012 where the focus will likely shift from Europe back to the U.S. and the fiscal cliff, post-elections. Long equity exposure is tilted toward Europe and the emerging markets. Call options on U.S. bonds (as well as on German bunds) are designed to limit the downside from the Fund’s otherwise short exposure to these markets in case yields fall further. Also, short exposure to the high dividend segment of the U.S. equity market is an attempt to hedge the potentially volatile and asymmetric risk around an expected increase in dividend tax rates. The Fund’s equity positioning during the past couple of months, in addition to its various currency positions, have added value.
Finally, the Fund’s current aggregate currency positioning remains likely to hold up relatively well during expected bouts of increased risk aversion. Short exposures to the Euro, Japanese yen, Swiss franc, and Australian dollar/New Zealand dollar are currently offset by long exposures to emerging markets and other Asian currencies.
2 Annual Report | October 31, 2012 |
Macro Allocation Fund
Performance Highlights (Unaudited)
Average Annual Total Return at 10/31/2012
| | | | |
| | | Since
Inception(a) | |
Class N | | | 13.61 | % |
Class I | | | 13.91 | |
Barclays Capital U.S. 1-3 Month Treasury Bill Index | | | 0.06 | |
Long-Term Comparative Index | | | 6.95 | |
| | (a) | | For the period from November 29, 2011 (Commencement of Operations) to October 31, 2012. | |
Performance cited represents past performance. Past performance does not guarantee future results and current performance may be lower or higher than the data quoted. Results shown are average annual total returns, which assume reinvestment of dividends and capital gains. Investment returns and principal will fluctuate and you may have a gain or loss when you sell shares. For the most current month-end performance information, please call 1-800-742-7272, or visit our Web site at www.williamblairfunds.com. The Fund involves a high level of risk and may not be appropriate for everyone. You could lose money by investing in the Fund. There can be no assurance that the Fund’s investment objective will be achieved or that the Fund’s investment strategies will be successful. The Fund is not a complete investment program. From time to time, the investment advisor may waive fees or reimburse expenses for the Fund. Without these waivers, performance would be lower. Class N shares are available to the general public without a sales load. Class I shares are available to certain institutional investors and advisory clients of William Blair & Company, L.L.C., without a sales load or distribution (12b-1) or service fees.
The performance highlights and graph presented above do not reflect the deduction of taxes that a shareholder would pay on fund distributions or the redemption of fund shares.
The Barclays Capital 1-3 Month U.S. Treasury Bill Index includes all publicly issued zero-coupon U.S. Treasury Bills that have a remaining maturity of less than 3 months and more than 1 month, are rated investment grade, and have $250 million or more of outstanding face value. In addition, the securities must be denominated in U.S. dollars and must be fixed rate and non convertible.
The Long-Term Comparative Index return is comprised of the following indices: 40% Barclays Capital U.S. Aggregate Index, 30% MSCI All Country World Index (net), and 30% Bank of America/Merrill Lynch 3-month US Treasury Bill Index.
This report identifies the Fund’s investments on October 31, 2012. These holdings are subject to change. Not all investments in the Fund performed the same, nor is there any guarantee that these investments will perform as well in the future. Market forecasts provided in this report may not necessarily come to pass.
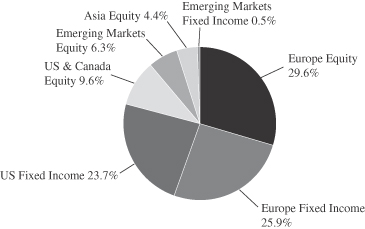
Sector Diversification (Unaudited)
The chart below is a graphical representation of gross portfolio exposure excluding forward foreign currency contracts as of October 31, 2012.
October 31, 2012 | William Blair Funds 3 |
Macro Allocation Fund
Portfolio of Investments, October 31, 2012
| | | | | | | | |
Issuer | | Shares or
Principal
Amount | | | Value | |
| | |
Exchange-Traded Funds—66.3% | | | | | | | | |
Equity Exchange-Traded Funds—36.0% | | | | | | | | |
Guggenheim China Small Cap ETF (a) | | | 15,539 | | | $ | 331,136 | |
Guggenheim Frontier Markets ETF (a) | | | 31,100 | | | | 615,158 | |
iShares FTSE China 25 Index Fund (a) | | | 8,853 | | | | 325,525 | |
iShares MSCI EAFE Value Index (a) | | | 8,500 | | | | 391,850 | |
iShares Russell 1000 Value Index Fund (a) | | | 33,300 | | | | 2,390,940 | |
iShares S&P Global Energy Sector Index Fund | | | 25,100 | | | | 976,892 | |
SPDR S&P 500 ETF Trust | | | 21,878 | | | | 3,088,736 | |
SPDR S&P Emerging Markets Small Cap ETF (a) | | | 38,400 | | | | 1,656,960 | |
Vanguard MSCI Emerging Markets ETF (a) | | | 7,406 | | | | 307,275 | |
Vanguard MSCI European ETF (a) | | | 40,563 | | | | 1,868,332 | |
| | | | | | | | |
| | | | | | | 11,952,804 | |
| | | | | | | | |
Fixed Income Exchange-Traded Funds—30.3% | | | | | |
iShares iBoxx Investment Grade Corporate Bond Fund (a) | | | 37,000 | | | | 4,551,740 | |
SPDR Barclays Capital High Yield Bond ETF | | | 129,200 | | | | 5,210,636 | |
WisdomTree Emerging Markets Local Debt ETF (a) | | | 5,050 | | | | 264,418 | |
| | | | | | | | |
| | | | | | | 10,026,794 | |
| | | | | | | | |
Total Exchange-Traded Funds—66.3%
(cost $21,368,722) | | | | | | | 21,979,598 | |
| | | | | | | | |
| | |
Repurchase Agreement—18.2% | | | | | | | | |
Fixed Income Clearing Corporation, 0.2000% dated 10/31/12, due 11/1/12, repurchase price $6,023,787 collateralized by FNMA, 0.600%, due 8/20/15 | | $ | 6,023,753 | | | | 6,023,753 | |
| | | | | | | | |
Total Repurchase Agreement
(cost $6,023,753) | | | | | | | 6,023,753 | |
| | | | | | | | |
| | |
U.S. Government—10.9% | | | | | | | | |
U.S. Treasury Bill,
0.110%, 11/15/12 (a)(b) | | | 550,000 | | | | 549,977 | |
U.S. Treasury Bill,
0.170%, 4/4/13 (a)(b) | | | 200,000 | | | | 199,847 | |
U.S. Treasury Bill,
0.180%, 5/2/13 (b) | | | 125,000 | | | | 124,888 | |
U.S. Treasury Bill,
0.170%, 5/30/13 (b) | | | 50,000 | | | | 49,951 | |
Issuer | | Shares/
Principal
Amount/
Contracts | | | Value | |
| | |
U.S. Government—(continued) | | | | | | | | |
U.S. Treasury Bill,
0.180%, 6/27/13 (a)(b) | | | 200,000 | | | $ | 199,737 | |
U.S. Treasury Bill,
0.180%, 7/25/13 (a)(b) | | | 350,000 | | | | 349,541 | |
U.S. Treasury Bill,
0.180%, 8/22/13 (a)(b) | | | 100,000 | | | | 99,849 | |
U.S. Treasury Bill,
0.170%, 9/19/13 (a)(b) | | | 1,550,000 | | | | 1,547,758 | |
U.S. Treasury Bill,
0.180%, 10/17/13 | | | 500,000 | | | | 499,135 | |
| | | | | | | | |
Total U.S. Government
(cost $3,620,683) | | | | | | | 3,620,683 | |
| | | | | | | | |
| | |
Purchased Options—0.3% | | | | | | | | |
10 Year U.S. Treasury Note, November 2012, Strike 133.50, CALL | | | 33 | | | | 15,468 | |
Euro STOXX 50 Index, November 2012, Strike €2,400, PUT | | | 429 | | | | 69,506 | |
| | | | | | | | |
Total Purchased Options
(cost $199,912) | | | | | | | 84,974 | |
| | | | | | | | |
Total Investments in Securities—95.7%
(cost $31,213,070) | | | | | | | 31,709,008 | |
| | | | | | | | |
| | |
Securities Sold Short—(5.8)% | | | | | | | | |
Exchange-Traded Funds | | | | | | | | |
iShares Russell 1000 Growth Index Fund | | | (29,700 | ) | | | (1,923,075 | ) |
| | | | | | | | |
Total Securities Sold Short—(5.8)%
(proceeds $1,891,364) | | | | | | | (1,923,075 | ) |
| | | | | | | | |
| | |
Written Options—(0.0)% | | | | | | | | |
DAX (German Stock Index), December 2013, Strike €4,000, PUT | | | (40 | ) | | | (10,447 | ) |
| | | | | | | | |
Total Written Options—(0.0)%
(premiums received $33,938) | | | | (10,447 | ) |
Cash and other assets, less liabilities—10.1% | | | | 3,364,281 | |
| | | | | | | | |
Net assets—100.0% | | | $ | 33,139,767 | |
| | | | | | | | |
| (a) | | Security, or portion of security, is segregated as collateral for written options, securities sold short, and swap contracts aggregating a total value of $3,497,745. |
| (b) | | Security, or portion of security, is pledged as collateral to cover initial margin requirements on open futures contracts aggregating a total value of $1,823,057. |
Forward Foreign Currency Contracts
| | | | | | | | | | | | | | | | |
Settlement
Date | | Deliver/Receive | | Counterparty | | Local Currency | | | Current Value | | | Net Unrealized
Appreciation
(Depreciation) | |
Purchased | | | | | | | | | | | | |
11/14/2012 | | British Pound Sterling | | State Street Bank & Trust Company | | | 2,079,000 | | | $ | 3,354,848 | | | $ | 48,681 | |
11/14/2012 | | Chinese Yuan Renminbi | | State Street Bank & Trust Company | | | 22,188,000 | | | | 3,553,429 | | | | 59,308 | |
11/14/2012 | | Euro | | State Street Bank & Trust Company | | | 121,000 | | | | 156,850 | | | | 500 | |
11/14/2012 | | Hong Kong Dollar | | State Street Bank & Trust Company | | | 6,040,000 | | | | 779,367 | | | | 416 | |
11/14/2012 | | Hungarian Forint | | State Street Bank & Trust Company | | | 99,376,000 | | | | 453,996 | | | | 13,267 | |
See accompanying Notes to Financial Statements.
4 Annual Report | October 31, 2012 |
Macro Allocation Fund
Portfolio of Investments, October 31, 2012
Forward Foreign Currency Contracts—(continued)
| | | | | | | | | | | | | | | | |
Settlement
Date | | Deliver/Receive | | Counterparty | | Local Currency | | | Current Value | | | Net Unrealized
Appreciation
(Depreciation) | |
11/14/2012 | | Malaysian Ringgit | | State Street Bank & Trust Company | | | 5,397,000 | | | $ | 1,770,212 | | | $ | 27,554 | |
11/14/2012 | | Mexican Peso | | State Street Bank & Trust Company | | | 19,449,000 | | | | 1,483,977 | | | | 5,983 | |
11/14/2012 | | Taiwan Dollar | | State Street Bank & Trust Company | | | 49,597,000 | | | | 1,697,744 | | | | 23,029 | |
11/14/2012 | | Thai Baht | | State Street Bank & Trust Company | | | 43,314,000 | | | | 1,412,093 | | | | 28,109 | |
11/15/2012 | | Indian Rupee | | State Street Bank & Trust Company | | | 147,876,000 | | | | 2,741,720 | | | | 48,471 | |
11/14/2012 | | Polish Zloty | | State Street Bank & Trust Company | | | 1,388,000 | | | | 434,275 | | | | 13,443 | |
11/15/2012 | | South Korean Won | | State Street Bank & Trust Company | | | 3,871,579,000 | | | | 3,547,362 | | | | 112,542 | |
| | | | | | | | | | | | | | | | |
| | | | | | | | | | | | | | $ | 381,303 | |
| | | | | | | | | | | | | | | | |
| | | |
Sold | | | | | | | | | | | | |
11/14/2012 | | Australian Dollar | | State Street Bank & Trust Company | | | 4,155,000 | | | $ | 4,309,005 | | | $ | 7,960 | |
11/14/2012 | | Brazilian Real | | State Street Bank & Trust Company | | | 4,565,000 | | | | 2,244,804 | | | | (23,374 | ) |
11/14/2012 | | Canadian Dollar | | State Street Bank & Trust Company | | | 1,124,000 | | | | 1,125,114 | | | | 8,940 | |
11/14/2012 | | Czech Koruna | | State Street Bank & Trust Company | | | 12,590,000 | | | | 650,466 | | | | (20,099 | ) |
11/14/2012 | | Danish Krone | | State Street Bank & Trust Company | | | 8,561,000 | | | | 1,487,781 | | | | (34,366 | ) |
11/14/2012 | | Euro | | State Street Bank & Trust Company | | | 1,353,000 | | | | 1,753,873 | | | | (50,310 | ) |
11/14/2012 | | Japanese Yen | | State Street Bank & Trust Company | | | 209,863,000 | | | | 2,629,122 | | | | 49,596 | |
11/14/2012 | | New Zealand Dollar | | State Street Bank & Trust Company | | | 2,651,000 | | | | 2,178,519 | | | | (19,648 | ) |
11/14/2012 | | Swiss Franc | | State Street Bank & Trust Company | | | 5,362,000 | | | | 5,758,572 | | | | (137,804 | ) |
| | | | | | | | | | | | | | | | |
| | | | | | | | | | | | | | $ | (219,105 | ) |
| | | | | | | | | | | | | | | | |
Futures Contracts and Options on Futures Contracts
| | | | | | | | | | | | |
Number of
Contracts | | Description | | Expiration Date | | Notional Amount | | | Net Unrealized
Appreciation/
(Depreciation) | |
Long | | | | | | | | | | | | |
2 | | ASX SPI 200 Index | | December 2012 | | $ | 233,769 | | | $ | 6,506 | |
55 | | CAC 40 Index | | November 2012 | | | 2,441,621 | | | | (59,676 | ) |
55 | | IBEX 35 Index | | November 2012 | | | 5,578,945 | | | | (145,507 | ) |
39 | | S&P 500 E Mini Index | | December 2012 | | | 2,743,260 | | | | (76,644 | ) |
18 | | FTSE 100 Index | | December 2012 | | | 1,674,297 | | | | (14,245 | ) |
30 | | NIKKEI 225 Index | | December 2012 | | | 1,675,122 | | | | 23,019 | |
75 | | EURO STOXX 50 Index | | December 2012 | | | 2,434,169 | | | | (16,486 | ) |
3 | | DAX Index | | December 2012 | | | 706,823 | | | | (351 | ) |
22 | | Euro-Bund Call, Strike 143.50 | | November 2012 | | | 6,273 | | | | (13,065 | ) |
16 | | FTSE MIB Index | | December 2012 | | | 1,608,055 | | | | (24,995 | ) |
| | | | | | | | | | | | |
| | | | | | | | | | $ | (321,444 | ) |
| | | | | | | | | | | | |
Short | | | | | | | | | | | | |
22 | | German Euro Bund* | | December 2012 | | $ | 4,040,046 | | | $ | (8,347 | ) |
20 | | 10YR Japanese Government Bond | | December 2012 | | | 3,612,677 | | | | (5,063 | ) |
42 | | 5YR US Treasury Notes* | | December 2012 | | | 5,218,500 | | | | 1,632 | |
77 | | 10YR US Treasury Notes* | | December 2012 | | | 10,243,406 | | | | (4,684 | ) |
6 | | S&P TSE 60 Index | | December 2012 | | | 853,066 | | | | (4,470 | ) |
39 | | Swiss Government Bond | | December 2012 | | | 6,389,584 | | | | (27,328 | ) |
| | | | | | | | | | | | |
| | | | | | | | | | $ | (48,260 | ) |
| | | | | | | | | | | | |
*Exposure to Futures Contract is achieved through the use of a swap contract with Credit Suisse.
Total Return Swap
| | | | | | | | | | | | | | | | | | | | | | |
Reference Entity | | Floating Rate | | | Pay/Receive
Floating Rate | | | Expiration
Date | | | Counterparty | | Notional
Amount | | | Unrealized
Appreciation
(Depreciation) | |
Credit Suisse Custom Equity Index | | | 1 Month LIBOR | | | | Receive | | | | 2/21/2013 | | | Credit Suisse Europe Limited | | $ | (2,772,598 | ) | | $ | 62,106 | |
See accompanying Notes to Financial Statements.
October 31, 2012 | William Blair Funds 5 |

John Abunassar

Peter Carl

Toby Elliman

Chris Walvoord

Brian Ziv, CFA
COMMODITY STRATEGY LONG/SHORT FUND
AN OVERVIEW FROM THE PORTFOLIO MANAGERS
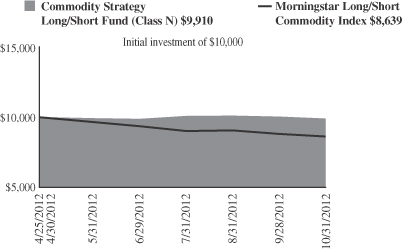
The Commodity Strategy Long/Short Fund has returned -1.10% (Class N Shares) for the period April 25, 2012 (commencement of operations) to October 31, 2012, significantly outperforming the Fund’s benchmark, the Morningstar Long/Short Commodity Index1, which returned -13.61%.
Overview of Commodity Markets
Since the inception of the Commodity Strategy Long/Short Fund, news headlines and market behavior have been dominated by a series of policy actions and political uncertainties.
For example, the second quarter ended with the European Central Bank (ECB) broadening the scope of acceptable collateral that European banks could use to access capital from the various ECB credit facilities. This decision, a mild surprise, ignited a furious rally in commodity (and other global asset) prices, which lasted until mid-September. During this rally, the average commodity price of major U.S.-listed commodities increased 16.3%. Interestingly, this broad-based move was led by those commodities most closely associated with hard assets, such as precious metals (Silver +32%, Platinum +23%, Gold +14%), energy (Heating Oil +27%, Crude Oil +25%, Gasoline +18%), and agricultural commodities (Soybeans +24%, Corn +24%, Wheat +21%). Please note that this broad increase in prices and demand for risky assets was in the face of a steady headwind of indifferent economic fundamental data. Source: Commodity Systems, Inc.
This upside move peaked in mid-September, and U.S. commodities sold off through the end of October in the run-up to the U.S. election. Ironically, mid-September and the corresponding market top was marked by yet another action by a central bank. The U.S. Federal Reserve announced the details of the much anticipated QE3 program (sometimes referred to as “QE Infinity”) mid-month. There are many hypotheses about why the announcement of QE3 marked a top in the commodity markets. Perhaps, it was a simple case of “buy the rumor, sell the news” or perhaps it’s a demonstration of the steadily decreasing efficacy of monetary policy. Whatever the case, price action in the markets continues to be dominated by policy action and not by fundamental forces.
Average Commodity Spot Price Returns (as of 2/24/12)
| | | | | | | | | | | | | | | | |
Sector | | 2/24 – 6/28 | | | Policy
Action | | 6/28 – 9/14 | | | Policy
Action | | 9/14 – 10/31 | |
Agriculture Energy Livestock Metals Soft All | | | (11.7) (15.8) (17.3) (9.7) (14.1) (13.1) | % % % % % % | | ECB eases collateral
definitions. | | | 18.5 20.9 12.3 15.8 12.3 16.3 | % % % % % % | | Fed announces
details of QE3. | | | (8.5) (1.0) (7.1) (5.5) (2.7) (4.9) | % % % % % % |
Since late February 2012, we have had three significant moves in commodity markets. Each time, the turning point was marked by an important policy move by a central bank (illustrated in the chart above). In fact, this phenomenon can be traced back to the initial responses of the Fed and the ECB to the financial crisis. Another description for this type of behavior in the
6 Annual Report | October 31, 2012 |
markets is risk-on/risk-off (RORO), and it reflects the uncertainty that businesses, individuals, and investors face in this environment. Despite the three significant moves in the commodity markets over the last eight months, the net result is commodity markets have essentially gone sideways despite the monetary spigot running essentially wide open.
Fund Results
Since inception (April 25, 2012), the Commodity Strategy Long/Short Fund has returned -1.10% (Class N Shares). Over the same time period, long-only commodity indices have been highly volatile with the net results being a mixed bag (S&P GSCI Index2 -4.75%, DJ-UBS Commodity Index3 +2.84%). Alternatively, the Morningstar Long/Short Commodity Index1 has struggled, returning -13.61%. While purely a systematic price-based index, the Morningstar Commodity index mirrors the Commodity Strategy Long/Short Fund’s ability to carry both long and short positions in a broad array of commodity markets. Furthermore, it does not suffer from the extreme weightings of the long-only indices. For example, crude oil represents more than 30% and energies as a group represent almost 70% of the S&P GSCI. Since inception, the Fund has outperformed the Morningstar Long/Short Commodity Index. While this represents excellent relative performance, we continue to position the Fund for improved absolute performance going forward.
As this year progressed, we anticipated that choppy market conditions were likely to persist; specifically, the concern was the prevalence of large directional moves punctuated by sharp reversals, which are particularly damaging to a long/short portfolio. In response, we positioned the portfolio with increased weightings to fundamental and sector specialists. In hindsight, the positioning was a benefit to investors. Since inception, the specialist managers have returned 2.64% and the fundamental managers navigated market conditions to post 0.14%. As noted above, systematic managers continue to struggle with the whipsaw action in the markets and have returned an average of -4.50% since inception.
While the markets as a whole have been dominated by a combination of policy actions and political uncertainty in 2012, the strong upward bias in the grains complex was equally a result of the poor expected harvest in the U.S. Corn, soybeans, and other agricultural futures contracts started a strong up move late in the second quarter due to drought conditions in the Midwest. As such, our best performing manager since inception has been a grain and meats specialist. Using a combination of outright long positions, specifically in corn, as well as various calendar spreads, this manager has managed returns of more than +17% since inception. The strong positive contribution of this manager highlights the unique ability of narrow, specialist managers to capture gains when volatility, positive or negative, appear in their area of market expertise.
Alternatively, our weakest manager since inception has been a systematic trend-follower which posted a loss of -9.4%. Traditionally, trend-following managers have been an excellent source of returns as they are able to track and capitalize upon the flow of investor dollars between markets. Our expectation is that systematic managers will continue to earn outsized returns in the long run, however if uncertainty and the attendant symptoms (RORO, high correlations, etc.) persist, these managers will act as a drag on performance over the short term.
The fixed income portion of the portfolio is invested in a diverse group of short duration and high quality securities. This portion of the portfolio is intended to remain stable while the commodity futures investments are intended to drive the overall return of the Fund.
Outlook and Positioning
We believe that over the near term, investors will likely face additional uncertainty and the RORO behavior of recent years is likely to persist. A litany of factors such as the looming fiscal cliff in the U.S., the turnover of the Chinese politburo, potential leadership change in
October 31, 2012 | William Blair Funds 7 |
Japan, percolating tensions in the Middle East, and the potential for continued sovereign debt issues in Europe all feed into this volatile mix. Given these conditions, the Fund will continue to focus investments in fundamental and specialist managers in lieu of systematic strategies. Traditionally, the systematic module is dominated by managers that rely upon sustained directional moves (long or short) in the markets to earn profits. However, in this environment, we deem it prudent to de-emphasize the impact of these trend-following managers and shift some portion to systematic strategies that are non-directional in nature. In the coming months, we also expect to add additional managers in each of the three categories to the portfolio; the net effect of these managers is intended to accomplish two goals: (1) capitalize on the local trading environment; and (2) diversify the potential sources of alpha that the Fund seeks to tap.
1 The Morningstar Long/Short Commodity Index is a fully collateralized commodity futures index that uses the momentum rule to determine if each commodity is held long, short, or flat. The momentum rule compares a commodity’s price to its 12 month moving average. If at monthly rebalance a commodity price is above its 12 month moving average, the index will take a long position. If the price is below its 12 month moving average, the index will take a short position. However, if the commodity is in the energy sector and the price is below its 12 month moving average, the index takes a flat position (position moved to cash).
2 The S&P GSCI Index is a composite index of commodity sector returns representing an unleveraged, long-only investment in commodity futures that is broadly diversified across the spectrum of commodities.
3 The Dow Jones-UBS Commodity Index is a broadly diversified index that allows investors to track commodity futures through a single measure.
8 Annual Report | October 31, 2012 |
Commodity Strategy Long/Short Fund
Performance Highlights (Unaudited)
Average Annual Total Return at 10/31/2012
| | | | |
| | | Since
Inception(a) | |
Class N | | | (1.10 | )% |
Class I | | | (0.90 | ) |
Morningstar Long/Short Commodity Index | | | (13.61 | ) |
| | (a) | | For the period from April 25, 2012 (Commencement of Operations) to October 31, 2012. | |
Performance cited represents past performance. Past performance does not guarantee future results and current performance may be lower or higher than the data quoted. Results shown are average annual total returns, which assume reinvestment of dividends and capital gains. Investment returns and principal will fluctuate and you may have a gain or loss when you sell shares. For the most current month-end performance information, please call 1-800-742-7272, or visit our Web site at www.williamblairfunds.com. The Fund involves a high level of risk and may not be appropriate for everyone. You could lose money by investing in the Fund. There can be no assurance that the Fund’s investment objective will be achieved or that the Fund’s investment strategies will be successful. The Fund is not a complete investment program. From time to time, the investment advisor may waive fees or reimburse expenses for the Fund. Without these waivers, performance would be lower. Class N shares are available to the general public without a sales load. Class I shares are available to certain institutional investors and advisory clients of William Blair & Company, L.L.C., without a sales load or distribution (12b-1) or service fees.
The performance highlights and graph presented above do not reflect the deduction of taxes that a shareholder would pay on fund distributions or the redemption of fund shares.
The Morningstar Long/Short Commodity Index is a commodity futures index that uses the momentum rule to determine if each commodity is held long, short, or flat. The momentum rule compares a commodity’s price to its 12 month moving average. If at monthly rebalance a commodity price is above its 12 month moving average, the index will take a long position. If the price is below its 12 month moving average, the index will take a short position. However, if the commodity is in the energy sector and the price is below its 12 month moving average, the index takes a flat position (position moved to cash).
This report identifies the Fund’s investments on October 31, 2012. These holdings are subject to change. Not all investments in the Fund performed the same, nor is there any guarantee that these investments will perform as well in the future. Market forecasts provided in this report may not necessarily come to pass.
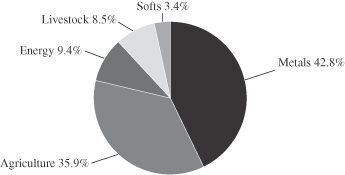
Sector Diversification (Unaudited)
The chart below provides a breakdown of the commodity exposure within the total return Swap as of October 31, 2012.
October 31, 2012 | William Blair Funds 9 |
Commodity Strategy Long/Short Fund
Consolidated Portfolio of Investments, October 31, 2012
| | | | | | | | | | | | |
Issuer | | NRSRO
Rating
(unaudited) | | | Principal
Amount | | | Value | |
|
U.S. Government and U.S. Government Agency—68.3% | |
U.S. Treasury Inflation Indexed Notes/Bonds—4.7% | | | | | | | | | | | | |
U.S. Treasury Inflation Indexed Note,
1.625%, 1/15/18 | | | | | | $ | 522,253 | | | $ | 608,098 | |
| | | | | | | | | | | | |
Total U.S. Treasury Obligations | | | | | | | | | | | 608,098 | |
| | | | | | | | | | | | |
Federal Home Loan Mortgage Corp. (FHLMC)—12.1% | | | | | | | | | | | | |
#G11697, 5.500%, due 4/1/20 | | | | | | | 215,945 | | | | 235,965 | |
#G13124, 6.000%, due 12/1/22 | | | | | | | 238,926 | | | | 265,374 | |
#J16051, 4.500%, due 7/1/26 | | | | | | | 375,280 | | | | 411,239 | |
#J19032, 3.500%, due 5/1/27 | | | | | | | 405,934 | | | | 437,346 | |
#G04053, 5.500%, due 3/1/38 | | | | | | | 201,511 | | | | 225,209 | |
| | | | | | | | | | | | |
Total FHLMC Mortgage Obligations | | | | | | | | | | | 1,575,133 | |
| | | | | | | | | | | | |
Federal National Mortgage Association (FNMA)—51.5% | | | | | | | | | | | | |
#705741, 5.000%, due 6/1/18 | | | | | | | 119,203 | | | | 130,611 | |
#751313, 5.000%, due 3/1/19 | | | | | | | 145,448 | | | | 160,731 | |
#889670, 5.500%, due 6/1/23 | | | | | | | 157,581 | | | | 175,903 | |
#AC3674, 4.500%, due 10/1/24 | | | | | | | 1,279,247 | | | | 1,411,716 | |
#AC5124, 4.000%, due 11/1/24 | | | | | | | 649,946 | | | | 713,974 | |
#AC0596, 4.000%, due 12/1/24 | | | | | | | 435,729 | | | | 478,654 | |
#AC6257, 4.000%, due 12/1/24 | | | | | | | 517,486 | | | | 568,466 | |
#932629, 4.000%, due 3/1/25 | | | | | | | 109,844 | | | | 120,665 | |
#AK0498, 3.500%, due 1/1/27 | | | | | | | 119,499 | | | | 129,792 | |
#AO0627, 3.500%, due 5/1/27 | | | | | | | 1,770,731 | | | | 1,923,245 | |
#AL2590, 4.000%, due 7/1/27 | | | | | | | 500,000 | | | | 549,259 | |
#AP0446, 3.500%, due 7/1/27 | | | | | | | 294,767 | | | | 320,155 | |
| | | | | | | | | | | | |
Total FNMA Mortgage Obligations | | | | | | | | | | | 6,683,171 | |
| | | | | | | | | | | | |
Total U.S. Government and U.S. Government Agency—68.3%
(cost $ 8,807,325) | | | | 8,866,402 | |
| | | | | | | | | | | | |
| |
Asset-Backed Securities—13.9% | | | | | |
Hertz Vehicle Financing LLC—144A, 2009-2A, Tranche A1,
4.260%, 3/25/14 | | | Aaa | | | | 200,000 | | | | 168,115 | |
Nissan Master Owner Trust Receivables—144A, 2010-AA, Tranche A,
1.364%, 1/15/15, VRN | | | AAA | | | | 200,000 | | | | 200,409 | |
CNH Equipment Trust, 2010-C, Tranche A3,
1.170%, 5/15/15 | | | AAA | | | | 39,346 | | | | 39,495 | |
Discover Card Master Trust, 2010-A1, Tranche A1,
0.864%, 9/15/15, VRN | | | AAA | | | | 100,000 | | | | 100,199 | |
Mercedes Benz Auto Recievables Trust, 2009-1, Tranche A4
2.430%, 3/15/16 | | | AAA | | | | 70,000 | | | | 70,481 | |
| |
Asset-Backed Securities—(continued) | | | | | |
American Express Credit Account Master Trust,
2008-5, Tranche A,
1.014%, 3/15/16, VRN | | | AAA | | | $ | 200,000 | | | $ | 201,219 | |
Bank of America Credit Card Trust, 2006-A14,
Tranche A14,
0.274%, 4/15/16, VRN | | | AAA | | | | 220,000 | | | | 220,039 | |
Bank One Issuance Trust,
2003-A8, Tranche A8,
0.464%, 5/16/16, VRN | | | AAA | | | | 200,000 | | | | 200,373 | |
Capital One Multi-Asset
Execution Trust, 2006-A12, Tranche A,
0.274%, 7/15/16, VRN | | | AAA | | | | 200,000 | | | | 199,862 | |
BMW Vehicle Owner Trust,
2010-A, Tranche A4,
2.100%, 10/25/16 | | | AAA | | | | 100,000 | | | | 101,192 | |
GE Dealer Floorplan Master Note Trust, 2012-1,
Tranche A,
0.781%, 2/20/17, VRN | | | AAA | | | | 100,000 | | | | 100,796 | |
Citibank Credit Card Issuance
Trust, 2006-A8,
0.380%, 12/17/18, VRN | | | AAA | | | | 200,000 | | | | 198,770 | |
| | | | | | | | | | | | |
Total Asset-Backed Securities
(cost $1,805,151) | | | | | | | | | | | 1,800,950 | |
| | | | | | | | | | | | |
|
Corporate Obligations—7.9% | |
General Dynamics Corporation,
1.375%, due 1/15/15 | | | A | | | | 100,000 | | | | 101,511 | |
Citigroup, Inc.,
2.650%, due 3/2/15 | | | A | | | | 200,000 | | | | 206,208 | |
Toyota Motor Credit
Corporation,
1.000%, due 2/17/15 | | | A+ | | | | 200,000 | | | | 201,697 | |
The Goldman Sachs
Group, Inc.,
3.300%, due 5/3/15 | | | A | | | | 200,000 | | | | 208,882 | |
American Express Credit Corporation,
2.750%, due 9/15/15 | | | A+ | | | | 200,000 | | | | 210,834 | |
Royal Bank of Scotland Group, PLC,
2.550%, due 9/18/15 | | | A | | | | 100,000 | | | | 102,511 | |
| | | | | | | | | | | | |
Total Corporate Obligations
(cost $1,009,769) | | | | | | | | | | | 1,031,643 | |
| | | | | | | | | | | | |
Total Long-Term Investments
(cost $11,622,245) | | | | | | | | | | | 11,698,995 | |
| | | | | | | | | | | | |
|
Short-Term Investments—7.0% | |
Money Market Funds—1.9% | | | | | | | | | | | | |
SSgA Prime Money Market Fund (a) | | | | | | | 250,000 | | | | 250,000 | |
| | | | | | | | | | | | |
Total Money Market Funds | | | | | | | | | | | 250,000 | |
| | | | | | | | | | | | |
See accompanying Notes to Financial Statements.
10 Annual Report | October 31, 2012 |
Commodity Strategy Long/Short Fund
Consolidated Portfolio of Investments, October 31, 2012
| | | | | | | | | | |
Issuer | | | | Principal
Amount | | | Value | |
Time Deposit—5.1% | | | | | | | | | | |
State Street Euro Dollar Time Deposit
0.010%, due 11/1/12 | | | | $ | 655,622 | | | $ | 655,622 | |
| | | | | | | | | | |
Total Time Deposit | | | | | | | | | 655,622 | |
| | | | | | | | | | |
Total Short-Term Investments—7.0%
(cost $905,622) | | | | 905,622 | |
| | | | | | | | | | |
Total Investments—97.1%
(cost $12,527,867) | | | | 12,604,617 | |
Cash and other assets, less liabilities—2.9% | | | | 377,213 | |
| | | | | | | | | | |
Net assets—100.0% | | | $ | 12,981,830 | |
| | | | | | | | | | |
Total Return Swap
| | | | | | | | | | | | | | |
Reference Entity | | Expiration
Date | | | Counterparty | | Notional
Amount | | | Unrealized
Appreciation
(Depreciation) | |
William Blair Commodity Strategy Long-Short Mutual Fund Index | | | 4/26/17 | | | Deutsche Bank AG,
London Branch | | $ | 12,502,163 | | | $ | (215,187 | ) |
| (a) | | Security, or portion of security, is segregated as collateral for the total return swap aggregating a total value of $250,000. |
NRSRO = Nationally Recognized Statistical Rating Organization—The credit quality ratings of the securities in the Fund reflect the highest category rating by either Fitch Ratings, Moody’s Investors Service Inc., or Standard & Poor’s, a division of the McGraw-Hill Companies, Inc.
The obligations of certain U. S. Government-sponsored securities are neither issued nor guaranteed by the U. S. Treasury.
VRN = Variable Rate Note. Rate disclosed is that in effect at October 31, 2012.
See accompanying Notes to Financial Statements.
October 31, 2012 | William Blair Funds 11 |
Statements of Assets and Liabilities
As of October 31, 2012
| | | | | | | | |
| | | Macro
Allocation
Fund | | | Commodity
Strategy
Long/Short
Fund
(Consolidated) | |
Assets | | | | | | | | |
Investments in securities, at cost | | $ | 31,213,070 | | | $ | 12,527,867 | |
| | | | | | | | |
| | |
Investments in securities, at value | | $ | 25,685,255 | | | $ | 12,604,617 | |
Repurchase agreement | | | 6,023,753 | | | | — | |
Cash | | | — | | | | 70,492 | |
Segregated cash at broker | | | 1,975,705 | | | | — | |
Segregated cash at broker, foreign currency, at value (cost $15,553, -) | | | 15,527 | | | | — | |
Receivable for fund shares sold | | | 1,892,225 | | | | 595,000 | |
Receivable from Advisor | | | 13,368 | | | | 20,908 | |
Dividend and interest receivable | | | 33 | | | | 34,982 | |
Unrealized appreciation on swap contract | | | 62,106 | | | | — | |
Net unrealized appreciation on forward foreign currency contracts | | | 162,198 | | | | — | |
| | | | | | | | |
Total assets | | | 35,830,170 | | | | 13,325,999 | |
Liabilities | | | | | | | | |
Security sold short (proceeds $1,891,364, -) | | | 1,923,075 | | | | — | |
Option written, at value (premiums $33,938, -) | | | 10,447 | | | | — | |
Payable for futures variation margin | | | 33,533 | | | | — | |
Payable for investment securities purchased | | | 583,884 | | | | — | |
Payable for fund shares redeemed | | | 22,620 | | | | — | |
Unrealized depreciation on swap contract | | | — | | | | 215,187 | |
Management fee payable | | | 21,435 | | | | 15,454 | |
Distribution and shareholder administration fee payable | | | 6,048 | | | | 1,912 | |
Other payables and accrued expenses | | | 89,361 | | | | 111,616 | |
| | | | | | | | |
Total liabilities | | | 2,690,403 | | | | 344,169 | |
| | | | | | | | |
Net Assets | | $ | 33,139,767 | | | $ | 12,981,830 | |
| | | | | | | | |
Capital | | | | | | | | |
Composition of Net Assets | | | | | | | | |
Par value of shares of beneficial interest | | $ | 2,933 | | | $ | 1,311 | |
Capital paid in excess of par value | | | 31,995,901 | | | | 13,120,365 | |
Accumulated net investment income (loss) | | | 27,749 | | | | 34,598 | |
Accumulated realized gain (loss) | | | 779,893 | | | | (36,007 | ) |
Net unrealized appreciation (depreciation) of investments and foreign currencies | | | 333,291 | | | | (138,437 | ) |
| | | | | | | | |
Net Assets | | $ | 33,139,767 | | | $ | 12,981,830 | |
| | | | | | | | |
| | |
Class N Shares | | | | | | | | |
Net Assets | | $ | 10,045,079 | | | $ | 1,146,277 | |
Shares Outstanding | | | 890,288 | | | | 115,868 | |
Net Asset Value Per Share | | $ | 11.28 | | | $ | 9.89 | |
Class I Shares | | | | | | | | |
Net Assets | | $ | 23,094,688 | | | $ | 11,835,553 | |
Shares Outstanding | | | 2,042,385 | | | | 1,194,769 | |
Net Asset Value Per Share | | $ | 11.31 | | | $ | 9.91 | |
See accompanying Notes to Financial Statements.
12 Annual Report | October 31, 2012 |
Statements of Operations
For the Period Ended October 31, 2012
| | | | | | | | |
| | | Macro
Allocation
Fund(a) | | | Commodity
Strategy
Long/Short
Fund(b)
(Consolidated) | |
Investment income | | | | | | | | |
Dividends | | $ | 322,386 | | | $ | — | |
Interest | | | 1,729 | | | | 90,078 | |
| | | | | | | | |
Total income | | | 324,115 | | | | 90,078 | |
Expenses | | | | | | | | |
Investment advisory fees | | | 93,532 | | | | 76,049 | |
Distribution fees | | | 8,209 | | | | 1,390 | |
Shareholder administration fees | | | 17,537 | | | | 8,148 | |
Custodian fees | | | 71,230 | | | | 59,808 | |
Transfer agent fees | | | 15,809 | | | | 8,861 | |
Professional fees | | | 71,103 | | | | 121,613 | |
Registration fees | | | 40,140 | | | | 8,911 | |
Shareholder reporting fees | | | 5,881 | | | | 14,888 | |
Trustee fees | | | 293 | | | | 113 | |
Other expenses | | | 11,077 | | | | 4,540 | |
Short dividend expenses | | | 9,144 | | | | — | |
| | | | | | | | |
Total expenses before waiver | | | 343,955 | | | | 304,321 | |
Expenses waived or absorbed by the Advisor | | | (198,161 | ) | | | (210,454 | ) |
| | | | | | | | |
Net expenses | | | 145,794 | | | | 93,867 | |
| | | | | | | | |
Net investment income (loss) | | | 178,321 | | | | (3,789 | ) |
Realized and unrealized gain (loss) | | | | | | | | |
Net realized gain (loss) on transactions from: | | | | | | | | |
Investments in securities | | | 23,390 | | | | 1,578 | |
Futures contracts | | | 826,718 | | | | — | |
Options | | | (273,823 | ) | | | — | |
Swaps | | | (54,431 | ) | | | — | |
Forward foreign currency contracts | | | 144,558 | | | | — | |
Foreign currency transactions | | | 4,359 | | | | — | |
| | | | | | | | |
Total net realized gain (loss) | | | 670,771 | | | | 1,578 | |
Change in net unrealized appreciation (depreciation) of: | | | | | | | | |
Investments in securities | | | 579,165 | | | | 76,750 | |
Futures contracts | | | (369,704 | ) | | | — | |
Options | | | (91,447 | ) | | | — | |
Swaps | | | 62,106 | | | | (215,187 | ) |
Forward foreign currency contracts | | | 162,198 | | | | — | |
Foreign currency translation | | | (9,027 | ) | | | — | |
| | | | | | | | |
Change in net unrealized appreciation (depreciation) | | | 333,291 | | | | (138,437 | ) |
| | | | | | | | |
Net increase (decrease) in net assets resulting from operations | | $ | 1,182,383 | | | $ | (140,648 | ) |
| | | | | | | | |
| (a) | | For the period from November 29, 2011 (Commencement of Operations) to October 31, 2012. |
| (b) | | For the period from April 25, 2012 (Commencement of Operations) to October 31, 2012. |
See accompanying Notes to Financial Statements.
October 31, 2012 | William Blair Funds 13 |
Statements of Changes in Net Assets
For the Period Ended October 31, 2012
| | | | | | | | |
| | | Macro
Allocation
Fund(a) | | | Commodity
Strategy
Long/Short
Fund(b)
(Consolidated) | |
Operations | | | | | | | | |
Net investment income (loss) | | $ | 178,321 | | | $ | (3,789 | ) |
Net realized gain (loss) on investments, and other assets and liabilities | | | 670,771 | | | | 1,578 | |
Change in net unrealized appreciation (depreciation) on investments, and other assets and liabilities | | | 333,291 | | | | (138,437 | ) |
| | | | | | | | |
Net increase (decrease) in net assets resulting from operations | | | 1,182,383 | | | | (140,648 | ) |
Distributions to shareholders from | | | | | | | | |
Net investment income | | | | | | | | |
Class N | | | (7,330 | ) | | | — | |
Class I | | | (35,165 | ) | | | — | |
| | | | | | | | |
| | | (42,495 | ) | | | — | |
Capital stock transactions | | | | | | | | |
Net proceeds from sale of shares | | | 35,028,121 | | | | 13,555,573 | |
Shares issued in reinvestment of income dividends and capital gain distributions | | | 30,634 | | | | — | |
Less cost of shares redeemed | | | (3,058,876 | ) | | | (433,095 | ) |
| | | | | | | | |
Net increase (decrease) in net assets resulting from capital share transactions | | | 31,999,879 | | | | 13,122,478 | |
| | | | | | | | |
Increase (decrease) in net assets | | | 33,139,767 | | | | 12,981,830 | |
Net assets | | | | | | | | |
Beginning of period | | | — | | | | — | |
| | | | | | | | |
End of period | | $ | 33,139,767 | | | $ | 12,981,830 | |
| | | | | | | | |
Accumulated net investment income (loss) at the end of the period | | $ | 27,749 | | | $ | 34,598 | |
| | | | | | | | |
| (a) | | For the period from November 29, 2011 (Commencement of Operations) to October 31, 2012. |
| (b) | | For the period from April 25, 2012 (Commencement of Operations) to October 31, 2012. |
See accompanying Notes to Financial Statements.
14 Annual Report | October 31, 2012 |
Notes to Financial Statements
(1) Organization
The William Blair Macro Allocation Fund (“MAF” or “Macro Allocation”) and the William Blair Commodity Strategy Long/Short Fund (“CLS” or “Commodity Strategy Long/Short”) are separate Funds (together the “Funds”) within the William Blair Funds (the “Trust”). The Trust is registered under the Investment Company Act of 1940 (the “1940 Act”), as amended, as an open-end management investment company. For each Fund, the number of shares authorized is unlimited.
(a) Share Classes
Three different classes of shares currently are available: N, I and Institutional. There are currently no assets in the Institutional Share Class. This report includes financial highlight information for Classes N and I. Below is a brief description of the Class N shares and the Class I shares covered by this report:
Class N shares are offered to the general public, either directly through the Trust’s distributor or through a select number of financial intermediaries. Class N shares are sold without any sales load, and carry an annual 12b-1 distribution fee of 0.25%, a Shareholder Administration fee of 0.15%, and may have a Sub-transfer agent fee that is not a fixed rate and may vary by Fund and class.
Class I shares are offered to a limited group of investors. They do not carry any sales load or distribution fees and generally have lower ongoing expenses than the Class N shares. Class I shares have a Shareholder Administration fee of 0.15% and may have a Sub-transfer agent fee that is not a fixed rate and may vary by Fund and class.
(b) Fund Objective and Description
Macro Allocation Fund
MAF’s objective is to maximize long-term risk-adjusted total return.
In pursuing its investment objective, MAF employs a dynamic global macro asset allocation strategy. This strategy attempts to exploit periodic market inefficiencies by taking long and short positions in various asset classes (e.g., equity, fixed income and currencies) with a view to profit from relative movements across and within such asset classes. MAF uses a top-down approach that focuses on general price movements in various asset classes and currencies rather than the performance of individual company securities. MAF’s macro asset allocation strategy is based primarily on the fundamental investment valuations of asset classes and currencies. The goal is to identify and exploit periodic discrepancies between fundamental values and market prices. These perceived value/price discrepancies are the foundation of the MAF’s portfolio construction. MAF may invest in or seek exposure to a wide range of asset classes including, without limitation, equity and fixed income markets (including asset-backed securities, mortgage-backed securities and other collateralized obligations and all grades and maturities of domestic and foreign credit, including high yield (junk bonds)), currencies, commodities, and real estate. MAF has no geographical or other limits on the allocation of its assets among asset classes.
Commodity Strategy Long/Short Fund
CLS’s objective is to seek long-term risk-adjusted total return.
CLS’s investment strategy seeks to provide broad exposure to commodities, provide attractive risk-adjusted returns with low correlations to traditional asset classes and maintain the inflation protection of commodities investing and profit in both up and down commodity markets. CLS seeks to provide exposure to the commodity trading strategies of independent commodity trading advisors (“CTAs”) selected by William Blair & Company, L.L.C., (the “Advisor”) primarily through derivative instruments (instruments whose values are based on, for example, indices, currencies or securities), and invests in fixed-income securities.
CLS’s commodity investments may include derivative instruments that provide exposure to CTAs selected by the Advisor and/or by investing in limited liability companies, limited partnerships, corporations or other pooled vehicles (“Underlying Vehicles”) managed by such CTAs. The Advisor seeks exposure to CTAs primarily through a total return swap (the “Swap”),
October 31, 2012 | William Blair Funds 15 |
with Deutsche Bank AG, London Branch (“Deutsche Bank”) as the counterparty. The Swap, which is a type of derivative instrument, is based on a customized index (the “Index”) designed to replicate the aggregate returns of the trading strategies of CTAs selected by the Advisor. The swap currently has exposure to six different CTAs which can be broadly placed into three different trading strategies. Systematic strategies which utilize quantitative systems to exploit trending behavior of futures markets over various time frames and may include some counter trend and mean reversion aspects. Fundamental strategies conduct deep research into fundamental supply and demand factors that drive futures markets and use specialized models, data sources and other tools to construct expectations of fundamental values. Specialist strategies employ specialized knowledge, research and analysis systems to seek value from niche markets. As of October 31, 2012, the swap was made up of 47.5% Systematic strategies, 33.2% Fundamental strategies and 19.3% Specialist strategies.
The Swap is based on a notional amount agreed to by the Advisor and Deutsche Bank. The Advisor may add or remove CTAs or adjust notional exposure between existing CTAs within the Swap. The Swap will expire on April 26, 2017, but may be terminated by the Fund on one days’ notice to Deutsche Bank. The notional amount of the Swap as of October 31, 2012 was $12,502,163.
The Swap value reflects the current cost of the fees of Deutsche Bank and the fixed fees of the CTAs together aggregating no more than 1.80% of the notional amount of the Swap and may include a deduction for the performance fees of the individual CTAs in an amount not to exceed 20%. The deduction for performance fees in the Index will be based on the performance results of each individual CTA’s trading strategy represented in the Index. Accordingly, a performance fee for one or more CTA trading strategies represented in the Index may be deducted in calculating the Index even if the aggregate returns of the trading strategies of the CTAs are negative. Fees are accrued daily within the Swap and deducted from the Swap value quarterly. During the period ended October 31, 2012, total fees of the Swap were $185,716 of which $89,660 was related to performance fees.
(2) Significant Accounting Policies
The following is a summary of the Funds’ significant accounting policies in effect during the period covered by the financial statements, which are in accordance with U.S. generally accepted accounting principles.
(a) Basis for Consolidation for Commodity Strategy Long/Short Fund
CLS’s investments in the Swap are made through William Blair CLS Ltd., a wholly-owned subsidiary of CLS organized under the laws of the Cayman Islands (the “Subsidiary”). The Subsidiary acts as an investment vehicle for CLS in order to effect certain investments for the Fund consistent with CLS’s investment objective and policies as specified in its Prospectus and Statement of Additional Information. CLS’s Portfolio of Investments has been consolidated and includes the portfolio holdings of CLS and the Subsidiary. The consolidated financial statements include the accounts of CLS and the Subsidiary. All inter-company transactions and balances have been eliminated. Under the Articles of Association, shares issued by the Subsidiary confer upon a shareholder the right to receive notice of, to attend and to vote at general meetings of the Subsidiary and shall confer upon the shareholder rights in a winding-up or repayment of capital and the right to participate in the profits or assets of the Subsidiary. Investments held within the Subsidiary are used to meet collateral requirements of the Swap and are invested in a money market fund. Under normal conditions, CLS will have an investment in the Subsidiary between 5% and 20% of the net assets of CLS. As of October 31, 2012, the total investment in the Subsidiary was $689,325, representing 5.3% of the net assets of CLS.
(b) Investment Income and Transactions
Dividend income and expense is recorded on the ex-dividend date, except for those dividends from certain foreign securities that are recorded when the information is available.
Interest income is recorded on an accrual basis, adjusted for amortization of premium or discount. Variable rate bonds and floating rate notes earn interest at coupon rates that fluctuate at specific time intervals. The interest rates shown in the Consolidated Portfolio of Investments for CLS were the rates in effect on October 31, 2012. Put bonds may be redeemed at the discretion of the holder on specified dates prior to maturity.
Premiums and discounts are accreted and amortized on a straight-line basis for short-term investments with maturities < 60 days and on an effective interest method for long-term investments.
Paydown gains and losses on mortgage and asset-backed securities are reclassified to interest income. For the period ended October 31, 2012, the Commodity Strategy Long/Short Fund recognized a reduction of income and an increase in net realized gains of $37,585.
16 Annual Report | October 31, 2012 |
The Funds do not isolate that portion of the results of operations resulting from changes in foreign exchange rates on investments from the fluctuations arising from changes in market prices of securities held. Such fluctuations are included with the net realized and unrealized gain or loss from investments.
Reported net realized foreign currency gains or losses arise from disposition of foreign currency, the difference in the foreign exchange rates between the trade and settlement dates on securities transactions, and the difference between the amounts of dividends, interest and foreign withholding taxes recorded on the ex-date or accrual date and the U.S. dollar equivalent of the amounts actually received or paid. Net unrealized foreign exchange gains and losses arise from changes (due to the changes in the exchange rate) in the value of foreign currency and other assets and liabilities denominated in foreign currencies held at year end.
Security and shareholder transactions are accounted for no later than one business day following the trade date. However, for financial reporting purposes, security and shareholder transactions are accounted for on the trade date of the last business day of the reporting period. Realized gains and losses from securities transactions are recognized on a specifically identified cost basis.
(c) Share Valuation and Distributions to Shareholders
Shares are sold and redeemed on a continuous basis at net asset value (“NAV”). The NAV per share is determined separately for each class by dividing each Fund’s net assets attributable to that class by the number of shares of the class outstanding as of the close of regular trading on the New York Stock Exchange (the “Exchange”), which is generally 4:00 p.m. Eastern time, on each day the Exchange is open. Redemption fees may be applicable to redemptions or exchanges within 60 days of purchase. For both Class N and Class I shares, the Funds assess a 2% redemption fee on shares sold or exchanged that have been owned 60 days or less as disclosed within each Fund’s Prospectus. The redemption fees collected by the Funds are netted against the amount of redemptions for presentation on the (Consolidated) Statements of Changes in Net Assets. As of October 31, 2012, the Funds have not collected any redemption fees.
Distributions from net investment income, if any, of the Funds are declared and paid at least annually. Capital gain distributions, if any, are declared and paid at least annually in December. Distributions payable to shareholders are recorded on the ex-dividend date.
(d) Foreign Currency Translation
The Funds may invest in securities denominated in foreign currencies. As such, assets and liabilities denominated in foreign currencies are translated into U.S. dollar amounts at the current exchange rate on the date of valuation. The values of foreign investments, open forward foreign currency contracts, and cash denominated in foreign currencies are translated into U.S. dollars using a spot market rate of exchange as of the time of the determination of each Fund’s NAV, typically 4:00 p.m. Eastern time on days when there is regular trading on the New York Stock Exchange. Payables and receivables for securities transactions, dividends, interest income and tax reclaims are translated into U.S. dollars using a spot market rate of exchange as of 4:00 p.m. Eastern time. Settlement of purchases and sales and dividend and interest receipts are translated into U.S. dollars using a spot market rate of exchange as of 11:00 a.m. Eastern time.
(e) Income Taxes
Each Fund intends to comply with the provisions of Subchapter M of the Internal Revenue Code available to regulated investment companies. Each Fund intends to make the requisite distributions of income and capital gains to its shareholders sufficient to relieve it from all, or substantially all, federal income and excise taxes. No provision for federal income and excise taxes has been made.
Management has evaluated all of the uncertain tax positions of the Funds and has determined that no provision for income tax is required to be recorded in the financial statements. As of October 31, 2012, the Funds had not been in existence for a complete fiscal year and therefore have not made annual filings with the Internal Revenue Service.
The Funds treat the deferred loss associated with current period wash sales as an adjustment to the cost of investments for tax purposes. The cost of investments for federal income tax purposes and related gross unrealized appreciation/(depreciation) and net unrealized appreciation (depreciation) at October 31, 2012, were as follows:
| | | | | | | | | | | | | | | | |
Fund | | Cost of Investments | | | Gross
Unrealized
Appreciation | | | Gross
Unrealized
Depreciation | | | Net
Unrealized
Appreciation/
(Depreciation) | |
Macro Allocation | | $ | 31,276,772 | | | $ | 647,158 | | | $ | 214,922 | | | $ | 432,236 | |
Commodity Strategy Long/Short | | | 12,527,867 | | | | 86,991 | | | | 10,241 | | | | 76,750 | |
October 31, 2012 | William Blair Funds 17 |
The timing and characterization of certain income and capital gain distributions are determined annually in accordance with federal income tax regulations that may differ from U.S. generally accepted accounting principles. As a result, net investment income or loss and net realized gain or loss for a reporting period may differ from the amount distributed during such period. In addition, the Funds may periodically record reclassifications among certain capital accounts to reflect differences between financial reporting and income tax basis distributions. The reclassifications were reported in order to reflect the tax treatment for certain permanent differences that exist between income tax regulations and U.S. generally accepted accounting principles. The reclassifications generally relate to differing treatment of paydown gains and losses, Section 988 currency transactions and income and gains from swap contracts. These reclassifications have no impact on the net asset values of the Funds. Accordingly, at October 31, 2012, the following reclassifications were recorded:
| | | | | | | | | | | | |
Fund | | Accumulated
Net Investment
Income(Loss) | | | Accumulated
Net Realized
Gain(Loss) | | | Capital
Paid in Excess
of Par Value | |
Macro Allocation | | $ | (108,077 | ) | | $ | 109,122 | | | $ | (1,045 | ) |
Commodity Strategy Long/Short | | | 38,387 | | | | (37,585 | ) | | | (802 | ) |
The tax character of distributions paid during fiscal year ended 2012 was as follows:
| | | | | | | | | | | | |
Fund | | Ordinary
Income | | | Long-Term
Capital Gains | | | Total
Distributions | |
Macro Allocation | | $ | 42,495 | | | $ | — | | | $ | 42,495 | |
Commodity Strategy Long/Short | | | — | | | | — | | | | — | |
As of October 31, 2012, the components of distributable earnings on a tax basis were as follows:
| | | | | | | | | | | | | | | | |
Fund | | Undistributed
Ordinary Income | | | Accumulated
Capital and
Other Losses | | | Undistributed
Long-Term
Capital Gain | | | Net Unrealized
Appreciation
(Depreciation) | |
Macro Allocation | | $ | 753,928 | | | $ | — | | | $ | 141,124 | | | $ | 245,881 | |
Commodity Strategy Long/Short | | | 34,598 | | | | (36,007 | ) | | | — | | | | (138,437 | ) |
As of October 31, 2012, the Commodity Strategy Long/Short Fund has short-term capital loss carryforward, without expiration, of $36,007.
(f) Repurchase Agreements
In a repurchase agreement, a Fund buys a security at one price and at the time of sale, the seller agrees to repurchase the obligation at a mutually agreed upon time and price (usually within seven days). The repurchase agreement thereby determines the yield during the purchaser’s holding period, while the seller’s obligation to repurchase is secured by the value of the underlying security. The Advisor will monitor, on an ongoing basis, the value of the underlying securities to ensure that the value always equals or exceeds the repurchase price plus accrued interest. Repurchase agreements may involve certain risks in the event of a default or insolvency of the other party to the agreement, including possible delays or restrictions upon a Fund’s ability to dispose of the underlying securities. The risk to a Fund is limited to the ability of the seller to pay the agreed upon sum on the delivery date. In the event of default, a repurchase agreement provides that a Fund is entitled to sell the underlying collateral. The loss, if any, to a Fund will be the difference between the proceeds from the sale and the repurchase price. However, if bankruptcy proceedings are commenced with respect to the seller of the security, disposition of the collateral by the Fund may be delayed or limited. Although no definitive creditworthiness criteria are used, the Advisor reviews the creditworthiness of the banks and non-bank dealers with which a Fund enters into repurchase agreements to evaluate those risks. A Fund may, for tax purposes, deem repurchase agreements collateralized by U.S. Government securities to be investments in U.S. Government securities.
(g) Use of Estimates
The preparation of financial statements in conformity with U.S. generally accepted accounting principles requires management to make estimates and assumptions that affect the amounts reported in the financial statements. Actual results may differ from those estimates.
(h) Indemnifications
In the normal course of business, the Funds have entered into contracts in which the Funds agree to indemnify the other party or parties against various potential cost or liabilities. The Funds’ maximum exposure under these arrangements is unknown. No claim has been made for indemnification pursuant to any such agreement of the Funds.
18 Annual Report | October 31, 2012 |
(3) Valuation
(a) Investment Valuation
The market value of equity securities, including exchange-traded funds, is determined by valuing securities traded on national securities markets or in the over-the-counter markets at the last sale price or, if applicable, the official closing price or, in the absence of a recent sale on the date of determination, at the latest bid price.
Investments in other funds that are not exchange-traded funds are valued at their respective net asset value per share.
Fixed-income securities are valued by using market quotations or independent pricing services that use either prices provided by market-makers or matrixes that produce estimates of market values obtained from yield data relating to instruments or securities with similar characteristics.
Option contracts on securities, currencies and other financial instruments traded on one or more exchanges are valued at their most recent sale price on the exchange on which they are traded most extensively. Futures contracts (and options and swaps thereon) are valued at the most recent settlement price on the exchange on which they are traded most extensively. Forward foreign currency contracts are valued on the basis of the value of the underlying currencies at the prevailing currency exchange rate.
The total return swap in the Macro Allocation Fund is valued by an independent pricing service using simulation pricing models. These models will value the underlying basket of exchange-traded equity securities within the total return swap based on readily observable market prices.
CLS’ shares of the Subsidiary are valued at the net asset value per share of the Subsidiary, which is calculated using the same valuation procedures as CLS. For CLS, the Subsidiary’s investment in the Swap is fair valued based on the calculation of the Index by the counterparty. The counterparty calculates the Index each index business day at the close of business in London, which is typically 11:00AM Eastern Time. The Advisor performs certain daily tests of the Swap value in order to test the reasonableness of the counterparty’s valuation. In determining the fair value of the Swap, the Advisor, under procedures approved by the Board of Trustees, will consider whether there have been significant events that have occurred from the close of business in London when the Swap is valued and the time that the Fund calculates its NAV.
Securities, and other assets, for which a market price is not available or is deemed unreliable (e.g., securities affected by unusual or extraordinary events, such as natural disasters or securities affected by market or economic events, such as bankruptcy filings), or the value of which is affected by a significant valuation event, are valued at a fair value as determined in good faith by, or under the direction of, the Board of Trustees and in accordance with the Fund’s valuation procedures. The value of fair valued securities may be different from the last sale price (or the latest bid price), and there is no guarantee that a fair valued security will be sold at the price at which a Fund is carrying the security.
(b) Fair Valuation Measurements
Fair value is defined as the price that a Fund would receive upon selling a security in an orderly transaction to an independent buyer in the principal or most advantageous market for the investment. Various inputs are used in determining the value of a Fund’s investments. A three-tier hierarchy of inputs is used to classify fair value measurements for disclosure purposes. The three-tier hierarchy of inputs is summarized in the three broad levels listed below:
| | • | | Level 1—Quoted prices (unadjusted) in active markets for an identical security. |
| | • | | Level 2—Prices determined using other significant observable inputs. Observable inputs are inputs that other market participants would use in pricing a security. These may include quoted prices for similar securities, interest rates, prepayment speeds, credit risk, and others. In addition, other observable inputs such as foreign exchange rates, benchmark securities indices and foreign futures contracts may be utilized in the valuation of certain foreign securities when significant events occur between the last sale on the foreign securities exchange and the time the net asset value of the Fund is calculated. |
| | • | | Level 3—Prices determined using significant unobservable inputs. In situations where quoted prices or observable inputs are unavailable (for example, when there is little or no market activity for an investment) unobservable inputs may be used. Unobservable inputs reflect the Fund’s own assumptions about the factors market participants would use in pricing an investment, and would be based on the best information available. |
October 31, 2012 | William Blair Funds 19 |
The inputs or methodology used for valuing an investment are not necessarily an indication of the risk associated with investing in those securities. For example, money market securities are valued using amortized cost, in accordance with rules under the 1940 Act. Generally, amortized cost approximates the current fair value of a security, but since the value is not obtained from a quoted price in an active market, such securities are reflected as Level 2.
Any transfers between Level 1 and Level 2 are disclosed, effective as of the beginning of the period, in the tables below with the reasons for the transfers disclosed in a note to the tables, if applicable.
A description of the valuation techniques applied to the Fund’s major categories of assets and liabilities measured at fair value on a recurring basis are as follows.
Exchange-Traded Securities
Securities traded on a national securities exchange (or reported on the NASDAQ national market), including exchange-traded funds, are stated at the last reported sales price on the day of valuation. Other securities traded in the over-the-counter market and listed securities for which no sale was reported on that date are stated at the last quoted bid price, except for short positions, for which the last quoted asked price is used. To the extent these securities are actively traded and valuation adjustments are not applied, they are categorized in Level 1 of the fair value hierarchy.
Fixed-Income Securities
Fixed-income securities including corporate, convertible and municipal bonds and notes, U.S. government agencies, U.S. treasury obligations, sovereign issues, bank loans, convertible preferred securities and non-U.S. bonds are normally valued by pricing service providers that use broker dealer quotations, reported trades or valuation estimates from their internal pricing models. The service providers’ internal models use inputs that are observable such as issuer details, interest rates, yield curves, prepayment speeds, credit risks/spreads, default rates and quoted prices for similar assets. Securities that use similar valuation techniques and observable inputs as described above are categorized as Level 2 of the fair value hierarchy.
Asset-Backed Securities
Mortgage-related and asset-backed securities are usually issued as separate tranches, or classes, of securities within each deal. These securities are also normally valued by pricing service providers that use broker dealer quotations or valuation estimates from their internal pricing models. The pricing models for these securities usually consider tranche-level attributes, current market data, estimated cash flows and market-based yield spreads for each tranche, and incorporate deal collateral performance, as available. Mortgage-related and asset-backed securities that use similar valuation techniques and inputs as described above are categorized as Level 2 of the fair value hierarchy.
Short-Term Investments
Short-term investments having a maturity of 60 days or less at the time of purchase are generally valued at amortized cost, which approximates fair market value. These investments are categorized as Level 2 of the fair value hierarchy.
Derivative Instruments
Listed derivatives, such as certain options and futures contracts, that are actively traded are valued based on quoted prices from the exchange on which they are traded most extensively and are categorized in Level 1 of the fair value hierarchy. Over-the-counter (OTC) derivative contracts include forward foreign currency contracts, swap and certain option contracts related to interest rates, foreign currencies, credit standing of reference entities, equity prices, or commodity prices. Depending on the product and the terms of the transaction, the fair value of OTC derivative products can be modeled taking into account the counterparties’ creditworthiness and using a series of techniques, including simulation models. Many pricing models do not entail material subjectivity because the methodologies employed do not necessitate significant judgments and the pricing inputs are observed from actively quoted markets, as is the case of forward foreign currency contracts and interest rate swaps. A substantial majority of OTC derivative products valued by a Fund using pricing models fall into this category and are categorized within Level 2 of the fair value hierarchy.
CLS Swap Contract
The Swap held by the Subsidiary of CLS is fair valued based on the calculation of the Index by the counterparty. The Swap is not a listed security nor does it actively trade. The fair value is based on inputs that are not readily observable in the market place, primarily of which are the underlying baskets of commodity investments on which the Swap value is derived. The
20 Annual Report | October 31, 2012 |
Value of the Swap also reflects deductions for management and performance fees from the underlying CTAs, counterparty fees and trading costs. The Swap is categorized within Level 3 of the fair value hierarchy.
As of October 31, 2012, the hierarchical input levels of securities in each Fund, segregated by security class, are as follows:
| | | | | | | | |
Investments in Securities | | Macro
Allocation | | | Commodity
Strategy
Long/Short | |
Assets | | | | | | | | |
Level 1—Quoted prices | | | | | | | | |
Exchange-traded funds | | $ | 21,979,598 | | | $ | — | |
Purchased options | | | 84,974 | | | | — | |
Level 2—Other significant observable inputs | | | | | | | | |
Government securities | | | 3,620,683 | | | | 8,866,402 | |
Asset-backed securities | | | — | | | | 1,800,950 | |
Corporate obligations | | | — | | | | 1,031,643 | |
Short-term investments | | | 6,023,753 | | | | 905,622 | |
Liabilities | | | | | | | | |
Level 1—Quoted prices | | | | | | | | |
Exchange-traded funds | | | (1,923,075 | ) | | | — | |
Written options | | | (10,447 | ) | | | — | |
| | | | | | | | |
Total investments in securities | | $ | 29,775,486 | | | $ | 12,604,617 | |
| | | | | | | | |
| | |
Other Financial Instruments | | | | | | |
Assets | | | | | | | | |
Level 2—Other significant observable inputs | | | | | | | | |
Forward foreign currency contracts | | $ | 162,198 | | | $ | — | |
Total return swap | | | 62,106 | | | | — | |
Liabilities | | | | | | | | |
Level 1—Quoted prices | | | | | | | | |
Futures contracts | | | (358,305 | ) | | | — | |
Level 2—Other significant observable inputs | | | | | | | | |
Futures contracts | | | (11,399 | ) | | | — | |
Level 3—Significant unobservable inputs | | | | | | | | |
Total return swap | | | — | | | | (215,187 | ) |
| | | | | | | | |
Total other financial instruments | | $ | (145,400 | ) | | $ | (215,187 | ) |
| | | | | | | | |
The following is a reconciliation of Level 3 investments in the Commodity Strategy Long/Short Fund for which significant unobservable inputs were used to determine fair value:
| | | | | | | | | | | | | | | | | | | | |
| | | Value
4/25/2012 | | | Notional
Increase | | | Notional
Decrease | | | Change in
Unrealized
Depreciation | | | Value
10/31/2012 | |
Total Return Swap | | $ | — | | | $ | 12,502,163 | | | $ | — | | | $ | (215,187 | ) | | $ | (215,187 | ) |
| | | | | | | | | | | | | | | | | | | | |
Significant unobservable inputs for the Swap consist primarily of the performance of the underlying CTAs. For the period ended October 31, 2012, the CTA performance ranged from -12.64% to 18.28%. The Swap value will increase or decrease generally in proportion to the weighted average performance of the CTAs.
(4) Recent Accounting Pronouncement
In December 2011, the Financial Accounting Standards Board (“FASB”) issued Accounting Standard Update (“ASU”) No. 2011-11 “Disclosures about Offsetting Assets and Liabilities.” These common disclosure requirements are intended to help investors and other financial statement users to better assess the effect or potential effect of offsetting arrangements on a Fund’s financial position. They also improve transparency in the reporting of how companies mitigate credit risk, including disclosure of related collateral pledged or received. In addition, ASU 2011-11 facilitates comparison between those entities that prepare their financial statements on the basis of U.S. GAAP and those entities that prepare their financial statements on the basis of
October 31, 2012 | William Blair Funds 21 |
International Financial Reporting Standards. ASU 2011-11 requires entities to disclose both gross and net information about both instruments and transactions eligible for offset in the financial position; and disclose instruments and transactions subject to an agreement similar to a master netting agreement. ASU 2011-11 is effective for fiscal years beginning on or after January 1, 2013, and interim periods within those annual periods. Management is currently evaluating the implications of ASU 2011-11 and its impact on financial statement disclosures.
(5) Transactions with Affiliates
(a) Management and Expense Limitation Agreements
Each Fund has a management agreement with the Advisor for investment advisory, clerical, bookkeeping and administrative services. Each Fund pays the Advisor an annual fee, payable monthly, based on a specified percentage of its average daily net assets. The annual advisory fee rates for the Macro Allocation Fund and the Commodity Strategy Long/Short Fund are 0.80% and 1.40%, respectively.
Each Fund has also entered into an Expense Limitation Agreement with the Advisor. Under the terms of the agreement, the Advisor will waive its management fee and/or reimburse each Fund for expenses (excluding interest, taxes, brokerage commissions, acquired fund fees and expenses, dividend expenses on short sales and other investment-related costs and extraordinary expenses, such as litigation and other expenses not incurred in the ordinary course of the Fund’s business) in excess of the agreed upon rate. The amount the Advisor owes a Fund as of the reporting date is recorded as Receivable from Advisor on the (Consolidated) Statements of Assets and Liabilities. The Advisor reimburses the Funds on a monthly basis. Under the terms of the agreement, the Advisor has agreed to waive its advisory fees and/or reimburse other operating expenses through April 30, 2013, if total expenses for each class of the following Funds exceed the following rates (as a percentage of average daily net assets):
| | | | | | | | |
Funds | | Class N | | | Class I | |
Macro Allocation | | | 1.35 | % | | | 1.10 | % |
Commodity Strategy Long/Short | | | 1.95 | % | | | 1.70 | % |
For the period ended October 31, 2012, the fee waivers and/or reimbursements for MAF and CLS were $198,161 and $210,454, respectively.
For a period of three years subsequent to the commencement of operations, the Advisor is entitled to reimbursement for previously waived fees and reimbursed expenses to the extent the overall expense ratio remains below the expense limitation in place at the time the fee was waived and/or the expense was reimbursed. The total amounts available for recapture at October 31, 2012 for MAF and CLS were $198,161 and $210,454, respectively.
(b) Underwriting, Distribution Services and Service Agreements
Each Fund has a Distribution Agreement with William Blair for distribution services to the Funds’ Class N shares. Each Fund pays William Blair an annual fee, payable monthly, based on a specified percentage of its average daily net assets of Class N shares. The annual rate expressed as a percentage of average daily net assets for Class N is 0.25% for each Fund. Pursuant to the Distribution Agreement, William Blair enters into related selling group agreements with various firms at various rates for sales of the Funds’ Class N shares.
Each Fund has a Shareholder Administration Agreement with William Blair to provide shareholder administration services. Class N and Class I shares of the Funds pay William Blair an annual fee, payable monthly, based upon 0.15% of average daily net assets attributable to each class, respectively. For the period ended October 31, 2012, the following shareholder administration fees were incurred:
| | | | | | | | | | | | |
Fund | | Class N | | | Class I | | | Total | |
Macro Allocation | | $ | 4,926 | | | $ | 12,611 | | | $ | 17,537 | |
Commodity Strategy Long/Short | | | 834 | | | | 7,314 | | | | 8,148 | |
(6) Investment Transactions
Investment transactions, excluding money market instruments, repurchase agreements and demand notes for the period ended October 31, 2012, were as follows:
| | | | | | | | |
Fund | | Purchases | | | Sales | |
Macro Allocation | | $ | 27,191,154 | | | $ | (3,920,519 | ) |
Commodity Strategy Long/Short | | | 12,996,496 | | | | 471,503 | |
22 Annual Report | October 31, 2012 |
Transactions in written call and put options for the period ended October 31, 2012 are as follows:
| | | | | | | | | | | | |
Macro Allocation Fund | | # of
Contracts | | | Notional
Amount | | | Premium | |
Balance at November 29, 2011 | | $ | — | | | $ | — | | | $ | — | |
Sales | | | 40 | | | | 1,036,920 | | | | 33,938 | |
Closing Buys | | | — | | | | — | | | | — | |
Expirations | | | — | | | | — | | | | — | |
Exercised | | | — | | | | — | | | | — | |
| | | | | | | | | | | | |
Balance at October 31, 2012 | | | 40 | | | $ | 1,036,920 | | | $ | 33,938 | |
(7) Short Sales
A Fund may sell a security it does not own in anticipation of a decline in the fair value of that security. When the Fund sells a security short, it must borrow the security sold short and deliver it to the broker-dealer through which it made the short sale. A gain, limited to the price at which the Fund sold the security short, or a loss unlimited in size, will be recognized upon the termination of the short sale. The Fund is also subject to the risk that it may be unable to reacquire a security to terminate a short position except at a price substantially in excess of the price it sold the security short.
(8) Financial Derivative Instruments
The Funds may use derivative instruments to obtain investment exposures, to maintain liquidity, to provide hedging, or in anticipation of changes in the composition of its portfolio holdings or as otherwise provided in each Fund’s prospectus.
Derivative transactions carry counterparty risk as they are based on contracts between the Fund and the applicable counterparty. For exchange-traded or cleared derivative contracts, such counterparty risk is limited due to the role of the exchange or clearinghouse. OTC derivative contracts, however, are exposed to counterparty risk in the amount of unrealized gains, net of collateral held, for the duration of the contract. The Funds seek to reduce counterparty risk in respect of OTC derivatives contracts by only transacting with high credit-standing counterparties and by regularly monitoring its exposure to counterparties.
Futures Contracts
A futures contract provides for the future sale by one party and purchase by another party of a specified amount of a specific financial instrument for a specified price at a designated date, time and place. An index futures contract is an agreement pursuant to which the parties agree to take or make delivery of an amount of cash equal to the difference between the value of the index at the close of the last trading day of the contract and the price at which the index futures contract was originally written. If the offsetting purchase price is less than the original sale price, a Fund realizes a gain; if it is more, a Fund realizes a loss. Conversely, if the offsetting sale price is more than the original purchase price, a Fund realizes a gain; if it is less, a Fund realizes a loss. The transaction costs must also be included in these calculations. There can be no assurance, however, that a Fund will be able to enter into an offsetting transaction with respect to a particular futures contract at a particular time. If a Fund is not able to enter into an offsetting transaction, a Fund will continue to be required to maintain the margin deposits on the futures contract.
Upon entering into a futures contract, a Fund is required to pledge to the broker an amount of cash, U.S. government securities, or other liquid assets equal to a certain percentage of the contract amount (initial margin deposit). Futures contracts are marked to market daily and an appropriate payable or receivable for the change in value (“variation margin”) is recorded by the Fund and a cash payment is either made to or received from the counterparty. Futures held through swaps are marked to market daily, however, the Fund does not make or receive cash payments to/from the counterparty. Gains or losses are recognized but not considered realized until the contracts expire or are closed.
Options
The purchase or sale of an option by the Funds involves the payment or receipt of a premium by the investor and the corresponding right or obligation, as the case may be, either to purchase or sell the underlying security, commodity, or other instrument for a specific price at a certain time or during a certain period. Purchasing options involves the risk that the underlying instrument will not change price in the manner expected, so the investor loses its premium. Selling options involves potentially greater risk because the investor is exposed to the extent of the actual price movement in the underlying security rather than only the amount of the premium paid (which could result in a potentially unlimited loss). OTC options also involve counterparty credit risk. Purchased options are shown as an asset on the (Consolidated) Statements of Assets and
October 31, 2012 | William Blair Funds 23 |
Liabilities and are included in Investments in securities. Premiums received for written options are shown as a liability on the (Consolidated) Statements of Assets and Liabilities. Realized gains and losses on the sale, expiration or assignment of an option are disclosed on the (Consolidated) Statements of Operations.
Forward Foreign Currency Contracts
The Funds may enter into forward foreign currency exchange contracts. When entering into a forward currency contract, the Funds agree to receive or deliver a fixed quantity of foreign currency for an agreed-upon price on an agreed future date. The Funds’ net equity therein, representing unrealized gain or loss on the contracts as measured by the difference between the forward foreign exchange rates at the dates of entry into the contracts and the forward rates at the reporting date, is included in the (Consolidated) Statements of Assets and Liabilities. Realized and unrealized gains and losses are included in the (Consolidated) Statements of Operations. These instruments may involve market risk, credit risk, or both kinds of risks in excess of the amount recognized in the (Consolidated) Statements of Assets and Liabilities. Risks arise from the possible inability of counterparties to meet the terms of their contracts and from the price movements in currencies.
Swap Contracts
Swap agreements may include total return, interest rate, securities index, commodity, security and currency exchange rate swaps. Swap agreements are two-party contracts entered into primarily by institutional investors for periods ranging from a few weeks to several years. In a standard “swap” transaction, two parties agree to exchange the returns (or differentials in rates of return) earned or realized on particular predetermined investments or instruments. The gross returns to be exchanged or “swapped” between the parties are calculated with respect to a “notional amount” (i.e., the change in the value of a particular dollar amount invested at a particular interest rate, in a particular foreign currency, or in a “basket” of securities representing a particular index). Swap agreements are subject to the risk that the counterparty to the swap will default on its obligation to pay the Fund and the risk that the Fund will not be able to meet its obligations to pay the counterparty to the swap. Swap agreements may also involve fees, commissions or other costs that may reduce the Fund’s gains from a swap agreement or may cause the Fund to lose money.
CLS gains exposure to the commodities market by investing in a total return swap with Deutsche Bank as counterparty. The Fund’s returns are reduced or its losses are increased by the costs associated with the Swap, which are the fees deducted by the counterparty in the valuation of the Swap. In addition, there is the risk that the Swap may be terminated by the Fund or the counterparty in accordance with its terms or as a result of regulatory changes. If the Swap were to terminate, the Fund may be unable to implement its investment strategies with respect to commodities investments and the Fund may not be able to seek to achieve its investment objective.
For the CLS Swap no price was paid upon entering into the arrangement nor is any initial margin required to be posted. Any increase or decrease in the Swap value will be recorded on the (Consolidated) Statements of Assets and Liabilities as appreciation or depreciation on the Swap contract. In the event of depreciation, the Fund is required to deposit in a segregated account with its custodian an amount at least equal to the unrealized losses.
The following table presents the value of financial derivative instruments, by primary risk exposure, as of October 31, 2012 and their respective location on the (Consolidated) Statements of Assets and Liabilities:
| | | | | | | | | | | | |
| | | Assets | | | Liabilities | |
Primary Risk Exposure | | Statements of Assets
and Liabilities | | Value | | | Statements of Assets
and Liabilities | | Value | |
Macro Allocation | | | | | | | | | | | | |
Currency | | Unrealized appreciation on forward foreign currency contracts | | $ | 162,198 | | | Unrealized depreciation on forward foreign currency contracts | | $ | — | |
Interest rate | | Receivable for variation margin | | | — | | | Payable for variation margin | | | 56,856 | |
Equity | | Receivable for variation margin | | | — | | | Payable for variation margin | | | 312,848 | |
Interest rate | | Investments in securities, at value | | | 15,468 | | | | | | | |
Equity | | Investments in securities, at value | | | 69,506 | | | Options written, at value | | | 10,447 | |
Equity | | Unrealized appreciation on swap contract | | | 62,106 | | | Unrealized depreciation on swap contract | | | — | |
Commodity Strategy Long/Short | | | | | | | | | | | | |
Commodities | | Unrealized appreciation on swap contract | | | — | | | Unrealized depreciation on swap contract | | | 215,187 | |
24 Annual Report | October 31, 2012 |
The following table indicates the effect of derivatives, by primary risk exposure, on the (Consolidated) Statements of Operations for the period ended October 31, 2012:
| | | | | | | | | | | | |
| | | Realized Gain (Loss) | | | Change in Net Unrealized
Appreciation (Depreciation) | |
Primary Risk Exposure | | Statements of Operations | | Value | | | Statements of Operations | | Value | |
Macro Allocation | | | | | | | | | | | | |
Currency | | Forward foreign currency
contracts | | $ | 144,558 | | | Forward foreign currency contracts | | $ | 162,198 | |
Interest rate | | Futures contracts | | | (388,380 | ) | | Futures contracts | | | (56,856 | ) |
Equity | | Futures contracts | | | 1,215,098 | | | Futures contracts | | | (312,848 | ) |
Interest rate | | Options | | | 3,000 | | | Options | | | (17,245 | ) |
Equity | | Options | | | (276,823 | ) | | Options | | | (74,202 | ) |
Equity | | Swaps | | | (54,431 | ) | | Swaps | | | 62,106 | |
Commodity Strategy Long/Short | | | | | | | | | | | | |
Commodities | | Swaps | | | — | | | Swaps | | | (215,187 | ) |
(9) Fund Share Transactions
The following table summarizes the activity in capital shares of each Fund for the period ending October 31, 2012:
| | | | | | | | | | | | | | | | |
| | | Macro Allocation (a) | | | Commodity Strategy
Long/Short (b) | |
Class N Shares | | Shares | | | Dollars | | | Shares | | | Dollars | |
Shares sold | | | 1,022,549 | | | $ | 11,087,240 | | | | 115,868 | | | $ | 1,159,178 | |
Reinvestment of distributions | | | 719 | | | | 7,331 | | | | — | | | | — | |
Less shares redeemed | | | (132,980 | ) | | | (1,505,829 | ) | | | — | | | | — | |
| | | | | | | | | | | | | | | | |
Net increase (decrease) | | | 890,288 | | | $ | 9,588,742 | | | | 115,868 | | | $ | 1,159,178 | |
| | | | | | | | | | | | | | | | |
| | | | |
Class I Shares | | Shares | | | Dollars | | | Shares | | | Dollars | |
Shares sold | | | 2,177,995 | | | $ | 23,940,881 | | | | 1,237,719 | | | $
| 12,396,408
|
|
Reinvestment of distributions | | | 2,285 | | | | 23,303 | | | | — | | | | — | |
Less shares redeemed | | | (137,895 | ) | | | (1,553,047 | ) | | | (42,950 | ) | | | (433,108 | ) |
| | | | | | | | | | | | | | | | |
Net increase (decrease) | | | 2,042,385 | | | $ | 22,411,137 | | | | 1,194,769 | | | $ | 11,963,300 | |
| | | | | | | | | | | | | | | | |
| | | | |
Total | | Shares | | | Dollars | | | Shares | | | Dollars | |
Shares sold | | | 3,200,544 | | | $ | 35,028,121 | | | | 1,353,587 | | | $
| 13,555,573
|
|
Reinvestment of distributions | | | 3,004 | | | | 30,634 | | | | — | | | | — | |
Less shares redeemed | | | (270,875 | ) | | | (3,058,876 | ) | | | (42,950 | ) | | | (433,095 | ) |
| | | | | | | | | | | | | | | | |
Net increase (decrease) | | | 2,932,673 | | | $ | 31,999,879 | | | | 1,310,637 | | | $ | 13,122,478 | |
| | | | | | | | | | | | | | | | |
| (a) | | For the period from November 29, 2011 (Commencement of Operations) to October 31, 2012. |
| (b) | | For the period from April 25, 2012 (Commencement of Operations) to October 31, 2012. |
October 31, 2012 | William Blair Funds 25 |
Financial Highlights
Macro Allocation Fund
| | | | |
| | | Class N | |
| | | Period Ended
October 31, | |
| | | 2012(a) | |
Net asset value, beginning of period | | $ | 10.00 | |
Income (loss) from investment operations: | | | | |
Net investment income (loss) | | | 0.11 | |
Net realized and unrealized gain (loss) on investments | | | 1.24 | |
| | | | |
Total from investment operations | | | 1.35 | |
Less distributions from: | | | | |
Net investment income | | | 0.07 | |
Net realized gain | | | — | |
| | | | |
Total distributions | | | 0.07 | |
| | | | |
Net asset value, end of period | | $ | 11.28 | |
| | | | |
Total Return (%)* | | | 13.61 | |
Ratios to average daily net assets (%)**: | | | | |
Expenses (excluding short dividend expense), net of waivers and reimbursement | | | 1.35 | |
Expenses, net of waivers and reimbursements | | | 1.41 | |
Expenses, before waivers and reimbursements | | | 2.95 | |
Net investment income (loss), net of waivers and reimbursements | | | 1.18 | |
Net investment income (loss), before waivers and reimbursements | | | (0.36 | ) |
| |
Class N net assets at end of period | | $ | 10,045,079 | |
Portfolio turnover rate (%)* | | | 40 | |
| | | | |
| | | Class I | |
| | | Period Ended
October 31, | |
| | | 2012(a) | |
Net asset value, beginning of period | | $ | 10.00 | |
Income (loss) from investment operations: | | | | |
Net investment income (loss) | | | 0.16 | |
Net realized and unrealized gain (loss) on investments | | | 1.22 | |
| | | | |
Total from investment operations | | | 1.38 | |
Less distributions from: | | | | |
Net investment income | | | 0.07 | |
Net realized gain | | | — | |
| | | | |
Total distributions | | | 0.07 | |
| | | | |
Net asset value, end of period | | $ | 11.31 | |
| | | | |
Total Return (%)* | | | 13.91 | |
Ratios to average daily net assets (%)**: | | | | |
Expenses (excluding short dividend expense), net of waivers and reimbursement | | | 1.10 | |
Expenses, net of waivers and reimbursements | | | 1.18 | |
Expenses, before waivers and reimbursements | | | 2.94 | |
Net investment income (loss), net of waivers and reimbursements | | | 1.67 | |
Net investment income (loss), before waivers and reimbursements | | | (0.09 | ) |
| |
Class I net assets at end of period | | $ | 23,094,688 | |
Portfolio turnover rate (%)* | | | 40 | |
| (a) | | For the period from November 29, 2011 (Commencement of Operations) to October 31, 2012. |
| * | | Rates not annualized for periods that are less than a year. |
| ** | | Ratios are annualized for periods that are less than a year. |
Performance cited represents past performance. Past performance does not guarantee future results and current performance may be lower or higher than the data quoted. Results shown are annual returns, which assume reinvestment of dividends and capital gains. Investment returns and principal will fluctuate and you may have a gain or loss when you sell shares. For the most current month-end performance information, please call 1-800-742-7272 or visit our Web site at www.williamblairfunds.com.
Note: Net investment income (loss) per share is based on the average shares outstanding during the year.
26 Annual Report | October 31, 2012 |
Financial Highlights
Commodity Strategy Long/Short Fund
| | | | |
| | | Class N | |
| | | Period Ended
October 31, | |
| | | 2012(a) | |
Net asset value, beginning of period | | $ | 10.00 | |
Income (loss) from investment operations: | | | | |
Net investment income (loss) | | | (0.02 | ) |
Net realized and unrealized gain (loss) on investments | | | (0.09 | ) |
| | | | |
Total from investment operations | | | (0.11 | ) |
Less distributions from: | | | | |
Net investment income | | | — | |
Net realized gain | | | — | |
| | | | |
Total distributions | | | — | |
| | | | |
Net asset value, end of period | | $ | 9.89 | |
| | | | |
Total Return (%)* | | | (1.10 | ) |
Ratios to average daily net assets (%)**: | | | | |
Expenses, net of waivers and reimbursements | | | 1.95 | |
Expenses, before waivers and reimbursements | | | 5.88 | |
Net investment income (loss), net of waivers and reimbursements | | | (0.30 | ) |
Net investment income (loss), before waivers and reimbursements | | | (4.23 | ) |
| |
Class N net assets at end of period | | $ | 1,146,277 | |
Portfolio turnover rate (%)* | | | 5 | |
| | | | |
| | | Class I | |
| | | Period Ended
October 31, | |
| | | 2012(a) | |
Net asset value, beginning of period | | $ | 10.00 | |
Income (loss) from investment operations: | | | | |
Net investment income (loss) | | | 0.00 | |
Net realized and unrealized gain (loss) on investments | | | (0.09 | ) |
| | | | |
Total from investment operations | | | (0.09 | ) |
Less distributions from: | | | | |
Net investment income | | | — | |
Net realized gain | | | — | |
| | | | |
Total distributions | | | — | |
| | | | |
Net asset value, end of period | | $ | 9.91 | |
| | | | |
Total Return (%)* | | | (0.90 | ) |
Ratios to average daily net assets (%)**: | | | | |
Expenses, net of waivers and reimbursements | | | 1.70 | |
Expenses, before waivers and reimbursements | | | 5.55 | |
Net investment income (loss), net of waivers and reimbursements | | | (0.05 | ) |
Net investment income (loss), before waivers and reimbursements | | | (3.90 | ) |
| |
Class I net assets at end of period | | $ | 11,835,553 | |
Portfolio turnover rate (%)* | | | 5 | |
| (a) | | For the period from April 25, 2012 (Commencement of Operations) to October 31, 2012. |
| * | | Rates not annualized for periods that are less than a year. |
| ** | | Ratios are annualized for periods that are less than a year. |
Performance cited represents past performance. Past performance does not guarantee future results and current performance may be lower or higher than the data quoted. Results shown are annual returns, which assume reinvestment of dividends and capital gains. Investment returns and principal will fluctuate and you may have a gain or loss when you sell shares. For the most current month-end performance information, please call 1-800-742-7272 or visit our Web site at www.williamblairfunds.com.
Note: Net investment income (loss) per share is based on the average shares outstanding during the year.
October 31, 2012 | William Blair Funds 27 |
REPORT OF INDEPENDENT REGISTERED PUBLIC ACCOUNTING FIRM
The Board of Trustees and Shareholders of William Blair Funds
We have audited the accompanying statements of assets and liabilities, including the portfolio of investments, of Macro Allocation Fund and Commodity Strategy Long/Short Fund (Consolidated) (collectively, the Funds) (two of the Funds constituting the William Blair Funds) as of October 31, 2012, and the related statements of operations, statements of changes in net assets and financial highlights for the periods indicated therein. These financial statements and financial highlights are the responsibility of the Funds’ management. Our responsibility is to express an opinion on these financial statements and financial highlights based on our audits.
We conducted our audits in accordance with the standards of the Public Company Accounting Oversight Board (United States). Those standards require that we plan and perform the audits to obtain reasonable assurance about whether the financial statements and financial highlights are free of material misstatement. We were not engaged to perform an audit of the Funds’ internal control over financial reporting. Our audits included consideration of internal control over financial reporting as a basis for designing audit procedures that are appropriate in the circumstances, but not for the purpose of expressing an opinion on the effectiveness of the Funds’ internal control over financial reporting. Accordingly, we express no such opinion. An audit also includes examining, on a test basis, evidence supporting the amounts and disclosures in the financial statements and financial highlights, assessing the accounting principles used and significant estimates made by management, and evaluating the overall financial statement presentation. Our procedures included confirmation of securities owned as of October 31, 2012, by correspondence with the custodian and brokers. We believe that our audits provide a reasonable basis for our opinion.
In our opinion, the financial statements and financial highlights referred to above present fairly, in all material respects, the financial position of Macro Allocation Fund and Commodity Strategy Long/Short Fund (Consolidated) at October 31, 2012, the results of their operations, the changes in their net assets and financial highlights for the periods indicated therein, in conformity with U.S. generally accepted accounting principles.

Chicago, Illinois
December 14, 2012
28 Annual Report | October 31, 2012 |
Trustees and Officers (Unaudited). The trustees and officers of the William Blair Funds, their year of birth, their principal occupations during the last five years, their affiliations, if any, with William Blair & Company, L.L.C., and other significant affiliations are set forth below. The address of each trustee and officer is 222 West Adams Street, Chicago, Illinois 60606.
| | | | | | | | | | |
Name and Year of Birth | | Position(s)
Held with
Fund | | Term of
Office and
Length of
Time
Served(1) | | Principal Occupation(s) During Past 5 Years(2) | | Number of
Portfolios
in Fund
Complex
Overseen
by Trustee | | Other Directorships Held by Trustee/Officer |
Interested Trustees | | | | | | | | | | |
Michelle R. Seitz,
1965* | | Chairman of the Board of Trustees and President | | Trustee since 2002; Chairman since 2010 Since 2007 | | Partner, William Blair & Company, L.L.C.; Limited Partner, WBC Holdings, L.P. (since November 2008); Member, WBC GP, L.L.P. (since November 2008) | | 25 | | Chairman, William Blair SICAV; Financial Accounting Foundation (FAF) |
| | | | | |
Richard W. Smirl,
1967* | | Trustee and Senior Vice President | | Trustee since 2010 and Senior Vice President Since 2007 | | Partner, William Blair & Company, L.L.C.; Limited Partner, WBC Holdings, L.P. (since November 2008) | | 25 | | Director, William Blair SICAV |
| | | | |
Non-Interested Trustees | | | | | | | | |
Vann A. Avedisian,
1964 | | Trustee | | Since 2012 | | Principal, Highgate Holdings since 2009; formerly, Co-founder and Managing Director, Oxford Capital Partners, Inc. from 1994 to 2006 | | 25 | | Potbelly Sandwich Works, LLC |
| | | | | |
Phillip O. Peterson,
1944 | | Trustee | | Since 2007 | | Retired; formerly, President, Strong Mutual Funds, 2004-2005; formerly, Partner, KPMG LLP | | 25 | | The Hartford Group of Mutual Funds (87 portfolios); Symetra Mutual Funds Trust (variable annuity funds) (14 portfolios) |
| | | | | |
Donald J. Reaves,
1946 | | Trustee | | Since 2004 | | Chancellor, Winston-Salem State University since 2007; formerly, Vice President for Administration and Chief Financial Officer, University of Chicago 2002-2007. | | 25 | | American Student Assistance Corp., guarantor of student loans; Amica Mutual Insurance Company |
| | | | | |
Donald L. Seeley,
1944 | | Trustee | | Since 2003 | | Retired; formerly, Director, Applied Investment Management Program, University of Arizona Department of Finance, prior thereto, Vice Chairman and Chief Financial Officer, True North Communications, Inc., marketing communications and advertising firm | | 25 | | Warnaco Group, Inc., intimate apparel, sportswear, and swimwear manufacturer; Center for Furniture Craftsmanship (not-for-profit) |
| | | | | |
Thomas J. Skelly,
1951 | | Trustee | | Since 2007 | | Advisory Board Member for various U.S. Companies; Director and Investment Committee Chairman of the US Accenture Foundation, Inc.; prior to 2005, Managing Partner of various divisions at Accenture | | 25 | | Mutual Trust Financial Group, provider of insurance and investment products; Board Member First MetLife Investors Insurance Company, NY Chartered Company for Metropolitan Life Insurance |
October 31, 2012 | William Blair Funds 29 |
| | | | | | | | | | |
Name and Year of Birth | | Position(s)
Held with
Fund | | Term of
Office and
Length of
Time
Served(1) | | Principal Occupation(s) During Past 5 Years(2) | | Number of
Portfolios
in Fund
Complex
Overseen
by Trustee | | Other Directorships Held by Trustee/Officer |
Officers | | | | | | | | | | |
Michael P. Balkin,
1959 | | Senior Vice President Vice President | | Since 2009 2008-2009 | | Partner, William Blair & Company, L.L.C. Associate, William Blair & Company, L.L.C.; former Partner, Magnetar Capital (2005-2009) | | | | N/A |
| | | | | |
Karl W. Brewer,
1966 | | Senior Vice President | | Since 2000 | | Partner, William Blair & Company, L.L.C. | | | | N/A |
| | | | | |
David C. Fording,
1967 | | Senior Vice President Vice President | | Since 2009 2006-2009 | | Partner, William Blair & Company, L.L.C. Associate, William Blair & Company, L.L.C.; former Portfolio Manager, TIAA-CREF. | | | | N/A |
| | | | | |
James S. Golan,
1961 | | Senior Vice President | | Since 2005 | | Partner, William Blair & Company, L.L.C. | | | | N/A |
| | | | | |
W. George Greig,
1952 | | Senior Vice President | | Since 1996 | | Partner, William Blair & Company, L.L.C. | | | | N/A |
| | | | | |
Michael A. Jancosek,
1959 | | Senior Vice President | | Since 2004 | | Partner, William Blair & Company L.L.C. | | | | N/A |
| | | | | |
John F. Jostrand,
1954 | | Senior Vice President | | Since 1999 | | Partner, William Blair & Company, L.L.C. | | | | N/A |
| | | | | |
Chad M. Kilmer,
1975 | | Senior Vice President Vice President | | Since 2011 2006-2011 | | Partner, William Blair & Company, L.L.C. Associate, William Blair & Company, L.L.C.; former analyst and Portfolio Manager U.S. Bancorp Asset Management. | | | | N/A |
| | | | | |
Robert C. Lanphier, IV,
1956 | | Senior Vice President | | Since 2003 | | Partner, William Blair & Company, L.L.C. | | | | Chairman, AG. Med, Inc. |
| | | | | |
Mark T. Leslie,
1967 | | Senior Vice President Vice President | | Since 2008 2005-2008 | | Partner, William Blair & Company, L.L.C. Associate, William Blair & Company, L.L.C. | | | | N/A |
| | | | | |
Matthew A. Litfin,
1972 | | Senior Vice President | | Since 2008 | | Partner, William Blair & Company, L.L.C. | | | | N/A |
| | | | | |
Kenneth J. McAtamney
1966 | | Senior Vice President | | Since 2008 | | Partner, William Blair & Company, L.L.C. | | | | N/A |
30 Annual Report | October 31, 2012 |
| | | | | | | | |
Name and Year of Birth | | Position(s) Held with Fund | | Term of
Office and
Length of Time
Served(1) | | Principal Occupation(s) During Past 5 Years(2) | | Other Directorships Held by Trustee/Officer |
Todd M. McClone,
1968 | | Senior Vice President Vice President | | Since 2006 2005-2006 | | Partner, William Blair & Company, L.L.C. Associate, William Blair & Company, L.L.C. | | N/A N/A |
| | | | |
David Merjan,
1960 | | Senior Vice President | | Since 2008 | | Partner, William Blair & Company, L.L.C. | | N/A |
| | | | |
David S. Mitchell,
1960 | | Senior Vice President | | Since 2004 | | Partner, William Blair & Company, L.L.C. | | N/A |
| | | | |
David P. Ricci,
1958 | | Senior Vice President | | Since 2006 | | Partner, William Blair & Company, L.L.C. | | N/A |
| | | | |
Brian D. Singer,
1960 | | Senior Vice President Vice President | | Since 2012 2011-2012 | | Partner, William Blair & Company, L.L.C. Associate, William Blair & Company, L.L.C. (since 2011); prior thereto, Managing Partner, Singer Partners, LLC (2009-2011); prior thereto, UBS Global Asset Management (Americas) Inc. (2003-2007) | | N/A |
| | | | |
Paul J. Sularz,
1967 | | Senior Vice President Vice President | | Since 2012 2009-2012 | | Partner, William Blair & Company, L.L.C. Associate, William Blair & Company, L.L.C.; Vice President, J.P. Morgan Securities, Inc. | | N/A |
| | | | |
Jeffrey A. Urbina,
1955 | | Senior Vice President | | Since 1998 | | Partner, William Blair & Company, L.L.C. | | N/A |
| | | | |
Christopher T. Vincent,
1956 | | Senior Vice President | | Since 2004 | | Partner, William Blair & Company, L.L.C. | | N/A |
| | | | |
Kathleen M. Lynch,
1971 | | Vice President | | Since 2010 | | Associate, William Blair & Company, L.L.C. | | N/A |
| | | | |
David F. Hone,
1967 | | Vice President | | Since 2011 | | Associate, William Blair & Company, L.L.C. (since 2011); prior thereto, Portfolio Manager Large Cap Value, Deutsche Asset Management (2002-2010) | | N/A |
| | | | |
John Abunassar,
1967 | | Vice President | | Since 2011 | | Associate, William Blair & Company, L.L.C. (since 2011); prior thereto, Principal, Guidance Capital LLC (2009-2011); prior thereto. President and CEO of Allegiant Asset Management (2004-2009) | | N/A |
| | | | |
Peter Carl,
1967 | | Vice President | | Since 2011 | | Associate, William Blair & Company L.L.C. (since 2011); prior thereto, Portfolio Manager, Guidance Capital LLC (2006-2011) | | N/A |
| | | | |
D. Trowbridge Elliman III, 1957 | | Vice President | | Since 2011 | | Associate, William Blair & Company L.L.C. (since 2011); prior thereto, Principal, Guidance Capital LLC (2001-2011) | | N/A |
October 31, 2012 | William Blair Funds 31 |
| | | | | | | | |
Name and Year of Birth | | Position(s) Held with Fund | | Term of
Office and
Length of Time
Served(1) | | Principal Occupation(s) During Past 5 Years(2) | | Other Directorships Held by Trustee/Officer |
Christopher Walvoord,
1966 | | Vice President | | Since 2011 | | Associate, William Blair & Company, L.L.C. (since 2011); prior thereto, Principal, Guidance Capital LLC (2002-2011) | | N/A |
| | | | |
Brian Ziv,
1957 | | Vice President | | Since 2011 | | Associate, William Blair & Company, L.L.C. (since 2011); prior thereto, Principal, Guidance Capital LLC (2001-2011) | | N/A |
| | | | |
Edwin Denson,
1967 | | Vice President | | Since 2011 | | Associate, William Blair & Company, L.L.C. (since 2011); prior thereto, Managing Partner, Singer Partners, LLC (2009-2011); prior thereto, UBS Global Asset Management (Americas) Inc. (2001-2009) | | N/A |
| | | | |
Thomas Clarke,
1968 | | Vice President | | Since 2011 | | Associate, William Blair & Company, L.L.C. (since 2011); prior thereto, Managing Partner, Singer Partners, LLC (2009-2011); prior thereto, UBS Global Asset Management (Americas) Inc. (2000-2009) | | N/A |
| | | | |
Walter R. Randall, Jr.,
1960 | | Chief Compliance Officer and Assistant Secretary | | Since 2009 | | Associate, William Blair & Company, L.L.C. (since 2008); prior thereto, Associate Counsel and Chief Compliance Officer, Calamos Investments (2006-2008) | | N/A |
| | | | |
Colette M. Garavalia,
1961 | | Treasurer | | Since 2009 | | Associate, William Blair & Company, L.L.C. | | N/A |
| | | | |
| | Secretary | | 2000-2009 | | Associate, William Blair & Company, L.L.C. | | N/A |
| | | | |
Andrew T. Pfau,
1970 | | Secretary | | Since 2009 | | Associate, William Blair & Company, L.L.C. (since 2008); prior thereto, Associate, Bell, Boyd & Lloyd, LLP (2006-2008) | | N/A |
| | | | |
John M. Raczek,
1970 | | Assistant Treasurer | | Since 2010 | | Associate, William Blair & Company, L.L.C. (since 2009); prior thereto, Manager, Calamos Investments (2003-2009) | | N/A |
| * | | Ms. Seitz and Mr. Smirl are interested persons of the William Blair Funds because each is a partner of William Blair & Company, L.L.C., the Fund’s investment advisor, principal underwriter and distributor. |
| (1) | | Each Trustee serves until the election and qualification of a successor, or until death, resignation or retirement or removal as provided in the Fund’s Declaration of Trust. Retirement for non-interested Trustees occurs no later than at the conclusion of the first regularly scheduled Board meeting of the Fund’s fiscal year that occurs after the earlier of (a) the non-interested Trustee’s 72nd birthday or (b) the 15th anniversary of the date that the non-interested Trustee was first elected or appointed as a member of the Board of Trustees. The Fund’s officers, except the Chief Compliance Officer, are elected annually by the Trustees. The Fund’s Chief Compliance Officer is designated by the Board of Trustees and may only be removed by action of the Board of Trustees, including a majority of the non-interested Trustees. |
| (2) | | In November 2008, all partners of William Blair & Company, L.L.C. also became limited partners in WBC Holdings, L.P. |
The Statement of Additional Information for the William Blair Funds includes additional information about the trustees and is available without charge by calling 1-800-635-2886 (in Massachusetts 1-800-635-2840) or by writing the Fund.
32 Annual Report | October 31, 2012 |
(unaudited)
Proxy Voting
A description of the policies and procedures that the Fund uses to determine how to vote proxies relating to portfolio securities and information regarding how the Fund voted proxies relating to portfolio securities for the most recent 12-month period ended June 30 are available without charge, upon request, by calling 1-800-635-2886 (in Massachusetts 1-800-635-2840), at www.williamblairfunds.com and on the SEC’s website at http://www.sec.gov.
Quarterly Portfolio Schedules
Each Fund files its complete schedule of portfolio holdings with the SEC for the first and third fiscal quarters of each fiscal year (quarters ended January 31 and July 31) on Form N-Q. The Fund’s Forms N-Q are available on the SEC’s website at http://www.sec.gov and may be reviewed and copied at the SEC’s Public Reference Room in Washington, D.C. Information on the operation of the SEC’s Public Reference Room may be obtained by calling 1-800-SEC-0330. The Fund’s Forms N-Q are also available on the Fund’s website at www.williamblairfunds.com.
Shareholder Meeting Results
A Special Meeting of Shareholders (the “Meeting”) of William Blair Funds (the “Trust”) was held on August 2, 2012 in the 2nd Floor Conference Room at 222 West Adams Street, Chicago, Illinois 60606. At the Meeting, the following matter was voted upon by shareholders (the resulting votes are presented below).
| 1. | Election of Trustees to the Board of Trustees of the Trust. (“Number of Votes” represents all series of the Trust.) |
| | | | |
| | | Number of Votes: |
Trustee | | For | | Withhold |
Vann A. Avedisian | | 1,644,687,158.154 | | 12,090,164.011 |
Phillip O. Peterson | | 1,644,159,693.572 | | 12,617,628.593 |
Lisa A. Pollina* | | 1,644,478,204.339 | | 12,299,117.826 |
Donald J. Reaves | | 1,642,694,755.277 | | 14,082,566.888 |
Donald L. Seeley | | 1,644,312,102.168 | | 12,465,219.997 |
Michelle R. Seitz | | 1,640,209,136.710 | | 16,568,185.455 |
Thomas J. Skelly | | 1,643,851,882.961 | | 12,925,439.204 |
Richard W. Smirl | | 1,640,721,918.768 | | 16,055,403.397 |
| * | | Ms. Pollina resigned from the Board of Trustees on October 23, 2012. |
October 31, 2012 | William Blair Funds 33 |
Useful Information About Your Report (unaudited)
Please refer to this information when reviewing the Expense Example for each Portfolio.
Expense Example
As a shareholder of a Portfolio, you incur two types of costs: (1) transaction costs such as redemption fees and (2) ongoing costs, including management fees, distribution (12b-1) fees, service fees, shareholder administration fees and other Portfolio expenses. The example is intended to help you understand your ongoing costs (in dollars) of investing in the Portfolio and to compare these costs with the ongoing costs of investing in other mutual funds. To do so, compare the Portfolio’s 5% hypothetical example with the 5% hypothetical examples that appear in the shareholder reports of other funds. The example is based on an investment of $1,000 invested at the beginning of the period and held for the entire six-month period from May 1, 2012 to October 31, 3012.
Actual Expenses
In each example, the first line for each share class in the table provides information about the actual account values and actual expenses. These expenses reflect the effect of any expense cap applicable to the share class during the period. Without this expense cap, the costs shown in the table would have been higher. You may use the information in this line, together with the amount you invested, to estimate the expenses that you paid over the period. Simply divide your account value by $1,000 (example, an $8,600 account value divided by $1,000 = 8.6), then multiply the result by the number in the first line under the heading entitled “Expenses Paid During the Period” to estimate the expenses you paid on your account during the period.
Hypothetical Example for Comparison Purposes
In each example, the second line for each share class in the table provides information about hypothetical account values and hypothetical expenses based on the Portfolio’s actual expense ratio and an assumed rate of return of 5% per year before expenses. This is not the Portfolio’s actual return. The hypothetical account values and expenses may not be used to estimate the actual ending account balance or expenses you paid for the period. You may use this information to compare the ongoing costs of investing in the Portfolio to other funds. To do so, compare this 5% hypothetical example with the 5% hypothetical examples that appear in the shareholder reports of other funds.
Please note that the expenses shown in both examples are meant to highlight your ongoing costs only and do not reflect any transactional costs or account type fees, such as redemption fees and IRA Fiduciary Administration fees, respectively. These fees are fully described in the prospectus. Therefore, the second line of each share class in the table is useful in comparing ongoing costs only and will not help you determine the relative costs of owning different funds. In addition, if these transactional costs or account fees were included, your costs would have been higher.
The expenses shown in the examples do not reflect the fees of the Commodity Strategy Long/Short Fund’s Swap, which are described in the Footnote 1(b) in the Notes to Financial Statements. The costs of the Swap will affect the Fund’s performance.
34 Annual Report | October 31, 2012 |
Fund Expenses (unaudited)
The examples below show you the ongoing costs (in dollars) of investing in your fund and allows you to compare these costs with those of other mutual funds. Please refer to the previous page for a detailed explanation of the information presented on this chart.
| | | | | | | | | | | | | | | | |
Expense Example | | Beginning
Account Value
5/1/2012 | | | Ending
Account Value
10/31/2012 | | | Expenses Paid
During
the Period(a) | | | Annualized
Expense Ratio | |
Macro Allocation Fund | | | | | | | | | | | | | | | | |
Class N—actual return | | $ | 1,000.00 | | | $ | 1,040.60 | | | $ | 7.23 | | | | 1.41 | % |
Class N—hypothetical 5% return | | | 1,000.00 | | | | 1,018.35 | | | | 7.15 | | | | 1.41 | |
Class I—actual return | | | 1,000.00 | | | | 1,042.40 | | | | 6.06 | | | | 1.18 | |
Class I—hypothetical 5% return | | | 1,000.00 | | | | 1,019.61 | | | | 5.99 | | | | 1.18 | |
| | | | |
Expense Example | | Beginning
Account Value
5/1/2012 | | | Ending
Account Value
10/31/2012 | | | Expenses Paid
During
the Period(a) | | | Annualized
Expense Ratio | |
Commodity Strategy Long/Short Fund | | | | | | | | | | | | | | | | |
Class N—actual return | | $ | 1,000.00 | | | $ | 987.00 | | | $ | 9.74 | | | | 1.95 | % |
Class N—hypothetical 5% return | | | 1,000.00 | | | | 1,015.33 | | | | 9.88 | | | | 1.95 | |
Class I—actual return | | | 1,000.00 | | | | 989.00 | | | | 8.50 | | | | 1.70 | |
Class I—hypothetical 5% return | | | 1,000.00 | | | | 1,016.59 | | | | 8.62 | | | | 1.70 | |
| (a) | | Expenses are equal to the annualized expense ratio, multiplied by the average account value over the period, multiplied by the number of days in the period 184, and divided by 366 (to reflect the one-half year period). |
October 31, 2012 | William Blair Funds 35 |
BOARD OF TRUSTEES
Vann A. Avedisian
Principal, Highgate Holdings
Phillip O. Peterson
Retired Partner, KPMG LLP
Donald J. Reaves
Chancellor, Winston-Salem State University
Donald L. Seeley
Retired Adjunct Lecturer and Director, University of Arizona Department of Finance
Michelle R. Seitz, Chairman and President
Partner, William Blair & Company, L.L.C.,
Thomas J. Skelly
Retired Managing Partner, Accenture U.S.
Richard W. Smirl, Senior Vice President
Partner, William Blair & Company L.L.C.
Officers
Michael P. Balkin, Senior Vice President
Karl W. Brewer, Senior Vice President
David C. Fording, Senior Vice President
James S. Golan, Senior Vice President
W. George Greig, Senior Vice President
Michael A. Jancosek, Senior Vice President
John F. Jostrand, Senior Vice President
Chad M. Kilmer, Senior Vice President
Robert C. Lanphier, IV, Senior Vice President
Mark T. Leslie, Senior Vice President
Matthew A. Litfin, Senior Vice President
Kenneth J. McAtamney, Senior Vice President
Todd M. McClone, Senior Vice President
David Merjan, Senior Vice President
David S. Mitchell, Senior Vice President
David P. Ricci, Senior Vice President
Jeffrey A. Urbina, Senior Vice President
Christopher T. Vincent, Senior Vice President
Kathleen M. Lynch, Vice President
Paul J. Sularz, Senior Vice President
David F. Hone, Vice President
John Abunassar, Vice President
Peter Carl, Vice President
D. Trowbridge Elliman III, Vice President
Christopher Walvoord, Vice President
Brian Ziv, Vice President
Brian D. Singer, Senior Vice President
Edwin Denson, Vice President
Thomas Clarke, Vice President
Walter R. Randall, Jr., Chief Compliance Officer and Assistant Secretary
Colette M. Garavalia, Treasurer
Andrew T. Pfau, Secretary
John M. Raczek, Assistant Treasurer
Investment Advisor
William Blair & Company, L.L.C.
Independent Registered Public Accounting Firm
Ernst & Young LLP
Legal Counsel
Vedder Price P.C.
Transfer Agent
Boston Financial Data Services, Inc.
P.O. Box 8506
Boston, MA 02266-8506
For customer assistance, call 1-800-635-2886
(Massachusetts 1-800-635-2840)
36 Annual Report | October 31, 2012 |
William Blair Funds
Multi-Asset and Alternatives
Macro Allocation Fund
Commodity Strategy Long/Short Fund
| | | | |
| | | | ©William Blair & Company, L.L.C., distributor |
 | | +1 800 742 7272 williamblairfunds.com | | 222 West Adams Street Chicago, Illinois 60606 |
As of the end of the period covered by this Form N-CSR, the Registrant has adopted a code of ethics that applies to its principal executive officer and principal financial officer. Such code of ethics is posted on the Registrant’s website: www.williamblairfunds.com. There were no amendments to or waivers of the code of ethics during the period covered by this report.
| Item 3. | Audit Committee Financial Expert |
The Registrant’s Board of Trustees has determined that the Registrant has at least one “audit committee financial expert” (as defined in Item 3 of Form N-CSR) serving on its Audit Committee. Mr. Phillip O. Peterson, the Registrant’s audit committee financial expert, is “independent” for purposes of Item 3 to Form N-CSR.
An “audit committee financial expert” is not an “expert” for any purpose, including for purposes of Section 11 of the Securities Act of 1933, as a result of being designated as an “audit committee financial expert.” Further, the designation of a person as an “audit committee financial expert” does not mean that the person has any greater duties, obligations, or liability than those imposed on the person without the “audit committee financial expert” designation. Similarly, the designation of a person as an “audit committee financial expert” does not affect the duties, obligations, or liability of any other member of the audit committee or Board of Trustees.
| Item 4. | Principal Accountant Fees and Services |
Audit Fees
For the fiscal year ended October 31, 2012, Ernst & Young, LLP, the Registrant’s principal accountant (“E&Y”), billed the Registrant $90,000, for professional services rendered for the audit of the Registrant’s annual financial statements or services that are normally provided in connection with statutory and regulatory filings.
Audit-Related Fees
For the fiscal years ended October 31, 2012, E&Y billed the Registrant $40,000, for assurance and related services that are reasonably related to the performance of the audit of the Registrant’s financial statements and that are not reported above, such as reviewing prospectuses, semiannual reports and SEC filings. For the fiscal years ended October 31, 2010, E&Y provided no audit-related services to William Blair & Company L.L.C., the Registrant’s investment advisor (“William Blair”) or any of its control affiliates that were for engagements directly related to the Registrant’s operations and financial reporting.
Tax Fees
For the fiscal year ended October 31, 2012, E&Y billed the Registrant $29,000, for professional services rendered for tax compliance, tax advice and tax planning. Such services consisted of preparation of tax returns, year-end distribution review, qualifying dividend income analysis and computation of foreign tax credit pass-through. For the fiscal years ended October 31, 2012, E&Y did not bill William Blair and its control affiliates for any services that were for engagements directly related to the Registrant’s operations and financial reporting.
All Other Fees
For the fiscal year ended October 31, 2012, E&Y did not bill the Registrant for products and services other than the services reported above. For the fiscal year ended October 31, 2012, E&Y provided no other services to William Blair or any of its control affiliates that were for engagements directly related to the Registrant’s operations and financial reporting.
Audit Committee Pre-Approval Policies and Procedures
Pursuant to Registrant’s Audit Committee Charter (the “Charter”), the Audit Committee is responsible for pre-approving any engagement of the principal accountant to provide non-prohibited services to the Registrant, including the fees and other compensation to be paid to the principal accountant, to the extent required by Rule 2-01(c)(7) of Regulation S-X. Pursuant to the Charter, the Audit Committee is also responsible for pre-approving any engagement of the principal accountant, including the fees and other compensation to be paid to the principal accountant, to provide non-audit services to the Registrant’s investment advisor (or any entity controlling, controlled by, or under common control with the adviser that provides ongoing services to the Registrant), if the engagement relates directly to the operations and financial reporting of the Registrant, to the extent required by Rule 2-01(c)(7) of Regulation S-X. The Chair of the Audit Committee may grant the pre-approval referenced above for non-prohibited and non-audit services. All such delegated pre-approvals will be presented to the Audit Committee no later than the next Audit Committee meeting.
| Item 5. | Audit Committee of Listed Registrants |
Not Applicable to this Registrant, insofar as the Registrant is not a listed company.
| Item 6. | Schedule of Investments |
See Schedule of Investments in Item 1
| Item 7. | Disclosure of Proxy Voting Policies and Procedures for Closed-End Management Investment Companies |
Not applicable to this Registrant, insofar as the Registrant is not a closed-end management investment company.
| Item 8. | Portfolio Managers of Closed Investment Companies |
Not applicable to this Registrant, insofar as the Registrant is not a closed-end management investment company.
| Item 9. | Purchase of Equity Securities by Closed-End Management Investment Companies and Affiliated Purchasers |
Not applicable to this Registrant, insofar as the Registrant is not a closed-end management investment company.
| Item 10. | Submission of Matters to a Vote of Security Holders |
There have been no material changes to the procedures by which shareholders may recommend nominees to the Registrant’s Board of Trustees since the Registrant last provided disclosure in response to this item.
Controls and Procedures
(a) The Registrant’s principal executive and principal financial officer, or persons performing similar functions, have concluded that the Registrant’s Disclosure Controls and Procedures (as defined in Rule 30a-3(c) under the Investment Company Act of 1940, as amended (the “1940 Act”) (17 CFR 270.30a-3(c)) are effective, as of a date within 90 days of the filing date of this report that includes the disclosure required by this paragraph, based on their evaluation of these controls and procedures required by Rule 30a-3 (b) under the 1940 Act (17 CFR 270.30a-3(b) and Rules 13a-15(b) or 15d-15(b) under the Exchange Act (17 CFR 240.13a-15(b) or 240.15d-15(b)).
(b) There were no changes in the Registrant’s internal control over financial reporting (as defined in Rule 30a-3(d) under the 1940 Act (17 CFR 270.30a-3(d)) that occurred during the final quarter of the period covered by this report that has materially affected, or is reasonably likely to materially affect, the Registrant’s internal control over financial reporting.
12. (a) (1) Code of Ethics
Not applicable because it is posted on Registrant’s website.
12. (a) (2) (1)
Certification of Principal Executive Officer Required by Rule 30a-2(a) of the Investment Company Act.
12. (a) (2) (2)
Certification of Principal Financial Officer Required by Rule 30a-2(a) of the Investment Company Act.
12. (a) (3)
Not applicable to this Registrant.
12. (b)
Certification of Chief Executive Officer and Certification of Chief Financial Officer Required by Rule 30a-2(b) of the Investment Company Act.
Pursuant to the requirements of the Securities Exchange Act of 1934 and the Investment Company Act of 1940, the Registrant has duly caused this report to be signed on its behalf by the undersigned, thereunto duly authorized.
| | |
| | William Blair Funds |
| |
| | | /s/ Michelle R. Seitz |
| By: | | Michelle R. Seitz |
| | President (Chief Executive Officer) |
Date: December 18, 2012
Pursuant to the requirements of the Securities Exchange Act of 1934 and the Investment Company Act of 1940, this report has been signed below by the following persons on behalf of the Registrant and in the capacities and on the dates indicated
| | |
| | | /s/ Michelle R. Seitz |
| By: | | Michelle R. Seitz |
| | President (Chief Executive Officer) |
Date: December 18, 2012
| | |
| | | /s/ Colette M. Garavalia |
| By: | | Colette M. Garavalia |
| | Treasurer (Chief Financial Officer) |
Date: December 18, 2012