UNITED STATES
SECURITIES AND EXCHANGE COMMISSION
Washington, D.C. 20549
Form N-CSR
CERTIFIED SHAREHOLDER REPORT OF REGISTERED
MANAGEMENT INVESTMENT COMPANIES
Investment Company Act File Number 811-5344
William Blair Funds
(Exact name of registrant as specified in charter)
| | |
| 222 West Adams Street, Chicago, IL | | 60606 |
| (Address of principal executive offices) | | (Zip Code) |
Michelle R. Seitz
William Blair Funds
222 West Adams Street, Chicago, IL 60606
(Name and address of agent for service)
Registrant’s telephone number, including area code: 312-236-1600
Date of fiscal year end: December 31
Date of reporting period: December 31, 2010
Form N-CSR is to be used by management investment companies to file reports with the Commission not later than 10 days after the transmission to stockholders of any report that is required to be transmitted to stockholders under Rule 30e-1 under the Investment Company Act of 1940 (17 CFR 270.30e-1). The Commission may use the information provided on Form N-CSR in its regulatory, disclosure review, inspection, and policymaking roles.
A registrant is required to disclose the information specified by Form N-CSR, and the Commission will make this information public. A Registrant is not required to respond to the collection of information contained in Form N-CSR unless the form displays a currently valid Office of Management and Budget (“OMB”) control number. Please direct comments concerning the accuracy of the information collection burden estimates and any suggestions for reducing the burden to Secretary, Securities and Exchange Commission, 450 Fifth Street, NW, Washington, DC 20549-0609. The OMB has reviewed this collection of information under the clearance requirements of 44 U.S.C. (ss) 3507.
| Item 1. | December 31, 2010 Annual Reports transmitted to shareholders. |

ANNUAL REPORT
DECEMBER 31, 2010
Table of Contents
The views expressed in the commentary for each Fund reflect those of the portfolio management team only through the end of the period of the report as stated on the cover. The portfolio management team’s views are subject to change at any time based on market and other conditions and should not be construed as a recommendation. Statements involving predictions, assessments, analyses, or outlook for individual securities, industries, market sectors, and/or markets involve risks and uncertainties, and there is no guarantee they will come to pass.
This report is submitted for the general information of the shareholders of the William Blair Funds. It is not authorized for distribution to prospective investors unless accompanied or preceded by a prospectus of the William Blair Funds. Please carefully consider the Funds’ investment objectives, risks, charges, and expenses before investing. This and other information is contained in the Funds’ prospectus, which you may obtain by calling 1-800-742-7272. Read it carefully before you invest or send money.
December 31, 2010 | William Blair Funds 1 |
PERFORMANCE AS OF DECEMBER 31, 2010—CLASS N SHARES (unaudited)
| | | | | | | | | | | | | | | | | | | | | | | | |
| | | 1 Yr. | | | 3 Yr. | | | 5 Yr. | | | 10 Yr
(or since
inception) | | | Inception
Date | | | Overall
Morningstar
Rating | |
Growth Fund | | | | | | | | | | | | | | | | | | | | | | | | |
Class N | | | 14.05 | | | | (0.38 | ) | | | 4.69 | | | | 1.62 | | | | 3/20/1946 | | |
| ««««
Among 1,504 Large Growth Funds |
|
Morningstar Large Growth | | | 15.53 | | | | (2.34 | ) | | | 2.77 | | | | 0.30 | | | | | | |
Russell 3000® Growth | | | 17.64 | | | | (0.26 | ) | | | 3.88 | | | | 0.30 | | | | | | |
Standard & Poor’s 500 | | | 15.06 | | | | (2.86 | ) | | | 2.29 | | | | 1.41 | | | | | | | | | |
| | | | | | |
Large Cap Growth Fund | | | | | | | | | | | | | | | | | | | | | | | | |
Class N | | | 15.91 | | | | (1.71 | ) | | | 1.99 | | | | (1.67 | ) | | | 12/27/1999 | | |
| «««
Among 1,504 Large Growth Funds |
|
Morningstar Large Growth | | | 15.53 | | | | (2.34 | ) | | | 2.77 | | | | 0.30 | | | | | | |
Russell 1000® Growth | | | 16.71 | | | | (0.47 | ) | | | 3.75 | | | | 0.02 | | | | | | |
| | | | | | |
Small Cap Growth Fund | | | | | | | | | | | | | | | | | | | | | | | | |
Class N | | | 16.16 | | | | 1.53 | | | | 3.17 | | | | 9.77 | | | | 12/27/1999 | | |
| «««
Among 670 Small Growth Funds |
|
Morningstar Small Growth | | | 26.98 | | | | 0.47 | | | | 4.24 | | | | 3.88 | | | | | | |
Russell 2000® Growth | | | 29.09 | | | | 2.18 | | | | 5.30 | | | | 3.78 | | | | | | |
Russell 2000® | | | 26.85 | | | | 2.22 | | | | 4.47 | | | | 6.33 | | | | | | | | | |
| | | | | | |
Mid Cap Growth Fund | | | | | | | | | | | | | | | | | | | | | | | | |
Class N | | | 24.01 | | | | 3.27 | | | | — | | | | 5.82 | | | | 2/1/2006 | | |
| ««««
Among 677 Mid-Cap Growth Funds |
|
Morningstar Mid-Cap Growth | | | 24.61 | | | | (0.48 | ) | | | — | | | | — | | | | | | |
Russell MidCap® Growth | | | 26.38 | | | | 0.97 | | | | — | | | | 3.70 | | | | | | |
| | | | | | |
Small-Mid Cap Growth Fund | | | | | | | | | | | | | | | | | | | | | | | | |
Class N | | | 22.76 | | | | 3.21 | | | | 6.26 | | | | 7.79 | | | | 12/29/2003 | | |
| ««««
Among 677 Mid-Cap Growth Funds |
|
Morningstar Mid-Cap Growth | | | 24.61 | | | | (0.48 | ) | | | 4.58 | | | | — | | | | | | |
Russell 2500™ Growth | | | 28.86 | | | | 2.21 | | | | 5.63 | | | | 7.10 | | | | | | |
| | | | | | |
Global Growth Fund | | | | | | | | | | | | | | | | | | | | | | | | |
Class N | | | 20.52 | | | | (5.09 | ) | | | — | | | | (5.09 | ) | | | 10/15/2007 | | |
| ««
Among 628 World Stock Funds |
|
Morningstar World Stock | | | 13.74 | | | | (3.94 | ) | | | — | | | | — | | | | | | |
MSCI All Country World IMI (net) | | | 14.35 | | | | (3.48 | ) | | | — | | | | (4.59 | ) | | | | | |
| | | | | | |
International Growth Fund | | | | | | | | | | | | | | | | | | | | | | | | |
Class N | | | 20.09 | | | | (6.61 | ) | | | 3.44 | | | | 5.92 | | | | 10/1/1992 | | |
| ««««
Among 209 Foreign Large Growth Funds |
|
Morningstar Foreign Large Growth | | | 14.78 | | | | (5.38 | ) | | | 4.14 | | | | 4.05 | | | | | | |
MSCI All Country World Ex-U.S. IMI (net) | | | 12.73 | | | | (4.38 | ) | | | 5.14 | | | | 6.24 | | | | | | |
| | | | | | |
International Equity Fund | | | | | | | | | | | | | | | | | | | | | | | | |
Class N | | | 10.92 | | | | (8.97 | ) | | | 1.26 | | | | 4.87 | | | | 5/24/2004 | | |
| ««
Among 209 Foreign Large Growth Funds |
|
Morningstar Foreign Large Growth | | | 14.78 | | | | (5.38 | ) | | | 4.14 | | | | — | | | | | | |
MSCI All Country World Ex-U.S. IMI (net) | | | 12.73 | | | | (4.38 | ) | | | 5.14 | | | | 9.72 | | | | | | |
| | | | | | |
International Small Cap Growth Fund | | | | | | | | | | | | | | | | | | | | | | | | |
Class N | | | 25.88 | | | | (1.60 | ) | | | 5.33 | | | | 7.41 | | | | 11/1/2005 | | |
| «««
Among 118 Foreign Small/Mid Growth Funds |
|
Morningstar Foreign Small/Mid Growth | | | 23.04 | | | | (2.88 | ) | | | 5.60 | | | | — | | | | | | |
MSCI All Country World Ex-U.S. Small Cap (net) | | | 25.21 | | | | 0.50 | | | | 7.36 | | | | 9.11 | | | | | | |
| | | | | | |
Emerging Markets Growth Fund | | | | | | | | | | | | | | | | | | | | | | | | |
Class N | | | 23.44 | | | | (6.33 | ) | | | 9.31 | | | | 15.43 | | | | 6/6/2005 | | |
| ««
Among 273 Diversified Emerging Markets Funds |
|
Morningstar Diversified Emerging Markets | | | 19.26 | | | | (2.11 | ) | | | 11.01 | | | | — | | | | | | |
MSCI Emerging Markets IMI (net) | | | 19.90 | | | | 0.35 | | | | 13.23 | | | | 16.84 | | | | | | |
Please see the next page for important disclosure information.
2 Annual Report | December 31, 2010 |
PERFORMANCE AS OF DECEMBER 31, 2010—CLASS N SHARES—CONTINUED (unaudited)
| | | | | | | | | | | | | | | | | | | | | | | | |
| | | 1 Yr. | | | 3 Yr. | | | 5 Yr. | | | 10 Yr
(or since
inception) | | | Inception
Date | | | Overall
Morningstar
Rating | |
Emerging Leaders Growth Fund | | | | | | | | | | | | | | | | | | | | | | | | |
Class N | | | — | | | | — | | | | — | | | | 18.43 | | | | 5/3/2010 | | | | Not rated. | |
MSCI Emerging Markets Large Cap Index (net) | | | — | | | | — | | | | — | | | | 15.64 | | | | | | |
| | | | | | |
Small Cap Value Fund | | | | | | | | | | | | | | | | | | | | | | | | |
Class N | | | 30.94 | | | | 7.02 | | | | 7.11 | | | | 8.77 | | | | 12/23/1996 | | |
| ««««
Among 307 Small Value Funds |
|
Morningstar Small Value | | | 26.17 | | | | 3.92 | | | | 4.22 | | | | 9.40 | | | | | | |
Russell 2000® Value | | | 24.50 | | | | 2.19 | | | | 3.52 | | | | 8.42 | | | | | | |
| | | | | | |
Mid Cap Value Fund | | | | | | | | | | | | | | | | | | | | | | | | |
Class N | | | — | | | | — | | | | — | | | | 8.36 | | | | 5/3/2010 | | | | Not rated. | |
Russell Midcap® Value | | | — | | | | — | | | | — | | | | 7.16 | | | | | | |
| | | | | | |
Bond Fund | | | | | | | | | | | | | | | | | | | | | | | | |
Class N | | | 7.86 | | | | 6.80 | | | | — | | | | 6.48 | | | | 5/1/2007 | | |
| ««««
Among 1,026 Intermediate-Term Bond Funds |
|
Morningstar Intermediate-Term Bond | | | 7.72 | | | | 5.49 | | | | — | | | | — | | | | | | |
Barclays Capital U.S. Aggregate Bond Index | | | 6.54 | | | | 5.90 | | | | — | | | | 6.14 | | | | | | |
| | | | | | |
Income Fund | | | | | | | | | | | | | | | | | | | | | | | | |
Class N | | | 6.04 | | | | 4.36 | | | | 3.67 | | | | 4.13 | | | | 10/1/1990 | | |
| ««
Among 1,026 Intermediate-Term Bond Funds |
|
Morningstar Short-term Bond | | | 7.72 | | | | 5.49 | | | | 5.15 | | | | 5.37 | | | | | | |
Barclays Capital Intermediate Govt./Credit
Bond Index | | | 5.89 | | | | 5.40 | | | | 5.53 | | | | 5.51 | | | | | | |
| | | | | | |
Low Duration Fund | | | | | | | | | | | | | | | | | | | | | | | | |
Class N | | | 1.86 | | | | — | | | | — | | | | 1.15 | | | | 12/1/2009 | | | | Not rated. | |
Morningstar Short-term Bond | | | 4.11 | | | | — | | | | — | | | | — | | | | | | | | | |
Merrill Lynch 1-Year U.S. Treasury Note Index | | | 0.83 | | | | — | | | | — | | | | 0.62 | | | | | | |
Performance cited represents past performance. Past performance does not guarantee future results and current performance may be lower or higher than the data quoted. Results shown are average annual total returns, which assume reinvestment of dividends and capital gains. Investment returns and principal will fluctuate and you may have a gain or a loss when you sell shares. For the most current month-end performance information, please call 1-800-742-7272, or visit our Web site at www.williamblairfunds.com. From time to time, William Blair & Co. (the “Advisor”) may waive fees or reimburse expenses for the Fund. Without these waivers, performance would be lower. Investing in smaller companies involves special risks, including higher volatility and lower liquidity. International and emerging markets investing involves special risk considerations, including currency fluctuations, lower liquidity, economic and political risk. As interest rates rise, bond prices will fall and bond funds may become more volatile. Class N shares are available to the general public without a sales load.
Morningstar RatingsTM are as of 12/31/2010 and are subject to change every month. The ratings are based on a risk-adjusted return measure that accounts for variation in a fund’s monthly performance, placing more emphasis on downward variations and rewarding consistent performance. The top 10% of funds in each Category receive 5 stars, the next 22.5% receive 4 stars, the middle 35% receive 3 stars, the next 22.5% receive 2 stars, and the bottom 10% receive 1 star. The Overall Morningstar Rating for a fund is derived from a weighted-average of the performance figures associated with its three-, five- and ten-year (if applicable) Morningstar Rating metrics. The 3/5/10 year Morningstar ratings were as follows: Growth Fund ««««/««««/««««, and Large Cap Growth Fund «««/«««/««, out of 1,504/1,286/787 large growth funds; Small Cap Growth Fund «««/««/««««, out of 670/563/341 small growth funds; Mid Cap Growth Fund ««««/NA/NA and Small-Mid Cap Growth Fund ««««/««««/NA out of 677/594/NA mid cap growth funds; Small Cap Value Fund ««««/««««/««« out of 307/241/135 small value funds; International Growth Fund ««««/«««/«««« and International Equity Fund ««/««/NA out of 209/162/89 foreign large growth funds; International Small Cap Growth Fund «««/«««/NA out of 118/97/NA foreign small/mid growth funds; Emerging Markets Growth Fund ««/««/NA out of 273/207/NA diversified emerging markets growth funds; Income Fund ««/««/« and Bond Fund ««««/NA/NA out of 1,026/878/560 intermediate-term bond funds; Global Growth Fund ««/NA/NA out of 628/NA/NA world stocks.
Please carefully consider the Funds’ investment objectives, risks, charges, and expenses before investing. This and other information is contained in the Funds’ prospectus, which you may obtain by calling 1-800-742-7272. Read it carefully before you invest or send money.
December 31, 2010 | William Blair Funds 3 |

David C. Fording

John F. Jostrand
GROWTH FUND
The Growth Fund seeks long-term capital appreciation.
AN OVERVIEW FROM THE PORTFOLIO MANAGERS
The Growth Fund increased 14.05% on a total return basis (Class N Shares) for the 12 months ended December 31, 2010. By comparison, the Fund’s benchmark, the Russell 3000® Growth Index, gained 17.64%.
While the Fund’s absolute return was strong, it lagged its benchmark, the Russell 3000® Growth Index, which returned 17.64%. While we are disappointed with these near-term results, the Fund has a strong performance record over the long-term; for the past five years, it returned 4.69% in comparison to the benchmark at 3.88%.
Several factors impacted the Fund’s performance in 2010. First, from a market perspective, macroeconomic forces dominated the psychology of the stock market throughout the year, leading to high stock correlations, making it more challenging for active managers. The pronounced shifts in sentiment, from macroeconomic forces, resulted in relatively high volatility, especially in the first half. More specifically through April, the equity market responded positively to continued signs of a U.S. economic recovery and stronger than expected corporate earnings reports on improved sales growth rather than expense control alone, which had been a big driver of 2009 earnings surprises. Beginning in late April, this trend reversed as equity markets sharply corrected given concerns over the sustainability of economic growth, European sovereign debt, and the possibility of a “double dip” recession. Since summer, while volatility has continued, the market’s direction was up on better-than-expected company earnings, positive economic reports, another round of quantitative easing, and extension of the Bush-era tax cuts. As a general theme, investors sought high confidence stocks with clear earnings visibility, and bid up past winners; this phenomenon was clearly displayed with select mid-cap Technology stocks, which had a powerful move. However, as we have discussed in the past, the Fund’s returns are primarily generated by stock selection. While there were headwinds due to macroeconomic drivers, volatility and momentum stocks, our main challenge was stock selection and cash drag (on average we held 3.0% cash).
The Fund’s weakest single stock was Baxter International Inc., a leading global diversified manufacturer of hospital supplies and medical equipment. We had a sizable position in this more defensive company, and it declined unexpectedly in the second quarter on a competitive pricing issue. As a result, it was sold from the portfolio. Also, in Health Care, CareFusion Corporation, a medical technology company, was challenged due to the unexpected departure announcements of senior executives as well a lower than expected revenues predominantly due to weakness in their respiratory franchise. We eliminated the stock due to management turnover which may cause a potential change in the strategy of the company. Lastly, our Consumer Discretionary positioning was a detractor. Strong results from Johnson Controls, Inc., P.F. Chang’s China Bistro, Inc., and Dick’s Sporting Goods, Inc. could not overcome losses from our positions in for-profit education stocks, DeVry, Inc. and Capella Education Co. These stocks did well in the first quarter, and we cut back our positions in the first half of the year. However, in the third quarter, there were unanticipated regulatory and legislative announcements; that caused uncertainty around future growth rates and profitability, causing both stocks to decline significantly. Heading into the fourth quarter, we believed that these issues were reflected in the stock prices. However, Capella Education’s stock price dropped further on lower enrollment growth that resulted from increased competition for its master’s programs, and some new pressure on education degrees given job prospects for teachers. As a result, we sold the stock in November. We continue to own DeVry, which we believe has attractive academic programs, provides a good value to students, and addresses significant education and training needs in the U.S. workforce. There should be clarity on the regulatory and legislative issues in the coming quarters.
4 Annual Report | December 31, 2010 |
The highest contributor to relative returns for the year was IHS, Inc., the leading global provider of critical technical information primarily to the energy industry; this Industrial firm benefited from accelerating subscription-based organic growth. In our view, the company should continue to see attractive earnings due to further cost rationalization, improved infrastructure with a common technology platform, as well as strategic acquisitions. Another strong performer in Industrials was TransDigm Group, Inc.—an aerospace and defense company. Its business benefited from the improving economy and increased airline miles flown; we expect this trend to continue. In Information Technology, we also had several stocks that stood out. McAfee, Inc., a provider of security software, rallied after it announced its acquisition by Intel. As a result of the acquisition, we sold this stock from the portfolio. Ultimate Software Group, Inc., the leading provider of on-demand payroll and human resources solutions, gained ground on continued momentum in both its Enterprise and Workplace divisions with new customer subscriptions, and add-on products. We expect this firm to continue to see attractive growth, high customer retention, and market share gains. Notably, we were underweight Information Technology for a good portion of the year due to rich earnings multiples, and high expectations for many stocks. Over the past several months, we have found several new opportunities in this sector. In order to fund these positions, in general, our Industrials exposure has come down; it remains an over-weighted sector as it has been all year, but to a lesser degree relative to the benchmark. We have reduced existing positions that have done well and eliminated others with less attractive risk/rewards, in our view.
Looking into 2011, we believe the U.S. economy will likely experience healthy growth as a result of a stabilized and improving macroeconomic environment. The Federal Reserve remains very accommodative with interest rates at all time lows and additional quantitative easing. This stance should assist asset prices, businesses, and ultimately, wages. Also, there is more certainty on high profile government-related issues; for example, the election results are complete with “balanced government” returning to Washington, tax cuts have been extended, and the health care and financial reform bills passed. All of these factors combined should give investors greater comfort with the sustainability of the U.S. economic recovery and the potential for continued economic expansion in 2011.
Despite the positive outlook for 2011, many risks to economic growth remain. The U.S. and other developed countries have significant (and growing) debt levels, European sovereign debt issues could resurface especially in Portugal, Ireland, Greece and Spain, and any plans for fiscal austerity may temper growth. Also, the U.S. consumer, while showing signs of life via increased spending in the second half of 2010, is likely to remain susceptible to swings in confidence until job growth returns in earnest or housing prices stabilize. With the potential for a large volume of foreclosed homes coming back onto the market in the first half of 2011, house prices in the U.S. could face further downward pressure. Any of these issues may flare up from time-to-time in 2011, and have the potential to create volatility, increase stock correlations (macroeconomic effects) in equity markets, and impact economic growth. However, as economic stability persists and the risks are better understood, the impact of any one issue should be less pronounced.
As we have discussed in the past, one of the bright spots remains the growth of emerging market countries especially China. Despite the effects of interest rate tightening to stem inflation, we believe China’s economic growth should continue to be attractive and a driving force along with other emerging countries behind the global economy. We will seek to take advantage of this growth through our investments in large, multinational companies in the portfolio. Another area of strength is U.S. corporations where strong, cash rich balance sheets remain. Capital spending cutbacks in recent years are unsustainable going forward in our view. We believe companies will increase their capital investments, dividend payouts, stock buybacks, and/or pursue acquisitions in 2011. We have begun to see corporations become more active recently (increasing employees and capital expenditures) due to improvements in order backlogs, increased consumer spending, and more clarity on the aforementioned legislative and regulatory issues.
December 31, 2010 | William Blair Funds 5 |
Going forward, given the broadening recovery, we believe macroeconomic influences will subside at the margin though inflation and rising interest rates are clear wildcards. This possibility, in combination with our expectations for a more stable growth backdrop, should favor stock pickers and our quality growth philosophy. As always, our focus will be on deep fundamental investment research in order to identify durable business franchises that can leverage their competitive advantages to sustain growth leadership in their respective industries. We feel confident the Fund is well positioned in quality firms that, in our view, can deliver on earnings growth expectations in any market environment.
6 Annual Report | December 31, 2010 |
Growth Fund
Performance Highlights (unaudited)
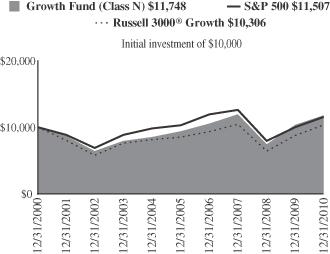
Average Annual Total Return at 12/31/2010
| | | | | | | | | | | | | | | | |
| | | 1
Year | | | 3
Year | | | 5
Year | | | 10
Year | |
Class N | | | 14.05 | % | | | (0.38 | )% | | | 4.69 | % | | | 1.62 | % |
Class I | | | 14.36 | | | | (0.05 | ) | | | 5.02 | | | | 1.91 | |
Russell 3000® Growth Index | | | 17.64 | | | | (0.26 | ) | | | 3.88 | | | | 0.30 | |
S&P 500 Index | | | 15.06 | | | | (2.86 | ) | | | 2.29 | | | | 1.41 | |
Performance cited represents past performance. Past performance does not guarantee future results and current performance may be lower or higher than the data quoted. Results shown are average annual returns, which assume reinvestment of dividends and capital gains. Investment returns and principal will fluctuate and you may have a gain or loss when you sell shares. For the most current month-end performance information, please call 1-800-742-7272, or visit our Web site at www.williamblairfunds.com. Class N shares are available to the general public without a sales load. Class I shares are available to certain institutional investors and advisory clients of William Blair & Company L.L.C. without a sales load or distribution (12b-1) or service fees.
The performance highlights and graph presented above do not reflect the deduction of taxes that a shareholder would pay on fund distributions or the redemption of fund shares.
The Russell 3000® Growth Index consists of large, medium, and small capitalization companies with above average price-to-book ratios and forecasted growth rates. The index is weighted by market capitalization and large/medium/small companies make up approximately 80%/15%/5% of the index.
The S&P 500 Index indicates broad larger capitalization equity market performance.
This report identifies the Fund’s investments on December 31, 2010. These holdings are subject to change. Not all stocks in the Fund performed the same, nor is there any guarantee that these stocks will perform as well in the future. Market forecasts provided in this report may not necessarily come to pass.
Sector Diversification (unaudited)
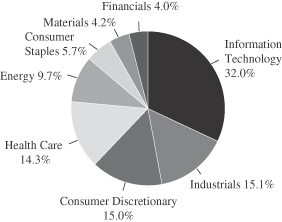
The sector diversification shown is based on the total long-term securities.
December 31, 2010 | William Blair Funds 7 |
Growth Fund
Portfolio of Investments, December 31, 2010 (all dollar amounts in thousands)
| | | | | | | | |
Issuer | | Shares | | | Value | |
| | |
Common Stocks | | | | | | | | |
Information Technology—28.7% | | | | | | | | |
*Apple, Inc. | | | 77,685 | | | $ | 25,058 | |
*Atheros Communications, Inc. | | | 225,000 | | | | 8,082 | |
*Citrix Systems, Inc. | | | 41,800 | | | | 2,860 | |
*Dolby Laboratories, Inc. Class “A” | | | 78,800 | | �� | | 5,256 | |
*FLIR Systems, Inc. | | | 426,353 | | | | 12,684 | |
*Genpact, Ltd.† | | | 346,600 | | | | 5,268 | |
*Google, Inc. Class “A” | | | 29,405 | | | | 17,466 | |
Microsoft Corporation | | | 799,900 | | | | 22,333 | |
*Monolithic Power Systems, Inc. | | | 406,400 | | | | 6,714 | |
QUALCOMM, Inc. | | | 228,640 | | | | 11,315 | |
*Silicon Laboratories, Inc. | | | 278,640 | | | | 12,823 | |
Solera Holdings, Inc. | | | 136,000 | | | | 6,979 | |
*Trimble Navigation, Ltd. | | | 258,300 | | | | 10,314 | |
*Ultimate Software Group, Inc. | | | 191,650 | | | | 9,320 | |
VeriSign, Inc. | | | 268,900 | | | | 8,785 | |
| | | | | | | | |
| | | | | | | 165,257 | |
| | | | | | | | |
Industrials—13.6% | | | | | | | | |
Fastenal Co. | | | 144,929 | | | | 8,683 | |
Flowserve Corporation | | | 57,700 | | | | 6,879 | |
Goodrich Corporation | | | 82,900 | | | | 7,301 | |
*IHS, Inc. Class “A” | | | 132,420 | | | | 10,645 | |
*Jacobs Engineering Group, Inc. | | | 258,400 | | | | 11,847 | |
Manpower, Inc. | | | 140,000 | | | | 8,786 | |
The Corporate Executive Board Co. | | | 280,639 | | | | 10,538 | |
*TransDigm Group, Inc. | | | 127,980 | | | | 9,216 | |
*Trimas Corporation | | | 207,709 | | | | 4,250 | |
| | | | | | | | |
| | | | | | | 78,145 | |
| | | | | | | | |
Consumer Discretionary—13.4% | | | | | | | | |
DeVry, Inc. | | | 141,048 | | | | 6,768 | |
*Dick’s Sporting Goods, Inc. | | | 206,400 | | | | 7,740 | |
Johnson Controls, Inc. | | | 290,000 | | | | 11,078 | |
*K12, Inc. | | | 202,388 | | | | 5,801 | |
McDonald’s Corporation | | | 266,964 | | | | 20,492 | |
*Tempur-Pedic International, Inc. | | | 222,800 | | | | 8,925 | |
*Urban Outfitters, Inc. | | | 123,700 | | | | 4,430 | |
*Valassis Communications, Inc. | | | 375,500 | | | | 12,148 | |
| | | | | | | | |
| | | | | | | 77,382 | |
| | | | | | | | |
Health Care—12.9% | | | | | | | | |
*Align Technology, Inc. | | | 236,800 | | | | 4,627 | |
Allergan, Inc. | | | 135,100 | | | | 9,277 | |
*Celgene Corporation | | | 190,180 | | | | 11,247 | |
*Cerner Corporation | | | 71,500 | | | | 6,774 | |
*Gilead Sciences, Inc. | | | 185,335 | | | | 6,717 | |
*Haemonetics Corporation | | | 102,300 | | | | 6,463 | |
*IDEXX Laboratories, Inc. | | | 113,330 | | | | 7,845 | |
*Illumina, Inc. | | | 129,600 | | | | 8,209 | |
*MedAssets, Inc. | | | 348,682 | | | | 7,040 | |
*NxStage Medical, Inc. | | | 236,172 | | | | 5,876 | |
| | | | | | | | |
| | | | | | | 74,075 | |
| | | | | | | | |
* = Non-income producing securities
† = U.S. listed foreign security
| | | | | | | | |
Issuer | | Shares or
Principal
Amount | | | Value | |
| | |
Common Stocks—(continued) | | | | | | | | |
Energy—8.7% | | | | | | | | |
Apache Corporation | | | 93,665 | | | $ | 11,168 | |
*Cameron International Corporation | | | 163,547 | | | | 8,297 | |
Occidental Petroleum Corporation | | | 117,900 | | | | 11,566 | |
Schlumberger, Ltd.† | | | 144,900 | | | | 12,099 | |
*Weatherford International, Ltd.† | | | 298,700 | | | | 6,810 | |
| | | | | | | | |
| | | | | | | 49,940 | |
| | | | | | | | |
Consumer Staples—5.1% | | | | | | | | |
*Green Mountain Coffee Roasters, Inc. | | | 218,700 | | | | 7,187 | |
PepsiCo, Inc. | | | 340,400 | | | | 22,238 | |
| | | | | | | | |
| | | | | | | 29,425 | |
| | | | | | | | |
Materials—3.8% | | | | | | | | |
Ecolab, Inc. | | | 222,820 | | | | 11,234 | |
Praxair, Inc. | | | 74,365 | | | | 7,100 | |
*Stillwater Mining Co. | | | 170,200 | | | | 3,634 | |
| | | | | | | | |
| | | | | | | 21,968 | |
| | | | | | | | |
Financials—3.6% | | | | | | | | |
Greenhill & Co., Inc. | | | 91,600 | | | | 7,482 | |
*IntercontinentalExchange, Inc. | | | 69,400 | | | | 8,269 | |
The Charles Schwab Corporation | | | 292,175 | | | | 4,999 | |
| | | | | | | | |
| | | | | | | 20,750 | |
| | | | | | | | |
Total Common Stocks—89.8%
(cost $415,427) | | | | 516,942 | |
| | | | | | | | |
| | |
Repurchase Agreement | | | | | | | | |
Fixed Income Clearing Corporation, 0.150% dated 12/31/10, due 1/3/10, repurchase price $6,302, collateralized by FNMA, 1.050%, due 10/22/13 | | $ | 6,302 | | | | 6,302 | |
| | | | | | | | |
Total Repurchase Agreement—1.1%
(cost $6,302) | | | | 6,302 | |
| | | | | | | | |
Total Investments—90.9%
(cost $421,729) | | | | 523,244 | |
Cash and other assets, less liabilities—9.1% | | | | 52,369 | |
| | | | | | | | |
Net assets—100.0% | | | $ | 575,613 | |
| | | | | | | | |
See accompanying Notes to Financial Statements.
8 Annual Report | December 31, 2010 |

James S. Golan

Tracy McCormick
LARGE CAP GROWTH FUND
The Large Cap Growth Fund seeks long-term capital appreciation.
AN OVERVIEW FROM THE PORTFOLIO MANAGERS
The Large Cap Growth Fund increased 15.91% on a total return basis (Class N Shares) for the year ended December 31, 2010. By comparison, the Fund’s benchmark, the Russell 1000® Growth Index, increased 16.71%.
Our quality growth portfolio of stocks kept up well, but trailed the robust performing market.
Several headwinds impacted the Fund’s performance in 2010. First, from a market perspective, macroeconomic forces dominated the psychology of the stock market throughout the year, leading to high stock correlations, making it more challenging for active managers. The pronounced shifts in sentiment resulted in relatively high volatility, especially in the first half. More specifically through April, the equity market responded positively to continued signs of a U.S. economic recovery and stronger than expected corporate earnings reports on improved sales growth rather than expense control alone, which had been a big driver of 2009 earnings surprises. Beginning in late April, this trend reversed as equity markets sharply corrected given concerns over the sustainability of economic growth, European sovereign debt, and the possibility of a “double dip” recession. Since summer, while volatility has continued, the market’s direction was up on better-than-expected company earnings, positive economic reports, another round of quantitative easing, and extension of the Bush-era tax cuts. As a result of uncertainty throughout the year and as a general theme, investors sought high confidence stocks with clear earnings visibility, and bid up past winners; this phenomenon was clearly displayed with select mid-cap Technology stocks, which had a powerful move. Furthermore, smaller-cap stocks continued their dominance in 2010 much like the previous year; small-cap stocks rose 29.09% while mid-cap stocks gained 26.38% as measured by the Russell 2000® Growth Index and Russell Mid Cap® Growth Index, respectively. Importantly, stock correlations subsided in the fourth quarter, which assisted stock pickers as company fundamentals mattered more than macro events. As a result, the Fund had a powerful fourth quarter return, and many of the stocks we held throughout the year were rewarded. However, these results could not overcome the relative weakness from earlier in the year. The Fund’s fourth quarter results were 13.88%; the Russell 1000® Growth returned 11.83%.
Our weakest single stock was Baxter International, Inc., where we had a sizable position in this more defensive company. It declined unexpectedly in the second quarter on a competitive pricing issue; we sold the position in May. Sectors that lagged for the year were Financials and Materials. Our Financial stock selection was weak due to CME Group, Inc., the largest futures exchange group in the U.S., as well as Invesco, Ltd., an investment manager. CME Group’s stock declined due to lower trading volumes in their interest rate futures business; we believe they should benefit from a pick-up in interest rate volatility and trading volume gains in other areas such as agriculture and energy. Invesco was sold from the portfolio in June on concerns about the Van Kampen acquisition and a weak net flow environment. In Materials, we had little exposure to more cyclical stocks such as those in Metals & Mining, which rallied in the second half of the year.
Our Industrials holdings were standouts in 2010. Our best overall portfolio contributor was Rockwell Automation, a leading global provider of industrial solutions. It benefited from a recovering economy and the original equipment manufacturers looking to reduce costs and enhance productivity. Another solid performer was W.W. Grainger, Inc., the largest wholesale supplier of facilities maintenance supplies and information in North America. It gained ground on strong revenues and operating margins. In our view, the company continues
December 31, 2010 | William Blair Funds 9 |
to execute well and should benefit from further economic recovery, expansion of products offered and efficiency programs. In general, our Industrial exposure was overweight relative to the benchmark for the year, which assisted results as it was one of the better performing sectors. Secondarily, our exposure to select Information Technology stocks was helpful as well. McAfee, Inc., a provider of security software, rallied after it announced its acquisition by Intel Corporation. As a result of the acquisition, this stock was sold from the portfolio. Broadcom Corporation also positively impacted results. Its stock price climbed on continued strength in its mobile and wireless segment as well as modest growth in the broadband and networking segments. We believe its earnings growth should be driven by continued market share gains and fiscal discipline. Notably, during the year, we reduced Information Technology names to below benchmark weight taking profits in stocks that had done well and exiting those where we felt there were better opportunities elsewhere. More recently, we have added several new companies with strong business models and sustainable earnings growth in our view. A few examples are Citrix Systems, Inc., Dolby Laboratories, Inc., and Trimble Navigation, Ltd.
Looking into 2011, we believe the U.S. economy will likely experience healthy growth as a result of a stabilized and improving macroeconomic environment. The Federal Reserve remains very accommodative with interest rates at all time lows and additional quantitative easing. This stance should assist asset prices, businesses, and ultimately, wages. Also, there is more certainty on high profile government-related issues; for example, the election results are complete with “balanced government” returning to Washington, tax cuts have been extended, and the health care and financial reform bills passed. All of these factors combined should give investors greater comfort with the sustainability of the U.S. economic recovery and the potential for continued economic expansion in 2011.
Despite the positive outlook for 2011, many risks to economic growth remain. The U.S. and other developed countries have significant (and growing) debt levels, European sovereign debt issues could resurface especially in Portugal, Ireland, Greece and Spain, and any plans for fiscal austerity may temper growth. Also, the U.S. consumer, while showing signs of life via increased spending in the second half of 2010, is likely to remain susceptible to swings in confidence until job growth returns in earnest or housing prices stabilize. With the potential for a large volume of foreclosed homes coming back onto the market in the first half of 2011, house prices in the U.S. could face further downward pressure. Any of these issues may flare up from time-to-time in 2011, and have the potential to create volatility, increase stock correlations (macroeconomic effects) in equity markets, and impact economic growth. However, as economic stability persists and the risks are better understood, the impact of any one issue should be less pronounced.
As we have discussed in the past, one of the bright spots in the global economy remains the growth of emerging market countries especially China. Despite the effects of interest rate tightening to stem inflation, we believe China’s economic growth should continue to be attractive and a driving force along with other emerging countries behind the global economy. We will seek to take advantage of this growth through our investments in large, multinational companies in the portfolio. Another area of strength is U.S. corporations where strong, cash rich balance sheets remain. Capital spending cutbacks in recent years are unsustainable going forward in our view. We believe companies will increase their capital investments, dividend payouts, stock buybacks, and/or pursue acquisitions in 2011. We have begun to see corporations become more active recently (increasing employees and capital expenditures) due to improvements in order backlogs, increased consumer spending, and more clarity on legislative and regulatory issues.
Going forward, given the broadening recovery, we believe macroeconomic influences will subside at the margin though inflation and rising interest rates are clear wildcards. This possibility, in combination with our expectations for a more stable growth backdrop, should favor stock pickers and our quality growth philosophy. As always, our focus will be on deep fundamental investment research in order to identify durable business franchises that can leverage their competitive advantages to sustain growth leadership in their respective industries. We feel confident the Fund is well positioned in quality firms that, in our view, can deliver on earnings growth expectations in any market environment.
10 Annual Report | December 31, 2010 |
Large Cap Growth Fund
Performance Highlights (unaudited)
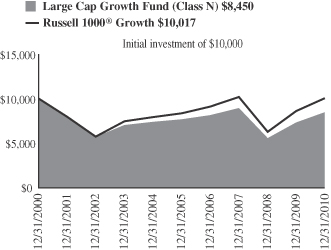
Average Annual Total Return at 12/31/2010
| | | | | | | | | | | | | | | | |
| | | 1
Year | | | 3
Year | | | 5
Year | | | 10
Year | |
Class N | | | 15.91 | % | | | (1.71 | )% | | | 1.99 | % | | | (1.67 | )% |
Class I | | | 16.03 | | | | (1.44 | ) | | | 2.21 | | | | (1.45 | ) |
Russell 1000® Growth Index | | | 16.71 | | | | (0.47 | ) | | | 3.75 | | | | 0.02 | |
Performance cited represents past performance. Past performance does not guarantee future results and current performance may be lower or higher than the data quoted. Results shown are average annual total returns, which assume reinvestment of dividends and capital gains. Investment returns and principal will fluctuate and you may have a gain or loss when you sell shares. For the most current month-end performance information, please call 1-800-742-7272, or visit our Web site at www.williamblairfunds.com. From time to time, the investment advisor may waive fees or reimburse expenses for the Fund. Without these waivers, performance would be lower. Class N shares are available to the general public without a sales load. Class I shares are available to certain institutional investors and advisory clients of William Blair & Company, L.L.C., without a sales load or distribution (12b-1) or service fees.
The performance highlights and graph presented above do not reflect the deduction of taxes that a shareholder would pay on fund distributions or the redemption of fund shares.
The Russell 1000® Growth Index consists of large capitalization companies with above average price-to-book ratios and forecasted growth rates.
This report identifies the Fund’s investments on December 31, 2010. These holdings are subject to change. Not all stocks in the Fund performed the same, nor is there any guarantee that these stocks will perform as well in the future. Market forecasts provided in this report may not necessarily come to pass.
Sector Diversification (unaudited)
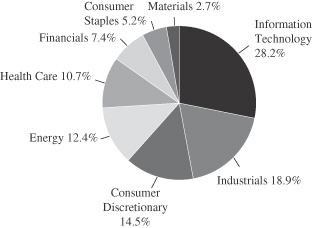
The sector diversification shown is based on the total long-term securities.
December 31, 2010 | William Blair Funds 11 |
Large Cap Growth Fund
Portfolio of Investments, December 31, 2010 (all dollar amounts in thousands)
| | | | | | | | |
Issuer | | Shares | | | Value | |
| | |
Common Stocks | | | | | | | | |
Information Technology—27.7% | | | | | | | | |
*Apple, Inc. | | | 5,295 | | | $ | 1,708 | |
Broadcom Corporation Class “A” | | | 12,550 | | | | 547 | |
*Citrix Systems, Inc. | | | 8,850 | | | | 606 | |
*Dolby Laboratories, Inc. Class “A” | | | 5,750 | | | | 384 | |
*eBay, Inc. | | | 34,750 | | | | 967 | |
*EMC Corporation | | | 23,500 | | | | 538 | |
*Google, Inc. Class “A” | | | 2,238 | | | | 1,329 | |
Microsoft Corporation | | | 46,935 | | | | 1,310 | |
QUALCOMM, Inc. | | | 21,115 | | | | 1,045 | |
*Trimble Navigation, Ltd. | | | 11,450 | | | | 457 | |
| | | | | | | | |
| | | | | | | 8,891 | |
| | | | | | | | |
Industrials—18.6% | | | | | | | | |
CH Robinson Worldwide, Inc. | | | 4,400 | | | | 353 | |
Danaher Corporation | | | 12,744 | | | | 601 | |
Goodrich Corporation | | | 7,400 | | | | 652 | |
*Jacobs Engineering Group, Inc. | | | 7,400 | | | | 339 | |
Manpower, Inc. | | | 9,900 | | | | 621 | |
Rockwell Automation, Inc. | | | 11,050 | | | | 792 | |
Roper Industries, Inc. | | | 4,500 | | | | 344 | |
*Stericycle, Inc. | | | 8,100 | | | | 656 | |
United Parcel Service, Inc. Class “B” | | | 12,470 | | | | 905 | |
W.W. Grainger, Inc. | | | 4,980 | | | | 688 | |
| | | | | | | | |
| | | | | | | 5,951 | |
| | | | | | | | |
Consumer Discretionary—14.3% | | | | | | | | |
*Discovery Communications, Inc. | | | 15,500 | | | | 647 | |
Johnson Controls, Inc. | | | 23,700 | | | | 905 | |
McDonald’s Corporation | | | 8,335 | | | | 640 | |
NIKE, Inc. Class “B” | | | 7,250 | | | | 619 | |
*O’Reilly Automotive, Inc. | | | 8,980 | | | | 543 | |
Scripps Networks Interactive, Inc. Class “A” | | | 9,085 | | | | 470 | |
Yum! Brands, Inc. | | | 15,500 | | | | 760 | |
| | | | | | | | |
| | | | | | | 4,584 | |
| | | | | | | | |
Energy—12.2% | | | | | | | | |
Apache Corporation | | | 6,215 | | | | 741 | |
National Oilwell Varco, Inc. | | | 10,150 | | | | 683 | |
Occidental Petroleum Corporation | | | 10,850 | | | | 1,064 | |
Schlumberger, Ltd.† | | | 16,930 | | | | 1,414 | |
| | | | | | | | |
| | | | | | | 3,902 | |
| | | | | | | | |
Health Care—10.6% | | | | | | | | |
*Agilent Technologies, Inc. | | | 27,000 | | | | 1,119 | |
Allergan, Inc. | | | 6,865 | | | | 471 | |
*Celgene Corporation | | | 11,240 | | | | 665 | |
Covidien plc† | | | 12,250 | | | | 559 | |
*Illumina, Inc. | | | 9,000 | | | | 570 | |
| | | | | | | | |
| | | | | | | 3,384 | |
| | | | | | | | |
Financials—7.2% | | | | | | | | |
American Express Co. | | | 18,300 | | | | 785 | |
Ameriprise Financial, Inc. | | | 13,250 | | | | 763 | |
* = Non-income producing securities
† = U.S. listed foreign security
| | | | | | | | |
Issuer | | Shares or
Principal
Amount | | | Value | |
| | |
Common Stocks—(continued) | | | | | | | | |
Financials—(continued) | | | | | | | | |
CME Group, Inc. | | | 2,400 | | | $ | 772 | |
| | | | | | | | |
| | | | | | | 2,320 | |
| | | | | | | | |
Consumer Staples—5.1% | | | | | | | | |
Mead Johnson Nutrition Co. | | | 11,700 | | | | 728 | |
PepsiCo, Inc. | | | 13,750 | | | | 898 | |
| | | | | | | | |
| | | | | | | 1,626 | |
| | | | | | | | |
Materials—2.6% | | | | | | | | |
Praxair, Inc. | | | 8,725 | | | | 833 | |
| | | | | | | | |
Total Common Stocks—98.3%
(cost $23,564) | | | | 31,491 | |
| | | | | | | | |
| | |
Repurchase Agreement | | | | | | | | |
State Street Bank and Trust Company, 0.150% dated 12/31/10, due 1/3/11, repurchase price $375, collateralized by FHLMC, 0.172%, due 6/20/11 | | $ | 375 | | | | 375 | |
| | | | | | | | |
Total Repurchase Agreement—1.2%
(cost $375) | | | | 375 | |
| | | | | | | | |
Total Investments—99.5%
(cost $23,939) | | | | 31,866 | |
Cash and other assets, less liabilities—0.5% | | | | 169 | |
| | | | | | | | |
Net assets—100.0% | | | $ | 32,035 | |
| | | | | | | | |
See accompanying Notes to Financial Statements.
12 Annual Report | December 31, 2010 |

Michael P. Balkin

Karl W. Brewer
SMALL CAP GROWTH FUND
The Small Cap Growth Fund seeks long-term capital appreciation.
AN OVERVIEW FROM THE PORTFOLIO MANAGERS
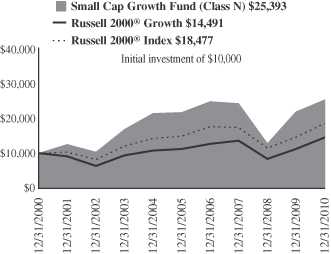
The Small Cap Growth Fund increased 16.16% on a total return basis (Class N shares) for the year ended December 31, 2010. By comparison the Fund’s benchmark, the Russell 2000® Growth Index, gained 29.09%.
The year started off as a continuation of 2009 with better-than-expected corporate earnings propelling stocks higher. Then, during the second quarter, European sovereign debt concerns and fears of a double-dip recession in the U.S. caused a steep mid-year correction. The selloff was short lived, however, as in late August the Federal Reserve signaled a second round of quantitative easing to help keep interest rates low and promote a more sustainable economic recovery. Improved investor sentiment was supported in part by stronger-than-expected retail sales that persisted into the holiday shopping season, U.S. industrial production data that proved better than many had expected at mid-year, and a more pro-business environment in Washington D.C. that emerged after the November elections. Strong growth in the emerging markets economies also boosted confidence in the reality of a global economic recovery.
From a sector perspective within the Russell 2000® Growth Index, Energy (+43.91%) and Information Technology (+36.54%) were the best performing sectors, with Consumer Discretionary (+32.22%), Industrials (+29.73%) and Materials (+33.47%) turning in impressive results for the year as well. Financials (+22.18%) and Consumer Staples (+23.50%) underperformed the broader small cap market, while Health Care (+16.78%) was the weakest sector during the year.
The Fund’s underperformance for 2010 was driven by style headwinds, industry factors and primarily stock selection. Although the Fund performed well in the first few months of the year and it stabilized in the last two months of the year, the five-month period from June through October witnessed dramatic underperformance. First of all, style headwinds—specifically both our contrarian bias and our smaller market cap bias—were most pronounced during this five-month period. The market favored momentum-oriented stocks and larger cap stocks during this period and our typical biases against these factors contributed to the underperformance. Second, although individual stock picks dictate our sector and industry weights, the Fund’s exposure to certain industries during 2010 detracted from performance. Real Estate Management & Development within Financials and Health Care Equipment & Supplies within Health Care were two such examples. Finally, negative stock selection was the primary contributor to the underperformance in 2010. The largest detractors from relative return came from the Consumer Discretionary and Information Technology sectors, while Telecommunication stock selection was a modest contributor.
During the fourth quarter specifically, the Fund’s underperformance can be explained by stock selection and industry factors. All of the quarter’s underperformance took place in October, with an improvement in November and December. Overweights to Health Care Equipment & Supplies and Diversified Consumer Services detracted during the quarter. From a stock selection perspective, certain holdings in Consumer Discretionary pulled down relative results while stock selection in Industrials, Information Technology and Materials partially offset the negative dynamics.
Detractors from return
Cenveo, Inc. (CVO) is a diversified printing company. The company’s portfolio of products include forms and labels manufacturing, packaging and publisher offerings, envelope
December 31, 2010 | William Blair Funds 13 |
production and commercial printing. Reason for underperformance: Irrational pricing by a weakened competitor in the envelopes business greatly impacted industry pricing, thereby reducing Cenveo’s revenues and earnings in the intermediate term. In addition, despite more recent signs of a recovery in the commercial printing industry, the industry has been weaker than expected coming out of the recession. Action: We maintain our position in the stock for a few reasons. First, the company announced an acquisition of MeadWestvaco’s envelopes business which should strengthen Cenveo’s leadership position in the industry. Second, the company announced an acquisition of a higher growth, niche, specialty packaging company which should complement Cenveo’s other higher growth, niche, specialty printing businesses. Third, new ownership of the weakened competitor discussed above has instituted more rational pricing and is reducing industry capacity aggressively. Finally, the valuation on the stock remains unjustifiably low.
Healthways, Inc. (HWAY) is a healthcare services firm that provides disease management solutions. The company’s services are implemented by managed care companies, governments, employers and hospitals in order to reduce both short- and long-term healthcare costs within their patient populations. Reason for underperformance: Lackluster employment data hurt investor sentiment as Healthways’ business model benefits as the employed base increases. In addition, new business decisions at prospective corporate clients have been lengthened given the uncertain economic environment. Finally, the healthcare reform bill has instilled further uncertainty given its potential impact on managed care, Healthways’ primary customer base. Action: We sold our position given these multiple headwinds and the lack of visibility into the company’s earnings over the intermediate term.
Princeton Review, Inc. (REVU) provides test preparation courses, tutoring services and various career-focused degree and vocational programs. Reason for underperformance: The sluggish economy reduced demand for the company’s core test preparation business. In general, some consumers decided not to take a test preparation course while others traded down from a longer (and more expensive) course to a shorter, more affordable one. In addition, the company expanded its balance sheet in 2009 to make an acquisition. This additional debt combined with slowing business dynamics caused a reduction in earnings throughout the year. Action: We continue to own a position in the stock as we believe Princeton Review is a leader in test preparation and tutoring services and earnings growth will reaccelerate once the macroeconomic backdrop improves. As well, we believe there is a good growth opportunity in its nascent career education partnerships with the National Labor College and several community colleges.
SurModics, Inc. (SRDX) provides surface modification and drug delivery technologies to the healthcare industry. The company develops relationships with many of the large medical device and pharmaceutical companies in order to create additional uses for its proprietary technologies. Reason for underperformance: Lackluster revenues and earnings which exacerbated ongoing investor concern that the company has not signed up another major partner to utilize its intellectual property. Action: We liquidated our position given the deterioration in fundamentals and lack of catalysts for meaningful reacceleration in its businesses.
VistaPrint N.V. (VPRT) is a worldwide provider of marketing and printing services to small business and home office customers via the internet. The company’s products include business cards, brochures, invitations, websites, and various types of marketing material. Reason for underperformance: Disappointing revenues announced in July raised concern among investors regarding long-term growth opportunities, especially given sub-par results from a then-recent television advertising campaign. Action: We sold our position given the uncertainty around customer acquisition costs and therefore the volatility of the company’s return on marketing investments.
Contributors to return
Air Methods Corporation (AIRM) is a leader in medical air transport. The company contracts with both hospitals and communities for emergency and non-emergency transport. Reason for
14 Annual Report | December 31, 2010 |
outperformance: Company fundamentals accelerated throughout 2010 in part due to growth in flight volumes, strong pricing and lower maintenance expense for its aircraft. Management also announced multiple price increases during the year with plans to continue regular increases in 2011. Action: We have trimmed our position on strength over the second half of 2010. However, we continue to own the stock as we believe the company’s pricing power is underappreciated and that future outsourcing of medical air transport by hospitals will increase in part due to implications of the health care reform bill.
MDC Partners, Inc. (MDCA), through its subsidiaries, provides marketing communications and consulting services primarily in the U.S., Canada, and Europe. Reason for outperformance: The company has strong business momentum from existing clients and new business wins alike, in part due to a general rebound in the advertising environment. In addition, investors have cheered the company’s investments in two growth-oriented areas of the advertising industry, social media and analytics. Action: We maintain a position as we believe this diversified marketing services firm is well-positioned for growth and that its stock is trading at an attractive valuation.
National Financial Partners Corporation (NFP) is a financial services firm that offers high net worth individuals and corporations a variety of financial services such as life insurance and wealth transfer, corporate and executive benefits, and investment advisory. Reason for outperformance: As a financial services company, the stock benefitted from improved investor sentiment and the rebound in capital markets. Also, company fundamentals improved during 2010, and the company strengthened its balance sheet and sold certain underperforming partner firms. Action: We maintain a position in the stock as we believe growth will continue to improve and the stock remains attractively valued.
Trinity Biotech plc (TRIB) develops, acquires, manufactures and markets medical diagnostic products for the clinical laboratory and point-of-care segments of the diagnostic market. Reason for outperformance: The company divested a slower growth business during the year which allowed it to strengthen its balance sheet and focus on the higher growth areas of its business. In addition, investors are anticipating a strong product pipeline over the next couple of years. Action: We added to our position early in the year but maintained our position on the rally during the second half of the year.
ValueClick, Inc. (VCLK) is a leading online marketing services firm. Reason for outperformance: Growth appears to be reaccelerating in part due to a recovery in the advertising environment generally, and a new ValueClick product more specifically. Many of ValueClick’s business lines have seen growth reaccelerate. Action: We trimmed our position on strength late in the year, but continue to hold a position as we believe growth will continue accelerating and the stock remains attractively valued.
Outlook
Looking ahead, almost universally, market strategists believe 2011 will produce a solid, yet more modest, equity market return in the U.S. Broadly speaking, corporate cash flow generation and profit margins generally are attractive due to effective expense management by U.S. companies. If the past is any indication, these dynamics should eventually entice capital spending and increased hiring by corporations. This would help alleviate one of the main concerns with this recovery, unemployment.
Risks to a full economic recovery loom, yet are well documented. Government budgets at every level are stretched. The extension of the Bush-era federal income tax rates and new payroll tax break, along with the extension of unemployment benefits, help consumers and businesses in the short run, but the long-run impact is yet unknown. The same can be said for the Federal Reserve’s second round of quantitative easing and its impact on longer-term inflation. Rapid growth in emerging economies poses two distinct risks as well: higher commodity price inflation and potentially negative effects from emerging governments’ efforts to combat overheating of their economies.
December 31, 2010 | William Blair Funds 15 |
In the end, however, while we factor various economic scenarios into our stock picking, we focus our time on constructing the Fund from a bottom-up perspective. As mentioned above, corporate fundamentals remain attractive. In combination with valuations that are broadly in line with long-term averages, the market outlook remains balanced. While macroeconomic data largely drove correlated stock prices again in 2010, we expect individual company fundamentals to be the leading determinant of forward stock price returns. In an environment where earnings growth will be less about cost cutting and more about organic revenue growth, investors are likely to seek companies which possess more internal growth drivers. Our philosophy of finding solid quality growth companies, which “control their own destiny” to a greater degree and are less dependent on overall economic growth, should benefit in such an environment. While we are disappointed with performance in 2010, we remain confident in our ability to create alpha over the long term. We continue to find good ideas across sectors, and are confident the Fund consists of great companies with solid competitive positions whose stocks are at attractive valuations compared to the growth, consistency and sustainability of their earnings.
16 Annual Report | December 31, 2010 |
Small Cap Growth Fund
Performance Highlights (unaudited)
Average Annual Total Return at 12/31/2010
| | | | | | | | | | | | | | | | |
| | | 1
Year | | | 3
Year | | | 5
Year | | | 10
Year | |
Class N | | | 16.16 | % | | | 1.53 | % | | | 3.17 | % | | | 9.77 | % |
Class I | | | 16.62 | | | | 1.86 | | | | 3.48 | | | | 10.07 | |
Russell 2000® Growth Index | | | 29.09 | | | | 2.18 | | | | 5.30 | | | | 3.78 | |
Russell 2000® Index | | | 26.85 | | | | 2.22 | | | | 4.47 | | | | 6.33 | |
Performance cited represents past performance. Past performance does not guarantee future results and current performance may be lower or higher than the data quoted. Results shown are average annual total returns, which assume reinvestment of dividends and capital gains. Investment returns and principal will fluctuate and you may have a gain or loss when you sell shares. For the most current month-end performance information, please call 1-800-742-7272, or visit our Web site at www.williamblairfunds.com. Investing in smaller companies involves special risks, including higher volatility and lower liquidity. Smaller Capitalization stocks are also more sensitive to purchase/sale transactions and changes in the issuer’s financial condition. From time to time, the investment advisor may waive fees or reimburse expenses for the Fund. Without these waivers, performance would be lower. Class N shares are available to the general public without a sales load. Class I shares are available to certain institutional investors and advisory clients of William Blair & Company, L.L.C., without a sales load or distribution (12b-1) or service fees.
The performance highlights and graph presented above do not reflect the deduction of taxes that a shareholder would pay on fund distributions or the redemption of fund shares.
The Russell 2000® Growth Index consists of small-capitalization companies with above average price-to-book ratios and forecasted growth rates.
The Russell 2000® Index is an unmanaged composite of the smallest 2000 stocks of the Russell 3000® Index.
This report identifies the Fund’s investments on December 31, 2010. These holdings are subject to change. Not all stocks in the Fund performed the same, nor is there any guarantee that these stocks will perform as well in the future. Market forecasts provided in this report may not necessarily come to pass.
Sector Diversification (unaudited)
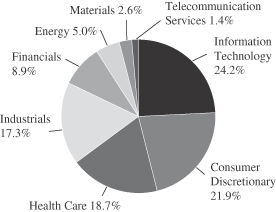
The sector diversification shown is based on the total long-term securities.
December 31, 2010 William Blair Funds 17 | |
Small Cap Growth Fund
Portfolio of Investments, December 31, 2010 (all dollar amounts in thousands)
| | | | | | | | |
Issuer | | Shares | | | Value | |
| | |
Common Stocks | | | | | | | | |
Information Technology—23.3% | | | | | | | | |
*Atheros Communications, Inc. | | | 287,200 | | | $ | 10,316 | |
*Cavium Networks, Inc. | | | 266,200 | | | | 10,030 | |
iGate Corporation | | | 446,300 | | | | 8,797 | |
*Inuvo, Inc. | | | 861,747 | | | | 4,447 | |
*j2 Global Communications, Inc. | | | 717,948 | | | | 20,785 | |
*KIT Digital, Inc. | | | 664,700 | | | | 10,662 | |
*Lionbridge Technologies, Inc. | | | 1,123,516 | | | | 4,146 | |
*MaxLinear, Inc. Class “A” | | | 359,831 | | | | 3,872 | |
*Monolithic Power Systems, Inc. | | | 721,300 | | | | 11,916 | |
*RightNow Technologies, Inc. | | | 475,855 | | | | 11,263 | |
*Silicon Laboratories, Inc. | | | 468,577 | | | | 21,564 | |
Syntel, Inc. | | | 168,900 | | | | 8,072 | |
*TeleTech Holdings, Inc. | | | 880,500 | | | | 18,129 | |
*Ultimate Software Group, Inc. | | | 308,976 | | | | 15,025 | |
United Online, Inc. | | | 1,618,575 | | | | 10,683 | |
*ValueClick, Inc. | | | 1,559,040 | | | | 24,991 | |
*Vertro, Inc. | | | 847,343 | | | | 4,152 | |
*Volterra Semiconductor Corporation | | | 380,800 | | | | 8,819 | |
| | | | | | | | |
| | | | | | | 207,669 | |
| | | | | | | | |
Consumer Discretionary—21.1% | | | | | | | | |
*Amerigon, Inc. | | | 979,500 | | | | 10,657 | |
*Belo Corporation | | | 1,491,843 | | | | 10,562 | |
*Career Education Corporation | | | 862,926 | | | | 17,888 | |
*ChinaCast Education Corporation† | | | 1,425,139 | | | | 11,059 | |
*Dreams, Inc. | | | 3,285,457 | | | | 8,674 | |
*Duckwall-ALCO Stores, Inc. | | | 429,693 | | | | 5,414 | |
Gaiam, Inc. Class “A” | | | 1,050,272 | | | | 8,087 | |
*Grand Canyon Education, Inc. | | | 450,151 | | | | 8,818 | |
Jarden Corporation | | | 483,317 | | | | 14,920 | |
*Kona Grill, Inc. | | | 1,019,792 | | | | 4,181 | |
MDC Partners, Inc. Class “A”† | | | 858,030 | | | | 14,818 | |
*Office Depot, Inc. | | | 2,383,400 | | | | 12,870 | |
*Princeton Review, Inc. | | | 3,519,896 | | | | 4,154 | |
Strayer Education, Inc. | | | 85,095 | | | | 12,953 | |
*U.S. Auto Parts Network, Inc. | | | 1,448,391 | | | | 12,167 | |
*Valassis Communications, Inc. | | | 479,900 | | | | 15,525 | |
*Vitacost.com, Inc.§** | | | 554,359 | | | | 1,109 | |
*WMS Industries, Inc. | | | 317,200 | | | | 14,350 | |
| | | | | | | | |
| | | | | | | 188,206 | |
| | | | | | | | |
Health Care—18.0% | | | | | | | | |
*Air Methods Corporation | | | 318,723 | | | | 17,935 | |
*Align Technology, Inc. | | | 399,500 | | | | 7,806 | |
*American Medical Systems Holdings, Inc. | | | 112,164 | | | | 2,115 | |
*Brookdale Senior Living, Inc. | | | 570,700 | | | | 12,219 | |
*Haemonetics Corporation | | | 253,465 | | | | 16,014 | |
*Integra LifeSciences Holdings Corporation | | | 338,700 | | | | 16,021 | |
*Kensey Nash Corporation | | | 424,466 | | | | 11,813 | |
*MedAssets, Inc. | | | 594,621 | | | | 12,005 | |
*Natus Medical, Inc. | | | 726,900 | | | | 10,307 | |
*NxStage Medical, Inc. | | | 382,807 | | | | 9,524 | |
*Quidel Corporation | | | 856,346 | | | | 12,374 | |
*SXC Health Solutions Corporation† | | | 206,800 | | | | 8,864 | |
| | | | | | | | |
Issuer | | Shares | | | Value | |
| | |
Common Stocks—(continued) | | | | | | | | |
Health Care—(continued) | | | | | | | | |
*The Providence Service Corporation | | | 439,811 | | | $ | 7,068 | |
*Trinity Biotech plc—ADR | | | 1,903,563 | | | | 16,751 | |
| | | | | | | | |
| | | | | | | 160,816 | |
| | | | | | | | |
Industrials—16.7% | | | | | | | | |
*Cenveo, Inc. | | | 2,773,539 | | | | 14,811 | |
*Corrections Corporation of America | | | 261,527 | | | | 6,554 | |
*Dolan Media Co. | | | 1,199,958 | | | | 16,704 | |
*Franklin Covey Co. | | | 758,841 | | | | 6,518 | |
*GrafTech International, Ltd. | | | 826,600 | | | | 16,400 | |
Healthcare Services Group, Inc. | | | 498,720 | | | | 8,114 | |
*Huron Consulting Group, Inc. | | | 394,583 | | | | 10,437 | |
*ICF International, Inc. | | | 569,800 | | | | 14,655 | |
*On Assignment, Inc. | | | 2,248,382 | | | | 18,324 | |
*Polypore International, Inc. | | | 177,800 | | | | 7,242 | |
*TransDigm Group, Inc. | | | 184,414 | | | | 13,279 | |
*Trimas Corporation | | | 750,089 | | | | 15,347 | |
| | | | | | | | |
| | | | | | | 148,385 | |
| | | | | | | | |
Financials—7.7% | | | | | | | | |
*Cowen Group, Inc. | | | 1,814,117 | | | | 8,454 | |
*FirstService Corporation† | | | 570,071 | | | | 17,262 | |
*Grubb & Ellis Co. | | | 225,000 | | | | 286 | |
*Internet Capital Group, Inc. | | | 1,474,535 | | | | 20,968 | |
*Marlin Business Services Corporation | | | 718,870 | | | | 9,093 | |
*National Financial Partners Corporation | | | 906,856 | | | | 12,152 | |
*United Western Bancorp, Inc. | | | 2,290,015 | | | | 664 | |
| | | | | | | | |
| | | | | | | 68,879 | |
| | | | | | | | |
Energy—4.8% | | | | | | | | |
*Dresser-Rand Group, Inc. | | | 213,099 | | | | 9,076 | |
*Dril-Quip, Inc. | | | 111,300 | | | | 8,650 | |
*Goodrich Petroleum Corporation | | | 448,415 | | | | 7,910 | |
*Oil States International, Inc. | | | 263,400 | | | | 16,882 | |
| | | | | | | | |
| | | | | | | 42,518 | |
| | | | | | | | |
Materials—2.5% | | | | | | | | |
*Horsehead Holding Corporation | | | 1,026,860 | | | | 13,390 | |
*Stillwater Mining Co. | | | 423,800 | | | | 9,048 | |
| | | | | | | | |
| | | | | | | 22,438 | |
| | | | | | | | |
Telecommunication Services—1.3% | | | | | | | | |
*Cbeyond, Inc. | | | 760,831 | | | | 11,626 | |
| | | | | | | | |
Total Common Stocks—95.4%
(cost $718,251) | | | | 850,537 | |
| | | | | | | | |
| | |
Preferred Stock | | | | | | | | |
Grubb & Ellis Co.—144A, 12.00%§ | | | 83,121 | | | | 7,779 | |
| | | | | | | | |
Total Preferred Stock—0.9%
(cost $8,312) | | | | 7,779 | |
| | | | | | | | |
See accompanying Notes to Financial Statements.
18 Annual Report | December 31, 2010 |
Small Cap Growth Fund
Portfolio of Investments, December 31, 2010 (all dollar amounts in thousands)
| | | | | | | | |
Issuer | | Principal
Amount | | | Value | |
| | |
Repurchase Agreement | | | | | | | | |
State Street Bank and Trust Company, 0.150% dated 12/31/10, due 1/3/11, repurchase price $20,042, collateralized by FHLMC, 0.172%, due 6/20/11 and U.S. Treasury Notes, 2.500%-2.750%, due 4/30/15-12/31/17 | | $ | 20,042 | | | $ | 20,042 | |
| | | | | | | | |
Total Repurchase Agreement—2.2%
(cost $20,042) | | | | 20,042 | |
| | | | | | | | |
Total Investments—98.5%
(cost $746,605) | | | | 878,358 | |
Cash and other assets, less liabilities—1.5% | | | | 13,231 | |
| | | | | | | | |
Net assets—100.0% | | | $ | 891,589 | |
| | | | | | | | |
ADR = American Depository Receipt
* = Non-income producing securities
† = U.S. listed foreign security
§ = Deemed illiquid pursuant to Liquidity Procedures approved by the Board of Trustees. These holdings represent 1.00% of the net assets at December 31, 2010.
** = Fair valued pursuant to Valuation Procedures adopted by the Board of Trustees. This holding represents 0.12% of the net assets at December 31, 2010.
If the Fund’s portfolio holdings represent ownership of 5% or more of the voting securities of a company, the company is deemed to be an affiliate as defined in the Investment Company Act of 1940. The Small Cap Growth Fund had the following transactions during the period ended December 31, 2010 with companies deemed affiliated during the period or at December 31, 2010.
| | | | | | | | | | | | | | | | | | | | | | | | |
| | | Share Activity | | | Year Ended
December 31, 2010 | |
| | | | | | | | | | | | | | | (in thousands) | |
Security Name | | Balance
12/31/2009 | | | Purchases | | | Sales | | | Balance
12/31/2010 | | | Value | | | Dividends
Included
in Income | |
CardioNet, Inc. | | | 1,344,381 | | | | 208,600 | | | | 1,552,981 | | | | — | | | $ | — | | | $ | — | |
DJSP Enterprises | | | — | | | | 788,419 | | | | 788,419 | | | | — | | | | — | | | | — | |
pDreams, Inc. | | | — | | | | 4,001,678 | | | | 716,221 | | | | 3,285,457 | | | | 8,674 | | | | — | |
pDuckwall-ALCO Stores, Inc. | | | 460,853 | | | | — | | | | 31,160 | | | | 429,693 | | | | 5,414 | | | | — | |
pGaiam, Inc. Class “A” | | | 1,511,007 | | | | 140,800 | | | | 601,535 | | | | 1,050,272 | | | | 8,087 | | | | 375 | |
pInuvo, Inc.* | | | 8,037,127 | | | | 776,634 | | | | 196,300 | | | | 861,747 | | | | 4,447 | | | | — | |
Kensey Nash Corporation | | | 422,340 | | | | 126,426 | | | | 124,300 | | | | 424,466 | | | | 11,813 | | | | — | |
pKona Grill, Inc. | | | 1,042,992 | | | | — | | | | 23,200 | | | | 1,019,792 | | | | 4,181 | | | | — | |
LCA-Vision Inc. | | | 948,955 | | | | 66,854 | | | | 1,015,809 | | | | — | | | | — | | | | — | |
Lionbridge Technologies, Inc. | | | 4,293,158 | | | | 553,800 | | | | 3,723,442 | | | | 1,123,516 | | | | 4,146 | | | | — | |
pMarlin Business Services Corporation | | | 988,701 | | | | — | | | | 269,831 | | | | 718,870 | | | | 9,093 | | | | — | |
pOn Assignment Inc. | | | 1,516,133 | | | | 1,293,264 | | | | 561,015 | | | | 2,248,382 | | | | 18,324 | | | | — | |
Overhill Farms, Inc. | | | 1,184,052 | | | | 53,900 | | | | 1,237,952 | | | | — | | | | — | | | | — | |
pPrinceton Review, Inc. | | | — | | | | 3,600,096 | | | | 80,200 | | | | 3,519,896 | | | | 4,154 | | | | — | |
pTrinity Biotech plc | | | 1,501,163 | | | | 486,500 | | | | 84,100 | | | | 1,903,563 | | | | 16,751 | | | | — | |
pUnited Western Bancorp, Inc. | | | 2,342,215 | | | | — | | | | 52,200 | | | | 2,290,015 | | | | 664 | | | | — | |
pVertro, Inc.** | | | 4,333,215 | | | | — | | | | 19,300 | | | | 847,343 | | | | 4,152 | | | | — | |
| | | | | | | | | | | | | | | | | | | | | | | | |
| | | | | | | | | | | | | | | | | | $ | 99,900 | | | $ | 375 | |
| | | | | | | | | | | | | | | | | | | | | | | | |
*1 per 10 stock split on 12/13/2010.
**1 per 5 stock split on 8/18/2010.
p Affiliated company at December 31, 2010. The Small Cap Growth Fund’s total value in companies deemed to be affiliated at December 31, 2010 was $83,941 (thousands).
See accompanying Notes to Financial Statements.
December 31, 2010 William Blair Funds 19 | |

Robert C. Lanphier, IV

David P. Ricci
MID CAP GROWTH FUND
The Mid Cap Growth Fund seeks long-term capital appreciation.
AN OVERVIEW FROM THE PORTFOLIO MANAGERS
The Mid Cap Growth Fund posted a 24.01% increase on a total return basis (Class N Shares) for the year ended December 31, 2010. By comparison, the Fund’s benchmark, the Russell Midcap Growth® Index, gained 26.38% during the period.
The U.S. equity market produced its third best calendar year return in the last decade after staging an impressive four-month rally to close out 2010.
The year started off as a continuation of 2009 with better-than-expected corporate earnings propelling stocks higher. Then, during the second quarter, European sovereign debt concerns and fears of a double-dip recession in the U.S. caused a steep mid-year correction. The selloff was short lived, however, as in late August the Federal Reserve signaled a second round of quantitative easing to help keep interest rates low and promote a more sustainable economic recovery. Improved investor sentiment was supported in part by stronger-than-expected retail sales that persisted into the holiday shopping season, U.S. industrial production data that proved better than many had expected at mid-year and what appears to be a more pro-business environment in Washington D.C. after the November elections. Strong growth in the emerging economies also boosted confidence in the reality of a global economic recovery.
A resilient consumer propelled the Consumer Discretionary sector up 37.18%, leading all sectors during 2010. Industrials also performed well up 34.35% on the heels of positive industrial production data. While Energy was the best performing sector during the fourth quarter, it was a relative underperformer during 2010 as a whole, up only 16.04%. Health Care underperformed as well up 20.38%, as the sector lived up to its defensive-natured stereotype.
The Fund’s performance for 2010 was characterized by a headwind from its more conservative investment style (i.e. typical lower portfolio beta) being mostly offset by positive effects from its smaller-than-benchmark weighted average market capitalization, higher growth profile and stock selection. The effect of stock selection was somewhat mixed by sector as certain stocks in Industrials, Information Technology and Materials boosted relative performance while others in Health Care and Financials detracted from return.
Many of the same dynamics were at play during the fourth quarter’s narrow underperformance as well. The Fund’s typical lower beta was the main detractor given the quarter’s swift market rally. Consumer Discretionary, Information Technology and Industrials stock selection contributed positively to relative performance while certain stocks in Materials and Consumer Staples mitigated that benefit.
Detractors from return
American Medical Systems Holdings, Inc. (AMMD) designs and manufactures pelvic health solutions, including incontinence, and markets them to urologists, gynecologists and urogynecologists. Reason for underperformance: The stock was a large detractor for the year and the fourth quarter as surgical procedures across the healthcare industry continue to be depressed, especially for elective procedures such as many of American Medical Systems’ solutions. Action: We continue to hold the stock in the Fund as the long-term growth of these types of procedures is likely to be strong given an aging population. While some of the company’s solutions are elective, they are often critical to the patient’s way of life and are
20 Annual Report | December 31, 2010 |
therefore usually just delayed rather than eliminated. In addition, the company increased its research and development spending over the past several years, contributing to an accelerated pace of new product introductions which should be most pronounced in 2011.
Athenahealth, Inc. (ATHN) is a provider of internet-based business services for physician practices. For example, the company’s solutions allow physician practices to improve accounts receivable days outstanding, bad debt expenses, and patient scheduling and follow-up. Reason for underperformance: The stock was one of the leading detractors from return during 2010. During the second quarter, Athenahealth announced disappointing contract wins with new physician practices, which brought into question whether the company has the appropriate infrastructure in place to compete with larger competitors. Action: The Fund liquidated our position on the news.
DeVry, Inc. (DV) operates in the post-secondary education industry. The company offers campus-based and online courses in areas including graduate level management courses, medical and nursing programs and professional exam preparation. Reason for underperformance: Legislative concerns regarding the for-profit post-secondary education industry have elevated investor concern about future earnings growth. Action: The Fund continues to hold a modest position in the stock. While adjustments to new regulations could significantly impact the profit pool of the entire industry, DeVry is one of the highest quality operators in the industry and should be a market share beneficiary of the industry turmoil.
Myriad Genetics, Inc. (MYGN) develops and markets therapeutic and molecular diagnostic products. Reason for underperformance: Although it was a detractor for the year overall, the stock was especially weak during the first half of the year based on deteriorating fundamentals and due to investor concern regarding the company’s patents. Action: The Fund sold its position in May given the non-recurring nature of the company’s diagnostic tests and the long-term earnings risk such a revenue stream poses in light of uncertainty in the company’s addressable market.
VistaPrint N.V. (VPRT) is a worldwide provider of marketing and printing services to small business and home office customers via the internet. The company’s products include business cards, brochures, invitations, websites, and various types of marketing material. Reason for underperformance: Disappointing revenues announced in July raised concern among investors regarding long-term growth opportunities, especially given sub-par results from its then-recent television advertising campaign. Action: The Fund sold its position given the uncertainty around customer acquisition costs and therefore the volatility of the company’s return on marketing investments.
Contributors to return
Chipotle Mexican Grill, Inc. (CMG) is a restaurant company that operates a chain of fast-casual, fresh Mexican food restaurants. Reason for outperformance: Accelerating revenue and margin growth resulted in a more than 30% increase in earnings expectations for 2010 over the course of the year. Sales growth at restaurants open at least one year will likely increase in the high single digits for 2010, suggesting fundamental consumer preference for Chipotle’s fresh, naturally-raised food. Action: While we continue to believe that this company has a long runway for growth, we have trimmed the Fund’s position on the strength due to an increased valuation and elevated growth expectations.
Illumina, Inc. (ILMN) develops and markets integrated systems used in the gene sequencing and genotyping markets. The company’s machines enable medical and academic institutions to understand the genetic make-up of individuals which allows for more productive research in disease treatment and prevention. Reason for outperformance: Illumina posted significantly better-than-expected revenue and earnings during the fourth quarter, and throughout the year, due to increasing demand for the company’s sequencing machines. Action: We maintain a position in the stock as we believe the company’s technological edge will continue to drive demand for its machines. In addition, as the installed base of the company’s machines grows,
December 31, 2010 | William Blair Funds 21 |
there will likely be a further boost to earnings and the sustainability of earnings due to the expanded use of higher-margin consumable instruments.
Stericycle, Inc. (SRCL) is the leading medical waste management company. The company collects and disposes of medical waste as a service for smaller facilities such as outpatient clinics and dental offices, and larger facilities such as hospitals and blood banks. Reason for outperformance: The stock proved to be resilient throughout the year, during both the mid-year correction and the second half rally, as the company quietly produced solid and consistent earnings growth in 2010 in part due to cross selling of additional services, such as pharmaceutical waste management, to its customers. In addition, Stericycle announced the acquisition of its nearest competitor, thereby strengthening its already dominant competitive position in the industry. Action: Strericycle continues to be one of the largest positions in the Fund as we believe investors underestimate the durability of the company’s long term growth opportunity.
Trimble Navigation, Ltd. (TRMB) develops and markets products embedded with its global positioning systems (GPS) technology to commercial and governmental customers for use in the construction and agriculture industries. Reason for outperformance: Fundamental business strength driven in part by a better economic backdrop from a year ago, but mainly due to increasing demand for the company’s GPS-enabled products in the Engineering & Construction and Agriculture businesses both in the U.S. and abroad. In addition, a recent distribution agreement with Caterpillar seems to be ramping well. Action: We trimmed the Fund’s position on the strength, but continue to own shares in the company in part due to the secular growth in infrastructure projects in the U.S. and abroad, as well as our belief that the company’s broader rollout of distribution partnerships are just beginning.
Verisign, Inc. (VRSN) manages the “.com” and “.net” domains on the internet. Reasons for outperformance: Web site growth was strong during the year and renewal trends have been positive. VeriSign’s cash flow generation and the divestiture of its slower-growth security business during the year provided cash to buy back shares and issue a large one-time dividend, and it allows them to focus on the faster-growth domain management business. In addition, the company instituted price increases starting on July 1, 2010. Action: We have trimmed the Fund’s position given an increased valuation on the stock but continue to own given the positive secular internet growth and dominant industry position.
Outlook
Almost universally, market strategists believe 2011 will produce a solid, yet more modest, equity market return in the U.S. Broadly speaking, corporate cash flow generation remains robust and profit margins generally are attractive. Although the rate of improvement for both of these metrics may slow, if the past is any indication, these dynamics should eventually entice capital spending and increased hiring by corporations. This would help alleviate one of the main concerns with this recovery, unemployment. On the other hand, the risks are somewhat well documented. Government budgets at every level are stretched. The extension of the Bush-era federal income tax rates and new payroll tax break, along with the extension of unemployment benefits, help consumers and businesses in the short run, but the long-run impact is more questionable. The same can be said for the Federal Reserve’s second round of quantitative easing and its impact on longer-term inflation. Rapid growth in emerging economies poses two distinct risks as well: higher commodity price inflation and potentially negative effects from emerging governments’ efforts to combat overheating of their economies.
In the end, however, while we factor various economic scenarios into our stock picking, we focus our time on constructing the Fund from a bottom-up perspective. As we mentioned above, corporate fundamentals remain attractive. In combination with valuations that are broadly in line with long-term averages, the market outlook remains balanced. While macro factors largely drove stock prices again in 2010, we continue to expect individual company
22 Annual Report | December 31, 2010 |
fundamentals to be the leading determinant of forward stock price returns. In an environment where earnings growth will be less about cost cutting and more about organic revenue growth, investors are likely to seek companies which possess more internal growth drivers. Our philosophy of finding solid quality growth companies, which “control their own destiny” to a greater degree and are less dependent on overall economic growth, should be a benefit in such an environment. We continue to find good ideas across sectors, and are confident the Fund consists of great companies with solid competitive positions whose stocks are at attractive valuations compared to the growth, consistency and sustainability of their business.
December 31, 2010 | William Blair Funds 23 |
Mid Cap Growth Fund
Performance Highlights (unaudited)
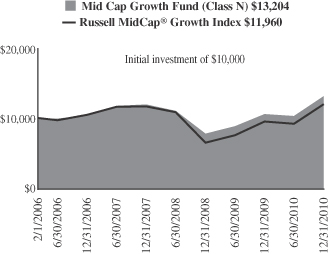
Average Annual Total Return at 12/31/2010
| | | | | | | | | | | | |
| | | 1
Year | | | 3
Year | | | Since
Inception(a) | |
Class N | | | 24.01 | % | | | 3.27 | % | | | 5.82 | % |
Class I | | | 24.31 | | | | 3.55 | | | | 6.12 | |
Russell MidCap® Growth Index | | | 26.38 | | | | 0.97 | | | | 3.70 | |
| | (a) | | For the period from February 1, 2006 (Commencement of Operations) to December 31, 2010. |
Performance cited represents past performance. Past performance does not guarantee future results and current performance may be lower or higher than the data quoted. Results shown are average annual total returns, which assume reinvestment of dividends and capital gains. Investment returns and principal will fluctuate and you may have a gain or loss when you sell shares. For the most current month-end performance information, please call 1-800-742-7272, or visit our Web site at www.williamblairfunds.com. Investing in medium capitalization companies involves special risks, including higher volatility and lower liquidity. Medium Capitalization stocks are also more sensitive to purchase/sale transactions and changes in the issuer’s financial condition. From time to time, the investment advisor may waive fees or reimburse expenses for the Fund. Without these waivers, performance would be lower. Class N shares are available to the general public without a sales load. Class I shares are available to certain institutional investors and advisory clients of William Blair & Company, L.L.C., without a sales load or distribution (12b-1) or service fees.
The performance highlights and graph presented above do not reflect the deduction of taxes that a shareholder would pay on fund distributions or the redemption of fund shares.
The Russell MidCap® Growth Index is an index that is constructed to provide a comprehensive and unbiased barometer of the mid-cap growth market.
This report identifies the Fund’s investments on December 31, 2010. These holdings are subject to change. Not all stocks in the Fund performed the same, nor is there any guarantee that these stocks will perform as well in the future. Market forecasts provided in this report may not necessarily come to pass.
Sector Diversification (unaudited)

The sector diversification shown is based on the total long-term securities.
24 Annual Report | December 31, 2010 |
Mid Cap Growth Fund
Portfolio of Investments, December 31, 2010 (all dollar amounts in thousands)
| | | | | | | | |
Issuer | | Shares | | | Value | |
| | |
Common Stocks | | | | | | | | |
Industrials—21.8% | | | | | | | | |
CH Robinson Worldwide, Inc. | | | 29,400 | | | $ | 2,358 | |
Expeditors International of Washington, Inc. | | | 24,800 | | | | 1,354 | |
Fastenal Co. | | | 35,875 | | | | 2,149 | |
Gardner Denver, Inc. | | | 22,600 | | | | 1,555 | |
*Jacobs Engineering Group, Inc. | | | 15,694 | | | | 720 | |
Manpower, Inc. | | | 17,690 | | | | 1,110 | |
MSC Industrial Direct Co. Class “A” | | | 32,500 | | | | 2,102 | |
Robert Half International, Inc. | | | 29,300 | | | | 897 | |
Rockwell Automation, Inc. | | | 27,600 | | | | 1,979 | |
Roper Industries, Inc. | | | 22,160 | | | | 1,694 | |
*Stericycle, Inc. | | | 43,330 | | | | 3,506 | |
*TransDigm Group, Inc. | | | 36,950 | | | | 2,661 | |
| | | | | | | | |
| | | | | | | 22,085 | |
| | | | | | | | |
Information Technology—19.8% | | | | | | | | |
Amphenol Corporation Class “A” | | | 19,200 | | | | 1,013 | |
*Atheros Communications, Inc. | | | 49,500 | | | | 1,778 | |
*Cavium Networks, Inc. | | | 27,200 | | | | 1,025 | |
*Citrix Systems, Inc. | | | 22,300 | | | | 1,526 | |
*Concur Technologies, Inc. | | | 35,930 | | | | 1,866 | |
*Dolby Laboratories, Inc. Class “A” | | | 23,770 | | | | 1,585 | |
*FLIR Systems, Inc. | | | 53,800 | | | | 1,601 | |
*Informatica Corporation | | | 23,000 | | | | 1,013 | |
*Silicon Laboratories, Inc. | | | 57,310 | | | | 2,637 | |
Solera Holdings, Inc. | | | 33,800 | | | | 1,735 | |
*Trimble Navigation, Ltd. | | | 56,300 | | | | 2,248 | |
VeriSign, Inc. | | | 59,700 | | | | 1,950 | |
| | | | | | | | |
| | | | | | | 19,977 | |
| | | | | | | | |
Consumer Discretionary—17.0% | | | | | | | | |
*Bed Bath & Beyond, Inc. | | | 31,060 | | | | 1,527 | |
*CarMax, Inc. | | | 108,770 | | | | 3,467 | |
*Chipotle Mexican Grill, Inc. | | | 2,100 | | | | 446 | |
DeVry, Inc. | | | 21,110 | | | | 1,013 | |
*Dick’s Sporting Goods, Inc. | | | 56,829 | | | | 2,131 | |
*Discovery Communications, Inc. | | | 11,900 | | | | 496 | |
*Discovery Communications, Inc. Class “C” | | | 13,700 | | | | 503 | |
Gentex Corporation | | | 48,180 | | | | 1,424 | |
*Harman International Industries, Inc. | | | 30,800 | | | | 1,426 | |
*O’Reilly Automotive, Inc. | | | 44,880 | | | | 2,712 | |
Scripps Networks Interactive, Inc. Class “A” | | | 18,900 | | | | 978 | |
*WMS Industries, Inc. | | | 24,440 | | | | 1,106 | |
| | | | | | | | |
| | | | | | | 17,229 | |
| | | | | | | | |
Health Care—12.7% | | | | | | | | |
*American Medical Systems Holdings, Inc. | | | 54,872 | | | | 1,035 | |
*CareFusion Corporation | | | 43,239 | | | | 1,111 | |
*Cerner Corporation | | | 16,100 | | | | 1,525 | |
*HMS Holdings Corporation | | | 30,300 | | | | 1,963 | |
*IDEXX Laboratories, Inc. | | | 29,872 | | | | 2,068 | |
*Illumina, Inc. | | | 45,920 | | | | 2,909 | |
Perrigo Co. | | | 15,100 | | | | 956 | |
* = Non-income producing securities
† = U.S. listed foreign security
| | | | | | | | |
Issuer | | Shares or
Principal
Amount | | | Value | |
| | |
Common Stocks—(continued) | | | | | | | | |
Health Care—(continued) | | | | | | | | |
*QIAGEN N.V.† | | | 66,346 | | | $ | 1,297 | |
| | | | | | | | |
| | | | | | | 12,864 | |
| | | | | | | | |
Consumer Staples—10.8% | | | | | | | | |
Church & Dwight Co., Inc. | | | 13,100 | | | | 904 | |
Flowers Foods, Inc. | | | 38,000 | | | | 1,022 | |
*Green Mountain Coffee Roasters, Inc. | | | 132,156 | | | | 4,343 | |
McCormick & Co., Inc. | | | 59,700 | | | | 2,778 | |
Mead Johnson Nutrition Co. | | | 30,300 | | | | 1,886 | |
| | | | | | | | |
| | | | | | | 10,933 | |
| | | | | | | | |
Financials—6.2% | | | | | | | | |
*Affiliated Managers Group, Inc. | | | 15,075 | | | | 1,496 | |
Greenhill & Co., Inc. | | | 21,420 | | | | 1,750 | |
*IntercontinentalExchange, Inc. | | | 12,350 | | | | 1,471 | |
Invesco, Ltd.† | | | 65,000 | | | | 1,564 | |
| | | | | | | | |
| | | | | | | 6,281 | |
| | | | | | | | |
Energy—5.4% | | | | | | | | |
*Cameron International Corporation | | | 22,200 | | | | 1,126 | |
*Denbury Resources, Inc. | | | 77,270 | | | | 1,475 | |
*Newfield Exploration Co. | | | 22,830 | | | | 1,647 | |
Range Resources Corporation | | | 14,500 | | | | 652 | |
*Southwestern Energy Co. | | | 15,870 | | | | 594 | |
| | | | | | | | |
| | | | | | | 5,494 | |
| | | | | | | | |
Materials—2.3% | | | | | | | | |
Ecolab, Inc. | | | 46,400 | | | | 2,340 | |
| | | | | | | | |
Telecommunication Services—1.8% | | | | | | | | |
*SBA Communications Corporation Class “A” | | | 44,100 | | | | 1,805 | |
| | | | | | | | |
Total Common Stocks—97.8%
(cost $75,842) | | | | 99,008 | |
| | | | | | | | |
| | |
Repurchase Agreement | | | | | | | | |
State Street Bank and Trust Company, 0.150% dated 12/31/10, due 1/3/11, repurchase price $2,020, collateralized by U. S. Treasury Note, 2.500%, due 4/30/15 | | $ | 2,020 | | | | 2,020 | |
| | | | | | | | |
Total Repurchase Agreement—2.0%
(cost $2,020) | | | | 2,020 | |
| | | | | | | | |
Total Investments—99.8%
(cost $77,862) | | | | 101,028 | |
Cash and other assets, less liabilities—0.2% | | | | 220 | |
| | | | | | | | |
Net assets—100.0% | | | $ | 101,248 | |
| | | | | | | | |
See accompanying Notes to Financial Statements.
December 31, 2010 | William Blair Funds 25 |
Karl W. Brewer
Robert C. Lanphier, IV

Matthew A. Litfin
SMALL-MID CAP GROWTH FUND
The Small-Mid Cap Growth Fund seeks long-term capital appreciation.
AN OVERVIEW FROM THE PORTFOLIO MANAGERS
The Small-Mid Cap Growth Fund increased 22.76% on a total return basis (Class N Shares) for the 12 months ended December 31, 2010. By comparison, the Fund’s benchmark, the Russell 2500 GrowthTM Index, gained 28.86% during the period.
The U.S. small and mid cap equity market produced its third best calendar year return in the last decade after staging an impressive four-month rally to close out 2010.
The year started off as a continuation of 2009 with better-than-expected corporate earnings propelling stocks higher. Then, during the second quarter, European sovereign debt concerns and fears of a double-dip recession in the U.S. caused a steep mid-year correction. The selloff was short lived, however, as in late August the Federal Reserve signaled a second round of quantitative easing to help keep interest rates low and promote a more sustainable economic recovery. Improved investor sentiment was supported in part by stronger-than-expected retail sales that persisted into the holiday shopping season, U.S. industrial production data that proved better than many had expected at mid-year, and a more pro-business environment in Washington D.C. that emerged after the November elections. Strong growth in the emerging economies also boosted confidence in the reality of a global economic recovery.
Within the Russell 2500TM Growth Index, market leadership was relatively broad-based from a sector perspective. Consumer Discretionary, Information Technology, Industrials, Energy and Materials all returned between 31% and 33%. Financials and typically defensive sectors, Health Care and Consumer Staples, lagged the overall market with returns just over 20%.
The Fund’s underperformance for 2010 was driven by its more conservative investment style (typical lower beta) and industry (sub-sector) headwinds. Although individual stock picks dictate our sector and industry weights, the Fund’s exposure to certain industries detracted from performance during the year. Examples include the Fund’s overweights to Diversified Consumer Services (within Consumer Discretionary) and Health Care Technology (within Health Care).
Partially offsetting these 2010 headwinds was stock selection. Positive stock specific drivers were most pronounced in the Consumer Discretionary, Materials and Telecom sectors while stock selection in Information Technology, Industrials and Health Care detracted from relative results.
During the fourth quarter specifically, the Fund’s lower beta detracted from relative performance given the benchmark’s 16.00% advance. This negative beta headwind was partially mitigated by strong stock selection in Financials, Consumer Discretionary and Health Care. On the other hand, certain stocks in Industrials and Consumer Staples detracted from performance for the quarter.
Detractors from return
Cenveo, Inc. (CVO) is a diversified printing company. The company’s portfolio of products include forms and labels manufacturing, packaging and publisher offerings, envelope production and commercial printing. Reason for underperformance: Irrational pricing by a weakened competitor in the envelopes business greatly impacted industry pricing, thereby reducing Cenveo’s revenues and earnings in the intermediate term. In addition, despite more
26 Annual Report | December 31, 2010 |
recent signs of a recovery in the commercial printing industry, the industry has been weaker than expected coming out of the recession, despite recent industry consolidation. Action: We liquidated the Fund’s position in the stock.
Comstock Resources, Inc. (CRK) engages in the acquisition, exploration and development of oil and natural gas properties in the United States. It operates primarily in the south and southeast regions of the U.S., in addition to the Gulf of Mexico. Reason for underperformance: In contrast to crude oil which rallied during 2010, natural gas prices were down dramatically. Since over 90% of Comstock’s business is focused on natural gas production, investors became nervous about the company’s fundamental outlook, especially relative to the broader energy sector. Action: We liquidated the Fund’s position in July in part due to the potential earnings impact from a depressed commodity price but also due to various planning issues for future production.
Heidrick & Struggles International, Inc. (HSII) is an executive search and leadership consulting firm. Reason for underperformance: While executive search activity has been recovering modestly, we believe consultant turnover has picked up, especially in Europe where the economic recovery has been weaker. Action: We liquidated the Fund’s position earlier in the year given lowered expectations for growth and unsettling employee turnover.
NuVasive, Inc. (NUVA) designs and markets products used in the surgical treatment of spine disorders. Reason for underperformance: Management reduced forward earnings guidance during the second half of the year in part due to a sluggish recovery in procedure growth following the recession, but primarily due to negative developments in the spine surgery market. Certain health insurance plans are changing their reimbursement policies for spine procedures which could meaningfully reduce demand for NuVasive’s products. Action: While we believe NuVasive can continue to gain market share based on its innovation, the industry headwinds may be too stiff. We therefore liquidated the Fund’s position.
VistaPrint N.V. (VPRT) is a worldwide provider of marketing and printing services to small business and home office customers via the internet. The company’s products include business cards, brochures, invitations, websites, and various types of marketing material. Reason for underperformance: Disappointing revenues announced in July raised concern among investors regarding long-term growth opportunities, especially given sub-par results from its then-recent television advertising campaign. Action: We trimmed the Fund’s position after the mid-year correction due to increased business risk, but continue to hold an investment in the company given our belief in management’s ability to make the necessary adjustments, as well as the stock’s improved valuation.
Contributors to return
Affiliated Managers Group, Inc. (AMG) is an asset management company with equity investments in various small- and mid-sized investment management firms. Reason for outperformance: As an asset manager, the stock was aided by the rally in the market given the rally’s impact on assets under management, and therefore the company’s expected revenues. In addition, during the fourth quarter the company announced better-than-expected asset flows with particular strength in the company’s global, emerging market and alternative strategies. Earlier in the year, the company raised equity capital to pay down debt and potentially make acquisitions, a historical and expected avenue of growth for the company. Action: We maintain a position in the stock as we believe the company is poised for further growth given it is a well-diversified and well-managed asset management company.
Chipotle Mexican Grill, Inc. (CMG) is a restaurant company that operates a chain of fast-casual, fresh Mexican food restaurants. Reason for outperformance: Accelerating revenue and margin growth resulted in a more than 30% increase in earnings expectations for 2010 over the course of the year. Sales growth at restaurants open at least one year likely increased in the high single digits for 2010, suggesting fundamental consumer preference for Chipotle’s
December 31, 2010 | William Blair Funds 27 |
fresh, naturally-raised food. Action: While we continue to believe that this company has a long runway for growth, we sold the Fund’s position given what we believe are a stretched valuation and elevated growth expectations.
Concho Resources, Inc. (CXO) is an exploration and production company in the oil and natural gas industry. Reason for outperformance: The company exceeded earnings expectations in each quarter announced during 2010 and recently raised forward earnings guidance. Higher production volumes and lower costs were the primary reasons for the stock outperforming its energy peers and the market overall. Investors also cheered Concho Resources’ acquisition of oil and natural gas assets from another company during the year. Action: We trimmed the Fund’s position on the strength displayed this year.
SXC Health Solutions Corporation (SXCI) provides pharmacy benefit management (PBM) services and healthcare information technology solutions. Reason for the outperformance: Throughout 2010, the stock performed well primarily due to new contract wins and accretive acquisitions, but also due to continued growth in mail delivery and generic utilization of pharmaceuticals. SXC Health Solutions’ recent business strength is in part driven by leveraging its strong customer relationships in its legacy healthcare IT business to cross-sell the company’s PBM capabilities. During the first and fourth quarters, SXC Health Solutions announced contract wins with major health plans. In December, the company announced an acquisition of a specialty pharmacy which investors viewed favorably. Action: We continue to hold a position as we believe the company’s focused management team and differentiated customer solutions will drive further market share gains and earnings growth.
Under Armour, Inc. (UA) engages in the design, development, marketing and distribution of a range of performance apparel and accessories utilizing various synthetic microfiber fabrications. Reason for outperformance: The company exceeded earnings expectations in each of the four quarterly reports announced during 2010, and in October, it raised forward earnings guidance above then-consensus expectations. Under Armour’s fundamental momentum is coming from its Men’s, Women’s and Youth apparel businesses with particular strength in the company’s direct-to-consumer channel (especially online). Action: We trimmed the Fund’s position on strength during the second half of the year but continue to own a position in this unique and fast growing company.
Outlook
Looking ahead, almost universally, market strategists believe 2011 will produce a solid, yet more modest, equity market return in the U.S. Broadly speaking, corporate cash flow generation and profit margins generally are attractive due to effective expense management by U.S. companies. If the past is any indication, these dynamics should eventually entice capital spending and increased hiring by corporations. This would help alleviate one of the main concerns with this recovery, unemployment.
Risks to a full economic recovery loom, yet are well documented. Government budgets at every level are stretched. The extension of the Bush-era federal income tax rates and new payroll tax break, along with the extension of unemployment benefits, help consumers and businesses in the short run, but the long-run impact is yet unknown. The same can be said for the Federal Reserve’s second round of quantitative easing and its impact on longer-term inflation. Rapid growth in emerging economies poses two distinct risks as well: higher commodity price inflation and potentially negative effects from emerging governments’ efforts to combat overheating of their economies.
In the end, however, while we factor various economic scenarios into our stock picking, we focus our time on constructing the Fund from a bottom-up perspective. As mentioned above, corporate fundamentals remain attractive. In combination with valuations that are broadly in line with long-term averages, the market outlook remains balanced. While macroeconomic data largely drove correlated stock prices again in 2010, we expect individual company
28 Annual Report | December 31, 2010 |
fundamentals to be the leading determinant of forward stock price returns. In an environment where earnings growth will be less about cost cutting and more about organic revenue growth, investors are likely to seek companies which possess more internal growth drivers. Our philosophy of finding solid quality growth companies, which “control their own destiny” to a greater degree and are less dependent on overall economic growth, should benefit in such an environment. We continue to find good ideas across sectors, and are confident the Fund consists of great companies with solid competitive positions whose stocks are at attractive valuations compared to the growth, consistency and sustainability of their earnings.
December 31, 2010 | William Blair Funds 29 |
Small-Mid Cap Growth Fund
Performance Highlights (unaudited)
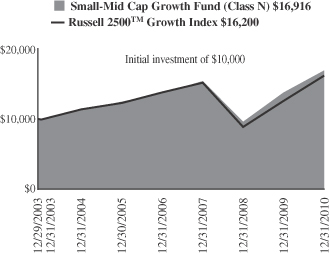
Average Annual Total Return at 12/31/2010
| | | | | | | | | | | | | | | | |
| | | 1
Year | | | 3
Year | | | 5
Year | | | Since
Inception(a) | |
Class N | | | 22.76 | % | | | 3.21 | % | | | 6.26 | % | | | 7.79 | % |
Class I | | | 23.05 | | | | 3.50 | | | | 6.53 | | | | 8.06 | |
Russell 2500™ Growth Index | | | 28.86 | | | | 2.21 | | | | 5.63 | | | | 7.10 | |
| | (a) | | For the period from December 29, 2003 (Commencement of Operations) to December 31, 2010. | |
Performance cited represents past performance. Past performance does not guarantee future results and current performance may be lower or higher than the data quoted. Results shown are average annual total returns, which assume reinvestment of dividends and capital gains. Investment returns and principal will fluctuate and you may have a gain or loss when you sell shares. For the most current month-end performance information, please call 1-800-742-7272, or visit our Web site at www.williamblairfunds.com. Investing in smaller and medium capitalization companies involves special risks, including higher volatility and lower liquidity. Smaller and medium capitalization stocks are also more sensitive to purchase/sale transactions and changes in the issuer’s financial condition. From time to time, the investment advisor may waive fees or reimburse expenses for the Fund. Without these waivers, performance would be lower. Class N shares are available to the general public without a sales load. Class I shares are available to certain institutional investors and advisory clients of William Blair & Company, L.L.C., without a sales load or distribution (12b-1) or service fees.
The performance highlights and graph presented above do not reflect the deduction of taxes that a shareholder would pay on fund distributions or the redemption of fund shares.
The Russell 2500™ Growth Index measures the performance of those Russell 2500 companies with above average price-to-book ratios and forecasted growth rates.
This report identifies the Fund’s investments on December 31, 2010. These holdings are subject to change. Not all stocks in the Fund performed the same, nor is there any guarantee that these stocks will perform as well in the future. Market forecasts provided in this report may not necessarily come to pass.
Sector Diversification (unaudited)
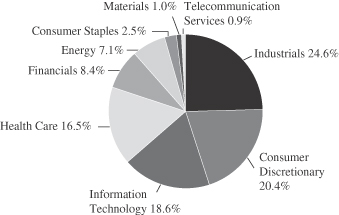
The sector diversification shown is based on the total long-term securities.
30 Annual Report | December 31, 2010 |
Small-Mid Cap Growth Fund
Portfolio of Investments, December 31, 2010 (all dollar amounts in thousands)
| | | | | | | | |
Issuer | | Shares | | | Value | |
| | |
Common Stocks | | | | | | | | |
Industrials—24.3% | | | | | | | | |
Allegiant Travel Co. | | | 54,065 | | | $ | 2,662 | |
*BE Aerospace, Inc. | | | 52,653 | | | | 1,950 | |
*Corrections Corporation of America | | | 141,755 | | | | 3,552 | |
*CoStar Group, Inc. | | | 43,700 | | | | 2,515 | |
Fastenal Co. | | | 66,460 | | | | 3,982 | |
Flowserve Corporation | | | 19,600 | | | | 2,337 | |
*GrafTech International, Ltd. | | | 181,400 | | | | 3,599 | |
Healthcare Services Group, Inc. | | | 127,400 | | | | 2,073 | |
*Huron Consulting Group, Inc. | | | 99,200 | | | | 2,624 | |
*ICF International, Inc. | | | 99,556 | | | | 2,561 | |
Kaydon Corporation | | | 59,859 | | | | 2,437 | |
Manpower, Inc. | | | 73,350 | | | | 4,603 | |
Roper Industries, Inc. | | | 41,600 | | | | 3,180 | |
*Stericycle, Inc. | | | 69,420 | | | | 5,617 | |
The Corporate Executive Board Co. | | | 70,277 | | | | 2,639 | |
*TransDigm Group, Inc. | | | 22,908 | | | | 1,650 | |
*Trimas Corporation | | | 125,288 | | | | 2,563 | |
| | | | | | | | |
| | | | | | | 50,544 | |
| | | | | | | | |
Consumer Discretionary—20.2% | | | | | | | | |
*Career Education Corporation | | | 112,025 | | | | 2,322 | |
*CarMax, Inc. | | | 65,200 | | | | 2,079 | |
DeVry, Inc. | | | 42,665 | | | | 2,047 | |
*Dick’s Sporting Goods, Inc. | | | 133,390 | | | | 5,002 | |
*Education Management Corporation | | | 145,472 | | | | 2,633 | |
Gentex Corporation | | | 107,800 | | | | 3,187 | |
Jarden Corporation | | | 106,400 | | | | 3,285 | |
*K12, Inc. | | | 96,850 | | | | 2,776 | |
*O’Reilly Automotive, Inc. | | | 53,250 | | | | 3,217 | |
P.F. Chang’s China Bistro, Inc. | | | 53,222 | | | | 2,579 | |
*Steiner Leisure, Ltd.† | | | 58,700 | | | | 2,741 | |
Strayer Education, Inc. | | | 11,000 | | | | 1,674 | |
*Tempur-Pedic International, Inc. | | | 53,800 | | | | 2,155 | |
*Under Armour, Inc. Class “A” | | | 32,860 | | | | 1,802 | |
*Urban Outfitters, Inc. | | | 82,200 | | | | 2,944 | |
*Valassis Communications, Inc. | | | 50,500 | | | | 1,634 | |
| | | | | | | | |
| | | | | | | 42,077 | |
| | | | | | | | |
Information Technology—18.4% | | | | | | | | |
Blackbaud, Inc. | | | 98,800 | | | | 2,559 | |
*Booz Allen Hamilton Holding Corporation | | | 100,465 | | | | 1,952 | |
*Cavium Networks, Inc. | | | 111,700 | | | | 4,209 | |
*Concur Technologies, Inc. | | | 51,700 | | | | 2,685 | |
*FLIR Systems, Inc. | | | 83,500 | | | | 2,484 | |
*Informatica Corporation | | | 55,800 | | | | 2,457 | |
*j2 Global Communications, Inc. | | | 124,975 | | | | 3,618 | |
*MICROS Systems, Inc. | | | 52,100 | | | | 2,285 | |
*RightNow Technologies, Inc. | | | 74,900 | | | | 1,773 | |
*Silicon Laboratories, Inc. | | | 92,060 | | | | 4,237 | |
*Trimble Navigation, Ltd. | | | 68,000 | | | | 2,715 | |
*Ultimate Software Group, Inc. | | | 44,925 | | | | 2,185 | |
VeriSign, Inc. | | | 76,900 | | | | 2,512 | |
*VistaPrint N.V.† | | | 59,157 | | | | 2,721 | |
| | | | | | | | |
| | | | | | | 38,392 | |
| | | | | | | | |
* = Non-income producing securities
† = U.S. listed foreign security
| | | | | | | | |
Issuer | | Shares or
Principal
Amount | | | Value | |
| | |
Common Stocks—(continued) | | | | | | | | |
Health Care—16.3% | | | | | | | | |
*Align Technology, Inc. | | | 92,300 | | | $ | 1,804 | |
*American Medical Systems Holdings, Inc. | | | 53,618 | | | | 1,011 | |
*athenahealth, Inc. | | | 55,740 | | | | 2,284 | |
*Brookdale Senior Living, Inc. | | | 134,876 | | | | 2,888 | |
*Cerner Corporation | | | 30,900 | | | | 2,927 | |
CR Bard, Inc. | | | 25,100 | | | | 2,303 | |
*Haemonetics Corporation | | | 31,100 | | | | 1,965 | |
*HMS Holdings Corporation | | | 39,300 | | | | 2,545 | |
*IDEXX Laboratories, Inc. | | | 29,905 | | | | 2,070 | |
*Illumina, Inc. | | | 40,000 | | | | 2,534 | |
*Kensey Nash Corporation | | | 56,327 | | | | 1,568 | |
*MedAssets, Inc. | | | 101,591 | | | | 2,051 | |
*NxStage Medical, Inc. | | | 45,261 | | | | 1,126 | |
Perrigo Co. | | | 50,900 | | | | 3,223 | |
*SXC Health Solutions Corporation† | | | 84,200 | | | | 3,609 | |
| | | | | | | | |
| | | | | | | 33,908 | |
| | | | | | | | |
Financials—8.3% | | | | | | | | |
*Affiliated Managers Group, Inc. | | | 56,780 | | | | 5,634 | |
*First Horizon National Corporation | | | 281,589 | | | | 3,317 | |
*FirstService Corporation† | | | 71,975 | | | | 2,179 | |
Invesco, Ltd.† | | | 178,400 | | | | 4,292 | |
Jones Lang LaSalle, Inc. | | | 21,300 | | | | 1,788 | |
| | | | | | | | |
| | | | | | | 17,210 | |
| | | | | | | | |
Energy—7.0% | | | | | | | | |
*Concho Resources, Inc. | | | 30,740 | | | | 2,695 | |
*Dresser-Rand Group, Inc. | | | 46,900 | | | | 1,997 | |
*Forest Oil Corporation | | | 76,100 | | | | 2,890 | |
*Oceaneering International, Inc. | | | 33,100 | | | | 2,437 | |
*Oil States International, Inc. | | | 40,400 | | | | 2,589 | |
*Petrohawk Energy Corporation | | | 107,100 | | | | 1,955 | |
| | | | | | | | |
| | | | | | | 14,563 | |
| | | | | | | | |
Consumer Staples—2.5% | | | | | | | | |
*Green Mountain Coffee Roasters, Inc. | | | 156,726 | | | | 5,150 | |
| | | | | | | | |
Materials—1.0% | | | | | | | | |
Celanese Corporation | | | 51,200 | | | | 2,108 | |
| | | | | | | | |
Telecommunication Services—0.9% | | | | | | | | |
*SBA Communications Corporation
Class “A” | | | 45,200 | | | | 1,850 | |
| | | | | | | | |
Total Common Stocks—98.9%
(cost $161,809) | | | | 205,802 | |
| | | | | | | | |
| | |
Repurchase Agreement | | | | | | | | |
State Street Bank and Trust Company, 0.150% dated 12/31/10, due 1/3/11, repurchase price $1,100, collateralized by U.S. Treasury Note, 2.500%, due 4/30/15 | | $ | 1,100 | | | | 1,100 | |
| | | | | | | | |
Total Repurchase Agreement—0.5%
(cost $1,100) | | | | 1,100 | |
| | | | | | | | |
Total Investments—99.4%
(cost $162,909) | | | | 206,902 | |
Cash and other assets, less liabilities—0.6% | | | | 1,163 | |
| | | | | | | | |
Net assets—100.0% | | | $ | 208,065 | |
| | | | | | | | |
See accompanying Notes to Financial Statements.
December 31, 2010 | William Blair Funds 31 |
GLOBAL MARKETS OVERVIEW
The year 2010 was marked by a mid-teens return in the global equity market with most markets and all global sectors in positive territory. This year seemed almost “normal,” as opposed to the wild swings of the last two years when the global equity market fell 42.34% in the midst of the 2008 financial crisis, then subsequently rebounded 36.41% during the initial stages of the recovery in 2009. The 2010 return, however, understates the market volatility that occurred during the year. Recovering corporate profits and economic activity bolstered the stock market generally as the recovery moved towards a more traditional expansion mode. These positives were somewhat offset by concerns about peripheral European debt that arose in the first quarter. In addition, rising emerging markets inflationary pressures and subsequent monetary policy tightening raised concerns about near term growth in the engine of the global recovery. The combination of these two issues and a rolling over of composite leading indicators gave rise to fears of a “double dip” in the second quarter and a resultant weak market. However, the Fed’s continued commitment to Quantitative Easing (QE) in the latter half of the year was viewed positively and was expected to support risk asset prices, while economic activity improved. These events supported the rally through year end and counteracted rising anxiety about governmental debt loads and persistently high unemployment rates in a number of developed countries.
While the broad market returned 14.35% during 2010, as reflected by the MSCI ACWI IMI, emerging markets outperformed their developed market counterparts, as these countries benefited from strong investment, industrial production and increasing domestic demand, despite concerns about monetary tightening and economic overheating. Within emerging markets, the Emerging Markets Europe, Mid-East, and Africa (EMEA) region was up approximately 25%, led by strength in South Africa and Turkey, which more than offset weaker returns in the Central and Eastern European region, affected by the debt concerns confronting its Western European neighbors. Emerging Asia returned approximately 19%, as Indonesia, Thailand and Malaysia had strong returns, but China lagged due to heightened concerns about the Chinese property market and overall economic overheating, and potential implications on overall growth rates. Latin America was the worst performing emerging markets region, rising just over 16% as strength in Chile and Mexico was more than offset by Brazil’s 9% return.
Developed market returns also varied significantly during the year as Europe lagged the rest of the world, rising just over 3%, due to double digit market declines in those countries most affected by debt concerns. Conversely, Canada and Pacific ex-Japan performed well, up 23% and 18%, respectively, while the U.K. rose just over 10%. The U.S. was up 16.52% during the 12 month period, benefiting from USD depreciation versus most currencies (with the notable exceptions of the Euro and Pound Sterling), and as economic activity improved. Developed non-U.S. small cap stocks significantly outpaced their larger cap counterparts with the MSCI World ex-U.S. Small Cap Index returning 24.51%, well ahead of the 10.66% MSCI World Ex-U.S. Index return. Small cap European markets were particularly strong during the year.
From a sector perspective Consumer Discretionary, Industrials and Materials each rose over 24%, leading global sectors as industrial production accelerated, commodity demand improved, and as consumer demand quickened in emerging markets and stabilized in most developed markets. Like 2009, Utilities and Healthcare were among the laggards, significantly trailing other global sectors and rising 1.26% and 5.04%, respectively.
Fourth quarter market performance was strong with the global equity market rising 9.35%. Emerging markets rose 7.42%, approximating developed non-U.S. returns, while the U.S. was up 11.52%. Japan and Canada led developed market performance during the period, rising 12.01% and 13.34%, respectively, while Europe and the U.K. lagged, rising 4.59% and 6.52%, respectively. Within emerging markets EMEA returned 10.42%, as South Africa and Russia performed well, far exceeding the approximately 7% Asia and Latin America returns. From a sector perspective, commodity-related stocks performed well as Energy and Materials each returned approximately 16.5%, while Consumer Discretionary, Industrials and
32 Annual Report | December 31, 2010 |
Information Technology (IT) were also strong, returning around 11%. Conversely, Telecom Services and Utilities trailed other global sectors, returning 3.53% and 2.18%, respectively.
Outlook
Markets are entering the new year with a favorable mix of promising growth prospects and conservative valuation metrics. Analysts are forecasting 17% earnings growth for 2011 for both developed markets and emerging markets. While over two thirds of developed market growth is expected to come from margin recovery, top line growth expectations for emerging markets are more closely aligned with GDP and inflation forecasts and expectations are less reliant on profitability improvements. While margin assumptions present a risk, the earnings outlook is stable and has moderated from a year ago. Multiples have recovered from the summer lows but ended the year below where they started and remain a source for potential returns should macro concerns subside.
Consumer Discretionary and Industrials have the strongest positive earnings trends among sectors. This has been the case throughout most of the year with very consistent increases to estimates among autos, capital goods, and transportation companies. These sectors currently demand a premium overall but with relatively attractive valuations in small and mid cap names. Materials are also seeing positive trends but prices have gotten ahead of earnings and the sector currently appears to be overvalued. The defensive sectors are seeing relatively weaker earnings trends.
Regionally there has been less of a distinction in earnings and price movement but there is some dispersion among valuations. Emerging markets continue to have superior quality and long-term growth profiles but became more expensive relative to developed markets throughout the year. India, for example, is the most expensive country while Japan is the least expensive. Emerging Markets Europe, Mid-East, and Africa (EMEA) and Asia ex-China and India are the least expensive among emerging markets and continue to offer relative value versus developed markets. Developed Europe, including the U.K., offers attractive valuations as well as stable earnings trends.
December 31, 2010 | William Blair Funds 33 |

W. George Greig

Kenneth J. McAtamney
GLOBAL GROWTH FUND
The Global Growth Fund seeks long-term capital appreciation.
AN OVERVIEW FROM THE PORTFOLIO MANAGERS
The Global Growth Fund posted a 20.52% increase (Class N Shares) for the 12 months ended December 31, 2010. By comparison, the Fund’s benchmark, the MSCI All Country World IMI index (net) gained 14.35%.
Fund performance was led by strong performance across most sectors and regions. From a sector perspective, Staples, Financials, Healthcare and Telecom Services stock selection was the most additive to results, staples benefited from strong performance in Europe and the US. Positive Financials stock selection resulted from good performance by Partners Group Holding AG, the Swiss private equity firm and Brookfield Asset Management, the Canadian real estate and infrastructure firm, coupled with strong U.K. and Emerging Asia performance. Healthcare stock selection was bolstered by 24% outperformance by European holdings, in addition to strong performance in the U.K. and the U.S. The sole Telecom Services holding, Softbank Corporation, benefited from a move towards smartphones along with its tie up with Apple, Inc. Regionally, Europe Ex-U.K. stocks outpaced the Index by 24.58%, led by strength in Consumer Discretionary, Financials and Industrials, while U.S. stock selection was augmented by strength across most sectors. Somewhat detracting from results was lagging non-U.S. Information Technology (IT) stock selection, due largely to underperformance in Japan and in Taiwan.
Fourth quarter absolute and relative performance was also strong, led by Europe Ex-U.K. and U.S. stock selection, coupled with strong Japanese Industrials and Telecom Services and Latin American Materials performance. Bolstering performance in Continental Europe was the underweighting and stock selection in European Financials, coupled with strong Healthcare, Energy and Consumer Discretionary results, along with chemicals exposure. U.S. value add was spread across most sectors, with the exception of Industrials, which slightly lagged the Index return. Somewhat offsetting these positive results were Japanese IT and U.K. Materials performance.
As of year-end 2010, the portfolio maintained its focus on Consumer Discretionary stocks across regions, with 22% of the portfolio invested in these holdings, well above the 11% Index weighting, but below the 26% weighting as of September 30. Approximately 17% each was invested in Financials and Industrials, weightings that remained relatively stable during the year. Approximately 35% of Financials exposure was in emerging markets, in addition to asset management. Industrials exposure was largely developed-markets based, and was focused in machinery, aerospace and electrical equipment. Regionally, the Fund remained overweighted in the U.K. and Europe, similar to September 30, but increased from year-end 2009. Conversely, U.S. exposure decreased from approximately 38% as of year-end 2009 to 30% as of year-end 2010, due to reductions across most sectors, with the exception of Staples and Industrials. Emerging markets represented approximately 18% of the Fund as of year-end 2010, decreasing during the year, but remaining well ahead of the 13% Index weighting, due largely to Latin America and, to some extent, Emerging Asia exposure.
34 Annual Report | December 31, 2010 |
Global Growth Fund
Performance Highlights (unaudited)
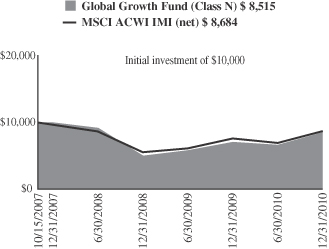
Average Annual Total Return at 12/31/2010
| | | | | | | | | | | | |
| | | 1
Year | | | 3
Year | | | Since
Inception(a) | |
Class N | | | 20.52 | % | | | (5.09 | )% | | | (5.09 | )% |
Class I | | | 20.73 | | | | (4.88 | ) | | | (4.82 | ) |
MSCI All Country World IMI (net) | | | 14.35 | | | | (3.48 | ) | | | (4.59 | ) |
| | (a) | | For the period from October 15, 2007 (Commencement of Operations) to December 31, 2010. |
Performance cited represents past performance. Past performance does not guarantee future results and current performance may be lower or higher than the data quoted. Results shown are average annual total returns, which assume reinvestment of dividends and capital gains. Investment returns and principal will fluctuate and you may have a gain or loss when you sell shares. For the most current month-end performance information, please call 1-800-742-7272, or visit our Web site at www.williamblairfunds.com. Investing in smaller and medium capitalization companies involves special risks, including higher volatility and lower liquidity. Smaller and medium capitalization stocks are also more sensitive to purchase/sale transactions and changes in the issuer’s financial condition. International investing involves special risk considerations, including currency fluctuations, lower liquidity, economic and political risk. From time to time, the investment advisor may waive fees or reimburse expenses for the Fund. Without these waivers, performance would be lower. Class N shares are available to the general public without a sales load. Class I shares are available to certain institutional investors and advisory clients of William Blair & Company, L.L.C., without a sales load or distribution fees (12b-1).
The performance highlights and graph presented above do not reflect the deduction of taxes that a shareholder would pay on fund distributions or the redemption of fund shares.
The Morgan Stanley Capital International (MSCI) All Country World Investable Market Index (IMI) (net) is a free float-adjusted market capitalization weighted index that is designed to measure the equity market of developed and emerging markets. This series approximates the minimum possible dividend reinvestment.
This report identifies the Fund’s investments on December 31, 2010. These holdings are subject to change. Not all stocks in the Fund performed the same, nor is there any guarantee that these stocks will perform as well in the future. Market forecasts provided in this report may not necessarily come to pass.
Sector Diversification (unaudited)
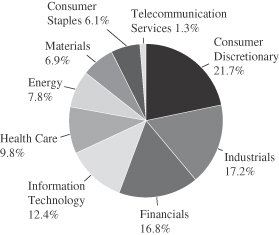
The sector diversification shown is based on the total long-term securities.
December 31, 2010 | William Blair Funds 35 |
Global Growth Fund
Portfolio of Investments, December 31, 2010 (all dollar amounts in thousands)
| | | | | | | | |
Issuer | | Shares | | | Value | |
| | |
Common Stocks | | | | | | | | |
| | |
Western Hemisphere—33.4% | | | | | | | | |
Canada—3.1% | | | | | | | | |
Brookfield Asset Management, Inc. Class “A” (Real estate management & development)† | | | 17,508 | | | $ | 583 | |
*Gildan Activewear, Inc. (Textiles, apparel & luxury goods) | | | 10,800 | | | | 308 | |
Saputo, Inc. (Food products) | | | 12,908 | | | | 514 | |
| | | | | | | | |
| | | | | | | 1,405 | |
| | | | | | | | |
United States—30.3% | | | | | | | | |
*Affiliated Managers Group, Inc. (Capital markets) | | | 4,882 | | | | 484 | |
American Express Co. (Consumer finance) | | | 15,828 | | | | 679 | |
*Apple, Inc. (Computers & peripherals) | | | 3,584 | | | | 1,156 | |
*Atheros Communications, Inc. (Semiconductors & semiconductor equipment) | | | 8,803 | | | | 316 | |
*AutoZone, Inc. (Specialty retail) | | | 2,056 | | | | 560 | |
*Bed Bath & Beyond, Inc. (Specialty retail) | | | 9,264 | | | | 455 | |
* Cerner Corporation (Health care technology) | | | 4,462 | | | | 423 | |
CH Robinson Worldwide, Inc. (Air freight & logistics) | | | 7,229 | | | | 580 | |
*Chipotle Mexican Grill, Inc. (Hotels, restaurants & leisure) | | | 1,734 | | | | 369 | |
*Citrix Systems, Inc. (Software) | | | 8,575 | | | | 587 | |
Emerson Electric Co. (Electrical equipment) | | | 15,761 | | | | 901 | |
*Google, Inc. Class “A” (Internet software & services) | | | 1,313 | | | | 780 | |
*Hansen Natural Corporation (Beverages) | | | 8,041 | | | | 420 | |
*IDEXX Laboratories, Inc. (Health care equipment & supplies) | | | 6,890 | | | | 477 | |
*j2 Global Communications, Inc. (Internet software & services) | | | 7,957 | | | | 230 | |
JPMorgan Chase & Co. (Diversified financial services) | | | 18,949 | | | | 804 | |
*Kohl’s Corporation (Multiline retail) | | | 6,938 | | | | 377 | |
McCormick & Co., Inc. (Food products) | | | 9,466 | | | | 440 | |
*Medco Health Solutions, Inc. (Health care providers & services) | | | 9,655 | | | | 592 | |
MSC Industrial Direct Co. Class “A” (Trading companies & distributors) | | | 6,100 | | | | 395 | |
*Newfield Exploration Co. (Oil, gas & consumable fuels) | | | 7,029 | | | | 507 | |
Starbucks Corporation (Hotels, restaurants & leisure) | | | 20,376 | | | | 655 | |
*Tempur-Pedic International, Inc. (Household durables) | | | 7,942 | | | | 318 | |
*Urban Outfitters, Inc. (Specialty retail) | | | 12,022 | | | | 431 | |
Yum! Brands, Inc. (Hotels, restaurants & leisure) | | | 13,420 | | | | 658 | |
| | | | | | | | |
| | | | | | | 13,594 | |
| | | | | | | | |
| | |
Europe—20.4% | | | | | | | | |
Denmark—3.3% | | | | | | | | |
Coloplast A/S (Health care equipment & supplies) | | | 2,002 | | | | 272 | |
Novo Nordisk A/S (Pharmaceuticals) | | | 7,050 | | | | 795 | |
Novozymes A/S (Chemicals) | | | 2,999 | | | | 418 | |
| | | | | | | | |
| | | | | | | 1,485 | |
| | | | | | | | |
Finland—1.0% | | | | | | | | |
Kone Oyj (Machinery) | | | 7,810 | | | | 434 | |
| | | | | | | | |
| | | | | | | | |
Issuer | | Shares | | | Value | |
| | |
Common Stocks—(continued) | | | | | | | | |
| | |
Europe—20.4%—(continued) | | | | | | | | |
Germany—5.9% | | | | | | | | |
Aixtron AG (Semiconductors & semiconductor equipment) | | | 6,073 | | | $ | 224 | |
BASF SE (Chemicals) | | | 9,579 | | | | 764 | |
*Daimler AG (Automobiles) | | | 10,699 | | | | 725 | |
SAP AG (Software) | | | 14,001 | | | | 713 | |
Wincor Nixdorf AG (Computers & peripherals) | | | 2,981 | | | | 243 | |
| | | | | | | | |
| | | | | | | 2,669 | |
| | | | | | | | |
Italy—2.5% | | | | | | | | |
DiaSorin SpA (Health care equipment & supplies) | | | 6,623 | | | | 285 | |
Saipem SpA (Energy equipment & services) | | | 17,283 | | | | 851 | |
| | | | | | | | |
| | | | | | | 1,136 | |
| | | | | | | | |
Spain—0.5% | | | | | | | | |
Tecnicas Reunidas S.A. (Energy equipment & services) | | | 3,321 | | | | 211 | |
| | | | | | | | |
Sweden—2.5% | | | | | | | | |
Atlas Copco AB (Machinery) | | | 28,912 | | | | 730 | |
Elekta AB (Health care equipment & supplies) | | | 10,136 | | | | 390 | |
| | | | | | | | |
| | | | | | | 1,120 | |
| | | | | | | | |
Switzerland—4.7% | | | | | | | | |
Cie Financiere Richemont S.A. (Textiles, apparel & luxury goods) | | | 9,516 | | | | 560 | |
Kuehne + Nagel International AG (Marine) | | | 4,244 | | | | 590 | |
*Mettler-Toledo International, Inc. (Life sciences tools & services) | | | 2,358 | | | | 357 | |
Partners Group Holding AG (Capital markets) | | | 3,080 | | | | 584 | |
| | | | | | | | |
| | | | | | | 2,091 | |
| | | | | | | | |
| | |
United Kingdom—13.7% | | | | | | | | |
Abcam plc (Biotechnology) | | | 44,755 | | | | 223 | |
Amlin plc (Insurance) | | | 51,366 | | | | 328 | |
Ashmore Group plc (Capital markets) | | | 65,496 | | | | 342 | |
Babcock International Group plc (Commercial services & supplies) | | | 26,966 | | | | 240 | |
BG Group plc (Oil, gas & consumable fuels) | | | 31,917 | | | | 645 | |
Compass Group plc (Hotels, restaurants & leisure) | | | 56,371 | | | | 511 | |
Hargreaves Lansdown plc (Capital markets) | | | 28,245 | | | | 258 | |
Intertek Group plc (Professional services) | | | 8,459 | | | | 234 | |
Michael Page International plc (Professional services) | | | 29,630 | | | | 256 | |
Petrofac, Ltd. (Energy equipment & services) | | | 23,129 | | | | 572 | |
Reckitt Benckiser Group plc (Household products) | | | 12,085 | | | | 664 | |
*Rolls-Royce Group plc (Aerospace & defense) | | | 75,638 | | | | 735 | |
Standard Chartered plc (Commercial banks) | | | 25,263 | | | | 680 | |
The Weir Group plc (Machinery) | | | 15,962 | | | | 443 | |
| | | | | | | | |
| | | | | | | 6,131 | |
| | | | | | | | |
| | |
Emerging Asia—9.7% | | | | | | | | |
China—4.6% | | | | | | | | |
CNOOC, Ltd. (Oil, gas & consumable fuels) | | | 250,000 | | | | 593 | |
Dongfeng Motor Group Co., Ltd. (Automobiles) | | | 168,000 | | | | 290 | |
See accompanying Notes to Financial Statements.
36 Annual Report | December 31, 2010 |
Global Growth Fund
Portfolio of Investments, December 31, 2010 (all dollar amounts in thousands)
| | | | | | | | |
Issuer | | Shares | | | Value | |
| | |
Common Stocks—(continued) | | | | | | | | |
| | |
Emerging Asia—9.7%—(continued) | | | | | | | | |
China—4.6%—(continued) | | | | | | | | |
Haitian International Holdings, Ltd. (Machinery) | | | 244,000 | | | $ | 255 | |
Industrial and Commercial Bank of China, Ltd. Class “H” (Commercial banks) | | | 724,185 | | | | 539 | |
Shanghai Electric Group Co., Ltd. (Electrical equipment) | | | 566,585 | | | | 374 | |
| | | | | | | | |
| | | | | | | 2,051 | |
| | | | | | | | |
India—0.8% | | | | | | | | |
Shriram Transport Finance Co., Ltd. (Consumer finance) | | | 21,501 | | | | 375 | |
| | | | | | | | |
Indonesia—1.7% | | | | | | | | |
PT Astra International Tbk (Automobiles) | | | 124,000 | | | | 751 | |
| | | | | | | | |
South Korea—2.1% | | | | | | | | |
*Hyundai Motor Co. (Automobiles) | | | 6,313 | | | | 965 | |
| | | | | | | | |
Taiwan—0.5% | | | | | | | | |
Tripod Technology Corporation (Electronic equipment, instruments & components) | | | 53,000 | | | | 216 | |
| | | | | | | | |
| | |
Japan—6.9% | | | | | | | | |
Canon, Inc. (Office electronics) | | | 14,400 | | | | 747 | |
Dena Co., Ltd. (Internet & catalog retail) | | | 12,300 | | | | 441 | |
Exedy Corporation (Auto components) | | | 5,900 | | | | 192 | |
Fanuc, Ltd. (Machinery) | | | 5,000 | | | | 768 | |
Gree, Inc. (Internet software & services) | | | 12,000 | | | | 153 | |
Miraca Holdings, Inc. (Health care providers & services) | | | 5,500 | | | | 221 | |
Softbank Corporation (Wireless telecommunication services) | | | 16,500 | | | | 571 | |
| | | | | | | | |
| | | | | | | 3,093 | |
| | | | | | | | |
| | |
Emerging Latin America—5.3% | | | | | | | | |
Brazil—2.7% | | | | | | | | |
Natura Cosmeticos S.A. (Personal products) | | | 21,600 | | | | 621 | |
PDG Realty S.A. Empreendimentos e Participacoes (Household durables) | | | 57,600 | | | | 352 | |
Tegma Gestao Logistica S.A. (Road & rail) | | | 16,826 | | | | 258 | |
| | | | | | | | |
| | | | | | | 1,231 | |
| | | | | | | | |
Chile—0.7% | | | | | | | | |
Banco Santander Chile—ADR (Commercial banks) | | | 3,360 | | | | 314 | |
| | | | | | | | |
Mexico—1.9% | | | | | | | | |
Grupo Mexico S.A.B. de C.V. Series “B” (Metals & mining) | | | 206,900 | | | | 852 | |
| | | | | | | | |
|
Emerging Europe, Mid-East, Africa—2.7% | |
South Africa—1.5% | | | | | | | | |
Adcock Ingram Holdings, Ltd. (Pharmaceuticals) | | | 22,333 | | | | 203 | |
Clicks Group, Ltd. (Multiline retail) | | | 23,528 | | | | 155 | |
Mr Price Group, Ltd. (Specialty retail) | | | 33,942 | | | | 343 | |
| | | | | | | | |
| | | | | | | 701 | |
| | | | | | | | |
| | | | | | | | |
Issuer | | Shares or
Principal
Amount | | | Value | |
| | |
Common Stocks—(continued) | | | | | | | | |
|
Emerging Europe, Mid-East, Africa—2.7%—(continued) | |
Turkey—1.2% | | | | | | | | |
Turkiye Garanti Bankasi A.S. (Commercial banks) | | | 103,499 | | | $ | 524 | |
| | | | | | | | |
| | |
Asia—2.1% | | | | | | | | |
Australia—2.1% | | | | | | | | |
BHP Billiton, Ltd. (Metals & mining) | | | 20,171 | | | | 933 | |
| | | | | | | | |
Total Common Stocks—94.2%
(cost $31,770) | | | | | | | 42,282 | |
| | | | | | | | |
| | |
Preferred Stocks | | | | | | | | |
| | |
Emerging Latin America | | | | | | | | |
Itau Unibanco Holding S.A. (Commercial banks) | | | 32,200 | | | | 772 | |
Randon Participacoes S.A. (Machinery) | | | 34,500 | | | | 255 | |
| | | | | | | | |
Total Preferred Stocks—2.3%
(cost $803) | | | | 1,027 | |
| | | | | | | | |
| | |
Repurchase Agreement | | | | | | | | |
State Street Bank and Trust Company, 0.150% dated 12/31/10, due 1/3/11, repurchase price $1,536, collateralized by U.S. Treasury Note, 2.500%, due 4/30/15 | | $ | 1,536 | | | | 1,536 | |
| | | | | | | | |
Total Repurchase Agreement—3.4%
(cost $1,536) | | | | 1,536 | |
| | | | | | | | |
Total Investments—99.9%
(cost $34,109) | | | | 44,845 | |
Cash and other assets, less liabilities—0.1% | | | | 32 | |
| | | | | | | | |
Net assets—100.0% | | | $ | 44,877 | |
| | | | | | | | |
ADR = American Depository Receipt
† = U.S. listed foreign security
* = Non-income producing securities
For securities primarily traded on exchanges or markets that close before the close of regular trading on the New York Stock Exchange, the Fund may use an independent pricing service to fair value price the securities pursuant to Valuation Procedures approved by the Board of Trustees.
At December 31, 2010, the Fund’s Portfolio of Investments includes the following industry categories:
| | | | |
Consumer Discretionary | | | 21.7% | |
Industrials | | | 17.2% | |
Financials | | | 16.8% | |
Information Technology | | | 12.4% | |
Health Care | | | 9.8% | |
Energy | | | 7.8% | |
Materials | | | 6.9% | |
Consumer Staples | | | 6.1% | |
Telecommunication Services | | | 1.3% | |
| | | | |
Total | | | 100.0% | |
| | | | |
See accompanying Notes to Financial Statements.
December 31, 2010 | William Blair Funds 37 |
Global Growth Fund
Portfolio of Investments, December 31, 2010 (all dollar amounts in thousands)
| | | | |
| At December 31, 2010, the Fund’s Portfolio of Investments includes the following currency categories: | |
U.S. Dollar | | | 34.3% | |
British Pound Sterling | | | 14.2% | |
Euro | | | 10.3% | |
Japanese Yen | | | 7.1% | |
Brazilian Real | | | 5.2% | |
Hong Kong Dollar | | | 4.7% | |
Swiss Franc | | | 4.0% | |
Danish Krone | | | 3.4% | |
Swedish Krona | | | 2.6% | |
South Korean Won | | | 2.2% | |
Australian Dollar | | | 2.2% | |
Mexican Peso | | | 2.0% | |
Canadian Dollar | | | 1.9% | |
Indonesian Rupiah | | | 1.7% | |
South African Rand | | | 1.6% | |
Turkish Lira | | | 1.2% | |
All Other Currencies | | | 1.4% | |
| | | | |
Total | | | 100.0% | |
| | | | |
See accompanying Notes to Financial Statements.
38 Annual Report | December 31, 2010 |
W. George Greig
INTERNATIONAL GROWTH FUND
The International Growth Fund seeks long-term capital appreciation.
AN OVERVIEW FROM THE PORTFOLIO MANAGER
The International Growth Fund posted a 20.09% increase (Class N Shares) for the 12 months ended December 31, 2010. By comparison, the Fund’s benchmark, the Morgan Stanley Capital International (MSCI) All Country World Ex-U.S. (ACWI) IMI Index (net), gained 12.73%.
The Fund significantly outpaced the MSCI ACWI Ex-US IMI during 2010. Strong year to date performance was bolstered by stock selection across most sectors, coupled with overall sector positioning and tactical currency hedging during the year. Consumer stock selection added significant value during the year, with auto-related and luxury holdings performing well, in addition to emerging markets Staples holdings. The Fund’s Energy holdings outperformed the Index by 11%, augmented by strength within European energy services and Exploration and Production (E&P) companies, coupled with good performance by Latin American producers. Financials stock selection was also a significant contributor to return, due to the Fund’s underweighting in European Financials, coupled with strong stock selection in the U.K., Canada and emerging markets. The Fund’s Healthcare and Industrials stocks each outpaced the Index sector returns by 13%, as the Fund’s European Healthcare holdings performed well, driving the outperformance, while emerging markets stock selection was also additive. Industrials stock selection benefited from good performance within the Fund’s defense, engineering and transportation holdings, coupled with an overweighting and positive stock selection in machinery stocks. Regionally, the Fund added significant value in Japan, Europe and emerging markets. Somewhat detracting from relative results were Developed Asia ex-Japan Financials, Industrials and Materials stock selection, coupled with Canadian Energy stock selection and overall Utilities stock selection.
Fourth quarter performance slightly trailed the Index. Positive stock selection in Healthcare, Materials, Telecom Services and Utilities was offset by underperformance in Consumer Discretionary, Energy and Financials, areas which performed well for the full 12 month period. In particular, Consumer Discretionary performance was hampered by the Fund’s Asian auto and Brazilian real estate holdings, while Energy stock selection lagged due to underperformance in the Fund’s U.K. E&P companies. Financials stock selection was largely hurt by Developed Asian Real Estate and Indian Financials holdings. Conversely, Healthcare stock selection was additive in Europe and emerging markets, while Materials performance benefited from strength in European chemicals and general mining names.
Year end Fund sector positioning generally paralleled positioning at the end of 2009 with Consumer Discretionary and Industrials remaining two areas of focus, and the most significant underweighting in Materials; however, this understates the changes that occurred within Fund sector structure during the year. Consumer Discretionary totaled approximately 14% at year end, a reduction from our high teens weighting most of the year, as we reduced exposure in companies that had performed well with higher valuations. During the year we also tilted more of our Consumer Discretionary exposure towards luxury-related holdings, an area which had underperformed in the initial stages of the recovery, and maintained significant exposure in auto-related holdings. Financials was another area in which the Fund was significantly underweighted most of the year, with a tilt towards emerging markets Financials. However, during the third quarter, we increased exposure in European and Japanese Financials on improved transparency, abatement of capital concerns, and differentiated growth outlook following the initial European debt crisis. At year end, Financials represented approximately 20%, an increase of nearly 4% since year end 2009, but a decrease since September 30. Materials exposure remained relatively stable during the year,
December 31, 2010 | William Blair Funds 39 |
with approximately 60% of the exposure in chemical-related holdings, and the remainder in mining companies. Regionally, we reduced exposure in emerging markets from over 29% as of year-end 2009 to just over 25% as of year-end 2010, although Fund exposure remained higher than the 24% Index weighting. This reduction was precipitated by concerns about higher valuations amidst monetary policy tightening, and better opportunities in the developed markets at the margin, which had underperformed. As a result, Europe increased from approximately 23% to 31%, while Japan increased from approximately 11% to 15% during the 12 month period.
40 Annual Report | December 31, 2010 |
International Growth Fund
Performance Highlights (unaudited)
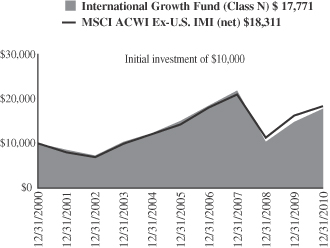
Average Annual Total Return at 12/31/2010
| | | | | | | | | | | | | | | | |
| | | 1
Year | | | 3
Year | | | 5
Year | | | 10
Year | |
Class N | | | 20.09 | % | | | (6.61 | )% | | | 3.44 | % | | | 5.92 | % |
Class I | | | 20.47 | | | | (6.33 | ) | | | 3.74 | | | | 6.21 | |
MSCI All Country World Ex-U.S. IMI (net) | | | 12.73 | | | | (4.38 | ) | | | 5.14 | | | | 6.24 | |
Performance cited represents past performance. Past performance does not guarantee future results and current performance may be lower or higher than the data quoted. Results shown are average annual total returns, which assume reinvestment of dividends and capital gains. Investment returns and principal will fluctuate and you may have a gain or loss when you sell shares. For the most current month-end performance information, please call 1-800-742-7272, or visit our Web site at www.williamblairfunds.com. From time to time, the investment advisor may waive fees or reimburse expenses for the Fund. Without these waivers, performance would be lower. International investing involves special risk considerations, including currency fluctuations, lower liquidity, economic and political risk. Class N shares are available to the general public without a sales load. Class I shares are available to certain institutional investors and advisory clients of William Blair & Company, L.L.C., without a sales load or distribution (12b-1) or service fees.
The performance highlights and graph presented above do not reflect the deduction of taxes that a shareholder would pay on fund distributions or the redemption of fund shares.
The Morgan Stanley Capital International (MSCI) All Country World Ex-U.S. Investable Market Index (IMI) (net) is a free float-adjusted market capitalization weighted index that is designed to measure the equity market performance of developed and emerging markets, excluding the United States. This series approximates the minimum possible dividend reinvestment.
This report identifies the Fund’s investments on December 31, 2010. These holdings are subject to change. Not all stocks in the Fund performed the same, nor is there any guarantee that these stocks will perform as well in the future. Market forecasts provided in this report may not necessarily come to pass.
Sector Diversification (unaudited)
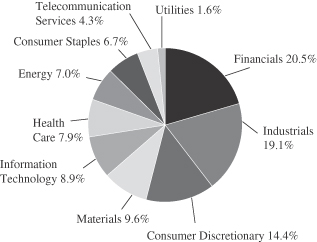
The sector diversification shown is based on the total long-term securities.
December 31, 2010 | William Blair Funds 41 |
International Growth Fund
Portfolio of Investments, December 31, 2010 (all dollar amounts in thousands)
| | | | | | | | |
Issuer | | Shares | | | Value | |
| | |
Common Stocks | | | | | | | | |
| | |
Europe—31.2% | | | | | | | | |
Belgium—0.5% | | | | | | | | |
Colruyt S.A. (Food & staples retailing) | | | 510,755 | | | $ | 25,970 | |
| | | | | | | | |
Denmark—1.7% | | | | | | | | |
Coloplast A/S (Health care equipment & supplies) | | | 171,991 | | | | 23,372 | |
FLSmidth & Co. A/S (Construction & engineering) | | | 108,851 | | | | 10,381 | |
Novo Nordisk A/S (Pharmaceuticals) | | | 292,150 | | | | 32,944 | |
Novozymes A/S (Chemicals) | | | 100,591 | | | | 14,012 | |
SimCorp A/S (Software) | | | 41,400 | | | | 6,643 | |
| | | | | | | | |
| | | | | | | 87,352 | |
| | | | | | | | |
Finland—1.2% | | | | | | | | |
Kone Oyj (Machinery) | | | 726,580 | | | | 40,390 | |
Nokian Renkaat Oyj (Auto components) | | | 618,424 | | | | 22,685 | |
| | | | | | | | |
| | | | | | | 63,075 | |
| | | | | | | | |
France—7.8% | | | | | | | | |
Air Liquide S.A. (Chemicals) | | | 405,513 | | | | 51,284 | |
AXA S.A. (Insurance) | | | 1,715,682 | | | | 28,544 | |
BNP Paribas (Commercial banks) | | | 1,020,049 | | | | 64,897 | |
Cie Generale des Etablissements Michelin (Auto components) | | | 451,035 | | | | 32,366 | |
EDF Energies Nouvelles S.A. (Independent power producers & energy traders) | | | 411,455 | | | | 17,407 | |
Essilor International S.A. (Health care equipment & supplies) | | | 414,723 | | | | 26,698 | |
L’Oreal S.A. (Personal products) | | | 550,864 | | | | 61,157 | |
Schneider Electric S.A. (Electrical equipment) | | | 329,967 | | | | 49,385 | |
Vinci S.A. (Construction & engineering) | | | 1,181,724 | | | | 64,239 | |
| | | | | | | | |
| | | | | | | 395,977 | |
| | | | | | | | |
Germany—3.9% | | | | | | | | |
Aixtron AG (Semiconductors & semiconductor equipment) | | | 356,822 | | | | 13,163 | |
BASF SE (Chemicals) | | | 785,175 | | | | 62,639 | |
*Daimler AG (Automobiles) | | | 391,134 | | | | 26,515 | |
Fielmann AG (Specialty retail) | | | 127,141 | | | | 12,086 | |
Lanxess AG (Chemicals) | | | 274,826 | | | | 21,704 | |
MTU Aero Engines Holding AG (Aerospace & defense) | | | 26,847 | | | | 1,816 | |
SAP AG (Software) | | | 912,573 | | | | 46,462 | |
Wincor Nixdorf AG (Computers & peripherals) | | | 194,616 | | | | 15,867 | |
| | | | | | | | |
| | | | | | | 200,252 | |
| | | | | | | | |
Greece—0.3% | | | | | | | | |
*National Bank of Greece S.A. (Commercial banks) | | | 1,748,872 | | | | 14,139 | |
| | | | | | | | |
Ireland—0.2% | | | | | | | | |
Paddy Power plc (Hotels, restaurants & leisure) | | | 255,196 | | | | 10,469 | |
| | | | | | | | |
Israel—1.4% | | | | | | | | |
Israel Chemicals, Ltd. (Chemicals) | | | 1,932,028 | | | | 33,120 | |
Teva Pharmaceutical Industries, Ltd.—ADR (Pharmaceuticals) | | | 717,227 | | | | 37,389 | |
| | | | | | | | |
| | | | | | | 70,509 | |
| | | | | | | | |
| | | | | | | | |
Issuer | | Shares | | | Value | |
| | |
Common Stocks—(continued) | | | | | | | | |
| | |
Europe—31.2%—(continued) | | | | | | | | |
Italy—1.2% | | | | | | | | |
Ansaldo STS SpA (Transportation infrastructure) | | | 781,596 | | | $ | 11,196 | |
DiaSorin SpA (Health care equipment & supplies) | | | 261,572 | | | | 11,259 | |
Saipem SpA (Energy equipment & services) | | | 766,956 | | | | 37,757 | |
| | | | | | | | |
| | | | | | | 60,212 | |
| | | | | | | | |
Norway—0.2% | | | | | | | | |
*Norwegian Air Shuttle ASA (Airlines) | | | 423,000 | | | | 8,518 | |
| | | | | | | | |
Spain—2.5% | | | | | | | | |
Banco Santander S.A. (Commercial banks) | | | 6,847,921 | | | | 72,548 | |
Inditex S.A. (Specialty retail) | | | 243,418 | | | | 18,225 | |
Prosegur Cia de Seguridad S.A. (Commercial services & supplies) | | | 318,338 | | | | 17,922 | |
Tecnicas Reunidas S.A. (Energy equipment & services) | | | 296,912 | | | | 18,892 | |
| | | | | | | | |
| | | | | | | 127,587 | |
| | | | | | | | |
Sweden—2.0% | | | | | | | | |
Atlas Copco AB (Machinery) | | | 1,594,007 | | | | 40,220 | |
Elekta AB (Health care equipment & supplies) | | | 387,491 | | | | 14,910 | |
Hexagon AB (Machinery) | | | 623,165 | | | | 13,361 | |
*Hexagon AB Unregistered Shares (Machinery) | | | 207,721 | | | | 4,453 | |
SKF AB (Machinery) | | | 936,355 | | | | 26,675 | |
| | | | | | | | |
| | | | | | | 99,619 | |
| | | | | | | | |
Switzerland—8.3% | | | | | | | | |
Cie Financiere Richemont S.A. (Textiles, apparel & luxury goods) | | | 536,086 | | | | 31,534 | |
Credit Suisse Group AG (Capital markets) | | | 968,287 | | | | 39,011 | |
*Dufry Group (Specialty retail) | | | 128,491 | | | | 17,288 | |
Geberit AG (Building products) | | | 80,966 | | | | 18,722 | |
Julius Baer Group, Ltd. (Capital markets) | | | 340,722 | | | | 15,961 | |
Kuehne + Nagel International AG (Marine) | | | 132,676 | | | | 18,447 | |
Nestle S.A. (Food products) | | | 855,456 | | | | 50,092 | |
Novartis AG (Pharmaceuticals) | | | 917,632 | | | | 53,929 | |
*Orascom Development Holding AG (Hotels, restaurants & leisure) | | | 212,871 | | | | 12,738 | |
Partners Group Holding AG (Capital markets) | | | 138,781 | | | | 26,331 | |
SGS S.A. (Professional services) | | | 20,804 | | | | 34,911 | |
Sika AG (Chemicals) | | | 7,385 | | | | 16,200 | |
Xstrata plc (Metals & mining) | | | 1,083,138 | | | | 25,424 | |
Zurich Financial Services AG (Insurance) | | | 235,802 | | | | 61,082 | |
| | | | | | | | |
| | | | | | | 421,670 | |
| | | | | | | | |
| | |
United Kingdom—19.4% | | | | | | | | |
Abcam plc (Biotechnology) | | | 1,854,615 | | | | 9,253 | |
Admiral Group plc (Insurance) | | | 795,949 | | | | 18,800 | |
Aggreko plc (Commercial services & supplies) | | | 632,195 | | | | 14,607 | |
AMEC plc (Energy equipment & services) | | | 1,396,300 | | | | 25,035 | |
Amlin plc (Insurance) | | | 2,793,860 | | | | 17,811 | |
Antofagasta plc (Metals & mining) | | | 630,558 | | | | 15,848 | |
Aveva Group plc (Software) | | | 598,624 | | | | 15,064 | |
See accompanying Notes to Financial Statements.
42 Annual Report | December 31, 2010 |
International Growth Fund
Portfolio of Investments, December 31, 2010 (all dollar amounts in thousands)
| | | | | | | | |
Issuer | | Shares | | | Value | |
| | |
Common Stocks—(continued) | | | | | | | | |
| | |
United Kingdom—19.4%—(continued) | | | | | | | | |
Babcock International Group plc (Commercial services & supplies) | | | 3,523,075 | | | $ | 31,364 | |
BG Group plc (Oil, gas & consumable fuels) | | | 1,221,869 | | | | 24,689 | |
BHP Billiton plc (Metals & mining) | | | 2,250,423 | | | | 89,505 | |
Britvic plc (Beverages) | | | 1,651,962 | | | | 12,190 | |
Burberry Group plc (Textiles, apparel & luxury goods) | | | 837,334 | | | | 14,674 | |
*Carphone Warehouse Group plc (Specialty retail) | | | 1,449,017 | | | | 8,929 | |
Centrica plc (Multi-utilities) | | | 11,556,959 | | | | 59,749 | |
Chemring Group plc (Aerospace & defense) | | | 349,383 | | | | 15,819 | |
Compass Group plc (Hotels, restaurants & leisure) | | | 3,130,583 | | | | 28,358 | |
Dunelm Group plc (Specialty retail) | | | 1,270,519 | | | | 10,112 | |
*EnQuest plc (Oil, gas & consumable fuels) | | | 3,439,475 | | | | 7,481 | |
GlaxoSmithKline plc (Pharmaceuticals) | | | 3,182,720 | | | | 61,531 | |
IG Group Holdings plc (Diversified financial services) | | | 1,889,052 | | | | 15,021 | |
Intertek Group plc (Professional services) | | | 545,470 | | | | 15,095 | |
Johnson Matthey plc (Chemicals) | | | 880,686 | | | | 27,983 | |
Lancashire Holdings, Ltd. (Insurance) | | | 1,385,320 | | | | 11,944 | |
Meggitt plc (Aerospace & defense) | | | 1,767,111 | | | | 10,194 | |
Michael Page International plc (Professional services) | | | 2,538,843 | | | | 21,969 | |
Next plc (Multiline retail) | | | 817,989 | | | | 25,188 | |
*Ocado Group plc (Internet & catalog retail) | | | 3,728,333 | | | | 10,364 | |
Petrofac, Ltd. (Energy equipment & services) | | | 1,374,970 | | | | 34,021 | |
*Rolls-Royce Group plc (Aerospace & defense) | | | 3,707,101 | | | | 36,008 | |
Rotork plc (Machinery) | | | 599,584 | | | | 17,088 | |
RPS Group plc (Commercial services & supplies) | | | 2,714,450 | | | | 9,751 | |
Serco Group plc (Commercial services & supplies) | | | 2,102,925 | | | | 18,213 | |
Spirax-Sarco Engineering plc (Machinery) | | | 505,624 | | | | 15,246 | |
Standard Chartered plc (Commercial banks) | | | 2,255,604 | | | | 60,681 | |
*Telecity Group plc (Internet software & services) | | | 1,181,288 | | | | 8,663 | |
*The Berkeley Group Holdings plc (Household durables) | | | 1,096,418 | | | | 15,214 | |
The Weir Group plc (Machinery) | | | 903,524 | | | | 25,074 | |
Tullow Oil plc (Oil, gas & consumable fuels) | | | 553,384 | | | | 10,880 | |
Ultra Electronics Holdings plc (Aerospace & defense) | | | 589,657 | | | | 15,592 | |
Victrex plc (Chemicals) | | | 554,848 | | | | 12,829 | |
Vodafone Group plc (Wireless telecommunication services) | | | 33,980,362 | | | | 87,839 | |
| | | | | | | | |
| | | | | | | 985,676 | |
| | | | | | | | |
Japan—14.6% | | | | | | | | |
Canon, Inc. (Office electronics) | | | 1,075,100 | | | | 55,748 | |
CyberAgent, Inc. (Media) | | | 3,018 | | | | 6,580 | |
Dena Co., Ltd. (Internet & catalog retail) | | | 737,500 | | | | 26,452 | |
Exedy Corporation (Auto components) | | | 315,000 | | | | 10,227 | |
| | | | | | | | |
Issuer | | Shares | | | Value | |
| | |
Common Stocks—(continued) | | | | | | | | |
Japan—14.6%—(continued) | | | | | | | | |
F.C.C. Co., Ltd. (Auto components) | | | 344,903 | | | $ | 8,037 | |
Fanuc, Ltd. (Machinery) | | | 452,500 | | | | 69,500 | |
Gree, Inc. (Internet software & services) | | | 900,600 | | | | 11,459 | |
K’s Holdings Corporation (Specialty retail) | | | 435,000 | | | | 11,835 | |
Kakaku.com, Inc. (Internet software & services) | | | 1,950 | | | | 11,601 | |
Keyence Corporation (Electronic equipment, instruments & components) | | | 132,000 | | | | 38,239 | |
Miraca Holdings, Inc. (Health care providers & services) | | | 282,000 | | | | 11,358 | |
MISUMI Group, Inc. (Trading companies & distributors) | | | 534,000 | | | | 13,306 | |
Murata Manufacturing Co., Ltd. (Electronic equipment, instruments & components) | | | 456,000 | | | | 31,958 | |
Nabtesco Corporation (Machinery) | | | 570,000 | | | | 12,160 | |
Nitori Co., Ltd. (Specialty retail) | | | 261,320 | | | | 22,852 | |
Nitto Denko Corporation (Chemicals) | | | 673,500 | | | | 31,730 | |
Osaka Securities Exchange Co., Ltd. (Diversified financial services) | | | 1,770 | | | | 8,927 | |
Point, Inc. (Specialty retail) | | | 219,050 | | | | 9,618 | |
Sawai Pharmaceutical Co., Ltd. (Pharmaceuticals) | | | 103,800 | | | | 8,489 | |
Softbank Corporation (Wireless telecommunication services) | | | 2,270,500 | | | | 78,610 | |
Sony Financial Holdings, Inc. (Insurance) | | | 9,450 | | | | 38,235 | |
Sumitomo Mitsui Financial Group, Inc. (Commercial banks) | | | 3,112,300 | | | | 110,861 | |
Terumo Corporation (Health care equipment & supplies) | | | 181,200 | | | | 10,199 | |
USS Co., Ltd. (Specialty retail) | | | 153,000 | | | | 12,513 | |
Yahoo! Japan Corporation (Internet software & services) | | | 169,969 | | | | 65,944 | |
Yamada Denki Co., Ltd. (Specialty retail) | | | 371,340 | | | | 25,338 | |
| | | | | | | | |
| | | | | | | 741,776 | |
| | | | | | | | |
| | |
Emerging Asia—13.2% | | | | | | | | |
China—3.5% | | | | | | | | |
AAC Acoustic Technologies Holdings, Inc. (Communications equipment) | | | 1,920,000 | | | | 5,126 | |
China Shenhua Energy Co., Ltd. (Oil, gas & consumable fuels) | | | 8,655,000 | | | | 36,300 | |
China Yurun Food Group, Ltd. (Food products) | | | 2,710,000 | | | | 8,908 | |
CNOOC, Ltd. (Oil, gas & consumable fuels) | | | 21,311,000 | | | | 50,558 | |
Dongfang Electric Corporation, Ltd. (Electrical equipment) | | | 3,257,200 | | | | 16,133 | |
Dongfeng Motor Group Co., Ltd. (Automobiles) | | | 8,002,000 | | | | 13,795 | |
Great Wall Motor Co., Ltd. (Automobiles) | | | 3,059,000 | | | | 9,445 | |
Haitian International Holdings, Ltd. (Machinery) | | | 2,254,000 | | | | 2,352 | |
*Hollysys Automation Technologies, Ltd. (Electronic equipment, instruments & components)† | | | 117,167 | | | | 1,776 | |
Lonking Holdings, Ltd. (Machinery) | | | 17,220,000 | | | | 9,416 | |
Minth Group, Ltd. (Auto components) | | | 2,820,000 | | | | 4,629 | |
Shanghai Electric Group Co., Ltd. (Electrical equipment) | | | 23,760,171 | | | | 15,682 | |
See accompanying Notes to Financial Statements.
December 31, 2010 | William Blair Funds 43 |
International Growth Fund
Portfolio of Investments, December 31, 2010 (all dollar amounts in thousands)
| | | | | | | | |
Issuer | | Shares | | | Value | |
| | |
Common Stocks—(continued) | | | | | | | | |
| | |
Emerging Asia—13.2%—(continued) | | | | | | | | |
China—3.5%—(continued) | | | | | | | | |
Zhuzhou CSR Times Electric Co., Ltd. (Electrical equipment) | | | 1,166,000 | | | $ | 4,583 | |
| | | | | | | | |
| | | | | | | 178,703 | |
| | | | | | | | |
India—2.4% | | | | | | | | |
Asian Paints, Ltd. (Chemicals) | | | 247,322 | | | | 15,922 | |
Axis Bank, Ltd. (Commercial banks) | | | 709,692 | | | | 21,428 | |
Infosys Technologies, Ltd. (IT services) | | | 429,695 | | | | 33,084 | |
Lupin, Ltd. (Pharmaceuticals) | | | 1,318,509 | | | | 14,226 | |
Shriram Transport Finance Co., Ltd. (Consumer finance) | | | 279,002 | | | | 4,873 | |
Tata Motors, Ltd. (Machinery) | | | 881,490 | | | | 25,792 | |
Yes Bank, Ltd. (Commercial banks) | | | 942,591 | | | | 6,594 | |
| | | | | | | | |
| | | | | | | 121,919 | |
| | | | | | | | |
Indonesia—3.1% | | | | | | | | |
PT Astra International Tbk (Automobiles) | | | 8,310,000 | | | | 50,312 | |
PT Bank Rakyat Indonesia (Commercial banks) | | | 24,900,000 | | | | 29,018 | |
PT Indo Tambangraya Megah (Oil, gas & consumable fuels) | | | 681,500 | | | | 3,838 | |
PT Indofood Sukses Makmur Tbk (Food products) | | | 34,784,500 | | | | 18,821 | |
PT Kalbe Farma Tbk (Pharmaceuticals) | | | 30,597,000 | | | | 11,037 | |
PT Perusahaan Perkebunan London Sumatra Indonesia Tbk (Food products) | | | 10,515,000 | | | | 14,996 | |
PT United Tractors Tbk (Machinery) | | | 11,340,000 | | | | 29,955 | |
| | | | | | | | |
| | | | | | | 157,977 | |
| | | | | | | | |
Malaysia—0.5% | | | | | | | | |
Genting Bhd (Hotels, restaurants & leisure) | | | 804,600 | | | | 2,918 | |
Kuala Lumpur Kepong Bhd (Food products) | | | 2,582,500 | | | | 18,509 | |
Top Glove Corporation Bhd (Health care equipment & supplies) | | | 3,114,000 | | | | 5,029 | |
| | | | | | | | |
| | | | | | | 26,456 | |
| | | | | | | | |
South Korea—3.0% | | | | | | | | |
*Halla Climate Control Corporation (Auto components) | | | 289,382 | | | | 5,100 | |
*Hankook Tire Co., Ltd. (Auto components) | | | 431,370 | | | | 12,068 | |
*Hyundai Mobis (Auto components) | | | 73,088 | | | | 18,322 | |
*Hyundai Motor Co. (Automobiles) | | | 248,809 | | | | 38,037 | |
Samsung Electronics Co., Ltd. (Semiconductors & semiconductor equipment) | | | 93,505 | | | | 78,188 | |
| | | | | | | | |
| | | | | | | 151,715 | |
| | | | | | | | |
Thailand—0.7% | | | | | | | | |
CP ALL PCL (Food & staples retailing) | | | 11,439,100 | | | | 14,894 | |
Kasikornbank PCL (Commercial banks) | | | 4,692,300 | | | | 19,535 | |
| | | | | | | | |
| | | | | | | 34,429 | |
| | | | | | | | |
Brazil—5.6% | | | | | | | | |
Amil Participacoes S.A. (Health care providers & services) | | | 23,804 | | | | 255 | |
| | | | | | | | |
Issuer | | Shares | | | Value | |
| | |
Common Stocks—(continued) | | | | | | | | |
| | |
Emerging Latin America—9.5% | | | | | | | | |
Brazil—5.6%—(continued) | | | | | | | | |
BM&F BOVESPA S.A. (Diversified financial services) | | | 1,687,200 | | | $ | 13,345 | |
BR Malls Participacoes S.A. (Real estate management & development) | | | 1,212,000 | | | | 12,485 | |
BR Properties S.A. (Real estate management & development) | | | 1,242,159 | | | | 13,589 | |
Cia de Concessoes Rodoviarias (Transportation infrastructure) | | | 526,000 | | | | 14,861 | |
Cia Hering (Textiles, apparel & luxury goods) | | | 593,100 | | | | 9,647 | |
Diagnosticos da America S.A. (Health care providers & services) | | | 888,000 | | | | 12,036 | |
Drogasil S.A. (Food & staples retailing) | | | 584,100 | | | | 4,750 | |
Iochpe-Maxion S.A. (Machinery) | | | 550,200 | | | | 7,988 | |
Localiza Rent a Car S.A. (Road & rail) | | | 1,290,000 | | | | 20,904 | |
Lojas Renner S.A. (Multiline retail) | | | 558,000 | | | | 18,959 | |
Mills Estruturas e Servicos de Engenharia S.A. (Trading companies & distributors) | | | 938,827 | | | | 11,650 | |
Natura Cosmeticos S.A. (Personal products) | | | 1,419,000 | | | | 40,766 | |
OdontoPrev S.A. (Health care providers & services) | | | 981,000 | | | | 14,827 | |
*OGX Petroleo e Gas Participacoes S.A. (Oil, gas & consumable fuels) | | | 3,205,200 | | | | 38,617 | |
PDG Realty S.A. Empreendimentos e Participacoes (Household durables) | | | 3,360,000 | | | | 20,565 | |
SLC Agricola S.A. (Food products) | | | 502,800 | | | | 6,664 | |
Vale S.A.—ADR (Metals & mining) | | | 718,991 | | | | 24,856 | |
| | | | | | | | |
| | | | | | | 286,764 | |
| | | | | | | | |
Chile—0.9% | | | | | | | | |
Banco Santander Chile—ADR (Commercial banks) | | | 282,452 | | | | 26,401 | |
Lan Airlines S.A. (Airlines) | | | 630,155 | | | | 19,658 | |
| | | | | | | | |
| | | | | | | 46,059 | |
| | | | | | | | |
Colombia—0.6% | | | | | | | | |
Pacific Rubiales Energy Corporation (Oil, gas & consumable fuels) | | | 881,856 | | | | 29,933 | |
| | | | | | | | |
Mexico—1.9% | | | | | | | | |
America Movil S.A.B. de C.V.—ADR (Wireless telecommunication services) | | | 814,536 | | | | 46,706 | |
*Compartamos S.A.B. de C.V. (Consumer finance) | | | 6,840,000 | | | | 14,876 | |
*Genomma Lab Internacional S.A.B. de C.V. (Pharmaceuticals) | | | 3,657,656 | | | | 8,879 | |
Grupo Mexico S.A.B. de C.V. Series “B” (Metals & mining) | | | 6,443,600 | | | | 26,526 | |
| | | | | | | | |
| | | | | | | 96,987 | |
| | | | | | | | |
Peru—0.5% | | | | | | | | |
Credicorp, Ltd. (Commercial banks)† | | | 203,697 | | | | 24,222 | |
| | | | | | | | |
| | |
Canada—3.9% | | | | | | | | |
Brookfield Asset Management, Inc. Class “A” (Real estate management & development)† | | | 2,142,795 | | | | 71,334 | |
Canadian National Railway Co. (Road & rail) | | | 376,100 | | | | 25,097 | |
See accompanying Notes to Financial Statements.
44 Annual Report | December 31, 2010 |
International Growth Fund
Portfolio of Investments, December 31, 2010 (all dollar amounts in thousands)
| | | | | | | | |
Issuer | | Shares | | | Value | |
| | |
Common Stocks—(continued) | | | | | | | | |
Canada—3.9%—(continued) | | | | | | | | |
Canadian Western Bank (Commercial banks) | | | 437,232 | | | $ | 12,471 | |
*Gildan Activewear, Inc. (Textiles, apparel & luxury goods) | | | 531,000 | | | | 15,140 | |
Home Capital Group, Inc. (Thrifts & mortgage finance) | | | 101,101 | | | | 5,266 | |
PetroBakken Energy, Ltd. Class “A” (Oil, gas & consumable fuels) | | | 949,237 | | | | 20,726 | |
Petrominerales, Ltd. (Oil, gas & consumable fuels) | | | 258,242 | | | | 8,613 | |
Saputo, Inc. (Food products) | | | 477,612 | | | | 19,012 | |
Tim Hortons, Inc. (Hotels, restaurants & leisure) | | | 425,416 | | | | 17,585 | |
| | | | | | | | |
| | | | | | | 195,244 | |
| | | | | | | | |
| | |
Asia—2.9% | | | | | | | | |
Hong Kong—1.0% | | | | | | | | |
Li & Fung, Ltd. (Distributors) | | | 4,236,000 | | | | 24,578 | |
Noble Group, Ltd. (Trading companies & distributors) | | | 15,284,000 | | | | 25,844 | |
| | | | | | | | |
| | | | | | | 50,422 | |
| | | | | | | | |
Singapore—1.9% | | | | | | | | |
CapitaLand, Ltd. (Real estate management & development) | | | 9,799,000 | | | | 28,328 | |
CapitaMalls Asia, Ltd. (Real estate management & development) | | | 18,687,000 | | | | 28,248 | |
*Global Logistic Properties, Ltd. (Real estate management & development) | | | 7,794,000 | | | | 13,118 | |
Midas Holdings, Ltd. (Metals & mining) | | | 6,510,000 | | | | 4,648 | |
Olam International, Ltd. (Food & staples retailing) | | | 8,244,000 | | | | 20,171 | |
| | | | | | | | |
| | | | | | | 94,513 | |
| | | | | | | | |
| |
Emerging Europe, Mid-East, Africa—2.6% | | | | | |
Egypt—0.4% | | | | | | | | |
Commercial International Bank Egypt S.A.E. (Commercial banks) | | | 1,663,888 | | | | 13,586 | |
Egyptian Financial Group-Hermes Holding (Capital markets) | | | 1,321,510 | | | | 7,722 | |
| | | | | | | | |
| | | | | | | 21,308 | |
| | | | | | | | |
South Africa—1.2% | | | | | | | | |
Adcock Ingram Holdings, Ltd. (Pharmaceuticals) | | | 789,848 | | | | 7,182 | |
*Aspen Pharmacare Holdings, Ltd. (Pharmaceuticals) | | | 1,215,909 | | | | 16,983 | |
Clicks Group, Ltd. (Multiline retail) | | | 1,987,096 | | | | 13,074 | |
Shoprite Holdings, Ltd. (Food & staples retailing) | | | 858,252 | | | | 12,983 | |
Wilson Bayly Holmes-Ovcon, Ltd. (Construction & engineering) | | | 536,674 | | | | 11,324 | |
| | | | | | | | |
| | | | | | | 61,546 | |
| | | | | | | | |
| | | | | | | | |
Issuer | | Shares or
Principal
Amount | | | Value | |
| | |
Common Stocks—(continued) | | | | | | | | |
|
Emerging Europe, Mid-East, Africa—2.6%—(continued) | |
Turkey—1.0% | | | | | | | | |
Tofas Turk Otomobil Fabrikasi A.S. (Automobiles) | | | 1,938,600 | | | $ | 9,994 | |
Turkiye Garanti Bankasi A.S. (Commercial banks) | | | 4,868,825 | | | | 24,660 | |
Turkiye Halk Bankasi A.S. (Commercial banks) | | | 1,945,319 | | | | 16,505 | |
| | | | | | | | |
| | | | | | | 51,159 | |
| | | | | | | | |
Total Common Stocks—97.3%
(cost $3,916,831) | | | | 4,942,157 | |
| | | | | | | | |
| | |
Convertible Bond | | | | | | | | |
Brazil—0.0% | | | | | | | | |
Lupatech S.A., 6.500%, due 4/15/18 (Machinery)**§ | | $ | 2,875 | | | | 1,876 | |
| | | | | | | | |
Total Convertible Bond—0.0%
(cost $1,491) | | | | 1,876 | |
| | | | | | | | |
| | |
Repurchase Agreement | | | | | | | | |
Fixed Income Clearing Corporation, 0.150% dated 12/31/10, due 1/3/11, repurchase price $153,881 collateralized by FHLB, 4.625%, due 8/15/12, FHLMC, 1.250%, due 9/30/13, FNMA, 1.050%—5.250%, due 8/12/12—10/22/13, and U.S. Treasury Notes, 0.625%—1.375%, due 5/12/12—6/30/12 | | | 153,879 | | | | 153,879 | |
| | | | | | | | |
Total Repurchase Agreement—3.0%
(cost $153,879) | | | | | | | 153,879 | |
| | | | | | | | |
Total Investments—100.3%
(cost $4,072,201) | | | | 5,097,912 | |
Liabilities, plus cash and other assets—(0.3)% | | | | (15,733 | ) |
| | | | | | | | |
Net assets—100.0% | | | $ | 5,082,179 | |
| | | | | | | | |
ADR = American Depository Receipt
* = Non-income producing securities
† = U.S. listed foreign security
** = Fair valued pursuant to Valuation Procedures adopted by the Board of Trustees. This holding represents 0.04% of the Fund’s net assets at December 31, 2010.
§ = Deemed illiquid pursuant to Liquidity Procedures approved by the Board of Trustees. This holding represents 0.04% of the net assets at December 31, 2010.
For securities primarily traded on exchanges or markets that close before the close of regular trading on the New York Stock Exchange, the Fund may use an independent pricing service to fair value price the securities pursuant to Valuation Procedures approved by the Board of Trustees.
See accompanying Notes to Financial Statements.
December 31, 2010 | William Blair Funds 45 |
International Growth Fund
Portfolio of Investments, December 31, 2010 (all dollar amounts in thousands)
At December 31, 2010, the Fund’s Portfolio of Investments includes the following industry categories:
| | | | |
Financials | | | 20.5% | |
Industrials | | | 19.1% | |
Consumer Discretionary | | | 14.4% | |
Materials | | | 9.6% | |
Information Technology | | | 8.9% | |
Health Care | | | 7.9% | |
Energy | | | 7.0% | |
Consumer Staples | | | 6.7% | |
Telecommunication Services | | | 4.3% | |
Utilities | | | 1.6% | |
| | | | |
Total | | | 100.0% | |
| | | | |
At December 31, 2010, the Fund’s Portfolio of Investments includes the following currency categories:
| | | | |
British Pound Sterling | | | 20.5% | |
Euro | | | 18.2% | |
Japanese Yen | | | 15.0% | |
Swiss Franc | | | 8.0% | |
Brazilian Real | | | 5.3% | |
U.S. Dollar | | | 4.7% | |
Hong Kong Dollar | | | 4.2% | |
Indonesian Rupiah | | | 3.2% | |
Canadian Dollar | | | 3.1% | |
South Korean Won | | | 3.1% | |
Indian Rupee | | | 2.5% | |
Singapore Dollar | | | 2.3% | |
Swedish Krona | | | 2.0% | |
Danish Krone | | | 1.8% | |
South African Rand | | | 1.2% | |
Turkish Lira | | | 1.0% | |
Mexican Peso | | | 1.0% | |
All Other Currencies | | | 2.9% | |
| | | | |
Total | | | 100.0% | |
| | | | |
See accompanying Notes to Financial Statements.
46 Annual Report | December 31, 2010 |

David Merjan
INTERNATIONAL EQUITY FUND
The International Equity Fund seeks long-term capital appreciation.
AN OVERVIEW FROM THE PORTFOLIO MANAGER
The International Equity Fund posted a 10.92% increase (Class N Shares) for the 12 months ended December 31, 2010. By comparison, the Fund’s benchmark, the MSCI All Country World ex-U.S. IMI Index (net), gained 12.73%.
Calendar year performance for the Fund outpaced the Europe, Australia and Far East (EAFE) Index but trailed the MSCI ACWI Ex-US Index. Energy stock selection added significant value versus the ACWI Ex-US Index, with stock performance more than doubling the Index sector return. Service companies were the primary drivers of strong returns, coupled with good performance by CNOOC, Ltd. on the back of strong production growth during the year. Industrials, Healthcare and Telecom Services stock selection was also strong, as Healthcare stock selection was led by Europe, while Industrials stock selection benefited from demand for Komatsu, Ltd.’s heavy construction equipment in emerging markets, coupled with stabilizing developed market demand. In addition, the Fund’s airline, machinery and electrical equipment names also performed well. Telecom Services stock selection was bolstered by Softbank, which benefited from increased use of smartphones and its tie up with Apple, Inc. The key detractors from performance during the year included Materials holdings CRH plc and Vedanta Resources plc, along with E.on in Utilities. We sold CRH earlier in the year on concerns about worse than expected trading conditions in building materials and Vedanta during the fourth quarter, due to deteriorating government relations and concerns about the associated impact on the timing and composition of the project pipeline. We sold E.on as a result of expected continued weakness in power prices.
The Fund’s fourth quarter performance approximated the EAFE Index, but trailed the MSCI ACWI Ex-US Index. While the Fund was up 6.77%, for the quarter, and Developed Asian and Europe Ex-U.K. stock selection was strong, the Fund’s U.K., Canadian and EMEA stock selection more than offset these positive relative results. U.K. stock selection lagged across most sectors, with the exception of Financials, although the overweighting in U.K. Financials was negative. Canadian stock selection was hampered by the lack of Energy exposure, coupled with underperformance by Goldcorp. The Fund’s focus on EMEA Financials also detracted from performance, as these names underperformed the region as a whole. Developed Asian stock selection was bolstered by good performance by BHP Billiton on a stock buyback program and accelerating commodity prices. Japanese stock selection added value through Financials performance coupled with strong results from Komatsu, Ltd. and Fanuc, Ltd., along with good performance by Japanese IT companies. Within Europe Ex-U.K., Saipem SpA, the energy services company, performed well, while the underweighting and stock selection in Financials was also a key contributor. European Healthcare stocks were also additive to results.
As of year-end 2010 the Fund maintained its focus in Industrials with just under 22% invested in the sector. While decreasing since September 30 due to a reduction in European holdings, it remained significantly overweighted versus the 12% Index weighting, due largely to significant developed market exposure, particularly in Japanese machinery and European electrical equipment and outsourcing companies, along with trading companies. Financials, while underweighted at 20% versus the 24% Index weighting, was the second largest sector, with significant exposure in emerging markets-related holdings, as well as European insurance companies, and remained relatively stable during the year. Materials remained the most underweighted sector at approximately 8% of the Fund versus the 13% Index weighting, as we were underweighted in chemicals and mining, the two significant industries within the Index. Regionally, the Fund remained focused in Europe, with approximately 26% invested in Europe Ex-U.K. and 23% in the U.K. Europe Ex-U.K. exposure moderated during the twelve
December 31, 2010 | William Blair Funds 47 |
month period from 32% as of year-end 2009 as an increase in European Staples was more than offset by a decrease in Financials and Healthcare. Conversely, U.K. exposure increased during the period from approximately 18% to nearly 23%, ahead of the Index weighting, as exposure broadened across a number of sectors. Japan represented approximately 14% of the Fund as of year end, below the Index weighting, but increased during the year, particularly in Financials and Industrials. Emerging markets were underweighted during the entire twelve month period and ended the year at 18% versus the 24% Index weighting, due to lower exposure in Emerging Asia and EMEA.
48 Annual Report | December 31, 2010 |
International Equity Fund
Performance Highlights (unaudited)
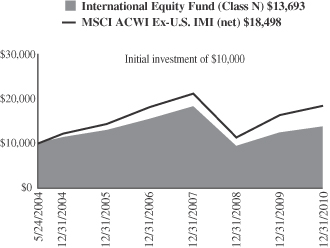
Average Annual Total Return at 12/31/2010
| | | | | | | | | | | | | | | | |
| | | 1
Year | | | 3
Year | | | 5
Year | | | Since
Inception(a) | |
Class N | | | 10.92 | % | | | (8.97 | )% | | | 1.26 | % | | | 4.87 | % |
Class I | | | 11.19 | | | | (8.76 | ) | | | 1.50 | | | | 5.15 | |
MSCI All Country World
Ex-U.S. IMI (net) | | | 12.73 | | | | (4.38 | ) | | | 5.14 | | | | 9.72 | |
| | (a) | | For the period from May 24, 2004 (Commencement of Operations) to December 31, 2010. | |
Performance cited represents past performance. Past performance does not guarantee future results and current performance may be lower or higher than the data quoted. Results shown are average annual returns, which assume reinvestment of dividends and capital gains. Investment returns and principal will fluctuate and you may have a gain or loss when you sell shares. For the most current month-end performance information, please call 1-800-742-7272, or visit our Web site at www.williamblairfunds.com. From time to time the investment advisor may waive fees or reimburse expenses for the Fund. Without these waivers, performance would be lower. International investing involves special risk considerations, including currency fluctuations, lower liquidity, economic and political risk. Class N shares are available to the general public without a sales load. Class I shares are available to certain institutional investors and advisory clients of William Blair & Company L.L.C. without a sales load or distribution (12b-1) or service fees.
The performance highlights and graph presented above do not reflect the deduction of taxes that a shareholder would pay on fund distributions or the redemption of fund shares.
The Morgan Stanley Capital International (MSCI) All Country World Ex-U.S. Investable Market Index (IMI) (net) is a free float-adjusted market capitalization weighted index that is designed to measure the equity market performance of developed and emerging markets, excluding the United States. This series approximates the minimum possible dividend reinvestment.
This report identifies the Fund’s investments on December 31, 2010. These holdings are subject to change. Not all stocks in the Fund performed the same, nor is there any guarantee that these stocks will perform as well in the future. Market forecasts provided in this report may not necessarily come to pass.
Sector Diversification (unaudited)
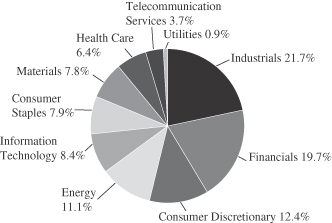
The sector diversification shown is based on the total long-term securities.
December 31, 2010 | William Blair Funds 49 |
International Equity Fund
Portfolio of Investments, December 31, 2010 (all dollar amounts in thousands)
| | | | | | | | |
Issuer | | Shares | | | Value | |
| | |
Common Stocks | | | | | | | | |
| | |
Europe—26.2% | | | | | | | | |
Belgium—0.8% | | | | | | | | |
Anheuser-Busch InBev N.V. (Beverages) | | | 24,127 | | | $ | 1,380 | |
| | | | | | | | |
Denmark—1.6% | | | | | | | | |
Novo Nordisk A/S (Pharmaceuticals) | | | 25,689 | | | | 2,897 | |
| | | | | | | | |
Finland—1.4% | | | | | | | | |
Kone Oyj (Machinery) | | | 43,364 | | | | 2,410 | |
| | | | | | | | |
France—3.8% | | | | | | | | |
AXA S.A. (Insurance) | | | 68,096 | | | | 1,133 | |
Cie Generale des Etablissements Michelin (Auto components) | | | 24,887 | | | | 1,786 | |
L’Oreal S.A. (Personal products) | | | 19,500 | | | | 2,165 | |
Schneider Electric S.A. (Electrical equipment) | | | 10,604 | | | | 1,587 | |
| | | | | | | | |
| | | | | | | 6,671 | |
| | | | | | | | |
Germany—2.8% | | | | | | | | |
MAN SE (Machinery) | | | 21,740 | | | | 2,585 | |
SAP AG (Software) | | | 48,673 | | | | 2,478 | |
| | | | | | | | |
| | | | | | | 5,063 | |
| | | | | | | | |
Ireland—1.5% | | | | | | | | |
Ryanair Holdings plc—ADR (Airlines) | | | 88,536 | | | | 2,723 | |
| | | | | | | | |
Israel—1.4% | | | | | | | | |
Teva Pharmaceutical Industries, Ltd.—ADR (Pharmaceuticals) | | | 47,137 | | | | 2,457 | |
| | | | | | | | |
Italy—1.9% | | | | | | | | |
Saipem SpA (Energy equipment & services) | | | 68,167 | | | | 3,356 | |
| | | | | | | | |
Spain—2.2% | | | | | | | | |
Banco Santander S.A. (Commercial banks) | | | 150,020 | | | | 1,589 | |
Inditex S.A. (Specialty retail) | | | 31,500 | | | | 2,359 | |
| | | | | | | | |
| | | | | | | 3,948 | |
| | | | | | | | |
Sweden—0.9% | | | | | | | | |
Atlas Copco AB (Machinery) | | | 65,342 | | | | 1,649 | |
| | | | | | | | |
Switzerland—7.9% | | | | | | | | |
*ABB, Ltd. (Electrical equipment) | | | 104,662 | | | | 2,332 | |
*Actelion, Ltd. (Biotechnology) | | | 19,836 | | | | 1,086 | |
Julius Baer Group, Ltd. (Capital markets) | | | 35,895 | | | | 1,682 | |
Nestle S.A. (Food products) | | | 59,982 | | | | 3,512 | |
Novartis AG (Pharmaceuticals) | | | 37,033 | | | | 2,177 | |
Sonova Holding AG (Health care equipment & supplies) | | | 8,609 | | | | 1,111 | |
Zurich Financial Services AG (Insurance) | | | 8,239 | | | | 2,134 | |
| | | | | | | | |
| | | | | | | 14,034 | |
| | | | | | | | |
| | |
United Kingdom—23.0% | | | | | | | | |
Amlin plc (Insurance) | | | 136,783 | | | | 872 | |
Antofagasta plc (Metals & mining) | | | 100,376 | | | | 2,523 | |
*Autonomy Corporation plc (Software) | | | 66,027 | | | | 1,549 | |
Barclays plc (Commercial banks) | | | 302,334 | | | | 1,233 | |
BG Group plc (Oil, gas & consumable fuels) | | | 149,628 | | | | 3,023 | |
British Sky Broadcasting Group plc (Media) | | | 219,085 | | | | 2,514 | |
Burberry Group plc (Textiles, apparel & luxury goods) | | | 99,975 | | | | 1,752 | |
Centrica plc (Multi-utilities) | | | 306,898 | | | | 1,587 | |
Compass Group plc (Hotels, restaurants & leisure) | | | 286,086 | | | | 2,592 | |
| | | | | | | | |
Issuer | | Shares | | | Value | |
| | |
Common Stocks—(continued) | | | | | | | | |
| | |
United Kingdom—(continued) | | | | | | | | |
Experian plc (Professional services) | | | 140,648 | | | $ | 1,750 | |
HSBC Holdings plc (Commercial banks) | | | 149,496 | | | | 1,533 | |
Johnson Matthey plc (Chemicals) | | | 52,126 | | | | 1,656 | |
Petrofac, Ltd. (Energy equipment & services) | | | 81,983 | | | | 2,029 | |
Prudential plc (Insurance) | | | 229,510 | | | | 2,390 | |
Reckitt Benckiser Group plc (Household products) | | | 56,950 | | | | 3,130 | |
*Rolls-Royce Group plc (Aerospace & defense) | | | 245,454 | | | | 2,384 | |
Rotork plc (Machinery) | | | 43,534 | | | | 1,241 | |
Standard Chartered plc (Commercial banks) | | | 78,667 | | | | 2,116 | |
The Capita Group plc (Professional services) | | | 131,467 | | | | 1,428 | |
Tullow Oil plc (Oil, gas & consumable fuels) | | | 98,865 | | | | 1,944 | |
Vodafone Group plc (Wireless telecommunication services) | | | 623,781 | | | | 1,612 | |
| | | | | | | | |
| | | | | | | 40,858 | |
| | | | | | | | |
| | |
Japan—13.9% | | | | | | | | |
Canon, Inc. (Office electronics) | | | 65,200 | | | | 3,381 | |
Fanuc, Ltd. (Machinery) | | | 14,800 | | | | 2,273 | |
Keyence Corporation (Electronic equipment, instruments & components) | | | 9,500 | | | | 2,752 | |
Komatsu, Ltd. (Machinery) | | | 81,200 | | | | 2,457 | |
Mitsubishi Corporation (Trading companies & distributors) | | | 125,600 | | | | 3,400 | |
Mitsubishi UFJ Financial Group, Inc. (Commercial banks) | | | 344,800 | | | | 1,864 | |
Nippon Electric Glass Co., Ltd. (Electronic equipment, instruments & components) | | | 100,000 | | | | 1,444 | |
Nitori Co., Ltd. (Specialty retail) | | | 10,000 | | | | 874 | |
Nitto Denko Corporation (Chemicals) | | | 30,900 | | | | 1,456 | |
Softbank Corporation (Wireless telecommunication services) | | | 75,400 | | | | 2,611 | |
Sony Financial Holdings, Inc. (Insurance) | | | 266 | | | | 1,076 | |
Terumo Corporation (Health care equipment & supplies) | | | 21,900 | | | | 1,233 | |
| | | | | | | | |
| | | | | | | 24,821 | |
| | | | | | | | |
| | |
Canada—8.7% | | | | | | | | |
Brookfield Asset Management, Inc. Class “A” (Real estate management & development)† | | | 75,108 | | | | 2,500 | |
Canadian National Railway Co. (Road & rail)† | | | 42,517 | | | | 2,826 | |
Goldcorp, Inc. (Metals & mining)† | | | 45,513 | | | | 2,093 | |
Saputo, Inc. (Food products) | | | 38,011 | | | | 1,513 | |
The Toronto-Dominion Bank (Commercial banks) | | | 39,681 | | | | 2,963 | |
Thomson Reuters Corporation (Media) | | | 33,956 | | | | 1,272 | |
Tim Hortons, Inc. (Hotels, restaurants & leisure) | | | 55,176 | | | | 2,281 | |
| | | | | | | | |
| | | | | | | 15,448 | |
| | | | | | | | |
| | |
Emerging Asia—9.1% | | | | | | | | |
China—4.2% | | | | | | | | |
China Life Insurance Co., Ltd. (Insurance) | | | 412,000 | | | | 1,683 | |
China Overseas Land & Investment, Ltd. (Real estate management & development) | | | 626,000 | | | | 1,158 | |
China Shenhua Energy Co., Ltd. (Oil, gas & consumable fuels) | | | 366,000 | | | | 1,535 | |
CNOOC, Ltd. (Oil, gas & consumable fuels) | | | 899,000 | | | | 2,133 | |
Weichai Power Co., Ltd. (Machinery) | | | 170,000 | | | | 1,046 | |
| | | | | | | | |
| | | | | | | 7,555 | |
| | | | | | | | |
See accompanying Notes to Financial Statements.
50 Annual Report | December 31, 2010 |
International Equity Fund
Portfolio of Investments, December 31, 2010 (all dollar amounts in thousands)
| | | | | | | | |
Issuer | | Shares | | | Value | |
| | |
Common Stocks—(continued) | | | | | | | | |
| | |
Emerging Asia—(continued) | | | | | | | | |
India—3.1% | | | | | | | | |
*Cairn India, Ltd. (Oil, gas & consumable fuels) | | | 199,443 | | | $ | 1,484 | |
HDFC Bank, Ltd.—ADR (Commercial banks) | | | 7,908 | | | | 1,321 | |
Infosys Technologies, Ltd. (IT services) | | | 35,702 | | | | 2,749 | |
| | | | | | | | |
| | | | | | | 5,554 | |
| | | | | | | | |
Indonesia—0.6% | | | | | | | | |
PT Bank Rakyat Indonesia (Commercial banks) | | | 901,000 | | | | 1,050 | |
| | | | | | | | |
South Korea—1.2% | | | | | | | | |
*Hyundai Motor Co. (Automobiles) | | | 14,185 | | | | 2,169 | |
| | | | | | | | |
| | |
Emerging Latin America—8.2% | | | | | | | | |
Brazil—5.3% | | | | | | | | |
Banco Santander Brasil S.A.—ADR (Commercial banks) | | | 49,003 | | | | 666 | |
BM&F BOVESPA S.A. (Diversified financial services) | | | 207,671 | | | | 1,643 | |
PDG Realty S.A. Empreendimentos e Participacoes (Household durables) | | | 167,000 | | | | 1,022 | |
Petroleo Brasileiro S.A.—ADR (Oil, gas & consumable fuels) | | | 39,021 | | | | 1,477 | |
Vale S.A.—ADR (Metals & mining) | | | 74,223 | | | | 2,566 | |
Weg S.A. (Machinery) | | | 150,500 | | | | 1,976 | |
| | | | | | | | |
| | | | | | | 9,350 | |
| | | | | | | | |
Mexico—2.2% | | | | | | | | |
America Movil S.A.B. de C.V.—ADR (Wireless telecommunication services) | | | 37,914 | | | | 2,174 | |
Wal-Mart de Mexico S.A.B. de C.V. (Food & staples retailing) | | | 640,900 | | | | 1,831 | |
| | | | | | | | |
| | | | | | | 4,005 | |
| | | | | | | | |
Panama—0.7% | | | | | | | | |
Copa Holdings S.A. Class “A” (Airlines)† | | | 21,081 | | | | 1,241 | |
| | | | | | | | |
| | |
Asia—5.2% | | | | | | | | |
Australia—1.7% | | | | | | | | |
BHP Billiton, Ltd.—ADR (Metals & mining) | | | 32,225 | | | | 2,994 | |
| | | | | | | | |
Hong Kong—2.6% | | | | | | | | |
Li & Fung, Ltd. (Distributors) | | | 458,000 | | | | 2,658 | |
Noble Group, Ltd. (Trading companies & distributors) | | | 1,106,727 | | | | 1,871 | |
| | | | | | | | |
| | | | | | | 4,529 | |
| | | | | | | | |
Singapore—0.9% | | | | | | | | |
CapitaLand, Ltd. (Real estate management & development) | | | 571,000 | | | | 1,651 | |
| | | | | | | | |
| | |
Emerging Europe, Mid-East, Africa—0.9% | | | | | | | | |
Turkey—0.9% | | | | | | | | |
Turkiye Garanti Bankasi A.S. (Commercial banks) | | | 330,320 | | | | 1,673 | |
| | | | | | | | |
Total Common Stocks—95.2%
(cost $130,004) | | | | 169,486 | |
| | | | | | | | |
| | | | | | | | |
Issuer | | Shares or
Principal
Amount | | | Value | |
| | |
Preferred Stock | | | | | | | | |
Brazil—1.1% | | | | | | | | |
Petroleo Brasileiro S.A. (Oil, gas & consumable fuels) | | | 125,793 | | | $ | 2,068 | |
| | | | | | | | |
Total Preferred Stock—1.1%
(cost $1,550) | | | | 2,068 | |
| | | | | | | | |
| | |
Repurchase Agreement | | | | | | | | |
State Street Bank and Trust Company, 0.150% dated 12/31/10, due 1/3/11, repurchase price $3,703, collateralized by U.S. Treasury Note, 1.375%, due 5/15/13 | | $ | 3,702 | | | | 3,702 | |
| | | | | | | | |
Total Repurchase Agreement—2.1%
(cost $3,702) | | | | 3,702 | |
| | | | | | | | |
Total Investments—98.4%
(cost $135,256) | | | | 175,256 | |
Cash and other assets, less liabilities—1.6% | | | | 2,799 | |
| | | | | | | | |
Net assets—100.0% | | | $ | 178,055 | |
| | | | | | | | |
ADR = American Depository Receipt
* = Non-income producing securities
† = U.S. listed foreign security
For securities primarily traded on exchanges or markets that close before the close of regular trading on the New York Stock Exchange, the Fund may use an independent pricing service to fair value price the securities pursuant to Valuation Procedures approved by the Board of Trustees.
At December 31, 2010, the Fund’s Portfolio of Investments includes the following industry categories:
| | | | |
Industrials | | | 21.7% | |
Financials | | | 19.7% | |
Consumer Discretionary | | | 12.4% | |
Energy | | | 11.1% | |
Information Technology | | | 8.4% | |
Consumer Staples | | | 7.9% | |
Materials | | | 7.8% | |
Health Care | | | 6.4% | |
Telecommunication Services | | | 3.7% | |
Utilities | | | 0.9% | |
| | | | |
Total | | | 100.0% | |
| | | | |
See accompanying Notes to Financial Statements.
December 31, 2010 | William Blair Funds 51 |
International Equity Fund
Portfolio of Investments, December 31, 2010 (all dollar amounts in thousands)
At December 31, 2010, the Fund’s Portfolio of Investments includes the following currency categories:
| | | | |
British Pound Sterling | | | 22.9% | |
U.S. Dollar | | | 14.6% | |
Japanese Yen | | | 14.5% | |
Euro | | | 13.3% | |
Swiss Franc | | | 8.2% | |
Hong Kong Dollar | | | 6.8% | |
Canadian Dollar | | | 4.7% | |
Brazilian Real | | | 3.9% | |
Indian Rupee | | | 2.5% | |
Singapore Dollar | | | 2.0% | |
Danish Krone | | | 1.7% | |
South Korean Won | | | 1.3% | |
Mexican Peso | | | 1.1% | |
All Other Currencies | | | 2.5% | |
| | | | |
Total | | | 100.0% | |
| | | | |
See accompanying Notes to Financial Statements.
52 Annual Report | December 31, 2010 |

Jeffrey A. Urbina
INTERNATIONAL SMALL CAP GROWTH FUND
The International Small Cap Growth Fund seeks long-term capital appreciation.
AN OVERVIEW FROM THE PORTFOLIO MANAGER
The International Small Cap Growth Fund posted a 25.88% increase (Class N Shares) for the 12 months ended December 31, 2010. By comparison, the Fund’s benchmark, the MSCI All Country World Ex-U.S. Small Cap Index (net), gained 25.21%.
The Fund outpaced the Index during the 12 month period, as stock selection was additive in virtually all sectors. Energy and Materials stock selection was particularly strong, with the Fund’s Energy stocks up approximately 57%, well ahead of the Index’s 31% Energy return. U.K. and Canadian stock selection augmented results on improving production growth, M&A activity and strength in services names, while Pacific Rubiales Energy Corporation, the Colombian Exploration and Production (E&P) company reported strong production growth. Materials stocks also enhanced performance, benefiting from M&A activity as Red Back Mining, Inc. was acquired during the year, and as other chemicals and mining holdings performed well. Healthcare was another sector where notable value was added, as Emerging Asian pharmaceuticals and Latin American healthcare names performed well, coupled with strong results in Europe and Japan. Finally, Staples stock selection was bolstered by M&A activity in Japan, coupled with strong results in agriculture-related and emerging markets grocery holdings. Somewhat detracting from results was performance by EDF Energies Nouvelles S.A., the Fund’s sole Utilities holding, which underperformed as investors were concerned about governmental policies surrounding alternative energy given recently announced austerity measures. Stock selection was strong across most regions as well, with the exception of Pacific Ex-Japan and Emerging Asia.
The Fund trailed the Index during the fourth quarter, due to underperformance in December. While stock selection was generally strong across most sectors, underperformance in Consumer Discretionary, Industrials and Information Technology (IT), coupled with overall sector positioning, detracted from fourth quarter results. Within Consumer Discretionary, Chinese sportswear and auto stocks detracted from performance, as did underperformance in Emerging Markets Europe, Mid-East, and Africa (EMEA) holdings. Industrials stock selection was hampered by lagging results in U.K. holdings, while IT stock selection was hurt by underperformance by Gree, Inc., the Japanese social networking company, on concerns about slowing revenues per user. Offsetting these results was strong value added in Materials, Energy and Financials.
While absolute weightings varied during the year, broad areas of sector emphasis did not change during the period. As of year end the Fund remains overweighted in Consumer Discretionary, Healthcare and IT at the expense of Financials and Materials. Consumer Discretionary increased during the year and represented approximately 24% of the Fund, albeit down from 26% as of September 30, as we reduced exposure on valuation concerns, but well above the 16% Index weighting. IT, on the other hand, has steadily increased during 2010 from approximately 16% as of year-end 2009 to approximately 18% as of year-end 2010, well ahead of the 10% Index weighting. IT exposure is centered in Europe with approximately half of the Fund’s IT weighting in that region, invested across several industries. Conversely, Materials is just shy of 5%, significantly underweighted versus the Index. Regionally, we reduced exposure in Europe ex-U.K. during the 12 month period in favor of emerging markets, which represented 24% of the Fund as of year end. Europe fell from over 30% to 26.8% by year end. Japan has remained at approximately 16.7% of the Fund during the entire period, with a focus in small cap consumer and, to some extent Healthcare companies. With this weighting, exposure has hovered around Index weight.
December 31, 2010 | William Blair Funds 53 |
International Small Cap Growth Fund
Performance Highlights (unaudited)
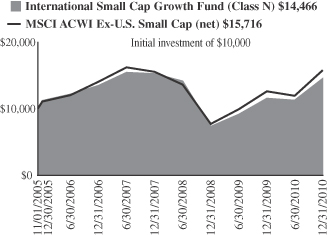
Average Annual Total Return at 12/31/2010
| | | | | | | | | | | | | | | | |
| | | 1
Year | | | 3
Year | | | 5
Year | | | Since
Inception(a) | |
Class N | | | 25.88 | % | | | (1.60 | )% | | | 5.33 | % | | | 7.41 | % |
Class I | | | 26.24 | | | | (1.24 | ) | | | 5.67 | | | | 7.74 | |
MSCI AC World Ex-U.S. Small Cap Index (net) | | | 25.21 | | | | 0.50 | | | | 7.36 | | | | 9.11 | |
| | (a) | | For the period from November 1, 2005 (Commencement of Operations) to December 31, 2010. | |
Performance cited represents past performance. Past performance does not guarantee future results and current performance may be lower or higher than the data quoted. Results shown are average annual returns, which assume reinvestment of dividends and capital gains. Investment returns and principal will fluctuate and you may have a gain or loss when you sell shares. For the most current month-end performance information, please call 1-800-742-7272, or visit our Web site at www.williamblairfunds.com. From time to time, the investment advisor may waive fees or reimburse expenses for the Fund. Without these waivers, performance would be lower. International investing involves special risk considerations, including currency fluctuations, lower liquidity, economic and political risk. Class N shares are available to the general public without a sales load. Class I shares are available to certain institutional investors and advisory clients of William Blair & Company L.L.C. without a sales load or distribution (12b-1) fees.
The performance highlights and graph presented above do not reflect the deduction of taxes that a shareholder would pay on fund distributions or the redemption of fund shares.
The Morgan Stanley Capital International (MSCI) All Country World Ex-U.S. Small Cap Index (net) is a free float-adjusted market capitalization weighted index that is designed to measure the equity market performance of small capitalization developed and emerging markets, excluding the United States. This series approximates the minimum possible dividend reinvestment.
This report identifies the Fund’s investments on December 31, 2010. These holdings are subject to change. Not all stocks in the Fund performed the same, nor is there any guarantee that these stocks will perform as well in the future. Market forecasts provided in this report may not necessarily come to pass.
Sector Diversification (unaudited)
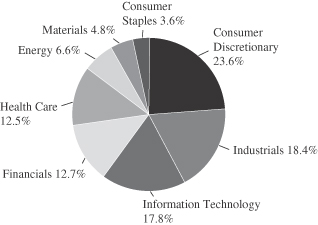
The sector diversification shown is based on the total long-term securities.
54 Annual Report | December 31, 2010 |
International Small Cap Growth Fund
Portfolio of Investments, December 31, 2010 (all dollar amounts in thousands)
| | | | | | | | |
Issuer | | Shares | | | Value | |
| | |
Common Stocks | | | | | | | | |
Europe—26.8% | | | | | | | | |
Denmark—1.9% | | | | | | | | |
FLSmidth & Co. A/S (Construction & engineering) | | | 126,535 | | | $ | 12,068 | |
| | | | | | | | |
Finland—1.0% | | | | | | | | |
Nokian Renkaat Oyj (Auto components) | | | 177,483 | | | | 6,510 | |
| | | | | | | | |
France—1.4% | | | | | | | | |
Gemalto N.V. (Computers & peripherals) | | | 217,146 | | | | 9,241 | |
| | | | | | | | |
Germany—7.5% | | | | | | | | |
Aixtron AG (Semiconductors & semiconductor equipment) | | | 353,519 | | | | 13,041 | |
Fielmann AG (Specialty retail) | | | 36,250 | | | | 3,446 | |
Lanxess AG (Chemicals) | | | 166,850 | | | | 13,177 | |
MTU Aero Engines Holding AG (Aerospace & defense) | | | 8,416 | | | | 569 | |
Wincor Nixdorf AG (Computers & peripherals) | | | 183,112 | | | | 14,929 | |
Wirecard AG (IT services) | | | 255,453 | | | | 3,499 | |
| | | | | | | | |
| | | | | | | 48,661 | |
| | | | | | | | |
Ireland—1.5% | | | | | | | | |
Paddy Power plc (Hotels, restaurants & leisure) | | | 236,965 | | | | 9,721 | |
| | | | | | | | |
Italy—1.5% | | | | | | | | |
DiaSorin SpA (Health care equipment & supplies) | | | 149,025 | | | | 6,414 | |
Tod’s SpA (Textiles, apparel & luxury goods) | | | 30,438 | | | | 3,006 | |
| | | | | | | | |
| | | | | | | 9,420 | |
| | | | | | | | |
Netherlands—0.3% | | | | | | | | |
BinckBank N.V. (Capital markets) | | | 125,245 | | | | 1,942 | |
| | | | | | | | |
Norway—0.1% | | | | | | | | |
*Pronova BioPharma A/S (Pharmaceuticals) | | | 619,646 | | | | 998 | |
| | | | | | | | |
Spain—3.7% | | | | | | | | |
Prosegur Cia de Seguridad S.A. (Commercial services & supplies) | | | 106,091 | | | | 5,973 | |
Tecnicas Reunidas S.A. (Energy equipment & services) | | | 171,750 | | | | 10,928 | |
Viscofan S.A. (Food products) | | | 182,590 | | | | 6,920 | |
| | | | | | | | |
| | | | | | | 23,821 | |
| | | | | | | | |
Sweden—1.6% | | | | | | | | |
Elekta AB (Health care equipment & supplies) | | | 265,618 | | | | 10,221 | |
| | | | | | | | |
Switzerland—6.3% | | | | | | | | |
*Dufry Group (Specialty retail) | | | 80,122 | | | | 10,780 | |
*Orascom Development Holding AG (Hotels, restaurants & leisure) | | | 55,352 | | | | 3,312 | |
Partners Group Holding AG (Capital markets) | | | 74,649 | | | | 14,163 | |
*Temenos Group AG (Software) | | | 296,213 | | | | 12,324 | |
| | | | | | | | |
| | | | | | | 40,579 | |
| | | | | | | | |
| | |
United Kingdom—20.7% | | | | | | | | |
Abcam plc (Biotechnology) | | | 886,958 | | | | 4,425 | |
Aggreko plc (Commercial services & supplies) | | | 251,754 | | | | 5,817 | |
Amlin plc (Insurance) | | | 1,198,156 | | | | 7,638 | |
Ashmore Group plc (Capital markets) | | | 640,980 | | | | 3,349 | |
| | | | | | | | |
Issuer | | Shares | | | Value | |
| | |
Common Stocks—(continued) | | | | | | | | |
United Kingdom—20.7%—(continued) | | | | | | | | |
*ASOS plc (Internet & catalog retail) | | | 9,663 | | | $ | 240 | |
Aveva Group plc (Software) | | | 240,979 | | | | 6,064 | |
Babcock International Group plc (Commercial services & supplies) | | | 983,798 | | | | 8,758 | |
*Blinkx plc (Internet software & services) | | | 1,212,606 | | | | 1,574 | |
Britvic plc (Beverages) | | | 391,893 | | | | 2,892 | |
Chemring Group plc (Aerospace & defense) | | | 61,137 | | | | 2,768 | |
Domino’s Pizza UK & IRL plc (Hotels, restaurants & leisure) | | | 198,124 | | | | 1,704 | |
Dunelm Group plc (Specialty retail) | | | 424,413 | | | | 3,378 | |
*EnQuest plc (Oil, gas & consumable fuels) | | | 3,183,121 | | | | 6,923 | |
Fidessa Group plc (Software) | | | 90,598 | | | | 2,189 | |
Hargreaves Lansdown plc (Capital markets) | | | 430,045 | | | | 3,929 | |
IG Group Holdings plc (Diversified financial services) | | | 375,671 | | | | 2,987 | |
*Imagination Technologies Group plc (Computers & peripherals) | | | 489,931 | | | | 2,754 | |
Intertek Group plc (Professional services) | | | 140,008 | | | | 3,875 | |
John Wood Group plc (Energy equipment & services) | | | 817,247 | | | | 7,123 | |
Lancashire Holdings, Ltd. (Insurance) | | | 528,696 | | | | 4,558 | |
Meggitt plc (Aerospace & defense) | | | 957,881 | | | | 5,526 | |
Michael Page International plc (Professional services) | | | 841,079 | | | | 7,278 | |
Serco Group plc (Commercial services & supplies) | | | 700,185 | | | | 6,064 | |
Spirax-Sarco Engineering plc (Machinery) | | | 294,024 | | | | 8,866 | |
*Telecity Group plc (Internet software & services) | | | 231,115 | | | | 1,695 | |
The Weir Group plc (Machinery) | | | 390,838 | | | | 10,846 | |
Ultra Electronics Holdings plc (Aerospace & defense) | | | 221,798 | | | | 5,865 | |
Victrex plc (Chemicals) | | | 209,237 | | | | 4,838 | |
| | | | | | | | |
| | | | | | | 133,923 | |
| | | | | | | | |
| | |
Japan—16.7% | | | | | | | | |
Aeon Delight Co., Ltd. (Commercial services & supplies) | | | 100,300 | | | | 1,975 | |
Ain Pharmaciez, Inc. (Food & staples retailing) | | | 92,500 | | | | 3,254 | |
CyberAgent, Inc. (Media) | | | 2,697 | | | | 5,880 | |
Dena Co., Ltd. (Internet & catalog retail) | | | 310,100 | | | | 11,122 | |
EPS Co., Ltd. (Life sciences tools & services) | | | 675 | | | | 1,652 | |
Exedy Corporation (Auto components) | | | 397,400 | | | | 12,902 | |
F.C.C. Co., Ltd. (Auto components) | | | 200,509 | | | | 4,673 | |
Gree, Inc. (Internet software & services) | | | 599,330 | | | | 7,625 | |
Kakaku.com, Inc. (Internet software & services) | | | 691 | | | | 4,111 | |
Miraca Holdings, Inc. (Health care providers & services) | | | 354,400 | | | | 14,274 | |
Nabtesco Corporation (Machinery) | | | 313,000 | | | | 6,677 | |
Nitori Co., Ltd. (Specialty retail) | | | 54,100 | | | | 4,731 | |
Osaka Securities Exchange Co., Ltd. (Diversified financial services) | | | 1,342 | | | | 6,769 | |
Sawai Pharmaceutical Co., Ltd. (Pharmaceuticals) | | | 61,200 | | | | 5,005 | |
Start Today Co., Ltd. (Internet & catalog retail) | | | 1,467 | | | | 5,863 | |
USS Co., Ltd. (Specialty retail) | | | 140,100 | | | | 11,458 | |
| | | | | | | | |
| | | | | | | 107,971 | |
| | | | | | | | |
See accompanying Notes to Financial Statements.
December 31, 2010 | William Blair Funds 55 |
International Small Cap Growth Fund
Portfolio of Investments, December 31, 2010 (all dollar amounts in thousands)
| | | | | | | | |
Issuer | | Shares | | | Value | |
| | |
Common Stocks—(continued) | | | | | | | | |
| | |
Emerging Asia—15.4% | | | | | | | | |
China—6.8% | | | | | | | | |
AAC Acoustic Technologies Holdings, Inc. (Communications equipment) | | | 2,945,559 | | | $ | 7,863 | |
Ajisen China Holdings, Ltd. (Hotels, restaurants & leisure) | | | 3,375,429 | | | | 5,671 | |
Comba Telecom Systems Holdings, Ltd. (Communications equipment) | | | 2,178,297 | | | | 2,461 | |
*Concord Medical Services Holdings, Ltd.—ADR (Health care providers & services) | | | 127,213 | | | | 939 | |
*E-Commerce China Dangdang, Inc.—ADR (Internet & catalog retail) | | | 39,664 | | | | 1,074 | |
Great Wall Motor Co., Ltd. (Automobiles) | | | 1,205,500 | | | | 3,722 | |
Haitian International Holdings, Ltd. (Machinery) | | | 5,540,496 | | | | 5,781 | |
*Hollysys Automation Technologies, Ltd. (Electronic equipment, instruments & components)† | | | 106,925 | | | | 1,621 | |
Lonking Holdings, Ltd. (Machinery) | | | 8,144,000 | | | | 4,453 | |
Minth Group, Ltd. (Auto components) | | | 2,795,384 | | | | 4,589 | |
*Noah Holdings, Ltd.—ADR (Capital markets) | | | 50,062 | | | | 979 | |
Peak Sport Products, Ltd. (Textiles, apparel & luxury goods) | | | 2,163,000 | | | | 1,419 | |
*WuXi PharmaTech Cayman, Inc.—ADR (Life sciences tools & services) | | | 134,953 | | | | 2,178 | |
*Youku.com, Inc.—ADR (Internet software & services) | | | 29,956 | | | | 1,049 | |
| | | | | | | | |
| | | | | | | 43,799 | |
| | | | | | | | |
India—2.4% | | | | | | | | |
eClerx Services, Ltd. (Professional services) | | | 55,468 | | | | 893 | |
Ipca Laboratories, Ltd. (Pharmaceuticals) | | | 419,452 | | | | 3,241 | |
Lupin, Ltd. (Pharmaceuticals) | | | 637,966 | | | | 6,883 | |
*Oberoi Realty, Ltd. (Real estate management & development) | | | 258,634 | | | | 1,479 | |
Shriram Transport Finance Co., Ltd. (Consumer finance) | | | 173,183 | | | | 3,025 | |
| | | | | | | | |
| | | | | | | 15,521 | |
| | | | | | | | |
Indonesia—1.5% | | | | | | | | |
*PT Ciputra Development Tbk (Real estate management & development) | | | 16,680,000 | | | | 648 | |
*PT Indofood CBP Sukses Makmur Tbk (Food products) | | | 2,388,500 | | | | 1,239 | |
PT Kalbe Farma Tbk (Pharmaceuticals) | | | 11,518,500 | | | | 4,155 | |
PT Perusahaan Perkebunan London Sumatra Indonesia Tbk (Food products) | | | 2,528,000 | | | | 3,605 | |
| | | | | | | | |
| | | | | | | 9,647 | |
| | | | | | | | |
South Korea—1.5% | | | | | | | | |
*Halla Climate Control Corporation (Auto components) | | | 541,048 | | | | 9,535 | |
| | | | | | | | |
Taiwan—3.2% | | | | | | | | |
Powertech Technology, Inc. (Semiconductors & semiconductor equipment) | | | 1,472,000 | | | | 4,897 | |
Tripod Technology Corporation (Electronic equipment, instruments & components) | | | 1,433,000 | | | | 5,849 | |
Wistron Corporation (Computers & peripherals) | | | 5,062,102 | | | | 10,313 | |
| | | | | | | | |
| | | | | | | 21,059 | |
| | | | | | | | |
| | | | | | | | |
Issuer | | Shares | | | Value | |
| | |
Common Stocks—(continued) | | | | | | | | |
Canada—6.6% | | | | | | | | |
Canadian Western Bank (Commercial banks) | | | 274,900 | | | $ | 7,841 | |
*Consolidated Thompson Iron Mines, Ltd. (Metals & mining) | | | 678,190 | | | | 9,610 | |
*Gildan Activewear, Inc. (Textiles, apparel & luxury goods) | | | 162,900 | | | | 4,645 | |
Home Capital Group, Inc. (Thrifts & mortgage finance) | | | 67,991 | | | | 3,541 | |
*Legacy Oil + Gas, Inc. (Oil, gas & consumable fuels) | | | 325,062 | | | | 5,084 | |
PetroBakken Energy, Ltd. Class “A” (Oil, gas & consumable fuels) | | | 223,778 | | | | 4,886 | |
Petrominerales, Ltd. (Oil, gas & consumable fuels) | | | 211,244 | | | | 7,045 | |
| | | | | | | | |
| | | | | | | 42,652 | |
| | | | | | | | |
| | |
Emerging Europe, Mid-East, Africa—4.6% | | | | | | | | |
Egypt—0.4% | | | | | | | | |
Ghabbour Auto (Automobiles) | | | 377,091 | | | | 2,822 | |
| | | | | | | | |
South Africa—2.7% | | | | | | | | |
Adcock Ingram Holdings, Ltd. (Pharmaceuticals) | | | 327,381 | | | | 2,977 | |
Clicks Group, Ltd. (Multiline retail) | | | 1,410,429 | | | | 9,279 | |
Mr Price Group, Ltd. (Specialty retail) | | | 496,785 | | | | 5,015 | |
| | | | | | | | |
| | | | | | | 17,271 | |
| | | | | | | | |
Turkey—1.0% | | | | | | | | |
BIM Birlesik Magazalar A.S. (Food & staples retailing) | | | 17,525 | | | | 596 | |
Tofas Turk Otomobil Fabrikasi A.S. (Automobiles) | | | 628,155 | | | | 3,238 | |
Turkiye Sinai Kalkinma Bankasi A.S. (Commercial banks) | | | 1,767,415 | | | | 2,988 | |
| | | | | | | | |
| | | | | | | 6,822 | |
| | | | | | | | |
United Arab Emirates—0.5% | | | | | | | | |
*Aramex Co. (Air freight & logistics) | | | 5,534,926 | | | | 3,134 | |
| | | | | | | | |
| | |
Emerging Latin America—3.9% | | | | | | | | |
Brazil—2.3% | | | | | | | | |
Brasil Brokers Participacoes S.A. (Real estate management & development) | | | 381,800 | | | | 2,197 | |
CETIP S.A. - Balcao Organizado de Ativos e Derivativos (Capital markets) | | | 362,200 | | | | 5,149 | |
Drogasil S.A. (Food & staples retailing) | | | 177,000 | | | | 1,439 | |
OdontoPrev S.A. (Health care providers & services) | | | 260,600 | | | | 3,939 | |
Tegma Gestao Logistica S.A. (Road & rail) | | | 129,000 | | | | 1,978 | |
| | | | | | | | |
| | | | | | | 14,702 | |
| | | | | | | | |
Mexico—1.6% | | | | | | | | |
*Compartamos S.A.B. de C.V. (Consumer finance) | | | 1,688,700 | | | | 3,673 | |
*Genomma Lab Internacional S.A.B. de C.V. (Pharmaceuticals) | | | 1,606,720 | | | | 3,900 | |
*Grupo Comercial Chedraui S.A. de C.V. (Food & staples retailing) | | | 962,387 | | | | 2,925 | |
| | | | | | | | |
| | | | | | | 10,498 | |
| | | | | | | | |
See accompanying Notes to Financial Statements.
56 Annual Report | December 31, 2010 |
International Small Cap Growth Fund
Portfolio of Investments, December 31, 2010 (all dollar amounts in thousands)
| | | | | | | | |
Issuer | | Shares or
Principal
Amount | | | Value | |
| | |
Common Stocks—(continued) | | | | | | | | |
| | |
Asia—2.7% | | | | | | | | |
Australia—1.2% | | | | | | | | |
Cochlear, Ltd. (Health care equipment & supplies) | | | 96,774 | | | $ | 7,959 | |
| | | | | | | | |
Hong Kong—0.5% | | | | | | | | |
Value Partners Group, Ltd. (Capital markets) | | | 3,453,000 | | | | 3,465 | |
| | | | | | | | |
Singapore—1.0% | | | | | | | | |
Goodpack, Ltd. (Air freight & logistics) | | | 2,163,000 | | | | 3,455 | |
Midas Holdings, Ltd. (Metals & mining) | | | 3,531,000 | | | | 2,600 | |
| | | | | | | | |
| | | | | | | 6,055 | |
| | | | | | | | |
Total Common Stocks—97.4%
(cost $495,830) | | | | 630,017 | |
| | | | | | | | |
| | |
Preferred Stock | | | | | | | | |
Brazil—0.6% | | | | | | | | |
Marcopolo S.A. (Machinery) | | | 905,600 | | | | 3,813 | |
| | | | | | | | |
Total Preferred Stock—0.6%
(cost $2,840) | | | | 3,813 | |
| | | | | | | | |
| | |
Convertible Bond | | | | | | | | |
Brazil—0.1% | | | | | | | | |
Lupatech S.A., 6.500%, due 4/15/18 (Machinery)**§ | | $ | 959 | | | | 626 | |
| | | | | | | | |
Total Convertible Bond—0.1%
(cost $497) | | | | 626 | |
| | | | | | | | |
| | |
Repurchase Agreement | | | | | | | | |
Fixed Income Clearing Corporation, 0.150% dated 12/31/10, due 1/3/11, repurchase price $16,170, collateralized by FNMA, 4.625%, due 10/15/13 | | | 16,170 | | | | 16,170 | |
| | | | | | | | |
Total Repurchase Agreement—2.5%
(cost $16,170) | | | | 16,170 | |
| | | | | | | | |
Total Investments—100.6%
(cost $515,337) | | | | 650,626 | |
Liabilities, plus cash and other assets—(0.6)% | | | | (3,675 | ) |
| | | | | | | | |
Net assets—100.0% | | | $ | 646,951 | |
| | | | | | | | |
ADR = American Depository Receipt
* = Non-income producing securities
** = Fair valued pursuant to Valuation Procedures adopted by the Board of Trustees. This holding represents 0.10% of the Fund’s net assets at December 31, 2010.
§ = Deemed illiquid pursuant to Liquidity Procedures approved by the Board of Trustees. This holding represents 0.10% of the net assets at December 31, 2010.
For securities primarily traded on exchanges or markets that close before the close of regular trading on the New York Stock Exchange, the Fund may use an independent pricing service to fair value price the securities pursuant to Valuation Procedures approved by the Board of Trustees.
At December 31, 2010, the Fund’s Portfolio of Investments includes the following industry categories:
| | | | |
Consumer Discretionary | | | 23.6 | % |
Industrials | | | 18.4 | % |
Information Technology | | | 17.8 | % |
Financials | | | 12.7 | % |
Health Care | | | 12.5 | % |
Energy | | | 6.6 | % |
Materials | | | 4.8 | % |
Consumer Staples | | | 3.6 | % |
| | | | |
Total | | | 100.0 | % |
| | | | |
At December 31, 2010, the Fund’s Portfolio of Investments includes the following currency categories:
| | | | |
British Pound Sterling | | | 21.1 | % |
Euro | | | 17.2 | % |
Japanese Yen | | | 17.0 | % |
Canadian Dollar | | | 6.7 | % |
Swiss Franc | | | 6.4 | % |
Hong Kong Dollar | | | 6.2 | % |
New Taiwan Dollar | | | 3.3 | % |
Brazilian Real | | | 3.0 | % |
South African Rand | | | 2.7 | % |
Indian Rupee | | | 2.5 | % |
Danish Krone | | | 1.9 | % |
Mexican Peso | | | 1.7 | % |
Swedish Krona | | | 1.6 | % |
Indonesian Rupiah | | | 1.5 | % |
South Korean Won | | | 1.5 | % |
Australian Dollar | | | 1.3 | % |
U.S. Dollar | | | 1.2 | % |
Turkish Lira | | | 1.1 | % |
All Other Currencies | | | 2.1 | % |
| | | | |
Total | | | 100.0 | % |
| | | | |
See accompanying Notes to Financial Statements.
December 31, 2010 | William Blair Funds 57 |

Todd M. McClone
Jeffrey A. Urbina
EMERGING MARKETS GROWTH FUND
The Emerging Markets Growth Fund seeks long-term capital appreciation.
AN OVERVIEW FROM THE PORTFOLIO MANAGERS
The Emerging Markets Growth Fund posted a 23.44% increase (Class N Shares) for the 12 months ended December 31, 2010. By comparison, the Fund’s benchmark, the MSCI Emerging Markets IMI Index (net), gained 19.90%.
The Fund significantly outpaced the Index during the twelve month period, as stock selection was strong across most sectors and was supported by overall strategic positioning. Specifically, the Fund’s overweighting and stock selection in Consumer stocks added significant value during the 12 month period. Consumer Discretionary stock selection was bolstered by auto-related corporate performance and stock price movement, along with good returns in Brazilian real estate. Staples stock selection was augmented by Emerging Markets Europe, Mid-East, and Africa (EMEA) grocery holdings, as well as Asian consumer product and agriculture-related holdings. In addition, the overweighting in the strongly performing Latin American Staples sector, coupled with positive stock selection added value. The Healthcare and Industrials sectors each outperformed by approximately 12% versus the Index sector returns, as infrastructure and transportation holdings bolstered the Industrials return, while Healthcare stock selection was particularly strong in Emerging Asia and EMEA. The Fund also outperformed across the three emerging markets regions during the year. Somewhat detracting from results was Materials stock selection, as several of our Asian and EMEA holdings underperformed, due to stock specific issues.
Despite strong full year results, fourth quarter performance trailed the Index, due solely to December performance. Asian stock selection was the key detractor during the period, as the Fund’s Chinese sportswear and auto-related companies underperformed. In addition, Indian Financials also contributed to underperformance as investors were concerned about increasing interest rates and the impact of additional governmental oversight in the microfinance industry on the broader sector. Information Technology (IT) stock selection was the third primary contributor to underperformance as Baidu, Inc.’s stock price retreated after a strong run. Offsetting these relative results was strong performance in Healthcare, Materials, Telecom Services and Utilities, along with broad outperformance in Latin America. Within Healthcare, Latin American holdings added value, as did Asian pharmaceutical companies. Materials stock selection was augmented by good results in the Fund’s Latin American mining names and increasing commodity prices generally.
As of year-end 2010, the Fund maintained its Consumer focus with approximately 30% of the Fund invested between Consumer Discretionary and Staples holdings. We reduced exposure in Consumer Discretionary following September 30 on valuation concerns to approximately 15.5% of the Fund. Conversely, Financials, while representing nearly 20% of the Fund, remained underweighted during 2010, due to lower Asian exposure, particularly in real estate, given the increasing interest rate environment and governmental measures to cool the property market. While the Fund’s 10.5% IT exposure is similar to September 30, it decreased from year-end 2009 due to concerns about the current supply/demand tradeoff and inventory cycle. The Fund was underweighted in Materials throughout the year, but increased from approximately 5.5% to 9% as of year-end 2010. Regionally, approximately half of the Fund was focused in Emerging Asia, less than the 59.73% Index weighting, while the overweighting in Latin America increased throughout the year as the Fund’s exposure increased from approximately 22% to 27%, due to an increase in Financials, Healthcare and Materials, which more than offset a reduction in Consumer Discretionary.
58 Annual Report | December 31, 2010 |
Emerging Markets Growth Fund
Performance Highlights (unaudited)
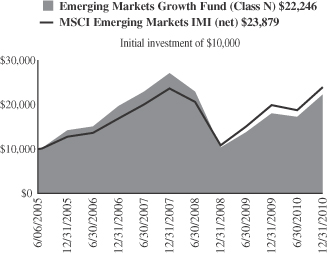
Average Annual Total Return at 12/31/2010
| | | | | | | | | | | | | | | | |
| | | 1
Year | | | 3
Year | | | 5
Year | | | Since
Inception(a) | |
Class N | | | 23.44 | % | | | (6.33 | )% | | | 9.31 | % | | | 15.43 | % |
Class I | | | 23.77 | | | | (6.10 | ) | | | 9.56 | | | | 15.70 | |
MSCI Emerging Markets IMI (net) | | | 19.90 | | | | 0.35 | | | | 13.23 | | | | 16.84 | |
| | (a) | | For the period from June 6, 2005 (Commencement of Operations) to December 31, 2010. |
Performance cited represents past performance. Past performance does not guarantee future results and current performance may be lower or higher than the data quoted. Results shown are average annual returns, which assume reinvestment of dividends and capital gains. Investment returns and principal will fluctuate and you may have a gain or loss when you sell shares. For the most current month-end performance information, please call 1-800-742-7272, or visit our Web site at www.williamblairfunds.com. From time to time, the investment advisor may waive fees or reimburse expenses for the Fund. Without these waivers, performance would be lower. International investing involves special risk considerations, including currency fluctuations, lower liquidity, economic and political risk. Class N shares are available to the general public without a sales load. Class I shares are available to certain institutional investors and advisory clients of William Blair & Company L.L.C. without a sales load or distribution (12b-1) fees.
The performance highlights and graph presented above do not reflect the deduction of taxes that a shareholder would pay on fund distributions or the redemption of fund shares.
The Morgan Stanley Capital International (MSCI) Emerging Markets Investable Market Index (IMI) (net) is a free float-adjusted market capitalization weighted index that is designed to measure the equity market performance of emerging markets. This series approximates the minimum possible dividend reinvestment.
This report identifies the Fund’s investments on December 31, 2010. These holdings are subject to change. Not all stocks in the Fund performed the same, nor is there any guarantee that these stocks will perform as well in the future. Market forecasts provided in this report may not necessarily come to pass.
Sector Diversification (unaudited)
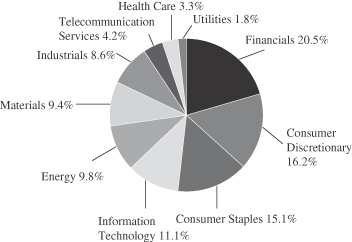
The sector diversification shown is based on the total long-term securities.
December 31, 2010 | William Blair Funds 59 |
Emerging Markets Growth Fund
Portfolio of Investments, December 31, 2010 (all dollar amounts in thousands)
| | | | | | | | |
Issuer | | Shares | | | Value | |
| | |
Common Stocks | | | | | | | | |
Emerging Asia—52.0% | | | | | | | | |
China—16.3% | | | | | | | | |
AAC Acoustic Technologies Holdings, Inc. (Communications equipment) | | | 1,603,949 | | | $ | 4,282 | |
Ajisen China Holdings, Ltd. (Hotels, restaurants & leisure) | | | 1,921,078 | | | | 3,228 | |
Angang Steel Co., Ltd. (Metals & mining) | | | 7,796,000 | | | | 11,936 | |
Anta Sports Products, Ltd. (Textiles, apparel & luxury goods) | | | 2,618,000 | | | | 4,156 | |
* Baidu, Inc.—ADR (Internet software & services) | | | 117,527 | | | | 11,345 | |
Belle International Holdings, Ltd. (Specialty retail) | | | 6,341,000 | | | | 10,720 | |
China Vanke Co., Ltd. (Real estate management & development) | | | 4,765,448 | | | | 5,886 | |
China Yurun Food Group, Ltd. (Food products) | | | 1,646,000 | | | | 5,411 | |
CNOOC, Ltd. (Oil, gas & consumable fuels) | | | 20,037,000 | | | | 47,535 | |
Comba Telecom Systems Holdings, Ltd. (Communications equipment) | | | 2,516,360 | | | | 2,842 | |
Dongfang Electric Corporation, Ltd. (Electrical equipment) | | | 1,815,800 | | | | 8,994 | |
Dongfeng Motor Group Co., Ltd. (Automobiles) | | | 6,782,000 | | | | 11,692 | |
* E-Commerce China Dangdang, Inc.—ADR (Internet & catalog retail) | | | 50,514 | | | | 1,367 | |
Great Wall Motor Co., Ltd. (Automobiles) | | | 1,130,000 | | | | 3,489 | |
Haitian International Holdings, Ltd. (Machinery) | | | 1,727,185 | | | | 1,802 | |
Hengan International Group Co., Ltd. (Personal products) | | | 569,500 | | | | 4,913 | |
Industrial and Commercial Bank of China, Ltd. Class “H” (Commercial banks) | | | 33,974,580 | | | | 25,308 | |
Lonking Holdings, Ltd. (Machinery) | | | 7,649,000 | | | | 4,182 | |
Minth Group, Ltd. (Auto components) | | | 892,000 | | | | 1,464 | |
Shandong Weigao Group Medical Polymer Co., Ltd. (Health care equipment & supplies) | | | 2,309,400 | | | | 6,551 | |
Want Want China Holdings, Ltd. (Food products) | | | 7,217,000 | | | | 6,323 | |
Weichai Power Co., Ltd. (Machinery) | | | 2,028,088 | | | | 12,485 | |
* WuXi PharmaTech Cayman, Inc.—ADR (Life sciences tools & services) | | | 129,898 | | | | 2,097 | |
* Youku.com, Inc.—ADR (Internet software & services) | | | 37,965 | | | | 1,329 | |
Zhuzhou CSR Times Electric Co., Ltd. (Electrical equipment) | | | 1,012,861 | | | | 3,981 | |
| | | | | | | | |
| | | | | | | 203,318 | |
| | | | | | | | |
India—10.2% | | | | | | | | |
Asian Paints, Ltd. (Chemicals) | | | 137,619 | | | | 8,860 | |
Axis Bank, Ltd. (Commercial banks) | | | 210,124 | | | | 6,344 | |
Bajaj Auto, Ltd. (Automobiles) | | | 299,206 | | | | 10,311 | |
Dabur India, Ltd. (Personal products) | | | 2,593,480 | | | | 5,815 | |
Housing Development Finance Corporation (Thrifts & mortgage finance) | | | 367,269 | | | | 5,982 | |
Infosys Technologies, Ltd. (IT services) | | | 353,170 | | | | 27,192 | |
Jindal Steel & Power, Ltd. (Metals & mining) | | | 408,895 | | | | 6,511 | |
Larsen & Toubro, Ltd. (Construction & engineering) | | | 276,181 | | | | 12,225 | |
Lupin, Ltd. (Pharmaceuticals) | | | 725,251 | | | | 7,825 | |
| | | | | | | | |
Issuer | | Shares | | | Value | |
| | |
Common Stocks—(continued) | | | | | | | | |
Emerging Asia—52.0%—(continued) | | | | | | | | |
India—10.2%—(continued) | | | | | | | | |
Mahindra & Mahindra, Ltd. (Automobiles) | | | 29,426 | | | $ | 512 | |
Nestle India, Ltd. (Food products) | | | 80,604 | | | | 6,875 | |
Shriram Transport Finance Co., Ltd. (Consumer finance) | | | 183,116 | | | | 3,199 | |
Sun TV Network, Ltd. (Media) | | | 299,774 | | | | 3,526 | |
Tata Motors, Ltd. (Machinery) | | | 675,716 | | | | 19,771 | |
Yes Bank, Ltd. (Commercial banks) | | | 418,587 | | | | 2,928 | |
| | | | | | | | |
| | | | | | | 127,876 | |
| | | | | | | | |
Indonesia—5.9% | | | | | | | | |
PT Astra International Tbk (Automobiles) | | | 2,341,500 | | | | 14,176 | |
PT Bank Rakyat Indonesia (Commercial banks) | | | 10,924,000 | | | | 12,730 | |
PT Indo Tambangraya Megah (Oil, gas & consumable fuels) | | | 1,111,500 | | | | 6,261 | |
PT Kalbe Farma Tbk (Pharmaceuticals) | | | 10,919,000 | | | | 3,939 | |
PT Perusahaan Gas Negara (Gas utilities) | | | 25,110,500 | | | | 12,332 | |
PT Unilever Indonesia Tbk (Household products) | | | 8,022,500 | | | | 14,692 | |
PT United Tractors Tbk (Machinery) | | | 3,756,500 | | | | 9,923 | |
| | | | | | | | |
| | | | | | | 74,053 | |
| | | | | | | | |
Malaysia—3.4% | | | | | | | | |
CIMB Group Holdings Bhd (Commercial banks) | | | 10,335,600 | | | | 28,491 | |
Genting Bhd (Hotels, restaurants & leisure) | | | 1,960,300 | | | | 7,107 | |
Kuala Lumpur Kepong Bhd (Food products) | | | 1,012,900 | | | | 7,260 | |
| | | | | | | | |
| | | | | | | 42,858 | |
| | | | | | | | |
Papua New Guinea—1.2% | | | | | | | | |
Oil Search, Ltd. (Oil, gas & consumable fuels) | | | 2,016,147 | | | | 14,517 | |
| | | | | | | | |
South Korea—8.3% | | | | | | | | |
* Amorepacific Corporation (Personal products) | | | 8,091 | | | | 8,120 | |
* Hankook Tire Co., Ltd. (Auto components) | | | 355,120 | | | | 9,935 | |
* Hyundai Mobis (Auto components) | | | 120,208 | | | | 30,134 | |
* Hyundai Motor Co. (Automobiles) | | | 149,484 | | | | 22,853 | |
* LG Household & Health Care, Ltd. (Household products) | | | 22,307 | | | | 7,666 | |
Samsung Electronics Co., Ltd. (Semiconductors & semiconductor equipment) | | | 30,045 | | | | 25,123 | |
| | | | | | | | |
| | | | | | | 103,831 | |
| | | | | | | | |
Taiwan—4.6% | | | | | | | | |
Hon Hai Precision Industry Co., Ltd. (Electronic equipment, instruments & components) | | | 9,085,992 | | | | 36,616 | |
Powertech Technology, Inc. (Semiconductors & semiconductor equipment) | | | 1,439,000 | | | | 4,788 | |
Tripod Technology Corporation (Electronic equipment, instruments & components) | | | 1,280,000 | | | | 5,224 | |
Wistron Corporation (Computers & peripherals) | | | 5,373,676 | | | | 10,948 | |
| | | | | | | | |
| | | | | | | 57,576 | |
| | | | | | | | |
Thailand—2.1% | | | | | | | | |
CP ALL PCL (Food & staples retailing) | | | 9,892,000 | | | | 12,880 | |
See accompanying Notes to Financial Statements.
60 Annual Report | December 31, 2010 |
Emerging Markets Growth Fund
Portfolio of Investments, December 31, 2010 (all dollar amounts in thousands)
| | | | | | | | |
Issuer | | Shares | | | Value | |
| | |
Common Stocks—(continued) | | | | | | | | |
Emerging Asia—52.0%—(continued) | | | | | | | | |
Thailand—2.1%—(continued) | | | | | | | | |
Kasikornbank PCL (Commercial banks) | | | 2,926,300 | | | $ | 12,183 | |
Minor International PCL (Hotels, restaurants & leisure) | | | 2,223,900 | | | | 870 | |
| | | | | | | | |
| | | | | | | 25,933 | |
| | | | | | | | |
| | |
Emerging Latin America—26.9% | | | | | | | | |
Brazil—13.6% | | | | | | | | |
Amil Participacoes S.A. (Health care providers & services) | | | 14,037 | | | | 151 | |
BR Malls Participacoes S.A. (Real estate management & development) | | | 926,200 | | | | 9,541 | |
BR Properties S.A. (Real estate management & development) | | | 348,545 | | | | 3,813 | |
Brasil Brokers Participacoes S.A. (Real estate management & development) | | | 452,200 | | | | 2,602 | |
CETIP S.A. - Balcao Organizado de Ativos e Derivativos (Capital markets) | | | 331,900 | | | | 4,719 | |
Cia de Bebidas das Americas—ADR (Beverages) | | | 745,630 | | | | 23,137 | |
Cia de Concessoes Rodoviarias (Transportation infrastructure) | | | 124,500 | | | | 3,518 | |
Cia Hering (Textiles, apparel & luxury goods) | | | 186,300 | | | | 3,030 | |
Diagnosticos da America S.A. (Health care providers & services) | | | 615,800 | | | | 8,347 | |
Drogasil S.A. (Food & staples retailing) | | | 322,700 | | | | 2,624 | |
*Hypermarcas S.A. (Personal products) | | | 309,528 | | | | 4,201 | |
Localiza Rent a Car S.A. (Road & rail) | | | 424,900 | | | | 6,885 | |
Lojas Renner S.A. (Multiline retail) | | | 190,600 | | | | 6,476 | |
Natura Cosmeticos S.A. (Personal products) | | | 253,200 | | | | 7,274 | |
OdontoPrev S.A. (Health care providers & services) | | | 247,400 | | | | 3,739 | |
*OGX Petroleo e Gas Participacoes S.A. (Oil, gas & consumable fuels) | | | 1,117,600 | | | | 13,465 | |
PDG Realty S.A. Empreendimentos e Participacoes (Household durables) | | | 1,534,400 | | | | 9,391 | |
Totvs S.A. (Software) | | | 35,600 | | | | 3,624 | |
Tractebel Energia S.A. (Independent power producers & energy traders) | | | 584,300 | | | | 9,662 | |
Vale S.A.—ADR (Metals & mining) | | | 1,255,249 | | | | 43,394 | |
| | | | | | | | |
| | | | | | | 169,593 | |
| | | | | | | | |
Chile—2.0% | | | | | | | | |
Banco Santander Chile—ADR (Commercial banks) | | | 153,667 | | | | 14,363 | |
Lan Airlines S.A. (Airlines) | | | 325,769 | | | | 10,163 | |
| | | | | | | | |
| | | | | | | 24,526 | |
| | | | | | | | |
Colombia—1.3% | | | | | | | | |
Pacific Rubiales Energy Corporation (Oil, gas & consumable fuels) | | | 482,159 | | | | 16,366 | |
| | | | | | | | |
Mexico—9.0% | | | | | | | | |
America Movil S.A.B. de C.V. (Wireless telecommunication services) | | | 9,054,600 | | | | 25,954 | |
Coca-Cola Femsa S.A.B. de C.V.—ADR (Beverages) | | | 86,999 | | | | 7,171 | |
*Compartamos S.A.B. de C.V. (Consumer finance) | | | 3,717,600 | | | | 8,085 | |
| | | | | | | | |
Issuer | | Shares | | | Value | |
| | |
Common Stocks—(continued) | | | | | | | | |
Emerging Latin America—26.9%—(continued) | | | | | |
Mexico—9.0%—(continued) | | | | | | | | |
*Genomma Lab Internacional S.A.B. de C.V. (Pharmaceuticals) | | | 1,680,734 | | | $ | 4,080 | |
*Grupo Comercial Chedraui S.A. de C.V. (Food & staples retailing) | | | 1,075,366 | | | | 3,268 | |
Grupo Mexico S.A.B. de C.V. Series “B” (Metals & mining) | | | 10,303,528 | | | | 42,416 | |
Wal-Mart de Mexico S.A.B. de C.V. (Food & staples retailing) | | | 7,684,600 | | | | 21,959 | |
| | | | | | | | |
| | | | | | | 112,933 | |
| | | | | | | | |
Peru—1.0% | | | | | | | | |
Credicorp, Ltd. (Commercial banks)† | | | 107,487 | | | | 12,781 | |
| | | | | | | | |
| |
Emerging Europe, Mid-East, Africa—13.3% | | | | | |
Egypt—0.6% | | | | | | | | |
Commercial International Bank Egypt S.A.E. (Commercial banks) | | | 921,018 | | | | 7,521 | |
| | | | | | | | |
Qatar—1.9% | | | | | | | | |
Qatar National Bank S.A.Q. (Commercial banks) | | | 468,047 | | | | 23,778 | |
| | | | | | | | |
Russia—1.7% | | | | | | | | |
Magnit OAO (Food & staples retailing)† | | | 105,337 | | | | 14,006 | |
*X5 Retail Group N.V.—GDR (Food & staples retailing) | | | 168,181 | | | | 7,778 | |
| | | | | | | | |
| | | | | | | 21,784 | |
| | | | | | | | |
South Africa—7.1% | | | | | | | | |
Adcock Ingram Holdings, Ltd. (Pharmaceuticals) | | | 352,834 | | | | 3,208 | |
Clicks Group, Ltd. (Multiline retail) | | | 1,276,204 | | | | 8,396 | |
Mr Price Group, Ltd. (Specialty retail) | | | 622,479 | | | | 6,284 | |
MTN Group, Ltd. (Wireless telecommunication services) | | | 1,221,587 | | | | 24,927 | |
Naspers, Ltd. (Media) | | | 250,682 | | | | 14,763 | |
Shoprite Holdings, Ltd. (Food & staples retailing) | | | 465,702 | | | | 7,045 | |
Standard Bank Group, Ltd. (Commercial banks) | | | 838,694 | | | | 13,693 | |
Truworths International, Ltd. (Specialty retail) | | | 681,097 | | | | 7,408 | |
Wilson Bayly Holmes-Ovcon, Ltd. (Construction & engineering) | | | 158,224 | | | | 3,339 | |
| | | | | | | | |
| | | | | | $ | 89,063 | |
| | | | | | | | |
| | | | | | | | |
Turkey—2.0% | | | | | | | | |
BIM Birlesik Magazalar A.S. (Food & staples retailing) | | | 97,546 | | | | 3,317 | |
Tofas Turk Otomobil Fabrikasi A.S. (Automobiles) | | | 621,238 | | | | 3,203 | |
Turkiye Garanti Bankasi A.S. (Commercial banks) | | | 2,454,713 | | | | 12,432 | |
Turkiye Halk Bankasi A.S. (Commercial banks) | | | 685,270 | | | | 5,814 | |
| | | | | | | | |
| | | | | | | 24,766 | |
| | | | | | | | |
See accompanying Notes to Financial Statements.
December 31, 2010 | William Blair Funds 61 |
Emerging Markets Growth Fund
Portfolio of Investments, December 31, 2010 (all dollar amounts in thousands)
| | | | | | | | |
Issuer | | Shares or
Principal
Amount | | | Value | |
| | |
Common Stocks—(continued) | | | | | | | | |
Emerging Europe, Mid-East, Africa—13.3%—(continued) | |
Turkey—2.0%—(continued) | | | | | | | | |
Total Common Stocks—92.2%
(cost $873,075) | | | $ | 1,153,073 | |
| | | | | | | | |
| | |
Preferred Stocks | | | | | | | | |
Brazil—4.1% | | | | | | | | |
Itau Unibanco Holding S.A. (Commercial banks) | | | 1,035,154 | | | | 24,813 | |
Petroleo Brasileiro S.A. (Oil, gas & consumable fuels) | | | 1,236,315 | | | | 20,325 | |
Randon Participacoes S.A. (Machinery) | | | 768,399 | | | | 5,689 | |
| | | | | | | | |
| | | | | | | 50,827 | |
| | | | | | | | |
Total Preferred Stocks—4.1%
(cost $46,291) | | | | 50,827 | |
| | | | | | | | |
| | |
Convertible Bond | | | | | | | | |
Brazil—0.1% | | | | | | | | |
Lupatech S.A., 6.500%, due 4/15/18 (Machinery)**§ | | $ | 1,602 | | | | 1,045 | |
| | | | | | | | |
Total Convertible Bond—0.1%
(cost $831) | | | | 1,045 | |
| | | | | | | | |
| | |
Repurchase Agreement | | | | | | | | |
Fixed Income Clearing Corporation, 0.150% dated 12/31/10, due 1/3/11, repurchase price $42,655, collateralized by FHLMC, 1.250%, due 9/30/13 | | | 42,654 | | | | 42,654 | |
| | | | | | | | |
Total Repurchase Agreement—3.4%
(cost $42,654) | | | | 42,654 | |
| | | | | | | | |
Total Investments—99.8%
(cost $962,851) | | | | 1,247,599 | |
Cash and other assets, less liabilities—0.2% | | | | 2,944 | |
| | | | | | | | |
Net assets—100.0% | | | $ | 1,250,543 | |
| | | | | | | | |
ADR = American Depository Receipt
GDR = Global Depository Receipt
* = Non-income producing securities
† = U.S. listed foreign security
** = Fair valued pursuant to Valuation Procedures adopted by the Board of Trustees. This holding represents 0.08% of the Fund’s net assets at December 31, 2010.
§ = Deemed illiquid pursuant to Liquidity Procedures approved by the Board of Trustees. This holding represents 0.08% of the net assets at December 31, 2010.
For securities primarily traded on exchanges or markets that close before the close of regular trading on the New York Stock Exchange, the Fund may use an independent pricing service to fair value price the securities pursuant to Valuation Procedures approved by the Board of Trustees.
At December 31, 2010, the Fund’s Portfolio of Investments includes the following industry categories:
| | | | |
Financials | | | 20.5% | |
Consumer Discretionary | | | 16.2% | |
Consumer Staples | | | 15.1% | |
Information Technology | | | 11.1% | |
Energy | | | 9.8% | |
Materials | | | 9.4% | |
Industrials | | | 8.6% | |
Telecommunication Services | | | 4.2% | |
Health Care | | | 3.3% | |
Utilities | | | 1.8% | |
| | | | |
Total | | | 100.0% | |
| | | | |
At December 31, 2010, the Fund’s Portfolio of Investments includes the following currency categories:
| | | | |
Hong Kong Dollar | | | 15.5% | |
Brazilian Real | | | 12.9% | |
U.S. Dollar | | | 11.5% | |
Indian Rupee | | | 10.6% | |
Mexican Peso | | | 8.8% | |
South Korean Won | | | 8.6% | |
South African Rand | | | 7.4% | |
Indonesian Rupiah | | | 6.1% | |
New Taiwan Dollar | | | 4.8% | |
Malaysian Ringgit | | | 3.6% | |
Thai Baht | | | 2.1% | |
Turkish Lira | | | 2.0% | |
Qatari Rial | | | 2.0% | |
Canadian Dollar | | | 1.4% | |
Australian Dollar | | | 1.2% | |
All Other Currencies | | | 1.5% | |
| | | | |
Total | | | 100.0% | |
| | | | |
See accompanying Notes to Financial Statements.
62 Annual Report | December 31, 2010 |
Todd M. McClone
Jeffrey A. Urbina
EMERGING LEADERS GROWTH FUND
The Emerging Leaders Growth Fund seeks long-term capital appreciation.
AN OVERVIEW FROM THE PORTFOLIO MANAGERS
The Emerging Leaders Growth Fund—Class N Shares commenced operations on May 3, 2010. In the seven-month period since the Fund inception on that date, the Fund posted an increase of 18.43%. By comparison, the Fund’s benchmark, the MSCI Emerging Markets Large Cap Index (net) gained 15.64% during the same period. The Class I shares one year return was 23.70% while the MSCI Emerging Markets Large Cap Index (net) gained 18.34% for the year.
The Fund significantly outpaced the Index during the twelve month period, as stock selection was strong across regions and was supported by overall strategic sector positioning. Within Asia, the Fund’s overweighting and stock selection in Staples added value as did strong Asian Energy performance, led by good production growth at CNOOC, Ltd. The Fund’s overweighting and stock selection in EMEA Staples was also positive, as grocery-related holdings performed well. Within Latin America, Energy holdings added value, as the Fund had a positive return, while the Index was negative, due to the Fund’s limited exposure to Petroleo Brasileiro S.A., the Brazilian Exploration and Production (E&P) company, as the stock price was weak on an overhang related to the company’s proposed equity offering and pricing. Industrials stock selection was also strong, as LAN Airlines S.A., the pan-Latin American airline, performed well. The Fund’s significant focus on Consumer stocks at the expense of Financials and IT also added to results. Somewhat detracting from 2010 performance was residual cash drag in a strong market, coupled with underperformance in Asian IT and Materials stocks.
Despite strong full year results, the Fund trailed the Index during the fourth quarter, due primarily to Chinese and Taiwanese stock selection, which more than offset good results in Latin America. While CNOOC and Industrials holdings continued to perform well, Chinese consumer and auto-related holdings underperformed, due to rising concerns about valuation and broader inflationary pressures in the economy. Similarly, the Fund’s Taiwanese IT holdings trailed the country as a whole. Indian Financials also contributed to underperformance as investors were concerned about increasing interest rates and the impact of additional governmental oversight in the microfinance industry on the broader sector. Conversely, the Fund’s Latin American Energy, Industrials and Materials stocks outperformed.
As of year end, the Fund maintained its focus on Consumer stocks with approximately 27% of the Fund invested across Discretionary and Staples holdings, well above the 11% Index weighting, but down from year-end 2009 and September 30. Conversely, while Financials represented approximately 20% of the Fund, they remained significantly underweighted versus the 26% Index weighting, due largely to lower exposure in Asian Insurance and Commercial Banks. While IT exposure increased from 5% as of September 30 to 10%, it remained below the 13% Index weighting, and lower than the 13.5% year-end 2009 exposure. Materials, while underweighted versus the Index, increased from approximately 11% to 14% during the 12 month period, particularly in Latin America. Regionally, while approximately half of the Fund’s exposure was in Asia, it was below the 57% Index weighting due largely to lower exposure in Korea and Taiwan. Conversely Latin American exposure grew during the period from approximately 22% as of year-end 2009 to 32% as of year-end 2010, above the 24% Index weighting. EMEA remained underweighted at approximately 13% of the Fund, due to limited Russian and Central/Eastern European exposure.
December 31, 2010 | William Blair Funds 63 |
Emerging Leaders Growth Fund
Performance Highlights (unaudited)
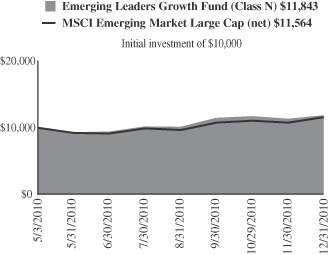
Average Annual Total Return at 12/31/2010
| | | | | | | | |
| | | 1
Year | | | Since
Inception | |
Class N | | | — | | | | 18.43 | %(a) |
MSCI Emerging Markets Large Cap Index (net) | | | — | | | | 15.64 | (a) |
Class I | | | 23.70 | % | | | 2.03 | (b) |
MSCI Emerging Markets Large Cap Index (net) | | | 18.34 | | | | 3.41 | (b) |
| | (a) | | For the period from May 3, 2010 (Commencement of Operations) to December 31, 2010. | |
| | (b) | | For the period from March 26, 2008 (Commencement of Operations) to December 31, 2010. | |
Performance cited represents past performance. Past performance does not guarantee future results and current performance may be lower or higher than the data quoted. Results shown are average annual total returns, which assume reinvestment of dividends and capital gains. Investment returns and principal will fluctuate and you may have a gain or loss when you sell shares. For the most current month-end performance information, please call 1-800-742-7272, or visit our Web site at www.williamblairfunds.com. International investing involves special risk considerations, including currency fluctuations, lower liquidity, economic and political risk. From time to time, the investment advisor may waive fees or reimburse expenses for the Fund. Without these waivers, performance would be lower. Class N shares are available to the general public without a sales load. Class I shares are available to certain institutional investors and advisory clients of William Blair & Company, L.L.C., without a sales load or distribution fees (12b-1).
The performance highlights and graph presented above do not reflect the deduction of taxes that a shareholder would pay on fund distributions or the redemption of fund shares.
The Morgan Stanley Capital International (MSCI) Emerging Markets Large Cap Index (net) is a free float-adjusted market capitalization weighted index that is designed to measure market performance of large capitalization stocks in emerging markets. This series approximates the minimum possible dividend reinvestment.
This report identifies the Fund’s investments on December 31, 2010. These holdings are subject to change. Not all stocks in the Fund performed the same, nor is there any guarantee that these stocks will perform as well in the future. Market forecasts provided in this report may not necessarily come to pass.
Sector Diversification (unaudited)
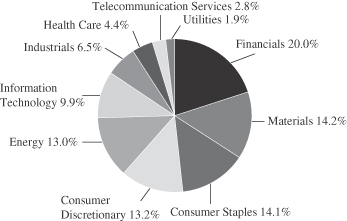
The sector diversification shown is based on the total long-term securities.
64 Annual Report | December 31, 2010 |
Emerging Leaders Growth Fund
Portfolio of Investments, December 31, 2010 (all dollar amounts in thousands)
| | | | | | | | |
Issuer | | Shares | | | Value | |
| | |
Common Stocks—Emerging Asia—52.5% | | | | | | | | |
China—14.3% | | | | | | | | |
Anta Sports Products, Ltd. (Textiles, apparel & luxury goods) | | | 265,000 | | | $ | 421 | |
*Baidu, Inc.—ADR (Internet software & services) | | | 8,899 | | | | 859 | |
Belle International Holdings, Ltd. (Specialty retail) | | | 264,000 | | | | 446 | |
China Yurun Food Group, Ltd. (Food products) | | | 239,000 | | | | 786 | |
CNOOC, Ltd. (Oil, gas & consumable fuels) | | | 1,854,000 | | | | 4,398 | |
Dongfang Electric Corporation, Ltd. (Electrical equipment) | | | 83,200 | | | | 412 | |
Dongfeng Motor Group Co., Ltd. (Automobiles) | | | 274,000 | | | | 472 | |
Golden Eagle Retail Group, Ltd. (Multiline retail) | | | 330,000 | | | | 814 | |
Hengan International Group Co., Ltd. (Personal products) | | | 60,000 | | | | 518 | |
Industrial and Commercial Bank of China, Ltd. Class “H” (Commercial banks) | | | 1,708,000 | | | | 1,272 | |
Ping An Insurance Group Co. of China, Ltd. Class “H” (Insurance) | | | 43,500 | | | | 486 | |
Shandong Weigao Group Medical Polymer Co., Ltd. (Health care equipment & supplies) | | | 252,000 | | | | 715 | |
Tencent Holdings, Ltd. (Internet software & services) | | | 41,200 | | | | 895 | |
Want Want China Holdings, Ltd. (Food products) | | | 465,000 | | | | 408 | |
Weichai Power Co., Ltd. (Machinery) | | | 110,000 | | | | 677 | |
| | | | | | | | |
| | | | | | | 13,579 | |
| | | | | | | | |
India—14.3% | | | | | | | | |
Asian Paints, Ltd. (Chemicals) | | | 7,431 | | | | 478 | |
Bajaj Auto, Ltd. (Automobiles) | | | 13,744 | | | | 474 | |
HDFC Bank, Ltd. (Commercial banks) | | | 19,155 | | | | 1,005 | |
Housing Development Finance Corporation (Thrifts & mortgage finance) | | | 30,383 | | | | 495 | |
Infosys Technologies, Ltd. (IT services) | | | 29,989 | | | | 2,309 | |
ITC, Ltd. (Tobacco) | | | 279,329 | | | | 1,091 | |
Jindal Steel & Power, Ltd. (Metals & mining) | | | 32,915 | | | | 524 | |
Larsen & Toubro, Ltd. (Construction & engineering) | | | 22,365 | | | | 990 | |
Lupin, Ltd. (Pharmaceuticals) | | | 95,070 | | | | 1,026 | |
Mahindra & Mahindra, Ltd. (Automobiles) | | | 67,775 | | | | 1,179 | |
Nestle India, Ltd. (Food products) | | | 8,753 | | | | 747 | |
Sun Pharmaceutical Industries, Ltd. (Pharmaceuticals) | | | 126,735 | | | | 1,374 | |
Tata Motors, Ltd. (Machinery) | | | 62,508 | | | | 1,829 | |
| | | | | | | | |
| | | | | | | 13,521 | |
| | | | | | | | |
Indonesia—6.7% | | | | | | | | |
PT Astra International Tbk (Automobiles) | | | 231,000 | | | | 1,398 | |
PT Bank Rakyat Indonesia (Commercial banks) | | | 1,231,500 | | | | 1,435 | |
PT Indo Tambangraya Megah (Oil, gas & consumable fuels) | | | 235,000 | | | | 1,324 | |
PT Perusahaan Gas Negara (Gas utilities) | | | 1,387,000 | | | | 681 | |
PT United Tractors Tbk (Machinery) | | | 573,500 | | | | 1,515 | |
| | | | | | | | |
| | | | | | | 6,353 | |
| | | | | | | | |
| | | | | | | | |
Issuer | | Shares | | | Value | |
|
Common Stocks—Emerging Asia—52.5%—(continued) | |
Malaysia—4.4% | | | | | | | | |
CIMB Group Holdings Bhd (Commercial banks) | | | 928,800 | | | $ | 2,560 | |
Genting Bhd (Hotels, restaurants & leisure) | | | 208,900 | | | | 758 | |
Kuala Lumpur Kepong Bhd (Food products) | | | 126,000 | | | | 903 | |
| | | | | | | | |
| | | | | | | 4,221 | |
| | | | | | | | |
Papua New Guinea—1.1% | | | | | | | | |
Oil Search, Ltd. (Oil, gas & consumable fuels) | | | 147,779 | | | | 1,064 | |
| | | | | | | | |
South Korea—6.4% | | | | | | | | |
*Hyundai Mobis (Auto components) | | | 9,175 | | | | 2,300 | |
*Hyundai Motor Co. (Automobiles) | | | 8,621 | | | | 1,318 | |
Samsung Electronics Co., Ltd. (Semiconductors & semiconductor equipment) | | | 2,936 | | | | 2,455 | |
| | | | | | | | |
| | | | | | | 6,073 | |
| | | | | | | | |
Taiwan—3.0% | | | | | | | | |
Hon Hai Precision Industry Co., Ltd. (Electronic equipment, instruments & components) | | | 374,000 | | | | 1,507 | |
HTC Corporation (Communications equipment) | | | 42,000 | | | | 1,297 | |
| | | | | | | | |
| | | | | | | 2,804 | |
| | | | | | | | |
Thailand—2.3% | | | | | | | | |
CP ALL PCL (Food & staples retailing) | | | 510,700 | | | | 665 | |
Kasikornbank PCL (Commercial banks) | | | 365,300 | | | | 1,521 | |
| | | | | | | | |
| | | | | | | 2,186 | |
| | | | | | | | |
| | |
Emerging Latin America—26.0% | | | | | | | | |
Brazil—14.0% | | | | | | | | |
Cia de Bebidas das Americas—ADR (Beverages) | | | 75,559 | | | | 2,345 | |
Cia de Concessoes Rodoviarias (Transportation infrastructure) | | | 22,900 | | | | 647 | |
Cyrela Brazil Realty S.A. (Household durables) | | | 76,200 | | | | 1,003 | |
*Hypermarcas S.A. (Personal products) | | | 93,600 | | | | 1,270 | |
Natura Cosmeticos S.A. (Personal products) | | | 17,100 | | | | 491 | |
*OGX Petroleo e Gas Participacoes S.A. (Oil, gas & consumable fuels) | | | 100,400 | | | | 1,210 | |
PDG Realty S.A. Empreendimentos e Participacoes (Household durables) | | | 79,500 | | | | 486 | |
Tractebel Energia S.A. (Independent power producers & energy traders) | | | 68,100 | | | | 1,126 | |
Vale S.A.—ADR (Metals & mining) | | | 136,494 | | | | 4,719 | |
| | | | | | | | |
| | | | | | | 13,297 | |
| | | | | | | | |
Colombia—2.0% | | | | | | | | |
Pacific Rubiales Energy Corporation (Oil, gas & consumable fuels) | | | 56,097 | | | | 1,904 | |
| | | | | | | | |
Mexico—8.8% | | | | | | | | |
America Movil S.A.B. de C.V.—ADR (Wireless telecommunication services) | | | 22,999 | | | | 1,319 | |
Grupo Mexico S.A.B. de C.V. Series “B” (Metals & mining) | | | 1,206,626 | | | | 4,967 | |
Mexichem S.A.B. de C.V. (Chemicals) | | | 297,200 | | | | 1,064 | |
Wal-Mart de Mexico S.A.B. de C.V. (Food & staples retailing) | | | 350,700 | | | | 1,002 | |
| | | | | | | | |
| | | | | | | 8,352 | |
| | | | | | | | |
See accompanying Notes to Financial Statements.
December 31, 2010 | William Blair Funds 65 |
Emerging Leaders Growth Fund
Portfolio of Investments, December 31, 2010 (all dollar amounts in thousands)
| | | | | | | | |
Issuer | | Shares | | | Value | |
| |
Common Stocks—Emerging Latin
America—26.0%—(continued) | | | | | |
Peru—1.2% | | | | | | | | |
Credicorp, Ltd. (Commercial banks)† | | | 9,578 | | | $ | 1,139 | |
| | | | | | | | |
| |
Emerging Europe, Mid-East, Africa—12.9% | | | | | |
Egypt—1.0% | | | | | | | | |
Commercial International Bank Egypt S.A.E. (Commercial banks) | | | 111,675 | | | | 912 | |
| | | | | | | | |
Qatar—1.6% | | | | | | | | |
Qatar National Bank S.A.Q. (Commercial banks) | | | 30,381 | | | | 1,544 | |
| | | | | | | | |
Russia—3.9% | | | | | | | | |
Magnit OJSC—144A—GDR (Food & staples retailing) | | | 39,928 | | | | 1,067 | |
Sberbank of Russian Federation (Commercial banks)† | | | 504,114 | | | | 1,717 | |
*X5 Retail Group N.V.—GDR (Food & staples retailing) | | | 21,050 | | | | 974 | |
| | | | | | | | |
| | | | | | | 3,758 | |
| | | | | | | | |
South Africa—4.9% | | | | | | | | |
*Aspen Pharmacare Holdings, Ltd. (Pharmaceuticals) | | | 74,066 | | | | 1,035 | |
MTN Group, Ltd. (Wireless telecommunication services) | | | 61,415 | | | | 1,253 | |
Naspers, Ltd. (Media) | | | 23,100 | | | | 1,360 | |
Shoprite Holdings, Ltd. (Food & staples retailing) | | | 66,898 | | | | 1,012 | |
| | | | | | | | |
| | | | | | | 4,660 | |
| | | | | | | | |
Turkey—1.5% | | | | | | | | |
Turkiye Garanti Bankasi A.S. (Commercial banks) | | | 190,923 | | | | 967 | |
Turkiye Halk Bankasi A.S. (Commercial banks) | | | 51,348 | | | | 436 | |
| | | | | | | | |
| | | | | | | 1,403 | |
| | | | | | | | |
ADR = American Depository Receipt
GDR = Global Depository Receipt
* = Non-income producing securities
† = U.S. listed foreign security
| | | | | | | | |
Issuer | | Shares or
Principal
Amount | | | Value | |
| |
Common Stocks—United Kingdom—1.7% | | | | | |
Vedanta Resources plc (Metals & mining) | | | 40,190 | | | $ | 1,577 | |
| | | | | | | | |
Total Common Stocks—93.1%
(cost $71,144) | | | | 88,347 | |
| | | | | | | | |
| | |
Preferred Stocks | | | | | | | | |
Brazil—6.0% | | | | | | | | |
Itau Unibanco Holding S.A. (Commercial banks) | | | 138,585 | | | | 3,322 | |
Petroleo Brasileiro S.A. (Oil, gas & consumable fuels) | | | 143,255 | | | | 2,355 | |
| | | | | | | | |
| | | | | | | 5,677 | |
| | | | | | | | |
Total Preferred Stocks—6.0%
(cost $5,253) | | | | 5,677 | |
| | | | | | | | |
| | |
Repurchase Agreement | | | | | | | | |
State Street Bank and Trust Company, 0.150% dated 12/31/10, due 1/3/11, repurchase price $1,507, collateralized by U.S. Treasury Note, 2.500%, due 4/30/15 | | $ | 1,507 | | | | 1,507 | |
| | | | | | | | |
Total Repurchase Agreement—1.6%
(cost $1,507) | | | | 1,507 | |
| | | | | | | | |
Total Investments—100.7%
(cost $77,904) | | | | 95,531 | |
Liabilities, plus cash and other assets—(0.7)% | | | | (630 | ) |
| | | | | | | | |
Net assets—100.0% | | | $ | 94,901 | |
| | | | | | | | |
For securities primarily traded on exchanges or markets that close before the close of regular trading on the New York Stock Exchange, the Fund may use an independent pricing service to fair value price the securities pursuant to Valuation Procedures approved by the Board of Trustees.
At December 31, 2010, the Fund’s Portfolio of Investments includes the following industry categories:
| | | | |
Financials | | | 20.0% | |
Materials | | | 14.2% | |
Consumer Staples | | | 14.1% | |
Consumer Discretionary | | | 13.2% | |
Energy | | | 13.0% | |
Information Technology | | | 9.9% | |
Industrials | | | 6.5% | |
Health Care | | | 4.4% | |
Telecommunication Services | | | 2.8% | |
Utilities | | | 1.9% | |
| | | | |
Total | | | 100.0% | |
| | | | |
At December 31, 2010, the Fund’s Portfolio of Investments includes the following currency categories:
| | | | |
U.S. Dollar | | | 15.0% | |
Indian Rupee | | | 14.4% | |
Hong Kong Dollar | | | 13.5% | |
Brazilian Real | | | 12.7% | |
Mexican Peso | | | 7.5% | |
Indonesian Rupiah | | | 6.8% | |
South Korean Won | | | 6.5% | |
South African Rand | | | 4.9% | |
Malaysian Ringgit | | | 4.5% | |
New Taiwan Dollar | | | 3.0% | |
Thai Baht | | | 2.3% | |
Canadian Dollar | | | 2.0% | |
British Pound Sterling | | | 1.7% | |
Qatari Rial | | | 1.6% | |
Turkish Lira | | | 1.5% | |
Australian Dollar | | | 1.1% | |
All Other Currencies | | | 1.0% | |
| | | | |
Total | | | 100.0% | |
| | | | |
See accompanying Notes to Financial Statements.
66 Annual Report | December 31, 2010 |

Chad M. Kilmer

Mark T. Leslie

David S. Mitchell
Small Cap Value Fund
The Small Cap Value Fund seeks long-term capital appreciation.
AN OVERVIEW FROM THE PORTFOLIO MANAGERS
The Small Cap Value Fund posted a 30.94% increase on a total return basis (Class N shares) during the 12 months ended December 31, 2010. By comparison, the Russell 2000® Value Index gained 24.50%.
The U.S. small cap value equity market produced its second best calendar year return in the last decade after staging an impressive four-month rally to close out 2010.
The year started off as a continuation of 2009 with better-than-expected corporate earnings propelling stocks higher. Then, during the second quarter, European sovereign debt concerns and fears of a double-dip recession in the US caused a steep mid-year correction. The selloff was short lived, however, as in late August the Federal Reserve signaled a second round of quantitative easing to help keep interest rates low and promote a more sustainable economic recovery. Improved investor sentiment was supported in part by stronger-than-expected retail sales that persisted into the holiday shopping season, US industrial production data that proved better than many had at expected at mid-year, and a more pro-business environment in Washington D.C. that emerged after the November elections. Strong growth in the emerging economies also boosted confidence in the reality of a global economic recovery.
From a sector perspective within the Russell 2000 Value, Materials (+37%), Industrials (+32%), Consumer Discretionary (+31%), Energy (+27%) and Information Technology (+26%) all outperformed the broader small cap value market. Financials (+20%) and the typically defensive sectors, Health Care (+20%), Utilities (+17%) and Consumer Staples (+15%), held back the absolute return of the index during the year.
The Fund’s outperformance during 2010 was attributable to strong stock selection across most sectors. This was most pronounced in Information Technology, but the Fund’s stocks beat their benchmark peers in Energy, Industrials and Financials as well. Stock selection in Materials, primarily not owning some of the more commodity-levered stocks in the benchmark, detracted on the margin.
Two stocks benefitting return during the year were Atmel Corporation and TAL International. Atmel Corporation (ATML) designs, develops and manufactures a range of semiconductor integrated circuit products and touch solutions. The company saw strong business momentum during the year in part due to 1) benefits from Atmel’s restructuring translating into an improved margin structure, 2) continued market share gains in microcontrollers, and 3) dramatic acceleration in touchscreen microcontroller revenue driven by the proliferation of touchscreen enabled cell phones. We trimmed the Fund’s position on the significant outperformance but still hold a position.
TAL International Group (TAL) owns, leases and trades intermodal shipping containers. The stock was a top contributor for the year as the company benefitted from its investment in additional containers during the downturn and the secular trend of shipping companies leasing containers as opposed to owning them continued. We continue to own the name given its solid cash flow characteristics and high caliber management team.
On the other hand, two stocks detracting from performance during the year were ATC Technology and Goodrich Petroleum. ATC Technology (ATAC) provides outsourced engineering solutions to the automotive industry and supply chain logistics services to the consumer electronics industry. The stock sold off during the year in part due to a slowdown in
December 31, 2010 | William Blair Funds 67 |
its logistics business with AT&T. Success and reliability of Apple’s iPhone, a big seller for AT&T, has decreased returns, repairs and overall turnover of cell phones, therefore impacting the services ATC Technology provides for AT&T. In addition, management implied an uptick in pricing pressure in the business. We liquidated the position due to these fundamental headwinds.
Goodrich Petroleum (GDP) engages in the exploration, exploitation, development and production of oil and natural gas properties primarily in East Texas and Northwest Louisiana. Since the company derives the majority of its earnings from natural gas production, the correction of natural gas prices during 2010 weighed on investor psychology. We liquidated the Fund’s position due to the depressed commodity price’s effect on the company’s intermediate-term earnings.
During the fourth quarter specifically, the Fund’s modest underperformance was the result of mixed stock selection across sectors. As mentioned above, the rally in commodities late in the year was a headwind for our Materials holdings on a relative basis. Consumer Discretionary stock selection was a mild detractor as well. On the other hand, positive stock selection in Industrials and Energy partially offset the negative effects.
Looking ahead, almost universally, market strategists believe 2011 will produce a solid, yet more modest, equity market return in the U.S. Broadly speaking, corporate cash flow generation and profit margins generally are attractive due to effective expense management by U.S. companies. If the past is any indication, these dynamics should eventually entice capital spending and increased hiring by corporations. This would help alleviate one of the main concerns with this recovery, unemployment.
Risks to a full economic recovery loom, yet are well documented. Government budgets at every level are stretched. The extension of the Bush-era federal income tax rates and new payroll tax break, along with the extension of unemployment benefits, help consumers and businesses in the short run, but the long-run impact is yet unknown. The same can be said for the Federal Reserve’s second round of quantitative easing and its impact on longer-term inflation. Rapid growth in emerging economies poses two distinct risks as well: higher commodity price inflation and potentially negative effects from emerging governments’ efforts to combat overheating of their economies.
In the end, however, while we factor various economic scenarios into our stock picking, we focus our time on constructing the Fund from a bottom-up perspective. As mentioned above, corporate fundamentals remain attractive. In combination with valuations that are broadly in line with long-term averages, the market outlook remains balanced. And while macroeconomic data largely drove correlated stock prices again in 2010, we expect individual company fundamentals to be the leading determinant of forward stock price returns. As always, we remain focused on finding quality companies at discount prices and corporate transformation opportunities. We believe building a Fund with these types of companies should produce solid investment results over the long term.
68 Annual Report | December 31, 2010 |
Small Cap Value Fund
Performance Highlights (unaudited)
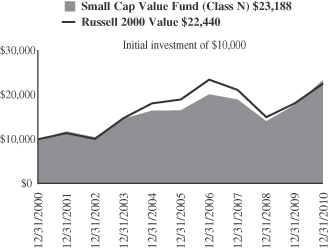
Average Annual Total Return at 12/31/2010
| | | | | | | | | | | | | | | | |
| | | 1
Year | | | 3
Year | | | 5
Year | | | 10
Year | |
Class N | | | 30.94 | % | | | 7.02 | % | | | 7.11 | % | | | 8.77 | % |
Class I | | | 31.16 | | | | 7.21 | | | | 7.33 | | | | 9.01 | |
Russell 2000® Value | | | 24.50 | | | | 2.19 | | | | 3.52 | | | | 8.42 | |
Performance cited represents past performance. Past performance does not guarantee future results and current performance may be lower or higher than the data quoted. Results shown are average annual total returns, which assume reinvestment of dividends and capital gains. Investment returns and principal will fluctuate and you may have a gain or loss when you sell shares. For the most current month-end performance information, please call 1-800-742-7272, or visit our Web site at www.williamblairfunds.com. Investing in smaller companies involves special risks, including higher volatility and lower liquidity. Smaller Capitalization stocks are also more sensitive to purchase/sale transactions and changes in the issuer’s financial condition. From time to time, the investment advisor may waive fees or reimburse expenses for the Fund. Without these waivers, performance would be lower. Class N shares are available to the general public without a sales load. Class I shares are available to certain institutional investors and advisory clients of William Blair & Company, L.L.C., without a sales load or distribution (12b-1) or service fees.
The performance highlights and graph presented above do not reflect the deduction of taxes that a shareholder would pay on fund distributions or the redemption of fund shares.
The Russell 2000® Value Index consists of small-capitalization companies with below average price-to-book ratios and forecasted growth rates.
This report identifies the Fund’s investments on December 31, 2010. These holdings are subject to change. Not all stocks in the Fund performed the same, nor is there any guarantee that these stocks will perform as well in the future. Market forecasts provided in this report may not necessarily come to pass.
Sector Diversification (unaudited)
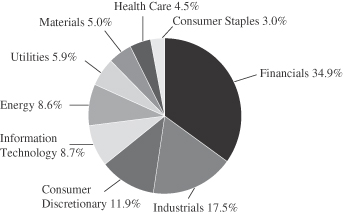
The sector diversification shown is based on the total long-term securities.
December 31, 2010 | William Blair Funds 69 |
Small Cap Value Fund
Portfolio of Investments, December 31, 2010 (all dollar amounts in thousands)
| | | | | | | | |
Issuer | | Shares | | | Value | |
|
Common Stocks | |
Financials—34.6% | |
Associated Banc-Corp | | | 139,710 | | | $ | 2,117 | |
BioMed Realty Trust, Inc. | | | 101,150 | | | | 1,886 | |
Brandywine Realty Trust | | | 190,810 | | | | 2,223 | |
*Eagle Bancorp, Inc. | | | 110,027 | | | | 1,588 | |
Education Realty Trust, Inc. | | | 275,375 | | | | 2,140 | |
Employers Holdings, Inc. | | | 95,085 | | | | 1,662 | |
Excel Trust, Inc. | | | 142,967 | | | | 1,730 | |
First Potomac Realty Trust | | | 140,062 | | | | 2,356 | |
FirstMerit Corporation | | | 113,752 | | | | 2,251 | |
Hancock Holding Co. | | | 24,995 | | | | 871 | |
Highwoods Properties, Inc. | | | 66,750 | | | | 2,126 | |
Iberiabank Corporation | | | 35,285 | | | | 2,086 | |
LaSalle Hotel Properties | | | 65,017 | | | | 1,716 | |
MarketAxess Holdings, Inc. | | | 80,405 | | | | 1,673 | |
Meadowbrook Insurance Group, Inc. | | | 201,855 | | | | 2,069 | |
Mid-America Apartment Communities, Inc. | | | 36,305 | | | | 2,305 | |
*National Financial Partners Corporation | | | 116,765 | | | | 1,565 | |
National Retail Properties, Inc. | | | 70,675 | | | | 1,873 | |
Old National Bancorp | | | 205,842 | | | | 2,447 | |
Platinum Underwriters Holdings, Ltd.† | | | 41,960 | | | | 1,887 | |
*ProAssurance Corporation | | | 28,860 | | | | 1,749 | |
Prosperity Bancshares, Inc. | | | 63,025 | | | | 2,476 | |
*Safeguard Scientifics, Inc. | | | 153,628 | | | | 2,624 | |
Sandy Spring Bancorp, Inc. | | | 91,100 | | | | 1,679 | |
*SVB Financial Group | | | 32,055 | | | | 1,700 | |
The Hanover Insurance Group, Inc. | | | 53,505 | | | | 2,500 | |
Umpqua Holdings Corporation | | | 164,843 | | | | 2,008 | |
Washington Federal, Inc. | | | 85,560 | | | | 1,448 | |
WSFS Financial Corporation | | | 44,633 | | | | 2,117 | |
| | | | | | | | |
| | | | 56,872 | |
| | | | | | | | |
Industrials—17.2% | |
Alexander & Baldwin, Inc. | | | 43,045 | | | | 1,723 | |
Ameron International Corporation | | | 21,215 | | | | 1,620 | |
Belden, Inc. | | | 43,045 | | | | 1,585 | |
Cubic Corporation | | | 33,170 | | | | 1,564 | |
*EMCOR Group, Inc. | | | 73,840 | | | | 2,140 | |
ESCO Technologies, Inc. | | | 52,565 | | | | 1,989 | |
G&K Services, Inc. Class “A” | | | 81,575 | | | | 2,522 | |
*Global Defense Technology & Systems, Inc. | | | 96,231 | | | | 1,622 | |
*GrafTech International, Ltd. | | | 88,225 | | | | 1,750 | |
*Hawaiian Holdings, Inc. | | | 185,360 | | | | 1,453 | |
*Kadant, Inc. | | | 78,982 | | | | 1,862 | |
Kaydon Corporation | | | 41,430 | | | | 1,687 | |
*L.B. Foster Co. Class “A” | | | 42,810 | | | | 1,753 | |
Quanex Building Products Corporation | | | 77,295 | | | | 1,466 | |
Robbins & Myers, Inc. | | | 55,585 | | | | 1,989 | |
TAL International Group, Inc. | | | 53,770 | | | | 1,660 | |
| | | | | | | | |
| | | | | | | 28,385 | |
| | | | | | | | |
Consumer Discretionary—11.8% | |
*AFC Enterprises, Inc. | | | 116,797 | | | | 1,623 | |
Ameristar Casinos, Inc. | | | 122,975 | | | | 1,922 | |
*Carter’s, Inc. | | | 56,580 | | | | 1,670 | |
Chico’s FAS, Inc. | | | 135,900 | | | | 1,635 | |
*Gaylord Entertainment Co. | | | 53,795 | | | | 1,933 | |
*Kirkland’s, Inc. | | | 83,245 | | | | 1,168 | |
Meredith Corporation | | | 43,395 | | | | 1,504 | |
*Pacific Sunwear of California, Inc. | | | 385,370 | | | | 2,089 | |
| | | | | | | | |
Issuer | | Shares | | | Value | |
Common Stocks—(continued) | |
Consumer Discretionary—11.8%—(continued) | |
*Pinnacle Entertainment, Inc. | | | 149,380 | | | $ | 2,094 | |
Stage Stores, Inc. | | | 121,600 | | | | 2,108 | |
The Jones Group, Inc. | | | 102,875 | | | | 1,599 | |
| | | | | | | | |
| | | | | | | 19,345 | |
| | | | | | | | |
Information Technology—8.5% | |
ADTRAN, Inc. | | | 48,025 | | | | 1,739 | |
*Atmel Corporation | | | 102,965 | | | | 1,268 | |
*Avid Technology, Inc. | | | 101,556 | | | | 1,773 | |
*Digital River, Inc. | | | 42,250 | | | | 1,454 | |
Earthlink, Inc. | | | 173,375 | | | | 1,491 | |
*Integrated Device Technology, Inc. | | | 174,575 | | | | 1,163 | |
*j2 Global Communications, Inc. | | | 73,955 | | | | 2,141 | |
*Parametric Technology Corporation | | | 91,595 | | | | 2,064 | |
*Ultra Clean Holdings | | | 103,843 | | | | 967 | |
| | | | | | | | |
| | | | | | | 14,060 | |
| | | | | | | | |
Energy—8.5% | |
Berry Petroleum Co. Class “A” | | | 54,529 | | | | 2,383 | |
*Forest Oil Corporation | | | 76,863 | | | | 2,918 | |
*Key Energy Services, Inc. | | | 141,055 | | | | 1,831 | |
*Magnum Hunter Resources Corporation | | | 153,346 | | | | 1,104 | |
*Newpark Resources, Inc. | | | 188,760 | | | | 1,163 | |
*Northern Oil and Gas, Inc. | | | 65,873 | | | | 1,792 | |
SM Energy Co. | | | 46,880 | | | | 2,763 | |
| | | | | | | | |
| | | | | | | 13,954 | |
| | | | | | | | |
Utilities—5.9% | |
Chesapeake Utilities Corporation | | | 43,895 | | | | 1,823 | |
Cleco Corporation | | | 65,750 | | | | 2,022 | |
NorthWestern Corporation | | | 64,550 | | | | 1,861 | |
Portland General Electric Co. | | | 91,275 | | | | 1,981 | |
UIL Holdings Corporation | | | 65,050 | | | | 1,949 | |
| | | | | | | | |
| | | | | | | 9,636 | |
| | | | | | | | |
Materials—5.0% | |
Minerals Technologies, Inc. | | | 41,375 | | | | 2,707 | |
*PolyOne Corporation | | | 181,875 | | | | 2,272 | |
*RTI International Metals, Inc. | | | 56,755 | | | | 1,531 | |
Silgan Holdings, Inc. | | | 47,145 | | | | 1,688 | |
| | | | | | | | |
| | | | | | | 8,198 | |
| | | | | | | | |
Health Care—4.4% | |
*CONMED Corporation | | | 31,179 | | | | 824 | |
*Greatbatch, Inc. | | | 33,960 | | | | 820 | |
Invacare Corporation | | | 59,130 | | | | 1,783 | |
*Magellan Health Services, Inc. | | | 46,415 | | | | 2,195 | |
*Mednax, Inc. | | | 25,083 | | | $ | 1,688 | |
| | | | | | | | |
| | | | | | | 7,310 | |
| | | | | | | | |
Consumer Staples—3.0% | |
Flowers Foods, Inc. | | | 45,065 | | | | 1,213 | |
J&J Snack Foods Corporation | | | 28,217 | | | | 1,361 | |
Spartan Stores, Inc. | | | 134,977 | | | | 2,288 | |
| | | | | | | | |
| | | | | | | 4,862 | |
| | | | | | | | |
Total Common Stocks—98.9%
(cost $136,164) | | | | 162,622 | |
| | | | | | | | |
See accompanying Notes to Financial Statements.
70 Annual Report | December 31, 2010 |
Small Cap Value Fund
Portfolio of Investments, December 31, 2010 (all dollar amounts in thousands)
| | | | | | | | |
Issuer | | Shares or
Principal
Amount | | | Value | |
|
Repurchase Agreement | |
State Street Bank and Trust Company, 0.150% dated 12/31/10, due 1/3/11, repurchase price $3,831, collateralized by U.S. Treasury Note, 2.500%, due 4/30/15 | | $ | 3,831 | | | $ | 3,831 | |
| | | | | | | | |
Total Repurchase Agreement—2.3%
(cost $3,831) | | | | 3,831 | |
| | | | | | | | |
Total Investments—101.2%
(cost $139,995) | | | | 166,453 | |
Liabilities, plus cash and other assets—(1.2)% | | | | (1,954 | ) |
| | | | | | | | |
Net assets—100.0% | | | $ | 164,499 | |
| | | | | | | | |
* = Non-income producing securities
† = U.S. listed foreign security
See accompanying Notes to Financial Statements.
December 31, 2010 | William Blair Funds 71 |
Chad M. Kilmer
Mark T. Leslie
David S. Mitchell
MID CAP VALUE FUND
The Mid Cap Value Fund seeks long-term capital appreciation.
AN OVERVIEW FROM THE PORTFOLIO MANAGERS
The Mid Cap Value Fund commenced operations on May 3, 2010. Through the seven-month period ending December 31, 2010, the Fund posted an 8.36% increase on a total return basis (Class N Shares). By comparison, the Fund’s benchmark the Russell Midcap® Value Index, gained 7.16% during this period.
The U.S. mid cap value equity market produced its third best calendar year return in the last decade after staging an impressive four-month rally to close out 2010.
The year started off as a continuation of 2009 with better-than-expected corporate earnings propelling stocks higher. Then, during the second quarter, European sovereign debt concerns and fears of a double-dip recession in the U.S. caused a steep mid-year correction. The selloff was short lived, however, as in late August the Federal Reserve signaled a second round of quantitative easing to help keep interest rates low and promote a more sustainable economic recovery. Improved investor sentiment was supported in part by stronger-than-expected retail sales that persisted into the holiday shopping season, U.S. industrial production data that proved better than many had expected at mid-year, and a more pro-business environment in Washington D.C. that emerged after the November elections. Strong growth in the emerging economies also boosted confidence in the reality of a global economic recovery.
The Fund’s outperformance from inception through year end was attributable to strong stock selection. Most of the outperformance came from within Industrials and Information Technology, with Financials and Health Care contributing as well. Consumer Discretionary stock selection was the main area of weakness for the Fund, tempering relative returns.
Two stocks benefitting return during the period were Atmel Corporation and Forest Oil Corporation. Atmel Corporation (ATML) designs, develops and manufactures a range of semiconductor integrated circuit products and touch solutions. The company saw strong business momentum during the year in part due to 1) benefits from Atmel’s restructuring translating into an improved margin structure, 2) continued market share gains in microcontrollers, and 3) dramatic acceleration in touchscreen microcontroller revenue driven by the proliferation of touchscreen enabled mobile devices. We trimmed the Fund’s position on the significant outperformance but still hold a position.
Forest Oil Corporation (FST) is an independent oil and gas company engaged in the acquisition, exploration, development and production of oil, natural gas and natural gas liquids primarily in North America. The stock was a solid performer during the year as the company had solid production from its oil and gas properties. And while dry natural gas prices declined during the year, Forest Oil’s production of liquid natural gas, where prices were stronger, was a benefit to the company. The Fund continues to hold the stock given the company’s productive asset base and experienced management team.
On the other hand, two stocks detracting from performance during the period were Chico’s FAS, Inc. and Petrohawk Energy Corporation. Chico’s FAS (CHS) is a specialty retailer of private branded, casual-to-dressy clothing and accessories primarily for women. The stock underperformed during 2010 as sales came in weaker than elevated expectations and due to some merchandising issues that were company-specific. This caused a reduction in forward earnings guidance and the valuation compressed given the execution issues. The Fund continues to own the stock however, as we believe expectations are more reasonable and we believe the management team will repair the execution issues going forward. Petrohawk
72 Annual Report | December 31, 2010 |
Energy Corporation (HK) is an independent oil and natural gas company engaged in the exploration, development and production of predominantly onshore natural gas properties in the United States. The stock under-performed as did most dry natural gas companies due to lower natural gas prices (as opposed to most commodities, including crude oil, which rallied during 2010). We added to the Fund’s position on the weakness as the company has solid hedges against falling prices for 2011, and as we expect it to have meaningful future production coming from the more liquids-rich Eagle Ford Shale.
During the fourth quarter specifically, the Fund’s modest underperformance was the result of mixed stock selection across sectors. Stock selection in Consumer Discretionary and Materials pulled down relative results while stock selection in Industrials and Energy were a benefit to relative performance.
Looking ahead, almost universally, market strategists believe 2011 will produce a solid, yet more modest, equity market return in the U.S. Broadly speaking, corporate cash flow generation and profit margins generally are attractive due to effective expense management by U.S. companies. If the past is any indication, these dynamics should eventually entice capital spending and increased hiring by corporations. This would help alleviate one of the main concerns with this recovery, unemployment.
Risks to a full economic recovery loom, yet are well documented. Government budgets at every level are stretched. The extension of the Bush-era federal income tax rates and new payroll tax break, along with the extension of unemployment benefits, help consumers and businesses in the short run, but the long-run impact is yet unknown. The same can be said for the Federal Reserve’s second round of quantitative easing and its impact on longer-term inflation. Rapid growth in emerging economies poses two distinct risks as well: higher commodity price inflation and potentially negative effects from emerging governments’ efforts to combat overheating of their economies.
In the end, however, while we factor various economic scenarios into our stock picking, we focus our time on constructing the fund from a bottom-up perspective. As mentioned above, corporate fundamentals remain attractive. In combination with valuations that are broadly in line with long-term averages, the market outlook remains balanced. And while macroeconomic data largely drove correlated stock prices again in 2010, we expect individual company fundamentals to be the leading determinant of forward stock price returns. As always, we remain focused on finding quality companies at discount prices and corporate transformation opportunities. We believe building a fund with these types of companies should produce solid investment results over the long term.
December 31, 2010 | William Blair Funds 73 |
Mid Cap Value Fund
Performance Highlights (unaudited)
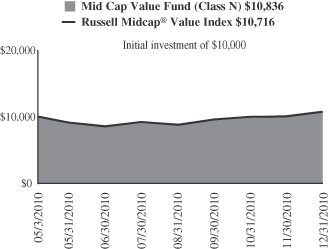
Average Annual Total Return at 12/31/2010
| | | | |
| | | Since
Inception(a) | |
Class N | | | 8.36 | % |
Class I | | | 8.66 | |
Russell Midcap® Value Index | | | 7.16 | |
| | (a) | | For the period May 3, 2010 (Commencement of Operations) to December 31, 2010. | |
Performance cited represents past performance. Past performance does not guarantee future results and current performance may be lower or higher than the data quoted. Results shown are average annual total returns, which assume reinvestment of dividends and capital gains. Investment returns and principal will fluctuate and you may have a gain or loss when you sell shares. For the most current month-end performance information, please call 1-800-742-7272, or visit our Web site at www.williamblairfunds.com. Investing in smaller and medium capitalization companies involves special risks, including higher volatility and lower liquidity. Medium Capitalization stocks are also more sensitive to purchase/sale transactions and changes in the issuer’s financial condition. From time to time, the investment advisor may waive fees or reimburse expenses for the Fund. Without these waivers, performance would be lower. Class N shares are available to the general public without a sales load. Class I shares are available to certain institutional investors and advisory clients of William Blair & Company, L.L.C., without a sales load or distribution (12b-1) or service fees.
The performance highlights and graph presented above do not reflect the deduction of taxes that a shareholder would pay on fund distributions or the redemption of fund shares.
The Russell Midcap® Value Index consists of Midcap-capitalization companies with below average price-to-book ratios and forecasted growth rates.
This report identifies the Fund’s investments on December 31, 2010. These holdings are subject to change. Not all stocks in the Fund performed the same, nor is there any guarantee that these stocks will perform as well in the future. Market forecasts provided in this report may not necessarily come to pass.
Sector Diversification (unaudited)
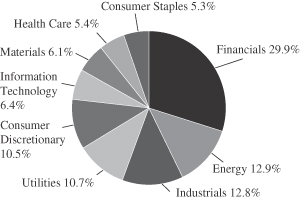
The sector diversification shown is based on the total long-term securities.
74 Annual Report | December 31, 2010 |
Mid Cap Value Fund
Portfolio of Investments, December 31, 2010 (all dollar amounts in thousands)
| | | | | | | | |
Issuer | | Shares | | | Value | |
|
Common Stocks | |
Financials—29.7% | |
Alexandria Real Estate Equities, Inc. | | | 565 | | | $ | 41 | |
Allied World Assurance Co. Holdings, Ltd.† | | | 770 | | | | 46 | |
Ameriprise Financial, Inc. | | | 1,140 | | | | 66 | |
Apartment Investment & Management Co. | | | 1,800 | | | | 46 | |
Associated Banc-Corp | | | 2,530 | | | | 38 | |
Brandywine Realty Trust | | | 4,070 | | | | 47 | |
Comerica, Inc. | | | 1,995 | | | | 84 | |
Corporate Office Properties Trust | | | 970 | | | | 34 | |
Discover Financial Services | | | 2,900 | | | | 54 | |
Fifth Third Bancorp | | | 6,100 | | | | 90 | |
*Forest City Enterprises, Inc. Class “A” | | | 2,800 | | | | 47 | |
Host Hotels & Resorts, Inc. | | | 2,410 | | | | 43 | |
PartnerRe, Ltd.† | | | 495 | | | | 40 | |
People’s United Financial, Inc. | | | 4,180 | | | | 59 | |
Realty Income Corporation | | | 1,040 | | | | 36 | |
SL Green Realty Corporation | | | 550 | | | | 37 | |
The Hanover Insurance Group, Inc. | | | 1,125 | | | | 53 | |
Unum Group | | | 1,450 | | | | 35 | |
Validus Holdings, Ltd.† | | | 1,320 | | | | 40 | |
Ventas, Inc. | | | 650 | | | | 34 | |
Washington Federal, Inc. | | | 2,210 | | | | 37 | |
| | | | | | | | |
| | | | 1,007 | |
| | | | | | | | |
Energy—12.8% | |
Consol Energy, Inc. | | | 1,035 | | | | 50 | |
*Forest Oil Corporation | | | 1,895 | | | | 72 | |
Patterson-UTI Energy, Inc. | | | 1,940 | | | | 42 | |
*Petrohawk Energy Corporation | | | 2,510 | | | | 46 | |
Pioneer Natural Resources Co. | | | 720 | | | | 63 | |
*Rowan Cos., Inc. | | | 1,150 | | | | 40 | |
SM Energy Co. | | | 1,040 | | | | 61 | |
*Whiting Petroleum Corporation | | | 510 | | | | 60 | |
| | | | | | | | |
| | | | | | | 434 | |
| | | | | | | | |
Industrials—12.6% | |
Armstrong World Industries, Inc. | | | 810 | | | | 35 | |
Cintas Corporation | | | 1,220 | | | | 34 | |
Eaton Corporation | | | 550 | | | | 56 | |
Ingersoll-Rand plc† | | | 1,240 | | | | 58 | |
Manpower, Inc. | | | 580 | | | | 36 | |
*Oshkosh Corporation | | | 1,120 | | | | 40 | |
Parker Hannifin Corporation | | | 640 | | | | 55 | |
Rockwell Collins, Inc. | | | 750 | | | | 44 | |
Snap-On, Inc. | | | 640 | | | | 36 | |
*URS Corporation | | | 800 | | | | 33 | |
| | | | | | | | |
| | | | | | | 427 | |
| | | | | | | | |
Utilities—10.6% | |
DTE Energy Co. | | | 1,285 | | | | 58 | |
Northeast Utilities | | | 1,980 | | | | 63 | |
NSTAR | | | 1,160 | | | | 49 | |
PPL Corporation | | | 2,340 | | | | 62 | |
TECO Energy, Inc. | | | 3,170 | | | | 56 | |
Xcel Energy, Inc. | | | 3,080 | | | | 73 | |
| | | | | | | | |
| | | | | | | 361 | |
| | | | | | | | |
† = U.S. listed foreign security
* = Non-income producing securities
| | | | | | | | |
Issuer | | Shares or
Principal
Amount | | | Value | |
|
Common Stocks—(continued) | |
Consumer Discretionary—10.4% | |
Chico’s FAS, Inc. | | | 3,550 | | | $ | 43 | |
*DISH Network Corporation | | | 1,360 | | | | 27 | |
Fortune Brands, Inc. | | | 620 | | | | 37 | |
Genuine Parts Co. | | | 690 | | | | 36 | |
Meredith Corporation | | | 990 | | | | 34 | |
*Mohawk Industries, Inc. | | | 600 | | | | 34 | |
Newell Rubbermaid, Inc. | | | 1,940 | | | | 35 | |
VF Corporation | | | 410 | | | | 35 | |
Whirlpool Corporation | | | 420 | | | | 37 | |
Wyndham Worldwide Corporation | | | 1,150 | | | | 35 | |
| | | | | | | | |
| | | | | | | 353 | |
| | | | | | | | |
Information Technology—6.4% | |
*Atmel Corporation | | | 2,400 | | | | 30 | |
*Ingram Micro, Inc. Class “A” | | | 1,600 | | | | 31 | |
Tellabs, Inc. | | | 6,260 | | | | 42 | |
VeriSign, Inc. | | | 1,760 | | | | 57 | |
Xerox Corporation | | | 4,920 | | | | 57 | |
| | | | | | | | |
| | | | | | | 217 | |
| | | | | | | | |
Materials—6.0% | |
Airgas, Inc. | | | 470 | | | | 29 | |
Carpenter Technology Corporation | | | 1,040 | | | | 42 | |
Lubrizol Corporation | | | 390 | | | | 42 | |
Sonoco Products Co. | | | 1,450 | | | | 49 | |
Steel Dynamics, Inc. | | | 2,360 | | | | 43 | |
| | | | | | | | |
| | | | | | | 205 | |
| | | | | | | | |
Health Care—5.4% | | | | | | | | |
CIGNA Corporation | | | 1,010 | | | | 37 | |
Hill-Rom Holdings, Inc. | | | 1,215 | | | | 48 | |
*Laboratory Corporation of America Holdings | | | 510 | | | | 45 | |
*Mettler-Toledo International, Inc.† | | | 345 | | | | 52 | |
| | | | | | | | |
| | | | | | | 182 | |
| | | | | | | | |
Consumer Staples—5.3% | |
Bunge, Ltd.† | | | 445 | | | | 29 | |
ConAgra Foods, Inc. | | | 1,850 | | | | 42 | |
Flowers Foods, Inc. | | | 990 | | | | 27 | |
HJ Heinz Co. | | | 990 | | | | 49 | |
The Kroger Co. | | | 1,410 | | | | 31 | |
| | | | | | | | |
| | | | | | | 178 | |
| | | | | | | | |
Total Common Stocks—99.2%
(cost $3,174) | | | $ | 3,364 | |
| | | | | | | | |
|
Repurchase Agreement | |
State Street Bank and Trust Company, 0.150% dated 12/31/10, due 1/3/11, repurchase price $65, collateralized by U.S. Treasury Note, 2.500%, due 4/30/15 | | $ | 65 | | | $ | 65 | |
| | | | | | | | |
Total Repurchase Agreement—1.9%
(cost $65) | | | | 65 | |
| | | | | | | | |
Total Investments—101.1%
(cost $3,239) | | | | 3,429 | |
Liabilities, plus cash and other assets—(1.1)% | | | | (36 | ) |
| | | | | | | | |
Net assets—100.0% | | | $ | 3,393 | |
| | | | | | | | |
See accompanying Notes to Financial Statements.
December 31, 2010 | William Blair Funds 75 |
Fixed Income Markets Overview
Fixed Income Funds
2010
After declining for most of the year, interest rates rose sharply during the month of December with the fixed income markets experiencing a bout of volatility reminiscent of one that occurred at about the same time a year ago. Longer-term interest rates spiked higher during the fourth quarter, with the 10-Year U.S. Treasury Note, which finished at 2.51% at the end of the third quarter, ending the fourth quarter at 3.29%.
At the time the Federal Reserve announced a second round of quantitative easing in early November, yields on long-term Treasuries were more or less unchanged from where they had ended the third quarter. The market, however, overestimated the scope and scale of the Fed’s quantitative easing program, and the subsequent decline in prices reflected investor disappointment. The fixed income markets treaded sideways through the second half of December, and moved higher late in the month, reflecting pessimism regarding the U.S. Federal budget deficit. Some market observers attributed the rise in rates and subsequent decline in bond prices to disappointment that the Federal Reserve did not increase the size of its purchases to offset the $858-billion tax cut package approved by Congress. While the tax cut deal is expected to help stimulate the economy, it will also increase the size of the deficit.
Prices of long-term Treasury securities rallied during the third quarter, prompted by expectations that the Federal Reserve would announce a second round of easing. In August, the Federal Reserve acknowledged that its confidence in the economic recovery had dimmed and announced that it would use the proceeds from the monthly amortization of its huge mortgage-bond portfolio to buy long-term Treasury securities.
The Fed’s actions throughout the year have been interpreted by investors as confirmation that the Fed remains concerned about the pace of the economic recovery.
In addition, Federal Reserve Governors, and Chairman Ben Bernanke in particular, have expressed longstanding concern about the danger of deflation, or falling prices, from a lack of demand stemming from slow economic growth, joblessness and weakness in the financial sector. And in one well-known major policy speech delivered in 2002, Bernanke identified asset purchases as a way to stimulate aggregate spending when short-term interest rates have reached zero.
Longer-term interest rates finished the year slightly lower than where they began, with the 10-Year U.S. Treasury Note at 3.29% at December 31, 2010, down from 3.84% at December 31, 2009.
Outlook
We believe the Fed will be successful in its efforts to keep interest rates at lower levels with its asset purchases of Treasury securities. Such moves would assist in helping to engineer further growth in the economy, spur capital expenditures by companies and bring inflation back into a range that the Federal Reserves considers acceptable. Consequently, we would expect TIPs (Treasury Inflation-Protected Securities) to outperform nominal Treasuries in such an environment, which would benefit our Bond and Income Funds.
Until fundamentals in the economy show significant signs of improvement—including gains in employment and strength in the housing market—and until inflation picks up, we believe the Fed will leave its Federal Funds target rate unchanged at 0.0% to 0.25%.
76 Annual Report | December 31, 2010 |
We believe interest rates will remain low and could very well remain so through the balance of 2011 and into 2012.
Finally, we are closely monitoring the Corporate Bond market for signs of leveraged buy-out (LBO) risk. As the economy strengthens and business conditions improve, companies become candidates for acquisition by private equity investors, who finance their purchases with debt, leveraging the companies’ balance sheets, and deteriorating the company’s credit profile. This can have a very adverse effect when this happens to companies whose debt had been rated investment grade. We research each credit and study the characteristics of the underlying market to avoid investing in bonds of companies we suspect could be LBO targets.
December 31, 2010 | William Blair Funds 77 |

Christopher T. Vincent

Paul J. Sularz
BOND FUND
The Bond Fund seeks to outperform the Barclays Capital U.S. Aggregate Bond Index by maximizing total return through a combination of income and capital appreciation.
AN OVERVIEW FROM THE PORTFOLIO MANAGERS
Bond Fund
The Bond Fund posted a 7.86% increase on a total return basis (Class N Shares) for the 12 months ended December 31, 2010. By comparison, the Fund’s benchmark, the Barclays Capital U.S. Aggregate Bond Index, gained 6.54%.
Security selection within the Mortgage-backed and Corporate bond sectors was the main reason the Fund outperformed the Fund’s benchmark during 2010. The Fund’s underweight position in U.S. Treasury securities versus the Index also benefitted the Fund.
Within our Mortgage-backed securities holdings, we favor securities that we believe are less likely to be refinanced through emphasizing specified pools with either low loan balances or above-market coupon rates. Put simply, we are seeking pools least likely to be “called away,” or pre-paid as interest rates decline and refinancings increase. The Fund has benefitted from this strategy, especially given the fact that lenders have more stringent financial criteria in place for borrowers to refinance their existing mortgages. Higher coupon mortgages, in turn, provide a cushion through better convexity characteristics, because they typically do not decline as much when interest rates fall. Finally, this strategy enables the Fund to generate and maintain the Fund’s cash flow and current income.
The Fund’s holdings of high yield Corporate bonds performed strongly, as did its holdings of investment grade Corporate securities. In particular, Ford Motor Credit was a standout performer. Ford Motor Credit has been upgraded several times this year, and Ford’s Chairman has indicated the company’s Corporate bonds could be rated investment grade within a years’ time. We have confidence in Ford’s restructuring and the positive changes to their product line. Another strong performer was Georgia Pacific, which we believe has a strong management team, disciplined business process and strong cash flows.
With interest rates at historically low levels, the Fund has been defensively positioned against a rising rate environment. This did occur during the fourth quarter. The Fund’s underweight exposure to Treasuries—versus its benchmark Index—provided underlying support to the Fund, especially as Treasury rates rose and risk spreads narrowed.
The Fund’s modest holdings in REITs were slight detractors to performance. We prefer to invest in REITs as a surrogate for Commercial Mortgage-backed securities (to which we were underweight). This theme is a bias of our portfolio construction process, as we prefer to hold REITs, which are backed by a dynamic pool of properties, instead of Commercial Mortgage-backed securities, which are comprised of a static pool of properties. This theme had a small negative impact during the fourth quarter, as Commercial Mortgage-backed securities was the best-performing sector of the investment-grade market.
The Fund continues to maintain its overweight position versus its benchmark to “spread” products such as Corporate Bonds, Mortgage-backed and Asset-backed securities. The Fund maintains its exposure to Treasury Securities through its holdings of TIPs (Treasury Inflation-Protected Securities.).
In particular, the Fund maintains an overweight allocation to Corporate Bonds. In the current low growth, low inflation environment, corporate balance sheets have improved drastically,
78 Annual Report | December 31, 2010 |
which improves the quality profile of corporate bonds. Investment ratings on some securities have risen. We believe that U.S. GDP growth will likely remain subpar due to structural unemployment in the U.S. economy. We believe this current environment is one that should remain favorable for Corporate Bonds.
At year end, the Bond Fund’s average maturity stood at 6.8 years, while its duration was 4.7 years.
December 31, 2010 | William Blair Funds 79 |
Bond Fund
Performance Highlights (unaudited)
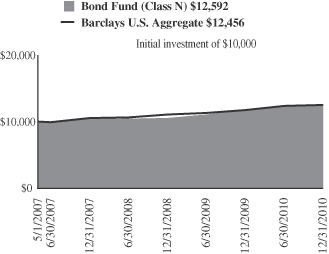
Average Annual Total Return at 12/31/2010
| | | | | | | | | | | | |
| | | 1
Year | | | 3
Year | | | Since
Inception(a) | |
Class N | | | 7.86 | % | | | 6.80 | % | | | 6.48 | % |
Class I | | | 7.89 | | | | 6.93 | | | | 6.62 | |
Barclays Capital U.S. Aggregate Bond Index | | | 6.54 | | | | 5.90 | | | | 6.14 | |
| | (a) | | For the period from May 1, 2007 (Commencement of Operations) to December 31, 2010. | |
Performance cited represents past performance. Past performance does not guarantee future results and current performance may be lower or higher than the data quoted. Results shown are average annual total returns, which assume reinvestment of dividends and capital gains. Investment returns and principal will fluctuate and you may have a gain or loss when you sell shares. For the most current month-end performance information, please call 1-800-742-7272, or visit our Web site at www.williamblairfunds.com. From time to time, the investment advisor may waive fees or reimburse expenses for the Fund. Without these waivers, performance would be lower. Class N shares are available to the general public without a sales load. Class I shares are available to certain institutional investors and advisory clients of William Blair & Company, L.L.C., without a sales load or distribution fees (12b-1).
The performance highlights and graph presented above do not reflect the deduction of taxes that a shareholder would pay on fund distributions or the redemption of fund shares.
The Barclays Capital U.S. Aggregate Bond Index indicates broad intermediate government/corporate bond market performance.
This report identifies the Fund’s investments on December 31, 2010. These holdings are subject to change. Not all investments in the Fund performed the same, nor is there any guarantee that these investments will perform as well in the future. Market forecasts provided in this report may not necessarily come to pass.
Sector Diversification (unaudited)
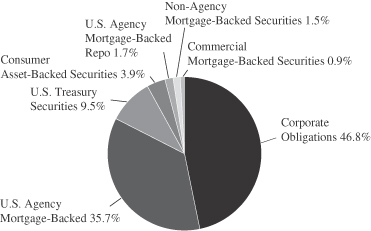
The sector diversification shown is based on the total investments.
80 Annual Report | December 31, 2010 |
Bond Fund
Portfolio of Investments, December 31, 2010 (all amounts in thousands)
| | | | | | | | | | |
Issuer | | Principal
Amount | | | Value | |
|
U.S. Government and U.S. Government Agency—45.9% | |
U.S. Treasury Inflation Indexed Notes/Bonds—7.8% | | | | | |
U.S. Treasury Inflation Indexed Bond,
3.875%, due 4/15/29 | | $ | 7,982 | | | $ | 10,705 | |
U.S. Treasury Inflation Indexed Note,
1.875%, due 7/15/13 | | | 625 | | | | 667 | |
U.S. Treasury Inflation Indexed Note,
2.375%, due 1/15/17 | | | 3,253 | | | | 3,626 | |
| | | | | | | | | | |
Total U.S. Treasury Inflation Indexed Notes/Bonds | | | | 14,998 | |
| | | | | | | | | | |
U.S. Treasury—1.6% | | | | | | | | |
U.S. Treasury Bond,
3.875%, due 8/15/40 | | | 500 | | | | 460 | |
U.S. Treasury Note,
2.625%, due 8/15/20 | | | 1,350 | | | | 1,280 | |
U.S. Treasury Strip Principal,
0.000%, due 5/15/20 | | | 2,000 | | | | 1,451 | |
| | | | | |
Total U.S. Treasury Obligations | | | | 3,191 | |
| | | | | | | | | | |
Government National Mortgage
Association (GNMA)—0.9% | | | | | | | | |
GNR 2004-2 M5, 4.891%, due 7/16/34 | | | 125 | | | | 134 | |
GNR 2006-67 GB, 4.470%, due 9/16/34, VRN | | | 1,540 | | | | 1,667 | |
| | | | | | | | | | |
Total GNMA Mortgage Obligations | | | | 1,801 | |
| | | | | | | | | | |
Federal Home Loan Mortgage
Corp. (FHLMC)—7.8% | | | | | | | | |
#G90024, 7.000%, due 1/20/13 | | | 33 | | | | 35 | |
#G30093, 7.000%, due 12/1/17 | | | 38 | | | | 42 | |
#G30255, 7.000%, due 7/1/21 | | | 79 | | | | 90 | |
#G12792, 4.500%, due 12/1/21 | | | 467 | | | | 493 | |
#D95897, 5.500%, due 3/1/23 | | | 246 | | | | 264 | |
#G30372, 5.000%, due 9/1/27 | | | 578 | | | | 613 | |
#G01728, 7.500%, due 7/1/32 | | | 306 | | | | 352 | |
#C01385, 6.500%, due 8/1/32 | | | 392 | | | | 441 | |
#G02141, 6.000%, due 3/1/36 | | | 1,887 | | | | 2,086 | |
#A62179, 6.000%, due 6/1/37 | | | 1,013 | | | | 1,120 | |
#A63539, 6.000%, due 7/1/37 | | | 1,263 | | | | 1,396 | |
#G03170, 6.500%, due 8/1/37 | | | 1,901 | | | | 2,124 | |
#A66843, 6.500%, due 10/1/37 | | | 1,021 | | | | 1,156 | |
#A78138, 5.500%, due 6/1/38 | | | 1,396 | | | | 1,514 | |
#A81799, 6.500%, due 9/1/38 | | | 2,862 | | | | 3,241 | |
| | | | | | | | | | |
Total FHLMC Mortgage Obligations | | | | 14,967 | |
| | | | | | | | | | |
Federal National Mortgage
Association (FNMA)—27.8% | | | | | | | | |
#535559, 7.500%, due 9/1/12 | | | 70 | | | | 70 | |
#598453, 7.000%, due 6/1/15 | | | 1 | | | | 1 | |
#689612, 5.000%, due 5/1/18 | | | 415 | | | | 444 | |
#695910, 5.000%, due 5/1/18 | | | 735 | | | | 794 | |
#747903, 4.500%, due 6/1/19 | | | 386 | | | | 408 | |
#745735, 5.000%, due 3/1/21 | | | 909 | | | | 975 | |
#253847, 6.000%, due 5/1/21 | | | 245 | | | | 268 | |
#900725, 6.000%, due 8/1/21 | | | 213 | | | | 233 | |
#AD8164, 4.000%, due 8/1/25 | | | 1,220 | | | | 1,269 | |
#545437, 7.000%, due 2/1/32 | | | 205 | | | | 234 | |
#545759, 6.500%, due 7/1/32 | | | 2,203 | | | | 2,478 | |
#254548, 5.500%, due 12/1/32 | | | 893 | | | | 961 | |
#684601, 6.000%, due 3/1/33 | | | 2,114 | | | | 2,357 | |
#190340, 5.000%, due 9/1/33 | | | 1,877 | | | | 1,985 | |
#254868, 5.000%, due 9/1/33 | | | 918 | | | | 971 | |
#555800, 5.500%, due 10/1/33 | | | 405 | | | | 437 | |
| | | | | | | | | | | | |
Issuer | | NRSRO
Rating
(unaudited) | | | Principal
Amount | | | Value | |
|
U.S. Government and U.S. Government Agency—(continued) | |
Federal National Mortgage Association (FNMA)—(continued) | |
#725027, 5.000%, due 11/1/33 | | | $ | 730 | | | $ | 772 | |
#555880, 5.500%, due 11/1/33 | | | | 482 | | | | 520 | |
#555946, 5.500%, due 11/1/33 | | | | 827 | | | | 897 | |
#756153, 5.500%, due 11/1/33 | | | | 2,305 | | | | 2,499 | |
#725231, 5.000%, due 2/1/34 | | | | 760 | | | | 803 | |
#725205, 5.000%, due 3/1/34 | | | | 1,619 | | | | 1,712 | |
#725220, 5.000%, due 3/1/34 | | | | 703 | | | | 743 | |
#725232, 5.000%, due 3/1/34 | | | | 3,511 | | | | 3,714 | |
#725238, 5.000%, due 3/1/34 | | | | 1,609 | | | | 1,701 | |
#763798, 5.500%, due 3/1/34 | | | | 491 | | | | 532 | |
#725424, 5.500%, due 4/1/34 | | | | 517 | | | | 557 | |
#725611, 5.500%, due 6/1/34 | | | | 488 | | | | 526 | |
#786546, 6.000%, due 7/1/34 | | | | 922 | | | | 1,019 | |
#787816, 6.000%, due 7/1/34 | | | | 928 | | | | 1,029 | |
#190353, 5.000%, due 8/1/34 | | | | 539 | | | | 570 | |
#357883, 5.000%, due 5/1/35 | | | | 1,146 | | | | 1,212 | |
#745092, 6.500%, due 7/1/35 | | | | 601 | | | | 676 | |
#357944, 6.000%, due 9/1/35 | | | | 118 | | | | 130 | |
#829306, 6.000%, due 9/1/35 | | | | 326 | | | | 361 | |
#843487, 6.000%, due 10/1/35 | | | | 274 | | | | 304 | |
#849191, 6.000%, due 1/1/36 | | | | 177 | | | | 195 | |
#848782, 6.500%, due 1/1/36 | | | | 829 | | | | 930 | |
#745349, 6.500%, due 2/1/36 | | | | 1,139 | | | | 1,287 | |
#831540, 6.000%, due 6/1/36 | | | | 218 | | | | 240 | |
#745802, 6.000%, due 7/1/36 | | | | 654 | | | | 726 | |
#886220, 6.000%, due 7/1/36 | | | | 1,128 | | | | 1,251 | |
#893318, 6.500%, due 8/1/36 | | | | 252 | | | | 282 | |
#909480, 6.000%, due 2/1/37 | | | | 1,408 | | | | 1,557 | |
#256859, 5.500%, due 8/1/37 | | | | 968 | | | | 1,027 | |
#928561, 6.000%, due 8/1/37 | | | | 814 | | | | 903 | |
#948689, 6.000%, due 8/1/37 | | | | 2,073 | | | | 2,271 | |
#888967, 6.000%, due 12/1/37 | | | | 1,795 | | | | 1,991 | |
#962058, 6.500%, due 3/1/38 | | | | 3,222 | | | | 3,659 | |
#934006, 6.500%, due 9/1/38 | | | | 1,646 | | | | 1,868 | |
#986856, 6.500%, due 9/1/38 | | | | 1,095 | | | | 1,228 | |
| | | | | | | | | | | | |
Total FNMA Mortgage Obligations | | | | 53,577 | |
| | | | | | | | | | | | |
| |
Non-Agency Mortgage-Backed Obligations—1.5% | | | | | |
Countrywide Alternative Loan Trust, 2003-11T1, Tranche M, 4.750%, 7/25/18 | | | CCC | | | | 228 | | | | 163 | |
First Plus Home Loan Trust, 1997-4, Tranche M1, 7.640%, 9/11/23§** | | | C | | | | 199 | | | | 170 | |
Renaissance Home Equity Loan Trust, 2004-2, Tranche M5, 6.455%, 7/25/34 | | | A2 | | | | 463 | | | | 113 | |
First Horizon Asset Securities, Inc., 2004-AR4, Tranche 3A1, 4.677%, 8/25/34, VRN | | | AAA | | | | 549 | | | | 510 | |
Soundview Home Equity Loan Trust, 2005-B, Tranche M1, 6.135%, 5/25/35 | | | AA | + | | | 14 | | | | 14 | |
Chase Mortgage Finance Corporation, 2006-A1, Tranche 2A3, 6.000%, 9/25/36, VRN | | | Caa2 | | | | 2,460 | | | | 1,938 | |
| | | | | | | | | | | | |
Total Non-Agency Mortgage-Backed Obligations | | | | 2,908 | |
| | | | | | | | | | | | |
See accompanying Notes to Financial Statements.
December 31, 2010 | William Blair Funds 81 |
Bond Fund
Portfolio of Investments, December 31, 2010 (all amounts in thousands)
| | | | | | | | | | | | |
Issuer | | NRSRO
Rating
(unaudited) | | | Principal
Amount | | | Value | |
| |
Consumer Asset-Backed Securities—3.9% | | | | | |
Avis Budget Rental Car Funding AESOP LLC—144A, 2009-1A, Tranche A, 9.310%, 10/20/13 | | | Aa1 | | | $ | 2,000 | | | $ | 2,190 | |
Avis Budget Rental Car Funding AESOP LLC—144A, 2009-2A, Tranche A, 5.680%, 2/20/14 | | | Aaa | | | | 2,000 | | | | 2,143 | |
Hertz Vehicle Financing LLC—144A, 2009-2A, Tranche A1,
4.260%, 3/25/14 | | | Aaa | | | | 2,230 | | | | 2,333 | |
Centre Point Funding LLC—144A, 2010-1A, Tranche 1,
5.430%, 7/20/16 | | | A2 | | | | 874 | | | | 903 | |
| | | | | | | | | | | | |
Total Consumer Asset-Backed Securities | | | | 7,569 | |
| | | | | | | | | | | | |
| |
Corporate Obligations—46.1% | | | | | |
Citigroup, Inc.,
5.500%, due 4/11/13 | | | A | + | | | 1,500 | | | | 1,597 | |
General Electric Capital Corporation,
4.800%, due 5/1/13 | | | AA | + | | | 600 | | | | 641 | |
Kansas City Southern de Mexico S.A. de C.V.,
7.625%, due 12/1/13 | | | BB | | | | 1,200 | | | | 1,242 | |
CME Group, Inc.,
5.750%, due 2/15/14 | | | AA | | | | 700 | | | | 775 | |
PACCAR, Inc.,
6.875%, due 2/15/14 | | | A | + | | | 800 | | | | 918 | |
General Electric Capital Corporation,
5.900%, due 5/13/14 | | | AA | + | | | 225 | | | | 249 | |
Bank of America Corporation,
7.375%, due 5/15/14 | | | A | + | | | 700 | | | | 778 | |
American Express Co.,
7.250%, due 5/20/14 | | | A | + | | | 500 | | | | 570 | |
Capital One Financial Corporation,
7.375%, due 5/23/14 | | | A- | | | | 1,235 | | | | 1,405 | |
Macquarie Group Ltd.—144A,
7.300%, due 8/1/14 | | | A2 | | | | 1,000 | | | | 1,092 | |
Petrohawk Energy Corporation,
10.500%, due 8/1/14 | | | B | + | | | 1,000 | | | | 1,140 | |
AT&T, Inc.,
5.100%, due 9/15/14 | | | A2 | | | | 1,250 | | | | 1,368 | |
D.R. Horton, Inc.,
5.625%, due 9/15/14 | | | BB | | | | 1,500 | | | | 1,530 | |
Corporation Nacional del Cobre de Chile—144A,
4.750%, due 10/15/14 | | | A1 | | | | 1,350 | | | | 1,442 | |
Boeing Capital Corporation,
3.250%, due 10/27/14 | | | A | + | | | 1,400 | | | | 1,459 | |
Crown Castle International Corporation,
9.000%, due 1/15/15 | | | BB- | | | | 1,000 | | | | 1,105 | |
EI du Pont de Nemours & Co.,
3.250%, due 1/15/15 | | | A | | | | 500 | | | | 519 | |
Georgia-Pacific LLC—144A,
7.000%, due 1/15/15 | | | BBB | | | | 500 | | | | 519 | |
The Kroger Co.,
4.950%, due 1/15/15 | | | BBB | | | | 1,175 | | | | 1,269 | |
Simon Property Group L.P.,
4.200%, due 2/1/15 | | | A- | | | | 1,500 | | | | 1,568 | |
| | | | | | | | | | | | |
Issuer | | NRSRO
Rating
(unaudited) | | | Principal
Amount | | | Value | |
|
Corporate Obligations—(continued) | |
Yum! Brands, Inc.,
4.250%, due 9/15/15 | | | BBB- | | | $ | 350 | | | $ | 369 | |
Fiserv, Inc.,
3.125%, due 10/1/15 | | | Baa2 | | | | 1,825 | | | | 1,807 | |
Cisco Systems, Inc.,
5.500%, due 2/22/16 | | | A | + | | | 2,000 | | | | 2,282 | |
Yum! Brands, Inc.,
6.250%, due 4/15/16 | | | BBB- | | | | 700 | | | | 791 | |
Owens-Brockway Glass Container, Inc., 7.375%, due 5/15/16 | | | BB | + | | | 1,250 | | | | 1,328 | |
SABMiller plc—144A,
6.500%, due 7/1/16 | | | BBB | + | | | 700 | | | | 811 | |
Petrobras International Finance Co.,
6.125%, due 10/6/16 | | | Baa1 | | | | 1,350 | | | | 1,485 | |
EI du Pont de Nemours & Co.,
5.250%, due 12/15/16 | | | A | | | | 500 | | | | 559 | |
Comcast Corporation,
6.500%, due 1/15/17 | | | BBB | + | | | 350 | | | | 403 | |
Corrections Corporation of America,
7.750%, due 6/1/17 | | | BB | | | | 1,250 | | | | 1,327 | |
ERP Operating L.P.,
5.750%, due 6/15/17 | | | BBB | + | | | 1,100 | | | | 1,205 | |
JPMorgan Chase & Co.,
6.125%, due 6/27/17 | | | A1 | | | | 600 | | | | 658 | |
American Express Co.,
6.150%, due 8/28/17 | | | A | + | | | 1,000 | | | | 1,127 | |
Exelon Generation Co. LLC,
6.200%, due 10/1/17 | | | A3 | | | | 1,100 | | | | 1,231 | |
Toll Brothers Finance Corporation,
8.910%, due 10/15/17 | | | BBB- | | | | 950 | | | | 1,121 | |
Triumph Group, Inc.,
8.000%, due 11/15/17 | | | B | + | | | 1,500 | | | | 1,560 | |
Union Pacific Corporation,
5.750%, due 11/15/17 | | | BBB | + | | | 800 | | | | 898 | |
Wells Fargo & Co.,
5.625%, due 12/11/17 | | | AA- | | | | 1,000 | | | | 1,107 | |
Kohl’s Corporation,
6.250%, due 12/15/17 | | | BBB | + | | | 350 | | | | 404 | |
American Tower Corporation,
4.500%, due 1/15/18 | | | Baa3 | | | | 1,150 | | | | 1,140 | |
Morgan Stanley,
6.625%, due 4/1/18 | | | A | | | | 950 | | | | 1,031 | |
General Electric Capital Corporation,
5.625%, due 5/1/18 | | | AA | + | | | 350 | | | | 382 | |
Philip Morris International, Inc.,
5.650%, due 5/16/18 | | | A | | | | 1,000 | | | | 1,127 | |
Time Warner Cable, Inc.,
6.750%, due 7/1/18 | | | BBB | | | | 1,000 | | | | 1,166 | |
Merrill Lynch & Co., Inc.,
6.875%, due 11/15/18 | | | A | + | | | 1,075 | | | | 1,158 | |
Anheuser-Busch InBev Worldwide, Inc.—144A,
7.750%, due 1/15/19 | | | BBB | + | | | 700 | | | | 871 | |
FedEx Corporation,
8.000%, due 1/15/19 | | | BBB | | | | 750 | | | | 925 | |
CSX Corporation,
7.375%, due 2/1/19 | | | BBB- | | | | 800 | | | | 965 | |
Honeywell International, Inc.,
5.000%, due 2/15/19 | | | A | | | | 925 | | | | 1,013 | |
See accompanying Notes to Financial Statements.
82 Annual Report | December 31, 2010 |
Bond Fund
Portfolio of Investments, December 31, 2010 (all amounts in thousands)
| | | | | | | | | | | | |
Issuer | | NRSRO
Rating
(unaudited) | | | Principal
Amount | | | Value | |
| |
Corporate Obligations—(continued) | | | | | |
Pfizer, Inc.,
6.200%, due 3/15/19 | | | AA | | | $ | 1,250 | | | $ | 1,464 | |
BHP Billiton Finance USA, Ltd.,
6.500%, due 4/1/19 | | | A | + | | | 1,300 | | | | 1,546 | |
Owens Corning,
9.000%, due 6/15/19 | | | BBB- | | | | 950 | | | | 1,115 | |
Jefferies Group, Inc.,
8.500%, due 7/15/19 | | | BBB | | | | 1,300 | | | | 1,486 | |
Discovery Communications LLC,
5.625%, due 8/15/19 | | | Baa2 | | | | 500 | | | | 549 | |
Roper Industries, Inc.,
6.250%, due 9/1/19 | | | BBB- | | | | 1,225 | | | | 1,356 | |
Boston Properties L.P.,
5.875%, due 10/15/19 | | | A- | | | | 1,500 | | | | 1,627 | |
Toll Brothers Finance Corporation,
6.750%, due 11/1/19 | | | BBB- | | | | 500 | | | | 525 | |
Macquarie Group Ltd.—144A,
6.000%, due 1/14/20 | | | A2 | | | | 250 | | | | 251 | |
Ford Motor Credit Co. LLC,
8.125%, due 1/15/20 | | | Ba2 | | | | 1,515 | | | | 1,763 | |
Jarden Corporation,
7.500%, due 1/15/20 | | | B | | | | 1,500 | | | | 1,564 | |
Motiva Enterprises LLC—144A,
5.750%, due 1/15/20 | | | A | | | | 1,500 | | | | 1,683 | |
Johnson Controls, Inc.,
5.000%, due 3/30/20 | | | BBB | + | | | 1,625 | | | | 1,726 | |
United Technologies Corporation,
4.500%, due 4/15/20 | | | A | + | | | 1,500 | | | | 1,575 | |
Iron Mountain, Inc.,
8.000%, due 6/15/20 | | | B | + | | | 1,250 | | | | 1,312 | |
The Goldman Sachs Group, Inc.,
6.000%, due 6/15/20 | | | A1 | | | | 1,800 | | | | 1,945 | |
Commonwealth Edison Co.,
4.000%, due 8/1/20 | | | A- | | | | 1,000 | | | | 984 | |
Alcoa, Inc.,
6.150%, due 8/15/20 | | | BBB- | | | | 1,775 | | | | 1,823 | |
Omnicom Group, Inc.,
4.450%, due 8/15/20 | | | A- | | | | 1,975 | | | | 1,933 | |
The Goodyear Tire & Rubber Co.,
8.250%, due 8/15/20 | | | B | + | | | 700 | | | | 724 | |
Ras Laffan Liquefied Natural Gas Co., Ltd. II—144A,
5.298%, due 9/30/20 | | | Aa2 | | | | 385 | | | | 404 | |
BE Aerospace, Inc.,
6.875%, due 10/1/20 | | | BB | | | | 650 | | | | 671 | |
Celgene Corporation,
3.950%, due 10/15/20 | | | BBB | + | | | 500 | | | | 475 | |
NRSRO = Nationally Recognized Statistical Rating Organization—The credit quality ratings of the securities in the Fund reflect the highest category rating by either Fitch Ratings, Moody’s Investors Service Inc., or Standard & Poor’s, a division of the McGraw-Hill Companies, Inc. The obligations of certain U.S. Government-sponsored securities are neither issued nor guaranteed by the U.S. Treasury.
VRN = Variable Rate Note
§ = Deemed illiquid pursuant to Liquidity Procedures approved by the Board of Trustees. This holding represents 0.09% of the Fund’s net assets at December 31, 2010.
** = Fair valued pursuant to Valuation Procedures adopted by the Board of Trustees. This holding represents 0.09% of the Fund’s net assets at December 31, 2010.
| | | | | | | | | | | | |
Issuer | | NRSRO
Rating
(unaudited) | | | Principal
Amount | | | Value | |
| |
Corporate Obligations—(continued) | | | | | |
Georgia-Pacific LLC—144A,
5.400%, due 11/1/20 | | | BBB | | | $ | 500 | | | $ | 494 | |
Southwest Airlines Co. 2007-1 Pass Through Trust,
6.150%, due 8/1/22 | | | A | | | | 664 | | | | 730 | |
The Kroger Co.,
8.000%, due 9/15/29 | | | BBB | | | | 325 | | | | 408 | |
Conoco Funding Co.,
7.250%, due 10/15/31 | | | A1 | | | | 400 | | | | 495 | |
Kohl’s Corporation,
6.000%, due 1/15/33 | | | BBB | + | | | 1,000 | | | | 1,020 | |
Wisconsin Electric Power Co.,
5.700%, due 12/1/36 | | | A | + | | | 500 | | | | 526 | |
Comcast Corporation,
6.450%, due 3/15/37 | | | BBB | + | | | 650 | | | | 695 | |
Yum! Brands, Inc.,
6.875%, due 11/15/37 | | | BBB- | | | | 600 | | | | 681 | |
JPMorgan Chase & Co.,
6.400%, due 5/15/38 | | | Aa3 | | | | 900 | | | | 1,021 | |
COX Communications, Inc.—144A, 6.950%, due 6/1/38 | | | Baa2 | | | | 350 | | | | 389 | |
General Electric Capital Corporation,
6.875%, due 1/10/39 | | | AA | + | | | 750 | | | | 867 | |
Burlington Northern Santa Fe LLC,
5.750%, due 5/1/40 | | | A3 | | | | 1,515 | | | | 1,567 | |
| | | | | | | | | | | | |
Total Corporate Obligations | | | | 88,831 | |
| | | | | | | | | | | | |
Total Long-Term Investments—97.4%
(cost $178,039) | | | | 187,842 | |
| | | | | | | | | | | | |
| | | |
Repurchase Agreement | | | | | | | | | | | | |
State Street Bank and Trust Company, 0.150% dated 12/31/10, due 1/3/11, repurchase price $3,285, collateralized by U.S. Treasury Note,
2.750%, due 12/31/17 | | | AAA | | | | 3,285 | | | | 3,285 | |
| | | | | | | | | | | | |
Total Repurchase Agreement—1.7%
(cost $3,285) | | | | 3,285 | |
| | | | | | | | | | | | |
Total Investments—99.1%
(cost $181,324) | | | | 191,127 | |
Cash and other assets, less liabilities—0.9% | | | | 1,649 | |
| | | | | | | | | | | | |
Net assets—100.0% | | | $ | 192,776 | |
| | | | | | | | | | | | |
See accompanying Notes to Financial Statements.
December 31, 2010 | William Blair Funds 83 |
Christopher T. Vincent
INCOME FUND
The Income Fund seeks a high level of current income with relative stability of principal.
AN OVERVIEW FROM THE PORTFOLIO MANAGER
Income Fund
The Income Fund posted a 6.04% increase on a total return basis (Class N Shares) for the 12 months ended December 31, 2010. By comparison, the Fund’s benchmark, the Barclays Capital Intermediate Government/Credit Bond Index, gained 5.89%.
Security selection within the Mortgage-backed and Corporate bond sectors was the main reason the Fund outperformed the Fund’s benchmark in 2010. The Fund’s underweight position in U.S. Treasury securities versus the Index also benefitted the Fund.
Within our Mortgage-backed securities holdings, we favor securities that we believe are less likely to be refinanced through emphasizing specified pools with either low loan balances or above-market coupon rates. Put simply, we are seeking pools least likely to be “called away,” or pre-paid as interest rates decline and refinancings increase. The Fund has benefitted from this strategy, especially given the fact that lenders have more stringent financial criteria in place for borrowers to refinance their existing mortgages. Higher coupon mortgages, in turn, provide a cushion through better convexity characteristics, because they typically do not decline as much when interest rates fall. Finally, this strategy enables the Fund to generate and maintain the Fund’s cash flow and current income.
Although high yield bonds were the best-performing sector of the Corporate bond market, the Fund’s lack of exposure to this sector (the Fund, has an investment policy restricting it from investing in high yield bonds) did not impact it negatively. It also should be noted that Fund has an upper limit with respect to holdings of BBB-rated securities, while the Index does not. Conversely, the Fund has the ability to invest in Mortgage-backed securities, which outperformed during the fourth quarter, while the benchmark Index does not include these securities.
With interest rates at historically low levels, the Fund has been defensively positioned against a rising rate environment. This did occur during the fourth quarter. The Fund’s underweight exposure to Treasuries—versus its benchmark Index—provided underlying support to the Fund, especially as Treasury rates rose and risk spreads narrowed.
The Fund’s modest holdings in REITs were slight detractors to performance. We prefer to invest in REITs as a surrogate for Commercial Mortgage-backed securities (to which we were underweight). This theme is a bias of our portfolio construction process, as we prefer to hold REITs, which are backed by a dynamic pool of properties, instead of Commercial Mortgage-backed securities, which are comprised of a static pool of properties. This theme had a small negative impact during the fourth quarter, as Commercial Mortgage-backed securities was the best-performing sector of the investment-grade market.
The Fund continues to maintain its overweight position versus its benchmark to “spread” products such as Corporate Bonds, Mortgage-backed and Asset-backed securities. The Fund maintains its exposure to Treasury Securities through its holdings of TIPs (Treasury Inflation-Protected Securities.).
In particular, the Fund maintains an overweight allocation to Corporate Bonds. In the current low growth, low inflation environment, corporate balance sheets have improved drastically, which improves the quality profile of corporate bonds. Investment ratings on some securities have risen. We believe that U.S. GDP growth will likely remain subpar due to structural unemployment in the U.S. economy. We believe this current environment is one that should remain favorable for Corporate bonds.
At year end, the Income Fund’s average maturity stood at 4.6 years, while its duration was 3.7 years.
84 Annual Report | December 31, 2010 |
Income Fund
Performance Highlights (unaudited)
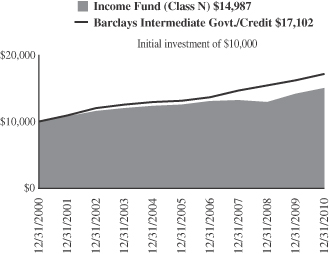
Average Annual Total Return at 12/31/2010
| | | | | | | | | | | | | | | | |
| | | 1
Year | | | 3
Year | | | 5
Year | | | 10
Year | |
Class N | | | 6.04 | % | | | 4.36 | % | | | 3.67 | % | | | 4.13 | % |
Class I | | | 6.33 | | | | 4.53 | | | | 3.85 | | | | 4.29 | |
Barclays Capital Intermediate Government/Credit Bond Index | | | 5.89 | | | | 5.40 | | | | 5.53 | | | | 5.51 | |
Performance cited represents past performance. Past performance does not guarantee future results and current performance may be lower or higher than the data quoted. Results shown are average annual total returns, which assume reinvestment of dividends and capital gains. Investment returns and principal will fluctuate and you may have a gain or loss when you sell shares. For the most current month-end performance information, please call 1-800-742-7272, or visit our Web site at www.williamblairfunds.com. From time to time, the investment advisor may waive fees or reimburse expenses for the Fund. Without these waivers, performance would be lower. Class N shares are available to the general public without a sales load. Class I shares are available to certain institutional investors and advisory clients of William Blair & Company, L.L.C., without a sales load or distribution (12b-1) or service fees.
The performance highlights and graph presented above do not reflect the deduction of taxes that a shareholder would pay on fund distributions or the redemption of fund shares.
The Barclays Capital Intermediate Government/Credit Bond Index indicates broad intermediate government/corporate bond market performance.
This report identifies the Fund’s investments on December 31, 2010. These holdings are subject to change. Not all investments in the Fund performed the same, nor is there any guarantee that these investments will perform as well in the future. Market forecasts provided in this report may not necessarily come to pass.
Sector Diversification (unaudited)
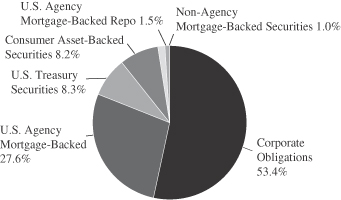
The sector diversification shown is based on the total investments.
December 31, 2010 | William Blair Funds 85 |
Income Fund
Portfolio of Investments, December 31, 2010 (all amounts in thousands)
| | | | | | | | | | |
Issuer | | Principal
Amount | | | Value | |
|
U.S. Government and U.S. Government Agency—35.6% | |
U.S. Treasury Inflation Indexed Notes/Bonds—3.7% | | | | | | | | |
U.S. Treasury Inflation Indexed Note, 2.375%, due 1/15/17 $ | | $ | 3,796 | | | $ | 4,230 | |
| | | | | | | | | | |
U.S. Treasury—5.2% | | | | | | | | | | |
U.S. Treasury Note,
5.125%, due 5/15/16 | | | 1,000 | | | | 1,152 | |
U.S. Treasury Note,
3.125%, due 5/15/19 | | | 1,500 | | | | 1,516 | |
U.S. Treasury Note,
2.625%, due 8/15/20 | | | 2,500 | | | | 2,370 | |
U.S. Treasury Strip Principal,
0.000%, due 5/15/20 | | | 1,185 | | | | 860 | |
| | | | | | | | | | |
Total U.S. Treasury Obligations | | | | 5,898 | |
| | | | | | | | | | |
Government National Mortgage Association (GNMA)—0.3% | | | | | | | | |
#780405, 9.500%, due 11/15/17 | | | 152 | | | | 167 | |
#357322, 7.000%, due 9/15/23 | | | 98 | | | | 111 | |
| | | | | | | | | | |
Total GNMA Mortgage Obligations | | | | 278 | |
| | | | | | | | | | |
Federal Home Loan Mortgage Corp. (FHLMC)—9.2% | | | | | | | | |
#M80925, 5.000%, due 6/1/11 | | | 286 | | | | 292 | |
#E00436, 7.000%, due 6/1/11 | | | 18 | | | | 18 | |
#G10708, 6.500%, due 8/1/12 | | | 25 | | | | 26 | |
#E72924, 7.000%, due 10/1/13 | | | 253 | | | | 266 | |
#E81703, 7.000%, due 5/1/15 | | | 276 | | | | 295 | |
#E81697, 8.000%, due 5/1/15 | | | 729 | | | | 798 | |
#E81908, 8.500%, due 12/1/15 | | | 39 | | | | 44 | |
#J02184, 8.000%, due 4/1/16 | | | 445 | | | | 480 | |
#G90022, 8.000%, due 9/17/16 | | | 227 | | | | 245 | |
#M30028, 5.500%, due 5/1/17 | | | 56 | | | | 58 | |
#E90398, 7.000%, due 5/1/17 | | | 635 | | | | 693 | |
#E96536, 5.000%, due 3/1/18 | | | 799 | | | | 852 | |
#E97112, 4.000%, due 5/1/18 | | | 336 | | | | 350 | |
#B13459, 4.500%, due 4/1/19 | | | 241 | | | | 254 | |
#C67537, 9.500%, due 8/1/21 | | | 11 | | | | 11 | |
#D95621, 6.500%, due 7/1/22 | | | 1,833 | | | | 2,031 | |
#A45790, 7.500%, due 5/1/35 | | | 354 | | | | 407 | |
#G02141, 6.000%, due 3/1/36 | | | 1,050 | | | | 1,161 | |
#A81799, 6.500%, due 9/1/38 | | | 1,829 | | | | 2,071 | |
| | | | | | | | | | |
Total FHLMC Mortgage Obligations | | | | 10,352 | |
| | | | | | | | | | |
Federal National Mortgage Association (FNMA)—17.2% | | | | | | | | | | |
#313816, 6.000%, due 4/1/11 | | | 3 | | | | 3 | |
#577395, 10.000%, due 8/1/11 | | | 5 | | | | 5 | |
#254788, 6.500%, due 4/1/13 | | | 69 | | | | 71 | |
#725315, 8.000%, due 5/1/13 | | | 78 | | | | 82 | |
#593561, 9.500%, due 8/1/14 | | | 133 | | | | 146 | |
#567027, 7.000%, due 9/1/14 | | | 545 | | | | 583 | |
#567026, 6.500%, due 10/1/14 | | | 437 | | | | 477 | |
#458124, 7.000%, due 12/15/14 | | | 72 | | | | 78 | |
#576554, 8.000%, due 1/1/16 | | | 609 | | | | 671 | |
#576553, 8.000%, due 2/1/16 | | | 944 | | | | 1,062 | |
#555747, 8.000%, due 5/1/16 | | | 89 | | | | 94 | |
#735569, 8.000%, due 10/1/16 | | | 565 | | | | 622 | |
#725410, 7.500%, due 4/1/17 | | | 337 | | | | 356 | |
#643217, 6.500%, due 6/1/17 | | | 179 | | | | 195 | |
| | | | | | | | | | | | |
Issuer | | NRSRO
Rating
(unaudited) | | | Principal
Amount | | | Value | |
|
U.S. Government and U.S. Government Agency—(continued) | |
Federal National Mortgage Association (FNMA)—(continued) | | | | | | | | | |
#679247, 7.000%, due 8/1/17 | | | $ | 755 | | | $ | 845 | |
#685194, 4.500%, due 3/1/18 | | | | 1,164 | | | | 1,233 | |
#689334, 5.000%, due 3/1/18 | | | | 170 | | | | 182 | |
#695910, 5.000%, due 5/1/18 | | | | 735 | | | | 794 | |
#740847, 6.000%, due 10/1/18 | | | | 469 | | | | 511 | |
#323501, 6.500%, due 1/1/19 | | | | 146 | | | | 160 | |
#255358, 5.000%, due 9/1/19 | | | | 215 | | | | 230 | |
#852864, 7.000%, due 7/1/20 | | | | 1,597 | | | | 1,803 | |
#458147, 10.000%, due 8/15/20 | | | | 389 | | | | 438 | |
#835563, 7.000%, due 10/1/20 | | | | 691 | | | | 773 | |
#735574, 8.000%, due 3/1/22 | | | | 408 | | | | 481 | |
#679253, 6.000%, due 10/1/22 | | | | 930 | | | | 1,023 | |
FNR G93-19 SH,
11.234%, due 4/25/23, VRN | | | | 11 | | | | 14 | |
#AD8164, 4.000%, due 8/1/25 | | | | 975 | | | | 1,015 | |
#AE1176, 4.000%, due 8/1/25 | | | | 977 | | | | 1,016 | |
#255956, 5.500%, due 10/1/25 | | | | 188 | | | | 202 | |
#806458, 8.000%, due 6/1/28 | | | | 392 | | | | 452 | |
#880155, 8.500%, due 7/1/29 | | | | 782 | | | | 907 | |
#797846, 7.000%, due 3/1/32 | | | | 988 | | | | 1,106 | |
#745519, 8.500%, due 5/1/32 | | | | 232 | | | | 269 | |
#654674, 6.500%, due 9/1/32 | | | | 238 | | | | 268 | |
#733897, 6.500%, due 12/1/32 | | | | 280 | | | | 318 | |
#886220, 6.000%, due 7/1/36 | | | | 937 | | | | 1,039 | |
| | | | | | | | | | | | |
Total FNMA Mortgage Obligations | | | | 19,524 | |
| | | | | | | | | | | | |
|
Non-Agency Mortgage-Backed Obligations—1.0% | |
First Plus Home Loan Trust, 1997-4, Tranche M1, 7.640%, 9/11/23**§ | | | C | | | | 676 | | | | 578 | |
First Plus Home Loan Trust, 1997-4, Tranche M2, 7.830%, 9/11/23**§ | | | C | | | | 143 | | | | 106 | |
First Plus Home Loan Trust, 1998-3, Tranche M2, 7.920%, 5/10/24**§ | | | Caa1 | | | | 256 | | | | 234 | |
Lehman Structured Securities Corp.—144A, 2004-2, Tranche M1, 2.783%, 2/28/33, VRN§ | | | CCC | | | | 403 | | | | 162 | |
ABFS Mortgage Loan Trust, 2002-2, Tranche A7,
5.715%, 7/15/33 | | | AAA | | | | 2 | | | | 2 | |
Soundview Home Equity Loan Trust, 2005-B, Tranche M1, 6.135%, 5/25/35 | | | AA | + | | | 35 | | | | 35 | |
| | | | | | | | | | | | |
Total Non-Agency Mortgage-Backed Obligations | | | | 1,117 | |
| | | | | | | | | | | | |
| |
Consumer Asset-Backed Securities—8.2% | | | | | |
Ford Credit Auto Owner Trust, 2010-B, Tranche A2, 0.650%, 12/15/12 | | | Aaa | | | | 500 | | | | 500 | |
Citibank Credit Card Issuance Trust, 2009-A3, Tranche A3, 2.700%, 6/24/13 | | | AAA | | | | 965 | | | | 976 | |
See accompanying Notes to Financial Statements.
86 Annual Report | December 31, 2010 |
Income Fund
Portfolio of Investments, December 31, 2010 (all amounts in thousands)
| | | | | | | | | | | | |
Issuer | | NRSRO
Rating
(unaudited) | | | Principal
Amount | | | Value | |
| |
Consumer Asset-Backed Securities—(continued) | | | | | |
John Deere Owner Trust, 2009-A, Tranche A3, 2.590%, 10/15/13 | | | AAA | | | $ | 273 | | | $ | 275 | |
Avis Budget Rental Car Funding AESOP LLC—144A, 2009-1A, Tranche A, 9.310%, 10/20/13 | | | Aa1 | | | | 1,000 | | | | 1,095 | |
Harley-Davidson Motorcycle Trust, 2009-1, Tranche A3, 3.190%, 11/15/13 | | | AAA | | | | 586 | | | | 594 | |
Mercedes-Benz Auto Receivables Trust, 2009-1, Tranche A3, 1.670%, 1/15/14 | | | AAA | | | | 405 | | | | 409 | |
Avis Budget Rental Car Funding AESOP LLC—144A, 2009-2A, Tranche A, 5.680%, 2/20/14 | | | Aaa | | | | 1,500 | | | | 1,607 | |
Volkswagen Auto Lease Trust, 2009-A, Tranche A4, 4.590%, 3/17/14 | | | AAA | | | | 500 | | | | 513 | |
Hertz Vehicle Financing LLC—144A, 2009-2A, Tranche A1, 4.260%, 3/25/14 | | | Aaa | | | | 1,500 | | | | 1,570 | |
Chase Issuance Trust, 2008-A10, Tranche A10, 1.010%, 8/17/15, VRN | | | AAA | | | | 1,500 | | | | 1,518 | |
Chase Issuance Trust, 2008-A3, Tranche A, 1.360%, 3/15/16, VRN | | | AAA | | | | 250 | | | | 256 | |
| | | | | | | | | | | | |
Total Consumer Asset-Backed Securities | | | | 9,313 | |
| | | | | | | | | | | | |
| | |
Corporate Obligations—52.4% | | | | | | | | | |
Wisconsin Energy Corporation, 6.500%, due 4/1/11 | | | A3 | | | | 1,250 | | | | 1,268 | |
Eli Lilly & Co.,
3.550%, due 3/6/12 | | | AA | - | | | 500 | | | | 516 | |
BHP Billiton Finance USA, Ltd., 5.125%, due 3/29/12 | | | A | + | | | 1,195 | | | | 1,257 | |
Morgan Stanley,
6.600%, due 4/1/12 | | | A | | | | 1,600 | | | | 1,705 | |
PepsiCo, Inc.,
4.650%, due 2/15/13 | | | Aa3 | | | | 540 | | | | 582 | |
Citigroup, Inc.,
5.500%, due 4/11/13 | | | A | + | | | 1,000 | | | | 1,065 | |
General Electric Capital Corporation, 4.800%, due 5/1/13 | | | AA | + | | | 1,500 | | | | 1,604 | |
Novartis Capital Corporation,
4.125%, due 2/10/14 | | | Aa2 | | | | 1,000 | | | | 1,067 | |
CME Group, Inc.,
5.750%, due 2/15/14 | | | AA | | | | 1,000 | | | | 1,107 | |
PACCAR, Inc.,
6.875%, due 2/15/14 | | | A | + | | | 1,000 | | | | 1,147 | |
PepsiAmericas, Inc.,
4.375%, due 2/15/14 | | | Aa3 | | | | 500 | | | | 541 | |
Coca-Cola Enterprises, Inc.,
7.375%, due 3/3/14 | | | A | + | | | 900 | | | | 1,049 | |
General Electric Capital Corporation, 5.900%, due 5/13/14 | | | AA | + | | | 225 | | | | 249 | |
| | | | | | | | | | | | |
Issuer | | NRSRO
Rating
(unaudited) | | | Principal
Amount | | | Value | |
| |
Corporate Obligations—(continued) | | | | | |
Bank of America Corporation, 7.375%, due 5/15/14 | | | A | + | | $ | 500 | | | $ | 556 | |
St. Jude Medical, Inc.,
3.750%, due 7/15/14 | | | A | | | | 500 | | | | 529 | |
AT&T, Inc.,
5.100%, due 9/15/14 | | | A2 | | | | 1,750 | | | | 1,915 | |
Corporation Nacional del Cobre de Chile—144A,
4.750%, due 10/15/14 | | | A1 | | | | 1,000 | | | | 1,068 | |
Boeing Capital Corporation,
3.250%, due 10/27/14 | | | A | + | | | 1,000 | | | | 1,042 | |
EI du Pont de Nemours & Co.,
3.250%, due 1/15/15 | | | A | | | | 1,200 | | | | 1,245 | |
Simon Property Group L.P.,
4.200%, due 2/1/15 | | | A | - | | | 1,125 | | | | 1,176 | |
United Technologies Corporation,
4.875%, due 5/1/15 | | | A | + | | | 1,000 | | | | 1,107 | |
Cisco Systems, Inc.,
5.500%, due 2/22/16 | | | A | + | | | 1,250 | | | | 1,426 | |
Yum! Brands, Inc.,
6.250%, due 4/15/16 | | | BBB | - | | | 750 | | | | 848 | |
Petrobras International Finance Co., 6.125%, due 10/6/16 | | | Baa1 | | | | 1,000 | | | | 1,100 | |
BHP Billiton Finance USA, Ltd.,
5.400%, due 3/29/17 | | | A | + | | | 1,000 | | | | 1,107 | |
ERP Operating L.P.,
5.750%, due 6/15/17 | | | BBB | + | | | 1,000 | | | | 1,096 | |
JPMorgan Chase & Co.,
6.125%, due 6/27/17 | | | A1 | | | | 1,750 | | | | 1,920 | |
Kimberly-Clark Corporation,
6.125%, due 8/1/17 | | | A | | | | 1,000 | | | | 1,167 | |
American Express Co.,
6.150%, due 8/28/17 | | | A | + | | | 1,500 | | | | 1,691 | |
IBM Corporation,
5.700%, due 9/14/17 | | | Aa3 | | | | 1,750 | | | | 2,009 | |
Exelon Generation Co. LLC,
6.200%, due 10/1/17 | | | A3 | | | | 2,000 | | | | 2,238 | |
Tesco plc—144A,
5.500%, due 11/15/17 | | | A | - | | | 1,750 | | | | 1,952 | |
Abbott Laboratories,
5.600%, due 11/30/17 | | | AA | | | | 500 | | | | 572 | |
Wells Fargo & Co.,
5.625%, due 12/11/17 | | | AA | - | | | 750 | | | | 830 | |
American Tower Corporation,
4.500%, due 1/15/18 | | | Baa3 | | | | 500 | | | | 496 | |
Philip Morris International, Inc.,
5.650%, due 5/16/18 | | | A | | | | 1,250 | | | | 1,409 | |
Time Warner Cable, Inc.,
6.750%, due 7/1/18 | | | BBB | | | | 750 | | | | 874 | |
Anheuser-Busch InBev Worldwide, Inc.—144A,
7.750%, due 1/15/19 | | | BBB | + | | | 800 | | | | 996 | |
FedEx Corporation,
8.000%, due 1/15/19 | | | BBB | | | | 750 | | | | 925 | |
Honeywell International, Inc.,
5.000%, due 2/15/19 | | | A | | | | 1,225 | | | | 1,341 | |
The Procter & Gamble Co., 4.700%, due 2/15/19 | | | AA | - | | | 500 | | | | 541 | |
Unilever Capital Corporation, 4.800%, due 2/15/19 | | | A | + | | | 500 | | | | 541 | |
See accompanying Notes to Financial Statements.
December 31, 2010 | William Blair Funds 87 |
Income Fund
Portfolio of Investments, December 31, 2010 (all amounts in thousands)
| | | | | | | | | | | | |
Issuer | | NRSRO
Rating
(unaudited) | | | Principal
Amount | | | Value | |
| |
Corporate Obligations—(continued) | | | | | |
Pfizer, Inc., 6.200%, due 3/15/19 | | | AA | | | $ | 1,000 | | | $ | 1,171 | |
Jefferies Group, Inc.,
8.500%, due 7/15/19 | | | BBB | | | | 700 | | | | 800 | |
Boston Properties L.P.,
5.875%, due 10/15/19 | | | A | - | | | 1,350 | | | | 1,464 | |
Macquarie Group Ltd.—144A, 6.000%, due 1/14/20 | | | A2 | | | | 1,000 | | | | 1,004 | |
Motiva Enterprises LLC—144A, 5.750%, due 1/15/20 | | | A | | | | 1,000 | | | | 1,122 | |
Johnson Controls, Inc.,
5.000%, due 3/30/20 | | | BBB | + | | | 1,000 | | | | 1,062 | |
The Goldman Sachs Group, Inc., 6.000%, due 6/15/20 | | | A1 | | | | 1,000 | | | | 1,081 | |
Alcoa, Inc., 6.150%, due 8/15/20 | | | BBB | - | | | 750 | | | | 770 | |
Omnicom Group, Inc.,
4.450%, due 8/15/20 | | | A | - | | | 750 | | | | 734 | |
Ras Laffan Liquefied Natural Gas Co., Ltd. II—144A,
5.298%, due 9/30/20 | | | Aa2 | | | | 1,202 | | | | 1,261 | |
Georgia-Pacific LLC—144A, 5.400%, due 11/1/20 | | | BBB | | | | 450 | | | | 445 | |
Southwest Airlines Co. 2007-1 Pass Through Trust, 6.150%, due 8/1/22 | | | A | | | | 1,460 | | | | 1,606 | |
| | | | | | | | | | | | |
Total Corporate Obligations | | | | 59,394 | |
| | | | | | | | | | | | |
Total Long-Term Investments—97.2%
(cost $104,251) | | | | 110,106 | |
| | | | | | | | | | | | |
| | | |
Repurchase Agreement | | | | | | | | | | | | |
State Street Bank and Trust Company, 0.150% dated 12/31/10, due 1/3/11, repurchase price $1,676, collateralized by U.S. Treasury Bill, 2.750%, due 12/31/17 | | | AAA | | | | 1,676 | | | | 1,676 | |
| | | | | | | | | | | | |
Total Repurchase Agreement—1.5%
(cost $1,676) | | | | 1,676 | |
| | | | | | | | | | | | |
Total Investments—98.7%
(cost $105,927) | | | | 111,782 | |
Cash and other assets, less liabilities—1.3% | | | | 1,495 | |
| | | | | | | | | | | | |
Net assets—100.0% | | | $ | 113,277 | |
| | | | | | | | | | | | |
NRSRO = Nationally Recognized Statistical Rating Organization—The credit quality ratings of the securities in the Fund reflect the highest category rating by either Fitch Ratings, Moody’s Investors Service Inc., or Standard & Poor’s, a division of the McGraw-Hill Companies, Inc.
The obligations of certain U.S. Government-sponsored securities are neither issued nor guaranteed by the U.S. Treasury.
VRN = Variable Rate Note
** = Fair valued pursuant to Valuation Procedures adopted by the Board of Trustees. These holdings represent 0.81% of the Fund’s net assets at December 31, 2010.
§ = Deemed illiquid pursuant to Liquidity Procedures approved by the Board of Trustees. These holdings represent 0.95% of the Fund’s net assets at December 31, 2010.
See accompanying Notes to Financial Statements.
88 Annual Report | December 31, 2010 |
Christopher T. Vincent
Paul J. Sularz
LOW DURATION FUND
The Low Duration Fund seeks to maximize total return. Total return includes both income and capital appreciation.
AN OVERVIEW FROM THE PORTFOLIO MANAGERS
The Low Duration Fund posted a 1.86% increase on a total return basis (Class N Shares) for the 12 months ended December 31, 2010. By comparison, the Fund’s benchmark, the Merrill Lynch 1-Year U.S. Treasury Note Index, gained 0.83%.
The Fund had a very positive first year, with the Fund meeting its objective of outperforming its Merrill Lynch 1-Year U.S. Treasury Note Index benchmark. We believe the Fund has been able to accomplish this objective without sacrificing credit quality. The Fund does not own securities with a rating below “A” from a Nationally Recognized Statistical Rating Organization.
The month of December, in particular, was reminiscent of the period one year ago when the Fund was launched, with interest rates rising sharply and market volatility high. Part of this was a function of the U.S. Government’s Treasury auction occurring during a period of very thinly traded markets at the end of the year.
The majority of the Fund’s portfolio is invested in seasoned U.S. Government-guaranteed short duration Mortgage-backed Fannie Mae and Freddie Mac securities. This is the Fund’s major sector emphasis. We favor such securities because they pay monthly principal and interest, which we then are able to reinvest. The benefits of this strategy are evident in a rising rate environment such as the one we experienced during December.
Assets in this new Fund continued to build since the Fund’s inception on December 1, 2009, with assets increasing to a new “high watermark” of approximately $142 million at December 31, 2010.
We continued to invest in new Consumer Asset-backed securities (such as “top tier” banks and auto receivables) as well as seasoned U.S. Agency Mortgage-backed securities and Corporate Bonds with a rating of single-A or higher.
We consider the Consumer Asset-backed securities that the Fund invests in to be highly liquid. Nearly a third of these investments are floating rate instruments that reset on a monthly basis.
The Fund kept its exposure to cash and cash equivalents extremely low, given the very low rates currently available from money market instruments.
We have increased the Fund’s holdings of Asset-backed securities whose coupons are reset monthly and are tied to LIBOR—the London Interbank Offered Rate. The income from these securities will rise with any increase in rates and will protect the Fund against falling prices.
December 31, 2010 | William Blair Funds 89 |
Low Duration Fund
Performance Highlights (unaudited)
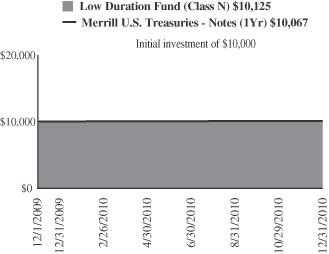
Average Annual Total Return at 12/31/2010
| | | | | | | | |
| | | 1
Year | | | Since
Inception(a) | |
Class N | | | 1.86 | % | | | 1.15 | % |
Class I | | | 1.89 | | | | 1.19 | |
Merrill Lynch 1-Year U.S. Treasury Note Index | | | 0.83 | | | | 0.62 | |
| | (a) | | For the period from December 1, 2009 (Commencement of Operations) to December 31, 2010. | |
Performance cited represents past performance. Past performance does not guarantee future results and current performance may be lower or higher than the data quoted. Results shown are average annual total returns, which assume reinvestment of dividends and capital gains. Investment returns and principal will fluctuate and you may have a gain or loss when you sell shares. For the most current month-end performance information, please call 1-800-742-7272, or visit our Web site at www.williamblairfunds.com. From time to time, the investment advisor may waive fees or reimburse expenses for the Fund. Without these waivers, performance would be lower. Class N shares are available to the general public without a sales load. Class I shares are available to certain institutional investors and advisory clients of William Blair & Company, L.L.C., without a sales load or distribution fees (12b-1).
The performance highlights and graph presented above do not reflect the deduction of taxes that a shareholder would pay on fund distributions or the redemption of fund shares.
The Merrill Lynch 1-Year U.S. Treasury Note Index is comprised of a single U.S. Treasury Note issue purchased at the beginning of the month and held for a full month. Each month the index is rebalanced and the issue selected is the outstanding U.S. Treasury Note that matures closest to, but not beyond one year from the rebalancing date.
This report identifies the Fund’s investments on December 31, 2010. These holdings are subject to change. Not all investments in the Fund performed the same, nor is there any guarantee that these investments will perform as well in the future. Market forecasts provided in this report may not necessarily come to pass.
Sector Diversification (unaudited)
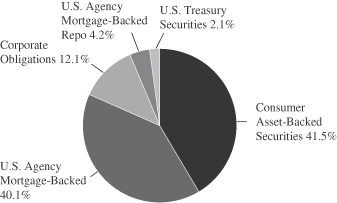
The sector diversification shown is based on the total investments.
90 Annual Report | December 31, 2010 |
Low Duration Fund
Portfolio of Investments, December 31, 2010 (all amounts in thousands)
| | | | | | | | | | | | |
Issuer | | | Principal
Amount | | | Value | |
|
U.S. Government and U.S. Government Agency—41.6% | |
U.S. Treasury—2.1% | | | | | | | | | | | | |
U.S. Treasury Note,
0.500%, due 11/15/13 | | | $ | 3,000 | | | $ | 2,961 | |
| | | | | | | | | | | | |
Government National Mortgage Association (GNMA)—0.2% | | | | | | | | | |
#003438, 4.500%, due 9/20/18 | | | | 323 | | | | 342 | |
| | | | | | | | | | | | |
Federal Home Loan Mortgage Corp. (FHLMC)—11.8% | | | | | | | | | |
#M80898, 4.500%, due 2/1/11 | | | | 152 | | | | 156 | |
#M80903, 4.000%, due 3/1/11 | | | | 268 | | | | 270 | |
#M80953, 4.000%, due 12/1/11 | | | | 286 | | | | 292 | |
#E86134, 5.000%, due 11/1/16 | | | | 264 | | | | 280 | |
#E96536, 5.000%, due 3/1/18 | | �� | | 498 | | | | 531 | |
#E95355, 5.000%, due 4/1/18 | | | | 587 | | | | 626 | |
#E01377, 4.500%, due 5/1/18 | | | | 583 | | | | 614 | |
#G11618, 4.500%, due 5/1/18 | | | | 2,754 | | | | 2,909 | |
#E99963, 4.500%, due 10/1/18 | | | | 161 | | | | 170 | |
#E01488, 5.000%, due 10/1/18 | | | | 618 | | | | 659 | |
#E99895, 5.000%, due 10/1/18 | | | | 1,157 | | | | 1,234 | |
#G12093, 4.500%, due 12/1/18 | | | | 722 | | | | 763 | |
#B11386, 5.000%, due 12/1/18 | | | | 272 | | | | 290 | |
#E01545, 5.000%, due 1/1/19 | | | | 348 | | | | 371 | |
#G11766, 5.000%, due 3/1/19 | | | | 252 | | | | 269 | |
#G18001, 4.500%, due 7/1/19 | | | | 320 | | | | 338 | |
#G11596, 5.500%, due 8/1/19 | | | | 267 | | | | 290 | |
#B16291, 5.000%, due 9/1/19 | | | | 1,666 | | | | 1,778 | |
#G18045, 5.000%, due 3/1/20 | | | | 278 | | | | 296 | |
#G11892, 4.000%, due 4/1/20 | | | | 281 | | | | 292 | |
#G18048, 5.000%, due 4/1/20 | | | | 191 | | | | 203 | |
#J08152, 5.000%, due 5/1/20 | | | | 235 | | | | 251 | |
#G12394, 5.000%, due 5/1/21 | | | | 357 | | | | 380 | |
#G12113, 5.500%, due 5/1/21 | | | | 441 | | | | 479 | |
#G12286, 5.000%, due 7/1/21 | | | | 205 | | | | 218 | |
#J13022, 4.000%, due 9/1/25 | | | | 2,814 | | | | 2,918 | |
| | | | | | | | | | | | |
Total FHLMC Mortgage Obligations | | | | 16,877 | |
| | | | | | | | | | | | |
Federal National Mortgage Association (FNMA)—27.5% | |
#255325, 4.500%, due 7/1/11 | | | | 1,012 | | | | 1,020 | |
#256224, 5.500%, due 4/1/16 | | | | 55 | | | | 60 | |
#256559, 5.500%, due 1/1/17 | | | | 29 | | | | 30 | |
#256606, 5.500%, due 2/1/17 | | | | 39 | | | | 42 | |
#256646, 5.500%, due 3/1/17 | | | | 29 | | | | 32 | |
#545898, 5.500%, due 9/1/17 | | | | 810 | | | | 873 | |
#545899, 5.500%, due 9/1/17 | | | | 919 | | | | 991 | |
#663692, 5.000%, due 1/1/18 | | | | 373 | | | | 400 | |
#254591, 5.500%, due 1/1/18 | | | | 568 | | | | 613 | |
#681310, 4.500%, due 2/1/18 | | | | 555 | | | | 588 | |
#683100, 5.500%, due 2/1/18 | | | | 711 | | | | 774 | |
#675717, 5.000%, due 3/1/18 | | | | 610 | | | | 654 | |
#681361, 5.000%, due 3/1/18 | | | | 157 | | | | 168 | |
#656564, 5.000%, due 4/1/18 | | | | 2,713 | | | | 2,905 | |
#696677, 5.000%, due 4/1/18 | | | | 221 | | | | 237 | |
#702888, 5.000%, due 4/1/18 | | | | 190 | | | | 204 | |
#929388, 4.500%, due 5/1/18 | | | | 770 | | | | 811 | |
#254721, 5.000%, due 5/1/18 | | | | 444 | | | | 476 | |
#702332, 5.000%, due 5/1/18 | | | | 101 | | | | 108 | |
#704049, 5.500%, due 5/1/18 | | | | 1,363 | | | | 1,488 | |
#254785, 4.000%, due 6/1/18 | | | | 373 | | | | 390 | |
#555622, 4.500%, due 6/1/18 | | | | 611 | | | | 647 | |
#656573, 5.000%, due 6/1/18 | | | | 377 | | | | 404 | |
| | | | | | | | | | | | |
Issuer | | NRSRO
Rating
(unaudited) | | | Principal
Amount | | | Value | |
|
U.S. Government and U.S. Government Agency—(continued) | |
Federal National Mortgage Association (FNMA)—(continued) | | | | | | | | | |
#709848, 5.000%, due 6/1/18 | | | $ | 330 | | | $ | 353 | |
#713380, 4.000%, due 7/1/18 | | | | 310 | | | | 323 | |
#254802, 4.500%, due 7/1/18 | | | | 486 | | | | 515 | |
#713807, 4.500%, due 7/1/18 | | | | 287 | | | | 304 | |
#735003, 5.500%, due 7/1/18 | | | | 1,733 | | | | 1,887 | |
#711991, 5.000%, due 8/1/18 | | | | 316 | | | | 339 | |
#740444, 4.500%, due 9/1/18 | | | | 498 | | | | 527 | |
#743183, 5.000%, due 10/1/18 | | | | 134 | | | | 144 | |
#747823, 4.000%, due 11/1/18 | | | | 835 | | | | 872 | |
#749596, 5.000%, due 11/1/18 | | | | 476 | | | | 510 | |
#745237, 5.000%, due 12/1/18 | | | | 117 | | | | 125 | |
#MA0045, 4.000%, due 4/1/19 | | | | 712 | | | | 745 | |
#255233, 4.000%, due 5/1/19 | | | | 719 | | | | 750 | |
#725445, 4.500%, due 5/1/19 | | | | 1,320 | | | | 1,396 | |
#785259, 5.000%, due 8/1/19 | | | | 573 | | | | 615 | |
#725953, 5.000%, due 10/1/19 | | | | 165 | | | | 178 | |
#745240, 4.500%, due 12/1/19 | | | | 755 | | | | 800 | |
#735401, 5.500%, due 3/1/20 | | | | 472 | | | | 509 | |
#735646, 4.500%, due 7/1/20 | | | | 908 | | | | 961 | |
#MA0517, 4.000%, due 9/1/20 | | | | 1,426 | | | | 1,493 | |
#836016, 4.500%, due 9/1/20 | | | | 1,516 | | | | 1,599 | |
#MA0548, 3.500%, due 10/1/20 | | | | 2,510 | | | | 2,600 | |
#881284, 4.500%, due 12/1/21 | | | | 1,579 | | | | 1,663 | |
#932723, 4.000%, due 4/1/25 | | | | 931 | | | | 968 | |
#935995, 4.000%, due 6/1/25 | | | | 258 | | | | 268 | |
#AD4677, 4.000%, due 6/1/25 | | | | 1,986 | | | | 2,066 | |
#AD8164, 4.000%, due 8/1/25 | | | | 2,000 | | | | 2,080 | |
#AE1176, 4.000%, due 8/1/25 | | | | 977 | | | | 1,016 | |
| | | | | | | | | | | | |
Total FNMA Mortgage Obligations | | | | 39,521 | |
| | | | | | | | | | | | |
|
Consumer Asset-Backed Securities—41.0% | |
Mercedes-Benz Auto Receivables Trust, 2010-1, Tranche A1, 0.309%, 5/13/11 | | | A-1 | + | | | 19 | | | | 19 | |
BMW Vehicle Lease Trust, 2009-1, Tranche A4, 3.660%, 9/15/11 | | | AAA | | | | 500 | | | | 509 | |
Nissan Auto Lease Trust, 2009-B, Tranche A2, 1.220%, 9/15/11 | | | AAA | | | | 366 | | | | 366 | |
Ford Credit Auto Owner Trust, 2009-D, Tranche A2, 1.210%, 1/15/12 | | | AAA | | | | 168 | | | | 168 | |
Honda Auto Receivables Owner Trust, 2009-2, Tranche A3, 2.790%, 1/16/12 | | | AAA | | | | 779 | | | | 787 | |
Honda Auto Receivables Owner Trust, 2008-1, Tranche A3, 4.470%, 1/18/12 | | | AAA | | | | 139 | | | | 139 | |
Honda Auto Receivables Owner Trust, 2010-1, Tranche A2, 0.620%, 2/21/12 | | | AAA | | | | 1,753 | | | | 1,754 | |
USAA Auto Owner Trust, 2009-2, Tranche A2, 0.740%, 3/15/12 | | | AAA | | | | 14 | | | | 14 | |
Ally Auto Receivables Trust, 2010-1, Tranche A2, 0.750%, 4/15/12 | | | AAA | | | | 848 | | | | 849 | |
Volkswagen Auto Lease Trust, 2009-A, Tranche A3, 3.410%, 4/16/12 | | | AAA | | | | 1,319 | | | | 1,333 | |
See accompanying Notes to Financial Statements.
December 31, 2010 | William Blair Funds 91 |
Low Duration Fund
Portfolio of Investments, December 31, 2010 (all amounts in thousands)
| | | | | | | | | | | | |
Issuer | | NRSRO
Rating
(unaudited) | | | Principal
Amount | | | Value | |
|
Consumer Asset-Backed Securities—(continued) | |
Volkswagen Auto Loan Enhanced Trust, 2010-1, Tranche A2, 0.660%, 5/21/12 | | | AAA | | | $ | 1,437 | | | $ | 1,438 | |
USAA Auto Owner Trust, 2010-1, Tranche A2, 0.630%, 6/15/12 | | | AAA | | | | 716 | | | | 717 | |
Ford Credit Auto Owner Trust, 2007-B, Tranche A4A, 5.240%, 7/15/12 | | | AAA | | | | 530 | | | | 540 | |
CNH Equipment Trust, 2008-B, Tranche A3A, 4.780%, 7/16/12 | | | AAA | | | | 37 | | | | 37 | |
CNH Equipment Trust, 2009-C, Tranche A2, 0.950%, 8/15/12 | | | AAA | | | | 91 | | | | 91 | |
CNH Equipment Trust, 2010-A, Tranche A2, 0.810%, 8/15/12 | | | AAA | | | | 798 | | | | 799 | |
BMW Vehicle Lease Trust, 2010-1, Tranche A2, 0.580%, 9/17/12 | | | Aaa | | | | 500 | | | | 500 | |
BMW Vehicle Owner Trust, 2010-A, Tranche A2, 0.680%, 9/25/12 | | | AAA | | | | 1,237 | | | | 1,238 | |
Capital Auto Receivables Asset Trust, 2008-2, Tranche A3B, 1.710%, 10/15/12, VRN | | | AAA | | | | 499 | | | | 501 | |
USAA Auto Owner Trust, 2008-3, Tranche A3, 4.280%, 10/15/12 | | | AAA | | | | 31 | | | | 31 | |
Ford Credit Auto Owner Trust, 2010-B, Tranche A2, 0.650%, 12/15/12 | | | Aaa | | | | 1,200 | | | | 1,201 | |
Chrysler Financial Auto Securitization Trust, 2010-A, Tranche A2, 0.690%, 1/8/13 | | | AAA | | | | 1,000 | | | | 1,000 | |
CarMax Auto Owner Trust, 2009-1, Tranche A3, 4.120%, 3/15/13 | | | AAA | | | | 384 | | | | 390 | |
Nissan Auto Lease Trust, 2010-A, Tranche A2, 1.100%, 3/15/13 | | | AAA | | | | 1,205 | | | | 1,207 | |
BMW Vehicle Owner Trust, 2010-A, Tranche A3, 1.390%, 4/25/13 | | | AAA | | | | 300 | | | | 302 | |
Ford Credit Auto Owner Trust, 2009-A, Tranche A3A, 3.960%, 5/15/13 | | | AAA | | | | 414 | | | | 421 | |
Bank of America Credit Card Trust, 2007-A2, Tranche A2, 0.280%, 6/17/13, VRN | | | AAA | | | | 1,283 | | | | 1,283 | |
USAA Auto Owner Trust, 2009-1, Tranche A3, 3.020%, 6/17/13 | | | AAA | | | | 899 | | | | 910 | |
Citibank Credit Card Issuance Trust, 2009-A3, Tranche A3, 2.700%, 6/24/13 | | | AAA | | | | 100 | | | | 101 | |
American Express Issuance Trust, 2007-2, Tranche A, 0.510%, 7/15/13, VRN | | | AAA | | | | 373 | | | | 373 | |
American Express Credit Account Master Trust, 2008-1, Tranche A, 0.710%, 8/15/13, VRN | | | AAA | | | | 1,200 | | | | 1,200 | |
American Express Credit Account Master Trust—144A, 2006-B, Tranche A, 0.300%, 8/15/13, VRN | | | AAA | | | | 1,070 | | | | 1,070 | |
Discover Card Master Trust I, 2006-1, Tranche A2, 0.310%, 8/16/13, VRN | | | AAA | | | | 354 | | | | 354 | |
| | | | | | | | | | | | |
Issuer | | NRSRO
Rating
(unaudited) | | | Principal
Amount | | | Value | |
|
Consumer Asset-Backed Securities—(continued) | |
Ford Credit Auto Owner Trust, 2009-D, Tranche A3, 2.170%, 10/15/13 | | | AAA | | | $ | 1,160 | | | $ | 1,173 | |
John Deere Owner Trust, 2009-A, Tranche A3, 2.590%, 10/15/13 | | | AAA | | | | 1,344 | | | | 1,357 | |
John Deere Owner Trust, 2009-B, Tranche A3, 1.570%, 10/15/13 | | | AAA | | | | 865 | | | | 871 | |
Avis Budget Rental Car Funding AESOP LLC—144A, 2009-1A, Tranche A, 9.310%, 10/20/13 | | | Aa1 | | | | 2,000 | | | | 2,189 | |
Harley-Davidson Motorcycle Trust, 2009-1, Tranche A3, 3.190%, 11/15/13 | | | AAA | | | | 2,411 | | | | 2,444 | |
Citibank Credit Card Issuance Trust, 2004-A7, Tranche A7, 0.374%, 11/25/13, VRN | | | AAA | | | | 1,043 | | | | 1,041 | |
CNH Equipment Trust, 2009-C, Tranche A3, 1.850%, 12/16/13 | | | AAA | | | | 351 | | | | 354 | |
Capital One Multi-Asset Execution Trust, 2006-A6, Tranche A6, 5.300%, 2/18/14 | | | AAA | | | | 652 | | | | 661 | |
Avis Budget Rental Car Funding AESOP LLC—144A, 2009-2A, Tranche A, 5.680%, 2/20/14 | | | Aaa | | | | 1,500 | | | | 1,607 | |
Harley-Davidson Motorcycle Trust, 2009-2, Tranche A3, 2.620%, 3/15/14 | | | AAA | | | | 825 | | | | 834 | |
Capital One Multi-Asset Execution Trust, 2006-A7, Tranche A7, 0.290%, 3/17/14, VRN | | | AAA | | | | 1,000 | | | | 999 | |
Capital One Multi-Asset Execution Trust, 2008-A6, Tranche A6, 1.360%, 3/17/14, VRN | | | AAA | | | | 1,610 | | | | 1,615 | |
Citibank Credit Card Issuance Trust, 2009-A1, Tranche A1, 2.010%, 3/17/14, VRN | | | AAA | | | | 200 | | | | 204 | |
Volkswagen Auto Lease Trust, 2009-A, Tranche A4, 4.590%, 3/17/14 | | | AAA | | | | 2,000 | | | | 2,052 | |
Hertz Vehicle Financing LLC—144A, 2009-2A, Tranche A1, 4.260%, 3/25/14 | | | Aaa | | | | 1,765 | | | | 1,847 | |
Chase Issuance Trust, 2007-A9, Tranche A, 3.151%, 6/16/14, VRN | | | AAA | | | | 2,000 | | | | 1,993 | |
Nissan Auto Receivables Owner Trust, 2008-A, Tranche A4, 4.280%, 6/16/14 | | | AAA | | | | 120 | | | | 122 | |
CNH Equipment Trust, 2010-A, Tranche A3, 1.540%, 7/15/14 | | | AAA | | | | 1,175 | | | | 1,184 | |
Nissan Auto Receivables Owner Trust, 2010-A, Tranche A3, 0.870%, 7/15/14 | | | AAA | | | | 500 | | | | 499 | |
Daimler Chrysler Auto Trust, 2008-A, Tranche A4, 4.480%, 8/8/14 | | | AAA | | | | 1,500 | | | | 1,538 | |
Citibank Credit Card Issuance Trust, 2007-A7, Tranche A7, 0.611%, 8/20/14, VRN | | | AAA | | | | 200 | | | | 200 | |
See accompanying Notes to Financial Statements.
92 Annual Report | December 31, 2010 |
Low Duration Fund
Portfolio of Investments, December 31, 2010 (all amounts in thousands)
| | | | | | | | | | | | |
Issuer | | NRSRO
Rating
(unaudited) | | | Principal
Amount | | | Value | |
|
Consumer Asset-Backed Securities—(continued) | |
American Express Credit Account Master Trust, 2007-5, Tranche A, 0.290%, 12/15/14, VRN | | | AAA | | | $ | 1,000 | | | $ | 998 | |
Nissan Master Owner Trust Receivables—144A, 2010-AA, Tranche A, 1.410%, 1/15/15, VRN | | | AAA | | | | 2,000 | | | | 2,023 | |
Capital One Multi-Asset Execution Trust, 2007-A4, Tranche A4, 0.290%, 3/16/15, VRN | | | AAA | | | | 1,778 | | | | 1,769 | |
Discover Card Master Trust, 2007-A2, Tranche A2, 0.642%, 6/15/15, VRN | | | AAA | | | | 192 | | | | 192 | |
Chase Issuance Trust, 2008-A10, Tranche A10, 1.010%, 8/17/15, VRN | | | AAA | | | | 2,000 | | | | 2,024 | |
Bank of America Credit Card Trust, 2010-A1, Tranche A1, 0.560%, 9/15/15, VRN | | | AAA | | | | 1,330 | | | | 1,330 | |
Discover Card Master Trust, 2010-A1, Tranche A1, 0.910%, 9/15/15, VRN | | | Aaa | | | | 347 | | | | 349 | |
Ford Credit Floorplan Master Owner Trust, 2010-A5, Tranche A2, 0.960%, 9/15/15, VRN | | | AAA | | | | 1,700 | | | | 1,700 | |
Chase Issuance Trust, 2008-A3, Tranche A, 1.360%, 3/15/16, VRN | | | AAA | | | | 2,000 | | | | 2,051 | |
| | | | | | | | | | | | |
Total Consumer Asset-Backed Securities | | | | 58,862 | |
| | | | | | | | | | | | |
| | | |
Corporate Obligations—11.8% | | | | | | | | | | | | |
Teva Pharmaceutical Finance III LLC, 1.500%, due 6/15/12 | | | A | - | | | 1,000 | | | | 1,009 | |
General Electric Capital Corporation, 3.500%, due 8/13/12 | | | AA | + | | | 1,000 | | | | 1,036 | |
Johnson & Johnson,
5.150%, due 8/15/12 | | | AAA | | | | 1,900 | | | | 2,038 | |
NRSRO = Nationally Recognized Statistical Rating Organization—The credit quality ratings of the securities in the Fund reflect the highest category rating by either Fitch Ratings, Moody’s Investors Service Inc., or Standard & Poor’s, a division of the McGraw-Hill Companies, Inc. The obligations of certain U.S. Government-sponsored securities are neither issued nor guaranteed by the U.S. Treasury.
VRN = Variable Rate Note
| | | | | | | | | | | | |
Issuer | | NRSRO
Rating
(unaudited) | | | Principal
Amount | | | Value | |
|
Corporate Obligations—(continued) | |
Bank of America Corporation, 5.375%, due 9/11/12 | | | A | + | | $ | 1,000 | | | $ | 1,050 | |
ConocoPhillips, 4.750%, due 10/15/12 | | | A | 1 | | | 1,000 | | | | 1,071 | |
Citigroup, Inc., 5.300%, due 10/17/12 | | | A | + | | | 1,000 | | | | 1,059 | |
Wells Fargo & Co.,
5.250%, due 10/23/12 | | | AA | - | | | 1,000 | | | | 1,072 | |
Morgan Stanley, 5.250%, due 11/2/12 | | | A | | | | 1,000 | | | | 1,067 | |
The Procter & Gamble Co.,
0.324%, due 11/14/12, VRN | | | AA | - | | | 700 | | | | 701 | |
The Walt Disney Co.,
4.700%, due 12/1/12 | | | A | | | | 1,500 | | | | 1,608 | |
Hewlett-Packard Co.,
4.500%, due 3/1/13 | | | A | + | | | 1,000 | | | | 1,070 | |
American Honda Finance Corp.—144A, 2.375%, due 3/18/13 | | | A | + | | | 1,000 | | | | 1,017 | |
American Express Co., 4.875%, due 7/15/13 | | | A | + | | | 1,000 | | | | 1,069 | |
MetLife, Inc., 2.375%, due 2/6/14 | | | A | - | | | 475 | | | | 477 | |
The Boeing Co., 5.000%, due 3/15/14 | | | A | + | | | 375 | | | | 411 | |
Shell International Finance BV, 4.000%, due 3/21/14 | | | Aa1 | | | | 1,142 | | | | 1,215 | |
| | | | | | | | | | | | |
Total Corporate Obligations | | | | 16,970 | |
| | | | | | | | | | | | |
Total Long-Term Investments—94.4%
(cost $135,633) | | | | 135,533 | |
| | | | | | | | | | | | |
| | | |
Repurchase Agreement | | | | | | | | | | | | |
State Street Bank and Trust Company, 0.150% dated 12/31/10, due 1/3/11, repurchase price $5,994, collateralized by U.S. Treasury Note, 2.750%, due 12/31/17 | | | AAA | | | | 5,994 | | | | 5,994 | |
| | | | | | | | | | | | |
Total Repurchase Agreement—4.2%
(cost $5,994) | | | | 5,994 | |
| | | | | | | | | | | | |
Total Investments—98.6%
(cost $141,627) | | | | 141,527 | |
Cash and other assets, less liabilities—1.4% | | | | 1,943 | |
| | | | | | | | | | | | |
Net assets—100.0% | | | $ | 143,470 | |
| | | | | |
See accompanying Notes to Financial Statements.
December 31, 2010 | William Blair Funds 93 |
Christopher T. Vincent

Kathleen M. Lynch
READY RESERVES FUND
The Ready Reserves Fund seeks current income, a stable share price and daily liquidity.
AN OVERVIEW FROM THE PORTFOLIO MANAGERS
The return for the 12 months ended December 31, 2010, of the Fund’s Class N Shares was 0.01%, versus the 0.03% return of the Fund’s benchmark, the AAA-Rated Money Market Funds Average. Total assets were $1.22 billion at December 31, 2010, compared to $1.27 billion at June 30, 2010 and $1.35 billion at December 31, 2009.
Federal Reserve Board Monetary policy continued to be the focus of the money markets during 2010.
In early November, the U.S. Federal Reserve Board announced a second round of asset purchases to provide further stimulus to the U.S. economy.
The Federal Reserve stated that it intended to purchase a further $600 billion of longer-term Treasury securities by the end of the second quarter of 2011—maintaining its existing policy of reinvesting principal payments from its securities holdings, a pace of about $75 billion per month. The Fed said that it considered the actions “necessary to support the economic recovery and to help ensure that inflation, over time, is at levels consistent with its mandate.”
Federal Reserve Chairman Ben Bernanke in particular has expressed longstanding concern about the danger of deflation, or falling prices, from a lack of demand stemming from slow economic growth, joblessness and weakness in the financial sector. And in one well-known major policy speech delivered in 2002, Bernanke identified asset purchases as a way to stimulate aggregate spending when short-term interest rates have reached zero.
The Fed said that information received since the Federal Open Market Committee (FOMC) met in November confirmed that the economic recovery was continuing, though at a rate that has been insufficient to bring down unemployment.
The Fed said, “Household spending is increasing at a moderate pace, but remains constrained by high unemployment, modest income growth, lower housing wealth, and tight credit. Business spending on equipment and software is rising, though less rapidly than earlier in the year, while investment in nonresidential structures continues to be weak. Employers remain reluctant to add to payrolls. The housing sector continues to be depressed. Longer-term inflation expectations have remained stable, but measures of underlying inflation have continued to trend downward.”
The Fed did not take any new steps on interest rates. The FOMC said that it will maintain the target range for the federal funds rate at 0.0% to 0.25% and that it “continues to anticipate that economic conditions, including low rates of resource utilization, subdued inflation trends, and stable inflation expectations, are likely to warrant exceptionally low levels for the federal funds rate for an extended period.”
We continue to favor overnight repurchase agreements, in an effort to maintain a high degree of overnight liquidity.
The Fund also continues to maintain a relatively short Average Maturity. On December 31, 2010, the Fund’s Average Maturity was approximately 40 days, compared to 37 days on September 30, 2010, 37 days on June 30, 2010, 48 days on March 31, 2010 and 50 days on December 31, 2009.
94 Annual Report | December 31, 2010 |
Ready Reserves Fund
Performance Highlights (unaudited)
The Fund’s 7 day yield on December 31, 2010 was 0.01%.
Average Annual Total Returns—Class N Shares period ended December 31, 2010.
| | | | | | | | | | | | | | | | |
| | | 1
Year | | | 3
Year | | | 5
Year | | | 10
Year | |
Ready Reserves Fund Class N | | | 0.01 | % | | | 0.78 | % | | | 2.29 | % | | | 2.04 | % |
AAA Ready Money Market Funds | | | 0.03 | | | | 0.80 | | | | 2.26 | | | | 2.00 | |
Performance cited represents past performance. Past performance does not guarantee future results and current performance may be lower or higher than the data quoted. For the most current month-end performance information, please call 1-800-742-7272, or visit our Web site at www.williamblairfunds.com. Class N Shares are available to the general public without a sales load. Total return includes reinvestment of income. Yields fluctuate and are not guaranteed. An investment in the Fund is neither insured nor guaranteed by the Federal Deposit Insurance Corp. (FDIC) or any government agency. Although the Fund seeks to preserve the value of your investment at $1.00 per share, it is possible to lose money by investing in the Fund.
The AAA Rated Money Market Funds Average represents the average annual composite performance of all AAA rated First Tier Retail Money Market Funds listed by iMoneyNet data.
This report identifies the Fund’s investments on December 31, 2010. These holdings are subject to change. Not all fixed-income securities in the Fund performed the same, nor is there any guarantee that these fixed-income securities will perform as well in the future. Market forecasts provided in this report may not necessarily come to pass.
Sector Diversification (unaudited)
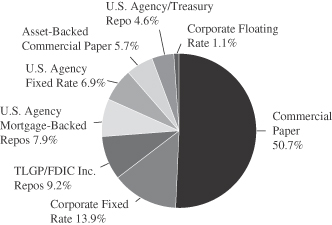
The sector diversification shown is based on the total Investments.
December 31, 2010 | William Blair Funds 95 |
Ready Reserves Fund
Portfolio of Investments, December 31, 2010 (all dollar amounts in thousands)
| | | | | | | | |
Issuer | | Principal
Amount | | | Amortized
Cost | |
U.S. Government Agency Mortgage-Backed Notes—0.0% | |
Federal National Mortgage Association (FNMA),
4.000%, 2/1/11 $366 | | | $ | 366 | |
| | | | | | | | |
Total U.S. Government Agency
Mortgage-Backed Notes | | | | 366 | |
| | | | | | | | |
U.S. Government Agency Notes—6.8% | | | | | | | | |
Federal Home Loan Bank (FHLB),
4.625%, 2/18/11 | | $ | 5,000 | | | | 5,027 | |
Federal Home Loan Mortgage Corporation (FHLMC),
1.625%-5.125%, 1/18/11-5/5/11 | | | 23,695 | | | | 23,825 | |
Federal National Mortgage Association (FNMA),
1.000%-5.500%, 2/15/11-11/23/11 | | | 54,246 | | | | 54,591 | |
| | | | | | | | |
Total U.S. Government Agency Notes | | | | | | | 83,443 | |
| | | | | | | | |
Corporate Notes—14.8% | | | | | | | | |
Abbott Laboratories,
3.750%-5.600%, 3/15/11-5/15/11 | | | 14,204 | | | | 14,451 | |
Boeing Capital Corporation,
6.100%, 3/1/11 | | | 6,612 | | | | 6,675 | |
Citibank NA,
1.500%-1.625%, 3/30/11-7/12/11 | | | 10,010 | | | | 10,061 | |
Citigroup Funding, Inc., 1.250%, 6/3/11 | | | 15,000 | | | | 15,064 | |
Dover Corporation, 6.500%, 2/15/11 | | | 1,380 | | | | 1,390 | |
General Electric Capital Corporation, 5.200%-6.125%, 2/1/11-4/28/11 | | | 17,668 | | | | 17,835 | |
IBM Corporation, 4.950%, 3/22/11 | | | 14,000 | | | | 14,144 | |
Merck & Co., Inc., 1.875%, 6/30/11 | | | 10,860 | | | | 10,943 | |
Oracle Corporation, 5.000%, 1/15/11 | | | 13,153 | | | | 13,176 | |
Pfizer, Inc., 2.252%, 3/15/11, VRN | | | 8,000 | | | | 8,032 | |
Procter & Gamble International Funding, 1.350%, 8/26/11 | | | 15,489 | | | | 15,585 | |
Shell International Finance BV,
1.300%, 9/22/11 | | | 10,000 | | | | 10,070 | |
U.S. Bank NA, 6.375%, 8/1/11 | | | 12,045 | | | | 12,456 | |
Wal-Mart Stores, Inc., 4.125%, 2/15/11 | | | 10,000 | | | | 10,045 | |
Wells Fargo & Co.,
0.738%, 1/24/11, VRN | | | 4,712 | | | | 4,713 | |
Wells Fargo & Co.,
4.000%-4.875%, 1/12/11-6/2/11 | | | 7,619 | | | | 7,640 | |
Wyeth, 6.950%, 3/15/11 | | | 7,400 | | | | 7,499 | |
| | | | | | | | |
Total Corporate Notes | | | | | | | 179,779 | |
| | | | | | | | |
Foreign Government Notes—2.3% | | | | | | | | |
Canadian Wheat Board,
0.170%-0.190%, 1/11/11-3/8/11 | | | 28,000 | | | | 27,994 | |
| | | | | | | | |
Total Foreign Government Notes | | | | | | | 27,994 | |
| | | | | | | | |
Commercial Paper—48.4% | | | | | | | | |
Abbott Laboratories,
0.160%-0.200%, 1/4/11-2/28/11 | | | 20,900 | | | | 20,896 | |
American Honda Finance Corporation, 0.200%-0.250%, 1/5/11-2/17/11 | | | 36,500 | | | | 36,495 | |
Caterpillar Financial Services Corporation, 0.150%-0.210%, 1/5/11-2/23/11 | | | 38,000 | | | | 37,996 | |
Chevron Funding Corporation,
0.110%-0.160%, 1/10/11-1/18/11 | | | 39,000 | | | | 39,000 | |
Coca-Cola Co.,
0.190%-0.230%, 1/10/11-4/4/11 | | | 36,000 | | | | 35,990 | |
| | | | | | | | |
Issuer | | Principal
Amount | | | Amortized
Cost | |
Commercial Paper—(continued) | | | | | | | | |
Colgate-Palmolive Co., 0.160%, 1/7/11 | | $ | 10,000 | | | $ | 10,000 | |
ConocoPhillips Qatar Funding, Ltd.,
0.190%-0.260%, 1/4/11-2/25/11 | | | 34,000 | | | | 33,996 | |
General Electric Capital Corporation, 0.170%-0.230%, 1/31/11-3/1/11 | | | 22,000 | | | | 21,994 | |
Hewlett Packard Co.,
0.150%-0.170%, 1/3/11-1/7/11 | | | 35,849 | | | | 35,849 | |
IBM Corporation,
0.110%-0.150%, 1/3/11-1/14/11 | | | 25,000 | | | | 25,000 | |
John Deere Credit, Inc.,
0.220%-0.230%, 1/6/11-1/26/11 | | | 20,650 | | | | 20,648 | |
John Deere Credit, Ltd., 0.230%, 2/2/11 | | | 12,000 | | | | 11,997 | |
Johnson & Johnson,
0.190%-0.240%, 3/9/11-6/2/11 | | | 34,985 | | | | 34,964 | |
Nestle Capital Corporation,
0.170%-0.190%, 1/18/11-3/9/11 | | | 33,460 | | | | 33,452 | |
PACCAR Financial Corporation,
0.180%-0.200%, 1/7/11-1/19/11 | | | 39,150 | | | | 39,148 | |
Praxair, Inc., 0.170%, 1/4/11 | | | 20,000 | | | | 20,000 | |
Private Export Funding,
0.180%-0.280%, 1/4/11-3/7/11 | | | 38,600 | | | | 38,594 | |
Procter & Gamble Co. (The),
0.160%-0.230%, 1/5/11-4/12/11 | | | 18,000 | | | | 17,996 | |
Procter & Gamble International Funding, 0.170%, 1/28/11 | | | 5,000 | | | | 4,999 | |
Roche Holding, Inc.,
0.160%, 1/5/11-1/6/11 | | | 10,000 | | | | 10,000 | |
Shell International Finance BV,
0.450%-0.500%, 1/3/11-2/1/11 | | | 10,000 | | | | 9,998 | |
Toyota Credit Corporation,
0.200%-0.250%, 1/7/11-1/21/11 | | | 42,000 | | | | 41,994 | |
Unilever Capital Corporation,
0.190%, 2/28/11 | | | 8,000 | | | | 7,997 | |
| | | | | | | | |
Total Commercial Paper3 | | | | | | | 589,003 | |
| | | | | | | | |
Asset-Backed Commercial Paper—5.8% | | | | | | | | |
Chariot Funding L.L.C.,
0.230%-0.260%, 1/10/11-1/26/11 | | | 18,000 | | | | 17,998 | |
Govco L.L.C,
0.230%-0.270%, 1/4/11-1/24/11 | | | 44,000 | | | | 43,996 | |
Wal-Mart Funding Corporation,
0.250%, 1/11/11 | | | 8,000 | | | | 7,999 | |
| | | | | | | | |
Total Asset-Backed Commercial Paper | | | | | | | 69,993 | |
| | | | | | | | |
Repurchase Agreements—21.8% | | | | | | | | |
Bank of America, 0.200% dated 12/31/10, due 1/3/11, repurchase price $57,001, collateralized by U.S. Government Agency securities, 1.375%-5.750%, due 4/28/11-12/1/40 | | | 57,000 | | | | 57,000 | |
Barclays Capital, 0.160% dated 12/28/10, due 1/4/11, repurchase price $30,001, collateralized by FDIC guaranteed securities, 0.000%-3.000%,
due 2/23/11-12/28/12 | | | 30,000 | | | | 30,000 | |
Barclays Capital, 0.250% dated 12/31/10, due 1/3/11, repurchase price $25,001, collateralized by GNMA, 4.500%-5.000%, due 1/20/35-9/20/40 | | | 25,000 | | | | 25,000 | |
See accompanying Notes to Financial Statements.
96 Annual Report | December 31, 2010 |
Ready Reserves Fund
Portfolio of Investments, December 31, 2010 (all dollar amounts in thousands)
| | | | | | | | |
Issuer | | Principal
Amount | | | Amortized
Cost | |
Repurchase Agreements—(continued) | | | | | | | | |
Fixed Income Clearing Corporation, 0.150% dated 12/31/10, due 1/3/11, repurchase price $55,704, collateralized by FNMA, 3.420%, due 11/24/20 | | $ | 55,703 | | | $ | 55,703 | |
Goldman Sachs, 0.180% dated 12/31/10, due 1/3/11, repurchase price $57,001, collateralized by a FDIC guaranteed security, 2.250%, due 3/12/12 | | | 57,000 | | | | 57,000 | |
JPMorgan & Co., 0.200% dated 12/31/10, due 1/3/11, repurchase price $40,001, collateralized by FNMA,
0.020%-8.139%, due 12/25/16-9/25/40 | | | 40,000 | | | | 40,000 | |
| | | | | | | | |
Total Repurchase Agreements | | | | | | | 264,703 | |
| | | | | | | | |
Total Investments—99.9%
(cost $1,215,281) | | | | | | | 1,215,281 | |
| | | | | | | | |
Cash and other assets, less liabilities—0.1% | | | | 1,262 | |
| | | | | | | | |
Net assets—100.0% | | | $ | 1,216,543 | |
| | | | | | | | |
Portfolio Weighted Average Maturity | | | | | | | 40 days | |
VRN = Variable Rate Note
See accompanying Notes to Financial Statements.
December 31, 2010 | William Blair Funds 97 |
Statements of Assets and Liabilities
December 31, 2010 (dollar amounts in thousands)
| | | | | | | | | | | | | | | | |
| | | Growth
Fund | | | Large Cap
Growth
Fund | | | Small Cap
Growth
Fund | | | Mid Cap
Growth
Fund | |
Assets | | | | | | | | | | | | | | | | |
Investments in securities, at cost | | $ | 421,729 | | | $ | 23,939 | | | $ | 632,055 | | | $ | 77,862 | |
Investments in Affiliated Companies, at cost | | | — | | | | — | | | | 114,550 | | | | — | |
| | | | | | | | | | | | | | | | |
| | | | |
Investments in securities, at value | | $ | 523,244 | | | $ | 31,866 | | | $ | 794,417 | | | $ | 101,028 | |
Investments in Affiliated Companies, at value | | | — | | | | — | | | | 83,941 | | | | — | |
Receivable for securities sold | | | 1,769 | | | | 43 | | | | 19,704 | | | | 367 | |
Receivable for fund shares sold | | | 52,539 | | | | 156 | | | | 1,159 | | | | 253 | |
Receivable from Advisor | | | — | | | | 5 | | | | 76 | | | | — | |
Dividend and interest receivable | | | 361 | | | | 23 | | | | 50 | | | | 44 | |
| | | | | | | | | | | | | | | | |
Total assets | | | 577,913 | | | | 32,093 | | | | 899,347 | | | | 101,692 | |
Liabilities | | | | | | | | | | | | | | | | |
Payable for investment securities purchased | | | 114 | | | | — | | | | 5,260 | | | | 290 | |
Payable for fund shares redeemed | | | 1,751 | | | | — | | | | 1,374 | | | | 40 | |
Management fee payable | | | 331 | | | | 22 | | | | 834 | | | | 84 | |
Distribution fee payable | | | 42 | | | | 1 | | | | 84 | | | | 3 | |
Other accrued expenses | | | 62 | | | | 35 | | | | 206 | | | | 27 | |
| | | | | | | | | | | | | | | | |
Total liabilities | | | 2,300 | | | | 58 | | | | 7,758 | | | | 444 | |
| | | | | | | | | | | | | | | | |
Net Assets | | $ | 575,613 | | | $ | 32,035 | | | $ | 891,589 | | | $ | 101,248 | |
| | | | | | | | | | | | | | | | |
Capital | | | | | | | | | | | | | | | | |
Composition of Net Assets | | | | | | | | | | | | | | | | |
Par value of shares of beneficial interest | | $ | 50 | | | $ | 4 | | | $ | 37 | | | $ | 8 | |
Capital paid in excess of par value | | | 482,224 | | | | 30,945 | | | | 856,238 | | | | 81,063 | |
Accumulated net investment income (loss) | | | 329 | | | | — | | | | — | | | | — | |
Accumulated net realized gain (loss) | | | (8,505 | ) | | | (6,841 | ) | | | (96,439 | ) | | | (2,989 | ) |
Net unrealized appreciation (depreciation) of investments and foreign currencies | | | 101,515 | | | | 7,927 | | | | 131,753 | | | | 23,166 | |
| | | | | | | | | | | | | | | | |
Net Assets | | $ | 575,613 | | | $ | 32,035 | | | $ | 891,589 | | | $ | 101,248 | |
| | | | | | | | | | | | | | | | |
| | | | |
Class N Shares | | | | | | | | | | | | | | | | |
Net Assets | | $ | 198,622 | | | $ | 7,135 | | | $ | 396,767 | | | $ | 13,802 | |
Shares Outstanding | | | 17,607,778 | | | | 999,776 | | | | 17,084,515 | | | | 1,104,271 | |
Net Asset Value Per Share | | $ | 11.28 | | | $ | 7.14 | | | $ | 23.22 | | | $ | 12.50 | |
Class I Shares | | | | | | | | | | | | | | | | |
Net Assets | | $ | 376,991 | | | $ | 24,900 | | | $ | 494,822 | | | $ | 87,446 | |
Shares Outstanding | | | 32,183,980 | | | | 3,411,336 | | | | 20,565,514 | | | | 6,896,804 | |
Net Asset Value Per Share | | $ | 11.71 | | | $ | 7.30 | | | $ | 24.07 | | | $ | 12.68 | |
See accompanying Notes to Financial Statements.
98 Annual Report | December 31, 2010 |
Statements of Operations
for the Year Ended December 31, 2010 (all amounts in thousands)
| | | | | | | | | | | | | | | | |
| | | Growth
Fund | | | Large Cap
Growth
Fund | | | Small Cap
Growth
Fund | | | Mid Cap
Growth
Fund | |
Investment income | | | | | | | | | | | | | | | | |
Dividends | | $ | 4,772 | | | $ | 328 | | | $ | 3,470 | | | $ | 779 | |
Less foreign tax withheld | | | — | | | | — | | | | (54 | ) | | | — | |
Dividend income from Affiliated Companies | | | — | | | | — | | | | 375 | | | | — | |
Interest | | | 16 | | | | 1 | | | | 31 | | | | 3 | |
| | | | | | | | | | | | | | | | |
Total income | | | 4,788 | | | | 329 | | | | 3,822 | | | | 782 | |
Expenses | | | | | | | | | | | | | | | | |
Investment advisory fees | | | 3,461 | | | | 235 | | | | 8,796 | | | | 774 | |
Distribution fees | | | 444 | | | | 15 | | | | 1,114 | | | | 30 | |
Custodian fees | | | 29 | | | | 35 | | | | 38 | | | | 37 | |
Transfer agent fees | | | 122 | | | | 9 | | | | 98 | | | | 14 | |
Sub-transfer agent fees | | | | | | | | | | | | | | | | |
Class N | | | 176 | | | | 8 | | | | 487 | | | | 7 | |
Class I | | | 83 | | | | — | | | | 304 | | | | 31 | |
Professional fees | | | 39 | | | | 26 | | | | 53 | | | | 26 | |
Registration fees | | | 33 | | | | 27 | | | | 62 | | | | 25 | |
Shareholder reporting fees | | | 34 | | | | 3 | | | | 193 | | | | 15 | |
Trustee fees | | | 15 | | | | 1 | | | | 28 | | | | 2 | |
Other expenses | | | 23 | | | | 4 | | | | 22 | | | | 8 | |
| | | | | | | | | | | | | | | | |
Total expenses before waiver | | | 4,459 | | | | 363 | | | | 11,195 | | | | 969 | |
Expenses waived by the Advisor | | | — | | | | (66 | ) | | | (90 | ) | | | (40 | ) |
| | | | | | | | | | | | | | | | |
Net expenses | | | 4,459 | | | | 297 | | | | 11,105 | | | | 929 | |
| | | | | | | | | | | | | | | | |
Net investment income (loss) | | | 329 | | | | 32 | | | | (7,283 | ) | | | (147 | ) |
Realized and unrealized gain (loss) | | | | | | | | | | | | | | | | |
Net realized gain (loss) on transactions from: | | | | | | | | | | | | | | | | |
Investments | | | 29,431 | | | | 1,167 | | | | 98,413 | (a) | | | 9,349 | |
Foreign currency transactions | | | — | | | | — | | | | 6 | | | | — | |
| | | | | | | | | | | | | | | | |
Total net realized gain (loss) | | | 29,431 | | | | 1,167 | | | | 98,419 | | | | 9,349 | |
Change in net unrealized appreciation (depreciation) of investments | | | 35,328 | | | | 3,134 | | | | 32,801 | (a) | | | 10,074 | |
| | | | | | | | | | | | | | | | |
Net increase (decrease) in net assets resulting from operations | | $ | 65,088 | | | $ | 4,333 | | | $ | 123,937 | | | $ | 19,276 | |
| | | | | | | | | | | | | | | | |
| (a) | | Affiliated Companies accounted for $(2,866) of the net realized gain on investments and $17,126 of the change in unrealized (depreciation) on investments during the year. |
See accompanying Notes to Financial Statements.
December 31, 2010 | William Blair Funds 99 |
Statements of Changes in Net Assets
for the Years Ended December 31, 2010 and 2009 (all amounts in thousands)
| | | | | | | | | | | | | | | | | | | | | | | | | | | | | | | | |
| | | Growth
Fund | | | Large Cap
Growth
Fund | | | Small Cap
Growth
Fund | | | Mid Cap
Growth
Fund | |
| | | 2010 | | | 2009 | | | 2010 | | | 2009 | | | 2010 | | | 2009 | | | 2010 | | | 2009 | |
Operations | | | | | | | | | | | | | | | | | | | | | | | | | | | | | | | | |
Net investment income (loss) | | $ | 329 | | | $ | 56 | | | $ | 32 | | | $ | 17 | | | $ | (7,283 | ) | | $ | (4,618 | ) | | $ | (147 | ) | | $ | (147 | ) |
Net realized gain (loss) on investments and foreign currency transactions | | | 29,431 | | | | (19,046 | ) | | | 1,167 | | | | (2,753 | ) | | | 98,419 | | | | (34,140 | ) | | | 9,349 | | | | (6,206 | ) |
Change in net unrealized appreciation (depreciation) on investments and foreign currency translation | | | 35,328 | | | | 119,029 | | | | 3,134 | | | | 9,950 | | | | 32,801 | | | | 322,910 | | | | 10,074 | | | | 22,569 | |
| | | | | | | | | | | | | | | | | | | | | | | | | | | | | | | | |
Net increase (decrease) in net assets resulting from operations | | | 65,088 | | | | 100,039 | | | | 4,333 | | | | 7,214 | | | | 123,937 | | | | 284,152 | | | | 19,276 | | | | 16,216 | |
Distributions to shareholders from | | | | | | | | | | | | | | | | | | | | | | | | | | | | | | | | |
Net investment income | | | (13 | ) | | | (43 | ) | | | (33 | ) | | | (16 | ) | | | — | | | | — | | | | — | | | | — | |
Net realized gain | | | — | | | | — | | | | — | | | | — | | | | — | | | | — | | | | — | | | | — | |
| | | | | | | | | | | | | | | | | | | | | | | | | | | | | | | | |
| | | (13 | ) | | | (43 | ) | | | (33 | ) | | | (16 | ) | | | — | | | | — | | | | — | | | | — | |
Capital stock transactions | | | | | | | | | | | | | | | | | | | | | | | | | | | | | | | | |
Net proceeds from sale of shares | | | 176,362 | | | | 131,594 | | | | 3,077 | | | | 6,234 | | | | 364,595 | | | | 317,852 | | | | 24,389 | | | | 21,823 | |
Shares issued in reinvestment of income dividends and capital gain distributions | | | 11 | | | | 34 | | | | 29 | | | | 14 | | | | — | | | | — | | | | — | | | | — | |
Less cost of shares redeemed | | | (85,355 | ) | | | (50,690 | ) | | | (5,682 | ) | | | (6,414 | ) | | | (359,741 | ) | | | (240,833 | ) | | | (13,251 | ) | | | (7,731 | ) |
| | | | | | | | | | | | | | | | | | | | | | | | | | | | | | | | |
Net increase (decrease) in net assets resulting from capital share transactions | | | 91,018 | | | | 80,938 | | | | (2,576 | ) | | | (166 | ) | | | 4,854 | | | | 77,019 | | | | 11,138 | | | | 14,092 | |
| | | | | | | | | | | | | | | | | | | | | | | | | | | | | | | | |
Increase (decrease) in net assets | | | 156,093 | | | | 180,934 | | | | 1,724 | | | | 7,032 | | | | 128,791 | | | | 361,171 | | | | 30,414 | | | | 30,308 | |
Net assets | | | | | | | | | | | | | | | | | | | | | | | | | | | | | | | | |
Beginning of year | | | 419,520 | | | | 238,586 | | | | 30,311 | | | | 23,279 | | | | 762,798 | | | | 401,627 | | | | 70,834 | | | | 40,526 | |
| | | | | | | | | | | | | | | | | | | | | | | | | | | | | | | | |
End of year | | $ | 575,613 | | | $ | 419,520 | | | $ | 32,035 | | | $ | 30,311 | | | $ | 891,589 | | | $ | 762,798 | | | $ | 101,248 | | | $ | 70,834 | |
| | | | | | | | | | | | | | | | | | | | | | | | | | | | | | | | |
Accumulated net investment income (loss) at the end of the year | | $ | 329 | | | $ | 13 | | | $ | — | | | $ | 1 | | | $ | — | | | $ | — | | | $ | — | | | $ | — | |
| | | | | | | | | | | | | | | | | | | | | | | | | | | | | | | | |
See accompanying Notes to Financial Statements.
100 Annual Report | December 31, 2010 |
Statements of Assets and Liabilities
for the Year Ended December 31, 2010 (all amounts in thousands)
| | | | | | | | | | | | | | | | |
| | | Small-Mid Cap
Growth
Fund | | | Global
Growth
Fund | | | International
Growth
Fund | | | International
Equity
Fund | |
Assets | | | | | | | | | | | | | | | | |
Investments in securities, at cost | | $ | 162,909 | | | $ | 34,109 | | | $ | 4,072,201 | | | $ | 135,256 | |
| | | | | | | | | | | | | | | | |
| | | | |
Investments in securities, at value | | $ | 206,902 | | | $ | 44,845 | | | $ | 5,097,912 | | | $ | 175,256 | |
Cash | | | — | | | | — | | | | 126 | | | | — | |
Foreign currency, at value (cost $—; $—; $818; $1,756) | | | — | | | | — | | | | 830 | | | | 1,879 | |
Receivable for securities sold | | | 1,131 | | | | 7 | | | | 2,956 | | | | 25 | |
Receivable for fund shares sold | | | 328 | | | | 75 | | | | 9,746 | | | | 942 | |
Receivable from Advisor | | | — | | | | 11 | | | | — | | | | — | |
Dividend and interest receivable | | | 31 | | | | 39 | | | | 13,990 | | | | 398 | |
| | | | | | | | | | | | | | | | |
Total assets | | | 208,392 | | | | 44,977 | | | | 5,125,560 | | | | 178,500 | |
Liabilities | | | | | | | | | | | | | | | | |
Payable for investment securities purchased | | | 14 | | | | — | | | | 32,637 | | | | — | |
Payable for fund shares redeemed | | | 105 | | | | 11 | | | | 4,787 | | | | 45 | |
Unrealized depreciation on forward foreign currency contracts | | | — | | | | — | | | | — | | | | 135 | |
Management fee payable | | | 178 | | | | 38 | | | | 4,292 | | | | 161 | |
Distribution and shareholder services fee payable | | | 6 | | | | 7 | | | | 564 | | | | 3 | |
Other accrued expenses | | | 24 | | | | 44 | | | | 1,101 | | | | 101 | |
| | | | | | | | | | | | | | | | |
Total liabilities | | | 327 | | | | 100 | | | | 43,381 | | | | 445 | |
| | | | | | | | | | | | | | | | |
Net Assets | | $ | 208,065 | | | $ | 44,877 | | | $ | 5,082,179 | | | $ | 178,055 | |
| | | | | | | | | | | | | | | | |
Capital | | | | | | | | | | | | | | | | |
Composition of Net Assets | | | | | | | | | | | | | | | | |
Par value of shares of beneficial interest | | $ | 14 | | | $ | 5 | | | $ | 230 | | | $ | 15 | |
Capital paid in excess of par value | | | 165,888 | | | | 56,524 | | | | 5,517,584 | | | | 255,766 | |
Accumulated net investment income (loss) | | | — | | | | (2 | ) | | | (14,016 | ) | | | (242 | ) |
Accumulated net realized gain (loss) | | | (1,830 | ) | | | (22,388 | ) | | | (1,448,204 | ) | | | (117,494 | ) |
Net unrealized appreciation (depreciation) of investments and foreign currencies | | | 43,993 | | | | 10,738 | | | | 1,026,585 | | | | 40,010 | |
| | | | | | | | | | | | | | | | |
Net Assets | | $ | 208,065 | | | $ | 44,877 | | | $ | 5,082,179 | | | $ | 178,055 | |
| | | | | | | | | | | | | | | | |
| | | | |
Class N Shares | | | | | | | | | | | | | | | | |
Net Assets | | $ | 26,876 | | | $ | 5,101 | | | $ | 2,689,417 | | | $ | 13,733 | |
Shares Outstanding | | | 1,866,337 | | | | 607,398 | | | | 123,062,605 | | | | 1,133,180 | |
Net Asset Value Per Share | | $ | 14.40 | | | $ | 8.40 | | | $ | 21.85 | | | $ | 12.12 | |
Class I Shares | | | | | | | | | | | | | | | | |
Net Assets | | $ | 181,189 | | | $ | 39,776 | | | $ | 2,392,762 | | | $ | 164,322 | |
Shares Outstanding | | | 12,342,787 | | | | 4,735,861 | | | | 107,093,147 | | | | 13,447,397 | |
Net Asset Value Per Share | | $ | 14.68 | | | $ | 8.40 | | | $ | 22.34 | | | $ | 12.22 | |
See accompanying Notes to Financial Statements.
December 31, 2010 | William Blair Funds 101 |
Statements of Operations
for the Year Ended December 31, 2010 (all amounts in thousands)
| | | | | | | | | | | | | | | | |
| | | Small-Mid Cap
Growth
Fund | | | Global
Growth
Fund | | | International
Growth
Fund | | | International
Equity Fund | |
Investment income | | | | | | | | | | | | | | | | |
Dividends | | $ | 983 | | | $ | 589 | | | $ | 105,119 | | | $ | 5,776 | |
Less foreign tax withheld | | | — | | | | (36 | ) | | | (7,831 | ) | | | (467 | ) |
Dividend income from Affiliated Fund | | | — | | | | — | | | | 1 | | | | — | |
Interest | | | 6 | | | | 1 | | | | 316 | | | | 10 | |
| | | | | | | | | | | | | | | | |
Total income | | | 989 | | | | 554 | | | | 97,605 | | | | 5,319 | |
Expenses | | | | | | | | | | | | | | | | |
Investment advisory fees | | | 1,631 | | | | 388 | | | | 45,848 | | | | 2,784 | |
Distribution fees | | | 60 | | | | 11 | | | | 6,276 | | | | 35 | |
Shareholder services fees | | | — | | | | 58 | | | | — | | | | — | |
Custodian fees | | | 43 | | | | 70 | | | | 786 | | | | 102 | |
Transfer agent fees | | | 34 | | | | 18 | | | | 423 | | | | 16 | |
Sub-transfer agent fees | | | | | | | | | | | | | | | | |
Class N | | | 28 | | | | 3 | | | | 2,543 | | | | 32 | |
Class I | | | 21 | | | | 1 | | | | 1,328 | | | | 254 | |
Professional fees | | | 32 | | | | 38 | | | | 194 | | | | 48 | |
Registration fees | | | 22 | | | | 44 | | | | 107 | | | | 36 | |
Shareholder reporting fees | | | 6 | | | | 4 | | | | 1,323 | | | | 7 | |
Trustee fees | | | 5 | | | | 1 | | | | 157 | | | | 10 | |
Other expenses | | | 9 | | | | 6 | | | | 124 | | | | 11 | |
| | | | | | | | | | | | | | | | |
Total expenses before waiver | | | 1,891 | | | | 642 | | | | 59,109 | | | | 3,335 | |
Expenses waived by the Advisor | | | (31 | ) | | | (139 | ) | | | — | | | | (218 | ) |
| | | | | | | | | | | | | | | | |
Net expenses | | | 1,860 | | | | 503 | | | | 59,109 | | | | 3,117 | |
| | | | | | | | | | | | | | | | |
Net investment income (loss) | | | (871 | ) | | | 51 | | | | 38,496 | | | | 2,202 | |
Realized and unrealized gain (loss) | | | | | | | | | | | | | | | | |
Net realized gain (loss) on transactions from: | | | | | | | | | | | | | | | | |
Investments | | | 22,299 | | | | 4,053 | | | | 670,020 | | | | 30,851 | |
Foreign currency transactions | | | — | | | | (64 | ) | | | 36,023 | | | | (320 | ) |
| | | | | | | | | | | | | | | | |
Total net realized gain (loss) | | | 22,299 | | | | 3,989 | | | | 706,043 | | | | 30,531 | |
Change in net unrealized appreciation (depreciation) of: | | | | | | | | | | | | | | | | |
Investments | | | 16,762 | | | | 3,531 | | | | 136,863 | | | | (21,776 | ) |
Foreign currency translations | | | — | | | | 2 | | | | (14,340 | ) | | | (22 | ) |
| | | | | | | | | | | | | | | | |
Total change in net unrealized appreciation (depreciation) | | | 16,762 | | | | 3,533 | | | | 122,523 | | | | (21,798 | ) |
| | | | | | | | | | | | | | | | |
Net increase (decrease) in net assets resulting from operations | | $ | 38,190 | | | $ | 7,573 | | | $ | 867,062 | | | $ | 10,935 | |
| | | | | | | | | | | | | | | | |
See accompanying Notes to Financial Statements.
102 Annual Report | December 31, 2010 |
Statements of Changes in Net Assets
for the Years Ended December 31, 2010 and 2009 (all amounts in thousands)
| | | | | | | | | | | | | | | | | | | | | | | | | | | | | | | | |
| | | Small-Mid
Cap Growth
Fund | | | Global
Growth
Fund | | | International
Growth
Fund | | | International
Equity
Fund | |
| | | 2010 | | | 2009 | | | 2010 | | | 2009 | | | 2010 | | | 2009 | | | 2010 | | | 2009 | |
Operations | | | | | | | | | | | | | | | | | | | | | | | | | | | | | | | | |
Net investment income (loss) | | $ | (871 | ) | | $ | (382 | ) | | $ | 51 | | | $ | 7 | | | $ | 38,496 | | | $ | 21,404 | | | $ | 2,202 | | | $ | 2,131 | |
Net realized gain (loss) on investments and foreign currency transactions | | | 22,299 | | | | (7,046 | ) | | | 3,989 | | | | (3,204 | ) | | | 706,043 | | | | (397,479 | ) | | | 30,531 | | | | (47,092 | ) |
Change in net unrealized appreciation (depreciation) on investments and foreign currency translation | | | 16,762 | | | | 47,865 | | | | 3,533 | | | | 14,318 | | | | 122,523 | | | | 1,657,928 | | | | (21,798 | ) | | | 112,766 | |
| | | | | | | | | | | | | | | | | | | | | | | | | | | | | | | | |
Net increase (decrease) in net assets resulting from operations | | | 38,190 | | | | 40,437 | | | | 7,573 | | | | 11,121 | | | | 867,062 | | | | 1,281,853 | | | | 10,935 | | | | 67,805 | |
Distributions to shareholders from | | | | | | | | | | | | | | | | | | | | | | | | | | | | | | | | |
Net investment income | | | — | | | | — | | | | (12 | ) | | | (3 | ) | | | (101,433 | ) | | | (31,541 | ) | | | (2,578 | ) | | | (1,449 | ) |
Net realized gain | | | — | | | | — | | | | — | | | | — | | | | — | | | | — | | | | — | | | | — | |
| | | | | | | | | | | | | | | | | | | | | | | | | | | | | | | | |
| | | — | | | | — | | | | (12 | ) | | | (3 | ) | | | (101,433 | ) | | | (31,541 | ) | | | (2,578 | ) | | | (1,449 | ) |
Capital stock transactions | | | | | | | | | | | | | | | | | | | | | | | | | | | | | | | | |
Net proceeds from sale of shares | | | 51,303 | | | | 52,642 | | | | 4,844 | | | | 4,434 | | | | 1,498,589 | | | | 1,361,082 | | | | 59,843 | | | | 87,167 | |
Shares issued in reinvestment of income dividends and capital gain distributions | | | — | | | | — | | | | 11 | | | | 3 | | | | 92,533 | | | | 28,646 | | | | 2,452 | | | | 1,387 | |
Less cost of shares redeemed | | | (28,256 | ) | | | (29,730 | ) | | | (5,826 | ) | | | (5,273 | ) | | | (1,747,980 | ) | | | (1,297,570 | ) | | | (190,765 | ) | | | (85,228 | ) |
| | | | | | | | | | | | | | | | | | | | | | | | | | | | | | | | |
Net increase (decrease) in net assets resulting from capital share transactions | | | 23,047 | | | | 22,912 | | | | (971 | ) | | | (836 | ) | | | (156,858 | ) | | | 92,158 | | | | (128,470 | ) | | | 3,326 | |
| | | | | | | | | | | | | | | | | | | | | | | | | | | | | | | | |
Increase (decrease) in net assets | | | 61,237 | | | | 63,349 | | | | 6,590 | | | | 10,282 | | | | 608,771 | | | | 1,342,470 | | | | (120,113 | ) | | | 69,682 | |
Net assets | | | | | | | | | | | | | | | | | | | | | | | | | | | | | | | | |
Beginning of year | | | 146,828 | | | | 83,479 | | | | 38,287 | | | | 28,005 | | | | 4,473,408 | | | | 3,130,938 | | | | 298,168 | | | | 228,486 | |
| | | | | | | | | | | | | | | | | | | | | | | | | | | | | | | | |
End of year | | $ | 208,065 | | | $ | 146,828 | | | $ | 44,877 | | | $ | 38,287 | | | $ | 5,082,179 | | | $ | 4,473,408 | | | $ | 178,055 | | | $ | 298,168 | |
| | | | | | | | | | | | | | | | | | | | | | | | | | | | | | | | |
Accumulated net investment income (loss) at the end of the year | | $ | — | | | $ | — | | | $ | (2 | ) | | $ | 10 | | | $ | (14,016 | ) | | $ | (13,777 | ) | | $ | (242 | ) | | $ | (39 | ) |
| | | | | | | | | | | | | | | | | | | | | | | | | | | | | | | | |
See accompanying Notes to Financial Statements.
December 31, 2010 | William Blair Funds 103 |
Statements of Assets and Liabilities
for the Year Ended December 31, 2010 (all amounts in thousands)
| | | | | | | | | | | | |
| | | International
Small Cap
Growth
Fund | | | Emerging
Markets
Growth
Fund | | | Emerging
Leaders
Growth
Fund | |
Assets | | | | | | | | | | | | |
Investments in securities, at cost | | $ | 515,337 | | | $ | 962,851 | | | $ | 77,904 | |
| | | | | | | | | | | | |
| | | |
Investments in securities, at value | | $ | 650,626 | | | $ | 1,247,599 | | | $ | 95,531 | |
Foreign currency, at value (cost $1,959; $1,558; $298) | | | 2,010 | | | | 1,610 | | | | 300 | |
Receivable for securities sold | | | 2,226 | | | | 4,731 | | | | 1,391 | |
Receivable for fund shares sold | | | 1,952 | | | | 360 | | | | 595 | |
Receivable from Advisor | | | — | | | | — | | | | 20 | |
Dividend and interest receivable | | | 1,322 | | | | 500 | | | | 21 | |
| | | | | | | | | | | | |
Total assets | | | 658,136 | | | | 1,254,800 | | | | 97,858 | |
Liabilities | | | | | | | | | | | | |
Payable for investment securities purchased | | | 10,331 | | | | 2,868 | | | | 2,830 | |
Payable for fund shares redeemed | | | 202 | | | | 15 | | | | — | |
Management fee payable | | | 531 | | | | 1,142 | | | | 86 | |
Distribution and shareholder services fee payable | | | 51 | | | | 36 | | | | 2 | |
Other accrued expenses | | | 70 | | | | 196 | | | | 39 | |
| | | | | | | | | | | | |
Total liabilities | | | 11,185 | | | | 4,257 | | | | 2,957 | |
| | | | | | | | | | | | |
Net Assets | | $ | 646,951 | | | $ | 1,250,543 | | | $ | 94,901 | |
| | | | | | | | | | | | |
Capital | | | | | | | | | | | | |
Composition of Net Assets | | | | | | | | | | | | |
Par value of shares of beneficial interest | | $ | 49 | | | $ | 78 | | | $ | 9 | |
Capital paid in excess of par value | | | 627,801 | | | | 994,772 | | | | 76,736 | |
Accumulated net investment income (loss) | | | (586 | ) | | | (12,327 | ) | | | (131 | ) |
Accumulated net realized gain (loss) | | | (115,660 | ) | | | (16,774 | ) | | | 665 | |
Net unrealized appreciation (depreciation) of investments and foreign currencies | | | 135,347 | | | | 284,794 | | | | 17,622 | |
| | | | | | | | | | | | |
Net Assets | | $ | 646,951 | | | $ | 1,250,543 | | | $ | 94,901 | |
| | | | | | | | | | | | |
| | | |
Class N Shares | | | | | | | | | | | | |
Net Assets | | $ | 21,916 | | | $ | 34,324 | | | $ | 53 | (a) |
Shares Outstanding | | | 1,677,391 | | | | 2,178,512 | | | | 5,119 | |
Net Asset Value Per Share | | $ | 13.07 | | | $ | 15.76 | | | $ | 10.34 | |
Class I Shares | | | | | | | | | | | | |
Net Assets | | $ | 349,679 | | | $ | 194,763 | | | $ | 16,332 | |
Shares Outstanding | | | 26,517,436 | | | | 12,271,314 | | | | 1,577,871 | |
Net Asset Value Per Share | | $ | 13.19 | | | $ | 15.87 | | | $ | 10.35 | |
| (a) | | The class commenced operations on May 3, 2010. |
See accompanying Notes to Financial Statements.
104 Annual Report | December 31, 2010 |
Statements of Operations
for the Year Ended December 31, 2010 (all amounts in thousands)
| | | | | | | | | | | | |
| | | International
Small Cap
Growth
Fund | | | Emerging
Markets
Growth
Fund | | | Emerging
Leaders
Growth
Fund | |
Investment income | | | | | | | | | | | | |
Dividends | | $ | 9,506 | | | $ | 19,206 | | | $ | 1,889 | |
Less foreign tax withheld | | | (564 | ) | | | (1,553 | ) | | | (167 | ) |
Interest | | | 91 | | | | 125 | | | | 1 | |
| | | | | | | | | | | | |
Total income | | | 9,033 | | | | 17,778 | | | | 1,723 | |
Expenses | | | | | | | | | | | | |
Investment advisory fees | | | 4,866 | | | | 12,197 | | | | 1,090 | |
Distribution fees | | | 46 | | | | 70 | | | | — | |
Shareholder services fees | | | 418 | | | | 302 | | | | 17 | |
Custodian fees | | | 153 | | | | 549 | | | | 138 | |
Transfer agent fees | | | 31 | | | | 51 | | | | 11 | |
Sub-transfer agent fees | | | | | | | | | | | | |
Class N | | | 12 | | | | 15 | | | | — | |
Class I | | | 57 | | | | 68 | | | | — | |
Professional fees | | | 52 | | | | 75 | | | | 36 | |
Registration fees | | | 75 | | | | 57 | | | | 44 | |
Shareholder reporting fees | | | 59 | | | | 25 | | | | 3 | |
Trustee fees | | | 15 | | | | 37 | | | | 4 | |
Other expenses | | | 14 | | | | 27 | | | | 10 | |
| | | | | | | | | | | | |
Total expenses before waiver | | | 5,798 | | | | 13,473 | | | | 1,353 | |
Expenses waived by the Advisor | | | — | | | | — | | | | (98 | ) |
| | | | | | | | | | | | |
Net expenses | | | 5,798 | | | | 13,473 | | | | 1,255 | |
| | | | | | | | | | | | |
Net investment income (loss) | | | 3,235 | | | | 4,305 | | | | 468 | |
Realized and unrealized gain (loss) | | | | | | | | | | | | |
Net realized gain (loss) on transactions from: | | | | | | | | | | | | |
Investments | | | 57,943 | | | | 248,631 | | | | 34,229 | |
Foreign currency transactions | | | (849 | ) | | | (3,290 | ) | | | (573 | ) |
| | | | | | | | | | | | |
Total net realized gain (loss) | | | 57,094 | | | | 245,341 | | | | 33,656 | |
Change in net unrealized appreciation (depreciation) of: | | | | | | | | | | | | |
Investments | | | 62,276 | | | | 13,573 | | | | (16,310 | ) |
Foreign currency translations | | | 39 | | | | (17 | ) | | | (5 | ) |
| | | | | | | | | | | | |
Total change in net unrealized appreciation (depreciation) | | | 62,315 | | | | 13,556 | | | | (16,315 | ) |
| | | | | | | | | | | | |
Net increase (decrease) in net assets resulting from operations | | $ | 122,644 | | | $ | 263,202 | | | $ | 17,809 | |
| | | | | | | | | | | | |
See accompanying Notes to Financial Statements.
December 31, 2010 | William Blair Funds 105 |
Statements of Changes in Net Assets
for the Years Ended December 31, 2010 and 2009 (all amounts in thousands)
| | | | | | | | | | | | | | | | | | | | | | | | |
| | | International
Small Cap
Growth
Fund | | | Emerging
Markets
Growth
Fund | | | Emerging
Leaders
Growth
Fund | |
| | | 2010 | | | 2009 | | | 2010 | | | 2009 | | | 2010 | | | 2009 | |
Operations | | | | | | | | | | | | | | | | | | | | | | | | |
Net investment income (loss) | | $ | 3,235 | | | $ | 1,001 | | | $ | 4,305 | | | $ | 3,476 | | | $ | 468 | | | $ | 507 | |
Net realized gain (loss) on investments and foreign currency transactions | | | 57,094 | | | | (30,308 | ) | | | 245,341 | | | | (59,561 | ) | | | 33,656 | | | | 3,205 | |
Change in net unrealized appreciation (depreciation) on investments and foreign currency translation | | | 62,315 | | | | 174,254 | | | | 13,556 | | | | 461,348 | | | | (16,315 | ) | | | 51,098 | |
| | | | | | | | | | | | | | | | | | | | | | | | |
Net increase (decrease) in net assets resulting from operations | | | 122,644 | | | | 144,947 | | | | 263,202 | | | | 405,263 | | | | 17,809 | | | | 54,810 | |
Distributions to shareholders from | | | | | | | | | | | | | | | | | | | | | | | | |
Net investment income | | | (2,781 | ) | | | (778 | ) | | | (13,461 | ) | | | (11,127 | ) | | | (255 | ) | | | (1,588 | ) |
Net realized gain | | | — | | | | — | | | | — | | | | — | | | | (505 | ) | | | — | |
| | | | | | | | | | | | | | | | | | | | | | | | |
| | | (2,781 | ) | | | (778 | ) | | | (13,461 | ) | | | (11,127 | ) | | | (760 | ) | | | (1,588 | ) |
Capital stock transactions | | | | | | | | | | | | | | | | | | | | | | | | |
Net proceeds from sale of shares | | | 222,392 | | | | 139,125 | | | | 357,761 | | | | 422,203 | | | | 14,224 | | | | 42,409 | |
Shares issued in reinvestment of income dividends and capital gain distributions | | | 2,417 | | | | 676 | | | | 12,072 | | | | 10,336 | | | | 681 | | | | 1,466 | |
Less cost of shares redeemed | | | (88,572 | ) | | | (185,107 | ) | | | (407,291 | ) | | | (174,003 | ) | | | (52,189 | ) | | | (28,637 | ) |
| | | | | | | | | | | | | | | | | | | | | | | | |
Net increase (decrease) in net assets resulting from capital share transactions | | | 136,237 | | | | (45,306 | ) | | | (37,458 | ) | | | 258,536 | | | | (37,284 | ) | | | 15,238 | |
| | | | | | | | | | | | | | | | | | | | | | | | |
Increase (decrease) in net assets | | | 256,100 | | | | 98,863 | | | | 212,283 | | | | 652,672 | | | | (20,235 | ) | | | 68,460 | |
Net assets | | | | | | | | | | | | | | | | | | | | | | | | |
Beginning of year | | | 390,851 | | | | 291,988 | | | | 1,038,260 | | | | 385,588 | | | | 115,136 | | | | 46,676 | |
| | | | | | | | | | | | | | | | | | | | | | | | |
End of year | | $ | 646,951 | | | $ | 390,851 | | | $ | 1,250,543 | | | $ | 1,038,260 | | | $ | 94,901 | | | $ | 115,136 | |
| | | | | | | | | | | | | | | | | | | | | | | | |
Accumulated net investment income (loss) at the end of the year | | $ | (586 | ) | | $ | (191 | ) | | $ | (12,327 | ) | | $ | (7,584 | ) | | $ | (131 | ) | | $ | (297 | ) |
| | | | | | | | | | | | | | | | | | | | | | | | |
See accompanying Notes to Financial Statements.
106 Annual Report | December 31, 2010 |
Statements of Assets and Liabilities
for the Year Ended December 31, 2010 (all amounts in thousands)
| | | | | | | | |
| | | Small Cap
Value
Fund | | | Mid Cap
Value
Fund | |
Assets | | | | | | | | |
Investments in securities, at cost | | $ | 139,995 | | | $ | 3,239 | |
| | | | | | | | |
| | |
Investments in securities, at value | | $ | 166,453 | | | $ | 3,429 | |
Receivable for securities sold | | | 25 | | | | — | |
Receivable for fund shares sold | | | 2,400 | | | | — | |
Receivable from Advisor | | | 27 | | | | 23 | |
Dividend and interest receivable | | | 143 | | | | 4 | |
| | | | | | | | |
Total assets | | | 169,048 | | | | 3,456 | |
Liabilities | | | | | | | | |
Payable for investment securities purchased | | | 4,096 | | | | — | |
Payable for fund shares redeemed | | | 270 | | | | — | |
Management fee payable | | | 146 | | | | 2 | |
Distribution and shareholder service fee payable | | | 7 | | | | — | |
Other accrued expenses | | | 30 | | | | 61 | |
| | | | | | | | |
Total liabilities | | | 4,549 | | | | 63 | |
| | | | | | | | |
Net Assets | | $ | 164,499 | | | $ | 3,393 | |
| | | | | | | | |
Capital | | | | | | | | |
Composition of Net Assets | | | | | | | | |
Par value of shares of beneficial interest | | $ | 12 | | | $ | 1 | |
Capital paid in excess of par value | | | 137,326 | | | | 3,183 | |
Accumulated net investment income (loss) | | | 127 | | | | 5 | |
Accumulated net realized gain (loss) | | | 576 | | | | 14 | |
Net unrealized appreciation (depreciation) of investments and foreign currencies | | | 26,458 | | | | 190 | |
| | | | | | | | |
Net Assets | | $ | 164,499 | | | $ | 3,393 | |
| | | | | | | | |
| | |
Class N Shares | | | | | | | | |
Net Assets | | $ | 34,285 | | | $ | 4 | |
Shares Outstanding | | | 2,501,260 | | | | 396 | |
Net Asset Value Per Share | | $ | 13.71 | | | $ | 10.75 | |
Class I Shares | | | | | | | | |
Net Assets | | $ | 130,214 | | | $ | 3,389 | |
Shares Outstanding | | | 9,345,449 | | | | 314,914 | |
Net Asset Value Per Share | | $ | 13.93 | | | $ | 10.76 | |
See accompanying Notes to Financial Statements.
December 31, 2010 | William Blair Funds 107 |
Statements of Operations
for the Year Ended December 31, 2010 (all amounts in thousands)
| | | | | | | | |
| | | Small Cap
Value
Fund | | | Mid Cap
Value
Fund(a) | |
Investment income | | | | | | | | |
Dividends | | $ | 1,553 | | | $ | 43 | |
Interest | | | 2 | | | | — | |
| | | | | | | | |
Total income | | | 1,555 | | | | 43 | |
Expenses | | | | | | | | |
Investment advisory fees | | | 1,117 | | | | 15 | |
Distribution fees | | | 31 | | | | — | |
Custodian fees | | | 50 | | | | 25 | |
Transfer agent fees | | | 21 | | | | 6 | |
Sub-transfer agent fees | | | | | | | | |
Class N | | | 9 | | | | — | |
Class I | | | 37 | | | | — | |
Professional fees | | | 25 | | | | 18 | |
Registration fees | | | 33 | | | | 41 | |
Shareholder reporting fees | | | 16 | | | | — | |
Trustee fees | | | 2 | | | | — | |
Other expenses | | | 8 | | | | — | |
| | | | | | | | |
Total expenses before waiver | | | 1,349 | | | | 105 | |
Expenses waived by the Advisor | | | (205 | ) | | | (88 | ) |
| | | | | | | | |
Net expenses | | | 1,144 | | | | 17 | |
| | | | | | | | |
Net investment income (loss) | | | 411 | | | | 26 | |
Realized and unrealized gain (loss) | | | | | | | | |
Net realized gain (loss) on transactions from investments | | | 9,981 | | | | 19 | |
| | | | | | | | |
Change in net unrealized appreciation (depreciation) of investments | | | 20,721 | | | | 190 | |
| | | | | | | | |
Net increase (decrease) in net assets resulting from operations | | $ | 31,113 | | | $ | 235 | |
| | | | | | | | |
| (a) | | For the period from May 3, 2010 (Commencement of Operations) to December 31, 2010. |
See accompanying Notes to Financial Statements.
108 Annual Report | December 31, 2010 |
Statements of Changes in Net Assets
for the Years Ended December 31, 2010 and 2009 (all amounts in thousands)
| | | | | | | | | | | | |
| | | Small Cap
Value
Fund | | | Mid Cap
Value
Fund | |
| | | 2010 | | | 2009 | | | 2010(a) | |
Operations | | | | | | | | | | | | |
Net investment income (loss) | | $ | 411 | | | $ | 347 | | | $ | 26 | |
Net realized gain (loss) on investments and foreign currency transactions | | | 9,981 | | | | (3,891 | ) | | | 19 | |
Change in net unrealized appreciation (depreciation) on investments and foreign currency translation | | | 20,721 | | | | 14,493 | | | | 190 | |
| | | | | | | | | | | | |
Net increase (decrease) in net assets resulting from operations | | | 31,113 | | | | 10,949 | | | | 235 | |
Distributions to shareholders from | | | | | | | | | | | | |
Net investment income | | | (404 | ) | | | (213 | ) | | | (21 | ) |
Net realized gain | | | — | | | | — | | | | (5 | ) |
| | | | | | | | | | | | |
| | | (404 | ) | | | (213 | ) | | | (26 | ) |
Capital stock transactions | | | | | | | | | | | | |
Net proceeds from sale of shares | | | 92,468 | | | | 14,901 | | | | 3,163 | |
Shares issued in reinvestment of income dividends and capital gain distributions | | | 354 | | | | 170 | | | | 26 | |
Less cost of shares redeemed | | | (13,891 | ) | | | (7,197 | ) | | | (5 | ) |
| | | | | | | | | | | | |
Net increase (decrease) in net assets resulting from capital share transactions | | | 78,931 | | | | 7,874 | | | | 3,184 | |
| | | | | | | | | | | | |
Increase (decrease) in net assets | | | 109,640 | | | | 18,610 | | | | 3,393 | |
Net assets | | | | | | | | | | | | |
Beginning of year | | | 54,859 | | | | 36,249 | | | | — | |
| | | | | | | | | | | | |
End of year | | $ | 164,499 | | | $ | 54,859 | | | $ | 3,393 | |
| | | | | | | | | | | | |
Accumulated net investment income (loss) at the end of the year | | $ | 127 | | | $ | 18 | | | $ | 5 | |
| | | | | | | | | | | | |
(a) For the period from May 3, 2010 (Commencement of Operations) to December 31, 2010.
See accompanying Notes to Financial Statements.
December 31, 2010 | William Blair Funds 109 |
Statements of Assets and Liabilities
for the Year Ended December 31, 2010 (all amounts in thousands)
| | | | | | | | | | | | | | | | |
| | | Bond
Fund | | | Income
Fund | | | Low
Duration
Fund | | | Ready
Reserves
Fund | |
Assets | | | | | | | | | | | | | | | | |
Investments in securities, at cost | | $ | 181,324 | | | $ | 105,927 | | | $ | 141,627 | | | $ | 1,215,281 | |
| | | | | | | | | | | | | | | | |
| | | | |
Investments in securities, at value | | $ | 191,127 | | | $ | 111,782 | | | $ | 141,527 | | | $ | 1,215,281 | |
Receivable for fund shares sold | | | 36 | | | | 527 | | | | 1,840 | | | | — | |
Receivable from Advisor | | | 7 | | | | — | | | | 36 | | | | 465 | |
Interest receivable | | | 1,891 | | | | 1,119 | | | | 436 | | | | 2,876 | |
| | | | | | | | | | | | | | | | |
Total assets | | | 193,061 | | | | 113,428 | | | | 143,839 | | | | 1,218,622 | |
Liabilities | | | | | | | | | | | | | | | | |
Payable for investment securities purchased | | | — | | | | — | | | | — | | | | 1,424 | |
Payable for fund shares redeemed | | | 178 | | | | 60 | | | | 278 | | | | 5 | |
Management fee payable | | | 49 | | | | 46 | | | | 35 | | | | 249 | |
Distribution fee payable | | | 20 | | | | 5 | | | | 13 | | | | 362 | |
Other accrued expenses | | | 38 | | | | 40 | | | | 43 | | | | 39 | |
| | | | | | | | | | | | | | | | |
Total liabilities | | | 285 | | | | 151 | | | | 369 | | | | 2,079 | |
| | | | | | | | | | | | | | | | |
Net Assets | | $ | 192,776 | | | $ | 113,277 | | | $ | 143,470 | | | $ | 1,216,543 | |
| | | | | | | | | | | | | | | | |
Capital | | | | | | | | | | | | | | | | |
Composition of Net Assets | | | | | | | | | | | | | | | | |
Par value of shares of beneficial interest | | $ | 18 | | | $ | 12 | | | $ | 14 | | | $ | 1,217 | |
Capital paid in excess of par value | | | 182,717 | | | | 149,329 | | | | 144,660 | | | | 1,215,263 | |
Accumulated net investment income (loss) | | | 1 | | | | — | | | | — | | | | 86 | |
Accumulated net realized gain (loss) . | | | 237 | | | | (41,919 | ) | | | (1,104 | ) | | | (23 | ) |
Net unrealized appreciation (depreciation) of investments and foreign currencies | | | 9,803 | | | | 5,855 | | | | (100 | ) | | | — | |
| | | | | | | | | | | | | | | | |
Net Assets | | $ | 192,776 | | | $ | 113,277 | | | $ | 143,470 | | | $ | 1,216,543 | |
| | | | | | | | | | | | | | | | |
| | | | |
Class N Shares | | | | | | | | | | | | | | | | |
Net Assets | | $ | 4,479 | | | $ | 35,755 | | | $ | 6,937 | | | $ | 1,216,543 | |
Shares Outstanding | | | 418,762 | | | | 3,878,036 | | | | 701,013 | | | | 1,216,599,981 | |
Net Asset Value Per Share | | $ | 10.70 | | | $ | 9.22 | | | $ | 9.90 | | | $ | 1.00 | |
Class I Shares | | | | | | | | | | | | | | | | |
Net Assets | | $ | 147,807 | | | $ | 77,522 | | | $ | 88,568 | | | | | |
Shares Outstanding | | | 13,953,785 | | | | 8,471,402 | | | | 8,951,205 | | | | | |
Net Asset Value Per Share | | $ | 10.59 | | | $ | 9.15 | | | $ | 9.89 | | | | | |
See accompanying Notes to Financial Statements.
110 Annual Report | December 31, 2010 |
Statements of Operations
for the Year Ended December 31, 2010 (all amounts in thousands)
| | | | | | | | | | | | | | | | |
| | | Bond
Fund | | | Income
Fund | | | Low
Duration
Fund | | | Ready
Reserves
Fund | |
Investment income | | | | | | | | | | | | | | | | |
Interest | | $ | 8,921 | | | $ | 5,431 | | | $ | 2,557 | | | $ | 3,203 | |
| | | | | | | | | | | | | | | | |
Total income | | | 8,921 | | | | 5,431 | | | | 2,557 | | | | 3,203 | |
Expenses | | | | | | | | | | | | | | | | |
Investment advisory fees | | | 546 | | | | 570 | | | | 381 | | | | 3,022 | |
Distribution fees | | | 6 | | | | 56 | | | | 7 | | | | — | |
Shareholder services fees | | | 228 | | | | — | | | | 127 | | | | 4,409 | |
Custodian fees | | | 53 | | | | 51 | | | | 52 | | | | 24 | |
Transfer agent fees | | | 22 | | | | 24 | | | | 15 | | | | 30 | |
Sub-transfer agent fees | | | | | | | | | | | | | | | | |
Class N | | | — | | | | 30 | | | | — | | | | — | |
Class I | | | 4 | | | | 3 | | | | — | | | | — | |
Professional fees | | | 32 | | | | 32 | | | | 28 | | | | 67 | |
Registration fees | | | 48 | | | | 31 | | | | 111 | | | | 27 | |
Shareholder reporting fees | | | 3 | | | | 12 | | | | 5 | | | | 29 | |
Trustee fees | | | 5 | | | | 4 | | | | 3 | | | | 46 | |
Other expenses | | | 13 | | | | 5 | | | | 11 | | | | 82 | |
| | | | | | | | | | | | | | | | |
Total expenses before waiver | | | 960 | | | | 818 | | | | 740 | | | | 7,736 | |
Expenses waived by the Advisor | | | (90 | ) | | | — | | | | (98 | ) | | | (4,659 | ) |
| | | | | | | | | | | | | | | | |
Net expenses | | | 870 | | | | 818 | | | | 642 | | | | 3,077 | |
| | | | | | | | | | | | | | | | |
Net investment income (loss) | | | 8,051 | | | | 4,613 | | | | 1,915 | | | | 126 | |
Realized and unrealized gain (loss) | | | | | | | | | | | | | | | | |
Net realized gain (loss) on transactions from investments | | | 2,212 | | | | 2,316 | | | | (60 | ) | | | — | |
| | | | | | | | | | | | | | | | |
Change in net unrealized appreciation (depreciation) of investments | | | 3,290 | | | | 202 | | | | 468 | | | | — | |
| | | | | | | | | | | | | | | | |
Net increase (decrease) in net assets resulting from operations | | $ | 13,553 | | | $ | 7,131 | | | $ | 2,323 | | | $ | 126 | |
| | | | | | | | | | | | | | | | |
See accompanying Notes to Financial Statements.
December 31, 2010 | William Blair Funds 111 |
Statements of Changes in Net Assets
for the Years Ended December 31, 2010 and 2009 (all amounts in thousands)
| | | | | | | | | | | | | | | | | | | | | | | | | | | | | | | | |
| | | Bond
Fund | | | Income
Fund | | | Low
Duration
Fund | | | Ready
Reserves
Fund | |
| | | 2010 | | | 2009 | | | 2010 | | | 2009 | | | 2010 | | | 2009(a) | | | 2010 | | | 2009 | |
Operations | | | | | | | | | | | | | | | | | | | | | | | | | | | | | | | | |
Net investment income (loss) | | $ | 8,051 | | | $ | 6,076 | | | $ | 4,613 | | | $ | 5,749 | | | $ | 1,915 | | | $ | 78 | | | $ | 126 | | | $ | 1,639 | |
Net realized gain (loss) on investments and foreign currency transactions | | | 2,212 | | | | 284 | | | | 2,316 | | | | (4,058 | ) | | | (60 | ) | | | — | | | | — | | | | — | |
Change in net unrealized appreciation (depreciation) on investments and foreign currency translation | | | 3,290 | | | | 7,229 | | | | 202 | | | | 9,909 | | | | 468 | | | | (568 | ) | | | — | | | | — | |
| | | | | | | | | | | | | | | | | | | | | | | | | | | | | | | | |
Net increase (decrease) in net assets resulting from operations | | | 13,553 | | | | 13,589 | | | | 7,131 | | | | 11,600 | | | | 2,323 | | | | (490 | ) | | | 126 | | | | 1,639 | |
Distributions to shareholders from | | | | | | | | | | | | | | | | | | | | | | | | | | | | | | | | |
Net investment income | | | (8,566 | ) | | | (6,213 | ) | | | (5,134 | ) | | | (6,533 | ) | | | (2,958 | ) | | | (86 | ) | | | (126 | ) | | | (1,639 | ) |
Net realized gain | | | (494 | ) | | | — | | | | — | | | | — | | | | — | | | | — | | | | — | | | | — | |
| | | | | | | | | | | | | | | | | | | | | | | | | | | | | | | | |
| | | (9,060 | ) | | | (6,213 | ) | | | (5,134 | ) | | | (6,533 | ) | | | (2,958 | ) | | | (86 | ) | | | (126 | ) | | | (1,639 | ) |
Capital stock transactions | | | | | | | | | | | | | | | | | | | | | | | | | | | | | | | | |
Net proceeds from sale of shares | | | 90,709 | | | | 77,912 | | | | 15,385 | | | | 16,970 | | | | 149,882 | | | | 97,472 | | | | 670,783 | | | | 638,552 | |
Shares issued in reinvestment of income dividends and capital gain distributions | | | 6,013 | | | | 4,029 | | | | 4,350 | | | | 5,431 | | | | 2,297 | | | | 37 | | | | 126 | | | | 1,710 | |
Less cost of shares redeemed | | | (55,783 | ) | | | (16,586 | ) | | | (26,063 | ) | | | (50,295 | ) | | | (103,208 | ) | | | (1,799 | ) | | | (807,267 | ) | | | (1,128,550 | ) |
| | | | | | | | | | | | | | | | | | | | | | | | | | | | | | | | |
Net increase (decrease) in net assets resulting from capital share transactions | | | 40,939 | | | | 65,355 | | | | (6,328 | ) | | | (27,894 | ) | | | 48,971 | | | | 95,710 | | | | (136,358 | ) | | | (488,288 | ) |
| | | | | | | | | | | | | | | | | | | | | | | | | | | | | | | | |
Increase (decrease) in net assets | | | 45,432 | | | | 72,731 | | | | (4,331 | ) | | | (22,827 | ) | | | 48,336 | | | | 95,134 | | | | (136,358 | ) | | | (488,288 | ) |
Net assets | | | | | | | | | | | | | | | | | | | | | | | | | | | | | | | | |
Beginning of year | | | 147,344 | | | | 74,613 | | | | 117,608 | | | | 140,435 | | | | 95,134 | | | | — | | | | 1,352,901 | | | | 1,841,189 | |
| | | | | | | | | | | | | | | | | | | | | | | | | | | | | | | | |
End of year | | $ | 192,776 | | | $ | 147,344 | | | $ | 113,277 | | | $ | 117,608 | | | $ | 143,470 | | | $ | 95,134 | | | $ | 1,216,543 | | | $ | 1,352,901 | |
| | | | | | | | | | | | | | | | | | | | | | | | | | | | | | | | |
Accumulated net investment income (loss) at the end of the year | | $ | 1 | | | $ | — | | | $ | — | | | $ | — | | | $ | — | | | $ | — | | | $ | 86 | | | $ | 84 | |
| | | | | | | | | | | | | | | | | | | | | | | | | | | | | | | | |
| (a) | For the period from December 1, 2009 (Commencement of Operations) to December 31, 2009. |
See accompanying Notes to Financial Statements.
112 Annual Report | December 31, 2010 |
Notes to Financial Statements
(1) Significant Accounting Policies
The following is a summary of William Blair Funds’ (the “Fund”) significant accounting policies in effect during the year covered by the financial statements, which are in accordance with U.S. generally accepted accounting principles.
(a) Description of the Fund
William Blair Funds is a diversified mutual fund registered under the Investment Company Act of 1940 (the “1940 Act”), as amended, as an open-end management investment company. The Fund currently consists of the following nineteen portfolios (the “Portfolios”), each with its own investment objective and policies. For each portfolio, the number of shares authorized is unlimited.
| | |
Equity Portfolios Growth Large Cap Growth Small Cap Growth Mid Cap Growth Small-Mid Cap Growth Small Cap Value Mid Cap Value Global Equity Portfolio Global Growth | | International Equity Portfolios International Growth International Equity Institutional International Growth Institutional International Equity International Small Cap Growth Emerging Markets Growth Emerging Leaders Growth Fixed-Income Portfolios Bond Income Low Duration Money Market Portfolio Ready Reserves |
| |
| |
| |
| |
| |
| |
| |
| |
| |
| |
| |
| |
| |
The investment objectives of the Portfolios are as follows:
| | |
Equity | | Long-term capital appreciation. |
Global Equity | | Long-term capital appreciation. |
International Equity | | Long-term capital appreciation. |
Fixed-Income | | High level of current income with relative stability of principal.
(Maximize total return—Low Duration) |
Money Market | | Current income, a stable share price and daily liquidity. |
The Institutional International Growth Portfolio, the Institutional International Equity Portfolio and the Institutional Class of the International Small Cap Growth Portfolio, the Emerging Markets Growth Portfolio, the Emerging Leaders Growth Portfolio, the Bond Portfolio and the Low Duration Portfolio issue a separate report.
(b) Share Classes
Three different classes of shares currently exist: N, I and Institutional. This report includes financial highlight information for Classes N and I. The table below describes the Class N shares and the Class I shares covered by this report:
| | |
Class | | Description |
| N | | Class N shares are sold to the general public, either directly through the Fund’s distributor or through a select number of financial intermediaries. Class N shares are sold without any sales load, and carry an annual 12b-1 distribution fee (0.25% for the Equity, Global Equity and International Equity Portfolios and 0.15% for the Fixed-Income Portfolios) or a service fee (0.35% for the Money Market Portfolio), a Sub-transfer agent expense which is not a fixed rate and may vary by Portfolio and class, and an annual shareholder administration fee (0.15% for the Global Growth Portfolio, the International Small Cap Growth Portfolio, the Emerging Markets Growth Portfolio, the Emerging Leaders Growth Portfolio, the Bond Portfolio and the Low Duration Portfolio). |
| I | | Class I shares are sold to a limited group of investors. They do not carry any sales load or distribution fees and generally have lower ongoing expenses than the Class N shares. Class I shares have a Sub-transfer agent expense which is not a fixed rate and may vary by Portfolio and class and the Global Growth Portfolio, the International Small Cap Growth Portfolio, the Emerging Markets Growth Portfolio, the Emerging Leaders Growth Portfolio, the Bond Portfolio and the Low Duration Portfolio carry an annual shareholder administration fee of 0.15%. |
December 31, 2010 | William Blair Funds 113 |
Sub-transfer: The Portfolios may reimburse the Advisor for fees paid to intermediaries such as banks, broker-dealers, financial advisors or other financial institutions for sub-administration, sub-transfer agency and other services provided to investors whose shares are held of record in omnibus, other group accounts, retirement plans or accounts traded through registered securities clearing agents. These fees may vary based on, for example, the nature of services provided, but generally range up to 0.15% of the assets of the class serviced or maintained by the intermediary.
Investment income, realized and unrealized gains and losses, and certain Portfolio level expenses and expense reductions, if any, are allocated based on the relative net assets of each class, except for certain class specific expenses, which are charged directly to the appropriate class. Differences in class expenses may result in the payment of different per share dividends by class. All share classes of the Portfolios have equal rights with respect to voting subject to class specific arrangements.
(c) Investment Valuation
The market value of domestic equity securities is determined by valuing securities traded on national securities markets or in the over-the-counter markets at the last sale price or, if applicable, the official closing price or, in the absence of a recent sale on the date of determination, at the latest bid price.
The value of foreign equity securities is generally determined based upon the last sale price on the foreign exchange or market on which it is primarily traded and in the currency of that market as of the close of the appropriate exchange or, if there have been no sales during that day, at the latest bid price. The Board of Trustees has determined that the passage of time between when the foreign exchanges or markets close and when the Portfolios compute their net asset values could cause the value of foreign equity securities to no longer be representative or accurate and, as a result, may necessitate that such securities be fair valued. Accordingly, for foreign equity securities, the Portfolios may use an independent pricing service to fair value price the security as of the close of regular trading on the New York Stock Exchange. As a result, a Portfolio’s value for a security may be different from the last sale price (or the latest bid price).
Fixed-income securities are valued by using market quotations or independent pricing services that use either prices provided by market-makers or matrixes that produce estimates of market values obtained from yield data relating to instruments or securities with similar characteristics.
Other securities, and all other assets, including securities for which a market price is not available or is deemed unreliable, (e.g., securities affected by unusual or extraordinary events, such as natural disasters or securities affected by market or economic events, such as bankruptcy filings), or the value of which is affected by a significant valuation event, are valued at a fair value as determined in good faith by, or under the direction of, the Board of Trustees and in accordance with the Fund’s Valuation Procedures. The value of fair valued securities may be different from the last sale price (or the latest bid price), and there is no guarantee that a fair valued security will be sold at the price at which a Portfolio is carrying the security.
Investments in other funds are valued at the underlying fund’s net asset value on the date of valuation. Securities held in the Ready Reserves Portfolio are valued at amortized cost, which approximates market value.
As of December 31, 2010, there were securities held in the Small Cap Growth, International Growth, International Small Cap Growth, Emerging Markets Growth, Bond and Income Portfolios requiring fair valuation pursuant to the Funds’ Valuation Procedures.
(d) Investment income and transactions
Dividend income is recorded on the ex-dividend date, except for those dividends from certain foreign securities that are recorded when the information is available.
Interest income is recorded on an accrual basis, adjusted for amortization of premium or discount. Variable rate bonds and floating rate notes earn interest at coupon rates that fluctuate at specific time intervals. The interest rates shown in the Portfolio of Investments for the Bond, Income, Low Duration and Ready Reserves Portfolios were the rates in effect on December 31, 2010. Put bonds may be redeemed at the discretion of the holder on specified dates prior to maturity.
Premiums and discounts are accreted and amortized on a straight-line basis for short-term investments and on an effective interest method for long-term investments.
Paydown gains and losses on mortgage and asset-backed securities are treated as an adjustment to interest income. For the year ended December 31, 2010, the Bond, Income and Low Duration Portfolios recognized a reduction of interest income and a decrease of net realized loss of $(517), $(517) and $(1,043), respectively (in thousands). This reclassification had no effect on the net asset value or the net assets of the Portfolios.
114 Annual Report | December 31, 2010 |
The Funds do not isolate that portion of the results of operations resulting from changes in foreign exchange rates on investments from the fluctuations arising from changes in market prices of securities held. Such fluctuations are included with the net realized and unrealized gain or loss from investments.
Reported net realized foreign currency gains or losses arise from disposition of foreign currency, the difference in the foreign exchange rates between the trade and settlement dates on securities transactions, and the difference between the amounts of dividends, interest and foreign withholding taxes recorded on the ex-date or accrual date and the U.S. dollar equivalent of the amounts actually received or paid. Net unrealized foreign exchange gains and losses arise from changes (due to the changes in the exchange rate) in the value of foreign currency and other assets and liabilities denominated in foreign currencies held at period end.
Security and shareholder transactions are accounted for no later than one business day following the trade date. However, for financial reporting purposes, security and shareholder transactions are accounted for on the trade date of the last business day of the reporting period. Realized gains and losses from securities transactions are recognized on a specifically identified cost basis.
Awards from class action litigation may be recorded as a reduction of cost. If the Portfolios no longer own the applicable securities, the proceeds are recorded as realized gains.
(e) Share Valuation and Dividends to Shareholders
Shares are sold and redeemed on a continuous basis at net asset value. The net asset value per share is determined separately for each class by dividing the Portfolio’s net assets attributable to that class by the number of shares of the class outstanding as of the close of regular trading on the New York Stock Exchange, which is generally 4:00 p.m. Eastern time, on each day the Exchange is open. Redemption fees may be applicable to redemptions or exchanges within 60 days of purchase. For both Class N and Class I shares, the William Blair domestic equity portfolios assess a 1% redemption fee on shares sold or exchanged that have been owned 60 days or less and the William Blair global equity and international equity portfolios assess a 2% redemption fee on shares sold or exchanged that have been owned 60 days or less as disclosed within the Fund’s Prospectus. The redemption fees collected by the Portfolio are netted against the amount of redemptions for presentation on the Statement of Changes in Net Assets.
The redemption fees collected by the Portfolios were as follows (in thousands):
| | | | | | | | |
| | | Year Ended
December 31,
2010 | | | Year Ended
December 31,
2009 | |
Growth | | $ | 10 | | | $ | 3 | |
Large Cap Growth | | | 1 | | | | — | |
Small Cap Growth | | | 78 | | | | 59 | |
Mid Cap Growth | | | 2 | | | | — | |
Small-Mid Cap Growth | | | — | | | | 1 | |
Global Growth | | | — | | | | — | |
International Growth | | | 149 | | | | 130 | |
International Equity | | | 7 | | | | 7 | |
International Small Cap Growth | | | 3 | | | | 8 | |
Emerging Markets Growth | | | 18 | | | | 9 | |
Emerging Leaders Growth | | | — | | | | — | |
Small Cap Value | | | 20 | | | | — | |
Mid Cap Value | | | — | | | | N/A | |
Dividends from net investment income, if any, of the Growth, Large Cap Growth, Small Cap Growth, Mid Cap Growth, Small-Mid Cap Growth, Global Growth, International Growth, International Equity, International Small Cap Growth, Emerging Markets Growth, Emerging Leaders Growth, Small Cap Value and Mid Cap Value Portfolios are declared and paid at least annually. At December 31, 2010, dividends from the Income and Bond Portfolio are declared and paid monthly. Effective April 16, 2011, dividends from the Income and Bond Portfolio will be declared daily and paid monthly. Dividends from the Low Duration and Ready Reserves Portfolios are declared daily and paid monthly. Capital gain distributions, if any, are declared and paid at least annually in December. Dividends payable to shareholders are recorded on the ex-dividend date.
December 31, 2010 | William Blair Funds 115 |
(f) Foreign Currency Translation and Forward Foreign Currency Contracts
The Global Growth, International Growth, International Equity, International Small Cap Growth, Emerging Markets Growth and Emerging Leaders Growth Portfolios may invest in securities denominated in foreign currencies. As such, assets and liabilities denominated in foreign currencies are translated into U.S. dollar amounts at the current exchange rate on the date of valuation. The values of foreign investments, open forward foreign currency contracts, and cash denominated in foreign currencies are translated into U.S. dollars using a spot market rate of exchange as of the time of the determination of each Portfolio’s Net Asset Value, typically 4:00 p.m. Eastern time on days when there is regular trading on the New York Stock Exchange. Payables and receivables for securities transactions, dividends, interest income and tax reclaims are translated into U.S. dollars using a spot market rate of exchange as of 4:00 p.m. Eastern time. Settlement of purchases and sales and dividend and interest receipts are translated into U.S. dollars using a spot market rate of exchange as of 11:00 a.m. Eastern time.
(g) Income Taxes
Each Portfolio intends to comply with the provisions of Subchapter M of the Internal Revenue Code available to regulated investment companies. Each portfolio intends to make the requisite distributions of income and capital gains to its shareholders sufficient to relieve it from all, or substantially all, federal income and excise taxes. No provision for federal income and excise taxes has been made.
The Global Growth, International Growth, International Equity, International Small Cap Growth, Emerging Markets Growth and Emerging Leaders Growth Portfolios may be subject to a tax imposed on net realized gains on securities of certain foreign countries.
Each Portfolio is subject to the provisions of Accounting Standards Codification (ASC) 740 Income Taxes. ASC 740 provides guidance for how uncertain tax positions should be recognized, measured, presented and disclosed in the financial statements. Management has evaluated the implications of ASC 740 and all of the uncertain tax positions of the Portfolios and has determined that no liability is required to be recorded in the financial statements.
The statute of limitations on the Funds’ tax returns for each of the tax years in the four year period ended December 31, 2010, remains open and the returns are subject to examination.
The Global Growth, International Growth, International Equity, International Small Cap Growth, Emerging Markets Growth and Emerging Leaders Growth Portfolios have elected to mark-to-market their investments in Passive Foreign Investment Companies (“PFICs”) for federal income tax purposes. The Portfolios also treat the deferred loss associated with current and prior year wash sales as an adjustment to the cost of investments for tax purposes. The cost of investments for federal income tax purposes and related gross unrealized appreciation/(depreciation) and net unrealized appreciation/(depreciation) at December 31, 2010, were as follows (in thousands):
| | | | | | | | | | | | | | | | |
Portfolio | | Cost of
Investments | | | Gross
Unrealized
Appreciation | | | Gross
Unrealized
Depreciation | | | Net
Unrealized
Appreciation/
(Depreciation) | |
Growth | | $ | 422,677 | | | $ | 103,970 | | | $ | 3,403 | | | $ | 100,567 | |
Large Cap Growth | | | 24,457 | | | | 7,409 | | | | — | | | | 7,409 | |
Small Cap Growth | | | 755,634 | | | | 178,728 | | | | 56,004 | | | | 122,724 | |
Mid Cap Growth | | | 78,214 | | | | 23,327 | | | | 513 | | | | 22,814 | |
Small-Mid Cap Growth | | | 165,140 | | | | 42,653 | | | | 891 | | | | 41,762 | |
Global Growth | | | 34,140 | | | | 10,824 | | | | 119 | | | | 10,705 | |
International Growth | | | 4,117,710 | | | | 1,051,316 | | | | 71,114 | | | | 980,202 | |
International Equity | | | 136,922 | | | | 40,081 | | | | 1,747 | | | | 38,334 | |
International Small Cap Growth | | | 524,436 | | | | 131,722 | | | | 5,532 | | | | 126,190 | |
Emerging Markets Growth | | | 986,045 | | | | 265,176 | | | | 3,622 | | | | 261,554 | |
Emerging Leaders Growth | | | 78,887 | | | | 17,216 | | | | 572 | | | | 16,644 | |
Small Cap Value | | | 140,909 | | | | 25,823 | | | | 279 | | | | 25,544 | |
Mid Cap Value | | | 3,241 | | | | 246 | | | | 58 | | | | 188 | |
Bond | | | 181,324 | | | | 10,728 | | | | 925 | | | | 9,803 | |
Income | | | 106,075 | | | | 6,507 | | | | 800 | | | | 5,707 | |
Low Duration | | | 141,627 | | | | 430 | | | | 530 | | | | (100 | ) |
Ready Reserves | | | 1,215,281 | | | | — | | | | — | | | | — | |
116 Annual Report | December 31, 2010 |
The timing and characterization of certain income and capital gain distributions are determined annually in accordance with federal income tax regulations that may differ from U.S. generally accepted accounting principles. As a result, net investment income or loss and net realized gain or loss for a reporting period may differ from the amount distributed during such period. In addition, the Portfolios may periodically record reclassifications among certain capital accounts to reflect differences between financial reporting and income tax basis distributions. The reclassifications were reported in order to reflect the tax treatment for certain permanent differences that exist between income tax regulations and U.S. generally accepted accounting principles. The reclassifications generally relate to net operating losses, Section 988 currency gains and losses, PFICs gains and losses, recharacterization of dividends received from investments in REITs, expired capital loss carryforwards and redemptions in-kind. These reclassifications have no impact on the net asset values of the Portfolios. Accordingly, at December 31, 2010, the following reclassifications were recorded (in thousands):
| | | | | | | | | | | | |
Portfolio | | Accumulated Net
Investment
Income (Loss) | | | Accumulated
Net Realized
Gain/(Loss) | | | Capital
Paid in Excess
of Par Value | |
Growth | | $ | — | | | $ | — | | | $ | — | |
Large Cap Growth | | | — | | | | 472 | | | | (472 | ) |
Small Cap Growth | | | 7,283 | | | | (6,138 | ) | | | (1,145 | ) |
Mid Cap Growth | | | 147 | | | | — | | | | (147 | ) |
Small-Mid Cap Growth | | | 871 | | | | — | | | | (871 | ) |
Global Growth | | | (51 | ) | | | 60 | | | | (9 | ) |
International Growth | | | 62,698 | | | | (62,698 | ) | | | — | |
International Equity | | | 173 | | | | (163 | ) | | | (10 | ) |
International Small Cap Growth | | | (849 | ) | | | 849 | | | | — | |
Emerging Markets Growth | | | 4,413 | | | | (33,541 | ) | | | 29,128 | |
Emerging Leaders Growth | | | (47 | ) | | | 51 | | | | (4 | ) |
Small Cap Value | | | 102 | | | | (30 | ) | | | (72 | ) |
Mid Cap Value | | | — | | | | — | | | | — | |
Bond | | | 516 | | | | (516 | ) | | | — | |
Income | | | 521 | | | | (517 | ) | | | (4 | ) |
Low Duration | | | 1,043 | | | | (1,043 | ) | | | — | |
Ready Reserves | | | 2 | | | | 930 | | | | (932 | ) |
Distributions from net realized gains for book purposes may include short-term capital gains, which are included as ordinary income for tax purposes. The tax character of distributions paid during 2010 and 2009 was as follows (in thousands):
| | | | | | | | | | | | | | | | | | | | | | | | |
| | | Distributions Paid in 2010 | | | Distributions Paid in 2009 | |
Portfolio | | Ordinary
Income | | | Long-Term
Capital
Gains | | | Total
Distributions | | | Ordinary
Income | | | Long-Term
Capital
Gains | | | Total
Distributions | |
Growth | | $ | 13 | | | $ | — | | | $ | 13 | | | $ | 43 | | | $ | — | | | $ | 43 | |
Large Cap Growth | | | 33 | | | | — | | | | 33 | | | | 16 | | | | — | | | | 16 | |
Small Cap Growth | | | — | | | | — | | | | — | | | | — | | | | — | | | | — | |
Mid Cap Growth | | | — | | | | — | | | | — | | | | — | | | | — | | | | — | |
Small-Mid Cap Growth | | | — | | | | — | | | | — | | | | — | | | | — | | | | — | |
Global Growth | | | 12 | | | | — | | | | 12 | | | | 3 | | | | — | | | | 3 | |
International Growth | | | 101,433 | | | | — | | | | 101,433 | | | | 31,541 | | | | — | | | | 31,541 | |
International Equity | | | 2,578 | | | | — | | | | 2,578 | | | | 1,449 | | | | — | | | | 1,449 | |
International Small Cap Growth | | | 2,781 | | | | — | | | | 2,781 | | | | 778 | | | | — | | | | 778 | |
Emerging Markets Growth | | | 13,461 | | | | — | | | | 13,461 | | | | 11,127 | | | | — | | | | 11,127 | |
Emerging Leaders Growth | | | 255 | | | | 505 | | | | 760 | | | | 1,588 | | | | — | | | | 1,588 | |
Small Cap Value | | | 269 | | | | 135 | | | | 404 | | | | 213 | | | | — | | | | 213 | |
Mid Cap Value | | | 26 | | | | — | | | | 26 | | | | — | | | | N/A | | | | N/A | |
Bond | | | 8,566 | | | | 494 | | | | 9,060 | | | | 6,213 | | | | — | | | | 6,213 | |
Income | | | 5,134 | | | | — | | | | 5,134 | | | | 6,533 | | | | — | | | | 6,533 | |
Low Duration | | | 2,958 | | | | — | | | | 2,958 | | | | 86 | | | | — | | | | 86 | |
Ready Reserves | | | 126 | | | | — | | | | 126 | | | | 1,639 | | | | — | | | | 1,639 | |
December 31, 2010 | William Blair Funds 117 |
As of December 31, 2010, the components of distributable earnings on a tax basis were as follows (in thousands):
| | | | | | | | | | | | | | | | |
Portfolio | | Undistributed
Ordinary Income | | | Accumulated
Capital and
Other Losses | | | Undistributed
Long-Term
Capital Gain | | | Net
Unrealized
Appreciation/
Depreciation | |
Growth | | $ | 329 | | | $ | (7,557 | ) | | $ | — | | | $ | 100,567 | |
Large Cap Growth | | | — | | | | (6,323 | ) | | | — | | | | 7,409 | |
Small Cap Growth | | | — | | | | (87,410 | ) | | | — | | | | 122,724 | |
Mid Cap Growth | | | — | | | | (2,637 | ) | | | — | | | | 22,814 | |
Small-Mid Cap Growth | | | — | | | | — | | | | 401 | | | | 41,762 | |
Global Growth | | | — | | | | (22,357 | ) | | | — | | | | 10,705 | |
International Growth | | | 6,047 | | | | (1,421,884 | ) | | | — | | | | 980,202 | |
International Equity | | | — | | | | (116,060 | ) | | | — | | | | 38,334 | |
International Small Cap Growth | | | 5,932 | | | | (113,021 | ) | | | — | | | | 126,190 | |
Emerging Markets Growth | | | — | | | | (5,861 | ) | | | — | | | | 261,554 | |
Emerging Leaders Growth | | | 987 | | | | (14 | ) | | | 539 | | | | 16,644 | |
Small Cap Value | | | — | | | | — | | | | 1,617 | | | | 25,544 | |
Mid Cap Value | | | 21 | | | | — | | | | — | | | | 188 | |
Bond | | | 2 | | | | — | | | | 236 | | | | 9,803 | |
Income | | | — | | | | (41,771 | ) | | | — | | | | 5,707 | |
Low Duration | | | — | | | | (1,104 | ) | | | — | | | | (100 | ) |
Ready Reserves | | | 86 | | | | (23 | ) | | | — | | | | — | |
As of December 31, 2010, the Portfolios have unused capital loss carryforwards available for federal income tax purposes to be applied against future capital gains, if any. If not applied, the carryforwards will expire as follows (in thousands):
| | | | | | | | | | | | | | | | | | | | | | | | | | | | | | | | | | | | |
Portfolio | | 2011 | | | 2012 | | | 2013 | | | 2014 | | | 2015 | | | 2016 | | | 2017 | | | 2018 | | | Total | |
Growth | | $ | — | | | $ | — | | | $ | — | | | $ | — | | | $ | — | | | $ | — | | | $ | 7,557 | | | $ | — | | | $ | 7,557 | |
Large Cap Growth | | | 769 | | | | — | | | | — | | | | — | | | | — | | | | 1,709 | | | | 3,845 | | | | — | | | | 6,323 | |
Small Cap Growth | | | — | | | | — | | | | — | | | | — | | | | — | | | | — | | | | 72,368 | | | | — | | | | 72,368 | |
Mid Cap Growth | | | — | | | | — | | | | — | | | | — | | | | — | | | | — | | | | 2,638 | | | | — | | | | 2,638 | |
Small-Mid Cap Growth | | | — | | | | — | | | | — | | | | — | | | | — | | | | — | | | | — | | | | — | | | | — | |
Global Growth | | | — | | | | — | | | | — | | | | — | | | | — | | | | 9,230 | | | | 13,127 | | | | — | | | | 22,357 | |
International Growth | | | — | | | | — | | | | — | | | | — | | | | — | | | | 224,515 | | | | 1,198,096 | | | | — | | | | 1,422,611 | |
International Equity | | | — | | | | — | | | | — | | | | — | | | | — | | | | 34,279 | | | | 81,926 | | | | — | | | | 116,205 | |
International Small Cap Growth | | | — | | | | — | | | | — | | | | — | | | | — | | | | 26,723 | | | | 86,330 | | | | — | | | | 113,053 | |
Emerging Markets Growth | | | — | | | | — | | | | — | | | | — | | | | — | | | | — | | | | 5,572 | | | | — | | | | 5,572 | |
Emerging Leaders Growth | | | — | | | | — | | | | — | | | | — | | | | — | | | | — | | | | — | | | | — | | | | — | |
Small Cap Value | | | — | | | | — | | | | — | | | | — | | | | — | | | | — | | | | — | | | | — | | | | — | |
Mid Cap Value | | | — | | | | — | | | | — | | | | — | | | | — | | | | — | | | | — | | | | — | | | | — | |
Bond | | | — | | | | — | | | | — | | | | — | | | | — | | | | — | | | | — | | | | — | | | | — | |
Income | | | 1,578 | | | | 4,431 | | | | 3,398 | | | | 4,138 | | | | 9,190 | | | | 14,459 | | | | 4,577 | | | | — | | | | 41,771 | |
Low Duration | | | — | | | | — | | | | — | | | | — | | | | — | | | | — | | | | — | | | | 955 | | | | 955 | |
Ready Reserves | | | — | | | | 20 | | | | — | | | | — | | | | 3 | | | | — | | | | — | | | | — | | | | 23 | |
118 Annual Report | December 31, 2010 |
For the period from November 1, 2010 through December 31, 2010, the following Portfolios incurred net realized capital losses or foreign currency losses. Each Portfolio intends to treat this loss as having occurred in fiscal year 2011 for federal income tax purposes (in thousands):
| | | | | | | | |
Portfolio | | Capital
Amount | | | Currency
Amount | |
Growth | | $ | — | | | $ | — | |
Large Cap Growth | | | — | | | | — | |
Small Cap Growth | | | 15,042 | | | | — | |
Mid Cap Growth | | | — | | | | — | |
Small-Mid Cap Growth | | | — | | | | — | |
Global Growth | | | — | | | | 2 | |
International Growth | | | — | | | | — | |
International Equity | | | — | | | | — | |
International Small Cap Growth | | | — | | | | — | |
Emerging Markets Growth | | | — | | | | 324 | |
Emerging Leaders Growth | | | — | | | | — | |
Small Cap Value | | | — | | | | — | |
Mid Cap Value | | | — | | | | — | |
Bond | | | — | | | | — | |
Income | | | — | | | | — | |
Low Duration | | | 149 | | | | — | |
Ready Reserves | | | — | | | | — | |
(h) Repurchase Agreements
In a repurchase agreement, a Portfolio buys a security at one price and at the time of sale, the seller agrees to repurchase the obligation at a mutually agreed upon time and price (usually within seven days). The repurchase agreement thereby determines the yield during the purchaser’s holding period, while the seller’s obligation to repurchase is secured by the value of the underlying security. William Blair & Co. (the “Advisor”) will monitor, on an ongoing basis, the value of the underlying securities to ensure that the value always equals or exceeds the repurchase price plus accrued interest. Repurchase agreements could involve certain risks in the event of a default or insolvency of the other party to the agreement, including possible delays or restrictions upon a Portfolio’s ability to dispose of the underlying securities. The risk to a Portfolio is limited to the ability of the seller to pay the agreed upon sum on the delivery date. In the event of default, a repurchase agreement provides that a Portfolio is entitled to sell the underlying collateral. The loss, if any, to a Portfolio will be the difference between the proceeds from the sale and the repurchase price. However, if bankruptcy proceedings are commenced with respect to the seller of the security, disposition of the collateral by the Portfolio may be delayed or limited. Although no definitive creditworthiness criteria are used, the Advisor reviews the creditworthiness of the banks and non-bank dealers with which a Portfolio enters into repurchase agreements to evaluate those risks. A Portfolio may, under certain circumstances, deem repurchase agreements collateralized by U.S. Government securities to be investments in U.S. Government securities.
(i) Use of Estimates
The preparation of financial statements in conformity with U.S. generally accepted accounting principles requires management to make estimates and assumptions that affect the amounts reported in the financial statements. Actual results may differ from those estimates.
(j) Fair Value Measurements
The Portfolios are subject to Fair Value measurement and Disclosures ASC 820. In accordance with ASC 820, “fair value” is defined as the price that a Portfolio would receive upon selling a security in an orderly transaction to an independent buyer in the principal or most advantageous market for the investment. Various inputs are used in determining the value of a Portfolio’s investments. ASC 820 establishes a three-tier hierarchy of inputs to classify fair value measurements for disclosure purposes. The three-tier hierarchy of inputs is summarized in the three broad levels listed below.
| | • | | Level 1—Quoted prices in active markets for an identical security. |
| | • | | Level 2—Prices determined using other significant observable inputs. Observable inputs are inputs that other market participants would use in pricing a security. These may include quoted prices for similar securities, interest rates, prepayment speeds, credit risk, and others. In addition, other observable inputs such as foreign exchange rates, |
December 31, 2010 | William Blair Funds 119 |
| | benchmark securities indices and foreign futures contracts may be utilized in the valuation of certain foreign securities when significant events occur between the last sale on the foreign securities exchange and the time the net asset value of the Portfolio is calculated. |
| | • | | Level 3—Prices determined using significant unobservable inputs. In situations where quoted prices or observable inputs are unavailable (for example, when there is little or no market activity for an investment), unobservable inputs may be used. Unobservable inputs reflect the Portfolio’s own assumptions about the factors market participants would use in pricing an investment, and would be based on the best information available. |
The inputs or methodology used for valuing an investment are not necessarily an indication of the risk associated with investing in those securities. For example, money market securities are valued using amortized cost, in accordance with rules under the 1940 Act. Generally, amortized cost approximates the current fair value of a security, but since the value is not obtained from a quoted price in an active market, such securities are reflected as Level 2.
The Fund adopted Financial Accounting Standards Board (the “FASB”) Accounting Standards Update 2010-06 “Fair Value Measurements and Disclosures (ASU 820)” which requires the Fund to disclose details of significant transfers in and out of Level 1 and Level 2 measurements and the reasons for the transfers. Any transfers between Level 1 and Level 2 are disclosed, effective beginning of the period, in the tables below with the reasons for the transfers disclosed in a note to the financial statements.
At December 31, 2010, the Portfolios held no other financial instruments, such as options or futures, that required fair valuation.
As of December 31, 2010, the hierarchical input levels of securities in each Portfolio, segregated by security class, are as follows (in thousands):
| | | | | | | | | | | | | | | | | | | | | | | | |
| | | Growth | | | Large Cap
Growth | | | Small Cap
Growth | | | Mid Cap Growth | | | Small- Mid Cap Growth | | | Global
Growth | |
Investments in securities | | | | | | | | | | | | | | | | | | | | | | | | |
Level 1—Quoted prices | | | | | | | | | | | | | | | | | | | | | | | | |
Common stock | | $ | 516,942 | | | $ | 31,491 | | | $ | 849,428 | | | $ | 99,008 | | | $ | 205,802 | | | $ | 42,282 | |
Preferred stock | | | — | | | | — | | | | — | | | | — | | | | — | | | | 1,027 | |
Level 2—Other significant observable inputs | | | | | | | | | | | | | | | | | | | | | | | | |
Preferred stock | | | — | | | | — | | | | 7,779 | | | | — | | | | — | | | | — | |
Short-term investments | | | 6,302 | | | | 375 | | | | 20,042 | | | | 2,020 | | | | 1,100 | | | | 1,536 | |
Level 3—Significant unobservable inputs | | | | | | | | | | | | | | | | | | | | | | | | |
Common stock | | | — | | | | — | | | | 1,109 | | | | — | | | | — | | | | — | |
| | | | | | | | | | | | | | | | | | | | | | | | |
Total investments in securities | | $ | 523,244 | | | $ | 31,866 | | | $ | 878,358 | | | $ | 101,028 | | | $ | 206,902 | | | $ | 44,845 | |
| | | | | | | | | | | | | | | | | | | | | | | | |
Level 1 and Level 2 transfers | | | | | | | | | | | | | | | | | | | | | | | | |
Transfers from Level 1 to Level 2(a) | | | — | | | | — | | | | — | | | | — | | | | — | | | | — | |
Transfers from Level 2 to Level 1(b) | | | — | | | | — | | | | — | | | | — | | | | — | | | $ | 4,961 | |
120 Annual Report | December 31, 2010 |
| | | | | | | | | | | | | | | | | | | | | | | | | | | | |
| | | International
Growth | | | International
Equity | | | International
Small Cap
Growth | | | Emerging
Markets
Growth | | | Emerging
Leaders
Growth | | | Small Cap
Value | | | Mid Cap
Value | |
Investments in securities | | | | | | | | | | | | | | | | | | | | | | | | | | | | |
Level 1—Quoted prices | | | | | | | | | | | | | | | | | | | | | | | | | | | | |
Common stock | | $ | 4,942,157 | | | $ | 169,486 | | | $ | 630,017 | | | $ | 1,153,073 | | | $ | 88,347 | | | $ | 162,622 | | | $ | 3,364 | |
Preferred stock | | | — | | | | 2,068 | | | | 3,813 | | | | 50,827 | | | | 5,677 | | | | — | | | | — | |
Level 2—Other significant observable inputs | | | | | | | | | | | | | | | | | | | | | | | | | | | | |
Convertible bonds | | | 1,876 | | | | — | | | | 626 | | | | 1,045 | | | | — | | | | — | | | | — | |
Short-term investments | | | 153,879 | | | | 3,702 | | | | 16,170 | | | | 42,654 | | | | 1,507 | | | | 3,831 | | | | 65 | |
Level 3—Significant unobservable inputs | | | | | | | | | | | | | | | | | | | | | | | | | | | | |
None | | | — | | | | — | | | | — | | | | — | | | | — | | | | — | | | | — | |
| | | | | | | | | | | | | | | | | | | | | | | | | | | | |
Total investments in securities | | $ | 5,097,912 | | | $ | 175,256 | | | $ | 650,626 | | | $ | 1,247,599 | | | $ | 95,531 | | | $ | 166,453 | | | $ | 3,429 | |
| | | | | | | | | | | | | | | | | | | | | | | | | | | | |
Level 1 and Level 2 transfers | | | | | | | | | | | | | | | | | | | | | | | | | | | | |
Transfers from Level 1 to
Level 2 (a) | | | — | | | | — | | | | — | | | | — | | | | — | | | | — | | | | — | |
Transfers from Level 2 to
Level 1 (b) | | $ | 1,735,589 | | | $ | 133,217 | | | $ | 153,495 | | | $ | 268,735 | | | $ | 25,676 | | | | — | | | | — | |
Other financial instruments | | | | | | | | | | | | | | | | | | | | | | | | | | | | |
Level 2—Other significant observable inputs | | | | | | | | | | | | | | | | | | | | | | | | | | | | |
Forward foreign currency contracts | | $ | — | | | $ | (135 | ) | | $ | — | | | $ | — | | | $ | — | | | $ | — | | | $ | — | |
| | | | | | | | | | | | | | | | | | | | | | | | | | | | |
| | | | | | | |
| | | Bond | | | Income | | | Low Duration | | | Ready
Reserves* | | | | | | | | | | |
Investments in securities | | | | | | | | | | | | | | | | | | | | | | | | | | | | |
Level 1—Quoted Prices | | | | | | | | | | | | | | | | | | | | | | | | | | | | |
None | | $ | — | | | $ | — | | | $ | — | | | $ | — | | | | | | | | | | | | | |
Level 2—Other significant observable inputs | | | | | | | | | | | | | | | | | | | | | | | | | | | | |
US Government and Agency Bonds | | | 88,534 | | | | 40,282 | | | | 59,701 | | | | 83,809 | | | | | | | | | | | | | |
Foreign Government Notes | | | — | | | | — | | | | — | | | | 27,994 | | | | | | | | | | | | | |
Corporate Bonds | | | 88,831 | | | | 59,394 | | | | 16,970 | | | | 179,779 | | | | | | | | | | | | | |
Asset Backed Bonds | | | 10,307 | | | | 9,512 | | | | 58,862 | | | | — | | | | | | | | | | | | | |
Commercial Paper | | | — | | | | — | | | | — | | | | 658,996 | | | | | | | | | | | | | |
Short-Term Investments | | | 3,285 | | | | 1,676 | | | | 5,994 | | | | 264,703 | | | | | | | | | | | | | |
Level 3—Significant unobservable inputs | | | | | | | | | | | | | | | | | | | | | | | | | | | | |
Asset Backed Bonds | | | 170 | | | | 918 | | | | — | | | | — | | | | | | | | | | | | | |
| | | | | | | | | | | | | | | | | | | | | | | | | | | | |
Total investments in securities | | $ | 191,127 | | | $ | 111,782 | | | $ | 141,527 | | | $ | 1,215,281 | | | | | | | | | | | | | |
| | | | | | | | | | | | | | | | | | | | | | | | | | | | |
Level 1 and Level 2 transfers | | | | | | | | | | | | | | | | | | | | | | | | | | | | |
Transfers from Level 1 to
Level 2 | | | — | | | | — | | | | — | | | | — | | | | | | | | | | | | | |
Transfers from Level 2 to
Level 1 | | | — | | | | — | | | | — | | | | — | | | | | | | | | | | | | |
| * | All of the investments held by Ready Reserves are short-term investments. |
| (a) | Fair valuation estimates were obtained from the Portfolios’ pricing vendor and applied to certain foreign securities at December 31, 2010 but not on December 31, 2009, resulting in a transfer from Level 1 to Level 2. |
| (b) | Fair valuation estimates were obtained from the Portfolios’ pricing vendor and applied to certain foreign securities at December 31, 2009 but not on December 31, 2010, resulting in a transfer from Level 2 to Level 1. |
Level 1 Common Stocks are exchange-traded securities with a quoted price. Typically, Level 2 Common Stocks are non-U.S. exchange-traded securities with a quoted price that are fair valued by an independent pricing service approved by the Board of Trustees.
December 31, 2010 | William Blair Funds 121 |
The following is a reconciliation of Level 3 securities for which significant unobservable inputs were used to determine fair value:
| | | | | | | | | | | | | | | | | | | | | | | | | | | | | | | | |
| | | Balance
January 1, 2010 | | | Purchases | | | Sales | | | Transfers to Level 3 | | | Transfers
from
Level 3 | | | Change in
Unrealized
Gain (Loss) | | | Realized
Gain (Loss) | | | Balance
December 31, 2010 | |
Small Cap Growth | | $ | 3,017 | | | | — | | | $ | (1,547 | ) | | $ | 1,109 | | | | — | | | $ | 11,463 | | | $ | (12,933 | ) | | $ | 1,109 | |
Bond | | | — | | | | — | | | | — | | | | 119 | | | | — | | | | 51 | | | | — | | | | 170 | |
Income | | | — | | | | — | | | | — | | | | 645 | | | | — | | | | 273 | | | | — | | | | 918 | |
The fair value estimates for the Level 3 securities in the Small Cap Growth, Bond and Income Portfolios were determined in good faith by the Pricing Committee in consultation with the Valuation Committee, pursuant to the Valuation Procedures adopted by the Board of Trustees. There were various factors considered in reaching this fair value determination, including, but not limited to, the following: the type of security, the extent of public trading of the security, information obtained from a broker-dealer for the security, analysis of the company’s performance, market trends that influence its performance and the potential for adverse outcome in pending litigation. At December 31, 2010, these securities represented 0.12%, 0.09% and 0.81% of the net assets of the Small Cap Growth, Bond and Income Portfolios respectively. The change in unrealized gain (loss) related to those securities held at December 31, 2010 was $(85), in thousands, and is included in the change in net unrealized appreciation (depreciation) of investments on the Statement of Operations.
BancTec Inc, held in the Small Cap Growth Portfolio, was sold during the year. Vitacost.com held in the Small Cap Growth Portfolio moved from Level 1 to Level 3 due to a lack of observable inputs. The First Plus Home Loan Trust bonds held in the Bond and Income Portfolios transferred from Level 2 to Level 3 during the period due to the lack of significant other observable inputs.
(k) Redemptions In-Kind
In accordance with the Funds’ prospectus, the Portfolios may distribute portfolio securities rather than cash as payment for a redemption of fund shares (in-kind redemption). For financial reporting purposes, the Portfolio recognizes a gain or loss on the transfer of securities depending on the market value of those securities on the date of redemption. Gains and losses realized on in-kind redemptions are not recognized for tax purposes and are reclassified from undistributed realized gain (loss) to paid-in capital. During the year ended December 31, 2010, the Small Cap Growth Portfolio and Emerging Markets Growth Portfolio redeemed in-kind (in thousands) $18,923 and $74,711, respectively, with a realized gain of $6,457 and $32,340, respectively.
(2) Transactions with Affiliates
(a) Management and Expense Limitation Agreements
Each Portfolio has a management agreement with the “Advisor” for investment advisory, clerical, bookkeeping and administrative services. Each Portfolio pays the Advisor an annual fee, payable monthly, based on a specified percentage of its average daily net assets. A summary of the annual rates expressed as a percentage of average daily net assets is as follows:
| | | | | | | | | | |
Equity Portfolios | | | | | International Portfolios | | | |
Growth | | | 0.75 | % | | International Growth: | | | | |
Large Cap Growth | | | 0.80 | % | | First $250 million | | | 1.10 | % |
Small Cap Growth | | | 1.10 | % | | Next $4.75 billion | | | 1.00 | % |
Mid Cap Growth | | | 0.95 | % | | Next $5 billion | | | 0.95 | % |
Small-Mid Cap Growth | | | 1.00 | % | | Next $5 billion | | | 0.925 | % |
Small Cap Value | | | 1.10 | % | | In excess of $15 billion | | | 0.90 | % |
Mid Cap Value | | | 0.95 | % | | International Equity | | | | |
| | | | | | First $250 million | | | 1.10 | % |
Global Portfolio | | | | | | In excess of $250 million | | | 1.00 | % |
Global Growth | | | 1.00 | % | | International Small Cap Growth | | | 1.00 | % |
| | | | | | Emerging Markets Growth | | | 1.10 | % |
| | | | | | Emerging Leaders Growth | | | 1.10 | % |
| | | |
Fixed-Income Portfolios | | | | | Money Market Portfolio | | | |
Bond | | | 0.30 | % | | Ready Reserves | | | | |
Low Duration | | | 0.30 | % | | First $250 million | | | 0.275 | % |
Income* | | | | | | Next $250 million | | | 0.250 | % |
First $250 million | | | 0.25 | % | | Next $2 billion | | | 0.225 | % |
In excess of $250 million | | | 0.20 | % | | In excess of $2.5 billion | | | 0.200 | % |
| | | | | | | | | | |
*Management fee also includes a charge of 5% of gross income. | | | | | | | | | | |
122 Annual Report | December 31, 2010 |
Some of the Portfolios have also entered into an Expense Limitation Agreement with the Advisor. Under the terms of the Agreement, the Advisor will waive its management fee and/or reimburse the Portfolio for expenses in excess of the agreed upon rate. The amount the Advisor owes a Portfolio as of the reporting date is recorded as the Receivable from Advisor on the Statement of Assets and Liabilities. The Advisor reimburses the Portfolios on a monthly basis. Under the terms of the Agreement, the Advisor has agreed to waive its advisory fees and/or absorb other operating expenses through April 30, 2011, if total expenses for each class of the following Portfolios exceed the following rates (as a percentage of average daily net assets):
| | | | | | | | | | | | | | | | |
| | | Class N | | | | | | Class I | | | | |
Portfolio | | Effective
May 1, 2010
through
April 30, 2011 | | | Effective
May 1, 2009
through
April 30, 2010 | | | Effective
May 1, 2010
through
April 30, 2011 | | | Effective
May 1, 2009
through
April 30, 2010 | |
Large Cap Growth | | | 1.20 | % | | | 1.23 | % | | | 0.95 | % | | | 0.98 | % |
Small Cap Growth | | | 1.50 | % | | | 1.50 | % | | | 1.25 | % | | | 1.25 | % |
Mid Cap Growth | | | 1.35 | % | | | 1.36 | % | | | 1.10 | % | | | 1.11 | % |
Small-Mid Cap Growth | | | 1.35 | % | | | 1.36 | % | | | 1.10 | % | | | 1.11 | % |
Global Growth | | | 1.50 | % | | | 1.55 | % | | | 1.25 | % | | | 1.30 | % |
International Growth | | | 1.45 | % | | | 1.45 | % | | | 1.20 | % | | | 1.20 | % |
International Equity | | | 1.45 | % | | | 1.45 | % | | | 1.20 | % | | | 1.20 | % |
International Small Cap Growth | | | 1.65 | % | | | 1.65 | % | | | 1.40 | % | | | 1.40 | % |
Emerging Markets Growth | | | 1.70 | % | | | 1.70 | % | | | 1.45 | % | | | 1.45 | % |
Emerging Leaders Growth | | | 1.65 | % | | | N/A | | | | 1.40 | % | | | 1.40 | % |
Small Cap Value | | | 1.35 | % | | | 1.29 | % | | | 1.10 | % | | | 1.09 | % |
Mid Cap Value (a) | | | 1.35 | % | | | N/A | | | | 1.10 | % | | | N/A | |
Bond | | | 0.65 | % | | | 0.65 | % | | | 0.50 | % | | | 0.50 | % |
Income | | | 0.85 | % | | | 0.85 | % | | | 0.70 | % | | | 0.70 | % |
Low Duration (b) | | | 0.70 | % | | | 0.70 | %(a) | | | 0.55 | % | | | 0.55 | %(a) |
(a) Effective May 3, 2011 through April 30, 2012.
(b) Effective December 1, 2009 through April 30, 2011.
For a period of three years subsequent to the commencement of operations of the Emerging Leaders Growth, Mid Cap Value and Low Duration Portfolios, the Advisor is entitled to reimbursement for previously waived fees and reimbursed expenses to the extent the overall expense ratio remains below the expense limitation in place at the time the fee was waived and/or the expense was reimbursed. The total amount available for recapture at December 31, 2010 was $278 (in thousands) for the Emerging Leaders Growth Portfolio, $88 for the Mid Cap Value Portfolio and $112 for the Low Duration Portfolio.
The Advisor has agreed to voluntarily waive fees and reimburse expenses incurred for the Ready Reserves Portfolio in order to maintain a minimum yield given the current rate environment.
For the year ended December 31, 2010, the fees incurred by the Portfolios and related fee waivers were as follows (in thousands):
| | | | | | | | | | | | | | | | |
Portfolio | | Fund
Level
Waiver | | | Class I
Specific
Waiver | | | Class N
Specific
Waiver | | | Total
Waiver | |
Growth | | $ | — | | | $ | — | | | $ | — | | | $ | — | |
Large Cap Growth | | | 58 | | | | — | | | | 8 | | | | 66 | |
Small Cap Growth | | | 19 | | | | — | | | | 71 | | | | 90 | |
Mid Cap Growth | | | 1 | | | | 31 | | | | 8 | | | | 40 | |
Small-Mid Cap Growth | | | — | | | | 6 | | | | 25 | | | | 31 | |
Global Growth | | | 135 | | | | 1 | | | | 3 | | | | 139 | |
International Growth | | | — | | | | — | | | | — | | | | — | |
International Equity | | | — | | | | 189 | | | | 29 | | | | 218 | |
International Small Cap Growth | | | — | | | | — | | | | — | | | | — | |
Emerging Markets Growth | | | — | | | | — | | | | — | | | | — | |
Emerging Leaders Growth | | | 97 | | | | 1 | | | | — | | | | 98 | |
Small Cap Value | | | 159 | | | | 35 | | | | 11 | | | | 205 | |
Mid Cap Value | | | 88 | | | | — | | | | — | | | | 88 | |
Bond | | | 86 | | | | 4 | | | | — | | | | 90 | |
Income | | | — | | | | — | | | | — | | | | — | |
Low Duration | | | 98 | | | | — | | | | — | | | | 98 | |
Ready Reserves | | | 4,659 | | | | — | | | | — | | | | 4,659 | |
December 31, 2010 | William Blair Funds 123 |
124 Annual Report | December 31, 2010 |
(b) Underwriting, Distribution Services and Service Agreement
Each Portfolio, except the Ready Reserves Portfolio, has a Distribution Agreement with the Advisor for distribution services to the Portfolios’ Class N shares. Each Portfolio pays the Advisor an annual fee, payable monthly, based on a specified percentage of its average daily net assets of Class N shares. The annual rate expressed as a percentage of average daily net assets for Class N is 0.25% for all Portfolios except the Income, Bond and Low Duration Portfolios, which is 0.15%. Pursuant to the Distribution Agreement, the Advisor enters into related selling group agreements with various firms at various rates for sales of the Portfolios’ Class N shares.
The Ready Reserves Portfolio has a Service Agreement with the Advisor to provide shareholder services and automatic sweep services. The Portfolio pays the Company an annual fee, payable monthly, based upon 0.35% of the average daily net assets of Class N shares. The Board of Trustees has determined that the amount payable for “service fees” (as defined by FINRA (Financial Industry Regulatory Authority)) will not exceed 0.25% of the average annual net assets attributable to Class N shares.
The Global Growth, International Small Cap Growth, Emerging Markets Growth, Emerging Leaders Growth, Bond and Low Duration Portfolios have a Shareholder Administration Agreement with the Advisor to provide shareholder administration services. Class N and Class I shares of the Portfolios pay the Advisor an annual fee, payable monthly, based upon 0.15% of average daily net assets attributable to each class, respectively. For the year ended December 31, 2010, the following fees were incurred (in thousands):
| | | | | | | | | | | | |
Portfolio | | Class N | | | Class I | | | Total | |
Global Growth | | $ | 7 | | | $ | 51 | | | $ | 58 | |
International Small Cap Growth | | | 28 | | | | 390 | | | | 418 | |
Emerging Markets Growth | | | 42 | | | | 260 | | | | 302 | |
Emerging Leaders Growth | | | — | | | | 17 | | | | 17 | |
Bond | | | 6 | | | | 222 | | | | 228 | |
Low Duration | | | 7 | | | | 120 | | | | 127 | |
(c) Investments in Affiliated Portfolio
Pursuant to the rules of the 1940 Act, each of the Portfolios of the Fund may invest in the Ready Reserves Portfolio, an open-end money market portfolio managed by the Advisor. Ready Reserves Portfolio is used as a cash management option by the other Portfolios in the Fund. The Advisor waives management fees in an amount equal to the management fee and service fee that Ready Reserves receives based on the Portfolio’s net assets, less any waivers, if applicable. The fees waived with respect to each Portfolio for the year ended December 31, 2010 are listed below. Distributions received from Ready Reserves are reflected as “Dividend income from Affiliated Fund” in each Portfolio’s Statement of Operations. Amounts relating to the Portfolios’ investments in Ready Reserves were as follows for the year ended December 31, 2010 (in thousands):
| | | | | | | | | | | | | | | | | | | | | | | | | | | | |
Portfolio | | December
31, 2009
Value | | | Purchases | | | Sales | | | Fees
Waived | | | Dividend
Income | | | December
31, 2010
Value | | | Percent of
Net Assets | |
Growth | | $ | 1,262 | | | $ | — | | | $ | 1,262 | | | $ | 2 | | | $ | — | | | $ | — | | | | 0.0 | % |
Large Cap | | | — | | | | — | | | | — | | | | — | | | | — | | | | — | | | | 0.0 | % |
Small Cap Growth | | | 3,297 | | | | — | | | | 3,297 | | | | 6 | | | | — | | | | — | | | | 0.0 | % |
Mid Cap Growth | | | 19 | | | | — | | | | 19 | | | | — | | | | — | | | | — | | | | 0.0 | % |
Small-Mid Cap Growth | | | 23 | | | | — | | | | 23 | | | | — | | | | — | | | | — | | | | 0.0 | % |
Global Growth | | | 29 | | | | — | | | | 29 | | | | — | | | | 1 | | | | — | | | | 0.0 | % |
International Growth | | | 6,376 | | | | — | | | | 6,376 | | | | 12 | | | | — | | | | — | | | | 0.0 | % |
International Equity | | | 5 | | | | — | | | | 5 | | | | — | | | | — | | | | — | | | | 0.0 | % |
International Small Cap Growth | | | 489 | | | | — | | | | 489 | | | | 1 | | | | — | | | | — | | | | 0.0 | % |
Emerging Markets Growth | | | 66 | | | | — | | | | 66 | | | | — | | | | — | | | | — | | | | 0.0 | % |
Emerging Leaders Growth | | | 440 | | | | — | | | | 440 | | | | 1 | | | | — | | | | — | | | | 0.0 | % |
Small Cap Value | | | 4 | | | | — | | | | 4 | | | | — | | | | — | | | | — | | | | 0.0 | % |
(3) Investment Transactions
Investment transactions, excluding money market instruments, repurchase agreements and demand notes for the year ended December 31, 2010, were as follows (in thousands):
| | | | | | | | |
Portfolio | | Purchases | | | Sales | |
Growth | | $ | 331,279 | | | $ | (294,795 | ) |
Large Cap Growth | | | 15,329 | | | | (18,218 | ) |
Small Cap Growth | | | 897,278 | | | | (911,440 | ) |
Mid Cap Growth | | | 68,243 | | | | (57,254 | ) |
Small-Mid Cap Growth | | | 170,215 | | | | (146,585 | ) |
Global Growth | | | 36,369 | | | | (38,642 | ) |
International Growth | | | 4,341,396 | | | | (4,518,981 | ) |
International Equity | | | 169,551 | | | | (298,166 | ) |
International Small Cap Growth | | | 530,131 | | | | (396,755 | ) |
Emerging Markets Growth | | | 1,284,378 | | | | (1,349,820 | ) |
Emerging Leaders Growth | | | 169,052 | | | | (205,980 | ) |
Small Cap Value | | | 148,854 | | | | (71,305 | ) |
Mid Cap Value | | | 3,972 | | | | (818 | ) |
Bond | | | 98,704 | | | | (60,843 | ) |
Income | | | 35,681 | | | | (44,561 | ) |
Low Duration | | | 159,270 | | | | (96,885 | ) |
(4) Forward Foreign Currency Contracts
The Global Growth, International Growth, International Equity, International Small Cap Growth, Emerging Markets Growth and Emerging Leaders Growth Portfolios from time to time may enter into forward foreign currency contracts with the Fund’s custodian and other counterparties in an attempt to hedge against a decline in the value of foreign currency against the U.S. dollar. The Portfolios bear the market risk that arises from changes in foreign currency rates and bear the credit risk if the counterparty fails to perform under the contract.
For the year ended December 31, 2010, the International Growth, International Equity, and International Small Cap Growth Portfolios engaged in forward foreign currency contracts with notional volume (in thousands) of $4,088,138, $11,261 and $215,506, respectively.
The following tables present the value of forward foreign currency contracts as of December 31, 2010, and their respective location on the Statement of Assets and Liabilities (values in thousands):
| | | | | | | | | | | | |
| | | Assets | | | Liabilities | |
Portfolio | | Statement of Assets and
Liabilities Location | | Value | | | Statement of Assets and
Liabilities Location | | Value | |
International Equity | | Unrealized appreciation on
foreign forward currency
contracts | | $ | — | | | Unrealized depreciation on
foreign forward currency
contracts | | $ | 135 | |
The effect of forward foreign currency contracts on the Statements of Operations for the year ended December 31, 2010 (values in thousands) were as follows:
| | | | |
Realized gain (loss) recognized in foreign currency transactions | | | |
Portfolio | | Value | |
International Growth | | $ | 49,389 | |
International Equity | | | 136 | |
International Small Cap Growth | | | 262 | |
| | | | |
Change in unrealized gain (loss) recognized in foreign currency translations | | | |
Portfolio | | Value | |
International Growth | | $ | (15,044 | ) |
International Equity | | | (135 | ) |
December 31, 2010 | William Blair Funds 125 |
The following table presents open forward foreign currency contracts as of December 31, 2010 (values in thousands):
| | | | | | | | | | | | | | | | | | |
International Equity Fund | |
Counterparty | | Short Contracts | | Settlement
Date | | | Local
Currency | | | Current
Value | | | Unrealized
Gain/Loss | |
Northern Trust Corporation | | Japanese Yen | | | 1/11/2011 | | | | ¥312,095 | | | $ | 3,844 | | | $ | (135 | ) |
(5) Fund Share Transactions
| | | | | | | | | | | | | | | | | | | | | | | | |
| | | Sales (Dollars) | |
| | | Year Ended December 31, 2010 | | | Year Ended December 31, 2009 | |
Portfolio | | Class N | | | Class I | | | Total | | | Class N | | | Class I | | | Total | |
Growth | | $ | 68,365 | | | $ | 107,997 | | | $ | 176,362 | | | $ | 67,911 | | | $ | 63,683 | | | $ | 131,594 | |
Large Cap Growth | | | 1,142 | | | | 1,935 | | | | 3,077 | | | | 923 | | | | 5,311 | | | | 6,234 | |
Small Cap Growth | | | 108,310 | | | | 256,285 | | | | 364,595 | | | | 225,583 | | | | 92,269 | | | | 317,852 | |
Mid Cap Growth | | | 2,798 | | | | 21,591 | | | | 24,389 | | | | 4,936 | | | | 16,887 | | | | 21,823 | |
Small Mid-Cap Growth | | | 3,028 | | | | 48,275 | | | | 51,303 | | | | 13,361 | | | | 39,281 | | | | 52,642 | |
Global Growth | | | 1,046 | | | | 3,798 | | | | 4,844 | | | | 465 | | | | 3,968 | | | | 4,433 | |
International Growth | | | 876,749 | | | | 621,840 | | | | 1,498,589 | | | | 645,844 | | | | 715,238 | | | | 1,361,082 | |
International Equity | | | 1,093 | | | | 58,750 | | | | 59,843 | | | | 4,147 | | | | 83,020 | | | | 87,167 | |
International Small Cap Growth | | | 7,838 | | | | 138,435 | | | | 146,273 | | | | 5,724 | | | | 102,689 | | | | 108,413 | |
Emerging Markets Growth | | | 6,588 | | | | 51,960 | | | | 58,548 | | | | 5,532 | | | | 68,836 | | | | 74,368 | |
Emerging Leaders Growth (a) | | | 49 | | | | 11,564 | | | | 11,613 | | | | — | | | | 3,863 | | | | 3,863 | |
Small Cap Value | | | 24,765 | | | | 67,703 | | | | 92,468 | | | | 1,351 | | | | 13,550 | | | | 14,901 | |
Mid Cap Value (b) | | | 4 | | | | 3,158 | | | | 3,162 | | | | — | | | | — | | | | — | |
Bond | | | 1,759 | | | | 65,749 | | | | 67,508 | | | | 3,270 | | | | 69,443 | | | | 72,713 | |
Income | | | 8,860 | | | | 6,525 | | | | 15,385 | | | | 5,949 | | | | 11,021 | | | | 16,970 | |
Low Duration (c) | | | 6,671 | | | | 77,708 | | | | 84,379 | | | | 1,872 | | | | 82,099 | | | | 83,971 | |
Ready Reserves | | | 670,783 | | | | — | | | | 670,783 | | | | 638,552 | | | | — | | | | 638,552 | |
| |
| | | Reinvested Distributions (Dollars) | |
| | | Year Ended December 31, 2010 | | | Year Ended December 31, 2009 | |
Portfolio | | Class N | | | Class I | | | Total | | | Class N | | | Class I | | | Total | |
Growth | | $ | — | | | $ | 11 | | | $ | 11 | | | $ | — | | | $ | 34 | | | $ | 34 | |
Large Cap Growth | | | — | | | | 29 | | | | 29 | | | | — | | | | 14 | | | | 14 | |
Small Cap Growth | | | — | | | | — | | | | — | | | | — | | | | — | | | | — | |
Mid Cap Growth | | | — | | | | — | | | | — | | | | — | | | | — | | | | — | |
Small Mid-Cap Growth | | | — | | | | — | | | | — | | | | — | | | | — | | | | — | |
Global Growth | | | — | | | | 11 | | | | 11 | | | | — | | | | 3 | | | | 3 | |
International Growth | | | 50,365 | | | | 42,168 | | | | 92,533 | | | | 15,272 | | | | 13,374 | | | | 28,646 | |
International Equity | | | 174 | | | | 2,278 | | | | 2,452 | | | | 13 | | | | 1,374 | | | | 1,387 | |
International Small Cap Growth | | | 38 | | | | 1,078 | | | | 1,116 | | | | — | | | | 249 | | | | 249 | |
Emerging Markets Growth | | | 234 | | | | 1,348 | | | | 1,582 | | | | 192 | | | | 1,432 | | | | 1,624 | |
Emerging Leaders Growth (a) | | | — | | | | 79 | | | | 79 | | | | — | | | | 100 | | | | 100 | |
Small Cap Value | | | 58 | | | | 296 | | | | 354 | | | | 19 | | | | 151 | | | | 170 | |
Mid Cap Value (b) | | | — | | | | 27 | | | | 27 | | | | — | | | | — | | | | — | |
Bond | | | 126 | | | | 4,728 | | | | 4,854 | | | | 86 | | | | 3,171 | | | | 3,257 | |
Income | | | 1,462 | | | | 2,888 | | | | 4,350 | | | | 2,004 | | | | 3,427 | | | | 5,431 | |
Low Duration (c) | | | 54 | | | | 1,211 | | | | 1,265 | | | | 1 | | | | 36 | | | | 37 | |
Ready Reserves | | | 126 | | | | — | | | | 126 | | | | 1,710 | | | | — | | | | 1,710 | |
| (a) | | For Class N shares for the period from May 3, 2010 (Commencement of Operations) to December 31, 2010. |
| (b) | | For the period from May 3, 2010 (Commencement of Operations) to December 31, 2010. |
| (c) | | For the period from December 1, 2009 (Commencement of Operations) to December 31, 2009. |
126 Annual Report | December 31, 2010 |
| | | | | | | | | | | | | | | | | | | | | | | | |
| |
| | | Redemptions (Dollars) | |
| | | Year Ended December 31, 2010 | | | Year Ended December 31, 2009 | |
Portfolio | | Class N | | | Class I | | | Total | | | Class N | | | Class I | | | Total | |
Growth | | $ | 47,695 | | | $ | 37,660 | | | $ | 85,355 | | | $ | 33,393 | | | $ | 17,297 | | | $ | 50,690 | |
Large Cap Growth | | | 925 | | | | 4,757 | | | | 5,682 | | | | 1,360 | | | | 5,054 | | | | 6,414 | |
Small Cap Growth | | | 235,001 | | | | 124,740 | | | | 359,741 | | | | 152,457 | | | | 88,376 | | | | 240,833 | |
Mid Cap Growth | | | 2,034 | | | | 11,217 | | | | 13,251 | | | | 1,417 | | | | 6,314 | | | | 7,731 | |
Small Mid-Cap Growth | | | 4,809 | | | | 23,447 | | | | 28,256 | | | | 1,450 | | | | 28,280 | | | | 29,730 | |
Global Growth | | | 1,468 | | | | 4,358 | | | | 5,826 | | | | 822 | | | | 4,451 | | | | 5,273 | |
International Growth | | | 1,196,684 | | | | 551,296 | | | | 1,747,980 | | | | 839,084 | | | | 458,486 | | | | 1,297,570 | |
International Equity | | | 4,139 | | | | 186,626 | | | | 190,765 | | | | 37,908 | | | | 47,320 | | | | 85,228 | |
International Small Cap Growth | | | 5,438 | | | | 62,241 | | | | 67,679 | | | | 7,257 | | | | 36,128 | | | | 43,385 | |
Emerging Markets Growth | | | 5,661 | | | | 70,448 | | | | 76,109 | | | | 6,566 | | | | 29,337 | | | | 35,903 | |
Emerging Leaders
Growth (a) | | | — | | | | 6,692 | | | | 6,692 | | | | — | | | | 743 | | | | 743 | |
Small Cap Value | | | 2,617 | | | | 11,274 | | | | 13,891 | | | | 2,315 | | | | 4,882 | | | | 7,197 | |
Mid Cap Value (b) | | | — | | | | 5 | | | | 5 | | | | — | | | | — | | | | — | |
Bond | | | 1,085 | | | | 54,078 | | | | 55,163 | | | | 308 | | | | 15,214 | | | | 15,522 | |
Income | | | 12,781 | | | | 13,282 | | | | 26,063 | | | | 19,152 | | | | 31,143 | | | | 50,295 | |
Low Duration (c) | | | 1,607 | | | | 69,878 | | | | 71,485 | | | | — | | | | 1,799 | | | | 1,799 | |
Ready Reserves | | | 807,267 | | | | — | | | | 807,267 | | | | 1,128,550 | | | | — | | | | 1,128,550 | |
| |
| | | Net Change in Net Assets relating to Fund Share Activity (Dollars) | |
| | | Year Ended December 31, 2010 | | | Year Ended December 31, 2009 | |
Portfolio | | Class N | | | Class I | | | Total | | | Class N | | | Class I | | | Total | |
Growth | | $ | 20,670 | | | $ | 70,348 | | | $ | 91,018 | | | $ | 34,518 | | | $ | 46,420 | | | $ | 80,938 | |
Large Cap Growth | | | 217 | | | | (2,793 | ) | | | (2,576 | ) | | | (437 | ) | | | 271 | | | | (166 | ) |
Small Cap Growth | | | (126,691 | ) | | | 131,545 | | | | 4,854 | | | | 73,126 | | | | 3,893 | | | | 77,019 | |
Mid Cap Growth | | | 764 | | | | 10,374 | | | | 11,138 | | | | 3,519 | | | | 10,573 | | | | 14,092 | |
Small Mid-Cap Growth | | | (1,781 | ) | | | 24,828 | | | | 23,047 | | | | 11,911 | | | | 11,001 | | | | 22,912 | |
Global Growth | | | (422 | ) | | | (549 | ) | | | (971 | ) | | | (357 | ) | | | (480 | ) | | | (837 | ) |
International Growth | | | (269,570 | ) | | | 112,712 | | | | (156,858 | ) | | | (177,968 | ) | | | 270,126 | | | | 92,158 | |
International Equity | | | (2,872 | ) | | | (125,598 | ) | | | (128,470 | ) | | | (33,748 | ) | | | 37,074 | | | | 3,326 | |
International Small Cap Growth | | | 2,438 | | | | 77,272 | | | | 79,710 | | | | (1,533 | ) | | | 66,810 | | | | 65,277 | |
Emerging Markets Growth | | | 1,161 | | | | (17,140 | ) | | | (15,979 | ) | | | (842 | ) | | | 40,931 | | | | 40,089 | |
Emerging Leaders Growth | | | 49 | | | | 4,951 | | | | 5,000 | | | | — | | | | 3,220 | | | | 3,220 | |
Small Cap Value | | | 22,206 | | | | 56,725 | | | | 78,931 | | | | (945 | ) | | | 8,819 | | | | 7,874 | |
Mid Cap Value (b) | | | 4 | | | | 3,180 | | | | 3,184 | | | | — | | | | — | | | | — | |
Bond | | | 800 | | | | 16,399 | | | | 17,199 | | | | 3,048 | | | | 57,400 | | | | 60,448 | |
Income | | | (2,459 | ) | | | (3,869 | ) | | | (6,328 | ) | | | (11,199 | ) | | | (16,695 | ) | | | (27,894 | ) |
Low Duration (c) | | | 5,118 | | | | 9,041 | | | | 14,159 | | | | 1,873 | | | | 80,336 | | | | 82,209 | |
Ready Reserves | | | (136,358 | ) | | | — | | | | (136,358 | ) | | | (488,288 | ) | | | — | | | | (488,288 | ) |
| (a) | | For Class N shares for the period from May 3, 2010 (Commencement of Operations) to December 31, 2010. |
| (b) | | For the period from May 3, 2010 (Commencement of Operations) to December 31, 2010. |
| (c) | | For the period from December 1, 2009 (Commencement of Operations) to December 31, 2009. |
December 31, 2010 | William Blair Funds 127 |
| | | | | | | | | | | | | | | | | | | | | | | | |
| | | Sales (Shares) | |
| | | Year Ended December 31, 2010 | | | Year Ended December 31, 2009 | |
Portfolio | | Class N | | | Class I | | | Total | | | Class N | | | Class I | | | Total | |
Growth | | | 6,808 | | | | 9,829 | | | | 16,637 | | | | 7,884 | | | | 7,054 | | | | 14,938 | |
Large Cap Growth | | | 182 | | | | 299 | | | | 481 | | | | 181 | | | | 978 | | | | 1,159 | |
Small Cap Growth | | | 5,035 | | | | 12,133 | | | | 17,168 | | | | 14,719 | | | | 5,427 | | | | 20,146 | |
Mid Cap Growth | | | 261 | | | | 1,998 | | | | 2,259 | | | | 551 | | | | 1,894 | | | | 2,445 | |
Small Mid-Cap Growth | | | 242 | | | | 3,846 | | | | 4,088 | | | | 1,183 | | | | 4,035 | | | | 5,218 | |
Global Growth | | | 139 | | | | 526 | | | | 665 | | | | 80 | | | | 709 | | | | 789 | |
International Growth | | | 45,601 | | | | 31,294 | | | | 76,895 | | | | 43,158 | | | | 45,616 | | | | 88,774 | |
International Equity | | | 96 | | | | 5,289 | | | | 5,385 | | | | 474 | | | | 8,525 | | | | 8,999 | |
International Small Cap Growth | | | 729 | | | | 12,221 | | | | 12,950 | | | | 688 | | | | 11,253 | | | | 11,941 | |
Emerging Markets Growth | | | 467 | | | | 3,722 | | | | 4,189 | | | | 571 | | | | 7,574 | | | | 8,145 | |
Emerging Leaders Growth (a) | | | 5 | | | | 1,252 | | | | 1,257 | | | | — | | | | 548 | | | | 548 | |
Small Cap Value | | | 1,978 | | | | 5,844 | | | | 7,822 | | | | 166 | | | | 1,517 | | | | 1,683 | |
Mid Cap Value (b) | | | — | | | | 313 | | | | 313 | | | | — | | | | — | | | | — | |
Bond | | | 164 | | | | 6,220 | | | | 6,384 | | | | 324 | | | | 7,009 | | | | 7,333 | |
Income | | | 957 | | | | 713 | | | | 1,670 | | | | 666 | | | | 1,244 | | | | 1,910 | |
Low Duration (c) | | | 670 | | | | 7,796 | | | | 8,466 | | | | 187 | | | | 8,211 | | | | 8,398 | |
Ready Reserves | | | 670,783 | | | | — | | | | 670,783 | | | | 638,552 | | | | — | | | | 638,552 | |
| |
| | | Reinvested Distributions (Shares) | |
| | | Year Ended December 31, 2010 | | | Year Ended December 31, 2009 | |
Portfolio | | Class N | | | Class I | | | Total | | | Class N | | | Class I | | | Total | |
Growth | | | — | | | | 1 | | | | 1 | | | | — | | | | 3 | | | | 3 | |
Large Cap Growth | | | — | | | | 4 | | | | 4 | | | | — | | | | 2 | | | | 2 | |
Small Cap Growth | | | — | | | | — | | | | — | | | | — | | | | — | | | | — | |
Mid Cap Growth | | | — | | | | — | | | | — | | | | — | | | | — | | | | — | |
Small Mid-Cap Growth | | | — | | | | — | | | | — | | | | — | | | | — | | | | — | |
Global Growth | | | — | | | | 1 | | | | 1 | | | | — | | | | — | | | | — | |
International Growth | | | 2,343 | | | | 1,918 | | | | 4,261 | | | | 843 | | | | 722 | | | | 1,565 | |
International Equity | | | 15 | | | | 189 | | | | 204 | | | | 2 | | | | 126 | | | | 128 | |
International Small Cap Growth | | | 3 | | | | 83 | | | | 86 | | | | — | | | | 24 | | | | 24 | |
Emerging Markets Growth | | | 15 | | | | 87 | | | | 102 | | | | 15 | | | | 115 | | | | 130 | |
Emerging Leaders Growth (a) | | | — | | | | 8 | | | | 8 | | | | — | | | | 12 | | | | 12 | |
Small Cap Value | | | 4 | | | | 22 | | | | 26 | | | | 2 | | | | 15 | | | | 17 | |
Mid Cap Value (b) | | | — | | | | 3 | | | | 3 | | | | — | | | | — | | | | — | |
Bond | | | 12 | | | | 447 | | | | 459 | | | | 9 | | | | 313 | | | | 322 | |
Income | | | 159 | | | | 315 | | | | 474 | | | | 225 | | | | 387 | | | | 612 | |
Low Duration (c) | | | 5 | | | | 122 | | | | 127 | | | | — | | | | 4 | | | | 4 | |
Ready Reserves | | | 126 | | | | — | | | | 126 | | | | 1,710 | | | | — | | | | 1,710 | |
| (a) | | For Class N shares for the period from May 3, 2010 (Commencement of Operations) to December 31, 2010. |
| (b) | | For the period from May 3, 2010 (Commencement of Operations) to December 31, 2010. |
| (c) | | For the period from December 1, 2009 (Commencement of Operations) to December 31, 2009. |
128 Annual Report | December 31, 2010 |
| | | | | | | | | | | | | | | | | | | | | | | | |
| |
| | | Redemptions (Shares) | |
| | | Year Ended December 31, 2010 | | | Year Ended December 31, 2009 | |
Portfolio | | Class N | | | Class I | | | Total | | | Class N | | | Class I | | | Total | |
Growth | | | 4,775 | | | | 3,591 | | | | 8,366 | | | | 4,263 | | | | 1,994 | | | | 6,257 | |
Large Cap Growth | | | 148 | | | | 761 | | | | 909 | | | | 249 | | | | 973 | | | | 1,222 | |
Small Cap Growth | | | 11,449 | | | | 5,763 | | | | 17,212 | | | | 10,272 | | | | 5,811 | | | | 16,083 | |
Mid Cap Growth | | | 187 | | | | 1,030 | | | | 1,217 | | | | 169 | | | | 744 | | | | 913 | |
Small Mid-Cap Growth | | | 386 | | | | 1,836 | | | | 2,222 | | | | 148 | | | | 2,837 | | | | 2,985 | |
Global Growth | | | 209 | | | | 615 | | | | 824 | | | | 140 | | | | 818 | | | | 958 | |
International Growth | | | 61,789 | | | | 28,153 | | | | 89,942 | | | | 58,042 | | | | 30,142 | | | | 88,184 | |
International Equity | | | 373 | | | | 17,372 | | | | 17,745 | | | | 4,210 | | | | 5,321 | | | | 9,531 | |
International Small Cap Growth | | | 483 | | | | 5,850 | | | | 6,333 | | | | 976 | | | | 4,632 | | | | 5,608 | |
Emerging Markets Growth | | | 422 | | | | 5,459 | | | | 5,881 | | | | 678 | | | | 3,007 | | | | 3,685 | |
Emerging Leaders Growth (a) | | | — | | | | 728 | | | | 728 | | | | — | | | | 123 | | | | 123 | |
Small Cap Value | | | 219 | | | | 945 | | | | 1,164 | | | | 278 | | | | 562 | | | | 840 | |
Mid Cap Value (b) | | | — | | | | 1 | | | | 1 | | | | — | | | | — | | | | — | |
Bond | | | 101 | | | | 5,087 | | | | 5,188 | | | | 30 | | | | 1,505 | | | | 1,535 | |
Income | | | 1,382 | | | | 1,449 | | | | 2,831 | | | | 2,155 | | | | 3,558 | | | | 5,713 | |
Low Duration (c) | | | 161 | | | | 7,002 | | | | 7,163 | | | | — | | | | 180 | | | | 180 | |
Ready Reserves | | | 807,267 | | | | — | | | | 807,267 | | | | 1,128,550 | | | | — | | | | 1,128,550 | |
| |
| | | Net Change in Shares Outstanding
relating to Fund Share Activity (Shares) | |
| | | Year Ended December 31, 2010 | | | Year Ended December 31, 2009 | |
Portfolio | | Class N | | | Class I | | | Total | | | Class N | | | Class I | | | Total | |
Growth | | | 2,033 | | | | 6,239 | | | | 8,272 | | | | 3,621 | | | | 5,063 | | | | 8,684 | |
Large Cap Growth | | | 34 | | | | (458 | ) | | | (424 | ) | | | (68 | ) | | | 7 | | | | (61 | ) |
Small Cap Growth | | | (6,414 | ) | | | 6,370 | | | | (44 | ) | | | 4,447 | | | | (384 | ) | | | 4,063 | |
Mid Cap Growth | | | 74 | | | | 968 | | | | 1,042 | | | | 382 | | | | 1,150 | | | | 1,532 | |
Small Mid-Cap Growth | | | (144 | ) | | | 2,010 | | | | 1,866 | | | | 1,035 | | | | 1,198 | | | | 2,233 | |
Global Growth | | | (70 | ) | | | (88 | ) | | | (158 | ) | | | (60 | ) | | | (109 | ) | | | (169 | ) |
International Growth | | | (13,845 | ) | | | 5,059 | | | | (8,786 | ) | | | (14,041 | ) | | | 16,196 | | | | 2,155 | |
International Equity | | | (262 | ) | | | (11,894 | ) | | | (12,156 | ) | | | (3,734 | ) | | | 3,330 | | | | (404 | ) |
International Small Cap Growth | | | 249 | | | | 6,454 | | | | 6,703 | | | | (288 | ) | | | 6,645 | | | | 6,357 | |
Emerging Markets Growth | | | 60 | | | | (1,650 | ) | | | (1,590 | ) | | | (92 | ) | | | 4,682 | | | | 4,590 | |
Emerging Leaders Growth (a) | | | 5 | | | | 532 | | | | 537 | | | | — | | | | 437 | | | | 437 | |
Small Cap Value | | | 1,763 | | | | 4,921 | | | | 6,684 | | | | (110 | ) | | | 970 | | | | 860 | |
Mid Cap Value (b) | | | — | | | | 315 | | | | 315 | | | | — | | | | — | | | | — | |
Bond | | | 75 | | | | 1,580 | | | | 1,655 | | | | 303 | | | | 5,817 | | | | 6,120 | |
Income | | | (266 | ) | | | (421 | ) | | | (687 | ) | | | (1,264 | ) | | | (1,927 | ) | | | (3,191 | ) |
Low Duration (c) | | | 514 | | | | 916 | | | | 1,430 | | | | 187 | | | | 8,035 | | | | 8,222 | |
Ready Reserves | | | (136,358 | ) | | | — | | | | (136,358 | ) | | | (488,288 | ) | | | — | | | | (488,288 | ) |
| (a) | | For Class N shares for the period from May 3, 2010 (Commencement of Operations) to December 31, 2010. |
| (b) | | For the period from May 3, 2010 (Commencement of Operations) to December 31, 2010. |
| (c) | | For the period from December 1, 2009 (Commencement of Operations) to December 31, 2009. |
December 31, 2010 | William Blair Funds 129 |
Financial Highlights
Growth Fund
| | | | | | | | | | | | | | | | | | | | |
| | | Class N | |
| | | Years Ended December 31, | |
| | | 2010 | | | 2009 | | | 2008 | | | 2007 | | | 2006 | |
Net asset value, beginning of year | | $ | 9.89 | | | $ | 7.12 | | | $ | 11.70 | | | $ | 11.42 | | | $ | 11.33 | |
Income (loss) from investment operations: | | | | | | | | | | | | | | | | | | | | |
Net investment income (loss) | | | (0.01 | ) | | | (0.02 | ) | | | (0.05 | ) | | | (0.04 | ) | | | (0.06 | ) |
Net realized and unrealized gain (loss) on investments | | | 1.40 | | | | 2.79 | | | | (4.35 | ) | | | 1.53 | | | | 1.48 | |
| | | | | | | | | | | | | | | | | | | | |
Total from investment operations | | | 1.39 | | | | 2.77 | | | | (4.40 | ) | | | 1.49 | | | | 1.42 | |
Less distributions from: | | | | | | | | | | | | | | | | | | | | |
Net investment income | | | — | | | | — | | | | — | | | | — | | | | — | |
Net realized gain | | | — | | | | — | | | | 0.18 | | | | 1.21 | | | | 1.33 | |
| | | | | | | | | | | | | | | | | | | | |
Total distributions | | | — | | | | — | | | | 0.18 | | | | 1.21 | | | | 1.33 | |
| | | | | | | | | | | | | | | | | | | | |
Net asset value, end of year | | $ | 11.28 | | | $ | 9.89 | | | $ | 7.12 | | | $ | 11.70 | | | $ | 11.42 | |
| | | | | | | | | | | | | | | | | | | | |
Total Return (%) | | | 14.05 | | | | 38.90 | | | | (37.61 | ) | | | 13.17 | | | | 12.42 | |
Ratios to average daily net assets (%): | | | | | | | | | | | | | | | | | | | | |
Expenses | | | 1.16 | | | | 1.23 | | | | 1.17 | | | | 1.22 | | | | 1.17 | |
Net investment income (loss) | | | (0.13 | ) | | | (0.20 | ) | | | (0.54 | ) | | | (0.35 | ) | | | (0.49 | ) |
| | | | | | | | | | | | | | | | | | | | |
| | | Class I | |
| | | Years Ended December 31, | |
| | | 2010 | | | 2009 | | | 2008 | | | 2007 | | | 2006 | |
Net asset value, beginning of year | | $ | 10.24 | | | $ | 7.35 | | | $ | 12.02 | | | $ | 11.66 | | | $ | 11.52 | |
Income (loss) from investment operations: | | | | | | | | | | | | | | | | | | | | |
Net investment income (loss) | | | 0.02 | | | | 0.01 | | | | (0.02 | ) | | | 0.00 | ^ | | | (0.02 | ) |
Net realized and unrealized gain (loss) on investments | | | 1.45 | | | | 2.88 | | | | (4.47 | ) | | | 1.57 | | | | 1.49 | |
| | | | | | | | | | | | | | | | | | | | |
Total from investment operations | | | 1.47 | | | | 2.89 | | | | (4.49 | ) | | | 1.57 | | | | 1.47 | |
Less distributions from: | | | | | | | | | | | | | | | | | | | | |
Net investment income | | | 0.00 | ^ | | | 0.00 | ^ | | | — | | | | — | | | | — | |
Net realized gain | | | — | | | | — | | | | 0.18 | | | | 1.21 | | | | 1.33 | |
| | | | | | | | | | | | | | | | | | | | |
Total distributions | | | — | | | | 0.00 | ^ | | | 0.18 | | | | 1.21 | | | | 1.33 | |
| | | | | | | | | | | | | | | | | | | | |
Net asset value, end of year | | $ | 11.71 | | | $ | 10.24 | | | $ | 7.35 | | | $ | 12.02 | | | $ | 11.66 | |
| | | | | | | | | | | | | | | | | | | | |
Total Return (%) | | | 14.36 | | | | 39.34 | | | | (37.35 | ) | | | 13.59 | | | | 12.64 | |
Ratios to average daily net assets (%): | | | | | | | | | | | | | | | | | | | | |
Expenses | | | 0.84 | | | | 0.89 | | | | 0.85 | | | | 0.87 | | | | 0.89 | |
Net investment income (loss) | | | 0.20 | | | | 0.14 | | | | (0.22 | ) | | | 0.00 | | | | (0.20 | ) |
| | | | | | | | | | | | | | | | | | | | |
| | | Years Ended December 31, | |
| | | 2010 | | | 2009 | | | 2008 | | | 2007 | | | 2006 | |
Supplemental data for all classes: | | | | | | | | | | | | | | | | | | | | |
Net assets at end of year (in thousands) | | $ | 575,613 | | | $ | 419,520 | | | $ | 238,586 | | | $ | 369,644 | | | $ | 264,525 | |
Portfolio turnover rate (%) | | | 66 | | | | 67 | | | | 60 | | | | 72 | | | | 61 | |
| ^ | | Amount is less than $0.005 per share. |
Performance cited represents past performance. Past performance does not guarantee future results and current performance may be lower or higher than the data quoted. Results shown are annual returns, which assume reinvestment of dividends and capital gains. Investment returns and principal will fluctuate and you may have a gain or loss when you sell shares. For the most current month-end performance information, please call 1-800-742-7272 or visit our Web site at www.williamblairfunds.com.
Note: Net investment income (loss) per share is based on the average shares outstanding during the year.
130 Annual Report | December 31, 2010 |
Financial Highlights
Large Cap Growth Fund
| | | | | | | | | | | | | | | | | | | | |
| | | Class N | |
| | | Years Ended December 31, | |
| | | 2010 | | | 2009 | | | 2008 | | | 2007 | | | 2006 | |
Net asset value, beginning of year | | $ | 6.16 | | | $ | 4.68 | | | $ | 7.52 | | | $ | 6.88 | | | $ | 6.47 | |
Income (loss) from investment operations: | | | | | | | | | | | | | | | | | | | | |
Net investment income (loss) | | | (0.00 | )^ | | | (0.01 | ) | | | (0.02 | ) | | | (0.01 | ) | | | (0.02 | ) |
Net realized and unrealized gain (loss) on investments | | | 0.98 | | | | 1.49 | | | | (2.82 | ) | | | 0.65 | | | | 0.43 | |
| | | | | | | | | | | | | | | | | | | | |
Total from investment operations | | | 0.98 | | | | 1.48 | | | | (2.84 | ) | | | 0.64 | | | | 0.41 | |
Less distributions from: | | | | | | | | | | | | | | | | | | | | |
Net investment income | | | — | | | | — | | | | 0.00 | ^ | | | — | | | | — | |
Net realized gain | | | — | | | | — | | | | — | | | | — | | | | — | |
| | | | | | | | | | | | | | | | | | | | |
Total distributions | | | — | | | | — | | | | 0.00 | ^ | | | — | | | | — | |
| | | | | | | | | | | | | | | | | | | | |
Net asset value, end of year | | $ | 7.14 | | | $ | 6.16 | | | $ | 4.68 | | | $ | 7.52 | | | $ | 6.88 | |
| | | | | | | | | | | | | | | | | | | | |
Total Return (%) | | | 15.91 | | | | 31.62 | | | | (37.76 | ) | | | 9.30 | | | | 6.34 | |
Ratios to average daily net assets (%): | | | | | | | | | | | | | | | | | | | | |
Expenses, net of waivers and reimbursements | | | 1.21 | | | | 1.23 | | | | 1.23 | | | | 1.23 | | | | 1.24 | |
Expenses, before waivers and reimbursements | | | 1.53 | | | | 2.28 | | | | 1.85 | | | | 1.50 | | | | 1.63 | |
Net investment income (loss), net of waivers and reimbursements | | | (0.08 | ) | | | (0.13 | ) | | | (0.29 | ) | | | (0.16 | ) | | | (0.29 | ) |
Net investment income (loss), before waivers and reimbursements | | | (0.40 | ) | | | (1.18 | ) | | | (0.91 | ) | | | (0.43 | ) | | | (0.68 | ) |
| | | | | | | | | | | | | | | | | | | | |
| | | Class I | |
| | | Years Ended December 31, | |
| | | 2010 | | | 2009 | | | 2008 | | | 2007 | | | 2006 | |
Net asset value, beginning of year | | $ | 6.30 | | | $ | 4.77 | | | $ | 7.64 | | | $ | 6.99 | | | $ | 6.56 | |
Income (loss) from investment operations: | | | | | | | | | | | | | | | | | | | | |
Net investment income (loss) | | | 0.01 | | | | 0.01 | | | | 0.00 | ^ | | | 0.01 | | | | 0.00 | |
Net realized and unrealized gain (loss) on investments | | | 1.00 | | | | 1.52 | | | | (2.87 | ) | | | 0.64 | | | | 0.43 | |
| | | | | | | | | | | | | | | | | | | | |
Total from investment operations | | | 1.01 | | | | 1.53 | | | | (2.87 | ) | | | 0.65 | | | | 0.43 | |
Less distributions from: | | | | | | | | | | | | | | | | | | | | |
Net investment income | | | 0.01 | | | | 0.00 | ^ | | | 0.00 | ^ | | | 0.00^ | | | | — | |
Net realized gain | | | — | | | | — | | | | — | | | | — | | | | — | |
| | | | | | | | | | | | | | | | | | | | |
Total distributions | | | 0.01 | | | | 0.00 | ^ | | | 0.00 | ^ | | | 0.00 | ^ | | | — | |
| | | | | | | | | | | | | | | | | | | | |
Net asset value, end of year | | $ | 7.30 | | | $ | 6.30 | | | $ | 4.77 | | | $ | 7.64 | | | $ | 6.99 | |
| | | | | | | | | | | | | | | | | | | | |
Total Return (%) | | | 16.03 | | | | 32.17 | | | | (37.56 | ) | | | 9.36 | | | | 6.55 | |
Ratios to average daily net assets (%): | | | | | | | | | | | | | | | | | | | | |
Expenses, net of waivers and reimbursements | | | 0.96 | | | | 0.98 | | | | 0.98 | | | | 0.98 | | | | 0.99 | |
Expenses, before waivers and reimbursements | | | 1.16 | | | | 1.26 | | | | 1.21 | | | | 1.20 | | | | 1.38 | |
Net investment income (loss), net of waivers and reimbursements | | | 0.16 | | | | 0.12 | | | | (0.04 | ) | | | 0.18 | | | | (0.04 | ) |
Net investment income (loss), before waivers and reimbursements | | | (0.04 | ) | | | (0.16 | ) | | | (0.27 | ) | | | (0.04 | ) | | | (0.43 | ) |
| | | | | | | | | | | | | | | | | | | | |
| | | Years Ended December 31, | |
| | | 2010 | | | 2009 | | | 2008 | | | 2007 | | | 2006 | |
Supplemental data for all classes: | | | | | | | | | | | | | | | | | | | | |
Net assets at end of year (in thousands) | | $ | 32,035 | | | $ | 30,311 | | | $ | 23,279 | | | $ | 33,667 | | | $ | 20,191 | |
Portfolio turnover rate (%) | | | 54 | | | | 88 | | | | 85 | | | | 60 | | | | 53 | |
| ^ | | Amount is between $(0.005) and $0.005 per share. |
Performance cited represents past performance. Past performance does not guarantee future results and current performance may be lower or higher than the data quoted. Results shown are annual returns, which assume reinvestment of dividends and capital gains. Investment returns and principal will fluctuate and you may have a gain or loss when you sell shares. For the most current month-end performance information, please call 1-800-742-7272 or visit our Web site at www.williamblairfunds.com.
Note: Net investment income (loss) per share is based on the average shares outstanding during the year.
December 31, 2010 | William Blair Funds 131 |
Financial Highlights
Small Cap Growth Fund
| | | | | | | | | | | | | | | | | | | | |
| | | Class N | |
| | | Years Ended December 31, | |
| | | 2010 | | | 2009 | | | 2008 | | | 2007 | | | 2006 | |
Net asset value, beginning of year | | $ | 19.99 | | | $ | 11.79 | | | $ | 23.30 | | | $ | 25.41 | | | $ | 23.76 | |
Income (loss) from investment operations: | | | | | | | | | | | | | | | | | | | | |
Net investment income (loss) | | | (0.21 | ) | | | (0.15 | ) | | | (0.19 | ) | | | (0.33 | ) | | | (0.29 | ) |
Net realized and unrealized gain (loss) on investments | | | 3.44 | | | | 8.35 | | | | (10.73 | ) | | | (0.25 | ) | | | 3.65 | |
| | | | | | | | | | | | | | | | | | | | |
Total from investment operations | | | 3.23 | | | | 8.20 | | | | (10.92 | ) | | | (0.58 | ) | | | 3.36 | |
Less distributions from: | | | | | | | | | | | | | | | | | | | | |
Net investment income | | | — | | | | — | | | | — | | | | — | | | | — | |
Net realized gain | | | — | | | | — | | | | 0.59 | | | | 1.53 | | | | 1.71 | |
| | | | | | | | | | | | | | | | | | | | |
Total distributions | | | — | | | | — | | | | 0.59 | | | | 1.53 | | | | 1.71 | |
| | | | | | | | | | | | | | | | | | | | |
Net asset value, end of year | | $ | 23.22 | | | $ | 19.99 | | | $ | 11.79 | | | $ | 23.30 | | | $ | 25.41 | |
| | | | | | | | | | | | | | | | | | | | |
Total Return (%) | | | 16.16 | | | | 69.55 | | | | (46.85 | ) | | | (2.15 | ) | | | 14.12 | |
Ratios to average daily net assets (%): | | | | | | | | | | | | | | | | | | | | |
Expenses, net of waivers and reimbursements | | | 1.50 | | | | 1.50 | | | | 1.50 | | | | 1.49 | | | | 1.48 | |
Expenses, before waivers and reimbursements | | | 1.52 | | | | 1.55 | | | | 1.50 | | | | 1.49 | | | | 1.48 | |
Net investment income (loss), net of waivers and reimbursements | | | (1.03 | ) | | | (0.93 | ) | | | (1.05 | ) | | | (1.24 | ) | | | (1.14 | ) |
Net investment income (loss), before waivers and reimbursements | | | (1.05 | ) | | | (0.98 | ) | | | (1.05 | ) | | | (1.24 | ) | | | (1.14 | ) |
| | | | | | | | | | | | | | | | | | | | |
| | | Class I | |
| | | Years Ended December 31, | |
| | | 2010 | | | 2009 | | | 2008 | | | 2007 | | | 2006 | |
Net asset value, beginning of year | | $ | 20.64 | | | $ | 12.14 | | | $ | 23.89 | | | $ | 25.94 | | | $ | 24.16 | |
Income (loss) from investment operations: | | | | | | | | | | | | | | | | | | | | |
Net investment income (loss) | | | (0.16 | ) | | | (0.11 | ) | | | (0.14 | ) | | | (0.25 | ) | | | (0.22 | ) |
Net realized and unrealized gain (loss) on investments | | | 3.59 | | | | 8.61 | | | | (11.02 | ) | | | (0.27 | ) | | | 3.71 | |
| | | | | | | | | | | | | | | | | | | | |
Total from investment operations | | | 3.43 | | | | 8.50 | | | | (11.16 | ) | | | (0.52 | ) | | | 3.49 | |
Less distributions from: | | | | | | | | | | | | | | | | | | | | |
Net investment income | | | — | | | | — | | | | — | | | | — | | | | — | |
Net realized gain | | | — | | | | — | | | | 0.59 | | | | 1.53 | | | | 1.71 | |
| | | | | | | | | | | | | | | | | | | | |
Total distributions | | | — | | | | — | | | | 0.59 | | | | 1.53 | | | | 1.71 | |
| | | | | | | | | | | | | | | | | | | | |
Net asset value, end of year | | $ | 24.07 | | | $ | 20.64 | | | $ | 12.14 | | | $ | 23.89 | | | $ | 25.94 | |
| | | | | | | | | | | | | | | | | | | | |
Total Return (%) | | | 16.62 | | | | 70.02 | | | | (46.70 | ) | | | (1.88 | ) | | | 14.42 | |
Ratios to average daily net assets (%): | | | | | | | | | | | | | | | | | | | | |
Expenses | | | 1.25 | | | | 1.20 | | | | 1.20 | | | | 1.20 | | | | 1.21 | |
Net investment income (loss) | | | (0.76 | ) | | | (0.63 | ) | | | (0.75 | ) | | | (0.94 | ) | | | (0.87 | ) |
| | | | | | | | | | | | | | | | | | | | |
| | | Years Ended December 31, | |
| | | 2010 | | | 2009 | | | 2008 | | | 2007 | | | 2006 | |
Supplemental data for all classes: | | | | | | | | | | | | | | | | | | | | |
Net assets at end of year (in thousands) | | $ | 891,589 | | | $ | 762,798 | | | $ | 401,627 | | | $ | 1,094,419 | | | $ | 1,261,174 | |
Portfolio turnover rate (%) | | | 117 | | | | 122 | | | | 135 | | | | 97 | | | | 105 | |
Performance cited represents past performance. Past performance does not guarantee future results and current performance may be lower or higher than the data quoted. Results shown are annual returns, which assume reinvestment of dividends and capital gains. Investment returns and principal will fluctuate and you may have a gain or loss when you sell shares. For the most current month-end performance information, please call 1-800-742-7272 or visit our Web site at www.williamblairfunds.com.
Note: Net investment income (loss) per share is based on the average shares outstanding during the year.
132 Annual Report | December 31, 2010 |
Financial Highlights
Mid Cap Growth Fund
| | | | | | | | | | | | | | | | | | | | |
| | | Class N | |
| | | Periods Ended December 31, | |
| | | 2010 | | | 2009 | | | 2008 | | | 2007 | | | 2006(a) | |
Net asset value, beginning of year | | $ | 10.08 | | | $ | 7.41 | | | $ | 11.35 | | | $ | 10.46 | | | $ | 10.00 | |
Income (loss) from investment operations: | | | | | | | | | | | | | | | | | | | | |
Net investment income (loss) | | | (0.05 | ) | | | (0.04 | ) | | | (0.07 | ) | | | (0.07 | ) | | | (0.07 | ) |
Net realized and unrealized gain (loss) on investments | | | 2.47 | | | | 2.71 | | | | (3.87 | ) | | | 1.59 | | | | 0.53 | |
| | | | | | | | | | | | | | | | | | | | |
Total from investment operations | | | 2.42 | | | | 2.67 | | | | (3.94 | ) | | | 1.52 | | | | 0.46 | |
Less distributions from: | | | | | | | | | | | | | | | | | | | | |
Net investment income | | | — | | | | — | | | | — | | | | — | | | | — | |
Net realized gain | | | — | | | | — | | | | 0.00 | ^ | | | 0.63 | | | | — | |
| | | | | | | | | | | | | | | | | | | | |
Total distributions | | | — | | | | — | | | | 0.00 | ^ | | | 0.63 | | | | — | |
| | | | | | | | | | | | | | | | | | | | |
Net asset value, end of year | | $ | 12.50 | | | $ | 10.08 | | | $ | 7.41 | | | $ | 11.35 | | | $ | 10.46 | |
| | | | | | | | | | | | | | | | | | | | |
Total Return (%)* | | | 24.01 | | | | 36.03 | | | | (34.71 | ) | | | 14.62 | | | | 4.60 | |
Ratios to average daily net assets (%):** | | | | | | | | | | | | | | | | | | | | |
Expenses, net of waivers and reimbursements | | | 1.35 | | | | 1.36 | | | | 1.36 | | | | 1.38 | | | | 1.40 | |
Expenses, before waivers and reimbursements | | | 1.42 | | | | 2.13 | | | | 2.03 | | | | 1.67 | | | | 2.35 | |
Net investment income (loss), net of waivers and reimbursements | | | (0.42 | ) | | | (0.51 | ) | | | (0.76 | ) | | | (0.58 | ) | | | (0.70 | ) |
Net investment income (loss), before waivers and reimbursements | | | (0.49 | ) | | | (1.28 | ) | | | (1.43 | ) | | | (0.87 | ) | | | (1.65 | ) |
| | | | | | | | | | | | | | | | | | | | |
| | | Class I | |
| | | Periods Ended December 31, | |
| | | 2010 | | | 2009 | | | 2008 | | | 2007 | | | 2006(a) | |
Net asset value, beginning of year | | $ | 10.20 | | | $ | 7.48 | | | $ | 11.42 | | | $ | 10.49 | | | $ | 10.00 | |
Income (loss) from investment operations: | | | | | | | | | | | | | | | | | | | | |
Net investment income (loss) | | | (0.02 | ) | | | (0.02 | ) | | | (0.05 | ) | | | (0.04 | ) | | | (0.04 | ) |
Net realized and unrealized gain (loss) on investments | | | 2.50 | | | | 2.74 | | | | (3.89 | ) | | | 1.60 | | | | 0.53 | |
| | | | | | | | | | | | | | | | | | | | |
Total from investment operations | | | 2.48 | | | | 2.72 | | | | (3.94 | ) | | | 1.56 | | | | 0.49 | |
Less distributions from: | | | | | | | | | | | | | | | | | | | | |
Net investment income | | | — | | | | — | | | | — | | | | — | | | | — | |
Net realized gain | | | — | | | | — | | | | 0.00 | ^ | | | 0.63 | | | | — | |
| | | | | | | | | | | | | | | | | | | | |
Total distributions | | | — | | | | — | | | | 0.00 | ^ | | | 0.63 | | | | — | |
| | | | | | | | | | | | | | | | | | | | |
Net asset value, end of year | | $ | 12.68 | | | $ | 10.20 | | | $ | 7.48 | | | $ | 11.42 | | | $ | 10.49 | |
| | | | | | | | | | | | | | | | | | | | |
Total Return (%)* | | | 24.31 | | | | 36.36 | | | | (34.50 | ) | | | 14.95 | | | | 4.90 | |
Ratios to average daily net assets (%):** | | | | | | | | | | | | | | | | | | | | |
Expenses, net of waivers and reimbursements | | | 1.10 | | | | 1.11 | | | | 1.11 | | | | 1.12 | | | | 1.15 | |
Expenses, before waivers and reimbursements | | | 1.15 | | | | 1.28 | | | | 1.23 | | | | 1.37 | | | | 2.10 | |
Net investment income (loss), net of waivers and reimbursements | | | (0.14 | ) | | | (0.26 | ) | | | (0.51 | ) | | | (0.32 | ) | | | (0.43 | ) |
Net investment income (loss), before waivers and reimbursements | | | (0.19 | ) | | | (0.43 | ) | | | (0.63 | ) | | | (0.57 | ) | | | (1.38 | ) |
| | | | | | | | | | | | | | | | | | | | |
| | | Periods Ended December 31, | |
| | | 2010 | | | 2009 | | | 2008 | | | 2007 | | | 2006(a) | |
Supplemental data for all classes: | | | | | | | | | | | | | | | | | | | | |
Net assets at end of year (in thousands) | | $ | 101,248 | | | $ | 70,834 | | | $ | 40,526 | | | $ | 45,393 | | | $ | 19,639 | |
Portfolio turnover rate (%)* | | | 73 | | | | 87 | | | | 76 | | | | 66 | | | | 56 | |
| (a) | | For the period February 1, 2006 (Comencement of Operations) to December 31, 2006. |
| * | | Rates not annualized for periods that are less than a year. |
| ** | | Rates are annualized for periods that are less than a year. |
| ^ | | Amount is less than $0.005 per share. |
Performance cited represents past performance. Past performance does not guarantee future results and current performance may be lower or higher than the data quoted. Results shown are annual returns, which assume reinvestment of dividends and capital gains. Investment returns and principal will fluctuate and you may have a gain or loss when you sell shares. For the most current month-end performance information, please call 1-800-742-7272 or visit our Web site at www.williamblairfunds.com.
Note: Net investment income (loss) per share is based on the average shares outstanding during the year.
December 31, 2010 | William Blair Funds 133 |
Financial Highlights
Small-Mid Cap Growth Fund
| | | | | | | | | | | | | | | | | | | | |
| | | Class N | |
| | | Years Ended December 31, | |
| | | 2010 | | | 2009 | | | 2008 | | | 2007 | | | 2006 | |
Net asset value, beginning of year | | $ | 11.73 | | | $ | 8.16 | | | $ | 13.10 | | | $ | 12.96 | | | $ | 12.40 | |
Income (loss) from investment operations: | | | | | | | | | | | | | | | | | | | | |
Net investment income (loss) | | | (0.09 | ) | | | (0.06 | ) | | | (0.03 | ) | | | (0.12 | ) | | | (0.11 | ) |
Net realized and unrealized gain (loss) on investments | | | 2.76 | | | | 3.63 | | | | (4.91 | ) | | | 1.71 | | | | 1.32 | |
| | | | | | | | | | | | | | | | | | | | |
Total from investment operations | | | 2.67 | | | | 3.57 | | | | (4.94 | ) | | | 1.59 | | | | 1.21 | |
Less distributions from: | | | | | | | | | | | | | | | | | | | | |
Net investment income | | | — | | | | — | | | | — | | | | — | | | | — | |
Net realized gain | | | — | | | | — | | | | 0.00 | ^ | | | 1.45 | | | | 0.65 | |
| | | | | | | | | | | | | | | | | | | | |
Total distributions | | | — | | | | — | | | | 0.00 | ^ | | | 1.45 | | | | 0.65 | |
| | | | | | | | | | | | | | | | | | | | |
Net asset value, end of year | | $ | 14.40 | | | $ | 11.73 | | | $ | 8.16 | | | $ | 13.10 | | | $ | 12.96 | |
| | | | | | | | | | | | | | | | | | | | |
Total Return (%) | | | 22.76 | | | | 43.75 | | | | (37.71 | ) | | | 12.34 | | | | 9.68 | |
Ratios to average daily net assets (%): | | | | | | | | | | | | | | | | | | | | |
Expenses, net of waivers and reimbursements | | | 1.35 | | | | 1.36 | | | | 1.36 | | | | 1.36 | | | | 1.38 | |
Expenses, before waivers and reimbursements | | | 1.46 | | | | 1.49 | | | | 1.41 | | | | 1.42 | | | | 1.45 | |
Net investment income (loss), net of waivers and reimbursements | | | (0.76 | ) | | | (0.60 | ) | | | (0.26 | ) | | | (0.79 | ) | | | (0.86 | ) |
Net investment income (loss), before waivers and reimbursements | | | (0.87 | ) | | | (0.73 | ) | | | (0.31 | ) | | | (0.85 | ) | | | (0.93 | ) |
| | | | | | | | | | | | | | | | | | | | |
| | | Class I | |
| | | Years Ended December 31, | |
| | | 2010 | | | 2009 | | | 2008 | | | 2007 | | | 2006 | |
Net asset value, beginning of year | | $ | 11.93 | | | $ | 8.27 | | | $ | 13.24 | | | $ | 13.06 | | | $ | 12.46 | |
Income (loss) from investment operations: | | | | | | | | | | | | | | | | | | | | |
Net investment income (loss) | | | (0.06 | ) | | | (0.03 | ) | | | 0.00 | ^ | | | (0.08 | ) | | | (0.08 | ) |
Net realized and unrealized gain (loss) on investments | | | 2.81 | | | | 3.69 | | | | (4.97 | ) | | | 1.71 | | | | 1.33 | |
| | | | | | | | | | | | | | | | | | | | |
Total from investment operations | | | 2.75 | | | | 3.66 | | | | (4.97 | ) | | | 1.63 | | | | 1.25 | |
Less distributions from: | | | | | | | | | | | | | | | | | | | | |
Net investment income | | | — | | | | 0.00 | ^ | | | — | | | | — | | | | — | |
Net realized gain | | | — | | | | — | | | | 0.00 | ^ | | | 1.45 | | | | 0.65 | |
| | | | | | | | | | | | | | | | | | | | |
Total distributions | | | — | | | | 0.00 | ^ | | | 0.00 | ^ | | | 1.45 | | | | 0.65 | |
| | | | | | | | | | | | | | | | | | | | |
Net asset value, end of year | | $ | 14.68 | | | $ | 11.93 | | | $ | 8.27 | | | $ | 13.24 | | | $ | 13.06 | |
| | | | | | | | | | | | | | | | | | | | |
Total Return (%) | | | 23.05 | | | | 44.26 | | | | (37.54 | ) | | | 12.54 | | | | 9.95 | |
Ratios to average daily net assets (%): | | | | | | | | | | | | | | | | | | | | |
Expenses, net of waivers and reimbursements | | | 1.10 | | | | 1.11 | | | | 1.11 | | | | 1.11 | | | | 1.13 | |
Expenses, before waivers and reimbursements | | | 1.11 | | | | 1.18 | | | | 1.17 | | | | 1.17 | | | | 1.20 | |
Net investment income (loss), net of waivers and reimbursements | | | (0.50 | ) | | | (0.33 | ) | | | 0.03 | | | | (0.54 | ) | | | (0.61 | ) |
Net investment income (loss), before waivers and reimbursements | | | (0.51 | ) | | | (0.40 | ) | | | (0.03 | ) | | | (0.60 | ) | | | (0.68 | ) |
| | | | | | | | | | | | | | | | | | | | |
| | | Years Ended December 31, | |
| | | 2010 | | | 2009 | | | 2008 | | | 2007 | | | 2006 | |
Supplemental data for all classes: | | | | | | | | | | | | | | | | | | | | |
Net assets at end of year (in thousands) | | $ | 208,065 | | | $ | 146,828 | | | $ | 83,479 | | | $ | 124,501 | | | $ | 92,766 | |
Portfolio turnover rate (%) | | | 93 | | | | 112 | | | | 77 | | | | 80 | | | | 68 | |
| ^ | | Amount is less than $0.005 per share. |
Performance cited represents past performance. Past performance does not guarantee future results and current performance may be lower or higher than the data quoted. Results shown are annual returns, which assume reinvestment of dividends and capital gains. Investment returns and principal will fluctuate and you may have a gain or loss when you sell shares. For the most current month-end performance information, please call 1-800-742-7272 or visit our Web site at www.williamblairfunds.com.
Note: Net investment income (loss) per share is based on the average shares outstanding during the year.
134 Annual Report | December 31, 2010 |
Financial Highlights
Global Growth Fund
| | | | | | | | | | | | | | | | |
| | | Class N | |
| | | Periods Ended December 31, | |
| | | 2010 | | | 2009 | | | 2008 | | | 2007(a) | |
Net asset value, beginning of year | | $ | 6.97 | | | $ | 4.96 | | | $ | 9.89 | | | $ | 10.00 | |
Income (loss) from investment operations: | | | | | | | | | | | | | | | | |
Net investment income (loss) (b) | | | (0.01 | ) | | | (0.01 | ) | | | 0.08 | | | | 0.00 | ^ |
Net realized and unrealized gain (loss) on investments | | | 1.44 | | | | 2.02 | | | | (4.98 | ) | | | (0.11 | ) |
| | | | | | | | | | | | | | | | |
Total from investment operations | | | 1.43 | | | | 2.01 | | | | (4.90 | ) | | | (0.11 | ) |
Less distributions from: | | | | | | | | | | | | | | | | |
Net investment income | | | — | | | | — | | | | 0.03 | | | | 0.00 | ^ |
Net realized gain | | | — | | | | — | | | | — | | | | — | |
| | | | | | | | | | | | | | | | |
Total distributions | | | — | | | | — | | | | 0.03 | | | | 0.00 | ^ |
| | | | | | | | | | | | | | | | |
Net asset value, end of year | | $ | 8.40 | | | $ | 6.97 | | | $ | 4.96 | | | $ | 9.89 | |
| | | | | | | | | | | | | | | | |
Total Return (%)* | | | 20.52 | | | | 40.52 | | | | (49.52 | ) | | | (1.10 | ) |
Ratios to average daily net assets (%):** | | | | | | | | | | | | | | | | |
Expenses, net of waivers and reimbursements | | | 1.52 | | | | 1.55 | | | | 1.55 | | | | 1.55 | |
Expenses, before waivers and reimbursements | | | 1.93 | | | | 2.61 | | | | 2.17 | | | | 2.14 | |
Net investment income (loss), net of waivers and reimbursements | | | (0.09 | ) | | | (0.17 | ) | | | 0.98 | | | | (0.08 | ) |
Net investment income (loss), before waivers and reimbursements | | | (0.50 | ) | | | (1.23 | ) | | | 0.36 | | | | (0.67 | ) |
| | | | | | | | | | | | | | | | |
| | | Class I | |
| | | Periods Ended December 31, | |
| | | 2010 | | | 2009 | | | 2008 | | | 2007(a) | |
Net asset value, beginning of year | | $ | 6.96 | | | $ | 4.94 | | | $ | 9.91 | | | $ | 10.00 | |
Income (loss) from investment operations: | | | | | | | | | | | | | | | | |
Net investment income (loss) (b) | | | 0.01 | | | | 0.00 | ^ | | | 0.08 | | | | 0.00 | ^ |
Net realized and unrealized gain (loss) on investments | | | 1.43 | | | | 2.02 | | | | (4.98 | ) | | | (0.09 | ) |
| | | | | | | | | | | | | | | | |
Total from investment operations | | | 1.44 | | | | 2.02 | | | | (4.90 | ) | | | (0.09 | ) |
Less distributions from: | | | | | | | | | | | | | | | | |
Net investment income | | | 0.00 | ^ | | | 0.00 | ^ | | | 0.07 | | | | 0.00 | ^ |
Net realized gain | | | — | | | | — | | | | — | | | | — | |
| | | | | | | | | | | | | | | | |
Total distributions | | | 0.00 | ^ | | | 0.00 | ^ | | | 0.07 | | | | 0.00 | ^ |
| | | | | | | | | | | | | | | | |
Net asset value, end of year | | $ | 8.40 | | | $ | 6.96 | | | $ | 4.94 | | | $ | 9.91 | |
| | | | | | | | | | | | | | | | |
Total Return (%)* | | | 20.73 | | | | 40.90 | | | | (49.41 | ) | | | (0.85 | ) |
Ratios to average daily net assets (%):** | | | | | | | | | | | | | | | | |
Expenses, net of waivers and reimbursements | | | 1.27 | | | | 1.30 | | | | 1.30 | | | | 1.30 | |
Expenses, before waivers and reimbursements | | | 1.62 | | | | 1.62 | | | | 1.74 | | | | 1.89 | |
Net investment income (loss), net of waivers and reimbursements | | | 0.16 | | | | 0.05 | | | | 1.05 | | | | 0.14 | |
Net investment income (loss), before waivers and reimbursements | | | (0.19 | ) | | | (0.27 | ) | | | 0.61 | | | | (0.45 | ) |
| | | | | | | | | | | | | | | | |
| | | Periods Ended December 31, | |
| | | 2010 | | | 2009 | | | 2008 | | | 2007(a) | |
Supplemental data for all classes: | | | | | | | | | | | | | | | | |
Net assets at end of year (in thousands) | | $ | 44,877 | | | $ | 38,287 | | | $ | 28,005 | | | $ | 45,576 | |
Portfolio turnover rate (%)* | | | 96 | | | | 133 | | | | 124 | | | | 63 | |
| (a) | | For the period October 15, 2007 (Commencement of Operations) to December 31, 2007. |
| (b) | | Excludes $0.00, $0.00, $0.00 and $0.00 of PFIC mark to market which is treated as ordinary income for Federal tax purposes for the years 2010, 2009, 2008 and 2007, respectively. |
| * | | Rates not annualized for periods that are less than a year. |
| ** | | Rates are annualized for periods that are less than a year. |
| ^ | | Amount is less than $0.005 per share. |
Performance cited represents past performance. Past performance does not guarantee future results and current performance may be lower or higher than the data quoted. Results shown are annual returns, which assume reinvestment of dividends and capital gains. Investment returns and principal will fluctuate and you may have a gain or loss when you sell shares. For the most current month-end performance information, please call 1-800-742-7272 or visit our Web site at www.williamblairfunds.com.
Note: Net investment income (loss) per share is based on the average shares outstanding during the year.
December 31, 2010 | William Blair Funds 135 |
Financial Highlights
International Growth Fund
| | | | | | | | | | | | | | | | | | | | |
| | | Class N | |
| | | Years Ended December 31, | |
| | | 2010 | | | 2009 | | | 2008 | | | 2007 | | | 2006 | |
Net asset value, beginning of year | | $ | 18.55 | | | $ | 13.12 | | | $ | 29.12 | | | $ | 27.70 | | | $ | 25.22 | |
Income (loss) from investment operations: | | | | | | | | | | | | | | | | | | | | |
Net investment income (loss) (a) | | | 0.14 | | | | 0.07 | | | | 0.29 | | | | 0.12 | | | | 0.05 | |
Net realized and unrealized gain (loss) on investments | | | 3.58 | | | | 5.47 | | | | (15.54 | ) | | | 4.77 | | | | 5.71 | |
| | | | | | | | | | | | | | | | | | | | |
Total from investment operations | | | 3.72 | | | | 5.54 | | | | (15.25 | ) | | | 4.89 | | | | 5.76 | |
Less distributions from: | | | | | | | | | | | | | | | | | | | | |
Net investment income | | | 0.42 | | | | 0.11 | | | | — | | | | 0.34 | | | | 0.37 | |
Net realized gain | | | — | | | | — | | | | 0.75 | | | | 3.13 | | | | 2.91 | |
| | | | | | | | | | | | | | | | | | | | |
Total distributions | | | 0.42 | | | | 0.11 | | | | 0.75 | | | | 3.47 | | | | 3.28 | |
| | | | | | | | | | | | | | | | | | | | |
Net asset value, end of year | | $ | 21.85 | | | $ | 18.55 | | | $ | 13.12 | | | $ | 29.12 | | | $ | 27.70 | |
| | | | | | | | | | | | | | | | | | | | |
Total Return (%) | | | 20.09 | | | | 42.27 | | | | (52.33 | ) | | | 18.13 | | | | 23.06 | |
Ratios to average daily net assets (%): | | | | | | | | | | | | | | | | | | | | |
Expenses, net of waivers and reimbursements | | | 1.43 | | | | 1.45 | | | | 1.39 | | | | 1.40 | | | | 1.42 | |
Expenses, before waivers and reimbursements | | | 1.43 | | | | 1.46 | | | | 1.39 | | | | 1.40 | | | | 1.42 | |
Net investment income (loss), net of waivers and reimbursements | | | 0.73 | | | | 0.48 | | | | 1.29 | | | | 0.38 | | | | 0.19 | |
Net investment income (loss), before waivers and reimbursements | | | 0.73 | | | | 0.47 | | | | 1.29 | | | | 0.38 | | | | 0.19 | |
| | | | | | | | | | | | | | | | | | | | |
| | | Class I | |
| | | Years Ended December 31, | |
| | | 2010 | | | 2009 | | | 2008 | | | 2007 | | | 2006 | |
Net asset value, beginning of year | | $ | 18.95 | | | $ | 13.40 | | | $ | 29.61 | | | $ | 28.10 | | | $ | 25.55 | |
Income (loss) from investment operations: | | | | | | | | | | | | | | | | | | | | |
Net investment income (loss) (a) | | | 0.20 | | | | 0.12 | | | | 0.37 | | | | 0.21 | | | | 0.13 | |
Net realized and unrealized gain (loss) on investments | | | 3.67 | | | | 5.59 | | | | (15.83 | ) | | | 4.86 | | | | 5.78 | |
| | | | | | | | | | | | | | | | | | | | |
Total from investment operations | | | 3.87 | | | | 5.71 | | | | (15.46 | ) | | | 5.07 | | | | 5.91 | |
Less distributions from: | | | | | | | | | | | | | | | | | | | | |
Net investment income | | | 0.48 | | | | 0.16 | | | | — | | | | 0.43 | | | | 0.45 | |
Net realized gain | | | — | | | | — | | | | 0.75 | | | | 3.13 | | | | 2.91 | |
| | | | | | | | | | | | | | | | | | | | |
Total distributions | | | 0.48 | | | | 0.16 | | | | 0.75 | | | | 3.56 | | | | 3.36 | |
| | | | | | | | | | | | | | | | | | | | |
Net asset value, end of year | | $ | 22.34 | | | $ | 18.95 | | | $ | 13.40 | | | $ | 29.61 | | | $ | 28.10 | |
| | | | | | | | | | | | | | | | | | | | |
Total Return (%) | | | 20.47 | | | | 42.63 | | | | (52.17 | ) | | | 18.53 | | | | 23.35 | |
Ratios to average daily net assets (%): | | | | | | | | | | | | | | | | | | | | |
Expenses | | | 1.14 | | | | 1.17 | | | | 1.08 | | | | 1.09 | | | | 1.11 | |
Net investment income (loss) | | | 0.99 | | | | 0.74 | | | | 1.58 | | | | 0.69 | | | | 0.45 | |
| | | | | | | | | | | | | | | | | | | | |
| | | Years Ended December 31, | |
| | | 2010 | | | 2009 | | | 2008 | | | 2007 | | | 2006 | |
Supplemental data for all classes: | | | | | | | | | | | | | | | | | | | | |
Net assets at end of year (in thousands) | | $ | 5,082,179 | | | $ | 4,473,408 | | | $ | 3,130,938 | | | $ | 8,048,654 | | | $ | 6,267,126 | |
Portfolio turnover rate (%) | | | 99 | | | | 121 | | | | 91 | | | | 56 | | | | 72 | |
| (a) | | Excludes $0.13, $0.08, $(0.18), $0.09, and $0.42 of PFIC mark to market which is treated as ordinary income for Federal tax purposes for the years 2010, 2009, 2008, 2007 and 2006, respectively. |
Performance cited represents past performance. Past performance does not guarantee future results and current performance may be lower or higher than the data quoted. Results shown are annual returns, which assume reinvestment of dividends and capital gains. Investment returns and principal will fluctuate and you may have a gain or loss when you sell shares. For the most current month-end performance information, please call 1-800-742-7272 or visit our Web site at www.williamblairfunds.com.
Note: Net investment income (loss) per share is based on the average shares outstanding during the year.
136 Annual Report | December 31, 2010 |
Financial Highlights
International Equity Fund
| | | | | | | | | | | | | | | | | | | | |
| | | Class N | |
| | | Years Ended December 31, | |
| | | 2010 | | | 2009 | | | 2008 | | | 2007 | | | 2006 | |
Net asset value, beginning of year | | $ | 11.07 | | | $ | 8.35 | | | $ | 16.53 | | | $ | 15.21 | | | $ | 12.86 | |
Income (loss) from investment operations: | | | | | | | | | | | | | | | | | | | | |
Net investment income (loss) (a) | | | 0.06 | | | | 0.09 | | | | 0.10 | | | | 0.09 | | | | 0.04 | |
Net realized and unrealized gain (loss) on investments | | | 1.15 | | | | 2.64 | | | | (8.16 | ) | | | 2.55 | | | | 2.52 | |
| | | | | | | | | | | | | | | | | | | | |
Total from investment operations | | | 1.21 | | | | 2.73 | | | | (8.06 | ) | | | 2.64 | | | | 2.56 | |
Less distributions from: | | | | | | | | | | | | | | | | | | | | |
Net investment income | | | 0.16 | | | | 0.01 | | | | — | | | | 0.14 | | | | 0.19 | |
Net realized gain | | | — | | | | — | | | | 0.12 | | | | 1.18 | | | | 0.02 | |
| | | | | | | | | | | | | | | | | | | | |
Total distributions | | | 0.16 | | | | 0.01 | | | | 0.12 | | | | 1.32 | | | | 0.21 | |
| | | | | | | | | | | | | | | | | | | | |
Net asset value, end of year | | $ | 12.12 | | | $ | 11.07 | | | $ | 8.35 | | | $ | 16.53 | | | $ | 15.21 | |
| | | | | | | | | | | | | | | | | | | | |
Total Return (%) | | | 10.92 | | | | 32.69 | | | | (48.75 | ) | | | 17.68 | | | | 19.96 | |
Ratios to average daily net assets (%): | | | | | | | | | | | | | | | | | | | | |
Expenses, net of waivers and reimbursements | | | 1.45 | | | | 1.45 | | | | 1.45 | | | | 1.45 | | | | 1.46 | |
Expenses, before waivers and reimbursements | | | 1.66 | | | | 1.59 | | | | 1.45 | | | | 1.47 | | | | 1.56 | |
Net investment income (loss), net of waivers and reimbursements | | | 0.55 | | | | 1.03 | | | | 0.80 | | | | 0.52 | | | | 0.26 | |
Net investment income (loss), before waivers and reimbursements | | | 0.34 | | | | 0.89 | | | | 0.80 | | | | 0.50 | | | | 0.16 | |
| |
| | | Class I | |
| | | Years Ended December 31, | |
| | | 2010 | | | 2009 | | | 2008 | | | 2007 | | | 2006 | |
Net asset value, beginning of year | | $ | 11.16 | | | $ | 8.44 | | | $ | 16.66 | | | $ | 15.31 | | | $ | 12.94 | |
Income (loss) from investment operations: | | | | | | | | | | | | | | | | | | | | |
Net investment income (loss) (a) | | | 0.10 | | | | 0.08 | | | | 0.15 | | | | 0.13 | | | | 0.06 | |
Net realized and unrealized gain (loss) on investments | | | 1.15 | | | | 2.70 | | | | (8.25 | ) | | | 2.57 | | | | 2.55 | |
| | | | | | | | | | | | | | | | | | | | |
Total from investment operations | | | 1.25 | | | | 2.78 | | | | (8.10 | ) | | | 2.70 | | | | 2.61 | |
Less distributions from: | | | | | | | | | | | | | | | | | | | | |
Net investment income | | | 0.19 | | | | 0.06 | | | | — | | | | 0.17 | | | | 0.22 | |
Net realized gain | | | — | | | | — | | | | 0.12 | | | | 1.18 | | | | 0.02 | |
| | | | | | | | | | | | | | | | | | | | |
Total distributions | | | 0.19 | | | | 0.06 | | | | 0.12 | | | | 1.35 | | | | 0.24 | |
| | | | | | | | | | | | | | | | | | | | |
Net asset value, end of year | | $ | 12.22 | | | $ | 11.16 | | | $ | 8.44 | | | $ | 16.66 | | | $ | 15.31 | |
| | | | | | | | | | | | | | | | | | | | |
Total Return (%) | | | 11.19 | | | | 32.93 | | | | (48.61 | ) | | | 17.97 | | | | 20.22 | |
Ratios to average daily net assets (%): | | | | | | | | | | | | | | | | | | | | |
Expenses, net of waivers and reimbursements | | | 1.20 | | | | 1.20 | | | | 1.20 | | | | 1.20 | | | | 1.21 | |
Expenses, before waivers and reimbursements | | | 1.28 | | | | 1.39 | | | | 1.22 | | | | 1.25 | | | | 1.35 | |
Net investment income (loss), net of waivers and reimbursements | | | 0.88 | | | | 0.86 | | | | 1.12 | | | | 0.76 | | | | 0.46 | |
Net investment income (loss), before waivers and reimbursements | | | 0.80 | | | | 0.67 | | | | 1.10 | | | | 0.71 | | | | 0.32 | |
| |
| | | | |
| | | Years Ended December 31, | |
| | | 2010 | | | 2009 | | | 2008 | | | 2007 | | | 2006 | |
Supplemental data for all classes: | | | | | | | | | | | | | | | | | | | | |
Net assets at end of year (in thousands) | | $ | 178,055 | | | $ | 298,168 | | | $ | 228,486 | | | $ | 408,609 | | | $ | 297,716 | |
Portfolio turnover rate (%) | | | 71 | | | | 88 | | | | 92 | | | | 70 | | | | 83 | |
| (a) | | Excludes $0.04, $0.00, $0.00, $(0.07) and $0.01 of PFIC mark to market which is treated as ordinary income for Federal tax purposes for the years 2010, 2009, 2008, 2007 and 2006, respectively. |
Performance cited represents past performance. Past performance does not guarantee future results and current performance may be lower or higher than the data quoted. Results shown are annual returns, which assume reinvestment of dividends and capital gains. Investment returns and principal will fluctuate and you may have a gain or loss when you sell shares. For the most current month-end performance information, please call 1-800-742-7272 or visit our Web site at www.williamblairfunds.com.
Note: Net investment income (loss) per share is based on the average shares outstanding during the year.
December 31, 2010 | William Blair Funds 137 |
Financial Highlights
International Small Cap Growth Fund
| | | | | | | | | | | | | | | | | | | | |
| | | Class N | |
| | | Years Ended December 31, | |
| | | 2010 | | | 2009 | | | 2008 | | | 2007 | | | 2006 | |
Net asset value, beginning of year | | $ | 10.40 | | | $ | 6.62 | | | $ | 13.98 | | | $ | 13.37 | | | $ | 11.16 | |
Income (loss) from investment operations: | | | | | | | | | | | | | | | | | | | | |
Net investment income (loss) (a) | | | 0.03 | | | | (0.01 | ) | | | (0.02 | ) | | | (0.02 | ) | | | (0.05 | ) |
Net realized and unrealized gain (loss) on investments | | | 2.66 | | | | 3.79 | | | | (7.22 | ) | | | 1.72 | | | | 2.32 | |
| | | | | | | | | | | | | | | | | | | | |
Total from investment operations | | | 2.69 | | | | 3.78 | | | | (7.24 | ) | | | 1.70 | | | | 2.27 | |
Less distributions from: | | | | | | | | | | | | | | | | | | | | |
Net investment income | | | 0.02 | | | | — | | | | — | | | | 0.05 | | | | 0.01 | |
Net realized gain | | | — | | | | — | | | | 0.12 | | | | 1.04 | | | | 0.05 | |
| | | | | | | | | | | | | | | | | | | | |
Total distributions | | | 0.02 | | | | — | | | | 0.12 | | | | 1.09 | | | | 0.06 | |
| | | | | | | | | | | | | | | | | | | | |
Net asset value, end of year | | $ | 13.07 | | | $ | 10.40 | | | $ | 6.62 | | | $ | 13.98 | | | $ | 13.37 | |
| | | | | | | | | | | | | | | | | | | | |
Total Return (%)* | | | 25.88 | | | | 57.10 | | | | (51.82 | ) | | | 13.06 | | | | 20.32 | |
Ratios to average daily net assets (%):** | | | | | | | | | | | | | | | | | | | | |
Expenses, net of waivers and reimbursements | | | 1.55 | | | | 1.65 | | | | 1.65 | | | | 1.60 | | | | 1.65 | |
Expenses, before waivers and reimbursements | | | 1.55 | | | | 1.83 | | | | 1.62 | | | | 1.60 | | | | 1.71 | |
Net investment income (loss), net of waivers and reimbursements | | | 0.30 | | | | (0.16 | ) | | | (0.20 | ) | | | (0.16 | ) | | | (0.40 | ) |
Net investment income (loss), before waivers and reimbursements | | | 0.30 | | | | (0.34 | ) | | | (0.17 | ) | | | (0.16 | ) | | | (0.46 | ) |
| | | | | | | | | | | | | | | | | | | | |
| | | Class I | |
| | | Years Ended December 31, | |
| | | 2010 | | | 2009 | | | 2008 | | | 2007 | | | 2006 | |
Net asset value, beginning of year | | $ | 10.49 | | | $ | 6.67 | | | $ | 14.01 | | | $ | 13.41 | | | $ | 11.16 | |
Income (loss) from investment operations: | | | | | | | | | | | | | | | | | | | | |
Net investment income (loss) (a) | | | 0.07 | | | | 0.01 | | | | 0.01 | | | | 0.03 | | | | (0.03 | ) |
Net realized and unrealized gain (loss) on investments | | | 2.68 | | | | 3.83 | | | | (7.23 | ) | | | 1.71 | | | | 2.34 | |
| | | | | | | | | | | | | | | | | | | | |
Total from investment operations | | | 2.75 | | | | 3.84 | | | | (7.22 | ) | | | 1.74 | | | | 2.31 | |
Less distributions from: | | | | | | | | | | | | | | | | | | | | |
Net investment income | | | 0.05 | | | | 0.02 | | | | — | | | | 0.10 | | | | 0.01 | |
Net realized gain | | | — | | | | — | | | | 0.12 | | | | 1.04 | | | | 0.05 | |
| | | | | | | | | | | | | | | | | | | | |
Total distributions | | | 0.05 | | | | 0.02 | | | | 0.12 | | | | 1.14 | | | | 0.06 | |
| | | | | | | | | | | | | | | | | | | | |
Net asset value, end of year | | $ | 13.19 | | | $ | 10.49 | | | $ | 6.67 | | | $ | 14.01 | | | $ | 13.41 | |
| | | | | | | | | | | | | | | | | | | | |
Total Return (%)* | | | 26.24 | | | | 57.51 | | | | (51.56 | ) | | | 13.34 | | | | 20.68 | |
Ratios to average daily net assets (%):** | | | | | | | | | | | | | | | | | | | | |
Expenses, net of waivers and reimbursements | | | 1.25 | | | | 1.31 | | | | 1.31 | | | | 1.29 | | | | 1.40 | |
Expenses, before waivers and reimbursements | | | 1.25 | | | | 1.31 | | | | 1.28 | | | | 1.29 | | | | 1.46 | |
Net investment income (loss), net of waivers and reimbursements | | | 0.61 | | | | 0.11 | | | | 0.11 | | | | 0.18 | | | | (0.25 | ) |
Net investment income (loss), before waivers and reimbursements | | | 0.61 | | | | 0.11 | | | | 0.14 | | | | 0.18 | | | | (0.31 | ) |
| | | | | | | | | | | | | | | | | | | | |
| | | Years Ended December 31, | |
| | | 2010 | | | 2009 | | | 2008 | | | 2007 | | | 2006 | |
Supplemental data for all classes: | | | | | | | | | | | | | | | | | | | | |
Net assets at end of year (in thousands) | | $ | 646,951 | | | $ | 390,851 | | | $ | 291,988 | | | $ | 401,459 | | | $ | 231,969 | |
Portfolio turnover rate (%)* | | | 85 | | | | 136 | | | | 78 | | | | 88 | | | | 109 | |
| (a) | | Excludes $0.15, $0.01, $(0.02), $0.05, and $0.00 of PFIC mark to market which is treated as ordinary income for Federal tax purposes for the years 2010, 2009, 2008, 2007 and 2006, respectively. |
| * | | Rates not annualized for periods that are less than a year. |
| ** | | Rates are annualized for periods that are less than a year. |
Performance cited represents past performance. Past performance does not guarantee future results and current performance may be lower or higher than the data quoted. Results shown are annual returns, which assume reinvestment of dividends and capital gains. Investment returns and principal will fluctuate and you may have a gain or loss when you sell shares. For the most current month-end performance information, please call 1-800-742-7272 or visit our Web site at www.williamblairfunds.com.
Note: Net investment income (loss) per share is based on the average shares outstanding during the year.
138 Annual Report | December 31, 2010 |
Financial Highlights
Emerging Markets Growth Fund
| | | | | | | | | | | | | | | | | | | | |
| | | Class N | |
| | | Years Ended December 31, | |
| | | 2010 | | | 2009 | | | 2008 | | | 2007 | | | 2006 | |
Net asset value, beginning of year | | $ | 12.87 | | | $ | 7.46 | | | $ | 21.92 | | | $ | 19.42 | | | $ | 14.17 | |
Income (loss) from investment operations: | | | | | | | | | | | | | | | | | | | | |
Net investment income (loss) (a) | | | (0.01 | ) | | | 0.00 | ^ | | | 0.11 | | | | (0.10 | ) | | | (0.04 | ) |
Net realized and unrealized gain (loss) on investments | | | 3.02 | | | | 5.51 | | | | (13.63 | ) | | | 7.23 | | | | 5.41 | |
| | | | | | | | | | | | | | | | | | | | |
Total from investment operations | | | 3.01 | | | | 5.51 | | | | (13.52 | ) | | | 7.13 | | | | 5.37 | |
Less distributions from: | | | | | | | | | | | | | | | | | | | | |
Net investment income | | | 0.12 | | | | 0.10 | | | | — | | | | 0.09 | | | | 0.01 | |
Net realized gain | | | — | | | | — | | | | 0.94 | | | | 4.54 | | | | 0.11 | |
| | | | | | | | | | | | | | | | | | | | |
Total distributions | | | 0.12 | | | | 0.10 | | | | 0.94 | | | | 4.63 | | | | 0.12 | |
| | | | | | | | | | | | | | | | | | | | |
Net asset value, end of year | | $ | 15.76 | | | $ | 12.87 | | | $ | 7.46 | | | $ | 21.92 | | | $ | 19.42 | |
| | | | | | | | | | | | | | | | | | | | |
Total Return (%) | | | 23.44 | | | | 73.85 | | | | (61.71 | ) | | | 37.75 | | | | 37.90 | |
Ratios to average daily net assets (%): | | | | | | | | | | | | | | | | | | | | |
Expenses, net of waivers and reimbursements | | | 1.63 | | | | 1.70 | | | | 1.67 | | | | 1.65 | | | | 1.65 | |
Expenses, before waivers and reimbursements | | | 1.63 | | | | 1.81 | | | | 1.65 | | | | 1.69 | | | | 1.78 | |
Net investment income (loss), net of waivers and reimbursements | | | (0.05 | ) | | | 0.04 | | | | 0.65 | | | | (0.45 | ) | | | (0.22 | ) |
Net investment income (loss), before waivers and reimbursements | | | (0.05 | ) | | | (0.07 | ) | | | 0.67 | | | | (0.49 | ) | | | (0.35 | ) |
| | | | | | | | | | | | | | | | | | | | |
| | | Class I | |
| | | Years Ended December 31, | |
| | | 2010 | | | 2009 | | | 2008 | | | 2007 | | | 2006 | |
Net asset value, beginning of year | | $ | 12.95 | | | $ | 7.51 | | | $ | 21.99 | | | $ | 19.47 | | | $ | 14.19 | |
Income (loss) from investment operations: | | | | | | | | | | | | | | | | | | | | |
Net investment income (loss) (a) | | | 0.04 | | | | 0.03 | | | | 0.15 | | | | (0.04 | ) | | | (0.01 | ) |
Net realized and unrealized gain (loss) on investments | | | 3.03 | | | | 5.54 | | | | (13.69 | ) | | | 7.26 | | | | 5.41 | |
| | | | | | | | | | | | | | | | | | | | |
Total from investment operations | | | 3.07 | | | | 5.57 | | | | (13.54 | ) | | | 7.22 | | | | 5.40 | |
Less distributions from: | | | | | | | | | | | | | | | | | | | | |
Net investment income | | | 0.15 | | | | 0.13 | | | | — | | | | 0.16 | | | | 0.01 | |
Net realized gain | | | — | | | | — | | | | 0.94 | | | | 4.54 | | | | 0.11 | |
| | | | | | | | | | | | | | | | | | | | |
Total distributions | | | 0.15 | | | | 0.13 | | | | 0.94 | | | | 4.70 | | | | 0.12 | |
| | | | | | | | | | | | | | | | | | | | |
Net asset value, end of year | | $ | 15.87 | | | $ | 12.95 | | | $ | 7.51 | | | $ | 21.99 | | | $ | 19.47 | |
| | | | | | | | | | | | | | | | | | | | |
Total Return (%) | | | 23.77 | | | | 74.18 | | | | (61.60 | ) | | | 38.13 | | | | 38.07 | |
Ratios to average daily net assets (%): | | | | | | | | | | | | | | | | | | | | |
Expenses, net of waivers and reimbursements | | | 1.36 | | | | 1.41 | | | | 1.41 | | | | 1.40 | | | | 1.40 | |
Expenses, before waivers and reimbursements | | | 1.36 | | | | 1.41 | | | | 1.39 | | | | 1.40 | | | | 1.47 | |
Net investment income (loss), net of waivers and reimbursements | | | 0.26 | | | | 0.31 | | | | 0.91 | | | | (0.20 | ) | | | (0.06 | ) |
Net investment income (loss), before waivers and reimbursements | | | 0.26 | | | | 0.31 | | | | 0.93 | | | | (0.20 | ) | | | (0.13 | ) |
| | | | | | | | | | | | | | | | | | | | |
| | | Years Ended December 31, | |
| | | 2010 | | | 2009 | | | 2008 | | | 2007 | | | 2006 | |
Supplemental data for all classes: | | | | | | | | | | | | | | | | | | | | |
Net assets at end of year (in thousands) | | $ | 1,250,543 | | | $ | 1,038,260 | | | $ | 385,588 | | | $ | 1,165,854 | | | $ | 813,649 | |
Portfolio turnover rate (%) | | | 121 | | | | 113 | | | | 118 | | | | 100 | | | | 113 | |
| (a) | | Excludes $0.11, $0.15, $(0.09), $0.21, and $0.00 of PFIC mark to market which is treated as ordinary income for Federal tax purposes for the years 2010, 2009, 2008, 2007 and 2006 respectively. |
| ^ | | Amount is less than $0.005 per share. |
Performance cited represents past performance. Past performance does not guarantee future results and current performance may be lower or higher than the data quoted. Results shown are annual returns, which assume reinvestment of dividends and capital gains. Investment returns and principal will fluctuate and you may have a gain or loss when you sell shares. For the most current month-end performance information, please call 1-800-742-7272 or visit our Web site at www.williamblairfunds.com.
Note: Net investment income (loss) per share is based on the average shares outstanding during the year.
December 31, 2010 | William Blair Funds 139 |
Financial Highlights
Emerging Leaders Growth Fund
| | | | |
| | | Class N | |
| | | Period Ended
December 31, 2010(a) | |
| | |
Net asset value, beginning of year | | $ | 8.80 | |
Income (loss) from investment operations: | | | | |
Net investment income (loss) (c) | | | (0.02 | ) |
Net realized and unrealized gain (loss) on investments | | | 1.64 | |
| | | | |
Total from investment operations | | | 1.62 | |
Less distributions from: | | | | |
Net investment income | | | 0.02 | |
Net realized gain | | | 0.06 | |
| | | | |
Total distributions | | | 0.08 | |
| | | | |
Net asset value, end of year | | $ | 10.34 | |
| | | | |
Total Return (%)* | | | 18.43 | |
Ratios to average daily net assets (%):** | | | | |
Expenses, net of waivers and reimbursements | | | 1.65 | |
Expenses, before waivers and reimbursements | | | 1.71 | |
Net investment income (loss), net of waivers and reimbursements | | | (0.38 | ) |
Net investment income (loss), before waivers and reimbursements | | | (0.44 | ) |
| | | | | | | | | | | | |
| | | Class I | |
| | | Periods Ended December 31, | |
| | | 2010 | | | 2009 | | | 2008(b) | |
Net asset value, beginning of year | | $ | 8.43 | | | $ | 4.79 | | | $ | 10.00 | |
Income (loss) from investment operations: | | | | | | | | | | | | |
Net investment income (loss) (c) | | | 0.02 | | | | 0.02 | | | | 0.04 | |
Net realized and unrealized gain (loss) on investments | | | 1.98 | | | | 3.73 | | | | (5.25 | ) |
| | | | | | | | | | | | |
Total from investment operations | | | 2.00 | | | | 3.75 | | | | (5.21 | ) |
Less distributions from: | | | | | | | | | | | | |
Net investment income | | | 0.02 | | | | 0.11 | | | | 0.00 | ^ |
Net realized gain | | | 0.06 | | | | — | | | | — | |
| | | | | | | | | | | | |
Total distributions | | | 0.08 | | | | 0.11 | | | | 0.00 | ^ |
| | | | | | | | | | | | |
Net asset value, end of year | | $ | 10.35 | | | $ | 8.43 | | | $ | 4.79 | |
| | | | | | | | | | | | |
Total Return (%)* | | | 23.70 | | | | 78.38 | | | | (52.09 | ) |
Ratios to average daily net assets (%):** | | | | | | | | | | | | |
Expenses, net of waivers and reimbursements | | | 1.40 | | | | 1.40 | | | | 1.40 | |
Expenses, before waivers and reimbursements | | | 1.52 | | | | 1.54 | | | | 1.56 | |
Net investment income (loss), net of waivers and reimbursements | | | 0.25 | | | | 0.37 | | | | 0.70 | |
Net investment income (loss), before waivers and reimbursements | | | 0.13 | | | | 0.23 | | | | 0.54 | |
| | | | | | | | | | | | |
| | | Periods Ended December 31, | |
| | | 2010 | | | 2009 | | | 2008 | |
Supplemental data for all classes: | | | | | | | | | | | | |
Net assets at end of year (in thousands) | | $ | 94,901 | | | $ | 115,136 | | | $ | 46,676 | |
Portfolio turnover rate (%)* | | | 176 | | | | 176 | | | | 151 | |
| (a) | | For the period May 3, 2010 (Commencement of Operations) to December 31, 2010. |
| (b) | | For the period March 26, 2008 (Commencement of Operations) to December 31, 2008. |
| (c) | | Excludes $0.96, $1.29 and $0.00 of PFIC mark to market which is treated as ordinary income for Federal tax purposes for the years 2010, 2009 and 2008 respectively. |
| * | | Rates not annualized for periods that are less than a year. |
| ** | | Rates are annualized for periods that are less than a year. |
| ^ | | Amount is less than $0.005 per share. |
Performance cited represents past performance. Past performance does not guarantee future results and current performance may be lower or higher than the data quoted. Results shown are annual returns, which assume reinvestment of dividends and capital gains. Investment returns and principal will fluctuate and you may have a gain or loss when you sell shares. For the most current month-end performance information, please call 1-800-742-7272 or visit our Web site at www.williamblairfunds.com.
Note: Net investment income (loss) per share is based on the average shares outstanding during the year.
140 Annual Report | December 31, 2010 |
Financial Highlights
Small Cap Value Fund
| | | | | | | | | | | | | | | | | | | | |
| | | Class N | |
| | | Years Ended December 31, | |
| | | 2010 | | | 2009 | | | 2008 | | | 2007 | | | 2006 | |
Net asset value, beginning of year | | $ | 10.49 | | | $ | 8.33 | | | $ | 11.31 | | | $ | 16.27 | | | $ | 14.95 | |
Income (loss) from investment operations: | | | | | | | | | | | | | | | | | | | | |
Net investment income (loss) | | | 0.03 | | | | 0.06 | | | | 0.09 | | | | 0.02 | | | | 0.03 | |
Net realized and unrealized gain (loss) on investments | | | 3.22 | | | | 2.13 | | | | (3.02 | ) | | | (0.96 | ) | | | 3.22 | |
| | | | | | | | | | | | | | | | | | | | |
Total from investment operations | | | 3.25 | | | | 2.19 | | | | (2.93 | ) | | | (0.94 | ) | | | 3.25 | |
Less distributions from: | | | | | | | | | | | | | | | | | | | | |
Net investment income | | | 0.03 | | | | 0.03 | | | | 0.05 | | | | — | | | | 0.01 | |
Net realized gain | | | — | | | | — | | | | — | | | | 4.02 | | | | 1.92 | |
| | | | | | | | | | | | | | | | | | | | |
Total distributions | | | 0.03 | | | | 0.03 | | | | 0.05 | | | | 4.02 | | | | 1.93 | |
| | | | | | | | | | | | | | | | | | | | |
Net asset value, end of year | | $ | 13.71 | | | $ | 10.49 | | | $ | 8.33 | | | $ | 11.31 | | | $ | 16.27 | |
| | | | | | | | | | | | | | | | | | | | |
Total Return (%) | | | 30.94 | | | | 26.24 | | | | (25.85 | ) | | | (5.54 | ) | | | 21.78 | |
Ratios to average daily net assets (%): | | | | | | | | | | | | | | | | | | | | |
Expenses, net of waivers and reimbursements | | | 1.33 | | | | 1.29 | | | | 1.29 | | | | 1.33 | | | | 1.34 | |
Expenses, before waivers and reimbursements | | | 1.57 | | | | 1.78 | | | | 1.82 | | | | 1.66 | | | | 1.75 | |
Net investment income (loss), net of waivers and reimbursements | | | 0.25 | | | | 0.68 | | | | 0.84 | | | | 0.10 | | | | 0.21 | |
Net investment income (loss), before waivers and reimbursements | | | 0.01 | | | | 0.19 | | | | 0.31 | | | | (0.23 | ) | | | (0.20 | ) |
| | | | | | | | | | | | | | | | | | | | |
| | | Class I | |
| | | Years Ended December 31, | |
| | | 2010 | | | 2009 | | | 2008 | | | 2007 | | | 2006 | |
Net asset value, beginning of year | | $ | 10.65 | | | $ | 8.45 | | | $ | 11.50 | | | $ | 16.51 | | | $ | 15.12 | |
Income (loss) from investment operations: | | | | | | | | | | | | | | | | | | | | |
Net investment income (loss) | | | 0.05 | | | | 0.08 | | | | 0.11 | | | | 0.09 | | | | 0.03 | |
Net realized and unrealized gain (loss) on investments | | | 3.27 | | | | 2.16 | | | | (3.08 | ) | | | (1.01 | ) | | | 3.30 | |
| | | | | | | | | | | | | | | | | | | | |
Total from investment operations | | | 3.32 | | | | 2.24 | | | | (2.97 | ) | | | (0.92 | ) | | | 3.33 | |
Less distributions from: | | | | | | | | | | | | | | | | | | | | |
Net investment income | | | 0.04 | | | | 0.04 | | | | 0.08 | | | | 0.07 | | | | 0.02 | |
Net realized gain | | | — | | | | — | | | | — | | | | 4.02 | | | | 1.92 | |
| | | | | | | | | | | | | | | | | | | | |
Total distributions | | | 0.04 | | | | 0.04 | | | | 0.08 | | | | 4.09 | | | | 1.94 | |
| | | | | | | | | | | | | | | | | | | | |
Net asset value, end of year | | $ | 13.93 | | | $ | 10.65 | | | $ | 8.45 | | | $ | 11.50 | | | $ | 16.51 | |
| | | | | | | | | | | | | | | | | | | | |
Total Return (%) | | | 31.16 | | | | 26.56 | | | | (25.77 | ) | | | (5.31 | ) | | | 22.10 | |
Ratios to average daily net assets (%): | | | | | | | | | | | | | | | | | | | | |
Expenses, net of waivers and reimbursements | | | 1.10 | | | | 1.09 | | | | 1.09 | | | | 1.09 | | | | 1.09 | |
Expenses, before waivers and reimbursements | | | 1.29 | | | | 1.50 | | | | 1.57 | | | | 1.37 | | | | 1.50 | |
Net investment income (loss), net of waivers and reimbursements | | | 0.43 | | | | 0.86 | | | | 1.06 | | | | 0.52 | | | | 0.16 | |
Net investment income (loss), before waivers and reimbursements | | | 0.24 | | | | 0.45 | | | | 0.58 | | | | 0.24 | | | | (0.25 | ) |
| | | | | | | | | | | | | | | | | | | | |
| | | Years Ended December 31, | |
| | | 2010 | | | 2009 | | | 2008 | | | 2007 | | | 2006 | |
Supplemental data for all classes: | | | | | | | | | | | | | | | | | | | | |
Net assets at end of year (in thousands) | | $ | 164,499 | | | $ | 54,859 | | | $ | 36,249 | | | $ | 47,118 | | | $ | 146,777 | |
Portfolio turnover rate (%) | | | 71 | | | | 62 | | | | 87 | | | | 102 | | | | 162 | |
Performance cited represents past performance. Past performance does not guarantee future results and current performance may be lower or higher than the data quoted. Results shown are annual returns, which assume reinvestment of dividends and capital gains. Investment returns and principal will fluctuate and you may have a gain or loss when you sell shares. For the most current month-end performance information,
please call 1-800-742-7272 or visit our Web site at www.williamblairfunds.com.
Note: Net investment income (loss) per share is based on the average shares outstanding during the year.
December 31, 2010 | William Blair Funds 141 |
Financial Highlights
Mid Cap Value Fund
| | | | |
| | | Class N | |
| | | Period Ended
December 31, | |
| | | 2010(a) | |
Net asset value, beginning of period | | $ | 10.00 | |
Income (loss) from investment operations: | | | | |
Net investment income (loss) | | | 0.09 | |
Net realized and unrealized gain (loss) on investments | | | 0.74 | |
| | | | |
Total from investment operations | | | 0.83 | |
Less distributions from: | | | | |
Net investment income | | | 0.06 | |
Net realized gain | | | 0.02 | |
| | | | |
Total distributions | | | 0.08 | |
| | | | |
Net asset value, end of period | | $ | 10.75 | |
| | | | |
Total Return (%)* | | | 8.36 | |
Ratios to average daily net assets (%):** | | | | |
Expenses, net of waivers and reimbursements | | | 1.35 | |
Expenses, before waivers and reimbursements | | | 5.09 | |
Net investment income (loss), net of waivers and reimbursements | | | 0.92 | |
Net investment income (loss), before waivers and reimbursements | | | (2.82 | ) |
| |
| | | Class I | |
| | | Period Ended
December 31, | |
| | | 2010(a) | |
Net asset value, beginning of period | | $ | 10.00 | |
Income (loss) from investment operations: | | | | |
Net investment income (loss) | | | 0.11 | |
Net realized and unrealized gain (loss) on investments | | | 0.75 | |
| | | | |
Total from investment operations | | | 0.86 | |
Less distributions from: | | | | |
Net investment income | | | 0.08 | |
Net realized gain | | | 0.02 | |
| | | | |
Total distributions | | | 0.10 | |
| | | | |
Net asset value, end of period | | $ | 10.76 | |
| | | | |
Total Return (%)* | | | 8.66 | |
Ratios to average daily net assets (%):** | | | | |
Expenses, net of waivers and reimbursements | | | 1.10 | |
Expenses, before waivers and reimbursements | | | 4.92 | |
Net investment income (loss), net of waivers and reimbursements | | | 1.10 | |
Net investment income (loss), before waivers and reimbursements | | | (2.72 | ) |
| |
| | | Period Ended
December 31, | |
| | | 2010(a) | |
Supplemental data for all classes: | | | | |
Net assets at end of year (in thousands) | | $ | 3,393 | |
Portfolio turnover rate (%)* | | | 35 | |
| (a) | | For the period May 3, 2010 (Commencement of Operations) to Decmeber 31, 2010. |
| * | | Rates not annualized for periods that are less than a year. |
| ** | | Rates are annualized for periods that are less than a year. |
Performance cited represents past performance. Past performance does not guarantee future results and current performance may be lower or higher than the data quoted. Results shown are annual returns, which assume reinvestment of dividends and capital gains. Investment returns and principal will fluctuate and you may have a gain or loss when you sell shares. For the most current month-end performance information, please call 1-800-742-7272 or visit our Web site at www.williamblairfunds.com.
Note: Net investment income (loss) per share is based on the average shares outstanding during the year.
142 Annual Report | December 31, 2010 |
Financial Highlights
Bond Fund
| | | | | | | | | | | | | | | | |
| | | Class N | |
| | | Periods Ended December 31, | |
| | | 2010 | | | 2009 | | | 2008 | | | 2007(a) | |
Net asset value, beginning of year | | $ | 10.40 | | | $ | 9.82 | | | $ | 10.07 | | | $ | 10.00 | |
Income (loss) from investment operations: | | | | | | | | | | | | | | | | |
Net investment income (loss) | | | 0.46 | | | | 0.48 | | | | 0.47 | | | | 0.31 | |
Net realized and unrealized gain (loss) on investments | | | 0.35 | | | | 0.59 | | | | (0.31 | ) | | | 0.02 | |
| | | | | | | | | | | | | | | | |
Total from investment operations | | | 0.81 | | | | 1.07 | | | | 0.16 | | | | 0.33 | |
Less distributions from: | | | | | | | | | | | | | | | | |
Net investment income | | | 0.48 | | | | 0.49 | | | | 0.41 | | | | 0.26 | |
Net realized gain | | | 0.03 | | | | — | | | | — | | | | — | |
| | | | | | | | | | | | | | | | |
Total distributions | | | 0.51 | | | | 0.49 | | | | 0.41 | | | | 0.26 | |
| | | | | | | | | | | | | | | | |
Net asset value, end of year | | $ | 10.70 | | | $ | 10.40 | | | $ | 9.82 | | | $ | 10.07 | |
| | | | | | | | | | | | | | | | |
Total Return (%)* | | | 7.86 | | | | 11.11 | | | | 1.64 | | | | 3.38 | |
Ratios to average daily net assets (%):** | | | | | | | | | | | | | | | | |
Expenses, net of waivers and reimbursements | | | 0.65 | | | | 0.65 | | | | 0.65 | | | | 0.65 | |
Expenses, before waivers and reimbursements | | | 0.70 | | | | 1.40 | | | | 2.47 | | | | 0.81 | |
Net investment income (loss), net of waivers and reimbursements | | | 4.25 | | | | 4.76 | | | | 4.69 | | | | 4.80 | |
Net investment income (loss), before waivers and reimbursements | | | 4.20 | | | | 4.01 | | | | 2.87 | | | | 4.64 | |
| | | | | | | | | | | | | | | | |
| | | Class I | |
| | | Periods Ended December 31, | |
| | | 2010 | | | 2009 | | | 2008 | | | 2007(a) | |
Net asset value, beginning of year | | $ | 10.31 | | | $ | 9.72 | | | $ | 10.04 | | | $ | 10.00 | |
Income (loss) from investment operations: | | | | | | | | | | | | | | | | |
Net investment income (loss) | | | 0.47 | | | | 0.49 | | | | 0.48 | | | | 0.32 | |
Net realized and unrealized gain (loss) on investments | | | 0.33 | | | | 0.59 | | | | (0.31 | ) | | | 0.02 | |
| | | | | | | | | | | | | | | | |
Total from investment operations | | | 0.80 | | | | 1.08 | | | | 0.17 | | | | 0.34 | |
Less distributions from: | | | | | | | | | | | | | | | | |
Net investment income | | | 0.49 | | | | 0.49 | | | | 0.49 | | | | 0.30 | |
Net realized gain | | | 0.03 | | | | — | | | | — | | | | — | |
| | | | | | | | | | | | | | | | |
Total distributions | | | 0.52 | | | | 0.49 | | | | 0.49 | | | | 0.30 | |
| | | | | | | | | | | | | | | | |
Net asset value, end of year | | $ | 10.59 | | | $ | 10.31 | | | $ | 9.72 | | | $ | 10.04 | |
| | | | | | | | | | | | | | | | |
Total Return (%)* | | | 7.89 | | | | 11.40 | | | | 1.72 | | | | 3.50 | |
Ratios to average daily net assets (%):** | | | | | | | | | | | | | | | | |
Expenses, net of waivers and reimbursements | | | 0.50 | | | | 0.50 | | | | 0.50 | | | | 0.50 | |
Expenses, before waivers and reimbursements | | | 0.55 | | | | 0.58 | | | | 0.71 | | | | 0.67 | |
Net investment income (loss), net of waivers and reimbursements | | | 4.41 | | | | 4.92 | | | | 4.90 | | | | 4.95 | |
Net investment income (loss), before waivers and reimbursements | | | 4.36 | | | | 4.84 | | | | 4.69 | | | | 4.78 | |
| | | | | | | | | | | | | | | | |
| | | Periods Ended December 31, | |
| | | 2010 | | | 2009 | | | 2008 | | | 2007(a) | |
Supplemental data for all classes: | | | | | | | | | | | | | | | | |
Net assets at end of year (in thousands) | | $ | 192,776 | | | $ | 147,344 | | | $ | 74,613 | | | $ | 68,483 | |
Portfolio turnover rate (%)* | | | 25 | | | | 29 | | | | 52 | | | | 38 | |
| (a) | | For the period May 1, 2007 (Commencement of Operations) to December 31, 2007. |
| * | | Rates not annualized for periods that are less than a year. |
| ** | | Rates are annualized for periods that are less than a year. |
Performance cited represents past performance. Past performance does not guarantee future results and current performance may be lower or higher than the data quoted. Results shown are annual returns, which assume reinvestment of dividends and capital gains. Investment returns and principal will fluctuate and you may have a gain or loss when you sell shares. For the most current month-end performance information, please call 1-800-742-7272 or visit our Web site at www.williamblairfunds.com.
Note: Net investment income (loss) per share is based on the average shares outstanding during the year.
December 31, 2010 | William Blair Funds 143 |
Financial Highlights
Income Fund
| | | | | | | | | | | | | | | | | | | | |
| | | Class N | |
| | | Years Ended December 31, | |
| | | 2010 | | | 2009 | | | 2008 | | | 2007 | | | 2006 | |
Net asset value, beginning of year | | $ | 9.07 | | | $ | 8.69 | | | $ | 9.29 | | | $ | 9.74 | | | $ | 9.83 | |
Income (loss) from investment operations: | | | | | | | | | | | | | | | | | | | | |
Net investment income (loss) | | | 0.35 | | | | 0.40 | | | | 0.37 | | | | 0.45 | | | | 0.44 | |
Net realized and unrealized gain (loss) on investments | | | 0.19 | | | | 0.44 | | | | (0.59 | ) | | | (0.35 | ) | | | (0.04 | ) |
| | | | | | | | | | | | | | | | | | | | |
Total from investment operations | | | 0.54 | | | | 0.84 | | | | (0.22 | ) | | | 0.10 | | | | 0.40 | |
| | | | | |
Less distributions from: | | | | | | | | | | | | | | | | | | | | |
Net investment income | | | 0.39 | | | | 0.46 | | | | 0.38 | | | | 0.55 | | | | 0.49 | |
Net realized gain | | | — | | | | — | | | | — | | | | — | | | | — | |
| | | | | | | | | | | | | | | | | | | | |
Total distributions | | | 0.39 | | | | 0.46 | | | | 0.38 | | | | 0.55 | | | | 0.49 | |
| | | | | | | | | | | | | | | | | | | | |
Net asset value, end of year | | $ | 9.22 | | | $ | 9.07 | | | $ | 8.69 | | | $ | 9.29 | | | $ | 9.74 | |
| | | | | | | | | | | | | | | | | | | | |
Total Return (%) | | | 6.04 | | | | 9.88 | | | | (2.46 | ) | | | 1.08 | | | | 4.25 | |
Ratios to average daily net assets (%): | | | | | | | | | | | | | | | | | | | | |
Expenses, net of waivers and reimbursements | | | 0.85 | | | | 0.85 | | | | 0.90 | | | | 0.79 | | | | 0.74 | |
Expenses, before waivers and reimbursements | | | 0.85 | | | | 0.93 | | | | 0.93 | | | | 0.81 | | | | 0.80 | |
Net investment income (loss), net of waivers and reimbursements | | | 3.79 | | | | 4.48 | | | | 4.38 | | | | 4.73 | | | | 4.54 | |
Net investment income (loss), before waivers and reimbursements | | | 3.79 | | | | 4.41 | | | | 4.35 | | | | 4.71 | | | | 4.48 | |
| | | | | | | | | | | | | | | | | | | | |
| | | Class I | |
| | | Years Ended December 31, | |
| | | 2010 | | | 2009 | | | 2008 | | | 2007 | | | 2006 | |
Net asset value, beginning of year | | $ | 9.00 | | | $ | 8.64 | | | $ | 9.30 | | | $ | 9.69 | | | $ | 9.82 | |
Income (loss) from investment operations: | | | | | | | | | | | | | | | | | | | | |
Net investment income (loss) | | | 0.37 | | | | 0.41 | | | | 0.39 | | | | 0.47 | | | | 0.45 | |
Net realized and unrealized gain (loss) on investments | | | 0.19 | | | | 0.43 | | | | (0.59 | ) | | | (0.34 | ) | | | (0.04 | ) |
| | | | | | | | | | | | | | | | | | | | |
Total from investment operations | | | 0.56 | | | | 0.84 | | | | (0.20 | ) | | | 0.13 | | | | 0.41 | |
| | | | | |
Less distributions from: | | | | | | | | | | | | | | | | | | | | |
Net investment income | | | 0.41 | | | | 0.48 | | | | 0.46 | | | | 0.52 | | | | 0.54 | |
Net realized gain | | | — | | | | — | | | | — | | | | — | | | | — | |
| | | | | | | | | | | | | | | | | | | | |
Total distributions | | | 0.41 | | | | 0.48 | | | | 0.46 | | | | 0.52 | | | | 0.54 | |
| | | | | | | | | | | | | | | | | | | | |
Net asset value, end of year | | $ | 9.15 | | | $ | 9.00 | | | $ | 8.64 | | | $ | 9.30 | | | $ | 9.69 | |
| | | | | | | | | | | | | | | | | | | | |
Total Return (%) | | | 6.33 | | | | 9.89 | | | | (2.26 | ) | | | 1.36 | | | | 4.33 | |
Ratios to average daily net assets (%): | | | | | | | | | | | | | | | | | | | | |
Expenses, net of waivers and reimbursements | | | 0.63 | | | | 0.66 | | | | 0.72 | | | | 0.60 | | | | 0.62 | |
Net investment income (loss), net of waivers and reimbursements | | | 4.01 | | | | 4.67 | | | | 4.57 | | | | 4.91 | | | | 4.66 | |
| | | | | | | | | | | | | | | | | | | | |
| | | Years Ended December 31, | |
| | | 2010 | | | 2009 | | | 2008 | | | 2007 | | | 2006 | |
Supplemental data for all classes: | | | | | | | | | | | | | | | | | | | | |
Net assets at end of year (in thousands) | | $ | 113,277 | | | $ | 117,608 | | | $ | 140,435 | | | $ | 204,630 | | | $ | 297,077 | |
Portfolio turnover rate (%) | | | 29 | | | | 40 | | | | 38 | | | | 34 | | | | 33 | |
Performance cited represents past performance. Past performance does not guarantee future results and current performance may be lower or higher than the data quoted. Results shown are annual returns, which assume reinvestment of dividends and capital gains. Investment returns and principal will fluctuate and you may have a gain or loss when you sell shares. For the most current month-end performance information, please call 1-800-742-7272 or visit our Web site at www.williamblairfunds.com.
Note: Net investment income (loss) per share is based on the average shares outstanding during the year.
144 Annual Report | December 31, 2010 |
Financial Highlights
Low Duration Fund
| | | | | | | | |
| | | Class N | |
| | | Periods Ended December 31, | |
| | | 2010 | | | 2009(a) | |
Net asset value, beginning of year | | $ | 9.93 | | | $ | 10.00 | |
Income (loss) from investment operations: | | | | | | | | |
Net investment income (loss) | | | 0.13 | | | | 0.01 | |
Net realized and unrealized gain (loss) on investments | | | 0.05 | | | | (0.07 | ) |
| | | | | | | | |
Total from investment operations | | | 0.18 | | | | (0.06 | ) |
Less distributions from: | | | | | | | | |
Net investment income | | | 0.21 | | | | 0.01 | |
Net realized gain | | | — | | | | — | |
| | | | | | | | |
Total distributions | | | 0.21 | | | | 0.01 | |
| | | | | | | | |
Net asset value, end of year | | $ | 9.90 | | | $ | 9.93 | |
| | | | | | | | |
Total Return (%)* | | | 1.86 | | | | (0.60 | ) |
Ratios to average daily net assets (%):** | | | | | | | | |
Expenses, net of waivers and reimbursements | | | 0.70 | | | | 0.70 | |
Expenses, before waivers and reimbursements | | | 0.78 | | | | 0.94 | |
Net investment income (loss), net of waivers and reimbursements | | | 1.33 | | | | 1.27 | |
Net investment income (loss), before waivers and reimbursements | | | 1.25 | | | | 1.03 | |
| |
| | | Class I | |
| | | Periods Ended December 31, | |
| | | 2010 | | | 2009(a) | |
Net asset value, beginning of year | | $ | 9.93 | | | $ | 10.00 | |
Income (loss) from investment operations: | | | | | | | | |
Net investment income (loss) | | | 0.15 | | | | 0.01 | |
Net realized and unrealized gain (loss) on investments | | | 0.04 | | | | (0.07 | ) |
| | | | | | | | |
Total from investment operations | | | 0.19 | | | | (0.06 | ) |
Less distributions from: | | | | | | | | |
Net investment income | | | 0.23 | | | | 0.01 | |
Net realized gain | | | — | | | | — | |
| | | | | | | | |
Total distributions | | | 0.23 | | | | 0.01 | |
| | | | | | | | |
Net asset value, end of year | | $ | 9.89 | | | $ | 9.93 | |
| | | | | | | | |
Total Return (%)* | | | 1.89 | | | | (0.59 | ) |
Ratios to average daily net assets (%):** | | | | | | | | |
Expenses, net of waivers and reimbursements | | | 0.55 | | | | 0.55 | |
Expenses, before waivers and reimbursements | | | 0.63 | | | | 0.79 | |
Net investment income (loss), net of waivers and reimbursements | | | 1.46 | | | | 1.39 | |
Net investment income (loss), before waivers and reimbursements | | | 1.38 | | | | 1.15 | |
| | | | | | | | |
| | | Periods Ended December 31, | |
| | | 2010 | | | 2009(a) | |
Supplemental data for all classes: | | | | | | | | |
Net assets at end of year (in thousands) | | $ | 143,470 | | | $ | 95,134 | |
Portfolio turnover rate (%)* | | | 51 | | | | — | |
| (a) | | For the period December 1, 2009 (Commencement of Operations) to December 31, 2009. |
| * | | Rates not annualized for periods that are less than a year. |
| ** | | Rates are annualized for periods that are less than a year. |
Performance cited represents past performance. Past performance does not guarantee future results and current performance may be lower or higher than the data quoted. Results shown are annual returns, which assume reinvestment of dividends and capital gains. Investment returns and principal will fluctuate and you may have a gain or loss when you sell shares. For the most current month-end performance information, please call 1-800-742-7272 or visit our Web site at www.williamblairfunds.com.
Note: Net investment income (loss) per share is based on the average shares outstanding during the year.
December 31, 2010 | William Blair Funds 145 |
Financial Highlights
Ready Reserves Fund
| | | | | | | | | | | | | | | | | | | | |
| | | Class N | |
| | | Years Ended December 31, | |
| | | 2010 | | | 2009 | | | 2008 | | | 2007 | | | 2006 | |
Net asset value, beginning of year | | $ | 1.00 | | | $ | 1.00 | | | $ | 1.00 | | | $ | 1.00 | | | $ | 1.00 | |
Income (loss) from investment operations: | | | | | | | | | | | | | | | | | | | | |
Net investment income (loss) | | | 0.00 | ^ | | | 0.00 | ^ | | | 0.02 | | | | 0.05 | | | | 0.04 | |
Net realized and unrealized gain (loss) on investments | | | — | | | | — | | | | — | | | | — | | | | — | |
| | | | | | | | | | | | | | | | | | | | |
Total from investment operations | | | 0.00 | ^ | | | 0.00 | ^ | | | 0.02 | | | | 0.05 | | | | 0.04 | |
Less distributions from: | | | | | | | | | | | | | | | | | | | | |
Net investment income | | | 0.00 | ^ | | | 0.00 | ^ | | | 0.02 | | | | 0.05 | | | | 0.04 | |
Net realized gain | | | — | | | | — | | | | — | | | | — | | | | — | |
| | | | | | | | | | | | | | | | | | | | |
Total distributions | | | 0.00 | ^ | | | 0.00 | ^ | | | 0.02 | | | | 0.05 | | | | 0.04 | |
| | | | | | | | | | | | | | | | | | | | |
Net asset value, end of year | | $ | 1.00 | | | $ | 1.00 | | | $ | 1.00 | | | $ | 1.00 | | | $ | 1.00 | |
| | | | | | | | | | | | | | | | | | | | |
Total Return (%) | | | 0.01 | | | | 0.10 | | | | 2.20 | | | | 4.75 | | | | 4.47 | |
Ratios to average daily net assets (%): | | | | | | | | | | | | | | | | | | | | |
Expenses, net of waivers and reimbursements | | | 0.24 | | | | 0.46 | | | | 0.60 | | | | 0.63 | | | | 0.63 | |
Expenses, before waivers and reimbursements | | | 0.61 | | | | 0.66 | | | | 0.60 | | | | 0.63 | | | | 0.63 | |
Net investment income (loss), net of waivers and reimbursements | | | 0.01 | | | | 0.11 | | | | 2.12 | | | | 4.63 | | | | 4.38 | |
Net investment income (loss), before waivers and reimbursements | | | (0.36 | ) | | | (0.09 | ) | | | 2.12 | | | | 4.63 | | | | 4.38 | |
| | | | | | | | | | | | | | | | | | | | |
| | | Years Ended December 31, | |
| | | 2010 | | | 2009 | | | 2008 | | | 2007 | | | 2006 | |
Supplemental data for all classes: | | | | | | | | | | | | | | | | | | | | |
Net assets at end of year (in thousands) | | $ | 1,216,543 | | | $ | 1,352,901 | | | $ | 1,841,189 | | | $ | 1,399,537 | | | $ | 1,195,593 | |
| ^ | | Amount is less than $0.005 per share. |
Performance cited represents past performance. Past performance does not guarantee future results and current performance may be lower or higher than the data quoted. Results shown are annual returns, which assume reinvestment of dividends and capital gains. Investment returns and principal will fluctuate and you may have a gain or loss when you sell shares. For the most current month-end performance information, please call 1-800-742-7272 or visit our Web site at www.williamblairfunds.com.
Note: Net investment income (loss) per share is based on the average shares outstanding during the year.
146 Annual Report | December 31, 2010 |
REPORT OF INDEPENDENT REGISTERED PUBLIC ACCOUNTING FIRM
To the Board of Trustees and Shareholders of
William Blair Funds
We have audited the accompanying statements of assets and liabilities, including the portfolios of investments, of the Growth Fund, Large Cap Growth Fund, Small Cap Growth Fund, Mid Cap Growth Fund, Small-Mid Cap Growth Fund, Global Growth Fund, International Growth Fund, International Equity Fund, International Small Cap Growth Fund, Emerging Markets Growth Fund, Emerging Leaders Growth Fund, Small Cap Value Fund, Mid Cap Value Fund, Bond Fund, Income Fund, Low Duration Fund and Ready Reserves Fund (collectively, the Portfolios) (seventeen of the Portfolios constituting William Blair Funds) as of December 31, 2010, and the related statements of operations, statements of changes in net assets and financial highlights for the periods indicated therein. These financial statements and financial highlights are the responsibility of the Portfolios’ management. Our responsibility is to express an opinion on these financial statements and financial highlights based on our audits.
We conducted our audits in accordance with the standards of the Public Company Accounting Oversight Board (United States). Those standards require that we plan and perform the audits to obtain reasonable assurance about whether the financial statements and financial highlights are free of material misstatement. We were not engaged to perform an audit of the Portfolios’ internal control over financial reporting. Our audits included consideration of internal control over financial reporting as a basis for designing audit procedures that are appropriate in the circumstances, but not for the purpose of expressing an opinion on the effectiveness of the Portfolios’ internal control over financial reporting. Accordingly, we express no such opinion. An audit also includes examining, on a test basis, evidence supporting the amounts and disclosures in the financial statements and financial highlights, assessing the accounting principles used and significant estimates made by management, and evaluating the overall financial statement presentation. Our procedures included confirmation of securities owned as of December 31, 2010, by correspondence with the custodian and brokers or by other appropriate auditing procedures where replies from brokers were not received. We believe that our audits provide a reasonable basis for our opinion.
In our opinion, the financial statements and financial highlights referred to above present fairly, in all material respects, the financial position for each of the above mentioned Portfolios of William Blair Funds at December 31, 2010, the results of their operations, the changes in their net assets and financial highlights for the periods indicated therein, in conformity with U.S. generally accepted accounting principles.

Chicago, Illinois
February 22, 2011
December 31, 2010 | William Blair Funds 147 |
Trustees and Officers (Unaudited). The trustees and officers of the William Blair Funds, their year of birth, their principal occupations during the last five years, their affiliations, if any, with William Blair & Company, L.L.C., and other significant affiliations are set forth below. The address of each trustee and officer is 222 West Adams Street, Chicago, Illinois 60606.
| | | | | | | | | | | | |
Name and Year of
Birth | | Position(s)
Held with
Fund | | Term of
Office and
Length of
Time
Served(1) | | Principal Occupation(s) During Past 5 Years | | Number of
Portfolios
in Fund
Complex
Overseen
by Trustee | | | Other Directorships Held by Trustee/Officer |
Interested Trustees | | | | | | | | | | | | |
| | | | | |
Michelle R. Seitz,
1965* | | Chairperson of the Board of Trustees and President | | Since 2010 Since 2007 | | Principal, William Blair & Company, L.L.C.; Limited Partner, WB Holdings, L.P. (since November 2008); Member, WBC GP, L.L.P. (since November 2008) | | | 19 | | | N/A |
| | | | | |
Richard W. Smirl,
1967* | | Trustee and Senior Vice President | | Trustee Since 2010 and Senior Vice President Since 2007 | | Principal, William Blair & Company, L.L.C., Vice President, Chief Compliance Officer 2004-2009 | | | 19 | | | N/A |
| | | | |
Non-Interested Trustees | | | | | | | | | | |
Ann P. McDermott,
1939 | | Trustee | | Since 1996 | | Board member and officer for various civic and charitable organizations over the past thirty years; professional experience prior thereto, registered representative for New York Stock Exchange firm | | | 19 | | | Northwestern University, Women’s Board; Rush Presbyterian St. Luke’s Medical Center, Women’s Board; University of Chicago, Women’s Board; Visiting Nurses Association, Honorary Director |
| | | | | |
Phillip O. Peterson,
1944 | | Trustee | | Since 2007 | | Trustee of Strong Funds Liquidating Trusts since 2005 and President, Strong Mutual Funds, 2004-2005; formerly, Partner, KPMG LLP | | | 19 | | | The Hartford Group of Mutual Funds (87 portfolios) |
| | | | | |
Donald J. Reaves,
1946 | | Trustee | | Since 2004 | | Chancellor, Winston-Salem State University since 2007; formerly, Vice President for Administration and Chief Financial Officer, University of Chicago 2002-2007. | | | 19 | | | American Student Assistance Corp., guarantor of student loans; Amica Mutual Insurance Company |
| | | | | |
Donald L. Seeley,
1944 | | Trustee | | Since 2003 | | Retired; formerly, Director, Applied Investment Management Program, University of Arizona Department of Finance, prior thereto, Vice Chairman and Chief Financial Officer, True North Communications, Inc., marketing communications and advertising firm | | | 19 | | | Warnaco Group, Inc., intimate apparel, sportswear, and swimwear manufacturer; Center for Furniture Craftsmanship (not-for-profit) |
| | | | | |
Thomas J. Skelly,
1951 | | Trustee | | Since 2007 | | Advisory Board Member for various U.S. Companies; Director and Investment Committee Chairman of the US Accenture Foundation, Inc.; prior to 2005, Managing Partner of various divisions at Accenture | | | 19 | | | First MetLife Investors Insurance Company |
| | | | | |
Robert E. Wood II,
1938 | | Trustee | | Since 1999 | | Retired; formerly, Executive Vice President, Morgan Stanley Dean Witter | | | 19 | | | Chairman, Add-Vision, Inc., manufacturer of surface animation systems; Chairman Micro-Combustion, LLC |
148 Annual Report | December 31, 2010 |
| | | | | | | | |
Name and Year of Birth | | Position(s)
Held with
Fund | | Term of
Office and
Length of
Time
Served(1) | | Principal Occupation(s) During Past 5 Years(2) | | Other Directorships Held by Trustee/Officer |
Officers | | | | | | | | |
Michael P. Balkin,
1959 | | Senior Vice President Vice President | | Since 2009 2008-2009 | | Principal, William Blair & Company, L.L.C. Associate, William Blair & Company, L.L.C.; former Chief Investment Officer, Magnetar Investment Management | | N/A |
| | | | |
Karl W. Brewer,
1966 | | Senior Vice President | | Since 2000 | | Principal, William Blair & Company, L.L.C. | | N/A |
| | | | |
David C. Fording,
1967 | | Senior Vice President Vice President | | Since 2009 2006-2009 | | Principal, William Blair & Company, L.L.C. Associate, William Blair & Company, L.L.C.; former Portfolio Manager, TIAA-CREF. | | N/A |
| | | | |
James S. Golan,
1961 | | Senior Vice President | | Since 2005 | | Principal, William Blair & Company, L.L.C. | | N/A |
| | | | |
W. George Greig,
1952 | | Senior Vice President | | Since 1996 | | Principal, William Blair & Company, L.L.C. | | N/A |
| | | | |
Michael A. Jancosek,
1959 | | Senior Vice President | | Since 2004 | | Principal, William Blair & Company L.L.C. | | N/A |
| | | | |
John F. Jostrand,
1954 | | Senior Vice President | | Since 1999 | | Principal, William Blair & Company, L.L.C. | | N/A |
| | | | |
Robert C. Lanphier, IV,
1956 | | Senior Vice President | | Since 2003 | | Principal, William Blair & Company, L.L.C. | | Chairman, AG. Med, Inc. |
| | | | |
Mark T. Leslie,
1967 | | Senior Vice President Vice President | | Since 2008 2005-2008 | | Principal, William Blair & Company, L.L.C. Associate, William Blair & Company, L.L.C. formerly, U.S. Bancorp Asset Management | | N/A |
| | | | |
Matthew A. Litfin,
1972 | | Senior Vice President | | Since 2008 | | Principal, William Blair & Company, L.L.C. | | N/A |
| | | | |
Kenneth J. McAtamney
1966 | | Senior Vice President | | Since 2008 | | Principal, William Blair & Company, L.L.C. | | N/A |
| | | | |
Todd M. McClone,
1968 | | Senior Vice President Vice President | | Since 2006 2005-2006 | | Principal, William Blair & Company, L.L.C. Associate, William Blair & Company, L.L.C. | | N/A N/A |
| | | | |
Tracy McCormick,
1954 | | Senior Vice President | | Since 2008 | | Principal, William Blair & Company, L.L.C. | | N/A |
| | | | |
David Merjan,
1960 | | Senior Vice President | | Since 2008 | | Principal, William Blair & Company, L.L.C. | | N/A |
December 31, 2010 | William Blair Funds 149 |
| | | | | | | | |
Name and Year of Birth | | Position(s)
Held with
Fund | | Term of
Office and
Length of
Time
Served(1) | | Principal Occupation(s) During Past 5 Years(2) | | Other Directorships Held by Trustee/Officer |
David S. Mitchell,
1960 | | Senior Vice President | | Since 2004 | | Principal, William Blair & Company, L.L.C. | | N/A |
| | | | |
David P. Ricci,
1958 | | Senior Vice President | | Since 2006 | | Principal, William Blair & Company, L.L.C. | | N/A |
| | | | |
Jeffrey A. Urbina,
1955 | | Senior Vice President | | Since 1998 | | Principal, William Blair & Company, L.L.C. | | N/A |
| | | | |
Christopher T. Vincent,
1956 | | Senior Vice President | | Since 2004 | | Principal, William Blair & Company, L.L.C. | | N/A |
| | | | |
Chad M. Kilmer,
1975 | | Vice President | | Since 2006 | | Associate, William Blair & Company, L.L.C.; former analyst and Portfolio Manager U.S. Bancorp Asset Management. | | N/A |
| | | | |
Kathleen M. Lynch,
1971 | | Vice President | | Since 2010 | | Associate, William Blair & Company, L.L.C. | | N/A |
| | | | |
Paul J. Sularz,
1967 | | Vice President | | Since 2009 | | Associate, William Blair & Company, L.L.C.; Vice President, J.P. Morgan Securities, Inc. | | N/A |
| | | | |
Walter R. Randall, Jr.,
1960 | | Chief Compliance Officer | | Since 2009 | | Associate, William Blair & Company, L.L.C.; Associate Counsel and Chief Compliance Officer, Calamos Investments; Assistant General Counsel, American Century Investments. | | N/A |
| | | | |
Colette M. Garavalia,
1961 | | Treasurer | | Since 2009 | | Associate, William Blair & Company, L.L.C. | | N/A |
| | | | |
| | Secretary | | 2000-2009 | | Associate, William Blair & Company, L.L.C.; | | N/A |
| | | | |
Andrew T. Pfau,
1970 | | Secretary | | Since 2009 | | Associate, William Blair & Company, L.L.C.; Associate, Bell, Boyd & Lloyd, LLP; Associate, Sidley Austin LLP | | N/A |
| * | | Ms. Seitz and Mr. Smirl are interested persons of the William Blair Funds because each is a principal of William Blair & Company, L.L.C., the Funds’ investment advisor, principal underwriter and distributor. |
| (1) | | Each Trustee serves until the election and qualification of a successor, or until death, resignation or retirement or removal as provided in the Fund’s Declaration of Trust. Retirement for non-interested Trustees occurs no later than at the conclusion of the first regularly scheduled Board meeting of the Fund’s fiscal year that occurs after the Trustee’s 72nd birthday. The Fund’s officers except the Chief Compliance Officer, are elected annually by the Trustees. The Fund’s Chief Compliance Officer is designated by the Board of Trustees and may only be removed by action of the Board of Trustees, including a majority of the non-interested Trustees. |
| (2) | | In November 2008, all current principals of William Blair & Company, L.L.C. also became limited partners in WB Holdings, L.P. |
The Statement of Additional Information for the William Blair Funds includes additional information about the trustees and is available without charge by calling 1-800-635-2886 (in Massachusetts 1-800-635-2840) or by writing the Fund.
150 Annual Report | December 31, 2010 |
(unaudited)
Proxy Voting
A description of the policies and procedures that the Fund uses to determine how to vote proxies relating to portfolio securities and information regarding how the Fund voted proxies relating to portfolio securities for the most recent 12-month period ended June 30 are available without charge, upon request, by calling 1-800-635-2886 (in Massachusetts 1-800-635-2840), at www.williamblairfunds.com and on the SEC’s website at http://www.sec.gov.
Quarterly Portfolio Schedules
Each Portfolio files its complete schedule of portfolio holdings with the SEC for the first and third fiscal quarters of each fiscal year (quarters ended March 31 and September 30) on Form N-Q. The Fund’s Forms N-Q are available on the SEC’s website at http://www.sec.gov and may be reviewed and copied at the SEC’s Public Reference Room in Washington, D.C. Information on the operation of the SEC’s Public Reference Room may be obtained by calling 1-800-SEC-0330. The Fund’s Forms N-Q are also available on the Fund’s website at www.williamblairfunds.com.
Additional Federal Income Tax Information: (unaudited)
Under Section 852(b)(3)(C) of the Code, the Funds hereby designate the following amounts as capital gain dividends for the fiscal year ended December 31, 2010:
| | | | |
Emerging Leaders Growth | | Small Cap Value | | Bond |
$505,181 | | $135,089 | | $493,757 |
The following table provides the percentage of the 2010 year-end distributions that qualify for the dividend received deduction, and the qualified dividend income percentage:
| | | | | | | | |
Portfolio | | Dividend
Received
Deduction% | | | Qualified
Dividend
Income% | |
Growth | | | 100.00 | % | | | 100.00 | % |
Large Cap Growth | | | 100.00 | % | | | 100.00 | % |
Small Cap Growth | | | 0.00 | % | | | 0.00 | % |
Mid Cap Growth | | | 0.00 | % | | | 0.00 | % |
Small-Mid Cap Growth | | | 0.00 | % | | | 0.00 | % |
Global Growth | | | 99.93 | % | | | 100.00 | % |
International Growth | | | 0.00 | % | | | 85.61 | % |
International Equity | | | 0.43 | % | | | 100.00 | % |
International Small Cap Growth | | | 0.13 | % | | | 100.00 | % |
Emerging Markets Growth | | | 0.16 | % | | | 83.93 | % |
Emerging Leaders Growth | | | 0.00 | % | | | 100.00 | % |
Small Cap Value | | | 100.00 | % | | | 100.00 | % |
Mid Cap Value | | | 75.51 | % | | | 100.00 | % |
Bond | | | 0.00 | % | | | 0.00 | % |
Income | | | 0.00 | % | | | 0.00 | % |
Low Duration | | | 0.00 | % | | | 0.00 | % |
Ready Reserves | | | 0.00 | % | | | 0.00 | % |
In January 2011, you were notified on IRS Form 1099-Div or substitute 1099 DIV as to the Federal tax status of the distributions received by you in the calendar year 2010.
December 31, 2010 | William Blair Funds 151 |
Useful Information About Your Report (unaudited)
Please refer to this information when reviewing the Expense Example for each Portfolio.
Expense Example
As a shareholder of a Portfolio, you incur two types of costs: (1) transaction costs such as redemption fees and (2) ongoing costs, including management fees, distribution (12b-1) fees (for Class N shares except for the Ready Reserves Portfolio), service fees (for Class N shares of the Ready Reserves Portfolio), shareholder administration fees (for Class N and Class I shares of the Global Growth Portfolio, the International Small Cap Growth Portfolio, the Emerging Markets Growth Portfolio, the Emerging Leaders Growth Portfolio, the Bond Portfolio and the Low Duration Portfolio) and other Portfolio expenses. The example is intended to help you understand your ongoing costs (in dollars) of investing in the Portfolio and to compare these costs with the ongoing costs of investing in other mutual funds. To do so, compare the Portfolio’s 5% hypothetical example with the 5% hypothetical examples that appear in the shareholder reports of other funds. The example is based on an investment of $1,000 invested at the beginning of the period and held for the entire six-month period from July 1, 2010 to December 31, 2010.
Actual Expenses
In each example, the first line for each share class in the table provides information about the actual account values and actual expenses. These expenses reflect the effect of any expense cap applicable to the share class during the period. Without this expense cap, the costs shown in the table would have been higher. You may use the information in this line, together with the amount you invested, to estimate the expenses that you paid over the period. Simply divide your account value by $1,000 (example, an $8,600 account value divided by $1,000 = 8.6), then multiply the result by the number in the first line under the heading entitled “Expenses Paid During the Period” to estimate the expenses you paid on your account during the period.
Hypothetical Example for Comparison Purposes
In each example, the second line for each share class in the table provides information about hypothetical account values and hypothetical expenses based on the Portfolio’s actual expense ratio and an assumed rate of return of 5% per year before expenses. This is not the Portfolio’s actual return. The hypothetical account values and expenses may not be used to estimate the actual ending account balance or expenses you paid for the period. You may use this information to compare the ongoing costs of investing in the Portfolio to other funds. To do so, compare this 5% hypothetical example with the 5% hypothetical examples that appear in the shareholder reports of other funds.
Please note that the expenses shown in both examples are meant to highlight your ongoing costs only and do not reflect any transactional costs or account type fees, such as redemption fees and IRA Fiduciary Administration fees, respectively. These fees are fully described in the prospectus. Therefore, the second line of each share class in the table is useful in comparing ongoing costs only and will not help you determine the relative costs of owning different funds. In addition, if these transactional costs or account fees were included, your costs would have been higher.
152 Annual Report | December 31, 2010 |
Fund Expenses (unaudited)
The examples below show you the ongoing costs (in dollars) of investing in your fund and allows you to compare these costs with those of other mutual funds. Please refer to the previous page for a detailed explanation of the information presented on this chart.
| | | | | | | | | | | | | | | | |
Expense Example | | Beginning
Account Value
7/1/2010 | | | Ending
Account Value
12/31/2010 | | | Expenses Paid
During the
Period(a) | | | Annualized
Expense Ratio | |
Growth Fund | | | | | | | | | | | | | | | | |
Class N—actual return | | $ | 1,000.00 | | | $ | 1,240.90 | | | $ | 6.69 | | | | 1.18 | % |
Class N—hypothetical 5% return | | | 1,000.00 | | | | 1,019.23 | | | | 6.03 | | | | 1.18 | |
Class I—actual return | | | 1,000.00 | | | | 1,243.10 | | | | 4.73 | | | | 0.84 | |
Class I—hypothetical 5% return | | | 1,000.00 | | | | 1,020.99 | | | | 4.26 | | | | 0.84 | |
Large Cap Growth Fund | | | | | | | | | | | | | | | | |
Class N—actual return | | | 1,000.00 | | | | 1,266.00 | | | | 6.85 | | | | 1.20 | |
Class N—hypothetical 5% return | | | 1,000.00 | | | | 1,019.16 | | | | 6.11 | | | | 1.20 | |
Class I—actual return | | | 1,000.00 | | | | 1,269.10 | | | | 5.43 | | | | 0.95 | |
Class I—hypothetical 5% return | | | 1,000.00 | | | | 1,020.42 | | | | 4.84 | | | | 0.95 | |
Small Cap Growth Fund | | | | | | | | | | | | | | | | |
Class N—actual return | | | 1,000.00 | | | | 1,205.60 | | | | 8.45 | | | | 1.52 | |
Class N—hypothetical 5% return | | | 1,000.00 | | | | 1,017.54 | | | | 7.73 | | | | 1.52 | |
Class I—actual return | | | 1,000.00 | | | | 1,208.30 | | | | 7.15 | | | | 1.29 | |
Class I—hypothetical 5% return | | | 1,000.00 | | | | 1,018.73 | | | | 6.54 | | | | 1.29 | |
Mid Cap Growth Fund | | | | | | | | | | | | | | | | |
Class N—actual return | | | 1,000.00 | | | | 1,272.90 | | | | 7.73 | | | | 1.35 | |
Class N—hypothetical 5% return | | | 1,000.00 | | | | 1,018.40 | | | | 6.87 | | | | 1.35 | |
Class I—actual return | | | 1,000.00 | | | | 1,274.40 | | | | 6.31 | | | | 1.10 | |
Class I—hypothetical 5% return | | | 1,000.00 | | | | 1,019.66 | | | | 5.60 | | | | 1.10 | |
Small—Mid Cap Growth Fund | | | | | | | | | | | | | | | | |
Class N—actual return | | | 1,000.00 | | | | 1,266.50 | | | | 7.71 | | | | 1.35 | |
Class N—hypothetical 5% return | | | 1,000.00 | | | | 1,018.40 | | | | 6.87 | | | | 1.35 | |
Class I—actual return | | | 1,000.00 | | | | 1,267.70 | | | | 6.29 | | | | 1.10 | |
Class I—hypothetical 5% return | | | 1,000.00 | | | | 1,019.66 | | | | 5.60 | | | | 1.10 | |
Global Growth Fund | | | | | | | | | | | | | | | | |
Class N—actual return | | | 1,000.00 | | | | 1,278.50 | | | | 8.61 | | | | 1.50 | |
Class N—hypothetical 5% return | | | 1,000.00 | | | | 1,017.64 | | | | 7.63 | | | | 1.50 | |
Class I—actual return | | | 1,000.00 | | | | 1,278.90 | | | | 7.18 | | | | 1.25 | |
Class I—hypothetical 5% return | | | 1,000.00 | | | | 1,018.90 | | | | 6.36 | | | | 1.25 | |
International Growth Fund | | | | | | | | | | | | | | | | |
Class N—actual return | | | 1,000.00 | | | | 1,253.60 | | | | 8.07 | | | | 1.42 | |
Class N—hypothetical 5% return | | | 1,000.00 | | | | 1,018.04 | | | | 7.23 | | | | 1.42 | |
Class I—actual return | | | 1,000.00 | | | | 1,255.00 | | | | 6.50 | | | | 1.14 | |
Class I—hypothetical 5% return | | | 1,000.00 | | | | 1,019.44 | | | | 5.82 | | | | 1.14 | |
International Equity Fund | | | | | | | | | | | | | | | | |
Class N—actual return | | | 1,000.00 | | | | 1,221.80 | | | | 8.13 | | | | 1.45 | |
Class N—hypothetical 5% return | | | 1,000.00 | | | | 1,017.89 | | | | 7.38 | | | | 1.45 | |
Class I—actual return | | | 1,000.00 | | | | 1,222.50 | | | | 6.77 | | | | 1.21 | |
Class I—hypothetical 5% return | | | 1,000.00 | | | | 1,019.11 | | | | 6.15 | | | | 1.21 | |
International Small Cap Growth Fund | | | | | | | | | | | | | | | | |
Class N—actual return | | | 1,000.00 | | | | 1,288.50 | | | | 8.87 | | | | 1.54 | |
Class N—hypothetical 5% return | | | 1,000.00 | | | | 1,017.46 | | | | 7.82 | | | | 1.54 | |
Class I—actual return | | | 1,000.00 | | | | 1,290.70 | | | | 7.21 | | | | 1.25 | |
Class I—hypothetical 5% return | | | 1,000.00 | | | | 1,018.91 | | | | 6.35 | | | | 1.25 | |
Emerging Markets Growth Fund | | | | | | | | | | | | | | | | |
Class N—actual return | | | 1,000.00 | | | | 1,289.50 | | | | 9.19 | | | | 1.59 | |
Class N—hypothetical 5% return | | | 1,000.00 | | | | 1,017.17 | | | | 8.10 | | | | 1.59 | |
Class I—actual return | | | 1,000.00 | | | | 1,290.50 | | | | 7.84 | | | | 1.36 | |
Class I—hypothetical 5% return | | | 1,000.00 | | | | 1,018.36 | | | | 6.91 | | | | 1.36 | |
December 31, 2010 | William Blair Funds 153 |
| | | | | | | | | | | | | | | | |
Expense Example | | Beginning
Account Value
7/1/2010 | | | Ending
Account Value
12/31/2010 | | | Expenses Paid
During the
Period(a) | | | Annualized
Expense Ratio | |
Emerging Leaders Growth Fund | | | | | | | | | | | | | | | | |
Class N—actual return | | $ | 1,000.00 | | | $ | 1,261.70 | | | $ | 4.44 | | | | 1.62 | % |
Class N—hypothetical 5% return | | | 1,000.00 | | | | 1,018.91 | | | | 8.24 | | | | 1.62 | |
Class I—actual return | | | 1,000.00 | | | | 1,262.40 | | | | 7.98 | | | | 1.40 | |
Class I—hypothetical 5% return | | | 1,000.00 | | | | 1,018.15 | | | | 7.12 | | | | 1.40 | |
Small Cap Value Fund | | | | | | | | | | | | | | | | |
Class N—actual return | | | 1,000.00 | | | | 1,304.40 | | | | 7.80 | | | | 1.34 | |
Class N—hypothetical 5% return | | | 1,000.00 | | | | 1,018.43 | | | | 6.83 | | | | 1.34 | |
Class I—actual return | | | 1,000.00 | | | | 1,305.40 | | | | 6.39 | | | | 1.10 | |
Class I—hypothetical 5% return | | | 1,000.00 | | | | 1,019.66 | | | | 5.60 | | | | 1.10 | |
Mid Cap Value Fund | | | | | | | | | | | | | | | | |
Class N—actual return | | | 1,000.00 | | | | 1,248.30 | | | | 7.66 | | | | 1.35 | |
Class N—hypothetical 5% return | | | 1,000.00 | | | | 1,018.09 | | | | 6.77 | | | | 1.35 | |
Class I—actual return | | | 1,000.00 | | | | 1,250.40 | | | | 6.24 | | | | 1.10 | |
Class N—hypothetical 5% return | | | 1,000.00 | | | | 1,019.34 | | | | 5.51 | | | | 1.10 | |
Bond Fund | | | | | | | | | | | | | | | | |
Class N—actual return | | | 1,000.00 | | | | 1,024.60 | | | | 3.32 | | | | 0.65 | |
Class N—hypothetical 5% return | | | 1,000.00 | | | | 1,021.93 | | | | 3.31 | | | | 0.65 | |
Class I—actual return | | | 1,000.00 | | | | 1,024.70 | | | | 2.55 | | | | 0.50 | |
Class I—hypothetical 5% return | | | 1,000.00 | | | | 1,022.68 | | | | 2.55 | | | | 0.50 | |
Income Fund | | | | | | | | | | | | | | | | |
Class N—actual return | | | 1,000.00 | | | | 1,020.30 | | | | 4.37 | | | | 0.86 | |
Class N—hypothetical 5% return | | | 1,000.00 | | | | 1,020.88 | | | | 4.37 | | | | 0.86 | |
Class I—actual return | | | 1,000.00 | | | | 1,021.80 | | | | 3.08 | | | | 0.60 | |
Class I—hypothetical 5% return | | | 1,000.00 | | | | 1,022.16 | | | | 3.08 | | | | 0.60 | |
Low Duration Fund | | | | | | | | | | | | | | | | |
Class N—actual return | | | 1,000.00 | | | | 1,004.30 | | | | 3.57 | | | | 0.71 | |
Class N—hypothetical 5% | | | 1,000.00 | | | | 1,021.64 | | | | 3.60 | | | | 0.71 | |
Class I—actual return | | | 1,000.00 | | | | 1,004.00 | | | | 2.81 | | | | 0.56 | |
Class I—hypothetical 5% | | | 1,000.00 | | | | 1,022.40 | | | | 2.83 | | | | 0.56 | |
Ready Reserves Fund | | | | | | | | | | | | | | | | |
Class N—actual return | | | 1,000.00 | | | | 1,000.10 | | | | 1.20 | | | | 0.24 | |
Class N—hypothetical 5% return | | | 1,000.00 | | | | 1,024.01 | | | | 1.21 | | | | 0.24 | |
| (a) | | Expenses are equal to the annualized expense ratio, multiplied by the average account value over the period, multiplied by the number of days in the period 184, and divided by 365 (to reflect the one-half year period). |
154 Annual Report | December 31, 2010 |
BOARD OF TRUSTEES
Ann P. McDermott
Director and Trustee
Profit and not-for-profit organizations
Phillip O. Peterson
Retired Partner, KPMG LLP
Donald J. Reaves
Chancellor, Winston-Salem State University
Donald L. Seeley
Retired Adjunct Lecturer and Director, University of Arizona Department of Finance
Michelle R. Seitz, Chairperson and President
Principal, William Blair & Company, L.L.C.,
Thomas J. Skelly
Retired Managing Partner, Accenture U.S.
Richard W. Smirl, Senior Vice President
Principal, William Blair & Company L.L.C.
Robert E. Wood II
Retired Executive Vice President, Morgan Stanley Dean Witter
Officers
Michael P. Balkin, Senior Vice President
Karl W. Brewer, Senior Vice President
David C. Fording, Senior Vice President
James S. Golan, Senior Vice President
W. George Greig, Senior Vice President
Michael A. Jancosek, Senior Vice President
John F. Jostrand, Senior Vice President
Robert C. Lanphier, IV, Senior Vice President
Mark T. Leslie, Senior Vice President
Matthew A. Litfin, Senior Vice President
Kenneth J. McAtamney, Senior Vice President
Todd M. McClone, Senior Vice President
Tracy McCormick, Senior Vice President
David Merjan, Senior Vice President
David S. Mitchell, Senior Vice President
David P. Ricci, Senior Vice President
Jeffrey A. Urbina, Senior Vice President
Christopher T. Vincent, Senior Vice President
Chad M. Kilmer, Vice President
Kathleen M. Lynch, Vice President
Paul J. Sularz, Vice President
Walter R. Randall, Jr., Chief Compliance Officer
Colette M. Garavalia, Treasurer
Andrew T. Pfau, Secretary
Investment Advisor
William Blair & Company, L.L.C.
Independent Registered Public Accounting Firm
Ernst & Young LLP
Legal Counsel
Vedder Price P.C.
Transfer Agent
Boston Financial Data Services, Inc.
P.O. Box 8506
Boston, MA 02266-8506
For customer assistance, call 1-800-635-2886
(Massachusetts 1-800-635-2840)
December 31, 2010 | William Blair Funds 155 |
| | | | |
EQUITY | | GLOBAL EQUITY | | FIXED-INCOME |
Growth Fund | | Global Growth Fund | | Bond Fund |
Large Cap Growth Fund | | | | Income Fund |
Small Cap Growth Fund | | INTERNATIONAL EQUITY | | Low Duration Fund |
Mid Cap Growth Fund | | International Growth Fund | | |
Small-Mid Cap Growth Fund | | International Equity Fund | | MONEY MARKET |
Small Cap Value Fund | | International Small Cap Growth Fund | | Ready Reserves Fund |
Mid Cap Value Fund | | Emerging Markets Growth Fund | | |
| | Emerging Leaders Growth Fund | | |

222 West Adams Street
Chicago, IL 60606
800.742.7272 Ÿ www.williamblairfunds.com
©William Blair & Company, L.L.C., distributor

INSTITUTIONAL
ANNUAL REPORT
DECEMBER 31, 2010
Table of Contents
The views expressed in the commentary for each Fund reflect those of the portfolio management team only through the end of the period of the report as stated on the cover. The portfolio management team’s views are subject to change at any time based on market and other conditions and should not be construed as a recommendation. Statements involving predictions, assessments, analyses, or outlook for individual securities, industries, market sectors, and/or markets involve risks and uncertainties, and there is no guarantee they will come to pass.
This report is submitted for the general information of the shareholders of the William Blair Funds. It is not authorized for distribution to prospective investors unless accompanied or preceded by a prospectus of the William Blair Funds. Please consider the Funds’ investment objectives, risks, charges, and expenses before investing. This and other information is contained in the Funds’ prospectus, which you may obtain by calling 1-800-742-7272. Read it carefully before you invest or send money. William Blair & Company, LLC., distributor.
December 31, 2010 | William Blair Funds 1 |
GLOBAL MARKETS OVERVIEW
The year 2010 was marked by a mid-teens return in the global equity market with most markets and all global sectors in positive territory. This year seemed almost “normal,” as opposed to the wild swings of the last two years when the global equity market fell 42.34% in the midst of the 2008 financial crisis, then subsequently rebounded 36.41% during the initial stages of the recovery in 2009. The 2010 return, however, understates the market volatility that occurred during the year. Recovering corporate profits and economic activity bolstered the stock market generally as the recovery moved towards a more traditional expansion mode. These positives were somewhat offset by concerns about peripheral European debt that arose in the first quarter. In addition, rising emerging markets inflationary pressures and subsequent monetary policy tightening raised concerns about near term growth in the engine of the global recovery. The combination of these two issues and a rolling over of composite leading indicators gave rise to fears of a “double dip” in the second quarter and a resultant weak market. However, the Fed’s continued commitment to Quantitative Easing (QE) in the latter half of the year was viewed positively and was expected to support risk asset prices, while economic activity improved. These events supported the rally through year end and counteracted rising anxiety about governmental debt loads and persistently high unemployment rates in a number of developed countries.
While the broad market returned 14.35% during 2010, as reflected by the MSCI ACWI IMI, emerging markets outperformed their developed market counterparts, as these countries benefited from strong investment, industrial production and increasing domestic demand, despite concerns about monetary tightening and economic overheating. Within emerging markets, the Emerging Markets Europe, Mid-East, and Africa (EMEA) region was up approximately 25%, led by strength in South Africa and Turkey, which more than offset weaker returns in the Central and Eastern European region, affected by the debt concerns confronting its Western European neighbors. Emerging Asia returned approximately 19%, as Indonesia, Thailand and Malaysia had strong returns, but China lagged due to heightened concerns about the Chinese property market and overall economic overheating, and potential implications on overall growth rates. Latin America was the worst performing emerging markets region, rising just over 16% as strength in Chile and Mexico was more than offset by Brazil’s 9% return.
Developed market returns also varied significantly during the year as Europe lagged the rest of the world, rising just over 3%, due to double digit market declines in those countries most affected by debt concerns. Conversely, Canada and Pacific ex-Japan performed well, up 23% and 18%, respectively, while the U.K. rose just over 10%. The U.S. was up 16.52% during the 12 month period, benefiting from USD depreciation versus most currencies (with the notable exception of the Euro and Pound Sterling), and as economic activity improved. Developed non-U.S. small cap stocks significantly outpaced their larger cap counterparts with the MSCI World Ex-U.S. Small Cap Index returning 24.51%, well ahead of the 10.66% MSCI World Ex-U.S. return Index. Small cap European markets were particularly strong during the year.
From a sector perspective Consumer Discretionary, Industrials and Materials each rose over 24%, leading global sectors as industrial production accelerated, commodity demand improved, and as consumer demand quickened in emerging markets and stabilized in most developed markets. Like 2009, Utilities and Healthcare were among the laggards, significantly trailing other global sectors and rising 1.26% and 5.04%, respectively.
Fourth quarter market performance was strong with the global equity market rising 9.35%. Emerging markets rose 7.42%, approximating developed non-U.S. returns, while the U.S. was up 11.52%. Japan and Canada led developed market performance during the period, rising 12.01% and 13.34%, respectively, while Europe and the U.K. lagged, rising 4.59% and 6.52%, respectively. Within emerging markets, EMEA returned 10.42%, as South Africa and Russia performed well, far exceeding the approximately 7% Asia and Latin America returns. From a sector perspective, commodity-related stocks performed well as Energy and Materials
2 Annual Report | December 31, 2010 |
each returned approximately 16.5%, while Consumer Discretionary, Industrials and IT were also strong, returning around 11%. Conversely, Telecom Services and Utilities trailed other global sectors, returning 3.53% and 2.18%, respectively.
Outlook
Markets are entering the new year with a favorable mix of promising growth prospects and conservative valuation metrics. Analysts are forecasting 17% earnings growth for 2011 for both developed markets and emerging markets. While over two thirds of developed market growth is expected to come from margin recovery, top line growth expectations for emerging markets are more closely aligned with GDP and inflation forecasts and expectations are less reliant on profitability improvements. While margin assumptions present a risk, the earnings outlook is stable and has moderated from a year ago. Multiples have recovered from the summer lows but ended the year below where they started and remain a source for potential returns should macro concerns subside.
Consumer Discretionary and Industrials have the strongest positive earnings trends among sectors. This has been the case throughout most of the year with very consistent increases to estimates among autos, capital goods, and transportation companies. These sectors currently demand a premium overall but with relatively attractive valuations in small and mid cap names. Materials are also seeing positive trends but prices have gotten ahead of earnings and the sector currently appears to be overvalued. The defensive sectors are seeing relatively weaker earnings trends.
Regionally there has been less of a distinction in earnings and price movement but there is some dispersion among valuations. Emerging markets continue to have superior quality and long-term growth profiles but became more expensive relative to developed markets throughout the year. India, for example, is the most expensive country while Japan is the least expensive. Emerging Markets Europe, Mid-East, and Africa (EMEA) and Asia ex-China and India are the least expensive among emerging markets and continue to offer relative value versus developed markets. Developed Europe, including the U.K., offers attractive valuations as well as stable earnings trends.
December 31, 2010 | William Blair Funds 3 |

W. George Greig
INSTITUTIONAL INTERNATIONAL GROWTH FUND
The Institutional International Growth Fund seeks long-term capital appreciation.
AN OVERVIEW FROM THE PORTFOLIO MANAGER
The Institutional International Growth Fund posted a 20.10% increase for the 12 months ended December 31, 2010. By comparison, the Fund’s benchmark, the Morgan Stanley Capital International (MSCI) All Country World Ex-U.S. (ACWI) IMI Index (net), gained 12.73%.
The Fund significantly outpaced the MSCI ACWI ex-US IMI during 2010. Strong year to date performance was bolstered by stock selection across most sectors, coupled with overall sector positioning and tactical currency hedging during the year. Consumer stock selection added significant value during the year, with auto-related and luxury holdings performing well, in addition to emerging markets Staples holdings. The Fund’s Energy holdings outperformed the Index by 11%, augmented by strength within European energy services and Exploration and Production (E&P) companies, coupled with good performance by Latin American producers. Financials stock selection was also a significant contributor to return, due to the Fund’s underweighting in European Financials, coupled with strong stock selection in the U.K., Canada and emerging markets. The Fund’s Healthcare and Industrials stocks each outpaced the Index sector returns by 13%, as the Fund’s European Healthcare holdings performed well, driving the outperformance, while emerging markets stock selection was also additive. Industrials stock selection benefited from good performance within the Fund’s defense, engineering and transportation holdings, coupled with an overweighting and positive stock selection in machinery stocks. Regionally, the Fund added significant value in Japan, Europe and emerging markets. Somewhat detracting from relative results were Developed Asia ex-Japan Financials, Industrials and Materials stock selection, coupled with Canadian Energy stock selection and overall Utilities stock selection.
Fourth quarter performance slightly trailed the Index. Positive stock selection in Healthcare, Materials, Telecom Services and Utilities was offset by underperformance in Consumer Discretionary, Energy and Financials, areas which performed well for the full 12 month period. In particular, Consumer Discretionary performance was hampered by the Fund’s Asian auto and Brazilian real estate holdings, while Energy stock selection lagged due to underperformance in the Fund’s U.K. E&P companies. Financials stock selection was largely hurt by Developed Asian Real Estate and Indian Financials holdings. Conversely, Healthcare stock selection was additive in Europe and emerging markets, while Materials performance benefited from strength in European chemicals and general mining names.
Year end Fund sector positioning generally paralleled positioning at the end of 2009 with Consumer Discretionary and Industrials remaining two areas of focus, and the most significant underweighting in Materials; however, this understates the changes that occurred within Fund sector structure during the year. Consumer Discretionary totaled approximately 14% at year end, a reduction from our high teens weighting most of the year, as we reduced exposure in companies that had performed well with higher valuations. During the year we also tilted more of our Consumer Discretionary exposure towards luxury-related holdings, an area which had underperformed in the initial stages of the recovery, and maintained significant exposure in auto-related holdings. Financials was another area in which the Fund was significantly underweighted most of the year, with a tilt towards emerging markets Financials. However, during the third quarter, we increased exposure in European and Japanese Financials on improved transparency, abatement of capital concerns, and differentiated growth outlook following the initial European debt crisis. At year end, Financials represented approximately 20%, an increase of nearly 4% since year end 2009, but a decrease since September 30. Materials exposure remained relatively stable during the year,
4 Annual Report | December 31, 2010 |
with approximately 60% of the exposure in chemical-related holdings, and the remainder in mining companies. Regionally, we reduced exposure in emerging markets from over 29% as of year-end 2009 to just over 25% as of year-end 2010, although Fund exposure remained higher than the 24.06% Index weighting. This reduction was precipitated by concerns about higher valuations amidst monetary policy tightening, and better opportunities in the developed markets at the margin, which had underperformed. As a result, Europe increased from approximately 23% to 31%, while Japan increased from approximately 11% to 14% during the 12 month period.
December 31, 2010 | William Blair Funds 5 |
Institutional International Growth Fund
Performance Highlights (unaudited)
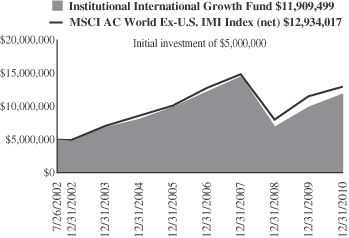
Average Annual Total Return at 12/31/2010
| | | | | | | | | | | | | | | | |
| | | 1
Year | | | 3
Year | | | 5
Year | | | Since
Inception(a) | |
Institutional International Growth Fund | | | 20.10 | % | | | (6.26 | )% | | | 3.80 | % | | | 10.84 | % |
MSCI All Country World Ex-U.S. IMI (net) | | | 12.73 | | | | (4.38 | ) | | | 5.14 | | | | 11.93 | |
| | (a) | | For the period July 26, 2002 (Commencement of Operations) to December 31, 2010. |
Performance cited represents past performance. Past performance does not guarantee future results and current performance may be lower or higher than the data quoted. Results shown are average annual returns, which assume reinvestment of dividends and capital gains. Investment returns and principal will fluctuate and you may have a gain or loss when you sell shares. For the most current month-end performance information, please call 1-800-742-7272, or visit our Web site at www.williamblairfunds.com. International investing involves special risk considerations, including currency fluctuations, lower liquidity, economic and political risk.
The performance highlights and graph presented above do not reflect the deduction of taxes that a shareholder would pay on fund distributions or the redemption of fund shares.
The Morgan Stanley Capital International (MSCI) All Country World Ex-U.S. Investable Market Index (IMI) (net) is a free float-adjusted market capitalization weighted index that is designed to measure the equity market performance of developed and emerging markets, excluding the United States. This series approximates the minimum possible dividend reinvestment.
This report identifies the Fund’s investments on December 31, 2010. These holdings are subject to change. Not all stocks in the Fund performed the same, nor is there any guarantee that these stocks will perform as well in the future. Market forecasts provided in this report may not necessarily come to pass.
Sector Diversification (unaudited)
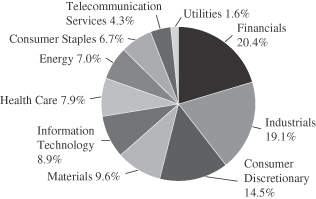
The sector diversification shown is based on the total long-term securities.
6 Annual Report December 31, 2010 | |
Institutional International Growth Fund
Portfolio of Investments, December 31, 2010 (all dollar amounts in thousands)
| | | | | | | | |
Issuer | | Shares | | | Value | |
| | |
Common Stocks | | | | | | | | |
| | |
Europe—31.0% | | | | | | | | |
Belgium—0.5% | | | | | | | | |
Colruyt S.A. (Food & staples retailing) | | | 187,909 | | | $ | 9,554 | |
| | | | | | | | |
Denmark—1.7% | | | | | | | | |
Coloplast A/S (Health care equipment & supplies) | | | 63,277 | | | | 8,599 | |
FLSmidth & Co. A/S (Construction & engineering) | | | 39,921 | | | | 3,807 | |
Novo Nordisk A/S (Pharmaceuticals) | | | 107,050 | | | | 12,071 | |
Novozymes A/S (Chemicals) | | | 37,987 | | | | 5,291 | |
SimCorp A/S (Software) | | | 15,634 | | | | 2,509 | |
| | | | | | | | |
| | | | | | | 32,277 | |
| | | | | | | | |
Finland—1.2% | | | | | | | | |
Kone Oyj (Machinery) | | | 266,468 | | | | 14,813 | |
Nokian Renkaat Oyj (Auto components) | | | 227,522 | | | | 8,346 | |
| | | | | | | | |
| | | | | | | 23,159 | |
| | | | | | | | |
France—7.7% | | | | | | | | |
Air Liquide S.A. (Chemicals) | | | 149,191 | | | | 18,868 | |
AXA S.A. (Insurance) | | | 631,210 | | | | 10,501 | |
BNP Paribas (Commercial banks) | | | 374,096 | | | | 23,800 | |
Cie Generale des Etablissements Michelin (Auto components) | | | 165,428 | | | | 11,871 | |
EDF Energies Nouvelles S.A. (Independent power producers & energy traders) | | | 153,820 | | | | 6,508 | |
Essilor International S.A. (Health care equipment & supplies) | | | 152,579 | | | | 9,822 | |
L’Oreal S.A. (Personal products) | | | 202,666 | | | | 22,500 | |
Schneider Electric S.A. (Electrical equipment) | | | 121,013 | | | | 18,112 | |
Vinci S.A. (Construction & engineering) | | | 433,386 | | | | 23,559 | |
| | | | | | | | |
| | | | | | | 145,541 | |
| | | | | | | | |
Germany—3.9% | | | | | | | | |
Aixtron AG (Semiconductors & semiconductor equipment) | | | 133,059 | | | | 4,908 | |
BASF SE (Chemicals) | | | 287,957 | | | | 22,972 | |
*Daimler AG (Automobiles) | | | 143,446 | | | | 9,724 | |
Fielmann AG (Specialty retail) | | | 48,014 | | | | 4,565 | |
Lanxess AG (Chemicals) | | | 100,790 | | | | 7,960 | |
MTU Aero Engines Holding AG (Aerospace & defense) | | | 9,851 | | | | 666 | |
SAP AG (Software) | | | 336,504 | | | | 17,133 | |
Wincor Nixdorf AG (Computers & peripherals) | | | 71,374 | | | | 5,819 | |
| | | | | | | | |
| | | | | | | 73,747 | |
| | | | | | | | |
Greece—0.3% | | | | | | | | |
*National Bank of Greece S.A. (Commercial banks) | | | 659,389 | | | | 5,331 | |
| | | | | | | | |
Ireland—0.2% | | | | | | | | |
Paddy Power plc (Hotels, restaurants & leisure) | | | 93,591 | | | | 3,840 | |
| | | | | | | | |
Israel—1.4% | | | | | | | | |
Israel Chemicals, Ltd. (Chemicals) | | | 711,824 | | | | 12,203 | |
Teva Pharmaceutical Industries, Ltd.—ADR (Pharmaceuticals) | | | 263,038 | | | | 13,712 | |
| | | | | | | | |
| | | | | | | 25,915 | |
| | | | | | | | |
| | | | | | | | |
Issuer | | Shares | | | Value | |
| |
Common Stocks—Europe—31.0%—(continued) | | | | | |
Italy—1.2% | | | | | | | | |
Ansaldo STS SpA (Transportation infrastructure) | | | 295,163 | | | $ | 4,228 | |
DiaSorin SpA (Health care equipment & supplies) | | | 98,780 | | | | 4,252 | |
Saipem SpA (Energy equipment & services) | | | 282,168 | | | | 13,891 | |
| | | | | | | | |
| | | | | | | 22,371 | |
| | | | | | | | |
Norway—0.2% | | | | | | | | |
*Norwegian Air Shuttle ASA (Airlines) | | | 159,700 | | | | 3,216 | |
| | | | | | | | |
Spain—2.5% | | | | | | | | |
Banco Santander S.A. (Commercial banks) | | | 2,519,376 | | | | 26,691 | |
Inditex S.A. (Specialty retail) | | | 89,413 | | | | 6,694 | |
Prosegur Cia de Seguridad S.A. (Commercial services & supplies) | | | 116,748 | | | | 6,573 | |
Tecnicas Reunidas S.A. (Energy equipment & services) | | | 112,126 | | | | 7,134 | |
| | | | | | | | |
| | | | | | | 47,092 | |
| | | | | | | | |
Sweden—2.0% | | | | | | | | |
Atlas Copco AB (Machinery) | | | 584,591 | | | | 14,750 | |
Elekta AB (Health care equipment & supplies) | | | 146,669 | | | | 5,644 | |
Hexagon AB (Machinery) | | | 235,389 | | | | 5,047 | |
*Hexagon AB Unregistered Shares (Machinery) | | | 76,136 | | | | 1,632 | |
SKF AB (Machinery) | | | 343,401 | | | | 9,783 | |
| | | | | | | | |
| | | | | | | 36,856 | |
| | | | | | | | |
Switzerland—8.2% | | | | | | | | |
Cie Financiere Richemont S.A. (Textiles, apparel & luxury goods) | | | 196,606 | | | | 11,565 | |
Credit Suisse Group AG (Capital markets) | | | 356,239 | | | | 14,353 | |
*Dufry Group (Specialty retail) | | | 48,524 | | | | 6,529 | |
Geberit AG (Building products) | | | 29,694 | | | | 6,866 | |
Julius Baer Group, Ltd. (Capital markets) | | | 124,957 | | | | 5,854 | |
Kuehne + Nagel International AG (Marine) | | | 48,658 | | | | 6,765 | |
Nestle S.A. (Food products) | | | 314,727 | | | | 18,429 | |
Novartis AG (Pharmaceuticals) | | | 336,535 | | | | 19,778 | |
*Orascom Development Holding AG (Hotels, restaurants & leisure) | | | 77,668 | | | | 4,648 | |
Partners Group Holding AG (Capital markets) | | | 51,058 | | | | 9,687 | |
SGS S.A. (Professional services) | | | 7,630 | | | | 12,804 | |
Sika AG (Chemicals) | | | 2,709 | | | | 5,942 | |
Xstrata plc (Metals & mining) | | | 397,059 | | | | 9,320 | |
Zurich Financial Services AG (Insurance) | | | 86,753 | | | | 22,472 | |
| | | | | | | | |
| | | | | | | 155,012 | |
| | | | | | | | |
| | |
United Kingdom—19.3% | | | | | | | | |
Abcam plc (Biotechnology) | | | 700,379 | | | | 3,494 | |
Admiral Group plc (Insurance) | | | 291,755 | | | | 6,891 | |
Aggreko plc (Commercial services & supplies) | | | 231,853 | | | | 5,357 | |
AMEC plc (Energy equipment & services) | | | 513,707 | | | | 9,211 | |
Amlin plc (Insurance) | | | 1,055,078 | | | | 6,726 | |
Antofagasta plc (Metals & mining) | | | 231,253 | | | | 5,812 | |
Aveva Group plc (Software) | | | 226,065 | | | | 5,689 | |
See accompanying Notes to Financial Statements.
December 31, 2010 | William Blair Funds 7 |
Institutional International Growth Fund
Portfolio of Investments, December 31, 2010 (all dollar amounts in thousands)
| | | | | | | | |
Issuer | | Shares | | | Value | |
| | |
United Kingdom—19.3%—(continued) | | | | | | | | |
Babcock International Group plc (Commercial services & supplies) | | | 1,296,160 | | | $ | 11,539 | |
BG Group plc (Oil, gas & consumable fuels) | | | 449,857 | | | | 9,090 | |
BHP Billiton plc (Metals & mining) | | | 825,328 | | | | 32,825 | |
Britvic plc (Beverages) | | | 623,849 | | | | 4,603 | |
Burberry Group plc (Textiles, apparel & luxury goods) | | | 307,086 | | | | 5,381 | |
*Carphone Warehouse Group plc (Specialty retail) | | | 531,280 | | | | 3,274 | |
Centrica plc (Multi-utilities) | | | 4,244,559 | | | | 21,944 | |
Chemring Group plc (Aerospace & defense) | | | 131,941 | | | | 5,974 | |
Compass Group plc (Hotels, restaurants & leisure) | | | 1,151,760 | | | | 10,433 | |
Dunelm Group plc (Specialty retail) | | | 446,845 | | | | 3,557 | |
*EnQuest plc (Oil, gas & consumable fuels) | | | 1,296,755 | | | | 2,820 | |
GlaxoSmithKline plc (Pharmaceuticals) | | | 1,167,240 | | | | 22,566 | |
IG Group Holdings plc (Diversified financial services) | | | 692,795 | | | | 5,509 | |
Intertek Group plc (Professional services) | | | 200,219 | | | | 5,541 | |
Johnson Matthey plc (Chemicals) | | | 324,010 | | | | 10,295 | |
Lancashire Holdings, Ltd. (Insurance) | | | 523,154 | | | | 4,511 | |
Meggitt plc (Aerospace & defense) | | | 648,075 | | | | 3,739 | |
Michael Page International plc (Professional services) | | | 931,103 | | | | 8,057 | |
Next plc (Multiline retail) | | | 301,626 | | | | 9,288 | |
*Ocado Group plc (Internet & catalog retail) | | | 1,405,731 | | | | 3,908 | |
Petrofac, Ltd. (Energy equipment & services) | | | 505,860 | | | | 12,516 | |
*Rolls-Royce Group plc (Aerospace & defense) | | | 1,359,553 | | | | 13,206 | |
Rotork plc (Machinery) | | | 226,428 | | | | 6,453 | |
RPS Group plc (Commercial services & supplies) | | | 1,025,089 | | | | 3,682 | |
Serco Group plc (Commercial services & supplies) | | | 794,152 | | | | 6,878 | |
Spirax-Sarco Engineering plc (Machinery) | | | 190,944 | | | | 5,758 | |
Standard Chartered plc (Commercial banks) | | | 818,457 | | | | 22,018 | |
*Telecity Group plc (Internet software & services) | | | 446,104 | | | | 3,272 | |
*The Berkeley Group Holdings plc (Household durables) | | | 414,053 | | | | 5,745 | |
The Weir Group plc (Machinery) | | | 331,361 | | | | 9,196 | |
Tullow Oil plc (Oil, gas & consumable fuels) | | | 208,981 | | | | 4,109 | |
Ultra Electronics Holdings plc (Aerospace & defense) | | | 222,179 | | | | 5,875 | |
Victrex plc (Chemicals) | | | 203,487 | | | | 4,705 | |
Vodafone Group plc (Wireless telecommunication services) | �� | | 12,455,518 | | | | 32,197 | |
| | | | | | | | |
| | | | | | | 363,644 | |
| | | | | | | | |
| | |
Japan—14.5% | | | | | | | | |
Canon, Inc. (Office electronics) | | | 396,200 | | | | 20,544 | |
CyberAgent, Inc. (Media) | | | 1,144 | | | | 2,494 | |
Dena Co., Ltd. (Internet & catalog retail) | | | 270,400 | | | | 9,698 | |
Exedy Corporation (Auto components) | | | 119,000 | | | | 3,864 | |
| | | | | | | | |
Issuer | | Shares | | | Value | |
| | |
Japan—14.5%—(continued) | | | | | | | | |
F.C.C. Co., Ltd. (Auto components) | | | 130,252 | | | $ | 3,035 | |
Fanuc, Ltd. (Machinery) | | | 165,600 | | | | 25,435 | |
Gree, Inc. (Internet software & services) | | | 339,900 | | | | 4,325 | |
K’s Holdings Corporation (Specialty retail) | | | 164,300 | | | | 4,470 | |
Kakaku.com, Inc. (Internet software & services) | | | 736 | | | | 4,378 | |
Keyence Corporation (Electronic equipment, instruments & components) | | | 48,600 | | | | 14,079 | |
Miraca Holdings, Inc. (Health care providers & services) | | | 106,500 | | | | 4,289 | |
MISUMI Group, Inc. (Trading companies & distributors) | | | 201,700 | | | | 5,026 | |
Murata Manufacturing Co., Ltd. (Electronic equipment, instruments & components) | | | 167,800 | | | | 11,760 | |
Nabtesco Corporation (Machinery) | | | 215,000 | | | | 4,587 | |
Nitori Co., Ltd. (Specialty retail) | | | 96,580 | | | | 8,446 | |
Nitto Denko Corporation (Chemicals) | | | 246,900 | | | | 11,632 | |
Osaka Securities Exchange Co., Ltd. (Diversified financial services) | | | 668 | | | | 3,369 | |
Point, Inc. (Specialty retail) | | | 82,820 | | | | 3,637 | |
Sawai Pharmaceutical Co., Ltd. (Pharmaceuticals) | | | 39,700 | | | | 3,247 | |
Softbank Corporation (Wireless telecommunication services) | | | 837,700 | | | | 29,003 | |
Sony Financial Holdings, Inc. (Insurance) | | | 3,477 | | | | 14,068 | |
Sumitomo Mitsui Financial Group, Inc. (Commercial banks) | | | 1,141,400 | | | | 40,657 | |
Terumo Corporation (Health care equipment & supplies) | | | 66,400 | | | | 3,737 | |
USS Co., Ltd. (Specialty retail) | | | 57,780 | | | | 4,725 | |
Yahoo! Japan Corporation (Internet software & services) | | | 62,670 | | | | 24,315 | |
Yamada Denki Co., Ltd. (Specialty retail) | | | 136,190 | | | | 9,293 | |
| | | | | | | | |
| | | | | | | 274,113 | |
| | | | | | | | |
| | |
Emerging Asia—13.2% | | | | | | | | |
China—3.5% | | | | | | | | |
AAC Acoustic Technologies Holdings, Inc. (Communications equipment) | | | 702,000 | | | | 1,874 | |
China Shenhua Energy Co., Ltd. (Oil, gas & consumable fuels) | | | 3,184,000 | | | | 13,354 | |
China Yurun Food Group, Ltd. (Food products) | | | 1,024,000 | | | | 3,366 | |
CNOOC, Ltd. (Oil, gas & consumable fuels) | | | 7,814,000 | | | | 18,538 | |
Dongfang Electric Corporation, Ltd. (Electrical equipment) | | | 1,216,800 | | | | 6,027 | |
Dongfeng Motor Group Co., Ltd. (Automobiles) | | | 2,934,000 | | | | 5,058 | |
Great Wall Motor Co., Ltd. (Automobiles) | | | 1,153,000 | | | | 3,560 | |
Haitian International Holdings, Ltd. (Machinery) | | | 819,000 | | | | 855 | |
* Hollysys Automation Technologies, Ltd. (Electronic equipment, instruments & components)† | | | 43,005 | | | | 652 | |
Lonking Holdings, Ltd. (Machinery) | | | 6,503,000 | | | | 3,556 | |
Minth Group, Ltd. (Auto components) | | | 1,064,000 | | | | 1,747 | |
Shanghai Electric Group Co., Ltd. (Electrical equipment) | | | 8,972,000 | | | | 5,921 | |
See accompanying Notes to Financial Statements.
8 Annual Report | December 31, 2010 |
Institutional International Growth Fund
Portfolio of Investments, December 31, 2010 (all dollar amounts in thousands)
| | | | | | | | |
Issuer | | Shares | | | Value | |
| |
Common Stocks—Emerging Asia—13.2%—(continued) | | | | | |
China—3.5%—(continued) | | | | | | | | |
Zhuzhou CSR Times Electric Co., Ltd. (Electrical equipment) | | | 428,000 | | | $ | 1,682 | |
| | | | | | | | |
| | | | | | | 66,190 | |
| | | | | | | | |
India—2.4% | | | | | | | | |
Asian Paints, Ltd. (Chemicals) | | | 93,399 | | | | 6,013 | |
Axis Bank, Ltd. (Commercial banks) | | | 260,170 | | | | 7,856 | |
Infosys Technologies, Ltd. (IT services) | | | 157,588 | | | | 12,133 | |
Lupin, Ltd. (Pharmaceuticals) | | | 497,924 | | | | 5,372 | |
Shriram Transport Finance Co., Ltd. (Consumer finance) | | | 105,363 | | | | 1,841 | |
Tata Motors, Ltd. (Machinery) | | | 322,944 | | | | 9,449 | |
Yes Bank, Ltd. (Commercial banks) | | | 345,543 | | | | 2,417 | |
| | | | | | | | |
| | | | | | | 45,081 | |
| | | | | | | | |
Indonesia—3.1% | | | | | | | | |
PT Astra International Tbk (Automobiles) | | | 3,057,500 | | | | 18,511 | |
PT Bank Rakyat Indonesia (Commercial banks) | | | 9,161,000 | | | | 10,676 | |
PT Indo Tambangraya Megah (Oil, gas & consumable fuels) | | | 250,000 | | | | 1,408 | |
PT Indofood Sukses Makmur Tbk (Food products) | | | 13,125,000 | | | | 7,102 | |
PT Kalbe Farma Tbk (Pharmaceuticals) | | | 11,246,000 | | | | 4,057 | |
PT Perusahaan Perkebunan London Sumatra Indonesia Tbk (Food products) | | | 3,971,000 | | | | 5,663 | |
PT United Tractors Tbk (Machinery) | | | 4,172,000 | | | | 11,020 | |
| | | | | | | | |
| | | | | | | 58,437 | |
| | | | | | | | |
Malaysia—0.5% | | | | | | | | |
Genting Bhd (Hotels, restaurants & leisure) | | | 293,400 | | | | 1,064 | |
Kuala Lumpur Kepong Bhd (Food products) | | | 974,300 | | | | 6,983 | |
Top Glove Corporation Bhd (Health care equipment & supplies) | | | 1,176,000 | | | | 1,899 | |
| | | | | | | | |
| | | | | | | 9,946 | |
| | | | | | | | |
South Korea—3.0% | | | | | | | | |
*Halla Climate Control Corporation (Auto components) | | | 109,285 | | | | 1,926 | |
*Hankook Tire Co., Ltd. (Auto components) | | | 158,200 | | | | 4,426 | |
*Hyundai Mobis (Auto components) | | | 26,804 | | | | 6,719 | |
*Hyundai Motor Co. (Automobiles) | | | 91,249 | | | | 13,950 | |
Samsung Electronics Co., Ltd. (Semiconductors & semiconductor equipment) | | | 34,283 | | | | 28,667 | |
| | | | | | | | |
| | | | | | | 55,688 | |
| | | | | | | | |
Thailand—0.7% | | | | | | | | |
CP ALL PCL (Food & staples retailing) | | | 4,319,900 | | | | 5,625 | |
Kasikornbank PCL (Commercial banks) | | | 1,720,000 | | | | 7,161 | |
| | | | | | | | |
| | | | | | | 12,786 | |
| | | | | | | | |
| | | | | | | | |
Issuer | | Shares | | | Value | |
| | |
Emerging Latin America—9.5% | | | | | | | | |
Brazil—5.6% | | | | | | | | |
Amil Participacoes S.A. (Health care providers & services) | | | 7,800 | | | $ | 84 | |
BM&F BOVESPA S.A. (Diversified financial services) | | | 635,600 | | | | 5,027 | |
BR Malls Participacoes S.A. (Real estate management & development) | | | 457,700 | | | | 4,715 | |
BR Properties S.A. (Real estate management & development) | | | 469,106 | | | | 5,132 | |
Cia de Concessoes Rodoviarias (Transportation infrastructure) | | | 192,900 | | | | 5,450 | |
Cia Hering (Textiles, apparel & luxury goods) | | | 223,200 | | | | 3,630 | |
Diagnosticos da America S.A. (Health care providers & services) | | | 335,300 | | | | 4,545 | |
Drogasil S.A. (Food & staples retailing) | | | 220,800 | | | | 1,796 | |
Iochpe-Maxion S.A. (Machinery) | | | 207,300 | | | | 3,010 | |
Localiza Rent a Car S.A. (Road & rail) | | | 455,400 | | | | 7,380 | |
Lojas Renner S.A. (Multiline retail) | | | 205,300 | | | | 6,975 | |
Mills Estruturas e Servicos de Engenharia S.A. (Trading companies & distributors) | | | 354,524 | | | | 4,399 | |
Natura Cosmeticos S.A. (Personal products) | | | 522,100 | | | | 14,999 | |
OdontoPrev S.A. (Health care providers & services) | | | 370,500 | | | | 5,600 | |
*OGX Petroleo e Gas Participacoes S.A. (Oil, gas & consumable fuels) | | | 1,175,700 | | | | 14,165 | |
PDG Realty S.A. Empreendimentos e Participacoes (Household durables) | | | 1,236,200 | | | | 7,566 | |
SLC Agricola S.A. (Food products) | | | 188,100 | | | | 2,493 | |
Vale S.A.—ADR (Metals & mining) | | | 264,960 | | | | 9,160 | |
| | | | | | | | |
| | | | | | | 106,126 | |
| | | | | | | | |
Chile—0.9% | | | | | | | | |
Banco Santander Chile—ADR (Commercial banks) | | | 103,916 | | | | 9,713 | |
Lan Airlines S.A. (Airlines) | | | 231,838 | | | | 7,232 | |
| | | | | | | | |
| | | | | | | 16,945 | |
| | | | | | | | |
Colombia—0.6% | | | | | | | | |
Pacific Rubiales Energy Corporation (Oil, gas & consumable fuels) | | | 324,440 | | | | 11,013 | |
| | | | | | | | |
Mexico—1.9% | | | | | | | | |
America Movil S.A.B. de C.V.—ADR (Wireless telecommunication services) | | | 299,673 | | | | 17,183 | |
*Compartamos S.A.B. de C.V. (Consumer finance) | | | 2,583,200 | | | | 5,618 | |
*Genomma Lab Internacional S.A.B. de C.V. (Pharmaceuticals) | | | 1,381,262 | | | | 3,353 | |
Grupo Mexico S.A.B. de C.V. Series “B” (Metals & mining) | | | 2,363,100 | | | | 9,728 | |
| | | | | | | | |
| | | | | | | 35,882 | |
| | | | | | | | |
Peru—0.5% | | | | | | | | |
Credicorp, Ltd. (Commercial banks)† | | | 74,745 | | | | 8,888 | |
| | | | | | | | |
See accompanying Notes to Financial Statements.
December 31, 2010 | William Blair Funds 9 |
Institutional International Growth Fund
Portfolio of Investments, December 31, 2010 (all dollar amounts in thousands)
| | | | | | | | |
Issuer | | Shares | | | Value | |
| |
Common Stocks—(continued) | | | | | |
| | |
Canada—3.8% | | | | | | | | |
Brookfield Asset Management, Inc. Class “A” (Real estate management & development)† | | | 788,347 | | | $ | 26,244 | |
Canadian National Railway Co. (Road & rail) | | | 137,900 | | | | 9,202 | |
Canadian Western Bank (Commercial banks) | | | 160,903 | | | | 4,589 | |
*Gildan Activewear, Inc. (Textiles, apparel & luxury goods) | | | 200,500 | | | | 5,717 | |
Home Capital Group, Inc. (Thrifts & mortgage finance) | | | 38,180 | | | | 1,989 | |
PetroBakken Energy, Ltd. Class “A” (Oil, gas & consumable fuels) | | | 358,471 | | | | 7,827 | |
Petrominerales, Ltd. (Oil, gas & consumable fuels) | | | 97,523 | | | | 3,252 | |
Saputo, Inc. (Food products) | | | 172,594 | | | | 6,871 | |
Tim Hortons, Inc. (Hotels, restaurants & leisure) | | | 156,018 | | | | 6,449 | |
| | | | | | | | |
| | | | | | | 72,140 | |
| | | | | | | | |
| | |
Asia—2.8% | | | | | | | | |
Hong Kong—1.0% | | | | | | | | |
Li & Fung, Ltd. (Distributors) | | | 1,552,000 | | | | 9,005 | |
Noble Group, Ltd. (Trading companies & distributors) | | | 5,629,000 | | | | 9,518 | |
| | | | | | | | |
| | | | | | | 18,523 | |
| | | | | | | | |
Singapore—1.8% | | | | | | | | |
CapitaLand, Ltd. (Real estate management & development) | | | 3,594,000 | | | | 10,390 | |
CapitaMalls Asia, Ltd. (Real estate management & development) | | | 6,853,000 | | | | 10,359 | |
*Global Logistic Properties, Ltd. (Real estate management & development) | | | 2,858,000 | | | | 4,810 | |
Midas Holdings, Ltd. (Metals & mining) | | | 2,421,000 | | | | 1,729 | |
Olam International, Ltd. (Food & staples retailing) | | | 3,035,000 | | | | 7,426 | |
| | | | | | | | |
| | | | | | | 34,714 | |
| | | | | | | | |
| |
Emerging Europe, Mid-East, Africa—2.6% | | | | | |
Egypt—0.4% | | | | | | | | |
Commercial International Bank Egypt S.A.E. (Commercial banks) | | | 610,221 | | | | 4,983 | |
Egyptian Financial Group-Hermes Holding (Capital markets) | | | 499,057 | | | | 2,916 | |
| | | | | | | | |
| | | | | | | 7,899 | |
| | | | | | | | |
South Africa—1.2% | | | | | | | | |
Adcock Ingram Holdings, Ltd. (Pharmaceuticals) | | | 298,958 | | | | 2,718 | |
*Aspen Pharmacare Holdings, Ltd. (Pharmaceuticals) | | | 459,178 | | | | 6,414 | |
Clicks Group, Ltd. (Multiline retail) | | | 728,753 | | | | 4,795 | |
Shoprite Holdings, Ltd. (Food & staples retailing) | | | 324,846 | | | | 4,914 | |
Wilson Bayly Holmes-Ovcon, Ltd. (Construction & engineering) | | | 202,670 | | | | 4,276 | |
| | | | | | | | |
| | | | | | | 23,117 | |
| | | | | | | | |
| | | | | | | | |
Issuer | | Shares or
Principal
Amount | | | Value | |
| |
Common Stocks—Emerging Europe, Mid-East, Africa—2.6%—(continued) | | | | | |
Turkey—1.0% | | | | | | | | |
Tofas Turk Otomobil Fabrikasi A.S. (Automobiles) | | | 710,967 | | | $ | 3,665 | |
Turkiye Garanti Bankasi A.S. (Commercial banks) | | | 1,791,270 | | | | 9,072 | |
Turkiye Halk Bankasi A.S. (Commercial banks) | | | 713,247 | | | | 6,052 | |
| | | | | | | | |
| | | | | | | 18,789 | |
| | | | | | | | |
Total Common Stocks—96.7%
(cost $1,479,411) | | | | 1,823,832 | |
| | | | | | | | |
| | | | | | | | |
| | |
Convertible Bond | | | | | | | | |
Brazil—0.0% | | | | | | | | |
Lupatech S.A., 6.500%, due 4/15/18 (Machinery)**§ | | $ | 941 | | | $ | 614 | |
| | | | | | | | |
Total Convertible Bond—0.0%
(cost $488) | | | | 614 | |
| | | | | | | | |
| | |
Repurchase Agreement | | | | | | | | |
Fixed Income Clearing Corporation, 0.150% dated 12/31/10, due 1/3/11, repurchase price $69,717, collateralized by FNMA, 4.625%, due 10/15/13 | | | 69,716 | | | | 69,716 | |
| | | | | | | | |
Total Repurchase Agreement—3.7%
(cost $69,716) | | | | 69,716 | |
| | | | | | | | |
Total Investments—100.4%
(cost $1,549,615) | | | | 1,894,162 | |
Liabilities, plus cash and other assets—(0.4)% | | | | (7,945 | ) |
| | | | | | | | |
Net assets—100.0% | | | $ | 1,886,217 | |
| | | | | | | | |
ADR = American Depository Receipt
* = Non-income producing securities
† = U.S. listed foreign security
** = Fair valued pursuant to Valuation Procedures adopted by the Board of Trustees. This holding represents 0.03% of the Fund’s net assets at December 31, 2010.
§ = Deemed illiquid pursuant to Liquidity Procedures approved by the Board of Trustees. This holding represents 0.03% of the net assets at December 31, 2010.
For securities primarily traded on exchanges or markets that close before the close of regular trading on the New York Stock Exchange, the Fund may use an independent pricing service to fair value price the securities pursuant to Valuation Procedures approved by the Board of Trustees.
See accompanying Notes to Financial Statements.
10 Annual Report | December 31, 2010 |
Institutional International Growth Fund
Portfolio of Investments, December 31, 2010 (all dollar amounts in thousands)
At December 31, 2010, the Fund’s Portfolio of Investments includes the following industry categories:
| | | | |
Financials | | | 20.4% | |
Industrials | | | 19.1% | |
Consumer Discretionary | | | 14.5% | |
Materials | | | 9.6% | |
Information Technology | | | 8.9% | |
Health Care | | | 7.9% | |
Energy | | | 7.0% | |
Consumer Staples | | | 6.7% | |
Telecommunication Services | | | 4.3% | |
Utilities | | | 1.6% | |
| | | | |
Total | | | 100.0% | |
| | | | |
At December 31, 2010, the Fund’s Portfolio of Investments includes the following currency categories:
| | | | |
British Pound Sterling | | | 20.4% | |
Euro | | | 18.1% | |
Japanese Yen | | | 15.0% | |
Swiss Franc | | | 8.0% | |
Brazilian Real | | | 5.4% | |
U.S. Dollar | | | 4.7% | |
Hong Kong Dollar | | | 4.2% | |
Indonesian Rupiah | | | 3.2% | |
Canadian Dollar | | | 3.1% | |
South Korean Won | | | 3.1% | |
Indian Rupee | | | 2.5% | |
Singapore Dollar | | | 2.3% | |
Swedish Krona | | | 2.0% | |
Danish Krone | | | 1.8% | |
South African Rand | | | 1.3% | |
Turkish Lira | | | 1.0% | |
Mexican Peso | | | 1.0% | |
All Other Currencies | | | 2.9% | |
| | | | |
Total | | | 100.0% | |
| | | | |
See accompanying Notes to Financial Statements.
December 31, 2010 | William Blair Funds 11 |

David Merjan
INSTITUTIONAL INTERNATIONAL EQUITY FUND
The Institutional International Equity Fund seeks long-term capital appreciation.
AN OVERVIEW FROM THE PORTFOLIO MANAGER
The Institutional International Equity Fund posted a 11.12% increase for the 12 months ended December 31, 2010. By comparison, the Fund’s benchmark, the MSCI All Country World ex-U.S. IMI Index (net), gained 12.73%.
Calendar year performance for the Fund outpaced the Europe, Australia and Far East (EAFE) Index but trailed the MSCI ACWI Ex-US Index. Energy stock selection added significant value versus the MSCI ACWI Ex-US Index, with stock performance more than doubling the Index sector return. Service companies were the primary drivers of strong returns, coupled with good performance by CNOOC, Ltd. on the back of strong production growth during the year. Industrials, Healthcare and Telecom Services stock selection was also strong, as Healthcare stock selection was led by Europe, while Industrials stock selection benefited from demand for Komatsu, Ltd.’s heavy construction equipment in emerging markets, coupled with stabilizing developed market demand. In addition, the Fund’s airline, machinery and electrical equipment names also performed well. Telecom Services stock selection was bolstered by Softbank, which benefited from increased use of smartphones and its tie up with Apple, Inc. The key detractors from performance during the year included Materials holdings CRH plc and Vedanta Resources plc, along with E.on in Utilities. We sold CRH earlier in the year on concerns about worse than expected trading conditions in building materials and Vedanta during the fourth quarter, due to deteriorating government relations and concerns about the associated impact on the timing and composition of the project pipeline. We sold E.on as a result of expected continued weakness in power prices.
The Fund’s fourth quarter performance approximated the EAFE Index, but trailed the MSCI ACWI Ex-US Index. While the Fund was up over 7%, for the quarter, and Developed Asian and Europe Ex-U.K. stock selection was strong, the Fund’s U.K., Canadian and EMEA stock selection more than offset these positive relative results. U.K. stock selection lagged across most sectors, with the exception of Financials, although the overweighting in U.K. Financials was negative. Canadian stock selection was hampered by the lack of Energy exposure, coupled with underperformance by Goldcorp. The Fund’s focus on EMEA Financials also detracted from performance, as these names underperformed the region as a whole. Developed Asian stock selection was bolstered by good performance by BHP Billiton on a stock buyback program and accelerating commodity prices. Japanese stock selection added value through Financials performance coupled with strong results from Komatsu, Ltd. and Fanuc, Ltd., along with good performance by Japanese IT companies. Within Europe Ex-U.K., Saipem SpA, the energy services company, performed well, while the underweighting and stock selection in Financials was also a key contributor. European Healthcare stocks were also additive to results.
As of year-end 2010 the Fund maintained its focus in Industrials with just over 23% invested in the sector. While decreasing since September 30 due to a reduction in European holdings, it remained significantly overweighted versus the 12% Index weighting, due largely to significant developed market exposure, particularly in Japanese machinery and European electrical equipment and outsourcing companies, along with trading companies. Financials, while underweighted at 20% versus the 24% Index weighting, was the second largest sector, with significant exposure in emerging markets-related holdings, as well as European insurance companies, and remained relatively stable during the year. Materials remained the most underweighted sector at approximately 8% of the Fund versus the 13% Index weighting, as we were underweighted in chemicals and mining, the two significant industries within the Index. Regionally, the Fund remained focused in Europe, with approximately 27% invested in Europe Ex-U.K. and 24% in the U.K. Europe Ex-U.K. exposure moderated during the twelve
12 Annual Report | December 31, 2010 |
month period from 31% as of year-end 2009 as an increase in European Staples was more than offset by a decrease in Financials and Healthcare. Conversely, U.K. exposure increased during the period from approximately 19% to nearly 24%, ahead of the Index weighting, as exposure broadened across a number of sectors. Japan represented approximately 14% of the Fund as of year end, below the Index weighting, but increased during the year, particularly in Financials and Industrials. Emerging markets were underweighted during the entire twelve month period and ended the year at 19% versus the 24.06% Index weighting, due to lower exposure in Emerging Asia and EMEA.
December 31, 2010 | William Blair Funds 13 |
Institutional International Equity Fund
Performance Highlights (unaudited)
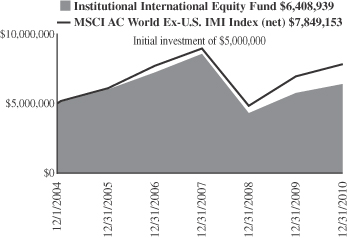
Average Annual Total Return at 12/31/2010
| | | | | | | | | | | | | | | | |
| | | 1
Year | | | 3
Year | | | 5
Year | | | Since
Inception(a) | |
Institutional International Equity Fund | | | 11.12 | % | | | (9.27 | )% | | | 1.22 | % | | | 4.15 | % |
MSCI All Country World Ex-U.S. IMI (net) | | | 12.73 | | | | (4.38 | ) | | | 5.14 | | | | 7.67 | |
| | (a) | | For the period December 1, 2004 (Commencement of Operations) to December 31, 2010. |
Performance cited represents past performance. Past performance does not guarantee future results and current performance may be lower or higher than the data quoted. Results shown are average annual returns, which assume reinvestment of dividends and capital gains. Investment returns and principal will fluctuate and you may have a gain or loss when you sell shares. For the most current month-end performance information, please call 1-800-742-7272, or visit our Web site at www.williamblairfunds.com. From time to time, the investment advisor may waive fees or reimburse expenses for the Fund. Without these waivers, performance would be lower. International investing involves special risk considerations, including currency fluctuations, lower liquidity, economic and political risk.
The performance highlights and graph presented above do not reflect the deduction of taxes that a shareholder would pay on fund distributions or the redemption of fund shares.
The Morgan Stanley Capital International (MSCI) All Country World Ex-U.S. Investable Market Index (IMI) (net) is a free float-adjusted market capitalization weighted index that is designed to measure the equity market performance of developed and emerging markets, excluding the United States. This series approximates the minimum possible dividend reinvestment.
This report identifies the Fund’s investments on December 31, 2010. These holdings are subject to change. Not all stocks in the Fund performed the same, nor is there any guarantee that these stocks will perform as well in the future. Market forecasts provided in this report may not necessarily come to pass.
Sector Diversification (unaudited)
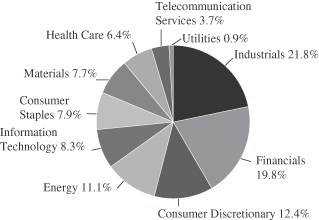
The sector diversification shown is based on the total long-term securities.
14 Annual Report | December 31, 2010 |
Institutional International Equity Fund
Portfolio of Investments, December 31, 2010 (all dollar amounts in thousands)
| | | | | | | | |
Issuer | | Shares | | | Value | |
| |
Common Stocks | | | | | |
| | |
Europe—27.0% | | | | | | | | |
Belgium—0.8% | | | | | | | | |
Anheuser-Busch InBev N.V. (Beverages) | | | 40,085 | | | $ | 2,292 | |
| | | | | | | | |
Denmark—1.7% | | | | | | | | |
Novo Nordisk A/S (Pharmaceuticals) | | | 43,257 | | | | 4,878 | |
| | | | | | | | |
Finland—1.4% | | | | | | | | |
Kone Oyj (Machinery) | | | 73,009 | | | | 4,058 | |
| | | | | | | | |
France—3.9% | | | | | | | | |
AXA S.A. (Insurance) | | | 114,649 | | | | 1,907 | |
Cie Generale des Etablissements Michelin (Auto components) | | | 41,900 | | | | 3,007 | |
L’Oreal S.A. (Personal products) | | | 32,831 | | | | 3,645 | |
Schneider Electric S.A. (Electrical equipment) | | | 17,854 | | | | 2,672 | |
| | | | | | | | |
| | | | | | | 11,231 | |
| | | | | | | | |
Germany—2.9% | | | | | | | | |
MAN SE (Machinery) | | | 36,602 | | | | 4,353 | |
SAP AG (Software) | | | 81,948 | | | | 4,172 | |
| | | | | | | | |
| | | | | | | 8,525 | |
| | | | | | | | |
Ireland—1.7% | | | | | | | | |
Ryanair Holdings plc—ADR (Airlines) | | | 157,773 | | | | 4,853 | |
| | | | | | | | |
Israel—1.4% | | | | | | | | |
Teva Pharmaceutical Industries, Ltd.—ADR (Pharmaceuticals) | | | 79,362 | | | | 4,137 | |
| | | | | | | | |
Italy—1.9% | | | | | | | | |
Saipem SpA (Energy equipment & services) | | | 114,768 | | | | 5,650 | |
| | | | | | | | |
Spain—2.3% | | | | | | | | |
Banco Santander S.A. (Commercial banks) | | | 252,579 | | | | 2,676 | |
Inditex S.A. (Specialty retail) | | | 53,034 | | | | 3,971 | |
| | | | | | | | |
| | | | | | | 6,647 | |
| | | | | | | | |
Sweden—0.9% | | | | | | | | |
Atlas Copco AB (Machinery) | | | 110,012 | | | | 2,776 | |
| | | | | | | | |
Switzerland—8.1% | | | | | | | | |
*ABB, Ltd. (Electrical equipment) | | | 176,213 | | | | 3,926 | |
*Actelion, Ltd. (Biotechnology) | | | 33,397 | | | | 1,829 | |
Julius Baer Group, Ltd. (Capital markets) | | | 60,434 | | | | 2,831 | |
Nestle S.A. (Food products) | | | 100,988 | | | | 5,914 | |
Novartis AG (Pharmaceuticals) | | | 62,351 | | | | 3,664 | |
Sonova Holding AG (Health care equipment & supplies) | | | 14,495 | | | | 1,871 | |
Zurich Financial Services AG (Insurance) | | | 13,872 | | | | 3,593 | |
| | | | | | | | |
| | | | | | | 23,628 | |
| | | | | | | | |
| | |
United Kingdom—23.6% | | | | | | | | |
Amlin plc (Insurance) | | | 225,789 | | | | 1,439 | |
Antofagasta plc (Metals & mining) | | | 168,997 | | | | 4,247 | |
*Autonomy Corporation plc (Software) | | | 111,165 | | | | 2,608 | |
Barclays plc (Commercial banks) | | | 509,021 | | | | 2,076 | |
BG Group plc (Oil, gas & consumable fuels) | | | 251,919 | | | | 5,090 | |
British Sky Broadcasting Group plc (Media) | | | 368,860 | | | | 4,233 | |
Burberry Group plc (Textiles, apparel & luxury goods) | | | 168,321 | | | | 2,950 | |
Centrica plc (Multi-utilities) | | | 516,705 | | | | 2,671 | |
Compass Group plc (Hotels, restaurants & leisure) | | | 481,665 | | | | 4,363 | |
| | | | | | | | |
Issuer | | Shares | | | Value | |
| |
Common Stocks—United Kingdom—23.6%—(continued) | | | | | |
Experian plc (Professional services) | | | 236,801 | | | $ | 2,946 | |
HSBC Holdings plc (Commercial banks) | | | 251,784 | | | | 2,582 | |
Johnson Matthey plc (Chemicals) | | | 87,762 | | | | 2,789 | |
Petrofac, Ltd. (Energy equipment & services) | | | 138,030 | | | | 3,415 | |
Prudential plc (Insurance) | | | 385,616 | | | | 4,016 | |
Reckitt Benckiser Group plc (Household products) | | | 95,883 | | | | 5,270 | |
*Rolls-Royce Group plc (Aerospace & defense) | | | 413,256 | | | | 4,014 | |
Rotork plc (Machinery) | | | 73,295 | | | | 2,089 | |
Standard Chartered plc (Commercial banks) | | | 132,446 | | | | 3,563 | |
The Capita Group plc (Professional services) | | | 221,343 | | | | 2,404 | |
Tullow Oil plc (Oil, gas & consumable fuels) | | | 166,453 | | | | 3,273 | |
Vodafone Group plc (Wireless telecommunication services) | | | 1,050,222 | | | | 2,715 | |
| | | | | | | | |
| | | | | | | 68,753 | |
| | | | | | | | |
| | |
Japan—14.3% | | | | | | | | |
Canon, Inc. (Office electronics) | | | 109,700 | | | | 5,688 | |
Fanuc, Ltd. (Machinery) | | | 25,000 | | | | 3,840 | |
Keyence Corporation (Electronic equipment, instruments & components) | | | 16,000 | | | | 4,635 | |
Komatsu, Ltd. (Machinery) | | | 136,700 | | | | 4,137 | |
Mitsubishi Corporation (Trading companies & distributors) | | | 211,500 | | | | 5,726 | |
Mitsubishi UFJ Financial Group, Inc. (Commercial banks) | | | 580,600 | | | | 3,139 | |
Nippon Electric Glass Co., Ltd. (Electronic equipment, instruments & components) | | | 169,000 | | | | 2,440 | |
Nitori Co., Ltd. (Specialty retail) | | | 16,850 | | | | 1,473 | |
Nitto Denko Corporation (Chemicals) | | | 51,700 | | | | 2,436 | |
Softbank Corporation (Wireless telecommunication services) | | | 127,000 | | | | 4,397 | |
Sony Financial Holdings, Inc. (Insurance) | | | 448 | | | | 1,813 | |
Terumo Corporation (Health care equipment & supplies) | | | 36,800 | | | | 2,071 | |
| | | | | | | | |
| | | | | | | 41,795 | |
| | | | | | | | |
| | |
Canada—8.9% | | | | | | | | |
Brookfield Asset Management, Inc. Class “A” (Real estate management & development)† | | | 126,454 | | | | 4,210 | |
Canadian National Railway Co. (Road & rail)† | | | 71,583 | | | | 4,758 | |
Goldcorp, Inc. (Metals & mining)† | | | 76,627 | | | | 3,523 | |
Saputo, Inc. (Food products) | | | 63,996 | | | | 2,548 | |
The Toronto-Dominion Bank (Commercial banks) | | | 66,808 | | | | 4,989 | |
Thomson Reuters Corporation (Media) | | | 57,169 | | | | 2,141 | |
Tim Hortons, Inc. (Hotels, restaurants & leisure) | | | 92,897 | | | | 3,840 | |
| | | | | | | | |
| | | | | | | 26,009 | |
| | | | | | | | |
| | |
Emerging Asia—9.5% | | | | | | | | |
China—4.4% | | | | | | | | |
China Life Insurance Co., Ltd. (Insurance) | | | 693,000 | | | | 2,831 | |
China Overseas Land & Investment, Ltd. (Real estate management & development) | | | 1,054,000 | | | | 1,950 | |
China Shenhua Energy Co., Ltd. (Oil, gas & consumable fuels) | | | 616,000 | | | | 2,583 | |
CNOOC, Ltd. (Oil, gas & consumable fuels) | | | 1,514,000 | | | | 3,592 | |
Weichai Power Co., Ltd. (Machinery) | | | 287,000 | | | | 1,767 | |
| | | | | | | | |
| | | | | | | 12,723 | |
| | | | | | | | |
See accompanying Notes to Financial Statements.
December 31, 2010 | William Blair Funds 15 |
Institutional International Equity Fund
Portfolio of Investments, December 31, 2010 (all dollar amounts in thousands)
| | | | | | | | |
Issuer | | Shares | | | Value | |
| |
Common Stocks—Emerging Asia—9.5%—(continued) | | | | | |
India—3.2% | | | | | | | | |
*Cairn India, Ltd. (Oil, gas & consumable fuels) | | | 335,790 | | | $ | 2,499 | |
HDFC Bank, Ltd.—ADR (Commercial banks) | | | 13,315 | | | | 2,225 | |
Infosys Technologies, Ltd. (IT services) | | | 60,109 | | | | 4,628 | |
| | | | | | | | |
| | | | | | | 9,352 | |
| | | | | | | | |
Indonesia—0.6% | | | | | | | | |
PT Bank Rakyat Indonesia (Commercial banks) | | | 1,517,000 | | | | 1,768 | |
| | | | | | | | |
South Korea—1.3% | | | | | | | | |
*Hyundai Motor Co. (Automobiles) | | | 23,882 | | | | 3,651 | |
| | | | | | | | |
| | |
Emerging Latin America—8.4% | | | | | | | | |
Brazil—5.4% | | | | | | | | |
Banco Santander Brasil S.A.—ADR (Commercial banks) | | | 87,479 | | | | 1,190 | |
BM&F BOVESPA S.A. (Diversified financial services) | | | 349,571 | | | | 2,765 | |
PDG Realty S.A. Empreendimentos e Participacoes (Household durables) | | | 281,200 | | | | 1,721 | |
Petroleo Brasileiro S.A.—ADR (Oil, gas & consumable fuels) | | | 65,697 | | | | 2,486 | |
Vale S.A.—ADR (Metals & mining) | | | 124,878 | | | | 4,317 | |
Weg S.A. (Machinery) | | | 253,300 | | | | 3,326 | |
| | | | | | | | |
| | | | | | | 15,805 | |
| | | | | | | | |
Mexico—2.3% | | | | | | | | |
America Movil S.A.B. de C.V.—ADR (Wireless telecommunication services) | | | 63,833 | | | | 3,660 | |
Wal-Mart de Mexico S.A.B. de C.V. (Food & staples retailing) | | | 1,079,000 | | | | 3,084 | |
| | | | | | | | |
| | | | | | | 6,744 | |
| | | | | | | | |
Panama—0.7% | | | | | | | | |
Copa Holdings S.A. Class “A” (Airlines)† | | | 35,492 | | | | 2,088 | |
| | | | | | | | |
| | |
Asia—5.3% | | | | | | | | |
Australia—1.7% | | | | | | | | |
BHP Billiton, Ltd.—ADR (Metals & mining) | | | 54,255 | | | | 5,041 | |
| | | | | | | | |
Hong Kong—2.6% | | | | | | | | |
Li & Fung, Ltd. (Distributors) | | | 770,000 | | | | 4,468 | |
Noble Group, Ltd. (Trading companies & distributors) | | | 1,863,090 | | | | 3,150 | |
| | | | | | | | |
| | | | | | | 7,618 | |
| | | | | | | | |
Singapore—1.0% | | | | | | | | |
CapitaLand, Ltd. (Real estate management & development) | | | 961,000 | | | | 2,778 | |
| | | | | | | | |
| | |
Emerging Europe, Mid-East, Africa—1.0% | | | | | | | | |
Turkey—1.0% | | | | | | | | |
Turkiye Garanti Bankasi A.S. (Commercial banks) | | | 556,139 | | | | 2,817 | |
| | | | | | | | |
Total Common Stocks—98.0%
(cost $216,715) | | | | 285,617 | |
| | | | | | | | |
| | | | | | | | |
Issuer | | Shares or
Principal
Amount | | | Value | |
| | |
Preferred Stock | | | | | | | | |
Brazil—1.2% | | | | | | | | |
Petroleo Brasileiro S.A. (Oil, gas & consumable fuels) | | | 211,808 | | | $ | 3,482 | |
| | | | | | | | |
Total Preferred Stock—1.2%
(cost $2,598) | | | | 3,482 | |
| | | | | | | | |
| | |
Repurchase Agreement | | | | | | | | |
State Street Bank and Trust Company, 0.150% dated 12/31/10, due 1/3/11, repurchase price $797, collateralized by U.S. Treasury Note, 2.500%, due 4/30/15 | | $ | 797 | | | | 797 | |
| | | | | | | | |
Total Repurchase Agreement—0.3%
(cost $797) | | | | 797 | |
| | | | | | | | |
Total Investments—99.5%
(cost $220,110) | | | | 289,896 | |
Cash and other assets, less liabilities—0.5% | | | | 1,572 | |
| | | | | | | | |
Net assets—100.0% | | | $ | 291,468 | |
| | | | | | | | |
ADR = American Depository Receipt
* = Non-income producing securities
† = U.S. listed foreign security
For securities primarily traded on exchanges or markets that close before the close of regular trading on the New York Stock Exchange, the Fund may use an independent pricing service to fair value price the securities pursuant to Valuation Procedures approved by the Board of Trustees.
See accompanying Notes to Financial Statements.
16 Annual Report | December 31, 2010 |
Institutional International Equity Fund
Portfolio of Investments, December 31, 2010 (all dollar amounts in thousands)
At December 31, 2010, the Fund’s Portfolio of Investments includes the following industry categories:
| | | | |
Industrials | | | 21.8% | |
Financials | | | 19.8% | |
Consumer Discretionary | | | 12.4% | |
Energy | | | 11.1% | |
Information Technology | | | 8.3% | |
Consumer Staples | | | 7.9% | |
Materials | | | 7.7% | |
Health Care | | | 6.4% | |
Telecommunication Services | | | 3.7% | |
Utilities | | | 0.9% | |
| | | | |
Total | | | 100.0% | |
| | | | |
At December 31, 2010, the Fund’s Portfolio of Investments includes the following currency categories:
| | | | |
British Pound Sterling | | | 22.9% | |
U.S. Dollar | | | 14.7% | |
Japanese Yen | | | 14.4% | |
Euro | | | 13.3% | |
Swiss Franc | | | 8.2% | |
Hong Kong Dollar | | | 6.8% | |
Canadian Dollar | | | 4.7% | |
Brazilian Real | | | 3.9% | |
Indian Rupee | | | 2.5% | |
Singapore Dollar | | | 2.0% | |
Danish Krone | | | 1.7% | |
South Korean Won | | | 1.3% | |
Mexican Peso | | | 1.1% | |
All Other Currencies | | | 2.5% | |
| | | | |
Total | | | 100.0% | |
| | | | |
See accompanying Notes to Financial Statements.
December 31, 2010 | William Blair Funds 17 |

Jeffrey A. Urbina
INTERNATIONAL SMALL CAP GROWTH FUND
The International Small Cap Growth Fund seeks long-term capital appreciation.
AN OVERVIEW FROM THE PORTFOLIO MANAGER
The International Small Cap Growth Fund posted a 26.40% increase (Institutional Class Shares) for the 12 months ended December 31, 2010. By comparison, the Fund’s benchmark, the MSCI All Country World Ex-U.S. Small Cap Index (net), gained 25.21%.
The Fund outpaced the Index during the 12 month period, as stock selection was additive in virtually all sectors. Energy and Materials stock selection was particularly strong, with the Fund’s Energy stocks up approximately 57%, well ahead of the Index’s 31% Energy return. U.K. and Canadian stock selection augmented results on improving production growth, M&A activity and strength in services names, while Pacific Rubiales Energy Corporation, the Colombian Exploration and Production (E&P) company reported strong production growth. Materials stocks also enhanced performance, benefiting from M&A activity as Red Back Mining, Inc. was acquired during the year, and as other chemicals and mining holdings performed well. Healthcare was another sector where notable value was added, as Emerging Asian pharmaceuticals and Latin American healthcare names performed well, coupled with strong results in Europe and Japan. Finally, Staples stock selection was bolstered by M&A activity in Japan, coupled with strong results in agriculture-related and emerging markets grocery holdings. Somewhat detracting from results was performance by EDF Energies Nouvelles S.A., the Fund’s sole Utilities holding, which underperformed as investors were concerned about governmental policies surrounding alternative energy given recently announced austerity measures. Stock selection was strong across most regions as well, with the exception of Pacific Ex-Japan and Emerging Asia.
The Fund trailed the Index during the fourth quarter, due to underperformance in December. While stock selection was generally strong across most sectors, underperformance in Consumer Discretionary, Industrials and Information Technology (IT), coupled with overall sector positioning, detracted from fourth quarter results. Within Consumer Discretionary, Chinese sportswear and auto stocks detracted from performance, as did underperformance in Emerging Markets Europe, Mid East, and Africa (EMEA) holdings. Industrials stock selection was hampered by lagging results in U.K. holdings, while IT stock selection was hurt by underperformance by Gree, Inc., the Japanese social networking company, on concerns about slowing revenues per user. Offsetting these results was strong value added in Materials, Energy and Financials.
While absolute weightings varied during the year, broad areas of sector emphasis did not change during the period. As of year end the Fund remains overweighted in Consumer Discretionary, Healthcare and IT at the expense of Financials and Materials. Consumer Discretionary increased during the year and represented approximately 24% of the Fund, albeit down from 26% as of September 30, as we reduced exposure on valuation concerns, but well above the 16% Index weighting. IT, on the other hand, has steadily increased during 2010 from approximately 16% as of year-end 2009 to approximately 18% as of year-end 2010, well ahead of the 10% Index weighting. IT exposure is centered in Europe with approximately half of the Fund’s IT weighting in that region, invested across several industries. Conversely, Materials is just shy of 5%, significantly underweighted versus the Index. Regionally, we reduced exposure in Europe ex-U.K. during the 12 month period in favor of emerging markets, which represented 24% of the Fund as of year end. Europe fell from over 30% to 26.8% by year end. Japan has remained at approximately 16.7% of the Fund during the entire period, with a focus in small cap consumer and, to some extent Healthcare companies. With this weighting, exposure has hovered around Index weight.
18 Annual Report | December 31, 2010 |
International Small Cap Growth Fund
Performance Highlights (unaudited)
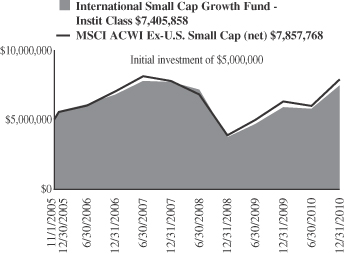
Average Annual Total Return at 12/31/2010
| | | | | | | | | | | | | | | | |
| | | 1
Year | | | 3
Year | | | 5
Year | | | Since
Inception(a) | |
Institutional Class | | | 26.40% | | | | (1.11 | )% | | | 5.82 | % | | | 7.90 | % |
MSCI All Country World Ex-U.S. Small Cap Index (net) | | | 25.21 | | | | 0.50 | | | | 7.36 | | | | 9.11 | |
| | (a) | | For the period November 1, 2005 (Commencement of Operations) to December 31, 2010. |
Performance cited represents past performance. Past performance does not guarantee future results and current performance may be lower or higher than the data quoted. Results shown are average annual returns, which assume reinvestment of dividends and capital gains. Investment returns and principal will fluctuate and you may have a gain or loss when you sell shares. For the most current month-end performance information, please call 1-800-742-7272, or visit our Web site at www.williamblairfunds.com. From time to time, the investment advisor may waive fees or reimburse expenses for the Fund. Without these waivers, performance would be lower. International investing involves special risk considerations, including currency fluctuations, lower liquidity, economic and political risk.
The performance highlights and graph presented above do not reflect the deduction of taxes that a shareholder would pay on fund distributions or the redemption of fund shares.
The Morgan Stanley Capital International (MSCI) All Country World Ex-U.S. Small Cap Index (net) is a free float-adjusted market capitalization weighted index that is designed to measure the equity market performance of small capitalization developed and emerging markets, excluding the United States. This series approximates the minimum possible dividend reinvestment.
This report identifies the Fund’s investments on December 31, 2010. These holdings are subject to change. Not all stocks in the Fund performed the same, nor is there any guarantee that these stocks will perform as well in the future. Market forecasts provided in this report may not necessarily come to pass.
Sector Diversification (unaudited)
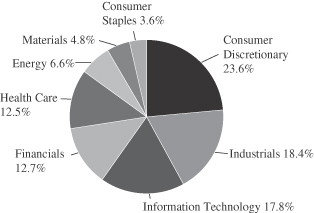
The sector diversification shown is based on the total long-term securities.
December 31, 2010 | William Blair Funds 19 |
International Small Cap Growth Fund
Portfolio of Investments, December 31, 2010 (all dollar amounts in thousands)
| | | | | | | | |
Issuer | | Shares | | | Value | |
| | |
Common Stocks | | | | | | | | |
Europe—26.8% | | | | | | | | |
Denmark—1.9% | | | | | | | | |
FLSmidth & Co. A/S (Construction & engineering) | | | 126,535 | | | $ | 12,068 | |
| | | | | | | | |
Finland—1.0% | | | | | | | | |
Nokian Renkaat Oyj (Auto components) | | | 177,483 | | | | 6,510 | |
| | | | | | | | |
France—1.4% | | | | | | | | |
Gemalto N.V. (Computers & peripherals) | | | 217,146 | | | | 9,241 | |
| | | | | | | | |
Germany—7.5% | | | | | | | | |
Aixtron AG (Semiconductors & semiconductor equipment) | | | 353,519 | | | | 13,041 | |
Fielmann AG (Specialty retail) | | | 36,250 | | | | 3,446 | |
Lanxess AG (Chemicals) | | | 166,850 | | | | 13,177 | |
MTU Aero Engines Holding AG (Aerospace & defense) | | | 8,416 | | | | 569 | |
Wincor Nixdorf AG (Computers & peripherals) | | | 183,112 | | | | 14,929 | |
Wirecard AG (IT services) | | | 255,453 | | | | 3,499 | |
| | | | | | | | |
| | | | | | | 48,661 | |
| | | | | | | | |
Ireland—1.5% | | | | | | | | |
Paddy Power plc (Hotels, restaurants & leisure) | | | 236,965 | | | | 9,721 | |
| | | | | | | | |
Italy—1.5% | | | | | | | | |
DiaSorin SpA (Health care equipment & supplies) | | | 149,025 | | | | 6,414 | |
Tod’s SpA (Textiles, apparel & luxury goods) | | | 30,438 | | | | 3,006 | |
| | | | | | | | |
| | | | | | | 9,420 | |
| | | | | | | | |
Netherlands—0.3% | | | | | | | | |
BinckBank N.V. (Capital markets) | | | 125,245 | | | | 1,942 | |
| | | | | | | | |
Norway—0.1% | | | | | | | | |
*Pronova BioPharma A/S (Pharmaceuticals) | | | 619,646 | | | | 998 | |
| | | | | | | | |
Spain—3.7% | | | | | | | | |
Prosegur Cia de Seguridad S.A. (Commercial services & supplies) | | | 106,091 | | | | 5,973 | |
Tecnicas Reunidas S.A. (Energy equipment & services) | | | 171,750 | | | | 10,928 | |
Viscofan S.A. (Food products) | | | 182,590 | | | | 6,920 | |
| | | | | | | | |
| | | | | | | 23,821 | |
| | | | | | | | |
Sweden—1.6% | | | | | | | | |
Elekta AB (Health care equipment & supplies) | | | 265,618 | | | | 10,221 | |
| | | | | | | | |
Switzerland—6.3% | | | | | | | | |
*Dufry Group (Specialty retail) | | | 80,122 | | | | 10,780 | |
*Orascom Development Holding AG (Hotels, restaurants & leisure) | | | 55,352 | | | | 3,312 | |
Partners Group Holding AG (Capital markets) | | | 74,649 | | | | 14,163 | |
*Temenos Group AG (Software) | | | 296,213 | | | | 12,324 | |
| | | | | | | | |
| | | | | | | 40,579 | |
| | | | | | | | |
| | |
United Kingdom—20.7% | | | | | | | | |
Abcam plc (Biotechnology) | | | 886,958 | | | | 4,425 | |
Aggreko plc (Commercial services & supplies) | | | 251,754 | | | | 5,817 | |
Amlin plc (Insurance) | | | 1,198,156 | | | | 7,638 | |
Ashmore Group plc (Capital markets) | | | 640,980 | | | | 3,349 | |
| | | | | | | | |
Issuer | | Shares | | | Value | |
| | |
Common Stocks—(continued) | | | | | | | | |
United Kingdom—20.7%—(continued) | | | | | | | | |
*ASOS plc (Internet & catalog retail) | | | 9,663 | | | $ | 240 | |
Aveva Group plc (Software) | | | 240,979 | | | | 6,064 | |
Babcock International Group plc (Commercial services & supplies) | | | 983,798 | | | | 8,758 | |
*Blinkx plc (Internet software & services) | | | 1,212,606 | | | | 1,574 | |
Britvic plc (Beverages) | | | 391,893 | | | | 2,892 | |
Chemring Group plc (Aerospace & defense) | | | 61,137 | | | | 2,768 | |
Domino’s Pizza UK & IRL plc (Hotels, restaurants & leisure) | | | 198,124 | | | | 1,704 | |
Dunelm Group plc (Specialty retail) | | | 424,413 | | | | 3,378 | |
*EnQuest plc (Oil, gas & consumable fuels) | | | 3,183,121 | | | | 6,923 | |
Fidessa Group plc (Software) | | | 90,598 | | | | 2,189 | |
Hargreaves Lansdown plc (Capital markets) | | | 430,045 | | | | 3,929 | |
IG Group Holdings plc (Diversified financial services) | | | 375,671 | | | | 2,987 | |
*Imagination Technologies Group plc (Computers & peripherals) | | | 489,931 | | | | 2,754 | |
Intertek Group plc (Professional services) | | | 140,008 | | | | 3,875 | |
John Wood Group plc (Energy equipment & services) | | | 817,247 | | | | 7,123 | |
Lancashire Holdings, Ltd. (Insurance) | | | 528,696 | | | | 4,558 | |
Meggitt plc (Aerospace & defense) | | | 957,881 | | | | 5,526 | |
Michael Page International plc (Professional services) | | | 841,079 | | | | 7,278 | |
Serco Group plc (Commercial services & supplies) | | | 700,185 | | | | 6,064 | |
Spirax-Sarco Engineering plc (Machinery) | | | 294,024 | | | | 8,866 | |
*Telecity Group plc (Internet software & services) | | | 231,115 | | | | 1,695 | |
The Weir Group plc (Machinery) | | | 390,838 | | | | 10,846 | |
Ultra Electronics Holdings plc (Aerospace & defense) | | | 221,798 | | | | 5,865 | |
Victrex plc (Chemicals) | | | 209,237 | | | | 4,838 | |
| | | | | | | | |
| | | | | | | 133,923 | |
| | | | | | | | |
| | |
Japan—16.7% | | | | | | | | |
Aeon Delight Co., Ltd. (Commercial services & supplies) | | | 100,300 | | | | 1,975 | |
Ain Pharmaciez, Inc. (Food & staples retailing) | | | 92,500 | | | | 3,254 | |
CyberAgent, Inc. (Media) | | | 2,697 | | | | 5,880 | |
Dena Co., Ltd. (Internet & catalog retail) | | | 310,100 | | | | 11,122 | |
EPS Co., Ltd. (Life sciences tools & services) | | | 675 | | | | 1,652 | |
Exedy Corporation (Auto components) | | | 397,400 | | | | 12,902 | |
F.C.C. Co., Ltd. (Auto components) | | | 200,509 | | | | 4,673 | |
Gree, Inc. (Internet software & services) | | | 599,330 | | | | 7,625 | |
Kakaku.com, Inc. (Internet software & services) | | | 691 | | | | 4,111 | |
Miraca Holdings, Inc. (Health care providers & services) | | | 354,400 | | | | 14,274 | |
Nabtesco Corporation (Machinery) | | | 313,000 | | | | 6,677 | |
Nitori Co., Ltd. (Specialty retail) | | | 54,100 | | | | 4,731 | |
Osaka Securities Exchange Co., Ltd. (Diversified financial services) | | | 1,342 | | | | 6,769 | |
Sawai Pharmaceutical Co., Ltd. (Pharmaceuticals) | | | 61,200 | | | | 5,005 | |
Start Today Co., Ltd. (Internet & catalog retail) | | | 1,467 | | | | 5,863 | |
USS Co., Ltd. (Specialty retail) | | | 140,100 | | | | 11,458 | |
| | | | | | | | |
| | | | | | | 107,971 | |
| | | | | | | | |
See accompanying Notes to Financial Statements.
20 Annual Report | December 31, 2010 |
International Small Cap Growth Fund
Portfolio of Investments, December 31, 2010 (all dollar amounts in thousands)
| | | | | | | | |
Issuer | | Shares | | | Value | |
| | |
Common Stocks—(continued) | | | | | | | | |
| | |
Emerging Asia—15.4% | | | | | | | | |
China—6.8% | | | | | | | | |
AAC Acoustic Technologies Holdings, Inc. (Communications equipment) | | | 2,945,559 | | | $ | 7,863 | |
Ajisen China Holdings, Ltd. (Hotels, restaurants & leisure) | | | 3,375,429 | | | | 5,671 | |
Comba Telecom Systems Holdings, Ltd. (Communications equipment) | | | 2,178,297 | | | | 2,461 | |
*Concord Medical Services Holdings, Ltd.—ADR (Health care providers & services) | | | 127,213 | | | | 939 | |
*E-Commerce China Dangdang, Inc.—ADR (Internet & catalog retail) | | | 39,664 | | | | 1,074 | |
Great Wall Motor Co., Ltd. (Automobiles) | | | 1,205,500 | | | | 3,722 | |
Haitian International Holdings, Ltd. (Machinery) | | | 5,540,496 | | | | 5,781 | |
*Hollysys Automation Technologies, Ltd. (Electronic equipment, instruments & components)† | | | 106,925 | | | | 1,621 | |
Lonking Holdings, Ltd. (Machinery) | | | 8,144,000 | | | | 4,453 | |
Minth Group, Ltd. (Auto components) | | | 2,795,384 | | | | 4,589 | |
*Noah Holdings, Ltd.—ADR (Capital markets) | | | 50,062 | | | | 979 | |
Peak Sport Products, Ltd. (Textiles, apparel & luxury goods) | | | 2,163,000 | | | | 1,419 | |
*WuXi PharmaTech Cayman, Inc.—ADR (Life sciences tools & services) | | | 134,953 | | | | 2,178 | |
*Youku.com, Inc.—ADR (Internet software & services) | | | 29,956 | | | | 1,049 | |
| | | | | | | | |
| | | | | | | 43,799 | |
| | | | | | | | |
India—2.4% | | | | | | | | |
eClerx Services, Ltd. (Professional services) | | | 55,468 | | | | 893 | |
Ipca Laboratories, Ltd. (Pharmaceuticals) | | | 419,452 | | | | 3,241 | |
Lupin, Ltd. (Pharmaceuticals) | | | 637,966 | | | | 6,883 | |
*Oberoi Realty, Ltd. (Real estate management & development) | | | 258,634 | | | | 1,479 | |
Shriram Transport Finance Co., Ltd. (Consumer finance) | | | 173,183 | | | | 3,025 | |
| | | | | | | | |
| | | | | | | 15,521 | |
| | | | | | | | |
Indonesia—1.5% | | | | | | | | |
*PT Ciputra Development Tbk (Real estate management & development) | | | 16,680,000 | | | | 648 | |
*PT Indofood CBP Sukses Makmur Tbk (Food products) | | | 2,388,500 | | | | 1,239 | |
PT Kalbe Farma Tbk (Pharmaceuticals) | | | 11,518,500 | | | | 4,155 | |
PT Perusahaan Perkebunan London Sumatra Indonesia Tbk (Food products) | | | 2,528,000 | | | | 3,605 | |
| | | | | | | | |
| | | | | | | 9,647 | |
| | | | | | | | |
South Korea—1.5% | | | | | | | | |
*Halla Climate Control Corporation (Auto components) | | | 541,048 | | | | 9,535 | |
| | | | | | | | |
Taiwan—3.2% | | | | | | | | |
Powertech Technology, Inc. (Semiconductors & semiconductor equipment) | | | 1,472,000 | | | | 4,897 | |
Tripod Technology Corporation (Electronic equipment, instruments & components) | | | 1,433,000 | | | | 5,849 | |
Wistron Corporation (Computers & peripherals) | | | 5,062,102 | | | | 10,313 | |
| | | | | | | | |
| | | | | | | 21,059 | |
| | | | | | | | |
| | | | | | | | |
Issuer | | Shares | | | Value | |
| | |
Common Stocks—(continued) | | | | | | | | |
Canada—6.6% | | | | | | | | |
Canadian Western Bank (Commercial banks) | | | 274,900 | | | $ | 7,841 | |
*Consolidated Thompson Iron Mines, Ltd. (Metals & mining) | | | 678,190 | | | | 9,610 | |
*Gildan Activewear, Inc. (Textiles, apparel & luxury goods) | | | 162,900 | | | | 4,645 | |
Home Capital Group, Inc. (Thrifts & mortgage finance) | | | 67,991 | | | | 3,541 | |
*Legacy Oil + Gas, Inc. (Oil, gas & consumable fuels) | | | 325,062 | | | | 5,084 | |
PetroBakken Energy, Ltd. Class “A” (Oil, gas & consumable fuels) | | | 223,778 | | | | 4,886 | |
Petrominerales, Ltd. (Oil, gas & consumable fuels) | | | 211,244 | | | | 7,045 | |
| | | | | | | | |
| | | | | | | 42,652 | |
| | | | | | | | |
| | |
Emerging Europe, Mid-East, Africa—4.6% | | | | | | | | |
Egypt—0.4% | | | | | | | | |
Ghabbour Auto (Automobiles) | | | 377,091 | | | | 2,822 | |
| | | | | | | | |
South Africa—2.7% | | | | | | | | |
Adcock Ingram Holdings, Ltd. (Pharmaceuticals) | | | 327,381 | | | | 2,977 | |
Clicks Group, Ltd. (Multiline retail) | | | 1,410,429 | | | | 9,279 | |
Mr Price Group, Ltd. (Specialty retail) | | | 496,785 | | | | 5,015 | |
| | | | | | | | |
| | | | | | | 17,271 | |
| | | | | | | | |
Turkey—1.0% | | | | | | | | |
BIM Birlesik Magazalar A.S. (Food & staples retailing) | | | 17,525 | | | | 596 | |
Tofas Turk Otomobil Fabrikasi A.S. (Automobiles) | | | 628,155 | | | | 3,238 | |
Turkiye Sinai Kalkinma Bankasi A.S. (Commercial banks) | | | 1,767,415 | | | | 2,988 | |
| | | | | | | | |
| | | | | | | 6,822 | |
| | | | | | | | |
United Arab Emirates—0.5% | | | | | | | | |
*Aramex Co. (Air freight & logistics) | | | 5,534,926 | | | | 3,134 | |
| | | | | | | | |
| | |
Emerging Latin America—3.9% | | | | | | | | |
Brazil—2.3% | | | | | | | | |
Brasil Brokers Participacoes S.A. (Real estate management & development) | | | 381,800 | | | | 2,197 | |
CETIP S.A. - Balcao Organizado de Ativos e Derivativos (Capital markets) | | | 362,200 | | | | 5,149 | |
Drogasil S.A. (Food & staples retailing) | | | 177,000 | | | | 1,439 | |
OdontoPrev S.A. (Health care providers & services) | | | 260,600 | | | | 3,939 | |
Tegma Gestao Logistica S.A. (Road & rail) | | | 129,000 | | | | 1,978 | |
| | | | | | | | |
| | | | | | | 14,702 | |
| | | | | | | | |
Mexico—1.6% | | | | | | | | |
*Compartamos S.A.B. de C.V. (Consumer finance) | | | 1,688,700 | | | | 3,673 | |
*Genomma Lab Internacional S.A.B. de C.V. (Pharmaceuticals) | | | 1,606,720 | | | | 3,900 | |
*Grupo Comercial Chedraui S.A. de C.V. (Food & staples retailing) | | | 962,387 | | | | 2,925 | |
| | | | | | | | |
| | | | | | | 10,498 | |
| | | | | | | | |
See accompanying Notes to Financial Statements.
December 31, 2010 | William Blair Funds 21 |
International Small Cap Growth Fund
Portfolio of Investments, December 31, 2010 (all dollar amounts in thousands)
| | | | | | | | |
Issuer | | Shares or
Principal
Amount | | | Value | |
| | |
Common Stocks—(continued) | | | | | | | | |
| | |
Asia—2.7% | | | | | | | | |
Australia—1.2% | | | | | | | | |
Cochlear, Ltd. (Health care equipment & supplies) | | | 96,774 | | | $ | 7,959 | |
| | | | | | | | |
Hong Kong—0.5% | | | | | | | | |
Value Partners Group, Ltd. (Capital markets) | | | 3,453,000 | | | | 3,465 | |
| | | | | | | | |
Singapore—1.0% | | | | | | | | |
Goodpack, Ltd. (Air freight & logistics) | | | 2,163,000 | | | | 3,455 | |
Midas Holdings, Ltd. (Metals & mining) | | | 3,531,000 | | | | 2,600 | |
| | | | | | | | |
| | | | | | | 6,055 | |
| | | | | | | | |
Total Common Stocks—97.4%
(cost $495,830) | | | | 630,017 | |
| | | | | | | | |
| | |
Preferred Stock | | | | | | | | |
Brazil—0.6% | | | | | | | | |
Marcopolo S.A. (Machinery) | | | 905,600 | | | | 3,813 | |
| | | | | | | | |
Total Preferred Stock—0.6%
(cost $2,840) | | | | 3,813 | |
| | | | | | | | |
| | |
Convertible Bond | | | | | | | | |
Brazil—0.1% | | | | | | | | |
Lupatech S.A., 6.500%, due 4/15/18 (Machinery)**§ | | $ | 959 | | | | 626 | |
| | | | | | | | |
Total Convertible Bond—0.1%
(cost $497) | | | | 626 | |
| | | | | | | | |
| | |
Repurchase Agreement | | | | | | | | |
Fixed Income Clearing Corporation, 0.150% dated 12/31/10, due 1/3/11, repurchase price $16,170, collateralized by FNMA, 4.625%, due 10/15/13 | | | 16,170 | | | | 16,170 | |
| | | | | | | | |
Total Repurchase Agreement—2.5%
(cost $16,170) | | | | 16,170 | |
| | | | | | | | |
Total Investments—100.6%
(cost $515,337) | | | | 650,626 | |
Liabilities, plus cash and other assets—(0.6)% | | | | (3,675 | ) |
| | | | | | | | |
Net assets—100.0% | | | $ | 646,951 | |
| | | | | | | | |
ADR = American Depository Receipt
* = Non-income producing securities
** = Fair valued pursuant to Valuation Procedures adopted by the Board of Trustees. This holding represents 0.10% of the Fund’s net assets at December 31, 2010.
§ = Deemed illiquid pursuant to Liquidity Procedures approved by the Board of Trustees. This holding represents 0.10% of the net assets at December 31, 2010.
For securities primarily traded on exchanges or markets that close before the close of regular trading on the New York Stock Exchange, the Fund may use an independent pricing service to fair value price the securities pursuant to Valuation Procedures approved by the Board of Trustees.
At December 31, 2010, the Fund’s Portfolio of Investments includes the following industry categories:
| | | | |
Consumer Discretionary | | | 23.6 | % |
Industrials | | | 18.4 | % |
Information Technology | | | 17.8 | % |
Financials | | | 12.7 | % |
Health Care | | | 12.5 | % |
Energy | | | 6.6 | % |
Materials | | | 4.8 | % |
Consumer Staples | | | 3.6 | % |
| | | | |
Total | | | 100.0 | % |
| | | | |
At December 31, 2010, the Fund’s Portfolio of Investments includes the following currency categories:
| | | | |
British Pound Sterling | | | 21.1 | % |
Euro | | | 17.2 | % |
Japanese Yen | | | 17.0 | % |
Canadian Dollar | | | 6.7 | % |
Swiss Franc | | | 6.4 | % |
Hong Kong Dollar | | | 6.2 | % |
New Taiwan Dollar | | | 3.3 | % |
Brazilian Real | | | 3.0 | % |
South African Rand | | | 2.7 | % |
Indian Rupee | | | 2.5 | % |
Danish Krone | | | 1.9 | % |
Mexican Peso | | | 1.7 | % |
Swedish Krona | | | 1.6 | % |
Indonesian Rupiah | | | 1.5 | % |
South Korean Won | | | 1.5 | % |
Australian Dollar | | | 1.3 | % |
U.S. Dollar | | | 1.2 | % |
Turkish Lira | | | 1.1 | % |
All Other Currencies | | | 2.1 | % |
| | | | |
Total | | | 100.0 | % |
| | | | |
See accompanying Notes to Financial Statements.
22 Annual Report | December 31, 2010 |

Todd M. McClone
Jeffrey A. Urbina
EMERGING MARKETS GROWTH FUND
The Emerging Markets Growth Fund seeks long-term capital appreciation.
AN OVERVIEW FROM THE PORTFOLIO MANAGERS
The Emerging Markets Growth Fund posted a 23.91% increase (Institutional Class Shares) for the 12 months ended December 31, 2010. By comparison, the Fund’s benchmark, the MSCI Emerging Markets IMI Index (net), gained 19.90%.
The Fund significantly outpaced the Index during the twelve month period, as stock selection was strong across most sectors and was supported by overall strategic positioning. Specifically, the Fund’s overweighting and stock selection in Consumer stocks added significant value during the 12 month period. Consumer Discretionary stock selection was bolstered by auto-related corporate performance and stock price movement, along with good returns in Brazilian real estate. Staples stock selection was augmented by Emerging Markets Europe, Mid-East, and Africa (EMEA) grocery holdings, as well as Asian consumer product and agriculture-related holdings. In addition, the overweighting in the strongly performing Latin American Staples sector, coupled with positive stock selection added value. The Healthcare and Industrials sectors each outperformed by approximately 12% versus the Index sector returns, as infrastructure and transportation holdings bolstered the Industrials return, while Healthcare stock selection was particularly strong in Emerging Asia and EMEA. The Fund also outperformed across the three emerging markets regions during the year. Somewhat detracting from results was Materials stock selection, as several of our Asian and EMEA holdings underperformed, due to stock specific issues.
Despite strong full year results, fourth quarter performance trailed the Index, due solely to December performance. Asian stock selection was the key detractor during the period, as the Fund’s Chinese sportswear and auto-related companies underperformed. In addition, Indian Financials also contributed to underperformance as investors were concerned about increasing interest rates and the impact of additional governmental oversight in the microfinance industry on the broader sector. Information Technology (IT) stock selection was the third primary contributor to underperformance as Baidu, Inc.’s stock price retreated after a strong run. Offsetting these relative results was strong performance in Healthcare, Materials, Telecom Services and Utilities, along with broad outperformance in Latin America. Within Healthcare, Latin American holdings added value, as did Asian pharmaceutical companies. Materials stock selection was augmented by good results in the Fund’s Latin American mining names and increasing commodity prices generally.
As of year-end 2010, the Fund maintained its Consumer focus with approximately 30% of the Fund invested between Consumer Discretionary and Staples holdings. We reduced exposure in Consumer Discretionary following September 30 on valuation concerns to approximately 15.5% of the Fund. Conversely, Financials, while representing nearly 20% of the Fund, remained underweighted during 2010, due to lower Asian exposure, particularly in real estate, given the increasing interest rate environment and governmental measures to cool the property market. While the Fund’s 10.5% IT exposure is similar to September 30, it decreased from year-end 2009 due to concerns about the current supply/demand tradeoff and inventory cycle. The Fund was underweighted in Materials throughout the year, but increased from approximately 5.5% to 9% as of year-end 2010. Regionally, approximately half of the Fund was focused in Emerging Asia, less than the 59.73% Index weighting, while the overweighting in Latin America increased throughout the year as the Fund’s exposure increased from approximately 22% to 27%, due to an increase in Financials, Healthcare and Materials, which more than offset a reduction in Consumer Discretionary.
December 31, 2010 | William Blair Funds 23 |
Emerging Markets Growth Fund
Performance Highlights (unaudited)
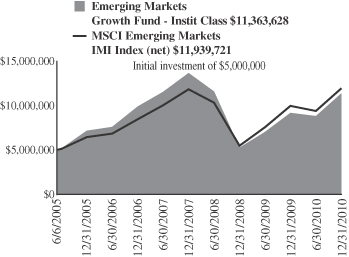
Average Annual Total Return at 12/31/2010
| | | | | | | | | | | | | | | | |
| | | 1
Year | | | 3
Year | | | 5
Year | | | Since
Inception(a) | |
Institutional Class | | | 23.91 | % | | | (5.97 | )% | | | 9.74 | % | | | 15.81 | % |
MSCI Emerging Markets IMI (net) | | | 19.90 | | | | 0.35 | | | | 13.23 | | | | 16.84 | |
| | (a) | | For the period June 6, 2005 (Commencement of Operations) to December 31, 2010. |
Performance cited represents past performance. Past performance does not guarantee future results and current performance may be lower or higher than the data quoted. Results shown are average annual returns, which assume reinvestment of dividends and capital gains. Investment returns and principal will fluctuate and you may have a gain or loss when you sell shares. For the most current month-end performance information, please call 1-800-742-7272, or visit our Web site at www.williamblairfunds.com. From time to time, the investment advisor may waive fees or reimburse expenses for the Fund. Without these waivers, performance would be lower. International investing involves special risk considerations, including currency fluctuations, lower liquidity, economic and political risk.
The performance highlights and graph presented above do not reflect the deduction of taxes that a shareholder would pay on fund distributions or the redemption of fund shares.
The Morgan Stanley Capital International (MSCI) Emerging Markets Investable Market Index (IMI) (net) is a free float-adjusted market capitalization weighted index that is designed to measure the equity market performance of emerging markets. This series approximates the minimum possible dividend reinvestment.
This report identifies the Fund’s investments on December 31, 2010. These holdings are subject to change. Not all stocks in the Fund performed the same, nor is there any guarantee that these stocks will perform as well in the future. Market forecasts provided in this report may not necessarily come to pass.
Sector Diversification (unaudited)
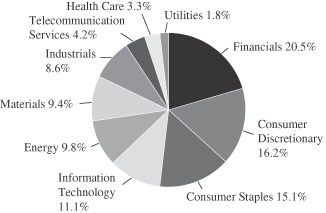
The sector diversification shown is based on the total long-term securities.
24 Annual Report | December 31, 2010 |
Emerging Markets Growth Fund
Portfolio of Investments, December 31, 2010 (all dollar amounts in thousands)
| | | | | | | | |
Issuer | | Shares | | | Value | |
| | |
Common Stocks | | | | | | | | |
Emerging Asia—52.0% | | | | | | | | |
China—16.3% | | | | | | | | |
AAC Acoustic Technologies Holdings, Inc. (Communications equipment) | | | 1,603,949 | | | $ | 4,282 | |
Ajisen China Holdings, Ltd. (Hotels, restaurants & leisure) | | | 1,921,078 | | | | 3,228 | |
Angang Steel Co., Ltd. (Metals & mining) | | | 7,796,000 | | | | 11,936 | |
Anta Sports Products, Ltd. (Textiles, apparel & luxury goods) | | | 2,618,000 | | | | 4,156 | |
* Baidu, Inc.—ADR (Internet software & services) | | | 117,527 | | | | 11,345 | |
Belle International Holdings, Ltd. (Specialty retail) | | | 6,341,000 | | | | 10,720 | |
China Vanke Co., Ltd. (Real estate management & development) | | | 4,765,448 | | | | 5,886 | |
China Yurun Food Group, Ltd. (Food products) | | | 1,646,000 | | | | 5,411 | |
CNOOC, Ltd. (Oil, gas & consumable fuels) | | | 20,037,000 | | | | 47,535 | |
Comba Telecom Systems Holdings, Ltd. (Communications equipment) | | | 2,516,360 | | | | 2,842 | |
Dongfang Electric Corporation, Ltd. (Electrical equipment) | | | 1,815,800 | | | | 8,994 | |
Dongfeng Motor Group Co., Ltd. (Automobiles) | | | 6,782,000 | | | | 11,692 | |
* E-Commerce China Dangdang, Inc.—ADR (Internet & catalog retail) | | | 50,514 | | | | 1,367 | |
Great Wall Motor Co., Ltd. (Automobiles) | | | 1,130,000 | | | | 3,489 | |
Haitian International Holdings, Ltd. (Machinery) | | | 1,727,185 | | | | 1,802 | |
Hengan International Group Co., Ltd. (Personal products) | | | 569,500 | | | | 4,913 | |
Industrial and Commercial Bank of China, Ltd. Class “H” (Commercial banks) | | | 33,974,580 | | | | 25,308 | |
Lonking Holdings, Ltd. (Machinery) | | | 7,649,000 | | | | 4,182 | |
Minth Group, Ltd. (Auto components) | | | 892,000 | | | | 1,464 | |
Shandong Weigao Group Medical Polymer Co., Ltd. (Health care equipment & supplies) | | | 2,309,400 | | | | 6,551 | |
Want Want China Holdings, Ltd. (Food products) | | | 7,217,000 | | | | 6,323 | |
Weichai Power Co., Ltd. (Machinery) | | | 2,028,088 | | | | 12,485 | |
* WuXi PharmaTech Cayman, Inc.—ADR (Life sciences tools & services) | | | 129,898 | | | | 2,097 | |
* Youku.com, Inc.—ADR (Internet software & services) | | | 37,965 | | | | 1,329 | |
Zhuzhou CSR Times Electric Co., Ltd. (Electrical equipment) | | | 1,012,861 | | | | 3,981 | |
| | | | | | | | |
| | | | | | | 203,318 | |
| | | | | | | | |
India—10.2% | | | | | | | | |
Asian Paints, Ltd. (Chemicals) | | | 137,619 | | | | 8,860 | |
Axis Bank, Ltd. (Commercial banks) | | | 210,124 | | | | 6,344 | |
Bajaj Auto, Ltd. (Automobiles) | | | 299,206 | | | | 10,311 | |
Dabur India, Ltd. (Personal products) | | | 2,593,480 | | | | 5,815 | |
Housing Development Finance Corporation (Thrifts & mortgage finance) | | | 367,269 | | | | 5,982 | |
Infosys Technologies, Ltd. (IT services) | | | 353,170 | | | | 27,192 | |
Jindal Steel & Power, Ltd. (Metals & mining) | | | 408,895 | | | | 6,511 | |
Larsen & Toubro, Ltd. (Construction & engineering) | | | 276,181 | | | | 12,225 | |
Lupin, Ltd. (Pharmaceuticals) | | | 725,251 | | | | 7,825 | |
| | | | | | | | |
Issuer | | Shares | | | Value | |
| | |
Common Stocks—(continued) | | | | | | | | |
Emerging Asia—52.0%—(continued) | | | | | | | | |
India—10.2%—(continued) | | | | | | | | |
Mahindra & Mahindra, Ltd. (Automobiles) | | | 29,426 | | | $ | 512 | |
Nestle India, Ltd. (Food products) | | | 80,604 | | | | 6,875 | |
Shriram Transport Finance Co., Ltd. (Consumer finance) | | | 183,116 | | | | 3,199 | |
Sun TV Network, Ltd. (Media) | | | 299,774 | | | | 3,526 | |
Tata Motors, Ltd. (Machinery) | | | 675,716 | | | | 19,771 | |
Yes Bank, Ltd. (Commercial banks) | | | 418,587 | | | | 2,928 | |
| | | | | | | | |
| | | | | | | 127,876 | |
| | | | | | | | |
Indonesia—5.9% | | | | | | | | |
PT Astra International Tbk (Automobiles) | | | 2,341,500 | | | | 14,176 | |
PT Bank Rakyat Indonesia (Commercial banks) | | | 10,924,000 | | | | 12,730 | |
PT Indo Tambangraya Megah (Oil, gas & consumable fuels) | | | 1,111,500 | | | | 6,261 | |
PT Kalbe Farma Tbk (Pharmaceuticals) | | | 10,919,000 | | | | 3,939 | |
PT Perusahaan Gas Negara (Gas utilities) | | | 25,110,500 | | | | 12,332 | |
PT Unilever Indonesia Tbk (Household products) | | | 8,022,500 | | | | 14,692 | |
PT United Tractors Tbk (Machinery) | | | 3,756,500 | | | | 9,923 | |
| | | | | | | | |
| | | | | | | 74,053 | |
| | | | | | | | |
Malaysia—3.4% | | | | | | | | |
CIMB Group Holdings Bhd (Commercial banks) | | | 10,335,600 | | | | 28,491 | |
Genting Bhd (Hotels, restaurants & leisure) | | | 1,960,300 | | | | 7,107 | |
Kuala Lumpur Kepong Bhd (Food products) | | | 1,012,900 | | | | 7,260 | |
| | | | | | | | |
| | | | | | | 42,858 | |
| | | | | | | | |
Papua New Guinea—1.2% | | | | | | | | |
Oil Search, Ltd. (Oil, gas & consumable fuels) | | | 2,016,147 | | | | 14,517 | |
| | | | | | | | |
South Korea—8.3% | | | | | | | | |
* Amorepacific Corporation (Personal products) | | | 8,091 | | | | 8,120 | |
* Hankook Tire Co., Ltd. (Auto components) | | | 355,120 | | | | 9,935 | |
* Hyundai Mobis (Auto components) | | | 120,208 | | | | 30,134 | |
* Hyundai Motor Co. (Automobiles) | | | 149,484 | | | | 22,853 | |
* LG Household & Health Care, Ltd. (Household products) | | | 22,307 | | | | 7,666 | |
Samsung Electronics Co., Ltd. (Semiconductors & semiconductor equipment) | | | 30,045 | | | | 25,123 | |
| | | | | | | | |
| | | | | | | 103,831 | |
| | | | | | | | |
Taiwan—4.6% | | | | | | | | |
Hon Hai Precision Industry Co., Ltd. (Electronic equipment, instruments & components) | | | 9,085,992 | | | | 36,616 | |
Powertech Technology, Inc. (Semiconductors & semiconductor equipment) | | | 1,439,000 | | | | 4,788 | |
Tripod Technology Corporation (Electronic equipment, instruments & components) | | | 1,280,000 | | | | 5,224 | |
Wistron Corporation (Computers & peripherals) | | | 5,373,676 | | | | 10,948 | |
| | | | | | | | |
| | | | | | | 57,576 | |
| | | | | | | | |
Thailand—2.1% | | | | | | | | |
CP ALL PCL (Food & staples retailing) | | | 9,892,000 | | | | 12,880 | |
See accompanying Notes to Financial Statements.
December 31, 2010 | William Blair Funds 25 |
Emerging Markets Growth Fund
Portfolio of Investments, December 31, 2010 (all dollar amounts in thousands)
| | | | | | | | |
Issuer | | Shares | | | Value | |
| | |
Common Stocks—(continued) | | | | | | | | |
Emerging Asia—52.0%—(continued) | | | | | | | | |
Thailand—2.1%—(continued) | | | | | | | | |
Kasikornbank PCL (Commercial banks) | | | 2,926,300 | | | $ | 12,183 | |
Minor International PCL (Hotels, restaurants & leisure) | | | 2,223,900 | | | | 870 | |
| | | | | | | | |
| | | | | | | 25,933 | |
| | | | | | | | |
| | |
Emerging Latin America—26.9% | | | | | | | | |
Brazil—13.6% | | | | | | | | |
Amil Participacoes S.A. (Health care providers & services) | | | 14,037 | | | | 151 | |
BR Malls Participacoes S.A. (Real estate management & development) | | | 926,200 | | | | 9,541 | |
BR Properties S.A. (Real estate management & development) | | | 348,545 | | | | 3,813 | |
Brasil Brokers Participacoes S.A. (Real estate management & development) | | | 452,200 | | | | 2,602 | |
CETIP S.A. - Balcao Organizado de Ativos e Derivativos (Capital markets) | | | 331,900 | | | | 4,719 | |
Cia de Bebidas das Americas—ADR (Beverages) | | | 745,630 | | | | 23,137 | |
Cia de Concessoes Rodoviarias (Transportation infrastructure) | | | 124,500 | | | | 3,518 | |
Cia Hering (Textiles, apparel & luxury goods) | | | 186,300 | | | | 3,030 | |
Diagnosticos da America S.A. (Health care providers & services) | | | 615,800 | | | | 8,347 | |
Drogasil S.A. (Food & staples retailing) | | | 322,700 | | | | 2,624 | |
*Hypermarcas S.A. (Personal products) | | | 309,528 | | | | 4,201 | |
Localiza Rent a Car S.A. (Road & rail) | | | 424,900 | | | | 6,885 | |
Lojas Renner S.A. (Multiline retail) | | | 190,600 | | | | 6,476 | |
Natura Cosmeticos S.A. (Personal products) | | | 253,200 | | | | 7,274 | |
OdontoPrev S.A. (Health care providers & services) | | | 247,400 | | | | 3,739 | |
*OGX Petroleo e Gas Participacoes S.A. (Oil, gas & consumable fuels) | | | 1,117,600 | | | | 13,465 | |
PDG Realty S.A. Empreendimentos e Participacoes (Household durables) | | | 1,534,400 | | | | 9,391 | |
Totvs S.A. (Software) | | | 35,600 | | | | 3,624 | |
Tractebel Energia S.A. (Independent power producers & energy traders) | | | 584,300 | | | | 9,662 | |
Vale S.A.—ADR (Metals & mining) | | | 1,255,249 | | | | 43,394 | |
| | | | | | | | |
| | | | | | | 169,593 | |
| | | | | | | | |
Chile—2.0% | | | | | | | | |
Banco Santander Chile—ADR (Commercial banks) | | | 153,667 | | | | 14,363 | |
Lan Airlines S.A. (Airlines) | | | 325,769 | | | | 10,163 | |
| | | | | | | | |
| | | | | | | 24,526 | |
| | | | | | | | |
Colombia—1.3% | | | | | | | | |
Pacific Rubiales Energy Corporation (Oil, gas & consumable fuels) | | | 482,159 | | | | 16,366 | |
| | | | | | | | |
Mexico—9.0% | | | | | | | | |
America Movil S.A.B. de C.V. (Wireless telecommunication services) | | | 9,054,600 | | | | 25,954 | |
Coca-Cola Femsa S.A.B. de C.V.—ADR (Beverages) | | | 86,999 | | | | 7,171 | |
*Compartamos S.A.B. de C.V. (Consumer finance) | | | 3,717,600 | | | | 8,085 | |
| | | | | | | | |
Issuer | | Shares | | | Value | |
| | |
Common Stocks—(continued) | | | | | | | | |
Emerging Latin America—26.9%—(continued) | | | | | |
Mexico—9.0%—(continued) | | | | | | | | |
*Genomma Lab Internacional S.A.B. de C.V. (Pharmaceuticals) | | | 1,680,734 | | | $ | 4,080 | |
*Grupo Comercial Chedraui S.A. de C.V. (Food & staples retailing) | | | 1,075,366 | | | | 3,268 | |
Grupo Mexico S.A.B. de C.V. Series “B” (Metals & mining) | | | 10,303,528 | | | | 42,416 | |
Wal-Mart de Mexico S.A.B. de C.V. (Food & staples retailing) | | | 7,684,600 | | | | 21,959 | |
| | | | | | | | |
| | | | | | | 112,933 | |
| | | | | | | | |
Peru—1.0% | | | | | | | | |
Credicorp, Ltd. (Commercial banks)† | | | 107,487 | | | | 12,781 | |
| | | | | | | | |
| |
Emerging Europe, Mid-East, Africa—13.3% | | | | | |
Egypt—0.6% | | | | | | | | |
Commercial International Bank Egypt S.A.E. (Commercial banks) | | | 921,018 | | | | 7,521 | |
| | | | | | | | |
Qatar—1.9% | | | | | | | | |
Qatar National Bank S.A.Q. (Commercial banks) | | | 468,047 | | | | 23,778 | |
| | | | | | | | |
Russia—1.7% | | | | | | | | |
Magnit OAO (Food & staples retailing)† | | | 105,337 | | | | 14,006 | |
*X5 Retail Group N.V.—GDR (Food & staples retailing) | | | 168,181 | | | | 7,778 | |
| | | | | | | | |
| | | | | | | 21,784 | |
| | | | | | | | |
South Africa—7.1% | | | | | | | | |
Adcock Ingram Holdings, Ltd. (Pharmaceuticals) | | | 352,834 | | | | 3,208 | |
Clicks Group, Ltd. (Multiline retail) | | | 1,276,204 | | | | 8,396 | |
Mr Price Group, Ltd. (Specialty retail) | | | 622,479 | | | | 6,284 | |
MTN Group, Ltd. (Wireless telecommunication services) | | | 1,221,587 | | | | 24,927 | |
Naspers, Ltd. (Media) | | | 250,682 | | | | 14,763 | |
Shoprite Holdings, Ltd. (Food & staples retailing) | | | 465,702 | | | | 7,045 | |
Standard Bank Group, Ltd. (Commercial banks) | | | 838,694 | | | | 13,693 | |
Truworths International, Ltd. (Specialty retail) | | | 681,097 | | | | 7,408 | |
Wilson Bayly Holmes-Ovcon, Ltd. (Construction & engineering) | | | 158,224 | | | | 3,339 | |
| | | | | | | | |
| | | | | | $ | 89,063 | |
| | | | | | | | |
| | | | | | | | |
Turkey—2.0% | | | | | | | | |
BIM Birlesik Magazalar A.S. (Food & staples retailing) | | | 97,546 | | | | 3,317 | |
Tofas Turk Otomobil Fabrikasi A.S. (Automobiles) | | | 621,238 | | | | 3,203 | |
Turkiye Garanti Bankasi A.S. (Commercial banks) | | | 2,454,713 | | | | 12,432 | |
Turkiye Halk Bankasi A.S. (Commercial banks) | | | 685,270 | | | | 5,814 | |
| | | | | | | | |
| | | | | | | 24,766 | |
| | | | | | | | |
See accompanying Notes to Financial Statements.
26 Annual Report | December 31, 2010 |
Emerging Markets Growth Fund
Portfolio of Investments, December 31, 2010 (all dollar amounts in thousands)
| | | | | | | | |
Issuer | | Shares or
Principal
Amount | | | Value | |
| | |
Common Stocks—(continued) | | | | | | | | |
Emerging Europe, Mid-East, Africa—13.3%—(continued) | |
Turkey—2.0%—(continued) | | | | | | | | |
Total Common Stocks—92.2%
(cost $873,075) | | | $ | 1,153,073 | |
| | | | | | | | |
| | |
Preferred Stocks | | | | | | | | |
Brazil—4.1% | | | | | | | | |
Itau Unibanco Holding S.A. (Commercial banks) | | | 1,035,154 | | | | 24,813 | |
Petroleo Brasileiro S.A. (Oil, gas & consumable fuels) | | | 1,236,315 | | | | 20,325 | |
Randon Participacoes S.A. (Machinery) | | | 768,399 | | | | 5,689 | |
| | | | | | | | |
| | | | | | | 50,827 | |
| | | | | | | | |
Total Preferred Stocks—4.1%
(cost $46,291) | | | | 50,827 | |
| | | | | | | | |
| | |
Convertible Bond | | | | | | | | |
Brazil—0.1% | | | | | | | | |
Lupatech S.A., 6.500%, due 4/15/18 (Machinery)**§ | | $ | 1,602 | | | | 1,045 | |
| | | | | | | | |
Total Convertible Bond—0.1%
(cost $831) | | | | 1,045 | |
| | | | | | | | |
| | |
Repurchase Agreement | | | | | | | | |
Fixed Income Clearing Corporation, 0.150% dated 12/31/10, due 1/3/11, repurchase price $42,655, collateralized by FHLMC, 1.250%, due 9/30/13 | | | 42,654 | | | | 42,654 | |
| | | | | | | | |
Total Repurchase Agreement—3.4%
(cost $42,654) | | | | 42,654 | |
| | | | | | | | |
Total Investments—99.8%
(cost $962,851) | | | | 1,247,599 | |
Cash and other assets, less liabilities—0.2% | | | | 2,944 | |
| | | | | | | | |
Net assets—100.0% | | | $ | 1,250,543 | |
| | | | | | | | |
ADR = American Depository Receipt
GDR = Global Depository Receipt
* = Non-income producing securities
† = U.S. listed foreign security
** = Fair valued pursuant to Valuation Procedures adopted by the Board of Trustees. This holding represents 0.08% of the Fund’s net assets at December 31, 2010.
§ = Deemed illiquid pursuant to Liquidity Procedures approved by the Board of Trustees. This holding represents 0.08% of the net assets at December 31, 2010.
For securities primarily traded on exchanges or markets that close before the close of regular trading on the New York Stock Exchange, the Fund may use an independent pricing service to fair value price the securities pursuant to Valuation Procedures approved by the Board of Trustees.
At December 31, 2010, the Fund’s Portfolio of Investments includes the following industry categories:
| | | | |
Financials | | | 20.5% | |
Consumer Discretionary | | | 16.2% | |
Consumer Staples | | | 15.1% | |
Information Technology | | | 11.1% | |
Energy | | | 9.8% | |
Materials | | | 9.4% | |
Industrials | | | 8.6% | |
Telecommunication Services | | | 4.2% | |
Health Care | | | 3.3% | |
Utilities | | | 1.8% | |
| | | | |
Total | | | 100.0% | |
| | | | |
At December 31, 2010, the Fund’s Portfolio of Investments includes the following currency categories:
| | | | |
Hong Kong Dollar | | | 15.5% | |
Brazilian Real | | | 12.9% | |
U.S. Dollar | | | 11.5% | |
Indian Rupee | | | 10.6% | |
Mexican Peso | | | 8.8% | |
South Korean Won | | | 8.6% | |
South African Rand | | | 7.4% | |
Indonesian Rupiah | | | 6.1% | |
New Taiwan Dollar | | | 4.8% | |
Malaysian Ringgit | | | 3.6% | |
Thai Baht | | | 2.1% | |
Turkish Lira | | | 2.0% | |
Qatari Rial | | | 2.0% | |
Canadian Dollar | | | 1.4% | |
Australian Dollar | | | 1.2% | |
All Other Currencies | | | 1.5% | |
| | | | |
Total | | | 100.0% | |
| | | | |
See accompanying Notes to Financial Statements.
December 31, 2010 | William Blair Funds 27 |
Todd M. McClone
Jeffrey A. Urbina
EMERGING LEADERS GROWTH FUND
The Emerging Leaders Growth Fund seeks long-term capital appreciation.
AN OVERVIEW FROM THE PORTFOLIO MANAGERS
The Emerging Leaders Growth Fund (Institutional Share Class) an increase of 23.84%. By comparison, the Fund’s benchmark, the MSCI Emerging Markets Large Cap Index (net) gained 18.34% during the same period.
The Fund significantly outpaced the Index during the twelve month period, as stock selection was strong across regions and was supported by overall strategic sector positioning. Within Asia, the Fund’s overweighting and stock selection in Staples added value as did strong Asian Energy performance, led by good production growth at CNOOC, Ltd. The Fund’s overweighting and stock selection in EMEA Staples was also positive, as grocery-related holdings performed well. Within Latin America, Energy holdings added value, as the Fund had a positive return, while the Index was negative, due to the Fund’s limited exposure to Petroleo Brasileiro S.A., the Brazilian Exploration and Production (E&P) company, as the stock price was weak on an overhang related to the company’s proposed equity offering and pricing. Industrials stock selection was also strong, as LAN Airlines S.A., the pan-Latin American airline, performed well. The Fund’s significant focus on Consumer stocks at the expense of Financials and IT also added to results. Somewhat detracting from 2010 performance was residual cash drag in a strong market, coupled with underperformance in Asian IT and Materials stocks.
Despite strong full year results, the Fund trailed the Index during the fourth quarter, due primarily to Chinese and Taiwanese stock selection, which more than offset good results in Latin America. While CNOOC and Industrials holdings continued to perform well, Chinese consumer and auto-related holdings underperformed, due to rising concerns about valuation and broader inflationary pressures in the economy. Similarly, the Fund’s Taiwanese IT holdings trailed the country as a whole. Indian Financials also contributed to underperformance as investors were concerned about increasing interest rates and the impact of additional governmental oversight in the microfinance industry on the broader sector. Conversely, the Fund’s Latin American Energy, Industrials and Materials stocks outperformed.
As of year end, the Fund maintained its focus on Consumer stocks with approximately 27% of the Fund invested across Discretionary and Staples holdings, well above the 11% Index weighting, but down from year-end 2009 and September 30. Conversely, while Financials represented approximately 20% of the Fund, they remained significantly underweighted versus the 26% Index weighting, due largely to lower exposure in Asian Insurance and Commercial Banks. While IT exposure increased from 5% as of September 30 to 10%, it remained below the 13% Index weighting, and lower than the 13.5% year-end 2009 exposure. Materials, while underweighted versus the Index, increased from approximately 11% to 14% during the 12 month period, particularly in Latin America. Regionally, while approximately half of the Fund’s exposure was in Asia, it was below the 57% Index weighting due largely to lower exposure in Korea and Taiwan. Conversely Latin American exposure grew during the period from approximately 22% as of year-end 2009 to 32% as of year-end 2010, above the 24% Index weighting. EMEA remained underweighted at approximately 13% of the Fund, due to limited Russian and Central/Eastern European exposure.
28 Annual Report | December 31, 2010 |
Emerging Leaders Growth Fund
Performance Highlights (unaudited)
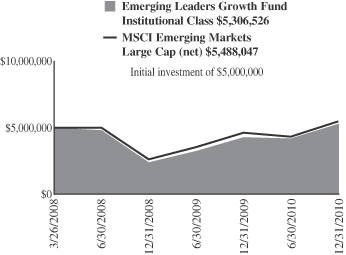
Average Annual Total Return at 12/31/2010
| | | | | | | | |
| | | 1
Year | | | Since
Inception(a) | |
Institutional Class | | | 23.84 | % | | | 2.17 | % |
MSCI Emerging Markets
Large Cap (net) | | | 18.34 | | | | 3.41 | |
| | (a) | | For the period March 26, 2008 (Commencement of Operations) to December 31, 2010. |
Performance cited represents past performance. Past performance does not guarantee future results and current performance may be lower or higher than the data quoted. Results shown are average annual total returns, which assume reinvestment of dividends and capital gains. Investment returns and principal will fluctuate and you may have a gain or loss when you sell shares. For the most current month-end performance information, please call 1-800-742-7272, or visit our Web site at www.williamblairfunds.com. International investing includes special risk considerations, including currency fluctuations, lower liquidity, economic and political risk. From time to time, the investment advisor may waive fees or reimburse expenses for the Fund. Without these waivers, performance would be lower.
The performance highlights and graph presented above do not reflect the deduction of taxes that a shareholder would pay on fund distributions or the redemption of fund shares.
The Morgan Stanley Capital International (MSCI) Emerging Markets Large Cap Index (net) is a free float-adjusted market capitalization weighted index that is designed to measure market performance of large capitalization on stocks in emerging markets. This series approximates the minimum possible dividend reinvestment.
This report identifies the Fund’s investments on December 31, 2010. These holdings are subject to change. Not all stocks in the Fund performed the same, nor is there any guarantee that these stocks will perform as well in the future. Market forecasts provided in this report may not necessarily come to pass.
Sector Diversification (unaudited)
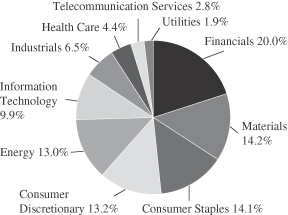
The sector diversification shown is based on the total long-term securities.
December 31, 2010 | William Blair Funds 29 |
Emerging Leaders Growth Fund
Portfolio of Investments, December 31, 2010 (all dollar amounts in thousands)
| | | | | | | | |
Issuer | | Shares | | | Value | |
| | |
Common Stocks—Emerging Asia—52.5% | | | | | | | | |
China—14.3% | | | | | | | | |
Anta Sports Products, Ltd. (Textiles, apparel & luxury goods) | | | 265,000 | | | $ | 421 | |
*Baidu, Inc.—ADR (Internet software & services) | | | 8,899 | | | | 859 | |
Belle International Holdings, Ltd. (Specialty retail) | | | 264,000 | | | | 446 | |
China Yurun Food Group, Ltd. (Food products) | | | 239,000 | | | | 786 | |
CNOOC, Ltd. (Oil, gas & consumable fuels) | | | 1,854,000 | | | | 4,398 | |
Dongfang Electric Corporation, Ltd. (Electrical equipment) | | | 83,200 | | | | 412 | |
Dongfeng Motor Group Co., Ltd. (Automobiles) | | | 274,000 | | | | 472 | |
Golden Eagle Retail Group, Ltd. (Multiline retail) | | | 330,000 | | | | 814 | |
Hengan International Group Co., Ltd. (Personal products) | | | 60,000 | | | | 518 | |
Industrial and Commercial Bank of China, Ltd. Class “H” (Commercial banks) | | | 1,708,000 | | | | 1,272 | |
Ping An Insurance Group Co. of China, Ltd. Class “H” (Insurance) | | | 43,500 | | | | 486 | |
Shandong Weigao Group Medical Polymer Co., Ltd. (Health care equipment & supplies) | | | 252,000 | | | | 715 | |
Tencent Holdings, Ltd. (Internet software & services) | | | 41,200 | | | | 895 | |
Want Want China Holdings, Ltd. (Food products) | | | 465,000 | | | | 408 | |
Weichai Power Co., Ltd. (Machinery) | | | 110,000 | | | | 677 | |
| | | | | | | | |
| | | | | | | 13,579 | |
| | | | | | | | |
India—14.3% | | | | | | | | |
Asian Paints, Ltd. (Chemicals) | | | 7,431 | | | | 478 | |
Bajaj Auto, Ltd. (Automobiles) | | | 13,744 | | | | 474 | |
HDFC Bank, Ltd. (Commercial banks) | | | 19,155 | | | | 1,005 | |
Housing Development Finance Corporation (Thrifts & mortgage finance) | | | 30,383 | | | | 495 | |
Infosys Technologies, Ltd. (IT services) | | | 29,989 | | | | 2,309 | |
ITC, Ltd. (Tobacco) | | | 279,329 | | | | 1,091 | |
Jindal Steel & Power, Ltd. (Metals & mining) | | | 32,915 | | | | 524 | |
Larsen & Toubro, Ltd. (Construction & engineering) | | | 22,365 | | | | 990 | |
Lupin, Ltd. (Pharmaceuticals) | | | 95,070 | | | | 1,026 | |
Mahindra & Mahindra, Ltd. (Automobiles) | | | 67,775 | | | | 1,179 | |
Nestle India, Ltd. (Food products) | | | 8,753 | | | | 747 | |
Sun Pharmaceutical Industries, Ltd. (Pharmaceuticals) | | | 126,735 | | | | 1,374 | |
Tata Motors, Ltd. (Machinery) | | | 62,508 | | | | 1,829 | |
| | | | | | | | |
| | | | | | | 13,521 | |
| | | | | | | | |
Indonesia—6.7% | | | | | | | | |
PT Astra International Tbk (Automobiles) | | | 231,000 | | | | 1,398 | |
PT Bank Rakyat Indonesia (Commercial banks) | | | 1,231,500 | | | | 1,435 | |
PT Indo Tambangraya Megah (Oil, gas & consumable fuels) | | | 235,000 | | | | 1,324 | |
PT Perusahaan Gas Negara (Gas utilities) | | | 1,387,000 | | | | 681 | |
PT United Tractors Tbk (Machinery) | | | 573,500 | | | | 1,515 | |
| | | | | | | | |
| | | | | | | 6,353 | |
| | | | | | | | |
| | | | | | | | |
Issuer | | Shares | | | Value | |
|
Common Stocks—Emerging Asia—52.5%—(continued) | |
Malaysia—4.4% | | | | | | | | |
CIMB Group Holdings Bhd (Commercial banks) | | | 928,800 | | | $ | 2,560 | |
Genting Bhd (Hotels, restaurants & leisure) | | | 208,900 | | | | 758 | |
Kuala Lumpur Kepong Bhd (Food products) | | | 126,000 | | | | 903 | |
| | | | | | | | |
| | | | | | | 4,221 | |
| | | | | | | | |
Papua New Guinea—1.1% | | | | | | | | |
Oil Search, Ltd. (Oil, gas & consumable fuels) | | | 147,779 | | | | 1,064 | |
| | | | | | | | |
South Korea—6.4% | | | | | | | | |
*Hyundai Mobis (Auto components) | | | 9,175 | | | | 2,300 | |
*Hyundai Motor Co. (Automobiles) | | | 8,621 | | | | 1,318 | |
Samsung Electronics Co., Ltd. (Semiconductors & semiconductor equipment) | | | 2,936 | | | | 2,455 | |
| | | | | | | | |
| | | | | | | 6,073 | |
| | | | | | | | |
Taiwan—3.0% | | | | | | | | |
Hon Hai Precision Industry Co., Ltd. (Electronic equipment, instruments & components) | | | 374,000 | | | | 1,507 | |
HTC Corporation (Communications equipment) | | | 42,000 | | | | 1,297 | |
| | | | | | | | |
| | | | | | | 2,804 | |
| | | | | | | | |
Thailand—2.3% | | | | | | | | |
CP ALL PCL (Food & staples retailing) | | | 510,700 | | | | 665 | |
Kasikornbank PCL (Commercial banks) | | | 365,300 | | | | 1,521 | |
| | | | | | | | |
| | | | | | | 2,186 | |
| | | | | | | | |
| | |
Emerging Latin America—26.0% | | | | | | | | |
Brazil—14.0% | | | | | | | | |
Cia de Bebidas das Americas—ADR (Beverages) | | | 75,559 | | | | 2,345 | |
Cia de Concessoes Rodoviarias (Transportation infrastructure) | | | 22,900 | | | | 647 | |
Cyrela Brazil Realty S.A. (Household durables) | | | 76,200 | | | | 1,003 | |
*Hypermarcas S.A. (Personal products) | | | 93,600 | | | | 1,270 | |
Natura Cosmeticos S.A. (Personal products) | | | 17,100 | | | | 491 | |
*OGX Petroleo e Gas Participacoes S.A. (Oil, gas & consumable fuels) | | | 100,400 | | | | 1,210 | |
PDG Realty S.A. Empreendimentos e Participacoes (Household durables) | | | 79,500 | | | | 486 | |
Tractebel Energia S.A. (Independent power producers & energy traders) | | | 68,100 | | | | 1,126 | |
Vale S.A.—ADR (Metals & mining) | | | 136,494 | | | | 4,719 | |
| | | | | | | | |
| | | | | | | 13,297 | |
| | | | | | | | |
Colombia—2.0% | | | | | | | | |
Pacific Rubiales Energy Corporation (Oil, gas & consumable fuels) | | | 56,097 | | | | 1,904 | |
| | | | | | | | |
Mexico—8.8% | | | | | | | | |
America Movil S.A.B. de C.V.—ADR (Wireless telecommunication services) | | | 22,999 | | | | 1,319 | |
Grupo Mexico S.A.B. de C.V. Series “B” (Metals & mining) | | | 1,206,626 | | | | 4,967 | |
Mexichem S.A.B. de C.V. (Chemicals) | | | 297,200 | | | | 1,064 | |
Wal-Mart de Mexico S.A.B. de C.V. (Food & staples retailing) | | | 350,700 | | | | 1,002 | |
| | | | | | | | |
| | | | | | | 8,352 | |
| | | | | | | | |
See accompanying Notes to Financial Statements.
30 Annual Report | December 31, 2010 |
Emerging Leaders Growth Fund
Portfolio of Investments, December 31, 2010 (all dollar amounts in thousands)
| | | | | | | | |
Issuer | | Shares | | | Value | |
| |
Common Stocks—Emerging Latin
America—26.0%—(continued) | | | | | |
Peru—1.2% | | | | | | | | |
Credicorp, Ltd. (Commercial banks)† | | | 9,578 | | | $ | 1,139 | |
| | | | | | | | |
| |
Emerging Europe, Mid-East, Africa—12.9% | | | | | |
Egypt—1.0% | | | | | | | | |
Commercial International Bank Egypt S.A.E. (Commercial banks) | | | 111,675 | | | | 912 | |
| | | | | | | | |
Qatar—1.6% | | | | | | | | |
Qatar National Bank S.A.Q. (Commercial banks) | | | 30,381 | | | | 1,544 | |
| | | | | | | | |
Russia—3.9% | | | | | | | | |
Magnit OJSC—144A—GDR (Food & staples retailing) | | | 39,928 | | | | 1,067 | |
Sberbank of Russian Federation (Commercial banks)† | | | 504,114 | | | | 1,717 | |
*X5 Retail Group N.V.—GDR (Food & staples retailing) | | | 21,050 | | | | 974 | |
| | | | | | | | |
| | | | | | | 3,758 | |
| | | | | | | | |
South Africa—4.9% | | | | | | | | |
*Aspen Pharmacare Holdings, Ltd. (Pharmaceuticals) | | | 74,066 | | | | 1,035 | |
MTN Group, Ltd. (Wireless telecommunication services) | | | 61,415 | | | | 1,253 | |
Naspers, Ltd. (Media) | | | 23,100 | | | | 1,360 | |
Shoprite Holdings, Ltd. (Food & staples retailing) | | | 66,898 | | | | 1,012 | |
| | | | | | | | |
| | | | | | | 4,660 | |
| | | | | | | | |
Turkey—1.5% | | | | | | | | |
Turkiye Garanti Bankasi A.S. (Commercial banks) | | | 190,923 | | | | 967 | |
Turkiye Halk Bankasi A.S. (Commercial banks) | | | 51,348 | | | | 436 | |
| | | | | | | | |
| | | | | | | 1,403 | |
| | | | | | | | |
ADR = American Depository Receipt
GDR = Global Depository Receipt
* = Non-income producing securities
† = U.S. listed foreign security
| | | | | | | | |
Issuer | | Shares or
Principal
Amount | | | Value | |
| |
Common Stocks—United Kingdom—1.7% | | | | | |
Vedanta Resources plc (Metals & mining) | | | 40,190 | | | $ | 1,577 | |
| | | | | | | | |
Total Common Stocks—93.1%
(cost $71,144) | | | | 88,347 | |
| | | | | | | | |
| | |
Preferred Stocks | | | | | | | | |
Brazil—6.0% | | | | | | | | |
Itau Unibanco Holding S.A. (Commercial banks) | | | 138,585 | | | | 3,322 | |
Petroleo Brasileiro S.A. (Oil, gas & consumable fuels) | | | 143,255 | | | | 2,355 | |
| | | | | | | | |
| | | | | | | 5,677 | |
| | | | | | | | |
Total Preferred Stocks—6.0%
(cost $5,253) | | | | 5,677 | |
| | | | | | | | |
| | |
Repurchase Agreement | | | | | | | | |
State Street Bank and Trust Company, 0.150% dated 12/31/10, due 1/3/11, repurchase price $1,507, collateralized by U.S. Treasury Note, 2.500%, due 4/30/15 | | $ | 1,507 | | | | 1,507 | |
| | | | | | | | |
Total Repurchase Agreement—1.6%
(cost $1,507) | | | | 1,507 | |
| | | | | | | | |
Total Investments—100.7%
(cost $77,904) | | | | 95,531 | |
Liabilities, plus cash and other assets—(0.7)% | | | | (630 | ) |
| | | | | | | | |
Net assets—100.0% | | | $ | 94,901 | |
| | | | | | | | |
For securities primarily traded on exchanges or markets that close before the close of regular trading on the New York Stock Exchange, the Fund may use an independent pricing service to fair value price the securities pursuant to Valuation Procedures approved by the Board of Trustees.
At December 31, 2010, the Fund’s Portfolio of Investments includes the following currency categories:
| | | | |
U.S. Dollar | | | 15.0% | |
Indian Rupee | | | 14.4% | |
Hong Kong Dollar | | | 13.5% | |
Brazilian Real | | | 12.7% | |
Mexican Peso | | | 7.5% | |
Indonesian Rupiah | | | 6.8% | |
South Korean Won | | | 6.5% | |
South African Rand | | | 4.9% | |
Malaysian Ringgit | | | 4.5% | |
New Taiwan Dollar | | | 3.0% | |
Thai Baht | | | 2.3% | |
Canadian Dollar | | | 2.0% | |
British Pound Sterling | | | 1.7% | |
Qatari Rial | | | 1.6% | |
Turkish Lira | | | 1.5% | |
Australian Dollar | | | 1.1% | |
All Other Currencies | | | 1.0% | |
| | | | |
Total | | | 100.0% | |
| | | | |
At December 31, 2010, the Fund’s Portfolio of Investments includes the following industry categories:
| | | | |
Financials | | | 20.0% | |
Materials | | | 14.2% | |
Consumer Staples | | | 14.1% | |
Consumer Discretionary | | | 13.2% | |
Energy | | | 13.0% | |
Information Technology | | | 9.9% | |
Industrials | | | 6.5% | |
Health Care | | | 4.4% | |
Telecommunication Services | | | 2.8% | |
Utilities | | | 1.9% | |
| | | | |
Total | | | 100.0% | |
| | | | |
See accompanying Notes to Financial Statements.
December 31, 2010 | William Blair Funds 31 |
FIXED-INCOME MARKET OVERVIEW
Fixed Income Funds
2010
After declining for most of the year, interest rates rose sharply during the month of December with the fixed income markets experiencing a bout of volatility reminiscent of one that occurred at about the same time a year ago. Longer-term interest rates spiked higher during the fourth quarter, with the 10-Year U.S. Treasury Note, which finished at 2.51% at the end of the third quarter, ending the fourth quarter at 3.29%.
At the time the Federal Reserve announced a second round of quantitative easing in early November, yields on long-term Treasuries were more or less unchanged from where they had ended the third quarter. The market, however, overestimated the scope and scale of the Fed’s quantitative easing program, and the subsequent decline in prices reflected investor disappointment. The fixed income markets treaded sideways through the second half of December, and moved higher late in the month, reflecting pessimism regarding the U.S. Federal budget deficit. Some market observers attributed the rise in rates and subsequent decline in bond prices to disappointment that the Federal Reserve did not increase the size of its purchases to offset the $858-billion tax cut package approved by Congress. While the tax cut deal is expected to help stimulate the economy, it will also increase the size of the deficit.
Prices of long-term Treasury securities rallied during the third quarter, prompted by expectations that the Federal Reserve would announce a second round of easing. In August, the Federal Reserve acknowledged that its confidence in the economic recovery had dimmed and announced that it would use the proceeds from the monthly amortization of its huge mortgage-bond portfolio to buy long-term Treasury securities.
The Fed’s actions throughout the year have been interpreted by investors as confirmation that the Fed remains concerned about the pace of the economic recovery.
In addition, Federal Reserve Governors, and Chairman Ben Bernanke in particular, have expressed longstanding concern about the danger of deflation, or falling prices, from a lack of demand stemming from slow economic growth, joblessness and weakness in the financial sector. And in one well-known major policy speech delivered in 2002, Bernanke identified asset purchases as a way to stimulate aggregate spending when short-term interest rates have reached zero.
Longer-term interest rates finished the year slightly lower than where they began, with the 10-Year U.S. Treasury Note at 3.29% at December 31, 2010, down from 3.84% at December 31, 2009.
Outlook
We believe the Fed will be successful in its efforts to keep interest rates at lower levels with its asset purchases of Treasury securities. Such moves would assist in helping to engineer further growth in the economy, spur capital expenditures by companies and bring inflation back into a range that the Federal Reserves considers acceptable. Consequently, we would expect TIPs (Treasury Inflation-Protected Securities) to outperform nominal Treasuries in such an environment, which would benefit our Bond and Income Funds.
Until fundamentals in the economy show significant signs of improvement—including gains in employment and strength in the housing market—and until inflation picks up, we believe the Fed will leave its Federal Funds target rate unchanged at 0.0% to 0.25%.
32 Annual Report | December 31, 2010 |

Christopher T. Vincent

Paul J. Sularz
BOND FUND
The Bond Fund seeks to outperform the Barclays Capital U.S. Aggregate Bond Index by maximizing total return through a combination of income and capital appreciation.
AN OVERVIEW FROM THE PORTFOLIO MANAGERS
Bond Fund
The Bond Fund posted a 8.06% increase on a total return basis (Institutional Class Shares) for the 12 months ended December 31, 2010. By comparison, the Fund’s benchmark, the Barclays Capital U.S. Aggregate Bond Index, gained 6.54%.
Security selection within the Mortgage-backed and Corporate bond sectors was the main reason the Fund outperformed the Fund’s benchmark during 2010. The Fund’s underweight position in U.S. Treasury securities versus the Index also benefitted the Fund.
Within our Mortgage-backed securities holdings, we favor securities that we believe are less likely to be refinanced through emphasizing specified pools with either low loan balances or above-market coupon rates. Put simply, we are seeking pools least likely to be “called away,” or pre-paid as interest rates decline and refinancings increase. The Fund has benefitted from this strategy, especially given the fact that lenders have more stringent financial criteria in place for borrowers to refinance their existing mortgages. Higher coupon mortgages, in turn, provide a cushion through better convexity characteristics, because they typically do not decline as much when interest rates fall. Finally, this strategy enables the Fund to generate and maintain the Fund’s cash flow and current income.
The Fund’s holdings of high yield Corporate bonds performed strongly, as did its holdings of investment grade Corporate securities. In particular, Ford Motor Credit was a standout performer. Ford Motor Credit has been upgraded several times this year, and Ford’s Chairman has indicated the company’s Corporate bonds could be rated investment grade within a years’ time. We have confidence in Ford’s restructuring and the positive changes to their product line. Another strong performer was Georgia Pacific, which we believe has a strong management team, disciplined business process and strong cash flows.
With interest rates at historically low levels, the Fund has been defensively positioned against a rising rate environment. This did occur during the fourth quarter. The Fund’s underweight exposure to Treasuries—versus its benchmark Index—provided underlying support to the Fund, especially as Treasury rates rose and risk spreads narrowed.
The Fund’s modest holdings in REIT’s were slight detractors to performance. We prefer to invest in REIT’s as a surrogate for Commercial Mortgage-backed securities (to which we were underweight). This theme is a bias of our portfolio construction process, as we prefer to hold REIT’s, which are backed by a dynamic pool of properties, instead of Commercial Mortgage-backed securities, which are comprised of a static pool of properties. This theme had a small negative impact during the fourth quarter, as Commercial Mortgage-backed securities was the best-performing sector of the investment-grade market.
The Fund continues to maintain its overweight position versus its benchmark to “spread” products such as Corporate Bonds, Mortgage-backed and Asset-backed securities. The Fund maintains its exposure to Treasury Securities through its holdings of TIPs (Treasury Inflation-Protected Securities.).
In particular, the Fund maintains an overweight allocation to Corporate Bonds. In the current low growth, low inflation environment, corporate balance sheets have improved drastically,
December 31, 2010 | William Blair Funds 33 |
which improves the quality profile of corporate bonds. Investment ratings on some securities have risen. We believe that U.S. GDP growth will likely remain subpar due to structural unemployment in the U.S. economy. We believe this current environment is one that should remain favorable for Corporate Bonds.
At year end, the Bond Fund’s average maturity stood at 6.8 years, while its duration was 4.7 years.
34 Annual Report | December 31, 2010 |
Bond Fund
Performance Highlights (unaudited)
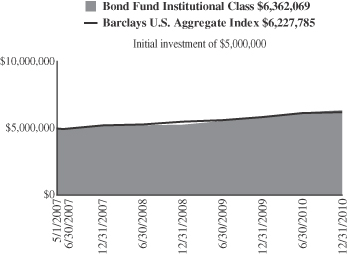
Average Annual Total Return at 12/31/2010
| | | | | | | | | | | | |
| | | 1
Year | | | 3
Year | | | Since
Inception(a) | |
Institutional Class | | | 8.06 | % | | | 7.09 | % | | | 6.77 | % |
Barclays Capital U.S. Aggregate Bond Index | | | 6.54 | | | | 5.90 | | | | 6.14 | |
| | (a) | | For the period May 1, 2007 (Commencement of Operations) to December 31, 2010. |
Performance cited represents past performance. Past performance does not guarantee future results and current performance may be lower or higher than the data quoted. Results shown are average annual total returns, which assume reinvestment of dividends and capital gains. Investment returns and principal will fluctuate and you may have a gain or loss when you sell shares. For the most current month-end performance information, please call 1-800-742-7272, or visit our Web site at www.williamblairfunds.com. From time to time, the investment advisor may waive fees or reimburse expenses for the Fund. Without these waivers, performance would be lower.
The performance highlights and graph presented above do not reflect the deduction of taxes that a shareholder would pay on fund distributions or the redemption of fund shares.
The Barclays Capital U.S. Aggregate Bond Index indicates broad intermediate government/corporate bond market performance.
This report identifies the Fund’s investments on December 31, 2010. These holdings are subject to change. Not all investments in the Fund performed the same, nor is there any guarantee that these investments will perform as well in the future. Market forecasts provided in this report may not necessarily come to pass.
Sector Diversification (unaudited)
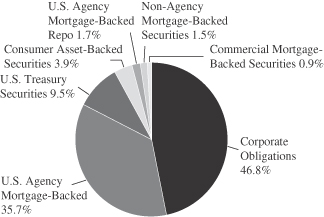
The sector diversification shown is based on the total investments.
December 31, 2010 | William Blair Funds 35 |
Bond Fund
Portfolio of Investments, December 31, 2010 (all amounts in thousands)
| | | | | | | | | | |
Issuer | | Principal
Amount | | | Value | |
|
U.S. Government and U.S. Government Agency—45.9% | |
U.S. Treasury Inflation Indexed Notes/Bonds—7.8% | | | | | |
U.S. Treasury Inflation Indexed Bond,
3.875%, due 4/15/29 | | $ | 7,982 | | | $ | 10,705 | |
U.S. Treasury Inflation Indexed Note,
1.875%, due 7/15/13 | | | 625 | | | | 667 | |
U.S. Treasury Inflation Indexed Note,
2.375%, due 1/15/17 | | | 3,253 | | | | 3,626 | |
| | | | | | | | | | |
Total U.S. Treasury Inflation Indexed Notes/Bonds | | | | 14,998 | |
| | | | | | | | | | |
U.S. Treasury—1.6% | | | | | | | | |
U.S. Treasury Bond,
3.875%, due 8/15/40 | | | 500 | | | | 460 | |
U.S. Treasury Note,
2.625%, due 8/15/20 | | | 1,350 | | | | 1,280 | |
U.S. Treasury Strip Principal,
0.000%, due 5/15/20 | | | 2,000 | | | | 1,451 | |
| | | | | |
Total U.S. Treasury Obligations | | | | 3,191 | |
| | | | | | | | | | |
Government National Mortgage
Association (GNMA)—0.9% | | | | | | | | |
GNR 2004-2 M5, 4.891%, due 7/16/34 | | | 125 | | | | 134 | |
GNR 2006-67 GB, 4.470%, due 9/16/34, VRN | | | 1,540 | | | | 1,667 | |
| | | | | | | | | | |
Total GNMA Mortgage Obligations | | | | 1,801 | |
| | | | | | | | | | |
Federal Home Loan Mortgage
Corp. (FHLMC)—7.8% | | | | | | | | |
#G90024, 7.000%, due 1/20/13 | | | 33 | | | | 35 | |
#G30093, 7.000%, due 12/1/17 | | | 38 | | | | 42 | |
#G30255, 7.000%, due 7/1/21 | | | 79 | | | | 90 | |
#G12792, 4.500%, due 12/1/21 | | | 467 | | | | 493 | |
#D95897, 5.500%, due 3/1/23 | | | 246 | | | | 264 | |
#G30372, 5.000%, due 9/1/27 | | | 578 | | | | 613 | |
#G01728, 7.500%, due 7/1/32 | | | 306 | | | | 352 | |
#C01385, 6.500%, due 8/1/32 | | | 392 | | | | 441 | |
#G02141, 6.000%, due 3/1/36 | | | 1,887 | | | | 2,086 | |
#A62179, 6.000%, due 6/1/37 | | | 1,013 | | | | 1,120 | |
#A63539, 6.000%, due 7/1/37 | | | 1,263 | | | | 1,396 | |
#G03170, 6.500%, due 8/1/37 | | | 1,901 | | | | 2,124 | |
#A66843, 6.500%, due 10/1/37 | | | 1,021 | | | | 1,156 | |
#A78138, 5.500%, due 6/1/38 | | | 1,396 | | | | 1,514 | |
#A81799, 6.500%, due 9/1/38 | | | 2,862 | | | | 3,241 | |
| | | | | | | | | | |
Total FHLMC Mortgage Obligations | | | | 14,967 | |
| | | | | | | | | | |
Federal National Mortgage
Association (FNMA)—27.8% | | | | | | | | |
#535559, 7.500%, due 9/1/12 | | | 70 | | | | 70 | |
#598453, 7.000%, due 6/1/15 | | | 1 | | | | 1 | |
#689612, 5.000%, due 5/1/18 | | | 415 | | | | 444 | |
#695910, 5.000%, due 5/1/18 | | | 735 | | | | 794 | |
#747903, 4.500%, due 6/1/19 | | | 386 | | | | 408 | |
#745735, 5.000%, due 3/1/21 | | | 909 | | | | 975 | |
#253847, 6.000%, due 5/1/21 | | | 245 | | | | 268 | |
#900725, 6.000%, due 8/1/21 | | | 213 | | | | 233 | |
#AD8164, 4.000%, due 8/1/25 | | | 1,220 | | | | 1,269 | |
#545437, 7.000%, due 2/1/32 | | | 205 | | | | 234 | |
#545759, 6.500%, due 7/1/32 | | | 2,203 | | | | 2,478 | |
#254548, 5.500%, due 12/1/32 | | | 893 | | | | 961 | |
#684601, 6.000%, due 3/1/33 | | | 2,114 | | | | 2,357 | |
#190340, 5.000%, due 9/1/33 | | | 1,877 | | | | 1,985 | |
#254868, 5.000%, due 9/1/33 | | | 918 | | | | 971 | |
#555800, 5.500%, due 10/1/33 | | | 405 | | | | 437 | |
| | | | | | | | | | | | |
Issuer | | NRSRO
Rating
(unaudited) | | | Principal
Amount | | | Value | |
|
U.S. Government and U.S. Government Agency—(continued) | |
Federal National Mortgage Association (FNMA)—(continued) | |
#725027, 5.000%, due 11/1/33 | | | $ | 730 | | | $ | 772 | |
#555880, 5.500%, due 11/1/33 | | | | 482 | | | | 520 | |
#555946, 5.500%, due 11/1/33 | | | | 827 | | | | 897 | |
#756153, 5.500%, due 11/1/33 | | | | 2,305 | | | | 2,499 | |
#725231, 5.000%, due 2/1/34 | | | | 760 | | | | 803 | |
#725205, 5.000%, due 3/1/34 | | | | 1,619 | | | | 1,712 | |
#725220, 5.000%, due 3/1/34 | | | | 703 | | | | 743 | |
#725232, 5.000%, due 3/1/34 | | | | 3,511 | | | | 3,714 | |
#725238, 5.000%, due 3/1/34 | | | | 1,609 | | | | 1,701 | |
#763798, 5.500%, due 3/1/34 | | | | 491 | | | | 532 | |
#725424, 5.500%, due 4/1/34 | | | | 517 | | | | 557 | |
#725611, 5.500%, due 6/1/34 | | | | 488 | | | | 526 | |
#786546, 6.000%, due 7/1/34 | | | | 922 | | | | 1,019 | |
#787816, 6.000%, due 7/1/34 | | | | 928 | | | | 1,029 | |
#190353, 5.000%, due 8/1/34 | | | | 539 | | | | 570 | |
#357883, 5.000%, due 5/1/35 | | | | 1,146 | | | | 1,212 | |
#745092, 6.500%, due 7/1/35 | | | | 601 | | | | 676 | |
#357944, 6.000%, due 9/1/35 | | | | 118 | | | | 130 | |
#829306, 6.000%, due 9/1/35 | | | | 326 | | | | 361 | |
#843487, 6.000%, due 10/1/35 | | | | 274 | | | | 304 | |
#849191, 6.000%, due 1/1/36 | | | | 177 | | | | 195 | |
#848782, 6.500%, due 1/1/36 | | | | 829 | | | | 930 | |
#745349, 6.500%, due 2/1/36 | | | | 1,139 | | | | 1,287 | |
#831540, 6.000%, due 6/1/36 | | | | 218 | | | | 240 | |
#745802, 6.000%, due 7/1/36 | | | | 654 | | | | 726 | |
#886220, 6.000%, due 7/1/36 | | | | 1,128 | | | | 1,251 | |
#893318, 6.500%, due 8/1/36 | | | | 252 | | | | 282 | |
#909480, 6.000%, due 2/1/37 | | | | 1,408 | | | | 1,557 | |
#256859, 5.500%, due 8/1/37 | | | | 968 | | | | 1,027 | |
#928561, 6.000%, due 8/1/37 | | | | 814 | | | | 903 | |
#948689, 6.000%, due 8/1/37 | | | | 2,073 | | | | 2,271 | |
#888967, 6.000%, due 12/1/37 | | | | 1,795 | | | | 1,991 | |
#962058, 6.500%, due 3/1/38 | | | | 3,222 | | | | 3,659 | |
#934006, 6.500%, due 9/1/38 | | | | 1,646 | | | | 1,868 | |
#986856, 6.500%, due 9/1/38 | | | | 1,095 | | | | 1,228 | |
| | | | | | | | | | | | |
Total FNMA Mortgage Obligations | | | | 53,577 | |
| | | | | | | | | | | | |
| |
Non-Agency Mortgage-Backed Obligations—1.5% | | | | | |
Countrywide Alternative Loan Trust, 2003-11T1, Tranche M, 4.750%, 7/25/18 | | | CCC | | | | 228 | | | | 163 | |
First Plus Home Loan Trust, 1997-4, Tranche M1, 7.640%, 9/11/23§** | | | C | | | | 199 | | | | 170 | |
Renaissance Home Equity Loan Trust, 2004-2, Tranche M5, 6.455%, 7/25/34 | | | A2 | | | | 463 | | | | 113 | |
First Horizon Asset Securities, Inc., 2004-AR4, Tranche 3A1, 4.677%, 8/25/34, VRN | | | AAA | | | | 549 | | | | 510 | |
Soundview Home Equity Loan Trust, 2005-B, Tranche M1, 6.135%, 5/25/35 | | | AA | + | | | 14 | | | | 14 | |
Chase Mortgage Finance Corporation, 2006-A1, Tranche 2A3, 6.000%, 9/25/36, VRN | | | Caa2 | | | | 2,460 | | | | 1,938 | |
| | | | | | | | | | | | |
Total Non-Agency Mortgage-Backed Obligations | | | | 2,908 | |
| | | | | | | | | | | | |
See accompanying Notes to Financial Statements.
36 Annual Report | December 31, 2010 |
Bond Fund
Portfolio of Investments, December 31, 2010 (all amounts in thousands)
| | | | | | | | | | | | |
Issuer | | NRSRO
Rating
(unaudited) | | | Principal
Amount | | | Value | |
| |
Consumer Asset-Backed Securities—3.9% | | | | | |
Avis Budget Rental Car Funding AESOP LLC—144A, 2009-1A, Tranche A, 9.310%, 10/20/13 | | | Aa1 | | | $ | 2,000 | | | $ | 2,190 | |
Avis Budget Rental Car Funding AESOP LLC—144A, 2009-2A, Tranche A, 5.680%, 2/20/14 | | | Aaa | | | | 2,000 | | | | 2,143 | |
Hertz Vehicle Financing LLC—144A, 2009-2A, Tranche A1,
4.260%, 3/25/14 | | | Aaa | | | | 2,230 | | | | 2,333 | |
Centre Point Funding LLC—144A, 2010-1A, Tranche 1,
5.430%, 7/20/16 | | | A2 | | | | 874 | | | | 903 | |
| | | | | | | | | | | | |
Total Consumer Asset-Backed Securities | | | | 7,569 | |
| | | | | | | | | | | | |
| |
Corporate Obligations—46.1% | | | | | |
Citigroup, Inc.,
5.500%, due 4/11/13 | | | A | + | | | 1,500 | | | | 1,597 | |
General Electric Capital Corporation,
4.800%, due 5/1/13 | | | AA | + | | | 600 | | | | 641 | |
Kansas City Southern de Mexico S.A. de C.V.,
7.625%, due 12/1/13 | | | BB | | | | 1,200 | | | | 1,242 | |
CME Group, Inc.,
5.750%, due 2/15/14 | | | AA | | | | 700 | | | | 775 | |
PACCAR, Inc.,
6.875%, due 2/15/14 | | | A | + | | | 800 | | | | 918 | |
General Electric Capital Corporation,
5.900%, due 5/13/14 | | | AA | + | | | 225 | | | | 249 | |
Bank of America Corporation,
7.375%, due 5/15/14 | | | A | + | | | 700 | | | | 778 | |
American Express Co.,
7.250%, due 5/20/14 | | | A | + | | | 500 | | | | 570 | |
Capital One Financial Corporation,
7.375%, due 5/23/14 | | | A- | | | | 1,235 | | | | 1,405 | |
Macquarie Group Ltd.—144A,
7.300%, due 8/1/14 | | | A2 | | | | 1,000 | | | | 1,092 | |
Petrohawk Energy Corporation,
10.500%, due 8/1/14 | | | B | + | | | 1,000 | | | | 1,140 | |
AT&T, Inc.,
5.100%, due 9/15/14 | | | A2 | | | | 1,250 | | | | 1,368 | |
D.R. Horton, Inc.,
5.625%, due 9/15/14 | | | BB | | | | 1,500 | | | | 1,530 | |
Corporation Nacional del Cobre de Chile—144A,
4.750%, due 10/15/14 | | | A1 | | | | 1,350 | | | | 1,442 | |
Boeing Capital Corporation,
3.250%, due 10/27/14 | | | A | + | | | 1,400 | | | | 1,459 | |
Crown Castle International Corporation,
9.000%, due 1/15/15 | | | BB- | | | | 1,000 | | | | 1,105 | |
EI du Pont de Nemours & Co.,
3.250%, due 1/15/15 | | | A | | | | 500 | | | | 519 | |
Georgia-Pacific LLC—144A,
7.000%, due 1/15/15 | | | BBB | | | | 500 | | | | 519 | |
The Kroger Co.,
4.950%, due 1/15/15 | | | BBB | | | | 1,175 | | | | 1,269 | |
Simon Property Group L.P.,
4.200%, due 2/1/15 | | | A- | | | | 1,500 | | | | 1,568 | |
| | | | | | | | | | | | |
Issuer | | NRSRO
Rating
(unaudited) | | | Principal
Amount | | | Value | |
|
Corporate Obligations—(continued) | |
Yum! Brands, Inc.,
4.250%, due 9/15/15 | | | BBB- | | | $ | 350 | | | $ | 369 | |
Fiserv, Inc.,
3.125%, due 10/1/15 | | | Baa2 | | | | 1,825 | | | | 1,807 | |
Cisco Systems, Inc.,
5.500%, due 2/22/16 | | | A | + | | | 2,000 | | | | 2,282 | |
Yum! Brands, Inc.,
6.250%, due 4/15/16 | | | BBB- | | | | 700 | | | | 791 | |
Owens-Brockway Glass Container, Inc., 7.375%, due 5/15/16 | | | BB | + | | | 1,250 | | | | 1,328 | |
SABMiller plc—144A,
6.500%, due 7/1/16 | | | BBB | + | | | 700 | | | | 811 | |
Petrobras International Finance Co.,
6.125%, due 10/6/16 | | | Baa1 | | | | 1,350 | | | | 1,485 | |
EI du Pont de Nemours & Co.,
5.250%, due 12/15/16 | | | A | | | | 500 | | | | 559 | |
Comcast Corporation,
6.500%, due 1/15/17 | | | BBB | + | | | 350 | | | | 403 | |
Corrections Corporation of America,
7.750%, due 6/1/17 | | | BB | | | | 1,250 | | | | 1,327 | |
ERP Operating L.P.,
5.750%, due 6/15/17 | | | BBB | + | | | 1,100 | | | | 1,205 | |
JPMorgan Chase & Co.,
6.125%, due 6/27/17 | | | A1 | | | | 600 | | | | 658 | |
American Express Co.,
6.150%, due 8/28/17 | | | A | + | | | 1,000 | | | | 1,127 | |
Exelon Generation Co. LLC,
6.200%, due 10/1/17 | | | A3 | | | | 1,100 | | | | 1,231 | |
Toll Brothers Finance Corporation,
8.910%, due 10/15/17 | | | BBB- | | | | 950 | | | | 1,121 | |
Triumph Group, Inc.,
8.000%, due 11/15/17 | | | B | + | | | 1,500 | | | | 1,560 | |
Union Pacific Corporation,
5.750%, due 11/15/17 | | | BBB | + | | | 800 | | | | 898 | |
Wells Fargo & Co.,
5.625%, due 12/11/17 | | | AA- | | | | 1,000 | | | | 1,107 | |
Kohl’s Corporation,
6.250%, due 12/15/17 | | | BBB | + | | | 350 | | | | 404 | |
American Tower Corporation,
4.500%, due 1/15/18 | | | Baa3 | | | | 1,150 | | | | 1,140 | |
Morgan Stanley,
6.625%, due 4/1/18 | | | A | | | | 950 | | | | 1,031 | |
General Electric Capital Corporation,
5.625%, due 5/1/18 | | | AA | + | | | 350 | | | | 382 | |
Philip Morris International, Inc.,
5.650%, due 5/16/18 | | | A | | | | 1,000 | | | | 1,127 | |
Time Warner Cable, Inc.,
6.750%, due 7/1/18 | | | BBB | | | | 1,000 | | | | 1,166 | |
Merrill Lynch & Co., Inc.,
6.875%, due 11/15/18 | | | A | + | | | 1,075 | | | | 1,158 | |
Anheuser-Busch InBev Worldwide, Inc.—144A,
7.750%, due 1/15/19 | | | BBB | + | | | 700 | | | | 871 | |
FedEx Corporation,
8.000%, due 1/15/19 | | | BBB | | | | 750 | | | | 925 | |
CSX Corporation,
7.375%, due 2/1/19 | | | BBB- | | | | 800 | | | | 965 | |
Honeywell International, Inc.,
5.000%, due 2/15/19 | | | A | | | | 925 | | | | 1,013 | |
See accompanying Notes to Financial Statements.
December 31, 2010 | William Blair Funds 37 |
Bond Fund
Portfolio of Investments, December 31, 2010 (all amounts in thousands)
| | | | | | | | | | | | |
Issuer | | NRSRO
Rating
(unaudited) | | | Principal
Amount | | | Value | |
| |
Corporate Obligations—(continued) | | | | | |
Pfizer, Inc.,
6.200%, due 3/15/19 | | | AA | | | $ | 1,250 | | | $ | 1,464 | |
BHP Billiton Finance USA, Ltd.,
6.500%, due 4/1/19 | | | A | + | | | 1,300 | | | | 1,546 | |
Owens Corning,
9.000%, due 6/15/19 | | | BBB- | | | | 950 | | | | 1,115 | |
Jefferies Group, Inc.,
8.500%, due 7/15/19 | | | BBB | | | | 1,300 | | | | 1,486 | |
Discovery Communications LLC,
5.625%, due 8/15/19 | | | Baa2 | | | | 500 | | | | 549 | |
Roper Industries, Inc.,
6.250%, due 9/1/19 | | | BBB- | | | | 1,225 | | | | 1,356 | |
Boston Properties L.P.,
5.875%, due 10/15/19 | | | A- | | | | 1,500 | | | | 1,627 | |
Toll Brothers Finance Corporation,
6.750%, due 11/1/19 | | | BBB- | | | | 500 | | | | 525 | |
Macquarie Group Ltd.—144A,
6.000%, due 1/14/20 | | | A2 | | | | 250 | | | | 251 | |
Ford Motor Credit Co. LLC,
8.125%, due 1/15/20 | | | Ba2 | | | | 1,515 | | | | 1,763 | |
Jarden Corporation,
7.500%, due 1/15/20 | | | B | | | | 1,500 | | | | 1,564 | |
Motiva Enterprises LLC—144A,
5.750%, due 1/15/20 | | | A | | | | 1,500 | | | | 1,683 | |
Johnson Controls, Inc.,
5.000%, due 3/30/20 | | | BBB | + | | | 1,625 | | | | 1,726 | |
United Technologies Corporation,
4.500%, due 4/15/20 | | | A | + | | | 1,500 | | | | 1,575 | |
Iron Mountain, Inc.,
8.000%, due 6/15/20 | | | B | + | | | 1,250 | | | | 1,312 | |
The Goldman Sachs Group, Inc.,
6.000%, due 6/15/20 | | | A1 | | | | 1,800 | | | | 1,945 | |
Commonwealth Edison Co.,
4.000%, due 8/1/20 | | | A- | | | | 1,000 | | | | 984 | |
Alcoa, Inc.,
6.150%, due 8/15/20 | | | BBB- | | | | 1,775 | | | | 1,823 | |
Omnicom Group, Inc.,
4.450%, due 8/15/20 | | | A- | | | | 1,975 | | | | 1,933 | |
The Goodyear Tire & Rubber Co.,
8.250%, due 8/15/20 | | | B | + | | | 700 | | | | 724 | |
Ras Laffan Liquefied Natural Gas Co., Ltd. II—144A,
5.298%, due 9/30/20 | | | Aa2 | | | | 385 | | | | 404 | |
BE Aerospace, Inc.,
6.875%, due 10/1/20 | | | BB | | | | 650 | | | | 671 | |
NRSRO = Nationally Recognized Statistical Rating Organization—The credit quality ratings of the securities in the Fund reflect the highest category rating by either Fitch Ratings, Moody’s Investors Service Inc., or Standard & Poor’s, a division of the McGraw-Hill Companies, Inc. The obligations of certain U.S. Government-sponsored securities are neither issued nor guaranteed by the U.S. Treasury.
VRN = Variable Rate Note
§ = Deemed illiquid pursuant to Liquidity Procedures approved by the Board of Trustees. This holding represents 0.09% of the Fund’s net assets at December 31, 2010.
** = Fair valued pursuant to Valuation Procedures adopted by the Board of Trustees. This holding represents 0.09% of the Fund’s net assets at December 31, 2010.
| | | | | | | | | | | | |
Issuer | | NRSRO
Rating
(unaudited) | | | Principal
Amount | | | Value | |
| |
Corporate Obligations—(continued) | | | | | |
Celgene Corporation,
3.950%, due 10/15/20 | | | BBB | + | | $ | 500 | | | $ | 475 | |
Georgia-Pacific LLC—144A,
5.400%, due 11/1/20 | | | BBB | | | | 500 | | | | 494 | |
Southwest Airlines Co. 2007-1 Pass Through Trust,
6.150%, due 8/1/22 | | | A | | | | 664 | | | | 730 | |
The Kroger Co.,
8.000%, due 9/15/29 | | | BBB | | | | 325 | | | | 408 | |
Conoco Funding Co.,
7.250%, due 10/15/31 | | | A1 | | | | 400 | | | | 495 | |
Kohl’s Corporation,
6.000%, due 1/15/33 | | | BBB | + | | | 1,000 | | | | 1,020 | |
Wisconsin Electric Power Co.,
5.700%, due 12/1/36 | | | A | + | | | 500 | | | | 526 | |
Comcast Corporation,
6.450%, due 3/15/37 | | | BBB | + | | | 650 | | | | 695 | |
Yum! Brands, Inc.,
6.875%, due 11/15/37 | | | BBB- | | | | 600 | | | | 681 | |
JPMorgan Chase & Co.,
6.400%, due 5/15/38 | | | Aa3 | | | | 900 | | | | 1,021 | |
COX Communications, Inc.—144A, 6.950%, due 6/1/38 | | | Baa2 | | | | 350 | | | | 389 | |
General Electric Capital Corporation,
6.875%, due 1/10/39 | | | AA | + | | | 750 | | | | 867 | |
Burlington Northern Santa Fe LLC,
5.750%, due 5/1/40 | | | A3 | | | | 1,515 | | | | 1,567 | |
| | | | | | | | | | | | |
Total Corporate Obligations | | | | 88,831 | |
| | | | | | | | | | | | |
Total Long-Term Investments—97.4%
(cost $178,039) | | | | 187,842 | |
| | | | | | | | | | | | |
| | | |
Repurchase Agreement | | | | | | | | | | | | |
State Street Bank and Trust Company, 0.150% dated 12/31/10, due 1/3/11, repurchase price $3,285, collateralized by U.S. Treasury Note,
2.750%, due 12/31/17 | | | AAA | | | | 3,285 | | | | 3,285 | |
| | | | | | | | | | | | |
Total Repurchase Agreement—1.7%
(cost $3,285) | | | | 3,285 | |
| | | | | | | | | | | | |
Total Investments—99.1%
(cost $181,324) | | | | 191,127 | |
Cash and other assets, less liabilities—0.9% | | | | 1,649 | |
| | | | | | | | | | | | |
Net assets—100.0% | | | $ | 192,776 | |
| | | | | | | | | | | | |
See accompanying Notes to Financial Statements.
38 Annual Report | December 31, 2010 |
Christopher T. Vincent
Paul J. Sularz
LOW DURATION FUND
The Low Duration Fund seeks to maximize total return. Total return includes both income and capital appreciation.
AN OVERVIEW FROM THE PORTFOLIO MANAGERS
The Low Duration Fund posted a 2.15% increase on a total return basis (Institutional Class Shares) for the 12 months ended December 31, 2010. By comparison, the Fund’s benchmark, the Merrill Lynch 1-Year U.S. Treasury Note Index, gained 0.83%.
The Fund had a very positive first year, with the Fund meeting its objective of outperforming its Merrill Lynch 1-Year U.S. Treasury Note Index benchmark. We believe the Fund has been able to accomplish this objective without sacrificing credit quality. The Fund does not own securities with a rating below “A” from a Nationally Recognized Statistical Rating Organization.
The month of December, in particular, was reminiscent of the period one year ago when the Fund was launched, with interest rates rising sharply and market volatility high. Part of this was a function of the U.S. Government’s Treasury auction occurring during a period of very thinly traded markets at the end of the year.
The majority of the Fund’s portfolio is invested in seasoned U.S. Government-guaranteed short duration Mortgage-backed Fannie Mae and Freddie Mac securities. This is the Fund’s major sector emphasis. We favor such securities because they pay monthly principal and interest, which we then are able to reinvest. The benefits of this strategy are evident in a rising rate environment such as the one we experienced during December.
Assets in this new Fund continued to build since the Fund’s inception on December 1, 2009, with assets increasing to a new “high watermark” of approximately $142 million at December 31, 2010.
We continued to invest in new Consumer Asset-backed securities (such as “top tier” banks and auto receivables) as well as seasoned U.S. Agency Mortgage-backed securities and Corporate Bonds with a rating of single-A or higher.
We consider the Consumer Asset-backed securities that the Fund invests in to be highly liquid. Nearly a third of these investments are floating rate instruments that reset on a monthly basis.
The Fund kept its exposure to cash and cash equivalents extremely low, given the very low rates currently available from money market instruments.
We have increased the Fund’s holdings of Asset-backed securities whose coupons are reset monthly and are tied to LIBOR—the London Interbank Offered Rate. The income from these securities will rise with any increase in rates and will protect the Fund against falling prices.
December 31, 2010 | William Blair Funds 39 |
Low Duration Fund
Performance Highlights (unaudited)
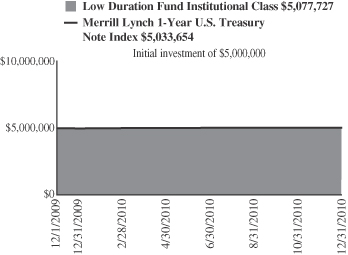
Average Annual Total Return at 12/31/2010
| | | | | | | | |
| | | 1
year | | | Since
Inception(a) | |
Institutional Class | | | 2.15 | % | | | 1.43 | % |
Merrill Lynch 1-Year U.S. Treasury Note Index | | | 0.83 | | | | 0.62 | |
| | (a) | | For the period December 1, 2009 (Commencement of Operations to December 31, 2010. |
Performance cited represents past performance. Past performance does not guarantee future results and current performance may be lower or higher than the data quoted. Results shown are average annual total returns, which assume reinvestment of dividends and capital gains. Investment returns and principal will fluctuate and you may have a gain or loss when you sell shares. For the most current month-end performance information, please call 1-800-742-7272, or visit our Web site at www.williamblairfunds.com. From time to time, the investment advisor may waive fees or reimburse expenses for the Fund. Without these waivers, performance would be lower. Class N shares are available to the general public without a sales load. Class I shares are available to certain institutional investors and advisory clients of William Blair & Company, L.L.C., without a sales load or distribution fees (12b-1).
The performance highlights and graph presented above do not reflect the deduction of taxes that a shareholder would pay on fund distributions or the redemption of fund shares.
The Merrill Lynch 1-Year U.S. Treasury Note Index is comprised of a single U.S. Treasury Note issue purchased at the beginning of the month and held for a full month. Each month the index is rebalanced and the issue selected is the outstanding U.S. Treasury Note that matures closest to, but not beyond one year from the rebalancing date.
This report identifies the Fund’s investments on December 31, 2010. These holdings are subject to change. Not all investments in the Fund performed the same, nor is there any guarantee that these investments will perform as well in the future. Market forecasts provided in this report may not necessarily come to pass.
Sector Diversification (unaudited)
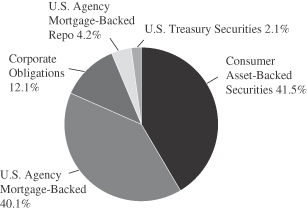
The sector diversification shown is based on the total investments.
40 Annual Report | December 31, 2010 |
Low Duration Fund
Portfolio of Investments, December 31, 2010 (all amounts in thousands)
| | | | | | | | | | | | |
Issuer | | | Principal
Amount | | | Value | |
|
U.S. Government and U.S. Government Agency—41.6% | |
U.S. Treasury—2.1% | | | | | | | | | | | | |
U.S. Treasury Note,
0.500%, due 11/15/13 | | | $ | 3,000 | | | $ | 2,961 | |
| | | | | | | | | | | | |
Government National Mortgage Association (GNMA)—0.2% | | | | | | | | | |
#003438, 4.500%, due 9/20/18 | | | | 323 | | | | 342 | |
| | | | | | | | | | | | |
Federal Home Loan Mortgage Corp. (FHLMC)—11.8% | | | | | | | | | |
#M80898, 4.500%, due 2/1/11 | | | | 152 | | | | 156 | |
#M80903, 4.000%, due 3/1/11 | | | | 268 | | | | 270 | |
#M80953, 4.000%, due 12/1/11 | | | | 286 | | | | 292 | |
#E86134, 5.000%, due 11/1/16 | | | | 264 | | | | 280 | |
#E96536, 5.000%, due 3/1/18 | | | | 498 | | | | 531 | |
#E95355, 5.000%, due 4/1/18 | | | | 587 | | | | 626 | |
#E01377, 4.500%, due 5/1/18 | | | | 583 | | | | 614 | |
#G11618, 4.500%, due 5/1/18 | | | | 2,754 | | | | 2,909 | |
#E99963, 4.500%, due 10/1/18 | | | | 161 | | | | 170 | |
#E01488, 5.000%, due 10/1/18 | | | | 618 | | | | 659 | |
#E99895, 5.000%, due 10/1/18 | | | | 1,157 | | | | 1,234 | |
#G12093, 4.500%, due 12/1/18 | | | | 722 | | | | 763 | |
#B11386, 5.000%, due 12/1/18 | | | | 272 | | | | 290 | |
#E01545, 5.000%, due 1/1/19 | | | | 348 | | | | 371 | |
#G11766, 5.000%, due 3/1/19 | | | | 252 | | | | 269 | |
#G18001, 4.500%, due 7/1/19 | | | | 320 | | | | 338 | |
#G11596, 5.500%, due 8/1/19 | | | | 267 | | | | 290 | |
#B16291, 5.000%, due 9/1/19 | | | | 1,666 | | | | 1,778 | |
#G18045, 5.000%, due 3/1/20 | | | | 278 | | | | 296 | |
#G11892, 4.000%, due 4/1/20 | | | | 281 | | | | 292 | |
#G18048, 5.000%, due 4/1/20 | | | | 191 | | | | 203 | |
#J08152, 5.000%, due 5/1/20 | | | | 235 | | | | 251 | |
#G12394, 5.000%, due 5/1/21 | | | | 357 | | | | 380 | |
#G12113, 5.500%, due 5/1/21 | | | | 441 | | | | 479 | |
#G12286, 5.000%, due 7/1/21 | | | | 205 | | | | 218 | |
#J13022, 4.000%, due 9/1/25 | | | | 2,814 | | | | 2,918 | |
| | | | | | | | | | | | |
Total FHLMC Mortgage Obligations | | | | 16,877 | |
| | | | | | | | | | | | |
Federal National Mortgage Association (FNMA)—27.5% | |
#255325, 4.500%, due 7/1/11 | | | | 1,012 | | | | 1,020 | |
#256224, 5.500%, due 4/1/16 | | | | 55 | | | | 60 | |
#256559, 5.500%, due 1/1/17 | | | | 29 | | | | 30 | |
#256606, 5.500%, due 2/1/17 | | | | 39 | | | | 42 | |
#256646, 5.500%, due 3/1/17 | | | | 29 | | | | 32 | |
#545898, 5.500%, due 9/1/17 | | | | 810 | | | | 873 | |
#545899, 5.500%, due 9/1/17 | | | | 919 | | | | 991 | |
#663692, 5.000%, due 1/1/18 | | | | 373 | | | | 400 | |
#254591, 5.500%, due 1/1/18 | | | | 568 | | | | 613 | |
#681310, 4.500%, due 2/1/18 | | | | 555 | | | | 588 | |
#683100, 5.500%, due 2/1/18 | | | | 711 | | | | 774 | |
#675717, 5.000%, due 3/1/18 | | | | 610 | | | | 654 | |
#681361, 5.000%, due 3/1/18 | | | | 157 | | | | 168 | |
#656564, 5.000%, due 4/1/18 | | | | 2,713 | | | | 2,905 | |
#696677, 5.000%, due 4/1/18 | | | | 221 | | | | 237 | |
#702888, 5.000%, due 4/1/18 | | | | 190 | | | | 204 | |
#929388, 4.500%, due 5/1/18 | | | | 770 | | | | 811 | |
#254721, 5.000%, due 5/1/18 | | | | 444 | | | | 476 | |
#702332, 5.000%, due 5/1/18 | | | | 101 | | | | 108 | |
#704049, 5.500%, due 5/1/18 | | | | 1,363 | | | | 1,488 | |
#254785, 4.000%, due 6/1/18 | | | | 373 | | | | 390 | |
#555622, 4.500%, due 6/1/18 | | | | 611 | | | | 647 | |
#656573, 5.000%, due 6/1/18 | | | | 377 | | | | 404 | |
| | | | | | | | | | | | |
Issuer | | NRSRO
Rating
(unaudited) | | | Principal
Amount | | | Value | |
|
U.S. Government and U.S. Government Agency—(continued) | |
Federal National Mortgage Association (FNMA)—(continued) | | | | | | | | | |
#709848, 5.000%, due 6/1/18 | | | $ | 330 | | | $ | 353 | |
#713380, 4.000%, due 7/1/18 | | | | 310 | | | | 323 | |
#254802, 4.500%, due 7/1/18 | | | | 486 | | | | 515 | |
#713807, 4.500%, due 7/1/18 | | | | 287 | | | | 304 | |
#735003, 5.500%, due 7/1/18 | | | | 1,733 | | | | 1,887 | |
#711991, 5.000%, due 8/1/18 | | | | 316 | | | | 339 | |
#740444, 4.500%, due 9/1/18 | | | | 498 | | | | 527 | |
#743183, 5.000%, due 10/1/18 | | | | 134 | | | | 144 | |
#747823, 4.000%, due 11/1/18 | | | | 835 | | | | 872 | |
#749596, 5.000%, due 11/1/18 | | | | 476 | | | | 510 | |
#745237, 5.000%, due 12/1/18 | | | | 117 | | | | 125 | |
#MA0045, 4.000%, due 4/1/19 | | | | 712 | | | | 745 | |
#255233, 4.000%, due 5/1/19 | | | | 719 | | | | 750 | |
#725445, 4.500%, due 5/1/19 | | | | 1,320 | | | | 1,396 | |
#785259, 5.000%, due 8/1/19 | | | | 573 | | | | 615 | |
#725953, 5.000%, due 10/1/19 | | | | 165 | | | | 178 | |
#745240, 4.500%, due 12/1/19 | | | | 755 | | | | 800 | |
#735401, 5.500%, due 3/1/20 | | | | 472 | | | | 509 | |
#735646, 4.500%, due 7/1/20 | | | | 908 | | | | 961 | |
#MA0517, 4.000%, due 9/1/20 | | | | 1,426 | | | | 1,493 | |
#836016, 4.500%, due 9/1/20 | | | | 1,516 | | | | 1,599 | |
#MA0548, 3.500%, due 10/1/20 | | | | 2,510 | | | | 2,600 | |
#881284, 4.500%, due 12/1/21 | | | | 1,579 | | | | 1,663 | |
#932723, 4.000%, due 4/1/25 | | | | 931 | | | | 968 | |
#935995, 4.000%, due 6/1/25 | | | | 258 | | | | 268 | |
#AD4677, 4.000%, due 6/1/25 | | | | 1,986 | | | | 2,066 | |
#AD8164, 4.000%, due 8/1/25 | | | | 2,000 | | | | 2,080 | |
#AE1176, 4.000%, due 8/1/25 | | | | 977 | | | | 1,016 | |
| | | | | | | | | | | | |
Total FNMA Mortgage Obligations | | | | 39,521 | |
| | | | | | | | | | | | |
|
Consumer Asset-Backed Securities—41.0% | |
Mercedes-Benz Auto Receivables Trust, 2010-1, Tranche A1, 0.309%, 5/13/11 | | | A-1 | + | | | 19 | | | | 19 | |
BMW Vehicle Lease Trust, 2009-1, Tranche A4, 3.660%, 9/15/11 | | | AAA | | | | 500 | | | | 509 | |
Nissan Auto Lease Trust, 2009-B, Tranche A2, 1.220%, 9/15/11 | | | AAA | | | | 366 | | | | 366 | |
Ford Credit Auto Owner Trust, 2009-D, Tranche A2, 1.210%, 1/15/12 | | | AAA | | | | 168 | | | | 168 | |
Honda Auto Receivables Owner Trust, 2009-2, Tranche A3, 2.790%, 1/16/12 | | | AAA | | | | 779 | | | | 787 | |
Honda Auto Receivables Owner Trust, 2008-1, Tranche A3, 4.470%, 1/18/12 | | | AAA | | | | 139 | | | | 139 | |
Honda Auto Receivables Owner Trust, 2010-1, Tranche A2, 0.620%, 2/21/12 | | | AAA | | | | 1,753 | | | | 1,754 | |
USAA Auto Owner Trust, 2009-2, Tranche A2, 0.740%, 3/15/12 | | | AAA | | | | 14 | | | | 14 | |
Ally Auto Receivables Trust, 2010-1, Tranche A2, 0.750%, 4/15/12 | | | AAA | | | | 848 | | | | 849 | |
Volkswagen Auto Lease Trust, 2009-A, Tranche A3, 3.410%, 4/16/12 | | | AAA | | | | 1,319 | | | | 1,333 | |
See accompanying Notes to Financial Statements.
December 31, 2010 | William Blair Funds 41 |
Low Duration Fund
Portfolio of Investments, December 31, 2010 (all amounts in thousands)
| | | | | | | | | | | | |
Issuer | | NRSRO
Rating
(unaudited) | | | Principal
Amount | | | Value | |
|
Consumer Asset-Backed Securities—(continued) | |
Volkswagen Auto Loan Enhanced Trust, 2010-1, Tranche A2, 0.660%, 5/21/12 | | | AAA | | | $ | 1,437 | | | $ | 1,438 | |
USAA Auto Owner Trust, 2010-1, Tranche A2, 0.630%, 6/15/12 | | | AAA | | | | 716 | | | | 717 | |
Ford Credit Auto Owner Trust, 2007-B, Tranche A4A, 5.240%, 7/15/12 | | | AAA | | | | 530 | | | | 540 | |
CNH Equipment Trust, 2008-B, Tranche A3A, 4.780%, 7/16/12 | | | AAA | | | | 37 | | | | 37 | |
CNH Equipment Trust, 2009-C, Tranche A2, 0.950%, 8/15/12 | | | AAA | | | | 91 | | | | 91 | |
CNH Equipment Trust, 2010-A, Tranche A2, 0.810%, 8/15/12 | | | AAA | | | | 798 | | | | 799 | |
BMW Vehicle Lease Trust, 2010-1, Tranche A2, 0.580%, 9/17/12 | | | Aaa | | | | 500 | | | | 500 | |
BMW Vehicle Owner Trust, 2010-A, Tranche A2, 0.680%, 9/25/12 | | | AAA | | | | 1,237 | | | | 1,238 | |
Capital Auto Receivables Asset Trust, 2008-2, Tranche A3B, 1.710%, 10/15/12, VRN | | | AAA | | | | 499 | | | | 501 | |
USAA Auto Owner Trust, 2008-3, Tranche A3, 4.280%, 10/15/12 | | | AAA | | | | 31 | | | | 31 | |
Ford Credit Auto Owner Trust, 2010-B, Tranche A2, 0.650%, 12/15/12 | | | Aaa | | | | 1,200 | | | | 1,201 | |
Chrysler Financial Auto Securitization Trust, 2010-A, Tranche A2, 0.690%, 1/8/13 | | | AAA | | | | 1,000 | | | | 1,000 | |
CarMax Auto Owner Trust, 2009-1, Tranche A3, 4.120%, 3/15/13 | | | AAA | | | | 384 | | | | 390 | |
Nissan Auto Lease Trust, 2010-A, Tranche A2, 1.100%, 3/15/13 | | | AAA | | | | 1,205 | | | | 1,207 | |
BMW Vehicle Owner Trust, 2010-A, Tranche A3, 1.390%, 4/25/13 | | | AAA | | | | 300 | | | | 302 | |
Ford Credit Auto Owner Trust, 2009-A, Tranche A3A, 3.960%, 5/15/13 | | | AAA | | | | 414 | | | | 421 | |
Bank of America Credit Card Trust, 2007-A2, Tranche A2, 0.280%, 6/17/13, VRN | | | AAA | | | | 1,283 | | | | 1,283 | |
USAA Auto Owner Trust, 2009-1, Tranche A3, 3.020%, 6/17/13 | | | AAA | | | | 899 | | | | 910 | |
Citibank Credit Card Issuance Trust, 2009-A3, Tranche A3, 2.700%, 6/24/13 | | | AAA | | | | 100 | | | | 101 | |
American Express Issuance Trust, 2007-2, Tranche A, 0.510%, 7/15/13, VRN | | | AAA | | | | 373 | | | | 373 | |
American Express Credit Account Master Trust, 2008-1, Tranche A, 0.710%, 8/15/13, VRN | | | AAA | | | | 1,200 | | | | 1,200 | |
American Express Credit Account Master Trust—144A, 2006-B, Tranche A, 0.300%, 8/15/13, VRN | | | AAA | | | | 1,070 | | | | 1,070 | |
Discover Card Master Trust I, 2006-1, Tranche A2, 0.310%, 8/16/13, VRN | | | AAA | | | | 354 | | | | 354 | |
| | | | | | | | | | | | |
Issuer | | NRSRO
Rating
(unaudited) | | | Principal
Amount | | | Value | |
|
Consumer Asset-Backed Securities—(continued) | |
Ford Credit Auto Owner Trust, 2009-D, Tranche A3, 2.170%, 10/15/13 | | | AAA | | | $ | 1,160 | | | $ | 1,173 | |
John Deere Owner Trust, 2009-A, Tranche A3, 2.590%, 10/15/13 | | | AAA | | | | 1,344 | | | | 1,357 | |
John Deere Owner Trust, 2009-B, Tranche A3, 1.570%, 10/15/13 | | | AAA | | | | 865 | | | | 871 | |
Avis Budget Rental Car Funding AESOP LLC—144A, 2009-1A, Tranche A, 9.310%, 10/20/13 | | | Aa1 | | | | 2,000 | | | | 2,189 | |
Harley-Davidson Motorcycle Trust, 2009-1, Tranche A3, 3.190%, 11/15/13 | | | AAA | | | | 2,411 | | | | 2,444 | |
Citibank Credit Card Issuance Trust, 2004-A7, Tranche A7, 0.374%, 11/25/13, VRN | | | AAA | | | | 1,043 | | | | 1,041 | |
CNH Equipment Trust, 2009-C, Tranche A3, 1.850%, 12/16/13 | | | AAA | | | | 351 | | | | 354 | |
Capital One Multi-Asset Execution Trust, 2006-A6, Tranche A6, 5.300%, 2/18/14 | | | AAA | | | | 652 | | | | 661 | |
Avis Budget Rental Car Funding AESOP LLC—144A, 2009-2A, Tranche A, 5.680%, 2/20/14 | | | Aaa | | | | 1,500 | | | | 1,607 | |
Harley-Davidson Motorcycle Trust, 2009-2, Tranche A3, 2.620%, 3/15/14 | | | AAA | | | | 825 | | | | 834 | |
Capital One Multi-Asset Execution Trust, 2006-A7, Tranche A7, 0.290%, 3/17/14, VRN | | | AAA | | | | 1,000 | | | | 999 | |
Capital One Multi-Asset Execution Trust, 2008-A6, Tranche A6, 1.360%, 3/17/14, VRN | | | AAA | | | | 1,610 | | | | 1,615 | |
Citibank Credit Card Issuance Trust, 2009-A1, Tranche A1, 2.010%, 3/17/14, VRN | | | AAA | | | | 200 | | | | 204 | |
Volkswagen Auto Lease Trust, 2009-A, Tranche A4, 4.590%, 3/17/14 | | | AAA | | | | 2,000 | | | | 2,052 | |
Hertz Vehicle Financing LLC—144A, 2009-2A, Tranche A1, 4.260%, 3/25/14 | | | Aaa | | | | 1,765 | | | | 1,847 | |
Chase Issuance Trust, 2007-A9, Tranche A, 3.151%, 6/16/14, VRN | | | AAA | | | | 2,000 | | | | 1,993 | |
Nissan Auto Receivables Owner Trust, 2008-A, Tranche A4, 4.280%, 6/16/14 | | | AAA | | | | 120 | | | | 122 | |
CNH Equipment Trust, 2010-A, Tranche A3, 1.540%, 7/15/14 | | | AAA | | | | 1,175 | | | | 1,184 | |
Nissan Auto Receivables Owner Trust, 2010-A, Tranche A3, 0.870%, 7/15/14 | | | AAA | | | | 500 | | | | 499 | |
Daimler Chrysler Auto Trust, 2008-A, Tranche A4, 4.480%, 8/8/14 | | | AAA | | | | 1,500 | | | | 1,538 | |
Citibank Credit Card Issuance Trust, 2007-A7, Tranche A7, 0.611%, 8/20/14, VRN | | | AAA | | | | 200 | | | | 200 | |
See accompanying Notes to Financial Statements.
42 Annual Report | December 31, 2010 |
Low Duration Fund
Portfolio of Investments, December 31, 2010 (all amounts in thousands)
| | | | | | | | | | | | |
Issuer | | NRSRO
Rating
(unaudited) | | | Principal
Amount | | | Value | |
|
Consumer Asset-Backed Securities—(continued) | |
American Express Credit Account Master Trust, 2007-5, Tranche A, 0.290%, 12/15/14, VRN | | | AAA | | | $ | 1,000 | | | $ | 998 | |
Nissan Master Owner Trust Receivables—144A, 2010-AA, Tranche A, 1.410%, 1/15/15, VRN | | | AAA | | | | 2,000 | | | | 2,023 | |
Capital One Multi-Asset Execution Trust, 2007-A4, Tranche A4, 0.290%, 3/16/15, VRN | | | AAA | | | | 1,778 | | | | 1,769 | |
Discover Card Master Trust, 2007-A2, Tranche A2, 0.642%, 6/15/15, VRN | | | AAA | | | | 192 | | | | 192 | |
Chase Issuance Trust, 2008-A10, Tranche A10, 1.010%, 8/17/15, VRN | | | AAA | | | | 2,000 | | | | 2,024 | |
Bank of America Credit Card Trust, 2010-A1, Tranche A1, 0.560%, 9/15/15, VRN | | | AAA | | | | 1,330 | | | | 1,330 | |
Discover Card Master Trust, 2010-A1, Tranche A1, 0.910%, 9/15/15, VRN | | | Aaa | | | | 347 | | | | 349 | |
Ford Credit Floorplan Master Owner Trust, 2010-A5, Tranche A2, 0.960%, 9/15/15, VRN | | | AAA | | | | 1,700 | | | | 1,700 | |
Chase Issuance Trust, 2008-A3, Tranche A, 1.360%, 3/15/16, VRN | | | AAA | | | | 2,000 | | | | 2,051 | |
| | | | | | | | | | | | |
Total Consumer Asset-Backed Securities | | | | 58,862 | |
| | | | | | | | | | | | |
| | | |
Corporate Obligations—11.8% | | | | | | | | | | | | |
Teva Pharmaceutical Finance III LLC, 1.500%, due 6/15/12 | | | A | - | | | 1,000 | | | | 1,009 | |
General Electric Capital Corporation, 3.500%, due 8/13/12 | | | AA | + | | | 1,000 | | | | 1,036 | |
Johnson & Johnson,
5.150%, due 8/15/12 | | | AAA | | | | 1,900 | | | | 2,038 | |
NRSRO = Nationally Recognized Statistical Rating Organization—The credit quality ratings of the securities in the Fund reflect the highest category rating by either Fitch Ratings, Moody’s Investors Service Inc., or Standard & Poor’s, a division of the McGraw-Hill Companies, Inc. The obligations of certain U.S. Government-sponsored securities are neither issued nor guaranteed by the U.S. Treasury.
VRN = Variable Rate Note
| | | | | | | | | | | | |
Issuer | | NRSRO
Rating
(unaudited) | | | Principal
Amount | | | Value | |
|
Corporate Obligations—(continued) | |
Bank of America Corporation, 5.375%, due 9/11/12 | | | A | + | | $ | 1,000 | | | $ | 1,050 | |
ConocoPhillips, 4.750%, due 10/15/12 | | | A | 1 | | | 1,000 | | | | 1,071 | |
Citigroup, Inc., 5.300%, due 10/17/12 | | | A | + | | | 1,000 | | | | 1,059 | |
Wells Fargo & Co.,
5.250%, due 10/23/12 | | | AA | - | | | 1,000 | | | | 1,072 | |
Morgan Stanley, 5.250%, due 11/2/12 | | | A | | | | 1,000 | | | | 1,067 | |
The Procter & Gamble Co.,
0.324%, due 11/14/12, VRN | | | AA | - | | | 700 | | | | 701 | |
The Walt Disney Co.,
4.700%, due 12/1/12 | | | A | | | | 1,500 | | | | 1,608 | |
Hewlett-Packard Co.,
4.500%, due 3/1/13 | | | A | + | | | 1,000 | | | | 1,070 | |
American Honda Finance Corp.—144A, 2.375%, due 3/18/13 | | | A | + | | | 1,000 | | | | 1,017 | |
American Express Co., 4.875%, due 7/15/13 | | | A | + | | | 1,000 | | | | 1,069 | |
MetLife, Inc., 2.375%, due 2/6/14 | | | A | - | | | 475 | | | | 477 | |
The Boeing Co., 5.000%, due 3/15/14 | | | A | + | | | 375 | | | | 411 | |
Shell International Finance BV, 4.000%, due 3/21/14 | | | Aa1 | | | | 1,142 | | | | 1,215 | |
| | | | | | | | | | | | |
Total Corporate Obligations | | | | 16,970 | |
| | | | | | | | | | | | |
Total Long-Term Investments—94.4%
(cost $135,633) | | | | 135,533 | |
| | | | | | | | | | | | |
| | | |
Repurchase Agreement | | | | | | | | | | | | |
State Street Bank and Trust Company, 0.150% dated 12/31/10, due 1/3/11, repurchase price $5,994, collateralized by U.S. Treasury Note, 2.750%, due 12/31/17 | | | AAA | | | | 5,994 | | | | 5,994 | |
| | | | | | | | | | | | |
Total Repurchase Agreement—4.2%
(cost $5,994) | | | | 5,994 | |
| | | | | | | | | | | | |
Total Investments—98.6%
(cost $141,627) | | | | 141,527 | |
Cash and other assets, less liabilities—1.4% | | | | 1,943 | |
| | | | | | | | | | | | |
Net assets—100.0% | | | $ | 143,470 | |
| | | | | |
See accompanying Notes to Financial Statements.
December 31, 2010 | William Blair Funds 43 |
Statements of Assets and Liabilities
December 31, 2010 (dollar amounts in thousands)
| | | | | | | | | | | | |
| | | Institutional
International
Growth
Fund | | | Institutional
International
Equity
Fund | | | International
Small Cap
Growth
Fund | |
Assets | | | | | | | | | | | | |
Investments in securities, at cost | | $ | 1,549,615 | | | $ | 220,110 | | | $ | 515,337 | |
| | | |
Investments in securities, at value | | $ | 1,894,162 | | | $ | 289,896 | | | $ | 650,626 | |
Cash | | | 46 | | | | — | | | | — | |
Foreign currency, at value (cost $282, $1,959 and $1,756). | | | 286 | | | | 2,055 | | | | 2,010 | |
Receivable for securities sold | | | 1,103 | | | | 49 | | | | 2,226 | |
Receivable for fund shares sold | | | 1,402 | | | | — | | | | 1,952 | |
Dividend and interest receivable | | | 3,147 | | | | 569 | | | | 1,322 | |
| | | | | | | | | | | | |
Total assets | | | 1,900,146 | | | | 292,569 | | | | 658,136 | |
Liabilities | | | | | | | | | | | | |
Payable for investment securities purchased | | | 11,951 | | | | — | | | | 10,331 | |
Payable for fund shares redeemed | | | 338 | | | | 575 | | | | 202 | |
Unrealized depreciation on forward foreign currency contracts | | | — | | | | 227 | | | | — | |
Management fee payable | | | 1,479 | | | | 244 | | | | 531 | |
Distribution and shareholder service fee payable | | | — | | | | — | | | | 51 | |
Other payables and accrued expenses | | | 161 | | | | 55 | | | | 70 | |
| | | | | | | | | | | | |
Total liabilities | | | 13,929 | | | | 1,101 | | | | 11,185 | |
| | | | | | | | | | | | |
Net Assets | | $ | 1,886,217 | | | $ | 291,468 | | | $ | 646,951 | |
| | | | | | | | | | | | |
Capital | | | | | | | | | | | | |
Composition of Net Assets | | | | | | | | | | | | |
Par value of shares of beneficial interest | | $ | 131 | | | $ | 27 | | | $ | 49 | |
Capital paid in excess of par value | | | 1,824,503 | | | | 382,156 | | | | 627,801 | |
Accumulated net investment income (loss) | | | (4,934 | ) | | | (357 | ) | | | (586 | ) |
Accumulated net realized gain (loss) | | | (278,065 | ) | | | (160,037 | ) | | | (115,660 | ) |
Net unrealized appreciation (depreciation) of investments and foreign currencies | | | 344,582 | | | | 69,679 | | | | 135,347 | |
| | | | | | | | | | | | |
Net Assets | | $ | 1,886,217 | | | $ | 291,468 | | | $ | 646,951 | |
| | | | | | | | | | | | |
| | | |
Net Assets | | $ | 1,886,217 | | | $ | 291,468 | | | | | |
Shares Outstanding | | | 131,218,332 | | | | 27,039,965 | | | | | |
Net Asset Value Per Share | | $ | 14.37 | | | $ | 10.78 | | | | | |
Institutional Share Class | | | | | | | | | | | | |
Net Assets | | | | | | | | | | $ | 275,356 | |
Shares Outstanding | | | | | | | | | | | 20,792,208 | |
Net Asset Value Per Share | | | | | | | | | | $ | 13.24 | |
See accompanying Notes to Financial Statements.
44 Annual Report | December 31, 2010 |
Statements of Operations
for the Year Ended December 31, 2010 (dollar amounts in thousands)
| | | | | | | | | | | | |
| | | Institutional
International
Growth
Fund | | | Institutional
International
Equity
Fund | | | International
Small Cap
Growth
Fund | |
Investment income | | | | | | | | | | | | |
Dividends | | $ | 34,646 | | | $ | 7,339 | | | $ | 9,506 | |
Less foreign tax withheld | | | (2,567 | ) | | | (565 | ) | | | (564 | ) |
Interest | | | 107 | | | | 9 | | | | 91 | |
| | | | | | | | | | | | |
Total income | | | 32,186 | | | | 6,783 | | | | 9,033 | |
Expenses | | | | | | | | | | | | |
Investment advisory fees | | | 14,477 | | | | 3,311 | | | | 4,866 | |
Distribution fees | | | — | | | | — | | | | 46 | |
Shareholder services fees | | | — | | | | — | | | | 418 | |
Custodian fees | | | 356 | | | | 124 | | | | 153 | |
Transfer agent fees | | | 30 | | | | 8 | | | | 31 | |
Sub-transfer agent fees | | | | | | | | | | | | |
Class N | | | — | | | | — | | | | 12 | |
Class I | | | — | | | | — | | | | 57 | |
Professional fees | | | 88 | | | | 50 | | | | 52 | |
Registration fees | | | 33 | | | | 22 | | | | 75 | |
Shareholder reporting fees | | | 44 | | | | 20 | | | | 59 | |
Trustee fees | | | 49 | | | | 13 | | | | 15 | |
Other expenses | | | 32 | | | | 9 | | | | 14 | |
| | | | | | | | | | | | |
Total expenses | | | 15,109 | | | | 3,557 | | | | 5,798 | |
| | | | | | | | | | | | |
Net investment income | | | 17,077 | | | | 3,226 | | | | 3,235 | |
Realized and unrealized gain (loss) | | | | | | | | | | | | |
Net realized gain (loss) on transactions from: | | | | | | | | | | | | |
Investments | | | 210,729 | | | | 44,977 | | | | 57,943 | |
Foreign currency transactions | | | 10,006 | | | | (187 | ) | | | (849 | ) |
| | | | | | | | | | | | |
Total net realized gain | | | 220,735 | | | | 44,790 | | | | 57,094 | |
Change in net unrealized appreciation (depreciation) of: | | | | | | | | | | | | |
Investments | | | 73,046 | | | | (14,068 | ) | | | 62,276 | |
Foreign currency translations | | | (4,447 | ) | | | (152 | ) | | | 39 | |
| | | | | | | | | | | | |
Total change in net unrealized appreciation (depreciation) | | | 68,599 | | | | (14,220 | ) | | | 62,315 | |
| | | | | | | | | | | | |
Net increase in net assets resulting from operations | | $ | 306,411 | | | $ | 33,796 | | | $ | 122,644 | |
| | | | | | | | | | | | |
See accompanying Notes to Financial Statements.
December 31, 2010 | William Blair Funds 45 |
Statements of Changes in Net Assets
for the Years Ended December 31, 2010 and 2009 (dollar amounts in thousands)
| | | | | | | | | | | | | | | | | | | | | | | | |
| | | Institutional
International
Growth
Fund | | | Institutional
International
Equity
Fund | | | International
Small Cap
Growth
Fund | |
| | | 2010 | | | 2009 | | | 2010 | | | 2009 | | | 2010 | | | 2009 | |
Operations | | | | | | | | | | | | | | | | | | | | | | | | |
Net investment income | | $ | 17,077 | | | $ | 10,704 | | | $ | 3,226 | | | $ | 3,447 | | | $ | 3,235 | | | $ | 1,001 | |
Net realized gain (loss) on investments and foreign currency transactions | | | 220,735 | | | | (117,747 | ) | | | 44,790 | | | | (66,506 | ) | | | 57,094 | | | | (30,308 | ) |
Change in net unrealized appreciation (depreciation) on investments and foreign currency translation | | | 68,599 | | | | 519,807 | | | | (14,220 | ) | | | 151,206 | | | | 62,315 | | | | 174,254 | |
| | | | | | | | | | | | | | | | | | | | | | | | |
Net increase in net assets resulting from operations | | | 306,411 | | | | 412,764 | | | | 33,796 | | | | 88,147 | | | | 122,644 | | | | 144,947 | |
Distributions to shareholders from | | | | | | | | | | | | | | | | | | | | | | | | |
Net investment income | | | (35,383 | ) | | | (18,261 | ) | | | (4,059 | ) | | | (2,719 | ) | | | (2,781 | ) | | | (778 | ) |
Net realized gain | | | — | | | | — | | | | — | | | | — | | | | — | | | | — | |
| | | | | | | | | | | | | | | | | | | | | | | | |
| | | (35,383 | ) | | | (18,261 | ) | | | (4,059 | ) | | | (2,719 | ) | | | (2,781 | ) | | | (778 | ) |
Capital stock transactions | | | | | | | | | | | | | | | | | | | | | | | | |
Net proceeds from sale of shares | | | 585,127 | | | | 165,765 | | | | 31,823 | | | | 20,848 | | | | 222,392 | | | | 139,125 | |
Shares issued in reinvestment of income dividends and capital gain distributions | | | 33,238 | | | | 16,959 | | | | 3,868 | | | | 2,587 | | | | 2,417 | | | | 676 | |
Less cost of shares redeemed | | | (379,024 | ) | | | (199,645 | ) | | | (139,231 | ) | | | (104,043 | ) | | | (88,572 | ) | | | (185,107 | ) |
| | | | | | | | | | | | | | | | | | | | | | | | |
Net increase (decrease) in net assets resulting from capital share transactions | | | 239,341 | | | | (16,921 | ) | | | (103,540 | ) | | | (80,608 | ) | | | 136,237 | | | | (45,306 | ) |
| | | | | | | | | | | | | | | | | | | | | | | | |
Increase (decrease) in net assets | | | 510,369 | | | | 377,582 | | | | (73,803 | ) | | | 4,820 | | | | 256,100 | | | | 98,863 | |
Net assets | | | | | | | | | | | | | | | | | | | | | | | | |
Beginning of year | | | 1,375,848 | | | | 998,266 | | | | 365,271 | | | | 360,451 | | | | 390,851 | | | | 291,988 | |
| | | | | | | | | | | | | | | | | | | | | | | | |
End of year | | $ | 1,886,217 | | | $ | 1,375,848 | | | $ | 291,468 | | | $ | 365,271 | | | $ | 646,951 | | | $ | 390,851 | |
| | | | | | | | | | | | | | | | | | | | | | | | |
Accumulated net investment income (loss) at the end of the year | | $ | (4,934 | ) | | $ | (4,182 | ) | | $ | (357 | ) | | $ | 1 | | | $ | (586 | ) | | $ | (191 | ) |
| | | | | | | | | | | | | | | | | | | | | | | | |
See accompanying Notes to Financial Statements.
46 Annual Report | December 31, 2010 |
Statements of Assets and Liabilities
December 31, 2010 (dollar amounts in thousands)
| | | | | | | | | | | | | | | | |
| | | Emerging
Markets
Growth
Fund | | | Emerging
Leaders
Growth
Fund | | | Bond
Fund | | | Low
Duration
Fund | |
Assets | | | | | | | | | | | | | | | | |
Investments in securities, at cost | | $ | 962,851 | | | $ | 77,904 | | | $ | 181,324 | | | $ | 141,627 | |
| | | | |
Investments in securities, at value | | $ | 1,247,599 | | | $ | 95,531 | | | $ | 191,127 | | | $ | 141,527 | |
Foreign currency, at value (cost $1,558 and $298) | | | 1,610 | | | | 300 | | | | — | | | | — | |
Receivable for securities sold | | | 4,731 | | | | 1,391 | | | | — | | | | — | |
Receivable for fund shares sold | | | 360 | | | | 595 | | | | 36 | | | | 1,840 | |
Receivable from Advisor | | | — | | | | 20 | | | | 7 | | | | 36 | |
Dividend and interest receivable | | | 500 | | | | 21 | | | | 1,891 | | | | 436 | |
| | | | | | | | | | | | | | | | |
Total assets | | | 1,254,800 | | | | 97,858 | | | | 193,061 | | | | 143,839 | |
Liabilities | | | | | | | | | | | | | | | | |
Payable for investment securities purchased | | | 2,868 | | | | 2,830 | | | | — | | | | — | |
Payable for fund shares redeemed | | | 15 | | | | — | | | | 178 | | | | 278 | |
Management fee payable | | | 1,142 | | | | 86 | | | | 49 | | | | 35 | |
Distribution and shareholder service fee payable | | | 36 | | | | 2 | | | | 20 | | | | 13 | |
Other payables and accrued expenses | | | 196 | | | | 39 | | | | 38 | | | | 43 | |
| | | | | | | | | | | | | | | | |
Total liabilities | | | 4,257 | | | | 2,957 | | | | 285 | | | | 369 | |
| | | | | | | | | | | | | | | | |
Net Assets | | $ | 1,250,543 | | | $ | 94,901 | | | $ | 192,776 | | | $ | 143,470 | |
| | | | | | | | | | | | | | | | |
Capital | | | | | | | | | | | | | | | | |
Composition of Net Assets | | | | | | | | | | | | | | | | |
Par value of shares of beneficial interest | | $ | 78 | | | $ | 9 | | | $ | 18 | | | $ | 14 | |
Capital paid in excess of par value | | | 994,772 | | | | 76,736 | | | | 182,717 | | | | 144,660 | |
Accumulated net investment income (loss) | | | (12,327 | ) | | | (131 | ) | | | 1 | | | | — | |
Accumulated net realized gain (loss) | | | (16,774 | ) | | | 665 | | | | 237 | | | | (1,104 | ) |
Net unrealized appreciation (depreciation) of investments and foreign currencies | | | 284,794 | | | | 17,622 | | | | 9,803 | | | | (100 | ) |
| | | | | | | | | | | | | | | | |
Net Assets | | $ | 1,250,543 | | | $ | 94,901 | | | $ | 192,776 | | | $ | 143,470 | |
| | | | | | | | | | | | | | | | |
| | | | |
Institutional Share Class | | | | | | | | | | | | | | | | |
Net Assets | | $ | 1,021,456 | | | $ | 78,516 | | | $ | 40,490 | | | $ | 47,965 | |
Shares Outstanding | | | 63,996,622 | | | | 7,584,820 | | | | 3,826,077 | | | | 4,845,665 | |
Net Asset Value Per Share | | $ | 15.96 | | | $ | 10.35 | | | $ | 10.58 | | | $ | 9.90 | |
See accompanying Notes to Financial Statements.
December 31, 2010 | William Blair Funds 47 |
Statements of Operations
for the Year Ended December 31, 2010 (dollar amounts in thousands)
| | | | | | | | | | | | | | | | |
| | | Emerging
Markets
Growth
Fund | | | Emerging
Leaders
Growth
Fund | | | Bond
Fund | | | Low
Duration
Fund | |
Investment income | | | | | | | | | | | | | | | | |
Dividends | | $ | 19,206 | | | $ | 1,889 | | | $ | — | | | $ | — | |
Less foreign tax withheld | | | (1,553 | ) | | | (167 | ) | | | — | | | | — | |
Interest | | | 125 | | | | 1 | | | | 8,921 | | | | 2,557 | |
| | | | | | | | | | | | | | | | |
Total income | | | 17,778 | | | | 1,723 | | | | 8,921 | | | | 2,557 | |
Expenses | | | | | | | | | | | | | | | | |
Investment advisory fees | | | 12,197 | | | | 1,090 | | | | 546 | | | | 381 | |
Distribution fees | | | 70 | | | | — | | | | 6 | | | | 7 | |
Shareholder services fees | | | 302 | | | | 17 | | | | 228 | | | | 127 | |
Custodian fees | | | 549 | | | | 138 | | | | 53 | | | | 52 | |
Transfer agent fees | | | 51 | | | | 11 | | | | 22 | | | | 15 | |
Sub-transfer agent fees | | | | | | | | | | | | | | | | |
Class N | | | 15 | | | | — | | | | — | | | | — | |
Class I | | | 68 | | | | — | | | | 4 | | | | — | |
Professional fees | | | 75 | | | | 36 | | | | 32 | | | | 28 | |
Registration fees | | | 57 | | | | 44 | | | | 48 | | | | 111 | |
Shareholder reporting fees | | | 25 | | | | 3 | | | | 3 | | | | 5 | |
Trustee fees | | | 37 | | | | 4 | | | | 5 | | | | 3 | |
Other expenses | | | 27 | | | | 10 | | | | 13 | | | | 11 | |
| | | | | | | | | | | | | | | | |
Total expenses before waiver | | | 13,473 | | | | 1,353 | | | | 960 | | | | 740 | |
Expenses waived by the Advisor | | | — | | | | (98 | ) | | | (90 | ) | | | (98 | ) |
| | | | | | | | | | | | | | | | |
Net expenses | | | 13,473 | | | | 1,255 | | | | 870 | | | | 642 | |
| | | | | | | | | | | | | | | | |
Net investment income | | | 4,305 | | | | 468 | | | | 8,051 | | | | 1,915 | |
Realized and unrealized gain (loss) | | | | | | | | | | | | | | | | |
Net realized gain (loss) on transactions from: | | | | | | | | | | | | | | | | |
Investments | | | 248,631 | | | | 34,229 | | | | 2,212 | | | | (60 | ) |
Foreign currency transactions | | | (3,290 | ) | | | (573 | ) | | | — | | | | — | |
| | | | | | | | | | | | | | | | |
Total net realized gain (loss) | | | 245,341 | | | | 33,656 | | | | 2,212 | | | | (60 | ) |
Change in net unrealized appreciation (depreciation) of: | | | | | | | | | | | | | | | | |
Investments | | | 13,573 | | | | (16,310 | ) | | | 3,290 | | | | 468 | |
Foreign currency translations | | | (17 | ) | | | (5 | ) | | | — | | | | — | |
| | | | | | | | | | | | | | | | |
Total change in net unrealized appreciation (depreciation) | | | 13,556 | | | | (16,315 | ) | | | 3,290 | | | | 468 | |
| | | | | | | | | | | | | | | | |
Net increase in net assets resulting from operations | | $ | 263,202 | | | $ | 17,809 | | | $ | 13,553 | | | $ | 2,323 | |
| | | | | | | | | | | | | | | | |
See accompanying Notes to Financial Statements.
48 Annual Report | December 31, 2010 |
Statements of Changes in Net Assets
for the Years Ended December 31, 2010 and 2009 (dollar amounts in thousands)
| | | | | | | | | | | | | | | | | | | | | | | | | | | | | | | | |
| | | Emerging
Markets
Growth
Fund | | | Emerging
Leaders
Growth
Fund | | | Bond
Fund | | | Low
Duration
Fund | |
| | | 2010 | | | 2009 | | | 2010 | | | 2009 | | | 2010 | | | 2009 | | | 2010 | | | 2009(a) | |
Operations | | | | | | | | | | | | | | | | | | | | | | | | | | | | | | | | |
Net investment income | | $ | 4,305 | | | $ | 3,476 | | | $ | 468 | | | $ | 507 | | | $ | 8,051 | | | $ | 6,076 | | | $ | 1,915 | | | $ | 78 | |
Net realized gain (loss) on investments and foreign currency transactions | | | 245,341 | | | | (59,561 | ) | | | 33,656 | | | | 3,205 | | | | 2,212 | | | | 284 | | | | (60 | ) | | | — | |
Change in net unrealized appreciation (depreciation) on investment and foreign currency transactions | | | 13,556 | | | | 461,348 | | | | (16,315 | ) | | | 51,098 | | | | 3,290 | | | | 7,229 | | | | 468 | | | | (568 | ) |
| | | | | | | | | | | | | | | | | | | | | | | | | | | | | | | | |
Net increase (decrease) in net assets resulting from operations | | | 263,202 | | | | 405,263 | | | | 17,809 | | | | 54,810 | | | | 13,553 | | | | 13,589 | | | | 2,323 | | | | (490 | ) |
Distributions to shareholders from | | | | | | | | | | | | | | | | | | | | | | | | | | | | | | | | |
Net investment income | | | (13,461 | ) | | | (11,127 | ) | | | (255 | ) | | | (1,588 | ) | | | (8,566 | ) | | | (6,213 | ) | | | (2,958 | ) | | | (86 | ) |
Net realized gain | | | — | | | | — | | | | (505 | ) | | | — | | | | (494 | ) | | | — | | | | — | | | | — | |
| | | | | | | | | | | | | | | | | | | | | | | | | | | | | | | | |
| | | (13,461 | ) | | | (11,127 | ) | | | (760 | ) | | | (1,588 | ) | | | (9,060 | ) | | | (6,213 | ) | | | (2,958 | ) | | | (86 | ) |
Capital stock transactions | | | | | | | | | | | | | | | | | | | | | | | | | | | | | | | | |
Net proceeds from sale of shares | | | 357,761 | | | | 422,203 | | | | 14,224 | | | | 42,409 | | | | 90,709 | | | | 77,912 | | | | 149,882 | | | | 97,472 | |
Shares issued in reinvestment of income dividends and capital gain distributions | | | 12,072 | | | | 10,336 | | | | 681 | | | | 1,466 | | | | 6,013 | | | | 4,029 | | | | 2,297 | | | | 37 | |
Less cost of shares redeemed | | | (407,291 | ) | | | (174,003 | ) | | | (52,189 | ) | | | (28,637 | ) | | | (55,783 | ) | | | (16,586 | ) | | | (103,208 | ) | | | (1,799 | ) |
| | | | | | | | | | | | | | | | | | | | | | | | | | | | | | | | |
Net increase (decrease) in net assets resulting from capital share transactions | | | (37,458 | ) | | | 258,536 | | | | (37,284 | ) | | | 15,238 | | | | 40,939 | | | | 65,355 | | | | 48,971 | | | | 95,710 | |
| | | | | | | | | | | | | | | | | | | | | | | | | | | | | | | | |
Increase (decrease) in net assets | | | 212,283 | | | | 652,672 | | | | (20,235 | ) | | | 68,460 | | | | 45,432 | | | | 72,731 | | | | 48,336 | | | | 95,134 | |
Net assets | | | | | | | | | | | | | | | | | | | | | | | | | | | | | | | | |
Beginning of year | | | 1,038,260 | | | | 385,588 | | | | 115,136 | | | | 46,676 | | | | 147,344 | | | | 74,613 | | | | 95,134 | | | | — | |
| | | | | | | | | | | | | | | | | | | | | | | | | | | | | | | | |
End of year | | $ | 1,250,543 | | | $ | 1,038,260 | | | $ | 94,901 | | | $ | 115,136 | | | $ | 192,776 | | | $ | 147,344 | | | $ | 143,470 | | | $ | 95,134 | |
| | | | | | | | | | | | | | | | | | | | | | | | | | | | | | | | |
Accumulated net investment income (loss) at the end of the year | | $ | (12,327 | ) | | $ | (7,584 | ) | | $ | (131 | ) | | $ | (297 | ) | | $ | 1 | | | $ | — | | | $ | — | | | $ | — | |
| | | | | | | | | | | | | | | | | | | | | | | | | | | | | | | | |
| (a) | | For the period December 1, 2009 (Commencement of Operations) to December 31, 2010. |
See accompanying Notes to Financial Statements.
December 31, 2010 | William Blair Funds 49 |
Notes to Financial Statements
(1) Significant Accounting Policies
The following is a summary of William Blair Funds’ (the “Fund”) significant accounting policies in effect during the year covered by the financial statements, which are in accordance with U.S. generally accepted accounting principles.
(a) Description of the Fund
William Blair Funds is a diversified mutual fund registered under the Investment Company Act of 1940 (the “1940 Act”), as amended, as an open-end management investment company. The number of shares authorized for this Fund is unlimited. The Fund currently consists of the following nineteen portfolios (the “Portfolios”), each with its own investment objective and policies.
| | |
Equity Portfolios | | International Equity Portfolios |
Growth Large Cap Growth Small Cap Growth Mid Cap Growth Small-Mid Cap Growth Small Cap Value Mid Cap Value Global Equity Portfolio Global Growth | | International Growth International Equity Institutional International Growth Institutional International Equity International Small Cap Growth Emerging Markets Growth Emerging Leaders Growth Fixed-Income Portfolios Bond Income Low Duration Money Market Portfolio Ready Reserves |
The investment objectives of the Portfolios are as follows:
| | |
Equity | | Long-term capital appreciation. |
Global Equity | | Long-term capital appreciation. |
International Equity | | Long-term capital appreciation. |
Fixed-Income | | High level of current income with relative stability of principal.
(Maximize total return—Low Duration) |
Money Market | | Current income, a stable share price and daily liquidity. |
The Institutional International Growth Portfolio, the Institutional International Equity Portfolio and the Institutional Share Classes of the International Small Cap Growth Portfolio, the Emerging Markets Growth Portfolio, the Emerging Leaders Growth Portfolio, Bond Portfolio, and the Low Duration Portfolio are the only Portfolios covered in this report.
(b) Share Classes
Three different classes of shares of the International Small Cap Growth Fund, Emerging Markets Growth Fund, Emerging Leaders Growth Fund, Bond Fund and the Low Duration Fund currently exist: N, I and Institutional. This report includes financial information for only the Institutional Class. The Institutional share class is sold to institutional investors, including but not limited to employee benefit plans, endowments, foundations, trusts and corporations, who are able to meet the Fund’s high minimum investment requirement. The minimum initial investment required is $5 million.
Investment income realized and unrealized gains and losses, and certain Portfolio level expenses and expense reductions, if any, are allocated based on the relative net assets of each class, except for certain class specific expenses, which are charged directly to the appropriate class. Differences in class expenses may result in the payment of different per share dividends by class. All share classes of the Portfolios have equal rights with respect to voting subject to class specific arrangements.
50 Annual Report | December 31, 2010 |
(c) Investment Valuation
The market value of domestic equity securities is determined by valuing securities traded on national securities markets or in the over-the-counter markets at the last sale price or, if applicable, the official closing price or, in the absence of a recent sale on the date of determination, at the latest bid price.
The value of foreign equity securities is generally determined based upon the last sale price on the foreign exchange or market on which it is primarily traded and in the currency of that market as of the close of the appropriate exchange or, if there have been no sales during that day, at the latest bid price. The Board of Trustees has determined that the passage of time between when the foreign exchanges or markets close and when the Portfolios compute their net asset values could cause the value of foreign equity securities to no longer be representative or accurate, and as a result, may necessitate that such securities be fair valued. Accordingly, for foreign equity securities, the Portfolios may use an independent pricing service to fair value price the security as of the close of regular trading on the New York Stock Exchange. As a result, a Portfolio’s value for a security may be different from the last sale price (or the latest bid price).
Fixed-income securities are valued by using market quotations or independent pricing services that use either prices provided by market-makers or matrixes that produce estimates of market values obtained from yield data relating to instruments or securities with similar characteristics.
Other securities, and all other assets, including securities for which a market price is not available or is deemed unreliable, (e.g., securities affected by unusual or extraordinary events, such as natural disasters or securities affected by market or economic events, such as bankruptcy filings), or the value of which is affected by a significant valuation event, are valued at a fair value as determined in good faith by, or under the direction of, the Board of Trustees and in accordance with the Trust’s valuation procedures. The value of fair valued securities may be different from the last sale price (or the latest bid price), and there is no guarantee that a fair valued security will be sold at the price at which a Portfolio is carrying the security.
Investments in other funds are valued at the underlying fund’s net asset value on the date of valuation. Other securities, and all other assets, including securities for which a market price is not available, or the value of which is affected by a significant valuation event, are valued at fair value as determined in good faith by the Pricing Committee or Valuation Committee, in accordance with the Fund’s Valuation Procedures approved by the Board of Trustees. As of December 31, 2010, there were securities held in the Institutional International Growth, International Small Cap Growth, Emerging Markets Growth and Bond Portfolios requiring fair valuation pursuant to the Funds’ Valuation Procedures.
(d) Investment income and transactions
Dividend income is recorded on the ex-dividend date, except for those dividends from certain foreign securities that are recorded when the information is available.
Interest income is recorded on an accrual basis, adjusted for amortization of premium or discount. Variable rate bonds and floating rate notes earn interest at coupon rates that fluctuate at specific time intervals. The interest rate shown on the Portfolio of Investments for the Bond Fund and Low Duration Fund were the rates in effect on December 31, 2010. Put bonds may be redeemed at the discretion of the holder on specified dates prior to maturity.
Premiums and discounts are accreted and amortized on a straight-line basis for short-term investments and on an effective interest method for long-term investments.
Paydown gains and losses on mortgage and asset-backed securities are treated as an adjustment to interest income. For the year ended December 31, 2010, the Bond and Low Duration Portfolios recognized an increase of interest income and a decrease of net realized loss of $(517) and $(1,043), respectively (in thousands). This reclassification had no effect on the net asset value or the net assets of the Portfolios.
The Funds do not isolate that portion of the results of operations resulting from changes in foreign exchange rates on investments from the fluctuations arising from changes in market prices of securities held. Such fluctuations are included with the net realized and unrealized gain or loss from investments.
Reported net realized foreign currency gains or losses arise from disposition of foreign currency, the difference in the foreign exchange rates between the trade and settlement dates on securities transactions, and the difference between the amounts of
December 31, 2010 | William Blair Funds �� 51 |
dividends, interest and foreign withholding taxes recorded on the ex-date or accrual date and the U.S. dollar equivalent of the amounts actually received or paid. Net unrealized foreign exchange gains and losses arise from changes (due to the changes in the exchange rate) in the value of foreign currency and other assets and liabilities denominated in foreign currencies held at year end.
Security and shareholder transactions are accounted for no later than one business day following the trade date. However, for financial reporting purposes, security and shareholder transactions are accounted for on the trade date of the last business day of the reporting period. Realized gains and losses from securities transactions are recognized on a specifically identified cost basis.
Awards from class action litigation may be recorded as a reduction of cost. If the Portfolios no longer own the applicable securities, the proceeds are recorded as realized gains.
(e) Share Valuation and Dividends to Shareholders
Shares are sold and redeemed on a continuous basis at net asset value. The net asset value per share is determined by dividing the Portfolio’s net assets by the number of shares outstanding as of the close of regular trading on the New York Stock Exchange, which is generally 4:00 p.m. Eastern time, on each day the Exchange is open.
Dividends from net investment income, if any, are declared at least annually for the Institutional International Growth, Institutional International Equity, International Small Cap Growth, Emerging Markets Growth and Emerging Leaders Growth Portfolio. At December 31, 2010, dividends from the Bond Portfolio are declared and paid monthly. Effective April 16, 2011 dividends from the Bond Portfolio will be declared daily and paid monthly. Dividends from the Low Duration Portfolio are declared daily and paid monthly. Dividends payable to shareholders are recorded on the ex-dividend date.
(f) Foreign Currency Translation and Foreign Currency Forward Contracts
The Portfolios (excluding the Bond Portfolio and the Low Duration Portfolio) may invest in securities denominated in foreign currencies. As such, assets and liabilities denominated in foreign currencies are translated into U.S. dollar amounts at the current exchange rate on the date of valuation. The values of foreign investments, forward open foreign currency contracts, and cash denominated in foreign currencies are translated into U.S. dollars using a spot market rate of exchange as of the time of the determination of each Fund’s net asset value, typically 4:00 p.m. Eastern time on days when there is regular trading on the New York Stock Exchange. Payables and receivables for securities transactions, dividends, interest income and tax reclaims are translated into U.S. dollars using a spot market rate of exchange as of 4:00 p.m. Eastern time. Settlement of purchases and sales and dividend and interest receipts are translated into U.S. dollars using a spot market rate of exchange as of 11:00 a.m. Eastern time.
(g) Income Taxes
Each Portfolio intends to comply with the provisions of Subchapter M of the Internal Revenue Code available to regulated investment companies. Each portfolio intends to make the requisite distributions of income and capital gains to its shareholders sufficient to relieve it from all, or substantially all, federal income and excise taxes. No provision for federal income and excise taxes has been made.
The Institutional International Growth, Institutional International Equity, International Small Cap Growth, Emerging Markets Growth, and Emerging Leaders Growth Portfolios may be subject to a tax imposed on net realized gains on securities of certain foreign countries.
Each Portfolio is subject to the provisions of Accounting Standards Codification (ASC) 740 Income Taxes. ASC 740 provides guidance for how uncertain tax positions should be recognized, measured, presented and disclosed in the financial statements. Management has evaluated the implications of ASC 740 and all of the uncertain tax positions of the Portfolios and has determined that no liability is required to be recorded in the financial statements.
The statute of limitations on the Funds’ tax returns for each of the tax years in the four year period ended December 31, 2010 remains open and the returns are subject to examination.
The Portfolios have elected to mark-to-market their investments in Passive Foreign Investment Companies (“PFICs”) for federal income tax purposes. The Portfolios also treat the deferred loss associated with current and prior year wash sales as
52 Annual Report | December 31, 2010 |
an adjustment to the cost of investments for tax purposes. The cost of investments for federal income tax purposes and related gross unrealized appreciation/(depreciation) and net unrealized appreciation/(depreciation) at December 31, 2010 were as follows (in thousands):
| | | | | | | | | | | | | | | | |
Portfolio | | Cost of
Investments | | | Gross
Unrealized
Appreciation | | | Gross
Unrealized
Depreciation | | | Net
Unrealized
Appreciation/
Depreciation | |
Institutional International Growth | | $ | 1,563,677 | | | $ | 355,017 | | | $ | 24,532 | | | $ | 330,485 | |
Institutional International Equity | | | 224,908 | | | | 67,847 | | | | 2,859 | | | | 64,988 | |
International Small Cap Growth | | | 524,436 | | | | 131,722 | | | | 5,532 | | | | 126,190 | |
Emerging Markets Growth | | | 986,045 | | | | 265,176 | | | | 3,622 | | | | 261,554 | |
Emerging Leaders Growth | | | 78,887 | | | | 17,216 | | | | 572 | | | | 16,644 | |
Bond | | | 181,324 | | | | 10,728 | | | | 925 | | | | 9,803 | |
Low Duration | | | 141,627 | | | | 430 | | | | 530 | | | | (100 | ) |
The timing and characterization of certain income and capital gain distributions are determined annually in accordance with federal income tax regulations that may differ from U.S. generally accepted accounting principles. As a result, net investment income or loss and net realized gain or loss for a reporting period may differ from the amount distributed during such period. In addition, the Portfolios may periodically record reclassifications among certain capital accounts to reflect differences between financial reporting and income tax basis distributions. The reclassifications were reported in order to reflect the tax treatment for certain permanent differences that exist between income tax regulations and U.S. generally accepted accounting principles. The reclassifications generally relate to Section 988 currency gains and losses, PFIC gains and losses and redemptions in-kind. These reclassifications have no impact on the net asset values of the Portfolios. Accordingly, at December 31, 2010, the following reclassifications were recorded (in thousands):
| | | | | | | | | | | | |
Portfolio | | Accumulated Net
Investment Income (Loss) | | | Accumulated Net Realized Gain/(Loss) | | | Capital Paid in Excess of Par Value | |
Institutional International Growth | | $ | 17,554 | | | $ | (17,554 | ) | | $ | - | |
Institutional International Equity | | | 475 | | | | (475 | ) | | | - | |
International Small Cap Growth | | | (849 | ) | | | 849 | | | | - | |
Emerging Markets Growth | | | 4,413 | | | | (33,541 | ) | | | 29,128 | |
Emerging Leaders Growth | | | (47 | ) | | | 51 | | | | (4 | ) |
Bond | | | 516 | | | | (516 | ) | | | - | |
Low Duration | | | 1,043 | | | | (1,043 | ) | | | - | |
Distributions from net realized gains for book purposes may include short-term capital gains, which are included as ordinary income for tax purposes. The tax character of distributions paid during 2010 and 2009 was as follows (in thousands):
| | | | | | | | | | | | | | | | | | | | | | | | |
| | | Distributions Paid in 2010 | | | | | | Distributions Paid in 2009 | | | | |
Portfolio | | Ordinary Income | | | Long-Term Capital Gains | | | Total Distributions | | | Ordinary Income | | | Long-Term Capital Gains | | | Total
Distributions | |
Institutional International Growth | | | $35,383 | | | $ | - | | | | $35,383 | | | | $18,261 | | | $ | - | | | | $18,261 | |
Institutional International Equity | | | 4,059 | | | | - | | | | 4,059 | | | | 2,719 | | | | - | | | | 2,719 | |
International Small Cap Growth | | | 2,781 | | | | - | | | | 2,781 | | | | 778 | | | | - | | | | 778 | |
Emerging Markets Growth | | | 13,461 | | | | - | | | | 13,461 | | | | 11,127 | | | | - | | | | 11,127 | |
Emerging Leaders Growth | | | 255 | | | | 505 | | | | 760 | | | | 1,588 | | | | - | | | | 1,588 | |
Bond | | | 8,566 | | | | 494 | | | | 9,060 | | | | 6,213 | | | | - | | | | 6,213 | |
Low Duration | | | 2,958 | | | | - | | | | 2,958 | | | | 86 | | | | - | | | | 86 | |
As of December 31, 2010, the components of distributable earnings on a tax basis were as follows (in thousands):
| | | | | | | | | | | | | | | | |
Portfolio | | Undistributed Ordinary Income | | | Accumulated Capital and Other Losses | | | Undistributed Long-Term Capital Gain | | | Net Unrealized Appreciation/ Depreciation | |
Institutional International Growth | | $ | 1,998 | | | $ | (270,900 | ) | | $ | - | | | $ | 330,485 | |
Institutional International Equity | | | 23 | | | | (155,726 | ) | | | - | | | | 64,988 | |
International Small Cap Growth | | | 5,932 | | | | (113,021 | ) | | | - | | | | 126,190 | |
Emerging Markets Growth | | | - | | | | (5,861 | ) | | | - | | | | 261,554 | |
December 31, 2010 | William Blair Funds 53 |
| | | | | | | | | | | | | | | | |
Portfolio | | Undistributed Ordinary Income | | | Accumulated Capital and Other Losses | | | Undistributed Long-Term Capital Gain | | | Net Unrealized Appreciation/ Depreciation | |
Emerging Leaders Growth | | | 987 | | | | (14 | ) | | | 539 | | | | 16,644 | |
Bond | | | 2 | | | | - | | | | 236 | | | | 9,803 | |
Low Duration | | | - | | | | (1,104 | ) | | | - | | | | (100 | ) |
As of December 31, 2010, the Portfolios have unused capital loss carry forwards available for federal income tax purposes to be applied against future gains, if any. If not applied, the carryforward will expire as follows (in thousands):
| | | | | | | | | | | | | | | | | | | | | | | | | | | | | | | | | | | | |
Portfolio | | 2011 | | | 2012 | | | 2013 | | | 2014 | | | 2015 | | | 2016 | | | 2017 | | | 2018 | | | Total | |
Institutional International Growth | | $ | - | | | $ | - | | | $ | - | | | $ | - | | | $ | - | | | $ | - | | | $ | 270,881 | | | $ | - | | | $ | 270,881 | |
Institutional International Equity | | | - | | | | - | | | | - | | | | - | | | | - | | | | 42,759 | | | | 113,087 | | | | - | | | | 155,846 | |
International Small Cap Growth | | | - | | | | - | | | | - | | | | - | | | | - | | | | 26,723 | | | | 86,330 | | | | - | | | | 113,053 | |
Emerging Markets Growth | | | - | | | | - | | | | - | | | | - | | | | - | | | | - | | | | 5,572 | | | | - | | | | 5,572 | |
Emerging Leaders Growth | | | - | | | | - | | | | - | | | | - | | | | - | | | | - | | | | - | | | | - | | | | - | |
Bond | | | - | | | | - | | | | - | | | | - | | | | - | | | | - | | | | - | | | | - | | | | - | |
Low Duration | | | - | | | | - | | | | - | | | | - | | | | - | | | | - | | | | - | | | | 955 | | | | 955 | |
For the period from November 1, 2010 through December 31, 2010, the following Portfolios incurred net realized capital losses or foreign currency losses. Each Portfolio intends to treat this loss as having occurred in fiscal year 2011 for federal income tax purposes (in thousands):
| | | | | | | | |
Portfolio | | Capital
Amount | | | Currency
Amount | |
Institutional International Growth | | $ | - | | | $ | - | |
Institutional International Equity | | | - | | | | - | |
International Small Cap Growth | | | - | | | | - | |
Emerging Markets Growth | | | - | | | | 324 | |
Emerging Leaders Growth | | | - | | | | - | |
Bond | | | - | | | | - | |
Low Duration | | | 149 | | | | - | |
(h) Repurchase Agreements
In a repurchase agreement, a Portfolio buys a security at one price and at the time of sale, the seller agrees to repurchase the obligation at a mutually agreed upon time and price (usually within seven days). The repurchase agreement thereby determines the yield during the purchaser’s holding period, while the seller’s obligation to repurchase is secured by the value of the underlying security. William Blair & Co. (the “Advisor”) will monitor, on an ongoing basis, the value of the underlying securities to ensure that the value always equals or exceeds the repurchase price plus accrued interest. Repurchase agreements could involve certain risks in the event of a default or insolvency of the other party to the agreement, including possible delays or restrictions upon a Portfolio’s ability to dispose of the underlying securities. The risk to a Portfolio is limited to the ability of the seller to pay the agreed upon sum on the delivery date. In the event of default, a repurchase agreement provides that a Portfolio is entitled to sell the underlying collateral. The loss, if any, to a Portfolio will be the difference between the proceeds from the sale and the repurchase price. However, if bankruptcy proceedings are commenced with respect to the seller of the security, disposition of the collateral by the Portfolio may be delayed or limited. Although no definitive creditworthiness criteria are used, the Advisor reviews the creditworthiness of the banks and non-bank dealers with which a Portfolio enters into repurchase agreements to evaluate those risks. A Portfolio may, under certain circumstances, deem repurchase agreements collateralized by U.S. Government securities to be investments in U.S. Government securities.
(i) Use of Estimates
The preparation of financial statements in conformity with U.S. generally accepted accounting principles requires management to make estimates and assumptions that affect the amounts reported in the financial statements. Actual results may differ from those estimates.
54 Annual Report | December 31, 2010 |
(j) Fair Value Measurements
The Portfolios are subject to Fair Value measurement and Disclosures (ASC 820), formally known as SFAS (Statement of Financial Accounting Standards) No. 157, “Fair Value Measurements”. In accordance with ASC 820, “fair value” is defined as the price that a Portfolio would receive upon selling a security in an orderly transaction to an independent buyer in the principal or most advantageous market for the investment. Various inputs are used in determining the value of a Portfolio’s investments. ASC 820 establishes a three-tier hierarchy of inputs to classify fair value measurements for disclosure purposes. The three-tier hierarchy of inputs is summarized in the three broad levels listed below.
| | • | | Level 1—Quoted prices in active markets for an identical security. |
| | • | | Level 2—Prices determined using other significant observable inputs. Observable inputs are inputs that other market participants would use in pricing a security. These may include quoted prices for similar securities, interest rates, prepayment speeds, credit risk, and others. In addition, other observable inputs such as foreign exchange rates, benchmark securities indices and foreign futures contracts may be utilized in the valuation of certain foreign securities when significant events occur between the last sale on the foreign securities exchange and the time the net asset value of the Portfolio is calculated. |
| | • | | Level 3—Prices determined using significant unobservable inputs. In situations where quoted prices or observable inputs are unavailable (for example, when there is little or no market activity for an investment), unobservable inputs may be used. Unobservable inputs reflect the Portfolio’s own assumptions about the factors market participants would use in pricing an investment, and would be based on the best information available. |
The inputs or methodology used for valuing an investment are not necessarily an indication of the risk associated with investing in those securities. For example, money market securities are valued using amortized cost, in accordance with rules under the 1940 Act. Generally, amortized cost approximates the current fair value of a security, but since the value is not obtained from a quoted price in an active market, such securities are reflected as Level 2.
The Fund adopted Financial Accounting Standards Board (the “FASB”) Accounting Standards Update 2010-06 “Fair Value Measurements and Disclosures (ASU 820)” which requires the Fund to disclose details of significant transfers in and out of Level 1 and Level 2 measurements and the reasons for the transfers. Any transfers between Level 1 and Level 2 are disclosed, effective beginning of the period, in the tables below with the reasons for the transfers disclosed in a footnote.
At December 31, 2010, the Portfolios held no other financial instruments, such as options or futures, that required fair valuation.
As of December 31, 2010, the hierarchical input levels of securities in each Portfolio, segregated by security class, are as follows (in thousands):
| | | | | | | | | | | | | | | | | | | | |
| | | Institutional
International
Growth | | | Institutional
International
Equity | | | International
Small Cap
Growth | | | Emerging
Markets
Growth | | | Emerging
Leaders
Growth | |
Investments in securities | | | | | | | | | | | | | | | | | | | | |
Level 1—Quoted prices | | | | | | | | | | | | | | | | | | | | |
Common Stock | | $ | 1,823,832 | | | $ | 285,617 | | | $ | 630,017 | | | $ | 1,153,073 | | | $ | 88,347 | |
Preferred Stock | | | — | | | | 3,482 | | | | 3,813 | | | | 50,827 | | | | 5,677 | |
Level 2—Other significant observable inputs | | | | | | | | | | | | | | | | | | | | |
Convertible Bonds | | | 614 | | | | — | | | | 626 | | | | 1,045 | | | | — | |
Short-Term Investments | | | 69,716 | | | | 797 | | | | 16,170 | | | | 42,654 | | | | 1,507 | |
Level 3—Significant unobservable inputs | | | | | | | | | | | | | | | | | | | | |
None | | | — | | | | — | | | | — | | | | — | | | | — | |
| | | | | | | | | | | | | | | | | | | | |
Total investments in securities | | $ | 1,894,162 | | | $ | 289,896 | | | $ | 650,626 | | | $ | 1,247,599 | | | $ | 95,531 | |
| | | | | | | | | | | | | | | | | | | | |
Level 1 and Level 2 transfers | | | | | | | | | | | | | | | | | | | | |
Transfers from Level 1 to Level 2 (a) | | | — | | | | — | | | | — | | | | — | | | | — | |
Transfers from Level 2 to Level 1 (b) | | $ | 532,676 | | | $ | 160,766 | | | $ | 153,495 | | | $ | 268,735 | | | $ | 25,676 | |
Other financial instruments | | | | | | | | | | | | | | | | | | | | |
Level 2—Other significant observable inputs | | | | | | | | | | | | | | | | | | | | |
Forward foreign currency contracts | | $ | — | | | $ | (227 | ) | | $ | — | | | $ | — | | | $ | — | |
| | | | | | | | | | | | | | | | | | | | |
December 31, 2010 | William Blair Funds 55 |
| | | | | | | | |
| | | Bond | | | Low
Duration | |
Investments in securities | | | | | | | | |
Level 1—Quoted Prices | | | | | | | | |
None | | $ | — | | | $ | — | |
Level 2—Other significant observable inputs | | | | | | | | |
US Government and Agency Bonds | | | 88,534 | | | | 59,701 | |
Corporate Bonds | | | 88,831 | | | | 16,970 | |
Asset Backed Bonds | | | 10,307 | | | | 58,862 | |
Short-Term Investments | | | 3,285 | | | | 5,994 | |
Level 3—Significant unobservable inputs | | | | | | | | |
Asset Backed Bonds | | | 170 | | | | — | |
| | | | | | | | |
Total investments in securities | | $ | 191,127 | | | $ | 141,527 | |
| | | | | | | | |
Level 1 and Level 2 transfers | | | | | | | | |
Transfers from Level 1 to Level 2 (a) | | | — | | | | — | |
Transfers from Level 2 to Level 1 (b) | | | — | | | | — | |
| (a) | | Fair valuation estimates were obtained from the Portfolio’s pricing vendor and applied to certain foreign securities at December 31, 2010 but not on December 31, 2009, resulting in a transfer from Level 1 to Level 2. |
| (b) | | Fair valuation estimates were obtained from the Portfolio’s pricing vendor and applied to certain foreign securities at December 31, 2009 but not on December 31, 2010, resulting in a transfer from Level 2 to Level 1. |
Level 1 Common Stocks are exchange-traded securities with a quoted price. Typically, Level 2 Common Stocks are non-U.S. exchange-traded securities with a quoted price that are fair valued by an independent pricing service approved by the Board of Trustees.
The following is a reconciliation of Level 3 securities for which significant unobservable inputs were used to determine fair value:
| | | | | | | | | | | | | | | | | | | | | | | | | | | | | | | | |
| | | Balance January 1, 2010 | | | (Sales) | | | Purchases | | | Transfers
to Level 3 | | | Transfers
(from)
Level 3 | | | Change in
Unrealized Gain (Loss) | | | Realized Gain (Loss) | | | Balance December 31, 2010 | |
| | | | | | | | |
Bond | | $ | — | | | | — | | | | — | | | | 119 | | | | — | | | | 51 | | | | — | | | $ | 170 | |
The fair value estimate for the Level 3 security in the Bond Portfolio was determined in good faith by the Pricing Committee in consultation with the Valuation Committee, pursuant to the Valuation Procedures adopted by the Board of Trustees. There were various factors considered in reaching this fair value determination, including, but not limited to, the following: the type of security, the extent of public trading of the security, information obtained from a broker-dealer for the security, analysis of the company’s performance, market trends that influence its performance and the potential for adverse outcome in pending litigation. At December 31, 2010, this security represented 0.09%, of the net assets of the Bond Portfolio. The change in unrealized gain (loss) related to the security held at December 31, 2010 was $(14), in thousands, and is included in the change in unrealized appreciation (depreciation) of investments on the Statement of Operations.
The First Plus Home Loan Trust bond held in the Bond Portfolio transferred from Level 2 to Level 3 during the period due to the lack of significant other observable inputs.
(k) Redemptions In- Kind
In accordance with the Funds’ prospectus, the Portfolios may distribute portfolio securities rather than cash as payment for a redemption of fund shares (in-kind redemption). For financial reporting purposes, the Portfolio recognizes a gain or loss on the transfer of securities depending on the market value of those securities on the date of redemption. Gains and losses realized on in-kind redemptions are not recognized for tax purposes and are reclassified from undistributed realized gain (loss) to paid-in capital. During the year ended December 31, 2010, the Emerging Markets Growth Fund transferred in-kind (in thousands) $74,711 for a realized gain of $32,340.
(2) Transactions with Affiliates
(a) Management and Expense Limitation Agreements
The Institutional International Growth and Institutional International Equity Portfolios have a management agreement with William Blair & Company L.L.C. (the “Advisor”) for investment advisory, administrative, and other accounting services. The Portfolios pay the Advisor an annual fee, payable monthly, based on a specified percentage of its average daily net assets. A summary of the annual rates expressed as a percentage of average daily net assets is as follows:
| | | | |
First $500 million | | | 1.00 | % |
Next $500 million | | | 0.95 | % |
In excess of $1 billion | | | 0.90 | % |
56 Annual Report | December 31, 2010 |
The International Small Cap Growth Portfolio pays the Company a 1.00% annual fee, payable monthly, based on its average daily net assets. The Emerging Markets Growth Portfolio and Emerging Leaders Growth Portfolio pay the Advisor a 1.10% annual fee, payable monthly, based on their average daily net assets. The Bond Portfolio and Low Duration Portfolio pay the Advisor a 0.30% annual fee, payable monthly, based on their average daily net assets.
All of the Portfolios, except Institutional International Growth Fund, have also entered into Expense Limitation Agreements with the Advisor. Under the terms of these agreements, the Advisor will waive its management fee and/or reimburse the Portfolio for expenses in excess of the agreed upon rate. The amount the Advisor owes a Portfolio as of the report date is recorded as the Receivable from Advisor on the Statement of Assets and Liabilities. The Advisor reimburses the Portfolios on an annual basis. Under the terms of these Agreements, the Advisor has agreed to waive its advisory fees and/or absorb other operating expenses through April 30, 2011, if total expenses of the Portfolios exceed the following rates (as a percentage of average daily net assets):
| | | | | | | | |
Portfolio | | Effective
May 1, 2010
through
April 30, 2011 | | | Effective
May 1, 2009
through
April 30, 2010 | |
Institutional International Equity | | | 1.10 | % | | | 1.10 | % |
International Small Cap Growth | | | 1.25 | % | | | 1.25 | % |
Emerging Markets Growth | | | 1.30 | % | | | 1.25 | % |
Emerging Leaders Growth | | | 1.25 | % | | | 1.25 | % |
Bond | | | 0.35 | % | | | 0.35 | % |
Low Duration | | | 0.40 | % | | | 0.40 | %(a) |
| (a) | | Effective December 1, 2009 through April 30, 2011. |
For a period of three years subsequent to the Commencement of Operations of the Portfolio, the Advisor is entitled to reimbursement from the Emerging Leaders Growth and Low Duration Portfolios for previously waived fees and expenses to the extent the overall expense ratio remains below the percentages indicated. The total amount available for recapture at December 31, 2010 is $278 and $112 (in thousands) for the Emerging Leaders Growth and Low Duration Bond Portfolio respectively. As a result, the total expense ratio for a Portfolio during the period the agreement is in effect will not fall below the percentage indicated.
For the period ended December 31, 2010, the fees incurred by the Portfolio and related fee waivers were as follows (in thousands):
| | | | | | | | | | | | |
Portfolio | | Fund
Level
Waiver | | | Class
Specific
Waiver | | | Total
Waiver | |
Emerging Leaders Growth | | $ | 97 | | | $ | 1 | | | $ | 98 | |
Bond | | | 86 | | | | 4 | | | | 90 | |
Low Duration | | | 98 | | | | — | | | | 98 | |
(b) Investments in Affiliated Portfolio
Pursuant to the rules of the 1940 Act, each of the Portfolios of the Fund may invest in the William Blair Ready Reserves Portfolio (“Ready Reserves”), an open-end money market portfolio managed by the Advisor. Ready Reserves Portfolio is used as a cash management option by the other Portfolios in the Fund. The Advisor waives management fees in an amount equal to the management fee and service fee that Ready Reserves receives based on the Portfolio’s net assets, less any waivers if applicable. The fees waived with respect to each Portfolio for the period ended December 31, 2010 are listed below. Distributions received from Ready Reserves are reflected as “Dividend income from Affiliated Fund” in each Portfolio’s Statement of Operations. Amounts relating to the Portfolios’ investments in Ready Reserves were as follows for the period ended December 31, 2010 (in thousands):
| | | | | | | | | | | | | | | | | | | | | | | | | | | | |
Portfolio | | December 31,
2009 Value | | | Purchases | | | Sales | | | Fees
Waived | | | Dividend
Income | | | December 31,
2010 Value | | | Percent
of Net
Assets | |
Institutional International Growth | | $ | 4,535 | | | | — | | | $ | 4,535 | | | $ | 9 | | | | — | | | | — | | | | 0.0 | % |
Institutional International Equity | | | 953 | | | | — | | | | 953 | | | | 2 | | | | — | | | | — | | | | 0.0 | % |
International Small Cap Growth | | | 489 | | | | — | | | | 489 | | | | 1 | | | | — | | | | — | | | | 0.0 | % |
Emerging Markets Growth | | | 66 | | | | — | | | | 66 | | | | — | | | | — | | | | — | | | | 0.0 | % |
Emerging Leaders Growth | | | 440 | | | | — | | | | 440 | | | | 1 | | | | — | | | | — | | | | 0.0 | % |
December 31, 2010 | William Blair Funds 57 |
(3) Investment Transactions
Investment transactions, excluding money market instruments, for the year ended December 31, 2010 were as follows (in thousands):
| | | | | | | | |
Portfolio | | Purchases | | | Sales | |
Institutional International Growth | | $ | 1,666,746 | | | $ | (1,451,625 | ) |
Institutional International Equity | | | 233,367 | | | | (330,685 | ) |
International Small Cap Growth | | | 530,131 | | | | (396,755 | ) |
Emerging Markets Growth | | | 1,284,378 | | | | (1,349,820 | ) |
Emerging Leaders Growth | | | 169,052 | | | | (205,980 | ) |
Bond | | | 98,704 | | | | (60,843 | ) |
Low Duration | | | 159,270 | | | | (96,885 | ) |
(4) Forward Foreign Currency Contracts
The Portfolios (excluding the Bond and Low Duration Portfolios) from time to time may enter into forward foreign currency contracts with the Fund’s custodian and other counterparties in an attempt to hedge against a decline in the value of foreign currency against the U.S. dollar. The Portfolios bear the market risk that arises from changes in foreign currency rates and bear the credit risk if the counterparty fails to perform under the contract.
For the year ended December 31, 2010, the Institutional International Growth, Institutional International Equity, and International Small Cap Growth Portfolios engaged in forward foreign currency contracts with notional volume (in thousands) of $1,292,889, $19,645 and $215,506 respectively.
The following table presents the value of open forward foreign currency contracts as of December 31, 2010 and their respective location on the Statement of Assets and Liabilities (values in thousands):
| | | | | | | | | | | | |
| | | Assets | | | Liabilities | |
Portfolio | | Statement of Assets and
Liabilities Location | | Value | | | Statement of Assets and
Liabilities Location | | Value | |
Institutional International Equity | | Unrealized appreciation on foreign
forward currency contracts | | $ | — | | | Unrealized depreciation on foreign
forward currency contracts | | $ | 227 | |
The effect of forward contracts on the Statements of Operations for the year ended December 31, 2010 (values in thousands):
| | | | |
Realized gain (loss) recognized in foreign currency transactions | | | |
Portfolio | | Value | |
Institutional International Growth | | | 15,163 | |
Institutional International Equity | | | 242 | |
International Small Cap Growth | | | 262 | |
| |
Change in unrealized gain (loss) recognized in foreign currency translations | | | |
Portfolio | | Value | |
Institutional International Growth | | | (4,511 | ) |
Institutional International Equity | | | (227 | ) |
The following table presents open forward foreign currency contracts as of December 31, 2010 (values in thousands):
| | | | | | | | | | | | | | | | | | |
Institutional International Equity Fund | |
Counter Party | | Short Contracts | | Settlement
Date | | | Local
Currency | | | Current
Value | | | Unrealized
Gain/(loss) | |
Northern Trust Corporation | | Japanese Yen | | | 1/11/2011 | | | ¥ | 524,473 | | | $ | 6,460 | | | $ | (227 | ) |
| | | | | | | | | | | | | | | | | | |
58 Annual Report | December 31, 2010 |
(5) Fund Share Transactions
The following table summarizes the activity in capital shares of each Portfolio (in thousands):
| | | | | | | | | | | | | | | | |
| | | Dollars | |
| | | For the year ended December 31, 2010 | |
Portfolio | | Sales | | | Reinvested
Distributions | | | Redemptions | | | Net change in
Net Assets
relating to fund
share activity | |
Institutional International Growth | | $ | 585,127 | | | $ | 33,238 | | | $ | 379,024 | | | $ | 239,341 | |
Institutional International Equity | | | 31,823 | | | | 3,868 | | | | 139,231 | | | | (103,540 | ) |
International Small Cap Growth | | | 76,119 | | | | 1,301 | | | | 20,893 | | | | 56,527 | |
Emerging Markets Growth | | | 299,213 | | | | 10,490 | | | | 331,182 | | | | (21,479 | ) |
Emerging Leaders Growth | | | 2,611 | | | | 602 | | | | 45,497 | | | | (42,284 | ) |
Bond | | | 23,201 | | | | 1,159 | | | | 620 | | | | 23,740 | |
Low Duration | | | 65,503 | | | | 1,032 | | | | 31,723 | | | | 34,812 | |
| |
| | | Dollars | |
| | | For the year ended December 31, 2009 | |
Portfolio | | Sales | | | Reinvested
Distributions | | | Redemptions | | | Net change in
Net Assets
relating to fund
share activity | |
Institutional International Growth | | $ | 165,765 | | | $ | 16,959 | | | $ | 199,645 | | | $ | (16,921 | ) |
Institutional International Equity | | | 20,848 | | | | 2,587 | | | | 104,043 | | | | (80,608 | ) |
International Small Cap Growth | | | 30,712 | | | | 427 | | | | 141,722 | | | | (110,583 | ) |
Emerging Markets Growth | | | 347,835 | | | | 8,712 | | | | 138,100 | | | | 218,447 | |
Emerging Leaders Growth | | | 38,546 | | | | 1,366 | | | | 27,894 | | | | 12,018 | |
Bond | | | 5,199 | | | | 772 | | | | 1,064 | | | | 4,907 | |
Low Duration (a) | | | 13,501 | | | | — | | | | — | | | | 13,501 | |
| |
| | | Shares | |
| | | For the year ended December 31, 2010 | |
Portfolio | | Sales | | | Reinvested
Distributions | | | Redemptions | | | Net change in
Net Assets
relating to fund
share activity | |
Institutional International Growth | | | 45,848 | | | | 2,351 | | | | 29,748 | | | | 18,451 | |
Institutional International Equity | | | 3,407 | | | | 365 | | | | 13,836 | | | | (10,064 | ) |
International Small Cap Growth | | | 6,879 | | | | 100 | | | | 1,893 | | | | 5,086 | |
Emerging Markets Growth | | | 22,585 | | | | 677 | | | | 23,038 | | | | 224 | |
Emerging Leaders Growth | | | 271 | | | | 60 | | | | 5,354 | | | | (5,023 | ) |
Bond | | | 2,199 | | | | 109 | | | | 58 | | | | 2,250 | |
Low Duration | | | 6,561 | | | | 104 | | | | 3,179 | | | | 3,486 | |
| |
| | | Shares | |
| | | For the year ended December 31, 2009 | |
Portfolio | | Sales | | | Reinvested
Distributions | | | Redemptions | | | Net change in
Net Assets
relating to fund
share activity | |
Institutional International Growth | | | 16,035 | | | | 1,423 | | | | 20,023 | | | | (2,565 | ) |
Institutional International Equity | | | 2,541 | | | | 270 | | | | 14,163 | | | | (11,352 | ) |
International Small Cap Growth | | | 3,235 | | | | 41 | | | | 16,155 | | | | (12,879 | ) |
Emerging Markets Growth | | | 36,231 | | | | 690 | | | | 12,815 | | | | 24,106 | |
Emerging Leaders Growth | | | 6,962 | | | | 167 | | | | 3,666 | | | | 3,463 | |
Bond | | | 532 | | | | 77 | | | | 108 | | | | 501 | |
Low Duration (a) | | | 1,360 | | | | — | | | | — | | | | 1,360 | |
| (a) | | For the period from December 1, 2009 (Commencement of Operations) to December 31, 2009. |
December 31, 2010 | William Blair Funds 59 |
Financial Highlights
Institutional International Growth Fund
| | | | | | | | | | | | | | | | | | | | |
| | | Years Ended December 31, | |
| | | 2010 | | | 2009 | | | 2008 | | | 2007 | | | 2006 | |
Net asset value, beginning of year | | $ | 12.20 | | | $ | 8.66 | | | $ | 19.20 | | | $ | 19.39 | | | $ | 18.11 | |
Income (loss) from investment operations: | | | | | | | | | | | | | | | | | | | | |
Net investment income (loss)(a) | | | 0.14 | | | | 0.10 | | | | 0.25 | | | | 0.15 | | | | 0.11 | |
Net realized and unrealized gain (loss) on investments | | | 2.31 | | | | 3.61 | | | | (10.24 | ) | | | 3.30 | | | | 4.09 | |
| | | | | | | | | | | | | | | | | | | | |
Total from investment operations | | | 2.45 | | | | 3.71 | | | | (9.99 | ) | | | 3.45 | | | | 4.20 | |
Less distributions from: | | | | | | | | | | | | | | | | | | | | |
Net investment income | | | 0.28 | | | | 0.17 | | | | — | | | | 0.35 | | | | 0.38 | |
Net realized gain | | | — | | | | — | | | | 0.55 | | | | 3.29 | | | | 2.54 | |
| | | | | | | | | | | | | | | | | | | | |
Total distributions | | | 0.28 | | | | 0.17 | | | | 0.55 | | | | 3.64 | | | | 2.92 | |
| | | | | | | | | | | | | | | | | | | | |
Net asset value, end of year | | $ | 14.37 | | | $ | 12.20 | | | $ | 8.66 | | | $ | 19.20 | | | $ | 19.39 | |
| | | | | | | | | | | | | | | | | | | | |
Total Return (%) | | | 20.10 | | | | 42.83 | | | | (51.99 | ) | | | 18.49 | | | | 23.45 | |
Ratios to average daily net assets (%): | | | | | | | | | | | | | | | | | | | | |
Expenses | | | 0.99 | | | | 1.01 | | | | 0.98 | | | | 1.02 | | | | 1.03 | |
Net investment income (loss) | | | 1.12 | | | | 0.95 | | | | 1.68 | | | | 0.74 | | | | 0.54 | |
| | | | | | | | | | | | | | | | | | | | |
| | | Years Ended December 31, | |
| | | 2010 | | | 2009 | | | 2008 | | | 2007 | | | 2006 | |
Supplemental data for all classes: | | | | | | | | | | | | | | | | | | | | |
Net assets at end of year (in thousands) | | $ | 1,886,217 | | | $ | 1,375,848 | | | $ | 998,266 | | | $ | 2,145,312 | | | $ | 1,875,341 | |
Portfolio turnover rate (%) | | | 99 | | | | 125 | | | | 86 | | | | 61 | | | | 74 | |
| (a) | | Excludes $0.09, $0.05, $(0.10), $0.06, and $0.29 of PFIC mark to market which is treated as ordinary income for Federal tax purposes for the years 2010, 2009, 2008, 2007, and 2006, respectively. |
Performance cited represents past performance. Past performance does not guarantee future results and current performance may be lower or higher than the data quoted. Results shown are annual returns, which assume reinvestment of dividends and capital gains. Investment returns and principal will fluctuate and you may have a gain or loss when you sell shares. For the most current month-end performance information, please call 1-800-742-7272 or visit our Web site at www.williamblairfunds.com.
Note: Net investment income (loss) per share is based on the average shares outstanding during the year.
60 Annual Report | December 31, 2010 |
Financial Highlights
Institutional International Equity Fund
| | | | | | | | | | | | | | | | | | | | |
| | | Years Ended December 31, | |
| | | 2010 | | | 2009 | | | 2008 | | | 2007 | | | 2006 | |
Net asset value, beginning of year | | $ | 9.84 | | | $ | 7.44 | | | $ | 15.03 | | | $ | 14.27 | | | $ | 12.04 | |
Income (loss) from investment operations: | | | | | | | | | | | | | | | | | | | | |
Net investment income (loss)(a) | | | 0.10 | | | | 0.09 | | | | 0.15 | | | | 0.13 | | | | 0.07 | |
Net realized and unrealized gain (loss) on investments | | | 0.99 | | | | 2.38 | | | | (7.60 | ) | | | 2.42 | | | | 2.37 | |
| | | | | | | | | | | | | | | | | | | | |
Total from investment operations | | | 1.09 | | | | 2.47 | | | | (7.45 | ) | | | 2.55 | | | | 2.44 | |
Less distributions from: | | | | | | | | | | | | | | | | | | | | |
Net investment income | | | 0.15 | | | | 0.07 | | | | — | | | | 0.22 | | | | 0.16 | |
Net realized gain | | | — | | | | — | | | | 0.14 | | | | 1.57 | | | | 0.05 | |
| | | | | | | | | | | | | | | | | | | | |
Total distributions | | | 0.15 | | | | 0.07 | | | | 0.14 | | | | 1.79 | | | | 0.21 | |
| | | | | | | | | | | | | | | | | | | | |
Net asset value, end of year | | $ | 10.78 | | | $ | 9.84 | | | $ | 7.44 | | | $ | 15.03 | | | $ | 14.27 | |
| | | | | | | | | | | | | | | | | | | | |
Total Return (%) | | | 11.12 | | | | 33.27 | | | | (49.57 | ) | | | 18.36 | | | | 20.22 | |
Ratios to average daily net assets (%): | | | | | | | | | | | | | | | | | | | | |
Expenses | | | 1.07 | | | | 1.09 | | | | 1.05 | | | | 1.09 | | | | 1.10 | |
Expenses, before waivers and reimbursements | | | 1.07 | | | | 1.09 | | | | 1.05 | | | | 1.06 | | | | 1.12 | |
Net investment income (loss) | | | 0.97 | | | | 1.04 | | | | 1.26 | | | | 0.86 | | | | 0.50 | |
Net investment income (loss), before waivers and reimbursements | | | 0.97 | | | | 1.04 | | | | 1.26 | | | | 0.89 | | | | 0.48 | |
| | | | | | | | | | | | | | | | | | | | |
| | | Years Ended December 31, | |
| | | 2010 | | | 2009 | | | 2008 | | | 2007 | | | 2006 | |
Supplemental data for all classes: | | | | | | | | | | | | | | | | | | | | |
Net assets at end of year (in thousands) | | $ | 291,468 | | | $ | 365,271 | | | $ | 360,451 | | | $ | 618,179 | | | $ | 598,375 | |
Portfolio turnover rate (%) | | | 73 | | | | 78 | | | | 91 | | | | 66 | | | | 79 | |
| (a) | | Excludes $0.04, $0.00, $0.00, $(0.07), and $0.01 of PFIC mark to market which is treated as ordinary income for Federal tax purposes for the years 2010, 2009, 2008, 2007 and 2006 respectively. |
Performance cited represents past performance. Past performance does not guarantee future results and current performance may be lower or higher than the data quoted. Results shown are annual returns, which assume reinvestment of dividends and capital gains. Investment returns and principal will fluctuate and you may have a gain or loss when you sell shares. For the most current month-end performance information, please call 1-800-742-7272 or visit our Web site at www.williamblairfunds.com.
Note: Net investment income (loss) per share is based on the average shares outstanding during the year.
December 31, 2010 | William Blair Funds 61 |
Financial Highlights
International Small Cap Growth Fund
| | | | | | | | | | | | | | | | | | | | |
| | | Institutional Class Shares | |
| | | Years Ended December 31, | |
| | | 2010 | | | 2009 | | | 2008 | | | 2007 | | | 2006 | |
Net asset value, beginning of year | | $ | 10.53 | | | $ | 6.69 | | | $ | 14.04 | | | $ | 13.43 | | | $ | 11.16 | |
Income (loss) from investment operations: | | | | | | | | | | | | | | | | | | | | |
Net investment income (loss)(a) | | | 0.09 | | | | 0.04 | | | | 0.03 | | | | 0.05 | | | | (0.01 | ) |
Net realized and unrealized gain (loss) on investments | | | 2.69 | | | | 3.83 | | | | (7.26 | ) | | | 1.72 | | | | 2.34 | |
| | | | | | | | | | | | | | | | | | | | |
Total from investment operations | | | 2.78 | | | | 3.87 | | | | (7.23 | ) | | | 1.77 | | | | 2.33 | |
Less distributions from: | | | | | | | | | | | | | | | | | | | | |
Net investment income | | | 0.07 | | | | 0.03 | | | | — | | | | 0.12 | | | | 0.01 | |
Net realized gain | | | — | | | | — | | | | 0.12 | | | | 1.04 | | | | 0.05 | |
| | | | | | | | | | | | | | | | | | | | |
Total distributions | | | 0.07 | | | | 0.03 | | | | 0.12 | | | | 1.16 | | | | 0.06 | |
| | | | | | | | | | | | | | | | | | | | |
Net asset value, end of year | | $ | 13.24 | | | $ | 10.53 | | | $ | 6.69 | | | $ | 14.04 | | | $ | 13.43 | |
| | | | | | | | | | | | | | | | | | | | |
Total Return (%) | | | 26.40 | | | | 57.84 | | | | (51.53 | ) | | | 13.53 | | | | 20.86 | |
Ratios to average daily net assets (%): | | | | | | | | | | | | | | | | | | | | |
Expenses, net of waivers and reimbursements | | | 1.08 | | | | 1.13 | | | | 1.14 | | | | 1.14 | | | | 1.25 | |
Expenses, before waivers and reimbursements | | | 1.08 | | | | 1.13 | | | | 1.11 | | | | 1.14 | | | | 1.31 | |
Net investment income (loss), net of waivers and reimbursements | | | 0.77 | | | | 0.48 | | | | 0.28 | | | | 0.32 | | | | (0.12 | ) |
Net investment income (loss), before waivers and reimbursements | | | 0.77 | | | | 0.48 | | | | 0.32 | | | | 0.32 | | | | (0.18 | ) |
| | | | | | | | | | | | | | | | | | | | |
| | | Years Ended December 31, | |
| | | 2010 | | | 2009 | | | 2008 | | | 2007 | | | 2006 | |
Supplemental data for all classes: | | | | | | | | | | | | | | | | | | | | |
Net assets at end of year (in thousands) | | $ | 646,951 | | | $ | 390,851 | | | $ | 291,988 | | | $ | 401,459 | | | $ | 231,969 | |
Portfolio turnover rate (%) | | | 85 | | | | 136 | | | | 78 | | | | 88 | | | | 109 | |
| (a) | | Excludes $0.15, $0.01, $(0.02), $0.05, and $0.00 of PFIC mark to market which is treated as ordinary income for Federal tax purposes for the years 2010, 2009, 2008, 2007, and 2006, respectively. |
Performance cited represents past performance. Past performance does not guarantee future results and current performance may be lower or higher than the data quoted. Results shown are annual returns, which assume reinvestment of dividends and capital gains. Investment returns and principal will fluctuate and you may have a gain or loss when you sell shares. For the most current month-end performance information, please call 1-800-742-7272 or visit our Web site at www.williamblairfunds.com.
Note: Net investment income (loss) per share is based on the average shares outstanding during the year.
62 Annual Report | December 31, 2010 |
Financial Highlights
Emerging Markets Growth Fund
| | | | | | | | | | | | | | | | | | | | |
| | | Institutional Class Shares | |
| | | Years Ended December 31, | |
| | | 2010 | | | 2009 | | | 2008 | | | 2007 | | | 2006 | |
Net asset value, beginning of year | | $ | 13.03 | | | $ | 7.56 | | | $ | 22.07 | | | $ | 19.54 | | | $ | 14.20 | |
Income (loss) from investment operations: | | | | | | | | | | | | | | | | | | | | |
Net investment income (loss) (a) | | | 0.06 | | | | 0.06 | | | | 0.17 | | | | (0.01 | ) | | | 0.02 | |
Net realized and unrealized gain (loss) on investments | | | 3.05 | | | | 5.55 | | | | (13.74 | ) | | | 7.27 | | | | 5.44 | |
| | | | | | | | | | | | | | | | | | | | |
Total from investment operations | | | 3.11 | | | | 5.61 | | | | (13.57 | ) | | | 7.26 | | | | 5.46 | |
Less distributions from: | | | | | | | | | | | | | | | | | | | | |
Net investment income | | | 0.18 | | | | 0.14 | | | | — | | | | 0.19 | | | | 0.01 | |
Net realized gain | | | — | | | | — | | | | 0.94 | | | | 4.54 | | | | 0.11 | |
| | | | | | | | | | | | | | | | | | | | |
Total distributions | | | 0.18 | | | | 0.14 | | | | 0.94 | | | | 4.73 | | | | 0.12 | |
| | | | | | | | | | | | | | | | | | | | |
Net asset value, end of year | | $ | 15.96 | | | $ | 13.03 | | | $ | 7.56 | | | $ | 22.07 | | | $ | 19.54 | |
| | | | | | | | | | | | | | | | | | | | |
Total Return (%) | | | 23.91 | | | | 74.33 | | | | (61.51 | ) | | | 38.21 | | | | 38.49 | |
Ratios to average daily net assets (%): | | | | | | | | | | | | | | | | | | | | |
Expenses, net of waivers and reimbursements | | | 1.17 | | | | 1.22 | | | | 1.22 | | | | 1.25 | | | | 1.25 | |
Expenses, before waivers and reimbursements | | | 1.17 | | | | 1.22 | | | | 1.20 | | | | 1.25 | | | | 1.32 | |
Net investment income (loss), net of waivers and reimbursements | | | 0.43 | | | | 0.54 | | | | 1.08 | | | | (0.05 | ) | | | 0.09 | |
Net investment income (loss), before waivers and reimbursements | | | 0.43 | | | | 0.54 | | | | 1.10 | | | | (0.05 | ) | | | 0.02 | |
| | | | | | | | | | | | | | | | | | | | |
| | | Years Ended December 31, | |
| | | 2010 | | | 2009 | | | 2008 | | | 2007 | | | 2006 | |
Supplemental data for all classes: | | | | | | | | | | | | | | | | | | | | |
Net assets at end of year (in thousands) | | $ | 1,250,543 | | | $ | 1,038,260 | | | $ | 385,588 | | | $ | 1,165,854 | | | $ | 813,649 | |
Portfolio turnover rate (%) | | | 121 | | | | 113 | | | | 118 | | | | 100 | | | | 113 | |
| (a) | | Excludes $0.11,$0.15, $(0.09), $0.21 and $0.00 of PFIC mark to market which is treated as ordinary income for Federal tax purposes for the years 2010, 2009, 2008, 2007 and 2006 respectively. |
Performance cited represents past performance. Past performance does not guarantee future results and current performance may be lower or higher than the data quoted. Results shown are annual returns, which assume reinvestment of dividends and capital gains. Investment returns and principal will fluctuate and you may have a gain or loss when you sell shares. For the most current month-end performance information, please call 1-800-742-7272 or visit our Web site at www.williamblairfunds.com.
Note: Net investment income (loss) per share is based on the average shares outstanding during the year.
December 31, 2010 | William Blair Funds 63 |
Financial Highlights
Emerging Leaders Growth Fund
| | | | | | | | | | | | |
| | | Institutional Class Shares | |
| | | Periods Ended December 31, | |
| | | 2010 | | | 2009 | | | 2008(a) | |
Net asset value, beginning of year | | $ | 8.43 | | | $ | 4.78 | | | $ | 10.00 | |
Income (loss) from investment operations: | | | | | | | | | | | | |
Net investment income (loss) (c) | | | 0.04 | | | | 0.04 | | | | 0.04 | |
Net realized and unrealized gain (loss) on investments | | | 1.97 | | | | 3.73 | | | | (5.26 | ) |
| | | | | | | | | | | | |
Total from investment operations | | | 2.01 | | | | 3.77 | | | | (5.22 | ) |
Less distributions from: | | | | | | | | | | | | |
Net investment income | | | 0.03 | | | | 0.12 | | | | 0.00 | ^ |
Net realized gain | | | 0.06 | | | | — | | | | — | |
| | | | | | | | | | | | |
Total distributions | | | 0.09 | | | | 0.12 | | | | 0.00 | ^ |
| | | | | | | | | | | | |
Net asset value, end of year | | $ | 10.35 | | | $ | 8.43 | | | $ | 4.78 | |
| | | | | | | | | | | | |
Total Return (%)* | | | 23.84 | | | | 78.93 | | | | (52.11 | ) |
Ratios to average daily net assets (%):** | | | | | | | | | | | | |
Expenses, net of waivers and reimbursements | | | 1.26 | | | | 1.25 | | | | 1.25 | |
Expenses, before waivers and reimbursements | | | 1.35 | | | | 1.36 | | | | 1.41 | |
Net investment income (loss), net of waivers and reimbursements | | | 0.50 | | | | 0.58 | | | | 0.70 | |
Net investment income (loss), before waivers and reimbursements | | | 0.41 | | | | 0.47 | | | | 0.54 | |
| | | | | | | | | | | | |
| | | Periods Ended December 31, | |
| | | 2010 | | | 2009 | | | 2008(a) | |
Supplemental data for all classes: | | | | | | | | | | | | |
Net assets at end of year (in thousands) | | $ | 94,901 | | | $ | 115,136 | | | $ | 46,676 | |
Portfolio turnover rate (%)* | | | 176 | | | | 176 | | | | 151 | |
| (a) | | For the period May 3, 2010 (Commencement of Operations) to December 31, 2010. |
| (c) | | Excludes $0.96, $1.29 and $0.00 of PFIC mark to market which is treated as ordinary income for Federal tax purposes for the years 2010, 2009 and 2008 respectively. |
| * | | Rates not annualized for periods that are less than a year. |
| ** | | Rates are annualized for periods that are less than a year. |
| ^ | | Amount is less than $0.005 per share. |
Performance cited represents past performance. Past performance does not guarantee future results and current performance may be lower or higher than the data quoted. Results shown are annual returns, which assume reinvestment of dividends and capital gains. Investment returns and principal will fluctuate and you may have a gain or loss when you sell shares. For the most current month-end performance information, please call 1-800-742-7272 or visit our Web site at www.williamblairfunds.com.
Note: Net investment income (loss) per share is based on the average shares outstanding during the year.
64 Annual Report | December 31, 2010 |
Financial Highlights
Bond Fund
| | | | | | | | | | | | | | | | |
| | | Institutional Class Shares | |
| | | Periods Ended December 31, | |
| | | 2010 | | | 2009 | | | 2008 | | | 2007(a) | |
Net asset value, beginning of year | | $ | 10.30 | | | $ | 9.72 | | | $ | 10.00 | | | $ | 10.00 | |
Income (loss) from investment operations: | | | | | | | | | | | | | | | | |
Net investment income (loss) | | | 0.48 | | | | 0.51 | | | | 0.50 | | | | 0.32 | |
Net realized and unrealized gain (loss) on investments | | | 0.34 | | | | 0.58 | | | | (0.31 | ) | | | 0.03 | |
| | | | | | | | | | | | | | | | |
Total from investment operations | | | 0.82 | | | | 1.09 | | | | 0.19 | | | | 0.35 | |
Less distributions from: | | | | | | | | | | | | | | | | |
Net investment income | | | 0.51 | | | | 0.51 | | | | 0.47 | | | | 0.35 | |
Net realized gain | | | 0.03 | | | | — | | | | — | | | | 0.00 | |
| | | | | | | | | | | | | | | | |
Total distributions | | | 0.54 | | | | 0.51 | | | | 0.47 | | | | 0.35 | |
| | | | | | | | | | | | | | | | |
Net asset value, end of year | | $ | 10.58 | | | $ | 10.30 | | | $ | 9.72 | | | $ | 10.00 | |
| | | | | | | | | | | | | | | | |
Total Return (%)* | | | 8.06 | | | | 11.47 | | | | 1.95 | | | | 3.57 | |
Ratios to average daily net assets (%):** | | | | | | | | | | | | | | | | |
Expenses, net of waivers and reimbursements | | | 0.35 | | | | 0.34 | | | | 0.35 | | | | 0.35 | |
Expenses, before waivers and reimbursements | | | 0.40 | | | | 0.43 | | | | 0.56 | | | | 0.52 | |
Net investment income (loss), net of waivers and reimbursements | | | 4.54 | | | | 5.07 | | | | 5.04 | | | | 5.09 | |
Net investment income (loss), before waivers and reimbursements | | | 4.49 | | | | 4.98 | | | | 4.83 | | | | 4.92 | |
| | | | | | | | | | | | | | | | |
| | | Periods Ended December 31, | |
| | | 2010 | | | 2009 | | | 2008 | | | 2007(a) | |
Supplemental data for all classes: | | | | | | | | | | | | | | | | |
Net assets at end of year (in thousands) | | $ | 192,776 | | | $ | 147,344 | | | $ | 74,613 | | | $ | 68,483 | |
Portfolio turnover rate (%)* | | | 25 | | | | 29 | | | | 52 | | | | 38 | |
| (a) | | For the period May 1, 2007 (Commencement of Operations) to December 31, 2007. |
| * | | Rates not annualized for periods that are less than a year. |
| ** | | Rates are annualized for periods that are less than a year. |
Performance cited represents past performance. Past performance does not guarantee future results and current performance may be lower or higher than the data quoted. Results shown are annual returns, which assume reinvestment of dividends and capital gains. Investment returns and principal will fluctuate and you may have a gain or loss when you sell shares. For the most current month-end performance information, please call 1-800-742-7272 or visit our Web site at www.williamblairfunds.com.
Note: Net investment income (loss) per share is based on the average shares outstanding during the year.
December 31, 2010 | William Blair Funds 65 |
Financial Highlights
Low Duration Fund
| | | | | | | | |
| | | Institutional Class Shares | |
| | | Periods Ended December 31, | |
| | | 2010 | | | 2009(a) | |
Net asset value, beginning of year | | $ | 9.93 | | | $ | 10.00 | |
Income (loss) from investment operations: | | | | | | | | |
Net investment income (loss) | | | 0.16 | | | | 0.01 | |
Net realized and unrealized gain (loss) on investments | | | 0.05 | | | | (0.07 | ) |
| | | | | | | | |
Total from investment operations | | | 0.21 | | | | (0.06 | ) |
Less distributions from: | | | | | | | | |
Net investment income | | | 0.24 | | | | 0.01 | |
Net realized gain | | | — | | | | — | |
| | | | | | | | |
Total distributions | | | 0.24 | | | | 0.01 | |
| | | | | | | | |
Net asset value, end of year | | $ | 9.90 | | | $ | 9.93 | |
| | | | | | | | |
Total Return (%)* | | | 2.15 | | | | (0.58 | ) |
Ratios to average daily net assets (%):** | | | | | | | | |
Expenses, net of waivers and reimbursements | | | 0.40 | | | | 0.40 | |
Expenses, before waivers and reimbursements | | | 0.48 | | | | 0.64 | |
Net investment income (loss), net of waivers and reimbursements | | | 1.61 | | | | 1.54 | |
Net investment income (loss), before waivers and reimbursements | | | 1.53 | | | | 1.30 | |
| | | | | | | | |
| | | Periods Ended December 31, | |
| | | 2010 | | | 2009(a) | |
Supplemental data for all classes: | | | | | | | | |
Net assets at end of year (in thousands) | | $ | 143,470 | | | $ | 95,134 | |
Portfolio turnover rate (%)* | | | 51 | | | | — | |
| (a) | | For the period December 1, 2009 (Commencement of Operations) to December 31, 2009. |
| * | | Rates not annualized for periods that are less than a year. |
| ** | | Rates are annualized for periods that are less than a year. |
Performance cited represents past performance. Past performance does not guarantee future results and current performance may be lower or higher than the data quoted. Results shown are annual returns, which assume reinvestment of dividends and capital gains. Investment returns and principal will fluctuate and you may have a gain or loss when you sell shares. For the most current month-end performance information, please call 1-800-742-7272 or visit our Web site at www.williamblairfunds.com.
Note: Net investment income (loss) per share is based on the average shares outstanding during the year.
66 Annual Report | December 31, 2010 |
REPORT OF INDEPENDENT REGISTERED PUBLIC ACCOUNTING FIRM
To the Board of Trustees and Shareholders of
William Blair Funds
We have audited the accompanying statements of assets and liabilities, including the portfolios of investments, of the Institutional International Growth Fund, Institutional International Equity Fund, International Small Cap Growth Fund, Emerging Markets Growth Fund, Emerging Leaders Growth Fund, Bond Fund, and Low Duration Fund (collectively, the Portfolios) (seven of the Portfolios constituting William Blair Funds) as of December 31, 2010, and the related statements of operations, the statements of changes in net assets and financial highlights for the periods indicated therein. These financial statements and financial highlights are the responsibility of the Portfolios’ management. Our responsibility is to express an opinion on these financial statements and financial highlights based on our audits.
We conducted our audits in accordance with the standards of the Public Company Accounting Oversight Board (United States). Those standards require that we plan and perform the audits to obtain reasonable assurance about whether the financial statements and financial highlights are free of material misstatement. We were not engaged to perform an audit of the Portfolios’ internal control over financial reporting. Our audits included consideration of internal control over financial reporting as a basis for designing audit procedures that are appropriate in the circumstances, but not for the purpose of expressing an opinion on the effectiveness of the Portfolios’ internal control over financial reporting. Accordingly, we express no such opinion. An audit also includes examining, on a test basis, evidence supporting the amounts and disclosures in the financial statements and financial highlights, assessing the accounting principles used and significant estimates made by management, and evaluating the overall financial statement presentation. Our procedures included confirmation of securities owned as of December 31, 2010, by correspondence with the custodian and brokers or by other appropriate auditing procedures where replies from brokers were not received. We believe that our audits provide a reasonable basis for our opinion.
In our opinion, the financial statements and financial highlights referred to above present fairly, in all material respects, the financial position of each of the above mentioned Portfolios of William Blair Funds at December 31, 2010, the results of their operations, changes in their net assets and financial highlights for the periods indicated therein, in conformity with U.S. generally accepted accounting principles.

Chicago, Illinois
February 22, 2011
December 31, 2010 | William Blair Funds 67 |
Trustees and Officers (Unaudited). The trustees and officers of the William Blair Funds, their year of birth, their principal occupations during the last five years, their affiliations, if any, with William Blair & Company, L.L.C., and other significant affiliations are set forth below. The address of each trustee and officer is 222 West Adams Street, Chicago, Illinois 60606.
| | | | | | | | | | | | |
Name and Year of Birth | | Position(s)
Held with
Fund | | Term of
Office and
Length of
Time
Served(1) | | Principal Occupation(s) During Past 5 Years | | Number of
Portfolios
in Fund
Complex
Overseen
by Trustee | | | Other Directorships Held by Trustee/Officer |
Interested Trustees | | | | | | | | | | | | |
Michelle R. Seitz,
1965* | | Chairperson of the Board of Trustees and President | | Since 2010 Since 2007 | | Principal, William Blair & Company, L.L.C.; Limited Partner, WB Holdings, L.P. (since November 2008); Member, WBC GP, L.L.P. (since November 2008) | | | 19 | | | N/A |
| | | | | |
Richard W. Smirl,
1967 | | Trustee and Senior Vice President | | Trustee since 2010 and Senior Vice President since 2007 | | Principal, William Blair & Company, L.L.C., Vice President, Chief Compliance Officer 2004-2009 | | | 19 | | | N/A |
| | | | |
Non-Interested Trustees | | | | | | | | | | |
Ann P. McDermott,
1939 | | Trustee | | Since 1996 | | Board member and officer for various civic and charitable organizations over the past thirty years; professional experience prior thereto, registered representative for New York Stock Exchange firm | | | 19 | | | Northwestern University, Women’s Board; Rush Presbyterian St. Luke’s Medical Center, Women’s Board; University of Chicago, Women’s Board; Visiting Nurses Association, Honorary Director |
| | | | | |
Phillip O. Peterson,
1944 | | Trustee | | Since 2007 | | Trustee of Strong Funds Liquidating Trusts since 2005 and President, Strong Mutual Funds, 2004-2005; formerly, Partner, KPMG LLP | | | 19 | | | The Hartford Group of Mutual Funds (87 portfolios) |
| | | | | |
Donald J. Reaves,
1946 | | Trustee | | Since 2004 | | Chancellor, Winston-Salem State University since 2007; formerly, Vice President for Administration and Chief Financial Officer, University of Chicago 2002-2007. | | | 19 | | | American Student Assistance Corp., guarantor of student loans; Amica Mutual Insurance Company |
| | | | | |
Donald L. Seeley,
1944 | | Trustee | | Since 2003 | | Retired; formerly, Director, Applied Investment Management Program, University of Arizona Department of Finance, prior there to, Vice Chairman and Chief Financial Officer, True North Communications, Inc., marketing communications and advertising firm | | | 19 | | | Warnaco Group, Inc., intimate apparel, sportswear, and swimwear manufacturer; Center for Furniture Craftsmanship (not-for-profit) |
68 Annual Report | December 31, 2010 |
| | | | | | | | | | | | |
Name and Year of Birth | | Position(s)
Held with
Fund | | Term of
Office and
Length of
Time
Served(1) | | Principal Occupation(s) During Past 5 Years | | Number of
Portfolios
in Fund
Complex
Overseen
by Trustee | | | Other Directorships Held by Trustee/Officer |
Thomas J. Skelly,
1951 | | Trustee | | Since 2007 | | Advisory Board member for various U.S. companies; Director and Investment Committee Chairman of the US Accenture Foundation, Inc.; prior to 2005, Managing Partner of various divisions at Accenture | | | 19 | | | First MetLife Investors Insurance Company |
| | | | | |
Robert E. Wood II,
1938 | | Trustee | | Since 1999 | | Retired; formerly, Executive Vice President, Morgan Stanley Dean Witter | | | 19 | | | Chairman, Add-Vision, Inc., manufacturer of surface animation systems; Chairman Micro-Combustion, LLC |
Officers | | | | | | | | | | | | |
Michael P. Balkin,
1959 | | Senior Vice President | | Since 2009 | | Principal, William Blair & Company, L.L.C. | | | | | | N/A |
| | | | | |
| | Vice President | | 2008-2009 | | Associate, William Blair & Company, L.L.C.; former Chief Investment Officer, Magnetar Investment Management | | | | | | |
| | | | | |
Karl W. Brewer,
1966 | | Senior Vice President | | Since 2000 | | Principal, William Blair & Company, L.L.C. | | | | | | N/A |
| | | | | |
David C. Fording,
1967 | | Senior Vice President | | Since 2009 | | Principal, William Blair & Company, L.L.C. | | | | | | N/A |
| | | | | |
| | Vice President | | 2006-2009 | | Associate, William Blair & Company, L.L.C.; former Portfolio Manager, TIAA-CREF. | | | | | | |
| | | | | |
James S. Golan,
1961 | | Senior Vice President | | Since 2005 | | Principal, William Blair & Company, L.L.C. | | | | | | N/A |
| | | | | |
W. George Greig,
1952 | | Senior Vice President | | Since 1996 | | Principal, William Blair & Company, L.L.C. | | | | | | N/A |
| | | | | |
Michael A. Jancosek,
1959 | | Senior Vice President | | Since 2004 | | Principal, William Blair & Company L.L.C. | | | | | | N/A |
| | | | | |
John F. Jostrand,
1954 | | Senior Vice President | | Since 1999 | | Principal, William Blair & Company, L.L.C. | | | | | | N/A |
| | | | | |
Robert C. Lanphier, IV,
1956 | | Senior Vice President | | Since 2003 | | Principal, William Blair & Company, L.L.C. | | | | | | Chairman, AG. Med, Inc. |
| | | | | |
Mark T. Leslie,
1967 | | Senior Vice President | | Since 2008 | | Principal, William Blair & Company, L.L.C. | | | | | | N/A |
| | | | | |
| | Vice President | | 2005-2008 | | Associate, William Blair & Company, L.L.C. formerly, U.S. Bancorp Asset Management | | | | | | |
December 31, 2010 | William Blair Funds 69 |
| | | | | | | | |
Name and Year of Birth | | Position(s)
Held with
Fund | | Term of
Office and
Length of
Time
Served(1) | | Principal
Occupation(s)
During Past 5 Years(2) | | Other Directorships Held by Trustee/Officer |
Matthew A. Litfin,
1972 | | Senior Vice President | | Since 2008 | | Principal, William Blair & Company, L.L.C. | | N/A |
| | | | |
Kenneth J. McAtamney
1966 | | Senior Vice President | | Since 2008 | | Principal, William Blair & Company, L.L.C. | | N/A |
| | | | |
Todd M. McClone,
1968 | | Senior Vice President | | Since 2006 | | Principal, William Blair & Company, L.L.C. | | N/A |
| | | | |
| | Vice President | | 2005-2006 | | Associate, William Blair & Company, L.L.C. | | N/A |
| | | | |
Tracy McCormick,
1954 | | Senior Vice President | | Since 2008 | | Principal, William Blair & Company, L.L.C. | | N/A |
| | | | |
David Merjan,
1960 | | Senior Vice President | | Since 2008 | | Principal, William Blair & Company, L.L.C. | | N/A |
| | | | |
David S. Mitchell,
1960 | | Senior Vice President | | Since 2004 | | Principal, William Blair & Company, L.L.C. | | N/A |
| | | | |
David P. Ricci,
1958 | | Senior Vice President | | Since 2006 | | Principal, William Blair & Company, L.L.C. | | N/A |
| | | | |
Richard W. Smirl,
1967 | | Senior Vice President | | Since 2004 | | Principal, William Blair & Company, L.L.C. | | N/A |
| | | | |
Jeffrey A. Urbina,
1955 | | Senior Vice President | | Since 1998 | | Principal, William Blair & Company, L.L.C. | | N/A |
| | | | |
Christopher T. Vincent,
1956 | | Senior Vice President | | Since 2004 | | Principal, William Blair & Company, L.L.C. | | N/A |
| | | | |
Chad M. Kilmer,
1975 | | Vice President | | Since 2006 | | Associate, William Blair & Company, L.L.C.; former analyst and Portfolio Manager U.S. Bancorp Asset Management. | | N/A |
| | | | |
Kathleen M. Lynch,
1971 | | Vice President | | Since 2010 | | Associate, William Blair & Company, L.L.C. | | N/A |
| | | | |
Paul J. Sularz,
1967 | | Vice President | | Since 2009 | | Associate, William Blair & Company, L.L.C.; Vice President, J.P. Morgan Securities, Inc. | | N/A |
| | | | |
Walter R. Randall, Jr.,
1960 | | Chief Compliance Officer | | Since 2009 | | Associate, William Blair & Company, L.L.C.; Associate Counsel and Chief Compliance Officer, Calamos Investments; Assistant General Counsel, American Century Investments. | | N/A |
| | | | |
Colette M. Garavalia,
1961 | | Treasurer | | Since 2009 | | Associate, William Blair & Company, L.L.C. | | N/A |
| | | | |
| | Secretary | | 2000-2009 | | Associate, William Blair & Company, L.L.C.; | | N/A |
70 Annual Report | December 31, 2010 |
| | | | | | | | |
Name and Year of Birth | | Position(s)
Held with
Fund | | Term of
Office and
Length of
Time
Served(1) | | Principal
Occupation(s)
During Past 5 Years(2) | | Other Directorships Held by Trustee/Officer |
Andrew T. Pfau,
1970 | | Secretary | | Since 2009 | | Associate, William Blair & Company, L.L.C.; Associate, Bell, Boyd & Lloyd, LLP; Associate, Sidley Austin LLP | | N/A |
| * | | Ms. Seitz and Mr. Smirl are interested persons of the William Blair Funds because each is a principal of William Blair & Company, L.L.C., the Funds’ investment advisor, principal underwriter and distributor. |
| (1) | | Each Trustee serves until the election and qualification of a successor, or until death, resignation or retirement or removal as provided in the Fund’s Declaration of Trust. Retirement for non-interested Trustees occurs no later than at the conclusion of the first regularly scheduled Board meeting of the Fund’s fiscal year that occurs after the Trustee’s 72nd birthday. The Fund’s officers except the Chief Compliance Officer, are elected annually by the Trustees. The Fund’s Chief Compliance Officer is designated by the Board of Trustees and may only be removed by action of the Board of Trustees, including a majority of the non-interested Trustees. |
| (2) | | In November 2008, all current principals of William Blair & Company, L.L.C. also became limited partners in WB Holdings, L.P. |
The Statement of Additional Information for the William Blair Funds includes additional information about the trustees and is available without charge by calling 1-800-635-2886 (in Massachusetts 1-800-635-2840) or by writing the Fund.
December 31, 2010 | William Blair Funds 71 |
(unaudited)
Proxy Voting
A description of the policies and procedures that the Fund uses to determine how to vote proxies relating to portfolio securities and information regarding how the Fund voted proxies relating to portfolio securities for the most recent 12-month period ended December 31 are available without charge, upon request, by calling 1-800-635-2886 (in Massachusetts 1-800-635-2840), at www.williamblairfunds.com and on the SEC’s website at http://www.sec.gov.
Quarterly Portfolio Schedules
Each Portfolio files its complete schedule of portfolio holdings with the SEC for the first and third fiscal quarters of each fiscal year (quarters ended March 31 and September 30) on Form N-Q. The Fund’s Forms N-Q are available on the SEC’s website at http://www.sec.gov and may be reviewed and copied at the SEC’s Public Reference Room in Washington, D.C. Information on the operation of the SEC’s Public Reference Room may be obtained by calling 1-800-SEC-0330. The Fund’s Forms N-Q are also available on the Fund’s website at www.williamblairfunds.com.
Additional Federal Income Tax Information: (unaudited)
Under Section 852(b)(3)(C) of the Code, the Funds hereby designate the following amounts as capital gain dividends for the fiscal year ended December 31, 2010:
| | |
Emerging Leaders Growth | | Bond |
$505,181 | | $493,757 |
The following table provides the percentage of the 2010 year-end distributions that qualify for the dividend received deduction, and the qualified dividend income percentage:
| | | | | | | | |
Portfolio | | Dividend
Received
Deduction% | | | Qualified
Dividend
Income% | |
Institutional International Growth | | | 0.00 | % | | | 80.38 | % |
Institutional International Equity | | | 0.31 | % | | | 100.00 | % |
International Small Cap Growth | | | 0.13 | % | | | 100.00 | % |
Emerging Markets Growth | | | 0.16 | % | | | 83.93 | % |
Emerging Leaders Growth | | | 0.00 | % | | | 100.00 | % |
Bond | | | 0.00 | % | | | 0.00 | % |
Low Duration | | | 0.00 | % | | | 0.00 | % |
In January 2011, you were notified on IRS Form 1099-Div or substitute 1099 DIV as to the Federal tax status of the distributions received by you in the calendar year 2010.
72 Annual Report | December 31, 2010 |
Useful Information About Your Report (unaudited)
Please refer to this information when reviewing the Expense Example for each Portfolio.
Expense Example
As a shareholder of a Portfolio, you incur ongoing costs, including management fees and other Portfolio expenses. The example is intended to help you understand your ongoing costs (in dollars) of investing in the Portfolio and to compare these costs with the ongoing costs of investing in other mutual funds. To do so, compare the Portfolio’s 5% hypothetical example with the 5% hypothetical examples that appear in the shareholder reports of other funds. The example is based on an investment of $1,000 invested at the beginning of the period and held for the entire six-month period from July 1, 2010 to December 31, 2010.
Actual Expenses
In each example, the first line for each share class in the table provides information about the actual account values and actual expenses. These expenses reflect the effect of any expense cap applicable to the share class during the period. Without this expense cap, the costs shown in the table would have been higher. You may use the information in this line, together with the amount you invested, to estimate the expenses that you paid over the period. Simply divide your account value by $1,000 (example, an $8,600 account value divided by $1,000 = 8.6), then multiply the result by the number in the first line under the heading entitled “Expenses Paid During the Period” to estimate the expenses you paid on your account during the period.
Hypothetical Example for Comparison Purposes
In each example, the second line for each share class in the table provides information about hypothetical account values and hypothetical expenses based on the Portfolio’s actual expense ratio and an assumed rate of return of 5% per year before expenses. This is not the Portfolio’s actual return. The hypothetical account values and expenses may not be used to estimate the actual ending account balance or expenses you paid for the period. You may use this information to compare the ongoing costs of investing in the Portfolio to other funds. To do so, compare this 5% hypothetical example with the 5% hypothetical examples that appear in the shareholder reports of other funds.
Please note that the expenses shown in both examples are meant to highlight your ongoing costs only and do not reflect any transactional costs or account type fees. These fees are fully described in the prospectus. Therefore, the second line of each share class in the table is useful in comparing ongoing costs only and will not help you determine the relative costs of owning different funds.
December 31, 2010 | William Blair Funds 73 |
Fund Expenses (unaudited)
The examples below show you the ongoing costs (in dollars) of investing in your fund and allows you to compare these costs with those of other mutual funds. Please refer to previous page for a detailed explanation of the information presented on this chart.
| | | | | | | | | | | | | | | | |
| | | Beginning
Account Value
7/1/2010 | | | Ending
Account Value
12/31/2010 | | | Expenses Paid
During the
Period (a) | | | Annualized
Expense Ratio | |
Institutional International Growth Fund | | | | | | | | | | | | | | | | |
Institutional Class—actual return | | $ | 1,000.00 | | | $ | 1,255.60 | | | $ | 5.60 | | | | 0.98 | % |
Institutional Class—hypothetical 5% return | | | 1,000.00 | | | | 1,020.24 | | | | 5.01 | | | | 0.98 | |
Institutional International Equity Fund | | | | | | | | | | | | | | | | |
Class I—actual return | | | 1,000.00 | | | | 1,224.40 | | | | 6.02 | | | | 1.07 | |
Institutional Class—hypothetical 5% return | | | 1,000.00 | | | | 1,019.79 | | | | 5.47 | | | | 1.07 | |
International Small Cap Growth Fund | | | | | | | | | | | | | | | | |
Institutional Class—actual return | | | 1,000.00 | | | | 1,291.00 | | | | 6.22 | | | | 1.08 | |
Institutional Class—hypothetical 5% return | | | 1,000.00 | | | | 1,019.78 | | | | 5.48 | | | | 1.08 | |
Emerging Markets Growth Fund | | | | | | | | | | | | | | | | |
Institutional Class—actual return | | | 1,000.00 | | | | 1,291.70 | | | | 6.75 | | | | 1.17 | |
Institutional Class—hypothetical 5% return | | | 1,000.00 | | | | 1,019.31 | | | | 5.95 | | | | 1.17 | |
Emerging Leaders Growth Fund | | | | | | | | | | | | | | | | |
Institutional Class—actual return | | | 1,000.00 | | | | 1,263.90 | | | | 9.25 | | | | 1.62 | |
Institutional Class—hypothetical 5% return | | | 1,000.00 | | | | 1,017.03 | | | | 8.24 | | | | 1.62 | |
Bond Fund | | | | | | | | | | | | | | | | |
Institutional Class—actual return | | | 1,000.00 | | | | 1,025.60 | | | | 1.79 | | | | 0.35 | |
Institutional Class—hypothetical 5% return | | | 1,000.00 | | | | 1,023.44 | | | | 1.79 | | | | 0.35 | |
Low Duration Fund | | | | | | | | | | | | | | | | |
Institutional Class—actual return | | | 1,000.00 | | | | 1,004.80 | | | | 2.04 | | | | 0.40 | |
Institutional Class—hypothetical 5% return | | | 1,000.00 | | | | 1,023.17 | | | | 2.06 | | | | 0.40 | |
| (a) | Expenses are equal to the annualized expense ratio, multiplied by the average account value over the period, multiplied by the number of days in the period 184, and divided by 365 (to reflect the one-half year period). |
74 Annual Report | December 31, 2010 |
BOARD OF TRUSTEES
Ann P. McDermott
Director and Trustee
Profit and not-for-profit organizations
Phillip O. Peterson
Retired Partner, KPMG LLP
Donald J. Reaves
Chancellor, Winston-Salem State University
Donald L. Seeley
Retired Adjunct Lecturer and Director, University of Arizona Department of Finance
Michelle R. Seitz, Chairperson and President
Principal, William Blair & Company, L.L.C.
Thomas J. Skelly
Retired Managing Partner, Accenture U.S.
Richard W. Smirl, Senior Vice President
Principal, William Blair & Company, L.L.C.
Robert E. Wood II
Retired Executive Vice President, Morgan Stanley Dean Witter
Officers
Michael P. Balkin, Senior Vice President
Karl W. Brewer, Senior Vice President
David C. Fording, Senior Vice President
James S. Golan, Senior Vice President
W. George Greig, Senior Vice President
Michael A. Jancosek, Senior Vice President
John F. Jostrand, Senior Vice President
Robert C. Lanphier, IV, Senior Vice President
Mark T. Leslie, Senior Vice President
Matthew A. Litfin, Senior Vice President
Kenneth J. McAtamney, Senior Vice President
Todd M. McClone, Senior Vice President
Tracy McCormick, Senior Vice President
David Merjan, Senior Vice President
David S. Mitchell, Senior Vice President
David P. Ricci, Senior Vice President
Jeffrey A. Urbina, Senior Vice President
Christopher T. Vincent, Senior Vice President
Chad M. Kilmer, Vice President
Kathleen M. Lynch, Vice President
Paul J. Sularz, Vice President
Walter R. Randall, Jr., Chief Compliance Officer
Colette M. Garavalia, Treasurer
Andrew T. Pfau, Secretary
Investment Advisor
William Blair & Company, L.L.C.
Independent Registered Public Accounting Firm
Ernst & Young LLP
Legal Counsel
Vedder Price P.C.
Transfer Agent
Boston Financial Data Services, Inc.
P.O. Box 8506
Boston, MA 02266-8506
For customer assistance, call 1-800-635-2886
(Massachusetts 1-800-635-2840)
December 31, 2010 | William Blair Funds 75 |
INSTITUTIONALFUNDS
Institutional International Growth Fund
Institutional International Equity Fund
International Small Cap Growth Fund - Institutional Class Shares
Emerging Markets Growth Fund - Institutional Class Shares
Emerging Leaders Growth Fund - Institutional Class Shares
Bond Fund - Institutional Class Shares
Low Duration Fund - Institutional Class Shares

222 West Adams Street
Chicago, IL 60606
800.742.7272 Ÿ www.williamblairfunds.com
©William Blair & Company, L.L.C., distributor
As of the end of the period covered by this Form N-CSR, the Registrant has adopted a code of ethics that applies to its principal executive officer and principal financial officer. Such code of ethics is posted on the Registrant’s website: www.williamblairfunds.com. There were no amendments to or waivers of the code of ethics during the period covered by this report.
| Item 3. | Audit Committee Financial Expert |
The Registrant’s Board of Trustees has determined that the Registrant has at least one “audit committee financial expert” (as defined in Item 3 of Form N-CSR) serving on its Audit Committee. Mr. Donald L. Seeley, the Registrant’s audit committee financial expert, is “independent” for purposes of Item 3 to Form N-CSR.
An “audit committee financial expert” is not an “expert” for any purpose, including for purposes of Section 11 of the Securities Act of 1933, as a result of being designated as an “audit committee financial expert.” Further, the designation of a person as an “audit committee financial expert” does not mean that the person has any greater duties, obligations, or liability than those imposed on the person without the “audit committee financial expert” designation. Similarly, the designation of a person as an “audit committee financial expert” does not affect the duties, obligations, or liability of any other member of the audit committee or Board of Trustees.
| Item 4. | Principal Accountant Fees and Services |
Audit Fees
For the fiscal years ended December 31, 2009 and 2010, Ernst & Young, LLP, the Registrant’s principal accountant (“E&Y”), billed the Registrant $484,000 and $501,000, respectively, for professional services rendered for the audit of the Registrant’s annual financial statements or services that are normally provided in connection with statutory and regulatory filings.
Audit-Related Fees
For the fiscal years ended December 31, 2009 and 2010, E&Y billed the Registrant $0 and $0, respectively, for assurance and related services that are reasonably related to the performance of the audit of the Registrant’s financial statements and that are not reported above, such as reviewing prospectuses and SEC filings. For the fiscal years ended December 31, 2009 and 2010, E&Y provided no audit-related services to William Blair & Company L.L.C., the Registrant’s investment advisor (“William Blair”) or any of its control affiliates that were for engagements directly related to the Registrant’s operations and financial reporting.
Tax Fees
For the fiscal years ended December 31, 2009 and 2010, E&Y billed the Registrant $92,475 and $117,850, respectively, for professional services rendered for tax compliance, tax advice and tax planning. Such services consisted of preparation of tax returns, year-end distribution review, qualifying dividend income analysis and computation of foreign tax credit pass-through. For the fiscal years ended December 31, 2009 and 2010, E&Y did not bill William Blair and its control affiliates for any services that were for engagements directly related to the Registrant’s operations and financial reporting.
All Other Fees
For the fiscal years ended December 31, 2009 and 2010, E&Y did not bill the Registrant for products and services other than the services reported above. For the fiscal years ended December 31, 2009 and 2010, E&Y provided no other services to William Blair or any of its control affiliates that were for engagements directly related to the Registrant’s operations and financial reporting.
Audit Committee Pre-Approval Policies and Procedures
Pursuant to Registrant’s Audit Committee Charter (the “Charter”), the Audit Committee is responsible for pre-approving any engagement of the principal accountant to provide non-prohibited services to the Registrant, including the fees and other compensation to be paid to the principal accountant, to the extent required by Rule 2-01(c)(7) of Regulation S-X. Pursuant to the Charter, the Audit Committee is also responsible for pre-approving any engagement of the principal accountant, including the fees and other compensation to be paid to the principal accountant, to provide non-audit services to the Registrant’s investment advisor (or any entity controlling, controlled by, or under common control with the adviser that provides ongoing services to the Registrant), if the engagement relates directly to the operations and financial reporting of the Registrant, to the extent required by Rule 2-01(c)(7) of Regulation S-X. The Chair of the Audit Committee may grant the pre-approval referenced above for non-prohibited and non-audit services. All such delegated pre-approvals will be presented to the Audit Committee no later than the next Audit Committee meeting.
Non-Audit Fees
For the fiscal years ended December 31, 2009 and 2010, E&Y billed the Registrant $92,475 and $117,850, respectively, in non-audit fees (tax services). For the same periods, E&Y billed William Blair and its control affiliates $0 and $97,000 (Custodian SAS 70 Report), respectively, in non-audit fees. The Registrant’s Audit Committee has considered whether the provision of non-audit services that were rendered to William Blair or any of its control affiliates that were not pre-approved pursuant to Rule 2-01(c)(7)(ii) of Regulation S-X is compatible with maintaining E&Y’s independence.
| Item 5. | Audit Committee of Listed Registrants |
Not Applicable to this Registrant, insofar as the Registrant is not a listed company.
| Item 6. | Schedule of Investments |
See Schedule of Investments in Item 1
| Item 7. | Disclosure of Proxy Voting Policies and Procedures for Closed-End Management Investment Companies |
Not applicable to this Registrant, insofar as the Registrant is not a closed-end management investment company.
| Item 8. | Portfolio Managers of Closed Investment Companies |
Not applicable to this Registrant, insofar as the Registrant is not a closed-end management investment company.
| Item 9. | Purchase of Equity Securities by Closed-End Management Investment Companies and Affiliated Purchasers |
Not applicable to this Registrant, insofar as the Registrant is not a closed-end management investment company.
| Item 10. | Submission of Matters to a Vote of Security Holders |
There have been no material changes to the procedures by which shareholders may recommend nominees to the Registrant’s Board of Trustees since the Registrant last provided disclosure in response to this item.
Controls and Procedures
(a) The Registrant’s principal executive and principal financial officer, or persons performing similar functions, have concluded that the Registrant’s Disclosure Controls and Procedures (as defined in Rule 30a-3(c) under the Investment Company Act of 1940, as amended (the “1940 Act”) (17 CFR 270.30a-3(c)) are effective, as of a date within 90 days of the filing date of this report that includes the disclosure required by this paragraph, based on their evaluation of these controls and procedures required by Rule 30a-3 (b) under the 1940 Act (17 CFR 270.30a-3(b) and Rules 13a-15(b) or 15d-15(b) under the Exchange Act (17 CFR 240.13a-15(b) or 240.15d-15(b)).
(b) There were no changes in the Registrant’s internal control over financial reporting (as defined in Rule 30a-3(d) under the 1940 Act (17 CFR 270.30a-3(d)) that occurred during the final quarter of the period covered by this report that has materially affected, or is reasonably likely to materially affect, the Registrant’s internal control over financial reporting.
12. (a) (1) Code of Ethics
Not applicable because it is posted on Registrant’s website.
12. (a) (2) (1)
Certification of Principal Executive Officer Required by Rule 30a-2(a) of the Investment Company Act
12. (a) (2) (2)
Certification of Principal Financial Officer Required by Rule 30a-2(a) of the Investment Company Act.
12. (a) (3)
Not applicable to this Registrant.
12. (b)
Certification of Chief Executive Officer and Certification of Chief Financial Officer Required by Rule 30a-2(b) of the Investment Company Act
Signatures
Pursuant to the requirements of the Securities Exchange Act of 1934 and the Investment Company Act of 1940, the Registrant has duly caused this report to be signed on its behalf by the undersigned, thereunto duly authorized.
| | |
| | | William Blair Funds |
| |
| | | /s/ Michelle R. Seitz |
| By: | | Michelle R. Seitz |
| | | President (Chief Executive Officer) |
Date: February 17, 2011
Pursuant to the requirements of the Securities Exchange Act of 1934 and the Investment Company Act of 1940, this report has been signed below by the following persons on behalf of the Registrant and in the capacities and on the dates indicated
| | |
| By: | | Michelle R. Seitz |
| | | President (Chief Executive Officer) |
Date: February 17, 2011
| | |
| By: | | Colette M. Garavalia |
| | | Treasurer (Chief Financial Officer) |
Date: February 17, 2011