UNITED STATES
SECURITIES AND EXCHANGE COMMISSION
Washington, D.C. 20549
Form N-CSR
CERTIFIED SHAREHOLDER REPORT OF REGISTERED
MANAGEMENT INVESTMENT COMPANIES
Investment Company Act File Number 811-5344
William Blair Funds
(Exact name of registrant as specified in charter)
| | |
| 222 West Adams Street, Chicago, IL | | 60606 |
| (Address of principal executive offices) | | (Zip Code) |
Michelle R. Seitz
William Blair Funds
222 West Adams Street, Chicago, IL 60606
(Name and address of agent for service)
Registrant’s telephone number, including area code: 312-236-1600
Date of fiscal year end: December 31
Date of reporting period: December 31, 2008
Form N-CSR is to be used by management investment companies to file reports with the Commission not later than 10 days after the transmission to stockholders of any report that is required to be transmitted to stockholders under Rule 30e-1 under the Investment Company Act of 1940 (17 CFR 270.30e-1). The Commission may use the information provided on Form N-CSR in its regulatory, disclosure review, inspection, and policymaking roles.
A registrant is required to disclose the information specified by Form N-CSR, and the Commission will make this information public. A Registrant is not required to respond to the collection of information contained in Form N-CSR unless the form displays a currently valid Office of Management and Budget (“OMB”) control number. Please direct comments concerning the accuracy of the information collection burden estimates and any suggestions for reducing the burden to Secretary, Securities and Exchange Commission, 450 Fifth Street, NW, Washington, DC 20549-0609. The OMB has reviewed this collection of information under the clearance requirements of 44 U.S.C. (ss) 3507.
| Item 1. | December 31, 2008 Annual Reports transmitted to shareholders. |

Table of Contents
This report is submitted for the general information of the shareholders of the William Blair Funds. It is not authorized for distribution to prospective investors unless accompanied or preceded by a prospectus of the William Blair Funds. Please carefully consider the Funds’ investment objectives, risks, charges, and expenses before investing. This and other information is contained in the Funds’ prospectus, which you may obtain by calling 1-800-742-7272. Read it carefully before you invest or send money.
December 31, 2008 | William Blair Funds 1 |
PERFORMANCE AS OF DECEMBER 31, 2008—CLASS N SHARES (unaudited)
| | | | | | | | | | | | | | | | |
| | | 1 Yr. | | | 3 Yr. | | | 5 Yr. | | | 10 Yr
(or since
inception) | | | Inception
Date | | Overall
Morningstar
Rating |
Growth Fund | | | | | | | | | | | | | | 3/20/1946 | | ««««
Among 1,507 large growth Funds |
Class N | | (37.61 | ) | | (7.41 | ) | | (1.34 | ) | | (1.93 | ) | | | |
Morningstar Large Growth | | (40.67 | ) | | (10.28 | ) | | (3.37 | ) | | (2.46 | ) | | | |
Russell 3000® Growth | | (38.44 | ) | | (9.12 | ) | | (3.33 | ) | | (4.01 | ) | | | | |
Standard & Poor’s 500 | | (37.00 | ) | | (8.36 | ) | | (2.19 | ) | | (1.38 | ) | | | | |
| | | | | | |
Tax-Managed Growth Fund | | | | | | | | | | | | | | | | ««««
Among 1,507 large growth Funds |
Class N Return before Taxes | | (39.57 | ) | | (10.41 | ) | | (2.87 | ) | | (3.46 | ) | | 12/27/1999 | |
After Taxes on Distributions | | (39.57 | ) | | (10.41 | ) | | (2.87 | ) | | (3.46 | ) | | | |
After Taxes on distributions and Sale of Fund Shares | | (25.72 | ) | | (8.69 | ) | | (2.42 | ) | | (2.89 | ) | | | | |
Morningstar Large Growth | | (40.67 | ) | | (10.28 | ) | | (3.37 | ) | | — | | | | | |
Russell 3000® Growth | | (38.44 | ) | | (9.12 | ) | | (3.33 | ) | | (7.38 | ) | | | | |
| | | | | | |
Large Cap Growth Fund | | | | | | | | | | | | | | 12/27/1999 | | «««
Among 1,507 large growth Funds |
Class N | | (37.76 | ) | | (10.23 | ) | | (4.62 | ) | | (8.05 | ) | | | |
Morningstar Large Growth | | (40.67 | ) | | (10.28 | ) | | (3.37 | ) | | — | | | | |
Russell 1000® Growth | | (38.44 | ) | | (9.11 | ) | | (3.42 | ) | | (7.63 | ) | | | | |
| | | | | | |
Small Cap Growth Fund | | | | | | | | | | | | | | 12/27/1999 | | ««
Among 704 small growth Funds |
Class N | | (46.85 | ) | | (15.96 | ) | | (5.24 | ) | | 6.42 | | | | |
Morningstar Small Growth | | (41.55 | ) | | (11.35 | ) | | (3.52 | ) | | — | | | | |
Russell 2000® Growth | | (38.54 | ) | | (9.32 | ) | | (2.35 | ) | | (4.15 | ) | | | | |
Russell 2000® | | (33.79 | ) | | (8.29 | ) | | (0.93 | ) | | 1.64 | | | | | |
| The Small Cap Growth Fund’s Performance during 2000 was primarily attributable to investments in initial public offerings (IPOs) during a rising market. Since then, IPOs have had an insignificant effect on the Fund’s performance. | | | | | | | | |
| | | | | | |
Mid Cap Growth Fund | | | | | | | | | | | | | | 2/1/2006 | | Not rated. |
Class N | | (34.71 | ) | | — | | | — | | | (8.04 | ) | | | | |
Morningstar Mid-Cap Growth | | (43.77 | ) | | — | | | — | | | — | | | | | |
Russell MidCap® Growth | | (44.32 | ) | | — | | | — | | | (13.84 | ) | | | | |
| | | | | | |
Small-Mid Cap Growth Fund | | | | | | | | | | | | | | 12/29/2003 | | ««««
Among 821 mid-cap growth funds |
Class N | | (37.71 | ) | | (8.44 | ) | | (0.72 | ) | | (0.84 | ) | | | |
Morningstar Mid-Cap Growth | | (43.77 | ) | | (10.92 | ) | | (2.44 | ) | | — | | | | |
Russell 2500™ Growth | | (41.50 | ) | | (10.36 | ) | | (2.24 | ) | | (2.35 | ) | | | | |
| | | | | | |
Global Growth Fund | | | | | | | | | | | | | | 10/15/2007 | | Not rated. |
Class N | | (49.52 | ) | | — | | | — | | | (43.43 | ) | | | | |
Morningstar World Stock | | (41.91 | ) | | — | | | — | | | — | | | | | |
MSCI All Country World IMI (net) | | (42.34 | ) | | — | | | — | | | (38.67 | ) | | | | |
MSCI All Country World (gross) | | (41.85 | ) | | — | | | — | | | (38.06 | ) | | | | |
| | | | | | |
International Growth Fund | | | | | | | | | | | | | | 10/1/1992 | | ««««
Among 209 foreign large growth funds |
Class N | | (52.33 | ) | | (11.51 | ) | | (0.02 | ) | | 6.49 | | | | |
Morningstar Foreign Large Growth | | (46.56 | ) | | (8.21 | ) | | 0.61 | | | 0.66 | | | | |
MSCI All Country World Ex-U.S. IMI (net) | | (45.99 | ) | | (7.44 | ) | | 2.61 | | | 2.26 | | | | | |
MSCI All Country World Ex-U.S. (gross) | | (45.24 | ) | | (6.57 | ) | | 3.00 | | | 2.27 | | | | | |
| | | | | | |
International Equity Fund | | | | | | | | | | | | | | 5/24/2004 | | «««
Among 209 foreign large growth funds |
Class N | | (48.75 | ) | | (10.23 | ) | | — | | | (1.55 | ) | | | |
Morningstar Foreign Large Growth | | (46.56 | ) | | (8.21 | ) | | — | | | — | | | | |
MSCI All Country World Ex-U.S. IMI (net) | | (45.99 | ) | | (7.44 | ) | | — | | | 2.91 | | | | | |
MSCI All Country World Ex-U.S. (gross) | | (45.24 | ) | | (6.57 | ) | | — | | | 3.42 | | | | | |
Please see the next page for important disclosure information.
2 Annual Report | December 31, 2008 |
PERFORMANCE AS OF DECEMBER 31, 2008—CLASS N SHARES—CONTINUED (unaudited)
| | | | | | | | | | | | | | | | |
| | | 1 Yr. | | | 3 Yr. | | | 5 Yr. | | | 10 Yr
(or since
inception) | | | Inception
Date | | Overall
Morningstar
Rating |
International Small Cap Growth Fund | | | | | | | | | | | | | | 11/1/2005 | | ««
Among 103 foreign small/mid growth funds |
Class N | | (51.82 | ) | | (13.13 | ) | | — | | | (9.37 | ) | | | |
Morningstar Foreign Small/Mid Growth | | (49.02 | ) | | (10.51 | ) | | — | | | — | | | | |
MSCI All Country World Small Cap Ex-U.S. (net) | | (50.23 | ) | | (11.29 | ) | | — | | | (7.91 | ) | | | |
MSCI World Small Cap Ex-U.S. (gross) | | (47.79 | ) | | (13.45 | ) | | — | | | (9.92 | ) | | | | |
| | | | | | |
Emerging Markets Growth Fund | | | | | | | | | | | | | | 6/6/2005 | | «
Among 233 diversified emerging
market funds |
Class N | | (61.71 | ) | | (10.06 | ) | | — | | | 1.01 | | | | |
Morningstar Diversified Emerging Markets | | (54.44 | ) | | (6.38 | ) | | — | | | — | | | | |
MSCI Emerging Markets IMI (net) | | (53.78 | ) | | (5.22 | ) | | — | | | 2.54 | | | | |
MSCI Emerging Markets (gross) | | (53.18 | ) | | (4.62 | ) | | — | | | 3.25 | | | | | |
| | | | | | | | |
| | | | | | |
Value Discovery Fund | | | | | | | | | | | | | | 12/23/1996 | | «««
Among 341 small value funds |
Class N | | (25.85 | ) | | (5.16 | ) | | (0.80 | ) | | 5.87 | | | | |
Morningstar Small Value | | (32.24 | ) | | (9.63 | ) | | (0.97 | ) | | 5.51 | | | | |
Russell 2000® Value | | (28.92 | ) | | (7.49 | ) | | 0.27 | | | 6.11 | | | | | |
Russell 2000® | | (33.79 | ) | | (8.29 | ) | | (0.93 | ) | | 3.02 | | | | | |
| | | | | | |
Bond Fund | | | | | | | | | | | | | | 5/1/2007 | | Not rated. |
Class N | | 1.64 | | | — | | | — | | | 3.00 | | | | | |
Morningstar Intermediate-Term Bond | | (4.70 | ) | | — | | | — | | | — | | | | | |
Barclays Capital U.S. Aggregate Bond Index | | 5.24 | | | — | | | — | | | 6.06 | | | | | |
| | | | | | |
Income Fund | | | | | | | | | | | | | | 10/1/1990 | | «««
Among 375 short-term bond funds |
Class N | | (2.46 | ) | | 0.92 | | | 1.41 | | | 3.57 | | | | |
Morningstar Short-term Bond | | (4.23 | ) | | 0.96 | | | 1.23 | | | 3.38 | | | | |
Barclays Capital Intermediate Govt./Credit
Bond Index | | 5.08 | | | 5.50 | | | 4.21 | | | 5.42 | | | | | |
Performance cited represents past performance. Past performance does not guarantee future results and current performance may be lower or higher than the data quoted. Results shown are average annual total returns, which assume reinvestment of dividends and capital gains. Investment returns and principal will fluctuate and you may have a gain or a loss when you sell shares. For the most current month-end performance information, please call 1-800-742-7272, or visit our Web site at www.williamblairfunds.com. From time to time, the investment advisor may waive fees or reimburse expenses for the Fund. Without these waivers, performance would be lower. Investing in smaller companies involves special risks, including higher volatility and lower liquidity. International and emerging markets investing involves special risk considerations, including currency fluctuations, lower liquidity, economic and political risk. As interest rates rise, bond prices will fall and bond funds become more volatile. Class N shares are available to the general public without a sales load. Emerging Leaders Growth Fund does not offer Class N shares.
Tax-Managed Growth Fund’s after-tax returns are calculated using the highest historical individual federal marginal income tax rates, and do not reflect the impact of state and local taxes. Actual after-tax returns depend on the investor’s tax situation and may differ from those shown. After-tax returns shown are not relevant to investors who hold their fund shares through tax-deferred arrangements such as 401(k) plans or individual retirement accounts. After-tax returns are shown only for Class N and the after-tax returns for Class N shares will vary.
Morningstar Ratings TM are as of 12/31/2008 and are subject to change every month. The ratings are based on a risk-adjusted return measure that accounts for variation in a fund’s monthly performance, placing more emphasis on downward variations and rewarding consistent performance. The top 10% of funds in each Category receive 5 stars, the next 22.5% receive 4 stars, the middle 35% receive 3 stars, the next 22.5% receive 2 stars, and the bottom 10% receive 1 star. The Overall Morningstar Rating for a fund is derived from a weighted-average of the performance figures associated with its three-, five- and ten-year (if applicable) Morningstar Rating metrics. The 3/5/10 year Morningstar ratings were as follows: Growth Fund ««««/« «««/«««, Tax-Managed Growth Fund «««/«««« /NA, and Large Cap Growth Fund «««/««« /NA, out of 1,507/1,243/608 large growth funds; Small Cap Growth Fund ««/««/NA out of 704/574/NA small growth funds; Small-Mid Cap Growth Fund ««««/««««/NA out of 821/674/NA mid cap growth funds; Value Discovery Fund ««««/«««/««« out of 341/269/121 small value funds; International Growth Fund ««/««/«««««and International Equity Fund «««/NA/NA out of 209/164/80 foreign large growth funds; International Small Cap Growth Fund ««/NA/NA out of 103/NA/NA foreign small/mid growth funds; Emerging Markets Growth Fund «/NA/NA out of 233/NA/NA diversified emerging markets growth funds; Income Fund «««/«««/««« out of 375/318/164 short-term bond funds.
Please carefully consider the Funds’ investment objectives, risks, charges, and expenses before investing. This and other information is contained in the Funds’ prospectus, which you may obtain by calling 1-800-742-7272. Read it carefully before you invest or send money.
December 31, 2008 | William Blair Funds 3 |

David C. Fording

John F. Jostrand
GROWTH FUND
The Growth Fund invests primarily in common stocks of domestic growth companies that the Advisor expects to have sustainable, above-average growth from one business cycle to the next.
AN OVERVIEW FROM THE PORTFOLIO MANAGERS
How did the Fund perform over the last year? How did the Fund’s performance compare to its benchmark and peers?
Under very difficult market conditions, the Growth Fund decreased (37.61)% on a total return basis (Class N Shares) for the 12 months ended December 31, 2008. The Fund held up better than its benchmark and Morningstar peer group for 2008. By comparison, the Fund’s benchmark, the Russell 3000 Growth® Index, declined (38.44)%, while the average return for funds in the Morningstar Large Growth peer funds dropped (40.67)%.
What were the most significant factors impacting Fund performance over the course of the year? What factors were behind the Fund’s performance versus the benchmark?
Looking back at 2008, it was an extremely challenging period with severe declines in equity markets and all time high levels of volatility. The Russell 3000® Growth Index had the worst annual decline since its inception in 1979. The broad U.S. market had its third worst annual return in its history—only superseded by two years in the 1930’s. A good portion of the significant retrenchment occurred in the fourth quarter, mostly in October, as the global financial crisis deepened after the demise of Lehman Brothers, investors priced in the prospect of a severe global growth slowdown, and uncertainty continued. The Russell 3000® Growth Index ended the fourth quarter down (23.15)%.
The financial system weakness continued to be focused on deleveraging and very tight credit markets, which caused significant duress for long standing financial institutions, corporations, and consumers. The weakness further manifested in domestic and global economic data with substantial declines in GDP, manufacturing, and industrial production. Corporate earnings have deteriorated too with significant revisions due to the global recession. The consumer also weakened further: unemployment reached 7.20%, credit card defaults rose, home prices dropped, and confidence fell to all time lows. In response, governments worldwide coordinated efforts to stimulate the global economy by reducing interest rates, and providing liquidity. In the U.S., the $700 billion Troubled Asset Relief Program (TARP) plan was passed, and the Federal Funds rate was lowered aggressively from 4.75% to 0.00-0.25%. With continued deterioration in economic data globally, there has been much debate over whether these stimulus initiatives have been enough to keep a significant slowdown at bay, or are focused on the right areas. While these discussions have caused near term confusion on the stimulus plan, there have been some modest signs of improvement with credit markets beginning to thaw as illustrated by lower high yield and Treasuries over Eurodollars (“TED”) spreads. Another positive in the overall global economy has been the decline in commodity prices, for example, oil dropped from all time highs of $145 to less than $40 per barrel. These declines have given a boost to consumers and corporations while also keeping inflation at bay.
As equity markets fell during the year, risk aversion increased with investors flocking to more defensive groups universally. While all sectors were down in the Russell 3000® Growth Index, Consumer Staples and Health Care sectors held up best. Financial stocks were the worst performers as the credit crisis worsened around the globe. Also, investors shunned more cyclical sectors like Energy and Materials as global growth slowed. On a market capitalization basis within the growth segment, investors sought the stability of mega- and large-caps, which
4 Annual Report | December 31, 2008 |
held up relatively well. Small-cap stocks also held up well in comparison to the mid-cap group which fell further. Similarly, developed markets outperformed emerging markets. Lastly, growth modestly lagged value due to its energy exposure and higher technology weight.
What were among the best performing sectors for the Fund? Are there any specific investments you would like to highlight?
In general, the fund was assisted by our quality growth focus which typically does better when earnings growth becomes rare and clean balance sheets are rewarded a premium. More specifically for the year, our stock selection and overweighted positions in Health Care and Materials sectors helped. Within Health Care, our biotechnology exposure performed particularly well. Gilead Sciences, Inc., the leading provider of drugs to treat HIV, rose more than 10% on strong quarterly earnings reports. We believe that the drivers of HIV growth will continue with increased diagnosis, earlier treatment, and switches from a competitor drug due to safety issues. Another strong relative portfolio performer was Genentech, Inc., which gained greater than 20% due to a takeover bid by Roche for the remaining 44% of the firm’s shares that Roche doesn’t currently own, solid quarterly earnings reports, and the approval of Avastin in the treatment of metastatic breast cancer.
In the Materials sector, our exposure was concentrated in the chemicals industry. The best relative performer was Praxair, Inc., a producer and distributor of industrial gases, which held up well against other materials stocks as a result of attractive earnings reports during the year. More recently, this stock has come under pressure as the market has priced-in slowing global growth. While we continue to favor Praxair due to its robust project pipeline and high bid activity, it will likely be negatively impacted by macro events and we have modestly cut back the position. Secondarily, Ecolab, Inc., a recent addition to the portfolio, was also a contributor. It is a leading global manufacturer and marketer of premium cleaning, sanitizing, and pest elimination products and services for the hospitality, food service, healthcare and industrial markets. They have the leading market share position (12)% and should benefit from favorable secular growth drivers, for example, heightened environmental awareness and increasing government regulation, which increase demand for their products and services. Going forward, Ecolab stands to gain market share from competitors weakened by the financial crisis.
What were among the weakest performing sectors or groups for the Fund (or specific names that were disappointments)?
Although the Consumer Staples sector had the best relative returns in the benchmark as investors sought safety, it was the largest detractor from portfolio performance due to our substantial underweight. In our view, we believe there are better opportunities for earnings growth in other groups. As you might expect, we do not tactically hide in slow growers that the market favors in the short term, but rather seek intermediate to long term growers. While in the near term we have surrendered some performance, our long term results should benefit from our focus on quality companies that have above-market long term growth rates. We held three positions in consumer staples during the year: Wal-Mart de Mexico, Pepsi—which was sold in the first quarter on valuation and commodity cost concerns, and Smart Balance, Inc.—which was added in the fourth quarter.
In the Financial Sector, our stock selection was also a detractor. Our exposure to this group was in-line with the benchmark and primarily included exchanges and asset managers. We did not hold significant positions in those that were credit or interest rate sensitive. The weakest performer was Affiliated Managers Group, Inc., which declined on near term challenges such as heightened redemption activity and market depreciation, both of which lowers assets under management, revenues and earnings. We believe this stock has been oversold and that it continues to offer strong long term value. With a sustained market recovery, it is well positioned to gain inflows globally due to its attractive long-term investment performance and
December 31, 2008 | William Blair Funds 5 |
well diversified equity array. Additionally, IntercontinentalExchange, Inc. came under pressure over slowing volume growth and an increased competitive environment, especially from a potential CME/NYMEX merger. This stock was eliminated on these concerns.
Lastly, market cap exposure had a material impact on the portfolio. As you may recall from previous discussions, we have traditionally been underweighted in slower growing mega cap stocks, while more highly committed to mid- and small-cap stocks, which have more attractive growth profiles in our view. Since mega cap did relatively better than other groups, our underweight hurt results.
What is your current strategy? How is the Fund positioned?
Going forward, the global equity market outlook remains uncertain. Economic conditions are likely to deteriorate further with additional weakness in bellwether metrics such as GDP, unemployment, housing, and consumer confidence. The global policy response to this financial crisis has been aggressive and is at unprecedented levels, which is a bright spot. We would expect these proactive global monetary and fiscal actions to gradually begin to stem and then eventually help reverse the global economic slowdown. The U.S. should see improvement ahead of other developed and emerging countries since we began the stimulus program much earlier, for example, the first Federal Funds rate cut occurred 16 months ago in September 2007. In 2009, we anticipate continued contraction in U.S. economic growth in the first half followed by a slow growing second half based on the stimulus applied. We also expect the consumer to continue to repair their balance sheet and build up savings.
Improvement in several key areas will be critical to the market stabilization and recovery. Credit spreads need to narrow further indicating that investors are more comfortable with risk taking and governmental policy actions. As the credit markets loosen, volatility will likely recede and more normal market activity should return. Another area of concern is the U.S. housing market where a reversal in both the decline in prices and the rise in inventory is required to support consumers, and to help stave off the possibility of deeper losses in the banking sector. As discussed above, emerging countries have started to slow, but it will be vital to global economic growth to have the slowdown in emerging economies be short in duration. Additionally, positive trends in leading economic indicators should show the first signs of progress. We have yet to see these, but we are hopeful for some improvement later in the year.
Entering 2009 with continued uncertainty on the direction of the U.S. equity markets, we must take great care in portfolio positioning to strike a balance in light of possible mixed economic signals and potential earnings disappointments. Investors will be weighing the market levels relative to incremental economic data points and looking for news reports to be relatively less negative as a sign of economic improvement. With that said, there remains a risk of further market declines as investors potentially face more negative economic reports in the near term. In the long term, we do feel comfortable that the fiscal and monetary stimulus will ultimately help and that the U.S. should recover earlier in comparison to other countries. Earnings forecasts for the U.S. market have begun to come down aggressively, and may yet fall further in the coming months, but we believe a substantial portion of the bad news has been priced-in. In our view, valuations are generally attractive and with intra-sector valuation spreads at multi-year highs, this should provide a tremendous opportunity for stock pickers going forward.
As always, we continue to rely on our quality growth philosophy, process and discipline to see us through these difficult market times. We thank you for your patience and perseverance during this challenging market environment.
6 Annual Report | December 31, 2008 |
Growth Fund
Performance Highlights (unaudited)
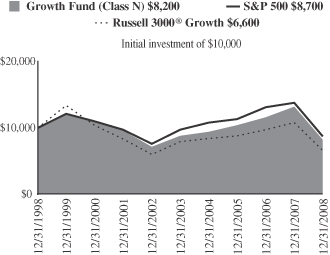
Average Annual Total Return at 12/31/2008
| | | | | | | | | | | | | | | |
| | | 1 Year | | | 3
Year | | | 5
Year | | | 10
Year | | | Since Inception | |
Growth Fund Class N | | (37.61 | )% | | (7.41 | )% | | (1.34 | )% | | (1.93 | )% | | — | % |
Growth Fund Class I | | (37.35 | ) | | (7.10 | ) | | (1.04 | ) | | — | | | (1.87 | )(a) |
Russell 3000® Growth Index | | (38.44 | ) | | (9.12 | ) | | (3.33 | ) | | (4.01 | ) | | (4.96 | )(a) |
S&P 500 Index | | (37.00 | ) | | (8.36 | ) | | (2.19 | ) | | (1.38 | ) | | (2.04 | )(a) |
| | (a) | | For the period from October 1, 1999 to December 31, 2008. |
Performance cited represents past performance. Past performance does not guarantee future results and current performance may be lower or higher than the data quoted. Results shown are average annual returns, which assume reinvestment of dividends and capital gains. Investment returns and principal will fluctuate and you may have a gain or loss when you sell shares. For the most current month-end performance information, please call 1-800-742-7272, or visit our Web site at www.williamblairfunds.com. Class N shares are available to the general public without a sales load. Class I shares are available to certain institutional investors and advisory clients of William Blair & Company L.L.C. without a sales load or distribution (12b-1) or service fees.
The performance highlights and graph presented above do not reflect the deduction of taxes that a shareholder would pay on fund distributions or the redemption of fund shares.
The Russell 3000® Growth Index consists of large, medium, and small capitalization companies with above average price-to-book ratios and forecasted growth rates. The index is weighted by market capitalization and large/medium/small companies make up approximately 80%/15%/5% of the index.
The S&P 500 Index indicates broad larger capitalization equity market performance.
This report identifies the Fund’s investments on December 31, 2008. These holdings are subject to change. Not all stocks in the Fund performed the same, nor is there any guarantee that these stocks will perform as well in the future. Market forecasts provided in this report may not necessarily come to pass.
Sector Diversification (unaudited)
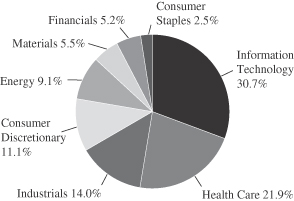
The sector diversification shown is based on the total long-term securities.
December 31, 2008 | William Blair Funds 7 |
Growth Fund
Portfolio of Investments, December 31, 2008 (all dollar amounts in thousands)
| | | | | |
Issuer | | Shares | | Value |
| | |
Common Stocks | | | | | |
Information Technology—30.1% | | | | | |
*Activision Blizzard, Inc. | | 341,870 | | $ | 2,954 |
*Adobe Systems Incorporated | | 197,149 | | | 4,197 |
Amphenol Corporation | | 141,680 | | | 3,398 |
*Apple, Inc. | | 47,980 | | | 4,095 |
*Cisco Systems, Inc. | | 673,050 | | | 10,971 |
*Cognizant Technology Solutions Corporation | | 241,090 | | | 4,354 |
*FLIR Systems, Inc. | | 186,960 | | | 5,736 |
*Google, Inc. | | 23,205 | | | 7,139 |
Qualcomm Incorporated | | 295,740 | | | 10,596 |
*Salesforce.com, Inc. | | 97,890 | | | 3,133 |
*Silicon Laboratories, Inc. | | 180,875 | | | 4,482 |
*The Ultimate Software Group, Inc. | | 135,950 | | | 1,985 |
Visa, Inc. | | 92,373 | | | 4,845 |
*VistaPrint Limited† | | 140,713 | | | 2,619 |
*WNS Holdings Limited—ADR | | 271,900 | | | 1,427 |
| | | | | |
| | | | | 71,931 |
| | | | | |
Health Care—21.4% | | | | | |
Allergan, Inc. | | 130,000 | | | 5,242 |
*CardioNet, Inc. | | 143,200 | | | 3,530 |
*Celgene Corporation | | 115,980 | | | 6,411 |
*Genentech, Inc. | | 86,210 | | | 7,148 |
*Gilead Sciences, Inc. | | 156,885 | | | 8,023 |
*IDEXX Laboratories, Inc. | | 181,330 | | | 6,542 |
Pharmaceutical Product Development, Inc. | | 176,810 | | | 5,129 |
*Qiagen N.V.† | | 295,620 | | | 5,191 |
*St. Jude Medical, Inc. | | 118,950 | | | 3,921 |
| | | | | |
| | | | | 51,137 |
| | | | | |
Industrials & Services—13.7% | | | | | |
Danaher Corporation | | 124,881 | | | 7,070 |
Expeditors International of Washington, Inc. | | 125,630 | | | 4,180 |
Fastenal Company | | 236,629 | | | 8,247 |
*InnerWorkings, Inc. | | 366,410 | | | 2,400 |
Knight Transportation, Inc. | | 295,130 | | | 4,758 |
Roper Industries, Inc. | | 138,570 | | | 6,015 |
| | | | | |
| | | | | 32,670 |
| | | | | |
Consumer Discretionary—10.9% | | | | | |
*Bed Bath & Beyond, Inc. | | 115,400 | | | 2,933 |
*Capella Education Company | | 49,928 | | | 2,934 |
DeVry, Inc. | | 93,645 | | | 5,376 |
*K12, Inc. | | 196,766 | | | 3,752 |
Omnicom Group, Inc. | | 326,670 | | | 8,794 |
Phillips-Van Heusen Corporation | | 107,385 | | | 2,162 |
| | | | | |
| | | | | 25,951 |
| | | | | |
*Non-income producing securities
† = U.S. listed foreign security
ADR = American Depository Receipt
**Fair valued pursuant to Valuation Procedures adopted by Board of Trustees. This holding represents 1.24% of the Fund’s net assets at December 31, 2008.
| | | | | | |
Issuer | | Shares or
Principal | | Value |
| | |
Common Stocks—(continued) | | | | | | |
Energy—8.9% | | | | | | |
Apache Corporation | | | 110,565 | | $ | 8,240 |
*IHS, Inc. | | | 124,215 | | | 4,648 |
Schlumberger Limited† | | | 51,890 | | | 2,197 |
Smith International, Inc. | | | 140,240 | | | 3,210 |
XTO Energy | | | 83,900 | | | 2,959 |
| | | | | | |
| | | | | | 21,254 |
| | | | | | |
Materials—5.4% | | | | | | |
Ecolab, Inc. | | | 101,620 | | | 3,572 |
Monsanto Company | | | 66,130 | | | 4,652 |
Praxair, Inc. | | | 76,565 | | | 4,545 |
| | | | | | |
| | | | | | 12,769 |
| | | | | | |
Financials—5.2% | | | | | | |
*Affiliated Managers Group, Inc. | | | 81,285 | | | 3,407 |
Charles Schwab & Co., Inc. | | | 296,275 | | | 4,791 |
Wells Fargo & Company | | | 139,150 | | | 4,102 |
| | | | | | |
| | | | | | 12,300 |
| | | | | | |
Consumer Staples—2.5% | | | | | | |
*Smart Balance, Inc. | | | 439,500 | | | 2,989 |
Wal Mart de Mexico—ADR** | | | 110,430 | | | 2,950 |
| | | | | | |
| | | | | | 5,939 |
| | | | | | |
Total Common Stock—98.1%
(cost $286,793) | | | 233,951 |
| | | | | | |
| | |
Investment in Affiliate | | | | | | |
William Blair Ready Reserves Fund | | | 3,060,445 | | | 3,060 |
| | | | | | |
Total Investment in Affiliate—1.3%
(cost $3,060) | | | 3,060 |
| | | | | | |
Repurchase Agreement | | | | | | |
Fixed Income Clearing Corporation, 0.010% dated 12/31/08 due 1/2/09, repurchase price $970, collateralized by FHLMC, 5.625%, due 11/23/35 | | $ | 970 | | | 970 |
| | | | | | |
Total Repurchase Agreement—0.4%
(cost $970) | | | 970 |
| | | | | | |
Total Investments—99.8%
(cost $290,823) | | | 237,981 |
Cash and other assets, less liabilities—0.2% | | | 605 |
| | | | | | |
Net assets—100.0% | | $ | 238,586 |
| | | | | | |
See accompanying Notes to Financial Statements.
8 Annual Report | December 31, 2008 |

Mark A. Fuller III

Gregory J. Pusinelli
TAX-MANAGED GROWTH FUND
The Tax-Managed Growth Fund invests primarily in common stocks of large, medium and small domestic growth companies that the Advisor expects will have sustainable, above-average growth from one business cycle to the next.
AN OVERVIEW FROM THE PORTFOLIO MANAGERS
How did the Fund perform during the past year? How did the Fund’s performance compare to its benchmark?
The Tax-Managed Growth Fund posted a (39.57)% decrease on a total return basis (Class N Shares) for the 12 months ended December 31, 2008. By comparison, the Fund’s benchmark, the Russell 3000® Growth Index, declined (38.44)% while the Standard & Poor’s 500 Stock Index dropped (37.00)%.
What were the most significant market factors impacting Fund performance?
The past year was the worst one for the equity markets since 1931. The Fund’s one-year performance was the worst year in the Fund’s nine-year history.
The equity markets were roiled during the first half of the year by a series of failures by major financial institutions, and the markets entered a state of upheaval during the third quarter. Declines in the financial markets worldwide continued into the fourth quarter and occurred in spite of moves by central banks to restore investor confidence by injecting massive amounts of capital into the financial system. Within the fixed-income markets especially, a “flight-to-liquidity” ensued and investors sought the safe haven of U.S. Treasury securities.
Among the ignominious milestones reached during the fourth quarter was the official declaration that the economy was in recession by the National Bureau of Economic Research, and news that the economy had experienced job losses not seen since the very severe recession of 1974.
The Federal Reserve Board also entered a new era as it set its benchmark overnight federal funds interest rate to a range of 0.00%—0.25%, in a move to signal it still had tools in its arsenal with which to stimulate the economy.
What factors were behind the Fund’s performance versus the benchmark?
The Fund underperformed its Russell 3000® Growth Index benchmark largely because of poor performance from its holdings in the Consumer Staples and Consumer Discretionary sectors.
The Fund’s performance was hampered by its underweight position in Consumer Discretionary and Consumer Staples stocks relative to its benchmark, but even had the Fund had an equal weighting, its holdings were poor performers. The Consumer Staples sector was one of the best performing sectors in the Russell 3000® Growth Index.
What were the weakest performing sectors and investments for the Fund?
Although the weakest performing sectors for the Fund during the quarter compared to the benchmark were Consumer Staples and Consumer Discretionary, two of the Funds weakest performing stocks were International Game Technologies, down (70.97)%, and Suncor Energy, Inc. down (63.99)%. These were held in the Consumer Discretionary and Energy sectors respectively.
December 31, 2008 | William Blair Funds 9 |
International Game Technology designs and manufactures computerized gaming equipment, network systems, and licensing and services for the casino gaming industry. With the downturn in the economy, casinos are deferring the replacement of older equipment, pushing out the “replacement cycle,” for machines. The company is the first to offer server-based gaming—meaning games on machines can be reprogrammed from a central hub. This means that multiple choices can be offered throughout the gaming process, and games can be changed to those that are most popular without having to actually physically install new equipment. However, the company continues to push out the launch date for this new technology. We sold this stock in the fourth quarter.
Suncor Energy’s performance reflected the sharp decline in oil prices and investor concerns that the company would not be nimble enough to be able to quickly adapt its business model to the new realities of lower energy prices.
What were the best performing sectors and investments for the Fund?
On a relative basis the best-performing sectors were Materials and Energy. The Fund’s Energy holdings are long-standing names in the portfolio that we believe are quality, industry-leading companies that have very strong fundamentals and solid prospects. However, we should note that the rapidity with which the commodity bubble burst during the second half of the year—a decline in the price of a barrel of oil from $145 to $40—left many energy companies scrambling to cut costs, and ramp down production in areas that were less profitable. These companies were caught up in investor nervousness about whether they could execute quickly enough with their businesses to respond to the drop in oil prices and whether or not the price of oil would eventually rebound.
The Fund’s two best performing investments were Health Care sector holding Gilead Sciences, Inc. and Consumer Discretionary holding Tractor Supply.
Gilead was up 12.08% for the fourth quarter. Gilead develops and produces drugs for life-threatening infectious diseases. The company currently has four products—Viread, Emtriva, combination pill Truvada, and triple combination Atripla—that are used for HIV treatment regimens and which represent a sizable percentage of the company’s sales. The company also has two promising products undergoing FDA review. Gilead maintained earnings guidance during the quarter when most of its peers did not.
Tractor Supply, a retailer which supplies farm-maintenance and related products, was up 25.90% for the year. However, during the second quarter, Tractor Supply lowered earnings guidance based on the larger macroeconomic outlook as well as weather-related issues. We subsequently sold this stock during the third quarter.
What is your current strategy? How is the Fund positioned?
Notable new additions to the Fund in the fourth quarter include The Kroger Co., in the Consumer Staples sector, and Apollo Group, Inc. in the Consumer Discretionary sector.
Kroger is the largest retail grocery chain in the United States, and uses sophisticated data-mining techniques to successfully target promotions and mailings tailored to specific households in a geographic area.
Apollo Group is the largest for-profit education company, with more than 380,000 students. Its core school is the University of Phoenix, which offers online courses. Apollo Group has an excellent student retention rate and attractive and economical pricing for its programs. The company is expected to benefit as those seeking new employment or advancement in their careers seek to expand their education during this economic downturn.
10 Annual Report | December 31, 2008 |
Consensus forecasts are for the economy to begin to show improvement during the middle of this year, and while the market is often viewed as a “discounting” mechanism, earnings results will provide a sobering reality check for investors that conditions could become worse before they ultimately get better.
By owning quality companies which still have solid fundamentals—such as strong balance sheets and durable business franchises—our hope is that the companies in the Fund’s portfolio will be able to weather the rough economic conditions ahead, yet still be poised to capture significant upside potential when the economy eventually improves.
We expect the Fund to experience a higher turnover rate in 2009, partly owing to the increased volatility we expect in the market. However, we believe this turnover could work to the Fund’s tax-efficient advantage, as it will allow us to offset any net short-term capital gains in the Fund with the historical tax-loss carry forward that the Fund has available from prior years. We believe this benefit may have more relevance in the coming year than it has had for some time.
December 31, 2008 | William Blair Funds 11 |
Tax-Managed Growth Fund
Performance Highlights (unaudited)
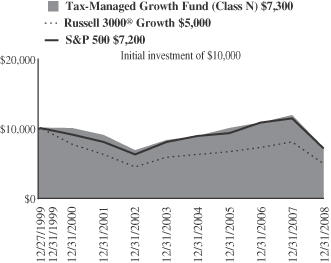
Average Annual Total Return at 12/31/2008
| | | | | | | | | | | | |
| | | 1
Year | | | 3
Year | | | 5
Year | | | Since
Inception(a) | |
Tax-Managed Growth Fund
Class N | | (39.57 | )% | | (10.41 | )% | | (2.87 | )% | | (3.46 | )% |
Tax-Managed Growth Fund
Class I | | (39.50 | ) | | (10.20 | ) | | (2.64 | ) | | (3.22 | ) |
Russell 3000®
Growth Index | | (38.44 | ) | | (9.12 | ) | | (3.33 | ) | | (7.38 | ) |
S&P 500 Index | | (37.00 | ) | | (8.36 | ) | | (2.19 | ) | | (3.49 | ) |
| | (a) | | For the period from December 27, 1999 to December 31, 2008. |
Performance cited represents past performance. Past performance does not guarantee future results and current performance may be lower or higher than the data quoted. Results shown are average annual total returns, which assume reinvestment of dividends and capital gains. Investment returns and principal will fluctuate and you may have a gain or loss when you sell shares. For the most current month-end performance information, please call 1-800-742-7272, or visit our Web site at www.williamblairfunds.com. From time to time, the investment advisor may waive fees or reimburse expenses for the Fund. Without these waivers, performance would be lower. Class N shares are available to the general public without a sales load. Class I shares are available to certain institutional investors and advisory clients of William Blair & Company, L.L.C., without a sales load or distribution (12b-1) or service fees.
The performance highlights and graph presented above do not reflect the deduction of taxes that a shareholder would pay on fund distributions or the redemption of fund shares.
The Russell 3000® Growth Index consists of large, medium, and small-capitalization companies with above average price-to-book ratios and forecasted growth rates. The index is weighted by market capitalization and large/medium/small companies make up approximately 80%/15%/5% of the index.
The S&P 500 Index indicates broad larger capitalization equity market performance.
This report identifies the Fund’s investments on December 31, 2008. These holdings are subject to change. Not all stocks in the Fund performed the same, nor is there any guarantee that these stocks will perform as well in the future. Market forecasts provided in this report may not necessarily come to pass.
Sector Diversification (unaudited)
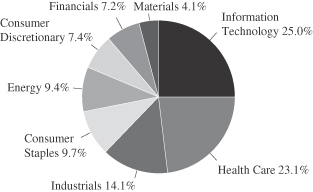
The sector diversification shown is based on the total long-term securities.
12 Annual Report | December 31, 2008 |
Tax-Managed Growth Fund
Portfolio of Investments, December 31, 2008 (all dollar amounts in thousands)
| | | | | |
Issuer | | Shares | | Value |
| | |
Common Stocks | | | | | |
Information Technology—24.1% | | | | | |
*Activision Blizzard, Inc. | | 10,766 | | $ | 93 |
*Adobe Systems Incorporated | | 5,620 | | | 120 |
*Apple, Inc. | | 790 | | | 67 |
*Citrix Systems, Inc. | | 3,430 | | | 81 |
*Dolby Laboratories, Inc., Class “A” | | 3,590 | | | 118 |
*Electronic Arts, Inc. | | 2,720 | | | 44 |
*Euronet Worldwide, Inc. | | 6,680 | | | 78 |
*FLIR Systems, Inc. | | 3,280 | | | 101 |
*Google, Inc. | | 285 | | | 88 |
Microsoft Corporation | | 4,730 | | | 92 |
*Nuance Communications, Inc. | | 4,060 | | | 42 |
Qualcomm Incorporated | | 5,100 | | | 183 |
*Salesforce.com, Inc. | | 3,380 | | | 108 |
*Silicon Laboratories, Inc. | | 3,000 | | | 74 |
*The Ultimate Software Group, Inc. | | 5,910 | | | 86 |
| | | | | |
| | | | | 1,375 |
| | | | | |
Health Care—22.4% | | | | | |
Abbott Laboratories | | 3,440 | | | 184 |
Allergan, Inc. | | 2,510 | | | 101 |
C.R. Bard, Inc. | | 1,580 | | | 133 |
*Celgene Corporation | | 2,310 | | | 128 |
*Gilead Sciences, Inc. | | 3,780 | | | 193 |
*Healthways, Inc. | | 5,190 | | | 60 |
*Illumina, Inc. | | 2,730 | | | 71 |
*Medco Health Solutions, Inc. | | 4,320 | | | 181 |
Pharmaceutical Product Development, Inc. | | 3,370 | | | 98 |
*Psychiatric Solutions, Inc. | | 4,440 | | | 124 |
| | | | | |
| | | | | 1,273 |
| | | | | |
Industrials—13.6% | | | | | |
*Corrections Corporation of America | | 8,420 | | | 138 |
Danaher Corporation | | 2,430 | | | 138 |
Expeditors International of Washington, Inc. | | 3,130 | | | 104 |
Fastenal Company | | 1,710 | | | 60 |
J. B. Hunt Transport Services, Inc. | | 3,020 | | | 79 |
Precision Castparts Corp. | | 1,330 | | | 79 |
Roper Industries, Inc. | | 2,260 | | | 98 |
*Stericycle, Inc. | | 1,480 | | | 77 |
| | | | | |
| | | | | 773 |
| | | | | |
Consumer Staples—9.3% | | | | | |
Campbell Soup Company | | 4,770 | | | 143 |
Colgate-Palmolive Company | | 2,780 | | | 190 |
CVS Caremark Corporation | | 3,474 | | | 100 |
The Kroger Co. | | 3,720 | | | 98 |
| | | | | |
| | | | | 531 |
| | | | | |
* Non-income producing securities
† = U.S. listed foreign security
| | | | | | | |
Issuer | | Shares or
Principal
Amount | | Value | |
| | | | | | | | |
| | |
Common Stocks—(continued) | | | | | | | |
Energy—9.0% | | | | | | | |
Apache Corporation | | | 1,590 | | $ | 118 | |
EnCana Corporation† | | | 2,120 | | | 98 | |
*IHS, Inc. | | | 2,750 | | | 103 | |
Schlumberger Limited† | | | 1,360 | | | 58 | |
Smith International, Inc. | | | 2,050 | | | 47 | |
Suncor Energy, Inc.† | | | 4,610 | | | 90 | |
| | | | | | | |
| | | | | | 514 | |
| | | | | | | |
Consumer Discretionary—7.2% | | | | | | | |
*Apollo Group, Inc. | | | 1,400 | | | 107 | |
*GameStop Corp. | | | 4,370 | | | 95 | |
*K12, Inc. | | | 3,230 | | | 62 | |
McDonald's Corporation | | | 1,440 | | | 89 | |
*Scientific Games Corporation | | | 3,260 | | | 57 | |
| | | | | | | |
| | | | | | 410 | |
| | | | | | | |
Financials—7.0% | | | | | | | |
*Affiliated Managers Group, Inc. | | | 2,300 | | | 96 | |
Charles Schwab & Co., Inc. | | | 9,050 | | | 146 | |
CME Group, Inc. | | | 290 | | | 60 | |
T. Rowe Price Group, Inc. | | | 2,690 | | | 95 | |
| | | | | | | |
| | | | | | 397 | |
| | | | | | | |
Materials—3.9% | | | | | | | |
Monsanto Company | | | 780 | | | 55 | |
Praxair, Inc. | | | 2,830 | | | 168 | |
| | | | | | | |
| | | | | | 223 | |
| | | | | | | |
Total Common Stock—96.5%
(cost $6,968) | | | 5,496 | |
| | | | | | | |
| | |
Investment in Affiliate | | | | | | | |
William Blair Ready Reserves Fund | | | 13,711 | | | 14 | |
| | | | | | | |
Total Investment in Affiliate—0.3%
(cost $14) | | | 14 | |
| | | | | | | |
Repurchase Agreement | | | | | | | |
Fixed Income Clearing Corporation, 0.010% dated 12/31/08 due 1/2/09, repurchase price $202, collateralized by FHLMC, 5.625%, due 11/23/35 | | $ | 202 | | | 202 | |
| | | | | | | |
Total Repurchase Agreement—3.5%
(cost $202) | | | 202 | |
| | | | | | | |
Total Investments—100.3%
(cost $7,184) | | | 5,712 | |
Liabilities, plus cash and other assets—(0.3)% | | | (16 | ) |
| | | | | | | |
Net assets—100.0% | | $ | 5,696 | |
| | | | | | | |
See accompanying Notes to Financial Statements.
December 31, 2008 | William Blair Funds 13 |

James S. Golan
John F. Jostrand

Tracy McCormick
LARGE CAP GROWTH FUND
The Large Cap Growth Fund invests primarily in common stocks of quality large domestic growth companies that the Advisor believes have demonstrated sustained growth over a long period of time.
AN OVERVIEW FROM THE PORTFOLIO MANAGERS
How did the Fund perform over the last year? How did the Fund’s performance compare to its benchmark and peers?
Under very difficult market conditions, the Large Cap Growth Fund decreased (37.76)% on a total return basis (Class N Shares) for the 12 months ended December 31, 2008. The Fund held up better than its benchmark and Morningstar peer group for 2008. By comparison, the Fund’s benchmark, the Russell 1000® Growth Index, declined (38.44)%, while the average return for funds in the Morningstar Large Growth category dropped (40.67)%.
What were the most significant factors impacting Fund performance over the course of the year? What factors were behind the Fund’s performance versus the benchmark?
Looking back at 2008, it was an extremely challenging period with severe declines in equity markets and all time high levels of volatility. The Russell 1000 Growth® Index had the worst annual decline since its inception in 1979. The broad U.S. market had its third worst annual return in its history—only superseded by two years in the 1930’s. A good portion of the significant retrenchment occurred in the fourth quarter, mostly in October, as the global financial crisis deepened after the demise of Lehman Brothers, investors priced in the prospect of a severe global growth slowdown, and uncertainty continued. The Russell 1000® Growth Index ended the fourth quarter down (22.79)%.
The financial system weakness continued to be focused on deleveraging and very tight credit markets, which caused significant duress for long standing financial institutions, corporations, and consumers. The weakness further manifested in domestic and global economic data with substantial declines in GDP, manufacturing, and industrial production. Corporate earnings have deteriorated too with significant revisions due to the global recession. The consumer also weakened further: unemployment reached 7.20%, credit card defaults rose, home prices dropped, and confidence fell to all time lows. In response, worldwide governments coordinated efforts to stimulate the global economy by reducing interest rates, and providing liquidity. In the U.S., the $700 billion Troubled Asset Relief Program (TARP) plan was passed, and the Federal Funds rate was lowered aggressively from 4.75% to 0.00-0.25%. With continued deterioration in economic data globally, there has been much debate over whether these stimulus initiatives have been enough to keep a significant slowdown at bay, or are focused on the right areas. While these discussions have caused near term confusion on the stimulus plan, there have been some modest signs of improvement with credit markets beginning to thaw as illustrated by lower high yield and Treasuries over Eurodollars (TED) spreads. Another positive in the overall global economy has been the decline in commodity prices, for example, oil dropped from all time highs of $145 to less than $40 per barrel. These declines have given a boost to consumers and corporations while also keeping inflation at bay.
As equity markets fell during the year, risk aversion increased with investors flocking to more defensive groups universally. While all sectors were down in the Russell 1000® Growth Index, Consumer Staples and Health Care sectors held up best. Financial stocks were the worst performers as the credit crisis worsened around the globe. Also, investors shunned more cyclical sectors like Energy and Materials as global growth slowed. On a market capitalization
14 Annual Report | December 31, 2008 |
basis within the growth segment, investors sought the stability of mega- and large-caps, which held up relatively well. Small-cap stocks also held up well in comparison to the mid-cap group which fell further. Similarly, developed markets outperformed emerging markets. Lastly, growth modestly lagged value due to its energy exposure and higher technology weight.
What were among the best performing sectors for the Fund? Are there any specific investments you would like to highlight?
In general, the portfolio was assisted by our quality growth focus which typically does better when earnings growth becomes rare and clean balance sheets are rewarded a premium. More specifically for the year, our stock selection and overweight in the Health Care sector helped. Our biotechnology exposure performed particularly well. Gilead Sciences, Inc., the leading provider of drugs to treat HIV, rose more than 10% on strong quarterly earnings reports. We believe that the drivers of HIV growth will continue with increased diagnosis, earlier treatment, and switches from a competitor drug due to safety issues. Another strong relative portfolio performer was Genentech, Inc., which gained greater than 20% due to a takeover bid by Roche for the remaining 44% of the firm’s shares that Roche doesn’t currently own, solid quarterly earnings reports, and the approval of Avastin in the treatment of metastatic breast cancer.
Our Consumer Discretionary stock selection also contributed on a relative basis. Apollo Group, Inc., a for profit education company specializing in on-line courses, a relatively new portfolio addition, had positive returns on a better than expected fiscal fourth quarter earnings report as a result of strong enrollments and improved operating efficiencies. Kohl’s Corporation was also a good relative performer due to their strong value positioning within a weak consumer spending environment, tight expense control, and strong inventory management. Going forward, we believe they will benefit from their exclusive private label brands, and increased market share as competitors fail, particularly Mervyn’s and Linens’N Things.
What were among the weakest performing sectors for the Fund (or specific names that were disappointments)?
Although the Consumer Staples sector had the best relative returns in the Fund’s benchmark as investors sought safety, it was the largest detractor from portfolio performance due to our underweight position and stock selection. Avon Products was the largest detractor and was eliminated from the portfolio due to a disappointing third quarter earnings report. U.S. sales came in weaker-than-expected highlighting the more discretionary nature of the firm’s non-beauty business; they also had issues in the execution of their cost control programs lowering their margin goal for the year. PepsiCo also detracted from results. The Portfolio owned this stock in the first half of the year, but sold it as we became concerned with rising input costs especially from corn and packaging, as well as a potential slow down in emerging market demand. However, as the market declined further, PepsiCo held up relatively well as investors looked for more defensive companies, which hurt results compared to the benchmark.
Another detractor was Information Technology stock selection especially in the software group. Electronic Arts declined and was eliminated on below expected results for the quarter and fiscal year 2009. They were challenged by the current consumer weakness, and also significantly adjusted their operating plan for fiscal year 2010, which has reduced our confidence in the management team. Secondarily, Autodesk fell on headwinds in the U.S. commercial construction market, and was eliminated in the first quarter.
What is your current strategy? How is the Fund positioned?
Going forward, the global equity market outlook remains uncertain. Economic conditions are likely to deteriorate further with additional weakness in bellwether metrics such as GDP, unemployment, housing, and consumer confidence. The global policy response to this
December 31, 2008 | William Blair Funds 15 |
financial crisis has been aggressive and is at unprecedented levels, which is a bright spot. We would expect these proactive global monetary and fiscal actions to gradually begin to stem and then eventually help reverse the global economic slowdown. The U.S. should see improvement ahead of other developed and emerging countries since we began the stimulus program much earlier, for example, the first Federal Funds rate cut occurred 16 months ago in September 2007. In 2009, we anticipate continued contraction in U.S. economic growth in the first half followed by a slow growing second half based on the stimulus applied. We also expect the consumer to continue to repair their balance sheet and build up savings.
Improvement in several key areas will be critical to market stabilization and recovery. Credit spreads need to narrow further indicating that investors are more comfortable with risk taking and governmental policy actions. As the credit markets loosen, volatility will likely recede and more normal market activity should return. Another area of concern is the U.S. housing market where a reversal in both the decline in prices and the rise in inventory is required to support consumers, and to help stave off the possibility of deeper losses in the banking sector. As discussed above, emerging countries have started to slow, but it will be vital to global economic growth to have the slowdown in emerging economies be short in duration. Additionally, positive trends in leading economic indicators should show the first signs of progress. We have yet to see these, but we are hopeful for some improvement later in the year.
Entering 2009 with continued uncertainty on the direction of the U.S. equity markets, we must take great care in portfolio positioning to strike a balance in light of possible mixed economic signals and potential earnings disappointments. Investors will be weighing the market levels relative to incremental economic data points and looking for news reports to be relatively less negative as a sign of economic improvement. With that said, there remains a risk of further market declines as investors potentially face more negative economic reports in the near term. In the long term, we do feel comfortable that the fiscal and monetary stimulus will ultimately help and that the U.S. should recover earlier in comparison to other countries. Earnings forecasts for the U.S. market have begun to come down aggressively, and may yet fall further in the coming months, but we believe a substantial portion of the bad news has been priced-in. In our view, valuations are generally attractive and with intra-sector valuation spreads at multi-year highs, this should provide a tremendous opportunity for stock pickers going forward.
As always, we continue to rely on our quality growth philosophy, process and discipline to see us through these difficult market times. We thank you for your patience and perseverance during this challenging market environment.
16 Annual Report | December 31, 2008 |
Large Cap Growth Fund
Performance Highlights (unaudited)
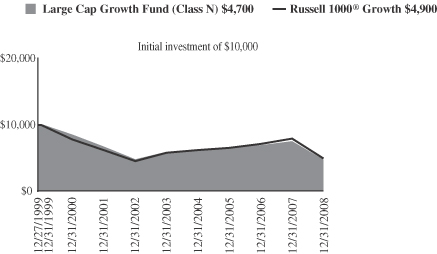
Average Annual Total Return at 12/31/2008
| | | | | | | | | | | | |
| | | 1
Year | | | 3
Year | | | 5
Year | | | Since
Inception(a) | |
Large Cap Growth Fund Class N | | (37.76 | )% | | (10.23 | )% | | (4.62 | )% | | (8.05 | )% |
Large Cap Growth Fund Class I | | (37.56 | ) | | (10.06 | ) | | (4.44 | ) | | (7.85 | ) |
Russell 1000®
Growth Index | | (38.44 | ) | | (9.11 | ) | | (3.42 | ) | | (7.63 | ) |
| | (a) | | For the period from December 27, 1999 to December 31, 2008. |
Performance cited represents past performance. Past performance does not guarantee future results and current performance may be lower or higher than the data quoted. Results shown are average annual total returns, which assume reinvestment of dividends and capital gains. Investment returns and principal will fluctuate and you may have a gain or loss when you sell shares. For the most current month-end performance information, please call 1-800-742-7272, or visit our Web site at www.williamblairfunds.com. From time to time, the investment advisor may waive fees or reimburse expenses for the Fund. Without these waivers, performance would be lower. Class N shares are available to the general public without a sales load. Class I shares are available to certain institutional investors and advisory clients of William Blair & Company, L.L.C., without a sales load or distribution (12b-1) or service fees.
The performance highlights and graph presented above do not reflect the deduction of taxes that a shareholder would pay on fund distributions or the redemption of fund shares.
The Russell 1000® Growth Index consists of large capitalization companies with above average price-to-book ratios and forecasted growth rates.
This report identifies the Fund’s investments on December 31, 2008. These holdings are subject to change. Not all stocks in the Fund performed the same, nor is there any guarantee that these stocks will perform as well in the future. Market forecasts provided in this report may not necessarily come to pass.
Sector Diversification (unaudited)
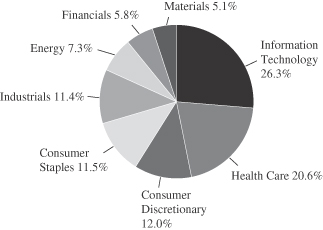
The sector diversification shown is based on the total long-term securities.
December 31, 2008 | William Blair Funds 17 |
Large Cap Growth Fund
Portfolio of Investments, December 31, 2008 (all dollar amounts in thousands)
| | | | | |
Issuer | | Shares | | Value |
| | |
Common Stocks | | | | | |
Information Technology—25.2% | | | | | |
*Adobe Systems Incorporated | | 10,805 | | $ | 230 |
*Apple, Inc. | | 8,570 | | | 731 |
*Cisco Systems, Inc. | | 58,564 | | | 955 |
*FLIR Systems, Inc. | | 13,150 | | | 403 |
*Google, Inc. | | 2,350 | | | 723 |
Microsoft Corporation | | 56,255 | | | 1,094 |
*NetApp, Inc. | | 16,650 | | | 233 |
Qualcomm Incorporated | | 32,155 | | | 1,152 |
*Salesforce.com, Inc. | | 11,000 | | | 352 |
| | | | | |
| | | | | 5,873 |
| | | | | |
Health Care—19.8% | | | | | |
Abbott Laboratories | | 22,520 | | | 1,202 |
Allergan, Inc. | | 9,545 | | | 385 |
*Celgene Corporation | | 15,240 | | | 843 |
*Genentech, Inc. | | 3,380 | | | 280 |
*Gilead Sciences, Inc. | | 16,935 | | | 866 |
*St. Jude Medical, Inc. | | 18,065 | | | 595 |
*Thermo Fisher Scientific, Inc. | | 12,885 | | | 439 |
| | | | | |
| | | | | 4,610 |
| | | | | |
Consumer Discretionary—11.5% | | | | | |
*Apollo Group, Inc. | | 5,350 | | | 410 |
*Kohl’s Corporation | | 14,896 | | | 539 |
Lowe’s Companies, Inc. | | 22,940 | | | 494 |
McDonald’s Corporation | | 12,575 | | | 782 |
Omnicom Group, Inc. | | 16,665 | | | 449 |
| | | | | |
| | | | | 2,674 |
| | | | | |
Consumer Staples—11.0% | | | | | |
Campbell Soup Company | | 13,990 | | | 420 |
CVS Caremark Corporation | | 14,290 | | | 411 |
The Kroger Co. | | 18,170 | | | 480 |
Wal-Mart Stores, Inc. | | 22,300 | | | 1,250 |
| | | | | |
| | | | | 2,561 |
| | | | | |
Industrials—11.0% | | | | | |
Danaher Corporation | | 10,652 | | | 603 |
Expeditors International of Washington, Inc. | | 8,315 | | | 277 |
Fastenal Company | | 15,300 | | | 533 |
J.B. Hunt Transport Services, Inc. | | 13,220 | | | 347 |
Precision Castparts Corp. | | 3,950 | | | 235 |
Roper Industries, Inc. | | 12,750 | | | 553 |
| | | | | |
| | | | | 2,548 |
| | | | | |
Energy—7.0% | | | | | |
Apache Corporation | | 10,995 | | | 819 |
EOG Resources, Inc. | | 5,410 | | | 360 |
Schlumberger Limited† | | 10,790 | | | 457 |
| | | | | |
| | | | | 1,636 |
| | | | | |
*Non-income producing securities
† = U.S. listed foreign security
ADR = American Depository Receipt
VRN = Variable Rate Note
| | | | | | | |
Issuer | | Shares or
Principal
Amount | | Value | |
| | |
Common Stocks—(continued) | | | | | | | |
Financials—5.6% | | | | | | | |
AXA—ADR | | | 10,700 | | $ | 240 | |
CME Group, Inc. | | | 1,965 | | | 409 | |
Charles Schwab & Co., Inc. | | | 26,885 | | | 435 | |
Wells Fargo & Company | | | 7,600 | | | 224 | |
| | | | | | | |
| | | | | | 1,308 | |
| | | | | | | |
Materials—4.9% | | | | | | | |
Ecolab, Inc. | | | 6,550 | | | 230 | |
Monsanto Company | | | 6,280 | | | 442 | |
Praxair, Inc. | | | 7,865 | | | 467 | |
| | | | | | | |
| | | | | | 1,139 | |
| | | | | | | |
Total Common Stock—96.0%
(cost $27,506) | | | 22,349 | |
| | | | | | | |
| | |
Investment in Affiliate | | | | | | | |
William Blair Ready Reserves Fund | | | 340,308 | | | 340 | |
| | | | | | | |
Total Investment in Affiliate—1.5%
(cost $340) | | | 340 | |
| | | | | | | |
| | |
Short-Term Investments | | | | | | | |
American Express Credit Corp. Demand Note, VRN 0.32125%, due 1/2/09 | | $ | 400 | | | 400 | |
| | | | | | | |
Total Short-Term Investments—1.7%
(cost $400) | | | 400 | |
| | | | | | | |
| | |
Repurchase Agreement | | | | | | | |
Fixed Income Clearing Corporation, 0.010% dated 12/31/08 due 1/2/09, repurchase price $231, collateralized by FHLMC, 5.625%, due 11/23/35 | | | 231 | | | 231 | |
| | | | | | | |
Total Repurchase Agreement—1.0%
(cost $231) | | | 231 | |
Total Investments—100.2%
(cost $28,477) | | | 23,320 | |
Liabilities, plus cash and other assets—(0.2)% | | | (41 | ) |
| | | | | | | |
Net assets—100.0% | | $ | 23,279 | |
| | | | | | | |
See accompanying Notes to Financial Statements.
18 Annual Report | December 31, 2008 |

Michael P. Balkin

Karl W. Brewer
SMALL CAP GROWTH FUND
The Small Cap Growth Fund invests primarily in common stocks of small domestic growth companies that the Advisor expects to have solid growth in earnings.
AN OVERVIEW FROM THE PORTFOLIO MANAGERS
How did the Fund perform during the past year? How did the Fund’s performance compare to its benchmark?
The Small Cap Growth Fund decreased (46.85)% on a total return basis (Class N shares) for the 12 months ended December 31, 2008. By comparison the Fund’s benchmark, the Russell 2000® Growth Index, declined (38.54)%.
What were the most significant factors impacting Fund performance? What factors were behind the Fund’s performance versus the benchmark?
As we entered 2008, the debate simply was over whether the United States was already in or headed towards a recession. As we exit the year, we are clearly in a global recession and the debate is over the duration and magnitude of the slowdown. The events during the year produced one of the most volatile and challenging equity markets ever.
Housing and mortgage problems morphed into balance sheet issues for financial institutions, which in turn led to credit market and short term liquidity concerns. During the first part of the third quarter, there were fresh signs of growth slowing in emerging markets, and with them, came a sharp reduction in commodity prices. The third quarter also witnessed major bankruptcy filings, government takeovers and government-brokered acquisitions of major financial institutions.
As we look back, the Lehman Brothers failure in mid-September caused a ripple effect that sent global markets into a freefall during the fourth quarter. Lehman’s bankruptcy intensified concerns about counterparty risk and the basic solvency of many well-established financial institutions. Tighter credit conditions and falling equity prices created a vicious feedback loop as leveraged investors were forced to sell stocks to meet margin calls, in turn driving stock prices down further and forcing additional margin calls. Shaken confidence among investors, consumers and businesses manifested itself in ever-worsening economic data. Corporate and consumer cost-cutting took their toll on capital expenditures, employment trends and retail sales both in the U.S. and abroad. Concerns about global economic activity propelled a collapse of energy prices due, in part, to shrinking demand for crude oil.
Global policy responses to ailing economies and financial markets have been unprecedented in scale and coordination. These responses, along with attractive equity valuations and greater clarity on President-elect Obama’s cabinet picks, helped the stock market stage a late fourth quarter rally. This rally allowed equity investors to take back at least a fraction of the losses suffered during the first half of the fourth quarter.
Small cap growth stocks, as measured by the Russell 2000® Growth Index, posted a decline of (38.54)% during 2008. Energy was the notable laggard given the precipitous drop in energy prices after their peak around the July 4th holiday. The sector finished down (51.02)% for the year. Information Technology and the Consumer Discretionary sectors both trailed the market by roughly 5% or more. Consumer Staples turned in the best return at (17.4)%, while the Financial sector had the second best return in the index. Although it might sound counter-intuitive given the troubles of many large financial institutions, small cap financials actually
December 31, 2008 | William Blair Funds 19 |
performed relatively well, finishing down (27.8)%. Health Care also out-performed the market with a (30.4)% return. From a style perspective, the market was biased toward higher momentum, higher quality and more expensive stocks during the year as a whole.
From a relative perspective, the Small Cap Growth Fund underperformed during 2008, with the majority of the underperformance coming in the first seven months of the year. The Fund’s lower-than-benchmark market cap bias, valuation sensitivity and lower allocation to momentum stocks detracted during 2008 as a whole. As an aside, many of these headwinds that have affected the Fund since the beginning of the credit crunch in 2007 seemed to lose steam late in 2008. In addition to the style headwinds, stock selection was also a meaningful detractor from relative performance for the year. This was most pronounced in the Health Care sector as certain Fund holdings trailed their Health Care peers in the benchmark. Our underweight in the sector, especially biotechnology stocks, detracted as well. Some of our larger Information Technology holdings disappointed during the year but we continue to feel comfortable about the long-term prospects for these companies. Also, select stocks in Consumer Discretionary and Financials detracted from relative performance. The largest sources of positive relative performance were stock selection in both the Energy and Telecommunications services sectors.
What were among the weakest performing investments for the Fund?
Two of the worst performing stocks during the year were DG FastChannel, Inc. and Providence Service Corporation.
DG FastChannel enables the electronic distribution of advertisements from advertising agencies to traditional radio and TV broadcasters and other media outlets. The stock underperformed during the year as investors grew increasingly pessimistic on advertising sales. Big advertisers, especially automakers, have cut their advertising budgets in the current economic environment. Another concern that developed late in the year was the potential for a delay in the expected February 2009 transition to digital broadcasting. This transition is expected to speed up the shift to High Definition (HD) advertisements, where DG FastChannel makes a higher profit margin. However, we feel those fears are overblown. DG FastChannel continues to be a large holding as the company stands to benefit greatly from the trend to HD advertising going forward.
Providence Service Corporation provides and manages government-sponsored non-emergency transportation services and social services, such as counseling and foster care. The stock was a meaningful detractor during the year as the company’s business was impacted severely by various macro factors. Since the company receives a fixed fee from government agencies for its services, higher fuel costs and increased utilization rates by patients reduced profit margins. In addition, the weak economy has pressured state budgets, and in turn, pressuring reimbursement levels for vendors such as Providence. Although the company’s business had held up better in the last recession, these factors greatly impacted Providence’s bottom line.
What were among the best performing investments for the Fund?
Two of the best performing stocks during the year were Syniverse and Orthovita, Inc..
Syniverse is a telecommunications services firm whose technologies enable wireless carriers to properly charge each other for voice and data roaming on their respective networks. The stock was a large contributor during 2008. This business strength was primarily due to strong revenues from its data business. The secular trend of increasing data transmitted over mobile networks has clearly helped Syniverse’s business. After the solid move in the stock we decided to exit the position.
20 Annual Report | December 31, 2008 |
Orthovita is a leading manufacturer and distributor of synthetic-based biomaterial products used in spine surgery and for other bone fractures. The stock performed well during the year on the heels of good momentum in its core business but also in anticipation of FDA approval for a new product, Cortoss, which is a bone augmentation material that mimics the characteristics of human bone. Cortoss should be the next big driver of growth for the company. The product has been used in Europe for the last three years and has just finished clinical trials in the United States. If approved by the FDA, Cortoss has a market opportunity of well over $100 million in revenue. We maintain our positive bias on this name.
What is your current outlook?
Looking forward, we continue to scrutinize our companies’ earnings vulnerability in a depressed economic environment. The global economy, credit markets and financial institutions remain fragile. At the same time, while we believe that the economy will get worse before it gets better, the market has priced in a great deal of bad news. We believe the abundance of fiscal and monetary stimulus, lower gasoline prices, easier earnings comparisons later in 2009 and 2010, and meaningfully high investor cash balances all provide a positive bias to equity markets. We continue to seek out quality growth companies where we believe investor sentiment has pushed valuations down to attractive levels. As always, we remain focused on finding individual companies with superior management teams and defensible business models that should afford them relative success regardless of outside forces.
December 31, 2008 | William Blair Funds 21 |
Small Cap Growth Fund
Performance Highlights (unaudited)
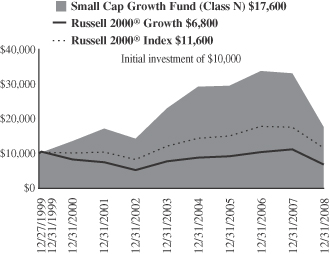
Average Annual Total Return at 12/31/2008
| | | | | | | | | | | | |
| | | 1
Year | | | 3
Year | | | 5
Year | | | Since
Inception(a) | |
Small Cap Growth Fund Class N | | (46.85 | )% | | (15.96 | )% | | (5.24 | )% | | 6.42 | % |
Small Cap Growth Fund Class I | | (46.70 | ) | | (15.73 | ) | | (4.98 | ) | | 6.69 | |
Russell 2000® Growth Index | | (38.54 | ) | | (9.32 | ) | | (2.35 | ) | | (4.15 | ) |
Russell 2000® Index | | (33.79 | ) | | (8.29 | ) | | (0.93 | ) | | 1.64 | |
| | (a) | | For the period from December 27, 1999 to December 31, 2008. |
Performance cited represents past performance. Past performance does not guarantee future results and current performance may be lower or higher than the data quoted. Results shown are average annual total returns, which assume reinvestment of dividends and capital gains. Investment returns and principal will fluctuate and you may have a gain or loss when you sell shares. For the most current month-end performance information, please call 1-800-742-7272, or visit our Web site at www.williamblairfunds.com. Investing in smaller companies involves special risks, including higher volatility and lower liquidity. From time to time, the investment advisor may waive fees or reimburse expenses for the Fund. Without these waivers, performance would be lower. Class N shares are available to the general public without a sales load. Class I shares are available to certain institutional investors and advisory clients of William Blair & Company, L.L.C., without a sales load or distribution (12b-1) or service fees.
The performance highlights and graph presented above do not reflect the deduction of taxes that a shareholder would pay on fund distributions or the redemption of fund shares.
The Russell 2000® Growth Index consists of small-capitalization companies with above average price-to-book ratios and forecasted growth rates.
The Russell 2000® Index is an unmanaged composite of the smallest 2000 stocks of the Russell 3000® Index.
This report identifies the Fund’s investments on December 31, 2008. These holdings are subject to change. Not all stocks in the Fund performed the same, nor is there any guarantee that these stocks will perform as well in the future. Market forecasts provided in this report may not necessarily come to pass.
Sector Diversification (unaudited)
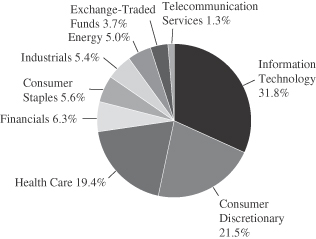
The sector diversification shown is based on the total long-term securities.
22 Annual Report | December 31, 2008 |
Small Cap Growth Fund
Portfolio of Investments, December 31, 2008 (all dollar amounts in thousands)
| | | | | |
Issuer | | Shares | | Value |
| | |
Common Stocks | | | | | |
Information Technology—31.3% | | | | | |
*Cavium Networks, Inc. | | 401,956 | | $ | 4,225 |
CryptoLogic, Ltd.† | | 357,996 | | | 820 |
*DG Fastchannel, Inc | | 1,013,551 | | | 12,649 |
*DTS, Inc. | | 244,431 | | | 4,485 |
*Euronet Worldwide, Inc. | | 907,234 | | | 10,533 |
*Exlservice Holdings, Inc. | | 628,613 | | | 5,387 |
*GigaMedia Limited† | | 1,567,417 | | | 8,824 |
*j2 Global Communications, Inc. | | 398,548 | | | 7,987 |
*Kowabunga!, Inc. | | 2,639,070 | | | 158 |
*Miva, Inc. | | 3,885,215 | | | 699 |
*Nuance Communications, Inc. | | 414,331 | | | 4,293 |
*Optimal Group, Inc.† | | 1,615,192 | | | 792 |
*Salesforce.com, Inc. | | 62,885 | | | 2,013 |
*Silicon Laboratories, Inc. | | 421,523 | | | 10,445 |
*Solera Holdings, Inc. | | 221,300 | | | 5,333 |
*Sonic Solutions | | 2,661,273 | | | 4,684 |
*SuccessFactors, Inc. | | 407,214 | | | 2,337 |
*The Ultimate Software Group, Inc. | | 440,585 | | | 6,433 |
United Online, Inc. | | 2,043,289 | | | 12,403 |
*Virtusa Corporation | | 1,307,147 | | | 7,372 |
*VistaPrint Limited† | | 165,246 | | | 3,075 |
*Web.com Group, Inc. | | 2,004,499 | | | 7,337 |
*WNS Holdings Limited—ADR | | 676,661 | | | 3,553 |
| | | | | |
| | | | | 125,837 |
| | | | | |
Consumer Discretionary—21.1% | | | | | |
*Amerigon Incorporated | | 1,181,267 | | | 3,851 |
*Bally Technologies, Inc. | | 222,300 | | | 5,342 |
*Century Casinos, Inc. | | 1,096,288 | | | 1,129 |
*Coinstar, Inc. | | 277,596 | | | 5,416 |
*Dolan Media | | 712,856 | | | 4,698 |
*Duckwall-ALCO Stores, Inc. | | 359,361 | | | 3,443 |
*Grand Canyon Education, Inc. | | 267,500 | | | 5,024 |
*Granite City Food & Brewery, Ltd. | | 1,137,260 | | | 370 |
*Imax Corporation† | | 315,605 | | | 1,407 |
*Jarden Corporation | | 750,837 | | | 8,634 |
*Jos. A. Bank Clothiers, Inc. | | 164,142 | | | 4,292 |
*K12, Inc. | | 265,859 | | | 5,070 |
*Kona Grill, Inc. | | 744,995 | | | 1,639 |
*Lions Gate Entertainment Corporation† | | 901,932 | | | 4,961 |
*MDC Partners, Inc.† | | 922,001 | | | 2,803 |
*Motorcar Parts of America, Inc. | | 678,936 | | | 2,648 |
*Penn National Gaming, Inc. | | 173,505 | | | 3,709 |
Phillips-Van Heusen Corporation | | 210,733 | | | 4,242 |
*Shuffle Master, Inc. | | 1,209,088 | | | 5,997 |
Strayer Education, Inc. | | 37,795 | | | 8,104 |
World Wrestling Entertainment, Inc., Class “A” | | 183,290 | | | 2,031 |
| | | | | |
| | | | | 84,810 |
| | | | | |
Health Care—19.1% | | | | | |
*Air Methods Corporation | | 520,264 | | | 8,319 |
*CardioNet, Inc. | | 354,961 | | | 8,750 |
*Eurand NV† | | 543,692 | | | 4,681 |
*Healthways, Inc. | | 560,995 | | | 6,440 |
*HMS Holdings Corporation | | 133,219 | | | 4,199 |
*Illumina, Inc. | | 80,793 | | | 2,105 |
*Integra Lifesciences Holding Corporation | | 185,852 | | | 6,611 |
*Kensey Nash Corporation | | 293,584 | | | 5,698 |
*Natus Medical, Inc. | | 298,672 | | | 3,868 |
*Orthovita, Inc. | | 1,503,861 | | | 5,098 |
*Providence Service Corporation | | 560,693 | | | 813 |
*Psychiatric Solutions, Inc. | | 199,205 | | | 5,548 |
| | | | | |
Issuer | | Shares | | Value |
| | |
Common Stocks—(continued) | | | | | |
Health Care—(continued) | | | | | |
*ResMed, Inc. | | 134,420 | | $ | 5,038 |
*Sangamo Biosciences, Inc. | | 702,274 | | | 2,444 |
*SurModics, Inc. | | 229,657 | | | 5,803 |
*Trinity Biotech plc—ADR | | 750,954 | | | 1,224 |
| | | | | |
| | | | | 76,639 |
| | | | | |
Financials—6.2% | | | | | |
*Affiliated Managers Group, Inc. | | 146,982 | | | 6,161 |
*Banctec, Inc.** | | 603,327 | | | 3,017 |
*FirstService Corporation† | | 485,501 | | | 6,350 |
GFI Group, Inc. | | 1,411,840 | | | 4,998 |
*Marlin Business Services Corporation | | 860,992 | | | 2,282 |
National Financial Partners Corporation | | 698,005 | | | 2,122 |
| | | | | |
| | | | | 24,930 |
| | | | | |
Consumer Staples—5.6% | | | | | |
*Bare Escentuals, Inc. | | 1,167,390 | | | 6,105 |
*Overhill Farms, Inc. | | 1,215,052 | | | 5,091 |
*Physicians Formula Holdings, Inc. | | 862,320 | | | 2,406 |
*Smart Balance, Inc. | | 1,272,027 | | | 8,650 |
| | | | | |
| | | | | 22,252 |
| | | | | |
Industrials—5.3% | | | | | |
Copa Holdings S.A., Class “A”† | | 136,688 | | | 4,144 |
Heidrick & Struggles International, Inc. | | 218,573 | | | 4,708 |
*ICF International, Inc. | | 218,098 | | | 5,359 |
*InnerWorkings, Inc. | | 1,082,395 | | | 7,090 |
| | | | | |
| | | | | 21,301 |
| | | | | |
Energy—5.0% | | | | | |
*Carrizo Oil & Gas, Inc. | | 215,500 | | | 3,470 |
*Comstock Resources, Inc. | | 97,760 | | | 4,619 |
*Concho Resources, Inc. | | 346,813 | | | 7,914 |
*Petrohawk Energy Corporation | | 245,069 | | | 3,830 |
| | | | | |
| | | | | 19,833 |
| | | | | |
Telecommunication Services—1.3% | | | | | |
*Cbeyond, Inc. | | 332,660 | | | 5,316 |
| | | | | |
Total Common Stock—94.9%
(cost $605,655) | | | 380,918 |
| | | | | |
| | |
Exchange-Traded Fund | | | | | |
iShares, Russell 2000® Growth | | 286,100 | | | 14,551 |
| | | | | |
Total Exchange-Traded Fund—3.6%
(cost $13,772) | | | 14,551 |
| | | | | |
| | |
Investment in Warrants | | | | | |
*Kowabunga! Inc., 2011, $2.50** | | 1,424,000 | | | — |
*Kowabunga! Inc., 2011, $3.05** | | 448,409 | | | — |
*Kowabunga! Inc., 2011, $4.00** | | 224,205 | | | — |
*Motorcar Parts of America, Inc., 2012, $15.00** | | 111,575 | | | — |
*Zila, Inc., 2011, $2.21** | | 2,407,202 | | | — |
| | | | | |
Total Investment in Warrants—0.0%
(cost $0) | | | — |
| | | | | |
| | |
Investment in Affiliate | | | | | |
William Blair Ready Reserves Fund | | 95,333 | | | 95 |
| | | | | |
Total Investment in Affiliate—0.0%
(cost $95) | | | 95 |
| | | | | |
See accompanying Notes to Financial Statements.
December 31, 2008 | William Blair Funds 23 |
Small Cap Growth Fund
Portfolio of Investments, December 31, 2008 (all dollar amounts in thousands)
| | | | | | |
Issuer | | Principal
Amount | | Value |
| | |
Short-Term Investments | | | | | | |
American Express Credit Corp. Demand Note, VRN 0.321%, due 1/2/09 | | $ | 100 | | $ | 100 |
| | | | | | |
Total Short-Term Investments—0.0%
(cost $100) | | | 100 |
| | | | | | |
Total Investments—98.5%
(cost $619,622) | | | 395,664 |
Cash and other assets, less liabilities—1.5% | | | 5,963 |
| | | | | | |
Net assets—100.0% | | $ | 401,627 |
| | | | | | |
*Non-income producing securities
† = U.S. listed foreign security
ADR = American Depository Receipt
VRN = Variable Rate Note
** = Fair valued pursuant to Valuation Procedures adopted by the Board of Trustees. These securities represents 0.75% of the Fund’s net assets at December 31, 2008. These securities were also deemed illiquid pursuant to Liquidity Procedures approved by Board of Trustees.
If the Fund’s portfolio holdings represent ownership of 5% or more of the voting securities of a company, the company is deemed to be a affiliate as defined in the Investment Company Act of 1940. The Small Cap Growth Fund had the following transactions during the year ended December 31, 2008 with companies deemed affiliated during the year or at year-end:
| | | | | | | | | | | | | | |
| | | Share Activity | | Year Ended
December 31, 2008 |
| | | | | | | | | | | (in thousands) |
Security Name | | Balance
12/31/2007 | | Purchases | | Sales | | Balance
12/31/2008 | | Value | | Dividends Included in Income |
pAmerigon | | — | | 1,445,335 | | 264,068 | | 1,181,267 | | $ | 3,851 | | $ | — |
Cash Systems | | 1,131,365 | | — | | 1,131,365 | | — | | | — | | | — |
Century Casinos, Inc. | | 1,289,233 | | 281,400 | | 474,345 | | 1,096,288 | | | 1,129 | | | — |
DG Fastchannel, Inc | | 1,046,244 | | 308,990 | | 341,683 | | 1,013,551 | | | 12,649 | | | — |
pDuckwall-ALCO Stores, Inc. | | 322,738 | | 65,379 | | 28,756 | | 359,361 | | | 3,443 | | | — |
pGranite City Food & Brewery, Ltd. | | 1,247,423 | | — | | 110,163 | | 1,137,260 | | | 370 | | | — |
pKona Grill, Inc. | | 645,829 | | 106,466 | | 7,300 | | 744,995 | | | 1,639 | | | — |
Kowabunga!, Inc. | | 4,626,270 | | — | | 1,987,200 | | 2,639,070 | | | 158 | | | — |
pMarlin Business Services Corp. | | 579,313 | | 328,296 | | 46,617 | | 860,992 | | | 2,282 | | | — |
pMiva, Inc. | | 3,027,199 | | 990,792 | | 132,776 | | 3,885,215 | | | 699 | | | — |
pMotorcar Parts of America, Inc. | | 706,436 | | — | | 27,500 | | 678,936 | | | 2,648 | | | — |
pOptimal Group, Inc. | | 2,164,208 | | — | | 549,016 | | 1,615,192 | | | 792 | | | — |
pOverhill Farms, Inc. | | 1,903,720 | | 80,820 | | 769,488 | | 1,215,052 | | | 5,091 | | | — |
PDF Solutions, Inc. | | 1,889,930 | | — | | 1,889,930 | | — | | | — | | | — |
pPhysicians Formula Holdings, Inc. | | 1,335,045 | | — | | 472,725 | | 862,320 | | | 2,406 | | | — |
*Progressive Gaming International Corporation | | 5,331,944 | | — | | 1,224,568 | | — | | | — | | | — |
Providence Service Corporation | | 821,414 | | 382,634 | | 643,355 | | 560,693 | | | 813 | | | — |
pSonic Solutions | | 1,143,655 | | 2,099,460 | | 581,842 | | 2,661,273 | | | 4,684 | | | — |
Trinity Biotech plc—ADR | | 1,010,654 | | — | | 259,700 | | 750,954 | | | 1,224 | | | — |
VistaCare Inc. | | 1,907,915 | | — | | 1,907,915 | | — | | | — | | | — |
Volterra Semiconductor Corporation | | 752,727 | | 307,000 | | 1,059,727 | | — | | | — | | | — |
pVirtusa Corporation | | 708,131 | | 1,188,494 | | 589,478 | | 1,307,147 | | | 7,372 | | | — |
pWeb.com Group, Inc. | | 1,922,561 | | 1,243,639 | | 1,161,701 | | 2,004,499 | | | 7,337 | | | — |
Zila, Inc. | | 7,237,388 | | — | | 7,237,388 | | — | | | — | | | — |
| | | | | | | | | | | | | | |
| | | | | | | | | | $ | 58,587 | | $ | — |
| | | | | | | | | | | | | | |
*1 for 8 Stock Split on 9/16/08.
p = Affiliated company at December 31, 2008. The Small Cap Growth Fund’s total value in companies deemed to be an affiliate at December 31, 2008 was $42,614 (in thousands).
See accompanying Notes to Financial Statements.
24 Annual Report | December 31, 2008 |

Robert C. Lanphier, IV

David P. Ricci
MID CAP GROWTH FUND
The Mid Cap Growth Fund primarily invests in a diversified portfolio of common stocks of medium-sized domestic growth companies.
AN OVERVIEW FROM THE PORTFOLIO MANAGERS
How did the Fund perform during the past year? How did the Fund’s performance compare to its benchmark?
The Mid Cap Growth Fund posted a (34.71)% decrease on a total return basis (Class N Shares) for the 12 months ended December 31, 2008. By comparison, the Fund’s benchmark, the Russell Midcap® Growth Index, declined (44.32)% during the period.
What were the most significant factors impacting Fund performance? What factors were behind the Fund’s performance versus the benchmark?
As we entered 2008, the debate simply was over whether the United States was already in or headed towards a recession. As we exit the year, we are clearly in a global recession and the debate is over the duration and magnitude of the slowdown. The events in between produced one of the most volatile and challenging equity markets ever. While the absolute return for the Mid Cap Growth Fund was not immune from these trends, the Fund proved to be more resilient than its benchmark during 2008.
Housing and mortgage problems morphed into balance sheet issues for financial institutions, which in turn led to credit market and short term liquidity concerns. During the first part of the third quarter, there were fresh signs of growth slowing in emerging markets, and with them, came a sharp reduction in commodity prices. The third quarter also witnessed major bankruptcy filings, government takeovers and government-brokered acquisitions of major financial institutions.
As we look back, the Lehman Brothers failure in mid-September caused a ripple effect that sent global markets into a freefall during the fourth quarter. Lehman’s bankruptcy intensified concerns about counterparty risk and the basic solvency of many well-established financial institutions. Tighter credit conditions and falling equity prices created a vicious feedback loop as leveraged investors were forced to sell stocks to meet margin calls, in turn driving stock prices down further and forcing additional margin calls. Shaken confidence among investors, consumers and businesses manifested itself in ever-worsening economic data. Corporate and consumer cost-cutting took their toll on capital expenditures, employment trends and retail sales both in the U.S. and abroad. Concerns about global economic activity propelled a collapse of energy prices due, in part, to shrinking demand for crude oil.
Global policy responses to ailing economies and financial markets have been unprecedented in scale and coordination. These responses, along with attractive equity valuations and greater clarity on President-elect Obama’s cabinet picks, helped the stock market stage a late fourth quarter rally. This allowed equity investors to take back at least a fraction of the losses suffered during the first half of the fourth quarter.
The Russell Midcap® Growth Index finished 2008 down (44.32)%. All major economic sectors took a substantial hit during the year. The out-performing sectors were the defensive-natured Health Care and Consumer Staples sectors, which returned (33.30)% and (29.00)%, respectively. All other sectors finished down more than (40)% during the year. The worst sector, Energy, plummeted (55.60)% over the year as energy prices cratered in the back half
December 31, 2008 | William Blair Funds 25 |
of the year. From a style perspective, the market had a bias toward higher quality and lower growth stocks during the year as a whole.
As we discussed above, the Fund was not invulnerable to the market downturn, but it out-performed the Russell Midcap® Growth Index. This was especially evident in the second half of year when the majority of the market declines occurred. Stock selection in the Information Technology sector was the main contributor to relative return. Also, select stocks in both the Industrials and Financials sectors helped the Fund out-perform the benchmark in each of these sectors. On the downside, our higher growth orientation compared to the benchmark was a meaningful detractor. In addition, stock selection in Health Care hurt relative performance.
What were among the weakest performing investments for the Fund?
Two of the worst performing stocks during the year were Hologic, Inc. and Affiliated Managers Group, Inc.
Affiliated Managers Group is an asset management company with equity investments in various small- and mid-sized investment management firms. The company has seen significant revenue pressure as overall assets under management deteriorated with the stock market correction. Investors also questioned Affiliated Managers Group’s balance sheet, given that many of its acquisitions were financed with debt. Despite the decline in share price, we continue to hold the stock as we believe the company’s business model remains solid and that it will experience above-average earnings growth into the future.
Hologic, Inc. is a leading developer, manufacturer and supplier of premium diagnostics products, medical imaging systems and surgical products dedicated to serving the healthcare needs of women. Hologic’s core business units are focused on breast health, diagnostics, GYN surgical, and skeletal health. Its business has been affected by the economic problems and credit market issues. One of the company’s services was hit by women delaying their use of an elective procedure offered by Hologic. More importantly, the company’s digital mammography business has been impacted. With hospital endowments under pressure, hospital budgets tightening, and credit availability becoming tougher to obtain, many hospitals are choosing to delay purchases of Hologic’s machines. However, we continue to hold the stock based on the growth outlook for the company’s other product lines, as well as the reacceleration and secular trend to digital mammography testing in the future.
What were among the best performing investments for the Fund?
Two of the best performing stocks during the year were C.H. Robinson Worldwide, Inc. and DeVry, Inc.
C.H. Robinson Worldwide is a third party transportation logistics company. The company, through its relationships with approximately 48,000 transportation companies, including motor carriers, railroads, air freight, and ocean carriers, selects and hires the appropriate transportation to manage its customers’ freight needs. The company’s business model has been resilient in this tough environment. C.H. Robinson has been able to maintain its bottom line despite lower shipping demands by capitalizing on the glut of truckers and other carriers on the market. The company is able to receive better pricing from these carriers, effectively lowering their costs at a time when shipping volumes are challenged. As the company is able to grow and maintain profit margins in varying macro environments, we continue to hold the position.
DeVry operates in the post-secondary education industry. The company offers campus based and online courses in areas including graduate level management courses, medical and nursing programs, and professional exam preparation. The stock performed quite well during
26 Annual Report | December 31, 2008 |
the year as the company’s business momentum continues to be robust. Student enrollment figures for the fall term were very encouraging. Management continues to operate the business well and the education environment remains strong as the job market weakens. We continue to hold a position in the name.
What is your current outlook?
Looking forward, we continue to scrutinize our companies’ earnings vulnerability in a depressed economic environment. The global economy, credit markets and financial institutions remain fragile. At the same time, we believe that while the economy will undoubtedly get worse before it gets better, the market has priced in a great deal of bad news. We believe the abundance of fiscal and monetary stimulus, lower gasoline prices, easier earnings comparisons later in 2009 and 2010, the emergence of more realistic earnings expectations from Wall Street analysts for 2009 and 2010, as well as meaningfully high investor cash balances all provide a positive bias to equity markets. We continue to seek out quality growth companies where we believe investor sentiment has pushed valuations down to attractive levels. As always, we remain focused on finding individual companies with superior management teams and defensible business models that should afford them relative success regardless of outside forces.
December 31, 2008 | William Blair Funds 27 |
Mid Cap Growth Fund
Performance Highlights (unaudited)
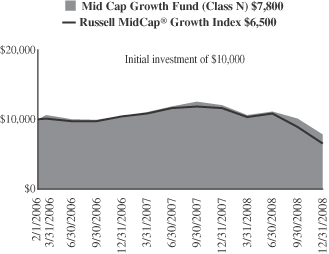
Average Annual Total Return at 12/31/2008
| | | | | | |
| | | 1
Year | | | Since
Inception(a) | |
Mid Cap Growth Fund Class N | | (34.71 | )% | | (8.04 | )% |
Mid Cap Growth Fund Class I | | (34.50 | ) | | (7.75 | ) |
Russell MidCap® Growth Index | | (44.32 | ) | | (13.84 | ) |
| | (a) | | For the period from February 1, 2006 (Commencement of Operations) to December 31, 2008. |
Performance cited represents past performance. Past performance does not guarantee future results and current performance may be lower or higher than the data quoted. Results shown are average annual total returns, which assume reinvestment of dividends and capital gains. Investment returns and principal will fluctuate and you may have a gain or loss when you sell shares. For the most current month-end performance information, please call 1-800-742-7272, or visit our Web site at www.williamblairfunds.com. Investing in smaller and medium capitalization companies involves special risks, including higher volatility and lower liquidity. Mid Cap stocks are also more sensitive to purchase/sale transactions and changes in the issuer’s financial condition. From time to time, the investment advisor may waive fees or reimburse expenses for the Fund. Without these waivers, performance would be lower. Class N shares are available to the general public without a sales load. Class I shares are available to certain institutional investors and advisory clients of William Blair & Company, L.L.C., without a sales load or distribution (12b-1) or service fees.
The performance highlights and graph presented above do not reflect the deduction of taxes that a shareholder would pay on fund distributions or the redemption of fund shares.
The Russell MidCap® Growth Index is an index that is constructed to provide a comprehensive and unbiased barometer of the mid-cap growth market.
This report identifies the Fund’s investments on December 31, 2008. These holdings are subject to change. Not all stocks in the Fund performed the same, nor is there any guarantee that these stocks will perform as well in the future. Market forecasts provided in this report may not necessarily come to pass.
Sector Diversification (unaudited)
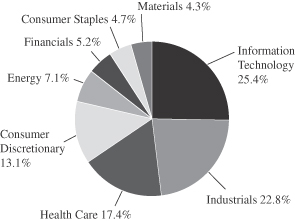
The sector diversification shown is based on the total long-term securities.
28 Annual Report | December 31, 2008 |
Mid Cap Growth Fund
Portfolio of Investments, December 31, 2008 (all dollar amounts in thousands)
| | | | | |
Issuer | | Shares | | Value |
| | |
Common Stocks | | | | | |
Information Technology—23.8% | | | | | |
*Activision Blizzard, Inc. | | 89,900 | | $ | 777 |
*Alliance Data Systems Corporation | | 22,680 | | | 1,055 |
*Autodesk, Inc. | | 34,600 | | | 680 |
*Cognizant Technology Solutions Corporation | | 56,350 | | | 1,018 |
*Dolby Laboratories, Inc., Class “A” | | 12,880 | | | 422 |
*F5 Networks, Inc. | | 23,798 | | | 544 |
*FLIR Systems, Inc. | | 37,240 | | | 1,143 |
*NetApp, Inc. | | 59,086 | | | 826 |
*Nuance Communications, Inc. | | 86,240 | | | 894 |
Paychex, Inc. | | 14,055 | | | 369 |
*Silicon Laboratories, Inc. | | 42,730 | | | 1,059 |
*Trimble Navigation Limited | | 38,520 | | | 832 |
| | | | | |
| | | | | 9,619 |
| | | | | |
Industrials—21.3% | | | | | |
C. H. Robinson Worldwide, Inc. | | 11,255 | | | 619 |
Dun & Bradstreet Corporation | | 9,280 | | | 716 |
Expeditors International of Washington, Inc. | | 13,920 | | | 463 |
Fastenal Company | | 36,525 | | | 1,273 |
J.B. Hunt Transport Services, Inc. | | 38,580 | | | 1,014 |
*Iron Mountain, Incorporated | | 41,767 | | | 1,033 |
Precision Castparts Corp. | | 11,680 | | | 695 |
Ritchie Bros. Auctioneers Incorporated† | | 8,000 | | | 171 |
Rockwell Collins, Inc. | | 16,405 | | | 641 |
Roper Industries, Inc. | | 23,100 | | | 1,003 |
*Stericycle, Inc. | | 13,660 | | | 711 |
*SunPower Corp., Class “B” | | 10,000 | | | 304 |
| | | | | |
| | | | | 8,643 |
| | | | | |
Health Care—16.3% | | | | | |
C.R. Bard, Inc. | | 6,745 | | | 568 |
*Hologic, Inc. | | 47,550 | | | 622 |
*IDEXX Laboratories, Inc. | | 35,870 | | | 1,294 |
*Illumina, Inc. | | 22,250 | | | 580 |
*Intuitive Surgical, Inc. | | 8,020 | | | 1,019 |
*Myriad Genetics, Inc. | | 10,900 | | | 722 |
Pharmaceutical Product Development, Inc. | | 28,625 | | | 830 |
*Qiagen N.V.† | | 21,580 | | | 379 |
*St. Jude Medical, Inc. | | 18,080 | | | 596 |
| | | | | |
| | | | | 6,610 |
| | | | | |
Consumer Discretionary—12.2% | | | | | |
*Bed Bath & Beyond, Inc. | | 15,560 | | | 396 |
*Chipotle Mexican Grill, Inc. Class “B” | | 15,840 | | | 908 |
DeVry, Inc. | | 15,010 | | | 862 |
*Dick’s Sporting Goods, Inc. | | 40,000 | | | 564 |
*GameStop Corp. | | 24,950 | | | 540 |
*O’Reilly Automotive, Inc. | | 26,770 | | | 823 |
Strayer Education, Inc. | | 4,030 | | | 864 |
| | | | | |
| | | | | 4,957 |
| | | | | |
* Non-income producing securities
† = U.S. listed foreign security
| | | | | | |
Issuer | | Shares or
Principal
Amount | | Value |
| | |
Common Stocks—(continued) | | | | | | |
Energy—6.7% | | | | | | |
*Forest Oil Corporation | | | 24,370 | | $ | 402 |
Helmerich & Payne, Inc. | | | 21,020 | | | 478 |
Smith International, Inc. | | | 29,690 | | | 680 |
*Southwestern Energy Company | | | 23,240 | | | 673 |
*Ultra Petroleum Corp.† | | | 13,965 | | | 482 |
| | | | | | |
| | | | | | 2,715 |
| | | | | | |
Financials—4.9% | | | | | | |
*Affiliated Managers Group, Inc. | | | 39,155 | | | 1,641 |
Greenhill & Co., Inc. | | | 4,760 | | | 332 |
| | | | | | |
| | | | | | 1,973 |
| | | | | | |
Consumer Staples—4.4% | | | | | | |
Alberto-Culver Company | | | 31,350 | | | 768 |
*Hansen Natural Corporation | | | 29,920 | | | 1,003 |
| | | | | | |
| | | | | | 1,771 |
| | | | | | |
Materials—4.0% | | | | | | |
Airgas, Inc. | | | 24,260 | | | 946 |
Ecolab, Inc. | | | 19,610 | | | 689 |
| | | | | | |
| | | | | | 1,635 |
| | | | | | |
Total Common Stock—93.6%
(cost $47,400) | | | 37,923 |
| | | | | | |
| | |
Investment in Affiliate | | | | | | |
William Blair Ready Reserves Fund | | | 518,130 | | | 518 |
| | | | | | |
Total Investment In Affiliate—1.3%
(cost $518) | | | 518 |
| | | | | | |
Repurchase Agreement | | | | | | |
Fixed Income Clearing Corporation, 0.010% dated 12/31/08, due 1/2/09, repurchase price $1,307, collateralized by FHLMC, 5.625%, due 11/23/35 | | $ | 1,307 | | | 1,307 |
| | | | | | |
Total Repurchase Agreement—3.2%
(cost $1,307) | | | 1,307 |
| | | | | | |
Total Investments—98.1%
(cost $49,225) | | | 39,748 |
Cash and other assets, less liabilities—1.9% | | | 778 |
| | | |
Net Assets—100.0% | | $ | 40,526 |
| | | | | | |
See accompanying Notes to Financial Statements.
December 31, 2008 | William Blair Funds 29 |
Karl W. Brewer
Robert C. Lanphier, IV

Matthew A. Litfin
SMALL-MID CAP GROWTH FUND
The Small-Mid Cap Growth Fund primarily invests in a diversified portfolio of common stocks of small and medium-sized U.S. growth companies that the Advisor expects to experience solid growth in earnings.
AN OVERVIEW FROM THE PORTFOLIO MANAGERS
How did the Fund perform during the past year? How did the Fund’s performance compare to its benchmark?
The Small-Mid Cap Growth Fund decreased (37.71)% on a total return basis (Class N Shares) for the 12 months ended December 31, 2008. By comparison, the Fund’s benchmark, the Russell 2500™ Growth Index, declined (41.50)% during the period.
What were the most significant factors impacting Fund performance? What factors were behind the Fund’s performance versus the benchmark?
As we entered 2008, the debate simply was over whether the United States was already in or headed towards a recession. As we exit the year, we are clearly in a global recession and the debate is over the duration and magnitude of the slowdown. The events in between produced one of the most volatile and challenging equity markets ever. While the absolute return for the Small-Mid Cap Growth Fund was not immune from these trends, the Fund proved to be more resilient than its benchmark during 2008.
Housing and mortgage problems morphed into balance sheet issues for financial institutions, which in turn led to credit market and short term liquidity concerns. During the first part of the third quarter, there were fresh signs of growth slowing in emerging markets, and with them, came a sharp reduction in commodity prices. The third quarter also witnessed major bankruptcy filings, government takeovers and government-brokered acquisitions of major financial institutions.
As we look back, the Lehman Brothers failure in mid-September caused a ripple effect that sent global markets into a freefall during the fourth quarter. Lehman’s bankruptcy intensified concerns about counterparty risk and the basic solvency of many well-established financial institutions. Tighter credit conditions and falling equity prices created a vicious feedback loop as leveraged investors were forced to sell stocks to meet margin calls, in turn driving stock prices down further and forcing additional margin calls. Shaken confidence among investors, consumers and businesses manifested itself in ever-worsening economic data. Corporate and consumer cost-cutting took their toll on capital expenditures, employment trends and retail sales both in the U.S. and abroad. Concerns about global economic activity propelled a collapse of energy prices due, in part, to shrinking demand for crude oil.
Global policy responses to ailing economies and financial markets have been unprecedented in scale and coordination. These responses, along with attractive equity valuations and greater clarity on President-elect Obama’s cabinet picks, helped the stock market stage a late-year fourth quarter rally. This rally allowed equity investors to take back at least a fraction of the losses suffered during the first half of the fourth quarter.
The Russell 2500™ Growth Index finished 2008 down (41.50)%, as all major economic sectors in the index returned worse than (30)%. Energy was the standout laggard. With the decline of energy prices in the second half of the year, energy stocks were by far the worst performers down (57.60)% for the year. Consumer Discretionary trailed the overall small-mid cap growth market by 5% while the defensive-natured Consumer Staples and Health Care
30 Annual Report | December 31, 2008 |
sectors out-performed by roughly 10% for the year. From a style perspective, the market had a bias toward higher quality, lower growth and smaller cap stocks within the small-mid cap growth space.
As we mentioned above, the Fund was clearly affected by the market downturn, but it out-performed the Russell 2500™ Growth Index during 2008. This was especially evident in the second half of the year when the majority of the market declines occurred. The Fund’s higher quality bias was a benefit, but stock selection was the primary differentiator. This was most pronounced in the Industrials sector. An airline and travel services company as well as an industrial distributor stood out among their industrial peers in the benchmark. Consumer Discretionary stock selection was also strong. The Fund’s post-secondary education stocks were the largest source of out-performance within this sector. Energy stock selection was also a positive relative contributor. On the downside, Health Care was the biggest source of relative weakness. Not owning biotechnology stocks detracted, but poor stock selection was the main dynamic in the sector. The Fund’s larger-than-benchmark market cap bias and higher growth bias detracted from performance as well during the year.
What were among the weakest performing investments for the Fund?
Two of the worst performing stocks during the year were Brookdale Senior Living and Affiliated Managers Group, Inc.
Brookdale Senior Living operates senior living facilities in the United States. The company offers three main types of facilities; Independent living, Assisted Living, and Continuing Care Retirement Communities. The stock came under increased pressure throughout the year as economic and credit availability fears escalated. The housing market and consumer woes have delayed new entrants to their facilities and therefore, occupancy rates are down year over year. Management has tried to offset this trend by providing reduced introductory pricing. However, lower occupancy rates and reduced pricing have caused a deterioration in the business, intensifying concerns about Brookdale’s financial flexibility. We sold our position in the stock given these concerns.
Affiliated Managers Group is an asset management company with equity investments in various small and mid-sized investment management firms. The company has seen significant revenue pressure as overall assets under management deteriorated with the stock market correction. Investors also questioned Affiliated Managers Group’s balance sheet, given many of its acquisitions were financed with debt. Despite the decline in share price, we continue to hold the stock as we believe the company’s business model remains solid and that it will experience above-average earnings growth into the future.
What were among the best performing investments for the Fund?
Two of the best performing stocks during the year were Allegiant Travel Company and Strayer Education, Inc.
Allegiant Travel Company, a leisure travel company, provides airline services from small cities to leisure destinations such as Las Vegas, Orlando and Tampa/St. Petersburg. The stock continued its momentum throughout the second half of the year on the heels of lower jet fuel costs. The stock out-performed the market and its airline peers as Wall Street analysts have had to readjust their earnings forecasts significantly higher. In addition to relief on fuel costs, management has executed quite well in this sluggish consumer environment. The company has very little debt, is the low cost producer and manages its fleet capacity to keep planes full, and therefore, individual flights more profitable. We continue to hold a position in the stock.
December 31, 2008 | William Blair Funds 31 |
Strayer Education is a post-secondary education company which offers Associate’s, Bachelor’s and Master’s degrees to working adults through campus-based and online settings. The stock was a top performer during 2008 as business momentum was strong and investors were attracted to the post-secondary education space in a weakening economy. Much of Strayer’s business strength in 2008 was a result of better than expected student enrollment trends, as well as a faster pace of new campus openings and the productivity of those campuses. We continue to hold the stock after the positive results from the company during the year.
What is your current outlook?
Looking forward, we continue to scrutinize our companies’ earnings vulnerability in a depressed economic environment. The global economy, credit markets and financial institutions remain fragile. At the same time, we believe that while the economy will undoubtedly get worse before it gets better, the market has priced in a great deal of bad news. We believe the abundance of fiscal and monetary stimulus, lower gasoline prices, easier earnings comparisons later in 2009 and 2010, the emergence of more realistic earnings expectations from Wall Street analysts for 2009 and 2010, as well as meaningfully high investor cash balances all provide a positive bias to equity markets. We continue to seek out quality growth companies where we believe investor sentiment has pushed valuations down to attractive levels. As always, we remain focused on finding individual companies with superior management teams and defensible business models that should afford them relative success regardless of outside forces.
32 Annual Report | December 31, 2008 |
Small-Mid Cap Growth Fund
Performance Highlights (unaudited)

Average Annual Total Return at 12/31/2008
| | | | | | | | | | | | |
| | | 1
Year | | | 3
Year | | | 5
Year | | | Since
Inception(a) | |
Small-Mid Cap Growth
Fund Class N | | (37.71 | )% | | (8.44 | )% | | (0.72 | )% | | (0.84 | )% |
Small-Mid Cap Growth
Fund Class I | | (37.54 | ) | | (8.23 | ) | | (0.49 | ) | | (0.60 | ) |
Russell 2500™ Growth Index | | (41.50 | ) | | (10.36 | ) | | (2.24 | ) | | (2.35 | ) |
| | (a) | | For the period from December 29, 2003 to December 31, 2008. | |
Performance cited represents past performance. Past performance does not guarantee future results and current performance may be lower or higher than the data quoted. Results shown are average annual total returns, which assume reinvestment of dividends and capital gains. Investment returns and principal will fluctuate and you may have a gain or loss when you sell shares. For the most current month-end performance information, please call 1-800-742-7272, or visit our Web site at www.williamblairfunds.com. Investing in smaller and medium capitalization companies involves special risks, including higher volatility and lower liquidity. Small and Mid cap stocks are also more sensitive to purchase/sale transactions and changes in the issuer’s financial condition. From time to time, the investment advisor may waive fees or reimburse expenses for the Fund. Without these waivers, performance would be lower. Class N shares are available to the general public without a sales load. Class I shares are available to certain institutional investors and advisory clients of William Blair & Company, L.L.C., without a sales load or distribution (12b-1) or service fees.
The performance highlights and graph presented above do not reflect the deduction of taxes that a shareholder would pay on fund distributions or the redemption of fund shares.
The Russell 2500™ Growth Index measures the performance of those Russell 2500 companies with above average price-to-book ratios and forecasted growth rates.
This report identifies the Fund’s investments on December 31, 2008. These holdings are subject to change. Not all stocks in the Fund performed the same, nor is there any guarantee that these stocks will perform as well in the future. Market forecasts provided in this report may not necessarily come to pass.
Sector Diversification (unaudited)
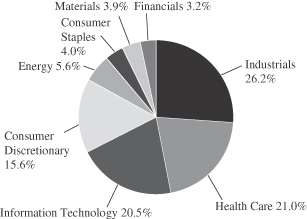
The sector diversification shown is based on the total long-term securities.
December 31, 2008 | William Blair Funds 33 |
Small-Mid Cap Growth Fund
Portfolio of Investments, December 31, 2008 (all dollar amounts in thousands)
| | | | | |
Issuer | | Shares | | Value |
| | |
Common Stocks | | | | | |
Industrials—25.6% | | | | | |
*Allegiant Travel Company | | 57,665 | | $ | 2,801 |
C. H. Robinson Worldwide, Inc. | | 24,920 | | | 1,371 |
*Corrections Corporation of America | | 124,855 | | | 2,043 |
Dun & Bradstreet Corporation | | 14,060 | | | 1,085 |
Expeditors International of Washington, Inc. | | 24,790 | | | 825 |
Fastenal Company | | 65,610 | | | 2,286 |
Heidrick & Struggles International, Inc. | | 47,240 | | | 1,018 |
J. B. Hunt Transport Services, Inc. | | 30,955 | | | 813 |
*InnerWorkings, Inc. | | 153,680 | | | 1,007 |
*Iron Mountain, Incorporated | | 110,261 | | | 2,727 |
Ritchie Bros. Auctioneers Incorporated† | | 38,100 | | | 816 |
Rockwell Collins, Inc. | | 48,770 | | | 1,906 |
Roper Industries, Inc. | | 18,225 | | | 791 |
*Stericycle, Inc. | | 35,720 | | | 1,860 |
| | | | | |
| | | | | 21,349 |
| | | | | |
Health Care—20.5% | | | | | |
*CardioNet, Inc. | | 17,527 | | | 432 |
C.R. Bard, Inc. | | 11,270 | | | 950 |
*Hologic, Inc. | | 119,510 | | | 1,562 |
*IDEXX Laboratories, Inc. | | 41,155 | | | 1,485 |
*Illumina, Inc. | | 32,580 | | | 849 |
*Integra Lifesciences Holding Corporation | | 23,020 | | | 819 |
*Intuitive Surgical, Inc. | | 9,255 | | | 1,175 |
*Myriad Genetics, Inc. | | 11,350 | | | 752 |
*NuVasive, Inc. | | 22,860 | | | 792 |
Perrigo Company | | 22,390 | | | 723 |
Pharmaceutical Product Development, Inc. | | 59,055 | | | 1,713 |
*Phase Forward Incorporated | | 92,860 | | | 1,163 |
*Psychiatric Solutions, Inc. | | 39,375 | | | 1,097 |
*Qiagen N.V.† | | 66,425 | | | 1,166 |
*ResMed, Inc. | | 35,360 | | | 1,325 |
*SurModics, Inc. | | 43,995 | | | 1,112 |
| | | | | |
| | | | | 17,115 |
| | | | | |
Information Technology—20.0% | | | | | |
*Citrix Systems, Inc. | | 37,360 | | | 881 |
*Cognizant Technology Solutions Corporation | | 83,695 | | | 1,512 |
*Cybersource Corporation | | 63,960 | | | 767 |
*Dolby Laboratories, Inc., Class “A” | | 32,580 | | | 1,067 |
*Euronet Worldwide, Inc. | | 104,733 | | | 1,216 |
*j2 Global Communications, Inc. | | 50,475 | | | 1,011 |
*NetApp, Inc. | | 76,220 | | | 1,065 |
*Nuance Communications, Inc. | | 202,340 | | | 2,096 |
*Silicon Laboratories, Inc. | | 88,010 | | | 2,181 |
*Skillsoft, plc—ADR | | 164,360 | | | 1,174 |
*Ultimate Software Group, Inc. | | 70,425 | | | 1,028 |
United Online, Inc. | | 271,830 | | | 1,650 |
*VistaPrint Limited† | | 58,105 | | | 1,081 |
| | | | | |
| | | | | 16,729 |
| | | | | |
Consumer Discretionary—15.2% | | | | | |
*Apollo Group, Inc. | | 11,440 | | | 876 |
*Bed Bath & Beyond, Inc. | | 38,500 | | | 979 |
*Capella Education Company | | 11,195 | | | 658 |
*Chipotle Mexican Grill, Inc. Class “B” | | 34,365 | | | 1,969 |
*Non-income producing securities
† = U.S. listed foreign security
| | | | | | | |
Issuer | | Shares or
Principal
Amount | | Value | |
| | |
Common Stocks—(continued) | | | | | | | |
Consumer Discretionary—(continued) | | | | | | | |
*Coinstar, Inc. | | | 58,763 | | $ | 1,146 | |
DeVry, Inc. | | | 23,465 | | | 1,347 | |
*GameStop Corp. | | | 42,885 | | | 929 | |
*K12, Inc. | | | 66,350 | | | 1,265 | |
*O’Reilly Automotive, Inc. | | | 52,850 | | | 1,625 | |
Strayer Education, Inc. | | | 5,040 | | | 1,081 | |
*Under Armour, Inc. | | �� | 34,560 | | | 824 | |
| | | | | | | |
| | | | | | 12,699 | |
| | | | | | | |
Energy—5.4% | | | | | | | |
*Concho Resources, Inc. | | | 43,040 | | | 982 | |
Helmerich & Payne, Inc. | | | 18,730 | | | 426 | |
*Petrohawk Energy Corporation | | | 45,430 | | | 710 | |
Smith International, Inc. | | | 36,640 | | | 839 | |
*Southwestern Energy Company | | | 29,690 | | | 860 | |
*Ultra Petroleum Corp.† | | | 20,375 | | | 703 | |
| | | | | | | |
| | | | | | 4,520 | |
| | | | | | | |
Consumer Staples—3.9% | | | | | | | |
Alberto-Culver Company | | | 42,350 | | | 1,038 | |
*Green Mountain Coffee Roasters, Inc. | | | 56,670 | | | 2,193 | |
| | | | | | | |
| | | | | | 3,231 | |
| | | | | | | |
Materials—3.8% | | | | | | | |
Airgas, Inc. | | | 44,335 | | | 1,729 | |
Ecolab, Inc. | | | 41,965 | | | 1,475 | |
| | | | | | | |
| | | | | | 3,204 | |
| | | | | | | |
Financials—3.2% | | | | | | | |
*Affiliated Managers Group, Inc. | | | 45,680 | | | 1,915 | |
Greenhill & Co., Inc. | | | 10,240 | | | 714 | |
| | | | | | | |
| | | | | | 2,629 | |
| | | | | | | |
Total Common Stock—97.6%
(cost $102,110) | | | 81,476 | |
| | | | | | | |
| | |
Investment in Affiliate | | | | | | | |
William Blair Ready Reserves Fund | | | 22,322 | | | 22 | |
| | | | | | | |
Total Investment in Affiliate—0.0%
(cost $22) | | | 22 | |
| | | | | | | |
| | |
Repurchase Agreement | | | | | | | |
Fixed Income Clearing Corporation, 0.010% dated 12/31/08, due 1/2/09, repurchase price $2,166, collateralized by FHLMC, 5.625%, due 11/23/35 | | $ | 2,166 | | | 2,166 | |
| | | | | | | |
Total Repurchase Agreement—2.6%
(cost $2,166) | | | 2,166 | |
| | | | | | | |
Total Investments—100.2%
(cost $104,298) | | | 83,664 | |
Liabilities, plus cash and other assets—(0.2)% | | | (185 | ) |
| | | | | | | |
Net Assets—100.0% | | $ | 83,479 | |
| | | | | | | |
See accompanying Notes to Financial Statements.
34 Annual Report | December 31, 2008 |
GLOBAL MARKETS OVERVIEW
The year 2008 will be remembered as one of the worst years in equity market history—only comparable in severity with 1931—due to the scope, scale and rapidity of the decline and to the extraordinary governmental measures to shore up a fragile (and gridlocked) financial system. What started in 2007 as a U.S. subprime crisis spread to global proportions during 2008 with a number of countries and financial institutions facing significant liquidity and credit issues. While the equity market declined approximately (10)% during the first half of the year, losses accelerated in September after Lehman Brothers declared bankruptcy, when fixed income markets froze and equity markets entered a free fall period marked by significant intraday volatility and fear as reflected by the CBOE (Chicago Board of Options Exchange) Volatility Index.
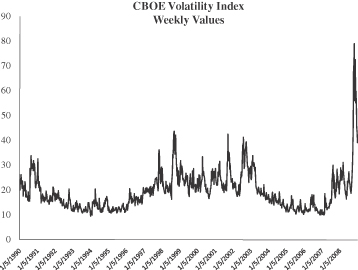
Despite a rally that began in mid-November, global equity markets ended 2008 down (42.34)%, as measured by the MSCI All Country World (IMI) Index (net), with approximately 35% of the decline occurring during the second half of the year. There was no place to hide amidst the market decline as correlations generally went to one. Emerging markets fell the furthest during the second half due to severe risk aversion, reversal of the “commodities trade,” and concerns about a deepening global recession. Non-U.S. equity returns to U.S. investors were also negatively impacted by U.S. Dollar appreciation as investors sold foreign currencies and assets and bought U.S. dollars. At year end, emerging markets were down (53.78)%, while the MSCI Europe, Australiasia, and Far East Index (EAFE) fell (43.71)% and the U.S. fell (37.00)% as measured by the Standard & Poor’s 500. Within emerging markets, Latin America, which was the strongest region during the first half of the year, fell faster during the second half, and ended the year down (51.92)%, while Asia and Emerging Markets Europe, Mid-East and Africa (EMEA) were down (53.70)% and (55.55)%, respectively. Asia, which trailed during most of the year, staged a comeback during November and December, benefitting from lower commodity and energy prices. Within developed markets Japan was the best performing market in USD terms, down (28.11)%, although down over 40% in local terms. The remaining developed regions were all down between 46-52%, with the more resource heavy Pacific ex-Japan economies down the most.
Sector results varied significantly in 2008. As indicated in the chart on the next page, the strongest sectors of Energy and Materials during the first half of the year fell the furthest during the second half, as commodity and energy prices fell significantly amidst a slowing global economy and demand destruction. Conversely, the more defensive Consumer Staples and Health Care sectors outperformed during the second half and therefore year to date. While the Financial sector was the epicenter of the global crisis during the second half of the year, interestingly, it outperformed Energy and Materials, although ended the year as the worst performing sector.
December 31, 2008 | William Blair Funds 35 |
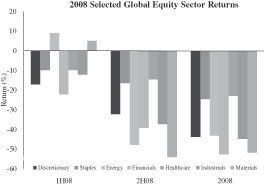
Outlook
Having stabilized and improved somewhat from the panic-stricken levels of the fourth quarter, we believe equity markets now face at least two quarters of extreme weakness in growth and profitability. Economic leading indicators are in sharp decline, consensus GDP growth expectations have dipped in virtually every major economy worldwide, and earnings forecasts for the year ahead continue to plunge, falling by an estimated 9-10% in the month of December alone.
Invariably when cyclical prospects are at their worst, scenarios of severely aggravated cyclical weakness and/or secular decline gain credibility. These concerns help to suppress market confidence and raise questions about the viability of recovery prospects. It may be difficult for the markets to build on their recent gains until the scope of these uncertainties is contained.
On the other hand, we feel that the opportunities that markets present in recessions are becoming increasingly visible. Over the last fifty years in the U.S., for example, whenever economic leading indicators have fallen two standard deviations below trendline, forward equity market returns have averaged roughly 30%—and results are similar in other developed markets. Moreover, money market fund balances as a percent of equity values are at record highs, indicating significant potential allocation to equities.
The message of market fundamentals is equally ambivalent. In our opinion valuations remain reasonably attractive at 10x forward earnings for the MSCI All Country World Ex- U.S. Index (cheaper for emerging markets, more expensive for the U.S.), but the standards of value remain highly uncertain in the context of severe deterioration of earnings expectations and still-elevated corporate credit spreads. Calculated on the basis of aggregate analyst estimates, we expect corporate profits for listed companies outside the U.S. to be roughly flat for 2009. This outcome continues to appear optimistic, although the dramatic pace of estimate cuts may begin to slow as the worst of the revisions in the energy and financial sectors are absorbed. Meanwhile, the relationship between corporate and government interest rates remains far from normal, with only a slight moderation in risk aversion evident in the last six weeks. This distortion makes it even more difficult to assess equity market valuation, especially without the benchmarks of M&A and public offering activity for the markets to reference.
As a result, after the market’s tentative year end recovery rally, there are cross currents of perception influencing markets: recovery opportunities—driven by financial stabilization and economic stimulus—and reasonably favorable valuation and timing signals, counterbalanced by the uncertainties associated with the unprecedented aspects of this downturn.
The increased transparency that investors are looking for in 2009 will come in four key areas: deleveraging and credit stability, consumer confidence and spending behavior, commodity pricing, and China’s cyclical outlook. These will be our key areas of cyclical focus in 2009, but after the wild thematic volatility of 2008, our sector positioning will at least begin the year in relatively neutral territory. Our stock selection strategy in an environment of continuing growth uncertainty will tend to focus on fundamental execution, financial strength, and sustainability of returns at the corporate level.
36 Annual Report | December 31, 2008 |

W. George Greig

Kenneth J. McAtamney
GLOBAL GROWTH FUND
The Global Growth Fund invests in quality growth companies of all sizes around the world.
AN OVERVIEW FROM THE PORTFOLIO MANAGERS
Please see page 35 for the Global Markets Overview.
The Global Growth Fund posted a (49.52)% decrease (Class N Shares) for the 12 months ended December 31, 2008. By comparison, the Fund’s benchmark, the MSCI All Country World IMI Index (net) declined (42.34)%.
The Fund underperformed the benchmark Index during 2008, due to second half results as the Fund added value during the first six months. Over the first half of the year, alpha was generated by strong stock selection across most sectors and developed regions, coupled with emerging markets positioning. However, during the second half of the year, the Fund’s weighting and stock selection in Information Technology and Industrials were the primary detractors of full year results, as was the Fund’s focus on Energy services stocks. Energy services companies, which had benefited from more stable earnings growth through long term contracts had earnings called into question due to concerns about delays and/or cancellations of contracts amidst the severe energy/commodity price declines. Within Industrials the Fund’s focus on alternative energy, infrastructure spending, and energy/mining construction and services companies hampered relative returns, due to the severe and sharp decline in commodity and energy prices and sharp deceleration of global growth, which accelerated during the year. Within Information Technology small cap stocks hurt relative results as did U.S. business services, emerging markets holdings, and Nintendo. Somewhat mitigating these negative effects was the Fund’s underweighting in Materials and Financials, and a Health Care overweighting.
As of year end, the Fund maintained a balanced structure between defensively oriented sectors such as Health Care, 15.9%, and more growth-oriented sectors such as Industrials, 20.1%. We decreased the Energy weightings from approximately 13% to just over 8% during the fourth quarter, due to concerns about energy capital spending and outlook, and remained underweighted in Financials with approximately 17% invested in these holdings, up slightly from 14.7% as of previous quarter end due to an increase outside the U.S. The Fund remained overweighted in Europe, primarily the U.K., and underweighted in Developed Asia, specifically Japan. The U.S. weighting declined during the quarter due largely to a reduction in Information Technology, Financials, and Industrials. The Fund’s weighting in emerging markets approximated 12% of the Fund, up slightly from September 30, with the biggest increase in emerging Asia, which has benefited from weakness in commodity and energy prices, along with a loosening monetary policy and reduction in inflationary concerns and corresponding decrease in Emerging Markets Europe, Mid-East and Africa (EMEA).
December 31, 2008 | William Blair Funds 37 |
Global Growth Fund
Performance Highlights (unaudited)
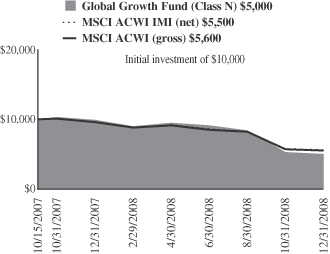
Average Annual Total Return at 12/31/2008
| | | | | | |
| | | 1
Year | | | Since
Inception(a) | |
Global Growth Fund Class N | | (49.52 | )% | | (43.43 | )% |
Global Growth Fund Class I | | (49.41 | ) | | (43.21 | ) |
MSCI ACWI IMI (net) | | (42.34 | ) | | (38.67 | ) |
MSCI ACWI (gross) | | (41.85 | ) | | (38.06 | ) |
| | (a) | | For the period from October 15, 2007 (Commencement of Operations) to December 31, 2008. |
Performance cited represents past performance. Past performance does not guarantee future results and current performance may be lower or higher than the data quoted. Results shown are average annual total returns, which assume reinvestment of dividends and capital gains. Investment returns and principal will fluctuate and you may have a gain or loss when you sell shares. For the most current month-end performance information, please call 1-800-742-7272, or visit our Web site at www.williamblairfunds.com. Investing in smaller and medium capitalization companies involves special risks, including higher volatility and lower liquidity. Small and Mid Cap stocks are also more sensitive to purchase/sale transactions and changes in the issuer’s financial condition. International investing involves special risk considerations, including currency fluctuations, lower liquidity, economic and political risk. From time to time, the investment advisor may waive fees or reimburse expenses for the Fund. Without these waivers, performance would be lower. Class N shares are available to the general public without a sales load. Class I shares are available to certain institutional investors and advisory clients of William Blair & Company, L.L.C., without a sales load or distribution (12b-1).
The performance highlights and graph presented above do not reflect the deduction of taxes that a shareholder would pay on fund distributions or the redemption of fund shares.
The Morgan Stanley Capital International (MSCI) All Country World Investable Market Index (IMI) (net) is a free float-adjusted market capitalization weighted index that is designed to measure the equity market of developed and emerging markets. This series approximates the minimum possible dividend reinvestment.
The Morgan Stanley Capital International MSCI All Country World (ACW) (gross) is an index that is designed to measure equity performance in the global market.
On June 30, 2008, the Fund’s Benchmark changed from the MSCI All Country World (ACW) (gross) to the MSCI All Country World ACW Investable Market Index (IMI) (net). There are two primary reasons for the change. First, the MSCI ACW IMI (net) represents a broader range of markets then the MSCI ACW (gross) and this range is more representative of the Fund’s investment strategy. Secondly, the net index reflects the deduction of dividend withholding tax paid by non-resident institutional investors in foreign countries, the Fund is a non-resident institutional investor.
This report identifies the Fund’s investments on December 31, 2008. These holdings are subject to change. Not all stocks in the Fund performed the same, nor is there any guarantee that these stocks will perform as well in the future. Market forecasts provided in this report may not necessarily come to pass.
Sector Diversification (unaudited)
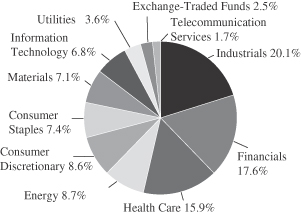
The sector diversification shown is based on the total long-term securities.
38 Annual Report | December 31, 2008 |
Global Growth Fund
Portfolio of Investments, December 31, 2008 (all dollar amounts in thousands)
| | | | | |
Issuer | | Shares | | Value |
|
Common Stocks—Western Hemisphere—39.6% |
United States—37.1% | | | | | |
Abbott Laboratories (Pharmaceuticals) | | 7,318 | | $ | 391 |
* Celgene Corporation (Biotechnology) | | 7,403 | | | 409 |
CME Group, Inc. (Diversified financial services) | | 2,444 | | | 509 |
Danaher Corporation (Machinery) | | 10,452 | | | 592 |
EOG Resources, Inc. (Oil, gas & consumable fuels) | | 7,396 | | | 492 |
* Express Scripts, Inc. (Health care providers & services) | | 8,361 | | | 460 |
Exxon Mobil Corporation (Oil, gas, & consumable fuels) | | 6,290 | | | 502 |
* FLIR Systems, Inc. (Electronic equipment & instruments) | | 18,652 | | | 572 |
* Genentech, Inc. (Biotechnology) | | 4,854 | | | 402 |
* Gilead Sciences, Inc. (Biotechnology) | | 9,648 | | | 493 |
J.B. Hunt Transport Services, Inc. (Road & rail) | | 10,261 | | | 270 |
L-3 Communications Holdings, Inc. (Aerospace & defense) | | 5,789 | | | 427 |
Lockheed Martin Corporation (Aerospace & defense) | | 4,020 | | | 338 |
Lowe’s Companies, Inc. (Specialty retail) | | 12,985 | | | 279 |
MasterCard Incorporated (IT services) | | 2,419 | | | 346 |
Monsanto Company (Chemicals) | | 6,432 | | | 452 |
* Myriad Genetics, Inc. (Biotechnology) | | 4,502 | | | 298 |
* The Nasdaq OMX Group, Inc. (Diversified financial services) | | 6,843 | | | 169 |
Praxair, Inc. (Chemicals) | | 7,236 | | | 430 |
Roper Industries, Inc. (Electrical equipment) | | 9,004 | | | 391 |
Smith International, Inc. (Energy equipment & services) | | 6,753 | | | 155 |
Strayer Education, Inc. (Diversified consumer services) | | 1,519 | | | 326 |
* SunPower Corporation, Class “A” (Electrical equipment) | | 4,985 | | | 184 |
* Trimble Navigation Limited (Electronic equipment & instruments) | | 12,542 | | | 271 |
Wal-Mart Stores, Inc. (Food & staples retailing) | | 9,128 | | | 512 |
Wells Fargo & Company (Commercial banks) | | 14,311 | | | 422 |
Yum! Brands, Inc. (Hotels, restaurants, & leisure) | | 9,352 | | | 295 |
| | | | | |
| | | | | 10,387 |
| | | | | |
Canada—2.5% | | | | | |
Brookfield Asset Management, Inc., Class “A” (Real estate management & development)† | | 25,093 | | | 383 |
Potash Corporation of Saskatchewan, Inc. (Chemicals)† | | 4,353 | | | 319 |
| | | | | |
| | | | | 702 |
| | | | | |
| | |
Europe—19.5% | | | | | |
Denmark—4.0% | | | | | |
Novo Nordisk A/S (Pharmaceuticals) | | 10,309 | | | 532 |
Novozymes A/S (Chemicals) | | 3,393 | | | 272 |
* Vestas Wind Systems A/S (Electrical equipment) | | 5,375 | | | 316 |
| | | | | |
| | | | | 1,120 |
| | | | | |
| | | | |
Issuer | | Shares | | Value |
France—6.8% | | | | |
Alstom S.A. (Electrical equipment) | | 7,078 | | 422 |
AXA (Insurance) | | 16,713 | | 375 |
EDF Energies Nouvelles S.A. (Independent power producers & energy traders) | | 11,530 | | 408 |
Iliad S.A. (Diversified telecommunication services) | | 5,436 | | 472 |
* Orpea (Health care providers & services) | | 6,013 | | 218 |
| | | | |
| | | | 1,895 |
| | | | |
Germany—2.1% | | | | |
Beiersdorf AG (Personal products) | | 6,385 | | 378 |
* Q-Cells AG (Electrical equipment) | | 5,894 | | 220 |
| | | | |
| | | | 598 |
| | | | |
Ireland—1.4% | | | | |
* ICON plc—ADR (Life sciences tools & services) | | 19,499 | | 384 |
| | | | |
Spain—2.0% | | | | |
* Iberdrola Renovables S.A. (Independent power producers & energy traders) | | 131,630 | | 574 |
| | | | |
Switzerland—3.2% | | | | |
* ABB Ltd. (Electrical equipment) | | 42,916 | | 655 |
Partners Group Global Opportunities, Ltd. (Capital markets) | | 3,317 | | 237 |
| | | | |
| | | | 892 |
| | | | |
| | |
United Kingdom—16.0% | | | | |
Amlin plc (Insurance) | | 74,952 | | 390 |
* Autonomy Corporation plc (Software) | | 31,056 | | 432 |
BAE Systems plc (Aerospace & defense) | | 102,915 | | 560 |
BG Group plc (Oil, gas & consumable fuels) | | 41,264 | | 571 |
BlueBay Asset Management plc (Capital markets) | | 26,758 | | 27 |
British American Tobacco plc (Tobacco) | | 13,000 | | 339 |
Capita Group plc (Commercial services & supplies) | | 71,320 | | 765 |
Domino’s Pizza UK & IRL plc (Hotels, restaurants, & leisure) | | 64,325 | | 156 |
Man Group plc (Capital markets) | | 90,010 | | 310 |
Reckitt Benckiser plc (Household products) | | 6,801 | | 255 |
VT Group plc (Aerospace & defense) | | 49,035 | | 396 |
Wellstream Holdings plc (Energy equipment & services) | | 53,504 | | 275 |
| | | | |
| | | | 4,476 |
| | | | |
See accompanying Notes to Financial Statements.
December 31, 2008 | William Blair Funds 39 |
Global Growth Fund
Portfolio of Investments, December 31, 2008 (all dollar amounts in thousands)
| | | | | |
Issuer | | Shares or
Principal
Amount | | Value |
| | |
Japan—5.7% | | | | | |
Aeon Mall Co., Ltd. (Real estate management & development) | | 28,800 | | $ | 557 |
Fast Retailing Co., Ltd. (Specialty retail) | | 2,100 | | | 308 |
Seven Bank, Ltd. (Commercial banks) | | 87 | | | 333 |
Terumo Corporation (Health care equipment & supplies) | | 8,400 | | | 393 |
| | | | | |
| | | | | 1,591 |
| | | | | |
| | |
Asia—4.9% | | | | | |
Australia—3.7% | | | | | |
BHP Billiton Limited—ADR (Metals & mining) | | 23,008 | | | 489 |
QBE Insurance Group Limited (Insurance) | | 30,512 | | | 551 |
| | | | | |
| | | | | 1,040 |
| | | | | |
Singapore—1.2% | | | | | |
Wilmar International, Ltd. (Food products) | | 174,700 | | | 342 |
| | | | | |
| |
Emerging Latin America—2.3% | | | |
Brazil—2.3% | | | | | |
Anhanguera Educacional Participacoes S.A. (Diversified consumer services) | | 35,800 | | | 186 |
Redecard S.A. (IT services) | | 21,500 | | | 237 |
SLC Agricola S.A. (Food products) | | 35,700 | | | 214 |
| | | | | |
| | | | | 637 |
| | | | | |
| |
Emerging Asia—3.2% | | | |
China—3.2% | | | | | |
China Life Insurance Co., Ltd. (Insurance) | | 100,000 | | | 307 |
China Vanke Co., Ltd. (Real estate management & development) | | 329,400 | | | 255 |
*New Oriental Education & Technology Group, Inc. —ADR (Diversified consumer services) | | 6,276 | | | 345 |
| | | | | |
| | | | | 907 |
| | | | | |
| |
Emerging Europe, Mid-East, Africa—3.0% | | | |
Israel—1.3% | | | | | |
Teva Pharmaceutical Industries, Ltd.—ADR (Pharmaceuticals) | | 8,826 | | | 376 |
| | | | | |
South Africa—1.7% | | | | | |
Naspers, Ltd. (Media) | | 25,600 | | | 463 |
| | | | | |
Total Common Stock—94.2%
(cost $33,435) | | | | | 26,384 |
| | | | | |
Preferred Stocks | | | |
Brazil—1.4% | | | |
Petroleo Brasileiro S.A.—ADR (Oil, gas & consumable fuels) | | 39,555 | | | 388 |
| | | | | |
Total Preferred Stocks—1.4%
(cost $418) | | | | | 388 |
| | | | | |
* Non-income producing securities
† = U.S. listed foreign security
ADR = American Depository Receipt
VRN = Variable Rate Note
| | | | | | |
Issuer | | Shares or
Principal
Amount | | Value |
Exchange-Traded Funds | | | | | | |
China—2.5% | | | | | | |
iShares FTSE/Xinhua A50 China Tracker | | | 317,700 | | | 343 |
*World Index Shares ETFs—CSI 300 China Tracker | | | 140,600 | | | 352 |
| | | | | | |
| | | | | | 695 |
| | | | | | |
Total Exchange-Traded Funds—2.5%
(cost $727) | | | | | | 695 |
| | | | | | |
Investment in Affiliate | | | | | | |
William Blair Ready Reserves Fund | | | 28,770 | | | 29 |
| | | | | | |
Total Investment in Affiliate— 0.1%
(cost $29) | | | | | | 29 |
| | | | | | |
Short-Term Investments | | | | | | |
American Express Credit Corp. Demand Note, VRN 0.321% due 1/2/09 | | $ | 35 | | | 35 |
| | | | | | |
Total Short-term Investments—0.1%
(cost $35) | | | | | | 35 |
| | | | | | |
Repurchase Agreement | | | | | | |
State Street Bank and Trust Company, 0.010% dated 12/31/08, due 1/2/09, repurchase price $91, collateralized by United States Treasury Bill, 0.020% due 2/12/09 | | | 91 | | | 91 |
| | | | | | |
Total Repurchase Agreement—0.3%
(cost $91) | | | | | | 91 |
| | | | | | |
Total Investments—98.6%
(cost $34,735) | | | | | | 27,622 |
Cash and other assets, less liabilities—1.4% | | | | | | 383 |
| | | | | | |
Net assets—100.0% | | | | | $ | 28,005 |
| | | | | | |
See accompanying Notes to Financial Statements.
40 Annual Report | December 31, 2008 |
Global Growth Fund
Portfolio of Investments, December 31, 2008 (all dollar amounts in thousands)
For securities primarily traded on exchanges or markets that close before the close of regular trading on the New York Stock Exchange, the Fund uses an independent pricing service on a daily basis to fair value price the securities pursuant to Valuation Procedures approved by the Board of Trustees.
At December 31, 2008 the Fund’s Portfolio of Investments includes the
following industry categories:
| | | |
Industrials | | 20.1 | % |
Financials | | 17.6 | % |
Health Care | | 15.9 | % |
Energy | | 8.7 | % |
Consumer Discretionary | | 8.6 | % |
Consumer Staples | | 7.4 | % |
Materials | | 7.1 | % |
Information Technology | | 6.8 | % |
Utilities | | 3.6 | % |
Exchange-Traded Funds | | 2.5 | % |
Telecommunication Services | | 1.7 | % |
| | | |
| | 100.0 | % |
| | | |
At December 31, 2008 the Fund’s Portfolio of Investments includes the following currency categories:
| | | |
U.S. Dollar | | 44.4 | % |
British Pound Sterling | | 16.3 | % |
Euro | | 11.2 | % |
Japanese Yen | | 5.8 | % |
Danish Krone | | 4.1 | % |
Australian Dollar | | 3.8 | % |
Brazilian Real | | 3.7 | % |
Swiss Franc | | 3.2 | % |
South African Rand | | 1.7 | % |
Singapore Dollar | | 1.2 | % |
Hong Kong Dollar | | 4.6 | % |
| | | |
Total | | 100.0 | % |
| | | |
See accompanying Notes to Financial Statements.
December 31, 2008 | William Blair Funds 41 |
W. George Greig
INTERNATIONAL GROWTH FUND
The International Growth Fund invests primarily in common stocks of foreign growth companies.
AN OVERVIEW FROM THE PORTFOLIO MANAGER
Please see page 35 for the Global Markets Overview.
The International Growth Fund posted a (52.33)% decrease (Class N Shares) for the 12 months ended December 31, 2008. By comparison, the Fund’s benchmark, the MSCI All Country World (ACWI) Ex-U.S. IMI Index (net), declined (45.99)%.
The Fund underperformed the benchmark Index during 2008 due primarily to the third quarter and October, ending the strategy’s worst absolute and relative year in our history. As we stated in our third quarter review, as the correction unfolded during the third quarter, the Fund remained focused on the areas where we continued to see good balance sheets, strong execution and solid growth prospects, with substantial positions in companies exposed to emerging markets infrastructure growth, resource development, and industrialization, with secondary thematic interest in the emerging markets consumer. As the developed market growth outlook worsened in the third quarter, we maintained an exposure in high quality, well run companies exposed to areas where growth appeared to be resilient. In retrospect, we should have been more sensitive to the influence of macro-level signals on investor sentiment. In short, the macroeconomic environment outweighed corporate fundamentals, while positive earnings trends, a good long term predictor of stock price performance, broke down.
During the fourth quarter, the Fund underperformed due largely to October, as it was being repositioned away from global growth-oriented holdings to a more defensive structure. In particular, the Fund’s weighting and stock selection in Industrials was a primary detractor from results due to its exposure to alternative energy and infrastructure building in emerging markets. Energy stock selection was another key detractor from performance, due primarily to its focus on services companies, and concerns about earnings growth prospectively amidst a significant decline in energy prices and potential contract cancellations and delays, with smaller cap stocks hit the hardest. The Fund’s underweighting, compared to its benchmark, in Japan, which outperformed other regions during the quarter also detracted from performance. Mitigating these negative results was good stock selection in Consumer Discretionary across most developed regions coupled with an underweighting in Financials and Energy and overweighting in Telecommunication Services, Health Care and Consumer Staples.
As of year end, the Fund maintained a balanced structure between defensively oriented sectors such as Consumer Staples, 13.6%, Health Care, 10.9%, and to some extent Telecommunication Services, 6.9%, and more growth-oriented sectors such as Industrials, 15.3% and Information Technology, 4.4%. We increased the weighting in Financials from approximately 15% to 20% during the fourth quarter, with an increased focus on European insurers and to some extent capital markets companies, but in particular those with good balance sheets, solid competitive positioning amidst a changing landscape, and strong management teams with a history of execution. We also began increasing our underweighted Consumer Discretionary exposure late in the fourth quarter at the margin. Regionally, the Fund maintained higher weightings in Europe and the UK, but underweighted in Developed Asia. While the Fund’s emerging markets weighting of approximately 17% was similar to the MSCI ACWI Ex-U.S. IMI Index, its composition changed during the quarter, with a reduction in Emerging Markets Europe, Mid-East and Africa (EMEA) and increase in Emerging Asia, which has been a beneficiary of reduced energy/commodity prices.
42 Annual Report | December 31, 2008 |
International Growth Fund
Performance Highlights (unaudited)
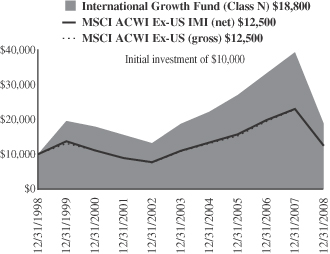
Average Annual Total Return at 12/31/2008
| | | | | | | | | | | | | | | |
| | | 1
Year | | | 3
Year | | | 5
Year | | | 10
Year | | | Since Inception(a) | |
International Growth Fund Class N | | (52.33 | )% | | (11.51 | )% | | (0.02 | )% | | 6.49 | % | | — | % |
International Growth Fund Class I | | (52.17 | ) | | (11.24 | ) | | 0.27 | | | — | | | 3.69 | |
MSCI AC World Ex-U.S. IMI Index (net) | | (45.99 | ) | | (7.44 | ) | | 2.61 | | | 2.26 | | | 0.84 | |
MSCI AC World Ex-U.S. Index (gross) | | (45.24 | ) | | (6.57 | ) | | 3.00 | | | 2.27 | | | 1.30 | |
| | (a) | | For the period from October 1, 1999 to December 31, 2008. |
Performance cited represents past performance. Past performance does not guarantee future results and current performance may be lower or higher than the data quoted. Results shown are average annual total returns, which assume reinvestment of dividends and capital gains. Investment returns and principal will fluctuate and you may have a gain or loss when you sell shares. For the most current month-end performance information, please call 1-800-742-7272, or visit our Web site at www.williamblairfunds.com. From time to time, the investment advisor may waive fees or reimburse expenses for the Fund. Without these waivers, performance would be lower. International investing involves special risk considerations, including currency fluctuations, lower liquidity, economic and political risk. Class N shares are available to the general public without a sales load. Class I shares are available to certain institutional investors and advisory clients of William Blair & Company, L.L.C., without a sales load or distribution (12b-1) or service fees.
The performance highlights and graph presented above do not reflect the deduction of taxes that a shareholder would pay on fund distributions or the redemption of fund shares.
The Morgan Stanley Capital International (MSCI) All Country World Ex-U.S. Investable Market Index (IMI) (net) is a free float-adjusted market capitalization weighted index that is designed to measure the equity market performance of developed and emerging markets, excluding the United States. This series approximates the minimum possible dividend reinvestment.
The Morgan Stanley Capital International (MSCI) All Country World Ex-U.S. Index (gross) is an unmanaged index that includes developed and emerging markets and reduced Japanese portion.
On June 30, 2008, the Fund’s Benchmark changed from the MSCI All Country World (ACW) Ex-U.S. (gross) to the MSCI All Country World Ex-U.S. Investable Market Index (IMI) (net). There are two primary reasons for the change. First, the MSCI ACW Ex-U.S. IMI (net) represents a broader range of markets then the MSCI ACW Ex-U.S. (gross) and this range is more representative of the Fund’s investment strategy. Secondly, the net index reflects the deduction of dividend withholding tax paid by non-resident institutional investors in foreign countries, the Fund is considered a non-resident institutional investor.
This report identifies the Fund’s investments on December 31, 2008. These holdings are subject to change. Not all stocks in the Fund performed the same, nor is there any guarantee that these stocks will perform as well in the future. Market forecasts provided in this report may not necessarily come to pass.
Sector Diversification (unaudited)
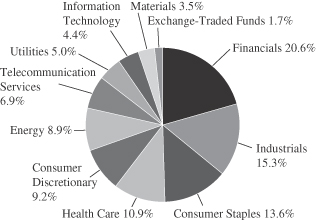
The sector diversification shown is based on the total long-term securities.
December 31, 2008 | William Blair Funds 43 |
International Growth Fund
Portfolio of Investments, December 31, 2008 (all dollar amounts in thousands)
| | | | | |
Issuer | | Shares | | Value |
| | |
Common Stocks—Europe—38.2% | | | | | |
Austria—0.2% | | | | | |
Schoeller-Bleckmann Oilfield Equipment AG (Energy equipment & services) | | 188,815 | | $ | 5,880 |
| | | | | |
Denmark—3.6% | | | | | |
Novo-Nordisk A/S (Pharmaceuticals) | | 1,656,000 | | | 85,423 |
Novozymes A/S (Chemicals) | | 227,767 | | | 18,267 |
*Vestas Wind Systems A/S (Electrical equipment) | | 182,100 | | | 10,716 |
| | | | | |
| | | | | 114,406 |
| | | | | |
France—11.5% | | | | | |
Alstom S.A. (Electrical equipment) | | 752,920 | | | 44,870 |
April Group S.A. (Insurance) | | 296,068 | | | 7,559 |
AXA (Insurance) | | 2,269,844 | | | 50,948 |
EDF Energies Nouvelles S.A. (Independent power producers & energy traders) | | 846,714 | | | 29,996 |
Eurazeo (Diversified financial services) | | 166,432 | | | 7,827 |
Iliad S.A. (Diversified telecommunication services) | | 310,281 | | | 26,938 |
*Orpea (Health care providers & services) | | 317,584 | | | 11,499 |
Schneider Electric S.A. (Electrical equipment) | | 201,963 | | | 15,037 |
Total S.A. (Oil, gas, & consumable fuels) | | 432,459 | | | 23,776 |
Veolia Environnement (Multi-utilities) | | 2,049,687 | | | 64,653 |
Vinci S.A. (Construction & engineering) | | 290,068 | | | 12,241 |
Vivendi S.A. (Media) | | 1,972,288 | | | 64,285 |
| | | | | |
| | | | | 359,629 |
| | | | | |
Germany—3.6% | | | | | |
Beiersdorf AG (Personal products) | | 516,319 | | | 30,582 |
CTS Eventim AG (Media) | | 267,578 | | | 9,180 |
E. ON AG (Electric utilities) | | 879,430 | | | 34,533 |
*Manz Automation AG (Semiconductors & semiconductor equipment) | | 55,571 | | | 3,273 |
*Q-Cells AG (Electrical equipment) | | 452,599 | | | 16,919 |
*Roth & Rau AG (Electronic equipment) | | 48,246 | | | 1,034 |
Solarworld AG (Electrical equipment) | | 308,354 | | | 6,901 |
*Wire Card AG (IT services) | | 1,776,122 | | | 10,380 |
| | | | | |
| | | | | 112,802 |
| | | | | |
Ireland—1.0% | | | | | |
CRH plc (Construction materials) | | 476,560 | | | 12,253 |
*ICON plc—ADR (Life sciences tools & services) | | 772,227 | | | 15,205 |
United Drug plc (Health care providers & services) | | 1,679,952 | | | 5,206 |
| | | | | |
| | | | | 32,664 |
| | | | | |
Italy—1.4% | | | | | |
Saipem SpA (Energy equipment & services) | | 2,220,635 | | | 37,874 |
Trevi Finanziaria SpA (Construction & engineering) | | 457,091 | | | 4,884 |
| | | | | |
| | | | | 42,758 |
| | | | | |
Luxembourg—0.8% | | | | | |
Millicom International Cellular S.A. (Wireless telecommunication services)† | | 589,729 | | | 26,485 |
| | | | | |
| | | | | |
Issuer | | Shares | | Value |
| |
Common Stocks—Europe—38.2%—(continued) | | | |
Netherlands—0.8% | | | | | |
*Qiagen N.V. (Life sciences tools & services) | | 1,087,230 | | $ | 19,229 |
*Smartrac N.V. (Electronic equipment & instruments) | | 354,471 | | | 5,904 |
| | | | | |
| | | | | 25,133 |
| | | | | |
Spain—3.5% | | | | | |
Banco Santander S.A. (Commercial banks) | | 4,086,650 | | | 39,480 |
Gamesa Corporacion Tecnologica S.A. (Electrical equipment) | | 533,089 | | | 9,720 |
Grifols S.A. (Biotechnology) | | 1,076,757 | | | 18,867 |
*Iberdrola Renovables S.A. (Independent power producers & energy traders) | | 5,906,950 | | | 25,752 |
Industria De Diseno Textil Inditex S.A. (Specialty retail) | | 319,164 | | | 14,213 |
| | | | | |
| | | | | 108,032 |
| | | | | |
Sweden—0.4% | | | | | |
Hennes & Maurtiz AB, Class “B” (Specialty retail) | | 313,200 | | | 12,458 |
| | | | | |
Switzerland—11.4% | | | | | |
*ABB, Ltd. (Electrical equipment) | | 4,035,189 | | | 61,537 |
*Actelion, Ltd. (Biotechnology) | | 496,596 | | | 28,093 |
Burckhardt Compression Holding AG (Machinery) | | 47,078 | | | 6,741 |
Credit Suisse Group AG (Capital markets) | | 649,607 | | | 18,205 |
Kuehne & Nagel International AG (Marine) | | 579,060 | | | 37,505 |
*Meyer Burger Technology AG (Machinery) | | 13,063 | | | 1,529 |
Nestle S.A. (Food products) | | 1,599,315 | | | 63,330 |
Partners Group Global Opportunities, Ltd. (Capital markets) | | 211,201 | | | 15,116 |
Roche Holdings, Ltd. AG (Pharmaceuticals) | | 364,702 | | | 56,462 |
SGS S.A. (Commercial services & supplies) | | 3,344 | | | 3,497 |
*Temenos Group AG (Software) | | 110,792 | | | 1,495 |
Zurich Financial Services (Insurance) | | 291,512 | | | 63,690 |
| | | | | |
| | | | | 357,200 |
| | | | | |
| | |
United Kingdom—17.9% | | | | | |
Admiral Group plc (Insurance) | | 703,236 | | | 9,283 |
AMEC plc (Construction & engineering) | | 1,253,638 | | | 9,050 |
Amlin plc (Insurance) | | 5,265,217 | | | 27,368 |
Ashmore Group plc (Capital markets) | | 1,498,456 | | | 2,894 |
*Autonomy Corporation plc (Software) | | 1,857,279 | | | 25,844 |
BG Group plc (Oil, gas & consumable fuels) | | 2,574,301 | | | 35,632 |
*Blinkx plc (Internet software & services) | | 8,158,800 | | | 1,536 |
BlueBay Asset Management plc (Capital markets) | | 1,456,495 | | | 1,482 |
British American Tobacco plc (Tobacco) | | 1,815,680 | | | 47,365 |
Capita Group plc (Commercial services & supplies) | | 4,691,305 | | | 50,323 |
Chemring Group plc (Aerospace & defense) | | 397,007 | | | 11,225 |
Domino’s Pizza UK & IRL plc (Hotels, restaurants, & leisure) | | 2,566,906 | | | 6,215 |
John Wood Group plc (Energy equipment & services) | | 2,099,658 | | | 5,730 |
Man Group plc (Capital markets) | | 6,392,953 | | | 21,993 |
Reckitt Benckiser plc (Household products) | | 1,424,746 | | | 53,386 |
Rolls-Royce Group plc (Aerospace & defense) | | 11,942,695 | | | 58,422 |
See accompanying Notes to Financial Statements.
44 Annual Report | December 31, 2008 |
International Growth Fund
Portfolio of Investments, December 31, 2008 (all dollar amounts in thousands)
| | | | | |
Issuer | | Shares | | Value |
|
Common Stocks—United Kingdom—17.9%—(continued) |
Rotork plc (Electronic equipment & instruments) | | 1,362,983 | | $ | 15,715 |
Serco Group plc (Commercial services & supplies) | | 2,510,630 | | | 16,435 |
Standard Chartered plc (Commercial banks) | | 4,350,073 | | | 55,664 |
Tullow Oil plc (Oil, gas & consumable fuels) | | 2,575,035 | | | 24,654 |
Ultra Electronic Holdings plc (Aerospace & defense) | | 606,379 | | | 9,969 |
Vodafone Group plc (Wireless telecommunication services) | | 21,021,069 | | | 43,044 |
VT Group plc (Aerospace & defense) | | 2,115,096 | | | 17,089 |
Wellstream Holdings plc (Energy equipment & services) | | 2,281,101 | | | 11,743 |
| | | | | |
| | | | | 562,061 |
| | | | | |
| | |
Japan—9.5% | | | | | |
Aeon Mall Co., Ltd. (Real estate management & development) | | 778,100 | | | 15,042 |
FamilyMart Co., Ltd. (Food & staples retailing) | | 416,000 | | | 18,066 |
Fast Retailing Co., Ltd. (Specialty retail) | | 117,900 | | | 17,300 |
Hisamitsu Pharmaceutical Co., Inc. (Pharmaceuticals) | | 293,600 | | | 12,002 |
Honda Motor Company, Ltd. (Automobiles) | | 1,037,500 | | | 22,097 |
Jupiter Telecommunications Co., Ltd. (Media) | | 40,123 | | | 41,762 |
Mitsubishi Estate Company, Ltd. (Real estate management & development) | | 1,982,000 | | | 32,740 |
Nintendo Co., Ltd. (Software) | | 60,200 | | | 23,006 |
Nitori Company, Ltd. (Specialty retail) | | 345,020 | | | 26,850 |
Point, Inc. (Specialty retail) | | 177,890 | | | 9,805 |
Seven Bank, Ltd. (Commercial banks) | | 3,989 | | | 15,247 |
So-net M3, Inc. (Health care technology) | | 3,303 | | | 11,319 |
Suruga Bank, Ltd. (Commercial banks) | | 3,499,000 | | | 34,761 |
Terumo Corporation (Health care equipment & supplies) | | 381,700 | | | 17,881 |
| | | | | |
| | | | | 297,878 |
| | | | | |
| | |
Emerging Asia—9.3% | | | | | |
China—5.1% | | | | | |
China High Speed Transmission (Electrical equipment) | | 9,553,000 | | | 11,657 |
China Life Insurance Co., Ltd. (Insurance) | | 11,183,000 | | | 34,360 |
China Merchants Bank Co., Ltd. (Commercial banks) | | 6,068,500 | | | 11,355 |
China Oilfield Services Limited (Energy equipment & services) | | 11,608,000 | | | 9,477 |
China Overseas Land & Investment, Ltd. (Real estate management & development) | | 6,108,000 | | | 8,576 |
China Yurun Food Group Limited (Food products) | | 7,248,570 | | | 8,574 |
CNOOC Limited (Oil, gas & consumable fuels) | | 43,337,000 | | | 41,221 |
Li Ning Co., Ltd. (Leisure equipment & products) | | 7,668,500 | | | 12,083 |
*New Oriental Education & Technology Group, Inc.—ADR (Diversified consumer services) | | 175,472 | | | 9,635 |
*SINA Corporation (Internet software & services)† | | 421,765 | | | 9,764 |
| | | | | |
Issuer | | Shares | | Value |
|
Common Stocks—Emerging Asia—9.3%—(continued) |
Tencent Holdings, Ltd. (Internet software & services) | | 395,200 | | $ | 2,568 |
| | | | | |
| | | | | 159,270 |
| | | | | |
India—2.7% | | | | | |
Asian Paints Limited (Chemicals) | | 484,508 | | | 8,933 |
*Bharti Airtel, Ltd. (Wireless telecommunication services) | | 1,578,994 | | | 23,276 |
Educomp Solutions, Limited (Diversified consumer services) | | 150,272 | | | 7,471 |
*Glenmark Pharmaceuticals, Ltd. (Pharmaceuticals) | | 1,534,847 | | | 9,427 |
Hindustan Unilever, Ltd. (Household products) | | 2,571,774 | | | 13,297 |
Housing Development Finance Corp. (Thrifts & mortgage finance) | | 299,331 | | | 9,160 |
Infosys Technologies Limited (IT services) | | 600,863 | | | 13,926 |
Sun Pharmaceutical Industries Limited (Pharmaceuticals) | | 10,285 | | | 226 |
| | | | | |
| | | | | 85,716 |
| | | | | |
Indonesia—0.5% | | | | | |
PT Bank Rakyat Indonesia (Commercial banks) | | 33,144,500 | | | 14,095 |
| | | | | |
Malaysia—0.2% | | | | | |
KNM Group Bhd (Energy equipment & services) | | 28,364,725 | | | 3,351 |
Kuala Lumpur Kepong Bhd (Food products) | | 1,224,350 | | | 3,163 |
| | | | | |
| | | | | 6,514 |
| | | | | |
South Korea—0.8% | | | | | |
*LG Household & Health Care, Ltd. (Household products) | | 91,518 | | | 13,947 |
*MegaStudy Co., Ltd. (Diversified consumer services) | | 69,557 | | | 10,298 |
| | | | | |
| | | | | 24,245 |
| | | | | |
| | |
Asia—8.0% | | | | | |
Australia—5.9% | | | | | |
BHP Billiton Limited—ADR (Metals & mining) | | 1,815,386 | | | 38,566 |
Macquarie Bank, Ltd. (Capital markets) | | 666,700 | | | 13,531 |
QBE Insurance Group Limited (Insurance) | | 3,323,355 | | | 60,064 |
Woolworths Limited (Food & staples retailing) | | 3,565,581 | | | 66,485 |
WorleyParsons, Ltd. (Energy equipment & services) | | 715,631 | | | 7,139 |
| | | | | |
| | | | | 185,785 |
| | | | | |
Hong Kong—0.7% | | | | | |
Noble Group Limited (Trading companies & distributors) | | 30,243,240 | | | 21,662 |
| | | | | |
Singapore—1.4% | | | | | |
Olam International, Ltd. (Food & staples retailing) | | 17,921,400 | | | 14,447 |
Wilmar International, Ltd. (Food products) | | 14,217,000 | | | 27,856 |
| | | | | |
| | | | | 42,303 |
| | | | | |
| | |
Canada—5.7% | | | | | |
Brookfield Asset Management, Inc., Class “A” (Real estate management & development)† | | 1,440,211 | | | 21,992 |
EnCana Corporation (Oil, gas, & consumable fuels) | | 514,140 | | | 23,722 |
See accompanying Notes to Financial Statements.
December 31, 2008 | William Blair Funds 45 |
International Growth Fund
Portfolio of Investments, December 31, 2008 (all dollar amounts in thousands)
| | | | | |
Issuer | | Shares | | Value |
| |
Common Stocks—Canada—5.7%—(continued) | | | |
Potash Corporation of Saskatchewan, Inc. (Chemicals)† | | 348,087 | | $ | 25,487 |
Rogers Communications, Inc., Class “B” (Wireless telecommunication services) | | 2,092,200 | | | 62,012 |
Shoppers Drug Mart Corporation (Food & staples retailing) | | 1,194,100 | | | 46,477 |
| | | | | |
| | | | | 179,690 |
| | | | | |
| | |
Emerging Latin America—3.6% | | | | | |
Brazil—2.7% | | | | | |
Anhanguera Educacional Participacoes S.A. (Diversified consumer services) | | 1,296,000 | | | 6,730 |
BM&F Bovespa S.A. (Diversified financial services) | | 5,411,420 | | | 13,969 |
*BR Malls Participacoes S.A. (Real estate management & development) | | 1,992,200 | | | 7,774 |
*GP Investments, Ltd. (Diversified financial services) | | 1,935,300 | | | 4,473 |
*GVT Holding S.A. (Diversified telecommunication services) | | 1,118,000 | | | 12,163 |
*LLX Logistica S.A. (Transportation infrastructure) | | 4,419,800 | | | 2,862 |
*Lupatech S.A. (Machinery) | | 415,500 | | | 4,171 |
*MMX Mineracao e Metalicos S.A. (Metals & mining) | | 3,012,700 | | | 3,579 |
Natura Cosmeticos S.A. (Personal products) | | 509,300 | | | 4,147 |
Redecard S.A. (IT services) | | 1,867,100 | | | 20,577 |
SLC Agricola S.A. (Food products) | | 835,500 | | | 5,016 |
| | | | | |
| | | | | 85,461 |
| | | | | |
Chile—0.0% | | | | | |
*Cencosud S.A.—ADR 144A (Specialty retail) | | 42,041 | | | 896 |
| | | | | |
Colombia—0.1% | | | | | |
*Pacific Rubiales Energy Corporation (Oil, gas & consumable fuels) | | 1,477,829 | | | 2,622 |
| | | | | |
Mexico—0.6% | | | | | |
Banco Compartamos S.A. de C.V. (Consumer finance) | | 3,370,200 | | | 6,084 |
*Desarrolladora Homex S.A. de C.V.—ADR (Household durables) | | 334,451 | | | 7,635 |
*Megacable Holdings S.A.B. de C.V. (Diversified telecommunication services) | | 4,475,500 | | | 5,963 |
| | | | | |
| | | | | 19,682 |
| | | | | |
Peru—0.2% | | | | | |
Credicorp, Ltd. (Commercial banks)† | | 124,486 | | | 6,219 |
| | | | | |
| |
Emerging Europe, Mid-East, Africa—3.2% | | | |
Egypt—0.4% | | | | | |
*ELSewedy Cables Holding Company (Electrical equipment) | | 893,271 | | | 12,295 |
| | | | | |
| | | | | | |
Issuer | | Shares or
Principal
Amount | | Value |
|
Emerging Europe, Mid-East, Africa—3.2%—(continued) |
Israel—1.5% | | | | | | |
Teva Pharmaceutical Industries, Ltd.—ADR (Pharmaceuticals) | | | 1,069,342 | | $ | 45,522 |
| | | | | | |
South Africa—0.8% | | | | | | |
MTN Group, Ltd. (Wireless telecommunication services) | | | 1,497,837 | | | 17,660 |
Wilson Bayly Holmes-Ovcon Limited (Construction & engineering) | | | 703,759 | | | 8,181 |
| | | | | | |
| | | | | | 25,841 |
| | | | | | |
United Arab Emirates—0.5% | | | | | | |
DP World, Ltd. (Marine)† | | | 36,458,850 | | | 14,219 |
| | | | | | |
Total Common Stock—95.4%
(cost $3,729,769) | | | 2,989,423 |
| | | | | | |
| | |
Preferred Stock | | | | | | |
Brazil—1.2% | | | | | | |
Banco Sofisa S.A. (Commercial banks) | | | 1,650,600 | | | 2,548 |
Petroleo Brasileiro S.A. (Oil, gas & consumable fuels) | | | 3,371,977 | | | 33,026 |
| | | | | | |
Total Preferred Stock—1.2%
(cost $47,195) | | | 33,574 |
| | | | | | |
| | |
Exchange-Traded Funds | | | | | | |
China—1.7% | | | | | | |
iShares FTSE/Xinhua A50 China Tracker | | | 26,207,500 | | | 28,269 |
*World Index Shares—CSI China Tracker | | | 9,607,000 | | | 24,023 |
| | | | | | |
| | | | | | 52,292 |
| | | | | | |
Total Exchange-Traded Funds—1.7%
(cost $53,362) | | | 52,292 |
| | | | | | |
| | |
Investment in Rights | | | | | | |
China Overseas Land & Investment, Ltd. (Real estate management & development) | | | 244,320 | | | 91 |
| | | | | | |
Total Investment in Rights—0.0%
(cost $0) | | | 91 |
| | | | | | |
| | |
Investment in Affiliate | | | | | | |
William Blair Ready Reserves Fund | | | 18,363,148 | | | 18,363 |
| | | | | | |
Total Investment in Affiliate—0.6%
(cost $18,363) | | | 18,363 |
| | | | | | |
| | |
Short-Term Investments | | | | | | |
American Express Credit Corp. Demand Note, VRN 0.321% due 1/2/09 | | $ | 100 | | | 100 |
Prudential Funding Demand Note, VRN 0.001% due 1/2/09 | | | 100 | | | 100 |
| | | | | | |
Total Short-term Investments—0.0%
(cost $200) | | | 200 |
| | | | | | |
See accompanying Notes to Financial Statements.
46 Annual Report | December 31, 2008 |
International Growth Fund
Portfolio of Investments, December 31, 2008 (all dollar amounts in thousands)
| | | | | | |
Issuer | | Principal
Amount | | Value |
| | |
Repurchase Agreement | | | | | | |
Fixed Income Clearing Corporation, 0.010% dated 12/31/08, due 1/2/09, repurchase price $21,789, collateralized by FHLMC, 5.625% due 11/23/35 | | $ | 21,789 | | $ | 21,789 |
| | | | | | |
Total Repurchase Agreement—0.7%
(cost $21,789) | | | 21,789 |
| | | | | | |
Total Investments—99.6%
(cost $3,870,678) | | | 3,117,732 |
Cash and other assets, less liabilities—0.4% | | | 13,206 |
| | | | | | |
Net assets—100.0% | | $ | 3,130,938 |
| | | | | | |
* Non-income producing securities
† = U.S. listed foreign security
ADR = American Depository Receipt
GDR = Global Depository Receipt
VRN = Variable Rate Note
For securities primarily traded on exchanges or markets that close before the close of regular trading on the New York Stock Exchange, the Fund uses an independent pricing service on a daily basis to fair value price the securities pursuant to Valuation Procedures approved by the Board of Trustees.
At December 31, 2008 the Fund’s Portfolio of Investments includes the following industry categories:
| | |
Financials | | 20.6% |
Industrials | | 15.3% |
Consumer Staples | | 13.6% |
Health Care | | 10.9% |
Consumer Discretionary | | 9.2% |
Energy | | 8.9% |
Telecommunication Services | | 6.9% |
Utilities | | 5.0% |
Information Technology | | 4.4% |
Materials | | 3.5% |
Exchange-Traded Funds | | 1.7% |
| | |
Total | | 100.0% |
| | |
At December 31, 2008 the Fund’s Portfolio of Investments includes the following currency categories:
| | |
Euro | | 21.8% |
British Pound Sterling | | 18.3% |
Swiss Franc | | 11.6% |
Japanese Yen | | 9.7% |
Hong Kong Dollar | | 6.3% |
Australian Dollar | | 6.0% |
United States Dollar | | 6.0% |
Canadian Dollar | | 4.4% |
Brazilian Real | | 3.9% |
Danish Krone | | 3.7% |
Indian Rupee | | 2.8% |
Singapore Dollar | | 2.1% |
South African Rand | | 0.8% |
South Korean Won | | 0.8% |
All Other Currencies | | 1.8% |
| | |
Total | | 100.0% |
| | |
See accompanying Notes to Financial Statements.
December 31, 2008 | William Blair Funds 47 |
W. George Greig

David Merjan
INTERNATIONAL EQUITY FUND
The International Equity Fund invests primarily in common stocks of companies included in the Morgan Stanley Capital International All Country World Ex-U.S. IMI Index (net).
AN OVERVIEW FROM THE PORTFOLIO MANAGERS
Please see page 35 for the Global Markets Overview.
The International Equity Fund posted a (48.75)% decrease (Class N Shares) for the 12 months ended December 31, 2008. By comparison, the Fund’s benchmark, the MSCI All Country World Ex-U.S. IMI Index (net), declined (45.99)%.
The Fund underperformed the Index during 2008, due largely to performance during the third quarter. As the correction unfolded during the third quarter, the Fund remained focused on the areas where we continued to see good balance sheets, strong execution and solid growth prospects, with substantial positions in companies exposed to emerging markets infrastructure growth, resource development, and industrialization, with secondary thematic interest in the emerging markets consumer. As the developed market growth outlook worsened in the third quarter, we maintained an exposure in high quality, well run companies exposed to areas where growth appeared to be resilient. In retrospect, we should have been more sensitive to the influence of macro-level signals on investor sentiment. In short, the macroeconomic environment led corporate fundamentals, while positive earnings trends, a good long-term predictor of stock price performance, broke down.
Fourth quarter absolute performance results were disappointing, due to a negative equity market overall. Relative results benefited from Consumer Discretionary, Information Technology and Telecommunication Services stock selection, coupled with sector positioning. Within Consumer Discretionary, the Fund’s Europe Ex-U.K. and Developed Asian holdings added while Information Technology stocks added value across regions. Telecommunication Services stock selection was positively impacted by Iliad S.A. and Rogers Communications, Inc. Stock selection added value across most regions as well. Negatively impacting performance was Consumer Staples, Energy, Industrials and Materials stock selection, along with the weak equity markets in general.
We began to become more defensive in our developed markets positioning during the third quarter by decreasing exposure to consumer, auto, mining, and select Financials and increasing exposure in Health Care and Utilities—but we also maintained exposure to those companies geared towards emerging markets growth. This transition did not occur overnight amidst wide intraday equity market swings and overall volatility. Instead, we attempted to use the volatility to our trading advantage in securing better prices for new and additions to existing positions, while using positive volatility to reduce exposure to global growth within the Fund. This transition was generally finished by the end of October and results in November and December reflected a strategy more geared towards a global slowdown.
As of year end, the Fund maintained a balanced structure between defensively oriented sectors such as Consumer Staples, 13.4%, Healthcare, 14.6%, and to some extent Telecommunication Services, 7.9% and more growth oriented sectors such as Industrials, 15.8%. We increased the weighting in Financials slightly to 17.5% during the fourth quarter, with an increased focus on European insurers and to some extent capital markets companies, but in particular those with good balance sheets, solid competitive positioning amidst a changing landscape, and strong management teams with a history of execution. We also began increasing our underweighted Consumer Discretionary exposure late in the fourth quarter. Regionally, the Fund maintained higher weightings in Europe and the U.K., but underweighted in Developed Asia. While the Fund’s emerging markets weighting of approximately 19% was similar to the All Country World Index (ACWI) Ex-U.S. IMI Index, it increased from September 30, when it approximated 16%, with an increase in Asia and Latin America.
48 Annual Report | December 31, 2008 |
International Equity Fund
Performance Highlights (unaudited)
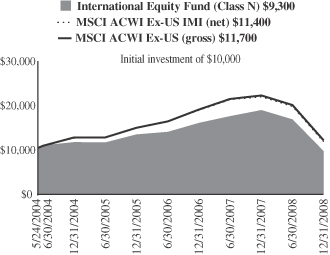
Average Annual Total Return at 12/31/2008
| | | | | | | | | |
| | | 1
Year | | | 3
Year | | | Since
Inception(a) | |
International Equity Fund
Class N | | (48.75 | )% | | (10.23 | )% | | (1.55 | )% |
International Equity Fund
Class I | | (48.61 | ) | | (10.01 | ) | | (1.26 | ) |
MSCI AC World
Ex-U.S. Index IMI (net) | | (45.99 | ) | | (7.44 | ) | | 2.91 | |
MSCI AC World
Ex-U.S. Index (gross) | | (45.24 | ) | | (6.57 | ) | | 3.42 | |
| | (a) | | For the period from May 24, 2004 to December 31, 2008. |
Performance cited represents past performance. Past performance does not guarantee future results and current performance may be lower or higher than the data quoted. Results shown are average annual returns, which assume reinvestment of dividends and capital gains. Investment returns and principal will fluctuate and you may have a gain or loss when you sell shares. For the most current month-end performance information, please call 1-800-742-7272, or visit our Web site at www.williamblairfunds.com. From time to time the investment advisor may waive fees or reimburse expenses for the Fund. Without these waivers, performance would be lower. International investing involves special risk considerations, including currency fluctuations, lower liquidity, economic and political risk. Class N shares are available to the general public without a sales load. Class I shares are available to certain institutional investors and advisory clients of William Blair & Company L.L.C. without a sales load or distribution (12b-1) or service fees.
The performance highlights and graph presented above do not reflect the deduction of taxes that a shareholder would pay on fund distributions or the redemption of fund shares.
The Morgan Stanley Capital International (MSCI) All Country World Ex-U.S. Investable Market Index (IMI) (net) is a free float-adjusted market capitalization weighted index that is designed to measure the equity market performance of developed and emerging markets, excluding the United States. This series approximates the minimum possible dividend reinvestment.
The Morgan Stanley Capital International (MSCI) All Country World Ex-U.S. Index (gross) is an unmanaged index that includes developed and emerging markets and reduced Japanese portion.
On June 30, 2008, the Fund’s Benchmark changed from the MSCI All Country World (ACW) Ex-U.S. (gross) to the MSCI All Country World Ex-U.S. Investable Market Index (IMI) (net). There are two primary reasons for the change. First, the MSCI ACW Ex-U.S. IMI (net) represents a broader range of markets then the MSCI ACW Ex-U.S. (gross) and this range is more representative of the Fund’s investment strategy. Secondly, the net index reflects the deduction of dividend withholding tax paid by non-resident institutional investors in foreign countries, the Fund is considered a non-resident institutional investor.
This report identifies the Fund’s investments on December 31, 2008. These holdings are subject to change. Not all stocks in the Fund performed the same, nor is there any guarantee that these stocks will perform as well in the future. Market forecasts provided in this report may not necessarily come to pass.
Sector Diversification (unaudited)

The sector diversification shown is based on the total long-term securities.
December 31, 2008 | William Blair Funds 49 |
International Equity Fund
Portfolio of Investments, December 31, 2008 (all dollar amounts in thousands)
| | | | | |
Issuer | | Shares | | Value |
| | |
Common Stocks—Europe—37.5% | | | | | |
Denmark—3.1% | | | | | |
Novo-Nordisk A/S (Pharmaceuticals) | | 123,189 | | $ | 6,355 |
*Vestas Wind Systems A/S (Electrical equipment) | | 11,304 | | | 665 |
| | | | | |
| | | | | 7,020 |
| | | | | |
France—6.8% | | | | | |
Alstom S.A. (Electrical equipment) | | 63,828 | | | 3,804 |
AXA (Insurance) | | 160,576 | | | 3,604 |
Eurazeo (Diversified financial services) | | 27,068 | | | 1,273 |
Iliad S.A. (Diversified telecommunication services) | | 27,378 | | | 2,377 |
Veolia Environnement (Multi-utilities) | | 142,409 | | | 4,492 |
| | | | | |
| | | | | 15,550 |
| | | | | |
Germany—3.4% | | | | | |
Beiersdorf AG (Personal products) | | 60,364 | | | 3,575 |
E. ON AG (Electric utilities) | | 107,314 | | | 4,214 |
| | | | | |
| | | | | 7,789 |
| | | | | |
Ireland—0.5% | | | | | |
*Ryanair Holdings Plc—ADR (Airlines) | | 40,164 | | | 1,168 |
| | | | | |
Italy—1.9% | | | | | |
Saipem SpA (Energy equipment & services) | | 254,500 | | | 4,341 |
| | | | | |
Netherlands—1.1% | | | | | |
*Qiagen N.V. (Life sciences tools & services) | | 145,818 | | | 2,579 |
| | | | | |
Spain—4.4% | | | | | |
Banco Santander S.A. (Commercial banks) | | 393,406 | | | 3,800 |
*Iberdrola Renovables (Independent power producers & energy traders) | | 717,241 | | | 3,127 |
Industria De Diseno Textile Inditex S.A. (Specialty retail) | | 68,291 | | | 3,041 |
| | | | | |
| | | | | 9,968 |
| | | | | |
Switzerland—16.3% | | | | | |
*ABB, Ltd. (Electrical equipment) | | 355,827 | | | 5,426 |
*Actelion, Ltd. (Biotechnology) | | 50,801 | | | 2,874 |
Credit Suisse Group AG (Capital markets) | | 85,897 | | | 2,407 |
Nestle S.A. (Food products) | | 191,403 | | | 7,579 |
Roche Holdings, Ltd. AG (Pharmaceuticals) | | 44,589 | | | 6,903 |
SGS S.A. (Commercial services & supplies) | | 2,781 | | | 2,909 |
Synthes, Inc. (Health care equipment & supplies) | | 27,218 | | | 3,451 |
Zurich Financial Services (Insurance) | | 26,244 | | | 5,734 |
| | | | | |
| | | | | 37,283 |
| | | | | |
| | |
United Kingdom—21.2% | | | | | |
AMEC plc (Construction & engineering) | | 178,395 | | | 1,288 |
Amlin plc (Insurance) | | 115,830 | | | 602 |
*Autonomy Corporation plc (Software) | | 162,308 | | | 2,259 |
BAE Systems plc (Aerospace & defense) | | 1,054,649 | | | 5,740 |
BG Group plc (Oil, gas & consumable fuels) | | 414,009 | | | 5,731 |
British Sky Broadcasting Group plc (Media) | | 387,774 | | | 2,738 |
Capita Group plc (Commercial services & supplies) | | 412,259 | | | 4,422 |
Petrofac Limited (Energy equipment & services) | | 157,313 | | | 787 |
Reckitt Benckiser plc (Household products) | | 162,856 | | | 6,102 |
| | | | | |
Issuer | | Shares | | Value |
| |
Common Stocks—United
Kingdom— 21.2%—(continued) | | | |
Rolls-Royce Group plc (Aerospace & defense) | | 1,040,579 | | $ | 5,090 |
Rotork plc (Electronic equipment & instruments) | | 85,649 | | | 988 |
Standard Chartered plc (Commercial banks) | | 288,544 | | | 3,692 |
Tullow Oil plc (Oil, gas & consumable fuels) | | 368,209 | | | 3,525 |
Vodafone Group plc (Wireless telecommunication services) | | 2,654,717 | | | 5,436 |
| | | | | |
| | | | | 48,400 |
| | | | | |
| | |
Japan—9.0% | | | | | |
Aeon Mall Co., Ltd. (Real estate management & development) | | 97,600 | | | 1,887 |
Fast Retailing Co., Ltd. (Specialty retail) | | 12,600 | | | 1,849 |
Jupiter Telecommunications Co., Ltd. (Media) | | 5,256 | | | 5,471 |
Nintendo Co., Ltd. (Software) | | 19,200 | | | 7,337 |
Suruga Bank, Ltd. (Commercial banks) | | 129,000 | | | 1,281 |
Terumo Corporation (Health care equipment & supplies) | | 60,700 | | | 2,844 |
| | | | | |
| | | | | 20,669 |
| | | | | |
| | |
Emerging Asia—7.9% | | | | | |
China—3.8% | | | | | |
China Life Insurance Company Ltd. (Insurance) | | 1,003,000 | | | 3,082 |
China Merchants Bank Co., Ltd (Commercial banks) | | 1,056,500 | | | 1,977 |
China Oilfield Services (Energy equipment & services) | | 1,792,000 | | | 1,463 |
CNOOC Limited (Oil, gas & consumable fuels) | | 2,185,000 | | | 2,078 |
| | | | | |
| | | | | 8,600 |
| | | | | |
India—3.5% | | | | | |
*Bharti Airtel, Ltd. (Wireless telecommunication services) | | 212,275 | | | 3,129 |
Infosys Technologies Limited (IT services) | | 119,440 | | | 2,768 |
Sun Pharmaceutical Industries Limited (Pharmaceuticals) | | 1,520 | | | 33 |
Vedanta Resources plc (Metals & mining) | | 217,330 | | | 1,952 |
| | | | | |
| | | | | 7,882 |
| | | | | |
Indonesia—0.6% | | | | | |
PT Bank Rakyat Indonesia (Commercial banks) | | 3,470,000 | | | 1,476 |
| | | | | |
| |
Emerging Europe, Mid-East, Africa—7.3% | | | |
Czech Republic—0.9% | | | | | |
CEZ AS (Electric utilities) | | 50,131 | | | 2,144 |
| | | | | |
Israel—3.4% | | | | | |
Teva Pharmaceutical Industries, Ltd.—ADR (Pharmaceuticals) | | 181,552 | | | 7,729 |
| | | | | |
South Africa—2.3% | | | | | |
MTN Group, Ltd. (Wireless telecommunication services) | | 277,769 | | | 3,275 |
Naspers, Ltd. (Media) | | 115,300 | | | 2,086 |
| | | | | |
| | | | | 5,361 |
| | | | | |
See accompanying Notes to Financial Statements.
50 Annual Report | December 31, 2008 |
International Equity Fund
Portfolio of Investments, December 31, 2008 (all dollar amounts in thousands)
| | | | | |
Issuer | | Shares | | Value |
| |
Common Stocks—Emerging Europe, Mid-East, Africa—7.3%—(continued) | | | |
United Arab Emirates—0.7% | | | | | |
Aldar Properties PJSC (Real estate management & development) | | 472,800 | | $ | 508 |
DP World, Ltd. (Marine)† | | 2,574,918 | | | 1,004 |
| | | | | |
| | | | | 1,512 |
| | | | | |
| | |
Asia—6.3% | | | | | |
Australia—5.8% | | | | | |
BHP Billiton Limited—ADR (Metals & mining) | | 44,676 | | | 1,917 |
Macquarie Bank, Ltd. (Capital markets) | | 67,759 | | | 1,375 |
QBE Insurance Group Limited (Insurance) | | 239,935 | | | 4,336 |
Woolworths Limited (Food & staples retailing) | | 261,528 | | | 4,877 |
WorleyParsons, Ltd. (Energy equipment & services) | | 75,232 | | | 751 |
| | | | | |
| | | | | 13,256 |
| | | | | |
Hong Kong—0.5% | | | | | |
Noble Group Limited (Trading companies & distributors) | | 1,482,000 | | | 1,061 |
| | | | | |
| | |
Canada—5.0% | | | | | |
Canadian National Railway Company (Road & rail)† | | 92,574 | | | 3,403 |
Rogers Communications, Inc., Class “B” (Wireless telecommunication services) | | 118,700 | | | 3,518 |
Shoppers Drug Mart Corporation (Food & staples retailing) | | 114,800 | | | 4,468 |
| | | | | |
| | | | | 11,389 |
| | | | | |
| | |
Emerging Latin America—3.3% | | | | | |
Brazil—1.3% | | | | | |
BM&F Bovespa S.A. (Diversified financial services) | | 379,071 | | | 979 |
*LLX Logistica S.A. (Transportation infrastructure) | | 76,100 | | | 49 |
*MMX Mineracao e Metalicos S.A. (Metals & mining) | | 119,100 | | | 141 |
Petroleo Brasileiro S.A.—ADR (Oil, gas & consumable fuels) | | 44,598 | | | 1,092 |
Weg S.A. (Machinery) | | 138,900 | | | 745 |
| | | | | |
| | | | | 3,006 |
| | | | | |
*Non-income producing securities
† = U.S. Listed Foreign Common Stock
GDR = Global Depository Receipt
ADR = American Depository Receipt
| | | | | |
Issuer | | Shares | | Value |
| |
Common Stocks—Emerging Latin
America—3.3%—(continued) | | | |
Chile—0.0% | | | | | |
*Cencosud S.A.—ADR 144A (Specialty retail) | | 2,290 | | $ | 49 |
| | | | | |
Mexico—1.4% | | | | | |
Wal-Mart de Mexico Sab de C.V. (Food & staples retailing) | | 1,151,300 | | | 3,076 |
| | | | | |
Peru—0.6% | | | | | |
Credicorp, Ltd. (Commercial banks)† | | 27,534 | | | 1,376 |
| | | | | |
Total Common Stock—97.5%
(cost $273,535) | | | 222,684 |
| | | | | |
| | |
Preferred Stocks | | | | | |
Brazil—0.8% | | | | | |
Petroleo Brasileiro S.A. (Oil, gas & consumable fuels) | | 185,824 | | | 1,820 |
Total Preferred Stocks—0.8%
(cost $1,857) | | | 1,820 |
| | | | | |
| | |
Investment in Affiliate | | | | | |
William Blair Ready Reserves Fund | | 3,661 | | | 4 |
| | | | | |
Total Investment in Affiliate—0.0%
(cost $4) | | | 4 |
| | | | | |
Total Investments—98.3%
(cost $275,396) | | | 224,508 |
Cash and other assets, less liabilities—1.7% | | | 3,978 |
| | | | | |
Net assets—100.0% | | $ | 228,486 |
| | | | | |
See accompanying Notes to Financial Statements.
December 31, 2008 | William Blair Funds 51 |
International Equity Fund
Portfolio of Investments, December 31, 2008 (all dollar amounts in thousands)
For securities primarily traded on exchanges or markets that close before the close of regular trading on the New York Stock Exchange, the Fund uses an independent pricing service on a daily basis to fair value price the securities pursuant to Valuation Procedures approved by the Board of Trustees.
At December 31, 2008 the Fund’s Portfolio of Investments includes the following industry categories:
| | |
Financials | | 17.5% |
Industrials | | 15.8% |
Health Care | | 14.6% |
Consumer Staples | | 13.4% |
Energy | | 10.2% |
Telecommunication Services | | 7.9% |
Consumer Discretionary | | 6.8% |
Utilities | | 6.2% |
Information Technology | | 5.9% |
Materials | | 1.7% |
| | |
Total | | 100.0% |
| | |
At December 31, 2008 the Fund’s Portfolio of Investments includes the following currency categories:
| | |
British Pound Sterling | | 22.4% |
Euro | | 17.9% |
Swiss Franc | | 16.6% |
Japanese Yen | | 9.2% |
U.S. Dollar | | 7.0% |
Australian Dollar | | 5.9% |
Hong Kong Dollar | | 3.8% |
Canadian Dollar | | 3.6% |
Danish Krone | | 3.1% |
Indian Rupee | | 2.6% |
South African Rand | | 2.4% |
Brazilian Real | | 1.7% |
All Other Currencies | | 3.8% |
| | |
Total | | 100.0% |
| | |
See accompanying Notes to Financial Statements.
52 Annual Report | December 31, 2008 |

Jeffrey A. Urbina
INTERNATIONAL SMALL CAP GROWTH FUND
The International Small Cap Growth Fund primarily invests in a diversified portfolio of common stocks of small cap companies in developed and emerging markets.
AN OVERVIEW FROM THE PORTFOLIO MANAGER
Please see page 35 for the Global Markets Overview.
The International Small Cap Growth Fund posted a (51.82)% decrease (Class N Shares) for the 12 months ended December 31, 2008. By comparison, the Fund’s benchmark, the MSCI All Country Ex-U.S. Small Cap Index (net), declined (50.23)%.
The Fund underperformed the benchmark Index during 2008, due to fourth quarter results as the Fund added value during the first nine months. While stock selection was strong across most sectors during the first nine months of the year and the Fund benefited from Japanese, Canadian, and European stock selection, during the fourth quarter, its Energy weighting and performance, along with select Health Care company performance were the primary detractors from fourth quarter results.
Within Energy, services companies, which had benefited from more stable earnings growth through long-term contracts, had earnings called into question due to concerns about delays and/or cancellations of contracts amidst the severe energy/commodity price declines. While we decreased exposure to Energy during the quarter, a higher weighting in October was also detrimental to absolute and relative performance. Within Health Care, several of our generics holdings underperformed due to company-specific issues, as well as those that were hampered by concerns of general biotech and pharmaceutical spending.
As of yearend, the Fund maintained a balanced structure between defensively oriented sectors such as Health Care, 19.9%, and more growth oriented sectors such as Industrials, 17.9%, and Information Technology, 12.9%. We decreased the Energy weightings from approximately 12% to 4% during the fourth quarter, due to concerns about energy capital spending and outlook, and remained underweighted in Financials with approximately 16% invested in these holdings. The Fund’s weighting in emerging markets approximated 20% of the Fund, up from approximately 14.5% as of September 30, with the biggest increase in emerging Asia, which has benefited from weakness in commodity and energy prices, along with a loosening monetary policy and reduction in inflationary concerns.
December 31, 2008 | William Blair Funds 53 |
International Small Cap Growth Fund
Performance Highlights (unaudited)
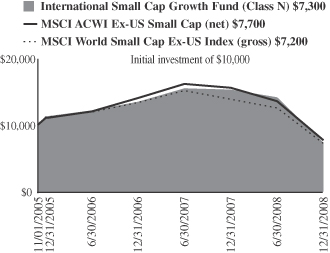
Average Annual Total Return at 12/31/2008
| | | | | | | | | |
| | | 1
Year | | | 3
Year | | | Since
Inception(a) | |
International Small Cap Growth Fund Class N | | (51.82 | )% | | (13.13 | )% | | (9.37 | )% |
International Small Cap Growth Fund Class I | | (51.56 | ) | | (12.82 | ) | | (9.07 | ) |
MSCI AC World Ex-U.S. Small Cap Index (net) | | (50.23 | ) | | (11.29 | ) | | (7.91 | ) |
MSCI World Ex-U.S. Small Cap Index (gross) | | (47.79 | ) | | (13.45 | ) | | (9.92 | ) |
| | (a) | | For the period from November 1, 2005 (Commencement of Operations) to December 31, 2008. |
Performance cited represents past performance. Past performance does not guarantee future results and current performance may be lower or higher than the data quoted. Results shown are average annual returns, which assume reinvestment of dividends and capital gains. Investment returns and principal will fluctuate and you may have a gain or loss when you sell shares. For the most current month-end performance information, please call 1-800-742-7272, or visit our Web site at www.williamblairfunds.com. From time to time, the investment advisor may waive fees or reimburse expenses for the Fund. Without these waivers, performance would be lower. International investing involves special risk considerations, including currency fluctuations, lower liquidity, economic and political risk. Class N shares are available to the general public without a sales load. Class I shares are available to certain institutional investors and advisory clients of William Blair & Company L.L.C. without a sales load or distribution (12b-1) fees.
The performance highlights and graph presented above do not reflect the deduction of taxes that a shareholder would pay on fund distributions or the redemption of fund shares.
The Morgan Stanley Capital International (MSCI) All Country World Ex-U.S. Small Cap Index (net) is a free float-adjusted market capitalization weighted index that is designed to measure the equity market performance of small capitalization developed and emerging markets, excluding the United States. This series approximates the minimum possible dividend reinvestment.
The Morgan Stanley Capital International (MSCI) World Ex-U.S. Small Cap Index (gross) is an unmanaged index that is designed to measure equity performance of small cap stocks in developed and emerging markets.
On June 30, 2008, the Fund’s Benchmark changed from the MSCI World Ex-U.S. Small Cap Index (gross) to the MSCI All Country World (ACW) Ex-U.S. Small Cap Index (net). There are two primary reasons for the change. First, the MSCI ACW Ex-U.S. Small Cap Index (net) represents a broader range of markets then the MSCI World Ex-U.S. Small Cap Index (gross) and this range is more representative of the Fund’s investment strategy. Secondly, the net index reflects the deduction of dividend withholding tax paid by non-resident institutional investors in foreign countries, the Fund is a non-resident institutional investor.
This report identifies the Fund’s investments on December 31, 2008. These holdings are subject to change. Not all stocks in the Fund performed the same, nor is there any guarantee that these stocks will perform as well in the future. Market forecasts provided in this report may not necessarily come to pass.
Sector Diversification (unaudited)
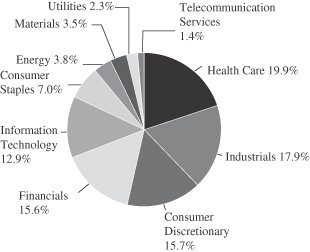
The sector diversification shown is based on the total long-term securities.
54 Annual Report | December 31, 2008 |
International Small Cap Growth Fund
Portfolio of Investments, December 31, 2008 (all dollar amounts in thousands)
| | | | | |
Issuer | | Shares | | Value |
| | |
Common Stocks—Europe—32.8% | | | | | |
Austria—0.4% | | | | | |
Schoeller-Bleckmann Oilfield Equipment AG (Energy equipment & services) | | 35,905 | | $ | 1,118 |
| | | | | |
Denmark—3.2% | | | | | |
Novozymes A/S (Chemicals) | | 117,928 | | | 9,458 |
| | | | | |
France—7.3% | | | | | |
April Group S.A. (Insurance) | | 82,864 | | | 2,116 |
EDF Energies Nouvelles S.A. (Independent power providers & energy trader) | | 182,825 | | | 6,477 |
*Gemalto NV (Computers & peripherals) | | 109,451 | | | 2,754 |
*Orpea (Heath care providers & services) | | 191,818 | | | 6,945 |
*UbiSoft Entertainment S.A. (Software) | | 151,543 | | | 2,973 |
| | | | | |
| | | | | 21,265 |
| | | | | |
Germany—6.4% | | | | | |
CTS Eventim AG (Media) | | 138,275 | | | 4,744 |
*Manz Automation AG (Semiconductors & semiconductor equipment) | | 12,539 | | | 739 |
*Roth & Rau AG (Electronic equipment) | | 31,959 | | | 685 |
Solarworld AG (Electrical equipment) | | 146,388 | | | 3,276 |
Strada Arzneimittel AG (Pharmaceuticals) | | 162,598 | | | 4,671 |
*Wire Card AG (IT services) | | 760,808 | | | 4,446 |
| | | | | |
| | | | | 18,561 |
| | | | | |
Greece—1.3% | | | | | |
Fourlis Holdings S.A. (Household durables) | | 85,528 | | | 596 |
Jumbo S.A. (Leisure equipment & products) | | 546,928 | | | 3,305 |
| | | | | |
| | | | | 3,901 |
| | | | | |
Ireland—2.7% | | | | | |
*ICON plc—ADR (Life science tools & services) | | 226,758 | | | 4,465 |
*Norkom Group plc (Software) | | 638,104 | | | 443 |
United Drug plc (Heath care providers & services) | | 974,012 | | | 3,018 |
| | | | | |
| | | | | 7,926 |
| | | | | |
Italy—0.5% | | | | | |
Trevi Finanziaria SpA (Construction & engineering) | | 139,088 | | | 1,486 |
| | | | | |
Netherlands—4.5% | | | | | |
*Qiagen N.V. (Life sciences tools & services) | | 660,288 | | | 11,678 |
*Smartrac N.V. (Electronic equipment & instruments) | | 92,544 | | | 1,542 |
| | | | | |
| | | | | 13,220 |
| | | | | |
Spain—2.9% | | | | | |
Grifols S.A. (Biotechnology) | | 432,388 | | | 7,576 |
Tecnicas Reunidas S.A. (Construction & engineering) | | 33,194 | | | 877 |
| | | | | |
| | | | | 8,453 |
| | | | | |
Switzerland—3.6% | | | | | |
Acino Holding AG (Pharmaceuticals) | | 3,666 | | | 798 |
*Meyer Burger Technology AG (Machinery) | | 7,513 | | | 879 |
Partners Group Global Opportunities, Ltd. (Capital markets) | | 96,096 | | | 6,878 |
*Temenos Group AG (Software) | | 133,022 | | | 1,795 |
| | | | | |
| | | | | 10,350 |
| | | | | |
| | | | | |
Issuer | | Shares | | Value |
| |
Common Stocks—Europe—32.8%—(continued) | | | |
Japan—18.5% | | | | | |
Aeon Delight Co., Ltd. (Commercial services & supplies) | | 52,000 | | $ | 1,508 |
Aeon Mall Co., Ltd. (Real estate management & development) | | 312,100 | | | 6,033 |
Capcom Co., Ltd. (Software) | | 151,600 | | | 3,430 |
EPS Co., Ltd. (Life sciences tools & services) | | 319 | | | 1,373 |
FamilyMart Co., Ltd. (Food & staples retailing) | | 248,000 | | | 10,770 |
Gourmet Navigator Incorporated (Internet software & services) | | 247 | | | 663 |
Hisamitsu Pharmaceutical Co., Inc. (Pharmaceuticals) | | 70,000 | | | 2,861 |
Nitori Company, Ltd. (Specialty retail) | | 109,300 | | | 8,506 |
Point, Inc. (Specialty retail) | | 64,700 | | | 3,566 |
Seven Bank, Ltd. (Commercial banks) | | 2,954 | | | 11,291 |
So-net M3, Inc. (Health care technology) | | 778 | | | 2,666 |
Suruga Bank, Ltd. (Commercial banks) | | 120,200 | | | 1,194 |
| | | | | |
| | | | | 53,861 |
| | | | | |
United Kingdom—18.3% | | | | | |
Admiral Group plc (Insurance) | | 215,442 | | | 2,844 |
Amlin plc (Insurance) | | 1,508,610 | | | 7,842 |
*Autonomy Corporation plc (Software) | | 404,700 | | | 5,631 |
Aveva Group plc (Software) | | 219,215 | | | 1,825 |
*Blinkx plc (Internet software & services) | | 4,235,401 | | | 797 |
*Ceres Power Holdings plc (Electrical equipment) | | 704,843 | | | 835 |
Chemring Group plc (Aerospace & defense) | | 151,831 | | | 4,293 |
*Climate Exchange plc (Diversified financial services) | | 95,696 | | | 1,218 |
Connaught plc (Real estate management & development) | | 244,500 | | | 1,238 |
Domino’s Pizza UK & IRL plc (Hotels, restaurants, & leisure) | | 691,464 | | | 1,674 |
Petrofac, Ltd. (Energy equipment & services) | | 558,951 | | | 2,798 |
Rotork plc (Electronic equipment & instruments) | | 134,455 | | | 1,550 |
Serco Group plc (Commercial services & supplies) | | 1,534,091 | | | 10,042 |
Spice plc (Commercial services & supplies) | | 535,380 | | | 643 |
Ultra Electronic Holdings plc (Aerospace & defense) | | 251,854 | | | 4,141 |
VT Group plc (Aerospace & defense) | | 585,560 | | | 4,731 |
Wellstream Holdings plc (Energy equipment & services) | | 265,965 | | | 1,369 |
| | | | | |
| | | | | 53,471 |
| | | | | |
| | |
Emerging Asia—10.4% | | | | | |
China—6.1% | | | | | |
*Baidu.com, Inc.—ADR (Internet software & services) | | 46,095 | | | 6,019 |
China High Speed Transmission (Electrical equipment) | | 3,711,000 | | | 4,528 |
Golden Eagle Retail Group, Ltd. (Multiline retail) | | 2,586,000 | | | 1,820 |
Li Ning Co., Ltd. (Leisure equipment & products) | | 781,873 | | | 1,232 |
* SINA Corporation (Internet software & services)† | | 61,508 | | | 1,424 |
Shandong Weigao Group Medical Polymer Company, Ltd. (Health care equipment & supplies) | | 1,768,800 | | | 2,692 |
| | | | | |
| | | | | 17,715 |
| | | | | |
See accompanying Notes to Financial Statements.
December 31, 2008 | William Blair Funds 55 |
International Small Cap Growth Fund
Portfolio of Investments, December 31, 2008 (all dollar amounts in thousands)
| | | | | |
Issuer | | Shares | | Value |
|
Common Stocks-Emerging Asia—10.4%—(continued) |
India—3.1% | | | | | |
Educomp Solutions, Limited (Diversified consumer services) | | 73,352 | | $ | 3,647 |
* Glenmark Pharmaceuticals, Ltd. (Pharmaceuticals) | | 633,895 | | | 3,894 |
Lupin, Limited (Pharmaceuticals) | | 120,420 | | | 1,532 |
| | | | | |
| | | | | 9,073 |
| | | | | |
South Korea—1.2% | | | | | |
Taewoong Co., Ltd. (Machinery) | | 58,337 | | | 3,601 |
| | | | | |
| |
Emerging Europe, Mid-East, Africa—4.6% | | | |
Egypt—1.4% | | | | | |
* ELSewedy Cables Holding Company (Electrical equipment) | | 187,189 | | | 2,577 |
* Ghabbour Auto (Machinery) | | 152,300 | | | 463 |
* Orascom Development Holding AG (Hotels, restaurants & leisure) | | 28,373 | | | 916 |
| | | | | |
| | | | | 3,956 |
| | | | | |
South Africa—2.3% | | | | | |
* Aspen Pharmacare Holdings, Limited (Pharmaceuticals) | | 425,588 | | | 1,553 |
Shoprite Holdings, Limited (Food & staples retailing) | | 629,998 | | | 3,623 |
Wilson Bayly Holmes-Ovcon Limited (Construction & engineering) | | 126,092 | | | 1,466 |
| | | | | |
| | | | | 6,642 |
| | | | | |
United Arab Emirates—0.9% | | | | | |
Arabtec Holding Company (Construction & engineering) | | 3,187,304 | | | 1,982 |
* National Central Cooling Company (Building products) | | 5,546,639 | | | 793 |
| | | | | |
| | | | | 2,775 |
| | | | | |
| | |
Canada—4.0% | | | | | |
Canadian Western Bank (Commercial banks) | | 223,000 | | | 2,236 |
*Consolidated Thompson Iron Mines, Limited (Metals & mining) | | 519,378 | | | 396 |
Tim Hortons, Inc. (Hotels, restaurants & leisure) | | 208,479 | | | 5,892 |
*TriStar Oil & Gas, Ltd. (Oil, gas & consumable fuels) | | 348,568 | | | 3,222 |
| | | | | |
| | | | | 11,746 |
| | | | | |
| | |
Emerging Latin America—3.9% | | | | | |
Brazil—3.5% | | | | | |
Anhanguera Educacional Participacoes S.A. (Diversified consumer services) | | 210,003 | | | 1,091 |
*BR Malls Participacoes S.A. (Real estate management & development) | | 276,300 | | | 1,078 |
*GVT Holding S.A. (Diversified telecommunication services) | | 367,744 | | | 4,001 |
* Non-income producing securities
†= U.S. listed foreign security
ADR = American Depository Receipt
VRN = Variable Rate Note
For securities primarily traded on exchanges or markets that close before the close of regular trading on the New York Stock Exchange, the Fund uses an independent pricing service on a daily basis to fair value price the securities pursuant to Valuation Procedures approved by the Board of Trustees.
| | | | | | | |
Issuer | | Shares or
Principal
Amount | | Value | |
| |
Emerging Latin America—3.9%—(continued) | | | | |
Brazil—(continued) | | | | | | | |
*Lupatech S.A. (Machinery) | | | 144,205 | | $ | 1,448 | |
Rodobens Negocioa Imobiliarios S.A. (Real estate management & development) | | | 135,500 | | | 456 | |
SLC Agricola S.A. (Food products) | | | 369,300 | | | 2,217 | |
| | | | | | | |
| | | | | | 10,291 | |
| | | | | | | |
Columbia—0.4% | | | | | | | |
*Pacific Rubiales Energy Corporation (Oil, gas & consumable fuels) | | | 642,741 | | | 1,140 | |
| | | | | | | |
| | |
Asia—3.3% | | | | | | | |
Australia —1.0% | | | | | | | |
JB Hi-Fi Limited (Specialty retail) | | | 445,980 | | | 3,035 | |
| | | | | | | |
Singapore —2.3% | | | | | | | |
Olam International, Ltd. (Food & staples retailing) | | | 3,593,700 | | | 2,897 | |
Raffles Education Corp., Ltd. (Diversified consumer services) | | | 9,581,000 | | | 3,795 | |
| | | | | | | |
| | | | | | 6,692 | |
| | | | | | | |
Total Common Stock—95.8%
(cost $380,946) | | | 279,736 | |
| | | | | | | |
| | | | | | | |
Investment in Affiliate | | | | | | | |
William Blair Ready Reserves Fund | | | 3,286,638 | | | 3,287 | |
| | | | | | | |
Total Investment in Affiliate—1.1%
(cost $3,287) | | | 3,287 | |
| | | | | | | |
| | | | | | | |
Short-Term Investments | | | | | | | |
American Express Credit Corp. Demand Note, VRN 3.559%, due 1/2/09 | | $ | 6,500 | | | 6,500 | |
| | | | | | | |
Total Short-term Investments—2.2%
(cost $6,500) | | | 6,500 | |
| | | | | | | |
| | |
Repurchase Agreement | | | | | | | |
Fixed Income Clearing Corporation, 0.010% dated 12/31/08 due 1/2/09, repurchase price $5,382, collateralized by FHLMC, 5.625%, due 11/23/35 | | | 5,382 | | | 5,382 | |
| | | | | | | |
Total Repurchase Agreement—1.8%
(cost $5,382) | | | 5,382 | |
| | | | | | | |
Total Investments—100.9%
(cost $396,115) | | | 294,905 | |
Liabilities, plus cash and other assets—(0.9)% | | | (2,917 | ) |
| | | | | | | |
Net assets—100.0% | | $ | 291,988 | |
| | | | | | | |
See accompanying Notes to Financial Statements.
56 Annual Report | December 31, 2008 |
International Small Cap Growth Fund
Portfolio of Investments, December 31, 2008 (all dollar amounts in thousands)
At December 31, 2008 the Fund’s Portfolio of Investments includes the following industry categories:
| | |
Health Care | | 19.9% |
Industrials | | 17.9% |
Consumer Discretionary | | 15.7% |
Financials | | 15.6% |
Information Technology | | 12.9% |
Consumer Staples | | 7.0% |
Energy | | 3.8% |
Materials | | 3.5% |
Utilities | | 2.3% |
Telecommunication Services | | 1.4% |
| | |
Total | | 100.0% |
| | |
At December 31, 2008 the Fund’s Portfolio of Investments includes the following currency categories:
| | |
Euro | | 25.5% |
Japanese Yen | | 19.3% |
British Pound Sterling | | 19.1% |
Canadian Dollar | | 4.6% |
U.S. Dollar | | 4.2% |
Swiss Franc | | 4.0% |
Brazilian Real | | 3.7% |
Hong Kong Dollar | | 3.7% |
Danish Krone | | 3.4% |
Indian Rupee | | 3.2% |
Singapore Dollar | | 2.4% |
South African Rand | | 2.4% |
South Korean Won | | 1.3% |
Egyptian Pound | | 1.1% |
Australian Dollar | | 1.1% |
UAE Dirham Spot | | 1.0% |
| | |
Total | | 100.0% |
| | |
See accompanying Notes to Financial Statements.
December 31, 2008 | William Blair Funds 57 |

Todd M. McClone
Jeffrey A. Urbina
EMERGING MARKETS GROWTH FUND
The Emerging Markets Growth Fund primarily invests in a diversified portfolio of equity securities issued by growth companies in emerging economies worldwide.
AN OVERVIEW FROM THE PORTFOLIO MANAGERS
Please see page 35 for the Global Markets Overview.
The Emerging Markets Growth Fund posted a (61.71)% decrease (Class N Shares) for the 12 months ended December 31, 2008. By comparison, the Fund’s benchmark, the MSCI Emerging Markets IMI Index (net), declined (53.78)%.
The Fund underperformed the benchmark Index during 2008 and during the fourth quarter, ending the strategy’s worst absolute and relative year in our history. In what turned out to be a boom-bust emerging markets environment, where corporate fundamentals lagged macroeconomic effects and often times did not matter in overall stock performance, we suffered an extremely disappointing year. Underperformance in 2008 was largely due to significant underperformance in the Fund’s Financials holdings (and the overweighting during the first quarter), first in real estate and small cap Brazil and India during the first quarter, then the impact of small cap Russian Financials during the third quarter. In addition, the Fund’s agriculture related holdings within the Consumer Staples sector hampered full year results (despite adding value during the first half of the year), as well as the weighting and stock selection in Consumer Discretionary (small cap Brazil and select Eastern European holdings). Adding to results during 2008 was the Fund’s underweighting and stock selection in Energy, along with the underweighted Materials sector and Industrials stock selection.
During the fourth quarter, the Fund lagged the Index, due largely to the higher weighting in Middle Eastern Industrials companies, coupled with performance and weighting of the Fund’s Indian generic healthcare holdings. Adding to relative results was the Fund weighting and stock selection in Energy, particularly in Asia, along with Telecommunication Services stock selection, due largely to good performance in Asia and Emerging Markets Europe, Mid-East and Africa (EMEA). Moreover, the Fund’s underweighting in Materials and Information Technology and overweighting in Health Care also added to fourth quarter relative results.
As of year end, the Fund maintained a balanced structure between defensively oriented sectors such as Consumer Staples, 17.4%, Health Care, 6.7%, and to some extent, Telecommunication Services, 10.7%, and more growth oriented sectors such as Industrials, 13.3%. We increased the weighting in Financials to 17.7% from approximately 13% during the fourth quarter, primarily in Asia, which have benefited from an easing monetary policy environment, government stimulus, and that have generally been unaffected by asset quality concerns. We also further decreased our underweighted Energy position from 13% to 9%. Regionally, the Fund remained underweighted in Asia, due largely to Korean and Taiwanese weightings, although the weighting increased from approximately 37% as of September 30 to 43%. Conversely, exposure to EMEA (particularly the Middle East and Russia) and Latin America was reduced.
58 Annual Report | December 31, 2008 |
Emerging Markets Growth Fund
Performance Highlights (unaudited)
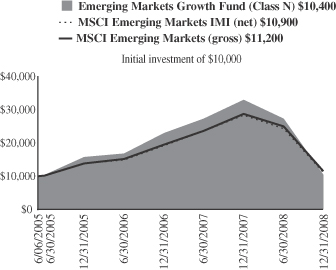
Average Annual Total Return at 12/31/2008
| | | | | | | | | |
| | | 1
Year | | | 3
Year | | | Since
Inception(a) | |
Emerging Markets Growth Fund Class N | | (61.71 | )% | | (10.06 | )% | | 1.01 | % |
Emerging Markets Growth Fund Class I | | (61.60 | ) | | (9.86 | ) | | 1.24 | |
MSCI Emerging Markets IMI Index (net) | | (53.78 | ) | | (5.22 | ) | | 2.54 | |
MSCI Emerging Markets
Index (gross) | | (53.18 | ) | | (4.62 | ) | | 3.25 | |
| | (a) | | For the period from June 6, 2005 (Commencement of Operations) to December 31, 2008. | |
Performance cited represents past performance. Past performance does not guarantee future results and current performance may be lower or higher than the data quoted. Results shown are average annual returns, which assume reinvestment of dividends and capital gains. Investment returns and principal will fluctuate and you may have a gain or loss when you sell shares. For the most current month-end performance information, please call 1-800-742-7272, or visit our Web site at www.williamblairfunds.com. From time to time, the investment advisor may waive fees or reimburse expenses for the Fund. Without these waivers, performance would be lower. International investing involves special risk considerations, including currency fluctuations, lower liquidity, economic and political risk. Class N shares are available to the general public without a sales load. Class I shares are available to certain institutional investors and advisory clients of William Blair & Company L.L.C. without a sales load or distribution (12b-1) fees.
The performance highlights and graph presented above do not reflect the deduction of taxes that a shareholder would pay on fund distributions or the redemption of fund shares.
The Morgan Stanley Capital International (MSCI) Emerging Markets Investable Market Index (IMI) (net) is a free float-adjusted market capitalization weighted index that is designed to measure the equity market performance of emerging markets.
The Morgan Stanley Capital International (MSCI) Emerging Markets Index (gross) is an index that is designed to measure equity performance in the global emerging markets.
On June 30, 2008, the Fund’s Benchmark changed from the MSCI Emerging Markets Index (gross) to the MSCI Emerging Markets Investable Market Index (IMI) (net). There are two primary reasons for the change. First, the MSCI Emerging Markets IMI (net) represents a broader range of markets then the MSCI Emerging Markets Index (gross) and this range is more representative of the Fund’s investment strategy. Secondly, the net index reflects the deduction of dividend withholding tax paid by non-resident institutional investors in foreign countries, the Fund is considered a non-resident institutional investor.
This report identifies the Fund’s investments on December 31, 2008. These holdings are subject to change. Not all stocks in the Fund performed the same, nor is there any guarantee that these stocks will perform as well in the future. Market forecasts provided in this report may not necessarily come to pass.
Sector Diversification (unaudited)
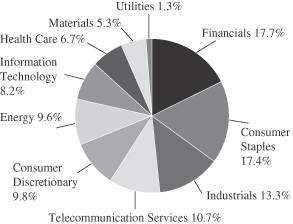
The sector diversification shown is based on the total long-term securities.
December 31, 2008 | William Blair Funds 59 |
Emerging Markets Growth Fund
Portfolio of Investments, December 31, 2008 (all dollar amounts in thousands)
| | | | | |
Issuer | | Shares | | Value |
| |
Common Stocks—Emerging Asia—42.9% | | | |
China—19.5% | | | | | |
*Baidu.com, Inc.—ADR (Internet software & services) | | 57,129 | | $ | 7,459 |
Belle International Holdings Limited (Specialty retail) | | 7,792,200 | | | 3,457 |
China High Speed Transmission (Electrical equipment) | | 4,608,000 | | | 5,623 |
China Life Insurance Co., Ltd. (Insurance) | | 3,722,000 | | | 11,436 |
China Merchants Bank Co., Ltd. (Commercial banks) | | 3,739,000 | | | 6,996 |
China Mobile, Ltd. (Wireless telecommunication services) | | 1,233,800 | | | 12,518 |
China Oilfield Services Limited (Energy equipment & services) | | 1,000 | | | 1 |
China Vanke Co., Ltd. (Real estate management & development) | | 6,365,543 | | | 4,936 |
China Yurun Food Group Limited (Food products) | | 2,401,419 | | | 2,841 |
CNOOC Limited (Oil, gas & consumable fuels) | | 11,501,000 | | | 10,940 |
Golden Eagle Retail Group, Ltd. (Multiline retail) | | 2,757,000 | | | 1,940 |
Li Ning Co., Ltd. (Leisure equipment & products) | | 1,294,500 | | | 2,040 |
Shandong Weigao Group Medical Polymer Company, Ltd. (Health care equipment & supplies) | | 1,508,700 | | | 2,296 |
*SINA Corporation (Internet software & services)† | | 79,593 | | | 1,843 |
Tencent Holdings, Ltd. (Internet software & services) | | 160,200 | | | 1,041 |
| | | | | |
| | | | | 75,367 |
| | | | | |
India—16.2% | | | | | |
Asian Paints Limited (Chemicals) | | 53,556 | | | 987 |
*Bharti Airtel, Ltd. (Wireless telecommunication services) | | 639,409 | | | 9,425 |
*Cairn India, Ltd. (Oil, gas & consumable fuels) | | 2,679,749 | | | 9,545 |
Educomp Solution, Limited (Diversified consumer services) | | 55,837 | | | 2,776 |
*Glenmark Pharmaceuticals, Ltd. (Pharmaceuticals) | | 724,980 | | | 4,453 |
Hindustan Unilever, Ltd. (Household products) | | 2,863,140 | | | 14,803 |
Housing Development Finance Corp. (Thrifts & mortgage finance) | | 178,656 | | | 5,467 |
Infosys Technologies Limited (IT services) | | 233,012 | | | 5,400 |
Larsen & Toubro, Ltd. (Construction & engineering) | | 451,020 | | | 7,211 |
Shoppers’ Stop, Ltd. (Multiline retail) | | 261,960 | | | 945 |
Sun Pharmaceutical Industries Limited (Pharmaceuticals) | | 65,336 | | | 1,437 |
| | | | | |
| | | | | 62,449 |
| | | | | |
Indonesia—2.2% | | | | | |
PT Bank Rakyat Indonesia (Commercial banks) | | 13,131,500 | | | 5,584 |
*PT London Sumatra Indonesia (Food products) | | 8,121,000 | | | 2,221 |
PT Unilever Indonesia Tbk (Household products) | | 1,133,000 | | | 821 |
| | | | | |
| | | | | 8,626 |
| | | | | |
| | | | | |
Issuer | | Shares | | Value |
|
Common Stocks—Emerging Asia—42.9%—(continued) |
Malaysia—0.1% | | | | | |
KNM Group Bhd (Energy equipment & services) | | 3,282,300 | | $ | 388 |
| | | | | |
South Korea—2.9% | | | | | |
*LG Household & Health Care, Ltd. (Household products) | | 27,913 | | | 4,254 |
*Megastudy Co., Ltd. (Diversified consumer services) | | 18,515 | | | 2,741 |
Taewoong Co., Ltd. (Machinery) | | 67,687 | | | 4,179 |
| | | | | |
| | | | | 11,174 |
| | | | | |
Taiwan—1.7% | | | | | |
Himax Technologies, Inc.—ADR (Semiconductors & semiconductor equipment) | | 1,877,069 | | | 3,003 |
MediaTek Inc. (Semiconductors & semiconductor equipment) | | 531,000 | | | 3,591 |
| | | | | |
| | | | | 6,594 |
| | | | | |
Thailand—0.3% | | | | | |
Minor International PCL (IT services) | | 4,434,900 | | | 1,007 |
| | | | | |
| |
Emerging Europe, Mid-East, Africa—25.9% | | | |
Czech Republic—1.2% | | | | | |
CEZ (Electric utilities) | | 108,887 | | | 4,657 |
| | | | | |
Egypt—3.0% | | | | | |
*ELSewedy Cables Holding Company (Electrical equipment) | | 357,179 | | | 4,916 |
Orascom Construction Industries (Construction & engineering) | | 217,012 | | | 5,525 |
*Orascom Hotels and Development (Hotels, restaurants & leisure) | | 38,542 | | | 1,244 |
| | | | | |
| | | | | 11,685 |
| | | | | |
Israel—5.1% | | | | | |
Israel Chemicals Limited (Chemicals) | | 676,966 | | | 4,736 |
Teva Pharmaceutical Industries, Ltd.—ADR (Pharmaceuticals) | | 346,726 | | | 14,760 |
| | | | | |
| | | | | 19,496 |
| | | | | |
Russia—1.0% | | | | | |
*Magnit—CLS (Multiline retail)† | | 93,787 | | | 1,509 |
*X5 Retail Group N.V.—GDR (Food & staples retailing) | | 267,900 | | | 2,326 |
| | | | | |
| | | | | 3,835 |
| | | | | |
South Africa—7.7% | | | | | |
*Aspen Pharmacare Holdings, Limited (Pharmaceuticals) | | 589,400 | | | 2,151 |
MTN Group, Ltd. (Wireless telecommunication services) | | 966,900 | | | 11,400 |
Naspers, Ltd. (Media) | | 537,000 | | | 9,715 |
Shoprite Holdings, Limited (Food & staples retailing) | | 712,039 | | | 4,095 |
Wilson Bayly Holmes-Ovcon, Limited (Construction & engineering) | | 183,503 | | | 2,133 |
| | | | | |
| | | | | 29,494 |
| | | | | |
See accompanying Notes to Financial Statements.
60 Annual Report | December 31, 2008 |
Emerging Markets Growth Fund
Portfolio of Investments, December 31, 2008 (all dollar amounts in thousands)
| | | | | |
Issuer | | Shares | | Value |
| |
Common Stocks—Emerging Europe, Mid-East, Africa—25.9%—(continued) | | | |
Turkey—3.7% | | | | | |
Bim Birlesik Magazalar A.S. (Food & staples retailing) | | 173,622 | | $ | 3,652 |
Coca Cola Icecek A.S. (Beverages) | | 544,000 | | | 2,261 |
*Turkiye Garanti Bankasi A.S. (Commercial banks) | | 4,886,919 | | | 8,412 |
| | | | | |
| | | | | 14,325 |
| | | | | |
United Arab Emirates—4.2% | | | | | |
Aldar Properties PJSC (Real estate management & development) | | 2,999,588 | | | 3,221 |
Arabtec Holding Company (Construction & engineering) | | 7,717,878 | | | 4,800 |
DP World, Ltd. (Marine)† | | 18,661,225 | | | 7,278 |
*National Central Cooling Company (Building products) | | 6,956,564 | | | 994 |
| | | | | |
| | | | | 16,293 |
| | | | | |
| | |
Emerging Latin America—24.4% | | | | | |
Brazil—15.3% | | | | | |
Anhanguera Educacional Participacoes S.A. (Diversified consumer services) | | 260,300 | | | 1,352 |
*BR Malls Participacoes S.A. (Real estate management & development) | | 473,000 | | | 1,846 |
Companhia Vale Do Rio Doce—ADR (Metals & mining) | | 1,143,469 | | | 13,847 |
*GP Investments, Ltd. (Diversified financial services) | | 863,600 | | | 1,996 |
*GVT Holding S.A. (Diversified telecommunication services) | | 579,200 | | | 6,301 |
Iguatemi Empresa de Shopping Centers S.A. (Real estate management & development) | | 383,115 | | | 2,136 |
*Lupatech S.A. (Machinery) | | 226,000 | | | 2,269 |
Natura Cosmeticos S.A. (Personal products) | | 243,100 | | | 1,980 |
Petroleo Brasileiro S.A. (Oil, gas & consumable fuels) | | 1,523,180 | | | 14,918 |
Redecard S.A. (IT services) | | 660,700 | | | 7,281 |
Rodobens Negocioa Imobiliarios S.A. (Real estate management & development) | | 344,800 | | | 1,161 |
SLC Agricola S.A. (Food products) | | 440,700 | | | 2,646 |
Totvs S.A. (Software) | | 67,000 | | | 1,063 |
| | | | | |
| | | | | 58,796 |
| | | | | |
Chile—1.0% | | | | | |
S.A.C.I. Falabella S.A. (Multiline retail) | | 1,485,062 | | | 3,915 |
| | | | | |
Mexico—7.1% | | | | | |
*Desarrolladora Homex S.A.B. de C.V.—ADR (Household durables) | | 168,348 | | | 3,843 |
Fomento Economico Mexicano S.A.B.—ADR (Beverages) | | 339,333 | | | 10,224 |
*Megacable Holdings S.A.B. de C.V. (Diversified telecommunication services) | | 1,158,400 | | | 1,543 |
* Non-income producing securities
† = U.S. listed Foreign Security
ADR = American Depository Receipt
GDR = Global Depository Receipt
VRN = Variable Rate Note
| | | | | | |
Issuer | | Shares or
Principal
Amount | | Value |
|
Common Stocks—Emerging Latin
America—24.4%—(continued) |
Mexico—(continued) | | | | | | |
*Promotora Ambiental S.A.B. de C.V. (Commercial services & supplies)** | | | 1,114,350 | | $ | 836 |
Wal-Mart de Mexico S.A.B. de C.V. (Food & staples retailing) | | | 4,134,500 | | | 11,046 |
| | | | | | |
| | | | | | 27,492 |
| | | | | | |
Peru—1.0% | | | | | | |
Credicorp, Ltd. (Commercial banks)† | | | 78,355 | | | 3,915 |
| | | | | | |
Total Common Stock—93.2%
(cost $541,784) | | | | | | 359,508 |
| | | | | | |
| | |
Preferred Stock | | | | | | |
Brazil—3.2% | | | | | | |
All America Latin Logistica (Road & rail) | | | 879,200 | | | 3,770 |
Banco Itau Holding Financeira S.A. (Commercial banks) | | | 679,600 | | | 7,606 |
Banco Sofisa S.A. (Commercial banks) | | | 637,600 | | | 985 |
| | | | | | |
| | | | | | 12,361 |
| | | | | | |
Total Preferred Stock—3.2%
(cost $20,236) | | | | | | 12,361 |
| | | | | | |
| | |
Investment in Affiliate | | | | | | |
William Blair Ready Reserves Fund | | | 2,065,261 | | | 2,065 |
| | | | | | |
Total Investment in Affiliate—0.5%
(cost $2,065) | | | | | | 2,065 |
| | | | | | |
| | |
Short-Term Investments | | | | | | |
American Express Credit Corp. Demand Note, VRN 0.321%, due 1/2/09 | | $ | 1,000 | | | 1,000 |
Prudential Funding Demand Note, VRN 0.001%, due 1/2/09 | | | 50 | | | 50 |
| | | | | | |
Total Short-Term Investments—0.3%
(cost $1,050) | | | | | | 1,050 |
| | | | | | |
Repurchase Agreement | | | | | | |
Fixed Income Clearing Corporation,
0.010% dated 12/31/08 due 1/2/09, repurchase price $8,015, collateralized by FHLMC, 5.625%, due 11/23/35 | | | 8,015 | | | 8,015 |
| | | | | | |
Total Repurchase Agreement—2.1%
(cost $8,015) | | | | | | 8,015 |
| | | | | | |
Total Investments—99.3%
(cost $573,150) | | | 382,999 |
Cash and other assets, less liabilities—0.7% | | | 2,589 |
| | | | | | |
Net assets—100.0% | | $ | 385,588 |
| | | | | | |
See accompanying Notes to Financial Statements.
December 31, 2008 | William Blair Funds 61 |
Emerging Markets Growth Fund
Portfolio of Investments, December 31, 2008 (all dollar amounts in thousands)
**Fair valued pursuant to Valuation Procedures adopted by Board of Trustees. This holding represents 0.22% of the Fund’s net assets at December 31, 2008. This security was also deemed illiquid pursuant to Liquidity Procedures approved by the Board of Trustees.
For securities primarily traded on exchanges or markets that close before the close of regular trading on the New York Stock Exchange, the Fund uses an independent pricing service on a daily basis to fair value price the securities pursuant to Valuation Procedures approved by the Board of Trustees.
At December 31, 2008 the Fund’s Portfolio of Investments includes the following industry categories:
| | |
Financials | | 17.7% |
Consumer Staples | | 17.4% |
Industrials | | 13.3% |
Telecommunication Services | | 10.7% |
Consumer Discretionary | | 9.8% |
Energy | | 9.6% |
Information Technology | | 8.2% |
Health Care | | 6.7% |
Materials | | 5.3% |
Utilities | | 1.3% |
| | |
Total | | 100.0% |
| | |
At December 31, 2008 the Fund’s Portfolio of Investments includes the following currency categories:
| | |
U.S. Dollar | | 18.8% |
Hong Kong Dollar | | 17.8% |
Indian Rupee | | 16.8% |
Brazilian Real | | 15.4% |
South African Rand | | 7.9% |
Turkish Lira Spot | | 3.9% |
Mexican Nuevo Peso | | 3.6% |
South Korean Won | | 3.0% |
Egyptian Pound | | 2.8% |
UAE Dirham Spot | | 2.4% |
Indonesian Rupiah | | 2.3% |
Czech Koruna | | 1.3% |
Israeli Shekel | | 1.3% |
Chilean Peso | | 1.1% |
All Other Currencies | | 1.6% |
| | |
Total | | 100.0% |
| | |
See accompanying Notes to Financial Statements.
62 Annual Report | December 31, 2008 |
Todd M. McClone
Jeffrey A. Urbina
EMERGING LEADERS GROWTH FUND
The Emerging Leaders Growth Fund invests primarily in a diversified portfolio of equity securities, including common stocks, issued by companies in emerging markets with a market capitalization of at least $3 billion at the time of the Fund’s investment.
AN OVERVIEW FROM THE PORTFOLIO MANAGERS
Please see page 35 for the Global Markets Overview.
The Emerging Leaders Growth Fund commenced operations on March 26, 2008. Through the period ending December 31, 2008, the Fund posted a decrease of (52.09)% (Class I Shares). By comparison, the Fund’s benchmark, the MSCI Emerging Markets Large Cap Index (net) declined (47.28)% during the same period.
During the fourth quarter, the Fund lagged the Index, due primarily to the weighting in the underperforming Consumer Staples sector, coupled with Health Care stock selection and the Industrials overweighting and stock selection. Within Consumer Staples, the Fund’s weighting in the underperforming Latin American region hampered returns, as did X5 Retail Group N.V., a Russian grocery store chain. Within Industrials, exposure to Middle East infrastructure building and Latin America transportation and mining/energy construction was negative. Health Care stock selection was hurt by exposure to Sun Pharmaceutical Industries Limited, a generics pharmaceutical company in India, which underperformed, although the overweighting in Health Care was additive to results. Somewhat mitigating these negative effects was stock selection in Consumer Discretionary and Telecommunication Services, coupled with the underweighting and stock selection in Energy and the underweighted Financials position.
As of year end, the Fund maintained a more defensive sector structure than as of September 30 as sectors such as Consumer Staples, 15.8%, Health Care, 7.3%, and to some extent Telecommunication Services, 15.7%, were at or above Index weightings. These increased with the sales of a number of Industrials, Energy, and Material holdings. In addition, Financials increased from approximately 11% of the Fund as of September 30, to 20%, with the increase largely occurring in Emerging Asia and Latin America. Particularly in Asia, we focused on companies that have benefited from an easing monetary policy environment, government stimulus measures, and those that have generally been unaffected by asset quality concerns. Regionally, the portfolio remained underweighted in Asia, compared to its benchmark, due largely to Korean and Taiwanese weightings, although the weighting increased from approximately 34% as of September 30 to 45%. Conversely, exposure to Emerging Markets Europe, Mid-East and Africa (EMEA) (particularly the Middle East and Russia) was reduced.
December 31, 2008 | William Blair Funds 63 |
Emerging Leaders Growth Fund
Performance Highlights (unaudited)

Average Annual Total Return at 12/31/2008
| | | |
| | | Since
Inception(a) | |
Emerging Leaders Growth Fund Class I | | (52.09 | )% |
MSCI Emerging Markets Large Cap
Index (net) | | (47.28 | ) |
MSCI Emerging Markets Large Cap
Index (gross) | | (47.15 | ) |
| | (a) | | For the period from March 26, 2008 (Commencement of Operations) to December 31, 2008. |
Performance cited represents past performance. Past performance does not guarantee future results and current performance may be lower or higher than the data quoted. Results shown are average annual total returns, which assume reinvestment of dividends and capital gains. Investment returns and principal will fluctuate and you may have a gain or loss when you sell shares. For the most current month-end performance information, please call 1-800-742-7272, or visit our Web site at www.williamblairfunds.com. International investing involves special risk considerations, including currency fluctuations, lower liquidity, economic and political risk. From time to time, the investment advisor may waive fees or reimburse expenses for the Fund. Without these waivers, performance would be lower. Class I shares are available to certain institutional investors and advisory clients of William Blair & Company, L.L.C., without a sales load or distribution (12b-1).
The performance highlights and graph presented above do not reflect the deduction of taxes that a shareholder would pay on fund distributions or the redemption of fund shares.
The Morgan Stanley Capital International (MSCI) Emerging Markets Large Cap Index (net) is a free float-adjusted market capitalization weighted index that is designed to measure market performance of large capitalization stocks in emerging markets. This series approximates the minimum possible dividend reinvestment.
The Morgan Stanley Capital International (MSCI) Emerging Markets Large Cap Index (gross) is a free float-adjusted market capitalization weighted index that is designed to measure market performance of large capitalization stocks in emerging markets.
On June 30, 2008, the Fund’s Benchmark changed from the MSCI Emerging Markets Large Cap Index (gross) to the MSCI Emerging Markets Large Cap Index (net). The primary reason for the change is that the MSCI Emerging Markets Large Cap (net) index reflects the deduction of dividend withholding tax paid by non-resident institutional investors in foreign countries; the Fund is considered a non-resident institutional investor.
This report identifies the Fund’s investments on December 31, 2008. These holdings are subject to change. Not all stocks in the Fund performed the same, nor is there any guarantee that these stocks will perform as well in the future. Market forecasts provided in this report may not necessarily come to pass.
Sector Diversification (unaudited)
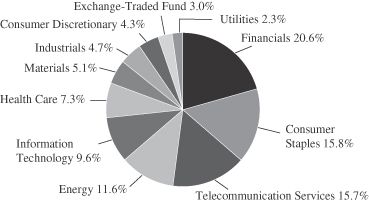
The sector diversification shown is based on the total long-term securities.
64 Annual Report | December 31, 2008 |
Emerging Leaders Growth Fund
Portfolio of Investments, December 31, 2008 (all dollar amounts in thousands)
| | | | | |
Issuer | | Shares | | Value |
| |
Common Stocks—Emerging Asia—42.0% | | | |
China—18.1% | | | | | |
*Baidu.com, Inc.—ADR (Internet software & services) | | 10,568 | | $ | 1,380 |
Belle International Holdings Limited (Specialty retail) | | 1,701,000 | | | 755 |
China Life Insurance Co., Ltd. (Insurance) | | 551,000 | | | 1,693 |
China Merchants Bank Co., Ltd. (Commercial banks) | | 284,500 | | | 532 |
China Mobile, Ltd. (Wireless telecommunication services) | | 168,500 | | | 1,710 |
China Overseas Land & Investment, Ltd. (Real estate management & development) | | 338,000 | | | 474 |
CNOOC Limited (Oil, gas & consumable fuels) | | 1,761,000 | | | 1,675 |
Tencent Holdings, Ltd. (Internet software & services) | | 34,400 | | | 224 |
| | | | | |
| | | | | 8,443 |
| | | | | |
India—19.9% | | | | | |
Bharat Heavy Electricals, Ltd. (Electrical equipment) | | 21,000 | | | 591 |
*Bharti Airtel, Ltd. (Wireless telecommunication services) | | 156,477 | | | 2,307 |
*Cairn India, Ltd. (Oil, gas & consumable fuels) | | 325,509 | | | 1,160 |
HDFC Bank, Ltd. (Commercial banks) | | 22,800 | | | 471 |
Hindustan Unilever, Ltd. (Household products) | | 339,692 | | | 1,756 |
Housing Development Finance Corp. (Thrifts & mortgage finance) | | 25,675 | | | 786 |
Infosys Technologies Limited (IT services) | | 32,913 | | | 763 |
Larsen & Toubro, Ltd. (Construction & engineering) | | 35,740 | | | 571 |
Sun Pharmaceutical Industries Limited (Pharmaceuticals) | | 41,019 | | | 902 |
| | | | | |
| | | | | 9,307 |
| | | | | |
Indonesia—2.9% | | | | | |
PT Bank Rakyat Indonesia (Commercial banks) | | 1,771,500 | | | 753 |
PT Unilever Indonesia Tbk (Household products) | | 828,500 | | | 600 |
| | | | | |
| | | | | 1,353 |
| | | | | |
Taiwan—1.1% | | | | | |
MediaTek Inc. (Semiconductors & semiconductor equipment) | | 75,000 | | | 507 |
| | | | | |
| | |
Emerging Latin America—26.8% | | | | | |
Brazil—15.5% | | | | | |
BM&F Bovespa S.A. (Diversified financial services) | | 230,590 | | | 595 |
Companhia Vale do Rio Doce—ADR (Metals & mining) | | 147,946 | | | 1,792 |
Natura Cosmeticos S.A. (Personal products) | | 70,400 | | | 573 |
*OGX Petroleo e Gas Participacoes S.A. (Oil, gas & consumable fuels) | | 2,300 | | | 519 |
Petroleo Brasileiro S.A. (Oil, gas & consumable fuels) | | 193,000 | | | 1,890 |
Redecard S.A. (IT services) | | 133,600 | | | 1,472 |
Weg S.A. (Machinery) | | 74,200 | | | 398 |
| | | | | |
| | | | | 7,239 |
| | | | | |
Mexico—8.6% | | | | | |
Fomento Economico Mexicano, S.A.B. de C.V.—ADR (Beverages) | | 57,580 | | | 1,735 |
Wal-Mart de Mexico S.A.B. de C.V. (Food & staples retailing) | | 845,600 | | | 2,259 |
| | | | | |
| | | | | 3,994 |
| | | | | |
Peru—2.7% | | | | | |
Credicorp, Ltd. (Commercial banks)† | | 25,477 | | | 1,273 |
| | | | | |
| | | | | |
Issuer | | Shares | | Value |
| |
Emerging Europe, Mid-East, Africa—18.5% | | | |
Czech Republic—2.2% | | | | | |
CEZ (Electric utilities) | | 24,474 | | $ | 1,047 |
| | | | | |
Israel—6.3% | | | | | |
Israel Chemicals Limited (Chemicals) | | 77,917 | | | 545 |
Teva Pharmaceutical Industries, Ltd.—ADR (Pharmaceuticals) | | 56,117 | | | 2,389 |
| | | | | |
| | | | | 2,934 |
| | | | | |
Russia—0.6% | | | | | |
*X5 Retail Group N.V.—GDR (Food & staples retailing) | | 30,420 | | | 264 |
| | | | | |
South Africa —7.8% | | | | | |
MTN Group, Ltd. (Wireless telecommunication services) | | 207,569 | | | 2,447 |
Naspers, Ltd. (Media) | | 66,000 | | | 1,194 |
| | | | | |
| | | | | 3,641 |
| | | | | |
Turkey—1.6% | | | | | |
*Turkiye Garanti Bankasi A.S. (Commercial banks) | | 430,200 | | | 741 |
| | | | | |
| | |
Europe—1.4% | | | | | |
Luxembourg—1.4 % | | | | | |
Millicom International Cellular S.A. (Wireless telecommunication services)† | | 14,770 | | | 663 |
| | | | | |
Total Common Stock—88.7%
(cost $57,937) | | | 41,406 |
| | | | | |
| | |
Preferred Stock | | | | | |
Brazil—5.6% | | | | | |
All America Latin Logistica (Road & rail) | | 136,200 | | | 584 |
Banco Itau Holding Financeira S.A. (Commercial banks) | | 181,446 | | | 2,031 |
| | | | | |
| | | | | 2,615 |
| | | | | |
Total Preferred Stock—5.6%
(cost $3,173) | | | 2,615 |
| | | | | |
| | |
Exchange-Traded Fund | | | | | |
China—2.9% | | | | | |
iShares FTSE/Xinhua A50 China Tracker | | 1,278,700 | | | 1,379 |
| | | | | |
Total Exchange-Traded Fund—2.9%
(cost $1,456) | | | 1,379 |
| | | | | |
Investment in Rights | | | | | |
China Overseas Land & Investment, Ltd. (Real estate management & development) | | 12,240 | | | 5 |
| | | | | |
Total Investment in Rights—0.0%
(cost $0) | | | 5 |
| | | | | |
See accompanying Notes to Financial Statements.
December 31, 2008 | William Blair Funds 65 |
Emerging Leaders Growth Fund
Portfolio of Investments, December 31, 2008 (all dollar amounts in thousands)
| | | | | | | |
Issuer | | Shares or
Principal
Amount | | Value | |
| | |
Investment in Affiliate | | | | | | | |
William Blair Ready Reserves Fund | | | 739,941 | | $ | 740 | |
| | | | | | | |
Total Investment in Affiliate—1.6%
(cost $740) | | | 740 | |
| | | | | | | |
Repurchase Agreement | | | | | | | |
Fixed Income Clearing Corporation, 0.010% dated 12/31/08, due 1/2/09, repurchase price $596, collateralized by FHLMC, 5.625% due 11/23/35 | | $ | 596,125 | | | 596 | |
| | | | | | | |
Total Repurchase Agreement—1.3%
(cost $596) | | | 596 | |
| | | | | | | |
Total Investments—100.1%
(cost $63,902) | | | 46,741 | |
Liabilities, plus cash and other assets—(0.1)% | | | (65 | ) |
| | | | | | | |
Net assets—100.0% | | $ | 46,676 | |
| | | | | | | |
*Non-income producing securities
† = U.S. listed Foreign Security
ADR = American Depository Receipt
GDR = Global Depository Receipt
For securities primarily traded on exchanges or markets that close before the close of regular trading on the New York Stock Exchange the Fund uses an independent pricing service on a daily basis to fair value price the securities pursuant to Valuation Procedures approved by the Board of Trustees.
At December 31, 2008 the Fund’s Portfolio of Investments includes the following industry categories:
| | |
Financials | | 20.6% |
Consumer Staples | | 15.8% |
Telecommunication Services | | 15.7% |
Energy | | 11.6% |
Information Technology | | 9.6% |
Health Care | | 7.3% |
Materials | | 5.1% |
Industrials | | 4.7% |
Consumer Discretionary | | 4.3% |
Exchange-Traded Fund | | 3.0% |
Utilities | | 2.3% |
| | |
Total | | 100.0% |
| | |
At December 31, 2008 the Fund’s Portfolio of Investments includes the following currency categories:
| | |
U.S. Dollar | | 20.9% |
Indian Rupee | | 20.5% |
Hong Kong Dollar | | 18.6% |
Brazilian Real | | 17.8% |
South African Rand | | 8.0% |
Mexican Nuevo Peso | | 5.0% |
Indonesian Rupiah | | 3.0% |
Czech Koruna | | 2.3% |
Turkish Lira | | 1.6% |
Israeli Shekel | | 1.2% |
New Taiwan Dollar | | 1.1% |
| | |
Total | | 100.0% |
| | |
See accompanying Notes to Financial Statements.
66 Annual Report | December 31, 2008 |

Chad M. Kilmer

Mark T. Leslie

David S. Mitchell
VALUE DISCOVERY FUND
The Value Discovery Fund invests in the equity securities of small companies that we believe offer a long-term investment value seeking to identify undervalued companies with sound business fundamentals.
AN OVERVIEW FROM THE PORTFOLIO MANAGERS
How did the Fund perform during the past year? How did the Fund’s performance compare to its benchmark?
The Value Discovery Fund posted a (25.85)% decrease on a total return basis (Class N shares) during the 12 months ended December 31, 2008. By comparison, the Russell 2000® Value Index declined (28.92)%, while the Russell 2000® Index dropped (33.79)%.
What were the most significant factors impacting Fund performance? What factors were behind the Fund’s performance versus the benchmark?
Investor fortitude was put to the ultimate test in 2008 during a year that saw unprecedented global market declines, the occurrence of numerous historical events, and the Federal Reserve and Central Banks’ sweeping financial market interventions. The market plummets were comprehensive and jaw-dropping, especially during the final three months of the year. The steps taken by government and financial institutions around the globe are too numerous to list but it is worth highlighting a few. Lehman Brothers filed for bankruptcy; Fannie Mae, Freddie Mac, and AIG were bailed out by the U.S. government; oil reached its all time high of $145 a barrel only to fall to less than $45 a barrel by year’s end; a $700 billion dollar rescue plan was enacted to help support the U.S. financial markets, and the Fed began lending directly to U.S. corporations in an action not witnessed since the Great Depression. Furthermore, market volatility spiked to extreme levels during the latter half of the year as light trading volumes, investor jitters, and late day market orders sent the various indices into relative downdrafts.
Generally speaking from a sector perspective, portfolios that were positioned with large allocations to Energy and Materials and lower allotments to Financials performed well during the first half of the year. However, sector leadership rotated during the second half as investors’ anxieties drove portfolios to a more defensive posturing with higher exposures to Consumer Staples and Health Care. Energy, Materials, and related commodities encountered demand destruction mid-year. This caused investors to pare back their weightings and the sectors to materially sell off. In addition, Financials performance was enhanced as the sector underwent a third quarter rally; thus, lower than benchmark Financials sector weight impacted performance negatively in the latter half of the year.
With respect to market capitalization, mid capitalization securities took the early lead during the first six months of the year versus their small and large cap counterparts, according to Russell Indices. Nevertheless, this dynamic reversed course with mid caps finishing the year in last place behind both small and large caps. This environment provided active management with a challenging exercise of not only attempting to outperform their respective index, but to also try and preserve investors’ capital, both of which proved difficult. According to Merrill Lynch research, only 26.8% of active small cap value funds beat the Russell 2000® Value in 2008; that number declined to 17.7% for the small cap growth (versus Russell 2000® Growth) active management category.
What were among the best performing sectors for the Fund? What were among the best performing investments?
While the Value Discovery Fund finished the year down, it posted a return greater than that of the Russell 2000® Value Index as well as the overall broad market, represented by the S&P 500
December 31, 2008 | William Blair Funds 67 |
(37.00)%. The Fund’s outperformance was attributable to stock selection across the majority of sectors, with the exceptions being Financials, Health Care, and Information Technology.
Offsetting losses in Health Care and Financials was exceptional relative performance within Consumer Discretionary and Consumer Staples. Although consumers considerably reigned in spending on all non-essential expenditures during the year, our holdings, which tend to exhibit strong financial characteristics, held up well. One of the most notable names in our Discretionary stocks was Jack in the Box, Inc. a fast food provider. Jack in the Box outperformed the Russell 2000® Value Consumer sector by a wide margin in 2008 and was one of the best performing Restaurant stocks in our universe for multiple reasons. First, given the challenging consumer environment, more and more diners are choosing to eat at these lower cost, quick serve restaurants (QSR) versus casual dining restaurants. Comparable store sales were strong for many QSR operators like McDonald’s, Burger King, and Jack in the Box. Jack in the Box stock also outperformed its peer group because of its well capitalized balance sheet, strong consumer appeal to their differentiated menu, and management’s continued focus on improving free cash flow and return on invested capital. The company continues to sell company-owned stores to new and existing franchisees as it transitions to a franchise business model that is common among its QSR peers. The long-term result of this transition will be to lower the capital intensity of the business, lower sensitivity to volatile food and labor costs, increase the sustainability and predictability of free cash flow, and improve overall corporate return on invested capital.
In Consumer Staples, J&J Snack Foods was an exceptionally strong performer during the fourth quarter when the company posted steady fiscal 4Q operating results, and provided a positive absolute return for the year; J&J produces Super Pretzel brand pretzels and other snack foods. Investors are also beginning to recognize the benefit of price increases taken by the company during the year coupled with the expectation of easing raw material costs.
What were among the weakest performing sectors for the Fund? What were among the weakest performing investments?
Within Financials, the portfolio’s almost 14% exposure to banks along with our REIT holdings negatively impacted annual results. In banking, performance was challenged by a combination of being slightly underweight in what was surprisingly one of the strongest areas of the benchmark combined with several subpar performers, most prominent of which was Nevada-based Community Bancorp. Despite historically strong management and results, Community was unable to overcome the rapid deceleration in the Las Vegas economy. In REITs, the portfolio had its share of relatively strong performers but also incurred difficult performance from several others, most notably Kite Realty Group. Despite a generally healthy portfolio of existing properties, Kite’s development strategy, which we felt was an above average and conservatively pre-leased approach, was viewed negatively in a market that looked unfavorably on retail REITs in general. Health Care was also a source of weakness, primarily in our Health Care Providers and Services namely due to Pediatrix Medical Group. (Pediatrix underwent a name change and is now called Mednax, Inc.). Mednax a provider of neonatology services, experienced weakness during the year on softening patient volumes caused by an unexpected slowdown in birth rates, an external factor beyond management’s control.
What is your current thinking about the markets?
While 2009 will surely be an eventful year, all investors are hoping it will be a year that equity markets stabilize in anticipation of better economic times ahead. Equities may display pockets of strength throughout the upcoming year; nonetheless, investors should not only proceed with caution, but also with a dose of guarded optimism while looking to take advantage of any further dislocations. Financial markets still require time to heal from 2008’s devastating crisis, yet we are beginning to see signs of improvement in credit markets. This improvement may indicate the liquidity lockup is coming to a close. With the government’s implementation of the Temporary Liquidity Guarantee Program that allows banks to issue debt with an FDIC guarantee, more than $120 billion in new issuances have occurred. We are beginning to see that companies with debt issuance needs are able to access credit, though at a higher marginal cost. However, obstacles remain along the capital markets’ road to recovery and active management’s role in helping to guide the way for investors will likely be meaningful.
68 Annual Report | December 31, 2008 |
Value Discovery Fund
Performance Highlights (unaudited)
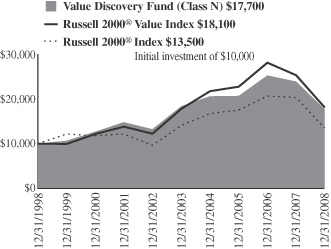
Average Annual Total Return at 12/31/2008
| | | | | | | | | | | | | | | |
| | | 1
Year | | | 3
Year | | | 5
Year | | | 10
Year | | | Since
Inception(a) | |
Value Discovery Fund Class N | | (25.85 | )% | | (5.16 | )% | | (0.80 | )% | | 5.87 | % | | — | % |
Value Discovery Fund Class I | | (25.77 | ) | | (4.97 | ) | | (0.62 | ) | | — | | | 7.11 | |
Russell 2000®
Value Index | | (28.92 | ) | | (7.49 | ) | | 0.27 | | | 6.11 | | | 6.94 | |
Russell 2000®
Index | | (33.79 | ) | | (8.29 | ) | | (0.93 | ) | | 3.02 | | | 3.00 | |
| | (a) | | For the period from October 1, 1999 to December 31, 2008. | |
Performance cited represents past performance. Past performance does not guarantee future results and current performance may be lower or higher than the data quoted. Results shown are average annual total returns, which assume reinvestment of dividends and capital gains. Investment returns and principal will fluctuate and you may have a gain or loss when you sell shares. For the most current month-end performance information, please call 1-800-742-7272, or visit our Web site at www.williamblairfunds.com. Investing in smaller companies involves special risks, including higher volatility and lower liquidity. From time to time, the investment advisor may waive fees or reimburse expenses for the Fund. Without these waivers, performance would be lower. Class N shares are available to the general public without a sales load. Class I shares are available to certain institutional investors and advisory clients of William Blair & Company, L.L.C., without a sales load or distribution (12b-1) or service fees.
The performance highlights and graph presented above do not reflect the deduction of taxes that a shareholder would pay on fund distributions or the redemption of fund shares.
The Russell 2000® Value Index is the Fund’s primary benchmark. The Russell 2000® Value consists of small-capitalization companies with below average price-to-book ratios and forecasted growth rates.
The Russell 2000® Index is an unmanaged composite of the smallest 2000 stocks of the Russell 3000® Index.
On May 1, 2008 the Fund’s primary benchmark changed from the Russell 2000® Index to the Russell 2000® Value Index. The Russell 2000® Value Index includes Russell 2000® Index companies with lower price-to-book ratios and lower forecasted growth values. The primary reason for the change is to compare the Fund to a benchmark that has a company selection methodology that more closely resembles that of the Fund.
This report identifies the Fund’s investments on December 31, 2008. These holdings are subject to change. Not all stocks in the Fund performed the same, nor is there any guarantee that these stocks will perform as well in the future. Market forecasts provided in this report may not necessarily come to pass.
Sector Diversification (unaudited)
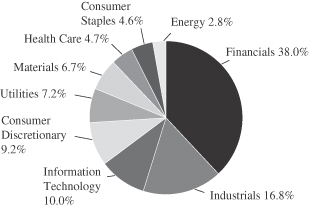
The sector diversification shown is based on the total long-term securities.
December 31, 2008 | William Blair Funds 69 |
Value Discovery Fund
Portfolio of Investments, December 31, 2008 (all dollar amounts in thousands)
| | | | | |
Issuer | | Shares | | Value |
| | |
Common Stocks | | | | | |
Financials—36.8% | | | | | |
American Campus Communities, Inc. | | 9,955 | | $ | 204 |
*Argonaut Group, Inc.† | | 18,252 | | | 619 |
Aspen Insurance Holdings Limited† | | 13,275 | | | 322 |
Astoria Financial Corporation | | 24,800 | | | 409 |
Bank Of Hawaii Corporation | | 11,440 | | | 517 |
Boston Private Financial Holdings, Inc. | | 59,174 | | | 405 |
Cogdell Spencer, Inc. | | 51,000 | | | 477 |
Delphi Financial Group, Class “A” | | 20,870 | | | 385 |
East West Bancorp, Inc. | | 27,857 | | | 445 |
First Niagara Financial Group, Inc. | | 19,125 | | | 309 |
First Potomac Realty Trust | | 55,017 | | | 512 |
FirstMerit Corporation | | 30,653 | | | 631 |
Glacier Bancorp, Inc. | | 20,175 | | | 384 |
Hanover Insurance Group, Inc. | | 19,560 | | | 840 |
Healthcare Realty Trust Incorporated | | 12,925 | | | 303 |
Highwoods Realty L.P. | | 16,595 | | | 454 |
Iberiabank Corporation | | 12,155 | | | 584 |
Lasalle Hotel Properties | | 17,730 | | | 196 |
MeadowBrook Insurance Group, Inc. | | 56,415 | | | 363 |
Mid-American Apartment Communities, Inc. | | 14,845 | | | 552 |
National Penn Bancshares, Inc. | | 17,205 | | | 250 |
Newalliance Bancshares, Inc. | | 21,920 | | | 289 |
Old National Bancorp | | 39,210 | | | 712 |
Onebeacon Insurance Group, Ltd.† | | 30,878 | | | 322 |
Platinum Underwriters Holdings, Ltd.† | | 7,425 | | | 268 |
*PMA Capital Corporation, Class “A” | | 74,843 | | | 530 |
*Proassurance Corporation | | 5,500 | | | 290 |
Realty Income Corporation | | 20,870 | | | 483 |
*Texas Capital Bancshares, Inc. | | 21,830 | | | 292 |
UMB Financial Corp | | 6,985 | | | 343 |
Validus Holdings, Ltd.† | | 10,655 | | | 279 |
Wilmington Trust Corporation | | 16,192 | | | 360 |
| | | | | |
| | | | | 13,329 |
| | | | | |
Industrials—16.2% | | | | | |
Acuity Brands, Inc. | | 11,355 | | | 396 |
*ATC Technology Corporation | | 22,970 | | | 336 |
Brady Corporation | | 13,010 | | | 312 |
*EMCOR Group, Inc. | | 20,785 | | | 466 |
*Esco Technologies, Inc. | | 13,800 | | | 565 |
G & K Services, Inc. | | 14,585 | | | 295 |
*Graftech International Ltd. | | 39,125 | | | 326 |
Interface, Inc., Class “A” | | 42,705 | | | 198 |
Kaydon Corporation | | 13,625 | | | 468 |
*Old Dominion Freight Line, Inc. | | 16,505 | | | 470 |
Quanex Building Products Corporation | | 18,340 | | | 172 |
Simpson Manufacturing Co., Inc. | | 13,450 | | | 373 |
Tal International Group, Inc. | | 23,665 | | | 334 |
Toro Company | | 11,525 | | | 380 |
Triumph Group, Inc. | | 11,180 | | | 475 |
Watson Wyatt Worldwide, Inc. | | 6,375 | | | 305 |
| | | | | |
| | | | | 5,871 |
| | | | | |
Information Technology—9.7% | | | | | |
ADTRAN, Inc. | | 21,745 | | | 324 |
*Anixter International, Inc. | | 10,390 | | | 313 |
*Atmel Corporation | | 41,920 | | | 131 |
*Avid Technology, Inc. | | 24,871 | | | 271 |
*EarthLink, Inc. | | 58,335 | | | 394 |
*MICROS Systems, Inc. | | 24,715 | | | 403 |
*Parametric Technology Corporation | | 37,900 | | | 479 |
*Semitool, Inc. | | 56,154 | | | 171 |
| | | | | |
Issuer | | Shares | | Value |
| | |
Common Stocks—(continued) | | | | | |
Information Technology—(continued) | | | | | |
*Sybase, Inc. | | 16,365 | | $ | 405 |
*Ultra Clean Holdings, Inc. | | 92,568 | | | 186 |
United Online, Inc. | | 70,385 | | | 427 |
| | | | | |
| | | | | 3,504 |
| | | | | |
Consumer Discretionary—8.8% | | | | | |
Ameristar Casinos, Inc. | | 61,565 | | | 532 |
Callaway Golf Company | | 42,790 | | | 398 |
Christopher & Banks Corporation | | 83,227 | | | 466 |
*Gaylord Entertainment Company | | 22,180 | | | 240 |
Interactive Data Corporation | | 18,075 | | | 446 |
*Jack In The Box, Inc. | | 26,025 | | | 575 |
*Rent-A-Center, Inc. | | 31,440 | | | 555 |
| | | | | |
| | | | | 3,212 |
| | | | | |
Utilities—7.0% | | | | | |
ALLETE, Inc. | | 14,670 | | | 473 |
Avista Corporation | | 22,095 | | | 428 |
Cleco Corporation | | 22,530 | | | 514 |
Northwest Natural Gas Company | | 8,207 | | | 363 |
South Jersey Industries, Inc. | | 10,830 | | | 432 |
Southwest Gas Corporation | | 12,750 | | | 322 |
| | | | | |
| | | | | 2,532 |
| | | | | |
Materials—6.5% | | | | | |
Arch Chemicals, Inc. | | 15,980 | | | 417 |
*Intrepid Potash, Inc. | | 21,079 | | | 438 |
Minerals Technologies, Inc. | | 9,080 | | | 371 |
*Polyone Corporation | | 64,885 | | | 204 |
Silgan Holdings, Inc. | | 13,535 | | | 647 |
Texas Industries, Inc. | | 7,860 | | | 271 |
| | | | | |
| | | | | 2,348 |
| | | | | |
Health Care—4.5% | | | | | |
*Magellan Health Services | | 11,965 | | | 469 |
*Matrixx Initiatives, Inc. | | 22,584 | | | 372 |
*Mednax, Inc. | | 10,443 | | | 331 |
*Varian, Inc. | | 14,059 | | | 471 |
| | | | | |
| | | | | 1,643 |
| | | | | |
Consumer Staples—4.5% | | | | | |
Flowers Foods, Inc. | | 19,770 | | | 482 |
J&J Snack Foods | | 15,807 | | | 567 |
Spartan Stores, Inc. | | 24,450 | | | 569 |
| | | | | |
| | | | | 1,618 |
| | | | | |
Energy—2.7% | | | | | |
*Forest Oil Corporation | | 12,208 | | | 201 |
*Newpark Resources, Inc. | | 86,997 | | | 322 |
*Petrohawk Energy Corporation | | 22,078 | | | 345 |
*TETRA Technologies, Inc. | | 25,240 | | | 123 |
| | | | | |
| | | | | 991 |
| | | | | |
Total Common Stock—96.7%
(cost $43,804) | | | 35,048 |
| | | | | |
| | |
Investment in Affiliate | | | | | |
William Blair Ready Reserves Fund | | 233,468 | | | 233 |
| | | | | |
Total Investment in Affiliate—0.6%
(cost $233) | | | 233 |
| | | | | |
See accompanying Notes to Financial Statements.
70 Annual Report | December 31, 2008 |
Value Discovery Fund
Portfolio of Investments, December 31, 2008 (all dollar amounts in thousands)
| | | | | | | |
Issuer | | Principal
Amount | | Value | |
| | |
Repurchase Agreement | | | | | | | |
Fixed Income Clearing Corporation,
0.010% dated 12/31/08, due 1/2/09, repurchase price $1,075, collateralized by FHLMC, 5.625%, due 11/23/35 | | $ | 1,075 | | $ | 1,075 | |
| | | | | | | |
Total Repurchase Agreement—3.0%
(cost $1,075) | | | 1,075 | |
| | | | | | | |
Total Investments—100.3%
(cost $45,112) | | | 36,356 | |
Liabilities, plus cash and other assets—(0.3)% | | | (107 | ) |
| | | | | | | |
Net assets—100.0% | | $ | 36,249 | |
| | | | | | | |
*Non-income producing
† = U.S. listed foreign security
See accompanying Notes to Financial Statements.
December 31, 2008 | William Blair Funds 71 |

Christopher T. Vincent
BOND FUND
The Bond Fund seeks to outperform the Barclays Capital U.S. Aggregate Bond Index by maximizing total return through a combination of income and capital appreciation.
AN OVERVIEW FROM THE PORTFOLIO MANAGER
How did the Fund perform during the past year? How did the Fund’s performance compare to its benchmark?
The Bond Fund posted a 1.64% increase on a total return basis (Class N Shares) for the 12 months ended December 31, 2008. By comparison, the Fund’s benchmark, the Barclays Capital U.S. Aggregate Bond Index, gained 5.24%.
After an unprecedented year of turmoil and upheaval in the financial markets, the performance of fixed income securities during 2008 was somewhat of a mixed bag.
The Barclays Capital U.S. Aggregate Bond Index return of 5.24% for 2008 was actually a rather middling one, as in recent years many returns have been both better and worse. Record gains in the prices of Treasury Securities and record losses in Corporate Bond prices offset each other to produce an average year for this Index.
In the first quarter alone, there were enough newsworthy events to fill an entire year. The fixed income markets had not seen such a quarter since the savings and loan crisis of the early 1990s.
The biggest of these events occurred on March 13, when executives at Bear Stearns first informed financial regulators that the bank, one of Wall Street’s biggest, was facing imminent bankruptcy. After a weekend of round-the-clock negotiations, the Federal Reserve mediated a “fire sale” of Bear Stearns to JP Morgan Chase. The Bear Stearns crisis was a great example of how the confidence of counterparties can affect the viability of a financial institution.
In addition, during the first quarter the Fed lowered the federal funds rate from 4.25% to 2.25%, lowered the discount rate from 4.75% to 2.50%, opened the discount window to investment banks, and reduced the capital holding requirements for Fannie Mae and Freddie Mac, all in an effort to provide liquidity in order to encourage borrowing and lending without reigniting inflation.
Lastly, an emergency financial stimulus package was passed by Congress in February in an attempt to reinvigorate consumer spending, and in turn the economy.
As much as a “flight to quality” had been underway since 2007, so was a “flight to liquidity,” in that demand for U.S. Treasury securities over other fixed-income assets soared.
Corporate bond prices led the fixed income markets down in the third quarter, in a move that was precipitated by the bankruptcy of the venerable 158-year old investment bank, Lehman Brothers. Roughly a week before the U.S. Treasury had stepped in to take over the Government-Sponsored Enterprises (GSEs) Fannie Mae and Freddie Mac.
The very same weekend that Lehman Brothers announced it was in liquidation, Merrill Lynch announced it would be acquired by Bank of America, and the insurance giant AIG suffered a liquidity crisis following the downgrade of its credit rating. At the company’s request, the Federal Reserve loaned money to AIG to prevent its collapse, in order for AIG to meet its obligations to post additional collateral to trading partners.
72 Annual Report | December 31, 2008 |
Exacerbating fears were reports that a prominent institutional money market fund had “broken the buck,” due to losses the fund experienced because of its holdings of Lehman commercial paper.
During the last two weeks of September, the Corporate Bond market experienced price moves that normally would have taken place over the course of a year or more. Market sentiment had literally devolved into a “shoot, first, ask questions later,” atmosphere, with investors assuming the worst with regard to securities. Compounding this was a systemic lack of confidence in the funding markets.
The U.S. Treasury’s Troubled Asset Relief Program (TARP), initially designed as a “one-off,” or piecemeal program to buy assets from troubled financial institutions and thereby inject capital to repair balance sheets, evolved into a system-wide solution to deal with the liquidity crisis.
The mid-September through end of October period was one of wholesale “de-risking” of fixed income portfolios. Undoubtedly there was a great deal of de-leveraging that was occurring during this time.
October especially was an unprecedented period of volatility in the investment grade corporate bond market. Investment grade bonds posted a (7.00)% to (8.00)% negative rate of return in a 30-day period.
By the end of the fourth quarter, the shorter-term/funding markets were functioning on a much improved basis, but with the assistance of a plethora of government programs.
The Federal Reserve Board also entered a new era as it set its benchmark overnight federal funds interest rate to a range of 0.00%—0.25%, in a move to signal it still had tools with which it could stimulate the economy. But with its move, the Fed essentially acknowledged that the economic downturn was worse than the Fed had thought at their meeting in October, and that they remained very concerned about the fragility of the economy. The Fed also stated that inflationary pressures had diminished appreciably, and that inflation should moderate further in coming quarters.
The credit markets began to improve during the middle of November, and the Corporate Bond market came back strongly during December. December, in fact, was a positive month for the riskier segments of the fixed-income markets. Investors had come to the realization that the dislocations within the financial markets were going to impact the economy for several quarters to come.
What is your current strategy? How is the Fund positioned?
During the third quarter we anticipated that market conditions would create opportunities in the Corporate Bond market. We believed investors were being well compensated over the long-term, and searched for attractive entry points at which to establish positions. During the fourth quarter we maintained and slightly increased our weighting to Corporate Bonds—to 34.2% at year end from 32.0% at the end of the third quarter, and we were overweight compared to our benchmark’s weighting of 20.3%.
Within sectors, we were underweight in Financials, as we believe Financials bore the brunt of the of the recent market volatility.
Although we would characterize the Fund as taking refuge during the market turmoil in what are considered quality “blue chip” (Corporate Bond) names including Kimberly Clark, Kroger and Wal-Mart, as the quarter progressed we gradually began to increase the Fund’s exposure to the Financial sector.
Exposure to Non-Agency Mortgage-backed securities decreased slightly.
December 31, 2008 | William Blair Funds 73 |
What is your outlook going forward?
Market participants continue to search for signs that the worst is over in terms of the financial crisis.
Fundamentally, we believe the case for maintaining overweight positions in Fannie Mae, Freddie Mac and Corporate Bonds is very compelling. We are still overweight the “spread” sectors, based on valuations we believe are stretched.
Nonetheless, there is still a great deal of uncertainty, unknown details, and developments yet to unfold at the macroeconomic level as a result of the government’s $700 billion dollar rescue package for the U.S. financial system, and the changes that have yet to be proposed and implemented by the new Administration. At the very least, we expect regulatory change and increased oversight to play an increased role in the post election period.
74 Annual Report | December 31, 2008 |
Bond Fund
Performance Highlights (unaudited)
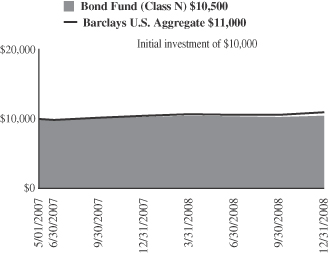
Average Annual Total Return at 12/31/2008
| | | | | | |
| | | 1
Year | | | Since
Inception(a) | |
Bond Fund Class N | | 1.64 | % | | 3.00 | % |
Bond Fund Class I | | 1.72 | | | 3.12 | |
Barclays Capital U.S. Aggregate Index | | 5.24 | | | 6.06 | |
| | (a) | | For the period from May 1, 2007 (Commencement of Operations) to December 31, 2008. | |
Performance cited represents past performance. Past performance does not guarantee future results and current performance may be lower or higher than the data quoted. Results shown are average annual total returns, which assume reinvestment of dividends and capital gains. Investment returns and principal will fluctuate and you may have a gain or loss when you sell shares. For the most current month-end performance information, please call 1-800-742-7272, or visit our Web site at www.williamblairfunds.com. From time to time, the investment advisor may waive fees or reimburse expenses for the Fund. Without these waivers, performance would be lower. Class N shares are available to the general public without a sales load. Class I shares are available to certain institutional investors and advisory clients of William Blair & Company, L.L.C., without a sales load or distribution (12b-1).
The performance highlights and graph presented above do not reflect the deduction of taxes that a shareholder would pay on fund distributions or the redemption of fund shares.
The Barclays Capital U.S. Aggregate Bond Index indicates broad intermediate government/corporate bond market performance.
This report identifies the Fund’s investments on December 31, 2008. These holdings are subject to change. Not all investments in the Fund performed the same, nor is there any guarantee that these investments will perform as well in the future. Market forecasts provided in this report may not necessarily come to pass.
Sector Diversification (unaudited)
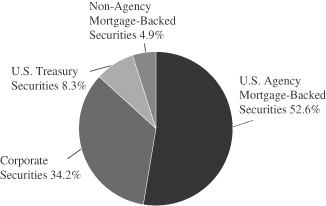
The sector diversification shown is based on the total long-term securities.
December 31, 2008 | William Blair Funds 75 |
Bond Fund
Portfolio of Investments, December 31, 2008 (all amounts in thousands)
| | | | | | |
| | | Principal
Amount | | Value |
|
U.S. Government and U.S. Government Agency—58.9% |
U.S. Treasury—7.9% | | | | | | |
U.S. Treasury Note, 4.750%, due 2/15/10 | | $ | 2,500 | | $ | 2,619 |
U.S. Treasury Note, 4.250%, due 9/30/12 | | | 210 | | | 234 |
U.S. Treasury Note, 4.750%, due 5/15/14 | | | 355 | | | 418 |
U.S. Treasury Note, 4.750%, due 8/15/17 | | | 1,200 | | | 1,435 |
U.S. Treasury Note, 5.500%, due 8/15/28 | | | 400 | | | 541 |
U.S. Treasury Note, 4.500%, due 2/15/36 | | | 500 | | | 664 |
| | | | | | |
Total U.S. Treasury Obligations | | | 5,165 | | | 5,911 |
| | | | | | |
Government National Mortgage Association (GNMA)—1.0% |
#357752, 7.000%, due 4/15/09 | | | 1 | | | 1 |
GNR 2006-67 GB, 4.186%, due 9/16/34 | | | 750 | | | 759 |
| | | | | | |
Total GNMA Mortgage Obligations | | | 751 | | | 760 |
| | | | | | |
Federal Home Loan Mortgage Corp. (FHLMC)—10.7% |
#G10330, 7.000%, due 1/1/10 | | | 9 | | | 10 |
#G90024, 7.000%, due 1/20/13 | | | 105 | | | 110 |
#G30093, 7.000%, due 12/1/17 | | | 57 | | | 60 |
#G30255, 7.000%, due 7/1/21 | | | 118 | | | 124 |
#E02360, 6.500%, due 7/1/22 | | | 915 | | | 951 |
#D95897, 5.500%, due 3/1/23 | | | 410 | | | 422 |
#G10728, 7.500%, due 7/1/32 | | | 406 | | | 431 |
#C01385, 6.500%, due 8/1/32 | | | 645 | | | 674 |
#A62179, 6.000%, due 6/1/37 | | | 1,303 | | | 1,348 |
#A63539, 6.000%, due 7/1/37 | | | 1,810 | | | 1,873 |
#A78138, 5.500%, due 6/1/38 | | | 1,958 | | | 2,012 |
| | | | | | |
Total FHLMC Mortgage Obligations | | | 7,736 | | | 8,015 |
| | | | | | |
Federal National Mortgage Association (FNMA)—39.3% |
#535559, 7.500%, due 9/1/12 | | | 484 | | | 500 |
#598453, 7.000%, due 6/1/15 | | | 12 | | | 12 |
#689612, 5.000%, due 5/1/18 | | | 712 | | | 737 |
#747903, 4.500%, due 6/1/19 | | | 627 | | | 643 |
#253847, 6.000%, due 5/1/21 | | | 431 | | | 447 |
#900725, 6.000%, due 8/1/21 | | | 353 | | | 367 |
#545437, 7.000%, due 2/1/32 | | | 310 | | | 328 |
#254548, 5.500%, due 12/1/32 | | | 1,725 | | | 1,774 |
#555522, 5.000%, due 6/1/33 | | | 799 | | | 818 |
#190337, 5.000%, due 7/1/33 | | | 967 | | | 990 |
#254868, 5.000%, due 9/1/33 | | | 1,411 | | | 1,444 |
#190340, 5.000%, due 9/1/33 | | | 2,915 | | | 2,984 |
#555880, 5.500%, due 11/1/33 | | | 829 | | | 852 |
#725027, 5.000%, due 11/1/33 | | | 1,130 | | | 1,157 |
#725205, 5.000%, due 3/1/34 | | | 877 | | | 898 |
#725238, 5.000%, due 3/1/34 | | | 884 | | | 905 |
#725220, 5.000%, due 3/1/34 | | | 1,665 | | | 1,704 |
#725232, 5.000%, due 3/1/34 | | | 2,320 | | | 2,374 |
#725424, 5.500%, due 4/1/34 | | | 890 | | | 915 |
#725611, 5.500%, due 6/1/34 | | | 698 | | | 717 |
#745092, 6.500%, due 7/1/35 | | | 973 | | | 1,016 |
#848782, 6.500%, due 1/1/36 | | | 1,330 | | | 1,389 |
#849191, 6.000%, due 1/1/36 | | | 160 | | | 166 |
#256859, 5.500%, due 8/1/37 | | | 1,743 | | | 1,752 |
#888967, 6.000%, due 12/1/37 | | | 2,015 | | | 2,089 |
#934006, 6.500%, due 9/1/38 | | | 2,263 | | | 2,364 |
| | | | | | |
Total FNMA Mortgage Obligations | | | 28,523 | | | 29,342 |
| | | | | | |
| | | | | | | | |
| | | NRSRO
Rating
(unaudited) | | Principal
Amount | | Value |
| |
Non-Agency Mortgage-Backed Obligations—4.8% | | | |
Countrywide Alternative Loan Trust, 2003-11T1, Tranche M,
4.750%, due 7/25/18 | | AA+ | | $ | 313 | | $ | 291 |
First Plus 1997-4 M1
7.640%, due 9/11/23 | | AA | | | 244 | | | 244 |
Aames Mortgage Trust, 2001-1, Tranche M2,
7.588%, due 6/25/31 | | A | | | 133 | | | 85 |
LSSCO, 2004-2, Tranche M2,
5.520%, due 2/28/33, VRN* | | A | | | 186 | | | 132 |
CWL, 2003-5, Tranche MF2,
5.959%, due 11/25/33 | | Aa1 | | | 225 | | | 142 |
Renaissance Home Equity Loan Trust, 2004-2, Tranche M5,
6.455%, due 7/25/34 | | A | | | 496 | | | 298 |
FHASI, 2004-AR4, Tranche 3A1,
4.603%, due 8/25/34, VRN | | AAA | | | 714 | | | 505 |
Security National Mortgage Loan Trust, 2004-2A, Tranche M2,
6.352%, due 11/25/34* | | A2 | | | 15 | | | 15 |
Security National Mortgage Loan Trust, 2005-1A, Tranche M2,
6.530%, due 2/25/35* | | A | | | 21 | | | 15 |
Soundview Home Equity Loan Trust, 2005-B, Tranche M1,
5.635%, due 5/25/35 | | AA+ | | | 153 | | | 137 |
Structured Asset Securities Corp., 2005-9XS, Tranche 1A2A,
4.840%, due 6/25/35 | | AAA | | | 369 | | | 359 |
Structured Asset Securities Corp., 2005-9XS, Tranche 1A2C,
4.950%, due 6/25/35 | | AAA | | | 173 | | | 167 |
Structured Asset Securities Corp., 2005-9XS, Tranche A2B,
6.500%, due 6/25/35 | | AAA | | | 228 | | | 225 |
Chase Mortgage Finance Corporation, 2006-A1, Tranche A3,
6.000%, due 9/25/36 | | AAA | | | 700 | | | 300 |
Mid-State Trust 2004-1, Tranche A,
6.005%, due 8/15/37 | | AAA | | | 716 | | | 604 |
Statewide Mortgage Loan Trust, 2006-1A, Tranche A2,
7.660%, due 9/25/37* | | AAA | | | 70 | | | 43 |
| | | | | | | | |
Total Non-Agency Mortgage-Backed Obligations | | | 4,756 | | | 3,562 |
| | | | | | | | |
| | |
Corporate Obligations—32.9% | | | | | | |
HSBC Finance Corporation
8.000%, due 7/15/10 | | AA- | | | 500 | | | 508 |
Morgan Stanley Dean Witter & Co., 6.600%, due 4/1/12 | | A2 | | | 545 | | | 527 |
Simon Property Group, Inc.,
6.350%, due 8/28/12 | | A- | | | 750 | | | 584 |
Cox Communications, Inc.,
7.125%, due 10/1/12 | | BBB | | | 400 | | | 383 |
Boeing Capital Corporation,
5.800%, due 1/15/13 | | A+ | | | 400 | | | 404 |
See accompanying Notes to Financial Statements.
76 Annual Report | December 31, 2008 |
Bond Fund
Portfolio of Investments, December 31, 2008 (all amounts in thousands)
| | | | | | | | |
| | | NRSRO
Rating
(unaudited) | | Principal
Amount | | Value |
| | |
Corporate Obligations—(continued) | | | | | | |
Wells Fargo & Company,
4.375%, due 1/31/13 | | Aa1 | | $ | 350 | | $ | 343 |
The Kroger Co.,
5.500%, due 2/1/13 | | Baa2 | | | 430 | | | 426 |
PepsiCo, Inc.,
4.650%, due 2/15/13 | | Aa2 | | | 550 | | | 565 |
Weatherford International, Ltd.,
5.150%, due 3/15/13 | | BBB+ | | | 650 | | | 572 |
John Deere Capital Corporation,
4.500%, due 4/3/13 | | A | | | 700 | | | 670 |
Citigroup, Inc.,
5.500%, due 4/11/13 | | A+ | | | 690 | | | 672 |
Merrill Lynch & Co., Inc.,
6.150%, due 4/25/13 | | Aa3 | | | 750 | | | 743 |
General Electric Capital Corporation,
4.800%, due 5/1/13 | | AAA | | | 600 | | | 590 |
American Movil S.A.B. de C.V.,
5.500%, due 3/1/14 | | A3 | | | 700 | | | 645 |
Coca-Cola Enterprises, Inc.,
7.375%, due 3/3/14 | | A | | | 575 | | | 631 |
AT&T, Inc.,
5.100%, due 9/15/14 | | A | | | 700 | | | 688 |
Goldman Sachs Group, Inc.,
5.000%, due 10/1/14 | | AA- | | | 545 | | | 487 |
CODELCO, Inc.—144A,
4.750%, due 10/15/14 | | A1 | | | 400 | | | 376 |
Johnson Controls, Inc.,
5.500%, due 1/15/16 | | A3 | | | 400 | | | 310 |
KeyBank National Association,
5.450%, due 3/3/16 | | Aaa | | | 515 | | | 406 |
ProLogis,
5.750%, due 4/1/16 | | Baa2 | | | 400 | | | 199 |
Omnicom Group, Inc.,
5.900%, due 4/15/16 | | A- | | | 400 | | | 325 |
Yum!, Brands, Inc.,
6.250%, due 4/15/16 | | BBB- | | | 700 | | | 594 |
SABMiller plc,
6.500%, due 7/1/16 | | BBB+ | | | 700 | | | 649 |
Petrobras International Finance Company,
6.125%, due 10/6/16 | | Baa1 | | | 400 | | | 390 |
DuPont (E.I.) de Nemours,
5.250%, due 12/15/16 | | A | | | 500 | | | 497 |
Comcast Corporation,
6.500%, due 1/15/17 | | BBB+ | | | 350 | | | 346 |
J.P. Morgan Chase & Co.,
6.125%, due 6/27/17 | | Aa3 | | | 600 | | | 590 |
BB&T Corporation,
4.900%, due 6/30/17 | | A1 | | | 665 | | | 600 |
American Express,
6.150%, due 8/28/17 | | A+ | | | 600 | | | 578 |
IBM Corporation,
5.700%, due 9/14/17 | | A+ | | | 700 | | | 748 |
VRN = Variable Rate Note
NRSRO = Nationally Recognized Statistical Rating Organization, such as S&P, Moody’s or Fitch
The obligations of certain U.S. Government-sponsored securities are neither issued nor guaranteed by the U.S. Treasury
* Deemed illiquid pursuant to Liquidity Procedures approved by the Board of Trustees. These holdings represent 0.66% of the net assets at December 31,2008.
| | | | | | | | |
| | | NRSRO
Rating
(unaudited) | | Principal
Amount | | Value |
| | |
Corporate Obligations—(continued) | | | | | | |
Exelon Generation Company, LLC.,
6.200%, due 10/1/17 | | A3 | | $ | 600 | | $ | 516 |
Union Pacific Corporation,
5.750%, due 11/15/17 | | BBB | | | 525 | | | 498 |
Tesco plc,
5.500%, due 11/15/17 | | A | | | 600 | | | 556 |
Wells Fargo & Company,
5.625%, due 12/11/17 | | AA | | | 500 | | | 522 |
General Electric Capital Corporation,
5.625%, due 5/1/18 | | AAA | | | 350 | | | 353 |
Philip Morris International, Inc.,
5.650%, due 5/16/18 | | A2 | | | 500 | | | 496 |
Verizon Communications, Inc.,
8.750%, due 11/1/18 | | A | | | 330 | | | 387 |
Iron Mountain, Incorporated,
8.000%, due 6/15/20 | | B+ | | | 750 | | | 602 |
Ras Laffan Lng II,
5.298%, due 9/30/20* | | Aa2 | | | 400 | | | 285 |
Southwest Airlines Co.,
6.150%, due 8/1/22 | | Aa3 | | | 725 | | | 566 |
The Kroger Co.,
8.000%, due 9/15/29 | | Baa2 | | | 325 | | | 367 |
Conoco Funding Company,
7.250%, due 10/15/31 | | A1 | | | 400 | | | 430 |
Kohl’s Corporation,
6.000%, due 1/15/33 | | BBB+ | | | 400 | | | 257 |
Pacific Gas and Electric Company,
6.050%, due 3/1/34 | | A | | | 250 | | | 266 |
Wisconsin Electric Power Company,
5.700%, due 12/1/36 | | A1 | | | 500 | | | 474 |
Comcast Corporation,
6.450%, due 3/15/37 | | BBB+ | | | 300 | | | 299 |
McDonald’s Corporation,
6.300%, due 3/1/38 | | A | | | 500 | | | 552 |
J.P. Morgan Chase & Co.,
6.400%, due 5/15/38 | | Aa2 | | | 350 | | | 414 |
Verizon Communications, Inc.,
8.950%, due 3/1/39 | | A | | | 375 | | | 484 |
Florida Power and Light Group Capital, Inc.,
6.650%, due 6/15/67, VRN | | A3 | | | 300 | | | 156 |
| | | | | | | | |
Total Corporate Obligations | | | 26,145 | | | 24,526 |
| | | | | | | | |
Total Fixed Income—96.6%
(Cost $72,832) | | | 73,076 | | | 72,116 |
| | | | | | | | |
Repurchase Agreement | | | | | | | | |
Fixed Income Clearing Corporation, 0.010% dated 12/31/08 due 1/2/09, repurchase price $574, collateralized by FHLMC, 5.625%, due 11/23/35 | | AAA | | | 574 | | | 574 |
| | | | | | | | |
Total Repurchase Agreement—0.8%
(Cost $574) | | | 574 | | | 574 |
| | | | | | | | |
Total Investments—97.4%
(cost $73,406) | | | 72,690 |
| | | | | | | | |
Cash and other assets, less liabilities—2.6% | | | 1,923 |
| | | | | | | | |
Net Assets—100.0% | | $ | 74,613 |
| | | | | | | | |
See accompanying Notes to Financial Statements.
December 31, 2008 | William Blair Funds 77 |
Christopher T. Vincent
INCOME FUND
The Income Fund invests in intermediate-term debt securities.
AN OVERVIEW FROM THE PORTFOLIO MANAGER
How did the Fund perform during the past year? How did the Fund’s performance compare to its benchmark?
The Income Fund posted a (2.46)% decrease on a total return basis (Class N Shares) for the 12 months ended December 31, 2008. By comparison, the Fund’s benchmark, the Barclays Capital Intermediate Government/Credit Bond Index, rose 5.08%, while the average of the Fund’s peer group, the Morningstar Short-term Bond Category, declined (4.23)%.
After an unprecedented year of turmoil and upheaval in the financial markets, the performance of fixed income securities during 2008 was somewhat of a mixed bag.
The returns of investment grade bonds for 2008 were the worst on record, while 30-year Treasury Bonds and posted their best returns ever. Returns on 10-Year Notes were the highest since 1995.
In the first quarter alone, there were enough newsworthy events to fill an entire year. The fixed income markets had not seen such a quarter since the savings and loan crisis of the early 1990s.
The biggest of these events occurred on March 13, when executives at Bear Stearns first informed financial regulators that the bank, one of Wall Street’s biggest, was facing imminent bankruptcy. After a weekend of round-the-clock negotiations, the Federal Reserve mediated a “fire sale” of Bear Stearns to JP Morgan Chase. The Bear Stearns crisis was a great example of how the confidence of counterparties can affect the viability of a financial institution.
In addition, during the first quarter the Fed lowered the federal funds rate from 4.25% to 2.25%, lowered the discount rate from 4.75% to 2.5%, opened the discount window to investment banks, and reduced the capital holding requirements for Fannie Mae and Freddie Mac, all in an effort to provide liquidity in order to encourage borrowing and lending without reigniting inflation.
Lastly, an emergency financial stimulus package was passed by Congress in February in an attempt to reinvigorate consumer spending, and in turn the economy.
As much as a “flight to quality” had been underway since 2007, so was a “flight to liquidity,” in that demand for U.S. Treasury securities over other fixed-income assets soared.
Corporate bond prices led the fixed income markets down in the third quarter, in a move that was precipitated by the bankruptcy of the venerable 158-year old investment bank, Lehman Brothers. Roughly a week before the U.S. Treasury had stepped in to take over the Government-Sponsored Enterprises (GSEs) Fannie Mae and Freddie Mac.
The very same weekend that Lehman Brothers announced it was in liquidation, Merrill Lynch announced it would be acquired by Bank of America, and the insurance giant AIG suffered a liquidity crisis following the downgrade of its credit rating. At the company’s request, the Federal Reserve loaned money to AIG to prevent its collapse, in order for AIG to meet its obligations to post additional collateral to trading partners.
78 Annual Report | December 31, 2008 |
Exacerbating fears were reports that a prominent institutional money market fund had “broken the buck,” due to losses the fund experienced because of its holdings of Lehman commercial paper.
During the last two weeks of September, the Corporate Bond market had experienced price moves that normally would have taken place over the course of a year or more. Market sentiment had literally devolved into a “shoot, first, ask questions later,” atmosphere, with investors assuming the worst with regard to securities. Compounding this was a systemic lack of confidence in the funding markets.
The U.S. Treasury’s Troubled Asset Relief Program (TARP), initially designed as a “one-off,” or piecemeal program to buy assets from troubled financial institutions and thereby inject capital to repair balance sheets, evolved into a system-wide solution to deal with the liquidity crisis.
The mid-September through end of October period was one of wholesale “de-risking” of fixed income portfolios. Undoubtedly, a great deal of de-leveraging was occurring during this time.
October especially was an unprecedented period of volatility in the investment grade corporate bond market. Investment grade bonds posted a (7.0)% to (8.0)% negative rate of return in a 30-day period.
By the end of the fourth quarter, the shorter-term/funding markets were functioning on a much improved basis, but with the assistance of a plethora of government programs.
The Federal Reserve Board also entered a new era as it set its benchmark overnight federal funds interest rate to a range of 0.00%—0.25%, in a move to signal it still had tools with which it could stimulate the economy. But with its move, the Fed essentially acknowledged that the economic downturn was worse than the Fed had thought at their meeting in October, and that they remained very concerned about the fragility of the economy. The Fed also stated that inflationary pressures had diminished appreciably, and that inflation should moderate further in coming quarters.
The credit markets began to improve during the middle of November, and the Corporate Bond market came back strongly during December. December, in fact, was a positive month for the riskier segments of the fixed-income markets. Investors had come to the realization that the dislocations within the financial markets were going to impact the economy for several quarters to come.
What is your current strategy? How is the Fund positioned?
During the third quarter, we anticipated that market conditions would create opportunities in the Corporate Bond market. We believed investors were being well compensated over the long-term, and searched for attractive entry points at which to establish positions.
During the fourth quarter we significantly raised our exposure to Corporate Bonds—to 53.4% at year end from 38.3% at the end of the third quarter, and we were overweight our benchmark’s weighting of 34.2%
Within sectors, we were underweight Financials, as we believe Financials bore the brunt of the recent market volatility.
Although we would characterize the Fund as taking refuge during the market turmoil in what are considered quality “blue chip” (Corporate Bond) names including Kimberly-Clark, Kroger Company and Wal-Mart Stores, as the quarter progressed we gradually began to increase the Fund’s exposure to the Financial sector.
December 31, 2008 | William Blair Funds 79 |
What is your outlook going forward?
Market participants continue to search for signs that the worst is over in terms of the financial crisis.
Fundamentally, we believe the case for maintaining overweight positions in Fannie Mae, Freddie Mac and Corporate Bonds is very compelling. We are still overweight the “spread” sectors, based on valuations we believe are stretched.
Nonetheless, there is still a great deal of uncertainty, unknown details, and developments yet to unfold at the macroeconomic level as a result of the government’s $700 billion dollar rescue package for the U.S. financial system, and the changes that have yet to be proposed and implemented by the new Administration. At the very least, we expect regulatory change and increased oversight to play an increased role in the post election period.
80 Annual Report | December 31, 2008 |
Income Fund
Performance Highlights (unaudited)
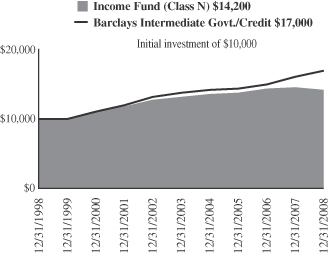
Average Annual Total Return at 12/31/2008
| | | | | | | | | | | | | | | |
| | | 1
Year | | | 3
Year | | | 5
Year | | | 10
Year | | | Since
Inception(a) | |
Income Fund Class N | | (2.46 | )% | | 0.92 | % | | 1.41 | % | | 3.57 | % | | — | % |
Income Fund Class I | | (2.26 | ) | | 1.11 | | | 1.61 | | | — | | | 4.00 | |
Barclays Capital Intermediate Government/Credit
Bond Index | | 5.08 | | | 5.50 | | | 4.21 | | | 5.42 | | | 5.82 | |
| | (a) | | For the period from October 1, 1999 to December 31, 2008. |
Performance cited represents past performance. Past performance does not guarantee future results and current performance may be lower or higher than the data quoted. Results shown are average annual total returns, which assume reinvestment of dividends and capital gains. Investment returns and principal will fluctuate and you may have a gain or loss when you sell shares. For the most current month-end performance information, please call 1-800-742-7272, or visit our Web site at www.williamblairfunds.com. From time to time, the investment advisor may waive fees or reimburse expenses for the Fund. Without these waivers, performance would be lower. Class N shares are available to the general public without a sales load. Class I shares are available to certain institutional investors and advisory clients of William Blair & Company, L.L.C., without a sales load or distribution (12b-1) or service fees.
The performance highlights and graph presented above do not reflect the deduction of taxes that a shareholder would pay on fund distributions or the redemption of fund shares.
The Barclays Capital Intermediate Government Credit Bond Index indicates broad intermediate government/corporate bond market performance.
This report identifies the Fund’s investments on December 31, 2008. These holdings are subject to change. Not all investments in the Fund performed the same, nor is there any guarantee that these investments will perform as well in the future. Market forecasts provided in this report may not necessarily come to pass.
Sector Diversification (unaudited)
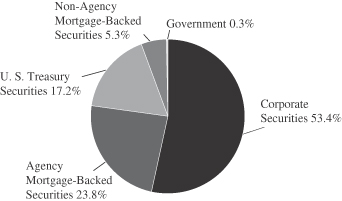
The sector diversification shown is based on the total long-term securities.
December 31, 2008 | William Blair Funds 81 |
Income Fund
Portfolio of Investments, December 31, 2008 (all dollar amounts in thousands)
| | | | | | | | |
Income Fund | | Principal
Amount | | Value |
|
U.S. Government and U.S. Government Agency—41.4% |
U.S. Treasury—17.2% | | | | | | | | |
U.S. Treasury Note,
6.500%, due 2/15/10 | | | | $ | 1,250 | | $ | 1,333 |
U.S. Treasury Note,
4.250%, due 9/30/12 | | | | | 12,000 | | | 13,399 |
U.S. Treasury Note,
5.125%, due 5/15/16 | | | | | 5,500 | | | 6,660 |
U.S. Treasury Note,
4.750%, due 8/15/17 | | | | | 2,250 | | | 2,690 |
| | | | | | | | |
Total U.S. Treasury Obligations | | | | | 21,000 | | | 24,082 |
| | | | | | | | |
Government National Mortgage Association (GNMA)—0.3% | | | | | | | | |
#780405, 9.500%, due 11/15/17 | | | | | 282 | | | 304 |
#357322, 7.000%, due 9/15/23 | | | | | 171 | | | 181 |
| | | | | | | | |
Total Government National Mortgage Association | | | | | 453 | | | 485 |
| | | | | | | | |
Federal Home Loan Mortgage Corp. (FHLMC)—6.5% | | | | | | | | |
#G90028, 7.000%, due 5/17/09 | | | | | 2 | | | 2 |
#E80050, 6.000%, due 10/1/09 | | | | | 7 | | | 7 |
#G90019, 7.500%, due 12/17/09 | | | | | 30 | | | 30 |
#E00436, 7.000%, due 6/1/11 | | | | | 171 | | | 177 |
#G10708, 6.500%, due 8/1/12 | | | | | 114 | | | 118 |
#E72924, 7.000%, due 10/1/13 | | | | | 547 | | | 570 |
#E81697, 8.000%, due 5/1/15 | | | | | 1,411 | | | 1,498 |
#E81703, 7.000%, due 5/1/15 | | | | | 583 | | | 608 |
#E81908, 8.500%, due 12/1/15 | | | | | 97 | | | 113 |
#J02184, 8.000%, due 4/1/16 | | | | | 925 | | | 979 |
#G90022, 8.000%, due 9/17/16 | | | | | 404 | | | 427 |
#E90398, 7.000%, due 5/1/17 | | | | | 1,007 | | | 1,055 |
#M30028, 5.500%, due 5/1/17 | | | | | 107 | | | 110 |
#C67537, 9.500%, due 8/1/21 | | | | | 58 | | | 63 |
#D95621, 6.500%, due 7/1/22 | | | | | 2,481 | | | 2,592 |
#A45790, 7.500%, due 5/1/35 | | | | | 764 | | | 810 |
| | | | | | | | |
Total FHLMC Mortgage Obligations | | | | | 8,708 | | | 9,159 |
| | | | | | | | |
Federal National Mortgage Association (FNMA)—17.4% | | | | | | | | |
#765396, 5.500%, due 1/1/09 | | | | | 1 | | | 1 |
#2002-27, Tranche SW,
22.110%, due 5/25/2009 VRN | | | | | 270 | | | 274 |
#695512, 8.000%, due 9/1/10 | | | | | 99 | | | 101 |
#725479, 8.500%, due 10/1/10 | | | | | 134 | | | 135 |
#313816, 6.000%, due 4/1/11 | | | | | 141 | | | 147 |
#577393, 10.000%, due 6/1/11 | | | | | 85 | | | 91 |
#577395, 10.000%, due 8/1/11 | | | | | 335 | | | 359 |
#254788, 6.500%, due 4/1/13 | | | | | 264 | | | 276 |
#725315, 8.000%, due 5/1/13 | | | | | 301 | | | 317 |
#593561, 9.500%, due 8/1/14 | | | | | 245 | | | 265 |
#567027, 7.000%, due 9/1/14 | | | | | 1,072 | | | 1,112 |
#567026, 6.500%, due 10/1/14 | | | | | 860 | | | 894 |
#458124, 7.000%, due 12/15/14 | | | | | 161 | | | 169 |
#576554, 8.000%, due 1/1/16 | | | | | 1,012 | | | 1,069 |
#256106, 5.000%, due 2/1/16 | | | | | 1,775 | | | 1,841 |
#576553, 8.000%, due 2/1/16 | | | | | 1,667 | | | 1,778 |
#555747, 8.000%, due 5/1/16 | | | | | 213 | | | 224 |
#735569, 8.000%, due 10/1/16 | | | | | 1,214 | | | 1,281 |
| | | | | | | | |
Income Fund | | NRSRO
Rating
(unaudited) | | Principal
Amount | | Value |
|
Federal National Mortgage Association (FNMA)—(continued) |
#725410, 7.500%, due 4/1/17 | | | | $ | 776 | | $ | 809 |
#643217, 6.500%, due 6/1/17 | | | | | 287 | | | 298 |
#679247, 7.000%, due 8/1/17 | | | | | 1,115 | | | 1,173 |
#740847, 6.000%, due 10/1/18 | | | | | 956 | | | 994 |
#852864, 7.000%, due 7/1/20 | | | | | 2,345 | | | 2,478 |
#458147, 10.000%, due 8/15/20 | | | | | 593 | | | 664 |
#835563, 7.000%, due 10/1/20 | | | | | 985 | | | 1,042 |
#735574, 8.000%, due 3/1/22 | | | | | 585 | | | 620 |
#679253, 6.000%, due 10/1/22 | | | | | 1,267 | | | 1,313 |
#1993-19, Tranche SH,
11.234%, due 4/25/23, VRN | | | | | 11 | | | 11 |
#806458, 8.000%, due 6/1/28 | | | | | 620 | | | 657 |
#880155, 8.500%, due 7/1/29 | | | | | 1,080 | | | 1,165 |
#797846, 7.000%, due 3/1/32 | | | | | 1,313 | | | 1,388 |
#745519, 8.500%, due 5/1/32 | | | | | 727 | | | 785 |
#654674, 6.500%, due 9/1/32 | | | | | 248 | | | 259 |
#733897, 6.500%, due 12/1/32 | | | | | 379 | | | 400 |
| | | | | | | | |
Total FNMA Mortgage Obligations | | | | | 23,136 | | | 24,390 |
| | | | | | | | |
| | | |
Non-Agency Mortgage-Backed Obligations—5.3% | | | | | | | | |
ABFS, 2002-2, Tranche A6,
5.850%, due 3/15/19 | | AAA | | | 102 | | | 102 |
First Plus, 1997-4, Tranche A8,
7.810%, due 9/11/23 | | AAA | | | 32 | | | 32 |
First Plus, 1997-4, Tranche M1,
7.640%, due 9/11/23 | | AA | | | 829 | | | 828 |
First Plus, 1997-4, Tranche M2,
7.830%, due 9/11/23 | | A | | | 175 | | | 169 |
First Plus, 1998-2, Tranche M2,
8.010%, due 5/10/24 | | A | | | 112 | | | 109 |
First Plus, 1998-3, Tranche M2,
7.920%, due 5/10/24, VRN | | A | | | 299 | | | 291 |
Security National Mortgage Loan Trust, 2004-1A, Tranche M2,
6.750%, due 6/25/32* | | A | | | 873 | | | 305 |
LSSCO, 2004-2, Tranche M1,
5.520%, due 2/28/33, VRN* | | AA | | | 486 | | | 431 |
LSSCO, 2004-2, Tranche M2,
5.520%, due 2/28/33, VRN* | | A | | | 373 | | | 264 |
ABFS, 2002-2, Tranche A-7,
5.720%, due 7/15/33 | | Aaa | | | 14 | | | 14 |
Residential Asset Mortgage Products, 2003-RS9, Tranche MI2,
6.300%, due 10/25/33 | | Aa3 | | | 1,153 | | | 571 |
Security National Mortgage Loan Trust, 2004-2A, Tranche M2,
6.352%, due 11/25/34* | | A2 | | | 656 | | | 645 |
Security National Mortgage Loan Trust, 2005-1A, Tranche B1,
7.450%, due 2/25/35* | | BBB | | | 795 | | | 594 |
Security National Mortgage Loan Trust, 2005-1A, Tranche M2,
6.530%, due 2/25/35* | | A | | | 1,234 | | | 876 |
Soundview Home Equity Loan Trust, 2005-B, Tranche M1
5.635%, due 5/25/35 | | AA+ | | | 386 | | | 347 |
See accompanying Notes to Financial Statements.
82 Annual Report | December 31, 2008 |
Income Fund
Portfolio of Investments, December 31, 2008 (all dollar amounts in thousands)
| | | | | | | | |
Income Fund | | NRSRO
Rating
(unaudited) | | Principal
Amount | | Value |
|
Non-Agency Mortgage-Backed Obligations—(continued) |
Blackrock Capital Finance, 1997-R1 WAC, 7.882%, due 3/25/37, VRN* | | Aaa | | $ | 274 | | $ | 232 |
Statewide Mortgage Loan Trust, 2006-1A, Tranche A2,
7.660%, due 9/25/37* | | AAA | | | 2,638 | | | 1,624 |
| | | | | | | | |
Total Non-Agency Mortgage-Backed Obligations | | | | | 10,431 | | | 7,434 |
| | | | | | | | |
| | | |
Corporate Obligations—51.7 % | | | | | | | | |
Diageo Capital PLC,
7.250%, due 11/1/09 | | A | | | 1,500 | | | 1,527 |
Philips Petroleum,
8.750%, due 5/25/10 | | A1 | | | 1,500 | | | 1,581 |
HSBC Finance Corporation,
8.000%, due 7/15/10 | | AA- | | | 1,450 | | | 1,474 |
Textron, Inc., 4.500%, due 8/1/10 | | BBB+ | | | 1,250 | | | 1,069 |
Boeing Capital Corporation,
7.375%, due 9/27/10 | | A+ | | | 1,549 | | | 1,617 |
Pacific Gas & Electric PCG,
4.200%, due 3/1/11 | | A | | | 1,250 | | | 1,235 |
Wisconsin Energy Corporation,
6.500%, due 4/1/11 | | A3 | | | 1,250 | | | 1,293 |
ERP Operating LP,
6.625%, due 3/15/12 | | A- | | | 1,000 | | | 822 |
BHP Billiton Finance,
5.125%, due 3/29/12 | | A1 | | | 1,195 | | | 1,124 |
Morgan Stanley Dean Witter & Co., 6.600%, due 4/1/12 | | A2 | | | 1,600 | | | 1,547 |
Key Bank NA,
3.200%, due 6/15/12 | | Aaa | | | 1,000 | | | 1,039 |
Simon Property Group, Inc., 6.350%, due 8/28/12 | | A- | | | 1,500 | | | 1,168 |
Cox Communications, Inc.,
7.125%, due 10/1/12 | | BBB | | | 1,500 | | | 1,435 |
Wells Fargo & Company,
4.375%, due 1/31/13 | | AA | | | 1,400 | | | 1,371 |
Kroger Company,
5.500%, due 2/1/13 | | BBB | | | 1,500 | | | 1,486 |
Ohio Power Company,
5.500%, due 2/15/13 | | A3 | | | 1,900 | | | 1,829 |
PepsiCo, Inc.,
4.650%, due 2/15/13 | | Aa2 | | | 1,450 | | | 1,491 |
Weatherford International, Ltd.,
5.150%, due 3/15/13 | | BBB+ | | | 1,000 | | | 881 |
John Deere Capital Company,
4.500%, due 4/3/13 | | A2 | | | 1,000 | | | 957 |
Wal- Mart Stores
4.250%, due 4/3/13 | | AA | | | 1,000 | | | 1,029 |
Citigroup, Inc.,
5.500%, due 4/11/13 | | A+ | | | 1,250 | | | 1,217 |
Merrill Lynch & Co., Inc.,
6.150%, due 4/25/13 | | Aa3 | | | 1,290 | | | 1,278 |
General Electric Capital Corporation, 4.800%, due 5/1/13 | | AAA | | | 1,500 | | | 1,476 |
American Movil S.A.B. de C.V.,
5.500%, due 3/1/14 | | A3 | | | 2,000 | | | 1,844 |
Coca Cola Enterprises, Inc.,
7.375%, due 3/3/14 | | A | | | 900 | | | 988 |
AT&T, Inc., 5.100%, due 9/15/14 | | A | | | 1,750 | | | 1,720 |
| | | | | | | | |
Income Fund | | NRSRO
Rating
(unaudited) | | Principal
Amount | | Value |
| | |
Corporate Obligations—(continued) | | | | | | |
Goldman Sachs Group, Inc.,
5.000%, due 10/1/14 | | AA- | | $ | 1,500 | | $ | 1,341 |
CODELCO, Inc. -144A, 4.750%, due 10/15/14* | | A1 | | | 1,815 | | | 1,705 |
United Technologies Corporation, 4.875%, due 5/1/15 | | A+ | | | 1,500 | | | 1,462 |
Pemex Master Trust,
5.750%, due 12/15/15 | | BBB+ | | | 1,000 | | | 933 |
Johnson Controls, Inc.,
5.500%, due 1/15/16 | | A3 | | | 1,925 | | | 1,492 |
ProLogis,
5.750%, due 4/15/16 | | Baa2 | | | 1,375 | | | 686 |
Omnicom Group, Inc.,
5.900%, due 4/15/16 | | A- | | | 2,000 | | | 1,624 |
YUM! Brands, Inc.,
6.250%, due 4/15/16 | | BBB- | | | 1,939 | | | 1,645 |
SABMiller plc,
6.500%, due 7/1/16 | | BBB+ | | | 1,600 | | | 1,484 |
Petrobras International Finance Company,
6.125%, due 10/6/16 | | Baa1 | | | 1,000 | | | 975 |
Comcast Corporation,
6.500%, due 1/15/17 | | BBB+ | | | 1,710 | | | 1,689 |
BHP Billiton Finance,
5.400%, due 3/29/17 | | A1 | | | 1,000 | | | 888 |
J.P. Morgan Chase & Co., 6.125%, due 6/27/17 | | Aa3 | | | 1,750 | | | 1,722 |
BB&T Corporation,
4.900%, due 6/30/17 | | A1 | | | 1,500 | | | 1,353 |
Kimberly—Clark,
6.125%, due 8/1/17 | | A2 | | | 2,000 | | | 2,131 |
American Express,
6.150%, due 8/28/17 | | A+ | | | 1,500 | | | 1,446 |
IBM Corporation,
5.700%, due 9/14/17 | | A+ | | | 1,750 | | | 1,871 |
Exelon Generation Company, LLC., 6.200%, due 10/1/17 | | A3 | | | 2,000 | | | 1,720 |
Tesco plc, 5.500%, due 11/15/17 | | A- | | | 1,750 | | | 1,622 |
Abbott Laboratories,
5.600%, due 11/30/17 | | AA | | | 1,650 | | | 1,786 |
Wells Fargo & Company,
5.875%, due 12/11/17 | | AA | | | 750 | | | 782 |
Goldman Sachs Group, Inc.,
6.150%, due 4/1/18 | | AA- | | | 750 | | | 721 |
Morgan Stanley Dean Witter & Co.,
6.625%, due 4/1/18 | | A2 | | | 750 | | | 658 |
Citigroup, Inc.,
5.125%, due 5/15/18 | | A+ | | | 750 | | | 758 |
Philip Morris International, Inc., 5.650%, due 5/16/18 | | A2 | | | 1,250 | | | 1,239 |
Verizon Communications, Inc.,
8.750%, due 11/1/18 | | A | | | 1,480 | | | 1,736 |
Ras Laffan Lng II,
5.298%, due 9/30/20* | | Aa2 | | | 2,000 | | | 1,425 |
Southwest Airlines Co.,
6.150%, due 8/1/22 | | Aa3 | | | 1,595 | | | 1,244 |
| | | | | | | | |
Total Corporate Obligations | | | | | 77,073 | | | 72,636 |
| | | | | | | | |
Total Long Term Investments—98.4%
(cost $142,442) | | | 140,801 | | | 138,186 |
| | | | | | | | |
See accompanying Notes to Financial Statements.
December 31, 2008 | William Blair Funds 83 |
Income Fund
Portfolio of Investments, December 31, 2008 (all dollar amounts in thousands)
| | | | | | | | |
Income Fund | | | | Principal
Amount | | Value |
| | | |
Repurchase Agreement | | | | | | | | |
Fixed Income Clearing Corporation
0.010% dated 12/31/08, due 1/2/09, repurchase price $1,839, collateralized by FHLMC, 5.625%, due 11/23/35 | | | | $ | 1,839 | | $ | 1,839 |
| | | | | | | | |
Total Repurchase Agreement—1.3%
(cost $1,839) | | | | | | 1,839 |
| | | | | | | | |
Total Investments—99.7%
(cost $144,281) | | $ | 142,640 | | | 140,025 |
| | | | | | | | |
Cash and other assets, less liabilities—0.3% | | | 410 |
| | | | | | | | |
Net Assets—100.0% | | $ | 140,435 |
| | | | | | | | |
WAC = Weighted Average Coupon
VRN = Variable Rate Note
NRSRO = Nationally Recognized Statistical Rating Organization, such as
S&P, Moody’s or Fitch (unaudited)
The obligations of certain U. S. Government-sponsored securities are neither issued nor guaranteed by the U. S. Treasury
*Deemed illiquid pursuant to Liquidity Procedures approved by the Board of Trustees. These holdings represent 5.77% of the net assets at December 31, 2008.
See accompanying Notes to Financial Statements.
84 Annual Report | December 31, 2008 |
Christopher T. Vincent
READY RESERVES FUND
AN OVERVIEW FROM THE PORTFOLIO MANAGER
The return for the 12 months ended December 31, 2008, of the Fund’s Class N Shares was 2.20%, versus the 2.12% return of the Fund���s benchmark, the AAA-Rated Money Market Funds Average. Total net assets were $1.84 billion, compared to $1.49 billion at June 30, 2008 and $1.40 billion at December 31, 2007.
Unprecedented is the best word to describe the events of 2008, the factors that precipitated those events, and the market turmoil that ensued and continued through the end of the year.
Declines in the financial markets worldwide occurred in spite of moves by central banks to restore investor confidence by injecting massive amounts of capital into the financial system. A “flight-to-quality” ensued and investors sought the safe haven of U.S. Treasury securities. LIBOR (London Interbank Offered Rate) rates, the interest rates charged for large loans by banks denominated in U.S. dollars held in banks outside of the U.S., spiked sharply higher.
By the end of the year, the shorter-term/funding markets were functioning on a much improved basis, but with the assistance of a plethora of government programs.
The Federal Reserve Board also entered a new era as it set its benchmark overnight federal funds interest rate to a range of 0.00%-0.25%, in a move to signal it still had tools with which it could stimulate the economy. But with its move, the Fed essentially acknowledged that the economic downturn was worse than the Fed had thought at their meeting in October, and that they remained very concerned about the fragility of the economy. The Fed also stated that inflationary pressures had diminished appreciably, and that inflation should moderate further in coming quarters.
We made significant shifts in the asset allocation of the Ready Reserves Fund over the course of the year, in a disciplined and concerted effort to build the liquidity and further strengthen the quality of the Fund’s portfolio.
To start with, we shrunk the Fund’s average days to maturity from 47.8 days at the start of the year to 40 days at year end. This shift largely occurred towards the end of the third quarter.
In addition, we substantially built up the Fund’s overnight liquidity, increasing our exposure to overnight security agreements from roughly 10% at the beginning of the year to 29% at year end.
Finally, we substantially reduced the Fund’s exposure to Asset-Backed Commercial Paper.
Lastly, we should note that the Ready Reserves Fund has elected to obtain extended coverage under the U.S. Treasury’s Temporary Guarantee Program for Money Market Funds (the “Program”) through April 30, 2009.
The Program is designed to guarantee to investors in participating money market funds that they receive the lesser of (1) $1.00 for each money market fund share held as of the close of business on September 19, 2008 or (2) $1.00 for each money market fund share held on the date the guarantee is triggered. The Program does not cover any increase in the number of Fund shares held in an account after the close of business on September 19, 2008 or any new purchases of Fund shares after the close of business on September 19, 2008. Under the Program, the temporary guarantee will be triggered if a participating fund’s share value declines to less than $1.00. The Program has been extended through April 30, 2009, after which the Secretary of the Treasury will review the need and terms for further extending the Program.
December 31, 2008 | William Blair Funds 85 |
The Fund is not in any manner approved, endorsed, sponsored or authorized by the U.S. Treasury Department. Additional information about the Program, including the consequences of the Fund’s triggering the guarantee, is available at http://www.ustreas.gov. The Fund bears the costs of participating in the Program, which means that all shareholders, including those whose share balances are not covered by the Program, bear the costs of the Program.
At William Blair & Company, we pride ourselves on the stringent credit standards we apply to the management of the Ready Reserves Fund. The Ready Reserves Fund has continued to meet its stated objectives of current income, a stable share price, and daily liquidity throughout the recent unprecedented turmoil; and we remain confident in the credit quality, diversification and liquidity of the Ready Reserves Fund. In addition, the Fund is rated AAAm by Standard & Poor’s, the highest credit quality rating given to money market funds. Nevertheless, we believe the program may provide increased confidence to our shareholders given these difficult markets.
86 Annual Report | December 31, 2008 |
Ready Reserves Fund
Performance Highlights (unaudited)
The Fund’s 7 day yield on December 31, 2008 was 0.72%.
Average Annual Total Returns—Class N Shares Year ended December 31, 2008.
| | | | | | | | | | | | |
| | | 1
Year | | | 3
Year | | | 5
Year | | | 10
Year | |
Ready Reserves Fund | | 2.20 | % | | 3.80 | % | | 2.96 | % | | 3.08 | % |
AAA-Rated Money Market Funds | | 2.12 | | | 3.68 | | | 2.83 | | | 3.04 | |
Performance cited represents past performance. Past performance does not guarantee future results and current performance may be lower or higher than the data quoted. For the most current month-end performance information, please call 1-800-742-7272, or visit our Web site at www.williamblairfunds.com. Class N Shares are available to the general public without a sales load. Total return includes reinvestment of income. Yields fluctuate and are not guaranteed. An investment in the Fund is neither insured nor guaranteed by the Federal Deposit Insurance Corp. (FDIC) or any government agency. Although the Fund seeks to preserve the value of your investment at $1.00 per share, it is possible to lose money by investing in the Fund.
The AAA Rated Money Market Funds Average represents the average annual composite performance of all AAA rated First Tier Retail Money Market Funds listed by iMoneyNet data.
This report identifies the Fund’s investment’s on December 31, 2008. These holdings are subject to change. Not all fixed-income securities in the Fund performed the same, nor is there any guarantee that these fixed-income securities will perform as well in the future. Market forecasts provided in this report may not necessarily come to pass.
Sector Diversification (unaudited)
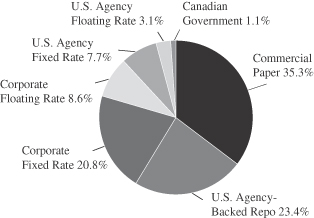
The sector diversification shown is based on the total long-term securities.
December 31, 2008 | William Blair Funds 87 |
Ready Reserves Fund
Portfolio of Investments, December 31, 2008 (all amounts in thousands)
| | | | | | |
Issuer | | Principal
Amount | | Amortized
Cost |
U.S. Agency Fixed Rate Notes—4.6% | | | | | | |
Federal Farm Credit Bank, (FFCB), 3.750%-5.250%, 1/15/09-8/3/09 | | $ | 11,333 | | $ | 11,243 |
Federal Home Loan Bank (FHLB), 1.466%-5.250%, 1/8/09-6/12/09 | | | 49,166 | | | 49,088 |
Federal Home Loan Mortgage Corporation (FHLMC), 3.755%-6.545%, 1/12/09-6/11/09 | | | 13,283 | | | 13,223 |
Federal National Mortgage Association (FNMA), 4.000%-5.250%, 1/15/09-1/26/09 | | | 10,784 | | | 10,731 |
| | | | | | |
Total U.S. Agency Fixed Rate Notes | | | 84,566 | | | 84,285 |
| | | | | | |
U.S. Agency Variable Rate Notes—3.1% | | | | | | |
Federal Farm Credit (FFCB), 0.349%-1.369%, 2/12/09-7/20/09 | | | 7,000 | | | 7,000 |
Federal Home Loan Bank (FHLB), 1.730%-2.683%, 5/20/09-8/10/09 | | | 22,830 | | | 22,832 |
Federal Home Loan Mortgage Corporation (FHLMC), 1.784%, 4/7/09 | | | 15,000 | | | 15,000 |
Federal National Mortgage Association (FNMA), 3.356%, 7/28/09 | | | 12,153 | | | 12,152 |
| | | | | | |
Total U.S. Agency Variable Rate Notes | | | 56,983 | | | 56,984 |
| | | | | | |
U.S. Agency Discount Notes—2.6% | | | | | | |
Federal Home Loan Bank (FHLB), 1.600%-2.100%, 1/7/09-2/3/09 | | | 27,786 | | | 27,761 |
Federal Home Loan Mortgage Corporation (FHLMC), 1.750%, 2/19/09 | | | 10,000 | | | 9,976 |
Federal National Mortgage Association (FNMA), 2.050%, 1/2/09 | | | 10,000 | | | 9,999 |
| | | | | | |
Total U.S. Agency Discount Notes | | | 47,786 | | | 47,736 |
| | | | | | |
Canadian Fixed Rate Note—0.9% | | | | | | |
Province of Quebec, 5.000%, 7/17/09 | | | 16,250 | | | 16,123 |
| | | | | | |
Total Canadian Government Fixed Rate Notes | | | 16,250 | | | 16,123 |
| | | | | | |
Canadian Discount Note—0.3% | | | | | | |
Canada, 1.250%, 4/29/09 | | | 5,000 | | | 4,980 |
| | | | | | |
Total Canadian Government Discount Notes | | | 5,000 | | | 4,980 |
| | | | | | |
Fixed Rate Notes—14.8% | | | | | | |
Abbott Laboratories, 3.500%, 2/17/09 | | | 2,401 | | | 2,398 |
American Honda Finance Corp., 1.508%-4.500%, 3/9/09-5/26/09 | | | 20,053 | | | 20,024 |
AT&T Corporation, 6.000%, 3/15/09 | | | 19,435 | | | 19,213 |
Atlantic Richfield, 5.900%, 4/15/09 | | | 12,194 | | | 11,957 |
Bellsouth Telecommunications, 5.875%, 1/15/09 | | | 8,282 | | | 8,183 |
BP Canada Finance, 3.625%, 1/15/09 | | | 12,954 | | | 12,918 |
Caterpillar Financial Services, 2.887%-4.500%, 1/15/09-6/15/09 | | | 31,803 | | | 31,761 |
ConocoPhillips, 6.375%, 3/30/09 | | | 8,430 | | | 8,387 |
IBM Corporation, 4.375%-5.390%, 1/22/09-6/1/09 | | | 6,328 | | | 6,283 |
IBM International Group, 2.225%, 2/13/09 | | | 30,552 | | | 30,565 |
Inter-American Development Bank, 8.400%-8.875%, 6/1/09-9/1/09 | | | 9,594 | | | 9,358 |
| | | | | | |
Issuer | | Principal
Amount | | Amortized
Cost |
Fixed Rate Notes—(continued) | | | | | | |
John Deere Capital Corp., 3.750%-6.000%, 1/13/09-7/15/09 | | $ | 29,779 | | $ | 29,552 |
JP Morgan, 3.500%, 3/15/09 | | | 7,301 | | | 7,301 |
Pfizer, Inc., 3.300%, 3/2/09 | | | 9,795 | | | 9,738 |
Procter & Gamble International Finance, 5.300%, 7/6/09 | | | 10,740 | | | 10,629 |
Toyota Motor Credit, 1.489%, 1/12/09 | | | 1,300 | | | 1,300 |
U.S. Bancorp, 5.300%, 4/28/09 | | | 10,723 | | | 10,580 |
U.S. Bank N.A., 3.400%, 3/2/09 | | | 2,002 | | | 2,000 |
Wal-Mart Stores, 6.875%, 8/10/09 | | | 16,524 | | | 16,270 |
Wells Fargo & Co., 3.125%, 4/1/09 | | | 24,270 | | | 24,223 |
| | | | | | |
Total Fixed Rate Notes | | | 274,460 | | | 272,640 |
| | | | | | |
Variable Rate Notes—8.6% | | | | | | |
American Honda Finance Corp., 2.144%, 5/14/09 | | | 4,998 | | | 4,999 |
BP AMI Leasing, 1.476%, 6/26/09 | | | 24,002 | | | 24,001 |
Caterpillar Financial Services, 2.296%, 5/18/09 | | | 5,530 | | | 5,530 |
ConocoPhillips, 4.420%, 4/9/09 | | | 19,894 | | | 19,895 |
IBM International Group, 3.848%, 7/29/09 | | | 4,666 | | | 4,659 |
PACCAR Financial, 2.260%-3.575%, 4/27/09-9/21/09 | | | 14,491 | | | 14,496 |
Procter & Gamble, 2.216%, 9/9/09 | | | 1,000 | | | 1,000 |
Procter & Gamble International, 4.218%, 7/6/09 | | | 11,579 | | | 11,577 |
Procter & Gamble International Finance, 2.459%, 8/19/09 | | | 5,766 | | | 5,759 |
Toyota Motor Credit, 0.590%-1.439%, 6/8/09-9/11/09 | | | 20,000 | | | 20,000 |
U.S. Bancorp, 0.501%, 4/28/09 | | | 9,789 | | | 9,796 |
U.S. Bank N.A., 2.253%, 8/24/09 | | | 10,000 | | | 10,000 |
Wells Fargo & Co., 1.345%-2.096%, 7/15/09-9/15/09 | | | 26,389 | | | 26,394 |
| | | | | | |
Total Variable Rate Notes | | | 158,104 | | | 158,106 |
| | | | | | |
Commercial Paper—36.3% | | | | | | |
American Honda Finance Corp., 2.200%-2.550%, 1/22/09-1/26/09 | | | 25,000 | | | 24,962 |
AT&T, Inc., 0.450%-1.850%, 1/20/09-1/22/09 | | | 9,000 | | | 8,994 |
Brown-Forman Corporation, 1.750%-2.250%, 1/7/09-1/27/09 | | | 40,000 | | | 39,962 |
Caterpillar Financial Services, 0.300%-0.350%, 2/2/09-2/26/09 | | | 20,000 | | | 19,992 |
Chevron Corporation, 1.050%, 1/12/09-1/13/09 | | | 10,000 | | | 9,997 |
Chevron Funding, 0.170%, 2/6/09 | | | 15,000 | | | 14,997 |
Citibank, 0.200%, 1/14/09 | | | 10,000 | | | 9,999 |
CME Group, Inc., 1.800%-2.750%, 1/5/09-2/4/09 | | | 53,000 | | | 52,944 |
Coca-Cola Company, 1.900%, 1/6/09-1/7/09 | | | 15,000 | | | 14,996 |
ConocoPhillips, 0.850%-2.260%, 1/6/09-1/28/09 | | | 27,655 | | | 27,638 |
General Electric Capital Corporation, 0.300%-1.700%, 1/7/09-1/21/09 | | | 45,000 | | | 44,977 |
John Deere Capital Corp., 2.250%, 1/28/09 | | | 10,000 | | | 9,983 |
JP Morgan Funding, 0.300%, 2/17/09 | | | 15,000 | | | 14,994 |
See accompanying Notes to Financial Statements.
88 Annual Report | December 31, 2008 |
Ready Reserves Fund
Portfolio of Investments, December 31, 2008 (all amounts in thousands)
| | | | | | |
Issuer | | Principal
Amount | | Amortized
Cost |
Commercial Paper—(continued) | | | | | | |
Kimberly-Clark Worldwide, 0.500%, 3/12/09 | | $ | 20,000 | | $ | 19,981 |
Merck & Co., 0.250%-1.150%, 1/13/09-2/5/09 | | | 35,000 | | | 34,990 |
National Rural Utility Cooperative, 1.700%, 1/8/09-1/23/09 | | | 30,000 | | | 29,983 |
Nokia Corporation, 0.550%-2.100%, 1/7/09-3/6/09 | | | 40,000 | | | 39,954 |
PACCAR Financial, 1.250%-1.550%, 1/20/09-2/23/09 | | | 22,100 | | | 22,070 |
Pfizer, Inc., 0.500%, 5/19/09 | | | 20,000 | | | 19,962 |
Pitney Bowes, Inc., 1.900%, 1/5/09 | | | 10,000 | | | 9,998 |
Private Export Funding, 1.200%-1.350%, 1/5/09-3/27/09 | | | 20,000 | | | 19,982 |
Procter & Gamble International Finance, 0.400%-1.400%, 3/3/09-4/16/09 | | | 25,000 | | | 24,965 |
Prudential Funding, 0.240%-0.550%, 1/16/09-1/30/09 | | | 30,000 | | | 29,994 |
Shell International Finance, 0.250%-1.800%, 2/3/09-5/5/09 | | | 50,000 | | | 49,825 |
Toyota Motor Credit, 1.250%-2.050%, 1/23/09-3/17/09 | | | 30,000 | | | 29,944 |
U.S.A.A. Capital Corporation, 0.150%, 1/7/09 | | | 11,900 | | | 11,900 |
Wal-Mart Stores, 0.200%-0.500%, 3/3/09-6/15/09 | | | 30,000 | | | 29,951 |
| | | | | | |
Total Commercial Paper | | | 668,655 | | | 667,934 |
| | | | | | |
VRN = Variable Rate Note
| | | | | | |
Issuer | | Principal
Amount | | Amortized
Cost |
Demand Notes—5.3% | | | | | | |
American Express Credit Corporation, VRN, 0.321%, 1/2/09 | | $ | 87,407 | | $ | 87,407 |
Prudential Funding, VRN, 0.001%, 1/2/09 | | | 10,914 | | | 10,914 |
| | | | | | |
Total Demand Notes | | | 98,321 | | | 98,321 |
| | | | | | |
Repurchase Agreement—23.3% | | | | | | |
Fixed Income Clearing Corporation, 0.010% dated 12/31/08, due 1/2/09, repurchase price $429,475, collateralized by U.S. Treasury Note and various FHLMC and FHLB notes | | | 429,474 | | | 429,474 |
| | | | | | |
Total Repurchase Agreement | | | 429,474 | | | 429,474 |
| | | | | | |
Total Investments—99.8%
(Cost $1,836,583) | | $ | 1,839,599 | | | 1,836,583 |
| | | | | | |
Cash and other assets, less liabilities—0.2% | | | 4,606 |
| | | | | | |
Net Assets—100.0% | | $ | 1,841,189 |
| | | | | | |
Portfolio Weighted Average Maturity | | | 40 Days |
See accompanying Notes to Financial Statements.
December 31, 2008 | William Blair Funds 89 |
Statements of Assets and Liabilities
December 31, 2008 (all dollar amounts in thousands)
| | | | | | | | | | | | | | | | |
| | | Growth
Fund | | | Tax-
Managed
Growth
Fund | | | Large Cap
Growth
Fund | | | Small Cap
Growth
Fund | |
Assets | | | | | | | | | | | | | | | | |
Investments in securities, at cost | | $ | 287,763 | | | $ | 7,170 | | | $ | 28,137 | | | $ | 504,636 | |
Investments in Affiliated Companies, at cost | | | — | | | | — | | | | — | | | | 114,891 | |
Investments in Affiliated Fund, at cost | | | 3,060 | | | | 14 | | | | 340 | | | | 95 | |
| | | | | | | | | | | | | | | | |
| | | | |
Investments in securities, at value | | $ | 234,921 | | | $ | 5,698 | | | $ | 22,980 | | | $ | 352,955 | |
Investments in Affiliated Companies, at value | | | — | | | | — | | | | — | | | | 42,614 | |
Investments in Affiliated Fund, at amortized cost | | | 3,060 | | | | 14 | | | | 340 | | | | 95 | |
Receivable for securities sold | | | 494 | | | | 50 | | | | — | | | | 35,235 | |
Receivable for fund shares sold | | | 485 | | | | — | | | | 61 | | | | 2,240 | |
Receivable from Advisor | | | — | | | | 12 | | | | 9 | | | | — | |
Dividend and interest receivable | | | 164 | | | | 4 | | | | 23 | | | | 2 | |
| | | | | | | | | | | | | | | | |
Total assets | | | 239,124 | | | | 5,778 | | | | 23,413 | | | | 433,141 | |
Liabilities | | | | | | | | | | | | | | | | |
Payable for investment securities purchased and other liabilities | | | — | | | | — | | | | — | | | | 656 | |
Payable for fund shares redeemed | | | 307 | | | | 57 | | | | 103 | | | | 28,314 | |
Payable to Custodian | | | — | | | | — | | | | — | | | | 2,078 | |
Management fee payable | | | 159 | | | | — | | | | 10 | | | | 388 | |
Distribution fee payable | | | 17 | | | | — | | | | 1 | | | | 47 | |
Other accrued expenses | | | 55 | | | | 25 | | | | 20 | | | | 31 | |
| | | | | | | | | | | | | | | | |
Total liabilities | | | 538 | | | | 82 | | | | 134 | | | | 31,514 | |
| | | | | | | | | | | | | | | | |
Net Assets | | $ | 238,586 | | | $ | 5,696 | | | $ | 23,279 | | | $ | 401,627 | |
| | | | | | | | | | | | | | | | |
Capital | | | | | | | | | | | | | | | | |
Composition of Net Assets | | | | | | | | | | | | | | | | |
Par value of shares of beneficial interest | | $ | 33 | | | $ | 1 | | | $ | 5 | | | $ | 34 | |
Capital paid in excess of par value | | | 310,285 | | | | 7,855 | | | | 36,275 | | | | 780,131 | |
Accumulated realized gain (loss) | | | (18,890 | ) | | | (688 | ) | | | (7,844 | ) | | | (154,580 | ) |
Net unrealized appreciation (depreciation) of investments and foreign currencies | | | (52,842 | ) | | | (1,472 | ) | | | (5,157 | ) | | | (223,958 | ) |
| | | | | | | | | | | | | | | | |
Net Assets | | $ | 238,586 | | | $ | 5,696 | | | $ | 23,279 | | | $ | 401,627 | |
| | | | | | | | | | | | | | | | |
| | | | |
Class N Shares | | | | | | | | | | | | | | | | |
Net Assets | | $ | 85,142 | | | $ | 368 | | | $ | 4,842 | | | $ | 224,612 | |
Shares Outstanding | | | 11,954,148 | | | | 50,564 | | | | 1,034,302 | | | | 19,051,549 | |
Net Asset Value Per Share | | $ | 7.12 | | | $ | 7.27 | | | $ | 4.68 | | | $ | 11.79 | |
Class I Shares | | | | | | | | | | | | | | | | |
Net Assets | | $ | 153,444 | | | $ | 5,328 | | | $ | 18,437 | | | $ | 177,015 | |
Shares Outstanding | | | 20,881,757 | | | | 716,827 | | | | 3,861,836 | | | | 14,579,654 | |
Net Asset Value Per Share | | $ | 7.35 | | | $ | 7.43 | | | $ | 4.77 | | | $ | 12.14 | |
See accompanying Notes to Financial Statements.
90 Annual Report | December 31, 2008 |
Statements of Operations
for the Year Ended December 31, 2008 (all amounts in thousands)
| | | | | | | | | | | | | | | | |
| | | Growth
Fund | | | Tax-Managed
Growth
Fund | | | Large Cap
Growth
Fund | | | Small Cap
Growth
Fund | |
Investment income | | | | | | | | | | | | | | | | |
Dividends | | $ | 1,742 | | | $ | 68 | | | $ | 246 | | | $ | 2,699 | |
Less foreign taxes withheld | | | — | | | | — | | | | — | | | | (20 | ) |
Dividend Income from Affiliated Fund | | | 61 | | | | 5 | | | | 6 | | | | 42 | |
Interest | | | 193 | | | | 8 | | | | 21 | | | | 495 | |
| | | | | | | | | | | | | | | | |
Total income | | | 1,996 | | | | 81 | | | | 273 | | | | 3,216 | |
Expenses | | | | | | | | | | | | | | | | |
Investment advisory fees | | | 2,364 | | | | 70 | | | | 232 | | | | 7,912 | |
Distribution fees | | | 275 | | | | 2 | | | | 16 | | | | 885 | |
Custodian fees | | | 31 | | | | 31 | | | | 35 | | | | 46 | |
Transfer agent fees | | | 278 | | | | 6 | | | | 33 | | | | 604 | |
Professional fees | | | 36 | | | | 22 | | | | 29 | | | | 56 | |
Registration fees | | | 34 | | | | 30 | | | | 31 | | | | 63 | |
Other expenses | | | 27 | | | | 5 | | | | 18 | | | | 123 | |
| | | | | | | | | | | | | | | | |
Total expenses before waiver | | | 3,045 | | | | 166 | | | | 394 | | | | 9,689 | |
Expenses reimbursed to (waived or absorbed by) the Advisor | | | — | | | | (70 | ) | | | (93 | ) | | | — | |
| | | | | | | | | | | | | | | | |
Net expenses | | | 3,045 | | | | 96 | | | | 301 | | | | 9,689 | |
| | | | | | | | | | | | | | | | |
Net investment income (loss) | | | (1,049 | ) | | | (15 | ) | | | (28 | ) | | | (6,473 | ) |
Net realized and unrealized gain (loss) on investments, foreign currency transactions and other assets and liabilities | | | | | | | | | | | | | | | | |
Net realized gain (loss) on investments | | | (18,762 | ) | | | (607 | ) | | | (3,294 | ) | | | (145,658 | )(a) |
| | | | | | | | | | | | | | | | |
Change in net unrealized appreciation (depreciation) on investments and other assets and liabilities | | | (120,242 | ) | | | (3,652 | ) | | | (9,707 | ) | | | (287,305 | )(a) |
| | | | | | | | | | | | | | | | |
Net increase (decrease) in net assets resulting from operations | | $ | (140,053 | ) | | $ | (4,274 | ) | | $ | (13,029 | ) | | $ | (439,436 | ) |
| | | | | | | | | | | | | | | | |
| (a) | | Affiliated companies accounted for $(80,539) of the Change in net unrealized appreciation (depreciation) on investments during the year and $(76,989) of Net realized gain (loss) on investments. |
See accompanying Notes to Financial Statements.
December 31, 2008 | William Blair Funds 91 |
Statements of Changes in Net Assets
for the Years Ended December 31, 2008 and 2007 (all amounts in thousands)
| | | | | | | | | | | | | | | | | | | | | | | | | | | | | | | | |
| | | Growth
Fund | | | Tax-
Managed
Growth
Fund | | | Large Cap
Growth
Fund | | | Small Cap
Growth
Fund | |
| | | 2008 | | | 2007 | | | 2008 | | | 2007 | | | 2008 | | | 2007 | | | 2008 | | | 2007 | |
Operations | | | | | | | | | | | | | | | | | | | | | | | | | | | | | | | | |
Net investment income (loss) | | $ | (1,049 | ) | | $ | (311 | ) | | $ | (15 | ) | | $ | 1 | | | $ | (28 | ) | | $ | 14 | | | $ | (6,473 | ) | | $ | (14,377 | ) |
Net realized gain (loss) on investments, foreign currency transactions and other assets and liabilities | | | (18,762 | ) | | | 33,557 | | | | (607 | ) | | | 950 | | | | (3,294 | ) | | | 597 | | | | (145,658 | ) | | | 77,343 | |
Change in net unrealized appreciation (depreciation) on investments, and other assets and liabilities | | | (120,242 | ) | | | 4,809 | | | | (3,652 | ) | | | 55 | | | | (9,707 | ) | | | 1,829 | | | | (287,305 | ) | | | (84,141 | ) |
| | | | | | | | | | | | | | | | | | | | | | | | | | | | | | | | |
Net increase (decrease) in net assets resulting from operations | | | (140,053 | ) | | | 38,055 | | | | (4,274 | ) | | | 1,006 | | | | (13,029 | ) | | | 2,440 | | | | (439,436 | ) | | | (21,175 | ) |
Distributions to shareholders from | | | | | | | | | | | | | | | | | | | | | | | | | | | | | | | | |
Net investment income | | | — | | | | — | | | | — | | | | (10 | ) | | | — | | | | (14 | ) | | | — | | | | — | |
Net realized gain | | | (5,607 | ) | | | (33,894 | ) | | | — | | | | — | | | | — | | | | — | | | | (20,533 | ) | | | (68,381 | ) |
| | | | | | | | | | | | | | | | | | | | | | | | | | | | | | | | |
| | | (5,607 | ) | | | (33,894 | ) | | | — | | | | (10 | ) | | | — | | | | (14 | ) | | | (20,533 | ) | | | (68,381 | ) |
Capital stock transactions | | | | | | | | | | | | | | | | | | | | | | | | | | | | | | | | |
Net proceeds from sale of shares | | | 63,269 | | | | 116,201 | | | | 614 | | | | 987 | | | | 7,597 | | | | 23,671 | | | | 278,755 | | | | 289,096 | |
Shares issued in reinvestment of income dividends and capital gain distributions | | | 5,275 | | | | 31,770 | | | | — | | | | 9 | | | | — | | | | 13 | | | | 20,141 | | | | 65,191 | |
Less cost of shares redeemed | | | (53,942 | ) | | | (47,013 | ) | | | (1,506 | ) | | | (774 | ) | | | (4,956 | ) | | | (12,634 | ) | | | (531,719 | ) | | | (431,486 | ) |
| | | | | | | | | | | | | | | | | | | | | | | | | | | | | | | | |
Net increase (decrease) in net assets resulting from capital share transactions | | | 14,602 | | | | 100,958 | | | | (892 | ) | | | 222 | | | | 2,641 | | | | 11,050 | | | | (232,823 | ) | | | (77,199 | ) |
| | | | | | | | | | | | | | | | | | | | | | | | | | | | | | | | |
Increase (decrease) in net assets | | | (131,058 | ) | | | 105,119 | | | | (5,166 | ) | | | 1,218 | | | | (10,388 | ) | | | 13,476 | | | | (692,792 | ) | | | (166,755 | ) |
Net assets | | | | | | | | | | | | | | | | | | | | | | | | | | | | | | | | |
Beginning of year | | | 369,644 | | | | 264,525 | | | | 10,862 | | | | 9,644 | | | | 33,667 | | | | 20,191 | | | | 1,094,419 | | | | 1,261,174 | |
| | | | | | | | | | | | | | | | | | | | | | | | | | | | | | | | |
End of year | | $ | 238,586 | | | $ | 369,644 | | | $ | 5,696 | | | $ | 10,862 | | | $ | 23,279 | | | $ | 33,667 | | | $ | 401,627 | | | $ | 1,094,419 | |
| | | | | | | | | | | | | | | | | | | | | | | | | | | | | | | | |
Undistributed net investment income (loss) at the end of the year | | $ | — | | | $ | — | | | $ | — | | | $ | — | | | $ | — | | | $ | — | | | $ | — | | | $ | — | |
| | | | | | | | | | | | | | | | | | | | | | | | | | | | | | | | |
See accompanying Notes to Financial Statements.
92 Annual Report | December 31, 2008 |
Statements of Assets and Liabilities
December 31, 2008 (dollar amounts in thousands)
| | | | | | | | | | | | | | | | |
| | | Mid Cap
Growth
Fund | | | Small-Mid
Cap Growth
Fund | | | Global
Growth
Fund | | | International
Growth
Fund | |
Assets | | | | | | | | | | | | | | | | |
Investments in securities, at cost | | $ | 48,707 | | | $ | 104,276 | | | $ | 34,706 | | | $ | 3,852,315 | |
Investments in Affiliated Fund, at cost | | | 518 | | | | 22 | | | | 29 | | | | 18,363 | |
| | | | | | | | | | | | | | | | |
| | | | |
Investments in securities, at value | | $ | 39,230 | | | $ | 83,642 | | | $ | 27,593 | | | $ | 3,099,369 | |
Investments in Affiliated Fund, at amortized cost | | | 518 | | | | 22 | | | | 29 | | | | 18,363 | |
Foreign currency, at value (cost $278) | | | — | | | | — | | | | — | | | | 278 | |
Receivable for fund shares sold | | | 894 | | | | 111 | | | | 60 | | | | 16,818 | |
Receivable for securities sold | | | 14 | | | | — | | | | 543 | | | | 13,299 | |
Receivable from Advisor | | | 18 | | | | — | | | | 43 | | | | — | |
Dividend and interest receivable | | | 11 | | | | 18 | | | | 23 | | | | 6,949 | |
| | | | | | | | | | | | | | | | |
Total assets | | | 40,685 | | | | 83,793 | | | | 28,291 | | | | 3,155,076 | |
Liabilities | | | | | | | | | | | | | | | | |
Payable for investment securities purchased | | | 2 | | | | 207 | | | | — | | | | 6,246 | |
Payable for fund shares redeemed | | | 124 | | | | 38 | | | | 192 | | | | 14,260 | |
Management fee payable | | | 18 | | | | 45 | | | | 43 | | | | 2,658 | |
Distribution fee payable | | | 1 | | | | 1 | | | | — | | | | 459 | |
Foreign tax liability | | | — | | | | — | | | | 2 | | | | 332 | |
Other accrued expenses | | | 14 | | | | 23 | | | | 49 | | | | 183 | |
| | | | | | | | | | | | | | | | |
Total liabilities | | | 159 | | | | 314 | | | | 286 | | | | 24,138 | |
| | | | | | | | | | | | | | | | |
Net Assets | | $ | 40,526 | | | $ | 83,479 | | | $ | 28,005 | | | $ | 3,130,938 | |
| | | | | | | | | | | | | | | | |
Capital | | | | | | | | | | | | | | | | |
Composition of Net Assets | | | | | | | | | | | | | | | | |
Par value of shares of beneficial interest | | $ | 5 | | | $ | 10 | | | $ | 6 | | | $ | 237 | |
Capital paid in excess of par value | | | 56,130 | | | | 121,186 | | | | 58,339 | | | | 5,582,277 | |
Accumulated net investment income (loss) | | | — | | | | — | | | | (17 | ) | | | (6,692 | ) |
Accumulated realized gain (loss) | | | (6,132 | ) | | | (17,083 | ) | | | (23,210 | ) | | | (1,691,018 | ) |
Net unrealized appreciation (depreciation) of investments and foreign currencies | | | (9,477 | ) | | | (20,634 | ) | | | (7,113 | ) | | | (753,866 | ) |
| | | | | | | | | | | | | | | | |
Net Assets | | $ | 40,526 | | | $ | 83,479 | | | $ | 28,005 | | | $ | 3,130,938 | |
| | | | | | | | | | | | | | | | |
| | | | |
Class N Shares | | | | | | | | | | | | | | | | |
Net Assets | | $ | 4,803 | | | $ | 7,954 | | | $ | 3,652 | | | $ | 1,980,750 | |
Shares Outstanding | | | 648,385 | | | | 975,379 | | | | 736,602 | | | | 150,949,352 | |
Net Asset Value Per Share | | $ | 7.41 | | | $ | 8.16 | | | $ | 4.96 | | | $ | 13.12 | |
Class I Shares | | | | | | | | | | | | | | | | |
Net Assets | | $ | 35,723 | | | $ | 75,525 | | | $ | 24,353 | | | $ | 1,150,188 | |
Shares Outstanding | | | 4,778,852 | | | | 9,134,626 | | | | 4,932,982 | | | | 85,837,659 | |
Net Asset Value Per Share | | $ | 7.48 | | | $ | 8.27 | | | $ | 4.94 | | | $ | 13.40 | |
See accompanying Notes to Financial Statements.
December 31, 2008 | William Blair Funds 93 |
Statements of Operations
for the Year Ended December 31, 2008 (all amounts in thousands)
| | | | | | | | | | | | | | | | |
| | | Mid Cap
Growth
Fund | | | Small-Mid
Cap Growth
Fund | | | Global
Growth
Fund | | | International
Growth
Fund | |
Investment income | | | | | | | | | | | | | | | | |
Dividends | | $ | 238 | | | $ | 1,200 | | | $ | 1,042 | | | $ | 171,123 | |
Less foreign taxes withheld | | | — | | | | — | | | | (37 | ) | | | (8,624 | ) |
Dividend Income from Affiliated Fund | | | 6 | | | | 1 | | | | 23 | | | | 386 | |
Interest | | | 30 | | | | 77 | | | | 49 | | | | 5,344 | |
| | | | | | | | | | | | | | | | |
Total income | | | 274 | | | | 1,278 | | | | 1,077 | | | | 168,229 | |
Expenses | | | | | | | | | | | | | | | | |
Investment advisory fees | | | 433 | | | | 1,124 | | | | 447 | | | | 63,082 | |
Distribution fees | | | 16 | | | | 32 | | | | 24 | | | | 9,955 | |
Shareholder services fees | | | — | | | | — | | | | 68 | | | | — | |
Custodian fees | | | 36 | | | | 43 | | | | 85 | | | | 1,432 | |
Transfer agent fees | | | 49 | | | | 48 | | | | 45 | | | | 3,885 | |
Professional fees | | | 28 | | | | 31 | | | | 40 | | | | 240 | |
Registration fees | | | 33 | | | | 32 | | | | 56 | | | | 137 | |
Other expenses | | | 21 | | | | 32 | | | | 61 | | | | 1,602 | |
| | | | | | | | | | | | | | | | |
Total expenses before waiver | | | 616 | | | | 1,342 | | | | 826 | | | | 80,333 | |
Expenses reimbursed to (waived or absorbed by) the Advisor | | | (91 | ) | | | (64 | ) | | | (215 | ) | | | — | |
| | | | | | | | | | | | | | | | |
Net expenses | | | 525 | | | | 1,278 | | | | 611 | | | | 80,333 | |
| | | | | | | | | | | | | | | | |
Net investment income (loss) | | | (251 | ) | | | — | | | | 466 | | | | 87,896 | |
Net realized and unrealized gain (loss) on investments, foreign currency transactions and other assets and liabilities | | | | | | | | | | | | | | | | |
Net realized gain (loss) on investments | | | (5,297 | ) | | | (15,910 | ) | | | (22,751 | ) | | | (1,646,751 | ) |
Net realized gain (loss) on foreign currency transactions and other assets and liabilities | | | — | | | | — | | | | (77 | ) | | | (8,712 | ) |
| | | | | | | | | | | | | | | | |
Total net realized gain (loss) | | | (5,297 | ) | | | (15,910 | ) | | | (22,828 | ) | | | (1,655,463 | ) |
Change in net unrealized appreciation (depreciation) on investments and other assets and liabilities | | | (13,013 | ) | | | (34,587 | ) | | | (7,228 | ) | | | (2,715,612 | ) |
| | | | | | | | | | | | | | | | |
Net increase (decrease) in net assets resulting from operations | | $ | (18,561 | ) | | $ | (50,497 | ) | | $ | (29,590 | ) | | $ | (4,283,179 | ) |
| | | | | | | | | | | | | | | | |
See accompanying Notes to Financial Statements.
94 Annual Report | December 31, 2008 |
Statements of Changes in Net Assets
for the Years Ended December 31, 2008 and 2007 (all amounts in thousands)
| | | | | | | | | | | | | | | | | | | | | | | | | | | | | | | | |
| | | Mid Cap
Growth
Fund | | | Small-Mid Cap
Growth
Fund | | | Global
Growth
Fund | | | International
Growth
Fund | |
| | | 2008 | | | 2007 | | | 2008 | | | 2007 | | | 2008 | | | 2007(a) | | | 2008 | | | 2007 | |
Operations | | | | | | | | | | | | | | | | | | | | | | | | | | | | | | | | |
Net investment income (loss) | | $ | (251 | ) | | $ | (133 | ) | | $ | — | | | $ | (647 | ) | | $ | 466 | | | $ | 8 | | | $ | 87,896 | | | $ | 35,450 | |
Net realized gain (loss) on investments, foreign currency transactions and other assets and liabilities | | | (5,297 | ) | | | 1,780 | | | | (15,910 | ) | | | 10,493 | | | | (22,828 | ) | | | (468 | ) | | | (1,655,463 | ) | | | 814,604 | |
Change in net unrealized appreciation (depreciation) on investments, and other assets and liabilities | | | (13,013 | ) | | | 2,472 | | | | (34,587 | ) | | | 2,316 | | | | (7,228 | ) | | | 115 | | | | (2,715,612 | ) | | | 325,850 | |
| | | | | | | | | | | | | | | | | | | | | | | | | | | | | | | | |
Net increase (decrease) in net assets resulting from operations | | | (18,561 | ) | | | 4,119 | | | | (50,497 | ) | | | 12,162 | | | | (29,590 | ) | | | (345 | ) | | | (4,283,179 | ) | | | 1,175,904 | |
Distributions to shareholders from | | | | | | | | | | | | | | | | | | | | | | | | | | | | | | | | |
Net investment income | | | — | | | | — | | | | — | | | | — | | | | (391 | ) | | | (17 | ) | | | — | | | | (91,166 | ) |
Net realized gain | | | — | | | | (2,295 | ) | | | (3 | ) | | | (11,850 | ) | | | — | | | | — | | | | (171,159 | ) | | | (765,168 | ) |
| | | | | | | | | | | | | | | | | | | | | | | | | | | | | | | | |
| | | — | | | | (2,295 | ) | | | (3 | ) | | | (11,850 | ) | | | (391 | ) | | | (17 | ) | | | (171,159 | ) | | | (856,334 | ) |
Capital stock transactions | | | | | | | | | | | | | | | | | | | | | | | | | | | | | | | | |
Net proceeds from sale of shares | | | 23,278 | | | | 25,023 | | | | 32,356 | | | | 33,865 | | | | 23,409 | | | | 46,237 | | | | 2,094,901 | | | | 1,936,694 | |
Shares issued in reinvestment of income dividends and capital gain distributions | | | — | | | | 2,160 | | | | 3 | | | | 10,904 | | | | 366 | | | | 15 | | | | 164,759 | | | | 814,447 | |
Less cost of shares redeemed | | | (9,584 | ) | | | (3,253 | ) | | | (22,881 | ) | | | (13,346 | ) | | | (11,365 | ) | | | (314 | ) | | | (2,723,038 | ) | | | (1,289,183 | ) |
| | | | | | | | | | | | | | | | | | | | | | | | | | | | | | | | |
Net increase (decrease) in net assets resulting from capital share transactions | | | 13,694 | | | | 23,930 | | | | 9,478 | | | | 31,423 | | | | 12,410 | | | | 45,938 | | | | (463,378 | ) | | | 1,461,958 | |
| | | | | | | | | | | | | | | | | | | | | | | | | | | | | | | | |
Increase (decrease) in net assets | | | (4,867 | ) | | | 25,754 | | | | (41,022 | ) | | | 31,735 | | | | (17,571 | ) | | | 45,576 | | | | (4,917,716 | ) | | | 1,781,528 | |
Net assets | | | | | | | | | | | | | | | | | | | | | | | | | | | | | | | | |
Beginning of year | | | 45,393 | | | | 19,639 | | | | 124,501 | | | | 92,766 | | | | 45,576 | | | | — | | | | 8,048,654 | | | | 6,267,126 | |
| | | | | | | | | | | | | | | | | | | | | | | | | | | | | | | | |
End of year | | $ | 40,526 | | | $ | 45,393 | | | $ | 83,479 | | | $ | 124,501 | | | $ | 28,005 | | | $ | 45,576 | | | $ | 3,130,938 | | | $ | 8,048,654 | |
| | | | | | | | | | | | | | | | | | | | | | | | | | | | | | | | |
Undistributed net investment income (loss) at the end of the year | | $ | — | | | $ | — | | | $ | — | | | $ | — | | | $ | (17 | ) | | $ | (16 | ) | | $ | (6,692 | ) | | $ | (129,363 | ) |
| | | | | | | | | | | | | | | | | | | | | | | | | | | | | | | | |
| (a) | | For the period from October 15, 2007 (Commencement of Operations) to December 31, 2007. |
See accompanying Notes to Financial Statements.
December 31, 2008 | William Blair Funds 95 |
Statements of Assets and Liabilities
December 31, 2008 (dollar amounts in thousands)
| | | | | | | | | | | | | | | | |
| | | International
Equity
Fund | | | International
Small Cap
Growth
Fund | | | Emerging
Markets
Growth
Fund | | | Emerging
Leaders
Growth
Fund | |
Assets | | | | | | | | | | | | | | | | |
Investments in securities, at cost | | $ | 275,392 | | | $ | 392,828 | | | $ | 571,085 | | | $ | 63,162 | |
Investments in Affiliated Fund, at cost | | | 4 | | | | 3,287 | | | | 2,065 | | | | 740 | |
| | | | | | | | | | | | | | | | |
| | | | |
Investments in securities, at value | | $ | 224,504 | | | $ | 291,618 | | | $ | 380,934 | | | $ | 46,001 | |
Investments in Affiliated Fund, at amortized cost | | | 4 | | | | 3,287 | | | | 2,065 | | | | 740 | |
Foreign currency, at value (cost $2,602 and $75) | | | — | | | | — | | | | 2,640 | | | | 75 | |
Receivable for fund shares sold | | | 3,280 | | | | 814 | | | | 887 | | | | 37 | |
Receivable for securities sold | | | 3,517 | | | | 1,468 | | | | 2,520 | | | | 183 | |
Dividend and interest receivable | | | 533 | | | | 268 | | | | 744 | | | | 106 | |
| | | | | | | | | | | | | | | | |
Total assets | | | 231,838 | | | | 297,455 | | | | 389,790 | | | | 47,142 | |
Liabilities | | | | | | | | | | | | | | | | |
Payable for investment securities purchased and other liabilities | | | — | | | | 4,954 | | | | 3,558 | | | | 391 | |
Payable for fund shares redeemed | | | 2,967 | | | | 230 | | | | 188 | | | | — | |
Payable to Custodian | | | 242 | | | | — | | | | — | | | | — | |
Management fee payable | | | 112 | | | | 240 | | | | 308 | | | | 29 | |
Distribution and shareholder administration fee payable | | | 9 | | | | 18 | | | | 36 | | | | — | |
Foreign tax liability | | | 21 | | | | 4 | | | | 107 | | | | 15 | |
Other accrued expenses | | | 1 | | | | 21 | | | | 5 | | | | 31 | |
| | | | | | | | | | | | | | | | |
Total liabilities | | | 3,352 | | | | 5,467 | | | | 4,202 | | | | 466 | |
| | | | | | | | | | | | | | | | |
Net Assets | | $ | 228,486 | | | $ | 291,988 | | | $ | 385,588 | | | $ | 46,676 | |
| | | | | | | | | | | | | | | | |
Capital | | | | | | | | | | | | | | | | |
Composition of Net Assets | | | | | | | | | | | | | | | | |
Par value of shares of beneficial interest | | $ | 27 | | | $ | 44 | | | $ | 51 | | | $ | 10 | |
Capital paid in excess of par value | | | 380,908 | | | | 536,882 | | | | 744,593 | | | | 98,785 | |
Accumulated net investment income (loss) | | | (213 | ) | | | (120 | ) | | | (674 | ) | | | (52 | ) |
Accumulated realized gain (loss) | | | (101,278 | ) | | | (143,596 | ) | | | (168,272 | ) | | | (34,906 | ) |
Net unrealized appreciation (depreciation) of investments and foreign currencies | | | (50,958 | ) | | | (101,222 | ) | | | (190,110 | ) | | | (17,161 | ) |
| | | | | | | | | | | | | | | | |
Net Assets | | $ | 228,486 | | | $ | 291,988 | | | $ | 385,588 | | | $ | 46,676 | |
| | | | | | | | | | | | | | | | |
| | | | |
Class N Shares | | | | | | | | | | | | | | | | |
Net Assets | | $ | 42,824 | | | $ | 11,363 | | | $ | 16,486 | | | | | |
Shares Outstanding | | | 5,129,461 | | | | 1,716,085 | | | | 2,210,520 | | | | | |
Net Asset Value Per Share | | $ | 8.35 | | | $ | 6.62 | | | $ | 7.46 | | | | | |
Class I Shares | | | | | | | | | | | | | | | | |
Net Assets | | $ | 185,662 | | | $ | 89,452 | | | $ | 69,363 | | | $ | 2,914 | |
Shares Outstanding | | | 22,010,677 | | | | 13,417,942 | | | | 9,239,269 | | | | 608,665 | |
Net Asset Value Per Share | | $ | 8.44 | | | $ | 6.67 | | | $ | 7.51 | | | $ | 4.79 | |
See accompanying Notes to Financial Statements.
96 Annual Report | December 31, 2008 |
Statements of Operations
for the Year Ended December 31, 2008 (all amounts in thousands)
| | | | | | | | | | | | | | | | |
| | | International
Equity
Fund | | | International
Small Cap
Growth
Fund | | | Emerging
Markets
Growth
Fund | | | Emerging
Leaders
Growth
Fund(a) | |
Investment income | | | | | | | | | | | | | | | | |
Dividends | | $ | 8,187 | | | $ | 5,478 | | | $ | 18,489 | | | $ | 1,023 | |
Less foreign taxes withheld | | | (563 | ) | | | (335 | ) | | | (814 | ) | | | (65 | ) |
Dividend Income from Affiliated Fund | | | 125 | | | | 89 | | | | 40 | | | | 20 | |
Interest | | | 294 | | | | 342 | | | | 202 | | | | 27 | |
| | | | | | | | | | | | | | | | |
Total income | | | 8,043 | | | | 5,574 | | | | 17,917 | | | | 1,005 | |
Expenses | | | | | | | | | | | | | | | | |
Investment advisory fees | | | 3,697 | | | | 3,887 | | | | 8,539 | | | | 559 | |
Distribution fees | | | 160 | | | | 47 | | | | 122 | | | | — | |
Shareholder services fees | | | — | | | | 237 | | | | 366 | | | | 5 | |
Custodian fees | | | 144 | | | | 195 | | | | 509 | | | | 89 | |
Transfer agent fees | | | 228 | | | | 137 | | | | 171 | | | | 5 | |
Professional fees | | | 52 | | | | 48 | | | | 62 | | | | 27 | |
Registration fees | | | 76 | | | | 85 | | | | 89 | | | | 26 | |
Other expenses | | | 46 | | | | 32 | | | | 32 | | | | 16 | |
| | | | | | | | | | | | | | | | |
Total expenses before waiver | | | 4,403 | | | | 4,668 | | | | 9,890 | | | | 727 | |
Expenses reimbursed to (waived or absorbed by) the Advisor | | | (75 | ) | | | 134 | | | | 208 | | | | (81 | ) |
| | | | | | | | | | | | | | | | |
Net expenses | | | 4,328 | | | | 4,802 | | | | 10,098 | | | | 646 | |
| | | | | | | | | | | | | | | | |
Net investment income (loss) | | | 3,715 | | | | 772 | | | | 7,819 | | | | 359 | |
Net realized and unrealized gain (loss) on investments, foreign currency transactions and other assets and liabilities | | | | | | | | | | | | | | | | |
Net realized gain (loss) on investments | | | (100,071 | ) | | | (142,730 | ) | | | (165,025 | ) | | | (34,906 | ) |
Net realized gain (loss) on foreign currency transactions and other assets and liabilities | | | (330 | ) | | | (921 | ) | | | (2,145 | ) | | | (344 | ) |
| | | | | | | | | | | | | | | | |
Total net realized gain (loss) | | | (100,401 | ) | | | (143,651 | ) | | | (167,170 | ) | | | (35,250 | ) |
Change in net unrealized appreciation (depreciation) on investments and other assets and liabilities | | | (133,552 | ) | | | (138,270 | ) | | | (484,606 | ) | | | (17,161 | ) |
| | | | | | | | | | | | | | | | |
Net increase (decrease) in net assets resulting from operations | | $ | (230,238 | ) | | $ | (281,149 | ) | | $ | (643,957 | ) | | $ | (52,052 | ) |
| | | | | | | | | | | | | | | | |
| (a) | | For the period from March 26, 2008 (Commencement of Operations) to December 31, 2008. |
See accompanying Notes to Financial Statements.
December 31, 2008 | William Blair Funds 97 |
Statements of Changes in Net Assets
for the Years Ended December 30, 2008 and 2007 (all amounts in thousands)
| | | | | | | | | | | | | | | | | | | | | | | | | | | | |
| | | International
Equity
Fund | | | International
Small Cap
Growth
Fund | | | Emerging
Markets
Growth
Fund | | | Emerging
Leaders
Growth
Fund | |
| | | 2008 | | | 2007 | | | 2008 | | | 2007 | | | 2008 | | | 2007 | | | 2008(a) | |
Operations | | | | | | | | | | | | | | | | | | | | | | | | | | | | |
Net investment income (loss) | | $ | 3,715 | | | $ | 2,577 | | | $ | 772 | | | $ | 818 | | | $ | 7,819 | | | $ | (1,119 | ) | | $ | 359 | |
Net realized gain (loss) on investments, foreign currency transactions and other assets and liabilities | | | (100,401 | ) | | | 27,069 | | | | (143,651 | ) | | | 29,596 | | | | (167,170 | ) | | | 220,106 | | | | (35,250 | ) |
Change in net unrealized appreciation (depreciation) on investments, and other assets and liabilities | | | (133,552 | ) | | | 27,356 | | | | (138,270 | ) | | | 6,611 | | | | (484,606 | ) | | | 117,024 | | | | (17,161 | ) |
| | | | | | | | | | | | | | | | | | | | | | | | | | | | |
Net increase (decrease) in net assets resulting from operations | | | (230,238 | ) | | | 57,002 | | | | (281,149 | ) | | | 37,025 | | | | (643,957 | ) | | | 336,011 | | | | (52,052 | ) |
Distributions to shareholders from | | | | | | | | | | | | | | | | | | | | | | | | | | | | |
Net investment income | | | — | | | | (3,639 | ) | | | — | | | | (2,890 | ) | | | — | | | | (7,865 | ) | | | (87 | ) |
Net realized gain | | | (3,234 | ) | | | (26,593 | ) | | | (4,881 | ) | | | (27,584 | ) | | | (41,761 | ) | | | (199,782 | ) | | | — | |
| | | | | | | | | | | | | | | | | | | | | | | | | | | | |
| | | (3,234 | ) | | | (30,232 | ) | | | (4,881 | ) | | | (30,474 | ) | | | (41,761 | ) | | | (207,647 | ) | | | (87 | ) |
Capital stock transactions | | | | | | | | | | | | | | | | | | | | | | | | | | | | |
Net proceeds from sale of shares | | | 166,058 | | | | 125,416 | | | | 259,319 | | | | 188,786 | | | | 81,613 | | | | 192,579 | | | | 107,010 | |
Shares issued in reinvestment of income dividends and capital gain distributions | | | 3,194 | | | | 29,404 | | | | 4,719 | | | | 25,293 | | | | 41,234 | | | | 201,805 | | | | 80 | |
Less cost of shares redeemed | | | (115,903 | ) | | | (70,697 | ) | | | (87,479 | ) | | | (51,140 | ) | | | (217,395 | ) | | | (170,543 | ) | | | (8,275 | ) |
| | | | | | | | | | | | | | | | | | | | | | | | | | | | |
Net increase (decrease) in net assets resulting from capital share transactions | | | 53,349 | | | | 84,123 | | | | 176,559 | | | | 162,939 | | | | (94,548 | ) | | | 223,841 | | | | 98,815 | |
| | | | | | | | | | | | | | | | | | | | | | | | | | | | |
Increase (decrease) in net assets | | | (180,123 | ) | | | 110,893 | | | | (109,471 | ) | | | 169,490 | | | | (780,266 | ) | | | 352,205 | | | | 46,676 | |
Net assets | | | | | | | | | | | | | | | | | | | | | | | | | | | | |
Beginning of year | | | 408,609 | | | | 297,716 | | | | 401,459 | | | | 231,969 | | | | 1,165,854 | | | | 813,649 | | | | — | |
| | | | | | | | | | | | | | | | | | | | | | | | | | | | |
End of year | | $ | 228,486 | | | $ | 408,609 | | | $ | 291,988 | | | $ | 401,459 | | | $ | 385,588 | | | $ | 1,165,854 | | | $ | 46,676 | |
| | | | | | | | | | | | | | | | | | | | | | | | | | | | |
Undistributed net investment income (loss) at the end of the year | | $ | (213 | ) | | $ | (4,913 | ) | | $ | (120 | ) | | $ | (2,779 | ) | | $ | (674 | ) | | $ | (9,849 | ) | | $ | (52 | ) |
| | | | | | | | | | | | | | | | | | | | | | | | | | | | |
| (a) | | For the period from March 26, 2008 (Commencement of Operations) to December 31, 2008. |
See accompanying Notes to Financial Statements.
98 Annual Report | December 31, 2008 |
Statements of Assets and Liabilities
December 31, 2008 (dollar amounts in thousands)
| | | | | | | | | | | | | | | | |
| | | Value
Discovery
Fund | | | Bond
Fund | | | Income
Fund | | | Ready
Reserves
Fund | |
Assets | | | | | | | | | | | | | | | | |
Investments in securities, at cost | | $ | 44,879 | | | $ | 73,406 | | | $ | 144,281 | | | $ | 1,836,583 | |
Investments in Affiliated Fund, at cost | | | 233 | | | | — | | | | — | | | | — | |
| | | | | | | | | | | | | | | | |
| | | | |
Investments in securities, at value | | $ | 36,123 | | | $ | 72,690 | | | $ | 140,025 | | | $ | 1,836,583 | |
Investments in Affiliated Fund, at amortized cost | | | 233 | | | | — | | | | — | | | | — | |
Receivable for fund shares sold | | | 179 | | | | 1,331 | | | | 58 | | | | — | |
Receivable from Advisor | | | — | | | | 12 | | | | — | | | | — | |
Dividend and interest receivable | | | 21 | | | | 669 | | | | 1,652 | | | | 5,231 | |
| | | | | | | | | | | | | | | | |
Total assets | | | 36,556 | | | | 74,702 | | | | 141,735 | | | | 1,841,814 | |
Liabilities | | | | | | | | | | | | | | | | |
Payable for investment securities purchased | | | 181 | | | | — | | | | — | | | | — | |
Payable for fund shares redeemed | | | 86 | | | | 35 | | | | 1,196 | | | | — | |
Management fee payable | | | 3 | | | | — | | | | 68 | | | | 352 | |
Distribution fee payable | | | 3 | | | | — | | | | — | | | | — | |
Shareholder service payable | | | — | | | | 8 | | | | — | | | | 191 | |
Dividend payable | | | — | | | | — | | | | — | | | | 72 | |
Other accrued expenses | | | 34 | | | | 46 | | | | 36 | | | | 10 | |
| | | | | | | | | | | | | | | | |
Total liabilities | | | 307 | | | | 89 | | | | 1,300 | | | | 625 | |
| | | | | | | | | | | | | | | | |
Net Assets | | $ | 36,249 | | | $ | 74,613 | | | $ | 140,435 | | | $ | 1,841,189 | |
| | | | | | | | | | | | | | | | |
Capital | | | | | | | | | | | | | | | | |
Composition of Net Assets | | | | | | | | | | | | | | | | |
Par value of shares of beneficial interest | | $ | 4 | | | $ | 8 | | | $ | 15 | | | $ | 1,537 | |
Capital paid in excess of par value | | | 50,606 | | | | 76,440 | | | | 183,557 | | | | 1,840,521 | |
Accumulated net investment income (loss) | | | 37 | | | | 10 | | | | 260 | | | | 84 | |
Accumulated realized gain (loss) | | | (5,642 | ) | | | (1,129 | ) | | | (39,141 | ) | | | (953 | ) |
Net unrealized appreciation (depreciation) of investments and foreign currencies | | | (8,756 | ) | | | (716 | ) | | | (4,256 | ) | | | — | |
| | | | | | | | | | | | | | | | |
Net Assets | | $ | 36,249 | | | $ | 74,613 | | | $ | 140,435 | | | $ | 1,841,189 | |
| | | | | | | | | | | | | | | | |
| | | | |
Class N Shares | | | | | | | | | | | | | | | | |
Net Assets | | $ | 7,061 | | | $ | 407 | | | $ | 47,009 | | | $ | 1,841,189 | |
Shares Outstanding | | | 847,979 | | | | 41,422 | | | | 5,408,357 | | | | 1,841,245,691 | |
Net Asset Value Per Share | | $ | 8.33 | | | $ | 9.82 | | | $ | 8.69 | | | $ | 1.00 | |
Class I Shares | | | | | | | | | | | | | | | | |
Net Assets | | $ | 29,188 | | | $ | 63,763 | | | $ | 93,426 | | | | | |
Shares Outstanding | | | 3,454,434 | | | | 6,556,895 | | | | 10,818,751 | | | | | |
Net Asset Value Per Share | | $ | 8.45 | | | $ | 9.72 | | | | 8.64 | | | | | |
See accompanying Notes to Financial Statements.
December 31, 2008 | William Blair Funds 99 |
Statements of Operations
for the Year Ended December 31, 2008 (all amounts in thousands)
| | | | | | | | | | | | | | | |
| | | Value
Discovery
Fund | | | Bond
Fund | | | Income
Fund | | | Ready
Reserves
Fund |
Investment income | | | | | | | | | | | | | | | |
Dividends | | $ | 898 | | | $ | 8 | | | $ | — | | | $ | — |
Dividend Income from Affiliated Fund | | | 3 | | | | — | | | | — | | | | — |
Interest | | | 15 | | | | 3,878 | | | | 9,460 | | | | 43,384 |
| | | | | | | | | | | | | | | |
Total income | | | 916 | | | | 3,886 | | | | 9,460 | | | | 43,384 |
Expenses | | | | | | | | | | | | | | | |
Investment advisory fees | | | 468 | | | | 215 | | | | 1,058 | | | | 3,796 |
Distribution fees | | | 23 | | | | 1 | | | | 96 | | | | — |
Shareholder services fees | | | — | | | | 91 | | | | — | | | | 5,624 |
Custodian fees | | | 45 | | | | 45 | | | | 48 | | | | 4 |
Transfer agent fees | | | 61 | | | | 20 | | | | 76 | | | | 27 |
Professional fees | | | 36 | | | | 31 | | | | 31 | | | | 71 |
Registration fees | | | 36 | | | | 45 | | | | 32 | | | | 22 |
Other expenses | | | 24 | | | | 56 | | | | 83 | | | | 57 |
| | | | | | | | | | | | | | | |
Total expenses before waiver | | | 693 | | | | 504 | | | | 1,424 | | | | 9,601 |
Expenses reimbursed to (waived or absorbed by) the Advisor | | | (211 | ) | | | (160 | ) | | | (18 | ) | | | — |
| | | | | | | | | | | | | | | |
Net expenses | | | 482 | | | | 344 | | | | 1,406 | | | | 9,601 |
| | | | | | | | | | | | | | | |
Net investment income (loss) | | | 434 | | | | 3,542 | | | | 8,054 | | | | 33,783 |
Net realized and unrealized gain (loss) on investments, foreign currency transactions and other assets and liabilities | | | | | | | | | | | | | | | |
Net realized gain (loss) on investments | | | (4,157 | ) | | | (939 | ) | | | (12,996 | ) | | | — |
| | | | | | | | | | | | | | | |
Change in net unrealized appreciation (depreciation) on investments and other assets and liabilities | | | (8,966 | ) | | | (1,455 | ) | | | 570 | | | | — |
| | | | | | | | | | | | | | | |
Net increase (decrease) in net assets resulting from operations | | $ | (12,689 | ) | | $ | 1,148 | | | $ | (4,372 | ) | | $ | 33,783 |
| | | | | | | | | | | | | | | |
See accompanying Notes to Financial Statements.
100 Annual Report | December 31, 2008 |
Statements of Changes in Net Assets
for the Years Ended December 31, 2007 and 2008 (all amounts in thousands)
| | | | | | | | | | | | | | | | | | | | | | | | | | | | | | | | |
| | | Value
Discovery
Fund | | | Bond
Fund | | | Income
Fund | | | Ready
Reserves
Fund | |
| | | 2008 | | | 2007 | | | 2008 | | | 2007(a) | | | 2008 | | | 2007 | | | 2008 | | | 2007 | |
Operations | | | | | | | | | | | | | | | | | | | | | | | | | | | | | | | | |
Net investment income (loss) | | $ | 434 | | | $ | 298 | | | $ | 3,542 | | | $ | 1,886 | | | $ | 8,054 | | | $ | 12,529 | | | $ | 33,783 | | | $ | 58,681 | |
Net realized gain (loss) on investments, foreign currency transactions and other assets and liabilities | | | (4,157 | ) | | | 12,916 | | | | (939 | ) | | | (206 | ) | | | (12,996 | ) | | | (8,317 | ) | | | — | | | | (2 | ) |
Change in net unrealized appreciation (depreciation) on investments, and other assets and liabilities | | | (8,966 | ) | | | (12,770 | ) | | | (1,455 | ) | | | 739 | | | | 570 | | | | (822 | ) | | | — | | | | — | |
| | | | | | | | | | | | | | | | | | | | | | | | | | | | | | | | |
Net increase (decrease) in net assets resulting from operations | | | (12,689 | ) | | | 444 | | | | 1,148 | | | | 2,419 | | | | (4,372 | ) | | | 3,390 | | | | 33,783 | | | | 58,679 | |
Distributions to shareholders from | | | | | | | | | | | | | | | | | | | | | | | | | | | | | | | | |
Net investment income | | | (322 | ) | | | (172 | ) | | | (3,517 | ) | | | (1,892 | ) | | | (8,436 | ) | | | (14,147 | ) | | | (33,783 | ) | | | (58,678 | ) |
Net realized gain | | | — | | | | (12,452 | ) | | | — | | | | — | | | | — | | | | — | | | | — | | | | — | |
| | | | | | | | | | | | | | | | | | | | | | | | | | | | | | | | |
| | | (322 | ) | | | (12,624 | ) | | | (3,517 | ) | | | (1,892 | ) | | | (8,436 | ) | | | (14,147 | ) | | | (33,783 | ) | | | (58,678 | ) |
Capital stock transactions | | | | | | | | | | | | | | | | | | | | | | | | | | | | | | | | |
Net proceeds from sale of shares | | | 12,504 | | | | 28,653 | | | | 18,146 | | | | 67,764 | | | | 16,425 | | | | 47,969 | | | | 1,439,460 | | | | 1,130,710 | |
Shares issued in reinvestment of income dividends and capital gain distributions | | | 287 | | | | 12,169 | | | | 2,956 | | | | 1,606 | | | | 6,815 | | | | 11,602 | | | | 33,710 | | | | 58,646 | |
Less cost of shares redeemed | | | (10,649 | ) | | | (128,301 | ) | | | (12,603 | ) | | | (1,414 | ) | | | (74,627 | ) | | | (141,261 | ) | | | (1,031,518 | ) | | | (985,413 | ) |
| | | | | | | | | | | | | | | | | | | | | | | | | | | | | | | | |
Net increase (decrease) in net assets resulting from capital share transactions | | | 2,142 | | | | (87,479 | ) | | | 8,499 | | | | 67,956 | | | | (51,387 | ) | | | (81,690 | ) | | | 441,652 | | | | 203,943 | |
| | | | | | | | | | | | | | | | | | | | | | | | | | | | | | | | |
Increase (decrease) in net assets | | | (10,869 | ) | | | (99,659 | ) | | | 6,130 | | | | 68,483 | | | | (64,195 | ) | | | (92,447 | ) | | | 441,652 | | | | 203,944 | |
Net assets | | | | | | | | | | | | | | | | | | | | | | | | | | | | | | | | |
Beginning of year | | | 47,118 | | | | 146,777 | | | | 68,483 | | | | — | | | $ | 204,630 | | | $ | 297,077 | | | | 1,399,537 | | | | 1,195,593 | |
| | | | | | | | | | | | | | | | | | | | | | | | | | | | | | | | |
End of year | | $ | 36,249 | | | $ | 47,118 | | | $ | 74,613 | | | $ | 68,483 | | | $ | 140,435 | | | $ | 204,630 | | | $ | 1,841,189 | | | $ | 1,399,537 | |
| | | | | | | | | | | | | | | | | | | | | | | | | | | | | | | | |
Undistributed net investment income (loss) at the end of the year | | $ | 37 | | | $ | 29 | | | $ | 10 | | | $ | 1 | | | $ | 260 | | | $ | — | | | $ | 84 | | | $ | 84 | |
| | | | | | | | | | | | | | | | | | | | | | | | | | | | | | | | |
| (a) | | For the period from May 1, 2007 (Commencement of Operations) to December 31, 2007. |
See accompanying Notes to Financial Statements.
December 31, 2008 | William Blair Funds 101 |
Notes to Financial Statements
(1) Significant Accounting Policies
The following is a summary of the William Blair Funds’ (the “Fund”) significant accounting policies in effect during the year covered by the financial statements, which are in accordance with U.S. generally accepted accounting principles.
(a) Description of the Fund
William Blair Funds is a diversified mutual fund registered under the Investment Company Act of 1940, as amended, as an open-end management investment company. For each portfolio, the number of shares authorized is unlimited. The Fund currently consists of the following eighteen portfolios (the “Portfolios”), each with its own investment objective and policies.
| | |
Equity Portfolios | | International Equity Portfolios |
Growth | | International Growth |
Tax-Managed Growth | | International Equity |
Large Cap Growth | | Institutional International Growth |
Small Cap Growth | | Institutional International Equity |
Mid Cap Growth | | International Small Cap Growth |
Small-Mid Cap Growth | | Emerging Markets Growth |
Value Discovery | | Emerging Leaders Growth |
Global Equity Portfolio | | Fixed-Income Portfolios |
Global Growth | | Bond |
| | Income |
| | Money Market Portfolio |
| | Ready Reserves |
The investment objectives of the Portfolios are as follows:
| | |
Equity | | Long-term capital appreciation. |
Global Equity | | Long-term capital appreciation. |
International Equity | | Long-term capital appreciation. |
Fixed-Income | | High level of current income with relative stability of principal. |
Money Market | | Current income, a stable share price and daily liquidity. |
The Institutional International Growth Portfolio, the Institutional International Equity Portfolio and the Institutional Class of the International Small Cap Growth Portfolio, the Emerging Markets Growth Portfolio, the Emerging Leaders Growth Portfolio and the Bond Portfolio issue a separate report.
(b) Share Classes
Three different classes of shares currently exist: N, I and Institutional. This report includes financial highlight information for Classes N and I. The table below describes the Class N shares and the Class I shares covered by this report:
| | |
Class | | Description |
| N | | Class N shares are sold to the general public, either directly through the Fund’s distributor or through a select number of financial intermediaries. Class N shares are sold without any sales load, and carry an annual 12b-1 distribution fee (0.25% for the Equity, Global Equity and International Equity Portfolios and 0.15% for the Fixed-Income Portfolios) or a service fee (0.35% for the Money Market Portfolio), transfer agent expense which is not a fixed rate and may vary by Portfolio and class and an annual shareholder administration fee (0.15% for the Global Growth Portfolio, the International Small Cap Growth Portfolio, the Emerging Markets Growth Portfolio and the Bond Portfolio). |
| I | | Class I shares are sold to a limited group of investors. They do not carry any sales load or distribution fees and generally have lower ongoing expenses than the Class N shares. Class I shares of the Global Growth Portfolio, the International Small Cap Growth Portfolio, the Emerging Markets Growth Portfolio, the Emerging Leaders Growth Portfolio and the Bond Portfolio carry an annual shareholder administration fee of 0.15%. |
Investment income, realized and unrealized gains and losses, and certain Portfolio level expenses and expense reductions, if any, are allocated based on the relative net assets of each class, except for certain class specific expenses which are charged
102 Annual Report | December 31, 2008 |
directly to the appropriate class. Differences in class expenses may result in the payment of different per share dividends by class. All share classes of the Portfolios have equal rights with respect to voting subject to class specific arrangements.
(c) Investment Valuation
The market value of domestic equity securities and options is determined by valuing securities traded on national securities exchanges or markets or in the over-the-counter markets at the last sales price or, if applicable, the official closing price or, in the absence of a sale on the date of valuation, at the latest bid price.
The Board of Trustees has determined that the passage of time between when the foreign exchanges or markets close and when the Funds compute their net asset values could cause the value of international securities to no longer be representative or accurate, and as a result, necessitates that such securities be fair valued on a daily basis. Accordingly, for international securities, if the foreign exchange or market on which a security is primarily traded closes before the close of regular trading on the New York Stock Exchange (generally 4:00 p.m. Eastern time), the Funds use an independent pricing service on a daily basis to fair value price the security as of the close of regular trading on the New York Stock Exchange. As a result, a Fund’s value for a security may be different from the last sale price (or the latest bid price). The independent pricing service may not provide a fair value price for all international securities owned by a Fund trading on a foreign exchange or market that closes before the close of regular trading on the New York Stock Exchange. For these securities and all other foreign securities, the value of the security is determined based upon the last sale price on the foreign exchange or market on which it is primarily traded and in the currency of that market as of the close of the appropriate exchange or, if there have been no sales during that day, at the latest bid price.
Long-term, fixed-income securities are valued based on market quotations, or by independent pricing services that use prices provided by market makers or matrixes that produce estimates of market values obtained from yield data relating to instruments or securities with similar characteristics.
Investments in other funds are valued at the underlying fund’s net asset value on the date of valuation. Other securities, and all other assets, including securities for which a market price is not available, or the value of which is affected by a significant valuation event, are valued at fair value as determined in good faith by the Pricing or Valuation Committee, in accordance with the Fund’s Valuation Procedures approved by the Board of Trustees. As of December 31, 2008, there were securities held in the Growth, Small Cap Growth and Emerging Markets Growth Portfolios requiring fair valuation pursuant to the Fund’s valuation procedures. Securities held in the Ready Reserves Fund are valued at amortized cost, which approximates market value.
(d) Investment income and transactions
Dividend income is recorded on the ex-dividend date, except for those dividends from certain foreign securities that are recorded as soon as the information is available. Foreign currency gains and losses associated with fluctuations in the foreign currency rate versus the United States dollar are recorded in the Statement of Operations as a component of the net realized gain (loss) on foreign currency translations and other assets and liabilities.
Premiums and discounts are accreted and amortized on a straight-line basis for short-term investments and on an effective interest method for long-term investments.
Interest income is recorded on an accrual basis, adjusted for amortization of premium or discount. Variable rate bonds and floating rate notes earn interest at coupon rates that fluctuate at specific time intervals. The interest rates shown in the Portfolio of Investments for the Bond, Income, and Ready Reserves Portfolios were the rates in effect on December 31, 2008. Put bonds may be redeemed at the discretion of the holder on specified dates prior to maturity.
Paydown gains and losses on mortgage and asset-backed securities are treated as an adjustment to interest income. For the year ended December 31, 2008, the Bond and Income Portfolios recognized an increase or reduction of interest income and an increase or reduction of net realized gain of $16 and (loss) of $(642), respectively (in thousands). This reclassification has no effect on the net asset value of the Portfolios.
Security and shareholder transactions are accounted for no later than one business day following the trade date. However, for financial reporting purposes, security and shareholder transactions are accounted for on the trade date of the last business day of the reporting period. Realized gains and losses from securities transactions are recognized on the basis of high cost lot sell selection.
December 31, 2008 | William Blair Funds 103 |
Awards from class action litigation may be recorded as a reduction of cost. If the Portfolios no longer own the applicable securities, the proceeds are recorded as realized gains.
(e) Share Valuation and Dividends to Shareholders
Shares are sold and redeemed on a continuous basis at net asset value. The net asset value per share is determined separately for each class by dividing the Portfolio’s net assets attributable to that class by the number of shares of the class outstanding as of the close of regular trading on the New York Stock Exchange, which is generally 4:00 p.m. Eastern time, on each day the Exchange is open. Redemption fees may be applicable to redemptions or exchanges within 60 days of purchase. For both Class N and Class I shares, the William Blair domestic equity portfolios assess a 1% redemption fee on shares sold or exchanged that have been owned 60 days or less and the William Blair international portfolios assess a 2% redemption fee on shares sold or exchanged that have been owned 60 days or less as disclosed within the Fund’s Prospectus. The redemption fees collected by the Portfolio are netted against the amount of Redemptions for presentation on the Statement of Changes in Net Assets.
Redemption fees are included as reduction of the cost of shares redeemed on the Statement of Changes in Net Assets. For the year ended December 31, 2008, the redemption fees collected by the Portfolios were as follows (in thousands):
| | | |
Portfolio | | Redemption
Fees |
Growth | | $ | 17 |
Tax-Managed Growth | | | — |
Large Cap Growth | | | 2 |
Small Cap Growth | | | 43 |
Mid Cap Growth | | | 10 |
Small-Mid Cap Growth | | | 1 |
Global Growth | | | 1 |
International Growth | | | 290 |
International Equity | | | 28 |
International Small Cap Growth | | | 42 |
Emerging Markets Growth | | | 24 |
Emerging Leaders Growth | | | — |
Value Discovery | | | 8 |
Bond | | | — |
Income | | | 7 |
Dividends from net investment income, if any, of the Growth, Tax-Managed Growth, Large Cap Growth, Small Cap Growth, Mid Cap Growth, Small-Mid Cap Growth, Global Growth, International Growth, International Equity, International Small Cap Growth, Emerging Markets Growth, Emerging Leaders Growth and Value Discovery Portfolios are declared and paid at least annually. Dividends from the Bond and Income Portfolios are declared and paid monthly and the Ready Reserves Portfolio is declared and paid daily. Capital gain distributions, if any, are declared and paid at least annually in December. Dividends payable to shareholders are recorded on the ex-dividend date.
(f) Foreign Currency Translation and Forward Foreign Currency Contracts
The Global Growth, International Growth, International Equity, International Small Cap Growth, Emerging Markets Growth and Emerging Leaders Growth Portfolios may invest in securities denominated in foreign currencies. As such, assets and liabilities denominated in foreign currencies are translated into U.S. dollar amounts at the current exchange rate on the date of valuation. The values of foreign investments, open foreign currency forward contracts, and cash denominated in foreign currencies are translated into U.S. dollars using a spot market rate of exchange as of the time of the determination of each Portfolio’s NAV, typically 4:00 p.m. Eastern time on days when there is regular trading on the New York Stock Exchange. Payables and receivables for securities transactions, dividends, interest income and tax reclaims are translated into U.S. dollars using a spot market rate of exchange as of 4:00 p.m. Eastern time. Settlement of purchases and sales and dividend and interest receipts are translated into U.S. dollars using a spot market rate of exchange as of 11:00 a.m. Eastern time.
The Portfolios may enter into foreign currency forward contracts (1) as a means of managing the risks associated with changes in the exchange rates for the purchase or sale of a specific amount of a particular foreign currency, and (2) to hedge the value, in U.S. dollars, of portfolio securities. Gains and losses from foreign currency transactions associated with purchases and sales of investments and foreign currency forward contracts are included with the net realized and unrealized gain or loss on investments. For tax purposes these foreign currency gains and losses are treated as ordinary income.
104 Annual Report | December 31, 2008 |
(g) Income Taxes
Each Portfolio intends to comply with the provisions of Subchapter M of the Internal Revenue Code available to regulated investment companies and, therefore, no provision for Federal income taxes has been made in the accompanying financial statements since each Portfolio intends to distribute substantially all of its taxable income to its shareholders and be relieved of all Federal income taxes.
The Global Growth, International Growth, International Equity, International Small Cap Growth, Emerging Markets Growth and Emerging Leaders Growth Portfolios may be subject to a tax imposed on net realized gains on securities of certain foreign countries. The Portfolios record an estimated deferred tax liability for net realized gains on these securities in an amount that would be payable if the securities were disposed of on the valuation date.
Each Portfolio is subject to the provisions of FASB Interpretation No. 48, Accounting for Uncertainties in Income Taxes (FIN 48). FIN 48 provides guidance for how uncertain tax positions should be recognized, measured, presented and disclosed in the financial statements. Management has evaluated the implications of FIN 48 and all of the uncertain tax positions of the Portfolios and has determined that no liability is required to be recorded in the financial statements as of December 31, 2008.
The statute of limitations on the Funds’ tax returns remains open for the tax years 2005, 2006, 2007 and 2008 are still subject to examination.
The Global Growth, International Growth, International Equity, International Small Cap Growth, Emerging Markets Growth and Emerging Leaders Growth Portfolios have elected to mark-to-market their investments in Passive Foreign Investment Companies (“PFICs”) for Federal income tax purposes. The Portfolios also treat the deferred loss associated with current and prior year wash sales as an adjustment to the cost of investments for tax purposes. The cost of investments for Federal income tax purposes and related gross unrealized appreciation/(depreciation) and net unrealized appreciation/(depreciation) at December 31, 2008, were as follows (in thousands):
| | | | | | | | | | | | | |
Portfolio | | Cost of
Investments | | Gross Unrealized
Appreciation | | Gross Unrealized
Depreciation | | Net
Unrealized Appreciation/
Depreciation | |
Growth | | $ | 290,942 | | $ | 14,578 | | $ | 67,539 | | $ | (52,961 | ) |
Tax-Managed Growth | | | 7,184 | | | 319 | | | 1,791 | | | (1,472 | ) |
Large Cap Growth | | | 28,853 | | | 405 | | | 5,938 | | | (5,533 | ) |
Small Cap Growth | | | 660,053 | | | 29,592 | | | 293,981 | | | (264,389 | ) |
Mid Cap Growth | | | 50,025 | | | 1,149 | | | 11,426 | | | (10,277 | ) |
Small-Mid Cap Growth | | | 104,925 | | | 3,418 | | | 24,679 | | | (21,261 | ) |
Global Growth | | | 35,856 | | | 1,024 | | | 9,258 | | | (8,234 | ) |
International Growth | | | 4,017,503 | | | 195,317 | | | 1,096,008 | | | (900,691 | ) |
International Equity | | | 282,507 | | | 8,349 | | | 66,418 | | | (58,069 | ) |
International Small Cap Growth | | | 403,796 | | | 13,686 | | | 122,589 | | | (108,903 | ) |
Emerging Markets Growth | | | 598,107 | | | 7,476 | | | 222,543 | | | (215,067 | ) |
Emerging Leaders Growth | | | 69,494 | | | 688 | | | 23,441 | | | (22,753 | ) |
Value Discovery | | | 46,581 | | | 1,342 | | | 11,567 | | | (10,225 | ) |
Bond | | | 73,554 | | | 2,202 | | | 3,066 | | | (864 | ) |
Income | | | 144,532 | | | 4,082 | | | 8,589 | | | (4,507 | ) |
Ready Reserves | | | 1,836,583 | | | — | | | — | | | — | |
The timing and characterization of certain income and capital gain distributions are determined annually in accordance with Federal income tax regulations that may differ from U.S. generally accepted accounting principles. As a result, net investment income or loss and net realized gain or loss for a reporting period may differ from the amount distributed during such period. In addition, the Portfolios may periodically record reclassifications among certain capital accounts to reflect differences between financial reporting and income tax basis distributions. The reclassifications were reported in order to reflect the tax treatment for certain permanent differences that exist between income tax regulations and U.S. generally accepted accounting principles. The reclassifications generally relate to net operating losses, Section 988 currency gains,
December 31, 2008 | William Blair Funds 105 |
PFICs and losses, recharacterization of dividends received from investments in REITs, expired capital loss carryforwards, and gain or loss on in-kind transactions. These reclassifications have no impact on the net asset values of the Portfolios. Accordingly, at December 31, 2008, the following reclassifications were recorded (in thousands):
| | | | | | | | | | | | |
Portfolio | | Undistributed Net
Investment
Income (Loss) | | | Accumulated
Undistributed
Net Realized
Gain/(Loss) | | | Capital
Paid in Excess
of Par Value | |
Growth | | $ | 1,049 | | | $ | 1 | | | $ | (1,050 | ) |
Tax-Managed Growth | | | 15 | | | | — | | | | (15 | ) |
Large Cap Growth | | | 28 | | | | — | | | | (28 | ) |
Small Cap Growth | | | 6,473 | | | | 2 | | | | (6,475 | ) |
Mid Cap Growth | | | 251 | | | | — | | | | (251 | ) |
Small-Mid Cap Growth | | | — | | | | — | | | | — | |
Global Growth | | | (76 | ) | | | 76 | | | | — | |
International Growth | | | 34,775 | | | | (34,775 | ) | | | — | |
International Equity | | | 985 | | | | (461 | ) | | | (524 | ) |
International Small Cap Growth | | | 1,887 | | | | 779 | | | | (2,666 | ) |
Emerging Markets Growth | | | 1,356 | | | | 778 | | | | (2,134 | ) |
Emerging Leaders Growth | | | (324 | ) | | | 344 | | | | (20 | ) |
Value Discovery | | | (104 | ) | | | 120 | | | | (16 | ) |
Bond | | | (16 | ) | | | 16 | | | | — | |
Income | | | 641 | | | | 2,651 | | | | (3,292 | ) |
Ready Reserves | | | — | | | | 24 | | | | (24 | ) |
Distributions from net realized gains for book purposes may include short-term capital gains, which are included as ordinary income for tax purposes. The tax character of distributions paid during 2008 and 2007 was as follows (in thousands):
| | | | | | | | | | | | | | | | | | |
| | | Distributions Paid in 2008 | | Distributions Paid in 2007 |
Portfolio | | Ordinary
Income | | Long-Term
Capital
Gains | | Total
Distributions | | Ordinary
Income | | Long-Term
Capital
Gains | | Total
Distributions |
Growth | | $ | — | | $ | 5,607 | | $ | 5,607 | | $ | 1,311 | | $ | 32,583 | | $ | 33,894 |
Tax-Managed Growth | | | — | | | — | | | — | | | 10 | | | — | | | 10 |
Large Cap Growth | | | — | | | — | | | — | | | 14 | | | — | | | 14 |
Small Cap Growth | | | 5,544 | | | 14,989 | | | 20,533 | | | 36,457 | | | 31,924 | | | 68,381 |
Mid Cap Growth | | | — | | | — | | | — | | | 872 | | | 1,423 | | | 2,295 |
Small-Mid Cap Growth | | | 3 | | | — | | | 3 | | | 2,734 | | | 9,116 | | | 11,850 |
Global Growth | | | 391 | | | — | | | 391 | | | 17 | | | — | | | 17 |
International Growth | | | — | | | 171,159 | | | 171,159 | | | 95,355 | | | 760,979 | | | 856,334 |
International Equity | | | 296 | | | 2,938 | | | 3,234 | | | 7,717 | | | 22,515 | | | 30,232 |
International Small Cap Growth | | | — | | | 4,881 | | | 4,881 | | | 9,634 | | | 20,840 | | | 30,474 |
Emerging Markets Growth | | | 10,054 | | | 31,707 | | | 41,761 | | | 71,085 | | | 136,562 | | | 207,647 |
Emerging Leaders Growth | | | 87 | | | — | | | 87 | | | — | | | — | | | — |
Value Discovery | | | 322 | | | — | | | 322 | | | 7,808 | | | 4,816 | | | 12,624 |
Bond | | | 3,517 | | | — | | | 3,517 | | | 1,892 | | | — | | | 1,892 |
Income | | | 8,436 | | | — | | | 8,436 | | | 14,147 | | | — | | | 14,147 |
Ready Reserves | | | 33,783 | | | — | | | 33,783 | | | 58,678 | | | — | | | 58,678 |
As of December 31, 2008, the components of distributable earnings on a tax basis were as follows (in thousands):
| | | | | | | | | | | | | |
Portfolio | | Undistributed
Ordinary Income | | Accumulated
Capital and
Other Losses | | Undistributed
Long-Term
Gain | | Net
Unrealized
Appreciation/
Depreciation | |
Growth | | $ | — | | $ | 18,771 | | $ | — | | $ | (52,961 | ) |
Tax-Managed Growth | | | — | | | 688 | | | — | | | (1,472 | ) |
Large Cap Growth | | | — | | | 7,468 | | | — | | | (5,533 | ) |
Small Cap Growth | | | — | | | 114,149 | | | — | | | (264,389 | ) |
106 Annual Report | December 31, 2008 |
| | | | | | | | | | | | | |
Portfolio | | Undistributed
Ordinary
Income(loss) | | Accumulated
Capital and
Other Losses | | Undistributed
Long-Term
Gain | | Net
Unrealized
Appreciation/
Depreciation | |
Mid Cap Growth | | $ | — | | $ | 5,332 | | $ | — | | $ | (10,277 | ) |
Small-Mid Cap Growth | | | — | | | 16,456 | | | — | | | (21,261 | ) |
Global Growth | | | — | | | 22,106 | | | — | | | (8,234 | ) |
International Growth | | | 461 | | | 1,551,346 | | | — | | | (900,691 | ) |
International Equity | | | — | | | 94,380 | | | — | | | (58,069 | ) |
International Small Cap Growth | | | — | | | 136,035 | | | — | | | (108,903 | ) |
Emerging Markets Growth | | | — | | | 143,989 | | | — | | | (215,067 | ) |
Emerging Leaders Growth | | | — | | | 29,366 | | | — | | | (22,753 | ) |
Value Discovery | | | — | | | 4,136 | | | — | | | (10,225 | ) |
Bond | | | 10 | | | 981 | | | — | | | (864 | ) |
Income | | | 260 | | | 38,890 | | | — | | | (4,507 | ) |
Ready Reserves | | | 84 | | | 953 | | | — | | | — | |
At December 31, 2008, the Portfolios have unused capital loss carryforwards available for Federal income tax purposes to be applied against future capital gains, if any. If not applied, the carryforwards will expire as follows (in thousands):
| | | | | | | | | | | | | | | | | | | | | | | | | | | |
Portfolio | | 2009 | | 2010 | | 2011 | | 2012 | | 2013 | | 2014 | | 2015 | | 2016 | | Total |
Growth | | $ | — | | $ | — | | $ | — | | $ | — | | $ | — | | $ | — | | $ | — | | $ | 8,153 | | $ | 8,153 |
Tax-Managed Growth | | | — | | | — | | | 79 | | | — | | | — | | | — | | | — | | | 309 | | | 388 |
Large Cap Growth | | | 2,116 | | | 1,582 | | | 769 | | | — | | | — | | | — | | | — | | | 1,710 | | | 6,177 |
Small Cap Growth | | | — | | | — | | | — | | | — | | | — | | | — | | | — | | | 36,185 | | | 36,185 |
Mid Cap Growth | | | — | | | — | | | — | | | — | | | — | | | — | | | — | | | 4,249 | | | 4,249 |
Small-Mid Cap Growth | | | — | | | — | | | — | | | — | | | — | | | — | | | — | | | 10,635 | | | 10,635 |
Global Growth | | | — | | | — | | | — | | | — | | | — | | | — | | | 126 | | | 13,022 | | | 13,148 |
International Growth | | | — | | | — | | | — | | | — | | | — | | | — | | | — | | | 835,953 | | | 835,953 |
International Equity | | | — | | | — | | | — | | | — | | | — | | | — | | | — | | | 61,377 | | | 61,377 |
International Small Cap Growth | | | — | | | — | | | — | | | — | | | — | | | — | | | — | | | 81,949 | | | 81,949 |
Emerging Markets Growth | | | — | | | — | | | — | | | — | | | — | | | — | | | — | | | 84,442 | | | 84,442 |
Emerging Leaders Growth | | | — | | | — | | | — | | | — | | | — | | | — | | | — | | | 21,249 | | | 21,249 |
Value Discovery | | | — | | | — | | | — | | | — | | | — | | | — | | | — | | | 2,082 | | | 2,082 |
Bond | | | — | | | — | | | — | | | — | | | — | | | — | | | 135 | | | 559 | | | 694 |
Income | | | — | | | 1,692 | | | 1,582 | | | 4,431 | | | 3,398 | | | 4,138 | | | 9,190 | | | 14,459 | | | 38,890 |
Ready Reserves | | | — | | | 930 | | | — | | | 20 | | | — | | | — | | | 3 | | | — | | | 953 |
For the period November 1, 2008 through December 31, 2008, the following Portfolios incurred net realized capital, foreign currency losses or PFIC losses. Each Portfolio intends to treat this loss as having occurred in fiscal year 2009 for Federal income tax purposes (in thousands):
| | | | | | | | | |
Portfolio | | Capital
Amount | | Currency
Amount | | PFIC
Amount |
Growth | | $ | 10,618 | | $ | — | | $ | — |
Tax-Managed Growth | | | 300 | | | — | | | — |
Large Cap Growth | | | 1,291 | | | — | | | — |
Small Cap Growth | | | 77,964 | | | — | | | — |
Mid Cap Growth | | | 1,083 | | | — | | | — |
Small-Mid Cap Growth | | | 5,821 | | | — | | | — |
Global Growth | | | 8,941 | | | 17 | | | — |
International Growth | | | 708,264 | | | 5,800 | | | 2,197 |
International Equity | | | 32,790 | | | 272 | | | — |
International Small Cap Growth | | | 53,966 | | | 120 | | | — |
Emerging Markets Growth | | | 59,152 | | | 395 | | | — |
Emerging Leaders Growth | | | 8,083 | | | 34 | | | — |
Value Discovery | | | 2,056 | | | — | | | — |
Bond | | | 287 | | | — | | | — |
Income | | | — | | | — | | | — |
Ready Reserves | | | — | | | — | | | — |
December 31, 2008 | William Blair Funds 107 |
(h) Repurchase Agreements
The Portfolios may enter into repurchase agreements with their custodian, State Street Bank & Trust Company, whereby the Portfolios acquire ownership of a debt security and the custodian agrees, at the time of sale, to repurchase the debt security from the Portfolios at a mutually agreed upon time and price. The Portfolios’ policy is to take possession of the debt security as collateral under the repurchase agreements. The Portfolios minimize credit risk by monitoring credit exposure to the custodian and by monitoring the collateral value on an ongoing basis.
(i) Use of Estimates
The preparation of financial statements in conformity with U.S. generally accepted accounting principles requires management to make estimates and assumptions that affect the amounts reported in the financial statements. Actual results may differ from those estimates.
(j) Fair Value Measurements
The Portfolios adopted SFAS No. 157, “Fair Value Measurements,” effective January 1, 2008. In accordance with SFAS 157, “fair value” is defined as the price that a Portfolio would receive upon selling a security in an orderly transaction to an independent buyer in the principal or most advantageous market for the investment. Various inputs are used in determining the value of a Portfolio’s investments. SFAS 157 established a three-tier hierarchy of inputs to classify value measurements for disclosure purposes. The three-tier hierarchy of inputs is summarized in the three broad Levels listed below.
| | • | | Level 1 – Quoted prices in active markets for an identical security. |
| | • | | Level 2 – Prices determined using other significant observable inputs. Observable inputs are inputs that other market participants would use in pricing a security. These may include quoted prices for similar securities, interest rates, prepayment speeds, credit risk and others. |
| | • | | Level 3 – Prices determined using significant unobservable inputs. In situations where quoted prices or observable inputs are unavailable (for example, when there is little or no market activity for an investment), unobservable inputs may be used. Unobservable inputs reflect the Fund’s own assumptions about the factors market participants would use in pricing an investment, and would be based on the best information available. |
The inputs or methodology used for valuing an investment are not necessarily an indication of the risk associated with investing in those securities. For example, money market securities are valued using amortized cost, in accordance with rules under the 1940 Act. Generally, amortized cost approximates the current fair value of a security, but since the value is not obtained from a quoted price in an active market, such securities are reflected as Level 2.
At December 31, 2008, the Portfolios held no other financial instruments, such as, options, futures, or foreign currency forward contracts, that required fair valuation. The Small Cap Growth Portfolio holds warrants that were valued using the intrinsic pricing method. Pursuant to this methodology, the warrants had no value at December 31, 2008.
As of December 31, 2008 the hierarchical input levels of securities in each Portfolio are as follows (in thousands):
| | | | | | | | | | | | |
Portfolio | | Level 1 | | Level 2 | | Level 3 | | Total |
Growth | | $ | 237,011 | | $ | 970 | | $ | — | | $ | 237,981 |
Tax-Managed Growth | | | 5,510 | | | 202 | | | — | | | 5,712 |
Large Cap Growth | | | 22,689 | | | 631 | | | — | | | 23,320 |
Small Cap Growth | | | 392,547 | | | 100 | | | 3,017 | | | 395,664 |
Mid Cap Growth | | | 38,441 | | | 1,307 | | | — | | | 39,748 |
Small Mid-Cap Growth | | | 81,498 | | | 2,166 | | | — | | | 83,664 |
Global Growth | | | 13,940 | | | 13,682 | | | — | | | 27,622 |
International Growth | | | 533,925 | | | 2,583,807 | | | — | | | 3,117,732 |
International Equity | | | 32,537 | | | 191,971 | | | — | | | 224,508 |
International Small Cap Growth. | | | 40,947 | | | 253,958 | | | — | | | 294,905 |
Emerging Markets Growth | | | 148,810 | | | 234,189 | | | — | | | 382,999 |
Emerging Leaders Growth | | | 21,673 | | | 25,068 | | | — | | | 46,741 |
Value Discovery | | | 35,281 | | | 1,075 | | | — | | | 36,356 |
Bond | | | — | | | 72,647 | | | 43 | | | 72,690 |
Income | | | — | | | 138,169 | | | 1,856 | | | 140,025 |
Ready Reserves | | | — | | | 1,836,583 | | | — | | | 1,836,583 |
108 Annual Report | December 31, 2008 |
The following is a reconciliation of Level 3 securities for which significant unobservable inputs were used to determine fair value:
| | | | | | | | | | | | | | | | |
| | | Balance
January 1, 2008 | | Net
Purchases
Sales | | Transfers to
Level 3 | | Change in
Unrealized
Gain(Loss) | | | Balance
December 31, 2008 |
Small Cap Growth | | $ | — | | $ | — | | $ | 10,860 | | $ | (7,843 | ) | | $ | 3,017 |
Bond | | | — | | | — | | | 69 | | | (26 | ) | | | 43 |
Income | | | — | | | — | | | 2,902 | | | (1,046 | ) | | | 1,856 |
Fair value estimate for the level three security in the Small Cap Portfolio was valued in good faith by the Pricing Committee, pursuant to the Valuation Procedures adopted by the Board of Trustees, and approved by the Valuation Committee. There were various factors considered in reaching this fair value determination, including but not limited to the following: the type of security, the extent of public trading of the security, information obtained from the broker-dealer for the security, analysis of the company’s performance and market trends that influence its performance. Fair value estimates of the level three securities in the Bond and Income Portfolios were obtained from outside parties and were reviewed by the Investment Advisor. At December 31, 2008, these securities represent 0.75%, 0.06% and 1.32% of the net assets of the Small Cap Portfolio, Bond Portfolio and Income Portfolio, respectively.
(k) U.S. Department of The Treasury’s Temporary Guaranty Program
On October 2, 2008, the Board of Trustees approved the participation of the Ready Reserve Portfolio in the U.S. Department of the Treasury’s Temporary Guaranty Program for Money Market Funds (“Program”). The Program protects the NAV of certain shares of a shareholder of record in the Portfolio at the close of business on September 19, 2008. A shareholder would receive a payment in the amount of $1.00 per covered share upon liquidation of the Portfolio, if the Portfolio’s market-based NAV per share were to fall below $0.995 and was not promptly restored to $1.00. The number of covered shares is the lesser of the number of shares owned on September 19, 2008 or the number of shares owned on the date when the payment is triggered. Shares acquired by a covered shareholder after the close of business on September 19, 2008 are not guaranteed. If a customer closes his or her account with the Portfolio or a broker-dealer or other intermediary, any future investment in the Portfolio will not be guaranteed. Guarantee payments under the Program will not exceed the amount available within the Treasury’s Exchange Stabilization Fund. The Portfolio will bear the expense of its participation in the Program without regard to any expense caps currently in place. Prior to December 3, 2008, the fee for participation in the Program was 0.01% of the NAV of the Ready Reserve Portfolio.
On December 2, 2008, the Board approved the participation of the Ready Reserve Portfolio in the extension (the “Extension”) of the Program.
The Ready Reserve Portfolio will continue to bear the expense of its participation in the Program without regard to any expense caps currently in place and, therefore, all shareholders will bear such expense irrespective of the extent of their coverage. The fee for participation in the Extension after December 3, 2008 is 0.015% of the NAV of the Portfolio, as of September 19, 2008.
The Extension terminates on April 30, 2009, but may be later extended by the Treasury Department to terminate no later than September 18, 2009. If the Treasury Department further extends the Program, the Board of Trustees will consider whether to continue to participate.
(2) Accounting Pronouncement
In March 2008, the FASB issued SFAS No. 161, “Disclosures about Derivative Instruments and Hedging Activities.” This standard is intended to enhance financial statement disclosures for derivative instruments and hedging activities and enable investors to understand: a) how and why a fund uses derivative instruments, b) how derivatives instruments and related hedge fund items are accounted for, and c) how derivative instruments and related hedge items affect a fund’s financial position, results of operations and cash flows. SFAS No. 161 is effective for financial statements issued for fiscal years and interim periods beginning after November 15, 2008. As of December 31, 2008, management does not believe the adoption of SFAS No. 161 will impact the financial statement amounts; however, additional footnote disclosures may be required about the use of derivative instruments and hedging items.
December 31, 2008 | William Blair Funds 109 |
(3) Transactions with Affiliates
(a) Management and Expense Limitation Agreements
Each Portfolio has a management agreement with William Blair & Company L.L.C. (the “Company”) for investment advisory, clerical, bookkeeping and administrative services. Each Portfolio pays the Company an annual fee, payable monthly, based on a specified percentage of its average daily net assets. A summary of the annual rates expressed as a percentage of average daily net assets is as follows:
| | | | | | | | |
Equity Portfolios | | | | | Global Portfolio | | | |
Growth | | 0.75 | % | | Global Growth | | 1.00 | % |
Tax-Managed Growth | | 0.80 | % | | International Portfolios | | | |
Large Cap Growth | | 0.80 | % | | International Growth and International Equity | | | |
Small Cap Growth | | 1.10 | % | | First $250 million | | 1.10 | % |
Mid Cap Growth | | 0.95 | % | | In excess of $250 million | | 1.00 | % |
Small-Mid Cap Growth | | 1.00 | % | | International Small Cap Growth | | 1.00 | % |
Value Discovery | | 1.10 | % | | Emerging Markets Growth | | 1.10 | % |
| | | | | Emerging Leaders Growth | | 1.10 | % |
| | | |
Fixed-Income Portfolios | | | | | Money Market Portfolio | | | |
Bond | | 0.30 | % | | Ready Reserves | | | |
Income* | | | | | First $250 million | | 0.275 | % |
First $250 million | | 0.25 | % | | Next $250 million | | 0.250 | % |
In excess of $250 million | | 0.20 | % | | Next $2 billion | | 0.225 | % |
| | | | | In excess of $2.5 billion | | 0.200 | % |
*Management fee also includes a charge of 5% of gross income. | | | | | | | | |
Some of the Portfolios have also entered into Expense Limitation Agreements with the Company. Under the terms of these agreements the Advisor will waive its management fee and/or reimburse the portfolio for expenses in excess of the agreed upon rate. The amount the Advisor owes a Portfolio is recorded as the Receivable from Advisor on the Statement of Assets and Liabilities. Under the terms of these Agreements, the Company has agreed to waive its advisory fees and/or absorb other operating expenses through April 30, 2009, if total expenses for each class of the following Portfolios exceed the following rates (as a percentage of average daily net assets):
| | | | | | | | | | | | |
| | | Class N Shares | | | Class I Shares | |
Portfolio | | Through April 30, 2009 | | | Effective
May 1, 2008 | | | Through April 30, 2009 | | | Effective
May 1, 2008 | |
Tax-Managed Growth | | 1.32 | % | | 1.32 | % | | 1.07 | % | | 1.07 | % |
Large Cap Growth | | 1.23 | % | | 1.23 | % | | 0.98 | % | | 0.98 | % |
Small Cap Growth | | 1.50 | % | | 1.50 | % | | 1.25 | % | | 1.25 | % |
Mid Cap Growth Fund | | 1.36 | % | | 1.36 | % | | 1.11 | % | | 1.11 | % |
Small-Mid Cap Growth | | 1.36 | % | | 1.36 | % | | 1.11 | % | | 1.11 | % |
Global Growth | | 1.55 | % | | 1.55 | % | | 1.30 | % | | 1.30 | % |
International Growth | | 1.45 | % | | 1.45 | % | | 1.20 | % | | 1.20 | % |
International Equity | | 1.45 | % | | 1.45 | % | | 1.20 | % | | 1.20 | % |
International Small Cap Growth | | 1.65 | % | | 1.65 | % | | 1.40 | % | | 1.40 | % |
Emerging Markets Growth | | 1.65 | % | | 1.70 | % | | 1.40 | % | | 1.45 | % |
Emerging Leaders Growth | | N/A | | | N/A | | | 1.40 | %(a) | | 1.40 | %(a) |
Value Discovery | | 1.29 | % | | 1.29 | % | | 1.09 | % | | 1.09 | % |
Bond Fund | | 0.65 | % | | 0.65 | % | | 0.50 | % | | 0.50 | % |
Income Fund | | N/A | | | 0.85 | % | | N/A | | | 0.70 | % |
| (a) | | Effective March 26, 2008. |
For a period of three years subsequent to the Commencement of Operations of the Mid Cap Growth, Global Growth, Emerging Leaders Growth and Bond Portfolios, the Company is entitled to reimbursement for previously waived fees and reimbursed expenses to the extent the overall expense ratio remains below the percentages indicated. The total amount available for recapture at December 31, 2008 was $294 (in thousands) for the Mid Cap Growth Portfolio, $265 for the Global
110 Annual Report | December 31, 2008 |
Growth Portfolio, $81 for the Emerging Leaders Growth Portfolio and $226 for the Bond Portfolio. The Company’s right to be reimbursed under the Expense Limitation Agreement for the Emerging Markets Growth Portfolio and International Small Cap Growth Portfolio expired June 6, 2008 and November 1, 2008, respectively. Under this provision, the Emerging Markets Growth Fund and International Small Cap Growth Portfolio reimbursed the Advisor $208,000 and $134,000, respectively during the year ended December 31, 2008.
For the year ended December 31, 2008, the investment advisory fees incurred by the Portfolios and related fee waivers were as follows (in thousands):
| | | | | | | | | | | | | |
Portfolio | | Gross
Advisory Fees | | Fee
Waiver | | Net
Advisory Fee | | Additional
Expenses
(Recovered) or
Absorbed
by Advisor | |
Growth | | $ | 2,364 | | $ | — | | $ | 2,364 | | $ | — | |
Tax-Managed Growth | | | 70 | | | 70 | | | — | | | — | |
Large Cap Growth | | | 232 | | | 68 | | | 164 | | | 9 | |
Small Cap Growth | | | 7,912 | | | — | | | 7,912 | | | — | |
Mid Cap Growth | | | 433 | | | 57 | | | 376 | | | 18 | |
Small-Mid Cap Growth | | | 1,124 | | | 64 | | | 1,060 | | | — | |
Global Growth | | | 447 | | | 196 | | | 251 | | | — | |
International Growth | | | 63,082 | | | — | | | 63,082 | | | — | |
International Equity | | | 3,697 | | | — | | | 3,697 | | | 75 | |
International Small Cap Growth | | | 3,887 | | | — | | | 3,887 | | | (134 | ) |
Emerging Markets Growth | | | 8,539 | | | — | | | 8,539 | | | (208 | ) |
Emerging Leaders Growth | | | 559 | | | 81 | | | 478 | | | — | |
Value Discovery | | | 468 | | | 206 | | | 262 | | | — | |
Bond | | | 215 | | | 146 | | | 69 | | | 12 | |
Income | | | 1,058 | | | — | | | 1,058 | | | — | |
Ready Reserves | | | 3,796 | | | — | | | 3,796 | | | — | |
(b) Underwriting, Distribution Services and Service Agreement
Each Portfolio except the Ready Reserves Portfolio has a Distribution Agreement with the Company for distribution services. Each Portfolio pays the Company an annual fee, payable monthly, based on a specified percentage of its average daily net assets of specified share classes. The annual rate expressed as a percentage of average daily net assets for Class N is 0.25% for all Portfolios except the Income and Bond Portfolios, which is 0.15%. Pursuant to the Distribution Agreement, the Company enters into related selling group agreements with various firms at various rates for sales of the Portfolios’ Class N shares.
Distribution fees incurred by the Portfolios to the Company, for the year ended December 31, 2008, were as follows (in thousands):
| | | | | | | | | |
Portfolio | | Gross
Distribution
Fees | | Fee
Waiver | | Net
Distribution
Fee |
Growth | | $ | 275 | | $ | — | | $ | 275 |
Tax-Managed Growth | | | 2 | | | — | | | 2 |
Large Cap Growth | | | 16 | | | 16 | | | — |
Small Cap Growth | | | 885 | | | — | | | 885 |
Mid Cap Growth | | | 16 | | | 16 | | | — |
Small-Mid Cap Growth | | | 32 | | | — | | | 32 |
Global Growth | | | 24 | | | 19 | | | 5 |
International Growth | | | 9,955 | | | — | | | 9,955 |
International Equity | | | 160 | | | — | | | 160 |
International Small Cap Growth | | | 47 | | | — | | | 47 |
Emerging Markets Growth | | | 122 | | | — | | | 122 |
Value Discovery | | | 23 | | | 5 | | | 18 |
Bond | | | 1 | | | 1 | | | — |
Income | | | 96 | | | 18 | | | 78 |
December 31, 2008 | William Blair Funds 111 |
The Ready Reserves Portfolio has a Service Agreement with the Company to provide shareholder services and automatic sweep services. The Portfolio pays the Company an annual fee, payable monthly, based upon 0.35% of the average daily net assets of Class N. The Board of Trustees has determined that the amount payable for “service fees” (as defined by FINRA) does not exceed 0.25% of the average annual net assets attributable to Class N shares. For the year ended December 31, 2008, the following fees were incurred (in thousands):
The Global Growth, International Small Cap Growth, Emerging Markets Growth, Emerging Leaders Growth and Bond Portfolios have a Shareholder Administration Agreement with the Company to provide shareholder administration services. Class N and Class I shares of the Portfolios pay the Company an annual fee, payable monthly, based upon 0.15% of average daily net assets attributable to each class, respectively. For the year ended December 31, 2008, the following fees were incurred (in thousands):
| | | | | | | | | |
Portfolio | | Class N | | Class I | | Total |
Global Growth | | $ | 15 | | $ | 53 | | $ | 68 |
International Small Cap Growth | | | 27 | | | 210 | | | 237 |
Emerging Markets Growth | | | 73 | | | 293 | | | 366 |
Emerging Leaders Growth* | | | — | | | 5 | | | 5 |
Bond** | | | 1 | | | 90 | | | 91 |
| * | | Emerging Leaders Growth Fund does not offer Class N shares. |
| ** | | The Company waived shareholder administration fees of $1 (in thousands) for the Bond Portfolio during 2008. |
(c) Trustees Fees
The Portfolios incurred fees of $259 (in thousands) to non-interested trustees of the Fund for the year ended December 31, 2008. Interested trustees are not compensated by the Fund.
(d) Investments in Affiliated Portfolio
Pursuant to the rules of the 1940 Act, each of the Portfolios of the Fund may invest in the William Blair Ready Reserves Portfolio (“Ready Reserves”), an open-end money market portfolio managed by the Advisor. Ready Reserves Portfolio is used as a cash management option by the other Portfolios in the Fund. The Advisor waives management fees in an amount equal to the management fee and service fee that Ready Reserves receives from the Portfolio’s investment. The fees waived with respect to each Portfolio for the year ended December 31, 2008 are listed below. Distributions received from Ready Reserves are reflected as “Dividend Income from Affiliated Fund” in each Portfolio’s statement of operations. Amounts relating to the Portfolios’ investments in Ready Reserves were as follows for the year ended December 31, 2008 (in thousands):
| | | | | | | | | | | | | | | | | | | | | |
Portfolio | | 12/31/07 Value | | Purchases | | Sales
Proceeds | | Fees
Waived | | Dividend
Income | | 12/31/08 Value | | Percent
of Net
Assets | |
Growth | | $ | 1,699 | | $ | 8,061 | | $ | 6,700 | | $ | 21 | | $ | 61 | | $ | 3,060 | | 1.3 | % |
Tax-Managed Growth | | | 309 | | | 225 | | | 520 | | | 1 | | | 5 | | | 14 | | 0.3 | |
Large Cap Growth | | | 244 | | | 96 | | | — | | | 2 | | | 6 | | | 340 | | 1.5 | |
Small Cap Growth | | | 1,554 | | | 14,041 | | | 15,500 | | | 14 | | | 42 | | | 95 | | 0.0 | |
Mid Cap Growth | | | 112 | | | 406 | | | — | | | 2 | | | 6 | | | 518 | | 1.3 | |
Small-Mid Cap Growth | | | 22 | | | — | | | — | | | — | | | 1 | | | 22 | | 0.0 | |
Global Growth | | | 1,006 | | | 2,223 | | | 3,200 | | | 6 | | | 23 | | | 29 | | 0.1 | |
International Growth | | | 9,878 | | | 61,985 | | | 53,500 | | | 122 | | | 386 | | | 18,363 | | 0.6 | |
International Equity | | | 5,278 | | | 13,126 | | | 18,400 | | | 39 | | | 125 | | | 4 | | 0.0 | |
International Small Cap Growth | | | 2,197 | | | 3,090 | | | 2,000 | | | 28 | | | 89 | | | 3,287 | | 1.1 | |
Emerging Markets Growth | | | 1,326 | | | 12,539 | | | 11,800 | | | 13 | | | 40 | | | 2,065 | | 0.5 | |
Emerging Leaders Growth | | | — | | | 11,620 | | | 10,880 | | | 6 | | | 20 | | | 740 | | 1.6 | |
Value Discovery | | | 31 | | | 502 | | | 300 | | | 1 | | | 3 | | | 233 | | 0.6 | |
112 Annual Report | December 31, 2008 |
(4) Investment Transactions
Investment transactions, excluding money market instruments, for the year ended December 31, 2008 were as follows (in thousands):
| | | | | | | |
Portfolio | | Purchases | | Sales | |
Growth | | $ | 193,569 | | $ | (185,919 | ) |
Tax-Managed Growth | | | 4,566 | | | (5,118 | ) |
Large Cap Growth | | | 26,543 | | | (24,135 | ) |
Small Cap Growth | | | 947,456 | | | (1,156,967 | ) |
Mid Cap Growth | | | 47,761 | | | (33,694 | ) |
Small Mid-Cap Growth | | | 99,581 | | | (84,397 | ) |
Global Growth | | | 68,354 | | | (53,067 | ) |
International Growth | | | 5,553,334 | | | (5,701,881 | ) |
International Equity | | | 379,471 | | | (304,248 | ) |
International Small Cap Growth | | | 458,056 | | | (293,072 | ) |
Emerging Markets Growth | | | 910,799 | | | (1,014,308 | ) |
Emerging Leaders Growth | | | 172,042 | | | (74,570 | ) |
Value Discovery | | | 38,429 | | | (36,680 | ) |
Bond | | | 51,570 | | | (40,886 | ) |
Income | | | 65,673 | | | (119,589 | ) |
(5) Foreign Currency Forward Contracts
The Global Growth, International Growth, International Equity, International Small Cap Growth, Emerging Markets Growth and Emerging Leaders Growth Portfolios from time to time may enter into foreign currency forward contracts with the Fund’s custodian and other counterparties in an attempt to hedge against a decline in the value of foreign currency against the U.S. dollar. The Portfolios bear the market risk that arises from changes in foreign currency rates and bear the credit risk if the counterparty fails to perform under the contract. The net realized and unrealized gains and losses associated with foreign currency forward contracts for the year ended December 31, 2008 are reflected in the accompanying financial statements.
(6) Fund Share Transactions
The following table summarizes the activity in capital shares of each Portfolio (in thousands):
| | | | | | | | | | | | | | | | | | |
| | | Sales (Dollars) |
| | | Year Ended December 31, 2008 | | Year Ended December 31, 2007 |
Portfolio | | Class N | | Class I | | Total | | Class N | | Class I | | Total |
Growth | | $ | 40,500 | | $ | 22,769 | | $ | 63,269 | | $ | 79,267 | | $ | 36,934 | | $ | 116,201 |
Tax-Managed Growth | | | 285 | | | 329 | | | 614 | | | 25 | | | 962 | | | 987 |
Large Cap Growth | | | 1,370 | | | 6,227 | | | 7,597 | | | 6,019 | | | 17,652 | | | 23,671 |
Small Cap Growth | | | 182,831 | | | 95,924 | | | 278,755 | | | 122,872 | | | 166,224 | | | 289,096 |
Mid Cap Growth | | | 1,694 | | | 21,584 | | | 23,278 | | | 3,154 | | | 21,869 | | | 25,023 |
Small Mid-Cap Growth | | | 1,672 | | | 30,684 | | | 32,356 | | | 3,805 | | | 30,060 | | | 33,865 |
Global Growth (a) | | | 5,845 | | | 17,564 | | | 23,409 | | | 9,461 | | | 36,776 | | | 46,237 |
International Growth | | | 1,279,021 | | | 815,880 | | | 2,094,901 | | | 1,171,189 | | | 765,505 | | | 1,936,694 |
International Equity | | | 62,107 | �� | | 103,951 | | | 166,058 | | | 28,861 | | | 96,555 | | | 125,416 |
International Small Cap Growth | | | 9,671 | | | 107,145 | | | 116,816 | | | 10,144 | | | 98,939 | | | 109,083 |
Emerging Markets Growth | | | 9,293 | | | 38,307 | | | 47,600 | | | 13,466 | | | 63,633 | | | 77,099 |
Emerging Leaders Growth (b) | | | — | | | 6,331 | | | 6,331 | | | — | | | — | | | — |
Value Discovery | | | 2,945 | | | 9,559 | | | 12,504 | | | 17,674 | | | 10,979 | | | 28,653 |
Bond (c) | | | 165 | | | 17,428 | | | 17,593 | | | 791 | | | 55,455 | | | 56,246 |
Income | | | 11,731 | | | 4,694 | | | 16,425 | | | 29,070 | | | 18,899 | | | 47,969 |
Ready Reserves | | | 1,439,460 | | | — | | | 1,439,460 | | | 1,130,710 | | | — | | | 1,130,710 |
| (a) | | The information for the year ended December 31, 2007 is for the period from October 15, 2007 (Commencement of Operations) to December 31, 2007. |
| (b) | | For the period from March 26, 2008 (Commencement of Operations) to December 31, 2008. |
| (c) | | The information for the year ended December 31, 2007 is for the period from May 1, 2007 (Commencement of Operations) to December 31, 2007. |
December 31, 2008 | William Blair Funds 113 |
| | | | | | | | | | | | | | | | | | |
| | | Reinvested Distributions (Dollars) |
| | | Year Ended December 31, 2008 | | Year Ended December 31, 2007 |
Portfolio | | Class N | | Class I | | Total | | Class N | | Class I | | Total |
Growth | | $ | 1,995 | | $ | 3,280 | | $ | 5,275 | | $ | 11,537 | | $ | 20,233 | | $ | 31,770 |
Tax-Managed Growth | | | — | | | — | | | — | | | — | | | 9 | | | 9 |
Large Cap Growth | | | — | | | — | | | — | | | — | | | 13 | | | 13 |
Small Cap Growth | | | 10,793 | | | 9,348 | | | 20,141 | | | 33,642 | | | 31,549 | | | 65,191 |
Mid Cap Growth | | | — | | | — | | | — | | | 370 | | | 1,790 | | | 2,160 |
Small Mid-Cap Growth | | | — | | | 3 | | | 3 | | | 1,635 | | | 9,269 | | | 10,904 |
Global Growth (a) | | | 21 | | | 345 | | | 366 | | | — | | | 15 | | | 15 |
International Growth | | | 108,020 | | | 56,739 | | | 164,759 | | | 544,079 | | | 270,368 | | | 814,447 |
International Equity | | | 603 | | | 2,591 | | | 3,194 | | | 4,176 | | | 25,228 | | | 29,404 |
International Small Cap Growth | | | 193 | | | 1,365 | | | 1,558 | | | 1,541 | | | 6,936 | | | 8,477 |
Emerging Markets Growth | | | 1,816 | | | 7,201 | | | 9,017 | | | 13,201 | | | 45,872 | | | 59,073 |
Emerging Leaders Growth (b) | | | — | | | 1 | | | 1 | | | — | | | — | | | — |
Value Discovery | | | 44 | | | 243 | | | 287 | | | 3,149 | | | 9,020 | | | 12,169 |
Bond (c) | | | 30 | | | 2,403 | | | 2,433 | | | 18 | | | 1,247 | | | 1,265 |
Income | | | 2,500 | | | 4,315 | | | 6,815 | | | 4,665 | | | 6,937 | | | 11,602 |
Ready Reserves | | | 33,783 | | | — | | | 33,783 | | | 58,646 | | | — | | | 58,646 |
| |
| | | Redemptions (Dollars) |
| | | Year Ended December 31, 2008 | | Year Ended December 31, 2007 |
Portfolio | | Class N | | Class I | | Total | | Class N | | Class I | | Total |
Growth | | $ | 31,338 | | $ | 22,604 | | $ | 53,942 | | $ | 22,235 | | $ | 24,778 | | $ | 47,013 |
Tax-Managed Growth | | | 299 | | | 1,207 | | | 1,506 | | | 422 | | | 352 | | | 774 |
Large Cap Growth | | | 1,051 | | | 3,905 | | | 4,956 | | | 10,247 | | | 2,387 | | | 12,634 |
Small Cap Growth | | | 278,090 | | | 253,629 | | | 531,719 | | | 280,620 | | | 150,866 | | | 431,486 |
Mid Cap Growth | | | 1,551 | | | 8,033 | | | 9,584 | | | 2,289 | | | 964 | | | 3,253 |
Small Mid-Cap Growth | | | 4,915 | | | 17,966 | | | 22,881 | | | 2,710 | | | 10,636 | | | 13,346 |
Global Growth (a) | | | 5,213 | | | 6,152 | | | 11,365 | | | 310 | | | 4 | | | 314 |
International Growth | | | 1,780,043 | | | 942,995 | | | 2,723,038 | | | 959,848 | | | 329,335 | | | 1,289,183 |
International Equity | | | 31,499 | | | 84,404 | | | 115,903 | | | 13,951 | | | 56,746 | | | 70,697 |
International Small Cap Growth | | | 7,979 | | | 66,904 | | | 74,883 | | | 7,789 | | | 25,704 | | | 33,493 |
Emerging Markets Growth | | | 27,912 | | | 85,134 | | | 113,046 | | | 15,733 | | | 60,321 | | | 76,054 |
Emerging Leaders Growth (b) | | | — | | | 373 | | | 373 | | | — | | | — | | | — |
Value Discovery | | | 4,879 | | | 5,770 | | | 10,649 | | | 106,443 | | | 21,858 | | | 128,301 |
Bond (c) | | | 493 | | | 9,925 | | | 10,418 | | | 82 | | | 1,332 | | | 1,414 |
Income | | | 37,838 | | | 36,789 | | | 74,627 | | | 44,378 | | | 96,883 | | | 141,261 |
Ready Reserves | | | 1,031,518 | | | — | | | 1,031,518 | | | 985,413 | | | — | | | 985,413 |
| (a) | | The information for the year ended December 31, 2007 is for the period from October 15, 2007 (Commencement of Operations) to December 31, 2007. |
| (b) | | For the period from March 26, 2008 (Commencement of Operations) to December 31, 2008. |
| (c) | | The information for the year ended December 31, 2007 is for the period from May 1, 2007 (Commencement of Operations) to December 31, 2007. |
114 Annual Report | December 31, 2008 |
| | | | | | | | | | | | | | | | | | | | | | | | |
| | | Net Change in Net Assets relating to Fund Share Activity (Dollars) | |
| | | Year Ended December 31, 2008 | | | Year Ended December 31, 2007 | |
Portfolio | | Class N | | | Class I | | | Total | | | Class N | | | Class I | | | Total | |
Growth | | $ | 11,157 | | | $ | 3,445 | | | $ | 14,602 | | | $ | 68,569 | | | $ | 32,389 | | | $ | 100,958 | |
Tax-Managed Growth | | | (14 | ) | | | (878 | ) | | | (892 | ) | | | (397 | ) | | | 619 | | | | 222 | |
Large Cap Growth | | | 319 | | | | 2,322 | | | | 2,641 | | | | (4,228 | ) | | | 15,278 | | | | 11,050 | |
Small Cap Growth | | | (84,466 | ) | | | (148,357 | ) | | | (232,823 | ) | | | (124,106 | ) | | | 46,907 | | | | (77,199 | ) |
Mid Cap Growth | | | 143 | | | | 13,551 | | | | 13,694 | | | | 1,235 | | | | 22,695 | | | | 23,930 | |
Small Mid-Cap Growth | | | (3,243 | ) | | | 12,721 | | | | 9,478 | | | | 2,730 | | | | 28,693 | | | | 31,423 | |
Global Growth (a) | | | 653 | | | | 11,757 | | | | 12,410 | | | | 9,151 | | | | 36,787 | | | | 45,938 | |
International Growth | | | (393,002 | ) | | | (70,376 | ) | | | (463,378 | ) | | | 755,420 | | | | 706,538 | | | | 1,461,958 | |
International Equity | | | 31,211 | | | | 22,138 | | | | 53,349 | | | | 19,086 | | | | 65,037 | | | | 84,123 | |
International Small Cap Growth | | | 1,885 | | | | 41,606 | | | | 43,491 | | | | 3,896 | | | | 80,171 | | | | 84,067 | |
Emerging Markets Growth | | | (16,803 | ) | | | (39,626 | ) | | | (56,429 | ) | | | 10,934 | | | | 49,184 | | | | 60,118 | |
Emerging Leaders Growth (b) | | | — | | | | 5,959 | | | | 5,959 | | | | — | | | | — | | | | — | |
Value Discovery | | | (1,890 | ) | | | 4,032 | | | | 2,142 | | | | (85,620 | ) | | | (1,859 | ) | | | (87,479 | ) |
Bond (c) | | | (298 | ) | | | 9,906 | | | | 9,608 | | | | 727 | | | | 55,370 | | | | 56,097 | |
Income | | | (23,607 | ) | | | (27,780 | ) | | | (51,387 | ) | | | (10,643 | ) | | | (71,047 | ) | | | (81,690 | ) |
Ready Reserves | | | 441,652 | | | | — | | | | 441,652 | | | | 203,943 | | | | — | | | | 203,943 | |
| |
| | | Sales (Shares) | |
| | | Year Ended December 31, 2008 | | | Year Ended December 31, 2007 | |
Portfolio | | Class N | | | Class I | | | Total | | | Class N | | | Class I | | | Total | |
Growth | | $ | 4,166 | | | $ | 2,490 | | | $ | 6,656 | | | $ | 6,415 | | | $ | 2,916 | | | $ | 9,331 | |
Tax-Managed Growth | | | 28 | | | | 30 | | | | 58 | | | | 2 | | | | 83 | | | | 85 | |
Large Cap Growth | | | 231 | | | | 1,052 | | | | 1,283 | | | | 865 | | | | 2,376 | | | | 3,241 | |
Small Cap Growth | | | 11,419 | | | | 5,193 | | | | 16,612 | | | | 4,705 | | | | 6,244 | | | | 10,949 | |
Mid Cap Growth | | | 183 | | | | 2,348 | | | | 2,531 | | | | 279 | | | | 1,911 | | | | 2,190 | |
Small Mid-Cap Growth | | | 152 | | | | 2,715 | | | | 2,867 | | | | 273 | | | | 2,136 | | | | 2,409 | |
Global Growth (a) | | | 731 | | | | 2,280 | | | | 3,011 | | | | 950 | | | | 3,681 | | | | 4,631 | |
International Growth | | | 57,462 | | | | 37,349 | | | | 94,811 | | | | 38,329 | | | | 24,939 | | | | 63,268 | |
International Equity | | | 4,578 | | | | 8,151 | | | | 12,729 | | | | 1,777 | | | | 5,747 | | | | 7,524 | |
International Small Cap Growth | | | 1,014 | | | | 10,306 | | | | 11,320 | | | | 693 | | | | 6,739 | | | | 7,432 | |
Emerging Markets Growth | | | 563 | | | | 2,670 | | | | 3,233 | | | | 616 | | | | 2,895 | | | | 3,511 | |
Emerging Leaders Growth (b) | | | — | | | | 663 | | | | 663 | | | | — | | | | — | | | | — | |
Value Discovery | | | 291 | | | | 974 | | | | 1,265 | | | | 1,082 | | | | 658 | | | | 1,740 | |
Bond (c) | | | 16 | | | | 1,769 | | | | 1,785 | | | | 79 | | | | 5,574 | | | | 5,653 | |
Income | | | 1,283 | | | | 519 | | | | 1,802 | | | | 3,016 | | | | 1,965 | | | | 4,981 | |
Ready Reserves | | | 1,439,460 | | | | — | | | | | | | | 1,130,710 | | | | — | | | | 1,130,710 | |
| (a) | | The information for the year ended December 31, 2007 is for the period from October 15, 2007 (Commencement of Operations) to December 31, 2007. |
| (b) | | For the period from March 26, 2008 (Commencement of Operations) to December 31, 2008. |
| (c) | | The information for the year ended December 31, 2007 is for the period from May 1, 2007 (Commencement of Operations) to December 31, 2007. |
December 31, 2008 | William Blair Funds 115 |
| | | | | | | | | | | | | | | | | | |
| | | Reinvested Distributions (Shares) |
| | | Year Ended December 31, 2008 | | Year Ended December 31, 2007 |
Portfolio | | Class N | | Class I | | Total | | Class N | | Class I | | Total |
Growth | | $ | 287 | | $ | 458 | | $ | 745 | | $ | 1,000 | | $ | 1,707 | | $ | 2,707 |
Tax-Managed Growth | | | — | | | — | | | — | | | — | | | 1 | | | 1 |
Large Cap Growth | | | — | | | — | | | — | | | — | | | 2 | | | 2 |
Small Cap Growth | | | 921 | | | 774 | | | 1,695 | | | 1,478 | | | 1,352 | | | 2,830 |
Mid Cap Growth | | | — | | | — | | | — | | | 33 | | | 158 | | | 191 |
Small Mid-Cap Growth | | | — | | | — | | | — | | | 126 | | | 704 | | | 830 |
Global Growth (a) | | | 4 | | | 71 | | | 75 | | | — | | | 2 | | | 2 |
International Growth | | | 8,341 | | | 4,289 | | | 12,630 | | | 19,369 | | | 9,470 | | | 28,839 |
International Equity | | | 74 | | | 313 | | | 387 | | | 262 | | | 1,571 | | | 1,833 |
International Small Cap Growth | | | 29 | | | 205 | | | 234 | | | 115 | | | 517 | | | 632 |
Emerging Markets Growth | | | 243 | | | 956 | | | 1,199 | | | 628 | | | 2,175 | | | 2,803 |
Emerging Leaders Growth (b) | | | — | | | — | | | — | | | — | | | — | | | — |
Value Discovery | | | 6 | | | 30 | | | 36 | | | 281 | | | 792 | | | 1,073 |
Bond (c) | | | 3 | | | 245 | | | 248 | | | 2 | | | 126 | | | 128 |
Income | | | 277 | | | 481 | | | 758 | | | 490 | | | 730 | | | 1,220 |
Ready Reserves | | | 33,710 | | | — | | | 33,710 | | | 58,646 | | | — | | | 58,646 |
| |
| | | Redemptions (Shares) |
| | | Year Ended December 31, 2008 | | Year Ended December 31, 2007 |
Portfolio | | Class N | | Class I | | Total | | Class N | | Class I | | Total |
Growth | | $ | 3,236 | | $ | 2,370 | | $ | 5,606 | | $ | 1,810 | | $ | 1,974 | | $ | 3,784 |
Tax-Managed Growth | | | 42 | | | 134 | | | 176 | | | 37 | | | 30 | | | 67 |
Large Cap Growth | | | 169 | | | 639 | | | 808 | | | 1,418 | | | 316 | | | 1,734 |
Small Cap Growth | | | 16,473 | | | 14,593 | | | 31,066 | | | 10,862 | | | 5,711 | | | 16,573 |
Mid Cap Growth | | | 175 | | | 907 | | | 1,082 | | | 195 | | | 81 | | | 276 |
Small Mid-Cap Growth | | | 481 | | | 1,693 | | | 2,174 | | | 193 | | | 741 | | | 934 |
Global Growth (a) | | | 917 | | | 1,100 | | | 2,017 | | | 31 | | | — | | | 31 |
International Growth | | | 92,111 | | | 53,305 | | | 145,416 | | | 31,795 | | | 10,740 | | | 42,535 |
International Equity | | | 3,155 | | | 7,369 | | | 10,524 | | | 834 | | | 3,433 | | | 4,267 |
International Small Cap Growth | | | 894 | | | 7,715 | | | 8,609 | | | 513 | | | 1,740 | | | 2,253 |
Emerging Markets Growth | | | 2,082 | | | 7,138 | | | 9,220 | | | 738 | | | 2,711 | | | 3,449 |
Emerging Leaders Growth (b) | | | — | | | 54 | | | 54 | | | — | | | — | | | — |
Value Discovery | | | 491 | | | 622 | | | 1,113 | | | 6,333 | | | 1,346 | | | 7,679 |
Bond (c) | | | 51 | | | 1,023 | | | 1,074 | | | 8 | | | 134 | | | 142 |
Income | | | 4,244 | | | 4,106 | | | 8,350 | | | 4,652 | | | 10,142 | | | 14,794 |
Ready Reserves | | | 1,031,518 | | | — | | | 1,031,518 | | | 985,413 | | | — | | | 985,413 |
| (a) | | The information for the year ended December 31, 2007 is for the period from October 15, 2007 (Commencement of Operations) to December 31, 2007. |
| (b) | | For the period from March 26, 2008 (Commencement of Operations) to December 31, 2008. |
| (c) | | The information for the year ended December 31, 2007 is for the period from May 1, 2007 (Commencement of Operations) to December 31, 2007. |
116 Annual Report | December 31, 2008 |
| | | | | | | | | | | | | | | | | | | | | | | | |
| | | Net Change in Shares Outstanding
relating to Fund Share Activity (Shares) | |
| | | Year Ended December 31, 2008 | | | Year Ended December 31, 2007 | |
Portfolio | | Class N | | | Class I | | | Total | | | Class N | | | Class I | | | Total | |
Growth | | $ | 1,217 | | | $ | 578 | | | $ | 1,795 | | | $ | 5,605 | | | $ | 2,649 | | | $ | 8,254 | |
Tax-Managed Growth | | | (14 | ) | | | (104 | ) | | | (118 | ) | | | (35 | ) | | | 54 | | | | 19 | |
Large Cap Growth | | | 62 | | | | 413 | | | | 475 | | | | (553 | ) | | | 2,062 | | | | 1,509 | |
Small Cap Growth | | | (4,133 | ) | | | (8,626 | ) | | | (12,759 | ) | | | (4,679 | ) | | | 1,885 | | | | (2,794 | ) |
Mid Cap Growth | | | 8 | | | | 1,441 | | | | 1,449 | | | | 117 | | | | 1,988 | | | | 2,105 | |
Small Mid-Cap Growth | | | (329 | ) | | | 1,022 | | | | 693 | | | | 206 | | | | 2,099 | | | | 2,305 | |
Global Growth (a) | | | (182 | ) | | | 1,251 | | | | 1,069 | | | | 919 | | | | 3,683 | | | | 4,602 | |
International Growth | | | (26,308 | ) | | | (11,667 | ) | | | (37,975 | ) | | | 25,903 | | | | 23,669 | | | | 49,572 | |
International Equity | | | 1,497 | | | | 1,095 | | | | 2,592 | | | | 1,205 | | | | 3,885 | | | | 5,090 | |
International Small Cap Growth | | | 149 | | | | 2,796 | | | | 2,945 | | | | 295 | | | | 5,516 | | | | 5,811 | |
Emerging Markets Growth | | | (1,276 | ) | | | (3,512 | ) | | | (4,788 | ) | | | 506 | | | | 2,359 | | | | 2,865 | |
Emerging Leaders Growth (b) | | | — | | | | 609 | | | | 609 | | | | — | | | | — | | | | — | |
Value Discovery | | | (194 | ) | | | 382 | | | | 188 | | | | (4,970 | ) | | | 104 | | | | (4,866 | ) |
Bond (c) | | | (32 | ) | | | 991 | | | | 959 | | | | 73 | | | | 5,566 | | | | 5,639 | |
Income | | | (2,684 | ) | | | (3,106 | ) | | | (5,790 | ) | | | (1,146 | ) | | | (7,447 | ) | | | (8,593 | ) |
Ready Reserves | | | 441,652 | | | | — | | | | 441,652 | | | | 203,943 | | | | — | | | | 203,943 | |
| (a) | | The information for the year ended December 31, 2007 is for the period from October 15, 2007 (Commencement of Operations) to December 31, 2007. |
| (b) | | For the period from March 26, 2008 (Commencement of Operations) to December 31, 2008. |
| (c) | | The information for the year ended December 31, 2007 is for the period from May 1, 2007 (Commencement of Operations) to December 31, 2007. |
(7) Subsequent Event
Upon the recommendation of William Blair & Company, L.L.C., the Board of Trustees determined that it was in the best interest of the William Blair Tax-Managed Growth Fund to redeem all shares of the Fund outstanding on March 20, 2009, and then to terminate the Fund.
December 31, 2008 | William Blair Funds 117 |
Financial Highlights
Growth Fund
| | | | | | | | | | | | | | | | | | | | |
| | | Class N | |
| | | Years Ended December 31, | |
| | 2008 | | | 2007 | | | 2006 | | | 2005 | | | 2004 | |
Net asset value, beginning of year | | $ | 11.70 | | | $ | 11.42 | | | $ | 11.33 | | | $ | 10.70 | | | $ | 9.97 | |
Income (loss) from investment operations: | | | | | | | | | | | | | | | | | | | | |
Net investment income (loss) | | | (0.05 | ) | | | (0.04 | ) | | | (0.06 | ) | | | (0.06 | ) | | | (0.06 | ) |
Net realized and unrealized gain (loss) on investments | | | (4.35 | ) | | | 1.53 | | | | 1.48 | | | | 1.11 | | | | 0.79 | |
| | | | | | | | | | | | | | | | | | | | |
Total from investment operations | | | (4.40 | ) | | | 1.49 | | | | 1.42 | | | | 1.05 | | | | 0.73 | |
Less distributions from: | | | | | | | | | | | | | | | | | | | | |
Net investment income | | | — | | | | — | | | | — | | | | — | | | | — | |
Net realized gain | | | 0.18 | | | | 1.21 | | | | 1.33 | | | | 0.42 | | | | — | |
| | | | | | | | | | | | | | | | | | | | |
Total distributions | | | 0.18 | | | | 1.21 | | | | 1.33 | | | | 0.42 | | | | — | |
| | | | | | | | | | | | | | | | | | | | |
Net asset value, end of year | | $ | 7.12 | | | $ | 11.70 | | | $ | 11.42 | | | $ | 11.33 | | | $ | 10.70 | |
| | | | | | | | | | | | | | | | | | | | |
Total return (%) | | | (37.61 | ) | | | 13.17 | | | | 12.42 | | | | 9.75 | | | | 7.32 | |
Ratios to average daily net assets (%): | | | | | | | | | | | | | | | | | | | | |
Expenses | | | 1.17 | | | | 1.22 | | | | 1.17 | | | | 1.15 | | | | 1.17 | |
Net investment income (loss) | | | (0.54 | ) | | | (0.35 | ) | | | (0.49 | ) | | | (0.60 | ) | | | (0.60 | ) |
| |
| | | Class I | |
| | | Years Ended December 31, | |
| | | 2008 | | | 2007 | | | 2006 | | | 2005 | | | 2004 | |
Net asset value, beginning of year | | $ | 12.02 | | | $ | 11.66 | | | $ | 11.52 | | | $ | 10.84 | | | $ | 10.08 | |
Income (loss) from investment operations: | | | | | | | | | | | | | | | | | | | | |
Net investment income (loss) | | | (0.02 | ) | | | — | | | | (0.02 | ) | | | (0.04 | ) | | | (0.04 | ) |
Net realized and unrealized gain (loss) on investments | | | (4.47 | ) | | | 1.57 | | | | 1.49 | | | | 1.14 | | | | 0.80 | |
| | | | | | | | | | | | | | | | | | | | |
Total from investment operations | | | (4.49 | ) | | | 1.57 | | | | 1.47 | | | | 1.10 | | | | 0.76 | |
Less distributions from: | | | | | | | | | | | | | | | | | | | | |
Net investment income | | | — | | | | — | | | | — | | | | — | | | | — | |
Net realized gain | | | 0.18 | | | | 1.21 | | | | 1.33 | | | | 0.42 | | | | — | |
| | | | | | | | | | | | | | | | | | | | |
Total distributions | | | 0.18 | | | | 1.21 | | | | 1.33 | | | | 0.42 | | | | — | |
| | | | | | | | | | | | | | | | | | | | |
Net asset value, end of year | | $ | 7.35 | | | $ | 12.02 | | | $ | 11.66 | | | $ | 11.52 | | | $ | 10.84 | |
| | | | | | | | | | | | | | | | | | | | |
Total return (%) | | | (37.35 | ) | | | 13.59 | | | | 12.64 | | | | 10.08 | | | | 7.54 | |
Ratios to average daily net assets (%): | | | | | | | | | | | | | | | | | | | | |
Expenses | | | 0.85 | | | | 0.87 | | | | 0.89 | | | | 0.90 | | | | 0.92 | |
Net investment income (loss) | | | (0.22 | ) | | | 0.00 | | | | (0.20 | ) | | | (0.35 | ) | | | (0.35 | ) |
| | | | | | | | | | | | | | | |
| |
| | | |
| | | Years Ended December 31, |
| | | 2008 | | 2007 | | 2006 | | 2005 | | 2004 |
Supplemental data for all classes: | | | | | | | | | | | | | | | |
Net assets at end of year (in thousands) | | $ | 238,586 | | $ | 369,644 | | $ | 264,525 | | $ | 253,599 | | $ | 275,506 |
Portfolio turnover rate (%) | | | 60 | | | 72 | | | 61 | | | 54 | | | 35 |
Performance cited represents past performance. Past performance does not guarantee future results and current performance may be lower or higher than the data quoted. Results shown are annual returns, which assume reinvestment of dividends and capital gains. Investment returns and principal will fluctuate and you may have a gain or loss when you sell shares. For the most current month-end performance information, please call 1-800-742-7272, or visit our Web site at www.williamblairfunds.com.
Note: Net investment income (loss) per share is based on the average shares outstanding during the year.
118 Annual Report | December 31, 2008 |
Financial Highlights
Tax-Managed Growth Fund
| | | | | | | | | | | | | | | | | | | | |
| | | Class N | |
| | | Years Ended December 31, | |
| | | 2008 | | | 2007 | | | 2006 | | | 2005 | | | 2004 | |
Net asset value, beginning of year | | $ | 12.03 | | | $ | 10.94 | | | $ | 10.11 | | | $ | 8.99 | | | $ | 8.41 | |
Income (loss) from investment operations: | | | | | | | | | | | | | | | | | | | | |
Net investment income (loss) | | | (0.04 | ) | | | (0.03 | ) | | | (0.04 | ) | | | (0.07 | ) | | �� | (0.08 | ) |
Net realized and unrealized gain (loss) on investments | | | (4.72 | ) | | | 1.12 | | | | 0.87 | | | | 1.19 | | | | 0.66 | |
| | | | | | | | | | | | | | | | | | | | |
Total from investment operations | | | (4.76 | ) | | | 1.09 | | | | 0.83 | | | | 1.12 | | | | 0.58 | |
Less distributions from: | | | | | | | | | | | | | | | | | | | | |
Net investment income | | | — | | | | — | | | | — | | | | — | | | | — | |
Net realized gain | | | — | | | | — | | | | — | | | | — | | | | — | |
| | | | | | | | | | | | | | | | | | | | |
Total distributions | | | — | | | | — | | | | — | | | | — | | | | — | |
| | | | | | | | | | | | | | | | | | | | |
Net asset value, end of year | | $ | 7.27 | | | $ | 12.03 | | | $ | 10.94 | | | $ | 10.11 | | | $ | 8.99 | |
| | | | | | | | | | | | | | | | | | | | |
Total return (%) | | | (39.57 | ) | | | 9.96 | | | | 8.21 | | | | 12.46 | | | | 6.90 | |
Ratios to average daily net assets (%): | | | | | | | | | | | | | | | | | | | | |
Expenses, net of waivers and reimbursements | | | 1.32 | | | | 1.34 | | | | 1.44 | | | | 1.53 | | | | 1.54 | |
Expenses, before waivers and reimbursements | | | 2.19 | | | | 2.06 | | | | 2.24 | | | | 2.55 | | | | 2.26 | |
Net investment income (loss), net of waivers and reimbursements | | | (0.42 | ) | | | (0.24 | ) | | | (0.41 | ) | | | (0.76 | ) | | | (0.92 | ) |
Net investment income (loss), before waivers and reimbursements | | | (1.29 | ) | | | (0.96 | ) | | | (1.21 | ) | | | (1.78 | ) | | | (1.64 | ) |
| |
| | | Class I | |
| | | Years Ended December 31, | |
| | | 2008 | | | 2007 | | | 2006 | | | 2005 | | | 2004 | |
Net asset value, beginning of year | | $ | 12.28 | | | $ | 11.15 | | | $ | 10.27 | | | $ | 9.10 | | | $ | 8.50 | |
Income (loss) from investment operations: | | | | | | | | | | | | | | | | | | | | |
Net investment income (loss) | | | (0.02 | ) | | | — | | | | (0.02 | ) | | | (0.05 | ) | | | (0.06 | ) |
Net realized and unrealized gain (loss) on investments | | | (4.83 | ) | | | 1.14 | | | | 0.90 | | | | 1.22 | | | | 0.66 | |
| | | | | | | | | | | | | | | | | | | | |
Total from investment operations | | | (4.85 | ) | | | 1.14 | | | | 0.88 | | | | 1.17 | | | | 0.60 | |
Less distributions from: | | | | | | | | | | | | | | | | | | | | |
Net investment income | | | — | | | | 0.01 | | | | — | | | | — | | | | — | |
Net realized gain | | | — | | | | — | | | | — | | | | — | | | | — | |
| | | | | | | | | | | | | | | | | | | | |
Total distributions | | | — | | | | 0.01 | | | | — | | | | — | | | | — | |
| | | | | | | | | | | | | | | | | | | | |
Net asset value, end of year | | $ | 7.43 | | | $ | 12.28 | | | $ | 11.15 | | | $ | 10.27 | | | $ | 9.10 | |
| | | | | | | | | | | | | | | | | | | | |
Total return (%) | | | (39.50 | ) | | | 10.24 | | | | 8.57 | | | | 12.86 | | | | 7.06 | |
Ratios to average daily net assets (%): | | | | | | | | | | | | | | | | | | | | |
Expenses, net of waivers and reimbursements | | | 1.07 | | | | 1.09 | | | | 1.19 | | | | 1.28 | | | | 1.29 | |
Expenses, before waivers and reimbursements | | | 1.84 | | | | 1.79 | | | | 1.99 | | | | 2.30 | | | | 2.01 | |
Net investment income (loss), net of waivers and reimbursements | | | (0.16 | ) | | | 0.03 | | | | (0.16 | ) | | | (0.51 | ) | | | (0.67 | ) |
Net investment income (loss), before waivers and reimbursements | | | (0.93 | ) | | | (0.67 | ) | | | (0.96 | ) | | | (1.53 | ) | | | (1.39 | ) |
| | | | | | | | | | | | | | | |
| |
| | | |
| | | Years Ended December 31, |
| | | 2008 | | 2007 | | 2006 | | 2005 | | 2004 |
Supplemental data for all classes: | | | | | | | | | | | | | | | |
Net assets at end of year (in thousands) | | $ | 5,696 | | $ | 10,862 | | $ | 9,644 | | $ | 7,815 | | $ | 5,847 |
Portfolio turnover rate (%) | | | 54 | | | 55 | | | 42 | | | 25 | | | 31 |
Performance cited represents past performance. Past performance does not guarantee future results and current performance may be lower or higher than the data quoted. Results shown are annual returns, which assume reinvestment of dividends and capital gains. Investment returns and principal will fluctuate and you may have a gain or loss when you sell shares. For the most current month-end performance information, please call 1-800-742-7272, or visit our Web site at www.williamblairfunds.com.
Note: Net investment income (loss) per share is based on the average shares outstanding during the year.
December 31, 2008 | William Blair Funds 119 |
Financial Highlights
Large Cap Growth Fund
| | | | | | | | | | | | | | | | | | | | |
| | | Class N | |
| | | Years Ended December 31, | |
| | | 2008 | | | 2007 | | | 2006 | | | 2005 | | | 2004 | |
Net asset value, beginning of year | | $ | 7.52 | | | $ | 6.88 | | | $ | 6.47 | | | $ | 6.24 | | | $ | 5.93 | |
Income (loss) from investment operations: | | | | | | | | | | | | | | | | | | | | |
Net investment income (loss) | | | (0.02 | ) | | | (0.01 | ) | | | (0.02 | ) | | | (0.02 | ) | | | (0.04 | ) |
Net realized and unrealized gain (loss) on investments | | | (2.82 | ) | | | 0.65 | | | | 0.43 | | | | 0.25 | | | | 0.35 | |
| | | | | | | | | | | | | | | | | | | | |
Total from investment operations | | | (2.84 | ) | | | 0.64 | | | | 0.41 | | | | 0.23 | | | | 0.31 | |
Less distributions from: | | | | | | | | | | | | | | | | | | | | |
Net investment income | | | — | (a) | | | — | | | | — | | | | — | | | | — | |
Net realized gain | | | — | | | | — | | | | — | | | | — | | | | — | |
| | | | | | | | | | | | | | | | | | | | |
Total distributions | | | — | | | | — | | | | — | | | | — | | | | — | |
| | | | | | | | | | | | | | | | | | | | |
Net asset value, end of year | | $ | 4.68 | | | $ | 7.52 | | | $ | 6.88 | | | $ | 6.47 | | | $ | 6.24 | |
| | | | | | | | | | | | | | | | | | | | |
Total return (%) | | | (37.76 | ) | | | 9.30 | | | | 6.34 | | | | 3.69 | | | | 5.23 | |
Ratios to average daily net assets (%): | | | | | | | | | | | | | | | | | | | | |
Expenses, net of waivers and reimbursements | | | 1.23 | | | | 1.23 | | | | 1.24 | | | | 1.28 | | | | 1.38 | |
Expenses, before waivers and reimbursements | | | 1.85 | | | | 1.50 | | | | 1.63 | | | | 2.08 | | | | 2.29 | |
Net investment income (loss), net of waivers and reimbursements | | | (0.29 | ) | | | (0.16 | ) | | | (0.29 | ) | | | (0.37 | ) | | | (0.63 | ) |
Net investment income (loss), before waivers and reimbursements | | | (0.91 | ) | | | (0.43 | ) | | | (0.68 | ) | | | (1.17 | ) | | | (1.54 | ) |
| | | | | | | | | | | | | | | | | | | | |
| | | Class I | |
| | | Years Ended December 31, | |
| | | 2008 | | | 2007 | | | 2006 | | | 2005 | | | 2004 | |
Net asset value, beginning of year | | $ | 7.64 | | | $ | 6.99 | | | $ | 6.56 | | | $ | 6.31 | | | $ | 5.99 | |
Income (loss) from investment operations: | | | | | | | | | | | | | | | | | | | | |
Net investment income (loss) | | | — | | | | 0.01 | | | | — | | | | (0.01 | ) | | | (0.02 | ) |
Net realized and unrealized gain (loss) on investments | | | (2.87 | ) | | | 0.64 | | | | 0.43 | | | | 0.26 | | | | 0.34 | |
| | | | | | | | | | | | | | | | | | | | |
Total from investment operations | | | (2.87 | ) | | | 0.65 | | | | 0.43 | | | | 0.25 | | | | 0.32 | |
Less distributions from: | | | | | | | | | | | | | | | | | | | | |
Net investment income | | | — | (a) | | | — | (a) | | | — | | | | — | | | | — | |
Net realized gain | | | — | | | | — | | | | — | | | | — | | | | — | |
| | | | | | | | | | | | | | | | | | | | |
Total distributions | | | — | | | | — | | | | — | | | | — | | | | — | |
| | | | | | | | | | | | | | | | | | | | |
Net asset value, end of year | | $ | 4.77 | | | $ | 7.64 | | | $ | 6.99 | | | $ | 6.56 | | | $ | 6.31 | |
| | | | | | | | | | | | | | | | | | | | |
Total return (%) | | | (37.56 | ) | | | 9.36 | | | | 6.55 | | | | 3.96 | | | | 5.34 | |
Ratios to average daily net assets (%): | | | | | | | | | | | | | | | | | | | | |
Expenses, net of waivers and reimbursements | | | 0.98 | | | | 0.98 | | | | 0.99 | | | | 1.03 | | | | 1.13 | |
Expenses, before waivers and reimbursements | | | 1.21 | | | | 1.20 | | | | 1.38 | | | | 1.83 | | | | 2.04 | |
Net investment income (loss), net of waivers and reimbursements | | | (0.04 | ) | | | 0.18 | | | | (0.04 | ) | | | (0.12 | ) | | | (0.38 | ) |
Net investment income (loss), before waivers and reimbursements | | | (0.27 | ) | | | (0.04 | ) | | | (0.43 | ) | | | (0.92 | ) | | | (1.29 | ) |
| | | | | | | | | | | | | | | |
| | | Years Ended December 31, |
| | | 2008 | | 2007 | | 2006 | | 2005 | | 2004 |
Supplemental data for all classes: | | | | | | | | | | | | | | | |
Net assets at end of year (in thousands) | | $ | 23,279 | | $ | 33,667 | | $ | 20,191 | | $ | 16,888 | | $ | 6,417 |
Portfolio turnover rate (%) | | | 85 | | | 60 | | | 53 | | | 53 | | | 39 |
| (a) | | Distribution less than $0.01 per share. |
Performance cited represents past performance. Past performance does not guarantee future results and current performance may be lower or higher than the data quoted. Results shown are annual returns, which assume reinvestment of dividends and capital gains. Investment returns and principal will fluctuate and you may have a gain or loss when you sell shares. For the most current month-end performance information, please call 1-800-742-7272, or visit our Web site at www.williamblairfunds.com.
Note: Net investment income (loss) per share is based on the average shares outstanding during the year.
120 Annual Report | December 31, 2008 |
Financial Highlights
Small Cap Growth Fund
| | | | | | | | | | | | | | | | | | | | |
| | | Class N | |
| | | Years Ended December 31, | |
| | | 2008 | | | 2007 | | | 2006 | | | 2005 | | | 2004 | |
Net asset value, beginning of year | | $ | 23.30 | | | $ | 25.41 | | | $ | 23.76 | | | $ | 25.72 | | | $ | 21.83 | |
Income (loss) from investment operations: | | | | | | | | | | | | | | | | | | | | |
Net investment income (loss) | | | (0.19 | ) | | | (0.33 | ) | | | (0.29 | ) | | | (0.30 | ) | | | (0.30 | ) |
Net realized and unrealized gain (loss) on investments | | | (10.73 | ) | | | (0.25 | ) | | | 3.65 | | | | 0.64 | | | | 6.20 | |
| | | | | | | | | | | | | | | | | | | | |
Total from investment operations | | | (10.92 | ) | | | (0.58 | ) | | | 3.36 | | | | 0.34 | | | | 5.90 | |
Less distributions from: | | | | | | | | | | | | | | | | | | | | |
Net investment income | | | — | | | | — | | | | — | | | | — | | | | — | |
Net realized gain | | | 0.59 | | | | 1.53 | | | | 1.71 | | | | 2.30 | | | | 2.01 | |
| | | | | | | | | | | | | | | | | | | | |
Total distributions | | | 0.59 | | | | 1.53 | | | | 1.71 | | | | 2.30 | | | | 2.01 | |
| | | | | | | | | | | | | | | | | | | | |
Net asset value, end of year | | $ | 11.79 | | | $ | 23.30 | | | $ | 25.41 | | | $ | 23.76 | | | $ | 25.72 | |
| | | | | | | | | | | | | | | | | | | | |
Total return (%) | | | (46.85 | ) | | | (2.15 | ) | | | 14.12 | | | | 1.18 | | | | 27.24 | |
Ratios to average daily net assets (%): | | | | | | | | | | | | | | | | | | | | |
Expenses, net of waivers and reimbursements | | | 1.50 | | | | 1.49 | | | | 1.48 | | | | 1.49 | | | | 1.49 | |
Expenses, before waivers and reimbursements | | | 1.50 | | | | 1.49 | | | | 1.48 | | | | 1.49 | | | | 1.46 | |
Net investment income (loss), net of waivers and reimbursements | | | (1.05 | ) | | | (1.24 | ) | | | (1.14 | ) | | | (1.23 | ) | | | (1.27 | ) |
Net investment income (loss), before waivers and reimbursements | | | (1.05 | ) | | | (1.24 | ) | | | (1.14 | ) | | | (1.23 | ) | | | (1.24 | ) |
| | | | | | | | | | | | | | | | | | | | |
| | | Class I | |
| | | Years Ended December 31, | |
| | | 2008 | | | 2007 | | | 2006 | | | 2005 | | | 2004 | |
Net asset value, beginning of year | | $ | 23.89 | | | $ | 25.94 | | | $ | 24.16 | | | $ | 26.04 | | | $ | 22.03 | |
Income (loss) from investment operations: | | | | | | | | | | | | | | | | | | | | |
Net investment income (loss) | | | (0.14 | ) | | | (0.25 | ) | | | (0.22 | ) | | | (0.25 | ) | | | (0.24 | ) |
Net realized and unrealized gain (loss) on investments | | | (11.02 | ) | | | (0.27 | ) | | | 3.71 | | | | 0.67 | | | | 6.26 | |
| | | | | | | | | | | | | | | | | | | | |
Total from investment operations | | | (11.16 | ) | | | (0.52 | ) | | | 3.49 | | | | 0.42 | | | | 6.02 | |
Less distributions from: | | | | | | | | | | | | | | | | | | | | |
Net investment income | | | — | | | | — | | | | — | | | | — | | | | — | |
Net realized gain | | | 0.59 | | | | 1.53 | | | | 1.71 | | | | 2.30 | | | | 2.01 | |
| | | | | | | | | | | | | | | | | | | | |
Total distributions | | | 0.59 | | | | 1.53 | | | | 1.71 | | | | 2.30 | | | | 2.01 | |
| | | | | | | | | | | | | | | | | | | | |
Net asset value, end of year | | $ | 12.14 | | | $ | 23.89 | | | $ | 25.94 | | | $ | 24.16 | | | $ | 26.04 | |
| | | | | | | | | | | | | | | | | | | | |
Total return (%) | | | (46.70 | ) | | | (1.88 | ) | | | 14.42 | | | | 1.48 | | | | 27.54 | |
Ratios to average daily net assets (%): | | | | | | | | | | | | | | | | | | | | |
Expenses, net of waivers and reimbursements | | | 1.20 | | | | 1.20 | | | | 1.21 | | | | 1.24 | | | | 1.24 | |
Expenses, before waivers and reimbursements | | | 1.20 | | | | 1.20 | | | | 1.21 | | | | 1.24 | | | | 1.21 | |
Net investment income (loss), net of waivers and reimbursements | | | (0.75 | ) | | | (0.94 | ) | | | (0.87 | ) | | | (0.98 | ) | | | (1.02 | ) |
Net investment income (loss), before waivers and reimbursements | | | (0.75 | ) | | | (0.94 | ) | | | (0.87 | ) | | | (0.98 | ) | | | (0.99 | ) |
| | | | | | | | | | | | | | | |
| | | Years Ended December 31, |
| | | 2008 | | 2007 | | 2006 | | 2005 | | 2004 |
Supplemental data for all classes: | | | | | | | | | | | | | | | |
Net assets at end of year (in thousands) | | $ | 401,627 | | $ | 1,094,419 | | $ | 1,261,174 | | $ | 831,738 | | $ | 771,209 |
Portfolio turnover rate (%) | | | 135 | | | 97 | | | 105 | | | 80 | | | 109 |
Performance cited represents past performance. Past performance does not guarantee future results and current performance may be lower or higher than the data quoted. Results shown are annual returns, which assume reinvestment of dividends and capital gains. Investment returns and principal will fluctuate and you may have a gain or loss when you sell shares. For the most current month-end performance information, please call 1-800-742-7272, or visit our Web site at www.williamblairfunds.com.
Note: Net investment income (loss) per share is based on the average shares outstanding during the year.
December 31, 2008 | William Blair Funds 121 |
Financial Highlights
Mid Cap Growth Fund
| | | | | | | | | | | | |
| | | Class N | |
| | | Years Ended December 31, | |
| | | 2008 | | | 2007 | | | 2006(a) | |
Net asset value, beginning of year | | $ | 11.35 | | | $ | 10.46 | | | $ | 10.00 | |
Income (loss) from investment operations: | | | | | | | | | | | | |
Net investment income (loss) | | | (0.07 | ) | | | (0.07 | ) | | | (0.07 | ) |
Net realized and unrealized gain (loss) on investments | | | (3.87 | ) | | | 1.59 | | | | 0.53 | |
| | | | | | | | | | | | |
Total from investment operations | | | (3.94 | ) | | | 1.52 | | | | 0.46 | |
Less distributions from: | | | | | | | | | | | | |
Net investment income | | | — | | | | — | | | | — | |
Net realized gain | | | — | (d) | | | 0.63 | | | | — | |
| | | | | | | | | | | | |
Total distributions | | | — | | | | 0.63 | | | | — | |
| | | | | | | | | | | | |
Net asset value, end of year | | $ | 7.41 | | | $ | 11.35 | | | $ | 10.46 | |
| | | | | | | | | | | | |
Total return (%) | | | (34.71 | ) | | | 14.62 | | | | 4.60 | (b) |
Ratios to average daily net assets (%): | | | | | | | | | | | | |
Expenses, net of waivers and reimbursements | | | 1.36 | | | | 1.38 | | | | 1.40 | (c) |
Expenses, before waivers and reimbursements | | | 2.03 | | | | 1.67 | | | | 2.35 | (c) |
Net investment income (loss), net of waivers and reimbursements | | | (0.76 | ) | | | (0.58 | ) | | | (0.70 | )(c) |
Net investment income (loss), before waivers and reimbursements | | | (1.43 | ) | | | (0.87 | ) | | | (1.65 | )(c) |
| |
| | | Class I | |
| | | Years Ended December 31, | |
| | | 2008 | | | 2007 | | | 2006(a) | |
Net asset value, beginning of year | | $ | 11.42 | | | $ | 10.49 | | | $ | 10.00 | |
Income (loss) from investment operations: | | | | | | | | | | | | |
Net investment income (loss) | | | (0.05 | ) | | | (0.04 | ) | | | (0.04 | ) |
Net realized and unrealized gain (loss) on investments | | | (3.89 | ) | | | 1.60 | | | | 0.53 | |
| | | | | | | | | | | | |
Total from investment operations | | | (3.94 | ) | | | 1.56 | | | | 0.49 | |
Less distributions from: | | | | | | | | | | | | |
Net investment income | | | — | | | | — | | | | — | |
Net realized gain | | | — | (d) | | | 0.63 | | | | — | |
| | | | | | | | | | | | |
Total distributions | | | — | | | | 0.63 | | | | — | |
| | | | | | | | | | | | |
Net asset value, end of year | | $ | 7.48 | | | $ | 11.42 | | | $ | 10.49 | |
| | | | | | | | | | | | |
Total return (%) | | | (34.50 | ) | | | 14.95 | | | | 4.90 | (b) |
Ratios to average daily net assets (%): | | | | | | | | | | | | |
Expenses, net of waivers and reimbursements | | | 1.11 | | | | 1.12 | | | | 1.15 | (c) |
Expenses, before waivers and reimbursements | | | 1.23 | | | | 1.37 | | | | 2.10 | (c) |
Net investment income (loss), net of waivers and reimbursements | | | (0.51 | ) | | | (0.32 | ) | | | (0.43 | )(c) |
Net investment income (loss), before waivers and reimbursements | | | (0.63 | ) | | | (0.57 | ) | | | (1.38 | )(c) |
| | | | |
| | | Years Ended December 31, | |
| | | 2008 | | | 2007 | | | 2006(a) | |
Supplemental data for all classes: | | | | | | | | | | | | |
Net assets at end of year (in thousands) | | $ | 40,526 | | | $ | 45,393 | | | $ | 19,639 | |
Portfolio turnover rate (%) | | | 76 | | | | 66 | | | | 56 | (c) |
| (a) | | For the period from February 1, 2006 (Commencement of Operations) to December 31, 2006. |
| (b) | | Total return is not annualized for periods that are less than a year. |
| (c) | | Rates are annualized for periods that are less than a year. |
| (d) | | Distribution less than $0.01 per share. |
Performance cited represents past performance. Past performance does not guarantee future results and current performance may be lower or higher than the data quoted. Results shown are annual returns, which assume reinvestment of dividends and capital gains. Investment returns and principal will fluctuate and you may have a gain or loss when you sell shares. For the most current month-end performance information, please call 1-800-742-7272, or visit our Web site at www.williamblairfunds.com.
Note: Net investment income (loss) per share is based on the average shares outstanding during the period.
122 Annual Report | December 31, 2008 |
Financial Highlights
Small-Mid Cap Growth Fund
| | | | | | | | | | | | | | | | | | | | |
| | | Class N | |
| | | Years Ended December 31, | |
| | | 2008 | | | 2007 | | | 2006 | | | 2005 | | | 2004 | |
Net asset value, beginning of year | | $ | 13.10 | | | $ | 12.96 | | | $ | 12.40 | | | $ | 11.28 | | | $ | 9.94 | |
Income (loss) from investment operations: | | | | | | | | | | | | | | | | | | | | |
Net investment income (loss) | | | (0.03 | ) | | | (0.12 | ) | | | (0.11 | ) | | | (0.11 | ) | | | (0.13 | ) |
Net realized and unrealized gain (loss) on investments | | | (4.91 | ) | | | 1.71 | | | | 1.32 | | | | 1.32 | | | | 1.47 | |
| | | | | | | | | | | | | | | | | | | | |
Total from investment operations | | | (4.94 | ) | | | 1.59 | | | | 1.21 | | | | 1.21 | | | | 1.34 | |
Less distributions from: | | | | | | | | | | | | | | | | | | | | |
Net investment income | | | — | | | | — | | | | — | | | | — | | | | — | |
Net realized gain | | | — | (a) | | | 1.45 | | | | 0.65 | | | | 0.09 | | | | — | |
| | | | | | | | | | | | | | | | | | | | |
Total distributions | | | — | | | | 1.45 | | | | 0.65 | | | | 0.09 | | | | — | |
| | | | | | | | | | | | | | | | | | | | |
Net asset value, end of year | | $ | 8.16 | | | $ | 13.10 | | | $ | 12.96 | | | $ | 12.40 | | | $ | 11.28 | |
| | | | | | | | | | | | | | | | | | | | |
Total return (%) | | | (37.71 | ) | | | 12.34 | | | | 9.68 | | | | 10.72 | | | | 13.48 | |
Ratios to average daily net assets (%): | | | | | | | | | | | | | | | | | | | | |
Expenses, net of waivers and reimbursements | | | 1.36 | | | | 1.36 | | | | 1.38 | | | | 1.45 | | | | 1.54 | |
Expenses, before waivers and reimbursements | | | 1.41 | | | | 1.42 | | | | 1.45 | | | | 1.54 | | | | 2.14 | |
Net investment income (loss), net of waivers and reimbursements | | | (0.26 | ) | | | (0.79 | ) | | | (0.86 | ) | | | (0.97 | ) | | | (1.26 | ) |
Net investment income (loss), before waivers and reimbursements | | | (0.31 | ) | | | (0.85 | ) | | | (0.93 | ) | | | (1.06 | ) | | | (1.86 | ) |
| | | | | | | | | | | | | | | | | | | | |
| | | Class I | |
| | | Years Ended December 31, | |
| | | 2008 | | | 2007 | | | 2006 | | | 2005 | | | 2004 | |
Net asset value, beginning of year | | $ | 13.24 | | | $ | 13.06 | | | $ | 12.46 | | | $ | 11.30 | | | $ | 9.94 | |
Income (loss) from investment operations: | | | | | | | | | | | | | | | | | | | | |
Net investment income (loss) | | | — | | | | (0.08 | ) | | | (0.08 | ) | | | (0.08 | ) | | | (0.11 | ) |
Net realized and unrealized gain (loss) on investments | | | (4.97 | ) | | | 1.71 | | | | 1.33 | | | | 1.33 | | | | 1.47 | |
| | | | | | | | | | | | | | | | | | | | |
Total from investment operations | | | (4.97 | ) | | | 1.63 | | | | 1.25 | | | | 1.25 | | | | 1.36 | |
Less distributions from: | | | | | | | | | | | | | | | | | | | | |
Net investment income | | | — | | | | — | | | | — | | | | — | | | | — | |
Net realized gain | | | — | (a) | | | 1.45 | | | | 0.65 | | | | 0.09 | | | | — | |
| | | | | | | | | | | | | | | | | | | | |
Total distributions | | | — | | | | 1.45 | | | | 0.65 | | | | 0.09 | | | | — | |
| | | | | | | | | | | | | | | | | | | | |
Net asset value, end of year | | $ | 8.27 | | | $ | 13.24 | | | $ | 13.06 | | | $ | 12.46 | | | $ | 11.30 | |
| | | | | | | | | | | | | | | | | | | | |
Total return (%) | | | (37.54 | ) | | | 12.54 | | | | 9.95 | | | | 11.05 | | | | 13.68 | |
Ratios to average daily net assets (%): | | | | | | | | | | | | | | | | | | | | |
Expenses, net of waivers and reimbursements | | | 1.11 | | | | 1.11 | | | | 1.13 | | | | 1.20 | | | | 1.29 | |
Expenses, before waivers and reimbursements | | | 1.17 | | | | 1.17 | | | | 1.20 | | | | 1.29 | | | | 1.89 | |
Net investment income (loss), net of waivers and reimbursements | | | 0.03 | | | | (0.54 | ) | | | (0.61 | ) | | | (0.72 | ) | | | (1.01 | ) |
Net investment income (loss), before waivers and reimbursements | | | (0.03 | ) | | | (0.60 | ) | | | (0.68 | ) | | | (0.81 | ) | | | (1.61 | ) |
| | | | | | | | | | | | | | | |
| | | Years Ended December 31, |
| | | 2008 | | 2007 | | 2006 | | 2005 | | 2004 |
Supplemental data for all classes: | | | | | | | | | | | | | | | |
Net assets at end of year (in thousands) | | $ | 83,479 | | $ | 124,501 | | $ | 92,766 | | $ | 70,211 | | $ | 25,974 |
Portfolio turnover rate (%) | | | 77 | | | 80 | | | 68 | | | 62 | | | 55 |
| (a) | | Distribution less than $0.01 per share. |
Performance cited represents past performance. Past performance does not guarantee future results and current performance may be lower or higher than the data quoted. Results shown are annual returns, which assume reinvestment of dividends and capital gains. Investment returns and principal will fluctuate and you may have a gain or loss when you sell shares. For the most current month-end performance information, please call 1-800-742-7272, or visit our Web site at www.williamblairfunds.com.
Note: Net investment income (loss) per share is based on the average shares outstanding during the year.
December 31, 2008 | William Blair Funds 123 |
Financial Highlights
Global Growth Fund
| | | | | | | | |
| | | Class N | |
| | | Periods Ended | |
| | | 12/31/2008 | | | 12/31/2007(a) | |
Net asset value, beginning of year | | $ | 9.89 | | | $ | 10.00 | |
Income (loss) from investment operations: | | | | | | | | |
Net investment income (loss) (c) | | | 0.08 | | | | — | |
Net realized and unrealized gain (loss) on investments | | | (4.98 | ) | | | (0.11 | ) |
| | | | | | | | |
Total from investment operations | | | (4.90 | ) | | | (0.11 | ) |
Less distributions from: | | | | | | | | |
Net investment income | | | 0.03 | | | | — | (b) |
Net realized gain | | | — | | | | — | |
| | | | | | | | |
Total distributions | | | 0.03 | | | | — | |
| | | | | | | | |
Net asset value, end of year | | $ | 4.96 | | | $ | 9.89 | |
| | | | | | | | |
Total return (%) | | | (49.52 | ) | | | (1.10 | )(d) |
Ratios to average daily net assets (%): | | | | | | | | |
Expenses, net of waivers and reimbursements | | | 1.55 | | | | 1.55 | (e) |
Expenses, before waivers and reimbursements | | | 2.17 | | | | 2.14 | (e) |
Net investment income (loss), net of waivers and reimbursements | | | 0.98 | | | | (0.08 | )(e) |
Net investment income (loss), before waivers and reimbursements | | | 0.36 | | | | (0.67 | )(e) |
| |
| | | Class I | |
| | | Periods Ended | |
| | | 12/31/2008 | | | 12/31/2007(a) | |
Net asset value, beginning of year | | $ | 9.91 | | | $ | 10.00 | |
Income (loss) from investment operations: | | | | | | | | |
Net investment income (loss) (c) | | | 0.08 | | | | — | |
Net realized and unrealized gain (loss) on investments | | | (4.98 | ) | | | (0.09 | ) |
| | | | | | | | |
Total from investment operations | | | (4.90 | ) | | | (0.09 | ) |
Less distributions from: | | | | | | | | |
Net investment income | | | 0.07 | | | | — | (b) |
Net realized gain | | | — | | | | — | |
| | | | | | | | |
Total distributions | | | 0.07 | | | | — | |
| | | | | | | | |
Net asset value, end of year | | $ | 4.94 | | | $ | 9.91 | |
| | | | | | | | |
Total return (%) | | | (49.41 | ) | | | (0.85 | )(d) |
Ratios to average daily net assets (%): | | | | | | | | |
Expenses, net of waivers and reimbursements | | | 1.30 | | | | 1.30 | (e) |
Expenses, before waivers and reimbursements | | | 1.74 | | | | 1.89 | (e) |
Net investment income (loss), net of waivers and reimbursements | | | 1.05 | | | | 0.14 | (e) |
Net investment income (loss), before waivers and reimbursements | | | 0.61 | | | | (0.45 | )(e) |
| |
| | | | |
| | | Periods Ended | |
| | | 12/31/2008 | | | 12/31/2007(a) | |
Supplemental data for all classes: | | | | | | | | |
Net assets at end of year (in thousands) | | $ | 28,005 | | | $ | 45,576 | |
Portfolio turnover rate (%) | | | 124 | | | | 63 | (e) |
| (a) | | For the period from October 15, 2007 (Commencement of Operations) to December 31, 2007. |
| (b) | | Distribution less than $0.01 per share. |
| (c) | | Excludes $0.00 and $0.00 of PFIC mark to market which is treated as ordinary income for Federal tax purposes for the years 2008 and 2007. |
| (d) | | Total return is not annualized for periods less than a year. |
| (e) | | Rates are annualized for periods that are less than a year. |
Performance cited represents past performance. Past performance does not guarantee future results and current performance may be lower or higher than the data quoted. Results shown are annual returns, which assume reinvestment of dividends and capital gains. Investment returns and principal will fluctuate and you may have a gain or loss when you sell shares. For the most current month-end performance information, please call 1-800-742-7272, or visit our Web site at www.williamblairfunds.com.
Note: Net investment income (loss) per share is based on the average shares outstanding during the year.
124 Annual Report | December 31, 2008 |
Financial Highlights
International Growth Fund
| | | | | | | | | | | | | | | | | |
| | | Class N | |
| | | Years Ended December 31, | |
| | | 2008 | | | 2007 | | 2006 | | 2005 | | 2004 | |
Net asset value, beginning of year | | | $29.12 | | | | $27.70 | | | $25.22 | | | $22.09 | | | $18.65 | |
Income (loss) from investment operations: | | | | | | | | | | | | | | | | | |
Net investment income (loss) (a) | | | 0.29 | | | | 0.12 | | | 0.05 | | | 0.15 | | | (0.02 | ) |
Net realized and unrealized gain (loss) on investments | | | (15.54 | ) | | | 4.77 | | | 5.71 | | | 4.60 | | | 3.47 | |
| | | | | | | | | | | | | | | | | |
Total from investment operations | | | (15.25 | ) | | | 4.89 | | | 5.76 | | | 4.75 | | | 3.45 | |
Less distributions from: | | | | | | | | | | | | | | | | | |
Net investment income | | | — | | | | 0.34 | | | 0.37 | | | 0.11 | | | 0.01 | |
Net realized gain | | | 0.75 | | | | 3.13 | | | 2.91 | | | 1.51 | | | — | |
| | | | | | | | | | | | | | | | | |
Total distributions | | | 0.75 | | | | 3.47 | | | 3.28 | | | 1.62 | | | 0.01 | |
| | | | | | | | | | | | | | | | | |
Net asset value, end of year | | | $13.12 | | | | $29.12 | | | $27.70 | | | $25.22 | | | $22.09 | |
| | | | | | | | | | | | | | | | | |
Total return (%) | | | (52.33 | ) | | | 18.13 | | | 23.06 | | | 21.65 | | | 18.48 | |
Ratios to average daily net assets (%): | | | | | | | | | | | | | | | | | |
Expenses | | | 1.39 | | | | 1.40 | | | 1.42 | | | 1.42 | | | 1.47 | |
Net investment income (loss) | | | 1.29 | | | | 0.38 | | | 0.19 | | | 0.16 | | | (0.16 | ) |
| |
| | | Class I | |
| | | Years Ended December 31, | |
| | | 2008 | | | 2007 | | 2006 | | 2005 | | 2004 | |
Net asset value, beginning of year | | | $29.61 | | | | $28.10 | | | $25.55 | | | $22.34 | | | $18.85 | |
Income (loss) from investment operations: | | | | | | | | | | | | | | | | | |
Net investment income (loss) (a) | | | 0.37 | | | | 0.21 | | | 0.13 | | | 0.27 | | | 0.01 | |
Net realized and unrealized gain (loss) on investments | | | (15.83 | ) | | | 4.86 | | | 5.78 | | | 4.61 | | | 3.53 | |
| | | | | | | | | | | | | | | | | |
Total from investment operations | | | (15.46 | ) | | | 5.07 | | | 5.91 | | | 4.88 | | | 3.54 | |
Less distributions from: | | | | | | | | | | | | | | | | | |
Net investment income | | | — | | | | 0.43 | | | 0.45 | | | 0.16 | | | 0.05 | |
Net realized gain | | | 0.75 | | | | 3.13 | | | 2.91 | | | 1.51 | | | — | |
| | | | | | | | | | | | | | | | | |
Total distributions | | | 0.75 | | | | 3.56 | | | 3.36 | | | 1.67 | | | 0.05 | |
| | | | | | | | | | | | | | | | | |
Net asset value, end of year | | | $13.40 | | | | $29.61 | | | $28.10 | | | $25.55 | | | $22.34 | |
| | | | | | | | | | | | | | | | | |
Total return (%) | | | (52.17 | ) | | | 18.53 | | | 23.35 | | | 22.00 | | | 18.79 | |
Ratios to average daily net assets (%): | | | | | | | | | | | | | | | | | |
Expenses | | | 1.08 | | | | 1.09 | | | 1.11 | | | 1.17 | | | 1.22 | |
Net investment income (loss) | | | 1.58 | | | | 0.69 | | | 0.45 | | | 0.41 | | | 0.09 | |
| |
| | | | |
| | | Years Ended December 31, | |
| | | 2008 | | | 2007 | | 2006 | | 2005 | | 2004 | |
Supplemental data for all classes: | | | | | | | | | | | | | | | | | |
Net assets at end of year (in thousands) | | $ | 3,130,938 | | | $ | 8,048,654 | | $ | 6,267,126 | | $ | 4,551,077 | | $ | 3,001,434 | |
Portfolio turnover rate (%) | | | 91 | | | | 56 | | | 72 | | | 70 | | | 79 | |
| (a) | | Excludes $(0.18), $0.09, $0.42, $0.37 and $0.12 of PFIC mark to market which are treated as ordinary income for Federal tax purposes for the years 2008, 2007, 2006, 2005 and 2004, respectively. |
Performance cited represents past performance. Past performance does not guarantee future results and current performance may be lower or higher than the data quoted. Results shown are annual returns, which assume reinvestment of dividends and capital gains. Investment returns and principal will fluctuate and you may have a gain or loss when you sell shares. For the most current month-end performance information, please call 1-800-742-7272, or visit our Web site at www.williamblairfunds.com.
Note: Net investment income (loss) per share is based on the average shares outstanding during the year.
December 31, 2008 | William Blair Funds 125 |
Financial Highlights
International Equity Fund
| | | | | | | | | | | | | | | | | | |
| | | Class N | |
| | | Years Ended December 31, | |
| | | 2008 | | | 2007 | | 2006 | | 2005 | | | 2004(a) | |
Net asset value, beginning of year | | $ | 16.53 | | | $ | 15.21 | | $ | 12.86 | | $ | 11.33 | | | $ | 10.00 | |
Income (loss) from investment operations: | | | | | | | | | | | | | | | | | | |
Net investment income (loss) (b) | | | 0.10 | | | | 0.09 | | | 0.04 | | | (0.01 | ) | | | (0.04 | ) |
Net realized and unrealized gain (loss) on investments | | | (8.16 | ) | | | 2.55 | | | 2.52 | | | 1.54 | | | | 1.37 | |
| | | | | | | | | | | | | | | | | | |
Total from investment operations | | | (8.06 | ) | | | 2.64 | | | 2.56 | | | 1.53 | | | | 1.33 | |
Less distributions from: | | | | | | | | | | | | | | | | | | |
Net investment income | | | — | | | | 0.14 | | | 0.19 | | | — | | | | — | |
Net realized gain | | | 0.12 | | | | 1.18 | | | 0.02 | | | — | | | | — | |
| | | | | | | | | | | | | | | | | | |
Total distributions | | | 0.12 | | | | 1.32 | | | 0.21 | | | — | | | | — | |
| | | | | | | | | | | | | | | | | | |
Net asset value, end of year | | $ | 8.35 | | | $ | 16.53 | | $ | 15.21 | | $ | 12.86 | | | $ | 11.33 | |
| | | | | | | | | | | | | | | | | | |
Total return (%) | | | (48.75 | ) | | | 17.68 | | | 19.96 | | | 13.50 | | | | 13.30 | (c) |
Ratios to average daily net assets (%): | | | | | | | | | | | | | | | | | | |
Expenses, net of waivers and reimbursements | | | 1.45 | | | | 1.45 | | | 1.46 | | | 1.48 | | | | 1.50 | (d) |
Expenses, before waivers and reimbursements | | | 1.45 | | | | 1.47 | | | 1.56 | | | 1.81 | | | | 2.96 | (d) |
Net investment income (loss), net of waivers and reimbursements | | | 0.80 | | | | 0.52 | | | 0.26 | | | (0.33 | ) | | | (0.77 | )(d) |
Net investment income (loss), before waivers and reimbursements | | | 0.80 | | | | 0.50 | | | 0.16 | | | (0.66 | ) | | | (2.23 | )(d) |
| | | | | | | | | | | | | | | | | | |
| | | Class I | |
| | | Years Ended December 31, | |
| | | 2008 | | | 2007 | | 2006 | | 2005 | | | 2004(a) | |
Net asset value, beginning of year | | $ | 16.66 | | | $ | 15.31 | | $ | 12.94 | | $ | 11.37 | | | $ | 10.00 | |
Income (loss) from investment operations: | | | | | | | | | | | | | | | | | | |
Net investment income (loss) (b) | | | 0.15 | | | | 0.13 | | | 0.06 | | | (0.01 | ) | | | (0.01 | ) |
Net realized and unrealized gain (loss) on investments | | | (8.25 | ) | | | 2.57 | | | 2.55 | | | 1.58 | | | | 1.38 | |
| | | | | | | | | | | | | | | | | | |
Total from investment operations | | | (8.10 | ) | | | 2.70 | | | 2.61 | | | 1.57 | | | | 1.37 | |
Less distributions from: | | | | | | | | | | | | | | | | | | |
Net investment income | | | — | | | | 0.17 | | | 0.22 | | | — | | | | — | |
Net realized gain | | | 0.12 | | | | 1.18 | | | 0.02 | | | — | | | | — | |
| | | | | | | | | | | | | | | | | | |
Total distributions | | | 0.12 | | | | 11.35 | | | 0.24 | | | — | | | | — | |
| | | | | | | | | | | | | | | | | | |
Net asset value, end of year | | $ | 8.44 | | | $ | 16.66 | | $ | 15.31 | | $ | 12.94 | | | $ | 11.37 | |
| | | | | | | | | | | | | | | | | | |
Total return (%) | | | (48.61 | ) | | | 17.97 | | | 20.22 | | | 13.81 | | | | 13.70 | (c) |
Ratios to average daily net assets (%): | | | | | | | | | | | | | | | | | | |
Expenses, net of waivers and reimbursements | | | 1.20 | | | | 1.20 | | | 1.21 | | | 1.23 | | | | 1.25 | (d) |
Expenses, before waivers and reimbursements | | | 1.22 | | | | 1.25 | | | 1.35 | | | 1.56 | | | | 2.71 | (d) |
Net investment income (loss), net of waivers and reimbursements | | | 1.12 | | | | 0.76 | | | 0.46 | | | (0.08 | ) | | | (0.52 | )(d) |
Net investment income (loss), before waivers and reimbursements | | | 1.10 | | | | 0.71 | | | 0.32 | | | (0.41 | ) | | | (1.98 | )(d) |
| | | | | | | | | | | | | | | | |
| | | | |
| | | Years Ended December 31, | |
| | | 2008 | | 2007 | | 2006 | | 2005 | | 2004 | |
Supplemental data for all classes: | | | | | | | | | | | | | | | | |
Net assets at end of year (in thousands) | | $ | 228,486 | | $ | 408,609 | | $ | 297,716 | | $ | 177,710 | | $ | 9,689 | |
Portfolio turnover rate (%) | | | 92 | | | 70 | | | 83 | | | 127 | | | 108 | (d) |
| (a) | | For the period from May 24, 2004 (Commencement of Operations) to December 31, 2004. |
| (b) | | Excludes $(0.07), $0.01, $0.22, $0.33 and $0.02 of PFIC mark to market which is treated as ordinary income for Federal tax purposes for the year 2008, 2007, 2006, 2005 and 2004, respectively. |
| (c) | | Total return is not annualized for periods that are less than a year. |
| (d) | | Rates are annualized for periods that are less than a year. |
Performance cited represents past performance. Past performance does not guarantee future results and current performance may be lower or higher than the data quoted. Results shown are annual returns, which assume reinvestment of dividends and capital gains. Investment returns and principal will fluctuate and you may have a gain or loss when you sell shares. For the most current month-end performance information, please call 1-800-742-7272, or visit our Web site at www.williamblairfunds.com.
Note: Net investment income (loss) per share is based on the average shares outstanding during the year.
126 Annual Report | December 31, 2008 |
Financial Highlights
International Small Cap Growth Fund
| | | | | | | | | | | | | | | | |
| | | Class N | |
| | | Years Ended December 31, | |
| | | 2008 | | | 2007 | | | 2006 | | | 2005(a) | |
Net asset value, beginning of year | | $ | 13.98 | | | $ | 13.37 | | | $ | 11.16 | | | $ | 10.00 | |
Income (loss) from investment operations: | | | | | | | | | | | | | | | | |
Net investment income (loss) (b) | | | (0.02 | ) | | | (0.02 | ) | | | (0.05 | ) | | | (0.01 | ) |
Net realized and unrealized gain (loss) on investments | | | (7.22 | ) | | | 1.72 | | | | 2.32 | | | | 1.17 | |
| | | | | | | | | | | | | | | | |
Total from investment operations | | | (7.24 | ) | | | 1.70 | | | | 2.27 | | | | 1.16 | |
Less distributions from: | | | | | | | | | | | | | | | | |
Net investment income | | | — | | | | 0.05 | | | | 0.01 | | | | — | |
Net realized gain | | | 0.12 | | | | 1.04 | | | | 0.05 | | | | — | |
| | | | | | | | | | | | | | | | |
Total distributions | | | 0.12 | | | | 1.09 | | | | 0.06 | | | | — | |
| | | | | | | | | | | | | | | | |
Net asset value, end of year | | $ | 6.62 | | | $ | 13.98 | | | $ | 13.37 | | | $ | 11.16 | |
| | | | | | | | | | | | | | | | |
Total return (%) | | | (51.82 | ) | | | 13.06 | | | | 20.32 | | | | 11.60 | (c) |
Ratios to average daily net assets (%): | | | | | | | | | | | | | | | | |
Expenses, net of waivers and reimbursements | | | 1.65 | | | | 1.60 | | | | 1.65 | | | | 1.65 | (d) |
Expenses, before waivers and reimbursements | | | 1.62 | | | | 1.60 | | | | 1.71 | | | | 2.57 | (d) |
Net investment income (loss), net of waivers and reimbursements | | | (0.20 | ) | | | (0.16 | ) | | | (0.40 | ) | | | (0.40 | )(d) |
Net investment income (loss), before waivers and reimbursements | | | (0.17 | ) | | | (0.16 | ) | | | (0.46 | ) | | | (1.32 | )(d) |
| |
| | | Class I | |
| | | Years Ended December 31, | |
| | | 2008 | | | 2007 | | | 2006 | | | 2005(a) | |
Net asset value, beginning of year | | $ | 14.01 | | | $ | 13.41 | | | $ | 11.16 | | | $ | 10.00 | |
Income (loss) from investment operations: | | | | | | | | | | | | | | | | |
Net investment income (loss) (b) | | | 0.01 | | | | 0.03 | | | | (0.03 | ) | | | — | |
Net realized and unrealized gain (loss) on investments | | | (7.23 | ) | | | 1.71 | | | | 2.34 | | | | 1.16 | |
| | | | | | | | | | | | | | | | |
Total from investment operations | | | (7.22 | ) | | | 1.74 | | | | 2.31 | | | | 1.16 | |
Less distributions from: | | | | | | | | | | | | | | | | |
Net investment income | | | — | | | | 0.10 | | | | 0.01 | | | | — | |
Net realized gain | | | 0.12 | | | | 1.04 | | | | 0.05 | | | | — | |
| | | | | | | | | | | | | | | | |
Total distributions | | | 0.12 | | | | 1.14 | | | | 0.06 | | | | — | |
| | | | | | | | | | | | | | | | |
Net asset value, end of year | | $ | 6.67 | | | $ | 14.01 | | | $ | 13.41 | | | $ | 11.16 | |
| | | | | | | | | | | | | | | | |
Total return (%) | | | (51.56 | ) | | | 13.34 | | | | 20.68 | | | | 11.60 | (c) |
Ratios to average daily net assets (%): | | | | | | | | | | | | | | | | |
Expenses, net of waivers and reimbursements | | | 1.31 | | | | 1.29 | | | | 1.40 | | | | 1.40 | (d) |
Expenses, before waivers and reimbursements | | | 1.28 | | | | 1.29 | | | | 1.46 | | | | 2.32 | (d) |
Net investment income (loss), net of waivers and reimbursements | | | 0.11 | | | | 0.18 | | | | (0.25 | ) | | | (0.15 | )(d) |
Net investment income (loss), before waivers and reimbursements | | | 0.14 | | | | 0.18 | | | | (0.31 | ) | | | (1.07 | )(d) |
| | | | | | | | | | | | | |
| | | | |
| | | Years Ended December 31, | |
| | | 2008 | | 2007 | | 2006 | | 2005(a) | |
Supplemental data for all classes: | | | | | | | | | | | | | |
Net assets at end of year (in thousands) | | $ | 291,988 | | $ | 401,459 | | $ | 231,969 | | $ | 50,534 | |
Portfolio turnover rate (%) | | | 78 | | | 88 | | | 109 | | | 127 | (d) |
| (a) | | For the period from November 1, 2005 (Commencement of Operations) to December 31, 2005. |
| (b) | | Excludes $(0.02), $0.05, $0.00 and $0.11 of PFIC mark to market which is treated as ordinary income for Federal tax purposes for the years ended 2008, 2007, 2006 and 2005, respectively. |
| (c) | | Total return is not annualized for periods that are less than a year. |
| (d) | | Rates are annualized for periods that are less than a year. |
Performance cited represents past performance. Past performance does not guarantee future results and current performance may be lower or higher than the data quoted. Results shown are annual returns, which assume reinvestment of dividends and capital gains. Investment returns and principal will fluctuate and you may have a gain or loss when you sell shares. For the most current month-end performance information, please call 1-800-742-7272, or visit our Web site at www.williamblairfunds.com.
Note: Net investment income (loss) per share is based on the average shares outstanding during the year.
December 31, 2008 | William Blair Funds 127 |
Financial Highlights
Emerging Markets Growth Fund
| | | | | | | | | | | | | | | | |
| | | Class N | |
| | | Years Ended December 31, | |
| | | 2008 | | | 2007 | | | 2006 | | | 2005(a) | |
Net asset value, beginning of year | | $ | 21.92 | | | $ | 19.42 | | | $ | 14.17 | | | $ | 10.00 | |
Income (loss) from investment operations: | | | | | | | | | | | | | | | | |
Net investment income (loss) (b) | | | 0.11 | | | | (0.10 | ) | | | (0.04 | ) | | | (0.01 | ) |
Net realized and unrealized gain (loss) on investments | | | (13.63 | ) | | | 7.23 | | | | 5.41 | | | | 4.26 | |
| | | | | | | | | | | | | | | | |
Total from investment operations | | | (13.52 | ) | | | 7.13 | | | | 5.37 | | | | 4.25 | |
Less distributions from: | | | | | | | | | | | | | | | | |
Net investment income | | | — | | | | 0.09 | | | | 0.01 | | | | — | |
Net realized gain | | | 0.94 | | | | 4.54 | | | | 0.11 | | | | 0.08 | |
| | | | | | | | | | | | | | | | |
Total distributions | | | 0.94 | | | | 4.63 | | | | 0.12 | | | | 0.08 | |
| | | | | | | | | | | | | | | | |
Net asset value, end of year | | $ | 7.46 | | | $ | 21.92 | | | $ | 19.42 | | | $ | 14.17 | |
| | | | | | | | | | | | | | | | |
Total return (%) | | | (61.71 | ) | | | 37.75 | | | | 37.90 | | | | 42.52 | (c) |
Ratios to average daily net assets (%): | | | | | | | | | | | | | | | | |
Expenses, net of waivers and reimbursements | | | 1.67 | | | | 1.65 | | | | 1.65 | | | | 1.55 | (d) |
Expenses, before waivers and reimbursements | | | 1.65 | | | | 1.69 | | | | 1.78 | | | | 1.91 | (d) |
Net investment income (loss), net of waivers and reimbursements | | | 0.65 | | | | (0.45 | ) | | | (0.22 | ) | | | (0.11 | )(d) |
Net investment income (loss), before waivers and reimbursements | | | 0.67 | | | | (0.49 | ) | | | (0.35 | ) | | | (0.47 | )(d) |
| | | | | | | | | | | | | | | | |
| | | Class I | |
| | | Years Ended December 31, | |
| | | 2008 | | | 2007 | | | 2006 | | | 2005(a) | |
Net asset value, beginning of year | | $ | 21.99 | | | $ | 19.47 | | | $ | 14.19 | | | $ | 10.00 | |
Income (loss) from investment operations: | | | | | | | | | | | | | | | | |
Net investment income (loss) (b) | | | 0.15 | | | | (0.04 | ) | | | (0.01 | ) | | | 0.01 | |
Net realized and unrealized gain (loss) on investments | | | (13.69 | ) | | | 7.26 | | | | 5.41 | | | | 4.26 | |
| | | | | | | | | | | | | | | | |
Total from investment operations | | | (13.54 | ) | | | 7.22 | | | | 5.40 | | | | 4.27 | |
Less distributions from: | | | | | | | | | | | | | | | | |
Net investment income | | | — | | | | 0.16 | | | | 0.01 | | | | — | |
Net realized gain | | | 0.94 | | | | 4.54 | | | | 0.11 | | | | 0.08 | |
| | | | | | | | | | | | | | | | |
Total distributions | | | 0.94 | | | | 4.70 | | | | 0.12 | | | | 0.08 | |
| | | | | | | | | | | | | | | | |
Net asset value, end of year | | $ | 7.51 | | | $ | 21.99 | | | $ | 19.47 | | | $ | 14.19 | |
| | | | | | | | | | | | | | | | |
Total return (%) | | | (61.60 | ) | | | 38.13 | | | | 38.07 | | | | 42.72 | (c) |
Ratios to average daily net assets (%): | | | | | | | | | | | | | | | | |
Expenses, net of waivers and reimbursements | | | 1.41 | | | | 1.40 | | | | 1.40 | | | | 1.40 | (d) |
Expenses, before waivers and reimbursements | | | 1.39 | | | | 1.40 | | | | 1.47 | | | | 1.76 | (d) |
Net investment income (loss), net of waivers and reimbursements | | | 0.91 | | | | (0.20 | ) | | | (0.06 | ) | | | 0.04 | (d) |
Net investment income (loss), before waivers and reimbursements | | | 0.93 | | | | (0.20 | ) | | | (0.13 | ) | | | (0.32 | )(d) |
| | | | | | | | | | | | | |
| | | | |
| | | Years Ended December 31, | |
| | | 2008 | | 2007 | | 2006 | | 2005(a) | |
Supplemental data for all classes: | | | | | | | | | | | | | |
Net assets at end of year (in thousands) | | $ | 385,588 | | $ | 1,165,854 | | $ | 813,649 | | $ | 249,348 | |
Portfolio turnover rate (%) | | | 118 | | | 100 | | | 113 | | | 77 | (d) |
| (a) | | For the period from June 6, 2005 (Commencement of Operations) to December 31, 2005. |
| (b) | | Excludes $(0.09), $0.21, $0.00 and $0.11 of PFIC mark to market which is treated as ordinary income for Federal tax purposes for years ended 2008, 2007, 2006 and 2005, respectively. |
| (c) | | Total return is not annualized for periods that are less than a year. |
| (d) | | Rates are annualized for periods that are less than a year. |
Performance cited represents past performance. Past performance does not guarantee future results and current performance may be lower or higher than the data quoted. Results shown are annual returns, which assume reinvestment of dividends and capital gains. Investment returns and principal will fluctuate and you may have a gain or loss when you sell shares. For the most current month-end performance information, please call 1-800-742-7272, or visit our Web site at www.williamblairfunds.com.
Note: Net investment income (loss) per share is based on the average shares outstanding during the year.
128 Annual Report | December 31, 2008 |
Financial Highlights
Emerging Leaders Growth Fund
| | | | | | |
| |
| | | Class I | |
| | | Period Ended December 31, | |
| | | | | 2008(a) | |
Net asset value, beginning of period | | | | $ | 10.00 | |
Income (loss) from investment operations: | | | | | | |
Net investment income (loss) (b) | | | | | 0.04 | |
Net realized and unrealized gain (loss) on investments | | | | | (5.25 | ) |
| | | | | | |
Total from investment operations | | | | | (5.21 | ) |
Less distributions from: | | | | | | |
Net investment income | | | | | — | (c) |
Net realized gain | | | | | — | |
| | | | | | |
Total distributions | | | | | — | |
| | | | | | |
Net asset value, end of period | | | | $ | 4.79 | |
| | | | | | |
Total return (%) | | | | | (52.09 | )(d) |
Ratios to average daily net assets (%): | | | | | | |
Expenses, net of waivers and reimbursements | | | | | 1.40 | (e) |
Expenses, before waivers and reimbursements | | | | | 1.56 | (e) |
Net investment income (loss), net of waivers and reimbursements | | | | | 0.70 | (e) |
Net investment income (loss), before waivers and reimbursements | | | | | 0.54 | (e) |
| |
| | | | |
| | | Period Ended December 31, | |
| | | | | 2008 | |
Supplemental data for all classes: | | | | | | |
Net assets at end of period (in thousands) | | | | $ | 46,676 | |
Portfolio turnover rate (%) | | | | | 151 | (e) |
| (a) | | For the period from March 26, 2008 (Commencement of Operations) to December 31, 2008. |
| (b) | | Excludes $0.00 of PFIC mark to market which is treated as ordinary income for Federal tax purposes for the year ended 2008. |
| (c) | | Distribution less than $0.01 per share. |
| (d) | | Total return is not annualized for periods less than a year. |
| (e) | | Rates are annualized for periods less than a year. |
Performance cited represents past performance. Past performance does not guarantee future results and current performance may be lower or higher than the data quoted. Results shown are annual returns, which assume reinvestment of dividends and capital gains. Investment returns and principal will fluctuate and you may have a gain or loss when you sell shares. For the most current month-end performance information, please call 1-800-742-7272, or visit our Web site at www.williamblairfunds.com.
Note: Net investment income (loss) per share is based on the average shares outstanding during the year.
December 31, 2008 | William Blair Funds 129 |
Financial Highlights
Value Discovery Fund
| | | | | | | | | | | | | | | | | | | | |
| | | Class N | |
| | | Years Ended December 31, | |
| | | 2008 | | | 2007 | | | 2006 | | | 2005 | | | 2004 | |
Net asset value, beginning of year | | $ | 11.31 | | | $ | 16.27 | | | $ | 14.95 | | | $ | 22.70 | | | $ | 22.68 | |
Income (loss) from investment operations: | | | | | | | | | | | | | | | | | | | | |
Net investment income (loss) | | | 0.09 | | | | 0.02 | | | | 0.03 | | | | (0.02 | ) | | | (0.01 | ) |
Net realized and unrealized gain (loss) on investments | | | (3.02 | ) | | | (0.96 | ) | | | 3.22 | | | | 0.14 | | | | 2.68 | |
| | | | | | | | | | | | | | | | | | | | |
Total from investment operations | | | (2.93 | ) | | | (0.94 | ) | | | 3.25 | | | | 0.12 | | | | 2.67 | |
Less distributions from: | | | | | | | | | | | | | | | | | | | | |
Net investment income | | | 0.05 | | | | — | | | | 0.01 | | | | — | | | | — | |
Net realized gain | | | — | | | | 4.02 | | | | 1.92 | | | | 7.87 | | | | 2.65 | |
| | | | | | | | | | | | | | | | | | | | |
Total distributions | | | 0.05 | | | | 4.02 | | | | 1.93 | | | | 7.87 | | | | 2.65 | |
| | | | | | | | | | | | | | | | | | | | |
Net asset value, end of year | | $ | 8.33 | | | $ | 11.31 | | | $ | 16.27 | | | $ | 14.95 | | | $ | 22.70 | |
| | | | | | | | | | | | | | | | | | | | |
Total return (%) | | | (25.85 | ) | | | (5.54 | ) | | | 21.78 | | | | 0.49 | | | | 12.05 | |
Ratios to average daily net assets (%): | | | | | | | | | | | | | | | | | | | | |
Expenses, net of waivers and reimbursements | | | 1.29 | | | | 1.33 | | | | 1.34 | | | | 1.34 | | | | 1.34 | |
Expenses, before waivers and reimbursements | | | 1.82 | | | | 1.66 | | | | 1.75 | | | | 1.64 | | | | 1.48 | |
Net investment income (loss), net of waivers and reimbursements | | | 0.84 | | | | 0.10 | | | | 0.21 | | | | (0.22 | ) | | | (0.06 | ) |
Net investment income (loss), before waivers and reimbursements | | | 0.31 | | | | (0.23 | ) | | | (0.20 | ) | | | (0.52 | ) | | | (0.20 | ) |
| |
| | | Class I | |
| | | Years Ended December 31, | |
| | | 2008 | | | 2007 | | | 2006 | | | 2005 | | | 2004 | |
Net asset value, beginning of year | | $ | 11.50 | | | $ | 16.51 | | | $ | 15.12 | | | $ | 22.82 | | | $ | 22.76 | |
Income (loss) from investment operations: | | | | | | | | | | | | | | | | | | | | |
Net investment income (loss) | | | 0.11 | | | | 0.09 | | | | 0.03 | | | | — | | | | 0.01 | |
Net realized and unrealized gain (loss) on investments | | | (3.08 | ) | | | (1.01 | ) | | | 3.30 | | | | 0.17 | | | | 2.70 | |
| | | | | | | | | | | | | | | | | | | | |
Total from investment operations | | | (2.97 | ) | | | (0.92 | ) | | | 3.33 | | | | 0.17 | | | | 2.71 | |
Less distributions from: | | | | | | | | | | | | | | | | | | | | |
Net investment income | | | 0.08 | | | | 0.07 | | | | 0.02 | | | | — | | | | — | |
Net realized gain | | | — | | | | 4.02 | | | | 1.92 | | | | 7.87 | | | | 2.65 | |
| | | | | | | | | | | | | | | | | | | | |
Total distributions | | | 0.08 | | | | 4.09 | | | | 1.94 | | | | 7.87 | | | | 2.65 | |
| | | | | | | | | | | | | | | | | | | | |
Net asset value, end of year | | $ | 8.45 | | | $ | 11.50 | | | $ | 16.51 | | | $ | 15.12 | | | $ | 22.82 | |
| | | | | | | | | | | | | | | | | | | | |
Total return (%) | | | (25.77 | ) | | | (5.31 | ) | | | 22.10 | | | | 0.70 | | | | 12.18 | |
Ratios to average daily net assets (%): | | | | | | | | | | | | | | | | | | | | |
Expenses, net of waivers and reimbursements | | | 1.09 | | | | 1.09 | | | | 1.09 | | | | 1.14 | | | | 1.23 | |
Expenses, before waivers and reimbursements | | | 1.57 | | | | 1.37 | | | | 1.50 | | | | 1.39 | | | | 1.23 | |
Net investment income (loss), net of waivers and reimbursements | | | 1.06 | | | | 0.52 | | | | 0.16 | | | | (0.02 | ) | | | 0.05 | |
Net investment income (loss), before waivers and reimbursements | | | 0.58 | | | | 0.24 | | | | (0.25 | ) | | | (0.27 | ) | | | 0.05 | |
| | | | | | | | | | | | | | | |
| | | |
| | | Years Ended December 31, |
| | | 2008 | | 2007 | | 2006 | | 2005 | | 2004 |
Supplemental data for all classes: | | | | | | | | | | | | | | | |
Net assets at end of year (in thousands) | | $ | 36,249 | | $ | 47,118 | | $ | 146,777 | | $ | 70,439 | | $ | 246,176 |
Portfolio turnover rate (%) | | | 87 | | | 102 | | | 162 | | | 125 | | | 50 |
Performance cited represents past performance. Past performance does not guarantee future results and current performance may be lower or higher than the data quoted. Results shown are annual returns, which assume reinvestment of dividends and capital gains. Investment returns and principal will fluctuate and you may have a gain or loss when you sell shares. For the most current month-end performance information, please call 1-800-742-7272, or visit our Web site at www.williamblairfunds.com.
Note: Net investment income (loss) per share is based on the average shares outstanding during the year.
130 Annual Report | December 31, 2008 |
Financial Highlights
Bond Fund
| | | | | | | | |
| | | Class N | |
| | | Years Ended December 31, | |
| | | 2008 | | | 2007(a) | |
Net asset value, beginning of year | | $ | 10.07 | | | $ | 10.00 | |
Income (loss) from investment operations: | | | | | | | | |
Net investment income (loss) | | | 0.47 | | | | 0.31 | |
Net realized and unrealized gain (loss) on investments | | | (0.31 | ) | | | 0.02 | |
| | | | | | | | |
| |
| 0.16
|
| | | 0.33 | |
Total from investment operations | | | | | | | | |
Less distributions from: | | | | | | | | |
Net investment income | | | 0.41 | | | | 0.26 | |
Net realized gain | | | — | | | | — | |
| | | | | | | | |
Total distributions | |
| 0.41
|
| | | 0.26 | |
| | | | | | | | |
Net asset value, end of year | | $ | 9.82 | | | $ | 10.07 | |
| | | | | | | | |
Total return (%) | | | 1.64 | | | | 3.38 | (b) |
Ratios to average daily net assets (%): | | | | | | | | |
Expenses, net of waivers and reimbursements | | | 0.65 | | | | 0.65 | (c) |
Expenses, before waivers and reimbursements | | | 2.47 | | | | 0.81 | (c) |
Net investment income (loss), net of waivers and reimbursements | | | 4.69 | | | | 4.80 | (c) |
Net investment income (loss), before waivers and reimbursements | | | 2.87 | | | | 4.64 | (c) |
| |
| | | Class I | |
| | | Years Ended December 31, | |
| | | 2008 | | | 2007(a) | |
Net asset value, beginning of year | | $ | 10.04 | | | $ | 10.00 | |
Income (loss) from investment operations: | | | | | | | | |
Net investment income (loss) | | | 0.48 | | | | 0.32 | |
Net realized and unrealized gain (loss) on investments | | | (0.31 | ) | | | 0.03 | |
| | | | | | | | |
| | | 0.17 | | | | 0.34 | |
Total from investment operations | | | | | | | | |
Less distributions from: | | | | | | | | |
Net investment income | | | 0.49 | | | | 0.30 | |
Net realized gain | | | — | | | | — | |
| | | | | | | | |
Total distributions | |
| 0.49
|
| | | 0.30 | |
| | | | | | | | |
Net asset value, end of year | | $ | 9.72 | | | $ | 10.04 | |
| | | | | | | | |
Total return (%) | | | 1.72 | | | | 3.50 | (b) |
Ratios to average daily net assets (%): | | | | | | | | |
Expenses, net of waivers and reimbursements | | | 0.50 | | | | 0.50 | (c) |
Expenses, before waivers and reimbursements | | | 0.71 | | | | 0.67 | (c) |
Net investment income (loss), net of waivers and reimbursements | | | 4.90 | | | | 4.95 | (c) |
Net investment income (loss), before waivers and reimbursements | | | 4.69 | | | | 4.78 | (c) |
| | | | |
| | | Years Ended December 31, | |
| | | 2008 | | | 2007(a) | |
Supplemental data for all classes: | | | | | | | | |
Net assets at end of year (in thousands) | | $ | 74,613 | | | $ | 68,483 | |
Portfolio turnover rate (%) | | | 52 | | | | 38 | (c) |
| (a) | | For the period from May 1, 2007 (Commencement of Operations) to December 31, 2007. |
| (b) | | Total return is not annualized for periods that are less than a year. |
| (c) | | Rates are annualized for periods less than a year. |
Performance cited represents past performance. Past performance does not guarantee future results and current performance may be lower or higher than the data quoted. Results shown are annual returns, which assume reinvestment of dividends and capital gains. Investment returns and principal will fluctuate and you may have a gain or loss when you sell shares. For the most current month-end performance information, please call 1-800-742-7272, or visit our Web site at www.williamblairfunds.com.
Note: Net investment income (loss) per share is based on the average shares outstanding during the period.
December 31, 2008 | William Blair Funds 131 |
Financial Highlights
Income Fund
| | | | | | | | | | | | | | | | | | | | |
| | | Class N | |
| | | Years Ended December 31, | |
| | | 2008 | | | 2007 | | | 2006 | | | 2005 | | | 2004 | |
Net asset value, beginning of year | | $ | 9.29 | | | $ | 9.74 | | | $ | 9.83 | | | $ | 10.19 | | | $ | 10.43 | |
Income (loss) from investment operations: | | | | | | | | | | | | | | | | | | | | |
Net investment income (loss) | | | 0.37 | | | | 0.45 | | | | 0.44 | | | | 0.47 | | | | 0.52 | |
Net realized and unrealized gain (loss) on investments | | | (0.59 | ) | | | (0.35 | ) | | | (0.04 | ) | | | (0.30 | ) | | | (0.26 | ) |
| | | | | | | | | | | | | | | | | | | | |
Total from investment operations | | | (0.22 | ) | | | 0.10 | | | | 0.40 | | | | 0.17 | | | | 0.26 | |
Less distributions from: | | | | | | | | | | | | | | | | | | | | |
Net investment income | | | 0.38 | | | | 0.55 | | | | 0.49 | | | | 0.53 | | | | 0.50 | |
Net realized gain | | | — | | | | — | | | | — | | | | — | | | | — | |
| | | | | | | | | | | | | | | | | | | | |
Total distributions | | | 0.38 | | | | 0.55 | | | | 0.49 | | | | 0.53 | | | | 0.50 | |
| | | | | | | | | | | | | | | | | | | | |
Net asset value, end of year | | $ | 8.69 | | | $ | 9.29 | | | $ | 9.74 | | | $ | 9.83 | | | $ | 10.19 | |
| | | | | | | | | | | | | | | | | | | | |
Total return (%) | | | (2.46 | ) | | | 1.08 | | | | 4.25 | | | | 1.71 | | | | 2.61 | |
Ratios to average daily net assets (%): | | | | | | | | | | | | | | | | | | | | |
Expenses, net of waivers and reimbursements | | | 0.90 | | | | 0.79 | | | | 0.74 | | | | 0.73 | | | | 0.78 | |
Expenses, before waivers and reimbursements | | | 0.93 | | | | 0.81 | | | | 0.80 | | | | 0.73 | | | | 0.78 | |
Net investment income (loss), net of waivers and reimbursements | | | 4.38 | | | | 4.73 | | | | 4.54 | | | | 4.09 | | | | 4.12 | |
Net investment income (loss) before waivers and reimbursements | | | 4.35 | | | | 4.71 | | | | 4.48 | | | | 4.09 | | | | 4.12 | |
| |
| | | Class I | |
| | | Years Ended December 31, | |
| | | 2008 | | | 2007 | | | 2006 | | | 2005 | | | 2004 | |
Net asset value, beginning of year | | $ | 9.30 | | | $ | 9.69 | | | $ | 9.82 | | | $ | 10.15 | | | $ | 10.40 | |
Income (loss) from investment operations: | | | | | | | | | | | | | | | | | | | | |
Net investment income (loss) | | | 0.39 | | | | 0.47 | | | | 0.45 | | | | 0.52 | | | | 0.59 | |
Net realized and unrealized gain (loss) on investments | | | (0.59 | ) | | | (0.34 | ) | | | (0.04 | ) | | | (0.33 | ) | | | (0.31 | ) |
| | | | | | | | | | | | | | | | | | | | |
Total from investment operations | | | (0.20 | ) | | | 0.13 | | | | 0.41 | | | | 0.19 | | | | 0.28 | |
Less distributions from: | | | | | | | | | | | | | | | | | | | | |
Net investment income | | | 0.46 | | | | 0.52 | | | | 0.54 | | | | 0.52 | | | | 0.53 | |
Net realized gain | | | — | | | | — | | | | — | | | | — | | | | — | |
| | | | | | | | | | | | | | | | | | | | |
Total distributions | | | 0.46 | | | | 0.52 | | | | 0.54 | | | | 0.52 | | | | 0.53 | |
| | | | | | | | | | | | | | | | | | | | |
Net asset value, end of year | | $ | 8.64 | | | $ | 9.30 | | | $ | 9.69 | | | $ | 9.82 | | | $ | 10.15 | |
| | | | | | | | | | | | | | | | | | | | |
Total return (%) | | | (2.26 | ) | | | 1.36 | | | | 4.33 | | | | 1.92 | | | | 2.79 | |
Ratios to average daily net assets (%): | | | | | | | | | | | | | | | | | | | | |
Expenses, net of waivers and reimbursements | | | 0.72 | | | | 0.60 | | | | 0.62 | | | | 0.58 | | | | 0.63 | |
Expenses, before waivers and reimbursements | | | 0.72 | | | | — | | | | — | | | | — | | | | — | |
Net investment income (loss), net of waivers and reimbursements | | | 4.57 | | | | 4.91 | | | | 4.66 | | | | 4.24 | | | | 4.27 | |
Net investment income (loss) before waivers and reimbursements | | | 4.57 | | | | — | | | | — | | | | — | | | | — | |
| | | | | | | | | | |
| |
| | | |
| | | Years Ended December 31, |
| | | 2008 | | 2007 | | 2006 | | 2005 | | 2004 |
Supplemental data for all classes: | | | | | | | | | | |
Net assets at end of year (in thousands) | | $140,435 | | $204,630 | | $297,077 | | $310,496 | | $294,084 |
Portfolio turnover rate (%) | | 38 | | 34 | | 33 | | 41 | | 43 |
Performance cited represents past performance. Past performance does not guarantee future results and current performance may be lower or higher than the data quoted. Results shown are annual returns, which assume reinvestment of dividends and capital gains. Investment returns and principal will fluctuate and you may have a gain or loss when you sell shares. For the most current month-end performance information, please call 1-800-742-7272, or visit our Web site at www.williamblairfunds.com.
Note: Net investment income (loss) per share is based on the average shares outstanding during the year.
132 Annual Report | December 31, 2008 |
Financial Highlights
Ready Reserves Fund
| | | | | | | | | | | | | | | |
| | | Class N |
| | | Years Ended December 31, |
| | | 2008 | | 2007 | | 2006 | | 2005 | | 2004 |
Net asset value, beginning of year | | $ | 1.00 | | $ | 1.00 | | $ | 1.00 | | $ | 1.00 | | $ | 1.00 |
Income (loss) from investment operations: | | | | | | | | | | | | | | | |
Net investment income (loss) | | | 0.02 | | | 0.05 | | | 0.04 | | | 0.03 | | | 0.01 |
| | | | | | | | | | | | | | | |
Total from investment operations | | | 0.02 | | | 0.05 | | | 0.04 | | | 0.03 | | | 0.01 |
Less distributions from: | | | | | | | | | | | | | | | |
Net investment income | | | 0.02 | | | 0.05 | | | 0.04 | | | 0.03 | | | 0.01 |
| | | | | | | | | | | | | | | |
Total distributions | | | 0.02 | | | 0.05 | | | 0.04 | | | 0.03 | | | 0.01 |
| | | | | | | | | | | | | | | |
Net asset value, end of year | | $ | 1.00 | | $ | 1.00 | | $ | 1.00 | | $ | 1.00 | | $ | 1.00 |
| | | | | | | | | | | | | | | |
Total return (%) | | | 2.20 | | | 4.75 | | | 4.47 | | | 2.62 | | | 0.80 |
Ratios to average daily net assets (%) | | | | | | | | | | | | | | | |
Expenses | | | 0.60 | | | 0.63 | | | 0.63 | | | 0.64 | | | 0.65 |
Net investment income (loss) | | | 2.12 | | | 4.63 | | | 4.38 | | | 2.57 | | | 0.80 |
Supplemental data: | | | | | | | | | | | | | | | |
Net assets at end of year (in thousands) | | $ | 1,841,189 | | $ | 1,399,537 | | $ | 1,195,593 | | $ | 1,091,854 | | $ | 1,092,940 |
Performance cited represents past performance. Past performance does not guarantee future results and current performance may be lower or higher than the data quoted. Results shown are annual returns, which assume reinvestment of dividends and capital gains. Investment returns and principal will fluctuate and you may have a gain or loss when you sell shares. For the most current month-end performance information, please call 1-800-742-7272, or visit our Web site at www.williamblairfunds.com.
Note: Net investment income (loss) per share is based on the average shares outstanding during the year.
December 31, 2008 | William Blair Funds 133 |
REPORT OF INDEPENDENT REGISTERED PUBLIC ACCOUNTING FIRM
To the Board of Trustees and Shareholders of
William Blair Funds
We have audited the accompanying statements of assets and liabilities, including the portfolios of investments, of the Growth Fund, Tax-Managed Growth Fund, Large Cap Growth Fund, Small Cap Growth Fund, Mid Cap Growth Fund, Small-Mid Cap Growth Fund, Global Growth Fund, International Growth Fund, International Equity Fund, International Small Cap Growth Fund, Emerging Markets Growth Fund, Emerging Leaders Growth Fund, Value Discovery Fund, Bond Fund, Income Fund and Ready Reserves Fund (collectively, the “Portfolios”) (sixteen of the Portfolios constituting the William Blair Funds) as of December 31, 2008, and the related statements of operations, statements of changes in net assets and financial highlights for the periods indicated therein. These financial statements and financial highlights are the responsibility of the Portfolios’ management. Our responsibility is to express an opinion on these financial statements and financial highlights based on our audits.
We conducted our audits in accordance with the standards of the Public Company Accounting Oversight Board (United States). Those standards require that we plan and perform the audit to obtain reasonable assurance about whether the financial statements and financial highlights are free of material misstatement. We were not engaged to perform an audit of the Portfolios’ internal control over financial reporting. Our audits included consideration of internal control over financial reporting as a basis for designing audit procedures that are appropriate in the circumstances, but not for the purpose of expressing an opinion on the effectiveness of the Portfolios’ internal control over financial reporting. Accordingly, we express no such opinion. An audit also includes examining, on a test basis, evidence supporting the amounts and disclosures in the financial statements and financial highlights, assessing the accounting principles used and significant estimates made by management, and evaluating the overall financial statement presentation. Our procedures included confirmation of securities owned as of December 31, 2008, by correspondence with the custodian and brokers or by other appropriate auditing procedures where replies from brokers were not received. We believe that our audits provide a reasonable basis for our opinion.
In our opinion, the financial statements and financial highlights referred to above present fairly, in all material respects, the financial position of each of the above mentioned Portfolios of the William Blair Funds at December 31, 2008, the results of their operations, changes in their net assets and financial highlights for the periods indicated therein, in conformity with U.S. generally accepted accounting principles.

Chicago, Illinois
February 19, 2009
134 Annual Report | December 31, 2008 |
Trustees and Officers (Unaudited). The trustees and officers of the William Blair Funds, their year of birth, their principal occupations during the last five years, their affiliations, if any, with William Blair & Company, L.L.C., and other significant affiliations are set forth below. The address of each trustee and officer is 222 West Adams Street, Chicago, Illinois 60606.
| | | | | | | | | | |
Name and Year of Birth | | Position(s)
Held with
Fund | | Term of
Office and
Length of
Time
Served(1) | | Principal Occupation(s) During Past 5 Years | | Number of
Portfolios
in Fund
Complex
Overseen
by Trustee | | Other Directorships Held by Trustee/Officer |
Interested Trustees | | | | | | | | | | |
Frederick Conrad Fischer,
1934* | | Chairman of the Board of Trustees | | Since 1987 | | Principal, William Blair & Company, L.L.C.; Partner, APM Limited Partnership; Limited Partner, WB Holdings, L.P. (since November 2008) | | 18 | | Trustee Emeritus, Chicago Child Care Society, a non-profit organization; Trustee Emeritus, Kalamazoo College |
| | | | | |
Michelle R. Seitz,
1965* | | Trustee and President | | Since 2002 Since 2007 | | Principal, William Blair & Company, L.L.C.; Limited Partner, WB Holdings, L.P. (since November 2008); Member, WBC GP, L.L.P. (since November 2008) | | 18 | | N/A |
| | | | |
Non-Interested Trustees | | | | | | | | |
Ann P. McDermott,
1939 | | Trustee | | Since 1996 | | Board member and officer for various civic and charitable organizations over the past thirty years; professional experience prior thereto, registered representative for New York Stock Exchange firm | | 18 | | Northwestern University, Women’s Board; Rush Presbyterian St. Luke’s Medical Center, Women’s Board; University of Chicago, Women’s Board; Visiting Nurses Association, Honorary Director |
| | | | | |
Phillip O. Peterson,
1944 | | Trustee | | Since 2007 | | Trustee of Strong Funds Liquidating Trusts since 2005 and President, Strong Mutual Funds, 2004-2005; formerly, Partner, KPMG LLP | | 18 | | The Hartford Group of Mutual Funds (87 portfolios) |
| | | | | |
Donald J. Reaves,
1946 | | Trustee | | Since 2004 | | Chancellor, Winston-Salem State University; formerly, Vice President for Administration and Chief Financial Officer, University of Chicago 2002-2007. | | 18 | | American Student Assistance Corp., guarantor of student loans; Amica Mutual Insurance Company |
| | | | | |
Donald L. Seeley,
1944 | | Trustee | | Since 2003 | | Director, Applied Investment Management Program, University of Arizona Department of Finance, formerly, Vice Chairman and Chief Financial Officer, True North Communications, Inc., marketing communications and advertising firm | | 18 | | Warnaco Group, Inc., intimate apparel, sportswear, and swimwear manufacturer; Center for Furniture Craftsmanship (not-for-profit) |
| | | | | |
Thomas J. Skelly,
1951 | | Trustee | | Since 2007 | | Director and Investment Committee Chairman of the U.S. Accenture Foundation Inc.; formerly, Managing Partner of various divisions at Accenture | | 18 | | First MetLife Investors Insurance Company |
| | | | | |
Robert E. Wood II,
1938 | | Trustee | | Since 1999 | | Retired; formerly Executive Vice President, Morgan Stanley Dean Witter | | 18 | | Chairman, Add-Vision, Inc., manufacturer of surface animation systems; Chairman Micro-Combustion, LLC |
December 31, 2008 | William Blair Funds 135 |
| | | | | | | | |
Name and Year of Birth | | Position(s)
Held with
Fund | | Term of
Office and
Length of
Time
Served(1) | | Principal Occupation(s) During Past 5 Years(2) | | Other Directorships Held by Trustee/Officer |
Officers | | | | | | | | |
| | | | |
Karl W. Brewer,
1966 | | Senior Vice President | | Since 2000 | | Principal, William Blair & Company, L.L.C. | | N/A |
| | | | |
Mark A. Fuller, III,
1957 | | Senior Vice President | | Since 1993 | | Principal, William Blair & Company, L.L.C. | | Partner, Fulsen Howney Partners |
| | | | |
James S. Golan,
1961 | | Senior Vice President | | Since 2005 | | Principal, William Blair & Company, L.L.C. | | N/A |
| | | | |
W. George Greig,
1952 | | Senior Vice President | | Since 1996 | | Principal, William Blair & Company, L.L.C. | | N/A |
| | | | |
Michael A. Jancosek,
1959 | | Senior Vice President Vice President | | Since 2004 2000-2004 | | Principal, William Blair & Company L.L.C. Associate, William Blair & Company, L.L.C. | | N/A |
| | | | |
John F. Jostrand,
1954 | | Senior Vice President | | Since 1999 | | Principal, William Blair & Company, L.L.C. | | N/A |
| | | | |
Robert C. Lanphier, IV,
1956 | | Senior Vice President | | Since 2003 | | Principal, William Blair & Company, L.L.C. | | Chairman, AG. Med, Inc. |
| | | | |
Mark T. Leslie,
1967 | | Senior Vice President Vice President | | Since 2008 2005-2008 | | Principal, William Blair & Company, L.L.C. Associate, William Blair & Company, L.L.C. formerly, U.S. Bancorp Asset Management | | N/A |
| | | | |
Matthew A. Litfin,
1972 | | Senior Vice President | | Since 2008 | | Principal, William Blair & Company, L.L.C. | | N/A |
| | | | |
Kenneth J. McAtamney
1966 | | Senior Vice President | | Since 2008 | | Principal, William Blair & Company, L.L.C. | | N/A |
| | | | |
Todd M. McClone,
1968 | | Senior Vice President Vice President | | Since 2006 2005-2006 | | Principal, William Blair & Company, L.L.C. Associate, William Blair & Company, L.L.C. | | N/A N/A |
| | | | |
Tracy McCormick
1954 | | Senior Vice President | | Since 2008 | | Principal, William Blair & Company, L.L.C. | | N/A |
| | | | |
David Merjan
1960 | | Senior Vice President | | Since 2008 | | Principal, William Blair & Company, L.L.C. | | N/A |
| | | | |
David S. Mitchell,
1960 | | Senior Vice President Vice President | | Since 2004 2003-2004 | | Principal, William Blair & Company, L.L.C. Associate, William Blair & Company, L.L.C. | | N/A |
| | | | |
Gregory J. Pusinelli,
1958 | | Senior Vice President | | Since 1999 | | Principal, William Blair & Company, L.L.C. | | N/A |
| | | | |
David P. Ricci,
1958 | | Senior Vice President | | Since 2006 | | Principal, William Blair & Company, L.L.C. | | N/A |
136 Annual Report | December 31, 2008 |
| | | | | | | | |
Name and Year of Birth | | Position(s)
Held with
Fund | | Term of
Office and
Length of
Time
Served(1) | | Principal Occupation(s) During Past 5 Years(2) | | Other Directorships Held by Trustee/Officer |
Richard W. Smirl,
1967 | | Senior Vice President and Chief Compliance Officer | | Since 2004 | | Principal, William Blair & Company, L.L.C.; former Chief Legal Officer, Strong Capital Management | | N/A |
| | | | |
Jeffrey A. Urbina,
1955 | | Senior Vice President | | Since 1998 | | Principal, William Blair & Company, L.L.C. | | N/A |
| | | | |
Christopher T. Vincent,
1956 | | Senior Vice President Vice President | | Since 2004 2002-2004 | | Principal, William Blair & Company, L.L.C. Associate, William Blair & Company, L.L.C. | | Uhlich Children’s Home |
| | | | |
Michael P. Balkin,
1959 | | Vice President | | Since 2008 | | Associate William Blair & Company, L.L.C.; former Chief Investment Officer, Magnetar Investment Management | | N/A |
| | | | |
David C. Fording,
1967 | | Vice President | | Since 2006 | | Associate, William Blair & Company, L.L.C.; former Portfolio Manager, TIAA-CREF | | N/A |
| | | | |
Chad M. Kilmer,
1975 | | Vice President | | Since 2006 | | Associate, William Blair & Company, L.L.C.; former analyst and Portfolio Manager U.S. Bancorp Asset Management and analyst Gabelli Woodland Partners. | | N/A |
| | | | |
Terence M. Sullivan,
1944 | | Vice President and Treasurer | | Since 1997 | | Associate, William Blair & Company, L.L.C. | | N/A |
| | | | |
Colette M. Garavalia,
1961 | | Secretary | | Since 2000 | | Associate, William Blair & Company, L.L.C. | | N/A |
| * | | Mr. Fischer and Ms. Seitz are interested persons of the William Blair Funds because each is a principal of William Blair & Company, L.L.C., the Funds’ investment advisor, principal underwriter and distributor. |
| (1) | | Each Trustee serves until the election and qualification of a successor, or until death, resignation or retirement or removal as provided in the Fund’s Declaration of Trust. Retirement for non-interested Trustees occurs no later than at the conclusion of the first regularly scheduled Board meeting of the Fund’s fiscal year that occurs after the Trustee’s 72nd birthday. The Fund’s officers except the Chief Compliance Officer, are elected annually by the Trustees. The Fund’s Chief Compliance Officer is designated by the Board of Trustees and may only be removed by action of the Board of Trustees, including a majority of the non-interested Trustees. |
| (2) | | In November 2008, all current principals of William Blair & Company, L.L.C. also became limited partners in WB Holdings, L.P. |
The Statement of Additional Information for the William Blair Funds includes additional information about the trustees and is available without charge by calling 1-800-635-2886 (in Massachusetts 1-800-635-2840) or by writing the Fund.
December 31, 2008 | William Blair Funds 137 |
(unaudited)
Proxy Voting
A description of the policies and procedures that the Fund uses to determine how to vote proxies relating to portfolio securities and information regarding how the Fund voted proxies relating to portfolio securities for the most recent 12-month period ended June 30 are available without charge, upon request, by calling 1-800-635-2886 (in Massachusetts 1-800-635-2840), at www.williamblairfunds.com and on the SEC’s website at http://www.sec.gov.
Quarterly Portfolio Schedules
The Fund files its complete schedule of portfolio holdings with the SEC for the first and third fiscal quarters of each fiscal year (quarters ended March 31 and September 30) on Form N-Q. The Fund’s Forms N-Q are available on the SEC’s website at http://www.sec.gov and may be reviewed and copied at the SEC’s Public Reference Room in Washington, D.C. Information on the operation of the SEC’s Public Reference Room may be obtained by calling 1-800-SEC-0330. The Fund’s Forms N-Q are also available on the Fund’s website at www.williamblairfunds.com.
Additional Federal Income Tax Information: (unaudited)
The following table provides the percentage of the 2008 year end distributions that qualify for the dividend received deduction, and the qualified dividend income percentage:
| | | | | | |
Portfolio | | Dividend
Received
Deduction% | | | Qualified
Dividend
Income% | |
Growth | | 0.00 | % | | 0.00 | % |
Tax-Managed Growth | | 0.00 | % | | 0.00 | % |
Large Cap Growth | | 100.00 | % | | 100.00 | % |
Small Cap Growth | | 3.03 | % | | 4.10 | % |
Mid Cap Growth | | 21.51 | % | | 24.60 | % |
Small-Mid Cap Growth | | 14.95 | % | | 16.86 | % |
Global Growth | | 10.16 | % | | 100.00 | % |
International Growth | | 0.00 | % | | 100.00 | % |
International Equity | | 0.00 | % | | 77.20 | % |
International Small Cap Growth | | 0.00 | % | | 42.24 | % |
Emerging Markets Growth | | 0.00 | % | | 8.29 | % |
Emerging Leaders Growth | | 0.00 | % | | 0.00 | % |
Value Discovery | | 94.21 | % | | 94.47 | % |
Bond | | 0.00 | % | | 0.00 | % |
Income | | 0.00 | % | | 0.00 | % |
Ready Reserves | | 0.00 | % | | 0.00 | % |
In January 2009, you will be advised on IRS Form 1099-Div or substitute 1099 DIV as to the Federal tax status of the distributions received by you in the calendar year 2008.
138 Annual Report | December 31, 2008 |
Useful Information About Your Report (unaudited)
Please refer to this information when reviewing the Expense Example for each Portfolio.
Expense Example
As a shareholder of a Portfolio, you incur two types of costs: (1) transaction costs such as redemption fees and (2) ongoing costs, including management fees, distribution (12b-1) fees (for Class N shares except for the Ready Reserves Portfolio), service fees (for Class N shares of the Ready Reserves Portfolio), shareholder administration fees (for Class N and Class I shares of the Global Growth Portfolio, the International Small Cap Growth Portfolio, the Emerging Markets Growth Portfolio and the Bond Portfolio and Class I shares of the Emerging Leaders Growth Portfolio) and other Portfolio expenses. The example is intended to help you understand your ongoing costs (in dollars) of investing in the Portfolio and to compare these costs with the ongoing costs of investing in other mutual funds. To do so, compare the Portfolio’s 5% hypothetical example with the 5% hypothetical examples that appear in the shareholder reports of other funds. The example is based on an investment of $1,000 invested at the beginning of the period and held for the entire six-month period from July 1, 2008 to December 31, 2008.
Actual Expenses
In each example, the first line for each share class in the table provides information about the actual account values and actual expenses. These expenses reflect the effect of any expense cap applicable to the share class during the period. Without this expense cap, the costs shown in the table would have been higher. You may use the information in this line, together with the amount you invested, to estimate the expenses that you paid over the period. Simply divide your account value by $1,000 (example, an $8,600 account value divided by $1,000 = 8.6), then multiply the result by the number in the first line under the heading entitled “Expenses Paid During the Period” to estimate the expenses you paid on your account during the period.
Hypothetical Example for Comparison Purposes
In each example, the second line for each share class in the table provides information about hypothetical account values and hypothetical expenses based on the Portfolio’s actual expense ratio and an assumed rate of return of 5% per year before expenses. This is not the Portfolio’s actual return. The hypothetical account values and expenses may not be used to estimate the actual ending account balance or expenses you paid for the period. You may use this information to compare the ongoing costs of investing in the Portfolio to other funds. To do so, compare this 5% hypothetical example with the 5% hypothetical examples that appear in the shareholder reports of other funds.
Please note that the expenses shown in both examples are meant to highlight your ongoing costs only and do not reflect any transactional costs or account type fees, such as redemption fees and IRA Fiduciary Administration fees, respectively. These fees are fully described in the prospectus. Therefore, the second line of each share class in the table is useful in comparing ongoing costs only and will not help you determine the relative costs of owning different funds. In addition, if these transactional costs or account fees were included, your costs would have been higher.
December 31, 2008 | William Blair Funds 139 |
Fund Expenses (unaudited)
The examples below show you the ongoing costs (in dollars) of investing in your fund and allows you to compare these costs with those of other mutual funds. Please refer to the previous page for a detailed explanation of the information presented on this chart.
| | | | | | | | | | | | |
| | | Beginning
Account Value
6/30/2008 | | Ending
Account Value
12/31/2008 | | Expenses Paid
during Period(a) | | Annualized
Expense Ratio | |
Growth Fund | | | | | | | | | | | | |
Class N—actual return | | $ | 1,000.00 | | $ | 671.60 | | $ | 4.92 | | 1.17 | % |
Class N—hypothetical 5% return | | | 1,000.00 | | | 1,019.25 | | | 5.94 | | 1.17 | |
Class I—actual return | | | 1,000.00 | | | 673.60 | | | 3.58 | | 0.85 | |
Class I—hypothetical 5% return | | | 1,000.00 | | | 1,020.86 | | | 4.32 | | 0.85 | |
Tax-Managed Growth Fund | | | | | | | | | | | | |
Class N—actual return | | | 1,000.00 | | | 663.90 | | | 5.52 | | 1.32 | |
Class N—hypothetical 5% return | | | 1,000.00 | | | 1,018.50 | | | 6.70 | | 1.32 | |
Class I—actual return | | | 1,000.00 | | | 664.00 | | | 4.48 | | 1.07 | |
Class I—hypothetical 5% return | | | 1,000.00 | | | 1,019.76 | | | 5.43 | | 1.07 | |
Large Cap Growth Fund | | | | | | | | | | | | |
Class N—actual return | | | 1,000.00 | | | 680.20 | | | 5.19 | | 1.23 | |
Class N—hypothetical 5% return | | | 1,000.00 | | | 1,018.95 | | | 6.24 | | 1.23 | |
Class I—actual return | | | 1,000.00 | | | 681.40 | | | 4.14 | | 0.98 | |
Class I—hypothetical 5% return | | | 1,000.00 | | | 1,020.21 | | | 4.98 | | 0.98 | |
Small Cap Growth Fund | | | | | | | | | | | | |
Class N—actual return | | | 1,000.00 | | | 635.40 | | | 6.17 | | 1.50 | |
Class N—hypothetical 5% return | | | 1,000.00 | | | 1,017.60 | | | 7.61 | | 1.50 | |
Class I—actual return | | | 1,000.00 | | | 636.40 | | | 4.94 | | 1.20 | |
Class I—hypothetical 5% return | | | 1,000.00 | | | 1,019.10 | | | 6.09 | | 1.20 | |
Mid Cap Growth Fund | | | | | | | | | | | | |
Class N—actual return | | | 1,000.00 | | | 705.70 | | | 5.83 | | 1.36 | |
Class N—hypothetical 5% return | | | 1,000.00 | | | 1,018.30 | | | 6.82 | | 1.36 | |
Class I—actual return | | | 1,000.00 | | | 707.00 | | | 4.76 | | 1.11 | |
Class I—hypothetical 5% return | | | 1,000.00 | | | 1,019.56 | | | 5.57 | | 1.11 | |
Small-Mid Cap Growth Fund | | | | | | | | | | | | |
Class N—actual return | | | 1,000.00 | | | 710.80 | | | 5.85 | | 1.36 | |
Class N—hypothetical 5% return | | | 1,000.00 | | | 1,018.30 | | | 6.90 | | 1.36 | |
Class I—actual return | | | 1,000.00 | | | 711.70 | | | 4.78 | | 1.11 | |
Class I—hypothetical 5% return | | | 1,000.00 | | | 1,019.56 | | | 5.63 | | 1.11 | |
Global Growth Fund | | | | | | | | | | | | |
Class N—actual return | | | 1,000.00 | | | 547.40 | | | 6.03 | | 1.55 | |
Class N—hypothetical 5% return | | | 1,000.00 | | | 1,017.34 | | | 7.86 | | 1.55 | |
Class I—actual return | | | 1,000.00 | | | 548.00 | | | 5.06 | | 1.30 | |
Class I—hypothetical 5% return | | | 1,000.00 | | | 1,018.60 | | | 6.60 | | 1.30 | |
International Growth Fund | | | | | | | | | | | | |
Class N—actual return | | | 1,000.00 | | | 539.50 | | | 5.38 | | 1.39 | |
Class N—hypothetical 5% return | | | 1,000.00 | | | 1,018.15 | | | 7.05 | | 1.39 | |
Class I—actual return | | | 1,000.00 | | | 540.50 | | | 4.18 | | 1.08 | |
Class I—hypothetical 5% return | | | 1,000.00 | | | 1,019.71 | | | 5.48 | | 1.08 | |
International Equity Fund | | | | | | | | | | | | |
Class N—actual return | | | 1,000.00 | | | 575.90 | | | 5.74 | | 1.45 | |
Class N—hypothetical 5% return | | | 1,000.00 | | | 1,017.85 | | | 7.35 | | 1.45 | |
Class I—actual return | | | 1,000.00 | | | 576.90 | | | 4.76 | | 1.20 | |
Class I—hypothetical 5% return | | | 1,000.00 | | | 1,019.10 | | | 6.09 | | 1.20 | |
140 Annual Report | December 31, 2008 |
| | | | | | | | | | | |
| | | Beginning
Account Value
6/30/2008 | | Ending
Account Value
12/31/2008 | | Expenses Paid
during Period(a) | | Annualized
Expense Ratio | |
International Small Cap Growth Fund | | | | | | | | | | | |
Class N—actual return | | 1,000.00 | | $ | 519.70 | | $ | 6.30 | | 1.65 | % |
Class N—hypothetical 5% return | | 1,000.00 | | | 1,016.84 | | | 8.36 | | 1.65 | |
Class I—actual return | | 1,000.00 | | | 521.60 | | | 5.01 | | 1.31 | |
Class I—hypothetical 5% return | | 1,000.00 | | | 1,018.50 | | | 6.65 | | 1.31 | |
Emerging Markets Growth Fund | | | | | | | | | | | |
Class N—actual return | | 1,000.00 | | | 453.20 | | | 6.10 | | 1.67 | |
Class N—hypothetical 5% return | | 1,000.00 | | | 1,016.74 | | | 8.47 | | 1.67 | |
Class I—actual return | | 1,000.00 | | | 453.70 | | | 5.15 | | 1.41 | |
Class I—hypothetical 5% return | | 1,000.00 | | | 1,018.05 | | | 7.15 | | 1.41 | |
Emerging Leaders Growth Fund | | | | | | | | | | | |
Class I—actual return | | 1,000.00 | | | 496.80 | | | 6.86 | | 1.40 | |
Class I—hypothetical 5% return | | 1,000.00 | | | 1,023.57 | | | 7.04 | | 1.40 | |
Value Discovery Fund | | | | | | | | | | | |
Class N—actual return | | 1,000.00 | | | 786.00 | | | 5.79 | | 1.29 | |
Class N—hypothetical 5% return | | 1,000.00 | | | 1,018.65 | | | 6.55 | | 1.29 | |
Class I—actual return | | 1,000.00 | | | 786.00 | | | 4.89 | | 1.09 | |
Class I—hypothetical 5% return | | 1,000.00 | | | 1,019.66 | | | 5.53 | | 1.09 | |
Bond Fund | | | | | | | | | | | |
Class N—actual return | | 1,000.00 | | | 1,007.70 | | | 3.28 | | 0.65 | |
Class N—hypothetical 5% return | | 1,000.00 | | | 1,021.87 | | | 3.30 | | 0.65 | |
Class I—actual return | | 1,000.00 | | | 1,007.70 | | | 2.52 | | 0.50 | |
Class I—hypothetical 5% return | | 1,000.00 | | | 1,022.62 | | | 2.54 | | 0.50 | |
Income Fund | | | | | | | | | | | |
Class N—actual return | | 1,000.00 | | | 976.70 | | | 4.47 | | 0.90 | |
Class N—hypothetical 5% return | | 1,000.00 | | | 1,020.61 | | | 4.57 | | 0.90 | |
Class I—actual return | | 1,000.00 | | | 978.60 | | | 3.58 | | 0.72 | |
Class I—hypothetical 5% return | | 1,000.00 | | | 1,021.52 | | | 3.66 | | 0.72 | |
Ready Reserves Fund | | | | | | | | | | | |
Class N—actual return | | 1,000.00 | | | 1,007.90 | | | 3.03 | | 0.60 | |
Class N—hypothetical 5% return | | 1,000.00 | | | 1,022.12 | | | 3.05 | | 0.60 | |
| (a) | | Expenses are equal to the annualized expense ratio, multiplied by the average account value over the period, multiplied by the number of days in the period 184, and divided by 366 (to reflect the one-half year period). |
| (b) | | For the period March 26, 2008 (Commencement of Operations) to December 31, 2008. |
December 31, 2008 | William Blair Funds 141 |
BOARD OF TRUSTEES
Frederick Conrad Fischer, Chairman
Principal, William Blair & Company, L.L.C.
Ann P. McDermott
Director and Trustee
Profit and not-for-profit organizations
Phillip O. Peterson
Retired Partner, KPMG LLP
Donald J. Reaves
Chancellor, Winston-Salem State University
Donald L. Seeley
Adjunct Lecturer and Director, University of Arizona Department of Finance
Michelle R. Seitz, President
Principal, William Blair & Company, L.L.C.,
Thomas J. Skelly
Director and Investment Committee Chairman, U.S. Accenture Foundation Inc.
Robert E. Wood II
Retired Executive Vice President, Morgan Stanley Dean Witter
Officers
Karl W. Brewer, Senior Vice President
Mark A. Fuller, III, Senior Vice President
James S. Golan, Senior Vice President
W. George Greig, Senior Vice President
Michael A. Jancosek, Senior Vice President
John F. Jostrand, Senior Vice President
Robert C. Lanphier, IV, Senior Vice President
Mark T. Leslie, Senior Vice President
Matthew A. Litfin, Senior Vice President
Kenneth J. McAtamney, Senior Vice President
Todd M. McClone, Senior Vice President
Tracy McCormick, Senior Vice President
David Merjan, Senior Vice President
David S. Mitchell, Senior Vice President
Gregory J. Pusinelli, Senior Vice President
David P. Ricci, Senior Vice President
Richard W. Smirl, Senior Vice President and Chief Compliance Officer
Jeffrey A. Urbina, Senior Vice President
Christopher T. Vincent, Senior Vice President
Michael P. Balkin, Vice President
David C. Fording, Vice President
Chad M. Kilmer, Vice President
Terence M. Sullivan, Vice President and Treasurer
Colette M. Garavalia, Secretary
Investment Advisor
William Blair & Company, L.L.C.
Independent Registered Public Accounting Firm
Ernst & Young LLP
Legal Counsel
Vedder Price P.C.
Transfer Agent
Boston Financial Data Services, Inc.
P.O. Box 8506
Boston, MA 02266-8506
For customer assistance, call 1-800-635-2886
(Massachusetts 1-800-635-2840)
142 Annual Report | December 31, 2008 |
Table of Contents
This report is submitted for the general information of the shareholders of the William Blair Funds. It is not authorized for distribution to prospective investors unless accompanied or preceded by a prospectus of the William Blair Funds. Please consider the Funds’ investment objectives, risks, charges, and expenses before investing. This and other information is contained in the Funds’ prospectus, which you may obtain by calling 1-800-742-7272. Read it carefully before you invest or send money. William Blair & Company, LLC., distributor.
December 31, 2008 | William Blair Funds 1 |
GLOBAL MARKETS OVERVIEW
The year 2008 will be remembered as one of the worst years in equity market history—only comparable in severity with 1931—due to the scope, scale and rapidity of the decline and to the extraordinary governmental measures to shore up a fragile (and gridlocked) financial system. What started in 2007 as a U.S. subprime crisis spread to global proportions during 2008 with a number of countries and financial institutions facing significant liquidity and credit issues. While the equity market declined approximately (10)% during the first half of the year, losses accelerated in September after Lehman Brothers declared bankruptcy, when fixed income markets froze and equity markets entered a free fall period marked by significant intraday volatility and fear as reflected by the CBOE (Chicago Board of Options Exchange) Volatility Index.

Despite a rally that began in mid-November, global equity markets ended 2008 down (42.34)%, as measured by the MSCI All Country World (IMI) Index (net), with approximately 35% of the decline occurring during the second half of the year. There was no place to hide amidst the market decline as correlations generally went to one. Emerging markets fell the furthest during the second half due to severe risk aversion, reversal of the “commodities trade,” and concerns about a deepening global recession. Non-U.S. equity returns to U.S. investors were also negatively impacted by U.S. Dollar appreciation as investors sold foreign currencies and assets and bought U.S. dollars. At year end, emerging markets were down (53.78)%, while the MSCI Europe, Australiasia, and Far East Index (EAFE) fell (43.71)% and the U.S. fell (37.00)% as measured by the Standard & Poor’s 500. Within emerging markets, Latin America, which was the strongest region during the first half of the year, fell faster during the second half, and ended the year down (51.92)%, while Asia and Emerging Markets Europe, Mid-East and Africa (EMEA) were down (53.70)% and (55.55)%, respectively. Asia, which trailed during most of the year, staged a comeback during November and December, benefitting from lower commodity and energy prices. Within developed markets Japan was the best performing market in USD terms, down (28.11)%, although down over 40% in local terms. The remaining developed regions were all down between 46-52%, with the more resource heavy Pacific ex-Japan economies down the most.
Sector results varied significantly in 2008. As indicated in the chart on the next page, the strongest sectors of Energy and Materials during the first half of the year fell the furthest during the second half, as commodity and energy prices fell significantly amidst a slowing global economy and demand destruction. Conversely, the more defensive Consumer Staples and Health Care sectors outperformed during the second half and therefore year to date. While the Financial sector was the epicenter of the global crisis during the second half of the year, interestingly, it outperformed Energy and Materials, although ended the year as the worst performing sector.
2 Annual Report | December 31, 2008 |
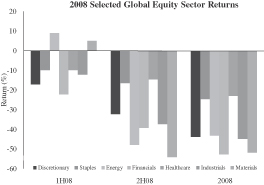
Outlook
Having stabilized and improved somewhat from the panic-stricken levels of the fourth quarter, we believe equity markets now face at least two quarters of extreme weakness in growth and profitability. Economic leading indicators are in sharp decline, consensus GDP growth expectations have dipped in virtually every major economy worldwide, and earnings forecasts for the year ahead continue to plunge, falling by an estimated 9-10% in the month of December alone.
Invariably when cyclical prospects are at their worst, scenarios of severely aggravated cyclical weakness and/or secular decline gain credibility. These concerns help to suppress market confidence and raise questions about the viability of recovery prospects. It may be difficult for the markets to build on their recent gains until the scope of these uncertainties is contained.
On the other hand, we feel that the opportunities that markets present in recessions are becoming increasingly visible. Over the last fifty years in the U.S., for example, whenever economic leading indicators have fallen two standard deviations below trendline, forward equity market returns have averaged roughly 30%—and results are similar in other developed markets. Moreover, money market fund balances as a percent of equity values are at record highs, indicating significant potential allocation to equities.
The message of market fundamentals is equally ambivalent. In our opinion valuations remain reasonably attractive at 10x forward earnings for the MSCI All Country World Ex- U.S. Index (cheaper for emerging markets, more expensive for the U.S.), but the standards of value remain highly uncertain in the context of severe deterioration of earnings expectations and still-elevated corporate credit spreads. Calculated on the basis of aggregate analyst estimates, we expect corporate profits for listed companies outside the U.S. to be roughly flat for 2009. This outcome continues to appear optimistic, although the dramatic pace of estimate cuts may begin to slow as the worst of the revisions in the energy and financial sectors are absorbed. Meanwhile, the relationship between corporate and government interest rates remains far from normal, with only a slight moderation in risk aversion evident in the last six weeks. This distortion makes it even more difficult to assess equity market valuation, especially without the benchmarks of M&A and public offering activity for the markets to reference.
As a result, after the market’s tentative year end recovery rally, there are cross currents of perception influencing markets: recovery opportunities—driven by financial stabilization and economic stimulus—and reasonably favorable valuation and timing signals, counterbalanced by the uncertainties associated with the unprecedented aspects of this downturn.
The increased transperancy that investors are looking for in 2009 will come in four key areas: deleveraging and credit stability, consumer confidence and spending behavior, commodity pricing, and China’s cyclical outlook. These will be our key areas of cyclical focus in 2009, but after the wild thematic volatility of 2008, our sector positioning will at least begin the year in relatively neutral territory. Our stock selection strategy in an environment of continuing growth uncertainty will tend to focus on fundamental execution, financial strength, and sustainability of returns at the corporate level.
December 31, 2008 | William Blair Funds 3 |

W. George Greig
INSTITUTIONAL INTERNATIONAL GROWTH FUND
The Institutional International Growth Fund invests primarily in common stocks of foreign growth companies of all sizes.
AN OVERVIEW FROM THE PORTFOLIO MANAGER
Please see page 2 for the Global Markets Overview.
The Institutional International Growth Fund posted a (51.99)% decrease for the 12 months ended December 31, 2008. By comparison, the Fund’s benchmark, the MSCI All Country World (ACWI) Ex-U.S. IMI Index (net), declined (45.99)%.
The Fund underperformed the benchmark Index during 2008 due primarily to the third quarter and October, ending the strategy’s worst absolute and relative year in our history. As we stated in our third quarter review, as the correction unfolded during the third quarter, the Fund remained focused on the areas where we continued to see good balance sheets, strong execution and solid growth prospects, with substantial positions in companies exposed to emerging markets infrastructure growth, resource development, and industrialization, with secondary thematic interest in the emerging markets consumer. As the developed market growth outlook worsened in the third quarter, we maintained an exposure in high quality, well run companies exposed to areas where growth appeared to be resilient. In retrospect, we should have been more sensitive to the influence of macro-level signals on investor sentiment. In short, the macroeconomic environment outweighed corporate fundamentals, while positive earnings trends, a good long term predictor of stock price performance, broke down.
During the fourth quarter, the Fund underperformed due largely to October, as it was being repositioned away from global growth-oriented holdings to a more defensive structure. In particular, the Fund’s weighting and stock selection in Industrials was a primary detractor from results due to its exposure to alternative energy and infrastructure building in emerging markets. Energy stock selection was another key detractor from performance, due primarily to its focus on services companies, and concerns about earnings growth prospectively amidst a significant decline in energy prices and potential contract cancellations and delays, with smaller cap stocks hit the hardest. The Fund’s underweighting, compared to its benchmark, in Japan, which outperformed other regions during the quarter also detracted from performance. Mitigating these negative results was good stock selection in Consumer Discretionary across most developed regions coupled with an underweighting in Financials and Energy and overweighting in Telecommunication Services, Health Care and Consumer Staples.
As of year end, the Fund maintained a balanced structure between defensively oriented sectors such as Consumer Staples, 13.6%, Health Care, 10.9%, and to some extent Telecommunication Services, 6.9%, and more growth-oriented sectors such as Industrials, 15.3% and Information Technology, 4.4%. We increased the weighting in Financials from approximately 15% to 20% during the fourth quarter, with an increased focus on European insurers and to some extent capital markets companies, but in particular those with good balance sheets, solid competitive positioning amidst a changing landscape, and strong management teams with a history of execution. We also began increasing our underweighted Consumer Discretionary exposure late in the fourth quarter at the margin. Regionally, the Fund maintained higher weightings in Europe and the UK, but underweighted in Developed Asia. While the Fund’s emerging markets weighting of approximately 17% was similar to the MSCI ACWI Ex-U.S. IMI Index, its composition changed during the quarter, with a reduction in Emerging Markets Europe, Mid-East and Africa (EMEA) and increase in Emerging Asia, which has been a beneficiary of reduced energy/commodity prices.
4 Annual Report | December 31, 2008 |
Institutional International Growth Fund
Performance Highlights (unaudited)
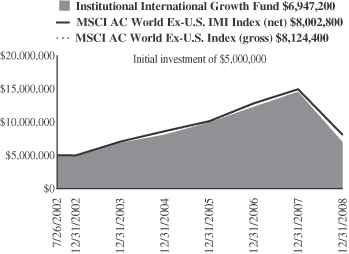
Average Annual Total Return at 12/31/08
| | | | | | | | | | | | |
| | | 1
Year | | | 3
Year | | | 5
Year | | | Since
Inception(a) | |
Institutional International Growth Fund | | (51.99 | )% | | (11.11 | )% | | 0.37 | % | | 5.23 | % |
MSCI AC
World Ex-U.S. IMI
Index (net) | | (45.99 | ) | | (7.44 | ) | | 2.61 | | | 7.54 | |
MSCI AC World Ex-U.S. Index (gross) | | (45.24 | ) | | (6.57 | ) | | 3.00 | | | 7.81 | |
| | (a) | For the period from July 26, 2002 (Commencement of Operations) to December 31, 2008. |
Performance cited represents past performance. Past performance does not guarantee future results and current performance may be lower or higher than the data quoted. Results shown are average annual returns, which assume reinvestment of dividends and capital gains. Investment returns and principal will fluctuate and you may have a gain or loss when you sell shares. For the most current month-end performance information, please call 1-800-742-7272, or visit our Web site at www.williamblairfunds.com. International investing involves special risk considerations, including currency fluctuations, lower liquidity, economic and political risk.
The performance highlights and graph presented above do not reflect the deduction of taxes that a shareholder would pay on fund distributions or the redemption of fund shares.
The Morgan Stanley Capital International (MSCI) All Country World Ex-U.S. Investable Market Index (IMI) (net) is a free float-adjusted market capitalization weighted index that is designed to measure the equity market performance of developed and emerging markets, excluding the United States. This series approximates the minimum possible dividend reinvestment.
The Morgan Stanley Capital International (MSCI) All Country World Ex-U.S. Index (gross) is an unmanaged index that includes developed and emerging markets and reduced Japanese portion.
On June 30, 2008, the Fund’s Benchmark changed from the MSCI All Country World (ACW) Ex-U.S. (gross) to the MSCI All Country World Ex-U.S. Investable Market Index (IMI) (net). There are two primary reasons for the change. First, the MSCI ACW Ex-U.S. IMI (net)represents a broader range of markets then the MSCI ACW Ex-U.S. (gross) and this range is more representative of the fund’s investment strategy. Secondly, the net index reflects the deduction of dividend withholding tax paid by non-resident institutional investors in foreign countries, the fund is considered a non-resident institutional investors.
This report identifies the Fund’s investments on December 31, 2008. These holdings are subject to change. Not all stocks in the Fund performed the same, nor is there any guarantee that these stocks will perform as well in the future. Market forecasts provided in this report may not necessarily come to pass.
Sector Diversification (unaudited)
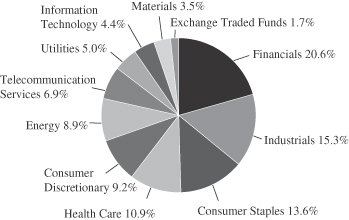
The sector diversification shown is based on the total long-term securities.
December 31, 2008 | William Blair Funds 5 |
Institutional International Growth Fund
Portfolio of Investments, December 31, 2008 (all dollar amounts in thousands)
| | | | | |
Issuer | | Shares | | Value |
| | |
Common Stocks—Europe—37.7% | | | | | |
Austria—0.2% | | | | | |
Schoeller-Bleckmann Oilfield Equipment AG (Energy equipment & services) | | 56,125 | | $ | 1,748 |
| | | | | |
Denmark—3.6% | | | | | |
Novo—Nordisk A/S (Pharmaceuticals) | | 520,425 | | | 26,845 |
Novozymes A/S (Chemicals) | | 72,037 | | | 5,777 |
*Vestas Wind Systems A/S (Electrical equipment) | | 54,225 | | | 3,191 |
| | | | | |
| | | | | 35,813 |
| | | | | |
France—11.3% | | | | | |
Alstom S.A. (Electrical equipment) | | 238,221 | | | 14,197 |
April Group S.A. (Insurance) | | 90,745 | | | 2,317 |
AXA (Insurance) | | 716,611 | | | 16,085 |
EDF Energies Nouvelles S.A. (Independent power producers & energy traders) | | 266,099 | | | 9,427 |
Eurazeo (Diversified financial services) | | 48,365 | | | 2,275 |
Iliad S.A. (Diversified telecommunication services) | | 97,513 | | | 8,466 |
*Orpea (Health care providers & services) | | 100,519 | | | 3,640 |
Schneider Electric S.A. (Electrical equipment) | | 60,829 | | | 4,529 |
Total S.A. (Oil, gas, & consumable fuels) | | 132,548 | | | 7,287 |
Veolia Environnement (Multi-utilities) | | 644,161 | | | 20,319 |
Vinci S.A. (Construction & engineering) | | 91,162 | | | 3,847 |
Vivendi S.A. (Media) | | 619,836 | | | 20,203 |
| | | | | |
| | | | | 112,592 |
| | | | | |
Germany—3.5% | | | | | |
Beiersdorf AG (Personal products) | | 162,265 | | | 9,611 |
CTS Eventim AG (Media) | | 78,762 | | | 2,702 |
E. ON AG (Electric utilities) | | 275,947 | | | 10,836 |
*Manz Automation AG (Semiconductors & semiconductor equipment) | | 15,085 | | | 889 |
*Q-Cells AG (Electrical equipment) | | 143,028 | | | 5,347 |
*Roth & Rau AG (Electronic equipment) | | 13,097 | | | 281 |
Solarworld AG (Electrical equipment) | | 100,144 | | | 2,241 |
*Wire Card AG (IT services) | | 545,750 | | | 3,189 |
| | | | | |
| | | | | 35,096 |
| | | | | |
Ireland—1.0% | | | | | |
CRH plc (Construction materials) | | 143,536 | | | 3,690 |
*ICON plc—ADR (Life sciences tools & services) | | 243,933 | | | 4,803 |
United Drug plc (Health care providers & services) | | 476,118 | | | 1,476 |
| | | | | |
| | | | | 9,969 |
| | | | | |
Italy—1.4% | | | | | |
Saipem SpA (Energy equipment & services) | | 706,562 | | | 12,051 |
Trevi Finanziaria SpA (Construction & engineering) | | 157,548 | | | 1,683 |
| | | | | |
| | | | | 13,734 |
| | | | | |
Luxembourg—0.8% | | | | | |
Millicom International Cellular S.A.(Wireless telecommunication services)† | | 185,336 | | | 8,323 |
| | | | | |
| | | | |
Issuer | | Shares | | Value |
|
Common Stocks—Europe—37.7%—(continued) |
Netherlands—0.8% | | | | |
*Qiagen N.V. (Life sciences tools & services) | | 341,147 | | 6,034 |
*Smartrac N.V. (Electronic equipment & instruments) | | 106,900 | | 1,781 |
| | | | |
| | | | 7,815 |
| | | | |
Spain—3.4% | | | | |
Banco Santander S.A. (Commercial banks) | | 1,294,070 | | 12,502 |
Gamesa Corporacion Tecnologica S.A. (Electrical equipment) | | 158,777 | | 2,895 |
Grifols S.A. (Biotechnology) | | 337,862 | | 5,920 |
*Iberdrola Renovables S.A. (Independent power producers & energy traders) | | 1,810,491 | | 7,893 |
Industria De Diseno Textil Inditex S.A. (Specialty retail) | | 96,129 | | 4,281 |
| | | | |
| | | | 33,491 |
| | | | |
Sweden—0.4% | | | | |
Hennes & Maurtiz AB, Class "B" (Specialty retail) | | 98,550 | | 3,920 |
| | | | |
Switzerland—11.3% | | | | |
*ABB, Ltd. (Electrical equipment) | | 1,274,960 | | 19,443 |
*Actelion, Ltd. (Biotechnology) | | 155,819 | | 8,815 |
Burckhardt Compression Holding AG (Machinery) | | 13,800 | | 1,976 |
Credit Suisse Group AG (Capital markets) | | 206,026 | | 5,774 |
Kuehne & Nagel International AG (Marine) | | 181,983 | | 11,787 |
*Meyer Burger Technology AG (Machinery) | | 3,545 | | 415 |
Nestle S.A. (Food products) | | 502,621 | | 19,903 |
Partners Group Global Opportunities, Ltd. (Capital markets) | | 68,636 | | 4,912 |
Roche Holdings, Ltd. AG (Pharmaceuticals) | | 115,787 | | 17,926 |
SGS S.A. (Commercial services & supplies) | | 1,060 | | 1,109 |
*Temenos Group AG (Software) | | 33,579 | | 453 |
Zurich Financial Services (Insurance) | | 92,037 | | 20,108 |
| | | | |
| | | | 112,621 |
| | | | |
| | |
United Kingdom—17.6% | | | | |
Admiral Group plc (Insurance) | | 217,696 | | 2,874 |
AMEC plc (Construction & engineering) | | 379,201 | | 2,738 |
Amlin plc (Insurance) | | 1,651,207 | | 8,583 |
Ashmore Group plc (Capital markets) | | 466,808 | | 901 |
*Autonomy Corporation plc (Software) | | 583,692 | | 8,122 |
BG Group plc (Oil, gas & consumable fuels) | | 817,644 | | 11,317 |
*Blinkx plc (Internet software & services) | | 2,374,700 | | 447 |
BlueBay Asset Management plc (Capital markets) | | 418,985 | | 426 |
British American Tobacco plc (Tobacco) | | 577,800 | | 15,073 |
Capita Group plc (Commercial services & supplies) | | 1,474,349 | | 15,815 |
Chemring Group plc (Aerospace & defense) | | 121,683 | | 3,440 |
Domino's Pizza UK & IRL plc (Hotels, restaurants, & leisure) | | 786,761 | | 1,905 |
John Wood Group plc (Energy equipment & services) | | 632,313 | | 1,725 |
Man Group plc (Capital markets) | | 1,962,646 | | 6,752 |
Reckitt Benckiser plc (Household products) | | 447,052 | | 16,751 |
Rolls-Royce Group plc (Aerospace & defense) | | 3,753,263 | | 18,361 |
See accompanying Notes to Financial Statements.
6 Annual Report | December 31, 2008 |
Institutional International Growth Fund
Portfolio of Investments, December 31, 2008 (all dollar amounts in thousands)
| | | | | |
Issuer | | Shares | | Value |
|
Common Stocks—United Kingdom—17.6% —(continued) |
Rotork plc (Electronic equipment & instruments) | | 441,500 | | $ | 5,091 |
Serco Group plc (Commercial services & supplies) | | 789,022 | | | 5,165 |
Standard Chartered plc (Commercial banks) | | 1,338,789 | | | 17,131 |
Tullow Oil plc (Oil, gas & consumable fuels) | | 789,253 | | | 7,556 |
Ultra Electronic Holdings plc (Aerospace & defense) | | 186,776 | | | 3,071 |
Vodafone Group plc (Wireless telecommunication services) | | 6,595,886 | | | 13,506 |
VT Group plc (Aerospace & defense) | | 664,717 | | | 5,371 |
Wellstream Holdings plc (Energy equipment & services) | | 716,889 | | | 3,690 |
| | | | | |
| | | | | 175,811 |
| | | | | |
|
Japan—9.4% |
Aeon Mall Co., Ltd. (Real estate management & development) | | 246,200 | | | 4,759 |
FamilyMart Co., Ltd. (Food & staples retailing) | | 130,700 | | | 5,676 |
Fast Retailing Co., Ltd. (Specialty retail) | | 36,200 | | | 5,312 |
Hisamitsu Pharmaceutical Co., Inc. (Pharmaceuticals) | | 93,500 | | | 3,822 |
Honda Motor Company, Ltd. (Automobiles) | | 325,800 | | | 6,939 |
Jupiter Telecommunications Co., Ltd. (Media) | | 12,604 | | | 13,119 |
Mitsubishi Estate Company, Ltd. (Real estate management & development) | | 624,000 | | | 10,308 |
Nintendo Co., Ltd. (Software) | | 18,900 | | | 7,223 |
Nitori Company, Ltd. (Specialty retail) | | 108,430 | | | 8,438 |
Point, Inc. (Specialty retail) | | 53,570 | | | 2,953 |
Seven Bank, Ltd. (Commercial banks) | | 1,289 | | | 4,927 |
So-net M3, Inc. (Health care technology) | | 1,051 | | | 3,602 |
Suruga Bank, Ltd. (Commercial banks) | | 1,100,000 | | | 10,928 |
Terumo Corporation (Health care equipment & supplies) | | 120,500 | | | 5,645 |
| | | | | |
| | | | | 93,651 |
| | | | | |
|
Emerging Asia—9.0% |
China—4.9% | | | | | |
China High Speed Transmission (Electrical equipment) | | 2,859,000 | | | 3,489 |
China Life Insurance Co., Ltd. (Insurance) | | 3,533,000 | | | 10,855 |
China Merchants Bank Co., Ltd. (Commercial banks) | | 1,906,000 | | | 3,566 |
China Oilfield Services Limited (Energy equipment & services) | | 3,468,000 | | | 2,831 |
China Overseas Land & Investment, Ltd. (Real estate management & development) | | 1,840,000 | | | 2,584 |
China Yurun Food Group Limited (Food products) | | 2,117,329 | | | 2,504 |
CNOOC Limited (Oil, gas & consumable fuels) | | 13,616,000 | | | 12,951 |
Li Ning Co., Ltd. (Leisure equipment & products) | | 2,353,500 | | | 3,708 |
*New Oriental Education & Techonolgy Group, Inc.—ADR (Diversified consumer services) | | 52,822 | | | 2,900 |
*SINA Corporation (Internet software & services)† | | 126,646 | | | 2,932 |
Tencent Holdings, Ltd. (Internet software & services) | | 125,400 | | | 815 |
| | | | | |
| | | | | 49,135 |
| | | | | |
| | | | | |
Issuer | | Shares | | Value |
|
Common Stocks—Emerging Asia—9.0%—(continued) |
India—2.7% | | | | | |
Asian Paints Limited (Chemicals) | | 161,866 | | $ | 2,984 |
*Bharti Airtel, Ltd. (Wireless telecommunication services) | | 483,964 | | | 7,134 |
Educomp Solutions, Limited (Diversified consumer services) | | 44,984 | | | 2,236 |
*Glenmark Pharmaceuticals, Ltd. (Pharmaceuticals) | | 472,850 | | | 2,904 |
Hindustan Unilever, Ltd. (Household products) | | 792,400 | | | 4,097 |
Housing Development Finance Corp. (Thrifts & mortgage finance) | | 93,249 | | | 2,854 |
Infosys Technologies Limited (IT services) | | 189,847 | | | 4,400 |
Sun Pharmaceutical Industries Limited (Pharmaceuticals) | | 2,994 | | | 66 |
| | | | | |
| | | | | 26,675 |
| | | | | |
Indonesia—0.4% | | | | | |
PT Bank Rakyat Indonesia (Commercial banks) | | 10,367,000 | | | 4,409 |
| | | | | |
Malaysia—0.2% | | | | | |
KNM Group Bhd (Energy equipment & services) | | 8,158,000 | | | 964 |
Kuala Lumpur Kepong Bhd (Food products) | | 351,400 | | | 908 |
| | | | | |
| | | | | 1,872 |
| | | | | |
South Korea—0.8% | | | | | |
*LG Household & Health Care, Ltd. (Household products) | | 29,791 | | | 4,540 |
*MegaStudy Co., Ltd. (Diversified consumer services) | | 21,600 | | | 3,198 |
| | | | | |
| | | | | 7,738 |
| | | | | |
Asia—7.8% | | | | | |
Australia—5.8% | | | | | |
BHP Billiton Limited—ADR (Metals & mining) | | 569,620 | | | 12,101 |
Macquarie Bank, Ltd. (Capital markets) | | 201,596 | | | 4,091 |
QBE Insurance Group Limited (Insurance) | | 1,039,383 | | | 18,785 |
Woolworths Limited (Food & staples retailing) | | 1,117,573 | | | 20,838 |
WorleyParsons, Ltd. (Energy equipment & services) | | 227,180 | | | 2,266 |
| | | | | |
| | | | | 58,081 |
| | | | | |
Hong Kong—0.7% | | | | | |
Noble Group Limited (Trading companies & distributors) | | 9,523,560 | | | 6,821 |
| | | | | |
Singapore—1.3% | | | | | |
Olam International, Ltd. (Food & staples retailing) | | 5,833,400 | | | 4,703 |
Wilmar International, Ltd. (Food products) | | 4,468,000 | | | 8,754 |
| | | | | |
| | | | | 13,457 |
| | | | | |
Canada—5.6% | | | | | |
Brookfield Asset Management, Inc., Class "A" (Real estate management & development)† | | 452,626 | | | 6,912 |
EnCana Corporation (Oil, gas, & consumable fuels) | | 158,680 | | | 7,321 |
Potash Corporation of Saskatchewan, Inc. (Chemicals)† | | 109,392 | | | 8,010 |
See accompanying Notes to Financial Statements.
December 31, 2008 | William Blair Funds 7 |
Institutional International Growth Fund
Portfolio of Investments, December 31, 2008 (all dollar amounts in thousands)
| | | | | |
Issuer | | Shares | | Value |
Common Stocks—Canada—5.6%—(continued) | | | |
Rogers Communications, Inc., Class “B” (Wireless telecommunication services) | | 657,500 | | $ | 19,488 |
Shoppers Drug Mart Corporation (Food & staples retailing) | | 375,300 | | | 14,608 |
| | | | | |
| | | | | 56,339 |
| | | | | |
Emerging Latin America—3.5% | | | | | |
Brazil—2.6% | | | | | |
Anhanguera Educacional Participacoes S.A. (Diversified consumer services) | | 385,700 | | | 2,003 |
BM&F Bovespa S.A. (Diversified financial services) | | 1,714,787 | | | 4,427 |
*BR Malls Participacoes S.A. (Real estate management & development) | | 665,100 | | | 2,595 |
*GP Investments, Ltd. (Diversified financial services) | | 626,100 | | | 1,447 |
*GVT Holding S.A. (Diversified telecommunication services) | | 349,100 | | | 3,798 |
*LLX Logistica S.A. (Transportation infrastructure) | | 1,162,800 | | | 753 |
*Lupatech S.A. (Machinery) | | 125,200 | | | 1,257 |
*MMX Mineracao e Metalicos S.A. (Metals & mining) | | 954,500 | | | 1,134 |
Natura Cosmeticos S.A. (Personal products) | | 157,100 | | | 1,279 |
Redecard S.A. (IT services) | | 586,800 | | | 6,467 |
SLC Agricola S.A. (Food products) | | 259,700 | | | 1,559 |
| | | | | |
| | | | | 26,719 |
| | | | | |
Chile—0.0% | | | | | |
*Cencosud S.A.—ADR 144A (Specialty retail) | | 11,680 | | | 249 |
| | | | | |
Colombia—0.1% | | | | | |
*Pacific Rubiales Energy Corporation (Oil, gas & consumable fuels) | | 469,000 | | | 832 |
| | | | | |
Mexico—0.6% | | | | | |
Banco Compartamos S.A.B. de C.V. (Consumer finance) | | 1,019,000 | | | 1,840 |
*Desarrolladora Homex S.A.B. de C.V.—ADR (Household durables) | | 102,175 | | | 2,333 |
*Megacable Holdings S.A.B. de C.V. (Diversified telecommunication services) | | 1,418,500 | | | 1,890 |
| | | | | |
| | | | | 6,063 |
| | | | | |
Peru—0.2% | | | | | |
Credicorp, Ltd. (Commercial banks)† | | 37,494 | | | 1,873 |
| | | | | |
Common Stocks— Emerging Europe, Mid-East, Africa—3.1% | | | |
Egypt—0.4% | | | | | |
*ELSewedy Cables Holding Company (Electrical Equipment) | | 286,330 | | | 3,941 |
| | | | | |
Israel—1.4% | | | | | |
Teva Pharmaceutical Industries, Ltd.—ADR (Phamaceuticals) | | 336,065 | | | 14,306 |
| | | | | |
* Non-income producing securities
† = U.S. listed foreign security
ADR = American Depository Receipt
GDR = Global Depository Receipt
VRN = Variable Rate Note
For securities primarily traded on exchanges or markets that close before the close of regular trading on the New York Stock Exchange, the Fund uses an independent pricing service on a daily basis to fair value price the securities pursuant to Valuation Procedures approved by the Board of Trustees.
| | | | | | |
Issuer | | Shares or
Principal
Amount | | Value |
South Africa—0.8% | | | | | | |
MTN Group, Ltd. (Wireless telecommunication services) | | | 467,073 | | $ | 5,507 |
Wilson Bayly Holmes-Ovcon Limited (Construction & engineering) | | | 229,085 | | | 2,663 |
| | | | | | |
| | | | | | 8,170 |
| | | | | | |
United Arab Emirates—0.5% | | | | | | |
DP World, Ltd. (Marine)† | | | 11,849,610 | | | 4,621 |
| | | | | | |
Total Common Stock—93.7%
(cost $1,175,744) | | | | | | 935,885 |
| | | | | | |
Preferred Stock | | | | | | |
Brazil—1.2% | | | | | | |
Banco Sofisa S.A. (Commercial banks) | | | 439,900 | | | 679 |
Petroleo Brasileiro S.A. (Oil, gas & consumable fuels) | | | 1,063,900 | | | 10,420 |
| | | | | | |
Total Preferred Stock—1.2%
(cost $14,342) | | | | | | 11,099 |
| | | | | | |
Exchange-Traded Funds | | | | | | |
China—1.7% | | | | | | |
iShares FTSE/Xinhua A50 China Tracker | | | 8,281,500 | | | 8,933 |
*World Index Shares ETFs—CSI China Tracker | | | 3,042,200 | | | 7,607 |
| | | | | | |
| | | | | | 16,540 |
| | | | | | |
Total Exchange-Traded Funds—1.7.%
(cost $17,029) | | | | | | 16,540 |
| | | | | | |
Investment in Rights | | | | | | |
China Overseas Land & Investment, Ltd. (Real estate management & development) | | | 73,600 | | | 27 |
| | | | | | |
Total Investment in Rights—0.0%
(cost $0) | | | | | | 27 |
| | | | | | |
Investment in Affiliate | | | | | | |
William Blair Ready Reserves Fund | | | 12,527,703 | | | 12,528 |
| | | | | | |
Total Investment in Affiliate—1.2%
(cost $12,528) | | | | | | 12,528 |
| | | | | | |
Short-Term Investments | | | | | | |
American Express Credit Corp. Demand Note, VRN 0.321% due 1/2/09 | | $ | 100 | | | 100 |
| | | | | | |
Total Short-term Investments—0.0%
(cost $100) | | | | | | 100 |
| | | | | | |
Repurchase Agreement | | | | | | |
Fixed Income Clearing Corporation, 0.010% dated 12/31/08, due 1/2/09, repurchase price $20,571, collateralized by FHLMC, 5.625% due 11/23/35 | | | 20,571 | | | 20,571 |
| | | | | | |
Total Repurchase Agreement—2.1%
(cost $20,571) | | | | | | 20,571 |
| | | | | | |
Total Investments—99.9%
(cost $1,240,314) | | | | | | 996,750 |
Cash and other assets, less liabilities—0.1% | | | | | | 1,516 |
| | | | | | |
Net assets—100.0% | | | | | $ | 998,266 |
| | | | | | |
See accompanying Notes to Financial Statements.
8 Annual Report | December 31, 2008 |
Institutional International Growth Fund
Portfolio of Investments, December 31, 2008 (all dollar amounts in thousands)
At December 31, 2008 the Fund's Portfolio of Investments includes the following industry categories:
| | | |
Financials | | 20.6 | % |
Industrials | | 15.3 | % |
Consumer Staples | | 13.6 | % |
Health Care | | 11.0 | % |
Consumer Discretionary | | 9.1 | % |
Energy | | 8.9 | % |
Telecommunication Services | | 6.9 | % |
Utilities | | 5.0 | % |
Information Technology | | 4.4 | % |
Materials | | 3.5 | % |
Exchange-Traded Funds | | 1.7 | % |
| | | |
Total | | 100.0 | % |
| | | |
At December 31, 2008 the Fund's Portfolio of Investments includes the following currency categories:
| | | |
Euro | | 21.8 | % |
British Pound Sterling | | 18.3 | % |
Swiss Franc | | 11.7 | % |
Japanese Yen | | 9.7 | % |
Hong Kong Dollar | | 6.2 | % |
Australian Dollar | | 6.0 | % |
United States Dollar | | 5.9 | % |
Canadian Dollar | | 4.4 | % |
Brazilian Real | | 3.9 | % |
Danish Krone | | 3.7 | % |
Indian Rupee | | 2.8 | % |
Singapore Dollar | | 2.1 | % |
South African Rand | | 0.9 | % |
South Korean Won | | 0.8 | % |
All other currencies | | 1.8 | % |
| | | |
Total | | 100.0 | % |
| | | |
See accompanying Notes to Financial Statements.
December 31, 2008 | William Blair Funds 9 |
W. George Greig

David Merjan
INSTITUTIONAL INTERNATIONAL EQUITY FUND
The Institutional International Equity Fund invests primarily in common stocks of companies included in the Morgan Stanley Capital International All Country World Ex-U.S. IMI Index (net).
AN OVERVIEW FROM THE PORTFOLIO MANAGERS
Please see page 2 for the Global Markets Overview.
The Institutional International Equity Fund posted a (49.57)% decrease for the 12 months ended December 31, 2008. By comparison, the Fund’s benchmark, the MSCI All Country World Ex-U.S. IMI Index (net), declined (45.99)%.
The Fund underperformed the Index during 2008, due largely to performance during the third quarter. As the correction unfolded during the third quarter, the Fund remained focused on the areas where we continued to see good balance sheets, strong execution and solid growth prospects, with substantial positions in companies exposed to emerging markets infrastructure growth, resource development, and industrialization, with secondary thematic interest in the emerging markets consumer. As the developed market growth outlook worsened in the third quarter, we maintained an exposure in high quality, well run companies exposed to areas where growth appeared to be resilient. In retrospect, we should have been more sensitive to the influence of macro-level signals on investor sentiment. In short, the macroeconomic environment led corporate fundamentals, while positive earnings trends, a good long-term predictor of stock price performance, broke down.
Fourth quarter absolute performance results were disappointing, due to a negative equity market overall. Relative results benefited from Consumer Discretionary, Information Technology and Telecommunication Services stock selection, coupled with sector positioning. Within Consumer Discretionary, the Fund’s Europe Ex-U.K. and Developed Asian holdings added while Information Technology stocks added value across regions. Telecommunication Services stock selection was positively impacted by Iliad S.A. and Rogers Communications, Inc. Stock selection added value across most regions as well. Negatively impacting performance was Consumer Staples, Energy, Industrials and Materials stock selection, along with the weak equity markets in general.
We began to become more defensive in our developed markets positioning during the third quarter by decreasing exposure to consumer, auto, mining, and select Financials and increasing exposure in Health Care and Utilities—but we also maintained exposure to those companies geared towards emerging markets growth. This transition did not occur overnight amidst wide intraday equity market swings and overall volatility. Instead, we attempted to use the volatility to our trading advantage in securing better prices for new and additions to existing positions, while using positive volatility to reduce exposure to global growth within the Fund. This transition was generally finished by the end of October and results in November and December reflected a strategy more geared towards a global slowdown.
As of year end, the Fund maintained a balanced structure between defensively oriented sectors such as Consumer Staples, 13.4%, Healthcare, 14.6%, and to some extent Telecommunication Services, 7.9% and more growth oriented sectors such as Industrials, 15.8%. We increased the weighting in Financials slightly to 17.5% during the fourth quarter, with an increased focus on European insurers and to some extent capital markets companies, but in particular those with good balance sheets, solid competitive positioning amidst a changing landscape, and strong management teams with a history of execution. We also began increasing our underweighted Consumer Discretionary exposure late in the fourth quarter. Regionally, the Fund maintained higher weightings in Europe and the U.K., but underweighted in Developed Asia. While the Fund’s emerging markets weighting of approximately 19% was similar to the All Country World Index (ACWI) Ex-U.S. IMI Index, it increased from September 30, when it approximated 16%, with an increase in Asia and Latin America.
10 Annual Report | December 31, 2008 |
Institutional International Equity Fund
Performance Highlights (unaudited)
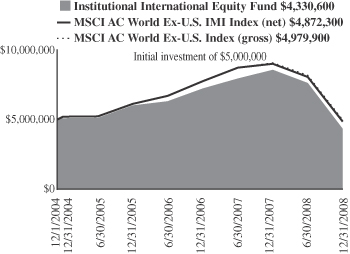
Average Annual Total Return at 12/31/2008
| | | | | | | | | |
| | | 1
Year | | | 3
Year | | | Since
Inception(a) | |
Institutional International Equity Fund | | (49.57 | )% | | (10.47 | )% | | (3.46 | )% |
MSCI AC World
Ex-U.S. IMI Index (net) | | (45.99 | ) | | (7.44 | ) | | (0.76 | ) |
MSCI AC World
Ex-U.S. Index (gross) | | (45.24 | ) | | (6.57 | ) | | (0.23 | ) |
| | (a) | | For the period from December 1, 2004 (Commencement of Operations) to December 31, 2008. |
Performance cited represents past performance. Past performance does not guarantee future results and current performance may be lower or higher than the data quoted. Results shown are average annual returns, which assume reinvestment of dividends and capital gains. Investment returns and principal will fluctuate and you may have a gain or loss when you sell shares. For the most current month-end performance information, please call 1-800-742-7272, or visit our Web site at www.williamblairfunds.com. From time to time, the investment advisor may waive fees or reimburse expenses for the Fund. Without these waivers, performance would be lower. International investing involves special risk considerations, including currency fluctuations, lower liquidity, economic and political risk.
The performance highlights and graph presented above do not reflect the deduction of taxes that a shareholder would pay on fund distributions or the redemption of fund shares.
The Morgan Stanley Capital International (MSCI) All Country World Ex-U.S. Investable Market Index (IMI) (net) is a free float-adjusted market capitalization weighted index that is designed to measure the equity market performance of developed and emerging markets, excluding the United States. This series approximates the minimum possible dividend reinvestment.
The Morgan Stanley Capital International (MSCI) All Country World Ex-U.S. Index (gross) is an unmanaged index that includes developed and emerging markets and reduced Japanese portion.
On June 30, 2008, the Fund’s Benchmark changed from the MSCI All Country World (ACW) Ex-U.S. (gross) to the MSCI All Country World Ex-U.S. Investable Market Index (IMI) (net). There are two primary reasons for the change. First, the MSCI ACW Ex-U.S. IMI (net)represents a broader range of markets then the MSCI ACW Ex-U.S. (gross) and this range is more representative of the fund’s investment strategy. Secondly, the net index reflects the deduction of dividend withholding tax paid by non-resident institutional investors in foreign countries, the fund is considered a non-resident institutional investors.
This report identifies the Fund’s investments on December 31, 2008. These holdings are subject to change. Not all stocks in the Fund performed the same, nor is there any guarantee that these stocks will perform as well in the future. Market forecasts provided in this report may not necessarily come to pass.
Sector Diversification (unaudited)
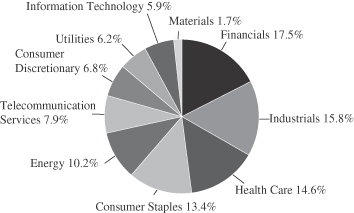
The sector diversification shown is based on the total long-term securities.
December 31, 2008 | William Blair Funds 11 |
Institutional International Equity Fund
Portfolio of Investments, December 31, 2008 (all dollar amounts in thousands)
| | | | | |
Issuer | | Shares | | Value |
| | |
Common Stocks—Europe—37.0% | | | | | |
Denmark—3.0% | | | | | |
Novo Nordisk A/S (Pharmaceuticals) | | 194,007 | | $ | 10,008 |
*Vestas Wind Systems A/S (Electrical equipment) | | 16,001 | | | 941 |
| | | | | |
| | | | | 10,949 |
| | | | | |
France—6.7% | | | | | |
Alstom S.A. (Electrical equipment) | | 99,626 | | | 5,937 |
AXA (Insurance) | | 251,031 | | | 5,635 |
Eurazeo (Diversified financial services) | | 41,175 | | | 1,936 |
Iliad S.A. (Diversified telecommunication services) | | 41,372 | | | 3,592 |
Veolia Environnement (Multi-utilities) | | 222,279 | | | 7,011 |
| | | | | |
| | | | | 24,111 |
| | | | | |
Germany—3.4% | | | | | |
Beiersdorf AG (Personal products) | | 95,053 | | | 5,630 |
E. ON AG (Electric utilities) | | 167,501 | | | 6,577 |
| | | | | |
| | | | | 12,207 |
| | | | | |
Ireland—0.5% | | | | | |
*Ryanair Holdings Plc—ADR (Airlines) | | 61,182 | | | 1,779 |
| | | | | |
Italy—1.9% | | | | | |
Saipem SpA (Energy equipment & services) | | 397,237 | | | 6,775 |
| | | | | |
Netherlands—1.1% | | | | | |
*Qiagen N.V. (Life sciences tools & services) | | 224,509 | | | 3,971 |
| | | | | |
Spain—4.3% | | | | | |
Banco Santander S.A. (Commercial banks) | | 612,443 | | | 5,917 |
*Iberdrola Renovables (Independent power producers & energy traders) | | 1,103,025 | | | 4,809 |
Industria De Diseno Textile Inditex S.A. (Specialty retail) | | 107,534 | | | 4,788 |
| | | | | |
| | | | | 15,514 |
| | | | | |
Switzerland—16.1% | | | | | |
*ABB, Ltd. (Electrical equipment) | | 546,573 | | | 8,335 |
*Actelion (Biotechnology) | | 78,126 | | | 4,420 |
Credit Suisse Group AG (Capital markets) | | 132,099 | | | 3,702 |
Nestle S.A. (Food products) | | 298,753 | | | 11,830 |
Roche Holdings, Ltd. AG (Pharmaceuticals) | | 69,575 | | | 10,772 |
SGS S.A. (Commercial services & supplies) | | 4,276 | | | 4,472 |
Synthes, Inc. (Health care equipment & supplies) | | 42,483 | | | 5,387 |
Zurich Financial Services (Insurance) | | 41,331 | | | 9,030 |
| | | | | |
| | | | | 57,948 |
| | | | | |
| | |
United Kingdom—21.0% | | | | | |
AMEC plc (Construction & engineering) | | 263,740 | | | 1,904 |
Amlin plc (Insurance) | | 177,679 | | | 924 |
*Autonomy Corporation plc (Software) | | 255,579 | | | 3,556 |
BAE Systems plc (Aerospace & defense) | | 1,661,036 | | | 9,040 |
BG Group plc (Oil, gas & consumable fuels) | | 651,906 | | | 9,023 |
British Sky Broadcasting Group plc (Media) | | 610,602 | | | 4,312 |
Capita Group plc (Commercial services & supplies) | | 643,476 | | | 6,903 |
Petrofac Limited (Energy equipment & services) | | 244,268 | | | 1,223 |
Reckitt Benckiser plc (Household products) | | 256,440 | | | 9,609 |
Rolls-Royce Group plc (Aerospace & defense) | | 1,624,193 | | | 7,945 |
Rotork plc (Electronic equipment & instruments) | | 131,272 | | | 1,514 |
Standard Chartered plc (Commercial banks) | | 450,857 | | | 5,769 |
Tullow Oil plc (Oil, gas & consumable fuels) | | 579,785 | | | 5,551 |
Vodafone Group plc (Wireless telecommunication services) | | 4,143,627 | | | 8,485 |
| | | | | |
| | | | | 75,758 |
| | | | | |
| | | | | |
Issuer | | Shares | | Value |
| | |
Japan—8.9% | | | | | |
Aeon Mall Co., Ltd. (Real estate management & development) | | 151,400 | | $ | 2,927 |
Fast Retailing Co., Ltd. (Specialty retail) | | 19,400 | | | 2,847 |
Jupiter Telecommunications Co., Ltd. (Media) | | 8,202 | | | 8,537 |
Nintendo Co., Ltd. (Software) | | 30,000 | | | 11,464 |
Suruga Bank, Ltd. (Commercial banks) | | 187,000 | | | 1,858 |
Terumo Corporation (Health care equipment & supplies) | | 95,500 | | | 4,474 |
| | | | | |
| | | | | 32,107 |
| | | | | |
| | |
Emerging Asia—7.7% | | | | | |
China—3.7% | | | | | |
China Life Insurance Company, Ltd. (Insurance) | | 1,580,000 | | | 4,855 |
China Merchants Bank Co., Ltd (Commercial banks) | | 1,590,500 | | | 2,976 |
China Oilfield Services (Energy equipment & services) | | 2,744,000 | | | 2,240 |
CNOOC Limited (Oil, gas & consumable fuels) | | 3,441,000 | | | 3,273 |
| | | | | |
| | | | | 13,344 |
| | | | | |
India—3.4% | | | | | |
*Bharti Airtel, Ltd. (Wireless telecommunication services) | | 331,331 | | | 4,884 |
Infosys Technologies Limited (IT services) | | 183,683 | | | 4,257 |
Sun Pharmaceutical Industries Limited (Pharmaceuticals) | | 2,210 | | | 49 |
Vedanta Resources plc (Metals & mining) | | 331,256 | | | 2,974 |
| | | | | |
| | | | | 12,164 |
| | | | | |
Indonesia—0.6% | | | | | |
PT Bank Rakyat Indonesia (Commercial banks) | | 5,311,000 | | | 2,259 |
| | | | | |
| | |
Emerging Europe, Mid-East, Africa—7.2% | | | | | |
Czech Republic—0.9% | | | | | |
CEZ (Electric utilities) | | 77,096 | | | 3,297 |
| | | | | |
Israel—3.4% | | | | | |
Teva Pharmaceutical Industries, Ltd.—ADR (Pharmaceuticals) | | 283,376 | | | 12,063 |
| | | | | |
South Africa—2.3% | | | | | |
MTN Group, Ltd. (Wireless telecommunication services) | | 433,557 | | | 5,112 |
Naspers, Ltd. (Media) | | 177,300 | | | 3,207 |
| | | | | |
| | | | | 8,319 |
| | | | | |
United Arab Emirates—0.6% | | | | | |
Aldar Properties PJSC (Real estate management & development) | | 679,300 | | | 730 |
DP World, Ltd. (Marine) † | | 3,858,501 | | | 1,505 |
| | | | | |
| | | | | 2,235 |
| | | | | |
| | |
Asia—6.2% | | | | | |
Australia—5.7% | | | | | |
BHP Billiton Limited—ADR (Metals & mining) | | 68,057 | | | 2,920 |
Macquarie Bank, Ltd. (Capital markets) | | 105,928 | | | 2,150 |
QBE Insurance Group Limited (Insurance) | | 374,423 | | | 6,767 |
Woolworths Limited (Food & staples retailing) | | 408,460 | | | 7,616 |
WorleyParsons, Ltd. (Energy equipment & services) | | 110,112 | | | 1,098 |
| | | | | |
| | | | | 20,551 |
| | | | | |
See accompanying Notes to Financial Statements.
12 Annual Report | December 31, 2008 |
Institutional International Equity Fund
Portfolio of Investments, December 31, 2008 (all dollar amounts in thousands)
| | | | | |
Issuer | | Shares | | Value |
| |
Common Stocks—Asia—6.2%—(continued) | | | |
Hong Kong—0.5% | | | | | |
Noble Group Limited (Trading companies & distributors) | | 2,303,000 | | $ | 1,650 |
| | | | | |
| | |
Canada—5.0% | | | | | |
Canadian National Railway Company (Road & rail) † | | 145,770 | | | 5,359 |
Rogers Communications, Inc., Class “B” (Wireless telecommunication services) | | 186,900 | | | 5,539 |
Shoppers Drug Mart Corporation (Food & staples retailing) | | 181,800 | | | 7,076 |
| | | | | |
| | | | | 17,974 |
| | | | | |
| | |
Emerging Latin America—3.1% | | | | | |
Brazil—1.2% | | | | | |
BM&F Bovespa S.A. (Diversified financial services) | | 560,071 | | | 1,446 |
*LLX Logistica S.A. (Transportation infrastructure) | | 108,100 | | | 70 |
*MMX Mineracao e Metalicos S.A. (Metals & mining) | | 138,200 | | | 164 |
Petroleo Brasileiro S.A.—ADR (Oil, gas & consumable fuels) | | 66,896 | | | 1,638 |
Weg S.A. (Machinery) | | 205,700 | | | 1,103 |
| | | | | |
| | | | | 4,421 |
| | | | | |
Chile—0.0% | | | | | |
Cencosud S.A.—ADR 144A (Specialty retail) | | 3,527 | | | 75 |
| | | | | |
Mexico—1.3% | | | | | |
Wal-Mart de Mexico Sab de C.V. (Food & staples retailing) | | 1,814,200 | | | 4,847 |
| | | | | |
ADR = American Depository Receipt
* Non-income producing securities
† = U.S. Listed Foreign Common Stock
For securities primarily traded on exchanges or markets that close before the close of regular trading on the New York Stock Exchange, the Fund uses an independent pricing service on a daily basis to fair value price the securities pursuant to Valuation Procedures approved by the Board of Trustees.
| | | | | | |
Issuer | | Shares or
Principal
Amount | | Value |
|
Common Stocks—Emerging Latin America—3.1%—(continued) |
*Peru—0.6% | | | | | | |
Credicorp, Ltd. (Commercial banks) † | | | 42,800 | | $ | 2,138 |
| | | | | | |
Total Common Stock—96.1%
(cost $413,652) | | | 346,456 |
| | | | | | |
| | |
*Preferred Stocks | | | | | | |
Brazil—0.8% | | | | | | |
Petroleo Brasileiro S.A. (Oil, gas & consumable fuels) | | | 285,800 | | | 2,799 |
Total Preferred Stocks—0.8%
(cost $2,842) | | | 2,799 |
| | | | | | |
| | |
Investment in Affiliate | | | | | | |
William Blair Ready Reserves Fund | | | 4,949,439 | | | 4,949 |
| | | | | | |
Total Investment in Affiliate—1.4%
(cost $4,949) | | | 4,949 |
| | | | | | |
| | |
Repurchase Agreement | | | | | | |
Fixed Income Clearing Corporation,
0.010% dated 12/31/08, due 1/2/09, repurchase price $813, collateralized by FHLMC, 5.625% due 11/23/35 | | $ | 813 | | | 813 |
| | | | | | |
Total Repurchase Agreement—0.2%
(cost $813) | | | 813 |
| | | | | | |
Total Investments—98.5%
(cost $422,256) | | | 355,017 |
Cash and other assets, less liabilities—1.5% | | | 5,434 |
| | | | | | |
Net assets—100.0% | | $ | 360,451 |
| | | | | | |
See accompanying Notes to Financial Statements.
December 31, 2008 | William Blair Funds 13 |
Institutional International Equity Fund
Portfolio of Investments, December 31, 2008 (all dollar amounts in thousands)
At December 31, 2008 the Fund’s Portfolio of Investments includes the following industry categories:
| | | |
Financials | | 17.5 | % |
Industrials | | 15.8 | % |
Health Care | | 14.6 | % |
Consumer Staples | | 13.4 | % |
Energy | | 10.2 | % |
Telecommunication Services | | 7.9 | % |
Consumer Discretionary | | 6.8 | % |
Utilities | | 6.2 | % |
Information Technology | | 5.9 | % |
Materials | | 1.7 | % |
| | | |
Total | | 100.0 | % |
| | | |
At December 31, 2008 the Fund’s Portfolio of Investments includes the following currency categories:
| | | |
British Pound Sterling | | 22.5 | % |
Euro | | 17.9 | % |
Swiss Franc | | 16.6 | % |
Japanese Yen | | 9.2 | % |
U.S. Dollar | | 7.0 | % |
Australian Dollar | | 5.9 | % |
Hong Kong Dollar | | 3.8 | % |
Canadian Dollar | | 3.6 | % |
Danish Krone | | 3.1 | % |
Indian Rupee | | 2.6 | % |
South African Rand | | 2.4 | % |
Brazilian Real | | 1.6 | % |
Singapore Dollar | | 0.5 | % |
All other currencies | | 3.2 | % |
| | | |
Total | | 100.0 | % |
| | | |
See accompanying Notes to Financial Statements.
14 Annual Report | December 31, 2008 |

Jeffery A. Urbina
INTERNATIONAL SMALL CAP GROWTH FUND
The International Small Cap Growth Fund primarily invests in a diversified portfolio of common stocks of small cap companies in developed and emerging markets.
AN OVERVIEW FROM THE PORTFOLIO MANAGER
Please see page 2 for the Global Markets Overview.
The International Small Cap Growth Fund posted a (51.53)% decrease (Institutional Class) for the 12 months ended December 31, 2008. By comparison, the Fund’s benchmark, the MSCI All Country Ex-U.S. Small Cap Index (net), declined (50.23)%.
The Fund underperformed the benchmark Index during 2008, due to fourth quarter results as the Fund added value during the first nine months. While stock selection was strong across most sectors during the first nine months of the year and the Fund benefited from Japanese, Canadian, and European stock selection, during the fourth quarter, its Energy weighting and performance, along with select Health Care company performance were the primary detractors from fourth quarter results.
Within Energy, services companies, which had benefited from more stable earnings growth through long-term contracts, had earnings called into question due to concerns about delays and/or cancellations of contracts amidst the severe energy/commodity price declines. While we decreased exposure to Energy during the quarter, a higher weighting in October was also detrimental to absolute and relative performance. Within Health Care, several of our generics holdings underperformed due to company-specific issues, as well as those that were hampered by concerns of general biotech and pharmaceutical spending.
As of yearend, the Fund maintained a balanced structure between defensively oriented sectors such as Health Care, 19.9%, and more growth oriented sectors such as Industrials, 17.9%, and Information Technology, 12.9%. We decreased the Energy weightings from approximately 12% to 4% during the fourth quarter, due to concerns about energy capital spending and outlook, and remained underweighted in Financials with approximately 16% invested in these holdings. The Fund’s weighting in emerging markets approximated 20% of the Fund, up from approximately 14.5% as of September 30, with the biggest increase in emerging Asia, which has benefited from weakness in commodity and energy prices, along with a loosening monetary policy and reduction in inflationary concerns.
December 31, 2008 | William Blair Funds 15 |
International Small Cap Growth Fund
Performance Highlights (unaudited)
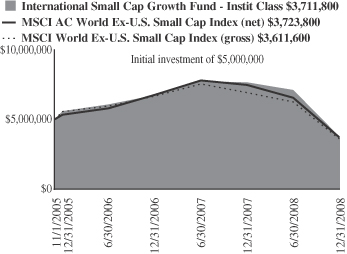
Average Annual Total Return at 12/31/2008
| | | | | | | | | |
| | | 1
Year | | | 3
Year | | | Since
Inception(a) | |
International Small Cap Growth Fund Institutional Class | | (51.53 | )% | | (12.71 | )% | | (8.95 | )% |
MSCI AC World Ex-U.S. Small Cap Index (net) | | (50.23 | ) | | (11.29 | ) | | (7.91 | ) |
MSCI World Ex-U.S. Small Cap Index (gross) | | (47.79 | ) | | (13.45 | ) | | (9.92 | ) |
| | (a) | | For the period from November 1, 2005 (Commencement of Operations) to December 31, 2008. | |
Performance cited represents past performance. Past performance does not guarantee future results and current performance may be lower or higher than the data quoted. Results shown are average annual returns, which assume reinvestment of dividends and capital gains. Investment returns and principal will fluctuate and you may have a gain or loss when you sell shares. For the most current month-end performance information, please call 1-800-742-7272, or visit our Web site at www.williamblairfunds.com. From time to time, the investment advisor may waive fees or reimburse expenses for the Fund. Without these waivers, performance would be lower. International investing involves special risk considerations, including currency fluctuations, lower liquidity, economic and political risk.
The performance highlights and graph presented above do not reflect the deduction of taxes that a shareholder would pay on fund distributions or the redemption of fund shares.
The Morgan Stanley Capital International (MSCI) All Country World Ex-U.S. Small Cap Index (net) is a free float-adjusted market capitalization weighted index that is designed to measure the equity market performance of small capitalization developed and emerging markets, excluding the United States. This series approximates the minimum possible dividend reinvestment.
The Morgan Stanley Capital International (MSCI) World Ex-U.S. Small Cap Index (gross) is an unmanaged index that is designed to measure equity performance of small cap stocks in developed and emerging markets.
On June 30, 2008, the Fund’s Benchmark changed from the MSCI World Ex-U.S. Small Cap Index (gross) to the MSCI All Country World (ACW) Ex-U.S. Small Cap Index (net). There are two primary reasons for the change. First, the MSCI ACW Ex-U.S. Small Cap Index (net) represents a broader range of markets then the MSCI World Ex-U.S. Small Cap Index (gross) and this range is more representative of the fund’s investment strategy. Secondly, the net indices reflect the deduction of dividend withholding tax paid by non-resident institutional investors in foreign countries, the fund is a non-resident institutional investors.
This report identifies the Fund’s investments on December 31, 2008. These holdings are subject to change. Not all stocks in the Fund performed the same, nor is there any guarantee that these stocks will perform as well in the future. Market forecasts provided in this report may not necessarily come to pass.
Sector Diversification (unaudited)
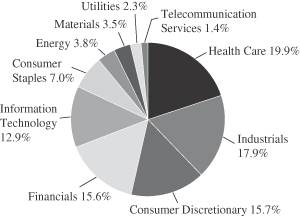
The sector diversification shown is based on the total long-term securities.
16 Annual Report | December 31, 2008 |
International Small Cap Growth Fund
Portfolio of Investments, December 31, 2008 (all dollar amounts in thousands)
| | | | | |
Issuer | | Shares | | Value |
| | |
Common Stocks—Europe—32.8% | | | | | |
Austria—0.4% | | | | | |
Schoeller-Bleckmann Oilfield Equipment AG (Energy equipment & services) | | 35,905 | | $ | 1,118 |
| | | | | |
Denmark—3.2% | | | | | |
Novozymes A/S (Chemicals) | | 117,928 | | | 9,458 |
| | | | | |
France—7.3% | | | | | |
April Group S.A. (Insurance) | | 82,864 | | | 2,116 |
EDF Energies Nouvelles S.A. (Independent power providers & energy trader) | | 182,825 | | | 6,477 |
*Gemalto NV (Computers & peripherals) | | 109,451 | | | 2,754 |
*Orpea (Heath care providers & services) | | 191,818 | | | 6,945 |
*UbiSoft Entertainment S.A. (Software) | | 151,543 | | | 2,973 |
| | | | | |
| | | | | 21,265 |
| | | | | |
Germany—6.4% | | | | | |
CTS Eventim AG (Media) | | 138,275 | | | 4,744 |
*Manz Automation AG (Semiconductors & semiconductor equipment) | | 12,539 | | | 739 |
*Roth & Rau AG (Electronic equipment) | | 31,959 | | | 685 |
Solarworld AG (Electrical equipment) | | 146,388 | | | 3,276 |
Strada Arzneimittel AG (Pharmaceuticals) | | 162,598 | | | 4,671 |
*Wire Card AG (IT services) | | 760,808 | | | 4,446 |
| | | | | |
| | | | | 18,561 |
| | | | | |
Greece—1.3% | | | | | |
Fourlis Holdings S.A. (Household durables) | | 85,528 | | | 596 |
Jumbo S.A. (Leisure equipment & products) | | 546,928 | | | 3,305 |
| | | | | |
| | | | | 3,901 |
| | | | | |
Ireland—2.7% | | | | | |
*ICON plc—ADR (Life science tools & services) | | 226,758 | | | 4,465 |
*Norkom Group plc (Software) | | 638,104 | | | 443 |
United Drug plc (Heath care providers & services) | | 974,012 | | | 3,018 |
| | | | | |
| | | | | 7,926 |
| | | | | |
Italy—0.5% | | | | | |
Trevi Finanziaria SpA (Construction & engineering) | | 139,088 | | | 1,486 |
| | | | | |
Netherlands—4.5% | | | | | |
*Qiagen N.V. (Life sciences tools & services) | | 660,288 | | | 11,678 |
*Smartrac N.V. (Electronic equipment & instruments) | | 92,544 | | | 1,542 |
| | | | | |
| | | | | 13,220 |
| | | | | |
Spain—2.9% | | | | | |
Grifols S.A. (Biotechnology) | | 432,388 | | | 7,576 |
Tecnicas Reunidas S.A. (Construction & engineering) | | 33,194 | | | 877 |
| | | | | |
| | | | | 8,453 |
| | | | | |
Switzerland—3.6% | | | | | |
Acino Holding AG (Pharmaceuticals) | | 3,666 | | | 798 |
*Meyer Burger Technology AG (Machinery) | | 7,513 | | | 879 |
Partners Group Global Opportunities, Ltd. (Capital markets) | | 96,096 | | | 6,878 |
*Temenos Group AG (Software) | | 133,022 | | | 1,795 |
| | | | | |
| | | | | 10,350 |
| | | | | |
| | | | | |
Issuer | | Shares | | Value |
| |
Common Stocks—Europe—32.8%—(continued) | | | |
Japan—18.5% | | | | | |
Aeon Delight Co., Ltd. (Commercial services & supplies) | | 52,000 | | $ | 1,508 |
Aeon Mall Co., Ltd. (Real estate management & development) | | 312,100 | | | 6,033 |
Capcom Co., Ltd. (Software) | | 151,600 | | | 3,430 |
EPS Co., Ltd. (Life sciences tools & services) | | 319 | | | 1,373 |
FamilyMart Co., Ltd. (Food & staples retailing) | | 248,000 | | | 10,770 |
Gourmet Navigator Incorporated (Internet software & services) | | 247 | | | 663 |
Hisamitsu Pharmaceutical Co., Inc. (Pharmaceuticals) | | 70,000 | | | 2,861 |
Nitori Company, Ltd. (Specialty retail) | | 109,300 | | | 8,506 |
Point, Inc. (Specialty retail) | | 64,700 | | | 3,566 |
Seven Bank, Ltd. (Commercial banks) | | 2,954 | | | 11,291 |
So-net M3, Inc. (Health care technology) | | 778 | | | 2,666 |
Suruga Bank, Ltd. (Commercial banks) | | 120,200 | | | 1,194 |
| | | | | |
| | | | | 53,861 |
| | | | | |
United Kingdom—18.3% | | | | | |
Admiral Group plc (Insurance) | | 215,442 | | | 2,844 |
Amlin plc (Insurance) | | 1,508,610 | | | 7,842 |
*Autonomy Corporation plc (Software) | | 404,700 | | | 5,631 |
Aveva Group plc (Software) | | 219,215 | | | 1,825 |
*Blinkx plc (Internet software & services) | | 4,235,401 | | | 797 |
*Ceres Power Holdings plc (Electrical equipment) | | 704,843 | | | 835 |
Chemring Group plc (Aerospace & defense) | | 151,831 | | | 4,293 |
*Climate Exchange plc (Diversified financial services) | | 95,696 | | | 1,218 |
Connaught plc (Real estate management & development) | | 244,500 | | | 1,238 |
Domino’s Pizza UK & IRL plc (Hotels, restaurants, & leisure) | | 691,464 | | | 1,674 |
Petrofac, Ltd. (Energy equipment & services) | | 558,951 | | | 2,798 |
Rotork plc (Electronic equipment & instruments) | | 134,455 | | | 1,550 |
Serco Group plc (Commercial services & supplies) | | 1,534,091 | | | 10,042 |
Spice plc (Commercial services & supplies) | | 535,380 | | | 643 |
Ultra Electronic Holdings plc (Aerospace & defense) | | 251,854 | | | 4,141 |
VT Group plc (Aerospace & defense) | | 585,560 | | | 4,731 |
Wellstream Holdings plc (Energy equipment & services) | | 265,965 | | | 1,369 |
| | | | | |
| | | | | 53,471 |
| | | | | |
| | |
Emerging Asia—10.4% | | | | | |
China—6.1% | | | | | |
*Baidu.com, Inc.—ADR (Internet software & services) | | 46,095 | | | 6,019 |
China High Speed Transmission (Electrical equipment) | | 3,711,000 | | | 4,528 |
Golden Eagle Retail Group, Ltd. (Multiline retail) | | 2,586,000 | | | 1,820 |
Li Ning Co., Ltd. (Leisure equipment & products) | | 781,873 | | | 1,232 |
* SINA Corporation (Internet software & services)† | | 61,508 | | | 1,424 |
Shandong Weigao Group Medical Polymer Company, Ltd. (Health care equipment & supplies) | | 1,768,800 | | | 2,692 |
| | | | | |
| | | | | 17,715 |
| | | | | |
See accompanying Notes to Financial Statements.
December 31, 2008 | William Blair Funds 17 |
International Small Cap Growth Fund
Portfolio of Investments, December 31, 2008 (all dollar amounts in thousands)
| | | | | |
Issuer | | Shares | | Value |
|
Common Stocks-Emerging Asia—10.4%—(continued) |
India—3.1% | | | | | |
Educomp Solutions, Limited (Diversified consumer services) | | 73,352 | | $ | 3,647 |
* Glenmark Pharmaceuticals, Ltd. (Pharmaceuticals) | | 633,895 | | | 3,894 |
Lupin, Limited (Pharmaceuticals) | | 120,420 | | | 1,532 |
| | | | | |
| | | | | 9,073 |
| | | | | |
South Korea—1.2% | | | | | |
Taewoong Co., Ltd. (Machinery) | | 58,337 | | | 3,601 |
| | | | | |
| |
Emerging Europe, Mid-East, Africa—4.6% | | | |
Egypt—1.4% | | | | | |
* ELSewedy Cables Holding Company (Electrical equipment) | | 187,189 | | | 2,577 |
* Ghabbour Auto (Machinery) | | 152,300 | | | 463 |
* Orascom Development Holding AG (Hotels, restaurants & leisure) | | 28,373 | | | 916 |
| | | | | |
| | | | | 3,956 |
| | | | | |
South Africa—2.3% | | | | | |
* Aspen Pharmacare Holdings, Limited (Pharmaceuticals) | | 425,588 | | | 1,553 |
Shoprite Holdings, Limited (Food & staples retailing) | | 629,998 | | | 3,623 |
Wilson Bayly Holmes-Ovcon Limited (Construction & engineering) | | 126,092 | | | 1,466 |
| | | | | |
| | | | | 6,642 |
| | | | | |
United Arab Emirates—0.9% | | | | | |
Arabtec Holding Company (Construction & engineering) | | 3,187,304 | | | 1,982 |
* National Central Cooling Company (Building products) | | 5,546,639 | | | 793 |
| | | | | |
| | | | | 2,775 |
| | | | | |
| | |
Canada—4.0% | | | | | |
Canadian Western Bank (Commercial banks) | | 223,000 | | | 2,236 |
*Consolidated Thompson Iron Mines, Limited (Metals & mining) | | 519,378 | | | 396 |
Tim Hortons, Inc. (Hotels, restaurants & leisure) | | 208,479 | | | 5,892 |
*TriStar Oil & Gas, Ltd. (Oil, gas & consumable fuels) | | 348,568 | | | 3,222 |
| | | | | |
| | | | | 11,746 |
| | | | | |
| | |
Emerging Latin America—3.9% | | | | | |
Brazil—3.5% | | | | | |
Anhanguera Educacional Participacoes S.A. (Diversified consumer services) | | 210,003 | | | 1,091 |
*BR Malls Participacoes S.A. (Real estate management & development) | | 276,300 | | | 1,078 |
*GVT Holding S.A. (Diversified telecommunication services) | | 367,744 | | | 4,001 |
* Non-income producing securities
†= U.S. listed foreign security
ADR = American Depository Receipt
VRN = Variable Rate Note
For securities primarily traded on exchanges or markets that close before the close of regular trading on the New York Stock Exchange, the Fund uses an independent pricing service on a daily basis to fair value price the securities pursuant to Valuation Procedures approved by the Board of Trustees.
| | | | | | | |
Issuer | | Shares or
Principal
Amount | | Value | |
| |
Emerging Latin America—3.9%—(continued) | | | | |
Brazil—(continued) | | | | | | | |
*Lupatech S.A. (Machinery) | | | 144,205 | | $ | 1,448 | |
Rodobens Negocioa Imobiliarios S.A. (Real estate management & development) | | | 135,500 | | | 456 | |
SLC Agricola S.A. (Food products) | | | 369,300 | | | 2,217 | |
| | | | | | | |
| | | | | | 10,291 | |
| | | | | | | |
Columbia—0.4% | | | | | | | |
*Pacific Rubiales Energy Corporation (Oil, gas & consumable fuels) | | | 642,741 | | | 1,140 | |
| | | | | | | |
| | |
Asia—3.3% | | | | | | | |
Australia —1.0% | | | | | | | |
JB Hi-Fi Limited (Specialty retail) | | | 445,980 | | | 3,035 | |
| | | | | | | |
Singapore —2.3% | | | | | | | |
Olam International, Ltd. (Food & staples retailing) | | | 3,593,700 | | | 2,897 | |
Raffles Education Corp., Ltd. (Diversified consumer services) | | | 9,581,000 | | | 3,795 | |
| | | | | | | |
| | | | | | 6,692 | |
| | | | | | | |
Total Common Stock—95.8%
(cost $380,946) | | | 279,736 | |
| | | | | | | |
| | | | | | | |
Investment in Affiliate | | | | | | | |
William Blair Ready Reserves Fund | | | 3,286,638 | | | 3,287 | |
| | | | | | | |
Total Investment in Affiliate—1.1%
(cost $3,287) | | | 3,287 | |
| | | | | | | |
| | | | | | | |
Short-Term Investments | | | | | | | |
American Express Credit Corp. Demand Note, VRN 3.559%, due 1/2/09 | | $ | 6,500 | | | 6,500 | |
| | | | | | | |
Total Short-term Investments—2.2%
(cost $6,500) | | | 6,500 | |
| | | | | | | |
| | |
Repurchase Agreement | | | | | | | |
Fixed Income Clearing Corporation, 0.010% dated 12/31/08 due 1/2/09, repurchase price $5,382, collateralized by FHLMC, 5.625%, due 11/23/35 | | | 5,382 | | | 5,382 | |
| | | | | | | |
Total Repurchase Agreement—1.8%
(cost $5,382) | | | 5,382 | |
| | | | | | | |
Total Investments—100.9%
(cost $396,115) | | | 294,905 | |
Liabilities, plus cash and other assets—(0.9)% | | | (2,917 | ) |
| | | | | | | |
Net assets—100.0% | | $ | 291,988 | |
| | | | | | | |
See accompanying Notes to Financial Statements.
18 Annual Report | December 31, 2008 |
International Small Cap Growth Fund
Portfolio of Investments, December 31, 2008 (all dollar amounts in thousands)
At December 31, 2008 the Fund’s Portfolio of Investments includes the following industry categories:
| | |
Health Care | | 19.9% |
Industrials | | 17.9% |
Consumer Discretionary | | 15.7% |
Financials | | 15.6% |
Information Technology | | 12.9% |
Consumer Staples | | 7.0% |
Energy | | 3.8% |
Materials | | 3.5% |
Utilities | | 2.3% |
Telecommunication Services | | 1.4% |
| | |
Total | | 100.0% |
| | |
At December 31, 2008 the Fund’s Portfolio of Investments includes the following currency categories:
| | |
Euro | | 25.5% |
Japanese Yen | | 19.3% |
British Pound Sterling | | 19.1% |
Canadian Dollar | | 4.6% |
U.S. Dollar | | 4.2% |
Swiss Franc | | 4.0% |
Brazilian Real | | 3.7% |
Hong Kong Dollar | | 3.7% |
Danish Krone | | 3.4% |
Indian Rupee | | 3.2% |
Singapore Dollar | | 2.4% |
South African Rand | | 2.4% |
South Korean Won | | 1.3% |
Egyptian Pound | | 1.1% |
Australian Dollar | | 1.1% |
UAE Dirham | | 1.0% |
| | |
Total | | 100.0% |
| | |
See accompanying Notes to Financial Statements.
December 31, 2008 | William Blair Funds 19 |

Todd M. McClone
Jeffrey A. Urbina
EMERGING MARKETS GROWTH FUND
The Emerging Markets Growth Fund primarily invests in a diversified portfolio of equity securities issued by growth companies in emerging economies worldwide.
AN OVERVIEW FROM THE PORTFOLIO MANAGERS
Please see page 2 for the Global Markets Overview.
The Emerging Markets Growth Fund posted a (61.51)% decrease (Institutional Class) for the 12 months ended December 31, 2008. By comparison, the Fund’s benchmark, the MSCI Emerging Markets IMI Index (net), declined (53.78)%.
The Fund underperformed the benchmark Index during 2008 and during the fourth quarter, ending the strategy’s worst absolute and relative year in our history. In what turned out to be a boom-bust emerging markets environment, where corporate fundamentals lagged macroeconomic effects and often times did not matter in overall stock performance, we suffered an extremely disappointing year. Underperformance in 2008 was largely due to significant underperformance in the Fund’s Financials holdings (and the overweighting during the first quarter), first in real estate and small cap Brazil and India during the first quarter, then the impact of small cap Russian Financials during the third quarter. In addition, the Fund’s agriculture related holdings within the Consumer Staples sector hampered full year results (despite adding value during the first half of the year), as well as the weighting and stock selection in Consumer Discretionary (small cap Brazil and select Eastern European holdings). Adding to results during 2008 was the Fund’s underweighting and stock selection in Energy, along with the underweighted Materials sector and Industrials stock selection.
During the fourth quarter, the Fund lagged the Index, due largely to the higher weighting in Middle Eastern Industrials companies, coupled with performance and weighting of the Fund’s Indian generic healthcare holdings. Adding to relative results was the Fund weighting and stock selection in Energy, particularly in Asia, along with Telecommunication Services stock selection, due largely to good performance in Asia and Emerging Markets Europe, Mid-East and Africa (EMEA). Moreover, the Fund’s underweighting in Materials and Information Technology and overweighting in Health Care also added to fourth quarter relative results.
As of year end, the Fund maintained a balanced structure between defensively oriented sectors such as Consumer Staples, 17.4%, Health Care, 6.7%, and to some extent, Telecommunication Services, 10.7%, and more growth oriented sectors such as Industrials, 13.3%. We increased the weighting in Financials to 17.7% from approximately 13% during the fourth quarter, primarily in Asia, which have benefited from an easing monetary policy environment, government stimulus, and that have generally been unaffected by asset quality concerns. We also further decreased our underweighted Energy position from 13% to 9%. Regionally, the Fund remained underweighted in Asia, due largely to Korean and Taiwanese weightings, although the weighting increased from approximately 37% as of September 30 to 43%. Conversely, exposure to EMEA (particularly the Middle East and Russia) and Latin America was reduced.
20 Annual Report | December 31, 2008 |
Emerging Markets Growth Fund
Performance Highlights (unaudited)
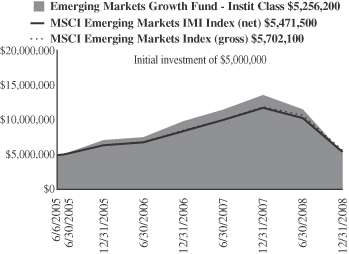
Average Annual Total Return at 12/31/2008
| | | | | | | | | |
| | | 1
Year | | | 3
Year | | | Since
Inception(a) | |
Emerging Markets Growth Fund Institutional Class | | (61.51 | )% | | (9.69 | )% | | 1.43 | % |
MSCI Emerging Markets IMI Index (net) | | (53.78 | ) | | (5.22 | ) | | 2.54 | |
MSCI Emerging Markets Index (gross) | | (53.18 | ) | | (4.62 | ) | | 3.25 | |
| | (a) | | For the period from June 6, 2005 (Commencement of Operations) to December 31, 2008. | |
Performance cited represents past performance. Past performance does not guarantee future results and current performance may be lower or higher than the data quoted. Results shown are average annual returns, which assume reinvestment of dividends and capital gains. Investment returns and principal will fluctuate and you may have a gain or loss when you sell shares. For the most current month-end performance information, please call 1-800-742-7272, or visit our Web site at www.williamblairfunds.com. From time to time, the investment advisor may waive fees or reimburse expenses for the Fund. Without these waivers, performance would be lower. International investing involves special risk considerations, including currency fluctuations, lower liquidity, economic and political risk.
The performance highlights and graph presented above do not reflect the deduction of taxes that a shareholder would pay on fund distributions or the redemption of fund shares.
The Morgan Stanley Capital International (MSCI) Emerging Markets Investable Market Index (IMI) (net) is a free float-adjusted market capitalization weighted index that is designed to measure the equity market performance of emerging markets. This series approximates the minimum possible dividend reinvestment.
The Morgan Stanley Capital International (MSCI) Emerging Markets Index (gross) is an index that is designed to measure equity performance in the global emerging markets.
On June 30, 2008, the Fund’s Benchmark changed from the MSCI Emerging Markets Index (gross) to the MSCI Emerging Markets Investable Market Index (IMI) (net). There are two primary reasons for the change. First, the MSCI Emerging Markets IMI (net) represents a broader range of markets then the MSCI Emerging Markets Index (gross) and this range is more representative of the fund’s investment strategy. Secondly, the net index reflects the deduction of dividend withholding tax paid by non-resident institutional investors in foreign countries, the fund is considered a non-resident institutional investors.
This report identifies the Fund’s investments on December 31, 2008. These holdings are subject to change. Not all stocks in the Fund performed the same, nor is there any guarantee that these stocks will perform as well in the future. Market forecasts provided in this report may not necessarily come to pass.
Sector Diversification (unaudited)
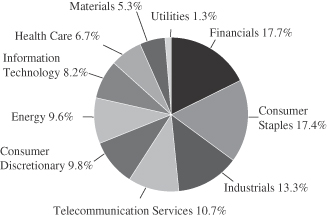
The sector diversification shown is based on the total long-term securities.
December 31, 2008 | William Blair Funds 21 |
Emerging Markets Growth Fund
Portfolio of Investments, December 31, 2008 (all dollar amounts in thousands)
| | | | | |
Issuer | | Shares | | Value |
| |
Common Stocks—Emerging Asia—42.9% | | | |
China—19.5% | | | | | |
*Baidu.com, Inc.—ADR (Internet software & services) | | 57,129 | | $ | 7,459 |
Belle International Holdings Limited (Specialty retail) | | 7,792,200 | | | 3,457 |
China High Speed Transmission (Electrical equipment) | | 4,608,000 | | | 5,623 |
China Life Insurance Co., Ltd. (Insurance) | | 3,722,000 | | | 11,436 |
China Merchants Bank Co., Ltd. (Commercial banks) | | 3,739,000 | | | 6,996 |
China Mobile, Ltd. (Wireless telecommunication services) | | 1,233,800 | | | 12,518 |
China Oilfield Services Limited (Energy equipment & services) | | 1,000 | | | 1 |
China Vanke Co., Ltd. (Real estate management & development) | | 6,365,543 | | | 4,936 |
China Yurun Food Group Limited (Food products) | | 2,401,419 | | | 2,841 |
CNOOC Limited (Oil, gas & consumable fuels) | | 11,501,000 | | | 10,940 |
Golden Eagle Retail Group, Ltd. (Multiline retail) | | 2,757,000 | | | 1,940 |
Li Ning Co., Ltd. (Leisure equipment & products) | | 1,294,500 | | | 2,040 |
Shandong Weigao Group Medical Polymer Company, Ltd. (Health care equipment & supplies) | | 1,508,700 | | | 2,296 |
*SINA Corporation (Internet software & services)† | | 79,593 | | | 1,843 |
Tencent Holdings, Ltd. (Internet software & services) | | 160,200 | | | 1,041 |
| | | | | |
| | | | | 75,367 |
| | | | | |
India—16.2% | | | | | |
Asian Paints Limited (Chemicals) | | 53,556 | | | 987 |
*Bharti Airtel, Ltd. (Wireless telecommunication services) | | 639,409 | | | 9,425 |
*Cairn India, Ltd. (Oil, gas & consumable fuels) | | 2,679,749 | | | 9,545 |
Educomp Solution, Limited (Diversified consumer services) | | 55,837 | | | 2,776 |
*Glenmark Pharmaceuticals, Ltd. (Pharmaceuticals) | | 724,980 | | | 4,453 |
Hindustan Unilever, Ltd. (Household products) | | 2,863,140 | | | 14,803 |
Housing Development Finance Corp. (Thrifts & mortgage finance) | | 178,656 | | | 5,467 |
Infosys Technologies Limited (IT services) | | 233,012 | | | 5,400 |
Larsen & Toubro, Ltd. (Construction & engineering) | | 451,020 | | | 7,211 |
Shoppers’ Stop, Ltd. (Multiline retail) | | 261,960 | | | 945 |
Sun Pharmaceutical Industries Limited (Pharmaceuticals) | | 65,336 | | | 1,437 |
| | | | | |
| | | | | 62,449 |
| | | | | |
Indonesia—2.2% | | | | | |
PT Bank Rakyat Indonesia (Commercial banks) | | 13,131,500 | | | 5,584 |
*PT London Sumatra Indonesia (Food products) | | 8,121,000 | | | 2,221 |
PT Unilever Indonesia Tbk (Household products) | | 1,133,000 | | | 821 |
| | | | | |
| | | | | 8,626 |
| | | | | |
| | | | | |
Issuer | | Shares | | Value |
|
Common Stocks—Emerging Asia—42.9%—(continued) |
Malaysia—0.1% | | | | | |
KNM Group Bhd (Energy equipment & services) | | 3,282,300 | | $ | 388 |
| | | | | |
South Korea—2.9% | | | | | |
*LG Household & Health Care, Ltd. (Household products) | | 27,913 | | | 4,254 |
*Megastudy Co., Ltd. (Diversified consumer services) | | 18,515 | | | 2,741 |
Taewoong Co., Ltd. (Machinery) | | 67,687 | | | 4,179 |
| | | | | |
| | | | | 11,174 |
| | | | | |
Taiwan—1.7% | | | | | |
Himax Technologies, Inc.—ADR (Semiconductors & semiconductor equipment) | | 1,877,069 | | | 3,003 |
MediaTek Inc. (Semiconductors & semiconductor equipment) | | 531,000 | | | 3,591 |
| | | | | |
| | | | | 6,594 |
| | | | | |
Thailand—0.3% | | | | | |
Minor International PCL (IT services) | | 4,434,900 | | | 1,007 |
| | | | | |
| |
Emerging Europe, Mid-East, Africa—25.9% | | | |
Czech Republic—1.2% | | | | | |
CEZ (Electric utilities) | | 108,887 | | | 4,657 |
| | | | | |
Egypt—3.0% | | | | | |
*ELSewedy Cables Holding Company (Electrical equipment) | | 357,179 | | | 4,916 |
Orascom Construction Industries (Construction & engineering) | | 217,012 | | | 5,525 |
*Orascom Hotels and Development (Hotels, restaurants & leisure) | | 38,542 | | | 1,244 |
| | | | | |
| | | | | 11,685 |
| | | | | |
Israel—5.1% | | | | | |
Israel Chemicals Limited (Chemicals) | | 676,966 | | | 4,736 |
Teva Pharmaceutical Industries, Ltd.—ADR (Pharmaceuticals) | | 346,726 | | | 14,760 |
| | | | | |
| | | | | 19,496 |
| | | | | |
Russia—1.0% | | | | | |
*Magnit—CLS (Multiline retail)† | | 93,787 | | | 1,509 |
*X5 Retail Group N.V.—GDR (Food & staples retailing) | | 267,900 | | | 2,326 |
| | | | | |
| | | | | 3,835 |
| | | | | |
South Africa—7.7% | | | | | |
*Aspen Pharmacare Holdings, Limited (Pharmaceuticals) | | 589,400 | | | 2,151 |
MTN Group, Ltd. (Wireless telecommunication services) | | 966,900 | | | 11,400 |
Naspers, Ltd. (Media) | | 537,000 | | | 9,715 |
Shoprite Holdings, Limited (Food & staples retailing) | | 712,039 | | | 4,095 |
Wilson Bayly Holmes-Ovcon, Limited (Construction & engineering) | | 183,503 | | | 2,133 |
| | | | | |
| | | | | 29,494 |
| | | | | |
See accompanying Notes to Financial Statements.
22 Annual Report | December 31, 2008 |
Emerging Markets Growth Fund
Portfolio of Investments, December 31, 2008 (all dollar amounts in thousands)
| | | | | |
Issuer | | Shares | | Value |
| |
Common Stocks—Emerging Europe, Mid-East, Africa—25.9%—(continued) | | | |
Turkey—3.7% | | | | | |
Bim Birlesik Magazalar A.S. (Food & staples retailing) | | 173,622 | | $ | 3,652 |
Coca Cola Icecek A.S. (Beverages) | | 544,000 | | | 2,261 |
*Turkiye Garanti Bankasi A.S. (Commercial banks) | | 4,886,919 | | | 8,412 |
| | | | | |
| | | | | 14,325 |
| | | | | |
United Arab Emirates—4.2% | | | | | |
Aldar Properties PJSC (Real estate management & development) | | 2,999,588 | | | 3,221 |
Arabtec Holding Company (Construction & engineering) | | 7,717,878 | | | 4,800 |
DP World, Ltd. (Marine)† | | 18,661,225 | | | 7,278 |
*National Central Cooling Company (Building products) | | 6,956,564 | | | 994 |
| | | | | |
| | | | | 16,293 |
| | | | | |
| | |
Emerging Latin America—24.4% | | | | | |
Brazil—15.3% | | | | | |
Anhanguera Educacional Participacoes S.A. (Diversified consumer services) | | 260,300 | | | 1,352 |
*BR Malls Participacoes S.A. (Real estate management & development) | | 473,000 | | | 1,846 |
Companhia Vale Do Rio Doce—ADR (Metals & mining) | | 1,143,469 | | | 13,847 |
*GP Investments, Ltd. (Diversified financial services) | | 863,600 | | | 1,996 |
*GVT Holding S.A. (Diversified telecommunication services) | | 579,200 | | | 6,301 |
Iguatemi Empresa de Shopping Centers S.A. (Real estate management & development) | | 383,115 | | | 2,136 |
*Lupatech S.A. (Machinery) | | 226,000 | | | 2,269 |
Natura Cosmeticos S.A. (Personal products) | | 243,100 | | | 1,980 |
Petroleo Brasileiro S.A. (Oil, gas & consumable fuels) | | 1,523,180 | | | 14,918 |
Redecard S.A. (IT services) | | 660,700 | | | 7,281 |
Rodobens Negocioa Imobiliarios S.A. (Real estate management & development) | | 344,800 | | | 1,161 |
SLC Agricola S.A. (Food products) | | 440,700 | | | 2,646 |
Totvs S.A. (Software) | | 67,000 | | | 1,063 |
| | | | | |
| | | | | 58,796 |
| | | | | |
Chile—1.0% | | | | | |
S.A.C.I. Falabella S.A. (Multiline retail) | | 1,485,062 | | | 3,915 |
| | | | | |
Mexico—7.1% | | | | | |
*Desarrolladora Homex S.A.B. de C.V.—ADR (Household durables) | | 168,348 | | | 3,843 |
Fomento Economico Mexicano S.A.B.—ADR (Beverages) | | 339,333 | | | 10,224 |
*Megacable Holdings S.A.B. de C.V. (Diversified telecommunication services) | | 1,158,400 | | | 1,543 |
* Non-income producing securities
† = U.S. listed Foreign Security
ADR = American Depository Receipt
GDR = Global Depository Receipt
VRN = Variable Rate Note
| | | | | | |
Issuer | | Shares or
Principal
Amount | | Value |
|
Common Stocks—Emerging Latin
America—24.4%—(continued) |
Mexico—(continued) | | | | | | |
*Promotora Ambiental S.A.B. de C.V. (Commercial services & supplies)** | | | 1,114,350 | | $ | 836 |
Wal-Mart de Mexico S.A.B. de C.V. (Food & staples retailing) | | | 4,134,500 | | | 11,046 |
| | | | | | |
| | | | | | 27,492 |
| | | | | | |
Peru—1.0% | | | | | | |
Credicorp, Ltd. (Commercial banks)† | | | 78,355 | | | 3,915 |
| | | | | | |
Total Common Stock—93.2%
(cost $541,784) | | | | | | 359,508 |
| | | | | | |
| | |
Preferred Stock | | | | | | |
Brazil—3.2% | | | | | | |
All America Latin Logistica (Road & rail) | | | 879,200 | | | 3,770 |
Banco Itau Holding Financeira S.A. (Commercial banks) | | | 679,600 | | | 7,606 |
Banco Sofisa S.A. (Commercial banks) | | | 637,600 | | | 985 |
| | | | | | |
| | | | | | 12,361 |
| | | | | | |
Total Preferred Stock—3.2%
(cost $20,236) | | | | | | 12,361 |
| | | | | | |
| | |
Investment in Affiliate | | | | | | |
William Blair Ready Reserves Fund | | | 2,065,261 | | | 2,065 |
| | | | | | |
Total Investment in Affiliate—0.5%
(cost $2,065) | | | | | | 2,065 |
| | | | | | |
| | |
Short-Term Investments | | | | | | |
American Express Credit Corp. Demand Note, VRN 0.321%, due 1/2/09 | | $ | 1,000 | | | 1,000 |
Prudential Funding Demand Note, VRN 0.001%, due 1/2/09 | | | 50 | | | 50 |
| | | | | | |
Total Short-Term Investments—0.3%
(cost $1,050) | | | | | | 1,050 |
| | | | | | |
Repurchase Agreement | | | | | | |
Fixed Income Clearing Corporation,
0.010% dated 12/31/08 due 1/2/09, repurchase price $8,015, collateralized by FHLMC, 5.625%, due 11/23/35 | | | 8,015 | | | 8,015 |
| | | | | | |
Total Repurchase Agreement—2.1%
(cost $8,015) | | | | | | 8,015 |
| | | | | | |
Total Investments—99.3%
(cost $573,150) | | | 382,999 |
Cash and other assets, less liabilities—0.7% | | | 2,589 |
| | | | | | |
Net assets—100.0% | | $ | 385,588 |
| | | | | | |
See accompanying Notes to Financial Statements.
December 31, 2008 | William Blair Funds 23 |
Emerging Markets Growth Fund
Portfolio of Investments, December 31, 2008 (all dollar amounts in thousands)
**Fair valued pursuant to Valuation Procedures adopted by Board of Trustees. This holding represents 0.22% of the Fund’s net assets at December 31, 2008. This security was also deemed illiquid pursuant to Liquidity Procedures approved by the Board of Trustees.
For securities primarily traded on exchanges or markets that close before the close of regular trading on the New York Stock Exchange, the Fund uses an independent pricing service on a daily basis to fair value price the securities pursuant to Valuation Procedures approved by the Board of Trustees.
At December 31, 2008 the Fund’s Portfolio of Investments includes the following industry categories:
| | |
Financials | | 17.7% |
Consumer Staples | | 17.4% |
Industrials | | 13.3% |
Telecommunication Services | | 10.7% |
Consumer Discretionary | | 9.8% |
Energy | | 9.6% |
Information Technology | | 8.2% |
Health Care | | 6.7% |
Materials | | 5.3% |
Utilities | | 1.3% |
| | |
Total | | 100.0% |
| | |
At December 31, 2008 the Fund’s Portfolio of Investments includes the following currency categories:
| | |
U.S. Dollar | | 18.8% |
Hong Kong Dollar | | 17.8% |
Indian Rupee | | 16.8% |
Brazilian Real | | 15.4% |
South African Rand | | 7.9% |
Turkish Lira | | 3.9% |
Mexican Nuevo Peso | | 3.6% |
South Korean Won | | 3.0% |
Egyptian Pound | | 2.8% |
UAE Dirham | | 2.4% |
Indonesian Rupiah | | 2.3% |
Czech Koruna | | 1.3% |
Israeli Shekel | | 1.3% |
Chilean Peso | | 1.1% |
All Other Currencies | | 1.6% |
| | |
Total | | 100.0% |
| | |
See accompanying Notes to Financial Statements.
24 Annual Report | December 31, 2008 |
Todd M. McClone
Jeffrey A. Urbina
EMERGING LEADERS GROWTH FUND
The Emerging Leaders Growth Fund invests primarily in a diversified portfolio of equity securities including common stocks, issued by companies in emerging markets with a market capitalization of at least $5 billion at the time of the Fund’s investment.
AN OVERVIEW FROM THE PORTFOLIO MANAGERS
Please see page 2 for the Global Markets Overview.
The Emerging Leaders Growth Fund commenced operations on March 26, 2008. Through the period ending December 31, 2008, the Fund posted a decrease of (52.11)% (Institutional Class). By comparison, the Fund’s benchmark, the MSCI Emerging Markets Large Cap Index (net) declined (47.28)% during the same period.
During the fourth quarter, the Fund lagged the Index, due primarily to the weighting in the underperforming Consumer Staples sector, coupled with Health Care stock selection and the Industrials overweighting and stock selection. Within Consumer Staples, the Fund’s weighting in the underperforming Latin American region hampered returns, as did X5 Retail Group N.V., a Russian grocery store chain. Within Industrials, exposure to Middle East infrastructure building and Latin America transportation and mining/energy construction was negative. Health Care stock selection was hurt by exposure to Sun Pharmaceutical Industries Limited, a generics pharmaceutical company in India, which underperformed, although the overweighting in Health Care was additive to results. Somewhat mitigating these negative effects was stock selection in Consumer Discretionary and Telecommunication Services, coupled with the underweighting and stock selection in Energy and the underweighted Financials position.
As of year end, the Fund maintained a more defensive sector structure than as of September 30 as sectors such as Consumer Staples, 15.8%, Health Care, 7.3%, and to some extent Telecommunication Services, 15.7%, were at or above Index weightings. These increased with the sales of a number of Industrials, Energy, and Material holdings. In addition, Financials increased from approximately 11% of the Fund as of September 30, to 20%, with the increase largely occurring in Emerging Asia and Latin America. Particularly in Asia, we focused on companies that have benefited from an easing monetary policy environment, government stimulus measures, and those that have generally been unaffected by asset quality concerns. Regionally, the portfolio remained underweighted in Asia, compared to its benchmark, due largely to Korean and Taiwanese weightings, although the weighting increased from approximately 34% as of September 30 to 45%. Conversely, exposure to Emerging Markets Europe, Mid-East and Africa (EMEA) (particularly the Middle East and Russia) was reduced.
December 31, 2008 | William Blair Funds 25 |
Emerging Leaders Growth Fund
Performance Highlights (unaudited)
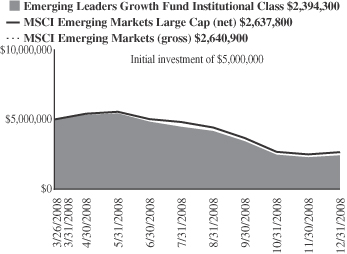
Average Annual Total Return at 12/31/2008
| | | |
| | | Since
Inception(a) | |
Emerging Leaders Growth Fund Institutional Class | | (52.11 | )% |
MSCI Emerging Markets Large Cap (net) | | (47.28 | ) |
MSCI Emerging Markets Large Cap (gross) | | (47.15 | ) |
| | (a) | | For the period from March 26, 2008 (Commencement of Operations) to December 31, 2008. |
Performance cited represents past performance. Past performance does not guarantee future results and current performance may be lower or higher than the data quoted. Results shown are average annual total returns, which assume reinvestment of dividends and capital gains. Investment returns and principal will fluctuate and you may have a gain or loss when you sell shares. For the most current month-end performance information, please call 1-800-742-7272, or visit our Web site at www.williamblairfunds.com. International investing includes special risk considerations, including currency fluctuations, lower liquidity, economic and political risk. From time to time, the investment advisor may waive fees or reimburse expenses for the Fund. Without these waivers, performance would be lower.
The performance highlights and graph presented above do not reflect the deduction of taxes that a shareholder would pay on fund distributions or the redemption of fund shares.
The Morgan Stanley Capital International (MSCI) Emerging Markets Large Cap Index (net) is a free float-adjusted market capitalization weighted index that is designed to measure market performance of large capitalization on stocks in emerging markets. This series approximates the minimum possible dividend reinvestment.
The Morgan Stanley Capital International (MSCI) Emerging Markets Large Cap Index (gross) is a free float-adjusted market capitalization weighted index that is designed to measure market performance of large capitalization on stocks in emerging markets.
On June 30, 2008, the Fund’s Benchmark changed from the MSCI Emerging Markets Large Cap Index (gross) to the MSCI Emerging Markets Large Cap Index (net). The primary reason for the change is that the MSCI Emerging Markets Large Cap (net) index reflects the deduction of dividend withholding tax paid by non-resident institutional investors in foreign countries; the fund is considered a non-resident institutional investors.
This report identifies the Fund’s investments on December 31, 2008. These holdings are subject to change. Not all stocks in the Fund performed the same, nor is there any guarantee that these stocks will perform as well in the future. Market forecasts provided in this report may not necessarily come to pass.
Sector Diversification (unaudited)
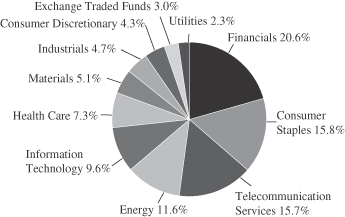
The sector diversification shown is based on the total long-term securities.
26 Annual Report | December 31, 2008 |
Emerging Leaders Growth Fund
Portfolio of Investments, December 31, 2008 (all dollar amounts in thousands)
| | | | | |
Issuer | | Shares | | Value |
| |
Common Stocks—Emerging Asia—42.0% | | | |
China—18.1% | | | | | |
*Baidu.com, Inc.—ADR (Internet software & services) | | 10,568 | | $ | 1,380 |
Belle International Holdings Limited (Specialty retail) | | 1,701,000 | | | 755 |
China Life Insurance Co., Ltd. (Insurance) | | 551,000 | | | 1,693 |
China Merchants Bank Co., Ltd. (Commercial banks) | | 284,500 | | | 532 |
China Mobile, Ltd. (Wireless telecommunication services) | | 168,500 | | | 1,710 |
China Overseas Land & Investment, Ltd. (Real estate management & development) | | 338,000 | | | 474 |
CNOOC Limited (Oil, gas & consumable fuels) | | 1,761,000 | | | 1,675 |
Tencent Holdings, Ltd. (Internet software & services) | | 34,400 | | | 224 |
| | | | | |
| | | | | 8,443 |
| | | | | |
India—19.9% | | | | | |
Bharat Heavy Electricals, Ltd. (Electrical equipment) | | 21,000 | | | 591 |
*Bharti Airtel, Ltd. (Wireless telecommunication services) | | 156,477 | | | 2,307 |
*Cairn India, Ltd. (Oil, gas & consumable fuels) | | 325,509 | | | 1,160 |
HDFC Bank, Ltd. (Commercial banks) | | 22,800 | | | 471 |
Hindustan Unilever, Ltd. (Household products) | | 339,692 | | | 1,756 |
Housing Development Finance Corp. (Thrifts & mortgage finance) | | 25,675 | | | 786 |
Infosys Technologies Limited (IT services) | | 32,913 | | | 763 |
Larsen & Toubro, Ltd. (Construction & engineering) | | 35,740 | | | 571 |
Sun Pharmaceutical Industries Limited (Pharmaceuticals) | | 41,019 | | | 902 |
| | | | | |
| | | | | 9,307 |
| | | | | |
Indonesia—2.9% | | | | | |
PT Bank Rakyat Indonesia (Commercial banks) | | 1,771,500 | | | 753 |
PT Unilever Indonesia Tbk (Household products) | | 828,500 | | | 600 |
| | | | | |
| | | | | 1,353 |
| | | | | |
Taiwan—1.1% | | | | | |
MediaTek Inc. (Semiconductors & semiconductor equipment) | | 75,000 | | | 507 |
| | | | | |
| | |
Emerging Latin America—26.8% | | | | | |
Brazil—15.5% | | | | | |
BM&F Bovespa S.A. (Diversified financial services) | | 230,590 | | | 595 |
Companhia Vale do Rio Doce—ADR (Metals & mining) | | 147,946 | | | 1,792 |
Natura Cosmeticos S.A. (Personal products) | | 70,400 | | | 573 |
*OGX Petroleo e Gas Participacoes S.A. (Oil, gas & consumable fuels) | | 2,300 | | | 519 |
Petroleo Brasileiro S.A. (Oil, gas & consumable fuels) | | 193,000 | | | 1,890 |
Redecard S.A. (IT services) | | 133,600 | | | 1,472 |
Weg S.A. (Machinery) | | 74,200 | | | 398 |
| | | | | |
| | | | | 7,239 |
| | | | | |
Mexico—8.6% | | | | | |
Fomento Economico Mexicano, S.A.B. de C.V.—ADR (Beverages) | | 57,580 | | | 1,735 |
Wal-Mart de Mexico S.A.B. de C.V. (Food & staples retailing) | | 845,600 | | | 2,259 |
| | | | | |
| | | | | 3,994 |
| | | | | |
Peru—2.7% | | | | | |
Credicorp, Ltd. (Commercial banks)† | | 25,477 | | | 1,273 |
| | | | | |
| | | | | |
Issuer | | Shares | | Value |
| |
Emerging Europe, Mid-East, Africa—18.5% | | | |
Czech Republic—2.2% | | | | | |
CEZ (Electric utilities) | | 24,474 | | $ | 1,047 |
| | | | | |
Israel—6.3% | | | | | |
Israel Chemicals Limited (Chemicals) | | 77,917 | | | 545 |
Teva Pharmaceutical Industries, Ltd.—ADR (Pharmaceuticals) | | 56,117 | | | 2,389 |
| | | | | |
| | | | | 2,934 |
| | | | | |
Russia—0.6% | | | | | |
*X5 Retail Group N.V.—GDR (Food & staples retailing) | | 30,420 | | | 264 |
| | | | | |
South Africa —7.8% | | | | | |
MTN Group, Ltd. (Wireless telecommunication services) | | 207,569 | | | 2,447 |
Naspers, Ltd. (Media) | | 66,000 | | | 1,194 |
| | | | | |
| | | | | 3,641 |
| | | | | |
Turkey—1.6% | | | | | |
*Turkiye Garanti Bankasi A.S. (Commercial banks) | | 430,200 | | | 741 |
| | | | | |
| | |
Europe—1.4% | | | | | |
Luxembourg—1.4 % | | | | | |
Millicom International Cellular S.A. (Wireless telecommunication services)† | | 14,770 | | | 663 |
| | | | | |
Total Common Stock—88.7%
(cost $57,937) | | | 41,406 |
| | | | | |
| | |
Preferred Stock | | | | | |
Brazil—5.6% | | | | | |
All America Latin Logistica (Road & rail) | | 136,200 | | | 584 |
Banco Itau Holding Financeira S.A. (Commercial banks) | | 181,446 | | | 2,031 |
| | | | | |
| | | | | 2,615 |
| | | | | |
Total Preferred Stock—5.6%
(cost $3,173) | | | 2,615 |
| | | | | |
| | |
Exchange-Traded Fund | | | | | |
China—2.9% | | | | | |
iShares FTSE/Xinhua A50 China Tracker | | 1,278,700 | | | 1,379 |
| | | | | |
Total Exchange-Traded Fund—2.9%
(cost $1,456) | | | 1,379 |
| | | | | |
Investment in Rights | | | | | |
China Overseas Land & Investment, Ltd. (Real estate management & development) | | 12,240 | | | 5 |
| | | | | |
Total Investment in Rights—0.0%
(cost $0) | | | 5 |
| | | | | |
See accompanying Notes to Financial Statements.
December 31, 2008 | William Blair Funds 27 |
Emerging Leaders Growth Fund
Portfolio of Investments, December 31, 2008 (all dollar amounts in thousands)
| | | | | | | |
Issuer | | Shares or
Principal
Amount | | Value | |
| | |
Investment in Affiliate | | | | | | | |
William Blair Ready Reserves Fund | | | 739,941 | | $ | 740 | |
| | | | | | | |
Total Investment in Affiliate—1.6%
(cost $740) | | | 740 | |
| | | | | | | |
Repurchase Agreement | | | | | | | |
Fixed Income Clearing Corporation, 0.010% dated 12/31/08, due 1/2/09, repurchase price $596, collateralized by FHLMC, 5.625% due 11/23/35 | | $ | 596,125 | | | 596 | |
| | | | | | | |
Total Repurchase Agreement—1.3%
(cost $596) | | | 596 | |
| | | | | | | |
Total Investments—100.1%
(cost $63,902) | | | 46,741 | |
Liabilities, plus cash and other assets—(0.1)% | | | (65 | ) |
| | | | | | | |
Net assets—100.0% | | $ | 46,676 | |
| | | | | | | |
*Non-income producing securities
† = U.S. listed Foreign Security
ADR = American Depository Receipt
GDR = Global Depository Receipt
For securities primarily traded on exchanges or markets that close before the close of regular trading on the New York Stock Exchange the Fund uses an independent pricing service on a daily basis to fair value price the securities pursuant to Valuation Procedures approved by the Board of Trustees.
At December 31, 2008 the Fund’s Portfolio of Investments includes the following industry categories:
| | |
Financials | | 20.6% |
Consumer Staples | | 15.8% |
Telecommunication Services | | 15.7% |
Energy | | 11.6% |
Information Technology | | 9.6% |
Health Care | | 7.3% |
Materials | | 5.1% |
Industrials | | 4.7% |
Consumer Discretionary | | 4.3% |
Exchange-Traded Fund | | 3.0% |
Utilities | | 2.3% |
| | |
Total | | 100.0% |
| | |
At December 31, 2008 the Fund’s Portfolio of Investments includes the following currency categories:
| | |
U.S. Dollar | | 20.9% |
Indian Rupee | | 20.5% |
Hong Kong Dollar | | 18.6% |
Brazilian Real | | 17.8% |
South African Rand | | 8.0% |
Mexican Nuevo Peso | | 5.0% |
Indonesian Rupiah | | 3.0% |
Czech Koruna | | 2.3% |
Turkish Lira | | 1.6% |
Israeli Shekel | | 1.2% |
New Taiwan Dollar | | 1.1% |
| | |
Total | | 100.0% |
| | |
See accompanying Notes to Financial Statements.
28 Annual Report | December 31, 2008 |

Christopher T. Vincent
BOND FUND
The Bond Fund seeks to outperform the Barclays Capital U.S. Aggregate Bond Index by maximizing total return through a combination of income and capital appreciation.
AN OVERVIEW FROM THE PORTFOLIO MANAGER
How did the Fund perform during the past year? How did the Fund’s performance compare to its benchmark?
The Bond Fund posted a 1.95% increase on a total return basis (Institutional Class) for the 12 months ended December 31, 2008. By comparison, the Fund’s benchmark, the Barclays Capital U.S. Aggregate Bond Index, gained 5.24%.
After an unprecedented year of turmoil and upheaval in the financial markets, the performance of fixed income securities during 2008 was somewhat of a mixed bag.
The Barclays Capital U.S. Aggregate Bond Index return of 5.24% for 2008 was actually a rather middling one, as in recent years many returns have been both better and worse. Record gains in the prices of Treasury Securities and record losses in Corporate Bond prices offset each other to produce an average year for this Index.
In the first quarter alone, there were enough newsworthy events to fill an entire year. The fixed income markets had not seen such a quarter since the savings and loan crisis of the early 1990s.
The biggest of these events occurred on March 13, when executives at Bear Stearns first informed financial regulators that the bank, one of Wall Street’s biggest, was facing imminent bankruptcy. After a weekend of round-the-clock negotiations, the Federal Reserve mediated a “fire sale” of Bear Stearns to JP Morgan Chase. The Bear Stearns crisis was a great example of how the confidence of counterparties can affect the viability of a financial institution.
In addition, during the first quarter the Fed lowered the federal funds rate from 4.25% to 2.25%, lowered the discount rate from 4.75% to 2.50%, opened the discount window to investment banks, and reduced the capital holding requirements for Fannie Mae and Freddie Mac, all in an effort to provide liquidity in order to encourage borrowing and lending without reigniting inflation.
Lastly, an emergency financial stimulus package was passed by Congress in February in an attempt to reinvigorate consumer spending, and in turn the economy.
As much as a “flight to quality” had been underway since 2007, so was a “flight to liquidity,” in that demand for U.S. Treasury securities over other fixed-income assets soared.
Corporate bond prices led the fixed income markets down in the third quarter, in a move that was precipitated by the bankruptcy of the venerable 158-year old investment bank, Lehman Brothers. Roughly a week before the U.S. Treasury had stepped in to take over the Government-Sponsored Enterprises (GSEs) Fannie Mae and Freddie Mac.
The very same weekend that Lehman Brothers announced it was in liquidation, Merrill Lynch announced it would be acquired by Bank of America, and the insurance giant AIG suffered a liquidity crisis following the downgrade of its credit rating. At the company’s request, the Federal Reserve loaned money to AIG to prevent its collapse, in order for AIG to meet its obligations to post additional collateral to trading partners.
December 31, 2008 | William Blair Funds 29 |
Exacerbating fears were reports that a prominent institutional money market fund had “broken the buck,” due to losses the fund experienced because of its holdings of Lehman commercial paper.
During the last two weeks of September, the Corporate Bond market experienced price moves that normally would have taken place over the course of a year or more. Market sentiment had literally devolved into a “shoot, first, ask questions later,” atmosphere, with investors assuming the worst with regard to securities. Compounding this was a systemic lack of confidence in the funding markets.
The U.S. Treasury’s Troubled Asset Relief Program (TARP), initially designed as a “one-off,” or piecemeal program to buy assets from troubled financial institutions and thereby inject capital to repair balance sheets, evolved into a system-wide solution to deal with the liquidity crisis.
The mid-September through end of October period was one of wholesale “de-risking” of fixed income portfolios. Undoubtedly there was a great deal of de-leveraging that was occurring during this time.
October especially was an unprecedented period of volatility in the investment grade corporate bond market. Investment grade bonds posted a (7.00)% to (8.00)% negative rate of return in a 30-day period.
By the end of the fourth quarter, the shorter-term/funding markets were functioning on a much improved basis, but with the assistance of a plethora of government programs.
The Federal Reserve Board also entered a new era as it set its benchmark overnight federal funds interest rate to a range of 0.00%—0.25%, in a move to signal it still had tools with which it could stimulate the economy. But with its move, the Fed essentially acknowledged that the economic downturn was worse than the Fed had thought at their meeting in October, and that they remained very concerned about the fragility of the economy. The Fed also stated that inflationary pressures had diminished appreciably, and that inflation should moderate further in coming quarters.
The credit markets began to improve during the middle of November, and the Corporate Bond market came back strongly during December. December, in fact, was a positive month for the riskier segments of the fixed-income markets. Investors had come to the realization that the dislocations within the financial markets were going to impact the economy for several quarters to come.
What is your current strategy? How is the Fund positioned?
During the third quarter we anticipated that market conditions would create opportunities in the Corporate Bond market. We believed investors were being well compensated over the long-term, and searched for attractive entry points at which to establish positions. During the fourth quarter we maintained and slightly increased our weighting to Corporate Bonds—to 34.2% at year end from 32.0% at the end of the third quarter, and we were overweight compared to our benchmark’s weighting of 20.3%.
Within sectors, we were underweight in Financials, as we believe Financials bore the brunt of the recent market volatility.
Although we would characterize the Fund as taking refuge during the market turmoil in what are considered quality “blue chip” (Corporate Bond) names including Kimberly Clark, Kroger and Wal-Mart, as the quarter progressed we gradually began to increase the Fund’s exposure to the Financial sector.
Exposure to Non-Agency Mortgage-backed securities decreased slightly.
30 Annual Report | December 31, 2008 |
What is your outlook going forward?
Market participants continue to search for signs that the worst is over in terms of the financial crisis.
Fundamentally, we believe the case for maintaining overweight positions in Fannie Mae, Freddie Mac and Corporate Bonds is very compelling. We are still overweight the “spread” sectors, based on valuations we believe are stretched.
Nonetheless, there is still a great deal of uncertainty, unknown details, and developments yet to unfold at the macroeconomic level as a result of the government’s $700 billion dollar rescue package for the U.S. financial system, and the changes that have yet to be proposed and implemented by the new Administration. At the very least, we expect regulatory change and increased oversight to play an increased role in the post election period.
December 31, 2008 | William Blair Funds 31 |
Bond Fund
Performance Highlights (unaudited)
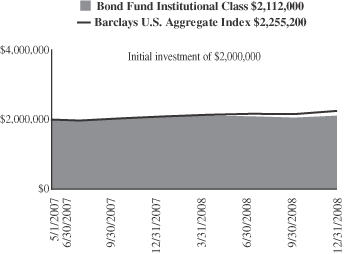
Average Annual Total Return at 12/31/2008
| | | | | | |
| | | 1
Year | | | Since
Inception(a) | |
Bond Fund Institutional Class | | 1.95 | % | | 3.32 | % |
Barclays Capital U.S. Aggregate Bond Index | | 5.24 | | | 6.06 | |
| | (a) | | For the period from May 1, 2007 (Commencement of Operations) to December 31, 2008. | |
Performance cited represents past performance. Past performance does not guarantee future results and current performance may be lower or higher than the data quoted. Results shown are average annual total returns, which assume reinvestment of dividends and capital gains. Investment returns and principal will fluctuate and you may have a gain or loss when you sell shares. For the most current month-end performance information, please call 1-800-742-7272, or visit our Web site at www.williamblairfunds.com. From time to time, the investment advisor may waive fees or reimburse expenses for the Fund. Without these waivers, performance would be lower.
The performance highlights and graph presented above do not reflect the deduction of taxes that a shareholder would pay on fund distributions or the redemption of fund shares.
The Barclays Capital U.S. Aggregate Bond Index indicates broad intermediate government/corporate bond market performance.
This report identifies the Fund’s investments on December 31, 2008. These holdings are subject to change. Not all investments in the Fund performed the same, nor is there any guarantee that these investments will perform as well in the future. Market forecasts provided in this report may not necessarily come to pass.
Sector Diversification (unaudited)
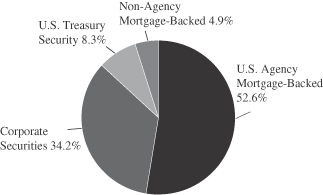
The sector diversification shown is based on the total long-term securities.
32 Annual Report | December 31, 2008 |
Bond Fund
Portfolio of Investments, December 31, 2008 (all amounts in thousands)
| | | | | | |
| | | Principal
Amount | | Value |
|
U.S. Government and U.S. Government Agency—58.9% |
U.S. Treasury—7.9% | | | | | | |
U.S. Treasury Note, 4.750%, due 2/15/10 | | $ | 2,500 | | $ | 2,619 |
U.S. Treasury Note, 4.250%, due 9/30/12 | | | 210 | | | 234 |
U.S. Treasury Note, 4.750%, due 5/15/14 | | | 355 | | | 418 |
U.S. Treasury Note, 4.750%, due 8/15/17 | | | 1,200 | | | 1,435 |
U.S. Treasury Note, 5.500%, due 8/15/28 | | | 400 | | | 541 |
U.S. Treasury Note, 4.500%, due 2/15/36 | | | 500 | | | 664 |
| | | | | | |
Total U.S. Treasury Obligations | | | 5,165 | | | 5,911 |
| | | | | | |
Government National Mortgage Association (GNMA)—1.0% |
#357752, 7.000%, due 4/15/09 | | | 1 | | | 1 |
GNR 2006-67 GB, 4.186%, due 9/16/34 | | | 750 | | | 759 |
| | | | | | |
Total GNMA Mortgage Obligations | | | 751 | | | 760 |
| | | | | | |
Federal Home Loan Mortgage Corp. (FHLMC)—10.7% |
#G10330, 7.000%, due 1/1/10 | | | 9 | | | 10 |
#G90024, 7.000%, due 1/20/13 | | | 105 | | | 110 |
#G30093, 7.000%, due 12/1/17 | | | 57 | | | 60 |
#G30255, 7.000%, due 7/1/21 | | | 118 | | | 124 |
#E02360, 6.500%, due 7/1/22 | | | 915 | | | 951 |
#D95897, 5.500%, due 3/1/23 | | | 410 | | | 422 |
#G10728, 7.500%, due 7/1/32 | | | 406 | | | 431 |
#C01385, 6.500%, due 8/1/32 | | | 645 | | | 674 |
#A62179, 6.000%, due 6/1/37 | | | 1,303 | | | 1,348 |
#A63539, 6.000%, due 7/1/37 | | | 1,810 | | | 1,873 |
#A78138, 5.500%, due 6/1/38 | | | 1,958 | | | 2,012 |
| | | | | | |
Total FHLMC Mortgage Obligations | | | 7,736 | | | 8,015 |
| | | | | | |
Federal National Mortgage Association (FNMA)—39.3% |
#535559, 7.500%, due 9/1/12 | | | 484 | | | 500 |
#598453, 7.000%, due 6/1/15 | | | 12 | | | 12 |
#689612, 5.000%, due 5/1/18 | | | 712 | | | 737 |
#747903, 4.500%, due 6/1/19 | | | 627 | | | 643 |
#253847, 6.000%, due 5/1/21 | | | 431 | | | 447 |
#900725, 6.000%, due 8/1/21 | | | 353 | | | 367 |
#545437, 7.000%, due 2/1/32 | | | 310 | | | 328 |
#254548, 5.500%, due 12/1/32 | | | 1,725 | | | 1,774 |
#555522, 5.000%, due 6/1/33 | | | 799 | | | 818 |
#190337, 5.000%, due 7/1/33 | | | 967 | | | 990 |
#254868, 5.000%, due 9/1/33 | | | 1,411 | | | 1,444 |
#190340, 5.000%, due 9/1/33 | | | 2,915 | | | 2,984 |
#555880, 5.500%, due 11/1/33 | | | 829 | | | 852 |
#725027, 5.000%, due 11/1/33 | | | 1,130 | | | 1,157 |
#725205, 5.000%, due 3/1/34 | | | 877 | | | 898 |
#725238, 5.000%, due 3/1/34 | | | 884 | | | 905 |
#725220, 5.000%, due 3/1/34 | | | 1,665 | | | 1,704 |
#725232, 5.000%, due 3/1/34 | | | 2,320 | | | 2,374 |
#725424, 5.500%, due 4/1/34 | | | 890 | | | 915 |
#725611, 5.500%, due 6/1/34 | | | 698 | | | 717 |
#745092, 6.500%, due 7/1/35 | | | 973 | | | 1,016 |
#848782, 6.500%, due 1/1/36 | | | 1,330 | | | 1,389 |
#849191, 6.000%, due 1/1/36 | | | 160 | | | 166 |
#256859, 5.500%, due 8/1/37 | | | 1,743 | | | 1,752 |
#888967, 6.000%, due 12/1/37 | | | 2,015 | | | 2,089 |
#934006, 6.500%, due 9/1/38 | | | 2,263 | | | 2,364 |
| | | | | | |
Total FNMA Mortgage Obligations | | | 28,523 | | | 29,342 |
| | | | | | |
| | | | | | | | |
| | | NRSRO
Rating
(unaudited) | | Principal
Amount | | Value |
| |
Non-Agency Mortgage-Backed Obligations—4.8% | | | |
Countrywide Alternative Loan Trust, 2003-11T1, Tranche M,
4.750%, due 7/25/18 | | AA+ | | $ | 313 | | $ | 291 |
First Plus 1997-4 M1
7.640%, due 9/11/23 | | AA | | | 244 | | | 244 |
Aames Mortgage Trust, 2001-1, Tranche M2,
7.588%, due 6/25/31 | | A | | | 133 | | | 85 |
LSSCO, 2004-2, Tranche M2,
5.520%, due 2/28/33, VRN* | | A | | | 186 | | | 132 |
CWL, 2003-5, Tranche MF2,
5.959%, due 11/25/33 | | Aa1 | | | 225 | | | 142 |
Renaissance Home Equity Loan Trust, 2004-2, Tranche M5,
6.455%, due 7/25/34 | | A | | | 496 | | | 298 |
FHASI, 2004-AR4, Tranche 3A1,
4.603%, due 8/25/34, VRN | | AAA | | | 714 | | | 505 |
Security National Mortgage Loan Trust, 2004-2A, Tranche M2,
6.352%, due 11/25/34* | | A2 | | | 15 | | | 15 |
Security National Mortgage Loan Trust, 2005-1A, Tranche M2,
6.530%, due 2/25/35* | | A | | | 21 | | | 15 |
Soundview Home Equity Loan Trust, 2005-B, Tranche M1,
5.635%, due 5/25/35 | | AA+ | | | 153 | | | 137 |
Structured Asset Securities Corp., 2005-9XS, Tranche 1A2A,
4.840%, due 6/25/35 | | AAA | | | 369 | | | 359 |
Structured Asset Securities Corp., 2005-9XS, Tranche 1A2C,
4.950%, due 6/25/35 | | AAA | | | 173 | | | 167 |
Structured Asset Securities Corp., 2005-9XS, Tranche A2B,
6.500%, due 6/25/35 | | AAA | | | 228 | | | 225 |
Chase Mortgage Finance Corporation, 2006-A1, Tranche A3,
6.000%, due 9/25/36 | | AAA | | | 700 | | | 300 |
Mid-State Trust 2004-1, Tranche A,
6.005%, due 8/15/37 | | AAA | | | 716 | | | 604 |
Statewide Mortgage Loan Trust, 2006-1A, Tranche A2,
7.660%, due 9/25/37* | | AAA | | | 70 | | | 43 |
| | | | | | | | |
Total Non-Agency Mortgage-Backed Obligations | | | 4,756 | | | 3,562 |
| | | | | | | | |
| | |
Corporate Obligations—32.9% | | | | | | |
HSBC Finance Corporation
8.000%, due 7/15/10 | | AA- | | | 500 | | | 508 |
Morgan Stanley Dean Witter & Co., 6.600%, due 4/1/12 | | A2 | | | 545 | | | 527 |
Simon Property Group, Inc.,
6.350%, due 8/28/12 | | A- | | | 750 | | | 584 |
Cox Communications, Inc.,
7.125%, due 10/1/12 | | BBB | | | 400 | | | 383 |
Boeing Capital Corporation,
5.800%, due 1/15/13 | | A+ | | | 400 | | | 404 |
See accompanying Notes to Financial Statements.
December 31, 2008 | William Blair Funds 33 |
Bond Fund
Portfolio of Investments, December 31, 2008 (all amounts in thousands)
| | | | | | | | |
| | | NRSRO
Rating
(unaudited) | | Principal
Amount | | Value |
| | |
Corporate Obligations—(continued) | | | | | | |
Wells Fargo & Company,
4.375%, due 1/31/13 | | Aa1 | | $ | 350 | | $ | 343 |
The Kroger Co.,
5.500%, due 2/1/13 | | Baa2 | | | 430 | | | 426 |
PepsiCo, Inc.,
4.650%, due 2/15/13 | | Aa2 | | | 550 | | | 565 |
Weatherford International, Ltd.,
5.150%, due 3/15/13 | | BBB+ | | | 650 | | | 572 |
John Deere Capital Corporation,
4.500%, due 4/3/13 | | A | | | 700 | | | 670 |
Citigroup, Inc.,
5.500%, due 4/11/13 | | A+ | | | 690 | | | 672 |
Merrill Lynch & Co., Inc.,
6.150%, due 4/25/13 | | Aa3 | | | 750 | | | 743 |
General Electric Capital Corporation,
4.800%, due 5/1/13 | | AAA | | | 600 | | | 590 |
American Movil S.A.B. de C.V.,
5.500%, due 3/1/14 | | A3 | | | 700 | | | 645 |
Coca-Cola Enterprises, Inc.,
7.375%, due 3/3/14 | | A | | | 575 | | | 631 |
AT&T, Inc.,
5.100%, due 9/15/14 | | A | | | 700 | | | 688 |
Goldman Sachs Group, Inc.,
5.000%, due 10/1/14 | | AA- | | | 545 | | | 487 |
CODELCO, Inc.—144A,
4.750%, due 10/15/14 | | A1 | | | 400 | | | 376 |
Johnson Controls, Inc.,
5.500%, due 1/15/16 | | A3 | | | 400 | | | 310 |
KeyBank National Association,
5.450%, due 3/3/16 | | Aaa | | | 515 | | | 406 |
ProLogis,
5.750%, due 4/1/16 | | Baa2 | | | 400 | | | 199 |
Omnicom Group, Inc.,
5.900%, due 4/15/16 | | A- | | | 400 | | | 325 |
Yum!, Brands, Inc.,
6.250%, due 4/15/16 | | BBB- | | | 700 | | | 594 |
SABMiller plc,
6.500%, due 7/1/16 | | BBB+ | | | 700 | | | 649 |
Petrobras International Finance Company,
6.125%, due 10/6/16 | | Baa1 | | | 400 | | | 390 |
DuPont (E.I.) de Nemours,
5.250%, due 12/15/16 | | A | | | 500 | | | 497 |
Comcast Corporation,
6.500%, due 1/15/17 | | BBB+ | | | 350 | | | 346 |
J.P. Morgan Chase & Co.,
6.125%, due 6/27/17 | | Aa3 | | | 600 | | | 590 |
BB&T Corporation,
4.900%, due 6/30/17 | | A1 | | | 665 | | | 600 |
American Express,
6.150%, due 8/28/17 | | A+ | | | 600 | | | 578 |
IBM Corporation,
5.700%, due 9/14/17 | | A+ | | | 700 | | | 748 |
VRN = Variable Rate Note
NRSRO = Nationally Recognized Statistical Rating Organization, such as S&P, Moody’s or Fitch
The obligations of certain U.S. Government-sponsored securities are neither issued nor guaranteed by the U.S. Treasury
* Deemed illiquid pursuant to Liquidity Procedures approved by the Board of Trustees. These holdings represent 0.66% of the net assets at December 31,2008.
| | | | | | | | |
| | | NRSRO
Rating
(unaudited) | | Principal
Amount | | Value |
| | |
Corporate Obligations—(continued) | | | | | | |
Exelon Generation Company, LLC.,
6.200%, due 10/1/17 | | A3 | | $ | 600 | | $ | 516 |
Union Pacific Corporation,
5.750%, due 11/15/17 | | BBB | | | 525 | | | 498 |
Tesco plc,
5.500%, due 11/15/17 | | A | | | 600 | | | 556 |
Wells Fargo & Company,
5.625%, due 12/11/17 | | AA | | | 500 | | | 522 |
General Electric Capital Corporation,
5.625%, due 5/1/18 | | AAA | | | 350 | | | 353 |
Philip Morris International, Inc.,
5.650%, due 5/16/18 | | A2 | | | 500 | | | 496 |
Verizon Communications, Inc.,
8.750%, due 11/1/18 | | A | | | 330 | | | 387 |
Iron Mountain, Incorporated,
8.000%, due 6/15/20 | | B+ | | | 750 | | | 602 |
Ras Laffan Lng II,
5.298%, due 9/30/20* | | Aa2 | | | 400 | | | 285 |
Southwest Airlines Co.,
6.150%, due 8/1/22 | | Aa3 | | | 725 | | | 566 |
The Kroger Co.,
8.000%, due 9/15/29 | | Baa2 | | | 325 | | | 367 |
Conoco Funding Company,
7.250%, due 10/15/31 | | A1 | | | 400 | | | 430 |
Kohl’s Corporation,
6.000%, due 1/15/33 | | BBB+ | | | 400 | | | 257 |
Pacific Gas and Electric Company,
6.050%, due 3/1/34 | | A | | | 250 | | | 266 |
Wisconsin Electric Power Company,
5.700%, due 12/1/36 | | A1 | | | 500 | | | 474 |
Comcast Corporation,
6.450%, due 3/15/37 | | BBB+ | | | 300 | | | 299 |
McDonald’s Corporation,
6.300%, due 3/1/38 | | A | | | 500 | | | 552 |
J.P. Morgan Chase & Co.,
6.400%, due 5/15/38 | | Aa2 | | | 350 | | | 414 |
Verizon Communications, Inc.,
8.950%, due 3/1/39 | | A | | | 375 | | | 484 |
Florida Power and Light Group Capital, Inc.,
6.650%, due 6/15/67, VRN | | A3 | | | 300 | | | 156 |
| | | | | | | | |
Total Corporate Obligations | | | 26,145 | | | 24,526 |
| | | | | | | | |
Total Fixed Income—96.6%
(Cost $72,832) | | | 73,076 | | | 72,116 |
| | | | | | | | |
Repurchase Agreement | | | | | | | | |
Fixed Income Clearing Corporation, 0.010% dated 12/31/08 due 1/2/09, repurchase price $574, collateralized by FHLMC, 5.625%, due 11/23/35 | | AAA | | | 574 | | | 574 |
| | | | | | | | |
Total Repurchase Agreement—0.8%
(Cost $574) | | | 574 | | | 574 |
| | | | | | | | |
Total Investments—97.4%
(cost $73,406) | | | 72,690 |
| | | | | | | | |
Cash and other assets, less liabilities—2.6% | | | 1,923 |
| | | | | | | | |
Net Assets—100.0% | | $ | 74,613 |
| | | | | | | | |
See accompanying Notes to Financial Statements.
34 Annual Report | December 31, 2008 |
Statements of Assets and Liabilities
December 31, 2008 (dollar amounts in thousands)
| | | | | | | | | | | | |
| | | Institutional
International
Growth
Fund | | | Institutional
International
Equity
Fund | | | International
Small Cap
Growth
Fund | |
Assets | | | | | | | | | | | | |
Investments in securities, at cost | | $ | 1,227,786 | | | $ | 417,307 | | | $ | 392,828 | |
Investments in Affiliated Fund, at cost | | | 12,528 | | | | 4,949 | | | | 3,287 | |
| | | | | | | | | | | | |
| | | |
Investments in securities, at value | | $ | 984,222 | | | $ | 350,068 | | | $ | 291,618 | |
Investments in Affiliated Fund, at amortized cost | | | 12,528 | | | | 4,949 | | | | 3,287 | |
Foreign currency, at value (cost $85, $7) | | | 85 | | | | 7 | | | | — | |
Receivable for fund shares sold | | | — | | | | 4,000 | | | | 814 | |
Receivable for securities sold | | | 3,808 | | | | 787 | | | | 1,468 | |
Dividend and interest receivable | | | 1,993 | | | | 975 | | | | 268 | |
| | | | | | | | | | | | |
Total assets | | | 1,002,636 | | | | 360,786 | | | | 297,455 | |
Liabilities | | | | | | | | | | | | |
Payable for investment securities purchased | | | 1,973 | | | | — | | | | 4,954 | |
Payable for fund shares redeemed | | | 1,329 | | | | — | | | | 230 | |
Management fee payable | | | 800 | | | | 257 | | | | 240 | |
Distribution fee payable | | | — | | | | — | | | | 18 | |
Foreign tax liability | | | 102 | | | | 32 | | | | 4 | |
Other accrued expenses | | | 166 | | | | 46 | | | | 21 | |
| | | | | | | | | | | | |
Total liabilities | | | 4,370 | | | | 335 | | | | 5,467 | |
| | | | | | | | | | | | |
Net Assets | | $ | 998,266 | | | $ | 360,451 | | | $ | 291,988 | |
| | | | | | | | | | | | |
Capital | | | | | | | | | | | | |
Composition of Net Assets | | | | | | | | | | | | |
Par value of shares of beneficial interest | | $ | 115 | | | $ | 48 | | | $ | 44 | |
Capital paid in excess of par value | | | 1,602,100 | | | | 566,282 | | | | 536,882 | |
Accumulated net investment income (loss) | | | 2,184 | | | | (277 | ) | | | (120 | ) |
Accumulated realized gain (loss) | | | (362,309 | ) | | | (138,295 | ) | | | (143,596 | ) |
Net unrealized appreciation (depreciation) of investments and foreign currencies | | | (243,824 | ) | | | (67,307 | ) | | | (101,222 | ) |
| | | | | | | | | | | | |
Net Assets | | $ | 998,266 | | | $ | 360,451 | | | $ | 291,988 | |
| | | | | | | | | | | | |
| | | |
Net Assets | | $ | 998,266 | | | $ | 360,451 | | | | | |
Shares Outstanding | | | 115,332,250 | | | | 48,455,804 | | | | | |
Net Asset Value Per Share | | $ | 8.66 | | | $ | 7.44 | | | | | |
Institutional Share Class | | | | | | | | | | | | |
Net Assets | | | | | | | | | | $ | 191,173 | |
Shares Outstanding | | | | | | | | | | | 28,585,458 | |
Net Asset Value Per Share | | | | | | | | | | $ | 6.69 | |
See accompanying Notes to Financial Statements.
December 31, 2008 | William Blair Funds 35 |
Statements of Operations
for the Year Ended December 31, 2008 (all amounts in thousands)
| | | | | | | | | | | | |
| | | Institutional
International
Growth
Fund | | | Institutional
International
Equity
Fund | | | International
Small Cap
Growth
Fund | |
Investment income | | | | | | | | | | | | |
Dividends | | $ | 45,543 | | | $ | 12,254 | | | $ | 5,478 | |
Less foreign taxes withheld | | | (2,313 | ) | | | (847 | ) | | | (335 | ) |
Dividend Income from Affiliated Fund | | | 63 | | | | 98 | | | | 89 | |
Interest | | | 987 | | | | 486 | | | | 342 | |
| | | | | | | | | | | | |
Total income | | | 44,280 | | | | 11,991 | | | | 5,574 | |
Expenses | | | | | | | | | | | | |
Investment advisory fees | | | 15,668 | | | | 5,141 | | | | 3,887 | |
Distribution fees | | | — | | | | — | | | | 47 | |
Shareholder services fees | | | — | | | | — | | | | 237 | |
Custodian fees | | | 465 | | | | 150 | | | | 195 | |
Transfer agent fees | | | 29 | | | | 9 | | | | 137 | |
Professional fees | | | 91 | | | | 52 | | | | 48 | |
Registration fees | | | 45 | | | | 29 | | | | 85 | |
Other expenses | | | 26 | | | | 98 | | | | 32 | |
| | | | | | | | | | | | |
Total expenses before waiver | | | 16,324 | | | | 5,479 | | | | 4,668 | |
Expenses reimbursed to (waived or absorbed by) the Advisor | | | — | | | | — | | | | 134 | |
| | | | | | | | | | | | |
Net expenses | | | 16,324 | | | | 5,479 | | | | 4,802 | |
| | | | | | | | | | | | |
Net investment income (loss) | | | 27,956 | | | | 6,512 | | | | 772 | |
Net realized and unrealized gain (loss) on investments, foreign currency
transactions and other assets and liabilities | | | | | | | | | | | | |
Net realized gain (loss) on investments | | | (349,875 | ) | | | (136,716 | ) | | | (142,730 | ) |
Net realized gain (loss) on foreign currency transactions and
other assets and liabilities | | | (1,875 | ) | | | (442 | ) | | | (921 | ) |
| | | | | | | | | | | | |
Total net realized gain (loss) | | | (351,750 | ) | | | (137,158 | ) | | | (143,651 | ) |
Change in net unrealized appreciation (depreciation) on investments and
other assets and liabilities | | | (788,174 | ) | | | (204,958 | ) | | | (138,270 | ) |
| | | | | | | | | | | | |
Net increase (decrease) in net assets resulting from operations | | $ | (1,111,968 | ) | | $ | (335,604 | ) | | $ | (281,149 | ) |
| | | | | | | | | | | | |
See accompanying Notes to Financial Statements.
36 Annual Report | December 31, 2008 |
Statements of Changes in Net Assets
for the Years Ended December 31, 2008 and 2007 (all amounts in thousands)
| | | | | | | | | | | | | | | | | | | | | | | | |
| | | Institutional
International
Growth
Fund | | | Institutional
International
Equity
Fund | | | International
Small Cap
Growth
Fund | |
| | | 2008 | | | 2007 | | | 2008 | | | 2007 | | | 2008 | | | 2007 | |
Operations | | | | | | | | | | | | | | | | | | | | | | | | |
Net investment income (loss) | | $ | 27,956 | | | $ | 15,392 | | | $ | 6,512 | | | $ | 5,314 | | | $ | 772 | | | $ | 818 | |
Net realized gain (loss) on investments, foreign currency transactions and other assets and liabilities | | | (351,750 | ) | | | 318,213 | | | | (137,158 | ) | | | 58,784 | | | | (143,651 | ) | | | 29,596 | |
Change in net unrealized appreciation (depreciation) on investments, and other assets and liabilities | | | (788,174 | ) | | | 21,153 | | | | (204,958 | ) | | | 39,199 | | | | (138,270 | ) | | | 6,611 | |
| | | | | | | | | | | | | | | | | | | | | | | | |
Net increase (decrease) in net assets resulting from operations | | | (1,111,968 | ) | | | 354,758 | | | | (335,604 | ) | | | 103,297 | | | | (281,149 | ) | | | 37,025 | |
Distributions to shareholders from | | | | | | | | | | | | | | | | | | | | | | | | |
Net investment income | | | — | | | | (31,967 | ) | | | — | | | | (8,242 | ) | | | — | | | | (2,890 | ) |
Net realized gain | | | (59,710 | ) | | | (302,737 | ) | | | (6,489 | ) | | | (57,957 | ) | | | (4,881 | ) | | | (27,584 | ) |
| | | | | | | | | | | | | | | | | | | | | | | | |
| | | (59,710 | ) | | | (334,704 | ) | | | (6,489 | ) | | | (66,199 | ) | | | (4,881 | ) | | | (30,474 | ) |
Capital stock transactions | | | | | | | | | | | | | | | | | | | | | | | | |
Net proceeds from sale of shares | | | 133,829 | | | | 189,014 | | | | 126,297 | | | | 16,134 | | | | 259,319 | | | | 188,786 | |
Shares issued in reinvestment of income
dividends and capital gain distributions | | | 59,025 | | | | 329,680 | | | | 6,176 | | | | 61,204 | | | | 4,719 | | | | 25,293 | |
Less cost of shares redeemed | | | (168,222 | ) | | | (268,777 | ) | | | (48,108 | ) | | | (94,632 | ) | | | (87,479 | ) | | | (51,140 | ) |
| | | | | | | | | | | | | | | | | | | | | | | | |
Net increase (decrease) in net assets resulting
from capital share transactions | | | 24,632 | | | | 249,917 | | | | 84,365 | | | | (17,294 | ) | | | 176,559 | | | | 162,939 | |
| | | | | | | | | | | | | | | | | | | | | | | | |
Increase (decrease) in net assets | | | (1,147,046 | ) | | | 269,971 | | | | (257,728 | ) | | | 19,804 | | | | (109,471 | ) | | | 169,490 | |
Net assets | | | | | | | | | | | | | | | | | | | | | | | | |
Beginning of year | | | 2,145,312 | | | | 1,875,341 | | | | 618,179 | | | | 598,375 | | | | 401,459 | | | | 231,969 | |
| | | | | | | | | | | | | | | | | | | | | | | | |
End of year | | $ | 998,266 | | | $ | 2,145,312 | | | $ | 360,451 | | | $ | 618,179 | | | $ | 291,988 | | | $ | 401,459 | |
| | | | | | | | | | | | | | | | | | | | | | | | |
Undistributed net investment income (loss) at
the end of the year | | $ | 2,184 | | | $ | (35,539 | ) | | $ | (277 | ) | | $ | (8,537 | ) | | $ | (120 | ) | | $ | (2,779 | ) |
| | | | | | | | | | | | | | | | | | | | | | | | |
See accompanying Notes to Financial Statements.
December 31, 2008 | William Blair Funds 37 |
Statements of Assets and Liabilities
December 31, 2008 (all amounts in thousands)
| | | | | | | | | | | | |
| | | Emerging
Markets
Growth
Fund | | | Emerging
Leaders
Growth
Fund | | | Bond
Fund | |
Assets | | | | | | | | | | | | |
Investments in securities, at cost | | $ | 571,085 | | | $ | 63,162 | | | $ | 73,406 | |
Investments in Affiliated Fund, at cost | | | 2,065 | | | | 740 | | | | — | |
| | | | | | | | | | | | |
| | | |
Investments in securities, at value | | $ | 380,934 | | | $ | 46,001 | | | $ | 72,690 | |
Investments in Affiliated Fund, at amortized cost | | | 2,065 | | | | 740 | | | | — | |
Foreign currency, at value (cost $2,602, $75) | | | 2,640 | | | | 75 | | | | — | |
Receivable for fund shares sold | | | 887 | | | | 37 | | | | 1,331 | |
Receivable for securities sold | | | 2,520 | | | | 183 | | | | — | |
Receivable from Advisor | | | — | | | | — | | | | 12 | |
Dividend and interest receivable | | | 744 | | | | 106 | | | | 669 | |
| | | | | | | | | | | | |
Total assets | | | 389,790 | | | | 47,142 | | | | 74,702 | |
Liabilities | | | | | | | | | | | | |
Payable for investment securities purchased | | | 3,558 | | | | 391 | | | | — | |
Payable for fund shares redeemed | | | 188 | | | | — | | | | 35 | |
Management fee payable | | | 308 | | | | 29 | | | | — | |
Distribution and shareholder administration fee payable | | | 36 | | | | — | | | | 8 | |
Foreign tax liability | | | 107 | | | | 15 | | | | — | |
Other accrued expenses | | | 5 | | | | 31 | | | | 46 | |
| | | | | | | | | | | | |
Total liabilities | | | 4,202 | | | | 466 | | | | 89 | |
| | | | | | | | | | | | |
Net Assets | | $ | 385,588 | | | $ | 46,676 | | | $ | 74,613 | |
| | | | | | | | | | | | |
Capital | | | | | | | | | | | | |
Composition of Net Assets | | | | | | | | | | | | |
Par value of shares of beneficial interest | | $ | 51 | | | $ | 10 | | | $ | 8 | |
Capital paid in excess of par value | | | 744,593 | | | | 98,785 | | | | 76,440 | |
Accumulated net investment income (loss) | | | (674 | ) | | | (52 | ) | | | 10 | |
Accumulated realized gain (loss) | | | (168,272 | ) | | | (34,906 | ) | | | (1,129 | ) |
Net unrealized appreciation (depreciation) of investments and foreign currencies | | | (190,110 | ) | | | (17,161 | ) | | | (716 | ) |
| | | | | | | | | | | | |
Net Assets | | $ | 385,588 | | | $ | 46,676 | | | $ | 74,613 | |
| | | | | | | | | | | | |
| | | |
Institutional Share Class | | | | | | | | | | | | |
Net Assets | | $ | 299,739 | | | $ | 43,762 | | | $ | 10,443 | |
Shares Outstanding | | | 39,667,313 | | | | 9,144,878 | | | | 1,074,646 | |
Net Asset Value Per Share | | $ | 7.56 | | | $ | 4.79 | | | $ | 9.72 | |
See accompanying Notes to Financial Statements.
38 Annual Report | December 31, 2008 |
Statements of Operations
for the Year Ended December 31, 2008 (all amounts in thousands)
| | | | | | | | | | | | |
| | | Emerging
Markets
Growth
Fund | | | Emerging
Leaders
Growth
Fund(a) | | | Bond
Fund | |
Investment income | | | | | | | | | | | | |
Dividends | | $ | 18,489 | | | $ | 1,023 | | | $ | 8 | |
Less foreign taxes withheld | | | (814 | ) | | | (65 | ) | | | — | |
Dividend Income from Affiliated Fund | | | 40 | | | | 20 | | | | — | |
Interest | | | 202 | | | | 27 | | | | 3,878 | |
| | | | | | | | | | | | |
Total income | | | 17,917 | | | | 1,005 | | | | 3,886 | |
Expenses | | | | | | | | | | | | |
Investment advisory fees | | | 8,539 | | | | 559 | | | | 215 | |
Distribution fees | | | 122 | | | | — | | | | 1 | |
Shareholder services fees | | | 366 | | | | 5 | | | | 91 | |
Custodian fees | | | 509 | | | | 89 | | | | 45 | |
Transfer agent fees | | | 171 | | | | 5 | | | | 20 | |
Professional fees | | | 62 | | | | 27 | | | | 31 | |
Registration fees | | | 89 | | | | 26 | | | | 45 | |
Other expenses | | | 32 | | | | 16 | | | | 56 | |
| | | | | | | | | | | | |
Total expenses before waiver | | | 9,890 | | | | 727 | | | | 504 | |
Expenses reimbursed to (waived or absorbed by) the Advisor | | | 208 | | | | (81 | ) | | | (160 | ) |
| | | | | | | | | | | | |
Net expenses | | | 10,098 | | | | 646 | | | | 344 | |
| | | | | | | | | | | | |
Net investment income (loss) | | | 7,819 | | | | 359 | | | | 3,542 | |
Net realized and unrealized gain (loss) on investments, foreign currency transactions and other assets and liabilities | | | | | | | | | | | | |
Net realized gain (loss) on investments | | | (165,025 | ) | | | (34,906 | ) | | | (939 | ) |
Net realized gain (loss) on foreign currency transactions and other assets and liabilities | | | (2,145 | ) | | | (344 | ) | | | — | |
| | | | | | | | | | | | |
Total net realized gain (loss) | | | (167,170 | ) | | | (35,250 | ) | | | (939 | ) |
Change in net unrealized appreciation (depreciation) on investments and other assets and liabilities | | | (484,606 | ) | | | (17,161 | ) | | | (1,455 | ) |
| | | | | | | | | | | | |
Net increase (decrease) in net assets resulting from operations | | $ | (643,957 | ) | | $ | (52,052 | ) | | $ | 1,148 | |
| | | | | | | | | | | | |
| (a) | | For the period from March 26, 2008 (Commencement of Operations) to December 31, 2008. |
See accompanying Notes to Financial Statements.
December 31, 2008 | William Blair Funds 39 |
Statements of Changes in Net Assets
for the Years Ended December 31, 2008 and 2007 (all amounts in thousands)
| | | | | | | | | | | | | | | | | | | | |
| | | Emerging
Markets
Growth
Fund | | | Emerging
Leaders
Growth
Fund | | | Bond
Fund | |
| | | 2008 | | | 2007 | | | 2008(a) | | | 2008 | | | 2007(b) | |
Operations | | | | | | | | | | | | | | | | | | | | |
Net investment income (loss) | | $ | 7,819 | | | $ | (1,119 | ) | | $ | 359 | | | $ | 3,542 | | | $ | 1,886 | |
Net realized gain (loss) on investments, foreign currency transactions and other assets and liabilities | | | (167,170 | ) | | | 220,106 | | | | (35,250 | ) | | | (939 | ) | | | (206 | ) |
Change in net unrealized appreciation (depreciation) on investments, and other assets and liabilities | | | (484,606 | ) | | | 117,024 | | | | (17,161 | ) | | | (1,455 | ) | | | 739 | |
| | | | | | | | | | | | | | | | | | | | |
Net increase (decrease) in net assets resulting from operations | | | (643,957 | ) | | | 336,011 | | | | (52,052 | ) | | | 1,148 | | | | 2,419 | |
Distributions to shareholders from | | | | | | | | | | | | | | | | | | | | |
Net investment income | | | — | | | | (7,865 | ) | | | (87 | ) | | | (3,517 | ) | | | (1,892 | ) |
Net realized gain | | | (41,761 | ) | | | (199,782 | ) | | | — | | | | — | | | | — | |
| | | | | | | | | | | | | | | | | | | | |
| | | (41,761 | ) | | | (207,647 | ) | | | (87 | ) | | | (3,517 | ) | | | (1,892 | ) |
Capital stock transactions | | | | | | | | | | | | | | | | | | | | |
Net proceeds from sale of shares | | | 81,613 | | | | 192,579 | | | | 107,010 | | | | 18,146 | | | | 67,764 | |
Shares issued in reinvestment of income dividends and capital gain distributions | | | 41,234 | | | | 201,805 | | | | 80 | | | | 2,956 | | | | 1,606 | |
Less cost of shares redeemed | | | (217,395 | ) | | | (170,543 | ) | | | (8,275 | ) | | | (12,603 | ) | | | (1,414 | ) |
| | | | | | | | | | | | | | | | | | | | |
Net increase (decrease) in net assets resulting from capital share transactions | | | (94,548 | ) | | | 223,841 | | | | 98,815 | | | | 8,499 | | | | 67,956 | |
| | | | | | | | | | | | | | | | | | | | |
Increase (decrease) in net assets | | | (780,266 | ) | | | 352,205 | | | | 46,676 | | | | 6,130 | | | | 68,483 | |
Net assets | | | | | | | | | | | | | | | | | | | | |
Beginning of year | | $ | 1,165,854 | | | $ | 813,649 | | | $ | — | | | $ | 68,483 | | | $ | — | |
| | | | | | | | | | | | | | | | | | | | |
End of year | | $ | 385,588 | | | $ | 1,165,854 | | | $ | 46,676 | | | $ | 74,613 | | | $ | 68,483 | |
| | | | | | | | | | | | | | | | | | | | |
Undistributed net investment income (loss) at the end of the year | | $ | (674 | ) | | $ | (9,849 | ) | | $ | (52 | ) | | $ | 10 | | | $ | 1 | |
| | | | | | | | | | | | | | | | | | | | |
| (a) | | For the period from March 26, 2008 (Commencement of Operations) to December 31, 2008. |
| (b) | | For the period from May 1, 2007 (Commencement of Operations) to December 31, 2007. |
See accompanying Notes to Financial Statements.
40 Annual Report | December 31, 2008 |
Notes to Financial Statements
(1) Significant Accounting Policies
The following is a summary of the William Blair Funds’ (the “Fund”) significant accounting policies in effect during the year covered by the financial statements, which are in accordance with U.S. generally accepted accounting principles.
(a) Description of the Fund
William Blair Funds is a diversified mutual fund registered under the Investment Company Act of 1940, as amended, as an open-end management investment company. The number of shares authorized for this Fund is unlimited. The Fund currently consists of the following seventeen portfolios (the “Portfolios”), each with its own investment objective and policies.
| | |
Equity Portfolios | | International Equity Portfolios |
Growth | | International Growth |
Tax-Managed Growth | | International Equity |
Large Cap Growth | | Institutional International Growth |
Small Cap Growth | | Institutional International Equity |
Mid Cap Growth | | International Small Cap Growth |
Small-Mid Cap Growth | | Emerging Markets Growth |
Value Discovery | | Emerging Leaders Growth |
| |
Global Equity Portfolio | | Fixed-Income Portfolios |
Global Growth | | Bond |
| | Income |
| |
| | Money Market Portfolio |
| | Ready Reserves |
The investment objectives of the Portfolios are as follows:
| | |
Equity | | Long-term capital appreciation. |
Global Equity | | Long-term capital appreciation. |
International Equity | | Long-term capital appreciation. |
Fixed-Income | | High level of current income with relative stability of principal. |
Money Market | | Current income, a stable share price and daily liquidity. |
The Institutional International Growth Portfolio, the Institutional International Equity Portfolio and the Institutional Share Classes of the International Small Cap Growth Portfolio, the Emerging Markets Growth Portfolio, the Emerging Leaders Growth Portfolio, and the Bond Portfolio are the only Portfolios covered in this report.
(b) Share Classes
Three different classes of shares of the International Small Cap Growth Fund, Emerging Markets Growth Fund, and the Bond Fund currently exist: N, I and Institutional. Two different classes of shares of the Emerging Leaders Growth Fund currently exist: I and Institutional. This report includes financial information for only the Institutional Class. The Institutional share class is sold to institutional investors, including but not limited to employee benefit plans, endowments, foundations, trusts and corporations, who are able to meet the Fund’s high minimum investment requirement. The minimum initial investment required is $5 million ($2 million for the Bond Portfolio).
Investment income realized and unrealized gains and losses, and certain Portfolio level expenses and expense reductions, if any, are allocated based on the relative net assets of each class, except for certain class specific expenses which are charged directly to the appropriate class. Differences in class expenses may result in the payment of different per share dividends by class. All share classes of the Portfolios have equal rights with respect to voting subject to class specific arrangements.
December 31, 2008 | William Blair Funds 41 |
(c) Investment Valuation
The market value of domestic equity securities and options is determined by valuing securities traded on national securities exchanges or markets or in the over-the-counter markets at the last sales price or, if applicable, the official closing price or, in the absence of a sale on the date of valuation, at the latest bid price.
The Board of Trustees has determined that the passage of time between when the foreign exchanges or markets close and when the Funds compute their net asset values could cause the value of international securities to no longer be representative or accurate, and as a result, necessitates that such securities be fair valued on a daily basis. Accordingly, for international securities, if the foreign exchange or market on which a security is primarily traded closes before the close of regular trading on the New York Stock Exchange (generally 4:00 p.m. Eastern time), the Funds use an independent pricing service on a daily basis to fair value price the security as of the close of regular trading on the New York Stock Exchange. As a result, a Portfolio’s value for a security may be different from the last sale price (or the latest bid price). The independent pricing service may not provide a fair value price for all international securities owned by a Portfolio trading on a foreign exchange or market that closes before the close of regular trading on the New York Stock Exchange. For these securities and all other foreign securities, the value of the security is determined based upon the last sale price on the foreign exchange or market on which it is primarily traded and in the currency of that market as of the close of the appropriate exchange or, if there have been no sales during that day, at the latest bid price.
Long-term, fixed-income securities are valued based on market quotations, or by independent pricing services that use prices provided by market makers or matrixes that produce estimates of market values obtained from yield data relating to instruments or securities with similar characteristics.
Investments in other funds are valued at the underlying fund’s net asset value on the date of valuation. Other securities, and all other assets, including securities for which a market price is not available, or the value of which is affected by a significant valuation event, are valued at fair value as determined in good faith by the Pricing Committee or Valuation Committee, in accordance with the Fund’s Valuation Procedures approved by the Board of Trustees. As of December 31, 2008, there was a security held in the Emerging Markets Growth Portfolio requiring fair valuation by the Board of Trustees pursuant to the Fund’s valuation procedures.
(d) Investment income and transactions
Dividend income is recorded on the ex-dividend date, except for those dividends from certain foreign securities that are recorded as soon as the information is available. Foreign currency gains and losses associated with fluctuation in the foreign currency rate versus the United States dollar are recorded on the Statement of Operations as a component of net realized gains/(losses) on foreign currency translation and other assets and liabilities.
Premiums and discounts are accreted and amortized on a straight-line basis for short-term investments and on an effective interest method for long-term investments. The interest rate shown on the Portfolio of Investments for the Bond Fund were the rates in effect on December 31, 2008. Put bonds may be redeemed at the discretion of the holder on specified dates prior to maturity.
Interest income is recorded on an accrual basis, adjusted for amortization of premium or discount. Variable rate bonds and floating rate notes earn interest at coupon rates that fluctuate at specific time intervals.
Paydown gains and losses on mortgage and asset-backed securities are treated as an adjustment to interest income. For the year ended December 31, 2008, the Bond Portfolio recognized an increase of interest income and a decrease of net realized gain of $16 (in thousands). This reclassification has no effect on the net asset value of the Portfolio.
Security and shareholder transactions are accounted for no later than one business day following the trade date. However, for financial reporting purposes, security and shareholder transactions are accounted for on the trade date of the last business day of the reporting period. Realized gains and losses from securities transactions are recognized on the basis of high cost lot sell selection.
Awards from class action litigation may be recorded as a reduction of cost. If the Portfolios no longer own the applicable securities, the proceeds are recorded as realized gains.
42 Annual Report | December 31, 2008 |
(e) Share Valuation and Dividends to Shareholders
Shares are sold and redeemed on a continuous basis at net asset value. The net asset value per share is determined by dividing the Portfolio’s net assets by the number of shares outstanding as of the close of regular trading on the New York Stock Exchange, which is generally 4:00 p.m. Eastern time, on each day the Exchange is open.
Dividends from net investment income, if any, are declared at least annually for all Portfolios covered by this report except the Bond Portfolio which is declared monthly. Capital gain distributions, if any, are declared at least annually in December. Dividends payable to shareholders are recorded on the ex-dividend date.
(f) Foreign Currency Translation and Foreign Currency Forward Contracts
The Portfolios (excluding the Bond Portfolio) may invest in securities denominated in foreign currencies. As such, assets and liabilities denominated in foreign currencies are translated into U.S. dollar amounts at the current exchange rate on the date of valuation. The values of foreign investments, open foreign currency forward contracts, and cash denominated in foreign currencies are translated into U.S. dollars using a spot market rate of exchange as of the time of the determination of each Fund’s NAV, typically 4:00 p.m. Eastern time on days when there is regular trading on the New York Stock Exchange. Payables and receivables for securities transactions, dividends, interest income and tax reclaims are translated into U.S. dollars using a spot market rate of exchange as of 4:00 p.m. Eastern time. Settlement of purchases and sales and dividend and interest receipts are translated into U.S. dollars using a spot market rate of exchange as of 11:00 a.m. Eastern time.
These Portfolios (excluding the Bond Portfolio) may enter into foreign currency forward contracts (1) as a means of managing the risks associated with changes in the exchange rates for the purchase or sale of a specific amount of a particular foreign currency, and (2) to hedge the value, in U.S. dollars, of portfolio securities. Gains and losses from foreign currency transactions associated with purchases and sales of investments and foreign currency forward contracts are included with the net realized and unrealized gain or loss on investments. For tax purposes, the foreign currency gains and losses are treated as ordinary income.
(g) Income Taxes
Each Portfolio intends to comply with the provisions of Subchapter M of the Internal Revenue Code available to regulated investment companies and, therefore, no provision for Federal income taxes has been made in the accompanying financial statements since each Portfolio intends to distribute substantially all of its taxable income to its shareholders and be relieved of all Federal income taxes.
The Institutional International Growth, Institutional International Equity, International Small Cap Growth, Emerging Markets Growth, and Emerging Leaders Growth Portfolios may be subject to a tax imposed on net realized gains on securities of certain foreign countries. The Portfolios record an estimated deferred tax liability for net realized gains on these securities in an amount that would be payable if the securities were disposed of on the valuation date.
Each Portfolio is subject to the provisions of FASB Interpretation No. 48, Accounting for Uncertainties in Income Taxes (FIN 48). FIN 48 provides guidance for how uncertain tax positions should be recognized, measured, presented and disclosed in the financial statements. Management has evaluated the implications of FIN 48 and all of the uncertain tax positions of the Portfolios and has determined that no liability is required to be recorded in the financial statements as of December 31, 2008.
The statute of limitations on the Funds’ tax returns remains open for the tax years 2005, 2006, 2007 and 2008 are still subject to examination.
The Portfolios have elected to mark-to-market their investments in Passive Foreign Investment Companies (“PFICs”) for Federal income tax purposes. The Portfolios also treat the deferred loss associated with current and prior year wash sales as an adjustment to the cost of investments for tax purposes. The cost of investments for Federal income tax purposes and related gross unrealized appreciation/(depreciation) and net unrealized appreciation/(depreciation) at December 31, 2008 were as follows (in thousands):
| | | | | | | | | | | | | |
Portfolio | | Cost of
Investments | | Gross
Unrealized
Appreciation | | Gross
Unrealized
Depreciation | | Net
Unrealized
Appreciation/
Depreciation | |
Institutional International Growth | | $ | 1,268,735 | | $ | 60,302 | | $ | 332,547 | | $ | (272,245 | ) |
Institutional International Equity | | | 435,693 | | | 15,046 | | | 95,790 | | | (80,744 | ) |
International Small Cap Growth | | | 403,796 | | | 13,686 | | | 122,589 | | | (108,903 | ) |
Emerging Markets Growth | | | 598,107 | | | 7,476 | | | 222,543 | | | (215,067 | ) |
Emerging Leaders Growth | | | 69,494 | | | 688 | | | 23,441 | | | (22,753 | ) |
Bond | | | 73,554 | | | 2,202 | | | 3,066 | | | (864 | ) |
December 31, 2008 | William Blair Funds 43 |
The timing and characterization of certain income and capital gain distributions are determined annually in accordance with Federal income tax regulations that may differ from U.S. generally accepted accounting principles. As a result, net investment income or loss and net realized gain or loss for a reporting period may differ from the amount distributed during such period. In addition, the Portfolios may periodically record reclassifications among certain capital accounts to reflect differences between financial reporting and income tax basis distributions. The reclassifications were reported in order to reflect the tax treatment for certain permanent differences that exist between income tax regulations and U.S. generally accepted accounting principles. The reclassifications generally relate to section 988 currency gains and losses, and recharacterization of unrealized appreciation on PFICs (Passive Foreign Investment Corporations). These reclassifications have no impact on the net asset values of the Portfolio. Accordingly, at December 31, 2008, the following reclassifications were recorded (in thousands):
| | | | | | | | | | | | |
Portfolio | | Undistributed Net
Investment Income (Loss) | | | Accumulated Undistributed Net Realized Gain/(Loss) | | | Capital Paid in Excess of Par Value | |
Institutional International Growth | | $ | 9,765 | | | $ | (9,765 | ) | | $ | — | |
Institutional International Equity | | | 1,748 | | | | (786 | ) | | | (962 | ) |
International Small Cap Growth | | | 1,887 | | | | 779 | | | | (2,666 | ) |
Emerging Markets Growth | | | 1,356 | | | | 778 | | | | (2,134 | ) |
Emerging Leaders Growth | | | (324 | ) | | | 344 | | | | (20 | ) |
Bond | | | (16 | ) | | | 16 | | | | — | |
Distributions from net realized gains for book purposes may include short-term capital gains, which are included as ordinary income for tax purposes. The tax character of distributions paid during 2008 and 2007 was as follows (in thousands):
| | | | | | | | | | | | | | | | | | |
| | | Distributions Paid in 2008 | | | | Distributions Paid in 2007 | | |
Portfolio | | Ordinary Income | | Long-Term Capital Gains | | Total Distributions | | Ordinary Income | | Long-Term Capital Gains | | Total
Distributions |
Institutional International Growth | | $ | 1,671 | | $ | 58,039 | | $
| 59,710
| | $ | 39,677 | | $ | 295,027 | | $
| 334,704
|
Institutional International Equity | | | 1,947 | | | 4,542 | |
| 6,489
| | | 24,899 | | | 41,300 | |
| 66,199
|
International Small Cap Growth | | | — | | | 4,881 | |
| 4,881
| | | 9,634 | | | 20,840 | |
| 30,474
|
Emerging Markets Growth | | | 10,054 | | | 31,707 | |
| 41,761
| | | 71,085 | | | 136,562 | |
| 207,647
|
Emerging Leaders Growth | | | 87 | | | — | |
| 87
| | | N/A | | | N/A | |
| N/A
|
Bond | | | 3,517 | | | — | |
| 3,517
| | | 1,892 | | | — | |
| 1,892
|
As of December 31, 2008, the components of distributable earnings on a tax basis were as follows (in thousands):
| | | | | | | | | | | | | |
Portfolio | | Undistributed Ordinary Income | | Undistributed Capital and Other Losses | | Undistributed Long-Term Gain | | Net Unrealized Appreciation/ Depreciation | |
Institutional International Growth | | $ | 3,736 | | $ | 335,440 | | $ | — | | $ | (272,245 | ) |
Institutional International Equity | | | — | | | 125,135 | | | — | | | (80,744 | ) |
International Small Cap Growth | | | — | | | 136,035 | | | — | | | (108,903 | ) |
Emerging Markets Growth | | | — | | | 143,989 | | | — | | | (215,067 | ) |
Emerging Leaders Growth | | | — | | | 29,366 | | | — | | | (22,753 | ) |
Bond | | | 10 | | | 981 | | | — | | | (864 | ) |
At December 31, 2008, the Portfolios have unused capital loss carry forwards available for Federal income tax purposes to be applied against future gains, if any. In not applied the carryforward will expire as follows (in thousands):
| | | | | | | | | | | | | | | | | | | | | | | | | | | |
Portfolio | | 2009 | | 2010 | | 2011 | | 2012 | | 2013 | | 2014 | | 2015 | | 2016 | | Total |
Institutional International Growth | | $ | — | | $ | — | | $ | — | | $ | — | | $ | — | | $ | — | | $ | — | | $ | 188,201 | | $ | 188,201 |
Institutional International Equity | | | — | | | — | | | — | | | — | | | — | | | — | | | — | | | 83,536 | | | 83,536 |
International Small Cap Growth | | | — | | | — | | | — | | | — | | | — | | | — | | | — | | | 81,949 | | | 81,949 |
Emerging Markets Growth | | | — | | | — | | | — | | | — | | | — | | | — | | | — | | | 84,442 | | | 84,442 |
Emerging Leaders Growth | | | — | | | — | | | — | | | — | | | — | | | — | | | — | | | 21,249 | | | 21,249 |
Bond | | | — | | | — | | | — | | | — | | | — | | | — | | | 135 | | | 559 | | | 694 |
44 Annual Report | December 31, 2008 |
For the period November 1, 2008 through December 31, 2008, the following Portfolios incurred net realized capital, foreign currency losses or PFIC losses. Each Portfolio intends to treat this loss as having occurred in fiscal year 2009 for Federal income tax purposes (in thousands):
| | | | | | | | | |
Portfolio | | Capital
Amount | | Currency
Amount | | PFIC
Amount |
Institutional International Growth | | $ | 145,693 | | $ | 1,246 | | $ | 554 |
Institutional International Equity | | | 41,322 | | | 366 | | | — |
International Small Cap Growth | | | 53,966 | | | 120 | | | — |
Emerging Markets Growth | | | 59,152 | | | 395 | | | — |
Emerging Leaders Growth | | | 8,083 | | | 34 | | | — |
Bond | | | 287 | | | — | | | — |
(h) Repurchase Agreements
The Portfolios may enter into repurchase agreements with its custodian, State Street Bank & Trust Company, whereby the Portfolios acquire ownership of a debt security and the custodian agrees, at the time of sale, to repurchase the debt security from the Portfolios at a mutually agreed upon time and price. The Portfolios’ policy is to take possession of the debt security as collateral under the repurchase agreements. The Portfolios minimize credit risk by monitoring credit exposure to the custodian and by monitoring the collateral value on an ongoing basis.
(i) Use of Estimates
The preparation of financial statements in conformity with U.S. generally accepted accounting principles requires management to make estimates and assumptions that affect the amounts reported in the financial statements. Actual results may differ from those estimates.
(j) Fair Value Measurements
The Portfolios adopted SFAS No. 157 effective January 1, 2008. In accordance with SFAS 157, “fair value” is defined as the price that a Portfolio would receive upon selling a security in an orderly transaction to an independent buyer in the principal or most advantageous market for the investment. Various inputs are used in determining the value of a Portfolio’s investments. SFAS 157 established a three-tier hierarchy of inputs to classify value measurements for disclosure purposes. The three-tier hierarchy of inputs is summarized in the three broad Levels listed below.
| | • | | Level 1—Quoted prices in active markets for an identical security. |
| | • | | Level 2—Prices determined using other significant observable inputs. Observable inputs are inputs that other market participants would use in pricing a security. These may include quoted prices for similar securities, interest rates, prepayment speeds, credit risk and others. |
| | • | | Level 3—Prices determined using significant unobservable inputs. In situations where quoted prices or observable inputs are unavailable (for example, when there is little or no market activity for an investment), unobservable inputs may be used. Unobservable inputs reflect the Fund’s own assumptions about the factors market participants would use in pricing an investment, and would be based on the best information available. |
The inputs or methodology used for valuing an investment are not necessarily an indication of the risk associated with investing in those securities. For example, money market securities are valued using amortized cost, in accordance with rules under the 1940 Act. Generally, amortized cost approximates the current fair value of a security, but since the value is not obtained from a quoted price in an active market, such securities are reflected as Level 2.
At December 31, 2008, the Portfolios held no other financial instruments, such as, options, futures, or foreign currency forward contracts, that required fair valuation. The Small Cap Growth Portfolio holds warrants that were valued using the intrinsic pricing method. Pursuant to this methodology, the warrants had no value at December 31, 2008.
December 31, 2008 | William Blair Funds 45 |
As of December 31, 2008 the hierarchical input levels of securities in each Portfolio are as follows (in thousands):
| | | | | | | | | | | | |
Portfolio | | Level 1 | | Level 2 | | Level 3 | | Total |
Institutional International Growth | | $ | 174,068 | | $ | 822,682 | | $ | — | | $ | 996,750 |
Institutional International Equity | | | 55,471 | | | 299,546 | | | — | | | 355,017 |
International Small Cap Growth | | | 40,947 | | | 253,958 | | | — | | | 294,905 |
Emerging Markets Growth | | | 148,810 | | | 234,189 | | | — | | | 382,999 |
Emerging Leaders Growth | | | 21,673 | | | 25,068 | | | — | | | 46,741 |
Bond | | | — | | | 72,647 | | | 43 | | | 72,690 |
The following is a reconciliation of Level 3 securities for which significant unobservable inputs were used to determine fair value:
| | | | | | | | | | |
| | | Balance
January 1, 2008 | | Net Purchases Sales | | Transfers to Level 3 | | Change in
Unrealized
Gain (Loss) | | Balance
December 31, 2008 |
Bond | | $— | | $— | | $69 | | $(26) | | $43 |
A fair value estimate of this level three security was obtained from an outside party and was reviewed by the Investment Advisor. At December 31, 2008, this securities represented 0.06% of the net assets of the Bond Portfolio.
(k) U.S. Department of The Treasury’s Temporary Guaranty Program
On October 2, 2008, the Board of Trustees approved the participation of the Ready Reserve Portfolio in the U.S. Department of the Treasury’s Temporary Guaranty Program for Money Markets Funds (“Program”). The Program protects the NAV of certain shares of a shareholder of record in the Portfolio at the close of business on September 19, 2008. A shareholder would receive a payment in the amount of $1.00 per covered share upon liquidation of the Portfolio, if the Portfolio’s market-based NAV per share were to fall below $0.995 and was not promptly restored to $1.00. The number of covered shares is the lesser of the number of shares owned on September 19, 2008 or the number of shares owned on the date when the payment is triggered. Shares acquired by a covered shareholder after the close of business on September 19, 2008 are not guaranteed. If a customer closes his or her account with the Portfolio or a broker-dealer or other intermediary, any future investment in the Portfolio will not be guaranteed. Guarantee payments under the Program will not exceed the amount available within the Treasury’s Exchange Stabilization Fund. The Portfolio will bear the expense of its participation in the Program without regard to any expense caps currently in place. Prior to December 3, 2008, the fee for participation in the Program was 0.01% of the NAV of the Ready Reserve Portfolio.
On December 2, 2008, the Board approved the participation of the Ready Reserve Portfolio in the extension (the “Extension”) of the Program.
The Ready Reserve Portfolio will continue to bear the expense of its participation in the Program without regard to any expense caps currently in place and, therefore, all shareholders will bear such expense irrespective of the extent of their coverage. The fee for participation in the Extension after December 3, 2008 is 0.015% of the NAV of the Portfolio, as of September 19, 2008.
The Extension terminates on April 30, 2009, but may be later extended by the Treasury Department to terminate no later than September 18, 2009. If the Treasury Department further extends the Program, the Board of Trustees will consider whether to continue to participate.
(2) Accounting Pronouncement
In March 2008, the FASB issued SFAS No. 161, “Disclosures about Derivative Instruments and Hedging Activities.” This standard is intended to enhance financial statement disclosures for derivative instruments and hedging activities and enable investors to understand: a) how and why a fund uses derivative instruments, b) how derivatives instruments and related hedge fund items are accounted for, and c) how derivative instruments and related hedge items affect a fund’s financial position, results of operations and cash flows. SFAS No. 161 is effective for financial statements issued for fiscal years and interim periods beginning after November 15, 2008. As of December 31, 2008, management does not believe the adoption of FAS No. 161 will impact the financial statement amounts; however, additional footnote disclosures may be required about the use of derivative instruments and hedging items.
46 Annual Report | December 31, 2008 |
(3) Transactions with Affiliates
(a) Management and Expense Limitation Agreements
The Institutional International Growth and Institutional International Equity Portfolios have a management agreement with William Blair & Company L.L.C. (the “Company”) for investment advisory, administrative, and other accounting services. The Portfolios pay the Company an annual fee, payable monthly, based on a specified percentage of its average daily net assets. A summary of the annual rates expressed as a percentage of average daily net assets is as follows:
| | | |
First $500 million | | 1.00 | % |
Next $500 million | | 0.95 | % |
In excess of $1 billion | | 0.90 | % |
The International Small Cap Growth Portfolio pays the Company a 1.00% annual fee payable monthly, based on its average daily net assets. The Emerging Markets Growth Portfolio and Emerging Leaders Growth Portfolio pay the Company a 1.10% annual fee payable monthly, based on its average daily net assets. The Bond Portfolio pays the Company a 0.30% annual fee payable monthly, based on its average daily net assets.
All of the Portfolios, except Institutional International Growth Fund, have also entered into Expense Limitation Agreements with the Company. Under the terms of these agreements the Advisor will waive its management fee and/or reimburse the portfolio for expenses in excess of the agreed upon rate. The amount the Advisor owes a Portfolio is recorded as the Receivable from Advisor on the Statement of Assets and Liabilities. Under the terms of these Agreements, the Company has agreed to waive its advisory fees and/or absorb other operating expenses through April 30, 2009, if total expenses of the Institutional International Equity Portfolios exceed 1.10% of average daily net assets, 1.25% of average daily net assets for the Institutional Share Classes of the International Small Cap Growth, Emerging Markets Growth Portfolios and Emerging Leaders Growth Portfolio or 0.35% of average daily net assets for the Institutional Share Class of the Bond Portfolio.
For a period of three years subsequent to the Commencement of Operations of the Portfolio, the Company is entitled to reimbursement from the Emerging Leaders Growth and Bond Portfolios for previously waived fees and expenses to the extent the overall expense ratio remains below the percentages indicated. The total amount available for recapture at December 31, 2008 is $81 and $226 (in thousands) for the Emerging Leaders and Bond Portfolios, respectively. As a result, the total expense ratio for a Portfolio during the period the agreement is in effect; will not fall below the percentage indicated. The Company’s right to be reimbursed under the Expense Limitation Agreement for the Emerging Markets Growth Fund and International Small Cap Growth Fund expired June 6, 2008 and November 1, 2008, respectively. Under this provision, the Emerging Markets Growth Fund and International Small Cap Growth Fund reimbursed the Advisor $208,000 and $134,000, respectively during the year ended December 31, 2008.
For the year ended December 31, 2008, the investment advisory fees incurred by the Portfolio and related fee waivers were as follows (in thousands):
| | | | | | | | | | | | | |
Portfolio | | Gross
Advisory Fees | | Fee
Waiver | | Net
Advisory Fee | | Additional Expenses (Recovered) or Absorbed by Advisor | |
Institutional International Growth | | $ | 15,668 | | $ | — | | $ | 15,668 | | $ | — | |
Institutional International Equity | | | 5,141 | | | — | | | 5,141 | | | — | |
International Small Cap Growth | | | 3,887 | | | — | | | 3,887 | | | (134 | ) |
Emerging Markets Growth | | | 8,539 | | | — | | | 8,539 | | | (208 | ) |
Emerging Leaders Growth | | | 559 | | | 81 | | | 478 | | | — | |
Bond* | | | 215 | | | 146 | | | 69 | | | 12 | |
| * | | The Company waived $1 and $1 (in thousands) of distribution fees and shareholder administration fees, respectively, for the Bond Portfolio during 2008. |
(b) Trustees Fees
The Portfolios incurred fees of $59 (in thousands) to non-interested trustees of the Fund for the year ended December 31, 2008. Interested trustees are not compensated by the Fund.
December 31, 2008 | William Blair Funds 47 |
(c) Investments in Affiliated Portfolio
Pursuant to the rules of the 1940 Act, each of the Portfolios of the Fund may invest in the William Blair Ready Reserves Portfolio (“Ready Reserves”), an open-end money market portfolio managed by the Company. Ready Reserves Portfolio is used as a cash management option to the other Portfolios in the Fund. The Company waives management fees and shareholder service fees earned from the other Portfolios investment in the Ready Reserves Fund. The fees waived with respect to the Portfolio for the year ended December 31, 2008 are listed below. Distributions received from Ready Reserves are reflected as “Dividend income from affiliated Fund” in the Portfolio’s statement of operations. Amounts relating to the Portfolio’s investments in Ready Reserves were as follows for the year ended December 31, 2008 (in thousands):
| | | | | | | | | | | | | | | | | | | | | |
Portfolio | | 12/31/07 Value | | Purchases | | Sales
Proceeds | | Fees
Waived | | Dividend Income | | 12/31/08 Value | | Percent
of Net
Assets | |
Institutional International Growth | | $
| 55
| | $ | 22,973 | | $ | 10,500 | | $ | 29 | | $ | 63 | | $ | 12,528 | | 1.2 | % |
Institutional International Equity | |
| 3,352
| | | 12,097 | | | 10,500 | | | 32 | | | 98 | | | 4,949 | | 1.4 | |
International Small Cap Growth | |
| 2,197
| | | 3,090 | | | 2,000 | | | 28 | | | 89 | | | 3,287 | | 1.1 | |
Emerging Markets Growth | |
| 1,326
| | | 12,539 | | | 11,800 | | | 13 | | | 40 | | | 2,065 | | 0.5 | |
Emerging Leaders Growth | |
| —
| | | 11,620 | | | 10,880 | | | 6 | | | 20 | | | 740 | | 1.6 | |
(4) Investment Transactions
Investment transactions, excluding money market instruments, for the year ended December 31, 2008, were as follows (in thousands):
| | | | | | | |
Portfolio | | Purchase | | Sales | |
Institutional International Growth | | $ | 1,459,066 | | $ | (1,404,290 | ) |
Institutional International Equity | | | 550,929 | | | (456,530 | ) |
International Small Cap Growth | | | 458,056 | | | (293,072 | ) |
Emerging Markets Growth | | | 910,799 | | | (1,014,308 | ) |
Emerging Leaders Growth | | | 172,042 | | | (74,570 | ) |
Bond | | | 51,570 | | | (40,886 | ) |
(5) Foreign Currency Forward Contracts
The Global Growth, International Growth, International Equity, International Small Cap Growth, Emerging Markets Growth and Emerging Leaders Growth Portfolios from time to time may enter into foreign currency forward contracts with the Fund’s custodian and other counterparties in an attempt to hedge against a decline in the value of foreign currency against the U.S. dollar. The Portfolios bear the market risk that arises from changes in foreign currency rates and bear the credit risk if the counterparty fails to perform under the contract. The net realized and unrealized gains and losses associated with foreign currency forward contracts for the year ending December 31, 2008 are reflected in the accompanying financial statements.
(6) Fund Share Transactions
The following table summarizes the activity in capital shares of each Portfolio (in thousands):
| | | | | | | | | | | | | |
| | | Dollars | |
| | | For the year ended December 31, 2008 | |
Portfolio | | Sales | | Reinvested
Distributions | | Redemptions | | Net change in
Net Assets
relating to fund
share activity | |
Institutional International Growth | | $ | 133,829 | | $ | 59,025 | | $ | 168,222 | | $ | 24,632 | |
Institutional International Equity | | | 126,297 | | | 6,176 | | | 48,108 | | | 84,365 | |
International Small Cap Growth | | | 142,503 | | | 3,161 | | | 12,596 | | | 133,068 | |
Emerging Markets Growth | | | 34,013 | | | 32,217 | | | 104,349 | | | (38,119 | ) |
Emerging Leaders Growth (a) | | | 100,679 | | | 79 | | | 7,902 | | | 92,856 | |
Bond | | | 553 | | | 523 | | | 2,185 | | | (1,109 | ) |
48 Annual Report | December 31, 2008 |
| | | | | | | | | | | | | |
| | | Dollars | |
| | | For the year ended December 31, 2007 | |
Portfolio | | Sales | | Reinvested
Distributions | | Redemptions | | Net change in
Net Assets
relating to fund
share activity | |
Institutional International Growth | | $ | 189,014 | | $ | 329,680 | | $ | 268,777 | | $ | 249,917 | |
Institutional International Equity | | | 16,134 | | | 61,204 | | | 94,632 | | | (17,294 | ) |
International Small Cap Growth | | | 79,703 | | | 16,816 | | | 17,647 | | | 78,872 | |
Emerging Markets Growth | | | 115,480 | | | 142,732 | | | 94,489 | | | 163,723 | |
Emerging Leaders Growth | | | — | | | — | | | — | | | — | |
Bond (b) | | | 11,518 | | | 341 | | | — | | | 11,859 | |
| |
| | | Shares | |
| | | For the year ended December 31, 2008 | |
Portfolio | | Sales | | Reinvested
Distributions | | Redemptions | | Net change in
Net Assets
relating to fund
share activity | |
Institutional International Growth | | | 8,158 | | | 6,903 | | | 11,459 | | | 3,602 | |
Institutional International Equity | | | 11,840 | | | 846 | | | 5,365 | | | 7,321 | |
International Small Cap Growth | | | 13,065 | | | 473 | | | 1,387 | | | 12,151 | |
Emerging Markets Growth | | | 4,314 | | | 4,250 | | | 5,552 | | | 3,012 | |
Emerging Leaders Growth (a) | | | 9,918 | | | 16 | | | 789 | | | 9,145 | |
Bond | | | 55 | | | 54 | | | 221 | | | (112 | ) |
| |
| | | Shares | |
| | | For the year ended December 31, 2007 | |
Portfolio | | Sales | | Reinvested
Distributions | | Redemptions | | Net change in
Net Assets
relating to fund
share activity | |
Institutional International Growth | | | 9,488 | | | 17,811 | | | 12,302 | | | 14,997 | |
Institutional International Equity | | | 1,042 | | | 4,229 | | | 6,063 | | | (792 | ) |
International Small Cap Growth | | | 5,483 | | | 1,251 | | | 1,210 | | | 5,524 | |
Emerging Markets Growth | | | 5,513 | | | 6,742 | | | 3,926 | | | 8,329 | |
Emerging Leaders Growth | | | — | | | — | | | — | | | — | |
Bond (b) | | | 1,153 | | | 34 | | | — | | | 1,187 | |
| (a) | | For the period from March 26, 2008 (Commencement of Operations) to December 31, 2008. |
| (b) | | The information for the year ended December 31, 2007 is for the period from May 1, 2007 (Commencement of Operations) to December 31, 2007. |
(7) Subsequent Event
Upon the recommendation of William Blair & Company, L.L.C., the Board of Trustees determined that it was in the best interest of the William Blair Tax-Managed Growth Fund to redeem all shares of the Fund outstanding on March 20, 2009, and then to terminate the Fund.
December 31, 2008 | William Blair Funds 49 |
Financial Highlights
Institutional International Growth Fund
| | | | | | | | | | | | | | | | | |
| | | |
| | | Years Ended December 31, |
| | 2008 | | | 2007 | | | 2006 | | 2005 | | 2004 |
Net asset value, beginning of year | | $ | 19.20 | | | $ | 19.39 | | | $ | 18.11 | | $ | 16.06 | | $ | 13.60 |
Income from investment operations: | | | | | | | | | | | | | | | | | |
Net investment income (a) | | | 0.25 | | | | 0.15 | | | | 0.11 | | | 0.09 | | | 0.03 |
Net realized and unrealized gain (loss) on investments | | | (10.24 | ) | | | 3.30 | | | | 4.09 | | | 3.53 | | | 2.44 |
| | | | | | | | | | | | | | | | | |
Total from investment operations | | | (9.99 | ) | | | 3.45 | | | | 4.20 | | | 3.62 | | | 2.47 |
Less distributions from: | | | | | | | | | | | | | | | | | |
Net investment income | | | — | | | | 0.35 | | | | 0.38 | | | 0.15 | | | 0.01 |
Net realized gain | | | 0.55 | | | | 3.29 | | | | 2.54 | | | 1.42 | | | — |
| | | | | | | | | | | | | | | | | |
Total distributions | | | 0.55 | | | | 3.64 | | | | 2.92 | | | 1.57 | | | 0.01 |
| | | | | | | | | | | | | | | | | |
Net asset value, end of year | | $ | 8.66 | | | $ | 19.20 | | | $ | 19.39 | | $ | 18.11 | | $ | 16.06 |
| | | | | | | | | | | | | | | | | |
Total return (%) | | | (51.99 | ) | | | 18.49 | | | | 23.45 | | | 22.76 | | | 18.15 |
Ratios to average daily net assets (%): | | | | | | | | | | | | | | | | | |
Expenses, net of waivers and reimbursements | | | 0.98 | | | | 1.02 | | | | 1.03 | | | 1.05 | | | 1.10 |
Expenses, before waivers and reimbursements | | | 0.98 | | | | 1.02 | | | | 1.03 | | | 1.05 | | | 1.11 |
Net investment income (loss), net of waivers and reimbursements | | | 1.68 | | | | 0.74 | | | | 0.54 | | | 0.52 | | | 0.18 |
Net investment income (loss), before waivers and reimbursements | | | 1.68 | | | | 0.74 | | | | 0.54 | | | 0.52 | | | 0.17 |
| | | | | | | | | | | | | | | |
| | | |
| | | Years Ended December 31, |
| | | 2008 | | 2007 | | 2006 | | 2005 | | 2004 |
Supplemental data: | | | | | | | | | | | | | | | |
Net assets at end of year (in thousands) | | $ | 998,266 | | $ | 2,145,312 | | $ | 1,875,341 | | $ | 1,555,414 | | $ | 1,223,436 |
Portfolio turnover rate (%) | | | 86 | | | 61 | | | 74 | | | 74 | | | 72 |
| (a) | | Excludes $(0.10), $0.06, $0.29, $0.10, and $0.25 of PFIC mark to market which is treated as ordinary income for Federal tax purposes for the years 2008, 2007, 2006, 2005 and 2004, respectively. |
Performance cited represents past performance. Past performance does not guarantee future results and current performance may be lower or higher that the data quoted. Results shown are annual returns, which assume reinvestment of dividends and capital gains. Investment returns and principal will fluctuate and you may have a gain or loss when you sell shares. For the most current month-end performance information, please call 1-800-742-7272, or visit our Web site at www.williamblairfunds. com.
Note: Net investment income (loss) per share is based on the average shares outstanding during the year.
50 Annual Report | December 31, 2008 |
Financial Highlights
Institutional International Equity Fund
| | | | | | | | | | | | | | | | | |
| | | | |
| | | Years Ended December 31, | |
| | | 2008 | | | 2007 | | 2006 | | 2005 | | 2004(a) | |
Net asset value, beginning of year | | $ | 15.03 | | | $ | 14.27 | | $ | 12.04 | | $ | 10.20 | | $ | 10.00 | |
Income from investment operations: | | | | | | | | | | | | | | | | | |
Net investment income (b) | | | 0.15 | | | | 0.13 | | | 0.07 | | | — | | | — | |
Net realized and unrealized gain (loss) on investments | | | (7.60 | ) | | | 2.42 | | | 2.37 | | | 1.86 | | | 0.20 | |
| | | | | | | | | | | | | | | | | |
Total from investment operations | | | (7.45 | ) | | | 2.55 | | | 2.44 | | | 1.86 | | | 0.20 | |
Less distributions from: | | | | | | | | | | | | | | | | | |
Net investment income | | | — | | | | 0.22 | | | 0.16 | | | 0.02 | | | — | |
Net realized gain | | | 0.14 | | | | 1.57 | | | 0.05 | | | — | | | — | |
| | | | | | | | | | | | | | | | | |
Total distributions | | | 0.14 | | | | 1.79 | | | 0.21 | | | 0.02 | | | — | |
| | | | | | | | | | | | | | | | | |
Net asset value, end of year | | $ | 7.44 | | | $ | 15.03 | | $ | 14.27 | | $ | 12.04 | | $ | 10.20 | |
| | | | | | | | | | | | | | | | | |
Total return (%) | | | (49.57 | ) | | | 18.36 | | | 20.22 | | | 18.26 | | | 2.00 | (c) |
Ratios to average daily net assets (%): | | | | | | | | | | | | | | | | | |
Expenses, net of waivers and reimbursements | | | 1.05 | | | | 1.09 | | | 1.10 | | | 1.10 | | | 1.10 | (d) |
Expenses, before waivers and reimbursements | | | 1.05 | | | | 1.06 | | | 1.12 | | | 1.35 | | | 2.46 | (d) |
Net investment income (loss), net of waivers and reimbursements | | | 1.26 | | | | 0.86 | | | 0.50 | | | 0.31 | | | (0.21 | )(d) |
Net investment income (loss), before waivers and reimbursements | | | 1.26 | | | | 0.89 | | | 0.48 | | | 0.06 | | | (1.57 | )(d) |
| | | | | | | | | | | | | | | | |
| | | | |
| | | Years Ended December 31, | |
| | | 2008 | | 2007 | | 2006 | | 2005 | | 2004 | |
Supplemental data: | | | | | | | | | | | | | | | | |
Net assets at end of year (in thousands) | | $ | 360,451 | | $ | 618,179 | | $ | 598,375 | | $ | 250,929 | | $ | 27,384 | |
Portfolio turnover rate (%) | | | 91 | | | 66 | | | 79 | | | 84 | | | 45 | (d) |
| (a) | | For the period from December 1, 2004 (Commencement of Operations) to December 31, 2004. |
| (b) | | Excludes $(0.07), $0.01, $0.23, $0.27 and $0.01 of PFIC mark to market which is treated as ordinary income for Federal tax purposes for the years 2008, 2007, 2006, 2005 and 2004, respectively. |
| (c) | | Total returns are not annualized for periods less than a year. |
| (d) | | Rates are annualized for periods that are less than a year. |
Performance cited represents past performance. Past performance does not guarantee future results and current performance may be lower or higher that the data quoted. Results shown are annual returns, which assume reinvestment of dividends and capital gains. Investment returns and principal will fluctuate and you may have a gain or loss when you sell shares. For the most current month-end performance information, please call 1-800-742-7272, or visit our Web site at www.williamblairfunds. com.
Note: Net investment income (loss) per share is based on the average shares outstanding during the year.
December 31, 2008 | William Blair Funds 51 |
Financial Highlights
International Small Cap Growth Fund
Institutional Class Shares
| | | | | | | | | | | | | | | |
| | | | |
| | | Years Ended December 31, | |
| | | 2008 | | | 2007 | | 2006 | | | 2005(a) | |
Net asset value, beginning of year | | $ | 14.04 | | | $ | 13.43 | | $ | 11.16 | | | $ | 10.00 | |
Income from investment operations: | | | | | | | | | | | | | | | |
Net investment income (loss)(b) | | | 0.03 | | | | 0.05 | | | (0.01 | ) | | | — | |
Net realized and unrealized gain on investments | | | (7.26 | ) | | | 1.72 | | | 2.34 | | | | 1.16 | |
| | | | | | | | | | | | | | | |
Total from investment operations | | | (7.23 | ) | | | 1.77 | | | 2.33 | | | | 1.16 | |
Less distributions from: | | | | | | | | | | | | | | | |
Net investment income | | | — | | | | 0.12 | | | 0.01 | | | | — | (c) |
Net realized gain | | | 0.12 | | | | 1.04 | | | 0.05 | | | | — | |
| | | | | | | | | | | | | | | |
Total distributions | | | 0.12 | | | | 1.16 | | | 0.06 | | | | — | |
| | | | | | | | | | | | | | | |
Net asset value, end of year | | $ | 6.69 | | | $ | 14.04 | | $ | 13.43 | | | $ | 11.16 | |
| | | | | | | | | | | | | | | |
Total return (%) | | | (51.53 | ) | | | 13.53 | | | 20.86 | | | | 11.62 | (d) |
Ratios to average daily net assets (%): | | | | | | | | | | | | | | | |
Expenses, net of waivers and reimbursements | | | 1.14 | | | | 1.14 | | | 1.25 | | | | 1.25 | (e) |
Expenses, before waivers and reimbursements | | | 1.11 | | | | 1.14 | | | 1.31 | | | | 2.17 | (e) |
Net investment income (loss), net of waivers and reimbursements | | | 0.28 | | | | 0.32 | | | (0.12 | ) | | | 0.00 | (e) |
Net investment income (loss), before waivers and reimbursements | | | 0.32 | | | | 0.32 | | | (0.18 | ) | | | (0.92 | )(e) |
| | | | | | | | | | | | | |
| | | | |
| | | Years Ended December 31, | |
| | | 2008 | | 2007 | | 2006 | | 2005(a) | |
Supplemental data for all classes: | | | | | | | | | | | | | |
Net assets at end of year (in thousands) | | $ | 291,988 | | $ | 401,459 | | $ | 231,969 | | $ | 50,534 | |
Portfolio turnover rate (%) | | | 78 | | | 88 | | | 109 | | | 127 | (e) |
| (a) | | For the period from November 1, 2005 (Commencement of Operations) to December 31, 2005. |
| (b) | | Excludes $(0.02), $0.05, $0.00, and $0.11 of PFIC mark to market which is treated as ordinary income for Federal tax purposes, for the years ended 2008, 2007, 2006 and 2005, respectively. |
| (c) | | Distribution less than $0.01 per share. |
| (d) | | Total returns are not annualized for periods less than one year. |
| (e) | | Rates are annualized for periods that are less than a year. |
Performance cited represents past performance. Past performance does not guarantee future results and current performance may be lower or higher that the data quoted. Results shown are annual returns, which assume reinvestment of dividends and capital gains. Investment returns and principal will fluctuate and you may have a gain or loss when you sell shares. For the most current month-end performance information, please call 1-800-742-7272, or visit our Web site at www.williamblairfunds. com.
Note: Net investment income (loss) per share is based on the average shares outstanding during the year.
52 Annual Report | December 31, 2008 |
Financial Highlights
Emerging Markets Growth Fund
Institutional Class Shares
| | | | | | | | | | | | | | | |
| | | | |
| | | Years Ended December 31, | |
| | | 2008 | | | 2007 | | | 2006 | | 2005(a) | |
Net asset value, beginning of year | | $ | 22.07 | | | $ | 19.54 | | | $ | 14.20 | | $ | 10.00 | |
Income from investment operations: | | | | | | | | | | | | | | | |
Net investment income (loss)(b) | | | 0.17 | | | | (0.01 | ) | | | 0.02 | | | 0.01 | |
Net realized and unrealized gain on investments | | | (13.74 | ) | | | 7.27 | | | | 5.44 | | | 4.27 | |
| | | | | | | | | | | | | | | |
Total from investment operations | | | (13.57 | ) | | | 7.26 | | | | 5.46 | | | 4.28 | |
Less distributions from: | | | | | | | | | | | | | | | |
Net investment income | | | — | | | | 0.19 | | | | 0.01 | | | — | |
Net realized gain | | | 0.94 | | | | 4.54 | | | | 0.11 | | | 0.08 | |
| | | | | | | | | | | | | | | |
Total distributions | | | 0.94 | | | | 4.73 | | | | 0.12 | | | 0.08 | |
| | | | | | | | | | | | | | | |
Net asset value, end of year | | $ | 7.56 | | | $ | 22.07 | | | $ | 19.54 | | $ | 14.20 | |
| | | | | | | | | | | | | | | |
Total return (%) | | | (61.51 | ) | | | 38.21 | | | | 38.49 | | | 42.82 | (c) |
Ratios to average daily net assets (%): | | | | | | | | | | | | | | | |
Expenses, net of waivers and reimbursements | | | 1.22 | | | | 1.25 | | | | 1.25 | | | 1.25 | (d) |
Expenses, before waivers and reimbursements | | | 1.20 | | | | 1.25 | | | | 1.32 | | | 1.61 | (d) |
Net investment income (loss), net of waivers and reimbursements | | | 1.08 | | | | (0.05 | ) | | | 0.09 | | | 0.19 | (d) |
Net investment income (loss), before waivers and reimbursements | | | 1.10 | | | | (0.05 | ) | | | 0.02 | | | (0.17 | )(d) |
| | | | | | | | | | | | | |
| | | | |
| | | Year Ended December 31, | |
| | | 2008 | | 2007 | | 2006 | | 2005(a) | |
Supplemental data for all classes: | | | | | | | | | | | | | |
Net assets at end of year (in thousands) | | $ | 385,588 | | $ | 1,165,854 | | $ | 813,649 | | $ | 249,348 | |
Portfolio turnover rate (%) | | | 118 | | | 100 | | | 113 | | | 77 | (d) |
| (a) | | For the period from June 6, 2005 (Commencement of Operations) to December 31, 2005. |
| (b) | | Excludes $(0.09), $0.21, $0.00 and $0.11 of PFIC mark to market which is treated as ordinary income for Federal tax purposes, for the years ended 2008, 2007, 2006 and 2005, respectively. |
| (c) | | Total returns are not annualized for periods less than a year. |
| (d) | | Rates are annualized for periods that are less than a year. |
Performance cited represents past performance. Past performance does not guarantee future results and current performance may be lower or higher that the data quoted. Results shown are annual returns, which assume reinvestment of dividends and capital gains. Investment returns and principal will fluctuate and you may have a gain or loss when you sell shares. For the most current month-end performance information, please call 1-800-742-7272, or visit our Web site at www.williamblairfunds. com.
Note: Net investment income (loss) per share is based on the average shares outstanding during the year.
December 31, 2008 | William Blair Funds 53 |
Financial Highlights
Emerging Leaders Growth Fund
Institutional Class Shares
| | | | |
| | | | |
| | | Period Ended
12/31/08(a) | |
| | | | |
Net asset value, beginning of period | | $ | 10.00 | |
Income from investment operations: | | | | |
Net investment income (b) | | | 0.04 | |
Net realized and unrealized gain on investments | | | (5.26 | ) |
| | | | |
Total from investment operations | | | 5.22 | |
Less distributions from: | | | | |
Net investment income | | | — | (c) |
Net realized gain | | | — | |
| | | | |
Total distributions | | | — | |
| | | | |
Net asset value, end of period | | $ | 4.78 | |
| | | | |
Total return (%) | | | (52.11 | )(d) |
Ratios to average daily net assets (%): | | | | |
Expenses, net of waivers and reimbursements | | | 1.25 | (e) |
Expenses, before waivers and reimbursements | | | 1.41 | (e) |
Net investment income (loss), net of waivers and reimbursements | | | 0.70 | (e) |
Net investment income (loss), before waivers and reimbursements | | | 0.54 | (e) |
| | | | |
| | | Period Ended
12/31/08 | |
Supplemental data for all classes: | | | | |
Net assets at end of period (in thousands) | | $ | 46,676 | |
Portfolio turnover rate (%) | | | 151 | (e) |
| (a) | | For the period from March 26, 2008 (Commencement of Operations) to June 30, 2008. |
| (b) | | Excludes $0.00 of PFIC mark to market which is treated as ordinary income for tax purposes for the year ended 2008. |
| (c) | | Distribution less than $0.01 per share. |
| (d) | | Total return is not annualized for periods less than one year. |
| (e) | | Rates are annualized for periods that are less than a year. |
Performance cited represents past performance. Past performance does not guarantee future results and current performance may be lower or higher that the data quoted. Results shown are annual returns, which assume reinvestment of dividends and capital gains. Investment returns and principal will fluctuate and you may have a gain or loss when you sell shares. For the most current month-end performance information, please call 1-800-742-7272, or visit our Web site at www.williamblairfunds. com.
Note: Net investment income (loss) per share is based on the average shares outstanding during the year.
54 Annual Report | December 31, 2008 |
Financial Highlights
Bond Fund
Institutional Class Shares
| | | | | | | | |
| | | | |
| | | Years Ended December 31, | |
| | | 2008 | | | 2007(a) | |
Net asset value, beginning of year | | $ | 10.00 | | | $ | 10.00 | |
Income from investment operations: | | | | | | | | |
Net investment income | | | 0.50 | | | | 0.32 | |
Net realized and unrealized gain on investments | | | (0.31 | ) | | | 0.03 | |
| | | | | | | | |
Total from investment operations | | | 0.19 | | | | 0.35 | |
Less distributions from: | | | | | | | | |
Net investment income | | | 0.47 | | | | 0.35 | |
Net realized gain | | | — | | | | — | (b) |
| | | | | | | | |
Total distributions | | | 0.47 | | | | 0.35 | |
| | | | | | | | |
Net asset value, end of year | | $ | 9.72 | | | $ | 10.00 | |
| | | | | | | | |
Total return (%) | | | 1.95 | | | | 3.57 | (c) |
Ratios to average daily net assets (%): | | | | | | | | |
Expenses, net of waivers and reimbursements | | | 0.35 | | | | 0.35 | (d) |
Expenses, before waivers and reimbursements | | | 0.56 | | | | 0.52 | (d) |
Net investment income (loss), net of waivers and reimbursements | | | 5.04 | | | | 5.09 | (d) |
Net investment income (loss), before waivers and reimbursements | | | 4.83 | | | | 4.92 | (d) |
| | | | |
| | | Years Ended December 31, | |
| | | 2008 | | | 2007(a) | |
Supplemental data for all classes: | | | | | | | | |
Net assets at end of year (in thousands) | | | 74,613 | | | $ | 68,483 | |
Portfolio turnover rate (%) | | | 52 | | | | 38 | (d) |
| (a) | | For the period from May 1, 2007 (Commencement of Operations) to December 31, 2007. |
| (b) | | Distribution is less than $0.01 per share. |
| (c) | | Total returns are not annualized for periods that are less than a year. |
| (d) | | Rates are annualized for periods that are less than a year. |
Performance cited represents past performance. Past performance does not guarantee future results and current performance may be lower or higher that the data quoted. Results shown are annual returns, which assume reinvestment of dividends and capital gains. Investment returns and principal will fluctuate and you may have a gain or loss when you sell shares. For the most current month-end performance information, please call 1-800-742-7272, or visit our Web site at www.williamblairfunds. com.
Note: Net investment income (loss) per share is based on the average shares outstanding during the year.
December 31, 2008 | William Blair Funds 55 |
REPORT OF INDEPENDENT REGISTERED PUBLIC ACCOUNTING FIRM
To the Board of Trustees and Shareholders of
William Blair Funds
We have audited the accompanying statements of assets and liabilities, including the portfolios of investments, of the Institutional International Growth Fund, Institutional International Equity Fund, International Small Cap Growth Fund, Emerging Markets Growth Fund, Emerging Leaders Growth Fund, and Bond Fund (collectively, the “Portfolios”) (six of the Portfolios constituting the William Blair Funds) as of December 31, 2008, and the related statements of operations, statements of changes in net assets and financial highlights for the periods indicated therein. These financial statements and financial highlights are the responsibility of the Portfolios’ management. Our responsibility is to express an opinion on these financial statements and financial highlights based on our audits.
We conducted our audits in accordance with the standards of the Public Company Accounting Oversight Board (United States). Those standards require that we plan and perform the audit to obtain reasonable assurance about whether the financial statements and financial highlights are free of material misstatement. We were not engaged to perform an audit of the Portfolios’ internal control over financial reporting. Our audits included consideration of internal control over financial reporting as a basis for designing audit procedures that are appropriate in the circumstances, but not for the purpose of expressing an opinion on the effectiveness of the Portfolios’ internal control over financial reporting. Accordingly, we express no such opinion. An audit also includes examining, on a test basis, evidence supporting the amounts and disclosures in the financial statements and financial highlights, assessing the accounting principles used and significant estimates made by management, and evaluating the overall financial statement presentation. Our procedures included confirmation of securities owned as of December 31, 2008, by correspondence with the custodian and brokers or by other appropriate auditing procedures where replies from brokers were not received. We believe that our audits provide a reasonable basis for our opinion.
In our opinion, the financial statements and financial highlights referred to above present fairly, in all material respects, the financial position of each of the above mentioned Portfolios of the William Blair Funds at December 31, 2008, the results of their operations, changes in their net assets and financial highlights for the periods indicated therein, in conformity with U.S. generally accepted accounting principles.

Chicago, Illinois
February 19, 2009
56 Annual Report | December 31, 2008 |
Trustees and Officers (Unaudited). The trustees and officers of the William Blair Funds, their year of birth, their principal occupations during the last five years, their affiliations, if any, with William Blair & Company, L.L.C., and other significant affiliations are set forth below. The address of each trustee and officer is 222 West Adams Street, Chicago, Illinois 60606.
| | | | | | | | | | |
Name and Year of Birth | | Position(s)
Held with
Fund | | Term of
Office and
Length of
Time
Served(1) | | Principal Occupation(s) During Past 5 Years | | Number of
Portfolios
in Fund
Complex
Overseen
by Trustee | | Other Directorships Held by Trustee/Officer |
Interested Trustees | | | | | | | | | | |
Frederick Conrad Fischer,
1934* | | Chairman of the Board of Trustees | | Since 1987 | | Principal, William Blair & Company, L.L.C.; Partner, APM Limited Partnership; Limited Partner, WB Holdings, L.P. (since November 2008) | | 18 | | Trustee Emeritus, Chicago Child Care Society, a non-profit organization; Trustee Emeritus, Kalamazoo College |
| | | | | |
Michelle R. Seitz,
1965* | | Trustee and President | | Since 2002 Since 2007 | | Principal, William Blair & Company, L.L.C.; Limited Partner, WB Holdings, L.P. (since November 2008); Member, WBC GP, L.L.P. (since November 2008) | | 18 | | N/A |
| | | | |
Non-Interested Trustees | | | | | | | | |
Ann P. McDermott,
1939 | | Trustee | | Since 1996 | | Board member and officer for various civic and charitable organizations over the past thirty years; professional experience prior thereto, registered representative for New York Stock Exchange firm | | 18 | | Northwestern University, Women’s Board; Rush Presbyterian St. Luke’s Medical Center, Women’s Board; University of Chicago, Women’s Board; Visiting Nurses Association, Honorary Director |
| | | | | |
Phillip O. Peterson,
1944 | | Trustee | | Since 2007 | | Trustee of Strong Funds Liquidating Trusts since 2005 and President, Strong Mutual Funds, 2004-2005; formerly, Partner, KPMG LLP | | 18 | | The Hartford Group of Mutual Funds (87 portfolios) |
| | | | | |
Donald J. Reaves,
1946 | | Trustee | | Since 2004 | | Chancellor, Winston-Salem State University; formerly, Vice President for Administration and Chief Financial Officer, University of Chicago 2002-2007. | | 18 | | American Student Assistance Corp., guarantor of student loans; Amica Mutual Insurance Company |
| | | | | |
Donald L. Seeley,
1944 | | Trustee | | Since 2003 | | Director, Applied Investment Management Program, University of Arizona Department of Finance, formerly, Vice Chairman and Chief Financial Officer, True North Communications, Inc., marketing communications and advertising firm | | 18 | | Warnaco Group, Inc., intimate apparel, sportswear, and swimwear manufacturer; Center for Furniture Craftsmanship (not-for-profit) |
| | | | | |
Thomas J. Skelly,
1951 | | Trustee | | Since 2007 | | Director and Investment Committee Chairman of the U.S. Accenture Foundation Inc.; formerly, Managing Partner of various divisions at Accenture | | 18 | | First MetLife Investors Insurance Company |
| | | | | |
Robert E. Wood II,
1938 | | Trustee | | Since 1999 | | Retired; formerly Executive Vice President, Morgan Stanley Dean Witter | | 18 | | Chairman, Add-Vision, Inc., manufacturer of surface animation systems; Chairman Micro-Combustion, LLC |
December 31, 2008 | William Blair Funds 57 |
| | | | | | | | |
Name and Year of Birth | | Position(s)
Held with
Fund | | Term of
Office and
Length of
Time
Served(1) | | Principal Occupation(s) During Past 5 Years(2) | | Other Directorships Held by Trustee/Officer |
Officers | | | | | | | | |
Karl W. Brewer,
1966 | | Senior Vice President | | Since 2000 | | Principal, William Blair & Company, L.L.C. | | N/A |
| | | | |
Mark A. Fuller, III,
1957 | | Senior Vice President | | Since 1993 | | Principal, William Blair & Company, L.L.C. | | Partner, Fulsen Howney Partners |
| | | | |
James S. Golan,
1961 | | Senior Vice President | | Since 2005 | | Principal, William Blair & Company, L.L.C. | | N/A |
| | | | |
W. George Greig,
1952 | | Senior Vice President | | Since 1996 | | Principal, William Blair & Company, L.L.C. | | N/A |
| | | | |
Michael A. Jancosek,
1959 | | Senior Vice President Vice President | | Since 2004 2000-2004 | | Principal, William Blair & Company L.L.C. Associate, William Blair & Company, L.L.C. | | N/A |
| | | | |
John F. Jostrand,
1954 | | Senior Vice President | | Since 1999 | | Principal, William Blair & Company, L.L.C. | | N/A |
| | | | |
Robert C. Lanphier, IV,
1956 | | Senior Vice President | | Since 2003 | | Principal, William Blair & Company, L.L.C. | | Chairman, AG. Med, Inc. |
| | | | |
Mark T. Leslie,
1967 | | Senior Vice President Vice President | | Since 2008 2005-2008 | | Principal, William Blair & Company, L.L.C. Associate, William Blair & Company, L.L.C. formerly, U.S. Bancorp Asset Management | | N/A |
| | | | |
Matthew A. Litfin,
1972 | | Senior Vice President | | Since 2008 | | Principal, William Blair & Company, L.L.C. | | N/A |
| | | | |
Kenneth J. McAtamney
1966 | | Senior Vice President | | Since 2008 | | Principal, William Blair & Company, L.L.C. | | N/A |
| | | | |
Todd M. McClone,
1968 | | Senior Vice President Vice President | | Since 2006 2005-2006 | | Principal, William Blair & Company, L.L.C. Associate, William Blair & Company, L.L.C. | | N/A N/A |
| | | | |
Tracy McCormick
1954 | | Senior Vice President | | Since 2008 | | Principal, William Blair & Company, L.L.C. | | N/A |
| | | | |
David Merjan
1960 | | Senior Vice President | | Since 2008 | | Principal, William Blair & Company, L.L.C. | | N/A |
| | | | |
David S. Mitchell,
1960 | | Senior Vice President Vice President | | Since 2004 2003-2004 | | Principal, William Blair & Company, L.L.C. Associate, William Blair & Company, L.L.C. | | N/A |
| | | | |
Gregory J. Pusinelli,
1958 | | Senior Vice President | | Since 1999 | | Principal, William Blair & Company, L.L.C. | | N/A |
| | | | |
David P. Ricci,
1958 | | Senior Vice President | | Since 2006 | | Principal, William Blair & Company, L.L.C. | | N/A |
58 Annual Report | December 31, 2008 |
| | | | | | | | |
Name and Year of Birth | | Position(s)
Held with
Fund | | Term of
Office and
Length of
Time
Served(1) | | Principal Occupation(s) During Past 5 Years(2) | | Other Directorships Held by Trustee/Officer |
Richard W. Smirl,
1967 | | Senior Vice President and Chief Compliance Officer | | Since 2004 | | Principal, William Blair & Company, L.L.C.; former Chief Legal Officer, Strong Capital Management | | N/A |
| | | | |
Jeffrey A. Urbina,
1955 | | Senior Vice President | | Since 1998 | | Principal, William Blair & Company, L.L.C. | | N/A |
| | | | |
Christopher T. Vincent,
1956 | | Senior Vice President Vice President | | Since 2004 2002-2004 | | Principal, William Blair & Company, L.L.C. Associate, William Blair & Company, L.L.C. | | Uhlich Children’s Home |
| | | | |
Michael P. Balkin,
1959 | | Vice President | | Since 2008 | | Associate William Blair & Company, L.L.C.; former Chief Investment Officer, Magnetar Investment Management | | N/A |
| | | | |
David C. Fording,
1967 | | Vice President | | Since 2006 | | Associate, William Blair & Company, L.L.C.; former Portfolio Manager, TIAA-CREF | | N/A |
| | | | |
Chad M. Kilmer,
1975 | | Vice President | | Since 2006 | | Associate, William Blair & Company, L.L.C.; former analyst and Portfolio Manager U.S. Bancorp Asset Management and analyst Gabelli Woodland Partners. | | N/A |
| | | | |
Terence M. Sullivan,
1944 | | Vice President and Treasurer | | Since 1997 | | Associate, William Blair & Company, L.L.C. | | N/A |
| | | | |
Colette M. Garavalia,
1961 | | Secretary | | Since 2000 | | Associate, William Blair & Company, L.L.C. | | N/A |
| * | | Mr. Fischer and Ms. Seitz are interested persons of the William Blair Funds because each is a principal of William Blair & Company, L.L.C., the Funds’ investment advisor, principal underwriter and distributor. |
| (1) | | Each Trustee serves until the election and qualification of a successor, or until death, resignation or retirement or removal as provided in the Fund’s Declaration of Trust. Retirement for non-interested Trustees occurs no later than at the conclusion of the first regularly scheduled Board meeting of the Fund’s fiscal year that occurs after the Trustee’s 72nd birthday. The Fund’s officers except the Chief Compliance Officer, are elected annually by the Trustees. The Fund’s Chief Compliance Officer is designated by the Board of Trustees and may only be removed by action of the Board of Trustees, including a majority of the non-interested Trustees. |
| (2) | | In November 2008, all current principals of William Blair & Company, L.L.C. also became limited partners in WB Holdings, L.P. |
The Statement of Additional Information for the William Blair Funds includes additional information about the trustees and is available without charge by calling 1-800-635-2886 (in Massachusetts 1-800-635-2840) or by writing the Fund.
December 31, 2008 | William Blair Funds 59 |
Additional Information (unaudited)
Proxy Voting
A description of the policies and procedures that the William Blair Institutional International Growth Fund, the William Blair Institutional International Equity Fund, the William Blair International Small Cap Growth Fund and the William Blair Emerging Markets Growth Fund and the William Blair Bond Fund use to determine how to vote proxies relating to portfolio securities and information regarding how the Fund voted proxies relating to portfolio securities for the most recent 12-month period ended June 30 are available without charge, upon request, by calling 1-800-635-2886 (in Massachusetts 1-800-635-2840), at www.williamblairfunds.com and on the SEC’s website at http://www.sec.gov.
Quarterly Portfolio Schedules
The Fund files its complete schedule of portfolio holdings with the SEC for the first and third fiscal quarters of each fiscal year (quarters ended March 31 and September 30) on Form N-Q. The Fund’s Forms N-Q are available on the SEC’s website at http://www.sec.gov and may be reviewed and copied at the SEC’s Public Reference Room in Washington, D.C. Information on the operation of the SEC’s Public Reference Room may be obtained by calling 1-800-SEC-0330. The Fund’s Forms N-Q are also available on the Fund’s website at www.williamblairfunds.com.
Additional Federal Income Tax Information: (unaudited)
The following table provides the percentage of the 2008 year end distributions that qualify for the dividend received deduction, and the qualified dividend income percentage:
| | | | | | |
Portfolio | | Dividend
Received
Deduction % | | | Qualified
Dividend
Income % | |
Institutional International Growth | | 0.00 | % | | 75.85 | % |
Institutional International Equity | | 0.00 | % | | 43.20 | % |
International Small Cap Growth | | 0.00 | % | | 42.24 | % |
Emerging Markets Growth | | 0.00 | % | | 8.29 | % |
Emerging Leaders Growth | | 0.00 | % | | 0.00 | % |
Bond | | 0.00 | % | | 0.00 | % |
In January 2009, you will be advised on IRS Form 1099-Div or substitute 1099 DIV as to the Federal tax status of the distributions received by you in the calendar year 2008.
60 Annual Report | December 31, 2008 |
Useful Information About Your Report (unaudited)
Please refer to this information when reviewing the Expense Example for each Portfolio.
Expense Example
As a shareholder of a Portfolio, you incur ongoing costs, including management fees and other Portfolio expenses. The example is intended to help you understand your ongoing costs (in dollars) of investing in the Portfolio and to compare these costs with the ongoing costs of investing in other mutual funds. To do so, compare the Portfolio’s 5% hypothetical example with the 5% hypothetical examples that appear in the shareholder reports of other funds. The example is based on an investment of $1,000 invested at the beginning of the period and held for the entire six-month period from July 1, 2008 to December 31, 2008.
Actual Expenses
In each example, the first line for each share class in the table provides information about the actual account values and actual expenses. These expenses reflect the effect of any expense cap applicable to the share class during the period. Without this expense cap, the costs shown in the table would have been higher. You may use the information in this line, together with the amount you invested, to estimate the expenses that you paid over the period. Simply divide your account value by $1,000 (example, an $8,600 account value divided by $1,000 = 8.6), then multiply the result by the number in the first line under the heading entitled “Expenses Paid During the Period” to estimate the expenses you paid on your account during the period.
Hypothetical Example for Comparison Purposes
In each example, the second line for each share class in the table provides information about hypothetical account values and hypothetical expenses based on the Portfolio’s actual expense ratio and an assumed rate of return of 5% per year before expenses. This is not the Portfolio’s actual return. The hypothetical account values and expenses may not be used to estimate the actual ending account balance or expenses you paid for the period. You may use this information to compare the ongoing costs of investing in the Portfolio to other funds. To do so, compare this 5% hypothetical example with the 5% hypothetical examples that appear in the shareholder reports of other funds.
Please note that the expenses shown in both examples are meant to highlight your ongoing costs only and do not reflect any transactional costs or account type fees. These fees are fully described in the prospectus. Therefore, the second line of each share class in the table is useful in comparing ongoing costs only and will not help you determine the relative costs of owning different funds.
December 31, 2008 | William Blair Funds 61 |
Fund Expenses (Unaudited)
The examples below show you the ongoing costs (in dollars) of investing in your fund and allows you to compare these costs with those of other mutual funds. Please refer to previous page for a detailed explanation of the information presented on this chart.
| | | | | | | | | | | | |
| | | Beginning
Account Value
7/1/2008 | | Ending
Account Value
12/31/2008 | | Expenses Paid
during
Period | | Annualized
Expense Ratio | |
Institutional International Growth Fund | | | | | | | | | | | | |
Actual return | | $ | 1,000.00 | | $ | 541.60 | | $ | 3.80 | | 0.98 | % |
Hypothetical 5% return | | | 1,000.00 | | | 1,020.21 | | | 4.98 | | 0.98 | % |
| | | | |
Institutional International Equity Fund | | | | | | | | | | | | |
Actual return | | | 1,000.00 | | | 567.30 | | | 4.14 | | 1.05 | % |
Hypothetical 5% return | | | 1,000.00 | | | 1,019.86 | | | 5.33 | | 1.05 | % |
| | | | |
International Small Cap Growth Fund Institutional Shares | | | | | | | | | | | | |
Actual return | | | 1,000.00 | | | 521.90 | | | 4.36 | | 1.14 | % |
Hypothetical 5% return | | | 1,000.00 | | | 1,019.41 | | | 5.79 | | 1.14 | % |
| | | | |
Emerging Markets Growth Fund Institutional Shares | | | | | | | | | | | | |
Actual return | | | 1,000.00 | | | 454.40 | | | 4.46 | | 1.22 | % |
Hypothetical 5% return | | | 1,000.00 | | | 1,019.00 | | | 6.19 | | 1.22 | % |
| | | | |
Emerging Leaders Growth Fund Institutional Shares | | | | | | | | | | | | |
Actual return (since inception) (b) | | | 1,000.00 | | | 497.50 | | | 6.13 | | 1.25 | % |
Hypothetical 5% return (6 month period) | | | 1,000.00 | | | 1,024.56 | | | 6.29 | | 1.25 | % |
| | | | |
Bond Fund Institutional Shares | | | | | | | | | | | | |
Actual return | | | 1,000.00 | | | 1,009.20 | | | 1.77 | | 0.35 | % |
Hypothetical 5% return | | | 1,000.00 | | | 1,023.38 | | | 1.78 | | 0.35 | % |
| (a) | | Expenses are equal to the annualized expense ratio, multiplied by the average account value over the period, multiplied by the number of days in the period 184, and divided by 366 (to reflect the one-half year period). |
| (b) | | For the period March 26, 2008 (Commencement of Operations) until December 31, 2008. |
62 Annual Report | December 31, 2008 |
BOARD OF TRUSTEES
Frederick Conrad Fischer, Chairman
Principal, William Blair & Company, L.L.C.
Ann P. McDermott
Director and Trustee
Profit and not-for-profit organizations
Phillip O. Peterson
Retired Partner, KPMG LLP
Donald J. Reaves
Chancellor, Winston-Salem State University
Donald L. Seeley
Adjunct Lecturer and Director, University of Arizona Department of Finance
Michelle R. Seitz, President
Principal, William Blair & Company, L.L.C.,
Thomas J. Skelly
Director and Investment Committee Chairman, U.S. Accenture Foundation Inc.
Robert E. Wood II
Retired Executive Vice President, Morgan Stanley Dean Witter
Officers
Karl W. Brewer, Senior Vice President
Mark A. Fuller, III, Senior Vice President
James S. Golan, Senior Vice President
W. George Greig, Senior Vice President
Michael A. Jancosek, Senior Vice President
John F. Jostrand, Senior Vice President
Robert C. Lanphier, IV, Senior Vice President
Mark T. Leslie, Senior Vice President
Matthew A. Litfin, Senior Vice President
Kenneth J. McAtamney, Senior Vice President
Todd M. McClone, Senior Vice President
Tracy McCormick, Senior Vice President
David Merjan, Senior Vice President
David S. Mitchell, Senior Vice President
Gregory J. Pusinelli, Senior Vice President
David P. Ricci, Senior Vice President
Richard W. Smirl, Senior Vice President and Chief Compliance Officer
Jeffrey A. Urbina, Senior Vice President
Christopher T. Vincent, Senior Vice President
Michael P. Balkin, Vice President
David C. Fording, Vice President
Chad M. Kilmer, Vice President
Terence M. Sullivan, Vice President and Treasurer
Colette M. Garavalia, Secretary
Investment Advisor
William Blair & Company, L.L.C.
Independent Registered Public Accounting Firm
Ernst & Young LLP
Legal Counsel
Vedder Price P.C.
Transfer Agent
Boston Financial Data Services, Inc.
P.O. Box 8506
Boston, MA 02266-8506
For customer assistance, call 1-800-635-2886
(Massachusetts 1-800-635-2840)
December 31, 2008 | William Blair Funds 63 |

As of the end of the period covered by this Form N-CSR, the Registrant has adopted a code of ethics that applies to its principal executive officer and principal financial officer. Such code of ethics is posted on the Registrant’s website: www.williamblairfunds.com. There were no amendments to or waivers of the code of ethics during the period covered by this report.
| Item 3. | Audit Committee Financial Expert |
The Registrant’s Board of Trustees has determined that the Registrant has at least one “audit committee financial expert” (as defined in Item 3 of Form N-CSR) serving on its Audit Committee. Mr. Donald L. Seeley, the Registrant’s audit committee financial expert, is “independent” for purposes of Item 3 to Form N-CSR.
An “audit committee financial expert” is not an “expert” for any purpose, including for purposes of Section 11 of the Securities Act of 1933, as a result of being designated as an “audit committee financial expert.” Further, the designation of a person as an “audit committee financial expert” does not mean that the person has any greater duties, obligations, or liability than those imposed on the person without the “audit committee financial expert” designation. Similarly, the designation of a person as an “audit committee financial expert” does not affect the duties, obligations, or liability of any other member of the audit committee or Board of Trustees.
| Item 4. | Principal Accountant Fees and Services |
Audit Fees
For the fiscal years ended December 31, 2007 and 2008, Ernst & Young, LLP, the Registrant’s principal accountant (“E&Y), billed the Registrant $431,500 and $488,500, respectively, for professional services rendered for the audit of the Registrant’s annual financial statements or services that are normally provided in connection with statutory and regulatory filings.
Audit-Related Fees
For the fiscal years ended December 31, 2007 and 2008, E&Y billed the Registrant $30,000 and $2,500, respectively for assurance and related services that are reasonably related to the performance of the audit of the Registrant’s financial statements and that are not reported above, such as reviewing prospectuses and SEC filings. For the fiscal years ended December 31, 2007 and 2008, E&Y provided no audit-related services to William Blair & Company L.L.C., the Registrant’s investment advisor (“William Blair”) or any of its control affiliates that were for engagements directly related to the Registrant’s operations and financial reporting.
Tax Fees
For the fiscal years ended December 31, 2007 and 2008, E&Y billed the Registrant $100,750 and $90,500, respectively, for professional services rendered for tax compliance, tax advice and tax planning. Such services consisted of preparation of tax returns, year-end distribution review, qualifying dividend income analysis and computation of foreign tax credit pass through. For the fiscal years ended December 31, 2007 and 2008, E&Y billed William Blair and its control affiliates for the services of $0 and $0, respectively, that were for engagements directly related to the Registrant’s operations and financial reporting.
All Other Fees
For the fiscal years ended December 31, 2007 and 2008, E&Y did not bill the Registrant for products and services other than the services reported above. For the fiscal years ended December 31, 2007 and 2008, E&Y provided no other services to William Blair or any of its control affiliates that were for engagements directly related to the Registrant’s operations and financial reporting.
Audit Committee Pre-Approval Policies and Procedures
Pursuant to Registrant’s Audit Committee Charter (the “Charter”), the Audit Committee is responsible for pre-approving any engagement of the principal accountant to provide non-prohibited services to the Registrant, including the fees and other compensation to be paid to the principal accountant, to the extent required by Rule 2-01(c)(7) of Regulation S-X. Pursuant to the Charter, the Audit Committee is also responsible for pre-approving any engagement of the principal accountant, including the fees and other compensation to be paid to the principal accountant, to provide non-audit services to the Registrant’s investment advisor (or any entity controlling, controlled by, or under common control with the adviser that provides ongoing services to the Registrant), if the engagement relates directly to the operations and financial reporting of the Registrant, to the extent required by Rule 2-01(c)(7) of Regulation S-X. The Chair of the Audit Committee may grant the pre-approval referenced above for non-prohibited and non-audit services. All such delegated pre-approvals will be presented to the Audit Committee no later than the next Audit Committee meeting.
Non-Audit Fees
For the fiscal years ended December 31, 2007 and 2008, E&Y billed the Registrant $100,750 and $90,500, respectively, in non-audit fees (tax services). For the same periods, E&Y billed William Blair and its control affiliates $22,500 and $0, respectively, in non-audit fees. The Registrant’s Audit Committee has considered whether the provision of non-audit services that were rendered to William Blair or any of its control affiliates that were not pre-approved pursuant to Rule 2-01(c)(7)(ii) of Regulation S-X is compatible with maintaining E&Y’s independence. Such non-audit services primarily pertained to due diligence reviews performed for the Corporate Finance Group and subsidiary tax preparation of William Blair and did not relate to the Registrant’s operations or financial reporting.
| Item 5. | Audit Committee of Listed Registrants |
Not Applicable to this Registrant, insofar as the Registrant is not a listed company.
| Item 6. | Schedule of Investments |
See Schedule of Investments in Item 1
| Item 7. | Disclosure of Proxy Voting Policies and Procedures for Closed-End Management Investment Companies |
Not applicable to this Registrant, insofar as the Registrant is not a closed-end management investment company.
| Item 8. | Portfolio Managers of Closed Investment Companies |
Not applicable to this Registrant, insofar as the Registrant is not a closed-end management investment company.
| Item 9. | Purchase of Equity Securities by Closed-End Management Investment Companies and Affiliated Purchasers |
Not applicable to this Registrant, insofar as the Registrant is not a closed-end management investment company.
| Item 10. | Submission of Matters to a Vote of Security Holders |
There have been no material changes to the procedures by which shareholders may recommend nominees to the Registrant’s Board of Trustees since the Registrant last provided disclosure in response to this item.
Controls and Procedures
(a) The Registrant’s principal executive and principal financial officer, or persons performing similar functions, have concluded that the Registrant’s Disclosure Controls and Procedures (as defined in Rule 30a-3(c) under the Investment Company Act of 1940, as amended (the “1940 Act”) (17 CFR 270.30a-3(c)) are effective, as of a date within 90 days of the filing date of this report that includes the disclosure required by this paragraph, based on their evaluation of these controls and procedures required by Rule 30a-3 (b) under the 1940 Act (17 CFR 270.30a-3(b) and Rules 13a-15(b) or 15d-15(b) under the Exchange Act (17 CFR 240.13a-15(b) or 240.15d-15(b)).
(b) There were no changes in the Registrant’s internal control over financial reporting (as defined in Rule 30a-3(d) under the 1940 Act (17 CFR 270.30a-3(d)) that occurred during the final quarter of the period covered by this report that has materially affected, or is reasonably likely to materially affect, the Registrant’s internal control over financial reporting.
12. (a) (1) Code of Ethics
Not applicable because it is posted on Registrant’s website.
12. (a) (2) (1)
Certification of Principal Executive Officer Required by Rule 30a-2(a) of the Investment Company Act
12. (a) (2) (2)
Certification of Principal Financial Officer Required by Rule 30a-2(a) of the Investment Company Act.
12. (a) (3)
Not applicable to this Registrant.
12. (b)
Certification of Chief Executive Officer and Certification of Chief Financial Officer Required by Rule 30a-2(b) of the Investment Company Act
Signatures
Pursuant to the requirements of the Securities Exchange Act of 1934 and the Investment Company Act of 1940, the Registrant has duly caused this report to be signed on its behalf by the undersigned, thereunto duly authorized.
| | |
| | | William Blair Funds |
| |
| | | /s/ Michelle R. Seitz |
| By: | | Michelle R. Seitz |
| | | President (Chief Executive Officer) |
Date: February 26, 2009
Pursuant to the requirements of the Securities Exchange Act of 1934 and the Investment Company Act of 1940, this report has been signed below by the following persons on behalf of the Registrant and in the capacities and on the dates indicated
| | |
| By: | | Michelle R. Seitz |
| | | President (Chief Executive Officer) |
Date: February 26, 2009
| | |
| By: | | Terence M. Sullivan |
| | | Treasurer (Chief Financial Officer) |
Date: February 26, 2009