UNITED STATES
SECURITIES AND EXCHANGE COMMISSION
Washington, D.C. 20549
Form N-CSR
CERTIFIED SHAREHOLDER REPORT OF REGISTERED
MANAGEMENT INVESTMENT COMPANIES
Investment Company Act File Number 811-5344
William Blair Funds
(Exact name of registrant as specified in charter)
| | |
| 222 West Adams Street, Chicago, IL | | 60606 |
| (Address of principal executive offices) | | (Zip Code) |
Marco Hanig
William Blair Funds
222 West Adams Street, Chicago, IL 60606
(Name and address of agent for service)
Registrant’s telephone number, including area code: 312-236-1600
Date of fiscal year end: December 31
Date of reporting period: December 31, 2005
Form N-CSR is to be used by management investment companies to file reports with the Commission not later than 10 days after the transmission to stockholders of any report that is required to be transmitted to stockholders under Rule 30e-1 under the Investment Company Act of 1940 (17 CFR 270.30e-1). The Commission may use the information provided on Form N-CSR in its regulatory, disclosure review, inspection, and policymaking roles.
A registrant is required to disclose the information specified by Form N-CSR, and the Commission will make this information public. A Registrant is not required to respond to the collection of information contained in Form N-CSR unless the form displays a currently valid Office of Management and Budget (“OMB”) control number. Please direct comments concerning the accuracy of the information collection burden estimates and any suggestions for reducing the burden to Secretary, Securities and Exchange Commission, 450 Fifth Street, NW, Washington, DC 20549-0609. The OMB has reviewed this collection of information under the clearance requirements of 44 U.S.C. (ss) 3507.
| Item 1. | December 31, 2005 Annual Reports transmitted to shareholders. |

Table of Contents
This report is submitted for the general information of the shareholders of the William Blair Funds. It is not authorized for distribution to prospective investors unless accompanied or preceded by a prospectus of the William Blair Funds. Please carefully consider the Funds’ investment objectives, risks, charges, and expenses before investing. This and other information is contained in the Funds’ prospectus, which you may obtain by calling 1-800-742-7272. Read it carefully before you invest or send money.
December 31, 2005 | William Blair Funds 1 |

Marco Hanig
A LETTER FROM THE PRESIDENT
Dear Shareholders:
In 2005, the U.S. stock market prolonged its rally into a third year, but with moderate growth. The Standard & Poor’s 500 Index of large cap stocks posted a 4.91% return, and the Russell 2000® Index of small cap stocks was up 4.55%. Despite the rise in interest rates, bonds had positive returns, with the Lehman Aggregate Bond Index increasing 2.44%. Abroad, returns were higher, with the MSCI All Country World Free Ex-US Index of foreign stocks up 17.11%
After the bursting of the technology bubble in 2000-2002, the market rebounded sharply in 2003, then began to slow down to low double-digit growth in 2004, and in 2005 leveled off further to a modest single-digit growth rate. The economy is growing quite nicely, but growth in stock prices has been dampened by high energy prices and the continuing efforts by the Fed to keep the economy from overheating by raising interest rates.
The big story was the out-performance of mid-cap stocks, which did better than both small and large-caps. Beginning in 2003, small caps had done much better than mid- and large-caps, and it had been widely expected that eventually this trend would reverse. This is beginning to happen, as leadership shifted from small-caps to mid-caps. It remains to be seen whether, as expected, this trend will continue and result in large-caps having their day in the sun in the coming year.
The differences between value and growth were very modest, with value just edging out growth one more year, continuing a five-year winning streak. This trend is also widely expected to reverse, and the fact that it didn’t happen in 2005 was a bit of a surprise.
Total Returns by Russell Style Index
January 1 through December 31, 2005
| | | | | | | | | |
| | | Value
| | | Blend
| | | Growth
| |
Large Cap (Russell 1000) | | 7.05 | % | | 6.27 | % | | 5.26 | % |
Mid Cap (Russell MidCap) | | 12.65 | % | | 12.65 | % | | 12.10 | % |
Small Cap (Russell 2000) | | 4.71 | % | | 4.55 | % | | 4.15 | % |
The best news for our shareholders is that each and every one of our funds had positive absolute returns in 2005. In terms of relative performance, the top performer was the newly launched Emerging Markets Growth Fund, which beat the MSCI Emerging Markets benchmark by a wide margin (42.52% vs. 29.26%) in the first seven months of its existence, due in significant part to participation in the IPO of Baidu, the Google of China. The Tax-Managed Growth Fund and the Growth Fund also did quite well, with returns of 12.46% and 9.75% respectively versus 5.17% for the Russell 3000 Growth Index. The International Growth Fund, with returns of 21.65% versus 17.11% for the MSCI World ex-US Index rounds out the list of strong relative performers. Funds that struggled in relative terms during the year were Value Discovery Fund, which posted a 0.49% return vs. 4.71% for the Russell 2000 Value Index, and the International Equity Fund, with a 13.50% return vs. 17.11% for the MSCI All Country World Free ex-US Index. The Fund managers’ letters discuss in greater detail the reasons for their over- or under-performance.
As always, thank you for investing with us!

Marco Hanig
As always, we thank you for investing with us!
Marco Hanig
Please see page 4 for important performance disclosure information.
2 Annual Report | December 31, 2005 |
PERFORMANCE AS OF DECEMBER 31, 2005—CLASS N SHARES
| | | | | | | | | | | | |
| | | 1 Yr
| | 3 Yr
| | 5 Yr
| | 10 Yr (or since
inception)
| | Inception
Date
| | Overall Morningstar Rating
|
Growth Fund | | 9.75 | | 13.36 | | -1.35 | | 6.45 | | 3/20/46 | | ««« |
Morningstar Large Growth | | 6.46 | | 13.88 | | -3.36 | | 6.95 | | | | Among 1,353 large growth funds |
Russell 3000® Growth | | 5.17 | | 13.78 | | -3.15 | | 6.48 | | | |
Standard & Poor’s 500 | | 4.91 | | 14.39 | | 0.54 | | 9.07 | | | | |
| | | | | | |
Tax-Managed Growth Fund | | | | | | | | | | | | «««« |
Return before Taxes | | 12.46 | | 13.80 | | 0.06 | | 0.18 | | 12/27/99 | | Among 1,353 large growth funds |
After Taxes on Distributions | | 12.46 | | 13.80 | | 0.06 | | 0.18 | | | |
After Taxes on Distributions and Sale of Fund Shares | | 8.10 | | 11.94 | | 0.05 | | 0.15 | | | | |
Morningstar Large Growth | | 6.46 | | 13.88 | | -3.36 | | — | | | | |
Russell 3000® Growth | | 5.17 | | 13.78 | | -3.15 | | -6.45 | | | | |
| | | | | | |
Large Cap Growth Fund | | 3.69 | | 10.46 | | -5.20 | | -6.96 | | 12/27/99 | | «« |
Morningstar Large Growth | | 6.46 | | 13.88 | | -3.36 | | — | | | | Among 1,353 large growth funds |
Russell 1000® Growth | | 5.26 | | 13.23 | | -3.58 | | -6.85 | | | |
| | | | | | |
Small Cap Growth Fund | | 1.18 | | 27.73 | | 16.79 | | 19.68 | | 12/27/99 | | ««««« |
Morningstar Small Growth | | 5.74 | | 19.56 | | 2.17 | | — | | | | Among 650 small growth funds |
Russell 2000® Growth | | 4.15 | | 20.93 | | 2.28 | | -1.37 | | | |
| The Small Cap Growth Fund’s performance during 2000 was primarily attributable to investments in initial public offerings (IPOs) during a rising market. Since then, IPOs have had an insignificant effect on the Fund’s performance. | | | | | | |
| | | | | | |
Small-Mid Cap Growth Fund | | 10.72 | | — | | — | | 11.64 | | 12/29/03 | | Not rated. |
Morningstar Mid-Cap Growth | | 9.70 | | — | | — | | — | | | | |
Russell 2500TM Growth | | 8.17 | | — | | — | | 11.75 | | | | |
| | | | | | |
International Growth Fund | | 21.65 | | 27.03 | | 8.46 | | 13.68 | | 10/1/92 | | ««««« |
Morningstar Foreign Large Growth | | 15.27 | | 21.66 | | 2.15 | | 5.69 | | | | Among 196 foreign large growth funds |
MSCI All Country World Free Ex-US | | 17.11 | | 26.20 | | 6.66 | | 6.70 | | | |
| | | | | | |
International Equity Fund | | 13.50 | | — | | — | | 16.85 | | 5/24/04 | | Not rated. |
Morningstar Foreign Large Growth | | 15.27 | | — | | — | | — | | | | |
MSCI All Country World Free Ex-US | | 17.11 | | — | | — | | 25.10 | | | | |
| | | | | | |
International Small Cap Growth | | — | | — | | — | | 11.60 | | 11/1/05 | | Not rated. |
MSCI All Country World Free Small Cap Ex-US | | — | | — | | — | | 10.68 | | | | |
| | | | | | |
Emerging Markets Growth Fund | | — | | — | | — | | 42.52 | | 6/6/05 | | Not rated. |
MSCI Emerging Markets Free | | — | | — | | — | | 29.26 | | | | |
| A portion of the Emerging Markets Growth Funds performance since inception was attributable to an investment in an initial public offering (IPO). | | | | | | |
| | | | | | |
Value Discovery Fund | | 0.49 | | 16.19 | | 10.46 | | 11.98 | | 12/23/96 | | «« |
Morningstar Small Value | | 6.13 | | 22.30 | | 13.50 | | — | | | | Among 276 small value funds |
Russell 2000® | | 4.55 | | 22.13 | | 8.22 | | 8.64 | | | |
Russell 2000® Value | | 4.71 | | 23.18 | | 13.55 | | 12.31 | | | | |
| | | | | | |
Income Fund | | 1.71 | | 2.66 | | 4.59 | | 5.11 | | 10/1/90 | | «««« |
Morningstar Short-Term Bond | | 1.43 | | 1.96 | | 3.82 | | 4.63 | | | | Among 317 short-term bond funds |
Lehman Intermediate Govt./Credit Bond Index | | 1.57 | | 2.96 | | 5.49 | | 5.80 | | | |
Please see the next page for important disclosure information.
December 31, 2005 | William Blair Funds 3 |
Performance cited represents past performance. Past performance does not guarantee future results and current performance may be lower or higher that the data quoted. Returns shown are average annual total returns, which assume reinvestment of dividends and capital gains. Investment returns and principal will fluctuate and you may have a gain or a loss when you sell shares. For the most current month-end performance information, please call 1-800-742-7272, or visit our Web site at www.williamblairfunds.com. Investing in smaller companies involves special risks, including higher volatility and lower liquidity. International and emerging markets investing involves special risk considerations, including currency fluctuations, lower liquidity, economic and political risk. As interest rates rise, bond prices will fall and bond funds become more volatile. From time to time, the investment advisor may waive fees or reimburse expenses for certain Funds. Without these waivers, performance would be lower. Class N shares are available to the general public without a sales load.
Tax-Managed Growth Fund’s after-tax returns are calculated using the highest historical individual federal marginal income tax rates, and do not reflect the impact of state and local taxes. Actual after-tax returns depend on the investor’s tax situation and may differ from those shown. After-tax returns shown are not relevant to investors who hold their fund shares through tax-deferred arrangements such as 401(k) plans or individual retirement accounts. After-tax returns are shown only for Class N and the after-tax returns for Class N shares will vary.
Morningstar RatingsTM are as of 12/31/05 and are subject to change every month. The ratings are based on a risk-adjusted return measure that accounts for variation in a fund’s monthly performance, placing more emphasis on downward variations and rewarding consistent performance. The top 10% of funds in each Category receive 5 stars, the next 22.5% receive 4 stars, the middle 35% receive 3 stars, the next 22.5% receive 2 stars, and the bottom 10% receive 1 star. The Overall Morningstar Rating for a fund is derived from a weighted-average of the performance figures associated with its three-, five- and ten-year (if applicable) Morningstar Rating metrics. The 3/5/10 year Morningstar ratings were as follows: Growth Fund «««/«««/«««, Tax-Managed Growth Fund «««/««««/NA, and Large Cap Growth Fund ««/««/NA, out of 1,353/1,065/370 large growth funds; Small Cap Growth Fund «««««/«««««/NA out of 650/507/NA small growth funds; Value Discovery Fund «/««/NA out of 276/192/NA small value funds; International Growth Fund ««««/«««««/««««« out of 196/151/62 foreign large growth funds; Income Fund ««««/««««/«««« out of 317/227/131 short-term bond funds.
Please carefully consider the Funds’ investment objectives, risks, charges, and expenses before investing. This and other information is contained in the Funds’ prospectus, which you may obtain by calling 1-800-742-7272. Read it carefully before you invest or send money. William Blair & Company, L.L.C., distributor. 02/06.
4 Annual Report | December 31, 2005 |

John F. Jostrand
GROWTH FUND
The Growth Fund invests primarily in common stocks of domestic growth companies that the Advisor expects to have sustainable, above-average growth from one business cycle to the next.
AN OVERVIEW FROM THE PORTFOLIO MANAGER
How did the Fund perform over the last year? How did the Fund’s performance compare to its benchmark?
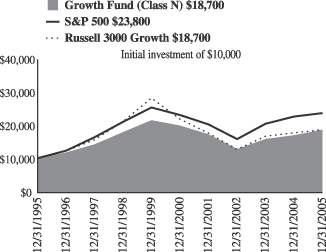
The Growth Fund posted a 9.75% increase on a total return basis (Class N Shares) for the 12 months ended December 31, 2005. By comparison, the Fund’s benchmarks, the Russell 3000® Growth Index gained 5.17%, while the Standard & Poor’s 500 Index rose 4.91%.
What were the most significant factors impacting Fund performance?
Stock selection was the strongest factor with respect to the Fund’s overall out-performance relative to the benchmark for the year. The Fund’s overweight position to stocks with the smallest capitalizations (below $2 billion), along with particularly strong stock selection in this area, provided the largest benefit to absolute and relative returns.
Which sectors enhanced the Fund’s return? What were among the best performing investments for the Fund?
The strongest contributing sector to the Fund and Russell 3000® Growth Index returns during the year was Health Care. Our extremely strong stock selection allowed the Fund to significantly outpace the Russell 3000® Growth Index in this area. Health Care Equipment and Supplies offered the largest benefit to absolute and relative returns. Alcon, Inc. in the eye care area, received approval for its ReStor Lens for cataract surgery, and Medicare approved funding of the procedure; these proved to be catalysts for stock appreciation. Kyphon, Inc. a provider of groundbreaking product and technique in spine restoration surgery, also experienced strong growth during the year. The Health Care Providers and Services industry provided the second best returns within health care for the portfolio, with UnitedHealth Group, Express Scripts, Inc. and American Healthways, Inc. posting positive stock price gains.
Information Technology stocks were the second largest contributors to Fund returns, on both an absolute and relative basis. A large benefit came from the software area, where the Fund showed positive results while the Russell 3000® Growth Index had negative returns. Nuance Communications, Inc., providing imaging services, with a focus on voice-oriented command services, scan-to-digital and fax-to-digital services, saw strong stock price gains during the year. Adobe Inc. also had excellent results, particularly in the fourth quarter.
Were there any investment strategies or themes that did not measure up to your expectations?
Consumer stocks were soft during the year, taking the brunt of rising interest rates and higher oil prices. In the Fund, our stocks within the Retail sector were particularly disappointing. Kohl’s Corporation was anticipated to achieve promising results after some significant management changes, remerchandising of products, and adding several items to higher
December 31, 2005 | William Blair Funds 5 |
margin personal care and beauty lines. The softness in consumer stocks in general, combined with discount pricing and unseasonable weather contributed to the stock’s weakness. In a similar vein, Bed, Bath and Beyond, Inc. had an optimistic outlook with respect to their new larger “box” stores, their strong competitive position, and their roll out of Christmas Tree Stores. The company experienced modest sales results during the year, which disappointed investors who anticipated much better growth. In the last quarter, the company announced that financial results were likely to be at the lower end of the expected range, news which further pressured the stock.
Dell Inc. was the largest detractor from returns, both on an absolute and relative basis. Despite meeting earnings estimates during the year, the stock experienced some weakness in revenues driven by aggressive pricing strategies to stave off the recently rejuvenated Hewlett-Packard Co. Additionally, the stock experienced significant Price/Earnings multiple compression.
We were slightly underweight in Energy stock during the year. Although our stock selection significantly outpaced the Russell 3000® Growth Index, our underweight caused a modest drag to relative performance.
What is your current strategy? How is the Fund positioned?
We continue to seek interesting opportunities for sustainable growth in the Information Technology and Health Care areas. We are cautious in the consumer area, particularly to stocks that are heavily reliant on the lower-end customer, and have not found compelling growth opportunities in the consumer staples area.
Compared to historic ratios, valuations are relatively compressed, resulting in no significant differentiation between higher and lower quality companies. As the economy slows, we believe the higher quality companies will be able to differentiate themselves from those of average quality due to superior business models that will likely generate above average growth, and be rewarded with higher earnings multiples.
6 Annual Report | December 31, 2005 |
Growth Fund
Performance Highlights (unaudited)
Average Annual Total Return at 12/31/2005
| | | | | | | | | | | | | | | | | |
| | | 1 Year
| | | 3 Year
| | | 5 Year
| | | 10 Year
| | | Since Inception(a)
| | | |
Growth Fund Class N | | 9.75 | % | | 13.36 | % | | (1.35 | )% | | 6.45 | % | | — | | | |
Growth Fund Class I | | 10.08 | | | 13.69 | | | (1.10 | ) | | — | | | 0.73 | | | |
Russell 3000® Growth Index | | 5.17 | | | 13.78 | | | (3.15 | ) | | 6.48 | | | (2.91 | ) | | |
S&P 500 Index | | 4.91 | | | 14.39 | | | 0.54 | | | 9.07 | | | 1.13 | | | |
| | (a) | | For the period from October 1, 1999 to December 31, 2005. |
Performance cited represents past performance. Past performance does not guarantee future results and current performance may be lower or higher than the data quoted. Results shown are average annual returns, which assume reinvestment of dividends and capital gains. Investment returns and principal will fluctuate and you may have a gain or loss when you sell shares. For the most current month-end performance information, please call 1-800-742-7272, or visit our Web site at www.williamblairfunds.com. Class N shares are available to the general public without a sales load. Class I shares are available to certain institutional investors and advisory clients of William Blair & Company L.L.C. without a sales load or distribution (12b-1) or service fees.
The performance highlights and graph presented above do not reflect the deduction of taxes that a shareholder would pay on fund distributions or the redemption of fund shares.
The Russell 3000® Growth Index consists of large, medium, and small-capitalization companies with above average price-to-book ratios and forecasted growth rates. The index is weighted by market capitalization and large/medium/small companies make up approximately 80%/15%/5% of the index.
The S&P 500 Index indicates broad larger capitalization equity market performance.
This report identifies the Fund’s investments on December 31, 2005. These holdings are subject to change. Not all stocks in the Fund performed the same, nor is there any guarantee that these stocks will perform as well in the future. Market forecasts provided in this report may not necessarily come to pass.
Sector Diversification (unaudited)
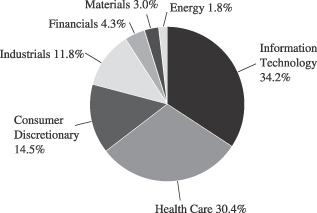
The sector diversification shown is based on the total investment portfolio.
December 31, 2005 | William Blair Funds 7 |
Growth Fund
Portfolio of Investments, December 31, 2005 (all dollar amounts in thousands)
| | | | | |
Issuer
| | Shares
| | Value
|
| | |
Common Stocks | | | | | |
Information Technology—33.4% | | | | | |
*Adobe Systems Incorporated | | 174,860 | | $ | 6,463 |
Arm Holding plc—ADR | | 749,885 | | | 4,657 |
*Cognizant Technology Solutions Corporation | | 64,565 | | | 3,251 |
*Dell, Inc. | | 255,425 | | | 7,660 |
*EMC Corporation | | 544,550 | | | 7,417 |
First Data Corporation | | 125,230 | | | 5,386 |
*J2 Global Communications, Inc. | | 106,415 | | | 4,548 |
*Jabil Circuit, Inc. | | 169,205 | | | 6,276 |
Linear Technology Corporation | | 97,420 | | | 3,514 |
Microchip Technology, Inc. | | 83,560 | | | 2,686 |
*Network Appliance, Inc. | | 109,780 | | | 2,964 |
*Nuance Communications, Inc. | | 737,765 | | | 5,629 |
Paychex, Inc. | | 163,200 | | | 6,221 |
*PDF Solutions, Inc. | | 82,870 | | | 1,347 |
Taiwan Semiconductor Mfg. Co. Ltd.—ADR | | 774,470 | | | 7,675 |
*ValueClick, Inc. | | 284,980 | | | 5,161 |
*WebEx Communications, Inc. | | 174,285 | | | 3,770 |
| | | | |
|
|
| | | | | | 84,625 |
| | | | |
|
|
Health Care—29.7% | | | | | |
Allergan, Inc. | | 35,440 | | | 3,826 |
*Amgen, Inc. | | 144,735 | | | 11,414 |
*Axcan Pharma, Inc.† | | 249,540 | | | 3,778 |
*IDEXX Laboratories, Inc. | | 59,090 | | | 4,253 |
*Integra Lifesciences Holding Corporation | | 143,470 | | | 5,088 |
*Kyphon, Inc. | | 77,510 | | | 3,165 |
*MedImmune, Inc. | | 94,065 | | | 3,294 |
Medtronic, Inc. | | 207,085 | | | 11,922 |
*ResMed, Inc. | | 81,830 | | | 3,135 |
Sanofi-Aventis—ADR | | 167,595 | | | 7,357 |
Schering-Plough Corporation | | 295,815 | | | 6,168 |
UnitedHealth Group, Inc. | | 163,435 | | | 10,156 |
Valeant Pharmaceuticals International | | 104,115 | | | 1,882 |
| | | | |
|
|
| | | | | | 75,438 |
| | | | |
|
|
Consumer Discretionary—14.2% | | | | | |
*Bed, Bath & Beyond, Inc. | | 174,480 | | | 6,307 |
*CarMax, Inc. | | 101,335 | | | 2,805 |
*Education Management Corporation | | 138,960 | | | 4,657 |
Johnson Controls, Inc. | | 52,855 | | | 3,854 |
*Kohl’s Corporation | | 118,190 | | | 5,744 |
*Laureate Education, Inc. | | 87,030 | | | 4,570 |
*Shuffle Master, Inc. | | 113,455 | | | 2,852 |
*Non-income producing securities
ADR = American Depository Receipt
† = U.S. listed foreign security
VRN = Variable Rate Note
| | | | | | |
Issuer
| | Shares or
Principal
Amount
| | Value
|
| | |
Common Stocks—(continued) | | | | | | |
Consumer Discretionary—(continued) | | | | | | |
*Williams-Sonoma, Inc. | | | 120,840 | | $ | 5,214 |
| | | | | |
|
|
| | | | | | | 36,003 |
| | | | | |
|
|
Industrials—11.5% | | | | | | |
*Coinstar, Inc. | | | 194,020 | | | 4,429 |
Corporate Executive Board Company | | | 44,780 | | | 4,017 |
Danaher Corporation | | | 185,946 | | | 10,372 |
Graco, Inc. | | | 111,730 | | | 4,076 |
Knight Transportation, Inc. | | | 300,900 | | | 6,238 |
| | | | | |
|
|
| | | | | | | 29,132 |
| | | | | |
|
|
Financials—4.2% | | | | | | |
Goldman Sachs Group, Inc. | | | 42,595 | | | 5,440 |
SLM Corporation | | | 94,295 | | | 5,194 |
| | | | | |
|
|
| | | | | | | 10,634 |
| | | | | |
|
|
Materials—2.9% | | | | | | |
Praxair, Inc. | | | 141,165 | | | 7,476 |
| | | | | |
|
|
Energy—1.8% | | | | | | |
Suncor Energy, Inc.† | | | 71,095 | | | 4,488 |
| | | | | |
|
|
Total Common Stock—97.7%
(cost $184,148) | | | 247,796 |
| | | | | |
|
|
| | |
Investment in Affiliate | | | | | | |
William Blair Ready Reserves | | | 724,307 | | | 724 |
| | | | | |
|
|
Total Investment in Affiliate—0.3%
(cost $724) | | | 724 |
| | | | | |
|
|
| | |
Short-Term Investment | | | | | | |
Prudential Funding Demand Note, VRN
3.93%, due 1/03/06 | | $ | 3,868,000 | | | 3,868 |
| | | | | |
|
|
Total Short-Term Investment—1.5%
(cost $3,868) | | | 3,868 |
| | | | | |
|
|
Total Investments—99.5%
(cost $188,740) | | | 252,388 |
Cash and other assets, less liabilities—0.5% | | | 1,171 |
| | | | | |
|
|
Net assets—100.0% | | $ | 253,559 |
| | | | | |
|
|
See accompanying Notes to Financial Statements.
8 Annual Report | December 31, 2005 |

Mark A. Fuller III

Gregory J. Pusinelli
TAX-MANAGED GROWTH FUND
The Tax-Managed Growth Fund invests primarily in common stocks of large, medium and small domestic growth companies that the Advisor expects will have sustainable, above-average growth from one business cycle to the next.
AN OVERVIEW FROM THE PORTFOLIO MANAGERS
How did the Fund perform over the last year? How did the Fund’s performance compare to its benchmark?
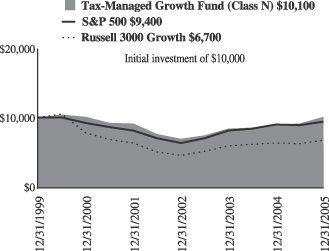
The Tax-Managed Growth Fund posted a strong 12.46% gain on a total return basis (Class N Shares) for the 12 months ended December 31, 2005. By comparison, the Fund’s primary benchmark, the Russell 3000® Growth Index increased 5.17% and the Standard & Poor’s 500 Stock Index gained 4.91%.
What were the most significant market factors impacting Fund performance?
The stock market, as represented by the Standard & Poor’s 500 Index, finished the year in positive territory. In spite of this showing, the equity markets were restrained in 2005 by high energy prices, an ongoing Federal Reserve campaign to raise short-term interest rates, and a flat interest rate yield curve, which many interpreted as a signal that slower economic growth might be on the horizon.
Concerns that rising energy prices could dampen economic growth weighed on the equity markets for a good part of the year. In addition, indications early in the year that inflationary pressures had the potential to increase had an unsettling effect on equity market participants.
Investors also worried about the potential for slowing corporate profits, although optimism during the second quarter earnings reporting period seemed to provide some underlying support to the market.
Lastly, investors were troubled by the Federal Reserve’s eight interest rate increases during 2005. Investors grew increasingly concerned that the Fed was being overly cautious—and perhaps too restrictive—with its monetary policy.
What were among the best performing investments for the Fund?
Health Care was the strongest performing sector for the Tax-Managed Growth Fund in 2005, followed by Energy and Industrials. Four of the top five performing stocks were Health Care names.
ExpressScripts, Inc., which was up over 119%, was the best performing stock in the Fund’s portfolio. ExpressScripts provides pharmacy-benefit management services to managed-care firms, third-party administrators, large employers, and union-sponsored benefit plans, representing more than 50 million members. ExpressScripts continued to experience strong growth in their business throughout the course of the year.
We trimmed our position in ExpressScripts during the fourth quarter, mainly taking profits in view of our belief that the stock had achieved fairly full valuation.
December 31, 2005 | William Blair Funds 9 |
Suncor Energy, Inc. was the second-best performing investment for the Fund in 2005, rising over 79%. Suncor Energy produces and refines oil from the Alberta oil sands in Canada and is a pioneer in oil sands production.
Genentech, Inc. was the third strongest contributor for the Fund in 2005, and was up over 69%. Genentech’s cancer products—and their crossover use for different types of cancers—look promising. Increased earnings estimates for the company, especially during the second quarter, reinforced our enthusiasm for this company. We especially favor this company because Genentech has an entire portfolio of products, compared to other biotechnology companies which may only have one drug either in test trials or to market. Valuation of this stock, however, seems “rich” in our view.
What were among the weakest performing investments for the Fund?
Valeant Pharmaceuticals International was the worst-performing investment for the Fund for the year. Valeant markets more than 400 health-care products worldwide. As we reported earlier this year, concerns about the company’s ability to get certain new drugs approved by the FDA hurt this stock. We nonetheless believe in this company and their strong new management team that has joined the firm from many of the world’s top pharmaceutical companies. We should also note that we “tax-traded” Valeant, harvesting a tax-loss by selling the stock in November and then buying it back in late December. This strategy was one example of our efforts to manage the Fund in a tax-efficient manner. We are willing to withstand the short-term fluctuations in the company’s share price because of this management, and because of Valeant’s promising portfolio of products which is in various stages of testing.
Investors Financial Services Corp., was the second worst-performing stock for the Fund last year. Investors’ earnings have suffered from the flattening interest rate yield curve resulting from the Federal Reserve’s short-term interest rate hikes, as higher short-term rates impact margins.
Pfizer, Inc., was the third worst-performing investment for the Fund in 2005, in terms of impacting the Fund’s return. With an insufficient lineup of new drugs coming down the pipeline, and competitive pressures to its cholesterol-lowering drug Lipitor, we sold the stock in December, believing the company was unlikely to meet our long-term minimum growth objectives.
What is your current strategy? How is the Fund positioned?
During the fourth quarter we added four new names to the Fund’s portfolio of investments: DR Horton, Inc., Johnson Controls, Inc., MedImmune, Inc., and Network Appliance, Inc.
DR Horton is the largest homebuilder in the country based on homes sold, and operates in about 75 major markets across 25 states. Although some investors are nervous about the prospects for the housing market in an environment of gradually rising interest rates, we like this company’s solid management team and long uninterrupted track record of growth. We took advantage of price weakness in the stock to add this company to the Fund’s portfolio.
Johnson Controls operates three distinct business segments: automotive interiors, vehicle batteries, and building controls and services. We chose this well-managed company in part to increase our exposure to the Industrial sector.
MedImmune, Inc., is a biotechnology company with a very interesting pipeline of new drugs and expectations for a strong earnings growth rate over the next several years.
10 Annual Report | December 31, 2005 |
Network Appliance, an information technology company, sells hardware, software, and services for customers to store and manage critical data across their networks. Network Appliance was an early pioneer in building storage hardware that could easily attach to a customer’s existing network as a simple “storage appliance.” In an era of ever-increasing information flow, we believe this company should benefit from the demand for its products, and its ability to take market share from its competitors.
After several years of “value” stocks outperforming their “growth” stock counterparts, sometime during 2005 the pendulum swung back towards growth. This strength in growth stocks is reflected in the performance of the Fund’s Russell 3000 Growth Index benchmark. With this trend seeming to now move in our favor, we are optimistic that the cycle may continue, as it has historically, for an extended period.
Regardless of whether this trend may continue, with the potential for higher interest rates and slower growth in the economy in 2006—and subsequently lower forecasted corporate profits growth—we are encouraged by the earnings growth potential of the companies in the Fund’s portfolio. In such an environment, security selection becomes even more important. We believe our focus on quality franchise businesses and a respect for downside risk should serve us well as we begin the new year.
December 31, 2005 | William Blair Funds 11 |
Tax-Managed Growth Fund
Performance Highlights (unaudited)
Average Annual Total Return at 12/31/2005
| | | | | | | | | | | | |
| | | 1
Year
| | | 3
Year
| | | 5
Year
| | | Since Inception(a)
| |
Tax-Managed Growth
Fund Class N | | 12.46 | % | | 13.80 | % | | 0.06 | % | | 0.18 | % |
Tax-Managed Growth
Fund Class I | | 12.86 | | | 14.07 | | | 0.31 | | | 0.44 | |
Russell 3000®
Growth Index | | 5.17 | | | 13.78 | | | (3.15 | ) | | (6.45 | ) |
S&P 500 Index | | 4.91 | | | 14.39 | | | 0.54 | | | (1.00 | ) |
| | (a) | | For the period from December 27, 1999 to December 31, 2005. |
Performance cited represents past performance. Past performance does not guarantee future results and current performance may be lower or higher than the data quoted. Results shown are average annual total returns, which assume reinvestment of dividends and capital gains. Investment returns and principal will fluctuate and you may have a gain or loss when you sell shares. For the most current month-end performance information, please call 1-800-742-7272, or visit our Web site at www.williamblairfunds.com. From time to time, the investment adviser may waive fees or reimburse expenses for the Fund. Without these waivers, performance would be lower. Class N shares are available to the general public without a sales load. Class I shares are available to certain institutional investors and advisory clients of William Blair & Company, L.L.C., without a sales load or distribution (12b-1) or service fees.
The performance highlights and graph presented above do not reflect the deduction of taxes that a shareholder would pay on fund distributions or the redemption of fund shares.
The Russell 3000® Growth Index consists of large, medium, and small-capitalization companies with above average price-to-book ratios and forecasted growth rates. The index is weighted by market capitalization and large/medium/small companies make up approximately 80%/15%/5% of the index.
The S&P 500 Index indicates broad larger capitalization equity market performance.
This report identifies the Fund’s investments on December 31, 2005. These holdings are subject to change. Not all stocks in the Fund performed the same, nor is there any guarantee that these stocks will perform as well in the future. Market forecasts provided in this report may not necessarily come to pass.
Sector Diversification (unaudited)
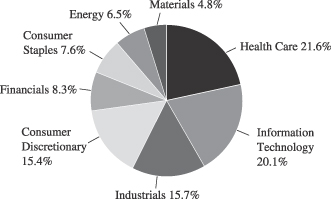
The sector diversification shown is based on the total investment portfolio.
12 Annual Report | December 31, 2005 |
Tax-Managed Growth Fund
Portfolio of Investments, December 31, 2005 (all dollar amounts in thousands)
| | | | | |
Issuer
| | Shares
| | Value
|
| | |
Common Stocks | | | | | |
Health Care—20.0% | | | | | |
Alcon, Inc.† | | 965 | | $ | 125 |
*Amgen, Inc. | | 2,625 | | | 207 |
*Express Scripts, Inc., Class “A” | | 1,420 | | | 119 |
*Genentech, Inc. | | 1,940 | | | 180 |
IMS Health, Inc. | | 5,110 | | | 127 |
*MedImmune, Inc. | | 2,080 | | | 73 |
*ResMed, Inc. | | 4,734 | | | 181 |
Sanofi-Aventis—ADR | | 2,480 | | | 109 |
*St. Jude Medical, Inc. | | 2,550 | | | 128 |
Stryker Corporation | | 1,330 | | | 59 |
Valeant Pharmaceuticals International | | 6,450 | | | 117 |
*Zimmer Holdings, Inc. | | 2,060 | | | 139 |
| | | | |
|
|
| | | | | | 1,564 |
| | | | |
|
|
Information Technology—18.6% | | | | | |
*Activision, Inc. | | 4,283 | | | 59 |
*Adobe Systems Incorporated | | 3,470 | | | 128 |
Arm Holdings plc—ADR | | 9,500 | | | 59 |
*CACI International, Inc., Class “A” | | 1,470 | | | 84 |
CDW Corporation | | 1,750 | | | 101 |
*EMC Corporation | | 7,110 | | | 97 |
First Data Corporation | | 3,130 | | | 135 |
*Intuit, Inc. | | 2,645 | | | 141 |
*Jabil Circuit, Inc. | | 3,825 | | | 142 |
Microchip Technology, Inc. | | 4,500 | | | 145 |
*Network Appliance, Inc. | | 2,550 | | | 69 |
Paychex, Inc. | | 3,660 | | | 139 |
*ScanSource, Inc. | | 1,330 | | | 73 |
Taiwan Semiconductor Mfg. Co. Ltd.—ADR | | 8,220 | | | 81 |
| | | | |
|
|
| | | | | | 1,453 |
| | | | |
|
|
Industrials—14.5% | | | | | |
C.H. Robinson Worldwide, Inc. | | 5,040 | | | 187 |
Danaher Corporation | | 3,260 | | | 182 |
Expeditors International of Washington | | 2,425 | | | 164 |
Fastenal Company | | 5,440 | | | 213 |
General Electric Company | | 3,615 | | | 127 |
Knight Transportation, Inc. | | 5,273 | | | 109 |
Pentair, Inc. | | 4,410 | | | 152 |
| | | | |
|
|
| | | | | | 1,134 |
| | | | |
|
|
Consumer Discretionary—14.2% | | | | | |
*Bed, Bath & Beyond, Inc. | | 2,230 | | | 81 |
*CarMax, Inc. | | 2,920 | | | 81 |
D. R. Horton, Inc. | | 2,230 | | | 80 |
Dollar General Corporation | | 4,560 | | | 87 |
*eBAY, Inc. | | 1,850 | | | 80 |
Johnson Controls, Inc. | | 1,580 | | | 115 |
*Laureate Education, Inc. | | 2,830 | | | 148 |
Lowe’s Companies, Inc. | | 1,875 | | | 125 |
Time Warner, Inc. | | 4,890 | | | 85 |
*Non-income producing securities
ADR = American Depository Receipt
† = U.S. listed foreign security
VRN = Variable Rate Note
| | | | | | |
Issuer
| | Shares or
Principal
Amount
| | Value
|
| | |
Common Stocks—(continued) | | | | | | |
Consumer Discretionary—(continued) | | | | | | |
*Univision Communications, Inc. | | | 1,960 | | $ | 57 |
*Williams-Sonoma, Inc. | | | 3,935 | | | 170 |
| | | | | |
|
|
| | | | | | | 1,109 |
| | | | | |
|
|
Financials—7.7% | | | | | | |
AFLAC, Inc. | | | 1,500 | | | 70 |
Ambac Financial Group, Inc. | | | 1,560 | | | 120 |
American International Group | | | 2,380 | | | 162 |
Investors Financial Service Corporation | | | 2,420 | | | 89 |
Moody’s Corporation | | | 2,620 | | | 161 |
| | | | | |
|
|
| | | | | | | 602 |
| | | | | |
|
|
Consumer Staples—7.0% | | | | | | |
Colgate-Palmolive Company | | | 2,590 | | | 142 |
PepsiCo, Inc. | | | 3,045 | | | 180 |
Walgreen Co. | | | 2,555 | | | 113 |
Whole Foods Market, Inc. | | | 1,460 | | | 113 |
| | | | | |
|
|
| | | | | | | 548 |
| | | | | |
|
|
Energy—6.0% | | | | | | |
EOG Resources, Inc. | | | 1,010 | | | 74 |
Smith International, Inc. | | | 2,050 | | | 76 |
Suncor Energy, Inc.† | | | 5,010 | | | 316 |
| | | | | |
|
|
| | | | | | | 466 |
| | | | | |
|
|
Materials—4.5% | | | | | | |
Airgas, Inc. | | | 5,990 | | | 197 |
Praxair, Inc. | | | 2,870 | | | 152 |
| | | | | |
|
|
| | | | | | | 349 |
| | | | | |
|
|
Total Common Stock—92.5%
(cost $5,112) | | | 7,225 |
| | | | | |
|
|
| | |
Investment in Affiliate | | | | | | |
William Blair Ready Reserves | | | 362,919 | | | 363 |
| | | | | |
|
|
Total Investment in Affiliate—4.6%
(cost $363) | | | 363 |
| | | | | |
|
|
| | |
Short-Term Investment | | | | | | |
Prudential Funding Demand Note, VRN
3.93%, due 1/03/06 | | $ | 165,000 | | | 165 |
| | | | | |
|
|
Total Short-Term Investment—2.1%
(cost $165) | | | 165 |
| | | | | |
|
|
Total Investments—99.2%
(cost $5,640) | | | 7,753 |
Cash and other assets, less liabilities—0.8% | | | 62 |
| | | | | |
|
|
Net assets—100.0% | | $ | 7,815 |
| | | | | |
|
|
See accompanying Notes to Financial Statements.
December 31, 2005 | William Blair Funds 13 |

James W. Golan
John F. Jostrand

Norbert W. Truderung
LARGE CAP GROWTH FUND
The Large Cap Growth Fund invests primarily in common stocks of large domestic growth companies of high quality that the Advisor believes have demonstrated sustained growth over a long period of time.
AN OVERVIEW FROM THE PORTFOLIO MANAGERS
How did the Fund perform over the last year? How did the Fund’s performance compare to its benchmark?
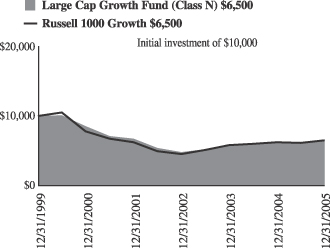
The Large Cap Growth Fund posted a 3.69% increase on a total return basis (Class N Shares) for the 12 months ended December 31, 2005. By comparison, the Fund’s benchmark, the Russell 1000 Growth® Index, gained 5.26%.
What were the most significant factors impacting Fund performance?
The Large Cap Growth strategy underperformed the Russell 1000 Growth® Index, facing two significant headwinds during the year: the considerable out-performance of the smaller capitalization stocks within the benchmark and relative under-performance by higher quality stocks. In the Russell 1000 Growth® Index, the smallest stocks (under $8 billion market capitalization) contributed nearly half of the Index’s returns for the year. Since we are required to invest at least 80% of the Fund’s net assets in stocks of companies with market capitalizations of at least $8 billion, we had little representation in that area. As a result, our portfolio underperformed the benchmark in the below $8 billion market cap range. That said, we were able to find some compelling quality growth stocks at the high end of the large cap range; in particular: UnitedHealth Group, Inc., Amgen, Inc., and Goldman Sachs Group, Inc. These stocks provided significant relative out-performance against names with market capitalizations above $50 billion held in the benchmark.
Higher quality stocks continued to give ground to lower quality counterparts during the year, a trend that began three years ago with the earnings acceleration at the beginning of the economic recovery. In 2005, using return on equity (ROE) as a proxy for quality, the stocks in the Russell 1000 Index with the highest ROEs returned an average of 3%, while the stocks with the lowest ROEs returned roughly 11%. Our philosophy leads us to invest in higher quality companies, which we believe tend to outperform over the long-term. While performance of our highest quality stocks was more than double those in the index, our lack of significant investment in lower quality issues has been a relative drag on the portfolio.
Which sectors enhanced the Fund’s return? What were among the best performing investments for the Fund?
With respect to sectors and stocks, Health Care stocks offered the strongest benefit to Fund performance during the year. UnitedHealth, Amgen and Alcon were three of the top performing stocks in the Fund. We were underweight large cap pharmaceuticals due to concerns about pricing, pipeline issues, and significant legal and regulatory problems, which was also a benefit to overall returns.
Our extremely strong stock selection allowed the Fund to significantly outpace the benchmark in the Health Care sector. Health care equipment and supplies offered the largest benefit to absolute and relative returns. Alcon, in the eye care area, received approval for its ReStor Lens for cataract surgery, and Medicare approved funding of the procedure; these proved to be catalysts for stock appreciation. Medtronic, Inc., a leader in devices and techniques for treating
14 Annual Report | December 31, 2005 |
chronic care patients, also achieved positive results during the year. The health care providers and services industry provided the second best returns within the Health Care sector of the Fund, with both UnitedHealth Group and Caremark posting positive stock price gains.
Financial stocks did well in the portfolio for the year as well. Goldman Sachs strengthened during the year as the company’s investment banking activity continued to be strong, and bodes well for the coming year. SLM Corp., the student loan processing company, overcame concerns regarding the significant regulatory and governmental issues facing other agencies, and posted modestly positive results for the year
Were there any investment strategies or themes that did not measure up to your expectations?
Consumer stocks were soft during the year, taking the brunt of rising interest rates and higher oil prices. In the portfolio, our stocks within the retail section were particularly disappointing. Kohl’s Corporation was anticipated to achieve promising results after some significant management changes, remerchandising of products, and adding several items to higher margin personal care and beauty lines. The softness in consumer stocks in general, combined with discount pricing and unseasonable weather contributed to the stock’s weakness. In a similar vein, Bed, Bath and Beyond, Inc. had an optimistic outlook with respect to their new larger “box” stores, their strong competitive position, and their roll out of Christmas Tree Stores. The company experienced modest sales results during the year, which disappointed investors who anticipated much better growth. In the last quarter, the company announced that financial results were likely to be at the lower end of the expected range, news which further pressured the stock.
Technology stocks offered a mixed bag during the year. Taiwan Semiconductor Mfg Co. Ltd. and Adobe Systems Incorporated both provided positive contribution to the Fund’s return. Conversely, Dell, Inc. was the largest detractor from returns, both on an absolute and relative basis. Despite meeting earnings estimates during the year, the stock experienced some weakness in revenues driven by aggressive pricing strategies to stave off the recently rejuvenated Hewlett-Packard Co. Additionally, the stock experienced significant Price/Earnings multiple compression.
What is your current strategy? How is the Fund positioned?
We continue to find the best opportunities for quality growth investments in the Technology and Health Care sectors. Although we did not hold many financial stocks in 2005 due to lack of compelling growth opportunities, we are now finding a few new investments in this area. Given that price-to-earnings ratios (P/Es) are at relatively low levels (20x currently versus 24x average over 16 years), we are seeking compelling growth stories at good valuations in the large cap area. We believe that the moderating growth environment that analysts anticipate for 2006 may tend to favor higher quality growth stocks.
December 31, 2005 | William Blair Funds 15 |
Large Cap Growth Fund
Performance Highlights (unaudited)
Average Annual Total Return at 12/31/2005
| | | | | | | | | | | | |
| | | 1
Year
| | | 3
Year
| | | 5
Year
| | | Since
Inception(a)
| |
Large Cap Growth Fund Class N | | 3.69 | % | | 10.46 | % | | (5.20 | )% | | (6.96 | )% |
Large Cap Growth Fund Class I | | 3.96 | | | 10.82 | | | (4.98 | ) | | (6.74 | ) |
Russell 1000®
Growth Index | | 5.26 | | | 13.23 | | | (3.58 | ) | | (6.85 | ) |
| | (a) | | For the period from December 27, 1999 to December 31, 2005. |
Performance cited represents past performance. Past performance does not guarantee future results and current performance may be lower or higher than the data quoted. Results shown are average annual total returns, which assume reinvestment of dividends and capital gains. Investment returns and principal will fluctuate and you may have a gain or loss when you sell shares. For the most current month-end performance information, please call 1-800-742-7272, or visit our Web site at www.williamblairfunds.com. From time to time, the investment adviser may waive fees or reimburse expenses for the Fund. Without these waivers, performance would be lower. Class N shares are available to the general public without a sales load. Class I shares are available to certain institutional investors and advisory clients of William Blair & Company, L.L.C., without a sales load or distribution (12b-1) or service fees.
The performance highlights and graph presented above do not reflect the deduction of taxes that a shareholder would pay on fund distributions or the redemption of fund shares.
The Russell 1000® Growth Index consists of large-capitalization companies with above average-to-book ratios and forecasted growth rates.
This report identifies the Fund’s investments on December 31, 2005. These holdings are subject to change. Not all stocks in the Fund performed the same, nor is there any guarantee that these stocks will perform as well in the future. Market forecasts provided in this report may not necessarily come to pass.
Sector Diversification (unaudited)
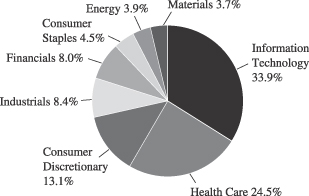
The sector diversification shown is based on the total investment portfolio.
16 Annual Report | December 31, 2005 |
Large Cap Growth Fund
Portfolio of Investments, December 31, 2005 (all dollar amounts in thousands)
| | | | | |
Issuer
| | Shares
| | Value
|
| | |
Common Stocks | | | | | |
Information Technology—32.7% | | | | | |
Accenture, Ltd.† | | 10,395 | | $ | 300 |
*Adobe Systems Incorporated | | 11,520 | | | 426 |
*Corning Incorporated | | 19,045 | | | 374 |
*Dell, Inc. | | 22,475 | | | 674 |
*EMC Corporation | | 32,560 | | | 444 |
First Data Corporation | | 10,025 | | | 431 |
Infosys Technologies Ltd.—ADR | | 2,720 | | | 220 |
Linear Technology Corporation | | 10,800 | | | 390 |
*Network Appliance, Inc. | | 7,120 | | | 192 |
Paychex, Inc. | | 11,300 | | | 431 |
Qualcomm Incorporated | | 7,970 | | | 343 |
SAP AG—ADR | | 3,625 | | | 163 |
Taiwan Semiconductor Mfg. Co. Ltd.—ADR | | 58,517 | | | 580 |
*Yahoo!, Inc. | | 14,235 | | | 558 |
| | | | |
|
|
| | | | | | 5,526 |
| | | | |
|
|
Health Care—23.6% | | | | | |
Allergan, Inc. | | 3,075 | | | 332 |
*Amgen, Inc. | | 7,640 | | | 602 |
*Caremark Rx, Inc. | | 6,375 | | | 330 |
*MedImmune, Inc. | | 6,325 | | | 222 |
Medtronic, Inc. | | 16,970 | | | 977 |
Sanofi-Aventis—ADR | | 11,355 | | | 498 |
Schering-Plough Corporation | | 15,015 | | | 313 |
UnitedHealth Group, Inc. | | 11,375 | | | 707 |
| | | | |
|
|
| | | | | | 3,981 |
| | | | |
|
|
Consumer Discretionary—12.6% | | | | | |
*Apollo Group, Inc., Class “A” | | 4,340 | | | 262 |
*Bed, Bath & Beyond, Inc. | | 11,470 | | | 415 |
Johnson Controls, Inc. | | 3,500 | | | 255 |
*Kohl’s Corporation | | 11,263 | | | 547 |
Nike, Inc., Class “B” | | 5,570 | | | 484 |
Staples, Inc. | | 7,350 | | | 167 |
| | | | |
|
|
| | | | | | 2,130 |
| | | | |
|
|
Industrials—8.1% | | | | | |
3M Company | | 4,230 | | | 328 |
Danaher Corporation | | 14,197 | | | 792 |
General Electric Company | | 7,155 | | | 251 |
| | | | |
|
|
| | | | | | 1,371 |
| | | | |
|
|
*Non-income producing securities
ADR = American Depository Receipt
† = U.S. listed foreign security
| | | | | |
Issuer
| | Shares
| | Value
|
| | |
Common Stocks—(continued) | | | | | |
Financials—7.7% | | | | | |
Capital One Financial Corporation | | 1,990 | | $ | 172 |
Goldman Sachs Group, Inc. | | 4,110 | | | 525 |
Schwab (Charles) Corporation | | 12,820 | | | 188 |
SLM Corporation | | 7,655 | | | 422 |
| | | | |
|
|
| | | | | | 1,307 |
| | | | |
|
|
Consumer Staples—4.4% | | | | | |
PepsiCo, Inc. | | 7,470 | | | 441 |
Walgreen Co. | | 6,675 | | | 296 |
| | | | |
|
|
| | | | | | 737 |
| | | | |
|
|
Energy—3.8% | | | | | |
Schlumberger Limited† | | 3,245 | | | 315 |
Suncor Energy, Inc.† | | 5,050 | | | 319 |
| | | | |
|
|
| | | | | | 634 |
| | | | |
|
|
Materials—3.5% | | | | | |
Praxair, Inc. | | 11,355 | | | 601 |
| | | | |
|
|
Total Common Stock—96.4%
(cost $14,585) | | | 16,287 |
| | | | |
|
|
| | |
Investment in Affiliate | | | | | |
William Blair Ready Reserves | | 424,078 | | | 424 |
| | | | |
|
|
Total Investment in Affiliate—2.5%
(cost $424) | | | 424 |
| | | | |
|
|
Total Investments—98.9%
(cost $15,009) | | | 16,711 |
Cash plus other assets less liabilities—1.1% | | | 177 |
| | | | |
|
|
Net assets—100.0% | | $ | 16,888 |
| | | | |
|
|
See accompanying Notes to Financial Statements.
December 31, 2005 | William Blair Funds 17 |

Karl W. Brewer
SMALL CAP GROWTH FUND
The Small Cap Growth Fund invests primarily in common stocks of small domestic growth companies that the Advisor expects to have solid growth in earnings.
AN OVERVIEW FROM THE PORTFOLIO MANAGER
How did the Fund perform over the last year? How did the Fund’s performance compare to its benchmark?
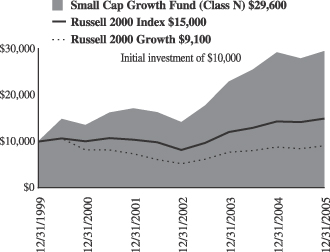
The Small Cap Growth Fund posted a 1.18% increase on a total return basis (Class N Shares) for the 12 months ended December 31, 2005. By comparison, the Fund’s benchmark, the Russell 2000 Growth® Index, gained 4.15% during the period, while the Russell 2000® Index rose 4.55%.
What were the most significant factors impacting Fund performance? What factors were behind the Fund’s performance versus the benchmark?
With respect to the Fund’s performance compared to the Russell 2000® Growth Index benchmark, stock selection in Health Care was the biggest detractor from relative performance while stock selection in the Consumer Discretionary and Energy sectors also detracted. Strong stock selection within the Information Technology sector was the main contributor toward relative performance.
While there was not a large disparity in returns from a style perspective, value narrowly outperformed growth during 2005 (and as evidenced by the Russell 2000 Value Index’s increase of 4.71%, compared to the Russell 2000 Growth Index’s gain of 4.15%). Growth outperformed value in the fourth quarter (with the Russell 2000 Growth Index up 1.61%, versus the Russell 2000 Value Index’s gain of 0.66%). From a market capitalization perspective, mid-cap stocks once again outperformed their small and large cap counterparts during the fourth quarter as they did for 2005 as a whole.
Within the Russell 2000 Growth Index during 2005, Energy was the sector of the year. Over half of the return for the index came from Energy stocks (roughly 2.8% of the 4.15% return of the index). The Health Care and Industrial sectors were also mildly outperforming sectors compared to the rest of the market. Within the small cap health care space, we saw a large disparity between the poor relative performance of pharmaceutical and biotechnology stocks as compared to both healthcare providers and healthcare equipment stocks. Information Technology finished the year down in absolute terms and was therefore an underperforming sector. Within the sector, the market preferred computer software and services over computer hardware and semiconductors. The small cap Financials sector, due to the many regional banks that were adversely affected by the flattening of the yield curve, and the Consumer Discretionary sector joined Information Technology as the major sectors that underperformed the broader small cap market.
What were among the best performing investments for the Fund?
Two specific stocks that helped the portfolio during 2005 were Nuance Communications, Inc. and ValueClick, Inc. Nuance Communications was a top contributor for the Fund in the fourth quarter and for 2005 as a whole. ScanSoft and Nuance merged during the year and the new entity kept the name Nuance. This merger of two industry leaders, the continued evolution of speech recognition technology and increased coverage of the stock by Wall
18 Annual Report | December 31, 2005 |
Street helped drive growth in the stock price during 2005. ValueClick was one of the top performers for the Fund for 2005 as well. The company is focused on the online advertising market. The stock price appreciated over the year as management executed and grew the business, made a strategic acquisition, and as Wall Street increasingly discovered the company.
What were among the weakest performing investments for the Fund?
Two of the Fund’s worst performing stocks were TRM Corp and Cell Therapeutics. TRM Corp, an owner and operator of ATM networks, was a poor performer for the Fund in both the fourth quarter and for 2005. The company announced disappointing earnings in November in part due to higher than expected expenses related to operating their expanding network of ATM’s. The company should have realized cost savings and scale as they built their network, but, this did not happen and as a result we liquidated the position. Cell Therapeutics, a biotechnology stock, was also one of the largest detractors from performance for 2005. We liquidated the position during the second quarter after they announced a series of negative data points relating to prospective pipeline drugs.
What is your current outlook?
As we look at 2006, there are a number of dynamics that could affect the equity markets. Ben Bernanke takes over for Alan Greenspan as the Chairman of the Federal Reserve in the first quarter of 2006. His efforts to tame inflation and keep the economy on track will be watched closely. A possible housing market slowdown, high heating bills and any implications of an inverted yield curve are the ubiquitously discussed headwinds in the marketplace. However, we are still seeing healthy levels of economic and corporate earnings growth, contained inflation, and signs of business spending picking up after the past couple years of record earnings growth have left companies flush with cash. A possible reversal of the multi-year trend of value outperforming growth, after growth’s outperformance in the second half of the 2005, could create another tailwind for our quality growth style of investing. Regardless of the macro environment, we will continue to look for durable businesses whose stocks have favorable risk reward profiles.
Is there any other news with respect to the Fund?
Also, with respect to illiquid securities in the Fund, Overhill Farms Inc. is a portfolio holding that we acquired through a Private Investment in Public Equity (PIPE) transaction in late December. Overhill Farms is a food distribution company whose customers include restaurants and airlines. We were able to purchase shares in the transaction at a discount to market prices and we expect these shares to become freely tradable within 120 days of the transaction. The Fund’s Pricing Committee and Valuation Committee is currently pricing the security at fair value.
December 31, 2005 | William Blair Funds 19 |
Small Cap Growth Fund
Performance Highlights (unaudited)
Average Annual Total Return at 12/31/2005
| | | | | | | | | | | | |
| | | 1
Year
| | | 3
Year
| | | 5
Year
| | | Since Inception(a)
| |
Small Cap Growth Fund Class N | | 1.18 | % | | 27.73 | % | | 16.79 | % | | 19.68 | % |
Small Cap Growth Fund Class I | | 1.48 | | | 28.03 | | | 17.09 | | | 19.97 | |
Russell 2000®
Growth Index | | 4.15 | | | 20.93 | | | 2.28 | | | (1.37 | ) |
Russell 2000® Index | | 4.55 | | | 22.13 | | | 8.22 | | | 7.03 | |
| | (a) | | For the period from December 27, 1999 to December 31, 2005. |
Performance cited represents past performance. Past performance does not guarantee future results and current performance may be lower or higher than the data quoted. Results shown are average annual total returns, which assume reinvestment of dividends and capital gains. Investment returns and principal will fluctuate and you may have a gain or loss when you sell shares. For the most current month-end performance information, please call 1-800-742-7272, or visit our Web site at www.williamblairfunds.com. Investing in smaller companies involves special risks, including higher volatility and lower liquidity. From time to time, the investment advisor may waive fees or reimburse expenses for the Fund. Without these waivers, performance would be lower. Class N shares are available to the general public without a sales load. Class I shares are available to certain institutional investors and advisory clients of William Blair & Company, L.L.C., without a sales load or distribution (12b-1) or service fees.
The performance highlights and graph presented above do not reflect the deduction of taxes that a shareholder would pay on fund distributions or the redemption of fund shares.
The Russell 2000® Growth Index consists of small-capitalization companies with above average price-to-book ratios and forecasted growth rates.
The Russell 2000® Index is an unmanaged composite of the smallest 2000 stocks of the Russell 3000® Index.
This report identifies the Fund’s investments on December 31, 2005. These holdings are subject to change. Not all stocks in the Fund performed the same, nor is there any guarantee that these stocks will perform as well in the future. Market forecasts provided in this report may not necessarily come to pass.
Sector Diversification (unaudited)
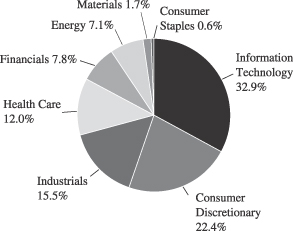
The sector diversification shown is based on the total investment portfolio.
20 Annual Report | December 31, 2005 |
Small Cap Growth Fund
Portfolio of Investments, December 31, 2005 (all dollar amounts in thousands)
| | | | | |
Issuer
| | Shares
| | Value
|
| | |
Common Stocks | | | | | |
Information Technology—31.3% | | | | | |
*Access Integrated Technologies, Inc. | | 444,977 | | $ | 4,619 |
*AMIS Holdings, Inc. | | 1,093,370 | | | 11,644 |
ARM Holdings, plc—ADR | | 670,962 | | | 4,167 |
*BISYS Group, Inc. (The) | | 30,400 | | | 426 |
*eCollege.com, Inc. | | 528,451 | | | 9,528 |
*Electronic Clearing House | | 652,297 | | | 6,503 |
*Euronet Worldwide, Inc. | | 269,342 | | | 7,488 |
*Heartland Payment Systems, Inc. | | 420,061 | | | 9,099 |
*Internet Capital Group, Inc. | | 1,547,474 | | | 12,720 |
*Intrado, Inc. | | 459,813 | | | 10,585 |
*J2 Global Communications, Inc. | | 272,164 | | | 11,632 |
*Kanbay International, Inc. | | 816,719 | | | 12,978 |
*Lionbridge Technologies, Inc. | | 1,184,467 | | | 8,315 |
*Nuance Communications, Inc. | | 2,834,256 | | | 21,625 |
*OPNET Technologies, Inc. | | 924,040 | | | 8,492 |
*Optimal Group, Inc.† | | 782,973 | | | 15,863 |
*Patni Computer Systems—ADR | | 32,800 | | | 760 |
*PDF Solutions, Inc. | | 1,035,312 | | | 16,824 |
*Skillsoft, plc—ADR | | 1,251,567 | | | 6,884 |
*TNS, Inc. | | 714,969 | | | 13,713 |
*Ultimate Software Group, Inc. | | 534,336 | | | 10,190 |
*ValueClick, Inc. | | 840,728 | | | 15,226 |
*Volterra Semiconductor Corporation | | 1,466,807 | | | 22,002 |
*WebEx Communications, Inc. | | 606,862 | | | 13,126 |
*Workstream, Inc.† | | 3,661,887 | | | 6,038 |
| | | | |
|
|
| | | | | | 260,447 |
| | | | |
|
|
Consumer Discretionary—21.4% | | | | | |
*4 Kids Entertainment, Inc. | | 466,935 | | | 7,326 |
*Century Casinos, Inc. | | 956,611 | | | 8,227 |
*Cumulus Media, Inc., Class “A” | | 918,476 | | | 11,398 |
*DeVry, Inc. | | 142,190 | | | 2,844 |
*Dick’s Sporting Goods, Inc. | | 326,915 | | | 10,866 |
*Jarden Corporation | | 593,687 | | | 17,900 |
*Laureate Education, Inc. | | 464,237 | | | 24,377 |
*Lions Gate Entertainment Corporation† | | 2,018,315 | | | 15,501 |
*Meritage Homes Corporation | | 141,540 | | | 8,906 |
*Mikohn Gaming Corporation | | 652,260 | | | 6,438 |
Nautilus Group, Inc. | | 623,177 | | | 11,628 |
*Nevada Gold and Casinos, Inc. | | 507,589 | | | 5,274 |
*Shuffle Master, Inc. | | 483,154 | | | 12,146 |
Strayer Education, Inc. | | 154,064 | | | 14,436 |
*ValueVision Media, Inc., Class “A” | | 1,047,885 | | | 13,203 |
*WMS Industries, Inc. | | 283,170 | | | 7,105 |
| | | | |
|
|
| | | | | | 177,575 |
| | | | |
|
|
Industrials—14.7% | | | | | |
*Coinstar, Inc. | | 454,275 | | | 10,371 |
Comfort Systems USA, Inc. | | 1,399,760 | | | 12,878 |
*Corrections Corporation of America | | 267,820 | | | 12,044 |
*CRA International, Inc. | | 199,420 | | | 9,510 |
*FirstService Corporation† | | 523,250 | | | 13,421 |
*Frozen Food Express Industries, Inc. | | 483,765 | | | 5,336 |
*Hudson Highland Group, Inc. | | 178,684 | | | 3,102 |
| | | | | |
Issuer
| | Shares
| | Value
|
| | |
Common Stocks—(continued) | | | | | |
Industrials—(continued) | | | | | |
*Huron Consulting Group, Inc. | | 352,527 | | $ | 8,457 |
*Kforce, Inc. | | 1,375,450 | | | 15,350 |
*Labor Ready, Inc. | | 560,035 | | | 11,660 |
*Marten Transport, Ltd. | | 480,115 | | | 8,748 |
*SIRVA, Inc. | | 1,430,630 | | | 11,445 |
| | | | |
|
|
| | | | | | 122,322 |
| | | | |
|
|
Health Care—11.4% | | | | | |
*Axcan Pharma, Inc.† | | 692,964 | | | 10,491 |
*Encore Medical Corporation | | 1,739,235 | | | 8,609 |
*Integra Lifesciences Holdings Corporation | | 387,449 | | | 13,739 |
*Lifecore Biomedical, Inc. | | 319,389 | | | 5,184 |
*Matria Healthcare, Inc. | | 239,815 | | | 9,295 |
*Nuvasive, Inc. | | 489,168 | | | 8,854 |
*PSS World Medical, Inc. | | 304,390 | | | 4,517 |
*Psychiatric Solutions, Inc. | | 161,196 | | | 9,469 |
*Sangamo Biosciences, Inc. | | 609,818 | | | 2,458 |
*Santarus, Inc. | | 974,738 | | | 5,341 |
*Telik, Inc. | | 560,033 | | | 9,515 |
*Zila, Inc. | | 1,965,922 | | | 7,569 |
| | | | |
|
|
| | | | | | 95,041 |
| | | | |
|
|
Financials—7.4% | | | | | |
*Affiliated Managers Group, Inc. | | 168,242 | | | 13,501 |
American Equity Investment Life Holding Co. | | 511,500 | | | 6,675 |
East West Bancorp, Inc. | | 248,557 | | | 9,070 |
*First Cash Financial Services, Inc. | | 527,424 | | | 15,380 |
Highland Hospitality Corporation | | 632,260 | | | 6,986 |
National Financial Partners Corporation | | 191,639 | | | 10,071 |
| | | | |
|
|
| | | | | | 61,683 |
| | | | |
|
|
Energy—6.8% | | | | | |
*ATP Oil and Gas Corporation | | 195,422 | | | 7,233 |
*Gasco Energy Inc. | | 860,817 | | | 5,621 |
*Grey Wolf, Inc. | | 1,658,622 | | | 12,821 |
*Hornbeck Offshore Services, Inc. | | 351,044 | | | 11,479 |
*Petrohawk Energy Corporation | | 876,596 | | | 11,589 |
*Toreador Resources Corporation | | 349,696 | | | 7,368 |
| | | | |
|
|
| | | | | | 56,111 |
| | | | |
|
|
Materials—1.6% | | | | | |
Airgas, Inc. | | 415,618 | | | 13,674 |
| | | | |
|
|
Consumer Staples—0.5% | | | | | |
*Overhill Farms, Inc.** | | 1,684,600 | | | 4,348 |
| | | | |
|
|
Total Common Stock—95.1%
(cost $670,756) | | | 791,201 |
| | |
|
|
| | |
Investment in Affiliate | | | | | |
William Blair Ready Reserves | | 11,002,174 | | | 11,002 |
| | | | |
|
|
Total Investment in Affiliate—1.3%
(cost $11,002) | | | 11,002 |
| | |
|
|
See accompanying Notes to Financial Statements.
December 31, 2005 | William Blair Funds 21 |
Small Cap Growth Fund
Portfolio of Investments, December 31, 2005 (all dollar amounts in thousands)
| | | | | | |
Issuer
| | Principal
Amount
| | Value
|
| | |
Short-Term Investments | | | | | | |
American Express Demand Note, VRN 4.235%, due 1/3/06 | | $ | 8,413,000 | | $ | 8,413 |
Prudential Funding Demand Note, VRN 3.930%, due 1/3/06 | | $ | 13,176,000 | | | 13,176 |
| | | | | |
|
|
Total Short-Term Investments—2.6%
(cost $21,589) | | | 21,589 |
| | | | | |
|
|
Total Investments—99.0%
(cost $703,347) | | | 823,792 |
Cash and other assets, less liabilities—1.0% | | | 7,946 |
| | | | | |
|
|
Net assets—100.0% | | $ | 831,738 |
| | | | | |
|
|
*Non-income producing securities
ADR = American Depository Receipt
† = U.S. listed foreign security
VRN = Variable Rate Note
**Fair Valued pursuant to Valuation Procedures adopted by the Board of Trustees. The holding represents 0.52% of the Fund’s net assets at December 31, 2005. This security was also deemed illiquid pursuant to Liquidity Procedures approved by the Board of Trustees.
See accompanying Notes to Financial Statements.
22 Annual Report | December 31, 2005 |
Karl W. Brewer

Harvey H. Bundy, III

Robert C. Lanphier, IV
SMALL-MID CAP GROWTH FUND
The Small-Mid Cap Growth Fund primarily invests in a diversified portfolio of common stocks of small and medium-sized domestic growth companies that the Advisor expects to experience solid growth in earnings.
AN OVERVIEW FROM THE PORTFOLIO MANAGERS
How did the Fund perform over the last year? How did the Fund’s performance compare to its benchmark?
The Small-Mid Cap Growth Fund posted a 10.72% total return (Class N Shares) for the year ended December 31, 2005. By comparison, the Fund’s benchmark, the Russell 2500 Growth® Index, returned 8.17% during the period.
What were the most significant factors impacting Fund performance? What factors were behind the Fund’s performance versus the benchmark?
There was no significant disparity in returns from a style perspective during the year. Measured by most broad-based indexes, value narrowly outperformed growth during 2005. However, within the small to mid cap space as represented by the Russell 2500 Indexes, growth edged value for 2005 (Russell 2500 Growth® Index +8.17%; Russell 2500 Value® Index +7.74%) as it did in the fourth quarter specifically. From a market capitalization perspective, mid-cap stocks once again outperformed their small and large cap counterparts during the fourth quarter as they did for 2005 as a whole.
Within the Russell 2500 Growth Index, energy stocks were by far the best performers during 2005. Small to mid cap industrial names turned in the second strongest results among the six major sectors. The Consumer Discretionary, Financials, Health Care and Information Technology sectors all underperformed the broader market. Within the small to mid cap health care space, we saw a large disparity between the poor relative performance of pharmaceutical and biotechnology stocks as compared to both healthcare providers and healthcare equipment stocks. Within the Information Technology sector, computer software and services outperformed computer hardware and semiconductor stocks. The small to mid cap Financials sector underperformed during the year mostly due to the many regional banks that were adversely affected by the flattening of the yield curve.
Relative to the benchmark, strong stock selection within the Information Technology sector was the main contributor toward the Fund’s relative outperformance. Stock selection and our overweight position in the Industrials sector also contributed to the Fund’s relative outperformance during 2005. Also, our higher average market capitalization was modestly advantageous toward relative performance. Stock selection in the Energy sector was a detractor from relative performance. This was mostly due to our stocks not keeping pace with the roughly 57% average return for energy stocks in the benchmark.
What were among the weakest performing investments for the Fund?
Two of the weakest performing issues in the Fund in 2005 were Cell Therapeutics and AMIS Holdings. Cell Therapeutics is a biotechnology stock in the Health Care sector. We liquidated the position during the second quarter after they announced a series of negative data points relating to prospective pipeline drugs. AMIS Holdings, a semiconductor holding within the information technology sector, detracted from the Fund’s performance for 2005 as well. The
December 31, 2005 | William Blair Funds 23 |
company’s design capabilities are used for various applications in the automotive, industrial and medical fields and represent attractive growth catalysts for the stock. However, the level of earnings growth investors were expecting for 2005 did not come to fruition and the stock price suffered accordingly.
What were among the best performing investments for the Fund?
Among the strongest performing issues for the Fund were ValueClick, Inc. and Fastenal Company. ValueClick is focused on the online advertising market. The stock price appreciated over the year as management executed and grew the business, made a strategic acquisition, and as Wall Street increasingly discovered the company. Fastenal, a distributor of various industrial supplies, was a strong contributor to the Fund’s performance for the fourth quarter and the full year 2005. The company continues to drive earnings growth organically through store growth and efficient management of the business. Fastenal, as did many of our industrial holdings, also benefited from the realization by the market that we are more likely in the earlier part of this capital goods cycle.
What is your current outlook?
As we look at 2006, there are a number of dynamics that could affect the equity markets. Ben Bernanke takes over for Alan Greenspan as the Chairman of the Federal Reserve in the first quarter of 2006. His efforts to tame inflation and keep the economy on track will be watched closely. A possible housing market slowdown, high heating bills and any implications of an inverted yield curve are the ubiquitously discussed headwinds in the marketplace. However, we are still seeing healthy levels of economic and corporate earnings growth, contained inflation, and signs of business spending picking up after the past couple years of record earnings growth have left companies flush with cash. A possible reversal of the multi-year trend of value outperforming growth, after growth’s outperformance in the second half of the 2005, could create another tailwind for our quality growth style of investing. Regardless of the macro environment, we will continue to look for durable businesses whose stocks have favorable risk reward profiles.
24 Annual Report | December 31, 2005 |
Small-Mid Cap Growth Fund
Performance Highlights (unaudited)

Average Annual Total Return at 12/31/2005
| | | | | | |
| | | 1 Year
| | | Since Inception(a)
| |
Small-Mid Cap Growth Fund
Class N | | 10.72 | % | | 11.64 | % |
Small-Mid Cap Growth Fund
Class I | | 11.05 | | | 11.90 | |
Russell 2500® Growth Index | | 8.17 | | | 11.75 | |
| | (a) | | For the period from December 29, 2003 to December 31, 2005. | |
Performance cited represents past performance. Past performance does not guarantee future results and current performance may be lower or higher than the data quoted. Results shown are average annual total returns, which assume reinvestment of dividends and capital gains. Investment returns and principal will fluctuate and you may have a gain or loss when you sell shares. For the most current month-end performance information, please call 1-800-742-7272, or visit our Web site at www.williamblairfunds.com. Investing in smaller companies involves special risks, including higher volatility and lower liquidity. From time to time, the investment advisor may waive fees or reimburse expenses for the Fund. Without these waivers, performance would be lower. Class N shares are available to the general public without a sales load. Class I shares are available to certain institutional investors and advisory clients of William Blair & Company, L.L.C., without a sales load or distribution (12b-1) or service fees.
The performance highlights and graph presented above do not reflect the deduction of taxes that a shareholder would pay on fund distributions or the redemption of fund shares.
The Russell 2500™ Growth Index measures the performance of those Russell 2500 companies with above average price-to-book ratios and forecasted growth rates.
This report identifies the Fund’s investments on December 31, 2005. These holdings are subject to change. Not all stocks in the Fund performed the same, nor is there any guarantee that these stocks will perform as well in the future. Market forecasts provided in this report may not necessarily come to pass.
Sector Diversification (unaudited)
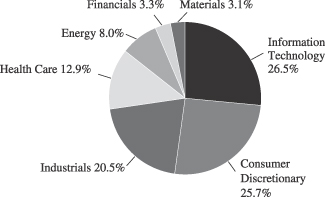
The sector diversification shown is based on the total investment portfolio.
December 31, 2005 | William Blair Funds 25 |
Small-Mid Cap Growth Fund
Portfolio of Investments, December 31, 2005 (all dollar amounts in thousands)
| | | | | |
Issuer
| | Shares
| | Value
|
| | |
Common Stocks | | | | | |
Information Technology—25.3% | | | | | |
*Activision, Inc. | | 52,600 | | $ | 723 |
*Amis Holdings, Inc. | | 67,700 | | | 721 |
CDW Corporation | | 19,460 | | | 1,120 |
*Intrado, Inc. | | 39,070 | | | 899 |
*Intuit, Inc. | | 34,400 | | | 1,834 |
*Iron Mountain, Inc. | | 32,514 | | | 1,373 |
*J2 Global Communications, Inc. | | 32,600 | | | 1,393 |
*Jabil Circuit, Inc. | | 48,200 | | | 1,788 |
*Kanbay International, Inc. | | 55,300 | | | 879 |
Microchip Technology, Inc. | | 57,400 | | | 1,845 |
*Nuance Communications, Inc. | | 123,400 | | | 942 |
*PDF Solutions, Inc. | | 57,000 | | | 926 |
*Ultimate Software Group, Inc. | | 51,200 | | | 976 |
*ValueClick, Inc. | | 72,636 | | | 1,315 |
*Webex Communications, Inc. | | 48,340 | | | 1,046 |
| | | | |
|
|
| | | | | | 17,780 |
| | | | |
|
|
Consumer Discretionary—24.6% | | | | | |
*Bed, Bath and Beyond, Inc. | | 36,800 | | | 1,330 |
*CarMax, Inc. | | 42,500 | | | 1,176 |
*DeVry, Inc. | | 11,200 | | | 224 |
*Dick’s Sporting Goods, Inc. | | 21,500 | | | 715 |
Gentex Corporation | | 17,200 | | | 335 |
*Getty Images, Inc. | | 12,200 | | | 1,089 |
*Jarden Corporation | | 39,550 | | | 1,193 |
*Lamar Advertising Company, Class “A” | | 23,700 | | | 1,094 |
*Laureate Education, Inc. | | 44,449 | | | 2,334 |
*Life Time Fitness, Inc. | | 20,800 | | | 792 |
*O’Reilly Automotive, Inc. | | 41,900 | | | 1,341 |
The Ryland Group, Inc. | | 13,100 | | | 945 |
*Shuffle Master, Inc. | | 36,400 | | | 915 |
*Sonic Corporation | | 23,700 | | | 699 |
Strayer Education, Inc. | | 10,400 | | | 975 |
*Tractor Supply Company | | 20,000 | | | 1,059 |
*Williams-Sonoma, Inc. | | 24,100 | | | 1,040 |
| | | | |
|
|
| | | | | | 17,256 |
| | | | |
|
|
Industrials—19.5% | | | | | |
*Beacon Roofing Supply, Inc. | | 28,203 | | | 810 |
C.H. Robinson Worldwide, Inc. | | 22,900 | | | 848 |
*Coinstar, Inc. | | 37,133 | | | 848 |
Corporate Executive Board Company | | 11,700 | | | 1,049 |
*Corrections Corporation of America | | 21,800 | | | 980 |
Expeditors International of Washington | | 15,800 | | | 1,067 |
Fastenal Company | | 55,400 | | | 2,171 |
Graco Inc. | | 20,100 | | | 733 |
*Kforce, Inc. | | 62,965 | | | 703 |
Knight Transportation, Inc. | | 50,950 | | | 1,056 |
*Monster Worldwide, Inc. | | 23,900 | | | 976 |
MSC Industrial Direct Company, Inc., Class “A” | | 20,340 | | | 818 |
Pentair, Inc. | | 47,900 | | | 1,654 |
| | | | |
|
|
| | | | | | 13,713 |
| | | | |
|
|
*Non-income producing securities
VRN = Variable Rate Note
† = U.S. listed foreign security
| | | | | | | |
Issuer
| | Shares or
Principal
Amount
| | Value
| |
| | |
Common Stocks—(continued) | | | | | | | |
Health Care—12.3% | | | | | | | |
*IDEXX Laboratories, Inc. | | | 12,500 | | $ | 900 | |
*Integra LifeSciences Holdings Corporation | | | 32,540 | | | 1,154 | |
*Kinetic Concepts, Inc. | | | 13,900 | | | 552 | |
*Kyphon, Inc. | | | 28,200 | | | 1,151 | |
*Patterson Companies, Inc. | | | 30,300 | | | 1,012 | |
*Pharmaceutical Product Development, Inc. | | | 7,300 | | | 452 | |
*PSS/World Medical, Inc. | | | 25,600 | | | 380 | |
*ResMed, Inc. | | | 39,600 | | | 1,517 | |
*Telik, Inc. | | | 55,200 | | | 938 | |
Valeant Pharmaceuticals International | | | 34,500 | | | 624 | |
| | | | | |
|
|
|
| | | | | | | 8,680 | |
| | | | | |
|
|
|
Energy—7.7% | | | | | | | |
*Grant Prideco, Inc. | | | 15,300 | | | 675 | |
Smith International, Inc. | | | 45,000 | | | 1,670 | |
*Toreador Resources Corporation | | | 29,500 | | | 621 | |
*Ultra Petroleum Corporation† | | | 19,000 | | | 1,060 | |
XTO Energy Corporation | | | 30,900 | | | 1,358 | |
| | | | | |
|
|
|
| | | | | | | 5,384 | |
| | | | | |
|
|
|
Financials—3.1% | | | | | | | |
American Equity Investment Life Holding Co. | | | 42,850 | | | 559 | |
East West Bancorp, Inc. | | | 22,600 | | | 825 | |
National Financial Partners Corporation | | | 15,200 | | | 799 | |
| | | | | |
|
|
|
| | | | | | | 2,183 | |
| | | | | |
|
|
|
Materials—3.0% | | | | | | | |
Airgas, Inc. | | | 63,300 | | | 2,083 | |
| | | | | |
|
|
|
Total Common Stock—95.5%
(cost $58,611) | | | 67,079 | |
| | | | | |
|
|
|
| | |
Investment in Affiliate | | | | | | | |
William Blair Ready Reserves | | | 2,012,239 | | | 2,012 | |
| | | | | |
|
|
|
Total Investment in Affiliate—2.9%
(cost $2,012) | | | 2,012 | |
| | | | | |
|
|
|
| | |
Short-Term Investment | | | | | | | |
Prudential Funding Demand Note, VRN
3.930%, due 1/3/06 | | $ | 2,971,000 | | | 2,971 | |
| | | | | |
|
|
|
Total Short-Term Investment—4.2%
(cost $2,971) | | | 2,971 | |
| | | | | |
|
|
|
Total Investments—102.6%
(cost $63,594) | | | 72,062 | |
Liabilities, plus cash and other assets—(2.6)% | | | (1,851 | ) |
| | | | | |
|
|
|
Net assets—100% | | $ | 70,211 | |
| | | | | |
|
|
|
See accompanying Notes to Financial Statements.
26 Annual Report | December 31, 2005 |

W. George Greig
INTERNATIONAL GROWTH FUND
The International Growth Fund invests primarily in common stocks of foreign growth companies.
AN OVERVIEW FROM THE PORTFOLIO MANAGER
How did the Fund perform over the last year? How did the Fund’s performance compare to its benchmark?
The International Growth Fund posted a 21.65% gain (Class N Shares) for the 12 months ended December 31, 2005. By comparison, the Fund’s benchmark, the MSCI All Country World Free except US Index, rose 17.11%.
What were the most significant factors impacting international markets during 2005?
During the first six months of 2005 the international equity markets were largely flat; however, during the last half of the year the equity markets sharply appreciated (and as evidenced by the annual 17.11% MSCI All Country World (Free) except US Index return). International equities significantly outpaced US equities as measured by the Standard & Poor’s 500 Index, which rose 4.91% year to date. This increase was despite US dollar appreciation versus most foreign currencies, which reduced returns to US investors. The MSCI EAFE Index rose 29.54% in local terms, which translated into 14.02% to US dollar investors, as the US dollar appreciated an average 13% relative to EAFE (Europe and Australasia, Far East Equity) country currencies.
Positive second half international equity market performance was driven by strong results across sectors, capitalizations and regions. With its improving macroeconomic backdrop and positive consumer sentiment, Japan was one of the strongest developed regions year to date, up 25.63% in US dollar terms, only lagging behind Canada, which returned nearly 29%. Emerging markets were the strongest part of the international markets overall, returning 34.54% as measured by the MSCI Emerging Markets Index, while developed small capitalization stocks rose 25.48%. Both areas outperformed larger capitalization developed markets, as measured by the EAFE Index.
What factors were behind the Fund’s performance versus the benchmark?
In this positive market environment, the Fund rose 21.65% during the year, significantly surpassing the 17.11% MSCI all Country World Index Free ex-US Index return. This outperformance was driven by strong stock selection across most sectors and regions. In particular, stock selection in Energy, Financials, Information Technology and Telecommunication Services sectors were the areas of the most value added, as was stock selection in Emerging Asia, Japan and Pacific Free ex-Japan. In addition, the Fund’s allocation to small capitalization and emerging markets companies, coupled with strong stock selection in these names, also added value.
What is your outlook for the international markets?
After a third consecutive year of strong equity returns worldwide, markets have for the most part erased the losses of the 2000-2002 bear market. As the new year begins, many national and regional indices (with the obvious exceptions of Nasdaq and the Japanese market benchmarks) are at or approaching historic highs. Even in the US, where index returns were modest, a majority of individual stocks offered better performance.
December 31, 2005 | William Blair Funds 27 |
Prices have been propelled higher by strong fundamentals: exceptional earnings growth and a surprisingly stable inflation and long term interest rate environment. The only two elements of cyclical risk in the global economic picture have been Fed tightening and rising energy costs, and up to now, neither of them has had a significant impact on growth. Relative economic stability has enabled strong corporate performance to act as the key driver of share price gains over the course of the last several years. Accordingly, if the structural framework of the global economy remains in equilibrium, and corporate growth and profitability continue to meet or exceed expectations, the market environment will remain conducive to solid equity returns.
The principal risks in the macro picture are well known, and mostly focused on the US: household sector leverage and inadequate savings; consumer vulnerability to weakness in home prices; interest rate and exchange rate risks associated with the US current account deficit; the potential for a central bank policy error (such as overreacting to transitory inflation signs); a ‘superspike’ in oil and gas prices beyond what has already taken place; and/or exogenous variables such as avian flu, terrorist disruptions, or natural disasters.
Since none of these issues are new, the only way they could have a dramatic impact on the market risk profile would be if one of them suddenly had a delayed or cumulative effect, or if two or more of them combined in some unforeseen way. These possibilities cannot be conclusively ruled out, but at the same time, the resilience of the financial and economic infrastructure—perhaps a byproduct of increasing global integration—has been impressive over the last decade.
The other key variable in the outlook is corporate profitability and growth, where we have seen continued strength in the US and dramatic improvement in Japan, Europe, and in many developing markets. This aspect of the market environment shows no sign of deteriorating or even slackening the pace of improvement. Corporate management continues to focus on improving supply chain management, capital and labor productivity, cost control, and marketing. Returns on capital are now well above the cost of capital in every principal region of the world; and while there are concerns that ‘excessive’ profitability is a risk factor in itself, there is no signal apparent of either complacency or irrational competitive behavior undermining corporate performance on a wide scale.
Even in a benign economic and earnings scenario, of course, there is no guarantee of supernormal returns or a continuation of the trends of 2003-05. There is a reasonable (although not conclusive) case that cyclical growth may slow in the US and China in 2006, and profit growth may be restrained as a result. In addition, growth in the energy and financial sectors may be held back by price declines and yield curve flattening, respectively. On the other hand, Japan and more recently Europe seem to be benefiting from the effects of a strong external environment and solid corporate profitability, and could continue to mount moderate but self-sustaining recoveries. On a global basis, there is probably not much reason to anticipate significantly lower earnings growth in 2006, but some deceleration seems likely.
In the context of the current profit and interest rate picture, current valuations should not present a significant issue for potential returns, and even areas that have seen relatively strong recent performance, such as small caps and Japan, are not so extended as to be unusually risky on valuation grounds alone.
Emerging markets continue to be a special case, influenced by long term changes outside of the business cycle. Whereas previous cycles were dominated by unstable investment flows and highly volatile production and trade patterns, virtually all of the developing world is now seeing new dynamics of high savings, credit development, job creation and household spending growth, as well as more responsible and transparent corporate behavior. These factors are reducing financial risk at the same time they create new avenues of growth in emerging economies, and have been instrumental in driving exceptional returns in this asset class since 1999.
28 Annual Report | December 31, 2005 |
On balance, we see a reasonable balance between risk and opportunity for the year ahead, particularly as international markets continue to be led by the ongoing trend toward better corporate performance and governance. At the margins of any set of expectations, of course, are the ‘unknown unknowns’. Volatility has been relatively low for some time, and global markets have not faced any major discontinuities for several years. Any investment strategy predicated on anticipation of normal growth and risk parameters has to be adaptable to evolving change, and adaptability built into portfolio structure from the bottom up is probably the most consistent method for refining strategy.
December 31, 2005 | William Blair Funds 29 |
International Growth Fund
Performance Highlights (unaudited)
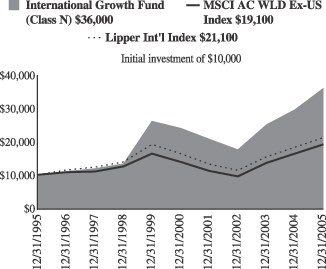
Average Annual Total Return at 12/31/2005
| | | | | | | | | | | | | | | | | |
| | | 1
Year
| | | 3
Year
| | | 5
Year
| | | 10
Year
| | | Since Inception(a)
| | | |
International Growth Fund Class N | | 21.65 | % | | 27.03 | % | | 8.46 | % | | 13.68 | % | | — | | | |
International Growth Fund Class I | | 22.00 | | | 27.32 | | | 8.74 | | | — | | | 11.69 | % | | |
MSCI All Country World Free
Ex-US Index | | 17.11 | | | 26.20 | | | 6.66 | | | 6.70 | | | 5.30 | | | |
Lipper International Index | | 15.67 | | | 23.10 | | | 5.33 | | | 7.74 | | | — | | | |
| | (a) | For the period from October 1, 1999 to December 31, 2005. |
Performance cited represents past performance. Past performance does not guarantee future results and current performance may be lower or higher than the data quoted. Results shown are average annual total returns, which assume reinvestment of dividends and capital gains. Investment returns and principal will fluctuate and you may have a gain or loss when you sell shares. For the most current month-end performance information, please call 1-800-742-7272, or visit our Web site at www.williamblairfunds.com. International investing involves special risk considerations, including currency fluctuations, lower liquidity, economic and political risk. Class N shares are available to the general public without a sales load. Class I shares are available to certain institutional investors and advisory clients of William Blair & Company, L.L.C., without a sales load or distribution (12b-1) or service fees.
The performance highlights and graph presented above do not reflect the deduction of taxes that a shareholder would pay on fund distributions or the redemption of fund shares.
The Morgan Stanley Capital International (MSCI) All Country World Free Ex-US Index is an unmanaged index that includes developed and emerging markets and reduced Japanese portion, making it more comparable to the International Growth Fund in terms of investment approach.
The Lipper International Index is a composite of international growth mutual funds.
This report identifies the Fund’s investments on December 31, 2005. These holdings are subject to change. Not all stocks in the Fund performed the same, nor is there any guarantee that these stocks will perform as well in the future. Market forecasts provided in this report may not necessarily come to pass.
Sector Diversification (unaudited)
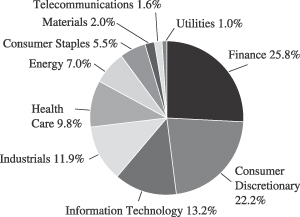
The sector diversification shown is based on the total investment portfolio.
30 Annual Report | December 31, 2005 |
International Growth Fund
Portfolio of Investments, December 31, 2005 (all dollar amounts in thousands)
| | | | | |
Issuer
| | Shares
| | Value
|
| | |
Common Stocks—Europe—31.7% | | | | | |
Austria—1.7% | | | | | |
Erste Bank (Banking) | | 716,600 | | $ | 39,783 |
*Raiffeisen Interantional Bank (Banking) | | 607,400 | | | 39,696 |
| | | | |
|
|
| | | | | | 79,479 |
| | | | |
|
|
France—8.4% | | | | | |
April Group S.A. (Insurance brokers) | | 271,643 | | | 11,197 |
BNP Paribas (Banking) | | 545,200 | | | 43,991 |
Dassault Systems S.A. (Computer aided design) | | 535,500 | | | 30,172 |
Essilor International (Health care supplies) | | 377,200 | | | 30,397 |
Eurazeo (Diversified financial services) | | 177,030 | | | 18,450 |
Hermes International SCA (Apparel and luxury goods) | | 135,000 | | | 33,652 |
Iliad S.A. (Internet software and services) | | 239,550 | | | 14,805 |
Klepierre (Real estate) | | 117,500 | | | 11,017 |
*Nexity (Real estate management) | | 283,600 | | | 14,389 |
*Orpea (Hospital and nursing management) | | 281,612 | | | 15,428 |
Sanofi-Aventis (Pharmaceuticals) | | 834,400 | | | 72,963 |
Technip-Coflexip S.A. (Construction) | | 505,160 | | | 30,499 |
Vinci S.A.(Construction) | | 408,200 | | | 35,117 |
Zodiac S.A. (Aerospace and defense) | | 341,000 | | | 21,860 |
| | | | |
|
|
| | | | | | 383,937 |
| | | | |
|
|
Germany—6.5% | | | | | |
AWD Holdings AG (Financial services) | | 74,116 | | | 2,047 |
Bijou Brigitte (Fashon jewelry accessories) | | 60,100 | | | 16,207 |
Celesio AG (Pharmaceuticals) | | 409,480 | | | 35,165 |
Continental AG (Diversified manufacturing) | | 602,200 | | | 53,331 |
Did Deutscher Industrie Svc (Commercial services) | | 290,894 | | | 16,972 |
E.ON AG (Energy) | | 450,000 | | | 46,442 |
GFK AG (Commercial services) | | 290,948 | | | 9,721 |
*Q-Cells AG (Alternative energy sources) | | 71,500 | | | 4,164 |
Rational AG (Business equipment) | | 70,300 | | | 9,336 |
SAP AG (Software) | | 450,500 | | | 81,078 |
Solarworld AG (Alternative energy sources) | | 42,500 | | | 5,686 |
Stada Arzneimittel AG (Pharmaceuticals) | | 433,000 | | | 14,127 |
| | | | |
|
|
| | | | | | 294,276 |
| | | | |
|
|
Greece—1.5% | | | | | |
Coca-Cola Hellenic Bottling S.A. (Beverages) | | 757,471 | | | 22,246 |
EFG Eurobank (Banking) | | 683,400 | | | 21,563 |
National Bank of Greece (Banking) | | 521,880 | | | 22,184 |
| | | | |
|
|
| | | | | | 65,993 |
| | | | |
|
|
Ireland—2.1% | | | | | |
Anglo Irish Bank plc (Finance) | | 2,645,100 | | | 39,923 |
Kingspan Group plc (Construction) | | 1,250,000 | | | 15,673 |
*Ryanair Holdings plc—ADR (Airlines) | | 568,000 | | | 31,802 |
United Drug plc (Pharmaceuticals) | | 2,090,100 | | | 9,038 |
| | | | |
|
|
| | | | | | 96,436 |
| | | | |
|
|
Italy—2.1% | | | | | |
Credito Emiliano SpA (Banking) | | 1,389,900 | | | 15,509 |
Luxottica Group SpA (Apparel and luxury goods) | | 1,708,600 | | | 43,359 |
| | | | | |
Issuer
| | Shares
| | Value
|
| |
Common Stocks—Europe—31.7%—(continued) | | | |
Italy—(continued) | | | | | |
Pirelli & C Real Estate SpA (Real estate development) | | 197,752 | | $ | 10,794 |
Saipem SpA (Energy equipment and services) | | 1,614,800 | | | 26,480 |
| | | | |
|
|
| | | | | | 96,142 |
| | | | |
|
|
Netherlands—0.6% | | | | | |
*Tomtom NV (Computer software) | | 781,500 | | | 26,806 |
| | | | |
|
|
Norway—0.6% | | | | | |
Statoil Asa (Oil and gas) | | 1,197,900 | | | 27,470 |
| | | | |
|
|
Spain—1.4% | | | | | |
Grupo Ferrovial S.A. (Industrial services) | | 331,900 | | | 23,015 |
*Industria De Textile (Retail trade) | | 1,313,400 | | | 42,858 |
| | | | |
|
|
| | | | | | 65,873 |
| | | | |
|
|
Sweden—0.8% | | | | | |
*Capio AB (Health care) | | 560,800 | | | 9,981 |
Clas Ohlson AB (Retail) | | 609,250 | | | 11,545 |
*Modern Times Group (Television) | | 348,800 | | | 14,551 |
| | | | |
|
|
| | | | | | 36,077 |
| | | | |
|
|
Switzerland—6.0% | | | | | |
*Actelion Ltd. (Biotechnology) | | 59,478 | | | 4,909 |
*EFG International (Commercial banking) | | 509,800 | | | 13,565 |
Nobel Biocare Holdings AG (Medical equipment and supplies) | | 100,400 | | | 22,078 |
Phonak Holdings AG (Hearing technology) | | 356,300 | | | 15,349 |
Roche Holdings AG (Health care) | | 722,900 | | | 108,280 |
SGS S.A. (Industrials) | | 35,800 | | | 30,149 |
UBS AG (Banking) | | 840,000 | | | 79,761 |
| | | | |
|
|
| | | | | | 274,091 |
| | | | |
|
|
| | |
Japan—22.0% | | | | | |
Aeon Credit Service Co., Ltd. (Consumer finance) | | 309,900 | | | 29,311 |
Aeon Mall Co., Ltd. (Real estate) | | 447,700 | | | 21,810 |
Arrk Corporation (Miscellaneous manufacturer) | | 200,300 | | | 14,727 |
*Askul Corporation (Retail trade) | | 173,900 | | | 5,394 |
*Chiyoda Corp. (Construction) | | 1,200,600 | | | 27,497 |
Chugai Pharmaceutical Company (Pharamceuticals) | | 2,386,900 | | | 51,333 |
Denso Corporation (Auto parts manufacturing) | | 2,360,800 | | | 81,695 |
Honeys Company, Ltd. (Luxury goods) | | 177,400 | | | 14,452 |
Hoya Corporation (Electronic technology) | | 1,678,200 | | | 60,293 |
ITO EN, Ltd. (Beverages) | | 246,800 | | | 14,803 |
*K.K. Davinci Advisors (Consulting services) | | 2,038 | | | 15,313 |
*Kenedix, Inc. (Investment management services) | | 2,697 | | | 16,986 |
Keyence Corporation (Electronic technology) | | 167,460 | | | 47,601 |
Komeri Co. (Speciality retail) | | 557,200 | | | 23,887 |
MISUMI Group, Inc. (Metal production) | | 305,600 | | | 13,279 |
Mitsubishi Tokyo Financial (Financial services) | | 6,497 | | | 88,433 |
Nakanishi Inc. (Medical specialties) | | 113,400 | | | 12,723 |
See accompanying Notes to Financial Statements.
December 31, 2005 | William Blair Funds 31 |
International Growth Fund
Portfolio of Investments, December 31, 2005 (all dollar amounts in thousands)
| | | | | |
Issuer
| | Shares
| | Value
|
| |
Common Stocks—Japan—22.0%—(continued) | | | |
Neomax Co., Ltd. (Electronic equipment and instruments) | | 453,400 | | $ | 14,920 |
Nidec Corporation (Electronic technology) | | 581,000 | | | 49,405 |
Nitori Company Ltd. (Specialty stores) | | 184,260 | | | 17,145 |
Nitto Denko Corporation (Electronic technology) | | 462,500 | | | 36,018 |
Orix Corporation (Consumer finance) | | 361,500 | | | 91,970 |
Park 24 Co., Ltd. (Commercial services) | | 629,200 | | | 22,469 |
Point Inc. Ltd. (Apparel and footwear retail) | | 293,900 | | | 24,550 |
Ryohin Keikaku Co. Ltd. (Retail stores) | | 328,000 | | | 28,680 |
Sharp Corp. (Electronics) | | 3,089,700 | | | 46,989 |
Shimamura Company Ltd. (Retail stores) | | 207,500 | | | 28,660 |
Sparx Asset Management Co. (Financial) | | 4,636 | | | 13,558 |
Sundrug Co., Ltd. (Drug stores) | | 262,500 | | | 14,376 |
United Arrows, Ltd. (Specialty retail) | | 333,900 | | | 21,184 |
Yamada Denki Company (Retail trade) | | 417,400 | | | 52,156 |
| | | | |
|
|
| | | | | | 1,001,617 |
| | | | |
|
|
| | |
Emerging Asia—10.2% | | | | | |
China—1.4% | | | | | |
China Mengniu Dairy Co. (Food products) | | 12,187,000 | | | 10,346 |
Ctrip.com International Ltd.—ADR (Hotels, restaurants and leisure) | | 211,700 | | | 12,226 |
*Foxconn International (Manufacturing services) | | 11,418,000 | | | 18,642 |
Fu Ji Food & Catering (Hotels, restaurants and leisure) | | 4,930,000 | | | 8,076 |
Li Ning Co. Ltd. (Leisure equipment and products) | | 14,320,000 | | | 10,158 |
Ports Design Limited (Apparel and luxury goods) | | 4,896,500 | | | 5,697 |
| | | | |
|
|
| | | | | | 65,145 |
| | | | |
|
|
India—1.9% | | | | | |
*Bharti Tele-Ventures (Wireless telecommunication services) | | 1,704,700 | | | 13,107 |
HDFC Bank (Banking) | | 1,340,400 | | | 21,039 |
Housing Development Finance Corp. (Financial services) | | 1,012,000 | | | 27,153 |
Infosys Technologies, Ltd. (Consulting and software services) | | 349,724 | | | 23,299 |
| | | | |
|
|
| | | | | | 84,598 |
| | | | |
|
|
Malaysia—0.8% | | | | | |
*Airasia Bhd (Air transport) | | 28,178,000 | | | 11,850 |
Bumiputra Commerce Holdings Bhd (Banking) | | 12,485,200 | | | 18,833 |
Transmile Group Bhd (Airport development and maintence) | | 1,237,300 | | | 3,467 |
| | | | |
|
|
| | | | | | 34,150 |
| | | | |
|
|
South Korea—3.7% | | | | | |
Hyundai Motor Co. (Automobiles) | | 283,490 | | | 27,061 |
*Kookmin Bank (Banking) | | 501,900 | | | 37,956 |
Korea Investment Holdings Co. Ltd. (Diversified financial services) | | 348,300 | | | 14,632 |
*NHN Corp. (Internet software and services) | | 118,200 | | | 31,235 |
| | | | | |
Issuer
| | Shares
| | Value
|
| |
Common Stocks—Emerging
Asia—10.2%—(continued) | | | |
South Korea—(continued) | | | | | |
Samsung Electronics Co. (Semiconductors) | | 65,290 | | $ | 42,149 |
Shinsegae Co. Ltd. (Discount retail) | | 39,190 | | | 17,138 |
| | | | |
|
|
| | | | | | 170,171 |
| | | | |
|
|
Taiwan—2.4% | | | | | |
Hon Hai Precision Industry (Computers) | | 9,040,150 | | | 49,774 |
*Mediatek Inc. (Semiconductors and equipment) | | 3,279,500 | | | 38,443 |
Novatek Microelectronics (Semiconductors and equipment) | | 3,832,847 | | | 22,478 |
| | | | |
|
|
| | | | | | 110,695 |
| | | | |
|
|
| | |
United Kingdom—9.5% | | | | | |
BG Group plc (Industrial services) | | 8,956,000 | | | 88,552 |
*Burren Energy plc (Energy) | | 1,374,137 | | | 21,583 |
*Cairn Energy plc (Petroleum refining) | | 841,900 | | | 27,762 |
Capita Group plc (Commercial services) | | 3,553,280 | | | 25,457 |
Carphone Warehouse Group plc (Consumer electronics) | | 2,538,498 | | | 12,089 |
HBOS plc (Commercial banking) | | 3,942,700 | | | 67,205 |
*Michael Page International (Personnel services) | | 3,694,200 | | | 17,138 |
Reckitt Benckiser plc (Household products) | | 987,000 | | | 32,519 |
Standard Chartered plc (Banking) | | 1,550,000 | | | 34,458 |
Tesco plc (Food retail) | | 13,483,100 | | | 76,782 |
Ultra Electronic Holdings plc (Electronic products) | | 864,200 | | | 14,706 |
VT Group plc (Shipbuilding) | | 1,733,900 | | | 12,626 |
| | | | |
|
|
| | | | | | 430,877 |
| | | | |
|
|
| | |
Asia—6.9% | | | | | |
Australia—3.4% | | | | | |
BHP Billiton Ltd. (Diversified resources) | | 2,769,400 | | | 46,155 |
Billabong International Ltd. (Apparel and luxury goods) | | 1,315,200 | | | 13,989 |
Macquarie Bank, Ltd. (Financial services) | | 900,400 | | | 44,772 |
*Sigma Company, Ltd. (Medical distributors) | | 9,378,397 | | | 21,478 |
Toll Holdings, Ltd. (Trucking) | | 2,632,900 | | | 28,666 |
| | | | |
|
|
| | | | | | 155,060 |
| | | | |
|
|
Hong Kong—2.3% | | | | | |
*China Insurance International (Insurance) | | 20,893,438 | | | 8,869 |
Esprit Holdings Ltd. (Apparel, footwear and retail) | | 3,740,500 | | | 26,534 |
Li & Fung Ltd. (Distributions) | | 17,030,000 | | | 32,771 |
Techtronic Industries Co. (Consumer durables) | | 14,861,200 | | | 35,356 |
| | | | |
|
|
| | | | | | 103,530 |
| | | | |
|
|
Singapore—1.2% | | | | | |
Capitaland, Ltd. (Real estate operation) | | 19,412,000 | | | 40,104 |
Goodpack Ltd. (Air freight and logistics) | | 5,561,000 | | | 5,698 |
Osim International Ltd. (Consumer sundries) | | 10,810,200 | | | 10,319 |
| | | | |
|
|
| | | | | | 56,121 |
| | | | |
|
|
See accompanying Notes to Financial Statements.
32 Annual Report | December 31, 2005 |
International Growth Fund
Portfolio of Investments, December 31, 2005 (all dollar amounts in thousands)
| | | | | |
Issuer
| | Shares
| | Value
|
| |
Common Stocks—Emerging Latin America—6.1% | | | |
Brazil—1.5% | | | | | |
Companhia de Concessoes Rodoviarias (Public thoroughfares) | | 257,300 | | $ | 8,149 |
*Diagnosticos Da America S.A. (Health care services) | | 436,600 | | | 8,128 |
Gol Linhas Aereas Int S.P—ADR (Air transport) | | 692,600 | | | 19,538 |
*Natura Cosmeticos S.A. (Cosmetics) | | 589,200 | | | 25,969 |
*Submarino S.A. (E-commerce) | | 400,000 | | | 7,105 |
| | | | |
|
|
| | | | | | 68,889 |
| | | | |
|
|
Chile—1.5% | | | | | |
Banco Santander SP—ADR (Banking) | | 403,300 | | | 17,987 |
Cencosud S.A.—ADR 144A (Retail stores) | | 783,030 | | | 23,282 |
S.A.C.I. Falabella (Department stores) | | 9,085,600 | | | 24,921 |
| | | | |
|
|
| | | | | | 66,190 |
| | | | |
|
|
Columbia—0.4% | | | | | |
Bancolombia S.A.—ADR (Banking) | | 632,400 | | | 18,232 |
| | | | |
|
|
Mexico—2.5% | | | | | |
America Movil S.A. (Communications) | | 14,460,800 | | | 21,171 |
*Consorcio Ara Sa De Cv (Construction) | | 2,013,300 | | | 8,825 |
*Corporacion Geo Sa De Cv (Real estate) | | 6,077,400 | | | 21,484 |
*Desarrolladora Homex S.A.—ADR (Household durables) | | 437,500 | | | 13,423 |
*Urbi Desarrollos Urbanos S.A. (Household durables) | | 2,116,800 | | | 14,667 |
Walmart de Mexico (Retail trade) | | 6,441,600 | | | 35,827 |
| | | | |
|
|
| | | | | | 115,397 |
| | | | |
|
|
Panama—0.2% | | | | | |
*Copa Holdings S.A. Class “A” (Airlines)† | | 278,000 | | | 7,589 |
| | | | |
|
|
| |
Emerging Europe, Mid-East, Africa—4.7% | | | |
Czech Republic—0.2% | | | | | |
*Central European Media Enterprises Ltd. Class “A” (Television)† | | 110,146 | | | 6,378 |
| | | | |
|
|
Egypt—0.5% | | | | | |
Orascom Contruction Industry (Construction) | | 649,041 | | | 24,679 |
| | | | |
|
|
Romania—0.2% | | | | | |
Romanian Development Bank (Commercial banks) | | 1,518,250 | | | 6,638 |
| | | | |
|
|
Russia—0.5% | | | | | |
*Novatek OAO—GDR (Oil, gas drilling and exploration) | | 719,200 | | | 16,067 |
*Pyaterochka Holdings—GDR (Consumer staples) | | 590,567 | | | 8,534 |
| | | | |
|
|
| | | | | | 24,601 |
| | | | |
|
|
South Africa—2.7% | | | | | |
African Bank Investments (Consumer loans) | | 1,492,522 | | | 5,794 |
Aspen Pharmacare (Pharmaceuticals) | | 2,383,200 | | | 12,602 |
Edgars Consolidated Stores (Apparel, footwear and retail) | | 3,157,630 | | | 17,595 |
*MTN Group Ltd. (Telecommunication services) | | 2,339,400 | | | 23,005 |
| | | | | | |
Issuer
| | Shares or
Principal
Amount
| | Value
|
| |
Common Stocks—Emerging Europe, Mid-East, Africa—4.7%—(continued) | | | |
South Africa—(continued) | | | | | | |
Naspers Ltd. (Media) | | | 997,500 | | $ | 17,714 |
Sasol ASA (Energy) | | | 1,301,900 | | | 46,951 |
| | | | | |
|
|
| | | | | | | 123,661 |
| | | | | |
|
|
Turkey—0.6% | | | | | | |
*Turkiye Garanti Bankasi A.S. (Banking) | | | 7,578,875 | | | 27,318 |
| | | | | |
|
|
| | |
Canada—4.2% | | | | | | |
Canadian National Railway Company (Railroads) | | | 759,400 | | | 60,817 |
*Gildan Activewear, Inc. (Apparel and luxury goods) | | | 368,900 | | | 15,860 |
Manulife Financial Corp. (Life and health insurance) | | | 767,500 | | | 45,053 |
*Research in Motion Ltd. (Wireless telecommunication) | | | 452,300 | | | 29,849 |
Ritchie Brothers Auctioneers, Inc. (Buisness services)† | | | 276,400 | | | 11,678 |
*Rona, Inc. (Building materials) | | | 787,100 | | | 14,517 |
Shoppers Drug Mart Corp. (Retail trade) | | | 356,700 | | | 13,489 |
| | | | | |
|
|
| | | | | | | 191,263 |
| | | | | |
|
|
Total Common Stock—95.3%
(cost $3,130,698) | | | 4,339,379 |
| | | | | |
|
|
| | |
Preferred Stock | | | | | | |
Brazil—1.4% | | | | | | |
Banco Itau Holding (Banking) | | | 1,766,500 | | | 42,565 |
Petroleo Brasileiro S.A. (Oil, gas drilling, and exploration) | | | 1,359,800 | | | 21,656 |
| | | | | |
|
|
| | | | | | | 64,221 |
| | | | | |
|
|
Germany—0.3% | | | | | | |
Porsche AG (Automobiles) | | | 19,732 | | | 14,151 |
| | | | | |
|
|
Total Preferred Stock—1.7%
(cost $49,612) | | | 78,372 |
| | | | | |
|
|
| | |
Investment in Affiliate | | | | | | |
William Blair Ready Reserves Fund | | | 28,677,624 | | | 28,678 |
| | | | | |
|
|
Total Investment in Affiliate—0.7%
(cost $28,678) | | | 28,678 |
| | | | | |
|
|
| | |
Short-Term Investments | | | | | | |
American Express Demand Note, VRN 4.235% due 1/3/06 | | $ | 37,499,000 | | | 37,499 |
Prudential Funding Demand Note, VRN 3.930% due 1/3/06 | | $ | 31,441,000 | | | 31,441 |
| | | | | |
|
|
Total Short-Term Investments—1.5%
(cost $68,940) | | | 68,940 |
| | | | | |
|
|
Total Investments—99.2%
(cost $3,277,928) | | | 4,515,369 |
Cash and other assets, less liabilities—0.8% | | | 35,708 |
| | | | | |
|
|
Net assets—100.0% | | $ | 4,551,077 |
| | | | | |
|
|
See accompanying Notes to Financial Statements.
December 31, 2005 | William Blair Funds 33 |
International Growth Fund
Portfolio of Investments, December 31, 2005 (all dollar amounts in thousands)
* Non-income producing securities
ADR = American Depository Receipt
GDR = Global Depository Receipt
VRN = Variable Rate Note
† = U.S. listed foreign security
For securities, primarily traded on exchanges or markets that close before the close of regular trading on the New York Stock Exchange, the Fund uses an independent pricing service on a daily basis to fair value price the securities pursant to Valuation Procedures adopted by the Board of Trustees.
At December 31, 2005 the Fund’s Portfolio of Investments includes the following industry categories:
| | |
Financials | | 25.8% |
Consumer Discretionary | | 22.2% |
Information Technology | | 13.2% |
Industrials and Services | | 11.9% |
Healthcare | | 9.8% |
Energy | | 7.0% |
Consumer Staples | | 5.5% |
Materials | | 2.0% |
Telecommunication Services | | 1.6% |
Utilities | | 1.0% |
| | |
|
| | | 100.0% |
| | |
|
At December 31, 2005 the Fund’s Portfolio of Investments includes the following currency categories:
| | |
Euro | | 24.7% |
Japanese Yen | | 22.7% |
British Pound Sterling | | 9.8% |
Swiss Franc | | 6.2% |
United States Dollar | | 4.2% |
Canadian Dollar | | 4.1% |
South Korean Won | | 3.9% |
Hong Kong Dollar | | 3.5% |
Australian Dollar | | 3.5% |
South African Rand | | 2.8% |
Brazilian Real | | 2.6% |
Taiwan Dollar | | 2.5% |
Mexico Nuevo Peso | | 2.3% |
Indian Rupee | | 1.9% |
Singapore Dollar | | 1.3% |
All other currencies | | 4.0% |
| | |
|
| | | 100.0% |
| | |
|
See accompanying Notes to Financial Statements.
34 Annual Report | December 31, 2005 |
W. George Greig
INTERNATIONAL EQUITY FUND
The International Equity Fund invests primarily in common stocks of companies included in the Morgan Stanley Capital International All Country World ex-U.S. Index.
AN OVERVIEW FROM THE PORTFOLIO MANAGER
How did the Fund perform during the last year? How did the Fund’s performance compare to its benchmark?
The International Equity Fund posted a 13.50% increase (Class N Shares) for the 12 months ended December 31, 2005. By comparison, the Fund’s benchmark, the MSCI All Country World Free except US Index, rose 17.11%.
What factors were behind the Fund’s performance versus the benchmark?
While the Fund significantly outperformed the broad and growth index benchmarks during the fourth quarter, it lagged the broad benchmark during the six month period ended December 31, 2005, due to third quarter results. The Fund’s quality growth discipline, which manifested itself in the overweighted allocation in Information Technology and Consumer sectors at the expense of Materials and Energy during the third quarter, hampered results. Somewhat mitigating this performance was strong stock selection across sectors and regions during the fourth quarter, coupled with positive results from emerging markets exposure.
What were the most significant factors impacting international markets during 2005?
During the first six months of 2005 the international equity markets were largely flat; however, during the last half of the year the equity markets sharply appreciated (and as evidenced by the annual 17.11% MSCI All Country World Free except US Index return). International equities significantly outpaced US equities as measured by the Standard & Poor’s 500 Index, which rose 4.91% year to date. This increase was despite US dollar appreciation versus most foreign currencies, which reduced returns to US investors. The MSCI EAFE Index rose 29.54% in local terms, which translated into 14.02% to US dollar investors, as the US dollar appreciated an average 13% relative to EAFE (Europe and Australasia, Far East Equity) country currencies.
Positive second half international equity market performance was driven by strong results across sectors, capitalizations and regions. With its improving macroeconomic backdrop and positive consumer sentiment, Japan was one of the strongest developed regions year to date, up 25.63% in US dollar terms, only lagging behind Canada, which returned nearly 29%. Emerging markets were the strongest part of the international markets overall, returning 34.54% as measured by the MSCI Emerging Markets Index, while developed small capitalization stocks rose 25.48%. Both areas outperformed larger capitalization developed stocks, as measured by the EAFE Index.
What is your outlook for the international markets?
After a third consecutive year of strong equity returns worldwide, markets have for the most part erased the losses of the 2000-2002 bear market. As the new year begins, many national and regional indices (with the obvious exceptions of Nasdaq and the Japanese market benchmarks) are at or approaching historic highs. Even in the US, where index returns were modest, a majority of individual stocks offered better performance.
December 31, 2005 | William Blair Funds 35 |
Prices have been propelled higher by strong fundamentals: exceptional earnings growth and a surprisingly stable inflation and long term interest rate environment. The only two elements of cyclical risk in the global economic picture have been Fed tightening and rising energy costs, and up to now, neither of them has had a significant impact on growth. Relative economic stability has enabled strong corporate performance to act as the key driver of share price gains over the course of the last several years. Accordingly, if the structural framework of the global economy remains in equilibrium, and corporate growth and profitability continue to meet or exceed expectations, the market environment will remain conducive to solid equity returns.
The principal risks in the macro picture are well known, and mostly focused on the US: household sector leverage and inadequate savings; consumer vulnerability to weakness in home prices; interest rate and exchange rate risks associated with the US current account deficit; the potential for a central bank policy error (such as overreacting to transitory inflation signs); a ‘superspike’ in oil and gas prices beyond what has already taken place; and/or exogenous variables such as avian flu, terrorist disruptions, or natural disasters.
Since none of these issues are new, the only way they could have a dramatic impact on the market risk profile would be if one of them suddenly had a delayed or cumulative effect, or if two or more of them combined in some unforeseen way. These possibilities cannot be conclusively ruled out, but at the same time, the resilience of the financial and economic infrastructure-perhaps a byproduct of increasing global integration-has been impressive over the last decade.
The other key variable in the outlook is corporate profitability and growth, where we have seen continued strength in the US and dramatic improvement in Japan, Europe, and in many developing markets. This aspect of the market environment shows no sign of deteriorating or even slackening the pace of improvement. Corporate management continues to focus on improving supply chain management, capital and labor productivity, cost control, and marketing. Returns on capital are now well above the cost of capital in every principal region of the world; and while there are concerns that ‘excessive’ profitability is a risk factor in itself, there is no signal apparent of either complacency or irrational competitive behavior undermining corporate performance on a wide scale.
Even in a benign economic and earnings scenario, of course, there is no guarantee of supernormal returns or a continuation of the trends of 2003-05. There is a reasonable (although not conclusive) case that cyclical growth may slow in the US and China in 2006, and profit growth may be restrained as a result. In addition, growth in the energy and financial sectors may be held back by price declines and yield curve flattening, respectively. On the other hand, Japan and more recently Europe seem to be benefiting from the effects of a strong external environment and solid corporate profitability, and could continue to mount moderate but self-sustaining recoveries. On a global basis, there is probably not much reason to anticipate significantly lower earnings growth in 2006, but some deceleration seems likely.
In the context of the current profit and interest rate picture, current valuations should not present a significant issue for potential returns, and even areas that have seen relatively strong recent performance, such as small caps and Japan, are not so extended as to be unusually risky on valuation grounds alone.
Emerging markets continue to be a special case, influenced by long term changes outside of the business cycle. Whereas previous cycles were dominated by unstable investment flows and highly volatile production and trade patterns, virtually all of the developing world is now seeing new dynamics of high savings, credit development, job creation and household spending growth, as well as more responsible and transparent corporate behavior. These factors are reducing financial risk at the same time they create new avenues of growth in emerging economies, and have been instrumental in driving exceptional returns in this asset class since 1999.
36 Annual Report | December 31, 2005 |
On balance, we see a reasonable balance between risk and opportunity for the year ahead, particularly as international markets continue to be led by the ongoing trend toward better corporate performance and governance. At the margins of any set of expectations, of course, are the ‘unknown unknowns’. Volatility has been relatively low for some time, and global markets have not faced any major discontinuities for several years. Any investment strategy predicated on anticipation of normal growth and risk parameters has to be adaptable to evolving change, and adaptability built into portfolio structure from the bottom up is probably the most consistent method for refining strategy.
December 31, 2005 | William Blair Funds 37 |
International Equity Fund
Performance Highlights (unaudited)
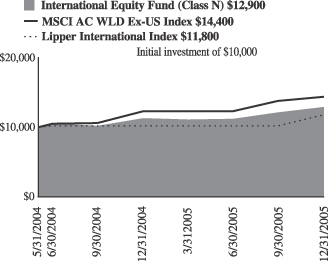
Average Annual Total Return at 12/31/2005
| | | | | | |
| | | 1
Year
| | | Since Inception(a)
| |
International Equity Fund
Class N | | 13.50 | % | | 16.85 | % |
International Equity Fund
Class I | | 13.81 | | | 17.30 | |
MSCI All Country World Free Ex-US | | 17.11 | | | 25.10 | |
Lipper International Index | | 15.67 | | | — | |
| | (a) | | For the period from May 24, 2004 to December 31, 2005. |
Performance cited represents past performance. Past performance does not guarantee future results and current performance may be lower or higher than the data quoted. Results shown are average annual returns, which assume reinvestment of dividends and capital gains. Investment returns and principal will fluctuate and you may have a gain or loss when you sell shares. For the most current month-end performance information, please call 1-800-742-7272, or visit our Web site at www.williamblairfunds.com. Class N shares are available to the general public without a sales load. Class I shares are available to certain institutional investors and advisory clients of William Blair & Company L.L.C. without a sales load or distribution (12b-1) or service fees.
The performance highlights and graph presented above do not reflect the deduction of taxes that a shareholder would pay on fund distributions or the redemption of fund shares.
The Morgan Stanley Capital International (MSCI) All Country World Free Ex-US Index is an unmanaged index that includes developed and emerging markets and reduced Japanese portion, making it more comparable to the International Growth Fund in terms of investment approach.
The Lipper International Index is a composite of international growth mutual funds.
This report identifies the Fund’s investments on December 31, 2005. These holdings are subject to change. Not all stocks in the Fund performed the same, nor is there any guarantee that these stocks will perform as well in the future. Market forecasts provided in this report may not necessarily come to pass.
Sector Diversification (unaudited)

The sector diversification shown is based on the total investment portfolio.
38 Annual Report | December 31, 2005 |
International Equity Fund
Portfolio of Investments, December 31, 2005 (all dollar amounts in thousands)
| | | | | |
Issuer
| | Shares
| | Value
|
| | |
Common Stocks—Europe—36.8% | | | | | |
Austria—1.8% | | | | | |
Erste Bank (Banking) | | 28,200 | | $ | 1,566 |
*Raiffeisen International Bank (Banking) | | 24,100 | | | 1,575 |
| | | | |
|
|
| | | | | | 3,141 |
| | | | |
|
|
France—8.5% | | | | | |
BNP Paribas (Banking) | | 29,500 | | | 2,380 |
Dassault Systems S.A. (Computer aided design) | | 17,700 | | | 997 |
Essilor International (Health care supplies) | | 17,600 | | | 1,418 |
Eurazeo (Diversified financial services) | | 8,300 | | | 865 |
Hermes International SCA (Apparel and luxury goods) | | 7,500 | | | 1,870 |
Iliad S.A. (Internet software and services) | | 6,600 | | | 408 |
Sanofi-Aventis (Pharmaceuticals) | | 47,100 | | | 4,119 |
Technip-Coflexip S.A. (Construction) | | 23,300 | | | 1,407 |
Vinci S.A. (Construction) | | 19,400 | | | 1,669 |
| | | | |
|
|
| | | | | | 15,133 |
| | | | |
|
|
Germany—7.6% | | | | | |
Bijou Brigitte (Fashion jewelry accessories) | | 1,900 | | | 512 |
Celesio AG (Pharmaceuticals) | | 21,200 | | | 1,821 |
Continental AG (Diversified manufacturing) | | 36,050 | | | 3,193 |
E.ON AG (Energy) | | 27,200 | | | 2,807 |
*Qiagen, Inc. (Health care) | | 53,800 | | | 630 |
SAP AG (Software) | | 25,600 | | | 4,607 |
| | | | |
|
|
| | | | | | 13,570 |
| | | | |
|
|
Greece—1.6% | | | | | |
Coca-Cola Hellenic Bottling S.A. (Beverages) | | 38,100 | | | 1,119 |
EFG Eurobank (Banking) | | 27,400 | | | 864 |
National Bank of Greece (Banking) | | 23,100 | | | 982 |
| | | | |
|
|
| | | | | | 2,965 |
| | | | |
|
|
Ireland—2.0% | | | | | |
Anglo Irish Bank plc (Finance) | | 113,600 | | | 1,715 |
*Ryanair-ADR (Air transport) | | 32,300 | | | 1,808 |
| | | | |
|
|
| | | | | | 3,523 |
| | | | |
|
|
Italy—2.0% | | | | | |
Luxottica Group SpA (Apparel and luxury goods) | | 97,300 | | | 2,469 |
Saipem SpA (Energy equipment and services) | | 70,500 | | | 1,156 |
| | | | |
|
|
| | | | | | 3,625 |
| | | | |
|
|
Netherlands—0.4% | | | | | |
*Tomtom NV (Computer software) | | 21,900 | | | 751 |
| | | | |
|
|
Norway—1.4% | | | | | |
Statoil ASA (Oil and gas) | | 109,600 | | | 2,513 |
| | | | |
|
|
Spain—1.9% | | | | | |
Grupo Ferrovial S.A. (Industrial services) | | 13,100 | | | 908 |
*Industria De Textile (Retail trade) | | 76,400 | | | 2,493 |
| | | | |
|
|
| | | | | | 3,401 |
| | | | |
|
|
Sweden—0.5% | | | | | |
*Capio AB (Health care) | | 21,300 | | | 379 |
*Modern Times Group (Television) | | 10,800 | | | 451 |
| | | | |
|
|
| | | | | | 830 |
| | | | |
|
|
| | | | | |
Issuer
| | Shares
| | Value
|
| |
Common Stocks—Europe—36.8%—(continued) | | | |
Switzerland—9.1% | | | | | |
*Actelion Ltd. (Biotechnology) | | 2,200 | | $ | 182 |
*EFG International (Commercial banking) | | 24,300 | | | 647 |
Nobel Biocare Holding AG (Medical equipment and supplies) | | 3,840 | | | 844 |
Phonak Holdings AG (Hearing technology) | | 11,400 | | | 491 |
Roche Holdings AG (Health care) | | 35,200 | | | 5,272 |
SGS S.A. (Industrials) | | 1,450 | | | 1,221 |
Synthes, Inc. (Health care) | | 28,500 | | | 3,204 |
UBS AG (Banking) | | 44,800 | | | 4,254 |
| | | | |
|
|
| | | | | | 16,115 |
| | | | |
|
|
Japan—21.7% | | | | | |
Aeon Credit Service Co., Ltd. (Consumer finance) | | 7,800 | | | 738 |
Aeon Mall Co., Ltd. (Real estate) | | 20,600 | | | 1,003 |
*Askul Corporation (Retail trade) | | 8,000 | | | 248 |
*Chiyoda Corporation (Construction ) | | 44,000 | | | 1,008 |
Chugai Pharmaceutical Company (Pharamceuticals) | | 99,400 | | | 2,138 |
Denso Corporation (Auto parts manufacturing) | | 119,200 | | | 4,125 |
Hoya Corporation (Electronic technology) | | 71,300 | | | 2,562 |
*K.K. Davinci Advisors (Consulting services) | | 66 | | | 496 |
*Kenedix, Inc. (Investment management services) | | 79 | | | 498 |
Keyence Corporation (Electronic technology) | | 11,100 | | | 3,155 |
Komeri Co., Ltd. (Specialty retail) | | 16,900 | | | 724 |
MISUMI Group, Inc. (Metal production) | | 11,500 | | | 500 |
Mitsubishi Tokyo Financial (Financial services) | | 377 | | | 5,131 |
Neomax Co., Ltd. (Electronic equipment and instruments) | | 16,000 | | | 526 |
Nidec Corporation (Electronic technology) | | 25,000 | | | 2,126 |
Nitto Denko Corporation (Electronic technology) | | 19,500 | | | 1,519 |
Orix Corporation (Consumer finance) | | 17,400 | | | 4,427 |
Point Inc. Ltd. (Apparel and footwear retail) | | 7,600 | | | 635 |
Ryohin Keikaku Co. Ltd. (Retail stores) | | 10,800 | | | 944 |
Sharp Corporation (Electronics) | | 184,400 | | | 2,804 |
Shimamura Company Ltd. (Retail stores) | | 6,300 | | | 870 |
Sundrug Co., Ltd. (Drug stores) | | 6,000 | | | 329 |
Yamada Denki Co., Ltd. (Retail trade) | | 16,000 | | | 1,999 |
| | | | |
|
|
| | | | | | 38,505 |
| | | | |
|
|
| | |
United Kingdom—11.0% | | | | | |
BG Group plc (Industrial services) | | 514,600 | | | 5,088 |
*Cairn Energy plc (Petroleum refining) | | 24,700 | | | 815 |
Capita Group plc (Commercial services) | | 222,600 | | | 1,595 |
Carphone Warehouse Group plc (Consumer electronics) | | 97,000 | | | 462 |
HBOS plc (Commercial banking) | | 202,700 | | | 3,455 |
Reckitt Benckiser plc (Household products) | | 65,500 | | | 2,158 |
Standard Chartered plc (Banking) | | 120,000 | | | 2,668 |
Tesco plc (Food retailer) | | 590,800 | | | 3,364 |
| | | | |
|
|
| | | | | | 19,605 |
| | | | |
|
|
| | |
Emerging Asia—8.6% | | | | | |
China—0.6% | | | | | |
*Foxconn International (Manufacturing services) | | 625,000 | | | 1,020 |
| | | | |
|
|
See accompanying Notes to Financial Statements.
December 31, 2005 | William Blair Funds 39 |
International Equity Fund
Portfolio of Investments, December 31, 2005 (all dollar amounts in thousands)
| | | | | |
Issuer
| | Shares
| | Value
|
|
Common Stocks—Emerging Asia—8.6%—(continued) |
India—2.2% | | | | | |
*Bharti Tele-Ventures (Wireless telecommunication services) | | 131,873 | | $ | 1,014 |
HDFC Bank (Banking) | | 66,300 | | | 1,041 |
Housing Development Finance Corp. (Financial services) | | 34,000 | | | 912 |
Infosys Technologies Ltd. (Consulting and software services) | | 15,100 | | | 1,006 |
| | | | |
|
|
| | | | | | 3,973 |
| | | | |
|
|
Malaysia—0.3% | | | | | |
Bumiputra Commerce Holdings Bhd (Banking) | | 407,700 | | | 615 |
| | | | |
|
|
South Korea—2.9% | | | | | |
Hyundai Motor Company (Automobiles) | | 15,900 | | | 1,518 |
*Kookmin Bank (Banking) | | 18,450 | | | 1,395 |
Samsung Electronics Co. (Semiconductors) | | 3,400 | | | 2,195 |
| | | | |
|
|
| | | | | | 5,108 |
| | | | |
|
|
Taiwan—2.6% | | | | | |
Hon Hai Precision Industry Corp. (Computers) | | 523,931 | | | 2,885 |
*Mediatek, Inc. (Electronic technology) | | 151,200 | | | 1,772 |
| | | | |
|
|
| | | | | | 4,657 |
| | | | |
|
|
| | |
Asia—6.1% | | | | | |
Australia—2.8% | | | | | |
BHP Billiton Ltd. (Diversified resources) | | 105,800 | | | 1,763 |
Macquarie Bank Ltd. (Financial services) | | 34,400 | | | 1,711 |
*Sigma Company, Ltd. (Medical distributors) | | 153,007 | | | 350 |
Toll Holdings Ltd. (Trucking) | | 109,800 | | | 1,196 |
| | | | |
|
|
| | | | | | 5,020 |
| | | | |
|
|
Hong Kong—2.5% | | | | | |
Esprit Holdings Ltd. (Apparel, footwear and retail) | | 226,500 | | | 1,607 |
Li & Fung Ltd. (Distributions) | | 612,000 | | | 1,178 |
Techtronic Industries Co. (Consumer durables) | | 682,800 | | | 1,624 |
| | | | |
|
|
| | | | | | 4,409 |
| | | | |
|
|
Singapore—0.8% | | | | | |
Capitaland, Ltd. (Real estate operations) | | 660,000 | | | 1,364 |
| | | | |
|
|
| | |
Canada—5.2% | | | | | |
Canadian National Railway Co. (Railroads) | | 49,500 | | | 3,964 |
Manulife Financial Corporation (Life and health insurance) | | 46,800 | | | 2,747 |
*Research in Motion Ltd. (Wireless telecommunication) | | 26,200 | | | 1,729 |
Shoppers Drug Mart Corporation (Retail trade) | | 20,600 | | | 779 |
| | | | |
|
|
| | | | | | 9,219 |
| | | | |
|
|
| | |
Emerging Latin America—2.8% | | | | | |
Brazil— 0.5% | | | | | |
Companhia de Concessoes Rodoviarias (Public thoroughfares) | | 8,300 | | | 263 |
*Natura Cosmeticos S.A. (Cosmetics) | | 12,700 | | | 560 |
| | | | |
|
|
| | | | | | 823 |
| | | | |
|
|
| | | | | | | |
Issuer
| | Shares or
Principal
Amount
| | Value
| |
| | |
Common Stocks—Emerging
Latin America—2.8%—(continued) | | | | | | | |
Columbia—0.4% | | | | | | | |
Bancolumbia S.A.—ADR (Banking) | | | 22,000 | | $ | 634 | |
| | | | | |
|
|
|
Mexico—1.9% | | | | | | | |
America Movil S.A. (Communications) | | | 730,100 | | | 1,069 | |
Walmart de Mexico (Retail trade) | | | 402,900 | | | 2,241 | |
| | | | | |
|
|
|
| | | | | | | 3,310 | |
| | | | | |
|
|
|
| |
Emerging Europe, Mid-East, Africa—1.6% | | | | |
South Africa—1.6% | | | | | | | |
Naspers Ltd. (Media) | | | 38,000 | | | 675 | |
Sasol ASA (Energy) | | | 58,999 | | | 2,128 | |
| | | | | |
|
|
|
| | | | | | | 2,803 | |
| | | | | |
|
|
|
Total Common Stock—93.8%
(cost $149,823) | | | 166,632 | |
| | | | | |
|
|
|
| | |
Preferred Stocks | | | | | | | |
Brazil—1.5% | | | | | | | |
Banco Itau S.A. (Banking) | | | 78,300 | | | 1,887 | |
Petroleo Brasileiro S.A. (Oil, gas drilling, and exploration) | | | 50,400 | | | 802 | |
| | | | | |
|
|
|
| | | | | | | 2,689 | |
| | | | | |
|
|
|
Germany—0.3% | | | | | | | |
Porsche AG (Automobiles) | | | 790 | | | 567 | |
| | | | | |
|
|
|
Total Preferred Stocks—1.8%
(cost $2,871) | | | 3,256 | |
| | | | | |
|
|
|
| | |
Investment in Affiliate | | | | | | | |
William Blair Ready Reserves Fund | | | 1,560,119 | | | 1,560 | |
| | | | | |
|
|
|
Total Investment in Affiliate—0.9%
(cost $1,560) | | | 1,560 | |
| | | | | |
|
|
|
| | |
Short-Term Investments | | | | | | | |
American Express Demand Note, VRN, 4.235%, due 1/03/06 | | $ | 4,875,000 | | | 4,875 | |
Prudential Funding Demand Note, VRN, 3.930%, due 1/03/06 | | $ | 2,480,000 | | | 2,480 | |
| | | | | |
|
|
|
Total Short-Term Investments—4.1%
(cost $7,355) | | | 7,355 | |
| | | | | |
|
|
|
Total Investments—100.6%
(cost $161,609) | | | 178,803 | |
Liabilities plus cash and other assets—(0.6%) | | | (1,093 | ) |
| | | | | |
|
|
|
Net assets—100.0% | | $ | 177,710 | |
| | | | | |
|
|
|
* Non-income producing securities
ADR = American Depository Receipt
VRN = Variable Rate Note
See accompanying Notes to Financial Statements.
40 Annual Report | December 31, 2005 |
International Equity Fund
Portfolio of Investments, December 31, 2005 (all dollar amounts in thousands)
For securities, primarily traded on exchanges or markets that close before the close of regular trading on the New York Stock Exchange, the Fund uses an independent pricing service on a daily basis to fair value price the securities pursuant to Valuation Procedures adopted by the Board of Trustees.
At December 31, 2005 the Fund’s Portfolio of Investments includes the following industry categories:
| | |
Financials | | 26.8% |
Consumer Discretionary | | 19.5% |
Information Technology | | 14.9% |
Healthcare | | 12.3% |
Industrials and Services | | 8.3% |
Energy | | 8.2% |
Consumer Staples | | 4.9% |
Materials | | 1.9% |
Utilities | | 1.7% |
Telecommunication Services | | 1.5% |
| | |
|
| | | 100.0% |
| | |
|
At December 31, 2005 the Fund’s Portfolio of Investments includes the following currency categories:
| | |
Euro | | 26.4% |
Japanese Yen | | 22.7% |
British Pound Sterling | | 11.5% |
Swiss Franc | | 9.5% |
Canadian Dollar | | 5.4% |
Hong Kong Dollar | | 3.2% |
South Korean Won | | 3.0% |
Australian Dollar | | 2.9% |
Taiwan Dollar | | 2.7% |
Indian Rupee | | 2.3% |
Brazilian Real | | 2.1% |
Mexico Nuevo Peso | | 2.0% |
South African Rand | | 1.7% |
Norwegian Krone | | 1.5% |
United States Dollar | | 1.4% |
Singapore Dollar | | 0.8% |
Swedish Krona | | 0.5% |
Malaysian Ringgit | | 0.4% |
| | |
|
| | | 100.0% |
| | |
|
See accompanying Notes to Financial Statements.
December 31, 2005 | William Blair Funds 41 |

Jeffrey A. Urbina
INTERNATIONAL SMALL CAP GROWTH FUND
The International Small Cap Growth Fund primarily invests in a diversified portfolio of common stocks of small cap companies in developed and emerging markets.
AN OVERVIEW FROM THE PORTFOLIO MANAGER
I am pleased to have the International Small Cap Growth Fund become the newest addition to the William Blair Fund Family and would like to thank our shareholders for investing with us.
I am enthusiastic about the opportunities available to me as the manager of the International Small Cap Growth Fund. The International Small Cap Growth Fund will invest in companies with market capitalizations of $5 billion or less, and will seek stocks of companies that historically have had and are expected to maintain superior growth, profitability and quality relative to local markets and relative to companies within the same industry worldwide. Such companies generally will exhibit superior business fundamentals, including leadership in their field, quality products or services, distinctive marketing and distribution, pricing flexibility and revenue from products or services consumed on a steady, recurring basis. In managing the Fund I will focus on companies with above-average returns on equity, strong balance sheets and consistent, above-average earnings growth.
How did the Fund perform since its inception? How did the Fund’s performance compare to its benchmark?
The International Small Cap Growth Fund commenced operations on November 1, 2005. Through the period ending December 31, 2005, the Fund posted a gain of 11.60% (Class N Shares), ahead of the 10.68% return of the Fund’s benchmark, the MSCI World Small Cap ex-U.S. Index, for this short time period.
What factors were behind the Fund’s performance versus the benchmark?
The International Small Cap Growth Fund’s “since inception” performance was driven by strong stock selection in emerging markets and Japanese small capitalization stocks. In particular, the Fund’s allocation to and stock selection in Japanese specialty retailers added value, as did the Fund’s focus on Japanese small cap financials. From a sector perspective, the Fund’s stock selection in Consumer Discretionary, Financials, Industrials and Information Technology augmented relative results.
What is your outlook for the international markets?
After a third consecutive year of strong equity returns worldwide, markets have for the most part erased the losses of the 2000-2002 bear market. As the new year begins, many national and regional indices (with the obvious exceptions of Nasdaq and the Japanese market benchmarks) are at or approaching historic highs. Even in the US, where index returns were modest, a majority of individual stocks offered better performance.
Prices have been propelled higher by strong fundamentals: exceptional earnings growth and a surprisingly stable inflation and long term interest rate environment. The only two elements of cyclical risk in the global economic picture have been Fed tightening and rising energy costs, and up to now, neither of them has had a significant impact on growth. Relative economic stability has enabled strong corporate performance to act as the key driver of share price gains over the course of the last several years. Accordingly, if the structural framework
42 Annual Report | December 31, 2005 |
of the global economy remains in equilibrium, and corporate growth and profitability continue to meet or exceed expectations, the market environment will remain conducive to solid equity returns.
The principal risks in the macro picture are well known, and mostly focused on the US: household sector leverage and inadequate savings; consumer vulnerability to weakness in home prices; interest rate and exchange rate risks associated with the US current account deficit; the potential for a central bank policy error (such as overreacting to transitory inflation signs); a ‘superspike’ in oil and gas prices beyond what has already taken place; and/or exogenous variables such as avian flu, terrorist disruptions, or natural disasters.
Since none of these issues are new, the only way they could have a dramatic impact on the market risk profile would be if one of them suddenly had a delayed or cumulative effect, or if two or more of them combined in some unforeseen way. These possibilities cannot be conclusively ruled out, but at the same time, the resilience of the financial and economic infrastructure—perhaps a byproduct of increasing global integration—has been impressive over the last decade.
The other key variable in the outlook is corporate profitability and growth, where we have seen continued strength in the US and dramatic improvement in Japan, Europe, and in many developing markets. This aspect of the market environment shows no sign of deteriorating or even slackening the pace of improvement. Corporate management continues to focus on improving supply chain management, capital and labor productivity, cost control, and marketing. Returns on capital are now well above the cost of capital in every principal region of the world; and while there are concerns that ‘excessive’ profitability is a risk factor in itself, there is no signal apparent of either complacency or irrational competitive behavior undermining corporate performance on a wide scale.
Even in a benign economic and earnings scenario, of course, there is no guarantee of supernormal returns or a continuation of the trends of 2003-05. There is a reasonable (although not conclusive) case that cyclical growth may slow in the US and China in 2006, and profit growth may be restrained as a result. In addition, growth in the energy and financial sectors may be held back by price declines and yield curve flattening, respectively. On the other hand, Japan and more recently Europe seem to be benefiting from the effects of a strong external environment and solid corporate profitability, and could continue to mount moderate but self-sustaining recoveries. On a global basis, there is probably not much reason to anticipate significantly lower earnings growth in 2006, but some deceleration seems likely.
In the context of the current profit and interest rate picture, current valuations should not present a significant issue for potential returns, and even areas that have seen relatively strong recent performance, such as small caps and Japan, are not so extended as to be unusually risky on valuation grounds alone.
Emerging markets continue to be a special case, influenced by long term changes outside of the business cycle. Whereas previous cycles were dominated by unstable investment flows and highly volatile production and trade patterns, virtually all of the developing world is now seeing new dynamics of high savings, credit development, job creation and household spending growth, as well as more responsible and transparent corporate behavior. These factors are reducing financial risk at the same time they create new avenues of growth in emerging economies, and have been instrumental in driving exceptional returns in this asset class since 1999.
On balance, we see a reasonable balance between risk and opportunity for the year ahead, particularly as international markets continue to be led by the ongoing trend toward better corporate performance and governance. At the margins of any set of expectations, of course, are the ‘unknown unknowns’. Volatility has been relatively low for some time, and global markets have not faced any major discontinuities for several years. Any investment strategy predicated on anticipation of normal growth and risk parameters has to be adaptable to evolving change, and adaptability built into portfolio structure from the bottom up is probably the most consistent method for refining strategy.
December 31, 2005 | William Blair Funds 43 |
International Small Cap Growth Fund
Performance Highlights (unaudited)
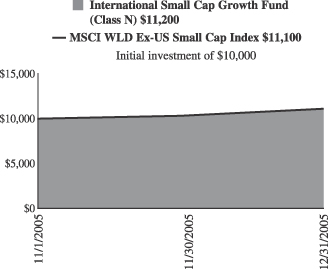
Average Annual Total Return at 12/31/2005
| | | |
| | | Since Inception(a)
| |
International Small Cap Growth Fund
Class N | | 11.60 | % |
International Small Cap Growth Fund
Class I | | 11.60 | |
MSCI World Ex-US Small Cap Index | | 10.68 | |
| | (a) | | For the period from November 1, 2005 (Commencement of Operations) to December 31, 2005. |
Performance cited represents past performance. Past performance does not guarantee future results and current performance may be lower or higher than the data quoted. Results shown are average annual returns, which assume reinvestment of dividends and capital gains. Investment returns and principal will fluctuate and you may have a gain or loss when you sell shares. For the most current month-end performance information, please call 1-800-742-7272, or visit our Web site at www.williamblairfunds.com. Class N shares are available to the general public without a sales load. Class I shares are available to certain institutional investors and advisory clients of William Blair & Company L.L.C. without a sales load or distribution (12b-1) fees. International investing involves special risk considerations, including currency fluctuations, lower liquidity, economic and political risk.
The performance highlights and graph presented above do not reflect the deduction of taxes that a shareholder would pay on fund distributions or the redemption of fund shares.
The Morgan Stanley Capital International (MSCI) World Ex-US Small Cap Index is an unmanaged index that is designated to measure equity performance of small cap stocks in developed and emerging markets.
This report identifies the Fund’s investments on December 31, 2005. These holdings are subject to change. Not all stocks in the Fund performed the same, nor is there any guarantee that these stocks will perform as well in the future. Market forecasts provided in this report may not necessarily come to pass.
Sector Diversification (unaudited)
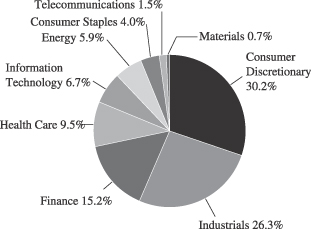
The sector diversification shown is based on the total investment portfolio.
44 Annual Report | December 31, 2005 |
International Small Cap Growth Fund
Portfolio of Investments, December 31, 2005 (all dollar amounts in thousands)
| | | | | |
Issuer
| | Shares
| | Value
|
| | |
Common Stocks—Europe—30.0% | | | | | |
France—7.0% | | | | | |
April Group S.A. (Insurance brokers) | | 18,600 | | $ | 767 |
Iliad S.A. (Internet software and services) | | 12,050 | | | 745 |
Klepierre (Real estate) | | 5,450 | | | 511 |
*Nexity (Real estate management) | | 9,850 | | | 500 |
*Orpea (Hospital and nursing management) | | 4,600 | | | 252 |
Zodiac S.A. (Aerospace and defense) | | 12,000 | | | 769 |
| | | | |
|
|
| | | | | | 3,544 |
| | | | |
|
|
Germany—9.0% | | | | | |
Bijou Brigitte (Fashion jewelry accessories) | | 2,400 | | | 647 |
*CTS Eventim (Leisure & recreation products) | | 20,700 | | | 503 |
Did Deutscher Industrie Svc (Commercial services) | | 8,500 | | | 496 |
GFK AG (Commercial services) | | 10,900 | | | 364 |
*Q-Cells AG (Alternative energy sources) | | 8,100 | | | 472 |
*Qiagen NV (Biomedical) | | 50,900 | | | 596 |
Rational AG (Business equipment) | | 3,900 | | | 518 |
Solarworld AG (Alternative energy sources) | | 3,550 | | | 475 |
Stada Arzneimittel AG (Pharmaceuticals) | | 15,000 | | | 489 |
| | | | |
|
|
| | | | | | 4,560 |
| | | | |
|
|
Greece—1.0% | | | | | |
Bank of Piraeus (Banking) | | 23,300 | | | 497 |
| | | | |
|
|
Ireland—1.7% | | | | | |
Kingspan Group plc (Construction) | | 38,600 | | | 484 |
United Drug plc (Pharmaceuticals) | | 86,500 | | | 374 |
| | | | |
|
|
| | | | | | 858 |
| | | | |
|
|
Italy—3.9% | | | | | |
Amplifon SpA (Retail) | | 7,480 | | | 505 |
Credito Emiliano SpA (Banking) | | 44,400 | | | 495 |
Pirelli & C Real Estate SpA (Real estate development) | | 4,500 | | | 246 |
Tod’s SpA (Footwear apparel) | | 11,200 | | | 755 |
| | | | |
|
|
| | | | | | 2,000 |
| | | | |
|
|
Luxembourg—0.5% | | | | | |
*Transcom Worldwide S.A. (E-services and consulting) | | 28,700 | | | 237 |
| | | | |
|
|
Netherlands—0.9% | | | | | |
*Tomtom NV (Computer software) | | 14,000 | | | 480 |
| | | | |
|
|
Sweden—4.1% | | | | | |
*Capio AB (Health care) | | 41,400 | | | 737 |
Clas Ohlson AB (Retail) | | 17,100 | | | 324 |
HIQ International AB (Computer services) | | 41,600 | | | 226 |
*Modern Times Group (Television) | | 12,100 | | | 505 |
*Tradedoubler AB (E-services and consulting) | | 14,000 | | | 271 |
| | | | |
|
|
| | | | | | 2,063 |
| | | | |
|
|
Switzerland—1.9% | | | | | |
*Actelion Ltd. (Biotechnology) | | 970 | | | 80 |
*EFG International (Banking) | | 9,250 | | | 246 |
Phonak Holdings AG (Hearing technology) | | 14,600 | | | 629 |
| | | | |
|
|
| | | | | | 955 |
| | | | |
|
|
| | | | | |
Issuer
| | Shares
| | Value
|
| |
Common Stocks—Japan—27.2% | | | |
Aeon Credit Service Co., Ltd. (Consumer finance) | | 8,500 | | $ | 804 |
Aeon Mall Co., Ltd. (Real estate) | | 21,400 | | | 1,043 |
Arrk Corporation (Miscellaneous manufacturer) | | 7,400 | | | 544 |
*Askul Corporation (Retail trade) | | 1,900 | | | 59 |
*Chiyoda Corp. (Construction) | | 32,000 | | | 733 |
Honeys Company, Ltd. (Luxury goods) | | 9,000 | | | 733 |
ITO EN, Ltd. (Beverages) | | 8,300 | | | 498 |
*K.K. Davinci Advisors (Consulting services) | | 32 | | | 240 |
*Kenedix, Inc. (Investment management services) | | 39 | | | 246 |
Komeri Co. (Specialty retail) | | 12,000 | | | 514 |
MISUMI Group, Inc. (Metal production) | | 16,800 | | | 730 |
Nakanishi Inc. (Medical specialties) | | 4,300 | | | 482 |
Neomax Co., Ltd. (Electronic equipment and instruments) | | 23,000 | | | 757 |
Nitori Company Ltd. (Specialty stores) | | 5,800 | | | 540 |
Park 24 Co., Ltd. (Commercial services) | | 17,000 | | | 607 |
Point Inc. Ltd. (Apparel and footwear retail) | | 9,500 | | | 793 |
Ryohin Keikaku Co. Ltd. (Retail stores) | | 9,700 | | | 848 |
Shimamura Company Ltd. (Retail stores) | | 5,700 | | | 787 |
Sparx Asset Management Co. (Financial) | | 188 | | | 550 |
Sundrug Co., Ltd. (Drug stores) | | 13,600 | | | 745 |
Suruga Bank (Banking) | | 56,000 | | | 703 |
United Arrows, Ltd. (Specialty retail) | | 12,200 | | | 774 |
| | | | |
|
|
| | | | | | 13,730 |
| | | | |
|
|
United Kingdom—10.3% | | | | | |
Accident Exchange Group plc (Auto rental) | | 34,200 | | | 242 |
*Burren Energy plc (Energy) | | 46,600 | | | 732 |
*Cairn Energy plc (Petroleum refining) | | 22,500 | | | 742 |
Capita Group plc (Commercial services) | | 105,100 | | | 753 |
Carphone Warehouse Group plc (Consumer electronics) | | 109,000 | | | 519 |
*Michael Page International (Personnel services) | | 106,200 | | | 493 |
Tullow Oil plc (Oil, gas drilling and exploration) | | 158,100 | | | 735 |
Ultra Electronic Holdings plc (Electronic products) | | 29,000 | | | 493 |
VT Group plc (Shipbuilding) | | 67,500 | | | 491 |
| | | | |
|
|
| | | | | | 5,200 |
| | | | |
|
|
Emerging Asia—8.0% | | | | | |
China—3.1% | | | | | |
Ctrip.com International Ltd.—ADR (Hotels, restaurants and leisure) | | 4,100 | | | 237 |
*Focus Media Holdings—ADR (Advertising sales) | | 7,500 | | | 253 |
Li Ning Co. Ltd. (Leisure equipment and products) | | 326,873 | | | 232 |
Ports Design Limited (Apparel and luxury goods) | | 207,500 | | | 241 |
*Suntech Power Holdings Co. Ltd—ADR (Alternative energy sources) | | 22,900 | | | 624 |
| | | | |
|
|
| | | | | | 1,587 |
| | | | |
|
|
India—1.0% | | | | | |
HDFC Bank—ADR (Banking) | | 9,500 | | | 483 |
| | | | |
|
|
Malaysia—0.9% | | | | | |
*Airasia Bhd (Air transport) | | 552,900 | | | 233 |
Transmile Group Bhd (Airport development and maintenance) | | 78,500 | | | 220 |
| | | | |
|
|
| | | | | | 453 |
| | | | |
|
|
See accompanying Notes to Financial Statements.
December 31, 2005 | William Blair Funds 45 |
International Small Cap Growth Fund
Portfolio of Investments, December 31, 2005 (all dollar amounts in thousands)
| | | | | |
Issuer
| | Shares
| | Value
|
|
Common Stocks—Emerging Asia—8.0%—(continued) |
South Korea—1.6% | | | | | |
Hana Tour Service Inc. (Travel services) | | 6,300 | | $ | 299 |
*NHN Corporation (Internet software and services) | | 1,900 | | | 502 |
| | | | |
|
|
| | | | | | 801 |
| | | | |
|
|
Taiwan—1.4% | | | | | |
Novatek Microelectronics (Semiconductors and equipment) | | 123,000 | | | 721 |
| | | | |
|
|
| | |
Emerging Latin America—6.3% | | | | | |
Brazil—3.3% | | | | | |
*Diagnosticos Da America S.A. (Health care services) | | 25,100 | | | 467 |
Gol Linhas Aereas Int S.P.—ADR (Air transport) | | 17,300 | | | 488 |
*Natura Cosmeticos S.A. (Cosmetics) | | 10,500 | | | 463 |
*Submarino S.A.(E-commerce) | | 14,600 | | | 259 |
| | | | |
|
|
| | | | | | 1,677 |
| | | | |
|
|
Chile—1.0% | | | | | |
Cencosud S.A.—ADR 144A (Retail stores) | | 16,500 | | | 491 |
| | | | |
|
|
Mexico—1.5% | | | | | |
*Urbi Desarrollos Urbanos S.A. (Household durables) | | 105,800 | | | 733 |
| | | | |
|
|
Panama—0.5% | | | | | |
*Copa Holdings S.A. Class “A” (Airlines)† | | 9,900 | | | 270 |
| | | | |
|
|
| | |
Asia—6.0% | | | | | |
Australia—2.6% | | | | | |
Billabong International Ltd. (Apparel and luxury goods) | | 24,400 | | | 260 |
*Sigma Company, Ltd. (Medical distributors) | | 231,972 | | | 531 |
Toll Holdings, Ltd. (Trucking) | | 46,500 | | | 506 |
| | | | |
|
|
| | | | | | 1,297 |
| | | | |
|
|
Hong Kong—1.4% | | | | | |
Techtronic Industries Co. (Consumer durables) | | 304,500 | | | 725 |
| | | | |
|
|
New Zeland—0.5% | | | | | |
*Pumpkin Patch, Ltd. (Retail apparel) | | 110,500 | | | 254 |
| | | | |
|
|
Singapore—1.5% | | | | | |
Goodpack Ltd. (Air freight and logistics) | | 322,000 | | | 330 |
Osim International Ltd. (Consumer sundries) | | 235,000 | | | 224 |
Raffles Education Corp. Ltd. (Schools) | | 199,800 | | | 202 |
| | | | |
|
|
| | | | | | 756 |
| | | | |
|
|
| | |
Emerging Europe, Mid-East, Africa—4.6% | | | | | |
Czech Republic—0.2% | | | | | |
*Central European Media Enterprises Ltd. Class “A” (Television)† | | 1,700 | | | 98 |
| | | | |
|
|
| | | | | | | |
Issuer
| | Shares or
Principal
Amount
| | Value
| |
|
Common Stocks—Emerging Europe, Mid-East, Africa—4.6%—(continued) | |
Egypt—1.1% | | | | | | | |
Orascom Construction Industry (Construction) | | | 14,200 | | $ | 540 | |
| | | | | |
|
|
|
Russia—0.4% | | | | | | | |
*Pyaterochka Holdings—GDR (Consumer staples) | | | 14,800 | | | 214 | |
| | | | | |
|
|
|
South Africa—2.9% | | | | | | | |
African Bank Investments (Consumer loans) | | | 193,700 | | | 752 | |
Aspen Pharmacare (Pharmaceuticals) | | | 94,500 | | | 500 | |
Edgars Consolidated Stores (Apparel, footwear and retail) | | | 40,900 | | | 228 | |
| | | | | |
|
|
|
| | | | | | | 1,480 | |
| | | | | |
|
|
|
| | |
Canada—2.0% | | | | | | | |
*FirstService Corp. (Diversified commercial services)† | | | 10,000 | | | 257 | |
*Gildan Activewear, Inc. (Apparel and luxury goods) | | | 5,800 | | | 249 | |
Ritchie Brothers Auctioneers, Inc. (Buisness services)† | | | 5,900 | | | 249 | |
*Rona, Inc. (Building materials) | | | 13,600 | | | 251 | |
| | | | | |
|
|
|
| | | | | | | 1,006 | |
| | | | | |
|
|
|
Total Common Stock—94.4%
(cost $43,429) | | | 47,711 | |
| | | | | |
|
|
|
| | |
Investment in Affiliate | | | | | | | |
William Blair Ready Reserves Fund | | | 410,264 | | | 410 | |
| | | | | |
|
|
|
Total Investment in Affiliate—0.8%
(cost $410) | | | 410 | |
| | | | | |
|
|
|
| | |
Short-Term Investments | | | | | | | |
American Express Demand Note, VRN
4.235 % due 1/3/06 | | $ | 1,416,000 | | | 1,416 | |
Prudential Funding Demand Note, VRN
3.930% due 1/3/06 | | $ | 1,915,000 | | | 1,915 | |
| | | | | |
|
|
|
Total Short-Term Investments—6.6%
(cost $3,331) | | | 3,331 | |
| | | | | |
|
|
|
Total Investments—101.8%
(cost $47,170) | | | 51,452 | |
Liabilities plus cash and other assets—(1.8)% | | | (918 | ) |
| | | | | |
|
|
|
Net assets—100.0% | | $ | 50,534 | |
| | | | | |
|
|
|
*Non-income producing securities
ADR = American Depository Receipt
GDR = Global Depository Receipt
VRN = Variable Rate Note
† = U.S. listed foreign security
See accompanying Notes to Financial Statements.
46 Annual Report | December 31, 2005 |
International Small Cap Growth Fund
Portfolio of Investments, December 31, 2005 (all dollar amounts in thousands)
For securities, primarily traded on exchanges or markets that close before the close of regular trading on the New York Stock Exchange, the Fund uses an independent pricing service on a daily basis to fair value price the securities pursuant to Valuation Procedures adopted by the Board of Trustees.
At December 31, 2005 the Fund’s Portfolio of Investments includes the following industry categories:
| | |
Consumer Discretionary | | 30.2% |
Industrials and Services | | 26.3% |
Financials | | 15.2% |
Healthcare | | 9.5% |
Information Technology | | 6.7% |
Energy | | 5.9% |
Consumer Staples | | 4.0% |
Telecommunication Services | | 1.5% |
Materials | | 0.7% |
| | |
|
| | | 100.0% |
| | |
|
At December 31, 2005 the Fund’s Portfolio of Investments includes the following currency categories:
| | |
Japanese Yen | | 28.8% |
Euro | | 25.0% |
British Pound Sterling | | 10.9% |
United States Dollar | | 7.7% |
Swedish Krona | | 4.8% |
South African Rand | | 3.1% |
Australian Dollar | | 2.7% |
Hong Kong Dollar | | 2.5% |
Brazilian Real | | 2.5% |
Swiss Franc | | 2.0% |
South Korean Won | | 1.7% |
Singapore Dollar | | 1.6% |
Mexican Nuevo Peso | | 1.5% |
Taiwan Dollar | | 1.5% |
Egyptian Pound | | 1.1% |
Canadian Dollar | | 1.1% |
All other currencies | | 1.5% |
| | |
|
| | | 100.0% |
| | |
|
See accompanying Notes to Financial Statements.
December 31, 2005 | William Blair Funds 47 |
W. George Greig

Todd M. McClone
Jeffrey A. Urbina
EMERGING MARKETS GROWTH FUND
The Emerging Markets Growth Fund primarily invests in a diversified portfolio of equity securities issued by growth companies in emerging economies worldwide.
AN OVERVIEW FROM THE PORTFOLIO MANAGERS
How did the Fund perform since its inception? How did the Fund’s performance compare to its benchmark?
The Emerging Markets Growth Fund commenced operations on June 6, 2005. Through the period ending December 31, 2005, the Fund posted a gain of 42.52%, ahead of the 29.26% return of the Fund’s benchmark, the MSCI Emerging Markets Free Index.
What were the most significant factors impacting international markets during 2005?
During the first six months of 2005 the international equity markets were largely flat; however, during the last half of the year the equity markets sharply appreciated (and as evidenced by the annual 17.11% MSCI All Country World (Free) except US Index return). International equities significantly outpaced the US as measured by the Standard & Poor’s 500 Index, which rose 4.91% year to date. This increase was despite US dollar appreciation versus most foreign currencies, which reduced returns to US investors. The MSCI EAFE Index rose 29.54% in local terms, which translated into 14.02% to US dollar investors, as the US dollar appreciated an average 13% relative to EAFE (Europe and Australasia, Far East Equity) country currencies.
Positive second half international equity market performance was driven by strong results across sectors, capitalizations and regions. Emerging markets were the strongest part of the international markets overall, returning 34.54% as measured by the MSCI Emerging Markets Index. Within emerging markets, Latin America was the strongest region, returning 50.42%, while the Emerging Europe and Africa region was up nearly 39%, and Emerging Asia returned 27.50%.
What factors were behind the Fund’s performance versus the benchmark?
The Emerging Markets Growth Fund’s “since inception” performance was augmented by strong stock selection in Emerging Asia and Latin America, coupled with regional positioning. Within Emerging Asia, Consumer Discretionary, Information Technology, and Telecommunication Services holdings in particular performed well while Latin American Telecommunication Services and Industrials holdings were the strongest performers. Stock selection across most sectors contributed to the Fund’s outperformance during the period with the largest value added in Industrials, Information Technology, Consumer Discretionary and Telecommunication Services.
What is your outlook for the international markets?
After a third consecutive year of strong equity returns worldwide, markets have for the most part erased the losses of the 2000-2002 bear market. As the new year begins, many national and regional indices (with the obvious exceptions of Nasdaq and the Japanese market benchmarks) are at or approaching historic highs. Even in the US, where index returns were modest, a majority of individual stocks offered better performance.
48 Annual Report | December 31, 2005 |
Prices have been propelled higher by strong fundamentals: exceptional earnings growth and a surprisingly stable inflation and long term interest rate environment. The only two elements of cyclical risk in the global economic picture have been Fed tightening and rising energy costs, and up to now, neither of them has had a significant impact on growth. Relative economic stability has enabled strong corporate performance to act as the key driver of share price gains over the course of the last several years. Accordingly, if the structural framework of the global economy remains in equilibrium, and corporate growth and profitability continue to meet or exceed expectations, the market environment will remain conducive to solid equity returns.
The principal risks in the macro picture are well known, and mostly focused on the US: household sector leverage and inadequate savings; consumer vulnerability to weakness in home prices; interest rate and exchange rate risks associated with the US current account deficit; the potential for a central bank policy error (such as overreacting to transitory inflation signs); a ‘superspike’ in oil and gas prices beyond what has already taken place; and/or exogenous variables such as avian flu, terrorist disruptions, or natural disasters.
Since none of these issues are new, the only way they could have a dramatic impact on the market risk profile would be if one of them suddenly had a delayed or cumulative effect, or if two or more of them combined in some unforeseen way. These possibilities cannot be conclusively ruled out, but at the same time, the resilience of the financial and economic infrastructure—perhaps a byproduct of increasing global integration—has been impressive over the last decade.
The other key variable in the outlook is corporate profitability and growth, where we have seen continued strength in the US and dramatic improvement in Japan, Europe, and in many developing markets. This aspect of the market environment shows no sign of deteriorating or even slackening the pace of improvement. Corporate management continues to focus on improving supply chain management, capital and labor productivity, cost control, and marketing. Returns on capital are now well above the cost of capital in every principal region of the world; and while there are concerns that ‘excessive’ profitability is a risk factor in itself, there is no signal apparent of either complacency or irrational competitive behavior undermining corporate performance on a wide scale.
Even in a benign economic and earnings scenario, of course, there is no guarantee of supernormal returns or a continuation of the trends of 2003-05. There is a reasonable (although not conclusive) case that cyclical growth may slow in the US and China in 2006, and profit growth may be restrained as a result. In addition, growth in the energy and financial sectors may be held back by price declines and yield curve flattening, respectively. On the other hand, Japan and more recently Europe seem to be benefiting from the effects of a strong external environment and solid corporate profitability, and could continue to mount moderate but self-sustaining recoveries. On a global basis, there is probably not much reason to anticipate significantly lower earnings growth in 2006, but some deceleration seems likely.
In the context of the current profit and interest rate picture, current valuations should not present a significant issue for potential returns, and even areas that have seen relatively strong recent performance, such as small caps and Japan, are not so extended as to be unusually risky on valuation grounds alone.
Emerging markets continue to be a special case, influenced by long term changes outside of the business cycle. Whereas previous cycles were dominated by unstable investment flows and highly volatile production and trade patterns, virtually all of the developing world is now seeing new dynamics of high savings, credit development, job creation and household spending growth, as well as more responsible and transparent corporate behavior. These factors are reducing financial risk at the same time they create new avenues of growth in emerging economies, and have been instrumental in driving exceptional returns in this asset class since 1999.
December 31, 2005 | William Blair Funds 49 |
On balance, we see a reasonable balance between risk and opportunity for the year ahead, particularly as international markets continue to be led by the ongoing trend toward better corporate performance and governance. At the margins of any set of expectations, of course, are the ‘unknown unknowns’. Volatility has been relatively low for some time, and global markets have not faced any major discontinuities for several years. Any investment strategy predicated on anticipation of normal growth and risk parameters has to be adaptable to evolving change, and adaptability built into portfolio structure from the bottom up is probably the most consistent method for refining strategy.
50 Annual Report | December 31, 2005 |
Emerging Markets Growth Fund
Performance Highlights (unaudited)
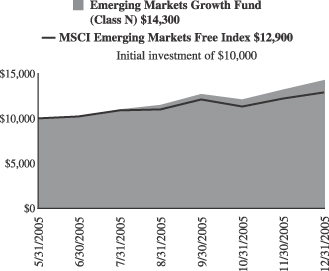
Average Annual Total Return at 12/31/2005
| | | |
| | | Since Inception(a)
| |
Emerging Markets Growth Fund
Class N | | 42.52 | % |
Emerging Markets Growth Fund
Class I | | 42.72 | |
MSCI Emerging Markets Free Index | | 29.26 | |
| | (a) | | For the period from June 6, 2005 (Commencement of Operations) to December 31, 2005. |
Performance cited represents past performance. Past performance does not guarantee future results and current performance may be lower or higher than the data quoted. Results shown are average annual returns, which assume reinvestment of dividends and capital gains. Investment returns and principal will fluctuate and you may have a gain or loss when you sell shares. For the most current month-end performance information, please call 1-800-742-7272, or visit our Web site at www.williamblairfunds.com. Class N shares are available to the general public without a sales load. Class I shares are available to certain institutional investors and advisory clients of William Blair & Company L.L.C. without a sales load or distribution (12b-1) fees. International investing involves special risk considerations, including currency fluctuations, lower liquidity, economic and political risk.
The performance highlights and graph presented above do not reflect the deduction of taxes that a shareholder would pay on fund distributions or the redemption of fund shares.
The Morgan Stanley Capital International (MSCI) Emerging Markets Free Index is an index that is designated to measure equity performance in the global emerging markets.
This report identifies the Fund’s investments on December 31, 2005. These holdings are subject to change. Not all stocks in the Fund performed the same, nor is there any guarantee that these stocks will perform as well in the future. Market forecasts provided in this report may not necessarily come to pass.
Sector Diversification (unaudited)
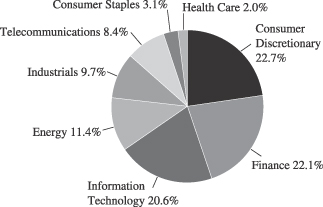
The sector diversification shown is based on the total investment portfolio.
December 31, 2005 | William Blair Funds 51 |
Emerging Markets Growth Fund
Portfolio of Investments, December 31, 2005 (all dollar amounts in thousands)
| | | | | |
Issuer
| | Shares
| | Value
|
| | |
Common Stocks—Emerging Asia—44.0% | | | | | |
China—7.5% | | | | | |
China Mungniu Dairy Co. Ltd. (Food products) | | 2,834,000 | | $ | 2,406 |
Ctrip.com International Ltd.—ADR (Hotels, restaurants, and leisure) | | 19,300 | | | 1,115 |
*Focus Media Holding Ltd.—ADR (Advertising sales) | | 31,000 | | | 1,047 |
*Foxconn International (Manufacturing services) | | 2,701,000 | | | 4,410 |
Fu Ji Food and Catering Services Holdings Ltd (Hotels, restaurants, and leisure) | | 782,000 | | | 1,281 |
Li Ning Co. Ltd (Leisure equipment and products) | | 1,640,000 | | | 1,163 |
*Parkson Retail Group Ltd. (Retail stores) | | 768,900 | | | 1,388 |
Ports Design Ltd. (Apparel and luxury goods) | | 1,075,000 | | | 1,251 |
*Suntech Power Holdings Co. Ltd—ADR (Alternate energy sources) | | 172,600 | | | 4,703 |
| | | | |
|
|
| | | | | | 18,764 |
| | | | |
|
|
India—10.6% | | | | | |
*Bharti Tele-Ventures (Wireless telecommunication services) | | 920,700 | | | 7,079 |
HDFC Bank (Banking) | | 302,300 | | | 4,745 |
*Housing Development Finance Corp. (Financial services) | | 177,900 | | | 4,773 |
Infosys Technologies, Ltd. (Consulting and software services) | | 146,800 | | | 9,780 |
| | | | |
|
|
| | | | | | 26,377 |
| | | | |
|
|
Malaysia—3.8% | | | | | |
*Airasia Bhd (Air transport) | | 5,449,000 | | | 2,291 |
Bumiputra Commerce Holding Bhd (Banking) | | 3,347,800 | | | 5,050 |
Transmile Group Bhd (Airport development and maintenance) | | 765,400 | | | 2,145 |
| | | | |
|
|
| | | | | | 9,486 |
| | | | |
|
|
South Korea—13.8% | | | | | |
Hana Tour Service (Travel service) | | 64,700 | | | 3,068 |
Hyundai Motor Co. Ltd. (Automobiles) | | 64,590 | | | 6,165 |
*Kookmin Bank (Banking) | | 65,940 | | | 4,987 |
Korea Investment Holdings Co. Ltd. (Diversified financial services) | | 61,630 | | | 2,589 |
*NHN Corporation (Internet software and services) | | 9,500 | | | 2,510 |
Samsung Electronics Co. (Semiconductors) | | 15,800 | | | 10,200 |
Shinsegae Co. Ltd. (Discount retail) | | 11,100 | | | 4,854 |
| | | | |
|
|
| | | | | | 34,373 |
| | | | |
|
|
Taiwan—8.3% | | | | | |
Hon Hai Precision Industry (Computers) | | 1,332,107 | | | 7,334 |
*Mediatek Inc. (Semiconductors and equipment) | | 685,800 | | | 8,039 |
Novatek Microelectronics (Semiconductors and equipment) | | 926,724 | | | 5,435 |
| | | | |
|
|
| | | | | | 20,808 |
| | | | |
|
|
| | | | | |
Issuer
| | Shares
| | Value
|
|
Common Stocks—Emerging Europe, Mid-East, Africa—22.4% |
Czech Republic—0.3% | | | | | |
*Central European Media Enterprises Ltd., Class “A” (Television)† | | 15,100 | | $ | 874 |
| | | | |
|
|
Egypt—2.1% | | | | | |
Orascom Contruction Industry—GDR (Construction) | | 69,900 | | | 5,242 |
| | | | |
|
|
Hungary—1.9% | | | | | |
MOL Magyar Olaj-es Gazipari (Oil company) | | 24,900 | | | 2,336 |
Richter Gedeon Rt. (Pharmaceuticals) | | 12,600 | | | 2,265 |
| | | | |
|
|
| | | | | | 4,601 |
| | | | |
|
|
Russia—2.4% | | | | | |
*Novatek OAO—GDR 144A (Oil, gas drilling, and exploration) | | 214,100 | | | 4,814 |
*Pyaterochka Holdings—GDR (Food and retail) | | 73,900 | | | 1,068 |
| | | | |
|
|
| | | | | | 5,882 |
| | | | |
|
|
South Africa—13.7% | | | | | |
African Bank Investments (Banking) | | 1,310,300 | | | 5,087 |
Aspen Pharmacare Holdings Ltd. (Pharmaceuticals) | | 471,700 | | | 2,494 |
Edgars Consolidated Stores (Apparel, footwear and retail) | | 312,200 | | | 1,740 |
*MTN Group Ltd. (Telecommunication services) | | 783,600 | | | 7,706 |
Naspers Ltd. (Media) | | 272,900 | | | 4,846 |
Sasol Ltd. (Oil company) | | 205,800 | | | 7,422 |
Standard Bank Group Ltd. (Banking) | | 402,700 | | | 4,839 |
| | | | |
|
|
| | | | | | 34,134 |
| | | | |
|
|
Turkey—2.0% | | | | | |
*Turkiye Garanti Bankasi A.S. (Banking) | | 1,414,300 | | | 5,098 |
| | | | |
|
|
| | |
Emerging Latin America—21.8% | | | | | |
Brazil— 3.9% | | | | | |
Cia de Concessoes Rodoviarias (Public thoroughfares) | | 38,900 | | | 1,232 |
*Diagnosticos da America S.A. (Health care services) | | 126,800 | | | 2,361 |
Gol Linhas Aereas Int S.P—ADR (Air transport) | | 85,700 | | | 2,418 |
*Natura Cosmeticos S.A. (Cosmetics) | | 53,900 | | | 2,376 |
*Submarino S.A. (Internet and catalog retail) | | 69,800 | | | 1,240 |
| | | | |
|
|
| | | | | | 9,627 |
| | | | |
|
|
Chile—5.8% | | | | | |
Banco Santander SP—ADR (Banking) | | 105,200 | | | 4,692 |
Cencosud S.A.—ADR 144A (Retail stores) | | 84,600 | | | 2,515 |
S.A.C.I. Falabella S.A. (Retail stores) | | 2,657,400 | | | 7,289 |
| | | | |
|
|
| | | | | | 14,496 |
| | | | |
|
|
Columbia—1.9% | | | | | |
Bancolombia S.A.—ADR (Banking) | | 166,900 | | | 4,812 |
| | | | |
|
|
See accompanying Notes to Financial Statements.
52 Annual Report | December 31, 2005 |
Emerging Markets Growth Fund
Portfolio of Investments, December 31, 2005 (all dollar amounts in thousands)
| | | | | | |
Issuer
| | Shares or
Principal
Amount
| | Value
|
| |
Common Stocks—Emerging Latin America—21.8%—(continued) | | | |
Mexico—9.8% | | | | | | |
America Movil S.A. (Communications) | | | 3,190,700 | | $ | 4,671 |
*Corporacion Geo Sa De Cv (Real estate) | | | 1,409,000 | | | 4,981 |
*Urbi Desarrollos Urbanos S.A. (Household durables) | | | 703,200 | | | 4,872 |
Walmart de Mexico (Retail trade) | | | 1,757,900 | | | 9,777 |
| | | | | |
|
|
| | | | | | | 24,301 |
| | | | | |
|
|
Panama—0.4% | | | | | | |
*Copa Holdings S.A., Class “A” (Airlines)† | | | 40,900 | | | 1,117 |
| | | | | |
|
|
Total Common Stock—88.2%
(cost $191,210) | | | 219,992 |
| | | | | |
|
|
| | |
Preferred Stock | | | | | | |
Brazil—4.7% | | | | | | |
Banco Itau Holding (Banking) | | | 189,800 | | | 4,574 |
Petroleo Brasileiro S.A. (Oil, gas drilling, and exploration) | | | 446,400 | | | 7,109 |
| | | | | |
|
|
Total Preferred Stock—4.7%
(cost $10,796) | | | 11,683 |
| | | | | |
|
|
| | |
Investment in Affiliate | | | | | | |
William Blair Ready Reserves Fund | | | 3,821,204 | | | 3,821 |
| | | | | |
|
|
Total Investment in Affiliate—1.5%
(cost $3,821) | | | 3,821 |
| | | | | |
|
|
| | |
Short-Term Investments | | | | | | |
American Express Demand Note, VRN
4.235% due 1/3/06 | | $ | 3,778,000 | | | 3,778 |
Prudential Funding Demand Note, VRN 3.930% due 1/3/06 | | $ | 3,659,000 | | | 3,659 |
| | | | | |
|
|
Total Short-Term Investments—3.0%
(cost $7,437) | | | 7,437 |
| | | | | |
|
|
Total Investments—97.4%
(cost $213,264) | | | 242,933 |
Cash and other assets less liabilities—2.6% | | | 6,415 |
| | | | | |
|
|
Net assets—100.0% | | $ | 249,348 |
| | | | | |
|
|
* Non-income producing securities
ADR = American Depository Receipt
GDR = Global Depository Receipt
VRN = Variable Rate Note
† = U.S. listed foreign security
For securities, primarily traded on exchanges or markets that close before the close of regular trading on the New York Stock Exchange, the Fund uses an independent pricing service on a daily basis to fair value price the securities pursant to Valuation Procedures adopted by the Board of Trustees.
At December 31, 2005 the Fund’s Portfolio of Investments includes the following currency categories:
| | |
United States Dollar | | 14.9% |
South Korean Won | | 14.8% |
South African Rand | | 14.7% |
Indian Rupee | | 11.4% |
Mexico Nuevo Peso | | 10.5% |
Taiwan Dollar | | 9.0% |
Brazilian Real | | 8.2% |
Hong Kong Dollar | | 5.1% |
Malaysian Ringgit | | 4.1% |
Chilean Peso | | 3.1% |
Turkish Lira | | 2.2% |
Hungarian Forint | | 2.0% |
| | |
|
| | | 100.0% |
| | |
|
At December 31, 2005 the Fund’s Portfolio of Investments includes the following industry categories:
| | |
Consumer Discretionary | | 22.7% |
Financials | | 22.1% |
Information Technology | | 20.6% |
Energy | | 11.4% |
Industrials and Services | | 9.7% |
Telecommunication Services | | 8.4% |
Consumer Staples | | 3.1% |
Health Care | | 2.0% |
| | |
|
| | | 100.0% |
| | |
|
See accompanying Notes to Financial Statements.
December 31, 2005 | William Blair Funds 53 |

Mark T. Leslie

David S. Mitchell
VALUE DISCOVERY FUND
The Value Discovery Fund invests in the equity securities of small companies that we believe offer a long-term investment value seeking to identify undervalued companies with sound business fundamentals—“broken stocks not broken companies.”
AN OVERVIEW FROM THE PORTFOLIO MANAGERS
How did the Fund perform over the last year?
The Value Discovery Fund posted a 0.49% increase on a total return basis (Class N shares) during the year ending December 31, 2005. By comparison, the Fund’s primary benchmark, the Russell 2000® Value Index, gained 4.71%, while the Russell 2000® Index gained 4.55%.
What were the most significant factors impacting Fund performance? What factors were behind the Fund’s performance versus the benchmark?
The Technology and Health Care sectors hampered both absolute and relative performance for the year. The underperformance relative to the benchmark was entirely a function of poor stock selection as opposed to any economic impact or ill-timed sector weightings. As detailed below, stock selection in Technology and Healthcare was plagued by unforeseen disappoints in company-specific fundamentals. Industrials and Energy were the two sectors that contributed most positively to absolute performance during the year as oil and gas prices remained strong and the manufacturing economy continued to be healthy. As a result, performance relative to the benchmark did improve significantly for the Fund during the fourth quarter.
What were among the best performing sectors for the Fund? Were there any investment themes that produced the best results?
Two sectors added meaningful value relative to the benchmark during 2005. The Industrials sector contributed 257 basis points of excess value relative to the benchmark. Three of the Fund’s five biggest contributors were Industrial Holdings: Midwest Air Group (a regional airline), which increased 93.8%; General Cable (a wire and cable manufacturer), which gained 42.2%, and Watsco (an HVAC distributor), which was up 72.3%. Midwest Air benefited from improved revenue and a dramatically improved competitive position at its primary hub in Milwaukee. General Cable continued to see strong demand for its products, particularly energy cable for electrical distribution, and was able to adequately offset rising raw material prices. Watsco, a long time Fund holding, saw good demand for air conditioning products and continues to experience margin expansion.
The Financials sector added 199 basis points of excess value to the Fund during 2005 relative to its primary benchmark. Strong performance from Seabright Insurance (a specialty workers’ comp underwriter), which was up 58.4%, and Jones Lang LaSalle (a real estate services and management company), which increased 35.3%, were the top two performers in this sector. Insurance stocks performed particularly well for the Fund in 2005 with six of the top ten performing holdings in the Financials sector and five of the top twenty overall portfolio contributors. The strong performance in insurance was broadly based across life and property/casualty and primarily company specific factors, the property insurers also have seen generally improved pricing post Hurricanes Katrina and Rita.
What were among the weakest performing sectors for the Fund? Were there any investments that did not measure up to your expectations?
As mentioned earlier, the Technology and Health Care sectors were far and away the biggest detractors for the year and, unfortunately, more than offset the positive performance in
54 Annual Report | December 31, 2005 |
Industrials and Financials. Technology performance was particularly dismal, detracting 463 basis points versus the benchmark. This was even more disappointing given that two of the Fund’s biggest positive contributors to performance were in this sector: SPSS (a statistical software company), which gained 97.8%, and Plexus (a contract manufacturer), which was up 47.2%. There were many disappointing performers in the sector with the biggest detractor being Borland Software (an application development company), which was down 50.2%. Borland was especially painful as the company had shown improving results throughout 2004 culminating in an excellent fourth quarter only to revert to its prior difficulties during the first quarter of 2005. The Health Care sector was plagued by poor stock selection and multiple disappointments including Par Pharmaceutical (a generic drugs company), which decreased 35.3%, Encore Medical (an orthopedic rehabilitation products company), which declined 27.1%, and two drug discovery companies, Discovery Partners, which decreased 23.8%, and Albany Molecular, which declined 27.1%.
While the previous paragraph highlights the primary difficulties experienced by the Fund in 2005, it is worth noting that subsequent to Mark Leslie joining the Fund as Co-Manager in late July, performance in both these sectors has significantly improved. This is encouraging as we have made major changes to our holdings in both these sectors over the last several months. The drag from these sectors was inconsequential during the fourth quarter as Health Care and Technology detracted only 3 and 20 basis points, respectively. In both cases we believe we enhanced the fundamental quality of the Fund’s holdings without a meaningful tradeoff in valuation.
What is your current strategy? How is the Fund positioned?
We continue to be somewhat underweighted in Financials although not to the same extent as in prior quarters. Overall it remains challenging to find value in this sector but we have discovered a few names that met our standards: Commercial Capital Bancorp, Western Alliance Bancorp, Cogdell Spencer, and Quanta Capital.
2005 was clearly a disappointing year for the Fund. In addition to sub-par performance we were forced to make a large, long-term capital gains distribution due in large part to significant redemption activity. However, we are encouraged by our first full quarter together as co-managers and look forward to proving ourselves as we move forward. We have made significant changes in the portfolio subsequent to Mark’s arrival and, while one full quarter is not a trend, we believe that our process and philosophy are sound and that a solid foundation has been put into place. We appreciate your confidence in us and thank you for investing in the Fund.
December 31, 2005 | William Blair Funds 55 |
Value Discovery Fund
Performance Highlights (unaudited)
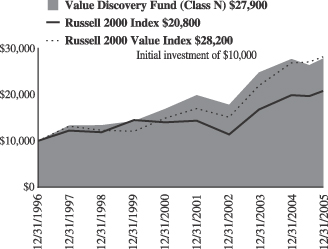
Average Annual Total Return at 12/31/2005
| | | | | | | | | | | | |
| | | 1
Year
| | | 3
Year
| | | 5
Year
| | | Since
Inception
| |
Value Discovery Fund Class N | | 0.49 | % | | 16.19 | % | | 10.46 | % | | 11.98 | (a) |
Value Discovery Fund Class I | | 0.70 | | | 16.38 | | | 10.72 | | | 13.43 | (b) |
Russell 2000® Index | | 4.55 | | | 22.13 | | | 8.22 | | | 8.64 | (a) |
| | | | | | | | | | | | 8.88 | (b) |
Russell 2000® Value Index | | 4.71 | | | 23.18 | | | 13.55 | | | 12.31 | (a) |
| | | | | | | | | | | | 14.62 | (b) |
| | (a) | | For the period from December 23, 1996 (Commencement of the Class) to December 31, 2005. |
| | (b) | | For the period from October 1, 1999 (Commencement of the Class) to December 31, 2005. |
Performance cited represents past performance. Past performance does not guarantee future results and current performance may be lower or higher than the data quoted. Results shown are average annual total returns, which assume reinvestment of dividends and capital gains. Investment returns and principal will fluctuate and you may have a gain or loss when you sell shares. For the most current month-end performance information, please call 1-800-742-7272, or visit our Web site at www.williamblairfunds.com. Investing in smaller companies involves special risks, including higher volatility and lower liquidity. From time to time, the investment adviser may waive fees or reimburse expenses for the Fund. Without these waivers, performance would be lower. Class N shares are available to the general public without a sales load. Class I shares are available to certain institutional investors and advisory clients of William Blair & Company, L.L.C., without a sales load or distribution (12b-1) or service fees.
The performance highlights and graph presented above do not reflect the deduction of taxes that a shareholder would pay on fund distributions or the redemption of fund shares.
The Russell 2000® Index is the Fund’s primary benchmark. The Russell 2000® Index is unmanaged composite of the smallest 2000 stocks of the Russell 3000 Index.
The Russell 2000® Value Index consists of small-capitalization companies with below average price-to-book ratios and forecasted growth rates.
This report identifies the Fund’s investments on December 31, 2005. These holdings are subject to change. Not all stocks in the Fund performed the same, nor is there any guarantee that these stocks will perform as well in the future. Market forecasts provided in this report may not necessarily come to pass.
Sector Diversification (unaudited)
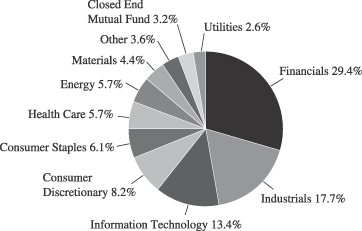
The sector diversification shown is based on the total investment portfolio.
56 Annual Report | December 31, 2005 |
Value Discovery Fund
Portfolio of Investments, December 31, 2005 (all dollar amounts in thousands)
| | | | | |
Issuer
| | Shares
| | Value
|
| | |
Common Stocks | | | | | |
Financials—28.2% | | | | | |
*AmericanWest Bancorporation | | 43,495 | | $ | 1,028 |
AmerUs Group, Class “A” | | 30,595 | | | 1,734 |
Argonaut Group, Inc. | | 30,745 | | | 1,008 |
Astoria Financial Corporation | | 45,425 | | | 1,335 |
Cogdell Spencer, Inc. | | 44,755 | | | 756 |
Comercial Capital Bancorp | | 49,795 | | | 852 |
Donegal Group, Inc., Class “A” | | 50,641 | | | 1,177 |
Equity Inns, Inc. | | 99,914 | | | 1,354 |
*Franklin Bank Corporation | | 74,210 | | | 1,335 |
*Jones Lang LaSalle, Inc | | 23,435 | | | 1,180 |
*KMG America Coporation | | 115,155 | | | 1,057 |
*Meadowbrook Insurance Group, Inc. | | 202,825 | | | 1,185 |
Midwest Banc Holdings, Inc. | | 59,477 | | | 1,323 |
National Financial Partners Corporation | | 18,900 | | | 993 |
*Quanta Capital Holdings | | 170,600 | | | 870 |
*Seabright Insurance Holdings, Inc. | | 75,248 | | | 1,251 |
*Western Alliance Bancorp | | 13,715 | | | 410 |
Winston Hotels, Inc. | | 102,675 | | | 1,017 |
| | | | |
|
|
| | | | | | 19,865 |
| | | | |
|
|
Industrials—16.9% | | | | | |
*Artesyn Technologies, Inc. | | 96,764 | | | 997 |
*Coinstar, Inc. | | 36,875 | | | 842 |
*Esco Technologies, Inc. | | 18,600 | | | 827 |
General Cable Corporation | | 66,845 | | | 1,317 |
*Genlyte Group, Inc. | | 18,900 | | | 1,012 |
Hughes Supply, Incorporated | | 20,705 | | | 742 |
Kennametal, Inc. | | 16,725 | | | 853 |
*SCS Transportation, Inc. | | 46,110 | | | 980 |
*Tal International Group, Inc. | | 35,530 | | | 734 |
*Teletech Holdings, Inc. | | 107,640 | | | 1,297 |
Toro Company | | 32,025 | | | 1,402 |
Watsco, Inc. | | 15,510 | | | 928 |
| | | | |
|
|
| | | | | | 11,931 |
| | | | |
|
|
Information Technology—12.9% | | | | | |
*Anixter International, Inc. | | 40,380 | | | 1,580 |
*Bisys Group, Inc. | | 125,605 | | | 1,760 |
*Carrier Access Corporation | | 116,935 | | | 578 |
*Entegris, Inc. | | 105,800 | | | 996 |
*LTX Corporation | | 203,210 | | | 914 |
*Semitool, Inc | | 68,179 | | | 742 |
*SPSS, Inc. | | 49,136 | | | 1,520 |
*Tier Technologies, Inc., Class “B” | | 132,871 | | | 975 |
| | | | |
|
|
| | | | | | 9,065 |
| | | | |
|
|
Consumer Discretionary—7.8% | | | | | |
BorgWarner, Inc. | | 25,610 | | | 1,553 |
*Casual Male Retail Group, Inc. | | 117,700 | | | 721 |
*Navigant International, Inc. | | 116,695 | | | 1,266 |
*Restoration Hardware, Inc. | | 152,989 | | | 921 |
Woverine World Wide | | 47,640 | | | 1,070 |
| | | | |
|
|
| | | | | | 5,531 |
| | | | |
|
|
Consumer Staples—5.9% | | | | | |
*BJ’s Wholesale Club, Inc. | | 33,100 | | | 978 |
*Elizabeth Arden, Inc. | | 53,685 | | | 1,077 |
*Hain Celestial Group, Inc. | | 52,993 | | | 1,121 |
*Playtex Products, Inc. | | 70,555 | | | 965 |
| | | | |
|
|
| | | | | | 4,141 |
| | | | |
|
|
| | | | | | |
Issuer
| | Shares or
Principal
Amount
| | Value
|
| | |
Common Stocks—(Continued) | | | | | | |
Health Care—5.5% | | | | | | |
*Encore Medical Corporation | | | 255,375 | | $ | 1,264 |
*Magellan Health Services | | | 33,870 | | | 1,065 |
*Pediatrix Medical Group | | | 8,590 | | | 761 |
Vital Signs, Inc. | | | 18,420 | | | 789 |
| | | | | |
|
|
| | | | | | | 3,879 |
| | | | | |
|
|
Energy—5.4% | | | | | | |
*Forest Oil Corporation | | | 15,245 | | | 695 |
*Grey Wolf, Inc. | | | 106,385 | | | 822 |
*KCS Energy, Inc. | | | 28,970 | | | 702 |
St. Mary Land & Exploration Company | | | 26,585 | | | 979 |
*Toreador Resources Corporation | | | 29,445 | | | 620 |
| | | | | |
|
|
| | | | | | | 3,818 |
| | | | | |
|
|
Materials—4.3% | | | | | | |
Silgan Holdings, Inc. | | | 29,595 | | | 1,069 |
Spartech Corporation | | | 87,755 | | | 1,926 |
| | | | | |
|
|
| | | | | | | 2,995 |
| | | | | |
|
|
Utilities—2.5% | | | | | | |
Atmos Energy Corporation | | | 68,125 | | | 1,782 |
| | | | | |
|
|
Total Common Stock—89.4%
(cost $50,986) | | | 63,007 |
| | | | | |
|
|
| | |
Convertible Bond | | | | | | |
Midwest Express Holdings,
6.750%, due 10/01/08** | | $ | 2,157,000 | | | 2,433 |
| | | | | |
|
|
Total Convertible Bond—3.4%
(cost $2,157) | | | 2,433 |
| | | | | |
|
|
| | |
Exchange Traded Fund | | | | | | |
ishares, Russell 2000 Value | | | 32,690 | | | 2,155 |
| | | | | |
|
|
Total Exchange Traded Fund—3.1%
(cost $2,232) | | | 2,155 |
| | | | | |
|
|
| | |
Investment in Affiliate | | | | | | |
William Blair Ready Reserves Fund | | | 73,242 | | | 73 |
| | | | | |
|
|
Total Investment in Affiliate—0.1%
(cost $73) | | | 73 |
| | | | | |
|
|
| | |
Short-Term Investment | | | | | | |
Prudential Funding Demand Note, VRN
3.930% due 1/3/06 | | $ | 545,000 | | | 545 |
| | | | | |
|
|
Total Short-Term Investment—0.8%
(cost $545) | | | 545 |
| | | | | |
|
|
Total Investments—96.8%
(cost $55,993) | | | 68,213 |
Cash and other assets, less liabilities—3.2% | | | 2,226 |
| | | | | |
|
|
Net assets—100.0% | | $ | 70,439 |
| | | | | |
|
|
*Non-income producing
**Fair Valued pursuant to Valuation Procedures adopted by the Board of Trustees. The holding represents 3.46% of the Fund’s net assets at December 31, 2005.
VRN = Variable Rate Note
See accompanying Notes to Financial Statements.
December 31, 2005 | William Blair Funds 57 |

James S. Kaplan

Christopher T. Vincent
INCOME FUND
The Income Fund invests in high-grade intermediate-term debt securities.
AN OVERVIEW FROM THE PORTFOLIO MANAGERS
How did the Fund perform over the last year? How did the Fund’s performance compare to its benchmark?
The Income Fund posted a 1.71% gain on a total return basis (Class N Shares) for the 12 months ended December 31, 2005. By comparison, the Fund’s benchmark, the Lehman Intermediate Government/Credit Bond Index, rose 1.57%, while the Fund’s peer group, the Morningstar Short-Term Bond Category, increased 1.43%.
What were the most significant factors impacting Fund performance? What factors were behind the Fund’s performance versus the benchmark?
Interest rates were the most significant factor impacting Fund performance during 2005. The year ended on a positive note with the Fund’s performance holding its own in spite of the Federal Reserve’s measured program to raise interest rates.
Beginning on February 2nd and ending on December 13th, the Federal Reserve raised the federal funds rate on overnight loans between banks eight times during the year, each time by 0.25%—starting at 2.25% and ending at 4.25%. The last rate increase was the thirteenth since June, 2004.
The Fund’s return remained positive, aided by the significant flattening of the yield curve over the course of the year, a trend which had begun in 2004. The short end of the yield curve underperformed, with the yields on 2-year Treasury notes rising 1.33% during the year. However, the long-end of the yield curve, as indicated by yields on 10-year Treasury securities, rose only slightly, by 0.17%.
Credit quality improved on the Corporate bond side of the market during 2005, and on the Mortgage-backed side it was a year in which prepayment risk lessened as the year progressed.
Which investment strategies enhanced the Fund’s return? Were there any investment strategies that produced the best results?
One of our primary strategies during the early part of 2005 was to tilt the Fund toward higher credit quality securities, as we did not believe risk premiums adequately compensated us for investing in corporate bonds—especially in lower-rated securities.
For example, we reduced our holdings in BBB-rated corporate securities from 9.7% at the end of the fourth quarter of 2004 to 5.8% at the end of March, reinvesting proceeds in U.S. Treasury and Agency securities. However, we generally evaluated risks on a security-by-security basis, and did not believe some of the default events occurring in the marketplace were part of a larger industry “contagion,” affecting all corporate issues. By mid-year, our holdings of BBB-rated securities stood at 7.3%, and at year end our BBB-rated holdings stood at 6.4%. At 25%, we consider the Fund to have a neutral allocation to Corporate bonds.
Mortgage-backed and Asset-backed securities continued to provide the Fund with consistent, solid excess returns when compared to U.S. Treasury securities.
58 Annual Report | December 31, 2005 |
The performance of Mortgage-backed securities was somewhat weak early in the fourth quarter, but finished the year with strength. December, in fact, was an excellent month for mortgage-backed issues. Part of the bullish enthusiasm for these securities stemmed from sentiment that the Federal Reserve may have come to the end of its recent credit-tightening cycle.
What were among the weakest performing investments for the Fund?
Corporate bonds were a modestly weak sector for the Fund. Nervousness about potential shareholder-friendly activity or actions by corporate management which might be to the detriment of Corporate bondholders continued to be a major theme that weighed on the Corporate bond market.
However, although there were some isolated default events in the Corporate bond market (and none involving any of the Fund’s investments) risk premiums continue to reflect solid fundamentals and healthy foreign demand.
What is your current strategy? How is the Fund positioned?
We remain committed to the Mortgage- and Asset-backed sectors of the bond market, although the yield advantage—or “spreads”—between these sectors and U.S. Treasury bonds are not quite as attractive compared to prior quarters. We nonetheless expect Mortgage-backed and Asset-backed securities to continue to provide solid levels of excess returns versus their Treasury counterparts.
We believe we have structured our Asset-backed holdings to withstand any weakness in the housing market, if, for example, the credit quality of borrowers should slip. Furthermore, the overall credit risk of our Fund’s portfolio is lower at year end than it was at the beginning of 2005.
Two noteworthy additions to the Fund’s Corporate bond holdings included American Express and Valero Energy. American Express, best known for its credit card business, is the streamlined business unit that remains after the firm’s divestiture of its former financial advisor segment, American Express Financial Advisors, which was spun off to shareholders in late September as Ameriprise.
Valero Energy is the largest refiner in North America, and we purchased its bonds based on improving credit fundamentals in the Energy sector.
The market behaves as though it believes that the Federal Reserve may hike rates one more time in January. We expect the Federal Reserve Board to move to raise rates at its January 31 meeting, which will also be Fed Chairman Alan Greenspan’s last before the new Fed Chairman nominee Ben Bernanke assumes the leadership role.
It should be noted that traditional Fed tightening cycles have typically been more painful for the fixed income markets; something we believe has been delayed by higher equity prices, a robust housing market with rising home values and strong foreign demand for U.S. debt investments. Only time will tell if the effects of the Fed’s credit tightening efforts will be more keenly felt later.
We may be moving into a period where the Fed is more “data dependent” than before. The measured and automatic interest rate increases of the last 18 months will give way to a period where the Fed analyzes economic data as it is released, then formulates its decisions regarding monetary policy accordingly. There is much more uncertainty regarding future Fed policy than there has been in recent memory.
December 31, 2005 | William Blair Funds 59 |
Income Fund
Performance Highlights (unaudited)
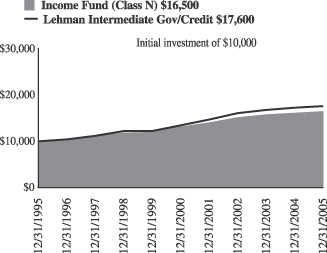
Average Annual Total Return at 12/31/2005
| | | | | | | | | | | | | | | | |
| | | 1
Year
| | | 3
Year
| | | 5
Year
| | | 10
Year
| | | Since
Inception(a)
| | |
Income Fund Class N | | 1.71 | % | | 2.66 | % | | 4.59 | % | | 5.11 | % | | — | | |
Income Fund Class I | | 1.92 | | | 2.82 | | | 4.74 | | | — | | | 5.43 | | |
Lehman Intermediate Government Credit Bond Index | | 1.57 | | | 2.96 | | | 5.49 | | | 5.80 | | | 5.98 | | |
| | (a) | | For the period from October 1, 1999 to December 31, 2005. |
Performance cited represents past performance. Past performance does not guarantee future results and current performance may be lower or higher than the data quoted. Results shown are average annual total returns, which assume reinvestment of dividends and capital gains. Investment returns and principal will fluctuate and you may have a gain or loss when you sell shares. For the most current month-end performance information, please call 1-800-742-7272, or visit our Web site at www.williamblairfunds.com. Class N shares are available to the general public without a sales load. Class I shares are available to certain institutional investors and advisory clients of William Blair & Company, L.L.C., without a sales load or distribution (12b-1) or service fees.
The performance highlights and graph presented above do not reflect the deduction of taxes that a shareholder would pay on fund distributions or the redemption of fund shares.
The Lehman Intermediate Government/Credit Bond Index indicates broad intermediate government/corporate bond market performance.
This report identifies the Fund’s investments on December 31, 2005. These holdings are subject to change. Not all investments in the Fund performed the same, nor is there any guarantee that these investments will perform as well in the future. Market forecasts provided in this report may not necessarily come to pass.
Sector Diversification (unaudited)
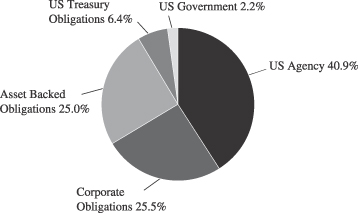
The sector diversification shown is based on the total investment portfolio.
60 Annual Report | December 31, 2005 |
Income Fund
Portfolio of Investments, December 31, 2005 (all amounts in thousands)
| | | | | | |
Issuer
| | Principal
Amount
| | Value
|
|
U.S. Government and U.S. Government Agency—48.8% |
U.S. Treasury—6.3% | | | | | | |
U.S. Treasury Note,
6.500%, due 2/15/10 | | | | $ 12,940 | | $ 13,959 |
U.S. Treasury Note,
4.750%, due 5/15/14 | | | | 5,550 | | 5,685 |
| | | | |
| |
|
Total U.S. Treasury Obligations | | | | 18,490 | | 19,644 |
| | | | |
| |
|
Government National Mortgage Association (GNMA)—2.2% | | | | | | |
#780405, 9.500%, due 11/15/17 | | | | 822 | | 892 |
#589335, 6.500%, due 10/15/22 | | | | 2,404 | | 2,513 |
#357322, 7.000%, due 9/15/23 | | | | 210 | | 221 |
#616250, 6.000%, due 2/15/24 | | | | 1,864 | | 1,913 |
#2002-48, Tranche 0B,
6.000%, due 5/16/30 | | | | 1,243 | | 1,255 |
| | | | |
| |
|
Total Government National Mortage Association | | | | 6,543 | | 6,794 |
| | | | |
| |
|
Small Business Administration—0.0% | | | | | | |
Receipt for Multiple Originator Fees,
#3, 0.669%, due 11/01/08 (Interest Only) WAC | | | | — | | 35 |
| | | | |
| |
|
Federal Home Loan Mortgage Corp. (FHLMC)—18.5% | | | | | | |
#1417, Tranche SA,
14.294%, due 11/15/07, VRN | | | | 828 | | 846 |
#G10067, 7.000%, due 1/1/08 | | | | 410 | | 417 |
#G10147, 8.500%, due 2/1/08 | | | | 91 | | 93 |
#1601, Tranche PJ,
6.000%, due 10/15/08, VRN | | | | 1,526 | | 1,539 |
#1612, Tranche SE,
8.100%, due 11/15/08, VRN | | | | 749 | | 759 |
#G90028, 7.000%, due 5/17/09 | | | | 460 | | 469 |
#E80050, 6.000%, due 10/1/09 | | | | 741 | | 754 |
#G90019, 7.500%, due 12/17/09 | | | | 569 | | 584 |
7.000%, due 3/15/10 | | | | 5,950 | | 6,459 |
#E65418, 7.000%, due 8/1/10 | | | | 389 | | 395 |
#G10457, 7.000%, due 2/1/11 | | | | 573 | | 592 |
#E00436, 7.000%, due 6/1/11 | | | | 536 | | 555 |
#G10708, 6.500%, due 8/1/12 | | | | 319 | | 328 |
#E91999, 5.000%, due 10/1/12 | | | | 1,228 | | 1,226 |
#G11218, 7.000%, due 10/1/12 | | | | 172 | | 177 |
#E96147, 5.000%, due 5/1/13 | | | | 1,673 | | 1,670 |
#E95846, 4.500%, due 5/1/13 | | | | 1,423 | | 1,388 |
#G10839, 5.500%, due 10/1/13 | | | | 1,500 | | 1,512 |
#E72924, 7.000%, due 10/1/13 | | | | 1,386 | | 1,439 |
#E00639, 5.000%, due 3/1/14 | | | | 2,020 | | 2,013 |
#J02572, 7.500%, due 6/1/14 | | | | 2,481 | | 2,605 |
#E81697, 8.000%, due 5/1/15 | | | | 2,930 | | 3,118 |
#E81908, 8.500%, due 12/1/15 | | | | 160 | | 171 |
#G11688, 7.000%, due 2/1/16 | | | | 982 | | 1,020 |
#J02184, 8.000%, due 4/1/16 | | | | 2,402 | | 2,555 |
#G90022, 8.000%, due 9/17/16 | | | | 826 | | 876 |
#G11702, 7.500%, due 12/1/16 | | | | 964 | | 1,012 |
#G11486, 7.500%, due 4/1/17 | | | | 1,181 | | 1,241 |
#E90398, 7.000%, due 5/1/17 | | | | 1,483 | | 1,538 |
#M30028, 5.500%, due 5/1/17 | | | | 448 | | 455 |
#G11549, 7.000%, due 7/1/17 | | | | 1,078 | | 1,119 |
#G90027, 6.000%, due 11/17/17 | | | | 1,776 | | 1,815 |
#G11756, 7.000%, due 12/1/17 | | | | 1,898 | | 1,969 |
#G30254, 6.500%, due 5/1/19 | | | | 3,166 | | 3,276 |
| | | | | | |
Issuer
| |
| | Principal
Amount
| | Value
|
|
U.S. Government and U.S. Government Agency—(continued) |
Federal Home Loan Mortgage Corp. (FHLMC)—(continued) |
#G30255, 7.000%, due 7/1/21 | | | | $1,112 | | $1,163 |
#G30268, 7.000%, due 7/1/21 | | | | 2,332 | | 2,447 |
#C67537, 9.500%, due 8/1/21 | | | | 238 | | 258 |
#G30243, 6.000%, due 12/1/21 | | | | 2,210 | | 2,253 |
#D95621, 6.500%, due 7/1/22 | | | | 3,911 | | 4,037 |
#A45790, 7.500%, due 5/1/35 | | | | 1,242 | | 1,303 |
| | | | |
| |
|
Total FHLMC Mortgage Obligations | | | | 55,363 | | 57,446 |
| | | | |
| |
|
Federal National Mortgage Association (FNMA)—21.8% | | | | | | |
#545560, 8.000%, due 5/1/07 | | | | 423 | | 433 |
#1992-192, Tranche SC,
7.470%, due 11/25/07, VRN | | | | 358 | | 357 |
#93-196, Tranche SA,
14.600%, due 10/25/08, VRN | | | | 553 | | 596 |
#1993-221, Tranche SG,
5.675%, due 12/25/08, VRN | | | | 415 | | 406 |
#765396, 5.500%, due 1/1/09 | | | | 401 | | 404 |
#695512, 8.000%, due 9/1/10 | | | | 542 | | 565 |
#725479, 8.5%, due 10/1/10 | | | | 1,011 | | 1,053 |
#255056, 5.000%, due 12/1/10 | | | | 2,119 | | 2,111 |
6.250%, due 2/1/11 | | | | 6,775 | | 7,155 |
#313816, 6.000%, due 4/1/11 | | | | 648 | | 661 |
#577393, 10.000%, due 6/1/11 | | | | 302 | | 325 |
#577395, 10.000%, due 8/1/11 | | | | 1,009 | | 1,093 |
#254705, 5.500%, due 3/1/13 | | | | 2,073 | | 2,092 |
#254788, 6.500%, due 4/1/13 | | | | 720 | | 742 |
#725315, 8.000%, due 5/1/13 | | | | 1,014 | | 1,078 |
#190539, 6.000%, due 1/1/14 | | | | 551 | | 562 |
#806463, 7.000%, due 3/1/14 | | | | 1,034 | | 1,074 |
#593561, 9.500%, due 8/1/14 | | | | 481 | | 522 |
#567027, 7.000%, due 9/1/14 | | | | 2,092 | | 2,175 |
#567026, 6.500%, due 10/1/14 | | | | 1,985 | | 2,042 |
#458124, 7.000%, due 12/15/14 | | | | 587 | | 601 |
#598453, 7.000%, due 6/1/15 | | | | 709 | | 729 |
#576554, 8.000%, due 1/1/16 | | | | 2,029 | | 2,166 |
#576553, 8.000%, due 2/1/16 | | | | 3,011 | | 3,215 |
#555747, 8.000%, due 5/1/16 | | | | 705 | | 750 |
#735569, 8.000%, due 10/1/16 | | | | 3,593 | | 3,821 |
#725410, 7.500%, due 4/1/17 | | | | 1,611 | | 1,695 |
#643217 , 6.500%, due 6/1/17 | | | | 436 | | 448 |
#682075, 5.500%, due 11/1/17 | | | | 1,324 | | 1,333 |
#662925, 6.000%, due 12/1/17 | | | | 1,758 | | 1,804 |
#251960, 6.000%, due 9/1/18 | | | | 757 | | 772 |
#740847, 6.000%, due 10/1/18 | | | | 1,734 | | 1,772 |
#458147, 10.000%, due 8/15/20 | | | | 1,228 | | 1,344 |
#735367, 6.000%, due 3/1/22 | | | | 3,098 | | 3,155 |
#835563, 7.000%, due 10/1/20 | | | | 1,595 | | 1,672 |
#735574, 8.00%, due 3/1/22 | | | | 1,309 | | 1,400 |
#735104, 7.000%, due 5/1/22 | | | | 3,218 | | 3,375 |
#725927, 7.000%, due 8/1/22 | | | | 2,591 | | 2,714 |
#735137, 6.500%, due 11/1/22 | | | | 1,709 | | 1,769 |
#1993-19, Tranche SH,
11.234%, due 4/25/23, VRN | | | | 11 | | 16 |
#254797, 5.000%, due 6/1/23 | | | | 2,123 | | 2,078 |
#806458, 8.00%, due 6/1/28 | | | | 1,699 | | 1,814 |
#797846, 7.000%, due 3/1/32 | | | | 2,671 | | 2,787 |
#654674, 6.500%, due 9/1/32 | | | | 386 | | 396 |
#733897, 6.500%, due 12/1/32 | | | | 648 | | 677 |
| | | | |
| |
|
Total FNMA Mortgage Obligations | | | | 65,046 | | 67,749 |
| | | | |
| |
|
See accompanying Notes to Financial Statements.
December 31, 2005 | William Blair Funds 61 |
Income Fund
Portfolio of Investments, December 31, 2005 (all amounts in thousands)
| | | | | | |
Issuer
| | NRSRO
Rating
| | Principal
Amount
| | Value
|
|
Collateralized Mortgage Obligations—24.7% |
Security National Mortgage Loan Trust, 2002-2, Tranche M2,
6.460%, due 8/25/08* | | A+ | | $ 2,500 | | $ 2,486 |
Countrywide Alternative Loan Trust, 2003-11T1, Tranche M,
4.750%, due 7/25/18 | | AA+ | | 1,881 | | 1,822 |
ABFS, 2002-2, Tranche A6,
5.850%, due 3/15/19 | | AAA | | 1,550 | | 1,570 |
RALI, 2004-QS16, Tranche 2M1, 5.000%, due 12/25/19 | | AA | | 1,764 | | 1,704 |
RALI, 2004-QS16, Tranche 2M3,
5.00%, due 12/25/19 | | BBB | | 298 | | 279 |
RALI, 2005-QS14, Tranche 1M1,
5.25%, due 9/25/20 | | AA | | 1,030 | | 1,002 |
RALI, 2005-QS14, Tranche 1M2,
5.25%, due 9/25/20 | | A | | 324 | | 311 |
First Plus, 1997-4, Tranche M2,
7.830%, due 9/11/23 | | A | | 538 | | 538 |
First Plus, 1997-4, Tranche A8,
7.810%, due 9/11/23 | | AAA | | 366 | | 366 |
First Plus, 1998-2, Tranche M2,
8.010%, due 5/10/24 | | A | | 337 | | 336 |
First Plus, 1998-3, Tranche M2,
7.920%, due 5/10/24 | | A2 | | 127 | | 127 |
Bear Stearns ABS, 2001-A, Tranche M1, 7.540%, due 2/15/31 | | A | | 2,700 | | 2,733 |
Delta Funding Home Equity Loan Trust, 2000-4, Tranche M1,
7.150%, due 2/15/31 | | AA | | 3,000 | | 3,023 |
Structured Asset Securities Corp., 2005-SC1, Tranche 1A2,
9.250%, due 5/25/31* | | AAA | | 3,320 | | 3,521 |
Aames Mortgage Trust, 2001-1, Tranche M2, 7.588%, due 6/25/31 | | A | | 1,216 | | 1,247 |
IMSA, 2001-5, Tranche M1
7.250%, due 8/25/31 | | AAA | | 2,222 | | 2,216 |
Conseco Finance, 2001-B, Tranche 1M1 7.272%, due 6/15/32 | | AA | | 1,263 | | 1,279 |
Credit Suisse First Boston, 2002-22, Tranche 2M2
6.500%, due 6/25/32 | | A | | 3,041 | | 3,049 |
Security National Mortgage Loan Trust, 2004-1A, Tranche M2,
6.750%, due 06/25/32* | | A | | 1,600 | | 1,562 |
Structured Assets Security Corporation, 2002-13, Tranche B1,
6.750%, due 7/25/32, VRN | | AAA | | 2,556 | | 2,578 |
Structured Assets Security Corporation, 2002-17, Tranche B3,
6.082%, due 9/25/32, VRN | | A | | 1,914 | | 1,902 |
LSSCO, 2004-2, Tranche M1,
5.898%, due 2/28/33, VRN* | | AA | | 1,794 | | 1,795 |
LSSCO, 2004-2, Tranche M2,
5.898%, due 2/28/33, VRN* | | A | | 1,376 | | 1,376 |
Ameriquest Mortgage Securities, 2003-5, Tranche M3,
6.009%, due 4/25/33 | | A+ | | 3,385 | | 3,387 |
ABFS, 2002-2, Tranche A-7,
5.215%, due 7/15/33, VRN | | AAA | | 244 | | 244 |
ABFS, 2002-3, Tranche M1,
5.402%, due 9/15/33, VRN | | AA | | 1,500 | | 1,495 |
| | | | | | |
Issuer
| | NRSRO
Rating
| | Principal
Amount
| | Value
|
|
Collateralized Mortgage Obligations—(continued) |
Structured Asset Securities Corp., 2003-28XS, Tranche M3,
6.500%, due 9/25/33 | | Baa1 | | $ 3,020 | | $ 3,023 |
Residential Asset Mortgage Prouducts, 2003-RS9, Tranche MI1,
5.800%, due 10/25/33 | | AA | | 250 | | 249 |
Residential Asset Mortgage Prouducts, 2003-RS9, Tranche MI2,
6.300%, due 10/25/33 | | A | | 2,200 | | 2,202 |
ACE, 2004-SD1, Tranche M3
7.129%, due 11/25/33, VRN | | BBB | | 2,099 | | 1,995 |
Residential Asset Mortgage Products, 2003-RS11, Tranche MI1,
5.597%, due 12/25/33 | | AA | | 2,400 | | 2,404 |
Deutsche Mortgage Securites, Inc., 2004-2, Tranche M1
5.090%, due 1/25/34 | | AA | | 2,055 | | 2,012 |
GRP Real Estate Asset Trust, 2004-2, Tranche A, 4.210%, due 7/25/34* | | A | | 1,428 | | 1,428 |
FHASI, 2004-AR4, Tranche 3A1
4.590%, due 8/25/34 | | AAA | | 1,715 | | 1,683 |
RAAC, 2005-SP1, Tranche M1
5.504%, due 9/25/34 | | AA | | 2,634 | | 2,543 |
Security National Mortgage Loan Trust, 2004-2A, Tranche M2,
6.352%, due 11/25/34* | | A | | 2,200 | | 2,138 |
GRP Real Estate Asset Trust, 2005-1 Tranche A, 4.850%, due 1/25/35* | | A | | 1,623 | | 1,623 |
Security National Mortgage Loan Trust, 2005-1A, Tranche M2,
6.530%, due 2/25/35* | | A | | 1,475 | | 1,437 |
Security National Mortgage Loan Trust, 2005-1A, Tranche B1,
7.450%, due 2/25/35* | | BBB | | 950 | | 927 |
Structured Asset Securities Corp., 2005-9XS, Tranche 1A2B,
6.500%, due 5/25/35 | | AAA | | 3,435 | | 3,467 |
Security National Mortgage Loan Trust, 2005-2, Tranche B1,
7.750%, due 2/25/36* | | BBB | | 1,550 | | 1,516 |
Security National Mortgage Loan Trust, 2005-2, Tranche M2,
7.321%, due 2/25/36* | | A | | 2,075 | | 2,074 |
Blackrock Capital Finance, 1997-R1 WAC,
1.876%, due 3/25/37, VRN* | | AAA | | 459 | | 470 |
ACE, 2005-SN1, Tranche M1,
5.520%, due 11/25/39, VRN | | AA+ | | 1,075 | | 1,061 |
ACE, 2005-SN1, Tranche M2,
5.770%, due 11/25/39, VRN | | A+ | | 625 | | 618 |
ACE, 2005-SD3, Tranche M2,
6.129%, due 8/25/45, VRN | | A+ | | 1,895 | | 1,895 |
| | | | |
| |
|
Total Collateralized Mortgage Obligations | | | | 77,009 | | 76,713 |
| | | | |
| |
|
| | | |
Corporate Obligations—25.2% | | | | | | |
Block Financial Corporation,
8.500%, due 4/15/07 | | BBB+ | | 2,724 | | 2,836 |
Applied Materials, Inc.,
6.750%, due 10/15/07 | | A- | | 2,875 | | 2,952 |
Amgen Inc., 6.500%, due 12/01/07 | | A+ | | 1,000 | | 1,030 |
See accompanying Notes to Financial Statements.
62 Annual Report | December 31, 2005 |
Income Fund
Portfolio of Investments, December 31, 2005 (all amounts in thousands)
| | | | | | |
Issuer
| | NRSRO
Rating
| | Principal
Amount
| | Value
|
|
Corporate Obligations—(continued) |
DaimlerChrysler, NA Holdings,
4.750%, due 1/15/08 | | A3 | | $ 2,675 | | $ 2,651 |
Wells Fargo Company,
3.500%, due 4/4/08 | | AA | | 1,450 | | 1,409 |
Philips Petroleum,
8.750%, due 5/25/10 | | A- | | 3,600 | | 4,141 |
Household Finance Corporation,
8.000%, due 7/15/10 | | A | | 2,450 | | 2,733 |
Boeing Capital Corporation,
7.375%, due 9/27/10 | | A | | 2,549 | | 2,805 |
Sprint Capital Corporation,
7.625%, due 1/30/11 | | A- | | 2,000 | | 2,206 |
Morgan Stanley,
6.750%, due 4/15/11 | | A+ | | 3,375 | | 3,633 |
Goldman Sachs Group, Inc.,
6.600%, due 1/15/12 | | A+ | | 3,050 | | 3,276 |
Lehman Brothers Holdings, Inc.
6.625%, due 1/18/12 | | A+ | | 2,650 | | 2,861 |
National Rural Utility Cooperative, 7.250%, due 3/1/12 | | A | | 3,025 | | 3,374 |
Valero Energy Corporation,
6.875%, due 4/15/12 | | BBB- | | 2,065 | | 2,250 |
General Electric Capital Corporation,
6.000%, due 6/15/12 | | AAA | | 2,650 | | 2,791 |
Citigroup, Inc. 5.625%, due 8/27/12 | | A+ | | 2,675 | | 2,757 |
SLM Corporation,
5.125%, due 8/27/12 | | A | | 2,050 | | 2,053 |
Verizon Global Funding Corporation, 7.375%, due 9/1/12 | | A+ | | 2,675 | | 2,983 |
Cox Communications,Inc.,
7.125%, due 10/1/12 | | BBB- | | 2,425 | | 2,598 |
IBM Corporation,
4.750%, due 11/29/12 | | A+ | | 3,375 | | 3,348 |
Kroger Company,
5.500%, due 2/1/13 | | BBB | | 1,500 | | 1,481 |
Ohio Power Company,
5.500%, due 2/15/13 | | A3 | | 1,900 | | 1,934 |
Altria Group, Inc.
7.000%, due 11/4/13 | | BBB | | 2,180 | | 2,386 |
American Movil SA,
5.500%, due 3/1/14 | | A3 | | 2,000 | | 1,975 |
| | | | | | |
Issuer
| | NRSRO
Rating
| | Principal
Amount
| | Value
|
|
Corporate Obligations—(continued) |
Bank of America Corporation,
5.375%, due 6/15/14 | | AA- | | $2,325 | | $2,364 |
SBC Communications, Inc.,
5.100%, due 9/15/14 | | A | | 2,500 | | 2,442 |
Codelco, Inc.—144A
4.750%, due 10/15/14* | | A | | 2,425 | | 2,349 |
United Technologies Corporation, 4.875%, due 5/1/15 | | A | | 2,725 | | 2,698 |
Telecom Italia, 5.250%, due 10/1/15 | | A- | | 3,000 | | 2,913 |
American Express Credit Corporation, 5.300%, due 12/2/15 | | A+ | | 3,000 | | 3,015 |
| | | | |
| |
|
Total Corporate Obligations | | | | 74,893 | | 78,244 |
| | | | |
| |
|
Total Long Term Investments—98.7%
(cost $310,427) | | 297,344 | | 306,625 |
| | | | |
| |
|
| | | |
Short-Term Investments | | | | | | |
American Express Corporation, VRN, 4.235%, due 1/3/06 | | A+ | | $249 | | 249 |
Prudential Funding LLC, VRN,
3.930%, due 1/3/06 | | A+ | | $224 | | 224 |
| | | | |
| |
|
Total Short-Term Investments—0.2%
(cost $473) | | 473 | | 473 |
| | | | |
| |
|
Total Investments—98.9%
(cost $310,900) | | $297,817 | | 307,098 |
| | | | |
| |
|
Cash and other assets, less liabilities—1.1% | | 3,398 |
| | | | | | |
|
Net Assets—100% | | $310,496 |
| | | | | | |
|
WAC = Weighted Average Coupon
VRN = Variable Rate Note
NRSRO = Nationally Recognized Statistical Rating Organization, such as S&P, Moody’s or Fitch (unaudited)
The obligations of certain U. S. Government-sponsored securities are neither issued nor guaranteed by the U. S. Treasury
*Deemed illiquid pursuant to Liquidity Procedures adopted by the Board of Trustees. These holdings represent 8.0% of the net assets at December 31, 2005.
See accompanying Notes to Financial Statements.
December 31, 2005 | William Blair Funds 63 |
James S. Kaplan
Christopher T. Vincent
READY RESERVES FUND
The Ready Reserves Fund invests primarily in short-term U.S. dollar-denominated money market instruments, and exclusively in high quality securities that are rated in the top two categories of credit quality.
AN OVERVIEW FROM THE PORTFOLIO MANAGERS
Federal Reserve Board Monetary policy was the focus of the money markets during 2005.
The Federal Reserve raised the federal funds rate on overnight loans between banks by 0.25% eight times during the year, on February 2, March 22, May 3, June 30, August 9, September 30, November 1 and December 13—from 2.50% to 4.25%. Since June of 2004, the Federal Reserve has raised this benchmark short-term interest rate 13 times.
In a statement that accompanied the announcement of its December rate increase, the Federal Reserve Board indicated its work may not be finished yet. In a statement that accompanied the rate hike the Fed said, “the committee judges that some further measured policy firming is likely to be needed.”
However, for the first time since the Fed began raising short-term interest rates in the summer of 2004, the Fed did not refer to its monetary policy as “accommodative,” a term which most Fed watchers interpret as meaning the Fed believes rates are lower than they should be in order to keep inflation in check over the long term.
Many Fed watchers, in turn, concluded from this language that the Fed officials moved closer to a “neutral” position.
The money markets behave as though one more Federal Reserve rate hike is expected in January. We expect the Federal Reserve Board to move to raise rates at its January 31 meeting, which will also be Fed Chairman Alan Greenspan’s last before the new Fed Chairman nominee Ben Bernanke assumes the leadership role.
We may be moving into a period where the Fed is more “data dependent” than before. The measured and automatic interest rate increases of the last 18 months will give way to a period where the Fed analyzes economic data as it is released, then formulates its decisions regarding monetary policy accordingly. There is much more uncertainty regarding future Fed policy than there has been in recent memory.
We intend to maintain our strategy of using commercial paper in the short end of the market, barbelled with fixed-rate obligations with slightly longer maturities, and also will continue to emphasize floating-rate obligations, which price off of LIBOR. (LIBOR is the London Interbank Offered Rate, which is the rate the creditworthiest international banks dealing in Eurodollars—U.S. currency held in banks outside of the U.S.—charge each other for large loans.)
At December 31, 2005, the Fund’s average maturity was 59 days, compared to 59 days at June 30, 2005, and 55.2 days at the end of 2004.
The return for the year ended December 31, 2005, of the Fund’s Class N Shares was 2.62%, versus the 2.44% return of the Fund’s benchmark, the AAA-Rated Money Market Funds Average. Total assets were $1.10 billion at December 31, 2005, compared to $1.14 billion at June 30, 2005 and $1.09 billion at December 31, 2004.
64 Annual Report | December 31, 2005 |
Ready Reserves Fund
Performance Highlights (unaudited)
The Fund’s 7 day yield on December 31, 2005 was 3.61%.
Average Annual Total Returns—Class N Shares year ending December 31, 2005.
| | | | | | | | | | | | | | |
| | | 1
Year
| | | 3
Year
| | | 5
Year
| | | 10
Year
| | | |
| Ready Reserves Fund | | 2.62 | % | | 1.35 | % | | 1.80 | % | | 3.43 | % | | |
AAA Rated Money Market Funds | | 2.44 | | | 1.22 | | | 1.70 | | | 3.43 | | | |
Performance cited represents past performance. Past performance does not guarantee future results and current performance may be lower or higher than the data quoted. For the most current month-end performance information, please call 1-800-742-7272, or visit our Web site at www.williamblairfunds.com. Class N Shares are available to the general public without a sales load. Total return includes reinvestment of income. Yields fluctuate and are not guaranteed. An investment in the Fund is neither insured nor guaranteed by the Federal Deposit Insurance Corp. (FDIC) or any government agency. Although the Fund seeks to preserve the value of your investment at $1.00 per share, it is possible to lose money by investing in the Fund.
The AAA Rated Money Market Funds Average represents the average annual composite performance of all AAA rated First Tier Retail Money Market Funds listed by IBC Financial data.
This report identifies the Fund’s investment’s on December 31, 2005. These holdings are subject to change. Not all fixed-income securities in the Fund performed the same, nor is there any guarantee that these fixed-income securities will perform as well in the future. Market forecasts provided in this report may not necessarily come to pass.
Sector Diversification (unaudited)
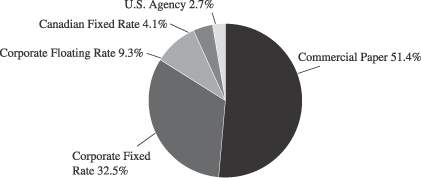
The sector diversification shown is based on the total investment portfolio.
December 31, 2005 | William Blair Funds 65 |
Ready Reserves Fund
Portfolio of Investments, December 31, 2005 (all dollar amounts in thousands)
| | | | | | |
Issuer
| | Principal
Amount
| | Amortized
Cost
|
Mortage Backed Securities—2.7% | | | | | | |
Federal Home Loan Bank (FHLB),
4.404%, 3/28/06 | | $ | 9,871 | | $ | 9,874 |
Federal Home Loan Mortgage Corp. (FHLMC),
2.750%, 5/17/06 | | | 6,682 | | | 6,718 |
Federal National Mortgage Assoc. (FNMA), 2.900%-5.500%, 2/22/06-4/1/06 | | | 12,995 | | | 12,999 |
| | |
|
| |
|
|
Total Mortgage Backed Securities | | | 29,548 | | | 29,591 |
| | |
|
| |
|
|
Canadian Fixed Rate Notes—4.1% | | | | | | |
Province of Ontario,
2.350%-6.000%, 2/21/06-12/15/06 | | | 12,721 | | | 12,566 |
Province of Quebec,
5.500%-6.500%, 1/17/06-4/11/06 | | | 32,292 | | | 32,063 |
| | |
|
| |
|
|
Total Canadian Fixed Rate Notes | | | 45,013 | | | 44,629 |
| | |
|
| |
|
|
Fixed Rate Notes—29.7% | | | | | | |
Abbott Laboratories,
5.625%-6.400%, 7/1/06-12/1/06 | | | 24,022 | | | 23,890 |
American General Finance Corp,
3.638%-5.875%, 1/6/06-7/14/06 | | | 21,643 | | | 21,641 |
Anheuser Busch Company,
5.600%, 7/06/06 | | | 5,060 | | | 5,038 |
B.P. Capital PLC,
2.350%-6.950%, 6/15/06-12/29/06 | | | 10,789 | | | 10,838 |
Brown Forman Corp, 2.125%, 3/15/06 | | | 21,819 | | | 21,906 |
Caterpillar Financial Services,
2.650%-9.000%, 1/30/06-5/1/06 | | | 22,647 | | | 22,652 |
Cheveron Corporation, 8.250%, 10/1/06 | | | 515 | | | 513 |
Colgate-Palmolive Corporation,
5.340%, 3/27/06 | | | 12,301 | | | 12,219 |
Du Pont (E.I) De Numours
8.250%, 9/15/06 | | | 10,243 | | | 10,131 |
Eli Lilly & Company, 5.500%, 7/15/06 | | | 13,220 | | | 13,157 |
GE Capital Corp
2.750%-5.350%, 1/30/06-9/25/06 | | | 24,372 | | | 24,260 |
IBM Corporation, 4.875%, 10/1/06 | | | 3,002 | | | 3,002 |
Merck & Company, 5.250%, 7/1/06 | | | 7,748 | | | 7,713 |
National Rural Utility Coop,
3.000%-6.000%, 2/15/06-5/15/06 | | | 19,582 | | | 19,611 |
Paccar Financial,
2.500%-4.290%, 2/17/06-8/1/06 | | | 4,460 | | | 4,463 |
Pfizer Inc., 5.625%, 2/1/06 | | | 9,232 | | | 9,089 |
Pitney Bowes Inc., 5.875%, 5/1/06 | | | 5,546 | | | 5,528 |
SBC Communications,
5.750%-5.875, 2/15/06-5/2/06 | | | 23,991 | | | 23,965 |
SLM Corporation, 3.361%, 1/13/06 | | | 11,961 | | | 11,951 |
Toyota Motor Credit,
2.800%-5.650%, 1/18/06-1/15/07 | | | 9,306 | | | 9,318 |
US Bancorp, 2.750%, 3/30/06 | | | 8,094 | | | 8,131 |
USAA Capital Corporation,
7.050%, 11/8/06 | | | 1,001 | | | 999 |
Wal-Mart Stores,
4.351%-8.000%, 3/16/06-9/15/06 | | | 33,299 | | | 33,172 |
Wells Fargo Financial,
4.540%-7.125%, 2/15/06-8/15/06 | | | 20,984 | | | 20,678 |
| | |
|
| |
|
|
Total Fixed Rate Notes | | | 324,837 | | | 323,865 |
| | |
|
| |
|
|
VRN = Variable Rate Note
| | | | | | | |
Issuer
| | Principal
Amount
| | Amortized
Cost
| |
Variable Rate Notes—9.3% | | | | | | | |
General Electric Capital Corporation, 4.457%-4.627%, 2/13/06-3/20/06 | | $ | 9,663 | | $ | 9,660 | |
Paccar Financial Corporation,
4.270%-4.520%, 2/17/06-3/20/06 | | | 28,490 | | | 28,494 | |
SLM Corp, 4.370%, 1/25/06 | | | 14,008 | | | 14,007 | |
Toyota Motor Credit,
4.360%-4.510%, 2/27/06-3/15/06 | | | 23,925 | | | 23,923 | |
US Bank,
4.230%-4.491%, 1/30/06-3/29/06 | | | 14,278 | | | 14,277 | |
Wells Fargo Financial,
3.960%-4.570%, 3/13/06-3/15/06 | | | 11,465 | | | 11,460 | |
| | |
|
| |
|
|
|
Total Variable Rate Notes | | | 101,829 | | | 101,821 | |
| | |
|
| |
|
|
|
Asset Backed Commercial Paper—51.4% | | | | |
Alpine Securitization Corporation,
4.260%-4.330%, 1/12/06-2/3/06 | | | 45,000 | | | 44,848 | |
Amsterdam Funding Corporation,
4.180%-4.320%, 1/5/06-1/20/06 | | | 35,000 | | | 34,941 | |
Chariot Funding, L.L.C., 4.350%, 2/10/06 | | | 14,763 | | | 14,692 | |
Ciesco, L.L.C., 4.190%, 1/12/06 | | | 10,000 | | | 9,987 | |
CRC Funding, L.L.C., 4.190%, 1/6/06 | | | 15,000 | | | 14,991 | |
FCAR Owner Trust,
4.280%-4.340%, 1/23/06-2/7/06 | | | 45,000 | | | 44,851 | |
Govco, Inc.,
4.300%-4.340%, 1/26/06-2/9/06 | | | 35,000 | | | 34,854 | |
Jupiter Securitization Corporation,
4.130%-4.300%, 1/4/06-1/27/06 | | | 25,000 | | | 24,949 | |
Kittyhawk Funding,
4.210%-4.220%, 1/11/06-1/20/06 | | | 30,000 | | | 29,952 | |
Mortgage Interest Networking Trust,
4.310%-4.370%, 1/26/06-2/2/06 | | | 45,000 | | | 44,850 | |
New Center Asset Trust,
4.160%-4.290%, 1/5/06-1/24/06 | | | 45,000 | | | 44,927 | |
Old Line Funding,
4.200%-4.270%, 1/10/06-1/17/06 | | | 34,708 | | | 34,655 | |
Park Avenue Receivables,
4.120%-4.300%, 1/3/06-1/25/06 | | | 20,000 | | | 19,969 | |
Ranger Funding,
4.230%-4.300%, 1/9/06-1/23/06 | | | 25,000 | | | 24,951 | |
Sheffield Receivables,
4.140%-4.190%, 1/3/06-1/10/06 | | | 45,000 | | | 44,966 | |
Thames Asset Global Securitization,
4.200%-4.330%, 1/4/06-1/24/06 | | | 45,916 | | | 45,836 | |
Thunder Bay Funding,
4.170%-4.200%, 1/4/06-1/17/06 | | | 26,806 | | | 26,776 | |
Variable Funding, 4.250%, 1/20/06 | | | 10,000 | | | 9,978 | |
Windmill Funding Corporation,
4.290%, 1/31/06 | | | 10,000 | | | 9,964 | |
| | |
|
| |
|
|
|
Total Asset Backed Commercial Paper | | | 562,193 | | | 560,937 | |
| | |
|
| |
|
|
|
Demand Notes—2.9% | | | | | | | |
American Express Corporation, VRN, 4.235%, 1/3/06 | | | 17,647 | | | 17,647 | |
Prudential Funding, VRN,
3.930%, 1/3/06 | | | 14,221 | | | 14,221 | |
| | |
|
| |
|
|
|
Total Demand Notes | | | 31,868 | | | 31,868 | |
| | |
|
| |
|
|
|
Total Investments—100.1%
(cost $1,092,711) | | $ | 1,095,288 | | | 1,092,711 | |
| | |
|
| |
|
|
|
Liabilities plus cash and other assets—(0.1)% | | | (857 | ) |
| | | | | |
|
|
|
Net assets—100.0% | | $ | 1,091,854 | |
| | | | | |
|
|
|
Portfolio Weighted Average Maturity | | | | | | 59 Days | |
See accompanying Notes to Financial Statements.
66 Annual Report | December 31, 2005 |
Statements of Assets and Liabilities
December 31, 2005 (all dollar amounts in thousands)
| | | | | | | | | | | | | | | | |
| | | Growth
Fund
| | | Tax-
Managed
Growth
Fund
| | | Large Cap
Growth
Fund
| | | Small Cap
Growth
Fund
| |
Assets | | | | | | | | | | | | | | | | |
Investments in securities, at cost | | $ | 188,016 | | | $ | 5,277 | | | $ | 14,585 | | | $ | 692,345 | |
Investments in Affiliated Fund, at cost | | | 724 | | | | 363 | | | | 424 | | | | 11,002 | |
| | |
|
|
| |
|
|
| |
|
|
| |
|
|
|
| | | | |
Investments in securities, at value | | $ | 251,664 | | | $ | 7,390 | | | $ | 16,287 | | | $ | 812,790 | |
Investments in Affiliated Fund, at value | | | 724 | | | | 363 | | | | 424 | | | | 11,002 | |
Cash | | | 15 | | | | — | | | | — | | | | 69 | |
Receivable for fund shares sold | | | 1,570 | | | | 175 | | | | 196 | | | | 15,029 | |
Receivable for investment securities sold | | | — | | | | — | | | | — | | | | 3,378 | |
Receivable from Advisor | | | — | | | | 12 | | | | 4 | | | | — | |
Dividend and interest receivable | | | 36 | | | | 5 | | | | 9 | | | | 218 | |
| | |
|
|
| |
|
|
| |
|
|
| |
|
|
|
Total assets | | | 254,009 | | | | 7,945 | | | | 16,920 | | | | 842,486 | |
Liabilities | | | | | | | | | | | | | | | | |
Payable for investment securities purchased | | | — | | | | 117 | | | | — | | | | 8,560 | |
Payable for fund shares redeemed | | | 189 | | | | — | | | | 15 | | | | 1,129 | |
Management fee payable | | | 180 | | | | — | | | | — | | | | 756 | |
Distribution fee payable | | | 11 | | | | — | | | | 2 | | | | 104 | |
Other accrued expenses | | | 70 | | | | 13 | | | | 15 | | | | 199 | |
| | |
|
|
| |
|
|
| |
|
|
| |
|
|
|
Total liabilities | | | 450 | | | | 130 | | | | 32 | | | | 10,748 | |
| | |
|
|
| |
|
|
| |
|
|
| |
|
|
|
Net Assets | | $ | 253,559 | | | $ | 7,815 | | | $ | 16,888 | | | $ | 831,738 | |
| | |
|
|
| |
|
|
| |
|
|
| |
|
|
|
Capital | | | | | | | | | | | | | | | | |
Composition of Net Assets | | | | | | | | | | | | | | | | |
Par value of shares of beneficial interest | | $ | 23 | | | $ | 1 | | | $ | 2 | | | $ | 35 | |
Capital paid in excess of par value | | | 188,022 | | | | 7,497 | | | | 20,554 | | | | 721,374 | |
Accumulated net investment income (loss) | | | (1 | ) | | | — | | | | — | | | | — | |
Accumulated realized gain (loss) | | | 1,867 | | | | (1,796 | ) | | | (5,370 | ) | | | (10,116 | ) |
Net unrealized appreciation (depreciation) of investments and foreign
currencies | | | 63,648 | | | | 2,113 | | | | 1,702 | | | | 120,445 | |
| | |
|
|
| |
|
|
| |
|
|
| |
|
|
|
Net Assets | | $ | 253,559 | | | $ | 7,815 | | | $ | 16,888 | | | $ | 831,738 | |
| | |
|
|
| |
|
|
| |
|
|
| |
|
|
|
| | | | |
Class N Shares | | | | | | | | | | | | | | | | |
Net Assets | | $ | 51,196 | | | $ | 305 | | | $ | 8,325 | | | $ | 499,603 | |
Shares Outstanding | | | 4,517,497 | | | | 30,212 | | | | 1,286,887 | | | | 21,025,345 | |
Net Asset Value Per Share | | $ | 11.33 | | | $ | 10.11 | | | $ | 6.47 | | | $ | 23.76 | |
Class I Shares | | | | | | | | | | | | | | | | |
Net Assets | | $ | 202,363 | | | $ | 7,510 | | | $ | 8,563 | | | $ | 332,135 | |
Shares Outstanding | | | 17,565,504 | | | | 731,554 | | | | 1,306,213 | | | | 13,748,968 | |
Net Asset Value Per Share | | $ | 11.52 | | | $ | 10.27 | | | $ | 6.56 | | | $ | 24.16 | |
See accompanying Notes to Financial Statements.
December 31, 2005 | William Blair Funds 67 |
Statements of Operations
For the Year Ended December 31, 2005 (all dollar amounts in thousands)
| | | | | | | | | | | | | | | | |
| | | Growth Fund
| | | Tax-
Managed
Growth
Fund
| | | Large Cap
Growth Fund
| | | Small Cap
Growth Fund
| |
Investment income | | | | | | | | | | | | | | | | |
Dividends | | $ | 1,326 | | | $ | 41 | | | $ | 83 | | | $ | 1,251 | |
Less foreign tax withheld | | | (28 | ) | | | (1 | ) | | | (1 | ) | | | — | |
Income from Affiliated Fund | | | 41 | | | | 6 | | | | 11 | | | | 220 | |
Interest | | | 52 | | | | 1 | | | | 2 | | | | 448 | |
| | |
|
|
| |
|
|
| |
|
|
| |
|
|
|
Total income | | | 1,391 | | | | 47 | | | | 95 | | | | 1,919 | |
Expenses | | | | | | | | | | | | | | | | |
Investment advisory fees | | | 1,873 | | | | 48 | | | | 83 | | | | 8,101 | |
Distribution fees | | | 122 | | | | — | | | | 8 | | | | 1,108 | |
Custodian fees | | | 73 | | | | 34 | | | | 39 | | | | 145 | |
Transfer agent fees | | | 144 | | | | 8 | | | | 15 | | | | 536 | |
Professional fees | | | 37 | | | | 18 | | | | 19 | | | | 57 | |
Registration fees | | | 30 | | | | 28 | | | | 29 | | | | 54 | |
Other expenses | | | 99 | | | | 5 | | | | 9 | | | | 267 | |
| | |
|
|
| |
|
|
| |
|
|
| |
|
|
|
Total expenses before waiver | | | 2,378 | | | | 141 | | | | 202 | | | | 10,268 | |
Less expenses waived or absorbed by the Advisor | | | — | | | | (62 | ) | | | (86 | ) | | | — | |
| | |
|
|
| |
|
|
| |
|
|
| |
|
|
|
Net expenses | | | 2,378 | | | | 79 | | | | 116 | | | | 10,268 | |
| | |
|
|
| |
|
|
| |
|
|
| |
|
|
|
Net investment income (loss) | | | (987 | ) | | | (32 | ) | | | (21 | ) | | | (8,349 | ) |
Net realized and unrealized gain (loss) on investments, foreign currency transactions and other assets and liabilities | | | | | | | | | | | | | | | | |
Net realized gain (loss) on investments | | | 27,667 | | | | 90 | | | | 79 | | | | 48,921 | |
| | |
|
|
| |
|
|
| |
|
|
| |
|
|
|
Change in net unrealized appreciation (depreciation) on investments and
other assets and liabilities | | | (3,560 | ) | | | 703 | | | | 593 | | | | (35,365 | ) |
| | |
|
|
| |
|
|
| |
|
|
| |
|
|
|
Net increase (decrease) in net assets resulting from operations | | $ | 23,120 | | | $ | 761 | | | $ | 651 | | | $ | 5,207 | |
| | |
|
|
| |
|
|
| |
|
|
| |
|
|
|
See accompanying Notes to Financial Statements.
68 Annual Report | December 31, 2005 |
Statements of Changes in Net Assets
For the Years Ended December 31, 2005 and 2004 (all amounts in thousands)
| | | | | | | | | | | | | | | | | | | | | | | | | | | | | | | | |
| | | Growth
Fund
| | | Tax-
Managed
Growth
Fund
| | | Large Cap
Growth
Fund
| | | Small Cap
Growth
Fund
| |
| | | 2005
| | | 2004
| | | 2005
| | | 2004
| | | 2005
| | | 2004
| | | 2005
| | | 2004
| |
Operations | | | | | | | | | | | | | | | | | | | | | | | | | | | | | | | | |
Net investment income (loss) | | $ | (987 | ) | | $ | (1,071 | ) | | $ | (32 | ) | | $ | (41 | ) | | $ | (21 | ) | | $ | (23 | ) | | $ | (8,349 | ) | | $ | (7,267 | ) |
Net realized gain (loss) on investments, foreign currency transactions and other assets and liabilities | | | 27,667 | | | | 14,917 | | | | 90 | | | | 460 | | | | 79 | | | | 196 | | | | 48,921 | | | | 80,817 | |
Change in net unrealized appreciation (depreciation) on investments, and other assets
and liabilities | | | (3,560 | ) | | | 5,610 | | | | 703 | | | | (38 | ) | | | 593 | | | | 149 | | | | (35,365 | ) | | | 78,333 | |
| | |
|
|
| |
|
|
| |
|
|
| |
|
|
| |
|
|
| |
|
|
| |
|
|
| |
|
|
|
Net increase (decrease) in net assets resulting from operations | | | 23,120 | | | | 19,456 | | | | 761 | | | | 381 | | | | 651 | | | | 322 | | | | 5,207 | | | | 151,883 | |
Distributions to shareholders from | | | | | | | | | | | | | | | | | | | | | | | | | | | | | | | | |
Net investment income | | | — | | | | — | | | | — | | | | — | | | | — | | | | — | | | | — | | | | — | |
Net realized gain | | | (8,977 | ) | | | — | | | | — | | | | — | | | | — | | | | — | | | | (71,631 | ) | | | (54,782 | ) |
| | |
|
|
| |
|
|
| |
|
|
| |
|
|
| |
|
|
| |
|
|
| |
|
|
| |
|
|
|
| | | | (8,977 | ) | | | — | | | | — | | | | — | | | | — | | | | — | | | | (71,631 | ) | | | (54,782 | ) |
Capital stock transactions | | | | | | | | | | | | | | | | | | | | | | | | | | | | | | | | |
Net proceeds from sale of shares | | | 19,807 | | | | 35,194 | | | | 1,775 | | | | 246 | | | | 11,656 | | | | 1,655 | | | | 345,073 | | | | 260,030 | |
Shares issued in reinvestment of income dividends and capital gain distributions | | | 8,262 | | | | — | | | | — | | | | — | | | | — | | | | — | | | | 69,879 | | | | 53,276 | |
Less cost of shares redeemed | | | (64,159 | ) | | | (60,798 | ) | | | (568 | ) | | | (1,651 | ) | | | (1,836 | ) | | | (1,079 | ) | | | (287,999 | ) | | | (158,022 | ) |
| | |
|
|
| |
|
|
| |
|
|
| |
|
|
| |
|
|
| |
|
|
| |
|
|
| |
|
|
|
Net increase (decrease) in net assets resulting from capital share transactions | | | (36,090 | ) | | | (25,604 | ) | | | 1,207 | | | | (1,405 | ) | | | 9,820 | | | | 576 | | | | 126,953 | | | | 155,284 | |
| | |
|
|
| |
|
|
| |
|
|
| |
|
|
| |
|
|
| |
|
|
| |
|
|
| |
|
|
|
Increase (decrease) in net assets | | | (21,947 | ) | | | (6,148 | ) | | | 1,968 | | | | (1,024 | ) | | | 10,471 | | | | 898 | | | | 60,529 | | | | 252,385 | |
Net assets | | | | | | | | | | | | | | | | | | | | | | | | | | | | | | | | |
Beginning of year | | | 275,506 | | | | 281,654 | | | | 5,847 | | | | 6,871 | | | | 6,417 | | | | 5,519 | | | | 771,209 | | | | 518,824 | |
| | |
|
|
| |
|
|
| |
|
|
| |
|
|
| |
|
|
| |
|
|
| |
|
|
| |
|
|
|
End of year | | $ | 253,559 | | | $ | 275,506 | | | $ | 7,815 | | | $ | 5,847 | | | $ | 16,888 | | | $ | 6,417 | | | $ | 831,738 | | | $ | 771,209 | |
| | |
|
|
| |
|
|
| |
|
|
| |
|
|
| |
|
|
| |
|
|
| |
|
|
| |
|
|
|
Undistributed net investment income (loss) at the end of the year | | $ | (1 | ) | | $ | — | | | $ | — | | | $ | — | | | $ | — | | | $ | — | | | $ | — | | | $ | — | |
| | |
|
|
| |
|
|
| |
|
|
| |
|
|
| |
|
|
| |
|
|
| |
|
|
| |
|
|
|
See accompanying Notes to Financial Statements.
December 31, 2005 | William Blair Funds 69 |
Statements of Assets and Liabilities
December 31, 2005 (all dollar amounts in thousands)
| | | | | | | | | | | | | | | |
| | | Small-Mid
Cap
Growth
Fund
| | International
Growth
Fund
| | | International
Equity
Fund
| | | International
Small Cap
Growth
Fund
| |
Assets | | | | | | | | | | | | | | | |
Investments in securities, at cost | | $ | 61,582 | | $ | 3,249,250 | | | $ | 160,049 | | | $ | 46,760 | |
Investments in Affiliated Fund, at cost | | | 2,012 | | | 28,678 | | | | 1,560 | | | | 410 | |
| | |
|
| |
|
|
| |
|
|
| |
|
|
|
| | | | |
Investments in securities, at value | | $ | 70,050 | | $ | 4,486,691 | | | $ | 177,243 | | | $ | 51,042 | |
Investments in Affiliated Fund, at value | | | 2,012 | | | 28,678 | | | | 1,560 | | | | 410 | |
Cash | | | — | | | 135 | | | | 9 | | | | — | |
Foreign currency, at value (cost $20,285, $1,346 and $44, respectively) | | | — | | | 20,397 | | | | 1,375 | | | | 45 | |
Receivable for fund shares sold | | | 397 | | | 32,017 | | | | 528 | | | | 254 | |
Receivable for investment securities sold | | | 138 | | | 9,454 | | | | 125 | | | | 304 | |
Receivable from Advisor | | | — | | | — | | | | — | | | | — | |
Dividend and interest receivable | | | 25 | | | 3,499 | | | | 77 | | | | 22 | |
| | |
|
| |
|
|
| |
|
|
| |
|
|
|
Total assets | | | 72,622 | | | 4,580,871 | | | | 180,917 | | | | 52,077 | |
Liabilities | | | | | | | | | | | | | | | |
Payable for investment securities purchased | | | 2,298 | | | 22,565 | | | | 819 | | | | 1,487 | |
Payable for fund shares redeemed | | | 28 | | | 2,009 | | | | 2,211 | | | | — | |
Management fee payable | | | 53 | | | 3,782 | | | | 121 | | | | 6 | |
Distribution and shareholder administration fee payable | | | 2 | | | 643 | | | | 4 | | | | 2 | |
Other accrued expenses | | | 30 | | | 795 | | | | 52 | | | | 48 | |
| | |
|
| |
|
|
| |
|
|
| |
|
|
|
Total liabilities | | | 2,411 | | | 29,794 | | | | 3,207 | | | | 1,543 | |
| | |
|
| |
|
|
| |
|
|
| |
|
|
|
Net Assets | | $ | 70,211 | | $ | 4,551,077 | | | $ | 177,710 | | | $ | 50,534 | |
| | |
|
| |
|
|
| |
|
|
| |
|
|
|
Capital | | | | | | | | | | | | | | | |
Composition of Net Assets | | | | | | | | | | | | | | | |
Par value of shares of beneficial interest | | $ | 6 | | $ | 180 | | | $ | 14 | | | $ | 5 | |
Capital paid in excess of par value | | | 60,869 | | | 3,322,455 | | | | 163,267 | | | | 45,907 | |
Accumulated net investment income (loss) | | | — | | | (40,521 | ) | | | (600 | ) | | | (99 | ) |
Accumulated realized gain (loss) | | | 868 | | | 31,482 | | | | (2,193 | ) | | | 442 | |
Net unrealized appreciation (depreciation) of investments and foreign currencies | | | 8,468 | | | 1,237,481 | | | | 17,222 | | | | 4,279 | |
| | |
|
| |
|
|
| |
|
|
| |
|
|
|
Net Assets | | $ | 70,211 | | $ | 4,551,077 | | | $ | 177,710 | | | $ | 50,534 | |
| | |
|
| |
|
|
| |
|
|
| |
|
|
|
| | | | |
Class N Shares | | | | | | | | | | | | | | | |
Net Assets | | $ | 11,409 | | $ | 3,144,078 | | | $ | 20,725 | | | $ | 2,618 | |
Shares Outstanding | | | 919,897 | | | 124,648,171 | | | | 1,611,361 | | | | 234,591 | |
Net Asset Value Per Share | | $ | 12.40 | | $ | 25.22 | | | $ | 12.86 | | | $ | 11.16 | |
Class I Shares | | | | | | | | | | | | | | | |
Net Assets | | $ | 58,802 | | $ | 1,406,999 | | | $ | 156,985 | | | $ | 12,753 | |
Shares Outstanding | | | 4,720,884 | | | 55,074,581 | | | | 12,132,710 | | | | 1,142,550 | |
Net Asset Value Per Share | | $ | 12.46 | | $ | 25.55 | | | $ | 12.94 | | | $ | 11.16 | |
See accompanying Notes to Financial Statements.
70 Annual Report | December 31, 2005 |
Statements of Operations
For the Year Ended December 31, 2005 (all dollar amounts in thousands)
| | | | | | | | | | | | | | | | |
| | | Small-Mid
Cap
Growth
Fund
| | | International
Growth
Fund
| | | International
Equity
Fund
| | | International
Small Cap
Growth
Fund(a)
| |
Investment income | | | | | | | | | | | | | | | | |
Dividends | | $ | 174 | | | $ | 56,041 | | | $ | 589 | | | $ | 57 | |
Less foreign tax withheld | | | — | | | | (4,516 | ) | | | (36 | ) | | | — | |
Income from Affiliated Fund | | | 32 | | | | 660 | | | | 38 | | | | 1 | |
Interest | | | 35 | | | | 2,909 | | | | 142 | | | | 16 | |
| | |
|
|
| |
|
|
| |
|
|
| |
|
|
|
Total income | | | 241 | | | | 55,094 | | | | 733 | | | | 74 | |
Expenses | | | | | | | | | | | | | | | | |
Investment advisory fees | | | 494 | | | | 34,942 | | | | 670 | | | | 61 | |
Distribution fees | | | 24 | | | | 5,945 | | | | 21 | | | | — | |
Shareholder administration fees | | | — | | | | — | | | | — | | | | 3 | |
Custodian fees | | | 51 | | | | 1,876 | | | | 158 | | | | 34 | |
Transfer agent fees | | | 31 | | | | 2,323 | | | | 21 | | | | 1 | |
Professional fees | | | 23 | | | | 166 | | | | 33 | | | | 24 | |
Registration fees | | | 32 | | | | 200 | | | | 47 | | | | 8 | |
Other expenses | | | 18 | | | | 1,163 | | | | 11 | | | | 3 | |
| | |
|
|
| |
|
|
| |
|
|
| |
|
|
|
Total expenses before waiver | | | 673 | | | | 46,615 | | | | 961 | | | | 134 | |
Less expenses waived or absorbed by the Advisor | | | (50 | ) | | | — | | | | (182 | ) | | | (54 | ) |
| | |
|
|
| |
|
|
| |
|
|
| |
|
|
|
Net expenses | | | 623 | | | | 46,615 | | | | 779 | | | | 80 | |
| | |
|
|
| |
|
|
| |
|
|
| |
|
|
|
Net investment income (loss) | | | (382 | ) | | | 8,479 | | | | (46 | ) | | | (6 | ) |
Net realized and unrealized gain (loss) on investments, foreign currency transactions and other assets and liabilities | | | | | | | | | | | | | | | | |
Net realized gain (loss) on investments | | | 1,453 | | | | 301,245 | | | | (1,923 | ) | | | 442 | |
Net realized gain (loss) on foreign currency transactions
and other assets and liabilities | | | — | | | | (14,433 | ) | | | (725 | ) | | | (87 | ) |
| | |
|
|
| |
|
|
| |
|
|
| |
|
|
|
Total net realized gain (loss) | | | 1,453 | | | | 286,812 | | | | (2,648 | ) | | | 355 | |
Change in net unrealized appreciation (depreciation) on investments and other assets and liabilities | | | 6,094 | | | | 457,704 | | | | 16,797 | | | | 4,279 | |
| | |
|
|
| |
|
|
| |
|
|
| |
|
|
|
Net increase (decrease) in net assets resulting from operations | | $ | 7,165 | | | $ | 752,995 | | | $ | 14,103 | | | $ | 4,628 | |
| | |
|
|
| |
|
|
| |
|
|
| |
|
|
|
| (a) | | For the period from November 1, 2005 (Commencement of Operations) to December 31, 2005. |
See accompanying Notes to Financial Statements.
December 31, 2005 | William Blair Funds 71 |
Statements of Changes in Net Assets
For the Years Ended December 31, 2005 and 2004 (all amounts in thousands)
| | | | | | | | | | | | | | | | | | | | | | | | | | | | |
| | | Small-Mid
Cap
Growth
Fund
| | | International
Growth
Fund
| | | International Equity Fund
| | | International
Small Cap
Growth
Fund
| |
| | | 2005
| | | 2004
| | | 2005
| | | 2004
| | | 2005
| | | 2004(a)
| | | 2005(b)
| |
Operations | | | | | | | | | | | | | | | | | | | | | | | | | | | | |
Net investment income (loss) | | $ | (382 | ) | | $ | (152 | ) | | $ | 8,479 | | | $ | (1,748 | ) | | $ | (46 | ) | | $ | (11 | ) | | $ | (6 | ) |
Net realized gain (loss) on investments, foreign currency transactions and other assets and liabilities | | | 1,453 | | | | 5 | | | | 286,812 | | | | 106,478 | | | | (2,648 | ) | | | 641 | | | | 355 | |
Change in net unrealized appreciation (depreciation) on investments, foreign currency transactions and other assets and liabilities | | | 6,094 | | | | 2,395 | | | | 457,704 | | | | 341,262 | | | | 16,797 | | | | 425 | | | | 4,279 | |
| | |
|
|
| |
|
|
| |
|
|
| |
|
|
| |
|
|
| |
|
|
| |
|
|
|
Net increase (decrease) in net assets resulting from operations | | | 7,165 | | | | 2,248 | | | | 752,995 | | | | 445,992 | | | | 14,103 | | | | 1,055 | | | | 4,628 | |
Distributions to shareholders from | | | | | | | | | | | | | | | | | | | | | | | | | | | | |
Net investment income | | | — | | | | — | | | | (21,550 | ) | | | (2,616 | ) | | | — | | | | — | | | | (6 | ) |
Net realized gain | | | (495 | ) | | | — | | | | (254,334 | ) | | | — | | | | — | | | | — | | | | — | |
| | |
|
|
| |
|
|
| |
|
|
| |
|
|
| |
|
|
| |
|
|
| |
|
|
|
| | | | (495 | ) | | | — | | | | (275,884 | ) | | | (2,616 | ) | | | — | | | | — | | | | (6 | ) |
Capital stock transactions | | | | | | | | | | | | | | | | | | | | | | | | | | | | |
Net proceeds from sale of shares | | | 43,370 | | | | 21,231 | | | | 1,424,671 | | | | 1,143,395 | | | | 196,067 | | | | 16,380 | | | | 46,006 | |
Shares issued in reinvestment of income dividends and capital gain
distributions | | | 457 | | | | — | | | | 246,145 | | | | 2,161 | | | | — | | | | — | | | | 6 | |
Less cost of shares redeemed | | | (6,260 | ) | | | (1,178 | ) | | | (598,284 | ) | | | (487,197 | ) | | | (42,149 | ) | | | (7,746 | ) | | | (100 | ) |
| | |
|
|
| |
|
|
| |
|
|
| |
|
|
| |
|
|
| |
|
|
| |
|
|
|
Net increase (decrease) in net assets resulting from capital stock transactions | | | 37,567 | | | | 20,053 | | | | 1,072,532 | | | | 658,359 | | | | 153,918 | | | | 8,634 | | | | 45,912 | |
| | |
|
|
| |
|
|
| |
|
|
| |
|
|
| |
|
|
| |
|
|
| |
|
|
|
Increase (decrease) in net assets | | | 44,237 | | | | 22,301 | | | | 1,549,643 | | | | 1,101,735 | | | | 168,021 | | | | 9,689 | | | | 50,534 | |
Net assets | | | | | | | | | | | | | | | | | | | | | | | | | | | | |
Beginning of year | | | 25,974 | | | | 3,673 | | | | 3,001,434 | | | | 1,899,699 | | | | 9,689 | | | | — | | | | — | |
| | |
|
|
| |
|
|
| |
|
|
| |
|
|
| |
|
|
| |
|
|
| |
|
|
|
End of year | | $ | 70,211 | | | $ | 25,974 | | | $ | 4,551,077 | | | $ | 3,001,434 | | | $ | 177,710 | | | $ | 9,689 | | | $ | 50,534 | |
| | |
|
|
| |
|
|
| |
|
|
| |
|
|
| |
|
|
| |
|
|
| |
|
|
|
Undistributed net investment income (loss) at the end of the year | | $ | — | | | $ | — | | | $ | (40,521 | ) | | $ | (17,106 | ) | | $ | (600 | ) | | $ | (79 | ) | | $ | (99 | ) |
| | |
|
|
| |
|
|
| |
|
|
| |
|
|
| |
|
|
| |
|
|
| |
|
|
|
(a) For the period from May 24, 2004 (Commencement of Operations) to December 31, 2004.
(b) For the period from November 1, 2005 (Commencement of Operations) to December 31, 2005.
See accompanying Notes to Financial Statements.
72 Annual Report | December 31, 2005 |
Statements of Assets and Liabilities
December 31, 2005 (all dollar amounts in thousands)
| | | | | | | | | | | | | | | |
| | | Emerging
Markets
Growth
Fund
| | | Value
Discovery
Fund
| | Income
Fund
| | | Ready
Reserves
Fund
| |
Assets | | | | | | | | | | | | | | | |
Investments in securities, at cost | | $ | 209,443 | | | $ | 55,920 | | $ | 310,900 | | | $ | 1,092,711 | |
Investments in Affiliated Fund, at cost | | | 3,821 | | | | 73 | | | — | | | | — | |
| | |
|
|
| |
|
| |
|
|
| |
|
|
|
Investments in securities, at value | | $ | 239,112 | | | $ | 68,140 | | $ | 307,098 | | | $ | 1,092,711 | |
Investments in Affiliated Fund, at value | | | 3,821 | | | | 73 | | | — | | | | — | |
Cash | | | 1 | | | | 165 | | | — | | | | — | |
Foreign currency, at value (cost $2,860) | | | 2,878 | | | | — | | | — | | | | — | |
Receivable for fund shares sold | | | 1,269 | | | | 45 | | | 1,491 | | | | — | |
Receivable for investment securities sold | | | 2,930 | | | | 2,372 | | | — | | | | — | |
Dividend and interest receivable | | | 132 | | | | 86 | | | 2,876 | | | | 5,356 | |
| | |
|
|
| |
|
| |
|
|
| |
|
|
|
Total assets | | | 250,143 | | | | 70,881 | | | 311,465 | | | | 1,098,067 | |
Liabilities | | | | | | | | | | | | | | | |
Payable for investment securities purchased | | | 518 | | | | — | | | — | | | | 5,398 | |
Payable for fund shares redeemed | | | 45 | | | | 340 | | | 777 | | | | — | |
Management fee payable | | | 153 | | | | 18 | | | 114 | | | | 202 | |
Distribution and shareholder administration fee payable | | | 9 | | | | 32 | | | 13 | | | | — | |
Shareholder services fee payable | | | — | | | | — | | | — | | | | 308 | |
Dividend payable | | | — | | | | — | | | — | | | | 218 | |
Other accrued expenses | | | 70 | | | | 52 | | | 65 | | | | 87 | |
| | |
|
|
| |
|
| |
|
|
| |
|
|
|
Total liabilities | | | 795 | | | | 442 | | | 969 | | | | 6,213 | |
| | |
|
|
| |
|
| |
|
|
| |
|
|
|
Net Assets | | $ | 249,348 | | | $ | 70,439 | | $ | 310,496 | | | $ | 1,091,854 | |
| | |
|
|
| |
|
| |
|
|
| |
|
|
|
Capital | | | | | | | | | | | | | | | |
Composition of Net Assets | | | | | | | | | | | | | | | |
Par value of shares of beneficial interest | | $ | 18 | | | $ | 4 | | $ | 31 | | | $ | 826 | |
Capital paid in excess of par value | | | 219,209 | | | | 55,221 | | | 331,017 | | | | 1,091,974 | |
Accumulated net investment income (loss) | | | (322 | ) | | | 3 | | | — | | | | 81 | |
Accumulated realized gain (loss) | | | 757 | | | | 2,991 | | | (16,750 | ) | | | (1,027 | ) |
Net unrealized appreciation (depreciation) of investments and foreign
currencies | | | 29,686 | | | | 12,220 | | | (3,802 | ) | | | — | |
| | |
|
|
| |
|
| |
|
|
| |
|
|
|
Net Assets | | $ | 249,348 | | | $ | 70,439 | | $ | 310,496 | | | $ | 1,091,854 | |
| | |
|
|
| |
|
| |
|
|
| |
|
|
|
| | | | |
Class N Shares | | | | | | | | | | | | | | | |
Net Assets | | $ | 21,673 | | | $ | 16,163 | | $ | 100,840 | | | $ | 1,091,854 | |
Shares Outstanding | | | 1,529,656 | | | | 1,081,344 | | | 10,259,859 | | | | 1,091,908,251 | |
Net Asset Value Per Share | | $ | 14.17 | | | $ | 14.95 | | $ | 9.83 | | | $ | 1.00 | |
Class I Shares | | | | | | | | | | | | | | | |
Net Assets | | $ | 38,244 | | | $ | 54,276 | | $ | 209,656 | | | | | |
Shares Outstanding | | | 2,696,122 | | | | 3,589,587 | | | 21,354,489 | | | | | |
Net Asset Value Per Share | | $ | 14.19 | | | $ | 15.12 | | $ | 9.82 | | | | | |
See accompanying Notes to Financial Statements.
December 31, 2005 | William Blair Funds 73 |
Statements of Operations
For the Year Ended December 31, 2005 (all dollar amounts in thousands)
| | | | | | | | | | | | | | | |
| | | Emerging
Markets
Growth
Fund(a)
| | | Value
Discovery
Fund
| | | Income
Fund
| | | Ready
Reserves
Fund
|
Investment income | | | | | | | | | | | | | | | |
Dividends | | $ | 586 | | | $ | 1,316 | | | $ | — | | | $ | — |
Less foreign tax withheld | | | (24 | ) | | | — | | | | — | | | | — |
Income from Affiliated Fund | | | 26 | | | | 28 | | | | — | | | | — |
Interest | | | 90 | | | | 172 | | | | 14,756 | | | | 34,688 |
| | |
|
|
| |
|
|
| |
|
|
| |
|
|
Total income | | | 678 | | | | 1,516 | | | | 14,756 | | | | 34,688 |
Expenses | | | | | | | | | | | | | | | |
Investment advisory fees | | | 508 | | | | 1,518 | | | | 1,422 | | | | 2,614 |
Distribution fees | | | 6 | | | | 53 | | | | 141 | | | | — |
Shareholder administration fees | | | 22 | | | | — | | | | — | | | | — |
Shareholder services fees | | | — | | | | — | | | | — | | | | 3,776 |
Custodian fees | | | 148 | | | | 112 | | | | 97 | | | | 170 |
Transfer agent fees | | | 12 | | | | 100 | | | | 102 | | | | 38 |
Professional fees | | | 29 | | | | 37 | | | | 40 | | | | 67 |
Registration fees | | | 41 | | | | 30 | | | | 36 | | | | 23 |
Other expenses | | | 4 | | | | 47 | | | | 66 | | | | 177 |
| | |
|
|
| |
|
|
| |
|
|
| |
|
|
Total expenses before waiver | | | 770 | | | | 1,897 | | | | 1,904 | | | | 6,865 |
Less expenses waived or absorbed by the Advisor | | | (161 | ) | | | (333 | ) | | | — | | | | — |
| | |
|
|
| |
|
|
| |
|
|
| |
|
|
Net expenses | | | 609 | | | | 1,564 | | | | 1,904 | | | | 6,865 |
| | |
|
|
| |
|
|
| |
|
|
| |
|
|
Net investment income (loss) | | | 69 | | | | (48 | ) | | | 12,852 | | | | 27,823 |
Net realized and unrealized gain (loss) on investments, foreign currency transactions and other assets and liabilities | | | | | | | | | | | | | | | |
Net realized gain (loss) on investments | | | 1,926 | | | | 39,004 | | | | (1,052 | ) | | | — |
Net realized gain (loss) on foreign currency transactions and other assets and liabilities | | | (391 | ) | | | — | | | | — | | | | — |
| | |
|
|
| |
|
|
| |
|
|
| |
|
|
Total net realized gain (loss) | | | 1,535 | | | | 39,004 | | | | (1,052 | ) | | | — |
Change in net unrealized appreciation (depreciation) on investments and other assets and liabilities | | | 29,686 | | | | (49,149 | ) | | | (6,151 | ) | | | — |
| | |
|
|
| |
|
|
| |
|
|
| |
|
|
Net increase (decrease) in net assets resulting from operations | | $ | 31,290 | | | $ | (10,193 | ) | | $ | 5,649 | | | $ | 27,823 |
| | |
|
|
| |
|
|
| |
|
|
| |
|
|
| (a) | | For the period from June 6, 2005 (Commencement of Operations) to December 31, 2005. |
See accompanying Notes to Financial Statements.
74 Annual Report | December 31, 2005 |
Statements of Changes in Net Assets
For the Years Ended December 31, 2005 and 2004 (all amounts in thousands)
| | | | | | | | | | | | | | | | | | | | | | | | | | | | |
| | | Emerging
Markets
Growth
Fund(a)
| | | Value
Discovery
Fund
| | | Income
Fund
| | | Ready
Reserves
Fund
| |
| | | 2005
| | | 2005
| | | 2004
| | | 2005
| | | 2004
| | | 2005
| | | 2004
| |
Operations | | | | | | | | | | | | | | | | | | | | | | | | | | | | |
Net investment income (loss) | | $ | 69 | | | $ | (48 | ) | | $ | 84 | | | $ | 12,852 | | | $ | 11,549 | | | $ | 27,823 | | | $ | 8,967 | |
Net realized gain (loss) on investments, foreign currency transactions and other assets and liabilities | | | 1,535 | | | | 39,004 | | | | 26,728 | | | | (1,052 | ) | | | (1,841 | ) | | | — | | | | 13 | |
Change in net unrealized appreciation (depreciation) on investments, foreign currency
transactions and other assets and liabilities | | | 29,686 | | | | (49,149 | ) | | | 240 | | | | (6,151 | ) | | | (2,534 | ) | | | — | | | | — | |
| | |
|
|
| |
|
|
| |
|
|
| |
|
|
| |
|
|
| |
|
|
| |
|
|
|
Net increase (decrease) in net assets resulting from operations | | | 31,290 | | | | (10,193 | ) | | | 27,052 | | | | 5,649 | | | | 7,174 | | | | 27,823 | | | | 8,980 | |
Distributions to shareholders from | | | | | | | | | | | | | | | | | | | | | | | | | | | | |
Net investment income | | | — | | | | — | | | | — | | | | (16,070 | ) | | | (14,033 | ) | | | (27,823 | ) | | | (8,967 | ) |
Net realized gain | | | (1,169 | ) | | | (24,647 | ) | | | (26,037 | ) | | | — | | | | — | | | | — | | | | — | |
| | |
|
|
| |
|
|
| |
|
|
| |
|
|
| |
|
|
| |
|
|
| |
|
|
|
| | | | (1,169 | ) | | | (24,647 | ) | | | (26,037 | ) | | | (16,070 | ) | | | (14,033 | ) | | | (27,823 | ) | | | (8,967 | ) |
Capital stock transactions | | | | | | | | | | | | | | | | | | | | | | | | | | | | |
Net proceeds from sale of shares | | | 224,893 | | | | 19,288 | | | | 58,405 | | | | 95,102 | | | | 93,503 | | | | 1,131,031 | | | | 1,678,077 | |
Shares issued in reinvestment of income dividends and capital gain distributions | | | 1,122 | | | | 24,267 | | | | 25,638 | | | | 12,541 | | | | 10,085 | | | | 27,698 | | | | 8,904 | |
Capital contribution by the Advisor | | | — | | | | — | | | | — | | | | — | | | | — | | | | — | | | | 1,000 | |
Less cost of shares redeemed | | | (6,788 | ) | | | (184,452 | ) | | | (75,993 | ) | | | (80,810 | ) | | | (67,707 | ) | | | (1,159,815 | ) | | | (1,748,986 | ) |
| | |
|
|
| |
|
|
| |
|
|
| |
|
|
| |
|
|
| |
|
|
| |
|
|
|
Net increase (decrease) in net assets resulting from capital stock transactions | | | 219,227 | | | | (140,897 | ) | | | 8,050 | | | | 26,833 | | | | 35,881 | | | | (1,086 | ) | | | (61,005 | ) |
| | |
|
|
| |
|
|
| |
|
|
| |
|
|
| |
|
|
| |
|
|
| |
|
|
|
Increase (decrease) in net assets | | | 249,348 | | | | (175,737 | ) | | | 9,065 | | | | 16,412 | | | | 29,022 | | | | (1,086 | ) | | | (60,992 | ) |
Net assets | | | | | | | | | | | | | | | | | | | | | | | | | | | | |
Beginning of year | | | — | | | | 246,176 | | | | 237,111 | | | | 294,084 | | | | 265,062 | | | | 1,092,940 | | | | 1,153,932 | |
| | |
|
|
| |
|
|
| |
|
|
| |
|
|
| |
|
|
| |
|
|
| |
|
|
|
End of year | | $ | 249,348 | | | $ | 70,439 | | | $ | 246,176 | | | $ | 310,496 | | | $ | 294,084 | | | $ | 1,091,854 | | | $ | 1,092,940 | |
| | |
|
|
| |
|
|
| |
|
|
| |
|
|
| |
|
|
| |
|
|
| |
|
|
|
Undistributed net investment income (loss) at the end of the year | | $ | (322 | ) | | $ | 3 | | | $ | 36 | | | $ | — | | | $ | 173 | | | $ | 81 | | | $ | 81 | |
| | |
|
|
| |
|
|
| |
|
|
| |
|
|
| |
|
|
| |
|
|
| |
|
|
|
| (a) | | For the period from June 6, 2005 (Commencement of Operations) to December 31, 2005. |
See accompanying Notes to Financial Statements.
December 31, 2005 | William Blair Funds 75 |
Notes to Financial Statements
(1) Significant Accounting Policies
(a) Description of the Fund
William Blair Funds (the “Fund”) is a diversified mutual fund registered under the Investment Company Act of 1940, as amended, as an open-end management investment company. For each portfolio, the number of shares authorized is unlimited. The Fund currently consists of the following fourteen portfolios (the “Portfolios”), each with its own investment objectives and policies.
| | |
Equity Portfolios
| | International Portfolios
|
Growth | | International Growth |
Tax-Managed Growth | | International Equity |
Large Cap Growth | | International Small Cap Growth |
Small Cap Growth | | Institutional International Growth |
Small-Mid Cap Growth | | Institutional International Equity |
Value Discovery | | Emerging Markets Growth |
| | | Fixed Income Portfolio
|
| | | Income |
| | | Money Market Portfolio
|
| | | Ready Reserves |
The investment objectives of the Portfolios are as follows:
| | |
Equity | | Long-term capital appreciation. |
International | | Long-term capital appreciation. |
Fixed Income | | High level of current income with relative stability of principal. |
Money Market | | Current income, a stable share price and daily liquidity. |
The Institutional International Growth Fund, the Institutional International Equity Fund and the Institutional Class of the International Small Cap Growth Fund and Emerging Markets Growth Fund issue a separate report.
(b) Share Classes
Three different classes of shares currently exist: N, I and Institutional. This report includes financial highlight information for Classes N and I. The table below describes the Class N shares and the Class I shares covered by this report:
| | |
Class
| | Description
|
| N | | Class N shares are sold to the general public, either directly through the Fund’s distributor or through a select number of financial intermediaries. Class N shares are sold without any sales load, and carry an annual 12b-1 distribution fee (0.25% for the Equity and International Portfolios and 0.15% for the Fixed Income Portfolio) or a service fee (0.35% for the Money Market Portfolio), and an annual shareholder administration fee (0.15% for the International Small Cap Growth Portfolio and Emerging Markets Growth Portfolio). |
| I | | Class I shares are sold to a limited group of investors. They do not carry any sales load or distribution fees and generally have lower ongoing expenses than the other classes. Class I shares of the International Small Cap Growth Portfolio and Emerging Markets Growth Portfolio carry an annual shareholder administration fee of 0.15%. |
Investment income, realized and unrealized gains and losses, and certain portfolio level expenses and expense reductions, if any, are allocated based on the relative net assets of each class, except for certain class specific expenses which are charged directly to the appropriate class. Differences in class expenses may result in the payment of different per share dividends by class. All share classes of the Portfolios have equal rights with respect to voting subject to class specific arrangements.
(c) Investment Valuation
The market value of domestic equity securities and options is determined by valuing securities traded on national securities exchanges or markets or in the over-the-counter markets at the last sales price or, if applicable, the official closing price or, in the absence of a sale on the date of valuation, at the latest bid price.
76 Annual Report | December 31, 2005 |
For international securities, if the foreign exchange or market on which a security is primarily traded closes before the close of regular trading on the New York Stock Exchange (4:00 p.m. Eastern time), the Funds use an independent pricing service on a daily basis to estimate the fair value price as of the close of regular trading on the New York Stock Exchange. The Board of Trustees has determined that the passage of time between when foreign exchanges or markets close and when the Funds calculate their net asset values could cause the value of international securities to no longer be representative of their market price or accurate. Otherwise, the value of foreign equity securities is determined based on the last sale price on the foreign exchange or market on which it is primarily traded or, if there have been no sales during that day, at the latest bid price. Foreign currency forward contracts and foreign currencies are valued at the forward and current exchange rates, respectively, prevailing on the date of valuation. In addition, quarterly the Board of Trustees receives a report which tracks the fair value prices used to calculate the net asset value to the next day’s opening local prices.
Long-term, fixed income securities are valued based on market quotations, or by independent pricing services that use prices provided by market makers or by estimates of market values obtained from yield data relating to instruments or securities with similar characteristics.
Investments in other funds are valued at the underlying fund’s net asset value on the date of valuation. Other securities, and all other assets, including securities for which a market price is not available, or the value of which is affected by a significant valuation event, are valued at fair value as determined in good faith by, or under the direction of the Board of Trustees and in accordance with the Fund’s valuation procedures. As of December 31, 2005, there were securities held in Small Cap Growth, International Growth, International Equity, International Small Cap Growth, Emerging Markets Growth and Value Discovery Portfolios requiring fair valuation pursuant to the Fund’s valuation procedures. Short-term securities held in the Ready Reserves Fund are valued at amortized cost, which approximates market value.
(d) Investment income and investment transactions
Dividend income is recorded on the ex-dividend date, except for those dividends from certain foreign securities which are recorded as soon as the information is available. Foreign currency gains and losses associated with fluctuations in the foreign currency rate versus the United States dollar are recorded in the Statement of Operations as a component of the net realized gain (loss) on foreign currency transactions and other assets and liabilities.
Premiums and discounts are accreted and amortized on a straight-line basis for short-term investments and on an effective interest method for long-term investments.
Interest income is determined on the basis of the interest accrued, adjusted for amortization of premium or discount. Variable rate bonds and floating rate notes earn interest at coupon rates that fluctuate at specific time intervals. The interest rates shown in the Portfolio of Investments for the Income Portfolio and the Ready Reserves Portfolio were the rates in effect on December 31, 2005. Put bonds may be redeemed at the discretion of the holder on specified dates prior to maturity.
Paydown gains and losses on mortgage and asset-backed securities are treated as an adjustment to interest income. For the year ended December 31, 2005, the Income Portfolio recognized a reduction of interest income and a reduction of net realized loss of $2,990 (in thousands). This reclassification has no effect on the net asset value of the Portfolio.
Securities transactions are recorded on the trade date. Realized gains and losses from securities transactions are recognized on the basis of high cost lot sell selection.
(e) Share Valuation and Dividends to Shareholders
Shares are sold and redeemed on a continuous basis at net asset value. The net asset value per share is determined separately for each class by dividing the Portfolio’s net assets attributable to that class by the number of shares of the class outstanding as of the close of regular trading on the New York Stock Exchange, which is generally 3:00 p.m. Central time (4:00 p.m. Eastern time), on each day the Exchange is open. Redemption fees may be applicable to redemptions within 60 days of purchase. The redemption fees collected by the Fund are netted against the amount of Redemptions for presentation on the Statement of Changes in Net Assets.
December 31, 2005 | William Blair Funds 77 |
For the year ended December 31, 2005, the redemption fees collected by the Portfolios were as follows (in thousands):
| | | |
| | | Redemption Fees
|
Growth | | $ | 3 |
Tax-Managed Growth | | | — |
Large Cap Growth | | | — |
Small Cap Growth | | | 17 |
Small Mid-Cap Growth | | | — |
International Growth | | | 51 |
International Equity | | | 3 |
International Small Cap Growth | | | — |
Emerging Markets Growth | | | 10 |
Value Discovery | | | 3 |
Income | | | — |
Dividends from net investment income, if any, of the Growth, Tax-Managed Growth, Large Cap Growth, Small Cap Growth, Small-Mid Cap Growth, International Growth, International Equity, International Small Cap Growth, Emerging Markets Growth and Value Discovery Portfolios are declared at least annually. Dividends from the Income and the Ready Reserves Portfolios are declared monthly and daily, respectively. Capital gain distributions, if any, are declared at least annually in December. Dividends payable to shareholders are recorded on the ex-dividend date.
The timing and characterization of certain income and capital gain distributions are determined annually in accordance with Federal income tax regulations that may differ from U.S. generally accepted accounting principles. As a result, net investment income or loss and net realized gain or loss for a reporting period may differ from the amount distributed during such period. In addition, the Portfolios may periodically record reclassifications among certain capital accounts to reflect differences between financial reporting and income tax basis distributions. The reclassifications were reported in order to reflect the tax treatment for certain permanent differences that exist between income tax regulations and U.S. generally accepted accounting principles. The reclassifications relate to net operating losses, Section 988 currency gains and losses, recharacterization of dividends received from investments in REITs, expired capital loss carryforwards, and gain or loss on in-kind transactions. These reclassifications have no impact on the net asset values of the Portfolios. Accordingly, at December 31, 2005, the following reclassifications were recorded (in thousands):
| | | | | | | | | | | | |
Portfolio
| | Undistributed Net
Investment Income/(Loss)
| | | Accumulated
Undistributed
Net Realized Gain/(Loss)
| | | Capital
Paid In Excess
of Par Value
| |
Growth | | $ | 986 | | | $ | 1 | | | $ | (987 | ) |
Tax-Managed Growth | | | 32 | | | | — | | | | (32 | ) |
Large Cap Growth | | | 21 | | | | — | | | | (21 | ) |
Small Cap Growth | | | 8,349 | | | | (8,316 | ) | | | (33 | ) |
Small-Mid Cap Growth | | | 382 | | | | (20 | ) | | | (362 | ) |
International Growth | | | (10,344 | ) | | | 10,344 | | | | — | |
International Equity | | | (475 | ) | | | 472 | | | | 3 | |
International Small Cap Growth | | | (87 | ) | | | 87 | | | | — | |
Emerging Markets Growth | | | (391 | ) | | | 391 | | | | — | |
Value Discovery | | | 15 | | | | (16,587 | ) | | | 16,572 | |
Income | | | 3,045 | | | | (2,990 | ) | | | (55 | ) |
Ready Reserves | | | — | | | | 1 | | | | (1 | ) |
78 Annual Report | December 31, 2005 |
Distributions from net realized gains for book purposes may include short-term capital gains, which are included as ordinary income for tax purposes. The tax character of distributions paid during 2005 and 2004 was as follows (in thousands):
| | | | | | | | | | | | |
| | | Distributions Paid In 2005
| | Distributions Paid In 2004
|
Portfolio
| | Ordinary
Income
| | Long-Term
Capital Gains
| | Ordinary
Income
| | Long-Term
Capital Gains
|
Growth | | $ | — | | $ | 8,977 | | $ | — | | $ | — |
Tax-Managed Growth | | | — | | | — | | | — | | | — |
Large Cap Growth | | | — | | | — | | | — | | | — |
Small Cap Growth | | | 11,335 | | | 60,296 | | | 15,332 | | | 39,450 |
Small-Mid Cap Growth | | | — | | | 495 | | | — | | | — |
International Growth | | | 21,550 | | | 254,334 | | | 2,616 | | | — |
International Equity | | | — | | | — | | | — | | | — |
International Small Cap Growth | | | 6 | | | — | | | — | | | — |
Emerging Markets Growth | | | 1,169 | | | — | | | — | | | — |
Value Discovery | | | — | | | 24,647 | | | — | | | 26,037 |
Income | | | 16,070 | | | — | | | 14,033 | | | — |
Ready Reserves | | | 27,823 | | | — | | | 8,967 | | | — |
As of December 31, 2005, the components of distributable earnings on a tax basis were as follows (in thousands):
| | | | | | | | | | | | | |
Portfolio
| | Undistributed
Ordinary
Income
| | Accumulated
Capital and
Other
Losses
| | Undistributed
Long-Term
Gain
| | Net Unrealized
Appreciation / (Depreciation)
| |
Growth | | $ | — | | $ | — | | $ | 2,034 | | $ | 63,480 | |
Tax-Managed Growth | | | — | | | 1,796 | | | — | | | 2,113 | |
Large Cap Growth | | | — | | | 5,327 | | | — | | | 1,659 | |
Small Cap Growth | | | — | | | 7,540 | | | — | | | 117,869 | |
Small-Mid Cap Growth | | | — | | | — | | | 1,113 | | | 8,223 | |
International Growth | | | 24,244 | | | — | | | 34,770 | | | 1,169,428 | |
International Equity | | | 1,109 | | | 1,042 | | | — | | | 14,362 | |
International Small Cap Growth | | | 511 | | | — | | | — | | | 4,111 | |
Emerging Markets Growth | | | 404 | | | — | | | 1,158 | | | 28,559 | |
Value Discovery | | | — | | | — | | | 4,318 | | | 10,896 | |
Income | | | — | | | 16,667 | | | — | | | (3,885 | ) |
Ready Reserves | | | 81 | | | 1,027 | | | — | | | — | |
(f) Options
The Portfolios may engage in options transactions on security indices and other financial indices and in doing so achieve similar objectives to what they would achieve through the sale or purchase of options on individual securities or other instruments.
Option writing. When a Portfolio writes an option, an amount equal to the premium received by the Portfolio is recorded as a liability and is subsequently adjusted to the current fair value of the option written. Premiums received from writing options that expire unexercised are treated by the Portfolio on the expiration date as realized gains from investments. The difference between the premium and the amount paid on effecting a closing purchase transaction, including brokerage commissions, is also treated as a realized gain, or, if the premium is less than the amount paid for the closing purchase transaction, as a realized loss. If a call option is exercised, the premium is added to the proceeds from the sale of the underlying security or currency in determining whether the Portfolio has realized a gain or loss. If a put option is exercised, the premium reduces the cost basis of the securities purchased by the Portfolio. The Portfolio as writer of an option bears the market risk of an unfavorable change in the price of the security underlying the written option. There were no open options at December 31, 2005.
(g) Foreign Currency Translation and Forward Foreign Currency Contracts
The International Growth, International Equity, International Small Cap Growth and Emerging Markets Growth Portfolios may invest in securities denominated in foreign currencies. As such, assets and liabilities denominated in foreign currencies are translated into U.S. dollar amounts at the current exchange rate on the date of valuation. The Portfolios may enter into
December 31, 2005 | William Blair Funds 79 |
foreign currency forward contracts (1) as a means of managing the risks associated with changes in the exchange rates for the purchase or sale of a specific amount of a particular foreign currency, and (2) to hedge the value, in U.S. dollars, of portfolio securities. Gains and losses from foreign currency transactions associated with purchases and sales of investments and foreign currency forward contracts are included with the net realized and unrealized gain or loss on investments.
(h) Income Taxes
Each Portfolio intends to comply with the special provisions of Subchapter M of the Internal Revenue Code available to regulated investment companies and, therefore, no provision for Federal income taxes has been made in the accompanying financial statements since each Portfolio intends to distribute substantially all of its taxable income to its shareholders and be relieved of all Federal income taxes.
The cost of investments for Federal income tax purposes and related gross unrealized appreciation/(depreciation) and net unrealized appreciation/(depreciation) at December 31, 2005, were as follows (in thousands):
| | | | | | | | | | | | | |
Portfolio
| | Cost of
Investments
| | Gross Unrealized Appreciation
| | Gross Unrealized Depreciation
| | Net Unrealized
Appreciation/ (Depreciation)
| |
Growth | | $ | 188,908 | | $ | 65,480 | | $ | 2,000 | | $ | 63,480 | |
Tax-Managed Growth | | | 5,640 | | | 2,158 | | | 45 | | | 2,113 | |
Large Cap Growth | | | 15,052 | | | 1,888 | | | 229 | | | 1,659 | |
Small Cap Growth | | | 705,923 | | | 141,526 | | | 23,657 | | | 117,869 | |
Small-Mid Cap Growth | | | 63,839 | | | 9,850 | | | 1,627 | | | 8,223 | |
International Growth | | | 3,345,981 | | | 1,185,856 | | | 16,428 | | | 1,169,428 | |
International Equity | | | 164,469 | | | 15,390 | | | 1,028 | | | 14,362 | |
International Small Cap Growth | | | 47,338 | | | 4,497 | | | 386 | | | 4,111 | |
Emerging Markets Growth | | | 214,391 | | | 28,804 | | | 245 | | | 28,559 | |
Value Discovery | | | 57,317 | | | 11,878 | | | 982 | | | 10,896 | |
Income | | | 310,983 | | | 1,449 | | | 5,334 | | | (3,885 | ) |
Ready Reserves | | | 1,092,711 | | | — | | | — | | | — | |
At December 31, 2005, the Portfolios have unused capital loss carryforwards available for Federal income tax purposes to be applied against future capital gains, if any. If not applied, the carryforwards will expire as follows (in thousands):
| | | | | | | | | | | | | | | | | | | | | | | | | | | |
Portfolio
| | 2006
| | 2007
| | 2008
| | 2009
| | 2010
| | 2011
| | 2012
| | 2013
| | Total
|
Growth | | $ | — | | $ | — | | $ | — | | $ | — | | $ | — | | $ | — | | $ | — | | $ | — | | $ | — |
Tax-Managed Growth | | | — | | | — | | | — | | | 273 | | | 1,037 | | | 468 | | | — | | | — | | | 1,778 |
Large Cap Growth | | | — | | | — | | | 246 | | | 2,714 | | | 1,582 | | | 769 | | | — | | | — | | | 5,311 |
Small Cap Growth | | | — | | | — | | | — | | | — | | | — | | | — | | | — | | | — | | | — |
Small-Mid Cap Growth | | | — | | | — | | | — | | | — | | | — | | | — | | | — | | | — | | | — |
International Growth | | | — | | | — | | | — | | | — | | | — | | | — | | | — | | | — | | | — |
International Equity | | | — | | | — | | | — | | | — | | | — | | | — | | | — | | | 1,042 | | | 1,042 |
International Small Cap Growth | | | — | | | — | | | — | | | — | | | — | | | — | | | — | | | — | | | — |
Emerging Markets Growth | | | — | | | — | | | — | | | — | | | — | | | — | | | — | | | — | | | — |
Value Discovery | | | — | | | — | | | — | | | — | | | — | | | — | | | — | | | — | | | — |
Income | | | — | | | 1,249 | | | 3,292 | | | — | | | 1,692 | | | 1,582 | | | 4,431 | | | 3,398 | | | 15,644 |
Ready Reserves | | | 1 | | | 51 | | | 24 | | | — | | | 930 | | | — | | | 21 | | | — | | | 1,027 |
The International Growth, International Equity, International Small Cap Growth and Emerging Markets Growth Portfolios have elected to mark-to-market their investments in Passive Foreign Investment Companies (“PFICs”) for Federal income tax purposes. In accordance with this election, the Portfolios recognized net unrealized appreciation/(depreciation) of $51,869, $1,706, $117 and $726, respectively (in thousands) in 2005, all of which has been reclassified from unrealized gain/(loss) on investments to undistributed net investment income.
80 Annual Report | December 31, 2005 |
For the period November 1, 2005 through December 31, 2005, the following Portfolios incurred net realized capital or foreign currency losses. Each Portfolio intends to treat this loss as having occurred in fiscal year 2006 for Federal income tax purposes (in thousands):
| | | |
Portfolio
| | Capital
Loss
|
Growth | | $ | — |
Tax-Managed Growth | | | 18 |
Large Cap Growth | | | 16 |
Small Cap Growth | | | 7,540 |
Small-Mid Cap Growth | | | — |
International Growth | | | — |
International Equity | | | — |
International Small Cap Growth | | | — |
Emerging Markets Growth | | | — |
Value Discovery | | | — |
Income | | | 1,023 |
Ready Reserves | | | — |
(i) Use of Estimates
The preparation of financial statements in conformity with U.S. generally accepted accounting principles requires management to make estimates and assumptions that affect the amounts reported in the financial statements. Actual results may differ from those estimates.
(2) Transactions with Affiliates
(a) Management and Expense Limitation Agreements
Each Portfolio has a management agreement with William Blair & Company L.L.C. (the “Company”) for investment advisory, administrative, and other accounting services. Each Portfolio pays the Company an annual fee, payable monthly, based on a specified percentage of its average daily net assets. A summary of the annual rates expressed as a percentage of average daily net assets is as follows:
| | | | | | | | |
Equity Portfolios
| | | | | International Portfolios
| | | |
Growth | | 0.75 | % | | International Growth and International Equity | | | |
Tax-Managed Growth | | 0.80 | % | | First $250 million | | 1.10 | % |
Large Cap Growth | | 0.80 | % | | In excess of $250 million | | 1.00 | % |
Small Cap Growth | | 1.10 | % | | International Small Cap Growth | | 1.00 | % |
Small-Mid Cap Growth | | 1.00 | % | | Emerging Markets Growth | | 1.10 | % |
Value Discovery | | 1.15 | % | | | | | |
| | | |
Fixed Income Portfolio
| | | | | Money Market Portfolio
| | | |
Income* | | | | | Ready Reserves | | | |
First $250 million | | 0.25 | % | | First $250 million | | 0.275 | % |
In excess of $250 million | | 0.20 | % | | Next $250 million | | 0.250 | % |
*Management fee also includes a charge of 5% of gross income. | | | | | Next $2 billion In excess of $2.5 billion | | 0.225
0.200 | %
% |
| | | | | | | | |
December 31, 2005 | William Blair Funds 81 |
Some of the Portfolios have also entered into Expense Limitation Agreements with the Company. Under the terms of these Agreements, the Company has agreed to waive its advisory fees and absorb other operating expenses through April 30, 2006, if total expenses for each class of the following Portfolios exceed the following rates (as a percentage of average daily net assets):
| | | | | | | | | | | | |
| | | Class N Shares
| | | Class I Shares
| |
| | | Through April 30, 2005
| | | Effective
May 1, 2005
| | | Through April 30, 2005
| | | Effective
May 1, 2005
| |
Tax-Managed Growth | | 1.54 | % | | 1.53 | % | | 1.29 | % | | 1.28 | % |
Large Cap Growth | | 1.34 | % | | 1.25 | % | | 1.09 | % | | 1.00 | % |
Small Cap Growth | | 1.53 | % | | 1.50 | % | | 1.40 | % | | 1.25 | % |
Small-Mid Cap Growth | | 1.54 | % | | 1.40 | % | | 1.29 | % | | 1.15 | % |
International Growth | | N/A | | | 1.48 | % | | N/A | | | 1.23 | % |
International Equity | | 1.50 | % | | 1.48 | % | | 1.25 | % | | 1.23 | % |
International Small Cap Growth | | N/A | | | 1.65 | % | | N/A | | | 1.40 | % |
Emerging Markets Growth | | N/A | | | 1.65 | % | | N/A | | | 1.40 | % |
Value Discovery | | 1.34 | % | | 1.34 | % | | 1.25 | % | | 1.09 | % |
Income Fund | | N/A | | | 0.75 | % | | N/A | | | N/A | |
For a period of five years subsequent to the Commencement of Operations of each Fund, the Company is entitled to reimbursement from the Tax-Managed Growth, Large Cap Growth, and Small Cap Growth Portfolios for previously waived fees and expenses to the extent the overall expense ratio remains below the percentages indicated. As a result, the total expense ratio for the Portfolios during the period the agreement is in effect will not fall below the percentages indicated. The Company’s right to be reimbursed under these agreements expired December 27, 2004. Under this provision, the Small Cap Growth Portfolio reimbursed the Advisor $164, for the year ended December 31, 2004 (in thousands).
For a period of three years subsequent to the Commencement of Operations of the Small-Mid Cap Growth, the International Equity, International Small Cap Growth and the Emerging Markets Growth Portfolios, the Company is entitled to reimbursement for previously waived fees and expenses to the extent the overall expense ratio remains below the percentages indicated. The total amount available for recapture at December 31, 2005 is $131 (in thousands) for the Small-Mid Cap Growth Portfolio, $244 for the International Equity Portfolio, $54 for the International Small Cap Growth Portfolio and $161 for the Emerging Markets Growth Portfolio.
For the year ended December 31, 2005, the investment advisory fees incurred by the Portfolios and related fee waivers were as follows (in thousands) :
| | | | | | | | | | | | |
Portfolio
| | Gross
Advisory Fee
| | Fee Waiver
| | Net
Advisory Fee
| | Additional Expenses
(Recovered) or
Absorbed
by Advisor
|
Growth | | $ | 1,873 | | $ | — | | $ | 1,873 | | $ | — |
Tax-Managed Growth | | | 48 | | | 48 | | | — | | | 14 |
Large Cap Growth | | | 83 | | | 83 | | | — | | | 3 |
Small Cap Growth | | | 8,101 | | | — | | | 8,101 | | | — |
Small-Mid Cap Growth | | | 494 | | | 50 | | | 444 | | | — |
International Growth | | | 34,942 | | | — | | | 34,942 | | | — |
International Equity | | | 670 | | | 182 | | | 488 | | | — |
International Small Cap Growth | | | 61 | | | 54 | | | 7 | | | — |
Emerging Markets Growth | | | 508 | | | 161 | | | 347 | | | — |
Value Discovery | | | 1,518 | | | 319 | | | 1,199 | | | — |
Income | | | 1,422 | | | — | | | 1,422 | | | — |
Ready Reserves | | | 2,614 | | | — | | | 2,614 | | | — |
(b) Underwriting, Distribution Services and Service Agreement
Each Portfolio except Ready Reserves Portfolio has a Distribution Agreement with the Company for distribution services. Each Portfolio pays the Company an annual fee, payable monthly, based on a specified percentage of its average daily net assets of specified share classes. The annual rates expressed as a percentage of average daily net assets for Class N is 0.25% for all Portfolios except the Income Portfolio, which is 0.15%. Pursuant to the Distribution Agreement, the Company enters into related selling group agreements with various firms at various rates for sales of the Portfolios’ Class N shares.
82 Annual Report | December 31, 2005 |
Distribution fees incurred by the Portfolios to the Company, for the year ended December 31, 2005, were as follows (in thousands):
| | | | | | | | | |
Portfolio
| | Gross Distribution Fees
| | Fee Waiver
| | Net Distribution Fee
|
Growth | | $ | 122 | | $ | — | | $ | 122 |
Tax-Managed Growth | | | — | | | — | | | — |
Large Cap Growth | | | 8 | | | — | | | 8 |
Small Cap Growth | | | 1,108 | | | — | | | 1,108 |
Small-Mid Cap Growth | | | 24 | | | — | | | 24 |
International Growth | | | 5,945 | | | — | | | 5,945 |
International Equity | | | 21 | | | — | | | 21 |
International Small Cap Growth | | | — | | | — | | | — |
Emerging Markets Growth | | | 8 | | | — | | | 8 |
Value Discovery | | | 53 | | | 14 | | | 39 |
Income | | | 141 | | | — | | | 141 |
The Ready Reserves Portfolio has a Service Agreement with the Company to provide shareholder services and automatic sweep services. The Portfolio pays the Company an annual fee, payable monthly, based upon 0.35% of the average daily net assets of Class N. For the year ended December 31, 2005, the following fees were incurred (in thousands):
The International Small Cap Growth and the Emerging Markets Growth Portfolios have a Shareholder Administration Agreement with the Company to provide shareholder administration services. Class N and Class I shares of the Portfolios pay the Company an annual fee, payable monthly, based upon 0.15% of average daily net assets attributable to each class, respectively. For the year ended December 31, 2005, the following fees were incurred (in thousands):
| | | |
International Small Cap Growth | | $ | 3 |
Emerging Markets Growth | | | 22 |
(c) Trustees Fees
The Portfolios incurred fees of $218 (in thousands) to non-interested trustees of the Fund for the year ended December 31, 2005. Interested trustees are not compensated.
(d) Investments in Affiliated Portfolio
Pursuant to an Exemptive Order granted by the Securities and Exchange Commission in January, 2001, each of the Portfolios of the Fund may invest in the William Blair Ready Reserves Portfolio (“Ready Reserves”), an open-end money market portfolio managed by the Advisor. Ready Reserves Portfolio is used as a cash management option to the other Portfolios in the Fund. The Advisor waives management fees and shareholder service fees earned from the other Portfolios’ investment in the Ready Reserves Fund. The fees waived with respect to each Portfolio for the year ended December 31, 2005 are listed below. Distributions received from Ready Reserves are reflected as dividend income in each Portfolio’s statement of operations. Amounts relating to the Portfolios’ investments in Ready Reserves were as follows for the year ended December 31, 2005 (in thousands):
| | | | | | | | | | | | | | | | | | |
Portfolio
| | Purchases
| | Sales
Proceeds
| | Fees
Waived
| | Dividend
Income
| | Value
| | Percent
of Net
Assets
| |
Growth | | $ | 46,212 | | $ | 45,626 | | $ | 11 | | $ | 41 | | $ | 724 | | 0.3 | % |
Tax-Managed Growth | | | 2,298 | | | 1,982 | | | 1 | | | 6 | | | 363 | | 4.6 | |
Large Cap Growth | | | 10,184 | | | 9,937 | | | 2 | | | 11 | | | 424 | | 2.5 | |
Small Cap Growth | | | 79,733 | | | 90,580 | | | 52 | | | 220 | | | 11,002 | | 1.3 | |
Small-Mid Cap Growth | | | 18,182 | | | 17,146 | | | 8 | | | 32 | | | 2,012 | | 2.9 | |
International Growth | | | 125,312 | | | 136,500 | | | 152 | | | 660 | | | 28,678 | | 0.7 | |
International Equity | | | 18,145 | | | 16,804 | | | 7 | | | 38 | | | 1,560 | | 0.9 | |
International Small Cap Growth | | | 3,170 | | | 2,760 | | | — | | | 1 | | | 410 | | 0.8 | |
Emerging Markets Growth | | | 17,270 | | | 13,449 | | | 5 | | | 26 | | | 3,821 | | 1.5 | |
Value Discovery | | | 33,889 | | | 40,717 | | | 8 | | | 28 | | | 73 | | 0.1 | |
December 31, 2005 | William Blair Funds 83 |
(e) Capital Contribution to Affiliated Portfolio
In 2004, the Company voluntarily contributed $1 million dollars to the Ready Reserves Portfolio for which it did not receive any shares. This contribution is reflected on the Statement of Changes in Net Assets.
(3) Investment Transactions
Investment transactions, excluding money market instruments, for the year ended December 31, 2005 were as follows (in thousands):
| | | | | | |
Portfolio
| | Purchases
| | Sales
|
Growth | | $ | 132,859 | | $ | 184,856 |
Tax-Managed Growth | | | 2,096 | | | 1,474 |
Large Cap Growth | | | 14,622 | | | 5,328 |
Small Cap Growth | | | 633,328 | | | 577,945 |
Small-Mid Cap Growth | | | 64,587 | | | 29,936 |
International Growth | | | 3,113,784 | | | 2,361,056 |
International Equity | | | 220,070 | | | 74,046 |
International Small Cap Growth | | | 50,786 | | | 7,799 |
Emerging Markets Growth | | | 240,654 | | | 40,574 |
Value Discovery | | | 163,644 | | | 326,814 |
Income | | | 155,850 | | | 127,568 |
(4) Foreign Currency Forward Contracts
To protect itself against a decline in the value of foreign currency against the U.S. dollar, the International Growth, International Equity, International Small Cap Growth and Emerging Markets Growth Portfolios enter into foreign currency forward contracts with its custodian and others. The Portfolios bear the market risk that arises from changes in foreign currency rates and bears the credit risk if the counterparty fails to perform under the contract. The net realized and unrealized gains and losses associated with foreign currency forward contracts are reflected in the accompanying financial statements. There were no open foreign currency forward contracts at December 31, 2005.
(5) Subsequent Events
The Fund filed a Post-Effective Amendment to its Registration Statement on November 17, 2005 for the purpose of adding a new portfolio to the Fund, William Blair Mid Cap Growth Fund-Class N and Class I. The new Portfolio commenced operations on February 1, 2006.
84 Annual Report | December 31, 2005 |
(5) Fund Share Transactions
The following table summarizes the activity in capital shares of each Portfolio (in thousands):
| | | | | | | | | | | | | | | | | | |
| | | Sales (Dollars)
|
| | | Year Ended December 31, 2005
| | Year Ended December 31, 2004
|
Portfolio
| | Class N
| | Class I
| | Total
| | Class N
| | Class I
| | Total
|
Growth | | $ | 10,753 | | $ | 9,054 | | $ | 19,807 | | $ | 19,930 | | $ | 15,264 | | $ | 35,194 |
Tax-Managed Growth | | | 113 | | | 1,662 | | | 1,775 | | | — | | | 246 | | | 246 |
Large Cap Growth | | | 7,918 | | | 3,738 | | | 11,656 | | | 99 | | | 1,556 | | | 1,655 |
Small Cap Growth | | | 236,433 | | | 108,640 | | | 345,073 | | | 182,154 | | | 77,876 | | | 260,030 |
Small Mid-Cap Growth | | | 5,104 | | | 38,266 | | | 43,370 | | | 7,409 | | | 13,822 | | | 21,231 |
International Growth | | | 1,066,440 | | | 358,231 | | | 1,424,671 | | | 806,487 | | | 336,908 | | | 1,143,395 |
International Equity (a) | | | 18,044 | | | 178,024 | | | 196,068 | | | 1,729 | | | 14,645 | | | 16,374 |
International Small Cap
Growth (b) | | | 2,422 | | | 11,684 | | | 14,106 | | | | | | | | | |
Emerging Markets Growth (c) | | | 20,123 | | | 31,981 | | | 52,104 | | | — | | | — | | | — |
Value Discovery | | | 1,656 | | | 17,632 | | | 19,288 | | | 13,405 | | | 45,000 | | | 58,405 |
Income (d) | | | 57,943 | | | 37,159 | | | 95,102 | | | 50,605 | | | 42,898 | | | 93,503 |
Ready Reserves | | | 1,131,031 | | | — | | | 1,131,031 | | | 1,678,077 | | | — | | | 1,678,077 |
| |
| | | Reinvested Distributions (Dollars)
|
| | | Year Ended December 31, 2005
| | Year Ended December 31, 2004
|
Portfolio
| | Class N
| | Class I
| | Total
| | Class N
| | Class I
| | Total
|
Growth | | $ | 1,778 | | $ | 6,484 | | $ | 8,262 | | $ | — | | $ | — | | $ | — |
Tax-Managed Growth | | | — | | | — | | | — | | | — | | | — | | | — |
Large Cap Growth | | | — | | | — | | | — | | | — | | | — | | | — |
Small Cap Growth | | | 42,338 | | | 27,541 | | | 69,879 | | | 33,424 | | | 19,852 | | | 53,276 |
Small Mid-Cap Growth | | | 77 | | | 380 | | | 457 | | | — | | | — | | | — |
International Growth | | | 170,874 | | | 75,271 | | | 246,145 | | | 497 | | | 1,664 | | | 2,161 |
International Equity (a) | | | — | | | — | | | — | | | — | | | — | | | — |
International Small Cap
Growth (b) | | | — | | | — | | | — | | | | | | | | | |
Emerging Markets Growth (c) | | | 104 | | | 160 | | | 264 | | | — | | | — | | | — |
Value Discovery | | | 5,835 | | | 18,431 | | | 24,266 | | | 3,559 | | | 22,079 | | | 25,638 |
Income | | | 4,620 | | | 7,921 | | | 12,541 | | | 2,575 | | | 7,510 | | | 10,085 |
Ready Reserves | | | 27,698 | | | — | | | 27,698 | | | 8,904 | | | — | | | 8,904 |
| |
| | | Redemptions (Dollars)
|
| | | Year Ended December 31, 2005
| | Year Ended December 31, 2004
|
Portfolio
| | Class N
| | Class I
| | Total
| | Class N
| | Class I
| | Total
|
Growth | | $ | 14,242 | | $ | 49,911 | | $ | 64,153 | | $ | 15,081 | | $ | 45,717 | | $ | 60,798 |
Tax-Managed Growth | | | 8 | | | 554 | | | 562 | | | 41 | | | 1,610 | | | 1,651 |
Large Cap Growth | | | 185 | | | 1,647 | | | 1,832 | | | 134 | | | 945 | | | 1,079 |
Small Cap Growth | | | 214,257 | | | 73,727 | | | 287,984 | | | 128,696 | | | 29,326 | | | 158,022 |
Small Mid-Cap Growth | | | 2,617 | | | 3,636 | | | 6,253 | | | 924 | | | 254 | | | 1,178 |
International Growth | | | 477,866 | | | 120,404 | | | 598,270 | | | 409,543 | | | 77,654 | | | 487,197 |
International Equity (a)(d) | | | 1,207 | | | 40,936 | | | 42,143 | | | 1 | | | 7,745 | | | 7,746 |
International Small Cap
Growth (b) | | | — | | | 100 | | | 100 | | | | | | | | | |
Emerging Markets Growth (c) | | | 1,024 | | | 605 | | | 1,629 | | | — | | | — | | | — |
Value Discovery | | | 18,736 | | | 165,704 | | | 184,440 | | | 9,478 | | | 66,515 | | | 75,993 |
Income | | | 40,325 | | | 40,480 | | | 80,805 | | | 16,560 | | | 51,147 | | | 67,707 |
Ready Reserves | | | 1,159,815 | | | — | | | 1,159,815 | | | 1,748,986 | | | — | | | 1,748,986 |
| (a) | | For the period from May 24, 2004 (Commencement of Operations) to December 31, 2004. |
| (b) | | For the period from November 1, 2005 (Commencement of Operation) to December 31, 2005. |
| (c) | | For the period from June 6, 2005 (Commencement of Operations) to December 31, 2005. |
| (d) | | For 2005, the sales of Class I shares for Income Fund reflect two in-kind purchases totaling $4.2 million dollars. For 2004, the sales of Class I for Income Fund reflect two in-kind purchases totaling $1.4 million dollars. For 2004, the redemptions for Class I for International Equity Fund reflects an in-kind redemption of $7.7 million. This in-kind redemption resulted in a non-taxable gain of $739 (in thousands). |
December 31, 2005 | William Blair Funds 85 |
| | | | | | | | | | | | | | | | | | | | | | | | |
| | | Net Change in Net Assets relating to Fund Share Activity (Dollars)
| |
| | | Year Ended December 31, 2005
| | | Year Ended December 31, 2004
| |
Portfolio
| | Class N
| | | Class I
| | | Total
| | | Class N
| | | Class I
| | | Total
| |
Growth | | $ | (1,711 | ) | | $ | (34,373 | ) | | $ | (36,084 | ) | | $ | 4,849 | | | $ | (30,453 | ) | | $ | (25,604 | ) |
Tax-Managed Growth | | | 105 | | | | 1,108 | | | | 1,213 | | | | (41 | ) | | | (1,364 | ) | | | (1,405 | ) |
Large Cap Growth | | | 7,733 | | | | 2,091 | | | | 9,824 | | | | (35 | ) | | | 611 | | | | 576 | |
Small Cap Growth | | | 64,514 | | | | 62,454 | | | | 126,968 | | | | 86,882 | | | | 68,402 | | | | 155,284 | |
Small Mid-Cap Growth | | | 2,564 | | | | 35,010 | | | | 37,574 | | | | 6,485 | | | | 13,568 | | | | 20,053 | |
International Growth | | | 759,448 | | | | 313,098 | | | | 1,072,546 | | | | 397,441 | | | | 260,918 | | | | 658,359 | |
International Equity (a) | | | 16,837 | | | | 137,088 | | | | 153,925 | | | | 1,728 | | | | 6,900 | | | | 8,628 | |
International Small Cap Growth (b) | | �� | 2,422 | | | | 11,584 | | | | 14,006 | | | | — | | | | — | | | | — | |
Emerging Markets Growth (c) | | | 19,203 | | | | 31,536 | | | | 50,739 | | | | — | | | | — | | | | — | |
Value Discovery | | | (11,245 | ) | | | (129,641 | ) | | | (140,886 | ) | | | 7,486 | | | | 564 | | | | 8,050 | |
Income | | | 22,238 | | | | 4,600 | | | | 26,838 | | | | 36,620 | | | | (739 | ) | | | 35,881 | |
Ready Reserves | | | (1,086 | ) | | | — | | | | (1,086 | ) | | | (62,005 | ) | | | — | | | | (62,005 | ) |
| |
| | | Sales (Shares)
| |
| | | Year Ended December 31, 2005
| | | Year Ended December 31, 2004
| |
Portfolio
| | Class N
| | | Class I
| | | Total
| | | Class N
| | | Class I
| | | Total
| |
Growth | | | 992 | | | | 846 | | | | 1,838 | | | | 2,031 | | | | 1,516 | | | | 3,547 | |
Tax-Managed Growth | | | 11 | | | | 168 | | | | 179 | | | | — | | | | 29 | | | | 29 | |
Large Cap Growth | | | 1,273 | | | | 597 | | | | 1,870 | | | | 16 | | | | 259 | | | | 275 | |
Small Cap Growth | | | 9,448 | | | | 4,272 | | | | 13,720 | | | | 7,573 | | | | 3,260 | | | | 10,833 | |
Small Mid-Cap Growth | | | 450 | | | | 3,393 | | | | 3,843 | | | | 714 | | | | 1,328 | | | | 2,042 | |
International Growth | | | 45,004 | | | | 15,184 | | | | 60,188 | | | | 41,858 | | | | 17,229 | | | | 59,087 | |
International Equity (a) | | | 1,550 | | | | 14,844 | | | | 16,394 | | | | 165 | | | | 1,392 | | | | 1,557 | |
International Small Cap Growth (b) | | | 235 | | | | 1,153 | | | | 1,388 | | | | — | | | | — | | | | — | |
Emerging Markets Growth (c) | | | 1,604 | | | | 2,731 | | | | 4,335 | | | | — | | | | — | | | | — | |
Value Discovery | | | 78 | | | | 829 | | | | 907 | | | | 576 | | | | 1,900 | | | | 2,476 | |
Income | | | 5,777 | | | | 3,717 | | | | 9,494 | | | | 4,919 | | | | 4,171 | | | | 9,090 | |
Ready Reserves | | | 1,131,031 | | | | — | | | | 1,131,031 | | | | 1,678,077 | | | | — | | | | 1,678,077 | |
| |
| | | Reinvested Distributions (Shares)
| |
| | | Year Ended December 31, 2005
| | | Year Ended December 31, 2004
| |
Portfolio
| | Class N
| | | Class I
| | | Total
| | | Class N
| | | Class I
| | | Total
| |
Growth | | | 155 | | | | 555 | | | | 710 | | | | — | | | | — | | | | — | |
Tax-Managed Growth | | | — | | | | — | | | | — | | | | — | | | | — | | | | — | |
Large Cap Growth | | | — | | | | — | | | | — | | | | — | | | | — | | | | — | |
Small Cap Growth | | | 1,752 | | | | 1,121 | | | | 2,873 | | | | 1,331 | | | | 781 | | | | 2,112 | |
Small Mid-Cap Growth | | | 6 | | | | 30 | | | | 36 | | | | — | | | | — | | | | — | |
International Growth | | | 6,912 | | | | 3,007 | | | | 9,919 | | | | 23 | | | | 78 | | | | 101 | |
International Equity (a) | | | — | | | | — | | | | — | | | | — | | | | — | | | | — | |
International Small Cap Growth (b) | | | — | | | | — | | | | — | | | | — | | | | — | | | | — | |
Emerging Markets Growth (c) | | | 7 | | | | 12 | | | | 19 | | | | — | | | | — | | | | — | |
Value Discovery | | | 390 | | | | 1,218 | | | | 1,608 | | | | 160 | | | | 991 | | | | 1,151 | |
Income | | | 464 | | | | 796 | | | | 1,260 | | | | 251 | | | | 734 | | | | 985 | |
Ready Reserves | | | 27,698 | | | | — | | | | 27,698 | | | | 8,904 | | | | — | | | | 8,904 | |
| (a) | | For the period from May 24, 2004 (Commencement of Operations) to December 31, 2004. |
| (b) | | For the period from November 1, 2005 (Commencement of Operations) to December 31, 2005. |
| (c) | | For the period from June 6, 2005 (Commencement of Operations) to December 31, 2005. |
86 Annual Report | December 31, 2005 |
| | | | | | | | | | | | | | | | | | |
| | | Redemptions (Shares)
| |
| | | Year Ended December 31, 2005
| | | Year Ended December 31, 2004
| |
Portfolio
| | Class N
| | | Class I
| | | Total
| | | Class N
| | | Class I
| | | Total
| |
Growth | | 1,313 | | | 4,632 | | | 5,945 | | | 1,529 | | | 4,528 | | | 6,057 | |
Tax-Managed Growth | | — | | | 59 | | | 59 | | | 5 | | | 190 | | | 195 | |
Large Cap Growth | | 30 | | | 264 | | | 294 | | | 22 | | | 158 | | | 180 | |
Small Cap Growth | | 8,709 | | | 2,954 | | | 11,663 | | | 5,546 | | | 1,239 | | | 6,785 | |
Small Mid-Cap Growth | | 234 | | | 303 | | | 537 | | | 86 | | | 26 | | | 112 | |
International Growth | | 20,661 | | | 5,142 | | | 25,803 | | | 21,332 | | | 4,005 | | | 25,337 | |
International Equity (a) | | 104 | | | 3,398 | | | 3,502 | | | — | | | 705 | | | 705 | |
International Small Cap Growth (b) | | — | | | 10 | | | 10 | | | — | | | — | | | — | |
Emerging Markets Growth (c) | | 81 | | | 47 | | | 128 | | | — | | | — | | | — | |
Value Discovery | | 892 | | | 7,748 | | | 8,640 | | | 408 | | | 2,844 | | | 3,252 | |
Income | | 4,028 | | | 4,056 | | | 8,084 | | | 1,614 | | | 4,985 | | | 6,599 | |
Ready Reserves | | 1,159,815 | | | — | | | 1,159,815 | | | 1,748,986 | | | — | | | 1,748,986 | |
| |
| | | Net Change in Shares Outstanding relating to Fund Share Activity (Shares)
| |
| | | Year Ended December 31, 2005
| | | Year Ended December 31, 2004
| |
Portfolio
| | Class N
| | | Class I
| | | Total
| | | Class N
| | | Class I
| | | Total
| |
Growth | | (166 | ) | | (3,231 | ) | | (3,397 | ) | | 502 | | | (3,012 | ) | | (2,510 | ) |
Tax-Managed Growth | | 11 | | | 109 | | | 120 | | | (5 | ) | | (161 | ) | | (166 | ) |
Large Cap Growth | | 1,243 | | | 333 | | | 1,576 | | | (6 | ) | | 101 | | | 95 | |
Small Cap Growth | | 2,491 | | | 2,439 | | | 4,930 | | | 3,358 | | | 2,802 | | | 6,160 | |
Small Mid-Cap Growth | | 222 | | | 3,120 | | | 3,342 | | | 628 | | | 1,302 | | | 1,930 | |
International Growth | | 31,255 | | | 13,049 | | | 44,304 | | | 20,549 | | | 13,302 | | | 33,851 | |
International Equity (a) | | 1,446 | | | 11,446 | | | 12,892 | | | 165 | | | 687 | | | 852 | |
International Small Cap Growth (b) | | 235 | | | 1,143 | | | 1,378 | | | — | | | — | | | — | |
Emerging Markets Growth (c) | | 1,530 | | | 2,696 | | | 4,226 | | | — | | | — | | | — | |
Value Discovery | | (424 | ) | | (5,701 | ) | | (6,125 | ) | | 328 | | | 47 | | | 375 | |
Income | | 2,213 | | | 457 | | | 2,670 | | | 3,556 | | | (80 | ) | | 3,476 | |
Ready Reserves | | (1,086 | ) | | — | | | (1,086 | ) | | (62,005 | ) | | — | | | (62,005 | ) |
| (a) | | For the period from May 24, 2004 (Commencement of Operations) to December 31, 2004. |
| (b) | | For the period from November 1, 2005 (Commencement of Operations) to December 31, 2005. |
| (c) | | For the period from June 6, 2005 (Commencement of Operations) to December 31, 2005. |
December 31, 2005 | William Blair Funds 87 |
Financial Highlights
Growth Fund
| | | | | | | | | | | | | | | | | | | | |
| | | Class N
| |
| | | Years Ended December 31,
| |
| | | 2005
| | | 2004
| | | 2003
| | | 2002
| | | 2001
| |
Net asset value, beginning of year | | $ | 10.70 | | | $ | 9.97 | | | $ | 8.06 | | | $ | 10.87 | | | $ | 12.73 | |
Income (loss) from investment operations: | | | | | | | | | | | | | | | | | | | | |
Net investment income (loss) | | | (0.06 | ) | | | (0.06 | ) | | | (0.06 | ) | | | (0.07 | ) | | | (0.06 | ) |
Net realized and unrealized gain (loss) on investments | | | 1.11 | | | | 0.79 | | | | 1.97 | | | | (2.74 | ) | | | (1.66 | ) |
| | |
|
|
| |
|
|
| |
|
|
| |
|
|
| |
|
|
|
Total from investment operations | | | 1.05 | | | | 0.73 | | | | 1.91 | | | | (2.81 | ) | | | (1.72 | ) |
Less distributions from: | | | | | | | | | | | | | | | | | | | | |
Net investment income | | | — | | | | — | | | | — | | | | — | | | | — | |
Net realized gain | | | 0.42 | | | | — | | | | — | | | | — | | | | 0.14 | |
| | |
|
|
| |
|
|
| |
|
|
| |
|
|
| |
|
|
|
Total distributions | | | 0.42 | | | | — | | | | — | | | | — | | | | 0.14 | |
| | |
|
|
| |
|
|
| |
|
|
| |
|
|
| |
|
|
|
Net asset value, end of year | | $ | 11.33 | | | $ | 10.70 | | | $ | 9.97 | | | $ | 8.06 | | | $ | 10.87 | |
| | |
|
|
| |
|
|
| |
|
|
| |
|
|
| |
|
|
|
Total return (%) | | | 9.75 | | | | 7.32 | | | | 23.70 | | | | (25.85 | ) | | | (13.53 | ) |
Ratios to average daily net assets (%): | | | | | | | | | | | | | | | | | | | | |
Expenses | | | 1.15 | | | | 1.17 | | | | 1.19 | | | | 1.19 | | | | 1.18 | |
Net investment income (loss) | | | (0.60 | ) | | | (0.60 | ) | | | (0.67 | ) | | | (0.73 | ) | | | (0.57 | ) |
| |
| | | Class I
| |
| | | Years Ended December 31,
| |
| | | 2005
| | | 2004
| | | 2003
| | | 2002
| | | 2001
| |
Net asset value, beginning of year | | $ | 10.84 | | | $ | 10.08 | | | $ | 8.12 | | | $ | 10.93 | | | $ | 12.77 | |
Income (loss) from investment operations: | | | | | | | | | | | | | | | | | | | | |
Net investment income (loss) | | | (0.04 | ) | | | (0.04 | ) | | | (0.04 | ) | | | (0.05 | ) | | | (0.04 | ) |
Net realized and unrealized gain (loss) on investments | | | 1.14 | | | | 0.80 | | | | 2.00 | | | | (2.76 | ) | | | (1.66 | ) |
| | |
|
|
| |
|
|
| |
|
|
| |
|
|
| |
|
|
|
Total from investment operations | | | 1.10 | | | | 0.76 | | | | 1.96 | | | | (2.81 | ) | | | (1.70 | ) |
Less distributions from: | | | | | | | | | | | | | | | | | | | | |
Net investment income | | | — | | | | — | | | | — | | | | — | | | | — | |
Net realized gain | | | 0.42 | | | | — | | | | — | | | | — | | | | 0.14 | |
| | |
|
|
| |
|
|
| |
|
|
| |
|
|
| |
|
|
|
Total distributions | | | 0.42 | | | | — | | | | — | | | | — | | | | 0.14 | |
| | |
|
|
| |
|
|
| |
|
|
| |
|
|
| |
|
|
|
Net asset value, end of year | | $ | 11.52 | | | $ | 10.84 | | | $ | 10.08 | | | $ | 8.12 | | | $ | 10.93 | |
| | |
|
|
| |
|
|
| |
|
|
| |
|
|
| |
|
|
|
Total return (%) | | | 10.08 | | | | 7.54 | | | | 24.14 | | | | (25.71 | ) | | | (13.33 | ) |
Ratios to average daily net assets (%): | | | | | | | | | | | | | | | | | | | | |
Expenses | | | 0.90 | | | | 0.92 | | | | 0.94 | | | | 0.94 | | | | 0.93 | |
Net investment income (loss) | | | (0.35 | ) | | | (0.35 | ) | | | (0.42 | ) | | | (0.48 | ) | | | (0.32 | ) |
| | | | | | | | | | | | | | | |
| | | Years Ended December 31,
|
| | | 2005
| | 2004
| | 2003
| | 2002
| | 2001
|
Supplemental data for all classes: | | | | | | | | | | | | | | | |
Net assets at end of year (in thousands) | | $ | 253,599 | | $ | 275,506 | | $ | 281,654 | | $ | 255,625 | | $ | 386,096 |
Portfolio turnover rate (%) | | | 54 | | | 35 | | | 45 | | | 29 | | | 74 |
Performance cited represents past performance. Past performance does not guarantee future results and current performance may be lower or higher than the data quoted. Results shown are annual returns, which assume reinvestment of dividends and capital gains. Investment returns and principal will fluctuate and you may have a gain or loss when you sell shares. For the most current month-end performance information, please call 1-800-742-7272, or visit our Web site at www.williamblairfunds.com.
Note: Net investment income (loss) per share is based on the average shares outstanding during the year.
88 Annual Report | December 31, 2005 |
Financial Highlights
Tax-Managed Growth Fund
| | | | | | | | | | | | | | | | | | | | |
| | | Class N
| |
| | | Years Ended December 31,
| |
| | | 2005
| | | 2004
| | | 2003
| | | 2002
| | | 2001
| |
Net asset value, beginning of year | | $ | 8.99 | | | $ | 8.41 | | | $ | 6.86 | | | $ | 9.07 | | | $ | 10.08 | |
Income (loss) from investment operations: | | | | | | | | | | | | | | | | | | | | |
Net investment income (loss) | | | (0.07 | ) | | | (0.08 | ) | | | (0.07 | ) | | | (0.06 | ) | | | (0.05 | ) |
Net realized and unrealized gain (loss) on investments | | | 1.19 | | | | 0.66 | | | | 1.62 | | | | (2.15 | ) | | | (0.96 | ) |
| | |
|
|
| |
|
|
| |
|
|
| |
|
|
| |
|
|
|
Total from investment operations | | | 1.12 | | | | 0.58 | | | | 1.55 | | | | (2.21 | ) | | | (1.01 | ) |
Less distributions from: | | | | | | | | | | | | | | | | | | | | |
Net investment income | | | — | | | | — | | | | — | | | | — | | | | — | |
Net realized gain | | | — | | | | — | | | | — | | | | — | | | | — | |
| | |
|
|
| |
|
|
| |
|
|
| |
|
|
| |
|
|
|
Total distributions | | | — | | | | — | | | | — | | | | — | | | | — | |
| | |
|
|
| |
|
|
| |
|
|
| |
|
|
| |
|
|
|
Net asset value, end of year | | $ | 10.11 | | | $ | 8.99 | | | $ | 8.41 | | | $ | 6.86 | | | $ | 9.07 | |
| | |
|
|
| |
|
|
| |
|
|
| |
|
|
| |
|
|
|
Total return (%) | | | 12.46 | | | | 6.90 | | | | 22.59 | | | | (24.37 | ) | | | (10.02 | ) |
Ratios to average daily net assets (%): | | | | | | | | | | | | | | | | | | | | |
Expenses, net of waivers and reimbursements | | | 1.53 | | | | 1.54 | | | | 1.49 | | | | 1.36 | | | | 1.36 | |
Expenses, before waivers and reimbursements | | | 2.55 | | | | 2.26 | | | | 2.26 | | | | 2.22 | | | | 3.64 | |
Net investment income (loss), net of waivers and reimbursements | | | (0.76 | ) | | | (0.92 | ) | | | (0.91 | ) | | | (0.72 | ) | | | (0.57 | ) |
Net investment income (loss), before waivers and reimbursements | | | (1.78 | ) | | | (1.64 | ) | | | (1.68 | ) | | | (1.58 | ) | | | (2.85 | ) |
| |
| | | Class I
| |
| | | Years Ended December 31,
| |
| | | 2005
| | | 2004
| | | 2003
| | | 2002
| | | 2001
| |
Net asset value, beginning of year | | $ | 9.10 | | | $ | 8.50 | | | $ | 6.92 | | | $ | 9.12 | | | $ | 10.11 | |
Income (loss) from investment operations: | | | | | | | | | | | | | | | | | | | | |
Net investment income (loss) | | | (0.05 | ) | | | (0.06 | ) | | | (0.05 | ) | | | (0.04 | ) | | | (0.03 | ) |
Net realized and unrealized gain (loss) on investments | | | 1.22 | | | | 0.66 | | | | 1.63 | | | | (2.16 | ) | | | (0.96 | ) |
| | |
|
|
| |
|
|
| |
|
|
| |
|
|
| |
|
|
|
Total from investment operations | | | 1.17 | | | | 0.60 | | | | 1.58 | | | | (2.20 | ) | | | (0.99 | ) |
Less distributions from: | | | | | | | | | | | | | | | | | | | | |
Net investment income | | | — | | | | — | | | | — | | | | — | | | | — | |
Net realized gain | | | — | | | | — | | | | — | | | | — | | | | — | |
| | |
|
|
| |
|
|
| |
|
|
| |
|
|
| |
|
|
|
Total distributions | | | — | | | | — | | | | — | | | | — | | | | — | |
| | |
|
|
| |
|
|
| |
|
|
| |
|
|
| |
|
|
|
Net asset value, end of year | | $ | 10.27 | | | $ | 9.10 | | | $ | 8.50 | | | $ | 6.92 | | | $ | 9.12 | |
| | |
|
|
| |
|
|
| |
|
|
| |
|
|
| |
|
|
|
Total return (%) | | | 12.86 | | | | 7.06 | | | | 22.83 | | | | (24.12 | ) | | | (9.79 | ) |
Ratios to average daily net assets (%): | | | | | | | | | | | | | | | | | | | | |
Expenses, net of waivers and reimbursements | | | 1.28 | | | | 1.29 | | | | 1.24 | | | | 1.11 | | | | 1.11 | |
Expenses, before waivers and reimbursements | | | 2.30 | | | | 2.01 | | | | 2.01 | | | | 1.97 | | | | 3.39 | |
Net investment income (loss), net of waivers and reimbursements | | | (0.51 | ) | | | (0.67 | ) | | | (0.66 | ) | | | (0.47 | ) | | | (0.32 | ) |
Net investment income (loss), before waivers and reimbursements | | | (1.53 | ) | | | (1.39 | ) | | | (1.43 | ) | | | (1.33 | ) | | | (2.60 | ) |
| | | | | | | | | | | | | | | |
| | | Years Ended December 31,
|
| | | 2005
| | 2004
| | 2003
| | 2002
| | 2001
|
Supplemental data for all classes: | | | | | | | | | | | | | | | |
Net assets at end of year (in thousands) | | $ | 7,815 | | $ | 5,847 | | $ | 6,871 | | $ | 5,303 | | $ | 7,211 |
Portfolio turnover rate (%) | | | 25 | | | 31 | | | 37 | | | 44 | | | 37 |
Performance cited represents past performance. Past performance does not guarantee future results and current performance may be lower or higher than the data quoted. Results shown are annual returns, which assume reinvestment of dividends and capital gains. Investment returns and principal will fluctuate and you may have a gain or loss when you sell shares. For the most current month-end performance information, please call 1-800-742-7272, or visit our Web site at www.williamblairfunds.com.
Note: Net investment income (loss) per share is based on the average shares outstanding during the year.
December 31, 2005 | William Blair Funds 89 |
Financial Highlights
Large Cap Growth Fund
| | | | | | | | | | | | | | | | | | | | |
| | | Class N
| |
| | | Years Ended December 31,
| |
| | | 2005
| | | 2004
| | | 2003
| | | 2002
| | | 2001
| |
Net asset value, beginning of year | | $ | 6.24 | | | $ | 5.93 | | | $ | 4.80 | | | $ | 6.72 | | | $ | 8.45 | |
Income (loss) from investment operations: | | | | | | | | | | | | | | | | | | | | |
Net investment income (loss) | | | (0.02 | ) | | | (0.04 | ) | | | (0.04 | ) | | | (0.04 | ) | | | (0.05 | ) |
Net realized and unrealized gain (loss) on investments | | | 0.25 | | | | 0.35 | | | | 1.17 | | | | (1.88 | ) | | | (1.68 | ) |
| | |
|
|
| |
|
|
| |
|
|
| |
|
|
| |
|
|
|
Total from investment operations | | | 0.23 | | | | 0.31 | | | | 1.13 | | | | (1.92 | ) | | | (1.73 | ) |
Less distributions from: | | | | | | | | | | | | | | | | | | | | |
Net investment income | | | — | | | | — | | | | — | | | | — | | | | — | |
Net realized gain | | | — | | | | — | | | | — | | | | — | | | | — | |
| | |
|
|
| |
|
|
| |
|
|
| |
|
|
| |
|
|
|
Total distributions | | | — | | | | — | | | | — | | | | — | | | | — | |
| | |
|
|
| |
|
|
| |
|
|
| |
|
|
| |
|
|
|
Net asset value, end of year | | $ | 6.47 | | | $ | 6.24 | | | $ | 5.93 | | | $ | 4.80 | | | $ | 6.72 | |
| | |
|
|
| |
|
|
| |
|
|
| |
|
|
| |
|
|
|
Total return (%) | | | 3.69 | | | | 5.23 | | | | 23.54 | | | | (28.57 | ) | | | (20.47 | ) |
Ratios to average daily net assets (%): | | | | | | | | | | | | | | | | | | | | |
Expenses, net of waivers and reimbursements | | | 1.28 | | | | 1.38 | | | | 1.42 | | | | 1.36 | | | | 1.36 | |
Expenses, before waivers and reimbursements | | | 2.08 | | | | 2.29 | | | | 2.39 | | | | 2.45 | | | | 3.01 | |
Net investment income (loss), net of waivers and reimbursements | | | (0.37 | ) | | | (0.63 | ) | | | (0.76 | ) | | | (0.71 | ) | | | (0.79 | ) |
Net investment income (loss), before waivers and reimbursements | | | (1.17 | ) | | | (1.54 | ) | | | (1.73 | ) | | | (1.80 | ) | | | (2.44 | ) |
| |
| | | Class I
| |
| | | Years Ended December 31,
| |
| | | 2005
| | | 2004
| | | 2003
| | | 2002
| | | 2001
| |
Net asset value, beginning of year | | $ | 6.31 | | | $ | 5.99 | | | $ | 4.82 | | | $ | 6.74 | | | $ | 8.47 | |
Income (loss) from investment operations: | | | | | | | | | | | | | | | | | | | | |
Net investment income (loss) | | | (0.01 | ) | | | (0.02 | ) | | | (0.03 | ) | | | (0.03 | ) | | | (0.04 | ) |
Net realized and unrealized gain (loss) on investments | | | 0.26 | | | | 0.34 | | | | 1.20 | | | | (1.89 | ) | | | (1.69 | ) |
| | |
|
|
| |
|
|
| |
|
|
| |
|
|
| |
|
|
|
Total from investment operations | | | 0.25 | | | | 0.32 | | | | 1.17 | | | | (1.92 | ) | | | (1.73 | ) |
Less distributions from: | | | | | | | | | | | | | | | | | | | | |
Net investment income | | | — | | | | — | | | | — | | | | — | | | | — | |
Net realized gain | | | — | | | | — | | | | — | | | | — | | | | — | |
| | |
|
|
| |
|
|
| |
|
|
| |
|
|
| |
|
|
|
Total distributions | | | — | | | | — | | | | — | | | | — | | | | — | |
| | |
|
|
| |
|
|
| |
|
|
| |
|
|
| |
|
|
|
Net asset value, end of year | | $ | 6.56 | | | $ | 6.31 | | | $ | 5.99 | | | $ | 4.82 | | | $ | 6.74 | |
| | |
|
|
| |
|
|
| |
|
|
| |
|
|
| |
|
|
|
Total return (%) | | | 3.96 | | | | 5.34 | | | | 24.27 | | | | (28.49 | ) | | | (20.43 | ) |
Ratios to average daily net assets (%): | | | | | | | | | | | | | | | | | | | | |
Expenses, net of waivers and reimbursements | | | 1.03 | | | | 1.13 | | | | 1.17 | | | | 1.11 | | | | 1.11 | |
Expenses, before waivers and reimbursements | | | 1.83 | | | | 2.04 | | | | 2.14 | | | | 2.20 | | | | 2.76 | |
Net investment income (loss), net of waivers and reimbursements | | | (0.12 | ) | | | (0.38 | ) | | | (0.51 | ) | | | (0.46 | ) | | | (0.54 | ) |
Net investment income (loss), before waivers and reimbursements | | | (0.92 | ) | | | (1.29 | ) | | | (1.48 | ) | | | (1.55 | ) | | | (2.19 | ) |
| | | | | | | | | | | | | | | | | | | | | |
| | | Years Ended December 31,
|
| | | 2005
| | | | | | | | 2004
| | 2003
| | 2002
| | 2001
|
Supplemental data for all classes: | | | | | | | | | | | | | | | | | | | | | |
Net assets at end of year (in thousands) | | $ | 16,888 | | | | | | | | $ | 6,417 | | $ | 5,519 | | $ | 5,469 | | $ | 5,991 |
Portfolio turnover rate (%) | | | 53 | | | | | | | | | 39 | | | 33 | | | 52 | | | 87 |
Performance cited represents past performance. Past performance does not guarantee future results and current performance may be lower or higher than the data quoted. Results shown are annual returns, which assume reinvestment of dividends and capital gains. Investment returns and principal will fluctuate and you may have a gain or loss when you sell shares. For the most current month-end performance information, please call 1-800-742-7272, or visit our Web site at www.williamblairfunds.com.
Note: Net investment income (loss) per share is based on the average shares outstanding during the year.
90 Annual Report | December 31, 2005 |
Financial Highlights
Small Cap Growth Fund
| | | | | | | | | | | | | | | | | | | | |
| | | Class N
| |
| | | Years Ended December 31,
| |
| | | 2005
| | | 2004
| | | 2003
| | | 2002
| | | 2001
| |
Net asset value, beginning of year | | $ | 25.72 | | | $ | 21.83 | | | $ | 13.72 | | | $ | 16.58 | | | $ | 13.16 | |
Income (loss) from investment operations: | | | | | | | | | | | | | | | | | | | | |
Net investment income (loss) | | | (0.30 | ) | | | (0.30 | ) | | | (0.21 | ) | | | (0.19 | ) | | | (0.17 | ) |
Net realized and unrealized gain (loss) on investments | | | 0.64 | | | | 6.20 | | | | 8.68 | | | | (2.67 | ) | | | 3.59 | |
| | |
|
|
| |
|
|
| |
|
|
| |
|
|
| |
|
|
|
Total from investment operations | | | 0.34 | | | | 5.90 | | | | 8.47 | | | | (2.86 | ) | | | 3.42 | |
Less distributions from: | | | | | | | | | | | | | | | | | | | | |
Net investment income | | | — | | | | — | | | | — | | | | — | | | | — | |
Net realized gain | | | 2.30 | | | | 2.01 | | | | 0.36 | | | | — | | | | — | |
| | |
|
|
| |
|
|
| |
|
|
| |
|
|
| |
|
|
|
Total distributions | | | 2.30 | | | | 2.01 | | | | 0.36 | | | | — | | | | — | |
| | |
|
|
| |
|
|
| |
|
|
| |
|
|
| |
|
|
|
Net asset value, end of year | | $ | 23.76 | | | $ | 25.72 | | | $ | 21.83 | | | $ | 13.72 | | | $ | 16.58 | |
| | |
|
|
| |
|
|
| |
|
|
| |
|
|
| |
|
|
|
Total return (%) | | | 1.18 | | | | 27.24 | | | | 61.88 | | | | (17.25 | ) | | | 25.99 | |
Ratios to average daily net assets (%): | | | | | | | | | | | | | | | | | | | | |
Expenses, net of waivers and reimbursements | | | 1.49 | | | �� | 1.49 | | | | 1.55 | | | | 1.56 | | | | 1.59 | |
Expenses, before waivers and reimbursements | | | 1.49 | | | | 1.46 | | | | 1.52 | | | | 1.62 | | | | 1.95 | |
Net investment income (loss), net of waivers and reimbursements | | | (1.23 | ) | | | (1.27 | ) | | | (1.22 | ) | | | (1.31 | ) | | | (1.15 | ) |
Net investment income (loss), before waivers and reimbursements | | | (1.23 | ) | | | (1.24 | ) | | | (1.19 | ) | | | (1.37 | ) | | | (1.51 | ) |
| |
| | | Class I
| |
| | | Years Ended December 31,
| |
| | | 2005
| | | 2004
| | | 2003
| | | 2002
| | | 2001
| |
Net asset value, beginning of year | | $ | 26.04 | | | $ | 22.03 | | | $ | 13.82 | | | $ | 16.65 | | | $ | 13.18 | |
Income (loss) from investment operations: | | | | | | | | | | | | | | | | | | | | |
Net investment income (loss) | | | (0.25 | ) | | | (0.24 | ) | | | (0.18 | ) | | | (0.16 | ) | | | (0.13 | ) |
Net realized and unrealized gain (loss) on investments | | | 0.67 | | | | 6.26 | | | | 8.75 | | | | (2.67 | ) | | | 3.60 | |
| | |
|
|
| |
|
|
| |
|
|
| |
|
|
| |
|
|
|
Total from investment operations | | | 0.42 | | | | 6.02 | | | | 8.57 | | | | (2.83 | ) | | | 3.47 | |
Less distributions from: | | | | | | | | | | | | | | | | | | | | |
Net investment income | | | — | | | | — | | | | — | | | | — | | | | — | |
Net realized gain | | | 2.30 | | | | 2.01 | | | | 0.36 | | | | — | | | | — | |
| | |
|
|
| |
|
|
| |
|
|
| |
|
|
| |
|
|
|
Total distributions | | | 2.30 | | | | 2.01 | | | | 0.36 | | | | — | | | | — | |
| | |
|
|
| |
|
|
| |
|
|
| |
|
|
| |
|
|
|
Net asset value, end of year | | $ | 24.16 | | | $ | 26.04 | | | $ | 22.03 | | | $ | 13.82 | | | $ | 16.65 | |
| | |
|
|
| |
|
|
| |
|
|
| |
|
|
| |
|
|
|
Total return (%) | | | 1.48 | | | | 27.54 | | | | 62.15 | | | | (17.00 | ) | | | 26.33 | |
Ratios to average daily net assets (%): | | | | | | | | | | | | | | | | | | | | |
Expenses, net of waivers and reimbursements | | | 1.24 | | | | 1.24 | | | | 1.35 | | | | 1.31 | | | | 1.34 | |
Expenses, before waivers and reimbursements | | | 1.24 | | | | 1.21 | | | | 1.28 | | | | 1.37 | | | | 1.70 | |
Net investment income (loss), net of waivers and reimbursements | | | (0.98 | ) | | | (1.02 | ) | | | (1.02 | ) | | | (1.06 | ) | | | (0.90 | ) |
Net investment income (loss), before waivers and reimbursements | | | (0.98 | ) | | | (0.99 | ) | | | (0.95 | ) | | | (1.12 | ) | | | (1.26 | ) |
| | | | | | | | | | | | | | | |
| | | Years Ended December 31,
|
| | | 2005
| | 2004
| | 2003
| | 2002
| | 2001
|
Supplemental data for all classes: | | | | | | | | | | | | | | | |
Net assets at end of period (in thousands) | | $ | 831,738 | | $ | 771,209 | | $ | 518,824 | | $ | 78,581 | | $ | 54,658 |
Portfolio turnover rate (%) | | | 80 | | | 109 | | | 103 | | | 133 | | | 147 |
Performance cited represents past performance. Past performance does not guarantee future results and current performance may be lower or higher than the data quoted. Results shown are annual returns, which assume reinvestment of dividends and capital gains. Investment returns and principal will fluctuate and you may have a gain or loss when you sell shares. For the most current month-end performance information, please call 1-800-742-7272, or visit our Web site at www.williamblairfunds.com.
Note: Net investment income (loss) per share is based on the average shares outstanding during the year.
December 31, 2005 | William Blair Funds 91 |
Financial Highlights
Small-Mid Cap Growth Fund
| | | | | | | | | | | | |
| | | Class N
| |
| | | Years Ended December 31,
| |
| | | 2005
| | | 2004
| | | 2003 (a)
| |
Net asset value, beginning of year | | $ | 11.28 | | | $ | 9.94 | | | $ | 10.00 | |
Income (loss) from investment operations: | | | | | | | | | | | | |
Net investment income (loss) | | | (0.11 | ) | | | (0.13 | ) | | | — | |
Net realized and unrealized gain (loss) on investments | | | 1.32 | | | | 1.47 | | | | (0.06 | ) |
| | |
|
|
| |
|
|
| |
|
|
|
Total from investment operations | | | 1.21 | | | | 1.34 | | | | (0.06 | ) |
Less distributions from: | | | | | | | | | | | | |
Net investment income | | | — | | | | — | | | | — | |
Net realized gain | | | 0.09 | | | | — | | | | — | |
| | |
|
|
| |
|
|
| |
|
|
|
Total distributions | | | 0.09 | | | | — | | | | — | |
| | |
|
|
| |
|
|
| |
|
|
|
Net asset value, end of year | | $ | 12.40 | | | $ | 11.28 | | | $ | 9.94 | |
| | |
|
|
| |
|
|
| |
|
|
|
Total return (%) | | | 10.72 | | | | 13.48 | | | | (0.60 | ) |
Ratios to average daily net assets (%): | | | | | | | | | | | | |
Expenses, net of waivers and reimbursements | | | 1.45 | | | | 1.54 | | | | 1.54 | (b) |
Expenses, before waivers and reimbursements | | | 1.54 | | | | 2.14 | | | | 1.54 | (b) |
Net investment income (loss), net of waivers and reimbursements | | | (0.97 | ) | | | (1.26 | ) | | | (1.54 | )(b) |
Net investment income (loss), before waivers and reimbursements | | | (1.06 | ) | | | (1.86 | ) | | | (1.54 | )(b) |
| |
| | | Class I
| |
| | | Years Ended December 31,
| |
| | | 2005
| | | 2004
| | | 2003 (a)
| |
Net asset value, beginning of year | | $ | 11.30 | | | $ | 9.94 | | | $ | 10.00 | |
Income (loss) from investment operations: | | | | | | | | | | | | |
Net investment income (loss) | | | (0.08 | ) | | | (0.11 | ) | | | — | |
Net realized and unrealized gain (loss) on investments | | | 1.33 | | | | 1.47 | | | | (0.06 | ) |
| | |
|
|
| |
|
|
| |
|
|
|
Total from investment operations | | | 1.25 | | | | 1.36 | | | | (0.06 | ) |
Less distributions from: | | | | | | | | | | | | |
Net investment income | | | — | | | | — | | | | — | |
Net realized gain | | | 0.09 | | | | — | | | | — | |
| | |
|
|
| |
|
|
| |
|
|
|
Total distributions | | | 0.09 | | | | — | | | | — | |
| | |
|
|
| |
|
|
| |
|
|
|
Net asset value, end of year | | $ | 12.46 | | | $ | 11.30 | | | $ | 9.94 | |
| | |
|
|
| |
|
|
| |
|
|
|
Total return (%) | | | 11.05 | | | | 13.68 | | | | (0.60 | ) |
Ratios to average daily net assets (%): | | | | | | | | | | | | |
Expenses, net of waivers and reimbursements | | | 1.20 | | | | 1.29 | | | | 1.29 | (b) |
Expenses, before waivers and reimbursements | | | 1.29 | | | | 1.89 | | | | 1.29 | (b) |
Net investment income (loss), net of waivers and reimbursements | | | (0.72 | ) | | | (1.01 | ) | | | (1.29 | )(b) |
Net investment income (loss), before waivers and reimbursements | | | (0.81 | ) | | | (1.61 | ) | | | (1.29 | )(b) |
| | | | | | | | | | |
| | | Years Ended December 31,
| |
| | | 2005
| | 2004
| | 2003
| |
Supplemental data for all classes: | | | | | | | | | | |
Net assets at end of year (in thousands) | | $ | 70,211 | | $ | 25,974 | | $ | 3,673 | |
Portfolio turnover rate (%) | | | 62 | | | 55 | | | — | (b) |
| (a) | | For the period from December 29, 2003 (Commencement of Operations) to December 31, 2003. |
| (b) | | Rates are annualized for periods that are less than a year. |
Performance cited represents past performance. Past performance does not guarantee future results and current performance may be lower or higher than the data quoted. Results shown are annual returns, which assume reinvestment of dividends and capital gains. Investment returns and principal will fluctuate and you may have a gain or loss when you sell shares. For the most current month-end performance information, please call 1-800-742-7272, or visit our Web site at www.williamblairfunds.com.
Note: Net investment income (loss) per share is based on the average shares outstanding during the year.
92 Annual Report | December 31, 2005 |
Financial Highlights
International Growth Fund
| | | | | | | | | | | | | | | | | | |
| | | Class N
| |
| | | Years Ended December 31,
| |
| | | 2005
| | 2004
| | | 2003
| | 2002
| | | 2001
| |
Net asset value, beginning of year | | $ | 22.09 | | $ | 18.65 | | | $ | 13.13 | | $ | 15.48 | | | $ | 17.93 | |
Income (loss) from investment operations: | | | | | | | | | | | | | | | | | | |
Net investment income (loss) (a) | | | 0.15 | | | (0.02 | ) | | | 0.02 | | | (0.05 | ) | | | (0.02 | ) |
Net realized and unrealized gain (loss) on investments | | | 4.60 | | | 3.47 | | | | 5.52 | | | (2.30 | ) | | | (2.43 | ) |
| | |
|
| |
|
|
| |
|
| |
|
|
| |
|
|
|
Total from investment operations | | | 4.75 | | | 3.45 | | | | 5.54 | | | (2.35 | ) | | | (2.45 | ) |
Less distributions from: | | | | | | | | | | | | | | | | | | |
Net investment income | | | 0.11 | | | 0.01 | | | | 0.02 | | | — | | | | — | |
Net realized gain | | | 1.51 | | | — | | | | — | | | — | | | | — | |
| | |
|
| |
|
|
| |
|
| |
|
|
| |
|
|
|
Total distributions | | | 1.62 | | | 0.01 | | | | 0.02 | | | — | | | | — | |
| | |
|
| |
|
|
| |
|
| |
|
|
| |
|
|
|
Net asset value, end of year | | $ | 25.22 | | $ | 22.09 | | | $ | 18.65 | | $ | 13.13 | | | $ | 15.48 | |
| | |
|
| |
|
|
| |
|
| |
|
|
| |
|
|
|
Total return (%) | | | 21.65 | | | 18.48 | | | | 42.21 | | | (15.18 | ) | | | (13.66 | ) |
Ratios to average daily net assets (%): | | | | | | | | | | | | | | | | | | |
Expenses | | | 1.42 | | | 1.47 | | | | 1.50 | | | 1.51 | | | | 1.60 | |
Net investment income (loss) | | | 0.16 | | | (0.16 | ) | | | 0.05 | | | (0.36 | ) | | | (0.11 | ) |
| |
| | | Class I
| |
| | | Years Ended December 31,
| |
| | | 2005
| | 2004
| | | 2003
| | 2002
| | | 2001
| |
Net asset value, beginning of year | | $ | 22.34 | | $ | 18.85 | | | $ | 13.27 | | $ | 15.60 | | | $ | 18.02 | |
Income (loss) from investment operations: | | | | | | | | | | | | | | | | | | |
Net investment income (loss) (a) | | | 0.27 | | | 0.01 | | | | 0.09 | | | (0.01 | ) | | | 0.02 | |
Net realized and unrealized gain (loss) on investments | | | 4.61 | | | 3.53 | | | | 5.54 | | | (2.32 | ) | | | (2.44 | ) |
| | |
|
| |
|
|
| |
|
| |
|
|
| |
|
|
|
Total from investment operations | | | 4.88 | | | 3.54 | | | | 5.63 | | | (2.33 | ) | | | (2.42 | ) |
Less distributions from: | | | | | | | | | | | | | | | | | | |
Net investment income | | | 0.16 | | | 0.05 | | | | 0.05 | | | — | | | | — | |
Net realized gain | | | 1.51 | | | — | | | | — | | | — | | | | — | |
| | |
|
| |
|
|
| |
|
| |
|
|
| |
|
|
|
Total distributions | | | 1.67 | | | 0.05 | | | | 0.05 | | | — | | | | — | |
| | |
|
| |
|
|
| |
|
| |
|
|
| |
|
|
|
Net asset value, end of year | | $ | 25.55 | | $ | 22.34 | | | $ | 18.85 | | $ | 13.27 | | | $ | 15.60 | |
| | |
|
| |
|
|
| |
|
| |
|
|
| |
|
|
|
Total return (%) | | | 22.00 | | | 18.79 | | | | 42.42 | | | (14.94 | ) | | | (13.43 | ) |
Ratios to average daily net assets (%): | | | | | | | | | | | | | | | | | | |
Expenses | | | 1.17 | | | 1.22 | | | | 1.25 | | | 1.26 | | | | 1.35 | |
Net investment income (loss) | | | 0.41 | | | 0.09 | | | | 0.30 | | | (0.11 | ) | | | 0.14 | |
| |
| | |
| |
| | | Years Ended December 31,
| |
| | | 2005
| | 2004
| | | 2003
| | 2002
| | | 2001
| |
Supplemental data for all classes: | | | | | | | | | | | | | | | | | | |
Net assets at end of year (in thousands) | | $ | 4,551,077 | | $ | 3,001,434 | | | $ | 1,899,699 | | $ | 778,788 | | | $ | 454,055 | |
Portfolio turnover rate (%) | | | 70 | | | 79 | | | | 57 | | | 73 | | | | 112 | |
| (a) | | Excludes $0.37, $0.12, $0.03, $0.00, and $0.00, of PFIC mark to market which are treated as ordinary income for Federal tax purposes for the years 2005, 2004, 2003, 2002, and 2001, respectively. |
Performance cited represents past performance. Past performance does not guarantee future results and current performance may be lower or higher than the data quoted. Results shown are annual returns, which assume reinvestment of dividends and capital gains. Investment returns and principal will fluctuate and you may have a gain or loss when you sell shares. For the most current month-end performance information, please call 1-800-742-7272, or visit our Web site at www.williamblairfunds.com.
Note: Net investment income (loss) per share is based on the average shares outstanding during the year.
December 31, 2005 | William Blair Funds 93 |
Financial Highlights
International Equity Fund
| | | | | | | | |
| | | Class N
| |
| | | Years Ended December 31,
| |
| | | 2005
| | | 2004 (a)
| |
Net asset value, beginning of year | | $ | 11.33 | | | $ | 10.00 | |
Income (loss) from investment operations: | | | | | | | | |
Net investment income (loss) (c) | | | (0.01 | ) | | | (0.04 | ) |
Net realized and unrealized gain (loss) on investments | | | 1.54 | | | | 1.37 | |
| | |
|
|
| |
|
|
|
Total from investment operations | | | 1.53 | | | | 1.33 | |
Less distributions from: | | | | | | | | |
Net investment income | | | — | | | | — | |
Net realized gain | | | — | | | | — | |
| | |
|
|
| |
|
|
|
Total distributions | | | — | | | | — | |
| | |
|
|
| |
|
|
|
Net asset value, end of year | | $ | 12.86 | | | $ | 11.33 | |
| | |
|
|
| |
|
|
|
Total return (%) | | | 13.50 | | | | 13.30 | |
Ratios to average daily net assets (%): | | | | | | | | |
Expenses, net of waivers and reimbursements | | | 1.48 | | | | 1.50 | (b) |
Expenses, before waivers and reimbursements | | | 1.81 | | | | 2.96 | (b) |
Net investment income (loss), net of waivers and reimbursements | | | (0.33 | ) | | | (0.77 | )(b) |
Net investment income (loss), before waivers and reimbursements | | | (0.66 | ) | | | (2.23 | )(b) |
| |
| | | Class I
| |
| | | Years Ended December 31,
| |
| | | 2005
| | | 2004 (a)
| |
Net asset value, beginning of year | | $ | 11.37 | | | $ | 10.00 | |
Income (loss) from investment operations: | | | | | | | | |
Net investment income (loss) (c) | | | (0.01 | ) | | | (0.01 | ) |
Net realized and unrealized gain (loss) on investments | | | 1.58 | | | | 1.38 | |
| | |
|
|
| |
|
|
|
Total from investment operations | | | 1.57 | | | | 1.37 | |
Less distributions from: | | | | | | | | |
Net investment income | | | — | | | | — | |
Net realized gain | | | — | | | | — | |
| | |
|
|
| |
|
|
|
Total distributions | | | — | | | | — | |
| | |
|
|
| |
|
|
|
Net asset value, end of year | | $ | 12.94 | | | $ | 11.37 | |
| | |
|
|
| |
|
|
|
Total return (%) | | | 13.81 | | | | 13.70 | |
Ratios to average daily net assets (%): | | | | | | | | |
Expenses, net of waivers and reimbursements | | | 1.23 | | | | 1.25 | (b) |
Expenses, before waivers and reimbursements | | | 1.56 | | | | 2.71 | (b) |
Net investment income (loss), net of waivers and reimbursements | | | (0.08 | ) | | | (0.52 | )(b) |
Net investment income (loss), before waivers and reimbursements | | | (0.41 | ) | | | (1.98 | )(b) |
| | | | | | | |
| | |
| |
| | | Years Ended December 31,
| |
| | | 2005
| | 2004
| |
Supplemental data for all classes: | | | | | | | |
Net assets at end of year (in thousands) | | $ | 177,710 | | $ | 9,689 | |
Portfolio turnover rate (%) | | | 127 | | | 108 | (b) |
| (a) | | For the period from May 24, 2004 (Commencement of Operations) to December 31, 2004. |
| (b) | | Rates are annualized for periods that are less than a year. |
| (c) | | Excludes $0.33 and $0.02 of PFIC mark to market which is treated as ordinary income for Federal tax purposes for the years 2005 and 2004, respectively. |
Performance cited represents past performance. Past performance does not guarantee future results and current performance may be lower or higher than the data quoted. Results shown are annual returns, which assume reinvestment of dividends and capital gains. Investment returns and principal will fluctuate and you may have a gain or loss when you sell shares. For the most current month-end performance information, please call 1-800-742-7272, or visit our Web site at www.williamblairfunds.com.
Note: Net investment income (loss) per share is based on the average shares outstanding during the year.
94 Annual Report | December 31, 2005 |
Financial Highlights
International Small Cap Growth Fund
| | | | |
| | | Class N
| |
| | | Period Ended
| |
| | | 12/31/2005 (a)
| |
Net asset value, beginning of period | | $ | 10.00 | |
Income (loss) from investment operations: | | | | |
Net investment income (loss) (b) | | | (0.01 | ) |
Net realized and unrealized gain (loss) on investments | | | 1.17 | |
| | |
|
|
|
Total from investment operations | | | 1.16 | |
Less distributions from: | | | | |
Net investment income | | | — | |
Net realized gain | | | — | |
| | |
|
|
|
Total distributions | | | — | |
| | |
|
|
|
Net asset value, end of period | | $ | 11.16 | |
| | |
|
|
|
Total return (%) | | | 11.60 | |
Ratios to average daily net assets (%) (c): | | | | |
Expenses, net of waivers and reimbursements | | | 1.65 | |
Expenses, before waivers and reimbursements | | | 2.57 | |
Net investment income (loss), net of waivers and reimbursements | | | (0.40 | ) |
Net investment income (loss), before waivers and reimbursements | | | (1.32 | ) |
| |
| | | Class I
| |
| | | Period Ended
| |
| | | 12/31/2005 (a)
| |
Net asset value, beginning of period | | $ | 10.00 | |
Income (loss) from investment operations: | | | | |
Net investment income (loss) (b) | | | — | |
Net realized and unrealized gain (loss) on investments | | | 1.16 | |
| | |
|
|
|
Total from investment operations | | | 1.16 | |
Less distributions from: | | | | |
Net investment income | | | — | |
Net realized gain | | | — | |
| | |
|
|
|
Total distributions | | | — | |
| | |
|
|
|
Net asset value, end of period | | $ | 11.16 | |
| | |
|
|
|
Total return (%) | | | 11.60 | |
Ratios to average daily net assets (%) (c): | | | | |
Expenses, net of waivers and reimbursements | | | 1.40 | |
Expenses, before waivers and reimbursements | | | 2.32 | |
Net investment income (loss), net of waivers and reimbursements | | | (0.15 | ) |
Net investment income (loss), before waivers and reimbursements | | | (1.07 | ) |
| | | |
| | |
|
| | | Period Ended
|
| | | 12/31/2005 (a)
|
Supplemental data for all classes: | | | |
Net assets at end of period (in thousands) | | $ | 50,534 |
Portfolio turnover rate (%) (c) | | | 127 |
| (a) | | For the period from November 1, 2005 (Commencement of Operations) to December 31, 2005. |
| (b) | | Excludes $0.11 of PFIC mark to market which is treated as ordinary income for Federal tax purposes. |
| (c) | | Rates are annualized for periods that are less than a year. |
Performance cited represents past performance. Past performance does not guarantee future results and current performance may be lower or higher than the data quoted. Results shown are annual returns, which assume reinvestment of dividends and capital gains. Investment returns and principal will fluctuate and you may have a gain or loss when you sell shares. For the most current month-end performance information, please call 1-800-742-7272, or visit our Web site at www.williamblairfunds.com.
Note: Net investment income (loss) per share is based on the average shares outstanding during the period.
December 31, 2005 | William Blair Funds 95 |
Financial Highlights
Emerging Markets Growth Fund
| | | | |
| | | Class N
| |
| | | Period Ended
| |
| | | 12/31/2005 (a)
| |
Net asset value, beginning of period | | $ | 10.00 | |
Income (loss) from investment operations: | | | | |
Net investment income (loss) (b) | | | (0.01 | ) |
Net realized and unrealized gain (loss) on investments | | | 4.26 | |
| | |
|
|
|
Total from investment operations | | | 4.25 | |
Less distributions from: | | | | |
Net investment income | | | — | |
Net realized gain | | | 0.08 | |
| | |
|
|
|
Total distributions | | | 0.08 | |
| | |
|
|
|
Net asset value, end of period | | $ | 14.17 | |
| | |
|
|
|
Total return (%) | | | 42.52 | |
Ratios to average daily net assets (%) (c): | | | | |
Expenses, net of waivers and reimbursements | | | 1.55 | |
Expenses, before waivers and reimbursements | | | 1.91 | |
Net investment income (loss), net of waivers and reimbursements | | | (0.11 | ) |
Net investment income (loss), before waivers and reimbursements | | | (0.47 | ) |
| |
| | | Class I
| |
| | | Period Ended
| |
| | | 12/31/2005 (a)
| |
Net asset value, beginning of period | | $ | 10.00 | |
Income (loss) from investment operations: | | | | |
Net investment income (loss) (b) | | | 0.01 | |
Net realized and unrealized gain (loss) on investments | | | 4.26 | |
| | |
|
|
|
Total from investment operations | | | 4.27 | |
Less distributions from: | | | | |
Net investment income | | | — | |
Net realized gain | | | 0.08 | |
| | |
|
|
|
Total distributions | | | 0.08 | |
| | |
|
|
|
Net asset value, end of period | | $ | 14.19 | |
| | |
|
|
|
Total return (%) | | | 42.72 | |
Ratios to average daily net assets (%) (c): | | | | |
Expenses, net of waivers and reimbursements | | | 1.40 | |
Expenses, before waivers and reimbursements | | | 1.76 | |
Net investment income (loss), net of waivers and reimbursements | | | 0.04 | |
Net investment income (loss), before waivers and reimbursements | | | (0.32 | ) |
| | |
| |
| | | Period Ended
| |
| | | 12/31/2005 (a)
| |
Supplemental data for all classes: | | | | |
Net assets at end of period (in thousands) | | $ | 249,348 | |
Portfolio turnover rate (%) (c) | | | 77 | |
| (a) | | For the period from June 6, 2005 (Commencement of Operations) to December 31, 2005. |
| (b) | | Excludes $0.11 of PFIC mark to market which is treated as ordinary income for Federal tax purposes. |
| (c) | | Rates are annualized for periods that are less than a year. |
Performance cited represents past performance. Past performance does not guarantee future results and current performance may be lower or higher than the data quoted. Results shown are annual returns, which assume reinvestment of dividends and capital gains. Investment returns and principal will fluctuate and you may have a gain or loss when you sell shares. For the most current month-end performance information, please call 1-800-742-7272, or visit our Web site at www.williamblairfunds.com.
Note: Net investment income (loss) per share is based on the average shares outstanding during the period.
96 Annual Report | December 31, 2005 |
Financial Highlights
Value Discovery Fund
| | | | | | | | | | | | | | | | | | | |
| | | Class N
|
| | | Years Ended December 31,
|
| | | 2005
| | | 2004
| | | 2003
| | | 2002
| | | 2001
|
Net asset value, beginning of year | | $ | 22.70 | | | $ | 22.68 | | | $ | 16.28 | | | $ | 18.23 | | | $ | 16.20 |
Income (loss) from investment operations: | | | | | | | | | | | | | | | | | | | |
Net investment income (loss) | | | (0.02 | ) | | | (0.01 | ) | | | (0.06 | ) | | | (0.03 | ) | | | 0.08 |
Net realized and unrealized gain (loss) on investments | | | 0.14 | | | | 2.68 | | | | 6.46 | | | | (1.92 | ) | | | 2.74 |
| | |
|
|
| |
|
|
| |
|
|
| |
|
|
| |
|
|
Total from investment operations | | | 0.12 | | | | 2.67 | | | | 6.40 | | | | (1.95 | ) | | | 2.82 |
Less distributions from: | | | | | | | | | | | | | | | | | | | |
Net investment income | | | — | | | | — | | | | — | | | | — | | | | 0.03 |
Net realized gain | | | 7.87 | | | | 2.65 | | | | — | | | | — | | | | 0.76 |
| | |
|
|
| |
|
|
| |
|
|
| |
|
|
| |
|
|
Total distributions | | | 7.87 | | | | 2.65 | | | | — | | | | — | | | | 0.79 |
| | |
|
|
| |
|
|
| |
|
|
| |
|
|
| |
|
|
Net asset value, end of year | | $ | 14.95 | | | $ | 22.70 | | | $ | 22.68 | | | $ | 16.28 | | | $ | 18.23 |
| | |
|
|
| |
|
|
| |
|
|
| |
|
|
| |
|
|
Total return (%) | | | 0.49 | | | | 12.05 | | | | 39.31 | | | | (10.70 | ) | | | 17.39 |
Ratios to average daily net assets (%): | | | | | | | | | | | | | | | | | | | |
Expenses, net of waivers and reimbursements | | | 1.34 | | | | 1.34 | | | | 1.49 | | | | 1.53 | | | | 1.61 |
Expenses, before waivers and reimbursements | | | 1.64 | | | | 1.48 | | | | 1.58 | | | | 1.53 | | | | 1.66 |
Net investment income (loss), net of waivers and reimbursements | | | (0.22 | ) | | | (0.06 | ) | | | (0.30 | ) | | | (0.16 | ) | | | 0.28 |
Net investment income (loss), before waivers and reimbursements | | | (0.52 | ) | | | (0.20 | ) | | | (0.39 | ) | | | (0.16 | ) | | | 0.23 |
| |
| | | Class I
|
| | | Years Ended December 31,
|
| | | 2005
| | | 2004
| | | 2003
| | | 2002
| | | 2001
|
Net asset value, beginning of year | | $ | 22.82 | | | $ | 22.76 | | | $ | 16.31 | | | $ | 18.19 | | | $ | 16.16 |
Income (loss) from investment operations: | | | | | | | | | | | | | | | | | | | |
Net investment income (loss) | | | — | | | | 0.01 | | | | (0.03 | ) | | | 0.01 | | | | 0.17 |
Net realized and unrealized gain (loss) on investments | | | 0.17 | | | | 2.70 | | | | 6.48 | | | | (1.89 | ) | | | 2.70 |
| | |
|
|
| |
|
|
| |
|
|
| |
|
|
| |
|
|
Total from investment operations | | | 0.17 | | | | 2.71 | | | | 6.45 | | | | (1.88 | ) | | | 2.87 |
Less distributions from: | | | | | | | | | | | | | | | | | | | |
Net investment income | | | — | | | | — | | | | — | | | | — | | | | 0.08 |
Net realized gain | | | 7.87 | | | | 2.65 | | | | — | | | | — | | | | 0.76 |
| | |
|
|
| |
|
|
| |
|
|
| |
|
|
| |
|
|
Total distributions | | | 7.87 | | | | 2.65 | | | | — | | | | — | | | | 0.84 |
| | |
|
|
| |
|
|
| |
|
|
| |
|
|
| |
|
|
Net asset value, end of year | | $ | 15.12 | | | $ | 22.82 | | | $ | 22.76 | | | $ | 16.31 | | | $ | 18.19 |
| | |
|
|
| |
|
|
| |
|
|
| |
|
|
| |
|
|
Total return (%) | | | 0.70 | | | | 12.18 | | | | 39.55 | | | | (10.34 | ) | | | 17.72 |
Ratios to average daily net assets (%): | | | | | | | | | | | | | | | | | | | |
Expenses, net of waivers and reimbursements | | | 1.14 | | | | 1.23 | | | | 1.33 | | | | 1.34 | | | | 1.36 |
Expenses, before waivers and reimbursements | | | 1.39 | | | | 1.23 | | | | 1.33 | | | | 1.34 | | | | 1.41 |
Net investment income (loss), net of waivers and reimbursements | | | (0.02 | ) | | | 0.05 | | | | (0.14 | ) | | | 0.03 | | | | 0.53 |
Net investment income (loss), before waivers and reimbursements | | | (0.27 | ) | | | 0.05 | | | | (0.14 | ) | | | 0.03 | | | | 0.48 |
| | | | | | | | | | | | | | | |
| | | Years Ended December 31,
|
| | | 2005
| | 2004
| | 2003
| | 2002
| | 2001
|
Supplemental data for all classes: | | | | | | | | | | | | | | | |
Net assets at end of year (in thousands) | | $ | 70,439 | | $ | 246,176 | | $ | 237,111 | | $ | 190,802 | | $ | 149,292 |
Portfolio turnover rate (%) | | | 125 | | | 50 | | | 51 | | | 20 | | | 48 |
Performance cited represents past performance. Past performance does not guarantee future results and current performance may be lower or higher than the data quoted. Results shown are annual returns, which assume reinvestment of dividends and capital gains. Investment returns and principal will fluctuate and you may have a gain or loss when you sell shares. For the most current month-end performance information, please call 1-800-742-7272, or visit our Web site at www.williamblairfunds.com.
Note: Net investment income (loss) per share is based on the average shares outstanding during the year.
December 31, 2005 | William Blair Funds 97 |
Financial Highlights
Income Fund
| | | | | | | | | | | | | | | | | | |
| | | Class N
|
| | | Years Ended December 31,
|
| | | 2005
| | | 2004
| | | 2003
| | | 2002
| | 2001
|
Net asset value, beginning of year | | $ | 10.19 | | | $ | 10.43 | | | $ | 10.62 | | | $ | 10.34 | | $ | 10.22 |
Income (loss) from investment operations: | | | | | | | | | | | | | | | | | | |
Net investment income (loss) (a) | | | 0.47 | | | | 0.52 | | | | 0.40 | | | | 0.55 | | | 0.55 |
Net realized and unrealized gain (loss) on investments | | | (0.30 | ) | | | (0.26 | ) | | | (0.02 | ) | | | 0.25 | | | 0.17 |
| | |
|
|
| |
|
|
| |
|
|
| |
|
| |
|
|
Total from investment operations | | | 0.17 | | | | 0.26 | | | | 0.38 | | | | 0.80 | | | 0.72 |
Less distributions from: | | | | | | | | | | | | | | | | | | |
Net investment income | | | 0.53 | | | | 0.50 | | | | 0.57 | | | | 0.52 | | | 0.60 |
Net realized gain | | | — | | | | — | | | | — | | | | — | | | — |
| | |
|
|
| |
|
|
| |
|
|
| |
|
| |
|
|
Total distributions | | | 0.53 | | | | 0.50 | | | | 0.57 | | | | 0.52 | | | 0.60 |
| | |
|
|
| |
|
|
| |
|
|
| |
|
| |
|
|
Net asset value, end of year | | $ | 9.83 | | | $ | 10.19 | | | $ | 10.43 | | | $ | 10.62 | | $ | 10.34 |
| | |
|
|
| |
|
|
| |
|
|
| |
|
| |
|
|
Total return (%) | | | 1.71 | | | | 2.61 | | | | 3.68 | | | | 7.91 | | | 7.18 |
Ratios to average daily net assets (%): | | | | | | | | | | | | | | | | | | |
Expenses | | | 0.73 | | | | 0.78 | | | | 0.77 | | | | 0.81 | | | 0.94 |
Net investment income (loss) | | | 4.09 | | | | 4.12 | | | | 4.09 | | | | 5.23 | | | 5.38 |
| |
| | | Class I
|
| | | Years Ended December 31,
|
| | | 2005
| | | 2004
| | | 2003
| | | 2002
| | 2001
|
Net asset value, beginning of year | | $ | 10.15 | | | $ | 10.40 | | | $ | 10.62 | | | $ | 10.35 | | $ | 10.24 |
Income (loss) from investment operations: | | | | | | | | | | | | | | | | | | |
Net investment income (loss) (a) | | | 0.52 | | | | 0.59 | | | | 0.43 | | | | 0.57 | | | 0.58 |
Net realized and unrealized gain (loss) on investments | | | (0.33 | ) | | | (0.31 | ) | | | (0.04 | ) | | | 0.24 | | | 0.15 |
| | |
|
|
| |
|
|
| |
|
|
| |
|
| |
|
|
Total from investment operations | | | 0.19 | | | | 0.28 | | | | 0.39 | | | | 0.81 | | | 0.73 |
Less distributions from: | | | | | | | | | | | | | | | | | | |
Net investment income | | | 0.52 | | | | 0.53 | | | | 0.61 | | | | 0.54 | | | 0.62 |
Net realized gain | | | — | | | | — | | | | — | | | | — | | | — |
| | |
|
|
| |
|
|
| |
|
|
| |
|
| |
|
|
Total distributions | | | 0.52 | | | | 0.53 | | | | 0.61 | | | | 0.54 | | | 0.62 |
| | |
|
|
| |
|
|
| |
|
|
| |
|
| |
|
|
Net asset value, end of year | | $ | 9.82 | | | $ | 10.15 | | | $ | 10.40 | | | $ | 10.62 | | $ | 10.35 |
| | |
|
|
| |
|
|
| |
|
|
| |
|
| |
|
|
Total return (%) | | | 1.92 | | | | 2.79 | | | | 3.76 | | | | 8.04 | | | 7.32 |
Ratios to average daily net assets (%): | | | | | | | | | | | | | | | | | | |
Expenses | | | 0.58 | | | | 0.63 | | | | 0.62 | | | | 0.66 | | | 0.79 |
Net investment income (loss) | | | 4.24 | | | | 4.27 | | | | 4.24 | | | | 5.38 | | | 5.53 |
| | | | | | | | | | | |
| | | Years Ended December 31,
|
| | | 2005
| | 2004
| | 2003
| | 2002
| | 2001
|
Supplemental data for all classes: | | | | | | | | | | | |
Net assets at end of year (in thousands) | | $310,496 | | $294,084 | | $265,062 | | $196,136 | | $ | 176,264 |
Portfolio turnover rate (%) | | 41 | | 43 | | 36 | | 66 | | | 82 |
| (a) | | As required, in 2001, the Fund has adopted the provisions of the AICPA Audit and Accounting Guide for Investment Companies and began treating any paydown gain or losses on mortgage and asset backed securities as an adjustment to income. The effect of this change for the year 2001 was to decrease net investment income per share by $.05 and increase the net realized and unrealized gain and loss per share by $.05. It decreases the Ratio of Net Investment Income to Average Net Assets from 5.87% to 5.38% for Class N for 2001. It decreased the Ratio of Net Investment Income from 6.02% to 5.53% for Class I shares for 2001. |
Performance cited represents past performance. Past performance does not guarantee future results and current performance may be lower or higher than the data quoted. Results shown are annual returns, which assume reinvestment of dividends and capital gains. Investment returns and principal will fluctuate and you may have a gain or loss when you sell shares. For the most current month-end performance information, please call 1-800-742-7272, or visit our Web site at www.williamblairfunds.com.
Note: Net investment income (loss) per share is based on the average shares outstanding during the year.
98 Annual Report | December 31, 2005 |
Financial Highlights
Ready Reserves Fund
| | | | | | | | | | | | | | | |
| | | Class N
|
| | | Years Ended December 31,
|
| | | 2005
| | 2004
| | 2003
| | 2002
| | 2001
|
Net asset value, beginning of year | | $ | 1.00 | | $ | 1.00 | | $ | 1.00 | | $ | 1.00 | | $ | 1.00 |
Income (loss) from investment operations: | | | | | | | | | | | | | | | |
Net investment income (loss) | | | 0.03 | | | 0.01 | | | 0.01 | | | 0.01 | | | 0.04 |
| | |
|
| |
|
| |
|
| |
|
| |
|
|
Total from investment operations | | | 0.03 | | | 0.01 | | | 0.01 | | | 0.01 | | | 0.04 |
Less distributions from: | | | | | | | | | | | | | | | |
Net investment income | | | 0.03 | | | 0.01 | | | 0.01 | | | 0.01 | | | 0.04 |
| | |
|
| |
|
| |
|
| |
|
| |
|
|
Total distributions | | | 0.03 | | | 0.01 | | | 0.01 | | | 0.01 | | | 0.04 |
| | |
|
| |
|
| |
|
| |
|
| |
|
|
Net asset value, end of year | | $ | 1.00 | | $ | 1.00 | | $ | 1.00 | | $ | 1.00 | | $ | 1.00 |
| | |
|
| |
|
| |
|
| |
|
| |
|
|
Total return (%) | | | 2.62 | | | 0.80 | | | 0.66 | | | 1.28 | | | 3.66 |
Ratios to average daily net assets (%) | | | | | | | | | | | | | | | |
Expenses | | | 0.64 | | | 0.65 | | | 0.66 | | | 0.67 | | | 0.67 |
Net investment income (loss) | | | 2.57 | | | 0.80 | | | 0.66 | | | 1.28 | | | 3.63 |
Supplemental data: | | | | | | | | | | | | | | | |
Net assets at end of year (in thousands) | | $ | 1,091,854 | | $ | 1,092,940 | | $ | 1,153,932 | | $ | 1,324,001 | | $ | 1,403,740 |
Performance cited represents past performance. Past performance does not guarantee future results and current performance may be lower or higher than the data quoted. Results shown are annual returns, which assume reinvestment of dividends and capital gains. Investment returns and principal will fluctuate and you may have a gain or loss when you sell shares. For the most current month-end performance information, please call 1-800-742-7272, or visit our Web site at www.williamblairfunds.com.
December 31, 2005 | William Blair Funds 99 |
REPORT OF INDEPENDENT REGISTERED PUBLIC ACCOUNTING FIRM
To the Board of Trustees and Shareholders
William Blair Funds
We have audited the accompanying statements of assets and liabilities, including the portfolios of investments, of the Growth Fund, Tax-Managed Growth Fund, Large Cap Growth Fund, Small Cap Growth Fund, Small-Mid Cap Growth Fund, International Growth Fund, International Equity Fund, International Small Cap Growth Fund, Emerging Markets Growth Fund, Value Discovery Fund, Income Fund and Ready Reserves Fund (collectively, the “Portfolios”) (twelve of the Portfolios constituting the William Blair Funds) as of December 31, 2005, and the related statements of operations, statements of changes in net assets and financial highlights for the periods indicated therein. These financial statements and financial highlights are the responsibility of the Portfolios’ management. Our responsibility is to express an opinion on these financial statements and financial highlights based on our audits.
We conducted our audits in accordance with the standards of the Public Company Accounting Oversight Board (United States). Those standards require that we plan and perform the audit to obtain reasonable assurance about whether the financial statements and financial highlights are free of material misstatement. We were not engaged to perform an audit of the Portfolios’ internal control over financial reporting. Our audits included consideration of internal control over financial reporting as a basis for designing audit procedures that are appropriate in the circumstances, but not for the purpose of expressing an opinion on the effectiveness of the Portfolios’ internal control over financial reporting. Accordingly, we express no such opinion. An audit also includes examining, on a test basis, evidence supporting the amounts and disclosures in the financial statements and financial highlights, assessing the accounting principles used and significant estimates made by management, and evaluating the overall financial statement presentation. Our procedures included confirmation of securities owned as of December 31, 2005, by correspondence with the custodian and brokers or by other appropriate auditing procedures where replies from brokers were not received. We believe that our audits provide a reasonable basis for our opinion.
In our opinion, the financial statements and financial highlights referred to above present fairly, in all material respects, the financial position of each of the above mentioned Portfolios of the William Blair Funds at December 31, 2005, the results of their operations, changes in their net assets and financial highlights for the periods indicated therein, in conformity with U.S. generally accepted accounting principles.

Chicago, Illinois
February 3, 2006
100 Annual Report | December 31, 2005 |
Trustees and Officers (Unaudited). The trustees and officers of the William Blair Funds, their ages, their principal occupations during the last five years, their affiliations, if any, with William Blair & Company, L.L.C., and other significant affiliations are set forth below. The address of each trustee and officer is 222 West Adams Street, Chicago, Illinois 60606.
| | | | | | | | | | |
Name and Age
| | Position(s)
Held with
Fund
| | Term of
Office and
Length of
Time Served(1)
| | Principal Occupation(s) During Past 5 Years
| | Number of
Portfolios
in Fund
Complex
Overseen
by Trustee
| | Other Directorships Held by Trustee/Officer
|
Interested Trustees | | | | | | | | | | |
Frederick Conrad Fischer, 71* | | Chairman of the Board of Trustees | | Since 1987 | | Principal, William Blair & Company, L.L.C.; Partner, APM Limited Partnership | | 14 | | Trustee Emeritus, Chicago Child Care Society, a non-profit organization; Trustee Emeritus Kalamazoo College |
| | | | | |
Michelle Seitz, 40* | | Trustee | | Since 2002 | | Principal, William Blair & Company, L.L.C. | | 14 | | N/A |
Non-Interested Trustees | | | | | | | | |
Theodore A. Bosler, 71 | | Trustee | | Since 1997 | | Retired Principal and Vice President, Lincoln Capital Management | | 14 | | Desert Foothills Land Trust, Institute of Chartered Financial Analysts, and Thresholds. |
| | | | | |
Ann P. McDermott, 66 | | Trustee | | Since 1996 | | Board member and officer for various civic and charitable organizations over the past thirty years; professional experience prior thereto, registered representative for New York Stock Exchange firm | | 14 | | Northwestern University, Women’s Board; Rush Presbyterian St. Luke’s Medical Center, Women’s Board; University of Chicago, Women’s Board; Visiting Nurses Association, Honorary Director |
| | | | | |
Donald J. Reaves, 59 | | Trustee | | Since 2004 | | Vice President for Administration and Chief Financial Officer, University of Chicago since 2002. Executive Vice President and Chief Financial Officer, Brown University from 1993 to 2002 | | 14 | | American Student Assistance Corp.; Amica Mutual Insurance Company; NACUBO (National Association of College and University Business Officers) |
| | | | | |
John B. Schwemm, 71 | | Trustee | | Since 1990 | | Retired Chairman and Chief Executive Officer, R.R. Donnelley & Sons Company | | 14 | | USG Corp., building material manufacturer, and Walgreen Co. |
| | | | | |
Donald L. Seeley, 61 | | Trustee | | Since 2003 | | Director, Applied Investment Management Program, University of Arizona Department of Finance, Formerly Vice Chairman and Chief Financial Officer, True North Communications, Inc., marketing communications and advertising firm | | 14 | | Beverly Enterprises, Inc., provider of eldercare and rehabilitative services; Warnaco Group, Inc. intimate apparel, sportswear, and swimwear manufacturer. |
| | | | | |
Robert E. Wood II, 67 | | Trustee | | Since 1999 | | Retired Executive Vice President, Morgan Stanley Dean Witter | | 14 | | Chairman, Add-Vision, Inc. manufacturer of surface animation systems, and Micro-Combustion, LLC |
December 31, 2005 | William Blair Funds 101 |
| | | | | | | | | | |
Name and Age
| | Position(s)
Held with
Fund
| | Term of
Office and
Length of
Time Served(1)
| | Principal Occupation(s) During Past 5 Years
| | Number of
Portfolios
in Fund
Complex
Overseen
by Trustee
| | Other Directorships Held by Trustee/Officer
|
Officers | | | | | | | | | | |
Marco Hanig, 47 | | President | | Since 1999 | | Principal, William Blair & Company, L.L.C. | | N/A | | Chicago Scores |
| | | | | |
Karl W. Brewer, 39 | | Senior Vice President | | Since 2000 | | Principal, William Blair & Company, L.L.C. | | N/A | | N/A |
| | | | | |
Harvey H. Bundy, III, 61 | | Senior Vice President | | Since 2003 | | Principal, William Blair & Company, L.L.C. | | N/A | | N/A |
| | | | | |
Mark A. Fuller, III, 48 | | Senior Vice President | | Since 1993 | | Principal, William Blair & Company, L.L.C. | | N/A | | Partner, Fulsen Howney Partners |
| | | | | |
James W. Golan , 44 | | Senior Vice President | | Since 2005 | | Principal, William Blair & Company, L.L.C. | | N/A | | N/A |
| | | | | |
W. George Greig, 53 | | Senior Vice President | | Since 1996 | | Principal, William Blair & Company, L.L.C. | | N/A | | N/A |
| | | | | |
Michael A. Jancosek, 46 | | Senior Vice President Vice President | | Since 2004 Since 2000 | | Principal, William Blair & Company L.L.C. Associate, William Blair & Company, L.L.C. | | N/A | | N/A |
| | | | | |
John F. Jostrand, 51 | | Senior Vice President | | Since 1999 | | Principal, William Blair & Company, L.L.C. | | N/A | | N/A |
| | | | | |
James S. Kaplan, 45 | | Senior Vice President Vice President | | Since 2004 Since 1995 | | Principal, William Blair & Company, L.L.C. Associate, William Blair & Company, L.L.C. | | N/A | | N/A |
| | | | | |
Robert C. Lanphier, IV, 49 | | Senior Vice President | | Since 2003 | | Principal, William Blair & Company, L.L.C. | | N/A | | Chairman, AG. Med, Inc. |
| | | | | |
David S. Mitchell, 45 | | Senior Vice President Vice President | | Since 2004 Since 2003 | | Principal, William Blair & Company, L.L.C. Associate, William Blair & Company, L.L.C. | | N/A | | N/A |
| | | | | |
Gregory J. Pusinelli, 47 | | Senior Vice President | | Since 1999 | | Principal, William Blair & Company, L.L.C. | | N/A | | N/A |
| | | | | |
Norbert W. Truderung, 53 | | Senior Vice President | | Since 1992 | | Principal, William Blair & Company, L.L.C. | | N/A | | N/A |
| | | | | |
Jeffrey A. Urbina, 50 | | Senior Vice President | | Since 1998 | | Principal, William Blair & Company, L.L.C. | | N/A | | N/A |
| | | | | |
Christopher T. Vincent, 49 | | Senior Vice President Vice President | | Since 2004 Since 2002 | | Principal, William Blair & Company, L.L.C. Associate, William Blair & Company, L.L.C.; former Managing Director/Senior Portfolio Manager, Zurich Scudder Investments | | N/A | | Uhlich Children’s Home |
102 Annual Report | December 31, 2005 |
| | | | | | | | | | |
Name and Age
| | Position(s)
Held with
Fund
| | Term of
Office and
Length of
Time Served(1)
| | Principal Occupation(s) During Past 5 Years
| | Number of
Portfolios
in Fund
Complex
Overseen
by Trustee
| | Other Directorships Held by Trustee/Officer
|
| | | | | |
Mark T. Leslie, 38 | | Vice President | | Since 2005 | | Associate, William Blair & Company, L.L.C. formerly, U.S. Bancorp Asset Management | | N/A | | N/A |
| | | | | |
Todd M. McClone, 36 | | Vice President | | Since 2005 | | Associate, William Blair & Company, L.L.C. | | N/A | | N/A |
| | | | | |
Terence M. Sullivan, 61 | | Vice President and Treasurer | | Since 1997 | | Associate, William Blair & Company, L.L.C. | | N/A | | N/A |
| | | | | |
Colette M. Garavalia, 44 | | Secretary | | Since 2000 | | Associate, William Blair & Company, L.L.C. | | N/A | | N/A |
| * | | Mr. Fischer and Ms. Seitz are interested persons of the William Blair Funds because each is a principal of William Blair & Company, L.L.C., the Funds’ investment advisor and principal underwriter. |
| (1) | | Each Trustee serves until the election and qualification of a successor, or until death, resignation or retirement or removal as provided in the Fund’s Declaration of Trust. Retirement for non-interested Trustees occurs no later than at the conclusion of the first regularly scheduled Board meeting of the Fund’s fiscal year that occurs after the Trustee’s 72nd birthday. The Fund’s officers are elected annually by the Trustees. |
The Statement of Additional Information for the William Blair Funds includes additional information about the trustees and is available without charge by calling 1-800-635-2886 (in Massachusetts 1-800-635-2840) or by writing the Fund.
December 31, 2005 | William Blair Funds 103 |
Board Approval of International Small Cap Growth Fund’s Advisory Agreement (unaudited)
During the six months ended December 31, 2005, the Board of Trustees approved the Fund’s advisory agreement with the Company on behalf of the International Small Cap Growth Fund (the “Portfolio”). The advisory agreement with respect to the Portfolio was approved, by the Board of Trustees, including all of the trustees who are not parties to such agreement or interested persons of any such party, on July 19, 2005. The Board of Trustees, including a majority of the independent trustees, determined that approval of the advisory agreement was in the best interests of the Portfolio. The independent trustees met separately from the “interested” trustees of the Fund and officers and employees of the Company to consider approval of the advisory agreement and were assisted by independent legal counsel in making their determination. The Board of Trustees, including the independent trustees, did not identify any single factor or group of factors as all important or controlling and considered all factors together.
Nature, Quality and Extent of Services. In evaluating the nature, quality and extent of services expected to be provided, the Board noted that the Company is a quality firm with a reputation for integrity and honesty that employs high quality people.
The Board considered the Company’s Form ADV, biographical information about the Portfolio’s portfolio manager, the administrative services to be performed by the Company, financial information regarding the Company, the compliance regime created by the Company and the anticipated financial support of the Portfolio.
The Board also reviewed the Company’s performance for managing a Canadian international small cap fund as well as the performance of the other William Blair international funds. The Board concluded that the performance of the Canadian fund was too new to judge and that the performance of the other William Blair international funds was good.
Profitability. With respect to the costs of services provided and profits realized by the Company, the Board considered profitability information provided by the Company with respect to the Fund as a whole and the proposed expense cap for the Portfolio. Based on this information, the Board concluded that the Company’s profitability was not unreasonable.
Economies of Scale. The Board considered the extent to which economies of scale would be realized as the Portfolio grows and considered management’s representations that there are few opportunities for economies of scale in the investment process, that economies of scale are unexpected during the start-up process and that the Portfolio has capacity constraints. In considering whether fee levels reflect economies of scale for the benefit of Portfolio investors, the Board reviewed the Portfolio’s projected asset size, the Portfolio’s projected total and net expense ratios and the expense cap proposed. The Board concluded that the projected total expense ratio, after giving effect to the expense cap proposed by the Company, were reasonable.
Fees and Expenses. The Board compared the amounts to be paid to the Company for advisory and administrative services with other registered funds included in the Portfolio’s Lipper expense universe. In addition, the Board compared amounts paid to the Company by other registered funds, including other Portfolios in the Fund and a fund for which the Company acts as a subadvisor, and by the Company’s other clients. The Board also considered that the Company proposed to waive advisory fees for the Portfolio according to the proposed expense cap. The Board concluded that the Portfolio’s advisory fee was reasonable.
Other Benefits to the Company. The Board considered benefits derived by the Company from its relationship with the Portfolio, including soft dollars. The Board concluded that, after taking into account this benefit, the advisory fee was reasonable. Based on all of the information considered and the conclusions reached, the Board determined to approve the advisory agreement.
104 Annual Report | December 31, 2005 |
(unaudited)
Proxy Voting
A description of the policies and procedures that the Fund uses to determine how to vote proxies relating to portfolio securities and information regarding how the Fund voted proxies relating to portfolio securities for the most recent 12-month period ended June 30 are available without charge, upon request, by calling 1-800-635-2886 (in Massachusetts 1-800-635-2840), at www.williamblairfunds.com and on the SEC’s website at http://www.sec.gov.
Quarterly Portfolio Schedules
The Fund files its complete schedule of portfolio holdings with the SEC for the first and third fiscal quarters of each fiscal year (quarters ended March 31 and September 30) on Form N-Q. The Fund’s Forms N-Q are available on the SEC’s website at http://www.sec.gov and may be reviewed and copied at the SEC’s Public Reference Room in Washington, D.C. Information on the operation of the SEC’s Public Reference Room may be obtained by calling 1-800-SEC-0330.
December 31, 2005 | William Blair Funds 105 |
Useful Information About Your Report (unaudited)
Please refer to this information when reviewing the Expense Example for each Fund.
Expense Example
As a shareholder of a Fund, you incur two types of costs: (1) transaction costs such as redemption fees and (2) ongoing costs, including management fees, distribution (12b-1) fees (for Class N shares except for Ready Reserves Fund), service fee (for Class N of Ready Reserves Fund), shareholder administration fee (for Class N and Class I shares of International Small Cap Growth Fund and Emerging Markets Growth Fund) and other Fund expenses. The example is intended to help you understand your ongoing costs (in dollars) of investing in the Fund and to compare these costs with the ongoing costs of investing in other mutual funds. To do so, compare the Fund’s 5% hypothetical example with the 5% hypothetical examples that appear in the shareholder reports of other funds. The example is based on an investment of $1,000 invested at the beginning of the period and held for the entire six-month period from July 1, 2005 to December 31, 2005.
Actual Expenses
In each example, the first line for each share class in the table provides information about the actual account values and actual expenses. These expenses reflect the effect of any expense cap applicable to the share class during the period. Without this expense cap, the costs shown in the table would have been higher. You may use the information in this line, together with the amount you invested, to estimate the expenses that you paid over the period. Simply divide your account value by $1,000 (example, an $8,600 account value divided by $1,000 = 8.6), then multiply the result by the number in the first line under the heading entitled “Expenses Paid During the Period” to estimate the expenses you paid on your account during the period.
Hypothetical Example for Comparison Purposes
In each example, the second line for each share class in the table provides information about hypothetical account values and hypothetical expenses based on the Fund’s actual expense ratio and an assumed rate of return of 5% per year before expenses. This is not the Fund’s actual return. The hypothetical account values and expenses may not be used to estimate the actual ending account balance or expenses you paid for the period. You may use this information to compare the ongoing costs of investing in the Fund to other funds. To do so, compare this 5% hypothetical example with the 5% hypothetical examples that appear in the shareholder reports of other funds.
Please note that the expenses shown in both examples are meant to highlight your ongoing costs only and do not reflect any transactional costs or account type fees, such as redemption fees and IRA Fiduciary Administration fees, respectively. These fees are fully described in the prospectus. Therefore, the second line of each share class in the table is useful in comparing ongoing costs only and will not help you determine the relative costs of owning different funds. In addition, if these transactional costs were included, your costs would have been higher.
106 Annual Report | December 31, 2005 |
Fund Expenses (unaudited)
The examples below show you the ongoing costs (in dollars) of investing in your fund and allows you to compare these costs with those of other mutual funds. Please refer to the previous page for a detailed explanation of the information presented on this chart.
| | | | | | | | | | | | | |
| | | Beginning
Account Value
7/1/2005
| | Ending
Account Value
12/31/2005
| | Expenses Paid
during
Period(a)
| | | Annualized
Expense Ratio
| |
Growth Fund | | | | | | | | | | | | | |
Class N—actual return | | $ | 1,000.00 | | $ | 1,105.70 | | $ | 6.10 | | | 1.15 | % |
Class N—hypothetical 5% return | | | 1,000.00 | | | 1,019.41 | | | 5.85 | | | 1.15 | |
Class I—actual return | | | 1,000.00 | | | 1,107.00 | | | 4.78 | | | 0.90 | |
Class I—hypothetical 5% return | | | 1,000.00 | | | 1,020.67 | | | 4.58 | | | 0.90 | |
Tax-Managed Growth Fund | | | | | | | | | | | | | |
Class N—actual return | | | 1,000.00 | | | 1,113.40 | | | 8.15 | | | 1.53 | |
Class N—hypothetical 5% return | | | 1,000.00 | | | 1,017.49 | | | 7.78 | | | 1.53 | |
Class I—actual return | | | 1,000.00 | | | 1,115.10 | | | 6.82 | | | 1.28 | |
Class I—hypothetical 5% return | | | 1,000.00 | | | 1,018.75 | | | 6.51 | | | 1.28 | |
Large Cap Growth Fund | | | | | | | | | | | | | |
Class N—actual return | | | 1,000.00 | | | 1,055.50 | | | 6.63 | | | 1.28 | |
Class N—hypothetical 5% return | | | 1,000.00 | | | 1,018.75 | | | 6.51 | | | 1.28 | |
Class I—actual return | | | 1,000.00 | | | 1,058.10 | | | 5.34 | | | 1.03 | |
Class I—hypothetical 5% return | | | 1,000.00 | | | 1,020.01 | | | 5.24 | | | 1.03 | |
Small Cap Growth Fund | | | | | | | | | | | | | |
Class N—actual return | | | 1,000.00 | | | 1,055.70 | | | 7.72 | | | 1.49 | |
Class N—hypothetical 5% return | | | 1,000.00 | | | 1,017.69 | | | 7.58 | | | 1.49 | |
Class I—actual return | | | 1,000.00 | | | 1,057.40 | | | 6.43 | | | 1.24 | |
Class I—hypothetical 5% return | | | 1,000.00 | | | 1,018.95 | | | 6.31 | | | 1.24 | |
Small-Mid Cap Growth Fund | | | | | | | | | | | | | |
Class N—actual return | | | 1,000.00 | | | 1,113.10 | | | 7.72 | | | 1.45 | |
Class N—hypothetical 5% return | | | 1,000.00 | | | 1,017.90 | | | 7.37 | | | 1.45 | |
Class I—actual return | | | 1,000.00 | | | 1,114.50 | | | 6.40 | | | 1.20 | |
Class I—hypothetical 5% return | | | 1,000.00 | | | 1,019.16 | | | 6.11 | | | 1.20 | |
International Growth Fund | | | | | | | | | | | | | |
Class N—actual return | | | 1,000.00 | | | 1,098.60 | | | 7.87 | | | 1.42 | |
Class N—hypothetical 5% return | | | 1,000.00 | | | 1,018.05 | | | 7.22 | | | 1.42 | |
Class I—actual return | | | 1,000.00 | | | 1,200.70 | | | 6.49 | | | 1.17 | |
Class I—hypothetical 5% return | | | 1,000.00 | | | 1,019.31 | | | 5.96 | | | 1.17 | |
International Equity Fund | | | | | | | | | | | | | |
Class N—actual return | | | 1,000.00 | | | 1,148.20 | | | 8.01 | | | 1.48 | |
Class N—hypothetical 5% return | | | 1,000.00 | | | 1,017.74 | | | 7.53 | | | 1.48 | |
Class I—actual return | | | 1,000.00 | | | 1,150.20 | | | 6.67 | | | 1.23 | |
Class I—hypothetical 5% return | | | 1,000.00 | | | 1,019.00 | | | 6.26 | | | 1.23 | |
International Small Cap Growth Fund | | | | | | | | | | | | | |
Class N—actual return (since inception period) | | | 1,000.00 | | | 1,116.00 | | | 2.87 | (b) | | 1.65 | |
Class N—hypothetical 5% return (6 month period) | | | 1,000.00 | | | 1,016.89 | | | 8.39 | | | 1.65 | |
Class I—actual return (since inception period) | | | 1,000.00 | | | 1,116.00 | | | 2.43 | (b) | | 1.40 | |
Class I—hypothetical 5% return (6 month period) | | | 1,000.00 | | | 1,018.15 | | | 7.12 | | | 1.40 | |
Emerging Markets Growth Fund | | | | | | | | | | | | | |
Class N—actual return | | | 1,000.00 | | | 1,389.10 | | | 9.33 | | | 1.55 | |
Class N—hypothetical 5% return | | | 1,000.00 | | | 1,017.39 | | | 7.88 | | | 1.55 | |
Class I—actual return | | | 1,000.00 | | | 1,391.10 | | | 8.44 | | | 1.40 | |
Class I—hypothetical 5% return | | | 1,000.00 | | | 1,018.15 | | | 7.12 | | | 1.40 | |
December 31, 2005 | William Blair Funds 107 |
| | | | | | | | | | | | |
| | | Beginning
Account Value
7/1/2005
| | Ending
Account Value
12/31/2005
| | Expenses Paid
during
Period(a)
| | Annualized
Expense Ratio
| |
Value Discovery Fund | | | | | | | | | | | | |
Class N—actual return | | $ | 1,000.00 | | $ | 1,054.10 | | $ | 6.94 | | 1.34 | % |
Class N—hypothetical 5% return | | | 1,000.00 | | | 1,018.45 | | | 6.82 | | 1.34 | |
Class I—actual return | | | 1,000.00 | | | 1,055.10 | | | 5.91 | | 1.14 | |
Class I—hypothetical 5% return | | | 1,000.00 | | | 1,019.46 | | | 5.80 | | 1.14 | |
Income Fund | | | | | | | | | | | | |
Class N—actual return | | | 1,000.00 | | | 1,003.80 | | | 3.69 | | 0.73 | |
Class N—hypothetical 5% return | | | 1,000.00 | | | 1,021.53 | | | 3.72 | | 0.73 | |
Class I—actual return | | | 1,000.00 | | | 1,005.10 | | | 2.93 | | 0.58 | |
Class I—hypothetical 5% return | | | 1,000.00 | | | 1,022.28 | | | 2.96 | | 0.58 | |
Ready Reserves Fund | | | | | | | | | | | | |
Class N—actual return | | | 1,000.00 | | | 1,015.80 | | | 3.25 | | 0.64 | |
Class N—hypothetical 5% return | | | 1,000.00 | | | 1,021.98 | | | 3.26 | | 0.64 | |
| (a) | | Expenses are equal to the annualized expense ratio, multiplied by the average account value over the period, multiplied by the number of days in the period (184), and divided by 365 (to reflect the one-half-year period.) |
| (b) | | For the period November 1, 2005 (Commencement of Operations) until December 31, 2005. |
108 Annual Report | December 31, 2005 |
BOARD OF TRUSTEES
Frederick Conrad Fischer, Chairman
Principal, William Blair & Company, L.L.C.
Theodore A. Bosler
Retired Principal and Vice President, Lincoln Capital Management Company
Ann P. McDermott
Director and Trustee
Profit and not-for-profit organizations
Donald J. Reaves
Vice President for Administration and Chief Financial Officer, University of Chicago
Donald L. Seeley
Adjunct Lecturer and Director, University of Arizona Department of Finance
John B. Schwemm
Retired Chairman and CEO, R.R. Donnelley & Sons Company
Michelle R. Seitz
Principal, William Blair & Company, L.L.C.,
Robert E. Wood II
Retired Executive Vice President, Morgan Stanley Dean Witter
Officers
Marco Hanig, President
Karl W. Brewer, Senior Vice President
Harvey H. Bundy III, Senior Vice President
Mark A. Fuller, III, Senior Vice President
James W. Golan, Senior Vice President
W. George Greig, Senior Vice President
Michael A. Jancosek, Senior Vice President
John F. Jostrand, Senior Vice President
James S. Kaplan, Senior Vice President
Robert C. Lanphier, IV, Senior Vice President
David S. Mitchell, Senior Vice President
Gregory J. Pusinelli, Senior Vice President
Norbert W. Truderung, Senior Vice President
Jeffrey A. Urbina, Senior Vice President
Christopher T. Vincent, Senior Vice President
Mark T. Leslie, Vice President
Todd M. McClone, Vice President
Terence M. Sullivan, Vice President and Treasurer
Colette M. Garavalia, Secretary
Investment Advisor
William Blair & Company, L.L.C.
Legal Counsel
Vedder, Price, Kaufman & Kammholz, P.C.
Independent Registered Public Accounting Firm
Ernst & Young LLP
Transfer Agent
State Street Bank and Trust Company
P.O. Box 8506
Boston, MA 02266-8506
For customer assistance, call 1-800-635-2886
(Massachusetts 1-800-635-2840)
| | Date of First Use February, 2006 109 |

Table of Contents
This report is submitted for the general information of the shareholders of the William Blair Funds. It is not authorized for distribution to prospective investors unless accompanied or preceded by a prospectus of the William Blair Funds. Please consider the Funds’ investment objectives, risks, charges, and expenses before investing. This and other information is contained in the Funds’ prospectus, which you may obtain by calling 1-800-742-7272. Read it carefully before you invest or send money. William Blair & Company, LLC., distributor.
December 31, 2005 | William Blair Funds 1 |

W. George Greig
INSTITUTIONAL INTERNATIONAL GROWTH FUND
The Institutional International Growth Fund invests primarily in common stocks of foreign growth companies of all sizes.
AN OVERVIEW FROM THE PORTFOLIO MANAGER
How did the Fund perform over the last year? How did the Fund’s performance compare to its benchmark?
The Institutional International Growth Fund posted a 22.76% gain for the 12 months ended December 31, 2005. By comparison, the Fund’s benchmark, the MSCI All Country World Free except US Index, rose 17.11%.
What factors were behind the Fund’s performance versus the benchmark?
In this positive market environment, the Fund rose 22.76% during the year, significantly surpassing the 17.11% MSCI All Country World Free ex-US Index return. In particular, stock selection in Energy, Financials, Information Technology and Telecommunication Services sectors were the areas of the most value added, as was stock selection in Emerging Asia, Japan and Pacific Free ex-Japan. In addition, the Fund’s allocation to small capitalization and emerging markets companies, coupled with strong stock selection in these names, also added value.
What were the most significant factors impacting international markets during 2005?
During the first six months of 2005 the international equity markets were largely flat; however, during the last half of the year the equity markets sharply appreciated as evidenced by the annual 17.11% MSCI All Country World Free except US Index return. International equities significantly outpaced the US equities as measured by the Standard and Poor’s 500 Index, which rose 4.91% year to date. This increase was despite US dollar appreciation versus most foreign currencies, which reduced returns to US investors. The MSCI EAFE Index rose 29.54% in local terms, which translated into 14.02% to US dollar investors, as the US dollar appreciated an average 13% relative to EAFE (Europe and Australasia, Far East Equity) country currencies.
Positive second half international equity market performance was driven by strong results across sectors, capitalizations and regions. With its improving macroeconomic backdrop and positive consumer sentiment, Japan was one of the strongest developed regions year to date, up 25.63% in US dollar terms, only lagging behind Canada, which returned nearly 29%. Emerging markets were the strongest part of the international markets overall, returning 34.54% as measured by the MSCI Emerging Markets Index, while developed small capitalization stocks rose 25.48%. Both areas outperformed larger capitalization developed stocks, as measured by the EAFE Index.
What is your outlook for the international markets?
After a third consecutive year of strong equity returns worldwide, markets have for the most part erased the losses of the 2000-2002 bear market. As the new year begins, many national and regional indices (with the obvious exceptions of Nasdaq and the Japanese market benchmarks) are at or approaching historic highs. Even in the US, where index returns were modest, a majority of individual stocks offered better performance.
2 Annual Report | December 31, 2005 |
Prices have been propelled higher by strong fundamentals: exceptional earnings growth and a surprisingly stable inflation and long term interest rate environment. The only two elements of cyclical risk in the global economic picture have been Fed tightening and rising energy costs, and up to now, neither of them has had a significant impact on growth. Relative economic stability has enabled strong corporate performance to act as the key driver of share price gains over the course of the last several years. Accordingly, if the structural framework of the global economy remains in equilibrium, and corporate growth and profitability continue to meet or exceed expectations, the market environment will remain conducive to solid equity returns.
The principal risks in the macro picture are well known, and mostly focused on the US: household sector leverage and inadequate savings; consumer vulnerability to weakness in home prices; interest rate and exchange rate risks associated with the US current account deficit; the potential for a central bank policy error (such as overreacting to transitory inflation signs); a ‘superspike’ in oil and gas prices beyond what has already taken place; and/or exogenous variables such as avian flu, terrorist disruptions, or natural disasters.
Since none of these issues are new, the only way they could have a dramatic impact on the market risk profile would be if one of them suddenly had a delayed or cumulative effect, or if two or more of them combined in some unforeseen way. These possibilities cannot be conclusively ruled out, but at the same time, the resilience of the financial and economic infrastructure-perhaps a byproduct of increasing global integration-has been impressive over the last decade.
The other key variable in the outlook is corporate profitability and growth, where we have seen continued strength in the US and dramatic improvement in Japan, Europe, and in many developing markets. This aspect of the market environment shows no sign of deteriorating or even slackening the pace of improvement. Corporate management continues to focus on improving supply chain management, capital and labor productivity, cost control, and marketing. Returns on capital are now well above the cost of capital in every principal region of the world; and while there are concerns that ‘excessive’ profitability is a risk factor in itself, there is no signal apparent of either complacency or irrational competitive behavior undermining corporate performance on a wide scale.
Even in a benign economic and earnings scenario, of course, there is no guarantee of supernormal returns or a continuation of the trends of 2003-05. There is a reasonable (although not conclusive) case that cyclical growth may slow in the US and China in 2006, and profit growth may be restrained as a result. In addition, growth in the energy and financial sectors may be held back by price declines and yield curve flattening, respectively. On the other hand, Japan and more recently Europe seem to be benefiting from the effects of a strong external environment and solid corporate profitability, and could continue to mount moderate but self-sustaining recoveries. On a global basis, there is probably not much reason to anticipate significantly lower earnings growth in 2006, but some deceleration seems likely.
In the context of the current profit and interest rate picture, current valuations should not present a significant issue for potential returns, and even areas that have seen relatively strong recent performance, such as small caps and Japan, are not so extended as to be unusually risky on valuation grounds alone.
Emerging markets continue to be a special case, influenced by long term changes outside of the business cycle. Whereas previous cycles were dominated by unstable investment flows and highly volatile production and trade patterns, virtually all of the developing world is now seeing new dynamics of high savings, credit development, job creation and household spending growth, as well as more responsible and transparent corporate behavior. These factors are reducing financial risk at the same time they create new avenues of growth in emerging economies, and have been instrumental in driving exceptional returns in this asset class since 1999.
December 31, 2005 | William Blair Funds 3 |
On balance, we see a reasonable balance between risk and opportunity for the year ahead, particularly as international markets continue to be led by the ongoing trend toward better corporate performance and governance. At the margins of any set of expectations, of course, are the ‘unknown unknowns’. Volatility has been relatively low for some time, and global markets have not faced any major discontinuities for several years. Any investment strategy predicated on anticipation of normal growth and risk parameters has to be adaptable to evolving change, and adaptability built into portfolio structure from the bottom up is probably the most consistent method for refining strategy.
4 Annual Report | December 31, 2005 |
Institutional International Growth Fund
Performance Highlights (unaudited)
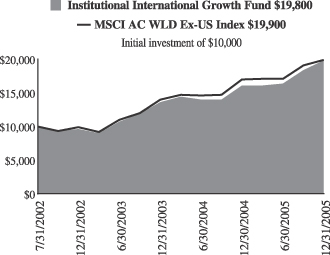
Average Annual Total Return at 12/31/2005
| | | | | | | | | |
| | | 1
Year
| | | 3
Year
| | | Since Inception(a)
| |
Institutional International Growth Fund | | 22.76 | % | | 27.37 | % | | 21.89 | % |
MSCI All Country World Free Ex-US Index | | 17.11 | | | 26.20 | | | 21.67 | |
| | (a) | For the period from July 26, 2002 (Commencement of Operations) to December 31, 2005. |
Performance cited represents past performance. Past performance does not guarantee future results and current performance may be lower or higher than the data quoted. Results shown are average annual returns, which assume reinvestment of dividends and capital gains. Investment returns and principal will fluctuate and you may have a gain or loss when you sell shares. For the most current month-end performance information, please call 1-800-742-7272, or visit our Web site at www.williamblairfunds.com. International investing involves special risk considerations, including currency fluctuations, lower liquidity, economic and political risk.
The performance highlights and graph presented above do not reflect the deduction of taxes that a shareholder would pay on fund distributions or the redemption of fund shares.
The Morgan Stanley Capital International (MSCI) All Country World Free ex-US Index is an unmanaged index that includes developed and emerging markets and reduced Japanese portion, making it more comparable to the Institutional International Growth Fund in terms of investment approach.
This report identifies the Fund’s investments on December 31, 2005. These holdings are subject to change. Not all stocks in the Fund performed the same, nor is there any guarantee that these stocks will perform as well in the future. Market forecasts provided in this report may not necessarily come to pass.
Sector Diversification (unaudited)
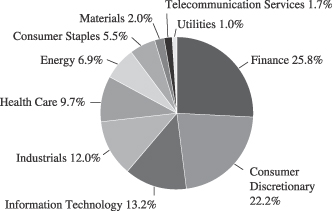
The sector diversification shown is based on the total investment portfolio.
December 31, 2005 | William Blair Funds 5 |
Institutional International Growth Fund
Portfolio of Investments, December 31, 2005 (all dollar amounts in thousands)
| | | | | |
Issuer
| | Shares
| | Value
|
| | |
Common Stocks—Europe—32.3% | | | | | |
Austria—1.8% | | | | | |
Erste Bank (Banking) | | 238,900 | | $ | 13,263 |
* Raiffeisen International Bank (Banking) | | 215,800 | | | 14,104 |
| | | | |
|
|
| | | | | | 27,367 |
| | | | |
|
|
France—8.6% | | | | | |
April Group S.A. (Insurance brokers) | | 99,500 | | | 4,101 |
BNP Paribas (Banking) | | 188,500 | | | 15,209 |
Dassault Systems S.A. (Computer aided design) | | 191,500 | | | 10,790 |
Essilor International (Health care supplies) | | 127,600 | | | 10,283 |
Eurazeo (Diversified financial services) | | 67,300 | | | 7,014 |
Hermes International SCA (Apparel and luxury goods) | | 46,700 | | | 11,641 |
Iliad S.A. (Internet software and services) | | 88,000 | | | 5,439 |
Klepierre (Real estate) | | 44,270 | | | 4,151 |
* Nexity (Real estate management) | | 94,900 | | | 4,815 |
* Orpea (Hospital and nursing management) | | 95,233 | | | 5,217 |
Sanofi-Aventis (Pharmaceuticals) | | 287,095 | | | 25,105 |
Technip-Coflexip S.A. (Construction) | | 179,580 | | | 10,842 |
Vinci S.A. (Construction) | | 143,200 | | | 12,319 |
Zodiac S.A. (Aerospace and defense) | | 115,700 | | | 7,417 |
| | | | |
|
|
| | | | | | 134,343 |
| | | | |
|
|
Germany—6.5% | | | | | |
AWD Holdings AG (Financial services) | | 28,800 | | | 795 |
Bijou Brigitte (Fashon jewelry accessories) | | 20,200 | | | 5,447 |
Celesio AG (Pharmaceuticals) | | 141,650 | | | 12,165 |
Continental AG (Diversified manufacturing) | | 208,100 | | | 18,429 |
Did Deutscher Industrie Svc (Commercial services) | | 102,524 | | | 5,982 |
E.ON AG (Energy) | | 151,080 | | | 15,592 |
GFK AG (Commercial services) | | 106,000 | | | 3,542 |
* Q-Cells AG (Alternative energy sources) | | 26,300 | | | 1,532 |
Rational AG (Business equipment) | | 24,890 | | | 3,305 |
SAP AG (Software) | | 156,400 | | | 28,148 |
Solarworld AG (Alternative energy sources) | | 15,700 | | | 2,100 |
Stada Arzneimittel AG (Pharmaceuticals) | | 149,800 | | | 4,887 |
| | | | |
|
|
| | | | | | 101,924 |
| | | | |
|
|
Greece—1.5% | | | | | |
Coca-Cola Hellenic Bottling S.A. (Beverages) | | 270,800 | | | 7,953 |
EFG Eurobank (Banking) | | 246,700 | | | 7,784 |
National Bank of Greece (Banking) | | 182,990 | | | 7,779 |
| | | | |
|
|
| | | | | | 23,516 |
| | | | |
|
|
Ireland—2.2% | | | | | |
Anglo Irish Bank plc (Finance) | | 915,100 | | | 13,812 |
Kingspan Group plc (Construction) | | 481,100 | | | 6,032 |
* Ryanair Holdings plc—ADR (Airlines) | | 196,500 | | | 11,002 |
United Drug plc (Pharmaceuticals) | | 736,700 | | | 3,186 |
| | | | |
|
|
| | | | | | 34,032 |
| | | | |
|
|
Italy—2.1% | | | | | |
Credito Emiliano SpA (Banking) | | 464,500 | | | 5,183 |
Luxottica Group SpA (Apparel and luxury goods) | | 581,100 | | | 14,747 |
| | | | | |
Issuer
| | Shares
| | Value
|
| |
Common Stocks—Europe—32.3%—(continued) | | | |
Italy—2.1%—(continued) | | | | | |
Pirelli & C Real Estate SpA (Real estate development) | | 75,800 | | $ | 4,137 |
Saipem SpA (Energy equipment and services) | | 544,300 | | | 8,926 |
| | | | |
|
|
| | | | | | 32,993 |
| | | | |
|
|
Netherlands—0.6% | | | | | |
* Tomtom NV (Computer software) | | 265,500 | | | 9,107 |
| | | | |
|
|
Norway—0.6% | | | | | |
Statoil Asa (Oil and gas) | | 415,600 | | | 9,531 |
| | | | |
|
|
Spain—1.5% | | | | | |
Grupo Ferrovial S.A. (Industrial services) | | 114,300 | | | 7,926 |
* Industria De Textile (Retail trade) | | 454,900 | | | 14,844 |
| | | | |
|
|
| | | | | | 22,770 |
| | | | |
|
|
Sweden—0.8% | | | | | |
* Capio AB (Health care) | | 185,800 | | | 3,307 |
Clas Ohlson AB (Retail) | | 201,700 | | | 3,822 |
* Modern Times Group (Television) | | 122,250 | | | 5,100 |
| | | | |
|
|
| | | | | | 12,229 |
| | | | |
|
|
Switzerland—6.1% | | | | | |
* Actelion Ltd. (Biotechnology) | | 20,700 | | | 1,709 |
* EFG International (Commercial banking) | | 189,300 | | | 5,037 |
*Nobel Biocare Holdings AG (Medical equipment and supplies) | | 34,210 | | | 7,523 |
Phonak Holdings AG (Hearing technology) | | 124,100 | | | 5,346 |
Roche Holdings AG (Health care) | | 248,600 | | | 37,237 |
SGS S.A. (Industrials) | | 12,400 | | | 10,442 |
UBS AG (Banking) | | 290,600 | | | 27,593 |
| | | | |
|
|
| | | | | | 94,887 |
| | | | |
|
|
| | |
Japan—22.3% | | | | | |
Aeon Credit Service Co., Ltd. (Consumer finance) | | 107,200 | | | 10,139 |
Aeon Mall Co., Ltd. (Real estate) | | 153,300 | | | 7,468 |
Arrk Corporation (Miscellaneous manufacturer) | | 69,400 | | | 5,103 |
* Askul Corporation (Retail trade) | | 65,100 | | | 2,019 |
* Chiyoda Corp. (Construction) | | 410,800 | | | 9,409 |
Chugai Pharmaceutical Company (Pharamceuticals) | | 825,800 | | | 17,760 |
Denso Corporation (Auto parts manufacturing) | | 817,400 | | | 28,286 |
Honeys Company, Ltd. (Luxury goods) | | 58,000 | | | 4,725 |
Hoya Corporation (Electronic technology) | | 580,600 | | | 20,859 |
ITO EN, Ltd. (Beverages) | | 85,400 | | | 5,122 |
* K.K. Davinci Advisors (Consulting services) | | 698 | | | 5,245 |
* Kenedix, Inc. (Investment management services) | | 924 | | | 5,819 |
Keyence Corporation (Electronic technology) | | 56,690 | | | 16,114 |
Komeri Co. (Speciality retail) | | 187,900 | | | 8,055 |
MISUMI Group, Inc. (Metal production) | | 110,500 | | | 4,801 |
Mitsubishi Tokyo Financial (Financial services) | | 2,242 | | | 30,517 |
Nakanishi Inc. (Medical specialties) | | 42,500 | | | 4,768 |
Neomax Co., Ltd. (Electronic equipment and instruments) | | 156,700 | | | 5,157 |
See accompanying Notes to Financial Statements.
6 Annual Report | December 31, 2005 |
Institutional International Growth Fund
Portfolio of Investments, December 31, 2005 (all dollar amounts in thousands)
| | | | | |
Issuer
| | Shares
| | Value
|
| |
Common Stocks—Japan—22.3%—(continued) | | | |
Nidec Corporation (Electronic technology) | | 201,000 | | $ | 17,092 |
Nitori Company Ltd. (Specialty stores) | | 67,340 | | | 6,266 |
Nitto Denko Corporation (Electronic technology) | | 158,300 | | | 12,328 |
Orix Corporation (Consumer finance) | | 124,200 | | | 31,598 |
Park 24 Co., Ltd. (Commercial services) | | 231,000 | | | 8,249 |
Point Inc. Ltd. (Apparel and footwear retail) | | 100,590 | | | 8,403 |
Ryohin Keikaku Co. Ltd. (Retail stores) | | 112,300 | | | 9,819 |
Sharp Corp. (Electronics) | | 1,069,100 | | | 16,259 |
Shimamura Company Ltd. (Retail stores) | | 73,100 | | | 10,097 |
Sparx Asset Management Co. (Financial) | | 1,547 | | | 4,524 |
Sundrug Co., Ltd. (Drug stores) | | 96,300 | | | 5,274 |
United Arrows, Ltd. (Specialty retail) | | 113,000 | | | 7,169 |
Yamada Denki Company (Retail trade) | | 142,900 | | | 17,856 |
| | | | |
|
|
| | | | | | 346,300 |
| | | | |
|
|
| | |
Emerging Asia—10.5% | | | | | |
China—1.5% | | | | | |
China Mengniu Dairy Co. (Food products) | | 4,495,000 | | | 3,816 |
Ctrip.com International Ltd.—ADR (Hotels, restaurants and leisure) | | 69,400 | | | 4,008 |
*Foxconn International (Manufacturing services) | | 3,918,800 | | | 6,398 |
Fu Ji Food & Catering (Hotels, restaurants and leisure) | | 1,819,000 | | | 2,980 |
Li Ning Co. Ltd. (Leisure equipment and products) | | 5,260,000 | | | 3,731 |
Ports Design Limited (Apparel and luxury goods) | | 2,184,000 | | | 2,541 |
| | | | |
|
|
| | | | | | 23,474 |
| | | | |
|
|
India—1.9% | | | | | |
*Bharti Tele-Ventures (Wireless telecommunication services) | | 585,900 | | | 4,505 |
HDFC Bank (Banking) | | 464,900 | | | 7,297 |
Housing Development Finance Corp. (Financial services) | | 375,400 | | | 10,073 |
Infosys Technologies, Ltd. (Consulting and software services) | | 123,928 | | | 8,256 |
| | | | |
|
|
| | |
| | | | | | 30,131 |
| | | | |
|
|
Malaysia—0.8% | | | | | |
*Airasia Bhd (Air transport) | | 9,748,600 | | | 4,100 |
Bumiputra Commerce Holdings Bhd (Banking) | | 4,251,600 | | | 6,413 |
Transmile Group Bhd (Airport development and maintenance) | | 475,400 | | | 1,332 |
| | | | |
|
|
| | | | | | 11,845 |
| | | | |
|
|
South Korea—3.8% | | | | | |
Hyundai Motor Co. (Automobiles) | | 97,300 | | | 9,288 |
*Kookmin Bank (Banking) | | 173,600 | | | 13,129 |
Korea Investment Holdings Co. Ltd. (Diversified financial services) | | 128,600 | | | 5,402 |
*NHN Corp. (Internet software and services) | | 41,200 | | | 10,887 |
Samsung Electronics Co. (Semiconductors) | | 22,560 | | | 14,564 |
Shinsegae (Discount retail) | | 14,010 | | | 6,127 |
| | | | |
|
|
| | | | | | 59,397 |
| | | | |
|
|
| | | | | |
Issuer
| | Shares
| | Value
|
|
Common Stocks—Emerging Asia—10.5%—(continued) |
Taiwan—2.5% | | | | | |
Hon Hai Precision Industry (Computers) | | 3,127,589 | | $ | 17,220 |
* Mediatek Inc. (Semiconductors and equipment) | | 1,212,200 | | | 14,210 |
Novatek Microelectronics (Semiconductors and equipment) | | 1,331,340 | | | 7,808 |
| | | | |
|
|
| | | | | | 39,238 |
| | | | |
|
|
| | |
United Kingdom—9.6% | | | | | |
BG Group plc (Industrial services) | | 3,100,920 | | | 30,660 |
*Burren Energy plc (Energy) | | 478,500 | | | 7,516 |
*Cairn Energy plc (Petroleum refining) | | 295,800 | | | 9,754 |
Capita Group plc (Commercial services) | | 1,211,000 | | | 8,676 |
Carphone Warehouse Group plc (Consumer electronics) | | 892,000 | | | 4,248 |
HBOS plc (Commercial banking) | | 1,351,900 | | | 23,043 |
*Michael Page International (Personnel services) | | 1,251,000 | | | 5,804 |
Reckitt Benckiser plc (Household products) | | 347,150 | | | 11,438 |
Standard Chartered plc (Banking) | | 531,800 | | | 11,822 |
Tesco plc (Food retail) | | 4,623,400 | | | 26,329 |
Ultra Electronic Holdings plc (Electronic products) | | 299,000 | | | 5,088 |
VT Group plc (Shipbuilding) | | 641,200 | | | 4,669 |
| | | | |
|
|
| | | | | | 149,047 |
| | | | |
|
|
| | |
Asia—7.0% | | | | | |
Australia—3.5% | | | | | |
BHP Billiton Ltd. (Diversified resources) | | 958,100 | | | 15,968 |
Billabong International Ltd. (Apparel and luxury goods) | | 455,800 | | | 4,848 |
Macquarie Bank, Ltd. (Financial services) | | 311,500 | | | 15,489 |
*Sigma Company, Ltd. (Medical distributors) | | 3,440,673 | | | 7,879 |
Toll Holdings, Ltd. (Trucking) | | 910,900 | | | 9,918 |
| | | | |
|
|
| | | | | | 54,102 |
| | | | |
|
|
Hong Kong—2.3% | | | | | |
*China Insurance International (Insurance) | | 7,841,160 | | | 3,328 |
Esprit Holdings Ltd. (Apparel, footwear and retail) | | 1,294,000 | | | 9,179 |
Li & Fung Ltd. (Distributions) | | 6,094,000 | | | 11,727 |
Techtronic Industries Co. (Consumer durables) | | 5,021,900 | | | 11,948 |
| | | | |
|
|
| | | | | | 36,182 |
| | | | |
|
|
Singapore—1.2% | | | | | |
Capitaland, Ltd. (Real estate operation) | | 6,569,000 | | | 13,571 |
Goodpack Ltd. (Air freight and logistics) | | 2,063,000 | | | 2,114 |
Osim International Ltd. (Consumer sundries) | | 3,612,200 | | | 3,448 |
| | | | |
|
|
| | | | | | 19,133 |
| | | | |
|
|
| | |
Emerging Latin America—6.2% | | | | | |
Brazil—1.6% | | | | | |
Companhia de Concessoes Rodoviarias (Public thoroughfares) | | 103,300 | | | 3,272 |
*Diagnosticos Da America S.A. (Health care services) | | 161,300 | | | 3,003 |
Gol Linhas Aereas Int S.P—ADR (Air transport) | | 239,600 | | | 6,759 |
See accompanying Notes to Financial Statements.
December 31, 2005 | William Blair Funds 7 |
Institutional International Growth Fund
Portfolio of Investments, December 31, 2005 (all dollar amounts in thousands)
| | | | | |
Issuer
| | Shares
| | Value
|
|
Common Stocks—Emerging Latin America—6.2%—(continued) |
*Natura Cosmeticos S.A. (Cosmetics) | | 193,300 | | $ | 8,519 |
*Submarino S.A. (E-commerce) | | 146,000 | | | 2,593 |
| | | | |
|
|
| | | | | | 24,146 |
| | | | |
|
|
Chile—1.4% | | | | | |
Banco Santander SP—ADR (Banking) | | 136,233 | | | 6,076 |
Cencosud S.A.—ADR 144A (Retail stores) | | 261,300 | | | 7,769 |
S.A.C.I. Falabella (Department stores) | | 3,143,300 | | | 8,622 |
| | | | |
|
|
| | | | | | 22,467 |
| | | | |
|
|
Columbia—0.4% | | | | | |
Bancolombia S.A.—ADR (Banking) | | 217,700 | | | 6,276 |
| | | | |
|
|
Mexico—2.6% | | | | | |
America Movil S.A. (Communications) | | 4,838,100 | | | 7,083 |
*Consorcio Ara Sa De Cv (Construction) | | 782,300 | | | 3,429 |
*Corporacion Geo Sa De Cv (Real estate) | | 2,052,400 | | | 7,255 |
*Desarrolladora Homex S.A.—ADR (Household durables) | | 160,600 | | | 4,927 |
*Urbi Desarrollos Urbanos S.A. (Household durables) | | 732,900 | | | 5,078 |
Walmart de Mexico (Retail trade) | | 2,186,800 | | | 12,163 |
| | | | |
|
|
| | | | | | 39,935 |
| | | | |
|
|
Panama—0.2% | | | | | |
*Copa Holdings S.A. Class "A" (Airlines)† | | 94,300 | | | 2,574 |
| | | | |
|
|
| |
Emerging Europe, Mid-East, Africa—4.7% | | | |
Czech Republic—0.1% | | | | | |
*Central European Media Enterprises Ltd. Class "A" (Television) | | 38,000 | | | 2,200 |
| | | | |
|
|
Egypt—0.5% | | | | | |
Orascom Construction Industry (Construction) | | 224,543 | | | 8,538 |
| | | | |
|
|
Romania—0.2% | | | | | |
Romanian Development Bank (Commercial banks) | | 531,500 | | | 2,324 |
| | | | |
|
|
Russia—0.5% | | | | | |
*Novatek OAO—GDR (Oil, gas drilling and exploration) | | 241,300 | | | 5,387 |
*Pyaterochka Holdings—GDR (Consumer staples) | | 201,500 | | | 2,912 |
| | | | |
|
|
| | | | | | 8,299 |
| | | | |
|
|
South Africa—2.8% | | | | | |
African Bank Investments (Consumer loans) | | 516,600 | | | 2,006 |
Aspen Pharmacare (Pharmaceuticals) | | 879,500 | | | 4,651 |
Edgars Consolidated Stores (Apparel, footwear and retail) | | 1,211,000 | | | 6,748 |
*Non-income producing securities
†U.S. listed foreign security
ADR = American Depository Receipt
GDR = Global Depository Receipt
VRN = Variable Rate Note
For securities, primarily traded on exchanges or markets that close before the close of regular trading on the New York Stock Exchange, the Fund uses an independent pricing service on a daily basis to fair value price the securities pursuant to Valuation Procedures adopted by the Board of Trustees.
| | | | | | |
Issuer
| |
| Shares or
Principal
Amount
| |
| Value
|
|
Common Stocks—Emerging Europe, Mid-East, Africa—4.7%—(continued) |
South Africa—2.8%—(continued) | | | | | | |
*MTN Group Ltd. (Telecommunication services) | | | 828,500 | | $ | 8,147 |
Naspers Ltd. (Media) | | | 333,600 | | | 5,924 |
Sasol ASA (Energy) | | | 430,000 | | | 15,507 |
| | | | | |
|
|
| | | | | | | 42,983 |
| | | | | |
|
|
Turkey—0.6% | | | | | | |
*Turkiye Garanti Bankasi A.S. (Banking) | | | 2,585,450 | | | 9,319 |
| | | | | |
|
|
| | |
Canada—4.3% | | | | | | |
Canadian National Railway Company (Railroads) | | | 260,500 | | | 20,862 |
*Gildan Activewear, Inc. (Apparel and luxury goods) | | | 123,400 | | | 5,305 |
Manulife Financial Corp. (Life and health insurance) | | | 260,100 | | | 15,268 |
*Research in Motion Ltd. (Wireless telecommunication) | | | 168,000 | | | 11,087 |
Ritchie Brothers Auctioneers, Inc. (Business services) † | | | 93,700 | | | 3,959 |
*Rona, Inc. (Building materials) | | | 279,600 | | | 5,157 |
Shoppers Drug Mart Corp. (Retail trade) | | | 123,400 | | | 4,667 |
| | | | | |
|
|
| | | | | | | 66,305 |
| | | | | |
|
|
Total Common Stock—96.9%
(cost $1,086,287) | | | | | | 1,506,914 |
| | | | | |
|
|
| | |
Preferred Stocks | | | | | | |
Brazil—1.4% | | | | | | |
Banco Itau Holding (Banking) | | | 597,400 | | | 14,395 |
Petroleo Brasileiro S.A. (Oil, gas drilling, and exploration) | | | 464,400 | | | 7,396 |
| | | | | |
|
|
| | | | | | | 21,791 |
| | | | | |
|
|
Germany—0.3% | | | | | | |
Porsche AG (Automobiles) | | | 6,780 | | | 4,862 |
| | | | | |
|
|
Total Preferred Stocks—1.7%
(cost $15,936) | | | | | | 26,653 |
| | | | | |
|
|
| | |
Investment in Affiliate | | | | | | |
William Blair Ready Reserves Fund | | | 1,079,430 | | | 1,079 |
| | | | | |
|
|
Total Investment in Affiliate—0.1%
(cost $1,079) | | | | | | 1,079 |
| | | | | |
|
|
| | |
Short-Term Investments | | | | | | |
American Express Demand Note, VRN 3.710% due 1/3/06 | | $ | 6,696,000 | | | 6,696 |
Prudential Funding Demand Note, VRN 3.868% due 1/3/06 | | $ | 6,964,000 | | | 6,964 |
| | | | | |
|
|
Total Short-term Investments—0.8%
(cost $13,660) | | | 13,660 |
| | | | | |
|
|
Total Investments—99.5%
(cost $1,116,962) | | | 1,548,306 |
Cash and other assets, less liabilities—0.5% | | | 7,108 |
| | | | | |
|
|
Net assets—100.0% | | $ | 1,555,414 |
| | | | | |
|
|
See accompanying Notes to Financial Statements.
8 Annual Report | December 31, 2005 |
Institutional International Growth Fund
Portfolio of Investments, December 31, 2005 (all dollar amounts in thousands)
At December 31, 2005 the Fund's Portfolio of Investments includes the following currency categories:
| | |
Euro | | 24.8% |
Japanese Yen | | 22.6% |
British Pound Sterling. | | 9.7% |
Swiss Franc | | 6.2% |
United States Dollar. | | 4.2% |
Canadian Dollar | | 4.1% |
South Korean Won | | 3.9% |
Hong Kong Dollar | | 3.6% |
Australian Dollar | | 3.5% |
South African Rand. | | 2.8% |
Brazilian Real. | | 2.6% |
Taiwan Dollar | | 2.6% |
Mexico Nuevo Peso. | | 2.3% |
Indian Rupee. | | 2.0% |
Singapore Dollar. | | 1.2% |
All other currencies. | | 3.9% |
| | |
|
| | | 100.0% |
| | |
|
At December 31, 2005 the Fund's Portfolio of Investments includes the following industry categories:
| | |
Finance | | 25.8% |
Consumer Discretionary | | 22.2% |
Information Technology | | 13.2% |
Industrials | | 12.0% |
Health Care | | 9.7% |
Energy | | 6.9% |
Consumer Staples | | 5.5% |
Materials | | 2.0% |
Telecommunication Services | | 1.7% |
Utilities | | 1.0% |
| | |
|
| | | 100.0% |
| | |
|
See accompanying Notes to Financial Statements.
December 31, 2005 | William Blair Funds 9 |
W. George Greig
INSTITUTIONAL INTERNATIONAL EQUITY FUND
The Institutional International Equity Fund invests primarily in common stocks of companies included in the Morgan Stanley Capital International All Country World ex-U.S. Index.
AN OVERVIEW FROM THE PORTFOLIO MANAGER
How did the Fund perform over the last year? How did the Fund’s performance compare to its benchmark?
The Institutional International Equity Fund posted an 18.26% increase for the 12 months ended December 31, 2005. By comparison, the Fund’s benchmark, the MSCI All Country World Free except US Index, rose 17.11%.
What factors were behind the Fund’s performance versus the benchmark?
In this positive market environment, the Fund rose 18.26% year to date, surpassing the MSCI All Country World Free ex-US Index return. Positive relative performance was bolstered by strong stock selection in Pacific ex-Japan and Japan as well as in emerging markets, coupled with the underweighted allocation to the UK. From a sector perspective, strong stock selection in Energy, Financials, Telecommunication Services and Utilities also contributed to the Fund’s outperformance versus its benchmark.
What were the most significant factors impacting international markets during 2005?
During the first six months of 2005 the international equity markets were largely flat; however, during the last half of the year the equity markets sharply appreciated as evidenced by the annual 17.11% MSCI All Country World Free except US Index return. International equities significantly outpaced US equities as measured by the Standard & Poor’s 500 Index, which rose 4.91% year to date. This increase was despite US dollar appreciation versus most foreign currencies, which reduced returns to US investors. The MSCI EAFE Index rose 29.54% in local terms, which translated into 14.02% to US dollar investors, as the US dollar appreciated an average 13% relative EAFE (Europe and Australasia, Far East Equity) country currencies.
Positive second half international equity market performance was driven by strong results across sectors, capitalizations and regions. With its improving macroeconomic backdrop and positive consumer sentiment, Japan was one of the strongest developed regions year to date, up 25.63% in US dollar terms, only lagging behind Canada, which returned nearly 29%. Emerging markets were the strongest part of the international markets overall, returning 34.54% as measured by the MSCI Emerging Markets Index, while developed small capitalization stocks rose 25.48%. Both areas outperformed larger capitalization developed stocks, as measured by the EAFE Index.
What is your outlook for the international markets?
The shape of the global economic cycle is shifting. The modest deceleration in growth driven by higher oil prices and a downturn in China’s imports may be receding into the background as other cyclical forces begin to edge growth higher.
Evidence from a number of sources—including recent purchasing managers’ index releases, indications of temporary help demand, technology demand indicators (in Asia), and credit
10 Annual Report | December 31, 2005 |
growth (in Europe)—suggest that the industrial economies may be poised to reaccelerate after a number of sluggish quarters.
On the other hand, rising short term interest rates, higher oil prices and the effects of housing inflation have not had the predicted negative effects on domestic demand, either in the US or elsewhere. Household spending in China and other emerging markets have remained strong, while strong employment and income growth in Japan have steadied the economy there in the face of slowing net exports.
A reacceleration in global growth after the 2004-05 slowdown could be reinforced by stronger investment spending backed by bulging corporate cash and profits, implying cyclical strength in technology and machinery as well as improving growth performance in previous laggards Europe and Japan.
What is your current outlook?
After a third consecutive year of strong equity returns worldwide, markets have for the most part erased the losses of the 2000-2002 bear market. As the new year begins, many national and regional indices (with the obvious exceptions of Nasdaq and the Japanese market benchmarks) are at or approaching historic highs. Even in the US, where index returns were modest, a majority of individual stocks offered better performance.
Prices have been propelled higher by strong fundamentals: exceptional earnings growth and a surprisingly stable inflation and long term interest rate environment. The only two elements of cyclical risk in the global economic picture have been Fed tightening and rising energy costs, and up to now, neither of them has had a significant impact on growth. Relative economic stability has enabled strong corporate performance to act as the key driver of share price gains over the course of the last several years. Accordingly, if the structural framework of the global economy remains in equilibrium, and corporate growth and profitability continue to meet or exceed expectations, the market environment will remain conducive to solid equity returns.
The principal risks in the macro picture are well known, and mostly focused on the US: household sector leverage and inadequate savings; consumer vulnerability to weakness in home prices; interest rate and exchange rate risks associated with the US current account deficit; the potential for a central bank policy error (such as overreacting to transitory inflation signs); a ‘superspike’ in oil and gas prices beyond what has already taken place; and/or exogenous variables such as avian flu, terrorist disruptions, or natural disasters.
Since none of these issues are new, the only way they could have a dramatic impact on the market risk profile would be if one of them suddenly had a delayed or cumulative effect, or if two or more of them combined in some unforeseen way. These possibilities cannot be conclusively ruled out, but at the same time, the resilience of the financial and economic infrastructure—perhaps a byproduct of increasing global integration—has been impressive over the last decade.
The other key variable in the outlook is corporate profitability and growth, where we have seen continued strength in the US and dramatic improvement in Japan, Europe, and in many developing markets. This aspect of the market environment shows no sign of deteriorating or even slackening the pace of improvement. Corporate management continues to focus on improving supply chain management, capital and labor productivity, cost control, and marketing. Returns on capital are now well above the cost of capital in every principal region of the world; and while there are concerns that ‘excessive’ profitability is a risk factor in itself, there is no signal apparent of either complacency or irrational competitive behavior undermining corporate performance on a wide scale.
Even in a benign economic and earnings scenario, of course, there is no guarantee of supernormal returns or a continuation of the trends of 2003-05. There is a reasonable
December 31, 2005 | William Blair Funds 11 |
(although not conclusive) case that cyclical growth may slow in the US and China in 2006, and profit growth may be restrained as a result. In addition, growth in the energy and financial sectors may be held back by price declines and yield curve flattening, respectively. On the other hand, Japan and more recently Europe seem to be benefiting from the effects of a strong external environment and solid corporate profitability, and could continue to mount moderate but self-sustaining recoveries. On a global basis, there is probably not much reason to anticipate significantly lower earnings growth in 2006, but some deceleration seems likely.
In the context of the current profit and interest rate picture, current valuations should not present a significant issue for potential returns, and even areas that have seen relatively strong recent performance, such as small caps and Japan, are not so extended as to be unusually risky on valuation grounds alone.
Emerging markets continue to be a special case, influenced by long term changes outside of the business cycle. Whereas previous cycles were dominated by unstable investment flows and highly volatile production and trade patterns, virtually all of the developing world is now seeing new dynamics of high savings, credit development, job creation and household spending growth, as well as more responsible and transparent corporate behavior. These factors are reducing financial risk at the same time they create new avenues of growth in emerging economies, and have been instrumental in driving exceptional returns in this asset class since 1999.
On balance, we see a reasonable balance between risk and opportunity for the year ahead, particularly as international markets continue to be led by the ongoing trend toward better corporate performance and governance. At the margins of any set of expectations, of course, are the ‘unknown unknowns’. Volatility has been relatively low for some time, and global markets have not faced any major discontinuities for several years. Any investment strategy predicated on anticipation of normal growth and risk parameters has to be adaptable to evolving change, and adaptability built into portfolio structure from the bottom up is probably the most consistent method for refining strategy.
12 Annual Report | December 31, 2005 |
Institutional International Equity Fund
Performance Highlights (unaudited)
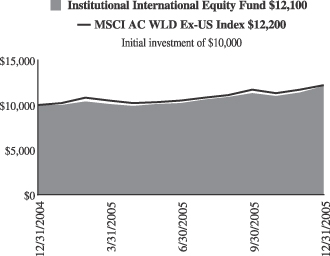
Average Annual Total Return at 12/31/2005
| | | | | | |
| | | 1
Year
| | | Since Inception(a)
| |
Institutional International Equity Fund | | 18.26 | % | | 18.80 | % |
MSCI All Country World Free Ex-US Index | | 17.11 | | | 20.17 | |
| | (a) | | For the period from December 1, 2004 (Commencement of Operations) to December 31, 2005. | |
Performance cited represents past performance. Past performance does not guarantee future results and current performance may be lower or higher than the data quoted. Results shown are average annual returns, which assume reinvestment of dividends and capital gains. Investment returns and principal will fluctuate and you may have a gain or loss when you sell shares. For the most current month-end performance information, please call 1-800-742-7272, or visit our Web site at www.williamblairfunds.com. International investing involves special risk considerations, including currency fluctuations, lower liquidity, economic and political risk.
The performance highlights and graph presented above do not reflect the deduction of taxes that a shareholder would pay on fund distributions or the redemption of fund shares.
The Morgan Stanley Capital International (MSCI) All Country World Free Ex-US Index is an unmanaged index that includes developed and emerging markets and reduced Japanese portion, making it more comparable to the Institutional International Equity Fund in terms of investment approach.
This report identifies the Fund’s investments on December 31, 2005. These holdings are subject to change. Not all stocks in the Fund performed the same, nor is there any guarantee that these stocks will perform as well in the future. Market forecasts provided in this report may not necessarily come to pass.
Sector Diversification (unaudited)

The sector diversification shown is based on the total investment portfolio.
December 31, 2005 | William Blair Funds 13 |
Institutional International Equity Fund
Portfolio of Investments, December 31, 2005 (all dollar amounts in thousands)
| | | | | |
Issuer
| | Shares
| | Value
|
| | |
Common Stocks—Europe—36.4% | | | | | |
Austria—1.8% | | | | | |
Erste Bank (Banking) | | 42,370 | | $ | 2,352 |
*Raiffeisen International Bank (Banking) | | 30,900 | | | 2,019 |
| | | | |
|
|
| | | | | | 4,371 |
| | | | |
|
|
France—8.4% | | | | | |
BNP Paribas (Banking) | | 41,700 | | | 3,365 |
Dassault Systems S.A. (Computer aided design) | | 24,300 | | | 1,369 |
Essilor International (Health care supplies) | | 24,200 | | | 1,950 |
Eurazeo (Diversified financial services) | | 11,100 | | | 1,157 |
Hermes International SCA (Apparel and luxury goods) | | 10,200 | | | 2,543 |
Iliad S.A. (Internet software and services) | | 8,500 | | | 525 |
Sanofi-Aventis (Pharmaceuticals) | | 66,200 | | | 5,789 |
Technip-Coflexip S.A. (Construction) | | 32,300 | | | 1,950 |
Vinci S.A. (Construction) | | 27,200 | | | 2,340 |
| | | | |
|
|
| | | | | | 20,988 |
| | | | |
|
|
Germany—7.6% | | | | | |
Bijou Brigitte (Fashion jewelry accessories) | | 2,700 | | | 728 |
Celesio AG (Pharmaceuticals) | | 29,700 | | | 2,551 |
Continental AG (Diversified manufacturing) | | 50,670 | | | 4,487 |
E.ON AG (Energy) | | 37,900 | | | 3,911 |
*Qiagen, Inc. (Health care) | | 79,900 | | | 936 |
SAP AG (Software) | | 35,950 | | | 6,470 |
| | | | |
|
|
| | | | | | 19,083 |
| | | | |
|
|
Greece—1.7% | | | | | |
Coca-Cola Hellenic Bottling S.A. (Beverages) | | 56,340 | | | 1,655 |
EFG Eurobank (Banking) | | 38,460 | | | 1,214 |
National Bank of Greece (Banking) | | 32,450 | | | 1,379 |
| | | | |
|
|
| | | | | | 4,248 |
| | | | |
|
|
Ireland—1.9% | | | | | |
Anglo Irish Bank plc (Finance) | | 154,700 | | | 2,335 |
*Ryanair-ADR (Air transport) | | 44,500 | | | 2,492 |
| | | | |
|
|
| | | | | | 4,827 |
| | | | |
|
|
Italy—2.0% | | | | | |
Luxottica Group SpA (Apparel and luxury goods) | | 135,400 | | | 3,436 |
Saipem SpA (Energy equipment and services) | | 99,100 | | | 1,625 |
| | | | |
|
|
| | | | | | 5,061 |
| | | | |
|
|
Netherlands—0.4% | | | | | |
*Tomtom NV (Computer software) | | 29,800 | | | 1,022 |
| | | | |
|
|
Norway—1.4% | | | | | |
Statoil ASA (Oil and gas) | | 150,060 | | | 3,441 |
| | | | |
|
|
Spain—1.8% | | | | | |
Grupo Ferrovial S.A. (Industrial services) | | 17,200 | | | 1,193 |
*Industria De Textile (Retail trade) | | 104,500 | | | 3,410 |
| | | | |
|
|
| | | | | | 4,603 |
| | | | |
|
|
Sweden—0.5% | | | | | |
*Capio AB (Health care) | | 32,200 | | | 573 |
*Modern Times Group (Television) | | 15,800 | | | 659 |
| | | | |
|
|
| | | | | | 1,232 |
| | | | |
|
|
Switzerland—8.9% | | | | | |
*Actelion Ltd. (Biotechnology) | | 3,650 | | | 301 |
*EFG International (Commercial banking) | | 31,200 | | | 830 |
| | | | | |
Issuer
| | Shares
| | Value
|
| | |
Common Stocks—Europe—36.4%—(continued) | | | | | |
Switzerland—8.9%—(continued) | | | | | |
Nobel Biocare Holdings AG (Medical equipment and supplies) | | 5,400 | | $ | 1,188 |
Phonak Holdings AG (Hearing technology) | | 16,000 | | | 690 |
Roche Holdings AG (Health care) | | 49,450 | | | 7,407 |
SGS SA (Industrials) | | 1,950 | | | 1,642 |
Synthes, Inc. (Health care) | | 39,280 | | | 4,416 |
UBS AG (Banking) | | 62,465 | | | 5,931 |
| | | | |
|
|
| | | | | | 22,405 |
| | | | |
|
|
Japan—21.3% | | | | | |
Aeon Credit Service Co., Ltd. (Consumer finance) | | 11,800 | | | 1,116 |
Aeon Mall Co., Ltd. (Real estate) | | 29,100 | | | 1,418 |
*Askul Corporation (Retail trade) | | 8,600 | | | 267 |
*Chiyoda Corporation (Construction) | | 63,000 | | | 1,443 |
Chugai Pharmaceutical Company (Pharamceuticals) | | 135,600 | | | 2,916 |
Denso Corporation (Auto parts manufacturing) | | 167,400 | | | 5,793 |
Hoya Corporation (Electronic technology) | | 100,200 | | | 3,600 |
*K.K. Davinci Advisors (Consulting services) | | 90 | | | 676 |
*Kenedix, Inc. (Investment management services) | | 109 | | | 686 |
Keyence Corporation (Electronic technology) | | 15,800 | | | 4,491 |
Komeri Co., Ltd. (Specialty retail) | | 24,700 | | | 1,059 |
MISUMI Group, Inc. (Metal production) | | 16,700 | | | 726 |
Mitsubishi Tokyo Financial (Financial Services) | | 529 | | | 7,200 |
Neomax Co., Ltd. (Electronic equipment and instruments) | | 22,000 | | | 724 |
Nidec Corporation (Electronic technology) | | 34,600 | | | 2,942 |
Nitto Denko Corporation (Electronic technology) | | 26,300 | | | 2,048 |
Orix Corporation (Consumer finance) | | 24,500 | | | 6,233 |
Point Inc. Ltd. (Apparel and footwear retail) | | 11,000 | | | 919 |
Ryohin Keikaku Co. Ltd. (Retail stores) | | 14,400 | | | 1,259 |
Sharp Corporation (Electronics) | | 236,000 | | | 3,589 |
Shimamura Company Ltd. (Retail stores) | | 8,200 | | | 1,133 |
Sundrug Co., Ltd. (Drug stores) | | 8,500 | | | 466 |
Yamada Denki Co. Ltd. (Retail trade) | | 22,600 | | | 2,824 |
| | | | |
|
|
| | | | | | 53,528 |
| | | | |
|
|
United Kingdom—11.0% | | | | | |
BG Group plc (Industrial services) | | 722,800 | | | 7,147 |
*Cairn Energy plc (Petroleum refining) | | 34,700 | | | 1,144 |
Capita Group plc (Commercial services) | | 312,550 | | | 2,239 |
Carphone Warehouse Group plc (Consumer electronics) | | 140,100 | | | 667 |
HBOS plc (Commercial banking) | | 284,700 | | | 4,853 |
Reckitt Benckiser plc (Household products) | | 91,200 | | | 3,005 |
Standard Chartered plc (Banking) | | 169,000 | | | 3,757 |
Tesco plc (Food retailer) | | 829,900 | | | 4,726 |
| | | | |
|
|
| | | | | | 27,538 |
| | | | |
|
|
Emerging Asia—8.7% | | | | | |
China—0.6% | | | | | |
*Foxconn International (Manufacturing services) | | 878,000 | | | 1,433 |
| | |
| |
|
|
India—2.2% | | | | | |
*Bharti Tele-Ventures (Wireless telecommunication services) | | 185,231 | | | 1,424 |
HDFC Bank (Banking) | | 91,190 | | | 1,431 |
See accompanying Notes to Financial Statements.
14 Annual Report | December 31, 2005 |
Institutional International Equity Fund
Portfolio of Investments, December 31, 2005 (all dollar amounts in thousands)
| | | | | |
Issuer
| | Shares
| | Value
|
| | |
Common Stocks—Emerging Asia—8.7%—(continued) | | | | | |
India—2.2%—(continued) | | | | | |
Housing Development Finance Corp. (Financial services) | | 48,000 | | $ | 1,288 |
Infosys Technologies Ltd. (Consulting and software services) | | 21,188 | | | 1,412 |
| | | | |
|
|
| | | | | | 5,555 |
| | | | |
|
|
Malaysia—0.4% | | | | | |
Bumiputra Commerce Holdings Bhd (Banking) | | 577,600 | | | 871 |
| | | | |
|
|
South Korea—2.9% | | | | | |
Hyundai Motor Company (Automobiles) | | 22,500 | | | 2,148 |
*Kookmin Bank (Banking) | | 25,400 | | | 1,921 |
Samsung Electronics Co. (Semiconductors) | | 4,822 | | | 3,113 |
| | | | |
|
|
| | | | | | 7,182 |
| | | | |
|
|
Taiwan—2.6% | | | | | |
Hon Hai Precision Industry Corp. (Computers) | | 737,234 | | | 4,059 |
*Mediatek, Inc. (Electronic technology) | | 214,900 | | | 2,519 |
| | | | |
|
|
| | | | | | 6,578 |
| | | | |
|
|
Asia—6.0% | | | | | |
Australia—2.8% | | | | | |
BHP Billiton Ltd. (Diversified resources) | | 146,600 | | | 2,443 |
Macquarie Bank Ltd. (Financial services) | | 48,300 | | | 2,402 |
*Sigma Company, Ltd. (Medical distributors) | | 219,089 | | | 502 |
Toll Holdings Ltd. (Trucking) | | 161,200 | | | 1,755 |
| | | | |
|
|
| | | | | | 7,102 |
| | | | |
|
|
Hong Kong—2.5% | | | | | |
Esprit Holdings Ltd. (Apparel, footwear and retail) | | 316,500 | | | 2,245 |
Li & Fung Ltd. (Distributions) | | 869,000 | | | 1,672 |
Techtronic Industries Co. (Consumer durables) | | 959,400 | | | 2,283 |
| | | | |
|
|
| | | | | | 6,200 |
| | | | |
|
|
Singapore—0.7% | | | | | |
Capital and, Ltd. (Real estate operations) | | 908,000 | | | 1,876 |
| | | | |
|
|
| | |
Canada—5.0% | | | | | |
Canadian National Railway Co. (Railroads) | | 69,600 | | | 5,574 |
Manulife Financial Corporation (Life and health insurance) | | 64,300 | | | 3,775 |
*Research in Motion Ltd. (Wireless telecommunication) | | 31,800 | | | 2,098 |
Shoppers Drug Mart Corporation (Retail trade) | | 29,800 | | | 1,127 |
| | | | |
|
|
| | | | | | 12,574 |
| | | | |
|
|
Emerging Latin America—2.7% | | | | | |
Brazil—0.5% | | | | | |
Companhia de Concessoes Rodoviarias (Public thoroughfares) | | 12,300 | | | 389 |
*Natura Cosmeticos S.A. (Cosmetics) | | 18,100 | | | 798 |
| | | | |
|
|
| | | | | | 1,187 |
| | | | |
|
|
Columbia—0.4 % | | | | | |
Bancolumbia S.A.—ADR (Commerical banks) | | 32,000 | | | 923 |
| | | | |
|
|
| | | | | | |
Issuer
| | Shares or
Principal
Amount
| | Value
|
| |
Common Stocks—Emerging Latin America—
2.7%—(continued) | | | |
Mexico—1.8% | | | | | | |
America Movil S.A. (Communications) | | | 1,025,600 | | $ | 1,501 |
Walmart de Mexico (Retail trade) | | | 564,300 | | | 3,139 |
| | | | | |
|
|
| | | | | | | 4,640 |
| | | | | |
|
|
Emerging Europe, Mid-East, Africa—1.5% | | | | | | |
South Africa—1.5% | | | | | | |
Naspers, Ltd. (Media) | | | 54,000 | | | 959 |
Sasol ASA (Energy) | | | 81,200 | | | 2,928 |
| | | | | |
|
|
| | | | | | | 3,887 |
| | | | | |
|
|
Total Common Stock—92.6%
(cost $206,975) | | | | | | 232,355 |
| | | | | |
|
|
| |
Preferred Stocks | | | |
Brazil—1.5% | | | | | | |
Banco Itau S.A. (Banking) | | | 106,600 | | | 2,569 |
Petroleo Brasileiro S.A. (Oil, gas drilling, and exploration) | | | 71,300 | | | 1,135 |
| | | | | |
|
|
| | | | | | | 3,704 |
| | | | | |
|
|
Germany—0.3% | | | | | | |
Porsche AG (Automobiles) | | | 1,215 | | | 872 |
| | | | | |
|
|
Total Preferred Stocks—1.8%
(cost $3,963) | | | | | | 4,576 |
| | | | | |
|
|
| |
Investment in Affiliate | | | |
William Blair Ready Reserves Fund | | | 93,454 | | | 93 |
| | | | | |
|
|
Total Investment in Affiliate—0.0%
(cost $93) | | | | | | 93 |
| | | | | |
|
|
Short-Term Investments | | | | | | |
American Express Demand Note, VRN 4.235%, due 1/03/06 | | $ | 8,895,000 | | | 8,895 |
| | | | | |
|
|
Prudential Funding Demand Note, VRN 3.930%, due 1/03/06 | | $ | 1,867,000 | | | 1,867 |
| | | | | |
|
|
Total Short-Term Investments—4.3%
(cost $10,762) | | | | | | 10,762 |
| | | | | |
|
|
Total Investments—98.7%
(cost $221,793) | | | | | | 247,786 |
Cash and other assets, less liabilities—1.3% | | | | | | 3,143 |
| | | | | |
|
|
Net assets—100.0% | | | | | $ | 250,929 |
| | | | | |
|
|
See accompanying Notes to Financial Statements.
December 31, 2005 | William Blair Funds 15 |
Institutional International Equity Fund
Portfolio of Investments, December 31, 2005 (all dollar amounts in thousands)
* Non-income producing securities
ADR = American Depository Receipt
GDR = Global Depository Receipt
VRN = Variable Rate Note
For securities, excluding those primarily traded on exchanges or markets that close before the close of regular trading on the New York Stock Exchange, the Fund uses an independent pricing service on a daily basis to fair value price the securities pursuant to Valuation Procedures adopted by the Board of Trustees.
At December 31, 2005 the Fund’s Portfolio of Investments includes the following currency categories:
| | |
Euro | | 26.4% |
Japanese Yen | | 22.6% |
British Pound Sterling. | | 11.6% |
Swiss Franc | | 9.5% |
Canadian Dollar | | 5.3% |
Hong Kong Dollar | | 3.2% |
South Korean Won | | 3.0% |
Australian Dollar | | 3.0% |
Taiwan Dollar | | 2.8% |
Indian Rupee. | | 2.3% |
Brazilian Real. | | 2.1% |
Mexico Nuevo Peso. | | 2.0% |
South African Rand | | 1.6% |
Norwegian Krone. | | 1.5% |
United States Dollar | | 1.4% |
Singapore Dollar | | 0.8% |
Swedish Krona | | 0.5% |
Malaysian Ringgit | | 0.4% |
| | |
|
| | | 100.0% |
| | |
|
At December 31, 2005 the Fund’s Portfolio of Investments includes the following industry categories:
| | |
Finance | | 26.8% |
Consumer Discretionary | | 19.4% |
Information Technology | | 14.9% |
Health Care | | 12.3% |
Industrials | | 8.4% |
Energy | | 8.2% |
Consumer Staples | | 5.0% |
Materials | | 1.9% |
Utilities | | 1.6% |
Telecommunication Services | | 1.5% |
| | |
|
| | | 100.0% |
| | |
|
See accompanying Notes to Financial Statements.
16 Annual Report December 31, 2005 | -- |

Jeffrey A. Urbina
INTERNATIONAL SMALL CAP GROWTH FUND
The International Small Cap Growth Fund primarily invests in a diversified portfolio of common stocks of small cap companies in developed and emerging markets.
AN OVERVIEW FROM THE PORTFOLIO MANAGER
I am pleased to have the International Small Cap Growth Fund become the newest addition to the William Blair Fund Family and would like to thank our shareholders for investing with us.
I am enthusiastic about the opportunities available to me as the manager of the International Small Cap Growth Fund. The International Small Cap Growth Fund will invest in companies with market capitalizations of $5 billion or less, and will seek stocks of companies that historically have had and are expected to maintain superior growth, profitability and quality relative to local markets and relative to companies within the same industry worldwide. Such companies generally will exhibit superior business fundamentals, including leadership in their field, quality products or services, distinctive marketing and distribution, pricing flexibility and revenue from products or services consumed on a steady, recurring basis. In managing the Fund I will focus on companies with above-average returns on equity, strong balance sheets and consistent, above-average earnings growth.
How did the Fund perform since its inception? How did the Fund’s performance compare to its benchmark?
The International Small Cap Growth Fund commenced operations on November 1, 2005. Through the period ending December 31, 2005, the Fund posted a gain of 11.62% (Institutional Class Shares), ahead of the 10.68% return of the Fund’s benchmark, the MSCI World Small Cap Free ex-U.S. Index, for this short time period.
What factors were behind the Fund’s performance versus the benchmark?
The International Small Cap Growth Fund’s “since inception” performance was driven by strong stock selection in emerging markets and Japanese small capitalization stocks. In particular, the Fund’s allocation to and stock selection in Japanese specialty retailers added value, as did the Fund’s focus on Japanese small cap financials. From a sector perspective, the Fund’s stock selection in Consumer Discretionary, Financials, Industrials and Information Technology augmented relative results.
What is your outlook for the international markets?
After a third consecutive year of strong equity returns worldwide, markets have for the most part erased the losses of the 2000-2002 bear market. As the new year begins, many national and regional indices (with the obvious exceptions of Nasdaq and the Japanese market benchmarks) are at or approaching historic highs. Even in the US, where index returns were modest, a majority of individual stocks offered better performance.
Prices have been propelled higher by strong fundamentals: exceptional earnings growth and a surprisingly stable inflation and long term interest rate environment. The only two elements of cyclical risk in the global economic picture have been Fed tightening and rising energy costs, and up to now, neither of them has had a significant impact on growth. Relative economic stability has enabled strong corporate performance to act as the key driver of share price gains over the course of the last several years. Accordingly, if the structural framework
December 31, 2005 | William Blair Funds 17 |
of the global economy remains in equilibrium, and corporate growth and profitability continue to meet or exceed expectations, the market environment will remain conducive to solid equity returns.
The principal risks in the macro picture are well known, and mostly focused on the US: household sector leverage and inadequate savings; consumer vulnerability to weakness in home prices; interest rate and exchange rate risks associated with the US current account deficit; the potential for a central bank policy error (such as overreacting to transitory inflation signs); a ‘superspike’ in oil and gas prices beyond what has already taken place; and/or exogenous variables such as avian flu, terrorist disruptions, or natural disasters.
Since none of these issues are new, the only way they could have a dramatic impact on the market risk profile would be if one of them suddenly had a delayed or cumulative effect, or if two or more of them combined in some unforeseen way. These possibilities cannot be conclusively ruled out, but at the same time, the resilience of the financial and economic infrastructure—perhaps a byproduct of increasing global integration—has been impressive over the last decade.
The other key variable in the outlook is corporate profitability and growth, where we have seen continued strength in the US and dramatic improvement in Japan, Europe, and in many developing markets. This aspect of the market environment shows no sign of deteriorating or even slackening the pace of improvement. Corporate management continues to focus on improving supply chain management, capital and labor productivity, cost control, and marketing. Returns on capital are now well above the cost of capital in every principal region of the world; and while there are concerns that ‘excessive’ profitability is a risk factor in itself, there is no signal apparent of either complacency or irrational competitive behavior undermining corporate performance on a wide scale.
Even in a benign economic and earnings scenario, of course, there is no guarantee of supernormal returns or a continuation of the trends of 2003-05. There is a reasonable (although not conclusive) case that cyclical growth may slow in the US and China in 2006, and profit growth may be restrained as a result. In addition, growth in the energy and financial sectors may be held back by price declines and yield curve flattening, respectively. On the other hand, Japan and more recently Europe seem to be benefiting from the effects of a strong external environment and solid corporate profitability, and could continue to mount moderate but self-sustaining recoveries. On a global basis, there is probably not much reason to anticipate significantly lower earnings growth in 2006, but some deceleration seems likely.
In the context of the current profit and interest rate picture, current valuations should not present a significant issue for potential returns, and even areas that have seen relatively strong recent performance, such as small caps and Japan, are not so extended as to be unusually risky on valuation grounds alone.
Emerging markets continue to be a special case, influenced by long term changes outside of the business cycle. Whereas previous cycles were dominated by unstable investment flows and highly volatile production and trade patterns, virtually all of the developing world is now seeing new dynamics of high savings, credit development, job creation and household spending growth, as well as more responsible and transparent corporate behavior. These factors are reducing financial risk at the same time they create new avenues of growth in emerging economies, and have been instrumental in driving exceptional returns in this asset class since 1999.
On balance, we see a reasonable balance between risk and opportunity for the year ahead, particularly as international markets continue to be led by the ongoing trend toward better corporate performance and governance. At the margins of any set of expectations, of course, are the ‘unknown unknowns’. Volatility has been relatively low for some time, and global markets have not faced any major discontinuities for several years. Any investment strategy predicated on anticipation of normal growth and risk parameters has to be adaptable to evolving change, and adaptability built into portfolio structure from the bottom up is probably the most consistent method for refining strategy.
18 Annual Report | December 31, 2005 |
International Small Cap Growth Fund
Performance Highlights (unaudited)
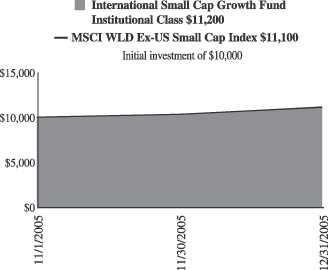
Average Annual Total Return at 12/31/2005
| | | |
| | | Since Inception(a)
| |
International Small Cap Growth Fund
Institutional Class | | 11.62 | % |
MSCI WLD EX-US Small Cap Free Index | | 10.68 | |
| | (a) | | For the period from November 1, 2005 (Commencement of Operations) to December 31, 2005. | |
Performance cited represents past performance. Past performance does not guarantee future results and current performance may be lower or higher than the data quoted. Results shown are average annual returns, which assume reinvestment of dividends and capital gains. Investment returns and principal will fluctuate and you may have a gain or loss when you sell shares. For the most current month-end performance information, please call 1-800-742-7272, or visit our Web site at www.williamblairfunds.com. International investing involves special risk considerations, including currency fluctuations, lower liquidity, economic and political risk.
The performance highlights and graph presented above do not reflect the deduction of taxes that a shareholder would pay on fund distributions or the redemption of fund shares.
The Morgan Stanley Capital International (MSCI) World Ex-US Small Cap Free Index is an unmanaged index that is designated to measure equity performance of small cap stocks in developed and emerging markets.
This report identifies the Fund’s investments on December 31, 2005. These holdings are subject to change. Not all stocks in the Fund performed the same, nor is there any guarantee that these stocks will perform as well in the future. Market forecasts provided in this report may not necessarily come to pass.
Sector Diversification (unaudited)
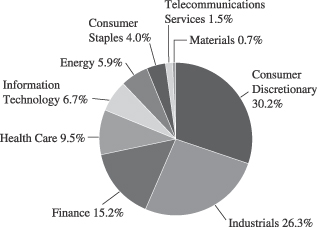
The sector diversification shown is based on the total investment portfolio.
December 31, 2005 | William Blair Funds 19 |
International Small Cap Growth Fund
Portfolio of Investments, December 31, 2005 (all dollar amounts in thousands)
| | | | | |
Issuer
| | Shares
| | Value
|
| | |
Common Stocks—Europe—30.0% | | | | | |
France—7.0% | | | | | |
April Group S.A. (Insurance brokers) | | 18,600 | | $ | 767 |
Iliad S.A. (Internet software and services) | | 12,050 | | | 745 |
Klepierre (Real estate) | | 5,450 | | | 511 |
*Nexity (Real estate management) | | 9,850 | | | 500 |
*Orpea (Hospital and nursing management) | | 4,600 | | | 252 |
Zodiac S.A. (Aerospace and defense) | | 12,000 | | | 769 |
| | | | |
|
|
| | | | | | 3,544 |
| | | | |
|
|
Germany—9.0% | | | | | |
Bijou Brigitte (Fashion jewelry accessories) | | 2,400 | | | 647 |
*CTS Eventim (Leisure and recreation products) | | 20,700 | | | 503 |
Did Deutscher Industrie Svc (Commercial services) | | 8,500 | | | 496 |
GFK AG (Commercial services) | | 10,900 | | | 364 |
*Q-Cells AG (Alternative energy sources) | | 8,100 | | | 472 |
*Qiagen NV (Biomedical) | | 50,900 | | | 596 |
Rational AG (Business equipment) | | 3,900 | | | 518 |
Solarworld AG (Alternative energy sources) | | 3,550 | | | 475 |
Stada Arzneimittel AG (Pharmaceuticals) | | 15,000 | | | 489 |
| | | | |
|
|
| | | | | | 4,560 |
| | | | |
|
|
Greece—1.0% | | | | | |
Bank of Piraeus (Banking) | | 23,300 | | | 497 |
| | | | |
|
|
Ireland—1.7% | | | | | |
Kingspan Group plc (Construction) | | 38,600 | | | 484 |
United Drug plc (Pharmaceuticals) | | 86,500 | | | 374 |
| | | | |
|
|
| | | | | | 858 |
| | | | |
|
|
Italy—3.9% | | | | | |
Amplifon SpA (Retail) | | 7,480 | | | 505 |
Credito Emiliano SpA (Banking) | | 44,400 | | | 495 |
Pirelli & C Real Estate SpA (Real estate development) | | 4,500 | | | 246 |
Tod’s SpA (Footwear apparel) | | 11,200 | | | 755 |
| | | | |
|
|
| | | | | | 2,000 |
| | | | |
|
|
Luxembourg—0.5% | | | | | |
*Transcom Worldwide S.A. (E-services and consulting) | | 28,700 | | | 237 |
| | | | |
|
|
Netherlands—0.9% | | | | | |
*Tomtom NV (Computer software) | | 14,000 | | | 480 |
| | | | |
|
|
Sweden—4.1% | | | | | |
*Capio AB (Health care) | | 41,400 | | | 737 |
Clas Ohlson AB (Retail) | | 17,100 | | | 324 |
HIQ International AB (Computer services) | | 41,600 | | | 226 |
*Modern Times Group (Television) | | 12,100 | | | 505 |
*Tradedoubler AB (E-services and consulting) | | 14,000 | | | 271 |
| | | | |
|
|
| | | | | | 2,063 |
| | | | |
|
|
Switzerland—1.9% | | | | | |
*Actelion Ltd. (Biotechnology) | | 970 | | | 80 |
*EFG International (Banking) | | 9,250 | | | 246 |
Phonak Holdings AG (Hearing technology) | | 14,600 | | | 629 |
| | | | |
|
|
| | | | | | 955 |
| | | | |
|
|
| | |
Japan—27.2% | | | | | |
Aeon Credit Service Co., Ltd. (Consumer finance) | | 8,500 | | | 804 |
Aeon Mall Co., Ltd. (Real estate) | | 21,400 | | | 1,043 |
| | | | | |
Issuer
| | Shares
| | Value
|
| |
Common Stocks—Japan—27.2%—(continued) | | | |
Arrk Corporation (Miscellaneous manufacturer) | | 7,400 | | $ | 544 |
*Askul Corporation (Retail trade) | | 1,900 | | | 59 |
*Chiyoda Corp. (Construction) | | 32,000 | | | 733 |
Honeys Company, Ltd. (Luxury goods) | | 9,000 | | | 733 |
ITO EN, Ltd. (Beverages) | | 8,300 | | | 498 |
*K.K. Davinci Advisors (Consulting services) | | 32 | | | 240 |
*Kenedix, Inc. (Investment management services) | | 39 | | | 246 |
Komeri Co. (Specialty retail) | | 12,000 | | | 514 |
MISUMI Group, Inc. (Metal production) | | 16,800 | | | 730 |
Nakanishi Inc. (Medical specialties) | | 4,300 | | | 482 |
Neomax Co., Ltd. (Electronic equipment and instruments) | | 23,000 | | | 757 |
Nitori Company Ltd. (Specialty stores) | | 5,800 | | | 540 |
Park 24 Co., Ltd. (Commercial services) | | 17,000 | | | 607 |
Point Inc. Ltd. (Apparel and footwear retail) | | 9,500 | | | 793 |
Ryohin Keikaku Co. Ltd. (Retail stores) | | 9,700 | | | 848 |
Shimamura Company Ltd. (Retail stores) | | 5,700 | | | 787 |
Sparx Asset Management Co. (Financial) | | 188 | | | 550 |
Sundrug Co., Ltd. (Drug stores) | | 13,600 | | | 745 |
Suruga Bank (Banking) | | 56,000 | | | 703 |
United Arrows, Ltd. (Specialty retail) | | 12,200 | | | 774 |
| | | | |
|
|
| | | | | | 13,730 |
| | | | |
|
|
| | |
United Kingdom—10.3% | | | | | |
Accident Exchange Group plc (Auto rental) | | 34,200 | | | 242 |
*Burren Energy plc (Energy) | | 46,600 | | | 732 |
*Cairn Energy plc (Petroleum refining) | | 22,500 | | | 742 |
Capita Group plc (Commercial services) | | 105,100 | | | 753 |
Carphone Warehouse Group plc (Consumer electronics) | | 109,000 | | | 519 |
*Michael Page International (Personnel services) | | 106,200 | | | 493 |
Tullow Oil plc (Oil, gas drilling and exploration) | | 158,100 | | | 735 |
Ultra Electronic Holdings plc (Electronic products) | | 29,000 | | | 493 |
VT Group plc (Shipbuilding) | | 67,500 | | | 491 |
| | | | |
|
|
| | | | | | 5,200 |
| | | | |
|
|
| | |
Emerging Asia—8.0% | | | | | |
China—3.1% | | | | | |
Ctrip.com International Ltd.—ADR (Hotels, restaurants and leisure) | | 4,100 | | | 237 |
*Focus Media Holdings—ADR (Advertising sales) | | 7,500 | | | 253 |
Li Ning Co. Ltd. (Leisure equipment and products) | | 326,873 | | | 232 |
Ports Design Limited (Apparel and luxury goods) | | 207,500 | | | 241 |
*Suntech Power Holdings Co. Ltd—ADR (Alternative energy sources) | | 22,900 | | | 624 |
| | | | |
|
|
| | | | | | 1,587 |
| | | | |
|
|
India—1.0% | | | | | |
HDFC Bank—ADR (Banking) | | 9,500 | | | 483 |
| | | | |
|
|
Malaysia—0.9% | | | | | |
*Airasia Bhd (Air transport) | | 552,900 | | | 233 |
Transmile Group Bhd (Airport development and maintenance) | | 78,500 | | | 220 |
| | | | |
|
|
| | | | | | 453 |
| | | | |
|
|
See accompanying Notes to Financial Statements.
20 Annual Report | December 31, 2005 |
International Small Cap Growth Fund
Portfolio of Investments, December 31, 2005 (all dollar amounts in thousands)
| | | | | |
Issuer
| | Shares
| | Value
|
|
Common Stocks—Emerging Asia—8.0%—(continued) |
South Korea—1.6% | | | | | |
Hana Tour Service Inc. (Travel services) | | 6,300 | | $ | 299 |
*NHN Corporation (Internet software and services) | | 1,900 | | | 502 |
| | | | |
|
|
| | | | | | 801 |
| | | | |
|
|
Taiwan—1.4% | | | | | |
Novatek Microelectronics (Semiconductors and equipment) | | 123,000 | | | 721 |
| | | | |
|
|
| | |
Emerging Latin America—6.3% | | | | | |
Brazil—3.3% | | | | | |
*Diagnosticos Da America S.A. (Health care services) | | 25,100 | | | 467 |
Gol Linhas Aereas Int S.P.—ADR (Air transport) | | 17,300 | | | 488 |
*Natura Cosmeticos S.A. (Cosmetics) | | 10,500 | | | 463 |
*Submarino S.A.(E-commerce) | | 14,600 | | | 259 |
| | | | |
|
|
| | | | | | 1,677 |
| | | | |
|
|
Chile—1.0% | | | | | |
Cencosud S.A.—ADR 144A (Retail stores) | | 16,500 | | | 491 |
| | | | |
|
|
Mexico—1.5% | | | | | |
*Urbi Desarrollos Urbanos S.A. (Household durables) | | 105,800 | | | 733 |
| | | | |
|
|
Panama—0.5% | | | | | |
*Copa Holdings S.A. Class “A” (Airlines)† | | 9,900 | | | 270 |
| | | | |
|
|
| | |
Asia—6.0% | | | | | |
Australia—2.6% | | | | | |
Billabong International Ltd. (Apparel and luxury goods) | | 24,400 | | | 260 |
*Sigma Company, Ltd. (Medical distributors) | | 231,972 | | | 531 |
Toll Holdings, Ltd. (Trucking) | | 46,500 | | | 506 |
| | | | |
|
|
| | | | | | 1,297 |
| | | | |
|
|
Hong Kong—1.4% | | | | | |
Techtronic Industries Co. (Consumer durables) | | 304,500 | | | 725 |
| | | | |
|
|
New Zeland—0.5% | | | | | |
*Pumpkin Patch, Ltd. (Retail apparel) | | 110,500 | | | 254 |
| | | | |
|
|
Singapore—1.5% | | | | | |
Goodpack Ltd. (Air freight and logistics) | | 322,000 | | | 330 |
Osim International Ltd. (Consumer sundries) | | 235,000 | | | 224 |
Raffles Education Corp. Ltd. (Schools) | | 199,800 | | | 202 |
| | | | |
|
|
| | | | | | 756 |
| | | | |
|
|
| | |
Emerging Europe, Mid-East, Africa—4.6% | | | | | |
Czech Republic—0.2% | | | | | |
*Central European Media Enterprises Ltd. Class “A” (Television)† | | 1,700 | | | 98 |
| | | | |
|
|
*Non-income producing securities
ADR = American Depository Receipt
GDR = Global Depository Receipt
VRN = Variable Rate Note
† = U.S. listed foreign security
| | | | | | | |
Issuer
| | Shares or
Principal
Amount
| | Value
| |
|
Common Stocks—Emerging Europe, Mid-East, Africa—4.6%—(continued) | |
Egypt—1.1% | | | | | | | |
Orascom Construction Industry (Construction) | | | 14,200 | | $ | 540 | |
| | | | | |
|
|
|
Russia—0.4% | | | | | | | |
*Pyaterochka Holdings—GDR (Consumer staples) | | | 14,800 | | | 214 | |
| | | | | |
|
|
|
South Africa—2.9% | | | | | | | |
African Bank Investments (Consumer loans) | | | 193,700 | | | 752 | |
Aspen Pharmacare (Pharmaceuticals) | | | 94,500 | | | 500 | |
Edgars Consolidated Stores (Apparel, footwear and retail) | | | 40,900 | | | 228 | |
| | | | | |
|
|
|
| | | | | | | 1,480 | |
| | | | | |
|
|
|
| | |
Canada—2.0% | | | | | | | |
*FirstService Corp. (Diversified commercial services)† | | | 10,000 | | | 257 | |
*Gildan Activewear, Inc. (Apparel and luxury goods) | | | 5,800 | | | 249 | |
Ritchie Brothers Auctioneers, Inc. (Business services)† | | | 5,900 | | | 249 | |
*Rona, Inc. (Building materials) | | | 13,600 | | | 251 | |
| | | | | |
|
|
|
| | | | | | | 1,006 | |
| | | | | |
|
|
|
Total Common Stock—94.4%
(cost $43,429) | | | 47,711 | |
| | | | | |
|
|
|
| | |
Investment in Affiliate | | | | | | | |
William Blair Ready Reserves Fund | | | 410,264 | | | 410 | |
| | | | | |
|
|
|
Total Investment in Affiliate—0.8%
(cost $410) | | | 410 | |
| | | | | |
|
|
|
| | |
Short-Term Investments | | | | | | | |
American Express Demand Note, VRN
4.235 % due 1/3/06 | | $ | 1,416,000 | | | 1,416 | |
Prudential Funding Demand Note, VRN
3.930% due 1/3/06 | | $ | 1,915,000 | | | 1,915 | |
| | | | | |
|
|
|
Total Short-Term Investments—6.6%
(cost $3,331) | | | 3,331 | |
| | | | | |
|
|
|
Total Investments—101.8%
(cost $47,170) | | | 51,452 | |
Liabilities plus cash and other assets—(1.8)% | | | (918 | ) |
| | | | | |
|
|
|
Net assets—100.0% | | $ | 50,534 | |
| | | | | |
|
|
|
See accompanying Notes to Financial Statements.
December 31, 2005 | William Blair Funds 21 |
International Small Cap Growth Fund
Portfolio of Investments, December 31, 2005 (all dollar amounts in thousands)
For securities, primarily traded on exchanges or markets that close before the close of regular trading on the New York Stock Exchange, the Fund uses an independent pricing service on a daily basis to fair value price the securities pursuant to Valuation Procedures adopted by the Board of Trustees.
At December 31, 2005 the Fund’s Portfolio of Investments includes the following industry categories:
| | |
Consumer Discretionary | | 30.2% |
Industrials and Services | | 26.3% |
Financials | | 15.2% |
Healthcare | | 9.5% |
Information Technology | | 6.7% |
Energy | | 5.9% |
Consumer Staples | | 4.0% |
Telecommunication Services | | 1.5% |
Materials | | 0.7% |
| | |
|
| | | 100.0% |
| | |
|
At December 31, 2005 the Fund’s Portfolio of Investments includes the following currency categories:
| | |
Japanese Yen | | 28.8% |
Euro | | 25.0% |
British Pound Sterling | | 10.9% |
United States Dollar | | 7.7% |
Swedish Krona | | 4.8% |
South African Rand | | 3.1% |
Australian Dollar | | 2.7% |
Hong Kong Dollar | | 2.5% |
Brazilian Real | | 2.5% |
Swiss Franc | | 2.0% |
South Korean Won | | 1.7% |
Singapore Dollar | | 1.6% |
Mexican Nuevo Peso | | 1.5% |
Taiwan Dollar | | 1.5% |
Egyptian Pound | | 1.1% |
Canadian Dollar | | 1.1% |
All other currencies | | 1.5% |
| | |
|
| | | 100.0% |
| | |
|
See accompanying Notes to Financial Statements.
22 Annual Report | December 31, 2005 |
W. George Greig

Todd M. McClone
Jeffrey A. Urbina
EMERGING MARKETS GROWTH FUND
The Emerging Markets Growth Fund primarily invests in a diversified portfolio of equity securities issued by growth companies in emerging economies worldwide.
AN OVERVIEW FROM THE PORTFOLIO MANAGERS
How did the Fund perform since its inception? How did the Fund’s performance compare to its benchmark?
The Emerging Markets Growth Fund commenced operations on June 6, 2005. Through the period ending December 31, 2005, the Fund posted a gain of 42.82% (Institutional Class Shares), ahead of the 29.26% return of the Fund’s benchmark, the MSCI Emerging Markets Index.
What factors were behind the Fund’s performance versus the benchmark?
The Emerging Markets Growth Fund’s “since inception” performance was augmented by strong stock selection in Emerging Asia and Latin America, coupled with regional positioning. Within Emerging Asia, Consumer Discretionary, Information Technology, and Telecommunication Services holdings in particular performed well while Latin American Telecommunication Services and Industrials holdings were the strongest performers. Stock selection across most sectors contributed to the Fund’s outperformance during the period with the largest value added in Industrials, Information Technology, Consumer Discretionary and Telecommunication Services.
What were the most significant factors impacting international markets during 2005?
During the first six months of 2005 the international equity markets were largely flat; however, during the last half of the year the equity markets sharply appreciated as evidenced by the annual 17.11% MSCI All Country World Free except US Index return. International equities significantly outpaced the US as measured by the Standard & Poor’s 500 Index, which rose 4.91% year to date. This increase was despite US dollar appreciation versus most foreign currencies, which reduced returns to US investors. The MSCI EAFE Index rose 29.54% in local terms, which translated into 14.02% to US dollar investors, as the US dollar appreciated an average 13% relative to EAFE (Europe and Australasia, Far East Equity) country currencies.
Positive second half international equity market performance was driven by strong results across sectors, capitalizations and regions. Emerging markets were the strongest part of the international markets overall, returning 34.54% as measured by the MSCI Emerging Markets Index. Within emerging markets, Latin America was the strongest region, returning 50.42%, while the Emerging Europe and Africa region was up nearly 39%, and Emerging Asia returned 27.50%.
What is your outlook for the international markets?
After a third consecutive year of strong equity returns worldwide, markets have for the most part erased the losses of the 2000-2002 bear market. As the new year begins, many national and regional indices (with the obvious exceptions of Nasdaq and the Japanese market benchmarks) are at or approaching historic highs. Even in the US, where index returns were modest, a majority of individual stocks offered better performance.
December 31, 2005 | William Blair Funds 23 |
Prices have been propelled higher by strong fundamentals: exceptional earnings growth and a surprisingly stable inflation and long term interest rate environment. The only two elements of cyclical risk in the global economic picture have been Fed tightening and rising energy costs, and up to now, neither of them has had a significant impact on growth. Relative economic stability has enabled strong corporate performance to act as the key driver of share price gains over the course of the last several years. Accordingly, if the structural framework of the global economy remains in equilibrium, and corporate growth and profitability continue to meet or exceed expectations, the market environment will remain conducive to solid equity returns.
The principal risks in the macro picture are well known, and mostly focused on the US: household sector leverage and inadequate savings; consumer vulnerability to weakness in home prices; interest rate and exchange rate risks associated with the US current account deficit; the potential for a central bank policy error (such as overreacting to transitory inflation signs); a ‘superspike’ in oil and gas prices beyond what has already taken place; and/or exogenous variables such as avian flu, terrorist disruptions, or natural disasters.
Since none of these issues are new, the only way they could have a dramatic impact on the market risk profile would be if one of them suddenly had a delayed or cumulative effect, or if two or more of them combined in some unforeseen way. These possibilities cannot be conclusively ruled out, but at the same time, the resilience of the financial and economic infrastructure—perhaps a byproduct of increasing global integration—has been impressive over the last decade.
The other key variable in the outlook is corporate profitability and growth, where we have seen continued strength in the US and dramatic improvement in Japan, Europe, and in many developing markets. This aspect of the market environment shows no sign of deteriorating or even slackening the pace of improvement. Corporate management continues to focus on improving supply chain management, capital and labor productivity, cost control, and marketing. Returns on capital are now well above the cost of capital in every principal region of the world; and while there are concerns that ‘excessive’ profitability is a risk factor in itself, there is no signal apparent of either complacency or irrational competitive behavior undermining corporate performance on a wide scale.
Even in a benign economic and earnings scenario, of course, there is no guarantee of supernormal returns or a continuation of the trends of 2003-05. There is a reasonable (although not conclusive) case that cyclical growth may slow in the US and China in 2006, and profit growth may be restrained as a result. In addition, growth in the energy and financial sectors may be held back by price declines and yield curve flattening, respectively. On the other hand, Japan and more recently Europe seem to be benefiting from the effects of a strong external environment and solid corporate profitability, and could continue to mount moderate but self-sustaining recoveries. On a global basis, there is probably not much reason to anticipate significantly lower earnings growth in 2006, but some deceleration seems likely.
In the context of the current profit and interest rate picture, current valuations should not present a significant issue for potential returns, and even areas that have seen relatively strong recent performance, such as small caps and Japan, are not so extended as to be unusually risky on valuation grounds alone.
Emerging markets continue to be a special case, influenced by long term changes outside of the business cycle. Whereas previous cycles were dominated by unstable investment flows and highly volatile production and trade patterns, virtually all of the developing world is now seeing new dynamics of high savings, credit development, job creation and household spending growth, as well as more responsible and transparent corporate behavior. These factors are reducing financial risk at the same time they create new avenues of growth in emerging economies, and have been instrumental in driving exceptional returns in this asset class since 1999.
24 Annual Report | December 31, 2005 |
On balance, we see a reasonable balance between risk and opportunity for the year ahead, particularly as international markets continue to be led by the ongoing trend toward better corporate performance and governance. At the margins of any set of expectations, of course, are the ‘unknown unknowns’. Volatility has been relatively low for some time, and global markets have not faced any major discontinuities for several years. Any investment strategy predicated on anticipation of normal growth and risk parameters has to be adaptable to evolving change, and adaptability built into portfolio structure from the bottom up is probably the most consistent method for refining strategy.
December 31, 2005 | William Blair Funds 25 |
Emerging Markets Growth Fund
Performance Highlights (unaudited)
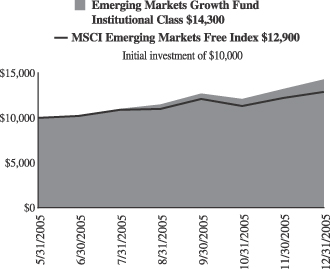
Average Annual Total Return at 12/31/2005
| | | |
| | | Since Inception(a)
| |
Emerging Markets Growth Fund Institutional Class | | 42.82 | % |
MSCI Emerging Markets Free Index | | 29.26 | |
| | (a) | | For the period from June 6, 2005 (Commencement of Operations) to December 31, 2005. | |
Performance cited represents past performance. Past performance does not guarantee future results and current performance may be lower or higher than the data quoted. Results shown are average annual returns, which assume reinvestment of dividends and capital gains. Investment returns and principal will fluctuate and you may have a gain or loss when you sell shares. For the most current month-end performance information, please call 1-800-742-7272, or visit our Web site at www.williamblairfunds.com. International investing involves special risk considerations, including currency fluctuations, lower liquidity, economic and political risk.
The performance highlights and graph presented above do not reflect the deduction of taxes that a shareholder would pay on fund distributions or the redemption of fund shares.
The Morgan Stanley Capital International (MSCI) Emerging Markets Free Index is an index that is designated to measure equity performance in the global emerging markets.
This report identifies the Fund’s investments on December 31, 2005. These holdings are subject to change. Not all stocks in the Fund performed the same, nor is there any guarantee that these stocks will perform as well in the future. Market forecasts provided in this report may not necessarily come to pass.
Sector Diversification (unaudited)
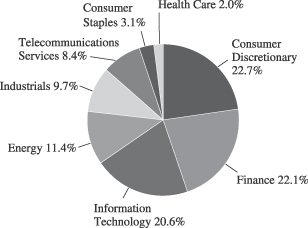
The sector diversification shown is based on the total investment portfolio.
26 Annual Report | December 31, 2005 |
Emerging Markets Growth Fund
Portfolio of Investments, December 31, 2005 (all dollar amounts in thousands)
| | | | | |
Issuer
| | Shares
| | Value
|
| | |
Common Stocks—Emerging Asia—44.0% | | | | | |
China—7.5% | | | | | |
China Mungniu Dairy Co. Ltd. (Food products) | | 2,834,000 | | $ | 2,406 |
Ctrip.com International Ltd.—ADR (Hotels, restaurants, and leisure) | | 19,300 | | | 1,115 |
*Focus Media Holding Ltd.—ADR (Advertising sales) | | 31,000 | | | 1,047 |
*Foxconn International (Manufacturing services) | | 2,701,000 | | | 4,410 |
Fu Ji Food and Catering Services Holdings Ltd (Hotels, restaurants, and leisure) | | 782,000 | | | 1,281 |
Li Ning Co. Ltd (Leisure equipment and products) | | 1,640,000 | | | 1,163 |
*Parkson Retail Group Ltd. (Retail stores) | | 768,900 | | | 1,388 |
Ports Design Ltd. (Apparel and luxury goods) | | 1,075,000 | | | 1,251 |
*Suntech Power Holdings Co. Ltd—ADR (Alternate energy sources) | | 172,600 | | | 4,703 |
| | | | |
|
|
| | | | | | 18,764 |
| | | | |
|
|
India—10.6% | | | | | |
*Bharti Tele-Ventures (Wireless telecommunication services) | | 920,700 | | | 7,079 |
HDFC Bank (Banking) | | 302,300 | | | 4,745 |
Housing Development Finance Corp. (Financial services) | | 177,900 | | | 4,773 |
Infosys Technologies, Ltd. (Consulting and software services) | | 146,800 | | | 9,780 |
| | | | |
|
|
| | | | | | 26,377 |
| | | | |
|
|
Malaysia—3.8% | | | | | |
*Airasia Bhd (Air transport) | | 5,449,000 | | | 2,291 |
Bumiputra Commerce Holding Bhd (Banking) | | 3,347,800 | | | 5,050 |
Transmile Group Bhd (Airport development and maintenance) | | 765,400 | | | 2,145 |
| | | | |
|
|
| | | | | | 9,486 |
| | | | |
|
|
South Korea—13.8% | | | | | |
Hana Tour Service (Travel service) | | 64,700 | | | 3,068 |
Hyundai Motor Co. Ltd. (Automobiles) | | 64,590 | | | 6,165 |
*Kookmin Bank (Banking) | | 65,940 | | | 4,987 |
Korea Investment Holdings Co. Ltd. (Diversified financial services) | | 61,630 | | | 2,589 |
*NHN Corporation (Internet software and services) | | 9,500 | | | 2,510 |
Samsung Electronics Co. (Semiconductors) | | 15,800 | | | 10,200 |
Shinsegae Co. Ltd. (Discount retail) | | 11,100 | | | 4,854 |
| | | | |
|
|
| | | | | | 34,373 |
| | | | |
|
|
Taiwan—8.3% | | | | | |
Hon Hai Precision Industry (Computers) | | 1,332,107 | | | 7,334 |
*Mediatek Inc. (Semiconductors and equipment) | | 685,800 | | | 8,039 |
Novatek Microelectronics (Semiconductors and equipment) | | 926,724 | | | 5,435 |
| | | | |
|
|
| | | | | | 20,808 |
| | | | |
|
|
| | | | | |
Issuer
| | Shares
| | Value
|
|
Common Stocks—Emerging Europe, Mid-East, Africa—22.4% |
Czech Republic—0.3% | | | | | |
*Central European Media Enterprises Ltd., Class “A” (Television)† | | 15,100 | | $ | 874 |
| | | | |
|
|
Egypt—2.1% | | | | | |
Orascom Contruction Industry—GDR (Construction) | | 69,900 | | | 5,242 |
| | | | |
|
|
Hungary—1.9% | | | | | |
MOL Magyar Olaj-es Gazipari (Oil company) | | 24,900 | | | 2,336 |
Richter Gedeon Rt. (Pharmaceuticals) | | 12,600 | | | 2,265 |
| | | | |
|
|
| | | | | | 4,601 |
| | | | |
|
|
Russia—2.4% | | | | | |
*Novatek OAO—GDR 144A (Oil, gas drilling, and exploration) | | 214,100 | | | 4,814 |
*Pyaterochka Holdings—GDR (Food and retail) | | 73,900 | | | 1,068 |
| | | | |
|
|
| | | | | | 5,882 |
| | | | |
|
|
South Africa—13.7% | | | | | |
African Bank Investments (Banking) | | 1,310,300 | | | 5,087 |
Aspen Pharmacare Holdings Ltd. (Pharmaceuticals) | | 471,700 | | | 2,494 |
Edgars Consolidated Stores (Apparel, footwear and retail) | | 312,200 | | | 1,740 |
*MTN Group Ltd. (Telecommunication services) | | 783,600 | | | 7,706 |
Naspers Ltd. (Media) | | 272,900 | | | 4,846 |
Sasol Ltd. (Oil company) | | 205,800 | | | 7,422 |
Standard Bank Group Ltd. (Banking) | | 402,700 | | | 4,839 |
| | | | |
|
|
| | | | | | 34,134 |
| | | | |
|
|
Turkey—2.0% | | | | | |
*Turkiye Garanti Bankasi A.S. (Banking) | | 1,414,300 | | | 5,098 |
| | | | |
|
|
| | |
Emerging Latin America—21.8% | | | | | |
Brazil— 3.9% | | | | | |
Cia de Concessoes Rodoviarias (Public thoroughfares) | | 38,900 | | | 1,232 |
*Diagnosticos da America S.A. (Health care services) | | 126,800 | | | 2,361 |
Gol Linhas Aereas Int S.P—ADR (Air transport) | | 85,700 | | | 2,418 |
*Natura Cosmeticos S.A. (Cosmetics) | | 53,900 | | | 2,376 |
*Submarino S.A. (Internet and catalog retail) | | 69,800 | | | 1,240 |
| | | | |
|
|
| | | | | | 9,627 |
| | | | |
|
|
Chile—5.8% | | | | | |
Banco Santander SP—ADR (Banking) | | 105,200 | | | 4,692 |
Cencosud S.A.—ADR 144A (Retail stores) | | 84,600 | | | 2,515 |
S.A.C.I. Falabella S.A. (Retail stores) | | 2,657,400 | | | 7,289 |
| | | | |
|
|
| | | | | | 14,496 |
| | | | |
|
|
Columbia—1.9% | | | | | |
Bancolombia S.A.—ADR (Banking) | | 166,900 | | | 4,812 |
| | | | |
|
|
See accompanying Notes to Financial Statements.
December 31, 2005 | William Blair Funds 27 |
Emerging Markets Growth Fund
Portfolio of Investments, December 31, 2005 (all dollar amounts in thousands)
| | | | | | |
Issuer
| | Shares or
Principal
Amount
| | Value
|
| |
Common Stocks—Emerging Latin America—21.8%—(continued) | | | |
Mexico—9.8% | | | | | | |
America Movil S.A. (Communications) | | | 3,190,700 | | $ | 4,671 |
*Corporacion Geo Sa De Cv (Real estate) | | | 1,409,000 | | | 4,981 |
*Urbi Desarrollos Urbanos S.A. (Household durables) | | | 703,200 | | | 4,872 |
Walmart de Mexico (Retail trade) | | | 1,757,900 | | | 9,777 |
| | | | | |
|
|
| | | | | | | 24,301 |
| | | | | |
|
|
Panama—0.4% | | | | | | |
*Copa Holdings S.A., Class “A” (Airlines)† | | | 40,900 | | | 1,117 |
| | | | | |
|
|
Total Common Stock—88.2%
(cost $191,210) | | | 219,992 |
| | | | | |
|
|
| | |
Preferred Stock | | | | | | |
Brazil—4.7% | | | | | | |
Banco Itau Holding (Banking) | | | 189,800 | | | 4,574 |
Petroleo Brasileiro S.A. (Oil, gas drilling, and exploration) | | | 446,400 | | | 7,109 |
| | | | | |
|
|
Total Preferred Stock—4.7%
(cost $10,796) | | | 11,683 |
| | | | | |
|
|
| | |
Investment in Affiliate | | | | | | |
William Blair Ready Reserves Fund | | | 3,821,204 | | | 3,821 |
| | | | | |
|
|
Total Investment in Affiliate—1.5%
(cost $3,821) | | | 3,821 |
| | | | | |
|
|
| | |
Short-Term Investments | | | | | | |
American Express Demand Note, VRN
4.235% due 1/3/06 | | $ | 3,778,000 | | | 3,778 |
Prudential Funding Demand Note, VRN 3.930% due 1/3/06 | | $ | 3,659,000 | | | 3,659 |
| | | | | |
|
|
Total Short-Term Investments—3.0%
(cost $7,437) | | | 7,437 |
| | | | | |
|
|
Total Investments—97.4%
(cost $213,264) | | | 242,933 |
Cash and other assets, less liabilities—2.6% | | | 6,415 |
| | | | | |
|
|
Net assets—100.0% | | $ | 249,348 |
| | | | | |
|
|
* Non-income producing securities
ADR = American Depository Receipt
GDR = Global Depository Receipt
VRN = Variable Rate Note
† = U.S. listed foreign security
For securities, excluding those primarily traded on exchanges or markets that close before the close of regular trading on the New York Stock Exchange, the Fund uses an independent pricing service on a daily basis to fair value price the securities to Valuation Procedures adopted by the Board of Trustees.
At December 31, 2005 the Fund’s Portfolio of Investments includes the following currency categories:
| | |
United States Dollar | | 14.9% |
South Korean Won | | 14.8% |
South African Rand | | 14.7% |
Indian Rupee | | 11.4% |
Mexico Nuevo Peso | | 10.5% |
Taiwan Dollar | | 9.0% |
Brazilian Real | | 8.2% |
Hong Kong Dollar | | 5.1% |
Malaysian Ringgit | | 4.1% |
Chilean Peso | | 3.1% |
Turkish Lira | | 2.2% |
Hungarian Forint | | 2.0% |
| | |
|
| | | 100.0% |
| | |
|
At December 31, 2005 the Fund’s Portfolio of Investments includes the following industry categories:
| | |
Consumer Discretionary | | 22.7% |
Finance | | 22.1% |
Information Technology | | 20.6% |
Energy | | 11.4% |
Industrials | | 9.7% |
Telecommunication Services | | 8.4% |
Consumer Staples | | 3.1% |
Health Care | | 2.0% |
| | |
|
| | | 100.0% |
| | |
|
See accompanying Notes to Financial Statements.
28 Annual Report | December 31, 2005 |
Statements of Assets and Liabilities
December 31, 2005 (all dollar amounts in thousands)
| | | | | | | | | | | | | | | | |
| | | Institutional International Growth Fund
| | | Institutional International Equity Fund
| | | International
Small Cap
Growth
Fund
| | | Emerging
Markets
Growth Fund
| |
Assets | | | | | | | | | | | | | | | | |
Investments in securities, at cost | | $ | 1,115,883 | | | $ | 221,700 | | | $ | 46,760 | | | $ | 209,443 | |
Investments in Affiliated Fund, at cost | | | 1,079 | | | | 93 | | | | 410 | | | | 3,821 | |
| | |
|
|
| |
|
|
| |
|
|
| |
|
|
|
| | | | |
Investments in securities, at value | | $ | 1,547,227 | | | $ | 247,693 | | | $ | 51,042 | | | $ | 239,112 | |
Investments in Affiliated Fund, at value | | | 1,079 | | | | 93 | | | | 410 | | | | 3,821 | |
Cash | | | 47 | | | | 13 | | | | — | | | | 1 | |
Foreign currency, at value (cost $7,455, $1,623, $44, and $2,860, respectively) | | | 7,557 | | | | 1,660 | | | | 45 | | | | 2,878 | |
Receivable for fund shares sold | | | 3,486 | | | | 2,500 | | | | 254 | | | | 1,269 | |
Receivable for investment securities sold | | | 3,915 | | | | 199 | | | | 304 | | | | 2,930 | |
Receivable from Advisor | | | — | | | | 7 | | | | — | | | | — | |
Dividend and interest receivable | | | 1,221 | | | | 129 | | | | 22 | | | | 132 | |
| | |
|
|
| |
|
|
| |
|
|
| |
|
|
|
Total assets | | | 1,564,532 | | | | 252,294 | | | | 52,077 | | | | 250,143 | |
Liabilities | | | | | | | | | | | | | | | | |
Payable for investment securities purchased | | | 7,633 | | | | 1,170 | | | | 1,487 | | | | 518 | |
Payable for fund shares redeemed | | | 96 | | | | — | | | | — | | | | 45 | |
Management fee payable | | | 1,234 | | | | 122 | | | | 6 | | | | 153 | |
Distribution and shareholder services fee payable | | | — | | | | — | | | | 2 | | | | 9 | |
Other accrued expenses | | | 155 | | | | 73 | | | | 48 | | | | 70 | |
| | |
|
|
| |
|
|
| |
|
|
| |
|
|
|
Total liabilities | | | 9,118 | | | | 1,365 | | | | 1,543 | | | | 795 | |
| | |
|
|
| |
|
|
| |
|
|
| |
|
|
|
Net Assets | | $ | 1,555,414 | | | $ | 250,929 | | | $ | 50,534 | | | $ | 249,348 | |
| | |
|
|
| |
|
|
| |
|
|
| |
|
|
|
Capital | | | | | | | | | | | | | | | | |
Composition of Net Assets | | | | | | | | | | | | | | | | |
Par value of shares of beneficial interest | | $ | 86 | | | $ | 21 | | | $ | 5 | | | $ | 18 | |
Capital paid in excess of par value | | | 1,126,781 | | | | 226,639 | | | | 45,907 | | | | 219,209 | |
Accumulated net investment income (loss) | | | (14,549 | ) | | | (581 | ) | | | (99 | ) | | | (322 | ) |
Accumulated realized gain (loss) | | | 11,677 | | | | (1,178 | ) | | | 442 | | | | 757 | |
Net unrealized appreciation (depreciation) of investments and foreign currencies | | | 431,419 | | | | 26,028 | | | | 4,279 | | | | 29,686 | |
| | |
|
|
| |
|
|
| |
|
|
| |
|
|
|
Net Assets | | $ | 1,555,414 | | | $ | 250,929 | | | $ | 50,534 | | | $ | 249,348 | |
| | |
|
|
| |
|
|
| |
|
|
| |
|
|
|
| | | | |
Net Assets | | $ | 1,555,414 | | | $ | 250,929 | | | $ | — | | | $ | — | |
Shares Outstanding | | | 85,869,096 | | | | 20,833,285 | | | | — | | | | — | |
Net Asset Value Per Share | | $ | 18.11 | | | $ | 12.04 | | | $ | — | | | $ | — | |
Institutional Share Class | | | | | | | | | | | | | | | | |
Net Assets | | $ | — | | | $ | — | | | $ | 35,163 | | | $ | 189,431 | |
Shares Outstanding | | | — | | | | — | | | | 3,150,242 | | | | 13,339,140 | |
Net Asset Value Per Share | | $ | — | | | $ | — | | | $ | 11.16 | | | $ | 14.20 | |
See accompanying Notes to Financial Statements.
December 31, 2005 | William Blair Funds 29 |
Statements of Operations
For the Year Ended December 31, 2005 (all dollar amounts in thousands)
| | | | | | | | | | | | | | | | |
| | | Institutional
International
Growth
Fund
| | | Institutional
International
Equity Fund
| | | International
Small Cap
Growth
Fund(a)
| | | Emerging
Markets
Growth
Fund (b)
| |
Investment income | | | | | | | | | | | | | | | | |
Dividends | | $ | 21,422 | | | $ | 1,033 | | | $ | 57 | | | $ | 586 | |
Less foreign tax withheld | | | (1,716 | ) | | | (76 | ) | | | — | | | | (24 | ) |
Income from Affiliated Fund | | | 175 | | | | 31 | | | | 1 | | | | 26 | |
Interest | | | 678 | | | | 183 | | | | 16 | | | | 90 | |
| | |
|
|
| |
|
|
| |
|
|
| |
|
|
|
Total income | | | 20,559 | | | | 1,171 | | | | 74 | | | | 678 | |
Expenses | | | | | | | | | | | | | | | | |
Investment advisory fees | | | 12,489 | | | | 824 | | | | 61 | | | | 508 | |
Distribution fees | | | — | | | | — | | | | — | | | | 6 | |
Shareholder administration fees | | | — | | | | — | | | | 3 | | | | 22 | |
Custodian fees | | | 845 | | | | 183 | | | | 34 | | | | 148 | |
Transfer agent fees | | | 47 | | | | 5 | | | | 1 | | | | 12 | |
Professional fees | | | 89 | | | | 44 | | | | 24 | | | | 29 | |
Registration fees | | | 47 | | | | 49 | | | | 8 | | | | 41 | |
Other expenses | | | 277 | | | | 17 | | | | 3 | | | | 4 | |
| | |
|
|
| |
|
|
| |
|
|
| |
|
|
|
Total expenses before waiver | | | 13,794 | | | | 1,122 | | | | 134 | | | | 770 | |
Less expenses waived or absorbed by the Advisor | | | — | | | | (208 | ) | | | (54 | ) | | | (161 | ) |
| | |
|
|
| |
|
|
| |
|
|
| |
|
|
|
Net expenses | | | 13,794 | | | | 914 | | | | 80 | | | | 609 | |
| | |
|
|
| |
|
|
| |
|
|
| |
|
|
|
Net investment income (loss) | | | 6,765 | | | | 257 | | | | (6 | ) | | | 69 | |
Net realized and unrealized gain (loss) on investments, foreign currency transactions and other assets and liabilities | | | | | | | | | | | | | | | | |
Net realized gain (loss) on investments | | | 116,446 | | | | (812 | ) | | | 442 | | | | 1,926 | |
Net realized gain (loss) on foreign currency transactions and other assets and liabilities | | | (6,149 | ) | | | (614 | ) | | | (87 | ) | | | (391 | ) |
| | |
|
|
| |
|
|
| |
|
|
| |
|
|
|
Total net realized gain (loss) | | | 110,297 | | | | (1,426 | ) | | | 355 | | | | 1,535 | |
Change in net unrealized appreciation (depreciation) on investments and other assets and liabilities | | | 167,187 | | | | 25,499 | | | | 4,279 | | | | 29,686 | |
| | |
|
|
| |
|
|
| |
|
|
| |
|
|
|
Net increase (decrease) in net assets resulting from operations | | $ | 284,249 | | | $ | 24,330 | | | $ | 4,628 | | | $ | 31,290 | |
| | |
|
|
| |
|
|
| |
|
|
| |
|
|
|
(a) For the period from November 1, 2005 (Commencement of Operations) to December 31, 2005.
(b) For the period from June 6, 2005 (Commencement of Operations) to December 31, 2005.
See accompanying Notes to Financial Statements.
30 Annual Report | December 31, 2005 |
Statements of Changes in Net Assets
For the Periods Ended December 31, 2005 and 2004 (all amounts in thousands)
| | | | | | | | | | | | | | | | | | | | | | | | |
| | | Institutional
International
Growth
Fund
| | | Institutional
International
Equity
Fund
| | | International
Small Cap
Growth
Fund
| | | Emerging
Markets
Growth
Fund
| |
| | | 2005
| | | 2004
| | | 2005
| | | 2004(a)
| | | 2005(b)
| | | 2005(c)
| |
Operations | | | | | | | | | | | | | | | | | | | | | | | | |
Net investment income (loss) | | $ | 6,765 | | | $ | 1,475 | | | $ | 257 | | | $ | (3 | ) | | $ | (6 | ) | | $ | 69 | |
Net realized gain (loss) on investments, foreign currency transactions and other assets and liabilities | | | 110,297 | | | | 6,935 | | | | (1,426 | ) | | | (142 | ) | | | 355 | | | | 1,535 | |
Change in net unrealized appreciation (depreciation) on investments, foreign currency transactions and other assets and liabilities | | | 167,187 | | | | 168,587 | | | | 25,499 | | | | 529 | | | | 4,279 | | | | 29,686 | |
| | |
|
|
| |
|
|
| |
|
|
| |
|
|
| |
|
|
| |
|
|
|
Net increase (decrease) in net assets resulting from operations | | | 284,249 | | | | 176,997 | | | | 24,330 | | | | 384 | | | | 4,628 | | | | 31,290 | |
Distributions to shareholders from | | | | | | | | | | | | | | | | | | | | | | | | |
Net investment income | | | (11,444 | ) | | | (605 | ) | | | (442 | ) | | | — | | | | (6 | ) | | | — | |
Net realized gain | | | (112,356 | ) | | | — | | | | (3 | ) | | | — | | | | — | | | | (1,169 | ) |
| | |
|
|
| |
|
|
| |
|
|
| |
|
|
| |
|
|
| |
|
|
|
| | | | (123,800 | ) | | | (605 | ) | | | (445 | ) | | | — | | | | (6 | ) | | | (1,169 | ) |
Capital stock transactions | | | | | | | | | | | | | | | | | | | | | | | | |
Net proceeds from sale of shares | | | 114,081 | | | | 597,277 | (d) | | | 201,804 | | | | 27,000 | | | | 46,006 | | | | 224,893 | |
Shares issued in reinvestment of income dividends and capital gain distributions | | | 120,609 | | | | 487 | | | | 383 | | | | — | | | | 6 | | | | 1,122 | |
Less cost of shares redeemed | | | (63,161 | ) | | | (28,231 | ) | | | (2,527 | ) | | | — | | | | (100 | ) | | | (6,788 | ) |
| | |
|
|
| |
|
|
| |
|
|
| |
|
|
| |
|
|
| |
|
|
|
Net increase (decrease) in net assets resulting from capital stock transactions | | | 171,529 | | | | 569,533 | | | | 199,660 | | | | 27,000 | | | | 45,912 | | | | 219,227 | |
| | |
|
|
| |
|
|
| |
|
|
| |
|
|
| |
|
|
| |
|
|
|
Increase (decrease) in net assets | | | 331,978 | | | | 745,925 | | | | 223,545 | | | | 27,384 | | | | 50,534 | | | | 249,348 | |
Net assets | | | | | | | | | | | | | | | | | | | | | | | | |
Beginning of period | | $ | 1,223,436 | | | $ | 477,511 | | | $ | 27,384 | | | $ | — | | | $ | — | | | $ | — | |
| | |
|
|
| |
|
|
| |
|
|
| |
|
|
| |
|
|
| |
|
|
|
End of period | | $ | 1,555,414 | | | $ | 1,223,436 | | | $ | 250,929 | | | $ | 27,384 | | | $ | 50,534 | | | $ | 249,348 | |
| | |
|
|
| |
|
|
| |
|
|
| |
|
|
| |
|
|
| |
|
|
|
Undistributed net investment income (loss) at the end of the year | | $ | (14,549 | ) | | $ | (5,484 | ) | | $ | (581 | ) | | $ | (125 | ) | | $ | (99 | ) | | $ | (322 | ) |
| | |
|
|
| |
|
|
| |
|
|
| |
|
|
| |
|
|
| |
|
|
|
Capital stock transactions in dollars | | | | | | | | | | | | | | | | | | | | | | | | |
Institutional Share Class (only) | | | | | | | | | | | | | | | | | | | | | | | | |
Sales | | | | | | | | | | | | | | | | | | $ | 31,900 | | | $ | 172,789 | |
Reinvested distributions | | | | | | | | | | | | | | | | | | | 6 | | | | 858 | |
Redemptions | | | | | | | | | | | | | | | | | | | — | | | | 5,159 | |
| | | | | | | | | | | | | | | | | | |
|
|
| |
|
|
|
Net change in net assets relating to fund share activity | | | | | | | | | | | | | | | | | | $ | 31,906 | | | $ | 168,488 | |
| | | | | | | | | | | | | | | | | | |
|
|
| |
|
|
|
Capital stock transactions in shares | | | | | | | | | | | | | | | | | | | | | | | | |
Shares sold | | | 6,656 | | | | 43,026 | | | | 18,357 | | | | 2,685 | | | | 3,150 | | | | 13,777 | |
Shares issued in reinvestment of income dividends or capital gain distributions | | �� | 6,798 | | | | 31 | | | | 32 | | | | — | | | | — | | | | 62 | |
Less shares redeemed | | | (3,750 | ) | | | (1,991 | ) | | | (240 | ) | | | — | | | | — | | | | (500 | ) |
| | |
|
|
| |
|
|
| |
|
|
| |
|
|
| |
|
|
| |
|
|
|
Net change in shares outstanding | | | 9,704 | | | | 41,066 | | | | 18,149 | | | | 2,685 | | | | 3,150 | | | | 13,339 | |
| | |
|
|
| |
|
|
| |
|
|
| |
|
|
| |
|
|
| |
|
|
|
| (a) | | For the period from December 1, 2004 (Commencement of Operations) to December 31, 2004. |
| (b) | | For the period from November 1, 2005 (Commencement of Operations) to December 31, 2005. |
| (c) | | For the period from June 6, 2005 (Commencement of Operations) to December 31, 2005. |
| (d) | | The net proceeds from sale of shares include $73 million dollars in two in-kind purchase transactions completed during 2004. |
See accompanying Notes to Financial Statements.
December 31, 2005 | William Blair Funds 31 |
Notes to Financial Statements
(1) Significant Accounting Policies
(a) Description of the Fund
William Blair Funds (the “Fund”) is a diversified mutual fund registered under the Investment Company Act of 1940, as amended, as an open-end management investment company. The number of shares authorized for this Fund is unlimited. The Fund currently consists of the following fourteen portfolios (the “Portfolios”), each with its own investment objectives and policies.
| | |
Equity Portfolios
| | International Portfolios
|
Growth | | International Growth |
Tax-Managed Growth | | International Equity |
Large Cap Growth | | Institutional International Growth |
Small Cap Growth | | Institutional International Equity |
Small-Mid Cap Growth | | International Small Cap Growth |
Value Discovery | | Emerging Markets Growth |
| | | Fixed Income Portfolio
|
| | | Income |
| | | Money Market Portfolio
|
| | | Ready Reserves |
The investment objectives of the Portfolios are as follows:
| | |
Equity | | Long-term capital appreciation. |
International | | Long-term capital appreciation. |
Fixed Income | | High level of current income with relative stability of principal. |
Money Market | | Current income, a stable share price and daily liquidity. |
The Institutional International Growth Fund, the Institutional International Equity Fund and the Institutional Share Class of the International Small Cap Growth Fund and the Emerging Markets Growth Fund are the only Portfolios covered in this report.
(b) Share Classes
Three different classes of shares of the International Small Cap Growth Fund and Emerging Markets Growth Fund currently exist: N, I and Institutional. This report includes financial information for only the Institutional Class. The Institutional share class is sold to institutional investors, including but not limited to employee benefit plans, endowments, foundations, trusts and corporations, who are able to meet the Fund’s high minimum investment requirement. The minimum initial investment required is $5 million.
(c) Investment Valuation
The market value of domestic equity securities and options is determined by valuing securities traded on national securities exchanges or markets or in the over-the-counter markets at the last sales price or, if applicable, the official closing price or, in the absence of a sale on the date of valuation, at the latest bid price.
For international securities, if the foreign exchange or market on which a security is primarily traded closes before the close of regular trading on the New York Stock Exchange (4:00 p.m. Eastern time), the Funds use an independent pricing service on a daily basis to estimate the fair value price as of the close of regular trading on the New York Stock Exchange. The Board of Trustees has determined that the passage of time between when foreign exchanges or markets close and when the Funds calculate their net asset values could cause the value of international securities to no longer be representative of their market price or accurate. In addition, quarterly the Board of Trustees receives a report which tracks the fair value prices used to calculate the net asset value to the next day’s opening local prices. Otherwise, the value of foreign equity securities is determined based on the last sale price on the foreign exchange or market on which it is primarily traded or, if there have been no sales during that day, at the latest bid price. Foreign currency forward contracts and foreign currencies are valued at the forward and current exchange rates, respectively, prevailing on the date of valuation.
32 Annual Report | December 31, 2005 |
Investments in other funds are valued at the underlying fund’s net asset value on the date of valuation. Other securities, and all other assets, including securities for which a market price is not available, or the value of which is affected by a significant valuation event, are valued at fair value as determined in good faith by, or under the direction of the Board of Trustees and in accordance with the Fund’s valuation procedures. As of December 31, 2005, there were securities held in the Institutional International Growth, Institutional International Equity, International Small Cap Growth and Emerging Markets Growth Portfolios requiring fair valuation by the Board of Trustees pursuant to the Fund’s valuation procedures.
(d) Investment income and investment transactions
Dividend income is recorded on the ex-dividend date, except for those dividends from certain foreign securities which are recorded as soon as the information is available. Foreign currency gains and losses associated with fluctuation in the foreign currency rate versus the United States dollar are recorded on the Statement of Operations as a component of net realized gains/(losses) on foreign currency transactions and other assets and liabilities.
Premiums and discounts are accreted and amortized on a straight-line basis for short-term investments and on an effective interest method for long-term investments.
Interest income is determined on the basis of the interest accrued, adjusted for amortization of premium or discount. Variable rate bonds and floating rate notes earn interest at coupon rates that fluctuate at specific time intervals.
Securities transactions are recorded on the trade date. Realized gains and losses from securities transactions are reported on an identified cost basis.
(e) Share Valuation and Dividends to Shareholders
Shares are sold and redeemed on a continuous basis at net asset value. The net asset value per share is determined by dividing the Portfolio’s net assets by the number of shares outstanding as of the close of regular trading on the New York Stock Exchange, which is generally 3:00 p.m. Central time (4:00 p.m. Eastern time), on each day the Exchange is open.
Dividends from net investment income, if any, are declared at least annually. Capital gain distributions, if any, are declared at least annually in December. Dividends payable to shareholders are recorded on the ex-dividend date.
The timing and characterization of certain income and capital gain distributions are determined annually in accordance with Federal income tax regulations that may differ from U.S. generally accepted accounting principles. As a result, net investment income or loss and net realized gain or loss for a reporting period may differ from the amount distributed during such period. In addition, the Portfolios may periodically record reclassifications among certain capital accounts to reflect differences between financial reporting and income tax basis distributions. The reclassifications were reported in order to reflect the tax treatment for certain permanent differences that exist between income tax regulations and U.S. generally accepted accounting principles. The reclassifications relate to section 988 currency gains and losses, and recharacterization of unrealized appreciation on PFICs (Passive Foreign Investment Corporations). These reclassifications have no impact on the net asset values of the Portfolio. Accordingly, at December 31, 2005, the following reclassifications were recorded (in thousands):
| | | | | | | | | | |
Portfolio
| | Undistributed Net
Investment Income/(Loss)
| | | Accumulated
Undistributed
Net Realized Gain/ (Loss)
| | Capital
Paid In Excess
of Par Value
|
Institutional International Growth | | $ | (4,386 | ) | | $ | 4,386 | | $ | — |
Institutional International Equity | | | (271 | ) | | | 271 | | | — |
International Small Cap Growth | | | (87 | ) | | | 87 | | | — |
Emerging Markets Growth | | | (391 | ) | | | 391 | | | — |
Distributions from net realized gains for book purposes may include short-term capital gains, which are included as ordinary income for tax purposes. The tax character of distributions paid during 2005 and 2004 was as follows (in thousands):
| | | | | | | | | | | | |
| | | Distributions Paid In 2005
| | Distributions Paid In 2004
|
Portfolio
| | Ordinary
Income
| | Long-Term
Capital Gains
| | Ordinary
Income
| | Long-Term
Capital Gains
|
Institutional International Growth | | $ | 14,610 | | $ | 109,190 | | $ | 605 | | $ | — |
Institutional International Equity | | | 445 | | | — | | | — | | | — |
International Small Cap Growth | | | 6 | | | — | | | — | | | — |
Emerging Markets Growth | | | 1,169 | | | — | | | — | | | — |
December 31, 2005 | William Blair Funds 33 |
As of December 31, 2005, the components of distributable earnings on a tax basis were as follows (in thousands):
| | | | | | | | | | | | |
Portfolio
| | Undistributed
Ordinary
Income
| | Accumulated
Capital and
Other Losses
| | Undistributed
Long-Term
Gain
| | Net Unrealized
Appreciation / (Depreciation)
|
Institutional International Growth | | $ | 12,597 | | $ | — | | $ | 9,285 | | $ | 406,665 |
Institutional International Equity | | | 1,453 | | | 493 | | | — | | | 23,309 |
International Small Cap Growth | | | 511 | | | — | | | — | | | 4,111 |
Emerging Markets Growth | | | 404 | | | — | | | 1,158 | | | 28,559 |
(f) Foreign Currency Translation and Foreign Currency Forward Contracts
The Portfolios may invest in securities denominated in foreign currencies. As such, assets and liabilities denominated in foreign currencies are translated into U.S. dollar amounts at the current exchange rate on the date of valuation. These Portfolios may enter into foreign currency forward contracts (1) as a means of managing the risks associated with changes in the exchange rates for the purchase or sale of a specific amount of a particular foreign currency, and (2) to hedge the value, in U.S. dollars, of portfolio securities. Gains and losses from foreign currency transactions associated with purchases and sales of investments and foreign currency forward contracts are included with the net realized and unrealized gain or loss on investments.
(g) Income Taxes
The Portfolios intend to comply with the special provisions of Subchapter M of the Internal Revenue Code available to regulated investment companies and, therefore, no provision for Federal income taxes has been made in the accompanying financial statements since each Portfolio intends to distribute substantially all of its taxable income to its shareholders and be relieved of all Federal income taxes.
The Portfolios have elected to mark-to-market their investments in Passive Foreign Investment Companies (“PFICs”) for Federal income tax purposes. In accordance with this election, the Institutional International Growth, Institutional International Equity, International Small Cap Growth and Emerging Markets Growth Portfolios recognized net unrealized appreciation (depreciation) of $19,062, $2,034, $117 and $726, respectively (in thousands) in 2005, all of which has been treated as an adjustment to the cost of investments for tax purposes. The Portfolios also treat the deferred loss associated with current and prior year wash sales as an adjustment to the cost of investments for tax purposes. The cost of investments for Federal income tax purposes and related gross unrealized appreciation/(depreciation) and net unrealized appreciation/(depreciation) at December 31, 2005 were as follows (in thousands):
| | | | | | | | | | | | |
Portfolio
| | Cost of
Investments
| | Gross Unrealized Appreciation
| | Gross Unrealized Depreciation
| | Net Unrealized
Appreciation / (Depreciation)
|
Institutional International Growth | | $ | 1,141,716 | | $ | 412,547 | | $ | 5,882 | | $ | 406,665 |
Institutional International Equity | | | 224,512 | | | 24,032 | | | 723 | | | 23,309 |
International Small Cap Growth | | | 47,338 | | | 4,497 | | | 386 | | | 4,111 |
Emerging Markets Growth | | | 214,391 | | | 28,804 | | | 245 | | | 28,559 |
At December 31, 2005, the Portfolios, with the exception of Institutional International Equity, have no unused capital loss carryforwards available for Federal income tax purposes to be applied against future capital gains, if any. Institutional International Equity Portfolio has an unused capital loss carryforward of $383 (in thousands) that will not expire until 2013.
For the period November 1, 2005 through December 31, 2005, the Institutional International Equity Portfolio incurred net realized capital or foreign currency losses. The Portfolio intends to treat this loss as having occurred in fiscal year 2006 for Federal income tax purposes (in thousands):
| | | |
Portfolio
| | Capital
Loss
|
Institutional International Growth | | $ | — |
Institutional International Equity | | | 110 |
International Small Cap Growth | | | — |
Emerging Markets Growth | | | — |
34 Annual Report | December 31, 2005 |
(h) Use of Estimates
The preparation of financial statements in conformity with U.S. generally accepted accounting principles requires management to make estimates and assumptions that affect the amounts reported in the financial statements. Actual results may differ from those estimates.
(2) Transactions with Affiliates
(a) Management and Expense Limitation Agreements
The Institutional International Growth and Institutional International Equity Portfolios have a management agreement with William Blair & Company L.L.C. (the “Company”) for investment advisory, administrative, and other accounting services. The Portfolios pay the Company an annual fee, payable monthly, based on a specified percentage of its average daily net assets. A summary of the annual rates expressed as a percentage of average daily net assets is as follows:
| | | |
First $500 million | | 1.00 | % |
Next $500 million | | 0.95 | % |
In excess of $1 billion | | 0.90 | % |
The Emerging Markets Growth Portfolio pays the Company a 1.10% annual fee payable monthly, based on its average daily net assets. The International Small Cap Growth Portfolio pays the Company a 1.00% annual fee payable monthly, based on its average daily net assets.
The Portfolios have also entered into Expense Limitation Agreements with the Company. Under the terms of these Agreements, the Company has agreed to waive its advisory fees and absorb other operating expenses through April 30, 2006, if total expenses of either the Institutional International Growth or Institutional International Equity Portfolios’ exceeds 1.10% of average daily net assets or 1.25% of average daily net assets for the Institutional Share Class of the International Small Cap Growth and Emerging Markets Growth Portfolios.
For a period of three years subsequent to the Commencement of Operations of the Fund, the Company is entitled to reimbursement from the Institutional International Growth, Institutional International Equity, International Small Cap Growth and Emerging Markets Growth Portfolios for previously waived fees and expenses to the extent the overall expense ratio remains below the percentages indicated. The total amount available for recapture at December 31, 2005 is $320, $229, $54 and $161 (in thousands) for Institutional International Growth, Institutional International Equity, International Small Cap Growth and Emerging Markets Growth Portfolios, respectively. As a result, the total expense ratio for a Portfolio during the period the agreement is in effect, will not fall below the percentage indicated.
For the year ended December 31, 2005, the investment advisory fees incurred by the Portfolio and related fee waivers were as follows (in thousands) :
| | | | | | | | | | | | |
Portfolio
| | Gross
Advisory Fee
| | Fee Waiver
| | Net
Advisory Fee
| | Expenses
(Recovered) or
Absorbed by
Advisor
|
Institutional International Growth | | $ | 12,489 | | $ | — | | $ | 12,489 | | $ | — |
Institutional International Equity | | | 824 | | | 208 | | | 616 | | | — |
International Small Cap Growth | | | 61 | | | 54 | | | 7 | | | — |
Emerging Markets Growth | | | 508 | | | 161 | | | 347 | | | — |
(b) Trustees Fees
The Portfolio incurred fees of $52 (in thousands) to non-interested trustees of the Fund for the year ended December 31, 2005. Interested trustees are not compensated.
(c) Investments in Affiliated Portfolio
Pursuant to an Exemptive Order granted by the Securities and Exchange Commission in January, 2001, each of the Portfolios of the Fund may invest in the William Blair Ready Reserves Portfolio (“Ready Reserves”), an open-end money market
December 31, 2005 | William Blair Funds 35 |
portfolio managed by the Advisor. Ready Reserves Portfolio is used as a cash management option to the other Portfolios in the Fund. The Advisor waives management fees and shareholder service fees earned from the other Portfolios investment in the Ready Reserves Fund. The fees waived with respect to the Portfolio for the year ended December 31, 2005 are listed below. Distributions received from Ready Reserves are reflected as dividend income in the Portfolio’s statement of operations. Amounts relating to the Portfolio’s investments in Ready Reserves were as follows for the year ended December 31, 2005 (in thousands):
| | | | | | | | | | | | | | | | | | |
Portfolio
| | Purchases
| | Sales
Proceeds
| | Fees
Waived
| | Dividend
Income
| | Value
| | Percent
of Net
Assets
| |
Institutional International Growth | | $ | 32,994 | | $ | 41,325 | | $ | 41 | | $ | 175 | | $ | 1,079 | | 0.1 | % |
Institutional International Equity | | | 17,931 | | | 18,212 | | | 7 | | | 31 | | | 93 | | — | |
International Small Cap Growth | | | 3,170 | | | 2,760 | | | — | | | 1 | | | 410 | | 0.8 | |
Emerging Markets Growth | | | 17,270 | | | 13,449 | | | 5 | | | 26 | | | 3,821 | | 1.5 | |
(3) Investment Transactions
Investment transactions, excluding money market instruments, for the year ended December 31, 2005 were as follows (in thousands):
| | | | | | |
Portfolio
| | Purchases
| | Sales
|
Institutional International Growth | | $ | 996,356 | | $ | 944,611 |
Institutional International Equity | | | 260,358 | | | 66,901 |
International Small Cap Growth | | | 50,786 | | | 7,799 |
Emerging Markets Growth | | | 240,654 | | | 40,574 |
(4) Foreign Currency Forward Contracts
To protect itself against a decline in the value of foreign currency against the U.S. dollar, each Portfolio enters into foreign currency forward contracts with its custodian and others. The Portfolio bears the market risk that arises from changes in foreign currency rates and bears the credit risk if the counterparty fails to perform under the contract. The net realized and unrealized gains and losses associated with foreign currency forward contracts are reflected in the accompanying financial statements. There were no open foreign forward contracts at December 31, 2005.
36 Annual Report | December 31, 2005 |
Financial Highlights
Institutional International Growth Fund
| | | | | | | | | | | | | |
| | |
| |
| | | Years Ended December 31,
| |
| | | 2005
| | 2004
| | 2003
| | 2002(a)
| |
Net asset value, beginning of year | | $ | 16.06 | | $ | 13.60 | | $ | 9.567 | | $ | 10.000 | |
Income from investment operations: | | | | | | | | | | | | | |
Net investment income (b) | | | 0.09 | | | 0.03 | | | 0.073 | | | — | |
Net realized and unrealized gain (loss) on investments | | | 3.53 | | | 2.44 | | | 3.993 | | | (0.430 | ) |
| | |
|
| |
|
| |
|
| |
|
|
|
Total from investment operations | | | 3.62 | | | 2.47 | | | 4.066 | | | (0.430 | ) |
Less distributions from: | | | | | | | | | | | | | |
Net investment income | | | 0.15 | | | 0.01 | | | 0.033 | | | 0.003 | |
Net realized gain | | | 1.42 | | | — | | | — | | | — | |
| | |
|
| |
|
| |
|
| |
|
|
|
Total distributions | | | 1.57 | | | 0.01 | | | 0.033 | | | 0.003 | |
| | |
|
| |
|
| |
|
| |
|
|
|
Net asset value, end of year | | $ | 18.11 | | $ | 16.06 | | $ | 13.600 | | $ | 9.567 | |
| | |
|
| |
|
| |
|
| |
|
|
|
Total return (%) | | | 22.76 | | | 18.15 | | | 42.47 | | | (4.27 | ) |
Ratios to average daily net assets (%): | | | | | | | | | | | | | |
Expenses, net of waivers and reimbursements | | | 1.05 | | | 1.10 | | | 1.10 | | | 1.10 | (c) |
Expenses, before waivers and reimbursements | | | 1.05 | | | 1.11 | | | 1.16 | | | 1.29 | (c) |
Net investment income (loss), net of waivers and reimbursements | | | 0.52 | | | 0.18 | | | 0.37 | | | (0.05 | )(c) |
Net investment income (loss), before waivers and reimbursements | | | 0.52 | | | 0.17 | | | 0.31 | | | (0.24 | )(c) |
| | | | | | | | | | | | | |
| | |
| |
| | | Years Ended December 31,
| |
| | | 2005
| | 2004
| | 2003
| | 2002
| |
Supplemental data: | | | | | | | | | | | | | |
Net assets at end of period (in thousands) | | $ | 1,555,414 | | $ | 1,223,436 | | $ | 477,511 | | $ | 149,848 | |
Portfolio turnover rate (%) | | | 74 | | | 72 | | | 56 | | | 59 | (c) |
| (a) | | For the period from July 26, 2002 (Commencement of Operations) to December 31, 2002. |
| (b) | | Excludes $0.25, $0.10, $0.06, and $0.02 of PFIC mark to market which is treated as ordinary income for Federal tax purposes for the years 2005, 2004, 2003 and 2002, respectively. |
| (c) | | Rates are annualized for periods that are less than a year. |
Performance cited represents past performance. Past performance does not guarantee future results and current performance may be lower or higher that the data quoted. Results shown are annual returns, which assume reinvestment of dividends and capital gains. Investment returns and principal will fluctuate and you may have a gain or loss when you sell shares. For the most current month-end performance information, please call 1-800-742-7272, or visit our Web site at www.williamblairfunds. com.
Note: Net investment income (loss) per share is based on the average shares outstanding during the year.
December 31, 2005 | William Blair Funds 37 |
Financial Highlights
Institutional International Equity Fund
| | | | | | | |
| | |
| |
| | | Years Ended
December 31,
| |
| | | 2005
| | 2004(a)
| |
Net asset value, beginning of year | | $ | 10.20 | | $ | 10.00 | |
Income from investment operations: | | | | | | | |
Net investment income (b) | | | — | | | — | |
Net realized and unrealized gain (loss) on investments | | | 1.86 | | | 0.20 | |
| | |
|
| |
|
|
|
Total from investment operations | | | 1.86 | | | 0.20 | |
Less distributions from: | | | | | | | |
Net investment income | | | 0.02 | | | — | |
Net realized gain | | | — | | | — | |
| | |
|
| |
|
|
|
Total distributions | | | 0.02 | | | — | |
| | |
|
| |
|
|
|
Net asset value, end of year | | $ | 12.04 | | $ | 10.20 | |
| | |
|
| |
|
|
|
Total return (%) | | | 18.26 | | | 2.00 | |
Ratios to average daily net assets (%): | | | | | | | |
Expenses, net of waivers and reimbursements | | | 1.10 | | | 1.10 | (c) |
Expenses, before waivers and reimbursements | | | 1.35 | | | 2.46 | (c) |
Net investment income (loss), net of waivers and reimbursements | | | 0.31 | | | (0.21 | )(c) |
Net investment income (loss), before waivers and reimbursements | | | 0.06 | | | (1.57 | )(c) |
| | | | | | | |
| | |
| |
| | | Years Ended
December 31,
| |
| | | 2005
| | 2004
| |
Supplemental data: | | | | | | | |
Net assets at end of period (in thousands) | | $ | 250,929 | | $ | 27,384 | |
Portfolio turnover rate (%) | | | 84 | | | 45 | (c) |
| (a) | | For the period from December 1, 2004 (Commencement of Operations) to December 31, 2004. |
| (b) | | Excludes $0.27 and $0.01 of PFIC mark to market which is treated as ordinary income for Federal tax purposes for the years 2005 and 2004, respectively. |
| (c) | | Rates are annualized for periods that are less than a year. |
Performance cited represents past performance. Past performance does not guarantee future results and current performance may be lower or higher that the data quoted. Results shown are annual returns, which assume reinvestment of dividends and capital gains. Investment returns and principal will fluctuate and you may have a gain or loss when you sell shares. For the most current month-end performance information, please call 1-800-742-7272, or visit our Web site at www.williamblairfunds. com.
Note: Net investment income (loss) per share is based on the average shares outstanding during the year.
38 Annual Report | December 31, 2005 |
Financial Highlights
International Small Cap Growth Fund
Institutional Share Class
| | | | |
| | |
| |
| | | Period Ended
| |
| | | December 31, 2005(a)
| |
Net asset value, beginning of period | | $ | 10.00 | |
Income from investment operations: | | | | |
Net investment income (b) | | | — | |
Net realized and unrealized gain on investments | | | 1.16 | |
| | |
|
|
|
Total from investment operations | | | 1.16 | |
Less distributions from: | | | | |
Net investment income (c) | | | — | |
Net realized gain | | | — | |
| | |
|
|
|
Total distributions | | | — | |
| | |
|
|
|
Net asset value, end of period | | $ | 11.16 | |
| | |
|
|
|
Total return (%) | | | 11.62 | |
Ratios to average daily net assets (%) (d): | | | | |
Expenses, net of waivers and reimbursements | | | 1.25 | |
Expenses, before waivers and reimbursements | | | 2.17 | |
Net investment income (loss), net of waivers and reimbursements | | | 0.00 | |
Net investment income (loss), before waivers and reimbursements | | | (0.92 | ) |
| | |
| |
| | | Period Ended
| |
| | | December 31, 2005
| |
Supplemental data for all classes: | | | | |
Net assets at end of period (in thousands) | | $ | 50,534 | |
Portfolio turnover rate (%) (d) | | | 127 | |
| (a) | | For the period from November 1, 2005 (Commencement of Operations) to December 31, 2005. |
| (b) | | Excludes $0.11 of PFIC mark to market which is treated as ordinary income for Federal tax purposes. |
| (c) | | Distribution less than $0.01 per share. |
| (d) | | Rates are annualized for periods that are less than a year. |
Performance cited represents past performance. Past performance does not guarantee future results and current performance may be lower or higher that the data quoted. Results shown are annual returns, which assume reinvestment of dividends and capital gains. Investment returns and principal will fluctuate and you may have a gain or loss when you sell shares. For the most current month-end performance information, please call 1-800-742-7272, or visit our Web site at www.williamblairfunds. com.
Note: Net investment income (loss) per share is based on the average shares outstanding during the period.
December 31, 2005 | William Blair Funds 39 |
Financial Highlights
Emerging Markets Growth Fund
Institutional Share Class
| | | | |
| | |
| |
| | | Period Ended
| |
| | | December 31, 2005(a)
| |
Net asset value, beginning of period | | $ | 10.00 | |
Income from investment operations: | | | | |
Net investment income (b) | | | 0.01 | |
Net realized and unrealized gain on investments | | | 4.27 | |
| | |
|
|
|
Total from investment operations | | | 4.28 | |
Less distributions from: | | | | |
Net investment income | | | — | |
Net realized gain | | | 0.08 | |
| | |
|
|
|
Total distributions | | | 0.08 | |
| | |
|
|
|
Net asset value, end of period | | $ | 14.20 | |
| | |
|
|
|
Total return (%) | | | 42.82 | |
Ratios to average daily net assets (%) (c): | | | | |
Expenses, net of waivers and reimbursements | | | 1.25 | |
Expenses, before waivers and reimbursements | | | 1.61 | |
Net investment income (loss), net of waivers and reimbursements | | | 0.19 | |
Net investment income (loss), before waivers and reimbursements | | | (0.17 | ) |
| | |
| |
| | | Period Ended
| |
| | | December 31, 2005(a)
| |
Supplemental data for all classes: | | | | |
Net assets at end of period (in thousands) | | $ | 249,348 | |
Portfolio turnover rate (%) (c) | | | 77 | |
| (a) | | For the period from June 6, 2005 (Commencement of Operations) to December 31, 2005. |
| (b) | | Excludes $0.11 of PFIC mark to market which is treated as ordinary income for Federal tax purposes. |
| (c) | | Rates are annualized for periods that are less than a year. |
Performance cited represents past performance. Past performance does not guarantee future results and current performance may be lower or higher that the data quoted. Results shown are annual returns, which assume reinvestment of dividends and capital gains. Investment returns and principal will fluctuate and you may have a gain or loss when you sell shares. For the most current month-end performance information, please call 1-800-742-7272, or visit our Web site at www.williamblairfunds. com.
Note: Net investment income (loss) per share is based on the average shares outstanding during the period.
40 Annual Report | December 31, 2005 |
REPORT OF INDEPENDENT REGISTERED PUBLIC ACCOUNTING FIRM
To the Board of Trustees and Shareholders
William Blair Funds
We have audited the accompanying statements of assets and liabilities, including the portfolios of investments, of the Institutional International Growth Fund, Institutional International Equity Fund, International Small Cap Growth Fund and Emerging Markets Growth Fund (collectively, the “Portfolios”) (four of the Portfolios constituting the William Blair Funds) as of December 31, 2005, and the related statements of operations, statements of changes in net assets and financial highlights for the periods indicated therein. These financial statements and financial highlights are the responsibility of the Portfolios’ management. Our responsibility is to express an opinion on these financial statements and financial highlights based on our audits.
We conducted our audits in accordance with the standards of the Public Company Accounting Oversight Board (United States). Those standards require that we plan and perform the audit to obtain reasonable assurance about whether the financial statements and financial highlights are free of material misstatement. We were not engaged to perform an audit of the Portfolios’ internal control over financial reporting. Our audits included consideration of internal control over financial reporting as a basis for designing audit procedures that are appropriate in the circumstances, but not for the purpose of expressing an opinion on the effectiveness of the Portfolios’ internal control over financial reporting. Accordingly, we express no such opinion. An audit also includes examining, on a test basis, evidence supporting the amounts and disclosures in the financial statements and financial highlights, assessing the accounting principles used and significant estimates made by management, and evaluating the overall financial statement presentation. Our procedures included confirmation of securities owned as of December 31, 2005, by correspondence with the custodian and brokers or by other appropriate auditing procedures where replies from brokers were not received. We believe that our audits provide a reasonable basis for our opinion.
In our opinion, the financial statements and financial highlights referred to above present fairly, in all material respects, the financial position of each of the above mentioned Portfolios of the William Blair Funds at December 31, 2005, the results of their operations, changes in their net assets and financial highlights for the periods indicated therein, in conformity with U.S. generally accepted accounting principles.

Chicago, Illinois
February 3, 2006
December 31, 2005 | William Blair Funds 41 |
Trustees and Officers. (Unaudited) The trustees and officers of the William Blair Funds, their ages, their principal occupations during the last five years, their affiliations, if any, with William Blair & Company, L.L.C., and other significant affiliations are set forth below. The address of each trustee and officer is 222 West Adams Street, Chicago, Illinois 60606.
| | | | | | | | | | |
Name and Age
| | Position(s)
Held with
Fund
| | Term of
Office and
Length of
Time
Served(1)
| | Principal Occupation(s) During Past 5 Years
| | Number of
Portfolios
in Fund
Complex
Overseen
by Trustee
| | Other Directorships Held by Trustee/Officer
|
Interested Trustees | | | | | | | | | | |
Frederick Conrad Fischer, 71* | | Chairman of the Board of Trustees | | Since 1987 | | Principal, William Blair & Company, L.L.C.; Partner, APM Limited Partnership | | 14 | | Trustee Emeritus, Chicago Child Care Society, a non-profit organization; Trustee Emeritus Kalamazoo College |
| | | | | |
Michelle Seitz, 40* | | Trustee | | Since 2002 | | Principal, William Blair & Company, L.L.C. | | 14 | | N/A |
Non-Interested Trustees | | | | | | | | |
Theodore A. Bosler, 71 | | Trustee | | Since 1997 | | Retired Principal and Vice President, Lincoln Capital Management | | 14 | | Desert Foothills Land Trust; Institute of Chartered Financial Analysts; Thresholds |
| | | | | |
Ann P. McDermott, 66 | | Trustee | | Since 1996 | | Board member and officer for various civic and charitable organizations over the past thirty years; professional experience prior thereto, registered representative for New York Stock Exchange firm | | 14 | | Northwestern University, Women’s Board; Rush Presbyterian St. Luke’s Medical Center, Women’s Board; University of Chicago, Women’s Board; Visiting Nurses Association, Honorary Director |
| | | | | |
Donald J. Reaves, 59 | | Trustee | | Since 2004 | | Vice President for Administration and Chief Financial Officer, University of Chicago since 2002. Executive Vice President and Chief Financial Officer, Brown University from 1993 to 2002 | | 14 | | American Student Assistance Corp.; Amica Mutual Insurance Company; NACUBO (National Association of College and University Business Officers) |
| | | | | |
John B. Schwemm, 71 | | Trustee | | Since 1990 | | Retired Chairman and Chief Executive Officer, R.R. Donnelley & Sons Company | | 14 | | USG Corp., building material manufacturer, and Walgreen Co. |
| | | | | |
Donald L. Seeley, 61 | | Trustee | | Since 2003 | | Director, Applied Investment Management Program, University of Arizona Department of Finance, Formerly Vice Chairman and Chief Financial Officer, True North Communications, Inc., marketing communications and advertising firm | | 14 | | Beverly Enterprises, Inc., provider of eldercare and rehabilitative services; Warnaco, Group Inc., intimate apparel, sportswear and swimwear manufacturer |
42 Annual Report | December 31, 2005 |
| | | | | | | | | | |
Name and Age
| | Position(s)
Held with
Fund
| | Term of
Office and
Length of
Time
Served(1)
| | Principal Occupation(s) During Past 5 Years
| | Number of
Portfolios
in Fund
Complex
Overseen
by Trustee
| | Other Directorships Held by Trustee/Officer
|
Robert E. Wood II, 67 | | Trustee | | Since 1999 | | Retired Executive Vice President, Morgan Stanley Dean Witter | | 14 | | Chairman, Add-Vision, Inc. manufacturer of surface animation systems, and Micro-Combustion, LLC |
Officers | | | | | | | | | | |
Marco Hanig, 47 | | President | | Since 1999 | | Principal, William Blair & Company, L.L.C. | | N/A | | Chicago Scores |
| | | | | |
Karl W. Brewer, 39 | | Senior Vice President | | Since 2000 | | Principal, William Blair & Company, L.L.C. | | N/A | | N/A |
| | | | | |
Harvey H. Bundy, III, 61 | | Senior Vice President | | Since 2003 | | Principal, William Blair & Company, L.L.C. | | N/A | | N/A |
| | | | | |
Mark A. Fuller, III, 48 | | Senior Vice President | | Since 1993 | | Principal, William Blair & Company, L.L.C. | | N/A | | Partner, Fulsen Howney Partners |
| | | | | |
James W. Golan, 44 | | Senior Vice President | | Since 2005 | | Principal, William Blair & Company, L.L.C. | | N/A | | N/A |
| | | | | |
W. George Greig, 53 | | Senior Vice President | | Since 1996 | | Principal, William Blair & Company, L.L.C. | | N/A | | N/A |
| | | | | |
Michael A. Jancosek, 46 | | Senior Vice President Vice President | | Since 2004 Since 2000 | | Principal, William Blair & Company L.L.C. Associate, William Blair & Company, L.L.C. | | N/A | | N/A |
| | | | | |
John F. Jostrand, 51 | | Senior Vice President | | Since 1999 | | Principal, William Blair & Company, L.L.C. | | N/A | | N/A |
| | | | | |
James S. Kaplan, 45 | | Senior Vice President Vice President | | Since 2004 Since 1995 | | Principal, William Blair & Company, L.L.C. Associate, William Blair & Company, L.L.C. | | N/A | | N/A |
| | | | | |
Robert C. Lanphier, IV, 49 | | Senior Vice President | | Since 2003 | | Principal, William Blair & Company, L.L.C. | | N/A | | Chairman, AG. Med, Inc. |
| | | | | |
David S. Mitchell, 45 | | Senior Vice President Vice President | | Since 2004 Since 2003 | | Principal, William Blair & Company, L.L.C. Associate, William Blair & Company, L.L.C. | | N/A | | N/A |
December 31, 2005 | William Blair Funds 43 |
| | | | | | | | | | |
Name and Age
| | Position(s)
Held with
Fund
| | Term of
Office and
Length of
Time
Served(1)
| | Principal Occupation(s) During Past 5 Years
| | Number of
Portfolios
in Fund
Complex
Overseen
by Trustee
| | Other Directorships Held by Trustee/Officer
|
Gregory J. Pusinelli, 46 | | Senior Vice President | | Since 1999 | | Principal, William Blair & Company, L.L.C. | | N/A | | N/A |
| | | | | |
Norbert W. Truderung, 53 | | Senior Vice President | | Since 1992 | | Principal, William Blair & Company, L.L.C. | | N/A | | N/A |
| | | | | |
Jeffrey A. Urbina, 50 | | Senior Vice President | | Since 1998 | | Principal, William Blair & Company, L.L.C. | | N/A | | N/A |
| | | | | |
Christopher T. Vincent, 49 | | Senior Vice President Vice President | | Since 2004 Since 2002 | | Principal, William Blair & Company, L.L.C. Associate, William Blair & Company, L.L.C.; former Managing Director/Senior Portfolio Manager, Zurich Scudder Investments | | N/A | | Uhlich Children’s Home |
| | | | | |
Mark T. Leslie, 38 | | Vice President | | Since 2005 | | Associate, William Blair & Company, L.L.C.; former Portfolio Manager, U.S. Bancorp Asset Management | | N/A | | N/A |
| | | | | |
Todd M. McClone, 36 | | Vice President | | Since 2005 | | Associate, William Blair & Company, L.L.C. | | N/A | | N/A |
| | | | | |
Terence M. Sullivan, 61 | | Vice President and Treasurer | | Since 1997 | | Associate, William Blair & Company, L.L.C. | | N/A | | N/A |
| | | | | |
Colette M. Garavalia, 44 | | Secretary | | Since 2000 | | Associate, William Blair & Company, L.L.C. | | N/A | | N/A |
| * | | Mr. Fischer and Ms. Seitz are interested persons of the William Blair Funds because each is a principal of William Blair & Company, L.L.C., the Funds’ investment advisor and principal underwriter. |
| (1) | | Each Trustee serves until the election and qualification of a successor, or until death, resignation or retirement or removal as provided in the Fund’s Declaration of Trust. Retirement for non-interested Trustees occurs no later than at the conclusion of the first regularly scheduled Board meeting of the Fund’s fiscal year that occurs after the Trustee’s 72nd birthday. The Fund’s officers are elected annually by the Trustees. |
The Statement of Additional Information for the William Blair Funds includes additional information about the trustees and is available without charge by calling 1-800-635-2886 (in Massachusetts 1-800-635-2840) or by writing the Fund.
44 Annual Report | December 31, 2005 |
Board Approval of International Small Cap Growth Fund’s Advisory Agreement (unaudited)
During the six months ended December 31, 2005, the Board of Trustees approved the Fund’s advisory agreement with the Company on behalf of the International Small Cap Growth Fund (the “Portfolio”). The advisory agreement with respect to the Portfolio was approved, by the Board of Trustees, including all of the trustees who are not parties to such agreement or interested persons of any such party, on July 19, 2005. The Board of Trustees, including a majority of the independent trustees, determined that approval of the advisory agreement was in the best interests of the Portfolio. The independent trustees met separately from the “interested” trustees of the Fund and officers and employees of the Company to consider approval of the advisory agreement and were assisted by independent legal counsel in making their determination. The Board of Trustees, including the independent trustees, did not identify any single factor or group of factors as all important or controlling and considered all factors together.
Nature, Quality and Extent of Services. In evaluating the nature, quality and extent of services expected to be provided, the Board noted that the Company is a quality firm with a reputation for integrity and honesty that employs high quality people.
The Board considered the Company’s Form ADV, biographical information about the Portfolio’s portfolio manager, the administrative services to be performed by the Company, financial information regarding the Company, the compliance regime created by the Company and the anticipated financial support of the Portfolio.
The Board also reviewed the Company’s performance for managing a Canadian international small cap fund as well as the performance of the other William Blair international funds. The Board concluded that the performance of the Canadian fund was too new to judge and that the performance of the other William Blair international funds was good.
Profitability. With respect to the costs of services provided and profits realized by the Company, the Board considered profitability information provided by the Company with respect to the Fund as a whole and the proposed expense cap for the Portfolio. Based on this information, the Board concluded that the Company’s profitability was not unreasonable.
Economies of Scale. The Board considered the extent to which economies of scale would be realized as the Portfolio grows and considered management’s representations that there are few opportunities for economies of scale in the investment process, that economies of scale are unexpected during the start-up process and that the Portfolio has capacity constraints. In considering whether fee levels reflect economies of scale for the benefit of Portfolio investors, the Board reviewed the Portfolio’s projected asset size, the Portfolio’s projected total and net expense ratios and the expense cap proposed. The Board concluded that the projected total expense ratio, after giving effect to the expense cap proposed by the Company, were reasonable.
Fees and Expenses. The Board compared the amounts to be paid to the Company for advisory and administrative services with other registered funds included in the Portfolio’s Lipper expense universe. In addition, the Board compared amounts paid to the Company by other registered funds, including other Portfolios in the Fund and a fund for which the Company acts as a subadvisor, and by the Company’s other clients. The Board also considered that the Company proposed to waive advisory fees for the Portfolio according to the proposed expense cap. The Board concluded that the Portfolio’s advisory fee was reasonable.
Other Benefits to the Company. The Board considered benefits derived by the Company from its relationship with the Portfolio, including soft dollars. The Board concluded that, after taking into account this benefit, the advisory fee was reasonable. Based on all of the information considered and the conclusions reached, the Board determined to approve the advisory agreement.
December 31, 2005 | William Blair Funds 45 |
Additional Information (unaudited)
Proxy Voting
A description of the policies and procedures that the William Blair Institutional International Growth Fund, the William Blair Institutional International Equity Fund and the William Blair Emerging Markets Growth Fund use to determine how to vote proxies relating to portfolio securities and information regarding how the Fund voted proxies relating to portfolio securities for the most recent 12-month period ended June 30 are available without charge, upon request, by calling 1-800-635-2886 (in Massachusetts 1-800-635-2840), at www.williamblairfunds.com and on the SEC’s website at http://www.sec.gov.
Quarterly Portfolio Schedules
The Fund files its complete schedule of portfolio holdings with the SEC for the first and third fiscal quarters of each fiscal year (quarters ended March 31 and September 30) on Form N-Q. The Fund’s Forms N-Q are available on the SEC’s website at http://www.sec.gov and may be reviewed and copied at the SEC’s Public Reference Room in Washington, D.C. Information on the operation of the SEC’s Public Reference Room may be obtained by calling 1-800-SEC-0330.
46 Annual Report | December 31, 2005 |
Useful Information About Your Report (unaudited)
Please refer to this information when reviewing the Expense Example for each Fund.
Expense Example
As a shareholder of a Fund, you incur ongoing costs, including management fees and other Fund expenses. The example is intended to help you understand your ongoing costs (in dollars) of investing in the Fund and to compare these costs with the ongoing costs of investing in other mutual funds. To do so, compare the Fund’s 5% hypothetical example with the 5% hypothetical examples that appear in the shareholder reports of other funds. The example is based on an investment of $1,000 invested at the beginning of the period and held for the entire six-month period from July 1, 2005 to December 31, 2005.
Actual Expenses
In each example, the first line for each share class in the table provides information about the actual account values and actual expenses. These expenses reflect the effect of any expense cap applicable to the share class during the period. Without this expense cap, the costs shown in the table would have been higher. You may use the information in this line, together with the amount you invested, to estimate the expenses that you paid over the period. Simply divide your account value by $1,000 (example, an $8,600 account value divided by $1,000 = 8.6), then multiply the result by the number in the first line under the heading entitled “Expenses Paid During the Period” to estimate the expenses you paid on your account during the period.
Hypothetical Example for Comparison Purposes
In each example, the second line for each share class in the table provides information about hypothetical account values and hypothetical expenses based on the Fund’s actual expense ratio and an assumed rate of return of 5% per year before expenses. This is not the Fund’s actual return. The hypothetical account values and expenses may not be used to estimate the actual ending account balance or expenses you paid for the period. You may use this information to compare the ongoing costs of investing in the Fund to other funds. To do so, compare this 5% hypothetical example with the 5% hypothetical examples that appear in the shareholder reports of other funds.
Please note that the expenses shown in both examples are meant to highlight your ongoing costs only and do not reflect any transactional costs or account type fees. These fees are fully described in the prospectus. Therefore, the second line of each share class in the table is useful in comparing ongoing costs only and will not help you determine the relative costs of owning different funds.
December 31, 2005 | William Blair Funds 47 |
Fund Expenses (Unaudited)
The examples below show you the ongoing costs (in dollars) of investing in your fund and allows you to compare these costs with those of other mutual funds. Please refer to previous page for a detailed explanation of the information presented on this chart.
| | | | | | | | | | | | | |
| | | Beginning
Account Value
7/1/2005
| | Ending
Account Value
12/31/2005
| | Expenses Paid
during
Period(a)
| | | Annualized
Expense Ratio
| |
| | | | |
Institutional International Growth Fund | | | | | | | | | | | | | |
Actual return | | $ | 1,000.00 | | $ | 1,207.30 | | $ | 5.84 | | | 1.05 | % |
Hypothetical 5% return | | | 1,000.00 | | | 1,019.91 | | | 5.35 | | | 1.05 | |
| | | | | | | | | | | | | | |
| | | | |
Institutional International Equity Fund | | | | | | | | | | | | | |
Actual return | | | 1,000.00 | | | 1,180.30 | | | 6.05 | | | 1.10 | |
Hypothetical 5% return | | | 1,000.00 | | | 1,019.66 | | | 5.60 | | | 1.10 | |
| | | | | | | | | | | | | | |
| | | | |
International Small Cap Growth Fund Institutional Share Class | | | | | | | | | | | | | |
Actual return (since inception period) | | | 1,000.00 | | | 1,116.20 | | | 2.17 | (b) | | 1.25 | |
Hypothetical 5% return (six month period) | | | 1,000.00 | | | 1,018.90 | | | 6.36 | | | 1.25 | |
| | | | | | | | | | | | | | |
| | | | |
Emerging Markets Growth Fund Institutional Share Class | | | | | | | | | | | | | |
Actual return | | | 1,000.00 | | | 1,390.70 | | | 7.53 | | | 1.25 | |
Hypothetical 5% return | | | 1,000.00 | | | 1,018.90 | | | 6.36 | | | 1.25 | |
| | | | | | | | | | | | | | |
| (a) | | Expenses are equal to the annualized expense ratio, multiplied by the average account value over the period, multiplied by the number of days in the period (184), and divided by 365 (to reflect the one-half-year period). |
| (b) | | For the period November 1, 2005 (Commencement of Operations) until December 31, 2005. |
48 Annual Report | December 31, 2005 |
BOARD OF TRUSTEES
Frederick Conrad Fischer, Chairman
Principal, William Blair & Company, L.L.C.
Theodore A. Bosler
Retired Principal and Vice President, Lincoln Capital Management Company
Ann P. McDermott
Director and Trustee
Profit and not-for-profit organizations
Donald J. Reaves
Vice President for Administration and Chief Financial Officer, University of Chicago
Donald L. Seeley
Adjunct Lecturer and Director, University of Arizona Department of Finance
John B. Schwemm
Retired Chairman and CEO, R.R. Donnelley & Sons Company
Michelle R. Seitz
Principal, William Blair & Company, L.L.C.
Robert E. Wood II
Retired Executive Vice President, Morgan Stanley Dean Witter
Officers
Marco Hanig, President
Karl W. Brewer, Senior Vice President
Harvey H. Bundy III, Senior Vice President
Mark A. Fuller, III, Senior Vice President
James W. Golan, Senior Vice President
W. George Greig, Senior Vice President
Michael A. Jancosek, Senior Vice President
John F. Jostrand, Senior Vice President
James S. Kaplan, Senior Vice President
Robert C. Lanphier, IV, Senior Vice President
David S. Mitchell, Senior Vice President
Gregory J. Pusinelli, Senior Vice President
Norbert W. Truderung, Senior Vice President
Jeffrey A. Urbina, Senior Vice President
Christopher T. Vincent, Senior Vice President
Mark T. Leslie, Vice President
Todd M. McClone, Vice President
Terence M. Sullivan, Vice President and Treasurer
Colette M. Garavalia, Secretary
Investment Advisor
William Blair & Company, L.L.C.
Legal Counsel
Vedder, Price, Kaufman & Kammholz, P.C.
Independent Registered Public Accounting Firm
Ernst & Young LLP
Transfer Agent
State Street Bank and Trust Company
P.O. Box 8506
Boston, MA 02266-8506
For customer assistance, call 1-800-635-2886
(Massachusetts 1-800-635-2840)
| | Date of First Use February 2006 49 |
As of the end of the period covered by this Form N-CSR, the Registrant has adopted a code of ethics that applies to its principal executive officer and principal financial officer. Such code of ethics is posted on the Registrant’s website: www.williamblairfunds.com. There were no amendments to or waives of the code of ethics during the period covered by this report.
| Item 3. | Audit Committee Financial Expert |
The Registrant’s Board of Trustees has determined that the Registrant has at least one “audit committee financial expert” (as defined in Item 3 of Form N-CSR) serving on its Audit Committee. Mr. Donald L. Seeley, the Registrant’s audit committee financial expert, is “independent” for purposes of Item 3 to Form N-CSR.
An “audit committee financial expert” is not an “expert” for any purpose, including for purposes of Section 11 of the Securities Act of 1933, as a result of being designated as an “audit committee financial expert.” Further, the designation of a person as an “audit committee financial expert” does not mean that the person has any greater duties, obligations, or liability than those imposed on the person without the “audit committee financial expert” designation. Similarly, the designation of a person as an “audit committee financial expert” does not affect the duties, obligations, or liability of any other member of the audit committee or Board of Trustees.
| Item 4. | Principal Accountant Fees and Services |
Audit Fees
For the fiscal years ended December 31, 2004 and 2005, Ernst & Young, LLP, the Registrant’s principal accountant (“E&Y), billed the Registrant $215,000 and $280,800, respectively, for professional services rendered for the audit of the Registrant’s annual financial statements or services that are normally provided in connection with statutory and regulatory filings.
Audit-Related Fees
For the fiscal years ended December 31, 2004 and 2005, E&Y billed the Registrant $0 and $27,700, respectively for assurance and related services that are reasonably related to the performance of the audit of the Registrant’s financial statements and that are not reported above, such as reviewing prospectuses and SEC filings. For engagements that William Blair & Company L.L.C, the Registrant’s investment adviser (“William Blair”) or any of its control affiliates entered into with E&Y on or after May 6, 2003, E&Y provided no audit-related services to William Blair or any of its control affiliates that were for engagements directly related to the Registrant’s operations and financial reporting.
Tax Fees
For the fiscal years ended December 31, 2004 and 2005, E&Y billed the Registrant $45,200 and $69,850, respectively, for professional services rendered for tax compliance, tax advice and tax planning. Such services consisted of preparation of tax returns, year-end distribution review, qualifying dividend income analysis and computation of foreign tax credit pass through. For engagements with E&Y entered into on or after May 6, 2003, the Audit Committee pre-approved all tax services that E&Y provided to the Registrant.
For engagements that William Blair or any of its control affiliates entered into with E&Y on or after May 6, 2003, E&Y provided no tax services to William Blair or any of its control affiliates that were for engagements directly related to the Registrant’s operations and financial reporting.
All Other Fees
For the fiscal years ended December 31, 2004 and 2005, E&Y did not bill the Registrant for products and services other than the services reported above. For engagements that William Blair or any of its control affiliates entered into with E&Y on or after May 6, 2003, E&Y provided no other services to William Blair or any of its control affiliates that were for engagements directly related to the Registrant’s operations and financial reporting.
Audit Committee Pre-Approval Policies and Procedures
Pursuant to Registrant’s Audit Committee Charter (the “Charter”), the Audit Committee is responsible for pre-approving any engagement of the principal accountant to provide non-prohibited services to the Registrant, including the fees and other compensation to be paid to the principal accountant, to the extent required by Rule 2-01(c)(7) of Regulation S-X. Any member of the Audit Committee may grant pre-approval for engagements of less than $5,000. All such delegated pre-approvals will be presented to the Audit Committee no later than the next Audit Committee meeting. Pursuant to the Charter, the Audit Committee is also responsible for pre-approving any engagement of the principal accountant, including the fees and other compensation to be paid to the principal accountant, to provide non-audit services to the Registrant’s investment adviser (or any entity controlling, controlled by, or under common control with the adviser that provides ongoing services to the Registrant), if the engagement relates directly to the operations and financial reporting of the Registrant, to the extent required by Rule 2-01(c)(7) of Regulation S-X. Any member of the Audit Committee may grant pre-approval for engagements of less than $5,000. All such delegated pre-approvals will be presented to the Audit Committee no later than the next Audit Committee meeting.
Non-Audit Fees
For the fiscal years ended December 31, 2004 and 2005, E&Y billed the Registrant $45,200 and $69,850, respectively, in non-audit fees (tax services). For the same periods, E&Y billed William Blair and its control affiliates $195,540 (#) and $8,600, respectively, in non-audit fees. The Registrant’s Audit Committee has considered whether the provision of non-audit services that were rendered to William Blair or any of its control affiliates that were not pre-approved pursuant to Rule 2-01(c)(7)(ii) of Regulation S-X is compatible with maintaining E&Y’s independence. Such non-audit services primarily pertained to due diligence reviews performed for the Corporate Finance Group of William Blair and did not relate to the Registrant’s operations or financial reporting.
# $39,240 of which includes audit and related tax work relating to a William Blair Company control affiliate.
| Item 5. | Audit Committee of Listed Registrants |
Not Applicable to this Registrant, insofar as the Registrant is not a listed company.
| Item 6. | Schedule of Investments |
See Schedule of Investments in Item 1
| Item 7. | Disclosure of Proxy Voting Policies and Procedures for Closed-End Management Investment Companies |
Not applicable to this Registrant, insofar as the Registrant is not a closed-end management investment company.
| Item 8. | Portfolio Mangers of Closed Investment Companies |
Not applicable to this Registrant, insofar as the Registrant is not a closed-end management investment company.
| Item 9. | Purchase of Equity Securities by Closed end Management Investment Companies and Affiliated Purchasers |
Not applicable to this Registrant, insofar as the Registrant is not a closed-end management investment company.
| Item 10. | Submission of Matters to a Vote of Security Holders |
There have been no material changes to the procedures by which shareholders may recommend nominees to the Registrant’s Board of Trustees since the Registrant last provided disclosure in response to this item.
Controls and Procedures
(a) The Registrant’s principal executive and principal financial officer, or persons performing similar functions, have concluded that the Registrant’s Disclosure Controls and Procedures (as defined in Rule 30-a-3( c ) under the Investment Company Act of 1940, as amended (the “1940 Act”) (17 CFR 270.30a-3 ( c )) are effective, as of a date within 90 days of the filing date of this report that includes the disclosure required by this paragraph, based on their evaluation of these controls and procedures required by Rule 30a-3 (b)1/c under the 1940 Act (17 CFR 270.30a-3( b ) and Rules 13a-15( b ) or 15d-15(b) under the Exchange Act (17 CFR 240.13a-15(b) or 240.15d-15(b)).
(b) There were no changes in the Registrant’s internal control over financial reporting (as defined in Rule 30a-3(d) under the 1940 Act (17 CFR 270.30a-3(d)) that occurred during the final quarter of the period covered by this report that has materially affected, or is reasonably likely to materially affect, the Registrant’s internal control over financial reporting.
12. (a) (1) Code of Ethics
Not applicable because it is posted on Registrant’s website.
12. (a) (2) (1)
Certification of Principal Executive Officer Required by Rule 30a-2(a) of the Investment Company Act
12. (a) (2) (2)
Certification of Principal Financial Officer Required by Rule 30a-2(a) of the Investment Company Act.
12. (a) (3)
Not applicable to this Registrant.
12. (b)
Certification of Chief Executive Officer and Certification of Chief Financial Officer Required by Rule 30a-2(b) of the Investment Company Act
Signatures
Pursuant to the requirements of the Securities Exchange Act of 1934 and the Investment Company Act of 1940, the Registrant has duly caused this report to be signed on its behalf by the undersigned, thereunto duly authorized.
| | |
| | | William Blair Funds |
| |
| | | /s/ Marco Hanig |
| By: | | Marco Hanig |
| | | President (Chief Executive Officer) |
Date: February 24, 2006
Pursuant to the requirements of the Securities Exchange Act of 1934 and the Investment Company Act of 1940, this Report has been signed below by the following persons on behalf of the Registrant and in the capacities and on the dates indicated
| | |
| By: | | Marco Hanig |
| | | President (Chief Executive Officer) |
Date: February 24, 2006
| | |
| By: | | Terence M. Sullivan |
| | | Treasurer (Chief Financial Officer) |
Date: February 24, 2006