UNITED STATES
SECURITIES AND EXCHANGE COMMISSION
Washington, D.C. 20549
Form N-CSR
CERTIFIED SHAREHOLDER REPORT OF REGISTERED
MANAGEMENT INVESTMENT COMPANIES
Investment Company Act File Number 811-5344
William Blair Funds
(Exact name of registrant as specified in charter)
| | |
| 222 West Adams Street, Chicago, IL | | 60606 |
| (Address of principal executive offices) | | (Zip Code) |
Marco Hanig
William Blair Funds
222 West Adams Street, Chicago, IL 60606
(Name and address of agent for service)
Registrant’s telephone number, including area code: 312-236-1600
Date of fiscal year end: December 31
Date of reporting period: December 31, 2006
Form N-CSR is to be used by management investment companies to file reports with the Commission not later than 10 days after the transmission to stockholders of any report that is required to be transmitted to stockholders under Rule 30e-1 under the Investment Company Act of 1940 (17 CFR 270.30e-1). The Commission may use the information provided on Form N-CSR in its regulatory, disclosure review, inspection, and policymaking roles.
A registrant is required to disclose the information specified by Form N-CSR, and the Commission will make this information public. A Registrant is not required to respond to the collection of information contained in Form N-CSR unless the form displays a currently valid Office of Management and Budget (“OMB”) control number. Please direct comments concerning the accuracy of the information collection burden estimates and any suggestions for reducing the burden to Secretary, Securities and Exchange Commission, 450 Fifth Street, NW, Washington, DC 20549-0609. The OMB has reviewed this collection of information under the clearance requirements of 44 U.S.C. (ss) 3507.
| Item 1. | December 31, 2006 Annual Reports transmitted to shareholders. |

Table of Contents
This report is submitted for the general information of the shareholders of the William Blair Funds. It is not authorized for distribution to prospective investors unless accompanied or preceded by a prospectus of the William Blair Funds. Please carefully consider the Funds’ investment objectives, risks, charges, and expenses before investing. This and other information is contained in the Funds’ prospectus, which you may obtain by calling 1-800-742-7272. Read it carefully before you invest or send money.
December 31, 2006 | William Blair Funds 1 |

Marco Hanig
A LETTER FROM THE PRESIDENT
Dear Shareholders:
2006 was a good year for investors. The stock market prolonged its rally into a fourth year, with the Standard & Poor’s 500 Index of large cap stocks up 15.79%, the Russell 2000® Index of small cap stocks up 18.37%, and the MSCI All Country World Ex-US Index of foreign stocks up 27.16%. Bonds also had positive returns, with the Lehman Aggregate Bond Index increasing 4.33%.
Once again, value outperformed growth, and small cap did slightly better than large cap, a trend that has now lasted for several years. Many observers have been predicting that this trend will finally reverse, but have been proven wrong so far. The current value cycle has now lasted for over 6 years (Q3 2000 until now), which is almost the exact length of the previous growth cycle (Q3 1994 to Q3 2000). Foreign stocks once again outperformed domestic ones, aided by the ongoing depreciation of the US dollar.
Total Returns by Russell Style Index
January 1 through December 31, 2006
| | | | | | | | | |
| | | Value | | | Blend | | | Growth | |
Large Cap (Russell® 1000) | | 22.25 | % | | 15.46 | % | | 9.07 | % |
Mid Cap (Russell Midcap®) | | 20.22 | % | | 15.26 | % | | 10.66 | % |
Small Cap (Russell® 2000) | | 23.48 | % | | 18.37 | % | | 13.35 | % |
The best news for our shareholders is that each and every one of our funds had positive absolute returns in 2006. In terms of relative performance, there were several stand-outs. Comparing the Funds’ 2006 returns to their respective Morningstar categories of peer funds, the Value Discovery Fund posted a return of 21.78% vs. 16.26% for its Small Value peers, the Emerging Markets Growth Fund returned 37.90% vs. 32.38% for Diversified Emerging Markets peers, and the Growth Fund returned 12.42% vs. 6.93% for its Large Growth peers.
Funds that did quite well in absolute returns in 2006, but not as well relative to peers were the International Small Cap Growth Fund (20.32% vs. 26.73% for Foreign Small/Mid Growth peers) and International Equity Fund (19.96% vs. 23.78% for Foreign Large Growth peers). The Funds’ managers discuss the challenges they faced in their letters to shareholders.
In terms of long-term returns, the 10-year return of the International Growth Fund (14.94% vs. 6.85% for Foreign Growth peers) the 10-year return for the Income Fund (5.23% vs. 4.59% for Short Term Bond peers), and the 5-year return of the Small Cap Growth Fund (14.50% vs. 6.12% for Small Growth peers) are particularly noteworthy.
As always, thank you for investing with us!

Marco Hanig
2 Annual Report | December 31, 2006 |
PERFORMANCE AS OF DECEMBER 31, 2006—CLASS N SHARES
| | | | | | | | | | | | |
| | | 1 Yr | | 3 Yr | | 5 Yr | | 10 Yr (or since
inception) | | Inception
Date | | Overall Morningstar Rating |
| | | | | | | | | | | | | |
Growth Fund | | 12.42 | | 9.81 | | 3.96 | | 5.94 | | 3/20/1946 | | ««« |
Morningstar Large Growth | | 6.93 | | 7.15 | | 2.88 | | 5.88 | | | | Among 1,405 large growth funds |
Russell 3000® Growth | | 9.46 | | 7.17 | | 3.02 | | 5.34 | | | |
Standard & Poor’s 500 | | 15.79 | | 10.44 | | 6.19 | | 8.42 | | | | |
| | | | | | |
Tax-Managed Growth Fund | | | | | | | | | | | | «««« |
Return before Taxes | | 8.21 | | 9.16 | | 3.82 | | 1.29 | | 12/27/1999 | | Among 1,405 large growth funds |
After Taxes on Distributions | | 8.21 | | 9.16 | | 3.82 | | 1.29 | | | |
After Taxes on Distributions and Sale of Fund Shares | | 5.34 | | 7.89 | | 3.28 | | 1.10 | | | | |
Morningstar Large Growth | | 6.93 | | 7.15 | | 2.88 | | — | | | | |
Russell 3000® Growth | | 9.46 | | 7.17 | | 3.02 | | -4.39 | | | | |
Standard & Poor’s 500 | | 15.79 | | 10.44 | | 6.19 | | 1.24 | | | | |
| | | | | | |
Large Cap Growth Fund | | 6.34 | | 5.08 | | 0.47 | | -5.18 | | 12/27/1999 | | «« |
Morningstar Large Growth | | 6.93 | | 7.15 | | 2.88 | | — | | | | Among 1,405 large growth funds |
Russell 1000® Growth | | 9.07 | | 6.87 | | 2.69 | | -4.79 | | | |
| | | | | | |
Small Cap Growth Fund | | 14.12 | | 13.68 | | 14.50 | | 18.89 | | 12/27/1999 | | ««««« |
Morningstar Small Growth | | 10.49 | | 9.22 | | 6.12 | | — | | | | Among 648 small growth funds |
Russell 2000® Growth | | 13.35 | | 10.51 | | 6.93 | | 0.50 | | | |
Russell 2000® | | 18.37 | | 13.56 | | 11.39 | | 8.51 | | | | |
The Small Cap Growth Fund’s Performance during 2000 was primarily attributable to investments in initial public offerings (IPOs) during a rising market. Since then, IPOs have had an insignificant effect on the Fund’s performance. | | | | | | |
| | | | | | |
Mid Cap Growth Fund | | — | | — | | — | | 4.60 | | 2/1/2006 | | Not rated. |
Russell Midcap® Growth Index | | — | | — | | — | | 4.28 | | | | |
| | | | | | |
Small-Mid Cap Growth Fund | | 9.68 | | 11.28 | | — | | 11.00 | | 12/29/2003 | | ««« |
Morningstar Mid-Cap Growth | | 9.01 | | 10.85 | | — | | — | | | | Among 823 |
Russell 2500TM Growth | | 12.26 | | 11.64 | | — | | 11.36 | | | | mid cap growth funds |
| | | | | | |
International Growth Fund | | 23.06 | | 21.05 | | 16.43 | | 14.94 | | 10/1/1992 | | ««««« |
Morningstar Foreign Large Growth | | 23.78 | | 17.96 | | 12.54 | | 6.85 | | | | Among 206 foreign large growth funds |
MSCI World Ex-US | | 27.16 | | 21.81 | | 16.87 | | 8.59 | | | |
| | | | | | |
International Equity Fund | | 19.96 | | — | | — | | 18.06 | | 5/24/2004 | | Not rated. |
Morningstar Foreign Large Growth | | 23.78 | | — | | — | | — | | | | |
MSCI World Ex-US | | 27.16 | | — | | — | | 25.80 | | | | |
| | | | | | |
International Small Cap Growth Fund | | 20.32 | | — | | — | | 28.78 | | 11/1/2005 | | Not rated. |
Morningstar Foreign Small/Mid Growth | | 26.73 | | — | | — | | — | | | | |
MSCI World Ex-US Small Cap | | 19.82 | | — | | — | | 27.41 | | | | |
Please see the next page for important disclosure information.
See accompanying Notes to Financial Statements.
December 31, 2006 | William Blair Funds 3 |
PERFORMANCE AS OF DECEMBER 31, 2006—CLASS N SHARES—CONTINUED
| | | | | | | | | | | | |
| | | 1 Yr | | 3 Yr | | 5 Yr | | 10 Yr (or since
inception) | | Inception
Date | | Overall Morningstar Rating |
| | | | | | |
Emerging Markets Growth Fund | | 37.90 | | — | | — | | 53.65 | | 6/6/2005 | | Not rated. |
Morningstar Diversified Emerging Markets | | 32.38 | | — | | — | | — | | | | |
MSCI Emerging Markets | | 32.59 | | — | | — | | 40.84 | | | | |
| A portion of the Emerging Markets Growth Funds performance since inception is attributable to an investment in an initial public offering (IPO). | | | | | | |
| | | | | | |
Value Discovery Fund | | 21.78 | | 11.10 | | 11.27 | | 12.99 | | 12/23/1996 | | ««« |
Morningstar Small Value | | 16.26 | | 14.04 | | 13.85 | | 12.39 | | | | Among 304 small value funds |
Russell 2000® | | 18.37 | | 13.56 | | 11.39 | | 9.44 | | | |
Russell 2000® Value | | 23.48 | | 16.48 | | 15.37 | | 13.27 | | | | |
| | | | | | |
Income Fund | | 4.25 | | 2.85 | | 4.01 | | 5.23 | | 10/1/1990 | | «««« |
Morningstar Short-Term Bond | | 4.01 | | 2.34 | | 3.15 | | 4.59 | | | | Among 371 short-term bond funds |
Lehman Intermediate Govt./Credit Bond Index | | 4.07 | | 2.89 | | 4.52 | | 5.80 | | | |
Performance cited represents past performance. Past performance does not guarantee future results and current performance may be lower or higher than the data quoted. Returns shown are average annual total returns, which assume reinvestment of dividends and capital gains. Investment returns and principal will fluctuate and you may have a gain or a loss when you sell shares. For the most current month-end performance information, please call 1-800-742-7272, or visit our Web site at www.williamblairfunds.com. Investing in smaller companies involves special risks, including higher volatility and lower liquidity. International and emerging markets investing involves special risk considerations, including currency fluctuations, lower liquidity, economic and political risk. As interest rates rise, bond prices will fall and bond funds become more volatile. From time to time, the investment advisor may waive fees or reimburse expenses for certain Funds. Without these waivers, performance would be lower. Class N shares are available to the general public without a sales load.
Tax-Managed Growth Fund’s after-tax returns are calculated using the highest historical individual federal marginal income tax rates, and do not reflect the impact of state and local taxes. Actual after-tax returns depend on the investor’s tax situation and may differ from those shown. After-tax returns shown are not relevant to investors who hold their fund shares through tax-deferred arrangements such as 401(k) plans or individual retirement accounts. After-tax returns are shown only for Class N and the after-tax returns for Class N shares will vary.
Morningstar RatingsTM are as of 12/31/06 and are subject to change every month. The ratings are based on a risk-adjusted return measure that accounts for variation in a fund’s monthly performance, placing more emphasis on downward variations and rewarding consistent performance. The top 10% of funds in each Category receive 5 stars, the next 22.5% receive 4 stars, the middle 35% receive 3 stars, the next 22.5% receive 2 stars, and the bottom 10% receive 1 star. The Overall Morningstar Rating for a fund is derived from a weighted-average of the performance figures associated with its three-, five- and ten-year (if applicable) Morningstar Rating metrics. The 3/5/10 year Morningstar ratings were as follows: Growth Fund ««««/«««/«««, Tax-Managed Growth Fund ««««/««««/NA, and Large Cap Growth Fund ««/««/NA, out of 1,405/1,109/447 large growth funds; Small Cap Growth Fund ««««/«««««/NA out of 648/532/NA small growth funds; Small-Mid Cap Growth Fund «««/NA/NA out of 823/NA/NA mid cap growth funds; Value Discovery Fund ««/««/««« out of 304/220/71 small value funds; International Growth Fund ««««/««««/««««« out of 206/174/71 foreign large growth funds; Income Fund ««««/««««/«««« out of 371/250/153 short-term bond funds.
Please carefully consider the Funds’ investment objectives, risks, charges, and expenses before investing. This and other information is contained in the Funds’ prospectus, which you may obtain by calling 1-800-742-7272. Read it carefully before you invest or send money.
See accompanying Notes to Financial Statements.
4 Annual Report | December 31, 2006 |

David C. Fording

John F. Jostrand
GROWTH FUND
The Growth Fund invests primarily in common stocks of domestic growth companies that the Advisor expects to have sustainable, above-average growth from one business cycle to the next.
AN OVERVIEW FROM THE PORTFOLIO MANAGERS
How did the Fund perform over the last year? How did the Fund’s performance compare to its benchmark?
The Growth Fund posted a 12.42% increase on a total return basis (Class N Shares) for the 12 months ended December 31, 2006. By comparison, the Fund’s benchmark, the Russell 3000® Growth Index, gained 9.46%.
What were the most significant factors impacting Fund performance?
US equity markets ultimately turned in very strong results for 2006, despite interim push-me-pull-you behavior. Investor sentiment and its relation to market activity during the year can be evaluated in terms of trimesters: extensive optimism in the first four months of the year, driven primarily by stronger than expected earnings reports from the fourth quarter of 2005; bearish defensiveness after the May Federal Reserve announcement that monetary policy would continue to tighten; and strong positive sentiment from mid-July forward as commodity prices receded, the Federal Reserve paused, and third quarter corporate earnings continued at a higher than expected double-digit pace.
Given the extended nature of this “recovery” cycle, during which value-oriented, traditionally cyclical stocks are out-performing, many strategists and economists are now referring to this era as a “profit supercycle”. Companies across the board have experienced double-digit earnings gains for an unprecedented 15 consecutive quarters. This has fed into the strong leadership of value over growth. Moreover, the fact that our portfolio has an even greater growth bias relative to the Russell 3000® Growth benchmark, caused a significant headwind to relative returns during the year. Additionally, our positioning towards the smaller end of the capitalization spectrum provided a negative bias in the portfolio versus the benchmark. However, our extremely strong stock selection significantly overwhelmed these factors.
Which sectors enhanced the Fund’s return? What were among the best performing investments for the Fund?
Our choices within the Information Technology sector showed the importance of strong stock selection to portfolio results on both an absolute and relative basis. Although technology stocks were among the weakest performers during the year in terms of absolute returns, the portfolio achieved its strongest results with stocks in this area. WebEx Communications, Inc. successfully navigated a successful transition in its pricing model and continued to beat estimates during the year, providing a sizeable stock return and benefit to the portfolio. Nuance Communications also appreciated significantly during the year. The firm’s strategic acquisitions in the past 18 months propelled it to a market leadership position in voice recognition technology, which is witnessing accelerated adoption in new applications. In the first quarter of 2006, Nuance announced the acquisition of Dictaphone, further securing its leadership position in this high growth area.
December 31, 2006 | William Blair Funds 5 |
Consumer Discretionary stock selection was also strongly beneficial to relative portfolio results. Monetary tightening, rising commodity prices and housing market concerns weighed on stocks within this sector, particularly in the first half of the year. Despite macro concerns, our bottom-up stock selection process brought us two interesting opportunities: Marriott International Inc. and Kohl’s Corp. Hotels and leisure stocks enjoyed very strong returns during the year, as strong trends in business travel particularly benefited these companies. Marriott was one of the biggest beneficiaries of this trend, with most of their properties located in major cities. Kohl’s Corp. had a stellar year as well. The company successfully executed on its new management strategies, branching out from its basic wear into proprietary designer lines from some of the most popular brands, such as Chaps from Ralph Lauren. Additionally, the company revamped several of its stores into more customer-friendly formats, and gained market share from some of the floundering larger department store chains. The company is just beginning to benefit from financial and operational strategies that should continue to provide margin improvement.
Were there any investment strategies or themes that did not measure up to your expectations?
Health Care provided indigestion during the year. With concerns about changes in Medicare reimbursement allowances, looming regulatory issues, and product safety concerns overhanging the market, much of health care had a tough year. Medtronic Inc., in the medical device area, suffered a significant pullback in stock price due to a significant decrease in the rate of growth in its implantable cardioverter defibrillator market. Certain pharmaceuticals and various specialty health technology companies did well, but biotechnology stocks performed poorly during the fourth quarter and the year. Amgen, Inc., one of our larger portfolio holdings, faced significant competitive issues regarding patent challenges during the year. We continue to think that several biotech firms offer great opportunity for new products that could have numerous applications over broad populations, but investors were not as appreciative of the longer-term outlook for these companies during 2006.
Although technology stocks as a whole benefited the portfolio, two names were among the greatest detractors; Jabil Circuit, Inc. and Cisco Systems, Inc. Jabil experienced some operational problems at a specific manufacturing plant earlier in the year, followed by a pall cast on the stock due to an options investigation which resulted in delayed reporting of financial results. Cisco Systems was not owned in the portfolio, but as one of the largest and strongest performing stocks in the benchmark, hurt on a relative basis.
What is your current strategy? How is the Fund positioned?
In 2007, given widespread belief that the US economy is set to slow, it is possible that markets will be less focused on absolute earnings growth (as long as it is flat to modestly positive, as expected), but will instead focus on the potential for earnings multiple expansion. Price-to-earnings (P/E) ratios have compressed significantly over the last few years, resulting in a lack of differentiation between companies with high short-term earnings growth and ones with truly sustainable earnings growth rates. Earnings growth continues to look healthy for the new year, although it will likely be at much more modest levels than those of the previous three years. Although it sounds paradoxical, growth stocks, particularly high quality growth stocks, tend to perform well in a slowing economy, as investors will commonly pay a premium for companies that can sustain earnings during this time. We believe that as overall earnings growth decelerates, investors will pay more attention to earnings multiples, and reward stocks with longer, more sustainable earnings trends.
6 Annual Report | December 31, 2006 |
Growth Fund
Performance Highlights (unaudited)

Average Annual Total Return at 12/31/2006
| | | | | | | | | | | | | | | | | |
| | | 1 Year | | | 3 Year | | | 5 Year | | | 10 Year | | | Since Inception | | | |
Growth Fund Class N | | 12.42 | % | | 9.81 | % | | 3.96 | % | | 5.94 | % | | — | % | | |
Growth Fund
Class I | | 12.64 | | | 10.07 | | | 4.22 | | | — | | | 2.29 | (a) | | |
Russell 3000® Growth Index | | 9.46 | | | 7.17 | | | 3.02 | | | 5.34 | | | (1.30 | )(a) | | |
S&P 500 Index | | 15.79 | | | 10.44 | | | 6.19 | | | 8.42 | | | 3.02 | (a) | | |
| | (a) | | For the period from October 1, 1999 to December 31, 2006. |
Performance cited represents past performance. Past performance does not guarantee future results and current performance may be lower or higher than the data quoted. Results shown are average annual returns, which assume reinvestment of dividends and capital gains. Investment returns and principal will fluctuate and you may have a gain or loss when you sell shares. For the most current month-end performance information, please call 1-800-742-7272, or visit our Web site at www.williamblairfunds.com. Class N shares are available to the general public without a sales load. Class I shares are available to certain institutional investors and advisory clients of William Blair & Company L.L.C. without a sales load or distribution (12b-1) or service fees.
The performance highlights and graph presented above do not reflect the deduction of taxes that a shareholder would pay on fund distributions or the redemption of fund shares.
The Russell 3000® Growth Index consists of large, medium, and small capitalization companies with above average price-to-book ratios and forecasted growth rates. The index is weighted by market capitalization and large/medium/small companies make up approximately 80%/15%/5% of the index.
The S&P 500 Index indicates broad larger capitalization equity market performance.
This report identifies the Fund’s investments on December 31, 2006. These holdings are subject to change. Not all stocks in the Fund performed the same, nor is there any guarantee that these stocks will perform as well in the future. Market forecasts provided in this report may not necessarily come to pass.
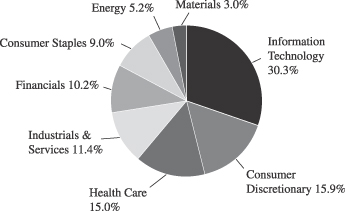
Sector Diversification (unaudited)
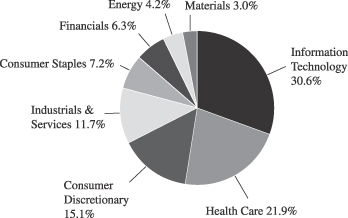
The sector diversification shown is based on the total investment portfolio.
December 31, 2006 | William Blair Funds 7 |
Growth Fund
Portfolio of Investments, December 31, 2006 (all dollar amounts in thousands)
| | | | | |
Issuer | | Shares | | Value |
| | |
Common Stocks | | | | | |
Information Technology—30.2% | | | | | |
*Activision, Inc. | | 204,385 | | $ | 3,524 |
*Adobe Systems Incorporated | | 147,180 | | | 6,052 |
Arm Holding plc—ADR | | 448,545 | | | 3,274 |
*Cognizant Technology Solutions Corporation | | 43,145 | | | 3,329 |
*EMC Corporation | | 501,570 | | | 6,621 |
*Euronet Worldwide, Inc. | | 141,655 | | | 4,206 |
*F5 Networks, Inc. | | 62,135 | | | 4,611 |
*FLIR Systems, Inc. | | 126,780 | | | 4,035 |
*J2 Global Communications, Inc. | | 234,870 | | | 6,400 |
Jabil Circuit, Inc. | | 263,885 | | | 6,478 |
*Network Appliance, Inc. | | 108,245 | | | 4,252 |
*Nuance Communications, Inc. | | 209,505 | | | 2,401 |
Paychex, Inc. | | 194,885 | | | 7,706 |
Taiwan Semiconductor Mfg. Co. Ltd.—ADR | | 787,360 | | | 8,606 |
*WebEx Communications, Inc. | | 128,815 | | | 4,494 |
*Yahoo!, Inc. | | 150,110 | | | 3,834 |
| | | | | |
| | | | | 79,823 |
| | | | | |
Health Care—21.6% | | | | | |
*Amgen, Inc. | | 128,085 | | | 8,750 |
C.R. Bard, Inc. | | 63,940 | | | 5,305 |
*Genentech, Inc. | | 91,860 | | | 7,453 |
*Gilead Sciences, Inc. | | 57,200 | | | 3,714 |
*Healthways, Incorporated | | 92,590 | | | 4,417 |
*Integra Lifesciences Holding Corporation | | 132,150 | | | 5,628 |
*Kyphon, Inc. | | 118,455 | | | 4,786 |
*MedImmune, Inc. | | 86,635 | | | 2,804 |
Medtronic, Inc. | | 99,495 | | | 5,324 |
*Pharmaceutical Product Development, Incorporated | | 180,955 | | | 5,830 |
ResMed, Inc. | | 61,905 | | | 3,047 |
| | | | | |
| | | | | 57,058 |
| | | | | |
Consumer Discretionary—14.8% | | | | | |
Coinstar, Inc. | | 152,820 | | | 4,672 |
Johnson Controls, Inc. | | 48,645 | | | 4,179 |
*Kohl’s Corporation | | 81,730 | | | 5,593 |
*Laureate Education, Inc. | | 98,645 | | | 4,797 |
Marriott International, Inc., Class “A” | | 110,625 | | | 5,279 |
McCormick & Schmick’s Seafood Restaurants, Inc. | | 26,196 | | | 630 |
*Nike, Inc., Class “B” | | 55,640 | | | 5,510 |
Staples, Inc. | | 210,550 | | | 5,621 |
*VistaPrint Limited† | | 90,056 | | | 2,982 |
| | | | | |
| | | | | 39,263 |
| | | | | |
Industrials & Services—11.6% | | | | | |
Corporate Executive Board Company | | 54,930 | | | 4,817 |
Danaher Corporation | | 142,066 | | | 10,291 |
Graco, Inc. | | 102,920 | | | 4,078 |
Knight Transportation, Inc. | | 164,090 | | | 2,798 |
Rockwell Automation, Inc. | | 60,330 | | | 3,685 |
Rockwell Collins, Inc. | | 77,660 | | | 4,915 |
| | | | | |
| | | | | 30,584 |
| | | | | |
*Non-income producing securities
ADR = American Depository Receipt
† = U.S. listed foreign security
VRN = Variable Rate Note
| | | | | | | |
Issuer | | Shares or
Principal
Amount | | Value | |
| | |
Common Stocks—(continued) | | | | | | | |
Consumer Staples—7.1% | | | | | | | |
PepsiCo, Inc. | | | 130,480 | | $ | 8,162 | |
Wal Mart De Mexico Sa De Cv—ADR | | | 112,220 | | | 4,853 | |
Walgreen Co. | | | 124,960 | | | 5,734 | |
| | | | | | | |
| | | | | | 18,749 | |
| | | | | | | |
Financials—6.2% | | | | | | | |
Goldman Sachs Group, Inc. | | | 39,250 | | | 7,825 | |
Charles Schwab & Co., Inc. | | | 229,755 | | | 4,443 | |
SLM Corporation | | | 86,850 | | | 4,236 | |
| | | | | | | |
| | | | | | 16,504 | |
| | | | | | | |
Energy—4.1% | | | | | | | |
Smith International, Inc. | | | 140,090 | | | 5,754 | |
Suncor Energy, Inc.† | | | 65,445 | | | 5,164 | |
| | | | | | | |
| | | | | | 10,918 | |
| | | | | | | |
Materials—2.9% | | | | | | | |
Praxair, Inc. | | | 130,065 | | | 7,717 | |
| | | | | | | |
Total Common Stock—98.5%
(cost $198,025) | | | 260,616 | |
| | | | | | | |
| | |
Investment in Affiliate | | | | | | | |
William Blair Ready Reserves | | | 2,573,577 | | | 2,574 | |
| | | | | | | |
Total Investment in Affiliate—1.0%
(cost $2,574) | | | 2,574 | |
| | | | | | | |
| | |
Short-Term Investment | | | | | | | |
Prudential Funding Demand Note, VRN 5.180%, due 1/2/07 | | $ | 300,000 | | | 300 | |
| | | | | | | |
Total Short-Term Investment—0.1%
(cost $300) | | | 300 | |
| | | | | | | |
| | |
Repurchase Agreement | | | | | | | |
Investors Bank & Trust Company,
5.01% dated 12/29/2006, due 1/2/2007, repurchase price $1,209, collateralized by FNMA Pool # 694524 | | | 1,208,656 | | | 1,209 | |
| | | | | | | |
Total Repurchase Agreement—0.5%
(cost $1,209) | | | 1,209 | |
| | | | | | | |
Total Investments—100.1%
(cost $202,108) | | | 264,699 | |
Liabilities, plus cash and other assets—(0.1)% | | | (174 | ) |
| | | | | | | |
Net assets—100.0% | | $ | 264,525 | |
| | | | | | | |
See accompanying Notes to Financial Statements.
8 Annual Report | December 31, 2006 |

Mark A. Fuller III

Gregory J. Pusinelli
TAX-MANAGED GROWTH FUND
The Tax-Managed Growth Fund invests primarily in common stocks of large, medium and small domestic growth companies that the Advisor expects will have sustainable, above-average growth from one business cycle to the next.
AN OVERVIEW FROM THE PORTFOLIO MANAGERS
How did the Fund perform during the past year? How did the Fund’s performance compare to its benchmark?
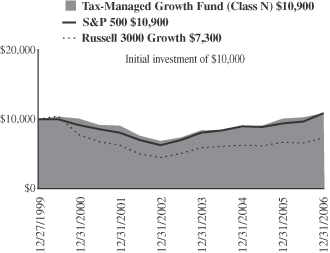
The Tax-Managed Growth Fund posted an 8.21% gain on a total return basis (Class N Shares) for the 12 months ended December 31, 2006. By comparison, the Fund’s benchmark, the Russell 3000® Growth Index increased 9.46% while the Standard & Poor’s 500 Stock Index rose 15.79%.
What were the most significant market factors impacting Fund performance?
Encouraged by the resilience of the economy in the face of Federal Reserve interest-rate increases, high oil prices and a cooling housing market, the equity markets advanced during 2006.
After stubbornly forging ahead in the first quarter of the year, concerns about inflation and the sustainability of corporate profits led to a market sell-off late in the second quarter. By the end of June, the Fed had conducted its fourth interest rate increase of the year, and investors began to worry that the Fed was being too heavy-handed in its administration of monetary policy. In fact, many economists began to worry about the prospects for a recession.
However, the economy and consumers proved to be stronger than expected. Job growth was favorable. Oil prices stabilized and the Fed ended its two-year campaign of measured rate increases. Although the housing market did slump, a feared collapse in housing prices did not materialize. Also, consumer spending contributed to a respectable holiday season for retail sales.
The equity markets, in turn, seemed to catch a second wind in the fourth quarter, which drove the Dow Jones Industrial Average and the Russell 2000® Index of small stocks to record levels late in the year.
On the downside, our underweight position in Consumer Discretionary stocks, along with their uninspiring returns relative to the benchmark hurt our performance relative to the Russell 3000® Growth Index.
With concerns about changes in Medicare reimbursements, looming regulatory issues and product concerns overhanging the market, Health Care companies had a tough year. Consequently, our holdings in the Health Care sector, in which we were slightly overweight the Russell 3000® Growth Index, modestly underperformed, and were a slight drag on Fund performance.
Financials were the best-performing sector for the Fund. Our overweight position in Financials relative to the Fund’s Russell 3000® Growth Index benchmark, combined with strong performance by our individual holdings in this sector, benefited the Fund.
Energy was the second-best performing sector for the Fund, followed by Industrials. Again in both sectors, our overweight position, combined with strong performance by our stocks in these sectors, were positive factors.
What were among the best performing investments for the Fund?
The Fund’s top three contributors to return in 2006 were Intercontinental Exchange, Expeditors International of Washington and Suncor Energy.
December 31, 2006 | William Blair Funds 9 |
The Fund’s biggest contributor to performance was Intercontinental Exchange, which was up 169% for the Fund for the calendar year. Intercontinental Exchange is an electronic marketplace for trading of energy futures, options and over-the-counter contracts. We view Intercontinental Exchange as the electronic counterpart to the New York Mercantile Exchange (NYMEX). Some of Intercontinental Exchange’s traded commodities include oil and refined products, natural gas, power and emissions, and the company has a good competitive position within the energy area.
Expeditors International, which advanced on the strength in the economy and the Industrial sector, gained 20.5% for the Fund. Expeditors International is primarily a consolidator and secondarily a forwarder of international air and ocean freight.
Suncor Energy was up 25% for the Fund for the year. Suncor’s strong performance reflected the strength throughout the Energy sector, which was the second strongest sector in terms of overall contribution to return. Suncor Energy produces and refines oil from the Alberta oil sands in Canada and is a pioneer in oil sands production.
What were among the weakest performing investments for the Fund?
Jabil Circuit, a Technology company which provides electronics manufacturing services for other firms, was the worst performing investment for the Fund for the year, declining 33%. The company missed its earnings forecasts for two consecutive quarters.
The second-worst performing investment for the Fund was retailer Williams Sonoma, which decreased 26.5%, and which we sold out of the Fund’s portfolio during the second half of the year. Worries about consumer spending during a period of rising interest rates, higher energy prices and declining home values weighed heavily on this stock.
The third worst performing stock for the Fund was St. Jude Medical, which was down 27%. St. Jude manufactures cardiovascular medical devices, including the world’s most widely used mechanical heart valve. Generally speaking, investors grew concerned about the less-than-friendly competitive market environment the company was facing, and a slowdown in the company’s sales had investors questioning the effectiveness of the company’s cardiac devices.
What is your current strategy? How is the Fund positioned?
During the fourth quarter of 2006, we started seeing some signs that large capitalization stocks might be poised to assume a leadership role in the market, in terms of price performance. In a moderating economic environment, larger and more established companies with proven business models and sustainable earnings growth typically do not have the overall significant correlation to economic growth than that of cyclically-oriented and smaller companies.
Because the Fund has the flexibility and freedom to move across the stock market capitalization spectrum, we are keeping a close watch on large cap stocks. More specifically, as the average weighted market capitalization of the Fund is well below half that of the Russell 3000® Growth Index benchmark, we will be closely evaluating whether we should raise this weighting. Currently, the Fund does not have any “mega” cap names in its portfolio, and we will be researching whether or not we believe the Fund should have representation in this area.
We are currently underweight in Technology, a very economically sensitive sector, and will be looking for opportunity to increase the Fund’s weighting.
We believe the environment remains favorable for corporate profit growth in 2007. And we are encouraged by the earnings growth potential of the companies in the Fund’s portfolio, despite what we expect to be a year of tempered economic growth. In such an environment, security selection becomes even more important. We believe our focus on quality franchise businesses and a respect for downside risk is the appropriate time-tested approach for the year ahead.
10 Annual Report | December 31, 2006 |
Tax-Managed Growth Fund
Performance Highlights (unaudited)
Average Annual Total Return at 12/31/2006
| | | | | | | | | | | | |
| | | 1
Year | | | 3
Year | | | 5
Year | | | Since Inception(a) | |
Tax-Managed Growth
Fund Class N | | 8.21 | % | | 9.16 | % | | 3.82 | % | | 1.29 | % |
Tax-Managed Growth
Fund Class I | | 8.57 | | | 9.47 | | | 4.10 | | | 1.56 | |
Russell 3000®
Growth Index | | 9.46 | | | 7.17 | | | 3.02 | | | (4.39 | ) |
S&P 500 Index | | 15.79 | | | 10.44 | | | 6.19 | | | 1.24 | |
| | (a) | | For the period from December 27, 1999 to December 31, 2006. |
Performance cited represents past performance. Past performance does not guarantee future results and current performance may be lower or higher than the data quoted. Results shown are average annual total returns, which assume reinvestment of dividends and capital gains. Investment returns and principal will fluctuate and you may have a gain or loss when you sell shares. For the most current month-end performance information, please call 1-800-742-7272, or visit our Web site at www.williamblairfunds.com. From time to time, the investment advisor may waive fees or reimburse expenses for the Fund. Without these waivers, performance would be lower. Class N shares are available to the general public without a sales load. Class I shares are available to certain institutional investors and advisory clients of William Blair & Company, L.L.C., without a sales load or distribution (12b-1) or service fees.
The performance highlights and graph presented above do not reflect the deduction of taxes that a shareholder would pay on fund distributions or the redemption of fund shares.
The Russell 3000® Growth Index consists of large, medium, and small-capitalization companies with above average price-to-book ratios and forecasted growth rates. The index is weighted by market capitalization and large/medium/small companies make up approximately 80%/15%/5% of the index.
The S&P 500 Index indicates broad larger capitalization equity market performance.
This report identifies the Fund’s investments on December 31, 2006. These holdings are subject to change. Not all stocks in the Fund performed the same, nor is there any guarantee that these stocks will perform as well in the future. Market forecasts provided in this report may not necessarily come to pass.
Sector Diversification (unaudited)
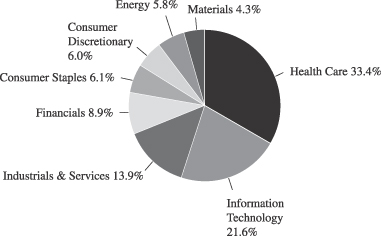
The sector diversification shown is based on the total investment portfolio.
December 31, 2006 | William Blair Funds 11 |
Tax-Managed Growth Fund
Portfolio of Investments, December 31, 2006 (all dollar amounts in thousands)
| | | | | |
Issuer | | Shares | | Value |
| | |
Common Stocks | | | | | |
Health Care—32.0% | | | | | |
*Amgen, Inc. | | 4,195 | | $ | 287 |
C.R.Bard, Inc. | | 1,720 | | | 143 |
Caremark Rx, Inc. | | 2,260 | | | 129 |
*Express Scripts, Inc., Class “A” | | 1,610 | | | 115 |
*Genentech, Inc. | | 2,270 | | | 184 |
*Healthways, Inc. | | 4,100 | | | 196 |
IMS Health, Inc. | | 8,850 | | | 243 |
*Kyphon, Inc. | | 2,750 | | | 111 |
*MedImmune, Inc. | | 4,310 | | | 140 |
Medtronic, Inc. | | 2,730 | | | 146 |
*Patterson Companies, Inc. | | 5,710 | | | 203 |
Pharmaceutical Product Development, Inc. | | 6,000 | | | 193 |
*Psychiatric Solutions, Inc. | | 4,840 | | | 182 |
*ResMed, Inc. | | 5,564 | | | 274 |
Sanofi-Aventis—ADR | | 3,130 | | | 144 |
*Santarus, Inc. | | 11,940 | | | 93 |
Stryker Corporation | | 3,630 | | | 200 |
*Zimmer Holdings, Inc. | | 1,310 | | | 103 |
| | | | | |
| | | | | 3,086 |
| | | | | |
Information Technology—20.7% | | | | | |
*Activision, Inc. | | 5,023 | | | 86 |
*Adobe Systems Incorporated | | 4,070 | | | 167 |
Arm Holdings plc—ADR | | 12,010 | | | 88 |
*CACI International, Inc., Class “A” | | 1,720 | | | 97 |
*Euronet Worldwide, Inc. | | 3,770 | | | 112 |
*F5 Networks, Inc. | | 1,710 | | | 127 |
First Data Corporation | | 3,670 | | | 94 |
Jabil Circuit, Inc. | | 2,570 | | | 63 |
Microchip Technology, Inc. | | 5,270 | | | 172 |
*Network Appliance, Inc. | | 5,680 | | | 223 |
Paychex, Inc. | | 6,000 | | | 237 |
Qualcomm Incorporated | | 2,030 | | | 77 |
*ScanSource, Inc. | | 3,120 | | | 95 |
Taiwan Semiconductor Mfg. Co. Ltd.—ADR | | 10,706 | | | 117 |
*WebEx Communications, Inc. | | 2,890 | | | 101 |
Western Union Company | | 6,240 | | | 140 |
| | | | | |
| | | | | 1,996 |
| | | | | |
Industrials & Services—13.3% | | | | | |
C.H. Robinson Worldwide, Inc. | | 2,950 | | | 121 |
Danaher Corporation | | 3,820 | | | 277 |
Fastenal Company | | 6,380 | | | 229 |
General Electric Company | | 7,015 | | | 261 |
Knight Transportation, Inc. | | 7,832 | | | 133 |
Rockwell Collins, Inc. | | 4,130 | | | 261 |
| | | | | |
| | | | | 1,282 |
| | | | | |
Financials—8.6% | | | | | |
*Affiliated Managers Group, Inc. | | 1,050 | | | 110 |
American International Group | | 2,790 | | | 200 |
*IntercontinentalExchange, Inc. | | 940 | | | 102 |
Investors Financial Services Corporation | | 4,740 | | | 202 |
Moody’s Corporation | | 3,070 | | | 212 |
| | | | | |
| | | | | 826 |
| | | | | |
*Non-income producing securities
ADR = American Depository Receipt
† = U.S. listed foreign security
VRN = Variable Rate Note
| | | | | | |
Issuer | | Shares or
Principal
Amount | | Value |
| | |
Common Stocks—(continued) | | | | | | |
Consumer Staples—5.8% | | | | | | |
Colgate-Palmolive Company | | | 3,030 | | $ | 198 |
PepsiCo, Inc. | | | 3,575 | | | 223 |
Walgreen Co. | | | 2,985 | | | 137 |
| | | | | | |
| | | | | | 558 |
| | | | | | |
Consumer Discretionary—5.8% | | | | | | |
*CarMax, Inc. | | | 3,430 | | | 184 |
Johnson Controls, Inc. | | | 1,900 | | | 163 |
*Laureate Education, Inc. | | | 4,280 | | | 208 |
| | | | | | |
| | | | | | 555 |
| | | | | | |
Energy—5.5% | | | | | | |
Smith International, Inc. | | | 4,380 | | | 180 |
Suncor Energy, Inc.† | | | 4,490 | | | 354 |
| | | | | | |
| | | | | | 534 |
| | | | | | |
Materials—4.1% | | | | | | |
Airgas, Inc. | | | 4,890 | | | 198 |
Praxair, Inc. | | | 3,360 | | | 200 |
| | | | | | |
| | | | | | 398 |
| | | | | | |
Total Common Stock—95.8%
(cost $7,110) | | | 9,235 |
| | | | | | |
| | |
Investment in Affiliate | | | | | | |
William Blair Ready Reserves | | | 105,621 | | | 106 |
| | | | | | |
Total Investment in Affiliate—1.1%
(cost $106) | | | 106 |
| | | | | | |
| | |
Short-Term Investment | | | | | | |
Prudential Funding Demand Note, VRN
5.180%, due 1/2/07 | | $ | 106,000 | | | 106 |
| | | | | | |
Total Short-Term Investment—1.1%
(cost $106) | | | 106 |
| | | | | | |
| | |
Repurchase Agreement | | | | | | |
Investors Bank & Trust Company,
5.01% dated 12/29/2006, due 1/2/2007, repurchase price $91, collateralized by
SBA Pool # 507426 | | | 90,992 | | | 91 |
| | | | | | |
Total Repurchase Agreement—0.9%
(cost $91) | | | 91 |
| | | | | | |
Total Investments—98.9%
(cost $7,413) | | | 9,538 |
Cash and other assets, less liabilities—1.1% | | | 106 |
| | | | | | |
Net assets—100.0% | | $ | 9,644 |
| | | | | | |
See accompanying Notes to Financial Statements.
12 Annual Report | December 31, 2006 |

James S. Golan
John F. Jostrand

Norbert W. Truderung
LARGE CAP GROWTH FUND
The Large Cap Growth Fund invests primarily in common stocks of large domestic growth companies of high quality that the Advisor believes have demonstrated sustained growth over a long period of time.
AN OVERVIEW FROM THE PORTFOLIO MANAGERS
How did the Fund perform over the last year? How did the Fund’s performance compare to its benchmark?
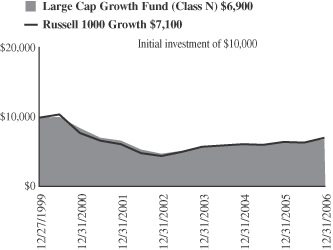
The Large Cap Growth Fund posted a 6.34% increase on a total return basis (Class N Shares) for the 12 months ended December 31, 2006. By comparison, the Fund’s benchmark, the Russell 1000® Growth Index, gained 9.07%.
What were the most significant factors impacting Fund performance?
US equity markets ultimately turned in very strong results for 2006, despite interim push-me-pull-you behavior. Investor sentiment and its relation to market activity during the year can be evaluated in terms of trimesters: extensive optimism in the first four months of the year, driven primarily by stronger than expected earnings reports from the fourth quarter of 2005; bearish defensiveness after the May Federal Reserve announcement that monetary policy would continue to tighten; and strong positive sentiment from mid-July forward as commodity prices receded, the Federal Reserve paused, and third quarter corporate earnings continued at a higher than expected double-digit pace.
Given the extended nature of this “recovery” cycle, during which value-oriented, traditionally cyclical stocks are out-performing, many strategists and economists are now referring to this era as a “profit supercycle”. Companies across the board have experienced double-digit earnings gains for an unprecedented 15 consecutive quarters. This has fed into the strong leadership of value over growth, and specifically lower quality. Given our high quality growth orientation, we faced some headwinds in the market, although our stock selection helped overcome these factors.
Were there any investment strategies or themes that did not measure up to your expectations?
Health Care provided indigestion during the year. With concerns about changes in Medicare reimbursement allowances, looming regulatory issues and product safety concerns overhanging the market, much of health care had a tough year. Medtronic Inc. in the medical device area suffered a large pullback in stock price due to a significant decrease in the rate of growth in its implantable cardioverter defibrillator market. Certain pharmaceuticals and various specialty health technology companies did well, but biotechnology stocks performed poorly during the fourth quarter and the year. Amgen, Inc., one of our larger portfolio holdings, faced potential competitive issues regarding patent challenges during the year. We continue to think that biotechs offer great opportunity for new products that could have numerous applications over broad populations, but investors were not as appreciative of the longer-term outlook for these companies during 2006.
December 31, 2006 | William Blair Funds 13 |
Information Technology stocks provided the largest contribution to index returns, but were not as strong in the portfolio. The largest detractor, accounting for most of the return differential, was Yahoo! Inc. The much vaunted Project Panama search platform was scheduled to be launched toward the end of third quarter 2006, but concerns related to quality control caused the launch to be delayed until early 2007. Faster than expected erosion in the branded business, combined with competitor Google Inc. extending its reach with the purchase of YouTube, further depressed the stock’s price.
Which sectors enhanced the Fund’s return? What were among the best performing investments for the Fund?
Our choices within the Consumer Discretionary sector showed the importance of strong stock selection to relative portfolio results. Monetary tightening, rising commodity prices and housing market concerns weighed on stocks within this sector, particularly in the first half of the year. Despite macro concerns, our bottom-up stock selection process brought us two interesting opportunities: Marriott International Inc. and Kohl’s Corp. Hotels and leisure stocks enjoyed very strong returns during the year, as strong trends in business travelers to urban areas particularly benefited these companies. Marriott was one of the biggest beneficiaries of this trend, with most of their properties located in major cities. Kohl’s Corp. had a stellar year as well. The company successfully executed on its new management strategies, branching out from its basic wear into proprietary designer lines from some of the most popular names, such as Chaps from Ralph Lauren. Additionally, the company revamped several of its stores into more customer-friendly formats, and gained market share from some of the floundering larger department store chains. The company is just beginning to benefit from financial strategies that should continue to provide margin improvement.
Similarly, although growth-oriented energy stocks did not see significant appreciation, our holdings did. Both Schlumberger Ltd. and Suncor Energy Inc. achieved strong double-digit gains during the year, as investors rewarded their innovative technologies and strong management teams.
What is your current strategy? How is the Fund positioned?
It is likely that several of the drivers in the second half of 2006 will persist in 2007. Earnings growth continues to look healthy for the new year, although it will likely be at much more modest levels than those of the previous three years. Although it sounds paradoxical, growth stocks, particularly high quality growth stocks, tend to perform well in a slowing economy, as investors will commonly pay a premium for companies that can sustain earnings during this time. We think that as overall earnings growth decelerates, investors will pay more attention to earnings multiples, and reward stocks with longer, more sustainable earnings trends.
14 Annual Report | December 31, 2006 |
Large Cap Growth Fund
Performance Highlights (unaudited)
Average Annual Total Return at 12/31/2006
| | | | | | | | | | | | |
| | | 1
Year | | | 3
Year | | | 5
Year | | | Since
Inception(a) | |
Large Cap Growth Fund Class N | | 6.34 | % | | 5.08 | % | | 0.47 | % | | (5.18 | )% |
Large Cap Growth Fund Class I | | 6.55 | | | 5.28 | | | 0.73 | | | (4.96 | ) |
Russell 1000®
Growth Index | | 9.07 | | | 6.87 | | | 2.69 | | | (4.79 | ) |
| | (a) | | For the period from December 27, 1999 to December 31, 2006. |
Performance cited represents past performance. Past performance does not guarantee future results and current performance may be lower or higher than the data quoted. Results shown are average annual total returns, which assume reinvestment of dividends and capital gains. Investment returns and principal will fluctuate and you may have a gain or loss when you sell shares. For the most current month-end performance information, please call 1-800-742-7272, or visit our Web site at www.williamblairfunds.com. From time to time, the investment advisor may waive fees or reimburse expenses for the Fund. Without these waivers, performance would be lower. Class N shares are available to the general public without a sales load. Class I shares are available to certain institutional investors and advisory clients of William Blair & Company, L.L.C., without a sales load or distribution (12b-1) or service fees.
The performance highlights and graph presented above do not reflect the deduction of taxes that a shareholder would pay on fund distributions or the redemption of fund shares.
The Russell 1000® Growth Index consists of large capitalization companies with above average-to-book ratios and forecasted growth rates.
This report identifies the Fund’s investments on December 31, 2006. These holdings are subject to change. Not all stocks in the Fund performed the same, nor is there any guarantee that these stocks will perform as well in the future. Market forecasts provided in this report may not necessarily come to pass.
Sector Diversification (unaudited)
The sector diversification shown is based on the total investment portfolio.
December 31, 2006 | William Blair Funds 15 |
Large Cap Growth Fund
Portfolio of Investments, December 31, 2006 (all dollar amounts in thousands)
| | | | | |
Issuer | | Shares | | Value |
| | |
Common Stocks | | | | | |
Information Technology—29.5% | | | | | |
*Adobe Systems Incorporated | | 16,180 | | $ | 665 |
*Cisco Systems Incorporated | | 32,834 | | | 897 |
*Corning Incorporated | | 17,080 | | | 320 |
*EMC Corporation | | 36,540 | | | 482 |
Infosys Technologies Ltd.—ADR | | 4,920 | | | 268 |
Jabil Circuit, Inc. | | 24,055 | | | 591 |
*Network Appliance, Inc. | | 11,020 | | | 433 |
Paychex, Inc. | | 21,030 | | | 831 |
Qualcomm Incorporated | | 9,265 | | | 350 |
Taiwan Semiconductor Mfg. Co. Ltd.—ADR | | 59,339 | | | 649 |
*Yahoo!, Inc. | | 18,430 | | | 471 |
| | | | | |
| | | | | 5,957 |
| | | | | |
Consumer Discretionary—15.5% | | | | | |
Johnson Controls, Inc. | | 5,210 | | | 448 |
*Kohl’s Corporation | | 6,398 | | | 438 |
Marriott International, Inc., Class “A” | | 16,944 | | | 809 |
Nike, Inc., Class “B” | | 8,920 | | | 883 |
Staples, Inc. | | 20,275 | | | 541 |
| | | | | |
| | | | | 3,119 |
| | | | | |
Health Care—14.6% | | | | | |
*Amgen, Inc. | | 10,210 | | | 698 |
C. R. Bard, Inc. | | 4,920 | | | 408 |
*Genentech, Inc. | | 8,455 | | | 686 |
*Gilead Sciences, Inc. | | 6,900 | | | 448 |
*MedImmune, Inc. | | 7,350 | | | 238 |
Medtronic, Inc. | | 8,825 | | | 472 |
| | | | | |
| | | | | 2,950 |
| | | | | |
Industrials & Services—11.1% | | | | | |
3M Company | | 6,195 | | | 483 |
Danaher Corporation | | 11,182 | | | 810 |
Rockwell Automation, Inc. | | 4,610 | | | 281 |
Rockwell Collins, Inc. | | 10,550 | | | 668 |
| | | | | |
| | | | | 2,242 |
| | | | | |
Financials—9.9% | | | | | |
Capital One Financial Corporation | | 4,880 | | | 375 |
Franklin Resources, Inc. | | 2,130 | | | 235 |
Goldman Sachs Group, Inc. | | 4,140 | | | 825 |
Charles Schwab & Co, Inc. | | 29,320 | | | 567 |
| | | | | |
| | | | | 2,002 |
| | | | | |
*Non-income producing securities
ADR = American Depository Receipt
† = U.S. listed foreign security
VRN = Variable Rate Note
| | | | | | |
Issuer | | Shares or
Principal
Amount | | Value |
| | |
Common Stocks—(continued) | | | | | | |
Consumer Staples—8.8% | | | | | | |
PepsiCo, Inc. | | | 10,250 | | $ | 641 |
Wal Mart De Mexico Sa De Cv—ADR | | | 8,530 | | | 369 |
Walgreen Co. | | | 16,545 | | | 759 |
| | | | | | |
| | | | | | 1,769 |
| | | | | | |
Energy—5.0% | | | | | | |
Schlumberger Limited† | | | 8,710 | | | 550 |
Suncor Energy, Inc.† | | | 5,860 | | | 462 |
| | | | | | |
| | | | | | 1,012 |
| | | | | | |
Materials—2.9% | | | | | | |
Praxair, Inc. | | | 9,840 | | | 584 |
| | | | | | |
Total Common Stock—97.3%
(cost $16,914) | | | 19,635 |
| | | | | | |
| | |
Investment in Affiliate | | | | | | |
William Blair Ready Reserves | | | 54,409 | | | 54 |
| | | | | | |
Total Investment in Affiliate—0.2%
(cost $54) | | | 54 |
| | | | | | |
| | |
Short-Term Investment | | | | | | |
Prudential Funding Demand Note, VRN 5.180%, due 1/2/07 | | $ | 115,000 | | | 115 |
| | | | | | |
Total Short-Term Investment—0.6%
(cost $115) | | | 115 |
| | | | | | |
| | |
Repurchase Agreement | | | | | | |
Investors Bank & Trust Company,
5.01% dated 12/29/2006, due 1/2/2007, repurchase price $381, collateralized by SBA Pool # 503480 | | | 381,194 | | | 381 |
| | | | | | |
Total Repurchase Agreement—1.9%
(cost $381) | | | 381 |
| | | | | | |
Total Investments—100.0%
(cost $17,464) | | | 20,185 |
Cash and other assets less liabilities—(0.0)% | | | 6 |
| | | | | | |
Net assets—100.0% | | $ | 20,191 |
| | | | | | |
See accompanying Notes to Financial Statements.
16 Annual Report | December 31, 2006 |

Karl W. Brewer

Colin J. Williams
SMALL CAP GROWTH FUND
The Small Cap Growth Fund invests primarily in common stocks of small domestic growth companies that the Advisor expects to have solid growth in earnings.
AN OVERVIEW FROM THE PORTFOLIO MANAGERS
How did the Fund perform over the last year? How did the Fund’s performance compare to its benchmark?
The Small Cap Growth Fund posted a 14.12% total return (Class N Shares) for the 12 months ended December 31, 2006. By comparison, the Fund’s benchmark, the Russell 2000® Growth Index, gained 13.35%.
What were the most significant factors impacting Fund performance? What factors were behind the Fund’s performance versus the benchmark?
The US stock market turned in strong results across styles and market capitalizations during calendar year 2006. However, the market’s return was far from consistent throughout the year—and can be dissected into three distinct time periods. We witnessed a strong first few months of the year in part due to a better than expected earnings season reported during January and February. In early May, however, hawkish Federal Reserve comments about the likelihood of further interest rate hikes sent the market into a sharp three month correction. Then, as the Fed was seeing signs of moderating economic growth and contained inflation, they held interest rates steady at their August meeting. Helping the Fed’s decision was easing energy prices—a downward pressure on inflation. The potential end to interest rate increases marked a sea change in sentiment from the tough summer months and served as the catalyst for a sustained rally through year end.
The negative headlines of 2006 included a slowing housing market, a troubled auto industry, the continued war in Iraq and corporate stock options backdating. These were outweighed by the positive effects of lower energy prices, an end to a two year interest rate tightening cycle and an abundance of merger and acquisition activity that kept the equity market strong to close 2006. For the year overall, the market was led by Consumer Staples and Materials. These two sectors are more heavily weighted in the value benchmarks—influencing value’s outperformance over growth. Energy gave up its market leadership during the year while the predominantly growth sectors of Information Technology and Health Care disappointed compared to their typical strength in market rallies.
The market’s bias against the smaller end of the small cap growth market during 2006 was a slight headwind for the Fund. Despite this, the Fund outperformed the benchmark with superior stock selection over the year. The majority of the outperformance came from stocks within the Information Technology and Health Care sectors. On the downside, stock selection in the Industrials and Services sector was a drag on relative performance.
What were among the weakest performing investments for the Fund?
Two of the weakest performing stocks in the Fund during the period were Telik and SIRVA. Telik is a biopharmaceutical company. The company received negative data out of three Phase III FDA trials and the stock market sold off accordingly. However, the company has ongoing clinical trials and continues to seek a commercialized product with its proprietary technology.
December 31, 2006 | William Blair Funds 17 |
SIRVA is an industrial company operating in the global relocation services market. The negative residential housing market trends affected the company’s primary business line and the stock sold off after the company missed earnings expectations in August. We sold the position due to our negative outlook for the company going forward.
What were among the best performing investments for the Fund?
Two of the strongest contributors to performance during the period were Nuance Communications and Kanbay International. Nuance Communications is a leader in the speech recognition market. We have talked about this stock in the past as the business momentum, and therefore stock appreciation, has been strong for the last year and a half. Nuance made an acquisition during the year, Dictaphone, which moved them into the medical dictation market. Speech recognition continues to evolve with demand coming from an increasing number of end markets—from cell phones to airline reservation systems.
Kanbay is a company that offers information technology consulting and technology integration solutions. The company’s acquisition of Adjoined Consulting is performing well, and Kanbay continues to benefit from the trend to outsource IT consulting services to India. These two factors helped drive growth in the stock price during the third quarter. In late October, the company again turned in strong earnings and revenue growth and at the same time announced that it was being acquired. The premium was roughly 15% above the previous day’s close and up over 100% from the stock’s summer bottom.
What is your current outlook?
We are four plus years into the current bull market—a great run by historical comparison. Bond investors have moved 10-year Treasury bond yields well below short term rates, suggesting they think the Fed may have to lower interest rates in the future in response to weakening economic activity. For now, the stock market is suggesting otherwise—that the Fed is orchestrating the ideal balance between economic growth and low inflation. Over the last few years, corporate earnings growth has been very robust at a consistent double digit annual pace. While earnings growth remains healthy and stock valuations reasonable, a slower and more sustainable level of earnings growth should be expected in the coming years. We expect investors to look for more durable business models that can grow despite the macro environment—a dynamic that should benefit our quality growth style of investing. From our perspective, stock picking will become increasingly crucial to investment success as the easy money made over the last few years of broad-based earnings growth is most likely behind us.
Is there any other news with respect to the Fund?
As previously disclosed, Colin Williams was promoted to co-portfolio manager of the Fund during the second quarter of 2006. Colin has worked on the Fund as a research analyst for the past four years. He joins Karl Brewer who has been a portfolio manager on the Fund since its inception. The Fund holds a number illiquid securities totaling roughly 1.5% of assets. Shares of Kona Grill, a restaurant company, were purchased in two private transactions during 2006. Shares of Zila Inc., a pharmaceutical company, were acquired through a Private Investment in Public Equity (PIPE) transaction in November. During December, we received warrants to purchase shares of Think Partnership that, if exercised, are currently not freely tradable. The Fund’s Pricing Committee and Valuation Committee are currently pricing the Kona Grill and Zila, Inc. securities at fair value. The Fund’s Pricing Committee is currently pricing the Think Partnership warrants at fair value.
18 Annual Report | December 31, 2006 |
Small Cap Growth Fund
Performance Highlights (unaudited)
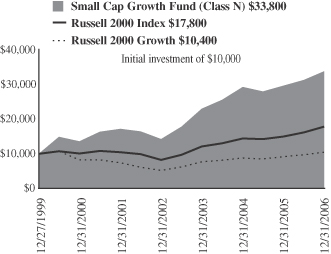
Average Annual Total Return at 12/31/2006
| | | | | | | | | | | | |
| | | 1
Year | | | 3
Year | | | 5
Year | | | Since Inception(a) | |
Small Cap Growth Fund Class N | | 14.12 | % | | 13.68 | % | | 14.50 | % | | 18.89 | % |
Small Cap Growth Fund Class I | | 14.42 | | | 13.98 | | | 14.79 | | | 19.17 | |
Russell 2000®
Growth Index | | 13.35 | | | 10.51 | | | 6.93 | | | 0.50 | |
Russell 2000® Index | | 18.37 | | | 13.56 | | | 11.39 | | | 8.51 | |
| | (a) | | For the period from December 27, 1999 to December 31, 2006. |
Performance cited represents past performance. Past performance does not guarantee future results and current performance may be lower or higher than the data quoted. Results shown are average annual total returns, which assume reinvestment of dividends and capital gains. Investment returns and principal will fluctuate and you may have a gain or loss when you sell shares. For the most current month-end performance information, please call 1-800-742-7272, or visit our Web site at www.williamblairfunds.com. Investing in smaller companies involves special risks, including higher volatility and lower liquidity. From time to time, the investment advisor may waive fees or reimburse expenses for the Fund. Without these waivers, performance would be lower. Class N shares are available to the general public without a sales load. Class I shares are available to certain institutional investors and advisory clients of William Blair & Company, L.L.C., without a sales load or distribution (12b-1) or service fees.
The performance highlights and graph presented above do not reflect the deduction of taxes that a shareholder would pay on fund distributions or the redemption of fund shares.
The Russell 2000® Growth Index consists of small-capitalization companies with above average price-to-book ratios and forecasted growth rates.
The Russell 2000® Index is an unmanaged composite of the smallest 2000 stocks of the Russell 3000® Index.
This report identifies the Fund’s investments on December 31, 2006. These holdings are subject to change. Not all stocks in the Fund performed the same, nor is there any guarantee that these stocks will perform as well in the future. Market forecasts provided in this report may not necessarily come to pass.
Sector Diversification (unaudited)
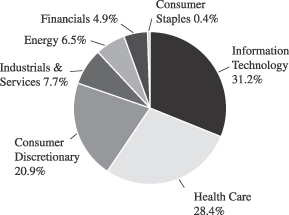
The sector diversification shown is based on the total investment portfolio.
December 31, 2006 | William Blair Funds 19 |
Small Cap Growth Fund
Portfolio of Investments, December 31, 2006 (all dollar amounts in thousands)
| | | | | |
Issuer | | Shares | | Value |
| | |
Common Stocks | | | | | |
Information Technology—30.2% | | | | | |
*Access Integrated Technologies, Inc. | | 1,530,387 | | $ | 13,345 |
*DTS, Inc. | | 730,155 | | | 17,662 |
*eCollege.com | | 746,570 | | | 11,684 |
*Euronet Worldwide, Inc. | | 556,830 | | | 16,532 |
*F5 Networks, Inc. | | 331,882 | | | 24,629 |
*J2 Global Communications, Inc. | | 946,007 | | | 25,779 |
*Nuance Communications, Inc. | | 2,207,998 | | | 25,304 |
*Optimal Group, Inc.† | | 2,150,379 | | | 20,472 |
Patni Computer Systems Limited—ADR | | 687,390 | | | 14,009 |
*PDF Solutions, Inc. | | 1,276,203 | | | 18,441 |
*Rackable Systems | | 679,167 | | | 21,034 |
*Silicon Labratories, Inc. | | 719,006 | | | 24,913 |
*Skillsoft, plc—ADR | | 1,868,117 | | | 11,601 |
*Stratasys, Inc. | | 590,537 | | | 18,549 |
*Think Partnership, Inc. | | 4,627,970 | | | 15,087 |
*Ultimate Software Group, Inc. | | 736,538 | | | 17,132 |
*ValueClick, Inc. | | 758,307 | | | 17,919 |
*Volterra Semiconductor Corporation | | 1,842,933 | | | 27,644 |
*WebEx Communications, Inc. | | 619,117 | | | 21,601 |
*WNS Holdings Limited—ADR | | 570,982 | | | 17,757 |
| | | | | |
| | | | | 381,094 |
| | | | | |
Health Care—27.6% | | | | | |
*Air Methods Corporation | | 367,540 | | | 10,262 |
*American Medical Systems Holdings, Inc. | | 1,157,284 | | | 21,433 |
*Axcan Pharma, Inc.† | | 1,068,541 | | | 15,216 |
*CryoLife, Inc. | | 688,326 | | | 5,266 |
*DJO, Inc. | | 656,387 | | | 28,106 |
*Healthways, Inc. | | 584,771 | | | 27,899 |
*Hythiam, Inc. | | 1,924,639 | | | 17,784 |
*Integra Lifesciences Holdings Corporation | | 681,070 | | | 29,007 |
*Kensey Nash Corporation | | 427,849 | | | 13,605 |
*Kyphon, Inc. | | 583,390 | | | 23,569 |
*Lifecore Biomedical, Inc. | | 1,117,713 | | | 19,929 |
*Providence Service Corp. | | 548,734 | | | 13,790 |
*PSS World Medical, Inc. | | 628,544 | | | 12,275 |
*Psychiatric Solutions, Inc. | | 426,598 | | | 16,006 |
*Quidel Corporation | | 1,001,153 | | | 13,636 |
*Sangamo Biosciences, Inc. | | 910,443 | | | 6,009 |
*Santarus, Inc. | | 3,588,835 | | | 28,100 |
*Surmodics, Inc. | | 587,112 | | | 18,271 |
*Telik, Inc. | | 2,093,121 | | | 9,272 |
*Trinity Biotech plc—ADR | | 95,627 | | | 819 |
*Zila, Inc. | | 2,580,537 | | | 6,555 |
*Zila, Inc.** (restricted) | | 4,732,351 | | | 10,953 |
| | | | | |
| | | | | 347,762 |
| | | | | |
Consumer Discretionary—20.3% | | | | | |
*4 Kids Entertainment, Inc. | | 696,575 | | | 12,691 |
*AFC Enterprises, Inc. | | 718,882 | | | 12,703 |
*BUCA, Inc. | | 200,068 | | | 962 |
*Century Casinos, Inc. | | 1,546,133 | | | 17,255 |
*Coinstar, Inc. | | 785,317 | | | 24,007 |
DeVry, Inc. | | 401,196 | | | 11,234 |
*DG Fastchannel, Inc | | 971,150 | | | 13,091 |
*Duckwall-ALCO Stores, Inc. | | 325,133 | | | 12,680 |
*Jarden Corporation | | 690,613 | | | 24,027 |
*Jos. A. Bank Clothiers, Inc. | | 371,136 | | | 10,893 |
*Kona Grill, Inc. | | 329,595 | | | 6,730 |
*Kona Grill, Inc.** (restricted) | | 435,134 | | | 7,188 |
| | | | | | |
Issuer | | Shares or
Principal
Amount | | Value |
| | |
Common Stocks—(continued) | | | | | | |
Consumer Discretionary—(continued) | | | | | | |
*Laureate Education, Inc. | | | 981,351 | | $ | 47,723 |
*Lions Gate Entertainment Corporation† | | | 1,409,202 | | | 15,121 |
Standard Pacific Corp. | | | 246,850 | | | 6,613 |
Strayer Education, Inc. | | | 115,694 | | | 12,269 |
*ValueVision Media, Inc., Class “A” | | | 1,618,354 | | | 21,265 |
| | | | | | |
| | | | | | 256,452 |
| | | | | | |
Industrials & Services—7.5% | | | | | | |
*Corrections Corporation of America | | | 275,212 | | | 12,448 |
*FirstService Corporation† | | | 484,434 | | | 11,191 |
Frozen Food Express Industries, Inc. | | | 894,816 | | | 7,695 |
*GEO Group, Inc. | | | 327,485 | | | 12,287 |
*InnerWorkings, Inc. | | | 349,860 | | | 5,584 |
*Kforce, Inc. | | | 899,771 | | | 10,950 |
*Lecg Corporation | | | 779,234 | | | 14,400 |
*NCI Building Systems, Inc. | | | 252,512 | | | 13,068 |
*On Assignment, Inc. | | | 617,450 | | | 7,255 |
| | | | | | |
| | | | | | 94,878 |
| | | | | | |
Energy—6.3% | | | | | | |
*Carrizo Oil & Gas, Inc. | | | 428,802 | | | 12,444 |
*Comstock Resources, Inc. | | | 417,149 | | | 12,957 |
*Hornbeck Offshore Services, Inc. | | | 559,172 | | | 19,962 |
*Petrohawk Energy Corporation | | | 1,400,614 | | | 16,107 |
*TETRA Technologies, Inc. | | | 695,920 | | | 17,802 |
| | | | | | |
| | | | | | 79,272 |
| | | | | | |
Financials—4.8% | | | | | | |
*Marlin Business Services Corp. | | | 756,915 | | | 18,189 |
Midwest Banc Holdings, Inc. | | | 331,051 | | | 7,862 |
National Financial Partners Corporation | | | 400,878 | | | 17,627 |
*Signature Bank New York | | | 545,846 | | | 16,910 |
| | | | | | |
| | | | | | 60,588 |
| | | | | | |
Consumer Staples—0.5% | | | | | | |
*Overhill Farms, Inc. | | | 1,903,720 | | | 5,464 |
| | | | | | |
Total Common Stock—97.2%
(Total cost $1,079,331) | | | 1,225,510 |
| | | | | | |
| | |
Investment in Warrants | | | | | | |
*Think Partnership, Inc., 2011, $2.50** | | | 1,424,000 | | | 1,082 |
*Think Partnership, Inc., 2011, $3.05** | | | 448,409 | | | — |
*Think Partnership, Inc., 2011, $4.00** | | | 224,205 | | | — |
*Zila, Inc., 2011, $2.21** | | | 2,271,528 | | | 227 |
| | | | | | |
Total Investment in Warrants—0.1%
(cost $0) | | | 1,309 |
| | | | | | |
| | |
Investment in Affiliate | | | | | | |
William Blair Ready Reserves | | | 9,894,269 | | | 9,894 |
| | | | | | |
Total Investment in Affiliate—0.8%
(cost $9,894) | | | 9,894 |
| | | | | | |
| | |
Short-Term Investments | | | | | | |
American Express Demand Note, VRN 5.176%, due 1/2/07 | | $ | 828,000 | | | 828 |
Prudential Funding Demand Note, VRN 5.180%, due 1/2/07 | | | 147,000 | | | 147 |
| | | | | | |
Total Short-Term Investments—0.1%
(cost $975) | | | 975 |
| | | | | | |
See accompanying Notes to Financial Statements.
20 Annual Report | December 31, 2006 |
Small Cap Growth Fund
Portfolio of Investments, December 31, 2006 (all dollar amounts in thousands)
| | | | | | |
Issuer | | Principal
Amount | | Value |
| | |
Repurchase Agreement | | | | | | |
Investors Bank & Trust Company, 5.01% dated 12/29/2006, due 1/2/2007, repurchase price $15,608, collateralized by FNMA Pool #826907 | | $ | 15,598,964 | | $ | 15,599 |
| | | | | | |
Total Repurchase Agreement—1.2%
(cost $15,599) | | | 15,599 |
| | | | | | |
Total Investments—99.4%
(cost $1,105,799) | | | 1,253,287 |
Cash and other assets, less liabilities—0.6% | | | 7,887 |
| | | | | | |
Net assets—100.0% | | $ | 1,261,174 |
| | | | | | |
*Non-income producing securities
ADR = American Depository Receipt
† = U.S. listed foreign security
VRN = Variable Rate Note
**Fair valued pursuant to Valuation Procedures adopted by the Board of Trustees. These holdings represent 1.54% of the Fund’s net assets at December 31, 2006. These securities were also deemed illiquid pursuant to Liquidity Procedures approved by the Board of Trustees. Additional information on each restricted illiquid security is as follows:
| | | | | |
Security | | Acquisition
Date | | Acquisition
Cost (in
thousands) |
Kona Grill, Inc. | | 8/4/2006 &
11/16/2006 | | $ | 6,391 |
Zila, Inc. | | 11/15/2006 | | | 8,282 |
Zila, Inc. warrants | | 11/15/2006 | | | — |
Think Partnership, Inc. warrants | | 3/22/2006 &
12/29/2006 | | | — |
If a Fund’s portfolio holding represents ownership of 5% or more of the voting securities of a company, the company is deemed to be an affiliate as defined in the Investment Company Act of 1940. The Small Cap Growth Fund had the following transactions during the year ended December 31, 2006 with affiliated companies:
| | | | | | | | | | | | | | |
| | | Share Activity | | Year Ended
December 31, 2006 |
| | | | | | | | | | | (in thousands) |
Security Name | | Balance
12/31/2005 | | Purchases | | Sales | | Balance
12/31/2006 | | Value | | Dividends
Included
in Income |
4 Kids Entertainment, Inc. | | 466,935 | | 229,640 | | — | | 696,575 | | $ | 12,691 | | $ | — |
Access Integrated Technologies, Inc. | | 444,977 | | 1,085,410 | | — | | 1,530,387 | | | 13,345 | | | — |
Century Casinos, Inc. | | 956,611 | | 589,522 | | — | | 1,546,133 | | | 17,255 | | | — |
DG Fastchannel, Inc | | — | | 971,150 | | — | | 971,150 | | | 13,091 | | | — |
Duckwall-ALCO Stores, Inc. | | — | | 352,833 | | 27,700 | | 325,133 | | | 12,680 | | | — |
Frozen Food Express Industries, Inc. | | 483,765 | | 411,051 | | — | | 894,816 | | | 7,695 | | | 27 |
Kona Grill, Inc. | | — | | 764,729 | | — | | 764,729 | | | 13,918 | | | — |
Lifecore Biomedical, Inc. | | 319,389 | | 798,324 | | — | | 1,117,713 | | | 19,929 | | | — |
Marlin Business Services Corp. | | — | | 756,915 | | — | | 756,915 | | | 18,189 | | | — |
Optimal Group, Inc. | | 782,973 | | 1,915,574 | | 548,168 | | 2,150,379 | | | 20,472 | | | — |
Overhill Farms, Inc. | | 1,684,600 | | 219,120 | | — | | 1,903,720 | | | 5,464 | | | — |
Santarus, Inc. | | 974,738 | | 2,614,097 | | — | | 3,588,835 | | | 28,100 | | | — |
Stratasys, Inc. | | — | | 590,537 | | — | | 590,537 | | | 18,549 | | | — |
Volterra Semiconductor Corporation | | 1,466,807 | | 832,006 | | 455,880 | | 1,842,933 | | | 27,644 | | | — |
Zila, Inc. | | 1,965,922 | | 5,346,966 | | — | | 7,312,888 | | | 17,508 | | | — |
| | | | | | | | | | | | | | |
| | | | | | | | | | $ | 246,530 | | | |
| | | | | | | | | | | | | | |
See accompanying Notes to Financial Statements.
December 31, 2006 | William Blair Funds 21 |

Harvey H. Bundy, III

Robert C. Lanphier, IV

David P. Ricci
MID CAP GROWTH FUND
The Mid Cap Growth Fund primarily invests in a diversified portfolio of common stocks of medium-sized domestic growth companies.
AN OVERVIEW FROM THE PORTFOLIO MANAGERS
We are pleased to have the Mid Cap Growth Fund become the newest addition to the William Blair Fund Family and would like to thank our shareholders for investing with us.
We are enthusiastic about the opportunities available to us as the managers of the Mid Cap Fund. The Mid Cap Growth Fund will invest at least 80% of its assets in companies with market capitalizations between $1.5 billion and $14 billion at the time of the Fund’s investment, and will seek stocks of companies that are expected to experience solid growth in earnings. Such companies generally will exhibit superior business fundamentals, including leadership in their field, distinctive attributes that cannot easily be duplicated by competitors, quality products or services, distinctive marketing and distribution, value to customer, conservative financial policies and accounting practices and strong management.
How did the Fund perform since inception through the end of 2006? How did the Fund’s performance compare to its benchmark?
The Mid Cap Growth Fund posted a 4.60% total return (Class N Shares) for the 11-month period ended December 31, 2006. By comparison, the Fund’s benchmark, the Russell Midcap Growth Index, returned 4.28% during the period.
What were the most significant factors impacting Fund performance? What factors were behind the Fund’s performance versus the benchmark?
The US stock market turned in strong results across styles and market capitalizations during calendar year 2006. However, the market’s return was far from consistent throughout the year—and can be dissected into three distinct time periods. We witnessed a strong first few months of the year in part due to a better than expected earnings season reported during January and February. In early May, however, hawkish Federal Reserve comments about the likelihood of further interest rate hikes sent the market into a sharp three month correction. Then, as the Fed was seeing signs of moderating economic growth and contained inflation, they held interest rates steady at their August meeting. Helping the Fed’s decision was easing energy prices—a downward pressure on inflation. The potential end to interest rate increases marked a sea change in sentiment from the tough summer months and served as the catalyst for a sustained rally through year end.
The negative headlines of 2006 included a slowing housing market, a troubled auto industry, the continued war in Iraq and corporate stock options backdating. These were outweighed by the positive effects of lower energy prices, an end to a two year interest rate tightening cycle and an abundance of merger and acquisition activity that kept the equity market strong to close 2006. For the year overall, the market was led by Consumer Staples and Materials. These two sectors are more heavily weighted in the value benchmarks—influencing value’s outperformance over growth. Energy gave up its market leadership during the year while the predominantly growth sectors of Information Technology and Health Care disappointed compared to their typical strength in market rallies.
Since inception on February 1, 2006, the Fund’s outperformance has come mostly from stock selection within the Information Technology sector. Energy and Financials stock selection
22 Annual Report | December 31, 2006 |
were both positive contributors as well, while the Industrials sector was the main source of negative relative performance for the Fund.
What were among the weakest performing investments for the Fund?
Two of the weakest performing stocks in the Fund during the period were Jabil Circuit and Getty Images. Jabil Circuit operates in the electronic manufacturing services industry. It is the outsourced manufacturer of choice for various technology, industrial, medical and consumer companies around the globe. The company has had a proven track record of meeting earnings expectations. However, in June the company announced some operational issues that would affect earnings negatively. After further analysis we felt revenues were on track and the operational issues were being corrected. However, during the fourth quarter the Company experienced another operational hiccup that put pressure on the stock once again. We still feel this is a solid growth company and is trading at an attractive valuation.
Getty Images has the largest digital library of stock photographs used by many publishers, advertisers and others looking for digital photographs. The company has seen increased competition in the low-end photograph market. One competitor’s low cost solution is changing the dynamics in the industry and has hurt Getty’s previously dominant market position. Sales growth has deteriorated and without the visibility of forward earnings, we have decided to liquidate the position.
What were among the best performing investments for the Fund?
Two of the strongest contributors to performance during the period were Intercontinental Exchange and CarMax. Intercontinental Exchange is a rapidly growing electronic exchange for various energy futures and physical commodity contracts. The company has benefited from the volatility in the energy markets as various market participants seek to speculate, invest, or hedge using energy derivatives traded on its exchange. The company also announced the acquisition of the New York Board of Trade during September, diversifying its product mix to commodities outside of energy. The company went public late last year and the gradual realization of the company’s true earnings potential has served as a catalyst for the stock throughout 2006.
CarMax is a specialty retailer operating in the highly fragmented used car market. The company buys, reconditions and sells used cars at their used car superstores as well as offering financing options, extended service plans and repair services. We have talked about CarMax in past letters and the fourth quarter was just a continuation of strength for the stock and for the fundamentals of the company. CarMax continues to see strong same store sales growth due to management execution and a healthy used car market—despite the new car market woes. During 2006, the company also finalized the successor to their outgoing CEO. This served as another catalyst as the uncertainty did not sit well with investors in 2005.
What is your current outlook?
We are four plus years into the current bull market—a great run by historical comparison. Bond investors have moved 10-year Treasury bond yields well below short term rates, suggesting they think the Fed may have to lower interest rates in the future in response to weakening economic activity. For now, the stock market is suggesting otherwise—that the Fed is orchestrating the ideal balance between economic growth and low inflation. Over the last few years, corporate earnings growth has been very robust at a consistent double digit annual pace. While earnings growth remains healthy and stock valuations reasonable, a slower and more sustainable level of earnings growth should be expected in the coming years. We expect investors to look for more durable business models that can grow despite the macro environment—a dynamic that should benefit our quality growth style of investing. From our perspective, stock picking will become increasingly crucial to investment success as the easy money made over the last few years of broad-based earnings growth is most likely behind us.
December 31, 2006 | William Blair Funds 23 |
Mid Cap Growth Fund
Performance Highlights (unaudited)
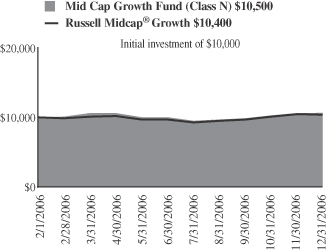
Average Annual Total Return at 12/31/2006
| | | |
| | | Since Inception(a) | |
Mid Cap Growth Fund
Class N | | 4.60 | % |
Mid Cap Growth Fund
Class I | | 4.90 | |
Russell Midcap® Growth Index | | 4.28 | |
| | (a) | | For the period from February 1, 2006 (Commencement of Operations) to December 31, 2006. | |
Performance cited represents past performance. Past performance does not guarantee future results and current performance may be lower or higher than the data quoted. Results shown are average annual total returns, which assume reinvestment of dividends and capital gains. Investment returns and principal will fluctuate and you may have a gain or loss when you sell shares. For the most current month-end performance information, please call 1-800-742-7272, or visit our Web site at www.williamblairfunds.com. Investing in smaller and medium capitalization companies involves special risks, including higher volatility and lower liquidity. Mid Cap stocks are also more sensitive to purchase/sale transactions and changes in the issuer’s financial condition. From time to time, the investment advisor may waive fees or reimburse expenses for the Fund. Without these waivers, performance would be lower. Class N shares are available to the general public without a sales load. Class I shares are available to certain institutional investors and advisory clients of William Blair & Company, L.L.C., without a sales load or distribution (12b-1) or service fees.
The performance highlights and graph presented above do not reflect the deduction of taxes that a shareholder would pay on fund distributions or the redemption of fund shares.
The Russell Mid Cap Growth Index is an index that is constructed to provide a comprehensive and unbiased barometer of the mid-cap growth market.
This report identifies the Fund’s investments on December 31, 2006. These holdings are subject to change. Not all stocks in the Fund performed the same, nor is there any guarantee that these stocks will perform as well in the future. Market forecasts provided in this report may not necessarily come to pass.
Sector Diversification (unaudited)
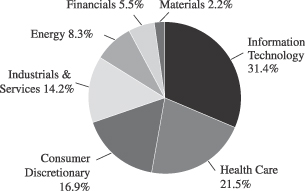
The sector diversification shown is based on the total investment portfolio.
24 Annual Report | December 31, 2006 |
Mid Cap Growth Fund
Portfolio of Investments, December 31, 2006 (all dollar amounts in thousands)
| | | | | |
Issuer | | Shares | | Value |
| | |
Common Stocks | | | | | |
Information Technology—28.6% | | | | | |
*Activision, Inc. | | 30,005 | | $ | 517 |
*Cognizant Technology Solutions, Class “A” | | 2,480 | | | 191 |
*F5 Networks, Inc. | | 7,049 | | | 523 |
*FLIR Systems, Inc. | | 10,670 | | | 340 |
*Intuit, Inc. | | 13,745 | | | 419 |
*Iron Mountain, Inc. | | 10,255 | | | 424 |
*J2 Global Communications, Inc. | | 15,765 | | | 430 |
Jabil Circuit, Inc. | | 20,960 | | | 515 |
Maxim Integrated Products, Inc. | | 9,695 | | | 297 |
Microchip Technology, Inc. | | 8,040 | | | 263 |
*Network Appliance, Inc. | | 11,071 | | | 435 |
Paychex, Inc. | | 18,700 | | | 739 |
*ValueClick, Inc. | | 11,420 | | | 270 |
*WebEx Communications, Inc. | | 7,005 | | | 244 |
| | | | | |
| | | | | 5,607 |
| | | | | |
Health Care—19.5% | | | | | |
C.R. Bard, Inc. | | 5,220 | | | 433 |
*Express Scripts, Inc., Class “A” | | 5,862 | | | 420 |
*Healthways, Inc. | | 8,245 | | | 393 |
*IDEXX Laboratories, Inc. | | 2,610 | | | 207 |
*Integra LifeSciences Holdings Corporation | | 7,425 | | | 316 |
*Kyphon, Inc. | | 7,779 | | | 314 |
*MedImmune, Inc. | | 14,240 | | | 461 |
*Patterson Companies, Inc. | | 8,125 | | | 289 |
Pharmaceutical Product Development, Inc. | | 16,720 | | | 539 |
*ResMed, Inc. | | 9,360 | | | 461 |
| | | | | |
| | | | | 3,833 |
| | | | | |
Consumer Discretionary—15.3% | | | | | |
*CarMax, Inc. | | 4,330 | | | 232 |
*Dick’s Sporting Goods, Inc. | | 3,850 | | | 189 |
*Lamar Advertising Company, Class “A” | | 3,410 | | | 223 |
*Laureate Education, Inc. | | 11,315 | | | 550 |
*Life Time Fitness, Inc. | | 8,885 | | | 431 |
*O’Reilly Automotive, Inc. | | 9,648 | | | 309 |
PetSmart, Inc. | | 6,350 | | | 183 |
Strayer Education, Inc. | | 2,610 | | | 277 |
*Tractor Supply Company | | 9,981 | | | 446 |
Weight Watchers International, Inc. | | 3,300 | | | 174 |
| | | | | |
| | | | | 3,014 |
| | | | | |
Industrials & Services—12.9% | | | | | |
Corporate Executive Board Company | | 4,380 | | | 384 |
Fastenal Company | | 16,460 | | | 591 |
Graco, Inc. | | 8,355 | | | 331 |
*Monster Worldwide, Inc. | | 7,230 | | | 337 |
Robert Half International, Inc. | | 8,805 | | | 327 |
Rockwell Collins, Inc. | | 8,815 | | | 558 |
| | | | | |
| | | | | 2,528 |
| | | | | |
*Non-income producing securities
VRN = Variable Rate Note
† = U.S. listed foreign security
| | | | | | |
Issuer | | Shares or
Principal
Amount | | Value |
| | |
Common Stocks—(continued) | | | | | | |
Energy—7.6% | | | | | | |
*Grant Prideco, Inc. | | | 6,650 | | $ | 264 |
Smith International, Inc. | | | 12,225 | | | 502 |
*Southwestern Energy Company | | | 7,075 | | | 248 |
*Ultra Petroleum Corp.† | | | 3,840 | | | 183 |
XTO Energy Corporation | | | 6,110 | | | 288 |
| | | | | | |
| | | | | | 1,485 |
| | | | | | |
Financials—5.0% | | | | | | |
*Affiliated Managers Group, Inc. | | | 1,975 | | | 208 |
*IntercontinentalExchange, Inc. | | | 2,953 | | | 318 |
Investors Financial Services Corporation | | | 10,680 | | | 456 |
| | | | | | |
| | | | | | 982 |
| | | | | | |
Materials—2.0% | | | | | | |
Airgas, Inc. | | | 9,905 | | | 401 |
| | | | | | |
Total Common Stock—90.9%
(cost $16,786) | | | 17,850 |
| | | | | | |
| | |
Investment in Affiliate | | | | | | |
William Blair Ready Reserves | | | 104,424 | | | 104 |
| | | | | | |
Total Investment in Affiliate—0.5%
(cost $104) | | | 104 |
| | | | | | |
| | |
Short-Term Investment | | | | | | |
Prudential Funding Demand Note, VRN 5.180%, due 1/2/07 | | $ | 225,000 | | | 225 |
| | | | | | |
Total Short-Term Investment—1.1%
(cost $225) | | | 225 |
| | | | | | |
| | |
Repurchase Agreement | | | | | | |
Investors Bank & Trust Company,
5.01% dated 12/29/2006,
due 1/2/2007, repurchase price $465, collateralized by SBA Pool # 503775 | | | 464,750 | | | 465 |
| | | | | | |
Total Repurchase Agreement—2.4%
(cost $465) | | | 465 |
| | | | | | |
Total Investments—94.9%
(cost $17,580) | | | 18,644 |
Cash and other assets, less liabilities—5.1% | | | 995 |
| | | | | | |
Net assets—100% | | $ | 19,639 |
| | | | | | |
See accompanying Notes to Financial Statements.
December 31, 2006 | William Blair Funds 25 |
Karl W. Brewer
Harvey H. Bundy, III
Robert C. Lanphier, IV
SMALL-MID CAP GROWTH FUND
The Small-Mid Cap Growth Fund primarily invests in a diversified portfolio of common stocks of small and medium-sized domestic growth companies that the Advisor expects to experience solid growth in earnings.
AN OVERVIEW FROM THE PORTFOLIO MANAGERS
How did the Fund perform over the last year? How did the Fund’s performance compare to its benchmark?
The Small-Mid Cap Growth Fund posted a 9.68% total return (Class N Shares) for the 12 months ended December 31, 2006. By comparison, the Fund’s benchmark, the Russell 2500TM Growth Index, gained 12.26%.
What were the most significant factors impacting Fund performance? What factors were behind the Fund’s performance versus the benchmark?
The US stock market turned in strong results across styles and market capitalizations during calendar year 2006. However, the market’s return was far from consistent throughout the year—and can be dissected into three distinct time periods. We witnessed a strong first few months of the year in part due to a better than expected earnings season reported during January and February. In early May, however, hawkish Federal Reserve comments about the likelihood of further interest rate hikes sent the market into a sharp three month correction. Then, as the Fed was seeing signs of moderating economic growth and contained inflation, they held interest rates steady at their August meeting. Helping the Fed’s decision was easing energy prices—a downward pressure on inflation. The potential end to interest rate increases marked a sea change in sentiment from the tough summer months and served as the catalyst for a sustained rally through year end.
The negative headlines of 2006 included a slowing housing market, a troubled auto industry, the continued war in Iraq and corporate stock options backdating. These were outweighed by the positive effects of lower energy prices, an end to a two year interest rate tightening cycle and an abundance of merger and acquisition activity that kept the equity market strong to close 2006. For the year overall, the market was led by Consumer Staples and Materials. These two sectors are more heavily weighted in the value benchmarks—influencing value’s outperformance over growth. Energy gave up its market leadership during the year while the predominantly growth sectors of Information Technology and Health Care disappointed compared to their typical strength in market rallies.
The Fund’s higher allocation to growth oriented stocks compared to the Russell 2500TM Growth Index was a sizeable performance detractor relative to the benchmark during 2006 as the market was biased against higher growth stocks. Stock selection also detracted from performance. This was most pronounced in the Industrials and Consumer Discretionary sectors while stock selection in the Information Technology sector was the largest positive contributor to relative performance.
What were among the weakest performing investments for the Fund?
Two of the weakest performing stocks in the Fund during the period were Telik and Getty Images. Telik is a biopharmaceutical company. The company received negative data out of three Phase III FDA trials and the stock sold off accordingly. Although the company has ongoing clinical trials and continues to seek a commercialized product, we decided to liquidate the position after this negative announcement.
26 Annual Report | December 31, 2006 |
Getty Images has the largest digital library of stock photographs used by many publishers, advertisers and others looking for digital photographs. The company has seen increased competition in the low-end photograph market. One competitor’s low cost solution is changing the dynamics in the industry and has hurt Getty’s previously dominant market position. Sales growth has deteriorated and without the visibility of forward earnings, we have decided to liquidate the position.
What were among the best performing investments for the Fund?
Two of the strongest contributors to performance during the period were Intercontinental Exchange and ValueClick. Intercontinental Exchange is a rapidly growing electronic exchange for various energy futures and physical commodity contracts. The company has benefited from the volatility in the energy markets as various market participants seek to speculate or invest in, or hedge using, energy derivatives traded on its exchange. The company also announced the acquisition of the New York Board of Trade during September, diversifying its product mix to commodities outside of energy. The company went public late last year and the gradual realization of the company’s true earnings potential has served as a catalyst for the stock throughout 2006.
ValueClick operates in the online advertising space. The stock was a solid contributor to the Fund for the fourth quarter as well as 2006 as a whole. The company reported solid earnings growth throughout the year—despite pessimism toward the overall online advertising space by some larger competitors such as Yahoo!. The fourth quarter catalyst, specifically, was its better than expected earnings and forward earnings guidance in early November.
What is your current outlook?
We are four plus years into the current bull market—a great run by historical comparison. Bond investors have moved 10-year Treasury bond yields well below short term rates, suggesting they think the Fed may have to lower interest rates in the future in response to weakening economic activity. For now, the stock market is suggesting otherwise—that the Fed is orchestrating the ideal balance between economic growth and low inflation. Over the last few years, corporate earnings growth has been very robust at a consistent double digit annual pace. While earnings growth remains healthy and stock valuations reasonable, a slower and more sustainable level of earnings growth should be expected in the coming years. We expect investors to look for more durable business models that can grow despite the macro environment—a dynamic that should benefit our quality growth style of investing. From our perspective, stock picking will become increasingly crucial to investment success as the easy money made over the last few years of broad-based earnings growth is most likely behind us.
December 31, 2006 | William Blair Funds 27 |
Small-Mid Cap Growth Fund
Performance Highlights (unaudited)
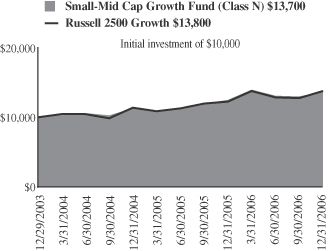
Average Annual Total Return at 12/31/2006
| | | | | | | | | |
| | | 1 Year | | | 3
Year | | | Since Inception(a) | |
Small-Mid Cap Growth Fund
Class N | | 9.68 | % | | 11.28 | % | | 11.00 | % |
Small-Mid Cap Growth Fund
Class I | | 9.95 | | | 11.55 | | | 11.27 | |
Russell 2500™ Growth Index | | 12.26 | | | 11.64 | | | 11.36 | |
| | (a) | | For the period from December 29, 2003 to December 31, 2006. | |
Performance cited represents past performance. Past performance does not guarantee future results and current performance may be lower or higher than the data quoted. Results shown are average annual total returns, which assume reinvestment of dividends and capital gains. Investment returns and principal will fluctuate and you may have a gain or loss when you sell shares. For the most current month-end performance information, please call 1-800-742-7272, or visit our Web site at www.williamblairfunds.com. Investing in smaller and medium capitalization companies involves special risks, including higher volatility and lower liquidity. Mid cap stocks are also more sensitive to purchase/sale transactions and changes in the issuer’s financial condition. From time to time, the investment advisor may waive fees or reimburse expenses for the Fund. Without these waivers, performance would be lower. Class N shares are available to the general public without a sales load. Class I shares are available to certain institutional investors and advisory clients of William Blair & Company, L.L.C., without a sales load or distribution (12b-1) or service fees.
The performance highlights and graph presented above do not reflect the deduction of taxes that a shareholder would pay on fund distributions or the redemption of fund shares.
The Russell 2500™ Growth Index measures the performance of those Russell 2500 companies with above average price-to-book ratios and forecasted growth rates.
This report identifies the Fund’s investments on December 31, 2006. These holdings are subject to change. Not all stocks in the Fund performed the same, nor is there any guarantee that these stocks will perform as well in the future. Market forecasts provided in this report may not necessarily come to pass.
Sector Diversification (unaudited)
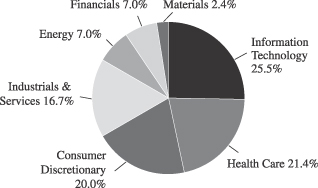
The sector diversification shown is based on the total investment portfolio.
28 Annual Report | December 31, 2006 |
Small-Mid Cap Growth Fund
Portfolio of Investments, December 31, 2006 (all dollar amounts in thousands)
| | | | | |
Issuer | | Shares | | Value |
| | |
Common Stocks | | | | | |
Information Technology—24.5% | | | | | |
*Activision, Inc. | | 135,579 | | $ | 2,337 |
*Euronet Worldwide, Inc. | | 73,375 | | | 2,179 |
*F5 Networks, Inc. | | 28,130 | | | 2,088 |
*Intuit, Inc. | | 51,635 | | | 1,575 |
*Iron Mountain, Inc. | | 54,114 | | | 2,237 |
*J2 Global Communications, Inc. | | 81,200 | | | 2,213 |
Jabil Circuit, Inc. | | 94,615 | | | 2,323 |
Microchip Technology, Inc. | | 32,845 | | | 1,074 |
*Nuance Communications, Inc. | | 143,235 | | | 1,642 |
*PDF Solutions, Inc. | | 64,800 | | | 936 |
*Ultimate Software Group, Inc. | | 52,200 | | | 1,214 |
*ValueClick, Inc. | | 56,957 | | | 1,346 |
*WebEx Communications, Inc. | | 47,040 | | | 1,641 |
| | | | | |
| | | | | 22,805 |
| | | | | |
Health Care—20.7% | | | | | |
C.R.Bard, Inc. | | 15,170 | | | 1,259 |
*DJO, Inc. | | 53,320 | | | 2,283 |
*Healthways, Inc. | | 47,665 | | | 2,274 |
*Integra LifeSciences Holdings Corporation | | 45,680 | | | 1,945 |
*Kyphon, Inc. | | 54,665 | | | 2,208 |
*Patterson Companies, Inc. | | 42,540 | | | 1,511 |
Pharmaceutical Product Development, Inc. | | 75,905 | | | 2,446 |
*PSS World Medical, Inc. | | 75,315 | | | 1,471 |
*ResMed, Inc. | | 37,515 | | | 1,846 |
*Santarus, Inc. | | 87,600 | | | 686 |
*Surmodics, Inc. | | 40,165 | | | 1,250 |
| | | | | |
| | | | | 19,179 |
| | | | | |
Consumer Discretionary—19.2% | | | | | |
*CarMax, Inc. | | 43,800 | | | 2,349 |
*Coinstar, Inc. | | 51,958 | | | 1,588 |
*Guitar Center, Inc. | | 24,885 | | | 1,131 |
*Jarden Corporation | | 41,420 | | | 1,441 |
*Lamar Advertising Company, Class “A” | | 21,460 | | | 1,403 |
*Laureate Education, Inc. | | 54,689 | | | 2,660 |
*Life Time Fitness, Inc. | | 47,465 | | | 2,303 |
*O’Reilly Automotive, Inc. | | 58,790 | | | 1,885 |
Strayer Education, Inc. | | 14,540 | | | 1,542 |
*Tractor Supply Company | | 16,415 | | | 734 |
Weight Watchers International, Inc. | | 15,400 | | | 809 |
| | | | | |
| | | | | 17,845 |
| | | | | |
Industrials & Services—16.1% | | | | | |
*Beacon Roofing Supply, Inc. | | 123,389 | | | 2,322 |
Corporate Executive Board Company | | 21,280 | | | 1,866 |
*Corrections Corporation of America | | 26,600 | | | 1,203 |
Fastenal Company | | 80,175 | | | 2,877 |
Graco, Inc. | | 28,225 | | | 1,118 |
*Kforce, Inc. | | 88,215 | | | 1,074 |
*Non-income producing securities
VRN = Variable Rate Note
† = U.S. listed foreign security
| | | | | |
Issuer | | Shares or
Principal
Amount | | Value |
| | |
Common Stocks—(continued) | | | | | |
Industrials & Services—(continued) | | | | | |
*Monster Worldwide, Inc. | | 43,600 | | $ | 2,033 |
Rockwell Collins, Inc. | | 38,595 | | | 2,443 |
| | | | | |
| | | | | 14,936 |
| | | | | |
Energy—6.8% | | | | | |
*Grant Prideco, Inc. | | 39,300 | | | 1,563 |
Smith International, Inc. | | 55,670 | | | 2,286 |
*Southwestern Energy Company | | 36,760 | | | 1,288 |
*Ultra Petroleum Corp.† | | 24,350 | | | 1,163 |
| | | | | |
| | | | | 6,300 |
| | | | | |
Financials—6.8% | | | | | |
*Affiliated Managers Group, Inc. | | 13,900 | | | 1,461 |
*IntercontinentalExchange, Inc. | | 13,360 | | | 1,441 |
Investors Financial Services Corporation | | 45,670 | | | 1,949 |
*Signature Bank New York | | 46,470 | | | 1,440 |
| | | | | |
| | | | | 6,291 |
| | | | | |
Materials—2.3% | | | | | |
Airgas, Inc. | | 52,110 | | | 2,112 |
| | | | | |
Total Common Stock—96.4%
(cost $77,831) | | | 89,468 |
| | | | | |
| | |
Investment in Affiliate | | | | | |
William Blair Ready Reserves | | 1,310,875 | | | 1,311 |
| | | | | |
Total Investment in Affiliate—1.4%
(cost $1,311) | | | 1,311 |
| | | | | |
| | |
Short-Term Investment | | | | | |
Prudential Funding Demand Note, VRN 5.180%, due 1/2/07 | | $786,000 | | | 786 |
| | | | | |
Total Short-Term Investment—0.9%
(cost $786) | | | 786 |
| | | | | |
| | |
Repurchase Agreement | | | | | |
Investors Bank & Trust Company,
5.01% dated 12/29/2006, due 1/2/2007, repurchase price $548, collateralized by SBA Pool #503904 | | 547,617 | | | 548 |
| | | | | |
Total Repurchase Agreement—0.6%
(cost $548) | | | 548 |
| | | | | |
Total Investments—99.3%
(cost $80,476) | | | 92,113 |
Cash and other assets, less liabilities—0.7% | | | 653 |
| | | | | |
Net assets—100% | | $ | 92,766 |
| | | | | |
See accompanying Notes to Financial Statements.
December 31, 2006 | William Blair Funds 29 |
INTERNATIONAL MARKETS OVERVIEW
There was a tale of three international equity markets in 2006. The first four months of 2006 prolonged the momentum of 2005 as global growth remained strong, energy and commodities prices rose, and investors continued to search for returns in areas such as emerging markets equity and small cap stocks. However, markets retreated during the second quarter as concerns about potential global inflationary pressures, monetary policy tightening (and uncertainty as to the duration and size of further tightening moves and their impact on the US consumer in particular), and higher valuations in a number of the recent strong markets such as emerging markets and small cap came to the forefront of investor psychology. The correction in equity markets during May and most of June was broad based and non-discriminatory, although the stocks that were the prime beneficiaries of the strong global growth trends over the past several years did suffer more than their more defensive-oriented counterparts as investors withdrew liquidity and invested in “safe havens.” These concerns abated during July, when it became clear that while global growth was slowing, an imminent global recession was not occurring.
As a result, international equity markets rebounded beginning in July, and ended the year up 27.16%, as reflected by the MSCI All-Country World ex-U.S. Index. Within international markets, emerging markets were up 32.59%, as measured by the MSCI Emerging Markets Index, despite their mid-year decline, outpacing the MSCI EAFE Index, which rose 26.86%. Developed small cap stocks underperformed their larger cap counterparts during the year, rising 19.82% as measured by the MSCI World Ex-U.S. Small Cap Index, due largely to negative Japanese small cap stock performance.
2007 Outlook
The consensus view of growth, inflation, interest rates and profits has been a moving target all year long. Overheating concerns gave way to slowdown fears in the first half, only for markets to settle down to a more moderate and balanced view of global economic prospects in the wake of the Federal Reserve pause in August.
Today, the US still looks likely to slow (although the tone of fear about the housing market may be softening) and China continues to restrain investment growth (although tightening remains selective in its application and limited in its effectiveness); at the same time, Europe and Japan give increasing evidence of being on track toward solid expansion, and the runaway commodity boom seems to have slowed before doing irreparable damage to the global cycle.
In the context of a view that an ‘intracyclical’ deceleration in growth will prove to be basically benign (i.e., no significant deterioration in employment conditions or credit quality), a number of factors emerge (or re-emerge) that suggest a relatively strong environment for equity returns:
For multinational corporations—and that really includes any company with a cross-border supply chain or customer base—globalization has meant two things: a wider range of opportunities for profit enhancement, and increased exposure to high-growth end markets. Both factors continue to have a positive influence on long term earnings potential.
| • | | Corporate Governance and Performance |
The vast majority of listed companies, particularly those with some scale and diversity of operations, see themselves as having an opportunity to improve profit margins, capital productivity, or both. Increasingly, firms benchmark profitability against the best in their peer group, and boards expect progress toward that goal. Competitive improvements in Information Technology (IT), logistics, marketing methods, sourcing, and production can all combine to raise the bar for growth for the market as a whole.
30 Annual Report | December 31, 2006 |
In the wake of the 2000-2001 slowdown, corporations have raised the burden of proof on investment spending plans. IT, equipment, and facilities spending all face greater scrutiny in an effort to improve the productivity of cash flow. In effect, there is increased competition between capital spending, acquisitions, and share buybacks as alternatives to enhance returns, and this competition provides an opportunity for optimizing potential earnings growth.
While multiples have contracted around the world, the global median return on equity (ROE) has risen by three percentage points, from 12.8% to 15.8%, in the last two years. Accordingly, free cash flow yields have risen (on the same basis) from 1.1% to 2.7% over the last five years. Even allowing for some cyclical easing of profitability in a slowdown, the combination of enhanced growth opportunities and greater free cash flow yields argues for sustainable improvement in expected returns from equities.
Comment on Style Performance
Since the end of the tech bubble market of the 1990s, there has been a pronounced and consistent relative style performance advantage of value over growth. As the excesses of the previous cycle unwound, there was a natural tendency for the defensive characteristics of value stocks to dominate, but even after the markets turned upward in late 2002 and 2003, the value performance edge persisted.
While there are elements of cyclicality in risk preference and relative valuation between growth and value stocks, there has clearly been more to the rotation than investor sentiment. Changes in the pattern of growth and returns across sectors have been of primary importance in establishing market leadership and redefining growth and value.
Four key sectors have seen significant shifts in their prospects for growth, sustainable returns and risk. Emerging as global growth sectors are Financials and Industrials and Services, while the ‘classic’ growth sectors of IT and Health Care show increasing signs of maturation. These relative shifts reflect globalization and a shift toward developing economies as the engine of economic growth worldwide. This evolution is more than simply cyclical; it will have lasting implications for investment strategy for growth and value investors alike, and has already changed our own portfolio structure and outlook.
December 31, 2006 | William Blair Funds 31 |

W. George Greig
INTERNATIONAL GROWTH FUND
The International Growth Fund invests primarily in common stocks of foreign growth companies.
AN OVERVIEW FROM THE PORTFOLIO MANAGER
See page 30 for the International Markets Overview.
How did the Fund perform during the past year? How did the Fund’s performance compare to its benchmark?
The International Growth Fund posted a 23.06% gain (Class N Shares) for the 12 months ended December 31, 2006. By comparison, the Fund’s benchmark, the Morgan Stanley Capital International (MSCI) All Country World (ACWI) ex-US Index, rose 27.16%.
What were the most significant factors impacting Fund performance? What factors were behind the Fund’s performance versus the benchmark?
Despite strong absolute performance, the Fund underperformed the Index during 2006, due to second quarter underperformance, coupled with the Fund’s quality growth focus. Value outperformed growth by over 6% during the year, with sectors such as Materials and Utilities, areas where the Fund was underweighted, significantly outpacing the more traditional growth areas of Consumer, Health Care and IT, areas where the Fund was overweighted relative to the Index. The Fund’s results during 2006, returning 23.06% (N Shares) were due largely to strong stock selection in Consumer Staples, Energy, Financials, Information Technology (IT), and Telecommunication Services. Consumer Staples stock selection was enhanced by strong performance in Emerging Asia and Latin America, while Energy stock selection was positive across most regions, due to the Fund’s focus on alternative energy companies, energy services, and exploration and production companies with strong production growth. Financials stock selection was enhanced from developed Asia, Europe ex-UK and emerging Asia holdings, while emerging Asia and Latin American IT stocks bolstered that sector’s performance. The Telecommunication Services holdings, which significantly outperformed their counterparts within the Index, as they were largely focused in the emerging markets, where subscriber growth continues to accelerate.
What is your current strategy? How is the Fund positioned?
As of year end, the Fund was focused on Consumer, Industrials, and IT stocks, at the expense of Materials, Telecommunication Services, and Energy. Financials, which maintained the highest absolute weighting in the Fund, were underweighted relative to the Index. From a regional perspective, the Fund was underweighted in most developed markets, particularly Japan, and overweighted in Latin America and emerging Asia.
32 Annual Report | December 31, 2006 |
International Growth Fund
Performance Highlights (unaudited)
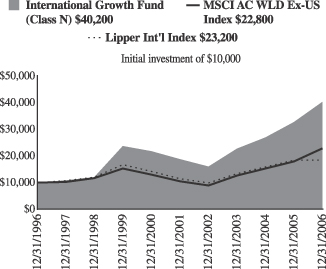
Average Annual Total Return at 12/31/2006
| | | | | | | | | | | | | | | | | |
| | | 1
Year | | | 3
Year | | | 5
Year | | | 10
Year | | | Since Inception | | | |
International Growth Fund Class N | | 23.06 | % | | 21.05 | % | | 16.43 | % | | 14.94 | % | | — | % | | |
International Growth Fund Class I | | 23.35 | | | 21.37 | | | 16.72 | | | — | | | 13.23 | (a) | | |
MSCI All Country World Ex-US Index | | 27.16 | | | 21.81 | | | 16.87 | | | 8.59 | | | 13.30 | (a) | | |
Lipper International Index | | 25.89 | | | 19.98 | | | 15.14 | | | 8.77 | | | — | | | |
| | (a) | | For the period from October 1, 1999 to December 31, 2006. |
Performance cited represents past performance. Past performance does not guarantee future results and current performance may be lower or higher than the data quoted. Results shown are average annual total returns, which assume reinvestment of dividends and capital gains. Investment returns and principal will fluctuate and you may have a gain or loss when you sell shares. For the most current month-end performance information, please call 1-800-742-7272, or visit our Web site at www.williamblairfunds.com. International investing involves special risk considerations, including currency fluctuations, lower liquidity, economic and political risk. Class N shares are available to the general public without a sales load. Class I shares are available to certain institutional investors and advisory clients of William Blair & Company, L.L.C., without a sales load or distribution (12b-1) or service fees.
The performance highlights and graph presented above do not reflect the deduction of taxes that a shareholder would pay on fund distributions or the redemption of fund shares.
The Morgan Stanley Capital International (MSCI) All Country World Ex-US Index is an unmanaged index that includes developed and emerging markets and reduced Japanese portion, making it more comparable to the International Growth Fund in terms of investment approach.
The Lipper International Index is a composite of international growth mutual funds.
This report identifies the Fund’s investments on December 31, 2006. These holdings are subject to change. Not all stocks in the Fund performed the same, nor is there any guarantee that these stocks will perform as well in the future. Market forecasts provided in this report may not necessarily come to pass.
Sector Diversification (unaudited)
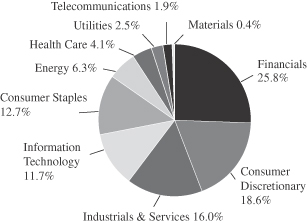
The sector diversification shown is based on the total investment portfolio.
December 31, 2006 | William Blair Funds 33 |
International Growth Fund
Portfolio of Investments, December 31, 2006 (all dollar amounts in thousands)
| | | | | |
Issuer | | Shares | | Value |
| | |
Common Stocks—Europe—35.5% | | | | | |
Austria—1.3% | | | | | |
Erste Bank (Commercial banks) | | 458,592 | | $ | 35,113 |
Raiffeisen International Bank (Commercial banks) | | 309,154 | | | 47,009 |
| | | | | |
| | | | | 82,122 |
| | | | | |
Belgium—0.4% | | | | | |
InBev NV (Beverages) | | 385,200 | | | 25,346 |
| | | | | |
France—11.4% | | | | | |
April Group S.A. (Insurance) | | 203,139 | | | 9,777 |
BNP Paribas (Commercial banks) | | 668,300 | | | 72,704 |
Capgemini S.A. (IT services) | | 759,300 | | | 47,506 |
Essilor International (Health care equipment & supplies) | | 462,400 | | | 49,643 |
Eurazeo (Diversified financial services) | | 239,240 | | | 34,149 |
Group Danone (Food products) | | 601,700 | | | 90,991 |
Iliad S.A. (Internet software & services) | | 268,950 | | | 23,245 |
Klepierre (Real estate investment trusts) | | 138,500 | | | 26,110 |
L’Oreal S.A. (Personal products) | | 1,205,800 | | | 120,534 |
LVMH Moet Hennessey Louis Vuitton SA (Textiles, apparel & luxury goods) | | 718,100 | | | 75,541 |
*Orpea (Health care providers & services) | | 187,312 | | | 17,719 |
*S.O.I.T.E.C. (Semiconductors & semiconductor equipment) | | 773,400 | | | 27,338 |
Veolia Environnement (Multi-utilities) | | 1,166,700 | | | 88,977 |
Vinci S.A. (Construction & engineering) | | 254,900 | | | 32,488 |
| | | | | |
| | | | | 716,722 |
| | | | | |
Germany—3.3% | | | | | |
Bijou Brigitte (Textiles, apparel & luxury goods) | | 66,750 | | | 13,136 |
CTS Eventim AG (Media) | | 198,703 | | | 7,648 |
E.ON AG (Electrical utilities) | | 482,100 | | | 65,105 |
*Patrizia Immobilien AG (Real estate management & development) | | 23,100 | | | 688 |
*Q-Cells AG (Electrical equipment) | | 494,420 | | | 22,136 |
*Qiagen NV (Life science tools & services) | | 1,227,600 | | | 18,849 |
SAP AG (Software) | | 1,202,400 | | | 63,767 |
Solarworld AG (Electrical equipment) | | 218,900 | | | 13,642 |
*Wire Card AG (Commercial services & supplies) | | 138,200 | | | 1,428 |
| | | | | |
| | | | | 206,399 |
| | | | | |
Greece—1.7% | | | | | |
Coca-Cola Hellenic Bottling S.A. (Beverages) | | 845,571 | | | 32,991 |
EFG Eurobank (Commercial banks) | | 1,004,200 | | | 36,282 |
National Bank of Greece (Commercial banks) | | 797,252 | | | 36,568 |
| | | | | |
| | | | | 105,841 |
| | | | | |
Ireland—2.7% | | | | | |
Anglo Irish Bank plc (Commercial banks) | | 3,014,700 | | | 62,425 |
IAWS Group plc (Food products) | | 754,300 | | | 19,322 |
Kingspan Group plc (Building products) | | 1,517,100 | | | 40,225 |
*Ryanair Holdings plc—ADR (Airlines) | | 416,900 | | | 33,977 |
United Drug plc (Health care providers & services) | | 2,625,500 | | | 13,795 |
| | | | | |
| | | | | 169,744 |
| | | | | |
| | | | | |
Issuer | | Shares | | Value |
| |
Common Stocks—Europe—35.5%—(continued) | | | |
Italy—3.6% | | | | | |
Azimut Holding SpA (Capital markets) | | 1,481,600 | | $ | 19,785 |
Banca Italease (Diversified financial services) | | 430,000 | | | 24,960 |
Credito Emiliano SpA (Commercial banks) | | 1,379,400 | | | 19,487 |
Luxottica Group SpA (Textiles, apparel & luxury goods) | | 1,834,700 | | | 56,239 |
Saipem SpA (Energy equipment & services) | | 3,255,600 | | | 84,471 |
Tod’s SpA (Textiles, apparel & luxury goods) | | 246,700 | | | 19,840 |
| | | | | |
| | | | | 224,782 |
| | | | | |
Luxembourg—0.3% | | | | | |
*Gagfah S.A. (Real estate management & development) | | 555,600 | | | 17,624 |
| | | | | |
Netherlands—1.1% | | | | | |
Royal Numico N.V. (Food products) | | 832,200 | | | 44,689 |
*Tomtom NV (Software) | | 541,400 | | | 23,311 |
| | | | | |
| | | | | 68,000 |
| | | | | |
Norway—0.5% | | | | | |
*Acergy S.A. (Energy equipment & services) | | 1,482,100 | | | 28,275 |
| | | | | |
Spain—1.8% | | | | | |
*Grifols S.A. (Biotechnology) | | 2,046,412 | | | 27,242 |
Industria De Textile (Specialty retail) | | 1,384,300 | | | 74,466 |
*Tecnicas Reunidas S.A. (Construction & engineering) | | 327,800 | | | 12,577 |
| | | | | |
| | | | | 114,285 |
| | | | | |
Sweden—1.5% | | | | | |
Ericsson (LM) (Communications equipment) | | 11,325,000 | | | 45,540 |
*Modern Times Group (Media) | | 387,300 | | | 25,375 |
Nobia AB (Specialty retail) | | 594,650 | | | 22,820 |
| | | | | |
| | | | | 93,735 |
| | | | | |
Switzerland—5.9% | | | | | |
ABB Ltd. (Electrical equipment) | | 7,514,900 | | | 134,573 |
*EFG International (Capital markets) | | 789,700 | | | 29,736 |
Kuehne & Nagel International AG (Marine) | | 652,440 | | | 47,398 |
Nobel Biocare Holdings AG (Health care equipment & supplies) | | 109,950 | | | 32,432 |
*Partners Group Global Opporunites, Ltd. (Capital markets) | | 217,278 | | | 26,219 |
Roche Holdings AG (Pharmaceuticals) | | 420,100 | | | 75,162 |
SGS S.A. (Commercial services & supplies) | | 18,710 | | | 20,786 |
| | | | | |
| | | | | 366,306 |
| | | | | |
| | |
United Kingdom—16.2% | | | | | |
Amlin plc (Insurance) | | 766,000 | | | 4,865 |
BG Group plc (Oil, gas & consumable fuels) | | 6,098,200 | | | 82,923 |
*Cairn Energy plc (Oil, gas & consumable fuels) | | 817,900 | | | 28,732 |
Capita Group plc (Commercial services & supplies) | | 5,501,500 | | | 65,231 |
See accompanying Notes to Financial Statements.
34 Annual Report | December 31, 2006 |
International Growth Fund
Portfolio of Investments, December 31, 2006 (all dollar amounts in thousands)
| | | | | |
Issuer | | Shares | | Value |
|
Common Stocks—United Kingdom—16.2%—(continued) |
Carphone Warehouse Group plc (Specialty retail) | | 4,517,180 | | $ | 27,682 |
Detica Group plc (IT services) | | 1,274,400 | | | 9,144 |
HBOS plc (Commercial banks) | | 5,728,800 | | | 126,645 |
Homeserve plc (Commercial services & supplies) | | 442,300 | | | 16,340 |
Man Group plc (Capital markets) | | 6,837,500 | | | 69,792 |
Michael Page International (Commercial services & supplies) | | 4,473,200 | | | 39,508 |
Northern Rock plc (Thrifts & mortgage finance) | | 2,826,900 | | | 64,997 |
Reckitt Benckiser plc (Household products) | | 2,377,100 | | | 108,437 |
*Rolls-Royce Group plc (Aerospace & defense) | | 11,858,249 | | | 103,628 |
Rotork plc (Electronic equipment & instruments) | | 1,301,364 | | | 21,260 |
RPS Group plc (Commercial services & supplies) | | 2,545,600 | | | 13,435 |
Serco Group (Commercial services & supplies) | | 4,877,209 | | | 36,383 |
Tesco plc (Food & staples retailing) | | 15,690,400 | | | 123,993 |
Tullow Oil plc (Oil, gas & consumable fuels) | | 2,909,190 | | | 22,613 |
Ultra Electronic Holdings plc (Aerospace & defense) | | 986,800 | | | 20,929 |
Victrex plc (Chemicals) | | 611,700 | | | 9,608 |
VT Group plc (Aerospace & defense) | | 2,016,000 | | | 18,721 |
| | | | | |
| | | | | 1,014,866 |
| | | | | |
| | |
Japan—14.0% | | | | | |
Aeon Mall Co., Ltd. (Real estate management & development) | | 501,900 | | | 28,341 |
Canon, Inc. (Office electronics) | | 1,677,500 | | | 94,443 |
Chiyoda Corp. (Construction & engineering) | | 1,138,600 | | | 22,258 |
*DeNA Co., Ltd. (Internet & catalog retail) | | 5,283 | | | 17,309 |
Denso Corporation (Auto components) | | 2,975,000 | | | 117,961 |
En-Japan Inc. (Commercial services & supplies) | | 433 | | | 2,074 |
Honeys Company, Ltd. (Specialty retail) | | 370,400 | | | 13,759 |
Hoya Corporation (Electronic equipment & instruments) | | 740,500 | | | 28,862 |
Joint Corporation (Real estate management & development) | | 634,400 | | | 24,395 |
*Jupiter Telecommunications Co., Ltd. (Media) | | 21,743 | | | 17,526 |
*K.K. DaVinci Advisors (Real estate management & development) | | 18,402 | | | 18,238 |
Kenedix, Inc. (Real estate management & development) | | 2,981 | | | 13,448 |
Keyence Corporation (Electronic equipment & instruments) | | 279,200 | | | 68,917 |
Komatsu Ltd. (Machinery) | | 2,206,800 | | | 44,665 |
MISUMI Group, Inc. (Trading companies & distributors) | | 838,200 | | | 16,006 |
Nakanishi Inc. (Health care equipment & supplies) | | 140,300 | | | 17,214 |
| | | | | |
Issuer | | Shares | | Value |
| |
Common Stocks—Japan—14.0%—(continued) | | | |
Nitori Company Ltd. (Specialty retail) | | 409,920 | | $ | 17,741 |
Orix Corporation (Consumer finance) | | 401,500 | | | 116,432 |
Park 24 Co., Ltd. (Commercial services & supplies) | | 1,282,900 | | | 16,402 |
Sharp Corp. (Household durables) | | 2,242,700 | | | 38,561 |
Suruga Bank (Commercial banks) | | 3,945,000 | | | 48,857 |
Yamada Denki Company (Specialty retail) | | 312,180 | | | 26,498 |
Yamaha Motor Company (Automobiles) | | 2,177,900 | | | 68,460 |
| | | | | |
| | | | | 878,367 |
| | | | | |
| | |
Emerging Asia—12.2% | | | | | |
China—3.1% | | | | | |
China Life Insurance Co. (Insurance) | | 3,955,000 | | | 13,500 |
China Mengniu Dairy Co. (Food products) | | 7,979,000 | | | 20,908 |
China Vanke Company Ltd. (Real estate management & development) | | 13,087,900 | | | 25,075 |
*Focus Media Holding Ltd.—ADR (Media) | | 326,900 | | | 21,703 |
*Foxconn International (Communications equipment) | | 3,820,000 | | | 12,459 |
Fu Ji Food & Catering (Hotels, restaurants & leisure) | | 6,424,000 | | | 16,567 |
Hopson Development Holdings Ltd. (Real estate management & development) | | 5,655,000 | | | 15,985 |
Lee and Man Paper Manufacturing Ltd. (Containers & packaging) | | 5,454,000 | | | 13,370 |
Li Ning Co. Ltd. (Leisure equipment & products) | | 9,334,000 | | | 14,924 |
Parkson Retail Group Ltd. (Multiline retail) | | 3,268,000 | | | 16,163 |
Ports Design Limited (Textiles, apparel & luxury goods) | | 6,067,000 | | | 13,254 |
Wumart Stores, Inc., Class “H” (Food & staples retailing)** | | 13,480,000 | | | 8,665 |
| | | | | |
| | | | | 192,573 |
| | | | | |
India —3.7% | | | | | |
Bharat Heavy Electricals Ltd. (Electrical equipment) | | 637,700 | | | 33,032 |
*Bharti Airtel Ltd. (Wireless telecommunication services) | | 1,788,200 | | | 25,457 |
Dabur India Ltd. (Personal products) | | 5,358,300 | | | 17,746 |
HDFC Bank (Commercial banks) | | 630,300 | | | 15,124 |
Hindustan Lever Ltd. (Household durables) | | 2,691,000 | | | 13,159 |
Housing Development Finance Corp. (Thrifts & mortgage finance) | | 673,600 | | | 24,693 |
Infosys Technologies, Ltd. (IT services) | | 1,178,148 | | | 59,539 |
Maruti Udyog Ltd. (Automobiles) | | 931,400 | | | 19,511 |
Suzlon Energy Ltd. (Electrical equipment) | | 689,100 | | | 20,297 |
| | | | | |
| | | | | 228,558 |
| | | | | |
Indonesia—1.1% | | | | | |
PT Bank Rakyat Indonesia (Commercial banks) | | 36,379,500 | | | 20,868 |
*PT Kalbe Farma Tbk (Pharmaceuticals) | | 22,828,700 | | | 3,030 |
PT Telekomunikasi Tbk (Diversified telecommunication services) | | 42,346,500 | | | 47,728 |
| | | | | |
| | | | | 71,626 |
| | | | | |
See accompanying Notes to Financial Statements.
December 31, 2006 | William Blair Funds 35 |
International Growth Fund
Portfolio of Investments, December 31, 2006 (all dollar amounts in thousands)
| | | | | |
Issuer | | Shares | | Value |
|
Common Stocks—Emerging Asia—12.2%—(continued) |
Malaysia—0.6% | | | | | |
Bumiputra Commerce Holdings Bhd (Commercial banks) | | 13,921,100 | | $ | 30,500 |
Transmile Group Bhd (Air freight & logistics) | | 2,555,400 | | | 10,306 |
| | | | | |
| | | | | 40,806 |
| | | | | |
South Korea—1.8% | | | | | |
*NHN Corp. (Internet software & services) | | 311,820 | | | 37,928 |
Samsung Electronics Co. (Semiconductors & semiconductor equipment) | | 77,180 | | | 50,631 |
*Shinsegae Co. Ltd. (Food & staples retailing) | | 43,060 | | | 26,821 |
| | | | | |
| | | | | 115,380 |
| | | | | |
Taiwan—1.9% | | | | | |
High Tech Computer Corporation (Computers & peripherals) | | 679,800 | | | 13,408 |
*Himax Technologies, Inc.—ADR (Semiconductors & equipment) | | 927,400 | | | 4,424 |
Hon Hai Precision Industry (Electronic equipment & instruments) | | 8,909,780 | | | 63,394 |
Largan Precision Co. Ltd. (Leisure equipment & products) | | 807,450 | | | 15,531 |
Mediatek Inc. (Semiconductors & semiconductor equipment) | | 2,376,450 | | | 24,473 |
| | | | | |
| | | | | 121,230 |
| | | | | |
| | |
Asia—8.1% | | | | | |
Australia—3.2% | | | | | |
Allco Finance Group, Limited (Capital markets) | | 2,763,604 | | | 28,049 |
Macquarie Bank, Ltd. (Capital markets) | | 1,668,700 | | | 103,719 |
Seek Ltd. (Commercial services & supplies) | | 4,228,163 | | | 19,588 |
United Group Ltd. (Construction & engineering) | | 1,958,500 | | | 21,542 |
WorleyParsons, Ltd. (Energy equipment & services) | | 1,528,400 | | | 25,667 |
| | | | | |
| | | | | 198,565 |
| | | | | |
Hong Kong—2.1% | | | | | |
Esprit Holdings Ltd. (Specialty retail) | | 5,969,500 | | | 66,491 |
Li & Fung Ltd. (Distributors) | | 21,765,200 | | | 67,577 |
| | | | | |
| | | | | 134,068 |
| | | | | |
Singapore—2.8% | | | | | |
Capital and, Ltd. (Real estate management & development) | | 26,246,000 | | | 105,617 |
Goodpack Ltd. (Air freight & logistics) | | 7,256,000 | | | 7,280 |
Osim International Ltd. (Specialty retail) | | 14,315,240 | | | 13,041 |
Raffles Education Corp. Ltd. (Diversified consumer services) | | 11,779,000 | | | 13,584 |
Singapore Exchange, Ltd. (Diversified financial services) | | 9,054,000 | | | 33,427 |
| | | | | |
| | | | | 172,949 |
| | | | | |
| | | | | |
Issuer | | Shares | | Value |
|
Common Stocks—Emerging Latin America—5.7% |
Brazil—2.0% | | | | | |
Companhia de Concessoes Rodoviarias (Transportation infrastructure) | | 1,900,700 | | $ | 25,666 |
Cyrela Brazil Realty S.A. (Household durables) | | 1,477,200 | | | 14,098 |
Gol Linhas Aereas Inteligentes S.P—ADR (Airlines) | | 526,200 | | | 15,086 |
Localiza Rent a Car S.A. (Road & rail) | | 503,300 | | | 15,135 |
Lojas Renner S.A. (Multiline retail) | | 1,123,500 | | | 16,144 |
Natura Cosmeticos S.A. (Personal products) | | 1,235,400 | | | 17,434 |
Submarino S.A. (Internet & catalog retail) | | 636,400 | | | 20,848 |
| | | | | |
| | | | | 124,411 |
| | | | | |
Chile—0.6% | | | | | |
*Cencosud S.A.—ADR 144A (Specialty retail) | | 721,730 | | | 33,866 |
S.A.C.I. Falabella (Multiline retail) | | 457,196 | | | 1,606 |
| | | | | |
| | | | | 35,472 |
| | | | | |
Columbia—0.3% | | | | | |
Bancolombia S.A.—ADR (Commercial banks) | | 664,200 | | | 20,690 |
| | | | | |
Mexico—2.5% | | | | | |
America Movil S.A. (Wireless telecommunication services) | | 20,172,600 | | | 45,488 |
*Desarrolladora Homex S.A.—ADR (Household durables) | | 327,400 | | | 19,340 |
Grupo Aeropuertario Del-ADR (Transportation infrastructure) | | 262,800 | | | 10,299 |
*Urbi Desarrollos Urbanos S.A. (Household durables) | | 8,358,600 | | | 30,175 |
Walmart de Mexico (Food & staples retailing) | | 12,131,200 | | | 53,374 |
| | | | | |
| | | | | 158,676 |
| | | | | |
Panama—0.3% | | | | | |
Copa Holdings S.A., Class “A” (Airlines)† | | 369,900 | | | 17,223 |
| | | | | |
| | |
Canada—3.0% | | | | | |
*Gildan Activewear, Inc. (Textiles, apparel & luxury goods) | | 401,600 | | | 18,765 |
Manulife Financial Corp. (Insurance) | | 1,353,100 | | | 45,658 |
Ritchie Brothers Auctioneers, Inc. (Commercial services & supplies)† | | 214,900 | | | 11,506 |
Shoppers Drug Mart Corp. (Food & staples retailing) | | 1,363,800 | | | 58,580 |
Suncor Energy, Inc. (Oil, gas & consumable fuels) | | 658,500 | | | 51,832 |
| | | | | |
| | | | | 186,341 |
| | | | | |
| |
Emerging Europe, Mid-East, Africa—2.4% | | | |
Czech Republic—0.2% | | | | | |
*Central European Media Enterprises Ltd. Class “A” (Media)† | | 177,000 | | | 12,390 |
| | | | | |
See accompanying Notes to Financial Statements.
36 Annual Report | December 31, 2006 |
International Growth Fund
Portfolio of Investments, December 31, 2006 (all dollar amounts in thousands)
| | | | | | |
Issuer | | Shares or
Principal
Amount | | Value |
|
Common Stocks—Emerging Europe, Mid-East, Africa—2.4% —(continued) |
Kazakhstan—0.5% | | | | | | |
*Kazkommertsbank—GDR 144A (Commercial banks) | | | 1,452,951 | | $ | 33,563 |
| | | | | | |
Russia—0.7% | | | | | | |
*CTC Media, Inc. (Media)† | | | 775,352 | | | 18,616 |
Sberbank—CLS (Commercial banks)† | | | 8,050 | | | 27,773 |
| | | | | | |
| | | | | | 46,389 |
| | | | | | |
South Africa—1.0% | | | | | | |
Naspers Ltd. (Media) | | | 749,990 | | | 17,778 |
Sasol Ltd. (Oil, gas, and consumable fuels) | | | 588,800 | | | 21,680 |
Truworths International Ltd. (Specialty retail) | | | 4,763,400 | | | 21,742 |
| | | | | | |
| | | | | | 61,200 |
| | | | | | |
Total Common Stock—97.1%
(cost $4,475,419) | | | | | | 6,084,524 |
| | | | | | |
| | |
Preferred Stock | | | | | | |
Brazil—1.1% | | | | | | |
Banco Itau Holding (Commercial banks) | | | 799,300 | | | 28,957 |
Petroleo Brasileiro S.A. (Oil, gas & consumable fuels) | | | 1,740,700 | | | 40,574 |
| | | | | | |
| | | | | | 69,531 |
| | | | | | |
Total Preferred Stock—1.1%
(cost $42,788) | | | | | | 69,531 |
| | | | | | |
| | |
Investment in Affiliate | | | | | | |
William Blair Ready Reserves Fund | | | 637,242 | | | 637 |
| | | | | | |
Total Investment in Affiliate—0.0%
(cost $637) | | | | | | 637 |
| | | | | | |
| | |
Short-Term Investments | | | | | | |
American Express Demand Note, VRN 5.176% due 1/2/07 | | $ | 13,186,000 | | | 13,186 |
Prudential Funding Demand Note, VRN 5.180% due 1/2/07 | | | 13,186,000 | | | 13,186 |
| | | | | | |
Total Short-Term Investments—0.4% (cost $26,372) | | | | | | 26,372 |
| | | | | | |
| | |
Repurchase Agreement | | | | | | |
Investors Bank & Trust Company, 5.01% dated 12/29/2006, due 1/2/2007, repurchase price $28,743, collateralized by FN, Pool# 735342 | | | 28,726,865 | | | 28,727 |
| | | | | | |
Total Repurchase Agreement—0.5%
(cost $28,727) | | | 28,727 |
| | | | | | |
Total Investments—99.1%
(cost $4,573,943) | | | 6,209,791 |
Cash and other assets, less liabilities—0.9% | | | 57,335 |
| | | | | | |
Net assets—100.0% | | $ | 6,267,126 |
| | | | | | |
* Non-income producing securities
ADR = American Depository Receipt
GDR = Global Depository Receipt
VRN = Variable Rate Note
† = U.S. listed foreign security
** Fair valued pursuant to Valuation Procedures adopted by the Board of Trustees. This holding represents 0.14% of the Fund’s net assets at December 31, 2006. This security is also deemed illiquid pursuant to Liquidity Procedures adopted by the Board of Trustees.
For securities, primarily traded on exchanges or markets that close before the close of regular trading on the New York Stock Exchange the Fund uses an independent pricing service on a daily basis to fair value price the securities pursuant to Valuation Procedures adopted by the Board of Trustees.
At December 31, 2006 the Fund’s Portfolio of Investments includes the following industry categories:
| | |
Financials | | 25.8% |
Consumer Discretionary | | 18.6% |
Industrials and Services | | 16.0% |
Consumer Staples | | 12.7% |
Information Technology | | 11.7% |
Energy | | 6.3% |
Health Care | | 4.1% |
Utilities | | 2.5% |
Telecommunication Services | | 1.9% |
Materials | | 0.4% |
| | |
| | 100.0% |
| | |
At December 31, 2006 the Fund’s Portfolio of Investments includes the following currency categories:
| | |
Euro | | 27.6% |
British Pound Sterling | | 16.5% |
Japanese Yen | | 14.3% |
Swiss Franc | | 6.0% |
Hong Kong Dollar | | 5.0% |
United States Dollar | | 4.6% |
Indian Rupee | | 3.7% |
Australian Dollar | | 3.2% |
Brazilian Real | | 2.9% |
Canadian Dollar | | 2.8% |
Singapore Dollar | | 2.8% |
Mexico Nuevo Peso | | 2.1% |
Taiwan Dollar | | 1.9% |
South Korean Won | | 1.9% |
Swedish Krona | | 1.5% |
Indonesian Rupiah | | 1.2% |
All other currencies | | 2.0% |
| | |
| | 100.0% |
| | |
See accompanying Notes to Financial Statements.
December 31, 2006 | William Blair Funds 37 |
W. George Greig
INTERNATIONAL EQUITY FUND
The International Equity Fund invests primarily in common stocks of companies included in the Morgan Stanley Capital International All Country World ex-U.S. Index.
AN OVERVIEW FROM THE PORTFOLIO MANAGER
See page 30 for the International Markets Overview.
How did the Fund perform during the past year? How did the Fund’s performance compare to its benchmark?
The International Equity Fund posted a 19.96% gain (Class N Shares) for the 12 months ended December 31, 2006. By comparison, the Fund’s benchmark, the Morgan Stanley Capital International (MSCI) All Country World (ACWI) ex-US Index, rose 27.16%.
What were the most significant factors impacting Fund performance? What factors were behind the Fund’s performance versus the benchmark?
Despite strong absolute performance, the Fund underperformed the Index during 2006. This underperformance was due largely to second quarter results. The Fund’s quality growth focus hampered relative performance during the quarter, due both to value domination during 2006, as value outperformed growth by over 6% during the year, coupled with the negative “quality” effect as quality companies underperformed by even a wider margin during the year. The portfolio’s significant underweighting of Materials and Utilities, two of the strongest performing sectors during the year, in favor of Consumer, IT and Health Care, sectors that underperformed, also hampered results. The Fund’s results during 2006, returning 19.96%, were due largely to strong stock selection in Consumer Staples, Energy, Financials, Information Technology (IT), and Telecommunication Services. Specifically, the Fund’s overweighting and stock selection within Latin American Consumer Staples stocks added value, as did the Fund’s overweighting in UK Consumer Staples companies. Energy stock selection was bolstered by the Fund’s Europe performance, while Financials stock selection was strong across most regions, coupled with regional positioning. Within IT, the Fund’s weighting in Europe ex-UK companies added value, coupled with the focus on Taiwanese consumer electronics and IT outsourcing companies. During the year, the Fund’s Telecommunications Services allocation was largely focused on emerging markets companies that have benefited from accelerating subscriber growth in Latin America and Asia.
What is your current strategy? How is the Fund positioned?
As of year end, the Fund was focused on Consumer, Industrials, and Information Technology (IT) stocks, at the expense of Materials, Telecommunication Services, and Energy. Financials, which maintained the highest absolute weighting in the Fund, was underweighted relative to the Index. From a regional perspective, the Fund was underweighted in most developed markets, particularly Japan, and overweighted in Latin America.
38 Annual Report | December 31, 2006 |
International Equity Fund
Performance Highlights (unaudited)
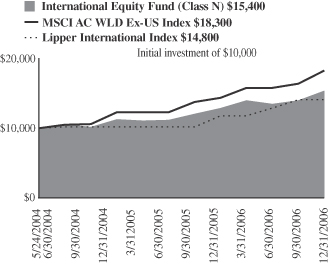
Average Annual Total Return at 12/31/2006
| | | | | | |
| | | 1
Year | | | Since Inception(a) | |
International Equity Fund
Class N | | 19.96 | % | | 18.06 | % |
International Equity Fund
Class I | | 20.22 | | | 18.43 | |
MSCI All Country World Ex-US | | 27.16 | | | 25.80 | |
Lipper International Index | | 25.89 | | | — | |
| | (a) | | For the period from May 24, 2004 to December 31, 2006. |
Performance cited represents past performance. Past performance does not guarantee future results and current performance may be lower or higher than the data quoted. Results shown are average annual returns, which assume reinvestment of dividends and capital gains. Investment returns and principal will fluctuate and you may have a gain or loss when you sell shares. For the most current month-end performance information, please call 1-800-742-7272, or visit our Web site at www.williamblairfunds.com. From time to time the investment advisor may waive fees or reimburse expenses for the Fund. Without these waivers, performance would be lower. International investing involves special risk considerations, including currency fluctuations, lower liquidity, economic and political risk. Class N shares are available to the general public without a sales load. Class I shares are available to certain institutional investors and advisory clients of William Blair & Company L.L.C. without a sales load or distribution (12b-1) or service fees.
The performance highlights and graph presented above do not reflect the deduction of taxes that a shareholder would pay on fund distributions or the redemption of fund shares.
The Morgan Stanley Capital International (MSCI) All Country World Ex-US Index is an unmanaged index that includes developed and emerging markets and reduced Japanese portion, making it more comparable to the International Equity Fund in terms of investment approach.
The Lipper International Index is a composite of international growth mutual funds.
This report identifies the Fund’s investments on December 31, 2006. These holdings are subject to change. Not all stocks in the Fund performed the same, nor is there any guarantee that these stocks will perform as well in the future. Market forecasts provided in this report may not necessarily come to pass.
Sector Diversification (unaudited)
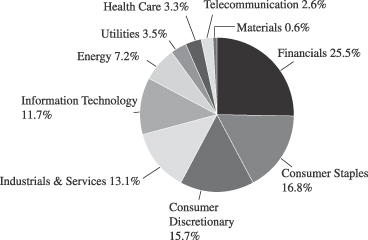
The sector diversification shown is based on the total investment portfolio.
December 31, 2006 | William Blair Funds 39 |
International Equity Fund
Portfolio of Investments, December 31, 2006 (all dollar amounts in thousands)
| | | | | |
Issuer | | Shares | | Value |
| | |
Common Stocks—Europe—39.4% | | | | | |
Austria—1.7% | | | | | |
Erste Bank (Commercial banks) | | 36,232 | | $ | 2,774 |
Raiffeisen International Bank (Commercial banks) | | 14,600 | | | 2,220 |
| | | | | |
| | | | | 4,994 |
| | | | | |
Belguim—0.4% | | | | | |
InBev N.V. (Beverages) | | 18,500 | | | 1,217 |
| | | | | |
France—14.7% | | | | | |
BNP Paribas (Commercial banks) | | 48,370 | | | 5,262 |
Capgemini S.A. (IT services) | | 37,300 | | | 2,334 |
Essilor International (Health care equipment & supplies) | | 27,500 | | | 2,952 |
Eurazeo (Diversified financial services) | | 17,900 | | | 2,555 |
Groupe Danone (Food products) | | 49,800 | | | 7,531 |
Iliad S.A. (Internet software & services) | | 11,500 | | | 994 |
L’Oreal S.A. (Personal products) | | 81,200 | | | 8,117 |
LVMH Moet Hennessey Louis Vuitton SA (Textiles, apparel & luxury goods) | | 48,400 | | | 5,091 |
Veolia Environnement (Multi-utilities) | | 69,000 | | | 5,262 |
Vinci S.A. (Construction & engineering) | | 27,600 | | | 3,518 |
| | | | | |
| | | | | 43,616 |
| | | | | |
Germany—2.7% | | | | | |
Bijou Brigitte (Textiles, apparel & luxury goods) | | 2,380 | | | 469 |
E.ON AG (Electric utilities) | | 37,900 | | | 5,118 |
SAP AG (Software) | | 45,500 | | | 2,413 |
| | | | | |
| | | | | 8,000 |
| | | | | |
Greece—1.0% | | | | | |
National Bank of Greece (Commercial banks) | | 64,160 | | | 2,943 |
| | | | | |
Ireland—1.5% | | | | | |
Anglo Irish Bank plc (Commercial banks) | | 165,300 | | | 3,423 |
IAWS Group plc (Food products) | | 37,600 | | | 963 |
| | | | | |
| | | | | 4,386 |
| | | | | |
Italy—3.3% | | | | | |
Luxottica Group SpA (Textiles, apparel & luxury goods) | | 163,200 | | | 5,003 |
Saipem SpA (Energy equipment & services) | | 189,100 | | | 4,906 |
| | | | | |
| | | | | 9,909 |
| | | | | |
Netherlands—1.3% | | | | | |
Royal Numico N.V. (Food products) | | 40,400 | | | 2,169 |
*Tomtom NV (Software) | | 39,500 | | | 1,701 |
| | | | | |
| | | | | 3,870 |
| | | | | |
Norway—0.4% | | | | | |
*Acergy S.A. (Energy equipment & services) | | 70,700 | | | 1,349 |
| | | | | |
Spain—1.9% | | | | | |
Industria De Textile (Specialty retail) | | 103,300 | | | 5,557 |
| | | | | |
Sweden—1.5% | | | | | |
Ericsson LM (Communications equipment) | | 850,000 | | | 3,418 |
*Modern Times Group (Media) | | 15,600 | | | 1,022 |
| | | | | |
| | | | | 4,440 |
| | | | | |
| | | | | |
Issuer | | Shares | | Value |
| |
Common Stocks—Europe—39.4%—(continued) | | | |
Switzerland—9.0% | | | | | |
ABB Ltd. (Electrical equipment) | | 505,500 | | $ | 9,052 |
*EFG International (Capital markets) | | 44,600 | | | 1,680 |
Kuehne & Nagel International AG (Marine) | | 31,300 | | | 2,274 |
Nestle S.A. (Food products) | | 14,110 | | | 5,005 |
Nobel Biocare Holding AG (Health care equipment & supplies) | | 5,290 | | | 1,560 |
Roche Holdings AG (Pharmaceuticals) | | 28,350 | | | 5,072 |
SGS S.A. (Commercial services & supplies) | | 2,030 | | | 2,255 |
| | | | | |
| | | | | 26,898 |
| | | | | |
United Kingdom—18.1% | | | | | |
BG Group plc (Oil, gas & consumable fuels) | | 498,600 | | | 6,780 |
*Cairn Energy plc (Oil, gas & consumable fuels) | | 48,900 | | | 1,718 |
Capita Group plc (Commercial services & supplies) | | 265,100 | | | 3,143 |
Carphone Warehouse Group plc (Specialty retail) | | 217,300 | | | 1,332 |
HBOS plc (Commercial banks) | | 359,700 | | | 7,952 |
Man Group plc (Capital markets) | | 330,700 | | | 3,375 |
Northern Rock plc (Thrift & mortgage finance) | | 161,600 | | | 3,716 |
Reckitt Benckiser plc (Household products) | | 151,700 | | | 6,920 |
*Rolls-Royce Group plc (Aerospace & defense) | | 660,900 | | | 5,776 |
Rotork plc (Electronic equipment & instruments) | | 62,400 | | | 1,019 |
Standard Chartered plc (Commercial banks) | | 125,400 | | | 3,653 |
Tesco plc (Food & staples retailing) | | 992,900 | | | 7,846 |
Tullow Oil plc (Oil, gas & consumable fuels) | | 102,700 | | | 798 |
| | | | | |
| | | | | 54,028 |
| | | | | |
Japan—15.7% | | | | | |
Aeon Mall Co., Ltd. (Real Estate management & development) | | 35,900 | | | 2,027 |
Canon, Inc. (Office electronics) | | 107,400 | | | 6,047 |
Denso Corporation (Auto components) | | 167,300 | | | 6,634 |
FANUC Ltd. (Machinery) | | 30,800 | | | 3,023 |
Honeys Company, Ltd. (Specialty retail) | | 18,200 | | | 676 |
Hoya Corporation (Electronic equipment & instruments) | | 67,400 | | | 2,627 |
*Jupiter Telecommunications Co., Ltd. (Media) | | 1,898 | | | 1,530 |
*K.K. DaVinci Advisors (Real Estate management & development) | | 761 | | | 754 |
Keyence Corporation (Electronic equipment & instruments) | | 13,480 | | | 3,327 |
Komatsu Ltd. (Machinery) | | 144,100 | | | 2,916 |
Orix Corporation (Consumer finance) | | 27,800 | | | 8,062 |
Sharp Corporation (Household durables) | | 153,000 | | | 2,631 |
Suruga Bank Ltd. (Commercial banks) | | 153,000 | | | 1,895 |
Yamada Denki Co., Ltd. (Specialty retail) | | 14,800 | | | 1,256 |
Yamaha Motor. Co., Ltd. (Automobiles) | | 105,900 | | | 3,329 |
| | | | | |
| | | | | 46,734 |
| | | | | |
| | |
Emerging Asia—7.7% | | | | | |
China—1.0% | | | | | |
*Focus Media Holding Ltd.—ADR (Media) | | 20,300 | | | 1,348 |
*Foxconn International (Communications equipment) | | 275,000 | | | 897 |
Hopson Development Holding Ltd. (Real estate management & development) | | 252,000 | | | 712 |
| | | | | |
| | | | | 2,957 |
| | | | | |
See accompanying Notes to Financial Statements.
40 Annual Report | December 31, 2006 |
International Equity Fund
Portfolio of Investments, December 31, 2006 (all dollar amounts in thousands)
| | | | | |
Issuer | | Shares | | Value |
|
Common Stocks—Emerging Asia—7.7%—(continued) |
India—3.8% | | | | | |
Bharat Heavy Electricals Ltd. (Electrical equipment) | | 41,300 | | $ | 2,139 |
*Bharti Airtel Limited (Wireless telecommunication services) | | 156,973 | | | 2,235 |
Infosys Technologies Ltd. (IT services) | | 69,100 | | | 3,492 |
Suzlon Energy Ltd. (Electrical equipment) | | 58,000 | | | 1,708 |
Vedanta Resources Plc (Metals & mining) | | 71,000 | | | 1,691 |
| | | | | |
| | | | | 11,265 |
| | | | | |
Indonesia—0.9% | | | | | |
PT Bank Rakyat Indonesia (Commercial banks) | | 2,508,000 | | | 1,439 |
PT Telekomunikasi Indonesia TbK (Diversified telecommunication services) | | 1,117,500 | | | 1,259 |
| | | | | |
| | | | | 2,698 |
| | | | | |
South Korea—0.7% | | | | | |
Samsung Electronics Co. (Semiconductors & semiconductor equipment) | | 3,370 | | | 2,211 |
| | | | | |
Taiwan—1.3% | | | | | |
High Tech Computer Corp. (Computers & peripherals) | | 12,000 | | | 236 |
Hon Hai Precision Industry Corp. (Electronic equipment & instruments) | | 512,117 | | | 3,644 |
| | | | | |
| | | | | 3,880 |
| | | | | |
| | |
Asia—6.7% | | | | | |
Australia—2.4% | | | | | |
Allco Finance Group Limited (Capital markets) | | 135,400 | | | 1,374 |
Macquarie Bank Ltd. (Capital markets) | | 90,600 | | | 5,632 |
| | | | | |
| | | | | 7,006 |
| | | | | |
Hong Kong—2.4% | | | | | |
Esprit Holdings Ltd. (Specialty retail) | | 292,500 | | | 3,258 |
Li & Fung Ltd. (Distributors) | | 1,257,200 | | | 3,903 |
| | | | | |
| | | | | 7,161 |
| | | | | |
Singapore—1.9% | | | | | |
Capitaland, Ltd. (Real estate management & development) | | 1,435,000 | | | 5,775 |
| | | | | |
| | |
Emerging Latin America—5.5% | | | | | |
Brazil—1.4% | | | | | |
Companhia de Concessoes Rodoviarias (Transportation infrastructure) | | 95,400 | | | 1,288 |
Gol-Linhas Aereas Inteligentes S.A.—ADR (Airlines) | | 25,100 | | | 720 |
Localiza Rent a Car S.A. (Road & rail) | | 19,800 | | | 595 |
Natura Cosmeticos S.A. (Personal products) | | 105,400 | | | 1,487 |
| | | | | |
| | | | | 4,090 |
| | | | | |
Chile—0.5% | | | | | |
*Cencosud S.A.—ADR 144A (Specialty retail) | | 33,300 | | | 1,563 |
| | | | | |
| | | | | | |
Issuer | | Shares or
Principal
Amount | | Value |
|
Common Stocks—Emerging Latin America—5.5%—(continued) |
Columbia—0.4% | | | | | | |
Bancolumbia S.A.—ADR (Commercial banks) | | | 41,400 | | $ | 1,290 |
| | | | | | |
Mexico—3.2% | | | | | | |
America Movil S.A. (Wireless telecommunications services) | | | 1,906,900 | | | 4,300 |
Walmart de Mexico (Food & staples retailing) | | | 1,185,900 | | | 5,218 |
| | | | | | |
| | | | | | 9,518 |
| | | | | | |
| | |
Canada—3.3% | | | | | | |
Manulife Financial Corporation (Insurance) | | | 131,100 | | | 4,424 |
Shoppers Drug Mart Corporation (Food & staples retailing) | | | 64,000 | | | 2,749 |
Suncor Energy, Inc. (Oil, gas & consumable fuels) | | | 32,600 | | | 2,566 |
| | | | | | |
| | | | | | 9,739 |
| | | | | | |
| |
Emerging Europe, Mid-East, Africa—0.9% | | | |
Russia—0.2% | | | | | | |
*CTC Media, Inc. (Media)† | | | 24,200 | | | 581 |
| | | | | | |
South Africa—0.7% | | | | | | |
Naspers Ltd. (Media) | | | 40,200 | | | 953 |
Sasol ASA (Oil, gas & consumable fuels) | | | 27,499 | | | 1,012 |
| | | | | | |
| | | | | | 1,965 |
| | | | | | |
Total Common Stock—97.3%
(cost $235,777) | | | | | | 289,640 |
| | | | | | |
| | |
Preferred Stocks | | | | | | |
Brazil—1.3% | | | | | | |
Banco Itau S.A. (Commercial banks) | | | 56,200 | | | 2,036 |
Petroleo Brasileiro S.A. (Oil, gas & consumable fuels) | | | 86,000 | | | 2,005 |
| | | | | | |
| | | | | | 4,041 |
| | | | | | |
Total Preferred Stocks—1.3%
(cost $2,664) | | | | | | 4,041 |
| | | | | | |
| | |
Investment in Affiliate | | | | | | |
William Blair Ready Reserves Fund | | | 5,158,100 | | | 5,158 |
| | | | | | |
Total Investment in Affiliate—1.7%
(cost $5,158) | | | | | | 5,158 |
| | | | | | |
| | |
Short-Term Investments | | | | | | |
American Express Demand Note, VRN, 5.176%, due 1/2/07 | | $ | 93,000 | | | 93 |
Prudential Funding Demand Note, VRN, 5.180%, due 1/2/07 | | | 1,072,000 | | | 1,072 |
| | | | | | |
Total Short-Term Investments—0.4%
(cost $1,165) | | | 1,165 |
| | | | | | |
See accompanying Notes to Financial Statements.
December 31, 2006 | William Blair Funds 41 |
International Equity Fund
Portfolio of Investments, December 31, 2006 (all dollar amounts in thousands)
| | | | | | | |
Issuer | | Principal
Amount | | Value | |
| | |
Repurchase Agreement | | | | | | | |
Investors Bank & Trust Company, 5.01% dated 12/29/2006, due 1/2/2007, repurchase price $2,264, collateralized by SBA Pool #506103 | | $ | 2,262,336 | | $ | 2,262 | |
| | | | | | | |
Total Repurchase Agreement—0.8%
(cost $2,262) | | | 2,262 | |
| | | | | | | |
Total Investments—101.5%
(cost $247,026) | | | 302,266 | |
Liabilities plus cash and other assets—(1.5%) | | | (4,550 | ) |
| | | | | | | |
Net assets—100.0% | | $ | 297,716 | |
| | | | | | | |
*Non-income producing securities
ADR = American Depository Receipt
VRN = Variable Rate Note
For securities, primarily traded on exchanges or markets that close before the close of regular trading on the New York Stock Exchange, the Fund uses an independent pricing service on a daily basis to fair value price the securities pursuant to Valuation Procedures adopted by the Board of Trustees.
At December 31, 2006 the Fund’s Portfolio of Investments includes the following industry categories:
| | |
Financials | | 25.5% |
Consumer Staples | | 16.8% |
Consumer Discretionary | | 15.7% |
Industrials and Services | | 13.1% |
Information Technology | | 11.7% |
Energy | | 7.2% |
Utilities | | 3.5% |
Health Care | | 3.3% |
Telecommunication Services | | 2.6% |
Materials | | 0.6% |
| | |
| | 100.0% |
| | |
At December 31, 2006 the Fund’s Portfolio of Investments includes the following currency categories:
| | |
Euro | | 28.8% |
British Pound Sterling | | 19.0% |
Japanese Yen | | 15.9% |
Swiss Franc | | 9.2% |
Canadian Dollar | | 3.3% |
Indian Rupee | | 3.3% |
Mexico Nuevo Peso | | 3.2% |
Hong Kong Dollar | | 3.0% |
Brazilian Real | | 2.5% |
Australian Dollar | | 2.4% |
Singapore Dollar | | 2.0% |
United States Dollar | | 1.9% |
Swedish Krona | | 1.5% |
Taiwan Dollar | | 1.3% |
Other Currencies | | 2.7% |
| | |
| | 100.0% |
| | |
See accompanying Notes to Financial Statements.
42 Annual Report | December 31, 2006 |

Jeffrey A. Urbina
INTERNATIONAL SMALL CAP GROWTH FUND
The International Small Cap Growth Fund primarily invests in a diversified portfolio of common stocks of small cap companies in developed and emerging markets.
AN OVERVIEW FROM THE PORTFOLIO MANAGER
See page 30 for the International Markets Overview.
How did the Fund perform during the past year? How did the Fund’s performance compare to its benchmark?
The International Small Cap Growth Fund posted a 20.32% increase (Class N Shares) for the 12 months ended December 31, 2006. By comparison, the Fund’s benchmark, the Morgan Stanley Capital International (MSCI) World Small Cap ex-U.S. Index gained 19.82%.
What were the most significant factors impacting Fund performance? What factors were behind the Fund’s performance versus the benchmark?
The Fund had strong absolute and relative results during 2006, returning 20.32%, due largely to strong stock selection across most sectors. In particular, stock selection in Consumer, Health Care, Industrials and Telecommunication Services added value. Within Consumer Discretionary, the portfolio’s weightings in developed Asia and Europe enhanced results, as did Chinese stock performance, coupled with Latin America stock selection. Within Health Care, the Fund’s weighting and stock selection in Europe ex-UK stocks added value, while Industrials stock selection was enhanced by European (including UK) weightings and stock selection. Stock selection was also strong in Europe ex-UK, while the Fund’s emerging markets allocation, and lower Japanese weighting were also additive to results. Sector positioning detracted from performance during the period, as did stock selection in Energy, Financials and Materials.
What is your current strategy? How is the Fund positioned?
As of year end, the Fund was focused on the Consumer, Financials, and Industrials and Services sectors. Information Technology (IT) and Energy were the most underweighted relative to the Index. Regionally, the Fund was underweighted in most developed markets, with the exception of Europe ex-UK, due to the emerging markets allocation.
December 31, 2006 | William Blair Funds 43 |
International Small Cap Growth Fund
Performance Highlights (unaudited)

Average Annual Total Return at 12/31/2006
| | | | | | |
| | | 1
Year | | | Since Inception(a) | |
International Small Cap Growth Fund
Class N | | 20.32 | % | | 28.78 | % |
International Small Cap Growth Fund
Class I | | 20.68 | | | 29.11 | |
MSCI World Ex-US Small Cap Index | | 19.82 | | | 27.41 | |
| | (a) | | For the period from November 1, 2005 (Commencement of Operations) to December 31, 2006. | |
Performance cited represents past performance. Past performance does not guarantee future results and current performance may be lower or higher than the data quoted. Results shown are average annual returns, which assume reinvestment of dividends and capital gains. Investment returns and principal will fluctuate and you may have a gain or loss when you sell shares. For the most current month-end performance information, please call 1-800-742-7272, or visit our Web site at www.williamblairfunds.com. From time to time, the investment advisor may waive fees or reimburse expenses for the Fund. Without these waivers, performance would be lower. International investing involves special risk considerations, including currency fluctuations, lower liquidity, economic and political risk. Class N shares are available to the general public without a sales load. Class I shares are available to certain institutional investors and advisory clients of William Blair & Company L.L.C. without a sales load or distribution (12b-1) fees.
The performance highlights and graph presented above do not reflect the deduction of taxes that a shareholder would pay on fund distributions or the redemption of fund shares.
The Morgan Stanley Capital International (MSCI) World Ex-US Small Cap Index is an unmanaged index that is designed to measure equity performance of small cap stocks in developed and emerging markets.
This report identifies the Fund’s investments on December 31, 2006. These holdings are subject to change. Not all stocks in the Fund performed the same, nor is there any guarantee that these stocks will perform as well in the future. Market forecasts provided in this report may not necessarily come to pass.
Sector Diversification (unaudited)
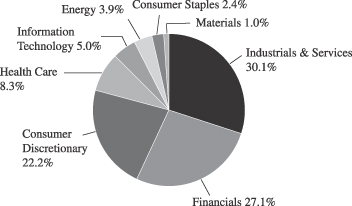
The sector diversification shown is based on the total investment portfolio.
44 Annual Report | December 31, 2006 |
International Small Cap Growth Fund
Portfolio of Investments, December 31, 2006 (all dollar amounts in thousands)
| | | | | |
Issuer | | Shares | | Value |
| | |
Common Stocks—Europe—37.4% | | | | | |
France—4.2% | | | | | |
April Group S.A. (Insurance) | | 46,882 | | $ | 2,256 |
*Orpea (Heath care providers & services) | | 28,863 | | | 2,730 |
*S.O.I.T.E.C. (Semiconductors & semiconductor equipment) | | 135,300 | | | 4,783 |
| | | | | |
| | | | | 9,769 |
| | | | | |
Germany—8.6% | | | | | |
Bijou Brigitte (Apparel & luxury goods) | | 8,100 | | | 1,594 |
*Colonia Real Estate AG (Real estate management and development) | | 49,000 | | | 2,348 |
CTS Eventim AG (Media) | | 69,000 | | | 2,656 |
MTU Aero Engines Holding AG (Aerospace & defense) | | 108,814 | | | 5,068 |
*Patrizia Immobilien AG (Real estate management & development) | | 4,200 | | | 125 |
*Q-Cells AG (Electrical equipment) | | 55,880 | | | 2,502 |
*Qiagen NV (Lifesciences tools & services) | | 200,073 | | | 3,072 |
Solarworld AG (Electrical equipment) | | 38,031 | | | 2,370 |
*Wire Card AG (Commercial services & supplies) | | 25,600 | | | 264 |
| | | | | |
| | | | | 19,999 |
| | | | | |
Ireland—6.1% | | | | | |
IAWS Group plc (Food products) | | 193,340 | | | 4,953 |
Kingspan Group plc (Building products) | | 181,090 | | | 4,802 |
*Norkom Group plc (Software) | | 229,400 | | | 614 |
United Drug plc (Heath care providers & services) | | 696,880 | | | 3,661 |
| | | | | |
| | | | | 14,030 |
| | | | | |
Italy—6.8% | | | | | |
Azimut Holdings SpA (Capital markets) | | 346,717 | | | 4,630 |
Banca Italease (Diversified financial services) | | 115,800 | | | 6,722 |
Credito Emiliano SpA (Commercial banks) | | 159,372 | | | 2,251 |
Tod’s SpA (Textiles, apparel & luxury goods) | | 27,500 | | | 2,212 |
| | | | | |
| | | | | 15,815 |
| | | | | |
Norway—1.8% | | | | | |
*Acergy S.A. (Energy equipment & services) | | 213,900 | | | 4,081 |
| | | | | |
Spain—3.3% | | | | | |
*Grifols S.A. (Biotechnolgy) | | 402,403 | | | 5,357 |
*Tecnicas Reunidas S.A. (Construction & engineering) | | 61,700 | | | 2,367 |
| | | | | |
| | | | | 7,724 |
| | | | | |
Sweden—4.3% | | | | | |
Hemtex AB (Specialty retail) | | 54,700 | | | 1,117 |
*Modern Times Group (Media) | | 71,200 | | | 4,665 |
Nobia AB (Specialty retail) | | 92,400 | | | 3,546 |
*Tradedoubler AB (Internet software & services) | | 22,500 | | | 670 |
| | | | | |
| | | | | 9,998 |
| | | | | |
Switzerland—2.3% | | | | | |
*Partners Group Global Opportunities, Ltd. (Capital markets) | | 43,771 | | | 5,282 |
| | | | | |
| | |
Japan—19.5% | | | | | |
Aeon Mall Co., Ltd. (Real estate management & development) | | 81,000 | | | 4,574 |
Chiyoda Corp. (Construction & engineering) | | 114,000 | | | 2,229 |
*DeNA Co., Ltd. (Internet & catalog retail) | | 719 | | | 2,356 |
En-Japan Inc. (Commercial services & supplies) | | 431 | | | 2,064 |
| | | | | |
Issuer | | Shares | | Value |
|
Common Stocks—Japan—19.5%—(continued) |
Honeys Company, Ltd. (Specialty retail) | | 54,400 | | $ | 2,021 |
Joint Corporation (Real estate management & development) | | 112,620 | | | 4,330 |
*K.K. DaVinci Advisors (Real estate management & development) | | 4,343 | | | 4,304 |
Kenedix, Inc. (Real estate management & development) | | 935 | | | 4,218 |
MISUMI Group, Inc. (Trading companies & distributors) | | 195,700 | | | 3,737 |
Nakanishi Inc. (Health care equipment & supplies) | | 28,600 | | | 3,509 |
Nitori Company Ltd. (Specialty retail) | | 49,500 | | | 2,142 |
Park 24 Co., Ltd. (Commercial services & supplies) | | 240,500 | | | 3,075 |
Suruga Bank (Commercial banks) | | 533,000 | | | 6,601 |
| | | | | |
| | | | | 45,160 |
| | | | | |
United Kingdom—14.8% | | | | | |
Accident Exchange Group plc (Commercial services & supplies) | | 301,274 | | | 2,276 |
Amlin plc (Insurance) | | 111,700 | | | 709 |
*Ceres Power Holdings plc (Electrical equipment) | | 395,200 | | | 1,694 |
Detica Group plc (IT services) | | 356,200 | | | 2,556 |
Homeserve plc (Commercial services & supplies) | | 94,280 | | | 3,483 |
Mears Group plc (Construction & engineering) | | 348,500 | | | 2,474 |
Michael Page International (Commercial services & supplies) | | 581,770 | | | 5,138 |
Rotork plc (Electronic equipement & instruments) | | 144,150 | | | 2,355 |
RPS Group plc (Commercial services & supplies) | | 460,400 | | | 2,430 |
Serco Group plc (Commercial services & supplies) | | 653,040 | | | 4,871 |
Ultra Electronic Holdings plc (Aerospace & defense) | | 102,750 | | | 2,179 |
Victrex plc (Chemicals) | | 134,450 | | | 2,112 |
VT Group plc (Aerospace & defense) | | 231,150 | | | 2,147 |
| | | | | |
| | | | | 34,424 |
| | | | | |
| | |
Emerging Asia—6.6% | | | | | |
China—2.8% | | | | | |
Ctrip.com International, Ltd.—ADR (Hotels, restaurants & leisure) | | 20,020 | | | 1,251 |
*Focus Media Holdings—ADR (Media) | | 36,900 | | | 2,450 |
Li Ning Co. Ltd. (Leisure equipment & products) | | 848,873 | | | 1,357 |
Ports Design Limited (Textiles, apparel & luxury goods) | | 690,500 | | | 1,508 |
| | | | | |
| | | | | 6,566 |
| | | | | |
India—2.3% | | | | | |
ABB Ltd. India (Electrical equipment) | | 13,100 | | | 1,101 |
Financial Technologies, Ltd. (Diversified financial services) | | 52,400 | | | 2,098 |
*Inox Leisure, Ltd. (Media) | | 333,579 | | | 1,085 |
Pantaloon Retail India, Ltd. (Multiline retail) | | 107,850 | | | 996 |
| | | | | |
| | | | | 5,280 |
| | | | | |
South Korea—0.5% | | | | | |
Hana Tour Service Inc. (Hotels, restaurants & leisure) | | 15,000 | | | 1,138 |
| | | | | |
See accompanying Notes to Financial Statements.
December 31, 2006 | William Blair Funds 45 |
International Small Cap Growth Fund
Portfolio of Investments, December 31, 2006 (all dollar amounts in thousands)
| | | | | |
Issuer | | Shares | | Value |
|
Common Stocks—Emerging Asia—6.6%—(continued) |
Taiwan—1.0% | | | | | |
Largan Precision Co., Ltd. (Leisure equipment & products) | | 119,300 | | $ | 2,295 |
| | | | | |
| | |
Asia—11.8% | | | | | |
Australia—6.9% | | | | | |
Allco Finance Group, Limited (Capital markets) | | 452,265 | | | 4,590 |
Seek Limited (Commercial services & supplies) | | 815,980 | | | 3,780 |
United Group, Ltd. (Construction & engineering) | | 292,570 | | | 3,218 |
WorleyParsons, Ltd. (Energy equipment & supplies) | | 267,820 | | | 4,498 |
| | | | | |
| | | | | 16,086 |
| | | | | |
Singapore—4.9% | | | | | |
Goodpack Ltd. (Air freight & logistics) | | 1,718,000 | | | 1,724 |
Osim International Ltd. (Specialty retail) | | 1,932,400 | | | 1,760 |
Petra Foods, Ltd. (Food products) | | 223,000 | | | 262 |
Raffles Education Corp. Ltd. (Diversifed consumer services) | | 2,560,000 | | | 2,952 |
Singapore Exchange, Ltd. (Diversified financial services) | | 1,245,000 | | | 4,596 |
| | | | | |
| | | | | 11,294 |
| | | | | |
| | |
Emerging Latin America—2.0% | | | | | |
Brazil—1.0% | | | | | |
Cyrela Brazil Realty S.A. (Household durables) | | 110,100 | | | 1,051 |
Submarino S.A. (Internet & catalog retail) | | 35,900 | | | 1,176 |
| | | | | |
| | | | | 2,227 |
| | | | | |
Mexico—1.0% | | | | | |
*Urbi Desarrollos Urbanos S.A. (Household durables) | | 672,100 | | | 2,426 |
| | | | | |
|
Emerging Europe, Mid-East, Africa—1.3% |
Czech Republic—0.5% | | | | | |
*Central European Media Enterprises Ltd., Class “A” (Media)† | | 16,000 | | | 1,120 |
| | | | | |
| | | | | | |
Issuer | | Shares or
Principal
Amount | | Value |
|
Common Stocks—Emerging Europe, Mid-East, Africa—1.3%—(continued) |
Russia—0.8% | | | | | | |
*CTC Media, Inc. (Media)† | | | 79,738 | | $ | 1,915 |
| | | | | | |
| | |
Canada—1.3% | | | | | | |
*Gildan Activewear, Inc. (Textiles, apparel & luxury goods) | | | 41,900 | | | 1,958 |
Richie Bros. Auctioneers Incorporated† (Commercial services & supplies) | | | 20,000 | | | 1,071 |
| | | | | | |
| | | | | | 3,029 |
| | | | | | |
Total Common Stock—94.7%
(cost $189,217) | | | 219,658 |
| | | | | | |
| | |
Investment in Affiliate | | | | | | |
William Blair Ready Reserves Fund | | | 5,228,467 | | | 5,228 |
| | | | | | |
Total Investment in Affiliate—2.3%
(cost $5,228) | | | | | | |
| | |
Short-Term Investments | | | | | | |
American Express Demand Note, VRN 5.176%, due 1/2/07 | | $ | 1,074,000 | | | 1,074 |
| | | | | | |
Prudential Funding Demand Note, VRN 5.180%, due 1/2/07 | | | 5,397,000 | | | 5,397 |
| | | | | | |
Total Short-term Investments—2.8%
(cost $6,471) | | | 6,471 |
| | | | | | |
| | |
Repurchase Agreement | | | | | | |
Investors Bank & Trust Company, 5.01% dated 12/29/2006, due 1/2/2007, repurchase price $339, collateralized by SBA Pool # 504705 | | | 338,909 | | | 339 |
| | | | | | |
Total Repurchase Agreement—0.1%
(cost $339) | | | 339 |
| | | | | | |
Total Investments—99.9%
(cost $201,255) | | | 231,696 |
Cash and other assets, less liabilities—0.1% | | | 273 |
| | | | | | |
Net assets—100.0% | | $ | 231,969 |
| | | | | | |
*Non-income producing securities
ADR = American Depository Receipt
GDR = Global Depository Receipt
VRN = Variable Rate Note
† = U.S. listed foreign security
For securities, primarily traded on exchanges or markets that close before the close of regular trading on the New York Stock Exchange the Fund uses an independent pricing service on a daily basis to fair value price the securities pursuant to Valuation Procedures adopted by the Board of Trustees.
At December 31, 2006 the Fund’s Portfolio of Investments includes the following industry categories:
| | |
Industrials and Services | | 30.1% |
Financials | | 27.1% |
Consumer Discretionary | | 22.2% |
Health Care | | 8.3% |
Information Technology | | 5.0% |
Energy | | 3.9% |
Consumer Staples | | 2.4% |
Materials | | 1.0% |
| | |
| | 100.0% |
| | |
At December 31, 2006 the Fund’s Portfolio of Investments includes the following currency categories:
| | |
Euro | | 30.7% |
Japanese Yen | | 20.5% |
British Pound Sterling | | 15.7% |
Australian Dollar | | 7.3% |
Signapore Dollar | | 5.1% |
Swedish Krona | | 4.6% |
United States Dollar | | 3.6% |
Swiss Franc | | 2.4% |
Indian Rupee | | 2.4% |
Norwegian Krone | | 1.9% |
Hong Kong Dollar | | 1.3% |
Mexican Neuvo Peso | | 1.1% |
New Taiwan Dollar | | 1.0% |
Brazilian Real | | 1.0% |
All other currencies | | 1.4% |
| | |
| | 100.0% |
| | |
See accompanying Notes to Financial Statements.
46 Annual Report | December 31, 2006 |
W. George Greig

Todd M. McClone
Jeffrey A. Urbina
EMERGING MARKETS GROWTH FUND
The Emerging Markets Growth Fund primarily invests in a diversified portfolio of equity securities issued by growth companies in emerging economies worldwide.
AN OVERVIEW FROM THE PORTFOLIO MANAGERS
See page 30 for the International Markets Overview.
How did the Fund perform during the past year? How did the Fund’s performance compare to its benchmark?
The Emerging Markets Growth Fund posted a 37.90% increase (Class N Shares) for the 12 months ended December 31, 2006. By comparison, the Fund’s benchmark, the Morgan Stanley Capital International (MSCI) Emerging Markets Index, gained 32.59%.
What were the most significant factors impacting Fund performance? What factors were behind the Fund’s performance versus the benchmark?
The Fund had strong absolute and relative results during 2006, returning 37.90%, due largely to strong stock selection across regions and most sectors. In particular, stock selection in Consumer, Energy, Financials, Industrials, and Materials added value. Within Consumer, the Fund’s Emerging Asia Discretionary holdings added the most value, coupled with the overweighting in this area. In addition, strong stock selection across regions within Consumer Staples was additive to results. Within Energy, the Fund’s Emerging Markets Europe, Mid-East and Africa (EMEA) holdings added value. The Fund’s Financials stocks were driven largely by China and India holdings. Industrial stock selection was augmented by Latin American airlines and toll road company performance, while Materials stock selection added value solely to Chinese exposure. From a regional perspective, the Fund’s overweighting in the strongest performing Latin America region at the expense of the weaker EMEA region added value. The Fund’s underweighting in Materials, Financials, Telecommunication Services and Utilities was a detractor from results, as these were the strongest sectors during the period.
What is your current strategy? How is the Fund positioned?
As of year end, the Fund was focused on Consumer and Industrials, with a significant, albeit underweighted, position in Financials as well. Materials and Energy were the most underweighted. Regionally, the Fund was underweighted in EMEA and overweighted in Latin America.
December 31, 2006 | William Blair Funds 47 |
Emerging Markets Growth Fund
Performance Highlights (unaudited)
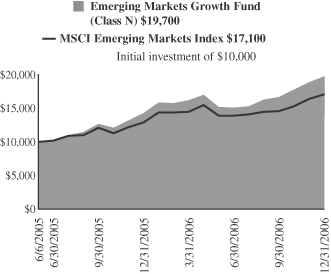
Average Annual Total Return at 12/31/2006
| | | | | | |
| | | 1
Year | | | Since Inception(a) | |
Emerging Markets Growth Fund
Class N | | 37.90 | % | | 53.65 | % |
Emerging Markets Growth Fund
Class I | | 38.07 | | | 53.92 | |
MSCI Emerging Markets Index | | 32.59 | | | 40.84 | |
| | (a) | | For the period from June 6, 2005 (Commencement of Operations) to December 31, 2006. | |
Performance cited represents past performance. Past performance does not guarantee future results and current performance may be lower or higher than the data quoted. Results shown are average annual returns, which assume reinvestment of dividends and capital gains. Investment returns and principal will fluctuate and you may have a gain or loss when you sell shares. For the most current month-end performance information, please call 1-800-742-7272, or visit our Web site at www.williamblairfunds.com. From time to time, the investment advisor may waive fees or reimburse expenses for the Fund. Without these waivers, performance would be lower. International investing involves special risk considerations, including currency fluctuations, lower liquidity, economic and political risk. Class N shares are available to the general public without a sales load. Class I shares are available to certain institutional investors and advisory clients of William Blair & Company L.L.C. without a sales load or distribution (12b-1) fees.
The performance highlights and graph presented above do not reflect the deduction of taxes that a shareholder would pay on fund distributions or the redemption of fund shares.
The Morgan Stanley Capital International (MSCI) Emerging Markets Index is an index that is designed to measure equity performance in the global emerging markets.
This report identifies the Fund’s investments on December 31, 2006. These holdings are subject to change. Not all stocks in the Fund performed the same, nor is there any guarantee that these stocks will perform as well in the future. Market forecasts provided in this report may not necessarily come to pass.
Sector Diversification (unaudited)
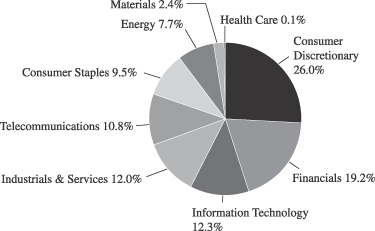
The sector diversification shown is based on the total investment portfolio.
48 Annual Report | December 31, 2006 |
Emerging Markets Growth Fund
Portfolio of Investments, December 31, 2006 (all dollar amounts in thousands)
| | | | | |
Issuer | | Shares | | Value |
|
Common Stocks—Emerging Asia—50.5% |
China—15.9% | | | | | |
China Life Insurance Co. (Insurance) | | 2,586,100 | | $ | 8,827 |
China Mengniu Dairy Co. Ltd. (Food products) | | 3,077,000 | | | 8,063 |
China Mobile Ltd. (Wireless telecommunication services) | | 2,730,300 | | | 23,535 |
China Vanke Company Ltd. (Real estate management & development) | | 10,212,000 | | | 19,565 |
Ctrip.com International Ltd.—ADR (Hotels, restaurants, & leisure) | | 142,700 | | | 8,916 |
*Focus Media Holding Ltd.—ADR (Media) | | 126,400 | | | 8,392 |
*Foxconn International (Communications equipment) | | 2,433,000 | | | 7,935 |
Fu Ji Food and Catering Services Holdings Ltd (Hotels, restaurants, & leisure) | | 1,685,000 | | | 4,346 |
Hopson Development Holdings Ltd. (Real estate management) | | 2,970,000 | | | 8,395 |
Lee and Man Paper Manufacturing Ltd. (Containers & packaging) | | 5,160,000 | | | 12,650 |
Li Ning Co. Ltd (Leisure equipment & products) | | 2,902,000 | | | 4,640 |
Parkson Retail Group Ltd. (Multiline retail) | | 808,400 | | | 3,998 |
Ports Design Ltd. (Textiles, apparel & luxury goods) | | 2,099,500 | | | 4,586 |
Wumart Stores, Inc., Class “H” (Food & staples retailing)** | | 8,680,000 | | | 5,580 |
| | | | | |
| | | | | 129,428 |
| | | | | |
India—17.7% | | | | | |
ABB Ltd. India (Electrical equipment) | | 92,100 | | | 7,739 |
Bharat Heavy Electricals, Ltd. (Electrical equipment) | | 401,400 | | | 20,792 |
*Bharti Airtel Ltd. (Wireless telecommunication services) | | 1,670,500 | | | 23,782 |
Dabur India Ltd. (Personal products) | | 1,124,400 | | | 3,724 |
Financial Technologies, Ltd. (Diversified financial services) | | 91,810 | | | 3,677 |
HDFC Bank (Commercial banks) | | 159,200 | | | 3,820 |
Hindustan Lever Ltd. (Household products) | | 1,390,300 | | | 6,799 |
Housing Development Finance Corp. (Thrifts & mortgage finance) | | 338,500 | | | 12,409 |
Infosys Technologies, Ltd. (IT services) | | 467,200 | | | 23,610 |
*Inox Leisure Ltd. (Media) | | 1,105,300 | | | 3,595 |
Maruti Udyog Ltd. (Automobiles) | | 566,700 | | | 11,871 |
Pantaloon Retail India Ltd. (Multiline retail) | | 444,700 | | | 4,106 |
Shopper’s Stop Ltd. (Multiline retail) | | 264,960 | | | 4,035 |
Suzlon Energy Ltd. (Electrical equipment) | | 244,800 | | | 7,210 |
Vedanta Resources Plc (Metals & mining) | | 271,100 | | | 6,457 |
| | | | | |
| | | | | 143,626 |
| | | | | |
Indonesia—3.0% | | | | | |
PT Bank Rakyat Indonesia (Commercial banks) | | 13,614,000 | | | 7,809 |
*PT Kalbe Farma Tbk (Pharmaceuticals) | | 5,702,700 | | | 757 |
PT Telekomunikasi Tbk (Diversified telecommunication services) | | 13,731,500 | | | 15,477 |
| | | | | |
| | | | | 24,043 |
| | | | | |
Malaysia—2.8% | | | | | |
Bumiputra Commerce Holding Bhd (Commercial banking) | | 7,473,900 | | | 16,375 |
Transmile Group Bhd (Air freight & logisitics) | | 1,645,700 | | | 6,637 |
| | | | | |
| | | | | 23,012 |
| | | | | |
| | | | | |
Issuer | | Shares | | Value |
|
Common Stocks—Emerging Asia—50.5%—(continued) |
South Korea—4.7% | | | | | |
Hana Tour Service (Hotels, restaurants, & leisure) | | 63,900 | | $ | 4,847 |
*NHN Corporation (Internet software & services) | | 54,600 | | | 6,641 |
Samsung Electronics Co. (Semiconductors & equipment) | | 29,460 | | | 19,326 |
*Shinsegae Co. Ltd. (Food & staples retailing) | | 12,170 | | | 7,581 |
| | | | | |
| | | | | 38,395 |
| | | | | |
Taiwan—6.4% | | | | | |
High Tech Computer Corporation (Computers & peripherals) | | 170,800 | | | 3,369 |
Hon Hai Precision Industry (Electronic equipment & instruments) | | 3,227,528 | | | 22,964 |
*Himax Technologies, Inc.—ADR (Semiconductors & equipment) | | 816,500 | | | 3,895 |
Johnson Health Tech Company Ltd. (Leisure equipment & products) | | 59,000 | | | 432 |
Largan Precision Co. Ltd. (Leisure equipment & products) | | 757,550 | | | 14,571 |
Mediatek Inc. (Semiconductors & equipment) | | 691,040 | | | 7,117 |
| | | | | |
| | | | | 52,348 |
| | | | | |
| | |
Emerging Latin America—27.3% | | | | | |
Brazil—9.7% | | | | | |
Companhia de Concessoes Rodoviarias (Transportation infrastructure) | | 1,210,900 | | | 16,351 |
Cyrela Brazil Realty S.A. (Household durables) | | 1,558,900 | | | 14,878 |
Gol Linhas Aereas Inteligentes S.P—ADR (Airlines) | | 135,900 | | | 3,896 |
Localiza Rent a Car S.A. (Road & rail) | | 557,900 | | | 16,778 |
Lojas Renner S.A. (Multiline retail) | | 327,800 | | | 4,710 |
Natura Cosmeticos S.A. (Personal products) | | 581,100 | | | 8,200 |
Submarino S.A. (Internet & catalog retail) | | 305,200 | | | 9,998 |
*Totvs S.A. (Software) | | 177,600 | | | 3,931 |
| | | | | |
| | | | | 78,742 |
| | | | | |
Chile—3.1% | | | | | |
*Cencosud S.A.—ADR 144A (Specialty retail) | | 286,800 | | | 13,458 |
S.A.C.I. Falabella S.A. (Multiline retail) | | 3,469,694 | | | 12,190 |
| | | | | |
| | | | | 25,648 |
| | | | | |
Columbia—1.4% | | | | | |
Bancolombia S.A.—ADR (Commercial banks) | | 357,900 | | | 11,149 |
| | | | | |
Mexico—12.0% | | | | | |
Alsea S.A.B. de C.V. (Hotels, restaurants, & leisure) | | 727,800 | | | 3,967 |
America Movil S.A. (Wireless telecommunication services) | | 10,596,200 | | | 23,894 |
*Desarrolladora Homex S.A. de C.V.—ADR (Household durables) | | 171,100 | | | 10,107 |
Grupo Financiero Banorte S.A. de C.V. (Commercial banks) | | 3,948,600 | | | 15,439 |
Grupo Aeropuertario Del—ADR (Transportation infrastructure) | | 195,100 | | | 7,646 |
*Urbi Desarrollos Urbanos S.A. (Household durables) | | 2,558,300 | | | 9,236 |
Walmart de Mexico (Food & staples retailing) | | 6,214,600 | | | 27,342 |
| | | | | |
| | | | | 97,631 |
| | | | | |
See accompanying Notes to Financial Statements.
December 31, 2006 | William Blair Funds 49 |
Emerging Markets Growth Fund
Portfolio of Investments, December 31, 2006 (all dollar amounts in thousands)
| | | | | |
Issuer | | Shares | | Value |
|
Common Stocks—Emerging Latin America—27.3%—(continued) |
Panama—1.1% | | | | | |
Copa Holdings S.A., Class “A” (Airlines)† | | 190,100 | | $ | 8,851 |
| | | | | |
| |
Emerging Europe, Mid-East, Africa—15.6% | | | |
Czech Republic—0.9% | | | | | |
*Central European Media Enterprises Ltd., Class “A” (Media)† | | 104,200 | | | 7,294 |
| | | | | |
Kazakhstan—2.1% | | | | | |
*Kazkommertsbank—GDR 144A (Commercial banks) | | 744,326 | | | 17,194 |
| | | | | |
Russia—5.6% | | | | | |
*CTC Media, Inc. (Media)† | | 352,545 | | | 8,464 |
*Magnit—CLS (Multiline retail)† | | 111,200 | | | 3,970 |
Novatek OAO—GDR 144A (Oil, gas, & consumable fuels) | | 312,800 | | | 19,863 |
Sberbank—CLS (Commercial banks)† | | 3,900 | | | 13,455 |
| | | | | |
| | | | | 45,752 |
| | | | | |
South Africa—5.9% | | | | | |
Naspers Ltd. (Media) | | 849,266 | | | 20,131 |
Sasol Ltd. (Oil, gas, and consumable fuels) | | 437,000 | | | 16,091 |
Truworths International Ltd. (Specialty retail) | | 2,622,327 | | | 11,969 |
| | | | | |
| | | | | 48,191 |
| | | | | |
Turkey—1.1% | | | | | |
Bim Birlesik Magazalar A.S. (Food & staples retailing) | | 172,700 | | | 9,150 |
| | | | | |
Total Common Stock—93.4%
(cost $592,116) | | | 760,454 |
| | | | | |
| | | | | | |
Issuer | | Shares or
Principal
Amout | | Value |
| | |
Preferred Stock | | | | | | |
Brazil—5.2% | | | | | | |
Banco Itau Holding (Commercial banks) | | | 443,000 | | $ | 16,049 |
Petroleo Brasileiro S.A. (Oil, gas & consumable fuels) | | | 1,108,700 | | | 25,843 |
| | | | | | |
Total Preferred Stock—5.2%
(cost $32,704) | | | 41,892 |
| | | | | | |
| | |
Investment in Affiliate | | | | | | |
William Blair Ready Reserves Fund | | | 1,265,478 | | | 1,265 |
| | | | | | |
Total Investment in Affiliate—0.2%
(cost $1,265) | | | 1,265 |
| | | | | | |
| | |
Short-Term Investments | | | | | | |
American Express Demand Note, VRN 5.176% due 1/2/07 | | $ | 1,875,000 | | | 1,875 |
Prudential Funding Demand Note, VRN 5.180% due 1/2/07 | | | 1,876,000 | | | 1,876 |
| | | | | | |
Total Short-Term Investments—0.5%
(cost $3,751) | | | 3,751 |
| | | | | | |
| | |
Repurchase Agreement | | | | | | |
Investors Bank & Trust Company, 5.01% dated 12/29/2006, due 1/2/2007, repurchase price $6,033, collateralized by SBA, Pool# 506352 | | | 6,029,442 | | | 6,029 |
| | | | | | |
Total Repurchase Agreement—0.7%
(cost $6,029) | | | 6,029 |
| | | | | | |
Total Investments—100.0%
(cost $635,865) | | | 813,391 |
Cash and other assets, less liabilities—0.0% | | | 258 |
| | | | | | |
Net assets—100.0% | | $ | 813,649 |
| | | | | | |
* Non-income producing securities
ADR = American Depository Receipt
GDR = Global Depository Receipt
VRN = Variable Rate Note
† = U.S. listed Foreign Security
**Fair valued pursuant to Valuation Procedures adopted by the Board of Trustees. This holding represents 0.69% of the Fund’s net assets at December 31, 2006. This security is also deemed illiquid pursuant to Liquidity Procedures adopted by the Board of Trustees.
For securities, primarily traded on exchanges or markets that close before the close of regular trading on the New York Stock Exchange the Fund uses an independent pricing service on a daily basis to fair value price the securities pursuant to Valuation Procedures adopted by the Board of Trustees.
At December 31, 2006 the Fund’s Portfolio of Investments includes the following industry categories:
| | |
Consumer Discretionary | | 26.0% |
Finance | | 19.2% |
Information Technology | | 12.3% |
Industrials & Services | | 12.0% |
Telecommunication Services | | 10.8% |
Consumer Staples | | 9.5% |
Energy | | 7.7% |
Materials | | 2.4% |
Health Care | | 0.1% |
| | |
| | 100.0% |
| | |
At December 31, 2006 the Fund’s Portfolio of Investments includes the following currency categories:
| | |
United States Dollar | | 18.3% |
Indian Rupee | | 17.1% |
Brazilian Real | | 14.5% |
Hong Kong Dollar | | 14.0% |
Mexico Nuevo Peso | | 10.0% |
Taiwan Dollar | | 6.0% |
South African Rand | | 6.0% |
South Korean Won | | 4.8% |
Indonesian Rupiah | | 3.0% |
Malaysian Ringgit | | 2.9% |
Chilean Peso | | 1.5% |
Turkish Lira | | 1.1% |
British Pound Sterling | | 0.8% |
| | |
| | 100.0% |
| | |
See accompanying Notes to Financial Statements.
50 Annual Report | December 31, 2006 |

Chad M. Kilmer

Mark T. Leslie

David S. Mitchell
VALUE DISCOVERY FUND
The Value Discovery Fund invests in the equity securities of small companies that we believe offer a long-term investment value seeking to identify undervalued companies with sound business fundamentals.
AN OVERVIEW FROM THE PORTFOLIO MANAGERS
How did the Fund perform over the last year? How did the Fund’s performance compare to its benchmark?
The Value Discovery Fund posted a 21.78% increase on a total return basis (Class N shares) for the 12 months ended December 31, 2006. By comparison, the Russell 2000® Value Index gained 23.48%, while the Russell 2000® Index rose 18.37%.
What were the most significant factors impacting Fund performance?
The year 2006 was very satisfying for the Value Discovery Fund. The absolute return was rewarding to shareholders and the Fund ranked in the 10th percentile in the Fund’s peer group, the Morningstar Small Value Category. (The Fund’s Class N shares actual rank and number of Funds in the Small Value Category for the one-, three-, five-, and 10-year periods ended December 31, 2006 was as follows: 34/387, 233/304, 162/220 and 22/71.) While the Fund nearly matched the Russell 2000 Value benchmark on a gross basis, it lagged by roughly 1.30% after fees. We characterize the latter as only somewhat disappointing as, per Prudential Equity Research, only 5.9% of small cap value Funds topped the benchmark and the average Fund trailed by almost 7.0%. Trailing the benchmark is frustrating and, while we had plenty of company, we take solace in the fact that the Fund generated a fairly respectable return in an environment that clearly did not favor active managers.
Several factors led to the Fund finishing better than more than 90% of all Small Cap Value Funds in 2006. As you may recall, the Fund’s management team has been strengthened considerably over the past eighteen months. With the additions of Mark Leslie in July 2005 and Chad Kilmer in March 2006, the Fund is now managed by a senior three person team with considerable small cap value experience and significantly more horsepower than previously existed. This team upgrade manifested itself in a variety of ways, some of which are difficult to quantify, but one clear outcome was a reduction in problem stocks and sectors. In the prior two years, the Fund had its share of good performers but those were offset by having more than its share of challenging stocks and sectors. Consider the following:
| | • | | The difference between the contributions of the best 10 stocks versus the negative contribution of the 10 worst stocks in 2006 was a positive 3.85%. In 2005 it was only 0.88% despite a greater contribution from the ten best in 2005 versus 2006. |
| | • | | In 2006, the Fund had only one sector with a negative contribution greater than 1.0% (Technology -1.26%). In 2005, the Fund had only two sectors with negative contributions greater than 1.00% but they cumulatively detracted 6.13% In 2004, the Fund had four sectors with negative contributions of greater than 1.0%, cumulatively detracting 6.23% of performance. |
The above statistics combined with the bottom-line improvement in performance versus the peer group and the Fund’s benchmark are quantifiable but they stem from qualitative moves made by the team. The most significant would be an overall better balance between fundamentals and valuation than in prior years. We have clearly upgraded the portfolio in this regard and performance reflects it. We have significantly upgraded our screening process to
December 31, 2006 | William Blair Funds 51 |
balance these factors as well. In the past, valuation was perhaps overemphasized to the detriment of fundamentals. Again, much of this is difficult to precisely quantify but we believe the results speak volumes.
Which sectors enhanced the Fund’s return? What were among the best performing investments for the Fund?
Looking at the drivers of performance in 2006, three sectors really stood out, driven by excellent stock selection. The Consumer Discretionary sector added 2.02% to performance relative to the benchmark, driven by four stocks that added 0.40% or more: Casual Male Retail Group (+140% total return, +0.93% contribution), Navigant International (+49% total return, +0.51% contribution), Ameristar Casinos (+52% total return, +0.42% contribution), and Interface (45% total return, +0.40% contribution). The Industrial and Services sector also witnessed superior stock selection, contributing 1.33% to performance relative to the benchmark. Three stocks contributed greater than 50 basis points to performance: General Cable (+58% total return, +0.67% contribution), Saia (+53% total return, +0.58% contribution) and Teletech (+98% total return, +0.58% contribution). Health Care also delivered healthy returns, contributing 0.80% relative to the benchmark. CNS was the best stock in the sector (+35% total return, +0.64% contribution).
Were there any investment strategies or themes that did not measure up to your expectations?
On the negative side, as mentioned earlier, Information Technology was the only sector to cost performance greater than 1.0%, detracting 1.26% relative to the benchmark. Two stocks were the primary culprits: Bisys Group (-23% total return, -1.29% contribution) and Plantronics (-39% total return, -0.66% contribution). Materials and Financials were also sub par for the year with Materials detracting 0.90% and Financials detracting 0.51%. Underperformance in Materials was not driven by any significant negative contributions. In fact, the worst stock penalized returns by only 0.02%. Underperformance was much more a function of what the Fund did not own versus what it did, primarily metals. Two stocks detracted greater than 0.60% in Financials: Quanta Capital (-53% total return, -0.87% contribution) and Commercial Capital Bancorp (-17% total return, -0.64% contribution).
What is your current strategy? How is the Fund positioned?
We are four plus years into the current bull market—a great run by historical comparison. Bond investors have moved 10-year Treasury bond yields well below short term rates, suggesting they think the Fed may have to lower interest rates in the future in response to weakening economic activity. For now, the stock market is suggesting otherwise—that the Fed is orchestrating the ideal balance between economic growth and low inflation. Over the last few years, corporate earnings growth has been very robust at a consistent double digit annual pace. While earnings growth remains healthy and stock valuations reasonable, a slower and more sustainable level of earnings growth should be expected in the coming years. From our perspective, stock picking will become increasingly crucial to investment success as the easy money made over the last few years of broad-based earnings growth is most likely behind us.
Going forward, given our focus on adding value via stock selection as opposed to making large sector bets, the Fund continues to be closely aligned to the benchmark from a sector weighting perspective. We will continue to emphasize a healthy balance between valuation and fundamentals and are confident that we have built a team that can deliver solid results over the long term. We appreciate your continued confidence.
52 Annual Report | December 31, 2006 |
Value Discovery Fund
Performance Highlights (unaudited)

Average Annual Total Return at 12/31/2006
| | | | | | | | | | | | | | | |
| | | 1
Year | | | 3
Year | | | 5
Year | | | 10 Year | | | Since
Inception | |
Value Discovery Fund Class N | | 21.78 | % | | 11.10 | % | | 11.27 | % | | 12.99 | % | | — | |
Value Discovery Fund Class I | | 22.10 | | | 11.32 | | | 11.53 | | | — | | | 14.58 | (a) |
Russell 2000® Index | | 18.37 | | | 13.56 | | | 11.39 | | | 9.44 | | | 10.14 | (a) |
Russell 2000® Value Index | | 23.48 | | | 16.48 | | | 15.37 | | | 13.27 | | | 15.80 | (a) |
| | (a) | | For the period from October 1, 1999 (Commencement of the Class) to December 31, 2006. | |
Performance cited represents past performance. Past performance does not guarantee future results and current performance may be lower or higher than the data quoted. Results shown are average annual total returns, which assume reinvestment of dividends and capital gains. Investment returns and principal will fluctuate and you may have a gain or loss when you sell shares. For the most current month-end performance information, please call 1-800-742-7272, or visit our Web site at www.williamblairfunds.com. Investing in smaller companies involves special risks, including higher volatility and lower liquidity. From time to time, the investment advisor may waive fees or reimburse expenses for the Fund. Without these waivers, performance would be lower. Class N shares are available to the general public without a sales load. Class I shares are available to certain institutional investors and advisory clients of William Blair & Company, L.L.C., without a sales load or distribution (12b-1) or service fees.
The performance highlights and graph presented above do not reflect the deduction of taxes that a shareholder would pay on fund distributions or the redemption of fund shares.
The Russell 2000® Index is the Fund’s primary benchmark. The Russell 2000® Index is an unmanaged composite of the smallest 2000 stocks of the Russell 3000 Index.
The Russell 2000® Value Index consists of small-capitalization companies with below average price-to-book ratios and forecasted growth rates.
This report identifies the Fund’s investments on December 31, 2006. These holdings are subject to change. Not all stocks in the Fund performed the same, nor is there any guarantee that these stocks will perform as well in the future. Market forecasts provided in this report may not necessarily come to pass.
Sector Diversification (unaudited)

The sector diversification shown is based on the total investment portfolio.
December 31, 2006 | William Blair Funds 53 |
Value Discovery Fund
Portfolio of Investments, December 31, 2006 (all dollar amounts in thousands) (unaudited)
| | | | | |
Issuer | | Shares | | Value |
| | |
Common Stocks | | | | | |
Financials—32.9% | | | | | |
*Argonaut Group, Inc. | | 68,475 | | $ | 2,387 |
Boston Private Financial Holdings, Inc. | | 87,305 | | | 2,463 |
BRT Realty Trust | | 62,305 | | | 1,723 |
Chittenden Corporation | | 55,035 | | | 1,689 |
Citizens Banking Corporation | | 109,975 | | | 2,914 |
Cogdell Spencer, Inc. | | 102,710 | | | 2,208 |
*Community Bancorp | | 62,900 | | | 1,899 |
*CompuCredit Corporation | | 66,780 | | | 2,659 |
Donegal Group, Inc., Class “A” | | 83,301 | | | 1,632 |
Equity Inns, Inc. | | 205,699 | | | 3,283 |
First Midwest Bancorp Incorporated | | 88,480 | | | 3,422 |
FirstMerit Corporation | | 123,410 | | | 2,979 |
Jones Lang LaSalle, Inc | | 22,385 | | | 2,063 |
Kite Realty Group Trust | | 157,250 | | | 2,928 |
Mid-American Apartment Communities, Inc. | | 54,740 | | | 3,133 |
*PMA Capital Corporation, Class “A” | | 176,260 | | | 1,625 |
*RAM Holdings, Ltd.† | | 173,670 | | | 2,482 |
Umpqua Holdings Corporation | | 110,770 | | | 3,260 |
*Western Alliance Bancorp | | 47,475 | | | 1,651 |
Winston Hotels, Inc. | | 140,730 | | | 1,865 |
| | | | | |
| | | | | 48,265 |
| | | | | |
Information Technology—14.3% | | | | | |
Adtran Incorporated | | 90,965 | | | 2,065 |
*Anixter International, Inc. | | 42,895 | | | 2,329 |
*Bisys Group, Inc. | | 165,610 | | | 2,138 |
*Entegris, Inc. | | 250,405 | | | 2,710 |
*Mastec Incorporated | | 62,616 | | | 723 |
*MICROS Systems, Inc. | | 44,390 | | | 2,339 |
*Parametric Technology Corporation | | 126,100 | | | 2,272 |
*Progress Software Corporation | | 68,575 | | | 1,915 |
*Semitool, Inc. | | 136,269 | | | 1,814 |
*Sybase, Inc. | | 107,585 | | | 2,657 |
| | | | | |
| | | | | 20,962 |
| | | | | |
Consumer Discretionary—13.0% | | | | | |
*Aeropostale, Inc. | | 47,275 | | | 1,459 |
*AFC Enterprises, Inc. | | 84,415 | | | 1,492 |
Ameristar Casinos, Inc. | | 68,980 | | | 2,121 |
BorgWarner, Inc. | | 32,245 | | | 1,903 |
*Cavco Industries, Inc. | | 27,170 | | | 952 |
Christopher & Banks Corporation | | 84,895 | | | 1,584 |
Entercom Communications Corporation | | 64,590 | | | 1,820 |
*Interface Incorporated, Class “A” | | 194,670 | | | 2,768 |
Ruby Tuesday, Inc. | | 70,165 | | | 1,925 |
Wolverine World Wide, Inc. | | 107,685 | | | 3,071 |
| | | | | |
| | | | | 19,095 |
| | | | | |
Industrials & Services—12.1% | | | | | |
Acuity Brands, Inc. | | 43,185 | | | 2,247 |
CLARCOR, Inc. | | 69,865 | | | 2,362 |
*EMCOR Group, Inc. | | 29,860 | | | 1,698 |
*Esco Technologies, Inc. | | 56,730 | | | 2,578 |
*Genlyte Group, Inc. | | 21,200 | | | 1,656 |
*K&F Industries Holdings, Inc. | | 40,905 | | | 929 |
*Labor Ready, Inc. | | 94,350 | | | 1,730 |
Tal International Group, Inc. | | 89,970 | | | 2,401 |
*Teletech Holdings, Inc. | | 91,465 | | | 2,184 |
| | | | | |
| | | | | 17,785 |
| | | | | |
| | | | | | |
Issuer | | Shares or
Principal
Amount | | Value |
| | |
Common Stocks—(continued) | | | | | | |
Materials—6.8% | | | | | | |
Arch Chemicals, Inc. | | | 71,260 | | $ | 2,374 |
*Claymont Steel Holdings, Inc. | | | 46,975 | | | 864 |
Silgan Holdings, Inc. | | | 59,315 | | | 2,605 |
Spartech Corporation | | | 57,210 | | | 1,500 |
Texas Industries, Inc. | | | 40,090 | | | 2,575 |
| | | | | | |
| | | | | | 9,918 |
| | | | | | |
Health Care—6.4% | | | | | | |
*Magellan Health Services | | | 49,465 | | | 2,138 |
*Matrixx Initiatives, Inc. | | | 90,470 | | | 1,441 |
*Pediatrix Medical Group | | | 43,990 | | | 2,151 |
*Varian, Inc. | | | 51,950 | | | 2,327 |
Vital Signs, Inc. | | | 26,530 | | | 1,324 |
| | | | | | |
| | | | | | 9,381 |
| | | | | | |
Utilities—4.8% | | | | | | |
Avista Corp | | | 70,665 | | | 1,789 |
Cleco Corporation | | | 63,895 | | | 1,612 |
Northwest Natural Gas Company | | | 42,595 | | | 1,808 |
South Jersey Industries, Inc. | | | 55,335 | | | 1,849 |
| | | | | | |
| | | | | | 7,058 |
| | | | | | |
Energy—4.8% | | | | | | |
*Forest Oil Corporation | | | 46,875 | | | 1,532 |
*Goodrich Petroleum Corporation | | | 35,250 | | | 1,275 |
*Petrohawk Energy Corporation | | | 132,468 | | | 1,523 |
RPC, Inc. | | | 99,862 | | | 1,686 |
St. Mary Land & Exploration Company | | | 26,675 | | | 983 |
| | | | | | |
| | | | | | 6,999 |
| | | | | | |
Consumer Staples—3.2% | | | | | | |
J&J Snack Foods | | | 48,170 | | | 1,994 |
*Playtex Products, Inc. | | | 192,480 | | | 2,770 |
| | | | | | |
| | | | | | 4,764 |
| | | | | | |
Total Common Stock—98.3%
(cost $131,247) | | | 144,227 |
| | | | | | |
| | |
Investment in Affiliate | | | | | | |
William Blair Ready Reserves Fund | | | 502,074 | | | 502 |
| | | | | | |
Total Investment in Affiliate—0.3%
(cost $502) | | | 502 |
| | | | | | |
| | |
Short-Term Investment | | | | | | |
Prudential Funding Demand Note, VRN
5.180%, due 1/2/07 | | $ | 14,000 | | | 14 |
| | | | | | |
Total Short-Term Investment—0.0%
(cost $14) | | | 14 |
| | | | | | |
Repurchase Agreement | | | | | | |
Investors Bank & Trust Company, 5.01%
dated 12/29/2006, due 1/2/2007,
repurchase price $1,750, collateralized by
SBA Pool # 506704 | | | 1,749,233 | | | 1,749 |
Total Repurchase Agreement—1.2%
(Cost $1,749) | | | 1,749 |
| | | | | | |
Total Investments—99.8%
(cost $133,512) | | | 146,492 |
Cash and other assets, less liabilities—0.2% | | | 285 |
| | | | | | |
Net assets—100.0% | | $ | 146,777 |
| | | | | | |
* Non-income producing
† = U.S. listed foreign security
VRN = Variable Rate Note
See accompanying Notes to Financial Statements.
54 Annual Report | December 31, 2006 |

James S. Kaplan

Christopher T. Vincent
INCOME FUND
The Income Fund invests in high-grade intermediate-term debt securities.
AN OVERVIEW FROM THE PORTFOLIO MANAGERS
How did the Fund perform during the past year? How did the Fund’s performance compare to its benchmark?
The Income Fund posted a 4.25% gain on a total return basis (Class N Shares) for the year ended December 31, 2006. By comparison, the Fund’s benchmark, the Lehman Intermediate Government/Credit Bond Index, increased 4.07%, while the Fund’s peer group, the Morningstar Short-term Bond Category, rose 4.01%.
What were the most significant factors impacting Fund performance? What factors were behind the Fund’s performance versus the benchmark?
Three major factors were behind the performance of the fixed-income markets during the course of the year: the consideration by investors during the final months of the year that the Federal Reserve’s next move would be to lower, rather than to raise, interest rates; the dominance of global liquidity and foreign demand for U.S. fixed-income securities, and a general decrease in investors’ risk aversion.
Through the end of the third quarter, interest rates across the interest rate yield curve had increased roughly 0.10% since the beginning of the year. During the third quarter, though, the bond market staged a significant rally, essentially erasing the losses sustained earlier in the year. However, the market got a little too optimistic regarding potential rate cuts and by the end of the fourth quarter, rates had risen 0.30% to 0.40%
For example, the yield on 2-year Treasury notes increased 0.13% during the fourth quarter, while the yield on 10-year Treasury securities increased 0.07%. For the one-year period, the yield on 2-year Treasury notes increased 0.41% to finish the year at 4.81%, while the yield on 10-year Treasury securities increased 0.31% to end the year at 4.70%. The interest rate yield curve steepened slightly toward the end of the first quarter, continued to flatten again in the second quarter, finished the third quarter very inverted, and remained that way through the end of the year.
Which investment strategies enhanced the Fund’s return? Were there any investment strategies that produced the best results?
In the latter part of the fourth quarter, it is not unusual for the fixed-income markets to have their own version of the historical “January effect” typically seen in the equity markets—whereby there is a general rise in the prices of non-Treasury securities. However, that effect this year was exacerbated once investors realized that the Federal Reserve’s two-year campaign to raise interest rates could be over. In particular, October and November were extremely strong months for the Mortgage- and Asset-backed sectors of the bond market.
Nearly half of the excess returns for the Mortgage-backed, Asset-backed and Corporate Bond sectors of the Lehman Aggregate Bond Index (an index reflecting broad fixed-income market performance) during 2006 were generated in the fourth quarter.
December 31, 2006 | William Blair Funds 55 |
Throughout the year, there was consistent demand on the part of investors for Mortgage- and Asset-backed securities, which continue to provide a safe haven for those investors seeking excess returns versus U.S. Treasury securities. Some of this demand reflected the continued strong appetite for U.S. securities on the part of foreign investors.
The catch words in the Corporate bond market were “shareholder rewards” as investors warily watched for signs that private equity investors were about to launch leveraged buyouts (LBOs) of publicly-traded companies. The most notable of these transactions was the $36 billion leveraged buyout of Equity Office Properties, which was the largest LBO in history.
Private equity investors have been purchasing investment grade-rated companies with a minimum amount of equity, then “leveraging up” the company by issuing more debt which in turn finances the LBO. While shareholders potentially reap the rewards from these types of transactions, bondholders may suffer as the company takes on more debt and the company’s credit ratings decrease.
This acquisition activity built over the course of the year, with growing numbers of buyers taking public companies in unrelated industries private. Risk premiums for securities of firms deemed to be acquisition targets have increased.
Although the LBO activity was not a widespread contagion in the Corporate bond market, exposure to names perceived as targets weighed on investment portfolios. With these considerations in mind, throughout 2006 we were extremely cautious as we managed the Corporate bond portion of the Fund’s portfolio. Our ability to weigh these issues—and avoid getting caught up by this speculative activity—benefited the Fund.
For example, at the end of 2005 we had sold Comcast, a company in the Fund’s portfolio that we believed fit the profile of an LBO target, with a flat share price, modest growth rate and stable cash flow. However, during 2006 Comcast’s stock price advanced, alleviating concerns it might be an acquisition target. We thought the relative valuation of the company remained attractive, and we thought the company’s risk potential had decreased. Consequently, we reestablished a position in the company in November. Conversely, we sold Fortune Brands, a company we believe has a strong growth profile, but believe that the company may continue to be acquisitive or engage in some other activity resulting in higher leverage and a weaker credit profile.
What is your current strategy? How is the Fund positioned?
As we have stated, within the Mortgage-, Asset-backed and Corporate bond sectors of the fixed-income markets, it has become a very security-specific trading environment.
Relying on an investment strategy of merely selecting bonds based on such criteria as type and ratings is not enough to ensure success. The current environment requires an analysis of each bond’s individual structure—because some lower-rated bonds may look more attractive and creditworthy as investment candidates than higher-rated bonds.
We are being particularly judicious in monitoring the Asset-backed and Mortgage-backed positions in our portfolio, making sure the assumptions about each bond remain the same as when they were first purchased. The housing market has slumped, and some borrowers may experience stress, but we do not see the market collapsing.
There has been a fair amount of coverage in the financial media about several bond issuers in the sub-prime lending area going out of business. We eliminated two Asset-backed positions from the Fund’s portfolio based on our analysis that the risk assumptions for certain securities might not be met. We nonetheless remain committed to this sector, viewing our sales as the normal result of closely monitoring this sector of the market.
56 Annual Report | December 31, 2006 |
We think that the current market environment within the Corporate bond market will be sustained into 2007. Fundamental considerations for U.S. companies, including earnings growth, remain favorable. There should be plenty of liquidity to support the current level of supply and LBO transactions. We will use our Corporate bond positions to add incremental yield to the Fund’s portfolio, but will do so cautiously.
The markets have acknowledged that the Federal Reserve’s campaign to raise interest rates could be over, but there is no consensus within the market as to when the Federal Reserve might begin to lower interest rates.
The rate of job growth and inflation will dictate the Fed’s next move. We remain in the camp of market observers that believe the Fed will be able to engineer a gradual slowing of economic growth, or “soft landing” that does not cause undue damage, triggering a recession. But we think an interest rate cut by the Fed is not going to happen anytime soon.
In such an environment, the risk of prepayments in the Mortgage-backed market is benign. We believe a trading range, in turn, would be beneficial for Mortgage-backed securities.
We will remain patient investors during 2007, and do not expect the Fund’s sector allocations to change much. As we stated, we intend to focus on the structure and characteristics of individual issues, and evaluate opportunities as they arise on a security-by-security basis.
December 31, 2006 | William Blair Funds 57 |
Income Fund
Performance Highlights (unaudited)
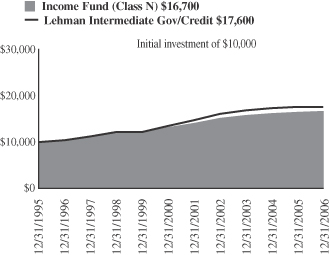
Average Annual Total Return at 12/31/2006
| | | | | | | | | | | | | | | | | |
| | | 1
Year | | | 3
Year | | | 5
Year | | | 10
Year | | | Since
Inception | | | |
Income Fund Class N | | 4.25 | % | | 2.85 | % | | 4.01 | % | | 5.23 | % | | — | % | | |
Income Fund Class I | | 4.33 | | | 3.01 | | | 4.15 | | | — | | | 5.28 | (a) | | |
Lehman Intermediate Government Credit Bond Index | | 4.07 | | | 2.89 | | | 4.52 | | | 5.80 | | | 5.72 | (a) | | |
| | (a) | | For the period from October 1, 1999 to December 31, 2006. |
Performance cited represents past performance. Past performance does not guarantee future results and current performance may be lower or higher than the data quoted. Results shown are average annual total returns, which assume reinvestment of dividends and capital gains. Investment returns and principal will fluctuate and you may have a gain or loss when you sell shares. For the most current month-end performance information, please call 1-800-742-7272, or visit our Web site at www.williamblairfunds.com. Class N shares are available to the general public without a sales load. Class I shares are available to certain institutional investors and advisory clients of William Blair & Company, L.L.C., without a sales load or distribution (12b-1) or service fees.
The performance highlights and graph presented above do not reflect the deduction of taxes that a shareholder would pay on fund distributions or the redemption of fund shares.
The Lehman Intermediate Government/Credit Bond Index indicates broad intermediate government/corporate bond market performance.
This report identifies the Fund’s investments on December 31, 2006. These holdings are subject to change. Not all investments in the Fund performed the same, nor is there any guarantee that these investments will perform as well in the future. Market forecasts provided in this report may not necessarily come to pass.
Sector Diversification (unaudited)
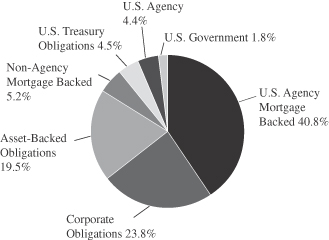
The sector diversification shown is based on the total investment portfolio.
58 Annual Report | December 31, 2006 |
Income Fund
Portfolio of Investments, December 31, 2006 (all amounts in thousands)
| | | | | | |
Issuer | | Principal
Amount | | Value |
|
U.S. Government and U.S. Government Agency—51.1% |
U.S. Treasury—4.4% | | | | | | |
U.S. Treasury Note, 6.500%, due 2/15/10 | | $ | 8,500 | | $ | 8,929 |
U.S. Treasury Note, 4.750%, due 5/15/14 | | | 2,000 | | | 2,005 |
U.S. Treasury Note, 5.125%, due 5/15/16 | | | 2,060 | | | 2,122 |
| | | | | | |
Total U.S. Treasury Obligations | | | 12,560 | | | 13,056 |
| | | | | | |
Government National Mortgage Association (GNMA)—1.7% | | | | | | |
#780405, 9.500%, due 11/15/17 | | | 591 | | | 630 |
#589335, 6.500%, due 10/15/22 | | | 2,042 | | | 2,097 |
#357322, 7.000%, due 9/15/23 | | | 166 | | | 172 |
#616250, 6.000%, due 2/15/24 | | | 1,581 | | | 1,605 |
#2002-48, Tranche 0B, 6.000%, due 5/16/30 | | | 643 | | | 644 |
| | | | | | |
Total Government National Mortgage Association | | | 5,023 | | | 5,148 |
| | | | | | |
Small Business Administration—0.0% | | | | | | |
Receipt for Multiple Originator Fees, #3,
0.821%, due 11/01/08 (Interest Only) WAC | | | — | | | 18 |
| | | | | | |
Federal Home Loan Mortgage Corp. (FHLMC)—20.0% | | | | | | |
#1417, Tranche SA,
11.326%, due 11/15/07, VRN | | | 281 | | | 283 |
#G10067, 7.000%, due 1/1/08 | | | 155 | | | 155 |
#G10147, 8.500%, due 2/1/08 | | | 14 | | | 14 |
#1601, Tranche PJ, 6.000%, due 10/15/08, VRN | | | 782 | | | 781 |
#1612, Tranche SE, 8.100%, due 11/15/08, VRN | | | 403 | | | 407 |
#G90028, 7.000%, due 5/17/09 | | | 227 | | | 228 |
#E80050, 6.000%, due 10/1/09 | | | 405 | | | 407 |
#G90019, 7.500%, due 12/17/09 | | | 303 | | | 306 |
7.000%, due 3/15/10 | | | 5,950 | | | 6,309 |
#E65418, 7.000%, due 8/1/10 | | | 188 | | | 189 |
#G10457, 7.000%, due 2/1/11 | | | 351 | | | 360 |
#E00436, 7.000%, due 6/1/11 | | | 382 | | | 392 |
#G10708, 6.500%, due 8/1/12 | | | 226 | | | 231 |
#E91999, 5.000%, due 10/1/12 | | | 950 | | | 942 |
#G11218, 7.000%, due 10/1/12 | | | 98 | | | 101 |
#E96147, 5.000%, due 5/1/13 | | | 1,287 | | | 1,277 |
#E95846, 4.500%, due 5/1/13 | | | 1,199 | | | 1,176 |
#G10839, 5.500%, due 10/1/13 | | | 1,174 | | | 1,178 |
#E72924, 7.000%, due 10/1/13 | | | 1,036 | | | 1,064 |
#E00639, 5.000%, due 3/1/14 | | | 1,659 | | | 1,640 |
#J02572, 7.500%, due 6/1/14 | | | 1,762 | | | 1,818 |
#E81697, 8.000%, due 5/1/15 | | | 2,261 | | | 2,383 |
#E81703, 7.000%, due 5/1/15 | | | 923 | | | 949 |
#E81908, 8.500%, due 12/1/15 | | | 118 | | | 125 |
#G11688, 7.000%, due 2/1/16 | | | 703 | | | 722 |
#J02184, 8.000%, due 4/1/16 | | | 1,747 | | | 1,834 |
#G12258, 6.000%, due 8/1/16 | | | 2,617 | | | 2,655 |
#G90022, 8.000%, due 9/17/16 | | | 665 | | | 697 |
#G11702, 7.500%, due 12/1/16 | | | 685 | | | 710 |
#G11486, 7.500%, due 4/1/17 | | | 819 | | | 849 |
#E90398, 7.000%, due 5/1/17 | | | 1,233 | | | 1,265 |
#M30028, 5.500%, due 5/1/17 | | | 320 | | | 324 |
#G11549, 7.000%, due 7/1/17 | | | 734 | | | 754 |
#G90027, 6.000%, due 11/17/17 | | | 1,254 | | | 1,268 |
#G11756, 7.000%, due 12/1/17 | | | 1,244 | | | 1,279 |
#G11725, 5.500%, due 11/1/18 | | | 2,101 | | | 2,105 |
#G30254, 6.500%, due 5/1/19 | | | 2,514 | | | 2,585 |
#G30255, 7.000%, due 7/1/21 | | | 917 | | | 951 |
| | | | | | |
Issuer | | Principal
Amount | | Value |
|
Federal Home Loan Mortgage Corp. (FHLMC)—(continued) |
#G30268, 7.000%, due 7/1/21 | | $ | 1,840 | | $ | 1,902 |
#J02986, 6.500%, due 7/1/21 | | | 2,736 | | | 2,795 |
#G30239, 7.000%, due 8/1/21 | | | 1,583 | | | 1,638 |
#C67537, 9.500%, due 8/1/21 | | | 200 | | | 214 |
#G18137, 6.500%, due 8/1/21 | | | 3,959 | | | 4,044 |
#G30243, 6.000%, due 12/1/21 | | | 1,774 | | | 1,801 |
#D95621, 6.500%, due 7/1/22 | | | 3,073 | | | 3,149 |
#G02183, 6.500%, due 3/1/30 | | | 2,010 | | | 2,059 |
#A45790, 7.500%, due 5/1/35 | | | 1,041 | | | 1,082 |
| | | | | | |
Total FHLMC Mortgage Obligations | | | 57,903 | | | 59,397 |
| | | | | | |
Federal National Mortgage Association (FNMA)—25.0% | | | | | | |
#545560, 8.000%, due 5/1/07 | | | 77 | | | 77 |
#1992-192, Tranche SC,
6.430%, due 11/25/07, VRN | | | 127 | | | 127 |
#93-196, Tranche SA,
9.960%, due 10/25/08, VRN | | | 284 | | | 293 |
#1993-221, Tranche SG,
3.556%, due 12/25/08, VRN | | | 223 | | | 221 |
#765396, 5.500%, due 1/1/09 | | | 192 | | | 191 |
#2002-27, Tranche SW,
4.220%, due 5/25/2009 VRN | | | 1,150 | | | 1,134 |
#695512, 8.000%, due 9/1/10 | | | 351 | | | 359 |
#725479, 8.500%, due 10/1/10 | | | 601 | | | 613 |
#255056, 5.000%, due 12/1/10 | | | 1,660 | | | 1,657 |
6.250%, due 2/1/11 | | | 6,775 | | | 7,061 |
#313816, 6.000%, due 4/1/11 | | | 461 | | | 466 |
#577393, 10.000%, due 6/1/11 | | | 215 | | | 229 |
#577395, 10.000%, due 8/1/11 | | | 794 | | | 850 |
#254705, 5.500%, due 3/1/13 | | | 1,615 | | | 1,618 |
#254788, 6.500%, due 4/1/13 | | | 577 | | | 589 |
#725315, 8.000%, due 5/1/13 | | | 646 | | | 672 |
#190539, 6.000%, due 1/1/14 | | | 424 | | | 431 |
#806463, 7.000%, due 3/1/14 | | | 684 | | | 704 |
#593561, 9.500%, due 8/1/14 | | | 384 | | | 412 |
#535560, 7.000%, due 8/1/14 | | | 1,071 | | | 1,103 |
#567027, 7.000%, due 9/1/14 | | | 1,653 | | | 1,701 |
#567026, 6.500%, due 10/1/14 | | | 1,525 | | | 1,562 |
#458124, 7.000%, due 12/15/14 | | | 400 | | | 412 |
#745459, 7.000%, due 2/1/15 | | | 918 | | | 945 |
#598453, 7.000%, due 6/1/15 | | | 377 | | | 382 |
#576554, 8.000%, due 1/1/16 | | | 1,671 | | | 1,757 |
#576553, 8.000%, due 2/1/16 | | | 2,526 | | | 2,676 |
#555747, 8.000%, due 5/1/16 | | | 497 | | | 517 |
#735569, 8.000%, due 10/1/16 | | | 2,491 | | | 2,592 |
#725410, 7.500%, due 4/1/17 | | | 1,562 | | | 1,619 |
#643217, 6.500%, due 6/1/17 | | | 378 | | | 387 |
#679247, 7.000%, due 8/1/17 | | | 1,668 | | | 1,731 |
#682075, 5.500%, due 11/1/17 | | | 1,086 | | | 1,089 |
#662925, 6.000%, due 12/1/17 | | | 1,559 | | | 1,584 |
#251960, 6.000%, due 9/1/18 | | | 597 | | | 606 |
#740847, 6.000%, due 10/1/18 | | | 1,345 | | | 1,364 |
#852864, 7.000%, due 7/1/20 | | | 3,445 | | | 3,542 |
#458147, 10.000%, due 8/15/20 | | | 989 | | | 1,101 |
#835563, 7.000%, due 10/1/20 | | | 1,360 | | | 1,409 |
#893325, 7.000%, due 9/1/21 | | | 3,444 | | | 3,536 |
#735367, 6.000%, due 3/1/22 | | | 2,450 | | | 2,485 |
#735574, 8.000%, due 3/1/22 | | | 1,018 | | | 1,080 |
#735104, 7.000%, due 5/1/22 | | | 2,519 | | | 2,612 |
#725927, 7.000%, due 8/1/22 | | | 2,002 | | | 2,072 |
See accompanying Notes to Financial Statements.
December 31, 2006 | William Blair Funds 59 |
Income Fund
Portfolio of Investments, December 31, 2006 (all amounts in thousands)
| | | | | | | | | |
Issuer | | NRSRO
Rating | | | Principal
Amount | | Value |
|
Federal National Mortgage Association (FNMA)—(continued) |
#679253, 6.000%, 10/1/22 | | | | | $ | 1,902 | | $ | 1,929 |
#735137, 6.500%, due 11/1/22 | | | | | | 1,312 | | | 1,348 |
#254633, 6.000%, due 1/1/2023 | | | | | | 693 | | | 702 |
#1993-19, Tranche SH,
11.234%, due 4/25/23, VRN | | | | | | 11 | | | 14 |
#254797, 5.000%, due 6/1/23 | | | | | | 2,502 | | | 2,438 |
#745633, 6.500%, due 7/1/24 | | | | | | 3,094 | | | 3,177 |
#806458, 8.000%, due 6/1/28 | | | | | | 1,371 | | | 1,450 |
#880155, 8.500%, due 7/1/29 | | | | | | 1,600 | | | 1,720 |
#797846, 7.000%, due 3/1/32 | | | | | | 1,806 | | | 1,859 |
#745519, 8.500%, due 5/1/32 | | | | | | 1,000 | | | 1,075 |
#654674, 6.500%, due 9/1/32 | | | | | | 347 | | | 355 |
#733897, 6.500%, due 12/1/32 | | | | | | 543 | | | 558 |
| | | | | | | | | |
Total FNMA Mortgage Obligations | | | | | | 71,972 | | | 74,193 |
| | | | | | | | | |
Collateralized Mortgage Obligations—24.5% |
Security National Mortgage Loan Trust, 2006-3A, Tranche M2,
7.500%, due 2/25/10* | | A | | | | 1,000 | | | 988 |
Countrywide Alternative Loan Trust,
2003-11T1, Tranche M,
4.750%, due 7/25/18 | | AA | + | | | 1,766 | | | 1,714 |
ABFS, 2002-2, Tranche A6,
5.850%, due 3/15/19 | | AAA | | | | 577 | | | 576 |
RALI, 2004-QS16, Tranche 2M1,
5.000%, due 12/25/19 | | AA | | | | 1,675 | | | 1,626 |
RALI, 2004-QS16, Tranche 2M3,
5.000%, due 12/25/19 | | BBB | | | | 283 | | | 265 |
RALI, 2005-QS14, Tranche 1M1,
5.250%, due 9/25/20 | | AA | | | | 982 | | | 960 |
RALI, 2005-QS14, Tranche 1M2,
5.250%, due 9/25/20 | | A | | | | 309 | | | 298 |
RALI, 2006-QS2, Tranche IIM1,
5.500%, due 2/25/21 | | AA | | | | 1,083 | | | 1,070 |
RALI, 2006-QS2, Tranche IIM2,
5.500%, due 2/25/21 | | A | | | | 506 | | | 493 |
RALI, 2006-QS6, Tranche 2M1,
6.000%, due 6/25/21 | | AA | | | | 528 | | | 532 |
RALI, 2006-QS6, Tranche 2M2,
6.000%, due 6/25/21 | | A | | | | 418 | | | 414 |
First Plus, 1997-4, Tranche M1,
7.640%, due 9/11/23 | | AA | | | | 1,660 | | | 1,691 |
First Plus, 1997-4, Tranche M2,
7.830%, due 9/11/23 | | A | | | | 350 | | | 353 |
First Plus, 1997-4, Tranche A8,
7.810%, due 9/11/23 | | AAA | | | | 194 | | | 201 |
First Plus, 1998-2, Tranche M2,
8.010%, due 5/10/24 | | A | | | | 216 | | | 218 |
First Plus, 1998-3, Tranche M2,
7.920%, due 5/10/24, VRN | | A | | | | 587 | | | 592 |
Bear Stearns ABS, 2001-A, Tranche M1, 7.540%, due 2/15/31 | | A | | | | 1,167 | | | 1,170 |
Delta Funding Home Equity Loan Trust, 2000-4, Tranche M1,
7.650%, due 2/15/31 | | AA | + | | | 2,048 | | | 2,043 |
Structured Asset Securities Corp.,
2005-SC1, Tranche 1A2,
10.276%, due 5/25/31, VRN* | | AAA | | | | 2,240 | | | 2,401 |
Aames Mortgage Trust, 2001-1,
Tranche M2,
7.588%, due 6/25/31 | | A | | | | 1,216 | | | 1,226 |
| | | | | | | | |
Issuer | | NRSRO
Rating | | Principal
Amount | | Value |
|
Collateralized Mortgage Obligations—(continued) |
Conseco Finance, 2001-B, Tranche 1M1 7.272%, due 6/15/32 | | AA | | $ | 829 | | $ | 831 |
Security National Mortgage Loan Trust, 2004-1A, Tranche M2,
6.750%, due 06/25/32* | | A | | | 1,600 | | | 1,608 |
Structured Assets Security Corporation, 2002-13, Tranche B1,
6.750%, due 7/25/32, VRN | | AAA | | | 2,550 | | | 2,551 |
Structured Assets Security Corporation, 2002-17, Tranche B3,
6.089%, due 9/25/32, VRN | | A | | | 1,846 | | | 1,831 |
LSSCO, 2004-2, Tranche M1,
6.292%, due 2/28/33, VRN* | | AA | | | 1,118 | | | 1,118 |
LSSCO, 2004-2, Tranche M2,
6.292%, due 2/28/33, VRN* | | A | | | 857 | | | 850 |
ABFS, 2002-2, Tranche A-7,
5.215%, due 7/15/33, VRN | | AAA | | | 80 | | | 80 |
ABFS, 2002-3, Tranche M1,
5.402%, due 9/15/33, VRN | | AA | | | 1,500 | | | 1,489 |
Residential Asset Mortgage Products, 2003-RS9, Tranche MI1,
5.800%, due 10/25/33 | | AA | | | 310 | | | 307 |
Residential Asset Mortgage Products, 2003-RS9, Tranche MI2,
6.300%, due 10/25/33 | | A | | | 2,057 | | | 2,040 |
ACE, 2004-SD1, Tranche M3,
8.100%, due 11/25/33, VRN | | BBB | | | 2,099 | | | 2,041 |
Residential Asset Mortgage Products, 2003-RS11, Tranche MI1,
5.597%, due 12/25/33 VRN | | AA | | | 2,400 | | | 2,389 |
Deutsche Mortgage Securities, Inc.,
2004-2, Tranche M1,
5.090%, due 1/25/34 | | AA | | | 2,055 | | | 2,028 |
GRP Real Estate Asset Trust, 2004-2, Tranche A, 4.210%, due 7/25/34* | | A | | | 73 | | | 73 |
FHASI, 2004-AR4, Tranche 3A1,
4.584%, due 8/25/34, VRN | | AAA | | | 1,557 | | | 1,534 |
RAAC, 2005-SP1, Tranche M1,
5.505%, due 9/25/34, VRN | | AA | | | 2,593 | | | 2,506 |
Security National Mortgage Loan Trust, 2004-2A, Tranche M2,
6.352%, due 11/25/34* | | A | | | 2,200 | | | 2,140 |
GRP Real Estate Asset Trust, 2005-1 Tranche A, 4.850%, due 1/25/35* | | A | | | 427 | | | 427 |
Security National Mortgage Loan Trust, 2005-1A, Tranche M2,
6.530%, due 2/25/35* | | A | | | 1,475 | | | 1,454 |
Security National Mortgage Loan Trust, 2005-1A, Tranche B1,
7.450%, due 2/25/35* | | BBB | | | 950 | | | 926 |
Structured Asset Securities Corp., 2005-9XS, Tranche 1A2B,
6.500%, due 6/25/35 | | AAA | | | 3,435 | | | 3,436 |
SACO, 2005-WM2, Tranche B2,
6.500%, due 7/25/35 | | BBB | | | 3,017 | | | 2,961 |
Security National Mortgage Loan Trust, 2005-2A, Tranche B1,
7.750%, due 2/25/36* | | BBB | | | 1,550 | | | 1,509 |
Security National Mortgage Loan Trust, 2005-2A, Tranche M2,
7.321%, due 2/25/36* | | A | | | 2,075 | | | 2,055 |
See accompanying Notes to Financial Statements.
60 Annual Report | December 31, 2006 |
Income Fund
Portfolio of Investments, December 31, 2006 (all amounts in thousands)
| | | | | | | | | |
Issuer | | NRSRO
Rating | | | Principal
Amount | | Value |
|
Collateralized Mortgage Obligations—(continued) |
ACE, 2006-SL4, Tranche M6,
6.500%, due 9/25/36 | | A | | | $ | 2,100 | | $ | 2,061 |
Security National Mortgage Loan Trust, 2006-1A, Tranche M2,
7.500%, due 9/25/36* | | A | | | | 2,195 | | | 2,183 |
Security National Mortgage Loan Trust, 2006-2A, Tranche M2,
7.500%, due 10/25/36* | | A | | | | 600 | | | 597 |
Blackrock Capital Finance,
1997-R1 WAC,
1.824%, due 3/25/37, VRN* | | AAA | | | | 359 | | | 367 |
Statewide Mortgage Loan Trust,
2006-1A, Tranche A2,
7.660%, due 7/25/37* | | AAA | | | | 2,638 | | | 2,753 |
Mid-State Trust 2004-1, Tranche A,
6.005%, due 8/15/37 | | AAA | | | | 4,117 | | | 4,181 |
ACE, 2005-SN1, Tranche M1,
5.520%, due 11/25/39, VRN | | AA | + | | | 1,075 | | | 1,058 |
ACE, 2005-SN1, Tranche M2,
5.770%, due 11/25/39, VRN | | A | + | | | 625 | | | 614 |
ACE, 2005-SD3, Tranche M2,
7.100%, due 8/25/45, VRN | | A | + | | | 1,895 | | | 1,908 |
| | | | | | | | | |
Total Collateralized Mortgage Obligations | | | | | | 73,062 | | | 72,737 |
| | | | | | | | | |
Corporate Obligations—23.6% | | | | | | | | | |
Philips Petroleum,
8.750%, due 5/25/10 | | A | - | | | 3,600 | | | 3,989 |
Residential Capital Corporation, 6.375%, due 6/30/10 | | BBB | | | | 3,000 | | | 3,035 |
HSBC Finance Corporation,
8.000%, due 7/15/10 | | AA | - | | | 2,450 | | | 2,661 |
Boeing Capital Corporation,
7.375%, due 9/27/10 | | A | + | | | 2,549 | | | 2,733 |
Goldman Sachs Group, Inc.,
6.600%, due 1/15/12 | | AA | - | | | 3,050 | | | 3,224 |
Lehman Brothers Holdings, Inc. 6.625%, due 1/18/12 | | A | + | | | 2,650 | | | 2,800 |
National Rural Utility Cooperative, 7.250%, due 3/1/12 | | A | | | | 3,025 | | | 3,287 |
Valero Energy Corporation,
6.875%, due 4/15/12 | | BBB | | | | 2,065 | | | 2,183 |
General Electric Capital Corporation, 6.000%, due 6/15/12 | | AAA | | | | 2,650 | | | 2,743 |
Citigroup, Inc.,
5.625%, due 8/27/12 | | A+ | | | | 2,675 | | | 2,714 |
SLM Corporation,
5.125%, due 8/27/12 | | A | | | | 2,050 | | | 2,014 |
Cox Communications, Inc.,
7.125%, due 10/1/12 | | BBB- | | | | 2,425 | | | 2,585 |
Kroger Company,
5.500%, due 2/1/13 | | BBB | | | | 3,000 | | | 2,968 |
Ohio Power Company,
5.500%, due 2/15/13 | | A3 | | | | 1,900 | | | 1,896 |
| | | | | | | | |
Issuer | | NRSRO
Rating | | Principal
Amount | | Value |
|
Corporate Obligations—(continued) |
American Movil SA,
5.500%, due 3/1/14 | | A3 | | $ | 3,000 | | $ | 2,933 |
Bank of America Corporation, 5.375%, due 6/15/14 | | AA- | | | 2,325 | | | 2,324 |
SBC Communications, Inc.,
5.100%, due 9/15/14 | | A | | | 3,000 | | | 2,913 |
Codelco, Inc.—144A,
4.750%, due 10/15/14* | | A | | | 2,815 | | | 2,676 |
United Technologies Corporation, 4.875%, due 5/1/15 | | A+ | | | 2,725 | | | 2,627 |
Johnson Controls, Inc.,
5.500%, due 1/15/16 | | A- | | | 2,925 | | | 2,868 |
Comcast Corporation,
5.900%, due 3/15/16 | | BBB+ | | | 3,075 | | | 3,084 |
Omnicom Group, Inc.,
5.900%, due 4/15/16 | | A- | | | 3,000 | | | 3,032 |
Sabmiller PLC,
6.500%, due 7/1/16 | | BBB+ | | | 3,100 | | | 3,234 |
Western Union Co.,
5.930%, due 10/1/16 | | A- | | | 2,900 | | | 2,872 |
Ras Laffan Lng II,
5.298%, due 9/30/20* | | A+ | | | 3,000 | | | 2,874 |
| | | | | | | | |
Total Corporate Obligations | | | | | 68,954 | | | 70,269 |
| | | | | | | | |
Total Long Term Investments—99.2% (Cost $298,822) | | | | | 289,474 | | | 294,818 |
| | | | | | | | |
| | | |
Repurchase Agreement | | | | | | | | |
Investors Bank & Trust Company, 5.01% dated 12/29/2006, due 1/2/2007, repurchase price $142, collateralized by FH Pool #789456 | | A+ | | | 142 | | | 142 |
| | | | | | | | |
Total Repurchase Agreement—0.1% (Cost $142) | | | | | 142 | | | 142 |
| | | | | | | | |
Total Investments—99.3%
(Cost $298,964) | | | | $ | 289,616 | | | 294,960 |
| | | | | | | | |
Cash and other assets, less
liabilities—0.7% | | | | | | | | 2,117 |
| | | | | | | | |
Net Assets—100% | | | | | | | $ | 297,077 |
| | | | | | | | |
WAC = Weighted Average Coupon
VRN = Variable Rate Note
NRSRO = Nationally Recognized Statistical Rating Organization, such as S&P, Moody’s or Fitch (unaudited)
The obligations of certain U. S. Government-sponsored securities are neither issued nor guaranteed by the U. S. Treasury
*Deemed illiquid pursuant to Liquidity Procedures adopted by the Board of Trustees. These holdings represent 9.1% of the net assets at December 31, 2006.
See accompanying Notes to Financial Statements.
December 31, 2006 | William Blair Funds 61 |
James S. Kaplan
Christopher T. Vincent
READY RESERVES FUND
The Ready Reserves Fund invests primarily in short-term U.S. dollar-denominated money market instruments, and exclusively in high quality securities that are rated in the top two categories of credit quality.
AN OVERVIEW FROM THE PORTFOLIO MANAGERS
Federal Reserve Board Monetary policy was the focus of the money markets during 2006.
The Federal Reserve raised the federal funds rate on overnight loans between banks by 0.25% four times during the first half of the year; on January 31—which was also Federal Reserve Board Chairman Alan Greenspan’s last day as chairman—and subsequently on March 28, May 10 and June 29. The last rate increase was the seventeenth consecutive rate hike by the Federal Reserve, and brought the federal funds rate to 5.25%. However, this two-year campaign of measured rate increases ended at the Federal Reserve’s September 20, 2006 meeting, when the Fed chose not to raise interest rates further. Since that time, there have been four consecutive meetings without a rate hike.
Heightened concern about the harsher-than-expected housing slump was an important factor in the Federal Reserve’s decision to hold interest rates steady following their mid-December meeting.
Minutes released of the Fed Reserve’s deliberations disclosed the Fed’s concerns about the downturn in the real estate market even as the Fed reiterated their primary goal of ensuring that inflation remained under control.
In its December 12th policy statement, the Fed did not speculate about a rate cut. Rather, policymakers adhered to previous language about the possibility of a rate increase, which most Fed watchers viewed as unlikely.
Many money market observers have interpreted the Fed’s policy decisions as a sign that the Fed believes that inflation will remain under control as the economy gradually slows. This in turn, will bring about the “soft-landing”—a moderating inflation rate without an increase in unemployment—that the Fed has been attempting to engineer. We would describe ourselves as being in this particular “camp”—we believe the Fed will be able to engineer a gradual slowing of economic growth, or “soft landing” that does not cause undue damage, triggering a recession. But we do not believe an interest rate cut by the Fed is going to happen anytime soon.
We presently intend to maintain our strategy of using commercial paper in the short end of the market, barbelled with fixed-rate obligations with slightly longer maturities, and also will continue to emphasize floating-rate obligations, which price off of LIBOR. (LIBOR is the London Interbank Offered Rate, which is the rate the creditworthiest international banks dealing in Eurodollars—U.S. currency held in banks outside of the U.S.—charge each other for large loans.)
The current inverted shape of the interest rate yield curve has decreased investment opportunities in the secondary fixed-rate market, but we do not see this as a particularly troubling development.
At December 31, 2006, the Fund’s Average Maturity was approximately 52.3 days, compared to 59.4 days at June 30, 2006 and 58.6 days at December 31, 2005.
The return for the 12 months ended December 31, 2006, of the Fund’s Class N Shares was 4.47%, versus the 4.22% return of the Fund’s benchmark, the AAA-Rated Money Market Funds Average. Total assets were $1.20 billion, compared to $1.16 billion at June 30, 2006 and $1.09 billion at December 31, 2005.
62 Annual Report | December 31, 2006 |
Ready Reserves Fund
Performance Highlights (unaudited)
The Fund’s 7 day yield on December 31, 2006 was 4.74%.
Average Annual Total Returns—Class N Shares year ending December 31, 2006.
| | | | | | | | | | | | | | |
| | | 1
Year | | | 3
Year | | | 5
Year | | | 10
Year | | | |
| Ready Reserves Fund | | 4.47 | % | | 2.62 | % | | 1.96 | % | | 3.39 | % | | |
AAA Rated Money Market Funds | | 4.22 | | | 2.47 | | | 1.85 | | | 3.39 | | | |
Performance cited represents past performance. Past performance does not guarantee future results and current performance may be lower or higher than the data quoted. For the most current month-end performance information, please call 1-800-742-7272, or visit our Web site at www.williamblairfunds.com. Class N Shares are available to the general public without a sales load. Total return includes reinvestment of income. Yields fluctuate and are not guaranteed. An investment in the Fund is neither insured nor guaranteed by the Federal Deposit Insurance Corp. (FDIC) or any government agency. Although the Fund seeks to preserve the value of your investment at $1.00 per share, it is possible to lose money by investing in the Fund.
The AAA Rated Money Market Funds Average represents the average annual composite performance of all AAA rated First Tier Retail Money Market Funds listed by IBC Financial data.
This report identifies the Fund’s investment’s on December 31, 2006. These holdings are subject to change. Not all fixed-income securities in the Fund performed the same, nor is there any guarantee that these fixed-income securities will perform as well in the future. Market forecasts provided in this report may not necessarily come to pass.
Sector Diversification (unaudited)
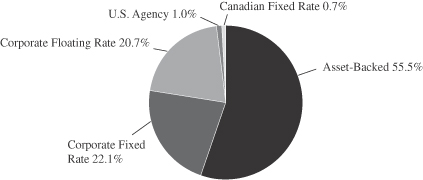
The sector diversification shown is based on the total investment portfolio.
December 31, 2006 | William Blair Funds 63 |
Ready Reserves Fund
Portfolio of Investments, December 31, 2006 (all amounts in thousands)
| | | | | | |
Issuer | | Principal
Amount | | Amortized
Cost |
Mortage-Backed Securities—1.0% | | | | | | |
Federal Home Loan Bank (FHLB),
2.600%-5.350%, 3/30/07-11/21/07 | | $ | 5,978 | | $ | 5,994 |
Federal Home Loan Mortgage Corp. (FHLMC), 4.125%-4.800%,
2/20/07-4/12/07 | | | 5,990 | | | 5,997 |
| | | | | | |
Total Mortgage-Backed Securities | | | 11,968 | | | 11,991 |
| | | | | | |
Canadian Fixed Rate Notes—0.7% | | | | | | |
Province of Quebec, 7.000%, 1/30/07 | | | 8,956 | | | 8,909 |
| | | | | | |
Total Canadian Fixed Rate Notes | | | 8,956 | | | 8,909 |
| | | | | | |
Fixed Rate Notes—30.7% | | | | | | |
American Honda Finance Corp,
5.406%-5.514%, 1/16/07-3/8/07 | | | 24,835 | | | 24,828 |
American General Finance Corp,
5.750%, 3/15/07 | | | 7,435 | | | 7,429 |
Berkshire Hathaway, 3.400%, 7/2/07 | | | 16,161 | | | 16,268 |
B.P. Argentina, 6.750%, 2/1/07 | | | 1,999 | | | 1,978 |
B.P. Canada Finance, 3.375%, 10/31/07 | | | 8,085 | | | 8,112 |
B.P. Capital PLC, 2.625%, 3/15/07 | | | 11,080 | | | 11,224 |
B.P. Company North America,
6.500%, 8/1/07 | | | 2,875 | | | 2,869 |
Caterpillar Financial Services,
2.625%-5.386%, 1/30/07-6/15/07 | | | 40,522 | | | 40,801 |
Chevron Corporation,
3.500%-7.090%, 2/1/07-9/17/07 | | | 14,917 | | | 14,955 |
GE Capital Corp,
2.850%-8.750%, 1/5/07-8/15/07 | | | 28,548 | | | 28,577 |
Gillette Company,
3.500%-4.125%, 8/30/07-10/15/07 | | | 20,075 | | | 20,135 |
IBM Corporation, 6.450%, 8/1/07 | | | 1,600 | | | 1,600 |
Kimberly-Clark Corp, 7.100%, 8/1/07 | | | 5,875 | | | 5,847 |
National Rural Utility Coop,
3.625%-6.500%, 3/1/07-4/10/07 | | | 19,891 | | | 19,862 |
Paccar Financial Corporation,
5.294%, 1/16/07 | | | 9,997 | | | 10,000 |
Pfizer, Inc., 2.500%, 3/15/07 | | | 14,413 | | | 14,683 |
Procter and Gamble Corporation,
4.750%, 6/15/07 | | | 14,088 | | | 14,134 |
SLM Corporation,
5.497%-5.625%, 1/25/07-4/10/07 | | | 23,915 | | | 23,905 |
Toyota Motor Credit,
2.700%-5.650%, 1/15/07-1/30/07 | | | 12,996 | | | 13,023 |
US Bancorp,
2.400%-5.100%, 02/01/07-8/23/07 | | | 32,749 | | | 32,915 |
Wal-Mart Stores,
4.375%-5.260%, 3/28/07-7/12/07 | | | 28,492 | | | 28,562 |
Wells Fargo Financial,
3.750%-6.750%, 2/15/07-10/15/07 | | | 24,876 | | | 24,851 |
| | | | | | |
Total Fixed Rate Notes | | | 365,424 | | | 366,558 |
| | | | | | |
| | | | | | |
Issuer | | Principal
Amount | | Amortized
Cost |
Variable Rate Notes—10.5% | | | | | | |
American General Finance Corp,
5.426%-5.470%, 4/5/07-6/27/07 | | $ | 17,513 | | $ | 17,507 |
Berkshire Hathaway, 5.420%, 1/11/08 | | | 15,437 | | | 15,436 |
General Electric Capital Corporation, 5.425%-5.430%, 6/22/07-1/3/08 | | | 14,549 | | | 14,548 |
IBM Corporation, 5.363%, 6/28/07 | | | 10,805 | | | 10,803 |
Paccar Financial Corporation,
5.274%, 7/16/07 | | | 14,994 | | | 14,995 |
SLM Corp, 5.597%, 7/25/07 | | | 7,897 | | | 7,896 |
Toyota Motor Credit,
5.327%-5.346%, 7/2/07-10/15/07 | | | 28,406 | | | 28,405 |
US Bank,
5.383%-5.402%, 3/23/07-9/28/07 | | | 5,834 | | | 5,833 |
Wells Fargo Financial, 5.423%, 9/28/07 | | | 10,011 | | | 10,008 |
| | | | | | |
Total Variable Rate Notes | | | 125,446 | | | 125,431 |
| | | | | | |
Asset-Backed Commercial Paper—55.5% | | | | | | |
Alpine Securitization Corporation,
5.260%, 1/3/07-1/11/07 | | | 20,000 | | | 19,982 |
Amsterdam Funding Corporation,
5.25%-5.260%, 1/12/07-1/19/07 | | | 35,000 | | | 34,923 |
CAFCO, L.L.C.,
5.270%-5.280%, 1/5/07-2/8/07 | | | 43,945 | | | 43,855 |
Chariot Funding, L.L.C.,
5.270%-5.320%, 1/9/07-2/7/07 | | | 48,570 | | | 48,372 |
Ciesco, L.L.C.,
5.260%-5.270%, 1/4/07-1/9/07 | | | 32,275 | | | 32,244 |
CRC Funding, L.L.C.,
5.260%, 1/8/07-1/23/07 | | | 36,818 | | | 36,729 |
Daimler Chrysler Revolving Auto,
5.260%-5.270%, 1/3/07-1/18/07 | | | 35,000 | | | 34,935 |
FCAR Owner Trust,
5.260-5.290%, 1/10/07-1/19/07 | | | 35,000 | | | 34,945 |
Jupiter Securitization Co. L.L.C.,
5.250%-5.270%, 1/17/07-2/5/07 | | | 26,380 | | | 26,283 |
Kittyhawk Funding, 5.260%, 1/23/07 | | | 10,000 | | | 9,968 |
New Center Asset Trust,
5.250%-5.260%, 1/5/07-1/24/07 | | | 50,000 | | | 49,865 |
Old Line Funding,
5.260%-5.270%, 1/8/07-1/12/07 | | | 14,292 | | | 14,271 |
Park Avenue Receivables,
5.260%-5.270%, 1/22/07-2/16/07 | | | 33,316 | | | 33,137 |
Ranger Funding,
5.260%-5.280%, 1/2/07-2/8/07 | | | 40,000 | | | 39,760 |
Sheffield Receivables,
5.260%-5.280%, 1/31/07-2/15/07 | | | 35,000 | | | 34,878 |
Thames Asset Global Securitization,
5.250%-5.280%, 1/25/07-2/12/07 | | | 37,650 | | | 37,451 |
Thunder Bay Funding,
5.260%-5.280%, 1/2/07-2/9/07 | | | 49,631 | | | 49,533 |
Variable Funding, 5.250%, 2/1/07-2/5/07 | | | 45,000 | | | 44,786 |
Wal-Mart Funding, 5.260%, 1/26/07 | | | 10,000 | | | 9,963 |
Windmill Funding Corporation,
5.240%-5.270%, 1/4/07-1/29/07 | | | 28,478 | | | 28,410 |
| | | | | | |
Total Asset-Backed Commercial Paper | | | 666,355 | | | 664,290 |
| | | | | | |
See accompanying Notes to Financial Statements.
64 Annual Report | December 31, 2006 |
Ready Reserves Fund
Portfolio of Investments, December 31, 2006 (all amounts in thousands)
| | | | | | | |
Issuer | | Principal
Amount | | Amortized
Cost | |
Demand Notes—1.7% | | | | | | | |
American Express Corporation, VRN, 5.176%, 1/2/07 | | $ | 9,348 | | $ | 9,348 | |
Prudential Funding, VRN,
5.180%, 1/2/07 | | | 10,783 | | | 10,783 | |
| | | | | | | |
Total Demand Notes | | | 20,131 | | | 20,131 | |
| | | | | | | |
Total Investments—100.1%
(cost $1,197,310) | | $ | 1,198,280 | | | 1,197,310 | |
| | | | | | | |
Liabilities, plus cash and other assets—(0.1)% | | | (1,717 | ) |
| | | | | | | |
Net assets—100.0% | | $ | 1,195,593 | |
| | | | | | | |
Portfolio Weighted Average Maturity | | | 52.3 Days | |
VRN = Variable Rate Note
See accompanying Notes to Financial Statements.
December 31, 2006 | William Blair Funds 65 |
Statements of Assets and Liabilities
December 31, 2006 (all dollar amounts in thousands)
| | | | | | | | | | | |
| | | Growth
Fund | | Tax-
Managed
Growth
Fund | | | Large Cap
Growth
Fund | |
Assets | | | | | | | | | | | |
Investments in securities, at cost | | $ | 199,534 | | $ | 7,307 | | | $ | 17,410 | |
Investments in Affiliated Fund, at cost | | | 2,574 | | | 106 | | | | 54 | |
| | | | | | | | | | | |
| | | |
Investments in securities, at value | | $ | 262,125 | | $ | 9,432 | | | $ | 20,131 | |
Investments in Affiliated Fund, at value | | | 2,574 | | | 106 | | | | 54 | |
Receivable for fund shares sold | | | 788 | | | 3 | | | | 21 | |
Receivable for investment securities sold | | | — | | | 259 | | | | — | |
Receivable from Advisor | | | — | | | 3 | | | | — | |
Dividend and interest receivable | | | 117 | | | 8 | | | | 14 | |
| | | | | | | | | | | |
Total assets | | | 265,604 | | | 9,811 | | | | 20,220 | |
Liabilities | | | | | | | | | | | |
Payable for investment securities purchased | | | — | | | 140 | | | | — | |
Payable for fund shares redeemed | | | 812 | | | — | | | | — | |
Management fee payable | | | 185 | | | — | | | | 8 | |
Distribution fee payable | | | 12 | | | — | | | | 2 | |
Other accrued expenses | | | 70 | | | 27 | | | | 19 | |
| | | | | | | | | | | |
Total liabilities | | | 1,079 | | | 167 | | | | 29 | |
| | | | | | | | | | | |
Net Assets | | $ | 264,525 | | $ | 9,644 | | | $ | 20,191 | |
| | | | | | | | | | | |
Capital | | | | | | | | | | | |
Composition of Net Assets | | | | | | | | | | | |
Par value of shares of beneficial interest | | $ | 23 | | $ | 1 | | | $ | 3 | |
Capital paid in excess of par value | | | 196,096 | | | 8,549 | | | | 22,614 | |
Accumulated net investment income (loss) | | | — | | | — | | | | — | |
Accumulated realized gain (loss) | | | 5,815 | | | (1,031 | ) | | | (5,147 | ) |
Net unrealized appreciation (depreciation) of investments and foreign
currencies | | | 62,591 | | | 2,125 | | | | 2,721 | |
| | | | | | | | | | | |
Net Assets | | $ | 264,525 | | $ | 9,644 | | | $ | 20,191 | |
| | | | | | | | | | | |
| | | |
Class N Shares | | | | | | | | | | | |
Net Assets | | $ | 58,602 | | $ | 1,095 | | | $ | 10,495 | |
Shares Outstanding | | | 5,131,665 | | | 100,038 | | | | 1,524,924 | |
Net Asset Value Per Share | | $ | 11.42 | | $ | 10.94 | | | $ | 6.88 | |
Class I Shares | | | | | | | | | | | |
Net Assets | | $ | 205,923 | | $ | 8,549 | | | $ | 9,696 | |
Shares Outstanding | | | 17,655,001 | | | 766,943 | | | | 1,387,101 | |
Net Asset Value Per Share | | $ | 11.66 | | $ | 11.15 | | | $ | 6.99 | |
See accompanying Notes to Financial Statements.
66 Annual Report | December 31, 2006 |
Statements of Operations
For the Year Ended December 31, 2006 (all dollar amounts in thousands)
| | | | | | | | | | | | |
| | | Growth
Fund | | | Tax-
Managed
Growth
Fund | | | Large Cap
Growth Fund | |
Investment income | | | | | | | | | | | | |
Dividends | | $ | 1,510 | | | $ | 62 | | | $ | 150 | |
Less foreign tax withheld | | | (26 | ) | | | (1 | ) | | | (3 | ) |
Dividend Income from Affiliated Fund | | | 28 | | | | 11 | | | | 10 | |
Interest | | | 224 | | | | 19 | | | | 20 | |
| | | | | | | | | | | | |
Total income | | | 1,736 | | | | 91 | | | | 177 | |
Expenses | | | | | | | | | | | | |
Investment advisory fees | | | 1,894 | | | | 69 | | | | 147 | |
Distribution fees | | | 125 | | | | 1 | | | | 24 | |
Custodian fees | | | 79 | | | | 39 | | | | 44 | |
Transfer agent fees | | | 135 | | | | 8 | | | | 12 | |
Professional fees | | | 32 | | | | 26 | | | | 23 | |
Registration fees | | | 28 | | | | 27 | | | | 27 | |
Other expenses | | | 95 | | | | 5 | | | | 2 | |
| | | | | | | | | | | | |
Total expenses before waiver | | | 2,388 | | | | 175 | | | | 279 | |
Less expenses waived or absorbed by the Advisor | | | — | | | | (69 | ) | | | (72 | ) |
| | | | | | | | | | | | |
Net expenses | | | 2,388 | | | | 106 | | | | 207 | |
| | | | | | | | | | | | |
Net investment income (loss) | | | (652 | ) | | | (15 | ) | | | (30 | ) |
Net realized and unrealized gain (loss) on investments and other assets and liabilities | | | | | | | | | | | | |
Net realized gain (loss) on investments | | | 31,916 | | | | 765 | | | | 223 | |
| | | | | | | | | | | | |
Change in net unrealized appreciation (depreciation) on investments and other assets and liabilities | | | (1,057 | ) | | | 12 | | | | 1,019 | |
| | | | | | | | | | | | |
Net increase (decrease) in net assets resulting from operations | | $ | 30,207 | | | $ | 762 | | | $ | 1,212 | |
| | | | | | | | | | | | |
See accompanying Notes to Financial Statements.
December 31, 2006 | William Blair Funds 67 |
Statements of Changes in Net Assets
For the Years Ended December 31, 2006 and 2005 (all amounts in thousands)
| | | | | | | | | | | | | | | | | | | | | | | | |
| | | Growth
Fund | | | Tax-
Managed
Growth
Fund | | | Large Cap
Growth
Fund | |
| | | 2006 | | | 2005 | | | 2006 | | | 2005 | | | 2006 | | | 2005 | |
Operations | | | | | | | | | | | | | | | | | | | | | | | | |
Net investment income (loss) | | $ | (652 | ) | | $ | (987 | ) | | $ | (15 | ) | | $ | (32 | ) | | $ | (30 | ) | | $ | (21 | ) |
Net realized gain (loss) on investments, foreign currency transactions and other assets and liabilities | | | 31,916 | | | | 27,667 | | | | 765 | | | | 90 | | | | 223 | | | | 79 | |
Change in net unrealized appreciation (depreciation) on investments, and other assets and liabilities | | | (1,057 | ) | | | (3,560 | ) | | | 12 | | | | 703 | | | | 1,019 | | | | 593 | |
| | | | | | | | | | | | | | | | | | | | | | | | |
Net increase (decrease) in net assets resulting from operations | | | 30,207 | | | | 23,120 | | | | 762 | | | | 761 | | | | 1,212 | | | | 651 | |
Distributions to shareholders from | | | | | | | | | | | | | | | | | | | | | | | | |
Net investment income | | | — | | | | — | | | | — | | | | — | | | | — | | | | — | |
Net realized gain | | | (27,315 | ) | | | (8,977 | ) | | | — | | | | — | | | | — | | | | — | |
| | | | | | | | | | | | | | | | | | | | | | | | |
| | | (27,315 | ) | | | (8,977 | ) | | | — | | | | — | | | | — | | | | — | |
Capital stock transactions | | | | | | | | | | | | | | | | | | | | | | | | |
Net proceeds from sale of shares | | | 33,215 | | | | 19,807 | | | | 1,445 | | | | 1,775 | | | | 4,950 | | | | 11,656 | |
Shares issued in reinvestment of income dividends and capital gain distributions | | | 25,204 | | | | 8,262 | | | | — | | | | — | | | | — | | | | — | |
Less cost of shares redeemed | | | (50,345 | ) | | | (64,159 | ) | | | (378 | ) | | | (568 | ) | | | (2,859 | ) | | | (1,836 | ) |
| | | | | | | | | | | | | | | | | | | | | | | | |
Net increase (decrease) in net assets resulting from capital share transactions | | | 8,074 | | | | (36,090 | ) | | | 1,067 | | | | 1,207 | | | | 2,091 | | | | 9,820 | |
| | | | | | | | | | | | | | | | | | | | | | | | |
Increase (decrease) in net assets | | | 10,966 | | | | (21,947 | ) | | | 1,829 | | | | 1,968 | | | | 3,303 | | | | 10,471 | |
Net assets | | | | | | | | | | | | | | | | | | | | | | | | |
Beginning of year | | | 253,559 | | | | 275,506 | | | | 7,815 | | | | 5,847 | | | | 16,888 | | | | 6,417 | |
| | | | | | | | | | | | | | | | | | | | | | | | |
End of year | | $ | 264,525 | | | $ | 253,559 | | | $ | 9,644 | | | $ | 7,815 | | | $ | 20,191 | | | $ | 16,888 | |
| | | | | | | | | | | | | | | | | | | | | | | | |
Undistributed net investment income (loss) at the end of the year | | $ | (653 | ) | | $ | (1 | ) | | $ | (15 | ) | | $ | — | | | $ | (30 | ) | | $ | — | |
| | | | | | | | | | | | | | | | | | | | | | | | |
See accompanying Notes to Financial Statements.
68 Annual Report | December 31, 2006 |
Statements of Assets and Liabilities
December 31, 2006 (all dollar amounts in thousands)
| | | | | | | | | | |
| | | Small Cap
Growth
Fund | | Mid Cap
Growth
Fund | | | Small-Mid
Cap
Growth
Fund |
Assets | | | | | | | | | | |
Investments in securities, at cost | | $ | 866,857 | | $ | 17,476 | | | $ | 79,165 |
Investments in Affiliated Companies, at cost | | | 229,048 | | | — | | | | — |
Investments in Affiliated Fund, at cost | | | 9,894 | | | 104 | | | | 1,311 |
| | | | | | | | | | |
| | | |
Investments in securities, at value | | $ | 996,863 | | $ | 18,540 | | | $ | 90,802 |
Investments in Affiliated Companies, at value | | | 246,530 | | | — | | | | — |
Investments in Affiliated Fund, at value | | | 9,894 | | | 104 | | | | 1,311 |
Receivable for fund shares sold | | | 10,374 | | | 974 | | | | 325 |
Receivable for investment securities sold | | | 8,288 | | | 40 | | | | 423 |
Receivable from Advisor | | | — | | | 5 | | | | — |
Dividend and interest receivable | | | 157 | | | 5 | | | | 18 |
| | | | | | | | | | |
Total assets | | | 1,272,106 | | | 19,668 | | | | 92,879 |
Liabilities | | | | | | | | | | |
Payable for investment securities purchased | | | 7,620 | | | 2 | | | | — |
Payable for fund shares redeemed | | | 1,804 | | | — | | | | 7 |
Management fee payable | | | 1,178 | | | — | | | | 73 |
Distribution fee payable | | | 151 | | | 1 | | | | 3 |
Other accrued expenses | | | 179 | | | 26 | | | | 30 |
| | | | | | | | | | |
Total liabilities | | | 10,932 | | | 29 | | | | 113 |
| | | | | | | | | | |
Net Assets | | $ | 1,261,174 | | $ | 19,639 | | | $ | 92,766 |
| | | | | | | | | | |
Capital | | | | | | | | | | |
Composition of Net Assets | | | | | | | | | | |
Par value of shares of beneficial interest | | $ | 49 | | $ | 2 | | | $ | 7 |
Capital paid in excess of par value | | | 1,096,613 | | | 18,760 | | | | 80,288 |
Accumulated net investment income (loss) | | | — | | | — | | | | — |
Accumulated realized gain (loss) | | | 17,024 | | | (187 | ) | | | 834 |
Net unrealized appreciation (depreciation) of investments and foreign currencies | | | 147,488 | | | 1,064 | | | | 11,637 |
| | | | | | | | | | |
Net Assets | | $ | 1,261,174 | | $ | 19,639 | | | $ | 92,766 |
| | | | | | | | | | |
| | | |
Class N Shares | | | | | | | | | | |
Net Assets | | $ | 708,113 | | $ | 5,481 | | | $ | 14,235 |
Shares Outstanding | | | 27,863,637 | | | 524,041 | | | | 1,098,167 |
Net Asset Value Per Share | | $ | 25.41 | | $ | 10.46 | | | $ | 12.96 |
Class I Shares | | | | | | | | | | |
Net Assets | | $ | 553,061 | | $ | 14,158 | | | $ | 78,531 |
Shares Outstanding | | | 21,321,170 | | | 1,349,752 | | | | 6,014,386 |
Net Asset Value Per Share | | $ | 25.94 | | $ | 10.49 | | | $ | 13.06 |
See accompanying Notes to Financial Statements.
December 31, 2006 | William Blair Funds 69 |
Statements of Operations
For the Year Ended December 31, 2006 (all dollar amounts in thousands)
| | | | | | | | | | | | |
| | | Small Cap
Growth Fund | | | Mid Cap
Growth
Fund(a) | | | Small-Mid
Cap
Growth
Fund | |
Investment income | | | | | | | | | | | | |
Dividends | | $ | 1,641 | | | $ | 57 | | | $ | 298 | |
Dividends from Affiliated Companies | | | 27 | | | | — | | | | — | |
Dividend Income from Affiliated Fund | | | 573 | | | | 5 | | | | 35 | |
Interest | | | 1,599 | | | | 20 | | | | 97 | |
| | | | | | | | | | | | |
Total income | | | 3,840 | | | | 82 | | | | 430 | |
Expenses | | | | | | | | | | | | |
Investment advisory fees | | | 12,197 | | | | 109 | | | | 825 | |
Distribution fees | | | 1,610 | | | | 11 | | | | 32 | |
Custodian fees | | | 192 | | | | 55 | | | | 60 | |
Transfer agent fees | | | 840 | | | | 19 | | | | 34 | |
Professional fees | | | 52 | | | | 22 | | | | 29 | |
Registration fees | | | 83 | | | | 33 | | | | 33 | |
Other expenses | | | 267 | | | | 5 | | | | 14 | |
| | | | | | | | | | | | |
Total expenses before waiver | | | 15,241 | | | | 254 | | | | 1,027 | |
Less expenses waived or absorbed by the Advisor | | | — | | | | (110 | ) | | | (59 | ) |
| | | | | | | | | | | | |
Net expenses | | | 15,241 | | | | 144 | | | | 968 | |
| | | | | | | | | | | | |
Net investment income (loss) | | | (11,401 | ) | | | (62 | ) | | | (538 | ) |
Net realized and unrealized gain (loss) on investments, foreign currency transactions and other assets and liabilities | | | | | | | | | | | | |
Net realized gain (loss) on investments | | | 117,178 | | | | (187 | ) | | | 4,908 | |
Net realized gain (loss) on investments in Affiliated Companies | | | (371 | ) | | | — | | | | — | |
| | | | | | | | | | | | |
Total net realized gain (loss) | | | 116,807 | | | | (187 | ) | | | 4,908 | |
Change in net unrealized appreciation (depreciation) on investments and other assets and liabilities | | | 27,043 | | | | 1,064 | | | | 3,169 | |
| | | | | | | | | | | | |
Net increase (decrease) in net assets resulting from operations | | $ | 132,449 | | | $ | 815 | | | $ | 7,539 | |
| | | | | | | | | | | | |
| (a) | | For the period from February 1, 2006 (Commencement of Operations) to December 31, 2006. |
See accompanying Notes to Financial Statements.
70 Annual Report | December 31, 2006 |
Statements of Changes in Net Assets
For the Years Ended December 31, 2006 and 2005 (all amounts in thousands)
| | | | | | | | | | | | | | | | | | | | |
| | | Small Cap
Growth
Fund | | | Mid Cap
Growth
Fund(a) | | | Small-Mid
Cap
Growth
Fund | |
| | | 2006 | | | 2005 | | | 2006 | | | 2006 | | | 2005 | |
Operations | | | | | | | | | | | | | | | | | | | | |
Net investment income (loss) | | $ | (11,401 | ) | | $ | (8,349 | ) | | $ | (62 | ) | | $ | (538 | ) | | $ | (382 | ) |
Net realized gain (loss) on investments, foreign currency transactions and other assets and liabilities | | | 116,807 | | | | 48,921 | | | | (187 | ) | | | 4,908 | | | | 1,453 | |
Change in net unrealized appreciation (depreciation) on investments, foreign currency transactions and other assets and liabilities | | | 27,043 | | | | (35,365 | ) | | | 1,064 | | | | 3,169 | | | | 6,094 | |
| | | | | | | | | | | | | | | | | | | | |
Net increase (decrease) in net assets resulting from operations | | | 132,449 | | | | 5,207 | | | | 815 | | | | 7,539 | | | | 7,165 | |
Distributions to shareholders from | | | | | | | | | | | | | | | | | | | | |
Net investment income | | | — | | | | — | | | | — | | | | — | | | | — | |
Net realized gain | | | (78,266 | ) | | | (71,631 | ) | | | — | | | | (4,404 | ) | | | (495 | ) |
| | | | | | | | | | | | | | | | | | | | |
| | | (78,266 | ) | | | (71,631 | ) | | | — | | | | (4,404 | ) | | | (495 | ) |
Capital stock transactions | | | | | | | | | | | | | | | | | | | | |
Net proceeds from sale of shares | | | 590,073 | | | | 345,073 | | | | 21,378 | | | | 24,304 | | | | 43,370 | |
Shares issued in reinvestment of income dividends and capital gain
distributions | | | 73,523 | | | | 69,879 | | | | — | | | | 3,992 | | | | 457 | |
Less cost of shares redeemed | | | (288,343 | ) | | | (287,999 | ) | | | (2,554 | ) | | | (8,876 | ) | | | (6,260 | ) |
| | | | | | | | | | | | | | | | | | | | |
Net increase (decrease) in net assets resulting from capital stock transactions | | | 375,253 | | | | 126,953 | | | | 18,824 | | | | 19,420 | | | | 37,567 | |
| | | | | | | | | | | | | | | | | | | | |
Increase (decrease) in net assets | | | 429,436 | | | | 60,529 | | | | 19,639 | | | | 22,555 | | | | 44,237 | |
Net assets | | | | | | | | | | | | | | | | | | | | |
Beginning of year | | | 831,738 | | | | 771,209 | | | | — | | | | 70,211 | | | | 25,974 | |
| | | | | | | | | | | | | | | | | | | | |
End of year | | $ | 1,261,174 | | | $ | 831,738 | | | $ | 19,639 | | | $ | 92,766 | | | $ | 70,211 | |
| | | | | | | | | | | | | | | | | | | | |
Undistributed net investment income (loss) at the end of the year | | $ | (11,401 | ) | | $ | — | | | $ | (62 | ) | | $ | (538 | ) | | $ | — | |
| | | | | | | | | | | | | | | | | | | | |
| (a) | | For the period from February 1, 2006 (Commencement of Operations) to December 31, 2006. |
See accompanying Notes to Financial Statements.
December 31, 2006 | William Blair Funds 71 |
Statements of Assets and Liabilities
December 31, 2006 (all dollar amounts in thousands)
| | | | | | | | | | | | | | | | |
| | | International
Growth
Fund | | | International
Equity
Fund | | | International
Small Cap
Growth
Fund | | | Emerging
Markets
Growth
Fund | |
Assets | | | | | | | | | | | | | | | | |
Investments in securities, at cost | | $ | 4,573,306 | | | $ | 241,868 | | | $ | 196,027 | | | $ | 634,600 | |
Investments in Affiliated Fund, at cost | | | 637 | | | | 5,158 | | | | 5,228 | | | | 1,265 | |
| | | | | | | | | | | | | | | | |
| | | | |
Investments in securities, at value | | $ | 6,209,154 | | | $ | 297,108 | | | $ | 226,468 | | | $ | 812,126 | |
Investments in Affiliated Fund, at value | | | 637 | | | | 5,158 | | | | 5,228 | | | | 1,265 | |
Cash | | | — | | | | — | | | | — | | | | 150 | |
Foreign currency, at value (cost $1,173, $29, $1,447, and $8,232, respectively) | | | 1,174 | | | | 27 | | | | 1,444 | | | | 8,184 | |
Receivable for fund shares sold | | | 27,666 | | | | 1,028 | | | | 165 | | | | 1,106 | |
Receivable for investment securities sold | | | 75,605 | | | | 110 | | | | 467 | | | | 2,180 | |
Receivable from Advisor | | | — | | | | 36 | | | | — | | | | 22 | |
Dividend and interest receivable | | | 6,311 | | | | 300 | | | | 183 | | | | 547 | |
| | | | | | | | | | | | | | | | |
Total assets | | | 6,320,547 | | | | 303,767 | | | | 233,955 | | | | 825,580 | |
Liabilities | | | | | | | | | | | | | | | | |
Payable for investment securities purchased | | | 35,438 | | | | 1,654 | | | | 1,688 | | | | 10,869 | |
Payable for fund shares redeemed | | | 10,980 | | | | 4,140 | | | | 2 | | | | 97 | |
Management fee payable | | | 5,261 | | | | 240 | | | | 203 | | | | 693 | |
Distribution and shareholder administration fee payable | | | 863 | | | | 8 | | | | 15 | | | | 45 | |
Other accrued expenses | | | 879 | | | | 9 | | | | 78 | | | | 227 | |
| | | | | | | | | | | | | | | | |
Total liabilities | | | 53,421 | | | | 6,051 | | | | 1,986 | | | | 11,931 | |
| | | | | | | | | | | | | | | | |
Net Assets | | $ | 6,267,126 | | | $ | 297,716 | | | $ | 231,969 | | | $ | 813,649 | |
| | | | | | | | | | | | | | | | |
Capital | | | | | | | | | | | | | | | | |
Composition of Net Assets | | | | | | | | | | | | | | | | |
Par value of shares of beneficial interest | | $ | 225 | | | $ | 20 | | | $ | 17 | | | $ | 42 | |
Capital paid in excess of par value | | | 4,583,709 | | | | 243,967 | | | | 200,077 | | | | 617,443 | |
Accumulated net investment income (loss) | | | (124,368 | ) | | | (4,627 | ) | | | (137 | ) | | | (492 | ) |
Accumulated realized gain (loss) | | | 171,664 | | | | 3,118 | | | | 1,575 | | | | 19,184 | |
Net unrealized appreciation (depreciation) of investments and foreign
currencies | | | 1,635,896 | | | | 55,238 | | | | 30,437 | | | | 177,472 | |
| | | | | | | | | | | | | | | | |
Net Assets | | $ | 6,267,126 | | | $ | 297,716 | | | $ | 231,969 | | | $ | 813,649 | |
| | | | | | | | | | | | | | | | |
| | | | |
Class N Shares | | | | | | | | | | | | | | | | |
Net Assets | | $ | 4,191,967 | | | $ | 36,926 | | | $ | 17,015 | | | $ | 57,882 | |
Shares Outstanding | | | 151,353,637 | | | | 2,427,471 | | | | 1,272,295 | | | | 2,980,882 | |
Net Asset Value Per Share | | $ | 27.70 | | | $ | 15.21 | | | $ | 13.37 | | | $ | 19.42 | |
Class I Shares | | | | | | | | | | | | | | | | |
Net Assets | | $ | 2,075,159 | | | $ | 260,790 | | | $ | 68,461 | | | $ | 202,394 | |
Shares Outstanding | | | 73,836,365 | | | | 17,030,637 | | | | 5,105,901 | | | | 10,392,630 | |
Net Asset Value Per Share | | $ | 28.10 | | | $ | 15.31 | | | $ | 13.41 | | | $ | 19.47 | |
See accompanying Notes to Financial Statements.
72 Annual Report | December 31, 2006 |
Statements of Operations
For the Year Ended December 31, 2006 (all dollar amounts in thousands)
| | | | | | | | | | | | | | | | |
| | | International
Growth
Fund | | | International
Equity
Fund | | | International
Small Cap
Growth
Fund | | | Emerging
Markets
Growth
Fund | |
Investment income | | | | | | | | | | | | | | | | |
Dividends | | $ | 86,322 | | | $ | 3,960 | | | $ | 1,235 | | | $ | 6,186 | |
Less foreign tax withheld | | | (6,999 | ) | | | (355 | ) | | | (105 | ) | | | (453 | ) |
Dividend Income from Affiliated Fund | | | 915 | | | | 51 | | | | 20 | | | | 102 | |
Interest | | | 5,929 | | | | 438 | | | | 312 | | | | 765 | |
| | | | | | | | | | | | | | | | |
Total income | | | 86,167 | | | | 4,094 | | | | 1,462 | | | | 6,600 | |
Expenses | | | | | | | | | | | | | | | | |
Investment advisory fees | | | 54,257 | | | | 2,668 | | | | 1,269 | | | | 5,363 | |
Distribution fees | | | 9,241 | | | | 78 | | | | 30 | | | | 99 | |
Shareholder administration fees | | | — | | | | — | | | | 63 | | | | 180 | |
Custodian fees | | | 2,933 | | | | 268 | | | | 253 | | | | 832 | |
Transfer agent fees | | | 2,993 | | | | 196 | | | | 21 | | | | 68 | |
Professional fees | | | 155 | | | | 47 | | | | 35 | | | | 41 | |
Registration fees | | | 225 | | | | 64 | | | | 73 | | | | 104 | |
Other expenses | | | 1,533 | | | | 19 | | | | 19 | | | | 82 | |
| | | | | | | | | | | | | | | | |
Total expenses before waiver | | | 71,337 | | | | 3,340 | | | | 1,763 | | | | 6,769 | |
Less expenses waived or absorbed by the Advisor | | | — | | | | (302 | ) | | | (80 | ) | | | (380 | ) |
| | | | | | | | | | | | | | | | |
Net expenses | | | 71,337 | | | | 3,038 | | | | 1,683 | | | | 6,389 | |
| | | | | | | | | | | | | | | | |
Net investment income (loss) | | | 14,830 | | | | 1,056 | | | | (221 | ) | | | 211 | |
Net realized and unrealized gain (loss) on investments, foreign currency transactions and other assets and liabilities | | | | | | | | | | | | | | | | |
Net realized gain (loss) on investments | | | 731,341 | | | | 5,767 | | | | 3,035 | | | | 26,278 | |
Net realized gain (loss) on foreign currency translation and other assets and liabilities | | | (18,138 | ) | | | (896 | ) | | | (736 | ) | | | (3,285 | ) |
| | | | | | | | | | | | | | | | |
Total net realized gain (loss) | | | 713,203 | | | | 4,871 | | | | 2,299 | | | | 22,993 | |
Change in net unrealized appreciation (depreciation) on investments and other assets and liabilities | | | 398,415 | | | | 38,016 | | | | 26,158 | | | | 147,786 | |
| | | | | | | | | | | | | | | | |
Net increase (decrease) in net assets resulting from operations | | $ | 1,126,448 | | | $ | 43,943 | | | $ | 28,236 | | | $ | 170,990 | |
| | | | | | | | | | | | | | | | |
See accompanying Notes to Financial Statements.
December 31, 2006 | William Blair Funds 73 |
Statements of Changes in Net Assets
For the Years Ended December 31, 2006 and the 2005 (all amounts in thousands)
| | | | | | | | | | | | | | | | | | | | | | | | | | | | | | | | |
| | | International
Growth
Fund | | | International Equity Fund | | | | | | International
Small Cap
Growth
Fund | | | | | | Emerging
Markets
Growth
Fund | |
| | | 2006 | | | 2005 | | | 2006 | | | 2005 | | | 2006 | | | 2005(a) | | | 2006 | | | 2005(b) | |
Operations | | | | | | | | | | | | | | | | | | | | | | | | | | | | | | | | |
Net investment income (loss) | | $ | 14,830 | | | $ | 8,479 | | | $ | 1,056 | | | $ | (46 | ) | | $ | (221 | ) | | $ | (6 | ) | | $ | 211 | | | $ | 69 | |
Net realized gain (loss) on investments, foreign currency transactions and other assets and liabilities | | | 713,203 | | | | 286,812 | | | | 4,871 | | | | (2,648 | ) | | | 2,299 | | | | 355 | | | | 22,993 | | | | 1,535 | |
Change in net unrealized appreciation (depreciation) on investments, foreign currency translation and other assets and liabilities | | | 398,415 | | | | 457,704 | | | | 38,016 | | | | 16,797 | | | | 26,158 | | | | 4,279 | | | | 147,786 | | | | 29,686 | |
| | | | | | | | | | | | | | | | | | | | | | | | | | | | | | | | |
Net increase (decrease) in net assets resulting from operations | | | 1,126,448 | | | | 752,995 | | | | 43,943 | | | | 14,103 | | | | 28,236 | | | | 4,628 | | | | 170,990 | | | | 31,290 | |
Distributions to shareholders from | | | | | | | | | | | | | | | | | | | | | | | | | | | | | | | | |
Net investment income | | | (81,288 | ) | | | (21,550 | ) | | | (4,187 | ) | | | — | | | | (106 | ) | | | (6 | ) | | | (405 | ) | | | — | |
Net realized gain | | | (590,410 | ) | | | (254,334 | ) | | | (456 | ) | | | — | | | | (877 | ) | | | — | | | | (4,544 | ) | | | (1,169 | ) |
| | | | | | | | | | | | | | | | | | | | | | | | | | | | | | | | |
| | | (671,698 | ) | | | (275,884 | ) | | | (4,643 | ) | | | — | | | | (983 | ) | | | (6 | ) | | | (4,949 | ) | | | (1,169 | ) |
Capital stock transactions | | | | | | | | | | | | | | | | | | | | | | | | | | | | | | | | |
Net proceeds from sale of shares | | | 1,785,719 | | | | 1,424,671 | | | | 137,733 | | | | 196,067 | | | | 172,153 | | | | 46,006 | | | | 529,925 | | | | 224,893 | |
Shares issued in reinvestment of income dividends and capital gain distributions | | | 633,412 | | | | 246,145 | | | | 4,390 | | | | — | | | | 868 | | | | 6 | | | | 4,687 | | | | 1,122 | |
Less cost of shares redeemed | | | (1,157,832 | ) | | | (598,284 | ) | | | (61,417 | ) | | | (42,149 | ) | | | (18,839 | ) | | | (100 | ) | | | (136,352 | ) | | | (6,788 | ) |
| | | | | | | | | | | | | | | | | | | | | | | | | | | | | | | | |
Net increase (decrease) in net assets resulting from capital stock transactions | | | 1,261,299 | | | | 1,072,532 | | | | 80,706 | | | | 153,918 | | | | 154,182 | | | | 45,912 | | | | 398,260 | | | | 219,227 | |
| | | | | | | | | | | | | | | | | | | | | | | | | | | | | | | | |
Increase (decrease) in net assets | | | 1,716,049 | | | | 1,549,643 | | | | 120,006 | | | | 168,021 | | | | 181,435 | | | | 50,534 | | | | 564,301 | | | | 249,348 | |
Net assets | | | | | | | | | | | | | | | | | | | | | | | | | | | | | | | | |
Beginning of year | | | 4,551,077 | | | | 3,001,434 | | | | 177,710 | | | | 9,689 | | | | 50,534 | | | | — | | | | 249,348 | | | | — | |
| | | | | | | | | | | | | | | | | | | | | | | | | | | | | | | | |
End of year | | $ | 6,267,126 | | | $ | 4,551,077 | | | $ | 297,716 | | | $ | 177,710 | | | $ | 231,969 | | | $ | 50,354 | | | $ | 813,649 | | | $ | 249,348 | |
| | | | | | | | | | | | | | | | | | | | | | | | | | | | | | | | |
Undistributed net investment income (loss) at the end of the year | | $ | (106,979 | ) | | $ | (40,521 | ) | | $ | (3,731 | ) | | $ | (600 | ) | | $ | (426 | ) | | $ | (99 | ) | | $ | (516 | ) | | $ | (322 | ) |
| | | | | | | | | | | | | | | | | | | | | | | | | | | | | | | | |
(a) For the period from November 1, 2005 (Commencement of Operations) to December 31, 2005.
| (b) | | For the period from June 6, 2005 (Commencement of Operations) to December 31, 2005. |
See accompanying Notes to Financial Statements.
74 Annual Report | December 31, 2006 |
Statements of Assets and Liabilities
December 31, 2006 (all dollar amounts in thousands)
| | | | | | | | | | | |
| | | Value
Discovery
Fund | | Income
Fund | | | Ready
Reserves
Fund | |
Assets | | | | | | | | | | | |
Investments in securities, at cost | | $ | 133,010 | | $ | 298,964 | | | $ | 1,197,310 | |
Investments in Affiliated Fund, at cost | | | 502 | | | — | | | | — | |
| | | | | | | | | | | |
| | | |
Investments in securities, at value | | $ | 145,990 | | $ | 294,960 | | | $ | 1,197,310 | |
Investments in Affiliated Fund, at value | | | 502 | | | — | | | | — | |
Cash | | | — | | | — | | | | 1 | |
Receivable for fund shares sold | | | 3,992 | | | 839 | | | | — | |
Receivable for investment securities sold | | | 726 | | | — | | | | — | |
Receivable from Advisor | | | — | | | 58 | | | | — | |
Dividend and interest receivable | | | 179 | | | 2,854 | | | | 5,651 | |
| | | | | | | | | | | |
Total assets | | | 151,389 | | | 298,711 | | | | 1,202,962 | |
Liabilities | | | | | | | | | | | |
Payable for investment securities purchased | | | 4,211 | | | — | | | | 6,074 | |
Payable for fund shares redeemed | | | 252 | | | 1,461 | | | | — | |
Management fee payable | | | 49 | | | 87 | | | | 231 | |
Distribution fee payable | | | 48 | | | 11 | | | | 353 | |
Shareholder services fee payable | | | — | | | — | | | | — | |
Dividend payable | | | — | | | — | | | | 619 | |
Other accrued expenses | | | 52 | | | 75 | | | | 92 | |
| | | | | | | | | | | |
Total liabilities | | | 4,612 | | | 1,634 | | | | 7,369 | |
| | | | | | | | | | | |
Net Assets | | $ | 146,777 | | $ | 297,077 | | | $ | 1,195,593 | |
| | | | | | | | | | | |
Capital | | | | | | | | | | | |
Composition of Net Assets | | | | | | | | | | | |
Par value of shares of beneficial interest | | $ | 9 | | $ | 29 | | | $ | 929 | |
Capital paid in excess of par value | | | 131,506 | | | 321,169 | | | | 1,195,609 | |
Accumulated net investment income (loss) | | | 11 | | | — | | | | 81 | |
Accumulated realized gain (loss) | | | 2,271 | | | (20,117 | ) | | | (1,026 | ) |
Net unrealized appreciation (depreciation) of investments and foreign currencies | | | 12,980 | | | (4,004 | ) | | | — | |
| | | | | | | | | | | |
Net Assets | | $ | 146,777 | | $ | 297,077 | | | $ | 1,195,593 | |
| | | | | | | | | | | |
| | | |
Class N Shares | | | | | | | | | | | |
Net Assets | | $ | 97,791 | | $ | 89,959 | | | $ | 1,195,593 | |
Shares Outstanding | | | 6,011,762 | | | 9,238,661 | | | | 1,195,647,351 | |
Net Asset Value Per Share | | $ | 16.27 | | $ | 9.74 | | | $ | 1.00 | |
Class I Shares | | | | | | | | | | | |
Net Assets | | $ | 48,986 | | $ | 207,118 | | | | | |
Shares Outstanding | | | 2,967,590 | | | 21,371,722 | | | | | |
Net Asset Value Per Share | | $ | 16.51 | | $ | 9.69 | | | | | |
See accompanying Notes to Financial Statements.
December 31, 2006 | William Blair Funds 75 |
Statements of Operations
For the Year Ended December 31, 2006 (all dollar amounts in thousands)
| | | | | | | | | | | |
| | | Value
Discovery
Fund | | | Income
Fund | | | Ready
Reserves
Fund |
Investment income | | | | | | | | | | | |
Dividends | | $ | 953 | | | $ | — | | | $ | — |
Dividend Income from Affiliated Fund | | | 17 | | | | — | | | | — |
Interest | | | 65 | | | | 16,094 | | | | 58,681 |
| | | | | | | | | | | |
Total income | | | 1,035 | | | | 16,094 | | | | 58,681 |
Expenses | | | | | | | | | | | |
Investment advisory fees | | | 834 | | | | 1,531 | | | | 2,820 |
Distribution fees | | | 80 | | | | 141 | | | | — |
Shareholder services fees | | | — | | | | — | | | | 4,096 |
Custodian fees | | | 115 | | | | 117 | | | | 190 |
Transfer agent fees | | | 42 | | | | 105 | | | | 28 |
Professional fees | | | 37 | | | | 35 | | | | 45 |
Registration fees | | | 53 | | | | 31 | | | | 32 |
Other expenses | | | 48 | | | | 90 | | | | 173 |
| | | | | | | | | | | |
Total expenses before waiver | | | 1,209 | | | | 2,050 | | | | 7,384 |
Less expenses waived or absorbed by the Advisor | | | (310 | ) | | | (58 | ) | | | — |
| | | | | | | | | | | |
Net expenses | | | 899 | | | | 1,992 | | | | 7,384 |
| | | | | | | | | | | |
Net investment income (loss) | | | 136 | | | | 14,102 | | | | 51,297 |
Net realized and unrealized gain (loss) on investments, and other assets and liabilities | | | | | | | | | | | |
Net realized gain (loss) on investments | | | 16,215 | | | | (1,052 | ) | | | — |
| | | | | | | | | | | |
Change in net unrealized appreciation (depreciation) on investments and other assets and liabilities | | | 760 | | | | (202 | ) | | | — |
| | | | | | | | | | | |
Net increase (decrease) in net assets resulting from operations | | $ | 17,111 | | | $ | 12,848 | | | $ | 51,297 |
| | | | | | | | | | | |
See accompanying Notes to Financial Statements.
76 Annual Report | December 31, 2006 |
Statements of Changes in Net Assets
For the Years Ended December 31, 2006 and 2005 (all amounts in thousands)
| | | | | | | | | | | | | | | | | | | | | | | | |
| | | Value
Discovery
Fund | | | Income
Fund | | | Ready
Reserves
Fund | |
| | | 2006 | | | 2005 | | | 2006 | | | 2005 | | | 2006 | | | 2005 | |
Operations | | | | | | | | | | | | | | | | | | | | | | | | |
Net investment income (loss) | | $ | 136 | | | $ | (48 | ) | | $ | 14,102 | | | $ | 12,852 | | | $ | 51,297 | | | $ | 27,823 | |
Net realized gain (loss) on investments, foreign currency transactions and other assets and liabilities | | | 16,215 | | | | 39,004 | | | | (1,052 | ) | | | (1,052 | ) | | | — | | | | — | |
Change in net unrealized appreciation (depreciation) on investments and other assets and liabilities | | | 760 | | | | (49,149 | ) | | | (202 | ) | | | (6,151 | ) | | | — | | | | — | |
| | | | | | | | | | | | | | | | | | | | | | | | |
Net increase (decrease) in net assets resulting from operations | | | 17,111 | | | | (10,193 | ) | | | 12,848 | | | | 5,649 | | | | 51,297 | | | | 27,823 | |
Distributions to shareholders from | | | | | | | | | | | | | | | | | | | | | | | | |
Net investment income | | | (129 | ) | | | — | | | | (16,500 | ) | | | (16,070 | ) | | | (51,297 | ) | | | (27,823 | ) |
Net realized gain | | | (15,001 | ) | | | (24,647 | ) | | | — | | | | — | | | | — | | | | — | |
| | | | | | | | | | | | | | | | | | | | | | | | |
| | | (15,130 | ) | | | (24,647 | ) | | | (16,500 | ) | | | (16,070 | ) | | | (51,297 | ) | | | (27,823 | ) |
Capital stock transactions | | | | | | | | | | | | | | | | | | | | | | | | |
Net proceeds from sale of shares | | | 100,537 | | | | 19,288 | | | | 61,832 | | | | 95,102 | | | | 1,030,633 | | | | 1,131,031 | |
Shares issued in reinvestment of income dividends and capital gain distributions | | | 14,164 | | | | 24,267 | | | | 13,061 | | | | 12,541 | | | | 51,002 | | | | 27,698 | |
Less cost of shares redeemed | | | (40,344 | ) | | | (184,452 | ) | | | (84,660 | ) | | | (80,810 | ) | | | (977,896 | ) | | | (1,159,815 | ) |
| | | | | | | | | | | | | | | | | | | | | | | | |
Net increase (decrease) in net assets resulting from capital stock transactions | | | 74,357 | | | | (140,897 | ) | | | (9,767 | ) | | | 26,833 | | | | 103,739 | | | | (1,086 | ) |
| | | | | | | | | | | | | | | | | | | | | | | | |
Increase (decrease) in net assets | | | 76,338 | | | | (175,737 | ) | | | (13,419 | ) | | | 16,412 | | | | 103,739 | | | | (1,086 | ) |
Net assets | | | | | | | | | | | | | | | | | | | | | | | | |
Beginning of year | | | 70,439 | | | | 246,176 | | | | 310,496 | | | | 294,084 | | | | 1,091,854 | | | | 1,092,940 | |
| | | | | | | | | | | | | | | | | | | | | | | | |
End of year | | $ | 146,777 | | | $ | 70,439 | | | $ | 297,077 | | | $ | 310,496 | | | $ | 1,195,593 | | | $ | 1,091,854 | |
| | | | | | | | | | | | | | | | | | | | | | | | |
Undistributed net investment income (loss) at the end of the year | | $ | 10 | | | $ | 3 | | | $ | (2,398 | ) | | $ | — | | | $ | 81 | | | $ | 81 | |
| | | | | | | | | | | | | | | | | | | | | | | | |
See accompanying Notes to Financial Statements.
December 31, 2006 | William Blair Funds 77 |
Notes to Financial Statements
(1) Significant Accounting Policies
The following is a summary of the Funds’ significant accounting policies in effect during the period covered by the financial statements, which are in accordance with U.S. generally accepted accounting principles.
(a) Description of the Fund
William Blair Funds (the “Fund”) is a diversified mutual fund registered under the Investment Company Act of 1940, as amended, as an open-end management investment company. For each portfolio, the number of shares authorized is unlimited. The Fund currently consists of the following fifteen portfolios (the “Portfolios”), each with its own investment objectives and policies.
| | |
Equity Portfolios | | International Portfolios |
Growth | | International Growth |
Tax-Managed Growth | | International Equity |
Large Cap Growth | | International Small Cap Growth |
Small Cap Growth | | Institutional International Growth |
Mid Cap Growth | | Institutional International Equity |
Small-Mid Cap Growth | | Emerging Markets Growth |
Value Discovery | | Fixed Income Portfolio |
| | Income |
| | Money Market Portfolio |
| | Ready Reserves |
The investment objectives of the Portfolios are as follows:
| | |
Equity | | Long-term capital appreciation. |
International | | Long-term capital appreciation. |
Fixed Income | | High level of current income with relative stability of principal. |
Money Market | | Current income, a stable share price and daily liquidity. |
The Institutional International Growth Fund, the Institutional International Equity Fund and the Institutional Class of the International Small Cap Growth Fund and Emerging Markets Growth Fund issue a separate report.
(b) Share Classes
Three different classes of shares currently exist: N, I and Institutional. This report includes financial highlight information for Classes N and I. The table below describes the Class N shares and the Class I shares covered by this report:
| | |
Class | | Description |
| N | | Class N shares are sold to the general public, either directly through the Fund’s distributor or through a select number of financial intermediaries. Class N shares are sold without any sales load, and carry an annual 12b-1 distribution fee (0.25% for the Equity and International Portfolios and 0.15% for the Fixed Income Portfolio) or a service fee (0.35% for the Money Market Portfolio), and an annual shareholder administration fee (0.15% for the International Small Cap Growth Portfolio and Emerging Markets Growth Portfolio). |
| I | | Class I shares are sold to a limited group of investors. They do not carry any sales load or distribution fees and generally have lower ongoing expenses than the other classes. Class I shares of the International Small Cap Growth Portfolio and Emerging Markets Growth Portfolio carry an annual shareholder administration fee of 0.15%. |
Investment income, realized and unrealized gains and losses, and certain Portfolio level expenses and expense reductions, if any, are allocated based on the relative net assets of each class, except for certain class specific expenses which are charged directly to the appropriate class. Differences in class expenses may result in the payment of different per share dividends by class. All share classes of the Portfolios have equal rights with respect to voting subject to class specific arrangements.
78 Annual Report | December 31, 2006 |
(c) Investment Valuation
The market value of domestic equity securities and options is determined by valuing securities traded on national securities exchanges or markets or in the over-the-counter markets at the last sales price or, if applicable, the official closing price or, in the absence of a sale on the date of valuation, at the latest bid price.
For international securities, if the foreign exchange or market on which a security is primarily traded closes before the close of regular trading on the New York Stock Exchange (4:00 p.m. Eastern time), the Portfolios use an independent pricing service on a daily basis to estimate the fair value price as of the close of regular trading on the New York Stock Exchange. The Board of Trustees has determined that the passage of time between when foreign exchanges or markets close and when the Portfolios calculate their net asset values could cause the value of international securities to no longer be representative of their market price or accurate. In addition, quarterly the Board of Trustees receives a report which compares the fair value prices used to calculate the net asset value to the next day’s opening local prices. Otherwise, the value of foreign equity securities is determined based on the last sale price on the foreign exchange or market on which it is primarily traded or, if there have been no sales during that day, at the latest bid price. Foreign currency forward contracts and foreign currencies are valued at the forward and current exchange rates, respectively, prevailing on the date of valuation.
Long-term, fixed-income securities are valued based on market quotations, or by independent pricing services that use prices provided by market makers or by estimates of market values obtained from yield data relating to instruments or securities with similar characteristics.
Investments in other funds are valued at the underlying fund’s net asset value on the date of valuation. Other securities, and all other assets, including securities for which a market price is not available, or the value of which is affected by a significant valuation event, are valued at fair value as determined in good faith by the Pricing or Valuation Committee, in accordance with the Fund’s Valuation Procedures approved by the Board of Trustees. As of December 31, 2006, there were securities held in Small Cap Growth, International Growth, International Equity, International Small Cap Growth and the Emerging Markets Growth Portfolios requiring fair valuation pursuant to the Fund’s valuation procedures. Securities held in the Ready Reserves Fund are valued at amortized cost, which approximates market value.
(d) Investment income and transactions
Dividend income is recorded on the ex-dividend date, except for those dividends from certain foreign securities which are recorded as soon as the information is available. Foreign currency gains and losses associated with fluctuations in the foreign currency rate versus the United States dollar are recorded in the Statement of Operations as a component of the net realized gain (loss) on foreign currency translations and other assets and liabilities.
Premiums and discounts are accreted and amortized on a straight-line basis for short-term investments and on an effective interest method for long-term investments.
Interest income is determined on the basis of the interest accrued, adjusted for amortization of premium or discount. Variable rate bonds and floating rate notes earn interest at coupon rates that fluctuate at specific time intervals. The interest rates shown in the Portfolio of Investments for the Income Portfolio and the Ready Reserves Portfolio were the rates in effect on December 31, 2006. Put bonds may be redeemed at the discretion of the holder on specified dates prior to maturity.
Paydown gains and losses on mortgage and asset-backed securities are treated as an adjustment to interest income. For the year ended December 31, 2006, the Income Portfolio recognized a reduction of interest income and a reduction of net realized loss of $2,315 (in thousands). This reclassification has no effect on the net asset value of the Portfolio.
Security and shareholder transactions are accounted for no later than one business day following the trade date. However, for financial reporting purposes, security and shareholder transactions are accounted for on the trade date of the last business day of the reporting period. Realized gains and losses from securities transactions are recognized on the basis of high cost lot sell selection.
Awards from class action litigation may be recorded as a reduction of cost. If the Funds no longer own the applicable securities, the proceeds are recorded as realized gains.
(e) Share Valuation and Dividends to Shareholders
Shares are sold and redeemed on a continuous basis at net asset value. The net asset value per share is determined separately for each class by dividing the Portfolio’s net assets attributable to that class by the number of shares of the class outstanding
December 31, 2006 | William Blair Funds 79 |
as of the close of regular trading on the New York Stock Exchange, which is generally 3:00 p.m. Central time (4:00 p.m. Eastern time), on each day the Exchange is open. Redemption fees may be applicable to redemptions or exchanges within 60 days of purchase. For both Class N and Class I shares, the William Blair domestic equity funds assess a 1% redemption fee on shares sold or exchanged that have been owned 60 days or less and the William Blair international funds assess a 2% redemption fee on shares sold or exchanged that have been owned 60 days or less as disclosed within the Funds’ Prospectus. The redemption fees collected by the Fund are netted against the amount of Redemptions for presentation on the Statement of Changes in Net Assets.
For the year ended December 31, 2006, the redemption fees collected by the Portfolios were as follows (in thousands):
| | | |
| | | Redemption
Fees |
Growth | | $ | 1 |
Tax-Managed Growth | | | — |
Large Cap Growth | | | — |
Small Cap Growth | | | 52 |
Mid Cap Growth Fund | | | — |
Small Mid-Cap Growth | | | 4 |
International Growth | | | 152 |
International Equity | | | 28 |
International Small Cap Growth | | | 3 |
Emerging Markets Growth | | | 8 |
Value Discovery | | | 5 |
Dividends from net investment income, if any, of the Growth, Tax-Managed Growth, Large Cap Growth, Small Cap Growth, Mid Cap Growth, Small-Mid Cap Growth, International Growth, International Equity, International Small Cap Growth, Emerging Markets Growth and Value Discovery Portfolios are declared at least annually. Dividends from the Income and the Ready Reserves Portfolios are declared monthly and daily, respectively. Capital gain distributions, if any, are declared at least annually in December. Dividends payable to shareholders are recorded on the ex-dividend date.
(f) Foreign Currency Translation and Forward Foreign Currency Contracts
The International Growth, International Equity, International Small Cap Growth and Emerging Markets Growth Portfolios may invest in securities denominated in foreign currencies. As such, assets and liabilities denominated in foreign currencies are translated into U.S. dollar amounts at the current exchange rate on the date of valuation. The values of foreign investments, open foreign currency forward contracts, and cash denominated in foreign currencies are translated into U.S. dollars using a spot market rate of exchange as of the time of the determination of each Portfolio’s NAV, typically 4:00 p.m. Eastern time on days when there is regular trading on the New York Stock Exchange. Payables and receivables for securities transactions, dividends, interest income and tax reclaims are translated into U.S. dollars using a spot market rate of exchange as of 4:00 p.m. Eastern time. Settlement of purchases and sales and dividend and interest receipts are translated into U.S. dollars using a spot market rate of exchange as of 11:00 a.m. Eastern time.
The Portfolios may enter into foreign currency forward contracts (1) as a means of managing the risks associated with changes in the exchange rates for the purchase or sale of a specific amount of a particular foreign currency, and (2) to hedge the value, in U.S. dollars, of portfolio securities. Gains and losses from foreign currency transactions associated with purchases and sales of investments and foreign currency forward contracts are included with the net realized and unrealized gain or loss on investments. For tax purposes these foreign currency gains and losses are treated as ordinary income.
(g) Options
The Portfolios may engage in options transactions on security indices and other financial indices and in doing so achieve similar objectives to what they would achieve through the sale or purchase of options on individual securities or other instruments.
Option writing. When a Portfolio writes an option, an amount equal to the premium received by the Portfolio is recorded as a liability and is subsequently adjusted to the current fair value of the option written. Premiums received from writing options that expire unexercised are treated by the Portfolio on the expiration date as realized gains from investments. The difference between the premium and the amount paid on effecting a closing purchase transaction, including brokerage commissions, is
80 Annual Report | December 31, 2006 |
also treated as a realized gain, or, if the premium is less than the amount paid for the closing purchase transaction, as a realized loss. If a call option is exercised, the premium is added to the proceeds from the sale of the underlying security or currency in determining whether the Portfolio has realized a gain or loss. If a put option is exercised, the premium reduces the cost basis of the securities purchased by the Portfolio. The Portfolio as writer of an option bears the market risk of an unfavorable change in the price of the security underlying the written option. There were no open options at December 31, 2006.
(h) Income Taxes
Each Portfolio intends to comply with the special provisions of Subchapter M of the Internal Revenue Code available to regulated investment companies and, therefore, no provision for Federal income taxes has been made in the accompanying financial statements since each Portfolio intends to distribute substantially all of its taxable income to its shareholders and be relieved of all Federal income taxes.
The International Growth, International Equity, International Small Cap Growth and Emerging Markets Growth Portfolios have elected to mark-to-market their investments in Passive Foreign Investment Companies (“PFICs”) for Federal income tax purposes. In accordance with this election, the Portfolios recognized net unrealized appreciation/(depreciation) of $83,007, $3,835, $— and $—, respectively (in thousands) in 2006, all of which has been treated as an adjustment to the cost of investments for tax purposes. The Portfolios also treat the deferred loss associated with current and prior year wash sales as an adjustment to the cost of investments for tax purposes. The cost of investments for Federal income tax purposes and related gross unrealized appreciation/(depreciation) and net unrealized appreciation/(depreciation) at December 31, 2006, were as follows (in thousands):
| | | | | | | | | | | | | |
Portfolio | | Cost of
Investments | | Gross Unrealized Appreciation | | Gross Unrealized Depreciation | | Net Unrealized
Appreciation/ (Depreciation) | |
Growth | | $ | 202,259 | | $ | 64,280 | | $ | 1,840 | | $ | 62,440 | |
Tax-Managed Growth | | | 7,413 | | | 2,140 | | | 15 | | | 2,125 | |
Large Cap Growth | | | 17,505 | | | 3,026 | | | 346 | | | 2,680 | |
Small Cap Growth | | | 1,109,713 | | | 170,213 | | | 26,639 | | | 143,574 | |
Mid Cap Growth | | | 17,612 | | | 1,432 | | | 400 | | | 1,032 | |
Small-Mid Cap Growth | | | 80,652 | | | 12,806 | | | 1,345 | | | 11,461 | |
International Growth | | | 4,724,612 | | | 1,502,662 | | | 17,435 | | | 1,485,227 | |
International Equity | | | 253,942 | | | 49,054 | | | 732 | | | 48,322 | |
International Small Cap Growth | | | 202,266 | | | 31,673 | | | 2,247 | | | 29,426 | |
Emerging Markets Growth | | | 641,493 | | | 175,190 | | | 3,346 | | | 171,844 | |
Value Discovery | | | 133,760 | | | 13,948 | | | 1,216 | | | 12,732 | |
Income | | | 298,964 | | | 1,366 | | | 5,370 | | | (4,004 | ) |
Ready Reserves | | | 1,197,310 | | | — | | | — | | | — | |
December 31, 2006 | William Blair Funds 81 |
The timing and characterization of certain income and capital gain distributions are determined annually in accordance with Federal income tax regulations that may differ from U.S. generally accepted accounting principles. As a result, net investment income or loss and net realized gain or loss for a reporting period may differ from the amount distributed during such period. In addition, the Portfolios may periodically record reclassifications among certain capital accounts to reflect differences between financial reporting and income tax basis distributions. The reclassifications were reported in order to reflect the tax treatment for certain permanent differences that exist between income tax regulations and U.S. generally accepted accounting principles. The reclassifications generally relate to net operating losses, Section 988 currency gains and losses, recharacterization of dividends received from investments in REITs, expired capital loss carryforwards, and gain or loss on in-kind transactions. These reclassifications have no impact on the net asset values of the Portfolios. Accordingly, at December 31, 2006, the following reclassifications were recorded (in thousands):
| | | | | | | | | | | | |
Portfolio | | Undistributed Net
Investment Income/(Loss) | | | Accumulated
Undistributed
Net Realized Gain/(Loss) | | | Capital
Paid In Excess
of Par Value | |
Growth | | $ | 653 | | | $ | (653 | ) | | $ | 0 | |
Tax-Managed Growth | | | 15 | | | | — | | | | (15 | ) |
Large Cap Growth | | | 30 | | | | — | | | | (30 | ) |
Small Cap Growth | | | 11,401 | | | | (11,401 | ) | | | — | |
Mid Cap Growth | | | 62 | | | | — | | | | (62 | ) |
Small-Mid Cap Growth | | | 538 | | | | (538 | ) | | | — | |
International Growth | | | (17,389 | ) | | | 17,389 | | | | — | |
International Equity | | | (896 | ) | | | 896 | | | | — | |
International Small Cap Growth | | | 289 | | | | (289 | ) | | | — | |
Emerging Markets Growth | | | 24 | | | | (22 | ) | | | (2 | ) |
Value Discovery | | | 1 | | | | (1,934 | ) | | | 1,933 | |
Income | | | 2,398 | | | | (2,315 | ) | | | (83 | ) |
Ready Reserves | | | — | | | | 1 | | | | (1 | ) |
Distributions from net realized gains for book purposes may include short-term capital gains, which are included as ordinary income for tax purposes. The tax character of distributions paid during 2006 and 2005 was as follows (in thousands):
| | | | | | | | | | | | |
| | | Distributions Paid In 2006 | | Distributions Paid In 2005 |
Portfolio | | Ordinary
Income | | Long-Term
Capital Gains | | Ordinary
Income | | Long-Term
Capital Gains |
Growth | | $ | 4,799 | | $ | 22,516 | | $ | — | | $ | 8,977 |
Tax-Managed Growth | | | — | | | — | | | — | | | — |
Large Cap Growth | | | — | | | — | | | — | | | — |
Small Cap Growth | | | — | | | 78,266 | | | 11,335 | | | 60,296 |
Mid Cap Growth | | | — | | | — | | | | | | |
Small-Mid Cap Growth | | | 506 | | | 3,898 | | | — | | | 495 |
International Growth | | | 90,245 | | | 581,453 | | | 21,550 | | | 254,334 |
International Equity | | | 4,187 | | | 456 | | | — | | | — |
International Small Cap Growth | | | 983 | | | — | | | 6 | | | — |
Emerging Markets Growth | | | 1,585 | | | 3,364 | | | 1,169 | | | — |
Value Discovery | | | 2,395 | | | 12,735 | | | — | | | 24,647 |
Income | | | 16,500 | | | — | | | 16,070 | | | — |
Ready Reserves | | | 51,297 | | | — | | | 27,823 | | | — |
82 Annual Report | December 31, 2006 |
As of December 31, 2006, the components of distributable earnings on a tax basis were as follows (in thousands):
| | | | | | | | | | | | | |
Portfolio | | Undistributed
Ordinary
Income | | Accumulated
Capital and
Other Losses | | Undistributed
Long-Term
Gain | | Net Unrealized
Appreciation/ (Depreciation) | |
Growth | | $ | 1,311 | | $ | — | | $ | 4,655 | | $ | 62,440 | |
Tax-Managed Growth | | | — | | | 1,031 | | | — | | | 2,125 | |
Large Cap Growth | | | — | | | 5,106 | | | — | | | 2,680 | |
Small Cap Growth | | | 1,774 | | | — | | | 19,164 | | | 143,574 | |
Mid Cap Growth | | | — | | | 155 | | | — | | | 1,032 | |
Small-Mid Cap Growth | | | 39 | | | — | | | 971 | | | 11,461 | |
International Growth | | | 27,392 | | | — | | | 170,573 | | | 1,485,227 | |
International Equity | | | 1,822 | | | — | | | 3,585 | | | 48,322 | |
International Small Cap Growth | | | 856 | | | 137 | | | 1,730 | | | 29,426 | |
Emerging Markets Growth | | | 5,520 | | | 503 | | | 19,303 | | | 171,844 | |
Value Discovery | | | 1,529 | | | — | | | 999 | | | 12,732 | |
Income | | | — | | | 20,117 | | | — | | | (4,004 | ) |
Ready Reserves | | | 81 | | | 1,026 | | | — | | | — | |
At December 31, 2006, the Portfolios have unused capital loss carryforwards available for Federal income tax purposes to be applied against future capital gains, if any. If not applied, the carryforwards will expire as follows (in thousands):
| | | | | | | | | | | | | | | | | | | | | | | | | | | |
Portfolio | | 2007 | | 2008 | | 2009 | | 2010 | | 2011 | | 2012 | | 2013 | | 2014 | | Total |
Growth | | $ | — | | $ | — | | $ | — | | $ | — | | $ | — | | $ | — | | $ | — | | $ | — | | $ | — |
Tax-Managed Growth | | | — | | | — | | | — | | | 554 | | | 468 | | | — | | | — | | | — | | | 1,022 |
Large Cap Growth | | | — | | | 41 | | | 2,714 | | | 1,582 | | | 769 | | | — | | | — | | | — | | | 5,106 |
Small Cap Growth | | | — | | | — | | | — | | | — | | | — | | | — | | | — | | | — | | | — |
Mid Cap Growth | | | — | | | — | | | — | | | — | | | — | | | — | | | — | | | 155 | | | 155 |
Small-Mid Cap Growth | | | — | | | — | | | — | | | — | | | — | | | — | | | — | | | — | | | — |
International Growth | | | — | | | — | | | — | | | — | | | — | | | — | | | — | | | — | | | — |
International Equity | | | — | | | — | | | — | | | — | | | — | | | — | | | — | | | — | | | — |
International Small Cap Growth | | | — | | | — | | | — | | | — | | | — | | | — | | | — | | | — | | | — |
Emerging Markets Growth | | | — | | | — | | | — | | | — | | | — | | | — | | | — | | | — | | | — |
Value Discovery | | | — | | | — | | | — | | | — | | | — | | | — | | | — | | | — | | | — |
Income | | | 1,249 | | | 3,292 | | | — | | | 1,692 | | | 1,582 | | | 4,431 | | | 3,398 | | | 4,138 | | | 19,782 |
Ready Reserves | | | 51 | | | 24 | | | — | | | 930 | | | — | | | 21 | | | — | | | — | | | 1,026 |
For the period November 1, 2006 through December 31, 2006, the following Portfolios incurred net realized capital or foreign currency losses. Each Portfolio intends to treat this loss as having occurred in fiscal year 2007 for Federal income tax purposes (in thousands):
| | | | | | |
Portfolio | | Capital
Amount | | Currency
Amount |
Growth | | $ | — | | $ | — |
Tax-Managed Growth | | | 9 | | | — |
Large Cap Growth | | | — | | | — |
Small Cap Growth | | | — | | | — |
Mid Cap Growth | | | — | | | — |
Small-Mid Cap Growth | | | — | | | — |
International Growth | | | — | | | — |
International Equity | | | — | | | — |
International Small Cap Growth | | | — | | | 137 |
Emerging Markets Growth | | | — | | | 503 |
Value Discovery | | | — | | | — |
Income | | | 335 | | | — |
Ready Reserves | | | — | | | — |
December 31, 2006 | William Blair Funds 83 |
(i) Repurchase Agreements
The Portfolios may enter into repurchase agreements with its custodian, Investors Bank & Trust Company, whereby the Portfolios acquire ownership of a debt security and the custodian agrees, at the time of sale, to repurchase the debt security from the Portfolios at a mutually agreed upon time and price. The Portfolios’ policy is to take possession of the debt security as collateral under the repurchase agreements. The Portfolios minimize credit risk by monitoring credit exposure to the custodian and by monitoring the collateral value on an ongoing basis.
(j) Use of Estimates
The preparation of financial statements in conformity with U.S. generally accepted accounting principles requires management to make estimates and assumptions that affect the amounts reported in the financial statements. Actual results may differ from those estimates.
(2) New Accounting Pronouncements
In July 2006, the Financial Accounting Standards Board (FASB) released FASB Interpretation No. 48 “Accounting for Uncertainty in Income Taxes” (FIN 48). FIN 48 provides guidance for how uncertain tax positions should be recognized, measured, presented and disclosed in the financial statements. FIN 48 requires the evaluation of tax positions taken or expected to be taken in the course of preparing the Fund’s tax returns to determine whether the tax positions are “more-likely-than-not” of being sustained by the applicable tax authority. Tax positions not deemed to meet the more-likely-than-not threshold would be recorded as a tax benefit or expense in the current year. Adoption of FIN 48 is required for fiscal years beginning after December 15, 2006. Recent SEC guidance allows implementing FIN 48 in fund NAV calculations as late as the fund’s last NAV calculation in the first required financial statement reporting period. As a result, the Funds will incorporate FIN 48 in their semi annual reports on June 30, 2007.
In September 2006, the Financial Accounting Standards Board (FASB) issued Statement on Financial Accounting Standards No. 157, “Fair Value Measurements” (FAS 157). This standard clarifies the definition of fair value for financial reporting, establishes a framework for measuring fair value and requires additional disclosures about the use of fair value measurements. FAS 157 is effective for financial statements issued for fiscal years beginning after November 15, 2007. Management is currently evaluating the impact that FAS 157 will have on the Funds’ financial statements.
(3) Transactions with Affiliates
(a) Management and Expense Limitation Agreements
Each Portfolio has a management agreement with William Blair & Company L.L.C. (the “Company”) for investment advisory, clerical, bookkeeping and administrative services. Each Portfolio pays the Company an annual fee, payable monthly, based on a specified percentage of its average daily net assets. A summary of the annual rates expressed as a percentage of average daily net assets is as follows:
| | | | | | | | |
Equity Portfolios | | | | | International Portfolios | | | |
Growth | | 0.75 | % | | International Growth and International Equity | | | |
Tax-Managed Growth | | 0.80 | % | | First $250 million | | 1.10 | % |
Large Cap Growth | | 0.80 | % | | In excess of $250 million | | 1.00 | % |
Small Cap Growth | | 1.10 | % | | International Small Cap Growth | | 1.00 | % |
Mid Cap Growth | | 0.95 | % | | Emerging Markets Growth | | 1.10 | % |
Small-Mid Cap Growth | | 1.00 | % | | | | | |
Value Discovery | | 1.10 | % | | | | | |
| | | |
Fixed Income Portfolio | | | | | Money Market Portfolio | | | |
Income* | | | | | Ready Reserves | | | |
First $250 million | | 0.25 | % | | First $250 million | | 0.275 | % |
In excess of $250 million | | 0.20 | % | | Next $250 million | | 0.250 | % |
| | | | | Next $2 billion | | 0.225 | % |
*Management fee also includes a charge of 5% of gross income. | | | | | In excess of $2.5 billion | | 0.200 | % |
84 Annual Report | December 31, 2006 |
Some of the Portfolios have also entered into Expense Limitation Agreements with the Company. Under the terms of these Agreements, the Company has agreed to waive its advisory fees and absorb other operating expenses through April 30, 2007, if total expenses for each class of the following Portfolios exceed the following rates (as a percentage of average daily net assets):
| | | | | | | | | | | | |
| | | Class N Shares | | | Class I Shares | |
| | | Through April 30, 2006 | | | Effective
May 1, 2006 | | | Through April 30, 2006 | | | Effective
May 1, 2006 | |
Tax-Managed Growth | | 1.53 | % | | 1.40 | % | | 1.28 | % | | 1.15 | % |
Large Cap Growth | | 1.25 | % | | 1.23 | % | | 1.00 | % | | 0.98 | % |
Small Cap Growth | | 1.50 | % | | 1.50 | % | | 1.25 | % | | 1.25 | % |
Mid Cap Growth Fund | | 1.40 | % | | 1.40 | % | | 1.15 | % | | 1.15 | % |
Small-Mid Cap Growth | | 1.40 | % | | 1.37 | % | | 1.15 | % | | 1.12 | % |
International Growth | | 1.48 | % | | 1.45 | % | | 1.23 | % | | 1.20 | % |
International Equity | | 1.48 | % | | 1.45 | % | | 1.23 | % | | 1.20 | % |
International Small Cap Growth | | 1.65 | % | | 1.65 | % | | 1.40 | % | | 1.40 | % |
Emerging Markets Growth | | 1.65 | % | | 1.65 | % | | 1.40 | % | | 1.40 | % |
Value Discovery | | 1.34 | % | | 1.34 | % | | 1.09 | % | | 1.09 | % |
Income Fund | | 0.75 | % | | 0.75 | % | | N/A | | | N/A | |
For a period of three years subsequent to the Commencement of Operations of the Mid Cap Growth, Small-Mid Cap Growth, the International Equity, International Small Cap Growth and the Emerging Markets Growth Portfolios, the Company is entitled to reimbursement for previously waived fees and expenses to the extent the overall expense ratio remains below the percentages indicated. The total amount available for recapture at December 31, 2006 is $110 (in thousands) for the Mid Cap Growth Portfolio, $190 for the Small-Mid Cap Growth Portfolio, $546 for the International Equity Portfolio, $134 for the International Small Cap Growth Portfolio and $541 for the Emerging Markets Growth Portfolio.
For the year ended December 31, 2006, the investment advisory fees incurred by the Portfolios and related fee waivers were as follows (in thousands):
| | | | | | | | | | | | |
Portfolio | | Gross
Advisory Fee | | Fee Waiver | | Net
Advisory Fee | | Additional Expenses
(Recovered) or
Absorbed
by Advisor |
Growth | | $ | 1,894 | | $ | — | | $ | 1,894 | | $ | — |
Tax-Managed Growth | | | 69 | | | 69 | | | — | | | — |
Large Cap Growth | | | 147 | | | 72 | | | 75 | | | — |
Small Cap Growth | | | 12,197 | | | — | | | 12,197 | | | — |
Mid Cap Growth | | | 109 | | | 109 | | | — | | | 1 |
Small-Mid Cap Growth | | | 825 | | | 59 | | | 766 | | | — |
International Growth | | | 54,257 | | | — | | | 54,257 | | | — |
International Equity | | | 2,668 | | | 267 | | | 2,401 | | | 35 |
International Small Cap Growth | | | 1,269 | | | 80 | | | 1,189 | | | — |
Emerging Markets Growth | | | 5,363 | | | 357 | | | 5,006 | | | — |
Value Discovery | | | 834 | | | 310 | | | 524 | | | — |
Income | | | 1,531 | | | — | | | 1,531 | | | — |
Ready Reserves | | | 2,820 | | | — | | | 2,820 | | | — |
(b) Underwriting, Distribution Services and Service Agreement
Each Portfolio except Ready Reserves Portfolio has a Distribution Agreement with the Company for distribution services. Each Portfolio pays the Company an annual fee, payable monthly, based on a specified percentage of its average daily net assets of specified share classes. The annual rates expressed as a percentage of average daily net assets for Class N is 0.25% for all Portfolios except the Income Portfolio, which is 0.15%. Pursuant to the Distribution Agreement, the Company enters into related selling group agreements with various firms at various rates for sales of the Portfolios’ Class N shares.
December 31, 2006 | William Blair Funds 85 |
Distribution fees incurred by the Portfolios to the Company, for the year ended December 31, 2006, were as follows (in thousands):
| | | | | | | | | |
Portfolio | | Gross Distribution Fees | | Fee Waiver | | Net Distribution Fee |
Growth | | $ | 125 | | $ | — | | $ | 125 |
Tax-Managed Growth | | | 1 | | | — | | | 1 |
Large Cap Growth | | | 24 | | | — | | | 24 |
Small Cap Growth | | | 1,610 | | | — | | | 1,610 |
Mid Cap Growth | | | 11 | | | — | | | 11 |
Small-Mid Cap Growth | | | 32 | | | — | | | 32 |
International Growth | | | 9,241 | | | — | | | 9,241 |
International Equity | | | 78 | | | — | | | 78 |
International Small Cap Growth | | | 30 | | | — | | | 30 |
Emerging Markets Growth | | | 99 | | | 23 | | | 76 |
Value Discovery | | | 80 | | | — | | | 80 |
Income | | | 141 | | | 58 | | | 83 |
The Ready Reserves Portfolio has a Service Agreement with the Company to provide shareholder services and automatic sweep services. The Portfolio pays the Company an annual fee, payable monthly, based upon 0.35% of the average daily net assets of Class N. For the year ended December 31, 2006, the following fees were incurred (in thousands):
The International Small Cap Growth and the Emerging Markets Growth Portfolios have a Shareholder Administration Agreement with the Company to provide shareholder administration services. Class N and Class I shares of the Portfolios pay the Company an annual fee, payable monthly, based upon 0.15% of average daily net assets attributable to each class, respectively. For the year ended December 31, 2006, the following fees were incurred (in thousands):
| | | |
International Small Cap Growth | | $ | 63 |
Emerging Markets Growth | | | 180 |
(c) Trustees Fees
The Portfolios incurred fees of $221 (in thousands) to non-interested trustees of the Fund for the year ended December 31, 2006. Interested trustees are not compensated by the Fund.
(d) Investments in Affiliated Portfolio
Until June 20, 2006 pursuant to an Exemptive Order granted by the Securities and Exchange Commission in January, 2001, and since June 20, 2006 pursuant to the rules of the 1940 Act, each of the Portfolios of the Fund may invest in the William Blair Ready Reserves Portfolio (“Ready Reserves”), an open-end money market portfolio managed by the Advisor. Ready Reserves Portfolio is used as a cash management option to the other Portfolios in the Fund. The Advisor waives management fees and shareholder service fees earned from the other Portfolios’ investment in the Ready Reserves Fund. The fees waived with respect to each Portfolio for the year ended December 31, 2006 are listed below. Distributions received from Ready Reserves are reflected as dividend income from affiliated Fund in each Portfolio’s statement of operations. Amounts relating to the Portfolios’ investments in Ready Reserves were as follows for the year ended December 31, 2006 (in thousands):
| | | | | | | | | | | | | | | | | | |
Portfolio | | Purchases | | Sales
Proceeds | | Fees
Waived | | Dividend
Income | | Value | | Percent
of Net
Assets | |
Growth | | $ | 7,467 | | $ | 5,617 | | $ | 4 | | $ | 28 | | $ | 2,574 | | 1.0 | % |
Tax-Managed Growth | | | 1,384 | | | 1,641 | | | 1 | | | 11 | | | 106 | | 1.1 | |
Large Cap Growth | | | 3,823 | | | 4,193 | | | 1 | | | 10 | | | 54 | | 0.2 | |
Small Cap Growth | | | 36,313 | | | 37,421 | | | 75 | | | 573 | | | 9,894 | | 0.8 | |
Mid Cap Growth | | | 723 | | | 619 | | | 1 | | | 5 | | | 104 | | 0.5 | |
Small-Mid Cap Growth | | | 3,230 | | | 3,931 | | | 5 | | | 35 | | | 1,311 | | 1.4 | |
International Growth | | | 95,414 | | | 123,455 | | | 124 | | | 915 | | | 637 | | — | |
International Equity | | | 9,544 | | | 5,946 | | | 7 | | | 51 | | | 5,158 | | 1.7 | |
International Small Cap Growth | | | 7,473 | | | 2,655 | | | 3 | | | 20 | | | 5,228 | | 2.3 | |
Emerging Markets Growth | | | 7,516 | | | 10,072 | | | 14 | | | 102 | | | 1,265 | | 0.2 | |
Value Discovery | | | 2,427 | | | 1,998 | | | 2 | | | 17 | | | 502 | | 0.3 | |
86 Annual Report | December 31, 2006 |
(4) Investment Transactions
Investment transactions, excluding money market instruments, for the year ended December 31, 2006 were as follows (in thousands):
| | | | | | |
Portfolio | | Purchases | | Sales |
Growth | | $ | 152,548 | | $ | 170,587 |
Tax-Managed Growth | | | 4,644 | | | 3,411 |
Large Cap Growth | | | 11,590 | | | 9,484 |
Small Cap Growth | | | 1,413,763 | | | 1,121,995 |
Mid Cap Growth | | | 23,508 | | | 6,535 |
Small-Mid Cap Growth | | | 69,332 | | | 55,020 |
International Growth | | | 4,398,784 | | | 3,792,228 |
International Equity | | | 276,286 | | | 196,306 |
International Small Cap Growth | | | 277,747 | | | 134,994 |
Emerging Markets Growth | | | 928,614 | | | 532,078 |
Value Discovery | | | 186,046 | | | 126,389 |
Income | | | 98,815 | | | 109,368 |
(5) Foreign Currency Forward Contracts
To protect itself against a decline in the value of foreign currency against the U.S. dollar, the International Growth, International Equity, International Small Cap Growth and Emerging Markets Growth Portfolios enter into foreign currency forward contracts with its custodian and others. The Portfolios bear the market risk that arises from changes in foreign currency rates and bears the credit risk if the counterparty fails to perform under the contract. The net realized and unrealized gains and losses associated with foreign currency forward contracts are reflected in the accompanying financial statements.
(6) Fund Share Transactions
The following table summarizes the activity in capital shares of each Portfolio (in thousands):
| | | | | | | | | | | | | | | | | | |
| | | Sales (Dollars) |
| | | Year Ended December 31, 2006 | | Year Ended December 31, 2005 |
Portfolio | | Class N | | Class I | | Total | | Class N | | Class I | | Total |
Growth | | $ | 25,590 | | $ | 7,625 | | $ | 33,215 | | $ | 10,753 | | $ | 9,054 | | $ | 19,807 |
Tax-Managed Growth | | | 735 | | | 710 | | | 1,445 | | | 113 | | | 1,662 | | | 1,775 |
Large Cap Growth | | | 2,079 | | | 2,871 | | | 4,950 | | | 7,918 | | | 3,738 | | | 11,656 |
Small Cap Growth | | | 327,203 | | | 262,870 | | | 590,073 | | | 236,433 | | | 108,640 | | | 345,073 |
Mid Cap Growth (a) | | | 7,132 | | | 14,246 | | | 21,378 | | | — | | | — | | | — |
Small Mid-Cap Growth | | | 3,522 | | | 20,782 | | | 24,304 | | | 5,104 | | | 38,266 | | | 43,370 |
International Growth | | | 1,221,792 | | | 563,927 | | | 1,785,719 | | | 1,066,440 | | | 358,231 | | | 1,424,671 |
International Equity | | | 23,189 | | | 114,544 | | | 137,733 | | | 18,044 | | | 178,024 | | | 196,068 |
International Small Cap
Growth (b) | | | 17,783 | | | 51,330 | | | 69,113 | | | 2,422 | | | 11,684 | | | 14,106 |
Emerging Markets Growth (c) | | | 35,769 | | | 147,530 | | | 183,299 | | | 20,123 | | | 31,981 | | | 52,104 |
Value Discovery | | | 88,879 | | | 11,658 | | | 100,537 | | | 1,656 | | | 17,632 | | | 19,288 |
Income (d) | | | 32,007 | | | 29,825 | | | 61,832 | | | 57,943 | | | 37,159 | | | 95,102 |
Ready Reserves | | | 1,030,633 | | | — | | | 1,030,633 | | | 1,131,031 | | | — | | | 1,131,031 |
| (a) | | For the period from February 1, 2006 (Commencement of Operations) to December 31, 2006. |
| (b) | | For the period from November 1, 2005 (Commencement of Operation) to December 31, 2005. |
| (c) | | For the period from June 6, 2005 (Commencement of Operations) to December 31, 2005. |
| (d) | | For 2005, the sales of Class I shares for Income Fund reflect two in-kind purchases totaling $4.2 million dollars. |
December 31, 2006 | William Blair Funds 87 |
| | | | | | | | | | | | | | | | | | | | | | | | |
| | | Reinvested Distributions (Dollars) | |
| | | Year Ended December 31, 2006 | | | Year Ended December 31, 2005 | |
Portfolio | | Class N | | | Class I | | | Total | | | Class N | | | Class I | | | Total | |
Growth | | $ | 5,960 | | | $ | 19,244 | | | $ | 25,204 | | | $ | 1,778 | | | $ | 6,484 | | | $ | 8,262 | |
Tax-Managed Growth | | | — | | | | — | | | | — | | | | — | | | | — | | | | — | |
Large Cap Growth | | | — | | | | — | | | | — | | | | — | | | | — | | | | — | |
Small Cap Growth | | | 43,585 | | | | 29,938 | | | | 73,523 | | | | 42,338 | | | | 27,541 | | | | 69,879 | |
Mid Cap Growth (a) | | | — | | | | — | | | | — | | | | — | | | | — | | | | — | |
Small Mid-Cap Growth | | | 645 | | | | 3,347 | | | | 3,992 | | | | 77 | | | | 380 | | | | 457 | |
International Growth | | | 439,429 | | | | 193,983 | | | | 633,412 | | | | 170,874 | | | | 75,271 | | | | 246,145 | |
International Equity | | | 504 | | | | 3,886 | | | | 4,390 | | | | — | | | | — | | | | — | |
International Small Cap
Growth (b) | | | 71 | | | | 204 | | | | 275 | | | | — | | | | — | | | | — | |
Emerging Markets Growth (c) | | | 322 | | | | 1,039 | | | | 1,361 | | | | 104 | | | | 160 | | | | 264 | |
Value Discovery | | | 9,410 | | | | 4,754 | | | | 14,164 | | | | 5,835 | | | | 18,431 | | | | 24,266 | |
Income | | | 4,314 | | | | 8,747 | | | | 13,061 | | | | 4,620 | | | | 7,921 | | | | 12,541 | |
Ready Reserves | | | 51,002 | | | | — | | | | 51,002 | | | | 27,698 | | | | — | | | | 27,698 | |
| |
| | | Redemptions (Dollars) | |
| | | Year Ended December 31, 2006 | | | Year Ended December 31, 2005 | |
Portfolio | | Class N | | | Class I | | | Total | | | Class N | | | Class I | | | Total | |
Growth | | $ | 24,102 | | | $ | 26,243 | | | $ | 50,345 | | | $ | 14,242 | | | $ | 49,911 | | | $ | 64,153 | |
Tax-Managed Growth | | | 34 | | | | 344 | | | | 378 | | | | 8 | | | | 554 | | | | 562 | |
Large Cap Growth | | | 516 | | | | 2,343 | | | | 2,859 | | | | 185 | | | | 1,647 | | | | 1,832 | |
Small Cap Growth | | | 193,966 | | | | 94,377 | | | | 288,343 | | | | 214,257 | | | | 73,727 | | | | 287,984 | |
Mid Cap Growth (a) | | | 1,913 | | | | 641 | | | | 2,554 | | | | — | | | | — | | | | — | |
Small Mid-Cap Growth | | | 1,816 | | | | 7,060 | | | | 8,876 | | | | 2,617 | | | | 3,636 | | | | 6,253 | |
International Growth | | | 927,830 | | | | 230,002 | | | | 1,157,832 | | | | 477,866 | | | | 120,404 | | | | 598,270 | |
International Equity | | | 11,966 | | | | 49,451 | | | | 61,417 | | | | 1,207 | | | | 40,936 | | | | 42,143 | |
International Small Cap
Growth (b) | | | 5,184 | | | | 1,990 | | | | 7,174 | | | | — | | | | 100 | | | | 100 | |
Emerging Markets Growth (c) | | | 11,956 | | | | 14,058 | | | | 26,014 | | | | 1,024 | | | | 605 | | | | 1,629 | |
Value Discovery | | | 14,585 | | | | 25,759 | | | | 40,344 | | | | 18,736 | | | | 165,704 | | | | 184,440 | |
Income | | | 46,237 | | | | 38,423 | | | | 84,660 | | | | 40,325 | | | | 40,480 | | | | 80,805 | |
Ready Reserves | | | 977,896 | | | | — | | | | 977,896 | | | | 1,159,815 | | | | — | | | | 1,159,815 | |
| |
| | | Net Change in Net Assets relating to Fund Share Activity (Dollars) | |
| | | Period Ended December 31, 2006 | | | Year Ended December 31, 2005 | |
Portfolio | | Class N | | | Class I | | | Total | | | Class N | | | Class I | | | Total | |
Growth | | $ | 7,448 | | | $ | 626 | | | $ | 8,074 | | | $ | (1,711 | ) | | $ | (34,373 | ) | | $ | (36,084 | ) |
Tax-Managed Growth | | | 701 | | | | 366 | | | | 1,067 | | | | 105 | | | | 1,108 | | | | 1,213 | |
Large Cap Growth | | | 1,563 | | | | 528 | | | | 2,091 | | | | 7,733 | | | | 2,091 | | | | 9,824 | |
Small Cap Growth | | | 176,822 | | | | 198,431 | | | | 375,253 | | | | 64,514 | | | | 62,454 | | | | 126,968 | |
Mid Cap Growth (a) | | | 5,219 | | | | 13,605 | | | | 18,824 | | | | — | | | | — | | | | — | |
Small Mid-Cap Growth | | | 2,351 | | | | 17,069 | | | | 19,420 | | | | 2,564 | | | | 35,010 | | | | 37,574 | |
International Growth | | | 733,391 | | | | 527,908 | | | | 1,261,299 | | | | 759,448 | | | | 313,098 | | | | 1,072,546 | |
International Equity | | | 11,727 | | | | 68,979 | | | | 80,706 | | | | 16,837 | | | | 137,088 | | | | 153,925 | |
International Small Cap
Growth (b) | | | 12,670 | | | | 49,544 | | | | 62,214 | | | | 2,422 | | | | 11,584 | | | | 14,006 | |
Emerging Markets Growth (c) | | | 24,135 | | | | 134,511 | | | | 158,646 | | | | 19,203 | | | | 31,536 | | | | 50,739 | |
Value Discovery | | | 83,704 | | | | (9,347 | ) | | | 74,357 | | | | (11,245 | ) | | | (129,641 | ) | | | (140,886 | ) |
Income | | | (9,916 | ) | | | 149 | | | | (9,767 | ) | | | 22,238 | | | | 4,600 | | | | 26,838 | |
Ready Reserves | | | 103,739 | | | | — | | | | 103,739 | | | | (1,086 | ) | | | — | | | | (1,086 | ) |
| (a) | | For the period from February 1, 2006 (Commencement of Operations) to December 31, 2006. |
| (b) | | For the period from November 1, 2005 (Commencement of Operation) to December 31, 2005. |
| (c) | | For the period from June 6, 2005 (Commencement of Operations) to December 31, 2005. |
88 Annual Report | December 31, 2006 |
| | | | | | | | | | | | |
| | | Sales (Shares) |
| | | Period Ended December 31, 2006 | | Year Ended December 31, 2005 |
Portfolio | | Class N | | Class I | | Total | | Class N | | Class I | | Total |
Growth | | 2,121 | | 632 | | 2,753 | | 992 | | 846 | | 1,838 |
Tax-Managed Growth | | 73 | | 67 | | 140 | | 11 | | 168 | | 179 |
Large Cap Growth | | 314 | | 430 | | 744 | | 1,273 | | 597 | | 1,870 |
Small Cap Growth | | 12,763 | | 10,023 | | 22,786 | | 9,448 | | 4,272 | | 13,720 |
Mid Cap Growth (a) | | 710 | | 1,412 | | 2,122 | | — | | — | | — |
Small Mid-Cap Growth | | 267 | | 1,562 | | 1,829 | | 450 | | 3,393 | | 3,843 |
International Growth | | 44,607 | | 20,102 | | 64,709 | | 45,004 | | 15,184 | | 60,188 |
International Equity | | 1,691 | | 8,196 | | 9,887 | | 1,550 | | 14,844 | | 16,394 |
International Small Cap
Growth (b) | | 1,449 | | 4,109 | | 5,558 | | 235 | | 1,153 | | 1,388 |
Emerging Markets Growth (c) | | 2,209 | | 8,482 | | 10,691 | | 1,604 | | 2,731 | | 4,335 |
Value Discovery | | 5,250 | | 689 | | 5,939 | | 78 | | 829 | | 907 |
Income | | 3,289 | | 3,073 | | 6,362 | | 5,777 | | 3,717 | | 9,494 |
Ready Reserves | | 1,030,633 | | — | | 1,030,633 | | 1,131,031 | | — | | 1,131,031 |
| |
| | | Reinvested Distributions (Shares) |
| | | Period Ended December 31, 2006 | | Year Ended December 31, 2005 |
Portfolio | | Class N | | Class I | | Total | | Class N | | Class I | | Total |
Growth | | 518 | | 1,639 | | 2,157 | | 155 | | 555 | | 710 |
Tax-Managed Growth | | — | | — | | — | | — | | — | | — |
Large Cap Growth | | — | | — | | — | | — | | — | | — |
Small Cap Growth | | 1,713 | | 1,152 | | 2,865 | | 1,752 | | 1,121 | | 2,873 |
Mid Cap Growth (a) | | — | | — | | — | | — | | — | | — |
Small Mid-Cap Growth | | 49 | | 253 | | 302 | | 6 | | 30 | | 36 |
International Growth | | 16,102 | | 7,005 | | 23,107 | | 6,912 | | 3,007 | | 9,919 |
International Equity | | 34 | | 257 | | 291 | | — | | — | | — |
International Small Cap
Growth (b) | | 5 | | 15 | | 20 | | — | | — | | — |
Emerging Markets Growth (c) | | 17 | | 55 | | 72 | | 7 | | 12 | | 19 |
Value Discovery | | 581 | | 289 | | 870 | | 390 | | 1,218 | | 1,608 |
Income | | 445 | | 904 | | 1,349 | | 464 | | 796 | | 1,260 |
Ready Reserves | | 51,002 | | — | | 51,002 | | 27,698 | | — | | 27,698 |
| |
| | | Redemptions (Shares) |
| | | Period Ended December 31, 2006 | | Year Ended December 31, 2005 |
Portfolio | | Class N | | Class I | | Total | | Class N | | Class I | | Total |
Growth | | 2,024 | | 2,182 | | 4,206 | | 1,313 | | 4,632 | | 5,945 |
Tax-Managed Growth | | 3 | | 32 | | 35 | | — | | 59 | | 59 |
Large Cap Growth | | 76 | | 349 | | 425 | | 30 | | 264 | | 294 |
Small Cap Growth | | 7,637 | | 3,603 | | 11,240 | | 8,709 | | 2,954 | | 11,663 |
Mid Cap Growth (a) | | 186 | | 62 | | 248 | | — | | — | | — |
Small Mid-Cap Growth | | 138 | | 522 | | 660 | | 234 | | 303 | | 537 |
International Growth | | 34,003 | | 8,346 | | 42,349 | | 20,661 | | 5,142 | | 25,803 |
International Equity | | 909 | | 3,555 | | 4,464 | | 104 | | 3,398 | | 3,502 |
International Small Cap
Growth (b) | | 417 | | 161 | | 578 | | — | | 10 | | 10 |
Emerging Markets Growth (c) | | 775 | | 840 | | 1,615 | | 81 | | 47 | | 128 |
Value Discovery | | 900 | | 1,600 | | 2,500 | | 892 | | 7,748 | | 8,640 |
Income | | 4,755 | | 3,959 | | 8,714 | | 4,028 | | 4,056 | | 8,084 |
Ready Reserves | | 977,896 | | — | | 977,896 | | 1,159,815 | | — | | 1,159,815 |
| (a) | | For the period from February 1, 2006 (Commencement of Operations) to December 31, 2006. |
| (b) | | For the period from November 1, 2005 (Commencement of Operations) to December 31, 2005. |
| (c) | | For the period from June 6, 2005 (Commencement of Operations) to December 31, 2005. |
December 31, 2006 | William Blair Funds 89 |
| | | | | | | | | | | | | | | | | | |
| | | Net Change in Shares Outstanding relating to Fund Share Activity (Shares) | |
| | | Period Ended December 31, 2006 | | | Year Ended December 31, 2005 | |
Portfolio | | Class N | | | Class I | | | Total | | | Class N | | | Class I | | | Total | |
Growth | | 615 | | | 89 | | | 704 | | | (166 | ) | | (3,231 | ) | | (3,397 | ) |
Tax-Managed Growth | | 70 | | | 35 | | | 105 | | | 11 | | | 109 | | | 120 | |
Large Cap Growth | | 238 | | | 81 | | | 319 | | | 1,243 | | | 333 | | | 1,576 | |
Small Cap Growth | | 6,839 | | | 7,572 | | | 14,411 | | | 2,491 | | | 2,439 | | | 4,930 | |
Mid Cap Growth (a) | | 524 | | | 1,350 | | | 1,874 | | | — | | | — | | | — | |
Small Mid-Cap Growth | | 178 | | | 1,293 | | | 1,471 | | | 222 | | | 3,120 | | | 3,342 | |
International Growth | | 26,706 | | | 18,761 | | | 45,467 | | | 31,255 | | | 13,049 | | | 44,304 | |
International Equity | | 816 | | | 4,898 | | | 5,714 | | | 1,446 | | | 11,446 | | | 12,892 | |
International Small Cap Growth (b) | | 1,037 | | | 3,963 | | | 5,000 | | | 235 | | | 1,143 | | | 1,378 | |
Emerging Markets Growth (c) | | 1,451 | | | 7,697 | | | 9,148 | | | 1,530 | | | 2,696 | | | 4,226 | |
Value Discovery | | 4,931 | | | (622 | ) | | 4,309 | | | (424 | ) | | (5,701 | ) | | (6,125 | ) |
Income | | (1,021 | ) | | 18 | | | (1,003 | ) | | 2,213 | | | 457 | | | 2,670 | |
Ready Reserves | | 103,739 | | | — | | | 103,739 | | | (1,086 | ) | | — | | | (1,086 | ) |
| (a) | | For the period from February 1, 2006 (Commencement of Operations) to December 31, 2006. |
| (b) | | For the period from November 1, 2005 (Commencement of Operations) to December 31, 2005. |
| (c) | | For the period from June 6, 2005 (Commencement of Operations) to December 31, 2005. |
90 Annual Report | December 31, 2006 |
Financial Highlights
Growth Fund
| | | | | | | | | | | | | | | | | | | | |
| | | Class N | |
| | | Years Ended December 31, | |
| | | 2006 | | | 2005 | | | 2004 | | | 2003 | | | 2002 | |
Net asset value, beginning of year | | $ | 11.33 | | | $ | 10.70 | | | $ | 9.97 | | | $ | 8.06 | | | $ | 10.87 | |
Income (loss) from investment operations: | | | | | | | | | | | | | | | | | | | | |
Net investment income (loss) | | | (0.06 | ) | | | (0.06 | ) | | | (0.06 | ) | | | (0.06 | ) | | | (0.07 | ) |
Net realized and unrealized gain (loss) on investments | | | 1.48 | | | | 1.11 | | | | 0.79 | | | | 1.97 | | | | (2.74 | ) |
| | | | | | | | | | | | | | | | | | | | |
Total from investment operations | | | 1.42 | | | | 1.05 | | | | 0.73 | | | | 1.91 | | | | (2.81 | ) |
Less distributions from: | | | | | | | | | | | | | | | | | | | | |
Net investment income | | | — | | | | — | | | | — | | | | — | | | | — | |
Net realized gain | | | 1.33 | | | | 0.42 | | | | — | | | | — | | | | — | |
| | | | | | | | | | | | | | | | | | | | |
Total distributions | | | 1.33 | | | | 0.42 | | | | — | | | | — | | | | — | |
| | | | | | | | | | | | | | | | | | | | |
Net asset value, end of year | | $ | 11.42 | | | $ | 11.33 | | | $ | 10.70 | | | $ | 9.97 | | | $ | 8.06 | |
| | | | | | | | | | | | | | | | | | | | |
Total return (%) | | | 12.42 | | | | 9.75 | | | | 7.32 | | | | 23.70 | | | | (25.85 | ) |
Ratios to average daily net assets (%): | | | | | | | | | | | | | | | | | | | | |
Expenses | | | 1.17 | | | | 1.15 | | | | 1.17 | | | | 1.19 | | | | 1.19 | |
Net investment income (loss) | | | (0.49 | ) | | | (0.60 | ) | | | (0.60 | ) | | | (0.67 | ) | | | (0.73 | ) |
| |
| | | Class I | |
| | | Years Ended December 31, | |
| | | 2006 | | | 2005 | | | 2004 | | | 2003 | | | 2002 | |
Net asset value, beginning of year | | $ | 11.52 | | | $ | 10.84 | | | $ | 10.08 | | | $ | 8.12 | | | $ | 10.93 | |
Income (loss) from investment operations: | | | | | | | | | | | | | | | | | | | | |
Net investment income (loss) | | | (0.02 | ) | | | (0.04 | ) | | | (0.04 | ) | | | (0.04 | ) | | | (0.05 | ) |
Net realized and unrealized gain (loss) on investments | | | 1.49 | | | | 1.14 | | | | 0.80 | | | | 2.00 | | | | (2.76 | ) |
| | | | | | | | | | | | | | | | | | | | |
Total from investment operations | | | 1.47 | | | | 1.10 | | | | 0.76 | | | | 1.96 | | | | (2.81 | ) |
Less distributions from: | | | | | | | | | | | | | | | | | | | | |
Net investment income | | | — | | | | — | | | | — | | | | — | | | | — | |
Net realized gain | | | 1.33 | | | | 0.42 | | | | — | | | | — | | | | — | |
| | | | | | | | | | | | | | | | | | | | |
Total distributions | | | 1.33 | | | | 0.42 | | | | — | | | | — | | | | — | |
| | | | | | | | | | | | | | | | | | | | |
Net asset value, end of year | | $ | 11.66 | | | $ | 11.52 | | | $ | 10.84 | | | $ | 10.08 | | | $ | 8.12 | |
| | | | | | | | | | | | | | | | | | | | |
Total return (%) | | | 12.64 | | | | 10.08 | | | | 7.54 | | | | 24.14 | | | | (25.71 | ) |
Ratios to average daily net assets (%): | | | | | | | | | | | | | | | | | | | | |
Expenses | | | 0.89 | | | | 0.90 | | | | 0.92 | | | | 0.94 | | | | 0.94 | |
Net investment income (loss) | | | (0.20 | ) | | | (0.35 | ) | | | (0.35 | ) | | | (0.42 | ) | | | (0.48 | ) |
| | | | | | | | | | | | | | | |
| | | |
| | | Years Ended December 31, |
| | | 2006 | | 2005 | | 2004 | | 2003 | | 2002 |
Supplemental data for all classes: | | | | | | | | | | | | | | | |
Net assets at end of year (in thousands) | | $ | 264,525 | | $ | 253,599 | | $ | 275,506 | | $ | 281,654 | | $ | 255,625 |
Portfolio turnover rate (%) | | | 61 | | | 54 | | | 35 | | | 45 | | | 29 |
Performance cited represents past performance. Past performance does not guarantee future results and current performance may be lower or higher than the data quoted. Results shown are annual returns, which assume reinvestment of dividends and capital gains. Investment returns and principal will fluctuate and you may have a gain or loss when you sell shares. For the most current month-end performance information, please call 1-800-742-7272, or visit our Web site at www.williamblairfunds.com.
Note: Net investment income (loss) per share is based on the average shares outstanding during the year.
December 31, 2006 | William Blair Funds 91 |
Financial Highlights
Tax-Managed Growth Fund
| | | | | | | | | | | | | | | | | | | | |
| | | Class N | |
| | | Years Ended December 31, | |
| | | 2006 | | | 2005 | | | 2004 | | | 2003 | | | 2002 | |
Net asset value, beginning of year | | $ | 10.11 | | | $ | 8.99 | | | $ | 8.41 | | | $ | 6.86 | | | $ | 9.07 | |
Income (loss) from investment operations: | | | | | | | | | | | | | | | | | | | | |
Net investment income (loss) | | | (0.04 | ) | | | (0.07 | ) | | | (0.08 | ) | | | (0.07 | ) | | | (0.06 | ) |
Net realized and unrealized gain (loss) on investments | | | 0.87 | | | | 1.19 | | | | 0.66 | | | | 1.62 | | | | (2.15 | ) |
| | | | | | | | | | | | | | | | | | | | |
Total from investment operations | | | 0.83 | | | | 1.12 | | | | 0.58 | | | | 1.55 | | | | (2.21 | ) |
Less distributions from: | | | | | | | | | | | | | | | | | | | | |
Net investment income | | | — | | | | — | | | | — | | | | — | | | | — | |
Net realized gain | | | — | | | | — | | | | — | | | | — | | | | — | |
| | | | | | | | | | | | | | | | | | | | |
Total distributions | | | — | | | | — | | | | — | | | | — | | | | — | |
| | | | | | | | | | | | | | | | | | | | |
Net asset value, end of year | | $ | 10.94 | | | $ | 10.11 | | | $ | 8.99 | | | $ | 8.41 | | | $ | 6.86 | |
| | | | | | | | | | | | | | | | | | | | |
Total return (%) | | | 8.21 | | | | 12.46 | | | | 6.90 | | | | 22.59 | | | | (24.37 | ) |
Ratios to average daily net assets (%): | | | | | | | | | | | | | | | | | | | | |
Expenses, net of waivers and reimbursements | | | 1.44 | | | | 1.53 | | | | 1.54 | | | | 1.49 | | | | 1.36 | |
Expenses, before waivers and reimbursements | | | 2.24 | | | | 2.55 | | | | 2.26 | | | | 2.26 | | | | 2.22 | |
Net investment income (loss), net of waivers and reimbursements | | | (0.41 | ) | | | (0.76 | ) | | | (0.92 | ) | | | (0.91 | ) | | | (0.72 | ) |
Net investment income (loss), before waivers and reimbursements | | | (1.21 | ) | | | (1.78 | ) | | | (1.64 | ) | | | (1.68 | ) | | | (1.58 | ) |
| |
| | | Class I | |
| | | Years Ended December 31, | |
| | | 2006 | | | 2005 | | | 2004 | | | 2003 | | | 2002 | |
Net asset value, beginning of year | | $ | 10.27 | | | $ | 9.10 | | | $ | 8.50 | | | $ | 6.92 | | | $ | 9.12 | |
Income (loss) from investment operations: | | | | | | | | | | | | | | | | | | | | |
Net investment income (loss) | | | (0.02 | ) | | | (0.05 | ) | | | (0.06 | ) | | | (0.05 | ) | | | (0.04 | ) |
Net realized and unrealized gain (loss) on investments | | | 0.90 | | | | 1.22 | | | | 0.66 | | | | 1.63 | | | | (2.16 | ) |
| | | | | | | | | | | | | | | | | | | | |
Total from investment operations | | | 0.88 | | | | 1.17 | | | | 0.60 | | | | 1.58 | | | | (2.20 | ) |
Less distributions from: | | | | | | | | | | | | | | | | | | | | |
Net investment income | | | — | | | | — | | | | — | | | | — | | | | — | |
Net realized gain | | | — | | | | — | | | | — | | | | — | | | | — | |
| | | | | | | | | | | | | | | | | | | | |
Total distributions | | | — | | | | — | | | | — | | | | — | | | | — | |
| | | | | | | | | | | | | | | | | | | | |
Net asset value, end of year | | $ | 11.15 | | | $ | 10.27 | | | $ | 9.10 | | | $ | 8.50 | | | $ | 6.92 | |
| | | | | | | | | | | | | | | | | | | | |
Total return (%) | | | 8.57 | | | | 12.86 | | | | 7.06 | | | | 22.83 | | | | (24.12 | ) |
Ratios to average daily net assets (%): | | | | | | | | | | | | | | | | | | | | |
Expenses, net of waivers and reimbursements | | | 1.19 | | | | 1.28 | | | | 1.29 | | | | 1.24 | | | | 1.11 | |
Expenses, before waivers and reimbursements | | | 1.99 | | | | 2.30 | | | | 2.01 | | | | 2.01 | | | | 1.97 | |
Net investment income (loss), net of waivers and reimbursements | | | (0.16 | ) | | | (0.51 | ) | | | (0.67 | ) | | | (0.66 | ) | | | (0.47 | ) |
Net investment income (loss), before waivers and reimbursements | | | (0.96 | ) | | | (1.53 | ) | | | (1.39 | ) | | | (1.43 | ) | | | (1.33 | ) |
| | | | | | | | | | | | | | | |
| | | |
| | | Years Ended December 31, |
| | | 2006 | | 2005 | | 2004 | | 2003 | | 2002 |
Supplemental data for all classes: | | | | | | | | | | | | | | | |
Net assets at end of year (in thousands) | | $ | 9,644 | | $ | 7,815 | | $ | 5,847 | | $ | 6,871 | | $ | 5,303 |
Portfolio turnover rate (%) | | | 42 | | | 25 | | | 31 | | | 37 | | | 44 |
| (a) | | Rates are annualized for periods that are less than a year. |
Performance cited represents past performance. Past performance does not guarantee future results and current performance may be lower or higher than the data quoted. Results shown are annual returns, which assume reinvestment of dividends and capital gains. Investment returns and principal will fluctuate and you may have a gain or loss when you sell shares. For the most current month-end performance information, please call 1-800-742-7272, or visit our Web site at www.williamblairfunds.com.
Note: Net investment income (loss) per share is based on the average shares outstanding during the year.
92 Annual Report | December 31, 2006 |
Financial Highlights
Large Cap Growth Fund
| | | | | | | | | | | | | | | | | | | | |
| | | Class N | |
| | | Years Ended December 31, | |
| | | 2006 | | | 2005 | | | 2004 | | | 2003 | | | 2002 | |
Net asset value, beginning of year | | $ | 6.47 | | | $ | 6.24 | | | $ | 5.93 | | | $ | 4.80 | | | $ | 6.72 | |
Income (loss) from investment operations: | | | | | | | | | | | | | | | | | | | | |
Net investment income (loss) | | | (0.02 | ) | | | (0.02 | ) | | | (0.04 | ) | | | (0.04 | ) | | | (0.04 | ) |
Net realized and unrealized gain (loss) on investments | | | 0.43 | | | | 0.25 | | | | 0.35 | | | | 1.17 | | | | (1.88 | ) |
| | | | | | | | | | | | | | | | | | | | |
Total from investment operations | | | 0.41 | | | | 0.23 | | | | 0.31 | | | | 1.13 | | | | (1.92 | ) |
Less distributions from: | | | | | | | | | | | | | | | | | | | | |
Net investment income | | | — | | | | — | | | | — | | | | — | | | | — | |
Net realized gain | | | — | | | | — | | | | — | | | | — | | | | — | |
| | | | | | | | | | | | | | | | | | | | |
Total distributions | | | — | | | | — | | | | — | | | | — | | | | — | |
| | | | | | | | | | | | | | | | | | | | |
Net asset value, end of year | | $ | 6.88 | | | $ | 6.47 | | | $ | 6.24 | | | $ | 5.93 | | | $ | 4.80 | |
| | | | | | | | | | | | | | | | | | | | |
Total return (%) | | | 6.34 | | | | 3.69 | | | | 5.23 | | | | 23.54 | | | | (28.57 | ) |
Ratios to average daily net assets (%): | | | | | | | | | | | | | | | | | | | | |
Expenses, net of waivers and reimbursements | | | 1.24 | | | | 1.28 | | | | 1.38 | | | | 1.42 | | | | 1.36 | |
Expenses, before waivers and reimbursements | | | 1.63 | | | | 2.08 | | | | 2.29 | | | | 2.39 | | | | 2.45 | |
Net investment income (loss), net of waivers and reimbursements | | | (0.29 | ) | | | (0.37 | ) | | | (0.63 | ) | | | (0.76 | ) | | | (0.71 | ) |
Net investment income (loss), before waivers and reimbursements | | | (0.68 | ) | | | (1.17 | ) | | | (1.54 | ) | | | (1.73 | ) | | | (1.80 | ) |
| |
| | | Class I | |
| | | Years Ended December 31, | |
| | | 2006 | | | 2005 | | | 2004 | | | 2003 | | | 2002 | |
Net asset value, beginning of year | | $ | 6.56 | | | $ | 6.31 | | | $ | 5.99 | | | $ | 4.82 | | | $ | 6.74 | |
Income (loss) from investment operations: | | | | | | | | | | | | | | | | | | | | |
Net investment income (loss) | | | — | | | | (0.01 | ) | | | (0.02 | ) | | | (0.03 | ) | | | (0.03 | ) |
Net realized and unrealized gain (loss) on investments | | | 0.43 | | | | 0.26 | | | | 0.34 | | | | 1.20 | | | | (1.89 | ) |
| | | | | | | | | | | | | | | | | | | | |
Total from investment operations | | | 0.43 | | | | 0.25 | | | | 0.32 | | | | 1.17 | | | | (1.92 | ) |
Less distributions from: | | | | | | | | | | | | | | | | | | | | |
Net investment income | | | — | | | | — | | | | — | | | | — | | | | — | |
Net realized gain | | | — | | | | — | | | | — | | | | — | | | | — | |
| | | | | | | | | | | | | | | | | | | | |
Total distributions | | | — | | | | — | | | | — | | | | — | | | | — | |
| | | | | | | | | | | | | | | | | | | | |
Net asset value, end of year | | $ | 6.99 | | | $ | 6.56 | | | $ | 6.31 | | | $ | 5.99 | | | $ | 4.82 | |
| | | | | | | | | | | | | | | | | | | | |
Total return (%) | | | 6.55 | | | | 3.96 | | | | 5.34 | | | | 24.27 | | | | (28.49 | ) |
Ratios to average daily net assets (%): | | | | | | | | | | | | | | | | | | | | |
Expenses, net of waivers and reimbursements | | | 0.99 | | | | 1.03 | | | | 1.13 | | | | 1.17 | | | | 1.11 | |
Expenses, before waivers and reimbursements | | | 1.38 | | | | 1.83 | | | | 2.04 | | | | 2.14 | | | | 2.20 | |
Net investment income (loss), net of waivers and reimbursements | | | (0.04 | ) | | | (0.12 | ) | | | (0.38 | ) | | | (0.51 | ) | | | (0.46 | ) |
Net investment income (loss), before waivers and reimbursements | | | (0.43 | ) | | | (0.92 | ) | | | (1.29 | ) | | | (1.48 | ) | | | (1.55 | ) |
| | | | | | | | | | | | | | | | | | | | | |
| | | Years Ended December 31, |
| | | 2006 | | 2005 | | | | | | | | 2004 | | 2003 | | 2002 |
Supplemental data for all classes: | | | | | | | | | | | | | | | | | | | | | |
Net assets at end of year (in thousands) | | $ | 20,191 | | $ | 16,888 | | | | | | | | $ | 6,417 | | $ | 5,519 | | $ | 5,469 |
Portfolio turnover rate (%) | | | 53 | | | 53 | | | | | | | | | 39 | | | 33 | | | 52 |
Performance cited represents past performance. Past performance does not guarantee future results and current performance may be lower or higher than the data quoted. Results shown are annual returns, which assume reinvestment of dividends and capital gains. Investment returns and principal will fluctuate and you may have a gain or loss when you sell shares. For the most current month-end performance information, please call 1-800-742-7272, or visit our Web site at www.williamblairfunds.com.
Note: Net investment income (loss) per share is based on the average shares outstanding during the year.
December 31, 2006 | William Blair Funds 93 |
Financial Highlights
Small Cap Growth Fund
| | | | | | | | | | | | | | | | | | | | |
| | | Class N | |
| | | Years Ended December 31, | |
| | | 2006 | | | 2005 | | | 2004 | | | 2003 | | | 2002 | |
Net asset value, beginning of year | | $ | 23.76 | | | $ | 25.72 | | | $ | 21.83 | | | $ | 13.72 | | | $ | 16.58 | |
Income (loss) from investment operations: | | | | | | | | | | | | | | | | | | | | |
Net investment income (loss) | | | (0.29 | ) | | | (0.30 | ) | | | (0.30 | ) | | | (0.21 | ) | | | (0.19 | ) |
Net realized and unrealized gain (loss) on investments | | | 3.65 | | | | 0.64 | | | | 6.20 | | | | 8.68 | | | | (2.67 | ) |
| | | | | | | | | | | | | | | | | | | | |
Total from investment operations | | | 3.36 | | | | 0.34 | | | | 5.90 | | | | 8.47 | | | | (2.86 | ) |
Less distributions from: | | | | | | | | | | | | | | | | | | | | |
Net investment income | | | — | | | | — | | | | — | | | | — | | | | — | |
Net realized gain | | | 1.71 | | | | 2.30 | | | | 2.01 | | | | 0.36 | | | | — | |
| | | | | | | | | | | | | | | | | | | | |
Total distributions | | | 1.71 | | | | 2.30 | | | | 2.01 | | | | 0.36 | | | | — | |
| | | | | | | | | | | | | | | | | | | | |
Net asset value, end of year | | $ | 25.41 | | | $ | 23.76 | | | $ | 25.72 | | | $ | 21.83 | | | $ | 13.72 | |
| | | | | | | | | | | | | | | | | | | | |
Total return (%) | | | 14.12 | | | | 1.18 | | | | 27.24 | | | | 61.88 | | | | (17.25 | ) |
Ratios to average daily net assets (%): | | | | | | | | | | | | | | | | | | | | |
Expenses, net of waivers and reimbursements | | | 1.48 | | | | 1.49 | | | | 1.49 | | | | 1.55 | | | | 1.56 | |
Expenses, before waivers and reimbursements | | | 1.48 | | | | 1.49 | | | | 1.46 | | | | 1.52 | | | | 1.62 | |
Net investment income (loss), net of waivers and reimbursements | | | (1.14 | ) | | | (1.23 | ) | | | (1.27 | ) | | | (1.22 | ) | | | (1.31 | ) |
Net investment income (loss), before waivers and reimbursements | | | (1.14 | ) | | | (1.23 | ) | | | (1.24 | ) | | | (1.19 | ) | | | (1.37 | ) |
| |
| | | Class I | |
| | | Years Ended December 31, | |
| | | 2006 | | | 2005 | | | 2004 | | | 2003 | | | 2002 | |
Net asset value, beginning of year | | $ | 24.16 | | | $ | 26.04 | | | $ | 22.03 | | | $ | 13.82 | | | $ | 16.65 | |
Income (loss) from investment operations: | | | | | | | | | | | | | | | | | | | | |
Net investment income (loss) | | | (0.22 | ) | | | (0.25 | ) | | | (0.24 | ) | | | (0.18 | ) | | | (0.16 | ) |
Net realized and unrealized gain (loss) on investments | | | 3.71 | | | | 0.67 | | | | 6.26 | | | | 8.75 | | | | (2.67 | ) |
| | | | | | | | | | | | | | | | | | | | |
Total from investment operations | | | 3.49 | | | | 0.42 | | | | 6.02 | | | | 8.57 | | | | (2.83 | ) |
Less distributions from: | | | | | | | | | | | | | | | | | | | | |
Net investment income | | | — | | | | — | | | | — | | | | — | | | | — | |
Net realized gain | | | 1.71 | | | | 2.30 | | | | 2.01 | | | | 0.36 | | | | — | |
| | | | | | | | | | | | | | | | | | | | |
Total distributions | | | 1.71 | | | | 2.30 | | | | 2.01 | | | | 0.36 | | | | — | |
| | | | | | | | | | | | | | | | | | | | |
Net asset value, end of year | | $ | 25.94 | | | $ | 24.16 | | | $ | 26.04 | | | $ | 22.03 | | | $ | 13.82 | |
| | | | | | | | | | | | | | | | | | | | |
Total return (%) | | | 14.42 | | | | 1.48 | | | | 27.54 | | | | 62.15 | | | | (17.00 | ) |
Ratios to average daily net assets (%): | | | | | | | | | | | | | | | | | | | | |
Expenses, net of waivers and reimbursements | | | 1.21 | | | | 1.24 | | | | 1.24 | | | | 1.35 | | | | 1.31 | |
Expenses, before waivers and reimbursements | | | 1.21 | | | | 1.24 | | | | 1.21 | | | | 1.28 | | | | 1.37 | |
Net investment income (loss), net of waivers and reimbursements | | | (0.87 | ) | | | (0.98 | ) | | | (1.02 | ) | | | (1.02 | ) | | | (1.06 | ) |
Net investment income (loss), before waivers and reimbursements | | | (0.87 | ) | | | (0.98 | ) | | | (0.99 | ) | | | (0.95 | ) | | | (1.12 | ) |
| | | | | | | | | | | | | | | |
| | | Years Ended December 31, |
| | | 2006 | | 2005 | | 2004 | | 2003 | | 2002 |
Supplemental data for all classes: | | | | | | | | | | | | | | | |
Net assets at end of year (in thousands) | | $ | 1,261,174 | | $ | 831,738 | | $ | 771,209 | | $ | 518,824 | | $ | 78,581 |
Portfolio turnover rate (%) | | | 105 | | | 80 | | | 109 | | | 103 | | | 133 |
Performance cited represents past performance. Past performance does not guarantee future results and current performance may be lower or higher than the data quoted. Results shown are annual returns, which assume reinvestment of dividends and capital gains. Investment returns and principal will fluctuate and you may have a gain or loss when you sell shares. For the most current month-end performance information, please call 1-800-742-7272, or visit our Web site at www.williamblairfunds.com.
Note: Net investment income (loss) per share is based on the average shares outstanding during the year.
94 Annual Report | December 31, 2006 |
Financial Highlights
Mid Cap Growth Fund
| | | | |
| | | Class N | |
| | | Period Ended | |
| | | 12/31/2006(a) | |
Net asset value, beginning of period | | $ | 10.00 | |
Income (loss) from investment operations: | | | | |
Net investment income (loss) | | | (0.07 | ) |
Net realized and unrealized gain (loss) on investments | | | 0.53 | |
| | | | |
Total from investment operations | | | 0.46 | |
Less distributions from: | | | | |
Net investment income | | | — | |
Net realized gain | | | — | |
| | | | |
Total distributions | | | — | |
| | | | |
Net asset value, end of period | | $ | 10.46 | |
| | | | |
Total return (%) (c) | | | 4.60 | |
Ratios to average daily net assets (%) (b): | | | | |
Expenses, net of waivers and reimbursements | | | 1.40 | |
Expenses, before waivers and reimbursements | | | 2.35 | |
Net investment income (loss), net of waivers and reimbursements | | | (0.70 | ) |
Net investment income (loss), before waivers and reimbursements | | | (1.65 | ) |
| |
| | | Class I | |
| | | Period Ended | |
| | | 12/31/2006(a) | |
Net asset value, beginning of period | | $ | 10.00 | |
Income (loss) from investment operations: | | | | |
Net investment income (loss) | | | (0.04 | ) |
Net realized and unrealized gain (loss) on investments | | | 0.53 | |
| | | | |
Total from investment operations | | | 0.49 | |
Less distributions from: | | | | |
Net investment income | | | — | |
Net realized gain | | | — | |
| | | | |
Total distributions | | | — | |
| | | | |
Net asset value, end of period | | $ | 10.49 | |
| | | | |
Total return (%) (c) | | | 4.90 | |
Ratios to average daily net assets (%) (b): | | | | |
Expenses, net of waivers and reimbursements | | | 1.15 | |
Expenses, before waivers and reimbursements | | | 2.10 | |
Net investment income (loss), net of waivers and reimbursements | | | (0.43 | ) |
Net investment income (loss), before waivers and reimbursements | | | (1.38 | ) |
| | | | |
| | | Period Ended | |
| | | 12/31/2006(a) | |
Supplemental data for all classes: | | | | |
Net assets at end of period (in thousands) | | $ | 19,639 | |
Portfolio turnover rate (%) (b) | | | 56 | |
| (a) | | For the period from February 1, 2006 (Commencement of Operations) to December 31, 2006. |
| (b) | | Rates are annualized for periods that are less than a year. |
| (c) | | Total return is not annualized for periods that are less than a year. |
Performance cited represents past performance. Past performance does not guarantee future results and current performance may be lower or higher than the data quoted. Results shown are annual returns, which assume reinvestment of dividends and capital gains. Investment returns and principal will fluctuate and you may have a gain or loss when you sell shares. For the most current month-end performance information, please call 1-800-742-7272, or visit our Web site at www.williamblairfunds.com.
Note: Net investment income (loss) per share is based on the average shares outstanding during the period.
December 31, 2006 | William Blair Funds 95 |
Financial Highlights
Small-Mid Cap Growth Fund
| | | | | | | | | | | | | | | | |
| | | Class N | |
| | | Years Ended December 31, | |
| | | 2006 | | | 2005 | | | 2004 | | | 2003(a) | |
Net asset value, beginning of year | | $ | 12.40 | | | $ | 11.28 | | | $ | 9.94 | | | $ | 10.00 | |
Income (loss) from investment operations: | | | | | | | | | | | | | | | | |
Net investment income (loss) | | | (0.11 | ) | | | (0.11 | ) | | | (0.13 | ) | | | — | |
Net realized and unrealized gain (loss) on investments | | | 1.32 | | | | 1.32 | | | | 1.47 | | | | (0.06 | ) |
| | | | | | | | | | | | | | | | |
Total from investment operations | | | 1.21 | | | | 1.21 | | | | 1.34 | | | | (0.06 | ) |
Less distributions from: | | | | | | | | | | | | | | | | |
Net investment income | | | — | | | | — | | | | — | | | | — | |
Net realized gain | | | 0.65 | | | | 0.09 | | | | — | | | | — | |
| | | | | | | | | | | | | | | | |
Total distributions | | | 0.65 | | | | 0.09 | | | | — | | | | — | |
| | | | | | | | | | | | | | | | |
Net asset value, end of year | | $ | 12.96 | | | $ | 12.40 | | | $ | 11.28 | | | $ | 9.94 | |
| | | | | | | | | | | | | | | | |
Total return (%) | | | 9.68 | | | | 10.72 | | | | 13.48 | | | | (0.60 | ) |
Ratios to average daily net assets (%): | | | | | | | | | | | | | | | | |
Expenses, net of waivers and reimbursements | | | 1.38 | | | | 1.45 | | | | 1.54 | | | | 1.54 | (b) |
Expenses, before waivers and reimbursements | | | 1.45 | | | | 1.54 | | | | 2.14 | | | | 1.54 | (b) |
Net investment income (loss), net of waivers and reimbursements | | | (0.86 | ) | | | (0.97 | ) | | | (1.26 | ) | | | (1.54 | )(b) |
Net investment income (loss), before waivers and reimbursements | | | (0.93 | ) | | | (1.06 | ) | | | (1.86 | ) | | | (1.54 | )(b) |
| |
| | | Class I | |
| | | Years Ended December 31, | |
| | | 2006 | | | 2005 | | | 2004 | | | 2003(a) | |
Net asset value, beginning of year | | $ | 12.46 | | | $ | 11.30 | | | $ | 9.94 | | | $ | 10.00 | |
Income (loss) from investment operations: | | | | | | | | | | | | | | | | |
Net investment income (loss) | | | (0.08 | ) | | | (0.08 | ) | | | (0.11 | ) | | | — | |
Net realized and unrealized gain (loss) on investments | | | 1.33 | | | | 1.33 | | | | 1.47 | | | | (0.06 | ) |
| | | | | | | | | | | | | | | | |
Total from investment operations | | | 1.25 | | | | 1.25 | | | | 1.36 | | | | (0.06 | ) |
Less distributions from: | | | | | | | | | | | | | | | | |
Net investment income | | | — | | | | — | | | | — | | | | — | |
Net realized gain | | | 0.65 | | | | 0.09 | | | | — | | | | — | |
| | | | | | | | | | | | | | | | |
Total distributions | | | 0.65 | | | | 0.09 | | | | — | | | | — | |
| | | | | | | | | | | | | | | | |
Net asset value, end of year | | $ | 13.06 | | | $ | 12.46 | | | $ | 11.30 | | | $ | 9.94 | |
| | | | | | | | | | | | | | | | |
Total return (%) | | | 9.95 | | | | 11.05 | | | | 13.68 | | | | (0.60 | ) |
Ratios to average daily net assets (%): | | | | | | | | | | | | | | | | |
Expenses, net of waivers and reimbursements | | | 1.13 | | | | 1.20 | | | | 1.29 | | | | 1.29 | (b) |
Expenses, before waivers and reimbursements | | | 1.20 | | | | 1.29 | | | | 1.89 | | | | 1.29 | (b) |
Net investment income (loss), net of waivers and reimbursements | | | (0.61 | ) | | | (0.72 | ) | | | (1.01 | ) | | | (1.29 | )(b) |
Net investment income (loss), before waivers and reimbursements | | | (0.68 | ) | | | (0.81 | ) | | | (1.61 | ) | | | (1.29 | )(b) |
| | | | | | | | | | | | | |
| | | Years Ended December 31, | |
| | | 2006 | | 2005 | | 2004 | | 2003 | |
Supplemental data for all classes: | | | | | | | | | | | | | |
Net assets at end of year (in thousands) | | $ | 92,766 | | $ | 70,211 | | $ | 25,974 | | $ | 3,673 | |
Portfolio turnover rate (%) | | | 68 | | | 62 | | | 55 | | | — | (b) |
| (a) | | For the period from December 29, 2003 (Commencement of Operations) to December 31, 2003. |
| (b) | | Rates are annualized for periods that are less than a year. |
Performance cited represents past performance. Past performance does not guarantee future results and current performance may be lower or higher than the data quoted. Results shown are annual returns, which assume reinvestment of dividends and capital gains. Investment returns and principal will fluctuate and you may have a gain or loss when you sell shares. For the most current month-end performance information, please call 1-800-742-7272, or visit our Web site at www.williamblairfunds.com.
Note: Net investment income (loss) per share is based on the average shares outstanding during the year.
96 Annual Report | December 31, 2006 |
Financial Highlights
International Growth Fund
| | | | | | | | | | | | | | | | | |
| | | Class N | |
| | | Years Ended December 31, | |
| | | 2006 | | 2005 | | 2004 | | | 2003 | | 2002 | |
Net asset value, beginning of year | | $ | 25.22 | | $ | 22.09 | | $ | 18.65 | | | $ | 13.13 | | $ | 15.48 | |
Income (loss) from investment operations: | | | | | | | | | | | | | | | | | |
Net investment income (loss) (a) | | | 0.05 | | | 0.15 | | | (0.02 | ) | | | 0.02 | | | (0.05 | ) |
Net realized and unrealized gain (loss) on investments | | | 5.71 | | | 4.60 | | | 3.47 | | | | 5.52 | | | (2.30 | ) |
| | | | | | | | | | | | | | | | | |
Total from investment operations | | | 5.76 | | | 4.75 | | | 3.45 | | | | 5.54 | | | (2.35 | ) |
Less distributions from: | | | | | | | | | | | | | | | | | |
Net investment income | | | 0.37 | | | 0.11 | | | 0.01 | | | | 0.02 | | | — | |
Net realized gain | | | 2.91 | | | 1.51 | | | — | | | | — | | | — | |
| | | | | | | | | | | | | | | | | |
Total distributions | | | 3.28 | | | 1.62 | | | 0.01 | | | | 0.02 | | | — | |
| | | | | | | | | | | | | | | | | |
Net asset value, end of year | | $ | 27.70 | | $ | 25.22 | | $ | 22.09 | | | $ | 18.65 | | $ | 13.13 | |
| | | | | | | | | | | | | | | | | |
Total return (%) | | | 23.06 | | | 21.65 | | | 18.48 | | | | 42.21 | | | (15.18 | ) |
Ratios to average daily net assets (%): | | | | | | | | | | | | | | | | | |
Expenses | | | 1.42 | | | 1.42 | | | 1.47 | | | | 1.50 | | | 1.51 | |
Net investment income (loss) | | | 0.19 | | | 0.16 | | | (0.16 | ) | | | 0.05 | | | (0.36 | ) |
| | | | | | | | | | | | | | | | |
| | | Class I | |
| | | Years Ended December 31, | |
| | | 2006 | | 2005 | | 2004 | | 2003 | | 2002 | |
Net asset value, beginning of year | | $ | 25.55 | | $ | 22.34 | | $ | 18.85 | | $ | 13.27 | | $ | 15.60 | |
Income (loss) from investment operations: | | | | | | | | | | | | | | | | |
Net investment income (loss) (a) | | | 0.13 | | | 0.27 | | | 0.01 | | | 0.09 | | | (0.01 | ) |
Net realized and unrealized gain (loss) on investments | | | 5.78 | | | 4.61 | | | 3.53 | | | 5.54 | | | (2.32 | ) |
| | | | | | | | | | | | | | | | |
Total from investment operations | | | 5.91 | | | 4.88 | | | 3.54 | | | 5.63 | | | (2.33 | ) |
Less distributions from: | | | | | | | | | | | | | | | | |
Net investment income | | | 0.45 | | | 0.16 | | | 0.05 | | | 0.05 | | | — | |
Net realized gain | | | 2.91 | | | 1.51 | | | — | | | — | | | — | |
| | | | | | | | | | | | | | | | |
Total distributions | | | 3.36 | | | 1.67 | | | 0.05 | | | 0.05 | | | — | |
| | | | | | | | | | | | | | | | |
Net asset value, end of year | | $ | 28.10 | | $ | 25.55 | | $ | 22.34 | | $ | 18.85 | | $ | 13.27 | |
| | | | | | | | | | | | | | | | |
Total return (%) | | | 23.35 | | | 22.00 | | | 18.79 | | | 42.42 | | | (14.94 | ) |
Ratios to average daily net assets (%): | | | | | | | | | | | | | | | | |
Expenses | | | 1.11 | | | 1.17 | | | 1.22 | | �� | 1.25 | | | 1.26 | |
Net investment income (loss) | | | 0.45 | | | 0.41 | | | 0.09 | | | 0.30 | | | (0.11 | ) |
| | | | | | | | | | | | | | | |
| | | | | Years Ended December 31, |
| | | 2006 | | 2005 | | 2004 | | 2003 | | 2002 |
Supplemental data for all classes: | | | | | | | | | | | | | | | |
Net assets at end of year (in thousands) | | $ | 6,267,126 | | $ | 4,551,077 | | $ | 3,001,434 | | $ | 1,899,699 | | $ | 778,788 |
Portfolio turnover rate (%) | | | 72 | | | 70 | | | 79 | | | 57 | | | 73 |
| (a) | | Excludes $0.42, $0.37, $0.12, $0.03, $0.00, and $0.00, of PFIC mark to market which are treated as ordinary income for Federal tax purposes for the years 2006, 2005, 2004, 2003 and 2002, respectively. |
Performance cited represents past performance. Past performance does not guarantee future results and current performance may be lower or higher than the data quoted. Results shown are annual returns, which assume reinvestment of dividends and capital gains. Investment returns and principal will fluctuate and you may have a gain or loss when you sell shares. For the most current month-end performance information, please call 1-800-742-7272, or visit our Web site at www.williamblairfunds.com.
Note: Net investment income (loss) per share is based on the average shares outstanding during the year.
December 31, 2006 | William Blair Funds 97 |
Financial Highlights
International Equity Fund
| | | | | | | | | | | |
| | | Class N | |
| | | Years Ended December 31, | |
| | | 2006 | | 2005 | | | 2004(a) | |
Net asset value, beginning of year | | $ | 12.86 | | $ | 11.33 | | | $ | 10.00 | |
Income (loss) from investment operations: | | | | | | | | | | | |
Net investment income (loss) (b) | | | 0.04 | | | (0.01 | ) | | | (0.04 | ) |
Net realized and unrealized gain (loss) on investments | | | 2.52 | | | 1.54 | | | | 1.37 | |
| | | | | | | | | | | |
Total from investment operations | | | 2.56 | | | 1.53 | | | | 1.33 | |
Less distributions from: | | | | | | | | | | | |
Net investment income | | | 0.19 | | | — | | | | — | |
Net realized gain | | | 0.02 | | | — | | | | — | |
| | | | | | | | | | | |
Total distributions | | | 0.21 | | | — | | | | — | |
| | | | | | | | | | | |
Net asset value, end of year | | $ | 15.21 | | $ | 12.86 | | | $ | 11.33 | |
| | | | | | | | | | | |
Total return (%) | | | 19.96 | | | 13.50 | | | | 13.30 | |
Ratios to average daily net assets (%): | | | | | | | | | | | |
Expenses, net of waivers and reimbursements | | | 1.46 | | | 1.48 | | | | 1.50 | (c) |
Expenses, before waivers and reimbursements | | | 1.56 | | | 1.81 | | | | 2.96 | (c) |
Net investment income (loss), net of waivers and reimbursements | | | 0.26 | | | (0.33 | ) | | | (0.77 | )(c) |
Net investment income (loss), before waivers and reimbursements | | | 0.16 | | | (0.66 | ) | | | (2.23 | )(c) |
| | | | | | | | | | | |
| | | Class I | |
| | | Years Ended December 31, | |
| | | 2006 | | 2005 | | | 2004(a) | |
Net asset value, beginning of year | | $ | 12.94 | | $ | 11.37 | | | $ | 10.00 | |
Income (loss) from investment operations: | | | | | | | | | | | |
Net investment income (loss) (b) | | | 0.06 | | | (0.01 | ) | | | (0.01 | ) |
Net realized and unrealized gain (loss) on investments | | | 2.55 | | | 1.58 | | | | 1.38 | |
| | | | | | | | | | | |
Total from investment operations | | | 2.61 | | | 1.57 | | | | 1.37 | |
Less distributions from: | | | | | | | | | | | |
Net investment income | | | 0.22 | | | — | | | | — | |
Net realized gain | | | 0.02 | | | — | | | | — | |
| | | | | | | | | | | |
Total distributions | | | 0.24 | | | — | | | | — | |
| | | | | | | | | | | |
Net asset value, end of year | | $ | 15.31 | | $ | 12.94 | | | $ | 11.37 | |
| | | | | | | | | | | |
Total return (%) | | | 20.22 | | | 13.81 | | | | 13.70 | |
Ratios to average daily net assets (%): | | | | | | | | | | | |
Expenses, net of waivers and reimbursements | | | 1.21 | | | 1.23 | | | | 1.25 | (c) |
Expenses, before waivers and reimbursements | | | 1.35 | | | 1.56 | | | | 2.71 | (c) |
Net investment income (loss), net of waivers and reimbursements | | | 0.46 | | | (0.08 | ) | | | (0.52 | )(c) |
Net investment income (loss), before waivers and reimbursements | | | 0.32 | | | (0.41 | ) | | | (1.98 | )(c) |
| | | | | | | | | | |
| | | Years Ended December 31, | |
| | | 2006 | | 2005 | | 2004 | |
Supplemental data for all classes: | | | | | | | | | | |
Net assets at end of year (in thousands) | | $ | 297,716 | | $ | 177,710 | | $ | 9,689 | |
Portfolio turnover rate (%) | | | 83 | | | 127 | | | 108 | (c) |
| (a) | | For the period from May 24, 2004 (Commencement of Operations) to December 31, 2004. |
| (b) | | Excludes $0.22, $0.33 and $0.02 of PFIC mark to market which is treated as ordinary income for Federal tax purposes for the years 2006, 2005 and 2004, respectively. |
| (c) | | Rates are annualized for periods that are less than a year. |
Performance cited represents past performance. Past performance does not guarantee future results and current performance may be lower or higher than the data quoted. Results shown are annual returns, which assume reinvestment of dividends and capital gains. Investment returns and principal will fluctuate and you may have a gain or loss when you sell shares. For the most current month-end performance information, please call 1-800-742-7272, or visit our Web site at www.williamblairfunds.com.
Note: Net investment income (loss) per share is based on the average shares outstanding during the year.
98 Annual Report | December 31, 2006 |
Financial Highlights
International Small Cap Growth Fund
| | | | | | | | | | |
| | | Class N | |
| | | Years Ended December 31, | |
| | | | | 2006 | | | 2005(a) | |
Net asset value, beginning of year | | | | $ | 11.16 | | | $ | 10.00 | |
Income (loss) from investment operations: | | | | | | | | | | |
Net investment income (loss) (b) | | | (0.05 | ) | | | (0.01 | ) |
Net realized and unrealized gain (loss) on investments | | | 2.32 | | | | 1.17 | |
| | | | | | | | | | |
Total from investment operations | | | 2.27 | | | | 1.16 | |
Less distributions from: | | | | | | | | | | |
Net investment income | | | 0.01 | | | | — | |
Net realized gain | | | 0.05 | | | | — | |
| | | | | | | | | | |
Total distributions | | | | | 0.06 | | | | — | |
| | | | | | | | | | |
Net asset value, end of year | | | | $ | 13.37 | | | $ | 11.16 | |
| | | | | | | | | | |
Total return (%) | | | | | 20.32 | | | | 11.60 | |
Ratios to average daily net assets (%): | | | | | | | | | | |
Expenses, net of waivers and reimbursements | | | 1.65 | | | | 1.65 | (c) |
Expenses, before waivers and reimbursements | | | 1.71 | | | | 2.57 | (c) |
Net investment income (loss), net of waivers and reimbursements | | | (0.40 | ) | | | (0.40 | )(c) |
Net investment income (loss), before waivers and reimbursements | | | (0.46 | ) | | | (1.32 | )(c) |
| |
| | | Class I | |
| | | Years Ended December 31, | |
| | | | | 2006 | | | 2005(a) | |
| | | | | (unaudited) | | | | |
Net asset value, beginning of year | | | | $ | 11.16 | | | $ | 10.00 | |
Income (loss) from investment operations: | | | | | | | | | | |
Net investment income (loss) (b) | | | (0.03 | ) | | | — | |
Net realized and unrealized gain (loss) on investments | | | 2.34 | | | | 1.16 | |
| | | | | | | | | | |
Total from investment operations | | | | | 2.31 | | | | 1.16 | |
Less distributions from: | | | | | | | | | | |
Net investment income | | | 0.01 | | | | — | |
Net realized gain | | | 0.05 | | | | — | |
| | | | | | | | | | |
Total distributions | | | | | 0.06 | | | | — | |
| | | | | | | | | | |
Net asset value, end of year | | | | $ | 13.41 | | | $ | 11.16 | |
| | | | | | | | | | |
Total return (%) | | | | | 20.68 | | | | 11.60 | |
Ratios to average daily net assets (%): | | | | | | | | | | |
Expenses, net of waivers and reimbursements | | | 1.40 | | | | 1.40 | (c) |
Expenses, before waivers and reimbursements | | | 1.46 | | | | 2.32 | (c) |
Net investment income (loss), net of waivers and reimbursements | | | (0.25 | ) | | | (0.15 | )(c) |
Net investment income (loss), before waivers and reimbursements | | | (0.31 | ) | | | (1.07 | )(c) |
| | | | | | | | | |
| | | | |
| | | Years Ended December 31, | |
| | | | | 2006 | | 2005(a) | |
Supplemental data for all classes: | | | | | | | | | |
Net assets at end of year (in thousands) | | $ | 231,969 | | $ | 50,534 | |
Portfolio turnover rate (%) | | | 109 | | | 127 | (c) |
| (a) | | For the period from November 1, 2005 (Commencement of Operations) to December 31, 2005. |
| (b) | | Excludes $0.00 and $0.11 of PFIC mark to market which is treated as ordinary income for Federal tax purposes for the years ended 2006 and 2005, respectively. |
| (c) | | Rates are annualized for periods that are less than a year. |
Performance cited represents past performance. Past performance does not guarantee future results and current performance may be lower or higher than the data quoted. Results shown are annual returns, which assume reinvestment of dividends and capital gains. Investment returns and principal will fluctuate and you may have a gain or loss when you sell shares. For the most current month-end performance information, please call 1-800-742-7272, or visit our Web site at www.williamblairfunds.com.
Note: Net investment income (loss) per share is based on the average shares outstanding during the year.
December 31, 2006 | William Blair Funds 99 |
Financial Highlights
Emerging Markets Growth Fund
| | | | | | | | |
| | | Class N | |
| | | Years Ended December 31, | |
| | | 2006 | | | 2005(a) | |
Net asset value, beginning of year | | $ | 14.17 | | | $ | 10.00 | |
Income (loss) from investment operations: | | | | | | | | |
Net investment income (loss) (b) | | | (0.04 | ) | | | (0.01 | ) |
Net realized and unrealized gain (loss) on investments | | | 5.41 | | | | 4.26 | |
| | | | | | | | |
Total from investment operations | | | 5.37 | | | | 4.25 | |
Less distributions from: | | | | | | | | |
Net investment income | | | 0.01 | | | | — | |
Net realized gain | | | 0.11 | | | | 0.08 | |
| | | | | | | | |
Total distributions | | | 0.12 | | | | 0.08 | |
| | | | | | | | |
Net asset value, end of year | | $ | 19.42 | | | $ | 14.17 | |
| | | | | | | | |
Total return (%) | | | 37.90 | | | | 42.52 | |
Ratios to average daily net assets (%): | | | | | | | | |
Expenses, net of waivers and reimbursements | | | 1.65 | | | | 1.55 | (c) |
Expenses, before waivers and reimbursements | | | 1.78 | | | | 1.91 | (c) |
Net investment income (loss), net of waivers and reimbursements | | | (0.22 | ) | | | (0.11 | )(c) |
Net investment income (loss), before waivers and reimbursements | | | (0.35 | ) | | | (0.47 | )(c) |
| | | | | | | | |
| | | Class I | |
| | | Years Ended December 31, | |
| | | 2006 | | | 2005(a) | |
Net asset value, beginning of year | | $ | 14.19 | | | $ | 10.00 | |
Income (loss) from investment operations: | | | | | | | | |
Net investment income (loss) (b) | | | (0.01 | ) | | | 0.01 | |
Net realized and unrealized gain (loss) on investments | | | 5.41 | | | | 4.26 | |
| | | | | | | | |
Total from investment operations | | | 5.40 | | | | 4.27 | |
Less distributions from: | | | | | | | | |
Net investment income | | | 0.01 | | | | — | |
Net realized gain | | | 0.11 | | | | 0.08 | |
| | | | | | | | |
Total distributions | | | 0.12 | | | | 0.08 | |
| | | | | | | | |
Net asset value, end of year | | $ | 19.47 | | | $ | 14.19 | |
| | | | | | | | |
Total return (%) | | | 38.07 | | | | 42.72 | |
Ratios to average daily net assets (%): | | | | | | | | |
Expenses, net of waivers and reimbursements | | | 1.40 | | | | 1.40 | (c) |
Expenses, before waivers and reimbursements | | | 1.47 | | | | 1.76 | (c) |
Net investment income (loss), net of waivers and reimbursements | | | (0.06 | ) | | | 0.04 | (c) |
Net investment income (loss), before waivers and reimbursements | | | (0.13 | ) | | | (0.32 | )(c) |
| | | | | | | |
| | | Years Ended December 31, | |
| | | 2006 | | 2005(a) | |
Supplemental data for all classes: | | | | | | | |
Net assets at end of year (in thousands) | | $ | 813,649 | | $ | 249,348 | |
Portfolio turnover rate (%) | | | 113 | | | 77 | (c) |
| (a) | | For the period from June 6, 2005 (Commencement of Operations) to December 31, 2005. |
| (b) | | Excludes $0.00 and $0.11 of PFIC mark to market which is treated as ordinary income for Federal tax purposes for years ended 2006 and 2005, respectively. |
| (c) | | Rates are annualized for periods that are less than a year. |
Performance cited represents past performance. Past performance does not guarantee future results and current performance may be lower or higher than the data quoted. Results shown are annual returns, which assume reinvestment of dividends and capital gains. Investment returns and principal will fluctuate and you may have a gain or loss when you sell shares. For the most current month-end performance information, please call 1-800-742-7272, or visit our Web site at www.williamblairfunds.com.
Note: Net investment income (loss) per share is based on the average shares outstanding during the year.
100 Annual Report | December 31, 2006 |
Financial Highlights
Value Discovery Fund
| | | | | | | | | | | | | | | | | | | | |
| | | Class N | |
| | | Years Ended December 31, | |
| | | 2006 | | | 2005 | | | 2004 | | | 2003 | | | 2002 | |
Net asset value, beginning of year | | $ | 14.95 | | | $ | 22.70 | | | $ | 22.68 | | | $ | 16.28 | | | $ | 18.23 | |
Income (loss) from investment operations: | | | | | | | | | | | | | | | | | | | | |
Net investment income (loss) | | | 0.03 | | | | (0.02 | ) | | | (0.01 | ) | | | (0.06 | ) | | | (0.03 | ) |
Net realized and unrealized gain (loss) on investments | | | 3.22 | | | | 0.14 | | | | 2.68 | | | | 6.46 | | | | (1.92 | ) |
| | | | | | | | | | | | | | | | | | | | |
Total from investment operations | | | 3.25 | | | | 0.12 | | | | 2.67 | | | | 6.40 | | | | (1.95 | ) |
Less distributions from: | | | | | | | | | | | | | | | | | | | | |
Net investment income | | | 0.01 | | | | — | | | | — | | | | — | | | | — | |
Net realized gain | | | 1.92 | | | | 7.87 | | | | 2.65 | | | | — | | | | — | |
| | | | | | | | | | | | | | | | | | | | |
Total distributions | | | 1.93 | | | | 7.87 | | | | 2.65 | | | | — | | | | — | |
| | | | | | | | | | | | | | | | | | | | |
Net asset value, end of year | | $ | 16.27 | | | $ | 14.95 | | | $ | 22.70 | | | $ | 22.68 | | | $ | 16.28 | |
| | | | | | | | | | | | | | | | | | | | |
Total return (%) | | | 21.78 | | | | 0.49 | | | | 12.05 | | | | 39.31 | | | | (10.70 | ) |
Ratios to average daily net assets (%): | | | | | | | | | | | | | | | | | | | | |
Expenses, net of waivers and reimbursements | | | 1.34 | | | | 1.34 | | | | 1.34 | | | | 1.49 | | | | 1.53 | |
Expenses, before waivers and reimbursements | | | 1.75 | | | | 1.64 | | | | 1.48 | | | | 1.58 | | | | 1.53 | |
Net investment income (loss), net of waivers and reimbursements | | | 0.21 | | | | (0.22 | ) | | | (0.06 | ) | | | (0.30 | ) | | | (0.16 | ) |
Net investment income (loss), before waivers and reimbursements | | | (0.20 | ) | | | (0.52 | ) | | | (0.20 | ) | | | (0.39 | ) | | | (0.16 | ) |
| |
| | | Class I | |
| | | Years Ended December 31, | |
| | | 2006 | | | 2005 | | | 2004 | | | 2003 | | | 2002 | |
Net asset value, beginning of year | | $ | 15.12 | | | $ | 22.82 | | | $ | 22.76 | | | $ | 16.31 | | | $ | 18.19 | |
Income (loss) from investment operations: | | | | | | | | | | | | | | | | | | | | |
Net investment income (loss) | | | 0.03 | | | | — | | | | 0.01 | | | | (0.03 | ) | | | 0.01 | |
Net realized and unrealized gain (loss) on investments | | | 3.30 | | | | 0.17 | | | | 2.70 | | | | 6.48 | | | | (1.89 | ) |
| | | | | | | | | | | | | | | | | | | | |
Total from investment operations | | | 3.33 | | | | 0.17 | | | | 2.71 | | | | 6.45 | | | | (1.88 | ) |
Less distributions from: | | | | | | | | | | | | | | | | | | | | |
Net investment income | | | 0.02 | | | | — | | | | — | | | | — | | | | — | |
Net realized gain | | | 1.92 | | | | 7.87 | | | | 2.65 | | | | — | | | | — | |
| | | | | | | | | | | | | | | | | | | | |
Total distributions | | | 1.94 | | | | 7.87 | | | | 2.65 | | | | — | | | | — | |
| | | | | | | | | | | | | | | | | | | | |
Net asset value, end of year | | $ | 16.51 | | | $ | 15.12 | | | $ | 22.82 | | | $ | 22.76 | | | $ | 16.31 | |
| | | | | | | | | | | | | | | | | | | | |
Total return (%) | | | 22.10 | | | | 0.70 | | | | 12.18 | | | | 39.55 | | | | (10.34 | ) |
Ratios to average daily net assets (%): | | | | | | | | | | | | | | | | | | | | |
Expenses, net of waivers and reimbursements | | | 1.09 | | | | 1.14 | | | | 1.23 | | | | 1.33 | | | | 1.34 | |
Expenses, before waivers and reimbursements | | | 1.50 | | | | 1.39 | | | | 1.23 | | | | 1.33 | | | | 1.34 | |
Net investment income (loss), net of waivers and reimbursements | | | 0.16 | | | | (0.02 | ) | | | 0.05 | | | | (0.14 | ) | | | 0.03 | |
Net investment income (loss), before waivers and reimbursements | | | (0.25 | ) | | | (0.27 | ) | | | 0.05 | | | | (0.14 | ) | | | 0.03 | |
| | | | | | | | | | | | | | | |
| | | Years Ended December 31, |
| | | 2006 | | 2005 | | 2004 | | 2003 | | 2002 |
Supplemental data for all classes: | | | | | | | | | | | | | | | |
Net assets at end of year (in thousands) | | $ | 146,777 | | $ | 70,439 | | $ | 246,176 | | $ | 237,111 | | $ | 190,802 |
Portfolio turnover rate (%) | | | 162 | | | 125 | | | 50 | | | 51 | | | 20 |
Performance cited represents past performance. Past performance does not guarantee future results and current performance may be lower or higher than the data quoted. Results shown are annual returns, which assume reinvestment of dividends and capital gains. Investment returns and principal will fluctuate and you may have a gain or loss when you sell shares. For the most current month-end performance information, please call 1-800-742-7272, or visit our Web site at www.williamblairfunds.com.
Note: Net investment income (loss) per share is based on the average shares outstanding during the year.
December 31, 2006 | William Blair Funds 101 |
Financial Highlights
Income Fund
| | | | | | | | | | | | | | | | | | | |
| | | Class N |
| | | Years Ended December 31, |
| | | 2006 | | | 2005 | | | 2004 | | | 2003 | | | 2002 |
Net asset value, beginning of year | | $ | 9.83 | | | $ | 10.19 | | | $ | 10.43 | | | $ | 10.62 | | | $ | 10.34 |
Income (loss) from investment operations: | | | | | | | | | | | | | | | | | | | |
Net investment income (loss) (a) | | | 0.44 | | | | 0.47 | | | | 0.52 | | | | 0.40 | | | | 0.55 |
Net realized and unrealized gain (loss) on investments | | | (0.04 | ) | | | (0.30 | ) | | | (0.26 | ) | | | (0.02 | ) | | | 0.25 |
| | | | | | | | | | | | | | | | | | | |
Total from investment operations | | | 0.40 | | | | 0.17 | | | | 0.26 | | | | 0.38 | | | | 0.80 |
Less distributions from: | | | | | | | | | | | | | | | | | | | |
Net investment income | | | 0.49 | | | | 0.53 | | | | 0.50 | | | | 0.57 | | | | 0.52 |
Net realized gain | | | — | | | | — | | | | — | | | | — | | | | — |
| | | | | | | | | | | | | | | | | | | |
Total distributions | | | 0.49 | | | | 0.53 | | | | 0.50 | | | | 0.57 | | | | 0.52 |
| | | | | | | | | | | | | | | | | | | |
Net asset value, end of year | | $ | 9.74 | | | $ | 9.83 | | | $ | 10.19 | | | $ | 10.43 | | | $ | 10.62 |
| | | | | | | | | | | | | | | | | | | |
Total return (%) | | | 4.25 | | | | 1.71 | | | | 2.61 | | | | 3.68 | | | | 7.91 |
Ratios to average daily net assets (%): | | | | | | | | | | | | | | | | | | | |
Expenses, net of waivers and reimbursements | | | 0.74 | | | | 0.73 | | | | 0.78 | | | | 0.77 | | | | 0.81 |
Expenses, before waivers and reimbursements | | | 0.80 | | | | 0.73 | | | | 0.78 | | | | 0.77 | | | | 0.81 |
Net investment income (loss), net of waivers and reimbursements | | | 4.54 | | | | 4.09 | | | | 4.12 | | | | 4.09 | | | | 5.23 |
Net investment income (loss) before waivers and reimbursements | | | 4.48 | | | | 4.09 | | | | 4.12 | | | | 4.09 | | | | 5.23 |
| | | Class I |
| | | Years Ended December 31, |
| | | 2006 | | | 2005 | | | 2004 | | | 2003 | | | 2002 |
Net asset value, beginning of year | | $ | 9.82 | | | $ | 10.15 | | | $ | 10.40 | | | $ | 10.62 | | | $ | 10.35 |
Income (loss) from investment operations: | | | | | | | | | | | | | | | | | | | |
Net investment income (loss) (a) | | | 0.45 | | | | 0.52 | | | | 0.59 | | | | 0.43 | | | | 0.57 |
Net realized and unrealized gain (loss) on investments | | | (0.04 | ) | | | (0.33 | ) | | | (0.31 | ) | | | (0.04 | ) | | | 0.24 |
| | | | | | | | | | | | | | | | | | | |
Total from investment operations | | | 0.41 | | | | 0.19 | | | | 0.28 | | | | 0.39 | | | | 0.81 |
Less distributions from: | | | | | | | | | | | | | | | | | | | |
Net investment income | | | 0.54 | | | | 0.52 | | | | 0.53 | | | | 0.61 | | | | 0.54 |
Net realized gain | | | — | | | | — | | | | — | | | | — | | | | — |
| | | | | | | | | | | | | | | | | | | |
Total distributions | | | 0.54 | | | | 0.52 | | | | 0.53 | | | | 0.61 | | | | 0.54 |
| | | | | | | | | | | | | | | | | | | |
Net asset value, end of year | | $ | 9.69 | | | $ | 9.82 | | | $ | 10.15 | | | $ | 10.40 | | | $ | 10.62 |
| | | | | | | | | | | | | | | | | | | |
Total return (%) | | | 4.33 | | | | 1.92 | | | | 2.79 | | | | 3.76 | | | | 8.04 |
Ratios to average daily net assets (%): | | | | | | | | | | | | | | | | | | | |
Expenses | | | 0.62 | | | | 0.58 | | | | 0.63 | | | | 0.62 | | | | 0.66 |
Net investment income (loss) | | | 4.66 | | | | 4.24 | | | | 4.27 | | | | 4.24 | | | | 5.38 |
| | | | | | | | | | |
| | | Years Ended December 31, |
| | | 2006 | | 2005 | | 2004 | | 2003 | | 2002 |
Supplemental data for all classes: | | | | | | | | | | |
Net assets at end of year (in thousands) | | $297,077 | | $310,496 | | $294,084 | | $265,062 | | $196,136 |
Portfolio turnover rate (%) | | 33 | | 41 | | 43 | | 36 | | 66 |
Performance cited represents past performance. Past performance does not guarantee future results and current performance may be lower or higher than the data quoted. Results shown are annual returns, which assume reinvestment of dividends and capital gains. Investment returns and principal will fluctuate and you may have a gain or loss when you sell shares. For the most current month-end performance information, please call 1-800-742-7272, or visit our Web site at www.williamblairfunds.com.
Note: Net investment income (loss) per share is based on the average shares outstanding during the year.
102 Annual Report | December 31, 2006 |
Financial Highlights
Ready Reserves Fund
| | | | | | | | | | | | | | | |
| | | Class N |
| | | Years Ended December 31, |
| | | 2006 | | 2005 | | 2004 | | 2003 | | 2002 |
Net asset value, beginning of year | | $ | 1.00 | | $ | 1.00 | | $ | 1.00 | | $ | 1.00 | | $ | 1.00 |
Income (loss) from investment operations: | | | | | | | | | | | | | | | |
Net investment income (loss) | | | 0.04 | | | 0.03 | | | 0.01 | | | 0.01 | | | 0.01 |
| | | | | | | | | | | | | | | |
Total from investment operations | | | 0.04 | | | 0.03 | | | 0.01 | | | 0.01 | | | 0.01 |
Less distributions from: | | | | �� | | | | | | | | | | | |
Net investment income | | | 0.04 | | | 0.03 | | | 0.01 | | | 0.01 | | | 0.01 |
| | | | | | | | | | | | | | | |
Total distributions | | | 0.04 | | | 0.03 | | | 0.01 | | | 0.01 | | | 0.01 |
| | | | | | | | | | | | | | | |
Net asset value, end of year | | $ | 1.00 | | $ | 1.00 | | $ | 1.00 | | $ | 1.00 | | $ | 1.00 |
| | | | | | | | | | | | | | | |
Total return (%) | | | 4.47 | | | 2.62 | | | 0.80 | | | 0.66 | | | 1.28 |
Ratios to average daily net assets (%) | | | | | | | | | | | | | | | |
Expenses | | | 0.63 | | | 0.64 | | | 0.65 | | | 0.66 | | | 0.67 |
Net investment income (loss) | | | 4.38 | | | 2.57 | | | 0.80 | | | 0.66 | | | 1.28 |
Supplemental data: | | | | | | | | | | | | | | | |
Net assets at end of year (in thousands) | | $ | 1,195,593 | | $ | 1,091,854 | | $ | 1,092,940 | | $ | 1,153,932 | | $ | 1,324,001 |
| (a) | | Rates are annualized for periods that are less than a year. |
Performance cited represents past performance. Past performance does not guarantee future results and current performance may be lower or higher than the data quoted. Results shown are annual returns, which assume reinvestment of dividends and capital gains. Investment returns and principal will fluctuate and you may have a gain or loss when you sell shares. For the most current month-end performance information, please call 1-800-742-7272, or visit our Web site at www.williamblairfunds.com.
Note: Net investment income (loss) per share is based on the average shares outstanding during the year.
December 31, 2006 | William Blair Funds 103 |
REPORT OF INDEPENDENT REGISTERED PUBLIC ACCOUNTING FIRM
To the Board of Trustees and Shareholders
William Blair Funds
We have audited the accompanying statements of assets and liabilities, including the portfolios of investments, of the Growth Fund, Tax-Managed Growth Fund, Large Cap Growth Fund, Small Cap Growth Fund, Mid Cap Growth Fund, Small-Mid Cap Growth Fund, International Growth Fund, International Equity Fund, International Small Cap Growth Fund, Emerging Markets Growth Fund, Value Discovery Fund, Income Fund and Ready Reserves Fund (collectively, the “Portfolios”) (thirteen of the Portfolios constituting the William Blair Funds) as of December 31, 2006, and the related statements of operations, statements of changes in net assets and financial highlights for the periods indicated therein. These financial statements and financial highlights are the responsibility of the Portfolios’ management. Our responsibility is to express an opinion on these financial statements and financial highlights based on our audits.
We conducted our audits in accordance with the standards of the Public Company Accounting Oversight Board (United States). Those standards require that we plan and perform the audit to obtain reasonable assurance about whether the financial statements and financial highlights are free of material misstatement. We were not engaged to perform an audit of the Portfolios’ internal control over financial reporting. Our audits included consideration of internal control over financial reporting as a basis for designing audit procedures that are appropriate in the circumstances, but not for the purpose of expressing an opinion on the effectiveness of the Portfolios’ internal control over financial reporting. Accordingly, we express no such opinion. An audit also includes examining, on a test basis, evidence supporting the amounts and disclosures in the financial statements and financial highlights, assessing the accounting principles used and significant estimates made by management, and evaluating the overall financial statement presentation. Our procedures included confirmation of securities owned as of December 31, 2006, by correspondence with the custodian and brokers or by other appropriate auditing procedures where replies from brokers were not received. We believe that our audits provide a reasonable basis for our opinion.
In our opinion, the financial statements and financial highlights referred to above present fairly, in all material respects, the financial position of each of the above mentioned Portfolios of the William Blair Funds at December 31, 2006, the results of their operations, changes in their net assets and financial highlights for the periods indicated therein, in conformity with U.S. generally accepted accounting principles.

Chicago, Illinois
February 12, 2007
104 Annual Report | December 31, 2006 |
Trustees and Officers (Unaudited). The trustees and officers of the William Blair Funds as of December 31, 2006, their year of birth, their principal occupations during the last five years, their affiliations, if any, with William Blair & Company, L.L.C., and other significant affiliations are set forth below. The address of each trustee and officer is 222 West Adams Street, Chicago, Illinois 60606.
| | | | | | | | | | |
Name and Year of Birth | | Position(s)
Held with
Fund | | Term of
Office and
Length of
Time
Served(1) | | Principal Occupation(s) During Past 5 Years | | Number of
Portfolios
in Fund
Complex
Overseen
by Trustee | | Other Directorships Held by Trustee/Officer |
Interested Trustees | | | | | | | | | | |
Frederick Conrad Fischer,
1934* | | Chairman of the Board of Trustees | | Since 1987 | | Principal, William Blair & Company, L.L.C.; Partner, APM Limited Partnership | | 15 | | Trustee Emeritus, Chicago Child Care Society, a non-profit organization; Trustee Emeritus Kalamazoo College |
| | | | | |
Michelle Seitz,
1965* | | Trustee | | Since 2002 | | Principal, William Blair & Company, L.L.C. | | 15 | | N/A |
Non-Interested Trustees | | | | | | | | |
Theodore A. Bosler,
1934 | | Trustee | | Since 1997 | | Retired Principal and Vice President, Lincoln Capital Management | | 15 | | Desert Foothills Land Trust, Institute of Chartered Financial Analysts, and Thresholds. |
| | | | | |
Ann P. McDermott,
1939 | | Trustee | | Since 1996 | | Board member and officer for various civic and charitable organizations over the past thirty years; professional experience prior thereto, registered representative for New York Stock Exchange firm | | 15 | | Northwestern University, Women’s Board; Rush Presbyterian St. Luke’s Medical Center, Women’s Board; University of Chicago, Women’s Board; Visiting Nurses Association, Honorary Director |
| | | | | |
Donald J. Reaves,
1946 | | Trustee | | Since 2004 | | Vice President for Administration and Chief Financial Officer, University of Chicago since 2002. Executive Vice President and Chief Financial Officer, Brown University from 1993 to 2002 | | 15 | | American Student Assistance Corp.; Amica Mutual Insurance Company; |
| | | | | |
John B. Schwemm,
1934 | | Trustee | | Since 1990 | | Retired Chairman and Chief Executive Officer, R.R. Donnelley & Sons Company | | 15 | | USG Corp., building material manufacturer, and Walgreen Co. |
| | | | | |
Donald L. Seeley,
1944 | | Trustee | | Since 2003 | | Director, Applied Investment Management Program, University of Arizona Department of Finance, Formerly Vice Chairman and Chief Financial Officer, True North Communications, Inc., marketing communications and advertising firm | | 15 | | Warnaco Group, Inc. intimate apparel, sportswear, and swimwear manufacturer. Center for Furniture Craftmanship (not-for-profit) |
| | | | | |
Robert E. Wood II,
1938 | | Trustee | | Since 1999 | | Retired Executive Vice President, Morgan Stanley Dean Witter | | 15 | | Chairman, Add-Vision, Inc. manufacturer of surface animation systems, and Micro-Combustion, LLC |
December 31, 2006 | William Blair Funds 105 |
| | | | | | | | |
Name and Year of Birth | | Position(s)
Held with
Fund | | Term of
Office and
Length of
Time
Served(1) | | Principal Occupation(s) During Past 5 Years | | Other Directorships Held by Trustee/Officer |
Officers | | | | | | | | |
Marco Hanig,
1958 | | President | | Since 1999 | | Principal, William Blair & Company, L.L.C. | | Chicago Scores |
| | | | |
Karl W. Brewer,
1966 | | Senior Vice President | | Since 2000 | | Principal, William Blair & Company, L.L.C. | | N/A |
| | | | |
Harvey H. Bundy, III,
1944 | | Senior Vice President | | Since 2003 | | Principal, William Blair & Company, L.L.C. | | N/A |
| | | | |
Mark A. Fuller, III,
1957 | | Senior Vice President | | Since 1993 | | Principal, William Blair & Company, L.L.C. | | Partner, Fulsen Howney Partners |
| | | | |
James S. Golan,
1961 | | Senior Vice President | | Since 2005 | | Principal, William Blair & Company, L.L.C. | | N/A |
| | | | |
W. George Greig,
1952 | | Senior Vice President | | Since 1996 | | Principal, William Blair & Company, L.L.C. | | N/A |
| | | | |
Michael A. Jancosek,
1959 | | Senior Vice President Vice President | | Since 2004 2000-2004 | | Principal, William Blair & Company L.L.C. Associate, William Blair & Company, L.L.C. | | N/A |
| | | | |
John F. Jostrand,
1954 | | Senior Vice President | | Since 1999 | | Principal, William Blair & Company, L.L.C. | | N/A |
| | | | |
James S. Kaplan,
1960 | | Senior Vice President Vice President | | Since 2004 1995-2004 | | Principal, William Blair & Company, L.L.C. Associate, William Blair & Company, L.L.C. | | N/A |
| | | | |
Robert C. Lanphier, IV,
1956 | | Senior Vice President | | Since 2003 | | Principal, William Blair & Company, L.L.C. | | Chairman, AG. Med, Inc. |
| | | | |
Todd M. McClone,
1968 | | Senior Vice President Vice President | | Since 2006 2005-2006 | | Principal, William Blair & Company, L.L.C. Associate, William Blair & Company, L.L.C. | | N/A N/A |
| | | | |
David S. Mitchell,
1960 | | Senior Vice President Vice President | | Since 2004 2003-2004 | | Principal, William Blair & Company, L.L.C. Associate, William Blair & Company, L.L.C. | | N/A |
| | | | |
Gregory J. Pusinelli,
1958 | | Senior Vice President | | Since 1999 | | Principal, William Blair & Company, L.L.C. | | N/A |
| | | | |
David P. Ricci,
1958 | | Senior Vice President | | Since 2006 | | Principal, William Blair & Company, L.L.C. | | N/A |
| | | | |
Norbert W. Truderung,
1952 | | Senior Vice President | | Since 1992 | | Principal, William Blair & Company, L.L.C. | | N/A |
| | | | |
Jeffrey A. Urbina,
1955 | | Senior Vice President | | Since 1998 | | Principal, William Blair & Company, L.L.C. | | N/A |
106 Annual Report | December 31, 2006 |
| | | | | | | | |
Name and Year of Birth | | Position(s)
Held with
Fund | | Term of
Office and
Length of
Time
Served(1) | | Principal Occupation(s) During Past 5 Years | | Other Directorships Held by Trustee/Officer |
Christopher T. Vincent,
1956 | | Senior Vice President Vice President | | Since 2004 2002-2004 | | Principal, William Blair & Company, L.L.C. Associate, William Blair & Company, L.L.C.; former Managing Director/Senior Portfolio Manager, Zurich Scudder Investments | | Uhlich Children’s Home |
| | | | |
Richard W. Smirl,
1967 | | Chief Compliance Officer | | Since 2004 | | Associate, William Blair & Company, L.L.C.; former Chief Legal Officer, Strong Capital Management | | N/A |
| | | | |
David C. Fording,
1967 | | Vice President | | Since 2006 | | Associate, William Blair & Company,; former Portfolio Manager, TIAA-CREF | | N/A |
| | | | |
Chad M. Kilmer,
1975 | | Vice President | | Since 2006 | | Associate, William Blair & Company,; former analyst and Portfolio Manager U.S. Bancorp Asset Management and analyst Gabelli Woodland Partners. | | N/A |
| | | | |
Mark T. Leslie,
1967 | | Vice President | | Since 2005 | | Associate, William Blair & Company, L.L.C. formerly, U.S. Bancorp Asset Management | | N/A |
| | | | |
Colin J. Williams,
1975 | | Vice President | | Since 2006 | | Associate William Blair & Company, L.L.C.; formerly, Andersen Consulting; Allegiance Healthcare | | N/A |
| | | | |
Terence M. Sullivan,
1944 | | Vice President and Treasurer | | Since 1997 | | Associate, William Blair & Company, L.L.C. | | N/A |
| | | | |
Colette M. Garavalia,
1961 | | Secretary | | Since 2000 | | Associate, William Blair & Company, L.L.C. | | N/A |
| * | | Mr. Fischer and Ms. Seitz are interested persons of the William Blair Funds because each is a principal of William Blair & Company, L.L.C., the Funds’ investment advisor, principal underwriter and distributor. |
| (1) | | Each Trustee serves until the election and qualification of a successor, or until death, resignation or retirement or removal as provided in the Fund’s Declaration of Trust. Retirement for non-interested Trustees occurs no later than at the conclusion of the first regularly scheduled Board meeting of the Fund’s fiscal year that occurs after the Trustee’s 72nd birthday. The Fund’s officers are elected annually by the Trustees. |
The Statement of Additional Information for the William Blair Funds includes additional information about the trustees and is available without charge by calling 1-800-635-2886 (in Massachusetts 1-800-635-2840) or by writing the Fund.
December 31, 2006 | William Blair Funds 107 |
(unaudited)
Proxy Voting
A description of the policies and procedures that the Fund uses to determine how to vote proxies relating to portfolio securities and information regarding how the Fund voted proxies relating to portfolio securities for the most recent 12-month period ended June 30 are available without charge, upon request, by calling 1-800-635-2886 (in Massachusetts 1-800-635-2840), at www.williamblairfunds.com and on the SEC’s website at http://www.sec.gov.
Quarterly Portfolio Schedules
The Fund files its complete schedule of portfolio holdings with the SEC for the first and third fiscal quarters of each fiscal year (quarters ended March 31 and September 30) on Form N-Q. The Fund’s Forms N-Q are available on the SEC’s website at http://www.sec.gov and may be reviewed and copied at the SEC’s Public Reference Room in Washington, D.C. Information on the operation of the SEC’s Public Reference Room may be obtained by calling 1-800-SEC-0330.
Shareholder Meeting Results
A Special Meeting of Shareholders (the “Meeting”) of the Fund was held on November 30, 2006 at the offices of the Fund, 222 West Adams Street, Chicago, Illinois 60606. At the Meeting, the following matter was voted upon by shareholders (the resulting votes are presented below).
1. Election of Trustees. (“Number of Votes” represents all Portfolios of the Fund.)
| | | | |
| | | Number of Votes: |
Trustee | | For | | Withhold |
Frederick Conrad Fischer | | 1,425,457,809.64 | | 2,021,812.06 |
Ann P. McDermott | | 1,425,077,600.17 | | 2,402,021.53 |
Phillip O. Peterson* | | 1,426,061,038.41 | | 1,418,583.29 |
Donald J. Reaves | | 1,425,552,754.75 | | 1,926,866.95 |
Donald L. Seeley | | 1,425,445.801.20 | | 2,033,820.50 |
Michelle R. Seitz | | 1,426,053,294.98 | | 1,426,326.72 |
Thomas J. Skelly* | | 1,426,143,800.45 | | 1,335,821.25 |
Robert E. Wood II | | 1,425,504,578.55 | | 1,975,043.15 |
| * | Messrs. Peterson and Skelly became Trustees of the Trust on February 15, 2007 upon the retirement of Trustees Bosler and Schwemm. |
108 Annual Report | December 31, 2006 |
Useful Information About Your Report (unaudited)
Please refer to this information when reviewing the Expense Example for each Portfolio.
Expense Example
As a shareholder of a Portfolio, you incur two types of costs: (1) transaction costs such as redemption fees and (2) ongoing costs, including management fees, distribution (12b-1) fees (for Class N shares except for Ready Reserves Fund), service fees (for Class N of Ready Reserves Fund), shareholder administration fees (for Class N and Class I shares of International Small Cap Growth Fund and Emerging Markets Growth Fund) and other Portfolio expenses. The example is intended to help you understand your ongoing costs (in dollars) of investing in the Portfolio and to compare these costs with the ongoing costs of investing in other mutual funds. To do so, compare the Portfolio’s 5% hypothetical example with the 5% hypothetical examples that appear in the shareholder reports of other funds. The example is based on an investment of $1,000 invested at the beginning of the period and held for the entire six-month period from July 1, 2006 to December 31, 2006.
Actual Expenses
In each example, the first line for each share class in the table provides information about the actual account values and actual expenses. These expenses reflect the effect of any expense cap applicable to the share class during the period. Without this expense cap, the costs shown in the table would have been higher. You may use the information in this line, together with the amount you invested, to estimate the expenses that you paid over the period. Simply divide your account value by $1,000 (example, an $8,600 account value divided by $1,000 = 8.6), then multiply the result by the number in the first line under the heading entitled “Expenses Paid During the Period” to estimate the expenses you paid on your account during the period.
Hypothetical Example for Comparison Purposes
In each example, the second line for each share class in the table provides information about hypothetical account values and hypothetical expenses based on the Portfolio’s actual expense ratio and an assumed rate of return of 5% per year before expenses. This is not the Portfolio’s actual return. The hypothetical account values and expenses may not be used to estimate the actual ending account balance or expenses you paid for the period. You may use this information to compare the ongoing costs of investing in the Portfolio to other funds. To do so, compare this 5% hypothetical example with the 5% hypothetical examples that appear in the shareholder reports of other funds.
Please note that the expenses shown in both examples are meant to highlight your ongoing costs only and do not reflect any transactional costs or account type fees, such as redemption fees and IRA Fiduciary Administration fees, respectively. These fees are fully described in the prospectus. Therefore, the second line of each share class in the table is useful in comparing ongoing costs only and will not help you determine the relative costs of owning different funds. In addition, if these transactional costs or account fees were included, your costs would have been higher.
December 31, 2006 | William Blair Funds 109 |
Fund Expenses (unaudited)
The examples below show you the ongoing costs (in dollars) of investing in your fund and allows you to compare these costs with those of other mutual funds. Please refer to the previous page for a detailed explanation of the information presented on this chart.
| | | | | | | | | | | | |
| | | Beginning
Account Value
7/1/2006 | | Ending
Account Value
12/31/2006 | | Expenses Paid
during Period(a) | | Annualized
Expense Ratio | |
Growth Fund | | | | | | | | | | | | |
Class N—actual return | | $ | 1,000.00 | | $ | 1,098.00 | | $ | 6.19 | | 1.17 | % |
Class N—hypothetical 5% return | | | 1,000.00 | | | 1,019.31 | | | 5.96 | | 1.17 | |
Class I—actual return | | | 1,000.00 | | | 1,098.80 | | | 4.71 | | 0.89 | |
Class I—hypothetical 5% return | | | 1,000.00 | | | 1,020.72 | | | 4.53 | | 0.89 | |
Tax-Managed Growth Fund | | | | | | | | | | | | |
Class N—actual return | | | 1,000.00 | | | 1,066.30 | | | 7.50 | | 1.44 | |
Class N—hypothetical 5% return | | | 1,000.00 | | | 1,017.95 | | | 7.32 | | 1.44 | |
Class I—actual return | | | 1,000.00 | | | 1,068.00 | | | 6.20 | | 1.19 | |
Class I—hypothetical 5% return | | | 1,000.00 | | | 1,019.21 | | | 6.06 | | 1.19 | |
Large Cap Growth Fund | | | | | | | | | | | | |
Class N—actual return | | | 1,000.00 | | | 1,073.30 | | | 6.48 | | 1.24 | |
Class N—hypothetical 5% return | | | 1,000.00 | | | 1,018.95 | | | 6.31 | | 1.24 | |
Class I—actual return | | | 1,000.00 | | | 1,075.40 | | | 5.18 | | 0.99 | |
Class I—hypothetical 5% return | | | 1,000.00 | | | 1,020.21 | | | 5.04 | | 0.99 | |
Small Cap Growth Fund | | | | | | | | | | | | |
Class N—actual return | | | 1,000.00 | | | 1,078.10 | | | 7.75 | | 1.48 | |
Class N—hypothetical 5% return | | | 1,000.00 | | | 1,017.74 | | | 7.53 | | 1.48 | |
Class I—actual return | | | 1,000.00 | | | 1,079.90 | | | 6.34 | | 1.21 | |
Class I—hypothetical 5% return | | | 1,000.00 | | | 1,019.11 | | | 6.16 | | 1.21 | |
Mid Cap Growth Fund | | | | | | | | | | | | |
Class N—actual return | | | 1,000.00 | | | 1,049.10 | | | 7.23 | | 1.40 | |
Class N—hypothetical 5% return | | | 1,000.00 | | | 1,018.15 | | | 7.01 | | 1.40 | |
Class I—actual return | | | 1,000.00 | | | 1,051.10 | | | 5.95 | | 1.15 | |
Class I—hypothetical 5% return | | | 1,000.00 | | | 1,019.41 | | | 5.76 | | 1.15 | |
Small-Mid Cap Growth Fund | | | | | | | | | | | | |
Class N—actual return | | | 1,000.00 | | | 1,043.80 | | | 7.11 | | 1.38 | |
Class N—hypothetical 5% return | | | 1,000.00 | | | 1,018.25 | | | 7.02 | | 1.38 | |
Class I—actual return | | | 1,000.00 | | | 1,045.80 | | | 5.83 | | 1.13 | |
Class I—hypothetical 5% return | | | 1,000.00 | | | 1,019.51 | | | 5.75 | | 1.13 | |
International Growth Fund | | | | | | | | | | | | |
Class N—actual return | | | 1,000.00 | | | 1,161.50 | | | 7.74 | | 1.42 | |
Class N—hypothetical 5% return | | | 1,000.00 | | | 1,018.05 | | | 7.22 | | 1.42 | |
Class I—actual return | | | 1,000.00 | | | 1,163.00 | | | 6.05 | | 1.11 | |
Class I—hypothetical 5% return | | | 1,000.00 | | | 1,019.61 | | | 5.65 | | 1.11 | |
International Equity Fund | | | | | | | | | | | | |
Class N—actual return | | | 1,000.00 | | | 1,146.20 | | | 7.90 | | 1.46 | |
Class N—hypothetical 5% return | | | 1,000.00 | | | 1,017.85 | | | 7.43 | | 1.46 | |
Class I—actual return | | | 1,000.00 | | | 1,147.20 | | | 6.55 | | 1.21 | |
Class I—hypothetical 5% return | | | 1,000.00 | | | 1,019.11 | | | 6.16 | | 1.21 | |
International Small Cap Growth Fund | | | | | | | | | | | | |
Class N—actual return | | | 1,000.00 | | | 1,108.80 | | | 8.77 | | 1.65 | |
Class N—hypothetical 5% return | | | 1,000.00 | | | 1,016.89 | | | 8.39 | | 1.65 | |
Class I—actual return | | | 1,000.00 | | | 1,110.30 | | | 7.45 | | 1.40 | |
Class I—hypothetical 5% return | | | 1,000.00 | | | 1,018.15 | | | 7.12 | | 1.40 | |
110 Annual Report | December 31, 2006 |
| | | | | | | | | | |
| | | Beginning
Account Value
7/1/2006 | | Ending
Account Value
12/31/2006 | | Expenses Paid
during Period(a) | | Annualized
Expense Ratio |
Emerging Markets Growth Fund | | | | | | | | | | |
Class N—actual return | | 1,000.00 | | $ | 1,302.70 | | $ | 9.58 | | 1.65 |
Class N—hypothetical 5% return | | 1,000.00 | | | 1,016.89 | | | 8.39 | | 1.65 |
Class I—actual return | | 1,000.00 | | | 1,302.70 | | | 8.13 | | 1.40 |
Class I—hypothetical 5% return | | 1,000.00 | | | 1,018.15 | | | 7.12 | | 1.40 |
Value Discovery Fund | | | | | | | | | | |
Class N—actual return | | 1,000.00 | | | 1,121.80 | | | 7.17 | | 1.34 |
Class N—hypothetical 5% return | | 1,000.00 | | | 1,018.45 | | | 6.82 | | 1.34 |
Class I—actual return | | 1,000.00 | | | 1,123.00 | | | 5.83 | | 1.09 |
Class I—hypothetical 5% return | | 1,000.00 | | | 1,019.71 | | | 5.55 | | 1.09 |
Income Fund | | | | | | | | | | |
Class N—actual return | | 1,000.00 | | | 1,040.10 | | | 3.81 | | 0.74 |
Class N—hypothetical 5% return | | 1,000.00 | | | 1,021.48 | | | 3.77 | | 0.74 |
Class I—actual return | | 1,000.00 | | | 1,040.90 | | | 3.19 | | 0.62 |
Class I—hypothetical 5% return | | 1,000.00 | | | 1,022.08 | | | 3.16 | | 0.62 |
Ready Reserves Fund | | | | | | | | | | |
Class N—actual return | | 1,000.00 | | | 1,023.90 | | | 3.21 | | 0.63 |
Class N—hypothetical 5% return | | 1,000.00 | | | 1,022.03 | | | 3.21 | | 0.63 |
| (a) | | Expenses are equal to the annualized expense ratio, multiplied by the average account value over the period, multiplied by the number of days in the period (184), and divided by 365 (to reflect the one-half year period.) |
December 31, 2006 | William Blair Funds 111 |
BOARD OF TRUSTEES
Frederick Conrad Fischer, Chairman
Principal, William Blair & Company, L.L.C.
Theodore A. Bosler
Retired Principal and Vice President, Lincoln Capital Management Company
Ann P. McDermott
Director and Trustee
Profit and not-for-profit organizations
Donald J. Reaves
Vice President for Administration and Chief Financial Officer, University of Chicago
Donald L. Seeley
Adjunct Lecturer and Director, University of Arizona Department of Finance
John B. Schwemm
Retired Chairman and CEO, R.R. Donnelley & Sons Company
Michelle R. Seitz
Principal, William Blair & Company, L.L.C.,
Robert E. Wood II
Retired Executive Vice President, Morgan Stanley Dean Witter
Officers
Marco Hanig, President
Karl W. Brewer, Senior Vice President
Harvey H. Bundy III, Senior Vice President
Mark A. Fuller, III, Senior Vice President
James S. Golan, Senior Vice President
W. George Greig, Senior Vice President
Michael A. Jancosek, Senior Vice President
John F. Jostrand, Senior Vice President
James S. Kaplan, Senior Vice President
Robert C. Lanphier, IV, Senior Vice President
Todd M. McClone, Senior Vice President
David S. Mitchell, Senior Vice President
Gregory J. Pusinelli, Senior Vice President
David P. Ricci, Senior Vice President
Norbert W. Truderung, Senior Vice President
Jeffrey A. Urbina, Senior Vice President
Christopher T. Vincent, Senior Vice President
Richard W. Smirl, Chief Compliance Officer
David C. Fording, Vice President
Chad M. Kilmer, Vice President
Mark T. Leslie, Vice President
Colin J. Williams, Vice President
Terence M. Sullivan, Vice President and Treasurer
Colette M. Garavalia, Secretary
Investment Advisor
William Blair & Company, L.L.C.
Independent Registered Public Accounting Firm
Ernst & Young LLP
Legal Counsel
Vedder, Price, Kaufman & Kammholz, P.C.
Transfer Agent
State Street Bank and Trust Company
P.O. Box 8506
Boston, MA 02266-8506
For customer assistance, call 1-800-635-2886
(Massachusetts 1-800-635-2840)
112 Date of First Use August, 2006

Table of Contents
This report is submitted for the general information of the shareholders of the William Blair Funds. It is not authorized for distribution to prospective investors unless accompanied or preceded by a prospectus of the William Blair Funds. Please consider the Funds’ investment objectives, risks, charges, and expenses before investing. This and other information is contained in the Funds’ prospectus, which you may obtain by calling 1-800-742-7272. Read it carefully before you invest or send money. William Blair & Company, LLC., distributor.
December 31, 2006 | William Blair Funds 1 |
International Markets Overview
There was a tale of three international equity markets in 2006. The first four months of 2006 prolonged the momentum of 2005 as global growth remained strong, energy and commodities prices rose, and investors continued to search for returns in areas such as emerging markets equity and small cap stocks. However, markets retreated during the second quarter as concerns about potential global inflationary pressures, monetary policy tightening (and uncertainty as to the duration and size of further tightening moves and their impact on the US consumer in particular), and higher valuations in a number of the recent strong markets such as emerging markets and small cap came to the forefront of investor psychology. The correction in equity markets during May and most of June was broad based and non-discriminatory, although the stocks that were the prime beneficiaries of the strong global growth trends over the past several years did suffer more than their more defensive-oriented counterparts as investors withdrew liquidity and invested in “safe havens.” These concerns abated during July, when it became clear that while global growth was slowing, an imminent global recession was not occurring.
As a result, international equity markets rebounded beginning in July, and ended the year up 27.16%, as reflected by the MSCI All-Country World ex-U.S. Index. Within international markets, emerging markets were up 32.59%, as measured by the MSCI Emerging Markets Index, despite their mid-year decline, outpacing the MSCI EAFE Index, which rose 26.86%. Within developed markets, Europe, Pacific ex-Japan, and the UK were the strongest regions, each up over 30%, while Japan was the laggard, returning only 6.33% during the year. Developed small cap stocks underperformed their larger cap counterparts during the year, rising 19.82% as measured by the MSCI World Ex-U.S. Small Cap Index, due largely to negative Japanese small cap stock performance.
2007 Outlook
The consensus view of growth, inflation, interest rates and profits has been a moving target all year long. Overheating concerns gave way to slowdown fears in the first half, only for markets to settle down to a more moderate and balanced view of global economic prospects in the wake of the Federal Reserve pause in August.
Today, the US still looks likely to slow (although the tone of fear about the housing market may be softening) and China continues to restrain investment growth (although tightening remains selective in its application and limited in its effectiveness); at the same time, Europe and Japan give increasing evidence of being on track toward solid expansion, and the runaway commodity boom seems to have slowed before doing irreparable damage to the global cycle.
In the context of a view that an ‘intracyclical’ deceleration in growth will prove to be basically benign (i.e., no significant deterioration in employment conditions or credit quality), a number of factors emerge (or re-emerge) that suggest a relatively strong environment for equity returns:
For multinational corporations—and that really includes any company with a cross-border supply chain or customer base—globalization has meant two things: a wider range of opportunities for profit enhancement, and increased exposure to high-growth end markets. Both factors continue to have a positive influence on long term earnings potential.
| • | | Corporate Governance and Performance |
The vast majority of listed companies, particularly those with some scale and diversity of operations, see themselves as having an opportunity to improve profit margins, capital
2 Annual Report | December 31, 2006 |
productivity, or both. Increasingly, firms benchmark profitability against the best in their peer group, and boards expect progress toward that goal. Competitive improvements in Information Technology (IT), logistics, marketing methods, sourcing, and production can all combine to raise the bar for growth for the market as a whole.
In the wake of the 2000-2001 slowdown, corporations have raised the burden of proof on investment spending plans. IT, equipment, and facilities spending all face greater scrutiny in an effort to improve the productivity of cash flow. In effect, there is increased competition between capital spending, acquisitions, and share buybacks as alternatives to enhance returns, and this competition provides an opportunity for optimizing potential earnings growth.
While multiples have contracted around the world, the global median return on equity (ROE) has risen by three percentage points, from 12.8% to 15.8%, in the last two years. Accordingly, free cash flow yields have risen (on the same basis) from 1.1% to 2.7% over the last five years. Even allowing for some cyclical easing of profitability in a slowdown, the combination of enhanced growth opportunities and greater free cash flow yields argues for sustainable improvement in expected returns from equities.
Comment on Style Performance
Since the end of the tech bubble market of the 1990s, there has been a pronounced and consistent relative style performance advantage of value over growth. As the excesses of the previous cycle unwound, there was a natural tendency for the defensive characteristics of value stocks to dominate, but even after the markets turned upward in late 2002 and 2003, the value performance edge persisted.
While there are elements of cyclicality in risk preference and relative valuation between growth and value stocks, there has clearly been more to the rotation than investor sentiment. Changes in the pattern of growth and returns across sectors have been of primary importance in establishing market leadership and redefining growth and value.
Four key sectors have seen significant shifts in their prospects for growth, sustainable returns and risk. Emerging as global growth sectors are Financials and Industrials and Services, while the ‘classic’ growth sectors of IT and Health Care show increasing signs of maturation. These relative shifts reflect globalization and a shift toward developing economies as the engine of economic growth worldwide. This evolution is more than simply cyclical; it will have lasting implications for investment strategy for growth and value investors alike, and has already changed our own portfolio structure and outlook.
December 31, 2006 | William Blair Funds 3 |

W. George Greig
INSTITUTIONAL INTERNATIONAL GROWTH FUND
The Institutional International Growth Fund invests primarily in common stocks of foreign growth companies of all sizes.
AN OVERVIEW FROM THE PORTFOLIO MANAGER
See page 2 for the International Markets Overview.
How did the Fund perform during the past year? How did the Fund’s performance compare to its benchmark?
The Institutional International Growth Fund posted a 23.45% gain for the 12 months ended December 31, 2006. By comparison, the Fund’s benchmark, the Morgan Stanley Capital International (MSCI) All Country World (ACWI) ex-US Index, rose 27.16%.
What were the most significant factors impacting Fund performance? What factors were behind the Fund’s performance versus the benchmark?
Despite strong absolute performance, the Fund underperformed the Index during 2006, due to second quarter underperformance, coupled with the Fund’s quality growth focus. Value outperformed growth by over 6% during the year, with sectors such as Materials and Utilities, areas where the Fund was underweighted, significantly outpacing the more traditional growth areas of Consumer, Health Care and IT, areas where the Fund was overweighted relative to the Index. The Fund’s results during 2006, returning 23.45% were due largely to strong stock selection in Consumer Staples, Energy, Financials, Information Technology (IT), and Telecommunication Services. Consumer Staples stock selection was enhanced by strong performance in Emerging Asia and Latin America, while Energy stock selection was positive across most regions, due to the Fund’s focus on alternative energy companies, energy services, and exploration and production companies with strong production growth. Financials stock selection was enhanced from developed Asia, Europe ex-UK and emerging Asia holdings, while emerging Asia and Latin American IT stocks bolstered that sector’s performance. The Telecommunication Services holdings, significantly outperformed their counterparts within the Index, as they were largely focused in the emerging markets, where subscriber growth continues to accelerate.
What is your current strategy? How is the Fund positioned?
As of year end, the Fund was focused on Consumer, Industrials, and IT stocks, at the expense of Materials, Telecommunication Services, and Energy. Financials, which maintained the highest absolute weighting in the Fund, were underweighted relative to the Index. From a regional perspective, the Fund was underweighted in most developed markets, particularly Japan, and overweighted in Latin America and emerging Asia.
4 Annual Report | December 31, 2006 |
Institutional International Growth Fund
Performance Highlights (unaudited)
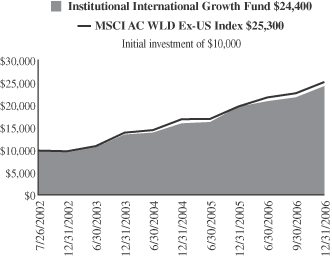
Average Annual Total Return at 12/31/2006
| | | | | | | | | |
| | | 1
Year | | | 3
Year | | | Since Inception(a) | |
Institutional International Growth Fund | | 23.45 | % | | 21.43 | % | | 22.26 | % |
MSCI All Country World Ex-US Index | | 27.16 | | | 21.81 | | | 23.28 | |
| | (a) | For the period from July 26, 2002 (Commencement of Operations) to December 31, 2006. |
Performance cited represents past performance. Past performance does not guarantee future results and current performance may be lower or higher than the data quoted. Results shown are average annual returns, which assume reinvestment of dividends and capital gains. Investment returns and principal will fluctuate and you may have a gain or loss when you sell shares. For the most current month-end performance information, please call 1-800-742-7272, or visit our Web site at www.williamblairfunds.com. International investing involves special risk considerations, including currency fluctuations, lower liquidity, economic and political risk.
The performance highlights and graph presented above do not reflect the deduction of taxes that a shareholder would pay on fund distributions or the redemption of fund shares.
The Morgan Stanley Capital International (MSCI) All Country World ex-US Index is an unmanaged index that includes developed and emerging markets and reduced Japanese portion, making it more comparable to the Institutional International Growth Fund in terms of investment approach.
This report identifies the Fund’s investments on December 31, 2006. These holdings are subject to change. Not all stocks in the Fund performed the same, nor is there any guarantee that these stocks will perform as well in the future. Market forecasts provided in this report may not necessarily come to pass.
Sector Diversification (unaudited)
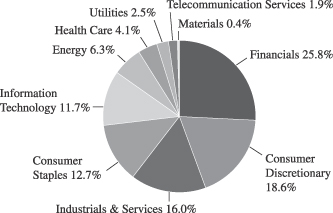
The sector diversification shown is based on the total investment portfolio.
December 31, 2006 | William Blair Funds 5 |
Institutional International Growth Fund
Portfolio of Investments, December 31, 2006 (all dollar amounts in thousands)
| | | | | |
Issuer | | Shares | | Value |
| | | | | |
| | |
Common Stocks—Europe—35.6% | | | | | |
Austria—1.3% | | | | | |
Erste Bank (Commercial banks) | | 138,904 | | $ | 10,636 |
Raiffeisen International Bank (Commercial banks) | | 93,600 | | | 14,232 |
| | | | | |
| | | | | 24,868 |
| | | | | |
Belgium—0.4% | | | | | |
InBev NV (Beverages) | | 117,500 | | | 7,731 |
| | | | | |
France—11.5% | | | | | |
April Group S.A. (Insurance) | | 62,000 | | | 2,984 |
BNP Paribas (Commercial banks) | | 202,450 | | | 22,024 |
Capgemini S.A. (IT services) | | 229,500 | | | 14,359 |
Essilor International (Health care equipment & supplies) | | 139,900 | | | 15,019 |
Eurazeo (Diversified financial services) | | 71,925 | | | 10,267 |
Group Danone (Food products) | | 179,200 | | | 27,099 |
Iliad S.A. (Internet software & services) | | 81,300 | | | 7,027 |
Klepierre (Real estate investment trusts) | | 41,570 | | | 7,837 |
L’Oreal S.A. (Personal products) | | 363,600 | | | 36,346 |
LVMH Moet Hennessey Louis Vuitton SA (Textiles, apparel & luxury goods) | | 217,900 | | | 22,922 |
*Orpea (Health care providers & services) | | 56,633 | | | 5,357 |
*S.O.I.T.E.C. (Semiconductors & semiconductor equipment) | | 235,900 | | | 8,339 |
Veolia Environnement (Multi-utilities) | | 352,700 | | | 26,898 |
Vinci S.A.(Construction & engineering) | | 77,300 | | | 9,852 |
| | | | | |
| | | | | 216,330 |
| | | | | |
Germany—3.3% | | | | | |
Bijou Brigitte (Textiles, apparel & luxury goods) | | 20,550 | | | 4,044 |
CTS Eventim AG (Media) | | 60,100 | | | 2,313 |
E.ON AG (Electrical utilities) | | 146,480 | | | 19,782 |
*Patrizia Immobilien AG (Real estate management & development) | | 7,300 | | | 218 |
*Q-Cells AG (Electrical equipment) | | 149,520 | | | 6,694 |
*Qiagen NV (Life science tools & services) | | 371,100 | | | 5,698 |
SAP AG (Software) | | 363,100 | | | 19,256 |
Solarworld AG (Electrical equipment) | | 66,400 | | | 4,138 |
*Wire Card AG (Commercial services & supplies) | | 41,900 | | | 433 |
| | | | | |
| | | | | 62,576 |
| | | | | |
Greece—1.7% | | | | | |
Coca-Cola Hellenic Bottling S.A. (Beverages) | | 255,500 | | | 9,969 |
EFG Eurobank (Commercial banks) | | 303,060 | | | 10,950 |
National Bank of Greece (Commercial banks) | | 241,226 | | | 11,064 |
| | | | | |
| | | | | 31,983 |
| | | | | |
Ireland—2.7% | | | | | |
Anglo Irish Bank plc (Commercial banks) | | 916,000 | | | 18,968 |
IAWS Group plc (Food products) | | 230,400 | | | 5,902 |
Kingspan Group plc (Building products) | | 458,700 | | | 12,162 |
*Ryanair Holdings plc—ADR (Airlines) | | 125,300 | | | 10,212 |
United Drug plc (Health care providers & services) | | 793,700 | | | 4,170 |
| | | | | |
| | | | | 51,414 |
| | | | | |
Italy—3.6% | | | | | |
Azimut Holding SpA (Capital markets) | | 445,800 | | | 5,953 |
Banca Italease (Diversified financial services) | | 129,600 | | | 7,523 |
| | | | | |
Issuer | | Shares | | Value |
| | | | | |
| |
Common Stocks—Europe—35.6%—(continued) | | | |
Italy—3.6%—(continued) | | | |
Credito Emiliano SpA (Commercial banks) | | 417,000 | | $ | 5,891 |
Luxottica Group SpA (Textiles, apparel & luxury goods) | | 556,600 | | | 17,061 |
Saipem SpA (Energy equipment & services) | | 985,200 | | | 25,562 |
Tod’s SpA (Textiles, apparel & luxury goods) | | 74,900 | | | 6,024 |
| | | | | |
| | | | | 68,014 |
| | | | | |
Luxembourg—0.3% | | | | | |
*Gagfah S.A. (Real estate management & development) | | 170,200 | | | 5,399 |
| | | | | |
Netherlands—1.1% | | | | | |
Royal Numico N.V. (Food products) | | 253,800 | | | 13,629 |
*Tomtom NV (Software) | | 164,300 | | | 7,074 |
| | | | | |
| | | | | 20,703 |
| | | | | |
Norway—0.5% | | | | | |
*Acergy S.A. (Energy equipment & services) | | 444,900 | | | 8,487 |
| | | | | |
Spain—1.8% | | | | | |
*Grifols S.A. (Biotechnology) | | 618,700 | | | 8,236 |
Industria De Textile (Specialty retail) | | 418,300 | | | 22,502 |
*Tecnicas Reunidas S.A. (Construction & engineering) | | 99,300 | | | 3,810 |
| | | | | |
| | | | | 34,548 |
| | | | | |
Sweden—1.5% | | | | | |
Ericsson (LM) (Communications equipment) | | 3,427,000 | | | 13,781 |
*Modern Times Group (Media) | | 117,850 | | | 7,721 |
Nobia AB (Specialty retail) | | 179,750 | | | 6,898 |
| | | | | |
| | | | | 28,400 |
| | | | | |
Switzerland—5.9% | | | | | |
ABB Ltd. (Electrical equipment) | | 2,266,000 | | | 40,578 |
*EFG International (Capital markets) | | 237,300 | | | 8,935 |
Kuehne & Nagel International AG (Marine) | | 198,400 | | | 14,413 |
Nobel Biocare Holdings AG (Health care equipment & supplies) | | 33,250 | | | 9,808 |
*Partners Group Global Opporunites, Ltd. (Capital markets) | | 66,050 | | | 7,970 |
Roche Holdings AG (Pharmaceuticals) | | 127,300 | | | 22,776 |
SGS S.A. (Commercial services & supplies) | | 5,700 | | | 6,333 |
| | | | | |
| | | | | 110,813 |
| | | | | |
| | |
United Kingdom—16.3% | | | | | |
Amlin plc (Insurance) | | 231,100 | | | 1,468 |
BG Group plc (Oil, gas & consumable fuels) | | 1,845,320 | | | 25,093 |
*Cairn Energy plc (Oil, gas & consumable fuels) | | 249,500 | | | 8,765 |
Capita Group plc (Commercial services & supplies) | | 1,668,500 | | | 19,783 |
Carphone Warehouse Group plc (Specialty retail) | | 1,367,000 | | | 8,377 |
Detica Group plc (IT services) | | 385,300 | | | 2,764 |
HBOS plc (Commercial banks) | | 1,727,400 | | | 38,187 |
Homeserve plc (Commercial services & supplies) | | 132,600 | | | 4,899 |
See accompanying Notes to Financial Statements.
6 Annual Report | December 31, 2006 |
Institutional International Growth Fund
Portfolio of Investments, December 31, 2006 (all dollar amounts in thousands)
| | | | | |
Issuer | | Shares | | Value |
| | | | | |
|
Common Stocks—United Kingdom—16.3%—(continued) |
United Kingdom—(continued) |
Man Group plc (Capital markets) | | 2,076,000 | | $ | 21,190 |
Michael Page International (Commercial services & supplies) | | 1,353,600 | | | 11,955 |
Northern Rock plc (Thrifts & mortgage finance) | | 857,200 | | | 19,709 |
Reckitt Benckiser plc (Household products) | | 708,950 | | | 32,341 |
*Rolls-Royce Group plc (Aerospace & defense) | | 3,586,100 | | | 31,339 |
Rotork plc (Electronic equipment & instruments) | | 389,300 | | | 6,360 |
RPS Group plc (Commercial services & supplies) | | 768,400 | | | 4,055 |
Serco Group (Commercial services & supplies) | | 1,466,100 | | | 10,937 |
Tesco plc (Food & staples retailing) | | 4,731,200 | | | 37,388 |
Tullow Oil plc (Oil, gas & consumable fuels) | | 879,480 | | | 6,836 |
Ultra Electronic Holdings plc (Aerospace & defense) | | 296,500 | | | 6,288 |
Victrex plc (Chemicals) | | 184,900 | | | 2,904 |
VT Group plc (Aerospace & defense) | | 604,100 | | | 5,610 |
| | | | | |
| | | | | 306,248 |
| | | | | |
| | |
Japan—14.2% | | | | | |
Aeon Mall Co., Ltd. (Real estate management & development) | | 153,100 | | | 8,645 |
Canon, Inc. (Office electronics) | | 499,500 | | | 28,122 |
Chiyoda Corp. (Construction & engineering) | | 346,800 | | | 6,780 |
*DeNA Co., Ltd. (Internet & catalog retail) | | 1,617 | | | 5,298 |
Denso Corporation (Auto components) | | 897,100 | | | 35,571 |
En-Japan Inc. (Commercial services & supplies) | | 135 | | | 647 |
Honeys Company, Ltd. (Specialty retail) | | 112,000 | | | 4,160 |
Hoya Corporation (Electronic equipment & instruments) | | 225,500 | | | 8,789 |
Joint Corporation (Real estate management & development) | | 191,800 | | | 7,375 |
*Jupiter Telecommunications Co., Ltd. (Media) | | 6,605 | | | 5,324 |
*K.K. DaVinci Advisors (Real estate management & development) | | 5,634 | | | 5,584 |
Kenedix, Inc. (Real estate management & development) | | 897 | | | 4,047 |
Keyence Corporation (Electronic equipment & instruments) | | 84,489 | | | 20,855 |
Komatsu Ltd. (Machinery) | | 670,400 | | | 13,569 |
MISUMI Group, Inc. (Trading companies & distributors) | | 254,400 | | | 4,858 |
Nakanishi Inc. (Health care equipment & supplies) | | 42,500 | | | 5,214 |
Nitori Company Ltd. (Specialty retail) | | 122,980 | | | 5,322 |
Orix Corporation (Consumer finance) | | 121,100 | | | 35,118 |
Park 24 Co., Ltd. (Commercial services & supplies) | | 384,900 | | | 4,921 |
Sharp Corp. (Household durables) | | 678,100 | | | 11,659 |
Suruga Bank (Commercial banks) | | 1,198,000 | | | 14,837 |
Yamada Denki Company (Specialty retail) | | 94,500 | | | 8,021 |
Yamaha Motor Company (Automobiles) | | 656,700 | | | 20,642 |
| | | | | |
| | | | | 265,358 |
| | | | | |
| | | | | |
Issuer | | Shares | | Value |
| | | | | |
|
Common Stocks—(continued) |
| | |
Emerging Asia—12.7% | | | | | |
China—3.1% | | | | | |
China Life Insurance Co. (Insurance) | | 1,193,000 | | $ | 4,072 |
China Mengniu Dairy Co. (Food products) | | 2,433,000 | | | 6,376 |
China Vanke Company Ltd. (Real estate management & development) | | 3,984,200 | | | 7,633 |
*Focus Media Holding Ltd.—ADR (Media) | | 100,300 | | | 6,659 |
*Foxconn International (Communications equipment) | | 1,156,800 | | | 3,773 |
Fu Ji Food & Catering (Hotels, restaurants & leisure) | | 1,819,000 | | | 4,691 |
Hopson Development Holdings Ltd. (Real estate management & development) | | 1,723,000 | | | 4,870 |
Lee and Man Paper Manufacturing Ltd. (Containers & packaging) | | 1,542,000 | | | 3,780 |
Li Ning Co. Ltd. (Leisure equipment & products) | | 2,860,000 | | | 4,573 |
Parkson Retail Group Ltd. (Multiline retail) | | 1,008,500 | | | 4,988 |
Ports Design Limited (Textiles, apparel & luxury goods) | | 1,890,500 | | | 4,130 |
Wumart Stores, Inc., Class “H” (Food & staples retailing)** | | 4,200,000 | | | 2,700 |
| | | | | |
| | | | | 58,245 |
| | | | | |
India—3.8% | | | | | |
Bharat Heavy Electricals Ltd. (Electrical equipment) | | 197,100 | | | 10,209 |
*Bharti Airtel Ltd. (Wireless telecommunication services) | | 541,100 | | | 7,703 |
Dabur India Ltd. (Personal products) | | 1,641,400 | | | 5,436 |
HDFC Bank (Commercial banks) | | 193,100 | | | 4,633 |
Hindustan Lever Ltd. (Household durables) | | 832,400 | | | 4,071 |
Housing Development Finance Corp. (Thrifts & mortgage finance) | | 208,100 | | | 7,629 |
Infosys Technologies, Ltd. (IT services) | | 365,056 | | | 18,448 |
Maruti Udyog Ltd. (Automobiles) | | 287,500 | | | 6,023 |
Suzlon Energy Ltd. (Electrical equipment) | | 212,800 | | | 6,268 |
| | | | | |
| | | | | 70,420 |
| | | | | |
Indonesia—1.2% | | | | | |
PT Bank Rakyat Indonesia (Commercial banks) | | 11,051,000 | | $ | 6,339 |
*PT Kalbe Farma Tbk (Pharmaceuticals) | | 7,229,200 | | | 959 |
PT Telekomunikasi Tbk (Diversified telecommunication services) | | 12,843,500 | | | 14,476 |
| | | | | |
| | | | | 21,774 |
| | | | | |
Malaysia—0.7% | | | | | |
Bumiputra Commerce Holdings Bhd (Commercial banks) | | 4,301,800 | | | 9,425 |
Transmile Group Bhd (Air freight & logistics) | | 796,300 | | | 3,212 |
| | | | | |
| | | | | 12,637 |
| | | | | |
South Korea—1.9% | | | | | |
*NHN Corp. (Internet software & services) | | 96,320 | | | 11,716 |
Samsung Electronics Co. (Semiconductors & semiconductor equipment) | | 23,580 | | | 15,469 |
*Shinsegae Co. Ltd. (Food & staples retailing) | | 13,310 | | | 8,290 |
| | | | | |
| | | | | 35,475 |
| | | | | |
See accompanying Notes to Financial Statements.
December 31, 2006 | William Blair Funds 7 |
Institutional International Growth Fund
Portfolio of Investments, December 31, 2006 (all dollar amounts in thousands)
| | | | | |
Issuer | | Shares | | Value |
| | | | | |
|
Common Stocks—Emerging Asia—12.7%—(continued) |
Taiwan—2.0% | | | | | |
High Tech Computer Corporation (Computers & peripherals) | | 205,600 | | $ | 4,055 |
*Himax Technologies, Inc.—ADR (Semiconductors & semiconductor equipment) | | 289,000 | | | 1,379 |
Hon Hai Precision Industry (Electronic equipment & instruments) | | 2,696,506 | | | 19,186 |
Largan Precision Co. Ltd. (Leisure equipment & products) | | 249,100 | | | 4,791 |
Mediatek Inc. (Semiconductors & equipment) | | 735,120 | | | 7,570 |
| | | | | |
| | | | | 36,981 |
| | | | | |
| | |
Asia—8.2% | | | | | |
Australia—3.2% | | | | | |
Allco Finance Group, Limited (Capital markets) | | 838,172 | | | 8,507 |
Macquarie Bank, Ltd. (Capital markets) | | 506,000 | | | 31,451 |
Seek Ltd. (Commercial services & supplies) | | 1,294,900 | | | 5,999 |
United Group Ltd. (Construction & engineering) | | 592,100 | | | 6,513 |
WorleyParsons, Ltd. (Energy equipment & services) | | 459,800 | | | 7,721 |
| | | | | |
| | | | | 60,191 |
| | | | | |
Hong Kong—2.2% | | | | | |
Esprit Holdings Ltd. (Specialty retail) | | 1,812,500 | | | 20,189 |
Li & Fung Ltd. (Distributors) | | 6,591,800 | | | 20,466 |
| | | | | |
| | | | | 40,655 |
| | | | | |
Singapore—2.8% | | | | | |
Capitaland, Ltd. (Real estate management & development) | | 7,913,800 | | | 31,846 |
Goodpack Ltd. (Air freight & logistics) | | 2,239,000 | | | 2,246 |
Osim International Ltd. (Specialty retail) | | 4,299,640 | | | 3,917 |
Raffles Education Corp. Ltd. (Diversified consumer services) | | 3,561,000 | | | 4,107 |
Singapore Exchange, Ltd. (Diversified financial services) | | 2,738,000 | | | 10,109 |
| | | | | |
| | | | | 52,225 |
| | | | | |
| | |
Emerging Latin America—5.8% | | | | | |
Brazil—2.0% | | | | | |
Companhia de Concessoes Rodoviarias (Transportation infrastructure) | | 582,700 | | | 7,868 |
Cyrela Brazil Realty S.A. (Household durables) | | 455,700 | | | 4,349 |
Gol Linhas Aereas Inteligentes S.P—ADR (Airlines) | | 159,500 | | | 4,573 |
Localiza Rent a Car S.A. (Road & rail) | | 142,400 | | | 4,282 |
Lojas Renner S.A. (Multiline retail) | | 346,200 | | | 4,975 |
Natura Cosmeticos S.A. (Personal products) | | 379,300 | | | 5,353 |
Submarino S.A.(Internet & catalog retail) | | 193,100 | | | 6,326 |
| | | | | |
| | | | | 37,726 |
| | | | | |
Chile—0.6% | | | | | |
*Cencosud S.A.—ADR 144A (Specialty retail) | | 221,200 | | | 10,380 |
S.A.C.I. Falabella (Multiline retail) | | 145,000 | | | 509 |
| | | | | |
| | | | | 10,889 |
| | | | | |
| | | | | |
Issuer | | Shares | | Value |
| | | | | |
|
Common Stocks—Emerging Latin
America—5.8%—(continued) |
Columbia—0.3% | | | | | |
Bancolombia S.A.—ADR (Commercial banks) | | 205,100 | | $ | 6,389 |
| | | | | |
Mexico—2.6% | | | | | |
America Movil S.A. (Wireless telecommunication services) | | 6,233,500 | | | 14,056 |
*Desarrolladora Homex S.A.—ADR (Household durables) | | 101,300 | | | 5,984 |
Grupo Aeropuertario Del—ADR (Transportation infrastructure) | | 81,900 | | | 3,210 |
*Urbi Desarrollos Urbanos S.A. (Household durables) | | 2,553,100 | | | 9,217 |
Walmart de Mexico (Food & staples retailing) | | 3,748,700 | | | 16,493 |
| | | | | |
| | | | | 48,960 |
| | | | | |
Panama—0.3% | | | | | |
Copa Holdings S.A., Class “A” (Airlines)† | | 113,300 | | | 5,275 |
| | | | | |
| | |
Canada—3.0% | | | | | |
*Gildan Activewear, Inc. (Textiles, apparel & luxury goods) | | 120,500 | | | 5,631 |
Manulife Financial Corp. (Insurance) | | 408,000 | | | 13,767 |
Ritchie Brothers Auctioneers, Inc. (Commercial services & supplies)† | | 66,700 | | | 3,571 |
Shoppers Drug Mart Corp. (Food & staples retailing) | | 415,100 | | | 17,830 |
Suncor Energy, Inc.(Oil, gas & consumable fuels) | | 199,300 | | | 15,687 |
| | | | | |
| | | | | 56,486 |
| | | | | |
| |
Emerging Europe, Mid-East, Africa—2.5% | | | |
Czech Republic—0.2% | | | | | |
*Central European Media Enterprises Ltd. Class “A” (Media)† | | 54,100 | | | 3,787 |
| | | | | |
Kazakhstan—0.5% | | | | | |
*Kazkommertsbank—GDR 144A (Commercial banks) | | 443,163 | | | 10,237 |
| | | | | |
Russia—0.8% | | | | | |
*CTC Media, Inc. (Media)† | | 236,802 | | | 5,686 |
Sberbank—CLS (Commercial banks) | | 2,500 | | | 8,625 |
| | | | | |
| | | | | 14,311 |
| | | | | |
South Africa—1.0% | | | | | |
Naspers Ltd. (Media) | | 227,800 | | | 5,400 |
Sasol Ltd. (Oil, gas, and consumable fuels) | | 180,400 | | | 6,643 |
Truworths International Ltd. (Specialty retail) | | 1,445,400 | | | 6,597 |
| | | | | |
| | | | | 18,640 |
| | | | | |
Total Common Stock—98.3%
(cost $1,331,009) | | | 1,844,175 |
| | | | | |
| | |
Preferred Stock | | | | | |
Brazil—1.1% | | | | | |
Banco Itau Holding (Commercial banks) | | 245,200 | | | 8,883 |
Petroleo Brasileiro S.A. (Oil, gas & consumable fuels) | | 534,200 | | | 12,452 |
| | | | | |
| | | | | 21,335 |
| | | | | |
Total Preferred Stock—1.1%
(cost $11,310) | | | 21,335 |
| | | | | |
See accompanying Notes to Financial Statements.
8 Annual Report | December 31, 2006 |
Institutional International Growth Fund
Portfolio of Investments, December 31, 2006 (all dollar amounts in thousands)
| | | | | | |
Issuer | | Shares or
Principal
Amount | | Value |
| | |
Investment in Affiliate | | | | | | |
William Blair Ready Reserves Fund | | | 52,033 | | $ | 52 |
| | | | | | |
Total Investment in Affiliate—0.0%
(cost $52) | | | 52 |
| | | | | | |
| | |
Short-Term Investments | | | | | | |
American Express Demand Note, VRN 5.176% due 1/2/07 | | $ | 2,387,000 | | | 2,387 |
Prudential Funding Demand Note, VRN 5.180% due 1/2/07 | | | 653,000 | | | 653 |
| | | | | | |
Total Short-term Investments—0.2%
(cost $3,040) | | | 3,040 |
| | | | | | |
Total Investments—99.6%
(cost $1,345,411) | | | 1,868,602 |
Cash and other assets, less liabilities—0.4% | | | 6,739 |
| | | | | | |
Net assets—100.0% | | $ | 1,875,341 |
| | | | | | |
* Non-income producing securities
ADR = American Depository Receipt
GDR = Global Depository Receipt
VRN = Variable Rate Note
† = U.S. listed foreign security
For securities, primarily traded on exchanges or markets that close before the close of regular trading on the New York Stock Exchange the Fund uses an independent pricing service on a daily basis to fair value price the securities pursuant to Valuation Procedures adopted by the Board of Trustees.
| ** | Fair valued pursuant to Valuation Procedures adopted by the Board of Trustees. This holding represents 0.14% of the Fund’s net assets at December 31, 2006. This security was also deemed illiquid pursuant to Liquidity Procedures approved by the Board of Trustees. |
At December 31, 2006 the Fund’s Portfolio of Investments includes the following industry categories:
| | |
Financials | | 25.8% |
Consumer Discretionary | | 18.6% |
Industrials & Services | | 16.0% |
Consumer Staples | | 12.7% |
Information Technology | | 11.7% |
Energy | | 6.3% |
Health Care | | 4.1% |
Utilities | | 2.5% |
Telecommunication Services | | 1.9% |
Materials | | 0.4% |
| | |
| | 100.0% |
| | |
At December 31, 2006 the Fund’s Portfolio of Investments includes the following currency categories:
| | |
Euro | | 27.5% |
British Pound Sterling | | 16.4% |
Japanese Yen | | 14.2% |
Swiss Franc | | 5.9% |
Hong Kong Dollar | | 4.9% |
United States Dollar | | 4.6% |
Indian Rupee | | 3.8% |
Australian Dollar | | 3.2% |
Brazilian Real | | 2.9% |
Canadian Dollar | | 2.8% |
Singapore Dollar | | 2.8% |
Mexico Nuevo Peso | | 2.1% |
Taiwan Dollar | | 1.9% |
South Korean Won | | 1.9% |
Swedish Krone | | 1.5% |
Indonesian Rupiah | | 1.2% |
South African Rand | | 1.0% |
All other currencies | | 1.4% |
| | |
| | 100.0% |
| | |
See accompanying Notes to Financial Statements.
December 31, 2006 | William Blair Funds 9 |
W. George Greig
INSTITUTIONAL INTERNATIONAL EQUITY FUND
The Institutional International Equity Fund invests primarily in common stocks of companies included in the Morgan Stanley Capital International All Country World ex-U.S. Index.
AN OVERVIEW FROM THE PORTFOLIO MANAGER
See page 2 for the International Markets Overview.
How did the Fund perform during the past year? How did the Fund’s performance compare to its benchmark?
The Institutional International Equity Fund posted a 20.22% gain for the 12 months ended December 31, 2006. By comparison, the Fund’s benchmark, the Morgan Stanley Capital International (MSCI) All Country World (ACWI) ex-US Index, rose 27.16%.
What were the most significant factors impacting Fund performance? What factors were behind the Fund’s performance versus the benchmark?
Despite strong absolute performance, the Fund underperformed the Index during 2006. This underperformance was due largely to second quarter results. The Fund’s quality growth focus hampered relative performance during the quarter, due both to value domination during 2006, as value outperformed growth by over 6% during the year, coupled with the negative “quality” effect as quality companies underperformed by even a wider margin during the year. The portfolio’s significant underweighting of Materials and Utilities, two of the strongest performing sectors during the year, in favor of Consumer, IT and Health Care, sectors that underperformed, also hampered results. The Fund’s results during 2006, returning 20.22%, were due largely to strong stock selection in Consumer Staples, Energy, Financials, Information Technology (IT), and Telecommunication Services. Specifically, the Fund’s overweighting and stock selection within Latin American Consumer Staples stocks added value, as did the Fund’s overweighting in UK Consumer Staples companies. Energy stock selection was bolstered by the Fund’s Europe performance, while Financials stock selection was strong across most regions, coupled with regional positioning. Within IT, the Fund’s weighting in Europe ex-UK companies added value, coupled with the focus on Taiwanese consumer electronics and IT outsourcing companies. During the year, the Fund’s Telecommunications Services allocation was largely focused on emerging markets companies that have benefited from accelerating subscriber growth in Latin America and Asia.
What is your current strategy? How is the Fund positioned?
As of year end, the Fund was focused on Consumer, Industrials, and Information Technology (IT) stocks, at the expense of Materials, Telecommunication Services, and Energy. Financials, which maintained the highest absolute weighting in the Fund, was underweighted relative to the Index. From a regional perspective, the Fund was underweighted in most developed markets, particularly Japan, and overweighted in Latin America.
10 Annual Report | December 31, 2006 |
Institutional International Equity Fund
Performance Highlights (unaudited)
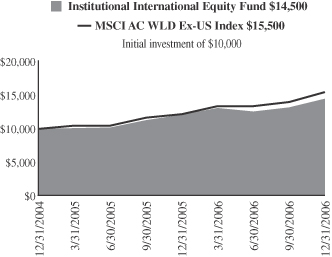
Average Annual Total Return at 12/31/2006
| | | | | | |
| | | 1
Year | | | Since Inception(a) | |
Institutional International Equity Fund | | 20.22 | % | | 19.52 | % |
MSCI All Country World Ex-US Index | | 27.16 | | | 23.18 | |
| | (a) | | For the period from December 1, 2004 (Commencement of Operations) to December 31, 2006. | |
Performance cited represents past performance. Past performance does not guarantee future results and current performance may be lower or higher than the data quoted. Results shown are average annual returns, which assume reinvestment of dividends and capital gains. Investment returns and principal will fluctuate and you may have a gain or loss when you sell shares. For the most current month-end performance information, please call 1-800-742-7272, or visit our Web site at www.williamblairfunds.com. From time to time, the investment advisor may waive fees or reimburse expenses for the Fund. Without these waivers, performance would be lower. International investing involves special risk considerations, including currency fluctuations, lower liquidity, economic and political risk.
The performance highlights and graph presented above do not reflect the deduction of taxes that a shareholder would pay on fund distributions or the redemption of fund shares.
The Morgan Stanley Capital International (MSCI) All Country World Ex-US Index is an unmanaged index that includes developed and emerging markets and reduced Japanese portion, making it more comparable to the Institutional International Equity Fund in terms of investment approach.
This report identifies the Fund’s investments on December 31, 2006. These holdings are subject to change. Not all stocks in the Fund performed the same, nor is there any guarantee that these stocks will perform as well in the future. Market forecasts provided in this report may not necessarily come to pass.
Sector Diversification (unaudited)
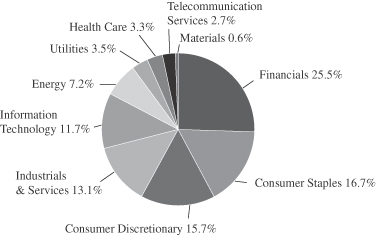
The sector diversification shown is based on the total investment portfolio.
December 31, 2006 | William Blair Funds 11 |
Institutional International Equity Fund
Portfolio of Investments, December 31, 2006 (all dollar amounts in thousands)
| | | | | |
Issuer | | Shares | | Value |
| | | | | |
| | |
Common Stocks Europe—38.8% | | | | | |
Austria—1.6% | | | | | |
Erste Bank (Commercial banks) | | 71,666 | | $ | 5,487 |
Raiffeisen International Bank (Commercial banks) | | 28,900 | | | 4,395 |
| | | | | |
| | | | | 9,882 |
| | | | | |
Belguim—0.4% | | | | | |
InBev N.V. (Beverages) | | 36,800 | | | 2,421 |
| | | | | |
France—14.5% | | | | | |
BNP Paribas (Commercial banks) | | 95,860 | | | 10,428 |
Capgemini S.A. (IT services) | | 73,800 | | | 4,617 |
Essilor International (Health care equipment & supplies) | | 54,400 | | | 5,840 |
Eurazeo (Diversified financial services) | | 35,445 | | | 5,060 |
Groupe Danone (Food products) | | 98,800 | | | 14,941 |
Iliad S.A. (Internet software & services) | | 22,800 | | | 1,971 |
L’Oreal S.A. (Personal products) | | 160,900 | | | 16,084 |
LVMH Moet Hennessey Louis Vuitton SA (Textiles, apparel & luxury goods) | | 95,900 | | | 10,088 |
Veolia Environnement (Multi-utilities) | | 136,600 | | | 10,418 |
Vinci S.A. (Construction & engineering) | | 55,000 | | | 7,010 |
| | | | | |
| | | | | 86,457 |
| | | | | |
Germany—2.6% | | | | | |
Bijou Brigitte (Textiles, apparel & luxury goods) | | 4,690 | | | 923 |
E.ON AG (Electric utilities) | | 75,200 | | | 10,155 |
SAP AG (Software) | | 90,200 | | | 4,784 |
| | | | | |
| | | | | 15,862 |
| | | | | |
Greece—1.0% | | | | | |
National Bank of Greece (Commercial banks) | | 127,830 | | | 5,863 |
| | | | | |
Ireland—1.4% | | | | | |
Anglo Irish Bank plc (Commercial banks) | | 326,700 | | | 6,765 |
IAWS Group plc (Food products) | | 75,200 | | | 1,926 |
| | | | | |
| | | | | 8,691 |
| | | | | |
Italy—3.3% | | | | | |
Luxottica Group SpA (Textiles, apparel & luxury goods) | | 323,500 | | | 9,916 |
Saipem SpA (Energy equipment & services) | | 374,000 | | | 9,704 |
| | | | | |
| | | | | 19,620 |
| | | | | |
Netherlands—1.3% | | | | | |
Royal Numico N.V. (Food products) | | 80,000 | | | 4,296 |
*Tomtom NV (Software) | | 78,100 | | | 3,363 |
| | | | | |
| | | | | 7,659 |
| | | | | |
Norway—0.5% | | | | | |
*Acergy S.A. (Energy equipment & services) | | 140,000 | | | 2,671 |
| | | | | |
Spain—1.8% | | | | | |
Industria De Textile (Specialty retail) | | 204,800 | | | 11,017 |
| | | | | |
Sweden—1.5% | | | | | |
Ericsson LM (Communications equipment) | | 1,686,000 | | | 6,780 |
*Modern Times Group (Media) | | 31,000 | | | 2,031 |
| | | | | |
| | | | | 8,811 |
| | | | | |
| | | | | |
Issuer | | Shares | | Value |
| | | | | |
|
Common Stocks—Europe—38.8%—(continued) |
Switzerland—8.9% | | | | | |
ABB Ltd. (Electrical equipment) | | 1,002,100 | | $ | 17,945 |
*EFG International (Capital markets) | | 88,400 | | | 3,329 |
Kuehne & Nagel International AG (Marine) | | 62,100 | | | 4,512 |
Nestle S.A. (Food products) | | 27,950 | | | 9,914 |
Nobel Biocare Holding AG (Health care equipment & supplies) | | 10,500 | | | 3,097 |
Roche Holdings AG (Pharmaceuticals) | | 56,100 | | | 10,037 |
SGS S.A. (Commercial services & supplies) | | 4,020 | | | 4,466 |
| | | | | |
| | | | | 53,300 |
| | | | | |
| | |
United Kingdom—17.9% | | | | | |
BG Group plc (Oil, gas & consumable fuels) | | 988,300 | | | 13,439 |
*Cairn Energy plc (Oil, gas & consumable fuels) | | 97,100 | | | 3,411 |
Capita Group plc (Commercial services & supplies) | | 525,500 | | | 6,231 |
Carphone Warehouse Group plc (Specialty retail) | | 432,700 | | | 2,652 |
HBOS plc (Commercial banks) | | 713,000 | | | 15,762 |
Man Group plc (Capital markets) | | 655,600 | | | 6,692 |
Northern Rock plc (Thrift & mortgage finance) | | 325,500 | | | 7,484 |
Reckitt Benckiser plc (Household products) | | 300,600 | | | 13,713 |
*Rolls-Royce Group plc (Aerospace & defense) | | 1,312,700 | | | 11,471 |
Rotork plc (Electronic equipment & instruments) | | 123,700 | | | 2,021 |
Standard Chartered plc (Commercial banks) | | 248,500 | | | 7,239 |
Tesco plc (Food & staples retailing) | | 1,968,300 | | | 15,554 |
Tullow Oil plc (Oil, gas & consumable fuels) | | 206,100 | | | 1,602 |
| | | | | |
| | | | | 107,271 |
| | | | | |
| | |
Japan—15.5% | | | | | |
Aeon Mall Co., Ltd. (Real estate management & development) | | 70,700 | | | 3,992 |
Canon, Inc. (Office electronics) | | 212,900 | | | 11,986 |
Denso Corporation (Auto components) | | 331,600 | | | 13,148 |
FANUC Ltd. (Machinery) | | 61,100 | | | 5,996 |
Honeys Company, Ltd. (Specialty retail) | | 36,100 | | | 1,341 |
Hoya Corporation (Electronic equipment & instruments) | | 133,600 | | | 5,207 |
*Jupiter Telecommunications Co., Ltd. (Media) | | 3,851 | | | 3,104 |
*K.K. DaVinci Advisors (Real estate management & development) | | 1,507 | | | 1,494 |
Keyence Corporation (Electronic equipment & instruments) | | 26,810 | | | 6,618 |
Komatsu Ltd. (Machinery) | | 284,000 | | | 5,748 |
Orix Corporation (Consumer finance) | | 55,150 | | | 15,993 |
Sharp Corporation (Household durables) | | 304,000 | | | 5,227 |
Suruga Bank Ltd. (Commercial banks) | | 303,000 | | | 3,753 |
Yamada Denki Co., Ltd. (Specialty retail) | | 209,900 | | | 6,598 |
Yamaha Motor. Co., Ltd. (Automobiles) | | 29,000 | | | 2,462 |
| | | | | |
| | | | | 92,667 |
| | | | | |
| | |
Emerging Asia—7.6% | | | | | |
China—1.0% | | | | | |
*Focus Media Holding Ltd.—ADR (Media) | | 40,000 | | | 2,656 |
See accompanying Notes to Financial Statements.
12 Annual Report | December 31, 2006 |
Institutional International Equity Fund
Portfolio of Investments, December 31, 2006 (all dollar amounts in thousands)
| | | | | |
Issuer | | Shares | | Value |
| | | | | |
|
Common Stocks—Emerging Asia—7.6%—(continued) |
China—(continued) | | | | | |
*Foxconn International (Communications equipment) | | 545,000 | | $ | 1,777 |
Hopson Development Holding Ltd. (Real estate management & development) | | 498,000 | | | 1,408 |
| | | | | |
| | | | | 5,841 |
| | | | | |
India—3.7% | | | | | |
Bharat Heavy Electricals Ltd. (Electrical equipment) | | 81,700 | | | 4,232 |
*Bharti Airtel Limited (Wireless telecommunication services) | | 312,631 | | | 4,451 |
Infosys Technologies Ltd. (IT services) | | 136,700 | | | 6,908 |
Suzlon Energy Ltd. (Electrical equipment) | | 114,900 | | | 3,384 |
Vedanta Resources Plc (Metals & mining) | | 140,300 | | | 3,342 |
| | | | | |
| | | | | 22,317 |
| | | | | |
Indonesia—0.9% | | | | | |
PT Bank Rakyat Indonesia (Commercial banks) | | 4,972,000 | | | 2,852 |
PT Telekomunikasi Indonesia Tbk (Diversified telecommunication services) | | 2,218,500 | | | 2,500 |
| | | | | |
| | | | | 5,352 |
| | | | | |
South Korea—0.7% | | | | | |
Samsung Electronics Co. (Semiconductors & semiconductor equipment) | | 6,680 | | | 4,382 |
| | | | | |
Taiwan—1.3% | | | | | |
High Tech Computer Corp. (Computers & peripherals) | | 24,200 | | | 478 |
Hon Hai Precision Industry Corp. (Electronic equipment & instruments) | | 1,016,880 | | | 7,235 |
| | | | | |
| | | | | 7,713 |
| | | | | |
| | |
Asia—6.6% | | | | | |
Australia—2.3% | | | | | |
Allco Finance Group Limited (Capital markets) | | 267,800 | | | 2,718 |
Macquarie Bank Ltd. (Capital markets) | | 180,500 | | | 11,219 |
| | | | | |
| | | | | 13,937 |
| | | | | |
Hong Kong—2.4% | | | | | |
Esprit Holdings Ltd. (Specialty retail) | | 579,500 | | | 6,455 |
Li & Fung Ltd. (Distributors) | | 2,491,100 | | | 7,734 |
| | | | | |
| | | | | 14,189 |
| | | | | |
Singapore—1.9% | | | | | |
Capitaland, Ltd. (Real estate management & development) | | 2,843,900 | | | 11,444 |
| | | | | |
| | |
Emerging Latin America—5.5% | | | | | |
Brazil—1.4% | | | | | |
Companhia de Concessoes Rodoviarias (Transportation infrastructure) | | 190,300 | | | 2,570 |
Gol-Linhas Aereas Inteligentes S.A.—ADR (Airlines) | | 50,200 | | | 1,439 |
Localiza Rent a Car S.A. (Road & rail) | | 39,200 | | | 1,179 |
Natura Cosmeticos S.A. (Personal products) | | 207,500 | | | 2,928 |
| | | | | |
| | | | | 8,116 |
| | | | | |
| | | | | | |
Issuer | | Shares or
Principal
Amount | | Value |
| | | | | | |
|
Common Stocks—Emerging Latin
America—5.5%—(continued) |
Chile—0.5% | | | | | | |
*Cencosud S.A.—ADR 144A (Specialty retail) | | | 67,500 | | $ | 3,167 |
| | | | | | |
Columbia—0.4% | | | | | | |
Bancolumbia S.A.—ADR (Commercial banks) | | | 82,100 | | | 2,557 |
| | | | | | |
Mexico—3.2% | | | | | | |
America Movil S.A. (Wireless telecommunications services) | | | 3,780,100 | | | 8,524 |
Walmart de Mexico (Food & staples retailing) | | | 2,350,800 | | | 10,343 |
| | | | | | |
| | | | | | 18,867 |
| | | | | | |
Canada—3.2% | | | | | | |
Manulife Financial Corporation (Insurance) | | | 260,400 | | | 8,787 |
Shoppers Drug Mart Corporation (Food & staples retailing) | | | 127,500 | | | 5,476 |
Suncor Energy, Inc. (Oil, gas & consumable fuels) | | | 64,400 | | | 5,069 |
| | | | | | |
| | | | | | 19,332 |
| | | | | | |
| |
Emerging Europe, Mid-East, Africa—0.9% | | | |
Russia—0.2% | | | | | | |
*CTC Media, Inc. (Media)† | | | 47,800 | | | 1,148 |
| | | | | | |
South Africa—0.7% | | | | | | |
Naspers Ltd. (Media) | | | 80,990 | | | 1,920 |
Sasol ASA (Oil, gas & consumable fuels) | | | 54,500 | | | 2,007 |
| | | | | | |
| | | | | | 3,927 |
| | | | | | |
Total Common Stock—96.0%
(cost $478,338) | | | 574,481 |
| | | | | | |
| | |
Preferred Stocks | | | | | | |
Brazil—1.3% | | | | | | |
Banco Itau S.A. (Commercial banks) | | | 111,400 | | | 4,036 |
Petroleo Brasileiro S.A. (Oil, gas & consumable fuels) | | | 169,600 | | | 3,953 |
| | | | | | |
| | | | | | 7,989 |
| | | | | | |
Total Preferred Stocks—1.3%
(cost $5,677) | | | 7,989 |
| | | | | | |
| | |
Investment in Affiliate | | | | | | |
William Blair Ready Reserves Fund | | | 4,005,631 | | | 4,006 |
| | | | | | |
Total Investment in Affiliate—0.7%
(cost $4,006) | | | 4,006 |
| | | | | | |
| | |
Short-Term Investments | | | | | | |
American Express Demand Note,
VRN, 5.176%, due 1/2/07 | | $ | 3,857,000 | | | 3,857 |
Prudential Funding Demand Note,
VRN, 5,180%, due 1/2/07 | | | 6,241,000 | | | 6,241 |
| | | | | | |
Total Short-Term Investments—1.7%
(cost $10,098) | | | 10,098 |
| | | | | | |
See accompanying Notes to Financial Statements.
December 31, 2006 | William Blair Funds 13 |
Institutional International Equity Fund
Portfolio of Investments, December 31, 2006 (all dollar amounts in thousands)
| | | | | | | |
Issuer | | Principal
Amount | | Value | |
| | |
Repurchase Agreement | | | | | | | |
Investors Bank & Trust Company, 5.01% dated 12/29/2006, due 1/2/2007, repurchase price $4,682, collateralized by SBA Pool #505911 | | $ | 4,678,968 | | $ | 4,679 | |
| | | | | | | |
Total Repurchase Agreement—0.8%
(cost $4,679) | | | 4,679 | |
| | | | | | | |
Total Investments—100.5%
(cost $502,798) | | | 601,253 | |
Liabilities plus cash and other assets—(0.5%) | | | (2,878 | ) |
| | | | | | | |
Net assets—100.0% | | $ | 598,375 | |
| | | | | | | |
* Non-income producing securities
ADR = American Depository Receipt
GDR = Global Depository Receipt
VRN = Variable Rate Note
† = U.S. listed foreign security
For securities primarily traded on exchanges or markets that close before the close of regular trading on the New York Stock Exchange, the Fund uses an independent pricing service on a daily basis to fair value price the securities pursuant to Valuation Procedures adopted by the Board of Trustees.
At December 31, 2006 the Fund’s Portfolio of Investments includes the following industry categories:
| | |
Financials | | 25.5% |
Consumer Staples | | 16.7% |
Consumer Discretionary | | 15.7% |
Industrials and Services | | 13.1% |
Information Technology | | 11.7% |
Energy | | 7.2% |
Utilities | | 3.5% |
Health Care | | 3.3% |
Telecommunication Services | | 2.7% |
Materials | | 0.6% |
| | |
| | 100.0% |
| | |
At December 31, 2006 the Fund’s Portfolio of Investments includes the following currency categories:
| | |
Euro | | 28.8% |
British Pound Sterling | | 19.0% |
Japanese Yen | | 15.9% |
Swiss Franc | | 9.2% |
Canadian Dollar | | 3.3% |
Indian Rupee | | 3.3% |
Mexico Nuevo Peso | | 3.2% |
Hong Kong Dollar | | 3.0% |
Brazilian Real | | 2.5% |
Australian Dollar | | 2.4% |
Singapore Dollar | | 2.0% |
United States Dollar | | 1.9% |
Swedish Krona | | 1.5% |
Taiwan Dollar | | 1.3% |
Other Currencies | | 2.7% |
| | |
| | 100.0% |
| | |
See accompanying Notes to Financial Statements.
14 Annual Report December 31, 2006 | -- |

Jeffery A. Urbina
INTERNATIONAL SMALL CAP GROWTH FUND
The International Small Cap Growth Fund primarily invests in a diversified portfolio of common stocks of small cap companies in developed and emerging markets.
AN OVERVIEW FROM THE PORTFOLIO MANAGER
See page 2 for the International Markets Overview.
How did the Fund perform during the past year? How did the Fund’s performance compare to its benchmark?
The International Small Cap Growth Fund posted a 20.86% increase (Institutional Class Shares) for the 12 months ended December 31, 2006. By comparison, the Fund’s benchmark, the Morgan Stanley Capital International (MSCI) World Small Cap ex-U.S. Index gained 19.82%.
What were the most significant factors impacting Fund performance? What factors were behind the Fund’s performance versus the benchmark?
The Fund had strong absolute and relative results during 2006, returning 20.86%, due largely to strong stock selection across most sectors. In particular, stock selection in Consumer, Health Care, Industrials and Telecommunication Services added value. Within Consumer Discretionary, the portfolio’s weightings in developed Asia and Europe enhanced results, as did Chinese stock performance, coupled with Latin America stock selection. Within Health Care, the Fund’s weighting and stock selection in Europe ex-UK stocks added value, while Industrials stock selection was enhanced by European (including UK) weightings and stock selection. Stock selection was also strong in Europe ex-UK, while the Fund’s emerging markets allocation, and lower Japanese weighting were also additive to results. Sector positioning detracted from performance during the period, as did stock selection in Energy, Financials and Materials.
What is your current strategy? How is the Fund positioned?
As of year end, the Fund was focused on the Consumer, Financials, and Industrials and Services sectors. Information Technology (IT) and Energy were the most underweighted relative to the Index. Regionally, the Fund was underweighted in most developed markets, with the exception of Europe ex-UK, due to the emerging markets allocation.
December 31, 2006 | William Blair Funds 15 |
International Small Cap Growth Fund
Performance Highlights (unaudited)
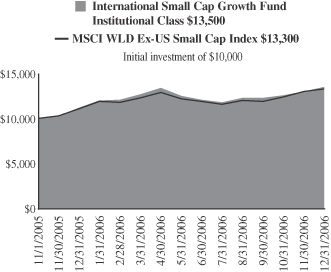
Average Annual Total Return at 12/31/2006
| | | | | | |
| | | 1
Year | | | Since Inception(a) | |
International Small Cap Growth Fund
Institutional Class | | 20.86 | % | | 29.29 | % |
MSCI WLD EX-US Small Cap Index | | 19.82 | | | 27.41 | |
| | (a) | | For the period from November 1, 2005 (Commencement of Operations) to December 31, 2006. | |
Performance cited represents past performance. Past performance does not guarantee future results and current performance may be lower or higher than the data quoted. Results shown are average annual returns, which assume reinvestment of dividends and capital gains. Investment returns and principal will fluctuate and you may have a gain or loss when you sell shares. For the most current month-end performance information, please call 1-800-742-7272, or visit our Web site at www.williamblairfunds.com. From time to time, the investment advisor may waive fees or reimburse expenses for the Fund. Without these waivers, performance would be lower. International investing involves special risk considerations, including currency fluctuations, lower liquidity, economic and political risk.
The performance highlights and graph presented above do not reflect the deduction of taxes that a shareholder would pay on fund distributions or the redemption of fund shares.
The Morgan Stanley Capital International (MSCI) World Ex-US Small Cap Index is an unmanaged index that is designed to measure equity performance of small cap stocks in developed and emerging markets.
This report identifies the Fund’s investments on December 31, 2006. These holdings are subject to change. Not all stocks in the Fund performed the same, nor is there any guarantee that these stocks will perform as well in the future. Market forecasts provided in this report may not necessarily come to pass.
Sector Diversification (unaudited)
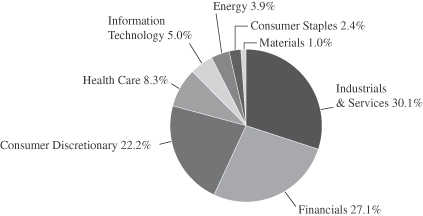
The sector diversification shown is based on the total investment portfolio.
16 Annual Report | December 31, 2006 |
International Small Cap Growth Fund
Portfolio of Investments, December 31, 2006 (all dollar amounts in thousands)
| | | | | |
Issuer | | Shares | | Value |
| | |
Common Stocks—Europe—37.4% | | | | | |
France—4.2% | | | | | |
April Group S.A. (Insurance) | | 46,882 | | $ | 2,256 |
*Orpea (Heath care providers & services) | | 28,863 | | | 2,730 |
*S.O.I.T.E.C. (Semiconductors & semiconductor equipment) | | 135,300 | | | 4,783 |
| | | | | |
| | | | | 9,769 |
| | | | | |
Germany—8.6% | | | | | |
Bijou Brigitte (Apparel & luxury goods) | | 8,100 | | | 1,594 |
*Colonia Real Estate AG (Real estate management and development) | | 49,000 | | | 2,348 |
CTS Eventim AG (Media) | | 69,000 | | | 2,656 |
MTU Aero Engines Holding AG (Aerospace & defense) | | 108,814 | | | 5,068 |
*Patrizia Immobilien AG (Real estate management & development) | | 4,200 | | | 125 |
*Q-Cells AG (Electrical equipment) | | 55,880 | | | 2,502 |
*Qiagen NV (Lifesciences tools & services) | | 200,073 | | | 3,072 |
Solarworld AG (Electrical equipment) | | 38,031 | | | 2,370 |
*Wire Card AG (Commercial services & supplies) | | 25,600 | | | 264 |
| | | | | |
| | | | | 19,999 |
| | | | | |
Ireland—6.1% | | | | | |
IAWS Group plc (Food products) | | 193,340 | | | 4,953 |
Kingspan Group plc (Building products) | | 181,090 | | | 4,802 |
*Norkom Group plc (Software) | | 229,400 | | | 614 |
United Drug plc (Heath care providers & services) | | 696,880 | | | 3,661 |
| | | | | |
| | | | | 14,030 |
| | | | | |
Italy—6.8% | | | | | |
Azimut Holdings SpA (Capital markets) | | 346,717 | | | 4,630 |
Banca Italease (Diversified financial services) | | 115,800 | | | 6,722 |
Credito Emiliano SpA (Commercial banks) | | 159,372 | | | 2,251 |
Tod’s SpA (Textiles, apparel & luxury goods) | | 27,500 | | | 2,212 |
| | | | | |
| | | | | 15,815 |
| | | | | |
Norway—1.8% | | | | | |
*Acergy S.A. (Energy equipment & services) | | 213,900 | | | 4,081 |
| | | | | |
Spain—3.3% | | | | | |
*Grifols S.A. (Biotechnolgy) | | 402,403 | | | 5,357 |
*Tecnicas Reunidas S.A. (Construction & engineering) | | 61,700 | | | 2,367 |
| | | | | |
| | | | | 7,724 |
| | | | | |
Sweden—4.3% | | | | | |
Hemtex AB (Specialty retail) | | 54,700 | | | 1,117 |
*Modern Times Group (Media) | | 71,200 | | | 4,665 |
Nobia AB (Specialty retail) | | 92,400 | | | 3,546 |
*Tradedoubler AB (Internet software & services) | | 22,500 | | | 670 |
| | | | | |
| | | | | 9,998 |
| | | | | |
Switzerland—2.3% | | | | | |
*Partners Group Global Opportunities, Ltd. (Capital markets) | | 43,771 | | | 5,282 |
| | | | | |
| | |
Japan—19.5% | | | | | |
Aeon Mall Co., Ltd. (Real estate management & development) | | 81,000 | | | 4,574 |
Chiyoda Corp. (Construction & engineering) | | 114,000 | | | 2,229 |
*DeNA Co., Ltd. (Internet & catalog retail) | | 719 | | | 2,356 |
En-Japan Inc. (Commercial services & supplies) | | 431 | | | 2,064 |
| | | | | |
Issuer | | Shares | | Value |
|
Common Stocks—Japan—19.5%—(continued) |
Honeys Company, Ltd. (Specialty retail) | | 54,400 | | $ | 2,021 |
Joint Corporation (Real estate management & development) | | 112,620 | | | 4,330 |
*K.K. DaVinci Advisors (Real estate management & development) | | 4,343 | | | 4,304 |
Kenedix, Inc. (Real estate management & development) | | 935 | | | 4,218 |
MISUMI Group, Inc. (Trading companies & distributors) | | 195,700 | | | 3,737 |
Nakanishi Inc. (Health care equipment & supplies) | | 28,600 | | | 3,509 |
Nitori Company Ltd. (Specialty retail) | | 49,500 | | | 2,142 |
Park 24 Co., Ltd. (Commercial services & supplies) | | 240,500 | | | 3,075 |
Suruga Bank (Commercial banks) | | 533,000 | | | 6,601 |
| | | | | |
| | | | | 45,160 |
| | | | | |
United Kingdom—14.8% | | | | | |
Accident Exchange Group plc (Commercial services & supplies) | | 301,274 | | | 2,276 |
Amlin plc (Insurance) | | 111,700 | | | 709 |
*Ceres Power Holdings plc (Electrical equipment) | | 395,200 | | | 1,694 |
Detica Group plc (IT services) | | 356,200 | | | 2,556 |
Homeserve plc (Commercial services & supplies) | | 94,280 | | | 3,483 |
Mears Group plc (Construction & engineering) | | 348,500 | | | 2,474 |
Michael Page International (Commercial services & supplies) | | 581,770 | | | 5,138 |
Rotork plc (Electronic equipement & instruments) | | 144,150 | | | 2,355 |
RPS Group plc (Commercial services & supplies) | | 460,400 | | | 2,430 |
Serco Group plc (Commercial services & supplies) | | 653,040 | | | 4,871 |
Ultra Electronic Holdings plc (Aerospace & defense) | | 102,750 | | | 2,179 |
Victrex plc (Chemicals) | | 134,450 | | | 2,112 |
VT Group plc (Aerospace & defense) | | 231,150 | | | 2,147 |
| | | | | |
| | | | | 34,424 |
| | | | | |
| | |
Emerging Asia—6.6% | | | | | |
China—2.8% | | | | | |
Ctrip.com International, Ltd.—ADR (Hotels, restaurants & leisure) | | 20,020 | | | 1,251 |
*Focus Media Holdings—ADR (Media) | | 36,900 | | | 2,450 |
Li Ning Co. Ltd. (Leisure equipment & products) | | 848,873 | | | 1,357 |
Ports Design Limited (Textiles, apparel & luxury goods) | | 690,500 | | | 1,508 |
| | | | | |
| | | | | 6,566 |
| | | | | |
India—2.3% | | | | | |
ABB Ltd. India (Electrical equipment) | | 13,100 | | | 1,101 |
Financial Technologies, Ltd. (Diversified financial services) | | 52,400 | | | 2,098 |
*Inox Leisure, Ltd. (Media) | | 333,579 | | | 1,085 |
Pantaloon Retail India, Ltd. (Multiline retail) | | 107,850 | | | 996 |
| | | | | |
| | | | | 5,280 |
| | | | | |
South Korea—0.5% | | | | | |
Hana Tour Service Inc. (Hotels, restaurants & leisure) | | 15,000 | | | 1,138 |
| | | | | |
See accompanying Notes to Financial Statements.
December 31, 2006 | William Blair Funds 17 |
International Small Cap Growth Fund
Portfolio of Investments, December 31, 2006 (all dollar amounts in thousands)
| | | | | |
Issuer | | Shares | | Value |
|
Common Stocks—Emerging Asia—6.6%—(continued) |
Taiwan—1.0% | | | | | |
Largan Precision Co. Ltd. (Leisure equipment & products) | | 119,300 | | $ | 2,295 |
| | | | | |
| | |
Asia—11.8% | | | | | |
Australia—6.9% | | | | | |
Allco Finance Group, Limited (Capital markets) | | 452,265 | | | 4,590 |
Seek Limited (Commercial services & supplies) | | 815,980 | | | 3,780 |
United Group, Ltd. (Construction & engineering) | | 292,570 | | | 3,218 |
WorleyParsons, Ltd. (Energy equipment & supplies) | | 267,820 | | | 4,498 |
| | | | | |
| | | | | 16,086 |
| | | | | |
Singapore—4.9% | | | | | |
Goodpack Ltd. (Air freight & logistics) | | 1,718,000 | | | 1,724 |
Osim International Ltd. (Specialty retail) | | 1,932,400 | | | 1,760 |
Petra Foods, Ltd. (Food products) | | 223,000 | | | 262 |
Raffles Education Corp. Ltd. (Diversified consumer services) | | 2,560,000 | | | 2,952 |
Singapore Exchange, Ltd. (Diversified financial services) | | 1,245,000 | | | 4,596 |
| | | | | |
| | | | | 11,294 |
| | | | | |
| | |
Emerging Latin America—2.0% | | | | | |
Brazil—1.0% | | | | | |
Cyrela Brazil Realty S.A. (Household durables) | | 110,100 | | | 1,051 |
Submarino S.A. (Internet & catalog retail) | | 35,900 | | | 1,176 |
| | | | | |
| | | | | 2,227 |
| | | | | |
Mexico—1.0% | | | | | |
*Urbi Desarrollos Urbanos S.A. (Household durables) | | 672,100 | | | 2,426 |
| | | | | |
|
Emerging Europe, Mid-East, Africa—1.3% |
Czech Republic—0.5% | | | | | |
*Central European Media Enterprises Ltd., Class “A” (Media)† | | 16,000 | | | 1,120 |
| | | | | |
| | | | | | |
Issuer | | Shares or
Principal
Amount | | Value |
|
Common Stocks—Emerging Europe, Mid-East, Africa—1.3%—(continued) |
Russia—0.8% | | | | | | |
*CTC Media, Inc. (Media)† | | | 79,738 | | $ | 1,915 |
| | | | | | |
| | |
Canada—1.3% | | | | | | |
*Gildan Activewear, Inc. (Textiles, apparel & luxury goods) | | | 41,900 | | | 1,958 |
Richie Bros. Auctioneers Incorporated† (Commercial services & supplies) | | | 20,000 | | | 1,071 |
| | | | | | |
| | | | | | 3,029 |
| | | | | | |
Total Common Stock—94.7%
(cost $189,217) | | | 219,658 |
| | | | | | |
| | |
Investment in Affiliate | | | | | | |
William Blair Ready Reserves Fund | | | 5,228,467 | | | 5,228 |
| | | | | | |
Total Investment in Affiliate—2.3%
(cost $5,228) | | | | | | |
| | |
Short-Term Investments | | | | | | |
American Express Demand Note, VRN 5.176%, due 1/2/07 | | $ | 1,074,000 | | | 1,074 |
| | | | | | |
Prudential Funding Demand Note, VRN 5.180%, due 1/2/07 | | | 5,397,000 | | | 5,397 |
| | | | | | |
Total Short-term Investments—2.8%
(cost $6,471) | | | 6,471 |
| | | | | | |
| | |
Repurchase Agreement | | | | | | |
Investors Bank & Trust Company, 5.01% dated 12/29/2006, due 1/2/2007, repurchase price $339, collateralized by SBA Pool # 504705 | | | 338,909 | | | 339 |
| | | | | | |
Total Repurchase Agreement—0.1%
(cost $339) | | | 339 |
| | | | | | |
Total Investments—99.9%
(cost $201,255) | | | 231,696 |
Cash and other assets, less liabilities—0.1% | | | 273 |
| | | | | | |
Net assets—100.0% | | $ | 231,969 |
| | | | | | |
*Non-income producing securities
ADR = American Depository Receipt
GDR = Global Depository Receipt
VRN = Variable Rate Note
† = U.S. listed foreign security
For securities, primarily traded on exchanges or markets that close before the close of regular trading on the New York Stock Exchange the Fund uses an independent pricing service on a daily basis to fair value price the securities pursuant to Valuation Procedures adopted by the Board of Trustees.
At December 31, 2006 the Fund’s Portfolio of Investments includes the following industry categories:
| | |
Industrials and Services | | 30.1% |
Financials | | 27.1% |
Consumer Discretionary | | 22.2% |
Health Care | | 8.3% |
Information Technology | | 5.0% |
Energy | | 3.9% |
Consumer Staples | | 2.4% |
Materials | | 1.0% |
| | |
| | 100.0% |
| | |
At December 31, 2006 the Fund’s Portfolio of Investments includes the following currency categories:
| | |
Euro | | 30.7% |
Japanese Yen | | 20.5% |
British Pound Sterling | | 15.7% |
Australian Dollar | | 7.3% |
Singapore Dollar | | 5.1% |
Swedish Krona | | 4.6% |
United States Dollar | | 3.6% |
Swiss Franc | | 2.4% |
Indian Rupee | | 2.4% |
Norwegian Krone | | 1.9% |
Hong Kong Dollar | | 1.3% |
Mexican Neuvo Peso | | 1.1% |
New Taiwan Dollar | | 1.0% |
Brazilian Real | | 1.0% |
Canadian Dollar | | 0.9% |
All other currencies | | 0.5% |
| | |
| | 100.0% |
| | |
See accompanying Notes to Financial Statements.
18 Annual Report | December 31, 2006 |
W. George Greig

Todd M. McClone
Jeffrey A. Urbina
EMERGING MARKETS GROWTH FUND
The Emerging Markets Growth Fund primarily invests in a diversified portfolio of equity securities issued by growth companies in emerging economies worldwide.
AN OVERVIEW FROM THE PORTFOLIO MANAGERS
See page 2 for the International Markets Overview.
How did the Fund perform during the past year? How did the Fund’s performance compare to its benchmark?
The Emerging Markets Growth Fund posted a 38.49% increase (Institutional Class Shares) for the 12 months ended December 31, 2006. By comparison, the Fund’s benchmark, the Morgan Stanley Capital International (MSCI) Emerging Markets Index, gained 32.59%.
What were the most significant factors impacting Fund performance? What factors were behind the Fund’s performance versus the benchmark?
The Fund had strong absolute and relative results during 2006, returning 38.49%, due largely to strong stock selection across regions and most sectors. In particular, stock selection in Consumer, Energy, Financials, Industrials, and Materials added value. Within Consumer, the Fund’s Emerging Asia Discretionary holdings added the most value, coupled with the overweighting in this area. In addition, strong stock selection across regions within Consumer Staples was additive to results. Within Energy, the Fund’s Emerging Markets Europe, Mid-East and Africa (EMEA) holdings added value. The Fund’s Financials stocks were driven largely by China and India holdings. Industrial stock selection was augmented by Latin American airlines and toll road company performance, while Materials stock selection added value solely to Chinese exposure. From a regional perspective, the Fund’s overweighting in the strongest performing Latin America region at the expense of the weaker EMEA region added value. The Fund’s underweighting in Materials, Financials, Telecommunication Services and Utilities was a detractor from results, as these were the strongest sectors during the period.
What is your current strategy? How is the Fund positioned?
As of year end, the Fund was focused on Consumer and Industrials, with a significant, albeit underweighted, position in Financials as well. Materials and Energy were the most underweighted. Regionally, the Fund was underweighted in EMEA and overweighted in Latin America.
December 31, 2006 | William Blair Funds 19 |
Emerging Markets Growth Fund
Performance Highlights (unaudited)
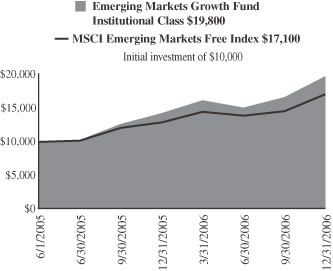
Average Annual Total Return at 12/31/2006
| | | | | | |
| | | 1
Year | | | Since Inception(a) | |
Emerging Markets Growth Fund Institutional Class | | 38.49 | % | | 54.27 | % |
MSCI Emerging Markets Index | | 32.59 | | | 40.84 | |
| | (a) | | For the period from June 6, 2005 (Commencement of Operations) to December 31, 2006. | |
Performance cited represents past performance. Past performance does not guarantee future results and current performance may be lower or higher than the data quoted. Results shown are average annual returns, which assume reinvestment of dividends and capital gains. Investment returns and principal will fluctuate and you may have a gain or loss when you sell shares. For the most current month-end performance information, please call 1-800-742-7272, or visit our Web site at www.williamblairfunds.com. From time to time, the investment advisor may waive fees or reimburse expenses for the Fund. Without these waivers, performance would be lower. International investing involves special risk considerations, including currency fluctuations, lower liquidity, economic and political risk.
The performance highlights and graph presented above do not reflect the deduction of taxes that a shareholder would pay on fund distributions or the redemption of fund shares.
The Morgan Stanley Capital International (MSCI) Emerging Markets Index is an index that is designed to measure equity performance in the global emerging markets.
This report identifies the Fund’s investments on December 31, 2006. These holdings are subject to change. Not all stocks in the Fund performed the same, nor is there any guarantee that these stocks will perform as well in the future. Market forecasts provided in this report may not necessarily come to pass.
Sector Diversification (unaudited)
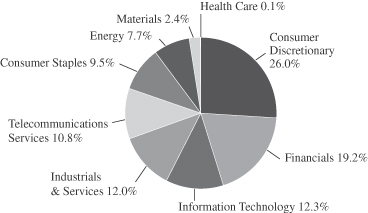
The sector diversification shown is based on the total investment portfolio.
20 Annual Report | December 31, 2006 |
Emerging Markets Growth Fund
Portfolio of Investments, December 31, 2006 (all dollar amounts in thousands)
| | | | | |
Issuer | | Shares | | Value |
|
Common Stocks—Emerging Asia—50.5% |
China—15.9% | | | | | |
China Life Insurance Co. (Insurance) | | 2,586,100 | | $ | 8,827 |
China Mengniu Dairy Co. Ltd. (Food products) | | 3,077,000 | | | 8,063 |
China Mobile Ltd. (Wireless telecommunication services) | | 2,730,300 | | | 23,535 |
China Vanke Company Ltd. (Real estate management & development) | | 10,212,000 | | | 19,565 |
Ctrip.com International Ltd.—ADR (Hotels, restaurants, & leisure) | | 142,700 | | | 8,916 |
*Focus Media Holding Ltd.—ADR (Media) | | 126,400 | | | 8,392 |
*Foxconn International (Communications equipment) | | 2,433,000 | | | 7,935 |
Fu Ji Food and Catering Services Holdings Ltd (Hotels, restaurants, & leisure) | | 1,685,000 | | | 4,346 |
Hopson Development Holdings Ltd. (Real estate management) | | 2,970,000 | | | 8,395 |
Lee and Man Paper Manufacturing Ltd. (Containers & packaging) | | 5,160,000 | | | 12,650 |
Li Ning Co. Ltd (Leisure equipment & products) | | 2,902,000 | | | 4,640 |
Parkson Retail Group Ltd. (Multiline retail) | | 808,400 | | | 3,998 |
Ports Design Ltd. (Textiles, apparel & luxury goods) | | 2,099,500 | | | 4,586 |
Wumart Stores, Inc., Class “H” (Food & staples retailing)** | | 8,680,000 | | | 5,580 |
| | | | | |
| | | | | 129,428 |
| | | | | |
India—17.7% | | | | | |
ABB Ltd. India (Electrical equipment) | | 92,100 | | | 7,739 |
Bharat Heavy Electricals, Ltd. (Electrical equipment) | | 401,400 | | | 20,792 |
*Bharti Airtel Ltd. (Wireless telecommunication services) | | 1,670,500 | | | 23,782 |
Dabur India Ltd. (Personal products) | | 1,124,400 | | | 3,724 |
Financial Technologies, Ltd. (Diversified financial services) | | 91,810 | | | 3,677 |
HDFC Bank (Commercial banks) | | 159,200 | | | 3,820 |
Hindustan Lever Ltd. (Household products) | | 1,390,300 | | | 6,799 |
Housing Development Finance Corp. (Thrifts & mortgage finance) | | 338,500 | | | 12,409 |
Infosys Technologies, Ltd. (IT services) | | 467,200 | | | 23,610 |
*Inox Leisure Ltd. (Media) | | 1,105,300 | | | 3,595 |
Maruti Udyog Ltd. (Automobiles) | | 566,700 | | | 11,871 |
Pantaloon Retail India Ltd. (Multiline retail) | | 444,700 | | | 4,106 |
Shopper’s Stop Ltd. (Multiline retail) | | 264,960 | | | 4,035 |
Suzlon Energy Ltd. (Electrical equipment) | | 244,800 | | | 7,210 |
Vedanta Resources Plc (Metals & mining) | | 271,100 | | | 6,457 |
| | | | | |
| | | | | 143,626 |
| | | | | |
Indonesia—3.0% | | | | | |
PT Bank Rakyat Indonesia (Commercial banks) | | 13,614,000 | | | 7,809 |
*PT Kalbe Farma Tbk (Pharmaceuticals) | | 5,702,700 | | | 757 |
PT Telekomunikasi Tbk (Diversified telecommunication services) | | 13,731,500 | | | 15,477 |
| | | | | |
| | | | | 24,043 |
| | | | | |
Malaysia—2.8% | | | | | |
Bumiputra Commerce Holding Bhd (Commercial banking) | | 7,473,900 | | | 16,375 |
Transmile Group Bhd (Air freight & logisitics) | | 1,645,700 | | | 6,637 |
| | | | | |
| | | | | 23,012 |
| | | | | |
| | | | | |
Issuer | | Shares | | Value |
|
Common Stocks—Emerging Asia—50.5%—(continued) |
South Korea—4.7% | | | | | |
Hana Tour Service (Hotels, restaurants, & leisure) | | 63,900 | | $ | 4,847 |
*NHN Corporation (Internet software & services) | | 54,600 | | | 6,641 |
Samsung Electronics Co. (Semiconductors & equipment) | | 29,460 | | | 19,326 |
*Shinsegae Co. Ltd. (Food & staples retailing) | | 12,170 | | | 7,581 |
| | | | | |
| | | | | 38,395 |
| | | | | |
Taiwan—6.4% | | | | | |
High Tech Computer Corporation (Computers & peripherals) | | 170,800 | | | 3,369 |
Hon Hai Precision Industry (Electronic equipment & instruments) | | 3,227,528 | | | 22,964 |
*Himax Technologies, Inc.—ADR (Semiconductors & equipment) | | 816,500 | | | 3,895 |
Johnson Health Tech Company Ltd. (Leisure equipment & products) | | 59,000 | | | 432 |
Largan Precision Co. Ltd. (Leisure equipment & products) | | 757,550 | | | 14,571 |
Mediatek Inc. (Semiconductors & equipment) | | 691,040 | | | 7,117 |
| | | | | |
| | | | | 52,348 |
| | | | | |
| | |
Emerging Latin America—27.3% | | | | | |
Brazil—9.7% | | | | | |
Companhia de Concessoes Rodoviarias (Transportation infrastructure) | | 1,210,900 | | | 16,351 |
Cyrela Brazil Realty S.A. (Household durables) | | 1,558,900 | | | 14,878 |
Gol Linhas Aereas Inteligentes S.P—ADR (Airlines) | | 135,900 | | | 3,896 |
Localiza Rent a Car S.A. (Road & rail) | | 557,900 | | | 16,778 |
Lojas Renner S.A. (Multiline retail) | | 327,800 | | | 4,710 |
Natura Cosmeticos S.A. (Personal products) | | 581,100 | | | 8,200 |
Submarino S.A. (Internet & catalog retail) | | 305,200 | | | 9,998 |
*Totvs S.A. (Software) | | 177,600 | | | 3,931 |
| | | | | |
| | | | | 78,742 |
| | | | | |
Chile—3.1% | | | | | |
*Cencosud S.A.—ADR 144A (Specialty retail) | | 286,800 | | | 13,458 |
S.A.C.I. Falabella S.A. (Multiline retail) | | 3,469,694 | | | 12,190 |
| | | | | |
| | | | | 25,648 |
| | | | | |
Columbia—1.4% | | | | | |
Bancolombia S.A.—ADR (Commercial banks) | | 357,900 | | | 11,149 |
| | | | | |
Mexico—12.0% | | | | | |
Alsea S.A.B. de C.V. (Hotels, restaurants, & leisure) | | 727,800 | | | 3,967 |
America Movil S.A. (Wireless telecommunication services) | | 10,596,200 | | | 23,894 |
*Desarrolladora Homex S.A. de C.V.—ADR (Household durables) | | 171,100 | | | 10,107 |
Grupo Financiero Banorte S.A. de C.V. (Commercial banks) | | 3,948,600 | | | 15,439 |
Grupo Aeropuertario Del—ADR (Transportation infrastructure) | | 195,100 | | | 7,646 |
*Urbi Desarrollos Urbanos S.A. (Household durables) | | 2,558,300 | | | 9,236 |
Walmart de Mexico (Food & staples retailing) | | 6,214,600 | | | 27,342 |
| | | | | |
| | | | | 97,631 |
| | | | | |
See accompanying Notes to Financial Statements.
December 31, 2006 | William Blair Funds 21 |
Emerging Markets Growth Fund
Portfolio of Investments, December 31, 2006 (all dollar amounts in thousands)
| | | | | |
Issuer | | Shares | | Value |
|
Common Stocks—Emerging Latin America—27.3%—(continued) |
Panama—1.1% | | | | | |
Copa Holdings S.A., Class “A” (Airlines)† | | 190,100 | | $ | 8,851 |
| | | | | |
| |
Emerging Europe, Mid-East, Africa—15.6% | | | |
Czech Republic—0.9% | | | | | |
*Central European Media Enterprises Ltd., Class “A” (Media)† | | 104,200 | | | 7,294 |
| | | | | |
Kazakhstan—2.1% | | | | | |
*Kazkommertsbank—GDR 144A (Commercial banks) | | 744,326 | | | 17,194 |
| | | | | |
Russia—5.6% | | | | | |
*CTC Media, Inc. (Media)† | | 352,545 | | | 8,464 |
*Magnit—CLS (Multiline retail)† | | 111,200 | | | 3,970 |
Novatek OAO—GDR 144A (Oil, gas, & consumable fuels) | | 312,800 | | | 19,863 |
Sberbank—CLS (Commercial banks)† | | 3,900 | | | 13,455 |
| | | | | |
| | | | | 45,752 |
| | | | | |
South Africa—5.9% | | | | | |
Naspers Ltd. (Media) | | 849,266 | | | 20,131 |
Sasol Ltd. (Oil, gas, and consumable fuels) | | 437,000 | | | 16,091 |
Truworths International Ltd. (Specialty retail) | | 2,622,327 | | | 11,969 |
| | | | | |
| | | | | 48,191 |
| | | | | |
Turkey—1.1% | | | | | |
Bim Birlesik Magazalar A.S. (Food & staples retailing) | | 172,700 | | | 9,150 |
| | | | | |
Total Common Stock—93.4%
(cost $592,116) | | | 760,454 |
| | | | | |
| | | | | | |
Issuer | | Shares or
Principal
Amount | | Value |
| | |
Preferred Stock | | | | | | |
Brazil—5.2% | | | | | | |
Banco Itau Holding (Commercial banks) | | | 443,000 | | $ | 16,049 |
Petroleo Brasileiro S.A. (Oil, gas & consumable fuels) | | | 1,108,700 | | | 25,843 |
| | | | | | |
Total Preferred Stock—5.2%
(cost $32,704) | | | 41,892 |
| | | | | | |
| | |
Investment in Affiliate | | | | | | |
William Blair Ready Reserves Fund | | | 1,265,478 | | | 1,265 |
| | | | | | |
Total Investment in Affiliate—0.2%
(cost $1,265) | | | 1,265 |
| | | | | | |
| | |
Short-Term Investments | | | | | | |
American Express Demand Note, VRN 5.176% due 1/2/07 | | $ | 1,875,000 | | | 1,875 |
Prudential Funding Demand Note, VRN 5.180% due 1/2/07 | | | 1,876,000 | | | 1,876 |
| | | | | | |
Total Short-Term Investments—0.5%
(cost $3,751) | | | 3,751 |
| | | | | | |
| | |
Repurchase Agreement | | | | | | |
Investors Bank & Trust Company, 5.01% dated 12/29/2006, due 1/2/2007, repurchase price $6,033, collateralized by SBA, Pool# 506352 | | | 6,029,442 | | | 6,029 |
| | | | | | |
Total Repurchase Agreement—0.7%
(cost $6,029) | | | 6,029 |
| | | | | | |
Total Investments—100.0%
(cost $635,865) | | | 813,391 |
Cash and other assets, less liabilities—0.0% | | | 258 |
| | | | | | |
Net assets—100.0% | | $ | 813,649 |
| | | | | | |
* Non-income producing securities
ADR = American Depository Receipt
GDR = Global Depository Receipt
VRN = Variable Rate Note
† = U.S. listed foreign security
For securities, primarily traded on exchanges or markets that close before the close of regular trading on the New York Stock Exchange, the Fund uses an independent pricing service on a daily basis to fair value price the securities pursant to Valuation Procedures adopted by the Board of Trustees.
| ** | Fair valued pursuant to Valuation Procedures adopted by the Board of Trustees. This holding represents 0.69% of the Fund’s net assets at December 31, 2006. This security was also deemed illiquid pursuant to Liquidity Procedures approved by the Board of Trustees. |
At December 30, 2006 the Fund’s Portfolio of Investments includes the following industry categories:
| | |
Consumer Discretionary | | 26.0% |
Finance | | 19.2% |
Information Technology | | 12.3% |
Industrials & Services | | 12.0% |
Telecommunication Services | | 10.8% |
Consumer Staples | | 9.5% |
Energy | | 7.7% |
Materials | | 2.4% |
Health Care | | 0.1% |
| | |
| | 100.0% |
| | |
At December 31, 2006 the Fund’s Portfolio of Investments includes the following currency categories:
| | |
United States Dollar | | 18.3% |
Indian Rupee | | 17.1% |
Brazilian Real | | 14.5% |
Hong Kong Dollar | | 14.0% |
Mexico Nuevo Peso | | 10.0% |
Taiwan Dollar | | 6.0% |
South African Rand | | 6.0% |
South Korean Won | | 4.8% |
Indonesian Rupiah | | 3.0% |
Malaysian Ringgit | | 2.9% |
Chilean Peso | | 1.5% |
Turkish Lira | | 1.1% |
British Pound Sterling | | 0.8% |
| | |
| | 100.0% |
| | |
See accompanying Notes to Financial Statements.
22 Annual Report | December 31, 2006 |
Statements of Assets and Liabilities
December 31, 2006 (all dollar amounts in thousands)
| | | | | | | | | | | | | | | | |
| | | Institutional International Growth Fund | | | Institutional International Equity Fund | | | International
Small Cap
Growth Fund | | | Emerging
Markets
Growth Fund | |
Assets | | | | | | | | | | | | | | | | |
Investments in securities, at cost | | $ | 1,345,359 | | | $ | 498,792 | | | $ | 196,027 | | | $ | 634,600 | |
Investments in Affiliated Fund, at cost | | | 52 | | | | 4,006 | | | | 5,228 | | | | 1,265 | |
| | | | | | | | | | | | | | | | |
| | | | |
Investments in securities, at value | | $ | 1,868,550 | | | $ | 597,247 | | | $ | 226,468 | | | $ | 812,126 | |
Investments in Affiliated Fund, at value | | | 52 | | | | 4,006 | | | | 5,228 | | | | 1,265 | |
Cash | | | — | | | | — | | | | — | | | | 150 | |
Foreign currency, at value (cost $225, $—, $1,447, and $8,232, respectively) | | | 220 | | | | — | | | | 1,444 | | | | 8,184 | |
Receivable for fund shares sold | | | — | | | | — | | | | 165 | | | | 1,106 | |
Receivable for investment securities sold | | | 25,399 | | | | 251 | | | | 467 | | | | 2,180 | |
Receivable from Advisor | | | — | | | | — | | | | — | | | | 22 | |
Dividend and interest receivable | | | 1,901 | | | | 572 | | | | 183 | | | | 547 | |
| | | | | | | | | | | | | | | | |
Total assets | | | 1,896,122 | | | | 602,076 | | | | 233,955 | | | | 825,580 | |
Liabilities | | | | | | | | | | | | | | | | |
Payable for investment securities purchased | | | 18,536 | | | | 3,146 | | | | 1,688 | | | | 10,869 | |
Payable for fund shares redeemed | | | 537 | | | | — | | | | 2 | | | | 97 | |
Management fee payable | | | 1,510 | | | | 457 | | | | 203 | | | | 693 | |
Distribution and shareholder administration fee payable | | | — | | | | — | | | | 15 | | | | 45 | |
Other accrued expenses | | | 198 | | | | 98 | | | | 78 | | | | 227 | |
| | | | | | | | | | | | | | | | |
Total liabilities | | | 20,781 | | | | 3,701 | | | | 1,986 | | | | 11,931 | |
| | | | | | | | | | | | | | | | |
Net Assets | | $ | 1,875,341 | | | $ | 598,375 | | | $ | 231,969 | | | $ | 813,649 | |
| | | | | | | | | | | | | | | | |
Capital | | | | | | | | | | | | | | | | |
Composition of Net Assets | | | | | | | | | | | | | | | | |
Par value of shares of beneficial interest | | $ | 97 | | | $ | 42 | | | $ | 17 | | | $ | 42 | |
Capital paid in excess of par value | | | 1,327,571 | | | | 500,179 | | | | 200,077 | | | | 617,443 | |
Accumulated net investment income (loss) | | | (40,814 | ) | | | (6,711 | ) | | | (137 | ) | | | (492 | ) |
Accumulated realized gain (loss) | | | 65,290 | | | | 6,413 | | | | 1,575 | | | | 19,184 | |
Net unrealized appreciation (depreciation) of investments and foreign currencies | | | 523,197 | | | | 98,452 | | | | 30,437 | | | | 177,472 | |
| | | | | | | | | | | | | | | | |
Net Assets | | $ | 1,875,341 | | | $ | 598,375 | | | $ | 231,969 | | | $ | 813,649 | |
| | | | | | | | | | | | | | | | |
| | | | |
Net Assets | | $ | 1,875,341 | | | $ | 598,375 | | | | | | | | | |
Shares Outstanding | | | 96,733,139 | | | | 41,925,377 | | | | | | | | | |
Net Asset Value Per Share | | $ | 19.39 | | | $ | 14.27 | | | | | | | | | |
Institutional Share Class | | | | | | | | | | | | | | | | |
Net Assets | | $ | — | | | $ | — | | | $ | 146,493 | | | $ | 553,373 | |
Shares Outstanding | | | — | | | | — | | | | 10,909,674 | | | | 28,325,003 | |
Net Asset Value Per Share | | $ | — | | | $ | — | | | $ | 13.43 | | | $ | 19.54 | |
See accompanying Notes to Financial Statements.
December 31, 2006 | William Blair Funds 23 |
Statements of Operations
For the Year Ended December 31, 2006 (all dollar amounts in thousands)
| | | | | | | | | | | | | | | | |
| | | Institutional
International
Growth
Fund | | | Institutional
International
Equity Fund | | | International
Small Cap
Growth
Fund | | | Emerging
Markets
Growth
Fund | |
Investment income | | | | | | | | | | | | | | | | |
Dividends | | $ | 27,968 | | | $ | 6,184 | | | $ | 1,235 | | | $ | 6,186 | |
Less foreign tax withheld | | | (2,282 | ) | | | (539 | ) | | | (105 | ) | | | (453 | ) |
Dividend Income from Affiliated Fund | | | 226 | | | | 72 | | | | 20 | | | | 102 | |
Interest | | | 1,305 | | | | 800 | | | | 312 | | | | 765 | |
| | | | | | | | | | | | | | | | |
Total income | | | 27,217 | | | | 6,517 | | | | 1,462 | | | | 6,600 | |
Expenses | | | | | | | | | | | | | | | | |
Investment advisory fees | | | 16,294 | | | | 4,068 | | | | 1,269 | | | | 5,363 | |
Distribution fees | | | — | | | | — | | | | 30 | | | | 99 | |
Shareholder administration fees | | | — | | | | — | | | | 63 | | | | 180 | |
Custodian fees | | | 1,123 | | | | 366 | | | | 253 | | | | 832 | |
Transfer agent fees | | | 42 | | | | 12 | | | | 21 | | | | 68 | |
Professional fees | | | 66 | | | | 45 | | | | 35 | | | | 41 | |
Registration fees | | | 54 | | | | 46 | | | | 73 | | | | 104 | |
Other expenses | | | 260 | | | | 49 | | | | 19 | | | | 82 | |
| | | | | | | | | | | | | | | | |
Total expenses before waiver | | | 17,839 | | | | 4,586 | | | | 1,763 | | | | 6,769 | |
Less expenses waived or absorbed by the Advisor | | | — | | | | (94 | ) | | | (80 | ) | | | (380 | ) |
| | | | | | | | | | | | | | | | |
Net expenses | | | 17,839 | | | | 4,492 | | | | 1,683 | | | | 6,389 | |
| | | | | | | | | | | | | | | | |
Net investment income (loss) | | | 9,378 | | | | 2,025 | | | | (221 | ) | | | 211 | |
Net realized and unrealized gain (loss) on investments, foreign currency transactions and other assets and liabilities | | | | | | | | | | | | | | | | |
Net realized gain (loss) on investments | | | 273,673 | | | | 9,483 | | | | 3,035 | | | | 26,278 | |
Net realized gain (loss) on foreign currency transactions and other assets and liabilities | | | (5,753 | ) | | | (1,660 | ) | | | (736 | ) | | | (3,285 | ) |
| | | | | | | | | | | | | | | | |
Total net realized gain (loss) | | | 267,920 | | | | 7,823 | | | | 2,299 | | | | 22,993 | |
Change in net unrealized appreciation (depreciation) on investments, foreign currency translation and other assets and liabilities | | | 91,778 | | | | 72,424 | | | | 26,158 | | | | 147,786 | |
| | | | | | | | | | | | | | | | |
Net increase (decrease) in net assets resulting from operations | | $ | 369,076 | | | $ | 82,272 | | | $ | 28,236 | | | $ | 170,990 | |
| | | | | | | | | | | | | | | | |
See accompanying Notes to Financial Statements.
24 Annual Report | December 31, 2006 |
Statements of Changes in Net Assets
For the Years Ended December 31, 2006 and 2005 (all amounts in thousands)
| | | | | | | | | | | | | | | | | | | | | | | | | | | | | | | | |
| | | Institutional
International
Growth
Fund | | | Institutional
International
Equity
Fund | | | International
Small Cap
Growth
Fund | | | Emerging
Markets
Growth
Fund | |
| | | 2006 | | | 2005 | | | 2006 | | | 2005 | | | 2006 | | | 2005(a) | | | 2006 | | | 2005(b) | |
Operations | | | | | | | | | | | | | | | | | | | | | | | | | | | | | | | | |
Net investment income (loss) | | $ | 9,378 | | | $ | 6,765 | | | $ | 2,025 | | | $ | 257 | | | $ | (221 | ) | | $ | (6 | ) | | $ | 211 | | | $ | 69 | |
Net realized gain (loss) on investments, foreign currency transactions and other assets and liabilities | | | 267,920 | | | | 110,297 | | | | 7,823 | | | | (1,426 | ) | | | 2,299 | | | | 355 | | | | 22,993 | | | | 1,535 | |
Change in net unrealized appreciation (depreciation) on investments, foreign currency translation and other assets and liabilities | | | 91,778 | | | | 167,187 | | | | 72,424 | | | | 25,499 | | | | 26,158 | | | | 4,279 | | | | 147,786 | | | | 29,686 | |
| | | | | | | | | | | | | | | | | | | | | | | | | | | | | | | | |
Net increase (decrease) in net assets resulting from operations | | | 369,076 | | | | 284,249 | | | | 82,272 | | | | 24,330 | | | | 28,236 | | | | 4,628 | | | | 170,990 | | | | 31,290 | |
Distributions to shareholders from | | | | | | | | | | | | | | | | | | | | | | | | | | | | | | | | |
Net investment income | | | (32,267 | ) | | | (11,444 | ) | | | (6,495 | ) | | | (442 | ) | | | (106 | ) | | | (6 | ) | | | (405 | ) | | | — | |
Net realized gain | | | (217,683 | ) | | | (112,356 | ) | | | (1,892 | ) | | | (3 | ) | | | (877 | ) | | | — | | | | (4,544 | ) | | | (1,169 | ) |
| | | | | | | | | | | | | | | | | | | | | | | | | | | | | | | | |
| | | (249,950 | ) | | | (123,800 | ) | | | (8,387 | ) | | | (445 | ) | | | (983 | ) | | | (6 | ) | | | (4,949 | ) | | | (1,169 | ) |
Capital stock transactions | | | | | | | | | | | | | | | | | | | | | | | | | | | | | | | | |
Net proceeds from sale of shares | | | 144,396 | | | | 114,081 | | | | 281,476 | | | | 201,804 | | | | 172,153 | | | | 46,006 | | | | 529,925 | | | | 224,893 | |
Shares issued in reinvestment of income dividends and capital gain distributions | | | 244,472 | | | | 120,609 | | | | 7,436 | | | | 383 | | | | 868 | | | | 6 | | | | 4,687 | | | | 1,122 | |
Less cost of shares redeemed | | | (188,067 | ) | | | (63,161 | ) | | | (15,351 | ) | | | (2,527 | ) | | | (18,839 | ) | | | (100 | ) | | | (136,352 | ) | | | (6,788 | ) |
| | | | | | | | | | | | | | | | | | | | | | | | | | | | | | | | |
Net increase (decrease) in net assets resulting from capital stock transactions | | | 200,801 | | | | 171,529 | | | | 273,561 | | | | 199,660 | | | | 154,182 | | | | 45,912 | | | | 398,260 | | | | 219,227 | |
| | | | | | | | | | | | | | | | | | | | | | | | | | | | | | | | |
Increase (decrease) in net assets | | | 319,927 | | | | 331,978 | | | | 347,446 | | | | 223,545 | | | | 181,435 | | | | 50,534 | | | | 564,301 | | | | 249,348 | |
Net assets | | | | | | | | | | | | | | | | | | | | | | | | | | | | | | | | |
Beginning of year | | $ | 1,555,414 | | | $ | 1,223,436 | | | $ | 250,929 | | | $ | 27,384 | | | $ | 50,534 | | | $ | — | | | $ | 249,348 | | | $ | — | |
| | | | | | | | | | | | | | | | | | | | | | | | | | | | | | | | |
End of year | | $ | 1,875,341 | | | $ | 1,555,414 | | | $ | 598,375 | | | $ | 250,929 | | | $ | 231,969 | | | $ | 50,534 | | | $ | 813,649 | | | $ | 249,348 | |
| | | | | | | | | | | | | | | | | | | | | | | | | | | | | | | | |
Undistributed net investment income (loss) at the end of the year | | $ | (37,438 | ) | | $ | (14,549 | ) | | $ | (5,051 | ) | | $ | (581 | ) | | $ | (426 | ) | | $ | (99 | ) | | $ | (516 | ) | | $ | (322 | ) |
| | | | | | | | | | | | | | | | | | | | | | | | | | | | | | | | |
Capital stock transactions in dollars | | | | | | | | | | | | | | | | | | | | | | | | | | | | | | | | |
Sales | | | | | | | | | | | | | | | | | | $ | 103,040 | | | $ | 31,900 | | | $ | 346,626 | | | $ | 172,789 | |
Reinvested distributions | | | | | | | | | | | | | | | | | | | 593 | | | | 6 | | | | 3,326 | | | | 858 | |
Redemptions | | | | | | | | | | | | | | | | | | | (11,665 | ) | | | — | | | | (110,338 | ) | | | (5,159 | ) |
| | | | | | | | | | | | | | | | | | | | | | | | | | | | | | | | |
Net change in net assets relating to fund share activity | | | | | | | | | | | | | | | | | | $ | 91,968 | | | $ | 31,906 | | | $ | 239,614 | | | $ | 168,488 | |
| | | | | | | | | | | | | | | | | | | | | | | | | | | | | | | | |
Capital stock transactions in shares | | | | | | | | | | | | | | | | | | | | | | | | | | | | | | | | |
Shares sold | | | 7,491 | | | | 6,656 | | | | 21,737 | | | | 18,357 | | | | 8,638 | | | | 3,150 | | | | 20,905 | | | | 13,777 | |
Shares issued in reinvestment of income dividends or capital gain distributions | | | 12,799 | | | | 6,798 | | | | 527 | | | | 32 | | | | 45 | | | | — | | | | 176 | | | | 62 | |
Less shares redeemed | | | (9,426 | ) | | | (3,750 | ) | | | (1,172 | ) | | | (240 | ) | | | (923 | ) | | | — | | | | (6,095 | ) | | | (500 | ) |
| | | | | | | | | | | | | | | | | | | | | | | | | | | | | | | | |
Net change in shares outstanding | | | 10,864 | | | | 9,704 | | | | 21,092 | | | | 18,149 | | | | 7,760 | | | | 3,150 | | | | 14,986 | | | | 13,339 | |
| | | | | | | | | | | | | | | | | | | | | | | | | | | | | | | | |
| (a) | | For the period from November 1, 2005 (Commencement of Operations) to December 31, 2005. |
| (b) | | For the period from June 6, 2005 (Commencement of Operations) to December 31, 2005. |
See accompanying Notes to Financial Statements.
December 31, 2006 | William Blair Funds 25 |
Notes to Financial Statements
(1) Significant Accounting Policies
The following is a summary of the Fund’s significant accounting policies in effect during the period covered by the financial statements, which are in accordance with U.S. generally accepted accounting principles.
(a) Description of the Fund
William Blair Funds (the “Fund”) is a diversified mutual fund registered under the Investment Company Act of 1940, as amended, as an open-end management investment company. The number of shares authorized for this Fund is unlimited. The Fund currently consists of the following fifteen portfolios (the “Portfolios”), each with its own investment objectives and policies.
| | |
Equity Portfolios | | International Portfolios |
Growth | | International Growth |
Tax-Managed Growth | | International Equity |
Large Cap Growth | | Institutional International Growth |
Small Cap Growth | | Institutional International Equity |
Mid Cap Growth | | International Small Cap Growth |
Small-Mid Cap Growth | | Emerging Markets Growth |
Value Discovery | | Fixed Income Portfolio |
| | Income |
| | Money Market Portfolio |
| | Ready Reserves |
The investment objectives of the Portfolios are as follows:
| | |
Equity | | Long-term capital appreciation. |
International | | Long-term capital appreciation. |
Fixed Income | | High level of current income with relative stability of principal. |
Money Market | | Current income, a stable share price and daily liquidity. |
The Institutional International Growth Fund, the Institutional International Equity Fund and the Institutional Share Classes of the International Small Cap Growth Fund and the Emerging Markets Growth Fund are the only Portfolios covered in this report.
(b) Share Classes
Three different classes of shares of the International Small Cap Growth Fund and Emerging Markets Growth Fund currently exist: N, I and Institutional. This report includes financial information for only the Institutional Class. The Institutional share class is sold to institutional investors, including but not limited to employee benefit plans, endowments, foundations, trusts and corporations, who are able to meet the Fund’s high minimum investment requirement. The minimum initial investment required is $5 million.
(c) Investment Valuation
The market value of domestic equity securities and options is determined by valuing securities traded on national securities exchanges or markets or in the over-the-counter markets at the last sales price or, if applicable, the official closing price or, in the absence of a sale on the date of valuation, at the latest bid price.
For international securities, if the foreign exchange or market on which a security is primarily traded closes before the close of regular trading on the New York Stock Exchange (4:00 p.m. Eastern time), the Portfolios use an independent pricing service on a daily basis to estimate the fair value price as of the close of regular trading on the New York Stock Exchange. The Board of Trustees has determined that the passage of time between when foreign exchanges or markets close and when the Portfolios calculate their net asset values could cause the value of international securities to no longer be representative of their market price or accurate. In addition, quarterly the Board of Trustees receives a report which compares the fair value prices used to calculate the net asset value to the next day’s opening local prices. Otherwise, the value of foreign equity securities is determined based on the last sale price on the foreign exchange or market on which it is primarily traded or, if
26 Annual Report | December 31, 2006 |
there have been no sales during that day, at the latest bid price. Foreign currency forward contracts and foreign currencies are valued at the forward and current exchange rates, respectively, prevailing on the date of valuation.
Investments in other funds are valued at the underlying fund’s net asset value on the date of valuation. Other securities, and all other assets, including securities for which a market price is not available, or the value of which is affected by a significant valuation event, are valued at fair value as determined in good faith by the Pricing Committee or Valuation Committee, in accordance with the Fund’s Valuation Procedures approved by the Board of Trustees. As of December 31, 2006, there were securities held in the Institutional International Growth, Institutional International Equity, International Small Cap Growth and Emerging Markets Growth Portfolios requiring fair valuation by the Board of Trustees pursuant to the Fund’s valuation procedures.
(d) Investment income and transactions
Dividend income is recorded on the ex-dividend date, except for those dividends from certain foreign securities which are recorded as soon as the information is available. Foreign currency gains and losses associated with fluctuation in the foreign currency rate versus the United States dollar are recorded on the Statement of Operations as a component of net realized gains/(losses) on foreign currency translation and other assets and liabilities.
Premiums and discounts are accreted and amortized on a straight-line basis for short-term investments and on an effective interest method for long-term investments.
Interest income is determined on the basis of the interest accrued, adjusted for amortization of premium or discount. Variable rate bonds and floating rate notes earn interest at coupon rates that fluctuate at specific time intervals.
Security and shareholder transactions are accounted for no later than one business day following the trade date. However, for financial reporting purposes, security and shareholder transactions are accounted for on the trade date of the last business day of the reporting period. Realized gains and losses from securities transactions are recognized on the basis of high cost lot sell selection.
Awards from class action litigation may be recorded as a reduction of cost. If the Funds no longer own the applicable securities, the proceeds are recorded as realized gains.
(e) Share Valuation and Dividends to Shareholders
Shares are sold and redeemed on a continuous basis at net asset value. The net asset value per share is determined by dividing the Portfolio’s net assets by the number of shares outstanding as of the close of regular trading on the New York Stock Exchange, which is generally 3:00 p.m. Central time (4:00 p.m. Eastern time), on each day the Exchange is open.
Dividends from net investment income, if any, are declared at least annually. Capital gain distributions, if any, are declared at least annually in December. Dividends payable to shareholders are recorded on the ex-dividend date.
(f) Foreign Currency Translation and Foreign Currency Forward Contracts
The Portfolios may invest in securities denominated in foreign currencies. As such, assets and liabilities denominated in foreign currencies are translated into U.S. dollar amounts at the current exchange rate on the date of valuation. The values of foreign investments, open foreign currency forward contracts, and cash denominated in foreign currencies are translated into U.S. dollars using a spot market rate of exchange as of the time of the determination of each Fund’s NAV typically 4:00 p.m. Eastern time on days when there is regular trading on the New York Stock Exchange. Payables and receivables for securities transactions, dividends, interest income and tax reclaims are translated into U.S. dollars using a spot market rate of exchange as of 4:00 p.m. Eastern time. Settlement of purchases and sales and dividend and interest receipts are translated into U.S. dollars using a spot market rate of exchange as of 11:00 a.m. Eastern time.
These Portfolios may enter into foreign currency forward contracts (1) as a means of managing the risks associated with changes in the exchange rates for the purchase or sale of a specific amount of a particular foreign currency, and (2) to hedge the value, in U.S. dollars, of portfolio securities. Gains and losses from foreign currency transactions associated with purchases and sales of investments and foreign currency forward contracts are included with the net realized and unrealized gain or loss on investments. For tax purposes, the foreign currency gains and losses are treated as ordinary income.
December 31, 2006 | Annual Report 27 |
(g) Income Taxes
The Portfolios intend to comply with the special provisions of Subchapter M of the Internal Revenue Code available to regulated investment companies and, therefore, no provision for Federal income taxes has been made in the accompanying financial statements since each Portfolio intends to distribute substantially all of its taxable income to its shareholders and be relieved of all Federal income taxes.
The Portfolios have elected to mark-to-market their investments in Passive Foreign Investment Companies (“PFICs”) for Federal income tax purposes. In accordance with this election, the Institutional International Growth, Institutional International Equity, International Small Cap Growth and Emerging Markets Growth Portfolios recognized net unrealized appreciation (depreciation) of $25,722, $7,000, $— and $—, respectively (in thousands) in 2006, all of which has been treated as an adjustment to the cost of investments for tax purposes. The Portfolios also treat the deferred loss associated with current and prior year wash sales as an adjustment to the cost of investments for tax purposes. The cost of investments for Federal income tax purposes and related gross unrealized appreciation/(depreciation) and net unrealized appreciation/(depreciation) at December 31, 2006 were as follows (in thousands):
| | | | | | | | | | | | |
Portfolio | | Cost of
Investments | | Gross Unrealized Appreciation | | Gross Unrealized Depreciation | | Net Unrealized
Appreciation / (Depreciation) |
Institutional International Growth | | $ | 1,394,360 | | $ | 479,698 | | $ | 5,450 | | $ | 474,248 |
Institutional International Equity | | | 512,715 | | | 90,137 | | | 1,602 | | | 88,535 |
International Small Cap Growth | | | 202,266 | | | 31,673 | | | 2,247 | | | 29,426 |
Emerging Markets Growth | | | 641,493 | | | 175,190 | | | 3,346 | | | 171,844 |
The timing and characterization of certain income and capital gain distributions are determined annually in accordance with Federal income tax regulations that may differ from U.S. generally accepted accounting principles. As a result, net investment income or loss and net realized gain or loss for a reporting period may differ from the amount distributed during such period. In addition, the Portfolios may periodically record reclassifications among certain capital accounts to reflect differences between financial reporting and income tax basis distributions. The reclassifications were reported in order to reflect the tax treatment for certain permanent differences that exist between income tax regulations and U.S. generally accepted accounting principles. The reclassifications generally relate to section 988 currency gains and losses, and recharacterization of unrealized appreciation on PFICs (Passive Foreign Investment Corporations). These reclassifications have no impact on the net asset values of the Portfolio. Accordingly, at December 31, 2006, the following reclassifications were recorded (in thousands):
| | | | | | | | | | | | |
Portfolio | | Undistributed Net
Investment Income/(Loss) | | | Accumulated
Undistributed
Net Realized Gain/ (Loss) | | | Capital
Paid In Excess
of Par Value | |
Institutional International Growth | | $ | (3,376 | ) | | $ | 3,376 | | | $ | — | |
Institutional International Equity | | | (1,660 | ) | | | 1,660 | | | | — | |
International Small Cap Growth | | | 289 | | | | (289 | ) | | | — | |
Emerging Markets Growth | | | 24 | | | | (22 | ) | | | (2 | ) |
Distributions from net realized gains for book purposes may include short-term capital gains, which are included as ordinary income for tax purposes. The tax character of distributions paid during 2006 and 2005 was as follows (in thousands):
| | | | | | | | | | | | |
| | | Distributions Paid In 2006 | | Distributions Paid In 2005 |
Portfolio | | Ordinary
Income | | Long-Term
Capital Gains | | Ordinary
Income | | Long-Term
Capital Gains |
Institutional International Growth | | $ | 48,076 | | $ | 201,874 | | $ | 14,610 | | $ | 109,190 |
Institutional International Equity | | | 6,495 | | | 1,892 | | | 445 | | | — |
International Small Cap Growth | | | 983 | | | — | | | 6 | | | — |
Emerging Markets Growth | | | 1,585 | | | 3,364 | | | 1,169 | | | — |
As of December 31, 2006, the components of distributable earnings on a tax basis were as follows (in thousands):
| | | | | | | | | | | | |
Portfolio | | Undistributed
Ordinary
Income | | Accumulated
Capital and
Other Losses | | Undistributed
Long-Term
Gain | | Net Unrealized
Appreciation / (Depreciation) |
Institutional International Growth | | $ | 8,636 | | $ | — | | $ | 64,789 | | $ | 474,248 |
Institutional International Equity | | | 4,100 | | | — | | | 5,519 | | | 88,535 |
International Small Cap Growth | | | 856 | | | 137 | | | 1,730 | | | 29,426 |
Emerging Markets Growth | | | 5,520 | | | 503 | | | 19,303 | | | 171,844 |
28 Annual Report | December 31, 2006 |
At December 31, 2006, the Portfolios, have no unused capital loss carryforwards available for Federal income tax purposes to be applied against future capital gains, if any.
For the period November 1, 2006 through December 31, 2006, the following Portfolios incurred net realized capital or foreign currency losses. Each Portfolio intends to treat this loss as having occurred in fiscal year 2007 for Federal income tax purposes (in thousands):
| | | |
Portfolio | | Currency Loss |
Institutional International Growth | | $ | — |
Institutional International Equity | | | — |
International Small Cap Growth | | | 137 |
Emerging Markets Growth | | | 503 |
(h) Repurchase Agreements
The Portfolios may enter into repurchase agreements with its custodian, Investors Bank & Trust Company, whereby the Portfolios acquire ownership of a debt security and the custodian agrees, at the time of sale, to repurchase the debt security from the Portfolios at a mutually agreed upon time and price. The Portfolios’ policy is to take possession of the debt security as collateral under the repurchase agreements. The Portfolios minimize credit risk by monitoring credit exposure to the custodian and by monitoring the collateral value on an ongoing basis.
(i) Use of Estimates
The preparation of financial statements in conformity with U.S. generally accepted accounting principles requires management to make estimates and assumptions that affect the amounts reported in the financial statements. Actual results may differ from those estimates.
(2) New Accounting Pronouncements
In July 2006, the Financial Accounting Standards Board (FASB) released FASB Interpretation No. 48 “Accounting for Uncertainty in Income Taxes” (FIN 48). FIN 48 provides guidance for how uncertain tax positions should be recognized, measured, presented and disclosed in the financial statements. FIN 48 requires the evaluation of tax positions taken or expected to be taken in the course of preparing the Fund’s tax returns to determine whether the tax positions are “more-likely-than-not” of being sustained by the applicable tax authority. Tax positions not deemed to meet the more-likely-than-not threshold would be recorded as a tax benefit or expense in the current year. Adoption of FIN 48 is required for fiscal years beginning after December 15, 2006. Recent SEC guidance allows implementing FIN 48 in fund NAV calculations as late as the fund’s last NAV calculation in the first required financial statement reporting period. As a result, the funds will incorporate FIN 48 in their semi-annual report on June 30, 2007.
In September 2006, the Financial Accounting Standards Board (FASB) issued Statement on Financial Accounting Standards No. 157, “Fair Value Measurements” (FAS 157). This standard clarifies the definition of fair value for financial reporting, establishes a framework for measuring fair value and requires additional disclosures about the use of fair value measurements. FAS 157 is effective for financial statements issued for fiscal years beginning after November 15, 2007. Management is currently evaluating the impact that FAS 157 will have on the Funds’ financial statements.
(3) Transactions with Affiliates
(a) Management and Expense Limitation Agreements
The Institutional International Growth and Institutional International Equity Portfolios have a management agreement with William Blair & Company L.L.C. (the “Company”) for investment advisory, administrative, and other accounting services. The Portfolios pay the Company an annual fee, payable monthly, based on a specified percentage of its average daily net assets. A summary of the annual rates expressed as a percentage of average daily net assets is as follows:
| | | |
First $500 million | | 1.00 | % |
Next $500 million | | 0.95 | % |
In excess of $1 billion | | 0.90 | % |
The International Small Cap Growth Portfolio pays the Company a 1.00% annual fee payable monthly, based on its average daily net assets. The Emerging Markets Growth Portfolio pays the Company a 1.10% annual fee payable monthly, based on its average daily net assets.
December 31, 2006 | William Blair Funds 29 |
All of the Portfolios, except Institutional International Growth Fund, have also entered into Expense Limitation Agreements with the Company. Under the terms of these Agreements, the Company has agreed to waive its advisory fees and absorb other operating expenses through April 30, 2007, if total expenses of the Institutional International Equity Portfolios exceed 1.10% of average daily net assets or 1.25% of average daily net assets for the Institutional Share Classes of the International Small Cap Growth and Emerging Markets Growth Portfolios.
For a period of three years subsequent to the Commencement of Operations of the Portfolio, the Company is entitled to reimbursement from the Institutional International Equity, International Small Cap Growth and Emerging Markets Growth Portfolios for previously waived fees and expenses to the extent the overall expense ratio remains below the percentages indicated. The total amount available for recapture at December 31, 2006 is $323, $134 and $541 (in thousands) for Institutional International Equity, International Small Cap Growth and Emerging Markets Growth Portfolios, respectively. As a result, the total expense ratio for a Portfolio during the period the agreement is in effect, will not fall below the percentage indicated.
For the year ended December 31, 2006, the investment advisory fees incurred by the Portfolio and related fee waivers were as follows (in thousands) :
| | | | | | | | | | | | |
Portfolio | | Gross
Advisory Fee | | Fee Waiver | | Net
Advisory Fee | | Expenses
(Recovered) or
Absorbed by
Advisor |
Institutional International Growth | | $ | 16,294 | | $ | — | | $ | 16,294 | | $ | — |
Institutional International Equity | | | 4,068 | | | 94 | | | 3,974 | | | — |
International Small Cap Growth | | | 1,269 | | | 80 | | | 1,189 | | | — |
Emerging Markets Growth | | | 5,363 | | | 357 | | | 5,006 | | | — |
(b) Trustees Fees
The Portfolios incurred fees of $34 (in thousands) to non-interested trustees of the Fund for the year ended December 31, 2006. Interested trustees are not compensated by the Fund.
(c) Investments in Affiliated Portfolio
Until June 20, 2006, pursuant to an Exemptive Order granted by the Securities and Exchange Commission in January, 2001, and since June 20, 2006 pursuant to the rules of the 1940 Act, each of the Portfolios of the Fund may invest in the William Blair Ready Reserves Portfolio (“Ready Reserves”), an open-end money market portfolio managed by the Advisor. Ready Reserves Portfolio is used as a cash management option to the other Portfolios in the Fund. The Advisor waives management fees and shareholder service fees earned from the other Portfolios investment in the Ready Reserves Fund. The fees waived with respect to the Portfolio for the year ended December 31, 2006 are listed below. Distributions received from Ready Reserves are reflected as dividend income from affiliated Fund in the Portfolio’s statement of operations. Amounts relating to the Portfolio’s investments in Ready Reserves were as follows for the year ended December 31, 2006 (in thousands):
| | | | | | | | | | | | | | | | | | |
Portfolio | | Purchases | | Sales
Proceeds | | Fees
Waived | | Dividend
Income | | Value | | Percent
of Net
Assets | |
Institutional International Growth | | $ | 18,847 | | $ | 19,874 | | $ | 29 | | $ | 226 | | $ | 52 | | — | % |
Institutional International Equity | | | 6,158 | | | 2,245 | | | 9 | | | 72 | | | 4,006 | | 0.7 | |
International Small Cap Growth | | | 7,473 | | | 2,655 | | | 3 | | | 20 | | | 5,228 | | 2.3 | |
Emerging Markets Growth | | | 7,516 | | | 10,072 | | | 14 | | | 102 | | | 1,265 | | 0.2 | |
(4) Investment Transactions
Investment transactions, excluding money market instruments, for the year ended December 31, 2006, were as follows (in thousands):
| | | | | | |
Portfolio | | Purchases | | Sales |
Institutional International Growth | | $ | 1,270,814 | | $ | 1,304,391 |
Institutional International Equity | | | 575,348 | | | 311,754 |
International Small Cap Growth | | | 277,747 | | | 134,994 |
Emerging Markets Growth | | | 928,614 | | | 532,078 |
(5) Foreign Currency Forward Contracts
To protect itself against a decline in the value of foreign currency against the U.S. dollar, each Portfolio enters into foreign currency forward contracts with its custodian and others. The Portfolio bears the market risk that arises from changes in
30 Annual Report | December 31, 2006 |
Financial Highlights
Institutional International Growth Fund
foreign currency rates and bears the credit risk if the counterparty fails to perform under the contract. The net realized and unrealized gains and losses associated with foreign currency forward contracts are reflected in the accompanying financial statements.
| | | | | | | | | | | | | | | | |
| | | | |
| | | Years Ended December 31, | |
| | | 2006 | | 2005 | | 2004 | | 2003 | | 2002(a) | |
Net asset value, beginning of year | | $ | 18.11 | | $ | 16.06 | | $ | 13.60 | | $ | 9.57 | | $ | 10.00 | |
Income from investment operations: | | | | | | | | | | | | | | | | |
Net investment income (b) | | | 0.11 | | | 0.09 | | | 0.03 | | | 0.07 | | | — | |
Net realized and unrealized gain (loss) on investments | | | 4.09 | | | 3.53 | | | 2.44 | | | 3.99 | | | (0.43 | ) |
| | | | | | | | | | | | | | | | |
Total from investment operations | | | 4.20 | | | 3.62 | | | 2.47 | | | 4.06 | | | (0.43 | ) |
Less distributions from: | | | | | | | | | | | | | | | | |
Net investment income | | | 0.38 | | | 0.15 | | | 0.01 | | | 0.03 | | | — | |
Net realized gain | | | 2.54 | | | 1.42 | | | — | | | — | | | — | |
| | | | | | | | | | | | | | | | |
Total distributions | | | 2.92 | | | 1.57 | | | 0.01 | | | 0.03 | | | — | |
| | | | | | | | | | | | | | | | |
Net asset value, end of year | | $ | 19.39 | | $ | 18.11 | | $ | 16.06 | | $ | 13.60 | | $ | 9.57 | |
| | | | | | | | | | | | | | | | |
Total return (%) | | | 23.45 | | | 22.76 | | | 18.15 | | | 42.47 | | | (4.27 | ) |
Ratios to average daily net assets (%): | | | | | | | | | | | | | | | | |
Expenses, net of waivers and reimbursements | | | 1.03 | | | 1.05 | | | 1.10 | | | 1.10 | | | 1.10 | (c) |
Expenses, before waivers and reimbursements | | | 1.03 | | | 1.05 | | | 1.11 | | | 1.16 | | | 1.29 | (c) |
Net investment income (loss), net of waivers and reimbursements | | | 0.54 | | | 0.52 | | | 0.18 | | | 0.37 | | | (0.05 | )(c) |
Net investment income (loss), before waivers and reimbursements | | | 0.54 | | | 0.52 | | | 0.17 | | | 0.31 | | | (0.24 | )(c) |
| | | | | | | | | | | | | | | | |
| | | Years Ended December 31, | |
| | | 2006 | | 2005 | | 2004 | | 2003 | | 2002 | |
Supplemental data: | | | | | | | | | | | | | | | | |
Net assets at end of year (in thousands) | | $ | 1,875,341 | | $ | 1,555,414 | | $ | 1,223,436 | | $ | 477,511 | | $ | 149,848 | |
Portfolio turnover rate (%) | | | 74 | | | 74 | | | 72 | | | 56 | | | 59 | (c) |
| (a) | | For the period from July 26, 2002 (Commencement of Operations) to December 31, 2002. |
| (b) | | Excludes $0.29, $0.25, $0.10, $0.06, and $0.02 of PFIC mark to market which is treated as ordinary income for Federal tax purposes for the years 2006, 2005, 2004, 2003 and 2002, respectively. |
| (c) | | Rates are annualized for periods that are less than a year. |
Performance cited represents past performance. Past performance does not guarantee future results and current performance may be lower or higher that the data quoted. Results shown are annual returns, which assume reinvestment of dividends and capital gains. Investment returns and principal will fluctuate and you may have a gain or loss when you sell shares. For the most current month-end performance information, please call 1-800-742-7272, or visit our Web site at www.williamblairfunds. com.
Note: Net investment income (loss) per share is based on the average shares outstanding during the year.
December 31, 2006 | William Blair Funds 31 |
Financial Highlights
Institutional International Equity Fund
| | | | | | | | | | |
| | | | |
| | | Years Ended December 31, | |
| | | 2006 | | 2005 | | 2004(a) | |
Net asset value, beginning of year | | $ | 12.04 | | $ | 10.20 | | $ | 10.00 | |
Income from investment operations: | | | | | | | | | | |
Net investment income (b) | | | 0.07 | | | — | | | — | |
Net realized and unrealized gain (loss) on investments | | | 2.37 | | | 1.86 | | | 0.20 | |
| | | | | | | | | | |
Total from investment operations | | | 2.44 | | | 1.86 | | | 0.20 | |
Less distributions from: | | | | | | | | | | |
Net investment income | | | 0.16 | | | 0.02 | | | — | |
Net realized gain | | | 0.05 | | | — | | | — | |
| | | | | | | | | | |
Total distributions | | | 0.21 | | | 0.02 | | | — | |
| | | | | | | | | | |
Net asset value, end of year | | $ | 14.27 | | $ | 12.04 | | $ | 10.20 | |
| | | | | | | | | | |
Total return (%) | | | 20.22 | | | 18.26 | | | 2.00 | |
Ratios to average daily net assets (%): | | | | | | | | | | |
Expenses, net of waivers and reimbursements | | | 1.10 | | | 1.10 | | | 1.10 | (c) |
Expenses, before waivers and reimbursements | | | 1.12 | | | 1.35 | | | 2.46 | (c) |
Net investment income (loss), net of waivers and reimbursements | | | 0.50 | | | 0.31 | | | (0.21 | )(c) |
Net investment income (loss), before waivers and reimbursements | | | 0.48 | | | 0.06 | | | (1.57 | )(c) |
| |
| | | | |
| | | Years Ended December 31, | |
| | | 2006 | | 2005 | | 2004 | |
Supplemental data: | | | | | | | | | | |
Net assets at end of year (in thousands) | | $ | 598,375 | | $ | 250,929 | | $ | 27,384 | |
Portfolio turnover rate (%) | | | 79 | | | 84 | | | 45 | (c) |
| (a) | | For the period from December 1, 2004 (Commencement of Operations) to December 31, 2004. |
| (b) | | Excludes $0.23, $0.27 and $0.01 of PFIC mark to market which is treated as ordinary income for Federal tax purposes for the years 2006, 2005 and 2004, respectively. |
| (c) | | Rates are annualized for periods that are less than a year. |
Performance cited represents past performance. Past performance does not guarantee future results and current performance may be lower or higher that the data quoted. Results shown are annual returns, which assume reinvestment of dividends and capital gains. Investment returns and principal will fluctuate and you may have a gain or loss when you sell shares. For the most current month-end performance information, please call 1-800-742-7272, or visit our Web site at www.williamblairfunds. com.
Note: Net investment income (loss) per share is based on the average shares outstanding during the year.
32 Annual Report | December 31, 2006 |
Financial Highlights
International Small Cap Growth Fund
Institutional Share Class
| | | | | | | | |
| | | | |
| | | Years Ended December 31, | |
| | | 2006 | | | 2005(a) | |
Net asset value, beginning of year | | $ | 11.16 | | | $ | 10.00 | |
Income from investment operations: | | | | | | | | |
Net investment income (b) | | | (0.01 | ) | | | — | |
Net realized and unrealized gain on investments | | | 2.34 | | | | 1.16 | |
| | | | | | | | |
Total from investment operations | | | 2.33 | | | | 1.16 | |
Less distributions from: | | | | | | | | |
Net investment income | | | 0.01 | | | | — | (c) |
Net realized gain | | | 0.05 | | | | — | |
| | | | | | | | |
Total distributions | | | 0.06 | | | | — | |
| | | | | | | | |
Net asset value, end of year | | $ | 13.43 | | | $ | 11.16 | |
| | | | | | | | |
Total return (%) | | | 20.86 | | | | 11.62 | |
Ratios to average daily net assets (%): | | | | | | | | |
Expenses, net of waivers and reimbursements | | | 1.25 | | | | 1.25 | (d) |
Expenses, before waivers and reimbursements | | | 1.31 | | | | 2.17 | (d) |
Net investment income (loss), net of waivers and reimbursements | | | (0.12 | ) | | | 0.00 | (d) |
Net investment income (loss), before waivers and reimbursements | | | (0.18 | ) | | | (0.92 | )(d) |
| | | | |
| | | Years Ended December 31, | |
| | | 2006 | | | 2005(a) | |
Supplemental data for all classes: | | | | | | | | |
Net assets at end of year (in thousands) | | $ | 231,969 | | | $ | 50,534 | |
Portfolio turnover rate (%) | | | 109 | | | | 127 | (d) |
| (a) | | For the period from November 1, 2005 (Commencement of Operations) to December 31, 2005. |
| (b) | | Excludes $0.00, $0.11 of PFIC mark to market which is treated as ordinary income for Federal tax purposes, for the years ended 2006 and 2005, respectively. |
| (c) | | Distribution less than $0.01 per share. |
| (d) | | Rates are annualized for periods that are less than a year. |
Performance cited represents past performance. Past performance does not guarantee future results and current performance may be lower or higher that the data quoted. Results shown are annual returns, which assume reinvestment of dividends and capital gains. Investment returns and principal will fluctuate and you may have a gain or loss when you sell shares. For the most current month-end performance information, please call 1-800-742-7272, or visit our Web site at www.williamblairfunds. com.
Note: Net investment income (loss) per share is based on the average shares outstanding during the year.
December 31, 2006 | William Blair Funds 33 |
Financial Highlights
Emerging Markets Growth Fund
Institutional Share Class
| | | | | | | |
| | | | |
| | | Years Ended December 31, | |
| | | 2006 | | 2005(a) | |
Net asset value, beginning of year | | $ | 14.20 | | $ | 10.00 | |
Income from investment operations: | | | | | | | |
Net investment income (b) | | | 0.02 | | | 0.01 | |
Net realized and unrealized gain on investments | | | 5.44 | | | 4.27 | |
| | | | | | | |
Total from investment operations | | | 5.46 | | | 4.28 | |
Less distributions from: | | | | | | | |
Net investment income | | | 0.01 | | | — | |
Net realized gain | | | 0.11 | | | 0.08 | |
| | | | | | | |
Total distributions | | | 0.12 | | | 0.08 | |
| | | | | | | |
Net asset value, end of year | | $ | 19.54 | | $ | 14.20 | |
| | | | | | | |
Total return (%) | | | 38.49 | | | 42.82 | |
Ratios to average daily net assets (%): | | | | | | | |
Expenses, net of waivers and reimbursements | | | 1.25 | | | 1.25 | (c) |
Expenses, before waivers and reimbursements | | | 1.32 | | | 1.61 | (c) |
Net investment income (loss), net of waivers and reimbursements | | | 0.09 | | | 0.19 | (c) |
Net investment income (loss), before waivers and reimbursements | | | 0.02 | | | (0.17 | )(c) |
| | | | |
| | | Year Ended December 31, | |
| | | 2006 | | 2005(a) | |
Supplemental data for all classes: | | | | | | | |
Net assets at end of year (in thousands) | | $ | 813,649 | | $ | 249,348 | |
Portfolio turnover rate (%) | | | 113 | | | 77 | (c) |
| (a) | | For the period from June 6, 2005 (Commencement of Operations) to December 31, 2005. |
| (b) | | Excludes $0.00 and $0.11 of PFIC mark to market which is treated as ordinary income for Federal tax purposes, for the years ended 2006 and 2005, respectively. |
| (c) | | Rates are annualized for periods that are less than a year. |
Performance cited represents past performance. Past performance does not guarantee future results and current performance may be lower or higher that the data quoted. Results shown are annual returns, which assume reinvestment of dividends and capital gains. Investment returns and principal will fluctuate and you may have a gain or loss when you sell shares. For the most current month-end performance information, please call 1-800-742-7272, or visit our Web site at www.williamblairfunds. com.
Note: Net investment income (loss) per share is based on the average shares outstanding during the year.
34 Annual Report | December 31, 2006 |
REPORT OF INDEPENDENT REGISTERED PUBLIC ACCOUNTING FIRM
To the Board of Trustees and Shareholders
William Blair Funds
We have audited the accompanying statements of assets and liabilities, including the portfolios of investments, of the Institutional International Growth Fund, Institutional International Equity Fund, International Small Cap Growth Fund and Emerging Markets Growth Fund (collectively, the “Portfolios”) (four of the Portfolios constituting the William Blair Funds) as of December 31, 2006, and the related statements of operations, statements of changes in net assets and financial highlights for the periods indicated therein. These financial statements and financial highlights are the responsibility of the Portfolios’ management. Our responsibility is to express an opinion on these financial statements and financial highlights based on our audits.
We conducted our audits in accordance with the standards of the Public Company Accounting Oversight Board (United States). Those standards require that we plan and perform the audit to obtain reasonable assurance about whether the financial statements and financial highlights are free of material misstatement. We were not engaged to perform an audit of the Portfolios’ internal control over financial reporting. Our audits included consideration of internal control over financial reporting as a basis for designing audit procedures that are appropriate in the circumstances, but not for the purpose of expressing an opinion on the effectiveness of the Portfolios’ internal control over financial reporting. Accordingly, we express no such opinion. An audit also includes examining, on a test basis, evidence supporting the amounts and disclosures in the financial statements and financial highlights, assessing the accounting principles used and significant estimates made by management, and evaluating the overall financial statement presentation. Our procedures included confirmation of securities owned as of December 31, 2006, by correspondence with the custodian and brokers or by other appropriate auditing procedures where replies from brokers were not received. We believe that our audits provide a reasonable basis for our opinion.
In our opinion, the financial statements and financial highlights referred to above present fairly, in all material respects, the financial position of each of the above mentioned Portfolios of the William Blair Funds at December 31, 2006, the results of their operations, changes in their net assets and financial highlights for the periods indicated therein, in conformity with U.S. generally accepted accounting principles.

Chicago, Illinois
February 12, 2007
December 31, 2006 | William Blair Funds 35 |
Trustees and Officers. (Unaudited) The trustees and officers of the William Blair Funds as of December 31, 2006, their year of birth, their principal occupations during the last five years, their affiliations, if any, with William Blair & Company, L.L.C., and other significant affiliations are set forth below. The address of each trustee and officer is 222 West Adams Street, Chicago, Illinois 60606.
| | | | | | | | | | |
Name and Year of Birth | | Position(s)
Held with
Fund | | Term of
Office and
Length of
Time
Served(1) | | Principal Occupation(s) During Past 5 Years | | Number of
Portfolios
in Fund
Complex
Overseen
by Trustee | | Other Directorships Held by Trustee/Officer |
Interested Trustees | | | | | | | | | | |
Frederick Conrad Fischer, 1934* | | Chairman of the Board of Trustees | | Since 1987 | | Principal, William Blair & Company, L.L.C.; Partner, APM Limited Partnership | | 15 | | Trustee Emeritus, Chicago Child Care Society, a non-profit organization; Trustee Emeritus, Kalamazoo College |
| | | | | |
Michelle Seitz, 1965* | | Trustee | | Since 2002 | | Principal, William Blair & Company, L.L.C. | | 15 | | N/A |
Non-Interested Trustees | | | | | | | | |
Theodore A. Bosler,
1934 | | Trustee | | Since 1997 | | Retired Principal and Vice President, Lincoln Capital Management | | 15 | | Desert Foothills Land Trust; Institute of Chartered Financial Analysts; and Thresholds |
| | | | | |
Ann P. McDermott,
1939 | | Trustee | | Since 1996 | | Board member and officer for various civic and charitable organizations over the past thirty years; professional experience prior thereto, registered representative for New York Stock Exchange firm | | 15 | | Northwestern University, Women’s Board; Rush Presbyterian St. Luke’s Medical Center, Women’s Board; University of Chicago, Women’s Board; Visiting Nurses Association, Honorary Director |
| | | | | |
Donald J. Reaves,
1946 | | Trustee | | Since 2004 | | Vice President for Administration and Chief Financial Officer, University of Chicago since 2002. Executive Vice President and Chief Financial Officer, Brown University from 1993 to 2002 | | 15 | | American Student Assistance Corp.; Amica Mutual Insurance Company; |
| | | | | |
John B. Schwemm,
1934 | | Trustee | | Since 1990 | | Retired Chairman and Chief Executive Officer, R.R. Donnelley & Sons Company | | 15 | | USG Corp., building material manufacturer, and Walgreen Co. (retail drugstores) |
| | | | | |
Donald L. Seeley,
1944 | | Trustee | | Since 2003 | | Director, Applied Investment Management Program, University of Arizona Department of Finance, Formerly Vice Chairman and Chief Financial Officer, True North Communications, Inc., marketing communications and advertising firm | | 15 | | Warnaco, Group Inc., intimate apparel, sportswear and swimwear manufacturer; Center for Furniture Craftmanship (not-for-profit) |
| | | | | |
Robert E. Wood II, 1938 | | Trustee | | Since 1999 | | Retired Executive Vice President, Morgan Stanley Dean Witter | | 15 | | Chairman, Add-Vision, Inc. manufacturer of surface animation systems, and Micro-Combustion, LLC |
36 Annual Report | December 31, 2006 |
| | | | | | | | |
Name and Year of Birth | | Position(s)
Held with
Fund | | Term of
Office and
Length of
Time
Served(1) | | Principal Occupation(s) During Past 5 Years | | Other Directorships Held by Trustee/Officer |
Officers | | | | | | | | |
Marco Hanig, 1958 | | President | | Since 1999 | | Principal, William Blair & Company, L.L.C. | | Chicago Scores |
| | | | |
Karl W. Brewer, 1966 | | Senior Vice President | | Since 2000 | | Principal, William Blair & Company, L.L.C. | | N/A |
| | | | |
Harvey H. Bundy, III, 1944 | | Senior Vice President | | Since 2003 | | Principal, William Blair & Company, L.L.C. | | N/A |
| | | | |
Mark A. Fuller, III, 1957 | | Senior Vice President | | Since 1993 | | Principal, William Blair & Company, L.L.C. | | Partner, Fulsen Howney Partners |
| | | | |
James S. Golan, 1961 | | Senior Vice President | | Since 2005 | | Principal, William Blair & Company, L.L.C. | | N/A |
| | | | |
W. George Greig, 1952 | | Senior Vice President | | Since 1996 | | Principal, William Blair & Company, L.L.C. | | N/A |
| | | | |
Michael A. Jancosek, 1959 | | Senior Vice President Vice President | | Since 2004 2000-2004 | | Principal, William Blair & Company L.L.C. Associate, William Blair & Company, L.L.C. | | N/A |
| | | | |
John F. Jostrand, 1954 | | Senior Vice President | | Since 1999 | | Principal, William Blair & Company, L.L.C. | | N/A |
| | | | |
James S. Kaplan, 1960 | | Senior Vice President Vice President | | Since 2004 1995-2004 | | Principal, William Blair & Company, L.L.C. Associate, William Blair & Company, L.L.C. | | N/A |
| | | | |
Robert C. Lanphier, IV, 1956 | | Senior Vice President | | Since 2003 | | Principal, William Blair & Company, L.L.C. | | Chairman, AG. Med, Inc. |
| | | | |
Todd M. McClone, 1968 | | Senior Vice President Vice President | | Since 2006 2005-2006 | | Principal, William Blair & Company, L.L.C. Associate, William Blair & Company, L.L.C. | | N/A |
| | | | |
David S. Mitchell, 1960 | | Senior Vice President Vice President | | Since 2004 2003-2004 | | Principal, William Blair & Company, L.L.C. Associate, William Blair & Company, L.L.C. | | N/A |
| | | | |
Gregory J. Pusinelli, 1958 | | Senior Vice President | | Since 1999 | | Principal, William Blair & Company, L.L.C. | | N/A |
| | | | |
David P. Ricci, 1958 | | Senior Vice President | | Since 2006 | | Principal, William Blair & Company, L.L.C. | | N/A |
| | | | |
Norbert W. Truderung, 1952 | | Senior Vice President | | Since 1992 | | Principal, William Blair & Company, L.L.C. | | N/A |
| | | | |
Jeffrey A. Urbina, 1955 | | Senior Vice President | | Since 1998 | | Principal, William Blair & Company, L.L.C. | | N/A |
December 31, 2006 | William Blair Funds 37 |
| | | | | | | | |
Name and Year of Birth | | Position(s)
Held with
Fund | | Term of
Office and
Length of
Time
Served(1) | | Principal Occupation(s) During Past 5 Years | | Other Directorships Held by Trustee/Officer |
Christopher T. Vincent, 1956 | | Senior Vice President Vice President | | Since 2004 2002-2004 | | Principal, William Blair & Company, L.L.C. Associate, William Blair & Company, L.L.C.; former Managing Director/Senior Portfolio Manager, Zurich Scudder Investments | | Uhlich Children’s Home |
| | | | |
Richard W. Smirl, 1967 | | Chief Compliance Officer | | Since 2004 | | Associate, William Blair & Company, L.L.C.; former Chief Legal Officer, Strong Capital Management | | N/A |
| | | | |
David C. Fording, 1967 | | Vice President | | Since 2006 | | Associate, William Blair & Company, L.L.C.; former Portfolio Manager, TIAA-CREF | | N/A |
| | | | |
Chad M. Kilmer, 1975 | | Vice President | | Since 2006 | | Associate, William Blair & Company, L.L.C.; former analyst and Portfolio Manager, US Bancorp Asset Management, and analyst Gabelli Woodland Partners. | | N/A |
| | | | |
Mark T. Leslie, 1967 | | Vice President | | Since 2005 | | Associate, William Blair & Company, L.L.C.; former Portfolio Manager, U.S. Bancorp Asset Management | | N/A |
| | | | |
Colin J. Williams, 1975 | | Vice President | | Since 2006 | | Associate, William Blair & Company, L.L.C.; formerly Andersen Consulting and Allegiance Healthcare | | N/A |
| | | | |
Terence M. Sullivan, 1944 | | Vice President and Treasurer | | Since 1997 | | Associate, William Blair & Company, L.L.C. | | N/A |
| | | | |
Colette M. Garavalia, 1961 | | Secretary | | Since 2000 | | Associate, William Blair & Company, L.L.C. | | N/A |
| * | | Mr. Fischer and Ms. Seitz are interested persons of the William Blair Funds because each is a principal of William Blair & Company, L.L.C., the Funds’ investment advisor, principal underwriter and distributor. |
| (1) | | Each Trustee serves until the election and qualification of a successor, or until death, resignation or retirement or removal as provided in the Fund’s Declaration of Trust. Retirement for non-interested Trustees occurs no later than at the conclusion of the first regularly scheduled Board meeting of the Fund’s fiscal year that occurs after the Trustee’s 72nd birthday. The Fund’s officers are elected annually by the Trustees. |
The Statement of Additional Information for the William Blair Funds includes additional information about the trustees and is available without charge by calling 1-800-635-2886 (in Massachusetts 1-800-635-2840) or by writing the Fund.
38 Annual Report | December 31, 2006 |
Additional Information (unaudited)
Proxy Voting
A description of the policies and procedures that the William Blair Institutional International Growth Fund, the William Blair Institutional International Equity Fund, the William Blair International Small Cap Growth Fund and the William Blair Emerging Markets Growth Fund use to determine how to vote proxies relating to portfolio securities and information regarding how the Fund voted proxies relating to portfolio securities for the most recent 12-month period ended June 30 are available without charge, upon request, by calling 1-800-635-2886 (in Massachusetts 1-800-635-2840), at www.williamblairfunds.com and on the SEC’s website at http://www.sec.gov.
Quarterly Portfolio Schedules
The Fund files its complete schedule of portfolio holdings with the SEC for the first and third fiscal quarters of each fiscal year (quarters ended March 31 and September 30) on Form N-Q. The Fund’s Forms N-Q are available on the SEC’s website at http://www.sec.gov and may be reviewed and copied at the SEC’s Public Reference Room in Washington, D.C. Information on the operation of the SEC’s Public Reference Room may be obtained by calling 1-800-SEC-0330.
Shareholder Meeting Results
A Special Meeting of Shareholders (the “Meeting”) of the Fund was held on November 30, 2006 at the offices of the Fund, 222 West Adams Street, Chicago, Illinois 60606. At the Meeting, the following matter was voted upon by shareholders (the resulting votes are presented below).
1. Election of Trustees. (“Number of Votes” represents all Portfolios of the Fund.)
| | | | |
| | | Number of Votes: |
Trustee | | For | | Withhold |
Frederick Conrad Fischer | | 1,425,457,809.64 | | 2,021,812.06 |
Ann P. McDermott | | 1,425,077,600.17 | | 2,402,021.53 |
Phillip O. Peterson* | | 1,426,061,038.41 | | 1,418,583.29 |
Donald J. Reaves | | 1,425,552,754.75 | | 1,926,866.95 |
Donald L. Seeley | | 1,425,445,801.20 | | 2,033,820.50 |
Michelle R. Seitz | | 1,426,053,294.98 | | 1,426,326.72 |
Thomas J. Skelly* | | 1,426,143,800.45 | | 1,335,821.25 |
Robert E. Wood II | | 1,425,504,578.55 | | 1,975,043.15 |
| * | Messrs. Peterson and Skelly became Trustees of the Trust on February 15, 2007 upon the retirement of Trustees Bosler and Schwemm. |
December 31, 2006 | William Blair Funds 39 |
Useful Information About Your Report (unaudited)
Please refer to this information when reviewing the Expense Example for each Fund.
Expense Example
As a shareholder of a Portfolio, you incur ongoing costs, including management fees and other Portfolio expenses. The example is intended to help you understand your ongoing costs (in dollars) of investing in the Fund and to compare these costs with the ongoing costs of investing in other mutual funds. To do so, compare the Portfolio’s 5% hypothetical example with the 5% hypothetical examples that appear in the shareholder reports of other funds. The example is based on an investment of $1,000 invested at the beginning of the period and held for the entire six-month period from July 1, 2006 to December 31, 2006.
Actual Expenses
In each example, the first line for each share class in the table provides information about the actual account values and actual expenses. These expenses reflect the effect of any expense cap applicable to the share class during the period. Without this expense cap, the costs shown in the table would have been higher. You may use the information in this line, together with the amount you invested, to estimate the expenses that you paid over the period. Simply divide your account value by $1,000 (example, an $8,600 account value divided by $1,000 = 8.6), then multiply the result by the number in the first line under the heading entitled “Expenses Paid During the Period” to estimate the expenses you paid on your account during the period.
Hypothetical Example for Comparison Purposes
In each example, the second line for each share class in the table provides information about hypothetical account values and hypothetical expenses based on the Portfolio’s actual expense ratio and an assumed rate of return of 5% per year before expenses. This is not the Portfolio’s actual return. The hypothetical account values and expenses may not be used to estimate the actual ending account balance or expenses you paid for the period. You may use this information to compare the ongoing costs of investing in the Portfolio to other funds. To do so, compare this 5% hypothetical example with the 5% hypothetical examples that appear in the shareholder reports of other funds.
Please note that the expenses shown in both examples are meant to highlight your ongoing costs only and do not reflect any transactional costs or account type fees. These fees are fully described in the prospectus. Therefore, the second line of each share class in the table is useful in comparing ongoing costs only and will not help you determine the relative costs of owning different funds.
40 Annual Report | December 31, 2006 |
Fund Expenses (Unaudited)
The examples below show you the ongoing costs (in dollars) of investing in your fund and allows you to compare these costs with those of other mutual funds. Please refer to previous page for a detailed explanation of the information presented on this chart.
| | | | | | | | | | | | |
| | | Beginning
Account Value
7/1/2006 | | Ending
Account Value
12/31/2006 | | Expenses Paid
during
Period(a) | | Annualized
Expense Ratio | |
| | | | |
Institutional International Growth Fund | | | | | | | | | | | | |
Actual return | | $ | 1,000.00 | | $ | 1,164.50 | | $ | 5.62 | | 1.03 | % |
Hypothetical 5% return | | | 1,000.00 | | | 1,020.01 | | | 5.24 | | 1.03 | |
| | | | | | | | | | | | | |
| | | | |
Institutional International Equity Fund | | | | | | | | | | | | |
Actual return | | | 1,000.00 | | | 1,148.70 | | | 5.96 | | 1.10 | |
Hypothetical 5% return | | | 1,000.00 | | | 1,019.66 | | | 5.60 | | 1.10 | |
| | | | | | | | | | | | | |
| | | | |
International Small Cap Growth Fund Institutional Share Class | | | | | | | | | | | | |
Actual return | | | 1,000.00 | | | 1,111.00 | | | 6.65 | | 1.25 | |
Hypothetical 5% return | | | 1,000.00 | | | 1,018.90 | | | 6.36 | | 1.25 | |
| | | | | | | | | | | | | |
| | | | |
Emerging Markets Growth Fund Institutional Share Class | | | | | | | | | | | | |
Actual return | | | 1,000.00 | | | 1,304.90 | | | 7.26 | | 1.25 | |
Hypothetical 5% return | | | 1,000.00 | | | 1,018.90 | | | 6.36 | | 1.25 | |
| | | | | | | | | | | | | |
| (a) | | Expenses are equal to the annualized expense ratio, multiplied by the average account value over the period, multiplied by the number of days in the period 184, and divided by 365 (to reflect the one-half year period). |
December 31, 2006 | William Blair Funds 41 |
BOARD OF TRUSTEES
Frederick Conrad Fischer, Chairman
Principal, William Blair & Company, L.L.C.
Theodore A. Bosler
Retired Principal and Vice President, Lincoln Capital Management Company
Ann P. McDermott
Director and Trustee
Profit and not-for-profit organizations
Donald J. Reaves
Vice President for Administration and Chief Financial Officer, University of Chicago
Donald L. Seeley
Adjunct Lecturer and Director, University of Arizona Department of Finance
John B. Schwemm
Retired Chairman and CEO, R.R. Donnelley & Sons Company
Michelle R. Seitz
Principal, William Blair & Company, L.L.C.
Robert E. Wood II
Retired Executive Vice President, Morgan Stanley Dean Witter
Officers
Marco Hanig, President
Karl W. Brewer, Senior Vice President
Harvey H. Bundy III, Senior Vice President
Mark A. Fuller, III, Senior Vice President
James S. Golan, Senior Vice President
W. George Greig, Senior Vice President
Michael A. Jancosek, Senior Vice President
John F. Jostrand, Senior Vice President
James S. Kaplan, Senior Vice President
Robert C. Lanphier, IV, Senior Vice President
Todd M. McClone, Senior Vice President
David S. Mitchell, Senior Vice President
Gregory J. Pusinelli, Senior Vice President
David P. Ricci, Senior Vice President
Norbert W. Truderung, Senior Vice President
Jeffrey A. Urbina, Senior Vice President
Christopher T. Vincent, Senior Vice President
Richard W. Smirl, Chief Compliance Officer
David C. Fording, Vice President
Chad M. Kilmer, Vice President
Mark T. Leslie, Vice President
Colin J. Williams, Vice President
Terence M. Sullivan, Vice President and Treasurer
Colette M. Garavalia, Secretary
Investment Advisor
William Blair & Company, L.L.C.
Independent Registered Public Accounting Firm
Ernst & Young LLP
Legal Counsel
Vedder, Price, Kaufman & Kammholz, P.C.
Transfer Agent
State Street Bank and Trust Company
P.O. Box 8506
Boston, MA 02266-8506
For customer assistance, call 1-800-635-2886
(Massachusetts 1-800-635-2840)
42 Date of First Use August 2006 | |

As of the end of the period covered by this Form N-CSR, the Registrant has adopted a code of ethics that applies to its principal executive officer and principal financial officer. Such code of ethics is posted on the Registrant’s website: www.williamblairfunds.com. There were no amendments to or waivers of the code of ethics during the period covered by this report.
| Item 3. | Audit Committee Financial Expert |
The Registrant’s Board of Trustees has determined that the Registrant has at least one “audit committee financial expert” (as defined in Item 3 of Form N-CSR) serving on its Audit Committee. Mr. Donald L. Seeley, the Registrant’s audit committee financial expert, is “independent” for purposes of Item 3 to Form N-CSR.
An “audit committee financial expert” is not an “expert” for any purpose, including for purposes of Section 11 of the Securities Act of 1933, as a result of being designated as an “audit committee financial expert.” Further, the designation of a person as an “audit committee financial expert” does not mean that the person has any greater duties, obligations, or liability than those imposed on the person without the “audit committee financial expert” designation. Similarly, the designation of a person as an “audit committee financial expert” does not affect the duties, obligations, or liability of any other member of the audit committee or Board of Trustees.
| Item 4. | Principal Accountant Fees and Services |
Audit Fees
For the fiscal years ended December 31, 2005 and 2006, Ernst & Young, LLP, the Registrant’s principal accountant (“E&Y), billed the Registrant $280,800 and $360,000, respectively, for professional services rendered for the audit of the Registrant’s annual financial statements or services that are normally provided in connection with statutory and regulatory filings.
Audit-Related Fees
For the fiscal years ended December 31, 2005 and 2006, E&Y billed the Registrant $27,700 and $0, respectively for assurance and related services that are reasonably related to the performance of the audit of the Registrant’s financial statements and that are not reported above, such as reviewing prospectuses and SEC filings. For the fiscal years ended December 31, 2005 and 2006, E&Y provided no audit-related services to William Blair & Company L.L.C., the Registrant’s investment adviser (“William Blair”) or any of its control affiliates that were for engagements directly related to the Registrant’s operations and financial reporting.
Tax Fees
For the fiscal years ended December 31, 2005 and 2006, E&Y billed the Registrant $69,850 and $76,550, respectively, for professional services rendered for tax compliance, tax advice and tax planning. Such services consisted of preparation of tax returns, year-end distribution review, qualifying dividend income analysis and computation of foreign tax credit pass through. For the fiscal years ended December 31, 2005 and 2006, E&Y provided no tax services to William Blair or any of its control affiliates that were for engagements directly related to the Registrant’s operations and financial reporting.
All Other Fees
For the fiscal years ended December 31, 2005 and 2006, E&Y did not bill the Registrant for products and services other than the services reported above. For the fiscal years ended December 31, 2005 and 2006, E&Y provided no other services to William Blair or any of its control affiliates that were for engagements directly related to the Registrant’s operations and financial reporting.
Audit Committee Pre-Approval Policies and Procedures
Pursuant to Registrant’s Audit Committee Charter (the “Charter”), the Audit Committee is responsible for pre-approving any engagement of the principal accountant to provide non-prohibited services to the Registrant, including the fees and other compensation to be paid to the principal accountant, to the extent required by Rule 2-01(c)(7) of Regulation S-X. Pursuant to the Charter, the Audit Committee is also responsible for pre-approving any engagement of the principal accountant, including the fees and other compensation to be paid to the principal accountant, to provide non-audit services to the Registrant’s investment adviser (or any entity controlling, controlled by, or under common control with the adviser that provides ongoing services to the Registrant), if the engagement relates directly to the operations and financial reporting of the Registrant, to the extent required by Rule 2-01(c)(7) of Regulation S-X. The Chairman of the Audit Committee may grant the pre-approval referenced above for non-prohibited and non-audit services. All such delegated pre-approvals will be presented to the Audit Committee no later than the next Audit Committee meeting.
Non-Audit Fees
For the fiscal years ended December 31, 2005 and 2006, E&Y billed the Registrant $69,850 and $76,550, respectively, in non-audit fees (tax services). For the same periods, E&Y billed William Blair and its control affiliates $8,600 and $6,800, respectively, in non-audit fees. The Registrant’s Audit Committee has considered whether the provision of non-audit services that were rendered to William Blair or any of its control affiliates that were not pre-approved pursuant to Rule 2-01(c)(7)(ii) of Regulation S-X is compatible with maintaining E&Y’s independence. Such non-audit services primarily pertained to due diligence reviews performed for the Corporate Finance Group of William Blair and did not relate to the Registrant’s operations or financial reporting.
| Item 5. | Audit Committee of Listed Registrants |
Not Applicable to this Registrant, insofar as the Registrant is not a listed company.
| Item 6. | Schedule of Investments |
See Schedule of Investments in Item 1
| Item 7. | Disclosure of Proxy Voting Policies and Procedures for Closed-End Management Investment Companies |
Not applicable to this Registrant, insofar as the Registrant is not a closed-end management investment company.
| Item 8. | Portfolio Mangers of Closed Investment Companies |
Not applicable to this Registrant, insofar as the Registrant is not a closed-end management investment company.
| Item 9. | Purchase of Equity Securities by Closed end Management Investment Companies and Affiliated Purchasers |
Not applicable to this Registrant, insofar as the Registrant is not a closed-end management investment company.
| Item 10. | Submission of Matters to a Vote of Security Holders |
There have been no material changes to the procedures by which shareholders may recommend nominees to the Registrant’s Board of Trustees since the Registrant last provided disclosure in response to this item.
Controls and Procedures
(a) The Registrant’s principal executive and principal financial officer, or persons performing similar functions, have concluded that the Registrant’s Disclosure Controls and Procedures (as defined in Rule 30-a-3( c ) under the Investment Company Act of 1940, as amended (the “1940 Act”) (17 CFR 270.30a-3 ( c )) are effective, as of a date within 90 days of the filing date of this report that includes the disclosure required by this paragraph, based on their evaluation of these controls and procedures required by Rule 30a-3 (b) under the 1940 Act (17 CFR 270.30a-3( b ) and Rules 13a-15( b ) or 15d-15(b) under the Exchange Act (17 CFR 240.13a-15(b) or 240.15d-15(b)).
(b) There were no changes in the Registrant’s internal control over financial reporting (as defined in Rule 30a-3(d) under the 1940 Act (17 CFR 270.30a-3(d)) that occurred during the final quarter of the period covered by this report that has materially affected, or is reasonably likely to materially affect, the Registrant’s internal control over financial reporting.
12. (a) (1) Code of Ethics
Not applicable because it is posted on Registrant’s website.
12. (a) (2) (1)
Certification of Principal Executive Officer Required by Rule 30a-2(a) of the Investment Company Act
12. (a) (2) (2)
Certification of Principal Financial Officer Required by Rule 30a-2(a) of the Investment Company Act.
12. (a) (3)
Not applicable to this Registrant.
12. (b)
Certification of Chief Executive Officer and Certification of Chief Financial Officer Required by Rule 30a-2(b) of the Investment Company Act
Signatures
Pursuant to the requirements of the Securities Exchange Act of 1934 and the Investment Company Act of 1940, the Registrant has duly caused this report to be signed on its behalf by the undersigned, thereunto duly authorized.
| | |
| | | William Blair Funds |
| |
| | | /s/ Marco Hanig |
| By: | | Marco Hanig |
| | | President (Chief Executive Officer) |
Date: February 26, 2007
Pursuant to the requirements of the Securities Exchange Act of 1934 and the Investment Company Act of 1940, this report has been signed below by the following persons on behalf of the Registrant and in the capacities and on the dates indicated
| | |
| By: | | Marco Hanig |
| | | President (Chief Executive Officer) |
Date: February 26, 2007
| | |
| By: | | Terence M. Sullivan |
| | | Treasurer (Chief Financial Officer) |
Date: February 26, 2007