UNITED STATES
SECURITIES AND EXCHANGE COMMISSION
Washington, D.C. 20549
Form N-CSR
CERTIFIED SHAREHOLDER REPORT OF REGISTERED
MANAGEMENT INVESTMENT COMPANIES
Investment Company Act File Number 811-5344
William Blair Funds
(Exact name of registrant as specified in charter)
| | |
| 222 West Adams Street, Chicago, IL | | 60606 |
| (Address of principal executive offices) | | (Zip Code) |
Michelle R. Seitz
William Blair Funds
222 West Adams Street, Chicago, IL 60606
(Name and address of agent for service)
Registrant’s telephone number, including area code: 312-236-1600
Date of fiscal year end: December 31
Date of reporting period: December 31, 2007
Form N-CSR is to be used by management investment companies to file reports with the Commission not later than 10 days after the transmission to stockholders of any report that is required to be transmitted to stockholders under Rule 30e-1 under the Investment Company Act of 1940 (17 CFR 270.30e-1). The Commission may use the information provided on Form N-CSR in its regulatory, disclosure review, inspection, and policymaking roles.
A registrant is required to disclose the information specified by Form N-CSR, and the Commission will make this information public. A Registrant is not required to respond to the collection of information contained in Form N-CSR unless the form displays a currently valid Office of Management and Budget (“OMB”) control number. Please direct comments concerning the accuracy of the information collection burden estimates and any suggestions for reducing the burden to Secretary, Securities and Exchange Commission, 450 Fifth Street, NW, Washington, DC 20549-0609. The OMB has reviewed this collection of information under the clearance requirements of 44 U.S.C. (ss) 3507.
| Item 1. | December 31, 2007 Annual Reports transmitted to shareholders. |

Table of Contents
This report is submitted for the general information of the shareholders of the William Blair Funds. It is not authorized for distribution to prospective investors unless accompanied or preceded by a prospectus of the William Blair Funds. Please carefully consider the Funds’ investment objectives, risks, charges, and expenses before investing. This and other information is contained in the Funds’ prospectus, which you may obtain by calling 1-800-742-7272. Read it carefully before you invest or send money.
December 31, 2007 | William Blair Funds 1 |
PERFORMANCE AS OF DECEMBER 31, 2007—CLASS N SHARES (unaudited)
| | | | | | | | | | | | | | |
| | | 1 Yr. | | | 3 Yr. | | 5 Yr. | | 10 Yr.
(or since
inception) | | | Inception
Date | | Overall
Morningstar
Rating |
Growth Fund | | 13.17 | | | 11.77 | | 13.14 | | 5.31 | | | 3/20/1946 | | ««« |
Morningstar Large Growth | | 13.35 | | | 9.11 | | 12.75 | | 5.28 | | | | | Among 1,449 |
Russell 3000® Growth | | 11.40 | | | 8.64 | | 12.42 | | 3.83 | | | | | large growth Funds |
Standard & Poor’s 500 | | 5.49 | | | 8.62 | | 12.83 | | 5.91 | | | | | |
| | | | | | |
Tax-Managed Growth Fund | | | | | | | | | | | | | | ««« |
Return before Taxes | | 9.96 | | | 10.20 | | 11.89 | | 2.33 | | | 12/27/1999 | | Among 1,449 |
After Taxes on Distributions | | 9.96 | | | 10.20 | | 11.89 | | 2.33 | | | | | large growth Funds |
After Taxes on distributions and Sale of Fund Shares | | 5.55 | | | 8.79 | | 10.41 | | 2.01 | | | | | |
Morningstar Large Growth | | 13.35 | | | 9.11 | | 12.75 | | — | | | | | |
Russell 3000® Growth | | 11.40 | | | 8.64 | | 12.42 | | (2.55 | ) | | | | |
Standard & Poor’s 500 | | 5.49 | | | 8.62 | | 12.83 | | 1.76 | | | | | |
| | | | | | |
Large Cap Growth Fund | | 9.30 | | | 6.42 | | 9.39 | | (3.48 | ) | | 12/27/1999 | | «« |
Morningstar Large Growth | | 13.35 | | | 9.11 | | 12.75 | | — | | | | | Among 1,449 |
Russell 1000® Growth | | 11.81 | | | 8.68 | | 12.11 | | (2.86 | ) | | | | large growth Funds |
| | | | | | |
Small Cap Growth Fund | | (2.15 | ) | | 4.15 | | 18.40 | | 16.03 | | | 12/27/1999 | | ««« |
Morningstar Small Growth | | 7.59 | | | 7.94 | | 15.63 | | — | | | | | Among 671 |
Russell 2000® Growth | | 7.05 | | | 8.11 | | 16.50 | | 1.29 | | | | | small growth Funds |
Russell 2000® | | (1.57 | ) | | 6.80 | | 16.25 | | 7.20 | | | | | |
| The Small Cap Growth Fund’s Performance during 2000 was primarily attributable to investments in initial public offerings (IPOs) during a rising market. Since then, IPOs have had an insignificant effect on the Fund’s performance. | | |
| | | | | | |
Mid Cap Growth Fund | | 14.62 | | | — | | — | | 9.93 | | | 2/1/2006 | | Not rated. |
Morningstar Mid-Cap Growth | | 15.09 | | | — | | — | | — | | | | | |
Russell Mid Cap® Growth | | 11.43 | | | — | | — | | 8.15 | | | | | |
| | | | | | |
Small-Mid Cap Growth Fund | | 12.34 | | | 10.91 | | — | | 11.32 | | | 12/29/2003 | | ««« |
Morningstar Mid-Cap Growth | | 15.09 | | | 11.23 | | — | | — | | | | | Among 811 |
Russell 2500™ Growth | | 9.69 | | | 10.03 | | — | | 10.93 | | | | | mid-cap growth funds |
| | | | | | |
Global Growth Fund | | — | | | — | | — | | (1.10 | ) | | 10/15/2007 | | Not rated. |
MSCI All Country World | | — | | | — | | — | | (4.10 | ) | | | | |
| | | | | | |
International Growth Fund | | 18.13 | | | 20.93 | | 24.40 | | 15.93 | | | 10/1/1992 | | ««««« |
Morningstar Foreign Large Growth | | 16.26 | | | 18.25 | | 20.90 | | 8.41 | | | | | Among 173 |
MSCI All Country World Ex-US | | 17.12 | | | 20.37 | | 24.52 | | 10.09 | | | | | foreign large growth funds |
| | | | | | |
International Equity Fund | | 17.68 | | | 17.02 | | — | | 17.93 | | | 5/24/2004 | | ««« |
Morningstar Foreign Large Growth | | 16.26 | | | 18.25 | | — | | — | | | | | Among 173 |
MSCI All Country World Ex-US | | 17.12 | | | 20.37 | | — | | 23.31 | | | | | foreign large growth funds |
Please see the next page for important disclosure information.
See accompanying Notes to Financial Statements.
2 Annual Report | December 31, 2007 |
PERFORMANCE AS OF DECEMBER 31, 2007—CLASS N SHARES—CONTINUED (unaudited)
| | | | | | | | | | | | | |
| | | 1 Yr. | | | 3 Yr. | | 5 Yr. | | 10 Yr.
(or since
inception) | | Inception
Date | | Overall
Morningstar
Rating |
International Small Cap Growth Fund | | 13.06 | | | — | | — | | 21.22 | | 11/1/2005 | | Not rated. |
Morningstar Foreign Small/Mid Growth | | 12.03 | | | — | | — | | — | | | | |
MSCI World Ex-US Small Cap | | 3.64 | | | — | | — | | 15.79 | | | | |
| | | | | | |
Emerging Markets Growth Fund | | 37.75 | | | — | | — | | 47.18 | | 6/6/2005 | | Not rated. |
Morningstar Diversified Emerging Markets | | 36.68 | | | — | | — | | — | | | | |
MSCI Emerging Markets | | 39.78 | | | — | | — | | 40.36 | | | | |
| A portion of the Emerging Markets Growth Fund’s performance since inception is attributable to an investment in an initial public offering. (IPO) | | |
| | | | | | |
Value Discovery Fund | | (5.54 | ) | | 4.95 | | 12.53 | | 9.16 | | 12/23/1996 | | ««« |
Morningstar Small Value | | (6.08 | ) | | 5.02 | | 14.58 | | 8.88 | | | | Among 329 |
Russell 2000® | | (1.57 | ) | | 6.80 | | 16.25 | | 7.08 | | | | small value funds |
Russell 2000® Value | | (9.78 | ) | | 5.27 | | 15.80 | | 9.06 | | | | |
| | | | | | |
Bond Fund | | — | | | — | | — | | 3.38 | | 5/1/2007 | | Not rated. |
Lehman Aggregate Bond Index | | — | | | — | | — | | 4.87 | | | | |
| | | | | | |
Income Fund | | 1.08 | | | 2.34 | | 2.66 | | 4.54 | | 10/1/1990 | | ««« |
Morningstar Short-term Bond | | 4.29 | | | 3.25 | | 2.88 | | 4.41 | | | | Among 374 |
Lehman Intermediate Govt./Credit Bond Index | | 7.39 | | | 4.32 | | 4.06 | | 5.75 | | | | short-term bond funds |
Performance cited represents past performance. Past performance does not guarantee future results and current performance may be lower or higher than the data quoted. Returns shown are average annual total returns, which assume reinvestment of dividends and capital gains. Investment returns and principal will fluctuate and you may have a gain or a loss when you sell shares. For the most current month-end performance information, please call 1-800-742-7272, or visit our Web site at www.williamblairfunds.com. From time to time, the investment advisor may waive fees or reimburse expenses for the Fund. Without these waivers, performance would be lower. Investing in smaller companies involves special risks, including higher volatility and lower liquidity. International and emerging markets investing involves special risk considerations, including currency fluctuations, lower liquidity, economic and political risk. As interest rates rise, bond prices will fall and bond funds become more volatile. From time to time, the investment advisor may waive fees or reimburse expenses for certain Funds. Without these waivers, performance would be lower. Class N shares are available to the general public without a sales load.
Tax-Managed Growth Fund’s after-tax returns are calculated using the highest historical individual federal marginal income tax rates, and do not reflect the impact of state and local taxes. Actual after-tax returns depend on the investor’s tax situation and may differ from those shown. After-tax returns shown are not relevant to investors who hold their fund shares through tax-deferred arrangements such as 401(k) plans or individual retirement accounts. After-tax returns are shown only for Class N and the after-tax returns for Class N shares will vary.
Morningstar RatingsTM are as of 12/31/2007 and are subject to change every month. The ratings are based on a risk-adjusted return measure that accounts for variation in a fund’s monthly performance, placing more emphasis on downward variations and rewarding consistent performance. The top 10% of funds in each Category receive 5 stars, the next 22.5% receive 4 stars, the middle 35% receive 3 stars, the next 22.5% receive 2 stars, and the bottom 10% receive 1 star. The Overall Morningstar Rating for a fund is derived from a weighted-average of the performance figures associated with its three-, five- and ten-year (if applicable) Morningstar Rating metrics. The 3/5/10 year Morningstar ratings were as follows: Growth Fund ««««/«««/«««, Tax-Managed Growth Fund ««««/«««/NA, and Large Cap Growth Fund ««/««/NA, out of 1,449/1,215/554 large growth funds; Small Cap Growth Fund ««/««««/NA out of 671/556/NA small growth funds; Small-Mid Cap Growth Fund «««/NA/NA out of 811/NA/NA mid cap growth funds; Value Discovery Fund ««/«/««« out of 329/258/92 small value funds; International Growth Fund ««««/««««/««««« and International Equity Fund «««/NA/NA out of 173/155/67 foreign large growth funds; Income Fund ««/««/««« out of 374/282/159 short-term bond funds.
Please carefully consider the Funds’ investment objectives, risks, charges, and expenses before investing. This and other information is contained in the Funds’ prospectus, which you may obtain by calling 1-800-742-7272. Read it carefully before you invest or send money.
See accompanying Notes to Financial Statements.
December 31, 2007 | William Blair Funds 3 |

David C. Fording

John F. Jostrand
GROWTH FUND
The Growth Fund invests primarily in common stocks of domestic growth companies that the Advisor expects to have sustainable, above-average growth from one business cycle to the next.
AN OVERVIEW FROM THE PORTFOLIO MANAGERS
How did the Fund perform over the last year? How did the Fund’s performance compare to its benchmark?
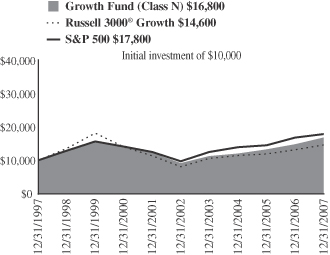
The Growth Fund posted a 13.17% increase on a total return basis (Class N Shares) for the 12 months ended December 31, 2007. By comparison, the Fund’s benchmark, the Russell 3000® Growth Index, gained 11.40% while the Standard & Poor’s 500 Stock Index rose 5.49%.
What were the most significant market factors impacting Fund performance?
For 2007, most US equity markets gained ground with the exception of those focused on value stocks and micro cap stocks. In a significant reversal since the beginning of the millennium, growth stocks surpassed value stocks with a 12% spread or more between Russell growth and value indices. From a market cap perspective, large caps outperformed small caps. The spread between Russell large and small indices for 2007 was more than 4.7%. Volatility remained high as investors responded to weakness in economic and employment data. Second and third quarter GDP was reported as solid but the fourth quarter GDP estimate was much lower. The unemployment rate rose to 5.0% by year end suggesting a weakening labor market. Additionally, the health of consumers and financial firms came under pressure during the period due to higher defaults on home loans and mortgage related investments as well as increasing losses on credit cards and other consumer loans. As a result of these strong market headwinds in December, many market observers have discussed the potential for a recession in the coming year.
On a positive note, US corporations have significant cash on their balance sheets and profit margins have remained elevated as a result of continued cost productivity. While the US economic growth seems to be slowing, foreign growth has continued to be healthy.
In terms of sector performance in the Russell 3000® Growth index, the best contributors to overall returns were technology and industrials. The technology group was up 18.3% for the year with many of the largest bellwether companies doing well in the flight to safety. Industrials gained 13.5% for the period benefiting from strong global demand. The weakest sector contributors were Consumer Discretionary and Financials. Consumer discretionary stocks declined 9.7% as investors were concerned over a possible recession that could impact future returns for the group while Financial stocks dropped 1.7% on the issues discussed above.
Which sectors enhanced the Fund’s return? What were among the best performing investments for the Fund?
In 2007, the Fund benefited from stock selection within the Financial, Energy and Health Care sectors. In fact, the Fund saw its strongest absolute returns come from energy which increased about 70% as well as materials which rose approximately 50% in the period. Our positioning within the Financials sector led to a nearly 30% absolute return during 2007 as the portfolio leaned towards companies that are beneficiaries of volatility (e.g., Intercontinental Exchange, which saw strong gains in 2007) and away from companies that are credit or
4 Annual Report | December 31, 2007 |
interest-rate sensitive. Charles Schwab was also a strong absolute and relative performer, as its attractive product and service offerings, combined with effective marketing, have resulted in on-going market share gains.
Within Energy, our exposure to both oil services and exploration and production stocks saw solid relative returns. The portfolio benefited from its holdings in Smith International, Apache Corp and Suncor Energy. The price of oil approached $100 per barrel during the fourth quarter, driving optimism about future earnings.
Stock selection within Health Care also had a positive impact on both absolute and relative performance. Kyphon, a small cap health care equipment and supplier, rose significantly during the period on news that the company would be acquired by Medtronic for $71 per share. This stock was sold from the portfolio at the end of July. Another strong performer was Gilead Sciences, the leading provider of drugs to treat HIV, which continued to deliver very solid earnings growth and was a strong stock for the full year.
Were there any investment strategies or themes that did not measure up to your expectations?
Poor stock selection in Technology was the principal drag on both absolute and relative performance of the Fund. While technology stocks, in general, outperformed the market, the Fund’s Technology sector returns lagged those of the benchmark. The benchmark’s Technology returns were led by a few large cap winners such as Apple and Google, each of which appreciated by more than 50% in 2007. The fact that we did not hold these names hurt our relative performance. Equally important, a number of our Technology positions did not perform well. Two of our mid-cap Technology stocks, Network Appliance and F5 Networks, underperformed. Network Appliance declined during the year on earnings weakness and was sold from the portfolio in the third quarter. F5 Networks fell as investors began to question whether spending, particularly within the financial services industry, would be sustained into 2008. We believe cyclical concerns have been priced into the F5 Networks and that its competitive position as well as the secular drivers of its growth rate remain strong, and remain committed to the stock.
Consumer Staple stocks also hurt the portfolio’s absolute and relative performance. Walgreen’s reported a very disappointing third quarter, as expense growth exceeded revenue growth, resulting in declining margins. We sold the stock, believing these issues will take several quarters to resolve and perceiving that the company’s growth rate may slow more rapidly than anticipated.
What is your current strategy? How is the Fund positioned?
The economy is slowing driven by subprime and credit issues. We believe that economic growth will be weak through the first-half of this year, but begin to strengthen as we move to the latter part of the year. Through continued strong export growth and actions by the Federal Reserve, the economy should continue to move forward. The factors that we will continue to watch include unemployment and inflation. A significant increase in the unemployment rate could have a detrimental impact on the economic outlook while a significant increase in inflation expectation could also limit the Federal Reserve’s response to slowing growth.
We have experienced an unprecedented period of corporate profitability growth. As the economy slows, the higher quality growth companies should continue to differentiate themselves relative to the average company. Regardless of the macro issues facing the market, we continue to find quality stocks that offer growth opportunities. We continue to find interesting opportunities in Technology, select Health Care, Industrials and Energy. We believe that as overall earnings growth decelerates, investors will pay more attention to earnings multiples, and reward stocks which exhibit longer, more sustainable earnings trends with higher P/E multiples.
December 31, 2007 | William Blair Funds 5 |
Growth Fund
Performance Highlights (unaudited)
Average Annual Total Return at 12/31/2007
| | | | | | | | | | | | | | | |
| | | 1 Year | | | 3
Year | | | 5
Year | | | 10
Year | | | Since Inception | |
Growth Fund Class N | | 13.17 | % | | 11.77 | % | | 13.14 | % | | 5.31 | % | | — | % |
Growth Fund
Class I | | 13.59 | | | 12.10 | | | 13.46 | | | — | | | 3.60 | (a) |
Russell 3000® Growth Index | | 11.40 | | | 8.64 | | | 12.42 | | | 3.83 | | | 0.16 | (a) |
S&P 500 Index | | 5.49 | | | 8.62 | | | 12.83 | | | 5.91 | | | 3.32 | (a) |
| | (a) | | For the period from October 1, 1999 to December 31, 2007. |
Performance cited represents past performance. Past performance does not guarantee future results and current performance may be lower or higher than the data quoted. Results shown are average annual returns, which assume reinvestment of dividends and capital gains. Investment returns and principal will fluctuate and you may have a gain or loss when you sell shares. For the most current month-end performance information, please call 1-800-742-7272, or visit our Web site at www.williamblairfunds.com. Class N shares are available to the general public without a sales load. Class I shares are available to certain institutional investors and advisory clients of William Blair & Company L.L.C. without a sales load or distribution (12b-1) or service fees.
The performance highlights and graph presented above do not reflect the deduction of taxes that a shareholder would pay on fund distributions or the redemption of fund shares.
The Russell 3000® Growth Index consists of large, medium, and small capitalization companies with above average price-to-book ratios and forecasted growth rates. The index is weighted by market capitalization and large/medium/small companies make up approximately 80%/15%/5% of the index.
The S&P 500 Index indicates broad larger capitalization equity market performance.
This report identifies the Fund’s investments on December 31, 2007. These holdings are subject to change. Not all stocks in the Fund performed the same, nor is there any guarantee that these stocks will perform as well in the future. Market forecasts provided in this report may not necessarily come to pass.
Sector Diversification (unaudited)
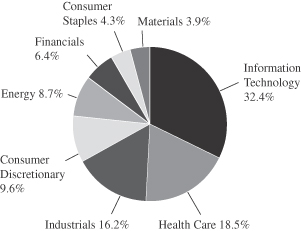
The sector diversification shown is based on the total investment portfolio.
6 Annual Report | December 31, 2007 |
Growth Fund
Portfolio of Investments, December 31, 2007 (all dollar amounts in thousands)
| | | | | |
Issuer | |
Shares | | Value |
| | |
Common Stocks | | | | | |
Information Technology—32.1% | | | | | |
*Activision, Inc. | | 223,605 | | $ | 6,641 |
*Adobe Systems Incorporated | | 163,435 | | | 6,984 |
*Cisco Systems, Inc. | | 496,970 | | | 13,453 |
*Citrix Systems, Inc. | | 123,070 | | | 4,678 |
*Cognizant Technology Solutions Corporation | | 190,320 | | | 6,459 |
*EMC Corporation | | 384,635 | | | 7,127 |
*Euronet Worldwide, Inc. | | 141,655 | | | 4,250 |
*F5 Networks, Inc. | | 228,515 | | | 6,517 |
*FLIR Systems, Inc. | | 134,410 | | | 4,207 |
*j2 Global Communications, Inc. | | 234,870 | | | 4,972 |
*Nuance Communications, Inc. | | 230,780 | | | 4,311 |
Paychex, Inc. | | 174,750 | | | 6,330 |
Qualcomm Incorporated | | 173,815 | | | 6,840 |
*Silicon Laboratories Inc. | | 229,980 | | | 8,608 |
Taiwan Semiconductor Mfg. Co. Ltd.—ADR | | 1,124,411 | | | 11,199 |
*Verisign Inc. | | 123,780 | | | 4,655 |
*Vistaprint Limited† | | 182,513 | | | 7,821 |
*WNS (Holdings) Limited—ADR | | 210,290 | | | 3,438 |
| | | | | |
| | | | | 118,490 |
| | | | | |
Health Care—18.3% | | | | | |
Allergan, Inc. | | 124,310 | | | 7,986 |
C.R. Bard, Inc. | | 67,755 | | | 6,423 |
*Genentech, Inc. | | 113,790 | | | 7,632 |
*Gilead Sciences, Inc. | | 248,620 | | | 11,439 |
*Healthways, Inc. | | 136,595 | | | 7,982 |
*Hologic, Inc. | | 118,780 | | | 8,153 |
*Idexx Laboratories, Inc. | | 71,870 | | | 4,214 |
*Integra Lifesciences Holding Corporation | | 111,535 | | | 4,677 |
Pharmaceutical Product Development, Inc. | | 225,855 | | | 9,118 |
| | | | | |
| | | | | 67,624 |
| | | | | |
Industrials & Services—16.0% | | | | | |
ABB Ltd—ADR | | 310,370 | | | 8,939 |
Danaher Corporation | | 160,426 | | | 14,076 |
Expeditors International of Washington, Inc. | | 118,720 | | | 5,304 |
Fastenal Company | | 171,954 | | | 6,950 |
*IHS Inc. | | 99,440 | | | 6,022 |
*InnerWorkings, Inc. | | 234,465 | | | 4,047 |
Rockwell Automation, Inc. | | 73,595 | | | 5,075 |
Rockwell Collins, Inc. | | 121,775 | | | 8,764 |
| | | | | |
| | | | | 59,177 |
| | | | | |
Consumer Discretionary—9.4% | | | | | |
*Coach, Inc. | | 124,705 | | | 3,814 |
*Coinstar, Inc. | | 186,730 | | | 5,257 |
International Game Technology | | 139,480 | | | 6,127 |
Johnson Controls, Inc. | | 242,631 | | | 8,744 |
*Life Time Fitness, Inc. | | 75,860 | | | 3,769 |
*McCormick & Schmick’s Seafood Restaurants, Inc. | | 142,945 | | | 1,705 |
Omnicom Group Inc. | | 115,785 | | | 5,503 |
| | | | | |
| | | | | 34,919 |
| | | | | |
*Non-income producing securities
ADR = American Depository Receipt
† = U.S. listed foreign security
VRN = Variable Rate Note
| | | | | | | |
Issuer | | Shares or
Principal
Amount | | Value | |
| | |
Common Stocks—(continued) | | | | | | | |
Energy—8.6% | | | | | | | |
Apache Corporation | | | 93,700 | | $ | 10,076 | |
Smith International, Inc. | | | 176,085 | | | 13,004 | |
Suncor Energy, Inc.† | | | 80,125 | | | 8,712 | |
| | | | | | | |
| | | | | | 31,792 | |
| | | | | | | |
Financials—6.3% | | | | | | | |
Charles Schwab & Co., Inc. | | | 232,780 | | | 5,948 | |
CME Group Inc. | | | 9,050 | | | 6,208 | |
*IntercontinentalExchange Inc. | | | 30,080 | | | 5,790 | |
*MF Global Ltd.† | | | 175,680 | | | 5,529 | |
| | | | | | | |
| | | | | | 23,475 | |
| | | | | | | |
Consumer Staples—4.2% | | | | | | | |
PepsiCo, Inc. | | | 140,010 | | | 10,627 | |
Wal Mart De Mexico—ADR | | | 140,415 | | | 4,844 | |
| | | | | | | |
| | | | | | 15,471 | |
| | | | | | | |
Materials—3.9% | | | | | | | |
Praxair, Inc. | | | 161,840 | | | 14,357 | |
| | | | | | | |
Total Common Stock—98.8%
(cost $297,905) | | | 365,305 | |
| | | | | | | |
| | |
Investment in Affiliate | | | | | | | |
William Blair Ready Reserves Fund | | | 1,699,132 | | | 1,699 | |
| | | | | | | |
Total Investment in Affiliate—0.5%
(cost $1,699) | | | 1,699 | |
| | | | | | | |
| | |
Short-Term Investment | | | | | | | |
Prudential Funding Demand Note, VRN 4.430%, due 1/2/08 | | $ | 200,000 | | | 200 | |
| | | | | | | |
Total Short-Term Investment—0.0%
(cost $200) | | | 200 | |
| | | | | | | |
| | |
Repurchase Agreement | | | | | | | |
State Street Bank & Trust Company, 3.80% dated 12/31/07 due 1/2/08, repurchase price $3,309, collateralized by FNR 2002-76 | | | 3,307,874 | | | 3,308 | |
| | | | | | | |
Total Repurchase Agreement—0.9%
(cost $3,308) | | | 3,308 | |
| | | | | | | |
Total Investments—100.2%
(cost $303,112) | | | 370,512 | |
Liabilities, plus cash and other assets—(0.2)% | | | (868 | ) |
| | | | | | | |
Net assets—100.0% | | $ | 369,644 | |
| | | | | | | |
See accompanying Notes to Financial Statements.
December 31, 2007 | William Blair Funds 7 |

Mark A. Fuller III

Gregory J. Pusinelli
TAX-MANAGED GROWTH FUND
The Tax-Managed Growth Fund invests primarily in common stocks of large, medium and small domestic growth companies that the Advisor expects will have sustainable, above-average growth from one business cycle to the next.
AN OVERVIEW FROM THE PORTFOLIO MANAGERS
How did the Fund perform during the past year? How did the Fund’s performance compare to its benchmark?
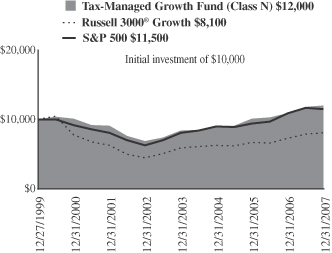
The Tax-Managed Growth Fund posted a 9.96% gain on a total return basis (Class N Shares) for the 12 months ended December 31, 2007. By comparison, the Fund’s benchmark, the Russell 3000® Growth Index increased 11.40% while the Standard & Poor’s 500 Stock Index rose 5.49%.
What factors were behind the Fund’s performance versus the benchmark?
The Fund benefited from its stock selection in the Consumer Discretionary, Financials, Energy and Industrials sectors, while Information Technology and Consumer Staples proved to be a drag on performance relative to the Fund’s Russell 3000® Growth Index benchmark.
What were the most significant market factors impacting Fund performance?
Following a relatively flat first quarter, and in spite of some setbacks along the way, the stock market forged ahead in the second quarter to a strong mid-year finish. Facing strong headwinds from rising interest rates, a slump in housing prices and rising energy prices, the Standard & Poor’s 500 stock index still set a record high in late May. Boosting the market’s performance was a strong flow of private equity acquisitions, a pickup in manufacturing activity and signs that inflation had moderated.
However, turmoil in the home-loan market during the third quarter sparked concerns about tightening credit worldwide. This anxiety in turn gave way to worry over signs that the economy was slipping and uncertainty about the Federal Reserve Board’s response in dealing with the credit crisis. A series of interest rate cuts by the Fed beginning in August provided some support for stocks, but for equity investors the net effect was a series of gut-wrenching ups and downs.
The equity markets fell into a slump during November and December, as investors began to worry that the crisis in the credit markets might be gradually damaging the broader economy beyond housing. In fact, the Fed’s 0.25% reduction in the discount rate in the final month of the year only seemed to heighten investor anxiety about the overall health of the economy.
What were the best performing sectors and investments for the Fund?
The two best performing sectors for the Fund during 2007 were Consumer Discretionary and Financials. Our stock selection and underweight positions in both sectors contributed to the Fund’s performance relative to the benchmark In addition, Energy was a standout sector performance-wise for the Fund during the year, as the Fund’s holdings have benefited from higher demand and the strength in oil and natural gas prices.
The Funds two best-performing investments were Smith International and Kyphon.
8 Annual Report | December 31, 2007 |
Smith International, which supplies drill bits, fluids, and other products to the oil and gas industry, continued to benefit from strength in oil and natural gas prices, with offshore drilling projects as a major driver of revenue in recent quarters. Smith International was up 81.06% for the year for the Fund.
Health Care holding Kyphon, Inc. was up 75.67% for the year. Kyphon developed a minimally invasive procedure, kyphoplasty, to fix spinal compression fractures. Medtronic announced in July that it would be acquiring Kyphon.
Like Kyphon, a number of other companies that the Fund owns were also involved in acquisitions, which we believe lends credibility to our quality growth philosophy of investing in high quality companies with strong management and durable business franchises. These included MedImmune, which was acquired by European drug manufacturer AstraZeneca, Laureate Education, which was bought by a private equity firm, WebEx Communications, which was subsequently acquired by Cisco Systems, and Investors Financial Services Company, which was acquired by State Street.
What were the weakest performing sectors and investments for the Fund?
As mentioned, the Information Technology sector was the single largest detractor to Fund performance during 2007, followed by Consumer Staples.
The Fund’s worst overall performing investment was Santarus, which was down 70.63% for the Fund. Santarus is a pharmaceutical company that makes less expensive versions of drugs made by large cap drug companies to treat gastrointestinal diseases and disorders. The company’s products came under pricing pressure from managed care discounts for over-the-counter versions of its drugs as well as from other generics, and growth was not nearly what the company had anticipated. Following a succession of missed quarterly earnings estimates, we had begun to eliminate our position in this stock in the third quarter. The stock was no longer held in the Fund’s portfolio at your end.
The Fund also saw weak performance from the Information Technology name Jabil.
Jabil Circuit, a technology company which provides electronics manufacturing services for other firms, was the worst performing investment for the year, declining 37.0% for the Fund. Jabil reported a weak third quarter and attributed it to lower sales in their industrial segment due to slowing U.S. economic growth. The company also reduced earnings “guidance” for the following quarter that was well below Wall Street analysts’ expectations.
What is your current strategy? How is the Fund positioned?
We currently intend to be cautious investors towards the Consumer Discretionary sector. The slump in the housing sector and recent problems in the subprime lending market are negative factors overhanging the market, and have the potential to negatively impact consumer spending. We continue to monitor these issues and the potential impact they may have on the Fund’s holdings.
In the Financial sector, we have eliminated positions where we believe a company is overexposed to “headline” risk, based on the problems in the credit markets. During the fourth quarter we finished selling our position in Moody’s, swapping it for asset management firm T. Rowe Price, a company that does not have significant credit exposure and that is experiencing strong growth in its institutional and overseas businesses. Other Financial companies in the Fund’s portfolio that we consider core names have so far demonstrated an ability to withstand the recent turbulence.
December 31, 2007 | William Blair Funds 9 |
Within the Information Technology sector we will stick to our quality growth approach and attempt to mitigate potential losses by exiting names that we believe have a high degree of vulnerability to a slowdown in consumer spending. At the same time, we will seek to “trade up” to attractive quality growth names that that have traded down in price. And while we have not changed our philosophy or process with regard to the types of companies we seek, we intend to be more open minded with regard to stock valuation considerations within this sector, particularly if a company has a very unique franchise.
10 Annual Report | December 31, 2007 |
Tax-Managed Growth Fund
Performance Highlights (unaudited)
Average Annual Total Return at 12/31/2007
| | | | | | | | | | | | |
| | | 1
Year | | | 3
Year | | | 5
Year | | | Since
Inception(a) | |
Tax-Managed Growth Fund
Class N | | 9.96 | % | | 10.20 | % | | 11.89 | % | | 2.33 | % |
Tax-Managed Growth Fund
Class I | | 10.24 | | | 10.54 | | | 12.18 | | | 2.60 | |
Russell 3000®
Growth Index | | 11.40 | | | 8.64 | | | 12.42 | | | (2.55 | ) |
S&P 500 Index | | 5.49 | | | 8.62 | | | 12.83 | | | 1.76 | |
| | (a) | | For the period from December 27, 1999 to December 31, 2007. |
Performance cited represents past performance. Past performance does not guarantee future results and current performance may be lower or higher than the data quoted. Results shown are average annual total returns, which assume reinvestment of dividends and capital gains. Investment returns and principal will fluctuate and you may have a gain or loss when you sell shares. For the most current month-end performance information, please call 1-800-742-7272, or visit our Web site at www.williamblairfunds.com. From time to time, the investment advisor may waive fees or reimburse expenses for the Fund. Without these waivers, performance would be lower. Class N shares are available to the general public without a sales load. Class I shares are available to certain institutional investors and advisory clients of William Blair & Company, L.L.C., without a sales load or distribution (12b-1) or service fees.
The performance highlights and graph presented above do not reflect the deduction of taxes that a shareholder would pay on fund distributions or the redemption of fund shares.
The Russell 3000® Growth Index consists of large, medium, and small-capitalization companies with above average price-to-book ratios and forecasted growth rates. The index is weighted by market capitalization and large/medium/small companies make up approximately 80%/15%/5% of the index.
The S&P 500 Index indicates broad larger capitalization equity market performance.
This report identifies the Fund’s investments on December 31, 2007. These holdings are subject to change. Not all stocks in the Fund performed the same, nor is there any guarantee that these stocks will perform as well in the future. Market forecasts provided in this report may not necessarily come to pass.
Sector Diversification (unaudited)
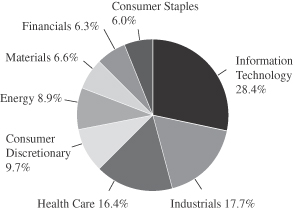
The sector diversification shown is based on the total investment portfolio.
December 31, 2007 | William Blair Funds 11 |
Tax-Managed Growth Fund
Portfolio of Investments, December 31, 2007 (all dollar amounts in thousands)
| | | | | |
Issuer | |
Shares | | Value |
| | |
Common Stocks | | | | | |
Information Technology—27.0% | | | | | |
*Activision, Inc. | | 8,453 | | $ | 251 |
*Adobe Systems Incorporated | | 6,160 | | | 263 |
Arm Holdings plc—ADR | | 11,960 | | | 89 |
*Cisco Systems, Inc. | | 7,180 | | | 194 |
*Cognizant Technology Solutions Corporation | | 5,350 | | | 182 |
*Electronic Arts Inc. | | 2,950 | | | 172 |
*EMC Corporation | | 14,140 | | | 262 |
*Euronet Worldwide, Inc. | | 3,770 | | | 113 |
*F5 Networks, Inc. | | 5,160 | | | 147 |
FactSet Research Systems Inc. | | 1,840 | | | 103 |
Jabil Circuit Inc. | | 15,770 | | | 241 |
Microchip Technology Incorporated | | 5,250 | | | 165 |
*Nuance Communications, Inc. | | 5,420 | | | 101 |
Paychex, Inc. | | 5,950 | | | 216 |
Qualcomm Incorporated | | 5,100 | | | 201 |
*Silicon Laboratories Inc. | | 3,300 | | | 124 |
Taiwan Semiconductor Mfg. Co. Ltd.—ADR | | 10,719 | | | 107 |
| | | | | |
| | | | | 2,931 |
| | | | | |
Industrials—16.9% | | | | | |
3M Company | | 2,430 | | | 205 |
*Corrections Corporation of America | | 6,210 | | | 183 |
Danaher Corporation | | 3,810 | | | 334 |
Expeditors International of Washington, Inc. | | 3,500 | | | 156 |
General Electric Company | | 6,985 | | | 259 |
*IHS Inc. | | 4,640 | | | 281 |
Knight Transportation, Inc. | | 7,832 | | | 116 |
Rockwell Collins, Inc. | | 4,110 | | | 296 |
| | | | | |
| | | | | 1,830 |
| | | | | |
Health Care—15.6% | | | | | |
Allergan Inc. | | 4,090 | | | 263 |
C.R.Bard, Inc. | | 1,710 | | | 162 |
*Gilead Sciences, Inc. | | 5,770 | | | 265 |
*Healthways, Inc. | | 5,710 | | | 334 |
Pharmaceutical Product Development, Inc. | | 5,970 | | | 241 |
*Psychiatric Solutions, Inc. | | 4,820 | | | 157 |
Stryker Corporation | | 3,600 | | | 269 |
| | | | | |
| | | | | 1,691 |
| | | | | |
Consumer Discretionary—9.2% | | | | | |
*CarMax, Inc. | | 6,840 | | | 135 |
*GameStop Corp. | | 2,810 | | | 175 |
International Game Technology | | 5,420 | | | 238 |
Johnson Controls, Inc. | | 5,670 | | | 204 |
*Scientific Games Corporation | | 3,590 | | | 119 |
*Tractor Supply Company | | 3,580 | | | 129 |
| | | | | |
| | | | | 1,000 |
| | | | | |
*Non-income producing securities
ADR = American Depository Receipt
† = U.S. listed foreign security
VRN = Variable Rate Note
| | | | | | | |
Issuer | | Shares or
Principal
Amount | | Value | |
| | |
Common Stocks—(continued) | | | | | | | |
Energy—8.4% | | | | | | | |
Apache Corporation | | | 1,780 | | $ | 191 | |
Encana Corporation† | | | 2,370 | | | 161 | |
Smith International, Inc. | | | 2,280 | | | 168 | |
Suncor Energy, Inc.† | | | 3,630 | | | 395 | |
| | | | | | | |
| | | | | | 915 | |
| | | | | | | |
Materials—6.2% | | | | | | | |
Airgas, Inc. | | | 4,870 | | | 254 | |
Praxair, Inc. | | | 4,750 | | | 421 | |
| | | | | | | |
| | | | | | 675 | |
| | | | | | | |
Financials—5.9% | | | | | | | |
*Affiliated Managers Group, Inc. | | | 1,040 | | | 122 | |
American International Group | | | 2,780 | | | 162 | |
*IntercontinentalExchange, Inc. | | | 930 | | | 179 | |
T. Rowe Price Group, Inc. | | | 2,990 | | | 182 | |
| | | | | | | |
| | | | | | 645 | |
| | | | | | | |
Consumer Staples—5.7% | | | | | | | |
Colgate-Palmolive Company | | | 3,020 | | | 235 | |
CVS/Caremark Corporation | | | 3,774 | | | 150 | |
PepsiCo, Inc. | | | 3,095 | | | 235 | |
| | | | | | | |
| | | | | | 620 | |
| | | | | | | |
Total Common Stock—94.9%
(cost $8,127) | | | 10,307 | |
| | | | | | | |
| | |
Investment in Affiliate | | | | | | | |
William Blair Ready Reserves Fund | | | 308,701 | | | 309 | |
| | | | | | | |
Total Investment in Affiliate—2.9%
(cost $309) | | | 309 | |
| | | | | | | |
| | |
Short-Term Investment | | | | | | | |
Prudential Funding Demand Note, VRN 4.430%, due 1/2/08 | | $ | 100,000 | | | 100 | |
| | | | | | | |
Total Short-Term Investment—0.9%
(cost $100) | | | 100 | |
| | | | | | | |
| | |
Repurchase Agreement | | | | | | | |
State Street Bank and Trust Company, 3.800% dated 12/31/07 due 1/2/08 repurchase price $154, collateralized by FN Pool #712321 | | | 154,120 | | | 154 | |
| | | | | | | |
Total Repurchase Agreement—1.4%
(cost $154) | | | 154 | |
| | | | | | | |
Total Investments—100.1%
(cost $8,690) | | | 10,870 | |
Liabilities, plus cash and other assets—( 0.1)% | | | (8 | ) |
| | | | | | | |
Net assets—100.0% | | $ | 10,862 | |
| | | | | | | |
See accompanying Notes to Financial Statements.
12 Annual Report | December 31, 2007 |

James S. Golan
John F. Jostrand
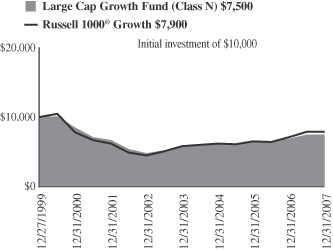
LARGE CAP GROWTH FUND
The Large Cap Growth Fund invests primarily in common stocks of quality large domestic growth companies that the Advisor believes have demonstrated sustained growth over a long period of time.
AN OVERVIEW FROM THE PORTFOLIO MANAGERS
How did the Fund perform over the last year? How did the Fund’s performance compare to its benchmark?
The Large Cap Growth Fund posted a 9.30% increase on a total return basis (Class N Shares) for the 12 months ended December 31, 2007. By comparison, the Fund’s benchmark, the Russell 1000® Growth Index, gained 11.81%.
What were the most significant market factors impacting Fund performance?
For 2007, most US equity markets gained ground with the exception of those focused on value and micro cap stocks. In a significant reversal since the beginning of the millennium, growth stocks surpassed value stocks with a 12% spread or more between Russell growth and value indices. From a market cap perspective, large caps outperformed small caps; the spread between Russell large and small indices for 2007 was more than 4.7%. Volatility remained high as investors responded to weakness in economic and employment data. Second and third quarter GDP was reported as solid but the fourth quarter GDP estimate was much lower. The unemployment rate rose to 5.0% by year end suggesting a weakening labor market. Additionally, the wealth and health of consumers and financial firms came under pressure during the period due to higher defaults on home loans and mortgage related investments as well as increasing losses on credit cards and other consumer loans. As a result of these strong market headwinds in December, many market observers have discussed the potential for a recession in the coming year.
On a positive note, US corporations have significant cash on their balance sheets and profit margins have remained elevated as a result of continued cost productivity. While the US economic growth seems to be slowing, foreign growth has continued to be healthy.
In terms of sector performance in the Russell 1000® Growth index, the best contributors to overall returns were technology and industrials. The technology group was up 19.1% for the year with many of the largest bell-whether companies doing well in the flight to safety. Industrials gained 14.0% for the period benefiting from strong global demand. The weakest sector contributors and the only ones with negative returns were consumer discretionary, telecommunications services and financials. Consumer discretionary stocks declined 10.5% as investors were concerned over a possible recession that could impact future returns for the group while financial stocks dropped 3.4% on the issues discussed above.
Were there any investment strategies or themes that did not measure up to your expectations?
Those sectors with the weakest relative portfolio performance for 2007 were Technology and Consumer Staples. For Technology, while we were overweighted in this solid performing group, a couple of factors drove the poor performance. First, our holdings in semiconductors detracted from results due to declines in Maxim Integrated Products and Taiwan Semiconductors. Maxim Integrated Products came under pressure relative to peers due to
December 31, 2007 | William Blair Funds 13 |
delayed restatement and share buyback issues. Taiwan Semiconductor was impacted by concerns over a slowing global economy as well as some emerging concerns over the competitive environment; however, this firm continues to be viewed as an industry leader and we believe that market concerns about the competitive environment for semiconductors were overdone. We added to this position during the fourth quarter on weakness and the stock has appreciated from third quarter lows. Secondly, there was a flight to safety during the last half of the year as investors worried over a slowing economy. Investors flocked to the very largest technology companies such as Microsoft and Intel, or those with strong product momentum like Apple. The fact that we didn’t own these stocks hurt our relative performance.
Although Consumer Staples had healthy returns in the benchmark, they were the second largest detractor from relative performance due to stock selection. While Pepsi was a good performer for us, Walgreens was a disappointment. The company reported very disappointing earnings in October causing a significant drop in the stock price. We exited the stock because we believed that the issues facing the company would take several quarters to be resolved.
Which sectors enhanced the Fund’s return? What were among the best performing investments for the Fund?
Stock selection in Financials, Energy and Industrials sectors assisted performance for the year. Financial stocks, which had a negative return in the benchmark, drove a significant part of the Fund’s performance. With positioning in select capital markets and diversified financial services companies, our financial stocks had positive results and we were able to avoid significant exposure to the sub prime and credit issues faced by the market during the year. Charles Schwab was a strong relative and absolute performer with solid quarterly earnings reports driven by continued strong asset growth.
Energy stocks were the best performing sector for the Fund versus the benchmark with a return of 41%. Our exploration and production stocks saw strong returns in the period. Appreciation was particularly pronounced for Apache and Suncor, as global demand for oil continued to rise and the price of oil reached near $100 per barrel. Schlumberger was also a strong performer as producers began a more aggressive push to find new energy reserves.
Our industrial stocks were also good performers for the Fund driven by strength in Danaher and ABB Ltd. Danaher continued to deliver the financial results investors have grown to expect over time while ABB continued to benefit from the strong global demand for its products used in the electrical power grid.
What is your current strategy? How is the Fund positioned?
The economy is slowing driven by sub prime and credit issues. We believe that economic growth will be weak through the first-half of this year, but begin to strengthen as we move to the latter part of the year. Through continued strong export growth and actions by the Federal Reserve, the economy should continue to move forward. The factors that we will continue to watch include unemployment and inflation. A significant increase in the unemployment rate could have a detrimental impact on the economic outlook while a significant increase in inflation expectation could also limit the Federal Reserve’s response to slowing growth.
We have experienced an unprecedented period of corporate profitability growth. As the economy slows, the higher quality growth companies should continue to differentiate themselves relative to the average company. Regardless of the macro issues facing the market, we continue to find quality stocks that offer growth opportunities. We continue to find interesting opportunities in Technology, select Health Care, Industrials and Energy. We believe that as overall earnings growth decelerates, investors will pay more attention to earnings multiples, and reward stocks which exhibit longer, more sustainable earnings trends with higher P/E multiples.
14 Annual Report | December 31, 2007 |
Large Cap Growth Fund
Performance Highlights (unaudited)
Average Annual Total Return at 12/31/2007
| | | | | | | | | | | | |
| | | 1
Year | | | 3
Year | | | 5
Year | | | Since
Inception(a) | |
Large Cap Growth Fund Class N | | 9.30 | % | | 6.42 | % | | 9.39 | % | | (3.48 | )% |
Large Cap Growth Fund Class I | | 9.36 | | | 6.60 | | | 9.66 | | | (3.29 | ) |
Russell 1000®
Growth Index | | 11.81 | | | 8.68 | | | 12.11 | | | (2.86 | ) |
| | (a) | | For the period from December 27, 1999 to December 31, 2007. |
Performance cited represents past performance. Past performance does not guarantee future results and current performance may be lower or higher than the data quoted. Results shown are average annual total returns, which assume reinvestment of dividends and capital gains. Investment returns and principal will fluctuate and you may have a gain or loss when you sell shares. For the most current month-end performance information, please call 1-800-742-7272, or visit our Web site at www.williamblairfunds.com. From time to time, the investment advisor may waive fees or reimburse expenses for the Fund. Without these waivers, performance would be lower. Class N shares are available to the general public without a sales load. Class I shares are available to certain institutional investors and advisory clients of William Blair & Company, L.L.C., without a sales load or distribution (12b-1) or service fees.
The performance highlights and graph presented above do not reflect the deduction of taxes that a shareholder would pay on fund distributions or the redemption of fund shares.
The Russell 1000® Growth Index consists of large capitalization companies with above average price-to-book ratios and forecasted growth rates.
This report identifies the Fund’s investments on December 31, 2007. These holdings are subject to change. Not all stocks in the Fund performed the same, nor is there any guarantee that these stocks will perform as well in the future. Market forecasts provided in this report may not necessarily come to pass.
Sector Diversification (unaudited)
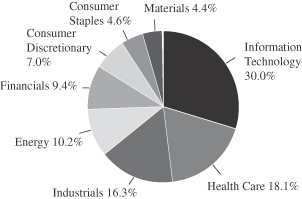
The sector diversification shown is based on the total investment portfolio.
December 31, 2007 | William Blair Funds 15 |
Large Cap Growth Fund
Portfolio of Investments, December 31, 2007 (all dollar amounts in thousands)
| | | | | |
Issuer | | Shares | | Value |
| | |
Common Stocks | | | | | |
Information Technology—29.3% | | | | | |
*Adobe Systems Incorporated | | 24,655 | | $ | 1,053 |
*Autodesk, Inc. | | 14,350 | | | 714 |
*Cisco Systems Inc. | | 68,954 | | | 1,867 |
Corning Incorporated | | 30,230 | | | 725 |
*EMC Corporation | | 55,945 | | | 1,037 |
*Fiserv, Inc. | | 9,850 | | | 547 |
*Google Inc. | | 630 | | | 436 |
Maxim Integrated Products, Inc. | | 19,340 | | | 512 |
Paychex, Inc. | | 20,035 | | | 726 |
Qualcomm Incorporated | | 16,695 | | | 657 |
Taiwan Semiconductor Mfg. Co. Ltd.—ADR | | 98,826 | | | 984 |
*Verisign, Inc. | | 16,390 | | | 616 |
| | | | | |
| | | | | 9,874 |
| | | | | |
Health Care—17.7% | | | | | |
Allergan, Inc. | | 15,520 | | | 997 |
C. R. Bard, Inc. | | 11,465 | | | 1,087 |
*Genentech, Inc. | | 11,975 | | | 803 |
*Gilead Sciences, Inc. | | 25,520 | | | 1,174 |
*Hologic, Inc. | | 10,410 | | | 715 |
Stryker Corporation | | 8,955 | | | 669 |
*Thermo Fisher Scientific Inc. | | 8,930 | | | 515 |
| | | | | |
| | | | | 5,960 |
| | | | | |
Industrials—16.0% | | | | | |
ABB Ltd.—ADR | | 32,250 | | | 929 |
Danaher Corporation | | 22,442 | | | 1,969 |
Expeditors International of Washington, Inc. | | 10,810 | | | 483 |
Rockwell Automation, Inc. | | 9,490 | | | 654 |
Rockwell Collins, Inc. | | 18,565 | | | 1,336 |
| | | | | |
| | | | | 5,371 |
| | | | | |
Energy—10.0% | | | | | |
Apache Corporation | | 11,720 | | | 1,260 |
Schlumberger Limited† | | 13,315 | | | 1,310 |
Suncor Energy, Inc.† | | 7,385 | | | 803 |
| | | | | |
| | | | | 3,373 |
| | | | | |
Financials—9.2% | | | | | |
Brookfield Asset Management Inc.† | | 8,730 | | | 312 |
Charles Schwab & Co, Inc. | | 42,655 | | | 1,090 |
CME Group Inc. | | 760 | | | 521 |
Franklin Resources, Inc. | | 5,705 | | | 653 |
*IntercontinentalExchange, Inc. | | 2,650 | | | 510 |
| | | | | |
| | | | | 3,086 |
| | | | | |
*Non-income producing securities
ADR = American Depository Receipt
† = U.S. listed foreign security
VRN = Variable Rate Note
| | | | | | | |
Issuer | | Shares or
Principal
Amount | | Value | |
| | |
Common Stocks—(continued) | | | | | | | |
Consumer Discretionary—6.9% | | | | | | | |
*Coach, Inc. | | | 11,690 | | $ | 358 | |
International Game Technology | | | 9,687 | | | 425 | |
Johnson Controls, Inc. | | | 29,895 | | | 1,077 | |
Omnicom Group Inc. | | | 9,550 | | | 454 | |
| | | | | | | |
| | | | | | 2,314 | |
| | | | | | | |
Consumer Staples—4.5% | | | | | | | |
PepsiCo, Inc. | | | 14,005 | | | 1,063 | |
Wal Mart De Mexico—ADR | | | 13,060 | | | 451 | |
| | | | | | | |
| | | | | | 1,514 | |
| | | | | | | |
Materials—4.3% | | | | | | | |
Praxair, Inc. | | | 16,345 | | | 1,450 | |
| | | | | | | |
Total Common Stock—97.9%
(cost $28,392) | | | 32,942 | |
| | | | | | | |
| | |
Investment in Affiliate | | | | | | | |
William Blair Ready Reserves Fund | | | 244,119 | | | 244 | |
| | | | | | | |
Total Investment in Affiliate—0.7%
(cost $244) | | | 244 | |
| | | | | | | |
| | |
Short-Term Investment | | | | | | | |
American Express Credit Corp. Demand Note, VRN 4.695%, due 1/2/08 | | $ | 407,000 | | | 407 | |
Prudential Funding Demand Note, VRN 4.430%, due 1/2/08 | | | 510,000 | | | 510 | |
| | | | | | | |
Total Short-Term Investment—2.7%
(cost $917) | | | 917 | |
| | | | | | | |
| | |
Repurchase Agreement | | | | | | | |
State Street Bank and Trust Company, 3.800% dated 12/31/07, due 1/2/08, repurchase price $600, collateralized by FN Pool #712321 | | | 599,500 | | | 600 | |
| | | | | | | |
Total Repurchase Agreement—1.8%
(cost $600) | | | 600 | |
| | | | | | | |
Total Investments—103.1%
(cost $30,153) | | | 34,703 | |
Liabilities, plus cash and other assets—(3.1)% | | | (1,036 | ) |
| | | | | | | |
Net assets—100.0% | | | | | $ | 33,667 | |
| | | | | | | |
See accompanying Notes to Financial Statements.
16 Annual Report | December 31, 2007 |

Karl W. Brewer

Colin J. Williams
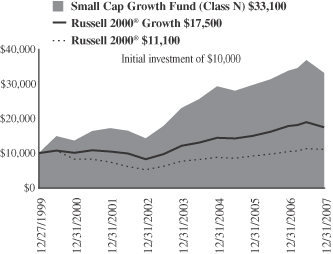
SMALL CAP GROWTH FUND
The Small Cap Growth Fund invests primarily in common stocks of small domestic growth companies that the Advisor expects to have solid growth in earnings.
AN OVERVIEW FROM THE PORTFOLIO MANAGERS
How did the Fund perform over the last year? How did the Fund’s performance compare to its benchmark?
The Small Cap Growth Fund posted a 2.15% loss on a total return basis (Class N Shares) for the 12 months ended December 31, 2007. By comparison, the Funds benchmark, the Russell® Growth Index gained 7.05% while the Russell 2000® Index lost 1.57% for the year end December 31, 2007.
What were the most significant factors impacting Fund performance? What factors were behind the Fund’s performance versus the benchmark?
As we look back at 2007, we entered the year much differently than we exited the year. The first half of the year was characterized by positive prospects for economic growth and corporate profit growth to continue their strong trends. The immense merger and buyout activity continued through the first six months of the year and was a boost to stock valuations. The housing market had already begun to slow but there was little fallout to consumer spending at that point, and despite a brief scare in February 2007, mortgage-related issues had not been a material problem. With that, most equity indices turned in strong mid to high single digit performances through the end of June — with a slight bias towards growth over value and towards small and mid caps over large. However, in the second half of 2007, the breadth and depth of the mortgage-related problems came to the surface and the slumping housing industry began to take its toll on consumers and those companies with revenue exposure to residential real estate investment and sales activity. As we exited 2007, stock market volatility had increased dramatically. This was caused by the expanding housing market and credit issues and the uncertain severity of their effects on the consumer and overall economy. Accordingly, equity indices finished the second half of the year considerably weaker than the first six months of the year. As earnings growth became less broad-based, growth indices sharply outpaced their value counterparts in the second half of the year, and for 2007 as a whole. The flight to quality witnessed in the back half of the year drove investors up the cap spectrum. Because of this, large caps narrowly outpaced mid caps during 2007, while small caps were the notable laggards.
With the housing market slump and credit quality concerns of 2007, the Consumer Discretionary and Financials sectors were the weakest performers for the Russell 2000® Growth Index. With rising crude prices and commodity prices in general, along with strong global industrial activity, the Energy, Materials and Industrials sectors turned in the strongest performances. The defensive-natured Health Care sector also outperformed the broad market during 2007, as it was one of the best performing sectors in the second half of the year when risk aversion increased dramatically.
From a relative standpoint, the Fund underperformed the Russell 2000® Growth Index during the year. Negative stock selection contributed to the Fund’s underperformance, but market headwinds played a role as well.
| | 1. | First, our market cap bias disadvantaged us this year given that “bigger was better” along the market cap spectrum and our investment process seeks to find smaller, less-discovered companies. We were underweight the largest quintile of stocks in |
December 31, 2007 | William Blair Funds 17 |
| | the Russell 2000® Growth which was up 13.5% for the year, while we were overweight the smallest quintile which turned in only a 4.3% return. |
| | 2. | The second style bias that detracted from performance was our valuation sensitivity. We believe that we are more valuation sensitive than most growth investors. During 2007 and especially later in the year, the market was biased toward more expensive stocks, which made it a tougher environment for our style of investing. |
| | 3. | Similarly, the third style dynamic that disadvantaged the Fund was the fact the market rewarded momentum stocks and the Fund suffered because of our bias to avoid chasing stocks simply because of great recent performance. |
| | 4. | Finally, industry factors also detracted from relative performance during the year. Some of the traditional cyclical and commodity-driven industries such as Industrial Conglomerates, Chemicals, and Metals & Mining performed well. Our style of finding companies with more sustainable growth prospects, which are often less economically sensitive, biases us away from these types of industries. |
| | 5. | Our stock selection in the Fund was a detractor from relative performance during 2007 as well. When simply examining the Fund by sector, certain stocks in the Consumer Discretionary, Information Technology, Industrials and Health Care sectors were particularly weak relative to the benchmark. |
What were among the weakest performing investments for the Fund?
Two of the weakest performing stocks for the Fund were Santarus and WNS Holdings.
Santarus, a specialty pharmaceutical company, was a stock we owned because they had one of the fastest-acting drugs in the huge ($12 billion) acid reflux drug category. Our investment thesis was that Santarus would rapidly penetrate this large market with a superior product to the competition. However, throughout the course of the year, we were disappointed with data on sales force productivity, and more importantly, increasing generic and over-the-counter utilization and the corresponding pricing pressure within the acid reflux market. The latter made us question the ongoing market opportunity and earnings power for the company, and we therefore sold the stock.
WNS Holdings Limited operates in the business process outsourcing (BPO) industry. The company offers its corporate clients an outsourced solution for various business functions in areas such as finance and accounting, supply chain management, human resources and market research. During August, one of the company’s mortgage servicing clients informed the company that it would no longer be in business, and therefore, earnings expectations needed to come down. The stock was down in the days following the announcement, which we thought mostly reflected the loss in earnings derived from that client. However, despite having minimal exposure to other mortgage servicers and the balance of their business performing well, the stock continued to sell off through year end as the valuation compressed due to the stigma of having “mortgage-related” exposure. We continue to be optimistic about the future growth prospects for WNS.
What were among the best performing investments for the Fund?
Two of the best performing stocks during the year were Air Methods and SurModics.
Air Methods is a leader in medical air transport. The company contracts with both hospitals and communities for emergency and non-emergency transport. The stock performed very well in 2007 as the company surpassed earnings expectations throughout the year. This business strength was the result of strong medical transport trends, and in turn, high earnings contribution due to Air Methods’ largely fixed cost model.
18 Annual Report | December 31, 2007 |
SurModics, a medical technology and device company, was another top performer in the Portfolio during 2007. In June, the company announced that it was entering an agreement with Merck to develop and commercialize products using Merck’s drug compounds and Surmodics’ I-Vation drug delivery system to treat various retinal diseases in the ophthalmology market. SurModics also bought back shares, made two acquisitions and announced a partnership with a leading orthopedics company. All of these events translated into positive sentiment for the stock during 2007.
What is your current outlook?
The threat of a recession is the main overhang on the markets as we look out to 2008. The housing market shows little signs of stabilizing, employment data has softened recently, and the conventional wisdom of a global economy moderating any US slowdown is being tested as two major pieces of the world economy, Europe and Japan, show signs of moderation as well. From an earnings perspective, growth forecasts appear overly optimistic for 2008 so the market could be at further risk if expectations ease in the coming months. However, valuation multiples are at reasonable levels and the Federal Reserve seems willing to combat any signs of a recession. The dichotomy in the market during 2007, in which consumer related shares vastly underperformed those on the industrial side of the economy, may still present opportunities on a bottom-up basis, as certain consumer stocks may be more fully discounting an economic slowdown than are many industrial companies. Regardless, we will continue to look across all sectors for companies with more company-specific growth drivers that should enable them to exceed growth expectations despite the macro-economic environment.
Is there any other news with respect to the Fund?
With respect to illiquid securities in the Fund, there are five companies for which the fund holds illiquid securities or warrants. These securities amounted to roughly 1.2% of the Fund as of December 31, 2007. The Fund holds warrants of Motorcar Parts of America, Zila Inc and Think Partnership, Inc. The underlying warrants for the above mentioned securities are exercisable at various dates until 2011. The Fund also holds common shares of Kona Grill, a restaurant company, which were purchased in two private transactions during 2006. These shares are expected to become freely tradable during 2008. Likewise, the Fund owns shares of BancTec which provides automation solutions to the retail banking industry; these shares are also expected to become freely tradable during 2008. The Fund’s Pricing Committee and Valuation Committee are currently pricing BancTec common shares, Kona Grill common shares and all warrants at fair value.
December 31, 2007 | William Blair Funds 19 |
Small Cap Growth Fund
Performance Highlights (unaudited)
Average Annual Total Return at 12/31/2007
| | | | | | | | | | | | |
| | | 1
Year | | | 3
Year | | | 5
Year | | | Since
Inception(a) | |
Small Cap Growth Fund Class N | | (2.15 | )% | | 4.15 | % | | 18.40 | % | | 16.03 | % |
Small Cap Growth Fund Class I | | (1.88 | ) | | 4.44 | | | 18.70 | | | 16.32 | |
Russell 2000®
Growth Index | | 7.05 | | | 8.11 | | | 16.50 | | | 1.29 | |
Russell 2000® Index | | (1.57 | ) | | 6.80 | | | 16.25 | | | 7.20 | |
| | (a) | | For the period from December 27, 1999 to December 31, 2007. |
Performance cited represents past performance. Past performance does not guarantee future results and current performance may be lower or higher than the data quoted. Results shown are average annual total returns, which assume reinvestment of dividends and capital gains. Investment returns and principal will fluctuate and you may have a gain or loss when you sell shares. For the most current month-end performance information, please call 1-800-742-7272, or visit our Web site at www.williamblairfunds.com. Investing in smaller companies involves special risks, including higher volatility and lower liquidity. From time to time, the investment advisor may waive fees or reimburse expenses for the Fund. Without these waivers, performance would be lower. Class N shares are available to the general public without a sales load. Class I shares are available to certain institutional investors and advisory clients of William Blair & Company, L.L.C., without a sales load or distribution (12b-1) or service fees.
The performance highlights and graph presented above do not reflect the deduction of taxes that a shareholder would pay on fund distributions or the redemption of fund shares.
The Russell 2000® Growth Index consists of small-capitalization companies with above average price-to-book ratios and forecasted growth rates.
The Russell 2000® Index is an unmanaged composite of the smallest 2000 stocks of the Russell 3000® Index.
This report identifies the Fund’s investments on December 31, 2007. These holdings are subject to change. Not all stocks in the Fund performed the same, nor is there any guarantee that these stocks will perform as well in the future. Market forecasts provided in this report may not necessarily come to pass.
Sector Diversification (unaudited)
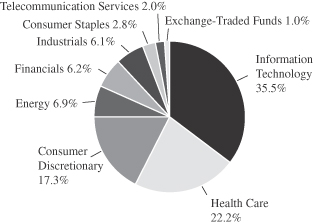
The sector diversification shown is based on the total investment portfolio.
20 Annual Report | December 31, 2007 |
Small Cap Growth Fund
Portfolio of Investments, December 31, 2007 (all dollar amounts in thousands)
| | | | | |
Issuer | | Shares | | Value |
| | |
Common Stocks | | | | | |
Information Technology—35.0% | | | | | |
*DTS, Inc. | | 827,500 | | $ | 21,159 |
*EarthLink, Inc. | | 2,401,291 | | | 16,977 |
*Euronet Worldwide, Inc. | | 1,107,282 | | | 33,218 |
*F5 Networks, Inc. | | 372,799 | | | 10,632 |
*GigaMedia Limited† | | 778,438 | | | 14,596 |
*j2 Global Communications, Inc. | | 784,347 | | | 16,605 |
*MathStar, Inc. | | 1,290,104 | | | 839 |
*Metavante Technologies, Inc. | | 455,806 | | | 10,629 |
*Miva, Inc. | | 3,027,199 | | | 5,782 |
*Monotype Imaging Holdings Inc. | | 185,745 | | | 2,818 |
*Nuance Communications, Inc. | | 994,644 | | | 18,580 |
*Optimal Group, Inc.† | | 2,164,208 | | | 8,981 |
*PDF Solutions, Inc. | | 1,889,930 | | | 17,028 |
*Silicon Laboratories, Inc. | | 546,303 | | | 20,448 |
*Skillsoft, plc—ADR | | 1,440,415 | | | 13,770 |
*Sonic Solutions | | 1,143,655 | | | 11,883 |
*SuccessFactors, Inc. | | 1,041,000 | | | 12,305 |
Syntel, Inc. | | 188,600 | | | 7,265 |
*Think Partnership, Inc. | | 4,626,270 | | | 7,032 |
*Ultimate Software Group, Inc. | | 462,285 | | | 14,548 |
United Online, Inc. | | 1,805,299 | | | 21,339 |
*Virtusa Corporation | | 708,131 | | | 12,272 |
*VistaPrint Limited† | | 668,112 | | | 28,629 |
*Volterra Semiconductor Corporation | | 752,727 | | | 8,303 |
*Website Pros, Inc. | | 1,922,561 | | | 22,321 |
*Wind River Systems, Inc. | | 989,375 | | | 8,835 |
*WNS Holdings Limited—ADR | | 1,003,909 | | | 16,414 |
| | | | | |
| | | | | 383,208 |
| | | | | |
Health Care—21.0% | | | | | |
*Air Methods Corporation | | 433,504 | | | 21,532 |
*Allscrpits Healthcare Solutions, Inc. | | 289,938 | | | 5,631 |
*Capital Senior Living Corporation | | 1,228,146 | | | 12,195 |
*Healthways, Inc. | | 408,893 | | | 23,896 |
*HMS Holdings Corp. | | 228,784 | | | 7,598 |
*Integra Lifesciences Holdings Corporation | | 377,872 | | | 15,844 |
*Iris International, Inc. | | 476,140 | | | 9,342 |
*Kensey Nash Corporation | | 310,869 | | | 9,301 |
*LifeCell Corporation | | 222,234 | | | 9,581 |
*Northstar Neuroscience, Inc. | | 577,926 | | | 5,375 |
*Omnicell, Inc. | | 128,300 | | | 3,455 |
*Providence Service Corporation | | 821,414 | | | 23,115 |
*Psychiatric Solutions, Inc. | | 411,054 | | | 13,359 |
*Sangamo Biosciences, Inc. | | 794,874 | | | 10,405 |
*Sciele Pharma, Inc. | | 441,098 | | | 9,020 |
*Surmodics, Inc. | | 415,453 | | | 22,547 |
*Trinity Biotech plc—ADR | | 1,010,654 | | | 6,893 |
*VistaCare, Inc. | | 1,907,915 | | | 13,832 |
*Zila, Inc. | | 7,237,388 | | | 7,020 |
| | | | | |
| | | | | 229,941 |
| | | | | |
Consumer Discretionary—15.1% | | | | | |
*Century Casinos, Inc. | | 1,289,233 | | | 8,303 |
*Coinstar, Inc. | | 529,804 | | | 14,914 |
*DG Fastchannel, Inc | | 1,046,244 | | | 26,826 |
*Duckwall-ALCO Stores, Inc. | | 322,738 | | | 10,302 |
*Granite City Food & Brewery, Ltd. | | 1,247,423 | | | 3,318 |
*Jarden Corporation | | 742,503 | | | 17,531 |
*Jos. A. Bank Clothiers, Inc. | | 334,222 | | | 9,509 |
*K12 Inc. | | 210,730 | | | 5,454 |
*Kona Grill, Inc.—144A | | 300,000 | | | 4,374 |
*Kona Grill, Inc.** (restricted) | | 135,134 | | | 1,701 |
| | | | | |
Issuer | | Shares | | Value |
| | |
Common Stocks—(continued) | | | | | |
Consumer Discretionary—(continued) | | | | | |
*Kona Grill, Inc. | | 210,695 | | $ | 3,072 |
*Lions Gate Entertainment Corporation† | | 1,092,832 | | | 10,294 |
*Motorcar Parts of America, Inc. | | 706,436 | | | 7,735 |
*Progressive Gaming International Corporation | | 5,331,944 | | | 13,222 |
*Shuffle Master, Inc. | | 761,512 | | | 9,131 |
Strayer Education, Inc. | | 100,706 | | | 17,178 |
*Ulta Salon, Cosmetics & Fragrance, Inc. | | 135,900 | | | 2,331 |
| | | | | |
| | | | | 165,195 |
| | | | | |
Energy—6.6% | | | | | |
*Concho Resources Inc. | | 742,883 | | | 15,311 |
*Dril-Quip, Inc. | | 213,588 | | | 11,888 |
*Oil States International, Inc. | | 319,025 | | | 10,885 |
*Petrohawk Energy Corporation | | 1,308,107 | | | 22,644 |
*W-H Energy Services, Inc. | | 196,730 | | | 11,058 |
| | | | | |
| | | | | 71,786 |
| | | | | |
Financials—5.8% | | | | | |
*Banctec, Inc.** | | 1,809,982 | | | 10,860 |
*Cash Systems, Inc. | | 1,131,365 | | | 5,001 |
*FirstService Corporation† | | 334,021 | | | 10,198 |
*Marlin Business Services Corporation | | 579,313 | | | 6,986 |
National Financial Partners Corporation | | 419,975 | | | 19,155 |
*Signature Bank New York | | 344,782 | | | 11,636 |
| | | | | |
| | | | | 63,836 |
| | | | | |
Industrials—5.8% | | | | | |
*GEO Group, Inc. | | 664,796 | | | 18,614 |
Heidrick & Struggles International, Inc. | | 314,631 | | | 11,676 |
*Hudson Highland Group, Inc. | | 617,358 | | | 5,192 |
*InnerWorkings, Inc. | | 1,382,752 | | | 23,866 |
*Kforce, Inc. | | 438,345 | | | 4,274 |
| | | | | |
| | | | | 63,622 |
| | | | | |
Consumer Staples—2.7% | | | | | |
*Overhill Farms, Inc. | | 1,903,720 | | | 5,406 |
*Physicians Formula Holdings, Inc. | | 1,335,045 | | | 15,860 |
*Smart Balance, Inc. | | 753,934 | | | 8,241 |
| | | | | |
| | | | | 29,507 |
| | | | | |
Telecommunication Services—1.9% | | | | | |
*Syniverse Holdings, Inc. | | 1,312,233 | | | 20,445 |
| | | | | |
Total Common Stock—93.9%
(Total Cost $964,213) | | | 1,027,540 |
| | | | | |
Exchange-Traded Funds—1.0% | | | | | |
iShares, Russell 2000 Growth | | 124,622 | | | 10,403 |
| | | | | |
Total Exchange-Traded Funds—1.0%
(cost $10,383) | | | 10,403 |
| | | | | |
| | |
Investment in Warrants | | | | | |
*Motorcar Parts of America, Inc.** | | 111,575 | | | — |
*Think Partnership, Inc., 2011, $2.50** | | 1,424,000 | | | — |
*Think Partnership, Inc., 2011, $3.05** | | 448,409 | | | — |
*Think Partnership, Inc., 2011, $4.00** | | 224,205 | | | — |
*Zila, Inc., 2011, $2.21** | | 2,271,528 | | | — |
| | | | | |
Total Investment in Warrants—0.0%
(cost $0) | | | — |
| | | | | |
See accompanying Notes to Financial Statements.
December 31, 2007 | William Blair Funds 21 |
Small Cap Growth Fund
Portfolio of Investments, December 31, 2007 (all dollar amounts in thousands)
| | | | | | |
Issuer | | Shares or
Principal
Amount | | Value |
| | |
Investment in Affiliate | | | | | | |
William Blair Ready Reserves Fund | | | 1,553,704 | | $ | 1,554 |
| | | | | | |
Total Investment in Affiliate—0.1%
(cost $1,554) | | | 1,554 |
| | | | | | |
| | |
Short-Term Investments | | | | | | |
American Express Credit Corp. Demand Note, VRN 4.695%, due 1/2/08 | | $ | 12,710,000 | | | 12,710 |
Prudential Funding Demand Note, VRN 4.430%, due 1/2/08 | | | 11,602,000 | | | 11,602 |
| | | | | | |
Total Short-Term Investments—2.2%
(cost $24,312) | | | 24,312 |
| | | | | | |
*Non-income producing securities
ADR = American Depository Receipt
† = U.S. listed foreign security
VRN = Variable Rate Note
** = Fair valued pursuant to Valuation Procedures adopted by the Board of Trustees. The holdings represents 1.15% of the Fund's net assets at December 31, 2007. These securities were also deemed illiquid pursuant to Liquidity Procedures approved by the Board of Trustees.
| | | | | | |
| | | |
Issuer | | Principal
Amount | | Value |
| | |
Repurchase Agreement | | | | | | |
State Street Bank and Trust Company, 3.800% dated 12/31/07, due 1/2/08, repurchase price $28,610, collateralized by
U.S. Treasury Bill, due 2/28/08 | | $ | 28,604,422 | | $ | 28,604 |
| | | | | | |
Total Repurchase Agreement—2.6%
(cost $28,604) | | | 28,604 |
| | | | | | |
Total Investments—99.8%
(cost $1,029,066) | | | 1,092,413 |
| | | | | | |
Cash and other assets, less liabilities—0.2% | | | 2,006 |
| | | | | | |
Net assets—100.0% | | $ | 1,094,419 |
| | | | | | |
If a Fund’s portfolio holding represents ownership of 5% or more of the voting securities of a company, the company is deemed to be an affiliate as defined in the Investment Company Act of 1940. The Small Cap Growth Fund had the following transactions during the year ended December 31, 2007 with affiliated companies:
| | | | | | | | | | | | | | |
| | | Share Activity | | Period Ended
December 31, 2007 |
| | | | | | | | | | | (in thousands) |
Security Name | | Balance
12/31/2006 | | Purchases | | Sales | | Balance
12/31/2007 | | Value | | Dividends
Included
in Income |
4 Kids Entertainment, Inc. | | 696,575 | | 23,800 | | 720,375 | | — | | $ | — | | $ | — |
Access Integrated Technologies, Inc. | | 1,530,387 | | 740,427 | | 2,270,814 | | — | | | — | | | — |
Cash Systems, Inc. | | — | | 1,146,065 | | 14,700 | | 1,131,365 | | | 5,001 | | | — |
Century Casinos, Inc. | | 1,546,133 | | 75,400 | | 332,300 | | 1,289,233 | | | 8,303 | | | — |
DG Fastchannel, Inc | | 971,150 | | 933,481 | | 858,387 | | 1,046,244 | | | 26,826 | | | — |
Duckwall-ALCO Stores, Inc. | | 325,133 | | 80,705 | | 83,100 | | 322,738 | | | 10,302 | | | — |
Frozen Food Express Industries, Inc. | | 894,816 | | 30,400 | | 925,216 | | — | | | — | | | 78 |
Granite City Food & Brewery, Ltd. | | — | | 1,372,423 | | 125,000 | | 1,247,423 | | | 3,318 | | | — |
Kona Grill, Inc. | | 764,729 | | — | | 118,900 | | 645,829 | | | 9,147 | | | — |
Lifecore Biomedical, Inc. | | 1,117,713 | | 29,700 | | 1,147,413 | | — | | | — | | | — |
Marlin Business Services Corp. | | 756,915 | | 96,400 | | 274,002 | | 579,313 | | | 6,986 | | | — |
Miva, Inc. | | — | | 3,027,199 | | — | | 3,027,199 | | | 5,782 | | | — |
Motorcar Parts of America, Inc. | | — | | 743,836 | | 37,400 | | 706,436 | | | 7,735 | | | — |
Optimal Group, Inc. | | 2,150,379 | | 780,542 | | 766,713 | | 2,164,208 | | | 8,981 | | | — |
Overhill Farms, Inc. | | 1,903,720 | | — | | — | | 1,903,720 | | | 5,406 | | | — |
PDF Solutions, Inc. | | 1,276,203 | | 785,038 | | 171,311 | | 1,889,930 | | | 17,028 | | | — |
Physicians Formula Holdings, Inc. | | — | | 1,352,345 | | 17,300 | | 1,335,045 | | | 15,860 | | | — |
Progressive Gaming International Corporation | | — | | 5,331,944 | | — | | 5,331,944 | | | 13,222 | | | — |
Providence Service Corporation | | 548,734 | | 409,852 | | 137,172 | | 821,414 | | | 23,115 | | | — |
Santarus, Inc. | | 3,588,835 | | 113,500 | | 3,702,335 | | — | | | — | | | — |
Stratasys, Inc. | | 590,537 | | 19,400 | | 609,937 | | — | | | — | | | — |
Think Partnership, Inc. | | 4,627,970 | | 125,400 | | 127,100 | | 4,626,270 | | | 7,032 | | | 85 |
Trinity Biotech plc-ADR | | 95,627 | | 1,406,523 | | 491,496 | | 1,010,654 | | | 6,893 | | | — |
VistaCare Inc. | | — | | 1,907,915 | | — | | 1,907,915 | | | 13,832 | | | — |
Volterra Semiconductor Corporation | | 1,842,933 | | 57,700 | | 1,147,906 | | 752,727 | | | 8,303 | | | — |
Website Pros, Inc. | | — | | 2,239,061 | | 316,500 | | 1,922,561 | | | 22,321 | | | — |
Zila, Inc. | | 7,312,888 | | — | | 75,500 | | 7,237,388 | | | 7,020 | | | — |
| | | | | | | | | | | | | | |
| | | | | | | | | | $ | 232,413 | | | |
| | | | | | | | | | | | | | |
See accompanying Notes to Financial Statements.
22 Annual Report | December 31, 2007 |

Harvey H. Bundy, III

Robert C. Lanphier, IV

David P. Ricci
MID CAP GROWTH FUND
The Mid Cap Growth Fund primarily invests in a diversified portfolio of common stocks of medium-sized domestic growth companies.
AN OVERVIEW FROM THE PORTFOLIO MANAGERS
How did the Fund perform during the past year? How did the Fund’s performance compare to its benchmark?
The Mid Cap Growth Fund posted a 14.62% increase on a total return basis (Class N Shares) for the 12-month period ending December 31, 2007. By comparison, the Fund’s benchmark, the Russell Midcap® Growth Index, gained 11.43% during the period.
What were the most significant market factors impacting Fund performance? What factors were behind the Fund’s performance versus the benchmark?
As we look back at 2007, we entered the year much differently than we exited the year. The first half of the year was characterized by positive prospects for economic growth and corporate profit growth to continue their strong trends. The immense merger and buyout activity continued through the first six months of the year and was a boost to stock valuations. The housing market had already begun to slow but there was little fallout to consumer spending at that point, and despite a brief scare in February, mortgage-related issues had not been a material problem. With that, most equity indices turned in strong mid to high single digit performances through the end of June—with a slight bias towards growth over value and towards small and mid caps over large. However, in the second half of 2007, the breadth and depth of the mortgage-related problems came to the surface and the slumping housing industry began to take its toll on consumers and those companies with revenue exposure to residential real estate investment and sales activity. As we exited 2007, stock market volatility had increased dramatically. This was caused by the deteriorating housing market and credit issues, and the uncertain severity of their effects on the consumer and overall economy. Accordingly, equity indices finished the second half of the year considerably weaker than the first six months of the year. As earnings growth became less broad-based, growth indices sharply outpaced their value counterparts in the second half of the year, and for 2007 as a whole. The flight to quality witnessed in the back half of the year drove investors up the cap spectrum. Because of this large caps narrowly outpaced mid caps during 2007, while small caps were the notable laggards.
Given the above events that transpired over 2007, it would be appropriate that the Consumer Discretionary and Financials sectors were the weakest performers in the Russell Midcap Growth® Index. With rising crude prices and commodity prices in general, along with strong global industrial activity, the Energy, Materials and Industrials sectors turned in the strongest performances. The defensive-natured Health Care sector also outperformed the broad market during 2007, with particular strength later in the year as risk aversion increased dramatically.
From a relative standpoint, the Fund outperformed its benchmark over the calendar year 2007. This was due to our investment style coming into favor and strong stock selection within many sectors. Our growth oriented Fund holdings and bias towards companies with lower debt on their balance sheet advantaged the Fund as earnings growth became less widespread and as credit concerns rose throughout the year. Stock selection within the Consumer Discretionary and Health Care sectors were the biggest contributors to relative return during the year, and the Financials and Energy sectors also contributed. The main area of relative weakness for the Fund was the Industrials sector. Also, our lower-than-benchmark
December 31, 2007 | William Blair Funds 23 |
average market capitalization was a slight positive to relative performance. Although it may seem a little counterintuitive given the market cap dynamic in the overall market, the small end of the mid cap space actually turned in the best annual returns.
What were among the best performing investments for the Fund?
Two of the best performing stocks during the year were Activision and Flir Systems.
Activision is a gaming software company with popular franchise titles such as Tony Hawk, Call of Duty and Spider-Man. Throughout the year, the company benefited from a strong video game cycle in general, but also from company-specific strength in its Guitar Hero franchise. During the fourth quarter, the company made an announcement that they would be combining with Vivendi’s Games division to create a leading video and online gaming business. This transaction was very well received by the market and the stock performed well accordingly. We continue to hold the name as we are positive on the growth potential of the combined entity.
Flir Systems is a leader in the design, manufacture, and marketing of thermal imaging and stabilized camera systems for use in both military and commercial applications. The stock traded higher throughout the year as the company witnessed strong business momentum in both their military and commercial Thermagraphy business lines. During June, Flir announced it had won a contract with the US Army to supply the US Marine Corps with a line of their stabilized multi sensor systems. Later in the year, the company reported strong earnings with particular strength in backlog growth. This provided an extra degree of earnings visibility at a time when investors were increasingly concerned about 2008 earnings for the overall market.
What were among the weakest performing investments for the Fund?
Two of the weakest performing stocks for the Fund were Jabil Circuit and Corporate Executive Board.
Jabil Circuit operates in the electronic manufacturing services industry. It is the outsourced manufacturer of choice for various technology, industrial, medical and consumer companies around the globe. The stock was sold off over the year after the company announced a few fundamental disappointments. During the first quarter, Jabil lost a contract from one of its biggest customers, Nokia, due to aggressive pricing from an Asian competitor. The stock traded in a sideways range during the second and third quarter before management lowered forward guidance for operating margins during the fourth quarter. This setback was mostly the result of a volatile consumer electronics business acquired a year earlier, compounded by a disappointing amount of new business wins. We liquidated the position on the news as we were uncomfortable with how much of the company’s overall revenues were represented by the cyclical and volatile consumer business.
Corporate Executive Board sells subscription-based, best-practices research on a variety of pertinent topics to corporate leaders. During February, the company had announced disappointing results. We managed the position down due to slowing revenue growth and cross selling patterns with existing clients. This was explained by management as a sales force execution issue, and we sought evidence as to whether this was a one-time event, or if the company’s market opportunity was perhaps becoming saturated. After seeing the company’s earnings report in April, we felt this issue may impact long term growth (not enough new products and not enough corporate demand for additional research services). We therefore decided to exit the position.
24 Annual Report | December 31, 2007 |
What is your current outlook?
The threat of a recession is the main overhang on the markets as we look to 2008. The housing market shows little signs of stabilizing, employment data has softened, and the conventional wisdom of a global economy moderating any US slowdown is being tested as two major pieces of the world economy, Europe and Japan, show signs of a moderation as well. From an earnings perspective, growth forecasts seem to be overly optimistic for 2008 so the market could be at further risk if expectations ease in the coming months. However, valuation multiples are at reasonable levels, corporate balance sheets are healthy, and the Federal Reserve seems willing to combat any signs of a recession. The dichotomy in the market during 2007, with consumer related shares vastly underperforming those on the industrial side of the economy, may still present opportunities on a bottom-up basis, as certain consumer companies may be more fully discounting an economic slowdown than are many industrial companies. Regardless, we will continue to look across all sectors for companies with more company-specific growth drivers that should enable them to exceed growth expectations despite the macro-economic environment.
December 31, 2007 | William Blair Funds 25 |
Mid Cap Growth Fund
Performance Highlights (unaudited)
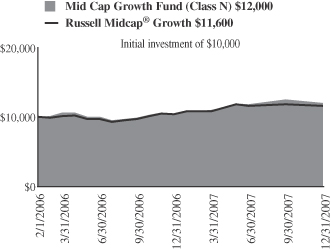
Average Annual Total Return at 12/31/2007
| | | | | | |
| | | 1
year | | | Since
Inception(a) | |
Mid Cap Growth Fund Class N | | 14.62 | % | | 9.93 | % |
Mid Cap Growth Fund Class I | | 14.95 | | | 10.27 | |
Russell Midcap® Growth Index | | 11.43 | | | 8.15 | |
| | (a) | | For the period from February 1, 2006 (Commencement of Operations) to December 31, 2007. |
Performance cited represents past performance. Past performance does not guarantee future results and current performance may be lower or higher than the data quoted. Results shown are average annual total returns, which assume reinvestment of dividends and capital gains. Investment returns and principal will fluctuate and you may have a gain or loss when you sell shares. For the most current month-end performance information, please call 1-800-742-7272, or visit our Web site at www.williamblairfunds.com. Investing in smaller and medium capitalization companies involves special risks, including higher volatility and lower liquidity. Mid Cap stocks are also more sensitive to purchase/sale transactions and changes in the issuer’s financial condition. From time to time, the investment advisor may waive fees or reimburse expenses for the Fund. Without these waivers, performance would be lower. Class N shares are available to the general public without a sales load. Class I shares are available to certain institutional investors and advisory clients of William Blair & Company, L.L.C., without a sales load or distribution (12b-1) or service fees.
The performance highlights and graph presented above do not reflect the deduction of taxes that a shareholder would pay on fund distributions or the redemption of fund shares.
The Russell Mid Cap® Growth Index is an index that is constructed to provide a comprehensive and unbiased barometer of the mid-cap growth market.
This report identifies the Fund’s investments on December 31, 2007. These holdings are subject to change. Not all stocks in the Fund performed the same, nor is there any guarantee that these stocks will perform as well in the future. Market forecasts provided in this report may not necessarily come to pass.
Sector Diversification (unaudited)
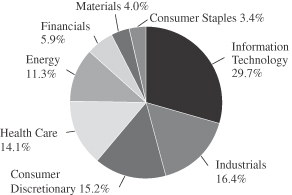
The sector diversification shown is based on the total investment portfolio.
26 Annual Report | December 31, 2007 |
Mid Cap Growth Fund
Portfolio of Investments, December 31, 2007 (all dollar amounts in thousands)
| | | | | |
Issuer | |
Shares | | Value |
| | |
Common Stocks | | | | | |
Information Technology—27.6% | | | | | |
*Activision, Inc. | | 69,205 | | $ | 2,055 |
*Autodesk, Inc. | | 15,960 | | | 794 |
*Cognizant Technology Solutions, Class “A” | | 25,290 | | | 858 |
*F5 Networks, Inc. | | 22,868 | | | 652 |
*FLIR Systems, Inc. | | 31,980 | | | 1,001 |
*Gartner Inc. | | 8,720 | | | 153 |
*Iron Mountain, Inc. | | 31,397 | | | 1,162 |
*j2 Global Communications, Inc. | | 24,765 | | | 524 |
Maxim Integrated Products, Inc. | | 19,560 | | | 518 |
Microchip Technology, Inc. | | 14,165 | | | 445 |
*Network Appliance, Inc. | | 13,226 | | | 330 |
*Nuance Communications, Inc. | | 31,950 | | | 597 |
Paychex, Inc. | | 38,265 | | | 1,386 |
*Silicon Laboratories, Inc. | | 25,160 | | | 942 |
*Trimble Navigation Limited | | 11,360 | | | 344 |
*Verisign, Inc. | | 19,990 | | | 752 |
| | | | | |
| | | | | 12,513 |
| | | | | |
Industrials—15.2% | | | | | |
C. H. Robinson Worldwide, Inc. | | 8,315 | | | 450 |
Expeditors International of Washington, Inc. | | 16,630 | | | 743 |
Fastenal Company | | 33,595 | | | 1,358 |
*IHS Inc. | | 11,170 | | | 676 |
Precision Castparts Corp. | | 6,470 | | | 897 |
Robert Half International, Inc. | | 23,935 | | | 647 |
Rockwell Automation, Inc. | | 9,390 | | | 648 |
Rockwell Collins, Inc. | | 12,075 | | | 869 |
*Stericycle, Inc. | | 10,280 | | | 611 |
| | | | | |
| | | | | 6,899 |
| | | | | |
Consumer Discretionary—14.2% | | | | | |
DeVry Inc. | | 8,010 | | | 416 |
*Dick’s Sporting Goods, Inc. | | 31,850 | | | 884 |
*Life Time Fitness, Inc. | | 30,350 | | | 1,508 |
*O’Reilly Automotive, Inc. | | 23,933 | | | 776 |
PetSmart, Inc. | | 33,595 | | | 790 |
Strayer Education, Inc. | | 5,540 | | | 945 |
*Tractor Supply Company | | 14,296 | | | 514 |
*Under Armour Inc. | | 13,520 | | | 591 |
| | | | | |
| | | | | 6,424 |
| | | | | |
Health Care—13.0% | | | | | |
C.R. Bard, Inc. | | 13,005 | | | 1,233 |
Brookdale Senior Living Inc | | 11,610 | | | 330 |
*Healthways, Inc. | | 15,595 | | | 911 |
*Hologic, Inc. | | 14,000 | | | 961 |
*IDEXX Laboratories, Inc. | | 19,030 | | | 1,116 |
Pharmaceutical Product Development, Inc. | | 34,135 | | | 1,378 |
| | | | | |
| | | | | 5,929 |
| | | | | |
*Non-income producing securities
† = U.S. listed foreign security
VRN = Variable Rate Note
| | | | | | |
Issuer | | Shares or
Principal
Amount | | Value |
| | |
Common Stocks—(continued) | | | | | | |
Energy—10.5% | | | | | | |
*Forest Oil Corporation | | | 21,100 | | $ | 1,073 |
Smith International, Inc. | | | 18,130 | | | 1,339 |
*Southwestern Energy Company | | | 14,700 | | | 819 |
*Ultra Petroleum Corp.† | | | 14,825 | | | 1,060 |
XTO Energy Corporation | | | 9,488 | | | 487 |
| | | | | | |
| | | | | | 4,778 |
| | | | | | |
Financials—5.4% | | | | | | |
*Affiliated Managers Group, Inc. | | | 8,145 | | | 957 |
BOK Financial Corporation | | | 8,140 | | | 421 |
National Financial Partners Corp. | | | 12,620 | | | 576 |
*Philadelphia Consolidated Holding Corp. | | | 13,650 | | | 537 |
| | | | | | |
| | | | | | 2,491 |
| | | | | | |
Materials—3.7% | | | | | | |
Airgas, Inc. | | | 9,810 | | | 511 |
Ecolab Inc. | | | 22,760 | | | 1,166 |
| | | | | | |
| | | | | | 1,677 |
| | | | | | |
Consumer Staples—3.2% | | | | | | |
*Hansen Natural Corporation | | | 20,340 | | | 901 |
Whole Foods Market, Inc. | | | 13,590 | | | 554 |
| | | | | | |
| | | | | | 1,455 |
| | | | | | |
Total Common Stock—92.8%
(cost $38,630) | | | 42,166 |
| | | | | | |
| | |
Investment in Affiliate | | | | | | |
William Blair Ready Reserves Fund | | | 112,399 | | | 112 |
| | | | | | |
Total Investment In Affiliate—0.3%
(cost $112) | | | 112 |
| | | | | | |
| | |
Short-Term Investment | | | | | | |
Prudential Funding Demand Note, VRN 4.430%, due 1/2/08 | | $ | 713,000 | | | 713 |
| | | | | | |
Total Short-Term Investment—1.6%
(cost $713) | | | 713 |
| | | | | | |
| | |
Repurchase Agreement | | | | | | |
State Street Bank and Trust Company, 3.800% dated 12/31/07, due 01/2/08, repurchase price $2,257, collateralized by U.S. Treasury Bill, due 2/28/08 | | | 2,256,039 | | | 2,256 |
| | | | | | |
Total Repurchase Agreement—5.0%
(cost $2,256) | | | 2,256 |
| | | | | | |
Total Investments—99.7%
(cost $41,711) | | | | | | 45,247 |
Cash and other assets, less liabilities—0.3% | | | 146 |
| | | | | | |
Net Assets—100.0% | | $ | 45,393 |
| | | | | | |
See accompanying Notes to Financial Statements.
December 31, 2007 | William Blair Funds 27 |
Karl W. Brewer
Harvey H. Bundy, III
Robert C. Lanphier, IV
SMALL-MID CAP GROWTH FUND
The Small-Mid Cap Growth Fund primarily invests in a diversified portfolio of common stocks of small and medium-sized domestic growth companies that the Advisor expects to experience solid growth in earnings.
AN OVERVIEW FROM THE PORTFOLIO MANAGERS
How did the Fund perform during the past year? How did the Fund’s performance compare to its benchmark?
The Small-Mid Cap Growth Fund gained 12.34% on a total return basis (Class N Shares) for the 12-month period ending December 31, 2007. By comparison, the Fund’s benchmark, the Russell 2500™ Growth Index, increased 9.69% during the period.
What were the most significant market factors impacting Fund performance? What factors were behind the Fund’s performance versus the benchmark?
As we look back at 2007, we entered the year much differently than we exited the year. The first half of the year was characterized by positive prospects for economic growth and corporate profit growth to continue their strong trends. The immense merger and buyout activity continued through the first six months of the year and was a boost to stock valuations. The housing market had already begun to slow but there was little fallout to consumer spending at that point, and despite a brief scare in February, mortgage-related issues had not been a material problem. With that, most equity indices turned in strong mid to high single digit performances through the end of June—with a slight bias towards growth over value and towards small and mid caps over large. However, in the second half of 2007, the breadth and depth of the mortgage-related problems came to the surface and the slumping housing industry began to take its toll on consumers and those companies with revenue exposure to residential real estate investment and sales activity. As we exited 2007, stock market volatility had increased dramatically. This was caused by the deteriorating housing market and credit issues, and the uncertain severity of their effects on the consumer and overall economy. Accordingly, equity indices finished the second half of the year considerably weaker than the first six months of the year. As earnings growth became less broad-based, growth indices sharply outpaced their value counterparts in the second half of the year, and for 2007 as a whole. The flight to quality witnessed in the back half of the year drove investors up the cap spectrum. Because of this, large caps narrowly outpaced mid caps during 2007, while small caps were the notable laggards.
With the housing market slump and credit quality concerns of 2007, the Consumer Discretionary and Financials sectors were the weakest performers for the Russell 2500™ Growth Index. With rising crude prices and commodity prices in general, along with strong global industrial activity, the Energy, Materials and Industrials sectors turned in the strongest performances. The defensive-natured Health Care sector also outperformed the broad market during 2007, as it was the best performing sector in the second half of the year when risk aversion increased dramatically.
With respect to relative performance, the Fund’s out-performance for the year was in part due to strong stock selection across most sectors, and also our investment style coming into favor during 2007. The Fund’s biases toward less volatile stocks and those companies with less debt on their balance sheet were a benefit to relative performance given the increased risk aversion and credit concerns of 2007. The Fund’s holdings in the Financials, Energy, Consumer Discretionary and Information Technology sectors outperformed their sector peers
28 Annual Report | December 31, 2007 |
in the Russell 2500™ Growth Index. Stock selection in the Industrials sector and our underweight to the strong-performing Materials sector were detractors from relative performance.
What were among the weakest performing investments for the Fund?
Two of the weakest performing stocks for the Fund were F5 Networks and Jabil Circuit.
F5 Networks is a networking company in the technology sector. Their products allow for increased performance, availability and security of applications run over networks. In early August the company announced an acquisition of a data storage optimization company. This acquisition was not in their core business (network efficiency) and overall investor sentiment turned negative as some interpreted this as an insight into management’s outlook for growth in the core networking business. Compounding this negative sentiment, management announced earnings during the fourth quarter that were basically in line with expectations but lowered forward earnings guidance. However, we feel the company has a leadership position in a rapidly growing market and is investing in its sales force—both of which should translate into solid growth.
Jabil Circuit operates in the electronic manufacturing services industry. It is the outsourced manufacturer of choice for various technology, industrial, medical and consumer companies around the globe. The stock sold off over the year after the company announced a few fundamental disappointments. During the first quarter, Jabil lost a contract from one of its biggest customers, Nokia, due to aggressive pricing from an Asian competitor. The stock traded in a sideways range during the second and third quarter before management lowered forward guidance for operating margins during the fourth quarter. This setback was mostly the result of a volatile consumer electronics business acquired a year earlier, compounded by a disappointing amount of new business wins. We liquidated the position on the news as we were uncomfortable with how much of the company’s overall revenues were represented by the cyclical and volatile consumer business.
What were among the best performing investments for the Fund?
Two of the best performing stocks during the quarter were Activision and Kyphon.
Activision is a gaming software company with popular franchise titles such as Tony Hawk, Call of Duty and Spider-Man. Throughout the year, the company benefited from a strong video game cycle in general, but also from company-specific strength in its Guitar Hero franchise. During the fourth quarter, the company made an announcement that they would be combining with Vivendi’s Vivendi Games division to create a leading video and online gaming business. This transaction was very well received by the market and the stock performed well accordingly. We continue to hold the name as we are positive on the growth potential of the combined entity.
Kyphon, a medical device company, was a leader in the spinal restoration market. The company had made some smart strategic acquisitions as recently as late-2006 which leveraged their specialized spinal sales force. During 2007, Medtronic, a leading large cap medical device company, recognized the value of the Kyphon franchise as it announced that it would be acquiring Kyphon at a premium to the then market price.
What is your current outlook?
The threat of a recession is the main overhang on the markets as we look out to 2008. The housing market shows little signs of stabilizing, employment data has softened recently, and the conventional wisdom of a global economy moderating any US slowdown is being tested
December 31, 2007 | William Blair Funds 29 |
as two major pieces of the world economy, Europe and Japan, show signs of moderation as well. From an earnings perspective, growth forecasts appear overly optimistic for 2008 so the market could be at further risk if expectations ease in the coming months. However, valuation multiples are at reasonable levels and the Federal Reserve seems willing to combat any signs of a recession. The dichotomy in the market during 2007, in which consumer related shares vastly underperformed those on the industrial side of the economy, may still present opportunities on a bottom-up basis, as certain consumer stocks may be more fully discounting an economic slowdown than are many industrial companies. Regardless, we will continue to look across all sectors for companies with more internal growth drivers that should enable them to exceed growth expectations despite the macro-economic environment.
30 Annual Report | December 31, 2007 |
Small-Mid Cap Growth Fund
Performance Highlights (unaudited)
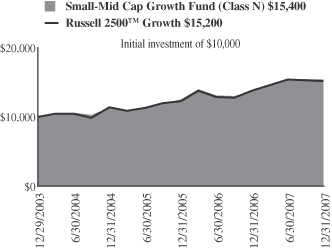
Average Annual Total Return at 12/31/2007
| | | | | | | | | |
| | | 1
Year | | | 3
Year | | | Since
Inception(a) | |
Small-Mid Cap Growth
Fund Class N | | 12.34 | % | | 10.91 | % | | 11.32 | % |
Small-Mid Cap Growth
Fund Class I | | 12.54 | | | 11.18 | | | 11.57 | |
Russell 2500™ Growth Index | | 9.69 | | | 10.03 | | | 10.93 | |
| | (a) | | For the period from December 29, 2003 to December 31, 2007. | |
Performance cited represents past performance. Past performance does not guarantee future results and current performance may be lower or higher than the data quoted. Results shown are average annual total returns, which assume reinvestment of dividends and capital gains. Investment returns and principal will fluctuate and you may have a gain or loss when you sell shares. For the most current month-end performance information, please call 1-800-742-7272, or visit our Web site at www.williamblairfunds.com. Investing in smaller and medium capitalization companies involves special risks, including higher volatility and lower liquidity. Small and Mid cap stocks are also more sensitive to purchase/sale transactions and changes in the issuer’s financial condition. From time to time, the investment advisor may waive fees or reimburse expenses for the Fund. Without these waivers, performance would be lower. Class N shares are available to the general public without a sales load. Class I shares are available to certain institutional investors and advisory clients of William Blair & Company, L.L.C., without a sales load or distribution (12b-1) or service fees.
The performance highlights and graph presented above do not reflect the deduction of taxes that a shareholder would pay on fund distributions or the redemption of fund shares.
The Russell 2500™ Growth Index measures the performance of those Russell 2500 companies with above average price-to-book ratios and forecasted growth rates.
This report identifies the Fund’s investments on December 31, 2007. These holdings are subject to change. Not all stocks in the Fund performed the same, nor is there any guarantee that these stocks will perform as well in the future. Market forecasts provided in this report may not necessarily come to pass.
Sector Diversification (unaudited)

The sector diversification shown is based on the total investment portfolio.
December 31, 2007 | William Blair Funds 31 |
Small-Mid Cap Growth Fund
Portfolio of Investments, December 31, 2007 (all dollar amounts in thousands)
| | | | | |
Issuer | |
Shares | | Value |
| | |
Common Stocks | | | | | |
Information Technology—27.7% | | | | | |
* Activision, Inc. | | 119,459 | | $ | 3,548 |
* Autodesk, Inc. | | 45,210 | | | 2,250 |
* Cognizant Technology Solutions, Class "A" | | 38,910 | | | 1,321 |
* Cybersource Corporation | | 42,180 | | | 749 |
* Euronet Worldwide, Inc. | | 105,923 | | | 3,178 |
* F5 Networks, Inc. | | 60,860 | | | 1,736 |
* Gartner Inc. | | 24,620 | | | 432 |
* Iron Mountain, Inc. | | 99,446 | | | 3,681 |
* j2 Global Communications, Inc. | | 83,000 | | | 1,757 |
Microchip Technology, Inc. | | 40,235 | | | 1,264 |
* Monotype Imaging Holdings, Inc. | | 19,360 | | | 294 |
* Nuance Communications, Inc. | | 132,860 | | | 2,482 |
* PDF Solutions, Inc. | | 51,200 | | | 461 |
* Silicon Laboratories, Inc. | | 64,330 | | | 2,408 |
* Trimble Navigation Limited | | 31,910 | | | 965 |
* Ultimate Software Group, Inc. | | 46,980 | | | 1,478 |
United Online, Inc. | | 156,150 | | | 1,846 |
* Verisign, Inc. | | 56,480 | | | 2,124 |
* VistaPrint Limited+ | | 58,040 | | | 2,487 |
| | | | | |
| | | | | 34,461 |
| | | | | |
Industrials—16.8% | | | | | |
* Allegiant Travel Company | | 68,940 | | | 2,216 |
C.H. Robinson Worldwide, Inc. | | 25,950 | | | 1,404 |
* Corrections Corporation of America | | 87,400 | | | 2,579 |
Expeditors International of Washington Inc. | | 30,210 | | | 1,350 |
Fastenal Company | | 76,695 | | | 3,100 |
Heidrick & Struggles International, Inc. | | 56,350 | | | 2,091 |
* Hudson Highland Group, Inc. | | 68,550 | | | 577 |
* IHS Inc | | 31,390 | | | 1,901 |
* InnerWorkings, Inc. | | 161,890 | | | 2,794 |
* Kforce, Inc. | | 16,320 | | | 159 |
Rockwell Collins, Inc. | | 38,440 | | | 2,767 |
| | | | | |
| | | | | 20,938 |
| | | | | |
Consumer Discretionary—15.3% | | | | | |
* Capella Education Company | | 12,460 | | | 816 |
* Coinstar, Inc. | | 59,008 | | | 1,661 |
DeVry Inc. | | 24,290 | | | 1,262 |
* Dick's Sporting Goods, Inc. | | 51,470 | | | 1,429 |
* Jarden Corporation | | 50,700 | | | 1,197 |
* K12 Inc. | | 22,740 | | | 588 |
* Life Time Fitness, Inc. | | 64,500 | | | 3,204 |
* O'Reilly Automotive, Inc. | | 72,025 | | | 2,336 |
PetSmart, Inc. | | 94,395 | | | 2,221 |
* Shuffle Master, Inc. | | 62,150 | | | 745 |
Strayer Education, Inc. | | 9,770 | | | 1,667 |
Tempur-Pedic International Inc. | | 31,030 | | | 806 |
* Under Armour, Inc. | | 25,710 | | | 1,123 |
| | | | | |
| | | | | 19,055 |
| | | | | |
Health Care—13.8% | | | | | |
* Allscripts Healthcare Solutions, Inc. | | 50,480 | | | 980 |
Brookdale Senior Living, Inc. | | 39,210 | | | 1,114 |
C.R.Bard, Inc. | | 18,580 | | | 1,762 |
* Healthways, Inc. | | 50,065 | | | 2,926 |
* Hologic Inc. | | 41,130 | | | 2,823 |
* IDEXX Laboratories, Inc. | | 22,280 | | | 1,306 |
* Integra LifeSciences Holdings Corporation | | 36,605 | | | 1,535 |
Pharmaceutical Product Development, Inc. | | 49,645 | | | 2,004 |
* SurModics, Inc. | | 49,180 | | | 2,669 |
| | | | | |
| | | | | 17,119 |
| | | | | |
*Non-income producing securities
† = U.S. listed foreign security
VRN = Variable Rate Note
| | | | | | | |
Issuer | | Shares or
Principal
Amount | | Value | |
| | |
Common Stocks—(continued) | | | | | | | |
Financials—6.7% | | | | | | | |
* Affiliated Managers Group, Inc. | | | 21,295 | | $ | 2,502 | |
* MF Global Ltd.+ | | | 55,510 | | | 1,747 | |
National Financial Partners Corporation | | | 34,600 | | | 1,578 | |
* Philadelphia Consolidated Holding Corp. | | | 29,510 | | | 1,161 | |
* Signature Bank New York | | | 38,370 | | | 1,295 | |
| | | | | | | |
| | | | | | 8,283 | |
| | | | | | | |
Energy—6.4% | | | | | | | |
* Forest Oil Corporation | | | 15,280 | | | 777 | |
Smith International, Inc. | | | 44,405 | | | 3,279 | |
* Southwestern Energy Company | | | 32,310 | | | 1,800 | |
* Ultra Petroleum Corp.+ | | | 29,925 | | | 2,140 | |
| | | | | | | |
| | | | | | 7,996 | |
| | | | | | | |
Materials—3.4% | | | | | | | |
Airgas, Inc. | | | 38,485 | | | 2,005 | |
Ecolab Inc. | | | 45,070 | | | 2,308 | |
| | | | | | | |
| | | | | | 4,313 | |
| | | | | | | |
Consumer Staples—2.5% | | | | | | | |
* Hansen Natural Corporation | | | 44,690 | | | 1,979 | |
Whole Foods Market, Inc. | | | 27,670 | | | 1,129 | |
| | | | | | | |
| | | | | | 3,108 | |
| | | | | | | |
Telecommunication Services—1.2% | | | | | | | |
* Syniverse Holdings, Inc. | | | 97,310 | | | 1,516 | |
| | | | | | | |
Total Common Stock—93.8%
(cost $102,836) | | | 116,789 | |
| | | | | | | |
| | |
Investment in Affiliate | | | | | | | |
William Blair Ready Reserves Fund | | | 21,834 | | | 22 | |
| | | | | | | |
Total Investment In Affiliate—0.0%
(cost $22) | | | 22 | |
| | | | | | | |
| | |
Short-Term Investment | | | | | | | |
Prudential Funding Demand Note, VRN 4.430%, due 1/2/08 | | $ | 3,678,000 | | | 3,678 | |
| | | | | | | |
Total Short-Term Investment—3.0%
(cost $3,678) | | | 3,678 | |
| | | | | | | |
| | |
Repurchase Agreement | | | | | | | |
State Street Bank & Trust Company, 3.80% dated 12/31/07 due 1/2/08, repurchase price $5,370, collateralized by FNMA Pool
#712321 | | | 5,369,181 | | | 5,369 | |
| | | | | | | |
Total Repurchase Agreement—4.3%
(cost $5,369) | | | 5,369 | |
| | | | | | | |
Total Investments—101.1%
(cost $111,905) | | | 125,858 | |
Liabilities, plus cash and other assets—(1.1)% | | | (1,357 | ) |
| | | | | | | |
Net Assets—100.0% | | | | | $ | 124,501 | |
| | | | | | | |
See accompanying Notes to Financial Statements.
32 Annual Report | December 31, 2007 |
GLOBAL MARKETS OVERVIEW
The year 2007 was marked by increased global market volatility in both the equity and fixed income markets. Like 2005 and 2006, investors became concerned about the durability of global growth as the economic cycle matured; however, in 2007, this fear was underscored by the US subprime crisis, which affected financial markets globally, as the impact of leverage in bank off-balance sheet vehicles, widening spreads, and seizing up of the interbank markets in the UK, portions of Europe and North America began to be felt during August and in the waning months of the year as investors became concerned about financial markets’ losses.
Despite the volatility in the summer and in November, global equity markets returned 12.18% during 2007, as measured by the MSCI All Country World Index. Emerging markets continued to lead the rest of the equity markets, up 39.78%, outperforming during both positive and negative markets during the year. During the summer months and in the fourth quarter when developed markets were down in the face of financial market turmoil, emerging markets, which were viewed as the engines of global growth, outperformed, while small cap stocks and Japan lagged. Latin America was the strongest region within emerging markets, approximating a 50% return, while Emerging Asia and Europe, the Middle East and Africa (“EMEA”) returned 41.58% and 28.74%, respectively. The Europe, Australasia and the Far East (“EAFE”) Index was up 11.63% during 2007, led by strong markets in the Pacific region (ex Japan), which was up over 30%. Canada was also up over 30%. Japan was the laggard market during 2007, continuing its trend of recent years, down 4.14%, although down over 10% in local terms. While most regions (with the exception of Japan) outpaced the 6.03% US return during the year in local terms, the depreciating US dollar also provided a tailwind to US based investors, adding 7.37% to the EAFE return, and 17.90% to Canadian returns. Developed small cap stocks trailed their larger cap counterparts, up 3.64% year to date, dragged down by the UK, which was down nearly 10% and Japan, which was down over 11%.
There was also a marked disparity in returns by sector globally during 2007 with Energy and Materials each up over 34% and Discretionary and Financials down nearly 2% and 5%, respectively, due to concerns about US-led consumer demand and the financial markets volatility.
Outlook
Discouraging data points about financial sector distress, consumer behavior over the holidays, and poor employment growth show that prospects have intensified speculation that a US recession is in the process of materializing. Internationally, market scenarios are increasingly focused on cyclical weakness as well, whether transmitted directly through the US or just by association.
The result has been an intense correction and rotation process in the early days of 2008 that has amounted to a landslide market vote for global recession. This consensus reflects recent reality in some respects, but it is worth keeping in mind that the global economic environment in aggregate is both more complex and at the same time less volatile than market reactions would suggest.
At the opposite pole of the economic earth from the US consumer/financial complex is the resource, infrastructure and capital investment cycle in China, the Middle East, and other emerging economies. This growth dynamic dichotomy existed throughout 2007 and continues today, notwithstanding the US downshift. Emerging economies have both the need for and the wherewithal to provide these investments, and the viability of fundamental development initiatives is generally unaffected by changes in external economic conditions.
The rest of the world—OECD Asia and Europe—has felt the influence of both US deceleration and emerging markets growth over the last year. At the margin, Japan, the UK and some of the Euro countries have seen some degree of domestic slowdown as well. But it is unlikely that the balance of global growth will be tipped by changes in the outlook for these relatively slow and steady economies.
December 31, 2007 | William Blair Funds 33 |
As the year progresses from here, the global recession scenario will not remain a static story. It will evolve and mutate in response to monetary and financial policy initiatives, US electoral politics, the Beijing Olympic gestalt, the influence of commodity markets, and the self-help capability of the financial sector. The cyclical outlook is highly provisional and is likely to be subject to continuous revision.
At the same time, ironically, a competitive equity market environment under the influence of abnormally uncertain cyclical strategy input can easily become more irrational rather than more efficient as a discounting mechanism. The current market is characterized not only by increasing volatility but also by an unusual degree of valuation divergence between extreme lows and highs.
Under these circumstances, equity strategy becomes a more improvisational process. There can be conflicting signals among leading indicators, earnings trends and valuation measures, and unstable market responses to incoming data. Our strategy approach is designed with long term corporate performance as the primary input, long term economic trends as secondary, and cyclical influences as a relatively minor influence. So wherever we go from here, our overall approach in 2008 will emphasize stock selection in an effort to be consistent with our objective of maintaining strong fundamental corporate financial performance at the portfolio level.
34 Annual Report | December 31, 2007 |
GLOBAL GROWTH FUND
The Global Growth Fund will invest in quality growth companies of all sizes around the world.
AN OVERVIEW FROM THE PORTFOLIO MANAGER
I am pleased to have the Global Growth Fund become the newest addition to the William Blair Fund Family and would like to thank our shareholders for investing with us.
I am enthusiastic about the opportunities available to me as the manager of the Global Growth Fund. The Global Growth Fund will seek securities of companies that historically have had and are expected to maintain superior growth, profitability and quality relative to local markets and relative to companies within the same industry worldwide. The Fund will seek investment opportunities in companies at different stages of development ranging from large, well-established companies to smaller companies at an earlier stage of growth. The Fund may also invest in new companies, both through initial public offerings (“IPOs”) and private placements.
How did the Fund perform since its inception? How did the Fund’s performance compare to its benchmark?
The Global Growth Fund commenced operations on October 15, 2007. Through the period ending December 31, 2007, the Fund posted a decrease of 1.10% (Class N Shares). By comparison, the Fund’s benchmark, the MSCI All Country World Index declined 4.10% during the same time period.
How is the Fund positioned as of year end?
As of year end, the Fund was focused in Consumer-oriented and Industrials stocks at the expense of Energy, Health Care, Materials and Utilities. Regionally, the Fund maintained a focus in Developed Asia ex-Japan (i.e., Hong Kong, Australia and Singapore) and emerging markets, while underweighting Japan. Within emerging markets there has been a shift from Emerging Asia, where we reduced holdings in China due largely to valuation concerns, and increased our holdings in EMEA, particularly the Middle East.
December 31, 2007 | William Blair Funds 35 |
Global Growth Fund
Performance Highlights (unaudited)
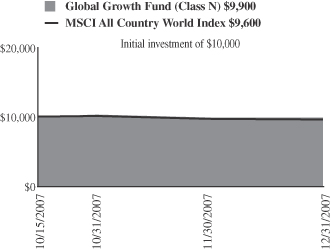
Average Annual Total Return at 12/31/2007
| | | |
| | | Since
Inception(a) | |
Global Growth Fund Class N | | (1.10 | )% |
Global Growth Fund Class I | | (0.85 | ) |
MSCI All Country World Index | | (4.10 | ) |
| | (a) | | For the period from October 15, 2007 (Commencement of Operations) to December 31, 2007. |
Performance cited represents past performance. Past performance does not guarantee future results and current performance may be lower or higher than the data quoted. Results shown are average annual total returns, which assume reinvestment of dividends and capital gains. Investment returns and principal will fluctuate and you may have a gain or loss when you sell shares. For the most current month-end performance information, please call 1-800-742-7272, or visit our Web site at www.williamblairfunds.com. Investing in smaller and medium capitalization companies involves special risks, including higher volatility and lower liquidity. Small and Mid Cap stocks are also more sensitive to purchase/sale transactions and changes in the issuer’s financial condition. International investing involves special risk considerations, including currency fluctuations, lower liquidity, economic and political risk. From time to time, the investment advisor may waive fees or reimburse expenses for the Fund. Without these waivers, performance would be lower. Class N shares are available to the general public without a sales load. Class I shares are available to certain institutional investors and advisory clients of William Blair & Company, L.L.C., without a sales load or distribution (12b-1) or service fees.
The performance highlights and graph presented above do not reflect the deduction of taxes that a shareholder would pay on fund distributions or the redemption of fund shares.
The Morgan Stanley Capital International (MSCI) All Country World Index is an index that is designed to measure equity performance in the global market.
This report identifies the Fund’s investments on December 31, 2007. These holdings are subject to change. Not all stocks in the Fund performed the same, nor is there any guarantee that these stocks will perform as well in the future. Market forecasts provided in this report may not necessarily come to pass.
Sector Diversification (unaudited)
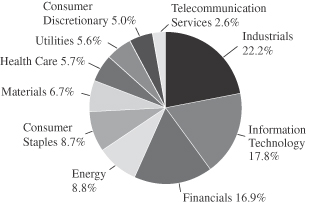
The sector diversification shown is based on the total investment portfolio.
36 Annual Report | December 31, 2007 |
Global Growth Fund
Portfolio of Investments, December 31, 2007 (all dollar amounts in thousands)
| | | | | |
Issuer | | Shares | | Value |
| |
Common Stocks—Western Hemisphere—37.2% | | | |
Canada—3.9% | | | | | |
*Agnico-Eagle Mines Limited (Metals & mining) | | 10,400 | | | 568 |
Brookfield Asset Management, Inc. Class “A” (Real estate management & development) | | 15,800 | | | 568 |
Rogers Communications, Inc. Class “B” (Wireless telecommunication services) | | 13,900 | | | 634 |
| | | | | |
| | | | | 1,770 |
| | | | | |
United States—33.3% | | | | | |
*Activision, Inc. (Software) | | 30,400 | | $ | 903 |
*Adobe Systems Incorporated (Software) | | 12,600 | | | 538 |
*Apple Inc. (Computers & peripherals) | | 4,800 | | | 951 |
CME Group Inc. (Diversified financial services) | | 1,300 | | | 892 |
*Cognizant Technology Solutions Corporation, Class “A” (IT services) | | 14,000 | | | 475 |
Corning Incorporated (Communications equipment) | | 17,700 | | | 425 |
Deere & Company (Machinery) | | 12,900 | | | 1,201 |
*EMC Corporation (Computers & peripherals) | | 30,400 | | | 563 |
*Express Scripts, Inc. (Health care providers & services) | | 8,100 | | | 591 |
FPL Group, Inc. (Electric utilities) | | 14,500 | | | 983 |
*GameStop Corporation (Specialty retail) | | 3,700 | | | 230 |
*Gilead Sciences, Inc. (Biotechnology) | | 13,500 | | | 621 |
The Goldman Sachs Group, Inc. (Capital markets) | | 3,600 | | | 774 |
*Google Inc. (Internet software & services) | | 700 | | | 484 |
Hewlett-Packard Company (Computers & peripherals) | | 13,400 | | | 676 |
*Hologic, Inc. (Health care equipment & supplies) | | 6,900 | | | 474 |
*IDEXX Laboratories, Inc. (Health care equipment & supplies) | | 6,000 | | | 352 |
L-3 Communications Holdings, Inc. (Aerospace & defense) | | 4,400 | | | 466 |
*Life Time Fitness, Inc. (Hotels, restaurants, & leisure) | | 5,500 | | | 273 |
The Manitowoc Company, Inc. (Machinery) | | 9,800 | | | 479 |
Monsanto Company (Chemicals) | | 5,100 | | | 570 |
Precision Castparts Corp. (Aerospace & defense) | | 3,200 | | | 444 |
T. Rowe Price Group Inc. (Capital markets) | | 6,000 | | | 365 |
Schlumberger, Ltd. (Energy equipment & services)† | | 9,200 | | | 905 |
Smith International, Inc. (Energy equipment & services) | | 7,600 | | | 561 |
| | | | | |
| | | | | 15,196 |
| | | | | |
| | |
Europe—19.6% | | | | | |
Austria—0.5% | | | | | |
Schoeller-Bleckmann Oilfield Equipment AG (Energy equipment & services) | | 2,300 | | | 206 |
| | | | | |
Belgium—1.3% | | | | | |
InBev NV (Beverages) | | 7,100 | | | 590 |
| | | | | |
Finland—2.1% | | | | | |
Nokia OYJ (Communications equipment) | | 19,500 | | | 749 |
Outotec OYJ (Construction & engineering) | | 3,500 | | | 190 |
| | | | | |
| | | | | 939 |
| | | | | |
France—6.0% | | | | | |
EDF Energies Nouvelles S.A. (Independent power producers & energy traders) | | 5,800 | | | 405 |
Eurazeo (Diversified financial services) | | 2,900 | | | 371 |
*Orpea (Health care providers & services) | | 3,400 | | | 223 |
| | | | | |
Issuer | | Shares | | Value |
|
Common Stocks—Europe—19.6%—(continued) |
France—(continued) | | | | | |
Schneider Electric SA (Electrical equipment) | | 5,600 | | $ | 758 |
Veolia Environnement (Multi-utilities) | | 11,000 | | | 1,002 |
| | | | | |
| | | | | 2,759 |
| | | | | |
Germany—4.6% | | | | | |
Beiersdorf AG (Personal products) | | 6,700 | | | 519 |
Deutsche Boerse AG (Diversified financial services) | | 3,700 | | | 730 |
*Q-Cells AG (Electrical equipment) | | 4,500 | | | 639 |
*Wire Card AG (Commercial services & supplies) | | 12,500 | | | 212 |
| | | | | |
| | | | | 2,100 |
| | | | | |
Netherlands—1.1% | | | | | |
*Tomtom NV (Software) | | 6,900 | | | 521 |
| | | | | |
Spain—0.4% | | | | | |
Tecnicas Reunidas S.A. (Construction & engineering) | | 2,700 | | | 173 |
| | | | | |
Switzerland—3.6% | | | | | |
ABB Ltd. (Electrical equipment) | | 34,400 | | | 992 |
EFG International (Capital markets) | | 3,400 | | | 137 |
Kuehne & Nagel International AG (Marine) | | 3,000 | | | 288 |
Partners Group Global Opportunities, Ltd. (Capital markets) | | 1,600 | | | 213 |
| | | | | |
| | | | | 1,630 |
| | | | | |
| | |
United Kingdom—11.3% | | | | | |
*Autonomy Corporation plc (Software) | | 21,900 | | | 385 |
BG Group plc (Oil, gas & consumable fuels) | | 46,800 | | | 1,074 |
BlueBay Asset Management plc (Capital markets) | | 22,700 | | | 159 |
Capita Group plc (Commercial services & supplies) | | 28,100 | | | 390 |
Expro International Group plc (Energy equipment & services) | | 12,600 | | | 258 |
Man Group plc (Capital markets) | | 56,062 | | | 636 |
Reckitt Benckiser plc (Household products) | | 9,000 | | | 523 |
Rotork plc (Electronic equipment & instruments) | | 9,600 | | | 185 |
Tesco plc (Food & staples retailing) | | 91,300 | | | 868 |
*Wellstream Holdings plc (Energy equipment & services) | | 11,600 | | | 250 |
Xstrata plc (Metals & mining) | | 6,200 | | | 435 |
| | | | | |
| | | | | 5,163 |
| | | | | |
| | |
Asia—9.2% | | | | | |
Australia—4.6% | | | | | |
BHP Billiton Limited (Metals & mining) | | 18,400 | | | 643 |
Macquarie Bank, Ltd. (Capital markets) | | 8,100 | | | 542 |
QBE Insurance Group Limited (Insurance) | | 14,200 | | | 412 |
WorleyParsons, Ltd. (Energy equipment & services) | | 10,600 | | | 478 |
| | | | | |
| | | | | 2,075 |
| | | | | |
Hong Kong—1.6% | | | | | |
Esprit Holdings Ltd. (Specialty retail) | | 29,900 | | | 440 |
Li & Fung Ltd. (Distributors) | | 78,000 | | | 311 |
| | | | | |
| | | | | 751 |
| | | | | |
Singapore—3.0% | | | | | |
Capitaland, Ltd. (Real estate management & development) | | 76,000 | | | 327 |
See accompanying Notes to Financial Statements.
December 31, 2007 | William Blair Funds 37 |
Global Growth Fund
Portfolio of Investments, December 31, 2007 (all dollar amounts in thousands)
| | | | | |
Issuer | | Shares | | Value |
|
Common Stocks—Asia—9.2%—(continued) |
Singapore—(continued) | | | | | |
Keppel Corporation Limited (Industrial conglomerates) | | 73,000 | | $ | 650 |
Wilmar International Ltd. (Food products) | | 106,700 | | | 396 |
| | | | | |
| | | | | 1,373 |
| | | | | |
| | |
Japan—5.4% | | | | | |
Aeon Mall Co., Ltd. (Real estate management & development) | | 14,800 | | | 389 |
Komatsu Ltd. (Machinery) | | 18,800 | | | 504 |
Mitsui & Co., Ltd. (Trading companies & distributors) | | 18,000 | | | 376 |
NGK Insulators, Ltd. (Machinery) | | 14,000 | | | 375 |
Nintendo Co., Ltd. (Software) | | 1,400 | | | 822 |
| | | | | |
| | | | | 2,466 |
| | | | | |
| | |
Emerging Latin America—4.5% | | | | | |
Brazil—2.8% | | | | | |
*Anhanguera Educacional Participacoes S.A. (Diversified consumer services) | | 23,000 | | | 491 |
B2W Companhia Global do Varejo (Internet & catalog retail) | | 2,100 | | | 84 |
Bovespa Holding SA (Diversified financial services) | | 23,500 | | | 453 |
Redecard SA (IT services) | | 15,700 | | | 254 |
| | | | | |
| | | | | 1,282 |
| | | | | |
Chile—1.7% | | | | | |
Cencosud S.A.—ADR 144A (Specialty retail) | | 12,700 | | | 767 |
| | | | | |
| |
Emerging Europe, Mid-East, Africa—3.7% | | | |
Egypt—1.7% | | | | | |
Orascom Construction Industries (Construction & engineering) | | 16,600 | | | 247 |
*Orascom Hotels & Development (Hotels, restaurants, & leisure) | | 5,000 | | | 515 |
| | | | | |
| | | | | 762 |
| | | | | |
South Africa—1.5% | | | | | |
*Eastern Platinum Limited (Metals & mining) | | 79,100 | | | 230 |
MTN Group, Ltd. (Wireless telecommunication services) | | 25,300 | | | 474 |
| | | | | |
| | | | | 704 |
| | | | | |
United Arab Emirates—0.5% | | | | | |
*DP World Ltd. (Marine) | | 175,800 | | | 209 |
| | | | | |
| | |
Emerging Asia—1.6% | | | | | |
China—0.7% | | | | | |
China Merchants Bank (Commercial banks) | | 41,500 | | | 167 |
Shandong Weigao Group Medical Polymer Company, Ltd. (Health care equipment & supplies) | | 72,000 | | | 165 |
| | | | | |
| | | | | 332 |
| | | | | |
India—0.9% | | | | | |
Vendanta Resources plc (Metals & mining) | | 9,700 | | | 394 |
| | | | | |
Total Common Stock—92.5%
(cost $42,044) | | | 42,162 |
| | | | | |
| | |
Investment in Affiliate | | | | | |
William Blair Ready Reserves Fund | | 1,006,038 | | | 1,006 |
| | | | | |
Total Investment in Affiliate—2.2%
(cost $1,006) | | | 1,006 |
| | | | | |
| | | | | | |
Issuer | | Principal
Amount | | Value |
| | |
Short-Term Investments | | | | | | |
American Express Credit Corp. Demand Note, VRN 4.695% due 1/2/08 | | $ | 575,000 | | $ | 575 |
Prudential Funding Demand Note, VRN
4.430% due 1/2/08 | | | 100,000 | | | 100 |
| | | | | | |
Total Short-term Investments—1.5%
(cost $675) | | | 675 |
| | | | | | |
| | |
Repurchase Agreement | | | | | | |
State Street Bank and Trust Company, 3.800% dated 12/31/07, due 1/2/08, repurchase price $507, collateralized by FN #729652 | | | 506,693 | | | 507 |
| | | | | | |
Total Repurchase Agreement—1.1%
(cost $507) | | | 507 |
| | | | | | |
Total Investments—97.3%
(cost $44,232) | | | 44,350 |
Cash and other assets, less liabilities—2.7% | | | 1,226 |
| | | | | | |
Net assets—100.0% | | $ | 45,576 |
| | | | | | |
*Non-income producing securities
ADR = American Depository Receipt
VRN = Variable Rate Note
See accompanying Notes to Financial Statements.
38 Annual Report | December 31, 2007 |
Global Growth Fund
Portfolio of Investments, December 31, 2007 (all dollar amounts in thousands)
For securities primarily traded on exchanges or markets that close before the close of regular trading on the New York Stock Exchange, the Fund uses an independent pricing service on a daily basis to fair value price the securities pursuant to Valuation Procedures adopted by the Board of Trustees.
At December 31, 2007 the Fund’s Portfolio of Investments includes the following industry categories:
| | |
Industrials | | 22.2% |
Information Technology | | 17.8% |
Financials | | 16.9% |
Energy | | 8.8% |
Consumer Staples | | 8.7% |
Materials | | 6.7% |
Health Care | | 5.7% |
Utilities | | 5.6% |
Consumer Discretionary | | 5.0% |
Telecommunication Services | | 2.6% |
| | |
Total | | 100.0% |
| | |
At December 31, 2007 the Fund’s Portfolio of Investments includes the following currency categories:
| | |
United States Dollar | | 39.7% |
Euro | | 17.3% |
British Pound Sterling | | 13.2% |
Japanese Yen | | 5.8% |
Australian Dollar | | 4.9% |
Swiss Franc | | 3.9% |
Canadian Dollar | | 3.4% |
Singapore Dollar | | 3.3% |
Brazilian Real | | 3.0% |
Hong Kong Dollar | | 2.6% |
South African Rand | | 1.1% |
All other currencies | | 1.8% |
| | |
Total | | 100.0% |
| | |
See accompanying Notes to Financial Statements.
December 31, 2007 | William Blair Funds 39 |

W. George Greig
INTERNATIONAL GROWTH FUND
The International Growth Fund invests primarily in common stocks of foreign growth companies.
AN OVERVIEW FROM THE PORTFOLIO MANAGER
Please see page 30 for the Global Markets Overview.
How did the Fund perform during the past year? How did the Fund’s performance compare to its benchmark?
The International Growth Fund posted an 18.13% gain (Class N Shares) for the 12 months ended December 31, 2007. By comparison, the Fund’s benchmark, the Morgan Stanley Capital International (MSCI) All Country World (ACWI) Ex-US Index, rose 17.12%.
What factors were behind the Fund’s performance versus the benchmark?
During 2007 the Fund outperformed across virtually all sectors. In particular, relative stock selection in Consumer Discretionary, Energy, Materials and Health Care was strong. In Consumer Discretionary, strong stock selection in Developed Asia, Canada, and emerging markets more than offset shortfalls in Europe and the UK. The Fund’s Energy stocks approximately doubled the return of the stocks in the Index due to the Fund’s focus on energy services companies coupled with exploration and production companies with high production growth. Materials stock selection added value primarily through the Fund’s emerging markets holdings while the Fund’s focus on specialty Health Care stocks at the expense of pharmaceutical companies augmented results. In addition, the Fund’s overweighting and stock selection in Consumer Staples and Industrials added value, as did its underweighting in Financials, whose performance approximated the Index during the year. Regionally, the Fund’s focus on emerging markets and Developed Asia (ex-Japan) was positive, as was its underemphasis of Japan. Stock selection across most regions was strong, with the exception of Japan and Latin America.
What is your current strategy? How is the Fund positioned?
As of year end, the Fund remained focused in Consumer-oriented and Industrials stocks at the expense of Energy, Health Care, Materials and Utilities. From a Consumer perspective, the Fund was nearly evenly balanced between Discretionary and Staples. Regionally, the Fund maintained a focus in Developed Asia, ex-Japan (i.e., Hong Kong, Australia and Singapore) and emerging markets, while continued its underweighting of Japan. Weightings in Europe declined during the quarter, due primarily to a continued de-emphasis of Financials in that region, where we remained significantly underweighted relative to the Index. While emerging markets was overweighted relative to the Index (at approximately 22% versus the Index 19.5% weighting), there has been a shift from Emerging Asia, where we have reduced holdings in China in particular due largely to valuation concerns and increased our holdings in EMEA (Europe, Mid-East and Africa), particularly the Middle East.
40 Annual Report | December 31, 2007 |
International Growth Fund
Performance Highlights (unaudited)
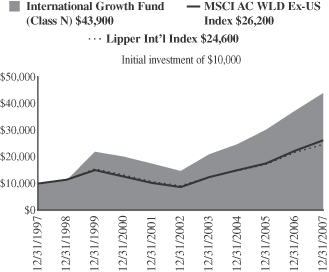
Average Annual Total Return at 12/31/2007
| | | | | | | | | | | | | | | | | |
| | | 1
Year | | | 3
Year | | | 5
Year | | | 10
Year | | | Since Inception | | | |
International Growth Fund Class N | | 18.13 | % | | 20.93 | % | | 24.40 | % | | 15.93 | % | | — | % | | |
International Growth Fund Class I | | 18.53 | | | 21.28 | | | 24.72 | | | — | | | 13.85 | (a) | | |
MSCI All Country World Ex-US Index | | 17.12 | | | 20.37 | | | 24.52 | | | 10.09 | | | 9.12 | (a) | | |
Lipper International Index | | 13.16 | | | 18.27 | | | 21.69 | | | 9.40 | | | — | | | |
| | (a) | | For the period from October 1, 1999 to December 31, 2007. |
Performance cited represents past performance. Past performance does not guarantee future results and current performance may be lower or higher than the data quoted. Results shown are average annual total returns, which assume reinvestment of dividends and capital gains. Investment returns and principal will fluctuate and you may have a gain or loss when you sell shares. For the most current month-end performance information, please call 1-800-742-7272, or visit our Web site at www.williamblairfunds.com. From time to time, the investment advisor may waive fees or reimburse expenses for the Fund. Without these waivers, performance would be lower. International investing involves special risk considerations, including currency fluctuations, lower liquidity, economic and political risk. Class N shares are available to the general public without a sales load. Class I shares are available to certain institutional investors and advisory clients of William Blair & Company, L.L.C., without a sales load or distribution (12b-1) or service fees.
The performance highlights and graph presented above do not reflect the deduction of taxes that a shareholder would pay on fund distributions or the redemption of fund shares.
The Morgan Stanley Capital International (MSCI) All Country World Ex-US Index is an unmanaged index that includes developed and emerging markets and reduced Japanese portion, making it more comparable to the International Growth Fund in terms of investment approach.
The Lipper International Index is a composite of international growth mutual funds.
This report identifies the Fund’s investments on December 31, 2007. These holdings are subject to change. Not all stocks in the Fund performed the same, nor is there any guarantee that these stocks will perform as well in the future. Market forecasts provided in this report may not necessarily come to pass.
Sector Diversification (unaudited)
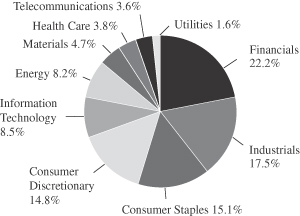
The sector diversification shown is based on the total investment portfolio.
December 31, 2007 | William Blair Funds 41 |
International Growth Fund
Portfolio of Investments, December 31, 2007 (all dollar amounts in thousands)
| | | | | |
Issuer | | Shares | | Value |
| | |
Common Stocks—Europe—27.3% | | | | | |
Austria—1.5% | | | | | |
Erste Bank (Commercial banks) | | 488,892 | | $ | 34,520 |
Raiffeisen International Bank (Commercial banks) | | 531,108 | | | 79,823 |
Schoeller-Bleckmann Oilfield Equipment AG (Energy equipment & services) | | 21,735 | | | 1,950 |
| | | | | |
| | | | | 116,293 |
| | | | | |
Belgium—1.2% | | | | | |
InBev NV (Beverages) | | 1,186,200 | | | 98,610 |
| | | | | |
Finland—1.6% | | | | | |
Nokia OYJ (Communications equipment) | | 2,183,100 | | | 83,869 |
Nokian Renkaat OYJ (Auto components) | | 1,116,800 | | | 38,770 |
Ramirent OYJ (Machinery) | | 505,305 | | | 8,288 |
| | | | | |
| | | | | 130,927 |
| | | | | |
France—4.9% | | | | | |
April Group S.A. (Insurance) | | 203,139 | | | 13,706 |
AXA (Insurance) | | 1,210,900 | | | 48,277 |
EDF Energies Nouvelles S.A. (Independent power producers & energy traders) | | 410,579 | | | 28,635 |
Eurazeo (Diversified financial services) | | 354,102 | | | 45,356 |
Iliad S.A. (Diversified telecommunication services) | | 287,850 | | | 30,956 |
Klepierre (Real estate investment trusts) | | 415,500 | | | 21,237 |
L’Oreal S.A. (Personal products) | | 543,500 | | | 77,828 |
*Orpea (Health care providers & services) | | 374,624 | | | 24,621 |
*Seloger.com (Media) | | 271,400 | | | 15,942 |
Veolia Environnement (Multi-utilities) | | 1,000,312 | | | 91,117 |
| | | | | |
| | | | | 397,675 |
| | | | | |
Germany—2.2% | | | | | |
Bauer AG (Construction & engineering) | | 234,700 | | | 16,582 |
*Colonia Real Estate AG (Real estate management & development) | | 476,500 | | | 11,823 |
CTS Eventim AG (Media) | | 242,903 | | | 9,383 |
*Q-Cells AG (Electrical equipment) | | 524,620 | | | 74,451 |
Solarworld AG (Electrical equipment) | | 676,500 | | | 41,065 |
*Wire Card AG (Commercial services & supplies) | | 1,560,400 | | | 26,439 |
| | | | | |
| | | | | 179,743 |
| | | | | |
Greece—2.1% | | | | | |
Coca-Cola Hellenic Bottling S.A. (Beverages) | | 1,323,706 | | | 57,127 |
EFG Eurobank (Commercial banks) | | 957,328 | | | 33,596 |
Jumbo S.A. (Leisure equipment & products) | | 725,600 | | | 26,122 |
National Bank of Greece S.A. (Commercial banks) | | 779,852 | | | 53,478 |
| | | | | |
| | | | | 170,323 |
| | | | | |
Ireland—0.2% | | | | | |
United Drug plc (Health care providers & services) | | 2,625,500 | | | 15,150 |
| | | | | |
Italy—2.5% | | | | | |
Azimut Holding SpA (Capital markets) | | 1,481,600 | | | 19,221 |
Geox SpA (Textiles, apparel & luxury goods) | | 1,953,400 | | | 39,344 |
Saipem SpA (Energy equipment & services) | | 3,481,300 | | | 139,021 |
| | | | | |
| | | | | 197,586 |
| | | | | |
| | | | | |
Issuer | | Shares | | Value |
| |
Common Stocks—Europe—27.3%—(continued) | | | |
Netherlands—0.8% | | | | | |
*Qiagen NV (Life science tools & services) | | 1,658,100 | | $ | 36,056 |
*Tomtom NV (Software) | | 351,700 | | | 26,563 |
| | | | | |
| | | | | 62,619 |
| | | | | |
Norway—0.7% | | | | | |
Acergy S.A. (Energy equipment & services) | | 1,865,200 | | | 41,036 |
*Electromagnetic GeoServices AS (Energy equipment & services) | | 1,404,050 | | | 13,085 |
| | | | | |
| | | | | 54,121 |
| | | | | |
Spain—1.6% | | | | | |
Grifols S.A. (Biotechnology) | | 2,118,812 | | | 47,563 |
Industria De Textile S.A. (Specialty retail) | | 876,800 | | | 53,055 |
Tecnicas Reunidas S.A. (Construction & engineering) | | 431,300 | | | 27,580 |
| | | | | |
| | | | | 128,198 |
| | | | | |
Switzerland—8.0% | | | | | |
ABB Ltd. (Electrical equipment) | | 5,939,700 | | | 171,252 |
*Actelion Ltd. (Biotechnology) | | 829,000 | | | 37,870 |
*Barry Callebaut AG (Food products) | | 35,550 | | | 26,934 |
Burckhardt Compression Holding AG (Machinery) | | 24,953 | | | 8,096 |
Compagnie Financiere Richemont S.A. (Textiles, apparel, & luxury goods) | | 748,600 | | | 51,145 |
EFG International (Capital markets) | | 841,900 | | | 33,924 |
Geberit AG (Building products) | | 209,480 | | | 28,535 |
Kuehne & Nagel International AG (Marine) | | 695,540 | | | 66,786 |
Nestle S.A. (Food products) | | 214,450 | | | 98,473 |
Partners Group Global Opportunities, Ltd. (Capital markets) | | 199,056 | | | 26,538 |
Roche Holdings AG (Pharmaceuticals) | | 455,950 | | | 78,818 |
SGS S.A. (Commercial services & supplies) | | 1,737 | | | 2,071 |
*Temenos Group AG (Software) | | 606,121 | | | 14,913 |
| | | | | |
| | | | | 645,355 |
| | | | | |
| | |
United Kingdom—16.0% | | | | | |
Amlin plc (Insurance) | | 5,892,266 | | | 34,799 |
Amlin plc—“B” Shares (Insurance) | | 6,628,800 | | | 2,956 |
Ashmore Group plc (Capital markets) | | 2,932,800 | | | 15,500 |
*Autonomy Corporation plc (Software) | | 2,241,200 | | | 39,395 |
BG Group plc (Oil, gas & consumable fuels) | | 5,128,600 | | | 117,668 |
*Blinkx plc (Internet software & services) | | 10,640,600 | | | 5,816 |
BlueBay Asset Management plc (Capital markets) | | 1,923,841 | | | 13,508 |
British Sky Broadcasting Group plc (Media) | | 5,560,000 | | | 68,392 |
*Cairn Energy plc (Oil, gas & consumable fuels) | | 904,481 | | | 55,288 |
Capita Group plc (Commercial services
& supplies) | | 5,646,019 | | | 78,273 |
Carphone Warehouse Group plc
(Specialty retail) | | 4,748,080 | | | 32,305 |
Detica Group plc (IT services) | | 2,104,700 | | | 9,236 |
Domino's Pizza UK & IRL plc (Hotels, restaurants, & leisure) | | 3,091,040 | | | 10,978 |
Expro International Group plc (Energy equipment & services) | | 1,250,900 | | | 25,591 |
Man Group plc (Capital markets) | | 3,797,325 | | | 43,106 |
See accompanying Notes to Financial Statements.
42 Annual Report | December 31, 2007 |
International Growth Fund
Portfolio of Investments, December 31, 2007 (all dollar amounts in thousands)
| | | | | |
Issuer | | Shares | | Value |
|
Common Stocks—United Kingdom—16.0%—(continued) |
Reckitt Benckiser plc (Household products) | | 2,539,200 | | $ | 147,553 |
Restaurant Group plc (Hotels, restaurants,
& leisure) | | 2,919,300 | | | 10,729 |
Rightmove plc (Media) | | 1,789,900 | | | 16,482 |
*Rolls-Royce Group plc (Aerospace
& defense) | | 9,490,869 | | | 103,014 |
Rotork plc (Electronic equipment & instruments) | | 1,660,564 | | | 32,021 |
RPS Group plc (Commercial services
& supplies) | | 3,545,000 | | | 22,399 |
Southern Cross Healthcare Limited
(Health care providers & services) | | 2,061,100 | | | 21,603 |
Tesco plc (Food & staples retailing) | | 16,956,500 | | | 161,299 |
Tullow Oil plc (Oil, gas & consumable fuels) | | 3,042,790 | | | 39,521 |
VT Group plc (Aerospace & defense) | | 2,600,200 | | | 35,692 |
*Wellstream Holdings plc (Energy
equipment & services) | | 1,121,400 | | | 24,157 |
Xstrata plc (Metals & mining) | | 1,740,400 | | | 122,125 |
| | | | | |
| | | | | 1,289,406 |
| | | | | |
| | |
Japan—12.4% | | | | | |
Aeon Mall Co., Ltd. (Real estate management & development) | | 1,503,900 | | | 39,467 |
ARDEPRO Co., Ltd. (Real estate management & development) | | 58,250 | | | 12,508 |
DeNA Co., Ltd. (Internet & catalog retail) | | 4,059 | | | 19,310 |
Denso Corporation (Auto components) | | 1,565,000 | | | 63,686 |
En-Japan Inc. (Commercial services & supplies) | | 5,602 | | | 15,743 |
Fujimi, Inc. (Chemicals) | | 134,043 | | | 2,028 |
Fukuoka Financial Group, Inc. (Commercial banks) | | 7,572,000 | | | 44,221 |
*Jupiter Telecommunications Co., Ltd. (Media) | | 48,858 | | | 41,105 |
*K.K. DaVinci Advisors (Real estate management & development) | | 33,266 | | | 28,820 |
Kenedix, Inc. (Real estate management & development) | | 10,091 | | | 15,987 |
Komatsu Ltd. (Machinery) | | 4,209,000 | | | 112,882 |
Miraial Company, Ltd. (Semiconductors & semiconductor equipment) | | 265,478 | | | 7,436 |
Mitsui & Co., Ltd. (Trading companies & distributors) | | 4,853,000 | | | 101,343 |
Nakanishi Inc. (Health care equipment & supplies) | | 48,140 | | | 6,160 |
NGK Insulators, Ltd. (Machinery) | | 3,007,000 | | | 80,622 |
Nintendo Co., Ltd. (Software) | | 241,500 | | | 141,797 |
Nippon Electric Glass Co., Ltd. (Electronic equipment & instruments) | | 1,680,000 | | | 27,329 |
Nitori Company Ltd. (Specialty retail) | | 409,920 | | | 19,645 |
*So-net M3, Inc. (Health care technology) | | 5,458 | | | 17,401 |
Sumitomo Realty & Development Co., Ltd. (Real estate management & development) | | 2,260,000 | | | 55,271 |
Suruga Bank, Ltd. (Commercial banks) | | 4,218,000 | | | 45,887 |
Yamada Denki Company (Specialty retail) | | 761,980 | | | 85,955 |
Zensho Company, Ltd. (Hotels, restaurants, & leisure) | | 1,356,400 | | | 13,651 |
| | | | | |
| | | | | 998,254 |
| | | | | |
| | | | | |
Issuer | | Shares | | Value |
| | |
Asia—12.0% | | | | | |
Australia—7.8% | | | | | |
Allco Finance Group, Limited (Capital markets) | | 2,452,119 | | $ | 13,164 |
BHP Billiton Limited (Metals & mining) | | 2,695,200 | | | 94,219 |
Macquarie Bank, Ltd. (Capital markets) | | 1,667,900 | | | 111,595 |
QBE Insurance Group Limited (Insurance) | | 3,569,500 | | | 103,633 |
Seek Ltd. (Commercial services & supplies) | | 4,228,163 | | | 29,388 |
United Group Ltd. (Construction & engineering) | | 2,359,900 | | | 39,410 |
Woolworths Limited (Food & staples retailing) | | 5,389,700 | | | 159,837 |
WorleyParsons, Ltd. (Energy equipment & services) | | 1,763,522 | | | 79,446 |
| | | | | |
| | | | | 630,692 |
| | | | | |
Hong Kong—2.0% | | | | | |
ASM Pacific Technology Limited (Semiconductors & semiconductor equipment) | | 2,994,000 | | | 21,763 |
Esprit Holdings Ltd. (Specialty retail) | | 6,329,100 | | | 93,198 |
Li & Fung Ltd. (Distributors) | | 11,633,200 | | | 46,378 |
| | | | | |
| | | | | 161,339 |
| | | | | |
Singapore—2.2% | | | | | |
Capitaland, Ltd. (Real estate management & development) | | 15,777,000 | | | 67,879 |
Olam International, Ltd. (Food & staples retailing) | | 13,720,000 | | | 26,989 |
Raffles Education Corp. Ltd. (Diversified consumer services) | | 11,779,000 | | | 24,717 |
Singapore Exchange, Ltd. (Diversified financial services) | | 6,595,000 | | | 60,414 |
| | | | | |
| | | | | 179,999 |
| | | | | |
| | |
Emerging Asia—10.7% | | | | | |
China—3.0% | | | | | |
Belle International Holdings Limited (Specialty retail) | | 24,204,000 | | | 36,210 |
China Mengniu Dairy Co. (Food products) | | 644,400 | | | 2,338 |
China Oilfield Services Limited (Energy equipment & services) | | 15,308,000 | | | 34,187 |
China Vanke Company Ltd. (Real estate management & development) | | 13,791,050 | | | 35,541 |
Ctrip.com International Ltd.—ADR (Hotels, restaurants, & leisure) | | 505,070 | | | 29,026 |
*E-House China Holdings Ltd.—ADR (Real estate management & development) | | 450,500 | | | 10,736 |
*Home Inns & Hotels Management, Inc.—ADR (Hotels, restaurants, & leisure) | | 321,200 | | | 11,448 |
Lee and Man Paper Manufacturing Ltd. (Paper & forest products) | | 3,697,200 | | | 16,118 |
Li Ning Co. Ltd. (Leisure equipment & products) | | 8,555,600 | | | 31,504 |
Parkson Retail Group Ltd. (Multiline retail) | | 2,890,000 | | | 34,488 |
| | | | | |
| | | | | 241,596 |
| | | | | |
India—3.2% | | | | | |
Bharat Heavy Electricals Ltd. (Electrical equipment) | | 523,700 | | | 34,082 |
*Bharti Airtel Limited (Wireless telecommunication services) | | 1,865,000 | | | 46,648 |
See accompanying Notes to Financial Statements.
December 31, 2007 | William Blair Funds 43 |
International Growth Fund
Portfolio of Investments, December 31, 2007 (all dollar amounts in thousands)
| | | | | |
Issuer | | Shares | | Value |
|
Common Stocks—Emerging Asia—10.7%—(continued) |
India—3.2%—(continued) | | | | | |
Dabur India Ltd. (Personal products) | | 8,037,450 | | $ | 23,091 |
DLF Ltd. (Real estate management & development) | | 923,835 | | | 24,939 |
Financial Technologies (India) Ltd. (Software) | | 396,500 | | | 26,086 |
Housing Development Finance Corp. (Thrifts & mortgage finance) | | 374,800 | | | 27,066 |
Larsen & Toubro Ltd. (Construction & engineering) | | 281,300 | | | 29,447 |
Unitech Limited (Real estate management & development) | | 3,413,500 | | | 41,829 |
| | | | | |
| | | | | 253,188 |
| | | | | |
Indonesia—0.4% | | | | | |
PT Bank Rakyat Indonesia (Commercial banks) | | 38,686,000 | | | 30,073 |
| | | | | |
Malaysia—1.2% | | | | | |
Bumiputra Commerce Holdings Bhd (Commercial banks) | | 14,961,300 | | | 49,259 |
Kuala Lumpur Kepong Bhd (Food products) | | 5,872,950 | | | 30,684 |
Zelan Bhd (Construction & engineering) | | 8,532,000 | | | 13,936 |
| | | | | |
| | | | | 93,879 |
| | | | | |
South Korea—1.0% | | | | | |
*LG Household & Health Care Ltd. (Household products) | | 114,010 | | | 23,492 |
*MegaStudy Co., Ltd. (Diversified consumer services) | | 78,100 | | | 22,208 |
*NHN Corp. (Internet software & services) | | 158,720 | | | 37,848 |
| | | | | |
| | | | | 83,548 |
| | | | | |
Taiwan—1.9% | | | | | |
Hon Hai Precision Industry Corp. (Electronic equipment & instrument) | | 6,882,736 | | | 42,421 |
Mediatek Inc. (Semiconductors & semiconductor equipment) | | 5,491,022 | | | 70,383 |
Taiwan Semiconductor Manufacturing Company Ltd. (Semiconductors & semiconductor equipment) | | 21,472,000 | | | 40,711 |
| | | | | |
| | | | | 153,515 |
| | | | | |
| |
Emerging Europe, Mid-East, Africa—5.6% | | | |
Czech Republic—0.3% | | | | | |
*Central European Media Enterprises Ltd. Class “A” (Media)† | | 177,000 | | | 20,528 |
| | | | | |
Egypt—1.1% | | | | | |
Egyptian Financial Group—Hermes Holding (Capital markets) | | 2,457,100 | | | 29,248 |
Orascom Construction Industries (Construction & engineering) | | 555,700 | | | 57,218 |
| | | | | |
| | | | | 86,466 |
| | | | | |
Georgia—0.1% | | | | | |
Bank of Georgia—GDR (Commercial banks) | | 337,195 | | | 9,957 |
| | | | | |
Poland—0.3% | | | | | |
*Central European Distribution Corporation (Beverages) | | 409,600 | | | 23,790 |
| | | | | |
| | | | | |
Issuer | | Shares | | Value |
| |
Common Stocks—Emerging Europe, Mid-East, Africa—5.6%—(continued) | | | |
Russia—0.8% | | | | | |
Sberbank—CLS (Commercial banks) | | 9,010,600 | | $ | 37,958 |
*X5 Retail Group N.V. (Food & staples retailing) | | 749,700 | | | 27,364 |
| | | | | |
| | | | | 65,322 |
| | | | | |
South Africa—1.8% | | | | | |
MTN Group, Ltd. (Wireless telecommunication services) | | 3,615,400 | | | 67,715 |
Naspers Ltd. (Media) | | 887,590 | | | 21,008 |
The Spar Group Limited (Food & staples retailing) | | 2,393,400 | | | 21,109 |
Truworths International Ltd. (Specialty retail) | | 5,110,600 | | | 20,251 |
Wilson Bayly Holmes-Ovcon Ltd. (Construction & engineering) | | 854,000 | | | 17,203 |
| | | | | |
| | | | | 147,286 |
| | | | | |
Turkey—0.3% | | | | | |
BIM Birlesik Magazalar A.S. (Food & staples retailing) | | 251,700 | | | 22,456 |
| | | | | |
United Arab Emirates—0.9% | | | | | |
*DP World Ltd. (Marine) | | 14,451,800 | | | 17,198 |
Emaar Properties PJSC (Real estate management & development) | | 9,439,900 | | | 38,098 |
Lamprell plc (Energy equipment & services) | | 1,968,595 | | | 16,723 |
| | | | | |
| | | | | 72,019 |
| | | | | |
| | |
Emerging Latin America—5.4% | | | | | |
Brazil—4.3% | | | | | |
*Anhanguera Educacional Participacoes S.A. (Diversified consumer services) | | 1,328,800 | | | 28,368 |
B2W Companhia Global do Varejo (Internet & catalog retail) | | 192,600 | | | 7,682 |
Bolsa de Mercadorias & Futuros S.A. (Diversified financial services) | | 579,700 | | | 8,142 |
Bovespa Holding S.A. (Diversified financial services) | | 2,538,200 | | | 48,910 |
*BR Malls Participacoes S.A. (Real estate management & development) | | 2,404,500 | | | 32,420 |
Companhia Vale do Rio Doce .—ADR (Metals & mining) | | 2,965,800 | | | 96,893 |
Cyrela Brazil Realty S.A. (Household durables) | | 1,477,200 | | | 20,083 |
*Cyrela Commercial Properties S.A. (Real estate management & development) | | 295,440 | | | 1,993 |
Iguatemi Empresa de Shopping Centers S.A. (Real estate management & development) | | 844,900 | | | 13,765 |
Localiza Rent a Car S.A. (Road & rail) | | 1,509,900 | | | 16,024 |
Lojas Renner S.A. (Multiline retail) | | 1,220,000 | | | 24,674 |
Redecard S.A. (IT services) | | 2,073,800 | | | 33,554 |
Totvs S.A. (Software) | | 343,900 | | | 11,399 |
| | | | | |
| | | | | 343,907 |
| | | | | |
Chile—0.5% | | | | | |
Cencosud S.A.—ADR 144A (Specialty retail) | | 652,330 | | | 39,379 |
| | | | | |
See accompanying Notes to Financial Statements.
44 Annual Report | December 31, 2007 |
International Growth Fund
Portfolio of Investments, December 31, 2007 (all dollar amounts in thousands)
| | | | | |
| | | |
Issuer | | Shares | | Value |
| |
Common Stocks—Emerging Latin America—5.4%—(continued) | | | |
Mexico—0.4% | | | | | |
*Banco Compartamos S.A. de C.V. (Consumer finance) | | 2,872,100 | | $ | 12,473 |
Grupo Aeropuertario Del—ADR (Transportation infrastructure) | | 302,700 | | | 13,510 |
*MegaCable Holdings S.A.B. de C.V. (Diversified telecommunication services) | | 2,867,800 | | | 9,738 |
| | | | | |
| | | | | 35,721 |
| | | | | |
Panama—0.2% | | | | | |
Copa Holdings S.A., Class “A” (Airlines)† | | 369,900 | | | 13,897 |
| | | | | |
| | |
Canada—4.3% | | | | | |
Brookfield Asset Management, Inc. Class “A” (Real estate management & development) | | 1,858,950 | | | 66,771 |
Canadian Western Bank (Commercial banks) | | 814,500 | | | 25,872 |
*FNX Mining Company, Inc. (Metals & mining) | | 903,000 | | | 27,677 |
*Gildan Activewear, Inc. (Textiles, apparel & luxury goods) | | 803,200 | | | 33,318 |
Rogers Communications, Inc. Class “B” (Wireless telecommunication services) | | 2,597,100 | | | 118,388 |
Shoppers Drug Mart Corp. (Food & staples retailing) | | 1,443,100 | | | 77,876 |
| | | | | |
| | | | | 349,902 |
| | | | | |
Total Common Stock—93.7%
(cost $5,604,053) | | | 7,542,719 |
| | | | | |
*Non-income producing securities
ADR = American Depository Receipt
GDR = Global Depository Receipt
† = U.S. listed foreign security
VRN = Variable Rate Note
For securities primarily traded on exchanges or markets that close before the close of regular trading on the New York Stock Exchange, the Fund uses an independent pricing service on a daily basis to fair value price the securities pursuant to Valuation Procedures adopted by the Board of Trustees.
At December 31, 2007 the Fund's Portfolio of Investments includes the following industry categories:
| | |
Financials | | 22.2% |
Industrials | | 17.5% |
Consumer Staples | | 15.1% |
Consumer Discretionary | | 14.8% |
Information Technology | | 8.5% |
Energy | | 8.2% |
Materials | | 4.7% |
Health Care | | 3.8% |
Telecommunication Services | | 3.6% |
Utilities | | 1.6% |
| | |
Total | | 100.0% |
| | |
| | | | | | |
Issuer | | Shares or
Principal
Amount | | Value |
| | |
Preferred Stock | | | | | | |
Brazil—0.6% | | | | | | |
Banco Sofisa S.A. (Commercial banks) | | | 1,775,800 | | $ | 13,817 |
Petroleo Brasileiro S.A. (Oil, gas & consumable fuels) | | | 672,100 | | | 33,378 |
| | | | | | |
| | | | | | 47,195 |
| | | | | | |
Total Preferred Stock—0.6%
(cost $21,571) | | | 47,195 |
| | | | | | |
| | |
Investment in Affiliate | | | | | | |
William Blair Ready Reserves Fund | | | 9,877,624 | | | 9,878 |
| | | | | | |
Total Investment in Affiliate—0.1%
(cost $9,878) | | | 9,878 |
| | | | | | |
| | |
Short-Term Investments | | | | | | |
American Express Credit Corp. Demand Note, VRN 4.695% due 1/2/08 | | $ | 75,668,000 | | | 75,668 |
Prudential Funding Demand Note, VRN 4.430% due 1/2/08 | | | 65,352,000 | | | 65,352 |
| | | | | | |
Total Short-term Investments—1.8%
(cost $141,020) | | | 141,020 |
| | | | | | |
Repurchase Agreement | | | | | | |
State Street Bank and Trust Company, 3.800% dated 12/31/07, due 1/2/08, repurchase price $239,878, collateralized by Various FNMA and FMLMC mortgage-backed pools | | | 239,827,576 | | | 239,828 |
| | | | | | |
Total Repurchase Agreement—3.0%
(cost $239,828) | | | 239,828 |
| | | | | | |
Total Investments—99.2%
(cost $6,016,350) | | | 7,980,640 |
Cash and other assets, less liabilities—0.8% | | | 68,014 |
| | | | | | |
Net assets—100.0% | | $ | 8,048,654 |
| | | | | | |
At December 31, 2007 the Fund's Portfolio of Investments includes the following currency categories:
| | |
Euro | | 19.7% |
British Pound Sterling | | 17.2% |
Japanese Yen | | 13.2% |
Swiss Franc | | 8.5% |
Australian Dollar | | 8.3% |
Hong Kong Dollar | | 4.6% |
United States Dollar | | 4.6% |
Canadian Dollar | | 4.6% |
Brazilian Real | | 3.9% |
Indian Rupee | | 3.4% |
Singapore Dollar | | 2.4% |
Taiwan Dollar | | 2.0% |
South African Rand | | 2.0% |
Malaysian Ringgit | | 1.2% |
Norwegian Krone | | 0.7% |
All other currencies | | 3.7% |
| | |
Total | | 100.0% |
| | |
See accompanying Notes to Financial Statements.
December 31, 2007 | William Blair Funds 45 |
W. George Greig
INTERNATIONAL EQUITY FUND
The International Equity Fund invests primarily in common stocks of companies included in the Morgan Stanley Capital International All Country World ex-U.S. Index.
AN OVERVIEW FROM THE PORTFOLIO MANAGER
Please see page 30 for the Global Markets Overview.
How did the Fund perform during the past year? How did the Fund’s performance compare to its benchmark?
The International Equity Fund posted a 17.68% gain (Class N Shares) for the 12 months ended December 31, 2007. By comparison, the Fund’s benchmark, the Morgan Stanley Capital International (MSCI) All Country World (ACWI) Ex-US Index, rose 17.12%.
What factors were behind the Fund’s performance versus the benchmark?
During 2007, the Fund outperformed across most sectors. In Consumer Staples, strong stock selection in Developed Asia and Canada, coupled with the weighting in Europe added value, while the Fund’s Energy stocks more than doubled the return of the stocks in the Index due to the Fund’s focus on energy services companies coupled with exploration and production companies with high production growth. Information Technology (IT) stock selection was driven by developed markets stock selection, while Materials stock selection added value primarily through the Fund’s emerging markets holdings. In addition, the Fund’s overweighting and stock selection in Consumer Staples and Industrials added value, as did its underweighting in Financials, whose performance slightly trailed the Index during the year. Regionally, the Fund’s focus on emerging markets and Developed Asia (ex-Japan) and Europe ex-UK was positive, as was its underemphasis of Japan. Stock selection in Europe and Japan also added value during the year.
What is your current strategy? How is the Fund positioned?
As of year end, the Fund remained focused in Consumer Staples and Industrials stocks at the expense of Energy, Health Care, Materials and Utilities. Financials, which was the largest weighting in the Fund at approximately 20%, was significantly underweighted relative to the Index, which had a 26.17% weighting. Regionally, the Fund maintained a focus in Developed Asia ex- Japan (i.e., Hong Kong, Australia and Singapore), while continuing its underweighting of Japan. The emerging markets weighting approximated 16% as of year end, below the Index’s 19.51% weighting, as we reduced our Emerging Asia holdings, particularly in China, due largely to valuation concerns.
46 Annual Report | December 31, 2007 |
International Equity Fund
Performance Highlights (unaudited)
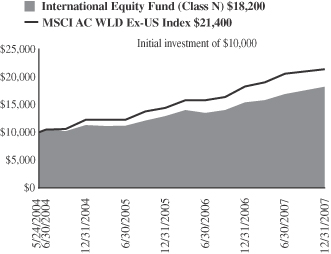
Average Annual Total Return at 12/31/2007
| | | | | | | | | |
| | | 1
Year | | | 3
Year | | | Since
Inception(a) | |
International Equity Fund
Class N | | 17.68 | % | | 17.02 | % | | 17.93 | % |
International Equity Fund
Class I | | 17.97 | | | 17.30 | | | 18.28 | |
MSCI All Country World Ex-US Index | | 17.12 | | | 20.37 | | | 23.31 | |
| | (a) | | For the period from May 24, 2004 to December 31, 2007. |
Performance cited represents past performance. Past performance does not guarantee future results and current performance may be lower or higher than the data quoted. Results shown are average annual returns, which assume reinvestment of dividends and capital gains. Investment returns and principal will fluctuate and you may have a gain or loss when you sell shares. For the most current month-end performance information, please call 1-800-742-7272, or visit our Web site at www.williamblairfunds.com. From time to time the investment advisor may waive fees or reimburse expenses for the Fund. Without these waivers, performance would be lower. International investing involves special risk considerations, including currency fluctuations, lower liquidity, economic and political risk. Class N shares are available to the general public without a sales load. Class I shares are available to certain institutional investors and advisory clients of William Blair & Company L.L.C. without a sales load or distribution (12b-1) or service fees.
The performance highlights and graph presented above do not reflect the deduction of taxes that a shareholder would pay on fund distributions or the redemption of fund shares.
The Morgan Stanley Capital International (MSCI) All Country World Ex-US Index is an unmanaged index that includes developed and emerging markets and reduced Japanese portion, making it more comparable to the International Equity Fund in terms of investment approach.
This report identifies the Fund’s investments on December 31, 2007. These holdings are subject to change. Not all stocks in the Fund performed the same, nor is there any guarantee that these stocks will perform as well in the future. Market forecasts provided in this report may not necessarily come to pass.
Sector Diversification (unaudited)
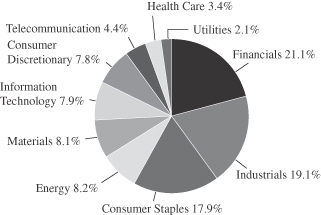
The sector diversification shown is based on the total investment portfolio.
December 31, 2007 | William Blair Funds 47 |
International Equity Fund
Portfolio of Investments, December 31, 2007 (all dollar amounts in thousands)
| | | | | |
Issuer | | Shares | | Value |
| | |
Common Stocks—Europe—31.4% | | | | | |
Austria—0.7% | | | | | |
Raiffeisen International Bank (Commercial banks) | | 17,808 | | $ | 2,676 |
| | | | | |
Belgium—1.4% | | | | | |
InBev N.V. (Beverages) | | 68,500 | | | 5,694 |
| | | | | |
Finland—1.2% | | | | | |
Nokia Oyj (Communications equipment) | | 128,500 | | | 4,937 |
| | | | | |
France—9.0% | | | | | |
AXA (Insurance) | | 97,100 | | | 3,871 |
Essilor International (Health care equipment & supplies) | | 61,900 | | | 3,949 |
Eurazeo (Diversified financial services) | | 21,230 | | | 2,719 |
Iliad S.A. (Diversified telecommunication services) | | 22,500 | | | 2,420 |
L’Oreal S.A. (Personal products) | | 61,000 | | | 8,735 |
Schneider Electric S.A. (Electrical equipment) | | 52,500 | | | 7,111 |
Veolia Environnement (Multi-utilities) | | 87,587 | | | 7,978 |
| | | | | |
| | | | | 36,783 |
| | | | | |
Germany—4.0% | | | | | |
Beiersdorf AG (Personal products) | | 53,100 | | | 4,115 |
Deutsche Boerse AG (Diversified financial services) | | 39,900 | | | 7,875 |
*Q-Cells AG (Electrical equipment) | | 32,200 | | | 4,570 |
| | | | | |
| | | | | 16,560 |
| | | | | |
Greece—1.1% | | | | | |
National Bank of Greece S.A. (Commercial banks) | | 65,060 | | | 4,461 |
| | | | | |
Italy—2.5% | | | | | |
Geox SpA (Textiles, apparel & luxury goods) | | 84,500 | | | 1,702 |
Saipem SpA (Energy equipment & services) | | 213,300 | | | 8,518 |
| | | | | |
| | | | | 10,220 |
| | | | | |
Spain—1.3% | | | | | |
Industria De Textile S.A. (Specialty retail) | | 88,800 | | | 5,373 |
| | | | | |
Switzerland—10.2% | | | | | |
ABB Ltd. (Electrical equipment) | | 445,200 | | | 12,836 |
*Actelion Ltd. (Biotechnology) | | 41,000 | | | 1,873 |
EFG International (Capital markets) | | 50,600 | | | 2,039 |
Geberit AG (Building products) | | 10,300 | | | 1,403 |
Julius Baer Holding AG (Capital markets) | | 43,900 | | | 3,602 |
Kuehne & Nagel International AG (Marine) | | 35,300 | | | 3,389 |
Nestle S.A. (Food products) | | 17,260 | | | 7,926 |
Roche Holdings AG (Pharmaceuticals) | | 22,850 | | | 3,950 |
SGS S.A. (Commercial services & supplies) | | 2,248 | | | 2,680 |
Sonova Holdings AG (Health care equipment & supplies) | | 16,186 | | | 1,817 |
| | | | | |
| | | | | 41,515 |
| | | | | |
| | |
United Kingdom—15.5% | | | | | |
BG Group plc (Oil, gas & consumable fuels) | | 415,800 | | | 9,540 |
British Sky Broadcasting Group plc (Media) | | 424,900 | | | 5,226 |
Capita Group plc (Commercial services & supplies) | | 289,316 | | | 4,011 |
Carphone Warehouse Group plc (Specialty retail) | | 238,100 | | | 1,620 |
Man Group plc (Capital markets) | | 320,950 | | | 3,643 |
Reckitt Benckiser plc (Household products) | | 171,000 | | | 9,937 |
| | | | | |
Issuer | | Shares | | Value |
|
Common Stocks—United Kingdom—15.5%—(continued) |
*Rolls-Royce Group plc (Aerospace & defense) | | 760,005 | | $ | 8,249 |
Rotork plc (Electronic equipment & instruments) | | 67,200 | | | 1,296 |
Tesco plc (Food & staples retailing) | | 1,085,600 | | | 10,327 |
Tullow Oil plc (Oil, gas, & consumable fuels) | | 257,300 | | | 3,342 |
Xstrata plc (Metal & mining) | | 86,400 | | | 6,063 |
| | | | | |
| | | | | 63,254 |
| | | | | |
| | |
Japan—13.1% | | | | | |
Aeon Mall Co., Ltd. (Real estate management & development) | | 78,400 | | | 2,057 |
FANUC Ltd. (Machinery) | | 54,800 | | | 5,313 |
Fukuoka Financial Group, Inc. (Commercial banks) | | 674,000 | | | 3,936 |
*Jupiter Telecommunications Co., Ltd. (Media) | | 3,400 | | | 2,860 |
*K.K. DaVinci Advisors (Real estate management & development) | | 1,304 | | | 1,130 |
Komatsu Ltd. (Machinery) | | 173,300 | | | 4,648 |
Mitsui & Co., Ltd. (Trading companies & distributors) | | 272,000 | | | 5,680 |
NGK Insulators, Ltd. (Machinery) | | 195,000 | | | 5,228 |
Nintendo Co., Ltd. (Software) | | 18,400 | | | 10,804 |
Nippon Electric Glass Co., Ltd. (Electronic equipment & instruments) | | 120,000 | | | 1,952 |
Shin-Etsu Chemical Co., Ltd. (Chemicals) | | 51,800 | | | 3,221 |
Sumitomo Realty and Development (Real estate management & development) | | 138,000 | | | 3,375 |
Suruga Bank Ltd. (Commercial banks) | | 291,000 | | | 3,166 |
| | | | | |
| | | | | 53,370 |
| | | | | |
| | |
Asia—12.5% | | | | | |
Australia—8.0% | | | | | |
BHP Billiton Limited (Metals & mining) | | 137,300 | | | 4,800 |
Macquarie Bank, Ltd. (Capital markets) | | 69,100 | | | 4,623 |
QBE Insurance Group Limited (Insurance) | | 168,300 | | | 4,886 |
Toll Holdings Limited (Air freight & logistics) | | 289,000 | | | 2,886 |
Woolworths Limited (Food & staples retailing) | | 319,200 | | | 9,466 |
WorleyParsons, Ltd. (Energy equipment & services) | | 133,900 | | | 6,032 |
| | | | | |
| | | | | 32,693 |
| | | | | |
Hong Kong—2.3% | | | | | |
Esprit Holdings Ltd. (Specialty retail) | | 324,200 | | | 4,774 |
Li & Fung Ltd. (Distributors) | | 1,165,200 | | | 4,645 |
| | | | | |
| | | | | 9,419 |
| | | | | |
Singapore—2.2% | | | | | |
Capitaland, Ltd. (Real estate management & development) | | 1,181,000 | | | 5,081 |
Wilmar International Ltd. (Food products) | | 1,074,700 | | | 3,994 |
| | | | | |
| | | | | 9,075 |
| | | | | |
| | |
Emerging Asia—8.3% | | | | | |
China—2.3% | | | | | |
China Communications Construction Co. Ltd. (Construction & engineering) | | 1,565,000 | | | 4,046 |
See accompanying Notes to Financial Statements.
48 Annual Report | December 31, 2007 |
International Equity Fund
Portfolio of Investments, December 31, 2007 (all dollar amounts in thousands)
| | | | | |
| | | |
Issuer | | Shares | | Value |
|
Common Stocks—Emerging Asia—8.4%—(continued) |
China—(continued) | | | | | |
China Merchants Bank Co. Ltd (Commercial banks) | | 399,000 | | $ | 1,605 |
China Oilfield Services Limited (Energy equipment & services) | | 748,000 | | | 1,671 |
*Country Garden Holdings Company (Real estate management & development) | | 815,000 | | | 929 |
Shandong Weigao Gp Medical (Health care equipment & supplies) | | 568,000 | | | 1,301 |
| | | | | |
| | | | | 9,552 |
| | | | | |
India—2.3% | | | | | |
*Bharti Airtel Limited (Wireless telecommunication services) | | 174,173 | | | 4,356 |
Vedanta Resources plc ( Metals & mining) | | 120,600 | | | 4,893 |
| | | | | |
| | | | | 9,249 |
| | | | | |
Indonesia—0.5% | | | | | |
PT Bank Rakyat Indonesia (Commercial banks) | | 2,828,000 | | | 2,198 |
| | | | | |
Malaysia—1.2% | | | | | |
Bumiputra Commerce Holdings Bhd (Commercial banks) | | 768,800 | | | 2,531 |
Kuala Lumpur Kepong Bhd (Food products) | | 485,800 | | | 2,538 |
| | | | | |
| | | | | 5,069 |
| | | | | |
South Korea—0.6% | | | | | |
*NHN Corp. (Internet software & services) | | 10,400 | | | 2,480 |
| | | | | |
Taiwan—1.4% | | | | | |
Hon Hai Precision Industry Corp. (Electronic equipment & instruments) | | 520,540 | | | 3,208 |
Mediatek, Inc. (Semiconductors & semiconductor equipment) | | 187,500 | | | 2,404 |
| | | | | |
| | | | | 5,612 |
| | | | | |
| | |
Canada—5.3% | | | | | |
Agnico-Eagle Mines Limited (Metals & mining) | | 79,642 | | | 4,351 |
Brookfield Asset Management, Inc. Class “A” (Real estate management & development) | | 118,350 | | | 4,251 |
*Research In Motion Limited (Communications equipment) | | 27,300 | | | 3,096 |
Rogers Communications, Inc. Class “B” (Wireless telecommunication services) | | 129,100 | | | 5,885 |
Shoppers Drug Mart Corp. (Food & staples retailing) | | 72,500 | | | 3,912 |
| | | | | |
| | | | | 21,495 |
| | | | | |
| |
Emerging Europe, Mid-East, Africa—3.5% | | | |
Egypt—1.0% | | | | | |
Egyptian Financial Group—Hermes Holding (Capital markets) | | 355,100 | | | 4,227 |
| | | | | |
South Africa—1.5% | | | | | |
MTN Group, Ltd. (Wireless telecommunication services) | | 227,900 | | | 4,269 |
Naspers Ltd. (Media) | | 70,900 | | | 1,678 |
| | | | | |
| | | | | 5,947 |
| | | | | |
| | | | | | |
Issuer | | Shares or
Principal
Amount | | Value |
|
Common Stocks—Emerging Europe, Mid-East,
Africa—3.5%—(continued) |
Russia—0.8% | | | | | | |
*PIK Group (Real estate management & development)** | | | 52,000 | | $ | 1,586 |
*PIK Group—GDR 144A (Real estate management & development) | | | 49,700 | | | 1,516 |
| | | | | | |
| | | | | | 3,102 |
| | | | | | |
United Arab Emirates—0.2% | | | | | | |
*DP World Ltd. (Marine) | | | 756,800 | | | 901 |
| | | | | | |
| | |
Emerging Latin America—3.5% | | | | | | |
Brazil —3.0% | | | | | | |
Bolsa de Mercadorias & Futuros S.A. (Diversified financial services) | | | 29,100 | | | 409 |
Bovespa Holding S.A. (Diversified financial services) | | | 123,400 | | | 2,378 |
*Net Servicos De Counicacao S.A. (Media) | | | 149,800 | | | 1,826 |
Companhia Vale do Rio Doce .—ADR (Metals & mining) | | | 239,100 | | | 7,811 |
| | | | | | |
| | | | | | 12,424 |
| | | | | | |
Chile—0.5% | | | | | | |
Cencosud S.A.—ADR 144A (Specialty retail) | | | 33,500 | | | 2,022 |
| | | | | | |
Total Common Stock—93.1%
(cost $299,411) | | | 380,308 |
| | | | | | |
| | |
Preferred Stocks | | | | | | |
Brazil—0.6% | | | | | | |
Petroleo Brasileiro S.A. (Oil, gas & consumable fuels) | | | 50,700 | | | 2,518 |
| | | | | | |
Total Preferred Stocks—0.6%
(cost $829) | | | 2,518 |
| | | | | | |
| | |
Investment in Affiliate | | | | | | |
William Blair Ready Reserves Fund | | | 5,278,372 | | | 5,278 |
| | | | | | |
Total Investment in Affiliate—1.3%
(cost $5,278) | | | 5,278 |
| | | | | | |
| | |
Short-Term Investments | | | | | | |
American Express Credit Corporation Demand Note, VRN,
4.695%, due 1/2/08 | | $ | 4,260,000 | | | 4,260 |
Prudential Funding Demand Note, VRN 4.430%, due 1/2/08 | | | 5,072,000 | | | 5,072 |
| | | | | | |
Total Short-Term Investments—2.3%
(cost $9,332) | | | 9,332 |
| | | | | | |
See accompanying Notes to Financial Statements.
December 31, 2007 | William Blair Funds 49 |
International Equity Fund
Portfolio of Investments, December 31, 2007 (all dollar amounts in thousands)
| | | | | | |
Issuer | | Principal
Amount | | Value |
| | |
Repurchase Agreement | | | | | | |
State Street Bank & Trust Company, 3.80% dated 12/31/07, due 1/2/08, repurchase price $4,902, collateralized by FNMA, Pool #712321 | | $ | 4,900,984 | | $ | 4,901 |
| | | | | | |
Total Repurchase Agreement—1.2%
(cost $4,901) | | | 4,901 |
| | | | | | |
Total Investments—98.5%
(cost $319,751) | | | 402,337 |
Cash and other assets, less liabilities—1.5% | | | 6,272 |
| | | | | | |
Net assets—100.0% | | $ | 408,609 |
| | | | | | |
*Non-income producing securities
ADR = American Depository Receipt
VRN = Variable Rate Note
** Fair valued pursuant to Valuation Procedures adopted by the Board of Trustees. This holding represents 0.39% of the Fund’s net assets at December 31, 2007. This security was also deemed illiquid pursuant to Liquidity Procedures adopted by the Board of Trustees.
For securities primarily traded on exchanges or markets that close before the close of regular trading on the New York Stock Exchange, the Fund uses an independent pricing service on a daily basis to fair value price the securities pursuant to Valuation Procedures adopted by the Board of Trustees.
At December 31, 2007 the Fund’s Portfolio of Investments includes the following industry categories:
| | |
Financials | | 21.1% |
Industrials | | 19.1% |
Consumer Staples | | 17.9% |
Energy | | 8.2% |
Materials | | 8.1% |
Information Technology | | 7.9% |
Consumer Discretionary | | 7.8% |
Telecommunication Services | | 4.4% |
Health Care | | 3.4% |
Utilities | | 2.1% |
| | |
Total | | 100.0% |
| | |
At December 31, 2007 the Fund’s Portfolio of Investments includes the following currency categories:
| | |
Euro | | 22.6% |
British Pound Sterling | | 17.7% |
Japanese Yen | | 14.0% |
Swiss Franc | | 10.8% |
Australian Dollar | | 8.5% |
U.S. Dollar | | 5.6% |
Hong Kong Dollar | | 5.0% |
Canadian Dollar | | 3.7% |
Singapore Dollar | | 2.4% |
Brazilian Real | | 1.9% |
South African Rand | | 1.6% |
New Taiwan Dollar | | 1.5% |
Malaysian Ringgit | | 1.3% |
Indian Rupee | | 1.1% |
Egyptian Pounds | | 1.1% |
All other currencies | | 1.2% |
| | |
Total | | 100.0% |
| | |
See accompanying Notes to Financial Statements.
50 Annual Report | December 31, 2007 |

Jeffrey A. Urbina
INTERNATIONAL SMALL CAP GROWTH FUND
The International Small Cap Growth Fund primarily invests in a diversified portfolio of common stocks of small cap companies in developed and emerging markets.
AN OVERVIEW FROM THE PORTFOLIO MANAGER
Please see page 30 for the Global Markets Overview.
How did the Fund perform during the past year? How did the Fund’s performance compare to its benchmark?
The International Small Cap Growth Fund posted a 13.06% increase (Class N Shares) for the 12 months ended December 31, 2007. By comparison, the Fund’s benchmark, the Morgan Stanley Capital International (MSCI) World Small Cap Ex-U.S. Index, gained 3.64%.
What factors were behind the Fund’s performance versus the benchmark?
During 2007, the Fund outperformed across most sectors. In particular, relative stock selection in Discretionary, Energy, Financials, Health Care, Industrials and Utilities was strong. Discretionary stock selection was bolstered by good performance in developed Asia and Canada, coupled with emerging markets exposure. In Energy, the Fund’s focus on energy services companies added value. Financials stock selection was strong across all regions, with the exception of Australia. European stocks augmented results in Health Care, while Industrials stock selection benefited from companies exposed to Energy and Materials spending, infrastructure building, and alternative energy. In addition, the Fund’s overweighting in Industrials added value, as did its underweighting in IT. Regionally, the Fund’s stock selection across developed regions was strong, while emerging markets exposure added value, as did the lower weighting in Japan.
What is your current strategy? How is the Fund positioned?
During the quarter, the Fund’s weighting in Consumer Discretionary stocks, which were significantly overweighted relative to the Index as of September 30, were decreased, and reinvested in Health Care and Financials holdings. From a sector perspective at year end, the Fund remained focused in Financials and Industrials, and a newly increased Healthcare weighting, at the expense of Materials and Utilities. Regionally, the Fund remained underweighted in Developed Asia, although the weighting in Japan was increased, overweighted in Europe, and approximately 16% in emerging markets. The weighting in emerging markets decreased from approximately 17% as of September 30, as we reduced our weightings in China and Latin America, with some of the proceeds reinvested in the Middle East.
December 31, 2007 | William Blair Funds 51 |
International Small Cap Growth Fund
Performance Highlights (unaudited)
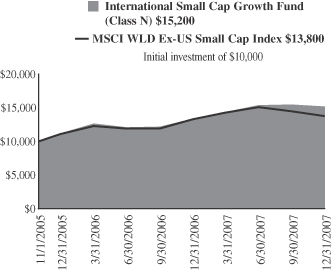
Average Annual Total Return at 12/31/2007
| | | | | | |
| | | 1
Year | | | Since
Inception(a) | |
International Small Cap Growth
Fund Class N | | 13.06 | % | | 21.22 | % |
International Small Cap Growth
Fund Class I | | 13.34 | | | 21.53 | |
MSCI World Ex-US Small Cap
Index | | 3.64 | | | 15.79 | |
| | (a) | | For the period from November 1, 2005 (Commencement of Operations) to December 31, 2007. | |
Performance cited represents past performance. Past performance does not guarantee future results and current performance may be lower or higher than the data quoted. Results shown are average annual returns, which assume reinvestment of dividends and capital gains. Investment returns and principal will fluctuate and you may have a gain or loss when you sell shares. For the most current month-end performance information, please call 1-800-742-7272, or visit our Web site at www.williamblairfunds.com. From time to time, the investment advisor may waive fees or reimburse expenses for the Fund. Without these waivers, performance would be lower. International investing involves special risk considerations, including currency fluctuations, lower liquidity, economic and political risk. Class N shares are available to the general public without a sales load. Class I shares are available to certain institutional investors and advisory clients of William Blair & Company L.L.C. without a sales load or distribution (12b-1) fees.
The performance highlights and graph presented above do not reflect the deduction of taxes that a shareholder would pay on fund distributions or the redemption of fund shares.
The Morgan Stanley Capital International (MSCI) World Ex-US Small Cap Index is an unmanaged index that is designed to measure equity performance of small cap stocks in developed and emerging markets.
This report identifies the Fund’s investments on December 31, 2007. These holdings are subject to change. Not all stocks in the Fund performed the same, nor is there any guarantee that these stocks will perform as well in the future. Market forecasts provided in this report may not necessarily come to pass.
Sector Diversification (unaudited)
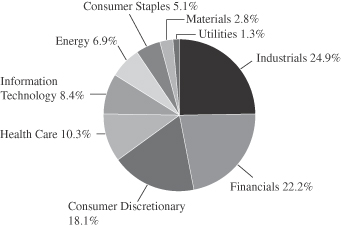
The sector diversification shown is based on the total investment portfolio.
52 Annual Report | December 31, 2007 |
International Small Cap Growth Fund
Portfolio of Investments, December 31, 2007 (all dollar amounts in thousands)
| | | | | |
Issuer | | Shares | | Value |
| | |
Common Stocks—Europe—37.9% | | | | | |
Austria—1.5% | | | | | |
Schoeller-Bleckmann Oilfield Equipment AG (Energy equipment & services) | | 66,920 | | $ | 6,003 |
| | | | | |
Finland—3.8% | | | | | |
Konecranes OYJ (Machinery) | | 53,600 | | | 1,826 |
Nokian Renkaat OYJ (Auto components) | | 229,550 | | | 7,969 |
Outotec OYJ (Construction & engineering) | | 32,300 | | | 1,751 |
Ramirent OYJ (Machinery) | | 220,512 | | | 3,617 |
| | | | | |
| | | | | 15,163 |
| | | | | |
France—6.0% | | | | | |
April Group S.A. (Insurance) | | 136,782 | | | 9,229 |
EDF Energies Nouvelles S.A.
(Independent power produusie energy traders) | | 71,000 | | | 4,952 |
*Orpea (Heath care providers & services) | | 92,713 | | | 6,093 |
*Seloger.com (Media) | | 68,400 | | | 4,018 |
| | | | | |
| | | | | 24,292 |
| | | | | |
Germany—6.8% | | | | | |
*Colonia Real Estate AG (Real estate management & development) | | 170,760 | | | 4,237 |
CTS Eventim AG (Media) | | 53,900 | | | 2,082 |
*Manz Automation AG (Semiconductors & semiconductor equipment) | | 11,200 | | | 2,710 |
MTU Aero Engines Holding AG (Aerospace & defense) | | 83,514 | | | 4,880 |
*Roth & Rau AG (Electronic equipment & instruments) | | 7,200 | | | 2,683 |
Solarworld AG (Electrical equipment) | | 71,062 | | | 4,314 |
*Wire Card AG (Commercial services & supplies) | | 371,000 | | | 6,286 |
| | | | | |
| | | | | 27,192 |
| | | | | |
Greece—3.6% | | | | | |
Fourlis Holdings S.A. (Household durables) | | 160,600 | | | 6,346 |
Jumbo S.A. (Leisure equipment & products) | | 228,200 | | | 8,215 |
| | | | | |
| | | | | 14,561 |
| | | | | |
Ireland—2.2% | | | | | |
*Norkom Group plc (Software) | | 286,500 | | | 733 |
United Drug plc (Heath care providers & services) | | 1,433,880 | | | 8,274 |
| | | | | |
| | | | | 9,007 |
| | | | | |
Italy—1.5% | | | | | |
Azimut Holdings SpA (Capital markets) | | 143,217 | | | 1,858 |
Trevi Finanziaria SpA (Construction & engineering) | | 234,800 | | | 4,208 |
| | | | | |
| | | | | 6,066 |
| | | | | |
Netherlands—1.6% | | | | | |
*Qiagen NV (Lifesciences tools & services) | | 297,273 | | | 6,464 |
| | | | | |
Norway—0.7% | | | | | |
* Electromagnetic GeoServices AS (Energy equipment & services) | | 284,450 | | | 2,651 |
| | | | | |
| | | | | |
Issuer | | Shares | | Value |
| |
Common Stocks—Europe—37.9%—(continued) | | | |
Spain—3.0% | | | | | |
Grifols S.A. (Biotechnology) | | 378,203 | | $ | 8,490 |
Tecnicas Reunidas S.A. (Construction & engineering) | | 56,300 | | | 3,600 |
| | | | | |
| | | | | 12,090 |
| | | | | |
Switzerland—7.2% | | | | | |
*Barry Callebaut AG (Food products) | | 5,920 | | | 4,485 |
Burckhardt Compression Holding AG (Machinery) | | 17,112 | | | 5,552 |
*Meyer Burger Technology AG (Machinery) | | 14,800 | | | 5,448 |
Partners Group Global Opportunities, Ltd (Capital markets) | | 69,100 | | | 9,213 |
*Temenos Group AG (Software) | | 164,280 | | | 4,042 |
| | | | | |
| | | | | 28,740 |
| | | | | |
| | |
United Kingdom—18.7% | | | | | |
Amlin plc (Insurance) | | 1,221,889 | | $ | 7,216 |
Amlin plc—B Shares, (Insurance) | | 1,306,000 | | | 582 |
Ashmore Group plc (Capital markets) | | 607,700 | | | 3,212 |
*Autonomy Corporation plc (Software) | | 476,900 | | | 8,383 |
*Blinkx plc (Internet software & services) | | 4,713,700 | | | 2,577 |
*Ceres Power Holdings plc (Electrical equipment) | | 721,500 | | | 4,456 |
*Climate Exchange plc (Diversified financial services) | | 103,600 | | | 2,048 |
Detica Group plc (IT services) | | 632,100 | | | 2,774 |
Domino's Pizza UK & IRL plc (Hotels, restaurants, & leisure) | | 617,280 | | | 2,192 |
Expro International Group plc (Energy equipment & services) | | 317,337 | | | 6,492 |
Restaurant Group plc (Hotels, restaurants, & leisure) | | 317,200 | | | 1,166 |
Rightmove plc (Media) | | 199,700 | | | 1,839 |
Rotork plc (Electronic equipment & instruments) | | 102,550 | | | 1,977 |
RPS Group plc (Commercial services & supplies) | | 319,700 | | | 2,020 |
Serco Group plc (Commercial services & supplies) | | 887,240 | | | 8,167 |
Southern Cross Healthcare Limited (Health care providers & services) | | 496,824 | | | 5,207 |
Ultra Electronic Holdings plc (Aerospace & defense) | | 94,050 | | | 2,572 |
VT Group plc (Aerospace & defense) | | 357,150 | | | 4,903 |
*Wellstream Holdings plc (Energy equipment & services) | | 332,200 | | | 7,156 |
| | | | | |
| | | | | 74,939 |
| | | | | |
| | |
Japan—15.5% | | | | | |
Aeon Mall Co., Ltd. (Real estate management & development) | | 490,000 | | | 12,859 |
ARDEPRO CO., Ltd. (Real estate management & development) | | 17,408 | | | 3,738 |
DeNA Co., Ltd. (Internet & catalog retail) | | 1,223 | | | 5,818 |
En-Japan Inc. (Commercial services & supplies) | | 871 | | | 2,448 |
Fujimi, Inc (Chemicals) | | 50,788 | | | 768 |
*K.K. DaVinci Advisors (Real estate management & development) | | 7,011 | | | 6,074 |
See accompanying Notes to Financial Statements.
December 31, 2007 | William Blair Funds 53 |
International Small Cap Growth Fund
Portfolio of Investments, December 31, 2007 (all dollar amounts in thousands)
| | | | | |
Issuer | | Shares | | Value |
| |
Common Stocks—Japan—15.5%—(continued) | | | |
Kenedix, Inc. (Real estate management & development) | | 2,448 | | $ | 3,878 |
Miraial Company, Ltd. (Semiconductors & semiconductor equipment) | | 94,920 | | | 2,659 |
Nitori Company Ltd. (Specialty retail) | | 158,200 | | | 7,582 |
*So-net M3, Inc. (Health care technology) | | 1,370 | | | 4,368 |
Suruga Bank Ltd. (Commercial banks) | | 724,000 | | | 7,876 |
Zensho Company, Ltd. (Hotels, restaurants, & leisure) | | 406,500 | | | 4,091 |
| | | | | |
| | | | | 62,159 |
| | | | | |
| | |
Emerging Asia—7.6% | | | | | |
China—2.6% | | | | | |
*China High Speed Transmission (Independent power producers & energy traders) | | 1,006,000 | | | 2,638 |
China Infrastructure Machinery Holdings, Ltd. (Machinery) | | 1,043,000 | | | 1,634 |
Ctrip.com International Ltd.—ADR (Hotels, restaurants & leisure) | | 20,640 | | | 1,186 |
*E-House China Holdings Ltd.—ADR (Real estate management & development) | | 38,400 | | | 915 |
*Home Inns & Hotels Management, Inc.—ADR(Hotels, restaurants & leisure) | | 25,900 | | | 923 |
Li Ning Co. Ltd. (Leisure equipment & products) | | 318,873 | | | 1,174 |
Shandong Weigao GP (Health care equipment & supplies) | | 884,800 | | | 2,026 |
| | | | | |
| | | | | 10,496 |
| | | | | |
India—1.7% | | | | | |
Financial Technologies, (India) Ltd. (Diversified financial services) | | 72,380 | | | 4,762 |
Thermax India Limited (Machinery) | | 107,200 | | | 2,201 |
| | | | | |
| | | | | 6,963 |
| | | | | |
Malaysia—2.3% | | | | | |
KNM Group Bhd (Energy equipment & services) | | 1,112,100 | | | 2,559 |
Kuala Lumpur Kepong Bhd (Food products) | | 848,450 | | | 4,433 |
Zelan Bhd (Construction & engineering) | | 1,289,800 | | | 2,107 |
| | | | | |
| | | | | 9,099 |
| | | | | |
South Korea—1.0% | | | | | |
*Taewoong Co., Ltd. (Machinery) | | 42,190 | | | 3,982 |
| | | | | |
| | |
Asia—6.0% | | | | | |
Australia—3.5% | | | | | |
Seek Limited (Commercial services & supplies) | | 1,151,680 | | | 8,005 |
United Group, Ltd. (Construction & engineering) | | 360,070 | | | 6,013 |
| | | | | |
| | | | | 14,018 |
| | | | | |
Singapore—2.5% | | | | | |
Olam International, Ltd. (Food & staples retailing) | | 3,106,000 | | | 6,110 |
Raffles Education Corp. Ltd. (Diversified consumer services) | | 1,967,000 | | | 4,128 |
| | | | | |
| | | | | 10,238 |
| | | | | |
| | | | | |
Issuer | | Shares | | Value |
| |
Emerging Europe, Mid-East, Africa—5.6% | | | |
Czech Republic—0.6% | | | | | |
*Central European Media Enterprises Ltd.,
Class “A"”(Media) † | | 21,700 | | $ | 2,517 |
| | | | | |
Egypt—0.8% | | | | | |
*Orascom Hotels & Development (Hotels, restaurants & leisure) | | 230,900 | | | 3,429 |
| | | | | |
Poland—1.9% | | | | | |
*Central European Distribution Corporation—ADR (Beverages) | | 86,800 | | | 5,041 |
*Cinema City International N.V. (Media) | | 173,600 | | | 2,453 |
| | | | | |
| | | | | 7,494 |
| | | | | |
South Africa—1.7% | | | | | |
*Eastern Platinum Ltd (Metals & mining) | | 1,618,300 | | | 4,706 |
Wilson Bayly Holmes-Ovcon Limited (Construction & engineering) | | 103,381 | | | 2,082 |
| | | | | |
| | | | | 6,788 |
| | | | | |
United Arab Emirates—0.6% | | | | | |
Lamprell plc (Energy equipment & services) | | 263,700 | | | 2,240 |
| | | | | |
| | |
Canada—4.3% | | | | | |
Canadian Western Bank (Commercial banks) | | 215,100 | | | 6,833 |
FNX Mining Company Inc. (Metals & mining) | | 189,400 | | | 5,805 |
*Gildan Activewear, Inc. (Textiles, apparel & luxury goods) | | 107,500 | | | 4,459 |
| | | | | |
| | | | | 17,097 |
| | | | | |
| | |
Emerging Latin America—2.4% | | | | | |
Brazil—2.4% | | | | | |
*Anhanguera Educational Parti (Diversified consumer services) | | 108,400 | | | 2,314 |
*Cyrela Commercial Properties S.A. (Real estate management & development) | | 249,640 | | | 1,684 |
Iguatemi Empresa de Shopping Centers S.A. (Real estate management & development) | | 129,300 | | | 2,106 |
Lupatech S.A. (Machinery) | | 47,700 | | | 1,608 |
Rodobens Negocioa Imobiliarios S.A. (Real estate management & development) | | 180,500 | | | 2,145 |
| | | | | |
| | | | | 9,857 |
| | | | | |
Total Common Stock—98.0%
(cost $356,874) | | | 393,545 |
| | | | | |
| |
Preferred Stock | | | |
Brazil—0.6% | | | | | |
Banco Sofisa S.A. (Commercial banks) | | 288,100 | | | 2,242 |
| | | | | |
Total Preferred Stock—0.6%
(cost $1,818) | | | 2,242 |
| | | | | |
| | |
Investment in Affiliate | | | | | |
William Blair Ready Reserves Fund | | 2,197,170 | | | 2,197 |
| | | | | |
Total Investment in Affiliate—0.5%
(cost $2,197) | | | 2,197 |
| | | | | |
See accompanying Notes to Financial Statements.
54 Annual Report | December 31, 2007 |
International Small Cap Growth Fund
Portfolio of Investments, December 31, 2007 (all dollar amounts in thousands)
| | | | | | |
Issuer | | Principal
Amount | | Value |
| | |
Short-Term Investments | | | | | | |
American Express Credit Corp. Demand Note, VRN 4.695%, due 1/2/08 | | $ | 3,969,000 | | $ | 3,969 |
Prudential Funding Demand Note, VRN 4.430%, due 1/2/08 | | | 1,065,000 | | | 1,065 |
| | | | | | |
Total Short-term Investments—1.3%
(cost $5,034) | | | 5,034 |
| | | | | | |
* Non-income producing securities
ADR = American Depository Receipt
GDR = Global Depository Receipt
† = U.S. listed foreign security
VRN = Variable Rate Note
For securities primarily traded on exchanges or markets that close before the close of regular trading on the New York Stock Exchange, the Fund uses an independent pricing service on a daily basis to fair value price the securities pursuant to Valuation Procedures adopted by the Board of Trustees.
At December 31, 2007 the Fund’s Portfolio of Investments includes the following industry categories:
| | |
Industrials | | 24.9% |
Financials | | 22.2% |
Consumer Discretionary | | 18.1% |
Health Care | | 10.3% |
Information Technology | | 8.4% |
Energy | | 6.9% |
Consumer Staples | | 5.1% |
Materials | | 2.8% |
Utilities | | 1.3% |
| | |
Total | | 100.0% |
| | |
| | | | | | | |
Issuer | | Principal
Amount | | Value | |
| | |
Repurchase Agreement | | | | | | | |
State Street Bank & Trust Company, 3.80% dated 12/31/07 due 1/2/08, repurchase price $967 collateralized by FNMA Pool #712321 | | $ | 966,783 | | $ | 967 | |
| | | | | | | |
Total Repurchase Agreement—0.2%
(cost $967) | | | 967 | |
| | | | | | | |
Total Investments—100.6%
(cost $366,890) | | | 403,985 | |
Liabilities, plus cash and other assets (0.6)% | | | (2,526 | ) |
| | | | | | | |
Net assets—100.0% | | $ | 401,459 | |
| | | | | | | |
At December 31, 2007 the Fund’s Portfolio of Investments includes the following currency categories:
| | |
Euro. | | 30.5% |
British Pound Sterling. | | 19.4% |
Japanese Yen. | | 15.7% |
Swiss Franc. | | 7.2% |
Canadian Dollar. | | 5.5% |
Australian Dollar. | | 3.6% |
Brazilian Real. | | 3.1% |
U.S. Dollar. | | 2.7% |
Singapore Dollar. | | 2.6% |
Malaysian Ringgit. | | 2.3% |
Hong Kong Dollar. | | 1.9% |
Indian Rupee. | | 1.8% |
South Korean Won. | | 1.0% |
All other currencies. | | 2.7% |
| | |
Total | | 100.0% |
| | |
See accompanying Notes to Financial Statements.
December 31, 2007 | William Blair Funds 55 |
W. George Greig

Todd M. McClone
Jeffrey A. Urbina
EMERGING MARKETS GROWTH FUND
The Emerging Markets Growth Fund primarily invests in a diversified portfolio of equity securities issued by growth companies in emerging economies worldwide.
AN OVERVIEW FROM THE PORTFOLIO MANAGERS
Please see page 30 for the Global Markets Overview.
How did the Fund perform during the past year? How did the Fund’s performance compare to its benchmark?
The Emerging Markets Growth Fund posted a 37.75% increase (Class N Shares) for the 12 months ended December 31, 2007. By comparison, the Fund’s benchmark, the Morgan Stanley Capital International (MSCI) Emerging Markets Index, gained 39.78%.
What factors were behind the Fund’s performance versus the benchmark?
During 2007 the Fund outperformed across virtually all sectors. In particular, relative stock selection in Energy, Financials, Information Technology (IT) and Telecommunication Services was strong. In Energy, the Fund’s focus on energy services companies coupled with exploration and production companies with high production growth added value. Financials stock selection was strong, due largely to strong gains in the Fund’s Chinese and Middle Eastern holdings, coupled with good results from Brazilian financials. IT stock selection benefited from strong performance in Latin American and Asian holdings, while the Fund’s focus on the leading Telecom companies in China and India augmented performance. In addition, the Fund’s overweighting in Industrials added value, as did its underweighting in IT. Regionally, the Fund’s stock selection in Emerging Asia was strong, but was slightly mitigated from underperformance in Latin America, due primarily to exposure to Mexico, which underperformed as the US economy slowed.
What is your current strategy? How is the Fund positioned?
During the fourth quarter, the Fund’s weighting in Consumer Discretionary stocks, which were significantly overweighted relative to the Index as of September 30, were decreased, in favor of Consumer Staples companies, due to expectations of a slower growth environment, and concerns about valuation in Chinese stocks. From a sector perspective at year end, however, the Fund remained focused in Consumer, Financials and Industrials companies at the expense of Energy, Materials and Utilities. Regionally, the weighting in Emerging Asia was decreased during the quarter, due largely to concerns about valuation in China in favor of Brazilian and Middle Eastern stocks. As of year end, the Fund had nearly an equal weighting (approximately 25% of the Fund) in EMEA (Emerging Europe, Middle East, Africa), was overweighted in Latin America (at approximately 26% of the Fund) and underweighted in the larger Emerging Asia region relative to the Index.
56 Annual Report | December 31, 2007 |
Emerging Markets Growth Fund
Performance Highlights (unaudited)
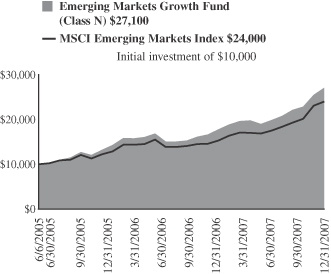
Average Annual Total Return at 12/31/2007
| | | | | | |
| | | 1
Year | | | Since
Inception(a) | |
Emerging Markets Growth Fund
Class N | | 37.75 | % | | 47.18 | % |
Emerging Markets Growth Fund
Class I | | 38.13 | | | 47.49 | |
MSCI Emerging Markets Index | | 39.78 | | | 40.36 | |
| | (a) | | For the period from June 6, 2005 (Commencement of Operations) to December 31, 2007. | |
Performance cited represents past performance. Past performance does not guarantee future results and current performance may be lower or higher than the data quoted. Results shown are average annual returns, which assume reinvestment of dividends and capital gains. Investment returns and principal will fluctuate and you may have a gain or loss when you sell shares. For the most current month-end performance information, please call 1-800-742-7272, or visit our Web site at www.williamblairfunds.com. From time to time, the investment advisor may waive fees or reimburse expenses for the Fund. Without these waivers, performance would be lower. International investing involves special risk considerations, including currency fluctuations, lower liquidity, economic and political risk. Class N shares are available to the general public without a sales load. Class I shares are available to certain institutional investors and advisory clients of William Blair & Company L.L.C. without a sales load or distribution (12b-1) fees.
The performance highlights and graph presented above do not reflect the deduction of taxes that a shareholder would pay on fund distributions or the redemption of fund shares.
The Morgan Stanley Capital International (MSCI) Emerging Markets Index is an index that is designed to measure equity performance in the global emerging markets.
This report identifies the Fund’s investments on December 31, 2007. These holdings are subject to change. Not all stocks in the Fund performed the same, nor is there any guarantee that these stocks will perform as well in the future. Market forecasts provided in this report may not necessarily come to pass.
Sector Diversification (unaudited)
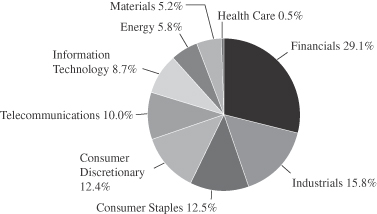
The sector diversification shown is based on the total investment portfolio.
December 31, 2007 | William Blair Funds 57 |
Emerging Markets Growth Fund
Portfolio of Investments, December 31, 2007 (all dollar amounts in thousands)
| | | | | |
Issuer | | Shares | | Value |
| |
Common Stocks—Emerging Asia—46.3% | | | |
China—10.6% | | | | | |
Belle International Holdings Limited (Specialty retail) | | 8,686,200 | | $ | 12,995 |
China Communications Construction Company Ltd. (Construction & engineering) | | 2,099,900 | | | 5,429 |
*China High Speed Transmission Equipment Group Co. (Electrical equipment) | | 2,213,000 | | | 5,802 |
China Infrastructure Machinery Holdings, Ltd. (Machinery) | | 3,019,000 | | | 4,728 |
China Merchants Bank (Commercial banks) | | 2,658,500 | | | 10,696 |
China Mobile Ltd. (Wireless telecommunication services) | | 982,300 | | | 17,106 |
China Oilfield Services Limited (Energy equipment & services) | | 1,245,000 | | | 2,780 |
China Vanke Company Ltd. (Real estate management & development) | | 4,419,147 | | | 11,389 |
*China Water Affairs Group (Household durables) | | 4,814,000 | | | 2,922 |
*CNinsure, Inc. (Insurance)† | | 194,200 | | | 3,059 |
*Country Garden Holdings Ltd. (Real estate management & development) | | 6,997,000 | | | 7,973 |
Ctrip.com International Ltd.—ADR (Hotels, restaurants & leisure) | | 48,600 | | | 2,793 |
*E-House China Holdings Ltd.—ADR (Real estate management & development) | | 111,300 | | | 2,652 |
*Home Inns & Hotels Management Inc.—ADR (Hotels, restaurants & leisure) | | 69,100 | | | 2,463 |
Lee and Man Paper Manufacturing Ltd. (Paper & forest products) | | 2,036,400 | | | 8,878 |
Li Ning Co. Ltd. (Leisure equipment & products) | | 922,500 | | | 3,397 |
Parkson Retail Group Ltd. (Multiline retail) | | 311,400 | | | 3,716 |
Shangdong Weigao GP Medical (Health care equipment & supplies) | | 2,585,700 | | | 5,922 |
Wumart Stores, Inc., Class “H” (Food & staples retailing) | | 6,764,000 | | | 5,751 |
Xinyu Hengdeli Holdings Ltd. (Distributors) | | 5,800,000 | | | 3,238 |
| | | | | |
| | | | | 123,689 |
| | | | | |
India—18.4% | | | | | |
ABB Ltd. India (Electrical equipment) | | 145,700 | | | 5,538 |
Bharat Heavy Electricals, Ltd. (Electrical equipment) | | 344,700 | | | 22,433 |
*Bharti Airtel Ltd. (Wireless telecommunication services) | | 1,508,000 | | | 37,719 |
*Cairn India Ltd. (Oil, gas & consumable fuels) | | 3,301,800 | | | 21,351 |
Dabur India Ltd. (Personal products) | | 2,083,300 | | | 5,985 |
DLF Ltd. (Real estate management & development) | | 272,666 | | | 7,360 |
Financial Technologies, (India) Ltd. (Software) | | 94,600 | | | 6,224 |
HDFC Bank Ltd. (Commercial banks)† | �� | 109,200 | | | 14,245 |
Housing Development Finance Corp. (Thrifts & mortgage finance) | | 340,790 | | | 24,610 |
Larsen & Toubro Ltd. (Construction & engineering) | | 222,400 | | | 23,281 |
Shoppers’ Stop Ltd. (Multiline retail) | | 280,860 | | | 3,940 |
Thermax India Limited (Machinery) | | 314,700 | | | 6,461 |
Unitech Limited (Real estate management & development) | | 1,214,600 | | | 14,884 |
Vedanta Resources plc (Metals & mining) | | 505,400 | | | 20,505 |
| | | | | |
| | | | | 214,536 |
| | | | | |
| | | | | |
Issuer | | Shares | | Value |
|
Common Stocks—Emerging Asia—46.3%—(continued) |
Indonesia—2.9% | | | | | |
PT Bank Rakyat Indonesia (Commercial banks) | | 28,280,500 | | $ | 21,984 |
*PT London Sumatra Indones PT (Food products) | | 10,329,000 | | | 11,609 |
| | | | | |
| | | | | 33,593 |
| | | | | |
Philippines—0.6% | | | | | |
Bank of Philippine Islands (Commercial banks) | | 5,050,000 | | | 7,492 |
| | | | | |
Malaysia—4.6% | | | | | |
*Airasia Bhd (Airlines) | | 6,636,600 | | | 3,191 |
Bumiputra Commerce Holding Bhd (Commercial banking) | | 7,581,400 | | | 24,961 |
KNM Group Bhd (Energy equipment & services) | | 2,868,200 | | | 6,601 |
Kuala Lumpur Kepong Bhd (Food products) | | 2,434,650 | | | 12,720 |
Zelan Bhd (Construction & engineering) | | 3,568,200 | | | 5,828 |
| | | | | |
| | | | | 53,301 |
| | | | | |
South Korea—3.9% | | | | | |
Hana Tour Service Inc. (Hotels, restaurants & leisure) | | 55,200 | | | 4,477 |
*LG Household & Health Care Ltd. (Household products) | | 57,799 | | | 11,910 |
*Megastudy Co. Ltd. Inc. (Diversified consumer services) | | 19,410 | | | 5,519 |
*NHN Corporation (Internet software & services) | | 46,200 | | | 11,017 |
*Taewoong Co., Ltd. (Machinery) | | 138,100 | | | 13,034 |
| | | | | |
| | | | | 45,957 |
| | | | | |
Taiwan—5.3% | | | | | |
Himax Technologies, Inc.—ADR (Semiconductors & semiconductor equipment) | | 1,807,424 | | | 7,718 |
Hon Hai Precision Industry Co., Ltd. (Electronic equipment & instruments) | | 4,880,033 | | | 30,078 |
Taiwan Semiconductor Manufacturing Company Ltd. (Semiconductors & semiconductor equipment) | | 12,367,000 | | | 23,448 |
| | | | | |
| | | | | 61,244 |
| | | | | |
| |
Emerging Europe, Mid-East, Africa—24.3% | | | |
Czech Republic—1.1% | | | | | |
*Central European Media Enterprises Ltd., Class “A” (Media)† | | 105,800 | | | 12,271 |
| | | | | |
Egypt—4.1% | | | | | |
Egyptian Financial Group-Hermes Holding SAE (Capital markets) | | 1,391,300 | | | 16,561 |
Orascom Construction Industries (Construction & engineering) | | 236,200 | | | 24,321 |
*Orascom Hotels and Development (Hotels, restaurants & leisure) | | 485,000 | | | 7,203 |
| | | | | |
| | | | | 48,085 |
| | | | | |
Poland—2.2% | | | | | |
*Amrest Holdings NV (Hotels, restaurants & leisure) | | 117,200 | | | 6,295 |
See accompanying Notes to Financial Statements.
58 Annual Report | December 31, 2007 |
Emerging Markets Growth Fund
Portfolio of Investments, December 31, 2007 (all dollar amounts in thousands)
| | | | | |
Issuer | | Shares | | Value |
|
Common Stocks—Emerging Europe, Mid-East, Africa—24.3%—(continued) |
Poland—(continued) | | | | | |
*Central European Distribution Corporation—ADR (Beverages) | | 242,500 | | $ | 14,084 |
*Cinema City International NV (Media) | | 401,500 | | | 5,672 |
| | | | | |
| | | | | 26,051 |
| | | | | |
Russia—4.4% | | | | | |
*Magnit—CLS (Multiline retail)† | | 118,800 | | | 5,981 |
*PIK Group—CLS (Real estate development & management)** | | 597,900 | | | 18,236 |
*PIK Group—Sponsored GDR 144A (Real estate development & management) | | 98,400 | | | 3,001 |
Sberbank—CLS (Commercial banks)† | | 2,830,700 | | | 11,925 |
*X5 Retail Group N.V.—GDR (Food & staples retailing) | | 331,200 | | | 12,089 |
| | | | | |
| | | | | 51,232 |
| | | | | |
South Africa—6.5% | | | | | |
*Eastern Platinum, Ltd. (Metals & mining) | | 2,342,600 | | | 6,812 |
MTN Group Ltd. (Wireless telecommunication services) | | 1,495,800 | | | 28,016 |
Naspers Ltd. (Media) | | 485,190 | | | 11,484 |
The Spar Group Limited (Food & staples retailing) | | 1,444,300 | | | 12,738 |
Truworths International Ltd. (Specialty retail) | | 2,262,800 | | | 8,966 |
Wilson Bayly Holmes-Ovcon Ltd. (Construction & engineering) | | 364,800 | | | 7,348 |
| | | | | |
| | | | | 75,364 |
| | | | | |
Turkey—3.8% | | | | | |
Bim Birlesik Magazalar A.S. (Food & staples retailing) | | 141,200 | | | 12,598 |
Coca Cola Icecek A.S. (Beverages) | | 603,600 | | | 6,951 |
Turkiye Garanti Bankasi A.S. (Commercial banks) | | 2,716,300 | | | 24,239 |
| | | | | |
| | | | | 43,788 |
| | | | | |
United Arab Emirates—2.2% | | | | | |
*DP World Ltd. (Marine) | | 5,379,700 | | | 6,402 |
Emaar Properties PJSC (Real estate management & development) | | 3,346,100 | | | 13,504 |
Lamprell plc (Energy equipment & services) | | 731,400 | | | 6,213 |
| | | | | |
| | | | | 26,119 |
| | | | | |
| | |
Emerging Latin America—22.6% | | | | | |
Brazil—13.3% | | | | | |
All America Latin Logistica (Road & rail) | | 896,400 | | | 11,603 |
*Anhanguera Educacional Participacoes S.A. (Diversified consumer services) | | 371,100 | | | 7,922 |
B2W Companhia Global do Varejo (Internet & catalog retail) | | 37,000 | | | 1,476 |
Bolsa de Mercadorias & Futuros S.A. (Diversified financial services) | | 286,200 | | | 4,020 |
Bovespa Holding S.A. (Diversified financial services) | | 1,298,500 | | | 25,022 |
*BR Malls Participacoes S.A. (Real estate management & development) | | 998,300 | | | 13,460 |
CIA Vale Do Rio Doce—Pref A—ADR (Metals & mining) | | 693,400 | | | 22,653 |
| | | | | |
Issuer | | Shares | | Value |
|
Common Stocks—Emerging Latin America—22.6%—(continued) |
Brazil—(continued) | | | | | |
Cyrela Brazil Realty S.A. (Household durables) | | 772,500 | | $ | 10,503 |
*Cyrela Commercial Properties S.A. (Real estate management & development) | | 831,900 | | | 5,613 |
Iguatemi Empresa de Shopping Centers S.A. (Real estate management & development) | | 389,115 | | | 6,339 |
Localiza Rent a Car S.A. (Road & rail) | | 555,200 | | | 5,892 |
Lojas Renner S.A. (Multiline retail) | | 322,100 | | | 6,514 |
Lupatech S.A. (Machinery) | | 240,300 | | | 8,100 |
Redecard S.A. (IT services) | | 899,800 | | | 14,559 |
Rodobens Negocioa Imobiliarios S.A. (Real estate management & development) | | 444,800 | | | 5,285 |
Totvs S.A. (Software) | | 167,000 | | | 5,535 |
| | | | | |
| | | | | 154,496 |
| | | | | |
Chile—1.6% | | | | | |
Cencosud S.A.—ADR 144A (Specialty retail) | | 223,500 | | | 13,492 |
S.A.C.I. Falabella S.A. (Multiline retail) | | 1,098,554 | | | 5,339 |
| | | | | |
| | | | | 18,831 |
| | | | | |
Mexico—6.6% | | | | | |
America Movil S.A. (Wireless telecommunication services) | | 8,023,800 | | | 24,628 |
*Groupo Famsa S.A. (Multiline retail) | | 1,065,000 | | | 3,317 |
Grupo Financiero Banorte S.A. de C.V. (Commercial banks) | | 2,763,400 | | | 11,419 |
Grupo Aeropuertario Del—ADR (Transportation infrastructure) | | 127,100 | | | 5,672 |
*MegaCable Holdings Sab de C.V. (Diversified telecommunication services) | | 1,725,000 | | | 5,857 |
*Promotora Ambiental sab de C.V. (Commercial services & supplies) | | 1,561,650 | | | 4,793 |
Wal-Mart de Mexico sab de C.V. (Food & staples retailing) | | 6,229,400 | | | 21,717 |
| | | | | |
| | | | | 77,403 |
| | | | | |
Peru—1.1% | | | | | |
Credicorp Ltd. (Commercial banks)† | | 171,700 | | | 13,101 |
| | | | | |
Total Common Stock—93.2%
(cost $805,452) | | | 1,086,553 |
| | | | | |
| | |
Preferred Stock | | | | | |
Brazil—3.7% | | | | | |
Banco Sofisa S.A. (Commercial banks) | | 686,200 | | | 5,339 |
*Net Servicos De Counicacao S.A. (Media) | | 796,300 | | | 9,708 |
Petroleo Brasileiro S.A. (Oil, gas & consumable fuels) | | 560,500 | | | 27,836 |
| | | | | |
| | | | | 42,883 |
| | | | | |
Total Preferred Stock—3.7%
(cost $25,102) | | | 42,883 |
| | | | | |
| | |
Investment in Affiliate | | | | | |
William Blair Ready Reserves Fund | | 1,325,503 | | | 1,326 |
| | | | | |
Total Investment in Affiliate—0.1%
(cost $1,326) | | | 1,326 |
| | | | | |
See accompanying Notes to Financial Statements.
December 31, 2007 | William Blair Funds 59 |
Emerging Markets Growth Fund
Portfolio of Investments, December 31, 2007 (all dollar amounts in thousands)
| | | | | | |
Issuer | | Principal
Amount | | Value |
| | |
Short-Term Investments | | | | | | |
American Express Credit Corp. Demand Note, VRN 4.695%, due 1/2/08 | | $ | 3,075,000 | | $ | 3,075 |
Prudential Funding Demand Note, VRN 4.430%, due 1/2/08 | | | 9,183,000 | | | 9,183 |
| | | | | | |
Total Short-Term Investments—1.1%
(cost $12,258) | | | 12,258 |
| | | | | | |
| | |
Repurchase Agreement | | | | | | |
State Street Bank and Trust Company, 3.800% dated 12/31/07, due 1/2/08, repurchase price $10,962, collateralized by FNR 2002-93 FH | | | 10,960,154 | | | 10,960 |
| | | | | | |
Total Repurchase Agreement—0.9%
(cost $10,960) | | | 10,960 |
| | | | | | |
Total Investments—99.0%
(cost $855,098) | | | 1,153,980 |
Cash and other assets, less liabilities—1.0% | | | 11,874 |
| | | | | | |
Net assets—100.0% | | $ | 1,165,854 |
| | | | | | |
* Non-income producing securities
ADR = American Depository Receipt
GDR = Global Depository Receipt
† = U.S. listed Foreign Security
VRN = Variable Rate Note
**Fair valued pursuant to Valuation Procedures adopted by Board of Trustees. This holding represents 1.56% of the Fund’s net assets at December 31, 2007. This security was also deemed illiquid pursuant to Liquidity Procedures securities adopted by the Board of Trustees.
For securities primarily traded on exchanges or markets that close before the close of regular trading on the New York Stock Exchange, the Fund uses an independent pricing service on a daily basis to fair value price the securities pursuant to Valuation Procedures adopted by the Board of Trustees.
At December 31, 2007 the Fund’s Portfolio of Investments includes the following industry categories:
| | |
Financials | | 29.1% |
Industrials | | 15.8% |
Consumer Staples | | 12.5% |
Consumer Discretionary | | 12.4% |
Telecommunication Services | | 10.0% |
Information Technology | | 8.7% |
Energy | | 5.8% |
Materials | | 5.2% |
Health Care | | 0.5% |
| | |
Total | | 100.0% |
| | |
At December 31, 2007 the Fund’s Portfolio of Investments includes the following currency categories:
| | |
Indian Rupee | | 15.8% |
Brazilian Real | | 15.5% |
U.S. Dollar | | 12.5% |
Hong Kong Dollar | | 7.2% |
Mexican Nuevo Peso | | 6.3% |
South African Rand | | 6.1% |
New Taiwan Dollar | | 4.7% |
Malaysian Ringgit | | 4.7% |
Egyptian Pounds | | 4.3% |
South Korean Won | | 4.1% |
Turkish Lira | | 3.9% |
Russian Ruble | | 3.2% |
Indonesian Rupiah | | 3.0% |
British Pound Sterling | | 2.4% |
Yuan Renminbi (China) | | 2.3% |
Dirham (United Arab Emirates) | | 1.2% |
All Other Currencies | | 2.8% |
| | |
Total | | 100.0% |
| | |
See accompanying Notes to Financial Statements.
60 Annual Report | December 31, 2007 |

Chad M. Kilmer

Mark T. Leslie

David S. Mitchell
VALUE DISCOVERY FUND
The Value Discovery Fund invests in the equity securities of small companies that we believe offer a long-term investment value seeking to identify undervalued companies with sound business fundamentals.
AN OVERVIEW FROM THE PORTFOLIO MANAGERS
How did the Fund perform over the last year? How did the Fund’s performance compare to its benchmark?
The Value Discovery Fund posted a 5.54% decrease on a total return basis (Class N shares) during the 12 months ended December 31, 2007. By comparison, the Russell 2000® Value Index, dropped 9.78%, while the Russell 2000® Index decreased 1.57%.
What were the most significant market factors impacting Fund performance?
2007 was a year of transition as the market was turned on its head after the August credit crunch, numerous write downs of subprime mortgage securities and associated derivatives occurred, and the collapse of several hedge funds. Market performance became unpredictable in the latter half of the year as equities, particularly securities of Financials, experienced significant price declines and contributed to diminished returns late in the year.
Large cap indices benefited from economic uncertainty and slowing earnings growth, while small cap indices underperformed not only in the second half but throughout 2007. Growth also pulled ahead of value as investors flocked to quality safe havens; this effect was most pronounced during the second half of the year. The first half of 2007 started out optimistically as many US indices posted strong positive returns, but, due to various liquidity events that occurred in the latter half of the year, a market sell off ensued. The Russell 2000® Value index posted a 3.8% return during the first six months, but then reversed course and proceeded to post a 13.8% decline during the last six months.
What were among the best performing sectors for the Fund? Were there any investment themes that produced the best results?
Consumer Discretionary was the largest contributor to relative performance with Industrials following closely behind. Strong stock selection comprised almost all of the outperformance in these two sectors. Aeropostale, a specialty retailer, added value in the Consumer Discretionary space as the company continued to execute very well and posted strong same store sales growth, solid margin expansion, and earnings per share (“EPS”) growth. Within Industrials, Genlyte Group was the largest positive contributor due to their acquisition by Royal Phillips Electronics at a 50% price premium in the fourth quarter.
What were among the weakest performing sectors for the Fund? Were there any investments that did not measure up to your expectations?
The portfolio had an average underweight position to the Telecommunication Services sector throughout the year and this allocation detracted from relative performance. Telecommunications experienced a bounce this year as the sector came off of a five year period of underperformance as its lack of participation in prior years’ strong returns made for easy comparisons; therefore, our underexposure was a negative. Additionally, our position in
December 31, 2007 | William Blair Funds 61 |
Syniverse underperformed in the fourth quarter as a weak market pressured the sector and the stock sold off unexpectedly. Yet, positive earnings estimate revisions are an indicator of solid fundamental performance and we expect the stock to be a strong relative performer in an economic downturn. Financials was a difficult sector during the year as concerns regarding liquidity, lending, and balance sheet write-offs continued to mount. While the portfolio’s underweight to Financials was a positive contributor to performance, our security selection within the space diminished the benefits of the portfolio’s exposure. In particular, weak relative performance from our bank and insurance holdings more than offset the strong relative performance from our REIT holdings.
What is your current strategy? How is the Fund positioned?
We are beginning to witness many indications that the US economy could be in the midst of or headed towards a recession, evident by a sharp increase in the unemployment rate and an ISM (Institute for Supply Management) reading which indicated manufacturing activities have slowed to levels last seen in 2003. Broad market indices continue to trend downward, some of which have wiped out their 2007 price gains. As home prices continue to decline, many homeowners’ reliance on their real estate portfolio will diminish and savings levels will increase, causing consumer spending to slow. On a positive note, the Federal Reserve is forecasting that employment growth will remain at positive levels and while officials have recently released several hawkish comments, we expect the Fed to be more aggressive with their monetary policy in order to stave off inflation and ensure that lending continues. The fixed income market is already demanding additional interest rate easing as demonstrated by two year Treasury notes, which remain below the fed funds’ rate.
While our Industrials holdings were some of the portfolio’s strongest performers during the second half of the year, Industrials and other cyclical sectors would be the first to feel the impact of an economic recession. In the context of our portfolio, the team actively monitors each sector’s exposure to the slowing economic environment and weak dollar and focuses on companies that are run by quality management teams who know how to continuously create value. We continue to find value within small caps and have not made many changes to our positioning, in which we maintain a relative sector neutrality approach that results in our sector weights remaining roughly proportional to those of the benchmark. Although earnings and profit growth is trending downward, valuations are decreasing which we believe positions equities to produce positive, long term, inflation-adjusted returns.
62 Annual Report | December 31, 2007 |
Value Discovery Fund
Performance Highlights (unaudited)
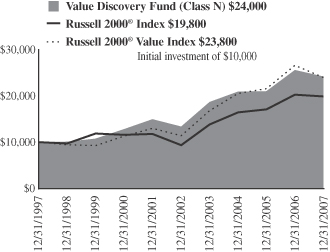
Average Annual Total Return at 12/31/2007
| | | | | | | | | | | | | | | |
| | | 1
Year | | | 3
Year | | | 5
Year | | | 10
Year | | | Since
Inception | |
Value Discovery Fund Class N | | (5.54 | )% | | 4.95 | % | | 12.53 | % | | 9.16 | % | | — | % |
Value Discovery Fund Class I | | (5.31 | ) | | 5.20 | | | 12.76 | | | — | | | 11.97 | (a) |
Russell 2000®
Index | | (1.57 | ) | | 6.80 | | | 16.25 | | | 7.08 | | | 8.65 | (a) |
Russell 2000®
Value Index | | (9.78 | ) | | 5.27 | | | 15.80 | | | 9.06 | | | 12.36 | (a) |
| | (a) | | For the period from October 1, 1999 (Commencement of the Class) to December 31, 2007. | |
Performance cited represents past performance. Past performance does not guarantee future results and current performance may be lower or higher than the data quoted. Results shown are average annual total returns, which assume reinvestment of dividends and capital gains. Investment returns and principal will fluctuate and you may have a gain or loss when you sell shares. For the most current month-end performance information, please call 1-800-742-7272, or visit our Web site at www.williamblairfunds.com. Investing in smaller companies involves special risks, including higher volatility and lower liquidity. From time to time, the investment advisor may waive fees or reimburse expenses for the Fund. Without these waivers, performance would be lower. Class N shares are available to the general public without a sales load. Class I shares are available to certain institutional investors and advisory clients of William Blair & Company, L.L.C., without a sales load or distribution (12b-1) or service fees.
The performance highlights and graph presented above do not reflect the deduction of taxes that a shareholder would pay on fund distributions or the redemption of fund shares.
The Russell 2000® Index is the Fund’s primary benchmark. The Russell 2000® Index is an unmanaged composite of the smallest 2000 stocks of the Russell 3000® Index.
The Russell 2000® Value Index consists of small-capitalization companies with below average price-to-book ratios and forecasted growth rates.
This report identifies the Fund’s investments on December 31, 2007. These holdings are subject to change. Not all stocks in the Fund performed the same, nor is there any guarantee that these stocks will perform as well in the future. Market forecasts provided in this report may not necessarily come to pass.
Sector Diversification (unaudited)
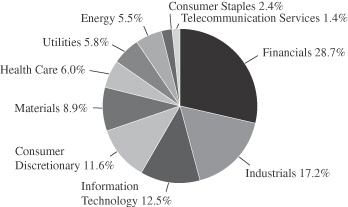
The sector diversification shown is based on the total investment portfolio.
December 31, 2007 | William Blair Funds 63 |
Value Discovery Fund
Portfolio of Investments, December 31, 2007 (all dollar amounts in thousands)
| | | | | |
Issuer | | Shares | | Value |
| | |
Common Stocks | | | | | |
Financials—28.2% | | | | | |
*Argonaut Group, Inc.† | | 24,257 | | $ | 1,022 |
Ashford Hospitality Trust, Inc. | | 78,665 | | | 566 |
Astoria Financial Corporation | | 22,570 | | | 525 |
Bank Of Hawaii Corporation | | 12,045 | | | 616 |
Boston Private Financial Holdings, Inc. | | 18,796 | | | 509 |
Citizens Banking Corporation | | 39,754 | | | 577 |
Cogdell Spencer, Inc. | | 24,930 | | | 397 |
*Community Bancorp | | 27,960 | | | 486 |
*CRM Holdings, Ltd.† | | 38,150 | | | 299 |
Employers Holdings, Inc. | | 25,350 | | | 424 |
Financial Federal Corporation | | 21,900 | | | 488 |
First Midwest Bancorp Incorporated | | 28,886 | | | 884 |
First Niagara Financial Group, Inc. | | 35,795 | | | 431 |
First Potomac Realty Trust | | 33,690 | | | 582 |
FirstMerit Corporation | | 31,835 | | | 637 |
Hanover Insurance Group, Inc. | | 19,625 | | | 899 |
Jones Lang LaSalle, Inc | | 2,610 | | | 186 |
Kite Realty Group Trust | | 50,280 | | | 768 |
Lasalle Hotel Properties | | 15,415 | | | 492 |
*MeadowBrook Insurance Group, Inc. | | 59,125 | | | 556 |
Mid-American Apartment Communities, Inc. | | 18,190 | | | 778 |
*PMA Capital Corporation, Class “A” | | 70,408 | | | 579 |
Wilmington Trust Corporation | | 17,350 | | | 611 |
| | | | | |
| | | | | 13,312 |
| | | | | |
Industrials—16.9% | | | | | |
ABM Industries Incorporated | | 21,055 | | | 429 |
Acuity Brands, Inc. | | 12,465 | | | 561 |
Barrett Business Services, Inc. | | 26,700 | | | 481 |
Brady Corporation | | 13,560 | | | 476 |
CLARCOR, Inc. | | 12,635 | | | 480 |
*EMCOR Group, Inc. | | 14,655 | | | 346 |
*Esco Technologies, Inc. | | 12,465 | | | 498 |
Forward Air Corporation | | 15,580 | | | 486 |
G & K Services, Inc. | | 12,465 | | | 468 |
Interface Inc., Class “A” | | 30,150 | | | 492 |
Kaydon Corporation | | 12,635 | | | 689 |
Tal International Group, Inc. | | 31,245 | | | 711 |
Triumph Group, Inc. | | 8,255 | | | 680 |
Watsco, Inc. | | 14,905 | | | 548 |
Watson Wyatt Worldwide, Inc. | | 13,390 | | | 621 |
| | | | | |
| | | | | 7,966 |
| | | | | |
Information Technology—12.4% | | | | | |
*Anixter International, Inc. | | 9,010 | | | 561 |
*Avid Technology, Inc. | | 18,931 | | | 536 |
*EarthLink, Inc. | | 81,780 | | | 578 |
*Entegris, Inc. | | 69,568 | | | 600 |
*Parametric Technology Corporation | | 50,535 | | | 902 |
*Progress Software Corporation | | 16,930 | | | 570 |
*Semitool, Inc. | | 62,069 | | | 539 |
*SRA International, Inc. | | 18,110 | | | 533 |
*Sybase, Inc. | | 38,405 | | | 1,002 |
| | | | | |
| | | | | 5,821 |
| | | | | |
Consumer Discretionary—11.4% | | | | | |
*Aftermarket Technology Corp. | | 19,875 | | | 542 |
Ameristar Casinos, Inc. | | 24,675 | | | 680 |
Callaway Golf Company | | 29,055 | | | 506 |
*Cavco Industries, Inc. | | 12,295 | | | 416 |
Christopher & Banks Corporation | | 67,712 | | | 775 |
Entercom Communications Corporation | | 25,858 | | | 354 |
*Non-income producing
† = U.S. listed foreign security
VRN = Variable Rate Note
| | | | | | |
Issuer | | Shares or
Principal
Amount | | Value | |
| | |
Common Stocks—(continued) | | | | | | |
Consumer Discretionary—(continued) | | | | | | |
Interactive Data Corporation | | 15,665 | | $ | 517 | |
*Jack In The Box Inc. | | 18,270 | | | 471 | |
*Select Comfort Corporation | | 65,270 | | | 457 | |
Wolverine World Wide, Inc. | | 27,540 | | | 675 | |
| | | | | | |
| | | | | 5,393 | |
| | | | | | |
Materials—8.8% | | | | | | |
Arch Chemicals, Inc. | | 14,655 | | | 539 | |
CF Industries Holdings, Inc. | | 4,380 | | | 482 | |
H.B. Fuller Company | | 17,685 | | | 397 | |
Minerals Technologies Inc. | | 7,075 | | | 474 | |
Quanex Corporation | | 15,920 | | | 826 | |
Silgan Holdings, Inc. | | 13,980 | | | 726 | |
Texas Industries, Inc. | | 9,855 | | | 691 | |
| | | | | | |
| | | | | 4,135 | |
| | | | | | |
Health Care—5.9% | | | | | | |
*Lifecore Biomedical, Inc. | | 20,720 | | | 299 | |
*Magellan Health Services | | 18,190 | | | 848 | |
*Pediatrix Medical Group | | 13,225 | | | 901 | |
*Varian, Inc. | | 11,369 | | | 742 | |
| | | | | | |
| | | | | 2,790 | |
| | | | | | |
Utilities—5.7% | | | | | | |
Avista Corporation | | 33,015 | | | 711 | |
Cleco Corporation | | 27,625 | | | 768 | |
Northwest Natural Gas Company | | 10,610 | | | 516 | |
South Jersey Industries, Inc. | | 19,285 | | | 696 | |
| | | | | | |
| | | | | 2,691 | |
| | | | | | |
Energy—5.4% | | | | | | |
*Forest Oil Corporation | | 21,898 | | | 1,113 | |
*Goodrich Petroleum Corporation | | 20,465 | | | 463 | |
*Petrohawk Energy Corporation | | 54,913 | | | 951 | |
| | | | | | |
| | | | | 2,527 | |
| | | | | | |
Consumer Staples—2.4% | | | | | | |
Flowers Foods, Inc. | | 26,480 | | | 620 | |
J&J Snack Foods | | 16,172 | | | 506 | |
| | | | | | |
| | | | | 1,126 | |
| | | | | | |
Telecommunication Services—1.4% | | | | | | |
*Syniverse Holdings, Inc. | | 42,450 | | | 661 | |
| | | | | | |
Total Common Stock—98.5%
(cost $46,212) | | | 46,422 | |
| | | | | | |
| | |
Investment in Affiliate | | | | | | |
William Blair Ready Reserves Fund | | 30,924 | | | 31 | |
| | | | | | |
Total Investment in Affiliate—0.1%
(cost $31) | | | 31 | |
| | | | | | |
Repurchase Agreement | | | | | | |
State Street Bank, 3.800%, Dated 12/31/07 due 1/2/08 repurchase price $667, collateralized by FN Pool # 712321 | | 666,531 | | | 667 | |
| | | | | | |
Total Repurchase Agreement—1.4%
(cost $667) | | | 667 | |
| | | | | | |
Total Investments—100.0%
(cost $46,910) | | | 47,120 | |
Liabilities, plus cash and other assets—(0.0)% | | | (2 | ) |
| | | | | | |
Net assets—100.0% | | $ | 47,118 | |
| | | | | | |
See accompanying Notes to Financial Statements.
64 Annual Report | December 31, 2007 |

James S. Kaplan

Christopher T. Vincent

Benjamin J. Armstrong
BOND FUND
The Bond Fund Seeks to outperform the Lehman Aggregate Bond Index by maximizing total return through a combination of income and capital appreciation.
AN OVERVIEW FROM THE PORTFOLIO MANAGERS
How did the Fund perform since its inception? How did the Fund’s performance compare to its benchmark?
The Bond Fund commenced operations on May 1, 2007. Through the eight-month period ending December 31, 2007, the Fund posted an increase of 3.38% (Class N Shares). By comparison, the Fund’s benchmark, the Lehman Brothers U.S. Aggregate Bond Index, gained 4.87%.
What were the most significant market factors impacting Fund performance? What factors were behind the Fund’s performance versus the benchmark?
The Fund’s relative underperformance generally resulted from the volatility of the fixed income market during 2007. The Fund, for example, was underweight short-duration U.S. Treasury securities; the U.S. Treasury sector was the best performing investment grade bond sector in 2007. The Fund also holds a fairly small percentage of non-agency mortgage securities, the prices of which were negatively impacted by ongoing subprime mortgage problems.
Given the current valuation of the Corporate bond and Mortgage-backed security sectors relative to U.S. Treasury securities, we are optimistic about the outlook for 2008. Good performance may depend on a return of substantial liquidity to the bond market. U.S. Treasury returns may struggle in the coming year, given the 3.59% average yield on U.S. Treasury securities.
The bond market (as measured by the Lehman Aggregate Bond Index) posted strong absolute returns of 4.87% since the Fund’s inception on May 1, 2007. The returns were driven by falling Treasury yields. The yield on the Lehman Treasury Index fell by over 1.00%, from 4.67% to 3.59%.
The year-end yield on the Treasury market reflects a “flight-to-quality” in the bond market. Given the current Fed Funds rate of 4.25%, Treasury yields are likely unsustainable at these levels unless the Fed continues to cut rates aggressively.
In contrast to U.S. Treasury securities, the major “spread” sector performance was not as strong. Since the Fund’s inception, the yield on the Credit Index actually rose by 0.07%, from 5.53% to 5.60%. 2007 was the worst year in the past decade for the performance of the Credit sector relative to U.S. Treasuries.
Which investment strategies enhanced the Fund’s return? Were there any investment strategies that produced the best results?
Within the Consumer non-cyclical subsector, Kroger and Kimberly Clark bonds performed well. Also, the only below investment grade bond, MGM Mirage contributed to performance.
December 31, 2007 | William Blair Funds 65 |
What were the weakest performing sectors for the Fund?
Within the Fund’s corporate bond holdings, the performance of the Financial sector was weaker than Industrials, which was consistent with market trends. Our holding of Rescap, a mortgage finance company, hurt performance and was eliminated from the portfolio. Other corporate bonds that underperformed the broad market include Prologis, a REIT, and FPL Group, a public utility holding company.
We have added a select few non-agency mortgages to the Fund that we believe are very attractive. Although some of these bonds have hurt performance recently, we continue to believe that they will benefit investors in the future.
What is your current strategy? How is the Fund positioned?
The Fund’s duration of 4.62 years is roughly consistent with the benchmark, reflecting no bias for changes in interest rates. Although we expect the Fed Funds rate to decline in 2008, future rate cuts are already priced into the Treasury market.
The Corporate bond sector holdings are marginally greater than the benchmark, reflecting our belief that spreads may tighten. Within the sector, we remain underweight financials and overweight industrials. We are also slightly overweight BBB-rated corporate bonds.
In the Fund, the Mortgage-related sectors (including Residential, Commercial and Asset backed securities) are marginally underweight relative to the benchmark. Within the sectors the Fund is overweight in Agency mortgages, including Fannie Mae and Freddie Mac mortgage pools.
The Commercial Mortgage sector is underweighted.
We believe the fixed income markets may be headed into a favorable relative return environment. The non-Treasury assets offer compelling valuations and the opportunity for spread tightening is considerable. The likelihood of spread tightening will increase if and when the liquidity in the bond market improves.
66 Annual Report | December 31, 2007 |
Bond Fund
Performance Highlights (unaudited)
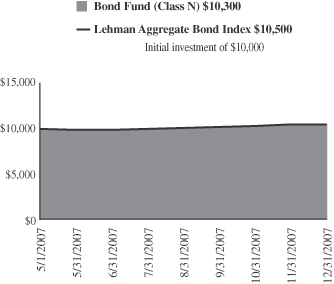
Average Annual Total Return at 12/31/2007
| | | |
| | | Since
Inception(a) | |
Bond Fund Class N | | 3.38 | % |
Bond Fund Class I | | 3.50 | |
Lehman Aggregate Bond Index | | 4.87 | |
| | (a) | | For the period from May 1, 2007 (Commencement of Operations) to December 31, 2007. | |
Performance cited represents past performance. Past performance does not guarantee future results and current performance may be lower or higher than the data quoted. Results shown are average annual total returns, which assume reinvestment of dividends and capital gains. Investment returns and principal will fluctuate and you may have a gain or loss when you sell shares. For the most current month-end performance information, please call 1-800-742-7272, or visit our Web site at www.williamblairfunds.com. From time to time, the investment advisor may waive fees or reimburse expenses for the Fund. Without these waivers, performance would be lower. Class N shares are available to the general public without a sales load. Class I shares are available to certain institutional investors and advisory clients of William Blair & Company, L.L.C., without a sales load or distribution (12b-1) or service fees.
The performance highlights and graph presented above do not reflect the deduction of taxes that a shareholder would pay on fund distributions or the redemption of fund shares.
The Lehman Aggregate Bond Index indicates broad intermediate government/corporate bond market performance.
This report identifies the Fund’s investments on December 31, 2007. These holdings are subject to change. Not all investments in the Fund performed the same, nor is there any guarantee that these investments will perform as well in the future. Market forecasts provided in this report may not necessarily come to pass.
Sector Diversification (unaudited)
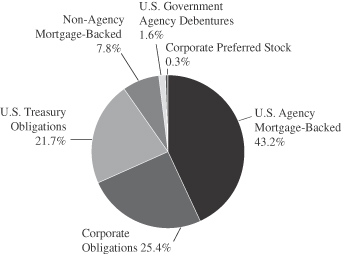
The sector diversification shown is based on the total investment portfolio.
December 31, 2007 | William Blair Funds 67 |
Bond Fund
Portfolio of Investments, December 31, 2007 (all amounts in thousands)
| | | | | | | | |
| | | Principal
Amount | | Value |
|
U.S. Government and U.S. Government Agency—62.0% |
U.S. Treasury—20.2% | | | | | | | | |
U.S. Treasury Note,
4.750%, due 2/15/10 | | | | $ | 3,950 | | $ | 4,086 |
U.S. Treasury Note,
4.250%, due 9/30/12 | | | | | 3,200 | | | 3,312 |
U.S. Treasury Note,
4.750%, due 5/15/14 | | | | | 2,300 | | | 2,446 |
U.S. Treasury Note,
5.125%, due 5/15/16 | | | | | 1,450 | | | 1,569 |
U.S. Treasury Note,
7.125%, due 2/15/23 | | | | | 325 | | | 419 |
U.S. Treasury Note,
5.125%, due 2/15/36 | | | | | 2,000 | | | 2,010 |
| | | | | | | | |
Total U.S. Treasury Obligations | | | | | 13,225 | | | 13,842 |
| | | | | | | | |
Government National Mortgage
Association (GNMA)—1.1% | | | | | | | | |
GNR 2006-67 GB,
4.087%, due 9/16/34 | | | | | 725 | | | 713 |
#357752, 7.000%, due 4/15/09 | | | | | 3 | | | 3 |
| | | | | | | | |
| | | | | 728 | | | 716 |
| | | | | | | | |
Federal Home Loan Bank
(FHLB)—0.5% | | | | | | | | |
4.750%, due 12/16/16 | | | | | 325 | | | 332 |
| | | | | | | | |
Federal Home Loan Mortgage Corp. (FHLMC)—8.8% | | | | | | | | |
#G10330, 7.000%, due 1/1/10 | | | | | 40 | | | 41 |
#G90024, 7.000%, due 1/20/13 | | | | | 147 | | | 153 |
#G30093, 7.000%, due 12/1/17 | | | | | 68 | | | 71 |
#G30254, 6.500%, due 5/1/19 | | | | | 111 | | | 116 |
#G30255, 7.000%, due 7/1/21 | | | | | 151 | | | 159 |
#G18137, 6.500%, due 8/1/21 | | | | | 591 | | | 609 |
#G18137, 6.500%, due 7/1/22 | | | | | 224 | | | 231 |
#E02360, 6.500%, due 7/1/22 | | | | | 1,072 | | | 1,104 |
#D95897, 5.500%, due 3/1/23 | | | | | 452 | | | 454 |
#C90896, 6.500%, due 2/1/25 | | | | | 1,113 | | | 1,148 |
6.750%, due 9/15/29 | | | | | 650 | | | 806 |
#G10728, 7.500%, due 7/1/32 | | | | | 459 | | | 490 |
#C01385, 6.500%, due 8/1/32 | | | | | 647 | | | 669 |
| | | | | | | | |
| | | | | 5,725 | | | 6,051 |
| | | | | | | | |
Federal National Mortgage Association (FNMA)—31.4% | | | | | | | | |
#535559, 7.500%, due 9/1/12 | | | | | 888 | | | 913 |
#598453, 7.000%, due 6/1/15 | | | | | 29 | | | 30 |
#689612, 5.000%, due 5/1/18 | | | | | 856 | | | 859 |
#747903, 4.500%, due 6/1/19 | | | | | 731 | | | 719 |
#791393, 5.500%, due 10/1/19 | | | | | 736 | | | 747 |
#831430, 5.500%, due 3/1/21 | | | | | 935 | | | 947 |
#253847, 6.000%, due 5/1/21 | | | | | 519 | | | 530 |
#900725, 6.000%, due 8/1/21 | | | | | 471 | | | 482 |
#254797, 5.000%, due 6/1/23 | | | | | 492 | | | 486 |
#545437, 7.000%, due 2/1/32 | | | | | 352 | | | 371 |
#254548, 5.500%, due 12/1/32 | | | | | 1,960 | | | 1,963 |
#555522, 5.000%, due 6/1/33 | | | | | 877 | | | 857 |
#254868, 5.000%, due 9/1/33 | | | | | 1,542 | | | 1,507 |
#555880, 5.500%, due 11/1/33 | | | | | 924 | | | 925 |
#725027, 5.000%, due 11/1/33 | | | | | 1,234 | | | 1,205 |
| | | | | | | | |
| | | NRSRO
Rating | | Principal
Amount | | Value |
|
Federal National Mortgage Association (FNMA)—(continued) |
#725205, 5.000%, due 3/1/34 | | | | $ | 959 | | $ | 937 |
#725238, 5.000%, due 3/1/34 | | | | | 965 | | | 943 |
#725424, 5.500%, due 4/1/34 | | | | | 992 | | | 993 |
#725611, 5.500%, due 6/1/34 | | | | | 780 | | | 780 |
#745092, 6.500%, due 7/1/35 | | | | | 1,034 | | | 1,069 |
#845188, 6.000%, due 12/1/35 | | | | | 921 | | | 936 |
#848782, 6.500%, due 1/1/36 | | | | | 1,454 | | | 1,497 |
#256859, 5.500%, due 8/1/37 | | | | | 1,803 | | | 1,783 |
| | | | | | | | |
| | | | | 21,454 | | | 21,479 |
| | | | | | | | |
| | | |
Non-Agency Mortgage-Backed Obligations—7.3% | | | | | | | | |
Countrywide Alternative Loan Trust, 2003-11T1, Tranche M,
4.750%, due 7/25/18 | | AA+ | | | 306 | | | 296 |
First Plus 1997-4 M1
7.640%, due 9/11/23 | | AA | | | 199 | | | 196 |
Aames Mortgage Trust, 2001-1, Tranche M2, 7.588%, due 6/25/31 | | A | | | 133 | | | 100 |
LSSCO, 2004-2, Tranche M2,
6.828%, due 2/28/33, VRN* | | A | | | 266 | | | 253 |
CWL, 2003-5, Tranche MF2
5.959%, due 11/25/33 | | AA- | | | 252 | | | 212 |
Renaissance Home Equity Loan Trust, 2004-2, Tranche M5
6.455%, due 7/25/34 | | A | | | 563 | | | 417 |
FHASI, 2004-AR4, Tranche 3A1, 4.593%, due 8/25/34, VRN | | AAA | | | 688 | | | 679 |
Security National Mortgage Loan Trust, 2004-2A, Tranche M2,
6.352%, due 11/25/34 | | A | | | 50 | | | 49 |
Security National Mortgage Loan Trust, 2005-1A, Tranche M2,
6.530%, due 2/25/35* | | A | | | 25 | | | 18 |
Soundview Home Equity Loan Trust, 2005-B, Tranche M1,
5.635%, due 5/25/35 | | AA+ | | | 523 | | | 487 |
Structured Asset Securities Corp., 2005-9XS, Tranche 1A2A
4.840%, due 6/25/35 | | AAA | | | 630 | | | 629 |
Structured Asset Securities Corp., 2005-9XS, Tranche 1A2C
4.950%, due 6/25/35 | | AAA | | | 295 | | | 292 |
Structured Asset Securities Corp., 2005-9XS, Tranche A2B,
6.500%, due 6/25/35 | | AAA | | | 325 | | | 327 |
Security National Mortgage Loan Trust, 2005-2A, Tranche M2,
7.321%, due 2/25/36* | | A | | | 125 | | | 107 |
Chase Mortgage Finance Corporation, 2006-A1, Tranche A3,
6.000%, due 9/25/36 | | AAA | | | 700 | | | 692 |
Security National Mortgage Loan Trust, 2006-1A, Tranche M2,
7.500%, due 9/25/36* | | A | | | 80 | | | 51 |
Mid-State Trust 2004-1, Tranche A 6.005%, due 8/15/37 | | AAA | | | 74 | | | 72 |
Statewide Mortgage Loan Trust, 2006-1A, Tranche A2, 7.660%, due 9/25/37* | | AAA | | | 70 | | | 69 |
See accompanying Notes to Financial Statements.
68 Annual Report | December 31, 2007 |
Bond Fund
Portfolio of Investments, December 31, 2007 (all dollar amounts in thousands)
| | | | | | | | |
| | | NRSRO
Rating | | Principal
Amount | | Value |
|
Non-Agency Mortgage-Backed Obligations—(continued) |
ACE, 2005-SN1, Tranche M2,
5.770%, due 11/25/39, VRN | | A+ | | $ | 50 | | $ | 27 |
ACE, 2005-SD3, Tranche M2,
6.615%, due 8/25/45, VRN | | A+ | | | 70 | | | 33 |
| | | | | | | | |
| | | | | 5,424 | | | 5,006 |
| | | | | | | | |
| | | |
Corporate Obligations—23.6% | | | | | | | | |
Bear Stearns Co. Inc.
4.000%, due 1/31/08 | | A+ | | | 200 | | | 200 |
CIT Group Inc. 4.000%, due 5/8/08 | | A | | | 250 | | | 248 |
Consolidated Edison Company of New York, 7.150%, due 12/1/09 | | A+ | | | 500 | | | 524 |
Household Finance Corporation,
8.000%, due 7/15/10 | | AA- | | | 500 | | | 533 |
Bank of America Corporation,
4.250%, due 10/1/10 | | AA | | | 500 | | | 497 |
Simon Property Group, Inc.,
6.350%, due 8/28/12 | | A- | | | 500 | | | 514 |
Cox Communications, Inc.,
7.125%, due 10/1/12 | | BBB- | | | 400 | | | 427 |
Boeing Capital Corporation,
5.800%, due 1/15/13 | | A+ | | | 400 | | | 419 |
PepsiCo, Inc. 4.650%, due 2/15/13 | | AA- | | | 550 | | | 554 |
CODELCO, Inc.—144A,
4.750%, due 10/15/14 | | A | | | 400 | | | 385 |
Johnson Controls, Inc.
5.500%, due 1/15/16 | | A- | | | 400 | | | 394 |
ProLogis, 5.750%, due 4/1/16 | | BBB+ | | | 400 | | | 375 |
Omnicom Group, Inc.,
5.900%, due 4/15/16 | | A- | | | 400 | | | 406 |
Yum!, Brands, Inc.,
6.250%, due 4/15/16 | | BBB- | | | 400 | | | 406 |
SAB Miller plc, 6.500%, due 7/1/16 | | BBB+ | | | 400 | | | 418 |
Petrobras International Finance Company, 6.125%, due 10/6/16 | | BBB- | | | 400 | | | 408 |
MGM Mirage 7.6250%, due 1/15/17 | | BB | | | 500 | | | 494 |
J.P. Morgan Chase & Co.
6.125%, due 6/27/17 | | A+ | | | 600 | | | 612 |
Lehman Brothers Holdings
6.500%, due 7/19/17 | | A+ | | | 610 | | | 617 |
Kimberly-Clark, 6.1250%, due 8/1/17 | | A+ | | | 600 | | | 632 |
American Express,
6.150%, due 8/28/17 | | A+ | | | 600 | | | 616 |
Exelon Generation Company, LLC. 6.200%, due 10/1/17 | | BBB+ | | | 600 | | | 596 |
Union Pacific Corporation,
5.750%, due 11/15/17 | | BBB | | | 525 | | | 523 |
Tesco plc, 5.500%, due 11/15/17 | | A+ | | | 600 | | | 598 |
NRSRO = Nationally Recognized Statistical Rating Organization, such as S&P, Moody's or Fitch (unaudited)
WAC = Weighted Average Coupon
VRN = Variable Rate Note
The obligations of certain U. S. Government-sponsored securities are neither issued nor guaranteed by the U. S. Treasury.
*Deemed illiquid pursuant to Liquidity Procedures adopted by the Board of Trustees. These holdings represent 0.73% of the net assets at December 31, 2007.
| | | | | | | | |
| | | NRSRO
Rating | | Principal
Amount/
Shares | | Value |
|
Corporate Obligations—(continued) |
Abbott Laboratories,
5.600%, due 11/30/17 | | AA | | $ | 600 | | $ | 616 |
Ras Laffan Lng II,
5.298%, due 9/30/20 | | AA | | | 400 | | | 388 |
Southwest Airlines Co.,
6.150%, due 8/1/22 | | AA- | | | 500 | | | 498 |
Kroger Company, 8.000%, due 9/15/29 | | BBB- | | | 400 | | | 465 |
Conoco Funding Company,
7.250%, due 10/15/31 | | A | | | 400 | | | 468 |
Kohl's Corporation,
6.000%, due 1/15/33 | | BBB+ | | | 400 | | | 346 |
Goldman Sachs Group, Inc.,
6.125%, due 2/15/33 | | AA- | | | 400 | | | 393 |
Pacific Gas and Electric Company, 6.050%, due 3/1/34 | | BBB+ | | | 250 | | | 250 |
Teva Pharmaceutical Finance LLC, 6.150%, due 2/1/36 | | BBB | | | 300 | | | 298 |
Wisconsin Electric Power Company, 5.700%, due 12/1/36 | | A+ | | | 500 | | | 479 |
Comcast Corporation,
6.450%, due 3/15/37 | | BBB+ | | | 300 | | | 305 |
Florida Power and Light Group Capital, Inc. 6.650%, due 6/15/67, VRN | | A- | | | 300 | | | 289 |
| | | | | | | | |
Total Corporate Obligations | | | | | 15,985 | | | 16,191 |
| | | | | | | | |
Total Fixed Income—92.9%
(Cost $62,826) | | | 62,866 | | | 63,617 |
| | | | | | | | |
| | | |
Preferred Stock | | | | | | | | |
Public Storage, Inc. | | | | | 10,000 | | | 193 |
| | | | | | | | |
Total Preferred Stock—0.3%
(cost $245) | | | 10,000 | | | 193 |
| | | | | | | | |
Total Long-Term Investments—93.2%
(cost $63,071) | | | 72,866 | | | 63,810 |
| | | | | | | | |
| | | |
Short-Term Investments | | | | | | | | |
American Express Credit Corp. Demand Note, VRN 4.695%, due 1/2/08 | | A+ | | | 869 | | | 869 |
Prudential Funding Demand Note, VRN 4.430%, due 1/2/08 | | A+ | | | 2,348 | | | 2,348 |
| | | | | | | | |
Total Short-Term Investments—4.7%
(cost $3,217) | | | 3,217 | | | 3,217 |
| | | | | | | | |
| | | |
Repurchase Agreement | | | | | | | | |
State Street Bank and Trust Company, 3.80% dated 12/31/07, due 1/2/08, repurchase price $401, collateralized by FN, Pool # 712321 | | A+ | | | 400 | | | 400 |
| | | | | | | | |
Total Repurchase Agreement—0.6%
(cost $400) | | | 400 | | | 400 |
| | | | | | | | |
Total Investments—98.5%
(cost $66,688) | | $ | 76,483 | | | 67,427 |
| | | | | | | | |
Cash and other assets, less liabilities—1.5% | | | 1,056 |
| | | | | | | | |
Net Assets—100.0% | | $ | 68,483 |
| | | | | | | | |
See accompanying Notes to Financial Statements.
December 31, 2007 | William Blair Funds 69 |
James S. Kaplan
Christopher T. Vincent
INCOME FUND
The Income Fund invests in intermediate-term debt securities.
AN OVERVIEW FROM THE PORTFOLIO MANAGERS
How did the Fund perform during the past year? How did the Fund’s performance compare to its benchmark?
The Income Fund posted a 1.08% gain on a total return basis (Class N Shares) for the 12 months ended December 31, 2007. By comparison, the Fund’s benchmark, the Lehman Intermediate Government/Credit Bond Index, rose 7.39%, while the Fund’s peer group, the Morningstar Short-term Bond Category, increased 4.29%.
What were the most significant market factors impacting Fund performance? What factors were behind the Fund’s performance versus the benchmark?
The Fund’s considerable underperformance resulted from a significant underweight in the U.S. Treasury sector, which was the best performing investment grade bond sector in 2007. The Fund’s performance was primarily hurt by holdings in Non-agency mortgages, an investment grade sector which is not represented in the benchmark.
Given the current valuations in the Corporate bond and Mortgage-backed security sectors, we are optimistic about the outlook for 2008. Good performance may depend on a return of substantial liquidity to the bond market. U.S. Treasury returns may struggle in the coming year, given the 3.37% average yield on U.S. Treasury securities.
During 2007, the bond market posted strong absolute returns of 7.39%, as measured by the Lehman Intermediate Government Credit index. The returns were driven by falling Treasury yields. The yield on the Lehman Intermediate Treasury Index fell by 1.40%, from 4.77% to 3.37%.
The year-end yield on the Treasury market reflects a “flight-to-quality” in the bond market. Given the current Fed Funds rate of 4.25%, Treasury yields are likely unsustainable at these levels unless the Fed continues to cut rates aggressively.
In contrast to Treasury securities, the major “spread” sector performance was not as strong. The yield on the Intermediate Credit Index fell by just 0.08%, from 5.42% to 5.34%. 2007 was the worst year in the past decade for the performance of the intermediate credit sector relative to U.S. Treasuries.
Which investment strategies enhanced the Fund’s return? Were there any investment strategies that produced the best results?
Our best performing corporate bond holdings include the international beverage company, SABMiller, and the U.S. industrial company, Johnson Controls.
We were fortunate to have maintained an underweight in the weak Finance sector during 2007. Our sell discipline helped us to eliminate some bonds in the Finance sector during the first half of the year, including Sallie Mae and RESCAP. Both of these bonds performed poorly in the second half of the year.
70 Annual Report | December 31, 2007 |
What were the weakest performing sectors for the Fund?
The Non-agency Mortgage sector proved challenging all year as a result of the overflow of subprime residential mortgage problems into other Mortgage sectors. The Fund has had heavy allocations for these sectors for many years and we did shift assets away from these sectors during the fourth quarter. Some of these transactions resulted in selling securities at a loss, which we believe was in the best interest of investors.
What is your current strategy? How is the Fund positioned?
The Fund’s duration of 3.71 years is roughly consistent with the benchmark, reflecting no bias for changes in interest rates. Although we expect the Fed Funds rate to decline in 2008, future rate cuts are already priced into the Treasury market.
The Corporate bond sector holdings are positioned somewhat conservatively relative to the benchmark. The nominal percentage of corporate bonds is slightly below the benchmark and we have an opportunity to increase our exposure in this sector as liquidity returns to the market. The Fund’s exposure to BBB-rated bonds, which is limited to 10%, remains slightly below the nominal percentage of BBBs in the intermediate index.
The Fund remains significantly overweight the Mortgage sector, although the nominal percentage of mortgage backed securities is at a 12-month low. The Fund will likely benefit significantly if the residential mortgage environment improves.
We believe the fixed income markets may be headed into a favorable relative return environment. The non-Treasury assets offer compelling valuations and the opportunity for spread tightening is considerable. The likelihood of spread tightening will increase if and when the liquidity in the bond market improves.
December 31, 2007 | William Blair Funds 71 |
Income Fund
Performance Highlights (unaudited)
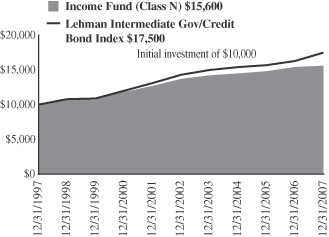
Average Annual Total Return at 12/31/2007
| | | | | | | | | | | | | | | |
| | | 1
Year | | | 3
Year | | | 5
Year | | | 10
Year | | | Since
Inception | |
Income Fund Class N | | 1.08 | % | | 2.34 | % | | 2.66 | % | | 4.54 | % | | — | % |
Income Fund Class I | | 1.36 | | | 2.53 | | | 2.83 | | | — | | | 4.79 | (a) |
Lehman Intermediate Government Credit Bond Index | | 7.39 | | | 4.32 | | | 4.06 | | | 5.75 | | | 5.92 | (a) |
| | (a) | | For the period from October 1, 1999 to December 31, 2007. |
Performance cited represents past performance. Past performance does not guarantee future results and current performance may be lower or higher than the data quoted. Results shown are average annual total returns, which assume reinvestment of dividends and capital gains. Investment returns and principal will fluctuate and you may have a gain or loss when you sell shares. For the most current month-end performance information, please call 1-800-742-7272, or visit our Web site at www.williamblairfunds.com. Class N shares are available to the general public without a sales load. Class I shares are available to certain institutional investors and advisory clients of William Blair & Company, L.L.C., without a sales load or distribution (12b-1) or service fees.
The performance highlights and graph presented above do not reflect the deduction of taxes that a shareholder would pay on fund distributions or the redemption of fund shares.
The Lehman Intermediate Government/Credit Bond Index indicates broad intermediate government/corporate bond market performance.
This report identifies the Fund’s investments on December 31, 2007. These holdings are subject to change. Not all investments in the Fund performed the same, nor is there any guarantee that these investments will perform as well in the future. Market forecasts provided in this report may not necessarily come to pass.
Sector Diversification (unaudited)
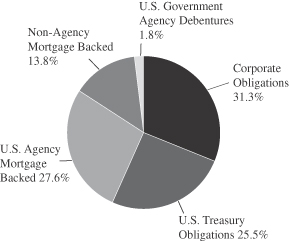
The sector diversification shown is based on the total investment portfolio.
72 Annual Report | December 31, 2007 |
Income Fund
Portfolio of Investments, December 31, 2007 (all amounts in thousands)
| | | | | | | | |
| | | NRSRO
Rating | | Principal
Amount | | Value |
|
U.S. Government and U.S. Government Agency—54.8% |
U.S. Treasury—25.4% | | | | | | | | |
U.S. Treasury Note,
6.500%, due 2/15/10 | | | | $ | 10,000 | | $ | 10,693 |
U.S. Treasury Note,
4.250%, due 9/30/2012 | | | | | 24,445 | | | 25,302 |
U.S. Treasury Note,
4.750%, due 5/15/14 | | | | | 2,000 | | | 2,127 |
U.S. Treasury Note,
5.125%, due 5/15/16 | | | | | 6,060 | | | 6,559 |
U.S. Treasury Note,
4.750%, due 8/15/17 | | | | | 7,000 | | | 7,393 |
| | | | | | | | |
Total U.S. Treasury Obligations | | | | | 49,505 | | | 52,074 |
| | | | | | | | |
Government National Mortgage Association (GNMA)—1.8% | | | | | | | | |
#780405, 9.500%, due 11/15/17 | | | | | 407 | | | 437 |
#589335, 6.500%, due 10/15/22 | | | | | 1,689 | | | 1,745 |
#357322, 7.000%, due 9/15/23 | | | | | 195 | | | 207 |
#616250, 6.000%, due 2/15/24 | | | | | 1,262 | | | 1,297 |
| | | | | | | | |
Total Government National Mortgage Association | | | | | 3,553 | | | 3,686 |
| | | | | | | | |
Small Business Administration—0.0% |
Receipt for Multiple Originator Fees, #3, 0.821%, due 11/01/08 (Interest Only) WAC | | | | | — | | | 10 |
| | | | | | | | |
Federal Home Loan Mortgage Corp. (FHLMC)—10.8% | | | | | | | | |
#G10067, 7.000%, due 1/1/08 | | | | | 1 | | | 1 |
1612 SE, 8.100%, due 11/15/08 | | | | | 161 | | | 162 |
#G90028, 7.000%, due 5/17/09 | | | | | 80 | | | 80 |
#E80050, 6.000%, due 10/1/09 | | | | | 136 | | | 137 |
#G90019, 7.500%, due 12/17/09 | | | | | 141 | | | 142 |
7.000%, due 3/15/10 | | | | | 4,000 | | | 4,287 |
#E00436, 7.000%, due 6/1/11 | | | | | 269 | | | 278 |
#G10708, 6.500%, due 8/1/12 | | | | | 175 | | | 181 |
#E72924, 7.000%, due 10/1/13 | | | | | 778 | | | 810 |
#E81697, 8.000%, due 5/1/15 | | | | | 1,801 | | | 1,904 |
#E81703, 7.000%, due 5/1/15 | | | | | 726 | | | 755 |
#E81908, 8.500%, due 12/1/15 | | | | | 108 | | | 120 |
#J02184, 8.000%, due 4/1/16 | | | | | 1,373 | | | 1,448 |
#G12258, 6.000%, due 8/1/16 | | | | | 2,048 | | | 2,097 |
#G90022, 8.000%, due 9/17/16 | | | | | 532 | | | 559 |
#E90398, 7.000%, due 5/1/17 | | | | | 1,119 | | | 1,166 |
#M30028, 5.500%, due 5/1/17 | | | | | 205 | | | 209 |
#G90027, 6.000%, due 11/17/17 | | | | | 1,056 | | | 1,076 |
#J02986, 6.500%, due 7/1/21 | | | | | 67 | | | 69 |
#C67537, 9.500%, due 8/1/21 | | | | | 89 | | | 96 |
#G18137, 6.500%, due 8/1/21 | | | | | 2,506 | | | 2,583 |
#D95621, 6.500%, due 7/1/22 | | | | | 2,857 | | | 2,956 |
#A45790, 7.500%, due 5/1/35 | | | | | 879 | | | 938 |
| | | | | | | | |
Total FHLMC Mortgage Obligations | | | | | 21,107 | | | 22,054 |
| | | | | | | | |
Federal National Mortgage Association (FNMA)—16.8% | | | | | | | | |
#1993-196, Tranche SA,
10.369%,due 10/25/08,VRN | | | | | 93 | | | 94 |
#1993-221, Tranche SG,
4.650%, due 12/25/08, VRN | | | | | 84 | | | 83 |
| | | | | | | | |
| | | NRSRO
Rating | | Principal
Amount | | Value |
Federal National Mortgage Association (FNMA)—(continued) |
#2002-27, Tranche SW,
5.995%, due 5/25/2009 VRN | | | | $ | 896 | | $ | 891 |
#765396, 5.500%, due 1/1/09 | | | | | 69 | | | 69 |
#695512, 8.000%, due 9/1/10 | | | | | 233 | | | 238 |
#725479, 8.500%, due 10/1/10 | | | | | 344 | | | 349 |
6.250%, due 2/1/11 | | | | | 1,500 | | | 1,607 |
#313816, 6.000%, due 4/1/11 | | | | | 271 | | | 275 |
#577393, 10.000%, due 6/1/11 | | | | | 146 | | | 156 |
#577395, 10.000%, due 8/1/11 | | | | | 563 | | | 606 |
#254788, 6.500%, due 4/1/13 | | | | | 400 | | | 415 |
#725315, 8.000%, due 5/1/13 | | | | | 419 | | | 438 |
#593561, 9.500%, due 8/1/14 | | | | | 321 | | | 345 |
#567027, 7.000%, due 9/1/14 | | | | | 1,352 | | | 1,409 |
#567026, 6.500%, due 10/1/14 | | | | | 1,166 | | | 1,208 |
#458124, 7.000%, due 12/15/14 | | | | | 255 | | | 265 |
#576554, 8.000%, due 1/1/16 | | | | | 1,352 | | | 1,424 |
#576553, 8.000%, due 2/1/16 | | | | | 2,067 | | | 2,197 |
#555747, 8.000%, due 5/1/16 | | | | | 320 | | | 335 |
#735569, 8.000%, due 10/1/16 | | | | | 1,723 | | | 1,807 |
#725410, 7.500%, due 4/1/17 | | | | | 1,132 | | | 1,180 |
#643217, 6.500%, due 6/1/17 | | | | | 340 | | | 352 |
#679247, 7.000%, due 8/1/17 | | | | | 1,478 | | | 1,553 |
#740847, 6.000%, due 10/1/18 | | | | | 1,083 | | | 1,109 |
#852864, 7.000%, due 7/1/20 | | | | | 2,895 | | | 3045 |
#458147, 10.000%, due 8/15/20 | | | | | 746 | | | 863 |
#835563, 7.000%, due 10/1/20 | | | | | 1,129 | | | 1,189 |
#735574, 8.000%, due 3/1/22 | | | | | 747 | | | 802 |
#679253, 6.000%, 10/1/22 | | | | | 1,705 | | | 1,747 |
#1993-19, Tranche SH,
11.234%, due 4/25/23, VRN | | | | | 11 | | | 14 |
#806458, 8.000%, due 6/1/28 | | | | | 912 | | | 977 |
#880155, 8.500%, due 7/1/29 | | | | | 1,260 | | | 1,356 |
#797846, 7.000%, due 3/1/32 | | | | | 1,490 | | | 1,569 |
#745519, 8.500%, due 5/1/32 | | | | | 762 | | | 821 |
#654674, 6.500%, due 9/1/32 | | | | | 252 | | | 261 |
#733897, 6.500%, due 12/1/32 | | | | | 472 | | | 489 |
#888305, 7.000, due 3/1/36 | | | | | 2,648 | | | 2,793 |
| | | | | | | | |
Total FNMA Mortgage Obligations | | | | | 32,636 | | | 34,331 |
| | | | | | | | |
| | | |
Non-Agency Mortgage-Backed Obligations—13.8% | | | | | | | | |
ABFS, 2002-2, Tranche A6,
5.850%, due 3/15/19 | | AAA | | | 114 | | | 112 |
First Plus, 1997-4, Tranche M1,
7.640%, due 9/11/23 | | AA | | | 1,144 | | | 1,127 |
First Plus, 1997-4, Tranche M2,
7.830%, due 9/11/23 | | A | | | 242 | | | 229 |
First Plus, 1997-4, Tranche A8,
7.810%, due 9/11/23 | | AAA | | | 93 | | | 93 |
First Plus, 1998-2, Tranche M2,
8.010%, due 5/10/24 | | A | | | 149 | | | 144 |
First Plus, 1998-3, Tranche M2,
7.920%, due 5/10/24, VRN | | A | | | 394 | | | 383 |
Bear Stearns ABS, 2001-A, Tranche M1, 8.040%, due 2/15/31 | | AA | | | 288 | | | 288 |
Structured Asset Securities Corp.,
2005-SC1, Tranche 1A2,
10.253%, due 5/25/31, VRN* | | AAA | | | 1,706 | | | 1,819 |
Aames Mortgage Trust, 2001-1, Tranche M2, 7.588%, due 6/25/31 | | A | | | 1,216 | | | 918 |
See accompanying Notes to Financial Statements.
December 31, 2007 | William Blair Funds 73 |
Income Fund
Portfolio of Investments, December 31, 2007 (all dollar amounts in thousands)
| | | | | | | | | |
| | | NRSRO
Rating | | | Principal
Amount | | Value |
|
Non-Agency Mortgage-Backed Obligations—(continued) |
Security National Mortgage Loan Trust, 2004-1A, Tranche M2,
6.750%, due 06/25/32 | | A | | | $ | 1,600 | | $ | 1,476 |
Structured Assets Security Corporation, 2002-17, Tranche B3,
6.095%, due 9/25/32, VRN | | A | | | | 1,774 | | | 1,766 |
LSSCO, 2004-2, Tranche M1,
6.828%, due 2/28/33, VRN* | | AA | | | | 694 | | | 696 |
LSSCO, 2004-2, Tranche M2,
6.828%, due 2/28/33, VRN* | | A | | | | 532 | | | 507 |
ABFS, 2002-2, Tranche A-7,
5.215%, due 7/15/33, VRN | | AAA | | | | 16 | | | 16 |
ABFS, 2002-3, Tranche M1,
5.402%, due 9/15/33, VRN | | AA | | | | 985 | | | 808 |
Residential Asset Mortgage Products, 2003-RS9, Tranche MI2,
6.300%, due 10/25/33 | | A | | | | 1,291 | | | 1,035 |
ACE, 2004-SD1, Tranche M3,
7.615%, due 11/25/33, VRN | | BBB | | | | 2,099 | | | 1,048 |
Security National Mortgage Loan Trust, 2004-2A, Tranche M2,
6.352%, due 11/25/34 | | A | | | | 2,200 | | | 2,150 |
Security National Mortgage Loan Trust, 2005-1A, Tranche B1,
7.450%, due 2/25/35* | | BBB | | | | 950 | | | 635 |
Security National Mortgage Loan Trust, 2005-1A, Tranche M2,
6.530%, due 2/25/35* | | A | | | | 1,475 | | | 1,039 |
Soundview Home Equity Loan Trust, 2005-B, Tranche M1
5.635%, due 5/25/35 | | Aaa | | | | 1,318 | | | 1,226 |
Security National Mortgage Loan Trust, 2005-2A, Tranche B1,
7.750%, due 2/25/36* | | BBB | | | | 1,550 | | | 1,046 |
Security National Mortgage Loan Trust, 2005-2A, Tranche M2,
7.321%, due 2/25/36* | | A | | | | 2,075 | | | 1,779 |
Security National Mortgage Loan Trust, 2006-1A, Tranche M2,
7.500%, due 9/25/36* | | A | | | | 2,195 | | | 1,402 |
Security National Mortgage Loan Trust, 2006-2A, Tranche M2,
7.500%, due 10/25/36* | | A | | | | 600 | | | 550 |
Security National Mortgage Loan Trust, 2006-3A, Tranche M2,
7.500%, due 1/25/37* | | A | | | | 1,000 | | | 888 |
Blackrock Capital Finance,
1997-R1 WAC,
7.840%, due 3/25/37, VRN* | | AAA | | | | 298 | | | 290 |
Statewide Mortgage Loan Trust, 2006-1A, Tranche A2,
7.660%, due 9/25/37* | | AAA | | | | 2,638 | | | 2,612 |
ACE, 2005-SN1, Tranche M1,
5.520%, due 11/25/39, VRN | | AA | + | | | 1,075 | | | 898 |
ACE, 2005-SN1, Tranche M2,
5.770%, due 11/25/39, VRN | | A | + | | | 625 | | | 337 |
| | | | | | | | | |
| | | NRSRO
Rating | | | Principal
Amount | | Value |
|
Non-Agency Mortgage-Backed Obligations—(continued) |
ACE, 2005-SD3, Tranche M2,
6.615%, due 8/25/45, VRN | | A | + | | $ | 1,895 | | $ | 892 |
| | | | | | | | | |
Total Non-Agency Mortgage-Backed Obligations | | | | | | 34,231 | | | 28,209 |
| | | | | | | | | |
| | | |
Corporate Obligations—31.4% | | | | | | | | | |
Philips Petroleum,
8.750%, due 5/25/10 | | A | | | | 2,500 | | | 2,739 |
HSBC Finance Corporation,
8.000%, due 7/15/10 | | AA | - | | | 2,450 | | | 2,611 |
Boeing Capital Corporation,
7.375%, due 9/27/10 | | A | + | | | 2,549 | | | 2,736 |
Lehman Brothers Holdings, Inc.,
6.625%, due 1/18/12 | | A | + | | | 2,650 | | | 2,752 |
BHP Billiton Finance,
5.125%, due 3/29/12 | | A | + | | | 1,195 | | | 1,205 |
General Electric Capital Corporation, 6.000%, due 6/15/12 | | AAA | | | | 2,650 | | | 2,778 |
Citigroup, Inc.,
5.625%, due 8/27/12 | | AA | - | | | 2,675 | | | 2,710 |
Kroger Company,
5.500%, due 2/1/13 | | BBB | | | | 2,000 | | | 2,005 |
Ohio Power Company,
5.500%, due 2/15/13 | | BBB | | | | 1,900 | | | 1,889 |
American Movil SA,
5.500%, due 3/1/14 | | A3 | | | | 2,000 | | | 1,987 |
Bank of America Corporation,
5.375%, due 6/15/14 | | AA | | | | 2,325 | | | 2,349 |
AT&T, Inc.
5.100%, due 9/15/14 | | A | | | | 2,500 | | | 2,474 |
Goldman Sachs Group, Inc.,
5.000%, due 10/1/14 | | AA | - | | | 2,000 | | | 1,961 |
Codeloc Inc.,
4.750%, due 10/15/14* | | A | | | | 1,815 | | | 1,747 |
Pemex Master Trust,
5.750%, due 12/15/15 | | BBB | + | | | 2,000 | | | 2,025 |
Johnson Controls, Inc.,
5.500%, due 1/15/16 | | A | - | | | 1,925 | | | 1,897 |
Teva Pharmaceutucal Finance LLC.
5.500%, due 2/1/16 | | BBB | | | | 2,000 | | | 1,976 |
Omnicom Group, Inc.,
5.900%, due 4/15/16 | | A | - | | | 3,000 | | | 3,043 |
YUM! Brands, Inc.,
6.250%, 4/15/16 | | BBB | | | | 1,939 | | | 1,966 |
Sabmiller PLC,
6.500%, due 7/1/16 | | BBB | + | | | 1,600 | | | 1,671 |
Petrobras International Finance Corporation,
6.125%, due 10/6/16 | | BBB | - | | | 2,000 | | | 2,040 |
Comcast Corporation,
6.500%, due 1/15/17 | | BBB | + | | | 2,000 | | | 2,085 |
BHP Billiton Finance,
5.400%, due 3/29/17 | | A | + | | | 1,000 | | | 962 |
J.P. Morgan Chase & Company,
6.125%, due 6/27/17 | | A | + | | | 2,500 | | | 2,548 |
Kimberly-Clark Corporation
6.125%, due 8/1/17 | | A | + | | | 2,000 | | | 2,107 |
See accompanying Notes to Financial Statements.
74 Annual Report | December 31, 2007 |
Income Fund
Portfolio of Investments, December 31, 2007 (all dollar amounts in thousands)
| | | | | | | | | |
| | | NRSRO
Rating | | | Principal
Amount | | Value |
| |
Corporate Obligations—(continued) | | | |
IBM Corporation,
5.700%, due 9/14/17 | | A | + | | $ | 2,500 | | $ | 2,584 |
Exelon Generation Company, LLC
6.200%, due 10/1/17 | | A3 | | | | 2,000 | | | 1,988 |
Tesco plc,
5.500%, due 11/15/17 | | A | + | | | 1,750 | | | 1,745 |
Ras Laffan Lng II,
5.298%, due 9/30/20* | | Aa2 | | | | 2,000 | | | 1,941 |
Southwest Airlines Company,
6.150%, due 8/1/22 | | AA | - | | | 1,650 | | | 1,643 |
| | | | | | | | | |
Total Corporate Obligations | | | | | | 63,073 | | | 64,164 |
| | | | | | | | | |
Total Long Term Investments—100.0%
(cost $209,354) | | | $ | 204,105 | | | 204,528 |
| | | | | | | | | |
Cash and other assets, less liabilities—0.0% | | | 102 |
| | | | | | | | | |
Net Assets—100.0% | | $ | 204,630 |
| | | | | | | | | |
WAC = Weighted Average Coupon
VRN = Variable Rate Note
NRSRO = Nationally Recognized Statistical Rating Organization, such as
S&P, Moody’s or Fitch (unaudited)
The obligations of certain U. S. Government-sponsored securities are neither issued nor guaranteed by the U. S. Treasury.
* Deemed illiquid pursuant to Liquidity Procedures adopted by the Board of Trustees. These holdings represent 8.28% of the net assets at December 31, 2007.
See accompanying Notes to Financial Statements.
December 31, 2007 | William Blair Funds 75 |
James S. Kaplan
Christopher T. Vincent
READY RESERVES FUND
AN OVERVIEW FROM THE PORTFOLIO MANAGERS
Federal Reserve Board Monetary policy was the focus of the money markets during 2007.
Federal Reserve Board Chairman Ben Bernanke reached the one-year anniversary of his appointment early in the year, a job he has grown into and for which market participants have generally given him high marks.
At the meeting of the Federal Open Market Committee just before mid-year, the Federal Reserve said that inflation remained its predominant policy concern. The Fed left its benchmark interest rate unchanged at 5.25% and signaled that it would keep it at that level for some time. The Fed’s rate decision, which had been widely anticipated by most market participants, meant that the Fed’s pause in rate increases was now one year old.
However, during the third quarter the Federal Reserve made two significant policy moves in order to calm markets in the wake of meltdowns in the housing and credit markets.
Turmoil in the home-loan market caused renewed concerns about tightening credit worldwide. Questions arose regarding the credibility of specific types of investment vehicles and liquidity dried up. In addition, there was increasing anxiety that the problems in the mortgage markets would spill over into housing and in turn affect the health of the economy.
On August 17th the Fed made the decision to cut the discount rate that banks use for short-term borrowing in emergencies, noting that the risks to the broader economy had increased “appreciably.”
Then on September 18th, the Fed lowered the Federal Funds rate by 0.50%. It was the first rate cut in four years, and was seen by many observers as a forceful policy shift intended to limit the damage to the economy from the disorder in the housing and credit markets. By September the debate among the policy makers appeared to be not whether to cut rates but by how much to cut them—if the rate cut was too small, the Fed risked a recession; if the rate cut was too much or done too early, the Fed risked stoking inflation.
Over the course of the year, we reduced our holdings of Asset-backed Commercial Paper and increased our balances in instruments having overnight liquidity. In addition, we raised our holdings of Government Agency paper. These actions were in response to difficult market conditions.
We presently intend to maintain our strategy of using commercial paper in the short end of the market, barbelled with fixed-rate obligations with slightly longer maturities, and we also will continue to emphasize floating-rate obligations, which price off of LIBOR. (LIBOR, the London Interbank Offered Rate, is the rate charged for large loans by banks denominated in U.S. dollars held in banks outside of the U.S.)
The current inverted shape of the money market yield curve has decreased investment opportunities in the secondary fixed-rate market, but we do not see this as a particularly troubling development. With fewer opportunities available, or until the yield curve changes, we will stay focused on the 30- to 60-day end of the market.
At December 31, 2007, the Fund’s Average Maturity was approximately 48 days, compared to 49 days at September 30, 2007, 53 days at June 30, 2007 and 52 days at December 31, 2006.
The return for the 12 months ended December 31, 2007, of the Fund’s Class N Shares was 4.75%, versus the 4.48% return of the Fund’s benchmark, the AAA-Rated Money Market Funds Average. Total assets were $1.40 billion, compared to $1.32 billion at September 30, 2007 and $1.20 billion at December 31, 2006.
76 Annual Report | December 31, 2007 |
Ready Reserves Fund
Performance Highlights (unaudited)
The Fund’s 7 day yield on December 31, 2007 was 4.26%.
Average Annual Total Returns—Class N Shares Year ended December 31, 2007.
| | | | | | | | | | | | |
| | | 1
Year | | | 3
Year | | | 5
Year | | | 10
Year | |
| Ready Reserves Fund | | 4.75 | % | | 3.94 | % | | 2.64 | % | | 3.36 | % |
AAA Rated Money Market Funds | | 4.48 | | | 3.79 | | | 2.51 | | | 3.33 | |
Performance cited represents past performance. Past performance does not guarantee future results and current performance may be lower or higher than the data quoted. For the most current month-end performance information, please call 1-800-742-7272, or visit our Web site at www.williamblairfunds.com. Class N Shares are available to the general public without a sales load. Total return includes reinvestment of income. Yields fluctuate and are not guaranteed. An investment in the Fund is neither insured nor guaranteed by the Federal Deposit Insurance Corp. (FDIC) or any government agency. Although the Fund seeks to preserve the value of your investment at $1.00 per share, it is possible to lose money by investing in the Fund.
The AAA Rated Money Market Funds Average represents the average annual composite performance of all AAA rated First Tier Retail Money Market Funds listed by imoneynet data.
This report identifies the Fund’s investment’s on December 31, 2007. These holdings are subject to change. Not all fixed-income securities in the Fund performed the same, nor is there any guarantee that these fixed-income securities will perform as well in the future. Market forecasts provided in this report may not necessarily come to pass.
Sector Diversification (unaudited)
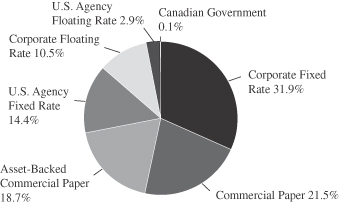
The sector diversification shown is based on the total investment portfolio.
December 31, 2007 | William Blair Funds 77 |
Ready Reserves Fund
Portfolio of Investments, December 31, 2007 (all amounts in thousands)
| | | | | | |
Issuer | | Principal
Amount | | Amortized
Cost |
U.S. Agency Fixed Rate Notes—5.5% | | | | | | |
Federal Home Loan Bank (FHLB),
3.375%-5.250%, 1/18/08-3/26/08 | | $ | 19,333 | | $ | 19,345 |
Federal Home Mortgage Corporation, (FHLMC), 2.750%-4.625%,
2/21/08-3/15/08 | | | 20,305 | | | 20,325 |
Federal National Mortgage Association (FNMA), 3.830%-6.320%,
1/11/08-8/15/08 | | | 36,877 | | | 36,877 |
| | | | | | |
Total U.S. Agency Fixed Rate Notes | | | 76,515 | | | 76,547 |
| | | | | | |
U.S. Agency Variable Rate Notes—2.8% | | | | | | |
Federal Home Loan Bank (FHLB),
4.775%-5.019%, 8/15/08-10/29/08 | | | 40,010 | | | 40,007 |
| | | | | | |
Total U.S. Agency Variable Rate Notes | | | 40,010 | | | 40,007 |
| | | | | | |
U.S. Agency Discount Notes—8.9% | | | | | | |
Federal Farm Credit Banks (FFCB),
4.210%-4.290%, 2/14/08-2/27/08 | | | 10,000 | | | 9,940 |
Federal Home Loan Mortgage Corporation (FHLMC), 4.230%-4.880%,
1/25/08-2/26/08 | | | 50,000 | | | 49,773 |
Federal National Mortgage Association (FNMA), 4.190%-4.280%,
1/14/08-2/29/08 | | | 65,000 | | | 64,711 |
| | | | | | |
Total U.S. Agency Discount Notes | | | 125,000 | | | 124,424 |
| | | | | | |
Canadian Government Fixed Rate Notes—0.1% | | | |
Canadian Government, 5.25%, 11/5/08 | | | 882 | | | 882 |
| | | | | | |
Total Canadian Government Fixed Rate Notes | | | 882 | | | 882 |
| | | | | | |
Fixed Rate Notes—22.1% | | | | | | |
Abbott Laboratories, 6.000%, 3/15/08 | | | 2,014 | | | 2,003 |
American General Finance Corp,
5.329%, 1/18/08 | | | 18,036 | | | 18,031 |
American Honda Finance Corp,
3.850%-4.870%, 3/20/08-11/6/08 | | | 10,628 | | | 10,633 |
AT&T Corporation, 6.125%-6.150%, 1/15/08-2/15/08 | | | 7,117 | | | 7,098 |
Berkshire Hathaway, 3.375%-5.299%, 1/11/08-10/15/08 | | | 28,090 | | | 28,093 |
Caterpillar Financial Services,
3.800%, 2/8/08-7/15/08 | | | 18,693 | | | 18,781 |
Chevron Corporation, 3.375%, 2/15/08 | | | 13,160 | | | 13,334 |
Eli Lilly & Company, 2.900%, 3/15/08 | | | 6,265 | | | 6,370 |
General Electric Capital Corporation,
3.500%-5.293%, 1/3/08-5/1/08 | | | 30,087 | | | 30,088 |
Gillette Company, 2.500%, 6/1/08 | | | 4,613 | | | 4,681 |
IBM Corporation, 3.800%, 2/1/08 | | | 7,557 | | | 7,591 |
John Deere Capital Corp, 3.900%-4.375%, 1/15/08-3/14/08 | | | 18,650 | | | 18,751 |
PACCAR Financial, 4.941%, 3/17/08 | | | 20,014 | | | 20,006 |
Pfizer, Inc., 6.000%, 1/15/08 | | | 3,004 | | | 3,001 |
Private Export Funding, 3.400%, 2/15/08 | | | 1,197 | | | 1,197 |
Toyota Motor Credit, 2.875%-5.500%, 8/1/08-12/15/08 | | | 15,117 | | | 15,177 |
US Bancorp, 3.125%-6.500%,
2/1/08-12/15/08 | | | 26,863 | | | 26,905 |
Verizon Communications,
4.000%, 1/15/08 | | | 26,551 | | | 26,688 |
| | | | | | |
Issuer | | Principal
Amount | | Amortized
Cost |
Fixed Rate Notes—(continued) | | | | | | |
Wal-Mart Stores, 3.375%, 10/1/08 | | $ | 13,016 | | $ | 13,048 |
Wells Fargo Financial, 3.120%-6.250%, 3/10/08-8/15/08 | | | 37,988 | | | 38,101 |
| | | | | | |
Total Fixed Rate Notes | | | 308,660 | | | 309,577 |
| | | | | | |
Variable Rate Notes—10.5% | | | | | | |
American Honda Finance Corp,
4.959%-5.273%, 4/10/08-5/12/08 | | | 19,525 | | | 19,522 |
AT&T Corporation, 4.959%, 5/15/08 | | | 15,688 | | | 15,690 |
Berkshire Hathaway, 4.938%, 5/16/08 | | | 15,017 | | | 15,007 |
General Electric Capital Corporation,
4.518%-5.111%, 5/19/08-10/24/08 | | | 18,301 | | | 18,296 |
General Electric Company,
5.186%, 12/9/08 | | | 9,603 | | | 9,603 |
John Deere Capital Corp, 5.271%-5.293%, 6/10/08-7/15/08 | | | 15,613 | | | 15,613 |
Toyota Motor Credit, 4.961%, 6/17/08 | | | 10,503 | | | 10,501 |
US Bancorp, 4.602%, 2/8/08 | | | 17,990 | | | 18,000 |
Wal-Mart Stores, 4.891%, 6/16/08 | | | 18,591 | | | 18,595 |
Wells Fargo Financial, 5.175%, 3/10/08 | | | 6,199 | | | 6,199 |
| | | | | | |
Total Variable Rate Notes | | | 147,030 | | | 147,026 |
| | | | | | |
Asset-Backed Commercial Paper—18.6% | | | | | | |
Alpine Securitization, 4.940%-5.550%, 1/4/08-1/16/08 | | | 20,000 | | | 19,973 |
Amsterdam Funding Corporation,
5.350%, 1/8/08-1/28/08 | | | 20,000 | | | 19,949 |
Chariot Funding, L.L.C., 5.150%-5.700%, 1/7/08-1/25/08 | | | 26,621 | | | 26,549 |
FCAR Owner Trust, 5.350%-5.850%,
1/9/08-1/17/08 | | | 25,000 | | | 24,949 |
Jupiter Securitization Co. L.L.C.,
5.250%-5.650%, 1/7/08-1/23/08 | | | 20,000 | | | 19,957 |
Kittyhawk Funding, 5.450%-5.950%, 1/25/08-2/5/08 | | | 15,721 | | | 15,645 |
New Center Asset Trust, 5.150%-6.000%, 1/9/08-1/22/08 | | | 20,000 | | | 19,954 |
Old Line Funding, 5.500%-5.650%,
1/4/08-1/30/08 | | | 25,000 | | | 24,948 |
Park Avenue Receivables, 5.350%-5.450%, 1/7/08-1/28/08 | | | 25,000 | | | 24,957 |
Ranger Funding, 4.950%, 1/2/08 | | | 15,000 | | | 14,998 |
Thunder Bay Funding, 5.350%-5.800%, 1/10/08-1/30/08 | | | 18,625 | | | 18,571 |
Variable Funding, 5.600%, 1/3/08 | | | 10,000 | | | 9,997 |
Windmill Funding Corporation,
5.100%-5.350%, 1/8/08-1/29/08 | | | 20,000 | | | 19,948 |
| | | | | | |
Total Asset-Backed Commercial Paper | | | 260,967 | | | 260,395 |
| | | | | | |
Commercial Paper—21.4% | | | | | | |
AIG Funding, 4.650%-4.700%,
1/22/08-1/23/08 | | | 30,000 | | | 29,916 |
BP Capital Markets, 4.245%-4.750%,
2/4/08-3/31/08 | | | 31,000 | | | 30,727 |
Chevron Funding, 4.250%, 1/24/08 | | | 10,000 | | | 9,973 |
Coca-Cola Company, 4.250%-4.440%, 2/1/08-2/28/08 | | | 20,000 | | | 19,892 |
Dover Corporation, 4.250%-4.450%, 1/14/08-2/15/08 | | | 24,700 | | | 24,610 |
IBM Capital, 4.300%, 3/10/08 | | | 10,000 | | | 9,918 |
IBM Corporation, 4.240%, 1/29/08 | | | 10,046 | | | 10,013 |
See accompanying Notes to Financial Statements.
78 Annual Report | December 31, 2007 |
Ready Reserves Fund
Portfolio of Investments, December 31, 2007 (all amounts in thousands)
| | | | | | |
Issuer | | Principal
Amount | | Amortized
Cost |
Commercial Paper—(continued) | | | | | | |
Kimberly-Clark Worldwide, 4.450%, 1/24/08 | | $ | 14,900 | | $ | 14,858 |
PACCAR Financial, 4.480%-4.520%, 1/30/08-2/19/08 | | | 24,200 | | | 24,079 |
Pfizer, Inc., 4.400%-4.410%,
5/7/08-5/22/08 | | | 20,000 | | | 19,671 |
Private Export Funding,
4.220%-5.000%, 1/17/08-3/12/08 | | | 42,600 | | | 42,343 |
Procter and Gamble International Flavors, 4.250%-4.480%, 1/29/08-3/19/08 | | | 42,500 | | | 42,260 |
Toyota Motor Credit, 4.620%, 2/12/08 | | | 10,000 | | | 9,946 |
U.S.A.A. Capital Corporation,
4.550%, 2/15/08 | | | 1,500 | | | 1,492 |
Walgreen Company 4.400%, 1/14/08 | | | 10,000 | | | 9,984 |
| | | | | | |
Total Commercial Paper | | | 301,446 | | | 299,682 |
| | | | | | |
VRN = Variable Rate Note
| | | | | | |
Issuer | | Principal
Amount | | Amortized
Cost |
Demand Notes—9.7% | | | | | | |
American Express Credit Corporation, VRN, 4.695%, 1/2/08 | | $ | 66,924 | | $ | 66,924 |
Prudential Funding, VRN,
4.430%, 1/2/08 | | | 68,640 | | | 68,640 |
| | | | | | |
Total Demand Notes | | | 135,564 | | | 135,564 |
| | | | | | |
Total Investments—99.6%
(Cost $1,394,202) | | $ | 1,396,074 | | | 1,394,104 |
| | | | | | |
Cash and other assets, less liabilities—0.4% | | | 5,433 |
| | | | | | |
Net Assets—100.0% | | $ | 1,399,537 |
| | | | | | |
Portfolio Weighted Average Maturity | | | | | | 48 Days |
See accompanying Notes to Financial Statements.
December 31, 2007 | William Blair Funds 79 |
Statements of Assets and Liabilities
December 31, 2007 (all dollar amounts in thousands)
| | | | | | | | | | | |
| | | Growth
Fund | | Tax-
Managed
Growth
Fund | | | Large Cap
Growth
Fund | |
Assets | | | | | | | | | | | |
Investments in securities, at cost | | $ | 301,413 | | $ | 8,381 | | | $ | 29,909 | |
Investments in Affiliated Fund, at cost | | | 1,699 | | | 309 | | | | 244 | |
| | | | | | | | | | | |
| | | |
Investments in securities, at value | | $ | 368,813 | | $ | 10,561 | | | $ | 34,459 | |
Investments in Affiliated Fund, at value | | | 1,699 | | | 309 | | | | 244 | |
Cash | | | — | | | — | | | | 1 | |
Foreign currency, at value (cost $7) | | | 7 | | | — | | | | — | |
Receivable for fund shares sold | | | 1,993 | | | 19 | | | | 253 | |
Dividend and interest receivable | | | 184 | | | 9 | | | | 25 | |
| | | | | | | | | | | |
Total assets | | | 372,696 | | | 10,898 | | | | 34,982 | |
Liabilities | | | | | | | | | | | |
Payable for investment securities purchased | | | 2,144 | | | — | | | | 1,278 | |
Payable for fund shares redeemed | | | 473 | | | — | | | | — | |
Management fee payable | | | 248 | | | 3 | | | | 19 | |
Distribution fee payable | | | 22 | | | — | | | | 1 | |
Other accrued expenses | | | 165 | | | 33 | | | | 17 | |
| | | | | | | | | | | |
Total liabilities | | | 3,052 | | | 36 | | | | 1,315 | |
| | | | | | | | | | | |
Net Assets | | $ | 369,644 | | $ | 10,862 | | | $ | 33,667 | |
| | | | | | | | | | | |
Capital | | | | | | | | | | | |
Composition of Net Assets | | | | | | | | | | | |
Par value of shares of beneficial interest | | $ | 31 | | $ | 1 | | | $ | 4 | |
Capital paid in excess of par value | | | 296,735 | | | 8,762 | | | | 33,663 | |
Accumulated realized gain (loss) | | | 5,478 | | | (81 | ) | | | (4,550 | ) |
Net unrealized appreciation (depreciation) of investments and foreign
currencies | | | 67,400 | | | 2,180 | | | | 4,550 | |
| | | | | | | | | | | |
Net Assets | | $ | 369,644 | | $ | 10,862 | | | $ | 33,667 | |
| | | | | | | | | | | |
| | | |
Class N Shares | | | | | | | | | | | |
Net Assets | | $ | 125,601 | | $ | 784 | | | $ | 7,307 | |
Shares Outstanding | | | 10,736,734 | | | 65,114 | | | | 972,284 | |
Net Asset Value Per Share | | $ | 11.70 | | $ | 12.03 | | | $ | 7.52 | |
Class I Shares | | | | | | | | | | | |
Net Assets | | $ | 244,043 | | $ | 10,078 | | | $ | 26,360 | |
Shares Outstanding | | | 20,304,127 | | | 820,893 | | | | 3,448,591 | |
Net Asset Value Per Share | | $ | 12.02 | | $ | 12.28 | | | $ | 7.64 | |
See accompanying Notes to Financial Statements.
80 Annual Report | December 31, 2007 |
Statements of Operations
For the Year Ended December 31, 2007 (all dollar amounts in thousands)
| | | | | | | | | | | | |
| | | Growth
Fund | | | Tax-
Managed
Growth
Fund | | | Large Cap
Growth
Fund | |
Investment income | | | | | | | | | | | | |
Dividends | | $ | 2,368 | | | $ | 94 | | | $ | 264 | |
Less foreign tax withheld | | | (61 | ) | | | (1 | ) | | | (5 | ) |
Dividend Income from Affiliated Fund | | | 126 | | | | 3 | | | | 10 | |
Interest | | | 352 | | | | 22 | | | | 40 | |
| | | | | | | | | | | | |
Total income | | | 2,785 | | | | 118 | | | | 309 | |
Expenses | | | | | | | | | | | | |
Investment advisory fees | | | 2,378 | | | | 84 | | | | 219 | |
Distribution fees | | | 227 | | | | 2 | | | | 24 | |
Custodian fees | | | 56 | | | | 34 | | | | 37 | |
Transfer agent fees | | | 191 | | | | 5 | | | | 19 | |
Professional fees | | | 28 | | | | 24 | | | | 26 | |
Registration fees | | | 33 | | | | 30 | | | | 29 | |
Other expenses | | | 183 | | | | 12 | | | | 5 | |
| | | | | | | | | | | | |
Total expenses before waiver | | | 3,096 | | | | 191 | | | | 359 | |
Less expenses waived or absorbed by the Advisor | | | — | | | | (74 | ) | | | (64 | ) |
| | | | | | | | | | | | |
Net expenses | | | 3,096 | | | | 117 | | | | 295 | |
| | | | | | | | | | | | |
Net investment income (loss) | | | (311 | ) | | | 1 | | | | 14 | |
Net realized and unrealized gain (loss) on investments, foreign currency transactions and other assets and liabilities | | | | | | | | | | | | |
Net realized gain (loss) on investments | | | 33,557 | | | | 950 | | | | 597 | |
| | | | | | | | | | | | |
Change in net unrealized appreciation (depreciation) on investments and other assets and liabilities | | | 4,809 | | | | 55 | | | | 1,829 | |
| | | | | | | | | | | | |
Net increase (decrease) in net assets resulting from operations | | $ | 38,055 | | | $ | 1,006 | | | $ | 2,440 | |
| | | | | | | | | | | | |
See accompanying Notes to Financial Statements.
December 31, 2007 | William Blair Funds 81 |
Statements of Changes in Net Assets
For the Years Ended December 31, 2007 and 2006 (all amounts in thousands)
| | | | | | | | | | | | | | | | | | | | | | | | |
| | | Growth
Fund | | | Tax-
Managed
Growth
Fund | | | Large Cap
Growth
Fund | |
| | | 2007 | | | 2006 | | | 2007 | | | 2006 | | | 2007 | | | 2006 | |
Operations | | | | | | | | | | | | | | | | | | | | | | | | |
Net investment income (loss) | | $ | (311 | ) | | $ | (652 | ) | | $ | 1 | | | $ | (15 | ) | | $ | 14 | | | $ | (30 | ) |
Net realized gain (loss) on investments, foreign currency transactions and other assets and liabilities | | | 33,557 | | | | 31,916 | | | | 950 | | | | 765 | | | | 597 | | | | 223 | |
Change in net unrealized appreciation (depreciation) on investments, and other assets and liabilities | | | 4,809 | | | | (1,057 | ) | | | 55 | | | | 12 | | | | 1,829 | | | | 1,019 | |
| | | | | | | | | | | | | | | | | | | | | | | | |
Net increase (decrease) in net assets resulting from operations | | | 38,055 | | | | 30,207 | | | | 1,006 | | | | 762 | | | | 2,440 | | | | 1,212 | |
Distributions to shareholders from | | | | | | | | | | | | | | | | | | | | | | | | |
Net investment income | | | — | | | | — | | | | (10 | ) | | | — | | | | (14 | ) | | | — | |
Net realized gain | | | (33,894 | ) | | | (27,315 | ) | | | — | | | | — | | | | — | | | | — | |
| | | | | | | | | | | | | | | | | | | | | | | | |
| | | (33,894 | ) | | | (27,315 | ) | | | (10 | ) | | | — | | | | (14 | ) | | | — | |
Capital stock transactions | | | | | | | | | | | | | | | | | | | | | | | | |
Net proceeds from sale of shares | | | 116,201 | | | | 33,215 | | | | 987 | | | | 1,445 | | | | 23,671 | | | | 4,950 | |
Shares issued in reinvestment of income dividends and capital gain distributions | | | 31,770 | | | | 25,204 | | | | 9 | | | | — | | | | 13 | | | | — | |
Less cost of shares redeemed | | | (47,013 | ) | | | (50,345 | ) | | | (774 | ) | | | (378 | ) | | | (12,634 | ) | | | (2,859 | ) |
| | | | | | | | | | | | | | | | | | | | | | | | |
Net increase (decrease) in net assets resulting from capital share transactions | | | 100,958 | | | | 8,074 | | | | 222 | | | | 1,067 | | | | 11,050 | | | | 2,091 | |
| | | | | | | | | | | | | | | | | | | | | | | | |
Increase (decrease) in net assets | | | 105,119 | | | | 10,966 | | | | 1,218 | | | | 1,829 | | | | 13,476 | | | | 3,303 | |
Net assets | | | | | | | | | | | | | | | | | | | | | | | | |
Beginning of year | | $ | 264,525 | | | $ | 253,559 | | | $ | 9,644 | | | $ | 7,815 | | | $ | 20,191 | | | $ | 16,888 | |
| | | | | | | | | | | | | | | | | | | | | | | | |
End of year | | $ | 369,444 | | | $ | 264,525 | | | $ | 10,862 | | | $ | 9,644 | | | $ | 33,667 | | | $ | 20,191 | |
| | | | | | | | | | | | | | | | | | | | | | | | |
Undistributed net investment income (loss) at the end of the year | | $ | — | | | $ | — | | | $ | — | | | $ | — | | | $ | — | | | $ | — | |
| | | | | | | | | | | | | | | | | | | | | | | | |
See accompanying Notes to Financial Statements.
82 Annual Report | December 31, 2007 |
Statements of Assets and Liabilities
December 31, 2007 (all dollar amounts in thousands)
| | | | | | | | | | | | | | | |
| | | Small Cap
Growth
Fund | | Mid Cap
Growth
Fund | | | Small-Mid
Cap
Growth
Fund | | | Global
Growth
Fund(a) | |
Assets | | | | | | | | | | | | | | | |
Investments in securities, at cost | | $ | 755,150 | | $ | 41,599 | | | $ | 111,883 | | | $ | 43,226 | |
Investments in Affiliated Companies, at cost | | | 272,362 | | | — | | | | — | | | | — | |
Investments in Affiliated Fund, at cost | | | 1,554 | | | 112 | | | | 22 | | | | 1,006 | |
| | | | | | | | | | | | | | | |
| | | | |
Investments in securities, at value | | $ | 858,446 | | $ | 45,135 | | | $ | 125,836 | | | $ | 43,344 | |
Investments in Affiliated Companies, at value | | | 232,413 | | | — | | | | — | | | | — | |
Investments in Affiliated Fund, at value | | | 1,554 | | | 112 | | | | 22 | | | | 1,006 | |
Foreign currency, at value (cost $181) | | | — | | | — | | | | — | | | | 181 | |
Receivable for fund shares sold | | | 3,138 | | | 1,530 | | | | 3,143 | | | | 2,523 | |
Receivable for investment securities sold | | | 9,360 | | | — | | | | 78 | | | | 100 | |
Receivable from Advisor | | | — | | | — | | | | — | | | | — | |
Dividend and interest receivable | | | 387 | | | 30 | | | | 65 | | | | 16 | |
| | | | | | | | | | | | | | | |
Total assets | | | 1,105,298 | | | 46,807 | | | | 129,144 | | | | 47,170 | |
Liabilities | | | | | | | | | | | | | | | |
Payable for investment securities purchased | | | 4,596 | | | 1,352 | | | | 4,477 | | | | 1,507 | |
Payable for fund shares redeemed | | | 4,850 | | | — | | | | 34 | | | | — | |
Management fee payable | | | 1,055 | | | 25 | | | | 90 | | | | 32 | |
Distribution and shareholder administration fee payable | | | 65 | | | 1 | | | | 3 | | | | 7 | |
Other accrued expenses | | | 313 | | | 36 | | | | 39 | | | | 48 | |
| | | | | | | | | | | | | | | |
Total liabilities | | | 10,879 | | | 1,414 | | | | 4,643 | | | | 1,594 | |
| | | | | | | | | | | | | | | |
Net Assets | | $ | 1,094,419 | | $ | 45,393 | | | $ | 124,501 | | | $ | 45,576 | |
| | | | | | | | | | | | | | | |
Capital | | | | | | | | | | | | | | | |
Composition of Net Assets | | | | | | | | | | | | | | | |
Par value of shares of beneficial interest | | $ | 46 | | $ | 4 | | | $ | 9 | | | $ | 5 | |
Capital paid in excess of par value | | | 1,019,417 | | | 42,688 | | | | 111,709 | | | | 45,930 | |
Accumulated net investment income (loss) | | | — | | | — | | | | — | | | | (16 | ) |
Accumulated realized gain (loss) | | | 11,609 | | | (835 | ) | | | (1,170 | ) | | | (458 | ) |
Net unrealized appreciation (depreciation) of investments and foreign currencies | | | 63,347 | | | 3,536 | | | | 13,953 | | | | 115 | |
| | | | | | | | | | | | | | | |
Net Assets | | $ | 1,094,419 | | $ | 45,393 | | | $ | 124,501 | | | $ | 45,576 | |
| | | | | | | | | | | | | | | |
| | | | |
Class N Shares | | | | | | | | | | | | | | | |
Net Assets | | $ | 540,137 | | $ | 7,272 | | | $ | 17,074 | | | $ | 9,089 | |
Shares Outstanding | | | 23,184,495 | | | 640,743 | | | | 1,303,767 | | | | 918,982 | |
Net Asset Value Per Share | | $ | 23.30 | | $ | 11.35 | | | $ | 13.10 | | | $ | 9.89 | |
Class I Shares | | | | | | | | | | | | | | | |
Net Assets | | $ | 554,282 | | $ | 38,121 | | | $ | 107,427 | | | $ | 36,487 | |
Shares Outstanding | | | 23,205,514 | | | 3,337,932 | | | | 8,112,628 | | | | 3,682,201 | |
Net Asset Value Per Share | | $ | 23.89 | | $ | 11.42 | | | $ | 13.24 | | | $ | 9.91 | |
See accompanying Notes to Financial Statements.
December 31, 2007 | William Blair Funds 83 |
Statements of Operations
For the Year Ended December 31, 2007 (all dollar amounts in thousands)
| | | | | | | | | | | | | | | | |
| | | Small Cap
Growth
Fund | | | Mid Cap
Growth
Fund | | | Small-Mid
Cap
Growth
Fund | | | Global
Growth
Fund(a) | |
Investment income | | | | | | | | | | | | | | | | |
Dividends | | $ | 1,315 | | | $ | 215 | | | $ | 465 | | | $ | 82 | |
Dividend Income from Affiliated Companies | | | 163 | | | | — | | | | — | | | | — | |
Dividend Income from Affiliated Fund | | | 259 | | | | 8 | | | | 11 | | | | 6 | |
Interest | | | 1,601 | | | | 67 | | | | 163 | | | | 32 | |
| | | | | | | | | | | | | | | | |
Total income | | | 3,338 | | | | 290 | | | | 639 | | | | 120 | |
Expenses | | | | | | | | | | | | | | | | |
Investment advisory fees | | | 14,390 | | | | 342 | | | | 1,118 | | | | 83 | |
Distribution fees | | | 1,717 | | | | 18 | | | | 42 | | | | 3 | |
Shareholder administration fees | | | — | | | | — | | | | — | | | | 12 | |
Custodian fees | | | 156 | | | | 53 | | | | 51 | | | | 12 | |
Transfer agent fees | | | 1,066 | | | | 37 | | | | 53 | | | | 2 | |
Professional fees | | | 54 | | | | 22 | | | | 28 | | | | 31 | |
Registration fees | | | 53 | | | | 32 | | | | 33 | | | | 12 | |
Other expenses | | | 279 | | | | 12 | | | | 32 | | | | 7 | |
| | | | | | | | | | | | | | | | |
Total expenses before waiver | | | 17,715 | | | | 516 | | | | 1,357 | | | | 162 | |
Less expenses waived or absorbed by the Advisor | | | — | | | | (93 | ) | | | (71 | ) | | | (50 | ) |
| | | | | | | | | | | | | | | | |
Net expenses | | | 17,715 | | | | 423 | | | | 1,286 | | | | 112 | |
| | | | | | | | | | | | | | | | |
Net investment income (loss) | | | (14,377 | ) | | | (133 | ) | | | (647 | ) | | | 8 | |
Net realized and unrealized gain (loss) on investments, foreign currency transactions and other assets and liabilities | | | | | | | | | | | | | | | | |
Net realized gain (loss) on investments | | | 77,343 | | | | 1,780 | | | | 10,493 | | | | (457 | ) |
Net realized gain (loss) on foreign currency transactions and other assets and liabilities | | | | | | | | | | | | | | | | |
| | | — | | | | — | | | | — | | | | (11 | ) |
| | | | | | | | | | | | | | | | |
Total net realized gain (loss) | | | 77,343 | | | | 1,780 | | | | 10,493 | | | | (468 | ) |
Change in net unrealized appreciation (depreciation) on investments and other assets and liabilities | | | (84,141 | ) | | | 2,472 | | | | 2,316 | | | | 115 | |
| | | | | | | | | | | | | | | | |
Net increase (decrease) in net assets resulting from operations | | $ | (21,175 | ) | | $ | 4,119 | | | $ | 12,162 | | | $ | (345 | ) |
| | | | | | | | | | | | | | | | |
| (a) | | For the period from October 15, 2007 (Commencement of Operations) to December 31, 2007. |
See accompanying Notes to Financial Statements.
84 Annual Report | December 31, 2007 |
Statements of Changes in Net Assets
For the Years Ended December 31, 2006 and 2007 (all amounts in thousands)
| | | | | | | | | | | | | | | | | | | | | | | | | | | | |
| | | Small Cap
Growth
Fund | | | Mid Cap
Growth
Fund | | | Small-Mid
Cap
Growth
Fund | | | Global
Growth
Fund | |
| | | 2007 | | | 2006 | | | 2007 | | | 2006(a) | | | 2007 | | | 2006 | | | 2007(b) | |
Operations | | | | | | | | | | | | | | | | | | | | | | | | | | | | |
Net investment income (loss) | | $ | (14,377 | ) | | $ | (11,401 | ) | | $ | (133 | ) | | $ | (62 | ) | | $ | (647 | ) | | $ | (538 | ) | | $ | 8 | |
Net realized gain (loss) on investments, foreign currency transactions and other assets and liabilities | | | 77,343 | | | | 116,807 | | | | 1,780 | | | | (187 | ) | | | 10,493 | | | | 4,908 | | | | (468 | ) |
Change in net unrealized appreciation (depreciation) on investments, foreign currency transactions and other assets and liabilities | | | (84,141 | ) | | | 27,043 | | | | 2,472 | | | | 1,064 | | | | 2,316 | | | | 3,169 | | | | 115 | |
| | | | | | | | | | | | | | | | | | | | | | | | | | | | |
Net increase (decrease) in net assets resulting from operations | | | (21,175 | ) | | | 132,449 | | | | 4,119 | | | | 815 | | | | 12,162 | | | | 7,539 | | | | (345 | ) |
Distributions to shareholders from | | | | | | | | | | | | | | | | | | | | | | | | | | | | |
Net investment income | | | — | | | | — | | | | — | | | | — | | | | — | | | | — | | | | (17 | ) |
Net realized gain | | | (68,381 | ) | | | (78,266 | ) | | | (2,295 | ) | | | — | | | | (11,850 | ) | | | (4,404 | ) | | | — | |
| | | | | | | | | | | | | | | | | | | | | | | | | | | | |
| | | (68,381 | ) | | | (78,266 | ) | | | (2,295 | ) | | | — | | | | (11,850 | ) | | | (4,404 | ) | | | (17 | ) |
Capital stock transactions | | | | | | | | | | | | | | | | | | | | | | | | | | | | |
Net proceeds from sale of shares | | | 289,096 | | | | 590,073 | | | | 25,023 | | | | 21,378 | | | | 33,865 | | | | 24,304 | | | | 46,237 | |
Shares issued in reinvestment of income dividends and capital gain distributions | | | 65,191 | | | | 73,523 | | | | 2,160 | | | | — | | | | 10,904 | | | | 3,992 | | | | 15 | |
Less cost of shares redeemed | | | (431,486 | ) | | | (288,343 | ) | | | (3,253 | ) | | | (2,554 | ) | | | (13,346 | ) | | | (8,876 | ) | | | (314 | ) |
| | | | | | | | | | | | | | | | | | | | | | | | | | | | |
Net increase (decrease) in net assets resulting from capital stock transactions | | | (77,199 | ) | | | 375,253 | | | | 23,930 | | | | 18,824 | | | | 31,423 | | | | 19,420 | | | | 45,938 | |
| | | | | | | | | | | | | | | | | | | | | | | | | | | �� | |
Increase (decrease) in net assets | | | (166,755 | ) | | | 429,436 | | | | 25,754 | | | | 19,639 | | | | 31,735 | | | | 22,555 | | | | 45,576 | |
Net assets | | | | | | | | | | | | | | | | | | | | | | | | | | | | |
Beginning of year | | $ | 1,261,174 | | | $ | 831,738 | | | $ | 19,639 | | | $ | — | | | $ | 92,766 | | | $ | 70,211 | | | $ | — | |
| | | | | | | | | | | | | | | | | | | | | | | | | | | | |
End of year | | $ | 1,094,419 | | | $ | 1,261,174 | | | $ | 45,393 | | | $ | 19,639 | | | $ | 124,501 | | | $ | 92,766 | | | $ | 45,576 | |
| | | | | | | | | | | | | | | | | | | | | | | | | | | | |
Undistributed net investment income (loss) at the end of the year | | $ | — | | | $ | (11,401 | ) | | $ | — | | | $ | — | | | $ | — | | | $ | — | | | $ | (16 | ) |
| | | | | | | | | | | | | | | | | | | | | | | | | | | | |
| (a) | | For the period from February 1, 2006 (Commencement of Operations) to December 31, 2006. |
| (b) | | For the period from October 15, 2007 (Commencement of Operations) to December 31, 2007. |
See accompanying Notes to Financial Statements.
December 31, 2007 | William Blair Funds 85 |
Statements of Assets and Liabilities
December 31, 2007 (all dollar amounts in thousands)
| | | | | | | | | | | | | | | | |
| | | International
Growth
Fund | | | International
Equity
Fund | | | International
Small Cap
Growth
Fund | | | Emerging
Markets
Growth
Fund | |
Assets | | | | | | | | | | | | | | | | |
Investments in securities, at cost | | $ | 6,006,472 | | | $ | 314,473 | | | $ | 364,693 | | | $ | 853,772 | |
Investments in Affiliated Fund, at cost | | | 9,878 | | | | 5,278 | | | | 2,197 | | | | 1,326 | |
| | | | | | | | | | | | | | | | |
| | | | |
Investments in securities, at value | | $ | 7,970,762 | | | $ | 397,059 | | | $ | 401,788 | | | $ | 1,152,654 | |
Investments in Affiliated Fund, at value | | | 9,878 | | | | 5,278 | | | | 2,197 | | | | 1,326 | |
Foreign currency, at value (cost $22,472, $1,810, $2,301, and $10,667, respectively) | | | 22,437 | | | | 1,808 | | | | 2,301 | | | | 10,650 | |
Receivable for fund shares sold | | | 75,388 | | | | 4,165 | | | | 2,011 | | | | 343 | |
Receivable for investment securities sold | | | 36,254 | | | | 717 | | | | 216 | | | | 7,467 | |
Dividend and interest receivable | | | 7,071 | | | | 398 | | | | 421 | | | | 776 | |
| | | | | | | | | | | | | | | | |
Total assets | | | 8,121,790 | | | | 409,425 | | | | 408,934 | | | | 1,173,216 | |
Liabilities | | | | | | | | | | | | | | | | |
Payable for investment securities purchased | | | 10,748 | | | | 373 | | | | 6,815 | | | | 1,005 | |
Payable for fund shares redeemed | | | 50,293 | | | | 49 | | | | 134 | | | | 386 | |
Management fee payable | | | 6,835 | | | | 361 | | | | 338 | | | | 1,104 | |
Distribution and shareholder administration fee payable | | | 1,147 | | | | 12 | | | | 26 | | | | 56 | |
Foreign tax liability | | | 2,952 | | | | 18 | | | | 26 | | | | 4,497 | |
Other accrued expenses | | | 1,161 | | | | 3 | | | | 136 | | | | 314 | |
| | | | | | | | | | | | | | | | |
Total liabilities | | | 73,136 | | | | 816 | | | | 7,475 | | | | 7,362 | |
| | | | | | | | | | | | | | | | |
Net Assets | | $ | 8,048,654 | | | $ | 408,609 | | | $ | 401,459 | | | $ | 1,165,854 | |
| | | | | | | | | | | | | | | | |
Capital | | | | | | | | | | | | | | | | |
Composition of Net Assets | | | | | | | | | | | | | | | | |
Par value of shares of beneficial interest | | $ | 274 | | | $ | 25 | | | $ | 28 | | | $ | 54 | |
Capital paid in excess of par value | | | 6,045,618 | | | | 328,085 | | | | 363,005 | | | | 841,272 | |
Accumulated net investment income (loss) | | | (129,363 | ) | | | (4,913 | ) | | | (2,779 | ) | | | (9,849 | ) |
Accumulated realized gain (loss) | | | 170,379 | | | | 2,818 | | | | 4,157 | | | | 39,881 | |
Net unrealized appreciation (depreciation) of investments and foreign currencies | | | 1,961,746 | | | | 82,594 | | | | 37,048 | | | | 294,496 | |
| | | | | | | | | | | | | | | | |
Net Assets | | $ | 8,048,654 | | | $ | 408,609 | | | $ | 401,459 | | | $ | 1,165,854 | |
| | | | | | | | | | | | | | | | |
| | | | |
Class N Shares | | | | | | | | | | | | | | | | |
Net Assets | | $ | 5,161,753 | | | $ | 60,058 | | | $ | 21,905 | | | $ | 76,413 | |
Shares Outstanding | | | 177,256,995 | | | | 3,632,596 | | | | 1,567,165 | | | | 3,486,643 | |
Net Asset Value Per Share | | $ | 29.12 | | | $ | 16.53 | | | $ | 13.98 | | | $ | 21.92 | |
| | | | |
Class I Shares | | | | | | | | | | | | | | | | |
Net Assets | | $ | 2,886,901 | | | $ | 348,551 | | | $ | 148,839 | | | $ | 280,370 | |
Shares Outstanding | | | 97,504,815 | | | | 20,916,170 | | | | 10,621,895 | | | | 12,751,578 | |
Net Asset Value Per Share | | $ | 29.61 | | | $ | 16.66 | | | $ | 14.01 | | | $ | 21.99 | |
See accompanying Notes to Financial Statements.
86 Annual Report | December 31, 2007 |
Statements of Operations
For the Year Ended December 31, 2007 (all dollar amounts in thousands)
| | | | | | | | | | | | | | | | |
| | | International
Growth
Fund | | | International
Equity
Fund | | | International
Small Cap
Growth
Fund | | | Emerging
Markets
Growth
Fund | |
Investment income | | | | | | | | | | | | | | | | |
Dividends | | $ | 125,084 | | | $ | 6,713 | | | $ | 4,357 | | | $ | 11,480 | |
Less foreign tax withheld | | | (6,338 | ) | | | (415 | ) | | | (188 | ) | | | (709 | ) |
Income from Affiliated Fund | | | 240 | | | | 220 | | | | 127 | | | | 60 | |
Interest | | | 10,275 | | | | 435 | | | | 690 | | | | 1,428 | |
| | | | | | | | | | | | | | | | |
Total income | | | 129,261 | | | | 6,953 | | | | 4,986 | | | | 12,259 | |
Expenses | | | | | | | | | | | | | | | | |
Investment advisory fees | | | 72,836 | | | | 3,778 | | | | 3,395 | | | | 11,212 | |
Distribution fees | | | 11,969 | | | | 126 | | | | 54 | | | | 166 | |
Shareholder administration fees | | | — | | | | — | | | | 223 | | | | 466 | |
Custodian fees | | | 2,900 | | | | 249 | | | | 290 | | | | 1,103 | |
Transfer agent fees | | | 3,978 | | | | 262 | | | | 47 | | | | 119 | |
Professional fees | | | 157 | | | | 48 | | | | 44 | | | | 63 | |
Registration fees | | | 217 | | | | 86 | | | | 64 | | | | 115 | |
Other expenses | | | 1,754 | | | | 9 | | | | 51 | | | | 159 | |
| | | | | | | | | | | | | | | | |
Total expenses before waiver | | | 93,811 | | | | 4,558 | | | | 4,168 | | | | 13,403 | |
Less expenses waived or absorbed by the Advisor | | | — | | | | (182 | ) | | | — | | | | (25 | ) |
| | | | | | | | | | | | | | | | |
Net expenses | | | 93,811 | | | | 4,376 | | | | 4,168 | | | | 13,378 | |
| | | | | | | | | | | | | | | | |
Net investment income (loss) | | | 35,450 | | | | 2,577 | | | | 818 | | | | (1,119 | ) |
Net realized and unrealized gain (loss) on investments, foreign currency transactions and other assets and liabilities | | | | | | | | | | | | | | | | |
Net realized gain (loss) on investments | | | 828,208 | | | | 27,768 | | | | 30,272 | | | | 221,850 | |
Net realized gain (loss) on foreign currency transactions and other assets and liabilities | | | (13,604 | ) | | | (699 | ) | | | (676 | ) | | | (1,744 | ) |
| | | | | | | | | | | | | | | | |
Total net realized gain (loss) | | | 814,604 | | | | 27,069 | | | | 29,596 | | | | 220,106 | |
Change in net unrealized appreciation (depreciation) on investments and other assets and liabilities—Net of Indian tax liability | | | 325,850 | | | | 27,356 | | | | 6,611 | | | | 117,024 | |
| | | | | | | | | | | | | | | | |
Net increase (decrease) in net assets resulting from operations | | $ | 1,175,904 | | | $ | 57,002 | | | $ | 37,025 | | | $ | 336,011 | |
| | | | | | | | | | | | | | | | |
See accompanying Notes to Financial Statements.
December 31, 2007 | William Blair Funds 87 |
Statements of Changes in Net Assets
For the Years Ended December 31, 2007 and 2006 (all amounts in thousands)
| | | | | | | | | | | | | | | | | | | | | | | | | | | | | | | | |
| | | International
Growth
Fund | | | International
Equity
Fund | | | International
Small Cap
Growth
Fund | | | Emerging
Markets
Growth
Fund | |
| | | 2007 | | | 2006 | | | 2007 | | | 2006 | | | 2007 | | | 2006 | | | 2007 | | | 2006 | |
Operations | | | | | | | | | | | | | | | | | | | | | | | | | | | | | | | | |
Net investment income (loss) | | $ | 35,450 | | | $ | 14,830 | | | $ | 2,577 | | | $ | 1,056 | | | $ | 818 | | | $ | (221 | ) | | $ | (1,119 | ) | | $ | 211 | |
Net realized gain (loss) on investments, foreign currency transactions and other assets and liabilities | | | 814,604 | | | | 713,203 | | | | 27,069 | | | | 4,871 | | | | 29,596 | | | | 2,299 | | | | 220,106 | | | | 22,993 | |
Change in net unrealized appreciation (depreciation) on investments, foreign currency transactions and other assets and liabilities | | | 325,850 | | | | 398,415 | | | | 27,356 | | | | 38,016 | | | | 6,611 | | | | 26,158 | | | | 117,024 | | | | 147,786 | |
| | | | | | | | | | | | | | | | | | | | | | | | | | | | | | | | |
Net increase (decrease) in net assets resulting from operations | | | 1,175,904 | | | | 1,126,448 | | | | 57,002 | | | | 43,943 | | | | 37,025 | | | | 28,236 | | | | 336,011 | | | | 170,990 | |
Distributions to shareholders from | | | | | | | | | | | | | | | | | | | | | | | | | | | | | | | | |
Net investment income | | | (91,166 | ) | | | (81,288 | ) | | | (3,639 | ) | | | (4,187 | ) | | | (2,890 | ) | | | (106 | ) | | | (7,865 | ) | | | (405 | ) |
Net realized gain | | | (765,168 | ) | | | (590,410 | ) | | | (26,593 | ) | | | (456 | ) | | | (27,584 | ) | | | (877 | ) | | | (199,782 | ) | | | (4,544 | ) |
| | | | | | | | | | | | | | | | | | | | | | | | | | | | | | | | |
| | | (856,334 | ) | | | (671,698 | ) | | | (30,232 | ) | | | (4,643 | ) | | | (30,474 | ) | | | (983 | ) | | | (207,647 | ) | | | (4,949 | ) |
Capital stock transactions | | | | | | | | | | | | | | | | | | | | | | | | | | | | | | | | |
Net proceeds from sale of shares | | | 1,936,694 | | | | 1,785,719 | | | | 125,416 | | | | 137,733 | | | | 188,786 | | | | 172,153 | | | | 192,579 | | | | 529,925 | |
Shares issued in reinvestment of income dividends and capital gain distributions | | | 814,447 | | | | 633,412 | | | | 29,404 | | | | 4,390 | | | | 25,293 | | | | 868 | | | | 201,805 | | | | 4,687 | |
Less cost of shares redeemed | | | (1,289,183 | ) | | | (1,157,832 | ) | | | (70,697 | ) | | | (61,417 | ) | | | (51,140 | ) | | | (18,839 | ) | | | (170,543 | ) | | | (136,352 | ) |
| | | | | | | | | | | | | | | | | | | | | | | | | | | | | | | | |
Net increase (decrease) in net assets resulting from capital stock transactions | | | 1,461,958 | | | | 1,261,299 | | | | 84,123 | | | | 80,706 | | | | 162,939 | | | | 154,182 | | | | 223,841 | | | | 398,260 | |
| | | | | | | | | | | | | | | | | | | | | | | | | | | | | | | | |
Increase (decrease) in net assets | | | 1,781,528 | | | | 1,716,049 | | | | 110,893 | | | | 120,006 | | | | 169,490 | | | | 181,435 | | | | 352,205 | | | | 564,301 | |
Net assets | | | | | | | | | | | | | | | | | | | | | | | | | | | | | | | | |
Beginning of year | | $ | 6,267,126 | | | $ | 4,551,077 | | | $ | 297,716 | | | | 177,710 | | | $ | 231,969 | | | | 50,534 | | | $ | 813,649 | | | $ | 249,348 | |
| | | | | | | | | | | | | | | | | | | | | | | | | | | | | | | | |
End of year | | $ | 8,048,654 | | | $ | 6,267,126 | | | $ | 408,609 | | | $ | 297,716 | | | $ | 401,459 | | | $ | 231,969 | | | $ | 1,165,854 | | | $ | 813,649 | |
| | | | | | | | | | | | | | | | | | | | | | | | | | | | | | | | |
Undistributed net investment income (loss) at the end of the year | | $ | (129,363 | ) | | $ | (124,368 | ) | | $ | (4,913 | ) | | $ | (4,627 | ) | | $ | (2,779 | ) | | $ | (137 | ) | | $ | (9,849 | ) | | $ | (492 | ) |
| | | | | | | | | | | | | | | | | | | | | | | | | | | | | | | | |
See accompanying Notes to Financial Statements.
88 Annual Report | December 31, 2007 |
Statements of Assets and Liabilities
December 31, 2007 (all dollar amounts in thousands)
| | | | | | | | | | | | | | | | |
| | | Value
Discovery
Fund | | | Bond
Fund | | | Income
Fund | | | Ready
Reserves
Fund | |
Assets | | | | | | | | | | | | | | | | |
Investments in securities, at cost | | $ | 46,879 | | | $ | 66,688 | | | $ | 209,354 | | | $ | 1,394,104 | |
Investments in Affiliated Fund, at cost | | | 31 | | | | — | | | | — | | | | — | |
| | | | | | | | | | | | | | | | |
| | | | |
Investments in securities, at value | | $ | 47,089 | | | $ | 67,427 | | | $ | 204,528 | | | $ | 1,394,104 | |
Investments in Affiliated Fund, at value | | | 31 | | | | — | | | | — | | | | — | |
Cash | | | — | | | | 1 | | | | — | | | | — | |
Receivable for fund shares sold | | | 231 | | | | 720 | | | | 119 | | | | 106 | |
Receivable for investment securities sold | | | — | | | | — | | | | — | | | | — | |
Receivable from Advisor | | | — | | | | — | | | | 12 | | | | — | |
Dividend and interest receivable | | | 51 | | | | 624 | | | | 2,310 | | | | 6,889 | |
| | | | | | | | | | | | | | | | |
Total assets | | | 47,402 | | | | 68,772 | | | | 206,969 | | | | 1,401,099 | |
Liabilities | | | | | | | | | | | | | | | | |
Payables for investment securities purchased and other | | | 39 | | | | — | | | | 1,790 | | | | — | |
Payable for fund shares redeemed | | | 113 | | | | 250 | | | | 515 | | | | — | |
Management fee payable | | | 65 | | | | 17 | | | | 10 | | | | 251 | |
Distribution fee payable | | | 27 | | | | — | | | | 10 | | | | — | |
Shareholder services payable | | | — | | | | 7 | | | | — | | | | 397 | |
Dividend payable | | | — | | | | — | | | | — | | | | 651 | |
Other accrued expenses | | | 40 | | | | 15 | | | | 14 | | | | 263 | |
| | | | | | | | | | | | | | | | |
Total liabilities | | | 284 | | | | 289 | | | | 2,339 | | | | 1,562 | |
| | | | | | | | | | | | | | | | |
Net Assets | | $ | 47,118 | | | $ | 68,483 | | | $ | 204,630 | | | $ | 1,399,537 | |
| | | | | | | | | | | | | | | | |
Capital | | | | | | | | | | | | | | | | |
Composition of Net Assets | | | | | | | | | | | | | | | | |
Par value of shares of beneficial interest | | $ | 4 | | | $ | 7 | | | $ | 20 | | | $ | 1,095 | |
Capital paid in excess of par value | | | 48,480 | | | | 67,942 | | | | 238,229 | | | | 1,399,335 | |
Accumulated net investment income (loss) | | | 29 | | | | 1 | | | | — | | | | 84 | |
Accumulated realized gain (loss) | | | (1,605 | ) | | | (206 | ) | | | (28,793 | ) | | | (977 | ) |
Net unrealized appreciation (depreciation) of investments and foreign currencies | | | 210 | | | | 739 | | | | (4,826 | ) | | | — | |
| | | | | | | | | | | | | | | | |
Net Assets | | $ | 47,118 | | | $ | 68,483 | | | $ | 204,630 | | | $ | 1,399,537 | |
| | | | | | | | | | | | | | | | |
| | | | |
Class N Shares | | | | | | | | | | | | | | | | |
Net Assets | | $ | 11,791 | | | $ | 736 | | | $ | 75,188 | | | $ | 1,399,537 | |
Shares Outstanding | | | 1,042,384 | | | | 73,054 | | | | 8,092,751 | | | | 1,399,590,655 | |
Net Asset Value Per Share | | $ | 11.31 | | | $ | 10.07 | | | $ | 9.29 | | | $ | 1.00 | |
Class I Shares | | | | | | | | | | | | | | | | |
Net Assets | | $ | 35,327 | | | $ | 55,873 | | | $ | 129,442 | | | | | |
Shares Outstanding | | | 3,072,303 | | | | 5,565,656 | | | | 13,924,551 | | | | | |
Net Asset Value Per Share | | $ | 11.50 | | | $ | 10.04 | | | $ | 9.30 | | | | | |
See accompanying Notes to Financial Statements.
December 31, 2007 | William Blair Funds 89 |
Statements of Operations
For the Year Ended December 31, 2007 (all dollar amounts in thousands)
| | | | | | | | | | | | | | | | |
| | | Value
Discovery
Fund | | | Bond
Fund(a) | | | Income
Fund | | | Ready
Reserves
Fund | |
Investment income | | | | | | | | | | | | | | | | |
Dividends | | $ | 1,331 | | | $ | 13 | | | $ | — | | | $ | — | |
Dividend Income from Affiliated Fund | | | 4 | | | | — | | | | — | | | | — | |
Interest | | | 44 | | | | 2,055 | | | | 14,257 | | | | 66,661 | |
| | | | | | | | | | | | | | | | |
Total income | | | 1,379 | | | | 2,068 | | | | 14,257 | | | | 66,661 | |
Expenses | | | | | | | | | | | | | | | | |
Investment advisory fees | | | 993 | | | | 114 | | | | 1,292 | | | | 3,039 | |
Distribution fees | | | 103 | | | | 1 | | | | 133 | | | | — | |
Shareholder administration fees | | | — | | | | 48 | | | | — | | | | 4,433 | |
Custodian fees | | | 79 | | | | 29 | | | | 100 | | | | 125 | |
Transfer agent fees | | | 110 | | | | 6 | | | | 126 | | | | 22 | |
Professional fees | | | 26 | | | | 30 | | | | 38 | | | | 59 | |
Registration fees | | | 33 | | | | 16 | | | | 37 | | | | 38 | |
Other expenses | | | 13 | | | | 4 | | | | 14 | | | | 264 | |
| | | | | | | | | | | | | | | | |
Total expenses before waiver | | | 1,357 | | | | 248 | | | | 1,740 | | | | 7,980 | |
Less expenses waived or absorbed by the Advisor | | | (276 | ) | | | (66 | ) | | | (12 | ) | | | — | |
| | | | | | | | | | | | | | | | |
Net expenses | | | 1,081 | | | | 182 | | | | 1,728 | | | | 7,980 | |
| | | | | | | | | | | | | | | | |
Net investment income (loss) | | | 298 | | | | 1,886 | | | | 12,529 | | | | 58,681 | |
Net realized and unrealized gain (loss) on investments, foreign currency transactions and other assets and liabilities | | | | | | | | | | | | | | | | |
Net realized gain (loss) on investments | | | 12,916 | | | | (206 | ) | | | (8,317 | ) | | | (2 | ) |
| | | | | | | | | | | | | | | | |
Change in net unrealized appreciation (depreciation) on investments and other assets and liabilities | | | (12,770 | ) | | | 739 | | | | (822 | ) | | | — | |
| | | | | | | | | | | | | | | | |
Net increase (decrease) in net assets resulting from operations | | $ | 444 | | | $ | 2,419 | | | $ | 3,390 | | | $ | 58,679 | |
| | | | | | | | | | | | | | | | |
| (a) | | For the period from May 1, 2007 (Commencement of Operations) to December 31, 2007. |
See accompanying Notes to Financial Statements.
90 Annual Report | December 31, 2007 |
Statements of Changes in Net Assets
For the Years Ended December 31, 2007 and 2006 (all amounts in thousands)
| | | | | | | | | | | | | | | | | | | | | | | | | | | | |
| | | Value
Discovery
Fund | | | Bond
Fund | | | Income
Fund | | | Ready
Reserves
Fund | |
| | | 2007 | | | 2006 | | | 2007(a) | | | 2007 | | | 2006 | | | 2007 | | | 2006 | |
Operations | | | | | | | | | | | | | | | | | | | | | | | | | | | | |
Net investment income (loss) | | $ | 298 | | | $ | 136 | | | $ | 1,886 | | | $ | 12,529 | | | $ | 14,102 | | | $ | 58,681 | | | $ | 51,297 | |
Net realized gain (loss) on investments, foreign currency transactions and other assets and liabilities | | | 12,916 | | | | 16,215 | | | | (206 | ) | | | (8,317 | ) | | | (1,052 | ) | | | (2 | ) | | | — | |
Change in net unrealized appreciation (depreciation) on investments, foreign currency transactions and other assets and liabilities | | | (12,770 | ) | | | 760 | | | | 739 | | | | (822 | ) | | | (202 | ) | | | — | | | | — | |
| | | | | | | | | | | | | | | | | | | | | | | | | | | | |
Net increase (decrease) in net assets resulting from operations | | | 444 | | | | 17,111 | | | | 2,419 | | | | 3,390 | | | | 12,848 | | | | 58,679 | | | | 51,297 | |
Distributions to shareholders from | | | | | | | | | | | | | | | | | | | | | | | | | | | | |
Net investment income | | | (172 | ) | | | (129 | ) | | | (1,892 | ) | | | (14,147 | ) | | | (16,500 | ) | | | (58,678 | ) | | | (51,297 | ) |
Net realized gain | | | (12,452 | ) | | | (15,001 | ) | | | — | | | | — | | | | — | | | | — | | | | — | |
| | | | | | | | | | | | | | | | | | | | | | | | | | | | |
| | | (12,624 | ) | | | (15,130 | ) | | | (1,892 | ) | | | (14,147 | ) | | | (16,500 | ) | | | (58,678 | ) | | | (51,297 | ) |
Capital stock transactions | | | | | | | | | | | | | | | | | | | | | | | | | | | | |
Net proceeds from sale of shares | | | 28,653 | | | | 100,537 | | | | 67,764 | | | | 47,969 | | | | 61,832 | | | | 1,130,710 | | | | 1,030,633 | |
Shares issued in reinvestment of income dividends and capital gain distributions | | | 12,169 | | | | 14,164 | | | | 1,606 | | | | 11,602 | | | | 13,061 | | | | 58,646 | | | | 51,002 | |
Less cost of shares redeemed | | | (128,301 | ) | | | (40,344 | ) | | | (1,414 | ) | | | (141,261 | ) | | | (84,660 | ) | | | (985,413 | ) | | | (977,896 | ) |
| | | | | | | | | | | | | | | | | | | | | | | | | | | | |
Net increase (decrease) in net assets resulting from capital stock transactions | | | (87,479 | ) | | | 74,357 | | | | 67,956 | | | | (81,690 | ) | | | (9,767 | ) | | | 203,943 | | | | 103,739 | |
| | | | | | | | | | | | | | | | | | | | | | | | | | | | |
Increase (decrease) in net assets | | | (99,659 | ) | | | 76,338 | | | | 68,483 | | | | (92,447 | ) | | | (13,419 | ) | | | 203,944 | | | | 103,739 | |
Net assets | | | | | | | | | | | | | | | | | | | | | | | | | | | | |
Beginning of year | | $ | 146,777 | | | $ | 70,439 | | | $ | — | | | $ | 297,077 | | | $ | 310,496 | | | $ | 1,195,593 | | | $ | 1,091,854 | |
| | | | | | | | | | | | | | | | | | | | | | | | | | | | |
End of year | | $ | 47,118 | | | $ | 146,777 | | | $ | 68,483 | | | $ | 204,630 | | | $ | 297,077 | | | $ | 1,399,537 | | | $ | 1,195,593 | |
| | | | | | | | | | | | | | | | | | | | | | | | | | | | |
Undistributed net investment income (loss) at the end of the year | | $ | 29 | | | $ | 11 | | | $ | 1 | | | $ | — | | | $ | — | | | $ | 84 | | | $ | 81 | |
| | | | | | | | | | | | | | | | | | | | | | | | | | | | |
| (a) | | For the period from May 1, 2007 (Commencement of Operations) to December 31, 2007. |
See accompanying Notes to Financial Statements.
December 31, 2007 | William Blair Funds 91 |
Notes to Financial Statements
(1) Significant Accounting Policies
The following is a summary of the Fund’s significant accounting policies in effect during the period covered by the financial statements, which are in accordance with U.S. generally accepted accounting principles.
(a) Description of the Fund
William Blair Funds (the “Fund”) is a diversified mutual fund registered under the Investment Company Act of 1940, as amended, as an open-end management investment company. For each portfolio, the number of shares authorized is unlimited. The Fund currently consists of the following seventeen portfolios (the “Portfolios”), each with its own investment objectives and policies.
| | |
Equity Portfolios | | International Portfolios |
Growth | | International Growth |
Tax-Managed Growth | | International Equity |
Large Cap Growth | | International Small Cap Growth |
Small Cap Growth | | Institutional International Growth |
Mid Cap Growth | | Institutional International Equity |
Small-Mid Cap Growth | | Emerging Markets Growth |
Value Discovery | | Fixed-Income Portfolios |
Global Portfolio | | Bond |
Global Growth | | Income |
| | Money Market Portfolio |
| | Ready Reserves |
The investment objectives of the Portfolios are as follows:
| | |
Equity | | Long-term capital appreciation. |
Global | | Long-term capital appreciation. |
International | | Long-term capital appreciation. |
Fixed Income | | High level of current income with relative stability of principal. |
Money Market | | Current income, a stable share price and daily liquidity. |
The Institutional International Growth Portfolio, the Institutional International Equity Portfolio and the Institutional Class of the Global Growth Portfolio, the International Small Cap Growth Portfolio, the Emerging Markets Growth Portfolio and the Bond Portfolio issue a separate report.
(b) Share Classes
Three different classes of shares currently exist: N, I and Institutional. This report includes financial highlight information for Classes N and I. The table below describes the Class N shares and the Class I shares covered by this report:
| | |
Class | | Description |
| N | | Class N shares are sold to the general public, either directly through the Fund’s distributor or through a select number of financial intermediaries. Class N shares are sold without any sales load, and carry an annual 12b-1 distribution fee (0.25% for the Equity and International Portfolios and 0.15% for the Fixed Income Portfolios) or a service fee (0.35% for the Money Market Portfolio), and an annual shareholder administration fee (0.15% for the Global Growth Portfolio, the International Small Cap Growth Portfolio, the Emerging Markets Growth Portfolio and the Bond Portfolio). |
| I | | Class I shares are sold to a limited group of investors. They do not carry any sales load or distribution fees and generally have lower ongoing expenses than the other classes. Class I shares of the Global Growth Portfolio, the International Small Cap Growth Portfolio, the Emerging Markets Growth Portfolio and the Bond Portfolio carry an annual shareholder administration fee of 0.15%. |
Investment income, realized and unrealized gains and losses, and certain Portfolio level expenses and expense reductions, if any, are allocated based on the relative net assets of each class, except for certain class specific expenses which are charged directly to the appropriate class. Differences in class expenses may result in the payment of different per share dividends by class. All share classes of the Portfolios have equal rights with respect to voting subject to class specific arrangements.
92 Annual Report | December 31, 2007 |
(c) Investment Valuation
The market value of domestic equity securities and options is determined by valuing securities traded on national securities exchanges or markets or in the over-the-counter markets at the last sales price or, if applicable, the official closing price or, in the absence of a sale on the date of valuation, at the latest bid price.
For international securities, if the foreign exchange or market on which a security is primarily traded closes before the close of regular trading on the New York Stock Exchange (4:00 p.m. Eastern time), the Portfolios use an independent pricing service on a daily basis to estimate the fair value price as of the close of regular trading on the New York Stock Exchange. The Board of Trustees has determined that the passage of time between when foreign exchanges or markets close and when the Portfolios calculate their net asset values could cause the value of international securities to no longer be representative of their market price or accurate. In addition, quarterly the Board of Trustees receives a report which compares the average fair value prices used to calculate the net asset value to the next day’s opening local prices. The value of foreign equity securities is determined based on the last sale price on the foreign exchange or market on which it is primarily traded or, if there have been no sales during that day, at the latest bid price. Foreign currency forward contracts and foreign currencies are valued at the forward and current exchange rates, respectively, prevailing on the date of valuation.
Long-term, fixed-income securities are valued based on market quotations, or by independent pricing services that use prices provided by market makers or by estimates of market values obtained from yield data relating to instruments or securities with similar characteristics.
Investments in other funds are valued at the underlying fund’s net asset value on the date of valuation. Other securities, and all other assets, including securities for which a market price is not available, or the value of which is affected by a significant valuation event, are valued at fair value as determined in good faith by the Pricing or Valuation Committee, in accordance with the Fund’s Valuation Procedures approved by the Board of Trustees. As of December 31, 2007, there were securities held in the Small Cap Growth, International Equity and Emerging Markets Growth portfolios requiring fair valuation pursuant to the Fund’s valuation procedures. Securities held in the Ready Reserves Fund are valued at amortized cost, which approximates market value.
(d) Investment income and transactions
Dividend income is recorded on the ex-dividend date, except for those dividends from certain foreign securities that are recorded as soon as the information is available. Foreign currency gains and losses associated with fluctuations in the foreign currency rate versus the United States dollar are recorded in the Statement of Operations as a component of the net realized gain (loss) on foreign currency translations and other assets and liabilities.
Premiums and discounts are accreted and amortized on a straight-line basis for short-term investments and on an effective interest method for long-term investments.
Interest income is determined on the basis of the interest accrued, adjusted for amortization of premium or discount. Variable rate bonds and floating rate notes earn interest at coupon rates that fluctuate at specific time intervals. The interest rates shown in the Portfolio of Investments for the Bond, Income, and Ready Reserves Portfolios were the rates in effect on December 31, 2007. Put bonds may be redeemed at the discretion of the holder on specified dates prior to maturity.
Paydown gains and losses on mortgage and asset-backed securities are treated as an adjustment to interest income. For the year ended December 31, 2007, the Bond and Income Portfolios recognized an increase or reduction of interest income and an increase or reduction of net realized gain (loss) of (1,608) and (1) respectively (in thousands). This reclassification has no effect on the net asset value of the Portfolio.
Security and shareholder transactions are accounted for no later than one business day following the trade date. However, for financial reporting purposes, security and shareholder transactions are accounted for on the trade date of the last business day of the reporting period. Realized gains and losses from securities transactions are recognized on the basis of high cost lot sell selection.
Awards from class action litigation may be recorded as a reduction of cost. If the Funds no longer own the applicable securities, the proceeds are recorded as realized gains.
(e) Share Valuation and Dividends to Shareholders
Shares are sold and redeemed on a continuous basis at net asset value. The net asset value per share is determined separately for each class by dividing the Portfolio’s net assets attributable to that class by the number of shares of the class outstanding
December 31, 2007 | William Blair Funds 93 |
as of the close of regular trading on the New York Stock Exchange, which is generally 3:00 p.m. Central time (4:00 p.m. Eastern time), on each day the Exchange is open. Redemption fees may be applicable to redemptions or exchanges within 60 days of purchase. For both Class N and Class I shares, the William Blair domestic equity portfolios assess a 1% redemption fee on shares sold or exchanged that have been owned 60 days or less and the William Blair international portfolios assess a 2% redemption fee on shares sold or exchanged that have been owned 60 days or less as disclosed within the Fund’s Prospectus. The redemption fees collected by the Fund are netted against the amount of Redemptions for presentation on the Statement of Changes in Net Assets.
For the period ended December 31, 2007, the redemption fees collected by the Portfolios were as follows (in thousands):
| | | |
| | | Redemption
Fees |
Growth | | $ | 5 |
Tax-Managed Growth | | | — |
Large Cap Growth | | | — |
Small Cap Growth | | | 52 |
Mid Cap Growth Fund | | | 1 |
Small Mid-Cap Growth | | | 1 |
Global Growth | | | — |
International Growth | | | 115 |
International Equity | | | 40 |
International Small Cap Growth | | | 14 |
Emerging Markets Growth | | | 17 |
Value Discovery | | | 16 |
Dividends from net investment income, if any, of the Growth, Tax-Managed Growth, Large Cap Growth, Small Cap Growth, Mid Cap Growth, Small-Mid Cap Growth, Global Growth, International Growth, International Equity, International Small Cap Growth, Emerging Markets Growth and Value Discovery Portfolios are declared and paid at least annually. Dividends from the Bond and Income and the Ready Reserves Portfolios are declared and paid monthly and daily, respectively. Capital gain distributions, if any, are declared and paid at least annually in December. Dividends payable to shareholders are recorded on the ex-dividend date.
(f) Foreign Currency Translation and Forward Foreign Currency Contracts
The Global Growth, International Growth, International Equity, International Small Cap Growth and Emerging Markets Growth Portfolios may invest in securities denominated in foreign currencies. As such, assets and liabilities denominated in foreign currencies are translated into U.S. dollar amounts at the current exchange rate on the date of valuation. The values of foreign investments, open foreign currency forward contracts, and cash denominated in foreign currencies are translated into U.S. dollars using a spot market rate of exchange as of the time of the determination of each Portfolio’s NAV, typically 4:00 p.m. Eastern time on days when there is regular trading on the New York Stock Exchange. Payables and receivables for securities transactions, dividends, interest income and tax reclaims are translated into U.S. dollars using a spot market rate of exchange as of 4:00 p.m. Eastern time. Settlement of purchases and sales and dividend and interest receipts are translated into U.S. dollars using a spot market rate of exchange as of 11:00 a.m. Eastern time.
The Portfolios may enter into foreign currency forward contracts (1) as a means of managing the risks associated with changes in the exchange rates for the purchase or sale of a specific amount of a particular foreign currency, and (2) to hedge the value, in U.S. dollars, of portfolio securities. Gains and losses from foreign currency transactions associated with purchases and sales of investments and foreign currency forward contracts are included with the net realized and unrealized gain or loss on investments. For tax purposes these foreign currency gains and losses are treated as ordinary income.
(g) Options
The Portfolios may engage in options transactions on security indices and other financial indices and in doing so achieve similar objectives to what they would achieve through the sale or purchase of options on individual securities or other instruments.
Option writing. When a Portfolio writes an option, an amount equal to the premium received by the Portfolio is recorded as a liability and is subsequently adjusted to the current fair value of the option written. Premiums received from writing options that expire unexercised are treated by the Portfolio on the expiration date as realized gains from investments. The difference between the premium and the amount paid on effecting a closing purchase transaction, including brokerage commissions, is
94 Annual Report | December 31, 2007 |
also treated as a realized gain, or, if the premium is less than the amount paid for the closing purchase transaction, as a realized loss. If a call option is exercised, the premium is added to the proceeds from the sale of the underlying security or currency in determining whether the Portfolio has realized a gain or loss. If a put option is exercised, the premium reduces the cost basis of the securities purchased by the Portfolio. The Portfolio as writer of an option bears the market risk of an unfavorable change in the price of the security underlying the written option. There were no open options at December 31, 2007.
(h) Income Taxes
Each Portfolio intends to comply with the special provisions of Subchapter M of the Internal Revenue Code available to regulated investment companies and, therefore, no provision for Federal income taxes has been made in the accompanying financial statements since each Portfolio intends to distribute substantially all of its taxable income to its shareholders and be relieved of all Federal income taxes.
The Global Growth, International Growth, International Equity, International Small Cap Growth and Emerging Markets Growth Portfolios may be subject to a tax imposed on net realized gains on securities of certain foreign countries. The portfolios record an estimated deferred tax liability for net realized gains on these securities in an amount that would be payable if the securities were disposed of on the valuation date.
In July 2006, the Financial Accounting Standards Board (FASB) released FASB Interpretation No. 48 “Accounting for Uncertainty in Income Taxes” (FIN 48). FIN 48 provides guidance for how uncertain tax positions should be recognized, measured, presented and disclosed in the financial statements. FIN 48 requires the evaluation of tax positions taken or expected to be taken in the course of preparing the Fund’s tax returns to determine whether the tax positions are “more-likely-than-not” of being sustained by the applicable tax authority. Tax positions not deemed to meet the more-likely-than-not threshold would be recorded as a tax benefit or expense in the current year. Adoption of FIN 48 is required for fiscal years beginning after December 15, 2006. Recent SEC guidance allows implementing FIN 48 in portfolio NAV calculations as late as the fund’s last NAV calculation in the first required financial statement reporting period for its fiscal year begining after December 15, 2006, and is to be applied to all open tax years as of the effective date. Management has evaluated the implications of FIN 48 and has determined it does not have an impact on the financial statements as of December 31, 2007.
Tax years 2004, 2005 and 2006 are still subject to examination by major jurisdictions.
The Global Growth, International Growth, International Equity, International Small Cap Growth and Emerging Markets Growth Portfolios have elected to mark-to-market their investments in Passive Foreign Investment Companies (“PFICs”) for Federal income tax purposes. The Portfolios also treat the deferred loss associated with current and prior year wash sales as an adjustment to the cost of investments for tax purposes. The cost of investments for Federal income tax purposes and related gross unrealized appreciation/(depreciation) and net unrealized appreciation/(depreciation) at December 31, 2007, were as follows (in thousands):
| | | | | | | | | | | | | |
Portfolio | | Cost of
Investments | | Gross
Unrealized
Appreciation | | Gross
Unrealized
Depreciation | | Net
Unrealized
Appreciation/
Depreciation | |
Growth | | $ | 303,240 | | $ | 77,397 | | $ | 10,125 | | $ | 67,272 | |
Tax-Managed Growth | | | 8,692 | | | 2,497 | | | 319 | | | 2,178 | |
Large Cap Growth | | | 30,191 | | | 5,268 | | | 756 | | | 4,512 | |
Small Cap Growth | | | 1,037,989 | | | 163,677 | | | 109,253 | | | 54,424 | |
Mid Cap Growth | | | 41,808 | | | 5,650 | | | 2,211 | | | 3,439 | |
Small-Mid Cap Growth | | | 112,136 | | | 19,892 | | | 6,170 | | | 13,722 | |
Global Growth | | | 44,255 | | | 2,015 | | | 1,923 | | | 92 | |
International Growth | | | 6,102,697 | | | 2,161,909 | | | 286,510 | | | 1,875,399 | |
International Equity | | | 322,809 | | | 89,919 | | | 10,383 | | | 79,536 | |
International Small Cap Growth | | | 368,775 | | | 61,235 | | | 26,072 | | | 35,163 | |
Emerging Markets Growth | | | 866,529 | | | 313,902 | | | 30,837 | | | 283,065 | |
Value Discovery | | | 47,469 | | | 3,931 | | | 4,280 | | | (349 | ) |
Bond | | | 66,754 | | | 1,158 | | | 485 | | | 673 | |
Income | | | 209,354 | | | 2,724 | | | 7,550 | | | (4,826 | ) |
Ready Reserves | | | 1,394,202 | | | — | | | — | | | — | |
December 31, 2007 | William Blair Funds 95 |
The timing and characterization of certain income and capital gain distributions are determined annually in accordance with Federal income tax regulations that may differ from U.S. generally accepted accounting principles. As a result, net investment income or loss and net realized gain or loss for a reporting period may differ from the amount distributed during such period. In addition, the Portfolios may periodically record reclassifications among certain capital accounts to reflect differences between financial reporting and income tax basis distributions. The reclassifications were reported in order to reflect the tax treatment for certain permanent differences that exist between income tax regulations and U.S. generally accepted accounting principles. The reclassifications generally relate to net operating losses, Section 988 currency gains, PFICs and losses, recharacterization of dividends received from investments in REITs, expired capital loss carryforwards, and gain or loss on in-kind transactions. These reclassifications have no impact on the net asset values of the Portfolios. Accordingly, at December 31, 2007, the following reclassifications were recorded (in thousands):
| | | | | | | | | | | | |
Portfolio | | Undistributed Net
Investment
Income (Loss) | | | Accumulated
Undistributed
Net Realized
Gain/(Loss) | | | Capital
Paid in Excess
of Par Value | |
Growth | | $ | 311 | | | $ | — | | | $ | (311 | ) |
Tax-Managed Growth | | | 9 | | | | — | | | | (9 | ) |
Large Cap Growth | | | — | | | | — | | | | — | |
Small Cap Growth | | | 14,377 | | | | (14,377 | ) | | | — | |
Mid Cap Growth | | | 133 | | | | (133 | ) | | | — | |
Small-Mid Cap Growth | | | 647 | | | | (647 | ) | | | — | |
Global Growth | | | (7 | ) | | | 10 | | | | (3 | ) |
International Growth | | | 50,721 | | | | (50,721 | ) | | | — | |
International Equity | | | 776 | | | | (776 | ) | | | — | |
International Small Cap Growth | | | (570 | ) | | | 570 | | | | — | |
Emerging Markets Growth | | | (373 | ) | | | 373 | | | | — | |
Value Discovery | | | (108 | ) | | | (4,340 | ) | | | 4,448 | |
Bond | | | 7 | | | | | | | | (7 | ) |
Income | | | 1,667 | | | | (359 | ) | | | (1,308 | ) |
Ready Reserves | | | — | | | | 51 | | | | (51 | ) |
Distributions from net realized gains for book purposes may include short-term capital gains, which are included as ordinary income for tax purposes. The tax character of distributions paid during 2007 and 2006 was as follows (in thousands):
| | | | | | | | | | | | |
| | | Distributions Paid In 2007 | | Distributions Paid In 2006 |
Portfolio | | Ordinary
Income | | Long-Term
Capital Gains | | Ordinary
Income | | Long-Term
Capital Gains |
Growth | | $ | 1,311 | | $ | 32,583 | | $ | 4,799 | | $ | 22,516 |
Tax-Managed Growth | | | 10 | | | — | | | — | | | — |
Large Cap Growth | | | 14 | | | — | | | — | | | — |
Small Cap Growth | | | 36,457 | | | 31,924 | | | — | | | 78,266 |
Mid Cap Growth | | | 872 | | | 1,423 | | | — | | | — |
Small-Mid Cap Growth | | | 2,734 | | | 9,116 | | | 506 | | | 3,898 |
Global Growth | | | 17 | | | — | | | — | | | — |
International Growth | | | 95,355 | | | 760,979 | | | 90,245 | | | 581,453 |
International Equity | | | 7,717 | | | 22,515 | | | 4,187 | | | 456 |
International Small Cap Growth | | | 9,634 | | | 20,840 | | | 983 | | | — |
Emerging Markets Growth | | | 71,085 | | | 136,562 | | | 1,585 | | | 3,364 |
Value Discovery | | | 7,808 | | | 4,816 | | | 2,395 | | | 12,735 |
Bond | | | 1,892 | | | — | | | — | | | — |
Income | | | 14,147 | | | — | | | 16,500 | | | — |
Ready Reserves | | | 58,839 | | | — | | | 51,297 | | | — |
96 Annual Report | December 31, 2007 |
As of December 31, 2007, the components of distributable earnings on a tax basis were as follows (in thousands):
| | | | | | | | | | | | | |
Portfolio | | Undistributed
Ordinary
Income | | Accumulated
Capital and
Other Losses | | Undistributed
Long-Term
Gain | | Net Unrealized
Appreciation/ (Depreciation) | |
Growth | | $ | — | | $ | — | | $ | 5,606 | | $ | 67,272 | |
Tax-Managed Growth | | | — | | | 79 | | | — | | | 2,178 | |
Large Cap Growth | | | — | | | 4,512 | | | — | | | 4,512 | |
Small Cap Growth | | | 5,544 | | | — | | | 14,988 | | | 54,424 | |
Mid Cap Growth | | | — | | | 738 | | | — | | | 3,434 | |
Small-Mid Cap Growth | | | 3 | | | 942 | | | — | | | 13,722 | |
Global Growth | | | — | | | 451 | | | — | | | 92 | |
International Growth | | | — | | | 43,789 | | | 171,152 | | | 1,875,399 | |
International Equity | | | 296 | | | 2,272 | | | 2,939 | | | 79,536 | |
International Small Cap Growth | | | — | | | 1,617 | | | 4,880 | | | 35,163 | |
Emerging Markets Growth | | | 10,054 | | | 299 | | | 31,708 | | | 283,065 | |
Value Discovery | | | 20 | | | 1,037 | | | — | | | (349 | ) |
Bond | | | — | | | 139 | | | — | | | 673 | |
Income | | | — | | | 28,794 | | | — | | | (4,826 | ) |
Ready Reserves | | | 84 | | | 977 | | | — | | | — | |
At December 31, 2007, the Portfolios have unused capital loss carryforwards available for Federal income tax purposes to be applied against future capital gains, if any. If not applied, the carryforwards will expire as follows (in thousands):
| | | | | | | | | | | | | | | | | | | | | | | | | | | |
Portfolio | | 2008 | | 2009 | | 2010 | | 2011 | | 2012 | | 2013 | | 2014 | | 2015 | | Total |
Growth | | $ | — | | $ | — | | $ | — | | $ | — | | $ | — | | $ | — | | $ | — | | $ | — | | $ | — |
Tax-Managed Growth | | | — | | | — | | | — | | | 79 | | | — | | | — | | | — | | | — | | | 79 |
Large Cap Growth | | | — | | | 2,116 | | | 1,582 | | | 769 | | | — | | | — | | | — | | | — | | | 4,467 |
Small Cap Growth | | | — | | | — | | | — | | | — | | | — | | | — | | | — | | | — | | | — |
Mid Cap Growth | | | — | | | — | | | — | | | — | | | — | | | — | | | — | | | — | | | — |
Small-Mid Cap Growth | | | — | | | — | | | — | | | — | | | — | | | — | | | — | | | — | | | — |
Global Growth | | | — | | | — | | | — | | | — | | | — | | | — | | | — | | | 126 | | | 126 |
International Growth | | | — | | | — | | | — | | | — | | | — | | | — | | | — | | | — | | | — |
International Equity | | | — | | | — | | | — | | | — | | | — | | | — | | | — | | | — | | | — |
International Small Cap Growth | | | — | | | — | | | — | | | — | | | — | | | — | | | — | | | — | | | — |
Emerging Markets Growth | | | — | | | — | | | — | | | — | | | — | | | — | | | — | | | — | | | — |
Value Discovery | | | — | | | — | | | — | | | — | | | — | | | — | | | — | | | — | | | — |
Bond | | | — | | | — | | | — | | | — | | | — | | | — | | | — | | | 135 | | | 135 |
Income | | | 3,292 | | | — | | | 1,692 | | | 1,582 | | | 4,431 | | | 3,398 | | | 4,138 | | | 9,190 | | | 27,723 |
Ready Reserves | | | 24 | | | — | | | 930 | | | — | | | 21 | | | — | | | — | | | 3 | | | 978 |
For the period November 1, 2007 through December 31, 2007, the following Portfolios incurred net realized capital, foreign currency losses or PFIC losses. Each Portfolio intends to treat this loss as having occurred in fiscal year 2008 for Federal income tax purposes (in thousands):
| | | | | | | | | |
Portfolio | | Capital
Amount | | Currency
Amount | | PFIC
Amount |
Growth | | $ | — | | $ | — | | $ | — |
Tax-Managed Growth | | | — | | | — | | | — |
Large Cap Growth | | | 45 | | | — | | | — |
Small Cap Growth | | | — | | | — | | | — |
Mid Cap Growth | | | 739 | | | — | | | — |
Small-Mid Cap Growth | | | 942 | | | — | | | — |
Global Growth | | | 308 | | | 5 | | | 11 |
International Growth | | | — | | | — | | | 43,788 |
International Equity | | | — | | | 37 | | | 2,235 |
International Small Cap Growth | | | — | | | — | | | 1,613 |
Emerging Markets Growth | | | — | | | 299 | | | — |
Value Discovery | | | 1,037 | | | — | | | — |
Bond | | | 4 | | | — | | | — |
Income | | | 1,071 | | | — | | | — |
Ready Reserves | | | — | | | — | | | — |
December 31, 2007 | William Blair Funds 97 |
(i) Repurchase Agreements
The Portfolios may enter into repurchase agreements with its custodian, State Street Bank & Trust Company, whereby the Portfolios acquire ownership of a debt security and the custodian agrees, at the time of sale, to repurchase the debt security from the Portfolios at a mutually agreed upon time and price. The Portfolios’ policy is to take possession of the debt security as collateral under the repurchase agreements. The Portfolios minimize credit risk by monitoring credit exposure to the custodian and by monitoring the collateral value on an ongoing basis.
(j) Use of Estimates
The preparation of financial statements in conformity with U.S. generally accepted accounting principles requires management to make estimates and assumptions that affect the amounts reported in the financial statements. Actual results may differ from those estimates.
(2) Accounting Pronouncement
In September 2006, the Financial Accounting Standards Board (FASB) issued Statement on Financial Accounting Standards No. 157, “Fair Value Measurements” (FAS 157). This standard clarifies the definition of fair value for financial reporting, establishes a framework for measuring fair value and requires additional disclosures about the use of fair value measurements. FAS 157 is effective for financial statements issued for fiscal years beginning after November 15, 2007. Management is currently evaluating the impact that FAS 157 will have on the Funds’ financial statements.
(3) Transactions with Affiliates
(a) Management and Expense Limitation Agreements
Each Portfolio has a management agreement with William Blair & Company L.L.C. (the “Company”) for investment advisory, clerical, bookkeeping and administrative services. Each Portfolio pays the Company an annual fee, payable monthly, based on a specified percentage of its average daily net assets. A summary of the annual rates expressed as a percentage of average daily net assets is as follows:
| | | | | | | | |
Equity Portfolios | | | | | Global Portfolios | | | |
Growth | | 0.75 | % | | Global Growth | | 1.00 | % |
| | | |
Tax-Managed Growth | | 0.80 | % | | International Portfolios | | | |
Large Cap Growth | | 0.80 | % | | International Growth and International Equity | | | |
Small Cap Growth | | 1.10 | % | | First $250 million | | 1.10 | % |
Mid Cap Growth | | 0.95 | % | | In excess of $250 million | | 1.00 | % |
Small-Mid Cap Growth | | 1.00 | % | | International Small Cap Growth | | 1.00 | % |
Value Discovery | | 1.10 | % | | Emerging Markets Growth | | 1.10 | % |
| | | |
Fixed-Income Portfolios | | | | | Money Market Portfolio | | | |
Bond | | 0.30 | % | | Ready Reserves | | | |
Income* | | | | | First $250 million | | 0.275 | % |
First $250 million | | 0.25 | % | | Next $250 million | | 0.250 | % |
In excess of $250 million | | 0.20 | % | | Next $2 billion | | 0.225 | % |
| | | | | In excess of $2.5 billion | | 0.200 | % |
*Management fee also includes a charge of 5% of gross income. | | | | | | | | |
98 Annual Report | December 31, 2007 |
Some of the Portfolios have also entered into Expense Limitation Agreements with the Company. Under the terms of these Agreements, the Company has agreed to waive its advisory fees and absorb other operating expenses through April 30, 2008, if total expenses for each class of the following Portfolios exceed the following rates (as a percentage of average daily net assets):
| | | | | | | | | | | | |
| | | Class N Shares | | | Class I Shares | |
| | | Through April 30, 2007 | | | Effective
May 1, 2007 | | | Through April 30, 2007 | | | Effective
May 1, 2007 | |
Tax-Managed Growth | | 1.40 | % | | 1.32 | % | | 1.15 | % | | 1.07 | % |
Large Cap Growth | | 1.23 | % | | 1.23 | % | | 0.98 | % | | 0.98 | % |
Small Cap Growth | | 1.50 | % | | 1.50 | % | | 1.25 | % | | 1.25 | % |
Mid Cap Growth Fund | | 1.40 | % | | 1.36 | % | | 1.15 | % | | 1.11 | % |
Small-Mid Cap Growth | | 1.37 | % | | 1.36 | % | | 1.12 | % | | 1.11 | % |
Global Growth | | N/A | | | 1.55 | %(a)(b) | | N/A | | | 1.30 | %(a)(b) |
International Growth | | 1.45 | % | | 1.45 | % | | 1.20 | % | | 1.20 | % |
International Equity | | 1.45 | % | | 1.45 | % | | 1.20 | % | | 1.20 | % |
International Small Cap Growth | | 1.65 | % | | 1.65 | % | | 1.40 | % | | 1.40 | % |
Emerging Markets Growth | | 1.65 | % | | 1.65 | % | | 1.40 | % | | 1.40 | % |
Value Discovery | | 1.34 | % | | 1.29 | % | | 1.09 | % | | 1.09 | % |
Bond Fund | | N/A | | | 0.65 | % | | N/A | | | 0.50 | %(b) |
Income Fund | | 0.75 | % | | N/A | | | N/A | | | N/A | |
| (a) | | Effective October 15, 2007. |
| (b) | | Effective through April 30, 2009. |
For a period of three years subsequent to the Commencement of Operations of the Mid Cap Growth, Global Growth, International Small Cap Growth, Emerging Markets Growth and Bond Portfolios, the Company is entitled to reimbursement for previously waived fees and reimbursed expenses to the extent the overall expense ratio remains below the percentages indicated. The total amount available for recapture at December 31, 2007 was $203 (in thousands) for the Mid Cap Growth Portfolio, $50 for the Global Growth Portfolio, $134 for the International Small Cap Growth Portfolio, $566 for the Emerging Markets Growth Portfolio and $66 for the Bond Portfolio.
For the period ended December 31, 2007, the investment advisory fees incurred by the Portfolios and related fee waivers were as follows (in thousands):
| | | | | | | | | | | | |
Portfolio | | Gross
Advisory Fee | | Fee Waiver | | Net
Advisory Fee | | Additional Expenses (Recovered) or Absorbed by Advisor |
Growth | | $ | 2,378 | | $ | — | | $ | 2,378 | | $ | — |
Tax-Managed Growth | | | 84 | | | 74 | | | 10 | | | — |
Large Cap Growth | | | 219 | | | 64 | | | 155 | | | — |
Small Cap Growth | | | 14,390 | | | — | | | 14,390 | | | — |
Mid Cap Growth | | | 342 | | | 93 | | | 249 | | | — |
Small Mid-Cap Growth | | | 1,118 | | | 71 | | | 1,047 | | | — |
Global Growth | | | 83 | | | 50 | | | 33 | | | — |
International Growth | | | 72,836 | | | — | | | 72,836 | | | — |
International Equity | | | 3,778 | | | 182 | | | 3,596 | | | — |
International Small Cap Growth | | | 3,395 | | | — | | | 3,395 | | | — |
Emerging Markets Growth | | | 11,212 | | | — | | | 11,212 | | | — |
Value Discovery | | | 993 | | | 231 | | | 762 | | | — |
Bond | | | 114 | | | 66 | | | 48 | | | — |
Income | | | 1,292 | | | — | | | 1,292 | | | — |
Ready Reserves | | | 3,039 | | | — | | | 3,039 | | | — |
(b) Underwriting, Distribution Services and Service Agreement
Each Portfolio except the Ready Reserves Portfolio has a Distribution Agreement with the Company for distribution services. Each Portfolio pays the Company an annual fee, payable monthly, based on a specified percentage of its average daily net assets of specified share classes. The annual rates expressed as a percentage of average daily net assets for Class N is 0.25% for all Portfolios except the Income and Bond Portfolios, which is 0.15%. Pursuant to the Distribution Agreement, the Company enters into related selling group agreements with various firms at various rates for sales of the Portfolios’ Class N shares.
December 31, 2007 | William Blair Funds 99 |
Distribution fees incurred by the Portfolios to the Company, for the year ended December 31, 2007, were as follows (in thousands):
| | | | | | | | | |
Portfolio | | Gross
Distribution
Fees | | Fee
Waiver | | Net
Distribution
Fee |
Growth | | $ | 227 | | $ | — | | $ | 227 |
Tax-Managed Growth | | | 2 | | | — | | | 2 |
Large Cap Growth | | | 24 | | | — | | | 24 |
Small Cap Growth | | | 1,717 | | | — | | | 1,717 |
Mid Cap Growth | | | 18 | | | — | | | 18 |
Small Mid-Cap Growth | | | 42 | | | — | | | 42 |
Global Growth | | | 3 | | | — | | | 15 |
International Growth | | | 11,969 | | | — | | | 11,969 |
International Equity | | | 126 | | | — | | | 126 |
International Small Cap Growth | | | 54 | | | — | | | 54 |
Emerging Markets Growth | | | 166 | | | 25 | | | 166 |
Value Discovery | | | 103 | | | 45 | | | 58 |
Bond | | | 1 | | | — | | | 1 |
Income | | | 133 | | | 12 | | | 121 |
The Ready Reserves Portfolio has a Service Agreement with the Company to provide shareholder services and automatic sweep services. The Portfolio pays the Company an annual fee, payable monthly, based upon 0.35% of the average daily net assets of Class N. The Board of Trustees has determined that the amount payable for “service fees” (as defined by FINRA) does not exceed 0.25% of the average annual net assets attributable to Class N shares. For the year ended December 31, 2007, the following fees were incurred (in thousands):
The Global Growth, International Small Cap Growth, Emerging Markets Growth and Bond Portfolios have a Shareholder Administration Agreement with the Company to provide shareholder administration services. Class N and Class I shares of the Portfolios pay the Company an annual fee, payable monthly, based upon 0.15% of average daily net assets attributable to each class, respectively. For the period ended December 31, 2007, the following fees were incurred (in thousands):
| | | |
Global Growth | | $ | 12 |
International Small Cap Growth | | $ | 223 |
Emerging Markets Growth | | $ | 466 |
Bond | | $ | 48 |
(c) Trustees Fees
The Portfolios incurred fees of $249 (in thousands) to non-interested trustees of the Fund for the year ended December 31, 2007. Interested trustees are not compensated by the Fund.
(d) Investments in Affiliated Portfolio
Pursuant to the rules of the 1940 Act, each of the Portfolios of the Fund may invest in the William Blair Ready Reserves Portfolio (“Ready Reserves”), an open-end money market portfolio managed by the Advisor. Ready Reserves Portfolio is used as a cash management option to the other Portfolios in the Fund. The Advisor waives management fees and shareholder service fees earned from the other Portfolios’ investment in the Ready Reserves Fund. The fees waived with respect to each Portfolio for the year ended December 31, 2007 are listed below. Distributions received from Ready Reserves are reflected as “Dividend Income from Affiliated Fund” in each Portfolio’s statement of operations. Amounts relating to the Portfolios’ investments in Ready Reserves were as follows for the year ended December 31, 2007 (in thousands):
| | | | | | | | | | | | | | | | | | |
Portfolio | | Purchases | | Sales
Proceeds | | Fees
Waived | | Dividend
Income | | Value | | Percent
of Net
Assets | |
Growth | | $ | 625 | | $ | 1,500 | | $ | 16 | | $ | 126 | | $ | 1,699 | | 0.5 | % |
Tax-Managed Growth | | | 303 | | | 100 | | | 1 | | | 3 | | | 309 | | 2.8 | |
Large Cap Growth | | | 1,090 | | | 900 | | | 1 | | | 10 | | | 244 | | 0.7 | |
Small Cap Growth | | | 10,260 | | | 18,600 | | | 31 | | | 259 | | | 1,554 | | 0.1 | |
Mid Cap Growth | | | 1,508 | | | 1,500 | | | 1 | | | 8 | | | 112 | | 0.2 | |
Small-Mid Cap Growth | | | 1,011 | | | 2,300 | | | 1 | | | 11 | | | 22 | | 0.0 | |
Global Growth | | | 1,006 | | | — | | | 1 | | | 6 | | | 1,006 | | 2.2 | |
International Growth | | | 9,241 | | | — | | | 31 | | | 240 | | | 9,878 | | 0.1 | |
International Equity | | | 6,220 | | | 6,100 | | | 27 | | | 220 | | | 5,278 | | 1.3 | |
International Small Cap Growth | | | 1,127 | | | 4,158 | | | 16 | | | 127 | | | 2,197 | | 0.5 | |
Emerging Markets Growth | | | 61 | | | — | | | 7 | | | 60 | | | 1,326 | | 0.1 | |
Value Discovery | | | 4 | | | 475 | | | 1 | | | 4 | | | 31 | | 0.1 | |
100 Annual Report | December 31, 2007 |
(4) Investment Transactions
Investment transactions, excluding money market instruments, for the period ended December 31, 2007 were as follows (in thousands):
| | | | | |
Portfolio | | Purchases | | Sales | |
Growth | | 289,763 | | (223,440 | ) |
Tax-Managed Growth | | 5,591 | | (5,524 | ) |
Large Cap Growth | | 26,724 | | (15,843 | ) |
Small Cap Growth | | 1,226,005 | | (1,408,083 | ) |
Mid Cap Growth | | 42,793 | | (22,729 | ) |
Small-Mid Cap Growth | | 101,409 | | (86,897 | ) |
Global Growth | | 47,499 | | (4,998 | ) |
International Growth | | 4,258,548 | | (3,979,339) | |
International Equity | | 272,136 | | (238,105 | ) |
International Small Cap Growth | | 426,569 | | (287,284 | ) |
Emerging Markets Growth | | 990,619 | | (1,006,710 | ) |
Value Discovery | | 90,896 | | (188,847 | ) |
Bond | | 84,871 | | (21,593 | ) |
Income | | 87,989 | | (169,140 | ) |
(5) Foreign Currency Forward Contracts
To protect itself against a decline in the value of foreign currency against the U.S. dollar, the Global Growth, International Growth, International Equity, International Small Cap Growth and Emerging Markets Growth Portfolios enter into foreign currency forward contracts with its custodian and others. The Portfolios bear the market risk that arises from changes in foreign currency rates and bears the credit risk if the counterparty fails to perform under the contract. The net realized and unrealized gains and losses associated with foreign currency forward contracts are reflected in the accompanying financial statements.
(6) Fund Share Transactions
The following table summarizes the activity in capital shares of each Portfolio (in thousands):
| | | | | | | | | | | | | | | | | | |
| | | Sales (Dollars) |
| | | Year Ended December 31, 2007 | | Year Ended December 31, 2006 |
Portfolio | | Class N | | Class I | | Total | | Class N | | Class I | | Total |
Growth | | $ | 79,267 | | $ | 36,934 | | $ | 116,201 | | $ | 25,590 | | $ | 7,625 | | $ | 33,215 |
Tax-Managed Growth | | | 25 | | | 962 | | | 987 | | | 735 | | | 710 | | | 1,445 |
Large Cap Growth | | | 6,019 | | | 17,652 | | | 23,671 | | | 2,079 | | | 2,871 | | | 4,950 |
Small Cap Growth | | | 122,872 | | | 166,224 | | | 289,096 | | | 327,203 | | | 262,870 | | | 590,073 |
Mid Cap Growth (a) | | | 3,154 | | | 21,869 | | | 25,023 | | | 7,132 | | | 14,246 | | | 21,378 |
Small Mid-Cap Growth | | | 3,805 | | | 30,060 | | | 33,865 | | | 3,522 | | | 20,782 | | | 24,304 |
Global Growth (b) | | | 9,461 | | | 36,776 | | | 46,237 | | | — | | | — | | | — |
International Growth | | | 1,171,189 | | | 765,505 | | | 1,936,694 | | | 1,221,792 | | | 563,927 | | | 1,785,719 |
International Equity | | | 28,861 | | | 96,555 | | | 125,416 | | | 23,189 | | | 114,544 | | | 137,733 |
International Small Cap Growth | | | 10,144 | | | 98,939 | | | 109,083 | | | 17,783 | | | 51,330 | | | 69,113 |
Emerging Markets Growth | | | 13,466 | | | 63,633 | | | 77,099 | | | 35,769 | | | 147,530 | | | 183,299 |
Value Discovery | | | 17,674 | | | 10,979 | | | 28,653 | | | 88,879 | | | 11,658 | | | 100,537 |
Bond (c) | | | 791 | | | 55,455 | | | 56,246 | | | — | | | — | | | — |
Income | | | 29,070 | | | 18,899 | | | 47,969 | | | 32,007 | | | 29,825 | | | 61,832 |
Ready Reserves | | | 1,130,710 | | | — | | | 1,130,710 | | | 1,030,633 | | | — | | | 1,030,633 |
| (a) | | The information for the year ended December 31, 2006 is for the period from February 1, 2006 (Commencement of Operations) to December 31, 2006. |
| (b) | | For the period from October 15, 2007 (Commencement of Operations) to December 31, 2007. |
| (c) | | For the period from May 1, 2007 (Commencement of Operations) to December 31, 2007. |
December 31, 2007 | William Blair Funds 101 |
| | | | | | | | | | | | | | | | | | | | | | | | |
| | | Reinvested Distributions (Dollars) | |
| | | Year Ended December 31, 2007 | | | Year Ended December 31, 2006 | |
Portfolio | | Class N | | | Class I | | | Total | | | Class N | | | Class I | | | Total | |
Growth | | $ | 11,537 | | | $ | 20,233 | | | $ | 31,770 | | | $ | 5,960 | | | $ | 19,244 | | | $ | 25,204 | |
Tax-Managed Growth | | | — | | | | 9 | | | | 9 | | | | — | | | | — | | | | — | |
Large Cap Growth | | | — | | | | 13 | | | | 13 | | | | — | | | | — | | | | — | |
Small Cap Growth | | | 33,642 | | | | 31,549 | | | | 65,191 | | | | 43,585 | | | | 29,938 | | | | 73,523 | |
Mid Cap Growth (a) | | | 370 | | | | 1,790 | | | | 2,160 | | | | — | | | | — | | | | — | |
Small Mid-Cap Growth | | | 1,635 | | | | 9,269 | | | | 10,904 | | | | 645 | | | | 3,347 | | | | 3,992 | |
Global Growth (b) | | | — | | | | 15 | | | | 15 | | | | — | | | | — | | | | — | |
International Growth | | | 544,079 | | | | 270,368 | | | | 814,447 | | | | 439,429 | | | | 193,983 | | | | 633,412 | |
International Equity | | | 4,176 | | | | 25,228 | | | | 29,404 | | | | 504 | | | | 3,886 | | | | 4,390 | |
International Small Cap Growth | | | 1,541 | | | | 6,936 | | | | 8,477 | | | | 71 | | | | 204 | | | | 275 | |
Emerging Markets Growth | | | 13,201 | | | | 45,872 | | | | 59,073 | | | | 322 | | | | 1,039 | | | | 1,361 | |
Value Discovery | | | 3,149 | | | | 9,020 | | | | 12,169 | | | | 9,410 | | | | 4,754 | | | | 14,164 | |
Bond (c) | | | 18 | | | | 1,247 | | | | 1,265 | | | | — | | | | — | | | | — | |
Income | | | 4,665 | | | | 6,937 | | | | 11,602 | | | | 4,314 | | | | 8,747 | | | | 13,061 | |
Ready Reserves | | | 58,646 | | | | — | | | | 58,646 | | | | 51,002 | | | | — | | | | 51,002 | |
| |
| | | Redemptions (Dollars) | |
| | | Year Ended December 31, 2007 | | | Year Ended December 31, 2006 | |
Portfolio | | Class N | | | Class I | | | Total | | | Class N | | | Class I | | | Total | |
Growth | | $ | 22,235 | | | $ | 24,778 | | | $ | 47,013 | | | $ | 24,102 | | | $ | 26,243 | | | $ | 50,345 | |
Tax-Managed Growth | | | 422 | | | | 352 | | | | 774 | | | | 34 | | | | 344 | | | | 378 | |
Large Cap Growth | | | 10,247 | | | | 2,387 | | | | 12,634 | | | | 516 | | | | 2,343 | | | | 2,859 | |
Small Cap Growth | | | 280,620 | | | | 150,866 | | | | 431,486 | | | | 193,966 | | | | 94,377 | | | | 288,343 | |
Mid Cap Growth (a) | | | 2,289 | | | | 964 | | | | 3,253 | | | | 1,913 | | | | 641 | | | | 2,554 | |
Small Mid-Cap Growth | | | 2,710 | | | | 10,636 | | | | 13,346 | | | | 1,816 | | | | 7,060 | | | | 8,876 | |
Global Growth (b) | | | 310 | | | | 4 | | | | 314 | | | | — | | | | — | | | | — | |
International Growth | | | 959,848 | | | | 329,335 | | | | 1,289,183 | | | | 927,830 | | | | 230,002 | | | | 1,157,832 | |
International Equity | | | 13,951 | | | | 56,746 | | | | 70,697 | | | | 11,966 | | | | 49,451 | | | | 61,417 | |
International Small Cap Growth | | | 7,789 | | | | 25,704 | | | | 33,493 | | | | 5,184 | | | | 1,990 | | | | 7,174 | |
Emerging Markets Growth | | | 15,733 | | | | 60,321 | | | | 76,054 | | | | 11,956 | | | | 14,058 | | | | 26,014 | |
Value Discovery | | | 106,443 | | | | 21,858 | | | | 128,301 | | | | 14,585 | | | | 25,759 | | | | 40,344 | |
Bond (c) | | | 82 | | | | 1,332 | | | | 1,414 | | | | — | | | | — | | | | — | |
Income | | | 44,378 | | | | 96,883 | | | | 141,261 | | | | 46,237 | | | | 38,423 | | | | 84,660 | |
Ready Reserves | | | 985,413 | | | | — | | | | 985,413 | | | | 977,896 | | | | — | | | | 977,896 | |
| |
| | | Net Change in Net Assets relating to Fund Share Activity (Dollars) | |
| | | Year Ended December 31, 2007 | | | Year Ended December 31, 2006 | |
Portfolio | | Class N | | | Class I | | | Total | | | Class N | | | Class I | | | Total | |
Growth | | $ | 68,569 | | | $ | 32,389 | | | $ | 100,958 | | | $ | 7,448 | | | $ | 626 | | | $ | 8,074 | |
Tax-Managed Growth | | | (397 | ) | | | 619 | | | | 222 | | | | 701 | | | | 366 | | | | 1,067 | |
Large Cap Growth | | | (4,228 | ) | | | 15,278 | | | | 11,050 | | | | 1,563 | | | | 528 | | | | 2,091 | |
Small Cap Growth | | | (124,106 | ) | | | 46,907 | | | | (77,199 | ) | | | 176,822 | | | | 198,431 | | | | 375,253 | |
Mid Cap Growth (a) | | | 1,235 | | | | 22,695 | | | | 23,930 | | | | 5,219 | | | | 13,605 | | | | 18,824 | |
Small Mid-Cap Growth | | | 2,730 | | | | 28,693 | | | | 31,423 | | | | 2,351 | | | | 17,069 | | | | 19,420 | |
Global Growth (b) | | | 9,151 | | | | 36,787 | | | | 45,938 | | | | — | | | | — | | | | — | |
International Growth | | | 755,420 | | | | 706,538 | | | | 1,461,958 | | | | 733,391 | | | | 527,908 | | | | 1,261,299 | |
International Equity | | | 19,086 | | | | 65,037 | | | | 84,123 | | | | 11,727 | | | | 68,979 | | | | 80,706 | |
International Small Cap Growth | | | 3,896 | | | | 80,171 | | | | 84,067 | | | | 12,670 | | | | 49,544 | | | | 62,214 | |
Emerging Markets Growth | | | 10,934 | | | | 49,184 | | | | 60,118 | | | | 24,135 | | | | 134,511 | | | | 158,646 | |
Value Discovery | | | (85,620 | ) | | | (1,859 | ) | | | (87,479 | ) | | | 83,704 | | | | (9,347 | ) | | | 74,357 | |
Bond (c) | | | 727 | | | | 55,370 | | | | 56,097 | | | | — | | | | — | | | | — | |
Income | | | (10,643 | ) | | | (71,047 | ) | | | (81,690 | ) | | | (9,916 | ) | | | 149 | | | | (9,767 | ) |
Ready Reserves | | | 203,943 | | | | — | | | | 203,943 | | | | 103,739 | | | | — | | | | 103,739 | |
| (a) | | The information for the year ended December 31, 2006 is for the period from February 1, 2006 (Commencement of Operations) to December 31, 2006. |
| (b) | | For the period October 15, 2007 (Commencement of Operations) to December 31, 2007. |
| (c) | | For the period from May 1, 2007 (Commencement of Operation) to December 31, 2007. |
102 Annual Report | December 31, 2007 |
| | | | | | | | | | | | |
| | | Sales (Shares) |
| | | Year Ended December 31, 2007 | | Year Ended December 31, 2006 |
Portfolio | | Class N | | Class I | | Total | | Class N | | Class I | | Total |
Growth | | 6,415 | | 2,916 | | 9,331 | | 2,121 | | 632 | | 2,753 |
Tax-Managed Growth | | 2 | | 83 | | 85 | | 73 | | 67 | | 140 |
Large Cap Growth | | 865 | | 2,376 | | 3,241 | | 314 | | 430 | | 744 |
Small Cap Growth | | 4,705 | | 6,244 | | 10,949 | | 12,763 | | 10,023 | | 22,786 |
Mid Cap Growth (a) | | 279 | | 1,911 | | 2,190 | | 710 | | 1,412 | | 2,122 |
Small Mid-Cap Growth | | 273 | | 2,136 | | 2,409 | | 267 | | 1,562 | | 1,829 |
Global Growth (b) | | 950 | | 3,681 | | 4,631 | | — | | — | | — |
International Growth | | 38,329 | | 24,939 | | 63,268 | | 44,607 | | 20,102 | | 64,709 |
International Equity | | 1,777 | | 5,747 | | 7,524 | | 1,691 | | 8,196 | | 9,887 |
International Small Cap Growth | | 693 | | 6,739 | | 7,432 | | 1,449 | | 4,109 | | 5,558 |
Emerging Markets Growth | | 616 | | 2,895 | | 3,511 | | 2,209 | | 8,482 | | 10,691 |
Value Discovery | | 1,082 | | 658 | | 1,740 | | 5,250 | | 689 | | 5,939 |
Bond (c) | | 79 | | 5,574 | | 5,653 | | — | | — | | — |
Income | | 3,016 | | 1,965 | | 4,981 | | 3,289 | | 3,073 | | 6,362 |
Ready Reserves | | 1,130,710 | | — | | 1,130,710 | | 1,030,633 | | — | | 1,030,633 |
| |
| | | Reinvested Distributions (Shares) |
| | | Year Ended December 31, 2007 | | Year Ended December 31, 2006 |
Portfolio | | Class N | | Class I | | Total | | Class N | | Class I | | Total |
Growth | | 1,000 | | 1,707 | | 2,707 | | 518 | | 1,639 | | 2,157 |
Tax-Managed Growth | | — | | 1 | | 1 | | — | | — | | — |
Large Cap Growth | | — | | 2 | | 2 | | — | | — | | — |
Small Cap Growth | | 1,478 | | 1,352 | | 2,830 | | 1,713 | | 1,152 | | 2,865 |
Mid Cap Growth (a) | | 33 | | 158 | | 191 | | — | | — | | — |
Small Mid-Cap Growth | | 126 | | 704 | | 830 | | 49 | | 253 | | 302 |
Global Growth (b) | | — | | 2 | | 2 | | | | | | |
International Growth | | 19,369 | | 9,470 | | 28,839 | | 16,102 | | 7,005 | | 23,107 |
International Equity | | 262 | | 1,571 | | 1,833 | | 34 | | 257 | | 291 |
International Small Cap Growth | | 115 | | 517 | | 632 | | 5 | | 15 | | 20 |
Emerging Markets Growth | | 628 | | 2,175 | | 2,803 | | 17 | | 55 | | 72 |
Value Discovery | | 281 | | 792 | | 1,073 | | 581 | | 289 | | 870 |
Bond (c) | | 2 | | 126 | | 128 | | — | | — | | — |
Income | | 490 | | 730 | | 1,220 | | 445 | | 904 | | 1,349 |
Ready Reserves | | 58,646 | | — | | 58,646 | | 51,002 | | — | | 51,002 |
| |
| | | Redemptions (Shares) |
| | | Year Ended December 31, 2007 | | Year Ended December 31, 2006 |
Portfolio | | Class N | | Class I | | Total | | Class N | | Class I | | Total |
Growth | | 1,810 | | 1,974 | | 3,784 | | 2,024 | | 2,182 | | 4,206 |
Tax-Managed Growth | | 37 | | 30 | | 67 | | 3 | | 32 | | 35 |
Large Cap Growth | | 1,418 | | 316 | | 1,734 | | 76 | | 349 | | 425 |
Small Cap Growth | | 10,862 | | 5,711 | | 16,573 | | 7,637 | | 3,603 | | 11,240 |
Mid Cap Growth (a) | | 195 | | 81 | | 276 | | 186 | | 62 | | 248 |
Small Mid-Cap Growth | | 193 | | 741 | | 934 | | 138 | | 522 | | 660 |
Global Growth (b) | | 31 | | — | | 31 | | — | | — | | — |
International Growth | | 31,795 | | 10,740 | | 42,535 | | 34,003 | | 8,346 | | 42,349 |
International Equity | | 834 | | 3,433 | | 4,267 | | 909 | | 3,555 | | 4,464 |
International Small Cap Growth | | 513 | | 1,740 | | 2,253 | | 417 | | 161 | | 578 |
Emerging Markets Growth | | 738 | | 2,711 | | 3,449 | | 775 | | 840 | | 1,615 |
Value Discovery | | 6,333 | | 1,346 | | 7,679 | | 900 | | 1,600 | | 2,500 |
Bond (c) | | 8 | | 134 | | 142 | | — | | — | | — |
Income | | 4,652 | | 10,142 | | 14,794 | | 4,755 | | 3,959 | | 8,714 |
Ready Reserves | | 985,413 | | — | | 985,413 | | 977,896 | | — | | 977,896 |
| (a) | | The information for the year ended December 31, 2006 is for the period from February 1, 2006 (Commencement of Operations) to December 31, 2006. |
| (b) | | For the period from October 15, 2007 (Commencement of Operations) to December 31, 2007. |
| (c) | | For the period from May 1, 2007 (Commencement of Operations) to December 31, 2007. |
December 31,��2007 | William Blair Funds 103 |
| | | | | | | | | | | | | | | | | | |
| | | Net Change
in Shares Outstanding relating to Fund Share Activity (Shares) | |
| | | Year Ended December 31, 2007 | | | Year Ended December 31, 2006 | |
Portfolio | | Class N | | | Class I | | | Total | | | Class N | | | Class I | | | Total | |
Growth | | 5,605 | | | 2,649 | | | 8,254 | | | 615 | | | 89 | | | 704 | |
Tax-Managed Growth | | (35 | ) | | 54 | | | 19 | | | 70 | | | 35 | | | 105 | |
Large Cap Growth | | (553 | ) | | 2,062 | | | 1,509 | | | 238 | | | 81 | | | 319 | |
Small Cap Growth | | (4,679 | ) | | 1,885 | | | (2,794 | ) | | 6,839 | | | 7,572 | | | 14,411 | |
Mid Cap Growth (a) | | 117 | | | 1,988 | | | 2,105 | | | 524 | | | 1,350 | | | 1,874 | |
Small Mid-Cap Growth | | 206 | | | 2,099 | | | 2,305 | | | 178 | | | 1,293 | | | 1,471 | |
Global Growth (b) | | 919 | | | 3,683 | | | 4,602 | | | — | | | — | | | — | |
International Growth | | 25,903 | | | 23,669 | | | 49,572 | | | 26,706 | | | 18,761 | | | 45,467 | |
International Equity | | 1,205 | | | 3,885 | | | 5,090 | | | 816 | | | 4,898 | | | 5,714 | |
International Small Cap Growth | | 295 | | | 5,516 | | | 5,811 | | | 1,037 | | | 3,963 | | | 5,000 | |
Emerging Markets Growth | | 506 | | | 2,359 | | | 2,865 | | | 1,451 | | | 7,697 | | | 9,148 | |
Value Discovery | | (4,970 | ) | | 104 | | | (4,866 | ) | | 4,931 | | | (622 | ) | | 4,309 | |
Bond (c) | | 73 | | | 5,566 | | | 5,639 | | | — | | | — | | | — | |
Income | | (1,146 | ) | | (7,447 | ) | | (8,593 | ) | | (1,021 | ) | | 18 | | | (1,003 | ) |
Ready Reserves | | 203,943 | | | — | | | 203,943 | | | 103,739 | | | — | | | 103,739 | |
| (a) | | The information for the year ended December 31, 2006 is for the period from February 1, 2006 (Commencement of Operations) to December 31, 2006. |
| (b) | | For the period from October 15, 2007 (Commencement of Operations) to December 31, 2007. |
| (c) | | For the period from May 1, 2007 (Commencement of Operations) to December 31, 2007. |
104 Annual Report | December 31, 2007 |
Financial Highlights
Growth Fund
| | | | | | | | | | | | | | | | | | | | |
| | | Class N | |
| | | Years Ended December 31, | |
| | | 2007 | | | 2006 | | | 2005 | | | 2004 | | | 2003 | |
Net asset value, beginning of year | | $ | 11.42 | | | $ | 11.33 | | | $ | 10.70 | | | $ | 9.97 | | | $ | 8.06 | |
Income (loss) from investment operations: | | | | | | | | | | | | | | | | | | | | |
Net investment income (loss) | | | (0.04 | ) | | | (0.06 | ) | | | (0.06 | ) | | | (0.06 | ) | | | (0.06 | ) |
Net realized and unrealized gain (loss) on investments | | | 1.53 | | | | 1.48 | | | | 1.11 | | | | 0.79 | | | | 1.97 | |
| | | | | | | | | | | | | | | | | | | | |
Total from investment operations | | | 1.49 | | | | 1.42 | | | | 1.05 | | | | 0.73 | | | | 1.91 | |
Less distributions from: | | | | | | | | | | | | | | | | | | | | |
Net investment income | | | — | | | | — | | | | — | | | | — | | | | — | |
Net realized gain | | | 1.21 | | | | 1.33 | | | | 0.42 | | | | — | | | | — | |
| | | | | | | | | | | | | | | | | | | | |
Total distributions | | | 1.21 | | | | 1.33 | | | | 0.42 | | | | — | | | | — | |
| | | | | | | | | | | | | | | | | | | | |
Net asset value, end of year | | $ | 11.70 | | | $ | 11.42 | | | $ | 11.33 | | | $ | 10.70 | | | $ | 9.97 | |
| | | | | | | | | | | | | | | | | | | | |
Total return (%) | | | 13.17 | | | | 12.42 | | | | 9.75 | | | | 7.32 | | | | 23.70 | |
Ratios to average daily net assets (%): | | | | | | | | | | | | | | | | | | | | |
Expenses | | | 1.22 | | | | 1.17 | | | | 1.15 | | | | 1.17 | | | | 1.19 | |
Net investment income (loss) | | | (0.35 | ) | | | (0.49 | ) | | | (0.60 | ) | | | (0.60 | ) | | | (0.67 | ) |
| |
| | | Class I | |
| | | Years Ended December 31, | |
| | | 2007 | | | 2006 | | | 2005 | | | 2004 | | | 2003 | |
Net asset value, beginning of year | | $ | 11.66 | | | $ | 11.52 | | | $ | 10.84 | | | $ | 10.08 | | | $ | 8.12 | |
Income (loss) from investment operations: | | | | | | | | | | | | | | | | | | | | |
Net investment income (loss) | | | — | | | | (0.02 | ) | | | (0.04 | ) | | | (0.04 | ) | | | (0.04 | ) |
Net realized and unrealized gain (loss) on investments | | | 1.57 | | | | 1.49 | | | | 1.14 | | | | 0.80 | | | | 2.00 | |
| | | | | | | | | | | | | | | | | | | | |
Total from investment operations | | | 1.57 | | | | 1.47 | | | | 1.10 | | | | 0.76 | | | | 1.96 | |
Less distributions from: | | | | | | | | | | | | | | | | | | | | |
Net investment income | | | — | | | | — | | | | — | | | | — | | | | — | |
Net realized gain | | | 1.21 | | | | 1.33 | | | | 0.42 | | | | — | | | | — | |
| | | | | | | | | | | | | | | | | | | | |
Total distributions | | | 1.21 | | | | 1.33 | | | | 0.42 | | | | — | | | | — | |
| | | | | | | | | | | | | | | | | | | | |
Net asset value, end of year | | $ | 12.02 | | | $ | 11.66 | | | $ | 11.52 | | | $ | 10.84 | | | $ | 10.08 | |
| | | | | | | | | | | | | | | | | | | | |
Total return (%) | | | 13.59 | | | | 12.64 | | | | 10.08 | | | | 7.54 | | | | 24.14 | |
Ratios to average daily net assets (%): | | | | | | | | | | | | | | | | | | | | |
Expenses | | | 0.87 | | | | 0.89 | | | | 0.90 | | | | 0.92 | | | | 0.94 | |
Net investment income (loss) | | | 0.00 | | | | (0.20 | ) | | | (0.35 | ) | | | (0.35 | ) | | | (0.42 | ) |
| | | | | | | | | | | | | | | |
| |
| | | |
| | | Years Ended December 31, |
| | | 2007 | | 2006 | | 2005 | | 2004 | | 2003 |
Supplemental data for all classes: | | | | | | | | | | | | | | | |
Net assets at end of year (in thousands) | | $ | 369,644 | | $ | 264,525 | | $ | 253,599 | | $ | 275,506 | | $ | 281,654 |
Portfolio turnover rate (%) | | | 72 | | | 61 | | | 54 | | | 35 | | | 45 |
Performance cited represents past performance. Past performance does not guarantee future results and current performance may be lower or higher than the data quoted. Results shown are annual returns, which assume reinvestment of dividends and capital gains. Investment returns and principal will fluctuate and you may have a gain or loss when you sell shares. For the most current month-end performance information, please call 1-800-742-7272, or visit our Web site at www.williamblairfunds.com.
Note: Net investment income (loss) per share is based on the average shares outstanding during the year.
December 31, 2007 | William Blair Funds 105 |
Financial Highlights
Tax-Managed Growth Fund
| | | | | | | | | | | | | | | | | | | | |
| | | Class N | |
| | | Years Ended December 31, | |
| | | 2007 | | | 2006 | | | 2005 | | | 2004 | | | 2003 | |
Net asset value, beginning of year | | $ | 10.94 | | | $ | 10.11 | | | $ | 8.99 | | | $ | 8.41 | | | $ | 6.86 | |
Income (loss) from investment operations: | | | | | | | | | | | | | | | | | | | | |
Net investment income (loss) | | | (0.03 | ) | | | (0.04 | ) | | | (0.07 | ) | | | (0.08 | ) | | | (0.07 | ) |
Net realized and unrealized gain (loss) on investments | | | 1.12 | | | | 0.87 | | | | 1.19 | | | | 0.66 | | | | 1.62 | |
| | | | | | | | | | | | | | | | | | | | |
Total from investment operations | | | 1.09 | | | | 0.83 | | | | 1.12 | | | | 0.58 | | | | 1.55 | |
Less distributions from: | | | | | | | | | | | | | | | | | | | | |
Net investment income | | | — | | | | — | | | | — | | | | — | | | | — | |
Net realized gain | | | — | | | | — | | | | — | | | | — | | | | — | |
| | | | | | | | | | | | | | | | | | | | |
Total distributions | | | — | | | | — | | | | — | | | | — | | | | — | |
| | | | | | | | | | | | | | | | | | | | |
Net asset value, end of year | | $ | 12.03 | | | $ | 10.94 | | | $ | 10.11 | | | $ | 8.99 | | | $ | 8.41 | |
| | | | | | | | | | | | | | | | | | | | |
Total return (%) | | | 9.96 | | | | 8.21 | | | | 12.46 | | | | 6.90 | | | | 22.59 | |
Ratios to average daily net assets (%): | | | | | | | | | | | | | | | | | | | | |
Expenses, net of waivers and reimbursements | | | 1.34 | | | | 1.44 | | | | 1.53 | | | | 1.54 | | | | 1.49 | |
Expenses, before waivers and reimbursements | | | 2.06 | | | | 2.24 | | | | 2.55 | | | | 2.26 | | | | 2.26 | |
Net investment income (loss), net of waivers and reimbursements | | | (0.24 | ) | | | (0.41 | ) | | | (0.76 | ) | | | (0.92 | ) | | | (0.91 | ) |
Net investment income (loss), before waivers and reimbursements | | | (0.96 | ) | | | (1.21 | ) | | | (1.78 | ) | | | (1.64 | ) | | | (1.68 | ) |
| |
| | | Class I | |
| | | Years Ended December 31, | |
| | | 2007 | | | 2006 | | | 2005 | | | 2004 | | | 2003 | |
Net asset value, beginning of year | | $ | 11.15 | | | $ | 10.27 | | | $ | 9.10 | | | $ | 8.50 | | | $ | 6.92 | |
Income (loss) from investment operations: | | | | | | | | | | | | | | | | | | | | |
Net investment income (loss) | | | — | | | | (0.02 | ) | | | (0.05 | ) | | | (0.06 | ) | | | (0.05 | ) |
Net realized and unrealized gain (loss) on investments | | | 1.14 | | | | 0.90 | | | | 1.22 | | | | 0.66 | | | | 1.63 | |
| | | | | | | | | | | | | | | | | | | | |
Total from investment operations | | | 1.14 | | | | 0.88 | | | | 1.17 | | | | 0.60 | | | | 1.58 | |
Less distributions from: | | | | | | | | | | | | | | | | | | | | |
Net investment income | | | 0.01 | | | | — | | | | — | | | | — | | | | — | |
Net realized gain | | | — | | | | — | | | | — | | | | — | | | | — | |
| | | | | | | | | | | | | | | | | | | | |
Total distributions | | | 0.01 | | | | — | | | | — | | | | — | | | | — | |
| | | | | | | | | | | | | | | | | | | | |
Net asset value, end of year | | $ | 12.28 | | | $ | 11.15 | | | $ | 10.27 | | | $ | 9.10 | | | $ | 8.50 | |
| | | | | | | | | | | | | | | | | | | | |
Total return (%) | | | 10.24 | | | | 8.57 | | | | 12.86 | | | | 7.06 | | | | 22.83 | |
Ratios to average daily net assets (%): | | | | | | | | | | | | | | | | | | | | |
Expenses, net of waivers and reimbursements | | | 1.09 | | | | 1.19 | | | | 1.28 | | | | 1.29 | | | | 1.24 | |
Expenses, before waivers and reimbursements | | | 1.79 | | | | 1.99 | | | | 2.30 | | | | 2.01 | | | | 2.01 | |
Net investment income (loss), net of waivers and reimbursements | | | 0.03 | | | | (0.16 | ) | | | (0.51 | ) | | | (0.67 | ) | | | (0.66 | ) |
Net investment income (loss), before waivers and reimbursements | | | (0.67 | ) | | | (0.96 | ) | | | (1.53 | ) | | | (1.39 | ) | | | (1.43 | ) |
| | | | | | | | | | | | | | | |
| |
| | | |
| | | Years Ended December 31, |
| | | 2007 | | 2006 | | 2005 | | 2004 | | 2003 |
Supplemental data for all classes: | | | | | | | | | | | | | | | |
Net assets at end of year (in thousands) | | $ | 10,862 | | $ | 9,644 | | $ | 7,815 | | $ | 5,847 | | $ | 6,871 |
Portfolio turnover rate (%) | | | 55 | | | 42 | | | 25 | | | 31 | | | 37 |
Performance cited represents past performance. Past performance does not guarantee future results and current performance may be lower or higher than the data quoted. Results shown are annual returns, which assume reinvestment of dividends and capital gains. Investment returns and principal will fluctuate and you may have a gain or loss when you sell shares. For the most current month-end performance information, please call 1-800-742-7272, or visit our Web site at www.williamblairfunds.com.
Note: Net investment income (loss) per share is based on the average shares outstanding during the year.
106 Annual Report | December 31, 2007 |
Financial Highlights
Large Cap Growth Fund
| | | | | | | | | | | | | | | | | | | | |
| | | Class N | |
| | | Years Ended December 31, | |
| | | 2007 | | | 2006 | | | 2005 | | | 2004 | | | 2003 | |
Net asset value, beginning of year | | $ | 6.88 | | | $ | 6.47 | | | $ | 6.24 | | | $ | 5.93 | | | $ | 4.80 | |
Income (loss) from investment operations: | | | | | | | | | | | | | | | | | | | | |
Net investment income (loss) | | | (0.01 | ) | | | (0.02 | ) | | | (0.02 | ) | | | (0.04 | ) | | | (0.04 | ) |
Net realized and unrealized gain (loss) on investments | | | 0.65 | | | | 0.43 | | | | 0.25 | | | | 0.35 | | | | 1.17 | |
| | | | | | | | | | | | | | | | | | | | |
Total from investment operations | | | 0.64 | | | | 0.41 | | | | 0.23 | | | | 0.31 | | | | 1.13 | |
Less distributions from: | | | | | | | | | | | | | | | | | | | | |
Net investment income | | | — | | | | — | | | | — | | | | — | | | | — | |
Net realized gain | | | — | | | | — | | | | — | | | | — | | | | — | |
| | | | | | | | | | | | | | | | | | | | |
Total distributions | | | — | | | | — | | | | — | | | | — | | | | — | |
| | | | | | | | | | | | | | | | | | | | |
Net asset value, end of year | | $ | 7.52 | | | $ | 6.88 | | | $ | 6.47 | | | $ | 6.24 | | | $ | 5.93 | |
| | | | | | | | | | | | | | | | | | | | |
Total return (%) | | | 9.30 | | | | 6.34 | | | | 3.69 | | | | 5.23 | | | | 23.54 | |
Ratios to average daily net assets (%): | | | | | | | | | | | | | | | | | | | | |
Expenses, net of waivers and reimbursements | | | 1.23 | | | | 1.24 | | | | 1.28 | | | | 1.38 | | | | 1.42 | |
Expenses, before waivers and reimbursements | | | 1.50 | | | | 1.63 | | | | 2.08 | | | | 2.29 | | | | 2.39 | |
Net investment income (loss), net of waivers and reimbursements | | | (0.16 | ) | | | (0.29 | ) | | | (0.37 | ) | | | (0.63 | ) | | | (0.76 | ) |
Net investment income (loss), before waivers and reimbursements | | | (0.43 | ) | | | (0.68 | ) | | | (1.17 | ) | | | (1.54 | ) | | | (1.73 | ) |
| |
| | | Class I | |
| | | Years Ended December 31, | |
| | | 2007 | | | 2006 | | | 2005 | | | 2004 | | | 2003 | |
Net asset value, beginning of year | | $ | 6.99 | | | $ | 6.56 | | | $ | 6.31 | | | $ | 5.99 | | | $ | 4.82 | |
Income (loss) from investment operations: | | | | | | | | | | | | | | | | | | | | |
Net investment income (loss) | | | 0.01 | | | | — | | | | (0.01 | ) | | | (0.02 | ) | | | (0.03 | ) |
Net realized and unrealized gain (loss) on investments | | | 0.64 | | | | 0.43 | | | | 0.26 | | | | 0.34 | | | | 1.20 | |
| | | | | | | | | | | | | | | | | | | | |
Total from investment operations | | | 0.65 | | | | 0.43 | | | | 0.25 | | | | 0.32 | | | | 1.17 | |
Less distributions from: | | | | | | | | | | | | | | | | | | | | |
Net investment income | | | — | (a) | | | — | | | | — | | | | — | | | | — | |
Net realized gain | | | — | | | | — | | | | — | | | | — | | | | — | |
| | | | | | | | | | | | | | | | | | | | |
Total distributions | | | — | | | | — | | | | — | | | | — | | | | — | |
| | | | | | | | | | | | | | | | | | | | |
Net asset value, end of year | | $ | 7.64 | | | $ | 6.99 | | | $ | 6.56 | | | $ | 6.31 | | | $ | 5.99 | |
| | | | | | | | | | | | | | | | | | | | |
Total return (%) | | | 9.36 | | | | 6.55 | | | | 3.96 | | | | 5.34 | | | | 24.27 | |
Ratios to average daily net assets (%): | | | | | | | | | | | | | | | | | | | | |
Expenses, net of waivers and reimbursements | | | 0.98 | | | | 0.99 | | | | 1.03 | | | | 1.13 | | | | 1.17 | |
Expenses, before waivers and reimbursements | | | 1.20 | | | | 1.38 | | | | 1.83 | | | | 2.04 | | | | 2.14 | |
Net investment income (loss), net of waivers and reimbursements | | | 0.18 | | | | (0.04 | ) | | | (0.12 | ) | | | (0.38 | ) | | | (0.51 | ) |
Net investment income (loss), before waivers and reimbursements | | | (0.04 | ) | | | (0.43 | ) | | | (0.92 | ) | | | (1.29 | ) | | | (1.48 | ) |
| | | | | | | | | | | | | | | | | | | | | |
| | | Years Ended December 31, |
| | | 2007 | | 2006 | | 2005 | | | | | | | | 2004 | | 2003 |
Supplemental data for all classes: | | | | | | | | | | | | | | | | | | | | | |
Net assets at end of year (in thousands) | | $ | 33,667 | | $ | 20,191 | | $ | 16,888 | | | | | | | | $ | 6,417 | | $ | 5,519 |
Portfolio turnover rate (%) | | | 60 | | | 53 | | | 53 | | | | | | | | | 39 | | | 33 |
| (a) | | Distribution less than $0.01 per share. |
Performance cited represents past performance. Past performance does not guarantee future results and current performance may be lower or higher than the data quoted. Results shown are annual returns, which assume reinvestment of dividends and capital gains. Investment returns and principal will fluctuate and you may have a gain or loss when you sell shares. For the most current month-end performance information, please call 1-800-742-7272, or visit our Web site at www.williamblairfunds.com.
Note: Net investment income (loss) per share is based on the average shares outstanding during the year.
December 31, 2007 | William Blair Funds 107 |
Financial Highlights
Small Cap Growth Fund
| | | | | | | | | | | | | | | | | | | | |
| | | Class N | |
| | | Years Ended December 31, | |
| | | 2007 | | | 2006 | | | 2005 | | | 2004 | | | 2003 | |
Net asset value, beginning of year | | $ | 25.41 | | | $ | 23.76 | | | $ | 25.72 | | | $ | 21.83 | | | $ | 13.72 | |
Income (loss) from investment operations: | | | | | | | | | | | | | | | | | | | | |
Net investment income (loss) | | | (0.33 | ) | | | (0.29 | ) | | | (0.30 | ) | | | (0.30 | ) | | | (0.21 | ) |
Net realized and unrealized gain (loss) on investments | | | (0.25 | ) | | | 3.65 | | | | 0.64 | | | | 6.20 | | | | 8.68 | |
| | | | | | | | | | | | | | | | | | | | |
Total from investment operations | | | (0.58 | ) | | | 3.36 | | | | 0.34 | | | | 5.90 | | | | 8.47 | |
Less distributions from: | | | | | | | | | | | | | | | | | | | | |
Net investment income | | | — | | | | — | | | | — | | | | — | | | | — | |
Net realized gain | | | 1.53 | | | | 1.71 | | | | 2.30 | | | | 2.01 | | | | 0.36 | |
| | | | | | | | | | | | | | | | | | | | |
Total distributions | | | 1.53 | | | | 1.71 | | | | 2.30 | | | | 2.01 | | | | 0.36 | |
| | | | | | | | | | | | | | | | | | | | |
Net asset value, end of year | | $ | 23.30 | | | $ | 25.41 | | | $ | 23.76 | | | $ | 25.72 | | | $ | 21.83 | |
| | | | | | | | | | | | | | | | | | | | |
Total return (%) | | | (2.15 | ) | | | 14.12 | | | | 1.18 | | | | 27.24 | | | | 61.88 | |
Ratios to average daily net assets (%): | | | | | | | | | | | | | | | | | | | | |
Expenses, net of waivers and reimbursements | | | 1.49 | | | | 1.48 | | | | 1.49 | | | | 1.49 | | | | 1.55 | |
Expenses, before waivers and reimbursements | | | 1.49 | | | | 1.48 | | | | 1.49 | | | | 1.46 | | | | 1.52 | |
Net investment income (loss), net of waivers and reimbursements | | | (1.24 | ) | | | (1.14 | ) | | | (1.23 | ) | | | (1.27 | ) | | | (1.22 | ) |
Net investment income (loss), before waivers and reimbursements | | | (1.24 | ) | | | (1.14 | ) | | | (1.23 | ) | | | (1.24 | ) | | | (1.19 | ) |
| |
| | | Class I | |
| | | Years Ended December 31, | |
| | | 2007 | | | 2006 | | | 2005 | | | 2004 | | | 2003 | |
Net asset value, beginning of year | | $ | 25.94 | | | $ | 24.16 | | | $ | 26.04 | | | $ | 22.03 | | | $ | 13.82 | |
Income (loss) from investment operations: | | | | | | | | | | | | | | | | | | | | |
Net investment income (loss) | | | (0.25 | ) | | | (0.22 | ) | | | (0.25 | ) | | | (0.24 | ) | | | (0.18 | ) |
Net realized and unrealized gain (loss) on investments | | | (0.27 | ) | | | 3.71 | | | | 0.67 | | | | 6.26 | | | | 8.75 | |
| | | | | | | | | | | | | | | | | | | | |
Total from investment operations | | | (0.52 | ) | | | 3.49 | | | | 0.42 | | | | 6.02 | | | | 8.57 | |
Less distributions from: | | | | | | | | | | | | | | | | | | | | |
Net investment income | | | — | | | | — | | | | — | | | | — | | | | — | |
Net realized gain | | | 1.53 | | | | 1.71 | | | | 2.30 | | | | 2.01 | | | | 0.36 | |
| | | | | | | | | | | | | | | | | | | | |
Total distributions | | | 1.53 | | | | 1.71 | | | | 2.30 | | | | 2.01 | | | | 0.36 | |
| | | | | | | | | | | | | | | | | | | | |
Net asset value, end of year | | $ | 23.89 | | | $ | 25.94 | | | $ | 24.16 | | | $ | 26.04 | | | $ | 22.03 | |
| | | | | | | | | | | | | | | | | | | | |
Total return (%) | | | (1.88 | ) | | | 14.42 | | | | 1.48 | | | | 27.54 | | | | 62.15 | |
Ratios to average daily net assets (%): | | | | | | | | | | | | | | | | | | | | |
Expenses, net of waivers and reimbursements | | | 1.20 | | | | 1.21 | | | | 1.24 | | | | 1.24 | | | | 1.35 | |
Expenses, before waivers and reimbursements | | | 1.20 | | | | 1.21 | | | | 1.24 | | | | 1.21 | | | | 1.28 | |
Net investment income (loss), net of waivers and reimbursements | | | (0.94 | ) | | | (0.87 | ) | | | (0.98 | ) | | | (1.02 | ) | | | (1.02 | ) |
Net investment income (loss), before waivers and reimbursements | | | (0.94 | ) | | | (0.87 | ) | | | (0.98 | ) | | | (0.99 | ) | | | (0.95 | ) |
| | | | | | | | | | | | | | | |
| |
| | | |
| | | Years Ended December 31, |
| | | 2007 | | 2006 | | 2005 | | 2004 | | 2003 |
Supplemental data for all classes: | | | | | | | | | | | | | | | |
Net assets at end of year (in thousands) | | $ | 1,094,419 | | $ | 1,261,174 | | $ | 831,738 | | $ | 771,209 | | $ | 518,824 |
Portfolio turnover rate (%) | | | 97 | | | 105 | | | 80 | | | 109 | | | 103 |
Performance cited represents past performance. Past performance does not guarantee future results and current performance may be lower or higher than the data quoted. Results shown are annual returns, which assume reinvestment of dividends and capital gains. Investment returns and principal will fluctuate and you may have a gain or loss when you sell shares. For the most current month-end performance information, please call 1-800-742-7272, or visit our Web site at www.williamblairfunds.com.
Note: Net investment income (loss) per share is based on the average shares outstanding during the year.
108 Annual Report | December 31, 2007 |
Financial Highlights
Mid Cap Growth Fund
| | | | | | | | |
| | | Class N | |
| | | Year Ended December 31, | |
| | | 2007 | | | 2006(a) | |
Net asset value, beginning of period | | $ | 10.46 | | | $ | 10.00 | |
Income (loss) from investment operations: | | | | | | | | |
Net investment income (loss) | | | (0.07 | ) | | | (0.07 | ) |
Net realized and unrealized gain (loss) on investments | | | 1.59 | | | | 0.53 | |
| | | | | | | | |
Total from investment operations | | | 1.52 | | | | 0.46 | |
Less distributions from: | | | | | | | | |
Net investment income | | | — | | | | — | |
Net realized gain | | | 0.63 | | | | — | |
| | | | | | | | |
Total distributions | | | 0.63 | | | | — | |
| | | | | | | | |
Net asset value, end of period | | $ | 11.35 | | | $ | 10.46 | |
| | | | | | | | |
Total return (%) | | | 14.62 | | | | 4.60 | (b) |
Ratios to average daily net assets (%): | | | | | | | | |
Expenses, net of waivers and reimbursements | | | 1.38 | | | | 1.40 | (c) |
Expenses, before waivers and reimbursements | | | 1.67 | | | | 2.35 | (c) |
Net investment income (loss), net of waivers and reimbursements | | | (0.58 | ) | | | (0.70 | )(c) |
Net investment income (loss), before waivers and reimbursements | | | (0.87 | ) | | | (1.65 | )(c) |
| |
| | | Class I | |
| | | Year Ended December 31, | |
| | | 2007 | | | 2006(a) | |
Net asset value, beginning of period | | $ | 10.49 | | | $ | 10.00 | |
Income (loss) from investment operations: | | | | | | | | |
Net investment income (loss) | | | (0.04 | ) | | | (0.04 | ) |
Net realized and unrealized gain (loss) on investments | | | 1.60 | | | | 0.53 | |
| | | | | | | | |
Total from investment operations | | | 1.56 | | | | 0.49 | |
Less distributions from: | | | | | | | | |
Net investment income | | | — | | | | — | |
Net realized gain | | | 0.63 | | | | — | |
| | | | | | | | |
Total distributions | | | 0.63 | | | | — | |
| | | | | | | | |
Net asset value, end of period | | $ | 11.42 | | | $ | 10.49 | |
| | | | | | | | |
Total return (%) | | | 14.95 | | | | 4.90 | (b) |
Ratios to average daily net assets (%): | | | | | | | | |
Expenses, net of waivers and reimbursements | | | 1.12 | | | | 1.15 | (c) |
Expenses, before waivers and reimbursements | | | 1.37 | | | | 2.10 | (c) |
Net investment income (loss), net of waivers and reimbursements | | | (0.32 | ) | | | (0.43 | )(c) |
Net investment income (loss), before waivers and reimbursements | | | (0.57 | ) | | | (1.38 | )(c) |
| |
| | | | |
| | | Year Ended December 31, | |
| | | 2007 | | | 2006(a) | |
Supplemental data for all classes: | | | | | | | | |
Net assets at end of period (in thousands) | | $ | 45,393 | | | $ | 19,639 | |
Portfolio turnover rate (%) | | | 66 | | | | 56 | (c) |
| (a) | | For the period from February 1, 2006 (Commencement of Operations) to December 31, 2006. |
| (b) | | Total return is not annualized for periods that are less than a year. |
| (c) | | Rates are annualized for periods that are less than a year. |
Performance cited represents past performance. Past performance does not guarantee future results and current performance may be lower or higher than the data quoted. Results shown are annual returns, which assume reinvestment of dividends and capital gains. Investment returns and principal will fluctuate and you may have a gain or loss when you sell shares. For the most current month-end performance information, please call 1-800-742-7272, or visit our Web site at www.williamblairfunds.com.
Note: Net investment income (loss) per share is based on the average shares outstanding during the period.
December 31, 2007 | William Blair Funds 109 |
Financial Highlights
Small-Mid Cap Growth Fund
| | | | | | | | | | | | | | | | | | | | |
| | | Class N | |
| | | Years Ended December 31, | |
| | | 2007 | | | 2006 | | | 2005 | | | 2004 | | | 2003(a) | |
Net asset value, beginning of year | | $ | 12.96 | | | $ | 12.40 | | | $ | 11.28 | | | $ | 9.94 | | | $ | 10.00 | |
Income (loss) from investment operations: | | | | | | | | | | | | | | | | | | | | |
Net investment income (loss) | | | (0.12 | ) | | | (0.11 | ) | | | (0.11 | ) | | | (0.13 | ) | | | — | |
Net realized and unrealized gain (loss) on investments | | | 1.71 | | | | 1.32 | | | | 1.32 | | | | 1.47 | | | | (0.06 | ) |
| | | | | | | | | | | | | | | | | | | | |
Total from investment operations | | | 1.59 | | | | 1.21 | | | | 1.21 | | | | 1.34 | | | | (0.06 | ) |
Less distributions from: | | | | | | | | | | | | | | | | | | | | |
Net investment income | | | — | | | | — | | | | — | | | | — | | | | — | |
Net realized gain | | | 1.45 | | | | 0.65 | | | | 0.09 | | | | — | | | | — | |
| | | | | | | | | | | | | | | | | | | | |
Total distributions | | | 1.45 | | | | 0.65 | | | | 0.09 | | | | — | | | | — | |
| | | | | | | | | | | | | | | | | | | | |
Net asset value, end of year | | $ | 13.10 | | | $ | 12.96 | | | $ | 12.40 | | | $ | 11.28 | | | $ | 9.94 | |
| | | | | | | | | | | | | | | | | | | | |
Total return (%) | | | 12.34 | | | | 9.68 | | | | 10.72 | | | | 13.48 | | | | (0.60 | ) |
Ratios to average daily net assets (%): | | | | | | | | | | | | | | | | | | | | |
Expenses, net of waivers and reimbursements | | | 1.36 | | | | 1.38 | | | | 1.45 | | | �� | 1.54 | | | | 1.54 | (b) |
Expenses, before waivers and reimbursements | | | 1.42 | | | | 1.45 | | | | 1.54 | | | | 2.14 | | | | 1.54 | (b) |
Net investment income (loss), net of waivers and reimbursements | | | (0.79 | ) | | | (0.86 | ) | | | (0.97 | ) | | | (1.26 | ) | | | (1.54 | )(b) |
Net investment income (loss), before waivers and reimbursements | | | (0.85 | ) | | | (0.93 | ) | | | (1.06 | ) | | | (1.86 | ) | | | (1.54 | )(b) |
| |
| | | Class I | |
| | | Years Ended December 31, | |
| | | 2007 | | | 2006 | | | 2005 | | | 2004 | | | 2003(a) | |
Net asset value, beginning of year | | $ | 13.06 | | | $ | 12.46 | | | $ | 11.30 | | | $ | 9.94 | | | $ | 10.00 | |
Income (loss) from investment operations: | | | | | | | | | | | | | | | | | | | | |
Net investment income (loss) | | | (0.08 | ) | | | (0.08 | ) | | | (0.08 | ) | | | (0.11 | ) | | | — | |
Net realized and unrealized gain (loss) on investments | | | 1.71 | | | | 1.33 | | | | 1.33 | | | | 1.47 | | | | (0.06 | ) |
| | | | | | | | | | | | | | | | | | | | |
Total from investment operations | | | 1.63 | | | | 1.25 | | | | 1.25 | | | | 1.36 | | | | (0.06 | ) |
Less distributions from: | | | | | | | | | | | | | | | | | | | | |
Net investment income | | | — | | | | — | | | | — | | | | — | | | | — | |
Net realized gain | | | 1.45 | | | | 0.65 | | | | 0.09 | | | | — | | | | — | |
| | | | | | | | | | | | | | | | | | | | |
Total distributions | | | 1.45 | | | | 0.65 | | | | 0.09 | | | | — | | | | — | |
| | | | | | | | | | | | | | | | | | | | |
Net asset value, end of year | | $ | 13.24 | | | $ | 13.06 | | | $ | 12.46 | | | $ | 11.30 | | | $ | 9.94 | |
| | | | | | | | | | | | | | | | | | | | |
Total return (%) | | | 12.54 | | | | 9.95 | | | | 11.05 | | | | 13.68 | | | | (0.60 | ) |
Ratios to average daily net assets (%): | | | | | | | | | | | | | | | | | | | | |
Expenses, net of waivers and reimbursements | | | 1.11 | | | | 1.13 | | | | 1.20 | | | | 1.29 | | | | 1.29 | (b) |
Expenses, before waivers and reimbursements | | | 1.17 | | | | 1.20 | | | | 1.29 | | | | 1.89 | | | | 1.29 | (b) |
Net investment income (loss), net of waivers and reimbursements | | | (0.54 | ) | | | (0.61 | ) | | | (0.72 | ) | | | (1.01 | ) | | | (1.29 | )(b) |
Net investment income (loss), before waivers and reimbursements | | | (0.60 | ) | | | (0.68 | ) | | | (0.81 | ) | | | (1.61 | ) | | | (1.29 | )(b) |
| | | | | | | | | | | | | | | | |
| |
| | | | |
| | | Years Ended December 31, | |
| | | 2007 | | 2006 | | 2005 | | 2004 | | 2003 | |
Supplemental data for all classes: | | | | | | | | | | | | | | | | |
Net assets at end of year (in thousands) | | $ | 124,501 | | $ | 92,766 | | $ | 70,211 | | $ | 25,974 | | $ | 3,673 | |
Portfolio turnover rate (%) | | | 80 | | | 68 | | | 62 | | | 55 | | | — | (b) |
| (a) | | For the period from December 29, 2003 (Commencement of Operations) to December 31, 2003. |
| (b) | | Rates are annualized for periods that are less than a year. |
Performance cited represents past performance. Past performance does not guarantee future results and current performance may be lower or higher than the data quoted. Results shown are annual returns, which assume reinvestment of dividends and capital gains. Investment returns and principal will fluctuate and you may have a gain or loss when you sell shares. For the most current month-end performance information, please call 1-800-742-7272, or visit our Web site at www.williamblairfunds.com.
Note: Net investment income (loss) per share is based on the average shares outstanding during the year.
110 Annual Report | December 31, 2007 |
Financial Highlights
Global Growth Fund
| | | | |
| | | Class N | |
| | | Period Ended December 31, | |
| | | 2007(a) | |
Net asset value, beginning of period | | $ | 10.00 | |
Income (loss) from investment operations: | | | | |
Net investment income (loss) (b) | | | — | |
Net realized and unrealized gain (loss) on investments | | | (0.11 | ) |
| | | | |
Total from investment operations | | | (0.11 | ) |
Less distributions from: | | | | |
Net investment income | | | — | (b) |
Net realized gain | | | — | |
| | | | |
Total distributions | | | — | |
| | | | |
Net asset value, end of period | | $ | 9.89 | |
| | | | |
Total return (%) | | | (1.10 | )(d) |
Ratios to average daily net assets (%): | | | | |
Expenses, net of waivers and reimbursements | | | 1.55 | (e) |
Expenses, before waivers and reimbursements | | | 2.14 | (e) |
Net investment income (loss), net of waivers and reimbursements | | | (0.08 | )(e) |
Net investment income (loss), before waivers and reimbursements | | | (0.67 | )(e) |
| | | | |
| | | Class I | |
| | | Period Ended December 31, | |
| | | 2007(a) | |
Net asset value, beginning of period | | $ | 10.00 | |
Income (loss) from investment operations: | | | | |
Net investment income (loss) (b) | | | — | |
Net realized and unrealized gain (loss) on investments | | | (0.09 | ) |
| | | | |
Total from investment operations | | | (0.09 | ) |
Less distributions from: | | | | |
Net investment income | | | — | (b) |
Net realized gain | | | — | |
| | | | |
Total distributions | | | — | |
| | | | |
Net asset value, end of period | | $ | 9.91 | |
| | | | |
Total return (%) | | | (0.85 | )(d) |
Ratios to average daily net assets (%): | | | | |
Expenses, net of waivers and reimbursements | | | 1.30 | (e) |
Expenses, before waivers and reimbursements | | | 1.89 | (e) |
Net investment income (loss), net of waivers and reimbursements | | | 0.14 | (e) |
Net investment income (loss), before waivers and reimbursements | | | (0.45 | )(e) |
| | | | |
| | | | |
| | | Period Ended December 31, | |
| | | 2007 | |
Supplemental data for all classes: | | | | |
Net assets at end of period (in thousands) | | $ | 45,576 | |
Portfolio turnover rate (%) | | | 63 | (e) |
| (a) | | For the period from October 15, 2007 (Commencement of Operations) to December 31, 2007. |
| (b) | | Distribution less than $0.01 per share. |
| (c) | | Excludes $0.00 of PFIC mark to market which is treated as ordinary income for Federal tax purposes for the year 2007. |
| (d) | | Total return is not annualized for periods less then a year. |
| (e) | | Rates are annualized for periods that are less than a year. |
Performance cited represents past performance. Past performance does not guarantee future results and current performance may be lower or higher than the data quoted. Results shown are annual returns, which assume reinvestment of dividends and capital gains. Investment returns and principal will fluctuate and you may have a gain or loss when you sell shares. For the most current month-end performance information, please call 1-800-742-7272, or visit our Web site at www.williamblairfunds.com.
Note: Net investment income (loss) per share is based on the average shares outstanding during the year.
December 31, 2007 | William Blair Funds 111 |
Financial Highlights
International Growth Fund
| | | | | | | | | | | |
| | | Class N |
| | | Years Ended December 31, |
| | | 2007 | | 2006 | | 2005 | | 2004 | | | 2003 |
Net asset value, beginning of year | | $27.70 | | $25.22 | | $22.09 | | $18.65 | | | $13.13 |
Income (loss) from investment operations: | | | | | | | | | | | |
Net investment income (loss) (a) | | 0.12 | | 0.05 | | 0.15 | | (0.02 | ) | | 0.02 |
Net realized and unrealized gain (loss) on investments | | 4.77 | | 5.71 | | 4.60 | | 3.47 | | | 5.52 |
| | | | | | | | | | | |
Total from investment operations | | 4.89 | | 5.76 | | 4.75 | | 3.45 | | | 5.54 |
Less distributions from: | | | | | | | | | | | |
Net investment income | | 0.34 | | 0.37 | | 0.11 | | 0.01 | | | 0.02 |
Net realized gain | | 3.13 | | 2.91 | | 1.51 | | — | | | — |
| | | | | | | | | | | |
Total distributions | | 3.47 | | 3.28 | | 1.62 | | 0.01 | | | 0.02 |
| | | | | | | | | | | |
Net asset value, end of year | | $29.12 | | $27.70 | | $25.22 | | $22.09 | | | $18.65 |
| | | | | | | | | | | |
Total return (%) | | 18.13 | | 23.06 | | 21.65 | | 18.48 | | | 42.21 |
Ratios to average daily net assets (%): | | | | | | | | | | | |
Expenses | | 1.40 | | 1.42 | | 1.42 | | 1.47 | | | 1.50 |
Net investment income (loss) | | 0.38 | | 0.19 | | 0.16 | | (0.16 | ) | | 0.05 |
| |
| | | Class I |
| | | Years Ended December 31, |
| | | 2007 | | 2006 | | 2005 | | 2004 | | | 2003 |
Net asset value, beginning of year | | $28.10 | | $25.55 | | $22.34 | | $18.85 | | | $13.27 |
Income (loss) from investment operations: | | | | | | | | | | | |
Net investment income (loss) (a) | | 0.21 | | 0.13 | | 0.27 | | 0.01 | | | 0.09 |
Net realized and unrealized gain (loss) on investments | | 4.86 | | 5.78 | | 4.61 | | 3.53 | | | 5.54 |
| | | | | | | | | | | |
Total from investment operations | | 5.07 | | 5.91 | | 4.88 | | 3.54 | | | 5.63 |
Less distributions from: | | | | | | | | | | | |
Net investment income | | 0.43 | | 0.45 | | 0.16 | | 0.05 | | | 0.05 |
Net realized gain | | 3.13 | | 2.91 | | 1.51 | | — | | | — |
| | | | | | | | | | | |
Total distributions | | 3.56 | | 3.36 | | 1.67 | | 0.05 | | | 0.05 |
| | | | | | | | | | | |
Net asset value, end of year | | $29.61 | | $28.10 | | $25.55 | | $22.34 | | | $18.85 |
| | | | | | | | | | | |
Total return (%) | | 18.53 | | 23.35 | | 22.00 | | 18.79 | | | 42.42 |
Ratios to average daily net assets (%): | | | | | | | | | | | |
Expenses | | 1.09 | | 1.11 | | 1.17 | | 1.22 | | | 1.25 |
Net investment income (loss) | | 0.69 | | 0.45 | | 0.41 | | 0.09 | | | 0.30 |
| | | | | | | | | | | | | | | |
| | | |
| | | Years Ended December 31, |
| | | 2007 | | 2006 | | 2005 | | 2004 | | 2003 |
Supplemental data for all classes: | | | | | | | | | | | | | | | |
Net assets at end of year (in thousands) | | $ | 8,048,654 | | $ | 6,267,126 | | $ | 4,551,077 | | $ | 3,001,434 | | $ | 1,899,699 |
Portfolio turnover rate (%) | | | 56 | | | 72 | | | 70 | | | 79 | | | 57 |
| (a) | | Excludes $0.09, $0.42, $0.37, $0.12, and $0.03, of PFIC mark to market which are treated as ordinary income for Federal tax purposes for the years 2007, 2006, 2005, 2004, and 2003 respectively. |
Performance cited represents past performance. Past performance does not guarantee future results and current performance may be lower or higher than the data quoted. Results shown are annual returns, which assume reinvestment of dividends and capital gains. Investment returns and principal will fluctuate and you may have a gain or loss when you sell shares. For the most current month-end performance information, please call 1-800-742-7272, or visit our Web site at www.williamblairfunds.com.
Note: Net investment income (loss) per share is based on the average shares outstanding during the year.
112 Annual Report | December 31, 2007 |
Financial Highlights
International Equity Fund
| | | | | | | | | | | | | | |
| | | Class N | |
| | | Years Ended December 31, | |
| | | 2007 | | 2006 | | 2005 | | | 2004(a) | |
Net asset value, beginning of year | | $ | 15.21 | | $ | 12.86 | | $ | 11.33 | | | $ | 10.00 | |
Income (loss) from investment operations: | | | | | | | | | | | | | | |
Net investment income (loss) (b) | | | 0.09 | | | 0.04 | | | (0.01 | ) | | | (0.04 | ) |
Net realized and unrealized gain (loss) on investments | | | 2.55 | | | 2.52 | | | 1.54 | | | | 1.37 | |
| | | | | | | | | | | | | | |
Total from investment operations | | | 2.64 | | | 2.56 | | | 1.53 | | | | 1.33 | |
Less distributions from: | | | | | | | | | | | | | | |
Net investment income | | | 0.14 | | | 0.19 | | | — | | | | — | |
Net realized gain | | | 1.18 | | | 0.02 | | | — | | | | — | |
| | | | | | | | | | | | | | |
Total distributions | | | 1.32 | | | 0.21 | | | — | | | | — | |
| | | | | | | | | | | | | | |
Net asset value, end of year | | $ | 16.53 | | $ | 15.21 | | $ | 12.86 | | | $ | 11.33 | |
| | | | | | | | | | | | | | |
Total return (%) | | | 17.68 | | | 19.96 | | | 13.50 | | | | 13.30 | |
Ratios to average daily net assets (%): | | | | | | | | | | | | | | |
Expenses, net of waivers and reimbursements | | | 1.45 | | | 1.46 | | | 1.48 | | | | 1.50 | (c) |
Expenses, before waivers and reimbursements | | | 1.47 | | | 1.56 | | | 1.81 | | | | 2.96 | (c) |
Net investment income (loss), net of waivers and reimbursements | | | 0.52 | | | 0.26 | | | (0.33 | ) | | | (0.77 | )(c) |
Net investment income (loss), before waivers and reimbursements | | | 0.50 | | | 0.16 | | | (0.66 | ) | | | (2.23 | )(c) |
| | | | | | | | | | | | | | |
| | | Class I | |
| | | Years Ended December 31, | |
| | | 2007 | | 2006 | | 2005 | | | 2004(a) | |
Net asset value, beginning of year | | $ | 15.31 | | $ | 12.94 | | $ | 11.37 | | | $ | 10.00 | |
Income (loss) from investment operations: | | | | | | | | | | | | | | |
Net investment income (loss) (b) | | | 0.13 | | | 0.06 | | | (0.01 | ) | | | (0.01 | ) |
Net realized and unrealized gain (loss) on investments | | | 2.57 | | | 2.55 | | | 1.58 | | | | 1.38 | |
| | | | | | | | | | | | | | |
Total from investment operations | | | 2.70 | | | 2.61 | | | 1.57 | | | | 1.37 | |
Less distributions from: | | | | | | | | | | | | | | |
Net investment income | | | 0.17 | | | 0.22 | | | — | | | | — | |
Net realized gain | | | 1.18 | | | 0.02 | | | — | | | | — | |
| | | | | | | | | | | | | | |
Total distributions | | | 11.35 | | | 0.24 | | | — | | | | — | |
| | | | | | | | | | | | | | |
Net asset value, end of year | | $ | 16.66 | | $ | 15.31 | | $ | 12.94 | | | $ | 11.37 | |
| | | | | | | | | | | | | | |
Total return (%) | | | 17.97 | �� | | 20.22 | | | 13.81 | | | | 13.70 | |
Ratios to average daily net assets (%): | | | | | | | | | | | | | | |
Expenses, net of waivers and reimbursements | | | 1.20 | | | 1.21 | | | 1.23 | | | | 1.25 | (c) |
Expenses, before waivers and reimbursements | | | 1.25 | | | 1.35 | | | 1.56 | | | | 2.71 | (c) |
Net investment income (loss), net of waivers and reimbursements | | | 0.76 | | | 0.46 | | | (0.08 | ) | | | (0.52 | )(c) |
Net investment income (loss), before waivers and reimbursements | | | 0.71 | | | 0.32 | | | (0.41 | ) | | | (1.98 | )(c) |
| | | | | | | | | | | | | |
| | | Years Ended December 31, | |
| | | 2007 | | 2006 | | 2005 | | 2004 | |
Supplemental data for all classes: | | | | | | | | | | | | | |
Net assets at end of year (in thousands) | | $ | 408,609 | | $ | 297,716 | | $ | 177,710 | | $ | 9,689 | |
Portfolio turnover rate (%) | | | 70 | | | 83 | | | 127 | | | 108 | (c) |
| (a) | | For the period from May 24, 2004 (Commencement of Operations) to December 31, 2004. |
| (b) | | Excludes $0.01, $0.22, $0.33 and $0.02 of PFIC mark to market which is treated as ordinary income for Federal tax purposes for the year 2007, 2006, 2005 and 2004, respectively. |
| (c) | | Rates are annualized for periods that are less than a year. |
Performance cited represents past performance. Past performance does not guarantee future results and current performance may be lower or higher than the data quoted. Results shown are annual returns, which assume reinvestment of dividends and capital gains. Investment returns and principal will fluctuate and you may have a gain or loss when you sell shares. For the most current month-end performance information, please call 1-800-742-7272, or visit our Web site at www.williamblairfunds.com.
Note: Net investment income (loss) per share is based on the average shares outstanding during the year.
December 31, 2007 | William Blair Funds 113 |
Financial Highlights
International Small Cap Growth Fund
| | | | | | | | | | | | |
| | | Class N | |
| | | Years Ended December 31, | |
| | | 2007 | | | 2006 | | | 2005(a) | |
Net asset value, beginning of year | | $ | 13.37 | | | $ | 11.16 | | | $ | 10.00 | |
Income (loss) from investment operations: | | | | | | | | | | | | |
Net investment income (loss) (b) | | | (0.02 | ) | | | (0.05 | ) | | | (0.01 | ) |
Net realized and unrealized gain (loss) on investments | | | 1.72 | | | | 2.32 | | | | 1.17 | |
| | | | | | | | | | | | |
Total from investment operations | | | 1.70 | | | | 2.27 | | | | 1.16 | |
Less distributions from: | | | | | | | | | | | | |
Net investment income | | | 0.05 | | | | 0.01 | | | | — | |
Net realized gain | | | 1.04 | | | | 0.05 | | | | — | |
| | | | | | | | | | | | |
Total distributions | | | 1.09 | | | | 0.06 | | | | — | |
| | | | | | | | | | | | |
Net asset value, end of year | | $ | 13.98 | | | $ | 13.37 | | | $ | 11.16 | |
| | | | | | | | | | | | |
Total return (%) | | | 13.06 | | | | 20.32 | | | | 11.60 | |
Ratios to average daily net assets (%): | | | | | | | | | | | | |
Expenses, net of waivers and reimbursements | | | 1.60 | | | | 1.65 | | | | 1.65 | (c) |
Expenses, before waivers and reimbursements | | | 1.60 | | | | 1.71 | | | | 2.57 | (c) |
Net investment income (loss), net of waivers and reimbursements | | | (0.16 | ) | | | (0.40 | ) | | | (0.40 | )(c) |
Net investment income (loss), before waivers and reimbursements | | | (0.16 | ) | | | (0.46 | ) | | | (1.32 | )(c) |
| |
| | | Class I | |
| | | Years Ended December 31, | |
| | | 2007 | | | 2006 | | | 2005(a) | |
Net asset value, beginning of year | | $ | 13.41 | | | $ | 11.16 | | | $ | 10.00 | |
Income (loss) from investment operations: | | | | | | | | | | | | |
Net investment income (loss) (b) | | | 0.03 | | | | (0.03 | ) | | | — | |
Net realized and unrealized gain (loss) on investments | | | 1.71 | | | | 2.34 | | | | 1.16 | |
| | | | | | | | | | | | |
Total from investment operations | | | 1.74 | | | | 2.31 | | | | 1.16 | |
Less distributions from: | | | | | | | | | | | | |
Net investment income | | | 0.10 | | | | 0.01 | | | | — | |
Net realized gain | | | 1.04 | | | | 0.05 | | | | — | |
| | | | | | | | | | | | |
Total distributions | | | 1.14 | | | | 0.06 | | | | — | |
| | | | | | | | | | | | |
Net asset value, end of year | | $ | 14.01 | | | $ | 13.41 | | | $ | 11.16 | |
| | | | | | | | | | | | |
Total return (%) | | | 13.34 | | | | 20.68 | | | | 11.60 | |
Ratios to average daily net assets (%): | | | | | | | | | | | | |
Expenses, net of waivers and reimbursements | | | 1.29 | | | | 1.40 | | | | 1.40 | (c) |
Expenses, before waivers and reimbursements | | | 1.29 | | | | 1.46 | | | | 2.32 | (c) |
Net investment income (loss), net of waivers and reimbursements | | | 0.18 | | | | (0.25 | ) | | | (0.15 | )(c) |
Net investment income (loss), before waivers and reimbursements | | | 0.18 | | | | (0.31 | ) | | | (1.07 | )(c) |
| | | | | | | | | | |
| |
| | | | |
| | | Years Ended December 31, | |
| | | 2007 | | 2006 | | 2005(a) | |
Supplemental data for all classes: | | | | | | | | | | |
Net assets at end of year (in thousands) | | $ | 401,459 | | $ | 231,969 | | $ | 50,534 | |
Portfolio turnover rate (%) | | | 88 | | | 109 | | | 127 | (c) |
| (a) | | For the period from November 1, 2005 (Commencement of Operations) to December 31, 2005. |
| (b) | | Excludes $0.05, $0.00 and $0.11 of PFIC mark to market which is treated as ordinary income for Federal tax purposes for the years ended 2007, 2006 and 2005, respectively. |
| (c) | | Rates are annualized for periods that are less than a year. |
Performance cited represents past performance. Past performance does not guarantee future results and current performance may be lower or higher than the data quoted. Results shown are annual returns, which assume reinvestment of dividends and capital gains. Investment returns and principal will fluctuate and you may have a gain or loss when you sell shares. For the most current month-end performance information, please call 1-800-742-7272, or visit our Web site at www.williamblairfunds.com.
Note: Net investment income (loss) per share is based on the average shares outstanding during the year.
114 Annual Report | December 31, 2007 |
Financial Highlights
Emerging Markets Growth Fund
| | | | | | | | | | | | |
| | | Class N | |
| | | Years Ended December 31, | |
| | | 2007 | | | 2006 | | | 2005(a) | |
Net asset value, beginning of year | | $ | 19.42 | | | $ | 14.17 | | | $ | 10.00 | |
Income (loss) from investment operations: | | | | | | | | | | | | |
Net investment income (loss) (b) | | | (0.10 | ) | | | (0.04 | ) | | | (0.01 | ) |
Net realized and unrealized gain (loss) on investments | | | 7.23 | | | | 5.41 | | | | 4.26 | |
| | | | | | | | | | | | |
Total from investment operations | | | 7.13 | | | | 5.37 | | | | 4.25 | |
Less distributions from: | | | | | | | | | | | | |
Net investment income | | | 0.09 | | | | 0.01 | | | | — | |
Net realized gain | | | 4.54 | | | | 0.11 | | | | 0.08 | |
| | | | | | | | | | | | |
Total distributions | | | 4.63 | | | | 0.12 | | | | 0.08 | |
| | | | | | | | | | | | |
Net asset value, end of year | | $ | 21.92 | | | $ | 19.42 | | | $ | 14.17 | |
| | | | | | | | | | | | |
Total return (%) | | | 37.75 | | | | 37.90 | | | | 42.52 | |
Ratios to average daily net assets (%): | | | | | | | | | | | | |
Expenses, net of waivers and reimbursements | | | 1.65 | | | | 1.65 | | | | 1.55 | (c) |
Expenses, before waivers and reimbursements | | | 1.69 | | | | 1.78 | | | | 1.91 | (c) |
Net investment income (loss), net of waivers and reimbursements | | | (0.45 | ) | | | (0.22 | ) | | | (0.11 | )(c) |
Net investment income (loss), before waivers and reimbursements | | | (0.49 | ) | | | (0.35 | ) | | | (0.47 | )(c) |
| | | | | | | | | | | | |
| | | Class I | |
| | | Years Ended December 31, | |
| | | 2007 | | | 2006 | | | 2005(a) | |
Net asset value, beginning of year | | $ | 19.47 | | | $ | 14.19 | | | $ | 10.00 | |
Income (loss) from investment operations: | | | | | | | | | | | | |
Net investment income (loss) (b) | | | (0.04 | ) | | | (0.01 | ) | | | 0.01 | |
Net realized and unrealized gain (loss) on investments | | | 7.26 | | | | 5.41 | | | | 4.26 | |
| | | | | | | | | | | | |
Total from investment operations | | | 7.22 | | | | 5.40 | | | | 4.27 | |
Less distributions from: | | | | | | | | | | | | |
Net investment income | | | 0.16 | | | | 0.01 | | | | — | |
Net realized gain | | | 4.54 | | | | 0.11 | | | | 0.08 | |
| | | | | | | | | | | | |
Total distributions | | | 4.70 | | | | 0.12 | | | | 0.08 | |
| | | | | | | | | | | | |
Net asset value, end of year | | $ | 21.99 | | | $ | 19.47 | | | $ | 14.19 | |
| | | | | | | | | | | | |
Total return (%) | | | 38.13 | | | | 38.07 | | | | 42.72 | |
Ratios to average daily net assets (%): | | | | | | | | | | | | |
Expenses, net of waivers and reimbursements | | | 1.40 | | | | 1.40 | | | | 1.40 | (c) |
Expenses, before waivers and reimbursements | | | 1.40 | | | | 1.47 | | | | 1.76 | (c) |
Net investment income (loss), net of waivers and reimbursements | | | (0.20 | ) | | | (0.06 | ) | | | 0.04 | (c) |
Net investment income (loss), before waivers and reimbursements | | | (0.20 | ) | | | (0.13 | ) | | | (0.32 | )(c) |
| | | | | | | | | | |
| |
| | | | |
| | | Years Ended December 31, | |
| | | 2007 | | 2006 | | 2005(a) | |
Supplemental data for all classes: | | | | | | | | | | |
Net assets at end of year (in thousands) | | $ | 1,165,854 | | $ | 813,649 | | $ | 249,348 | |
Portfolio turnover rate (%) | | | 100 | | | 113 | | | 77 | (c) |
| (a) | | For the period from June 6, 2005 (Commencement of Operations) to December 31, 2005. |
| (b) | | Excludes $0.21, $0.00 and $0.11 of PFIC mark to market which is treated as ordinary income for Federal tax purposes for years ended 2007, 2006 and 2005, respectively. |
| (c) | | Rates are annualized for periods that are less than a year. |
Performance cited represents past performance. Past performance does not guarantee future results and current performance may be lower or higher than the data quoted. Results shown are annual returns, which assume reinvestment of dividends and capital gains. Investment returns and principal will fluctuate and you may have a gain or loss when you sell shares. For the most current month-end performance information, please call 1-800-742-7272, or visit our Web site at www.williamblairfunds.com.
Note: Net investment income (loss) per share is based on the average shares outstanding during the year.
December 31, 2007 | William Blair Funds 115 |
Financial Highlights
Value Discovery Fund
| | | | | | | | | | | | | | | | | | | | |
| | | Class N | |
| | | Years Ended December 31, | |
| | | 2007 | | | 2006 | | | 2005 | | | 2004 | | | 2003 | |
Net asset value, beginning of year | | $ | 16.27 | | | $ | 14.95 | | | $ | 22.70 | | | $ | 22.68 | | | $ | 16.28 | |
Income (loss) from investment operations: | | | | | | | | | | | | | | | | | | | | |
Net investment income (loss) | | | 0.02 | | | | 0.03 | | | | (0.02 | ) | | | (0.01 | ) | | | (0.06 | ) |
Net realized and unrealized gain (loss) on investments | | | (0.96 | ) | | | 3.22 | | | | 0.14 | | | | 2.68 | | | | 6.46 | |
| | | | | | | | | | | | | | | | | | | | |
Total from investment operations | | | (0.94 | ) | | | 3.25 | | | | 0.12 | | | | 2.67 | | | | 6.40 | |
Less distributions from: | | | | | | | | | | | | | | | | | | | | |
Net investment income | | | — | | | | 0.01 | | | | — | | | | — | | | | — | |
Net realized gain | | | 4.02 | | | | 1.92 | | | | 7.87 | | | | 2.65 | | | | — | |
| | | | | | | | | | | | | | | | | | | | |
Total distributions | | | 4.02 | | | | 1.93 | | | | 7.87 | | | | 2.65 | | | | — | |
| | | | | | | | | | | | | | | | | | | | |
Net asset value, end of year | | $ | 11.31 | | | $ | 16.27 | | | $ | 14.95 | | | $ | 22.70 | | | $ | 22.68 | |
| | | | | | | | | | | | | | | | | | | | |
Total return (%) | | | (5.54 | ) | | | 21.78 | | | | 0.49 | | | | 12.05 | | | | 39.31 | |
Ratios to average daily net assets (%): | | | | | | | | | | | | | | | | | | | | |
Expenses, net of waivers and reimbursements | | | 1.33 | | | | 1.34 | | | | 1.34 | | | | 1.34 | | | | 1.49 | |
Expenses, before waivers and reimbursements | | | 1.66 | | | | 1.75 | | | | 1.64 | | | | 1.48 | | | | 1.58 | |
Net investment income (loss), net of waivers and reimbursements | | | 0.10 | | | | 0.21 | | | | (0.22 | ) | | | (0.06 | ) | | | (0.30 | ) |
Net investment income (loss), before waivers and reimbursements | | | (0.23 | ) | | | (0.20 | ) | | | (0.52 | ) | | | (0.20 | ) | | | (0.39 | ) |
| |
| | | Class I | |
| | | Years Ended December 31, | |
| | | 2007 | | | 2006 | | | 2005 | | | 2004 | | | 2003 | |
Net asset value, beginning of year | | $ | 16.51 | | | $ | 15.12 | | | $ | 22.82 | | | $ | 22.76 | | | $ | 16.31 | |
Income (loss) from investment operations: | | | | | | | | | | | | | | | | | | | | |
Net investment income (loss) | | | 0.09 | | | | 0.03 | | | | — | | | | 0.01 | | | | (0.03 | ) |
Net realized and unrealized gain (loss) on investments | | | (1.01 | ) | | | 3.30 | | | | 0.17 | | | | 2.70 | | | | 6.48 | |
| | | | | | | | | | | | | | | | | | | | |
Total from investment operations | | | (0.92 | ) | | | 3.33 | | | | 0.17 | | | | 2.71 | | | | 6.45 | |
Less distributions from: | | | | | | | | | | | | | | | | | | | | |
Net investment income | | | 0.07 | | | | 0.02 | | | | — | | | | — | | | | — | |
Net realized gain | | | 4.02 | | | | 1.92 | | | | 7.87 | | | | 2.65 | | | | — | |
| | | | | | | | | | | | | | | | | | | | |
Total distributions | | | 4.09 | | | | 1.94 | | | | 7.87 | | | | 2.65 | | | | — | |
| | | | | | | | | | | | | | | | | | | | |
Net asset value, end of year | | $ | 11.50 | | | $ | 16.51 | | | $ | 15.12 | | | $ | 22.82 | | | $ | 22.76 | |
| | | | | | | | | | | | | | | | | | | | |
Total return (%) | | | (5.31 | ) | | | 22.10 | | | | 0.70 | | | | 12.18 | | | | 39.55 | |
Ratios to average daily net assets (%): | | | | | | | | | | | | | | | | | | | | |
Expenses, net of waivers and reimbursements | | | 1.09 | | | | 1.09 | | | | 1.14 | | | | 1.23 | | | | 1.33 | |
Expenses, before waivers and reimbursements | | | 1.37 | | | | 1.50 | | | | 1.39 | | | | 1.23 | | | | 1.33 | |
Net investment income (loss), net of waivers and reimbursements | | | 0.52 | | | | 0.16 | | | | (0.02 | ) | | | 0.05 | | | | (0.14 | ) |
Net investment income (loss), before waivers and reimbursements | | | 0.24 | | | | (0.25 | ) | | | (0.27 | ) | | | 0.05 | | | | (0.14 | ) |
| | | | | | | | | | | | | | | |
| | | Years Ended December 31, |
| | | 2007 | | 2006 | | 2005 | | 2004 | | 2003 |
Supplemental data for all classes: | | | | | | | | | | | | | | | |
Net assets at end of year (in thousands) | | $ | 47,118 | | $ | 146,777 | | $ | 70,439 | | $ | 246,176 | | $ | 237,111 |
Portfolio turnover rate (%) | | | 102 | | | 162 | | | 125 | | | 50 | | | 51 |
Performance cited represents past performance. Past performance does not guarantee future results and current performance may be lower or higher than the data quoted. Results shown are annual returns, which assume reinvestment of dividends and capital gains. Investment returns and principal will fluctuate and you may have a gain or loss when you sell shares. For the most current month-end performance information, please call 1-800-742-7272, or visit our Web site at www.williamblairfunds.com.
Note: Net investment income (loss) per share is based on the average shares outstanding during the year.
116 Annual Report | December 31, 2007 |
Financial Highlights
Bond Fund
| | | | |
| | | Class N | |
| | | Period Ended December 31, | |
| | | 2007(a) | |
Net asset value, beginning of period | | $ | 10.00 | |
Income (loss) from investment operations: | | | | |
Net investment income (loss) | | | 0.31 | |
Net realized and unrealized gain (loss) on investments | | | 0.02 | |
| | | | |
| | | 0.33 | |
Total from investment operations | | | | |
Less distributions from: | | | | |
Net investment income | | | 0.26 | |
Net realized gain | | | — | |
| | | | |
| | | 0.26 | |
| | | | |
Total distributions | | $ | 10.07 | |
| | | | |
Net asset value, end of period | | | 3.38 | (b) |
Total return (%) | | | | |
Ratios to average daily net assets (%): | | | | |
Expenses, net of waivers and reimbursements | | | 0.65 | (c) |
Expenses, before waivers and reimbursements | | | 0.81 | (c) |
Net investment income (loss), net of waivers and reimbursements | | | 4.80 | (c) |
Net investment income (loss), before waivers and reimbursements | | | 4.64 | (c) |
| |
| | | Class I | |
| | | Period Ended December 31, | |
| | | 2007(a) | |
Net asset value, beginning of period | | $ | 10.00 | |
Income (loss) from investment operations: | | | | |
Net investment income (loss) | | | 0.32 | |
Net realized and unrealized gain (loss) on investments | | | 0.03 | |
| | | | |
| | | 0.34 | |
Total from investment operations | | | | |
Less distributions from: | | | | |
Net investment income | | | 0.30 | |
Net realized gain | | | — | |
| | | | |
| | | 0.30 | |
| | | | |
Total distributions | | $ | 10.04 | |
| | | | |
Net asset value, end of period | | | 3.50 | (b) |
Total return (%) | | | | |
Ratios to average daily net assets (%): | | | | |
Expenses, net of waivers and reimbursements | | | 0.50 | (c) |
Expenses, before waivers and reimbursements | | | 0.67 | (c) |
Net investment income (loss), net of waivers and reimbursements | | | 4.95 | (c) |
Net investment income (loss), before waivers and reimbursements | | | 4.78 | (c) |
| | | | |
| | | Period Ended December 31, | |
| | | 2007(a) | |
Supplemental data for all classes: | | | | |
Net assets at end of period (in thousands) | | $ | 68,483 | |
Portfolio turnover rate (%) | | | 38 | (c) |
| (a) | | For the period from May 1, 2007 (Commencement of Operations) to December 31, 2007. |
| (b) | | Total return is not annualized for periods that are less than a year. |
| (c) | | Rates are annualized for periods less than a year. |
Performance cited represents past performance. Past performance does not guarantee future results and current performance may be lower or higher than the data quoted. Results shown are annual returns, which assume reinvestment of dividends and capital gains. Investment returns and principal will fluctuate and you may have a gain or loss when you sell shares. For the most current month-end performance information, please call 1-800-742-7272, or visit our Web site at www.williamblairfunds.com.
Note: Net investment income (loss) per share is based on the average shares outstanding during the period.
December 31, 2007 | William Blair Funds 117 |
Financial Highlights
Income Fund
| | | | | | | | | | | | | | | | | | | | |
| | | Class N | |
| | | Years Ended December 31, | |
| | | 2007 | | | 2006 | | | 2005 | | | 2004 | | | 2003 | |
Net asset value, beginning of year | | $ | 9.74 | | | $ | 9.83 | | | $ | 10.19 | | | $ | 10.43 | | | $ | 10.62 | |
Income (loss) from investment operations: | | | | | | | | | | | | | | | | | | | | |
Net investment income (loss) | | | 0.45 | | | | 0.44 | | | | 0.47 | | | | 0.52 | | | | 0.40 | |
Net realized and unrealized gain (loss) on investments | | | (0.35 | ) | | | (0.04 | ) | | | (0.30 | ) | | | (0.26 | ) | | | (0.02 | ) |
| | | | | | | | | | | | | | | | | | | | |
Total from investment operations | | | 0.10 | | | | 0.40 | | | | 0.17 | | | | 0.26 | | | | 0.38 | |
Less distributions from: | | | | | | | | | | | | | | | | | | | | |
Net investment income | | | 0.55 | | | | 0.49 | | | | 0.53 | | | | 0.50 | | | | 0.57 | |
Net realized gain | | | — | | | | — | | | | — | | | | — | | | | — | |
| | | | | | | | | | | | | | | | | | | | |
Total distributions | | | 0.55 | | | | 0.49 | | | | 0.53 | | | | 0.50 | | | | 0.57 | |
| | | | | | | | | | | | | | | | | | | | |
Net asset value, end of year | | $ | 9.29 | | | $ | 9.74 | | | $ | 9.83 | | | $ | 10.19 | | | $ | 10.43 | |
| | | | | | | | | | | | | | | | | | | | |
Total return (%) | | | 1.08 | | | | 4.25 | | | | 1.71 | | | | 2.61 | | | | 3.68 | |
Ratios to average daily net assets (%): | | | | | | | | | | | | | | | | | | | | |
Expenses, net of waivers and reimbursements | | | 0.79 | | | | 0.74 | | | | 0.73 | | | | 0.78 | | | | 0.77 | |
Expenses, before waivers and reimbursements | | | 0.81 | | | | 0.80 | | | | 0.73 | | | | 0.78 | | | | 0.77 | |
Net investment income (loss), net of waivers and reimbursements | | | 4.73 | | | | 4.54 | | | | 4.09 | | | | 4.12 | | | | 4.09 | |
Net investment income (loss) before waivers and reimbursements | | | 4.71 | | | | 4.48 | | | | 4.09 | | | | 4.12 | | | | 4.09 | |
| |
| | | Class I | |
| | | Years Ended December 31, | |
| | | 2007 | | | 2006 | | | 2005 | | | 2004 | | | 2003 | |
| | | | | | | | | | | | | | | | |
Net asset value, beginning of year | | $ | 9.69 | | | $ | 9.82 | | | $ | 10.15 | | | $ | 10.40 | | | $ | 10.62 | |
Income (loss) from investment operations: | | | | | | | | | | | | | | | | | | | | |
Net investment income (loss) | | | 0.47 | | | | 0.45 | | | | 0.52 | | | | 0.59 | | | | 0.43 | |
Net realized and unrealized gain (loss) on investments | | | (0.34 | ) | | | (0.04 | ) | | | (0.33 | ) | | | (0.31 | ) | | | (0.04 | ) |
| | | | | | | | | | | | | | | | | | | | |
Total from investment operations | | | 0.13 | | | | 0.41 | | | | 0.19 | | | | 0.28 | | | | 0.39 | |
Less distributions from: | | | | | | | | | | | | | | | | | | | | |
Net investment income | | | 0.52 | | | | 0.54 | | | | 0.52 | | | | 0.53 | | | | 0.61 | |
Net realized gain | | | — | | | | — | | | | — | | | | — | | | | — | |
| | | | | | | | | | | | | | | | | | | | |
Total distributions | | | 0.52 | | | | 0.54 | | | | 0.52 | | | | 0.53 | | | | 0.61 | |
| | | | | | | | | | | | | | | | | | | | |
Net asset value, end of year | | $ | 9.30 | | | $ | 9.69 | | | $ | 9.82 | | | $ | 10.15 | | | $ | 10.40 | |
| | | | | | | | | | | | | | | | | | | | |
Total return (%) | | | 1.36 | | | | 4.33 | | | | 1.92 | | | | 2.79 | | | | 3.76 | |
Ratios to average daily net assets (%): | | | | | | | | | | | | | | | | | | | | |
Expenses | | | 0.60 | | | | 0.62 | | | | 0.58 | | | | 0.63 | | | | 0.62 | |
Net investment income (loss) | | | 4.91 | | | | 4.66 | | | | 4.24 | | | | 4.27 | | | | 4.24 | |
| | | | | | | | | | |
| |
| | | |
| | | Years Ended December 31, |
| | | 2007 | | 2006 | | 2005 | | 2004 | | 2003 |
Supplemental data for all classes: | | | | | | | | | | |
Net assets at end of year (in thousands) | | $204,630 | | $297,077 | | $310,496 | | $294,084 | | $265,062 |
Portfolio turnover rate (%) | | 34 | | 33 | | 41 | | 43 | | 36 |
Performance cited represents past performance. Past performance does not guarantee future results and current performance may be lower or higher than the data quoted. Results shown are annual returns, which assume reinvestment of dividends and capital gains. Investment returns and principal will fluctuate and you may have a gain or loss when you sell shares. For the most current month-end performance information, please call 1-800-742-7272, or visit our Web site at www.williamblairfunds.com.
Note: Net investment income (loss) per share is based on the average shares outstanding during the year.
118 Annual Report | December 31, 2007 |
Financial Highlights
Ready Reserves Fund
| | | | | | | | | | | | | | | |
| | | Class N |
| | | Years Ended December 31, |
| | | 2007 | | 2006 | | 2005 | | 2004 | | 2003 |
Net asset value, beginning of year | | $ | 1.00 | | $ | 1.00 | | $ | 1.00 | | $ | 1.00 | | $ | 1.00 |
Income (loss) from investment operations: | | | | | | | | | | | | | | | |
Net investment income (loss) | | | 0.05 | | | 0.04 | | | 0.03 | | | 0.01 | | | 0.01 |
| | | | | | | | | | | | | | | |
Total from investment operations | | | 0.05 | | | 0.04 | | | 0.03 | | | 0.01 | | | 0.01 |
Less distributions from: | | | | | | | | | | | | | | | |
Net investment income | | | 0.05 | | | 0.04 | | | 0.03 | | | 0.01 | | | 0.01 |
| | | | | | | | | | | | | | | |
Total distributions | | | 0.05 | | | 0.04 | | | 0.03 | | | 0.01 | | | 0.01 |
| | | | | | | | | | | | | | | |
Net asset value, end of year | | $ | 1.00 | | $ | 1.00 | | $ | 1.00 | | $ | 1.00 | | $ | 1.00 |
| | | | | | | | | | | | | | | |
Total return (%) | | | 4.75 | | | 4.47 | | | 2.62 | | | 0.80 | | | 0.66 |
Ratios to average daily net assets (%) | | | | | | | | | | | | | | | |
Expenses | | | 0.63 | | | 0.63 | | | 0.64 | | | 0.65 | | | 0.66 |
Net investment income (loss) | | | 4.63 | | | 4.38 | | | 2.57 | | | 0.80 | | | 0.66 |
Supplemental data: | | | | | | | | | | | | | | | |
Net assets at end of year (in thousands) | | $ | 1,399,537 | | $ | 1,195,593 | | $ | 1,091,854 | | $ | 1,092,940 | | $ | 1,153,932 |
Performance cited represents past performance. Past performance does not guarantee future results and current performance may be lower or higher than the data quoted. Results shown are annual returns, which assume reinvestment of dividends and capital gains. Investment returns and principal will fluctuate and you may have a gain or loss when you sell shares. For the most current month-end performance information, please call 1-800-742-7272, or visit our Web site at www.williamblairfunds.com.
Note: Net investment income (loss) per share is based on the average shares outstanding during the year.
December 31, 2007 | William Blair Funds 119 |
REPORT OF INDEPENDENT REGISTERED PUBLIC ACCOUNTING FIRM
To the Board of Trustees and Shareholders
William Blair Funds
We have audited the accompanying statements of assets and liabilities, including the portfolios of investments, of the Growth Fund, Tax-Managed Growth Fund, Large Cap Growth Fund, Small Cap Growth Fund, Mid Cap Growth Fund, Small-Mid Cap Growth Fund, Global Growth Fund, International Growth Fund, International Equity Fund, International Small Cap Growth Fund, Emerging Markets Growth Fund, Value Discovery Fund, Bond Fund, Income Fund and Ready Reserves Fund (collectively, the “Portfolios”) (fifteen of the Portfolios constituting the William Blair Funds) as of December 31, 2007, and the related statements of operations, statements of changes in net assets and financial highlights for the periods indicated therein. These financial statements and financial highlights are the responsibility of the Portfolios’ management. Our responsibility is to express an opinion on these financial statements and financial highlights based on our audits.
We conducted our audits in accordance with the standards of the Public Company Accounting Oversight Board (United States). Those standards require that we plan and perform the audit to obtain reasonable assurance about whether the financial statements and financial highlights are free of material misstatement. We were not engaged to perform an audit of the Portfolios’ internal control over financial reporting. Our audits included consideration of internal control over financial reporting as a basis for designing audit procedures that are appropriate in the circumstances, but not for the purpose of expressing an opinion on the effectiveness of the Portfolios’ internal control over financial reporting. Accordingly, we express no such opinion. An audit also includes examining, on a test basis, evidence supporting the amounts and disclosures in the financial statements and financial highlights, assessing the accounting principles used and significant estimates made by management, and evaluating the overall financial statement presentation. Our procedures included confirmation of securities owned as of December 31, 2007, by correspondence with the custodian and brokers or by other appropriate auditing procedures where replies from brokers were not received. We believe that our audits provide a reasonable basis for our opinion.
In our opinion, the financial statements and financial highlights referred to above present fairly, in all material respects, the financial position of each of the above mentioned Portfolios of the William Blair Funds at December 31, 2007, the results of their operations, changes in their net assets and financial highlights for the periods indicated therein, in conformity with U.S. generally accepted accounting principles.

Chicago, Illinois
February 21, 2008
120 Annual Report | December 31, 2007 |
Trustees and Officers (Unaudited). The trustees and officers of the William Blair Funds as of December 31, 2007, their year of birth, their principal occupations during the last five years, their affiliations, if any, with William Blair & Company, L.L.C., and other significant affiliations are set forth below. The address of each trustee and officer is 222 West Adams Street, Chicago, Illinois 60606.
| | | | | | | | | | |
Name and Year of Birth | | Position(s)
Held with
Fund | | Term of
Office and
Length of
Time
Served(1) | | Principal Occupation(s) During Past 5 Years | | Number of
Portfolios
in Fund
Complex
Overseen
by Trustee | | Other Directorships Held by Trustee/Officer |
Interested Trustees | | | | | | | | | | |
Frederick Conrad Fischer,
1934* | | Chairman of the Board of Trustees | | Since 1987 | | Principal, William Blair & Company, L.L.C.; Partner, APM Limited Partnership | | 17 | | Trustee Emeritus, Chicago Child Care Society, a non-profit organization; Trustee Emeritus, Kalamazoo College |
| | | | | |
Michelle R. Seitz,
1965* | | Trustee and President | | Since 2007 | | Principal, William Blair & Company, L.L.C. | | 17 | | N/A |
Non-Interested Trustees | | | | | | | | |
Ann P. McDermott,
1939 | | Trustee | | Since 1996 | | Board member and officer for various civic and charitable organizations over the past thirty years; professional experience prior thereto, registered representative for New York Stock Exchange firm | | 17 | | Northwestern University, Women’s Board; Rush Presbyterian St. Luke’s Medical Center, Women’s Board; University of Chicago, Women’s Board; Visiting Nurses Association, Honorary Director |
| | | | | |
Phillip O. Peterson,
1944 | | Trustee | | Since 2007 | | Trustee of Strong Funds Liquidating Trusts since 2005 and President, Strong Mutual Funds, 2004-2005; formerly, Partner, KPMG LLP | | 17 | | The Hartford Group of Mutual Funds (87 portfolios) |
| | | | | |
Donald J. Reaves,
1946 | | Trustee | | Since 2004 | | Chancellor, Winston-Salem State University; formerly, Vice President for Administration and Chief Financial Officer, University of Chicago 2002-2007. | | 17 | | American Student Assistance Corp., guarantor of student loans; Amica Mutual Insurance Company |
| | | | | |
Donald L. Seeley,
1944 | | Trustee | | Since 2003 | | Director, Applied Investment Management Program, University of Arizona Department of Finance, formerly, Vice Chairman and Chief Financial Officer, True North Communications, Inc., marketing communications and advertising firm | | 17 | | Warnaco Group, Inc., intimate apparel, sportswear, and swimwear manufacturer; Center for Furniture Craftsmanship (not-for-profit) |
| | | | | |
Thomas J. Skelly,
1951 | | Trustee | | Since 2007 | | Director and Investment Committee Chairman of the U.S. Accenture Foundation Inc.; formerly, Managing Partner of various divisions at Accenture | | 17 | | Clayton Holdings, Inc., provider of information-based analytics, consulting and outsourced services to various financial institutions and investors |
| | | | | |
Robert E. Wood II,
1938 | | Trustee | | Since 1999 | | Retired; formerly Executive Vice President, Morgan Stanley Dean Witter | | 17 | | Chairman, Add-Vision, Inc., manufacturer of surface animation systems; Chairman Micro-Combustion, LLC |
December 31, 2007 | William Blair Funds 121 |
| | | | | | | | |
Name and Year of Birth | | Position(s)
Held with
Fund | | Term of
Office and
Length of
Time
Served(1) | | Principal Occupation(s) During Past 5 Years | | Other Directorships Held by Trustee/Officer |
Officers | | | | | | | | |
| | | | |
Karl W. Brewer,
1966 | | Senior Vice President | | Since 2000 | | Principal, William Blair & Company, L.L.C. | | N/A |
| | | | |
Harvey H. Bundy, III,
1944 | | Senior Vice President | | Since 2003 | | Principal, William Blair & Company, L.L.C. | | N/A |
| | | | |
Mark A. Fuller, III,
1957 | | Senior Vice President | | Since 1993 | | Principal, William Blair & Company, L.L.C. | | Partner, Fulsen Howney Partners |
| | | | |
James S. Golan,
1961 | | Senior Vice President | | Since 2005 | | Principal, William Blair & Company, L.L.C. | | N/A |
| | | | |
W. George Greig,
1952 | | Senior Vice President | | Since 1996 | | Principal, William Blair & Company, L.L.C. | | N/A |
| | | | |
Michael A. Jancosek,
1959 | | Senior Vice President Vice President | | Since 2004 2000-2004 | | Principal, William Blair & Company L.L.C. Associate, William Blair & Company, L.L.C. | | N/A |
| | | | |
John F. Jostrand,
1954 | | Senior Vice President | | Since 1999 | | Principal, William Blair & Company, L.L.C. | | N/A |
| | | | |
James S. Kaplan,
1960 | | Senior Vice President Vice President | | Since 2004 1995-2004 | | Principal, William Blair & Company, L.L.C. Associate, William Blair & Company, L.L.C. | | N/A |
| | | | |
Robert C. Lanphier, IV,
1956 | | Senior Vice President | | Since 2003 | | Principal, William Blair & Company, L.L.C. | | Chairman, AG. Med, Inc. |
| | | | |
Todd M. McClone,
1968 | | Senior Vice President Vice President | | Since 2006 2005-2006 | | Principal, William Blair & Company, L.L.C. Associate, William Blair & Company, L.L.C. | | N/A N/A |
| | | | |
David S. Mitchell,
1960 | | Senior Vice President Vice President | | Since 2004 2003-2004 | | Principal, William Blair & Company, L.L.C. Associate, William Blair & Company, L.L.C. | | N/A |
| | | | |
Gregory J. Pusinelli,
1958 | | Senior Vice President | | Since 1999 | | Principal, William Blair & Company, L.L.C. | | N/A |
| | | | |
David P. Ricci,
1958 | | Senior Vice President | | Since 2006 | | Principal, William Blair & Company, L.L.C. | | N/A |
| | | | |
Jeffrey A. Urbina,
1955 | | Senior Vice President | | Since 1998 | | Principal, William Blair & Company, L.L.C. | | N/A |
122 Annual Report | December 31, 2007 |
| | | | | | | | |
Name and Year of Birth | | Position(s)
Held with
Fund | | Term of
Office and
Length of
Time
Served(1) | | Principal Occupation(s) During Past 5 Years | | Other Directorships Held by Trustee/Officer |
Christopher T. Vincent,
1956 | | Senior Vice President Vice President | | Since 2004 2002-2004 | | Principal, William Blair & Company, L.L.C. Associate, William Blair & Company, L.L.C.; former Managing Director/Senior Portfolio Manager, Zurich Scudder Investments | | Uhlich Children’s Home |
| | | | |
Colin J. Williams,
1975 | | Senior Vice President Vice President | | Since 2007 Since 2006 | | Principal, William Blair & Company, L.L.C. Associate William Blair & Company, L.L.C.; formerly, Andersen Consulting; Allegiance Healthcare | | N/A |
| | | | |
Richard W. Smirl,
1967 | | Chief Compliance Officer | | Since 2004 | | Principal, William Blair & Company, L.L.C.; former Chief Legal Officer, Strong Capital Management | | N/A |
| | | | |
Benjamin J. Armstrong
1965 | | Vice President | | Since 2007 | | Associate, William Blair & Company, LLC | | |
| | | | |
David C. Fording,
1967 | | Vice President | | Since 2006 | | Associate, William Blair & Company,; former Portfolio Manager, TIAA-CREF | | N/A |
| | | | |
Chad M. Kilmer,
1975 | | Vice President | | Since 2006 | | Associate, William Blair & Company,; former analyst and Portfolio Manager U.S. Bancorp Asset Management and analyst Gabelli Woodland Partners. | | N/A |
| | | | |
Mark T. Leslie,
1967 | | Vice President | | Since 2005 | | Associate, William Blair & Company, L.L.C. formerly, U.S. Bancorp Asset Management | | N/A |
| | | | |
Terence M. Sullivan,
1944 | | Vice President and Treasurer | | Since 1997 | | Associate, William Blair & Company, L.L.C. | | N/A |
| | | | |
Colette M. Garavalia,
1961 | | Secretary | | Since 2000 | | Associate, William Blair & Company, L.L.C. | | N/A |
| * | | Mr. Fischer and Ms. Seitz are interested persons of the William Blair Funds because each is a principal of William Blair & Company, L.L.C., the Funds’ investment advisor, principal underwriter and distributor. |
| (1) | | Each Trustee serves until the election and qualification of a successor, or until death, resignation or retirement or removal as provided in the Fund’s Declaration of Trust. Retirement for non-interested Trustees occurs no later than at the conclusion of the first regularly scheduled Board meeting of the Fund’s fiscal year that occurs after the Trustee’s 72nd birthday. The Fund’s officers are elected annually by the Trustees. |
The Statement of Additional Information for the William Blair Funds includes additional information about the trustees and is available without charge by calling 1-800-635-2886 (in Massachusetts 1-800-635-2840) or by writing the Fund.
December 31, 2007 | William Blair Funds 123 |
Board Approval of the Global Growth Portfolio’s Management Agreement
During the six months ended December 31, 2007, the Board approved the Fund’s Management Agreement with the Advisor, on behalf of the Global Growth Portfolio of the Fund. The Management Agreement with respect to the Portfolio was approved by the Board of Trustees, including all of the Trustees who are not parties to such agreement or interested persons of any such party, on July 24, 2007. The Board, including a majority of the Independent Trustees, determined that approval of the Management Agreement was in the best interests of the Portfolio. On July 23 and 24, 2007, the Independent Trustees met separately from the “interested” trustees of the Fund and officers and employees of the Advisor to consider approval of the Management Agreement. The Independent Trustees reviewed materials provided by the Advisor for the approval of the Management Agreement and were assisted by independent legal counsel in making their determination. The Board, including the Independent Trustees, did not identify any single factor or group of factors as all important or controlling and considered all factors together.
Nature, Quality and Extent of Services. In evaluating the nature, quality and extent of services expected to be provided by the Advisor to the Portfolio, the Board noted that the Advisor is a quality firm with a reputation for integrity and honesty that employs high quality people. The Board considered biographical information about the Portfolio’s portfolio manager, financial information regarding the Advisor, the compliance regime created by the Advisor and the proposed financial support of the Portfolio. The Board considered the Advisor’s experience in managing new funds. Based upon all relevant factors, the Board concluded that the nature, quality and extent of the services to be provided by the Advisor to the Portfolio are expected to be satisfactory.
Fees and Expenses. The Board reviewed the Portfolio’s proposed advisory fee and estimated expense ratio and reviewed information comparing the advisory fee and expense ratio to a Lipper peer group. The Lipper peer group for the Portfolio consists of a group of funds with a similar investment style as the Portfolio. The Board considered that the Advisor has proposed to cap total expenses, including waiving advisory fees, if necessary, for the Portfolio. The Board also reviewed the Advisor’s fee schedule for a Global Growth SICAV (a Luxembourg based collective investment vehicle) that the Advisor intends to offer.
In considering the information, the Board noted that the proposed advisory fee for the Portfolio was above the median of the peer group, but that such advisory fee was within an acceptable range of the peer group and consistent with reasonable expectations in light of the nature, quality and extent of services expected to be provided by the Advisor. On the basis of the information provided, the Board concluded that the proposed advisory fee, coupled with the Advisor’s expense limitation agreement, was reasonable and appropriate in light of the nature, quality and extent of services to be provided by the Advisor.
Profitability. With respect to the estimated profitability of the Management Agreement to the Advisor, the Board considered the overall fees expected to be paid under the Management Agreement, the expected size of the Portfolio and the Advisor’s expense limitation agreement. The Board concluded that the expected profits to be realized by the Advisor were not unreasonable.
Economies of Scale. The Board considered the extent to which economies of scale would be realized as the Portfolio grows and whether fee levels reflect these economies of scale. The Board considered whether the proposed advisory fee is reasonable in relation to the projected asset size of the Portfolio. In considering whether fee levels reflect economies of scale for the benefit of Portfolio investors, the Board reviewed the Portfolio’s advisory fee compared to peer funds, the Portfolio’s projected asset size, the Portfolio’s estimated expense ratio and the proposed expense cap, and concluded that the advisory fee was reasonable.
Other Benefits to the Advisor. The Board considered benefits to be derived by the Advisor from its relationship with the Portfolio. The Board concluded that, after taking into account these benefits, the proposed advisory fee was reasonable.
Conclusion. Based upon all of the information considered and the conclusions reached, the Board, including a majority of the Independent Trustees, determined that the terms of the Management Agreement are fair and reasonable and that the approval of the Management Agreement is in the best interests of the Portfolio.
124 Annual Report | December 31, 2007 |
(unaudited)
Proxy Voting
A description of the policies and procedures that the Fund uses to determine how to vote proxies relating to portfolio securities and information regarding how the Fund voted proxies relating to portfolio securities for the most recent 12-month period ended June 30 are available without charge, upon request, by calling 1-800-635-2886 (in Massachusetts 1-800-635-2840), at www.williamblairfunds.com and on the SEC’s website at http://www.sec.gov.
Quarterly Portfolio Schedules
The Fund files its complete schedule of portfolio holdings with the SEC for the first and third fiscal quarters of each fiscal year (quarters ended March 31 and September 30) on Form N-Q. The Fund’s Forms N-Q are available on the SEC’s website at http://www.sec.gov and may be reviewed and copied at the SEC’s Public Reference Room in Washington, D.C. Information on the operation of the SEC’s Public Reference Room may be obtained by calling 1-800-SEC-0330. The Fund’s Forms N-Q are also available on the Fund’s website at www.williamblairfunds.com.
December 31, 2007 | William Blair Funds 125 |
Useful Information About Your Report (unaudited)
Please refer to this information when reviewing the Expense Example for each Portfolio.
Expense Example
As a shareholder of a Portfolio, you incur two types of costs: (1) transaction costs such as redemption fees and (2) ongoing costs, including management fees, distribution (12b-1) fees (for Class N shares except for Ready Reserves Portfolio), service fees (for Class N shares of Ready Reserves Portfolio), shareholder administration fees (for Class N and Class I shares of the Global Growth Portfolio, the International Small Cap Growth Portfolio, the Emerging Markets Growth Portfolio and the Bond Portfolio) and other Portfolio expenses. The example is intended to help you understand your ongoing costs (in dollars) of investing in the Portfolio and to compare these costs with the ongoing costs of investing in other mutual funds. To do so, compare the Portfolio’s 5% hypothetical example with the 5% hypothetical examples that appear in the shareholder reports of other funds. The example is based on an investment of $1,000 invested at the beginning of the period and held for the entire six-month period from July 1, 2007 to December 31, 2007.
Actual Expenses
In each example, the first line for each share class in the table provides information about the actual account values and actual expenses. These expenses reflect the effect of any expense cap applicable to the share class during the period. Without this expense cap, the costs shown in the table would have been higher. You may use the information in this line, together with the amount you invested, to estimate the expenses that you paid over the period. Simply divide your account value by $1,000 (example, an $8,600 account value divided by $1,000 = 8.6), then multiply the result by the number in the first line under the heading entitled “Expenses Paid During the Period” to estimate the expenses you paid on your account during the period.
Hypothetical Example for Comparison Purposes
In each example, the second line for each share class in the table provides information about hypothetical account values and hypothetical expenses based on the Portfolio’s actual expense ratio and an assumed rate of return of 5% per year before expenses. This is not the Portfolio’s actual return. The hypothetical account values and expenses may not be used to estimate the actual ending account balance or expenses you paid for the period. You may use this information to compare the ongoing costs of investing in the Portfolio to other funds. To do so, compare this 5% hypothetical example with the 5% hypothetical examples that appear in the shareholder reports of other funds.
Please note that the expenses shown in both examples are meant to highlight your ongoing costs only and do not reflect any transactional costs or account type fees, such as redemption fees and IRA Fiduciary Administration fees, respectively. These fees are fully described in the prospectus. Therefore, the second line of each share class in the table is useful in comparing ongoing costs only and will not help you determine the relative costs of owning different funds. In addition, if these transactional costs or account fees were included, your costs would have been higher.
126 Annual Report | December 31, 2007 |
Fund Expenses (unaudited)
The examples below show you the ongoing costs (in dollars) of investing in your fund and allows you to compare these costs with those of other mutual funds. Please refer to the previous page for a detailed explanation of the information presented on this chart.
| | | | | | | | | | | | |
| | | Beginning
Account Value
7/1/2007 | | Ending
Account Value
12/31/2007 | | Expenses Paid
during Period(a) | | Annualized
Expense Ratio | |
Growth Fund | | | | | | | | | | | | |
Class N—actual return | | $ | 1,000.00 | | $ | 1,049.00 | | $ | 6.30 | | 1.22 | % |
Class N—hypothetical 5% return | | | 1,000.00 | | | 1,019.06 | | | 6.21 | | 1.22 | |
Class I—actual return | | | 1,000.00 | | | 1,050.30 | | | 4.50 | | 0.87 | |
Class I—hypothetical 5% return | | | 1,000.00 | | | 1,020.82 | | | 4.43 | | 0.87 | |
Tax-Managed Growth Fund | | | | | | | | | | | | |
Class N—actual return | | | 1,000.00 | | | 1,023.80 | | | 6.84 | | 1.34 | |
Class N—hypothetical 5% return | | | 1,000.00 | | | 1,018.45 | | | 6.82 | | 1.34 | |
Class I—actual return | | | 1,000.00 | | | 1,025.10 | | | 5.56 | | 1.09 | |
Class I—hypothetical 5% return | | | 1,000.00 | | | 1,019.71 | | | 5.55 | | 1.09 | |
Large Cap Growth Fund | | | | | | | | | | | | |
Class N—actual return | | | 1,000.00 | | | 1,033.00 | | | 6.30 | | 1.23 | |
Class N—hypothetical 5% return | | | 1,000.00 | | | 1,019.00 | | | 6.26 | | 1.23 | |
Class I—actual return | | | 1,000.00 | | | 1,034.40 | | | 5.03 | | 0.98 | |
Class I—hypothetical 5% return | | | 1,000.00 | | | 1,020.27 | | | 4.99 | | 0.98 | |
Small Cap Growth Fund | | | | | | | | | | | | |
Class N—actual return | | | 1,000.00 | | | 897.90 | | | 7.13 | | 1.49 | |
Class N—hypothetical 5% return | | | 1,000.00 | | | 1,017.69 | | | 7.58 | | 1.49 | |
Class I—actual return | | | 1,000.00 | | | 899.10 | | | 5.74 | | 1.20 | |
Class I—hypothetical 5% return | | | 1,000.00 | | | 1,019.16 | | | 6.11 | | 1.20 | |
Mid Cap Growth Fund | | | | | | | | | | | | |
Class N—actual return | | | 1,000.00 | | | 1,015.10 | | | 7.01 | | 1.38 | |
Class N—hypothetical 5% return | | | 1,000.00 | | | 1,018.25 | | | 6.91 | | 1.38 | |
Class I—actual return | | | 1,000.00 | | | 1,015.90 | | | 5.69 | | 1.12 | |
Class I—hypothetical 5% return | | | 1,000.00 | | | 1,019.56 | | | 5.61 | | 1.12 | |
Small-Mid Cap Growth Fund | | | | | | | | | | | | |
Class N—actual return | | | 1,000.00 | | | 991.80 | | | 6.83 | | 1.36 | |
Class N—hypothetical 5% return | | | 1,000.00 | | | 1,018.35 | | | 6.92 | | 1.36 | |
Class I—actual return | | | 1,000.00 | | | 992.40 | | | 5.57 | | 1.11 | |
Class I—hypothetical 5% return | | | 1,000.00 | | | 1,019.61 | | | 5.65 | | 1.11 | |
Global Growth Fund | | | | | | | | | | | | |
Class N—actual return (since inception period) (b) | | | 1,000.00 | | | 989.00 | | | 3.29 | | 1.55 | |
Class N—hypothetical 5% return (6 month period) | | | 1,000.00 | | | 1,007.37 | | | 7.84 | | 1.55 | |
Class I—actual return (since inception period) (b) | | | 1,000.00 | | | 991.50 | | | 2.77 | | 1.30 | |
Class I—hypothetical 5% return (6 month period) | | | 1,000.00 | | | 1,007.91 | | | 6.58 | | 1.30 | |
International Growth Fund | | | | | | | | | | | | |
Class N—actual return | | | 1,000.00 | | | 1,057.90 | | | 7.26 | | 1.40 | |
Class N—hypothetical 5% return | | | 1,000.00 | | | 1,018.15 | | | 7.12 | | 1.40 | |
Class I—actual return | | | 1,000.00 | | | 1,059.80 | | | 5.66 | | 1.09 | |
Class I—hypothetical 5% return | | | 1,000.00 | | | 1,019.71 | | | 5.55 | | 1.09 | |
International Equity Fund | | | | | | | | | | | | |
Class N—actual return | | | 1,000.00 | | | 1,075.00 | | | 7.58 | | 1.45 | |
Class N—hypothetical 5% return | | | 1,000.00 | | | 1,017.90 | | | 7.37 | | 1.45 | |
Class I—actual return | | | 1,000.00 | | | 1,076.40 | | | 6.28 | | 1.20 | |
Class I—hypothetical 5% return | | | 1,000.00 | | | 1,019.16 | | | 6.11 | | 1.20 | |
December 31, 2007 | William Blair Funds 127 |
| | | | | | | | |
| | | Beginning
Account Value
7/1/2007 | | Ending
Account Value
12/31/2007 | | Expenses Paid
during Period(a) | | Annualized
Expense Ratio |
International Small Cap Growth Fund | | | | | | | | |
Class N—actual return | | 1,000.00 | | 988.60 | | 8.02 | | 1.60 |
Class N—hypothetical 5% return | | 1,000.00 | | 1,016.86 | | 8.13 | | 1.60 |
Class I—actual return | | 1,000.00 | | 990.20 | | 6.47 | | 1.29 |
Class I—hypothetical 5% return | | 1,000.00 | | 1,018.40 | | 6.56 | | 1.29 |
Emerging Markets Growth Fund | | | | | | | | |
Class N—actual return | | 1,000.00 | | 1,182.10 | | 9.08 | | 1.65 |
Class N—hypothetical 5% return | | 1,000.00 | | 1,016.89 | | 8.39 | | 1.65 |
Class I—actual return | | 1,000.00 | | 1,183.20 | | 7.70 | | 1.40 |
Class I—hypothetical 5% return | | 1,000.00 | | 1,018.15 | | 7.12 | | 1.40 |
Value Discovery Fund | | | | | | | | |
Class N—actual return | | 1,000.00 | | 887.30 | | 6.33 | | 1.33 |
Class N—hypothetical 5% return | | 1,000.00 | | 1,018.50 | | 6.77 | | 1.33 |
Class I—actual return | | 1,000.00 | | 888.80 | | 5.19 | | 1.09 |
Class I—hypothetical 5% return | | 1,000.00 | | 1,019.71 | | 5.55 | | 1.09 |
Bond Fund | | | | | | | | |
Class N—actual return | | 1,000.00 | | 1,045.80 | | 3.35 | | 0.65 |
Class N—hypothetical 5% return | | 1,000.00 | | 1,021.93 | | 3.31 | | 0.65 |
Class I—actual return | | 1,000.00 | | 1,047.00 | | 2.58 | | 0.50 |
Class I—hypothetical 5% return | | 1,000.00 | | 1,022.68 | | 2.55 | | 0.50 |
Income Fund | | | | | | | | |
Class N—actual return | | 1,000.00 | | 1,006.30 | | 4.00 | | 0.79 |
Class N—hypothetical 5% return | | 1,000.00 | | 1,021.22 | | 4.02 | | 0.79 |
Class I—actual return | | 1,000.00 | | 1,007.70 | | 3.04 | | 0.60 |
Class I—hypothetical 5% return | | 1,000.00 | | 1,022.18 | | 3.06 | | 0.60 |
Ready Reserves Fund | | | | | | | | |
Class N—actual return | | 1,000.00 | | 1,023.95 | | 3.21 | | 0.63 |
Class N—hypothetical 5% return | | 1,000.00 | | 1,022.03 | | 3.21 | | 0.63 |
| (a) | | Expenses are equal to the annualized expense ratio, multiplied by the average account value over the period, multiplied by the number of days in the period (184), and divided by 365 (to reflect the one-half year period). |
| (b) | | For the period October 15, 2007 (Commencement of Operations) until December 31, 2007. |
128 Annual Report | December 31, 2007 |
BOARD OF TRUSTEES
Frederick Conrad Fischer, Chairman
Principal, William Blair & Company, L.L.C.
Ann P. McDermott
Director and Trustee
Profit and not-for-profit organizations
Phillip O. Peterson
Retired Partner, KPMG LLP
Donald J. Reaves
Chancellor, Winston-Salem State University
Donald L. Seeley
Adjunct Lecture and Director, University of Arizona Department of Finance
Michelle R. Seitz, President
Principal, William Blair & Company, L.L.C.,
Thomas J. Skelly
Director and Investment Committee Chairman, U.S. Accenture Foundation Inc.
Robert E. Wood II
Retired Executive Vice President, Morgan Stanley Dean Witter
Officers
Karl W. Brewer, Senior Vice President
Harvey H. Bundy III, Senior Vice President
Mark A. Fuller, III, Senior Vice President
James S. Golan, Senior Vice President
W. George Greig, Senior Vice President
Michael A. Jancosek, Senior Vice President
John F. Jostrand, Senior Vice President
James S. Kaplan, Senior Vice President
Robert C. Lanphier, IV, Senior Vice President
Todd M. McClone, Senior Vice President
David S. Mitchell, Senior Vice President
Gregory J. Pusinelli, Senior Vice President
David P. Ricci, Senior Vice President
Jeffrey A. Urbina, Senior Vice President
Christopher T. Vincent, Senior Vice President
Colin J. Williams, Senior Vice President
Richard W. Smirl, Chief Compliance Officer
Benjamin J. Armstrong, Vice President
David C. Fording, Vice President
Chad M. Kilmer, Vice President
Mark T. Leslie, Vice President
Terence M. Sullivan, Vice President and Treasurer
Colette M. Garavalia, Secretary
Investment Advisor
William Blair & Company, L.L.C.
Independent Registered Public Accounting Firm
Ernst & Young LLP
Legal Counsel
Vedder Price PC
Transfer Agent
Boston Financial Data Services, Inc.
P.O. Box 8506
Boston, MA 02266-8506
For customer assistance, call 1-800-635-2886
(Massachusetts 1-800-635-2840)
December 31, 2007 | William Blair Funds 129 |

Table of Contents
This report is submitted for the general information of the shareholders of the William Blair Funds. It is not authorized for distribution to prospective investors unless accompanied or preceded by a prospectus of the William Blair Funds. Please consider the Funds’ investment objectives, risks, charges, and expenses before investing. This and other information is contained in the Funds’ prospectus, which you may obtain by calling 1-800-742-7272. Read it carefully before you invest or send money. William Blair & Company, LLC., distributor.
December 31, 2007 | William Blair Funds 1 |
Global Markets Overview
The year 2007 was marked by increased global market volatility in both the equity and fixed income markets. Like 2005 and 2006, investors became concerned about the durability of global growth as the economic cycle matured; however, in 2007, this fear was underscored by the US subprime crisis, which affected financial markets globally, as the impact of leverage in bank off-balance sheet vehicles, widening spreads, and seizing up of the interbank markets in the UK, portions of Europe and North America began to be felt during August and in the waning months of the year as investors became concerned about financial markets’ losses.
Despite the volatility in the summer and in November, global equity markets returned 12.18% during 2007, as measured by the MSCI All Country World Index. Emerging markets continued to lead the rest of the equity markets, up 39.78%, outperforming during both positive and negative markets during the year. During the summer months and in the fourth quarter when developed markets were down in the face of financial market turmoil, emerging markets, which were viewed as the engines of global growth, outperformed, while small cap stocks and Japan lagged. Latin America was the strongest region within emerging markets, approximating a 50% return, while Emerging Asia and Europe, the Middle East and Africa (“EMEA”) returned 41.58% and 28.74%, respectively. The Europe, Australasia and the Far East (“EAFE”) Index was up 11.63% during 2007, led by strong markets in the Pacific region (ex Japan), which was up over 30%. Canada was also up over 30%. Japan was the laggard market during 2007, continuing its trend of recent years, down 4.14%, although down over 10% in local terms. While most regions (with the exception of Japan) outpaced the 6.03% US return during the year in local terms, the depreciating US dollar also provided a tailwind to US based investors, adding 7.37% to the EAFE return, and 17.90% to Canadian returns. Developed small cap stocks trailed their larger cap counterparts, up 3.64% year to date, dragged down by the UK, which was down nearly 10% and Japan, which was down over 11%.
There was also a marked disparity in returns by sector globally during 2007 with Energy and Materials each up over 34% and Discretionary and Financials down nearly 2% and 5%, respectively, due to concerns about US-led consumer demand and the financial markets volatility.
Outlook
Discouraging data points about financial sector distress, consumer behavior over the holidays, and poor employment growth shown that prospects have intensified speculation that a US recession is in the process of materializing. Internationally, market scenarios are increasingly focused on cyclical weakness as well, whether transmitted directly through the US or just by association.
The result has been an intense correction and rotation process in the early days of 2008 that has amounted to a landslide market vote for global recession. This consensus reflects recent reality in some respects, but it is worth keeping in mind that the global economic environment in aggregate is both more complex and at the same time less volatile than market reactions would suggest.
At the opposite pole of the economic earth from the US consumer/financial complex is the resource, infrastructure and capital investment cycle in China, the Middle East, and other emerging economies. This growth dynamic dichotomy existed throughout 2007 and continues today, notwithstanding the US downshift. Emerging economies have both the need for and the wherewithal to provide these investments, and the viability of fundamental development initiatives is generally unaffected by changes in external economic conditions.
The rest of the world—OECD Asia and Europe—has felt the influence of both US deceleration and emerging markets growth over the last year. At the margin, Japan, the UK and some of the Euro countries have seen some degree of domestic slowdown as well. But it is unlikely that the balance of global growth will be tipped by changes in the outlook for these relatively slow and steady economies.
2 Annual Report | December 31, 2007 |
As the year progresses from here, the global recession scenario will not remain a static story. It will evolve and mutate in response to monetary and financial policy initiatives, US electoral politics, the Beijing Olympic gestalt, the influence of commodity markets, and the self-help capability of the financial sector. The cyclical outlook is highly provisional and is likely to be subject to continuous revision.
At the same time, ironically, a competitive equity market environment under the influence of abnormally uncertain cyclical strategy input can easily become more irrational rather than more efficient as a discounting mechanism. The current market is characterized not only by increasing volatility but also by an unusual degree of valuation divergence between extreme lows and highs.
Under these circumstances, equity strategy becomes a more improvisational process. There can be conflicting signals among leading indicators, earnings trends and valuation measures, and unstable market responses to incoming data. Our strategy approach is designed with long term corporate performance as the primary input, long term economic trends as secondary, and cyclical influences as a relatively minor influence. So wherever we go from here, our overall approach in 2008 will emphasize stock selection in an effort to be consistent with our objective of maintaining strong fundamental corporate financial performance at the portfolio level.
December 31, 2007 | William Blair Funds 3 |
GLOBAL GROWTH FUND
The Global Growth Fund will invest in quality growth companies of all sizes around the world.
AN OVERVIEW FROM THE PORTFOLIO MANAGER
I am pleased to have the Global Growth Fund become the newest addition to the William Blair Fund Family and would like to thank our shareholders for investing with us.
I am enthusiastic about the opportunities available to me as the manager of the Global Growth Fund. The Global Growth Fund will seek securities of companies that historically have had and are expected to maintain superior growth, profitability and quality relative to local markets and relative to companies within the same industry worldwide. The Fund will seek investment opportunities in companies at different stages of development ranging from large, well-established companies to smaller companies at an earlier stage of growth. The Fund may also invest in new companies, both through initial public offerings (“IPOs”) and private placements.
How did the Fund perform since its inception? How did the Fund’s performance compare to its benchmark?
The Global Growth Fund commenced operations on October 15, 2007. Through the period ending December 31, 2007, the Fund posted a decrease of 0.70% (Institutional Class). By comparison, the Fund’s benchmark, the MSCI All Country World Index declined 4.10% during the same time period.
How is the Fund positioned as of year end?
As of year end, the Fund was focused in Consumer-oriented and Industrials stocks at the expense of Energy, Health Care, Materials and Utilities. Regionally, the Fund maintained a focus in Developed Asia ex-Japan (i.e., Hong Kong, Australia and Singapore) and emerging markets, while underweighting Japan. Within emerging markets there has been a shift from Emerging Asia, where we reduced holdings in China due largely to valuation concerns, and increased our holdings in EMEA, particularly the Middle East.
4 Annual Report | December 31, 2007 |
Global Growth Fund
Performance Highlights (unaudited)
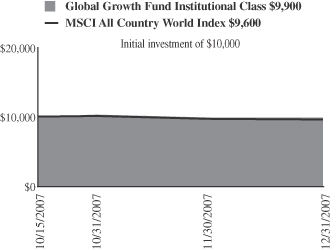
Average Annual Total Return at 12/31/2007
| | | |
| | | Since
Inception(a) | |
Global Growth Fund Institutional Class | | (0.70 | )% |
MSCI All Country World Index | | (4.10 | ) |
| | (a) | | For the period from October 15, 2007 (Commencement of Operations) to December 31, 2007. |
Performance cited represents past performance. Past performance does not guarantee future results and current performance may be lower or higher than the data quoted. Results shown are average annual total returns, which assume reinvestment of dividends and capital gains. Investment returns and principal will fluctuate and you may have a gain or loss when you sell shares. For the most current month-end performance information, please call 1-800-742-7272, or visit our Web site at www.williamblairfunds.com. Investing in smaller and medium capitalization companies involves special risks, including higher volatility and lower liquidity. Small and Mid Cap stocks are also more sensitive to purchase/sale transactions and changes in the issuer’s financial condition. From time to time, the investment advisor may waive fees or reimburse expenses for the Fund. Without these waivers, performance would be lower.
The performance highlights and graph presented above do not reflect the deduction of taxes that a shareholder would pay on fund distributions or the redemption of fund shares.
The Morgan Stanley Capital International (MSCI) All Country World Index is an index that is designed to measure equity performance in the global market.
This report identifies the Fund’s investments on December 31, 2007. These holdings are subject to change. Not all stocks in the Fund performed the same, nor is there any guarantee that these stocks will perform as well in the future. Market forecasts provided in this report may not necessarily come to pass.
Sector Diversification (unaudited)

International investing includes special risk considerations, including currency fluctuations, lower liquidity, economic and political risk.
The sector diversification shown is based on the total investment portfolio.
December 31, 2007 | William Blair Funds 5 |
Global Growth Fund
Portfolio of Investments, December 31, 2007 (all dollar amounts in thousands)
| | | | | |
Issuer | | Shares | | Value |
| |
Common Stocks—Western Hemisphere—37.2% | | | |
Canada—3.9% | | | | | |
*Agnico-Eagle Mines Limited (Metals & mining) | | 10,400 | | $ | 568 |
Brookfield Asset Management, Inc. Class “A” (Real estate management & development) | | 15,800 | | | 568 |
Rogers Communications, Inc. Class “B” (Wireless telecommunication services) | | 13,900 | | | 634 |
| | | | | |
| | | | | 1,770 |
| | | | | |
United States—33.3% | | | | | |
*Activision, Inc. (Software) | | 30,400 | | | 903 |
*Adobe Systems Incorporated (Software) | | 12,600 | | | 538 |
*Apple Inc. (Computers & peripherals) | | 4,800 | | | 951 |
CME Group Inc. (Diversified financial services) | | 1,300 | | | 892 |
*Cognizant Technology Solutions Corporation, Class “A” (IT services) | | 14,000 | | | 475 |
Corning Incorporated (Communications equipment) | | 17,700 | | | 425 |
Deere & Company (Machinery) | | 12,900 | | | 1,201 |
*EMC Corporation (Computers & peripherals) | | 30,400 | | | 563 |
*Express Scripts, Inc. (Health care providers & services) | | 8,100 | | | 591 |
FPL Group, Inc. (Electric utilities) | | 14,500 | | | 983 |
*GameStop Corporation (Specialty retail) | | 3,700 | | | 230 |
*Gilead Sciences, Inc. (Biotechnology) | | 13,500 | | | 621 |
The Goldman Sachs Group, Inc. (Capital markets) | | 3,600 | | | 774 |
*Google Inc. (Internet software & services) | | 700 | | | 484 |
Hewlett-Packard Company (Computers & peripherals) | | 13,400 | | | 676 |
*Hologic, Inc. (Health care equipment & supplies) | | 6,900 | | | 474 |
*IDEXX Laboratories, Inc. (Health care equipment & supplies) | | 6,000 | | | 352 |
L-3 Communications Holdings, Inc. (Aerospace & defense) | | 4,400 | | | 466 |
*Life Time Fitness, Inc. (Hotels, restaurants, & leisure) | | 5,500 | | | 273 |
The Manitowoc Company, Inc. (Machinery) | | 9,800 | | | 479 |
Monsanto Company (Chemicals) | | 5,100 | | | 570 |
Precision Castparts Corp. (Aerospace & defense) | | 3,200 | | | 444 |
T. Rowe Price Group Inc. (Capital markets) | | 6,000 | | | 365 |
Schlumberger, Ltd. (Energy equipment & services)† | | 9,200 | | | 905 |
Smith International, Inc. (Energy equipment & services) | | 7,600 | | | 561 |
| | | | | |
| | | | | 15,196 |
| | | | | |
| | |
Europe—19.6% | | | | | |
Austria—0.5% | | | | | |
Schoeller-Bleckmann Oilfield Equipment AG (Energy equipment & services) | | 2,300 | | | 206 |
| | | | | |
Belgium—1.3% | | | | | |
InBev NV (Beverages) | | 7,100 | | | 590 |
| | | | | |
Finland—2.1% | | | | | |
Nokia OYJ (Communications equipment) | | 19,500 | | | 749 |
Outotec OYJ (Construction & engineering) | | 3,500 | | | 190 |
| | | | | |
| | | | | 939 |
| | | | | |
France—6.0% | | | | | |
EDF Energies Nouvelles S.A. (Independent power producers & energy traders) | | 5,800 | | | 405 |
Eurazeo (Diversified financial services) | | 2,900 | | | 371 |
*Orpea (Health care providers & services) | | 3,400 | | | 223 |
| | | | | |
Issuer | | Shares | | Value |
|
Common Stocks—Europe—19.6%—(continued) |
France—(continued) | | | | | |
Schneider Electric SA (Electrical equipment) | | 5,600 | | $ | 758 |
Veolia Environnement (Multi-utilities) | | 11,000 | | | 1,002 |
| | | | | |
| | | | | 2,759 |
| | | | | |
Germany—4.6% | | | | | |
Beiersdorf AG (Personal products) | | 6,700 | | | 519 |
Deutsche Boerse AG (Diversified financial services) | | 3,700 | | | 730 |
*Q-Cells AG (Electrical equipment) | | 4,500 | | | 639 |
*Wire Card AG (Commercial services & supplies) | | 12,500 | | | 212 |
| | | | | |
| | | | | 2,100 |
| | | | | |
Netherlands—1.1% | | | | | |
*Tomtom NV (Software) | | 6,900 | | | 521 |
| | | | | |
Spain—0.4% | | | | | |
Tecnicas Reunidas S.A. (Construction & engineering) | | 2,700 | | | 173 |
| | | | | |
Switzerland—3.6% | | | | | |
ABB Ltd. (Electrical equipment) | | 34,400 | | | 992 |
EFG International (Capital markets) | | 3,400 | | | 137 |
Kuehne & Nagel International AG (Marine) | | 3,000 | | | 288 |
Partners Group Global Opportunities, Ltd. (Capital markets) | | 1,600 | | | 213 |
| | | | | |
| | | | | 1,630 |
| | | | | |
| | |
United Kingdom—11.3% | | | | | |
*Autonomy Corporation plc (Software) | | 21,900 | | | 385 |
BG Group plc (Oil, gas & consumable fuels) | | 46,800 | | | 1,074 |
BlueBay Asset Management plc (Capital markets) | | 22,700 | | | 159 |
Capita Group plc (Commercial services & supplies) | | 28,100 | | | 390 |
Expro International Group plc (Energy equipment & services) | | 12,600 | | | 258 |
Man Group plc (Capital markets) | | 56,062 | | | 636 |
Reckitt Benckiser plc (Household products) | | 9,000 | | | 523 |
Rotork plc (Electronic equipment & instruments) | | 9,600 | | | 185 |
Tesco plc (Food & staples retailing) | | 91,300 | | | 868 |
*Wellstream Holdings plc (Energy equipment & services) | | 11,600 | | | 250 |
Xstrata plc (Metals & mining) | | 6,200 | | | 435 |
| | | | | |
| | | | | 5,163 |
| | | | | |
| | |
Asia—9.2% | | | | | |
Australia—4.6% | | | | | |
BHP Billiton Limited (Metals & mining) | | 18,400 | | | 643 |
Macquarie Bank, Ltd. (Capital markets) | | 8,100 | | | 542 |
QBE Insurance Group Limited (Insurance) | | 14,200 | | | 412 |
WorleyParsons, Ltd. (Energy equipment & services) | | 10,600 | | | 478 |
| | | | | |
| | | | | 2,075 |
| | | | | |
Hong Kong—1.6% | | | | | |
Esprit Holdings Ltd. (Specialty retail) | | 29,900 | | | 440 |
Li & Fung Ltd. (Distributors) | | 78,000 | | | 311 |
| | | | | |
| | | | | 751 |
| | | | | |
Singapore—3.0% | | | | | |
Capitaland, Ltd. (Real estate management & development) | | 76,000 | | | 327 |
See accompanying Notes to Financial Statements.
6 Annual Report | December 31, 2007 |
Global Growth Fund
Portfolio of Investments, December 31, 2007 (all dollar amounts in thousands)
| | | | | |
Issuer | | Shares | | Value |
|
Common Stocks—Asia—9.2%—(continued) |
Singapore—(continued) | | | | | |
Keppel Corporation Limited (Industrial conglomerates) | | 73,000 | | $ | 650 |
Wilmar International Ltd. (Food products) | | 106,700 | | | 396 |
| | | | | |
| | | | | 1,373 |
| | | | | |
| | |
Japan—5.4% | | | | | |
Aeon Mall Co., Ltd. (Real estate management & development) | | 14,800 | | | 389 |
Komatsu Ltd. (Machinery) | | 18,800 | | | 504 |
Mitsui & Co., Ltd. (Trading companies & distributors) | | 18,000 | | | 376 |
NGK Insulators, Ltd. (Machinery) | | 14,000 | | | 375 |
Nintendo Co., Ltd. (Software) | | 1,400 | | | 822 |
| | | | | |
| | | | | 2,466 |
| | | | | |
| | |
Emerging Latin America—4.5% | | | | | |
Brazil—2.8% | | | | | |
*Anhanguera Educacional Participacoes S.A. (Diversified consumer services) | | 23,000 | | | 491 |
B2W Companhia Global do Varejo (Internet & catalog retail) | | 2,100 | | | 84 |
Bovespa Holding SA (Diversified financial services) | | 23,500 | | | 453 |
Redecard SA (IT services) | | 15,700 | | | 254 |
| | | | | |
| | | | | 1,282 |
| | | | | |
Chile—1.7% | | | | | |
Cencosud S.A.—ADR 144A (Specialty retail) | | 12,700 | | | 767 |
| | | | | |
| |
Emerging Europe, Mid-East, Africa—3.7% | | | |
Egypt—1.7% | | | | | |
Orascom Construction Industries (Construction & engineering) | | 16,600 | | | 247 |
*Orascom Hotels & Development (Hotels, restaurants, & leisure) | | 5,000 | | | 515 |
| | | | | |
| | | | | 762 |
| | | | | |
South Africa—1.5% | | | | | |
*Eastern Platinum Limited (Metals & mining) | | 79,100 | | | 230 |
MTN Group, Ltd. (Wireless telecommunication services) | | 25,300 | | | 474 |
| | | | | |
| | | | | 704 |
| | | | | |
United Arab Emirates—0.5% | | | | | |
*DP World Ltd. (Marine) | | 175,800 | | | 209 |
| | | | | |
| | |
Emerging Asia—1.6% | | | | | |
China—0.7% | | | | | |
China Merchants Bank (Commercial banks) | | 41,500 | | | 167 |
Shandong Weigao Group Medical Polymer Company, Ltd. (Health care equipment & supplies) | | 72,000 | | | 165 |
| | | | | |
| | | | | 332 |
| | | | | |
India—0.9% | | | | | |
Vendanta Resources plc (Metals & mining) | | 9,700 | | | 394 |
| | | | | |
Total Common Stock—92.5%
(cost $42,044) | | | 42,162 |
| | | | | |
| | |
Investment in Affiliate | | | | | |
William Blair Ready Reserves Fund | | 1,006,038 | | | 1,006 |
| | | | | |
Total Investment in Affiliate—2.2%
(cost $1,006) | | | 1,006 |
| | | | | |
| | | | | | |
Issuer | | Principal
Amount | | Value |
| | |
Short-Term Investments | | | | | | |
American Express Credit Corp. Demand Note, VRN 4.695% due 1/2/08 | | $ | 575,000 | | $ | 575 |
Prudential Funding Demand Note, VRN
4.430% due 1/2/08 | | | 100,000 | | | 100 |
| | | | | | |
Total Short-term Investments—1.5%
(cost $675) | | | 675 |
| | | | | | |
| | |
Repurchase Agreement | | | | | | |
State Street Bank and Trust Company, 3.800% dated 12/31/07, due 1/2/08, repurchase price $507, collateralized by FN #729652 | | | 506,693 | | | 507 |
| | | | | | |
Total Repurchase Agreement—1.1%
(cost $507) | | | 507 |
| | | | | | |
Total Investments—97.3%
(cost $44,232) | | | 44,350 |
Cash and other assets, less liabilities—2.7% | | | 1,226 |
| | | | | | |
Net assets—100.0% | | $ | 45,576 |
| | | | | | |
* Non-income producing securities
ADR = American Depository Receipt
VRN = Variable Rate Note
See accompanying Notes to Financial Statements.
December 31, 2007 | William Blair Funds 7 |
For securities primarily traded on exchanges or markets that close before the close of regular trading on the New York Stock Exchange, the Fund uses an independent pricing service on a daily basis to fair value price the securities pursuant to Valuation Procedures adopted by the Board of Trustees.
At December 31, 2007 the Fund’s Portfolio of Investments includes the following industry categories:
| | |
Industrials | | 22.2% |
Information Technology | | 17.8% |
Financials | | 16.9% |
Energy | | 8.8% |
Consumer Staples | | 8.7% |
Materials | | 6.7% |
Health Care | | 5.7% |
Utilities | | 5.6% |
Consumer Discretionary | | 5.0% |
Telecommunication Services | | 2.6% |
| | |
Total | | 100.0% |
| | |
At December 31, 2007 the Fund’s Portfolio of Investments includes the following currency categories:
| | |
United States Dollar | | 39.7% |
Euro | | 17.3% |
British Pound Sterling | | 13.2% |
Japanese Yen | | 5.8% |
Australian Dollar | | 4.9% |
Swiss Franc | | 3.9% |
Canadian Dollar | | 3.4% |
Singapore Dollar | | 3.3% |
Brazilian Real | | 3.0% |
Hong Kong Dollar | | 2.6% |
South African Rand | | 1.1% |
All other currencies | | 1.8% |
| | |
Total | | 100.0% |
| | |
See accompanying Notes to Financial Statements.
8 Annual Report | December 31, 2007 |
Global Growth Fund
Portfolio of Investments, December 31, 2007 (all dollar amounts in thousands)

W. George Greig
INSTITUTIONAL INTERNATIONAL GROWTH FUND
The Institutional International Growth Fund invests primarily in common stocks of foreign growth companies of all sizes.
AN OVERVIEW FROM THE PORTFOLIO MANAGER
Please see page 2 for the Global Markets Overview.
How did the Fund perform over the first half of the year? How did the Fund’s performance compare to its benchmark?
The Institutional International Growth Fund posted an 18.49% gain for the year ended December 31, 2007. By comparison, the Fund’s benchmark, the Morgan Stanley Capital International (MSCI) All Country World (ACWI) ex-US Index, rose 17.12%.
What factors were behind the Fund’s performance versus the benchmark?
During 2007 the Fund outperformed across virtually all sectors. In particular, relative stock selection in Consumer Discretionary, Energy, Materials and Health Care was strong. In Consumer Discretionary strong stock selection in Developed Asia, Canada, and emerging markets more than offset shortfalls in Europe and the UK. The Fund’s Energy stocks approximately doubled the return of the stocks in the Index due to the Fund’s focus on energy services companies coupled with exploration and production companies with high production growth. Materials stock selection added value primarily through the Fund’s emerging markets holdings while the Fund’s focus on specialty Health Care stocks at the expense of pharmaceutical companies augmented results. In addition, the Fund’s overweighting and stock selection in Consumer Staples and Industrials added value, as did its underweighting in Financials, whose performance approximated the Index during the year. Regionally, the Fund’s focus on emerging markets and Developed Asia (ex-Japan) was positive, as was its underemphasis of Japan. Stock selection across most regions was strong, with the exception of Japan and Latin America.
What is your current strategy? How is the Fund positioned?
As of year end, the Fund remained focused in Consumer-oriented and Industrials stocks at the expense of Energy, Health Care, Materials and Utilities. From a Consumer perspective, the Fund was nearly evenly balanced between Discretionary and Staples. Regionally, the Fund maintained a focus in Developed Asia, ex-Japan (i.e., Hong Kong, Australia and Singapore) and emerging markets, while continued its underweighting of Japan. Weightings in Europe declined during the quarter, due primarily to a continued de-emphasis of Financials in that region, where we remained significantly underweighted relative to the Index. While emerging markets was overweighted relative to the Index (at approximately 22% versus the Index 19.5% weighting), there has been a shift from Emerging Asia, where we have reduced holdings in China in particular due largely to valuation concerns and increased our holdings in EMEA (Europe, Mid-East and Africa), particularly the Middle East.
December 31, 2007 | William Blair Funds 9 |
Institutional International Growth Fund
Performance Highlights (unaudited)
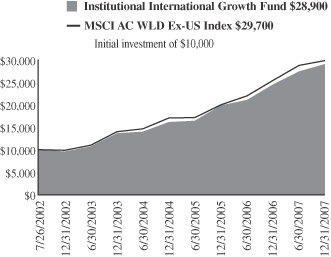
Average Annual Total Return at 12/31/2007
| | | | | | | | | | | | |
| | | 1
Year | | | 3
Year | | | 5
Year | | | Since Inception(a) | |
Institutional International Growth Fund | | 18.49 | % | | 21.55 | % | | 24.76 | % | | 21.54 | % |
MSCI All Country World Ex-US Index | | 17.12 | | | 20.37 | | | 24.52 | | | 22.11 | |
| | (a) | For the period from July 26, 2002 (Commencement of Operations) to December 31, 2007. |
Performance cited represents past performance. Past performance does not guarantee future results and current performance may be lower or higher than the data quoted. Results shown are average annual returns, which assume reinvestment of dividends and capital gains. Investment returns and principal will fluctuate and you may have a gain or loss when you sell shares. For the most current month-end performance information, please call 1-800-742-7272, or visit our Web site at www.williamblairfunds.com. International investing involves special risk considerations, including currency fluctuations, lower liquidity, economic and political risk.
The performance highlights and graph presented above do not reflect the deduction of taxes that a shareholder would pay on fund distributions or the redemption of fund shares.
The Morgan Stanley Capital International (MSCI) All Country World ex-US Index is an unmanaged index that includes developed and emerging markets and reduced Japanese portion, making it more comparable to the Institutional International Growth Fund in terms of investment approach.
This report identifies the Fund’s investments on December 31, 2007. These holdings are subject to change. Not all stocks in the Fund performed the same, nor is there any guarantee that these stocks will perform as well in the future. Market forecasts provided in this report may not necessarily come to pass.
Sector Diversification (unaudited)
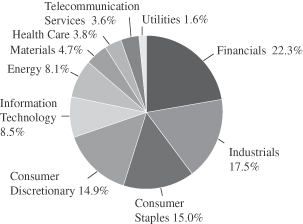
The sector diversification shown is based on the total investment portfolio.
10 Annual Report | December 31, 2007 |
| | | | | |
Issuer | | Shares | | Value |
| | | | | |
| | |
Common Stocks—Europe—27.4% | | | | | |
Austria—1.4% | | | | | |
Erste Bank (Commercial banks) | | 128,304 | | $ | 9,059 |
Raiffeisen International Bank (Commercial banks) | | 142,883 | | | 21,475 |
Schoeller-Bleckmann Oilfield Equipment AG (Energy equipment & services) | | 6,015 | | | 540 |
| | | | | |
| | | | | 31,074 |
| | | | | |
Belgium—1.2% | | | | | |
InBev NV (Beverages) | | 317,800 | | | 26,419 |
| | | | | |
Finland—1.6% | | | | | |
Nokia OYJ (Communications equipment) | | 591,400 | | | 22,720 |
Nokian Renkaat OYJ (Auto components) | | 296,950 | | | 10,309 |
Ramirent OYJ (Machinery) | | 140,326 | | | 2,302 |
| | | | | |
| | | | | 35,331 |
| | | | | |
France—5.0% | | | | | |
April Group S.A. (Insurance) | | 56,300 | | | 3,799 |
AXA (Insurance) | | 318,100 | | | 12,682 |
EDF Energies Nouvelles S.A. (Independent power producers & energy traders) | | 110,193 | | | 7,685 |
Eurazeo (Diversified financial services) | | 96,341 | | | 12,340 |
Iliad S.A. (Diversified telecommunication services) | | 76,000 | | | 8,173 |
Klepierre (Real estate investment trusts) | | 116,710 | | | 5,965 |
L’Oreal S.A. (Personal products) | | 145,800 | | | 20,878 |
*Orpea (Health care providers & services) | | 104,866 | | | 6,892 |
*Seloger.com (Media) | | 77,300 | | | 4,541 |
Veolia Environnement (Multi-utilities) | | 269,325 | | | 24,532 |
| | | | | |
| | | | | 107,487 |
| | | | | |
Germany—2.3% | | | | | |
Bauer AG (Construction & engineering) | | 65,600 | | | 4,635 |
*Colonia Real Estate AG (Real estate management & development) | | 128,700 | | | 3,193 |
CTS Eventim AG (Media) | | 72,700 | | | 2,808 |
*Q-Cells AG (Electrical equipment) | | 138,720 | | | 19,686 |
Solarworld AG (Electrical equipment) | | 179,900 | | | 10,920 |
*Wire Card AG (Commercial services & supplies) | | 436,600 | | | 7,398 |
| | | | | |
| | | | | 48,640 |
| | | | | |
Greece—2.1% | | | | | |
Coca-Cola Hellenic Bottling S.A. (Beverages) | | 360,150 | | | 15,543 |
EFG Eurobank (Commercial banks) | | 254,592 | | | 8,934 |
Jumbo S.A. (Leisure equipment & products) | | 191,100 | | | 6,880 |
National Bank of Greece S.A. (Commercial banks) | | 212,226 | | | 14,553 |
| | | | | |
| | | | | 45,910 |
| | | | | |
Ireland—0.2% | | | | | |
United Drug plc (Health care providers & services) | | 727,300 | | | 4,197 |
| | | | | |
Italy—2.5% | | | | | |
Azimut Holding SpA (Capital markets) | | 424,100 | | | 5,502 |
Geox SpA (Textiles, apparel & luxury goods) | | 538,600 | | | 10,848 |
Saipem SpA (Energy equipment & services) | | 925,700 | | | 36,967 |
| | | | | |
| | | | | 53,317 |
| | | | | |
| | | | | |
Issuer | | Shares | | Value |
| | | | | |
| |
Common Stocks—Europe—27.4%—(continued) | | | |
Netherlands—0.8% | | | | | |
*Qiagen NV (Life science tools & services) | | 453,000 | | $ | 9,851 |
*Tomtom NV (Software) | | 94,000 | | | 7,100 |
| | | | | |
| | | | | 16,951 |
| | | | | |
Norway—0.7% | | | | | |
Acergy S.A. (Energy equipment & services) | | 506,000 | | | 11,132 |
*Electromagnetic GeoServices AS (Energy equipment & services) | | 380,500 | | | 3,546 |
| | | | | |
| | | | | 14,678 |
| | | | | |
Spain—1.6% | | | | | |
Grifols S.A. (Biotechnology) | | 580,700 | | | 13,035 |
Industria De Textile S.A. (Specialty retail) | | 237,600 | | | 14,377 |
Tecnicas Reunidas S.A. (Construction & engineering) | | 116,300 | | | 7,437 |
| | | | | |
| | | | | 34,849 |
| | | | | |
Switzerland—8.0% | | | | | |
ABB Ltd. (Electrical equipment) | | 1,579,300 | | | 45,534 |
*Actelion Ltd. (Biotechnology) | | 223,600 | | | 10,214 |
*Barry Callebaut AG (Food products) | | 9,910 | | | 7,508 |
Burckhardt Compression Holding AG (Machinery) | | 6,773 | | | 2,198 |
Compagnie Financiere Richemont S.A. (Textiles, apparel, & luxury goods) | | 201,900 | | | 13,794 |
EFG International (Capital markets) | | 220,400 | | | 8,881 |
Geberit AG (Building products) | | 56,500 | | | 7,696 |
Kuehne & Nagel International AG (Marine) | | 187,600 | | | 18,014 |
Nestle S.A. (Food products) | | 56,350 | | | 25,875 |
Partners Group Global Opportunities, Ltd. (Capital markets) | | 56,150 | | | 7,486 |
Roche Holdings AG (Pharmaceuticals) | | 120,400 | | | 20,813 |
SGS S.A. (Commercial services & supplies) | | 499 | | | 595 |
*Temenos Group AG (Software) | | 164,478 | | | 4,047 |
| | | | | |
| | | | | 172,655 |
| | | | | |
| | |
United Kingdom—16.2% | | | | | |
Amlin plc (Insurance) | | 1,618,755 | | | 9,560 |
Amlin plc—“B” Shares (Insurance) | | 1,821,100 | | | 812 |
Ashmore Group plc (Capital markets) | | 832,100 | | | 4,398 |
*Autonomy Corporation plc (Software) | | 601,300 | | | 10,569 |
BG Group plc (Oil, gas & consumable fuels) | | 1,353,220 | | | 31,048 |
*Blinkx plc (Internet software & services) | | 3,019,000 | | | 1,650 |
BlueBay Asset Management plc (Capital markets) | | 545,800 | | | 3,832 |
British Sky Broadcasting Group plc (Media) | | 1,498,200 | | | 18,429 |
*Cairn Energy plc (Oil, gas & consumable fuels) | | 238,937 | | | 14,605 |
Capita Group plc (Commercial services & supplies) | | 1,519,670 | | | 21,068 |
Carphone Warehouse Group plc (Specialty retail) | | 1,234,500 | | | 8,399 |
Detica Group plc (IT services) | | 624,600 | | | 2,741 |
Domino’s Pizza UK & IRL plc (Hotels, restaurants, & leisure) | | 888,580 | | | 3,156 |
Expro International Group plc (Energy equipment & services) | | 344,800 | | | 7,054 |
Man Group plc (Capital markets) | | 1,051,925 | | | 11,941 |
See accompanying Notes to Financial Statements.
Institutional International Growth Fund
Portfolio of Investments, December 31, 2007 (all dollar amounts in thousands)
December 31, 2007 | William Blair Funds 11 |
| | | | | |
Issuer | | Shares | | Value |
| | | | | |
|
Common Stocks—United Kingdom—16.2%—(continued) |
Reckitt Benckiser plc (Household products) | | 675,150 | | $ | 39,233 |
Restaurant Group plc (Hotels, restaurants, & leisure) | | 829,500 | | | 3,049 |
Rightmove plc (Media) | | 524,700 | | | 4,831 |
*Rolls-Royce Group plc (Aerospace & defense) | | 2,553,858 | | | 27,720 |
Rotork plc (Electronic equipment & instruments) | | 441,500 | | | 8,514 |
RPS Group plc (Commercial services & supplies) | | 982,800 | | | 6,210 |
Southern Cross Healthcare Limited (Health care providers & services) | | 550,200 | | | 5,767 |
Tesco plc (Food & staples retailing) | | 4,508,700 | | | 42,889 |
Tullow Oil plc (Oil, gas & consumable fuels) | | 813,680 | | | 10,568 |
VT Group plc (Aerospace & defense) | | 701,200 | | | 9,625 |
*Wellstream Holdings plc (Energy equipment & services) | | 309,100 | | | 6,658 |
Xstrata plc (Metals & mining) | | 466,900 | | | 32,763 |
| | | | | |
| | | | | 347,089 |
| | | | | |
| | |
Japan—12.5% | | | | | |
Aeon Mall Co., Ltd. (Real estate management & development) | | 412,100 | | | 10,815 |
ARDEPRO Co., Ltd. (Real estate management & development) | | 15,750 | | | 3,382 |
DeNA Co., Ltd. (Internet & catalog retail) | | 1,066 | | | 5,071 |
Denso Corporation (Auto components) | | 416,100 | | | 16,933 |
En-Japan Inc. (Commercial services & supplies) | | 1,535 | | | 4,314 |
Fujimi, Inc. (Chemicals) | | 40,252 | | | 609 |
Fukuoka Financial Group, Inc. (Commercial banks) | | 2,060,000 | | | 12,030 |
*Jupiter Telecommunications Co., Ltd. (Media) | | 13,175 | | | 11,084 |
*K.K. DaVinci Advisors (Real estate management & development) | | 9,129 | | | 7,909 |
Kenedix, Inc. (Real estate management & development) | | 2,800 | | | 4,436 |
Komatsu Ltd. (Machinery) | | 1,105,800 | | | 29,657 |
Miraial Company, Ltd. (Semiconductors & semiconductor equipment) | | 75,107 | | | 2,104 |
Mitsui & Co., Ltd. (Trading companies & distributors) | | 1,282,000 | | | 26,771 |
Nakanishi Inc. (Health care equipment & supplies) | | 12,914 | | | 1,652 |
NGK Insulators, Ltd. (Machinery) | | 790,000 | | | 21,181 |
Nintendo Co., Ltd. (Software) | | 64,700 | | | 37,989 |
Nippon Electric Glass Co., Ltd. (Electronic equipment & instruments) | | 459,000 | | | 7,467 |
Nitori Company Ltd. (Specialty retail) | | 112,180 | | | 5,376 |
*So-net M3, Inc. (Health care technology) | | 1,499 | | | 4,779 |
Sumitomo Realty & Development Co., Ltd. (Real estate management & development) | | 606,000 | | | 14,820 |
Suruga Bank (Commercial banks) | | 1,155,000 | | | 12,565 |
Yamada Denki Company (Specialty retail) | | 205,600 | | | 23,193 |
Zensho Company, Ltd. (Hotels, restaurants, & leisure) | | 392,300 | | | 3,948 |
| | | | | |
| | | | | 268,085 |
| | | | | |
| | | | | |
Issuer | | Shares | | Value |
| | | | | |
| | |
Asia—12.2% | | | | | |
Australia—7.9% | | | | | |
Allco Finance Group, Limited (Capital markets) | | 680,572 | | $ | 3,654 |
BHP Billiton Limited (Metals & mining) | | 727,400 | | | 25,428 |
Macquarie Bank, Ltd. (Capital markets) | | 438,200 | | | 29,319 |
QBE Insurance Group Limited (Insurance) | | 937,800 | | | 27,227 |
Seek Ltd. (Commercial services & supplies) | | 1,182,900 | | | 8,222 |
United Group Ltd. (Construction & engineering) | | 627,500 | | | 10,479 |
Woolworths Limited (Food & staples retailing) | | 1,441,700 | | | 42,755 |
WorleyParsons, Ltd. (Energy equipment & services) | | 475,433 | | | 21,418 |
| | | | | |
| | | | | 168,502 |
| | | | | |
Hong Kong—2.0% | | | | | |
ASM Pacific Technology Limited (Semiconductors & semiconductor equipment) | | 825,000 | | | 5,997 |
Esprit Holdings Ltd. (Specialty retail) | | 1,707,100 | | | 25,137 |
Li & Fung Ltd. (Distributors) | | 3,165,800 | | | 12,621 |
| | | | | |
| | | | | 43,755 |
| | | | | |
Singapore—2.3% | | | | | |
Capitaland, Ltd. (Real estate management & development) | | 4,204,300 | | | 18,089 |
Olam International, Ltd. (Food & staples retailing) | | 3,657,000 | | | 7,194 |
Raffles Education Corp. Ltd. (Diversified consumer services) | | 3,326,000 | | | 6,979 |
Singapore Exchange, Ltd. (Diversified financial services) | | 1,777,900 | | | 16,286 |
| | | | | |
| | | | | 48,548 |
| | | | | |
| | |
Emerging Asia—10.9% | | | | | |
China—3.1% | | | | | |
Belle International Holdings Limited (Specialty retail) | | 6,766,000 | | | 10,122 |
China Mengniu Dairy Co. (Food products) | | 174,000 | | | 631 |
China Oilfield Services Limited (Energy equipment & services) | | 4,096,000 | | | 9,148 |
China Vanke Company Ltd. (Real estate management & development) | | 3,768,950 | | | 9,713 |
Ctrip.com International Ltd.—ADR (Hotels, restaurants, & leisure) | | 137,600 | | | 7,908 |
*E-House China Holdings Ltd.—ADR (Real estate management & development) | | 130,500 | | | 3,110 |
*Home Inns & Hotels Management, Inc.—ADR (Hotels, restaurants, & leisure) | | 86,600 | | | 3,086 |
Lee and Man Paper Manufacturing Ltd. (Paper & forest products) | | 998,800 | | | 4,355 |
Li Ning Co. Ltd. (Leisure equipment & products) | | 2,242,400 | | | 8,257 |
Parkson Retail Group Ltd. (Multiline retail) | | 779,000 | | | 9,296 |
| | | | | |
| | | | | 65,626 |
| | | | | |
See accompanying Notes to Financial Statements.
Institutional International Growth Fund
Portfolio of Investments, December 31, 2007 (all dollar amounts in thousands)
12 Annual Report | December 31, 2007 |
| | | | | |
Issuer | | Shares | | Value |
| | | | | |
|
Common Stocks—Emerging Asia—10.9%—(continued) |
India—3.2% | | | | | |
Bharat Heavy Electricals Ltd. (Electrical equipment) | | 141,200 | | $ | 9,189 |
*Bharti Airtel Ltd. (Wireless telecommunication services) | | 506,000 | | | 12,656 |
Dabur India Ltd. (Personal products) | | 2,280,550 | | | 6,552 |
DLF Ltd. (Real estate management & development) | | 241,933 | | | 6,531 |
Financial Technologies (India) Ltd. (Software) | | 112,200 | | | 7,382 |
Housing Development Finance Corp. (Thrifts & mortgage finance) | | 104,900 | | | 7,575 |
Larsen & Toubro Ltd. (Construction & engineering) | | 76,200 | | | 7,977 |
Unitech Limited (Real estate management & development) | | 907,600 | | | 11,122 |
| | | | | |
| | | | | 68,984 |
| | | | | |
Indonesia—0.4% | | | | | |
PT Bank Rakyat Indonesia (Commercial banks) | | 10,178,000 | | | 7,912 |
| | | | | |
Malaysia—1.2% | | | | | |
Bumiputra Commerce Holdings Bhd (Commercial banks) | | 4,093,400 | | | 13,477 |
Kuala Lumpur Kepong Bhd (Food products) | | 1,654,500 | | | 8,644 |
Zelan Bhd (Construction & engineering) | | 2,327,200 | | | 3,801 |
| | | | | |
| | | | | 25,922 |
| | | | | |
South Korea—1.1% | | | | | |
*LG Household & Health Care Ltd. (Household products) | | 31,520 | | | 6,495 |
*MegaStudy Co., Ltd. (Diversified consumer services) | | 21,600 | | | 6,142 |
*NHN Corp. (Internet software & services) | | 41,920 | | | 9,996 |
| | | | | |
| | | | | 22,633 |
| | | | | |
Taiwan—1.9% | | | | | |
Hon Hai Precision Industry Corp. (Electronic equipment & instrument) | | 1,816,207 | | | 11,194 |
Mediatek Inc. (Semiconductors & semiconductor equipment) | | 1,508,426 | | | 19,335 |
Taiwan Semiconductor Manufacturing Company Ltd. (Semiconductors & semiconductor equipment) | | 5,800,000 | | | 10,997 |
| | | | | |
| | | | | 41,526 |
| | | | | |
| |
Emerging Europe, Mid-East, Africa—5.7% | | | |
Czech Republic—0.3% | | | | | |
*Central European Media Enterprises Ltd. Class “A” (Media)† | | 47,500 | | | 5,509 |
| | | | | |
Egypt—1.1% | | | | | |
Egyptian Financial Group—Hermes Holding (Capital markets) | | 686,500 | | | 8,172 |
Orascom Construction Industries (Construction & engineering) | | 151,200 | | | 15,568 |
| | | | | |
| | | | | 23,740 |
| | | | | |
| | | | | |
Issuer | | Shares | | Value |
| | | | | |
|
Common Stocks—Emerging Europe, Mid-East,
Africa—5.7%—(continued) |
Georgia—0.1% | | | | | |
Bank of Georgia—GDR (Commercial banks) | | 99,400 | | $ | 2,935 |
| | | | | |
Poland—0.3% | | | | | |
*Central European Distribution Corporation (Beverages) | | 111,200 | | | 6,458 |
| | | | | |
Russia—0.8% | | | | | |
Sberbank—CLS (Commercial banks) | | 2,417,300 | | | 10,183 |
*X5 Retail Group N.V. (Food & staples retailing) | | 199,400 | | | 7,278 |
| | | | | |
| | | | | 17,461 |
| | | | | |
South Africa—1.9% | | | | | |
MTN Group, Ltd. (Wireless telecommunication services) | | 964,200 | | | 18,059 |
Naspers Ltd. (Media) | | 251,700 | | | 5,957 |
The Spar Group Limited (Food & staples retailing) | | 686,200 | | | 6,052 |
Truworths International Ltd. (Specialty retail) | | 1,338,400 | | | 5,304 |
Wilson Bayly Holmes-Ovcon Ltd. (Construction & engineering) | | 245,400 | | | 4,943 |
| | | | | |
| | | | | 40,315 |
| | | | | |
Turkey—0.3% | | | | | |
BIM Birlesik Magazalar A.S. (Food & staples retailing) | | 69,800 | | | 6,227 |
| | | | | |
United Arab Emirates—0.9% | | | | | |
*DP World Ltd. (Marine) | | 3,830,200 | | | 4,558 |
Emaar Properties PJSC (Real estate management & development) | | 2,578,800 | | | 10,408 |
Lamprell plc (Energy equipment & services) | | 555,000 | | | 4,715 |
| | | | | |
| | | | | 19,681 |
| | | | | |
| | |
Emerging Latin America—5.5% | | | | | |
Brazil—4.3% | | | | | |
*Anhanguera Educacional Participacoes S.A. (Diversified consumer services) | | 365,600 | | | 7,805 |
B2W Companhia Global do Varejo (Internet & catalog retail) | | 54,000 | | | 2,154 |
Bolsa de Mercadorias & Futuros S.A. (Diversified financial services) | | 154,200 | | | 2,166 |
Bovespa Holding S.A. (Diversified financial services) | | 691,800 | | | 13,331 |
*BR Malls Participacoes S.A. (Real estate management & development) | | 665,100 | | | 8,968 |
Companhia Vale do Rio Doce.—ADR (Metals & mining) | | 782,600 | | | 25,568 |
Cyrela Brazil Realty S.A. (Household durables) | | 410,400 | | | 5,580 |
*Cyrela Commercial Properties SA (Real estate management & development) | | 86,180 | | | 581 |
Iguatemi Empresa de Shopping Centers S.A. (Real estate management & development) | | 245,400 | | | 3,998 |
Localiza Rent a Car S.A. (Road & rail) | | 425,300 | | | 4,514 |
See accompanying Notes to Financial Statements.
Institutional International Growth Fund
Portfolio of Investments, December 31, 2007 (all dollar amounts in thousands)
December 31, 2007 | William Blair Funds 13 |
Institutional International Growth Fund
Portfolio of Investments, December 31, 2007 (all dollar amounts in thousands)
| | | | | | |
Issuer | | Shares or
Principal
Amount | | Value |
| | | | | | |
|
Common Stocks—Emerging Latin America—5.5%—(continued) |
Lojas Renner S.A. (Multiline retail) | | | 319,000 | | $ | 6,452 |
Redecard S.A. (IT services) | | | 560,300 | | | 9,066 |
Totvs S.A. (Software) | | | 102,200 | | | 3,388 |
| | | | | | |
| | | | | | 93,571 |
| | | | | | |
Chile—0.5% | | | | | | |
Cencosud S.A. -ADR 144A (Specialty retail) | | | 171,200 | | | 10,335 |
| | | | | | |
Mexico—0.5% | | | | | | |
*Banco Compartamos S.A. de C.V. (Consumer finance) | | | 815,900 | | | 3,544 |
Grupo Aeropuertario Del—ADR (Transportation infrastructure) | | | 85,800 | | | 3,829 |
*MegaCable Holdings S.A.B. de C.V. (Diversified telecommunication services) | | | 777,300 | | | 2,639 |
| | | | | | |
| | | | | | 10,012 |
| | | | | | |
Panama—0.2% | | | | | | |
Copa Holdings S.A., Class “A” (Airlines)+ | | | 104,700 | | | 3,933 |
| | | | | | |
| | |
Canada—4.4% | | | | | | |
Brookfield Asset Management, Inc. Class “A” (Real estate management & development) | | | 502,300 | | | 18,042 |
Canadian Western Bank (Commercial banks) | | | 230,100 | | | 7,309 |
*FNX Mining Company, Inc. (Metals & mining) | | | 255,100 | | | 7,819 |
*Gildan Activewear, Inc. (Textiles, apparel & luxury goods) | | | 219,500 | | | 9,105 |
Rogers Communications, Inc. Class “B” (Wireless telecommunication services) | | | 690,600 | | | 31,481 |
Shoppers Drug Mart Corp. (Food & staples retailing) | | | 386,600 | | | 20,862 |
| | | | | | |
| | | | | | 94,618 |
| | | | | | |
Total Common Stock—94.8%
(cost $1,497,030) | | | 2,034,885 |
| | | | | | |
| | |
Preferred Stock | | | | | | |
Brazil—0.6% | | | | | | |
*Banco Sofisa S.A. (Commercial banks) | | | 473,500 | | | 3,684 |
Petroleo Brasileiro S.A. (Oil, gas & consumable fuels) | | | 176,500 | | | 8,766 |
| | | | | | |
| | | | | | 12,450 |
| | | | | | |
Total Preferred Stock—0.6%
(cost $5,184) | | | 12,450 |
| | | | | | |
| | |
Investment in Affiliate | | | | | | |
William Blair Ready Reserves Fund | | | 54,501 | | | 55 |
| | | | | | |
Total Investment in Affiliate—0.0%
(cost $55) | | | 55 |
| | | | | | |
| | |
Short-Term Investments | | | | | | |
American Express Credit Corp. Demand Note, VRN 4.695% due 1/2/08 | | $ | 9,100,000 | | | 9,100 |
Prudential Funding Demand Note, VRN 4.430% due 1/2/08 | | | 16,100,000 | | | 16,100 |
| | | | | | |
Total Short-term Investments—1.2%
(cost $25,200) | | | 25,200 |
| | | | | | |
| | | | | | |
Issuer | | Principal
Amount | | Value |
| | | | | | |
| | |
Repurchase Agreement | | | | | | |
State Street Bank and Trust Company, 3.800% dated 12/31/07, due 1/2/08, repurchase price $71,099, collateralized by U.S. Treasury Bill, due 2/28/08 | | $ | 71,084,078 | | $ | 71,084 |
| | | | | | |
Total Repurchase Agreement—3.3%
(cost $71,084) | | | 71,084 |
| | | | | | |
Total Investments—99.9%
(cost $1,598,553) | | | 2,143,674 |
| | | | | | |
Cash and other assets, less liabilities—0.1% | | | 1,638 |
| | | | | | |
Net assets—100.0% | | $ | 2,145,312 |
| | | | | | |
* Non-income producing securities
ADR = American Depository Receipt
GDR = Global Depository Receipt
VRN = Variable Rate Note
† = U.S. listed foreign security
For securities primarily traded on exchanges or markets that close before the close of regular trading on the New York Stock Exchange the Fund uses an independent pricing service on a daily basis to fair value price the securities pursuant to Valuation Procedures adopted by the Board of Trustees.
At December 31, 2007 the Fund’s Portfolio of Investments includes the following industry categories:
| | |
Financials | | 22.3 |
Industrials | | 17.5 |
Consumer Staples | | 15.0 |
Consumer Discretionary | | 14.9 |
Information Technology | | 8.5 |
Energy | | 8.1 |
Materials | | 4.7 |
Health Care | | 3.8 |
Telecommunication Services | | 3.6 |
Utilities | | 1.6 |
| | |
| | 100.0% |
| | |
At December 31, 2007 the Fund’s Portfolio of Investments includes the following currency categories:
| | |
Euro | | 19.7 |
British Pound Sterling | | 17.2 |
Japanese Yen | | 13.1 |
Swiss Franc | | 8.4 |
Australian Dollar | | 8.2 |
Hong Kong Dollar | | 4.7 |
United States Dollar | | 4.6 |
Canadian Dollar | | 4.6 |
Brazilian Real | | 3.9 |
Indian Rupee | | 3.4 |
Singapore Dollar | | 2.4 |
Taiwan Dollar | | 2.0 |
South African Rond | | 2.0 |
Malaysian Ringgit | | 1.3 |
Egyptian Pound | | 1.2 |
South Korean Wan | | 1.1 |
All other currencies | | 2.2 |
| | |
| | 100.0% |
| | |
See accompanying Notes to Financial Statements.
14 Annual Report | December 31, 2007 |
W. George Greig
INSTITUTIONAL INTERNATIONAL EQUITY FUND
The Institutional International Equity Fund invests primarily in common stocks of companies included in the Morgan Stanley Capital International All Country World ex-U.S. Index.
AN OVERVIEW FROM THE PORTFOLIO MANAGER
Please see page 2 for the Global Markets Overview.
How did the Fund perform over the first half of the year? How did the Fund’s performance compare to its benchmark?
The Institutional International Equity Fund posted a 18.36% increase for the year ended December 31, 2007. By comparison, the Fund’s benchmark, the Morgan Stanley Capital International (MSCI) All Country World (ACWI) ex-US Index, rose 17.12%.
What factors were behind the Fund’s performance versus the benchmark?
During 2007 the Fund outperformed across most sectors. In Consumer Staples, strong stock selection in Developed Asia and Canada, coupled with the weighting in Europe added value, while the Fund’s Energy stocks more than doubled the return of the stocks in the Index due to the Fund’s focus on energy services companies coupled with exploration and production companies with high production growth. Information Technology (IT) stock selection was driven by developed markets stock selection, while Materials stock selection added value primarily through the Fund’s emerging markets holdings. In addition, the Fund’s overweighting and stock selection in Consumer Staples and Industrials added value, as did its underweighting in Financials, whose performance slightly trailed the Index during the year. Regionally, the Fund’s focus on emerging markets and Developed Asia (ex-Japan) and Europe ex-UK was positive, as was its underemphasis of Japan. Stock selection in Europe and Japan also added value during the year.
What is your current strategy? How is the Fund positioned?
As of year end, the Fund remained focused in Consumer Staples and Industrials stocks at the expense of Energy, Health Care, Materials and Utilities. Financials, which was the largest weighting in the Fund at approximately 20%, was significantly underweighted relative to the Index, which had a 26.17% weighting. Regionally, the Fund maintained a focus in Developed Asia ex- Japan (i.e., Hong Kong, Australia and Singapore), while continuing its underweighting of Japan. The emerging markets weighting approximated 16% as of year end, below the Index’s 19.51% weighting, as we reduced our Emerging Asia holdings, particularly in China, due largely to valuation concerns.
December 31, 2007 | William Blair Funds 15 |
Institutional International Equity Fund
Performance Highlights (unaudited)
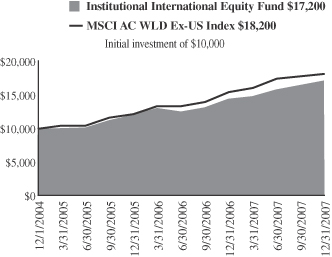
Average Annual Total Return at 12/31/2007
| | | | | | | | | |
| | | 1
Year | | | 3
Year | | | Since
Inception(a) | |
Institutional International Equity Fund | | 18.36 | % | | 18.94 | % | | 19.11 | % |
MSCI All Country World Ex-US Index | | 17.12 | | | 20.37 | | | 21.15 | |
| | (a) | | For the period from December 1, 2004 (Commencement of Operations) to December 31, 2007. |
Performance cited represents past performance. Past performance does not guarantee future results and current performance may be lower or higher than the data quoted. Results shown are average annual returns, which assume reinvestment of dividends and capital gains. Investment returns and principal will fluctuate and you may have a gain or loss when you sell shares. For the most current month-end performance information, please call 1-800-742-7272, or visit our Web site at www.williamblairfunds.com. From time to time, the investment advisor may waive fees or reimburse expenses for the Fund. Without these waivers, performance would be lower. International investing involves special risk considerations, including currency fluctuations, lower liquidity, economic and political risk.
The performance highlights and graph presented above do not reflect the deduction of taxes that a shareholder would pay on fund distributions or the redemption of fund shares.
The Morgan Stanley Capital International (MSCI) All Country World Ex-US Index is an unmanaged index that includes developed and emerging markets and reduced Japanese portion, making it more comparable to the Institutional International Equity Fund in terms of investment approach.
This report identifies the Fund’s investments on December 31, 2007. These holdings are subject to change. Not all stocks in the Fund performed the same, nor is there any guarantee that these stocks will perform as well in the future. Market forecasts provided in this report may not necessarily come to pass.
Sector Diversification (unaudited)
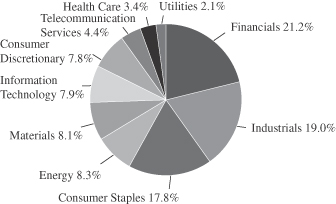
The sector diversification shown is based on the total investment portfolio.
16 Annual Report | December 31, 2007 |
Institutional International Equity Fund
Portfolio of Investments, December 31, 2007 (all dollar amounts in thousands)
| | | | | |
Issuer | | Shares | | Value |
| | |
Common Stocks—Europe—32.2% | | | | | |
Austria—0.6% | | | | | |
Raiffeisen International Bank (Commercial banks) | | 27,625 | | $ | 4,152 |
| | | | | |
Belguim—1.4% | | | | | |
InBev N.V. (Beverages) | | 106,100 | | | 8,820 |
| | | | | |
Finland—1.2% | | | | | |
Nokia Oyj (Communications equipment) | | 199,700 | | | 7,672 |
| | | | | |
France—9.2% | | | | | |
AXA (Insurance) | | 153,100 | | | 6,104 |
Essilor International (Health care equipment & supplies) | | 96,000 | | | 6,124 |
Eurazeo (Diversified financial services) | | 32,817 | | | 4,203 |
Iliad S.A. (Diversified telecommunication services) | | 34,900 | | | 3,753 |
L’Oreal S.A. (Personal products) | | 94,600 | | | 13,546 |
Schneider Electric S.A. (Electrical equipment) | | 81,400 | | | 11,025 |
Veolia Environnement (Multi-utilities) | | 135,800 | | | 12,370 |
| | | | | |
| | | | | 57,125 |
| | | | | |
Germany—4.2% | | | | | |
Beiersdorf AG (Personal products) | | 83,000 | | | 6,432 |
Deutsche Boerse AG (Diversified financial services) | | 61,800 | | | 12,197 |
*Q-Cells AG (Electrical equipment) | | 49,900 | | | 7,082 |
| | | | | |
| | | | | 25,711 |
| | | | | |
Greece—1.1% | | | | | |
National Bank of Greece S.A. (Commercial banks) | | 100,930 | | | 6,921 |
| | | | | |
Italy—2.6% | | | | | |
Geox SpA (Textiles, apparel & luxury goods) | | 132,300 | | | 2,665 |
Saipem SpA (Energy equipment & services) | | 330,700 | | | 13,206 |
| | | | | |
| | | | | 15,871 |
| | | | | |
Spain—1.4% | | | | | |
Industria De Textile S. A. (Specialty retail) | | 137,700 | | | 8,332 |
| | | | | |
Switzerland—10.5% | | | | | |
ABB Ltd. (Electrical equipment) | | 690,300 | | | 19,902 |
*Actelion Ltd. (Biotechnology) | | 65,200 | | | 2,978 |
EFG International (Capital markets) | | 78,500 | | | 3,163 |
Geberit AG (Building products) | | 16,500 | | | 2,248 |
Julius Baer Holding AG (Capital markets) | | 69,100 | | | 5,670 |
Kuehne & Nagel International AG (Marine) | | 54,800 | | | 5,262 |
Nestle S.A. (Food products) | | 26,630 | | | 12,228 |
Roche Holdings AG (Pharmaceuticals) | | 35,600 | | | 6,154 |
SGS S.A. (Commercial services & supplies) | | 3,543 | | | 4,224 |
Sonova Holdings AG (Health care equipment & supplies) | | 25,061 | | | 2,814 |
| | | | | |
| | | | | 64,643 |
| | | | | |
| | |
United Kingdom—15.9% | | | | | |
BG Group plc (Oil, gas & consumable fuels) | | 644,000 | | | 14,776 |
British Sky Broadcasting Group plc (Media) | | 654,800 | | | 8,054 |
Capita Group plc (Commercial services & supplies) | | 448,645 | | | 6,220 |
Carphone Warehouse Group plc (Specialty retail) | | 381,200 | | | 2,593 |
Man Group plc (Capital markets) | | 506,012 | | | 5,744 |
| | | | | |
Issuer | | Shares | | Value |
|
Common Stocks—United Kingdom—15.9%—(continued) |
Reckitt Benckiser plc (Household products) | | 265,200 | | $ | 15,411 |
*Rolls-Royce Group plc (Aerospace & defense) | | 1,178,371 | | | 12,790 |
Rotork plc (Electronic equipment & instruments) | | 109,200 | | | 2,106 |
Tesco plc (Food & staples retailing) | | 1,674,900 | | | 15,932 |
Tullow Oil (Oil, gas, & consumable fuels) | | 398,400 | | | 5,175 |
Xstrata plc (Metal & mining) | | 134,000 | | | 9,403 |
| | | | | |
| | | | | 98,204 |
| | | | | |
| | |
Japan—13.5% | | | | | |
Aeon Mall Co., Ltd. (Real estate management & development) | | 125,400 | | | 3,291 |
FANUC Ltd. (Machinery) | | 85,000 | | | 8,241 |
Fukuoka Financial Group, Inc. (Commercial banks) | | 1,045,000 | | | 6,103 |
*Jupiter Telecommunications Co., Ltd. (Media) | | 5,267 | | | 4,431 |
*K.K. DaVinci Advisors (Real estate management & development) | | 2,180 | | | 1,889 |
Komatsu Ltd. (Machinery) | | 270,100 | | | 7,244 |
Mitsui & Co., Ltd. (Trading companies & distributors) | | 425,000 | | | 8,875 |
NGK Insulators Ltd. (Machinery) | | 302,000 | | | 8,097 |
Nintendo Co., Ltd. (Software) | | 28,600 | | | 16,792 |
Nippon Electric Glass Co., Ltd. (Electronic equipment & instruments) | | 189,000 | | | 3,074 |
Shin-Etsu Chemical Co., Ltd. (Chemicals) | | 80,400 | | | 5,000 |
Sumitomo Realty and Development (Real estate management & development) | | 217,000 | | | 5,307 |
Suruga Bank Ltd. (Commercial banks) | | 452,000 | | | 4,917 |
| | | | | |
| | | | | 83,261 |
| | | | | |
| | |
Asia—13.0% | | | | | |
Australia—8.3% | | | | | |
BHP Billiton Limited (Metals & mining) | | 211,600 | | | 7,397 |
Macquarie Bank, Ltd. (Capital markets) | | 108,900 | | | 7,286 |
QBE Insurance Group Limited (Insurance) | | 265,300 | | | 7,703 |
Toll Holdings Limited (Air freight & logistics) | | 448,200 | | | 4,475 |
Woolworths Limited (Food & staples retailing) | | 494,900 | | | 14,677 |
WorleyParsons, Ltd. (Energy equipment & services) | | 217,500 | | | 9,798 |
| | | | | |
| | | | | 51,336 |
| | | | | |
Hong Kong—2.4% | | | | | |
Esprit Holdings Ltd. (Specialty retail) | | 511,100 | | | 7,526 |
Li & Fung Ltd. (Distributors) | | 1,807,100 | | | 7,204 |
| | | | | |
| | | | | 14,730 |
| | | | | |
Singapore—2.3% | | | | | |
Capitaland, Ltd. (Real estate management & development) | | 1,816,900 | | | 7,817 |
Wilmar International Ltd. (Food products) | | 1,673,800 | | | 6,220 |
| | | | | |
| | | | | 14,037 |
| | | | | |
| | |
Emerging Asia—8.6% | | | | | |
China—2.5% | | | | | |
China Communications Construction Co. Ltd. (Construction & engineering) | | 2,467,000 | | | 6,378 |
See accompanying Notes to Financial Statements.
December 31, 2007 | William Blair Funds 17 |
Institutional International Equity Fund
Portfolio of Investments, December 31, 2007 (all dollar amounts in thousands)
| | | | | |
Issuer | | Shares | | Value |
|
Common Stocks—Emerging
Asia—8.6%—(continued) |
China—(continued) |
China Merchants Bank Co. Ltd (Commercial banks) | | 631,500 | | $ | 2,541 |
China Oilfield Services Limited (Energy equipment & services) | | 1,186,000 | | | 2,649 |
*Country Garden Holdings Company (Real estate management & development) | | 1,313,000 | | | 1,496 |
Shandong Weigao Gp Medical (Health care equipment & supplies) | | 920,000 | | | 2,107 |
| | | | | |
| | | | | 15,171 |
| | | | | |
India—2.3% | | | | | |
*Bharti Airtel Limited (Wireless telecommunication services) | | 274,531 | | | 6,867 |
Vedanta Resources plc (Metals & mining) | | 187,000 | | | 7,587 |
| | | | | |
| | | | | 14,454 |
| | | | | |
Indonesia—0.6% | | | | | |
PT Bank Rakyat Indonesia (Commercial banks) | | 4,385,000 | | | 3,409 |
| | | | | |
Malaysia—1.3% | | | | | |
Bumiputra Commerce Holdings Bhd (Commercial banks) | | 1,225,500 | | | 4,035 |
Kuala Lumpur Kepong Bhd (Food product) | | 753,200 | | | 3,935 |
| | | | | |
| | | | | 7,970 |
| | | | | |
South Korea—0.6% | | | | | |
*NHN Corp. (Internet software & services) | | 16,600 | | | 3,958 |
| | | | | |
Taiwan—1.4% | | | | | |
Hon Hai Precision Industry Corp. (Electronic equipment & instruments) | | 805,656 | | | 4,966 |
Mediatek, Inc. (Semiconductors & semiconductor equipment) | | 290,500 | | | 3,723 |
| | | | | |
| | | | | 8,689 |
| | | | | |
Canada—5.4% | | | | | |
Agnico-Eagle Mines Limited (Metals & mining) | | 122,749 | | | 6,706 |
Brookfield Asset Management, Inc. Class “A” (Real estate management & development) | | 183,500 | | | 6,591 |
*Research In Motion Limited (Communications equipment) | | 42,750 | | | 4,848 |
Rogers Communications, Inc. Class “B” (Wireless telecommunication services) | | 200,100 | | | 9,121 |
Shoppers Drug Mart Corp. (Food & staples retailing) | | 112,400 | | | 6,066 |
| | | | | |
| | | | | 33,332 |
| | | | | |
| | |
Emerging Latin America—3.7% | | | | | |
Brazil— 3.2% | | | | | |
Bolsa de Mercadorias & Futuros S.A. (Diversified financial services) | | 45,300 | | | 636 |
Bovespa Holding SA (Diversified financial services) | | 195,100 | | | 3,760 |
*Net Servicos De Counicacao S.A. (Media) | | 237,900 | | | 2,900 |
Companhia Vale do Rio Doce.—ADR (Metals & mining) | | 370,400 | | | 12,101 |
| | | | | |
| | | | | 19,397 |
| | | | | |
| | | | | | |
Issuer | | Shares or
Principal
Amount | | Value |
|
Common Stocks—Emerging
Latin America—3.7%—(continued) |
Chile—0.5% | | | | | | |
Cencosud S.A.—ADR 144A (Specialty retail) | | | 52,000 | | $ | 3,139 |
| | | | | | |
| |
Emerging Europe, Mid-East, Africa—3.6% | | | |
Egypt—1.1% | | | | | | |
Egyptian Financial Group—Hermes Holding (Capital markets) | | | 550,500 | | | 6,553 |
| | | | | | |
South Africa—1.5% | | | | | | |
MTN Group, Ltd. (Wireless telecommunication services) | | | 359,200 | | | 6,728 |
Naspers Ltd. (Media) | | | 109,890 | | | 2,601 |
| | | | | | |
| | | | | | 9,329 |
| | | | | | |
Russia—0.8% | | | | | | |
*PIK Group (Real estate management & development)** | | | 95,400 | | | 2,909 |
*PIK Group—GDR 144A ( (Real estate management & development)) | | | 65,500 | | | 1,998 |
| | | | | | |
| | | | | | 4,907 |
| | | | | | |
United Arab Emirates—0.2% | | | | | | |
*DP World Ltd. (Marine) | | | 1,188,000 | | | 1,414 |
| | | | | | |
Total Common Stock—95.9%
(cost $457,735) | | | | | | 592,537 |
| | | | | | |
| | |
Preferred Stocks | | | | | | |
Brazil—0.6% | | | | | | |
Petroleo Brasileiro S.A. (Oil, gas & consumable fuels) | | | 78,000 | | | 3,874 |
| | | | | | |
Total Preferred Stocks—0.6%
(cost $1,076) | | | | | | 3,874 |
| | | | | | |
| | |
Investment in Affiliate | | | | | | |
William Blair Ready Reserves Fund | | | 3,351,852 | | | 3,352 |
| | | | | | |
Total Investment in Affiliate—0.5%
(cost $3,352) | | | | | | 3,352 |
| | | | | | |
| | |
Short-Term Investments | | | | | | |
American Express Credit Corporation Demand Note, VRN, 4.695%, due 1/2/08 | | $ | 4,624,000 | | | 4,624 |
Prudential Funding Demand Note, VRN
4.430%, due 1/2/08 | | | 4,028,000 | | | 4,028 |
| | | | | | |
Total Short-Term Investments—1.4%
(cost $8,652) | | | | | | 8,652 |
| | | | | | |
| | |
Repurchase Agreement | | | | | | |
State Street Bank & Trust Company,
3.80% dated 12/31/07, due 1/2/08, repurchase price $6,779, collateralized by FNMA, Pool #712321 | | | 6,777,556 | | | 6,778 |
Total Repurchase Agreement—1.1%
(cost $6,778) | | | | | | 6,778 |
| | | | | | |
Total Investments—99.5%
(cost $477,593) | | | | | | 615,193 |
Cash and other assets, less liabilities—0.5% | | | 2,986 |
| | | | | | |
Net assets—100.0% | | | | | $ | 618,179 |
| | | | | | |
See accompanying Notes to Financial Statements.
18 Annual Report | December 31, 2007 |
Institutional International Equity Fund
Portfolio of Investments, December 31, 2007 (all dollar amounts in thousands)
* Non-income producing securities
ADR = American Depository Receipt
VRN= Variable Rate Note
** Fair valued pursuant to Valuation Procedures adopted by the Board of Trustees. This holding represents 0.47% of the Fund’s net assets at December 31, 2007. This security was also deemed illiquid pursuant to Liquidity Procedures adopted by the Board of Trustees.
For securities, primarily traded on exchanges or markets that close before the close of regular trading on the New York Stock Exchange, the Fund uses an independent pricing service on a daily basis to fair value price the securities pursuant to Valuation Procedures adopted by the Board of Trustees.
At December 31, 2007 the Fund’s Portfolio of Investments includes the following industry categories:
| | |
Financials | | 21.2% |
Industrials | | 19.0% |
Consumer Staples | | 17.8% |
Energy | | 8.3% |
Materials | | 8.1% |
Information Technology | | 7.9% |
Consumer Discretionary | | 7.8% |
Telecommunication Services | | 4.4% |
Health Care | | 3.4% |
Utilities | | 2.1% |
| | |
| | 100.0% |
| | |
At December 31, 2007 the Fund’s Portfolio of Investments includes the following currency categories:
| | |
Euro | | 22.6% |
British Pound Sterling | | 17.7% |
Japanese Yen | | 14.0% |
Swiss Franc | | 10.8% |
Australian Dollar | | 8.6% |
U.S. Dollar | | 5.5% |
Hong Kong Dollar | | 5.0% |
Canadian Dollar | | 3.6% |
Singapore Dollar | | 2.4% |
Brazilian Real | | 1.9% |
South African Rand | | 1.6% |
New Taiwan Dollar | | 1.5% |
Malaysian Ringgit | | 1.3% |
Indian Rupee | | 1.2% |
Egyptian Pounds | | 1.1% |
All other currencies | | 1.2% |
| | |
| | 100.0% |
| | |
See accompanying Notes to Financial Statements.
December 31, 2007 | William Blair Funds 19 |

Jeffery A. Urbina
INTERNATIONAL SMALL CAP GROWTH FUND
The International Small Cap Growth Fund primarily invests in a diversified portfolio of common stocks of small cap companies in developed and emerging markets.
AN OVERVIEW FROM THE PORTFOLIO MANAGER
Please see page 2 for the Global Markets Overview.
How did the Fund perform over the first half of the year? How did the Fund’s performance compare to its benchmark?
The International Small Cap Growth Fund posted a 13.53% increase (Institutional Class) for the year ended December 31, 2007. By comparison, the Fund’s benchmark, the Morgan Stanley Capital International (MSCI) World ex-U.S. Small Cap Index, gained 3.64%.
What factors were behind the Fund’s performance versus the benchmark?
During 2007 the Fund outperformed across most sectors. In particular, relative stock selection in Discretionary, Energy, Financials, Health Care, Industrials and Utilities was strong. Discretionary stock selection was bolstered by good performance in developed Asia and Canada, coupled with emerging markets exposure. In Energy, the Fund’s focus on energy services companies added value. Financials stock selection was strong across all regions, with the exception of Australia. European stocks augmented results in Health Care, while Industrials stock selection benefited from companies exposed to Energy and Materials spending, infrastructure building, and alternative energy. In addition, the Fund’s overweighting in Industrials added value, as did its underweighting in IT. Regionally, the Fund’s stock selection across developed regions was strong, while emerging markets exposure added value, as did the lower weighting in Japan.
What is your current strategy? How is the Fund positioned?
During the quarter, the Fund’s weighting in Consumer Discretionary stocks, which were significantly overweighted relative to the Index as of September 30, were decreased, and reinvested in Health Care and Financials holdings. From a sector perspective at year end, the Fund remained focused in Financials and Industrials, and a newly increased Healthcare weighting, at the expense of Materials and Utilities. Regionally, the Fund remained underweighted in Developed Asia, although the weighting in Japan was increased, overweighted in Europe, and approximately 16% in emerging markets. The weighting in emerging markets decreased from approximately 17% as of September 30, as we reduced our weightings in China and Latin America, with some of the proceeds reinvested in the Middle East.
20 Annual Report | December 31, 2007 |
International Small Cap Growth Fund
Performance Highlights (unaudited)
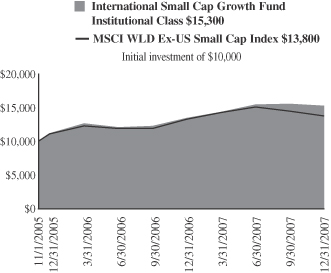
Average Annual Total Return at 12/31/2007
| | | | | | |
| | | 1
Year | | | Since
Inception(a) | |
International Small Cap Growth Fund Institutional Class | | 13.53 | % | | 21.71 | % |
MSCI World Ex-US Small Cap Index | | 3.64 | | | 15.79 | |
| | (a) | | For the period from November 1, 2005 (Commencement of Operations) to December 31, 2007. | |
Performance cited represents past performance. Past performance does not guarantee future results and current performance may be lower or higher than the data quoted. Results shown are average annual returns, which assume reinvestment of dividends and capital gains. Investment returns and principal will fluctuate and you may have a gain or loss when you sell shares. For the most current month-end performance information, please call 1-800-742-7272, or visit our Web site at www.williamblairfunds.com. From time to time, the investment advisor may waive fees or reimburse expenses for the Fund. Without these waivers, performance would be lower. International investing involves special risk considerations, including currency fluctuations, lower liquidity, economic and political risk.
The performance highlights and graph presented above do not reflect the deduction of taxes that a shareholder would pay on fund distributions or the redemption of fund shares.
The Morgan Stanley Capital International (MSCI) World Ex-US Small Cap Index is an unmanaged index that is designed to measure equity performance of small cap stocks in developed and emerging markets.
This report identifies the Fund’s investments on December 31, 2007. These holdings are subject to change. Not all stocks in the Fund performed the same, nor is there any guarantee that these stocks will perform as well in the future. Market forecasts provided in this report may not necessarily come to pass.
Sector Diversification (unaudited)
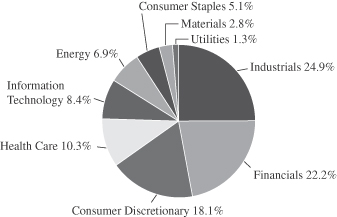
The sector diversification shown is based on the total investment portfolio.
December 31, 2007 | William Blair Funds 21 |
International Small Cap Growth Fund
Portfolio of Investments, December 31, 2007 (all dollar amounts in thousands)
| | | | | |
Issuer | | Shares | | Value |
| | |
Common Stocks—Europe—37.9% | | | | | |
Austria—1.5% | | | | | |
Schoeller-Bleckmann Oilfield Equipment AG (Energy equipment & services) | | 66,920 | | $ | 6,003 |
| | | | | |
Finland—3.8% | | | | | |
Konecranes OYJ (Machinery) | | 53,600 | | | 1,826 |
Nokian Renkaat OYJ (Auto components) | | 229,550 | | | 7,969 |
Outotec OYJ (Construction & engineering) | | 32,300 | | | 1,751 |
Ramirent OYJ (Machinery) | | 220,512 | | | 3,617 |
| | | | | |
| | | | | 15,163 |
| | | | | |
France—6.0% | | | | | |
April Group S.A. (Insurance) | | 136,782 | | | 9,229 |
EDF Energies Nouvelles S.A.
(Independent power energy traders) | | 71,000 | | | 4,952 |
*Orpea (Heath care providers & services) | | 92,713 | | | 6,093 |
*Seloger.com (Media) | | 68,400 | | | 4,018 |
| | | | | |
| | | | | 24,292 |
| | | | | |
Germany—6.8% | | | | | |
*Colonia Real Estate AG (Real estate management & development) | | 170,760 | | | 4,237 |
CTS Eventim AG (Media) | | 53,900 | | | 2,082 |
*Manz Automation AG (Semiconductors & semiconductor equipment) | | 11,200 | | | 2,710 |
MTU Aero Engines Holding AG (Aerospace & defense) | | 83,514 | | | 4,880 |
*Roth & Rau AG (Electronic equipment & instruments) | | 7,200 | | | 2,683 |
Solarworld AG (Electrical equipment) | | 71,062 | | | 4,314 |
*Wire Card AG (Commercial services & supplies) | | 371,000 | | | 6,286 |
| | | | | |
| | | | | 27,192 |
| | | | | |
Greece—3.6% | | | | | |
Fourlis Holdings S.A. (Household durables) | | 160,600 | | | 6,346 |
Jumbo S.A. (Leisure equipment & products) | | 228,200 | | | 8,215 |
| | | | | |
| | | | | 14,561 |
| | | | | |
Ireland—2.2% | | | | | |
*Norkom Group plc (Software) | | 286,500 | | | 733 |
United Drug plc (Health providers & services) | | 1,433,880 | | | 8,274 |
| | | | | |
| | | | | 9,007 |
| | | | | |
Italy—1.5% | | | | | |
Azimut Holdings SpA (Capital markets) | | 143,217 | | | 1,858 |
Trevi Finanziaria SpA (Construction & engineering) | | 234,800 | | | 4,208 |
| | | | | |
| | | | | 6,066 |
| | | | | |
Netherlands—1.6% | | | | | |
*Qiagen NV (Lifesciences tools & services) | | 297,273 | | | 6,464 |
| | | | | |
Norway—0.7% | | | | | |
* Electromagnetic GeoServices AS (Energy equipment & services) | | 284,450 | | | 2,651 |
| | | | | |
Spain—3.0% | | | | | |
Grifols S.A. (Biotechnology) | | 378,203 | | | 8,490 |
Tecnicas Reunidas S.A. (Construction & engineering) | | 56,300 | | | 3,600 |
| | | | | |
| | | | | 12,090 |
| | | | | |
| | | | | |
Issuer | | Shares | | Value |
| |
Common Stocks—Europe—37.9%—(continued) | | | |
Switzerland—7.2% | | | | | |
*Barry Callebaut AG (Food products) | | 5,920 | | $ | 4,485 |
Burckhardt Compression Holding AG (Machinery) | | 17,112 | | | 5,552 |
*Meyer Burger Technology AG (Machinery) | | 14,800 | | | 5,448 |
Partners Group Global Opportunities, Ltd (Capital markets) | | 69,100 | | | 9,213 |
*Temenos Group AG (Software) | | 164,280 | | | 4,042 |
| | | | | |
| | | | | 28,740 |
| | | | | |
| | |
United Kingdom—18.7% | | | | | |
Amlin plc (Insurance) | | 1,221,889 | | | 7,216 |
Amlin plc—B Shares, (Insurance) | | 1,306,000 | | | 582 |
Ashmore Group plc (Capital markets) | | 607,700 | | | 3,212 |
*Autonomy Corporation plc (Software) | | 476,900 | | | 8,383 |
*Blinkx plc (Internet software & services) | | 4,713,700 | | | 2,577 |
*Ceres Power Holdings plc (Electrical equipment) | | 721,500 | | | 4,456 |
*Climate Exchange plc (Diversified financial services) | | 103,600 | | | 2,048 |
Detica Group plc (IT services) | | 632,100 | | | 2,774 |
Domino's Pizza UK & IRL plc (Hotels, restaurants, & leisure) | | 617,280 | | | 2,192 |
Expro International Group plc (Energy equipment & services) | | 317,337 | | | 6,492 |
Restaurant Group plc (Hotels, restaurants, & leisure) | | 317,200 | | | 1,166 |
Rightmove plc (Media) | | 199,700 | | | 1,839 |
Rotork plc (Electronic equipment & instruments) | | 102,550 | | | 1,977 |
RPS Group plc (Commercial services & supplies) | | 319,700 | | | 2,020 |
Serco Group plc (Commercial services & supplies) | | 887,240 | | | 8,167 |
Southern Cross Healthcare Limited (Health care providers & services) | | 496,824 | | | 5,207 |
Ultra Electronic Holdings plc (Aerospace & defense) | | 94,050 | | | 2,572 |
VT Group plc (Aerospace & defense) | | 357,150 | | | 4,903 |
*Wellstream Holdings plc (Energy equipment & services) | | 332,200 | | | 7,156 |
| | | | | |
| | | | | 74,939 |
| | | | | |
| | |
Japan—15.5% | | | | | |
Aeon Mall Co., Ltd. (Real estate management & development) | | 490,000 | | | 12,859 |
ARDEPRO CO., Ltd. (Real estate management & development) | | 17,408 | | | 3,738 |
DeNA Co., Ltd. (Internet & catalog retail) | | 1,223 | | | 5,818 |
En-Japan Inc. (Commercial services & supplies) | | 871 | | | 2,448 |
Fujimi, Inc (Chemicals) | | 50,788 | | | 768 |
*K.K. DaVinci Advisors (Real estate management & development) | | 7,011 | | | 6,074 |
Kenedix, Inc. (Real estate management & development) | | 2,448 | | | 3,878 |
Miraial Company, Ltd. (Semiconductors & semiconductor equipment) | | 94,920 | | | 2,659 |
Nitori Company Ltd. (Specialty retail) | | 158,200 | | | 7,582 |
*So-net M3, Inc. (Health care technology) | | 1,370 | | | 4,368 |
Suruga Bank Ltd. (Commercial banks) | | 724,000 | | | 7,876 |
See accompanying Notes to Financial Statements.
22 Annual Report | December 31, 2007 |
International Small Cap Growth Fund
Portfolio of Investments, December 31, 2007 (all dollar amounts in thousands)
| | | | | |
Issuer | | Shares | | Value |
| |
Common Stocks—Japan—15.5%—(continued) | | | |
Zensho Company, Ltd. (Hotels, restaurants, & leisure) | | 406,500 | | $ | 4,091 |
| | | | | |
| | | | | 62,159 |
| | | | | |
| | |
Emerging Asia—7.6% | | | | | |
China—2.6% | | | | | |
*China High Speed Transmission (Independent power producers & energy traders) | | 1,006,000 | | | 2,638 |
China Infrastructure Machinery Holdings, Ltd. (Machinery) | | 1,043,000 | | | 1,634 |
Ctrip.com International, Ltd.—ADR (Hotels, restaurants & leisure) | | 20,640 | | | 1,186 |
*E-House China Holdings Ltd.—ADR (Real estate management & development) | | 38,400 | | | 915 |
*Home Inns & Hotels Management, Inc.—ADR (Hotels, restaurants & leisure) | | 25,900 | | | 923 |
Li Ning Co. Ltd. (Leisure equipment & products) | | 318,873 | | | 1,174 |
Shandong Weigao GP (Health care equipment & supplies) | | 884,800 | | | 2,026 |
| | | | | |
| | | | | 10,496 |
| | | | | |
India—1.7% | | | | | |
Financial Technologies, (India) Ltd. (Diversified financial services) | | 72,380 | | | 4,762 |
Thermax India Limited (Machinery) | | 107,200 | | | 2,201 |
| | | | | |
| | | | | 6,963 |
| | | | | |
Malaysia—2.3% | | | | | |
KNM Group Bhd (Energy equipment & services) | | 1,112,100 | | | 2,559 |
Kuala Lumpur Kepong Bhd (Food products) | | 848,450 | | | 4,433 |
Zelan Bhd (Construction & engineering) | | 1,289,800 | | | 2,107 |
| | | | | |
| | | | | 9,099 |
| | | | | |
South Korea—1.0% | | | | | |
*Taewoong Co., Ltd. (Machinery) | | 42,190 | | | 3,982 |
| | | | | |
| | |
Asia—6.0% | | | | | |
Australia—3.5% | | | | | |
Seek Limited (Commercial services & supplies) | | 1,151,680 | | | 8,005 |
United Group, Ltd. (Construction & engineering) | | 360,070 | | | 6,013 |
| | | | | |
| | | | | 14,018 |
| | | | | |
Singapore—2.5% | | | | | |
Olam International, Ltd. (Food & staples retailing) | | 3,106,000 | | | 6,110 |
Raffles Education Corp. Ltd. (Diversified consumer services) | | 1,967,000 | | | 4,128 |
| | | | | |
| | | | | 10,238 |
| | | | | |
| | |
Emerging Europe, Mid-East, Africa—5.6% | | | | | |
Czech Republic—0.6% | | | | | |
*Central European Media Enterprises Ltd.,
Class “A"”(Media) † | | 21,700 | | | 2,517 |
| | | | | |
| | | | | |
Issuer | | Shares | | Value |
|
Emerging Europe, Mid-East, Africa—5.6%—(continued) |
Egypt—0.8% | | | | | |
*Orascom Hotels & Development (Hotels, restaurants & leisure) | | 230,900 | | $ | 3,429 |
| | | | | |
Poland—1.9% | | | | | |
*Central European Distribution Corporation ADR (Beverages) | | 86,800 | | | 5,041 |
*Cinema City International N.V. (Media) | | 173,600 | | | 2,453 |
| | | | | |
| | | | | 7,494 |
| | | | | |
South Africa—1.7% | | | | | |
*Eastern Platinum Ltd (Metals & mining) | | 1,618,300 | | | 4,706 |
Wilson Bayly Holmes-Ovcon Limited (Construction & engineering) | | 103,381 | | | 2,082 |
| | | | | |
| | | | | 6,788 |
| | | | | |
United Arab Emirates—0.6% | | | | | |
Lamprell plc (Energy equipment & services) | | 263,700 | | | 2,240 |
| | | | | |
| | |
Canada—4.3% | | | | | |
Canadian Western Bank (Commercial banks) | | 215,100 | | | 6,833 |
FNX Mining Company Inc. (Metals & mining) | | 189,400 | | | 5,805 |
*Gildan Activewear, Inc. (Textiles, apparel & luxury goods) | | 107,500 | | | 4,459 |
| | | | | |
| | | | | 17,097 |
| | | | | |
| | |
Emerging Latin America—2.4% | | | | | |
Brazil—2.4% | | | | | |
*Anhanguera Educational Parti (Diversified consumer services) | | 108,400 | | | 2,314 |
*Cyrela Commercial Properties S.A. (Real estate management & development) | | 249,640 | | | 1,684 |
Iguatemi Empresa de Shopping Centers S.A. (Real estate management & development) | | 129,300 | | | 2,106 |
Lupatech S.A. (Machinery) | | 47,700 | | | 1,608 |
Rodobens Negocioa Imobiliarios S.A. (Real estate management & development) | | 180,500 | | | 2,145 |
| | | | | |
| | | | | 9,857 |
| | | | | |
Total Common Stock—98.0%
(cost $356,874) | | | 393,545 |
| | | | | |
| |
Preferred Stock | | | |
Brazil—0.6% | | | | | |
Banco Sofisa S.A. (Commercial banks) | | 288,100 | | | 2,242 |
| | | | | |
Total Preferred Stock—0.6%
(cost $1,818) | | | 2,242 |
| | | | | |
See accompanying Notes to Financial Statements.
December 31, 2007 | William Blair Funds 23 |
International Small Cap Growth Fund
Portfolio of Investments, December 31, 2007 (all dollar amounts in thousands)
| | | | | | |
Issuer | | Shares or
Principal
Amount | | Value |
| | |
Investment in Affiliate | | | | | | |
William Blair Ready Reserves Fund | | | 2,197,170 | | $ | 2,197 |
| | | | | | |
Total Investment in Affiliate—0.5%
(cost $2,197) | | | 2,197 |
| | | | | | |
| | |
Short-Term Investments | | | | | | |
American Express Credit Corp. Demand Note, VRN 4.695%, due 1/2/08 | | $ | 3,969,000 | | | 3,969 |
Prudential Funding Demand Note, VRN 4.430%, due 1/2/08 | | | 1,065,000 | | | 1,065 |
| | | | | | |
Total Short-term Investments—1.3%
(cost $5,034) | | | 5,034 |
| | | | | | |
* Non-income producing securities
ADR = American Depository Receipt
GDR = Global Depository Receipt
† = U.S. listed foreign security
VRN = Variable Rate Note
For securities primarily traded on exchanges or markets that close before the close of regular trading on the New York Stock Exchange, the Fund uses an independent pricing service on a daily basis to fair value price the securities pursuant to Valuation Procedures adopted by the Board of Trustees.
At December 31, 2007 the Fund’s Portfolio of Investments includes the following industry categories:
| | |
Industrials | | 24.9% |
Financials | | 22.2% |
Consumer Discretionary | | 18.1% |
Health Care | | 10.3% |
Information Technology | | 8.4% |
Energy | | 6.9% |
Consumer Staples | | 5.1% |
Materials | | 2.8% |
Utilities | | 1.3% |
| | |
Total | | 100.0% |
| | |
| | | | | | | |
| | | |
Issuer | | Principal
Amount | | Value | |
| | |
Repurchase Agreement | | | | | | | |
State Street Bank & Trust Company, 3.80% dated 12/31/07 due 1/2/08, repurchase price $967 collateralized by FNMA Pool #712321 | | $ | 966,783 | | $ | 967 | |
| | | | | | | |
Total Repurchase Agreement—0.2%
(cost $967) | | | 967 | |
| | | | | | | |
Total Investments—100.6%
(cost $366,890) | | | 403,985 | |
Liabilities, plus cash and other assets (0.6)% | | | (2,526 | ) |
| | | | | | | |
Net assets—100.0% | | $ | 401,459 | |
| | | | | | | |
At December 31, 2007 the Fund’s Portfolio of Investments includes the following currency categories:
| | |
Euro. | | 30.5% |
British Pound Sterling. | | 19.4% |
Japanese Yen. | | 15.7% |
Swiss Franc. | | 7.2% |
Canadian Dollar. | | 5.5% |
Australian Dollar. | | 3.6% |
Brazilian Real. | | 3.1% |
U.S. Dollar. | | 2.7% |
Singapore Dollar. | | 2.6% |
Malaysian Ringgit. | | 2.3% |
Hong Kong Dollar. | | 1.9% |
Indian Rupee. | | 1.8% |
South Korean Won. | | 1.0% |
All other currencies. | | 2.7% |
| | |
Total | | 100.0% |
| | |
See accompanying Notes to Financial Statements.
24 Annual Report | December 31, 2007 |
W. George Greig

Todd M. McClone
Jeffrey A. Urbina
EMERGING MARKETS GROWTH FUND
The Emerging Markets Growth Fund primarily invests in a diversified portfolio of equity securities issued by growth companies in emerging economies worldwide.
AN OVERVIEW FROM THE PORTFOLIO MANAGERS
Please see page 2 for the Global Markets Overview.
How did the Fund perform over the first half of the year? How did the Fund’s performance compare to its benchmark?
The Emerging Markets Growth Fund posted a 38.21% increase (Institutional Class) for the year ended December 31, 2007. By comparison, the Fund’s benchmark, the Morgan Stanley Capital International (MSCI) Emerging Markets Index, gained 39.78%.
What factors were behind the Fund’s performance versus the benchmark?
During 2007 the Fund outperformed across virtually all sectors. In particular, relative stock selection in Energy, Financials, Information Technology (IT) and Telecommunication Services was strong. In Energy, the Fund’s focus on energy services companies coupled with exploration and production companies with high production growth added value. Financials stock selection was strong, due largely to strong gains in the Fund’s Chinese and Middle Eastern holdings, coupled with good results from Brazilian financials. IT stock selection benefited from strong performance in Latin American and Asian holdings, while the Fund’s focus on the leading Telecom companies in China and India augmented performance. In addition, the Fund’s overweighting in Industrials added value, as did its underweighting in IT. Regionally, the Fund’s stock selection in Emerging Asia was strong, but was slightly mitigated from underperformance in Latin America, due primarily to exposure to Mexico, which underperformed as the US economy slowed.
What is your current strategy? How is the Fund positioned?
During the fourth quarter, the Fund’s weighting in Consumer Discretionary stocks, which were significantly overweighted relative to the Index as of September 30, were decreased, in favor of Consumer Staples companies, due to expectations of a slower growth environment, and concerns about valuation in Chinese stocks. From a sector perspective at year end, however, the Fund remained focused in Consumer, Financials and Industrials companies at the expense of Energy, Materials and Utilities. Regionally, the weighting in Emerging Asia was decreased during the quarter, due largely to concerns about valuation in China in favor of Brazilian and Middle Eastern stocks. As of year end, the Fund had nearly an equal weighting (approximately 25% of the Fund) in EMEA, was overweighted in Latin America (at approximately 26% of the Fund) and underweighted in the larger Emerging Asia region relative to the Index.
December 31, 2007 | William Blair Funds 25 |
Emerging Markets Growth Fund
Performance Highlights (unaudited)
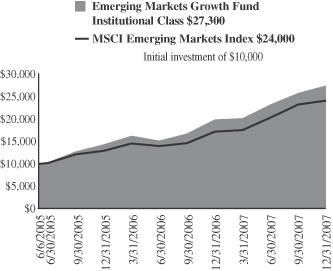
Average Annual Total Return at 12/31/07
| | | | | | |
| | | 1
Year | | | Since
Inception(a) | |
Emerging Markets Growth Fund Institutional Class | | 38.21 | % | | 47.74 | % |
MSCI Emerging Markets Index | | 39.78 | | | 40.36 | |
| | (a) | | For the period from June 6, 2005 (Commencement of Operations) to December 31, 2007. | |
Performance cited represents past performance. Past performance does not guarantee future results and current performance may be lower or higher than the data quoted. Results shown are average annual returns, which assume reinvestment of dividends and capital gains. Investment returns and principal will fluctuate and you may have a gain or loss when you sell shares. For the most current month-end performance information, please call 1-800-742-7272, or visit our Web site at www.williamblairfunds.com. From time to time, the investment advisor may waive fees or reimburse expenses for the Fund. Without these waivers, performance would be lower. International investing involves special risk considerations, including currency fluctuations, lower liquidity, economic and political risk.
The performance highlights and graph presented above do not reflect the deduction of taxes that a shareholder would pay on fund distributions or the redemption of fund shares.
The Morgan Stanley Capital International (MSCI) Emerging Markets Index is an index that is designed to measure equity performance in the global emerging markets.
This report identifies the Fund’s investments on December 31, 2007. These holdings are subject to change. Not all stocks in the Fund performed the same, nor is there any guarantee that these stocks will perform as well in the future. Market forecasts provided in this report may not necessarily come to pass.
Sector Diversification (unaudited)
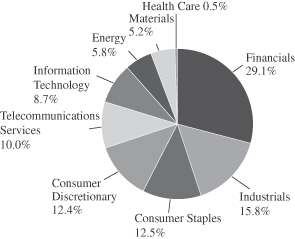
The sector diversification shown is based on the total investment portfolio.
26 Annual Report | December 31, 2007 |
Emerging Markets Growth Fund
Portfolio of Investments, December 31, 2007 (all dollar amounts in thousands)
| | | | | |
Issuer | | Shares | | Value |
| |
Common Stocks—Emerging Asia—46.3% | | | |
China—10.6% | | | | | |
Belle International Holdings Limited (Specialty retail) | | 8,686,200 | | $ | 12,995 |
China Communications Construction Company Ltd. (Construction & engineering) | | 2,099,900 | | | 5,429 |
*China High Speed Transmission Equipment Group Co. (Electrical equipment) | | 2,213,000 | | | 5,802 |
China Infrastructure Machinery Holdings, Ltd. (Machinery) | | 3,019,000 | | | 4,728 |
China Merchants Bank (Commercial banks) | | 2,658,500 | | | 10,696 |
China Mobile Ltd. (Wireless telecommunication services) | | 982,300 | | | 17,106 |
China Oilfield Services Limited (Energy equipment & services) | | 1,245,000 | | | 2,780 |
China Vanke Company Ltd. (Real estate management & development) | | 4,419,147 | | | 11,389 |
*China Water Affairs Group (Household durables) | | 4,814,000 | | | 2,922 |
*CNinsure, Inc. (Insurance)† | | 194,200 | | | 3,059 |
*Country Garden Holdings Ltd. (Real estate management & development) | | 6,997,000 | | | 7,973 |
Ctrip.com International Ltd.—ADR (Hotels, restaurants & leisure) | | 48,600 | | | 2,793 |
*E-House China Holdings Ltd.—ADR (Real estate management & development) | | 111,300 | | | 2,652 |
*Home Inns & Hotels Management Inc.—ADR (Hotels, restaurants & leisure) | | 69,100 | | | 2,463 |
Lee and Man Paper Manufacturing Ltd. (Paper & forest products) | | 2,036,400 | | | 8,878 |
Li Ning Co. Ltd. (Leisure equipment & products) | | 922,500 | | | 3,397 |
Parkson Retail Group Ltd. (Multiline retail) | | 311,400 | | | 3,716 |
Shangdong Weigao GP Medical (Health care equipment & supplies) | | 2,585,700 | | | 5,922 |
Wumart Stores, Inc., Class “H” (Food & staples retailing) | | 6,764,000 | | | 5,751 |
Xinyu Hengdeli Holdings Ltd. (Distributors) | | 5,800,000 | | | 3,238 |
| | | | | |
| | | | | 123,689 |
| | | | | |
India—18.4% | | | | | |
ABB Ltd. India (Electrical equipment) | | 145,700 | | | 5,538 |
Bharat Heavy Electricals, Ltd. (Electrical equipment) | | 344,700 | | | 22,433 |
*Bharti Airtel Ltd. (Wireless telecommunication services) | | 1,508,000 | | | 37,719 |
*Cairn India Ltd. (Oil, gas & consumable fuels) | | 3,301,800 | | | 21,351 |
Dabur India Ltd. (Personal products) | | 2,083,300 | | | 5,985 |
DLF Ltd. (Real estate management & development) | | 272,666 | | | 7,360 |
Financial Technologies, (India) Ltd. (Software) | | 94,600 | | | 6,224 |
HDFC Bank Ltd. (Commercial banks)† | | 109,200 | | | 14,245 |
Housing Development Finance Corp. (Thrifts & mortgage finance) | | 340,790 | | | 24,610 |
Larsen & Toubro Ltd. (Construction & engineering) | | 222,400 | | | 23,281 |
Shoppers’ Stop Ltd. (Multiline retail) | | 280,860 | | | 3,940 |
Thermax India Limited (Machinery) | | 314,700 | | | 6,461 |
Unitech Limited (Real estate management & development) | | 1,214,600 | | | 14,884 |
Vedanta Resources plc (Metals & mining) | | 505,400 | | | 20,505 |
| | | | | |
| | | | | 214,536 |
| | | | | |
| | | | | |
Issuer | | Shares | | Value |
|
Common Stocks—Emerging Asia—46.3%—(continued) |
Indonesia—2.9% | | | | | |
PT Bank Rakyat Indonesia (Commercial banks) | | 28,280,500 | | $ | 21,984 |
*PT London Sumatra Indones PT (Food products) | | 10,329,000 | | | 11,609 |
| | | | | |
| | | | | 33,593 |
| | | | | |
Philippines—0.6% | | | | | |
Bank of Philippine Islands (Commercial banks) | | 5,050,000 | | | 7,492 |
| | | | | |
Malaysia—4.6% | | | | | |
*Airasia Bhd (Airlines) | | 6,636,600 | | | 3,191 |
Bumiputra Commerce Holding Bhd (Commercial banking) | | 7,581,400 | | | 24,961 |
KNM Group Bhd (Energy equipment & services) | | 2,868,200 | | | 6,601 |
Kuala Lumpur Kepong Bhd (Food products) | | 2,434,650 | | | 12,720 |
Zelan Bhd (Construction & engineering) | | 3,568,200 | | | 5,828 |
| | | | | |
| | | | | 53,301 |
| | | | | |
South Korea—3.9% | | | | | |
Hana Tour Service Inc. (Hotels, restaurants & leisure) | | 55,200 | | | 4,477 |
*LG Household & Health Care Ltd. (Household products) | | 57,799 | | | 11,910 |
*Megastudy Co. Ltd. Inc. (Diversified consumer services) | | 19,410 | | | 5,519 |
*NHN Corporation (Internet software & services) | | 46,200 | | | 11,017 |
*Taewoong Co., Ltd. (Machinery) | | 138,100 | | | 13,034 |
| | | | | |
| | | | | 45,957 |
| | | | | |
Taiwan—5.3% | | | | | |
Himax Technologies, Inc.—ADR (Semiconductors & semiconductor equipment) | | 1,807,424 | | | 7,718 |
Hon Hai Precision Industry Co., Ltd. (Electronic equipment & instruments) | | 4,880,033 | | | 30,078 |
Taiwan Semiconductor Manufacturing Company Ltd. (Semiconductors & semiconductor equipment) | | 12,367,000 | | | 23,448 |
| | | | | |
| | | | | 61,244 |
| | | | | |
| |
Emerging Europe, Mid-East, Africa—24.3% | | | |
Czech Republic—1.1% | | | | | |
*Central European Media Enterprises Ltd., Class “A” (Media)† | | 105,800 | | | 12,271 |
| | | | | |
Egypt—4.1% | | | | | |
Egyptian Financial Group-Hermes Holding SAE (Capital markets) | | 1,391,300 | | | 16,561 |
Orascom Construction Industries (Construction & engineering) | | 236,200 | | | 24,321 |
*Orascom Hotels and Development (Hotels, restaurants & leisure) | | 485,000 | | | 7,203 |
| | | | | |
| | | | | 48,085 |
| | | | | |
Poland—2.2% | | | | | |
*Amrest Holdings NV (Hotels, restaurants & leisure) | | 117,200 | | | 6,295 |
See accompanying Notes to Financial Statements.
December 31, 2007 | William Blair Funds 27 |
Emerging Markets Growth Fund
Portfolio of Investments, December 31, 2007 (all dollar amounts in thousands)
| | | | | |
Issuer | | Shares | | Value |
|
Common Stocks—Emerging Europe, Mid-East, Africa—24.3%—(continued) |
Poland—(continued) | | | | | |
*Central European Distribution Corporation ADR (Beverages) | | 242,500 | | $ | 14,084 |
*Cinema City International NV (Media) | | 401,500 | | | 5,672 |
| | | | | |
| | | | | 26,051 |
| | | | | |
Russia—4.4% | | | | | |
*Magnit—CLS (Multiline retail)† | | 118,800 | | | 5,981 |
*PIK Group—CLS (Real estate development & management)** | | 597,900 | | | 18,236 |
*PIK Group—Sponsored GDR 144A (Real estate development & management) | | 98,400 | | | 3,001 |
Sberbank—CLS (Commercial banks)† | | 2,830,700 | | | 11,925 |
*X5 Retail Group N.V.—GDR (Food & staples retailing) | | 331,200 | | | 12,089 |
| | | | | |
| | | | | 51,232 |
| | | | | |
South Africa—6.5% | | | | | |
*Eastern Platinum, Ltd. (Metals & mining) | | 2,342,600 | | | 6,812 |
MTN Group Ltd. (Wireless telecommunication services) | | 1,495,800 | | | 28,016 |
Naspers Ltd. (Media) | | 485,190 | | | 11,484 |
The Spar Group Limited (Food & staples retailing) | | 1,444,300 | | | 12,738 |
Truworths International Ltd. (Specialty retail) | | 2,262,800 | | | 8,966 |
Wilson Bayly Holmes-Ovcon Ltd. (Construction & engineering) | | 364,800 | | | 7,348 |
| | | | | |
| | | | | 75,364 |
| | | | | |
Turkey—3.8% | | | | | |
Bim Birlesik Magazalar A.S. (Food & staples retailing) | | 141,200 | | | 12,598 |
Coca Cola Icecek A.S. (Beverages) | | 603,600 | | | 6,951 |
Turkiye Garanti Bankasi A.S. (Commercial banks) | | 2,716,300 | | | 24,239 |
| | | | | |
| | | | | 43,788 |
| | | | | |
United Arab Emirates—2.2% | | | | | |
*DP World Ltd. (Marine) | | 5,379,700 | | | 6,402 |
Emaar Properties PJSC (Real estate management & development) | | 3,346,100 | | | 13,504 |
Lamprell plc (Energy equipment & services) | | 731,400 | | | 6,213 |
| | | | | |
| | | | | 26,119 |
| | | | | |
| | |
Emerging Latin America—22.6% | | | | | |
Brazil—13.3% | | | | | |
All America Latin Logistica (Road & rail) | | 896,400 | | | 11,603 |
*Anhanguera Educacional Participacoes S.A. (Diversified consumer services) | | 371,100 | | | 7,922 |
B2W Companhia Global do Varejo (Internet & catalog retail) | | 37,000 | | | 1,476 |
Bolsa de Mercadorias & Futuros S.A. (Diversified financial services) | | 286,200 | | | 4,020 |
Bovespa Holding S.A. (Diversified financial services) | | 1,298,500 | | | 25,022 |
*BR Malls Participacoes S.A. (Real estate management & development) | | 998,300 | | | 13,460 |
CIA Vale Do Rio Doce—Pref A—ADR (Metals & mining) | | 693,400 | | | 22,653 |
| | | | | |
Issuer | | Shares | | Value |
|
Common Stocks—Emerging Latin America—22.6%—(continued) |
Brazil—(continued) | | | | | |
Cyrela Brazil Realty S.A. (Household durables) | | 772,500 | | $ | 10,503 |
*Cyrela Commercial Properties S.A. (Real estate management & development) | | 831,900 | | | 5,613 |
Iguatemi Empresa de Shopping Centers S.A. (Real estate management & development) | | 389,115 | | | 6,339 |
Localiza Rent a Car S.A. (Road & rail) | | 555,200 | | | 5,892 |
Lojas Renner S.A. (Multiline retail) | | 322,100 | | | 6,514 |
Lupatech S.A. (Machinery) | | 240,300 | | | 8,100 |
Redecard S.A. (IT services) | | 899,800 | | | 14,559 |
Rodobens Negocioa Imobiliarios S.A. (Real estate management & development) | | 444,800 | | | 5,285 |
Totvs S.A. (Software) | | 167,000 | | | 5,535 |
| | | | | |
| | | | | 154,496 |
| | | | | |
Chile—1.6% | | | | | |
Cencosud S.A.—ADR 144A (Specialty retail) | | 223,500 | | | 13,492 |
S.A.C.I. Falabella S.A. (Multiline retail) | | 1,098,554 | | | 5,339 |
| | | | | |
| | | | | 18,831 |
| | | | | |
Mexico—6.6% | | | | | |
America Movil S.A. (Wireless telecommunication services) | | 8,023,800 | | | 24,628 |
*Groupo Famsa S.A. (Multiline retail) | | 1,065,000 | | | 3,317 |
Grupo Financiero Banorte S.A. de C.V. (Commercial banks) | | 2,763,400 | | | 11,419 |
Grupo Aeropuertario Del—ADR (Transportation infrastructure) | | 127,100 | | | 5,672 |
*MegaCable Holdings Sab de C.V. (Diversified telecommunication services) | | 1,725,000 | | | 5,857 |
*Promotora Ambiental sab de C.V. (Commercial services & supplies) | | 1,561,650 | | | 4,793 |
Wal-Mart de Mexico sab de C.V. (Food & staples retailing) | | 6,229,400 | | | 21,717 |
| | | | | |
| | | | | 77,403 |
| | | | | |
Peru—1.1% | | | | | |
Credicorp Ltd. (Commercial banks)† | | 171,700 | | | 13,101 |
| | | | | |
Total Common Stock—93.2%
(cost $805,452) | | | 1,086,553 |
| | | | | |
| | |
Preferred Stock | | | | | |
Brazil—3.7% | | | | | |
Banco Sofisa S.A. (Commercial banks) | | 686,200 | | | 5,339 |
*Net Servicos De Counicacao S.A. (Media) | | 796,300 | | | 9,708 |
Petroleo Brasileiro S.A. (Oil, gas & consumable fuels) | | 560,500 | | | 27,836 |
| | | | | |
| | | | | 42,883 |
| | | | | |
Total Preferred Stock—3.7%
(cost $25,102) | | | 42,883 |
| | | | | |
| | |
Investment in Affiliate | | | | | |
William Blair Ready Reserves Fund | | 1,325,503 | | | 1,326 |
| | | | | |
Total Investment in Affiliate—0.1%
(cost $1,326) | | | 1,326 |
| | | | | |
See accompanying Notes to Financial Statements.
28 Annual Report | December 31, 2007 |
Emerging Markets Growth Fund
Portfolio of Investments, December 31, 2007 (all dollar amounts in thousands)
| | | | | | |
Issuer | | Principal
Amount | | Value |
| | |
Short-Term Investments | | | | | | |
American Express Credit Corp. Demand Note, VRN 4.695%, due 1/2/08 | | $ | 3,075,000 | | $ | 3,075 |
Prudential Funding Demand Note, VRN 4.430%, due 1/2/08 | | | 9,183,000 | | | 9,183 |
| | | | | | |
Total Short-Term Investments—1.1%
(cost $12,258) | | | 12,258 |
| | | | | | |
| | |
Repurchase Agreement | | | | | | |
State Street Bank and Trust Company, 3.800% dated 12/31/07, due 1/2/08, repurchase price $10,962, collateralized by FNR 2002-93 FH | | | 10,960,154 | | | 10,960 |
| | | | | | |
Total Repurchase Agreement—0.9%
(cost $10,960) | | | 10,960 |
| | | | | | |
Total Investments—99.0%
(cost $855,098) | | | 1,153,980 |
Cash, less liabilities—1.0% | | | 11,874 |
| | | | | | |
Net assets—100.0% | | $ | 1,165,854 |
| | | | | | |
* Non-income producing securities
ADR = American Depository Receipt
GDR = Global Depository Receipt
† = U.S. listed Foreign Security
VRN = Variable Rate Note
**Fair valued pursuant to Valuation Procedures adopted by Board of Trustees. This holding represents 1.56% of the Fund’s net assets at December 31, 2007. This security was also deemed illiquid pursuant to Liquidity Procedures securities pursuant to Valuation Procedures adopted by the Board of Trustees.
For securities primarily traded on exchanges or markets that close before the close of regular trading on the New York Stock Exchange, the Fund uses an independent pricing service on a daily basis to fair value price the securities pursuant to Valuation Procedures adopted by the Board of Trustees.
At December 31, 2007 the Fund’s Portfolio of Investments includes the following industry categories:
| | |
Financials | | 29.1% |
Industrials | | 15.8% |
Consumer Staples | | 12.5% |
Consumer Discretionary | | 12.4% |
Telecommunication Services | | 10.0% |
Information Technology | | 8.7% |
Energy | | 5.8% |
Materials | | 5.2% |
Health Care | | 0.5% |
| | |
Total | | 100.0% |
| | |
At December 31, 2007 the Fund’s Portfolio of Investments includes the following currency categories:
| | |
Indian Rupee | | 15.8% |
Brazilian Real | | 15.5% |
U.S. Dollar | | 12.5% |
Hong Kong Dollar | | 7.2% |
Mexican Nuevo Peso | | 6.3% |
South African Rand | | 6.1% |
New Taiwan Dollar | | 4.7% |
Malaysian Ringgit | | 4.7% |
Egyptian Pound | | 4.3% |
South Korean Won | | 4.1% |
Turkish Lira | | 3.9% |
Russian Ruble | | 3.2% |
Indonesian Rupiah | | 3.0% |
British Pound Sterling | | 2.4% |
Yuan Renminbi | | 2.3% |
Uae Dirham | | 1.2% |
All Other Currencies | | 2.8% |
| | |
Total | | 100.0% |
| | |
See accompanying Notes to Financial Statements.
December 31, 2007 | William Blair Funds 29 |

James S. Kaplan

Christopher T. Vincent

Benjamin J. Armstrong
BOND FUND
The Bond Fund seeks to outperform the Lehman Brothers U.S. Aggregate Bond Index by maximizing total return through a combination of income and capital appreciation.
AN OVERVIEW FROM THE PORTFOLIO MANAGERS
How did the Fund perform since its inception? How did the Fund’s performance compare to its benchmark?
The Bond Fund commenced operations on May 1, 2007. Through the eight-month period ending December 31, 2007, the Fund posted an increase of 3.57% (Institutional Shares). By comparison, the Fund’s benchmark, the Lehman Brothers U.S. Aggregate Bond Index, gained 4.87%.
What were the most significant market factors impacting Fund performance? What factors were behind the Fund’s performance versus the benchmark?
The Fund’s relative underperformance generally resulted from the volatility of the fixed income market during 2007. The Fund, for example, was underweight short-duration U.S. Treasury securities; the U.S. Treasury sector was the best performing investment grade bond sector in 2007. The Fund also holds a fairly small percentage of non-agency mortgage securities, the prices of which were negatively impacted by ongoing subprime mortgage problems.
Given the current valuation of the Corporate bond and Mortgage-backed security sectors relative to U.S. Treasury securities, we are optimistic about the outlook for 2008. Good performance may depend on a return of substantial liquidity to the bond market. U.S. Treasury returns may struggle in the coming year, given the 3.59% average yield on U.S. Treasury securities.
The bond market (as measured by the Lehman U.S. Aggregate Bond Index) posted strong absolute returns of 4.87% since the Fund’s inception on May 1, 2007. The returns were driven by falling Treasury yields. The yield on the Lehman Treasury Index fell by over 1.00%, from 4.67% to 3.59%.
The year-end yield on the Treasury market reflects a “flight-to-quality” in the bond market. Given the current Fed Funds rate of 4.25%, Treasury yields are likely unsustainable at these levels unless the Fed continues to cut rates aggressively.
In contrast to U.S. Treasury securities, the major “spread” sector performance was not as strong. Since the Fund’s inception, the yield on the Credit Index actually rose by 0.07%, from 5.53% to 5.60%. 2007 was the worst year in the past decade for the performance of the Credit sector relative to U.S. Treasuries.
Which investment strategies enhanced the Fund’s return? Were there any investment strategies that produced the best results?
Within the Consumer non-cyclical subsector, Kroger and Kimberly Clark bonds performed well. Also, the only below investment grade bond, MGM Mirage contributed to performance.
30 Annual Report | December 31, 2007 |
What were the weakest performing sectors for the Fund?
Within the Fund’s corporate bond holdings, the performance of the Financial sector was weaker than Industrials, which was consistent with market trends. Our holding of Rescap, a mortgage finance company, hurt performance and was eliminated from the portfolio. Other corporate bonds that underperformed the broad market include Prologis, a REIT, and FPL Group, a public utility holding company.
We have added a select few non-agency mortgages to the Fund that we believe are very attractive. Although some of these bonds have hurt performance recently, we continue to believe that they will benefit investors in the future.
What is your current strategy? How is the Fund positioned?
The Fund’s duration of 4.62 years is roughly consistent with the benchmark, reflecting no bias for changes in interest rates. Although we expect the Fed Funds rate to decline in 2008, future rate cuts are already priced into the Treasury market.
The Corporate bond sector holdings are marginally greater than the benchmark, reflecting our belief that spreads may tighten. Within the sector, we remain underweight financials and overweight industrials. We are also slightly overweight BBB-rated corporate bonds.
In the Fund, the Mortgage-related sectors (including Residential, Commercial and Asset backed securities) are marginally underweight relative to the benchmark. Within the sectors the Fund is overweight in Agency mortgages, including Fannie Mae and Freddie Mac mortgage pools.
The Commercial Mortgage sector is underweighted.
We believe the fixed income markets may be headed into a favorable relative return environment. The non-Treasury assets offer compelling valuations and the opportunity for spread tightening is considerable. The likelihood of spread tightening will increase if and when the liquidity in the bond market improves.
December 31, 2007 | William Blair Funds 31 |
Bond Fund
Performance Highlights (unaudited)
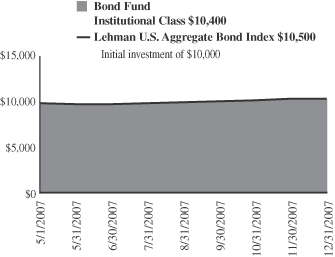
Average Annual Total Return at 12/31/07
| | | | | |
| | | Since
Inception(a) | | | |
Bond Fund Institutional Class | | 3.57 | % | | |
Lehman U.S. Aggregate Bond Index | | 4.87 | | | |
| | (a) | | For the period from May 1, 2007 (Commencement of Operations) to December 31, 2007. | |
Performance cited represents past performance. Past performance does not guarantee future results and current performance may be lower or higher than the data quoted. Results shown are average annual total returns, which assume reinvestment of dividends and capital gains. Investment returns and principal will fluctuate and you may have a gain or loss when you sell shares. For the most current month-end performance information, please call 1-800-742-7272, or visit our Web site at www.williamblairfunds.com. From time to time, the investment advisor may waive fees or reimburse expenses for the Fund. Without these waivers, performance would be lower.
The performance highlights and graph presented above do not reflect the deduction of taxes that a shareholder would pay on fund distributions or the redemption of fund shares.
The Lehman Brothers U.S. Aggregate Bond Index indicates broad intermediate government/corporate bond market performance.
This report identifies the Fund’s investments on December 31, 2007. These holdings are subject to change. Not all investments in the Fund performed the same, nor is there any guarantee that these investments will perform as well in the future. Market forecasts provided in this report may not necessarily come to pass.
Sector Diversification (unaudited)
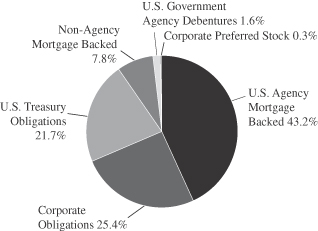
The sector diversification shown is based on the total investment portfolio.
32 Annual Report | December 31, 2007 |
Bond Fund
Portfolio of Investments, December 31, 2007 (all amounts in thousands)
| | | | | | | | |
| | | Principal
Amount | | Value |
|
U.S. Government and U.S. Government Agency—62.0% |
U.S. Treasury—20.2% | | | | | | | | |
U.S. Treasury Note,
4.750%, due 2/15/10 | | | | $ | 3,950 | | $ | 4,086 |
U.S. Treasury Note,
4.250%, due 9/30/12 | | | | | 3,200 | | | 3,312 |
U.S. Treasury Note,
4.750%, due 5/15/14 | | | | | 2,300 | | | 2,446 |
U.S. Treasury Note,
5.125%, due 5/15/16 | | | | | 1,450 | | | 1,569 |
U.S. Treasury Note,
7.125%, due 2/15/23 | | | | | 325 | | | 419 |
U.S. Treasury Note,
5.125%, due 2/15/36 | | | | | 2,000 | | | 2,010 |
| | | | | | | | |
Total U.S. Treasury Obligations | | | | | 13,225 | | | 13,842 |
| | | | | | | | |
Government National Mortgage
Association (GNMA)—1.1% | | | | | | | | |
GNR 2006-67 GB,
4.087%, due 9/16/34 | | | | | 725 | | | 713 |
#357752, 7.000%, due 4/15/09 | | | | | 3 | | | 3 |
| | | | | | | | |
| | | | | 728 | | | 716 |
| | | | | | | | |
Federal Home Loan Bank
(FHLB)—0.5% | | | | | | | | |
4.750%, due 12/16/16 | | | | | 325 | | | 332 |
| | | | | | | | |
Federal Home Loan Mortgage Corp. (FHLMC)—8.8% | | | | | | | | |
#G10330, 7.000%, due 1/1/10 | | | | | 40 | | | 41 |
#G90024, 7.000%, due 1/20/13 | | | | | 147 | | | 153 |
#G30093, 7.000%, due 12/1/17 | | | | | 68 | | | 71 |
#G30254, 6.500%, due 5/1/19 | | | | | 111 | | | 116 |
#G30255, 7.000%, due 7/1/21 | | | | | 151 | | | 159 |
#G18137, 6.500%, due 8/1/21 | | | | | 591 | | | 609 |
#G18137, 6.500%, due 7/1/22 | | | | | 224 | | | 231 |
#E02360, 6.500%, due 7/1/22 | | | | | 1,072 | | | 1,104 |
#D95897, 5.500%, due 3/1/23 | | | | | 452 | | | 454 |
#C90896, 6.500%, due 2/1/25 | | | | | 1,113 | | | 1,148 |
6.750%, due 9/15/29 | | | | | 650 | | | 806 |
#G10728, 7.500%, due 7/1/32 | | | | | 459 | | | 490 |
#C01385, 6.500%, due 8/1/32 | | | | | 647 | | | 669 |
| | | | | | | | |
| | | | | 5,725 | | | 6,051 |
| | | | | | | | |
Federal National Mortgage Association (FNMA)—31.4% | | | | | | | | |
#535559, 7.500%, due 9/1/12 | | | | | 888 | | | 913 |
#598453, 7.000%, due 6/1/15 | | | | | 29 | | | 30 |
#689612, 5.000%, due 5/1/18 | | | | | 856 | | | 859 |
#747903, 4.500%, due 6/1/19 | | | | | 731 | | | 719 |
#791393, 5.500%, due 10/1/19 | | | | | 736 | | | 747 |
#831430, 5.500%, due 3/1/21 | | | | | 935 | | | 947 |
#253847, 6.000%, due 5/1/21 | | | | | 519 | | | 530 |
#900725, 6.000%, due 8/1/21 | | | | | 471 | | | 482 |
#254797, 5.000%, due 6/1/23 | | | | | 492 | | | 486 |
#545437, 7.000%, due 2/1/32 | | | | | 352 | | | 371 |
#254548, 5.500%, due 12/1/32 | | | | | 1,960 | | | 1,963 |
#555522, 5.000%, due 6/1/33 | | | | | 877 | | | 857 |
#254868, 5.000%, due 9/1/33 | | | | | 1,542 | | | 1,507 |
#555880, 5.500%, due 11/1/33 | | | | | 924 | | | 925 |
#725027, 5.000%, due 11/1/33 | | | | | 1,234 | | | 1,205 |
| | | | | | | | |
| | | NRSRO
Rating | | Principal
Amount | | Value |
|
Federal National Mortgage Association (FNMA)—(continued) |
#725205, 5.000%, due 3/1/34 | | | | $ | 959 | | $ | 937 |
#725238, 5.000%, due 3/1/34 | | | | | 965 | | | 943 |
#725424, 5.500%, due 4/1/34 | | | | | 992 | | | 993 |
#725611, 5.500%, due 6/1/34 | | | | | 780 | | | 780 |
#745092, 6.500%, due 7/1/35 | | | | | 1,034 | | | 1,069 |
#845188, 6.000%, due 12/1/35 | | | | | 921 | | | 936 |
#848782, 6.500%, due 1/1/36 | | | | | 1,454 | | | 1,497 |
#256859, 5.500%, due 8/1/37 | | | | | 1,803 | | | 1,783 |
| | | | | | | | |
| | | | | 21,454 | | | 21,479 |
| | | | | | | | |
| | | |
Non-Agency Mortgage-Backed Obligations—7.3% | | | | | | | | |
Countrywide Alternative Loan Trust, 2003-11T1, Tranche M,
4.750%, due 7/25/18 | | AA+ | | | 306 | | | 296 |
First Plus 1997-4 M1
7.6400%, due 9/11/23 | | AA | | | 199 | | | 196 |
Aames Mortgage Trust, 2001-1, Tranche M2, 7.588%, due 6/25/31 | | A | | | 133 | | | 100 |
LSSCO, 2004-2, Tranche M2,
6.828%, due 2/28/33, VRN* | | A | | | 266 | | | 253 |
CWL, 2003-5, Tranche MF2
5.959%, due 11/25/33 | | AA- | | | 252 | | | 212 |
Renaissance Home Equity Loan Trust, 2004-2, Tranche M5
6.455%, due 7/25/34 | | A | | | 563 | | | 417 |
FHASI, 2004-AR4, Tranche 3A1, 4.593%, due 8/25/34, VRN | | AAA | | | 688 | | | 679 |
Security National Mortgage Loan Trust, 2004-2A, Tranche M2,
6.352%, due 11/25/34* | | A | | | 50 | | | 49 |
Security National Mortgage Loan Trust, 2005-1A, Tranche M2,
6.530%, due 2/25/35* | | A | | | 25 | | | 18 |
Soundview Home Equity Loan Trust, 2005-B, Tranche M1,
5.635%, due 5/25/35 | | AA+ | | | 523 | | | 487 |
Structured Asset Securities Corp., 2005-9XS, Tranche 1A2A
4.840%, due 6/25/35 | | AAA | | | 630 | | | 629 |
Structured Asset Securities Corp., 2005-9XS, Tranche 1A2C
4.950%, due 6/25/35 | | AAA | | | 295 | | | 292 |
Structured Asset Securities Corp., 2005-9XS, Tranche A2B,
6.500%, due 6/25/35 | | AAA | | | 325 | | | 327 |
Security National Mortgage Loan Trust, 2005-2A, Tranche M2,
7.321%, due 2/25/36* | | A | | | 125 | | | 107 |
Chase Mortgage Finance Corporation, 2006-A1, Tranche A3,
6.000%, due 9/25/36 | | AAA | | | 700 | | | 692 |
Security National Mortgage Loan Trust, 2006-1A, Tranche M2,
7.500%, due 9/25/36* | | A | | | 80 | | | 51 |
Mid-State Trust 2004-1, Tranche A 6.005%, due 8/15/37 | | AAA | | | 74 | | | 72 |
Statewide Mortgage Loan Trust, 2006-1A, Tranche A2, 7.660%, due 9/25/37* | | AAA | | | 70 | | | 69 |
See accompanying Notes to Financial Statements.
December 31, 2007 | William Blair Funds 33 |
Bond Fund
Portfolio of Investments, December 31, 2007 (all dollar amounts in thousands)
| | | | | | | | |
| | | NRSRO
Rating | | Principal
Amount | | Value |
|
Non-Agency Mortgage-Backed Obligations—(continued) |
ACE, 2005-SN1, Tranche M2,
5.770%, due 11/25/39, VRN | | A+ | | $ | 50 | | $ | 27 |
ACE, 2005-SD3, Tranche M2,
6.615%, due 8/25/45, VRN | | A+ | | | 70 | | | 33 |
| | | | | | | | |
| | | | | 5,424 | | | 5,006 |
| | | | | | | | |
| | | |
Corporate Obligations—23.6% | | | | | | | | |
Bear Stearns Co. Inc.
4.000%, due 1/31/08 | | A+ | | | 200 | | | 200 |
CIT Group Inc. 4.000%, due 5/8/08 | | A | | | 250 | | | 248 |
Consolidated Edison Company of New York, 7.150%, due 12/1/09 | | A+ | | | 500 | | | 524 |
Household Finance Corporation,
8.000%, due 7/15/10 | | AA- | | | 500 | | | 533 |
Bank of America Corporation,
4.250%, due 10/1/10 | | AA | | | 500 | | | 497 |
Simon Property Group, Inc.,
6.350%, due 8/28/12 | | A- | | | 500 | | | 514 |
Cox Communications, Inc.,
7.125%, due 10/1/12 | | BBB- | | | 400 | | | 427 |
Boeing Capital Corporation,
5.800%, due 1/15/13 | | A+ | | | 400 | | | 419 |
PepsiCo, Inc. 4.650%, due 2/15/13 | | AA- | | | 550 | | | 554 |
CODELCO, Inc.—144A,
4.750%, due 10/15/14 | | A | | | 400 | | | 385 |
Johnson Controls, Inc.
5.500%, due 1/15/16 | | A- | | | 400 | | | 394 |
ProLogis, 5.750%, due 4/1/16 | | BBB+ | | | 400 | | | 375 |
Omnicom Group, Inc.,
5.900%, due 4/15/16 | | A- | | | 400 | | | 406 |
Yum!, Brands, Inc.,
6.250%, due 4/15/16 | | BBB- | | | 400 | | | 406 |
SAB Miller plc, 6.500%, due 7/1/16 | | BBB+ | | | 400 | | | 418 |
Petrobras International Finance Company, 6.125%, due 10/6/16 | | BBB- | | | 400 | | | 408 |
MGM Mirage 7.625%, due 1/15/17 | | BB | | | 500 | | | 494 |
J.P. Morgan Chase & Co.
6.125%, due 6/27/17 | | A+ | | | 600 | | | 612 |
Lehman Brothers Holdings
6.500%, due 7/19/17 | | A+ | | | 610 | | | 617 |
Kimberly-Clark, 6.125%, due 8/1/17 | | A+ | | | 600 | | | 632 |
American Express,
6.150%, due 8/28/17 | | A+ | | | 600 | | | 616 |
Exelon Generation Company, LLC. 6.200%, due 10/1/17 | | BBB+ | | | 600 | | | 596 |
Union Pacific Corporation,
5.750%, due 11/15/17 | | BBB | | | 525 | | | 523 |
Tesco plc, 5.500%, due 11/15/17 | | A+ | | | 600 | | | 598 |
NRSRO = Nationally Recognized Statistical Rating Organization, such as S&P, Moody's or Fitch (unaudited)
WAC = Weighted Average Coupon
VRN = Variable Rate Note
The obligations of certain U. S. Government-sponsored securities are neither issued nor guaranteed by the U. S. Treasury
*Deemed illiquid pursuant to Liquidity Procedures adopted by the Board of Trustees. These holdings represent 0.73% of the net assets at December 31, 2007.
| | | | | | | | |
| | | NRSRO
Rating | | Principal
Amount/
Shares | | Value |
|
Corporate Obligations—(continued) |
Abbott Laboratories,
5.600%, due 11/30/17 | | AA | | $ | 600 | | $ | 616 |
Ras Laffan Lng II,
5.298%, due 9/30/20 | | AA | | | 400 | | | 388 |
Southwest Airlines Co.,
6.150%, due 8/1/22 | | AA- | | | 500 | | | 498 |
Kroger Company, 8.000%, due 9/15/29 | | BBB- | | | 400 | | | 465 |
Conoco Funding Company,
7.250%, due 10/15/31 | | A | | | 400 | | | 468 |
Kohl's Corporation,
6.000%, due 1/15/33 | | BBB+ | | | 400 | | | 346 |
Goldman Sachs Group, Inc.,
6.125%, due 2/15/33 | | AA- | | | 400 | | | 393 |
Pacific Gas and Electric Company, 6.050%, due 3/1/34 | | BBB+ | | | 250 | | | 250 |
Teva Pharmaceutical Finance LLC, 6.150%, due 2/1/36 | | BBB | | | 300 | | | 298 |
Wisconsin Electric Power Company, 5.700%, due 12/1/36 | | A+ | | | 500 | | | 479 |
Comcast Corporation,
6.450%, due 3/15/37 | | BBB+ | | | 300 | | | 305 |
Florida Power and Light Group Capital, Inc. 6.650%, due 6/15/67, VRN | | A- | | | 300 | | | 289 |
| | | | | | | | |
Total Corporate Obligations | | | | | 15,985 | | | 16,191 |
| | | | | | | | |
Total Fixed Income—92.9%
(Cost $62,826) | | | 62,866 | | | 63,617 |
| | | | | | | | |
| | | |
Preferred Stock | | | | | | | | |
Public Storage, Inc. | | | | | 10,000 | | | 193 |
| | | | | | | | |
Total Preferred Stock—0.3%
(cost $245) | | | 10,000 | | | 193 |
| | | | | | | | |
Total Long-Term Investments—93.2%
(cost $63,071) | | | 72,866 | | | 63,810 |
| | | | | | | | |
| | | |
Short-Term Investments | | | | | | | | |
American Express Credit Corp. Demand Note, VRN 4.695%, due 1/2/08 | | A+ | | | 869 | | | 869 |
Prudential Funding Demand Note, VRN 4.430%, due 1/2/08 | | A+ | | | 2,348 | | | 2,348 |
| | | | | | | | |
Total Short-Term Investments—4.7%
(cost $3,217) | | | 3,217 | | | 3,217 |
| | | | | | | | |
| | | |
Repurchase Agreement | | | | | | | | |
State Street Bank and Trust Company, 3.80% dated 12/31/07, due 1/2/08, repurchase price $401, collateralized by FN, Pool # 712321 | | A+ | | | 400 | | | 400 |
| | | | | | | | |
Total Repurchase Agreement—0.6%
(cost $400) | | | 400 | | | 400 |
| | | | | | | | |
Total Investments—98.5%
(cost $66,688) | | $ | 76,483 | | | 67,427 |
| | | | | | | | |
Cash and other assets, less liabilities—1.5% | | | 1,056 |
| | | | | | | | |
Net Assets—100.0% | | $ | 68,483 |
| | | | | | | | |
See accompanying Notes to Financial Statements.
34 Annual Report | December 31, 2007 |
Statements of Assets and Liabilities
December 31, 2007 (all dollar amounts in thousands)
| | | | | | | | | | | | | | | | |
| | | Global
Growth
Fund | | | Institutional
International
Growth
Fund | | | Institutional
International
Equity
Fund | | | International
Small Cap
Growth
Fund | |
Assets | | | | | | | | | | | | | | | | |
Investments in securities, at cost | | $ | 43,226 | | | $ | 1,598,498 | | | $ | 474,241 | | | $ | 364,693 | |
Investments in Affiliated Fund, at cost | | | 1,006 | | | | 55 | | | | 3,352 | | | | 2,197 | |
| | | | | | | | | | | | | | | | |
| | | | |
Investments in securities, at value | | $ | 43,344 | | | $ | 2,143,619 | | | $ | 611,841 | | | $ | 401,788 | |
Investments in Affiliated Fund, at value | | | 1,006 | | | | 55 | | | | 3,352 | | | | 2,197 | |
Foreign currency, at value (cost $181, $6,648, $1,435, and $2,301 respectively) | | | 181 | | | | 6,638 | | | | 1,435 | | | | 2,301 | |
Receivable for fund shares sold | | | 2,523 | | | | — | | | | — | | | | 2,011 | |
Receivable for investment securities sold | | | 100 | | | | 10,025 | | | | 2,063 | | | | 216 | |
Dividend and interest receivable | | | 16 | | | | 1,976 | | | | 572 | | | | 421 | |
| | | | | | | | | | | | | | | | |
Total assets | | | 47,170 | | | | 2,162,313 | | | | 619,263 | | | | 408,934 | |
Liabilities | | | | | | | | | | | | | | | | |
Payable for investment securities purchased | | | 1,507 | | | | 2,681 | | | | 484 | | | | 6,815 | |
Payable for fund shares redeemed | | | — | | | | 11,233 | | | | — | | | | 134 | |
Management fee payable | | | 32 | | | | 1,697 | | | | 501 | | | | 338 | |
Distribution and shareholder administration fee payable | | | 7 | | | | — | | | | — | | | | 26 | |
Foreign tax liability | | | — | | | | 895 | | | | 19 | | | | 26 | |
Other accrued expenses | | | 48 | | | | 495 | | | | 80 | | | | 136 | |
| | | | | | | | | | | | | | | | |
Total liabilities | | | 1,594 | | | | 17,001 | | | | 1,084 | | | | 7,475 | |
| | | | | | | | | | | | | | | | |
Net Assets | | $ | 45,576 | | | $ | 2,145,312 | | | $ | 618,179 | | | $ | 401,459 | |
| | | | | | | | | | | | | | | | |
Capital | | | | | | | | | | | | | | | | |
Composition of Net Assets | | | | | | | | | | | | | | | | |
Par value of shares of beneficial interest | | $ | 5 | | | $ | 112 | | | $ | 42 | | | $ | 28 | |
Capital paid in excess of par value | | | 45,930 | | | | 1,577,471 | | | | 482,885 | | | | 363,005 | |
Accumulated net investment income (loss) | | | (16 | ) | | | (35,539 | ) | | | (8,537 | ) | | | (2,779 | ) |
Accumulated realized gain (loss) | | | (458 | ) | | | 58,918 | | | | 6,138 | | | | 4,157 | |
Net unrealized appreciation (depreciation) of investments and foreign currencies | | | 115 | | | | 544,350 | | | | 137,651 | | | | 37,048 | |
| | | | | | | | | | | | | | | | |
Net Assets | | $ | 45,576 | | | $ | 2,145,312 | | | $ | 618,179 | | | $ | 401,459 | |
| | | | | | | | | | | | | | | | |
| | | | |
Net Assets | | $ | — | | | $ | 2,145,312 | | | $ | 618,179 | | | $ | — | |
Shares Outstanding | | | — | | | | 111,730,112 | | | | 41,134,516 | | | | — | |
Net Asset Value Per Share | | $ | — | | | $ | 19.20 | | | $ | 15.03 | | | $ | — | |
Institutional Share Class | | | | | | | | | | | | | | | | |
Net Assets | | $ | — | (a) | | $ | — | | | $ | — | | | $ | 230,715 | |
Shares Outstanding | | | 1 | | | | — | | | | — | | | | 16,434,148 | |
Net Asset Value Per Share | | $ | 9.93 | | | $ | — | | | $ | — | | | $ | 14.04 | |
| (a) | | At December 31, 2007, William Blair & Co., LLC. is the sole shareholder of one share of the Institutional share class of the Global Growth Fund. |
See accompanying Notes to Financial Statements.
December 31, 2007 | William Blair Funds 35 |
Statements of Operations
For the Year Ended December 31, 2007 (all dollar amounts in thousands)
| | | | | | | | | | | | | | | | |
| | | Global
Growth
Fund(a) | | | Institutional
International
Growth
Fund | | | Institutional
International
Equity
Fund | | | International
Small Cap
Growth
Fund | |
Investment income | | | | | | | | | | | | | | | | |
Dividends | | $ | 82 | | | $ | 36,822 | | | $ | 12,093 | | | $ | 4,357 | |
Less foreign tax withheld | | | — | | | | (1,894 | ) | | | (762 | ) | | | (188 | ) |
Income from Affiliated Fund | | | 6 | | | | 2 | | | | 196 | | | | 127 | |
Interest | | | 32 | | | | 1,707 | | | | 547 | | | | 690 | |
| | | | | | | | | | | | | | | | |
Total income | | | 120 | | | | 36,637 | | | | 12,074 | | | | 4,986 | |
Expenses | | | | | | | | | | | | | | | | |
Investment advisory fees | | | 83 | | | | 19,530 | | | | 6,138 | | | | 3,395 | |
Distribution fees | | | 3 | | | | — | | | | — | | | | 54 | |
Shareholder administration fees | | | 12 | | | | — | | | | — | | | | 223 | |
Custodian fees | | | 12 | | | | 1,203 | | | | 345 | | | | 290 | |
Transfer agent fees | | | 2 | | | | 38 | | | | 15 | | | | 47 | |
Professional fees | | | 31 | | | | 82 | | | | 53 | | | | 44 | |
Registration fees | | | 12 | | | | 99 | | | | 21 | | | | 64 | |
Other expenses | | | 7 | | | | 293 | | | | 6 | | | | 51 | |
| | | | | | | | | | | | | | | | |
Total expenses before waiver | | | 162 | | | | 21,245 | | | | 6,578 | | | | 4,168 | |
Expense reimbursed to (waived or absorbed) by the Advisor | | | (50 | ) | | | — | | | | 182 | | | | — | |
| | | | | | | | | | | | | | | | |
Net expenses | | | 112 | | | | 21,245 | | | | 6,760 | | | | 4,168 | |
| | | | | | | | | | | | | | | | |
Net investment income (loss) | | | 8 | | | | 15,392 | | | | 5,314 | | | | 818 | |
Net realized and unrealized gain (loss) on investments, foreign currency transactions and other assets and liabilities | | | | | | | | | | | | | | | | |
Net realized gain (loss) on investments | | | (457 | ) | | | 322,333 | | | | 60,098 | | | | 30,190 | |
Net realized gain (loss) on foreign currency transactions and other assets and liabilities | | | (11 | ) | | | (4,120 | ) | | | (1,314 | ) | | | (594 | ) |
| | | | | | | | | | | | | | | | |
Total net realized gain (loss) | | | (468 | ) | | | 318,213 | | | | 58,784 | | | | 29,596 | |
Change in net unrealized appreciation (depreciation) on investments and other assets and liabilities—Net of Indian tax liability | | | 115 | | | | 21,153 | | | | 39,199 | | | | 6,611 | |
| | | | | | | | | | | | | | | | |
Net increase (decrease) in net assets resulting from operations | | $ | (345 | ) | | $ | 354,758 | | | $ | 103,297 | | | $ | 37,025 | |
| | | | | | | | | | | | | | | | |
| (a) | | For the period from October 15, 2007 (Commencement of Operations) to December 31, 2007. |
See accompanying Notes to Financial Statements.
36 Annual Report | December 31, 2007 |
Statements of Changes in Net Assets
For the Years Ended December 31, 2007 and 2006 (all amounts in thousands)
| | | | | | | | | | | | | | | | | | | | | | | | | | | | |
| | | Global
Growth
Fund | | | Institutional
International
Growth
Fund | | | Institutional
International
Equity
Fund | | | International
Small Cap
Growth
Fund | |
| | | 2007(a) | | | 2007 | | | 2006 | | | 2007 | | | 2006 | | | 2007 | | | 2006 | |
Operations | | | | | | | | | | | | | | | | | | | | | | | | | | | | |
Net investment income (loss) | | $ | 8 | | | $ | 15,392 | | | $ | 9,378 | | | $ | 5,314 | | | $ | 2,025 | | | $ | 818 | | | $ | (221 | ) |
Net realized gain (loss) on investments, foreign currency transactions and other assets and liabilities | | | (468 | ) | | | 318,213 | | | | 267,920 | | | | 58,784 | | | | 7,823 | | | | 29,596 | | | | 2,299 | |
Change in net unrealized appreciation (depreciation) on investments, foreign currency transactions and other assets and liabilities | | | 115 | | | | 21,153 | | | | 91,778 | | | | 39,199 | | | | 72,424 | | | | 6,611 | | | | 26,158 | |
| | | | | | | | | | | | | | | | | | | | | | | | | | | | |
Net increase (decrease) in net assets resulting from operations | | | (345 | ) | | | 354,758 | | | | 369,076 | | | | 103,297 | | | | 82,272 | | | | 37,025 | | | | 28,236 | |
Distributions to shareholders from | | | | | | | | | | | | | | | | | | | | | | | | | | | | |
Net investment income | | | (17 | ) | | | (31,967 | ) | | | (32,267 | ) | | | (8,242 | ) | | | (6,495 | ) | | | (2,890 | ) | | | (106 | ) |
Net realized gain | | | — | | | | (302,737 | ) | | | (217,683 | ) | | | (57,957 | ) | | | (1,892 | ) | | | (27,584 | ) | | | (877 | ) |
| | | | | | | | | | | | | | | | | | | | | | | | | | | | |
| | | (17 | ) | | | (334,704 | ) | | | (249,950 | ) | | | (66,199 | ) | | | (8,387 | ) | | | (30,474 | ) | | | (983 | ) |
Capital stock transactions | | | | | | | | | | | | | | | | | | | | | | | | | | | | |
Net proceeds from sale of shares | | | 46,237 | | | | 189,014 | | | | 144,396 | | | | 16,134 | | | | 281,476 | | | | 188,786 | | | | 172,153 | |
Shares issued in reinvestment of income dividends and capital gain distributions | | | 15 | | | | 329,680 | | | | 244,472 | | | | 61,204 | | | | 7,436 | | | | 25,293 | | | | 868 | |
Less cost of shares redeemed | | | (314 | ) | | | (268,777 | ) | | | (188,067 | ) | | | (94,632 | ) | | | (15,351 | ) | | | (51,140 | ) | | | (18,839 | ) |
| | | | | | | | | | | | | | | | | | | | | | | | | | | | |
Net increase (decrease) in net assets resulting from capital stock transactions | | | 45,938 | | | | 249,917 | | | | 200,801 | | | | (17,294 | ) | | | 273,561 | | | | 162,939 | | | | 154,182 | |
| | | | | | | | | | | | | | | | | | | | | | | | | | | | |
Increase (decrease) in net assets | | | 45,576 | | | | 269,971 | | | | 319,927 | | | | 19,804 | | | | 347,446 | | | | 169,490 | | | | 181,435 | |
Net assets | | | | | | | | | | | | | | | | | | | | | | | | | | | | |
Beginning of year | | | — | | | | 1,875,341 | | | | 1,555,414 | | | | 598,375 | | | | 250,929 | | | | 231,969 | | | | 50,534 | |
| | | | | | | | | | | | | | | | | | | | | | | | | | | | |
End of year | | $ | 45,576 | | | $ | 2,145,312 | | | $ | 1,875,341 | | | $ | 618,179 | | | $ | 598,375 | | | $ | 401,459 | | | $ | 231,969 | |
| | | | | | | | | | | | | | | | | | | | | | | | | | | | |
Undistributed net investment income (loss) at the end of the year | | $ | (16 | ) | | $ | (35,539 | ) | | $ | (40,814 | ) | | $ | (8,537 | ) | | $ | (6,711 | ) | | $ | (2,779 | ) | | $ | (137 | ) |
| | | | | | | | | | | | | | | | | | | | | | | | | | | | |
| (a) | | For the period from October 15, 2007 (Commencement of Operations) to December 31, 2007. |
See accompanying Notes to Financial Statements.
December 31, 2007 | William Blair Funds 37 |
Statements of Assets and Liabilities
December 31, 2007 (all dollar amounts in thousands)
| | | | | | | | |
| | | Emerging
Markets
Growth
Fund | | | Bond
Fund | |
Assets | | | | | | | | |
Investments in securities, at cost | | $ | 853,772 | | | $ | 66,688 | |
Investments in Affiliated Fund, at cost | | | 1,326 | | | | — | |
| | | | | | | | |
| | |
Investments in securities, at value | | $ | 1,152,654 | | | $ | 67,427 | |
Investments in Affiliated Fund, at value | | | 1,326 | | | | — | |
Cash | | | — | | | | 1 | |
Foreign currency, at value (cost $10,667) | | | 10,650 | | | | — | |
Receivable for fund shares sold | | | 343 | | | | 720 | |
Receivable for investment securities sold | | | 7,467 | | | | — | |
Dividend and interest receivable | | | 776 | | | | 624 | |
| | | | | | | | |
Total assets | | | 1,173,216 | | | | 68,772 | |
| | | | | | | | |
Liabilities | | | | | | | | |
Payable for investment securities purchased | | | 1,005 | | | | — | |
Payable for fund shares redeemed | | | 386 | | | | 250 | |
Management fee payable | | | 1,104 | | | | 17 | |
Distribution and shareholder administration fee payable | | | 56 | | | | 7 | |
Foreign tax liability | | | 4,497 | | | | — | |
Other accrued expenses | | | 314 | | | | 15 | |
| | | | | | | | |
Total liabilities | | | 7,362 | | | | 289 | |
| | | | | | | | |
Net Assets | | $ | 1,165,854 | | | $ | 68,483 | |
| | | | | | | | |
Capital | | | | | | | | |
Composition of Net Assets | | | | | | | | |
Par value of shares of beneficial interest | | $ | 54 | | | $ | 7 | |
Capital paid in excess of par value | | | 841,272 | | | | 67,942 | |
Accumulated net investment income (loss) | | | (9,849 | ) | | | 1 | |
Accumulated realized gain (loss) | | | 39,881 | | | | (206 | ) |
Net unrealized appreciation (depreciation) of investments and foreign currencies | | | 294,496 | | | | 739 | |
| | | | | | | | |
Net Assets | | $ | 1,165,854 | | | $ | 68,483 | |
| | | | | | | | |
| | |
Institutional Share Class | | | | | | | | |
Net Assets | | $ | 809,071 | | | $ | 11,874 | |
Shares Outstanding | | | 36,654,420 | | | | 1,187,387 | |
Net Asset Value Per Share | | $ | 22.07 | | | $ | 10.00 | |
See accompanying Notes to Financial Statements.
38 Annual Report | December 31, 2007 |
Statements of Operations
For the Year Ended December 31, 2007 (all dollar amounts in thousands)
| | | | | | | | |
| | | Emerging
Markets
Growth
Fund | | | Bond
Fund(a) | |
Investment income | | | | | | | | |
Dividends | | $ | 11,480 | | | $ | 13 | |
Less foreign tax withheld | | | (709 | ) | | | — | |
Income from Affiliated Fund | | | 60 | | | | — | |
Interest | | | 1,428 | | | | 2,055 | |
| | | | | | | | |
Total income | | | 12,259 | | | | 2,068 | |
Expenses | | | | | | | | |
Investment advisory fees | | | 11,212 | | | | 114 | |
Distribution fees | | | 166 | | | | 1 | |
Shareholder administration fees | | | 466 | | | | 48 | |
Custodian fees | | | 1,103 | | | | 29 | |
Transfer agent fees | | | 119 | | | | 6 | |
Professional fees | | | 63 | | | | 30 | |
Registration fees | | | 115 | | | | 16 | |
Other expenses | | | 159 | | | | 4 | |
| | | | | | | | |
Total expenses before waiver | | | 13,403 | | | | 248 | |
Less expenses waived or absorbed by the Advisor | | | (25 | ) | | | (66 | ) |
| | | | | | | | |
Net expenses | | | 13,378 | | | | 182 | |
| | | | | | | | |
Net investment income (loss) | | | (1,119 | ) | | | 1,886 | |
Net realized and unrealized gain (loss) on investments, foreign currency
transactions and other assets and liabilities | | | | | | | | |
Net realized gain (loss) on investments | | | 221,850 | | | | (206 | ) |
Net realized gain (loss) on foreign currency transactions and
other assets and liabilities | | | (1,744 | ) | | | — | |
| | | | | | | | |
| | | 220,106 | | | | (206 | ) |
| | | | | | | | |
Change in net unrealized appreciation (depreciation) on investments and other assets and liabilities—Net of Indian tax liability—Emerging Markets Portfolio only | | | 117,024 | | | | 739 | |
| | | | | | | | |
Net increase (decrease) in net assets resulting from operations | | $ | 336,011 | | | $ | 2,419 | |
| | | | | | | | |
| (a) | | For the period from May 1, 2007 (Commencement of Operations) to December 31, 2007. |
See accompanying Notes to Financial Statements.
December 31, 2007 | William Blair Funds 39 |
Statements of Changes in Net Assets
For the Years Ended December 31, 2007 (all amounts in thousands)
| | | | | | | | | | | | |
| | | Emerging
Markets
Growth
Fund | | | Bond
Fund | |
| | | 2007 | | | 2006 | | | 2007(a) | |
Operations | | | | | | | | | | | | |
Net investment income (loss) | | $ | (1,119 | ) | | $ | 211 | | | $ | 1,886 | |
Net realized gain (loss) on investments, foreign currency transactions and other assets and liabilities | | | 220,106 | | | | 22,993 | | | | (206 | ) |
Change in net unrealized appreciation (depreciation) on investments, foreign currency transactions and other assets and liabilities | | | 117,024 | | | | 147,786 | | | | 739 | |
| | | | | | | | | | | | |
Net increase (decrease) in net assets resulting from operations | | | 336,011 | | | | 170,990 | | | | 2,419 | |
Distributions to shareholders from | | | | | | | | | | | | |
Net investment income | | | (7,865 | ) | | | (405 | ) | | | (1,892 | ) |
Net realized gain | | | (199,782 | ) | | | (4,544 | ) | | | — | |
| | | | | | | | | | | | |
| | | (207,647 | ) | | | (4,949 | ) | | | (1,892 | ) |
Capital stock transactions | | | | | | | | | | | | |
Net proceeds from sale of shares | | | 192,579 | | | | 529,925 | | | | 67,764 | |
Shares issued in reinvestment of income dividends and capital gain distributions | | | 201,805 | | | | 4,687 | | | | 1,606 | |
Less cost of shares redeemed | | | (170,543 | ) | | | (136,352 | ) | | | (1,414 | ) |
| | | | | | | | | | | | |
Net increase (decrease) in net assets resulting from capital stock transactions | | | 223,841 | | | | 398,260 | | | | 67,956 | |
| | | | | | | | | | | | |
Increase (decrease) in net assets | | | 352,205 | | | | 564,301 | | | | 68,483 | |
Net assets | | | | | | | | | | | | |
Beginning of year | | $ | 813,649 | | | $ | 249,348 | | | $ | — | |
| | | | | | | | | | | | |
End of year | | $ | 1,165,854 | | | $ | 813,649 | | | $ | 68,483 | |
| | | | | | | | | | | | |
Undistributed net investment income (loss) at the end of the year | | $ | (9,849 | ) | | $ | (492 | ) | | $ | 1 | |
| | | | | | | | | | | | |
| (a) | | For the period from May 1, 2007 (Commencement of Operations) to December 31, 2007. |
See accompanying Notes to Financial Statements.
40 Annual Report | December 31, 2007 |
Notes to Financial Statements
(1) Significant Accounting Policies
The following is a summary of the Fund’s significant accounting policies in effect during the period covered by the financial statements, which are in accordance with U.S. generally accepted accounting principles.
(a) Description of the Fund
William Blair Funds (the “Fund”) is a diversified mutual fund registered under the Investment Company Act of 1940, as amended, as an open-end management investment company. The number of shares authorized for this Fund is unlimited. The Fund currently consists of the following seventeen portfolios (the “Portfolios”), each with its own investment objectives and policies.
| | |
Equity Portfolios | | International Portfolios |
Growth | | International Growth |
Tax-Managed Growth | | International Equity |
Large Cap Growth | | Institutional International Growth |
Small Cap Growth | | Institutional International Equity |
Mid Cap Growth | | International Small Cap Growth |
Small-Mid Cap Growth | | Emerging Markets Growth |
Value Discovery | | Fixed-Income Portfolios |
Global Portfolio | | Bond |
Global Growth | | Income |
| | Money Market Portfolio |
| | Ready Reserves |
The investment objectives of the Portfolios are as follows:
| | |
Equity | | Long-term capital appreciation. |
International | | Long-term capital appreciation. |
Fixed Income | | High level of current income with relative stability of principal. |
Money Market | | Current income, a stable share price and daily liquidity. |
The Institutional International Growth Portfolio, the Institutional International Equity Portfolio and the Institutional Share Classes of the Global Growth Portfolio, the International Small Cap Growth Portfolio, the Emerging Markets Growth Portfolio, and the Bond Portfolio are the only Portfolios covered in this report.
(b) Share Classes
Three different classes of shares of the Global Growth Fund, International Small Cap Growth Fund, Emerging Markets Growth Fund, and the Bond Fund currently exist: N, I and Institutional. This report includes financial information for only the Institutional Class. The Institutional share class is sold to institutional investors, including but not limited to employee benefit plans, endowments, foundations, trusts and corporations, who are able to meet the Fund’s high minimum investment requirement. The minimum initial investment required is $5 million ($2 million for the Bond Portfolio).
Investment income realized and unrealized gains and losses, and certain Portfolio level expenses and expense reductions, if any, are allocated based on the relative net assets of each class, except for certain class specific expenses which are charged directly to the appropriate class. Differences in class expenses may result in the payment of different per share dividends by class. All share classes of the Portfolios have equal rights with respect to voting subject to class specific arrangements.
(c) Investment Valuation
The market value of domestic equity securities and options is determined by valuing securities traded on national securities exchanges or markets or in the over-the-counter markets at the last sales price or, if applicable, the official closing price or, in the absence of a sale on the date of valuation, at the latest bid price.
December 31, 2007 | William Blair Funds 41 |
For international securities, if the foreign exchange or market on which a security is primarily traded closes before the close of regular trading on the New York Stock Exchange (4:00 p.m. Eastern time), the Portfolios use an independent pricing service on a daily basis to estimate the fair value price as of the close of regular trading on the New York Stock Exchange. The Board of Trustees has determined that the passage of time between when foreign exchanges or markets close and when the Portfolios calculate their net asset values could cause the value of international securities to no longer be representative of their market price or accurate. In addition, quarterly the Board of Trustees receives a report which compares the average fair value prices used to calculate the net asset value to the next day’s opening local prices. The value of foreign equity securities is determined based on the last sale price on the foreign exchange or market on which it is primarily traded or, if there have been no sales during that day, at the latest bid price. Foreign currency forward contracts and foreign currencies are valued at the forward and current exchange rates, respectively, prevailing on the date of valuation.
Long-term, fixed-income securities are valued based on market quotations, or by independent pricing services that use prices provided by market makers or by estimates of market values obtained from yield data relating to instruments or securities with similar characteristics.
Investments in other funds are valued at the underlying fund’s net asset value on the date of valuation. Other securities, and all other assets, including securities for which a market price is not available, or the value of which is affected by a significant valuation event, are valued at fair value as determined in good faith by the Pricing Committee or Valuation Committee, in accordance with the Fund’s Valuation Procedures approved by the Board of Trustees. As of December 31, 2007, there were securities held in the Institutional International Growth, Institutional International Equity, and Emerging Markets Growth Portfolios requiring fair valuation by the Board of Trustees pursuant to the Fund’s valuation procedures.
(d) Investment income and transactions
Dividend income is recorded on the ex-dividend date, except for those dividends from certain foreign securities that are recorded as soon as the information is available. Foreign currency gains and losses associated with fluctuation in the foreign currency rate versus the United States dollar are recorded on the Statement of Operations as a component of net realized gains/(losses) on foreign currency translation and other assets and liabilities.
Premiums and discounts are accreted and amortized on a straight-line basis for short-term investments and on an effective interest method for long-term investments. The interest rate shown on the Portfolio of Investments for the Bond Fund were the rates in effect on December 31, 2007. Put bonds may be redeemed at the discretion of the holder on specified dates prior to maturity.
Interest income is determined on the basis of the interest accrued, adjusted for amortization of premium or discount. Variable rate bonds and floating rate notes earn interest at coupon rates that fluctuate at specific time intervals.
Paydown gains and losses on mortgage and asset-backed securities are treated as an adjustment to interest income. For the period ended December 31, 2007, the Bond Portfolio recognized a decrease of interest income and an increase of net realized (loss) of -$1- (in thousands). This reclassification has no effect on the net asset value of the Portfolio.
Security and shareholder transactions are accounted for no later than one business day following the trade date. However, for financial reporting purposes, security and shareholder transactions are accounted for on the trade date of the last business day of the reporting period. Realized gains and losses from securities transactions are recognized on the basis of high cost lot sell selection.
Awards from class action litigation may be recorded as a reduction of cost. If the Funds no longer own the applicable securities, the proceeds are recorded as realized gains.
(e) Share Valuation and Dividends to Shareholders
Shares are sold and redeemed on a continuous basis at net asset value. The net asset value per share is determined by dividing the Portfolio’s net assets by the number of shares outstanding as of the close of regular trading on the New York Stock Exchange, which is generally 3:00 p.m. Central time (4:00 p.m. Eastern time), on each day the Exchange is open.
Dividends from net investment income, if any, are declared at least annually for all Portfolios covered by this report except the Bond Portfolio which is declared monthly. Capital gain distributions, if any, are declared at least annually in December. Dividends payable to shareholders are recorded on the ex-dividend date.
42 Annual Report | December 31, 2007 |
(f) Foreign Currency Translation and Foreign Currency Forward Contracts
The Portfolios (excluding the Bond Portfolio) may invest in securities denominated in foreign currencies. As such, assets and liabilities denominated in foreign currencies are translated into U.S. dollar amounts at the current exchange rate on the date of valuation. The values of foreign investments, open foreign currency forward contracts, and cash denominated in foreign currencies are translated into U.S. dollars using a spot market rate of exchange as of the time of the determination of each Fund’s NAV, typically 4:00 p.m. Eastern time on days when there is regular trading on the New York Stock Exchange. Payables and receivables for securities transactions, dividends, interest income and tax reclaims are translated into U.S. dollars using a spot market rate of exchange as of 4:00 p.m. Eastern time. Settlement of purchases and sales and dividend and interest receipts are translated into U.S. dollars using a spot market rate of exchange as of 11:00 a.m. Eastern time.
These Portfolios (excluding the Bond Portfolio) may enter into foreign currency forward contracts (1) as a means of managing the risks associated with changes in the exchange rates for the purchase or sale of a specific amount of a particular foreign currency, and (2) to hedge the value, in U.S. dollars, of portfolio securities. Gains and losses from foreign currency transactions associated with purchases and sales of investments and foreign currency forward contracts are included with the net realized and unrealized gain or loss on investments. For tax purposes, the foreign currency gains and losses are treated as ordinary income.
(g) Income Taxes
The Portfolios intend to comply with the special provisions of Subchapter M of the Internal Revenue Code available to regulated investment companies and, therefore, no provision for Federal income taxes has been made in the accompanying financial statements since each Portfolio intends to distribute substantially all of its taxable income to its shareholders and be relieved of all Federal income taxes.
The Global Growth, International Growth, International Equity, International Small Cap Growth and Emerging Markets Growth Portfolios may be subject to a tax imposed on net realized gains on securities of certain foreign countries. The portfolios record an estimated deferred tax liability for net realized gains on these securities in an amount that would be payable if the securities were disposed of on the valuation date.
In July 2006, the Financial Accounting Standards Board (FASB) released FASB Interpretation No. 48 “Accounting for Uncertainty in Income Taxes” (FIN 48). FIN 48 provides guidance for how uncertain tax positions should be recognized, measured, presented and disclosed in the financial statements. FIN 48 requires the evaluation of tax positions taken or expected to be taken in the course of preparing the Fund’s tax returns to determine whether the tax positions are “more-likely-than-not” of being sustained by the applicable tax authority. Tax positions not deemed to meet the more-likely-than-not threshold would be recorded as a tax benefit or expense in the current year. Adoption of FIN 48 is required for fiscal years beginning after December 15, 2006. Recent SEC guidance allows implementing FIN 48 in portfolio NAV calculations as late as the fund’s last NAV calculation in the first required financial statement reporting period for its fiscal year beginning after December 15, 2006, and is to be applied to all open tax years as of the effective date. Management has evaluated the implications of FIN 48 and has determined it does not have an impact on the financial statements as of December 31, 2007.
Tax years 2004, 2005 and 2006 are still subject to examination by major jurisdictions.
The Portfolios have elected to mark-to-market their investments in Passive Foreign Investment Companies (“PFICs”) for Federal income tax purposes. The Portfolios also treat the deferred loss associated with current and prior year wash sales as an adjustment to the cost of investments for tax purposes. The cost of investments for Federal income tax purposes and related gross unrealized appreciation/(depreciation) and net unrealized appreciation/(depreciation) at December 31, 2007 were as follows (in thousands):
| | | | | | | | | | | | |
Portfolio | | Cost of
Investments | | Gross Unrealized Appreciation | | Gross Unrealized Depreciation | | Net Unrealized
Appreciation / (Depreciation) |
Global Growth | | $ | 44,255 | | $ | 2,015 | | $ | 1,923 | | $ | 92 |
Institutional International Growth | | | 1,622,809 | | | 597,555 | | | 77,461 | | | 520,094 |
Institutional International Equity | | | 482,433 | | | 148,079 | | | 15,268 | | | 132,811 |
International Small Cap Growth | | | 368,775 | | | 61,235 | | | 26,072 | | | 35,163 |
Emerging Markets Growth | | | 866,529 | | | 313,902 | | | 30,837 | | | 283,065 |
Bond | | | 66,754 | | | 1,158 | | | 485 | | | 673 |
December 31, 2007 | William Blair Funds 43 |
The timing and characterization of certain income and capital gain distributions are determined annually in accordance with Federal income tax regulations that may differ from U.S. generally accepted accounting principles. As a result, net investment income or loss and net realized gain or loss for a reporting period may differ from the amount distributed during such period. In addition, the Portfolios may periodically record reclassifications among certain capital accounts to reflect differences between financial reporting and income tax basis distributions. The reclassifications were reported in order to reflect the tax treatment for certain permanent differences that exist between income tax regulations and U.S. generally accepted accounting principles. The reclassifications generally relate to section 988 currency gains and losses, and recharacterization of unrealized appreciation on PFICs (Passive Foreign Investment Corporations). These reclassifications have no impact on the net asset values of the Portfolio. Accordingly, at December 31, 2007, the following reclassifications were recorded (in thousands):
| | | | | | | | | | | | |
Portfolio | | Undistributed Net
Investment Income/(Loss) | | | Accumulated
Undistributed
Net Realized Gain/ (Loss) | | | Capital
Paid In Excess
of Par Value | |
Global Growth | | $ | (7 | ) | | $ | 10 | | | $ | (3 | ) |
Institutional International Growth | | | 21,848 | | | | (21,850 | ) | | | 2 | |
Institutional International Equity | | | 1,102 | | | | (1,102 | ) | | | — | |
International Small Cap Growth | | | (570 | ) | | | 570 | | | | — | |
Emerging Markets Growth | | | (373 | ) | | | 373 | | | | — | |
Bond | | | 7 | | | | — | | | | (7 | ) |
Distributions from net realized gains for book purposes may include short-term capital gains, which are included as ordinary income for tax purposes. The tax character of distributions paid during 2007 and 2006 was as follows (in thousands):
| | | | | | | | | | | | |
| | | Distributions Paid In 2007 | | Distributions Paid In 2006 |
Portfolio | | Ordinary
Income | | Long-Term
Capital Gains | | Ordinary
Income | | Long-Term
Capital Gains |
Global Growth | | $ | 17 | | $ | — | | $ | N/A | | $ | N/A |
Institutional International Growth | | | 39,677 | | | 295,027 | | | 48,076 | | | 201,874 |
Institutional International Equity | | | 24,899 | | | 41,300 | | | 6,495 | | | 1,892 |
International Small Cap Growth | | | 9,634 | | | 20,840 | | | 983 | | | — |
Emerging Markets Growth | | | 71,085 | | | 136,562 | | | 1,585 | | | 3,364 |
Bond | | | 1,892 | | | — | | | N/A | | | N/A |
As of December 31, 2007, the components of distributable earnings on a tax basis were as follows (in thousands):
| | | | | | | | | | | | |
Portfolio | | Undistributed
Ordinary
Income | | Accumulated
Capital and
Other Losses | | Undistributed
Long-Term
Gain | | Net Unrealized
Appreciation / (Depreciation) |
Global Growth | | $ | — | | $ | 451 | | $ | — | | $ | 92 |
Institutional International Growth | | | 1,671 | | | 12,076 | | | 58,040 | | | 520,094 |
Institutional International Equity | | | 1,946 | | | 4,046 | | | 4,541 | | | 132,811 |
International Small Cap Growth | | | — | | | 1,617 | | | 4,880 | | | 35,163 |
Emerging Markets Growth | | | 10,054 | | | 299 | | | 31,708 | | | 283,065 |
Bond | | | — | | | 139 | | | — | | | 673 |
At December 31, 2007, the Global Growth and Bond Portfolios have $126 and $135 (in thousands), respectively, of unused capital loss carryforwards available for Federal income tax purposes to be applied against future gains, if any. If not applied, the carryforwards will expire in 2015. The International Growth, International Equity, International Small Cap Growth and Emerging Markets Growth Portfolios have no unused capital loss carryforwards.
For the period November 1, 2007 through December 31, 2007, the following Portfolios incurred net realized capital, foreign currency losses or PFIC losses. Each Portfolio intends to treat this loss as having occurred in fiscal year 2008 for Federal income tax purposes (in thousands):
| | | | | | | | | |
Portfolio | | Capital
Amount | | Currency
Amount | | PFIC
Amount |
Global Growth | | $ | 308 | | $ | 5 | | $ | 11 |
Institutional International Growth | | | — | | | — | | | 12,075 |
Institutional International Equity | | | — | | | 83 | | | 3,962 |
International Small Cap Growth… | | | — | | | — | | | 1,613 |
Emerging Markets Growth ……. | | | — | | | 299 | | | — |
Bond | | | 4 | | | — | | | — |
44 Annual Report | December 31, 2007 |
(h) Repurchase Agreements
The Portfolios may enter into repurchase agreements with its custodian, State Street Bank & Trust Company, whereby the Portfolios acquire ownership of a debt security and the custodian agrees, at the time of sale, to repurchase the debt security from the Portfolios at a mutually agreed upon time and price. The Portfolios’ policy is to take possession of the debt security as collateral under the repurchase agreements. The Portfolios minimize credit risk by monitoring credit exposure to the custodian and by monitoring the collateral value on an ongoing basis.
(i) Use of Estimates
The preparation of financial statements in conformity with U.S. generally accepted accounting principles requires management to make estimates and assumptions that affect the amounts reported in the financial statements. Actual results may differ from those estimates.
(2) Accounting Pronouncement
In September 2006, the Financial Accounting Standards Board (FASB) issued Statement on Financial Accounting Standards No. 157, “Fair Value Measurements” (FAS 157). This standard clarifies the definition of fair value for financial reporting, establishes a framework for measuring fair value and requires additional disclosures about the use of fair value measurements. FAS 157 is effective for financial statements issued for fiscal years beginning after November 15, 2007. Management is currently evaluating the impact that FAS 157 will have on the Funds’ financial statements.
(3) Transactions with Affiliates
(a) Management and Expense Limitation Agreements
The Institutional International Growth and Institutional International Equity Portfolios have a management agreement with William Blair & Company L.L.C. (the “Company”) for investment advisory, administrative, and other accounting services. The Portfolios pay the Company an annual fee, payable monthly, based on a specified percentage of its average daily net assets. A summary of the annual rates expressed as a percentage of average daily net assets is as follows:
| | | |
First $500 million | | 1.00 | % |
Next $500 million | | 0.95 | % |
In excess of $1 billion | | 0.90 | % |
The Global Growth and International Small Cap Growth Portfolio pay the Company a 1.00% annual fee payable monthly, based on its average daily net assets. The Emerging Markets Growth Portfolio pays the Company a 1.10% annual fee payable monthly, based on its average daily net assets. The Bond Portfolio pays the Company a 0.30% annual fee payable monthly, based on its average daily net assets.
All of the Portfolios, except Institutional International Growth Fund, have also entered into Expense Limitation Agreements with the Company. Under the terms of these Agreements, the Company has agreed to waive its advisory fees and absorb other operating expenses through April 30, 2008, if total expenses of the Institutional Share Class of the Global Growth Portfolio exceed 1.15%, Institutional International Equity Portfolios exceed 1.10% of average daily net assets, 1.25% of average daily net assets for the Institutional Share Classes of the International Small Cap Growth and Emerging Markets Growth Portfolios or 0.35% of average daily net assets for the Institutional Share Class of the Bond Portfolio.
For a period of three years subsequent to the commencement of operations of the Portfolio, the Company is entitled to reimbursement from the Global Growth, International Small Cap Growth, Emerging Markets Growth and Bond Portfolios for previously waived fees and expenses to the extent the overall expense ratio remains below the percentages indicated. The total amount available for recapture at December 31, 2007 is $50, $134, $566 and $66 (in thousands) for Global Growth, International Small Cap Growth, Emerging Markets Growth and Bond Portfolios, respectively. As a result, the total expense ratio for a Portfolio during the period the agreement is in effect, will not fall below the percentage indicated. The Company’s right to be reimbursed under the Expense Limitation Agreement for the Institutional International Equity Fund expired December 1, 2007. Under this provision, the Institutional International Equity Fund reimbursed the Advisor $182,000 during the year ended 2007.
December 31, 2007 | William Blair Funds 45 |
For the year ended December 31, 2007, the investment advisory fees incurred by the Portfolio and related fee waivers were as follows (in thousands):
| | | | | | | | | | | | | |
Portfolio | | Gross
Advisory Fee | | Fee Waiver | | Net
Advisory Fee | | Expenses
(Recovered) or
Absorbed by
Advisor | |
Global Growth | | $ | 83 | | $ | 50 | | $ | 33 | | $ | — | |
Institutional International Growth | | | 19,530 | | | — | | | 19,530 | | | — | |
Institutional International Equity | | | 6,138 | | | — | | | 6,138 | | | (182 | ) |
International Small Cap Growth | | | 3,395 | | | — | | | 3,395 | | | — | |
Emerging Markets Growth | | | 11,212 | | | — | | | 11,212 | | | — | |
Bond | | | 114 | | | 66 | | | 48 | | | — | |
(b) Trustees Fees
The Portfolios incurred fees of $52 (in thousands) to non-interested trustees of the Fund for the year ended December 31, 2007. Interested trustees are not compensated by the Fund.
(c) Investments in Affiliated Portfolio
Pursuant to the rules of the 1940 Act, each of the Portfolios of the Fund may invest in the William Blair Ready Reserves Portfolio (“Ready Reserves”), an open-end money market portfolio managed by the Company. Ready Reserves Portfolio is used as a cash management option to the other Portfolios in the Fund. The Company waives management fees and shareholder service fees earned from the other Portfolios investment in the Ready Reserves Fund. The fees waived with respect to the Portfolio for the year ended December 31, 2007 are listed below. Distributions received from Ready Reserves are reflected as “Dividend income from affiliated Fund” in the Portfolio’s statement of operations. Amounts relating to the Portfolio’s investments in Ready Reserves were as follows for the year ended December 31, 2007 (in thousands):
| | | | | | | | | | | | | | | | | | |
Portfolio | | Purchases | | Sales
Proceeds | | Fees
Waived | | Dividend
Income | | Value | | Percent
of Net
Assets | |
Global Growth | | $ | 1,006 | | $ | — | | $ | 1 | | $ | 6 | | $ | 1,006 | | 2.2 | % |
Institutional International Growth | | | 3 | | | — | | | — | | | 2 | | | 55 | | — | |
Institutional International Equity | | | 8,696 | | | 9,350 | | | 24 | | | 196 | | | 3,352 | | 0.5 | |
International Small Cap Growth | | | 1,127 | | | 4,158 | | | 16 | | | 127 | | | 2,197 | | 0.5 | |
Emerging Markets Growth | | | 61 | | | — | | | 7 | | | 60 | | | 1,326 | | 0.1 | |
(4) Investment Transactions
Investment transactions, excluding money market instruments, for the year ended December 31, 2007, were as follows (in thousands):
| | | | | | |
Portfolio | | Purchases | | Sales |
Global Growth | | $ | 47,499 | | $ | 4,998 |
Institutional International Growth | | | 1,252,211 | | | 1,414,650 |
Institutional International Equity | | | 398,798 | | | 484,100 |
International Small Cap Growth | | | 426,569 | | | 287,284 |
Emerging Markets Growth | | | 990,619 | | | 1,006,710 |
Bond | | | 84,871 | | | 21,593 |
(5) Foreign Currency Forward Contracts
To protect itself against a decline in the value of foreign currency against the U.S. dollar, each Portfolio enters into foreign currency forward contracts with its custodian and others. The Portfolio bears the market risk that arises from changes in foreign currency rates and bears the credit risk if the counterparty fails to perform under the contract. The net realized and unrealized gains and losses associated with foreign currency forward contracts are reflected in the accompanying financial statements.
46 Annual Report | December 31, 2007 |
(6) Fund Share Transactions
The following table summarizes the activity in capital shares of each Portfolio (in thousands):
| | | | | | | | | | | | | |
| | | Dollars | |
| | | For the year ended December 31, 2007 | |
Portfolio | | Sales | | Reinvested
Distributions | | Redemptions | | Net change in
Net Assets
relating to fund
share activity | |
Global Growth (a) | | $ | — | | $ | — | | $ | — | | $ | — | |
Institutional International Growth | | | 189,014 | | | 329,680 | | | 268,777 | | | 249,917 | |
Institutional International Equity | | | 16,134 | | | 61,204 | | | 94,632 | | | (17,294 | ) |
International Small Cap Growth | | | 79,703 | | | 16,816 | | | 17,647 | | | 78,872 | |
Emerging Markets Growth | | | 115,480 | | | 142,732 | | | 94,489 | | | 163,723 | |
Bond (b) | | | 11,518 | | | 341 | | | — | | | 11,859 | |
| |
| | | Dollars | |
| | | For the year ended December 31, 2006 | |
Portfolio | | Sales | | Reinvested
Distributions | | Redemptions | | Net change in
Net Assets
relating to fund
share activity | |
Global Growth (a) | | $ | — | | $ | — | | $ | — | | $ | — | |
Institutional International Growth | | | 144,396 | | | 244,472 | | | 188,067 | | | 200,801 | |
Institutional International Equity | | | 281,476 | | | 7,436 | | | 15,351 | | | 273,561 | |
International Small Cap Growth | | | 103,040 | | | 593 | | | 11,665 | | | 91,968 | |
Emerging Markets Growth | | | 346,626 | | | 3,326 | | | 110,338 | | | 239,614 | |
Bond (b) | | | — | | | — | | | — | | | — | |
| |
| | | Shares | |
| | | For the year ended December 31, 2007 | |
Portfolio | | Sales | | Reinvested
Distributions | | Redemptions | | Net change in
Net Assets
relating to fund
share activity | |
Global Growth (a) | | | — | | | — | | | — | | | — | |
Institutional International Growth | | | 9,488 | | | 17,811 | | | 12,302 | | | 14,997 | |
Institutional International Equity | | | 1,042 | | | 4,229 | | | 6,063 | | | (792 | ) |
International Small Cap Growth | | | 5,483 | | | 1,251 | | | 1,210 | | | 5,524 | |
Emerging Markets Growth | | | 5,513 | | | 6,742 | | | 3,926 | | | 8,329 | |
Bond (b) | | | 1,153 | | | 34 | | | — | | | 1,187 | |
| |
| | | Shares | |
| | | For the year ended December 31, 2006 | |
Portfolio | | Sales | | Reinvested
Distributions | | Redemptions | | Net change in
Net Assets
relating to fund
share activity | |
Global Growth (a) | | | — | | | — | | | — | | | — | |
Institutional International Growth | | | 7,491 | | | 12,799 | | | 9,426 | | | 10,864 | |
Institutional International Equity | | | 21,737 | | | 527 | | | 1,172 | | | 21,092 | |
International Small Cap Growth | | | 8,638 | | | 45 | | | 923 | | | 7,760 | |
Emerging Markets Growth | | | 13,777 | | | 62 | | | 500 | | | 13,339 | |
Bond (b) | | | — | | | — | | | — | | | — | |
| (a) | | For the period from October 15, 2007 (Commencement of Operations) to December 31, 2007. |
| (b) | | For the period from May 1, 2007 (Commencement of Operations) to December 31, 2007. |
December 31, 2007 | William Blair Funds 47 |
Financial Highlights
Global Growth Fund
Institutional Share Class
| | | | | | |
| | | | |
| | | Period Ended December 31, | |
| | | | | 2007(a) | |
| | | | | | |
Net asset value, beginning of year | | | | $ | 10.00 | |
Income from investment operations: | | | | | | |
Net investment income (d) | | | | | (0.01 | ) |
Net realized and unrealized gain on investments | | | | | (0.06 | ) |
| | | | | | |
Total from investment operations | | | | | (0.07 | ) |
Less distributions from: | | | | | | |
Net investment income | | | | | — | |
Net realized gain | | | | | — | |
| | | | | | |
Total distributions | | | | | — | |
| | | | | | |
Net asset value, end of year | | | | $ | 9.93 | |
| | | | | | |
Total return (%) | | | | | (0.70 | )%(b) |
Ratios to average daily net assets (%): | | | | | | |
Expenses, net of waivers and reimbursements | | | | | 1.15 | (c) |
Expenses, before waivers and reimbursements | | | | | 1.74 | (c) |
Net investment income (loss), net of waivers and reimbursements | | | | | 0.29 | (c) |
Net investment income (loss), before waivers and reimbursements | | | | | (0.30 | )(c) |
| |
| | | | |
| | | Period Ended December 31, | |
| | | | | 2007(a) | |
| | | | | | |
Supplemental data for all classes: | | | | | | |
Net assets at end of year (in thousands) | | | | $ | 45,576 | |
Portfolio turnover rate (%) | | | | | 63 | (c) |
| (a) | | For the period from October 15, 2007 (Commencement of Operations) to December 31, 2007. |
| (b) | | Total return is not annualized for periods less than one year. |
| (c) | | Rates are annualized for periods that are less than a year. |
| (d) | | Excludes $0.00 of PFIC mark to market which is treated as ordinary income for Federal tax purposes for the period ended December 31, 2007. |
Performance cited represents past performance. Past performance does not guarantee future results and current performance may be lower or higher that the data quoted. Results shown are annual returns, which assume reinvestment of dividends and capital gains. Investment returns and principal will fluctuate and you may have a gain or loss when you sell shares. For the most current month-end performance information, please call 1-800-742-7272, or visit our Web site at www.williamblairfunds. com.
Note: Net investment income (loss) per share is based on the average shares outstanding during the year.
48 Annual Report | December 31, 2007 |
Financial Highlights
Institutional International Growth Fund
| | | | | | | | | | | | | | | | |
| | | |
| | | Years Ended December 31, |
| | | 2007 | | | 2006 | | 2005 | | 2004 | | 2003 |
Net asset value, beginning of year | | $ | 19.39 | | | $ | 18.11 | | $ | 16.06 | | $ | 13.60 | | $ | 9.57 |
Income from investment operations: | | | | | | | | | | | | | | | | |
Net investment income (a) | | | 0.15 | | | | 0.11 | | | 0.09 | | | 0.03 | | | 0.07 |
Net realized and unrealized gain (loss) on investments | | | 3.30 | | | | 4.09 | | | 3.53 | | | 2.44 | | | 3.99 |
| | | | | | | | | | | | | | | | |
Total from investment operations | | | 3.45 | | | | 4.20 | | | 3.62 | | | 2.47 | | | 4.06 |
Less distributions from: | | | | | | | | | | | | | | | | |
Net investment income | | | 0.35 | | | | 0.38 | | | 0.15 | | | 0.01 | | | 0.03 |
Net realized gain | | | 3.29 | | | | 2.54 | | | 1.42 | | | — | | | — |
| | | | | | | | | | | | | | | | |
Total distributions | | | 3.64 | | | | 2.92 | | | 1.57 | | | 0.01 | | | 0.03 |
| | | | | | | | | | | | | | | | |
Net asset value, end of year | | $ | 19.20 | | | $ | 19.39 | | $ | 18.11 | | $ | 16.06 | | $ | 13.60 |
| | | | | | | | | | | | | | | | |
Total return (%) | | | 18.49 | | | | 23.45 | | | 22.76 | | | 18.15 | | | 42.47 |
Ratios to average daily net assets (%): | | | | | | | | | | | | | | | | |
Expenses, net of waivers and reimbursements | | | 1.02 | | | | 1.03 | | | 1.05 | | | 1.10 | | | 1.10 |
Expenses, before waivers and reimbursements | | | 1.02 | | | | 1.03 | | | 1.05 | | | 1.11 | | | 1.16 |
Net investment income (loss), net of waivers and reimbursements | | | 0.74 | | | | 0.54 | | | 0.52 | | | 0.18 | | | 0.37 |
Net investment income (loss), before waivers and reimbursements | | | 0.74 | | | | 0.54 | | | 0.52 | | | 0.17 | | | 0.31 |
| | | | | | | | | | | | | | | |
| | | Years Ended December 31, |
| | | 2007 | | 2006 | | 2005 | | 2004 | | 2003 |
Supplemental data: | | | | | | | | | | | | | | | |
Net assets at end of year (in thousands) | | $ | 2,145,312 | | $ | 1,875,341 | | $ | 1,555,414 | | $ | 1,223,436 | | $ | 477,511 |
Portfolio turnover rate (%) | | | 61 | | | 74 | | | 74 | | | 72 | | | 56 |
| (a) | | Excludes $0.06, $0.29, $0.25, $0.10, and $0.06 of PFIC mark to market which is treated as ordinary income for Federal tax purposes for the years 2007, 2006, 2005, 2004 and 2003, respectively. |
Performance cited represents past performance. Past performance does not guarantee future results and current performance may be lower or higher that the data quoted. Results shown are annual returns, which assume reinvestment of dividends and capital gains. Investment returns and principal will fluctuate and you may have a gain or loss when you sell shares. For the most current month-end performance information, please call 1-800-742-7272, or visit our Web site at www.williamblairfunds. com.
Note: Net investment income (loss) per share is based on the average shares outstanding during the year.
December 31, 2007 | William Blair Funds 49 |
Financial Highlights
Institutional International Equity Fund
| | | | | | | | | | | | | |
| | | | |
| | | Years Ended December 31, | |
| | | 2007 | | 2006 | | 2005 | | 2004(a) | |
Net asset value, beginning of year | | $ | 14.27 | | $ | 12.04 | | $ | 10.20 | | $ | 10.00 | |
Income from investment operations: | | | | | | | | | | | | | |
Net investment income (b) | | | 0.13 | | | 0.07 | | | — | | | — | |
Net realized and unrealized gain (loss) on investments | | | 2.42 | | | 2.37 | | | 1.86 | | | 0.20 | |
| | | | | | | | | | | | | |
Total from investment operations | | | 2.55 | | | 2.44 | | | 1.86 | | | 0.20 | |
Less distributions from: | | | | | | | | | | | | | |
Net investment income | | | 0.22 | | | 0.16 | | | 0.02 | | | — | |
Net realized gain | | | 1.57 | | | 0.05 | | | — | | | — | |
| | | | | | | | | | | | | |
Total distributions | | | 1.79 | | | 0.21 | | | 0.02 | | | — | |
| | | | | | | | | | | | | |
Net asset value, end of year | | $ | 15.03 | | $ | 14.27 | | $ | 12.04 | | $ | 10.20 | |
| | | | | | | | | | | | | |
Total return (%) | | | 18.36 | | | 20.22 | | | 18.26 | | | 2.00 | |
Ratios to average daily net assets (%): | | | | | | | | | | | | | |
Expenses, net of waivers and reimbursements | | | 1.09 | | | 1.10 | | | 1.10 | | | 1.10 | (c) |
Expenses, before waivers and reimbursements | | | 1.06 | | | 1.12 | | | 1.35 | | | 2.46 | (c) |
Net investment income (loss), net of waivers and reimbursements | | | 0.86 | | | 0.50 | | | 0.31 | | | (0.21 | )(c) |
Net investment income (loss), before waivers and reimbursements | | | 0.89 | | | 0.48 | | | 0.06 | | | (1.57 | )(c) |
| |
| | | | |
| | | Years Ended December 31, | |
| | | 2007 | | 2006 | | 2005 | | 2004 | |
Supplemental data: | | | | | | | | | | | | | |
Net assets at end of year (in thousands) | | $ | 618,179 | | $ | 598,375 | | $ | 250,929 | | $ | 27,384 | |
Portfolio turnover rate (%) | | | 66 | | | 79 | | | 84 | | | 45 | (c) |
| (a) | | For the period from December 1, 2004 (Commencement of Operations) to December 31, 2004. |
| (b) | | Excludes $0.01, $0.23, $0.27 and $0.01 of PFIC mark to market which is treated as ordinary income for Federal tax purposes for the years 2007, 2006, 2005 and 2004, respectively. |
| (c) | | Rates are annualized for periods that are less than a year. |
Performance cited represents past performance. Past performance does not guarantee future results and current performance may be lower or higher that the data quoted. Results shown are annual returns, which assume reinvestment of dividends and capital gains. Investment returns and principal will fluctuate and you may have a gain or loss when you sell shares. For the most current month-end performance information, please call 1-800-742-7272, or visit our Web site at www.williamblairfunds. com.
Note: Net investment income (loss) per share is based on the average shares outstanding during the year.
50 Annual Report | December 31, 2007 |
Financial Highlights
International Small Cap Growth Fund
Institutional Share Class
| | | | | | | | | | | |
| | | | |
| | | Years Ended December 31, | |
| | | 2007 | | 2006 | | | 2005(a) | |
Net asset value, beginning of year | | $ | 13.43 | | $ | 11.16 | | | $ | 10.00 | |
Income from investment operations: | | | | | | | | | | | |
Net investment income (loss)(b) | | | 0.05 | | | (0.01 | ) | | | — | |
Net realized and unrealized gain on investments | | | 1.72 | | | 2.34 | | | | 1.16 | |
| | | | | | | | | | | |
Total from investment operations | | | 1.77 | | | 2.33 | | | | 1.16 | |
Less distributions from: | | | | | | | | | | | |
Net investment income | | | 0.12 | | | 0.01 | | | | — | (c) |
Net realized gain | | | 1.04 | | | 0.05 | | | | — | |
| | | | | | | | | | | |
Total distributions | | | 1.16 | | | 0.06 | | | | — | |
| | | | | | | | | | | |
Net asset value, end of year | | $ | 14.04 | | $ | 13.43 | | | $ | 11.16 | |
| | | | | | | | | | | |
Total return (%) | | | 13.53 | | | 20.86 | | | | 11.62 | |
Ratios to average daily net assets (%): | | | | | | | | | | | |
Expenses, net of waivers and reimbursements | | | 1.14 | | | 1.25 | | | | 1.25 | (d) |
Expenses, before waivers and reimbursements | | | 1.14 | | | 1.31 | | | | 2.17 | (d) |
Net investment income (loss), net of waivers and reimbursements | | | 0.32 | | | (0.12 | ) | | | 0.00 | (d) |
Net investment income (loss), before waivers and reimbursements | | | 0.32 | | | (0.18 | ) | | | (0.92 | )(d) |
| |
| | | | |
| | | Years Ended December 31, | |
| | | 2007 | | 2006 | | | 2005(a) | |
Supplemental data for all classes: | | | | | | | | | | | |
Net assets at end of year (in thousands) | | $ | 401,459 | | $ | 231,969 | | | $ | 50,534 | |
Portfolio turnover rate (%) | | | 88 | | | 109 | | | | 127 | (d) |
| (a) | | For the period from November 1, 2005 (Commencement of Operations) to December 31, 2005. |
| (b) | | Excludes $0.05, $0.00, and $0.11 of PFIC mark to market which is treated as ordinary income for Federal tax purposes, for the years ended 2007, 2006 and 2005, respectively. |
| (c) | | Distribution less than $0.01 per share. |
| (d) | | Rates are annualized for periods that are less than a year. |
Performance cited represents past performance. Past performance does not guarantee future results and current performance may be lower or higher that the data quoted. Results shown are annual returns, which assume reinvestment of dividends and capital gains. Investment returns and principal will fluctuate and you may have a gain or loss when you sell shares. For the most current month-end performance information, please call 1-800-742-7272, or visit our Web site at www.williamblairfunds. com.
Note: Net investment income (loss) per share is based on the average shares outstanding during the year.
December 31, 2007 | William Blair Funds 51 |
Financial Highlights
Emerging Markets Growth Fund
Institutional Share Class
| | | | | | | | | | | |
| | | | |
| | | Years Ended December 31, | |
| | | 2007 | | | 2006 | | 2005(a) | |
Net asset value, beginning of year | | $ | 19.54 | | | $ | 14.20 | | $ | 10.00 | |
Income from investment operations: | | | | | | | | | | | |
Net investment income (loss)(b) | | | (0.01 | ) | | | 0.02 | | | 0.01 | |
Net realized and unrealized gain on investments | | | 7.27 | | | | 5.44 | | | 4.27 | |
| | | | | | | | | | | |
Total from investment operations | | | 7.26 | | | | 5.46 | | | 4.28 | |
Less distributions from: | | | | | | | | | | | |
Net investment income | | | 0.19 | | | | 0.01 | | | — | |
Net realized gain | | | 4.54 | | | | 0.11 | | | 0.08 | |
| | | | | | | | | | | |
Total distributions | | | 4.73 | | | | 0.12 | | | 0.08 | |
| | | | | | | | | | | |
Net asset value, end of year | | $ | 22.07 | | | $ | 19.54 | | $ | 14.20 | |
| | | | | | | | | | | |
Total return (%) | | | 38.21 | | | | 38.49 | | | 42.82 | |
Ratios to average daily net assets (%): | | | | | | | | | | | |
Expenses, net of waivers and reimbursements | | | 1.25 | | | | 1.25 | | | 1.25 | (c) |
Expenses, before waivers and reimbursements | | | 1.25 | | | | 1.32 | | | 1.61 | (c) |
Net investment income (loss), net of waivers and reimbursements | | | (0.05 | ) | | | 0.09 | | | 0.19 | (c) |
Net investment income (loss), before waivers and reimbursements | | | (0.05 | ) | | | 0.02 | | | (0.17 | )(c) |
| |
| | | | |
| | | Year Ended December 31, | |
| | | 2007 | | | 2006 | | 2005(a) | |
Supplemental data for all classes: | | | | | | | | | | | |
Net assets at end of year (in thousands) | | $ | 1,165,854 | | | $ | 813,649 | | $ | 249,348 | |
Portfolio turnover rate (%) | | | 100 | | | | 113 | | | 77 | (c) |
| (a) | | For the period from June 6, 2005 (Commencement of Operations) to December 31, 2005. |
| (b) | | Excludes $0.21, $0.00 and $0.11 of PFIC mark to market which is treated as ordinary income for Federal tax purposes, for the years ended 2006 and 2005, respectively. |
| (c) | | Rates are annualized for periods that are less than a year. |
Performance cited represents past performance. Past performance does not guarantee future results and current performance may be lower or higher that the data quoted. Results shown are annual returns, which assume reinvestment of dividends and capital gains. Investment returns and principal will fluctuate and you may have a gain or loss when you sell shares. For the most current month-end performance information, please call 1-800-742-7272, or visit our Web site at www.williamblairfunds. com.
Note: Net investment income (loss) per share is based on the average shares outstanding during the year.
52 Annual Report | December 31, 2007 |
Financial Highlights
Bond Fund
Institutional Share Class
| | | | | | |
| | | | |
| | | Period Ended December 31, | |
| | | | | 2007(a) | |
| | | | | | |
Net asset value, beginning of year | | | | $ | 10.00 | |
Income from investment operations: | | | | | | |
Net investment income | | | | | 0.32 | |
Net realized and unrealized gain on investments | | | | | 0.03 | |
| | | | | | |
Total from investment operations | | | | | 0.35 | |
Less distributions from: | | | | | | |
Net investment income | | | | | 0.35 | |
Net realized gain | | | | | — | (b) |
| | | | | | |
Total distributions | | | | | 0.35 | |
| | | | | | |
Net asset value, end of year | | | | $ | 10.00 | |
| | | | | | |
Total return (%) | | | | | 3.57 | (c) |
Ratios to average daily net assets (%): | | | | | | |
Expenses, net of waivers and reimbursements | | | | | 0.35 | (d) |
Expenses, before waivers and reimbursements | | | | | 0.52 | (d) |
Net investment income (loss), net of waivers and reimbursements | | | | | 5.09 | (d) |
Net investment income (loss), before waivers and reimbursements | | | | | 4.92 | (d) |
| |
| | | | |
| | | Year Ended December 31, | |
| | | | | 2007(a) | |
| | | | | | |
Supplemental data for all classes: | | | | | | |
Net assets at end of year (in thousands) | | | | $ | 68,483 | |
Portfolio turnover rate (%) | | | | | 38 | (d) |
| (a) | | For the period from May 1, 2007 (Commencement of Operations) to December 31, 2007. |
| (b) | | Distribution is less than $0.01 per share. |
| (c) | | Total returns are not annualized for periods that are less than a year. |
| (d) | | Rates are annualized for periods that are less than a year. |
Performance cited represents past performance. Past performance does not guarantee future results and current performance may be lower or higher that the data quoted. Results shown are annual returns, which assume reinvestment of dividends and capital gains. Investment returns and principal will fluctuate and you may have a gain or loss when you sell shares. For the most current month-end performance information, please call 1-800-742-7272, or visit our Web site at www.williamblairfunds. com.
Note: Net investment income (loss) per share is based on the average shares outstanding during the year.
December 31, 2007 | William Blair Funds 53 |
REPORT OF INDEPENDENT REGISTERED PUBLIC ACCOUNTING FIRM
To the Board of Trustees and Shareholders
William Blair Funds
We have audited the accompanying statements of assets and liabilities, including the portfolios of investments, of the Global Growth Fund, Institutional International Growth Fund, Institutional International Equity Fund, International Small Cap Growth Fund, Emerging Markets Growth Fund and Bond Fund (collectively, the “Portfolios”) (six of the Portfolios constituting the William Blair Funds) as of December 31, 2007, and the related statements of operations, statements of changes in net assets and financial highlights for the periods indicated therein. These financial statements and financial highlights are the responsibility of the Portfolios’ management. Our responsibility is to express an opinion on these financial statements and financial highlights based on our audits.
We conducted our audits in accordance with the standards of the Public Company Accounting Oversight Board (United States). Those standards require that we plan and perform the audit to obtain reasonable assurance about whether the financial statements and financial highlights are free of material misstatement. We were not engaged to perform an audit of the Portfolios’ internal control over financial reporting. Our audits included consideration of internal control over financial reporting as a basis for designing audit procedures that are appropriate in the circumstances, but not for the purpose of expressing an opinion on the effectiveness of the Portfolios’ internal control over financial reporting. Accordingly, we express no such opinion. An audit also includes examining, on a test basis, evidence supporting the amounts and disclosures in the financial statements and financial highlights, assessing the accounting principles used and significant estimates made by management, and evaluating the overall financial statement presentation. Our procedures included confirmation of securities owned as of December 31, 2007, by correspondence with the custodian and brokers or by other appropriate auditing procedures where replies from brokers were not received. We believe that our audits provide a reasonable basis for our opinion.
In our opinion, the financial statements and financial highlights referred to above present fairly, in all material respects, the financial position of each of the above mentioned Portfolios of the William Blair Funds at December 31, 2007, the results of their operations, changes in their net assets and financial highlights for the periods indicated therein, in conformity with U.S. generally accepted accounting principles.

Chicago, Illinois
February 21, 2008
54 Annual Report | December 31, 2007 |
Trustees and Officers. (Unaudited) The trustees and officers of the William Blair Funds as of December 31, 2007, their year of birth, their principal occupations during the last five years, their affiliations, if any, with William Blair & Company, L.L.C., and other significant affiliations are set forth below. The address of each trustee and officer is 222 West Adams Street, Chicago, Illinois 60606.
| | | | | | | | | | |
Name and Year of Birth | | Position(s)
Held with
Fund | | Term of
Office and
Length of
Time
Served(1) | | Principal Occupation(s) During Past 5 Years | | Number of
Portfolios
in Fund
Complex
Overseen
by Trustee | | Other Directorships Held by Trustee/Officer |
Interested Trustees | | | | | | | | | | |
Frederick Conrad Fischer, 1934* | | Chairman of the Board of Trustees | | Since 1987 | | Principal, William Blair & Company, L.L.C.; Partner, APM Limited Partnership | | 17 | | Trustee Emeritus, Chicago Child Care Society, a non-profit organization; Trustee Emeritus, Kalamazoo College |
| | | | | |
Michelle R. Seitz, 1965* | | Trustee and President | | Since 2007 | | Principal, William Blair & Company, L.L.C. | | 17 | | N/A |
Non-Interested Trustees | | | | | | | | |
| | | | | |
Ann P. McDermott,
1939 | | Trustee | | Since 1996 | | Board member and officer for various civic and charitable organizations over the past thirty years; professional experience prior thereto, registered representative for New York Stock Exchange firm | | 17 | | Northwestern University, Women’s Board; Rush Presbyterian St. Luke’s Medical Center, Women’s Board; University of Chicago, Women’s Board; Visiting Nurses Association, Honorary Director |
| | | | | |
Phillip O. Peterson,
1944 | | Trustee | | Since 2007 | | Trustee of Strong Funds Liquidating Trusts since 2005 and President, Strong Mutual Funds, 2004-2005; formerly, Partner, KPMG LLP | | 17 | | The Hartford Group of Mutual Funds (87 portfolios) |
| | | | | |
Donald J. Reaves,
1946 | | Trustee | | Since 2004 | | Chancellor, Winston- Salem State University; formerly, Vice President for Administration and Chief Financial Officer, University of Chicago 2002-2007. | | 17 | | American Student Assistance Corp., guarantor of student loans; Amica Mutual Insurance Company |
| | | | | |
Donald L. Seeley,
1944 | | Trustee | | Since 2003 | | Director, Applied Investment Management Program, University of Arizona Department of Finance; formerly, Vice Chairman and Chief Financial Officer, True North Communications, Inc., marketing communications and advertising firm | | 17 | | Warnaco, Group Inc., intimate apparel, sportswear and swimwear manufacturer; Center for Furniture Craftmanship (not-for-profit) |
| | | | | |
Thomas J. Skelly,
1951 | | Trustee | | Since 2007 | | Director and Investment Committee Chairman of the U.S. Accenture Foundation Inc.; formerly, Managing Partner of various divisions at Accenture | | 17 | | Clayton Holdings, Inc., provider of information-based analytics, consulting and outsourced services to various financial institutions and investors |
| | | | | |
Robert E. Wood II, 1938 | | Trustee | | Since 1999 | | Retired; formerly Executive Vice President, Morgan Stanley Dean Witter | | 17 | | Chairman, Add-Vision, Inc., manufacturer of surface animation systems; Chairman Micro-Combustion, LLC |
December 31, 2007 | William Blair Funds 55 |
| | | | | | | | |
Name and Year of Birth | | Position(s)
Held with
Fund | | Term of
Office and
Length of
Time
Served(1) | | Principal Occupation(s) During Past 5 Years | | Other Directorships Held by Trustee/Officer |
Officers | | | | | | | | |
Karl W. Brewer, 1966 | | Senior Vice President | | Since 2000 | | Principal, William Blair & Company, L.L.C. | | N/A |
| | | | |
Harvey H. Bundy, III, 1944 | | Senior Vice President | | Since 2003 | | Principal, William Blair & Company, L.L.C. | | N/A |
| | | | |
Mark A. Fuller, III, 1957 | | Senior Vice President | | Since 1993 | | Principal, William Blair & Company, L.L.C. | | Partner, Fulsen Howney Partners |
| | | | |
James S. Golan, 1961 | | Senior Vice President | | Since 2005 | | Principal, William Blair & Company, L.L.C. | | N/A |
| | | | |
W. George Greig, 1952 | | Senior Vice President | | Since 1996 | | Principal, William Blair & Company, L.L.C. | | N/A |
| | | | |
Michael A. Jancosek, 1959 | | Senior Vice President Vice President | | Since 2004 2000-2004 | | Principal, William Blair & Company L.L.C. Associate, William Blair & Company, L.L.C. | | N/A |
| | | | |
John F. Jostrand, 1954 | | Senior Vice President | | Since 1999 | | Principal, William Blair & Company, L.L.C. | | N/A |
| | | | |
James S. Kaplan, 1960 | | Senior Vice President Vice President | | Since 2004 1995-2004 | | Principal, William Blair & Company, L.L.C. Associate, William Blair & Company, L.L.C. | | N/A |
| | | | |
Robert C. Lanphier, IV, 1956 | | Senior Vice President | | Since 2003 | | Principal, William Blair & Company, L.L.C. | | Chairman, AG. Med, Inc. |
| | | | |
Todd M. McClone, 1968 | | Senior Vice President Vice President | | Since 2006 2005-2006 | | Principal, William Blair & Company, L.L.C. Associate, William Blair & Company, L.L.C. | | N/A |
| | | | |
David S. Mitchell, 1960 | | Senior Vice President Vice President | | Since 2004 2003-2004 | | Principal, William Blair & Company, L.L.C. Associate, William Blair & Company, L.L.C. | | N/A |
| | | | |
Gregory J. Pusinelli, 1958 | | Senior Vice President | | Since 1999 | | Principal, William Blair & Company, L.L.C. | | N/A |
| | | | |
David P. Ricci, 1958 | | Senior Vice President | | Since 2006 | | Principal, William Blair & Company, L.L.C. | | N/A |
| | | | |
Jeffrey A. Urbina, 1955 | | Senior Vice President | | Since 1998 | | Principal, William Blair & Company, L.L.C. | | N/A |
56 Annual Report | December 31, 2007 |
| | | | | | | | |
Name and Year of Birth | | Position(s)
Held with
Fund | | Term of
Office and
Length of
Time
Served(1) | | Principal Occupation(s) During Past 5 Years | | Other Directorships Held by Trustee/Officer |
| | | | |
Christopher T. Vincent, 1956 | | Senior Vice President Vice President | | Since 2004 2002-2004 | | Principal, William Blair & Company, L.L.C. Associate, William Blair & Company, L.L.C.; former Managing Director/Senior Portfolio Manager, Zurich Scudder Investments | | Uhlich Children’s Home |
| | | | |
Colin J. Williams, 1975 | | Senior Vice President | | Since 2007 | | Principal, William Blair & Company, L.L.C.; formerly Andersen Consulting and Allegiance Healthcare | | N/A |
| | | | |
Richard W. Smirl, 1967 | | Chief Compliance Officer | | Since 2004 | | Principal, William Blair & Company, L.L.C.; former Chief Legal Officer, Strong Capital Management | | N/A |
| | | | |
Benjamin J. Armstrong, 1965 | | Vice President | | Since 2007 | | Associate, William Blair & Company, LLC. | | |
| | | | |
David C. Fording, 1967 | | Vice President | | Since 2006 | | Associate, William Blair & Company, L.L.C.; former Portfolio Manager, TIAA-CREF | | N/A |
| | | | |
Chad M. Kilmer, 1975 | | Vice President | | Since 2006 | | Associate, William Blair & Company, L.L.C.; former analyst and Portfolio Manager, US Bancorp Asset Management, and analyst Gabelli Woodland Partners. | | N/A |
| | | | |
Mark T. Leslie, 1967 | | Vice President | | Since 2005 | | Associate, William Blair & Company, L.L.C.; former Portfolio Manager, U.S. Bancorp Asset Management | | N/A |
| | | | |
Terence M. Sullivan, 1944 | | Vice President and Treasurer | | Since 1997 | | Associate, William Blair & Company, L.L.C. | | N/A |
| | | | |
Colette M. Garavalia, 1961 | | Secretary | | Since 2000 | | Associate, William Blair & Company, L.L.C. | | N/A |
| * | | Mr. Fischer and Ms. Seitz are interested persons of the William Blair Funds because each is a principal of William Blair & Company, L.L.C., the Funds’ investment advisor, principal underwriter and distributor. |
| (1) | | Each Trustee serves until the election and qualification of a successor, or until death, resignation or retirement or removal as provided in the Fund’s Declaration of Trust. Retirement for non-interested Trustees occurs no later than at the conclusion of the first regularly scheduled Board meeting of the Fund’s fiscal year that occurs after the Trustee’s 72nd birthday. The Fund’s officers are elected annually by the Trustees. |
The Statement of Additional Information for the William Blair Funds includes additional information about the trustees and is available without charge by calling 1-800-635-2886 (in Massachusetts 1-800-635-2840) or by writing the Fund.
December 31, 2007 | William Blair Funds 57 |
During the six months ended December 31, 2007, the Board approved the Fund’s Management Agreement with the Advisor, on behalf of the Global Growth Portfolio of the Fund. The Management Agreement with respect to the Portfolio was approved by the Board of Trustees, including all of the Trustees who are not parties to such agreement or interested persons of any such party, on July 24, 2007. The Board, including a majority of the Independent Trustees, determined that approval of the Management Agreement was in the best interests of the Portfolio. On July 23 and 24, 2007, the Independent Trustees met separately from the “interested” trustees of the Fund and officers and employees of the Advisor to consider approval of the Management Agreement. The Independent Trustees reviewed materials provided by the Advisor for the approval of the Management Agreement and were assisted by independent legal counsel in making their determination. The Board, including the Independent Trustees, did not identify any single factor or group of factors as all important or controlling and considered all factors together.
Nature, Quality and Extent of Services. In evaluating the nature, quality and extent of services expected to be provided by the Advisor to the Portfolio, the Board noted that the Advisor is a quality firm with a reputation for integrity and honesty that employs high quality people. The Board considered biographical information about the Portfolio’s portfolio manager, financial information regarding the Advisor, the compliance regime created by the Advisor and the proposed financial support of the Portfolio. The Board considered the Advisor’s experience in managing new funds. Based upon all relevant factors, the Board concluded that the nature, quality and extent of the services to be provided by the Advisor to the Portfolio are expected to be satisfactory.
Fees and Expenses. The Board reviewed the Portfolio’s proposed advisory fee and estimated expense ratio and reviewed information comparing the advisory fee and expense ratio to a Lipper peer group. The Lipper peer group for the Portfolio consists of a group of funds with a similar investment style as the Portfolio. The Board considered that the Advisor has proposed to cap total expenses, including waiving advisory fees, if necessary, for the Portfolio. The Board also reviewed the Advisor’s fee schedule for a Global Growth SICAV (a Luxembourg based collective investment vehicle) that the Advisor intends to offer.
In considering the information, the Board noted that the proposed advisory fee for the Portfolio was above the median of the peer group, but that such advisory fee was within an acceptable range of the peer group and consistent with reasonable expectations in light of the nature, quality and extent of services expected to be provided by the Advisor. On the basis of the information provided, the Board concluded that the proposed advisory fee, coupled with the Advisor’s expense limitation agreement, was reasonable and appropriate in light of the nature, quality and extent of services to be provided by the Advisor.
Profitability. With respect to the estimated profitability of the Management Agreement to the Advisor, the Board considered the overall fees expected to be paid under the Management Agreement, the expected size of the Portfolio and the Advisor’s expense limitation agreement. The Board concluded that the expected profits to be realized by the Advisor were not unreasonable.
Economies of Scale. The Board considered the extent to which economies of scale would be realized as the Portfolio grows and whether fee levels reflect these economies of scale. The Board considered whether the proposed advisory fee is reasonable in relation to the projected asset size of the Portfolio. In considering whether fee levels reflect economies of scale for the benefit of Portfolio investors, the Board reviewed the Portfolio’s advisory fee compared to peer funds, the Portfolio’s projected asset size, the Portfolio’s estimated expense ratio and the proposed expense cap, and concluded that the advisory fee was reasonable.
Other Benefits to the Advisor. The Board considered benefits to be derived by the Advisor from its relationship with the Portfolio. The Board concluded that, after taking into account these benefits, the proposed advisory fee was reasonable.
Conclusion. Based upon all of the information considered and the conclusions reached, the Board, including a majority of the Independent Trustees, determined that the terms of the Management Agreement are fair and reasonable and that the approval of the Management Agreement is in the best interests of the Portfolio.
58 Annual Report | December 31, 2007 |
Additional Information (unaudited)
Proxy Voting
A description of the policies and procedures that the William Blair Institutional International Growth Fund, the William Blair Institutional International Equity Fund, the William Blair International Small Cap Growth Fund and the William Blair Emerging Markets Growth Fund and the William Blair Bond Fund use to determine how to vote proxies relating to portfolio securities and information regarding how the Fund voted proxies relating to portfolio securities for the most recent 12-month period ended June 30 are available without charge, upon request, by calling 1-800-635-2886 (in Massachusetts 1-800-635-2840), at www.williamblairfunds.com and on the SEC’s website at http://www.sec.gov.
Quarterly Portfolio Schedules
The Fund files its complete schedule of portfolio holdings with the SEC for the first and third fiscal quarters of each fiscal year (quarters ended March 31 and September 30) on Form N-Q. The Fund’s Forms N-Q are available on the SEC’s website at http://www.sec.gov and may be reviewed and copied at the SEC’s Public Reference Room in Washington, D.C. Information on the operation of the SEC’s Public Reference Room may be obtained by calling 1-800-SEC-0330. The Fund’s Forms N-Q are also available on the Fund’s website at www.williamblairfunds.com.
December 31, 2007 | William Blair Funds 59 |
Useful Information About Your Report (unaudited)
Please refer to this information when reviewing the Expense Example for each Portfolio.
Expense Example
As a shareholder of a Portfolio, you incur ongoing costs, including management fees and other Portfolio expenses. The example is intended to help you understand your ongoing costs (in dollars) of investing in the Portfolio and to compare these costs with the ongoing costs of investing in other mutual funds. To do so, compare the Portfolio’s 5% hypothetical example with the 5% hypothetical examples that appear in the shareholder reports of other funds. The example is based on an investment of $1,000 invested at the beginning of the period and held for the entire six-month period from July 1, 2007 to December 31, 2007.
Actual Expenses
In each example, the first line for each share class in the table provides information about the actual account values and actual expenses. These expenses reflect the effect of any expense cap applicable to the share class during the period. Without this expense cap, the costs shown in the table would have been higher. You may use the information in this line, together with the amount you invested, to estimate the expenses that you paid over the period. Simply divide your account value by $1,000 (example, an $8,600 account value divided by $1,000 = 8.6), then multiply the result by the number in the first line under the heading entitled “Expenses Paid During the Period” to estimate the expenses you paid on your account during the period.
Hypothetical Example for Comparison Purposes
In each example, the second line for each share class in the table provides information about hypothetical account values and hypothetical expenses based on the Portfolio’s actual expense ratio and an assumed rate of return of 5% per year before expenses. This is not the Portfolio’s actual return. The hypothetical account values and expenses may not be used to estimate the actual ending account balance or expenses you paid for the period. You may use this information to compare the ongoing costs of investing in the Portfolio to other funds. To do so, compare this 5% hypothetical example with the 5% hypothetical examples that appear in the shareholder reports of other funds.
Please note that the expenses shown in both examples are meant to highlight your ongoing costs only and do not reflect any transactional costs or account type fees. These fees are fully described in the prospectus. Therefore, the second line of each share class in the table is useful in comparing ongoing costs only and will not help you determine the relative costs of owning different funds.
60 Annual Report | December 31, 2007 |
Fund Expenses (Unaudited)
The examples below show you the ongoing costs (in dollars) of investing in your fund and allows you to compare these costs with those of other mutual funds. Please refer to previous page for a detailed explanation of the information presented on this chart.
| | | | | | | | | | | | |
| | | Beginning
Account Value
7/1/2007 | | Ending
Account Value
12/31/2007 | | Expenses Paid
during Period(a) | | Annualized
Expense Ratio | |
Global Growth Institutional Share Class | | | | | | | | | | | | |
Actual return (since inception period)(b) | | $ | 1,000.00 | | $ | 993.00 | | $ | 2.45 | | 1.15 | % |
Hypothetical 5% return (6 month period) | | | 1,000.00 | | | 1,008.23 | | | 5.82 | | 1.15 | |
| | | | | | | | | | | | | |
| | | | |
Institutional International Growth Fund | | | | | | | | | | | | |
Actual return | | | 1,000.00 | | | 1,059.30 | | | 5.29 | | 1.02 | |
Hypothetical 5% return | | | 1,000.00 | | | 1,020.06 | | | 5.19 | | 1.02 | |
| | | | | | | | | | | | | |
| | | | |
Institutional International Equity Fund | | | | | | | | | | | | |
Actual return | | | 1,000.00 | | | 1,077.90 | | | 5.71 | | 1.09 | |
Hypothetical 5% return | | | 1,000.00 | | | 1,019.71 | | | 5.55 | | 1.09 | |
| | | | | | | | | | | | | |
| | | | |
International Small Cap Growth Fund Institutional Share Class | | | | | | | | | | | | |
Actual return | | | 1,000.00 | | | 990.70 | | | 5.72 | | 1.14 | |
Hypothetical 5% return | | | 1,000.00 | | | 1,019.14 | | | 5.80 | | 1.14 | |
| | | | | | | | | | | | | |
| | | | |
Emerging Markets Growth Fund Institutional Share Class | | | | | | | | | | | | |
Actual return | | | 1,000.00 | | | 1,183.50 | | | 6.88 | | 1.25 | |
Hypothetical 5% return | | | 1,000.00 | | | 1,018.90 | | | 6.36 | | 1.25 | |
| | | | | | | | | | | | | |
| | | | |
Bond Fund Institutional Share Class | | | | | | | | | | | | |
Actual return | | | 1,000.00 | | | 1,047.50 | | | 1.81 | | 0.35 | |
Hypothetical 5% return | | | 1,000.00 | | | 1,023.44 | | | 1.79 | | 0.35 | |
| | | | | | | | | | | | | |
| (a) | | Expenses are equal to the annualized expense ratio, multiplied by the average account value over the period, multiplied by the number of days in the period 181, and divided by 365 (to reflect the one-half year period). |
| (b) | | For the period October 15, 2007 (Commencement of Operations) until December 31, 2007. |
December 31, 2007 | William Blair Funds 61 |
BOARD OF TRUSTEES
Frederick Conrad Fischer, Chairman
Principal, William Blair & Company, L.L.C.
Phillip O. Peterson
Retired Partner, KPMG LLP
Ann P. McDermott
Director and Trustee
Profit and not-for-profit organizations
Donald J. Reaves
Chancellor, Winston-Salem State University
Donald L. Seeley
Adjunct Lecturer and Director, University of Arizona Department of Finance
Thomas J. Skelly
Director and Investment Committee Chairman, U.S. Accenture Foundation Inc.
Michelle R. Seitz, President
Principal, William Blair & Company, L.L.C.
Robert E. Wood II
Retired Executive Vice President, Morgan Stanley Dean Witter
Officers
Karl W. Brewer, Senior Vice President
Harvey H. Bundy III, Senior Vice President
Mark A. Fuller, III, Senior Vice President
James S. Golan, Senior Vice President
W. George Greig, Senior Vice President
Michael A. Jancosek, Senior Vice President
John F. Jostrand, Senior Vice President
James S. Kaplan, Senior Vice President
Robert C. Lanphier, IV, Senior Vice President
Todd M. McClone, Senior Vice President
David S. Mitchell, Senior Vice President
Gregory J. Pusinelli, Senior Vice President
David P. Ricci, Senior Vice President
Jeffrey A. Urbina, Senior Vice President
Christopher T. Vincent, Senior Vice President
Colin J. Williams, Senior Vice President
Richard W. Smirl, Chief Compliance Officer
Benjamin J. Armstrong, Vice President
David C. Fording, Vice President
Chad M. Kilmer, Vice President
Mark T. Leslie, Vice President
Terence M. Sullivan, Vice President and Treasurer
Colette M. Garavalia, Secretary
Investment Advisor
William Blair & Company, L.L.C.
Independent Registered Public Accounting Firm
Ernst & Young LLP
Legal Counsel
Vedder Price PC
Transfer Agent
Boston Financial Data Services
P.O. Box 8506
Boston, MA 02266-8506
For customer assistance, call 1-800-635-2886
(Massachusetts 1-800-635-2840)
62 Annual Report | December 31, 2007 |

As of the end of the period covered by this Form N-CSR, the Registrant has adopted a code of ethics that applies to its principal executive officer and principal financial officer. Such code of ethics is posted on the Registrant’s website: www.williamblairfunds.com. There were no amendments to or waivers of the code of ethics during the period covered by this report.
| Item 3. | Audit Committee Financial Expert |
The Registrant’s Board of Trustees has determined that the Registrant has at least one “audit committee financial expert” (as defined in Item 3 of Form N-CSR) serving on its Audit Committee. Mr. Donald L. Seeley, the Registrant’s audit committee financial expert, is “independent” for purposes of Item 3 to Form N-CSR.
An “audit committee financial expert” is not an “expert” for any purpose, including for purposes of Section 11 of the Securities Act of 1933, as a result of being designated as an “audit committee financial expert.” Further, the designation of a person as an “audit committee financial expert” does not mean that the person has any greater duties, obligations, or liability than those imposed on the person without the “audit committee financial expert” designation. Similarly, the designation of a person as an “audit committee financial expert” does not affect the duties, obligations, or liability of any other member of the audit committee or Board of Trustees.
| Item 4. | Principal Accountant Fees and Services |
Audit Fees
For the fiscal years ended December 31, 2006 and 2007, Ernst & Young, LLP, the Registrant’s principal accountant (“E&Y), billed the Registrant $360,000 and $431,500, respectively, for professional services rendered for the audit of the Registrant’s annual financial statements or services that are normally provided in connection with statutory and regulatory filings.
Audit-Related Fees
For the fiscal years ended December 31, 2006 and 2007, E&Y billed the Registrant $0 and $30,000, respectively for assurance and related services that are reasonably related to the performance of the audit of the Registrant’s financial statements and that are not reported above, such as reviewing prospectuses and SEC filings. For the fiscal years ended December 31, 2006 and 2007, E&Y provided no audit-related services to William Blair & Company L.L.C., the Registrant’s investment advisor (“William Blair”) or any of its control affiliates that were for engagements directly related to the Registrant’s operations and financial reporting.
Tax Fees
For the fiscal years ended December 31, 2006 and 2007, E&Y billed the Registrant $76,550 and $100,750, respectively, for professional services rendered for tax compliance, tax advice and tax planning. Such services consisted of preparation of tax returns, year-end distribution review, qualifying dividend income analysis and computation of foreign tax credit pass through. For the fiscal years ended December 31, 2006 and 2007, E&Y billed William Blair and its control affiliates for the services of $0 and $0, respectively that were for engagements directly related to the Registrant’s operations and financial reporting.
All Other Fees
For the fiscal years ended December 31, 2006 and 2007, E&Y did not bill the Registrant for products and services other than the services reported above. For the fiscal years ended December 31, 2006 and 2007, E&Y provided no other services to William Blair or any of its control affiliates that were for engagements directly related to the Registrant’s operations and financial reporting.
Audit Committee Pre-Approval Policies and Procedures
Pursuant to Registrant’s Audit Committee Charter (the “Charter”), the Audit Committee is responsible for pre-approving any engagement of the principal accountant to provide non-prohibited services to the Registrant, including the fees and other compensation to be paid to the principal accountant, to the extent required by Rule 2-01(c)(7) of Regulation S-X. Pursuant to the Charter, the Audit Committee is also responsible for pre-approving any engagement of the principal accountant, including the fees and other compensation to be paid to the principal accountant, to provide non-audit services to the Registrant’s investment advisor (or any entity controlling, controlled by, or under common control with the adviser that provides ongoing services to the Registrant), if the engagement relates directly to the operations and financial reporting of the Registrant, to the extent required by Rule 2-01(c)(7) of Regulation S-X. The Chair of the Audit Committee may grant the pre-approval referenced above for non-prohibited and non-audit services. All such delegated pre-approvals will be presented to the Audit Committee no later than the next Audit Committee meeting.
Non-Audit Fees
For the fiscal years ended December 31, 2006 and 2007, E&Y billed the Registrant $76,550 and $100,750, respectively, in non-audit fees (tax services). For the same periods, E&Y billed William Blair and its control affiliates $6,800 and $22,500, respectively, in non-audit fees. The Registrant’s Audit Committee has considered whether the provision of non-audit services that were rendered to William Blair or any of its control affiliates that were not pre-approved pursuant to Rule 2-01(c)(7)(ii) of Regulation S-X is compatible with maintaining E&Y’s independence. Such non-audit services primarily pertained to due diligence reviews performed for the Corporate Finance Group and subsidiary tax preparation of William Blair and did not relate to the Registrant’s operations or financial reporting.
| Item 5. | Audit Committee of Listed Registrants |
Not Applicable to this Registrant, insofar as the Registrant is not a listed company.
| Item 6. | Schedule of Investments |
See Schedule of Investments in Item 1
| Item 7. | Disclosure of Proxy Voting Policies and Procedures for Closed-End Management Investment Companies |
Not applicable to this Registrant, insofar as the Registrant is not a closed-end management investment company.
| Item 8. | Portfolio Managers of Closed Investment Companies |
Not applicable to this Registrant, insofar as the Registrant is not a closed-end management investment company.
| Item 9. | Purchase of Equity Securities by Closed-End Management Investment Companies and Affiliated Purchasers |
Not applicable to this Registrant, insofar as the Registrant is not a closed-end management investment company.
| Item 10. | Submission of Matters to a Vote of Security Holders |
There have been no material changes to the procedures by which shareholders may recommend nominees to the Registrant’s Board of Trustees since the Registrant last provided disclosure in response to this item.
Controls and Procedures
(a) The Registrant’s principal executive and principal financial officer, or persons performing similar functions, have concluded that the Registrant’s Disclosure Controls and Procedures (as defined in Rule 30a-3(c) under the Investment Company Act of 1940, as amended (the “1940 Act”) (17 CFR 270.30a-3(c)) are effective, as of a date within 90 days of the filing date of this report that includes the disclosure required by this paragraph, based on their evaluation of these controls and procedures required by Rule 30a-3 (b) under the 1940 Act (17 CFR 270.30a-3(b) and Rules 13a-15(b) or 15d-15(b) under the Exchange Act (17 CFR 240.13a-15(b) or 240.15d-15(b)).
(b) There were no changes in the Registrant’s internal control over financial reporting (as defined in Rule 30a-3(d) under the 1940 Act (17 CFR 270.30a-3(d)) that occurred during the final quarter of the period covered by this report that has materially affected, or is reasonably likely to materially affect, the Registrant’s internal control over financial reporting.
12. (a) (1) Code of Ethics
Not applicable because it is posted on Registrant’s website.
12. (a) (2) (1)
Certification of Principal Executive Officer Required by Rule 30a-2(a) of the Investment Company Act
12. (a) (2) (2)
Certification of Principal Financial Officer Required by Rule 30a-2(a) of the Investment Company Act.
12. (a) (3)
Not applicable to this Registrant.
12. (b)
Certification of Chief Executive Officer and Certification of Chief Financial Officer Required by Rule 30a-2(b) of the Investment Company Act
Signatures
Pursuant to the requirements of the Securities Exchange Act of 1934 and the Investment Company Act of 1940, the Registrant has duly caused this report to be signed on its behalf by the undersigned, thereunto duly authorized.
| | |
| | | William Blair Funds |
| |
| | | /s/ Michelle R. Seitz |
| By: | | Michelle R. Seitz |
| | | President (Chief Executive Officer) |
Date: February 27, 2008
Pursuant to the requirements of the Securities Exchange Act of 1934 and the Investment Company Act of 1940, this report has been signed below by the following persons on behalf of the Registrant and in the capacities and on the dates indicated
| | |
| By: | | Michelle R. Seitz |
| | | President (Chief Executive Officer) |
Date: February 27, 2008
| | |
| By: | | Terence M. Sullivan |
| | | Treasurer (Chief Financial Officer) |
Date: February 27, 2008