UNITED STATES
SECURITIES AND EXCHANGE COMMISSION
Washington, D.C. 20549
Form N-CSR
CERTIFIED SHAREHOLDER REPORT OF REGISTERED
MANAGEMENT INVESTMENT COMPANIES
Investment Company Act File Number 811-5344
William Blair Funds
(Exact name of registrant as specified in charter)
| | |
| 222 West Adams Street, Chicago, IL | | 60606 |
| (Address of principal executive offices) | | (Zip Code) |
Michelle R. Seitz
William Blair Funds
222 West Adams Street, Chicago, IL 60606
(Name and address of agent for service)
Registrant’s telephone number, including area code: 312-236-1600
Date of fiscal year end: December 31
Date of reporting period: December 31, 2009
Form N-CSR is to be used by management investment companies to file reports with the Commission not later than 10 days after the transmission to stockholders of any report that is required to be transmitted to stockholders under Rule 30e-1 under the Investment Company Act of 1940 (17 CFR 270.30e-1). The Commission may use the information provided on Form N-CSR in its regulatory, disclosure review, inspection, and policymaking roles.
A registrant is required to disclose the information specified by Form N-CSR, and the Commission will make this information public. A Registrant is not required to respond to the collection of information contained in Form N-CSR unless the form displays a currently valid Office of Management and Budget (“OMB”) control number. Please direct comments concerning the accuracy of the information collection burden estimates and any suggestions for reducing the burden to Secretary, Securities and Exchange Commission, 450 Fifth Street, NW, Washington, DC 20549-0609. The OMB has reviewed this collection of information under the clearance requirements of 44 U.S.C. (ss) 3507.
| Item 1. | December 31, 2009 Annual Reports transmitted to shareholders. |

Table of Contents
This report is submitted for the general information of the shareholders of the William Blair Funds. It is not authorized for distribution to prospective investors unless accompanied or preceded by a prospectus of the William Blair Funds. Please carefully consider the Funds’ investment objectives, risks, charges, and expenses before investing. This and other information is contained in the Funds’ prospectus, which you may obtain by calling 1-800-742-7272. Read it carefully before you invest or send money.
December 31, 2009 | William Blair Funds 1 |
PERFORMANCE AS OF DECEMBER 31, 2009—CLASS N SHARES (unaudited)
| | | | | | | | | | | | | | | |
| | | 1 Yr. | | 3 Yr. | | | 5 Yr. | | | 10 Yr
(or since
inception) | | | Inception
Date | | Overall
Morningstar
Rating |
Growth Fund | | | | | | | | | | | | | | | ««««
Among 1,548 large growth funds |
Class N | | 38.90 | | (0.64 | ) | | 3.89 | | | (0.48 | ) | | 3/20/1946 | |
Morningstar Large Growth | | 35.68 | | (2.89 | ) | | 1.21 | | | (2.11 | ) | | | �� |
Russell 3000® Growth | | 37.01 | | (2.06 | ) | | 1.58 | | | (3.79 | ) | | | | |
Standard & Poor’s 500 | | 26.46 | | (5.63 | ) | | 0.42 | | | (0.95 | ) | | | | |
| | | | | | |
Large Cap Growth Fund | | | | | | | | | | | | | | | «««
Among 1,548 large growth funds |
Class N | | 31.62 | | (3.62 | ) | | (0.26 | ) | | (4.86 | ) | | 12/27/1999 | |
Morningstar Large Growth | | 35.68 | | (2.89 | ) | | 1.21 | | | (2.11 | ) | | | |
Russell 1000® Growth | | 37.21 | | (1.89 | ) | | 1.63 | | | (3.99 | ) | | | | |
| | | | | | |
Small Cap Growth Fund | | | | | | | | | | | | | | | ««««
Among 669 small growth funds |
Class N | | 69.55 | | (4.11 | ) | | 0.36 | | | 11.32 | | | 12/27/1999 | |
Morningstar Small Growth | | 35.46 | | (4.89 | ) | | 0.37 | | | 0.60 | | | | |
Russell 2000® Growth | | 34.47 | | (4.00 | ) | | 0.87 | | | (1.37 | ) | | | | |
Russell 2000® | | 27.17 | | (6.07 | ) | | 0.51 | | | 3.51 | | | | | |
| The Small Cap Growth Fund’s Performance during 2000 was primarily attributable to investments in initial public offerings (IPOs) during a rising market. Since then, IPOs have had an insignificant effect on the Fund’s performance. | | | | | | | | |
| | | | | | |
Mid Cap Growth Fund | | | | | | | | | | | | | | | «««««
Among 727 mid-cap growth funds |
Class N | | 36.03 | | 0.59 | | | — | | | 1.61 | | | 2/1/2006 | |
Morningstar Mid-Cap Growth | | 39.11 | | (3.09 | ) | | — | | | — | | | | |
Russell MidCap® Growth | | 46.29 | | (3.18 | ) | | — | | | (1.39 | ) | | | | |
| | | | | | |
Small-Mid Cap Growth Fund | | | | | | | | | | | | | | | ««««
Among 727 mid-cap growth funds |
Class N | | 43.75 | | 0.20 | | | 4.08 | | | 5.46 | | | 12/29/2003 | |
Morningstar Mid-Cap Growth | | 39.11 | | (3.09 | ) | | 1.76 | | | — | | | | |
Russell 2500™ Growth | | 41.66 | | (3.13 | ) | | 2.00 | | | 3.87 | | | | | |
| | | | | | |
Global Growth Fund | | | | | | | | | | | | | | | Not rated. |
Class N | | 40.52 | | — | | | — | | | (14.74 | ) | | 10/15/2007 | | |
Morningstar World Stock | | 35.27 | | — | | | — | | | — | | | | | |
MSCI All Country World IMI (net) | | 36.41 | | — | | | — | | | (12.05 | ) | | | | |
| | | | | | |
International Growth Fund | | | | | | | | | | | | | | | «««
Among 206 foreign large growth funds |
Class N | | 42.27 | | (7.12 | ) | | 3.70 | | | 3.12 | | | 10/1/1992 | |
Morningstar Foreign Large Growth | | 38.02 | | (4.93 | ) | | 4.25 | | | 0.16 | | | | |
MSCI All Country World Ex-U.S. IMI (net) | | 43.60 | | (3.43 | ) | | 6.04 | | | 2.73 | | | | | |
| | | | | | |
International Equity Fund | | | | | | | | | | | | | | | ««
Among 206 foreign large growth funds |
Class N | | 32.69 | | (7.16 | ) | | 1.73 | | | 3.82 | | | 5/24/2004 | |
Morningstar Foreign Large Growth | | 38.02 | | (4.93 | ) | | 4.25 | | | — | | | | |
MSCI All Country World Ex-U.S. IMI (net) | | 43.60 | | (3.43 | ) | | 6.04 | | | 9.20 | | | | | |
| | | | | | |
International Small Cap Growth Fund | | | | | | | | | | | | | | | «««
Among 103 foreign small/mid growth funds |
Class N | | 57.10 | | (5.06 | ) | | — | | | 3.38 | | | 11/1/2005 | |
Morningstar Foreign Small/Mid Growth | | 49.24 | | (6.17 | ) | | — | | | — | | | | |
MSCI All Country World Small Cap
Ex-U.S. (net) | | 62.91 | | (3.52 | ) | | — | | | 5.59 | | | | |
| | | | | | |
Emerging Markets Growth Fund | | | | | | | | | | | | | | | «
Among 259 diversified emerging market funds |
Class N | | 73.85 | | (2.84 | ) | | — | | | 13.70 | | | 6/6/2005 | |
Morningstar Diversified Emerging Markets | | 73.81 | | 2.21 | | | — | | | — | | | | |
MSCI Emerging Markets IMI (net) | | 82.36 | | 5.63 | | | — | | | 16.20 | | | | |
Please see the next page for important disclosure information.
2 Annual Report | December 31, 2009 |
PERFORMANCE AS OF DECEMBER 31, 2009—CLASS N SHARES—CONTINUED (unaudited)
| | | | | | | | | | | | | | | |
| | | 1 Yr. | | 3 Yr. | | | 5 Yr. | | | 10 Yr
(or since
inception) | | | Inception
Date | | Overall
Morningstar
Rating |
Value Discovery Fund | | | | | | | | | | | | | | | ««««
Among 310 small value funds |
Class N | | 26.24 | | (4.02 | ) | | 1.59 | | | 7.73 | | | 12/23/1996 | |
Morningstar Small Value | | 31.32 | | (6.13 | ) | | 0.67 | | | 8.63 | | | | |
Russell 2000® Value | | 20.58 | | (8.22 | ) | | (0.01 | ) | | 8.27 | | | | | |
Russell 2000® | | 27.17 | | (6.07 | ) | | 0.51 | | | 3.51 | | | | | |
| | | | | | |
Bond Fund | | | | | | | | | | | | | | | Not rated. |
Class N | | 11.11 | | — | | | — | | | 5.95 | | | 5/1/2007 | | |
Morningstar Intermediate-Term Bond | | 13.97 | | — | | | — | | | — | | | | | |
Barclays Capital U.S. Aggregate Bond Index | | 5.93 | | — | | | — | | | 6.00 | | | | | |
| | | | | | |
Income Fund | | | | | | | | | | | | | | | «««
Among 384 short-term bond funds |
Class N | | 9.88 | | 2.70 | | | 2.81 | | | 4.51 | | | 10/1/1990 | |
Morningstar Short-term Bond | | 9.30 | | 3.47 | | | 3.28 | | | 4.14 | | | | |
Barclays Capital Intermediate Govt./Credit
Bond Index | | 5.24 | | 5.90 | | | 4.65 | | | 5.92 | | | | | |
| | | | | | |
Low Duration Fund | | | | | | | | | | | | | | | Not rated. |
Class N | | — | | — | | | — | | | (0.60 | ) | | 12/1/2009 | | |
Morningstar Short-term Bond | | — | | — | | | — | | | — | | | | | |
Merrill Lynch 1-Year U.S. Treasury Note Index | | — | | — | | | — | | | (0.15 | ) | | | | |
Performance cited represents past performance. Past performance does not guarantee future results and current performance may be lower or higher than the data quoted. Results shown are average annual total returns, which assume reinvestment of dividends and capital gains. Investment returns and principal will fluctuate and you may have a gain or a loss when you sell shares. For the most current month-end performance information, please call 1-800-742-7272, or visit our Web site at www.williamblairfunds.com. From time to time, the investment advisor may waive fees or reimburse expenses for the Fund. Without these waivers, performance would be lower. Investing in smaller companies involves special risks, including higher volatility and lower liquidity. International and emerging markets investing involves special risk considerations, including currency fluctuations, lower liquidity, economic and political risk. As interest rates rise, bond prices will fall and bond funds may become more volatile. Class N shares are available to the general public without a sales load. Emerging Leaders Growth Fund does not offer Class N shares.
Morningstar RatingsTM are as of 12/31/2009 and are subject to change every month. The ratings are based on a risk-adjusted return measure that accounts for variation in a fund’s monthly performance, placing more emphasis on downward variations and rewarding consistent performance. The top 10% of funds in each Category receive 5 stars, the next 22.5% receive 4 stars, the middle 35% receive 3 stars, the next 22.5% receive 2 stars, and the bottom 10% receive 1 star. The Overall Morningstar Rating for a fund is derived from a weighted-average of the performance figures associated with its three-, five- and ten-year (if applicable) Morningstar Rating metrics. The 3/5/10 year Morningstar ratings were as follows: Growth Fund ««««/««««/«««, and Large Cap Growth Fund «««/«««/««, out of 1,548/1,276/698 large growth funds; Small Cap Growth Fund «««/« ««/««« «« out of 669/563/317 small growth funds; Mid Cap Growth Fund «««««/NA /NA and Small-Mid Cap Growth Fund ««««/««««/NA out of 727/631/NA mid cap growth funds; Value Discovery Fund « «««/«« ««/««« out of 310/245/131 small value funds; International Growth Fund ««/««/«««« and International Equity Fund ««/««/NA out of 206/149/80 foreign large growth funds; International Small Cap Growth Fund «««/NA/NA out of 103/NA/NA foreign small/mid growth funds; Emerging Markets Growth Fund «/NA/NA out of 259/NA/NA diversified emerging markets growth funds; Income Fund ««/««/««« out of 384/318/168 short-term bond funds.
Please carefully consider the Funds’ investment objectives, risks, charges, and expenses before investing. This and other information is contained in the Funds’ prospectus, which you may obtain by calling 1-800-742-7272. Read it carefully before you invest or send money.
December 31, 2009 | William Blair Funds 3 |

David C. Fording

John F. Jostrand
GROWTH FUND
The Growth Fund invests primarily in common stocks of domestic growth companies that the Advisor expects to have sustainable, above-average growth from one business cycle to the next.
AN OVERVIEW FROM THE PORTFOLIO MANAGERS
How did the Fund perform over the last year? How did the Fund’s performance compare to its benchmark?
The Growth Fund increased 38.90% on a total return basis (Class N Shares) for the 12 months ended December 31, 2009. By comparison, the Fund’s benchmark, the Russell 3000® Growth Index, gained 37.01%.
What were the most significant factors impacting Fund performance?
Overall, 2009 had strong results despite rapid shifts in market sentiment that created high levels of volatility and uncertainty. The Russell 3000® Growth Index gained 65.2% from its March 9th low, but remains 21.9% below its high in October 2007. A significant rally occurred beginning March 9th as a result of continued stabilization in the economy and further improvement in unemployment, manufacturing, and leading economic indicators. This stabilization was driven by massive liquidity and stimulus provided by the government. Company earnings reports were also positive, surpassing reduced expectations albeit mostly through very tight expense control. In combination, these trends gave investors a sense of comfort that the economy was recovering and a reflation trade commenced during March. Investors began to look ahead to when significant government rescue efforts would take effect globally, and started to aggressively increase risk exposure to their portfolios. Technology stocks performed best, 61.9%, followed up by Consumer Discretionary, 44.1%— both on the potential for or actual improved demand. Investors also focused on raw materials and commodity-related stocks that would benefit from an increase in global activity; the Materials sector rose 42.0%. More generally investors flocked to lower valuation, higher beta stocks, more cyclical and smaller capitalization stocks, which had severely declined in 2008 as investors questioned their ability to survive under economic duress. The weaker sectors were those investors had rotated out of after strong results in 2008: Consumer Staples, 17.4%, and Healthcare, 21.8%. Notably, growth outperformed value across capitalizations; mid-cap growth stocks were the strongest, 46.3%, followed by micro-cap growth stocks, 39.2%, while large-cap growth, 37.2%, and small-cap growth, 34.5%, stocks were relative laggards.
In the period, the portfolio benefited from good stock selection, and allocation among sectors. Its exposure to lower capitalization stocks was helpful, but it also had good results from its positions in the mega-cap space. As always, our primary focus has been stock selection, and not forecasting the macro environment or economic cycle. Therefore, with uncertainty in the market direction, we invested in quality growth stocks that have historically held up well in challenging markets, as well as more cyclical stocks that fit within our quality growth framework and have potential upside in an economic recovery. Additionally, we have been opportunistic in investing in quality growth companies that have attractive valuations in this volatile environment. We believe this posture has served the portfolio well.
Which sectors enhanced the Fund’s return? What were among the best performing investments for the Fund?
The Information Technology sector far outshined other groups for the portfolio due to strong stock selection and an overweight over the year in the best benchmark group. VistaPrint
4 Annual Report | December 31, 2009 |
Limited, an online provider of marketing products and services to small businesses globally, and Cognizant Technology Solutions Corporation, an information technology (IT) consulting and technology services company, contributed significantly due to strong earnings reports and material upward revaluations. Hewlett-Packard Company, Silicon Laboratories, Inc. and Google, Inc. were very strong absolute and relative performers as well. Consumer Staples also contributed nicely due to our substantial underweight in this trailing sector; in the period, we did increase our exposure relative to the benchmark closing the gap somewhat with the addition of PepsiCo, Inc. and CVS Caremark Corporation. We remain notably underweight here due to the relative lack of fast growing companies.
What sectors and investments did not measure up to your expectations?
Healthcare stock selection was a disappointment and hurt returns. CardioNet, Inc., the world’s leading supplier of mobile cardiac outpatient telemetry, declined in the third quarter on uncertainty around the Medicare reimbursement rate from Centers for Medicare and Medicaid Services (CMS) for its services. It was subsequently sold on this near term concern. Gilead Sciences, Inc. came under pressure in the first half as investors rotated out of stock that had held up well; in the second half, it declined on news that a Phase III drug trial did not meet expectations and will be discontinued; however, we believe that new HIV opportunities (quad pill and Truvada combination) will be the main growth drivers for the company. It is important to note; this sector was significantly reduced beginning in the second quarter as it had done well in 2008 and early 2009. Consumer Discretionary also lagged due to our exposure to education stocks like DeVry, Inc. and K12, Inc., which also held up well in the market declines; we continue to favor this group. Lastly, our cash position hurt relative results in a significant up-trending market; our average position was 3.1%.
What is your current strategy? How is the Fund positioned?
The significant global government stimulus actions have begun to help the economic recovery process. In the U.S., the ISM Manufacturing Index rose from mid 40s to above 50 (a sign that manufacturing is expanding), the Conference Board Leading Economic Index has risen over the past eight months, and unemployment and the housing market appear to have stabilized. With the economy strengthening, we are optimistic about the prospects for fourth quarter GDP and company earnings. As we move further into 2010, the visibility on economic and company earnings growth is less certain. The maximum benefit of the rebuild of inventory levels and fiscal stimulus will largely be behind us. Also, as the recovery takes hold, the market will likely anticipate higher interest rates, given less economic slack in the system. As a result of these factors, economic and company earnings growth may decelerate in the second half of 2010 putting a damper on financial market performance especially in developed markets. We believe emerging markets should continue to have an attractive growth profile, which is a bright spot globally, and has the potential to benefit the portfolio as many of our large-cap companies have good exposure to global markets.
In terms of positioning at the end of 2009, we maintain our overweight in Information Technology and continue to like the group’s strong balance sheets, attractive valuations, and products that enhance productivity. Industrials are also significantly overweight as we anticipate improving earnings in select companies as the economy recovers; we added Allegiant Travel Company, FTI Consulting, Inc., Goodrich Corporation, and Manpower Inc. Our largest underweight remains in Consumer Staples and we expect this to continue. Healthcare also has a below benchmark weight due to the overhang from Healthcare reform in the near term. Nonetheless, we stand ready to add to our Healthcare exposure should the legal and regulatory environment become clearer, given very attractive valuations within the group.
Unlike the more macro, valuation, and beta driven markets over the last two years, we believe investors in 2010 will focus on a company’s ability to deliver earnings growth relative to
December 31, 2009 | William Blair Funds 5 |
increasingly rising expectations. In our view, correlations among stocks are likely to fall as companies differentiate themselves in terms of their ability to meet or exceed these expectations. As such, this environment should favor stock pickers. As in the past, we will focus on our research intensive investment approach to identify these leading companies and our portfolio construction with the goal of competitive long-term results against our benchmark and peers.
6 Annual Report | December 31, 2009 |
Growth Fund
Performance Highlights (unaudited)
Average Annual Total Return at 12/31/2009
| | | | | | | | | | | | |
| | | 1
Year | | | 3
Year | | | 5
Year | | | 10
Year | |
Growth Fund Class N | | 38.90 | % | | (0.64 | )% | | 3.89 | % | | (0.48 | )% |
Growth Fund Class I | | 39.34 | | | (0.28 | ) | | 4.22 | | | (0.20 | ) |
Russell 3000® Growth Index | | 37.01 | | | (2.06 | ) | | 1.58 | | | (3.79 | ) |
S&P 500 Index | | 26.46 | | | (5.63 | ) | | 0.42 | | | (0.95 | ) |
Performance cited represents past performance. Past performance does not guarantee future results and current performance may be lower or higher than the data quoted. Results shown are average annual returns, which assume reinvestment of dividends and capital gains. Investment returns and principal will fluctuate and you may have a gain or loss when you sell shares. For the most current month-end performance information, please call 1-800-742-7272, or visit our Web site at www.williamblairfunds.com. Class N shares are available to the general public without a sales load. Class I shares are available to certain institutional investors and advisory clients of William Blair & Company L.L.C. without a sales load or distribution (12b-1) or service fees.
The performance highlights and graph presented above do not reflect the deduction of taxes that a shareholder would pay on fund distributions or the redemption of fund shares.
The Russell 3000® Growth Index consists of large, medium, and small capitalization companies with above average price-to-book ratios and forecasted growth rates. The index is weighted by market capitalization and large/medium/small companies make up approximately 80%/15%/5% of the index.
The S&P 500 Index indicates broad larger capitalization equity market performance.
This report identifies the Fund’s investments on December 31, 2009. These holdings are subject to change. Not all stocks in the Fund performed the same, nor is there any guarantee that these stocks will perform as well in the future. Market forecasts provided in this report may not necessarily come to pass.
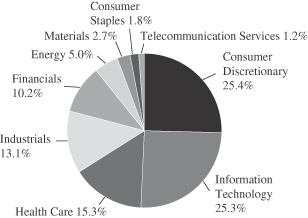
Sector Diversification (unaudited)
The sector diversification shown is based on the total long-term securities.
December 31, 2009 | William Blair Funds 7 |
Growth Fund
Portfolio of Investments, December 31, 2009 (all dollar amounts in thousands)
| | | | | |
Issuer | | Shares | | Value |
| | |
Common Stocks | | | | | |
Information Technology—35.6% | | | | | |
*Activision Blizzard, Inc. | | 435,070 | | $ | 4,834 |
*Apple, Inc. | | 62,580 | | | 13,196 |
*Cavium Networks, Inc. | | 181,200 | | | 4,318 |
*Cognizant Technology Solutions Corporation | | 115,490 | | | 5,232 |
*Genpact Limited† | | 347,700 | | | 5,181 |
*Google, Inc. | | 29,305 | | | 18,169 |
Hewlett-Packard Company | | 389,100 | | | 20,042 |
*McAfee, Inc. | | 160,500 | | | 6,511 |
Microsoft Corporation | | 621,200 | | | 18,940 |
Qualcomm Incorporated | | 426,040 | | | 19,709 |
*Silicon Laboratories, Inc. | | 168,375 | | | 8,139 |
Solera Holdings, Inc. | | 122,000 | | | 4,393 |
*Trimble Navigation Limited | | 180,400 | | | 4,546 |
*The Ultimate Software Group, Inc. | | 175,950 | | | 5,168 |
*VistaPrint Limited† | | 155,793 | | | 8,827 |
*WNS Holdings Limited—ADR | | 133,725 | | | 2,013 |
| | | | | |
| | | | | 149,218 |
| | | | | |
Industrials—17.4% | | | | | |
*ABB Ltd—ADR | | 289,700 | | | 5,533 |
*Allegiant Travel Company | | 68,500 | | | 3,231 |
Danaher Corporation | | 106,381 | | | 8,000 |
Fastenal Company | | 272,929 | | | 11,365 |
*FTI Consulting, Inc. | | 129,600 | | | 6,112 |
Goodrich Corporation | | 91,900 | | | 5,904 |
*IHS, Inc. | | 109,615 | | | 6,008 |
Knight Transportation, Inc. | | 318,330 | | | 6,141 |
Manpower Inc. | | 134,100 | | | 7,319 |
Roper Industries, Inc. | | 120,570 | | | 6,314 |
TransDigm Group Incorporated | | 151,080 | | | 7,175 |
| | | | | |
| | | | | 73,102 |
| | | | | |
Health Care—12.1% | | | | | |
Allergan, Inc. | | 176,300 | | | 11,109 |
Baxter International Inc. | | 171,000 | | | 10,034 |
*Celgene Corporation | | 147,280 | | | 8,200 |
*Gilead Sciences, Inc. | | 261,635 | | | 11,324 |
*IDEXX Laboratories, Inc. | | 102,230 | | | 5,463 |
*Nuvasive, Inc. | | 142,000 | | | 4,541 |
| | | | | |
| | | | | 50,671 |
| | | | | |
Consumer Discretionary—11.4% | | | | | |
*Bed Bath & Beyond, Inc. | | 166,900 | | | 6,447 |
*Capella Education Company | | 61,928 | | | 4,663 |
DeVry, Inc. | | 250,545 | | | 14,213 |
Johnson Controls, Inc. | | 242,200 | | | 6,598 |
*K12, Inc. | | 223,288 | | | 4,526 |
McDonald’s Corporation | | 186,500 | | | 11,645 |
| | | | | |
| | | | | 48,092 |
| | | | | |
*Non-income producing securities
† = U.S. listed foreign security
ADR = American Depository Receipt
| | | | | | | |
Issuer | | Shares or
Principal
Amount | | Value | |
| | |
Common Stocks—(continued) | | | | | | | |
Consumer Staples—7.6% | | | | | | | |
CVS Caremark Corporation | | | 321,300 | | $ | 10,349 | |
PepsiCo, Inc. | | | 287,000 | | | 17,450 | |
*Smart Balance, Inc. | | | 675,020 | | | 4,050 | |
| | | | | | | |
| | | | | | 31,849 | |
| | | | | | | |
Materials—5.9% | | | | | | | |
Ecolab, Inc. | | | 173,320 | | | 7,727 | |
*Freeport-McMoRan Copper & Gold Inc. | | | 61,400 | | | 4,930 | |
Monsanto Company | | | 51,230 | | | 4,188 | |
Praxair, Inc. | | | 97,365 | | | 7,819 | |
| | | | | | | |
| | | | | | 24,664 | |
| | | | | | | |
Energy—5.2% | | | | | | | |
Apache Corporation | | | 85,865 | | | 8,859 | |
*Cameron International Corporation | | | 103,600 | | | 4,330 | |
*Newfield Exploration Company | | | 44,500 | | | 2,146 | |
Occidental Petroleum Corporation | | | 81,400 | | | 6,622 | |
| | | | | | | |
| | | | | | 21,957 | |
| | | | | | | |
Financials—3.9% | | | | | | | |
*Affiliated Managers Group, Inc. | | | 135,363 | | | 9,117 | |
Charles Schwab & Co., Inc. | | | 376,675 | | | 7,089 | |
| | | | | | | |
| | | | | | 16,206 | |
| | | | | | | |
Total Common Stocks—99.1%
(cost $349,572) | | | 415,759 | |
| | | | | | | |
| | |
Investment in Affiliate | | | | | | | |
William Blair Ready Reserves Fund | | | 1,262,182 | | | 1,262 | |
| | | | | | | |
Total Investment in Affiliate—0.3%
(cost $1,262) | | | 1,262 | |
| | | | | | | |
| | |
Repurchase Agreement | | | | | | | |
Fixed Income Clearing Corporation,
0.000% dated 12/31/09, due 1/4/10, repurchase price $7,805, collateralized by FNMA, 5.000%, due 2/13/17 | | $ | 7,805 | | | 7,805 | |
| | | | | | | |
Total Repurchase Agreement—1.9%
(cost $7,805) | | | 7,805 | |
| | | | | | | |
Total Investments—101.3%
(cost $358,639) | | | 424,826 | |
Liabilities, plus cash and other assets—(1.3)% | | | (5,306 | ) |
| | | | | | | |
Net assets—100.0% | | $ | 419,520 | |
| | | | | | | |
See accompanying Notes to Financial Statements.
8 Annual Report | December 31, 2009 |

James S. Golan
John F. Jostrand

Tracy McCormick
LARGE CAP GROWTH FUND
The Large Cap Growth Fund invests primarily in common stocks of quality large domestic growth companies that the Advisor believes have demonstrated sustained growth over a long period of time.
AN OVERVIEW FROM THE PORTFOLIO MANAGERS
How did the Fund perform over the last year? How did the Fund’s performance compare to its benchmark and peers?
The Large Cap Growth Fund increased 31.62% on a total return basis (Class N Shares) for the 12 months ended December 31, 2009. By comparison, the Fund’s benchmark, the Russell 1000® Growth Index, increased 37.21%.
What were the most significant factors impacting Fund performance?
Overall, 2009 had strong results despite rapid shifts in market sentiment that created high levels of volatility and uncertainty. The Russell 1000® Growth Index gained 64.1% from the March 9th low, but remains 21.7% below its high in October 2007. A significant rally occurred beginning March 9th as a result of continued stabilization in the economy and further improvement in unemployment, manufacturing, and leading economic indicators. This stabilization was driven by massive liquidity and stimulus provided by the government. Company earnings reports were also positive, surpassing reduced expectations albeit mostly through very tight expense control. In combination, these trends gave investors a sense of comfort that the economy was recovering and a reflation trade commenced during March. Investors began to look ahead to when significant government rescue efforts would take effect globally, and started to aggressively increase risk exposure to their portfolios. Information Technology stocks performed best, 62.0%, followed up by Consumer Discretionary, 42.6%—both on the potential for or actual improved demand. Investors also focused on raw materials and commodity-related stocks that would benefit from an increase in global activity; the Materials sector rose 41.8%. More generally, investors flocked to smaller capitalization, lower valuation, higher beta, and more cyclical stocks, which had severely declined in 2008 as investors questioned their ability to survive under economic duress. The weaker sectors were those investors had rotated out of after strong results in 2008: Consumer Staples, 17.1%, and Healthcare, 21.7%. Notably, growth outperformed value across capitalizations; mid-cap growth stocks were the strongest, 46.3%, followed by micro-cap growth stocks, 39.2%, while large-cap growth, 37.2%, and small-cap growth, 34.5%, stocks were relative laggards.
Our quality growth portfolio lagged the benchmark in this environment. Substantial detractors for the portfolio were lack of smaller cap stocks, and a cash drag (average position 2.2%). On market capitalization, the Russell 1000® Growth Index had a 7.1% exposure, on average, to stocks with a market cap under $3 billion. This group returned 65.4% and significantly outperformed other mid-, large- and mega-cap segments in the benchmark. Notably, it also far outperformed the Russell small cap benchmark, 34.5%. The portfolio owns companies with market caps above $3 billion. Furthermore, with our quality growth discipline, we generally invest in companies with consistent earnings, and the market generally pays a premium for that stability; in 2009, lower valuation and cyclically oriented stocks outperformed as investors were willing to take on risk due to the unprecedented government intervention.
In retrospect, we entered the year with a portfolio somewhat more defensively positioned due to the high degree of uncertainty in the market direction. As massive global government
December 31, 2009 | William Blair Funds 9 |
intervention began to show signs of economic stabilization, investors rapidly rotated away from more defensive stocks and took on more risk. Recognizing this sentiment shift early on, we made adjustments to the portfolio in March through May to become more balanced between quality growth stocks, which have historically been able to survive in challenging markets and those that have the potential upside in an economic recovery. Starting in March, we increased our mid capitalization stock exposure; we added Broadcom Corporation, Discovery Communications, Inc., Johnson Controls, Inc., Juniper Networks, Inc., and O’Reilly Automotive, Inc. During this period, we also increased our exposure to high quality cyclical growth stocks with United Parcel Service, Inc., Suncor Energy Inc., and The Goldman Sachs Group, Inc. Additionally, these newly purchased stocks had attractive valuation levels. While these moves assisted results, our exposure was not large enough to overcome the significant and powerful cyclical snapback that occurred.
Which sectors enhanced the Fund’s return? What were among the best performing investments for the Fund?
The greatest positive performance impact in the year came from our overweight and good stock selection in Information Technology. We added to our exposure in the second quarter and latter half of the year; we had a very favorable view of this group based on their strong balance sheets, attractive valuations, and products that enhance productivity. The portfolio’s best overall performer was Apple on strong earnings reports. Another important position was Google, which performed well in a difficult economic environment. Microsoft Corporation, Qualcomm Incorporated and Hewlett-Packard Company were top performers as well. Our results were also assisted by no exposure to Utilities, which did poorly. Lastly, Johnson Controls, Inc., a Consumer Discretionary stock, rallied substantially as the economy and outlook for the automotive industry looked less dire.
What sectors and investments did not measure up to your expectations?
From a sector view, we had disappointments in Healthcare and Consumer Staples in 2009. Within Healthcare, Celgene Corporation declined on near term concerns over upcoming trial data, which looks at Revlimid for maintenance with myeloma; we believe these issues were overblown and we added to our position. UnitedHealth Group Incorporated also came under pressure on uncertainty over healthcare reform and a rising medical loss ratio. As a result, we sold the stock in September. While our underweight in Consumer Staples helped, our selection hurt. Campbell Soup lost ground on product price discounting concerns. Wal-Mart Stores, Inc. declined on growing concerns over deflationary pressures in the food retail segment as it is roughly 40% of its revenues. We sold both Consumer Staples positions.
What is your current strategy? How is the Fund positioned?
The significant global government stimulus actions have begun to help the economic recovery process. In the U.S., the ISM Manufacturing Index rose from mid 40s to above 50 (a sign that manufacturing is expanding), the Conference Board Leading Economic Index has risen over the past eight months, and unemployment and housing market appear to have stabilized. With the economy strengthening, we are optimistic about the prospects for fourth quarter GDP and company earnings. As we move further into 2010, the visibility on economic and company earnings growth is less certain. The maximum benefit of the rebuild of inventory levels and fiscal stimulus will largely be behind us. Also, as the recovery takes hold, the market will likely anticipate higher interest rates, given less economic slack in the system. As a result of these factors, economic and company earnings growth may decelerate in the second half of 2010 putting a damper on financial market performance especially in developed markets. We believe emerging markets should continue to have an attractive growth profile, which is a bright spot globally, and has the potential to benefit the portfolio as many of our companies have good exposure to global markets.
10 Annual Report | December 31, 2009 |
In terms of positioning at the end of 2009, we maintain our largest overweight in Industrials, which we built up in the second half of the year to take advantage of improving earnings in select companies as the economy recovers; we added new positions, Goodrich Corporation and Rockwell Automation, Inc. Another group with notable exposure is Energy; we believe our higher than benchmark weighting should benefit from an increase in demand with growing economic activity. Conversely, our largest underweight remains in Consumer Staples and we expect this to continue due to the weaker relative growth profile of many of these stocks. Healthcare also has a below benchmark weight; we cut back during the first quarter due to macro issues such as the impact of mega-mergers on growth, reimbursement level concerns, and patent expirations. Also, Healthcare reform added more uncertainty, and valuations were relatively less attractive.
Unlike the more macro, valuation, and beta driven markets over the last two years, we believe investors in 2010 will focus on a company’s ability to deliver earnings growth relative to increasingly rising expectations. In our view, correlations among stocks are likely to fall as companies differentiate themselves in terms of their ability to meet or exceed these expectations. As such, this environment should favor stock pickers. As in the past, we will focus on our research intensive investment approach to identify these leading companies and our portfolio construction with the goal of competitive long-term results against our benchmark and peers.
December 31, 2009 | William Blair Funds 11 |
Large Cap Growth Fund
Performance Highlights (unaudited)
Average Annual Total Return at 12/31/2009
| | | | | | | | | | | | |
| | | 1
Year | | | 3
Year | | | 5
Year | | | 10
Year | |
Large Cap Growth Fund Class N | | 31.62 | % | | (3.62 | )% | | (0.26 | )% | | (4.86 | )% |
Large Cap Growth Fund Class I | | 32.17 | | | (3.36 | ) | | (0.01 | ) | | (4.17 | ) |
Russell 1000® Growth Index | | 37.21 | | | (1.89 | ) | | 1.63 | | | (3.99 | ) |
Performance cited represents past performance. Past performance does not guarantee future results and current performance may be lower or higher than the data quoted. Results shown are average annual total returns, which assume reinvestment of dividends and capital gains. Investment returns and principal will fluctuate and you may have a gain or loss when you sell shares. For the most current month-end performance information, please call 1-800-742-7272, or visit our Web site at www.williamblairfunds.com. From time to time, the investment advisor may waive fees or reimburse expenses for the Fund. Without these waivers, performance would be lower. Class N shares are available to the general public without a sales load. Class I shares are available to certain institutional investors and advisory clients of William Blair & Company, L.L.C., without a sales load or distribution (12b-1) or service fees.
The performance highlights and graph presented above do not reflect the deduction of taxes that a shareholder would pay on fund distributions or the redemption of fund shares.
The Russell 1000® Growth Index consists of large capitalization companies with above average price-to-book ratios and forecasted growth rates.
This report identifies the Fund’s investments on December 31, 2009. These holdings are subject to change. Not all stocks in the Fund performed the same, nor is there any guarantee that these stocks will perform as well in the future. Market forecasts provided in this report may not necessarily come to pass.
Sector Diversification (unaudited)
The sector diversification shown is based on the total long-term securities.
12 Annual Report | December 31, 2009 |
Large Cap Growth Fund
Portfolio of Investments, December 31, 2009 (all dollar amounts in thousands)
| | | | | |
Issuer | | Shares | | Value |
| | |
Common Stocks | | | | | |
Information Technology—35.1% | | | | | |
*Activision Blizzard, Inc. | | 31,350 | | $ | 348 |
Amphenol Corporation | | 10,500 | | | 485 |
*Apple, Inc. | | 6,375 | | | 1,344 |
*Broadcom Corporation | | 19,050 | | | 599 |
*Cognizant Technology Solutions Corporation | | 10,300 | | | 467 |
*EMC Corporation | | 37,250 | | | 651 |
*Google, Inc. | | 2,380 | | | 1,476 |
Hewlett-Packard Company | | 25,245 | | | 1,300 |
*McAfee, Inc. | | 14,750 | | | 598 |
Microsoft Corporation | | 68,385 | | | 2,085 |
Qualcomm Incorporated | | 27,765 | | | 1,284 |
| | | | | |
| | | | | 10,637 |
| | | | | |
Industrials—15.3% | | | | | |
Danaher Corporation | | 9,672 | | | 727 |
Goodrich Corporation | | 9,050 | | | 582 |
J. B. Hunt Transport Services, Inc. | | 14,970 | | | 483 |
Rockwell Automation, Inc. | | 14,750 | | | 693 |
Roper Industries, Inc. | | 10,050 | | | 526 |
United Parcel Service, Inc. | | 17,920 | | | 1,028 |
W.W. Grainger, Inc. | | 6,350 | | | 615 |
| | | | | |
| | | | | 4,654 |
| | | | | |
Health Care—13.6% | | | | | |
Allergan, Inc. | | 7,865 | | | 496 |
Baxter International, Inc. | | 22,410 | | | 1,315 |
*Celgene Corporation | | 13,890 | | | 773 |
*Medco Health Solutions, Inc. | | 8,700 | | | 556 |
*Thermo Fisher Scientific Inc. | | 20,445 | | | 975 |
| | | | | |
| | | | | 4,115 |
| | | | | |
Consumer Discretionary—11.3% | | | | | |
*Discovery Communications, Inc. | | 19,200 | | | 589 |
Johnson Controls, Inc. | | 19,450 | | | 530 |
*Kohl’s Corporation | | 13,596 | | | 733 |
McDonald’s Corporation | | 10,935 | | | 683 |
*O’Reilly Automotive, Inc. | | 10,380 | | | 396 |
Yum! Brands, Inc. | | 14,100 | | | 493 |
| | | | | |
| | | | | 3,424 |
| | | | | |
*Non-income producing securities
† = U.S. listed foreign security
| | | | | |
Issuer | | Shares | | Value |
| | |
Common Stocks—(continued) | | | | | |
Energy—7.2% | | | | | |
Apache Corporation | | 3,715 | | $ | 383 |
EOG Resources, Inc. | | 3,970 | | | 386 |
Schlumberger Limited† | | 12,130 | | | 790 |
Suncor Energy Inc.† | | 17,180 | | | 607 |
| | | | | |
| | | | | 2,166 |
| | | | | |
Consumer Staples—6.9% | | | | | |
Colgate-Palmolive Company | | 9,080 | | | 746 |
CVS Caremark Corporation | | 6,810 | | | 219 |
Mead Johnson Nutrition Company | | 3,750 | | | 164 |
PepsiCo, Inc. | | 16,000 | | | 973 |
| | | | | |
| | | | | 2,102 |
| | | | | |
Financials—5.7% | | | | | |
CME Group, Inc. | | 2,020 | | | 679 |
The Goldman Sachs Group, Inc. | | 2,607 | | | 440 |
Invesco Ltd.† | | 26,150 | | | 614 |
| | | | | |
| | | | | 1,733 |
| | | | | |
Materials—4.1% | | | | | |
*Freeport-McMoRan Copper & Gold Inc. | | 3,950 | | | 317 |
Praxair, Inc. | | 11,625 | | | 934 |
| | | | | |
| | | | | 1,251 |
| | | | | |
Total Common Stocks—99.2%
(cost $25,289) | | | 30,082 |
Cash and other assets, less liabilities—0.8% | | | 229 |
| | | | | |
Net assets—100.0% | | $ | 30,311 |
| | | | | |
See accompanying Notes to Financial Statements.
December 31, 2009 | William Blair Funds 13 |

Michael P. Balkin

Karl W. Brewer
SMALL CAP GROWTH FUND
The Small Cap Growth Fund invests primarily in common stocks of small domestic growth companies that the Advisor expects to have solid growth in earnings.
AN OVERVIEW FROM THE PORTFOLIO MANAGERS
How did the Fund perform during the past year? How did the Fund’s performance compare to its benchmark?
The Small Cap Growth Fund increased 69.55% on a total return basis (Class N shares) for the 12 months ended December 31, 2009. By comparison the Fund’s benchmark, the Russell 2000® Growth Index, gained 34.47%.
The past twelve months stand in stark contrast to the prior twelve month period. The Russell 2000® Growth Index returned 34.5% during 2009 after rallying 81.0% from its March 2009 low. The crisis in confidence that ensued after the September 2008 Lehman Brothers collapse led to a freeze in consumer and business spending. This led to further compression in stock valuations and draconian earnings expectations. However, the fourth quarter of 2008 and first quarter of 2009 proved to be the worst as the pace of economic decline slowed and eventually improved throughout 2009. The massive amounts of government stimulus—from various liquidity programs for the mortgage and consumer lending market to its industry-specific assistance to the financial and automotive industries—provided the necessary boost to economic activity during a deep trough in private consumption.
From a style perspective, the market’s rally this year saw many of 2008’s underperformers become the best performers in 2009. Underlying this trend was the market’s preference for stocks with lower market caps, stocks with lower valuations and stocks with more economic cyclicality. From a sector perspective, the Russell 2000® Growth Index was led by Information Technology, 60%, and Consumer Discretionary, 59%, as well as the commodity-oriented sectors, Energy, 43%, and Materials, 48%. Financials, 10%, Industrials, 12%, and Healthcare, 22%, were the worst performers in the small cap growth market.
The Small Cap Growth Fund’s significant outperformance of its benchmark and peers during 2009 is a testament to sticking to one’s investment style even when it may be out of favor in the market over shorter periods of time. As we discussed in past letters, one such time period was from mid-2007 to mid-2008 when the market punished our valuation sensitivity, our tendency to “go against the grain” at times, and our typical overweight to smaller small cap stocks. But staying the course with many of our investments during the downturn paid off in spades this year. To that end, half of the Fund’s top ten contributors for 2009 were originally purchased in 2004 or earlier, and only two were purchased in 2008 or later.
Overall, the Fund’s outperformance is attributable to strong stock selection, our style coming back into favor, and sector positioning. From a stock selection perspective, the Fund’s holdings beat their sector peers in every major sector within the Russell 2000® Growth Index. This dynamic was strongest within the Information Technology, Consumer Discretionary, Healthcare, Financials and Industrials sectors. From a style perspective, our typical overweight to the smaller end of the small cap growth market, our valuation sensitivity (i.e. overweight to lower-valued stocks versus the benchmark), and our contrarian streak were all meaningful drivers of the outperformance. Finally, although somewhat overlapping with the style effect, the Fund’s sector positioning boosted relative returns as well. Much of the sector positioning was driven by our style and bottom-up portfolio construction process. Coming into 2009, this process had taken us to an overweight in Consumer Discretionary and Information Technology, and to an underweight in Healthcare and Industrials. All of these proved to be beneficial in 2009.
14 Annual Report | December 31, 2009 |
Two of the leading contributors to Fund returns in 2009 were Jarden Corporation and DG Fastchannel, Inc. These two stocks were both significant detractors of performance in 2008 and are good examples of our conviction to stay the course in companies that we felt had good long term fundamentals. Having conviction in company-specific fundamentals proved beneficial as both stocks were large detractors from return in 2008, and were originally purchased in 2004 and 2006, respectively. Jarden Corporation, a diversified consumer products company, benefitted from improved sentiment toward the consumer and a realization that Jarden Corporation’s fundamentals were perhaps more resilient than many had expected a year earlier. DG Fastchannel, Inc, an electronic distributor of radio and television advertisements, performed well during the year as the previously underappreciated trend towards high-definition TV advertisements increased the company’s earnings throughout the year.
CardioNet, Inc. and InnerWorkings, Inc. were two of the largest detractors from return during the year. CardioNet, Inc., a medical device company, performed poorly during the year as reimbursement cuts by Medicare and commercial health plans for the company’s mobile heart rhythm monitoring device significantly reduced profitability. InnerWorkings, Inc., which provides outsourced printing solutions for its corporate clients, underperformed during the year as many customers kept print-related expenditures in check throughout the year.
For the fourth quarter specifically, the Fund modestly trailed the benchmark. It appeared profit taking could be partly to blame, especially among the smaller stocks in the Russell 2000® Growth Index, which underperformed the benchmark return by over 4.0%. From a stock selection perspective, the Fund’s relative laggards in the Consumer Discretionary, Financials and Consumer Staples sectors overshadowed positive stock selection in the Industrials and Information Technology sectors.
Our outlook for the market remains relatively unchanged from three months ago. We believe a “stock pickers market” is in order as individual company fundamentals should drive stock prices going forward. This stands in stark contrast to the past two years when macro events and sentiment whipsawed individual stocks and the overall market in 2008 and 2009. Current earnings expectations for 2010 represent significant growth over 2009 earnings. With continued improvement on the economic front, many of these individual company expectations are well within reach. While valuations for many stocks are still at or below long-term averages, some stocks are already discounting lofty earnings growth. We think that this type of environment plays well to our style of bottom-up active management with a discerning eye towards valuations that can produce attractive risk/reward opportunities.
Inflation expectations, interest rate moves by the Federal Reserve, changes in the employment picture, and the outlook for housing and consumer spending likely will occupy the headlines during 2010. In addition, the government will continue to wrestle with how and when to unwind its liquidity programs and other policy initiatives. While factoring various economic scenarios into our bottom-up analysis, we remain focused on finding great companies with solid competitive positions at attractive valuations. We believe these companies will be the market share gainers coming out of this recession and those that should sustain above-average growth over the long term.
December 31, 2009 | William Blair Funds 15 |
Small Cap Growth Fund
Performance Highlights (unaudited)
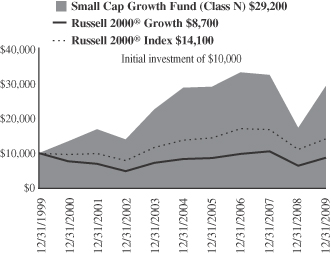
Average Annual Total Return at 12/31/2009
| | | | | | | | | | | | |
| | | 1
Year | | | 3
Year | | | 5
Year | | | 10
Year | |
Small Cap Growth Fund Class N | | 69.55 | % | | (4.11 | )% | | 0.36 | % | | 11.32 | % |
Small Cap Growth Fund Class I | | 70.02 | | | (3.84 | ) | | 0.64 | | | 11.60 | |
Russell 2000® Growth Index | | 34.47 | | | (4.00 | ) | | 0.87 | | | (1.37 | ) |
Russell 2000® Index | | 27.17 | | | (6.07 | ) | | 0.51 | | | 3.51 | |
Performance cited represents past performance. Past performance does not guarantee future results and current performance may be lower or higher than the data quoted. Results shown are average annual total returns, which assume reinvestment of dividends and capital gains. Investment returns and principal will fluctuate and you may have a gain or loss when you sell shares. For the most current month-end performance information, please call 1-800-742-7272, or visit our Web site at www.williamblairfunds.com. Investing in smaller companies involves special risks, including higher volatility and lower liquidity. From time to time, the investment advisor may waive fees or reimburse expenses for the Fund. Without these waivers, performance would be lower. Class N shares are available to the general public without a sales load. Class I shares are available to certain institutional investors and advisory clients of William Blair & Company, L.L.C., without a sales load or distribution (12b-1) or service fees.
The performance highlights and graph presented above do not reflect the deduction of taxes that a shareholder would pay on fund distributions or the redemption of fund shares.
The Russell 2000® Growth Index consists of small-capitalization companies with above average price-to-book ratios and forecasted growth rates.
The Russell 2000® Index is an unmanaged composite of the smallest 2000 stocks of the Russell 3000® Index.
This report identifies the Fund’s investments on December 31, 2009. These holdings are subject to change. Not all stocks in the Fund performed the same, nor is there any guarantee that these stocks will perform as well in the future. Market forecasts provided in this report may not necessarily come to pass.
Sector Diversification (unaudited)
The sector diversification shown is based on the total long-term securities.
16 Annual Report | December 31, 2009 |
Small Cap Growth Fund
Portfolio of Investments, December 31, 2009 (all dollar amounts in thousands)
| | | | | |
Issuer | | Shares | | Value |
| | |
Common Stocks | | | | | |
Consumer Discretionary—24.7% | | | | | |
*American Apparel, Inc. | | 2,450,972 | | $ | 7,598 |
Belo Corp. | | 1,350,800 | | | 7,348 |
*Bridgepoint Education, Inc. | | 496,011 | | | 7,450 |
*Career Education Corporation | | 468,426 | | | 10,919 |
*Chinacast Education Corporation | | 1,139,811 | | | 8,617 |
*Coinstar, Inc. | | 454,700 | | | 12,632 |
*Dolan Media Company | | 1,442,666 | | | 14,730 |
*Duckwall-ALCO Stores, Inc. | | 460,853 | | | 7,088 |
*Gaiam, Inc. | | 1,511,007 | | | 11,620 |
*Grand Canyon Education, Inc. | | 457,010 | | | 8,688 |
*Imax Corporation† | | 821,623 | | | 10,927 |
Jarden Corporation | | 685,917 | | | 21,202 |
*Kona Grill, Inc. | | 1,042,992 | | | 3,139 |
*Lincoln Educational Services Corporation | | 521,703 | | | 11,305 |
*Lions Gate Entertainment Corporation† | | 1,692,532 | | | 9,834 |
*MDC Partners, Inc.† | | 1,078,488 | | | 8,995 |
*Motorcar Parts of America, Inc. | | 218,922 | | | 1,106 |
*P.F. Chang’s China Bistro, Inc. | | 236,094 | | | 8,950 |
Strayer Education, Inc. | | 35,295 | | | 7,500 |
*U.S. Auto Parts Network Inc. | | 157,751 | | | 829 |
*WMS Industries, Inc. | | 210,000 | | | 8,400 |
| | | | | |
| | | | | 188,877 |
| | | | | |
Information Technology—24.5% | | | | | |
*Alliance Data Systems Corporation | | 230,632 | | | 14,896 |
*Banctec, Inc.**S | | 603,327 | | | 3,017 |
*Cavium Networks, Inc. | | 290,600 | | | 6,925 |
*DG Fastchannel, Inc | | 746,690 | | | 20,855 |
*Euronet Worldwide, Inc. | | 294,134 | | | 6,456 |
*Genpact Limited† | | 695,000 | | | 10,356 |
*Inuvo, Inc | | 8,037,127 | | | 2,733 |
*j2 Global Communications, Inc. | | 522,448 | | | 10,632 |
*Lionbridge Technologies, Inc. | | 4,293,158 | | | 9,874 |
*Silicon Laboratories, Inc. | | 243,023 | | | 11,748 |
Solera Holdings, Inc. | | 407,200 | | | 14,663 |
*Sonic Solutions | | 623,286 | | | 7,373 |
*The Ultimate Software Group, Inc. | | 550,885 | | | 16,179 |
United Online, Inc. | | 2,764,710 | | | 19,878 |
*ValueClick, Inc. | | 1,035,500 | | | 10,479 |
*Vertro, Inc. | | 4,333,215 | | | 1,820 |
*VistaPrint Limited† | | 161,668 | | | 9,160 |
*WNS Holdings Limited—ADR | | 683,706 | | | 10,290 |
| | | | | |
| | | | | 187,334 |
| | | | | |
Health Care—14.8% | | | | | |
*Air Methods Corporation | | 234,393 | | | 7,880 |
*American Medical Systems Holdings, Inc. | | 736,400 | | | 14,205 |
*CardioNet, Inc. | | 1,344,381 | | | 7,986 |
*Eurand NV† | | 573,606 | | | 7,400 |
*Haemonetics Corporation | | 168,300 | | | 9,282 |
*Healthways, Inc. | | 647,994 | | | 11,884 |
*Iris International, Inc. | | 459,592 | | | 5,681 |
*Kensey Nash Corporation | | 422,340 | | | 10,770 |
*LCA-Vision Inc. | | 948,955 | | | 4,859 |
*Natus Medical Incorporated | | 98,601 | | | 1,458 |
*Orthovita, Inc. | | 2,223,061 | | | 7,803 |
*Providence Service Corporation | | 547,293 | | | 8,647 |
*SurModics, Inc. | | 395,148 | | | 8,954 |
*Trinity Biotech plc—ADR | | 1,501,163 | | | 6,080 |
| | | | | |
| | | | | 112,889 |
| | | | | |
| | | | | |
Issuer | | Shares | | Value |
| | |
Common Stocks—(continued) | | | | | |
Industrials—11.6% | | | | | |
*Allegiant Travel Company | | 109,720 | | $ | 5,175 |
*Cenveo, Inc. | | 805,591 | | | 7,049 |
*FTI Consulting, Inc. | | 239,000 | | | 11,271 |
*Graftech International Ltd. | | 502,400 | | | 7,812 |
*InnerWorkings, Inc. | | 1,025,195 | | | 6,049 |
*KAR Auction Services, Inc. | | 686,027 | | | 9,460 |
MSC Industrial Direct Co., Inc. | | 260,400 | | | 12,239 |
*Odyssey Marine Exploration, Inc. | | 2,677,030 | | | 3,775 |
*On Assignment, Inc. | | 1,516,133 | | | 10,840 |
Transdigm Group, Inc. | | 308,214 | | | 14,637 |
| | | | | |
| | | | | 88,307 |
| | | | | |
Financials—9.9% | | | | | |
*Affiliated Managers Group, Inc. | | 132,682 | | | 8,936 |
Allied World Assurance Company Holdings, Ltd† | | 190,700 | | | 8,786 |
*Cowen Group, Inc. | | 1,697,817 | | | 10,051 |
*FBR Capital Markets Corporation | | 772,931 | | | 4,777 |
*FirstService Corporation† | | 530,771 | | | 10,148 |
*Marlin Business Services Corporation | | 988,701 | | | 7,840 |
*National Financial Partners Corporation | | 1,493,472 | | | 12,082 |
*Penson Worldwide, Inc. | | 733,100 | | | 6,642 |
United Western Bancorp, Inc. | | 2,342,215 | | | 6,464 |
| | | | | |
| | | | | 75,726 |
| | | | | |
Energy—4.9% | | | | | |
*Carrizo Oil & Gas, Inc. | | 365,200 | | | 9,674 |
*Comstock Resources, Inc. | | 137,660 | | | 5,585 |
*Concho Resources, Inc. | | 301,013 | | | 13,515 |
*Oil States International, Inc. | | 208,800 | | | 8,204 |
| | | | | |
| | | | | 36,978 |
| | | | | |
Material—2.6% | | | | | |
Celanese Corporation | | 292,700 | | | 9,396 |
*Horsehead Holding Corp. | | 817,300 | | | 10,421 |
| | | | | |
| | | | | 19,817 |
| | | | | |
Consumer Staples—1.8% | | | | | |
*Overhill Farms, Inc. | | 1,184,052 | | | 5,754 |
*Smart Balance, Inc. | | 1,301,307 | | | 7,808 |
| | | | | |
| | | | | 13,562 |
| | | | | |
Telecommunication Services—1.2% | | | | | |
*Cbeyond, Inc. | | 570,800 | | | 8,990 |
| | | | | |
Total Common Stocks—96.0%
(cost $633,301) | | | 732,480 |
| | | | | |
Preferred Stock | | | | | |
Grubb & Ellis Company, 12.0%
Series “144A”S | | 90,609 | | | 8,834 |
| | | | | |
Total Preferred Stock—1.2%
(cost $9,061) | | | 8,834 |
| | | | | |
Investment in Warrants | | | | | |
Motorcar Parts of America, Inc.,
2012, $15.00** | | 111,575 | | | — |
| | | | | |
Total Investment in Warrants—0.0%
(cost $0) | | | — |
| | | | | |
| | |
Investment in Affiliate | | | | | |
William Blair Ready Reserves Fund | | 3,296,768 | | | 3,297 |
| | | | | |
Total Investment in Affiliate—0.4%
(cost $3,297) | | | 3,297 |
| | | | | |
See accompanying Notes to Financial Statements.
December 31, 2009 | William Blair Funds 17 |
Small Cap Growth Fund
Portfolio of Investments, December 31, 2009 (all dollar amounts in thousands)
| | | | | | | |
Issuer | | Principal
Amount | | Value | |
| | |
Short-Term Investment | | | | | | | |
American Express Credit Corp., Demand Note,
VRN, 0.081%, due 1/4/10 | | $ | 500 | | $ | 500 | |
| | | | | | | |
Total Short-Term Investment—0.1%
(cost $500) | | | 500 | |
| | | | | | | |
| | |
Repurchase Agreement | | | | | | | |
Fixed Income Clearing Corporation,
0.000% dated 12/31/09, due 1/4/10, repurchase price $23,061, collateralized by FNMA, 5.000%, due 2/13/17 | | $ | 23,061 | | | 23,061 | |
| | | | | | | |
Total Repurchase Agreement—3.0%
(cost $23,061) | | | 23,061 | |
| | | | | | | |
Total Investments—100.7%
(cost $669,220) | | | 768,172 | |
Liabilities, plus cash and other assets—(0.7)% | | | (5,374 | ) |
| | | | | | | |
Net assets—100.0% | | $ | 762,798 | |
| | | | | | | |
* Non-income producing securities
† = U.S. listed foreign security
ADR = American Depository Receipt
VRN = Variable Rate Note
** = Fair valued pursuant to Valuation Procedures adopted by the Board of Trustees. This holding represents 0.40% of the Fund’s net assets at December 31, 2009.
S = These securities were also deemed illiquid pursuant to the Fund/Advisor’s Liquidity Procedures. These holdings represent 1.55% of the Fund’s net assets at December 31, 2009.
See accompanying Notes to Financial Statements.
18 Annual Report | December 31, 2009 |
Small Cap Growth Fund
If the Fund’s portfolio holdings represent ownership of 5% or more of the voting securities of a company, the company is deemed to be a affiliate as defined in the Investment Company Act of 1940. The Small Cap Growth Fund had the following transactions during the year ended December 31, 2009 with companies deemed affiliated during the year or at December 31, 2009:
| | | | | | | | | | | | | | |
| | | Share Activity | | Year Ended December 31, 2009 |
| | | | | | | | | | | (in thousands) |
Security Name | | Balance
12/31/2008 | | Purchases | | Sales | | Balance
12/31/2009 | | Value | | Dividends
Included in
Income |
Amerigon | | 1,181,267 | | 243,400 | | 1,424,667 | | — | | $ | — | | $ | — |
pCardioNet, Inc. | | 354,961 | | 1,519,781 | | 530,361 | | 1,344,381 | | | 7,986 | | | — |
pDuckwall-ALCO Stores, Inc. | | 359,361 | | 101,492 | | — | | 460,853 | | | 7,088 | | | — |
pGaiam, Inc. | | — | | 1,511,007 | | — | | 1,511,007 | | | 11,620 | | | — |
Granite City Food & Brewery, Ltd. | | 1,137,260 | | — | | 1,137,260 | | — | | | — | | | — |
pInuvo, Inc | | 2,639,070 | | 5,398,057 | | — | | 8,037,127 | | | 2,733 | | | — |
pKona Grill, Inc.* | | 744,995 | | 297,997 | | — | | 1,042,992 | | | 3,139 | | | — |
pLCA-Vision Inc. | | — | | 948,955 | | — | | 948,955 | | | 4,859 | | | — |
pLionbridge Technologies, Inc. | | — | | 4,293,158 | | — | | 4,293,158 | | | 9,874 | | | — |
pMarlin Business Services Corp. | | 860,992 | | 163,033 | | 35,324 | | 988,701 | | | 7,840 | | | — |
MDC Partners, Inc. | | 922,001 | | 959,963 | | 803,476 | | 1,078,488 | | | 8,995 | | | — |
Motorcar Parts of America, Inc. | | 678,936 | | 97,815 | | 557,829 | | 218,922 | | | 1,106 | | | — |
Optimal Group, Inc. | | 1,615,192 | | — | | 1,615,192 | | — | | | — | | | — |
pOverhill Farms, Inc. | | 1,215,052 | | 293,000 | | 324,000 | | 1,184,052 | | | 5,754 | | | — |
Physicians Formula Holdings, Inc. | | 862,320 | | 278,889 | | 1,141,209 | | — | | | — | | | — |
Providence Service Corporation | | 560,693 | | 737,822 | | 751,222 | | 547,293 | | | 8,647 | | | — |
Sonic Solutions | | 2,661,273 | | 780,416 | | 2,818,403 | | 623,286 | | | 7,373 | | | — |
pUnited Western Bancorp, Inc. | | — | | 2,342,215 | | — | | 2,342,215 | | | 6,464 | | | — |
pVertro, Inc. | | 3,885,215 | | 448,000 | | — | | 4,333,215 | | | 1,820 | | | — |
Virtusa Corporation | | 1,307,147 | | 3,700 | | 1,310,847 | | — | | | — | | | — |
Web.com Group, Inc. | | 2,004,499 | | 227,647 | | 2,232,146 | | — | | | — | | | — |
* 2 per 5 rights offer on 4/15/2009.
p Affiliated company at December 31, 2009. The Small Cap Growth Fund’s total value in companies deemed to be affiliated at December 31, 2009 was $69,177 (in thousands).
See accompanying Notes to Financial Statements.
December 31, 2009 | William Blair Funds 19 |

Robert C. Lanphier, IV

David P. Ricci
MID CAP GROWTH FUND
The Mid Cap Growth Fund primarily invests in a diversified portfolio of common stocks of medium-sized domestic growth companies.
AN OVERVIEW FROM THE PORTFOLIO MANAGERS
How did the Fund perform during the past year? How did the Fund’s performance compare to its benchmark?
The Mid Cap Growth Fund posted a 36.03% increase on a total return basis (Class N Shares) for the 12 months ended December 31, 2009. By comparison, the Fund’s benchmark, the Russell Midcap® Growth Index, gained 46.29% during the period.
The past twelve months stand in stark contrast to the prior twelve month period. The Russell Midcap® Growth Index returned 46.29% during 2009 after rallying 79.3% from its March 2009 low. The crisis in confidence that ensued after the September 2008 Lehman Brothers collapse led to a freeze in consumer and business spending. This led to further compression in stock valuations and draconian earnings expectations. However, the fourth quarter of 2008 and first quarter of 2009 proved to be the worst as the pace of economic decline slowed and then eventually improved throughout 2009. The massive amounts of fiscal and monetary stimulus across the globe incentivized a bias toward risk taking and provided the necessary boost to economic activity during a deep falloff in private consumption.
From a style perspective, the market’s rally this year saw 2008’s underperformers become the best performers in 2009. Underlying this trend was the market’s preference for lower market cap stocks, stocks with cheaper valuations and stocks with more economic cyclicality. From a sector perspective, the Russell Midcap® Growth Index was led by commodity-oriented sectors, Energy, 71.8%, and Materials, 52.8%, along with Information Technology, 68.8%, and Consumer Discretionary, 48.6%. Healthcare, 39.4%, Financials, 34.2%, Consumer Staples, 31.0%, and Industrials, 29.0%, while turning in solid absolute returns, underperformed the broader mid cap growth market.
The Mid Cap Growth Fund faced some very difficult style headwinds during 2009. While the market’s preference for lower market cap stocks benefitted relative performance on the margin, its preference for lower-valued stocks where investor fear had been excessive, and for those with more economic sensitivity, more than offset this and were the primary reasons for the underperformance. While we are not happy with the underperformance this year, we have done quite well over the trailing two-year period. Given the extreme sell-off and eventual swift rally off the bottom, we feel taking a two-year time horizon may be appropriate. This is especially important given that macro variables, and not company fundamentals, were primarily responsible for many stock-specific and overall market returns over this period. Therefore, when taken as a whole, this two-year period may be a more rational period to examine—especially compared to either year taken in isolation.
From a more traditional, sector-based perspective, some of the Fund’s Information Technology and Industrials holdings pulled down relative results. While some of the Information Technology woes were stock-specific issues, much of the Industrials underperformance was due to some of our business service companies not keeping pace with their more cyclically-oriented Industrials peers. On the other hand, stock selection in the Consumer Discretionary and Financials sectors were meaningfully positive contributors toward relative performance.
For the fourth quarter specifically, the Fund’s underperformance was driven primarily by industry factors and by stock selection. The Fund’s allocation to post-secondary education
20 Annual Report | December 31, 2009 |
stocks detracted as regulatory concerns regarding tuition pricing put pressure on share prices during the quarter. In addition, the Fund’s business service holdings within Industrials detracted, as they did for 2009 as a whole. Finally, the typical underweight to the high-beta semiconductor industry within Information Technology detracted as well. From a stock selection perspective, certain stocks in the Information Technology and Healthcare sectors detracted, while stock selection in Consumer Staples helped buoy relative results.
Specific stocks boosting relative results this year were Dick’s Sporting Goods and Cognizant Technology Solutions. Dick’s Sporting Goods, a leading retailer of sporting goods and athletic apparel, reported solid earnings during the year and fourth quarter as the retail sales environment improved and as management controlled expenses. The outlook for the company remains strong as the company rolls out additional stores and as many of their sporting-goods-retailing peers exit the recession in a weakened capacity. Cognizant Technology Solutions, an offshore provider of IT application development and management services, contributed to Fund performance in 2009 and the fourth quarter specifically. Improving business momentum was driven by a stabilization in corporate budgets and a heightened pursuit of cost savings by the company’s corporate customers.
Flir Systems and Trimble Navigation both detracted from relative performance during 2009. Flir Systems, a thermal-imaging technology company, performed poorly due to potential cuts in defense spending and as the recession pressured sales of the company’s thermal imaging cameras in the non-government side of the business. We sold the position in Flir Systems as we believe the company has grown increasingly dependent on the success of its government segment, a less predictable business. Trimble Navigation develops and markets global positioning systems (GPS) in a variety of commercial and governmental applications. The company’s engineering and construction segment was the main drag on overall company results, as many corporations and government agencies slowed or halted many construction projects during the recession. The overall environment has improved, and we continue to own the stock as we feel this is a well-managed company set to benefit from increased use of its GPS technologies in the construction, infrastructure, agriculture and fleet management markets both domestically and abroad.
Looking forward, our outlook for the market remains relatively unchanged from three months ago. We believe a “stock pickers market” is in order as individual company fundamentals should drive stock prices going forward. This differs greatly from the past two years when macro events and sentiment whipsawed individual stocks and the overall market in 2008 and 2009. Current earnings expectations for 2010 represent significant growth over 2009 earnings. With continued improvement on the economic front, many of these individual company expectations are well within reach. In addition, valuations for many stocks are still at or below long-term averages. But on the other hand, some stocks are trading at elevated valuations and are discounting lofty earnings growth, which is another reason we feel bottom-up active managers should perform well in this environment.
Inflation expectations, interest rate moves by the Federal Reserve, changes in the employment picture, and the outlook for housing and consumer spending likely will occupy the headlines during 2010. In addition, the government will continue to wrestle with how and when to unwind its liquidity programs and other policy initiatives. While factoring various economic scenarios into our bottom-up analysis, we remain focused on finding great companies with solid competitive positions at attractive valuations. We believe these companies will be the market share gainers coming out of this recession and those that should sustain above-average growth over the long term.
December 31, 2009 | William Blair Funds 21 |
Mid Cap Growth Fund
Performance Highlights (unaudited)
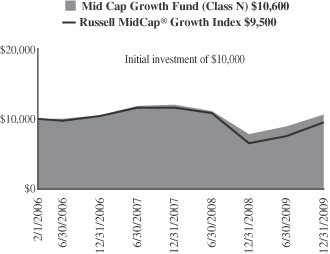
Average Annual Total Return at 12/31/2009
| | | | | | | | | |
| | | 1
Year | | | 3
Year | | | Since
Inception(a) | |
Mid Cap Growth Fund Class N | | 36.03 | % | | 0.59 | % | | 1.61 | % |
Mid Cap Growth Fund Class I | | 36.36 | | | 0.88 | | | 1.91 | |
Russell MidCap® Growth Index | | 46.29 | | | (3.18 | ) | | (1.39 | ) |
| | (a) | | For the period from February 1, 2006 (Commencement of Operations) to December 31, 2009. |
Performance cited represents past performance. Past performance does not guarantee future results and current performance may be lower or higher than the data quoted. Results shown are average annual total returns, which assume reinvestment of dividends and capital gains. Investment returns and principal will fluctuate and you may have a gain or loss when you sell shares. For the most current month-end performance information, please call 1-800-742-7272, or visit our Web site at www.williamblairfunds.com. Investing in smaller and medium capitalization companies involves special risks, including higher volatility and lower liquidity. Mid Cap stocks are also more sensitive to purchase/sale transactions and changes in the issuer’s financial condition. From time to time, the investment advisor may waive fees or reimburse expenses for the Fund. Without these waivers, performance would be lower. Class N shares are available to the general public without a sales load. Class I shares are available to certain institutional investors and advisory clients of William Blair & Company, L.L.C., without a sales load or distribution (12b-1) or service fees.
The performance highlights and graph presented above do not reflect the deduction of taxes that a shareholder would pay on fund distributions or the redemption of fund shares.
The Russell MidCap® Growth Index is an index that is constructed to provide a comprehensive and unbiased barometer of the mid-cap growth market.
This report identifies the Fund’s investments on December 31, 2009. These holdings are subject to change. Not all stocks in the Fund performed the same, nor is there any guarantee that these stocks will perform as well in the future. Market forecasts provided in this report may not necessarily come to pass.
Sector Diversification (unaudited)
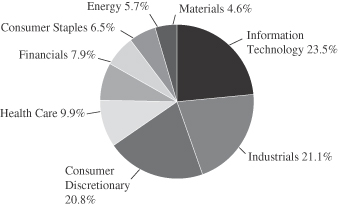
The sector diversification shown is based on the total long-term securities.
22 Annual Report | December 31, 2009 |
Mid Cap Growth Fund
Portfolio of Investments, December 31, 2009 (all dollar amounts in thousands)
| | | | | |
Issuer | | Shares | | Value |
| | |
Common Stocks | | | | | |
Information Technology—22.8% | | | | | |
*Alliance Data Systems Corporation | | 30,350 | | $ | 1,960 |
Amphenol Corporation—Class “A” | | 20,900 | | | 965 |
*Broadcom Corporation | | 34,750 | | | 1,093 |
*Cognizant Technology Solutions Corporation | | 15,590 | | | 706 |
*Concur Technologies, Inc. | | 43,030 | | | 1,840 |
*Dolby Laboratories, Inc. Class “A” | | 28,070 | | | 1,340 |
*Genpact Limited† | | 99,000 | | | 1,475 |
*McAfee, Inc. | | 30,000 | | | 1,217 |
*Silicon Laboratories, Inc. | | 25,646 | | | 1,240 |
Solera Holdings, Inc. | | 39,200 | | | 1,412 |
*Trimble Navigation Limited | | 47,700 | | | 1,202 |
*Verisign, Inc. | | 29,500 | | | 715 |
*VistaPrint Limited† | | 17,230 | | | 976 |
| | | | | |
| | | | | 16,141 |
| | | | | |
Industrials—20.5% | | | | | |
Fastenal Company | | 57,575 | | | 2,397 |
*FTI Consulting, Inc. | | 20,600 | | | 971 |
J.B. Hunt Transport Services, Inc. | | 24,410 | | | 788 |
*Iron Mountain Incorporated | | 46,920 | | | 1,068 |
Manpower, Inc. | | 18,590 | | | 1,015 |
MSC Industrial Direct Co., Inc. | | 32,800 | | | 1,542 |
Precision Castparts Corp. | | 7,750 | | | 855 |
Robert Half International, Inc. | | 62,200 | | | 1,663 |
Roper Industries, Inc. | | 24,960 | | | 1,307 |
*Stericycle, Inc. | | 30,930 | | | 1,706 |
TransDigm Group Incorporated | | 24,950 | | | 1,185 |
| | | | | |
| | | | | 14,497 |
| | | | | |
Consumer Discretionary—20.2% | | | | | |
*Bed Bath & Beyond, Inc. | | 36,160 | | | 1,397 |
*Carmax, Inc. | | 59,470 | | | 1,442 |
*Chipotle Mexican Grill, Inc. Class “B” | | 17,500 | | | 1,543 |
DeVry, Inc. | | 16,210 | | | 920 |
*Dick’s Sporting Goods, Inc. | | 123,729 | | | 3,077 |
*Education Management LLC | | 42,700 | | | 940 |
Gentex Corporation | | 63,380 | | | 1,131 |
*O’Reilly Automotive, Inc. | | 39,980 | | | 1,524 |
Strayer Education, Inc. | | 2,045 | | | 435 |
*WMS Industries, Inc. | | 46,540 | | | 1,862 |
| | | | | |
| | | | | 14,271 |
| | | | | |
Health Care—9.6% | | | | | |
*athenahealth, Inc. | | 26,210 | | | 1,186 |
C. R. Bard, Inc. | | 9,000 | | | 701 |
*IDEXX Laboratories, Inc. | | 30,810 | | | 1,646 |
*Illumina, Inc. | | 40,620 | | | 1,245 |
*Intuitive Surgical, Inc. | | 1,320 | | | 400 |
*Mettler-Toledo Holding, Inc. | | 10,070 | | | 1,057 |
*Myriad Genetics, Inc. | | 22,230 | | | 580 |
| | | | | |
| | | | | 6,815 |
| | | | | |
*Non-income producing securities
† = U.S. listed foreign security
| | | | | | |
Issuer | | Shares or
Principal
Amount | | Value |
| | |
Common Stocks —(continued) | | | | | | |
Financials—7.6% | | | | | | |
*Affiliated Managers Group, Inc. | | | 20,575 | | $ | 1,386 |
Greenhill & Co., Inc. | | | 15,920 | | | 1,277 |
HCC Insurance Holdings, Inc. | | | 48,570 | | | 1,359 |
Invesco, Ltd.† | | | 58,113 | | | 1,365 |
| | | | | | |
| | | | | | 5,387 |
| | | | | | |
Consumer Staples—6.2% | | | | | | |
Church & Dwight Co., Inc. | | | 17,700 | | | 1,070 |
*Green Mountain Coffee Roasters, Inc. | | | 32,152 | | | 2,619 |
McCormick & Company, Incorporated | | | 20,300 | | | 733 |
| | | | | | |
| | | | | | 4,422 |
| | | | | | |
Energy—5.5% | | | | | | |
*Cameron International Corporation | | | 17,400 | | | 727 |
*Denbury Resources, Inc. | | | 38,570 | | | 571 |
*Newfield Exploration Company | | | 18,230 | | | 879 |
*Petrohawk Energy Corporation | | | 15,300 | | | 367 |
Range Resources Corporation | | | 14,700 | | | 733 |
*Southwestern Energy Company | | | 13,470 | | | 649 |
| | | | | | |
| | | | | | 3,926 |
| | | | | | |
Materials—4.4% | | | | | | |
Airgas, Inc. | | | 28,900 | | | 1,376 |
Ecolab, Inc. | | | 39,500 | | | 1,761 |
| | | | | | |
| | | | | | 3,137 |
| | | | | | |
Total Common Stocks—96.8%
(cost $55,504) | | | 68,596 |
| | | | | | |
| | |
Investment in Affiliate | | | | | | |
William Blair Ready Reserves Fund | | | 18,724 | | | 19 |
| | | | | | |
Total Investment in Affiliate—0.1%
(cost $19) | | | 19 |
| | | | | | |
| | |
Repurchase Agreement | | | | | | |
Fixed Income Clearing Corporation, 0.000% dated 12/31/09, due 1/4/10, repurchase price $1,996, collateralized by FNMA, 5.000%, due 2/13/17 | | $ | 1,996 | | | 1,996 |
| | | | | | |
Total Repurchase Agreement—2.8%
(cost $1,996) | | | 1,996 |
| | | | | | |
Total Investments—99.7%
(cost $57,519) | | | 70,611 |
Cash and other assets, less liabilities—0.3% | | | 223 |
| | | | | | |
Net assets—100.0% | | $ | 70,834 |
| | | | | | |
See accompanying Notes to Financial Statements.
December 31, 2009 | William Blair Funds 23 |
Karl W. Brewer
Robert C. Lanphier, IV

Matthew A. Litfin
SMALL-MID CAP GROWTH FUND
The Small-Mid Cap Growth Fund primarily invests in a diversified portfolio of common stocks of small and medium-sized U.S. growth companies that the Advisor expects to experience solid growth in earnings.
AN OVERVIEW FROM THE PORTFOLIO MANAGERS
How did the Fund perform during the past year? How did the Fund’s performance compare to its benchmark?
The Small-Mid Cap Growth Fund increased 43.75% on a total return basis (Class N Shares) for the 12 months ended December 31, 2009. By comparison, the Fund’s benchmark, the Russell 2500™ Growth Index, gained 41.66% during the period.
As the year 2009 began, the Federal Reserve and other world central banks had just slashed short-term interest rates to near zero percent in response to an international crisis of credit, liquidity, and confidence that was causing vicious deleveraging by institutions and consumers. Government bailouts of failing global corporations had become daily events, and governments worldwide were introducing unprecedented stimulus programs by running massive budget deficits. Thus, the stock market during the first two months of 2009 continued the steep downward trajectory established during the second half of 2008. Rampant pessimism pervaded the business press and dominated investor dialogue.
In March 2009, however, the stock market reversed course, beginning one of its steepest and swiftest recoveries on record throughout 2009. The Russell 2500™ Growth Index returned 41.66% for the year. All major economic sectors returned at least 20%.
The Consumer sector was one of the best-performing in 2009, up 57.2%; within the Fund, Green Mountain Coffee Roasters, was the strongest Consumer-related stock due to increased adoption of its single-cup coffee system. The Information Technology sector also performed robustly in 2009. VistaPrint Limited was a standout stock selection within that sector as company fundamentals proved its low-cost printing solutions for small businesses were more resilient than investors had expected. The Healthcare sector detracted from the benchmark’s overall performance, as this sector is perceived to be defensive in nature, and the prospect of new, sweeping legislation created uncertainty during the year. Pharmaceutical Product Development Inc., which was affected by lackluster research and development spending by large pharmaceutical companies, and CardioNet Inc., which was impacted by reduced reimbursement rates for its cardiac monitoring devices, were two examples of poorly performing stocks within the Healthcare sector. Stepping back, however, the Small-Mid Cap Growth Fund outperformed its benchmark in 2009, and the main reason was stock selection.
During the fourth quarter specifically, the Fund performed essentially in-line with its Russell 2500™ Growth benchmark. Modestly negative stock-specific drivers within Healthcare and Information Technology were offset by positive stock selection within Consumer Discretionary and Industrials.
One’s outlook for the U.S. stock market will be influenced by one’s view of the causes of the impressive 2009 market rally. There are many potential explanations for the rally, but we offer three here that we believe have merit: i) Chinese central government stimulus programs created domestic demand that spilled over into global production increases; ii) rapid and deep corporate cost-cutting that buoyed companies’ profit margins above investor fears; and iii) a short-term confidence boost among U.S. consumers (from very low levels) due to Federal Reserve stimulus and accommodative monetary policy.
24 Annual Report | December 31, 2009 |
The Small-Mid Cap Growth Fund remains conservatively positioned, as none of these three potential explanations for the 2009 rally are sustainable long-term, in our view. We believe the 2009 rally was strengthened by easy money global central banking policies intended to avert financial disaster. These emergency programs and policies cannot persist long-term, and many of them will likely be rescinded during 2010. This could cause market pain, especially if economic growth stagnates or if business and consumer confidence does not sufficiently redevelop. We are also concerned that inflation could take root, if the Federal Reserve remains too accommodative, too long, while economic growth accelerates. Fed policy decisions over the next few years will be crucial and even more difficult than usual. We also are mindful of potential global instability due to Middle East political and military actions, which could have outsized effects on commodity prices.
As domestic small- and mid-cap growth investors, we are fortunate for two reasons, and they are why we remain confident in the Fund’s prospects. First, the United States remains a hotbed of innovation and risk-taking with a highly educated workforce and a flexible economic and business climate. Second, we can be very selective during our investment process because we have a large number of small- and mid-cap companies to choose from that operate within the large and attractive United States economy.
There are 2,500 public companies within our benchmark, yet we only invest the Fund’s assets in about 70 of them at any one time. Thus, we have the luxury of saying “no” to 35 out of every 36 potential investments, allowing us to focus only on what we believe are the very best companies and stock opportunities.
As we enter 2010 we have not deviated from our historical investment approach, which has a long-term track record of success. Our vigilance regarding the overall U.S. economy and stock market means we continue to focus on higher-quality growth companies. We strive to invest in those companies that are innovating and delighting their customers, those that can fund their growth independent of government support, those whose profit margins are not overly dependent on uncontrollable cost inputs (e.g., commodities), and those that hire management teams with proven track records of reacting quickly and smartly to rapidly changing business conditions in the United States and abroad. Paying the right prices for these kinds of companies remains our daily goal; our success in this regard will largely determine the overall success of the Small-Mid Cap Growth Fund in 2010.
December 31, 2009 | William Blair Funds 25 |
Small-Mid Cap Growth Fund
Performance Highlights (unaudited)

Average Annual Total Return at 12/31/2009
| | | | | | | | | | | | |
| | | 1
Year | | | 3
Year | | | 5
Year | | | Since
Inception(a) | |
Small-Mid Cap Growth Fund Class N | | 43.75 | % | | 0.20 | % | | 4.08 | % | | 5.46 | % |
Small-Mid Cap Growth Fund Class I | | 44.26 | | | 0.47 | | | 4.37 | | | 5.73 | |
Russell 2500™ Growth Index | | 41.66 | | | (3.13 | ) | | 2.00 | | | 3.87 | |
| | (a) | | For the period from December 29, 2003 (Commencement of Operations) to December 31, 2009. | |
Performance cited represents past performance. Past performance does not guarantee future results and current performance may be lower or higher than the data quoted. Results shown are average annual total returns, which assume reinvestment of dividends and capital gains. Investment returns and principal will fluctuate and you may have a gain or loss when you sell shares. For the most current month-end performance information, please call 1-800-742-7272, or visit our Web site at www.williamblairfunds.com. Investing in smaller and medium capitalization companies involves special risks, including higher volatility and lower liquidity. Small and Mid cap stocks are also more sensitive to purchase/sale transactions and changes in the issuer’s financial condition. From time to time, the investment advisor may waive fees or reimburse expenses for the Fund. Without these waivers, performance would be lower. Class N shares are available to the general public without a sales load. Class I shares are available to certain institutional investors and advisory clients of William Blair & Company, L.L.C., without a sales load or distribution (12b-1) or service fees.
The performance highlights and graph presented above do not reflect the deduction of taxes that a shareholder would pay on fund distributions or the redemption of fund shares.
The Russell 2500™ Growth Index measures the performance of those Russell 2500 companies with above average price-to-book ratios and forecasted growth rates.
This report identifies the Fund’s investments on December 31, 2009. These holdings are subject to change. Not all stocks in the Fund performed the same, nor is there any guarantee that these stocks will perform as well in the future. Market forecasts provided in this report may not necessarily come to pass.
Sector Diversification (unaudited)
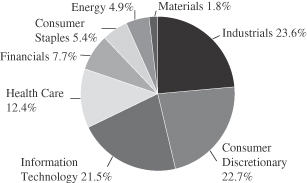
The sector diversification shown is based on the total long-term securities.
26 Annual Report | December 31, 2009 |
Small-Mid Cap Growth Fund
Portfolio of Investments, December 31, 2009 (all dollar amounts in thousands)
| | | | | |
Issuer | | Shares | | Value |
| | |
Common Stocks | | | | | |
Industrials—23.0% | | | | | |
*Allegiant Travel Company | | 61,265 | | $ | 2,890 |
*Cenveo, Inc. | | 140,300 | | | 1,228 |
*Corrections Corporation of America | | 73,155 | | | 1,796 |
*CoStar Group, Inc. | | 47,600 | | | 1,988 |
Fastenal Company | | 82,460 | | | 3,434 |
*FTI Consulting, Inc. | | 41,600 | | | 1,962 |
*Graftech International, Ltd. | | 113,800 | | | 1,770 |
Heidrick & Struggles International, Inc. | | 72,240 | | | 2,257 |
*InnerWorkings, Inc. | | 233,680 | | | 1,379 |
*Iron Mountain Incorporated | | 51,561 | | | 1,173 |
Manpower, Inc. | | 35,650 | | | 1,946 |
*Monster Worldwide, Inc. | | 83,800 | | | 1,458 |
Robert Half International, Inc. | | 110,300 | | | 2,948 |
Roper Industries, Inc. | | 40,700 | | | 2,131 |
*Stericycle, Inc. | | 66,520 | | | 3,670 |
TransDigm Group Incorporated | | 37,800 | | | 1,795 |
| | | | | |
| | | | | 33,825 |
| | | | | |
Consumer Discretionary—22.1% | | | | | |
*Career Education Corporation | | 85,025 | �� | | 1,982 |
*Chipotle Mexican Grill, Inc. Class “B” | | 18,465 | | | 1,628 |
DeVry, Inc. | | 37,965 | | | 2,154 |
*Dick’s Sporting Goods, Inc. | | 175,800 | | | 4,372 |
*Education Management LLC | | 88,200 | | | 1,941 |
Gentex Corporation | | 158,800 | | | 2,835 |
*IMAX Corporation† | | 130,373 | | | 1,734 |
Jarden Corporation | | 91,900 | | | 2,841 |
*K12, Inc. | | 90,750 | | | 1,839 |
*O’Reilly Automotive, Inc. | | 29,550 | | | 1,126 |
*P.F. Chang’s China Bistro, Inc. | | 65,722 | | | 2,491 |
*Steiner Leisure Limited† | | 38,200 | | | 1,519 |
Strayer Education, Inc. | | 9,300 | | | 1,976 |
*Tempur-Pedic International, Inc. | | 96,600 | | | 2,283 |
*Under Armour, Inc. | | 65,260 | | | 1,780 |
| | | | | |
| | | | | 32,501 |
| | | | | |
Information Technology—21.0% | | | | | |
*Alliance Data Systems Corporation | | 35,700 | | | 2,306 |
*ANSYS, Inc. | | 36,100 | | | 1,569 |
Blackbaud, Inc. | | 89,800 | | | 2,122 |
*Cavium Networks, Inc. | | 84,600 | | | 2,016 |
*Concur Technologies, Inc. | | 61,800 | | | 2,642 |
*Cybersource Corporation | | 122,095 | | | 2,455 |
*DG Fastchannel, Inc. | | 86,750 | | | 2,423 |
*j2 Global Communications, Inc. | | 62,475 | | | 1,271 |
*McAfee, Inc. | | 73,100 | | | 2,966 |
*Silicon Laboratories, Inc. | | 35,260 | | | 1,704 |
Solera Holdings, Inc. | | 52,812 | | | 1,902 |
*Ultimate Software Group, Inc. | | 73,725 | | | 2,165 |
United Online, Inc. | | 351,130 | | | 2,525 |
*VistaPrint Limited† | | 47,557 | | | 2,695 |
| | | | | |
| | | | | 30,761 |
| | | | | |
Health Care—12.1% | | | | | |
*athenahealth, Inc. | | 25,500 | | | 1,154 |
*Covance, Inc. | | 23,600 | | | 1,288 |
C. R. Bard, Inc. | | 26,800 | | | 2,088 |
*Non-income producing securities
† = U.S. listed foreign security
| | | | | | |
Issuer | | Shares or
Principal
Amount | | Value |
| | |
Common Stocks —(continued) | | | | | | |
*Haemonetics Corporation | | | 45,600 | | $ | 2,515 |
*HMS Holdings Corp. | | | 39,900 | | | 1,943 |
*IDEXX Laboratories, Inc. | | | 40,705 | | | 2,175 |
*Kensey Nash Corporation | | | 27,900 | | | 711 |
Perrigo Company | | | 57,400 | | | 2,287 |
*Phase Forward Incorporated | | | 146,617 | | | 2,250 |
*SurModics, Inc. | | | 60,795 | | | 1,377 |
| | | | | | |
| | | | | | 17,788 |
| | | | | | |
Financials—7.5% | | | | | | |
*Affiliated Managers Group, Inc. | | | 42,480 | | | 2,861 |
*First Horizon National Corporation | | | 103,736 | | | 1,390 |
*FirstService Corporation† | | | 54,400 | | | 1,040 |
Greenhill & Co., Inc. | | | 17,940 | | | 1,440 |
HCC Insurance Holdings, Inc. | | | 44,550 | | | 1,246 |
Invesco, Ltd.† | | | 126,583 | | | 2,973 |
| | | | | | |
| | | | | | 10,950 |
| | | | | | |
Consumer Staples—5.2% | | | | | | |
Alberto-Culver Company | | | 99,150 | | | 2,904 |
*Green Mountain Coffee Roasters, Inc. | | | 58,707 | | | 4,783 |
| | | | | | |
| | | | | | 7,687 |
| | | | | | |
Energy—4.8% | | | | | | |
*Comstock Resources, Inc. | | | 34,200 | | | 1,387 |
*Concho Resources, Inc. | | | 50,440 | | | 2,265 |
Helmerich & Payne, Inc. | | | 36,780 | | | 1,467 |
*Newfield Exploration Company | | | 39,000 | | | 1,881 |
| | | | | | |
| | | | | | 7,000 |
| | | | | | |
Materials—1.8% | | | | | | |
Airgas, Inc. | | | 54,835 | | | 2,610 |
| | | | | | |
Total Common Stocks—97.5%
(cost $115,891) | | | 143,122 |
| | | | | | |
| | |
Investment in Affiliate | | | | | | |
William Blair Ready Reserves Fund | | | 22,696 | | | 23 |
| | | | | | |
Total Investment in Affiliate—0.0%
(cost $23) | | | 23 |
| | | | | | |
| | |
Repurchase Agreement | | | | | | |
State Street Bank and Trust Company, 0.000% dated 12/31/09 due 1/4/10, repurchase price $2,438, collateralized by U.S. Treasury Bill, 0.020%, due 2/18/10 | | $ | 2,438 | | | 2,438 |
| | | | | | |
Total Repurchase Agreement—1.7%
(cost $2,438) | | | 2,438 |
| | | | | | |
Total Investments—99.2%
(cost $118,352) | | | 145,583 |
Cash and other assets, less liabilities—0.8% | | | 1,245 |
| | | | | | |
Net assets—100.0% | | $ | 146,828 |
| | | | | | |
See accompanying Notes to Financial Statements.
December 31, 2009 | William Blair Funds 27 |
GLOBAL MARKETS OVERVIEW
2009 Summary
After a rough start during the first several months of 2009, when investors remained concerned about the breadth and depth of the global financial crisis and recession, the markets rallied strongly beginning in March, after a number of banks reported better than feared results and investors began to believe that the worst was over, bidding up Financials shares as well as lower quality companies. Beginning in September, however, while the market continued to rise, the rally broadened and included sectors such as Healthcare and Consumer Staples, which were left behind the previous six months. During the entire year, Materials and Information Technology were the strongest performers, returning 70.85% and 60.25%, respectively, outperforming the other sectors, while the more defensive Utilities and Telecommunication Services were the biggest laggards, returning 11.21% and 17.06%, respectively. Global equities broadly returned 36.41% during 2009.
Regional performance was virtually a mirror image of 2008, with emerging markets performing the strongest at 82.36%, led by Latin America—specifically Brazil, which was consistently strong the entire year. Emerging Asia, which was led by China in the initial months of 2009, lagged during the remainder of the year, as China trailed, although India, Indonesia, and Taiwan were strong. After concerns about global macroeconomic risk receded during the mid part of 2009 the Central and Eastern European countries in Emerging Markets Europe Mid-East and Africa (EMEA) performed well, as did Russia, which was up 106% in 2009. During the entire year, however EMEA was the worst performing markets region, up approximately 69%, while Emerging Asia was up 79% and Latin America returned approximately 108%. Non-US small cap stocks also performed well during the year, returning 62.91%. While Europe, Australia and Far East (EAFE) lagged small cap and emerging markets during the year, it was up 33.24%, ahead of the U.S., which rose 27.86%. The difference between non-U.S. developed and U.S. stocks, however, was due to U.S. dollar depreciation, as the EAFE rose 26.17% in local terms. Within the developed markets, the more natural resource oriented economies of Pacific Ex-Japan and Canada were the strongest regions, while Pacific Ex-Japan benefited from its proximity to and integration with the strongly performing Asian emerging markets. Japan was the notable laggard, returning 6.12%.
Outlook
It is fair to assert—as far as it goes—that the global cycle is moving through a transition from government-dominated financial stabilization into a more normal recovery and expansion phase. Within that broad context, however, the world’s major economies are performing very differently, as emerging markets lead the way out of the slowdown.
China is the growth leader for the region if not the world, having improved dramatically on almost every measure over just the past six months. Both housing and auto sales in China are showing annualized growth of over 50% at this point. Electricity output, declining a year ago, has accelerated to a year-on-year increase of over 25% in the latest reading. Credit and money supply growth measures are well above trend, and fixed asset investment continues to outpace the economy as a whole.
In the U.S., while leading indicators turned up several months ago, growth rates are still generally negative. Industrial production and personal income are still declining, and retail sales only just turned positive on an annual basis, even against last year’s distressed figures. European economies are still showing dismal comparisons, and Japan is only just beginning to find some stability after a breathtakingly steep decline in output.
28 Annual Report | December 31, 2009 |
The result of this growth disparity between emerging and developed economies is that while they started from the same point a year ago, they now appear to be at different stages of the economic cycle. The strongest economies, especially China, are beginning to be concerned about inflation risk and monetary tightening, while the rest of the world continues to struggle to see any positive effects from its collective stimulus efforts.
‘Asset values’ in China—real estate prices, commodities, stock markets—are beginning to suggest overheating; ‘asset values’ in developed markets, not so much. In the long run, as in 2009, it probably makes more sense to own an apartment in Shanghai or a ranch in Chile than the equivalent in Luxembourg or Arizona, but what about now, when policy and cyclical pressure might be pushing in the opposite direction?
We could see a period ahead of cyclical adjustment in which emerging markets hit a growth and valuation plateau while OECD (Organization for Economic Co-Operation and Development) markets play catch-up with a delayed recovery and still-easy policy settings. In the broader context of Asia being the world’s strongest region, followed by the Western Hemisphere and Europe, a tilt toward developed market recovery would tend to favor Japan and the U.S. in a global context. Similarly, a cooling off in China’s housing and auto sectors might enable a sectoral rotation away from consumer cyclicals and commodities toward longer cycle industrial exposure and even toward more undervalued defensive areas.
Our portfolio exposure is relatively balanced in this context. We have shifted some weighting from emerging to developed Asia, but we would expect to retain at least a neutral position in emerging markets unless we saw signs that cyclical volatility was getting out of hand. We continue to favor areas exposed to investment spending in resources, industry, and infrastructure, in particular Information Technology, automation, engineering services, and electrical equipment.
December 31, 2009 | William Blair Funds 29 |

W. George Greig

Kenneth J. McAtamney
GLOBAL GROWTH FUND
The Global Growth Fund invests in quality growth companies of all sizes around the world.
AN OVERVIEW FROM THE PORTFOLIO MANAGERS
Please see page 28 for the Global Markets Overview.
The Global Growth Fund posted a 40.52% increase (Class N Shares) for the 12 months ended December 31, 2009. By comparison, the Fund’s benchmark, the MSCI All Country World IMI index (net) gained 36.41%.
The Fund outpaced the MSCI ACWI IMI during the fourth quarter and year to date. During the fourth quarter, stock selection across most sectors added value, as did Developed Asian and emerging markets performance. During 2009, the Fund had strong performance across most sectors with particular value added in Telecommunication Services, Consumer Staples, Consumer Discretionary, Energy, Financials and Healthcare. Within Consumer Discretionary, U.K. stock selection was strong, while emerging markets autos names added value. Consumer Staples stock selection benefited from strong performance by Wilmar International, Ltd., Anheuser-Busch Inbev S.A. NV, and emerging markets holdings, while Energy stock selection was bolstered by a focus on energy services companies, which outperformed, coupled with strong performance in the portfolio’s exploration and production companies. Financials stock selection was strong in the U.K. and in emerging markets, although more defensive positioning in well capitalized companies in Europe and the U.S. detracted from results. Finally, within Healthcare Sonova Holding AG, Express Scripts, Inc., and generic emerging markets pharmaceutical companies added value. Regionally, the Fund was bolstered by strong performance in Pacific Ex-Japan, U.K. and emerging markets. Somewhat detracting from strong absolute and relative results was the Fund’s Information Technology (IT) stock selection, particularly in the U.S., and Materials stock selection.
As of year end, the Fund maintained significant exposure in Consumer Discretionary (16.6% v. 8.6%), higher than year end 2008 as the Fund increased exposure in developed markets retailers and emerging markets auto companies. IT also increased significantly during the year from 6.8% to 12.8%. The increase in Consumer Discretionary and IT was funded by a decrease in Healthcare from approximately 15.9% to 11.3% coupled with a reduction in Telecommunication and Utilities companies. Industrials represented 16.7% of the Fund as of year end, above the Index weighting due largely to higher exposure in Developed Asia and Europe, but lower than the approximately 19% held at year end 2008. As of December 31, the Fund had approximately 16% each in Consumer Discretionary, Financials and Industrials, with significant weightings in Energy, Healthcare and IT. Regionally, the Fund’s exposure in emerging markets totaled 22.4%, higher than the 7.6% the year earlier, due to an increase in exposure particularly in emerging Asia, but also in Latin America, specifically Brazil. This change was funded by a decrease in U.K. Consumer Discretionary and Industrials holdings. The Fund remained underweighted in the United States during the entire year.
30 Annual Report | December 31, 2009 |
Global Growth Fund
Performance Highlights (unaudited)
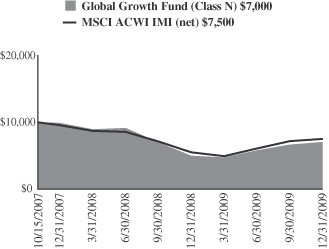
Average Annual Total Return at 12/31/2009
| | | | | | |
| | | 1
Year | | | Since
Inception(a) | |
Global Growth Fund Class N | | 40.52 | % | | (14.74 | )% |
Global Growth Fund Class I | | 40.90 | | | (14.45 | ) |
MSCI All Country World IMI (net) | | 36.41 | | | (12.05 | ) |
| | (a) | | For the period from October 15, 2007 (Commencement of Operations) to December 31, 2009. |
Performance cited represents past performance. Past performance does not guarantee future results and current performance may be lower or higher than the data quoted. Results shown are average annual total returns, which assume reinvestment of dividends and capital gains. Investment returns and principal will fluctuate and you may have a gain or loss when you sell shares. For the most current month-end performance information, please call 1-800-742-7272, or visit our Web site at www.williamblairfunds.com. Investing in smaller and medium capitalization companies involves special risks, including higher volatility and lower liquidity. Small and Mid Cap stocks are also more sensitive to purchase/sale transactions and changes in the issuer’s financial condition. International investing involves special risk considerations, including currency fluctuations, lower liquidity, economic and political risk. From time to time, the investment advisor may waive fees or reimburse expenses for the Fund. Without these waivers, performance would be lower. Class N shares are available to the general public without a sales load. Class I shares are available to certain institutional investors and advisory clients of William Blair & Company, L.L.C., without a sales load or distribution fees (12b-1).
The performance highlights and graph presented above do not reflect the deduction of taxes that a shareholder would pay on fund distributions or the redemption of fund shares.
The Morgan Stanley Capital International (MSCI) All Country World Investable Market Index (IMI) (net) is a free float-adjusted market capitalization weighted index that is designed to measure the equity market of developed and emerging markets. This series approximates the minimum possible dividend reinvestment.
This report identifies the Fund’s investments on December 31, 2009. These holdings are subject to change. Not all stocks in the Fund performed the same, nor is there any guarantee that these stocks will perform as well in the future. Market forecasts provided in this report may not necessarily come to pass.
Sector Diversification (unaudited)
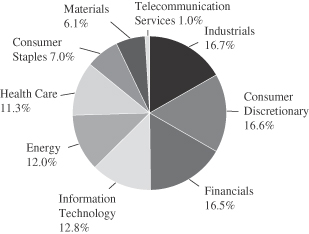
The sector diversification shown is based on the total long-term securities.
December 31, 2009 | William Blair Funds 31 |
Global Growth Fund
Portfolio of Investments, December 31, 2009 (all dollar amounts in thousands)
| | | | | |
Issuer | | Shares | | Value |
|
Common Stocks—Western Hemisphere—40.5% |
United States—38.3% | | | | | |
*Adobe Systems Incorporated (Software) | | 13,548 | | $ | 498 |
American Express Company (Consumer finance) | | 9,356 | | | 379 |
Apache Corporation (Oil, gas & consumable fuels) | | 5,923 | | | 611 |
*Apple, Inc. (Computers & peripherals) | | 3,158 | | | 666 |
*Autozone, Inc. (Specialty retail) | | 2,447 | | | 387 |
C.H. Robinson Worldwide, Inc. (Air freight & logistics) | | 7,950 | | | 467 |
*Cameron International Corporation (Energy equipment & services) | | 11,304 | | | 473 |
*Cerner Corporation (Health care technology) | | 4,563 | | | 376 |
*Chipotle Mexican Grill, Inc., Class “A” (Hotels, restaurants & leisure) | | 2,515 | | | 222 |
*Discovery Communications, Inc. (Media) | | 12,348 | | | 379 |
EOG Resources, Inc. (Oil, gas & consumable fuels) | | 7,495 | | | 729 |
*Express Scripts, Inc. (Health care providers & services) | | 5,628 | | | 487 |
Gentex Corporation (Auto components) | | 18,588 | | | 332 |
*Gilead Sciences, Inc. (Biotechnology) | | 9,316 | | | 403 |
The Goldman Sachs Group, Inc. (Capital markets) | | 2,491 | | | 421 |
Goodrich Corporation (Aerospace & defense) | | 4,818 | | | 309 |
*Google, Inc. (Internet software & services) | | 1,160 | | | 719 |
Hewlett-Packard Company (Computers & peripherals) | | 11,555 | | | 595 |
J.B. Hunt Transport Services, Inc. (Road & rail) | | 11,222 | | | 362 |
*IDEXX Laboratories, Inc. (Health care equipment & supplies) | | 7,047 | | | 377 |
*Illumina, Inc. (Life sciences tools & services) | | 10,934 | | | 335 |
Invesco Ltd. (Capital markets)† | | 17,420 | | | 409 |
JPMorgan Chase & Co. (Diversified financial services) | | 16,043 | | | 669 |
*Kohl’s Corporation (Multiline retail) | | 6,805 | | | 367 |
*McAfee, Inc. (Software) | | 8,413 | | | 341 |
*Newfield Exploration Company (Oil, gas & consumable fuels) | | 8,748 | | | 422 |
*NVR, Inc. (Household durables) | | 439 | | | 312 |
Praxair, Inc. (Chemicals) | | 6,987 | | | 561 |
Precision Castparts Corp. (Aerospace & defense) | | 4,156 | | | 459 |
*Priceline.com Incorporated (Internet & catalog retail) | | 2,395 | | | 523 |
*Silicon Laboratories Inc. (Semiconductors & semiconductor equipment) | | 4,016 | | | 194 |
*Urban Outfitters, Inc. (Specialty retail) | | 12,126 | | | 424 |
Yum! Brands, Inc. (Hotels, restaurants, & leisure) | | 13,406 | | | 469 |
| | | | | |
| | | | | 14,677 |
| | | | | |
Canada—2.2% | | | | | |
Brookfield Asset Management, Inc. Class “A” (Real estate management & development)† | | 24,221 | | | 537 |
Crescent Point Energy Corp. (Oil, gas & consumable fuels) | | 7,865 | | | 297 |
| | | | | |
| | | | | 834 |
| | | | | |
| | | | | |
Issuer | | Shares | | Value |
| | |
Common Stocks—Europe—14.1% | | | | | |
Belgium—1.4% | | | | | |
Anheuser-Busch Inbev S.A. NV (Beverages) | | 10,380 | | $ | 537 |
| | | | | |
Denmark—0.8% | | | | | |
Novozymes A/S (Chemicals) | | 3,068 | | | 319 |
| | | | | |
France—2.3% | | | | | |
Alstom S.A. (Electrical equipment) | | 6,787 | | | 475 |
Essilor International (Health care equipment & supplies) | | 6,657 | | | 398 |
| | | | | |
| | | | | 873 |
| | | | | |
Germany—1.1% | | | | | |
MAN SE (Machinery) | | 5,393 | | | 418 |
| | | | | |
Ireland—1.1% | | | | | |
Accenture plc, Class “A” (IT services)† | | 10,005 | | | 415 |
| | | | | |
Italy—1.5% | | | | | |
Ansaldo STS SpA (Transportation infrastructure) | | 17,258 | | | 329 |
Trevi Finanziaria SpA (Construction & engineering) | | 16,506 | | | 261 |
| | | | | |
| | | | | 590 |
| | | | | |
Portugal—1.0% | | | | | |
Jeronimo Martins SGPS S.A. (Food & staples retailing) | | 38,503 | | | 385 |
| | | | | |
Spain—0.5% | | | | | |
Tecnicas Reunidas S.A. (Energy equipment & services) | | 3,397 | | | 195 |
| | | | | |
Switzerland—4.4% | | | | | |
Credit Suisse Group AG (Capital markets) | | 8,934 | | | 443 |
Novartis AG (Pharmaceuticals) | | 10,279 | | | 561 |
Partners Group Global Opportunities, Ltd. (Capital markets) | | 3,077 | | | 388 |
Sonova Holding AG (Health care equipment & supplies) | | 2,540 | | | 308 |
| | | | | |
| | | | | 1,700 |
| | | | | |
| | |
Emerging Asia—12.1% | | | | | |
China—6.1% | | | | | |
China Life Insurance Co., Ltd. (Insurance) | | 96,000 | | | 470 |
China Railway Construction Corporation Limited (Construction & engineering) | | 138,500 | | | 176 |
China Shenhua Energy Company Limited (Oil, gas, & consumable fuels) | | 92,000 | | | 447 |
China Vanke Co., Ltd. (Real estate management & development) | | 283,900 | | | 355 |
Geely Automobile Holdings Limited (Automobiles) | | 365,000 | | | 199 |
Industrial and Commercial Bank of China (Commercial banks) | | 463,000 | | | 381 |
Wasion Group Holdings Limited (Electronic equipment, instruments, & components) | | 302,000 | | | 314 |
| | | | | |
| | | | | 2,342 |
| | | | | |
India—1.0% | | | | | |
Larsen & Toubro, Ltd. (Construction & engineering) | | 10,206 | | | 367 |
| | | | | |
See accompanying Notes to Financial Statements.
32 Annual Report | December 31, 2009 |
Global Growth Fund
Portfolio of Investments, December 31, 2009 (all dollar amounts in thousands)
| | | | | |
Issuer | | Shares | | Value |
|
Common Stocks—Emerging Asia—12.1%—(continued) |
Indonesia—1.2% | | | | | |
PT Astra International Tbk (Automobiles) | | 124,000 | | $ | 456 |
| | | | | |
South Korea—2.9% | | | | | |
*Hyundai Motor Company (Automobiles) | | 7,035 | | | 728 |
*LG Household & Health Care Ltd. (Household products) | | 1,581 | | | 396 |
| | | | | |
| | | | | 1,124 |
| | | | | |
Taiwan—0.9% | | | | | |
Taiwan Semiconductor Manufacturing Company Ltd. (Semiconductors & semiconductor equipment) | | 175,000 | | | 353 |
| | | | | |
| | |
United Kingdom—9.3% | | | | | |
Amlin plc (Insurance) | | 52,539 | | | 303 |
*Autonomy Corporation plc (Software) | | 14,155 | | | 344 |
Barclays plc (Commercial banks) | | 92,109 | | | 406 |
BG Group plc (Oil, gas & consumable fuels) | | 20,773 | | | 375 |
BlueBay Asset Management plc (Capital markets) | | 55,971 | | | 272 |
Experian plc (Professional services) | | 59,598 | | | 589 |
Petrofac Limited (Energy equipment & services) | | 23,109 | | | 387 |
Standard Chartered plc (Commercial banks) | | 18,302 | | | 462 |
Vedanta Resources plc (Metals & mining) | | 10,317 | | | 432 |
| | | | | |
| | | | | 3,570 |
| | | | | |
| | |
Japan—7.5% | | | | | |
Daikin Industries Ltd (Building products) | | 10,200 | | | 403 |
Gree, Inc. (Internet software & services) | | 4,000 | | | 247 |
Honda Motor Company, Ltd. (Automobiles) | | 19,900 | | | 675 |
Kakaku.com, Inc. (Internet software & services) | | 48 | | | 187 |
Komatsu Ltd. (Machinery) | | 28,800 | | | 603 |
Kurita Water Industries, Ltd. (Machinery) | | 12,100 | | | 380 |
Softbank Corp. (Wireless telecommunication services) | | 16,700 | | | 391 |
| | | | | |
| | | | | 2,886 |
| | | | | |
| | |
Emerging Latin America—5.7% | | | | | |
Brazil—3.8% | | | | | |
BM&F Bovespa S.A. (Diversified financial services) | | 55,400 | | | 390 |
Natura Cosmeticos S.A. (Personal products) | | 21,600 | | | 450 |
Petroleo Brasileiro S.A.—ADR (Oil, gas & consumable fuels) | | 13,101 | | | 625 |
| | | | | |
| | | | | 1,465 |
| | | | | |
Mexico—1.9% | | | | | |
Wal-Mart de Mexico S.A.B. de C.V. (Food & staples retailing) | | 159,500 | | | 711 |
| | | | | |
* Non-income producing securities
† = U.S. listed foreign security
ADR = American Depository Receipt
| | | | | | |
Issuer | | Shares or
Principal
Amount | | Value |
| | |
Asia—5.4% | | | | | | |
Australia—1.9% | | | | | | |
BHP Billiton Limited (Metals & mining) | | | 18,502 | | $ | 708 |
| | | | | | |
Hong Kong—3.0% | | | | | | |
Li & Fung, Ltd. (Distributors) | | | 96,000 | | | 397 |
Noble Group Limited (Trading companies & distributors) | | | 321,000 | | | 736 |
| | | | | | |
| | | | | | 1,133 |
| | | | | | |
Singapore—0.5% | | | | | | |
Wilmar International, Ltd. (Food products) | | | 38,700 | | | 176 |
| | | | | | |
|
Emerging Europe, Mid-East, Africa—4.6% |
Israel—2.3% | | | | | | |
Israel Chemicals Limited (Chemicals) | | | 20,839 | | | 274 |
Teva Pharmaceutical Industries, Ltd.—ADR (Pharmaceuticals) | | | 10,853 | | | 610 |
| | | | | | |
| | | | | | 884 |
| | | | | | |
South Africa—2.3% | | | | | | |
*Aspen Pharmacare Holdings Limited (Pharmaceuticals) | | | 45,272 | | | 451 |
Naspers Limited (Media) | | | 10,600 | | | 429 |
| | | | | | |
| | | | | | 880 |
| | | | | | |
Total Common Stocks—99.2%
(cost $30,793) | | | | | | 37,998 |
| | | | | | |
| | |
Investment in Affiliate | | | | | | |
William Blair Ready Reserves Fund | | | 28,798 | | | 29 |
| | | | | | |
Total Investment in Affiliate—0.1%
(cost $29) | | | | | | 29 |
| | | | | | |
| | |
Repurchase Agreement | | | | | | |
State Street Bank and Trust Company,
0.000% dated 12/31/09, due 1/4/10, repurchase price $237, collateralized by U.S. Treasury Bill, 0.040%, due 3/18/10 | | $ | 237 | | | 237 |
| | | | | | |
Total Repurchase Agreement—0.6%
(cost $237) | | | | | | 237 |
| | | | | | |
Total Investments—99.9%
(cost $31,059) | | | 38,264 |
Cash and other assets, less liabilities—0.1% | | | 23 |
| | | | | | |
Net assets—100.0% | | $ | 38,287 |
| | | | | | |
See accompanying Notes to Financial Statements.
December 31, 2009 | William Blair Funds 33 |
Global Growth Fund
Portfolio of Investments, December 31, 2009 (all dollar amounts in thousands)
For securities primarily traded on exchanges or markets that close before the close of regular trading on the New York Stock Exchange, the Fund uses an independent pricing service on a daily basis to fair value price the securities pursuant to Valuation Procedures approved by the Board of Trustees.
At December 31, 2009, the Fund’s Portfolio of Investments includes the following industry categories:
| | | |
Industrials | | 16.7 | % |
Consumer Discretionary | | 16.6 | % |
Financials | | 16.5 | % |
Information Technology | | 12.8 | % |
Energy | | 12.0 | % |
Health Care | | 11.3 | % |
Consumer Staples | | 7.0 | % |
Materials | | 6.1 | % |
Telecommunication Services | | 1.0 | % |
| | | |
Total | | 100.0 | % |
| | | |
At December 31, 2009, the Fund’s Portfolio of Investments includes the following currency categories:
| | | |
U.S. Dollar | | 44.4 | % |
Pound Sterling | | 9.4 | % |
Euro | | 7.9 | % |
Japanese Yen | | 7.6 | % |
Hong Kong Dollar | | 7.2 | % |
Swiss Franc | | 4.5 | % |
South Korean Won | | 2.9 | % |
Singapore Dollar | | 2.4 | % |
South African Rand | | 2.3 | % |
Brazilian Real | | 2.2 | % |
Mexican Peso | | 1.9 | % |
Australian Dollar | | 1.8 | % |
Indonesian Rupiah | | 1.2 | % |
Indian Rupee | | 1.0 | % |
All Other Currencies | | 3.3 | % |
| | | |
Total | | 100.0 | % |
| | | |
See accompanying Notes to Financial Statements.
34 Annual Report | December 31, 2009 |
W. George Greig
INTERNATIONAL GROWTH FUND
The International Growth Fund invests primarily in common stocks of foreign growth companies.
AN OVERVIEW FROM THE PORTFOLIO MANAGER
Please see page 28 for the Global Markets Overview.
The International Growth Fund posted a 42.27% increase (Class N Shares) for the 12 months ended December 31, 2009. By comparison, the Fund’s benchmark, the MSCI All Country World Ex-U.S. IMI Index (net), gained 43.60%.
The Fund outpaced the Index during the fourth quarter but slightly trailed it for the year. Fourth quarter performance was bolstered by strong stock selection in Consumer Staples, Consumer Discretionary, Healthcare and Industrials, in addition to good performance in Developed Asian and emerging markets holdings. Also adding to results was the Fund’s overall regional positioning, although sector positioning and European stock selection detracted from results. During 2009, stock selection was strong across most sectors. A number of the areas of underperformance during 2008 were strong contributors to results during 2009, as was general regional positioning. In particular, Consumer Staples stock selection was strong, augmented by performance in agriculture related companies, coupled with strong results in consumer products holdings. Energy stock selection was also a significant driver of absolute and relative results, given strong performance in a number of the Fund’s energy services and high production growth exploration and production companies. Information Technology stock selection added value due to the weighting and performance of U.K. stocks, coupled with performance in emerging markets technology companies. The key detractors from 2009 relative performance were the quality bias of the Fund in mid-year, coupled with overall sector positioning. Specifically, the Fund’s underweighting in Materials, particularly in mining, was a key detractor from overall results, as Materials was the strongest performing sector during the year.
Portfolio structure changed significantly during 2009 as the Fund moved from a more defensive structure, to one with more exposure to global growth. As of year end the Fund maintained its focus in Consumer Staples and Consumer Discretionary stocks, totaling 25.3%, with a tilt towards Consumer Discretionary, which at 15.4% of the Fund, was above the 9.2% Index weighting. We reduced exposure in Consumer Discretionary from September 30, however, from 19.7%, largely in Japan and Europe, although we also reduced exposure to Emerging Asian Discretionary on valuation concerns. Financials was also marginally reduced from 18.5% of the Fund to 16.8% and remained underweighted versus the 25.9% Index weighting, largely through reductions in developed markets. Energy and Materials exposure increased to 11.0% and 10.2%, respectively, although Materials remained underweighted versus the Index, particularly in Mining holdings. We also increased Healthcare from 5.7% to 7.1%, as this sector underperformed significantly in 2009 and fundamentals appeared sound. Regionally, the Fund remained underweighted in developed Asia and Europe Ex-U.K. in favor of emerging markets and the U.K. Emerging markets, which represented 26.0% of the Fund as of September 30 increased to 29.3%, due both to market appreciation, coupled with additional exposure in Asian and Emerging Markets Europe, Mid-East and Africa (EMEA) and Latin America.
December 31, 2009 | William Blair Funds 35 |
International Growth Fund
Performance Highlights (unaudited)
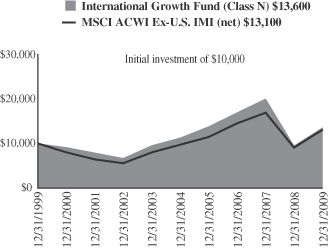
Average Annual Total Return at 12/31/2009
| | | | | | | | | | | | |
| | | 1
Year | | | 3
Year | | | 5
Year | | | 10
Year | |
International Growth Fund Class N | | 42.27 | % | | (7.12 | )% | | 3.70 | % | | 3.12 | % |
International Growth Fund Class I | | 42.63 | | | (6.84 | ) | | 4.00 | | | 3.40 | |
MSCI All Country World Ex-U.S. IMI (net) | | 43.60 | | | (3.43 | ) | | 6.04 | | | 2.73 | |
Performance cited represents past performance. Past performance does not guarantee future results and current performance may be lower or higher than the data quoted. Results shown are average annual total returns, which assume reinvestment of dividends and capital gains. Investment returns and principal will fluctuate and you may have a gain or loss when you sell shares. For the most current month-end performance information, please call 1-800-742-7272, or visit our Web site at www.williamblairfunds.com. From time to time, the investment advisor may waive fees or reimburse expenses for the Fund. Without these waivers, performance would be lower. International investing involves special risk considerations, including currency fluctuations, lower liquidity, economic and political risk. Class N shares are available to the general public without a sales load. Class I shares are available to certain institutional investors and advisory clients of William Blair & Company, L.L.C., without a sales load or distribution (12b-1) or service fees.
The performance highlights and graph presented above do not reflect the deduction of taxes that a shareholder would pay on fund distributions or the redemption of fund shares.
The Morgan Stanley Capital International (MSCI) All Country World Ex-U.S. Investable Market Index (IMI) (net) is a free float-adjusted market capitalization weighted index that is designed to measure the equity market performance of developed and emerging markets, excluding the United States. This series approximates the minimum possible dividend reinvestment.
This report identifies the Fund’s investments on December 31, 2009. These holdings are subject to change. Not all stocks in the Fund performed the same, nor is there any guarantee that these stocks will perform as well in the future. Market forecasts provided in this report may not necessarily come to pass.
Sector Diversification (unaudited)
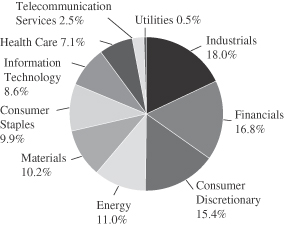
The sector diversification shown is based on the total long-term securities.
36 Annual Report | December 31, 2009 |
International Growth Fund
Portfolio of Investments, December 31, 2009 (all dollar amounts in thousands)
| | | | | |
Issuer | | Shares | | Value |
| | |
Common Stocks—Europe—23.5% | | | | | |
Belgium—1.9% | | | | | |
Anheuser-Busch InBev S.A. NV (Beverages) | | 1,139,819 | | $ | 59,005 |
Colruyt S.A. (Food & staples retailing) | | 109,339 | | | 26,378 |
| | | | | |
| | | | | 85,383 |
| | | | | |
Denmark—1.0% | | | | | |
Novo-Nordisk A/S (Pharmaceuticals) | | 394,150 | | | 25,163 |
Novozymes A/S (Chemicals) | | 115,632 | | | 12,030 |
SimCorp A/S (Software) | | 44,313 | | | 8,311 |
| | | | | |
| | | | | 45,504 |
| | | | | |
Finland—0.3% | | | | | |
F-Secure Corporation OYJ (Software) | | 1,572,036 | | | 6,157 |
Kone OYJ (Machinery) | | 86,858 | | | 3,722 |
Nokian Renkaat OYJ (Auto components) | | 213,089 | | | 5,167 |
| | | | | |
| | | | | 15,046 |
| | | | | |
France—6.5% | | | | | |
Alstom S.A. (Electrical equipment) | | 616,375 | | | 43,107 |
April Group S.A. (Insurance) | | 372,202 | | | 12,902 |
bioMerieux S.A. (Health care equipment & supplies) | | 89,777 | | | 10,489 |
EDF Energies Nouvelles S.A. (Independent power producers & energy traders) | | 405,821 | | | 20,931 |
Essilor International (Health care equipment & supplies) | | 615,700 | | | 36,826 |
*Gemalto NV (Computers & peripherals) | | 150,280 | | | 6,538 |
Hermes International S.C.A. (Textiles, apparel & luxury goods) | | 161,455 | | | 21,493 |
L’ Air Liquide S.A. (Chemicals) | | 562,781 | | | 66,930 |
Orpea (Health care providers & services) | | 200,374 | | | 9,067 |
Schneider Electric S.A. (Electrical equipment) | | 273,491 | | | 31,800 |
Vinci S.A. (Construction & engineering) | �� | 539,886 | | | 30,380 |
| | | | | |
| | | | | 290,463 |
| | | | | |
Germany—2.0% | | | | | |
BASF Group (Chemicals) | | 950,299 | | | 58,815 |
MAN SE (Machinery) | | 375,765 | | | 29,156 |
| | | | | |
| | | | | 87,971 |
| | | | | |
Ireland—0.3% | | | | | |
Paddy Power plc (Hotels, restaurants & leisure) | | 376,986 | | | 13,324 |
| | | | | |
Italy—0.5% | | | | | |
Ansaldo STS SpA (Transportation infrastructure) | | 580,249 | | | 11,059 |
Diasorin SpA (Health care equipment & supplies) | | 279,978 | | | 9,950 |
| | | | | |
| | | | | 21,009 |
| | | | | |
Netherlands—0.2% | | | | | |
BinckBank N.V. (Capital markets) | | 413,636 | | | 7,409 |
| | | | | |
Norway—1.1% | | | | | |
*Norwegian Air Shuttle ASA (Airlines) | | 196,521 | | | 3,886 |
Opera Software ASA (Internet software & services) | | 1,021,357 | | | 3,525 |
Statoil ASA (Oil, gas & consumable fuels) | | 1,714,700 | | | 42,764 |
| | | | | |
| | | | | 50,175 |
| | | | | |
| | | | | |
Issuer | | Shares | | Value |
|
Common Stocks—Europe—23.5%—(continued) |
Portugal—0.7% | | | | | |
Jeronimo Martins SGPS S.A. (Food & staples retailing) | | 3,001,017 | | $ | 30,013 |
| | | | | |
Spain—2.4% | | | | | |
Banco Santander, S.A. (Commercial banks) | | 2,641,757 | | | 43,654 |
Tecnicas Reunidas S.A. (Energy equipment & services) | | 317,805 | | | 18,277 |
Telefonica, S.A. (Diversified telecommunication services) | | 1,546,797 | | | 43,293 |
| | | | | |
| | | | | 105,224 |
| | | | | |
Sweden—0.4% | | | | | |
Hennes & Maurtiz AB, Class “B” (Specialty retail) | | 351,225 | | | 19,471 |
| | | | | |
Switzerland—6.2% | | | | | |
*ABB Ltd. (Electrical equipment) | | 1,560,155 | | | 30,063 |
*Actelion, Ltd. (Biotechnology) | | 385,013 | | | 20,564 |
Credit Suisse Group AG (Capital markets) | | 802,234 | | | 39,744 |
Kuehne & Nagel International AG (Marine) | | 191,605 | | | 18,630 |
Novartis AG (Pharmaceuticals) | | 1,042,843 | | | 56,949 |
*Orascom Development (Hotels, restaurants & leisure) | | 85,737 | | | 6,040 |
Partners Group Global Opportunities, Ltd. (Capital markets) | | 215,177 | | | 27,131 |
SGS S.A. (Professional services) | | 25,338 | | | 33,078 |
Sika AG (Chemicals) | | 8,156 | | | 12,682 |
Sonova Holding AG (Health care equipment & supplies) | | 193,309 | | | 23,419 |
*Temenos Group AG (Software) | | 324,835 | | | 8,371 |
| | | | | |
| | | | | 276,671 |
| | | | | |
| | |
United Kingdom—19.8% | | | | | |
Aberdeen Asset Management plc (Capital markets) | | 3,591,917 | | | 7,718 |
Admiral Group plc (Insurance) | | 876,122 | | | 16,752 |
Aggreko plc (Commercial services & supplies) | | 768,132 | | | 11,467 |
AMEC plc (Energy equipment & services) | | 2,083,568 | | | 26,546 |
Amlin plc (Insurance) | | 2,976,907 | | | 17,189 |
Antofagasta plc (Metals & mining) | | 2,736,453 | | | 43,530 |
Ashmore Group plc (Capital markets) | | 2,360,366 | | | 10,329 |
*ASOS plc (Internet & catalog retail) | | 1,122,319 | | | 8,817 |
*Autonomy Corporation plc (Software) | | 1,460,963 | | | 35,479 |
AVEVA Group plc (Software) | | 321,472 | | | 5,229 |
Barclays plc (Commercial banks) | | 9,752,751 | | | 42,975 |
Bellway plc (Household durables) | | 656,225 | | | 8,650 |
*The Berkeley Group Holdings plc (Household durables) | | 811,482 | | | 10,703 |
BG Group plc (Oil, gas & consumable fuels) | | 2,494,495 | | | 45,041 |
BHP Billiton Limited (Metals & mining) | | 1,451,555 | | | 46,276 |
*Blinkx plc (Internet software & services) | | 6,265,874 | | | 1,696 |
BlueBay Asset Management plc (Capital markets) | | 2,027,405 | | | 9,867 |
British Sky Broadcasting Group plc (Media) | | 4,681,813 | | | 42,290 |
Britvic plc (Beverages) | | 1,768,203 | | | 11,595 |
Capita Group plc (Professional services) | | 1,764,446 | | | 21,335 |
Chemring Group plc (Aerospace & defense) | | 373,967 | | | 17,653 |
*Climate Exchange plc (Diversified financial services) | | 574,271 | | | 5,876 |
See accompanying Notes to Financial Statements.
December 31, 2009 | William Blair Funds 37 |
International Growth Fund
Portfolio of Investments, December 31, 2009 (all dollar amounts in thousands)
| | | | | |
Issuer | | Shares | | Value |
|
Common Stocks—United Kingdom—19.8% —(continued) |
*Dana Petroleum plc (Oil, gas & consumable fuels) | | 587,934 | | $ | 11,124 |
Experian plc (Professional services) | | 2,453,970 | | | 24,240 |
*Heritage Oil plc (Oil, gas, & consumable fuels) | | 1,895,813 | | | 13,301 |
Michael Page International plc (Professional services) | | 1,922,594 | | | 11,706 |
Mothercare plc (Multiline retail) | | 715,393 | | | 7,852 |
NEXT plc (Multiline retail) | | 1,391,378 | | | 46,522 |
Petrofac Limited (Energy equipment & services) | | 1,471,721 | | | 24,637 |
Reckitt Benckiser plc (Household products) | | 853,066 | | | 46,177 |
Rightmove plc (Media) | | 706,286 | | | 5,735 |
*Rolls-Royce Group plc (Aerospace & defense) | | 4,960,442 | | | 38,629 |
Rotork plc (Electronic equipment & instruments) | | 1,384,025 | | | 26,446 |
RPS Group plc (Commercial services & supplies) | | 3,819,563 | | | 13,354 |
Serco Group plc (Commercial services & supplies) | | 2,473,462 | | | 21,094 |
Standard Chartered plc (Commercial banks) | | 2,575,511 | | | 65,021 |
*Telecity Group plc (Internet software & services) | | 772,692 | | | 4,763 |
Ultra Electronic Holdings plc (Aerospace & defense) | | 559,434 | | | 12,366 |
Vedanta Resources plc (Metals & mining) | | 807,693 | | | 33,782 |
VT Group plc (Aerospace & defense) | | 2,307,731 | | | 19,262 |
The Weir Group plc (Machinery) | | 1,144,989 | | | 13,205 |
| | | | | |
| | | | | 886,229 |
| | | | | |
| | |
Emerging Asia—18.3% | | | | | |
China—4.8% | | | | | |
China High Speed Transmission (Electrical equipment) | | 6,454,000 | | | 15,670 |
China Railway Construction Corporation Limited (Construction & engineering) | | 6,759,500 | | | 8,613 |
China Shenhua Energy Company Limited (Oil, gas, & consumable fuels) | | 4,383,000 | | | 21,276 |
*China Zhongwang Holdings Limited (Metals & mining) | | 16,523,600 | | | 13,162 |
CNOOC Limited (Oil, gas & consumable fuels) | | 19,042,000 | | | 29,666 |
Dongfeng Motor Group Company Limited (Automobiles) | | 27,552,000 | | | 39,343 |
Geely Automobile Holdings Limited (Automobiles) | | 15,555,000 | | | 8,490 |
Hengan International Group Co., Ltd. (Personal products) | | 2,794,000 | | | 20,687 |
Industrial and Commercial Bank of China (Commercial banks) | | 52,759,000 | | | 43,450 |
Minth Group, Ltd. (Auto components) | | 4,842,000 | | | 7,108 |
Shandong Weigao Group Medical Polymer Company, Ltd. (Health care equipment & supplies) | | 1,668,000 | | | 5,559 |
| | | | | |
| | | | | 213,024 |
| | | | | |
India—5.3% | | | | | |
Bharat Heavy Electricals, Ltd. (Electrical equipment) | | 833,639 | | | 42,916 |
Hero Honda Motors Limited (Automobiles) | | 882,287 | | | 32,451 |
| | | | | |
Issuer | | Shares | | Value |
|
Common Stocks—Emerging Asia—18.3%—(continued) |
India—(continued) | | | | | |
Housing Development Finance Corp. (Thrifts & mortgage finance) | | 378,431 | | $ | 21,652 |
India Infoline Limited (Capital markets) | | 1,543,746 | | | 4,246 |
Infosys Technologies Limited (IT services) | | 802,427 | | | 44,659 |
Jindal Steel & Power Limited (Metals & mining) | | 1,754,556 | | | 26,396 |
Larsen & Toubro, Ltd. (Construction & engineering) | | 628,127 | | | 22,615 |
Lupin Limited (Pharmaceuticals) | | 282,257 | | | 8,916 |
Reliance Industries Limited (Oil, gas, & consumable fuels) | | 1,504,943 | | | 35,164 |
| | | | | |
| | | | | 239,015 |
| | | | | |
Indonesia—2.4% | | | | | |
PT Astra International Tbk (Automobiles) | | 8,895,000 | | | 32,702 |
PT Bank Rakyat Indonesia (Commercial banks) | | 39,191,500 | | | 31,500 |
PT London Sumatra Indonesia (Food products) | | 11,030,500 | | | 9,714 |
PT Telekomunikasi Indonesia Tbk (Diversified telecommunication services) | | 6,339,000 | | | 6,310 |
PT United Tractors Tbk (Machinery) | | 17,340,000 | | | 28,397 |
| | | | | |
| | | | | 108,623 |
| | | | | |
Malaysia—0.9% | | | | | |
CIMB Group Holdings Berhad (Commercial banks) | | 4,608,000 | | | 17,244 |
IOI Corporation Berhad (Food products) | | 8,232,060 | | | 13,108 |
Kuala Lampur Kepg (Food products) | | 1,883,200 | | | 9,056 |
| | | | | |
| | | | | 39,408 |
| | | | | |
Papua New Guinea—0.3% | | | | | |
Oil Search Limited (Oil, gas, & consumable fuels) | | 2,150,391 | | | 11,790 |
| | | | | |
South Korea—2.2% | | | | | |
*Amorepacific Corporation (Personal products) | | 15,606 | | | 12,513 |
*Hyundai Mobis (Auto components) | | 112,143 | | | 16,433 |
*Hyundai Motor Company (Automobiles) | | 239,742 | | | 24,816 |
*LG Household & Health Care, Ltd. (Household products) | | 112,678 | | | 28,190 |
*MegaStudy Co., Ltd. (Diversified consumer services) | | 81,723 | | | 16,800 |
| | | | | |
| | | | | 98,752 |
| | | | | |
Taiwan—2.2% | | | | | |
MediaTek Inc. (Semiconductors & semiconductor equipment) | | 1,060,000 | | | 18,417 |
Siliconware Precision Industries Co., Ltd. (Semiconductors & semiconductor equipment) | | 12,748,000 | | | 17,377 |
Taiwan Semiconductor Manufacturing Company Ltd. (Semiconductors & semiconductor equipment) | | 23,184,000 | | | 46,727 |
Yuanta Financial Holding Co., Ltd. (Capital markets) | | 21,161,000 | | | 15,483 |
| | | | | |
| | | | | 98,004 |
| | | | | |
Thailand—0.2% | | | | | |
CP ALL PCL (Food & staples retailing) | | 12,244,000 | | | 9,108 |
| | | | | |
See accompanying Notes to Financial Statements.
38 Annual Report | December 31, 2009 |
International Growth Fund
Portfolio of Investments, December 31, 2009 (all dollar amounts in thousands)
| | | | | |
Issuer | | Shares | | Value |
| | |
Common Stocks—Japan—10.7% | | | | | |
Canon, Inc. (Office electronics) | | 1,114,300 | | $ | 47,401 |
Daikin Industries, Ltd. (Building products) | | 876,600 | | | 34,623 |
Fanuc, Ltd. (Machinery) | | 308,300 | | | 28,734 |
Gree, Inc. (Internet software & services) | | 154,100 | | | 9,528 |
Honda Motor Company, Ltd. (Automobiles) | | 1,046,800 | | | 35,517 |
Hoya Corporation (Electronic equipment, instruments & components) | | 815,600 | | | 21,762 |
Jupiter Telecommunications Co., Ltd. (Media) | | 26,203 | | | 25,929 |
kabu.com Securities Co., Ltd. (Capital markets) | | 4,881 | | | 4,714 |
Kakaku.com, Inc. (Internet software & services) | | 1,720 | | | 6,686 |
Keyence Corporation (Electronic equipment, instruments & components) | | 140,900 | | | 29,243 |
Komatsu, Ltd. (Machinery) | | 1,660,100 | | | 34,753 |
K’s Holdings Corporation (Specialty retail) | | 321,100 | | | 9,639 |
Kurita Water Industries, Ltd. (Machinery) | | 613,300 | | | 19,268 |
Miraca Holdings, Inc. (Health care equipment & supplies) | | 205,500 | | | 5,656 |
Misumi Group, Inc. (Trading companies & distributors) | | 459,200 | | | 7,860 |
Nitori Company, Ltd. (Specialty retail) | | 192,670 | | | 14,341 |
Park24 Co., Ltd. (Commercial services & supplies) | | 550,000 | | | 5,850 |
Point, Inc. (Specialty retail) | | 265,240 | | | 14,820 |
Softbank Corp. (Wireless telecommunication services) | | 2,376,200 | | | 55,705 |
Start Today Co., Ltd. (Internet & catalog retail) | | 4,014 | | | 7,345 |
Terumo Corporation (Health care equipment & supplies) | | 475,200 | | | 28,640 |
Unicharm Petcare (Food products) | | 170,600 | | | 5,211 |
USS Co., Ltd. (Specialty retail) | | 6,580 | | | 402 |
YAHOO! Japan Corporation (Internet software & services) | | 81,781 | | | 24,589 |
| | | | | |
| | | | | 478,216 |
| | | | | |
| | |
Asia—7.6% | | | | | |
Australia—4.0% | | | | | |
BHP Billiton Limited—ADR (Metals & mining) | | 1,497,249 | | | 57,295 |
Energy Resources of Australia Limited (Oil, gas & consumable fuels) | | 453,536 | | | 9,679 |
JB Hi-Fi Limited (Specialty retail) | | 693,506 | | | 13,999 |
QBE Insurance Group Limited (Insurance) | | 2,479,370 | | | 56,580 |
SEEK Limited (Professional services) | | 380,454 | | | 2,349 |
WorleyParsons Limited (Energy equipment & services) | | 1,482,093 | | | 38,483 |
| | | | | |
| | | | | 178,385 |
| | | | | |
Hong Kong—2.1% | | | | | |
Li & Fung, Ltd. (Distributors) | | 12,202,000 | | | 50,448 |
Noble Group Limited (Trading companies & distributors) | | 19,392,240 | | | 44,481 |
| | | | | |
| | | | | 94,929 |
| | | | | |
Singapore—1.5% | | | | | |
Capitaland, Ltd. (Real estate management & development) | | 7,546,000 | | | 22,386 |
*CapitaMalls Asia Limited (Real estate management & development) | | 7,032,000 | | | 12,714 |
| | | | | |
Issuer | | Shares | | Value |
|
Common Stocks—Asia—7.6%—(continued) |
Singapore—(continued) | | | | | |
Olam International, Ltd. (Food & staples retailing) | | 7,045,400 | | $ | 13,237 |
Wilmar International, Ltd. (Food products) | | 4,431,000 | | | 20,148 |
| | | | | |
| | | | | 68,485 |
| | | | | |
| | |
Emerging Latin America—5.7% | | | | | |
Brazil—4.3% | | | | | |
BM&F Bovespa S.A. (Diversified financial services) | | 2,533,600 | | | 17,827 |
Cyrela Brazil Realty S.A. (Household durables) | | 488,100 | | | 6,869 |
Diagnosticos da America S.A. (Health care providers & services) | | 242,900 | | | 7,951 |
*GP Investments, Ltd. (Capital markets) | | 2,289,700 | | | 13,415 |
*Hypermarcas S.A. (Personal products) | | 778,553 | | | 17,888 |
Localiza Rent a Car S.A. (Road & rail) | | 1,380,800 | | | 15,323 |
Lojas Renner S.A. (Multiline retail) | | 597,300 | | | 13,483 |
MRV Engenharia e Participacoes; S.A. (Household durables) | | 1,111,464 | | | 9,002 |
Natura Cosmeticos S.A. (Personal products) | | 1,518,900 | | | 31,678 |
*OGX Petroleo e Gas Participacoes S.A. (Oil, gas, & consumable fuels) | | 1,648,200 | | | 16,189 |
PDG Realty S.A. Empreendimentos e Participacoes (Household durables) | | 584,400 | | | 5,824 |
Petroleo Brasileiro S.A. (Oil, gas & consumable fuels) | | 1,274,526 | | | 30,491 |
SLC Agricola S.A. (Food products) | | 619,200 | | | 5,797 |
| | | | | |
| | | | | 191,737 |
| | | | | |
Chile—0.0% | | | | | |
Banco Santander Chile—GDR (Commercial Banks) | | 17,091 | | | 1,107 |
| | | | | |
Mexico—0.8% | | | | | |
Banco Compartamos S.A. de C.V. (Consumer finance) | | 1,776,700 | | | 9,170 |
*Megacable Holdings S.A.B. de C.V. (Media) | | 1,688,400 | | | 3,562 |
Wal-Mart de Mexico S.A.B. de C.V. (Food & staples retailing) | | 4,970,800 | | | 22,152 |
| | | | | |
| | | | | 34,884 |
| | | | | |
Panama—0.2% | | | | | |
Copa Holdings, S.A. (Airlines)† | | 178,644 | | | 9,731 |
| | | | | |
Peru—0.4% | | | | | |
Credicorp, Ltd. (Commercial banks)† | | 255,541 | | | 19,682 |
| | | | | |
| | |
Canada—5.5% | | | | | |
Brookfield Asset Management, Inc., Class “A” (Real estate management & development)† | | 1,582,119 | | | 35,091 |
Canadian Western Bank (Commercial banks) | | 249,000 | | | 5,224 |
*Consolidated Thompson (Metals & mining) | | 1,244,020 | | | 8,041 |
Crescent Point Energy Corp. (Oil, gas & consumable fuels) | | 837,300 | | | 31,615 |
First Quantum Minerals Ltd. (Metals & mining) | | 443,392 | | | 34,027 |
Niko Resources Ltd. (Oil, gas, & consumable fuels) | | 298,345 | | | 28,070 |
*Pacific Rubiales Energy Corporation (Oil, gas & consumable fuels) | | 1,401,531 | | | 20,704 |
See accompanying Notes to Financial Statements.
December 31, 2009 | William Blair Funds 39 |
International Growth Fund
Portfolio of Investments, December 31, 2009 (all dollar amounts in thousands)
| | | | | |
Issuer | | Shares | | Value |
|
Common Stocks—Canada—5.5%—(continued) |
PetroBakken Energy Ltd. (Oil, gas & consumable fuels) | | 701,469 | | $ | 21,684 |
Royal Bank of Canada (Commercial banks) | | 656,292 | | | 35,392 |
Tim Hortons, Inc. (Hotels, restaurants & leisure) | | 906,050 | | | 27,835 |
| | | | | |
| | | | | 247,683 |
| | | | | |
| |
Emerging Europe, Mid-East, Africa—5.3% | | | |
Israel—1.4% | | | | | |
Israel Chemicals Limited (Chemicals) | | 1,892,570 | | | 24,852 |
Teva Pharmaceutical Industries, Ltd.—ADR (Pharmaceuticals) | | 675,331 | | | 37,940 |
| | | | | |
| | | | | 62,792 |
| | | | | |
Egypt—0.1% | | | | | |
Egyptian Financial Group—Hermes Holding S.A.E. (Capital markets) | | 1,052,537 | | | 4,793 |
| | | | | |
South Africa—2.8% | | | | | |
*Aspen Pharmacare Holdings Limited (Pharmaceuticals) | | 2,127,753 | | | 21,185 |
Naspers Limited (Media) | | 1,310,100 | | | 53,020 |
Shoprite Holdings Limited (Food & staples retailing) | | 1,660,246 | | | 14,597 |
Standard Bank Group Limited (Commercial banks) | | 1,711,559 | | | 23,508 |
Wilson Bayly Holmes-Ovcon Limited (Construction & engineering) | | 866,489 | | | 12,589 |
| | | | | |
| | | | | 124,899 |
| | | | | |
Turkey—1.0% | | | | | |
Bim Birlesik Magazalar A.S. (Food & staples retailing) | | 456,372 | | | 21,223 |
Turkiye Garanti Bankasi A.S. (Commercial banks) | | 5,211,424 | | | 22,200 |
| | | | | |
| | | | | 43,423 |
| | | | | |
* Non-income producing securities
† = U.S. listed foreign security
ADR = American Depository Receipt
GDR = Global Depository Receipt
VRN = Variable Rate Note
** = Fair valued pursuant to Valuation Procedures adopted by the Board of Trustees. This holding represents 0.04% of the Fund’s net assets at December 31, 2009. This security was also deemed illiquid pursuant to the Fund/Advisor’s Liquidity Procedures.
| | | | | | |
Issuer | | Shares or
Principal
Amount | | Value |
|
Emerging Europe, Mid-East, Africa—5.3%—(continued) |
United Arab Emirates—0.0% | | | | | | |
First Gulf Bank PJSC (Commercial banks) | | | 267,134 | | $ | 1,166 |
| | | | | | |
| |
Total Common Stocks—96.4%
(cost $3,424,953) | | | 4,313,528 |
| | | | | | |
| | |
Convertible Bond | | | | | | |
Brazil—0.1% | | | | | | |
Lupatech S.A., 6.500%, due 4/15/18 (Machinery)** | | $ | 2,875 | | | 1,777 |
| | | | | | |
Total Convertible Bond—0.1%
(cost $1,504) | | | 1,777 |
| | | | | | |
| | |
Investment in Affiliate | | | | | | |
William Blair Ready Reserves Fund | | | 6,375,915 | | | 6,376 |
| | | | | | |
Total Investment in Affiliate—0.1%
(cost $6,376) | | | 6,376 |
| | | | | | |
| | |
Short-Term Investment | | | | | | |
American Express Credit Corp. Demand Note, VRN 0.081%, due 1/4/10 | | $ | 6,000 | | | 6,000 |
| | | | | | |
Total Short-Term Investment—0.1%
(cost $6,000) | | | 6,000 |
| | | | | | |
| | |
Repurchase Agreement | | | | | | |
Fixed Income Clearing Corporation, 0.000% dated 12/31/09, due 1/4/10, repurchase price $86,880, collateralized by FNMA, 4.875%, due 12/15/16, and by FNMA, 4.375%, due 7/17/2013 | | $ | 86,880 | | | 86,880 |
| | | | | | |
Total Repurchase Agreement—2.0%
(cost $86,880) | | | 86,880 |
| | | | | | |
Total Investments—98.7%
(cost $3,525,713) | | | 4,414,561 |
Cash and other assets, less liabilities—1.3% | | | 58,847 |
| | | | | | |
Net assets—100.0% | | $ | 4,473,408 |
| | | | | | |
See accompanying Notes to Financial Statements.
40 Annual Report | December 31, 2009 |
International Growth Fund
Portfolio of Investments, December 31, 2009 (all dollar amounts in thousands)
For securities primarily traded on exchanges or markets that close before the close of regular trading on the New York Stock Exchange, the Fund uses an independent pricing service on a daily basis to fair value price the securities pursuant to Valuation Procedures approved by the Board of Trustees.
At December 31, 2009, the Fund’s Portfolio of Investments includes the following industry categories:
| | |
Industrials | | 18.0% |
Financials | | 16.8% |
Consumer Discretionary | | 15.4% |
Energy | | 11.0% |
Materials | | 10.2% |
Consumer Staples | | 9.9% |
Information Technology | | 8.6% |
Health Care | | 7.1% |
Telecommunication Services | | 2.5% |
Utilities | | 0.5% |
| | |
Total | | 100.0% |
| | |
At December 31, 2009, the Fund’s Portfolio of Investments includes the following currency categories:
| | |
British Pound Sterling | | 20.5% |
Euro | | 15.2% |
Japanese Yen | | 11.1% |
Swiss Franc | | 6.4% |
Hong Kong Dollar | | 6.1% |
Indian Rupee | | 5.5% |
Canadian Dollar | | 4.9% |
Brazilian Real | | 4.5% |
Australian Dollar | | 4.4% |
South African Rand | | 2.9% |
Singapore Dollar | | 2.6% |
Indonesian Rupiah | | 2.5% |
United States Dollar | | 2.4% |
South Korean Won | | 2.3% |
New Taiwan Dollar | | 2.3% |
Norwegian Krone | | 1.2% |
Danish Krone | | 1.1% |
Turkish Lira | | 1.0% |
All Other Currencies | | 3.1% |
| | |
Total | | 100.0% |
| | |
See accompanying Notes to Financial Statements.
December 31, 2009 | William Blair Funds 41 |
W. George Greig

David Merjan
INTERNATIONAL EQUITY FUND
The International Equity Fund invests primarily in common stocks of companies included in the Morgan Stanley Capital International All Country World Ex-U.S. IMI Index (net).
AN OVERVIEW FROM THE PORTFOLIO MANAGERS
Please see page 28 for the Global Markets Overview.
The International Equity Fund posted a 32.69% increase (Class N Shares) for the 12 months ended December 31, 2009. By comparison, the Fund’s benchmark, the MSCI All Country World Ex-U.S. IMI Index (net) (the “Index”), gained 43.60%.
The Fund outpaced the Index during the first and fourth quarters but lagged for the year. Fourth quarter performance was bolstered by strong stock selection in Consumer Discretionary, Energy, Industrials and Telecommunication Services in addition to good performance in Developed and emerging Asian and Emerging Markets, Europe, Mid-East and Africa (EMEA) holdings. The key detractors from 2009 relative performance were the quality bias of the Fund in mid-year, coupled with a more conservative sector positioning during the initial stages of the rally. Specifically, the Fund’s underweighting in Materials and Financials and overweighting in Healthcare detracted over 6% in relative performance during the period. Augmenting performance was strong Energy, Healthcare, Materials and Telecommunication stock selection. In particular, the Fund’s Energy stocks outperformed the Index by over 35% during the year with strong performance in a number of the Fund’s energy services and high production growth exploration and production companies. Developed European and Japanese Healthcare stocks performed well, while the Fund’s mining names bolstered results.
As of year end the Fund maintained its focus in Industrials and Information Technology at 20.0% and 12.7% of the Fund, respectively, and these sectors were the most overweighted versus the Index. While absolute exposure was reduced throughout the year to 8.9%, Healthcare remained overweighted versus the broad Index at year end. Exposure to Financials totaled 18.7%, down marginally from September 30 through a reduction in developed markets exposure, although the weighting remained well below the Index, as it did throughout the year. Materials holdings totaled 5.1% at year end, well below the 11.1% weighting in the Index. Regionally, the Fund remained underweighted in Developed Asia and Canada in favor of the U.K.. Emerging markets approximated the benchmark at approximately 20.8% of the Fund, with a tilt towards Emerging Asia.
42 Annual Report | December 31, 2009 |
International Equity Fund
Performance Highlights (unaudited)
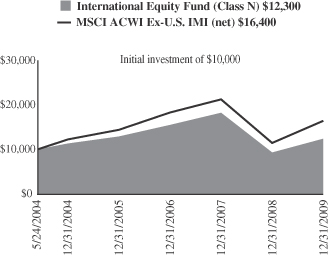
Average Annual Total Return at 12/31/2009
| | | | | | | | | | | | |
| | | 1
Year | | | 3
Year | | | 5
Year | | | Since
Inception(a) | |
International Equity Fund Class N | | 32.69 | % | | (7.16 | )% | | 1.73 | % | | 3.82 | % |
International Equity Fund Class I | | 32.93 | | | (6.94 | ) | | 1.97 | | | 4.10 | |
MSCI All Country World
Ex-U.S. IMI (net) | | 43.60 | | | (3.43 | ) | | 6.04 | | | 9.20 | |
| | (a) | | For the period from May 24, 2004 (Commencement of Operations) to December 31, 2009. | |
Performance cited represents past performance. Past performance does not guarantee future results and current performance may be lower or higher than the data quoted. Results shown are average annual returns, which assume reinvestment of dividends and capital gains. Investment returns and principal will fluctuate and you may have a gain or loss when you sell shares. For the most current month-end performance information, please call 1-800-742-7272, or visit our Web site at www.williamblairfunds.com. From time to time the investment advisor may waive fees or reimburse expenses for the Fund. Without these waivers, performance would be lower. International investing involves special risk considerations, including currency fluctuations, lower liquidity, economic and political risk. Class N shares are available to the general public without a sales load. Class I shares are available to certain institutional investors and advisory clients of William Blair & Company L.L.C. without a sales load or distribution (12b-1) or service fees.
The performance highlights and graph presented above do not reflect the deduction of taxes that a shareholder would pay on fund distributions or the redemption of fund shares.
The Morgan Stanley Capital International (MSCI) All Country World Ex-U.S. Investable Market Index (IMI) (net) is a free float-adjusted market capitalization weighted index that is designed to measure the equity market performance of developed and emerging markets, excluding the United States. This series approximates the minimum possible dividend reinvestment.
This report identifies the Fund’s investments on December 31, 2009. These holdings are subject to change. Not all stocks in the Fund performed the same, nor is there any guarantee that these stocks will perform as well in the future. Market forecasts provided in this report may not necessarily come to pass.
Sector Diversification (unaudited)
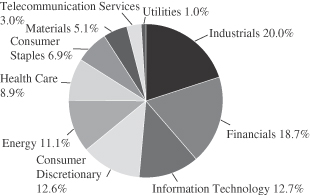
The sector diversification shown is based on the total long-term securities.
December 31, 2009 | William Blair Funds 43 |
International Equity Fund
Portfolio of Investments, December 31, 2009 (all dollar amounts in thousands)
| | | | | |
Issuer | | Shares | | Value |
|
Common Stocks—Europe—31.7% |
Belgium—2.5% | | | | | |
Anheuser-Busch Inbev S.A. N.V. (Beverages) | | 144,870 | | | 7,500 |
| | | | | |
Denmark—1.3% | | | | | |
Novo-Nordisk A/S (Pharmaceuticals) | | 59,889 | | $ | 3,823 |
| | | | | |
France—5.9% | | | | | |
Alstom S.A. (Electrical equipment) | | 61,599 | | | 4,308 |
AXA (Insurance) | | 113,135 | | | 2,656 |
Iliad S.A. (Diversified telecommunication services) | | 26,033 | | | 3,111 |
Schneider Electric S.A. (Electrical equipment) | | 35,842 | | | 4,167 |
Vinci S.A. (Construction & engineering) | | 57,407 | | | 3,230 |
| | | | | |
| | | | | 17,472 |
| | | | | |
Germany—3.4% | | | | | |
E. ON AG (Electric utilities) | | 70,052 | | | 2,940 |
MAN SE (Machinery) | | 41,528 | | | 3,222 |
SAP AG (Software) | | 85,343 | | | 4,069 |
| | | | | |
| | | | | 10,231 |
| | | | | |
Ireland—2.6% | | | | | |
CRH plc (Materials) | | 149,358 | | | 4,061 |
* Ryanair Holdings plc—ADR (Airlines) | | 132,011 | | | 3,541 |
| | | | | |
| | | | | 7,602 |
| | | | | |
Italy—1.7% | | | | | |
Saipem SpA (Energy equipment & services) | | 144,413 | | | 4,984 |
| | | | | |
Netherlands—1.0% | | | | | |
* Qiagen N.V. (Life sciences tools & services) | | 138,654 | | | 3,123 |
| | | | | |
Spain—4.8% | | | | | |
Banco Santander S.A. (Commercial banks) | | 255,085 | | | 4,215 |
Inditex Group (Specialty retail) | | 74,344 | | | 4,643 |
Telefonica, S.A. (Diversified telecommunication services) | | 198,398 | | | 5,553 |
| | | | | |
| | | | | 14,411 |
| | | | | |
Switzerland—8.5% | | | | | |
* ABB, Ltd. (Electrical equipment) | | 185,210 | | | 3,569 |
* Actelion, Ltd. (Biotechnology) | | 52,820 | | | 2,821 |
Credit Suisse Group AG (Capital markets) | | 111,305 | | | 5,514 |
Julius Baer Holding, Ltd. (Capital markets) | | 46,877 | | | 1,649 |
Nestle S.A. (Food products) | | 52,099 | | | 2,529 |
Roche Holdings AG (Pharmaceuticals) | | 27,019 | | | 4,621 |
Sonova Holding AG (Health care equipment & supplies) | | 13,953 | | | 1,690 |
Zurich Financial Services (Insurance) | | 13,601 | | | 2,974 |
| | | | | |
| | | | | 25,367 |
| | | | | |
| | |
United Kingdom—18.3% | | | | | |
AMEC plc (Energy equipment & services) | | 169,630 | | | 2,161 |
Amlin plc (Insurance) | | 250,883 | | | 1,449 |
* Autonomy Corporation plc (Software) | | 159,082 | | | 3,863 |
Barclays plc (Commercial banks) | | 757,691 | | | 3,339 |
BG Group plc (Oil, gas & consumable fuels) | | 322,559 | | | 5,824 |
British Sky Broadcasting Group plc (Media) | | 579,780 | | | 5,237 |
Capita Group plc (Professional services) | | 171,632 | | | 2,075 |
Experian plc (Professional services) | | 241,165 | | | 2,382 |
HSBC Holdings plc (Commercial banks) | | 252,304 | | | 2,870 |
Petrofac Limited (Energy equipment & services) | | 151,819 | | | 2,542 |
Reckitt Benckiser plc (Household products) | | 100,877 | | | 5,461 |
| | | | | |
Issuer | | Shares | | Value |
|
Common Stocks—United Kingdom—18.3%—(continued) |
* Rolls-Royce Group plc (Aerospace & defense) | | 606,763 | | $ | 4,725 |
Rotork plc (Electronic equipment & instruments) | | 81,441 | | | 1,556 |
Standard Chartered plc (Commercial banks) | | 124,908 | | | 3,153 |
Tullow Oil plc (Oil, gas & consumable fuels) | | 168,606 | | | 3,537 |
Vedanta Resources plc (Metals & mining) | | 108,739 | | | 4,548 |
| | | | | |
| | | | | 54,722 |
| | | | | |
| | |
Emerging Asia—13.5% | | | | | |
China—5.2% | | | | | |
China Life Insurance Co., Ltd. (Insurance) | | 739,000 | | | 3,616 |
China Overseas Land & Investment, Ltd. (Real estate management & development) | | 1,360,000 | | | 2,850 |
China Railway Construction Corporation Limited (Construction & engineering) | | 1,952,000 | | | 2,487 |
CNOOC Limited (Oil, gas & consumable fuels) | | 2,109,000 | | | 3,286 |
Li Ning Company Limited (Textiles, apparel & luxury goods) | | 829,000 | | | 3,143 |
| | | | | |
| | | | | 15,382 |
| | | | | |
India—3.8% | | | | | |
Bharat Heavy Electricals, Ltd. (Electrical equipment) | | 56,871 | | | 2,928 |
* Cairn India, Ltd. (Oil, gas & consumable fuels) | | 369,339 | | | 2,228 |
HDFC Bank, Ltd.—ADR (Commercial banks) | | 14,646 | | | 1,905 |
Infosys Technologies, Limited (IT services) | | 78,650 | | | 4,377 |
| | | | | |
| | | | | 11,438 |
| | | | | |
Indonesia—0.9% | | | | | |
PT Bank Rakyat Indonesia (Commercial banks) | | 3,299,500 | | | 2,652 |
| | | | | |
South Korea—1.7% | | | | | |
* Hyundai Motor Company (Automobiles) | | 47,554 | | | 4,922 |
| | | | | |
Taiwan—1.9% | | | | | |
MediaTek Inc. (Semiconductors & semiconductor equipment) | | 156,312 | | | 2,716 |
Taiwan Semiconductor, Ltd. (Semiconductors & semiconductor equipment) | | 1,402,344 | | | 2,826 |
| | | | | |
| | | | | 5,542 |
| | | | | |
| | |
Japan—12.7% | | | | | |
Canon Inc. (Office electronics ) | | 103,800 | | | 4,415 |
Daikin Industries, Ltd. (Building product) | | 75,500 | | | 2,982 |
Fast Retailing Co., Ltd. (Specialty retail) | | 13,400 | | | 2,518 |
Honda Motor Co., Ltd. (Automobiles) | | 112,300 | | | 3,810 |
Hoya Corporation (Electronic equipment, instruments & components ) | | 113,700 | | | 3,034 |
Jupiter Telecommunications Co., Ltd. (Media) | | 3,017 | | | 2,985 |
Keyence Corporation (Electronic equipment, instruments & components ) | | 18,900 | | | 3,923 |
Kurita Water Industries, Ltd (Machinery) | | 125,800 | | | 3,952 |
Mitsubishi Corporation (Trading companies & distribution) | | 184,200 | | | 4,588 |
Nippon Electric Glass Co., Ltd. (Electronic equipment, instruments & components ) | | 191,000 | | | 2,629 |
Terumo Corporation (Health care equipment & supplies) | | 48,900 | | | 2,947 |
| | | | | |
| | | | | 37,783 |
| | | | | |
See accompanying Notes to Financial Statements.
44 Annual Report | December 31, 2009 |
International Equity Fund
Portfolio of Investments, December 31, 2009 (all dollar amounts in thousands)
| | | | | |
Issuer | | Shares | | Value |
|
Common Stocks—Asia—7.0% |
Australia—2.7% | | | | | |
BHP Billiton Limited—ADR (Metals & mining) | | 40,880 | | $ | 3,131 |
Woolworths Limited (Food & staples retailing) | | 95,278 | | | 2,390 |
WorleyParsons Limited (Energy equipment & services) | | 99,977 | | | 2,596 |
| | | | | |
| | | | | 8,117 |
| | | | | |
Hong Kong—2.6% | | | | | |
ASM Pacific Technology Limited (Semiconductors & semiconductor equipment) | | 153,600 | | | 1,452 |
Li & Fung, Ltd. (Distributors) | | 778,000 | | | 3,216 |
Noble Group Limited (Trading companies & distributors) | | 1,289,000 | | | 2,957 |
| | | | | |
| | | | | 7,625 |
| | | | | |
Singapore—1.7% | | | | | |
Capitaland, Ltd. (Real estate management & development) | | 1,200,000 | | | 3,560 |
Wilmar International, Ltd.—ADR (Food products) | | 340,000 | | | 1,546 |
| | | | | |
| | | | | 5,106 |
| | | | | |
| | |
Canada—6.0% | | | | | |
Brookfield Asset Management, Inc., Class “A” (Real estate management & development)† | | 133,733 | | | 2,966 |
Canadian National Railway Company (Road & rail)† | | 89,341 | | | 4,857 |
Goldcorp Holdings Co. (Metals & mining)† | | 82,377 | | | 3,241 |
* Research In Motion Limited (Communications equipment)† | | 31,400 | | | 2,121 |
Royal Bank of Canada (Commercial banks) | | 54,532 | | | 2,941 |
Tim Hortons, Inc. (Hotels, restaurants & leisure) | | 56,352 | | | 1,731 |
| | | | | |
| | | | | 17,857 |
| | | | | |
| | |
Emerging Europe, Mid-East, Africa—4.7% | | | | | |
Israel —2.3% | | | | | |
Teva Pharmaceutical Industries, Ltd.—ADR (Pharmaceuticals) | | 121,966 | | | 6,852 |
| | | | | |
South Africa —1.5% | | | | | |
Naspers, Ltd. (Media) | | 109,600 | | | 4,436 |
| | | | | |
Turkey —0.9% | | | | | |
Turkiye Garanti Bankasi A.S. (Commercial banks) | | 614,632 | | | 2,618 |
| | | | | |
* Non-income producing securities
† = U.S. Listed Foreign Common Stock
ADR = American Depository Receipt
| | | | | | |
Issuer | | Shares or
Principal
Amount | | Value |
|
Common Stocks—Emerging Latin America—2.6% |
| | |
Emerging Latin America—2.6% | | | | | | |
Brazil—2.4% | | | | | | |
BM&F Bovespa S.A. (Diversified financial services) | | | 501,871 | | $ | 3,531 |
Petroleo Brasileiro S.A.- ADR (Oil, gas & consumable fuels) | | | 27,328 | | | 1,303 |
Weg S.A. (Machinery) | | | 210,200 | | | 2,222 |
| | | | | | |
| | | | | | 7,056 |
| | | | | | |
Mexico—0.2% | | | | | | |
Wal-Mart de Mexico Sab de C.V. (Food & staples retailing) | | | 168,500 | | | 751 |
| | | | | | |
Total Common Stocks—96.5%
(cost $227,379) | | | 287,372 |
| | | | | | |
| | |
Preferred Stock | | | | | | |
Brazil—1.2% | | | | | | |
Petroleo Brasileiro S.A. (Oil, gas & consumable fuels) | | | 176,723 | | | 3,724 |
| | | | | | |
Total Preferred Stock—1.2%
(cost $1,941) | | | 3,724 |
| | | | | | |
| | |
Investment in Affiliate | | | | | | |
William Blair Ready Reserves Fund | | | 4,954 | | | 5 |
| | | | | | |
Total Investment in Affiliate—0.0%
(cost $5) | | | 5 |
| | | | | | |
| | |
Repurchase Agreement | | | | | | |
State Street Bank and Trust Company, 0.000% dated 12/31/09 due 1/4/10, repurchase price $6,386, collateralized by U.S. Treasury Bill, 0.020%, due 2/18/10 | | $ | 6,386 | | | 6,386 |
| | | | | | |
Total Repurchase Agreement—2.1%
(cost $6,386) | | | 6,386 |
| | | | | | |
Total Investments—99.8%
(cost $235,711) | | | 297,487 |
Cash and other assets, less liabilities—0.2% | | | 681 |
| | | | | | |
Net assets—100.0% | | $ | 298,168 |
| | | | | | |
See accompanying Notes to Financial Statements.
December 31, 2009 | William Blair Funds 45 |
International Equity Fund
Portfolio of Investments, December 31, 2009 (all dollar amounts in thousands)
For securities, primarily traded on exchanges or markets that close before the close of regular trading on the New York Stock Exchange, the Fund uses an independent pricing service on a daily basis to fair value price the securities pursuant to Valuation Procedures approved by the Board of Trustees.
At December 31, 2009, the Fund’s Portfolio of Investments includes the following industry categories:
| | | |
Industrials | | 20.0 | % |
Financials | | 18.7 | % |
Information Technology | | 12.7 | % |
Consumer Discretionary | | 12.6 | % |
Energy | | 11.1 | % |
Health Care | | 8.9 | % |
Consumer Staples | | 6.9 | % |
Materials | | 5.1 | % |
Telecommunication Services | | 3.0 | % |
Utilities | | 1.0 | % |
| | | |
Total | | 100.0 | % |
| | | |
At December 31, 2009, the Fund’s Portfolio of Investments includes the following currency categories:
| | | |
Euro | | 21.2 | % |
British Pound Sterling | | 17.8 | % |
Japanese Yen | | 13.0 | % |
U.S. Dollar | | 9.6 | % |
Swiss Franc | | 8.7 | % |
Hong Kong Dollar | | 7.9 | % |
Indian Rupee | | 3.9 | % |
Brazilian Real | | 3.3 | % |
Singapore Dollar | | 2.8 | % |
New Taiwan Dollar | | 1.9 | % |
Australian Dollar | | 1.7 | % |
South Korean Won | | 1.7 | % |
Canadian Dollar | | 1.6 | % |
South African Rand | | 1.5 | % |
Danish Krone | | 1.3 | % |
All Other Currencies | | 2.1 | % |
| | | |
Total | | 100.0 | % |
| | | |
See accompanying Notes to Financial Statements.
46 Annual Report | December 31, 2009 |

Jeffrey A. Urbina
INTERNATIONAL SMALL CAP GROWTH FUND
The International Small Cap Growth Fund primarily invests in a diversified portfolio of common stocks of small cap companies in developed and emerging markets.
AN OVERVIEW FROM THE PORTFOLIO MANAGER
Please see page 28 for the Global Markets Overview.
The International Small Cap Growth Fund posted a 57.10% increase (Class N Shares) for the 12 months ended December 31, 2009. By comparison, the Fund’s benchmark, the MSCI All Country Ex-U.S. Small Cap Index (net) (the “Index”), gained 62.91%.
The Fund outpaced the Index during the fourth quarter, but trailed it for the year. Fourth quarter performance was bolstered by strong stock selection across most sectors and regions. In particular, Consumer Discretionary and Consumer Staples stock selection was strong in Europe and emerging markets, mining exposure added value within Materials, and Information Technology (IT) stock selection was strong across most regions. During 2009, the Fund trailed the ACWI Ex-U.S. Small Cap Index but was well ahead of the World Ex-U.S. Small Cap Index. Augmenting performance was good stock selection across most sectors and regions, with significant value added in Consumer Staples, Energy, IT and Materials. Within Energy, a number of the service companies that were significant detractors from 2008 performance added value in 2009, while Baidu, Inc., Aixtron Aktiengesellschaft AG, Autonomy Corporation plc, ASM Pacific Technology Limited and Gree, Inc. performed strongly in IT. Detracting from 2009 results, however, was the Fund’s underweightings in the strong Materials sector and Asian emerging markets, coupled with Japanese Consumer Discretionary, Consumer Staples and IT stock selection.
As of December 31, the Fund maintained its focus on Consumer Staples and Consumer Discretionary, Industrials and IT at 7.9%, 18.6%, 21.7% and 15.9% of the Fund, respectively. Financials, which represented 12.6% of the Fund as of year-end, remained underweighted versus the ACWI Ex-U.S. Small Cap Index, while the 12.2% Healthcare exposure was nearly double the Index weighting. The Fund was most underweighted in Financials and Materials and most overweighted in Healthcare and IT as of year end. Regionally, the Fund was overweighted in Europe (31.4% v. 26.9%) and the U.K. (21.0% v. 14.1%), and underweighted in emerging markets (14.4% v. 24.2%). During the quarter we reduced exposure in Japan across most sectors from 20.3% to 17.4%.
December 31, 2009 | William Blair Funds 47 |
International Small Cap Growth Fund
Performance Highlights (unaudited)
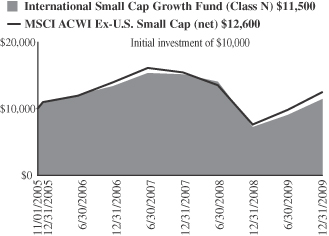
Average Annual Total Return at 12/31/2009
| | | | | | | | | |
| | | 1
Year | | | 3
Year | | | Since
Inception(a) | |
International Small Cap Growth Fund Class N | | 57.10 | % | | (5.06 | )% | | 3.38 | % |
International Small Cap Growth Fund Class I | | 57.51 | | | (4.73 | ) | | 3.71 | |
MSCI AC World Ex-U.S. Small Cap Index (net) | | 62.91 | | | (3.52 | ) | | 5.59 | |
| | (a) | | For the period from November 1, 2005 (Commencement of Operations) to December 31, 2009. | |
Performance cited represents past performance. Past performance does not guarantee future results and current performance may be lower or higher than the data quoted. Results shown are average annual returns, which assume reinvestment of dividends and capital gains. Investment returns and principal will fluctuate and you may have a gain or loss when you sell shares. For the most current month-end performance information, please call 1-800-742-7272, or visit our Web site at www.williamblairfunds.com. From time to time, the investment advisor may waive fees or reimburse expenses for the Fund. Without these waivers, performance would be lower. International investing involves special risk considerations, including currency fluctuations, lower liquidity, economic and political risk. Class N shares are available to the general public without a sales load. Class I shares are available to certain institutional investors and advisory clients of William Blair & Company L.L.C. without a sales load or distribution (12b-1) fees.
The performance highlights and graph presented above do not reflect the deduction of taxes that a shareholder would pay on fund distributions or the redemption of fund shares.
The Morgan Stanley Capital International (MSCI) All Country World Ex-U.S. Small Cap Index (net) is a free float-adjusted market capitalization weighted index that is designed to measure the equity market performance of small capitalization developed and emerging markets, excluding the United States. This series approximates the minimum possible dividend reinvestment.
This report identifies the Fund’s investments on December 31, 2009. These holdings are subject to change. Not all stocks in the Fund performed the same, nor is there any guarantee that these stocks will perform as well in the future. Market forecasts provided in this report may not necessarily come to pass.
Sector Diversification (unaudited)
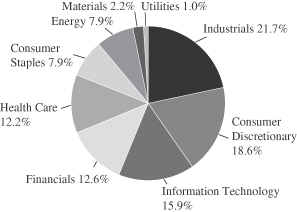
The sector diversification shown is based on the total long-term securities.
48 Annual Report | December 31, 2009 |
International Small Cap Growth Fund
Portfolio of Investments, December 31, 2009 (all dollar amounts in thousands)
| | | | | |
Issuer | | Shares | | Value |
| | |
Common Stocks—Europe—30.5% | | | | | |
Austria—0.3% | | | | | |
Schoeller-Bleckmann Oilfield Equipment AG (Energy equipment & services) | | 23,296 | | $ | 1,143 |
| | | | | |
Denmark—0.2% | | | | | |
SimCorp A/S (Software) | | 4,690 | | | 880 |
| | | | | |
Finland—0.7% | | | | | |
F-Secure OYJ (Software) | | 426,058 | | | 1,669 |
Nokian Renkaat OYJ (Auto components) | | 47,262 | | | 1,146 |
| | | | | |
| | | | | 2,815 |
| | | | | |
France—6.2% | | | | | |
April Group S.A. (Insurance) | | 96,389 | | | 3,341 |
bioMerieux S.A. (Health care
equipment & supplies) | | 82,366 | | | 9,624 |
*Boursorama (Capital markets) | | 137,625 | | | 1,903 |
EDF Energies Nouvelles S.A. (Independent power providers & energy trader) | | 72,503 | | | 3,739 |
*Gemalto N.V. (Computers & peripherals) | | 94,859 | | | 4,127 |
Orpea (Heath care providers & services) | | 33,725 | | | 1,526 |
| | | | | |
| | | | | 24,260 |
| | | | | |
Germany—5.9% | | | | | |
Aixtron Aktiengesellschaft AG (Semiconductors & semiconductor equipment) | | 216,882 | | | 7,289 |
CTS Eventim AG (Media) | | 66,977 | | | 3,278 |
*Qiagen N.V. (Life sciences tools & services) | | 351,553 | | | 7,917 |
Wire Card AG (IT services) | | 319,676 | | | 4,420 |
| | | | | |
| | | | | 22,904 |
| | | | | |
Greece—0.2% | | | | | |
Jumbo S.A. (Specialty retail) | | 83,034 | | | 1,050 |
| | | | | |
Ireland—1.9% | | | | | |
*Norkom Group plc (Software) | | 215,133 | | | 453 |
Paddy Power plc (Hotels, restaurants, & leisure) | | 191,412 | | | 6,765 |
| | | | | |
| | | | | 7,218 |
| | | | | |
Italy—3.1% | | | | | |
Ansaldo STS SpA (Transportation infrastructure) | | 190,132 | | | 3,624 |
Diasorin SpA (Health care equipment & supplies) | | 108,514 | | | 3,856 |
Trevi Finanziaria SpA (Construction & engineering) | | 296,946 | | | 4,700 |
| | | | | |
| | | | | 12,180 |
| | | | | |
Luxembourg—1.8% | | | | | |
Oriflame Cosmetics S.A. (Personal products) | | 116,775 | | | 6,963 |
| | | | | |
Netherlands—1.0% | | | | | |
BinckBank N.V. (Capital markets) | | 219,226 | | | 3,927 |
| | | | | |
Norway—0.6% | | | | | |
*Norwegian Air Shuttle ASA (Airlines) | | 72,356 | | | 1,431 |
Opera Software ASA (Internet software & services) | | 263,405 | | | 909 |
| | | | | |
| | | | | 2,340 |
| | | | | |
Portugal—0.6% | | | | | |
Jeronimo Martins (Food & staples retailing) | | 249,376 | | | 2,494 |
| | | | | |
| | | | | |
Issuer | | Shares | | Value |
|
Common Stocks—Europe—30.5%—(continued) |
Spain—2.0% | | | | | |
Tecnicas Reunidas S.A. (Energy equipment & services) | | 138,577 | | $ | 7,970 |
| | | | | |
Switzerland—6.0% | | | | | |
*Orascom Development Holding AG (Hotels, restaurants & leisure) | | 35,906 | | | 2,530 |
Partners Group Global Opportunities, Ltd. (Capital markets) | | 69,004 | | | 8,700 |
Sika AG (Chemicals) | | 2,571 | | | 3,998 |
*Temenos Group AG (Software) | | 312,986 | | | 8,065 |
| | | | | |
| | | | | 23,293 |
| | | | | |
|
United Kingdom—20.5% |
Aberdeen Asset Management plc (Capital markets) | | 1,605,702 | | | 3,450 |
Aggreko plc (Commercial services & supplies) | | 489,918 | | | 7,314 |
Amlin plc (Insurance) | | 1,239,802 | | | 7,159 |
Ashmore Group plc (Capital markets) | | 530,967 | | | 2,324 |
*ASOS plc (Internet & catalog retail) | | 100,775 | | | 792 |
AVEVA Group plc (Software) | | 71,776 | | | 1,167 |
*The Berkeley Group Holdings plc (Household durables) | | 194,633 | | | 2,567 |
*Blinkx plc (Internet software & services) | | 3,979,517 | | | 1,077 |
BlueBay Asset Management plc (Capital markets) | | 174,222 | | | 848 |
Britvic plc (Beverages) | | 643,852 | | | 4,222 |
*Ceres Power Holdings plc (Electrical equipment) | | 262,261 | | | 676 |
Chemring Group plc (Aerospace & defense) | | 113,780 | | | 5,371 |
Connaught plc (Commercial services & supplies) | | 197,416 | | | 1,130 |
*Dana Petroleum plc (Oil, gas, & consumable fuels) | | 314,492 | | | 5,951 |
Domino’s Pizza UK & IRL plc (Hotels, restaurants, & leisure) | | 206,254 | | | 990 |
*Heritage Oil plc (Oil, gas, & consumable fuels) | | 142,573 | | | 1,000 |
Intertek Group plc (Professional services) | | 101,882 | | | 2,059 |
Michael Page International plc (Professional services) | | 906,076 | | | 5,517 |
Micro Focus International plc (Software) | | 419,987 | | | 3,072 |
Mothercare plc (Multiline retail) | | 238,221 | | | 2,615 |
Petrofac, Ltd. (Energy equipment & services) | | 287,269 | | | 4,809 |
RPS Group plc (Commercial services & supplies) | | 1,180,344 | | | 4,127 |
Serco Group plc (Commercial services & supplies) | | 529,087 | | | 4,512 |
*Telecity Group plc (Internet software & services) | | 529,697 | | | 3,265 |
The Weir Group plc (Machinery) | | 354,564 | | | 4,089 |
| | | | | |
| | | | | 80,103 |
| | | | | |
|
Japan—17.0% |
ABC-Mart, Inc. (Specialty retail) | | 145,614 | | | 4,039 |
Aeon Delight Co., Ltd. (Commercial services & supplies) | | 73,200 | | | 1,037 |
EPS Co., Ltd. (Life sciences tools & services) | | 254 | | | 996 |
Exedy Corporation (Auto components) | | 146,500 | | | 3,051 |
F.C.C. Co., Ltd. (Auto components) | | 109,009 | | | 1,931 |
Goldcrest Co., Ltd. (Real estate management & development) | | 130,050 | | | 3,642 |
See accompanying Notes to Financial Statements.
December 31, 2009 | William Blair Funds 49 |
International Small Cap Growth Fund
Portfolio of Investments, December 31, 2009 (all dollar amounts in thousands)
| | | | | |
Issuer | | Shares | | Value |
|
Common Stocks—Japan—17.0% —(continued) |
Gree, Inc. (Internet software & services) | | 72,130 | | $ | 4,460 |
kabu.com Securities Co., Ltd. (Capital markets) | | 1,280 | | | 1,236 |
Kakaku.com, Inc. (Internet software & services) | | 558 | | | 2,169 |
K’s Holdings Corporation (Specialty retail) | | 126,100 | | | 3,785 |
Kurita Water Industries, Ltd. (Machinery) | | 234,400 | | | 7,364 |
M3, Inc. (Health care technology) | | 130 | | | 393 |
Miraca Holdings Inc. (Health care equipment & supplies) | | 257,800 | | | 7,095 |
Nabtesco Corporation (Machinery) | | 220,000 | | | 2,520 |
Nitori Company, Ltd. (Specialty retail) | | 48,400 | | | 3,603 |
Osaka Securities Exchange Co., Ltd. (Diversified financial services) | | 1,205 | | | 5,744 |
Park24 Co., Ltd. (Commercial services & supplies) | | 417,500 | | | 4,441 |
Point, Inc. (Specialty retail) | | 76,740 | | | 4,288 |
Start Today Co., Ltd. (Internet & catalog retail) | | 245 | | | 448 |
Unicharm Petcare Corporation (Food products) | | 104,205 | | | 3,183 |
Zappallas, Inc. (Internet software & services) | | 572 | | | 901 |
| | | | | |
| | | | | 66,326 |
| | | | | |
| | |
Emerging Asia—13.0% | | | | | |
China—11.6% | | | | | |
AAC Acoustic Technologies Holdings Inc. (Communications equipment) | | 1,153,559 | | | 1,906 |
China Dongxiang (Group) Co., Ltd. (Textiles, apparel, & luxury goods) | | 3,907,000 | | | 3,015 |
China Green (Holdings) Limited (Food products) | | 1,580,556 | | | 1,497 |
China High Speed Transmission (Electrical equipment) | | 1,921,000 | | | 4,664 |
Comba Telecom Systems Holdings Limited (Communications equipment) | | 3,825,635 | | | 4,443 |
* Concord Medical Services Holdings Limited—ADR (Health care providers & services) | | 43,588 | | | 377 |
* E-House (China) Holdings Limited—ADR (Real estate management & development) | | 198,590 | | | 3,598 |
Geely Automobile Holdings Limited (Automobiles) | | 2,605,000 | | | 1,422 |
Golden Eagle Retail Group, Ltd. (Multiline retail) | | 285,000 | | | 578 |
Li Ning Co., Ltd. (Textile, apparel & luxury goods) | | 1,118,873 | | | 4,243 |
Lonking Holdings Limited (Machinery) | | 6,755,000 | | | 4,655 |
Minth Group Limited (Auto components) | | 2,677,384 | | | 3,930 |
Shandong Weigao Group Medical Polymer Company, Ltd. (Health care equipment & supplies) | | 264,800 | | | 882 |
Wasion Group Holdings Limited (Electronic equipment, instruments, & components) | | 2,880,000 | | | 2,993 |
Zhuzhou CSR Times Electric Co., Ltd. (Electrical equipment) | | 3,393,865 | | | 6,926 |
| | | | | |
| | | | | 45,129 |
| | | | | |
India—1.0% | | | | | |
India Infoline Limited (Capital markets) | | 357,426 | | | 983 |
Lupin Limited (Pharmaceuticals) | | 91,530 | | | 2,891 |
| | | | | |
| | | | | 3,874 |
| | | | | |
| | | | | |
Issuer | | Shares | | Value |
|
Common Stocks—Emerging Asia—13.0%—(continued) |
South Korea—0.2% | | | | | |
*Megastudy Co., Ltd. (Diversified consumer services) | | 4,575 | | $ | 940 |
| | | | | |
Taiwan—0.2% | | | | | |
Tripod Technology Corporation (Electronic equipment, instruments, & components) | | 205,000 | | | 692 |
| | | | | |
| | |
Asia—7.5% | | | | | |
Australia—3.3% | | | | | |
Cochlear Limited (Health care equipment & supplies) | | 70,249 | | | 4,338 |
JB Hi-Fi Limited (Specialty retail) | | 326,642 | | | 6,594 |
SEEK Limited (Professional services) | | 345,571 | | | 2,134 |
| | | | | |
| | | | | 13,066 |
| | | | | |
Hong Kong—1.7% | | | | | |
ASM Pacific Technology Limited (Semiconductors & semiconductor equipment) | | 700,700 | | | 6,625 |
| | | | | |
New Zealand—0.5% | | | | | |
Fisher & Paykel Healthcare Corp., Ltd. (Health care equipment & supplies) | | 741,038 | | | 1,810 |
| | | | | |
Singapore—2.0% | | | | | |
Midas Holdings Limited (Metals & mining) | | 2,718,000 | | | 1,769 |
Olam International, Ltd. (Food & staples retailing) | | 3,111,700 | | | 5,846 |
| | | | | |
| | | | | 7,615 |
| | | | | |
|
Canada—3.0% |
Niko Resources Ltd. (Oil, gas, & consumable fuels) | | 40,032 | | | 3,766 |
*Pacific Rubiales Energy Corporation (Oil, gas & consumable fuels) | | 376,472 | | | 5,562 |
*Red Back Mining Inc. (Metals & mining) | | 177,949 | | | 2,552 |
| | | | | |
| | | | | 11,880 |
| | | | | |
|
Emerging Europe, Mid-East, Africa—2.9% |
Russia—0.1% | | | | | |
*CTC Media, Inc. (Media)† | | 37,759 | | | 562 |
| | | | | |
South Africa—2.3% | | | | | |
*Aspen Pharmacare Holdings Limited (Pharmaceuticals) | | 233,940 | | | 2,329 |
Mr Price Group Limited (Specialty retail) | | 208,695 | | | 987 |
Shoprite Holdings, Limited (Food & staples retailing) | | 447,600 | | | 3,935 |
Wilson Bayly Holmes-Ovcon Limited (Construction & engineering) | | 106,171 | | | 1,543 |
| | | | | |
| | | | | 8,794 |
| | | | | |
Turkey—0.5% | | | | | |
BIM Birlesik Magazalar A.S. (Food & staples retailing) | | 45,077 | | | 2,096 |
| | | | | |
| | |
Emerging Latin America—2.9% | | | | | |
Brazil—2.9% | | | | | |
*Anhanguera Educacional Participacoes S.A. (Diversified consumer services) | | 62,703 | | | 896 |
See accompanying Notes to Financial Statements.
50 Annual Report | December 31, 2009 |
International Small Cap Growth Fund
Portfolio of Investments, December 31, 2009 (all dollar amounts in thousands)
| | | | | | |
Issuer | | Shares or
Principal
Amount | | Value |
|
Common Stocks—Emerging Latin America—2.9%—(continued) |
Brasil Brokers Participacoes S.A. (Real estate management & development) | | | 280,000 | | $ | 1,042 |
Diagnosticos da America S.A. (Health care providers & services) | | | 75,300 | | | 2,465 |
Localiza Rent a Car S.A. (Road & rail) | | | 181,500 | | | 2,014 |
Lojas Renner S.A. (Multiline retail) | | | 72,100 | | | 1,628 |
PDG Realty S.A. Empreendimentos e Participacoes (Household durables) | | | 231,900 | | | 2,311 |
Rodobens Negocioa Imobiliarios S.A. (Household durables) | | | 93,500 | | | 965 |
| | | | | | |
| | | | | | 11,321 |
| | | | | | |
Total Common Stocks—97.3%
(cost $307,348) | | | 380,270 |
| | | | | | |
| | |
Convertible Bond | | | | | | |
Brazil—0.2% | | | | | | |
Lupatech S.A., 6.500% due 4/15/18 (Machinery)** | | $ | 959 | | | 592 |
| | | | | | |
Total Convertible Bond—0.2%
(cost $501) | | | 592 |
| | | | | | |
| | |
Investment in Affiliate | | | | | | |
William Blair Ready Reserves Fund | | | 488,883 | | | 489 |
| | | | | | |
Total Investment in Affiliate—0.1%
(cost $489) | | | 489 |
| | | | | | |
| | |
Short-Term Investment | | | | | | |
American Express Credit Corp. Demand Note, VRN 0.081%, due 1/4/10 | | $ | 500 | | | 500 |
| | | | | | |
Total Short-Term Investment—0.1%
(cost $500) | | | 500 |
| | | | | | |
| | |
Repurchase Agreement | | | | | | |
Fixed Income Clearing Corporation, 0.000% dated 12/31/09, due 1/4/10, repurchase price $3,891, collateralized by FNMA,
4.375%, due 7/17/23 | | | 3,891 | | | 3,891 |
| | | | | | |
Total Repurchase Agreement—1.0%
(cost $3,891) | | | 3,891 |
| | | | | | |
Total Investments—98.7%
(cost $312,729) | | | 385,742 |
Cash and other assets, less liabilities—1.3% | | | 5,109 |
| | | | | | |
Net assets—100.0% | | $ | 390,851 |
| | | | | | |
*Non-income producing securities
† = U.S. listed foreign security
ADR = American Depository Receipt
VRN = Variable Rate Note
**Fair valued pursuant to Valuation Procedures adopted by the Board of Trustees. This holding represents 0.15% of the net assets at December 31, 2009. This security was also deemed illiquid pursuant to the Fund/Advisor’s Liquidity Procedures.
For securities primarily traded on exchanges or markets that close before the close of regular trading on the New York Stock Exchange, the Fund uses an independent pricing service on a daily basis to fair value price the securities pursuant to Valuation Procedures approved by the Board of Trustees.
At December 31, 2009, the Fund’s Portfolio of Investments includes the following industry categories:
| | |
Industrials | | 21.7% |
Consumer Discretionary | | 18.6% |
Information Technology | | 15.9% |
Financials | | 12.6% |
Health Care | | 12.2% |
Energy | | 7.9% |
Consumer Staples | | 7.9% |
Materials | | 2.2% |
Utilities | | 1.0% |
| | |
Total | | 100.0% |
| | |
At December 31, 2009, the Fund’s Portfolio of Investments includes the following currency categories:
| | |
Euro | | 22.6% |
British Pound Sterling | | 21.0% |
Japanese Yen | | 17.4% |
Hong Kong Dollar | | 12.5% |
Swiss Franc | | 6.1% |
Australian Dollar | | 3.4% |
Canadian Dollar | | 3.1% |
Brazilian Real | | 3.1% |
South African Rand | | 2.3% |
Singapore Dollar | | 2.0% |
Swedish Krone | | 1.8% |
U.S. Dollar | | 1.2% |
Indian Rupee | | 1.0% |
All other currencies | | 2.5% |
| | |
Total | | 100.0% |
| | |
See accompanying Notes to Financial Statements.
December 31, 2009 | William Blair Funds 51 |

Todd M. McClone
Jeffrey A. Urbina
EMERGING MARKETS GROWTH FUND
The Emerging Markets Growth Fund primarily invests in a diversified portfolio of equity securities issued by growth companies in emerging economies worldwide.
AN OVERVIEW FROM THE PORTFOLIO MANAGERS
Please see page 28 for the Global Markets Overview.
The Emerging Markets Growth Fund posted a 73.85% increase (Class N Shares) for the 12 months ended December 31, 2009. By comparison, the Fund’s benchmark, the MSCI Emerging Markets IMI Index (the “Index”), gained 82.36%.
The Fund fell slightly behind the Index during the fourth quarter and trailed it for the year. Portfolio results were augmented by Consumer Discretionary and Staples stock selection and weightings, coupled with strong Energy stock selection. In addition, Emerging Asia and Latin America stock selection was strong. Specifically, the Fund’s exposure to the Asian automobile industry added value, as did strong performance by Naspers, Ltd., Russian grocery stores and Latin American holdings. Detracting from fourth quarter results was Middle Eastern exposure, in the wake of the Dubai world debt concerns. The Fund posted a strong absolute return during 2009, but trailed the broad Indices. While stock selection was strong across most sectors throughout the year, sector positioning was the biggest drag on results, particularly during the first half of 2009. In particular, the Fund’s Consumer Staples holdings outperformed the Index by approximately 20%, Information Technology stock selection was augmented by Taiwanese exposure, and Brazilian and Chinese exploration and production companies boosted Energy performance.
As of December 31, the Fund maintained its focus on Consumer Discretionary and Consumer Staples stocks at 31.0% of the Fund, well ahead of the Index weighting. While Information Technology decreased by approximately 3% during the quarter, it approximated the Index weighting. Financials, Materials and Telecommunication Services remained the most underweighted during the period, while Consumer (Discretionary and Staples) was the most overweighted exposure. Regionally, the Fund remained underweighted in Emerging Asia and Emerging Markets Europe, Mid-East and Africa (EMEA) in favor of Latin America.
52 Annual Report | December 31, 2009 |
Emerging Markets Growth Fund
Performance Highlights (unaudited)
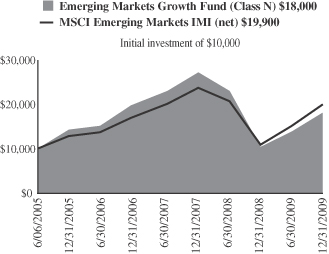
Average Annual Total Return at 12/31/2009
| | | | | | | | | |
| | | 1
Year | | | 3
Year | | | Since
Inception(a) | |
Emerging Markets Growth Fund Class N | | 73.85 | % | | (2.84 | )% | | 13.70 | % |
Emerging Markets Growth Fund Class I | | 74.18 | | | (2.61 | ) | | 13.95 | |
MSCI Emerging Markets IMI (net) | | 82.36 | | | 5.63 | | | 16.20 | |
| | (a) | | For the period from June 6, 2005 (Commencement of Operations) to December 31, 2009. | |
Performance cited represents past performance. Past performance does not guarantee future results and current performance may be lower or higher than the data quoted. Results shown are average annual returns, which assume reinvestment of dividends and capital gains. Investment returns and principal will fluctuate and you may have a gain or loss when you sell shares. For the most current month-end performance information, please call 1-800-742-7272, or visit our Web site at www.williamblairfunds.com. From time to time, the investment advisor may waive fees or reimburse expenses for the Fund. Without these waivers, performance would be lower. International investing involves special risk considerations, including currency fluctuations, lower liquidity, economic and political risk. Class N shares are available to the general public without a sales load. Class I shares are available to certain institutional investors and advisory clients of William Blair & Company L.L.C. without a sales load or distribution (12b-1) fees.
The performance highlights and graph presented above do not reflect the deduction of taxes that a shareholder would pay on fund distributions or the redemption of fund shares.
The Morgan Stanley Capital International (MSCI) Emerging Markets Investable Market Index (IMI) (net) is a free float-adjusted market capitalization weighted index that is designed to measure the equity market performance of emerging markets.
This report identifies the Fund’s investments on December 31, 2009. These holdings are subject to change. Not all stocks in the Fund performed the same, nor is there any guarantee that these stocks will perform as well in the future. Market forecasts provided in this report may not necessarily come to pass.
Sector Diversification (unaudited)
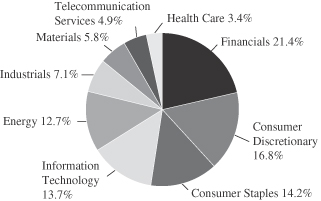
The sector diversification shown is based on the total long-term securities.
December 31, 2009 | William Blair Funds 53 |
Emerging Markets Growth Fund
Portfolio of Investments, December 31, 2009 (all dollar amounts in thousands)
| | | | | |
Issuer | | Shares | | Value |
| |
Common Stocks—Emerging Asia—51.9% | | | |
China—20.4% | | | | | |
AAC Acoustic Technologies Holdings Inc. (Communications equipment) | | 1,511,949 | | $ | 2,498 |
Angang Steel Company Limited (Metals & mining) | | 5,192,000 | | | 11,322 |
Anhui Conch Cement Company Limited (Construction materials) | | 938,000 | | | 5,994 |
Belle International Holdings Limited (Specialty retail) | | 4,629,200 | | | 5,363 |
China Dongxiang (Group) Co., Ltd. (Textiles, apparel, & luxury goods) | | 7,084,000 | | | 5,466 |
China High Speed Transmission (Electrical equipment) | | 2,352,000 | | | 5,711 |
China Life Insurance Co., Ltd. (Insurance) | | 3,020,000 | | | 14,778 |
China Overseas Land & Investment, Lts. (Real estate management & development) | | 3,468,000 | | | 7,266 |
China Railway Construction Corporation Limited (Construction & engineering) | | 8,129,000 | | | 10,358 |
China Shenhua Energy Company Limited (Oil, gas, & consumable fuels) | | 4,493,406 | | | 21,812 |
China Vanke Co., Ltd. (Real estate management & development) | | 7,423,234 | | | 9,276 |
*China Zhongwang Holdings Limited (Metals & mining) | | 8,088,800 | | | 6,443 |
*Concord Medical Services Holdings Limited—ADR (Health care providers & services) | | 68,593 | | | 593 |
CNOOC Limited (Oil, gas & consumable fuels) | | 15,686,000 | | | 24,438 |
Dongfeng Motor Group Company Limited (Automobiles) | | 7,180,000 | | | 10,253 |
*E-House (China) Holdings Limited—ADR (Real estate management & development) | | 120,653 | | | 2,186 |
Geely Automobile Holdings Limited (Automobiles) | | 3,650,000 | | | 1,992 |
Golden Eagle Retail Group, Ltd. (Multiline retail) | | 719,000 | | | 1,458 |
Hengan International Group Co., Ltd. (Personal products) | | 353,000 | | | 2,614 |
Industrial and Commercial Bank of China (Commercial banks) | | 43,717,000 | | | 36,004 |
Li Ning Co., Ltd. (Textiles, apparel & luxury goods) | | 1,042,500 | | | 3,953 |
Lonking Holdings Limited (Machinery) | | 3,974,000 | | | 2,738 |
Shandong Weigao Group Medical Polymer Company, Ltd. (Health care equipment & supplies) | | 640,700 | | | 2,135 |
Tencent Holdings, Ltd. (Internet software & services) | | 134,000 | | | 2,898 |
Wasion Group Holdings Limited (Electronic equipment, instruments, & components) | | 2,256,000 | | | 2,345 |
Zhuzhou CSR Times Electric Co., Ltd. (Electrical equipment) | | 1,199,861 | | | 2,449 |
Zijin Mining Group Company Limited (Metals & mining) | | 7,266,000 | | | 6,887 |
ZTE Corporation (Communications equipment) | | 458,400 | | | 2,818 |
| | | | | |
| | | | | 212,048 |
| | | | | |
India—8.5% | | | | | |
Bharat Heavy Electricals, Ltd. (Electrical equipment) | | 188,598 | | | 9,709 |
| | | | | |
Issuer | | Shares | | Value |
|
Common Stocks—Emerging Asia—51.9%—(continued) |
*Cairn India, Ltd. (Oil, gas & consumable fuels) | | 1,286,792 | | $ | 7,761 |
Dabur India Limited (Personal products) | | 688,638 | | | 2,337 |
Financial Technologies (India) Limited (Software) | | 71,919 | | | 2,063 |
HDFC Bank, Ltd. (Commercial banks) | | 154,385 | | | 5,625 |
Hero Honda Motors Limited (Automobiles) | | 148,903 | | | 5,477 |
Housing Development Finance Corp. (Thrifts & mortgage finance) | | 90,110 | | | 5,156 |
India Infoline Limited (Capital markets) | | 894,226 | | | 2,460 |
Infosys Technologies Limited (IT services) | | 196,058 | | | 10,912 |
Jindal Steel & Power Limited (Metals & mining) | | 827,566 | | | 12,450 |
Larsen & Toubro, Ltd. (Construction & engineering) | | 146,373 | | | 5,270 |
Lupin Limited (Pharmaceuticals) | | 85,565 | | | 2,703 |
Maruti Suzuki India Limited (Automobiles) | | 159,033 | | | 5,305 |
Reliance Industries Limited (Oil, gas, & consumable fuels) | | 455,921 | | | 10,653 |
| | | | | |
| | | | | 87,881 |
| | | | | |
Indonesia—2.6% | | | | | |
PT Astra International Tbk (Automobiles) | | 3,428,000 | | | 12,603 |
PT Bank Rakyat Indonesia (Commercial banks) | | 9,490,000 | | | 7,627 |
*PT Ciputra Development Tbk (Real estate management & development) | | 27,192,728 | | | 1,402 |
PT Telekomunikasi Indonesia Tbk (Diversified telecommunication services) | | 2,414,000 | | | 2,403 |
PT United Tractors Tbk (Machinery) | | 1,911,500 | | | 3,130 |
| | | | | |
| | | | | 27,165 |
| | | | | |
Malaysia—1.0% | | | | | |
CIMB Group Holdings Berhad (Commercial banks) | | 2,677,500 | | | 10,019 |
| | | | | |
Papua New Guinea—0.7% | | | | | |
Oil Search Limited (Oil, gas, & consumable fuels) | | 1,392,177 | | | 7,633 |
| | | | | |
South Korea—8.9% | | | | | |
*Amorepacific Corporation (Personal products) | | 7,244 | | | 5,808 |
*Hyundai Mobis (Auto components) | | 84,788 | | | 12,425 |
*Hyundai Motor Company (Automobiles) | | 235,739 | | | 24,402 |
*LG Household & Health Care, Ltd. (Household products) | | 36,527 | | | 9,138 |
*Megastudy Co., Ltd. (Diversified consumer services) | | 11,421 | | | 2,348 |
*NHN Corporation (Internet software & services) | | 35,244 | | | 5,825 |
Samsung Electronics Co., Ltd. (Semiconductors & semiconductor equipment) | | 23,520 | | | 16,128 |
Samsung Fire & Marine Insurance Co., Ltd. (Insurance) | | 52,571 | | | 8,999 |
*Shinsegae Co., Ltd. (Food & staples retailing) | | 10,680 | | | 4,933 |
*Taewoong Co., Ltd. (Machinery) | | 38,801 | | | 2,494 |
| | | | | |
| | | | | 92,500 |
| | | | | |
See accompanying Notes to Financial Statements.
54 Annual Report | December 31, 2009 |
Emerging Markets Growth Fund
Portfolio of Investments, December 31, 2009 (all dollar amounts in thousands)
| | | | | |
Issuer | | Shares | | Value |
|
Common Stocks—Emerging Asia—51.9%—(continued) |
Taiwan—9.0% | | | | | |
Hon Hai Precision Industry Co., Ltd. (Electronic equipment, instruments, & components) | | 7,244,100 | | $ | 33,878 |
MediaTek Inc. (Semiconductors & semiconductor equipment) | | 995,142 | | | 17,290 |
Siliconware Precision Industries Co., Ltd. (Semiconductors & semiconductor equipment) | | 3,995,000 | | | 5,446 |
Taiwan Semiconductor Manufacturing Company Ltd. (Semiconductors & semiconductor equipment) | | 15,434,947 | | | 31,109 |
Tripod Technology Corporation (Electronic equipment, instruments, & components) | | 301,000 | | | 1,015 |
Yuanta Financial Holding Co., Ltd. (Capital markets) | | 6,691,000 | | | 4,896 |
| | | | | |
| | | | | 93,634 |
| | | | | |
Thailand—0.8% | | | | | |
CP ALL PCL (Food & staples retailing) | | 8,625,000 | | | 6,416 |
Minor International PCL (Hotels, restaurants, & leisure) | | 5,447,300 | | | 1,846 |
| | | | | |
| | | | | 8,262 |
| | | | | |
| | |
Emerging Latin America—22.3% | | | | | |
Brazil—12.6% | | | | | |
*Anhanguera Educacional Participacoes S.A. (Diversified consumer services) | | 162,800 | | | 2,326 |
Banco Santander (Brasil) S.A.—GDR (Commercial banks) | | 786,438 | | | 10,963 |
BM&F Bovespa S.A. (Diversified financial services) | | 869,600 | | | 6,119 |
*BR Malls Participacoes S.A. (Real estate management & development) | | 594,100 | | | 7,337 |
Brasil Brokers Participacoes S.A. (Real estate management & development) | | 438,200 | | | 1,631 |
Companhia de Bebidas das Americas-AMBEV—ADR (Beverages) | | 188,211 | | | 19,026 |
*GP Investments, Ltd.—GDR (Capital markets) | | 487,800 | | | 2,858 |
Diagnosticos da America S.A. (Health care providers & services) | | 130,500 | | | 4,272 |
*Hypermarcas S.A. (Personal products) | | 398,414 | | | 9,154 |
Iguatemi Empresa de Shopping Centers S.A. (Real estate management & development) | | 86,115 | | | 1,682 |
Localiza Rent a Car S.A. (Road & rail) | | 443,200 | | | 4,918 |
Lojas Renner S.A. (Multiline retail) | | 203,500 | | | 4,594 |
M. Dias Branco S.A. Industria e Comercio de Alimentos (Food products) | | 112,400 | | | 2,712 |
MRV Engenharia e Participacoes, S.A. (Household durables) | | 1,115,880 | | | 9,037 |
Natura Cosmeticos S.A. (Personal products) | | 414,200 | | | 8,639 |
*OGX Petroleo e Gas Participacoes S.A. (Oil, gas, & consumable fuels) | | 600,000 | | | 5,893 |
PDG Realty S.A. Empreendimentos e Participacoes (Household durables) | | 833,100 | | | 8,302 |
Rodobens Negocioa Imobiliarios S.A. (Household durables) | | 152,500 | | | 1,574 |
Totvs S.A. (Software) | | 60,500 | | | 4,101 |
Vale S.A.—ADR (Metals & mining) | | 366,875 | | | 10,650 |
WEG S.A. (Machinery) | | 438,400 | | | 4,633 |
| | | | | |
| | | | | 130,421 |
| | | | | |
| | | | | |
Issuer | | Shares | | Value |
|
Common Stocks—Emerging Latin America—22.3%—(continued) |
Chile—1.2% | | | | | |
Banco Santander Chile—GDR (Commercial Banks) | | 8,417 | | $ | 545 |
S.A.C.I. Falabella S.A. (Multiline retail) | | 2,041,832 | | | 12,051 |
| | | | | |
| | | | | 12,596 |
| | | | | |
Columbia—0.5% | | | | | |
Ecopetrol S.A. (Oil, gas, & consumable fuels) | | 4,488,290 | | | 5,447 |
| | | | | |
Mexico—6.8% | | | | | |
America Movil S.A.B. de C.V. (Wireless telecommunication services) | | 8,962,500 | | | 21,081 |
Banco Compartamos S.A.B. de C.V. (Consumer finance) | | 591,300 | | | 3,052 |
*Desarrolladora Homex S.A.B. de C.V.—ADR (Household durables) | | 171,281 | | | 5,759 |
Fomento Economico Mexicano S.A.B. de C.V.—ADR (Beverages) | | 168,817 | | | 8,083 |
Grupo Televisa S.A.B. de C.V.—ADR (Media) | | 611,847 | | | 12,702 |
*Megacable Holdings S.A.B. de C.V. (Media) | | 851,400 | | | 1,796 |
Wal-Mart de Mexico S.A.B. de C.V. (Food & staples retailing) | | 3,963,100 | | | 17,662 |
| | | | | |
| | | | | 70,135 |
| | | | | |
Panama—0.2% | | | | | |
Copa Holdings S.A. (Airlines)† | | 36,845 | | | 2,007 |
| | | | | |
Peru—1.0% | | | | | |
Credicorp, Ltd. (Commercial banks)† | | 137,920 | | | 10,623 |
| | | | | |
| |
Emerging Europe, Mid-East, Africa—17.4% | | | |
Egypt—0.6% | | | | | |
Egyptian Financial Group—Hermes Holding S.A.E. (Capital markets) | | 282,784 | | | 1,288 |
Orascom Construction Industries (Construction & engineering) | | 116,106 | | | 5,261 |
| | | | | |
| | | | | 6,549 |
| | | | | |
Israel—1.8% | | | | | |
Teva Pharmaceutical Industries, Ltd.—ADR (Pharmaceuticals) | | 325,971 | | | 18,313 |
| | | | | |
Qatar—0.4% | | | | | |
Qatar National Bank S.A.Q. (Commercial banks) | | 114,559 | | | 4,660 |
| | | | | |
Russia—5.6% | | | | | |
*CTC Media, Inc. (Media)† | | 101,632 | | | 1,514 |
Magnit—CLS (Food & staples retailing)† | | 237,268 | | | 16,341 |
Mobile TeleSystems OJSC—ADR (Wireless telecommunication services) | | 158,360 | | | 7,742 |
Novatek OAO—GDR (Oil, gas, & consumable fuels) | | 114,800 | | | 7,499 |
Vimpel-Communications OJSC—ADR (Diversified telecommunication services) | | 462,026 | | | 8,589 |
*X 5 Retail Group N.V.—GDR (Food & staples retailing) | | 520,150 | | | 16,488 |
| | | | | |
| | | | | 58,173 |
| | | | | |
See accompanying Notes to Financial Statements.
December 31, 2009 | William Blair Funds 55 |
Emerging Markets Growth Fund
Portfolio of Investments, December 31, 2009 (all dollar amounts in thousands)
| | | | | | |
Issuer | | Shares or
Principal
Amount | | Value |
|
Emerging Europe, Mid-East, Africa—17.4%—(continued) |
South Africa—6.0% | | | | | | |
AngloGold Ashanti Limited (Metals & mining) | | | 117,181 | | $ | 4,747 |
*Aspen Pharmacare Holdings Limited (Pharmaceuticals) | | | 590,966 | | | 5,884 |
Mr Price Group Limited (Specialty retail) | | | 519,279 | | | 2,455 |
MTN Group, Ltd. (Wireless telecommunication services) | | | 629,347 | | | 10,017 |
Naspers, Ltd. (Media) | | | 345,387 | | | 13,978 |
Shoprite Holdings Limited (Food & staples retailing) | | | 596,598 | | | 5,245 |
Standard Bank Group Limited (Commercial banks) | | | 1,134,012 | | | 15,576 |
Wilson Bayly Holmes-Ovcon Limited (Construction & engineering) | | | 279,734 | | | 4,064 |
| | | | | | |
| | | | | | 61,966 |
| | | | | | |
Turkey—2.6% | | | | | | |
Bim Birlesik Magazalar A.S. (Food & staples retailing) | | | 118,235 | | | 5,498 |
Coca Cola Icecek A.S. (Beverages) | | | 300,966 | | | 3,009 |
Turkiye Garanti Bankasi A.S. (Commercial banks) | | | 4,420,308 | | | 18,830 |
| | | | | | |
| | | | | | 27,337 |
| | | | | | |
United Arab Emirates—0.4% | | | | | | |
Aldar Properties PJSC (Real estate management & development) | | | 1,588,719 | | | 2,101 |
First Gulf Bank PJSC (Commercial banks) | | | 479,819 | | | 2,095 |
| | | | | | |
| | | | | | 4,196 |
| | | | | | |
Total Common Stocks—91.6%
(cost $696,307) | | | 951,565 |
| | | | | | |
| | |
Preferred Stocks | | | | | | |
Brazil—5.4% | | | | | | |
All America Latina Logistica (Road & rail) | | | 870,100 | | | 8,146 |
Itau Unibanco Banco Multiplo S.A. (Commercial banks) | | | 487,254 | | | 10,828 |
Petroleo Brasileiro S.A. (Oil, gas & consumable fuels) | | | 1,740,480 | | | 36,679 |
| | | | | | |
| | | | | | 55,653 |
| | | | | | |
Total Preferred Stocks—5.4%
(cost $39,888) | | | 55,653 |
| | | | | | |
| | |
Convertible Bond | | | | | | |
Brazil—0.1% | | | | | | |
Lupatech S.A., 6.500% 4/15/18 (Machinery)** | | $ | 1,602 | | | 990 |
| | | | | | |
Total Convertible Bond—0.1%
(cost $838) | | | 990 |
| | | | | | |
| | |
Investment in Affiliate | | | | | | |
William Blair Ready Reserves Fund | | | 66,214 | | | 66 |
| | | | | | |
Total Investment in Affiliate—0.0%
(cost $66) | | | 66 |
| | | | | | |
| | |
Short-Term Investment | | | | | | |
American Express Credit Corp. Demand Note, VRN 0.081%, due 1/4/10 | | $ | 2,000 | | | 2,000 |
| | | | | | |
Total Short-Term Investment—0.2%
(cost $2,000) | | | 2,000 |
| | | | | | |
| | | | | | | |
Issuer | | Principal
Amount | | Value | |
| | |
Repurchase Agreement | | | | | | | |
Fixed Income Clearing Corporation,
0.000% dated 12/31/09 due 1/4/10, repurchase price $33,460, collateralized by FNMA, 4.875%, due 12/15/16 | | $ | 33,460 | | $ | 33,460 | |
| | | | | | | |
Total Repurchase Agreement—3.2%
(cost $33,460) | | | 33,460 | |
| | | | | | | |
Total Investments—100.5%
(cost $772,559) | | | 1,043,734 | |
Liabilities, plus cash and other assets—(0.5)% | | | (5,474 | ) |
| | | | | | | |
Net assets—100.0% | | $ | 1,038,260 | |
| | | | | | | |
† = U.S. listed Foreign Security
ADR = American Depository Receipt
GDR = Global Depository Receipt
VRN = Variable Rate Note
** = Fair valued pursuant to Valuation Procedures adopted by the Board of Trustees. This holding represents 0.10% of the Fund’s net assets at December 31, 2009. This security was also deemed illiquid pursuant to the Fund/Advisor’s Liquidity Procedures.
For securities primarily traded on exchanges or markets that close before the close of regular trading on the New York Stock Exchange the Fund uses an independent pricing service on a daily basis to fair value price the securities pursuant to Valuation Procedures approved by the Board of Trustees.
At December 31, 2009, the Fund’s Portfolio of Investments includes the following industry categories:
| | |
Financials | | 21.4% |
Consumer Discretionary | | 16.8% |
Consumer Staples | | 14.2% |
Information Technology | | 13.7% |
Energy | | 12.7% |
Industrials | | 7.1% |
Materials | | 5.8% |
Telecommunication Services | | 4.9% |
Health Care | | 3.4% |
| | |
Total | | 100.0% |
| | |
At December 31, 2009, the Fund’s Portfolio of Investments includes the following currency categories:
| | |
Hong Kong Dollar | | 20.8% |
U.S. Dollar | | 15.8% |
Brazilian Real | | 14.5% |
New Taiwan Dollar | | 9.3% |
South Korean Won | | 9.2% |
Indian Rupee | | 8.7% |
South African Rand | | 6.2% |
Mexican Nuevo Peso | | 4.3% |
Indonesian Rupiah | | 2.7% |
Turkish Lira Spot | | 2.7% |
Chilean Peso | | 1.2% |
Malaysian Ringgit | | 1.0% |
All Other Currencies | | 3.6% |
| | |
Total | | 100.0% |
| | |
See accompanying Notes to Financial Statements.
56 Annual Report | December 31, 2009 |
Todd M. McClone
Jeffrey A. Urbina
EMERGING LEADERS GROWTH FUND
The Emerging Leaders Growth Fund invests primarily in a diversified portfolio of equity securities, including common stocks, issued by companies in emerging markets with a market capitalization of at least $3 billion at the time of the Fund’s investment.
AN OVERVIEW FROM THE PORTFOLIO MANAGERS
Please see page 28 for the Global Markets Overview.
The Emerging Leaders Growth Fund posted an increase of 78.38% (Class I Shares) for the 12 months ended December 31, 2009. By comparison, the Fund’s benchmark, the MSCI Emerging Markets Large Cap Index (net) (the “Index”) gained 75.92% during the same period.
The Fund outpaced the Index during the fourth quarter and for the year. Fourth quarter results were bolstered by good stock selection in Consumer Staples, Energy, and Materials holdings, coupled with overweightings in Consumer Discretionary and Consumer Staples and an underweighting in Telecommunication Services. In addition, the Fund had strong stock selection in Asia and Emerging Markets, Europe, Mid-East and Africa (EMEA). During 2009, the Fund had strong stock selection across most sectors, which drove performance during the period. In particular, strong performance by Energy names OGX Petroleo e Gas Participacoes S.A. and Petroleo Brasileiro S.A., EMEA Financials, and overall Latin American Financials exposure boosted results. In addition, the Fund’s infrastructure-related Asian Industrials holdings performed well, as did the Fund’s mining companies. Regional positioning and stock selection were also strong. Somewhat detracting from strong absolute and relative results was the Fund’s overweighting in Consumer Staples and underweightings in Energy and Materials.
As of year end, the Fund maintained its focus on Consumer Discretionary and Consumer Staples stocks at 35.0% of the Fund, well ahead of the 8.6% Index weighting, and an increase from year end 2008, when Consumer Discretionary and Consumer Staples holdings approximated 20.1%. This increase was driven by Consumer Discretionary, which increased from 4.3% to 18.9%. Information Technology (IT) approximated the Index at 13.8% as of year end, but increased from 9.6% at year end 2008 due to a higher weighting in Asian technology companies. These increases were funded by a decrease in Healthcare from 7.3% to 0.0% and Telecommunication Services from 15.7% to 2.9%. While Financials represented 22.1% of the Fund as of year end, it was slightly underweighted versus the Index and remained a relatively stable weighting during the year. As of year end 2009, the Fund was most underweighted in Telecommunication Services, Energy and Materials and most overweighted in Consumer Discretionary and Consumer Staples. Regionally, the Fund was focused on Emerging Asia at 57.1% of the Fund at the expense of EMEA and Latin America. Exposure in Emerging Asia increased throughout the year from 42.0%, while Emerging Latin America decreased from 26.8% to 19.9%.
December 31, 2009 | William Blair Funds 57 |
Emerging Leaders Growth Fund
Performance Highlights (unaudited)
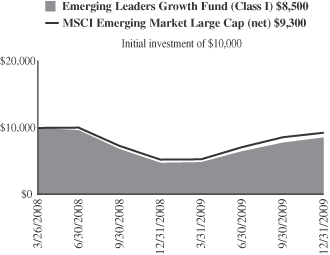
Average Annual Total Return at 12/31/2009
| | | | | |
| | | 1
Year | | Since
Inception(a) | |
Emerging Leaders Growth Fund Class I | | 78.38% | | (8.47 | )% |
MSCI Emerging Markets Large Cap Index (net) | | 75.92 | | (4.16 | ) |
| | (a) | | For the period from March 26, 2008 (Commencement of Operations) to December 31, 2009. | |
Performance cited represents past performance. Past performance does not guarantee future results and current performance may be lower or higher than the data quoted. Results shown are average annual total returns, which assume reinvestment of dividends and capital gains. Investment returns and principal will fluctuate and you may have a gain or loss when you sell shares. For the most current month-end performance information, please call 1-800-742-7272, or visit our Web site at www.williamblairfunds.com. International investing involves special risk considerations, including currency fluctuations, lower liquidity, economic and political risk. From time to time, the investment advisor may waive fees or reimburse expenses for the Fund. Without these waivers, performance would be lower. Class I shares are available to certain institutional investors and advisory clients of William Blair & Company, L.L.C., without a sales load or distribution fees (12b-1).
The performance highlights and graph presented above do not reflect the deduction of taxes that a shareholder would pay on fund distributions or the redemption of fund shares.
The Morgan Stanley Capital International (MSCI) Emerging Markets Large Cap Index (net) is a free float-adjusted market capitalization weighted index that is designed to measure market performance of large capitalization stocks in emerging markets. This series approximates the minimum possible dividend reinvestment.
This report identifies the Fund’s investments on December 31, 2009. These holdings are subject to change. Not all stocks in the Fund performed the same, nor is there any guarantee that these stocks will perform as well in the future. Market forecasts provided in this report may not necessarily come to pass.
Sector Diversification (unaudited)
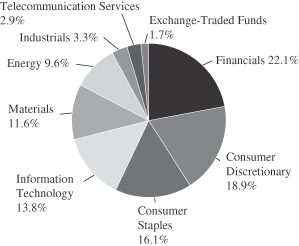
The sector diversification shown is based on the total long-term securities.
58 Annual Report | December 31, 2009 |
Emerging Leaders Growth Fund
Portfolio of Investments, December 31, 2009 (all dollar amounts in thousands)
| | | | | |
Issuer | | Shares | | Value |
| |
Common Stocks—Emerging Asia—57.1% | | | |
China—23.7% | | | | | |
Belle International Holdings Limited (Specialty retail) | | 2,010,000 | | $ | 2,328 |
China Dongxiang (Group) Co., Ltd. (Textiles, apparel, & luxury goods) | | 1,966,000 | | | 1,517 |
China Life Insurance Co., Ltd. (Insurance) | | 523,000 | | | 2,559 |
China Overseas Land & Investment, Ltd. (Real estate management & development) | | 538,240 | | | 1,128 |
China Shenhua Energy Company Limited (Oil, gas, & consumable fuels) | | 418,500 | | | 2,032 |
CNOOC Limited (Oil, gas & consumable fuels) | | 1,486,000 | | | 2,315 |
* Ctrip.com International, Ltd.—ADR (Hotels, restaurants, & leisure) | | 15,582 | | | 1,120 |
Dongfeng Motor Group Company Limited (Automobiles) | | 852,000 | | | 1,217 |
Golden Eagle Retail Group Limited (Multiline retail) | | 437,000 | | | 886 |
Hengan International Group Co., Ltd. (Personal products) | | 313,000 | | | 2,317 |
Industrial and Commercial Bank of China (Commercial banks) | | 3,490,000 | | | 2,874 |
Tencent Holdings, Ltd. (Internet software & services) | | 189,600 | | | 4,101 |
Want Want China Holdings Limited (Food products) | | 2,476,000 | | | 1,729 |
Zijin Mining Group Company Limited (Metals & mining) | | 1,198,000 | | | 1,136 |
| | | | | |
| | | | | 27,259 |
| | | | | |
India—12.8% | | | | | |
Bharat Heavy Electricals, Ltd. (Electrical equipment) | | 25,837 | | | 1,330 |
* Cairn India, Ltd. (Oil, gas & consumable fuels) | | 228,185 | | | 1,376 |
HDFC Bank, Ltd. (Commercial banks) | | 59,047 | | | 2,152 |
Housing Development Finance Corp. (Thrifts & mortgage finance) | | 26,209 | | | 1,500 |
Infosys Technologies Limited (IT services) | | 29,926 | | | 1,666 |
Jindal Steel & Power Limited (Metals & mining) | | 172,111 | | | 2,589 |
Larsen & Toubro, Ltd. (Construction & engineering) | | 37,029 | | | 1,333 |
Maruti Suzuki India Limited (Automobiles) | | 42,791 | | | 1,427 |
Nestle India Limited (Food products) | | 23,627 | | | 1,291 |
| | | | | |
| | | | | 14,664 |
| | | | | |
Indonesia—4.5% | | | | | |
PT Astra International Tbk (Automobiles) | | 508,500 | | | 1,870 |
PT Bank Rakyat Indonesia (Commercial banks) | | 2,464,000 | | | 1,980 |
PT Telekomunikasi Indonesia Tbk (Diversified telecommunication services) | | 242,000 | | | 241 |
PT United Tractors Tbk (Machinery) | | 680,500 | | | 1,114 |
| | | | | |
| | | | | 5,205 |
| | | | | |
Malaysia—1.8% | | | | | |
CIMB Group Holdings Berhad (Commercial banks) | | 546,900 | | | 2,047 |
| | | | | |
| | | | | |
Issuer | | Shares | | Value |
|
Common Stocks—Emerging Asia—57.1%—(continued) |
South Korea—9.2% | | | | | |
* Amorepacific Corporation (Personal products) | | 1,747 | | $ | 1,401 |
* Hyundai Mobis (Auto components) | | 11,899 | | | 1,743 |
* Hyundai Motor Company (Automobiles) | | 16,511 | | | 1,709 |
LG Household & Health Care, Ltd. (Household products) | | 6,907 | | | 1,728 |
* NHN Corporation (Internet software & services) | | 8,361 | | | 1,382 |
Samsung Electronics Co., Ltd. (Semiconductors & semiconductor equipment) | | 3,870 | | | 2,654 |
| | | | | |
| | | | | 10,617 |
| | | | | |
Taiwan—5.1% | | | | | |
Hon Hai Precision Industry Co., Ltd. (Electronic equipment, instruments & components) | | 523,000 | | | 2,446 |
Mediatek Inc. (Semiconductors & semiconductor equipment) | | 122,200 | | | 2,123 |
Taiwan Semiconductor Manufacturing Company Ltd. (Semiconductors & semiconductor equipment) | | 652,919 | | | 1,316 |
| | | | | |
| | | | | 5,885 |
| | | | | |
| | |
Emerging Latin America—19.9% | | | | | |
Brazil—14.9% | | | | | |
Banco Santander (Brasil) S.A.—GDR (Commercial banks) | | 101,691 | | | 1,418 |
BM&F Bovespa S.A. (Diversified financial services) | | 205,090 | | | 1,443 |
Companhia de Bebidas das Americas-AMBEV—ADR (Beverages) | | 13,860 | | | 1,401 |
Cyrela Brazil Realty (Household durables) | | 102,000 | | | 1,435 |
Natura Cosmeticos S.A. (Personal products) | | 64,300 | | | 1,341 |
PDG Realty S.A. Empreendimentos e Participacoes (Household durables) | | 142,000 | | | 1,415 |
Petroleo Brasileiro S.A.—ADR (Oil, gas & consumable fuels) | | 106,648 | | | 5,085 |
Vale S.A.—ADR (Metals & mining) | | 125,614 | | | 3,647 |
| | | | | |
| | | | | 17,185 |
| | | | | |
Mexico—4.2% | | | | | |
America Movil S.A.B. de C.V.—ADR (Wireless telecommunication services) | | 27,894 | | | 1,310 |
Grupo Televisa S.A.B. de C.V.—ADR (Media) | | 71,607 | | | 1,487 |
Wal-Mart de Mexico S.A.B. de C.V. (Food & staples retailing) | | 466,700 | | | 2,080 |
| | | | | |
| | | | | 4,877 |
| | | | | |
Peru—0.8% | | | | | |
Credicorp, Ltd. (Commercial banks)† | | 12,503 | | | 963 |
| | | | | |
| |
Emerging Europe, Mid-East, Africa—13.6% | | | |
Israel—1.2% | | | | | |
Israel Chemicals Limited (Chemicals) | | 108,135 | | | 1,420 |
| | | | | |
Russia—7.0% | | | | | |
Magnit-CLS (Food & staples retailing)† | | 19,657 | | | 1,354 |
Sberbank—CLS (Commercial banks)† | | 1,090,418 | | | 3,063 |
See accompanying Notes to Financial Statements.
December 31, 2009 | William Blair Funds 59 |
Emerging Leaders Growth Fund
Portfolio of Investments, December 31, 2009 (all dollar amounts in thousands)
| | | | | | |
Issuer | | Shares or
Principal
Amount | | Value |
|
Common Stocks—Emerging Europe, Mid-East, Africa—13.6%—(continued) |
Vimpel-Communications OJSC—ADR (Diversified telecommunication services) | | | 90,938 | | $ | 1,690 |
* X5 Retail Group N.V.—GDR (Food & staples retailing) | | | 59,850 | | | 1,901 |
| | | | | | |
| | | | | | 8,008 |
| | | | | | |
South Africa—2.8% | | | | | | |
Naspers, Ltd. (Media) | | | 78,900 | | | 3,193 |
| | | | | | |
Turkey—2.6% | | | | | | |
Bim Birlesik Magazalar A.S. (Food & staples retailing) | | | 34,854 | | | 1,621 |
Turkiye Garanti Bankasi A.S. (Commercial banks) | | | 316,478 | | | 1,348 |
| | | | | | |
| | | | | | 2,969 |
| | | | | | |
| | |
United Kingdom—3.7% | | | | | | |
Vedanta Resources plc (Metals & mining) | | | 102,759 | | | 4,298 |
| | | | | | |
Total Common Stocks—94.3%
(cost $76,081) | | | 108,590 |
| | | | | | |
| | |
Preferred Stock | | | | | | |
Brazil—2.2% | | | | | | |
Banco Itau Holding Financeira S.A. (Commercial banks) | | | 114,485 | | | 2,544 |
| | | | | | |
Total Preferred Stock—2.2%
(cost $1,114) | | | 2,544 |
| | | | | | |
| | |
Exchange-Traded Fund | | | | | | |
China—1.6% | | | | | | |
iShares FTSE/Xinhua A50 China Tracker | | | 987,000 | | | 1,899 |
| | | | | | |
Total Exchange-Traded Fund—1.6%
(cost $1,901) | | | 1,899 |
| | | | | | |
| | |
Investment in Affiliate | | | | | | |
William Blair Ready Reserves Fund | | | 440 | | | 440 |
| | | | | | |
Total Investment in Affiliate—0.4%
(cost $440) | | | 440 |
| | | | | | |
| | |
Repurchase Agreement | | | | | | |
State Street Bank and Trust Company,
0.000% dated 12/31/09 due 1/4/10, repurchase price $1,235, collateralized by U.S. Treasury Bill, 0.020%, due 2/18/10 | | $ | 1,235 | | | 1,235 |
| | | | | | |
Total Repurchase Agreement—1.1%
(cost $1,235) | | | 1,235 |
| | | | | | |
Total Investments—99.6%
(cost $80,771) | | | 114,708 |
Cash and other assets, less liabilities—0.4% | | | 428 |
| | | | | | |
Net assets—100.0% | | $ | 115,136 |
| | | | | | |
* = Non-income producing securities
† = U.S. listed Foreign Security
ADR = American Depository Receipt
GDR = Global Depository Receipt
For securities primarily traded on exchanges or markets that close before the close of regular trading on the New York Stock Exchange the Fund uses an independent pricing service on a daily basis to fair value price the securities pursuant to Valuation Procedures approved by the Board of Trustees.
At December 31, 2009, the Fund’s Portfolio of Investments includes the following industry categories:
| | |
Financials | | 22.1% |
Consumer Discretionary | | 18.9% |
Consumer Staples | | 16.1% |
Information Technology | | 13.9% |
Materials | | 11.6% |
Energy | | 9.5% |
Industrials | | 3.3% |
Telecommunication Services | | 2.9% |
Exchange-Traded Fund | | 1.7% |
| | |
Total | | 100.0% |
| | |
At December 31, 2009, the Fund’s Portfolio of Investments includes the following currency categories:
| | |
Hong Kong Dollar | | 24.8% |
U.S. Dollar | | 21.6% |
Indian Rupee | | 13.0% |
South Korean Won | | 9.4% |
Brazilian Real | | 7.2% |
New Taiwan Dollar | | 5.2% |
Indonesian Rupiah | | 4.6% |
British Pound Sterling | | 3.8% |
South African Rand | | 2.8% |
Mexican Nuevo Peso | | 1.9% |
Malaysian Ringgit | | 1.8% |
Turkish Lira | | 1.4% |
Israeli Shekel | | 1.3% |
New Turkish Lira | | 1.2% |
| | |
Total | | 100.0% |
| | |
See accompanying Notes to Financial Statements.
60 Annual Report | December 31, 2009 |

Chad M. Kilmer

Mark T. Leslie

David S. Mitchell
VALUE DISCOVERY FUND
The Value Discovery Fund invests in the equity securities of small companies that we believe offer a long-term investment value seeking to identify undervalued companies with sound business fundamentals.
AN OVERVIEW FROM THE PORTFOLIO MANAGERS
How did the Fund perform during the past year? How did the Fund’s performance compare to its benchmark?
The Value Discovery Fund posted a 26.24% increase on a total return basis (Class N shares) during the 12 months ended December 31, 2009. By comparison, the Russell 2000® Value Index gained 20.58%, while the Russell 2000® Index rose 27.17%.
The past twelve months stand in stark contrast to the prior twelve month period. The Russell 2000® Value Index returned 20.58% during 2009 after rallying 88.1% from its March 2009 low. The crisis in confidence that ensued after the September 2008 Lehman Brothers collapse led to a freeze in consumer and business spending. This led to further compression in stock valuations and draconian earnings expectations. However, the fourth quarter of 2008 and first quarter of 2009 proved to be the worst as the pace of economic decline slowed and eventually improved throughout 2009. The massive amounts of government stimulus—from various liquidity programs for the mortgage and consumer lending market to its industry-specific assistance to the financial and automotive industries—provided the necessary boost to economic activity during a deep trough in private consumption.
From a style perspective, the market’s rally in 2009 saw 2008’s underperformers become the best performers in 2009. Underlying this trend was the market’s preference for lower market cap stocks, stocks with cheaper valuations and stocks with more economic cyclicality. From a sector perspective, the Russell 2000® Value was led by commodity-oriented sectors, Energy, 40.1%, and Materials, 65.3%, along with Information Technology, 59.3%, and Consumer Discretionary, 64.5%. Financials were the big story holding back the small cap value index during 2009. The sector represents 34.7% of the index’s weight and it finished the year in negative territory, (2.9%). Other underperforming sectors included Consumer Staples, 17.4%, and Industrials, 14.4%.
The Value Discovery Fund handily outpaced its benchmark during 2009, primarily driven by solid stock selection. This was strongest in the Financials and Industrials sectors where the Fund holdings significantly outperformed their benchmark sector peers. Certain Materials and Consumer Staples holdings detracted from relative results, as did our higher-than-benchmark weighted average market capitalization.
Two specific stocks boosting returns in 2009 were Ameristar Casinos and Semitool. Ameristar Casinos was the largest contributor to return during 2009 after the company reported solid fundamentals throughout the year on the heels of a completed debt refinancing, giving it the liquidity and flexibility it needed to complete the final phase of their capital expenditure program. We expect the company to generate significant amounts of free cash flow beginning in calendar year 2010 that will be used to deleverage their balance sheet and enhance shareholder value. Semitool, a semiconductor equipment company, produced better than expected business results throughout the year. In the fourth quarter specifically, the company announced it was being acquired at a premium to its market price at the time.
Two stocks detracting from returns during the year were Spartan Stores and Cogdell Spencer. Spartan Stores underperformed based on food deflation concerns and fears of potential price
December 31, 2009 | William Blair Funds 61 |
competition. Spartan has also contended with negative economic headlines in its primary market of Michigan. Though these issues bear watching, we remain confident in management’s ability to navigate these challenges. Cogdell Spencer is a real estate investment trust (REIT) and designs, builds and manages medical office buildings and other healthcare facilities. Earlier in the year, the company’s balance sheet weighed on investor psychology given the depressed state of the capital markets. Also, medical office building vacancies were higher than in past recessions and therefore, there was less demand for the construction of new properties.
It is worth noting that while the Fund performed very well relative to the benchmark, it faced a significant headwind relative to peers given its sector-neutral investment discipline. The Portfolio Management team’s sector-neutral investment discipline aims to dampen benchmark-relative volatility from year to year, allowing the team to focus on adding alpha through stock selection. This discipline succeeded in 2009 relative to the benchmark, but its sector-neutrality to the underperforming Financials sector was a drag on peer group rankings in the short-term given many peers were underweight Financials.
For the fourth quarter specifically, the Fund turned in solid results versus the benchmark as well. The sector dynamics were quite similar to the year as a whole, with Financials and Industrials stock selection standing out on the upside, along with Information Technology, which was the leading contributor to relative results. On the other hand, Materials and Consumer Staples stock selection detracted versus the Russell 2000® Value.
Our outlook for the market remains relatively unchanged from three months ago. We believe a “stock pickers market” is in order as individual company fundamentals should drive stock prices going forward. This differs greatly from the past two years when macro events and sentiment whipsawed individual stocks and the overall market in 2008 and 2009. Current earnings expectations for 2010 represent significant growth over 2009 earnings. With continued improvement on the economic front, many of these individual company expectations are well within reach. In addition, valuations for many stocks are still at or below long term averages. But on the other hand, some stocks are trading at elevated valuations and are discounting lofty earnings growth, which is another reason we feel bottom-up active managers should perform well in this environment.
Inflation expectations, interest rate moves by the Federal Reserve, changes in the employment picture, and the outlook for housing and consumer spending likely will occupy the headlines during 2010. In addition, the government will continue to wrestle with how and when to unwind its liquidity programs and other policy initiatives. While factoring various economic scenarios into our bottom-up analysis, we remain focused on finding quality companies at discount prices and corporate transformation opportunities. As always, we believe building a fund with these types of companies should produce solid investment results over the long term.
62 Annual Report | December 31, 2009 |
Value Discovery Fund
Performance Highlights (unaudited)
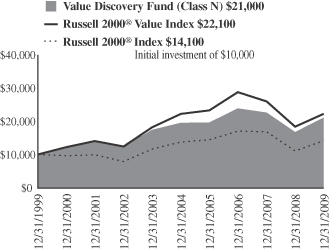
Average Annual Total Return at 12/31/2009
| | | | | | | | | | | | |
| | | 1
Year | | | 3
Year | | | 5
Year | | | 10
Year | |
Value Discovery Fund Class N | | 26.24 | % | | (4.02 | )% | | 1.59 | % | | 7.73 | % |
Value Discovery Fund Class I | | 26.56 | | | (3.83 | ) | | 1.81 | | | 7.97 | |
Russell 2000® Value Index | | 20.58 | | | (8.22 | ) | | (0.01 | ) | | 8.27 | |
Russell 2000® Index | | 27.17 | | | (6.07 | ) | | 0.51 | | | 3.51 | |
Performance cited represents past performance. Past performance does not guarantee future results and current performance may be lower or higher than the data quoted. Results shown are average annual total returns, which assume reinvestment of dividends and capital gains. Investment returns and principal will fluctuate and you may have a gain or loss when you sell shares. For the most current month-end performance information, please call 1-800-742-7272, or visit our Web site at www.williamblairfunds.com. Investing in smaller companies involves special risks, including higher volatility and lower liquidity. From time to time, the investment advisor may waive fees or reimburse expenses for the Fund. Without these waivers, performance would be lower. Class N shares are available to the general public without a sales load. Class I shares are available to certain institutional investors and advisory clients of William Blair & Company, L.L.C., without a sales load or distribution (12b-1) or service fees.
The performance highlights and graph presented above do not reflect the deduction of taxes that a shareholder would pay on fund distributions or the redemption of fund shares.
The Russell 2000® Value Index is the Fund’s primary benchmark. The Russell 2000® Value consists of small-capitalization companies with below average price-to-book ratios and forecasted growth rates.
The Russell 2000® Index is an unmanaged composite of the smallest 2000 stocks of the Russell 3000® Index.
This report identifies the Fund’s investments on December 31, 2009. These holdings are subject to change. Not all stocks in the Fund performed the same, nor is there any guarantee that these stocks will perform as well in the future. Market forecasts provided in this report may not necessarily come to pass.
Sector Diversification (unaudited)
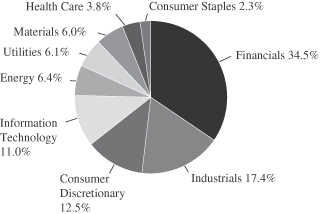
The sector diversification shown is based on the total long-term securities.
December 31, 2009 | William Blair Funds 63 |
Value Discovery Fund
Portfolio of Investments, December 31, 2009 (all dollar amounts in thousands)
| | | | | |
Issuer | | Shares | | Value |
| | |
Common Stocks | | | | | |
Financials—34.2% | | | | | |
American Campus Communities, Inc. | | 29,050 | | $ | 816 |
Astoria Financial Corporation | | 48,850 | | | 607 |
Boston Private Financial Holdings, Inc. | | 77,119 | | | 445 |
Delphi Financial Group, Class “A” | | 34,960 | | | 782 |
*Eagle Bancorp, Inc. | | 31,291 | | | 328 |
First Busey Corporation | | 64,047 | | | 249 |
FirstMerit Corporation | | 31,987 | | | 644 |
First Niagara Financial Group, Inc. | | 40,390 | | | 562 |
First Potomac Realty Trust | | 57,387 | | | 721 |
Hanover Insurance Group, Inc. | | 21,915 | | | 974 |
Highwoods Realty L.P. | | 25,090 | | | 837 |
Iberiabank Corporation | | 17,275 | | | 930 |
Lasalle Hotel Properties | | 30,977 | | | 658 |
Markettaxess Holdings, Inc. | | 53,075 | | | 738 |
MB Financial, Inc. | | 30,165 | | | 595 |
MeadowBrook Insurance Group, Inc. | | 73,900 | | | 547 |
Mid-American Apartment Communities, Inc. | | 18,380 | | | 887 |
Newalliance Bancshares, Inc. | | 41,065 | | | 493 |
Old National Bancorp | | 68,757 | | | 855 |
Platinum Underwriters Holdings, Ltd. † | | 14,515 | | | 556 |
*PMA Capital Corporation, Class “A” | | 72,935 | | | 459 |
*Proassurance Corporation | | 10,065 | | | 541 |
Realty Income Corporation | | 27,570 | | | 714 |
*Safeguard Scientifics, Inc. | | 42,530 | | | 438 |
*SVB Financial Group | | 19,735 | | | 823 |
SWS Group, Inc. | | 58,965 | | | 713 |
*Texas Capital Bancshares, Inc. | | 45,495 | | | 635 |
Umpqua Holdings Corporation | | 64,030 | | | 859 |
*Western Alliance Bancorporation | | 95,360 | | | 360 |
| | | | | |
| | | | | 18,766 |
| | | | | |
Industrials—17.2% | | | | | |
Acuity Brands, Inc. | | 16,135 | | | 575 |
*ATC Technology Corporation | | 23,380 | | | 558 |
Belden, Inc. | | 28,445 | | | 624 |
*DXP Enterprises, Inc. | | 27,085 | | | 354 |
Esco Technologies, Inc. | | 13,395 | | | 480 |
G & K Services, Inc. | | 30,965 | | | 778 |
*Graftech International, Ltd. | | 36,435 | | | 567 |
Granite Construction Incorporated | | 17,100 | | | 576 |
Interface, Inc., Class “A” | | 65,675 | | | 546 |
Kaydon Corporation | | 15,650 | | | 560 |
*K-Tron International, Inc. | | 4,110 | | | 447 |
*Old Dominion Freight Line, Inc. | | 18,485 | | | 567 |
*On Assignment, Inc. | | 81,875 | | | 585 |
Quanex Building Products Corporation | | 31,670 | | | 537 |
Robbins & Myers, Inc. | | 21,720 | | | 511 |
Simpson Manufacturing Co., Inc. | | 17,335 | | | 466 |
Tal International Group, Inc. | | 30,495 | | | 403 |
Werner Enterprises, Inc. | | 16,435 | | | 325 |
| | | | | |
| | | | | 9,459 |
| | | | | |
Consumer Discretionary—11.7% | | | | | |
*AFC Enterprises, Inc. | | 59,134 | | | 482 |
Ameristar Casinos, Inc. | | 37,280 | | | 568 |
*Carter’s, Inc. | | 15,790 | | | 414 |
Christopher & Banks Corporation | | 70,517 | | | 537 |
Fred’s, Inc., Class “A” | | 40,545 | | | 413 |
*Gaylord Entertainment Company | | 30,165 | | | 596 |
Interactive Data Corporation | | 20,003 | | | 506 |
| | | | | |
Issuer | | Shares | | Value |
|
Common Stocks—(continued) |
Consumer Discretionary—(continued) | | | |
*Jack In The Box, Inc. | | 24,030 | | $ | 473 |
*Jo-Ann Stores, Inc. | | 18,145 | | | 658 |
*Kirkland’s, Inc. | | 36,890 | | | 641 |
*Maidenform Brands, Inc. | | 33,425 | | | 558 |
*Tempur-Pedic International, Inc. | | 24,360 | | | 576 |
| | | | | |
| | | | | 6,422 |
| | | | | |
Information Technology—10.9% | | | | | |
ADTRAN, Inc. | | 28,015 | | | 632 |
*Atmel Corporation | | 130,615 | | | 602 |
*Avid Technology, Inc. | | 41,616 | | | 531 |
Cognex Corporation | | 24,200 | | | 429 |
EarthLink, Inc. | | 75,165 | | | 624 |
*Parametric Technology Corporation | | 54,630 | | | 893 |
*Sybase, Inc. | | 20,810 | | | 903 |
*Ultra Clean Holdings, Inc. | | 118,058 | | | 825 |
United Online, Inc. | | 71,575 | | | 515 |
| | | | | |
| | | | | 5,954 |
| | | | | |
Energy—6.3% | | | | | |
Berry Petroleum Company | | 22,530 | | | 657 |
*Forest Oil Corporation | | 37,898 | | | 843 |
*Goodrich Petroleum Corporation | | 21,175 | | | 516 |
*Newpark Resources, Inc. | | 77,330 | | | 327 |
St. Mary Land & Exploration Company | | 16,385 | | | 561 |
*TETRA Technologies, Inc. | | 49,720 | | | 551 |
| | | | | |
| | | | | 3,455 |
| | | | | |
Utilities—6.1% | | | | | |
ALLETE, Inc. | | 18,900 | | | 617 |
Avista Corporation | | 28,470 | | | 615 |
Cleco Corporation | | 21,815 | | | 596 |
Northwest Natural Gas Company | | 14,802 | | | 667 |
South Jersey Industries, Inc. | | 21,930 | | | 837 |
| | | | | |
| | | | | 3,332 |
| | | | | |
Materials—6.0% | | | | | |
*Intrepid Potash, Inc. | | 20,384 | | | 594 |
Minerals Technologies, Inc. | | 11,710 | | | 638 |
*Polyone Corporation | | 83,625 | | | 625 |
*RTI International Metals, Inc. | | 20,375 | | | 513 |
Silgan Holdings, Inc. | | 9,660 | | | 559 |
Texas Industries, Inc. | | 10,155 | | | 355 |
| | | | | |
| | | | | 3,284 |
| | | | | |
Health Care—3.7% | | | | | |
*Kensey Nash Corporation | | 23,405 | | | 597 |
*Magellan Health Services | | 14,035 | | | 572 |
*Mednax, Inc. | | 6,253 | | | 376 |
*Zoll Medical Corporation | | 19,125 | | | 511 |
| | | | | |
| | | | | 2,056 |
| | | | | |
Consumer Staples—2.3% | | | | | |
J&J Snack Foods | | 11,567 | | | 462 |
Spartan Stores, Inc. | | 56,025 | | | 801 |
| | | | | |
| | | | | 1,263 |
| | | | | |
Total Common Stocks—98.4%
(cost $48,318) | | | 53,991 |
| | | | | |
See accompanying Notes to Financial Statements.
64 Annual Report | December 31, 2009 |
Value Discovery Fund
Portfolio of Investments, December 31, 2009 (all dollar amounts in thousands)
| | | | | |
Issuer | | Shares | | Value |
| | |
Preferred Stock | | | | | |
Callaway Golf Company, 7.5% Series “B” | | 3,105 | | $ | 382 |
| | | | | |
Total Preferred Stock—0.7%
(cost $318) | | | 382 |
| | | | | |
Investment in Affiliate | | | | | |
William Blair Ready Reserves Fund | | 4 | | | 4 |
| | | | | |
Total Investment in Affiliate—0.0%
(cost $4) | | | 4 |
| | | | | |
* Non-income producing
†=U.S. listed foreign security
| | | | | | | |
Issuer | | Principal
Amount | | Value | |
| | |
Repurchase Agreement | | | | | | | |
State Street Bank and Trust Company,
0.000% dated 12/31/09, due 1/4/10, repurchase price $ 622, collateralized by U.S. Treasury Bill, 0.040%, due 3/18/10 | | $ | 622 | | $ | 622 | |
| | | | | | | |
Total Repurchase Agreement—1.1%
(cost $622) | | | 622 | |
| | | | | | | |
Total Investments—100.2%
(cost $49,262) | | | 54,999 | |
Liabilities, plus cash and other assets —(0.2)% | | | (140 | ) |
| | | | | | | |
Net assets—100.0% | | $ | 54,859 | |
| | | | | | | |
See accompanying Notes to Financial Statements.
December 31, 2009 | William Blair Funds 65 |
Fixed-Income Market Overview
2009 Summary
In less than one year the fixed income markets have experienced returns of a magnitude not seen in the last 10 years, including two of the best and worst quarters during that time.
During the first quarter the Federal Reserve Board applied an additional and non-traditional monetary policy of purchasing securities to try to lower mortgage rates. The Fed’s move followed a very similar one by U.K monetary authorities, and marked the third time since the second world war that the Fed has pursued this type of quantitative easing policy.
The Fed was indeed successful in bringing rates on 30-year fixed rate mortgages down, starting a mini-refinancing wave that continued into the second quarter.
To restart consumer lending, the Federal Reserve implemented TALF, the Term Asset-Backed Securities Loan Facility, a program introduced in November of 2008. TALF supports the issuance of asset-backed securities (ABS) collateralized by student loans, auto loans, credit card loans, and loans guaranteed by the Small Business Administration (SBA). Following moderate success late in the first quarter with the issuance of auto loans that were securitized, this program gained important momentum in the second quarter.
In late March, U.S. Treasury Secretary Geithner unveiled the Public-Private Investment Program (P-PIP) to buy toxic assets from banks’ balance sheets, and the program was met with guarded optimism in the marketplace.
Lastly, the “stress test” results released by the Obama administration for many of the largest financial institutions were also acceptable, allowing these firms to raise equity capital, even at its dilutive cost.
The fixed-income markets had moved from a period of extreme risk aversion during the fourth quarter of last year to one where investors sought to add risk.
Corporate Bonds were clearly the beneficiaries of the favorable move in equity prices that started during the middle of March. The strength in investment grade bond prices helped provide a sense of stability and normalization to the credit markets, and ultimately to investment grade risk premiums or spreads. As this normalcy returned to the investment grade bond market, investors recognized value in quality liquid, fixed-income securities.
Excess returns were positive across the “spread” sectors during the second quarter, but were led by the returns in the Corporate Bond sector, which experienced its best quarter in more than 20 years.
The first half of the year was characterized by valuations we would describe as exceptionally cheap and attractive for fixed-income investors. As a result, quite a bit of cash came into the fixed-income market.
September marked the one-year anniversary of a whole series of major events involving financial institutions, including the U.S Treasury’s takeover of government-sponsored enterprises (GSEs) Fannie Mae and Freddie Mac, the failure of Lehman Brothers, the government bailout of AIG and Bank of America’s agreement to acquire Merrill Lynch.
The psychological hold that these events had on the on the risk-taking mentality of the fixed-income markets represented a major hurdle for fixed-income investors. As confidence in the markets returned, so did investors’ appetite for risk.
66 Annual Report | December 31, 2009 |
It was also an important quarter from the standpoint that investors realized that in an economy with significant slack in resource utilization and employment, inflation is not an imminent prospect. As the perceived threat of inflation subsided, rates on 10-year Treasury securities fell.
Finally, flows into bond mutual funds were quite robust, as investors were attracted to yields that were higher than other short-term fixed-income investments.
The primary factor influencing the fixed income markets during the fourth quarter was the U.S. employment situation. Job losses began to moderate significantly during the fourth quarter, which was viewed favorably and a positive sign for the domestic economy.
Consequently, growth estimates for the nation’s Gross Domestic Product (GDP) for the first half of 2010 steadily increased from 3% to as high as 4.5%.
However, the employment picture and expectations for strengthening GDP growth led to upward pressure on interest rates, and most specifically U.S. Treasury securities, as the year drew to a close.
In particular, the last month of the year was very tough on bond investors as they faced the headwinds of a rising short- and long-term interest rate environment.
Outlook
In spite of the rising GDP forecasts, many economic statistics indicate a subpar recovery is underway, which reflects the fact that lingering credit issues still remain. The credit markets are healing, but some dislocations continue to exist.
The fixed income markets are in unprecedented times of low Federal Reserve policy rates—specifically the Federal Funds rate—and the Fed controls the short end of the interest rate yield curve.
The fixed income markets are trying to balance the extreme credit dislocation of the past year with massive government intervention. We believe the next phase of this recovery process will be less government involvement and more private sector economic activity and growth.
The Federal Reserve continued to espouse their policy of low short-term rates for an extended period of time. The Fed, however, did appear to float a number of “trial balloons” to the marketplace indicating that at some point the numerous and non-traditional government programs in place to provide support and stimulus to the economy would be phased out or withdrawn.
There were several relatively minor events during the fourth quarter that were worth noting, including Dubai’s credit problems, rescheduling of debt and subsequent bailout by other Gulf neighbors, and the downgrade of the sovereign debt of a number of other countries, including Portugal, Italy, Greece and Spain. The theme connecting all of these events were the relatively short but violent credit cycles that bond investors have experienced for the last two years.
This all sets up for a very interesting 2010.
We are encouraged that the fixed-income markets have been able to absorb major potential policy changes in the health care and financial services industries with relatively minor changes in risk premiums.
We don’t anticipate any major changes in Federal Reserve policy or interest rates until late 2010.
December 31, 2009 | William Blair Funds 67 |

Christopher T. Vincent
BOND FUND
The Bond Fund seeks to outperform the Barclays Capital U.S. Aggregate Bond Index by maximizing total return through a combination of income and capital appreciation.
AN OVERVIEW FROM THE PORTFOLIO MANAGER
Please see page 66 for the Fixed Income Market Overview.
How did the Fund perform during the past year? How did the Fund’s performance compare to its benchmark?
The Bond Fund posted a 11.11% increase on a total return basis (Class N Shares) for the 12 months ended December 31, 2009. By comparison, the Fund’s benchmark, the Barclays Capital Aggregate Bond Index, gained 5.93%, while the Fund’s peer group, the Morningstar Intermediate-Term Bond Category, gained 13.97%.
During 2009, the Fund benefitted from its overweight position in investment grade Corporate Bonds and seasoned Mortgage-backed securities, and a corresponding underweight position in U.S. Treasury securities.
Corporate Bonds in particular had an exceptional year. During the April-June period, the Corporate Bond sector experienced its best quarter in more than 20 years.
Offsetting the Fund’s strong performance was the Fund’s lack of exposure to lower quality, high-yield securities, as many of these issues rebounded as the year progressed. In addition, the Fund’s longer duration hurt performance somewhat as interest rates continued to rise in early June.
The third quarter was a very positive one for the Fund, with a great deal of the Fund’s total return generated by a combination of lower interest rates and a rally in the major “spread” sectors—Agency Mortgage-backed securities and Corporate Bonds.
Flows into bond mutual funds were also quite robust, as investors were attracted to yields that were higher than other short-term fixed-income investments.
Risk premiums continued to contract during the fourth quarter, which tended to insulate the portfolio against upward pressure from rising interest rates.
We were significant buyers of investment grade Corporate Bonds, primarily in the new issue market during the first half of the year, and in the secondary market as well, taking advantage of the favorable market fundamentals.
We feel that Corporate Bonds are moderately attractive, and intend to maintain an overweight position in that sector. We believe that we are still in an environment where Corporate Bonds will perform favorably, based on the prospects for the economy stabilizing and eventually recovering.
We anticipate seeing a continuation of a trend that has been in place for several years of foreign-domiciled commercial enterprises being attracted to access our capital markets for funding.
One example of such a company is Macquarie Group Ltd., an Australian-based diversified financial services company. Macquarie is a recent purchase and addition to the Fund’s portfolio of investments.
68 Annual Report | December 31, 2009 |
Another company, also a recent portfolio addition, is Motiva, a joint venture for oil refining between Shell Oil Company and Saudi Arabia’s Aramco.
We expect this trend of foreign companies issuing dollar-denominated securities to continue, and we believe it is both an interesting and encouraging example that global commerce has not regressed—nor been negatively impacted—by protectionist sentiment.
At year end, the Bond Fund’s average maturity stood at 6.4 years, while its duration was 4.5 years.
December 31, 2009 | William Blair Funds 69 |
Bond Fund
Performance Highlights (unaudited)
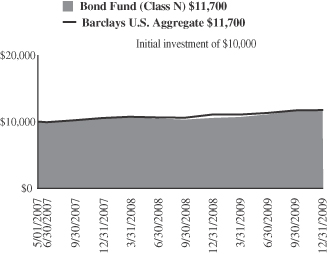
Average Annual Total Return at 12/31/2009
| | | | | | |
| | | 1
Year | | | Since
Inception(a) | |
Bond Fund Class N | | 11.11 | % | | 5.95 | % |
Bond Fund Class I | | 11.40 | | | 6.13 | |
Barclays Capital U.S. Aggregate Bond Index | | 5.93 | | | 6.00 | |
| | (a) | | For the period from May 1, 2007 (Commencement of Operations) to December 31, 2009. | |
Performance cited represents past performance. Past performance does not guarantee future results and current performance may be lower or higher than the data quoted. Results shown are average annual total returns, which assume reinvestment of dividends and capital gains. Investment returns and principal will fluctuate and you may have a gain or loss when you sell shares. For the most current month-end performance information, please call 1-800-742-7272, or visit our Web site at www.williamblairfunds.com. From time to time, the investment advisor may waive fees or reimburse expenses for the Fund. Without these waivers, performance would be lower. Class N shares are available to the general public without a sales load. Class I shares are available to certain institutional investors and advisory clients of William Blair & Company, L.L.C., without a sales load or distribution fees (12b-1).
The performance highlights and graph presented above do not reflect the deduction of taxes that a shareholder would pay on fund distributions or the redemption of fund shares.
The Barclays Capital U.S. Aggregate Bond Index indicates broad intermediate government/corporate bond market performance.
This report identifies the Fund’s investments on December 31, 2009. These holdings are subject to change. Not all investments in the Fund performed the same, nor is there any guarantee that these investments will perform as well in the future. Market forecasts provided in this report may not necessarily come to pass.
Sector Diversification (unaudited)
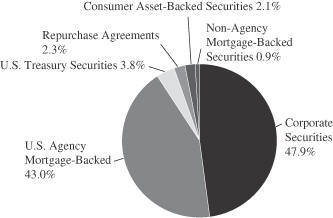
The sector diversification shown is based on the total investments.
70 Annual Report | December 31, 2009 |
Bond Fund
Portfolio of Investments, December 31, 2009 (all dollar amounts in thousands)
| | | | | | | | |
| | | Principal
Amount | | Value |
|
U.S. Government and U.S. Government Agency—47.2% |
U.S. Treasury Inflation Indexed Notes/Bonds—1.8% | | | | | | | | |
U.S. Treasury Inflation Indexed Note, 1.875%, due 7/15/13 | | | | $ | 588 | | $ | 620 |
U.S. Treasury Inflation Indexed Note, 2.375%, due 1/15/17 | | | | | 1,072 | | | 1,158 |
U.S. Treasury Inflation Indexed Bond, 3.875%, due 4/15/29 | | | | | 657 | | | 846 |
| | | | | | | | |
Total U.S. Treasury Inflation Indexed Notes/Bonds | | | | | | | | 2,624 |
| | | | | | | | |
U.S. Treasury—2.0% | | | | | | | | |
U.S. Treasury Note,
4.750%, due 5/15/14 | | | | | 595 | | | 655 |
U.S. Treasury Note,
4.750%, due 8/15/17 | | | | | 1,300 | | | 1,410 |
U.S. Treasury Note,
3.125%, due 5/15/19 | | | | | 1,000 | | | 947 |
| | | | | | | | |
Total U.S. Treasury Obligations | | | | | | | | 3,012 |
| | | | | | | | |
Government National Mortgage Association (GNMA)—0.5% | | | | | | | | |
GNR 2006-67 GB,
4.279%, due 9/16/34, VRN | | | | | 750 | | | 782 |
| | | | | | | | |
Total GNMA Mortgage Obligations | | | | | | | | 782 |
| | | | | | | | |
Federal Home Loan Mortgage Corp. (FHLMC)—7.2% | | | | | | | | |
#G90024, 7.000%, due 1/20/13 | | | | | 68 | | | 71 |
#G30093, 7.000%, due 12/1/17 | | | | | 45 | | | 50 |
#G30255, 7.000%, due 7/1/21 | | | | | 100 | | | 111 |
#G12792, 4.500%, due 12/1/21 | | | | | 654 | | | 679 |
#D95897, 5.500%, due 3/1/23 | | | | | 327 | | | 347 |
#G30372, 5.000%, due 9/1/27 | | | | | 784 | | | 811 |
#G10728, 7.500%, due 7/1/32 | | | | | 356 | | | 400 |
#C01385, 6.500%, due 8/1/32 | | | | | 503 | | | 544 |
#A62179, 6.000%, due 6/1/37 | | | | | 1,174 | | | 1,266 |
#A63539, 6.000%, due 7/1/37 | | | | | 1,598 | | | 1,723 |
#G03170, 6.500%, due 8/1/37 | | | | | 1,339 | | | 1,440 |
#A66843, 6.500%, due 10/1/37 | | | | | 1,308 | | | 1,412 |
#A78138, 5.500%, due 6/1/38 | | | | | 1,672 | | | 1,774 |
| | | | | | | | |
Total FHLMC Mortgage Obligations | | | | | | | | 10,628 |
| | | | | | | | |
Federal National Mortgage Association (FNMA)—35.7% | | | | | | | | |
#535559, 7.500%, due 9/1/12 | | | | | 218 | | | 223 |
#598453, 7.000%, due 6/1/15 | | | | | 2 | | | 2 |
#689612, 5.000%, due 5/1/18 | | | | | 557 | | | 588 |
#695910, 5.000%, due 5/1/18 | | | | | 952 | | | 1,007 |
#747903, 4.500%, due 6/1/19 | | | | | 506 | | | 526 |
#745735, 5.000%, due 3/1/21 | | | | | 769 | | | 808 |
#253847, 6.000%, due 5/1/21 | | | | | 338 | | | 364 |
#900725, 6.000%, due 8/1/21 | | | | | 270 | | | 291 |
#255956, 5.500%, due 10/1/25 | | | | | 2,608 | | | 2,757 |
#545437, 7.000%, due 2/1/32 | | | | | 260 | | | 289 |
#545759, 6.500%, due 7/1/32 | | | | | 2,850 | | | 3,079 |
#254548, 5.500%, due 12/1/32 | | | | | 1,236 | | | 1,301 |
#735415, 6.500%, due 12/1/32 | | | | | 1,432 | | | 1,547 |
#684601, 6.000%, due 3/1/33 | | | | | 2,434 | | | 2,639 |
#555522, 5.000%, due 6/1/33 | | | | | 640 | | | 659 |
| | | | | | | | | |
| | | NRSRO
Rating
(unaudited) | | | Principal
Amount | | Value |
| | | |
Federal National Mortgage Association (FNMA)—(continued) | | | | | | | | | |
#190337, 5.000%, due 7/1/33 | | | | | $ | 772 | | $ | 795 |
#190340, 5.000%, due 9/1/33 | | | | | | 2,445 | | | 2,519 |
#254868, 5.000%, due 9/1/33 | | | | | | 1,184 | | | 1,220 |
#555783, 4.500%, due 10/1/33 | | | | | | 2,230 | | | 2,244 |
#555800, 5.500%, due 10/1/33 | | | | | | 550 | | | 578 |
#555880, 5.500%, due 11/1/33 | | | | | | 641 | | | 674 |
#725027, 5.000%, due 11/1/33 | | | | | | 955 | | | 984 |
#756153, 5.500%, due 11/1/33 | | | | | | 1,482 | | | 1,558 |
#725231, 5.000%, due 2/1/34 | | | | | | 986 | | | 1,016 |
#725205, 5.000%, due 3/1/34 | | | | | | 1,890 | | | 1,948 |
#725220, 5.000%, due 3/1/34 | | | | | | 916 | | | 944 |
#725232, 5.000%, due 3/1/34 | | | | | | 2,736 | | | 2,819 |
#725238, 5.000%, due 3/1/34 | | | | | | 1,670 | | | 1,721 |
#725424, 5.500%, due 4/1/34 | | | | | | 690 | | | 726 |
#725611, 5.500%, due 6/1/34 | | | | | | 606 | | | 637 |
#786546, 6.000%, due 7/1/34 | | | | | | 1,179 | | | 1,270 |
#190353, 5.000%, due 8/1/34 | | | | | | 502 | | | 517 |
#745092, 6.500%, due 7/1/35 | | | | | | 810 | | | 875 |
#357944, 6.000%, due 9/1/35 | | | | | | 148 | | | 159 |
#829306, 6.000%, due 9/1/35 | | | | | | 378 | | | 403 |
#843487, 6.000%, due 10/1/35 | | | | | | 343 | | | 365 |
#848782, 6.500%, due 1/1/36 | | | | | | 1,136 | | | 1,224 |
#849191, 6.000%, due 1/1/36 | | | | | | 129 | | | 138 |
#745349, 6.500%, due 2/1/36 | | | | | | 1,599 | | | 1,716 |
#831540, 6.000%, due 6/1/36 | | | | | | 278 | | | 295 |
#893318, 6.500%, due 8/1/36 | | | | | | 334 | | | 359 |
#256859, 5.500%, due 8/1/37 | | | | | | 1,603 | | | 1,676 |
#928561, 6.000%, due 8/1/37 | | | | | | 992 | | | 1,068 |
#948689, 6.000%, due 8/1/37 | | | | | | 1,817 | | | 1,930 |
#888967, 6.000%, due 12/1/37 | | | | | | 1,823 | | | 1,947 |
#934006, 6.500%, due 9/1/38 | | | | | | 1,985 | | | 2,153 |
| | | | | | | | | |
Total FNMA Mortgage Obligations | | | | | | | | | 52,558 |
| | | | | | | | | |
| | | |
Non-Agency Mortgage-Backed Obligations—0.9% | | | | | | | | | |
Countrywide Alternative Loan Trust, 2003-11T1, Tranche M,
4.750%, due 7/25/18 | | CCC | | | | 271 | | | 231 |
LSSCO, 2004-2, Tranche M2,
3.477%, due 2/28/33, VRN* | | CC | | | | 166 | | | 44 |
FHASI, 2004-AR4, Tranche 3A1,
4.628%, due 8/25/34, VRN | | Aaa | | | | 571 | | | 528 |
Chase Mortgage Finance Corporation, 2006-A1, Tranche 2A3,
6.000%, due 9/25/36 | | B3 | | | | 700 | | | 480 |
| | | | | | | | | |
Total Non-Agency Mortgage-Backed Obligations | | | | | | | | | 1,283 |
| | | | | | | | | |
| | | |
Consumer Asset-Backed Securities—2.2% | | | | | | | | | |
AESOP Funding II, LLC, 2009-2A, A, 5.680%, due 2/20/13 | | Aaa | | | | 1,100 | | | 1,136 |
Hertz Vehicle Financing, 2009-2A, A1, 4.260%, due 3/15/14 | | Aaa | | | | 850 | | | 847 |
First Plus 1997-4 M1,
7.640%, due 9/11/23* | | AA | † | | | 199 | | | 184 |
Aames Mortgage Trust, 2001-1,
Tranche M2, 7.588%, due 6/25/31 | | A | | | | 133 | | | 93 |
See accompanying Notes to Financial Statements.
December 31, 2009 | William Blair Funds 71 |
Bond Fund
Portfolio of Investments, December 31, 2009 (all dollar amounts in thousands)
| | | | | | | | |
| | | NRSRO
Rating
(unaudited) | | Principal
Amount | | Value |
| | | |
Consumer Asset-Backed Securities—(continued) | | | | | | | | |
CWL, 2003-5, Tranche MF2,
5.959%, due 11/25/33 | | Aa3 | | $ | 200 | | $ | 108 |
Renaissance Home Equity Loan Trust, 2004-2, Tranche M5,
6.455%, due 7/25/34 | | A | | | 463 | | | 127 |
Soundview Home Equity Loan Trust, 2005-B, Tranche M1,
5.635%, due 5/25/35 | | AA+ | | | 72 | | | 70 |
Mid-State Trust 2004-1, Tranche A, 6.005%, due 8/15/37 | | Aaa | | | 672 | | | 632 |
| | | | | | | | |
Total Consumer Asset-Backed Securities | | | | | | | | 3,197 |
| | | | | | | | |
| | | |
Corporate Obligations—47.8% | | | | | | | | |
General Dynamics,
1.800%, due 7/15/11 | | A | | | 500 | | | 506 |
Morgan Stanley Dean Witter & Co., 6.600%, due 4/1/12 | | A | | | 545 | | | 593 |
Simon Property Group, Inc.,
6.350%, due 8/28/12 | | A- | | | 1,000 | | | 1,067 |
Cox Communications, Inc.,
7.125%, due 10/1/12 | | BBB | | | 700 | | | 778 |
Wells Fargo & Company,
4.375%, due 1/31/13 | | AA- | | | 350 | | | 364 |
The Kroger Co.,
5.500%, due 2/1/13 | | BBB | | | 430 | | | 459 |
Weatherford International Ltd.,
5.150%, due 3/15/13 | | BBB+ | | | 650 | | | 681 |
John Deere Capital Corporation,
4.500%, due 4/3/13 | | A | | | 700 | | | 735 |
Citigroup,
5.500%, due 4/11/13 | | A+ | | | 1,500 | | | 1,555 |
General Electric Capital Corporation, 4.800%, due 5/1/13 | | AA+ | | | 600 | | | 627 |
CME Group, Inc.,
5.750%, due 2/15/14 | | AA | | | 700 | | | 766 |
PACCAR, Inc.,
6.875%, due 2/15/14 | | AA- | | | 800 | | | 902 |
PepsiAmericas, Inc.,
4.375%, due 2/15/14 | | A+ | | | 300 | | | 312 |
American Movil S.A.B. de C.V.,
5.500%, due 3/1/14 | | A3 | | | 700 | | | 743 |
Coca-Cola Enterprises, Inc.,
7.375%, due 3/3/14 | | A | | | 1,000 | | | 1,160 |
Smith International, Inc.,
8.625%, due 3/15/14 | | BBB+ | | | 970 | | | 1,122 |
General Electric Capital Corporation, 5.900%, due 5/13/14 | | AA+ | | | 225 | | | 243 |
Bank of America,
7.375%, due 5/15/14 | | A+ | | | 700 | | | 794 |
American Express Company,
7.250%, due 5/20/14 | | A+ | | | 500 | | | 564 |
Capital One Financial Corporation,
7.375%, due 5/23/14 | | A- | | | 1,235 | | | 1,398 |
State Street Corporation,
4.300%, due 5/30/14 | | A+ | | | 350 | | | 362 |
Hewlett-Packard Company,
4.750%, due 6/2/14 | | A+ | | | 800 | | | 854 |
| | | | | | | | |
| | | NRSRO
Rating
(unaudited) | | Principal
Amount | | Value |
|
Corporate Obligations—(continued) |
St. Jude Medical, Inc.,
3.750%, due 7/15/14 | | A | | $ | 1,000 | | $ | 1,011 |
Petrohawk Energy Corporation,
10.500%, due 8/1/14 | | B | | | 1,000 | | | 1,093 |
Macquarie Group,
7.300%, due 8/1/14 | | A2 | | | 1,000 | | | 1,080 |
D.R. Horton, Inc.
5.625%, due 9/15/14 | | BB | | | 1,000 | | | 968 |
SBC Communications Inc.,
5.100%, due 9/15/14 | | A | | | 1,250 | | | 1,345 |
Goldman Sachs Group, Inc.,
5.000%, due 10/1/14 | | A1 | | | 545 | | | 575 |
CODELCO, Inc.—144A,*
4.750%, due 10/15/14 | | A1 | | | 400 | | | 428 |
Boeing Capital Corporation,
3.250%, due 10/27/14 | | A+ | | | 1,400 | | | 1,390 |
Crown Castle International Corp.,
9.000%, due 1/15/15 | | B+ | | | 1,000 | | | 1,065 |
DuPont (E.I.) de Nemours and Company, 3.250%, due 1/15/15 | | A | | | 500 | | | 495 |
Georgia-Pacific, LLC,
7.000%, due 1/15/15 | | BB+ | | | 1,000 | | | 1,013 |
Yum! Brands, Inc.,
4.250%, due 9/15/15 | | BBB- | | | 350 | | | 351 |
Omnicom Group, Inc.,
5.900%, due 4/15/16 | | A- | | | 750 | | | 799 |
Yum! Brands, Inc.,
6.250%, due 4/15/16 | | BBB- | | | 700 | | | 752 |
Owens-Brockway,
7.375%, due 5/15/16 | | BB+ | | | 750 | | | 774 |
MetLife, Inc.,
6.750%, due 6/1/16 | | A | | | 1,000 | | | 1,120 |
SABMiller plc,
6.500%, due 7/1/16 | | BBB+ | | | 700 | | | 768 |
Petrobras International Finance Company, 6.125%, due 10/6/16 | | Baa1 | | | 400 | | | 429 |
DuPont (E.I.) de Nemours and Company, 5.250%, due 12/15/16 | | A | | | 500 | | | 528 |
Comcast Corporation,
6.500%, due 1/15/17 | | BBB+ | | | 350 | | | 387 |
Corrections Corporation of America, 7.750%, due 6/1/17 | | BB | | | 575 | | | 592 |
ERP Operating Limited Partnership, 5.750%, due 6/15/17 | | A- | | | 1,100 | | | 1,100 |
J.P. Morgan Chase & Co.,
6.125%, due 6/27/17 | | A1 | | | 600 | | | 634 |
BB&T Corporation,
4.900%, due 6/30/17 | | A2 | | | 665 | | | 647 |
American Express Company,
6.150%, due 8/28/17 | | A+ | | | 1,000 | | | 1,045 |
IBM Corporation,
5.700%, due 9/14/17 | | A+ | | | 1,250 | | | 1,367 |
Exelon Generation Company, LLC., 6.200%, due 10/1/17 | | A3 | | | 1,100 | | | 1,179 |
Toll Brothers Finance Corporation, 8.910%, due 10/15/17 | | BBB- | | | 950 | | | 1,079 |
Union Pacific Corporation,
5.750%, due 11/15/17 | | BBB | | | 800 | | | 844 |
See accompanying Notes to Financial Statements.
72 Annual Report | December 31, 2009 |
Bond Fund
Portfolio of Investments, December 31, 2009 (all dollar amounts in thousands)
| | | | | | | | |
| | | NRSRO
Rating
(unaudited) | | Principal
Amount | | Value |
|
Corporate Obligations—(continued) |
Wells Fargo & Company,
5.625%, due 12/11/17 | | AA- | | $ | 1,000 | | $ | 1,040 |
Kohl’s Corporation,
6.250%, due 12/15/17 | | BBB+ | | | 350 | | | 387 |
The Goldman Sachs Group, Inc.,
6.150%, due 4/1/18 | | A1 | | | 950 | | | 1,017 |
Morgan Stanley,
6.625%, due 4/1/18 | | A | | | 950 | | | 1,027 |
General Electric Capital Corporation, 5.625%, due 5/1/18 | | AA+ | | | 350 | | | 359 |
Philip Morris International, Inc.,
5.650%, due 5/16/18 | | A+ | | | 1,000 | | | 1,052 |
Time Warner Cable,
6.750%, due 7/1/18 | | BBB | | | 1,000 | | | 1,099 |
Merrill Lynch & Co., Inc.,
6.875%, due 11/15/18 | | A+ | | | 1,075 | | | 1,152 |
Anheuser-Busch InBev,
7.750%, due 1/15/19 | | BBB+ | | | 700 | | | 820 |
FedEx Corporation,
8.000%, due 1/15/19 | | BBB | | | 750 | | | 903 |
CSX Corporation,
7.375%, due 2/1/19 | | BBB- | | | 800 | | | 914 |
Honeywell International, Inc.,
5.000%, due 2/15/19 | | A | | | 925 | | | 958 |
Pfizer, Inc.,
6.200%, due 3/15/19 | | AA | | | 1,250 | | | 1,390 |
Abbott Laboratories,
5.125%, due 4/1/19 | | AA | | | 900 | | | 941 |
BHP Billiton Finance (USA) Limited, 6.500%, due 4/1/19 | | A+ | | | 1,300 | | | 1,491 |
Owens Corning,
9.000%, due 6/15/19 | | BBB- | | | 950 | | | 1,059 |
Jeffries Group, Inc.,
8.500%, due 7/15/19 | | BBB | | | 1,300 | | | 1,421 |
Discovery Communications, LLC, 5.625%, due 8/15/19 | | Baa2 | | | 500 | | | 516 |
Roper Industries, Inc.,
6.250%, due 9/1/19 | | BBB- | | | 1,225 | | | 1,275 |
Halliburton Company,
6.150%, due 9/15/19 | | A | | | 1,250 | | | 1,396 |
Boston Properties Limited Partnership, 5.875%, due 10/15/19 | | A- | | | 1,500 | | | 1,505 |
Iron Mountain Incorporated,
8.000%, due 6/15/20 | | B+ | | | 1,000 | | | 1,015 |
VRN = Variable Rate Notes
NRSRO = Nationally Recognized Statistical Rating Organization—The credit quality ratings of the securities in the Fund reflect the highest category rating by either Fitch Ratings, Moody’s Investors Service Inc., or Standard & Poor’s, a division of the McGraw-Hill Companies, Inc.
The obligations of certain U. S. Government-sponsored securities are neither issued nor guaranteed by the U.S. Treasury.
* Deemed illiquid pursuant to the Fund/Advisor’s Liquidity Procedures. These holdings represent 0.71% of the net assets of the Fund at December 31, 2009.
† As of January 26th, 2010, Fitch has lowered the rating on this security to C.
| | | | | | | | | |
| | | NRSRO
Rating(unaudited) | | Principal
Amount | | Value | |
|
Corporate Obligations—(continued) | |
Ras Laffan Lng II,
5.298%, due 9/30/20* | | Aa2 | | $ | 400 | | $ | 403 | |
Southwest Airlines Co.,
6.150%, due 8/1/22 | | A | | | 701 | | | 702 | |
The Kroger Co.,
8.000%, due 9/15/29 | | BBB | | | 325 | | | 391 | |
Conoco Funding Company,
7.250%, due 10/15/31 | | A1 | | | 400 | | | 463 | |
Kohl’s Corporation,
6.000%, due 1/15/33 | | BBB+ | | | 400 | | | 405 | |
Pacific Gas and Electric Company, 6.050%, due 3/1/34 | | A | | | 750 | | | 783 | |
Wisconsin Electric Power Company, 5.700%, due 12/1/36 | | A1 | | | 500 | | | 504 | |
Comcast Corporation,
6.450%, due 3/15/37 | | BBB+ | | | 650 | | | 670 | |
J.P. Morgan Chase & Co.,
6.400%, due 5/15/38 | | Aa3 | | | 350 | | | 385 | |
Cox Communications, Inc.,
6.950%, due 6/1/38 | | BBB | | | 350 | | | 371 | |
General Electric Capital Corporation, 6.875%, due 1/10/39 | | AA+ | | | 750 | | | 775 | |
ConocoPhillips Company,
6.500%, due 2/1/39 | | A1 | | | 400 | | | 444 | |
| | | | | | | | | |
Total Corporate Obligations | | | | | | | | 70,476 | |
| | | | | | | | | |
Total Long-Term Investments—98.1%
(cost $138,047) | | | | | | 144,560 | |
| | | | | | | | | |
Repurchase Agreement | | | | | | | | | |
State Street Bank and Trust Company, 0.000% dated 12/31/09, due 1/4/10, repurchase price $3,443, collateralized by U.S. Treasury Bill, 0.020%, due 2/18/10 | | AAA | | | 3,443 | | | 3,443 | |
| | | | | | | | | |
Total Repurchase Agreement—2.3%
(cost $3,443) | | | | | | 3,443 | |
| | | | | | | | | |
Total Investments—100.4%
(cost $141,490) | | | | | | 148,003 | |
| | | | | | | | | |
Liabilities, plus cash and other assets—(0.4)% | | | (659 | ) |
| | | | | | | | | |
Net Assets—100.0% | | $ | 147,344 | |
| | | | | | | | | |
See accompanying Notes to Financial Statements.
December 31, 2009 | William Blair Funds 73 |
Christopher T. Vincent
INCOME FUND
The Income Fund invests in intermediate-term debt securities.
AN OVERVIEW FROM THE PORTFOLIO MANAGER
Please see page 66 for the Fixed Income Market Overview.
How did the Fund perform during the past year? How did the Fund’s performance compare to its benchmark?
The Income Fund posted a 9.88% increase on a total return basis (Class N Shares) for the 12 months ended December 31, 2009. By comparison, the Fund’s benchmark, the Barclays Capital Intermediate Government/Credit Bond Index, rose 5.24%, while the Fund’s peer group, the Morningstar Short-Term Bond Category, gained 9.30%.
During 2009, the Fund benefitted from its overweight position in investment grade Corporate Bonds and seasoned Mortgage-backed securities, and a corresponding underweight position in U.S. Treasury securities.
Corporate Bonds in particular had an exceptional year. During the April-June period, the Corporate Bond sector experienced its best quarter in more than 20 years.
Offsetting the Fund’s strong performance was the Fund’s lack of exposure to lower quality, high-yield securities, as many of these issues rebounded as the year progressed. In addition, the Fund’s longer duration hurt performance somewhat as interest rates continued to rise in early June.
The third quarter was a very positive one for the Fund, with a great deal of the Fund’s total return generated by a combination of lower interest rates and a rally in the major “spread” sectors—Agency Mortgage-backed securities and Corporate Bonds.
Flows into bond mutual funds were also quite robust, as investors were attracted to yields that were higher than other short-term fixed-income investments.
Risk premiums continued to contract during the fourth quarter, which tended to insulate the portfolio against upward pressure from rising interest rates.
We were significant buyers of investment grade Corporate Bonds, primarily in the new issue market during the first half of the year, and in the secondary market as well, taking advantage of the favorable market fundamentals.
We feel that Corporate Bonds are moderately attractive, and intend to maintain an overweight position in that sector. We believe that we are still in an environment where Corporate Bonds will perform favorably, based on the prospects for the economy stabilizing and eventually recovering.
We anticipate seeing a continuation of a trend that has been in place for several years of foreign-domiciled commercial enterprises being attracted to access our capital markets for funding.
One example of such a company is Macquarie Group Ltd., an Australian-based diversified financial services company. Macquarie is a recent purchase and addition to the Fund’s portfolio of investments.
74 Annual Report | December 31, 2009 |
Another company, also a recent portfolio addition, is Motiva, a joint venture for oil refining between Shell Oil Company and Saudi Arabia’s Aramco.
We expect this trend of foreign companies issuing dollar-denominated securities to continue, and we believe it is both an interesting and encouraging example that global commerce has not regressed—nor been negatively impacted—by protectionist sentiment.
At year end, the Income Fund’s average maturity stood at 4.9 years, while its duration was 3.8 years.
December 31, 2009 | William Blair Funds 75 |
Income Fund
Performance Highlights (unaudited)
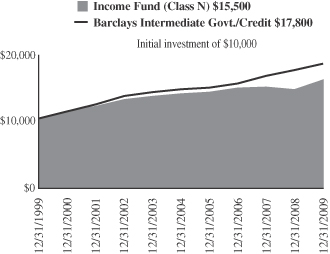
Average Annual Total Return at 12/31/2009
| | | | | | | | | | | | |
| | | 1
Year | | | 3
Year | | | 5
Year | | | 10
Year | |
Income Fund Class N | | 9.88 | % | | 2.70 | % | | 2.81 | % | | 4.51 | % |
Income Fund Class I | | 9.89 | | | 2.87 | | | 2.97 | | | 4.67 | |
Barclays Capital Intermediate Government/Credit Bond Index | | 5.24 | | | 5.90 | | | 4.65 | | | 5.92 | |
Performance cited represents past performance. Past performance does not guarantee future results and current performance may be lower or higher than the data quoted. Results shown are average annual total returns, which assume reinvestment of dividends and capital gains. Investment returns and principal will fluctuate and you may have a gain or loss when you sell shares. For the most current month-end performance information, please call 1-800-742-7272, or visit our Web site at www.williamblairfunds.com. From time to time, the investment advisor may waive fees or reimburse expenses for the Fund. Without these waivers, performance would be lower. Class N shares are available to the general public without a sales load. Class I shares are available to certain institutional investors and advisory clients of William Blair & Company, L.L.C., without a sales load or distribution (12b-1) or service fees.
The performance highlights and graph presented above do not reflect the deduction of taxes that a shareholder would pay on fund distributions or the redemption of fund shares.
The Barclays Capital Intermediate Government Credit Bond Index indicates broad intermediate government/corporate bond market performance.
This report identifies the Fund’s investments on December 31, 2009. These holdings are subject to change. Not all investments in the Fund performed the same, nor is there any guarantee that these investments will perform as well in the future. Market forecasts provided in this report may not necessarily come to pass.
Sector Diversification (unaudited)
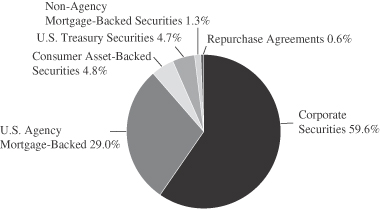
The sector diversification shown is based on the total investments.
76 Annual Report | December 31, 2009 |
Income Fund
Portfolio of Investments, December 31, 2009 (all dollar amounts in thousands)
| | | | | | | | |
| | | Principal
Amount | | Value |
|
U.S. Government and U.S. Government Agency—33.6% |
U.S. Treasury Inflation Indexed Notes/Bonds—1.5% | | | | | | | | |
U.S. Treasury Inflation Indexed Note, 2.375%, due 1/15/17 | | | | $ | 1,608 | | $ | 1,737 |
| | | | | | | | |
U.S. Treasury—3.2% | | | | | | | | |
U.S. Treasury Note,
2.250%, due 5/31/14 | | | | | 400 | | | 397 |
U.S. Treasury Note,
5.125%, due 5/15/16 | | | | | 1,000 | | | 1,115 |
U.S. Treasury Note,
4.750%, due 8/15/17 | | | | | 1,075 | | | 1,167 |
U.S. Treasury Note,
3.125%, due 5/15/19 | | | | | 1,200 | | | 1,136 |
| | | | | | | | |
Total U.S. Treasury Obligations | | | | | | | | 3,815 |
| | | | | | | | |
Government National Mortgage Association (GNMA)—0.3% | | | | | | | | |
#780405, 9.500%, due 11/15/17 | | | | | 202 | | | 220 |
#357322, 7.000%, due 9/15/23 | | | | | 132 | | | 146 |
| | | | | | | | |
Total Government National Mortgage Association | | | | | | | | 366 |
| | | | | | | | |
| | | |
Federal Home Loan Mortgage Corp. (FHLMC)—8.4% | | | | | | | | |
#E00436, 7.000%, due 6/1/11 | | | | | 84 | | | 88 |
#M80925, 5.000%, due 6/1/11 | | | | | 436 | | | 443 |
#G10708, 6.500%, due 8/1/12 | | | | | 61 | | | 64 |
#E72924, 7.000%, due 10/1/13 | | | | | 355 | | | 376 |
#E81697, 8.000%, due 5/1/15 | | | | | 1,013 | | | 1,104 |
#E81703, 7.000%, due 5/1/15 | | | | | 407 | | | 434 |
#E81908, 8.500%, due 12/1/15 | | | | | 85 | | | 96 |
#J02184, 8.000%, due 4/1/16 | | | | | 723 | | | 779 |
#G90022, 8.000%, due 9/17/16 | | | | | 295 | | | 317 |
#E90398, 7.000%, due 5/1/17 | | | | | 781 | | | 845 |
#M30028, 5.500%, due 5/1/17 | | | | | 71 | | | 74 |
#E97112, 4.000%, due 5/1/18 | | | | | 430 | | | 441 |
#E96536, 5.000%, due 10/1/18 | | | | | 1,205 | | | 1,270 |
#B13459, 4.500%, due 4/1/19 | | | | | 352 | | | 365 |
#C67537, 9.500%, due 8/1/21 | | | | | 30 | | | 33 |
#D95621, 6.500%, due 7/1/22 | | | | | 2,270 | | | 2,467 |
#A45790, 7.500%, due 5/1/35 | | | | | 551 | | | 618 |
| | | | | | | | |
Total FHLMC Mortgage Obligations | | | | | | | | 9,814 |
| | | | | | | | |
| | | |
Federal National Mortgage Association (FNMA)—20.2% | | | | | | | | |
#695512, 8.000%, due 9/1/10 | | | | | 24 | | | 24 |
#725479, 8.500%, due 10/1/10 | | | | | 5 | | | 6 |
#313816, 6.000%, due 4/1/11 | | | | | 45 | | | 46 |
#577393, 10.000%, due 6/1/11 | | | | | 32 | | | 33 |
#577395, 10.000%, due 8/1/11 | | | | | 132 | | | 137 |
#254788, 6.500%, due 4/1/13 | | | | | 156 | | | 164 |
#725315, 8.000%, due 5/1/13 | | | | | 172 | | | 185 |
#593561, 9.500%, due 8/1/14 | | | | | 197 | | | 216 |
#567027, 7.000%, due 9/1/14 | | | | | 731 | | | 781 |
#567026, 6.500%, due 10/1/14 | | | | | 637 | | | 685 |
#458124, 7.000%, due 12/15/14 | | | | | 107 | | | 115 |
#576554, 8.000%, due 1/1/16 | | | | | 780 | | | 854 |
#256106, 5.000%, due 2/1/16 | | | | | 1,229 | | | 1,279 |
#576553, 8.000%, due 2/1/16 | | | | | 1,281 | | | 1,431 |
#555747, 8.000%, due 5/1/16 | | | | | 142 | | | 152 |
#735569, 8.000%, due 10/1/16 | | | | | 840 | | | 918 |
| | | | | | | | |
| | | NRSRO
Rating
(unaudited) | | Principal
Amount | | Value |
|
Federal National Mortgage Association
(FNMA)—(continued) |
#725410, 7.500%, due 4/1/17 | | | | $ | 542 | | $ | 577 |
#643217, 6.500%, due 6/1/17 | | | | | 261 | | | 283 |
#679247, 7.000%, due 8/1/17 | | | | | 924 | | | 1,021 |
#888979, 6.000%, due 12/1/17 | | | | | 1,034 | | | 1,095 |
#685194, 4.500%, due 3/1/18 | | | | | 1,541 | | | 1,607 |
#689334, 5.000%, due 3/1/18 | | | | | 228 | | | 240 |
#695910, 5.000%, due 5/1/18 | | | | | 952 | | | 1,007 |
#740847, 6.000%, due 10/1/18 | | | | | 642 | | | 687 |
#323501, 6.500%, due 1/1/19 | | | | | 194 | | | 212 |
#255358, 5.000%, due 9/1/19 | | | | | 297 | | | 312 |
#852864, 7.000%, due 7/1/20 | | | | | 1,963 | | | 2,166 |
#458147, 10.000%, due 8/15/20 | | | | | 456 | | | 506 |
#835563, 7.000%, due 10/1/20 | | | | | 802 | | | 886 |
#735574, 8.000%, due 3/1/22 | | | | | 504 | | | 579 |
#679253, 6.000%, due 10/1/22 | | | | | 1,126 | | | 1,213 |
#G93-19, Tranche SH,
11.234%, due 4/25/23, VRN | | | | | 11 | | | 12 |
#255956, 5.500%, due 10/1/25 | | | | | 261 | | | 276 |
#806458, 8.000%, due 6/1/28 | | | | | 445 | | | 511 |
#880155, 8.500%, due 7/1/29 | | | | | 946 | | | 1,090 |
#797846, 7.000%, due 3/1/32 | | | | | 1,093 | | | 1,208 |
#745519, 8.500%, due 5/1/32 | | | | | 578 | | | 666 |
#654674, 6.500%, due 9/1/32 | | | | | 243 | | | 263 |
#733897, 6.500%, due 12/1/32 | | | | | 286 | | | 308 |
| | | | | | | | |
Total FNMA Mortgage Obligations | | | | | | | | 23,751 |
| | | | | | | | |
| | | |
Consumer Asset-Backed
Securities—4.8% | | | | | | | | |
PECO Energy Transition Trust, 2001-A, Tranche A1, 6.520%, due 12/31/10 | | AAA | | | 600 | | | 615 |
USAA Auto Owner Trust, 2006-2, Tranche A4, 5.370%, due 2/15/12 | | AAA | | | 566 | | | 572 |
Capital One Multi-Asset Execution Trust, 2009-A1, Tranche A1,
1.333%, due 4/15/13 | | AAA | | | 1,000 | | | 1,002 |
Citibank Credit Card Issuance Trust, 2009-A3, Tranche A3,
2.700%, due 6/24/13 | | AAA | | | 965 | | | 983 |
John Deere Owner Trust, 2009 -A, Tranche A3, 2.590%, due 10/15/13 | | AAA | | | 500 | | | 508 |
Mercedes-Benz Auto Receivables Trust, 2009-1, Tranche A3,
1.670%, due 1/15/14 | | Aaa | | | 405 | | | 405 |
AESOP Funding, 2009-2A, Tranche A, 5.680%, due 2/20/14 | | AAA | | | 1,000 | | | 1,033 |
Hertz Vehicle Financing LLC, 2009-2A, Tranche A1, 4.26%, due 3/25/14 | | Aaa | | | 500 | | | 498 |
| | | | | | | | |
Total Consumer Asset-Backed Securities | | | | | | | | 5,616 |
| | | | | | | | |
| | | |
Non-Agency Mortgage-Backed Obligations—1.3% | | | | | | | | |
ABFS, 2002-2, Tranche A6,
5.850%, due 3/15/19 | | AAA | | | 102 | | | 101 |
See accompanying Notes to Financial Statements.
December 31, 2009 | William Blair Funds 77 |
Income Fund
Portfolio of Investments, December 31, 2009 (all dollar amounts in thousands)
| | | | | | | | | |
| | | NRSRO
Rating
(unaudited) | | | Principal
Amount | | Value |
| | | |
Non-Agency Mortgage-Backed Obligations—(continued) | | | | | | | | | |
First Plus, 1997-4, Tranche M1, 7.640%, due 9/11/23* | | AA | † | | $ | 676 | | $ | 623 |
First Plus, 1997-4, Tranche M2,
7.830%, due 9/11/23* | | A | † | | | 143 | | | 127 |
First Plus, 1998-3, Tranche M2,
7.920%, due 5/10/24* | | A | † | | | 256 | | | 239 |
LSSCO, 2004-2, Tranche M1,
3.477%, due 2/28/33, VRN* | | CCC | | | | 432 | | | 188 |
LSSCO, 2004-2, Tranche M2,
3.480%, due 2/28/33, VRN* | | CC | | | | 332 | | | 88 |
ABFS, 2002-2, Tranche A7,
5.125%, due 7/15/33 | | AAA | | | | 14 | | | 14 |
Soundview Home Equity Loan Trust, 2005-B, Tranche M1
5.635%, due 5/25/35 | | A | | | | 181 | | | 177 |
| | | | | | | | | |
Total Non-Agency Mortgage-Backed Obligations | | | | | | | | | 1,557 |
| | | | | | | | | |
| | | |
Corporate Obligations—59.3% | | | | | | | | | |
Pacific Gas & Electric PCG,
4.200%, due 3/1/11 | | A | | | | 1,250 | | | 1,290 |
Wisconsin Energy Corporation,
6.500%, due 4/1/11 | | A- | | | | 1,250 | | | 1,322 |
Eli Lilly & Co., 3.550%, due 3/6/12 | | AA | | | | 500 | | | 520 |
BP Capital Markets plc,
3.125%, due 3/10/12 | | AA+ | | | | 1,125 | | | 1,159 |
BHP Billiton Finance (USA) Limited, 5.125%, due 3/29/12 | | A+ | | | | 1,195 | | | 1,272 |
Morgan Stanley Dean Witter & Co., 6.600%, due 4/1/12 | | A | | | | 1,600 | | | 1,741 |
Simon Property Group, Inc.,
6.350%, due 8/28/12 | | A- | | | | 1,500 | | | 1,601 |
Cox Communications, Inc.,
7.125%, due 10/1/12 | | BBB | | | | 1,000 | | | 1,111 |
Wells Fargo & Company,
4.375%, due 1/31/13 | | AA- | | | | 1,400 | | | 1,454 |
PepsiCo, Inc., 4.650%, due 2/15/13 | | Aa2 | | | | 540 | | | 577 |
John Deere Capital Corporation,
4.500%, due 4/3/13 | | A | | | | 1,000 | | | 1,050 |
Citigroup, Inc., 5.500%, due 4/11/13 | | A+ | | | | 1,000 | | | 1,037 |
General Electric Capital Corporation, 4.800%, due 5/1/13 | | AA+ | | | | 1,500 | | | 1,568 |
Novartis Capital Corp.,
4.125%, due 2/10/14 | | AA | | | | 1,000 | | | 1,051 |
CME Group, Inc., 5.750%, due 2/15/14 | | AA | | | | 1,000 | | | 1,094 |
PACCAR, Inc., 6.875%, due 2/15/14 | | AA- | | | | 1,000 | | | 1,128 |
PepsiAmericas, Inc.,
4.375%, due 2/15/14 | | A+ | | | | 500 | | | 520 |
American Movil S.A.B. De C.V.,
5.500%, due 3/1/14 | | A- | | | | 1,000 | | | 1,061 |
Coca—Cola Enterprises, Inc.,
7.375%, due 3/3/14 | | A | | | | 900 | | | 1,044 |
| | | | | | | | |
| | | NRSRO
Rating
(unaudited) | | Principal
Amount | | Value |
|
Corporate Obligations—(continued) |
General Electric Capital Corporation, 5.900%, due 5/13/14 | | AA+ | | $ | 225 | | $ | 243 |
Bank Of America,
7.375%, due 5/15/14 | | A+ | | | 500 | | | 567 |
Hewlett-Packard Company,
4.750%, due 6/2/14 | | A+ | | | 1,100 | | | 1,175 |
St. Jude Medical, Inc.
3.750%, due 7/15/14 | | A | | | 500 | | | 505 |
AT&T, Inc.,
5.100%, due 9/15/14 | | A | | | 1,750 | | | 1,882 |
Goldman Sachs Group, Inc.,
5.000%, due 9/24/14 | | A+ | | | 1,500 | | | 1,582 |
CODELCO, Inc. -144A,
4.750%, due 10/15/14* | | A1 | | | 1,815 | | | 1,943 |
Boeing Capital Corporation,
3.250%, due 10/27/14 | | A | | | 1,000 | | | 993 |
EI Du Pont de Nemours & Co.,
3.250%, due 1/15/15 | | A | | | 1,200 | | | 1,189 |
United Technologies Corporation, 4.875%, due 5/1/15 | | A+ | | | 1,500 | | | 1,610 |
Omnicom Group, Inc.,
5.900%, due 4/15/16 | | A- | | | 1,000 | | | 1,065 |
YUM! Brands, Inc.,
6.250%, due 4/15/16 | | BBB- | | | 1,000 | | | 1,074 |
Petrobras International Finance Company, 6.125%, due 10/6/16 | | Baa1 | | | 1,000 | | | 1,073 |
BHP Billiton Finance (USA) Limited, 5.400%, due 3/29/17 | | A+ | | | 1,000 | | | 1,071 |
ERP Operating LP,
5.750%, due 6/15/17 | | A | | | 1,000 | | | 1,000 |
J.P. Morgan Chase & Co.,
6.125%, due 6/27/17 | | A+ | | | 1,750 | | | 1,850 |
BB&T Corporation,
4.900%, due 6/30/17 | | A | | | 1,500 | | | 1,460 |
Kimberly—Clark Company,
6.125%, due 8/1/17 | | A | | | 1,000 | | | 1,109 |
American Express Company,
6.150%, due 8/28/17 | | A+ | | | 1,500 | | | 1,568 |
IBM Corporation,
5.700%, due 9/14/17 | | A+ | | | 1,750 | | | 1,913 |
Exelon Generation Company, LLC., 6.200%, due 10/1/17 | | A3 | | | 2,000 | | | 2,144 |
Tesco plc,
5.500%, due 11/15/17 | | A- | | | 1,750 | | | 1,842 |
Abbott Laboratories,
5.600%, due 11/30/17 | | AA | | | 1,650 | | | 1,792 |
Wells Fargo & Company,
5.625%, due 12/11/17 | | AA- | | | 750 | | | 780 |
Kohl’s Corporation,
6.250%, due 12/15/17 | | BBB+ | | | 1,000 | | | 1,107 |
Goldman Sachs Group, Inc.,
6.150%, due 4/1/18 | | A+ | | | 750 | | | 803 |
Morgan Stanley,
6.625%, due 4/1/18 | | A | | | 750 | | | 811 |
Philip Morris International, Inc.,
5.650%, due 5/16/18 | | A+ | | | 1,250 | | | 1,314 |
Time Warner Cable, Inc.,
6.750%, due 7/1/18 | | BBB | | | 1,000 | | | 1,099 |
Anheuser-Busch InBev Worldwide, Inc., 7.750%, due 1/15/19 | | BBB+ | | | 1,150 | | | 1,347 |
See accompanying Notes to Financial Statements.
78 Annual Report | December 31, 2009 |
Income Fund
Portfolio of Investments, December 31, 2009 (all dollar amounts in thousands)
| | | | | | | | |
| | | NRSRO
Rating
(unaudited) | | Principal
Amount | | Value |
|
Corporate Obligations—(continued) |
FedEx Corporation,
8.000%, due 1/15/19 | | BBB | | $ | 1,250 | | $ | 1,505 |
Honeywell International, Inc.,
5.000%, due 2/15/19 | | A | | | 1,225 | | | 1,268 |
Procter & Gamble Co.,
4.700%, due 2/15/19 | | AA- | | | 500 | | | 512 |
Unilever Capital Corp.,
4.800%, due 2/15/19 | | A+ | | | 500 | | | 513 |
Pfizer, Inc., 6.200%, due 3/15/19 | | AAA | | | 1,000 | | | 1,112 |
Jefferies Group, Inc.,
8.500%, due 7/15/19 | | BBB | | | 1,100 | | | 1,203 |
Boston Properties LP,
5.875%, due 10/15/19 | | A | | | 1,350 | | | 1,354 |
Ras Laffan Lng II,
5.298%, due 9/30/20* | | A+ | | | 1,250 | | | 1,260 |
Southwest Airlines Co.,
6.150%, due 8/1/22 | | A+ | | | 1,543 | | | 1,544 |
| | | | | | | | |
Total Corporate Obligations | | | | | | | | 69,782 |
| | | | | | | | |
Total Long-Term Investments—99.0%
(cost $110,785) | | | | | | 116,438 |
| | | | | | | | |
Repurchase Agreement | | | | | | | | |
State Street Bank and Trust Company, 0.000% dated 12/31/09, due 1/4/10, repurchase price $666, collateralized by U.S. Treasury Bill,
0.020%, due 2/18/10 | | AAA | | | 666 | | | 666 |
| | | | | | | | |
Total Repurchase Agreement—0.6%
(cost $666) | | | | | | 666 |
| | | | | | | | |
Total Investments—99.6%
(cost $111,451) | | | | | | 117,104 |
Cash and other assets, less liabilities—0.4% | | | 504 |
| | | | | | | | |
Net assets—100.0% | | $ | 117,608 |
| | | | | | | | |
VRN = Variable Rate Note
NRSRO = Nationally Recognized Statistical Rating Organization—The credit quality ratings of the securities in the Fund reflect the highest category rating by either Fitch Ratings, Moody’s Investors Service Inc., or Standard & Poor’s, a division of the McGraw-Hill Companies, Inc.
The obligations of certain U. S. Government-sponsored securities are neither issued nor guaranteed by the U.S. Treasury
* Deemed illiquid pursuant to the Fund/Advisor’s Liquidity Procedures. These holdings represent 3.84% of the net assets of the Fund at December 31, 2009.
† As of January 26th, 2010, Fitch has lowered the rating on this security to C.
See accompanying Notes to Financial Statements.
December 31, 2009 | William Blair Funds 79 |
Christopher T. Vincent

Paul J. Sularz
LOW DURATION FUND
The Low Duration Fund seeks to outperform the Merrill Lynch 1-Year U.S. Treasury Note Index by investing in a diversified portfolio of investment grade low duration debt securities.
AN OVERVIEW FROM THE PORTFOLIO MANAGERS
Please see page 66 for the Fixed Income Market Overview.
The William Blair Low Duration Fund seeks to maximize total return by investing in a diversified portfolio of investment grade low duration debt securities.
AN OVERVIEW FROM THE PORTFOLIO MANAGERS
We are pleased to have the Low Duration Fund become the newest addition to the William Blair Fund Family and would like to thank our shareholders for investing with us.
We are enthusiastic about the opportunities available to us as the managers of the Low Duration Fund. The Fund seeks to outperform the total return of the Merrill Lynch 1-Year U.S. Treasury Bill Index (the Fund’s Benchmark) through an actively managed diversified portfolio of securities.
In managing the Fund we will emphasize individual security selection, as well as shifts in the Fund’s portfolio among market sectors. In addition, we will also actively manage the Fund’s average duration relative to the Benchmark. Other important investment criteria are as follows:
| | • | | The Fund will invest in U.S.-dollar-denominated securities. |
| | • | | The broad sectors represented in the portfolio will include government securities, corporate debt securities issued by domestic and foreign companies, mortgage-backed securities and asset-backed securities. |
| | • | | The Fund will invest primarily in investment grade securities rated in the highest three categories at time of purchase by at least one of the following three nationally recognized statistical rating organizations: Fitch Ratings, Moody’s Investors Service, Inc. and Standard & Poor’s, a division of The McGraw-Hill Companies, Inc. |
How did the Fund perform since its inception? How did the Fund’s performance compare to its benchmark?
The Low Duration Fund commenced operations on December 1, 2009. Through the period ended December 31, 2009, the Fund posted a slight decrease of (0.60)% (Class N Shares). By comparison, the Merrill Lynch 1-Year U.S. Treasury Note Index, decreased (0.15)%, for this short time period.
What were the most significant factors impacting Fund performance during the last month of 2009? What factors were behind the Fund’s performance versus the benchmark?
The primary factor influencing the fixed income markets during the fourth quarter was the U.S. employment situation. Job losses began to moderate significantly during the fourth quarter, which was viewed favorably and a positive sign for the domestic economy.
Consequently, growth estimates for the nation’s Gross Domestic Product (GDP) for the first half of 2010 steadily increased from 3% to as high as 4.5%.
80 Annual Report | December 31, 2009 |
However, the employment picture and expectations for strengthening GDP growth led to upward pressure on interest rates, and most specifically U.S. Treasury securities, as the year drew to a close.
In particular, the last month of the year was very tough on bond investors as they faced the headwinds of rising short- and long-term interest rates. The roughly 0.50% increase in the 2-Year U.S. Treasury Note in 30 days provides an example of the challenging environment the new Fund faced.
The Fund invested capital as the Fund’s asset flows grew steadily from its inception.
It is worth noting that the Low Duration Fund paid its first dividend of $0.00989 per share (Class N Shares) on December 30, 2009, to shareholders of record on December 28, 2009.
How is the Fund’s portfolio currently structured?
The majority of the Fund’s portfolio is invested in seasoned U.S. Government-guaranteed short duration Mortgage-backed Fannie Mae and Fredie Mac securities. This is the Fund’s major sector emphasis. We favor such securities because they pay monthly principal and interest, which we then are able to reinvest. The benefits of this strategy are evident in a rising rate environment such as the one we experienced during the month of December.
The Fund kept its exposure to cash and cash equivalents extremely low, given the very low rates currently available from money market instruments.
December 31, 2009 | William Blair Funds 81 |
Low Duration Fund
Performance Highlights (unaudited)
Average Annual Total Return at 12/31/2009
| | | |
| | | Since
Inception | |
Low Duration Fund Class N | | (0.60 | )% |
Low Duration Fund Class I | | (0.59 | ) |
Merrill Lynch 1-Year U.S. Treasury Note Index | | (0.15 | ) |
| | (a) | | For the period from December 1, 2009 (Commencement of Operations) to December 31, 2009. | |
Performance cited represents past performance. Past performance does not guarantee future results and current performance may be lower or higher than the data quoted. Results shown are average annual total returns, which assume reinvestment of dividends and capital gains. Investment returns and principal will fluctuate and you may have a gain or loss when you sell shares. For the most current month-end performance information, please call 1-800-742-7272, or visit our Web site at www.williamblairfunds.com. From time to time, the investment advisor may waive fees or reimburse expenses for the Fund. Without these waivers, performance would be lower. Class N shares are available to the general public without a sales load. Class I shares are available to certain institutional investors and advisory clients of William Blair & Company, L.L.C., without a sales load or distribution fees (12b-1).
The performance highlights and graph presented above do not reflect the deduction of taxes that a shareholder would pay on fund distributions or the redemption of fund shares.
The Merrill Lynch 1-Year U.S. Treasury Note Index is comprised of a single U.S. Treasury Note issue purchased at the beginning of the month and held for a full month. Each month the index is rebalanced and the issue selected is the outstanding U.S. Treasury Note that matures closest to, but not beyond one year from the rebalancing date.
This report identifies the Fund’s investments on December 31, 2009. These holdings are subject to change. Not all investments in the Fund performed the same, nor is there any guarantee that these investments will perform as well in the future. Market forecasts provided in this report may not necessarily come to pass.
Sector Diversification (unaudited)
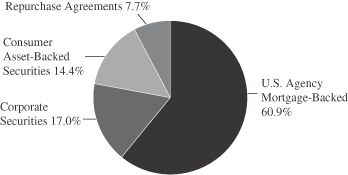
The sector diversification shown is based on the total investments.
82 Annual Report | December 31, 2009 |
Low Duration Fund
Portfolio of Investments, December 31, 2009 (all dollar amounts in thousands)
| | | | | | | | |
| | | NRSRO
Rating
(unaudited) | | Principal
Amount | | Value |
|
U.S. Government and U.S. Government Agency—50.7% |
Federal Home Loan Mortgage Corp. (FHLMC)—20.9% | | | | | | | | |
#M80822, 3.500%, due 3/1/10 | | | | $ | 4,002 | | $ | 4,066 |
#M80856, 4.500%, due 10/1/10 | | | | | 149 | | | 152 |
#M80898, 4.500%, due 2/1/11 | | | | | 245 | | | 256 |
#G11320, 6.000%, due 4/1/14 | | | | | 950 | | | 1,015 |
#G11211, 6.000%, due 7/1/16 | | | | | 533 | | | 570 |
#G11187, 5.500%, due 9/1/16 | | | | | 658 | | | 699 |
#G11337, 5.500%, due 11/1/17 | | | | | 2,446 | | | 2,604 |
#E96536, 5.000%, due 3/1/18 | | | | | 751 | | | 792 |
#E95355, 5.000%, due 4/1/18 | | | | | 806 | | | 849 |
#E01377, 4.500%, due 5/1/18 | | | | | 810 | | | 843 |
#G11618, 4.500%, due 5/1/18 | | | | | 3,855 | | | 4,020 |
#E01488, 5.000%, due 10/1/18 | | | | | 822 | | | 867 |
#E99895, 5.000%, due 10/1/18 | | | | | 1,681 | | | 1,772 |
#G11506, 5.500%, due 12/1/18 | | | | | 638 | | | 679 |
#G11567, 5.500%, due 12/1/18 | | | | | 697 | | | 742 |
| | | | | | | | |
Total FHLMC Mortgage Obligations | | | | | | | | 19,926 |
| | | | | | | | |
Federal National Mortgage Association (FNMA)—29.8% | | | | | | | | |
#255325, 4.500%, due 7/1/11 | | | | | 847 | | | 881 |
#735647, 5.000%, due 12/1/17 | | | | | 3,395 | | | 3,578 |
#681310, 4.500%, due 2/1/18 | | | | | 769 | | | 801 |
#675717, 5.000%, due 3/1/18 | | | | | 822 | | | 866 |
#257188, 4.500%, due 4/1/18 | | | | | 990 | | | 1,029 |
#656564, 5.000%, due 4/1/18 | | | | | 3,652 | | | 3,847 |
#656573, 5.000%, due 6/1/18 | | | | | 468 | | | 493 |
#709848, 5.000%, due 6/1/18 | | | | | 459 | | | 483 |
#722106, 4.500%, due 7/1/18 | | | | | 3,568 | | | 3,719 |
#711991, 5.000%, due 8/1/18 | | | | | 442 | | | 466 |
#743183, 5.000%, due 10/1/18 | | | | | 169 | | | 178 |
#749596, 5.000%, due 11/1/18 | | | | | 572 | | | 603 |
#770853, 4.500%, due 4/1/19 | | | | | 1,816 | | | 1,889 |
#725445, 4.500%, due 5/1/19 | | | | | 1,032 | | | 1,073 |
#995234, 5.000%, due 7/1/19 | | | | | 3,849 | | | 4,057 |
#MA0124, 4.000%, due 7/1/19 | | | | | 1,879 | | | 1,922 |
#785259, 5.000%, due 8/1/19 | | | | | 702 | | | 739 |
#745240, 4.500%, due 12/1/19 | | | | | 966 | | | 1,006 |
#735401, 5.500%, due 3/1/20 | | | | | 635 | | | 676 |
| | | | | | | | |
Total FNMA Mortgage Obligations | | | | | | | | 28,306 |
| | | | | | | | |
|
Consumer Asset-Backed Securities—12.0% |
Nissan Receivables Owner Trust, 2009-1, A2, 3.920%, due 4/15/11 | | AAA | | | 428 | | | 431 |
Volkswagen Auto Lease Trust, 2009-A, A2, 2.870%, due 7/15/11 | | AAA | | | 146 | | | 148 |
Honda Auto Receivables Owner Trust, 2009-2, A2, 2.220%, due 8/15/11 | | AAA | | | 140 | | | 141 |
Nissan Auto Lease Trust, 2009-A, A3, 2.920%, due 12/15/11 | | AAA | | | 610 | | | 621 |
Ford Credit Auto Owner Trust, 2009-D, A2, 1.210%, due 1/15/12 | | AAA | | | 500 | | | 501 |
Volkswagen Auto Lease Trust, 2009-A, A3, 3.410%, due 4/16/12 | | AAA | | | 1,000 | | | 1,025 |
Harley-Davidson Motorcycle Trust, 2009-1, A2, 2.520%, due 5/15/12 | | AAA | | | 100 | | | 101 |
BA Credit Card Trust, 2008-A9, A9, 4.070%, due 7/16/12 | | AAA | | | 200 | | | 201 |
| | | | | | | | |
| | | NRSRO
Rating
(unaudited) | | Principal
Amount | | Value |
|
Consumer Asset-Backed Securities—(continued) |
Chase Issuance Trust, 2009-A6, A6, 1.083%, due 7/16/12, VRN | | AAA | | $ | 1,300 | | $ | 1,305 |
CNH Equipment Trust, 2009-C, A2, 0.950%, due 8/15/12 | | AAA | | | 1,000 | | | 999 |
Citibank Credit Card Issuance Trust, 2005-A7,
4.750%, due 10/22/12 | | AAA | | | 200 | | | 206 |
CarMax Auto Owner Trust, 2009-1, A3, 4.120%, due 3/15/13 | | AAA | | | 421 | | | 436 |
Ford Credit Auto Owner Trust, 2009-A, A3A, 3.960%, due 5/15/13 | | AAA | | | 600 | | | 619 |
Ford Credit Auto Owner Trust, 2009-D, A3, 2.170%, due 10/15/13 | | AAA | | | 1,160 | | | 1,171 |
John Deere Owner Trust, 2009-A, A3, 2.590%, due 10/15/13 | | AAA | | | 1,000 | | | 1,016 |
John Deere Owner Trust, 2009-B, A3, 1.570%, due 10/15/13 | | AAA | | | 450 | | | 450 |
Harley-Davidson Motorcycle Trust, 2009-1, A3, 3.190%, due 11/15/13 | | AAA | | | 1,007 | | | 1,029 |
American Express Credit Account Master Trust, 2007-5, A,
0.263%, due 12/15/14, VRN | | AAA | | | 1,000 | | | 987 |
| | | | | | | | |
Total Consumer Asset-Backed Securities | | | | | | | | 11,387 |
| | | | | | | | |
|
Corporate Obligations—14.1% |
Procter & Gamble International Funding SCA, 1.350%, due 8/26/11 | | AA- | | | 1,000 | | | 1,005 |
Shell International Finance B.V., 1.300%, due 9/22/11 | | AA+ | | | 1,000 | | | 1,002 |
Morgan Stanley, 3.250%, due 12/1/11 | | AAA | | | 1,000 | | | 1,037 |
BP Capital Markets plc,
3.125%, due 3/10/12 | | AA+ | | | 1,000 | | | 1,030 |
The Goldman Sachs Group, Inc., 3.250%, due 6/15/12 | | AAA | | | 1,000 | | | 1,039 |
General Electric Capital Corporation, 3.500%, due 8/13/12 | | AA+ | | | 1,000 | | | 1,021 |
Bank of America Corporation,
5.375%, due 9/11/12 | | A+ | | | 1,000 | | | 1,061 |
ConocoPhillips,
4.750%, due 10/15/12 | | A | | | 1,000 | | | 1,072 |
Citigroup, Inc., 5.300%, due 10/17/12 | | A+ | | | 1,000 | | | 1,042 |
Wells Fargo & Company,
5.250%, due 10/23/12 | | AA- | | | 1,000 | | | 1,068 |
Morgan Stanley, 5.250%, due 11/2/12 | | A | | | 1,000 | | | 1,064 |
Caterpillar Financial Services,
1.900%, due 12/17/12 | | A | | | 1,000 | | | 996 |
PACCAR Financial Corporation, 1.950%, due 12/17/12 | | AA- | | | 1,000 | | | 990 |
| | | | | | | | |
Total Corporate Obligations | | | | | | | | 13,427 |
| | | | | | | | |
Total Long-Term Investments—76.8%
(cost $73,614) | | | | | | 73,046 |
| | | | | | | | |
See accompanying Notes to Financial Statements.
December 31, 2009 | William Blair Funds 83 |
Low Duration Fund
Portfolio of Investments, December 31, 2009 (all dollar amounts in thousands)
| | | | | | | | |
| | | NRSRO
Rating
(unaudited) | | Principal
Amount | | Value |
Repurchase Agreement | | | | | | | | |
State Street Bank and Trust Company, 0.000% dated 12/31/09, due 1/4/10, repurchase price $6,139, collateralized by U.S. Treasury Bill,
0.020%, due 2/18/10 | | AAA | | $ | 6,139 | | $ | 6,139 |
| | | | | | | | |
Total Repurchase Agreement—6.4%
(cost $6,139) | | | | | | 6,139 |
| | | | | | | | |
Total Investments—83.2%
(cost $79,753) | | | | | | 79,185 |
Cash and other assets, less liabilities—16.8% | | | 15,949 |
| | | | | | | | |
Net assets—100.0% | | $ | 95,134 |
| | | |
VRN = Variable Rate Note
NRSRO = Nationally Recognized Statistical Rating Organization—The credit quality ratings of the securities in the Fund reflect the highest category rating by either Fitch Ratings, Moody’s Investors Service Inc., or Standard & Poor’s, a division of the McGraw-Hill Companies, Inc.
The obligations of certain U. S. Government-sponsored securities are neither issued nor guaranteed by the U. S. Treasury.
See accompanying Notes to Financial Statements.
84 Annual Report | December 31, 2009 |
Christopher T. Vincent
READY RESERVES FUND
AN OVERVIEW FROM THE PORTFOLIO MANAGER
The return for the 12 months ended December 31, 2009 of the Fund’s Class N Shares was 0.10%, versus the 0.18% return of the Fund’s benchmark, the AAA-Rated Money Market Funds Average. Total assets were $1.35 billion at December 31, 2009, compared to $1.51 billion at June 30, 2009 and $1.84 billion at December 31, 2008.
Federal Reserve Board Monetary policy continued to be the focus of the money markets during 2009.
Minutes from the Federal Open Market Committee (FOMC) meeting on December 16 indicated that the Federal Reserve believed the economy was still in a fragile state but that it remained wary of raising interest rates.
At the same time, the Fed indicated that it had taken steps to wind down its program of emergency lending.
Fed watchers noted that while the language was unchanged from those released after other recent Fed meetings, it was nonetheless marginally more upbeat.
In a statement released after the two days of FOMC meetings, the Fed said that its benchmark overnight Federal Funds interest rate would remain at virtually zero, the level it has maintained for the last year. The Fed also reiterated its expectation that it would keep rates “exceptionally low” for “an extended period.”
The Fed’s statements and its intention to wind down its policy of government intervention would seem to indicate a growing level of cautious optimism about the economy.
The FOMC noted that economic activity, including household spending, had continued to pick up and that the deterioration in the job market was slowing. According to the FOMC statement, improvements in the financial markets had also become “more supportive of growth.”
The Fed noted that it was gradually winding down its purchases of mortgage-backed securities and other agency debt, and that most of its emergency liquidity programs would expire in February. In addition, the government’s TARP program, which was created to help banks supply credit to households and small businesses by supporting the issuance of certain asset-backed securities, is expected to end by June 30.
As we noted last quarter, we take the Federal Reserve Board at its word as it indicates that it intends to maintain the target range for the federal funds rate at 0.0 to 0.25 percent for an extended period, based on current economic conditions.
As the extreme financial conditions of the past year have eased—and in particular the lingering effects of the credit crisis—money market funds have seen gradual liquidations and orderly outflows to longer-fixed income securities, as well as equities. Corporations are rightly and rationally looking to longer-term funding markets as a source for capital, and less short-term Commercial Paper is being issued.
In such a low interest rate environment, with an exceedingly low federal funds rate, managing the Fund is a challenge, and we expect it to remain throughout the first half of 2010, when we expect economic fundamentals to strengthen, and short-term rates to firm somewhat.
December 31, 2009 | William Blair Funds 85 |
We continue to favor overnight repurchase agreements, in an effort to maintain a high degree of overnight liquidity.
The Fund also continues to maintain a relatively short Average Maturity. At December 31, 2009, the Fund’s Average Maturity was approximately 50.6 days, compared to 51.9 days at June 30, 2009 and 40 days at December 31, 2008.
86 Annual Report | December 31, 2009 |
Ready Reserves Fund
Performance Highlights (unaudited)
The Fund’s 7 day yield on December 31, 2009 was 0.01%.
Average Annual Total Returns—Class N Shares Year ended June 30, 2009.
| | | | | | | | | | | | |
| | | 1
Year | | | 3
Year | | | 5
Year | | | 10
Year | |
Ready Reserves Fund | | 0.10 | % | | 2.33 | % | | 2.81 | % | | 2.63 | % |
AAA-Rated Money Market Funds | | 0.18 | | | 2.32 | | | 2.75 | | | 2.59 | |
Performance cited represents past performance. Past performance does not guarantee future results and current performance may be lower or higher than the data quoted. For the most current month-end performance information, please call 1-800-742-7272, or visit our Web site at www.williamblairfunds.com. Class N Shares are available to the general public without a sales load. Total return includes reinvestment of income. Yields fluctuate and are not guaranteed. An investment in the Fund is neither insured nor guaranteed by the Federal Deposit Insurance Corp. (FDIC) or any government agency. Although the Fund seeks to preserve the value of your investment at $1.00 per share, it is possible to lose money by investing in the Fund.
The AAA Rated Money Market Funds Average represents the average annual composite performance of all AAA rated First Tier Retail Money Market Funds listed by iMoneyNet data.
This report identifies the Fund’s investments on December 31, 2009. These holdings are subject to change. Not all fixed-income securities in the Fund performed the same, nor is there any guarantee that these fixed-income securities will perform as well in the future. Market forecasts provided in this report may not necessarily come to pass.
Sector Diversification (unaudited)
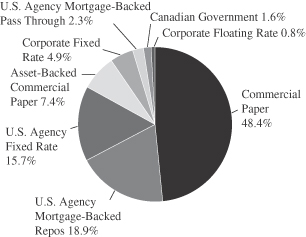
The sector diversification shown is based on the total Investments.
December 31, 2009 | William Blair Funds 87 |
Ready Reserves Fund
Portfolio of Investments, December 31, 2009 (all dollar amounts in thousands)
| | | | | | |
Issuer | | Principal
Amount | | Amortized
Cost |
U.S. Agency Fixed Rate Notes—15.7% | | | | | | |
Federal Farm Credit Bank, (FFCB),
0.800%, 2/2/10 | | $ | 3,000 | | $ | 3,000 |
Federal Home Loan Bank (FHLB),
0.500%—5.250%, 1/15/10—10/29/10 | | | 83,770 | | | 84,306 |
Federal Home Loan Mortgage Corporation (FHLMC), 2.875%—5.500%, 2/9/10—1/18/11 | | | 57,428 | | | 58,408 |
Federal National Mortgage Association (FNMA), 3.000%—4.000%, 2/10/10—7/12/10 | | | 65,932 | | | 66,449 |
| | | | | | |
Total U.S. Agency Fixed Rate Notes | | | | | | 212,163 |
| | | | | | |
U.S. Agency Variable Rate Notes—2.3% | | | | | | |
Federal Home Loan Mortgage Corporation (FHLMC), 0.815%—4.750%, 1/1/10—9/1/10 | | | 18,530 | | | 18,708 |
Federal National Mortgage Association (FNMA), 2.375%—5.000%, 2/1/10—11/1/10 | | | 12,585 | | | 12,709 |
| | | | | | |
Total U.S. Agency Variable Rate Notes | | | | | | 31,417 |
| | | | | | |
Corporate-Fixed Rate Notes—4.9% | | | | | | |
Du Pont (E.I.) de Nemours,
4.125%, 4/30/10 | | | 14,209 | | | 14,353 |
General Electric Capital Corporation,
7.375% , 1/19/10 | | | 11,500 | | | 11,534 |
JPMorgan Chase & Co.,
2.625%, 12/1/10 | | | 15,310 | | | 15,617 |
Morgan Stanley,
2.900%, 12/1/10 | | | 9,000 | | | 9,202 |
Regions Bank,
2.750%, 12/10/10 | | | 3,000 | | | 3,066 |
Wal-Mart Stores, Inc.,
4.125%, 7/1/10—8/15/10 | | | 12,100 | | | 12,333 |
| | | | | | |
Total Fixed Rate Notes | | | | | | 66,105 |
| | | | | | |
Variable Rate Note—0.8% | | | | | | |
The Procter & Gamble Company,
0.437%, 3/9/10 | | | 11,125 | | | 11,132 |
| | | | | | |
Total Variable Rate Note | | | | | | 11,132 |
| | | | | | |
Canadian Fixed Rate Note—1.7% | | | | | | |
Canadian Wheat Board, 0.060%,
1/11/10—2/1/10 | | | 22,000 | | | 21,999 |
| | | | | | |
Total Canadian Fixed Rate Note | | | | | | 21,999 |
| | | | | | |
Commercial Paper—48.3% | | | | | | |
Abbott Laboratories,
0.050%—0.150%, 1/4/10—1/19/10 | | | 55,000 | | | 54,999 |
American Honda Finance Corporation, 0.120%—0.190%, 1/5/10—2/11/10 | | | 44,000 | | | 43,997 |
Brown-Forman Corporation,
0.150%—0.220%, 1/5/10—2/8/10 | | | 31,750 | | | 31,747 |
Caterpillar Financial Services Corporation, 0.140%, 3/1/10 | | | 5,000 | | | 4,999 |
Chevron Funding Corporation,
0.070%—0.090%, 1/4/10—1/27/10 | | | 43,500 | | | 43,499 |
CME Group, Inc.,
0.170%, 2/3/10 | | | 8,000 | | | 7,999 |
Coca-Cola Company,
0.100%—0.150%, 1/7/10—2/5/10 | | | 42,520 | | | 42,517 |
ConocoPhillips Qatar Funding Ltd.,
0.100%—0.120%, 1/7/10—1/21/10 | | | 33,750 | | | 33,749 |
General Electric Capital Corporation,
0.020%, 1/19/10—1/22/10 | | | 12,000 | | | 12,000 |
| | | | | | |
Issuer | | Principal
Amount | | Amortized
Cost |
Commercial Paper—(continued) | | | | | | |
General Electric Capital Services, Inc., 0.120%—0.180%, 1/26/10—2/23/10 | | $ | 16,000 | | $ | 15,997 |
General Electric Company,
0.170%, 2/1/10 | | | 5,000 | | | 4,999 |
Hewlett-Packard Company,
0.110%, 1/13/10—1/22/10 | | | 22,000 | | | 21,999 |
IBM Corporation,
0.050%—0.100%, 1/4/10—1/29/10 | | | 20,000 | | | 19,999 |
John Deere Credit Inc.,
0.120%, 1/7/10—1/12/10 | | | 13,000 | | | 13,000 |
John Deere Credit Ltd.,
0.120%, 1/8/10 | | | 8,000 | | | 8,000 |
John Deere Ltd.,
0.120%—0.13%, 1/13/10—1/25/10 | | | 17,000 | | | 16,999 |
Johnson & Johnson,
0.090%—0.150%, 1/25/10—5/3/10 | | | 40,000 | | | 39,991 |
Nokia Corporation,
0.140%—0.160%, 1/11/10—2/4/10 | | | 35,500 | | | 35,497 |
PACCAR Financial Corporation,
0.110%—0.190%, 1/4/10—3/18/10 | | | 31,900 | | | 31,894 |
Pfizer Inc.,
0.270%—0.370%, 1/12/10—3/9/10 | | | 15,000 | | | 14,995 |
Private Export Funding,
0.080%—0.130%, 1/7/10—3/4/10 | | | 38,900 | | | 38,897 |
Procter & Gamble International Funding SCA, 0.090%—0.110%, 1/11/10—2/1/10 | | | 32,000 | | | 31,998 |
Roche Holdings Inc.,
0.090%—0.100%, 1/5/10—1/20/10 | | | 29,000 | | | 28,999 |
Toyota Credit de Puerto Rico,
0.130%—0.170%, 1/4/10—2/5/10 | | | 55,000 | | | 54,996 |
| | | | | | |
Total Commercial Paper | | | | | | 653,766 |
| | | | | | |
Asset-Backed Commercial Paper—7.3% | | | | | | |
Chariot Funding, L.L.C.,
0.100%—0.170%, 1/6/10—2/12/10 | | | 46,000 | | | 45,996 |
Govco L.L.C.,
0.170%—0.200%, 1/4/10—3/4/10 | | | 43,180 | | | 43,174 |
Wal-Mart Funding Corporation,
0.190%—0.200%, 1/8/10 | | | 9,810 | | | 9,810 |
| | | | | | |
Total Asset-Backed Commercial Paper | | | | | | 98,980 |
| | | | | | |
Repurchase Agreements—18.8% | | | | | | |
Bank of America, 0.010% dated 12/31/09, due 1/4/10, repurchase price $61,000, collateralized by various U.S. Agency securities 4.694%—5.805%, 12/1/19—1/1/38 | | | 61,000 | | | 61,000 |
Fixed Income Clearing Corporation, 0.000% dated 12/31/09, due 1/4/10, repurchase price $132,762, collateralized by various U.S. Agency securities 4.875%—5.000%, due 12/15/16—2/13/17 | | | 132,762 | | | 132,762 |
Goldman Sachs, 0.020% dated 12/31/09, due 1/4/10, repurchase price $ 61,000, collateralized by various FDIC guaranteed securities 1.700%—2.250%, 12/23/10—12/10/12 | | | 61,000 | | | 61,000 |
| | | | | | |
Total Repurchase Agreements | | | | | | 254,762 |
| | | | | | |
Total Investments—99.8%
(cost $1,350,324) | | | | | | 1,350,324 |
Cash and other assets, less liabilities—0.2% | | | 2,577 |
| | | | | | |
Net assets—100.0% | | $ | 1,352,901 |
| | | | | | |
Portfolio Weighted Average Maturity | | | | | | 51 Days |
See accompanying Notes to Financial Statements.
88 Annual Report | December 31, 2009 |
Statements of Assets and Liabilities
December 31, 2009 (dollar amounts in thousands)
| | | | | | | | | | | | | | | | |
| | | Growth
Fund | | | Large Cap
Growth
Fund | | | Small Cap
Growth
Fund | | | Mid Cap
Growth
Fund | |
Assets | | | | | | | | | | | | | | | | |
Investments in securities, at cost | | $ | 357,377 | | | $ | 25,289 | | | $ | 564,023 | | | $ | 57,500 | |
Investments in Affiliated Companies, at cost | | | — | | | | — | | | | 101,900 | | | | — | |
Investments in Affiliated Fund, at cost | | | 1,262 | | | | — | | | | 3,297 | | | | 19 | |
| | | | | | | | | | | | | | | | |
| | | | |
Investments in securities, at value | | $ | 423,564 | | | $ | 30,082 | | | $ | 695,698 | | | $ | 70,592 | |
Investments in Affiliated Companies, at value | | | — | | | | — | | | | 69,177 | | | | — | |
Investments in Affiliated Fund, at net asset value | | | 1,262 | | | | — | | | | 3,297 | | | | 19 | |
Receivable for securities sold | | | — | | | | 346 | | | | 1 | | | | 589 | |
Receivable for fund shares sold | | | 1,047 | | | | 124 | | | | 1,997 | | | | 166 | |
Dividends and interest receivable | | | 310 | | | | 24 | | | | 218 | | | | 21 | |
| | | | | | | | | | | | | | | | |
Total assets | | | 426,183 | | | | 30,576 | | | | 770,388 | | | | 71,387 | |
Liabilities | | | | | | | | | | | | | | | | |
Payable for investment securities purchased | | | 5,416 | | | | — | | | | 3,680 | | | | 496 | |
Payable for fund shares redeemed | | | 876 | | | | — | | | | 3,034 | | | | 2 | |
Payable to custodian | | | — | | | | 217 | | | | — | | | | — | |
Management fee payable | | | 256 | | | | 9 | | | | 634 | | | | 13 | |
Distribution fee payable | | | 30 | | | | 1 | | | | 98 | | | | 2 | |
Other accrued expenses | | | 85 | | | | 38 | | | | 144 | | | | 40 | |
| | | | | | | | | | | | | | | | |
Total liabilities | | | 6,663 | | | | 265 | | | | 7,590 | | | | 553 | |
| | | | | | | | | | | | | | | | |
Net Assets | | $ | 419,520 | | | $ | 30,311 | | | $ | 762,798 | | | $ | 70,834 | |
| | | | | | | | | | | | | | | | |
Capital | | | | | | | | | | | | | | | | |
Composition of Net Assets | | | | | | | | | | | | | | | | |
Par value of shares of beneficial interest | | $ | 42 | | | $ | 5 | | | $ | 38 | | | $ | 7 | |
Capital paid in excess of par value | | | 391,214 | | | | 33,992 | | | | 852,528 | | | | 70,073 | |
Accumulated net investment income (loss) | | | 13 | | | | 1 | | | | — | | | | — | |
Accumulated net realized gain (loss) | | | (37,936 | ) | | | (8,480 | ) | | | (188,720 | ) | | | (12,338 | ) |
Net unrealized appreciation (depreciation) of investments and foreign currencies | | | 66,187 | | | | 4,793 | | | | 98,952 | | | | 13,092 | |
| | | | | | | | | | | | | | | | |
Net Assets | | $ | 419,520 | | | $ | 30,311 | | | $ | 762,798 | | | $ | 70,834 | |
| | | | | | | | | | | | | | | | |
| | | | |
Class N Shares | | | | | | | | | | | | | | | | |
Net Assets | | $ | 153,987 | | | $ | 5,952 | | | $ | 469,746 | | | $ | 10,379 | |
Shares Outstanding | | | 15,575,313 | | | | 965,990 | | | | 23,498,687 | | | | 1,029,897 | |
Net Asset Value Per Share | | $ | 9.89 | | | $ | 6.16 | | | $ | 19.99 | | | $ | 10.08 | |
Class I Shares | | | | | | | | | | | | | | | | |
Net Assets | | $ | 265,533 | | | $ | 24,359 | | | $ | 293,052 | | | $ | 60,455 | |
Shares Outstanding | | | 25,944,966 | | | | 3,869,495 | | | | 14,195,695 | | | | 5,928,621 | |
Net Asset Value Per Share | | $ | 10.24 | | | $ | 6.30 | | | $ | 20.64 | | | $ | 10.20 | |
See accompanying Notes to Financial Statements.
December 31, 2009 | William Blair Funds 89 |
Statements of Operations
for the Year Ended December 31, 2009 (all amounts in thousands)
| | | | | | | | | | | | | | | | |
| | | Growth Fund | | | Large Cap
Growth Fund | | | Small Cap
Growth Fund | | | Mid Cap
Growth Fund | |
Investment income | | | | | | | | | | | | | | | | |
Dividends | | $ | 3,020 | | | $ | 278 | | | $ | 3,232 | | | $ | 430 | |
Less foreign tax withheld | | | — | | | | (1 | ) | | | — | | | | (2 | ) |
Dividend income from Affiliated Fund | | | 2 | | | | — | | | | 1 | | | | 1 | |
Interest | | | 8 | | | | 1 | | | | 17 | | | | 1 | |
| | | | | | | | | | | | | | | | |
Total income | | | 3,030 | | | | 278 | | | | 3,250 | | | | 430 | |
Expenses | | | | | | | | | | | | | | | | |
Investment advisory fees | | | 2,214 | | | | 202 | | | | 6,263 | | | | 479 | |
Distribution fees | | | 258 | | | | 14 | | | | 860 | | | | 16 | |
Custodian fees | | | 36 | | | | 37 | | | | 53 | | | | 43 | |
Transfer agent fees | | | 306 | | | | 50 | | | | 566 | | | | 70 | |
Professional fees | | | 34 | | | | 26 | | | | 44 | | | | 27 | |
Registration fees | | | 29 | | | | 28 | | | | 52 | | | | 28 | |
Shareholder reporting fees | | | 68 | | | | 5 | | | | 127 | | | | 17 | |
Trustee fees | | | 10 | | | | 1 | | | | 19 | | | | 2 | |
Other expenses | | | 19 | | | | 10 | | | | 66 | | | | 20 | |
| | | | | | | | | | | | | | | | |
Total expenses before waiver | | | 2,974 | | | | 373 | | | | 8,050 | | | | 702 | |
Expenses reimbursed to (waived or absorbed by) the Advisor | | | — | | | | (112 | ) | | | (182 | ) | | | (125 | ) |
| | | | | | | | | | | | | | | | |
Net expenses | | | 2,974 | | | | 261 | | | | 7,868 | | | | 577 | |
| | | | | | | | | | | | | | | | |
Net investment income (loss) | | | 56 | | | | 17 | | | | (4,618 | ) | | | (147 | ) |
Net realized gain (loss) on transactions from: | | | | | | | | | | | | | | | | |
Investments | | | (19,046 | ) | | | (2,753 | ) | | | (34,140 | )(a) | | | (6,206 | ) |
Foreign currency transactions | | | — | | | | — | | | | — | | | | — | |
| | | | | | | | | | | | | | | | |
Total net realized gain (loss) | | | (19,046 | ) | | | (2,753 | ) | | | (34,140 | )(a) | | | (6,206 | ) |
Change in net unrealized appreciation (depreciation) of: | | | | | | | | | | | | | | | | |
Investments | | | 119,029 | | | | 9,950 | | | | 322,910 | (a) | | | 22,569 | |
Foreign currency translations | | | — | | | | — | | | | — | | | | — | |
| | | | | | | | | | | | | | | | |
Change in net unrealized appreciation (depreciation) | | | 119,029 | | | | 9,950 | | | | 322,910 | (a) | | | 22,569 | |
| | | | | | | | | | | | | | | | |
Net increase (decrease) in net assets resulting from operations | | $ | 100,039 | | | $ | 7,214 | | | $ | 284,152 | | | $ | 16,216 | |
| | | | | | | | | | | | | | | | |
| (a) | | Affiliated Companies accounted for $(44,307) of net realized gain (loss) on investments and $93,205 of the change in net unrealized appreciation (depreciation) on investments during the year. |
See accompanying Notes to Financial Statements.
90 Annual Report | December 31, 2009 |
Statements of Changes in Net Assets
for the Years Ended December 31, 2009 and 2008 (all amounts in thousands)
| | | | | | | | | | | | | | | | | | | | | | | | | | | | | | | | |
| | | Growth
Fund | | | Large Cap
Growth
Fund | | | Small Cap
Growth
Fund | | | Mid Cap
Growth
Fund | |
| | | 2009 | | | 2008 | | | 2009 | | | 2008 | | | 2009 | | | 2008 | | | 2009 | | | 2008 | |
Operations | | | | | | | | | | | | | | | | | | | | | | | | | | | | | | | | |
Net investment income (loss) | | $ | 56 | | | $ | (1,049 | ) | | $ | 17 | | | $ | (28 | ) | | $ | (4,618 | ) | | $ | (6,473 | ) | | $ | (147 | ) | | $ | (251 | ) |
Net realized gain (loss) on investments and foreign currency transactions | | | (19,046 | ) | | | (18,762 | ) | | | (2,753 | ) | | | (3,294 | ) | | | (34,140 | ) | | | (145,658 | ) | | | (6,206 | ) | | | (5,297 | ) |
Change in net unrealized appreciation (depreciation) of investments and foreign currency translations | | | 119,029 | | | | (120,242 | ) | | | 9,950 | | | | (9,707 | ) | | | 322,910 | | | | (287,305 | ) | | | 22,569 | | | | (13,013 | ) |
| | | | | | | | | | | | | | | | | | | | | | | | | | | | | | | | |
Net increase (decrease) in net assets resulting from operations | | | 100,039 | | | | (140,053 | ) | | | 7,214 | | | | (13,029 | ) | | | 284,152 | | | | (439,436 | ) | | | 16,216 | | | | (18,561 | ) |
Distributions to shareholders from | | | | | | | | | | | | | | | | | | | | | | | | | | | | | | | | |
Net investment income | | | (43 | ) | | | — | | | | (16 | ) | | | — | | | | — | | | | — | | | | — | | | | — | |
Net realized gain | | | — | | | | (5,607 | ) | | | — | | | | — | | | | — | | | | (20,533 | ) | | | — | | | | — | |
| | | | | | | | | | | | | | | | | | | | | | | | | | | | | | | | |
| | | (43 | ) | | | (5,607 | ) | | | (16 | ) | | | — | | | | — | | | | (20,533 | ) | | | — | | | | — | |
Capital stock transactions | | | | | | | | | | | | | | | | | | | | | | | | | | | | | | | | |
Net proceeds from sale of shares | | | 131,594 | | | | 63,269 | | | | 6,234 | | | | 7,597 | | | | 317,852 | | | | 278,755 | | | | 21,823 | | | | 23,278 | |
Shares issued in reinvestment of income dividends and capital gain distributions | | | 34 | | | | 5,275 | | | | 14 | | | | — | | | | — | | | | 20,141 | | | | — | | | | — | |
Less cost of shares redeemed | | | (50,690 | ) | | | (53,942 | ) | | | (6,414 | ) | | | (4,956 | ) | | | (240,833 | ) | | | (531,719 | ) | | | (7,731 | ) | | | (9,584 | ) |
| | | | | | | | | | | | | | | | | | | | | | | | | | | | | | | | |
Net increase (decrease) in net assets resulting from capital share transactions | | | 80,938 | | | | 14,602 | | | | (166 | ) | | | 2,641 | | | | 77,019 | | | | (232,823 | ) | | | 14,092 | | | | 13,694 | |
| | | | | | | | | | | | | | | | | | | | | | | | | | | | | | | | |
Increase (decrease) in net assets | | | 180,934 | | | | (131,058 | ) | | | 7,032 | | | | (10,388 | ) | | | 361,171 | | | | (692,792 | ) | | | 30,308 | | | | (4,867 | ) |
Net assets | | | | | | | | | | | | | | | | | | | | | | | | | | | | | | | | |
Beginning of year | | | 238,586 | | | | 369,644 | | | | 23,279 | | | | 33,667 | | | | 401,627 | | | | 1,094,419 | | | | 40,526 | | | | 45,393 | |
| | | | | | | | | | | | | | | | | | | | | | | | | | | | | | | | |
End of year | | $ | 419,520 | | | $ | 238,586 | | | $ | 30,311 | | | $ | 23,279 | | | $ | 762,798 | | | $ | 401,627 | | | $ | 70,834 | | | $ | 40,526 | |
| | | | | | | | | | | | | | | | | | | | | | | | | | | | | | | | |
Undistributed net investment income (loss) at the end of the year | | $ | 13 | | | $ | — | | | $ | 1 | | | $ | — | | | $ | — | | | $ | — | | | $ | — | | | $ | — | |
| | | | | | | | | | | | | | | | | | | | | | | | | | | | | | | | |
See accompanying Notes to Financial Statements.
December 31, 2009 | William Blair Funds 91 |
Statements of Assets and Liabilities
December 31, 2009 (dollar amounts in thousands)
| | | | | | | | | | | | | | | | |
| | | Small-Mid
Cap Growth
Fund | | | Global
Growth
Fund | | | International
Growth
Fund | | | International
Equity
Fund | |
Assets | | | | | | | | | | | | | | | | |
Investments in securities, at cost | | $ | 118,329 | | | $ | 31,030 | | | $ | 3,519,337 | | | $ | 235,706 | |
Investments in Affiliated Fund, at cost | | | 23 | | | | 29 | | | | 6,376 | | | | 5 | |
| | | | | | | | | | | | | | | | |
| | | | |
Investments in securities, at value | | $ | 145,560 | | | $ | 38,235 | | | $ | 4,408,185 | | | $ | 297,482 | |
Investments in Affiliated Fund, at net asset value | | | 23 | | | | 29 | | | | 6,376 | | | | 5 | |
Foreign currency, at value (cost $-, $16, $859, $2,233) | | | — | | | | 17 | | | | 875 | | | | 2,260 | |
Receivable for securities sold | | | 712 | | | | 74 | | | | 57,054 | | | | 517 | |
Receivable for fund shares sold | | | 2,662 | | | | 85 | | | | 20,086 | | | | 393 | |
Dividends and interest receivable | | | 17 | | | | 22 | | | | 8,448 | | | | 346 | |
Unrealized appreciation on forward foreign currency contracts | | | — | | | | — | | | | 15,044 | | | | — | |
| | | | | | | | | | | | | | | | |
Total assets | | | 148,974 | | | | 38,462 | | | | 4,516,068 | | | | 301,003 | |
Liabilities | | | | | | | | | | | | | | | | |
Payable for investment securities purchased | | | 406 | | | | — | | | | 24,920 | | | | 2,635 | |
Payable for fund shares redeemed | | | 1,571 | | | | 46 | | | | 11,977 | | | | 37 | |
Management fee payable | | | 123 | | | | 77 | | | | 4,103 | | | | 68 | |
Distribution and shareholder administration fee payable | | | 4 | | | | 6 | | | | 539 | | | | 3 | |
Foreign tax liability | | | — | | | | 1 | | | | 163 | | | | 9 | |
Other accrued expenses | | | 42 | | | | 45 | | | | 958 | | | | 83 | |
| | | | | | | | | | | | | | | | |
Total liabilities | | | 2,146 | | | | 175 | | | | 42,660 | | | | 2,835 | |
| | | | | | | | | | | | | | | | |
Net Assets | | $ | 146,828 | | | $ | 38,287 | | | $ | 4,473,408 | | | $ | 298,168 | |
| | | | | | | | | | | | | | | | |
Capital | | | | | | | | | | | | | | | | |
Composition of Net Assets | | | | | | | | | | | | | | | | |
Par value of shares of beneficial interest | | $ | 12 | | | $ | 6 | | | $ | 239 | | | $ | 27 | |
Capital paid in excess of par value | | | 143,714 | | | | 57,503 | | | | 5,674,433 | | | | 384,234 | |
Accumulated net investment income (loss) | | | — | | | | 10 | | | | (13,777 | ) | | | (39 | ) |
Accumulated net realized gain (loss) | | | (24,129 | ) | | | (26,437 | ) | | | (2,091,549 | ) | | | (147,862 | ) |
Net unrealized appreciation (depreciation) of investments and foreign currencies | | | 27,231 | | | | 7,205 | | | | 904,062 | | | | 61,808 | |
| | | | | | | | | | | | | | | | |
Net Assets | | $ | 146,828 | | | $ | 38,287 | | | $ | 4,473,408 | | | $ | 298,168 | |
| | | | | | | | | | | | | | | | |
| | | | |
Class N Shares | | | | | | | | | | | | | | | | |
Net Assets | | $ | 23,576 | | | $ | 4,721 | | | $ | 2,539,596 | | | $ | 15,436 | |
Shares Outstanding | | | 2,009,942 | | | | 677,175 | | | | 136,907,971 | | | | 1,394,984 | |
Net Asset Value Per Share | | $ | 11.73 | | | $ | 6.97 | | | $ | 18.55 | | | $ | 11.07 | |
Class I Shares | | | | | | | | | | | | | | | | |
Net Assets | | $ | 123,252 | | | $ | 33,566 | | | $ | 1,933,812 | | | $ | 282,732 | |
Shares Outstanding | | | 10,333,482 | | | | 4,824,370 | | | | 102,033,937 | | | | 25,341,140 | |
Net Asset Value Per Share | | $ | 11.93 | | | $ | 6.96 | | | $ | 18.95 | | | $ | 11.16 | |
See accompanying Notes to Financial Statements.
92 Annual Report | December 31, 2009 |
Statements of Operations
for the Year Ended December 31, 2009 (all amounts in thousands)
| | | | | | | | | | | | | | | | |
| | | Small-Mid
Cap Growth
Fund | | | Global
Growth
Fund | | | International
Growth
Fund | | | International
Equity
Fund | |
Investment income | | | | | | | | | | | | | | | | |
Dividends | | $ | 849 | | | $ | 454 | | | $ | 74,251 | | | $ | 5,549 | |
Less foreign tax withheld | | | (4 | ) | | | (20 | ) | | | (4,619 | ) | | | (446 | ) |
Dividend income from Affiliated Fund | | | — | | | | — | | | | 13 | | | | 1 | |
Interest | | | 4 | | | | 1 | | | | 134 | | | | 8 | |
| | | | | | | | | | | | | | | | |
Total income | | | 849 | | | | 435 | | | | 69,779 | | | | 5,112 | |
Expenses | | | | | | | | | | | | | | | | |
Investment advisory fees | | | 1,086 | | | | 321 | | | | 36,350 | | | | 2,648 | |
Distribution fees | | | 25 | | | | 10 | | | | 5,358 | | | | 67 | |
Shareholder services fees | | | — | | | | 48 | | | | — | | | | — | |
Custodian fees | | | 46 | | | | 50 | | | | 791 | | | | 127 | |
Transfer agent fees | | | 57 | | | | 49 | | | | 3,969 | | | | 341 | |
Professional fees | | | 31 | | | | 26 | | | | 134 | | | | 42 | |
Registration fees | | | 28 | | | | 32 | | | | 102 | | | | 41 | |
Shareholder reporting fees | | | 15 | | | | 6 | | | | 1,311 | | | | 16 | |
Trustee fees | | | 4 | | | | 1 | | | | 131 | | | | 10 | |
Other expenses | | | 21 | | | | 19 | | | | 358 | | | | 132 | |
| | | | | | | | | | | | | | | | |
Total expenses before waiver | | | 1,313 | | | | 562 | | | | 48,504 | | | | 3,424 | |
Expenses reimbursed to (waived or absorbed by) the Advisor | | | (82 | ) | | | (134 | ) | | | (129 | ) | | | (443 | ) |
| | | | | | | | | | | | | | | | |
Net expenses | | | 1,231 | | | | 428 | | | | 48,375 | | | | 2,981 | |
| | | | | | | | | | | | | | | | |
Net investment income (loss) | | | (382 | ) | | | 7 | | | | 21,404 | | | | 2,131 | |
Net realized gain (loss) on transactions from: | | | | | | | | | | | | | | | | |
Investments | | | (7,046 | ) | | | (3,210 | ) | | | (391,640 | ) | | | (46,584 | ) |
Foreign currency transactions | | | — | | | | 6 | | | | (5,839 | ) | | | (508 | ) |
| | | | | | | | | | | | | | | | |
Total net realized gain (loss) | | | (7,046 | ) | | | (3,204 | ) | | | (397,479 | ) | | | (47,092 | ) |
Change in net unrealized appreciation (depreciation) of: | | | | | | | | | | | | | | | | |
Investments | | | 47,865 | | | | 14,318 | | | | 1,641,795 | | | | 112,664 | |
Foreign currency translations | | | — | | | | — | | | | 16,133 | | | | 102 | |
| | | | | | | | | | | | | | | | |
Change in net unrealized appreciation (depreciation) | | | 47,865 | | | | 14,318 | | | | 1,657,928 | | | | 112,766 | |
| | | | | | | | | | | | | | | | |
Net increase (decrease) in net assets resulting from operations | | $ | 40,437 | | | $ | 11,121 | | | $ | 1,281,853 | | | $ | 67,805 | |
| | | | | | | | | | | | | | | | |
See accompanying Notes to Financial Statements.
December 31, 2009 | William Blair Funds 93 |
Statements of Changes in Net Assets
for the Years Ended December 31, 2009 and 2008 (all amounts in thousands)
| | | | | | | | | | | | | | | | | | | | | | | | | | | | | | | | |
| | | Small-Mid
Cap Growth
Fund | | | Global
Growth
Fund | | | International
Growth
Fund | | | International
Equity
Fund | |
| | | 2009 | | | 2008 | | | 2009 | | | 2008 | | | 2009 | | | 2008 | | | 2009 | | | 2008 | |
Operations | | | | | | | | | | | | | | | | | | | | | | | | | | | | | | | | |
Net investment income (loss) | | $ | (382 | ) | | $ | — | | | $ | 7 | | | $ | 466 | | | $ | 21,404 | | | $ | 87,896 | | | $ | 2,131 | | | $ | 3,715 | |
Net realized gain (loss) on investments and foreign currency transactions | | | (7,046 | ) | | | (15,910 | ) | | | (3,204 | ) | | | (22,828 | ) | | | (397,479 | ) | | | (1,655,463 | ) | | | (47,092 | ) | | | (100,401 | ) |
Change in net unrealized appreciation (depreciation) of investments and foreign currency translations | | | 47,865 | | | | (34,587 | ) | | | 14,318 | | | | (7,228 | ) | | | 1,657,928 | | | | (2,715,612 | ) | | | 112,766 | | | | (133,552 | ) |
| | | | | | | | | | | | | | | | | | | | | | | | | | | | | | | | |
Net increase (decrease) in net assets resulting from operations | | | 40,437 | | | | (50,497 | ) | | | 11,121 | | | | (29,590 | ) | | | 1,281,853 | | | | (4,283,179 | ) | | | 67,805 | | | | (230,238 | ) |
Distributions to shareholders from | | | | | | | | | | | | | | | | | | | | | | | | | | | | | | | | |
Net investment income | | | — | | | | — | | | | (3 | ) | | | (391 | ) | | | (31,541 | ) | | | — | | | | (1,449 | ) | | | — | |
Net realized gain | | | — | | | | (3 | ) | | | — | | | | — | | | | — | | | | (171,159 | ) | | | — | | | | (3,234 | ) |
| | | | | | | | | | | | | | | | | | | | | | | | | | | | | | | | |
| | | — | | | | (3 | ) | | | (3 | ) | | | (391 | ) | | | (31,541 | ) | | | (171,159 | ) | | | (1,449 | ) | | | (3,234 | ) |
Capital stock transactions | | | | | | | | | | | | | | | | | | | | | | | | | | | | | | | | |
Net proceeds from sale of shares | | | 52,642 | | | | 32,356 | | | | 4,434 | | | | 23,409 | | | | 1,361,082 | | | | 2,094,901 | | | | 87,167 | | | | 166,058 | |
Shares issued in reinvestment of income dividends and capital gain distributions | | | — | | | | 3 | | | | 3 | | | | 366 | | | | 28,646 | | | | 164,759 | | | | 1,387 | | | | 3,194 | |
Less cost of shares redeemed | | | (29,730 | ) | | | (22,881 | ) | | | (5,273 | ) | | | (11,365 | ) | | | (1,297,570 | ) | | | (2,723,038 | ) | | | (85,228 | ) | | | (115,903 | ) |
| | | | | | | | | | | | | | | | | | | | | | | | | | | | | | | | |
Net increase (decrease) in net assets resulting from capital share transactions | | | 22,912 | | | | 9,478 | | | | (836 | ) | | | 12,410 | | | | 92,158 | | | | (463,378 | ) | | | 3,326 | | | | 53,349 | |
| | | | | | | | | | | | | | | | | | | | | | | | | | | | | | | | |
Increase (decrease) in net assets | | | 63,349 | | | | (41,022 | ) | | | 10,282 | | | | (17,571 | ) | | | 1,342,470 | | | | (4,917,716 | ) | | | 69,682 | | | | (180,123 | ) |
Net assets | | | | | | | | | | | | | | | | | | | | | | | | | | | | | | | | |
Beginning of year | | | 83,479 | | | | 124,501 | | | | 28,005 | | | | 45,576 | | | | 3,130,938 | | | | 8,048,654 | | | | 228,486 | | | | 408,609 | |
| | | | | | | | | | | | | | | | | | | | | | | | | | | | | | | | |
End of year | | $ | 146,828 | | | $ | 83,479 | | | $ | 38,287 | | | $ | 28,005 | | | $ | 4,473,408 | | | $ | 3,130,938 | | | $ | 298,168 | | | $ | 228,486 | |
| | | | | | | | | | | | | | | | | | | | | | | | | | | | | | | | |
Undistributed net investment income (loss) at the end of the year | | $ | — | | | $ | — | | | $ | 10 | | | $ | (17 | ) | | $ | (13,777 | ) | | $ | (6,692 | ) | | $ | (39 | ) | | $ | (213 | ) |
| | | | | | | | | | | | | | | | | | | | | | | | | | | | | | | | |
See accompanying Notes to Financial Statements.
94 Annual Report | December 31, 2009 |
Statements of Assets and Liabilities
December 31, 2009 (dollar amounts in thousands)
| | | | | | | | | | | | | | | | |
| | | International
Small Cap
Growth
Fund | | | Emerging
Markets
Growth
Fund | | | Emerging
Leaders
Growth
Fund | | | Value
Discovery
Fund | |
Assets | | | | | | | | | | | | | | | | |
Investments in securities, at cost | | $ | 312,240 | | | $ | 772,493 | | | $ | 80,331 | | | $ | 49,258 | |
Investments in Affiliated Fund, at cost | | | 489 | | | | 66 | | | | 440 | | | | 4 | |
| | | | | | | | | | | | | | | | |
| | | | |
Investments in securities, at value | | $ | 385,253 | | | $ | 1,043,668 | | | $ | 114,268 | | | $ | 54,995 | |
Investments in Affiliated Fund, at net asset value | | | 489 | | | | 66 | | | | 440 | | | | 4 | |
Foreign currency, at value (cost $2,754, $4,432, $6) | | | 2,777 | | | | 4,480 | | | | 6 | | | | — | |
Receivable for securities sold | | | 2,473 | | | | 4,896 | | | | — | | | | — | |
Receivable for fund shares sold | | | 762 | | | | 490 | | | | 763 | | | | 7 | |
Dividends and interest receivable | | | 570 | | | | 389 | | | | 85 | | | | 28 | |
| | | | | | | | | | | | | | | | |
Total assets | | | 392,324 | | | | 1,053,989 | | | | 115,562 | | | | 55,034 | |
Liabilities | | | | | | | | | | | | | | | | |
Payable for investment securities purchased | | | 853 | | | | 1,956 | | | | 245 | | | | 30 | |
Payable for fund shares redeemed | | | 173 | | | | 12,556 | | | | — | | | | 43 | |
Management fee payable | | | 321 | | | | 1,014 | | | | 127 | | | | 65 | |
Distribution and shareholder administration fee payable | | | 31 | | | | 32 | | | | 1 | | | | 2 | |
Foreign tax liability | | | 16 | | | | 41 | | | | 9 | | | | — | |
Other accrued expenses | | | 79 | | | | 130 | | | | 44 | | | | 35 | |
| | | | | | | | | | | | | | | | |
Total liabilities | | | 1,473 | | | | 15,729 | | | | 426 | | | | 175 | |
| | | | | | | | | | | | | | | | |
Net Assets | | $ | 390,851 | | | $ | 1,038,260 | | | $ | 115,136 | | | $ | 54,859 | |
| | | | | | | | | | | | | | | | |
Capital | | | | | | | | | | | | | | | | |
Composition of Net Assets
Par value of shares of beneficial interest | | $ | 37 | | | $ | 80 | | | $ | 14 | | | $ | 5 | |
Capital paid in excess of par value | | | 491,576 | | | | 1,003,100 | | | | 114,019 | | | | 58,474 | |
Accumulated net investment income (loss) | | | (191 | ) | | | (7,584 | ) | | | (297 | ) | | | 18 | |
Accumulated net realized gain (loss) | | | (173,603 | ) | | | (228,574 | ) | | | (32,537 | ) | | | (9,375 | ) |
Net unrealized appreciation (depreciation) of investments and foreign currencies | | | 73,032 | | | | 271,238 | | | | 33,937 | | | | 5,737 | |
| | | | | | | | | | | | | | | | |
Net Assets | | $ | 390,851 | | | $ | 1,038,260 | | | $ | 115,136 | | | $ | 54,859 | |
| | | | | | | | | | | | | | | | |
| | | | |
Class N Shares | | | | | | | | | | | | | | | | |
Net Assets | | $ | 14,854 | | | $ | 27,271 | | | | | | | $ | 7,745 | |
Shares Outstanding | | | 1,428,132 | | | | 2,119,070 | | | | | | | | 738,169 | |
Net Asset Value Per Share | | $ | 10.40 | | | $ | 12.87 | | | | | | | $ | 10.49 | |
Class I Shares | | | | | | | | | | | | | | | | |
Net Assets | | $ | 210,561 | | | $ | 180,329 | | | $ | 8,823 | | | $ | 47,114 | |
Shares Outstanding | | | 20,063,370 | | | | 13,921,223 | | | | 1,046,198 | | | | 4,424,005 | |
Net Asset Value Per Share | | $ | 10.49 | | | $ | 12.95 | | | $ | 8.43 | | | $ | 10.65 | |
See accompanying Notes to Financial Statements.
December 31, 2009 | William Blair Funds 95 |
Statements of Operations
for the Year Ended December 31, 2009 (all amounts in thousands)
| | | | | | | | | | | | | | | | |
| | | International
Small Cap
Growth
Fund | | | Emerging
Markets
Growth
Fund | | | Emerging
Leaders
Growth
Fund | | | Value
Discovery
Fund | |
Investment income | | | | | | | | | | | | | | | | |
Dividends | | $ | 5,218 | | | $ | 13,643 | | | $ | 1,797 | | | $ | 815 | |
Less foreign tax withheld | | | (281 | ) | | | (1,173 | ) | | | (169 | ) | | | — | |
Dividend income from Affiliated Fund | | | 2 | | | | 1 | | | | — | | | | — | |
Interest | | | 13 | | | | 25 | | | | 2 | | | | 1 | |
| | | | | | | | | | | | | | | | |
Total income | | | 4,952 | | | | 12,496 | | | | 1,630 | | | | 816 | |
Expenses | | | | | | | | | | | | | | | | |
Investment advisory fees | | | 3,237 | | | | 7,825 | | | | 981 | | | | 460 | |
Distribution fees | | | 30 | | | | 54 | | | | — | | | | 17 | |
Shareholder services fees | | | 208 | | | | 224 | | | | 8 | | | | — | |
Custodian fees | | | 147 | | | | 491 | | | | 124 | | | | 51 | |
Transfer agent fees | | | 120 | | | | 137 | | | | 2 | | | | 43 | |
Professional fees | | | 35 | | | | 58 | | | | 33 | | | | 23 | |
Registration fees | | | 64 | | | | 88 | | | | 48 | | | | 28 | |
Shareholder reporting fees | | | 47 | | | | 29 | | | | 3 | | | | 11 | |
Trustee fees | | | 12 | | | | 20 | | | | 3 | | | | 2 | |
Other expenses | | | 71 | | | | 119 | | | | 20 | | | | 11 | |
| | | | | | | | | | | | | | | | |
Total expenses before waiver | | | 3,971 | | | | 9,045 | | | | 1,222 | | | | 646 | |
Expenses reimbursed to (waived or absorbed by) the Advisor | | | (20 | ) | | | (25 | ) | | | (99 | ) | | | (177 | ) |
| | | | | | | | | | | | | | | | |
Net expenses | | | 3,951 | | | | 9,020 | | | | 1,123 | | | | 469 | |
| | | | | | | | | | | | | | | | |
Net investment income (loss) | | | 1,001 | | | | 3,476 | | | | 507 | | | | 347 | |
Net Realized gain (loss) on transactions from: | | | | | | | | | | | | | | | | |
Investments. | | | (29,463 | ) | | | (57,782 | ) | | | 3,463 | | | | (3,891 | ) |
Foreign currency transactions | | | (845 | ) | | | (1,779 | ) | | | (258 | ) | | | — | |
| | | | | | | | | | | | | | | | |
Total net realized gain (loss) | | | (30,308 | ) | | | (59,561 | ) | | | 3,205 | | | | (3,891 | ) |
Change in net unrealized appreciation (depreciation) of: | | | | | | | | | | | | | | | | |
Investments | | | 174,223 | | | | 461,326 | | | | 51,098 | | | | 14,493 | |
Foreign currency translations | | | 31 | | | | 22 | | | | — | | | | — | |
| | | | | | | | | | | | | | | | |
Change in net unrealized appreciation (depreciation) | | | 174,254 | | | | 461,348 | | | | 51,098 | | | | 14,493 | |
| | | | | | | | | | | | | | | | |
Net increase (decrease) in net assets resulting from operations | | $ | 144,947 | | | $ | 405,263 | | | $ | 54,810 | | | $ | 10,949 | |
| | | | | | | | | | | | | | | | |
See accompanying Notes to Financial Statements.
96 Annual Report | December 31, 2009 |
Statements of Changes in Net Assets
for the Years Ended December 31, 2009 and 2008 (all amounts in thousands)
| | | | | | | | | | | | | | | | | | | | | | | | | | | | | | | | |
| | | International
Small Cap
Growth
Fund | | | Emerging
Markets
Growth
Fund | | | Emerging
Leaders
Growth
Fund | | | Value
Discovery
Fund | |
| | | 2009 | | | 2008 | | | 2009 | | | 2008 | | | 2009 | | | 2008(a) | | | 2009 | | | 2008 | |
Operations | | | | | | | | | | | | | | | | | | | | | | | | | | | | | | | | |
Net investment income (loss) | | $ | 1,001 | | | $ | 772 | | | $ | 3,476 | | | $ | 7,819 | | | $ | 507 | | | $ | 359 | | | $ | 347 | | | $ | 434 | |
Net realized gain (loss) on investments and foreign currency transactions | | | (30,308 | ) | | | (143,651 | ) | | | (59,561 | ) | | | (167,170 | ) | | | 3,205 | | | | (35,250 | ) | | | (3,891 | ) | | | (4,157 | ) |
Change in net unrealized appreciation (depreciation) of investments and foreign currency translations | | | 174,254 | | | | (138,270 | ) | | | 461,348 | | | | (484,606 | ) | | | 51,098 | | | | (17,161 | ) | | | 14,493 | | | | (8,966 | ) |
| | | | | | | | | | | | | | | | | | | | | | | | | | | | | | | | |
Net increase (decrease) in net assets resulting from operations | | | 144,947 | | | | (281,149 | ) | | | 405,263 | | | | (643,957 | ) | | | 54,810 | | | | (52,052 | ) | | | 10,949 | | | | (12,689 | ) |
Distributions to shareholders from | | | | | | | | | | | | | | | | | | | | | | | | | | | | | | | | |
Net investment income | | | (778 | ) | | | — | | | | (11,127 | ) | | | — | | | | (1,588 | ) | | | (87 | ) | | | (213 | ) | | | (322 | ) |
Net realized gain | | | — | | | | (4,881 | ) | | | — | | | | (41,761 | ) | | | — | | | | — | | | | — | | | | — | |
| | | | | | | | | | | | | | | | | | | | | | | | | | | | | | | | |
| | | (778 | ) | | | (4,881 | ) | | | (11,127 | ) | | | (41,761 | ) | | | (1,588 | ) | | | (87 | ) | | | (213 | ) | | | (322 | ) |
Capital stock transactions | | | | | | | | | | | | | | | | | | | | | | | | | | | | | | | | |
Net proceeds from sale of shares | | | 139,125 | | | | 259,319 | | | | 422,203 | | | | 81,613 | | | | 42,409 | | | | 107,010 | | | | 14,901 | | | | 12,504 | |
Shares issued in reinvestment of income dividends and capital gain distributions | | | 676 | | | | 4,719 | | | | 10,336 | | | | 41,234 | | | | 1,466 | | | | 80 | | | | 170 | | | | 287 | |
Less cost of shares redeemed | | | (185,107 | ) | | | (87,479 | ) | | | (174,003 | ) | | | (217,395 | ) | | | (28,637 | ) | | | (8,275 | ) | | | (7,197 | ) | | | (10,649 | ) |
| | | | | | | | | | | | | | | | | | | | | | | | | | | | | | | | |
Net increase (decrease) in net assets resulting from capital share transactions | | | (45,306 | ) | | | 176,559 | | | | 258,536 | | | | (94,548 | ) | | | 15,238 | | | | 98,815 | | | | 7,874 | | | | 2,142 | |
| | | | | | | | | | | | | | | | | | | | | | | | | | | | | | | | |
Increase (decrease) in net assets | | | 98,863 | | | | (109,471 | ) | | | 652,672 | | | | (780,266 | ) | | | 68,460 | | | | 46,676 | | | | 18,610 | | | | (10,869 | ) |
Net assets | | | | | | | | | | | | | | | | | | | | | | | | | | | | | | | | |
Beginning of year | | | 291,988 | | | | 401,459 | | | | 385,588 | | | | 1,165,854 | | | | 46,676 | | | | — | | | | 36,249 | | | | 47,118 | |
| | | | | | | | | | | | | | | | | | | | | | | | | | | | | | | | |
End of year | | $ | 390,851 | | | $ | 291,988 | | | $ | 1,038,260 | | | $ | 385,588 | | | $ | 115,136 | | | $ | 46,676 | | | $ | 54,859 | | | $ | 36,249 | |
| | | | | | | | | | | | | | | | | | | | | | | | | | | | | | | | |
Undistributed net investment income (loss) at the end of the year | | $ | (191 | ) | | $ | (120 | ) | | $ | (7,584 | ) | | $ | (674 | ) | | $ | (297 | ) | | $ | (52 | ) | | $ | 18 | | | $ | 37 | |
| | | | | | | | | | | | | | | | | | | | | | | | | | | | | | | | |
| (a) | | For the period from March 26, 2008 (Commencement of Operations) to December 31, 2008. |
See accompanying Notes to Financial Statements.
December 31, 2009 | William Blair Funds 97 |
Statements of Assets and Liabilities
December 31, 2009 (dollar amounts in thousands)
| | | | | | | | | | | | | | | | |
| | | Bond Fund | | | Income
Fund | | | Low
Duration
Fund | | | Ready
Reserves
Fund | |
Assets | | | | | | | | | | | | | | | | |
Investments in securities, at cost | | $ | 141,490 | | | $ | 111,451 | | | $ | 79,753 | | | $ | 1,350,324 | |
| | | | | | | | | | | | | | | | |
| | | | |
Investments in securities, at value | | $ | 148,003 | | | $ | 117,104 | | | $ | 79,185 | | | $ | 1,350,324 | |
Receivable for fund shares sold | | | 3,498 | | | | 46 | | | | 16,105 | | | | — | |
Dividends and interest receivable | | | 1,500 | | | | 1,244 | | | | 288 | | | | 2,809 | |
Prepaid expenses | | | — | | | | — | | | | 47 | | | | — | |
| | | | | | | | | | | | | | | | |
Total assets | | | 153,001 | | | | 118,394 | | | | 95,625 | | | | 1,353,133 | |
Liabilities | | | | | | | | | | | | | | | | |
Payable for investment securities purchased | | | 5,586 | | | | — | | | | — | | | | — | |
Payable for fund shares redeemed | | | 10 | | | | 675 | | | | 460 | | | | — | |
Management fee payable | | | 2 | | | | 56 | | | | 3 | | | | 61 | |
Distribution and shareholder administration fee payable | | | 17 | | | | 5 | | | | 9 | | | | 91 | |
Other accrued expenses | | | 42 | | | | 50 | | | | 19 | | | | 80 | |
| | | | | | | | | | | | | | | | |
Total liabilities | | | 5,657 | | | | 786 | | | | 491 | | | | 232 | |
| | | | | | | | | | | | | | | | |
Net Assets | | $ | 147,344 | | | $ | 117,608 | | | $ | 95,134 | | | $ | 1,352,901 | |
| | | | | | | | | | | | | | | | |
Capital | | | | | | | | | | | | | | | | |
Composition of Net Assets | | | | | | | | | | | | | | | | |
Par value of shares of beneficial interest | | $ | 14 | | | $ | 13 | | | $ | 10 | | | $ | 1,353 | |
Capital paid in excess of par value | | | 141,782 | | | | 155,660 | | | | 95,693 | | | | 1,352,417 | |
Accumulated net investment income (loss) | | | — | | | | — | | | | — | | | | 84 | |
Accumulated net realized gain (loss) | | | (965 | ) | | | (43,718 | ) | | | (1 | ) | | | (953 | ) |
Net unrealized appreciation (depreciation) of investments and foreign currencies | | | 6,513 | | | | 5,653 | | | | (568 | ) | | | — | |
| | | | | | | | | | | | | | | | |
Net Assets | | $ | 147,344 | | | $ | 117,608 | | | $ | 95,134 | | | $ | 1,352,901 | |
| | | | | | | | | | | | | | | | |
| | | | |
Class N Shares | | | | | | | | | | | | | | | | |
Net Assets | | $ | 3,580 | | | $ | 37,567 | | | $ | 1,861 | | | $ | 1,352,901 | |
Shares Outstanding | | | 344,160 | | | | 4,143,648 | | | | 187,384 | | | | 1,352,957,914 | |
Net Asset Value Per Share | | $ | 10.40 | | | $ | 9.07 | | | $ | 9.93 | | | $ | 1.00 | |
Class I Shares | | | | | | | | | | | | | | | | |
Net Assets | | $ | 127,538 | | | $ | 80,041 | | | $ | 79,773 | | | | | |
Shares Outstanding | | | 12,374,312 | | | | 8,892,116 | | | | 8,034,542 | | | | | |
Net Asset Value Per Share | | $ | 10.31 | | | $ | 9.00 | | | $ | 9.93 | | | | | |
See accompanying Notes to Financial Statements.
98 Annual Report | December 31, 2009 |
Statements of Operations
for the Year Ended December 31, 2009 (all amounts in thousands)
| | | | | | | | | | | | | | | | |
| | | Bond
Fund | | | Income
Fund | | | Low
Duration
Fund(a) | | | Ready
Reserves
Fund | |
Investment income | | | | | | | | | | | | | | | | |
Interest | | $ | 6,673 | | | $ | 6,653 | | | $ | 109 | | | $ | 8,854 | |
| | | | | | | | | | | | | | | | |
Total income | | | 6,673 | | | | 6,653 | | | | 109 | | | | 8,854 | |
Expenses | | | | | | | | | | | | | | | | |
Investment advisory fees | | | 370 | | | | 650 | | | | 17 | | | | 3,682 | |
Distribution fees | | | 4 | | | | 63 | | | | — | | | | — | |
Shareholder services fees | | | 162 | | | | — | | | | 8 | | | | 5,436 | |
Custodian fees | | | 52 | | | | 55 | | | | 3 | | | | 29 | |
Transfer agent fees | | | 33 | | | | 81 | | | | 1 | | | | 43 | |
Professional fees | | | 32 | | | | 28 | | | | 15 | | | | 94 | |
Registration fees | | | 40 | | | | 29 | | | | — | | | | 22 | |
Shareholder reporting fees | | | 7 | | | | 22 | | | | 1 | | | | 73 | |
Trustee fees | | | 4 | | | | 5 | | | | — | | | | 67 | |
Temporary Guarantee Program fees | | | — | | | | — | | | | — | | | | 463 | |
Other expenses | | | 8 | | | | 3 | | | | — | | | | 333 | |
| | | | | | | | | | | | | | | | |
Total expenses before waiver | | | 712 | | | | 936 | | | | 45 | | | | 10,242 | |
Expenses reimbursed to (waived or absorbed by) the Advisor | | | (115 | ) | | | (32 | ) | | | (14 | ) | | | (3,027 | ) |
| | | | | | | | | | | | | | | | |
Net expenses | | | 597 | | | | 904 | | | | 31 | | | | 7,215 | |
| | | | | | | | | | | | | | | | |
Net investment income (loss) | | | 6,076 | | | | 5,749 | | | | 78 | | | | 1,639 | |
Net realized gain (loss) on transactions from: | | | | | | | | | | | | | | | | |
Investments | | | 284 | | | | (4,058 | ) | | | — | | | | — | |
Foreign currency transactions | | | — | | | | — | | | | — | | | | — | |
| | | | | | | | | | | | | | | | |
Total net realized gain (loss) | | | 284 | | | | (4,058 | ) | | | — | | | | — | |
Change in net unrealized appreciation (depreciation) of: | | | | | | | | | | | | | | | | |
Investments | | | 7,229 | | | | 9,909 | | | | (568 | ) | | | — | |
Foreign currency translations | | | — | | | | — | | | | — | | | | — | |
| | | | | | | | | | | | | | | | |
Change in net unrealized appreciation (depreciation) | | | 7,229 | | | | 9,909 | | | | (568 | ) | | | — | |
| | | | | | | | | | | | | | | | |
Net increase (decrease) in net assets resulting from operations | | $ | 13,589 | | | $ | 11,600 | | | $ | (490 | ) | | $ | 1,639 | |
| | | | | | | | | | | | | | | | |
| (a) | | For the period December 1, 2009 (Commencement of Operations) to December 31, 2009. |
See accompanying Notes to Financial Statements.
December 31, 2009 | William Blair Funds 99 |
Statements of Changes in Net Assets
for the Years Ended December 31, 2009 and 2008 (all amounts in thousands)
| | | | | | | | | | | | | | | | | | | | | | | | | | | | |
| | | Bond
Fund | | | Income
Fund | | | Low
Duration
Fund | | | Ready
Reserves
Fund | |
| | | 2009 | | | 2008 | | | 2009 | | | 2008 | | | 2009(a) | | | 2009 | | | 2008 | |
Operations | | | | | | | | | | | | | | | | | | | | | | | | | | | | |
Net investment income (loss) | | $ | 6,076 | | | $ | 3,542 | | | $ | 5,749 | | | $ | 8,054 | | | $ | 78 | | | $ | 1,639 | | | $ | 33,783 | |
Net realized gain (loss) on investments and foreign currency transactions | | | 284 | | | | (939 | ) | | | (4,058 | ) | | | (12,996 | ) | | | — | | | | — | | | | — | |
Change in net unrealized appreciation (depreciation) of investments and foreign currency translations | | | 7,229 | | | | (1,455 | ) | | | 9,909 | | | | 570 | | | | (568 | ) | | | — | | | | — | |
| | | | | | | | | | | | | | | | | | | | | | | | | | | | |
Net increase (decrease) in net assets resulting from operations | | | 13,589 | | | | 1,148 | | | | 11,600 | | | | (4,372 | ) | | | (490 | ) | | | 1,639 | | | | 33,783 | |
Distributions to shareholders from | | | | | | | | | | | | | | | | | | | | | | | | | | | | |
Net investment income | | | (6,213 | ) | | | (3,517 | ) | | | (6,533 | ) | | | (8,436 | ) | | | (86 | ) | | | (1,639 | ) | | | (33,783 | ) |
Net realized gain | | | — | | | | — | | | | — | | | | — | | | | — | | | | — | | | | — | |
| | | | | | | | | | | | | | | | | | | | | | | | | | | | |
| | | (6,213 | ) | | | (3,517 | ) | | | (6,533 | ) | | | (8,436 | ) | | | (86 | ) | | | (1,639 | ) | | | (33,783 | ) |
Capital stock transactions | | | | | | | | | | | | | | | | | | | | | | | | | | | | |
Net proceeds from sale of shares | | | 77,912 | | | | 18,146 | | | | 16,970 | | | | 16,425 | | | | 97,472 | | | | 638,552 | | | | 1,439,460 | |
Shares issued in reinvestment of income dividends and capital gain distributions | | | 4,029 | | | | 2,956 | | | | 5,431 | | | | 6,815 | | | | 37 | | | | 1,710 | | | | 33,710 | |
Less cost of shares redeemed | | | (16,586 | ) | | | (12,603 | ) | | | (50,295 | ) | | | (74,627 | ) | | | (1,799 | ) | | | (1,128,550 | ) | | | (1,031,518 | ) |
| | | | | | | | | | | | | | | | | | | | | | | | | | | | |
Net increase (decrease) in net assets resulting from capital share transactions | | | 65,355 | | | | 8,499 | | | | (27,894 | ) | | | (51,387 | ) | | | 95,710 | | | | (488,288 | ) | | | 441,652 | |
| | | | | | | | | | | | | | | | | | | | | | | | | | | | |
Increase (decrease) in net assets | | | 72,731 | | | | 6,130 | | | | (22,827 | ) | | | (64,195 | ) | | | 95,134 | | | | (488,288 | ) | | | 441,652 | |
Net assets | | | | | | | | | | | | | | | | | | | | | | | | | | | | |
Beginning of year | | | 74,613 | | | | 68,483 | | | | 140,435 | | | | 204,630 | | | | — | | | | 1,841,189 | | | | 1,399,537 | |
| | | | | | | | | | | | | | | | | | | | | | | | | | | | |
End of year | | $ | 147,344 | | | $ | 74,613 | | | $ | 117,608 | | | $ | 140,435 | | | $ | 95,134 | | | $ | 1,352,901 | | | $ | 1,841,189 | |
| | | | | | | | | | | | | | | | | | | | | | | | | | | | |
Undistributed net investment income (loss) at the end of the year | | $ | — | | | $ | 10 | | | $ | — | | | $ | 260 | | | $ | — | | | $ | 84 | | | $ | 84 | |
| | | | | | | | | | | | | | | | | | | | | | | | | | | | |
| (a) | | For the period December 1, 2009 (Commencement of Operations) to December 31, 2009. |
See accompanying Notes to Financial Statements.
100 Annual Report | December 31, 2009 |
Notes to Financial Statements
(1) Significant Accounting Policies
The following is a summary of the William Blair Funds’ (the “Fund”) significant accounting policies in effect during the year covered by the financial statements, which are in accordance with U.S. generally accepted accounting principles.
(a) Description of the Fund
William Blair Funds is a diversified mutual fund registered under the Investment Company Act of 1940, as amended, as an open-end management investment company. For each portfolio, the number of shares authorized is unlimited. The Fund currently consists of the following eighteen portfolios (the “Portfolios”), each with its own investment objective and policies.
| | |
Equity Portfolios | | International Equity Portfolios |
Growth | | International Growth |
Large Cap Growth | | International Equity |
Small Cap Growth | | Institutional International Growth |
Mid Cap Growth | | Institutional International Equity |
Small-Mid Cap Growth | | International Small Cap Growth |
Value Discovery | | Emerging Markets Growth |
Global Equity Portfolio | | Emerging Leaders Growth |
Global Growth | | Fixed-Income Portfolios |
| | Bond |
| | Income |
| | Low Duration |
| | Money Market Portfolio |
| | Ready Reserves |
The investment objectives of the Portfolios are as follows:
| | |
Equity | | Long-term capital appreciation. |
Global Equity | | Long-term capital appreciation. |
International Equity | | Long-term capital appreciation. |
Fixed-Income | | High level of current income with relative stability of principal.
(Maximize total return—Low Duration) |
Money Market | | Current income, a stable share price and daily liquidity. |
The Institutional International Growth Portfolio, the Institutional International Equity Portfolio and the Institutional Class of the International Small Cap Growth Portfolio, the Emerging Markets Growth Portfolio, the Emerging Leaders Growth Portfolio, the Bond Portfolio and the Low Duration Portfolio issue a separate report.
(b) Share Classes
Three different classes of shares currently exist: N, I and Institutional. This report includes financial highlight information for Classes N and I. The table below describes the Class N shares and the Class I shares covered by this report:
| | |
Class | | Description |
| N | | Class N shares are sold to the general public, either directly through the Fund’s distributor or through a select number of financial intermediaries. Class N shares are sold without any sales load, and carry an annual 12b-1 distribution fee (0.25% for the Equity, Global Equity and International Equity Portfolios and 0.15% for the Fixed-Income Portfolios) or a service fee (0.35% for the Money Market Portfolio), transfer agent expense which is not a fixed rate and may vary by Portfolio and class, and an annual shareholder administration fee (0.15% for the Global Growth Portfolio, the International Small Cap Growth Portfolio, the Emerging Markets Growth Portfolio, the Bond Portfolio and the Low Duration Portfolio). |
| I | | Class I shares are sold to a limited group of investors. They do not carry any sales load or distribution fees and generally have lower ongoing expenses than the Class N shares. Class I shares of the Global Growth Portfolio, the International Small Cap Growth Portfolio, the Emerging Markets Growth Portfolio, the Emerging Leaders Growth Portfolio, the Bond Portfolio and the Low Duration Portfolio carry an annual shareholder administration fee of 0.15%. |
December 31, 2009 | William Blair Funds 101 |
Investment income, realized and unrealized gains and losses, and certain Portfolio level expenses and expense reductions, if any, are allocated based on the relative net assets of each class, except for certain class specific expenses, which are charged directly to the appropriate class. Differences in class expenses may result in the payment of different per share dividends by class. All share classes of the Portfolios have equal rights with respect to voting subject to class specific arrangements.
(c) Investment Valuation
The market value of domestic equity securities and options is determined by valuing securities traded on national securities exchanges or markets or in the over-the-counter markets at the last sales price or, if applicable, the official closing price or, in the absence of a sale on the date of valuation, at the latest bid price.
The Board of Trustees has determined that the passage of time between when the foreign exchanges or markets close and when the Funds compute their net asset values could cause the value of international securities to no longer be representative or accurate and, as a result, necessitates that such securities be fair valued on a daily basis. Accordingly, for international securities, if the foreign exchange or market on which a security is primarily traded closes before the close of regular trading on the New York Stock Exchange (generally 4:00 p.m. Eastern time), the Funds use an independent pricing service on a daily basis to fair value price the security as of the close of regular trading on the New York Stock Exchange. As a result, a Fund’s value for a security may be different from the last sale price (or the latest bid price). The independent pricing service may not provide a fair value price for all international securities owned by a Fund trading on a foreign exchange or market that closes before the close of regular trading on the New York Stock Exchange. For these securities and all other foreign securities, the value of the security is determined based upon the last sale price on the foreign exchange or market on which it is primarily traded and in the currency of that market as of the close of the appropriate exchange or, if there have been no sales during that day, at the latest bid price.
Long-term, fixed-income securities are valued based on market quotations, or by independent pricing services that use prices provided by market makers or matrixes that produce estimates of fair market values obtained from yield data relating to instruments or securities with similar characteristics. Securities held in the Ready Reserves Fund are valued at amortized cost, which approximates market value.
Investments in other funds are valued at the underlying fund’s net asset value on the date of valuation. Other securities, and all other assets, including securities for which a market price is not available, or the value of which is affected by a significant valuation event, are valued at fair value as determined in good faith by the Pricing Committee or Valuation Committee, in accordance with the Fund’s Valuation Procedures approved by the Board of Trustees. As of December 31, 2009, there were securities held in the Small Cap Growth, International Growth, International Small Cap Growth and Emerging Markets Growth Portfolios requiring fair valuation pursuant to the Fund’s Valuation Procedures.
(d) Investment income and transactions
Dividend income is recorded on the ex-dividend date, except for those dividends from certain foreign securities that are recorded when the information is available.
Interest income is recorded on an accrual basis, adjusted for amortization of premium or discount. Variable rate bonds and floating rate notes earn interest at coupon rates that fluctuate at specific time intervals. The interest rates shown in the Portfolio of Investments for the Bond, Income, Low Duration and Ready Reserves Portfolios were the rates in effect on December 31, 2009. Put bonds may be redeemed at the discretion of the holder on specified dates prior to maturity.
Premiums and discounts are accreted and amortized on a straight-line basis for short-term investments and on an effective interest method for long-term investments.
Paydown gains and losses on mortgage and asset-backed securities are treated as an adjustment to interest income. For the year ended December 31, 2009, the Bond and Income Portfolios recognized a reduction of interest income and a decrease of net realized (loss) of $(120) and $(519), respectively (in thousands). This reclassification had no effect on the net asset value of the Portfolios.
The Funds do not isolate that portion of the results of operations resulting from changes in foreign exchange rates on investments from the fluctuations arising from changes in market prices of securities held. Such fluctuations are included with the net realized and unrealized gain or loss from investments.
Reported net realized foreign currency gains or losses arise from disposition of foreign currency, the difference in the foreign exchange rates between the trade and settlement dates on securities transactions, and the difference between the amounts of
102 Annual Report | December 31, 2009 |
dividends, interest and foreign withholding taxes recorded on the ex-date or accrual date and the U.S. dollar equivalent of the amounts actually received or paid. Net unrealized foreign exchange gains and losses arise from changes (due to the changes in the exchange rate) in the value of foreign currency and other assets and liabilities denominated in foreign currencies held at period end.
Security and shareholder transactions are accounted for no later than one business day following the trade date. However, for financial reporting purposes, security and shareholder transactions are accounted for on the trade date of the last business day of the reporting period. Realized gains and losses from securities transactions are recognized on a specifically identified cost basis.
Awards from class action litigation may be recorded as a reduction of cost. If the Portfolios no longer own the applicable securities, the proceeds are recorded as realized gains.
(e) Share Valuation and Dividends to Shareholders
Shares are sold and redeemed on a continuous basis at net asset value. The net asset value per share is determined separately for each class by dividing the Portfolio’s net assets attributable to that class by the number of shares of the class outstanding as of the close of regular trading on the New York Stock Exchange, which is generally 4:00 p.m. Eastern time, on each day the Exchange is open. Redemption fees may be applicable to redemptions or exchanges within 60 days of purchase. For both Class N and Class I shares, the William Blair domestic equity portfolios assess a 1% redemption fee on shares sold or exchanged that have been owned 60 days or less and the William Blair international portfolios assess a 2% redemption fee on shares sold or exchanged that have been owned 60 days or less as disclosed within the Fund’s Prospectus. The redemption fees collected by the Portfolio are netted against the amount of redemptions for presentation on the Statement of Changes in Net Assets.
The redemption fees collected by the Portfolios were as follows (in thousands):
| | | | | | |
Portfolio | | Year Ended
December
31, 2009 | | Year Ended
December
31, 2008 |
Growth | | $ | 3 | | $ | 17 |
Large Cap Growth | | | — | | | 2 |
Small Cap Growth | | | 59 | | | 43 |
Mid Cap Growth | | | 0 | | | 10 |
Small-Mid Cap Growth | | | 1 | | | 1 |
Global Growth | | | 0 | | | 1 |
International Growth | | | 130 | | | 290 |
International Equity | | | 7 | | | 28 |
International Small Cap Growth | | | 8 | | | 42 |
Emerging Markets Growth | | | 9 | | | 24 |
Emerging Leaders Growth | | | — | | | — |
Value Discovery | | | — | | | 8 |
Dividends from net investment income, if any, of the Growth, Large Cap Growth, Small Cap Growth, Mid Cap Growth, Small-Mid Cap Growth, Global Growth, International Growth, International Equity, International Small Cap Growth, Emerging Markets Growth, Emerging Leaders Growth and Value Discovery Portfolios are declared and paid at least annually. Dividends from the Bond, Income and Low Duration Portfolios are declared and paid monthly and dividends from the Ready Reserves Portfolio are declared daily and paid monthly. Capital gain distributions, if any, are declared and paid at least annually in December. Dividends payable to shareholders are recorded on the ex-dividend date.
(f) Foreign Currency Translation and Forward Foreign Currency Contracts
The Global Growth, International Growth, International Equity, International Small Cap Growth, Emerging Markets Growth and Emerging Leaders Growth Portfolios may invest in securities denominated in foreign currencies. As such, assets and liabilities denominated in foreign currencies are translated into U.S. dollar amounts at the current exchange rate on the date of valuation. The values of foreign investments, open forward foreign currency contracts, and cash denominated in foreign currencies are translated into U.S. dollars using a spot market rate of exchange as of the time of the determination of each Portfolio’s Net Asset Value, typically 4:00 p.m. Eastern time on days when there is regular trading on the New York Stock Exchange. Payables and receivables for securities transactions, dividends, interest income and tax reclaims are translated into U.S. dollars using a spot market rate of exchange as of 4:00 p.m. Eastern time. Settlement of purchases and sales and dividend and interest receipts are translated into U.S. dollars using a spot market rate of exchange as of 11:00 a.m. Eastern time.
December 31, 2009 | William Blair Funds 103 |
(g) Income Taxes
Each Portfolio intends to comply with the provisions of Subchapter M of the Internal Revenue Code available to regulated investment companies. Each portfolio intends to make the requisite distributions of income and capital gains to its shareholders sufficient to relieve it from all, or substantially all, federal income and excise taxes. No provision for federal income and excise taxes has been made.
The Global Growth, International Growth, International Equity, International Small Cap Growth, Emerging Markets Growth and Emerging Leaders Growth Portfolios may be subject to a tax imposed on net realized gains on securities of certain foreign countries.
Each Portfolio is subject to the provisions of Accounting Standards Codification (ASC) 740 Income Taxes, formally known as FASB (Financial Accounting Standards Board) Interpretation No. 48, Accounting for Uncertainties in Income Taxes. ASC 740 provides guidance for how uncertain tax positions should be recognized, measured, presented and disclosed in the financial statements. Management has evaluated the implications of ASC 740 and all of the uncertain tax positions of the Portfolios and has determined that no liability is required to be recorded in the financial statements as of December 31, 2009 and December 31, 2008.
The statute of limitations on the Funds’ tax returns for each of the tax years in the four year period ended December 31, 2009, remains open and the returns are subject to examination.
The Global Growth, International Growth, International Equity, International Small Cap Growth, Emerging Markets Growth and Emerging Leaders Growth Portfolios have elected to mark-to-market their investments in Passive Foreign Investment Companies (“PFICs”) for Federal income tax purposes. The Portfolios also treat the deferred loss associated with current and prior year wash sales as an adjustment to the cost of investments for tax purposes. The cost of investments for Federal income tax purposes and related gross unrealized appreciation/(depreciation) and net unrealized appreciation/(depreciation) at December 31, 2009, were as follows (in thousands):
| | | | | | | | | |
Portfolio | | Cost of
Investments | | Gross
Unrealized
Appreciation | | Gross
Unrealized
Depreciation | | Net
Unrealized
Appreciation/
(Depreciation) | |
Growth | | 359,476 | | 69,118 | | 3,768 | | 65,350 | |
Large Cap Growth | | 25,864 | | 4,312 | | 94 | | 4,218 | |
Small Cap Growth | | 704,877 | | 136,420 | | 73,125 | �� | 63,295 | |
Mid Cap Growth | | 58,108 | | 12,875 | | 372 | | 12,503 | |
Small-Mid Cap Growth | | 121,727 | | 25,142 | | 1,286 | | 23,856 | |
Global Growth | | 31,196 | | 7,544 | | 476 | | 7,068 | |
International Growth | | 3,599,727 | | 870,600 | | 55,766 | | 814,834 | |
International Equity | | 240,270 | | 61,396 | | 4,179 | | 57,217 | |
International Small Cap Growth | | 318,052 | | 75,074 | | 7,384 | | 67,690 | |
Emerging Markets Growth | | 811,449 | | 238,586 | | 6,301 | | 232,285 | |
Emerging Leaders Growth | | 84,208 | | 30,674 | | 174 | | 30,500 | |
Value Discovery | | 51,027 | | 5,878 | | 1,906 | | 3,972 | |
Bond | | 141,580 | | 7,379 | | 956 | | 6,423 | |
Income | | 111,702 | | 6,185 | | 783 | | 5,402 | |
Low Duration | | 79,753 | | 58 | | 626 | | (568 | ) |
Ready Reserves | | 1,350,324 | | — | | — | | — | |
104 Annual Report | December 31, 2009 |
The timing and characterization of certain income and capital gain distributions are determined annually in accordance with Federal income tax regulations that may differ from U.S. generally accepted accounting principles. As a result, net investment income or loss and net realized gain or loss for a reporting period may differ from the amount distributed during such period. In addition, the Portfolios may periodically record reclassifications among certain capital accounts to reflect differences between financial reporting and income tax basis distributions. The reclassifications were reported in order to reflect the tax treatment for certain permanent differences that exist between income tax regulations and U.S. generally accepted accounting principles. The reclassifications generally relate to net operating losses, Section 988 currency gains and losses, PFICs gains and losses, recharacterization of dividends received from investments in REITs, expired capital loss carryforwards. These reclassifications have no impact on the net asset values of the Portfolios. Accordingly, at December 31, 2009, (the Funds’ most recent fiscal year end) the following reclassifications were recorded (in thousands):
| | | | | | | | | | | | |
Portfolio | | Accumulated Net
Investment
Income (Loss) | | | Accumulated
Net Realized
Gain/(Loss) | | | Capital
Paid in Excess
of Par Value | |
Growth | | $ | — | | | $ | — | | | $ | — | |
Large Cap Growth | | | — | | | | 2,117 | | | | (2,117 | ) |
Small Cap Growth | | | 4,618 | | | | — | | | | (4,618 | ) |
Mid Cap Growth | | | 147 | | | | — | | | | (147 | ) |
Small-Mid Cap Growth | | | 382 | | | | — | | | | (382 | ) |
Global Growth | | | 23 | | | | (23 | ) | | | — | |
International Growth | | | 3,052 | | | | (3,052 | ) | | | — | |
International Equity | | | (508 | ) | | | 508 | | | | — | |
International Small Cap Growth | | | (294 | ) | | | 301 | | | | (7 | ) |
Emerging Markets Growth | | | 741 | | | | (741 | ) | | | — | |
Emerging Leaders Growth | | | 836 | | | | (836 | ) | | | — | |
Value Discovery | | | (153 | ) | | | 158 | | | | (5 | ) |
Bond | | | 127 | | | | (120 | ) | | | (7 | ) |
Income | | | 524 | | | | (519 | ) | | | (5 | ) |
Low Duration | | | 8 | | | | (1 | ) | | | (7 | ) |
Ready Reserves | | | — | | | | — | | | | — | |
Distributions from net realized gains for book purposes may include short-term capital gains, which are included as ordinary income for tax purposes. The tax character of distributions paid during 2009 and 2008 was as follows (in thousands):
| | | | | | | | | | | | | | | | | | |
| | | Distributions Paid in 2009 | | Distributions Paid in 2008 |
Portfolio | | Ordinary
Income | | Long-Term
Capital
Gains | | Total
Distributions | | Ordinary
Income | | Long-Term
Capital
Gains | | Total
Distributions |
Growth | | $ | 43 | | $ | — | | $ | 43 | | $ | — | | $ | 5,607 | | $ | 5,607 |
Large Cap Growth | | | 16 | | | — | | | 16 | | | — | | | — | | | — |
Small Cap Growth | | | — | | | — | | | — | | | 5,544 | | | 14,989 | | | 20,533 |
Mid Cap Growth | | | — | | | — | | | — | | | — | | | — | | | — |
Small-Mid Cap Growth | | | — | | | — | | | — | | | 3 | | | — | | | 3 |
Global Growth | | | 3 | | | — | | | 3 | | | 391 | | | — | | | 391 |
International Growth | | | 31,541 | | | — | | | 31,541 | | | — | | | 171,159 | | | 171,159 |
International Equity | | | 1,449 | | | — | | | 1,449 | | | 296 | | | 2,938 | | | 3,234 |
International Small Cap Growth | | | 778 | | | — | | | 778 | | | — | | | 4,881 | | | 4,881 |
Emerging Markets Growth | | | 11,127 | | | — | | | 11,127 | | | 10,054 | | | 31,707 | | | 41,761 |
Emerging Leaders Growth | | | 1,588 | | | — | | | 1,588 | | | 87 | | | — | | | 87 |
Value Discovery | | | 213 | | | — | | | 213 | | | 322 | | | — | | | 322 |
Bond | | | 6,213 | | | — | | | 6,213 | | | 3,517 | | | — | | | 3,517 |
Income | | | 6,533 | | | — | | | 6,533 | | | 8,436 | | | — | | | 8,436 |
Low Duration(a) | | | 86 | | | — | | | 86 | | | | | | | | | |
Ready Reserves | | | 1,639 | | | — | | | 1,639 | | | 33,783 | | | — | | | 33,783 |
| (a) | For the period from December 1, 2009 (commencement of operations) to December 31, 2009. |
December 31, 2009 | William Blair Funds 105 |
As of December 31, 2009, the components of distributable earnings on a tax basis were as follows (in thousands):
| | | | | | | | | | | | | | |
Portfolio | | Undistributed
Ordinary Income | | Accumulated
Capital and
Other Losses | | | Undistributed
Long-Term
Gain | | Net
Unrealized
Appreciation/
Depreciation | |
Growth | | $ | 13 | | $ | (37,099 | ) | | $ | — | | $ | 65,350 | |
Large Cap Growth | | | 1 | | | (7,905 | ) | | | — | | | 4,218 | |
Small Cap Growth | | | — | | | (153,063 | ) | | | — | | | 63,295 | |
Mid Cap Growth | | | — | | | (11,749 | ) | | | — | | | 12,503 | |
Small-Mid Cap Growth | | | — | | | (20,754 | ) | | | — | | | 23,856 | |
Global Growth | | | 10 | | | (26,300 | ) | | | — | | | 7,068 | |
International Growth | | | 17,572 | | | (2,033,670 | ) | | | — | | | 814,834 | |
International Equity | | | — | | | (143,310 | ) | | | — | | | 57,217 | |
International Small Cap Growth | | | — | | | (168,452 | ) | | | — | | | 67,690 | |
Emerging Markets Growth | | | 2,427 | | | (199,632 | ) | | | — | | | 232,285 | |
Emerging Leaders Growth | | | 130 | | | (29,527 | ) | | | — | | | 30,500 | |
Value Discovery | | | — | | | (7,592 | ) | | | — | | | 3,972 | |
Bond | | | — | | | (875 | ) | | | — | | | 6,423 | |
Income | | | — | | | (43,467 | ) | | | — | | | 5,402 | |
Low Duration | | | — | | | (1 | ) | | | — | | | (568 | ) |
Ready Reserves | | | 84 | | | (953 | ) | | | — | | | — | |
As of December 31, 2009, the Portfolios have unused capital loss carryforwards available for Federal income tax purposes to be applied against future capital gains, if any. If not applied, the carryforwards will expire as follows (in thousands):
| | | | | | | | | | | | | | | | | | | | | | | | | | | |
Portfolio | | 2010 | | 2011 | | 2012 | | 2013 | | 2014 | | 2015 | | 2016 | | 2017 | | Total |
Growth | | $ | — | | $ | — | | $ | — | | $ | — | | $ | — | | $ | — | | $ | 8,153 | | $ | 28,946 | | $ | 37,099 |
Large Cap Growth | | | 1,582 | | | 769 | | | — | | | — | | | — | | | — | | | 1,709 | | | 3,845 | | | 7,905 |
Small Cap Growth | | | — | | | — | | | — | | | — | | | — | | | — | | | 36,185 | | | 116,878 | | | 153,063 |
Mid Cap Growth | | | — | | | — | | | — | | | — | | | — | | | — | | | 4,249 | | | 7,500 | | | 11,749 |
Small-Mid Cap Growth | | | — | | | — | | | — | | | — | | | — | | | — | | | 10,635 | | | 9,806 | | | 20,441 |
Global Growth | | | — | | | — | | | — | | | — | | | — | | | 126 | | | 13,022 | | | 13,125 | | | 26,273 |
International Growth | | | — | | | — | | | — | | | — | | | — | | | — | | | 835,953 | | | 1,198,096 | | | 2,034,049 |
International Equity | | | — | | | — | | | — | | | — | | | — | | | — | | | 61,377 | | | 81,925 | | | 143,302 |
International Small Cap Growth | | | — | | | — | | | — | | | — | | | — | | | — | | | 81,949 | | | 86,330 | | | 168,279 |
Emerging Markets Growth | | | — | | | — | | | — | | | — | | | — | | | — | | | 84,442 | | | 115,253 | | | 199,695 |
Emerging Leaders Growth | | | — | | | — | | | — | | | — | | | — | | | — | | | 21,249 | | | 8,278 | | | 29,527 |
Value Discovery | | | — | | | — | | | — | | | — | | | — | | | — | | | 2,082 | | | 5,414 | | | 7,496 |
Bond | | | — | | | — | | | — | | | — | | | — | | | 135 | | | 559 | | | 174 | | | 868 |
Income | | | 1,692 | | | 1,582 | | | 4,431 | | | 3,398 | | | 4,138 | | | 9,190 | | | 14,459 | | | 4,577 | | | 43,467 |
Low Duration | | | — | | | — | | | — | | | — | | | — | | | — | | | — | | | 1 | | | 1 |
Ready Reserves | | | 930 | | | — | | | 20 | | | — | | | — | | | 3 | | | — | | | — | | | 953 |
106 Annual Report | December 31, 2009 |
For the period from November 1, 2009 through December 31, 2009, the following Portfolios incurred net realized capital losses, foreign currency losses or PFIC losses. Each Portfolio intends to treat this loss as having occurred in fiscal year 2010 for Federal income tax purposes (in thousands):
| | | | | | | | | |
Portfolio | | Capital
Amount | | Currency
Amount | | PFIC
Amount |
Growth | | $ | — | | $ | — | | $ | — |
Large Cap Growth | | | — | | | — | | | — |
Small Cap Growth | | | — | | | — | | | — |
Mid Cap Growth | | | — | | | — | | | — |
Small-Mid Cap Growth | | | 313 | | | — | | | — |
Global Growth | | | 27 | | | — | | | — |
International Growth | | | — | | | — | | | — |
International Equity | | | — | | | 72 | | | — |
International Small Cap Growth | | | — | | | 211 | | | — |
Emerging Markets Growth | | | — | | | — | | | — |
Emerging Leaders Growth | | | — | | | — | | | — |
Value Discovery | | | 96 | | | — | | | — |
Bond | | | 7 | | | — | | | — |
Income | | | — | | | — | | | — |
Low Duration | | | — | | | — | | | — |
Ready Reserves | | | — | | | — | | | — |
(h) Repurchase Agreements
The Portfolios may enter into repurchase agreements with a select group of counterparties whereby the Portfolios acquire ownership of a debt security and the counterparty agrees, at the time of sale, to repurchase the debt security from the Portfolios at a mutually agreed upon time and price. The Portfolios’ policy is to take possession of the debt security as collateral under the repurchase agreements. The Portfolios minimize credit risk by monitoring credit exposure to the counterparty and by monitoring the collateral value on an ongoing basis.
(i) Use of Estimates
The preparation of financial statements in conformity with U.S. generally accepted accounting principles requires management to make estimates and assumptions that affect the amounts reported in the financial statements. Actual results may differ from those estimates.
(j) Fair Value Measurements
The Portfolios are subject to ASC 820 Fair Value Measurement and Disclosures, formally known as SFAS (Statement of Financial Accounting Standards) No. 157, “Fair Value Measurements.” In accordance with ASC 820, “fair value” is defined as the price that a Portfolio would receive upon selling a security in an orderly transaction to an independent buyer in the principal or most advantageous market for the investment. Various inputs are used in determining the value of a Portfolio’s investments. ASC 820 established a three-tier hierarchy of inputs to classify fair value measurements for disclosure purposes. The three-tier hierarchy of inputs is summarized in the three broad levels listed below.
| | • | | Level 1 – Quoted prices in active markets for an identical security. |
| | • | | Level 2 – Prices determined using other significant observable inputs. Observable inputs are inputs that other market participants would use in pricing a security. These may include quoted prices for similar securities, interest rates, prepayment speeds, credit risk and others. |
| | • | | Level 3 – Prices determined using significant unobservable inputs. In situations where quoted prices or observable inputs are unavailable (for example, when there is little or no market activity for an investment), unobservable inputs may be used. Unobservable inputs reflect the Fund’s own assumptions about the factors market participants would use in pricing an investment, and would be based on the best information available. |
The inputs or methodology used for valuing an investment are not necessarily an indication of the risk associated with investing in those securities. For example, money market securities are valued using amortized cost, in accordance with rules under the 1940 Act. Generally, amortized cost approximates the current fair value of a security, but since the value is not obtained from a quoted price in an active market, such securities are reflected as Level 2.
December 31, 2009 | William Blair Funds 107 |
At December 31, 2009, the Portfolios held no other financial instruments, such as, options or futures, that required fair valuation. The Small Cap Growth Portfolio holds warrants that were valued using the intrinsic pricing method. Pursuant to this methodology, the warrants had no value at December 31, 2009.
As of December 31, 2009, the hierarchical input levels of securities in, segregated by security type, each Portfolio are as follows (in thousands):
| | | | | | | | | | | | | | | | | | |
| | | Growth | | Large Cap
Growth | | Small Cap
Growth | | Mid Cap
Growth | | Small-
Mid Cap
Growth | | Global
Growth |
Investments in securities | | | | | | | | | | | | | | | | | | |
Level 1—Quoted prices | | | | | | | | | | | | | | | | | | |
Common stocks | | $ | 415,759 | | $ | 30,082 | | $ | 728,634 | | $ | 68,596 | | $ | 143,122 | | $ | 18,712 |
Preferred stock | | | — | | | — | | | 8,834 | | | — | | | — | | | — |
Short-Term Investments | | | 1,262 | | | — | | | 3,297 | | | 19 | | | 23 | | | 29 |
Level 2—Other significant observable inputs | | | | | | | | | | | | | | | | | | |
Common stocks | | | — | | | — | | | 829 | | | — | | | — | | | 19,286 |
Short-Term Investments | | | 7,805 | | | — | | | 23,561 | | | 1,996 | | | 2,438 | | | 237 |
Level 3—Significant unobservable inputs | | | | | | | | | | | | | | | | | | |
Common stock | | | — | | | — | | | 3,017 | | | — | | | — | | | — |
| | | | | | | | | | | | | | | | | | |
Total investments in securities | | $ | 424,826 | | $ | 30,082 | | $ | 768,172 | | $ | 70,611 | | $ | 145,583 | | $ | 38,264 |
| | | | | | | | | | | | | | | | | | |
| | | | | | |
| | | International
Growth | | International
Equity | | International
Small Cap
Growth | | Emerging
Markets
Growth | | Emerging
Leaders
Growth | | Value
Discovery |
Investments in securities | | | | | | | | | | | | | | | | | | |
Level 1—Quoted prices | | | | | | | | | | | | | | | | | | |
Common stocks | | $ | 564,584 | | $ | 42,740 | | $ | 27,738 | | $ | 286,573 | | $ | 29,525 | | $ | 53,991 |
Preferred stock | | | — | | | 3,724 | | | — | | | 47,507 | | | 2,544 | | | — |
Exchange-Traded Fund | | | — | | | — | | | — | | | — | | | 1,899 | | | — |
Short-Term Investments | | | 6,376 | | | 5 | | | 489 | | | 66 | | | 440 | | | 4 |
Level 2—Other significant observable inputs | | | | | | | | | | | | | | | | | | |
Common stocks | | | 3,748,944 | | | 244,632 | | | 352,532 | | | 673,138 | | | 79,065 | | | — |
Preferred stocks | | | — | | | — | | | — | | | — | | | — | | | 382 |
Convertible bond | | | 1,777 | | | — | | | 592 | | | 990 | | | — | | | — |
Short-Term Investments | | | 92,880 | | | 6,386 | | | 4,391 | | | 35,460 | | | 1,235 | | | 622 |
Level 3—Significant unobservable inputs | | | | | | | | | | | | | | | | | | |
None | | | — | | | — | | | — | | | — | | | — | | | — |
| | | | | | | | | | | | | | | | | | |
Total investments in securities | | $ | 4,414,561 | | $ | 297,487 | | $ | 385,742 | | $ | 1,043,734 | | $ | 114,708 | | $ | 54,999 |
| | | | | | | | | | | | | | | | | | |
Other financial instruments | | | | | | | | | | | | | | | | | | |
Level 2—Other significant observable inputs | | | | | | | | | | | | | | | | | | |
Forward Foreign currency contracts | | $ | 15,044 | | | — | | | — | | | — | | | — | | | — |
| | | | | | | | | | | | | | | | | | |
| | | | | | |
| | | Bond | | Income | | Low
Duration | | Ready
Reserves* | | | | |
Investments in securities | | | | | | | | | | | | | | | | | | |
Level 1—Quoted Prices | | | | | | | | | | | | | | | | | | |
None | | $ | — | | $ | — | | $ | — | | $ | — | | | | | | |
Level 2—Other significant observable inputs | | | | | | | | | | | | | | | | | | |
U.S. Government and agency bonds | | | 69,604 | | | 39,484 | | | 48,232 | | | 243,580 | | | | | | |
Corporate bonds | | | 69,371 | | | 66,977 | | | 13,426 | | | 77,237 | | | | | | |
Asset-backed bonds | | | 5,585 | | | 9,977 | | | 11,388 | | | — | | | | | | |
Commercial paper | | | — | | | — | | | — | | | 774,745 | | | | | | |
Short-Term Investments | | | 3,443 | | | 666 | | | 6,139 | | | 254,762 | | | | | | |
Level 3—Significant unobservable inputs | | | | | | | | | | | | | | | | | | |
None | | | — | | | — | | | — | | | — | | | | | | |
| | | | | | | | | | | | | | | | | | |
Total investments in securities | | $ | 148,003 | | $ | 117,104 | | $ | 79,185 | | $ | 1,350,324 | | | | | | |
| | | | | | | | | | | | | | | | | | |
| * | All of the investments held by the Ready Reserve Fund are short-term investments. |
108 Annual Report | December 31, 2009 |
The following is a reconciliation of Level 3 securities for which significant unobservable inputs were used to determine fair value:
| | | | | | | | | | | | | | | | | | | | |
| | | Balance
January 1, 2009 | | Net
Purchases/
(Sales) | | | Transfers
to/from
Level 3 | | Change in
Unrealized
Gain (Loss) | | Realized
Gain (Loss) | | | Balance
December 31, 2009 |
Small Cap Growth | | $ | 3,017 | | $ | — | | | $ | — | | $ | — | | $ | — | | | $ | 3,017 |
Bond | | | 43 | | | (15 | ) | | | — | | | 28 | | | (56 | ) | | | — |
Income | | | 1,856 | | | (562 | ) | | | — | | | 1,055 | | | (2,349 | ) | | | — |
The fair value estimate for the Level 3 security in the Small Cap Growth Portfolio was determined in good faith by the Pricing Committee in consultation with the Valuation Committee, pursuant to the Valuation Procedures adopted by the Board of Trustees. There were various factors considered in reaching this fair value determination, including, but not limited, to the following: the type of security, the extent of public trading of the security, information obtained from the broker-dealer for the security, analysis of the company’s performance and market trends that influence its performance. At December 31, 2009, these securities represented 0.40% of the net assets of the Small Cap Growth Portfolio.
(k) Subsequent Events
The Funds have evaluated subsequent events through the issuance of their financial statements on February 22, 2010 and determined no subsequent event occurred.
(l) U.S. Department of The Treasury’s Temporary Guaranty Program
On October 2, 2008, the Board of Trustees approved the participation of the Ready Reserves Portfolio in the U.S. Department of the Treasury’s Temporary Guaranty Program for Money Market Funds (the “Program”). The Program protected the NAV of certain shares of a shareholder of record in the Portfolio at the close of business on September 19, 2008. A shareholder would have received a payment in the amount of $1.00 per covered share upon liquidation of the Portfolio, if the Portfolio’s market-based NAV per share had fallen below $0.995 and was not promptly restored to $1.00. The number of covered shares is the lesser of the number of shares owned on September 19, 2008 or the number of shares owned on the date when the payment is triggered. Shares acquired by a covered shareholder after the close of business on September 19, 2008 were not guaranteed. If a customer had closed his or her account with the Portfolio or a broker-dealer or other intermediary, any future investment in the Portfolio would not have been guaranteed. Guarantee payments under the Program would not have exceeded the amount available within the Treasury’s Exchange Stabilization Fund. The Portfolio bore the expense of its participation in the Program without regard to any expense caps currently in place. The fee for initial participation in the Program was an annualized rate of 0.01% of the net assets of the Ready Reserves Portfolio as of September 18, 2008.
On December 2, 2008, the Board approved the participation of the Ready Reserves Portfolio in the First Extension (the “First Extension”) of the Program. The First Extension terminated on April 30, 2009. The fee for participating in the First Extension was an annualized rate of 0.015% of the net assets of the Portfolio as of September 18, 2008.
On April 3, 2009, the Board approved the participation of the Ready Reserves Portfolio in the Second Extension (the “Second Extension”) of the Program granted by the U.S. Department of the Treasury. The fee for participation in the Second Extension was an annualized rate of 0.015% of the net assets of the Portfolio, as of September 19, 2008. The Second Extension terminated on September 18, 2009.
(2) Accounting Pronouncements
In January 2010, the Financial Accounting Standards Board (“FASB”) issued Accounting Standards Update “Improving Disclosures about Fair Value Measurements” that requires additional disclosures regarding fair value measurements. Certain required disclosures are effective for interim and annual reporting periods beginning after December 15, 2009, and other required disclosures are effective for fiscal years beginning after December 15, 2010, and for interim periods within those fiscal years. Management is currently evaluating the impact it will have on its financial statement disclosures.
In June 2009, the FASB issued SFAS No. 168, “The FASB Accounting Standards Codification™ and the Hierarchy of Generally Accepted Accounting Principles—a replacement of FASB Statement No 162” (“SFAS 168”). SFAS 168 replaces SFAS No. 162, “The Hierarchy of Generally Accepted Accounting Principles” and establishes the “FASB Accounting Standards Codification™” (“Codification”) as the source of authoritative accounting principles recognized by the FASB to be applied by nongovernmental entities in the preparation of financial statements in conformity with U.S. GAAP. All guidance
December 31, 2009 | William Blair Funds 109 |
contained in the Codification carries an equal level of authority. On the effective date of SFAS 168, the Codification will supersede all then-existing non-SEC accounting and reporting standards. All other non-grandfathered non-SEC accounting literature not included in the Codification will become non-authoritative. SFAS 168 is effective for financial statements issued for interim and annual periods ending after September 15, 2009. The Funds adopted and incorporated this statement, and it did not have a significant impact on the determination or reporting of the Funds’ financial statements.
(3) Transactions with Affiliates
(a) Management and Expense Limitation Agreements
Each Portfolio has a management agreement with William Blair & Company L.L.C. (the “Company”) for investment advisory, clerical, bookkeeping and administrative services. Each Portfolio pays the Company an annual fee, payable monthly, based on a specified percentage of its average daily net assets. A summary of the annual rates expressed as a percentage of average daily net assets is as follows:
| | | | | | | | |
Equity Portfolios | | | | | Global Portfolio | | | |
Growth | | 0.75 | % | | Global Growth | | 1.00 | % |
Large Cap Growth Small Cap Growth | | 0.80
1.10 | %
% | | | | | |
| | | International Portfolios | | | |
Mid Cap Growth | | 0.95 | % | | International Growth and International Equity | | | |
Small-Mid Cap Growth | | 1.00 | % | | First $250 million | | 1.10 | % |
Value Discovery | | 1.10 | % | | In excess of $250 million | | 1.00 | % |
| | | | | International Small Cap Growth | | 1.00 | % |
| | | | | Emerging Markets Growth | | 1.10 | % |
| | | | | Emerging Leaders Growth | | 1.10 | % |
Fixed-Income Portfolios | | | | | | | | |
Bond Low Duration | | 0.30 | % | | Money Market Portfolio | | | |
| | 0.30 | % | | Ready Reserves | | | |
Income* | | | | | First $250 million | | 0.275 | % |
First $250 million | | 0.25 | % | | Next $250 million | | 0.250 | % |
In excess of $250 million | | 0.20 | % | | Next $2 billion | | 0.225 | % |
| | | | | In excess of $2.5 billion | | 0.200 | % |
| | | | | | | | |
*Management fee also includes a charge of 5% of gross income. | | | | | | | | |
Some of the Portfolios have also entered into Expense Limitation Agreements with the Company. Under the terms of these agreements, the Advisor will waive its management fee and/or reimburse the Portfolio for expenses in excess of the agreed upon rate. The amount the Advisor owes a Portfolio as of the reporting date is recorded as the Receivable from Advisor on the Statement of Assets and Liabilities. The Advisor reimburses the Funds on a monthly basis. Under the terms of these Agreements, the Company has agreed to waive its advisory fees and/or absorb other operating expenses through April 30, 2010, if total expenses for each class of the following Portfolios exceed the following rates (as a percentage of average daily net assets):
| | | | | | | | | | | | |
| | | Class N Shares | | | Class I Shares | |
Portfolio | | Effective
May 1, 2008
through
April 30, 2009 | | | Effective
May 1, 2009
through
April 30, 2010 | | | Effective
May 1, 2008
through
April 30, 2009 | | | Effective
May 1, 2009
through
April 30, 2010 | |
Large Cap Growth | | 1.23 | % | | 1.23 | % | | 0.98 | % | | 0.98 | % |
Small Cap Growth | | 1.50 | % | | 1.50 | % | | 1.25 | % | | 1.25 | % |
Mid Cap Growth | | 1.36 | % | | 1.36 | % | | 1.11 | % | | 1.11 | % |
Small-Mid Cap Growth | | 1.36 | % | | 1.36 | % | | 1.11 | % | | 1.11 | % |
Global Growth | | 1.55 | % | | 1.55 | % | | 1.30 | % | | 1.30 | % |
International Growth | | 1.45 | % | | 1.45 | % | | 1.20 | % | | 1.20 | % |
International Equity | | 1.45 | % | | 1.45 | % | | 1.20 | % | | 1.20 | % |
International Small Cap Growth | | 1.65 | % | | 1.65 | % | | 1.40 | % | | 1.40 | % |
Emerging Markets Growth | | 1.70 | % | | 1.70 | % | | 1.45 | % | | 1.45 | % |
Emerging Leaders Growth | | N/A | | | N/A | | | 1.40 | % | | 1.40 | % |
Value Discovery | | 1.29 | % | | 1.29 | % | | 1.09 | % | | 1.09 | % |
Bond | | 0.65 | % | | 0.65 | % | | 0.50 | % | | 0.50 | % |
Income | | 0.85 | % | | 0.85 | % | | 0.70 | % | | 0.70 | % |
Low Duration | | N/A | | | 0.70 | %(a) | | N/A | | | 0.55 | %(a) |
(a) Effective December 1, 2009 through April 30, 2011.
110 Annual Report | December 31, 2009 |
For a period of three years subsequent to the commencement of operations of the Global Growth, Emerging Leaders Growth, Bond and Low Duration Portfolios, the Company is entitled to reimbursement for previously waived fees and reimbursed expenses to the extent the overall expense ratio remains below the percentages indicated. The total amount available for recapture at December 31, 2009 was $399 (in thousands) for the Global Growth Portfolio, $180 for the Emerging Leaders Growth Portfolio, $341 for the Bond Portfolio and $14 for the Low Duration Portfolio.
The Advisor has agreed to voluntarily waive fees and reimburse expenses incurred for the Ready Reserves Fund in order to maintain a minimum yield given the current rate environment.
For the year ended December 31, 2009, the fees incurred by the Portfolios and related fee waivers were as follows (in thousands):
| | | | | | | | | | | | |
Portfolio | | Fund
Level
Waiver | | Class I
Specific
Waiver | | Class N
Specific
Waiver | | Total
Waiver |
Large Cap Growth | | $ | 71 | | $ | — | | $ | 41 | | $ | 112 |
Small Cap Growth | | | — | | | — | | | 182 | | | 182 |
Mid Cap Growth | | | 67 | | | 16 | | | 42 | | | 125 |
Small-Mid Cap Growth | | | 59 | | | 16 | | | 7 | | | 82 |
Global Growth | | | 101 | | | 3 | | | 30 | | | 134 |
International Growth | | | — | | | — | | | 129 | | | 129 |
International Equity | | | 118 | | | 300 | | | 25 | | | 443 |
International Small Cap Growth | | | — | | | — | | | 20 | | | 20 |
Emerging Markets Growth | | | — | | | — | | | 25 | | | 25 |
Emerging Leaders Growth | | | 98 | | | 1 | | | — | | | 99 |
Value Discovery | | | 161 | | | 9 | | | 7 | | | 177 |
Bond | | | 96 | | | 3 | | | 16 | | | 115 |
Income | | | — | | | — | | | 32 | | | 32 |
Low Duration | | | 14 | | | — | | | — | | | 14 |
Ready Reserves | | | 3,027 | | | — | | | — | | | 3,027 |
(b) Underwriting, Distribution Services and Service Agreement
Each Portfolio, except the Ready Reserves Portfolio and Emerging Leaders Growth Portfolio, has a Distribution Agreement with the Company for distribution services to the Portfolios’ Class N shares. Each Portfolio pays the Company an annual fee, payable monthly, based on a specified percentage of its average daily net assets of Class N shares. The annual rate expressed as a percentage of average daily net assets for Class N is 0.25% for all Portfolios except the Income, Bond and Low Duration Portfolios, which is 0.15%. Pursuant to the Distribution Agreement, the Company enters into related selling group agreements with various firms at various rates for sales of the Portfolios’ Class N shares.
The Ready Reserves Portfolio has a Service Agreement with the Company to provide shareholder services and automatic sweep services. The Portfolio pays the Company an annual fee, payable monthly, based upon 0.35% of the average daily net assets of Class N shares. The Board of Trustees has determined that the amount payable for “service fees” (as defined by FINRA (Financial Industry Regulatory Authority)) does not exceed 0.25% of the average annual net assets attributable to Class N shares.
The Global Growth, International Small Cap Growth, Emerging Markets Growth, Emerging Leaders Growth, Bond and Low Duration Portfolios have a Shareholder Administration Agreement with the Company to provide shareholder administration services. Class N and Class I shares of the Portfolios pay the Company an annual fee, payable monthly, based upon 0.15% of average daily net assets attributable to each class, respectively. For the year ended December 31, 2009, the following fees were incurred (in thousands):
| | | | | | | | | |
Portfolio | | Class N | | Class I | | Total |
Global Growth | | $ | 6 | | $ | 42 | | $ | 48 |
International Small Cap Growth | | | 18 | | | 190 | | | 208 |
Emerging Markets Growth | | | 32 | | | 192 | | | 224 |
Emerging Leaders Growth* | | | — | | | 8 | | | 8 |
Bond | | | 4 | | | 158 | | | 162 |
Low Duration | | | — | | | 8 | | | 8 |
| * | | Emerging Leaders Growth Fund does not offer Class N shares. |
December 31, 2009 | William Blair Funds 111 |
(c) Investments in Affiliated Portfolio
Pursuant to the rules of the 1940 Act, each of the Portfolios of the Fund may invest in the William Blair Ready Reserves Portfolio (“Ready Reserves”), an open-end money market portfolio managed by the Advisor. Ready Reserves Portfolio is used as a cash management option by the other Portfolios in the Fund. The Advisor waives management fees in an amount equal to the management fee and service fee that Ready Reserves receives based on the Portfolio’s net assets, less any waivers, if applicable. The fees waived with respect to each Portfolio for the year ended December 31, 2009 are listed below. Distributions received from Ready Reserves are reflected as “Dividend income from Affiliated Fund” in each Portfolio’s Statement of Operations. Amounts relating to the Portfolios’ investments in Ready Reserves were as follows for the year ended December 31, 2009 (in thousands):
| | | | | | | | | | | | | | | | | | | | | |
Portfolio | | 12/31/2008 Value | | Purchases | | Sales | | Fees
Waived | | Dividend Income | | 12/31/2009 Value | | Percent of Net Assets | |
Growth | | $ | 3,060 | | $ | 2 | | $ | 1,800 | | $ | 5 | | $ | 2 | | $ | 1,262 | | 0.3 | % |
Large Cap Growth | | | 340 | | | — | | | 340 | | | — | | | — | | | — | | 0.0 | % |
Small Cap Growth | | | 95 | | | 6,002 | | | 2,800 | | | 9 | | | 1 | | | 3,297 | | 0.4 | % |
Mid Cap Growth | | | 518 | | | 1,001 | | | 1,500 | | | 2 | | | 1 | | | 19 | | 0.1 | % |
Small-Mid Cap Growth | | | 22 | | | 2,001 | | | 2,000 | | | 1 | | | — | | | 23 | | 0.0 | % |
Global Growth | | | 29 | | | — | | | — | | | — | | | — | | | 29 | | 0.1 | % |
International Growth | | | 18,363 | | | 13 | | | 12,000 | | | 36 | | | 13 | | | 6,376 | | 0.1 | % |
International Equity | | | 4 | | | 11,001 | | | 11,000 | | | 4 | | | 1 | | | 5 | | 0.0 | % |
International Small Cap Growth | | | 3,287 | | | 2 | | | 2,800 | | | 5 | | | 2 | | | 489 | | 0.1 | % |
Emerging Markets Growth | | | 2,065 | | | 1 | | | 2,000 | | | 2 | | | 1 | | | 66 | | 0.0 | % |
Emerging Leaders Growth | | | 740 | | | 500 | | | 800 | | | 1 | | | — | | | 440 | | 0.4 | % |
Value Discovery | | | 233 | | | — | | | 229 | | | — | | | — | | | 4 | | 0.0 | % |
(4) Investment Transactions
Investment transactions, excluding money market instruments, for the year ended December 31, 2009, were as follows (in thousands):
| | | | | | | |
Portfolio | | Purchases | | Sales | |
Growth | | $ | 276,228 | | $ | (194,292 | ) |
Large Cap Growth | | | 22,458 | | | (21,912 | ) |
Small Cap Growth | | | 732,759 | | | (675,228 | ) |
Mid Cap Growth | | | 57,197 | | | (42,884 | ) |
Small-Mid Cap Growth | | | 138,691 | | | (117,864 | ) |
Global Growth | | | 41,748 | | | (42,326 | ) |
International Growth | | | 4,210,933 | | | (4,222,736 | ) |
International Equity | | | 208,820 | | | (208,310 | ) |
International Small Cap Growth | | | 425,453 | | | (469,087 | ) |
Emerging Markets Growth | | | 1,000,892 | | | (768,098 | ) |
Emerging Leaders Growth | | | 163,646 | | | (150,579 | ) |
Value Discovery | | | 34,447 | | | (25,588 | ) |
Bond | | | 110,740 | | | (34,843 | ) |
Income | | | 49,363 | | | (65,254 | ) |
Low Duration | | | 73,657 | | | (33 | ) |
(5) Forward Foreign Currency Contracts
The Global Growth, International Growth, International Equity, International Small Cap Growth, Emerging Markets Growth and Emerging Leaders Growth Portfolios from time to time may enter into forward foreign currency contracts with the Fund’s custodian and other counterparties in an attempt to hedge against a decline in the value of foreign currency against the U.S. dollar. The Portfolios bear the market risk that arises from changes in foreign currency rates and bear the credit risk if the counterparty fails to perform under the contract.
For the year ended December 31, 2009, the International Growth and International Equity Portfolios engaged in forward foreign currency contracts with total notional volume (in thousands) of $1,605,800 and $11,200, respectively.
112 Annual Report | December 31, 2009 |
The following table presents the value of open forward foreign currency contracts as of December 31, 2009 and their respective location on the Statement of Assets and Liabilities (values in thousands):
| | | | | | | | | | |
| | | Assets | | Liabilities |
Fund | | Statement of Assets and Liabilities Location | | Value | | Statement of Assets and Liabilities Location | | Value |
International Growth | | Unrealized appreciation on foreign forward currency contracts | | $ | 15,044 | | Unrealized depreciation on foreign forward currency contracts | | $ | — |
The effect of foreign currency forward contracts on the Statements of Operations for the year ended December 31, 2009 (values in thousands):
| | | |
Realized gain (loss) recognized in foreign currency transactions | | |
Fund | | Value |
International Growth | | $ | 17,657 |
International Equity | | | 486 |
| | | |
Change in unrealized gain (loss) recognized in foreign currency translations | | |
Fund | | Value |
International Growth | | $ | 15,044 |
The following table presents open forward foreign currency contracts as of December 31, 2009 (values in thousands):
| | | | | | | | | | | |
International Growth Fund | | Settlement Date | | Currency Received | | Currency Delivered | | Unrealized
Gain/Loss |
Swiss Francs | | 3/17/2010 | | USD | 68,671 | | CHF | 71,005 | | $ | 557 |
European Monetary Unit | | 3/16/2010 | | USD | 241,422 | | EUR | 168,427 | | | 6,658 |
British Pound Sterling | | 3/17/2010 | | USD | 310,773 | | GBP | 192,490 | | | 2,647 |
Japanese Yen | | 3/18/2010 | | USD | 96,567 | | JPY | 8,990,482 | | | 5,182 |
| | | | | | | | | | | |
| | | | | | | | | | $ | 15,044 |
| | | | | | | | | | | |
(6) Fund Share Transactions
The following table summarizes the activity in capital shares of each Portfolio (in thousands):
| | | | | | | | | | | | | | | | | | |
| | | Sales (Dollars) |
| | | Year Ended December 31, 2009 | | Year Ended December 31, 2008 |
Portfolio | | Class N | | Class I | | Total | | Class N | | Class I | | Total |
Growth | | $ | 67,911 | | $ | 63,683 | | $ | 131,594 | | $ | 40,500 | | $ | 22,769 | | $ | 63,269 |
Large Cap Growth | | | 923 | | | 5,311 | | | 6,234 | | | 1,370 | | | 6,227 | | | 7,597 |
Small Cap Growth | | | 225,583 | | | 92,269 | | | 317,852 | | | 182,831 | | | 95,924 | | | 278,755 |
Mid Cap Growth | | | 4,936 | | | 16,887 | | | 21,823 | | | 1,694 | | | 21,584 | | | 23,278 |
Small Mid-Cap Growth | | | 13,361 | | | 39,281 | | | 52,642 | | | 1,672 | | | 30,684 | | | 32,356 |
Global Growth | | | 465 | | | 3,968 | | | 4,433 | | | 5,845 | | | 17,564 | | | 23,409 |
International Growth | | | 645,844 | | | 715,238 | | | 1,361,082 | | | 1,279,021 | | | 815,880 | | | 2,094,901 |
International Equity | | | 4,147 | | | 83,020 | | | 87,167 | | | 62,107 | | | 103,951 | | | 166,058 |
International Small Cap Growth | | | 5,724 | | | 102,689 | | | 108,413 | | | 9,671 | | | 107,145 | | | 116,816 |
Emerging Markets Growth | | | 5,532 | | | 68,836 | | | 74,368 | | | 9,293 | | | 38,307 | | | 47,600 |
Emerging Leaders Growth (a) | | | — | | | 3,863 | | | 3,863 | | | — | | | 6,331 | | | 6,331 |
Value Discovery | | | 1,351 | | | 13,550 | | | 14,901 | | | 2,945 | | | 9,559 | | | 12,504 |
Bond | | | 3,270 | | | 69,443 | | | 72,713 | | | 165 | | | 17,428 | | | 17,593 |
Income | | | 5,949 | | | 11,021 | | | 16,970 | | | 11,731 | | | 4,694 | | | 16,425 |
Low Duration (b) | | | 1,872 | | | 82,099 | | | 83,971 | | | — | | | — | | | — |
Ready Reserves | | | 638,552 | | | — | | | 638,552 | | | 1,439,460 | | | — | | | 1,439,460 |
December 31, 2009 | William Blair Funds 113 |
| | | | | | | | | | | | | | | | | | |
| | | Reinvested Distributions (Dollars) |
| | | Year Ended December 31, 2009 | | Year Ended December 31, 2008 |
Portfolio | | Class N | | Class I | | Total | | Class N | | Class I | | Total |
Growth | | $ | — | | $ | 34 | | $ | 34 | | $ | 1,995 | | $ | 3,280 | | $ | 5,275 |
Large Cap Growth | | | — | | | 14 | | | 14 | | | — | | | — | | | — |
Small Cap Growth | | | — | | | — | | | — | | | 10,793 | | | 9,348 | | | 20,141 |
Mid Cap Growth | | | — | | | — | | | — | | | — | | | — | | | — |
Small Mid-Cap Growth | | | — | | | — | | | — | | | — | | | 3 | | | 3 |
Global Growth | | | — | | | 3 | | | 3 | | | 21 | | | 345 | | | 366 |
International Growth | | | 15,272 | | | 13,374 | | | 28,646 | | | 108,020 | | | 56,739 | | | 164,759 |
International Equity | | | 13 | | | 1,374 | | | 1,387 | | | 603 | | | 2,591 | | | 3,194 |
International Small Cap Growth | | | — | | | 249 | | | 249 | | | 193 | | | 1,365 | | | 1,558 |
Emerging Markets Growth | | | 192 | | | 1,432 | | | 1,624 | | | 1,816 | | | 7,201 | | | 9,017 |
Emerging Leaders Growth (a) | | | — | | | 100 | | | 100 | | | — | | | 1 | | | 1 |
Value Discovery | | | 19 | | | 151 | | | 170 | | | 44 | | | 243 | | | 287 |
Bond | | | 86 | | | 3,171 | | | 3,257 | | | 30 | | | 2,403 | | | 2,433 |
Income | | | 2,004 | | | 3,427 | | | 5,431 | | | 2,500 | | | 4,315 | | | 6,815 |
Low Duration (b) | | | 1 | | | 36 | | | 37 | | | — | | | — | | | — |
Ready Reserves | | | 1,710 | | | — | | | 1,710 | | | 33,710 | | | — | | | 33,710 |
| | | | | | | | | | | | | | | | | | |
| | | Redemptions (Dollars) |
| | | Year Ended December 31, 2009 | | Year Ended December 31, 2008 |
Portfolio | | Class N | | Class I | | Total | | Class N | | Class I | | Total |
Growth | | $ | 33,393 | | $ | 17,297 | | $ | 50,690 | | $ | 31,338 | | $ | 22,604 | | $ | 53,942 |
Large Cap Growth | | | 1,360 | | | 5,054 | | | 6,414 | | | 1,051 | | | 3,905 | | | 4,956 |
Small Cap Growth | | | 152,457 | | | 88,376 | | | 240,833 | | | 278,090 | | | 253,629 | | | 531,719 |
Mid Cap Growth | | | 1,417 | | | 6,314 | | | 7,731 | | | 1,551 | | | 8,033 | | | 9,584 |
Small Mid-Cap Growth | | | 1,450 | | | 28,280 | | | 29,730 | | | 4,915 | | | 17,966 | | | 22,881 |
Global Growth | | | 822 | | | 4,451 | | | 5,273 | | | 5,213 | | | 6,152 | | | 11,365 |
International Growth | | | 839,084 | | | 458,486 | | | 1,297,570 | | | 1,780,043 | | | 942,995 | | | 2,723,038 |
International Equity | | | 37,908 | | | 47,320 | | | 85,228 | | | 31,499 | | | 84,404 | | | 115,903 |
International Small Cap Growth | | | 7,257 | | | 36,128 | | | 43,385 | | | 7,979 | | | 66,904 | | | 74,883 |
Emerging Markets Growth | | | 6,566 | | | 29,337 | | | 35,903 | | | 27,912 | | | 85,134 | | | 113,046 |
Emerging Leaders Growth (a) | | | — | | | 743 | | | 743 | | | — | | | 373 | | | 373 |
Value Discovery | | | 2,315 | | | 4,882 | | | 7,197 | | | 4,879 | | | 5,770 | | | 10,649 |
Bond | | | 308 | | | 15,214 | | | 15,522 | | | 493 | | | 9,925 | | | 10,418 |
Income | | | 19,152 | | | 31,143 | | | 50,295 | | | 37,838 | | | 36,789 | | | 74,627 |
Low Duration (b) | | | — | | | 1,799 | | | 1,799 | | | — | | | — | | | — |
Ready Reserves | | | 1,128,550 | | | — | | | 1,128,550 | | | 1,031,518 | | | — | | | 1,031,518 |
114 Annual Report | December 31, 2009 |
| | | | | | | | | | | | | | | | | | | | | | | | |
| | | Net Change in Net Assets relating to Fund Share Activity (Dollars) | |
| | | Year Ended December 31, 2009 | | | Year Ended December 31, 2008 | |
Portfolio | | Class N | | | Class I | | | Total | | | Class N | | | Class I | | | Total | |
Growth | | $ | 34,518 | | | $ | 46,420 | | | $ | 80,938 | | | $ | 11,157 | | | $ | 3,445 | | | $ | 14,602 | |
Large Cap Growth | | | (437 | ) | | | 271 | | | | (166 | ) | | | 319 | | | | 2,322 | | | | 2,641 | |
Small Cap Growth | | | 73,126 | | | | 3,893 | | | | 77,019 | | | | (84,466 | ) | | | (148,357 | ) | | | (232,823 | ) |
Mid Cap Growth | | | 3,519 | | | | 10,573 | | | | 14,092 | | | | 143 | | | | 13,551 | | | | 13,694 | |
Small Mid-Cap Growth | | | 11,911 | | | | 11,001 | | | | 22,912 | | | | (3,243 | ) | | | 12,721 | | | | 9,478 | |
Global Growth | | | (357 | ) | | | (480 | ) | | | (837 | ) | | | 653 | | | | 11,757 | | | | 12,410 | |
International Growth | | | (177,968 | ) | | | 270,126 | | | | 92,158 | | | | (393,002 | ) | | | (70,376 | ) | | | (463,378 | ) |
International Equity | | | (33,748 | ) | | | 37,074 | | | | 3,326 | | | | 31,211 | | | | 22,138 | | | | 53,349 | |
International Small Cap Growth | | | (1,533 | ) | | | 66,810 | | | | 65,277 | | | | 1,885 | | | | 41,606 | | | | 43,491 | |
Emerging Markets Growth | | | (842 | ) | | | 40,931 | | | | 40,089 | | | | (16,803 | ) | | | (39,626 | ) | | | (56,429 | ) |
Emerging Leaders Growth (a) | | | — | | | | 3,220 | | | | 3,220 | | | | — | | | | 5,959 | | | | 5,959 | |
Value Discovery | | | (945 | ) | | | 8,819 | | | | 7,874 | | | | (1,890 | ) | | | 4,032 | | | | 2,142 | |
Bond | | | 3,048 | | | | 57,400 | | | | 60,448 | | | | (298 | ) | | | 9,906 | | | | 9,608 | |
Income | | | (11,199 | ) | | | (16,695 | ) | | | (27,894 | ) | | | (23,607 | ) | | | (27,780 | ) | | | (51,387 | ) |
Low Duration (b) | | | 1,873 | | | | 80,336 | | | | 82,209 | | | | — | | | | — | | | | — | |
Ready Reserves | | | (488,288 | ) | | | — | | | | (488,288 | ) | | | 441,652 | | | | — | | | | 441,652 | |
| (a) | | 2008 information is for the period from March 26, 2008 (Commencement of Operations) to June 30, 2008. |
| (b) | | For the period from December 1, 2009 (Commencement of Operations) to December 31, 2009. |
| | | | | | | | | | | | |
| | | Sales (Shares) |
| | | Year Ended December 31, 2009 | | Year Ended December 31, 2008 |
Portfolio | | Class N | | Class I | | Total | | Class N | | Class I | | Total |
Growth | | 7,884 | | 7,054 | | 14,938 | | 4,166 | | 2,490 | | 6,656 |
Large Cap Growth | | 181 | | 978 | | 1,159 | | 231 | | 1,052 | | 1,283 |
Small Cap Growth | | 14,719 | | 5,427 | | 20,146 | | 11,419 | | 5,193 | | 16,612 |
Mid Cap Growth | | 551 | | 1,894 | | 2,445 | | 183 | | 2,348 | | 2,531 |
Small Mid-Cap Growth | | 1,183 | | 4,035 | | 5,218 | | 152 | | 2,715 | | 2,867 |
Global Growth | | 80 | | 709 | | 789 | | 731 | | 2,280 | | 3,011 |
International Growth | | 43,158 | | 45,616 | | 88,774 | | 57,462 | | 37,349 | | 94,811 |
International Equity | | 474 | | 8,525 | | 8,999 | | 4,578 | | 8,151 | | 12,729 |
International Small Cap Growth | | 688 | | 11,253 | | 11,941 | | 1,014 | | 10,306 | | 11,320 |
Emerging Markets Growth | | 571 | | 7,574 | | 8,145 | | 563 | | 2,670 | | 3,233 |
Emerging Leaders
Growth (a) | | — | | 548 | | 548 | | — | | 663 | | 663 |
Value Discovery | | 166 | | 1,517 | | 1,683 | | 291 | | 974 | | 1,265 |
Bond | | 324 | | 7,009 | | 7,333 | | 16 | | 1,769 | | 1,785 |
Income | | 666 | | 1,244 | | 1,910 | | 1,283 | | 519 | | 1,802 |
Low Duration (b) | | 187 | | 8,211 | | 8,398 | | — | | — | | — |
Ready Reserves | | 638,552 | | — | | 638,552 | | 1,439,460 | | — | | 1,439,460 |
December 31, 2009 | William Blair Funds 115 |
| | | | | | | | | | | | |
| | | Reinvested Distributions (Shares) |
| | | Year Ended December 31, 2009 | | Year Ended December 31, 2008 |
Portfolio | | Class N | | Class I | | Total | | Class N | | Class I | | Total |
Growth | | — | | 3 | | 3 | | 287 | | 458 | | 745 |
Large Cap Growth | | — | | 2 | | 2 | | — | | — | | — |
Small Cap Growth | | — | | — | | — | | 921 | | 774 | | 1,695 |
Mid Cap Growth | | — | | — | | — | | — | | — | | — |
Small Mid-Cap Growth | | — | | — | | — | | — | | — | | — |
Global Growth | | — | | — | | — | | 4 | | 71 | | 75 |
International Growth | | 843 | | 722 | | 1,565 | | 8,341 | | 4,289 | | 12,630 |
International Equity | | 2 | | 126 | | 128 | | 74 | | 313 | | 387 |
International Small Cap Growth | | — | | 24 | | 24 | | 29 | | 205 | | 234 |
Emerging Markets Growth | | 15 | | 115 | | 130 | | 243 | | 956 | | 1,199 |
Emerging Leaders
Growth (a) | | — | | 12 | | 12 | | — | | — | | — |
Value Discovery | | 2 | | 15 | | 17 | | 6 | | 30 | | 36 |
Bond | | 9 | | 313 | | 322 | | 3 | | 245 | | 248 |
Income | | 225 | | 387 | | 612 | | 277 | | 481 | | 758 |
Low Duration (b) | | — | | 4 | | 4 | | — | | — | | — |
Ready Reserves | | 1,710 | | — | | 1,710 | | 33,710 | | — | | 33,710 |
| | | | | | | | | | | | |
| | | Redemptions (Shares) |
| | | Year Ended December 31, 2009 | | Year Ended December 31, 2008 |
Portfolio | | Class N | | Class I | | Total | | Class N | | Class I | | Total |
Growth | | 4,263 | | 1,994 | | 6,257 | | 3,236 | | 2,370 | | 5,606 |
Large Cap Growth | | 249 | | 973 | | 1,222 | | 169 | | 639 | | 808 |
Small Cap Growth | | 10,272 | | 5,811 | | 16,083 | | 16,473 | | 14,593 | | 31,066 |
Mid Cap Growth | | 169 | | 744 | | 913 | | 175 | | 907 | | 1,082 |
Small Mid-Cap Growth | | 148 | | 2,837 | | 2,985 | | 481 | | 1,693 | | 2,174 |
Global Growth | | 140 | | 818 | | 958 | | 917 | | 1,100 | | 2,017 |
International Growth | | 58,042 | | 30,142 | | 88,184 | | 92,111 | | 53,305 | | 145,416 |
International Equity | | 4,210 | | 5,321 | | 9,531 | | 3,155 | | 7,369 | | 10,524 |
International Small Cap Growth | | 976 | | 4,632 | | 5,608 | | 894 | | 7,715 | | 8,609 |
Emerging Markets Growth | | 678 | | 3,007 | | 3,685 | | 2,082 | | 7,138 | | 9,220 |
Emerging Leaders
Growth (a) | | — | | 123 | | 123 | | — | | 54 | | 54 |
Value Discovery | | 278 | | 562 | | 840 | | 491 | | 622 | | 1,113 |
Bond | | 30 | | 1,505 | | 1,535 | | 51 | | 1,023 | | 1,074 |
Income | | 2,155 | | 3,558 | | 5,713 | | 4,244 | | 4,106 | | 8,350 |
Low Duration (b) | | — | | 180 | | 180 | | — | | — | | — |
Ready Reserves | | 1,128,550 | | — | | 1,128,550 | | 1,031,518 | | — | | 1,031,518 |
116 Annual Report | December 31, 2009 |
| | | | | | | | | | | | | | | | | | |
| | | Net Change in Shares Outstanding
relating to Fund Share Activity (Shares) | |
| | | Year Ended December 31, 2009 | | | Year Ended December 31, 2008 | |
Portfolio | | Class N | | | Class I | | | Total | | | Class N | | | Class I | | | Total | |
Growth | | 3,621 | | | 5,063 | | | 8,684 | | | 1,217 | | | 578 | | | 1,795 | |
Large Cap Growth | | (68 | ) | | 7 | | | (61 | ) | | 62 | | | 413 | | | 475 | |
Small Cap Growth | | 4,447 | | | (384 | ) | | 4,063 | | | (4,133 | ) | | (8,626 | ) | | (12,759 | ) |
Mid Cap Growth | | 382 | | | 1,150 | | | 1,532 | | | 8 | | | 1,441 | | | 1,449 | |
Small Mid-Cap Growth | | 1,035 | | | 1,198 | | | 2,233 | | | (329 | ) | | 1,022 | | | 693 | |
Global Growth | | (60 | ) | | (109 | ) | | (169 | ) | | (182 | ) | | 1,251 | | | 1,069 | |
International Growth | | (14,041 | ) | | 16,196 | | | 2,155 | | | (26,308 | ) | | (11,667 | ) | | (37,975 | ) |
International Equity | | (3,734 | ) | | 3,330 | | | (404 | ) | | 1,497 | | | 1,095 | | | 2,592 | |
International Small Cap Growth | | (288 | ) | | 6,645 | | | 6,357 | | | 149 | | | 2,796 | | | 2,945 | |
Emerging Markets Growth | | (92 | ) | | 4,682 | | | 4,590 | | | (1,276 | ) | | (3,512 | ) | | (4,788 | ) |
Emerging Leaders
Growth (a) | | — | | | 437 | | | 437 | | | — | | | 609 | | | 609 | |
Value Discovery | | (110 | ) | | 970 | | | 860 | | | (194 | ) | | 382 | | | 188 | |
Bond | | 303 | | | 5,817 | | | 6,120 | | | (32 | ) | | 991 | | | 959 | |
Income | | (1,264 | ) | | (1,927 | ) | | (3,191 | ) | | (2,684 | ) | | (3,106 | ) | | (5,790 | ) |
Low Duration (b) | | 187 | | | 8,035 | | | 8,222 | | | — | | | — | | | — | |
Ready Reserves | | (488,288 | ) | | — | | | (488,288 | ) | | 441,652 | | | — | | | 441,652 | |
| (a) | | 2008 information is for the period from March 26, 2008 (Commencement of Operations) to December 31, 2008. |
| (b) | | For the period from December 1, 2009 (Commencement of Operations) to December 31, 2009. |
December 31, 2009 | William Blair Funds 117 |
Financial Highlights
Growth Fund
| | | | | | | | | | | | | | | | | | | | |
| | | Class N | |
| | | Years Ended December 31, | |
| | | 2009 | | | 2008 | | | 2007 | | | 2006 | | | 2005 | |
Net asset value, beginning of year | | $ | 7.12 | | | $ | 11.70 | | | $ | 11.42 | | | $ | 11.33 | | | $ | 10.70 | |
Income (loss) from investment operations: | | | | | | | | | | | | | | | | | | | | |
Net investment income (loss) | | | (0.02 | ) | | | (0.05 | ) | | | (0.04 | ) | | | (0.06 | ) | | | (0.06 | ) |
Net realized and unrealized gain (loss) on investments | | | 2.79 | | | | (4.35 | ) | | | 1.53 | | | | 1.48 | | | | 1.11 | |
| | | | | | | | | | | | | | | | | | | | |
Total from investment operations | | | 2.77 | | | | (4.40 | ) | | | 1.49 | | | | 1.42 | | | | 1.05 | |
Less distributions from: | | | | | | | | | | | | | | | | | | | | |
Net investment income | | | — | | | | — | | | | — | | | | — | | | | — | |
Net realized gain | | | — | | | | 0.18 | | | | 1.21 | | | | 1.33 | | | | 0.42 | |
| | | | | | | | | | | | | | | | | | | | |
Total distributions | | | — | | | | 0.18 | | | | 1.21 | | | | 1.33 | | | | 0.42 | |
| | | | | | | | | | | | | | | | | | | | |
Net asset value, end of year | | $ | 9.89 | | | $ | 7.12 | | | $ | 11.70 | | | $ | 11.42 | | | $ | 11.33 | |
| | | | | | | | | | | | | | | | | | | | |
Total return (%) | | | 38.90 | | | | (37.61 | ) | | | 13.17 | | | | 12.42 | | | | 9.75 | |
Ratios to average daily net assets (%): | | | | | | | | | | | | | | | | | | | | |
Expenses | | | 1.23 | | | | 1.17 | | | | 1.22 | | | | 1.17 | | | | 1.15 | |
Net investment income (loss) | | | (0.20 | ) | | | (0.54 | ) | | | (0.35 | ) | | | (0.49 | ) | | | (0.60 | ) |
| | | | | | | | | | | | | | | | | | | | |
| | | Class I | |
| | | Years Ended December 31, | |
| | | 2009 | | | 2008 | | | 2007 | | | 2006 | | | 2005 | |
Net asset value, beginning of year | | $ | 7.35 | | | $ | 12.02 | | | $ | 11.66 | | | $ | 11.52 | | | $ | 10.84 | |
Income (loss) from investment operations: | | | | | | | | | | | | | | | | | | | | |
Net investment income (loss) | | | 0.01 | | | | (0.02 | ) | | | 0.00 | * | | | (0.02 | ) | | | (0.04 | ) |
Net realized and unrealized gain (loss) on investments | | | 2.88 | | | | (4.47 | ) | | | 1.57 | | | | 1.49 | | | | 1.14 | |
| | | | | | | | | | | | | | | | | | | | |
Total from investment operations | | | 2.89 | | | | (4.49 | ) | | | 1.57 | | | | 1.47 | | | | 1.10 | |
Less distributions from: | | | | | | | | | | | | | | | | | | | | |
Net investment income | | | 0.00 | * | | | — | | | | — | | | | — | | | | — | |
Net realized gain | | | — | | | | 0.18 | | | | 1.21 | | | | 1.33 | | | | 0.42 | |
| | | | | | | | | | | | | | | | | | | | |
Total distributions | | | 0.00 | * | | | 0.18 | | | | 1.21 | | | | 1.33 | | | | 0.42 | |
| | | | | | | | | | | | | | | | | | | | |
Net asset value, end of year | | $ | 10.24 | | | $ | 7.35 | | | $ | 12.02 | | | $ | 11.66 | | | $ | 11.52 | |
| | | | | | | | | | | | | | | | | | | | |
Total return (%) | | | 39.34 | | | | (37.35 | ) | | | 13.59 | | | | 12.64 | | | | 10.08 | |
Ratios to average daily net assets (%): | | | | | | | | | | | | | | | | | | | | |
Expenses | | | 0.89 | | | | 0.85 | | | | 0.87 | | | | 0.89 | | | | 0.90 | |
Net investment income (loss) | | | 0.14 | | | | (0.22 | ) | | | 0.00 | | | | (0.20 | ) | | | (0.35 | ) |
| | | | | | | | | | | | | | | |
| | | Years Ended December 31, |
| | | 2009 | | 2008 | | 2007 | | 2006 | | 2005 |
Supplemental data for all classes: | | | | | | | | | | | | | | | |
Net assets at end of year (in thousands) | | $ | 419,520 | | $ | 238,586 | | $ | 369,644 | | $ | 264,525 | | $ | 253,599 |
Portfolio turnover rate (%) | | | 67 | | | 60 | | | 72 | | | 61 | | | 54 |
| * | | Amount is less than $0.005 per share. |
Performance cited represents past performance. Past performance does not guarantee future results and current performance may be lower or higher than the data quoted. Results shown are annual returns, which assume reinvestment of dividends and capital gains. Investment returns and principal will fluctuate and you may have a gain or loss when you sell shares. For the most current month-end performance information, please call 1-800-742-7272 or visit our Web site at www.williamblairfunds.com.
Note: Net investment income (loss) per share is based on the average shares outstanding during the year.
118 Annual Report | December 31, 2009 |
Financial Highlights
Large Cap Growth Fund
| | | | | | | | | | | | | | | | | | | | |
| | | Class N | |
| | | Years Ended December 31, | |
| | | 2009 | | | 2008 | | | 2007 | | | 2006 | | | 2005 | |
Net asset value, beginning of year | | $ | 4.68 | | | $ | 7.52 | | | $ | 6.88 | | | $ | 6.47 | | | $ | 6.24 | |
Income (loss) from investment operations: | | | | | | | | | | | | | | | | | | | | |
Net investment income (loss) | | | (0.01 | ) | | | (0.02 | ) | | | (0.01 | ) | | | (0.02 | ) | | | (0.02 | ) |
Net realized and unrealized gain (loss) on investments | | | 1.49 | | | | (2.82 | ) | | | 0.65 | | | | 0.43 | | | | 0.25 | |
| | | | | | | | | | | | | | | | | | | | |
Total from investment operations | | | 1.48 | | | | (2.84 | ) | | | 0.64 | | | | 0.41 | | | | 0.23 | |
Less distributions from: | | | | | | | | | | | | | | | | | | | | |
Net investment income | | | — | | | | 0.00 | * | | | — | | | | — | | | | — | |
Net realized gain | | | — | | | | — | | | | — | | | | — | | | | — | |
| | | | | | | | | | | | | | | | | | | | |
Total distributions | | | — | | | | 0.00 | * | | | — | | | | — | | | | — | |
| | | | | | | | | | | | | | | | | | | | |
Net asset value, end of year | | $ | 6.16 | | | $ | 4.68 | | | $ | 7.52 | | | $ | 6.88 | | | $ | 6.47 | |
| | | | | | | | | | | | | | | | | | | | |
Total return (%) | | | 31.62 | | | | (37.76 | ) | | | 9.30 | | | | 6.34 | | | | 3.69 | |
Ratios to average daily net assets (%): | | | | | | | | | | | | | | | | | | | | |
Expenses, net of waivers and reimbursements | | | 1.23 | | | | 1.23 | | | | 1.23 | | | | 1.24 | | | | 1.28 | |
Expenses, before waivers and reimbursements | | | 2.28 | | | | 1.85 | | | | 1.50 | | | | 1.63 | | | | 2.08 | |
Net investment income (loss), net of waivers and reimbursements | | | (0.13 | ) | | | (0.29 | ) | | | (0.16 | ) | | | (0.29 | ) | | | (0.37 | ) |
Net investment income (loss), before waivers and reimbursements | | | (1.18 | ) | | | (0.91 | ) | | | (0.43 | ) | | | (0.68 | ) | | | (1.17 | ) |
| | | | | | | | | | | | | | | | | | | | |
| | | Class I | |
| | | Years Ended December 31, | |
| | | 2009 | | | 2008 | | | 2007 | | | 2006 | | | 2005 | |
Net asset value, beginning of year | | $ | 4.77 | | | $ | 7.64 | | | $ | 6.99 | | | $ | 6.56 | | | $ | 6.31 | |
Income (loss) from investment operations: | | | | | | | | | | | | | | | | | | | | |
Net investment income (loss) | | | 0.01 | | | | 0.00 | * | | | 0.01 | | | | (0.00 | )* | | | (0.01 | ) |
Net realized and unrealized gain (loss) on investments | | | 1.52 | | | | (2.87 | ) | | | 0.64 | | | | 0.43 | | | | 0.26 | |
| | | | | | | | | | | | | | | | | | | | |
Total from investment operations | | | 1.53 | | | | (2.87 | ) | | | 0.65 | | | | 0.43 | | | | 0.25 | |
Less distributions from: | | | | | | | | | | | | | | | | | | | | |
Net investment income | | | 0.00 | * | | | 0.00 | * | | | — | | | | — | | | | — | |
Net realized gain | | | — | | | | — | | | | — | | | | — | | | | — | |
| | | | | | | | | | | | | | | | | | | | |
Total distributions | | | 0.00 | * | | | 0.00 | * | | | — | | | | — | | | | — | |
| | | | | | | | | | | | | | | | | | | | |
Net asset value, end of year | | $ | 6.30 | | | $ | 4.77 | | | $ | 7.64 | | | $ | 6.99 | | | $ | 6.56 | |
| | | | | | | | | | | | | | | | | | | | |
Total return (%) | | | 32.17 | | | | (37.56 | ) | | | 9.36 | | | | 6.55 | | | | 3.96 | |
Ratios to average daily net assets (%): | | | | | | | | | | | | | | | | | | | | |
Expenses, net of waivers and reimbursements | | | 0.98 | | | | 0.98 | | | | 0.98 | | | | 0.99 | | | | 1.03 | |
Expenses, before waivers and reimbursements | | | 1.26 | | | | 1.21 | | | | 1.20 | | | | 1.38 | | | | 1.83 | |
Net investment income (loss), net of waivers and reimbursements | | | 0.12 | | | | (0.04 | ) | | | 0.18 | | | | (0.04 | ) | | | (0.12 | ) |
Net investment income (loss), before waivers and reimbursements | | | (0.16 | ) | | | (0.27 | ) | | | (0.04 | ) | | | (0.43 | ) | | | (0.92 | ) |
| | | | | | | | | | | | | | | |
| | | Years Ended December 31, |
| | | 2009 | | 2008 | | 2007 | | 2006 | | 2005 |
Supplemental data for all classes: | | | | | | | | | | | | | | | |
Net assets at end of year (in thousands) | | $ | 30,311 | | $ | 23,279 | | $ | 33,667 | | $ | 20,191 | | $ | 16,888 |
Portfolio turnover rate (%) | | | 88 | | | 85 | | | 60 | | | 53 | | | 53 |
| * | | Amount is less than $0.005 per share. |
Performance cited represents past performance. Past performance does not guarantee future results and current performance may be lower or higher than the data quoted. Results shown are annual returns, which assume reinvestment of dividends and capital gains. Investment returns and principal will fluctuate and you may have a gain or loss when you sell shares. For the most current month-end performance information, please call 1-800-742-7272 or visit our Web site at www.williamblairfunds.com.
Note: Net investment income (loss) per share is based on the average shares outstanding during the year.
December 31, 2009 | William Blair Funds 119 |
Financial Highlights
Small Cap Growth Fund
| | | | | | | | | | | | | | | | | | | | |
| | | Class N | |
| | | Years Ended December 31, | |
| | | 2009 | | | 2008 | | | 2007 | | | 2006 | | | 2005 | |
Net asset value, beginning of year | | $ | 11.79 | | | $ | 23.30 | | | $ | 25.41 | | | $ | 23.76 | | | $ | 25.72 | |
Income (loss) from investment operations: | | | | | | | | | | | | | | | | | | | | |
Net investment income (loss) | | | (0.15 | ) | | | (0.19 | ) | | | (0.33 | ) | | | (0.29 | ) | | | (0.30 | ) |
Net realized and unrealized gain (loss) on investments | | | 8.35 | | | | (10.73 | ) | | | (0.25 | ) | | | 3.65 | | | | 0.64 | |
| | | | | | | | | | | | | | | | | | | | |
Total from investment operations | | | 8.20 | | | | (10.92 | ) | | | (0.58 | ) | | | 3.36 | | | | 0.34 | |
Less distributions from: | | | | | | | | | | | | | | | | | | | | |
Net investment income | | | — | | | | — | | | | — | | | | — | | | | — | |
Net realized gain | | | — | | | | 0.59 | | | | 1.53 | | | | 1.71 | | | | 2.30 | |
| | | | | | | | | | | | | | | | | | | | |
Total distributions | | | — | | | | 0.59 | | | | 1.53 | | | | 1.71 | | | | 2.30 | |
| | | | | | | | | | | | | | | | | | | | |
Net asset value, end of year | | $ | 19.99 | | | $ | 11.79 | | | $ | 23.30 | | | $ | 25.41 | | | $ | 23.76 | |
| | | | | | | | | | | | | | | | | | | | |
Total return (%) | | | 69.55 | | | | (46.85 | ) | | | (2.15 | ) | | | 14.12 | | | | 1.18 | |
Ratios to average daily net assets (%): | | | | | | | | | | | | | | | | | | | | |
Expenses, net of waivers and reimbursements | | | 1.50 | | | | 1.50 | | | | 1.49 | | | | 1.48 | | | | 1.49 | |
Expenses, before waivers and reimbursements | | | 1.55 | | | | 1.50 | | | | 1.49 | | | | 1.48 | | | | 1.49 | |
Net investment income (loss) | | | (0.93 | ) | | | (1.05 | ) | | | (1.24 | ) | | | (1.14 | ) | | | (1.23 | ) |
Net investment income (loss), before waivers and reimbursements | | | (0.98 | ) | | | (1.05 | ) | | | (1.24 | ) | | | (1.14 | ) | | | (1.23 | ) |
| | | | | | | | | | | | | | | | | | | | |
| | | Class I | |
| | | Years Ended December 31, | |
| | | 2009 | | | 2008 | | | 2007 | | | 2006 | | | 2005 | |
Net asset value, beginning of year | | $ | 12.14 | | | $ | 23.89 | | | $ | 25.94 | | | $ | 24.16 | | | $ | 26.04 | |
Income (loss) from investment operations: | | | | | | | | | | | | | | | | | | | | |
Net investment income (loss) | | | (0.11 | ) | | | (0.14 | ) | | | (0.25 | ) | | | (0.22 | ) | | | (0.25 | ) |
Net realized and unrealized gain (loss) on investments | | | 8.61 | | | | (11.02 | ) | | | (0.27 | ) | | | 3.71 | | | | 0.67 | |
| | | | | | | | | | | | | | | | | | | | |
Total from investment operations | | | 8.50 | | | | (11.16 | ) | | | (0.52 | ) | | | 3.49 | | | | 0.42 | |
Less distributions from: | | | | | | | | | | | | | | | | | | | | |
Net investment income | | | — | | | | — | | | | — | | | | — | | | | — | |
Net realized gain | | | — | | | | 0.59 | | | | 1.53 | | | | 1.71 | | | | 2.30 | |
| | | | | | | | | | | | | | | | | | | | |
Total distributions | | | — | | | | 0.59 | | | | 1.53 | | | | 1.71 | | | | 2.30 | |
| | | | | | | | | | | | | | | | | | | | |
Net asset value, end of year | | $ | 20.64 | | | $ | 12.14 | | | $ | 23.89 | | | $ | 25.94 | | | $ | 24.16 | |
| | | | | | | | | | | | | | | | | | | | |
Total return (%) | | | 70.02 | | | | (46.70 | ) | | | (1.88 | ) | | | 14.42 | | | | 1.48 | |
Ratios to average daily net assets (%): | | | | | | | | | | | | | | | | | | | | |
Expenses | | | 1.20 | | | | 1.20 | | | | 1.20 | | | | 1.21 | | | | 1.24 | |
Net investment income (loss) | | | (0.63 | ) | | | (0.75 | ) | | | (0.94 | ) | | | (0.87 | ) | | | (0.98 | ) |
| | | | | | | | | | | | | | | |
| | | Years Ended December 31, |
| | | 2009 | | 2008 | | 2007 | | 2006 | | 2005 |
Supplemental data for all classes: | | | | | | | | | | | | | | | |
Net assets at end of year (in thousands) | | $ | 762,798 | | $ | 401,627 | | $ | 1,094,419 | | $ | 1,261,174 | | $ | 831,738 |
Portfolio turnover rate (%) | | | 122 | | | 135 | | | 97 | | | 105 | | | 80 |
Performance cited represents past performance. Past performance does not guarantee future results and current performance may be lower or higher than the data quoted. Results shown are annual returns, which assume reinvestment of dividends and capital gains. Investment returns and principal will fluctuate and you may have a gain or loss when you sell shares. For the most current month-end performance information, please call 1-800-742-7272 or visit our Web site at www.williamblairfunds.com.
Note: Net investment income (loss) per share is based on the average shares outstanding during the year.
120 Annual Report | December 31, 2009 |
Financial Highlights
Mid Cap Growth Fund
| | | | | | | | | | | | | | | | |
| | | Class N | |
| | | Periods Ended December 31, | |
| | | 2009 | | | 2008 | | | 2007 | | | 2006(a) | |
Net asset value, beginning of year | | $ | 7.41 | | | $ | 11.35 | | | $ | 10.46 | | | $ | 10.00 | |
Income (loss) from investment operations: | | | | | | | | | | | | | | | | |
Net investment income (loss) | | | (0.04 | ) | | | (0.07 | ) | | | (0.07 | ) | | | (0.07 | ) |
Net realized and unrealized gain (loss) on investments | | | 2.71 | | | | (3.87 | ) | | | 1.59 | | | | 0.53 | |
| | | | | | | | | | | | | | | | |
Total from investment operations | | | 2.67 | | | | (3.94 | ) | | | 1.52 | | | | 0.46 | |
Less distributions from: | | | | | | | | | | | | | | | | |
Net investment income | | | — | | | | — | | | | — | | | | — | |
Net realized gain | | | — | | | | 0.00 | * | | | 0.63 | | | | — | |
| | | | | | | | | | | | | | | | |
Total distributions | | | — | | | | 0.00 | | | | 0.63 | | | | — | |
| | | | | | | | | | | | | | | | |
Net asset value, end of year | | $ | 10.08 | | | $ | 7.41 | | | $ | 11.35 | | | $ | 10.46 | |
| | | | | | | | | | | | | | | | |
Total return (%) | | | 36.03 | | | | (34.71 | ) | | | 14.62 | | | | 4.60 | (b) |
Ratios to average daily net assets (%): | | | | | | | | | | | | | | | | |
Expenses, net of waivers and reimbursements | | | 1.36 | | | | 1.36 | | | | 1.38 | | | | 1.40 | (c) |
Expenses, before waivers and reimbursements | | | 2.13 | | | | 2.03 | | | | 1.67 | | | | 2.35 | (c) |
Net investment income (loss), net of waivers and reimbursements | | | (0.51 | ) | | | (0.76 | ) | | | (0.58 | ) | | | (0.70 | )(c) |
Net investment income (loss), before waivers and reimbursements | | | (1.28 | ) | | | (1.43 | ) | | | (0.87 | ) | | | (1.65 | )(c) |
| | | | | | | | | | | | | | | | |
| | | Class I | |
| | | Periods Ended December 31, | |
| | | 2009 | | | 2008 | | | 2007 | | | 2006(a) | |
Net asset value, beginning of year | | $ | 7.48 | | | $ | 11.42 | | | $ | 10.49 | | | $ | 10.00 | |
Income (loss) from investment operations: | | | | | | | | | | | | | | | | |
Net investment income (loss) | | | (0.02 | ) | | | (0.05 | ) | | | (0.04 | ) | | | (0.04 | ) |
Net realized and unrealized gain (loss) on investments | | | 2.74 | | | | (3.89 | ) | | | 1.60 | | | | 0.53 | |
| | | | | | | | | | | | | | | | |
Total from investment operations | | | 2.72 | | | | (3.94 | ) | | | 1.56 | | | | 0.49 | |
Less distributions from: | | | | | | | | | | | | | | | | |
Net investment income | | | — | | | | — | | | | — | | | | — | |
Net realized gain | | | — | | | | 0.00 | * | | | 0.63 | | | | — | |
| | | | | | | | | | | | | | | | |
Total distributions | | | — | | | | 0.00 | * | | | 0.63 | | | | — | |
| | | | | | | | | | | | | | | | |
Net asset value, end of year | | $ | 10.20 | | | $ | 7.48 | | | $ | 11.42 | | | $ | 10.49 | |
| | | | | | | | | | | | | | | | |
Total return (%) | | | 36.36 | | | | (34.50 | ) | | | 14.95 | | | | 4.90 | (b) |
Ratios to average daily net assets (%): | | | | | | | | | | | | | | | | |
Expenses, net of waivers and reimbursements | | | 1.11 | | | | 1.11 | | | | 1.12 | | | | 1.15 | (c) |
Expenses, before waivers and reimbursements | | | 1.28 | | | | 1.23 | | | | 1.37 | | | | 2.10 | (c) |
Net investment income (loss), net of waivers and reimbursements | | | (0.26 | ) | | | (0.51 | ) | | | (0.32 | ) | | | (0.43 | )(c) |
Net investment income (loss), before waivers and reimbursements | | | (0.43 | ) | | | (0.63 | ) | | | (0.57 | ) | | | (1.38 | )(c) |
| | | | | | | | | | | | | |
| | | Periods Ended December 31, | |
| | | 2009 | | 2008 | | 2007 | | 2006(a) | |
Supplemental data for all classes: | | | | | | | | | | | | | |
Net assets at end of year (in thousands) | | $ | 70,834 | | $ | 40,526 | | $ | 45,393 | | $ | 19,639 | |
Portfolio turnover rate (%) | | | 87 | | | 76 | | | 66 | | | 56 | (c) |
| (a) | | For the period February 1, 2006 (Commencement of Operations) to December 31, 2006. |
| (b) | | Total return is not annualized for periods that are less than a year. |
| (c) | | Rates are annualized for periods that are less than a year. |
| * | | Amount is less than $0.005 per share. |
Performance cited represents past performance. Past performance does not guarantee future results and current performance may be lower or higher than the data quoted. Results shown are annual returns, which assume reinvestment of dividends and capital gains. Investment returns and principal will fluctuate and you may have a gain or loss when you sell shares. For the most current month-end performance information, please call 1-800-742-7272 or visit our Web site at www.williamblairfunds.com.
Note: Net investment income (loss) per share is based on the average shares outstanding during the year.
December 31, 2009 | William Blair Funds 121 |
Financial Highlights
Small Mid Cap Growth Fund
| | | | | | | | | | | | | | | | | | | | |
| | | Class N | |
| | | Years Ended December 31, | |
| | | 2009 | | | 2008 | | | 2007 | | | 2006 | | | 2005 | |
Net asset value, beginning of year | | $ | 8.16 | | | $ | 13.10 | | | $ | 12.96 | | | $ | 12.40 | | | $ | 11.28 | |
Income (loss) from investment operations: | | | | | | | | | | | | | | | | | | | | |
Net investment income (loss) | | | (0.06 | ) | | | (0.03 | ) | | | (0.12 | ) | | | (0.11 | ) | | | (0.11 | ) |
Net realized and unrealized gain (loss) on investments | | | 3.63 | | | | (4.91 | ) | | | 1.71 | | | | 1.32 | | | | 1.32 | |
| | | | | | | | | | | | | | | | | | | | |
Total from investment operations | | | 3.57 | | | | (4.94 | ) | | | 1.59 | | | | 1.21 | | | | 1.21 | |
Less distributions from: | | | | | | | | | | | | | | | | | | | | |
Net investment income | | | — | | | | — | | | | — | | | | — | | | | — | |
Net realized gain | | | — | | | | 0.00 | * | | | 1.45 | | | | 0.65 | | | | 0.09 | |
| | | | | | | | | | | | | | | | | | | | |
Total distributions | | | — | | | | 0.00 | * | | | 1.45 | | | | 0.65 | | | | 0.09 | |
| | | | | | | | | | | | | | | | | | | | |
Net asset value, end of year | | $ | 11.73 | | | $ | 8.16 | | | $ | 13.10 | | | $ | 12.96 | | | $ | 12.40 | |
| | | | | | | | | | | | | | | | | | | | |
Total return (%) | | | 43.75 | | | | (37.71 | ) | | | 12.34 | | | | 9.68 | | | | 10.72 | |
Ratios to average daily net assets (%): | | | | | | | | | | | | | | | | | | | | |
Expenses, net of waivers and reimbursements | | | 1.36 | | | | 1.36 | | | | 1.36 | | | | 1.38 | | | | 1.45 | |
Expenses, before waivers and reimbursements | | | 1.49 | | | | 1.41 | | | | 1.42 | | | | 1.45 | | | | 1.54 | |
Net investment income (loss), net of waivers and reimbursements | | | (0.60 | ) | | | (0.26 | ) | | | (0.79 | ) | | | (0.86 | ) | | | (0.97 | ) |
Net investment income (loss), before waivers and reimbursements | | | (0.73 | ) | | | (0.31 | ) | | | (0.85 | ) | | | (0.93 | ) | | | (1.06 | ) |
| | | | | | | | | | | | | | | | | | | | |
| | | Class I | |
| | | Years Ended December 31, | |
| | | 2009 | | | 2008 | | | 2007 | | | 2006 | | | 2005 | |
Net asset value, beginning of year | | $ | 8.27 | | | $ | 13.24 | | | $ | 13.06 | | | $ | 12.46 | | | $ | 11.30 | |
Income (loss) from investment operations: | | | | | | | | | | | | | | | | | | | | |
Net investment income (loss) | | | (0.03 | ) | | | 0.00 | * | | | (0.08 | ) | | | (0.08 | ) | | | (0.08 | ) |
Net realized and unrealized gain (loss) on investments | | | 3.69 | | | | (4.97 | ) | | | 1.71 | | | | 1.33 | | | | 1.33 | |
| | | | | | | | | | | | | | | | | | | | |
Total from investment operations | | | 3.66 | | | | (4.97 | ) | | | 1.63 | | | | 1.25 | | | | 1.25 | |
Less distributions from: | | | | | | | | | | | | | | | | | | | | |
Net investment income | | | 0.00 | * | | | — | | | | — | | | | — | | | | — | |
Net realized gain | | | — | | | | 0.00 | * | | | 1.45 | | | | 0.65 | | | | 0.09 | |
| | | | | | | | | | | | | | | | | | | | |
Total distributions | | | 0.00 | * | | | 0.00 | * | | | 1.45 | | | | 0.65 | | | | 0.09 | |
| | | | | | | | | | | | | | | | | | | | |
Net asset value, end of year | | $ | 11.93 | | | $ | 8.27 | | | $ | 13.24 | | | $ | 13.06 | | | $ | 12.46 | |
| | | | | | | | | | | | | | | | | | | | |
Total return (%) | | | 44.26 | | | | (37.54 | ) | | | 12.54 | | | | 9.95 | | | | 11.05 | |
Ratios to average daily net assets (%): | | | | | | | | | | | | | | | | | | | | |
Expenses, net of waivers and reimbursements | | | 1.11 | | | | 1.11 | | | | 1.11 | | | | 1.13 | | | | 1.20 | |
Expenses, before waivers and reimbursements | | | 1.18 | | | | 1.17 | | | | 1.17 | | | | 1.20 | | | | 1.29 | |
Net investment income (loss), net of waivers and reimbursements | | | (0.33 | ) | | | 0.03 | | | | (0.54 | ) | | | (0.61 | ) | | | (0.72 | ) |
Net investment income (loss), before waivers and reimbursements | | | (0.40 | ) | | | (0.03 | ) | | | (0.60 | ) | | | (0.68 | ) | | | (0.81 | ) |
| | | | | | | | | | | | | | | |
| | | Years Ended December 31, |
| | | 2009 | | 2008 | | 2007 | | 2006 | | 2005 |
Supplemental data for all classes: | | | | | | | | | | | | | | | |
Net assets at end of year (in thousands) | | $ | 146,828 | | $ | 83,479 | | $ | 124,501 | | $ | 92,766 | | $ | 70,211 |
Portfolio turnover rate (%) | | | 112 | | | 77 | | | 80 | | | 68 | | | 62 |
| * | | Amount is less than $0.005 per share. |
Performance cited represents past performance. Past performance does not guarantee future results and current performance may be lower or higher than the data quoted. Results shown are annual returns, which assume reinvestment of dividends and capital gains. Investment returns and principal will fluctuate and you may have a gain or loss when you sell shares. For the most current month-end performance information, please call 1-800-742-7272 or visit our Web site at www.williamblairfunds.com.
Note: Net investment income (loss) per share is based on the average shares outstanding during the year.
122 Annual Report | December 31, 2009 |
Financial Highlights
Global Growth Fund
| | | | | | | | | | | | |
| | | Class N | |
| | | Periods Ended December 31, | |
| | | 2009 | | | 2008 | | | 2007(a) | |
Net asset value, beginning of year | | $ | 4.96 | | | $ | 9.89 | | | $ | 10.00 | |
Income (loss) from investment operations: | | | | | | | | | | | | |
Net investment income (loss) (b) | | | (0.01 | ) | | | 0.08 | | | | 0.00 | * |
Net realized and unrealized gain (loss) on investments | | | 2.02 | | | | (4.98 | ) | | | (0.11 | ) |
| | | | | | | | | | | | |
Total from investment operations | | | 2.01 | | | | (4.90 | ) | | | (0.11 | ) |
Less distributions from: | | | | | | | | | | | | |
Net investment income | | | — | | | | 0.03 | | | | 0.00 | * |
Net realized gain | | | — | | | | — | | | | — | |
| | | | | | | | | | | | |
Total distributions | | | — | | | | 0.03 | | | | 0.00 | * |
| | | | | | | | | | | | |
Net asset value, end of year | | $ | 6.97 | | | $ | 4.96 | | | $ | 9.89 | |
| | | | | | | | | | | | |
Total return (%) | | | 40.52 | | | | (49.52 | ) | | | (1.10 | )(c) |
Ratios to average daily net assets (%): | | | | | | | | | | | | |
Expenses, net of waivers and reimbursements | | | 1.55 | | | | 1.55 | | | | 1.55 | (d) |
Expenses, before waivers and reimbursements | | | 2.61 | | | | 2.17 | | | | 2.14 | (d) |
Net investment income (loss), net of waivers and reimbursements | | | (0.17 | ) | | | 0.98 | | | | (0.08 | )(d) |
Net investment income (loss), before waivers and reimbursements | | | (1.23 | ) | | | 0.36 | | | | (0.67 | )(d) |
| | | | | | | | | | | | |
| | | Class I | |
| | | Periods Ended December 31, | |
| | | 2009 | | | 2008 | | | 2007(a) | |
Net asset value, beginning of year | | $ | 4.94 | | | $ | 9.91 | | | $ | 10.00 | |
Income (loss) from investment operations: | | | | | | | | | | | | |
Net investment income (loss) (b) | | | 0.00 | * | | | 0.08 | | | | 0.00 | * |
Net realized and unrealized gain (loss) on investments | | | 2.02 | | | | (4.98 | ) | | | (0.09 | ) |
| | | | | | | | | | | | |
Total from investment operations | | | 2.02 | | | | (4.90 | ) | | | (0.09 | ) |
Less distributions from: | | | | | | | | | | | | |
Net investment income | | | 0.00 | * | | | 0.07 | | | | 0.00 | * |
Net realized gain | | | — | | | | — | | | | — | |
| | | | | | | | | | | | |
Total distributions | | | 0.00 | * | | | 0.07 | | | | 0.00 | * |
| | | | | | | | | | | | |
Net asset value, end of year | | $ | 6.96 | | | $ | 4.94 | | | $ | 9.91 | |
| | | | | | | | | | | | |
Total return (%) | | | 40.90 | | | | (49.41 | ) | | | (0.85 | )(c) |
Ratios to average daily net assets (%): | | | | | | | | | | | | |
Expenses, net of waivers and reimbursements | | | 1.30 | | | | 1.30 | | | | 1.30 | (d) |
Expenses, before waivers and reimbursements | | | 1.62 | | | | 1.74 | | | | 1.89 | (d) |
Net investment income (loss), net of waivers and reimbursements | | | 0.05 | | | | 1.05 | | | | 0.14 | (d) |
Net investment income (loss), before waivers and reimbursements | | | (0.27 | ) | | | 0.61 | | | | (0.45 | )(d) |
| | | | | | | | | | |
| | | Periods Ended December 31, | |
| | | 2009 | | 2008 | | 2007(a) | |
Supplemental data for all classes: | | | | | | | | | | |
Net assets at end of year (in thousands) | | $ | 38,287 | | $ | 28,005 | | $ | 45,576 | |
Portfolio turnover rate (%) | | | 133 | | | 124 | | | 63 | (d) |
| (a) | | For the period October 15, 2007 (Commencement of Operations) to December 31, 2007. |
| (b) | | Excludes $0.00, $0.00 and $0.00 of PFIC mark to market, which is treated as ordinary income for Federal tax purposes for the years 2009, 2008 and 2007, respectively. |
| (c) | | Total return is not annualized for periods that are less than a year. |
| (d) | | Rates are annualized for periods that are less than a year. |
| * | | Amount is less than $0.005 per share. |
Performance cited represents past performance. Past performance does not guarantee future results and current performance may be lower or higher than the data quoted. Results shown are annual returns, which assume reinvestment of dividends and capital gains. Investment returns and principal will fluctuate and you may have a gain or loss when you sell shares. For the most current month-end performance information, please call 1-800-742-7272 or visit our Web site at www.williamblairfunds.com.
Note: Net investment income (loss) per share is based on the average shares outstanding during the year.
December 31, 2009 | William Blair Funds 123 |
Financial Highlights
International Growth Fund
| | | | | | | | | | | | | | | | |
| | | Class N |
| | | Years Ended December 31, |
| | | 2009 | | 2008 | | | 2007 | | 2006 | | 2005 |
Net asset value, beginning of year | | $ | 13.12 | | $ | 29.12 | | | $ | 27.70 | | $ | 25.22 | | $ | 22.09 |
Income (loss) from investment operations: | | | | | | | | | | | | | | | | |
Net investment income (loss) (a) | | | 0.07 | | | 0.29 | | | | 0.12 | | | 0.05 | | | 0.15 |
Net realized and unrealized gain (loss) on investments | | | 5.47 | | | (15.54 | ) | | | 4.77 | | | 5.71 | | | 4.60 |
| | | | | | | | | | | | | | | | |
Total from investment operations | | | 5.54 | | | (15.25 | ) | | | 4.89 | | | 5.76 | | | 4.75 |
Less distributions from: | | | | | | | | | | | | | | | | |
Net investment income | | | 0.11 | | | — | | | | 0.34 | | | 0.37 | | | 0.11 |
Net realized gain | | | — | | | 0.75 | | | | 3.13 | | | 2.91 | | | 1.51 |
| | | | | | | | | | | | | | | | |
Total distributions | | | 0.11 | | | 0.75 | | | | 3.47 | | | 3.28 | | | 1.62 |
| | | | | | | | | | | | | | | | |
Net asset value, end of year | | $ | 18.55 | | $ | 13.12 | | | $ | 29.12 | | $ | 27.70 | | $ | 25.22 |
| | | | | | | | | | | | | | | | |
Total return (%) | | | 42.27 | | | (52.33 | ) | | | 18.13 | | | 23.06 | | | 21.65 |
Ratios to average daily net assets (%): | | | | | | | | | | | | | | | | |
Expenses, net of waivers and reimbursements | | | 1.45 | | | 1.39 | | | | 1.40 | | | 1.42 | | | 1.42 |
Expenses, before waivers and reimbursements | | | 1.46 | | | — | | | | — | | | — | | | — |
Net investment income (loss), net of waivers and reimbursements | | | 0.48 | | | 1.29 | | | | 0.38 | | | 0.19 | | | 0.16 |
Net investment income (loss), before waivers and reimbursements | | | 0.47 | | | — | | | | — | | | — | | | — |
| | | | | | | | | | | | | | | | |
| | | Class I |
| | | Years Ended December 31, |
| | | 2009 | | 2008 | | | 2007 | | 2006 | | 2005 |
Net asset value, beginning of year | | $ | 13.40 | | $ | 29.61 | | | $ | 28.10 | | $ | 25.55 | | $ | 22.34 |
Income (loss) from investment operations: | | | | | | | | | | | | | | | | |
Net investment income (loss) (a) | | | 0.12 | | | 0.37 | | | | 0.21 | | | 0.13 | | | 0.27 |
Net realized and unrealized gain (loss) on investments | | | 5.59 | | | (15.83 | ) | | | 4.86 | | | 5.78 | | | 4.61 |
| | | | | | | | | | | | | | | | |
Total from investment operations | | | 5.71 | | | (15.46 | ) | | | 5.07 | | | 5.91 | | | 4.88 |
Less distributions from: | | | | | | | | | | | | | | | | |
Net investment income | | | 0.16 | | | — | | | | 0.43 | | | 0.45 | | | 0.16 |
Net realized gain | | | — | | | 0.75 | | | | 3.13 | | | 2.91 | | | 1.51 |
| | | | | | | | | | | | | | | | |
Total distributions | | | 0.16 | | | 0.75 | | | | 3.56 | | | 3.36 | | | 1.67 |
| | | | | | | | | | | | | | | | |
Net asset value, end of year | | $ | 18.95 | | $ | 13.40 | | | $ | 29.61 | | $ | 28.10 | | $ | 25.55 |
| | | | | | | | | | | | | | | | |
Total return (%) | | | 42.63 | | | (52.17 | ) | | | 18.53 | | | 23.35 | | | 22.00 |
Ratios to average daily net assets (%): | | | | | | | | | | | | | | | | |
Expenses, net of waivers and reimbursements | | | 1.17 | | | 1.08 | | | | 1.09 | | | 1.11 | | | 1.17 |
Expenses, before waivers and reimbursements | | | 1.17 | | | 1.08 | | | | 1.09 | | | 1.11 | | | 1.17 |
Net investment income (loss), net of waivers and reimbursements | | | 0.74 | | | 1.58 | | | | 0.69 | | | 0.45 | | | 0.41 |
Net investment income (loss), before waivers and reimbursements | | | 0.74 | | | 1.58 | | | | 0.69 | | | 0.45 | | | 0.41 |
| | | | | | | | | | | | | | | |
| | | Years Ended December 31, |
| | | 2009 | | 2008 | | 2007 | | 2006 | | 2005 |
Supplemental data for all classes: | | | | | | | | | | | | | | | |
Net assets at end of year (in thousands) | | $ | 4,473,408 | | $ | 3,130,938 | | $ | 8,048,654 | | $ | 6,267,126 | | $ | 4,551,077 |
Portfolio turnover rate (%) | | | 121 | | | 91 | | | 56 | | | 72 | | | 70 |
| (a) | | Excludes $0.08, $(0.18), $0.09, $0.42, and $0.37 of PFIC mark to market, which is treated as ordinary income for Federal tax purposes for the years 2009, 2008, 2007, 2006 and 2005, respectively. |
Performance cited represents past performance. Past performance does not guarantee future results and current performance may be lower or higher than the data quoted. Results shown are annual returns, which assume reinvestment of dividends and capital gains. Investment returns and principal will fluctuate and you may have a gain or loss when you sell shares. For the most current month-end performance information, please call 1-800-742-7272 or visit our Web site at www.williamblairfunds.com.
Note: Net investment income (loss) per share is based on the average shares outstanding during the year.
124 Annual Report | December 31, 2009 |
Financial Highlights
International Equity Fund
| | | | | | | | | | | | | | | | | |
| | | Class N | |
| | | Years Ended December 31, | |
| | | 2009 | | 2008 | | | 2007 | | 2006 | | 2005 | |
Net asset value, beginning of year | | $ | 8.35 | | $ | 16.53 | | | $ | 15.21 | | $ | 12.86 | | $ | 11.33 | |
Income (loss) from investment operations: | | | | | | | | | | | | | | | | | |
Net investment income (loss) (a) | | | 0.09 | | | 0.10 | | | | 0.09 | | | 0.04 | | | (0.01 | ) |
Net realized and unrealized gain (loss) on investments | | | 2.64 | | | (8.16 | ) | | | 2.55 | | | 2.52 | | | 1.54 | |
| | | | | | | | | | | | | | | | | |
Total from investment operations | | | 2.73 | | | (8.06 | ) | | | 2.64 | | | 2.56 | | | 1.53 | |
Less distributions from: | | | | | | | | | | | | | | | | | |
Net investment income | | | 0.01 | | | — | | | | 0.14 | | | 0.19 | | | — | |
Net realized gain | | | — | | | 0.12 | | | | 1.18 | | | 0.02 | | | — | |
| | | | | | | | | | | | | | | | | |
Total distributions | | | 0.01 | | | 0.12 | | | | 1.32 | | | 0.21 | | | — | |
| | | | | | | | | | | | | | | | | |
Net asset value, end of year | | $ | 11.07 | | $ | 8.35 | | | $ | 16.53 | | $ | 15.21 | | $ | 12.86 | |
| | | | | | | | | | | | | | | | | |
Total return (%) | | | 32.69 | | | (48.75 | ) | | | 17.68 | | | 19.96 | | | 13.50 | |
Ratios to average daily net assets (%): | | | | | | | | | | | | | | | | | |
Expenses, net of waivers and reimbursements | | | 1.45 | | | 1.45 | | | | 1.45 | | | 1.46 | | | 1.48 | |
Expenses, before waivers and reimbursements | | | 1.59 | | | 1.45 | | | | 1.47 | | | 1.56 | | | 1.81 | |
Net investment income (loss), net of waivers and reimbursements | | | 1.03 | | | 0.80 | | | | 0.52 | | | 0.26 | | | (0.33 | ) |
Net investment income (loss), before waivers and reimbursements | | | 0.89 | | | 0.80 | | | | 0.50 | | | 0.16 | | | (0.66 | ) |
| | | | | | | | | | | | | | | | | |
| | | Class I | |
| | | Years Ended December 31, | |
| | | 2009 | | 2008 | | | 2007 | | 2006 | | 2005 | |
Net asset value, beginning of year | | $ | 8.44 | | $ | 16.66 | | | $ | 15.31 | | $ | 12.94 | | $ | 11.37 | |
Income (loss) from investment operations: | | | | | | | | | | | | | | | | | |
Net investment income (loss) (a) | | | 0.08 | | | 0.15 | | | | 0.13 | | | 0.06 | | | (0.01 | ) |
Net realized and unrealized gain (loss) on investments | | | 2.70 | | | (8.25 | ) | | | 2.57 | | | 2.55 | | | 1.58 | |
| | | | | | | | | | | | | | | | | |
Total from investment operations | | | 2.78 | | | (8.10 | ) | | | 2.70 | | | 2.61 | | | 1.57 | |
Less distributions from: | | | | | | | | | | | | | | | | | |
Net investment income | | | 0.06 | | | — | | | | 0.17 | | | 0.22 | | | — | |
Net realized gain | | | — | | | 0.12 | | | | 1.18 | | | 0.02 | | | — | |
| | | | | | | | | | | | | | | | | |
Total distributions | | | 0.06 | | | 0.12 | | | | 1.35 | | | 0.24 | | | — | |
| | | | | | | | | | | | | | | | | |
Net asset value, end of year | | $ | 11.16 | | $ | 8.44 | | | $ | 16.66 | | $ | 15.31 | | $ | 12.94 | |
| | | | | | | | | | | | | | | | | |
Total return (%) | | | 32.93 | | | (48.61 | ) | | | 17.97 | | | 20.22 | | | 13.81 | |
Ratios to average daily net assets (%): | | | | | | | | | | | | | | | | | |
Expenses, net of waivers and reimbursements | | | 1.20 | | | 1.20 | | | | 1.20 | | | 1.21 | | | 1.23 | |
Expenses, before waivers and reimbursements | | | 1.39 | | | 1.22 | | | | 1.25 | | | 1.35 | | | 1.56 | |
Net investment income (loss), net of waivers and reimbursements | | | 0.86 | | | 1.12 | | | | 0.76 | | | 0.46 | | | (0.08 | ) |
Net investment income (loss), before waivers and reimbursements | | | 0.67 | | | 1.10 | | | | 0.71 | | | 0.32 | | | (0.41 | ) |
| | | | | | | | | | | | | | | |
| | | Years Ended December 31, |
| | | 2009 | | 2008 | | 2007 | | 2006 | | 2005 |
Supplemental data for all classes: | | | | | | | | | | | | | | | |
Net assets at end of year (in thousands) | | $ | 298,168 | | $ | 228,486 | | $ | 408,609 | | $ | 297,716 | | $ | 177,710 |
Portfolio turnover rate (%) | | | 88 | | | 92 | | | 70 | | | 83 | | | 127 |
| (a) | | Excludes $0.00, $(0.07), $0.01, $0.22, and $0.33 of PFIC mark to market, which is treated as ordinary income for Federal tax purposes for the years 2009, 2008, 2007, 2006 and 2005, respectively. |
Performance cited represents past performance. Past performance does not guarantee future results and current performance may be lower or higher than the data quoted. Results shown are annual returns, which assume reinvestment of dividends and capital gains. Investment returns and principal will fluctuate and you may have a gain or loss when you sell shares. For the most current month-end performance information, please call 1-800-742-7272 or visit our Web site at www.williamblairfunds.com.
Note: Net investment income (loss) per share is based on the average shares outstanding during the year.
December 31, 2009 | William Blair Funds 125 |
Financial Highlights
International Small Cap Growth Fund
| | | | | | | | | | | | | | | | | | | | |
| | | Class N | |
| | | Periods Ended December 31, | |
| | | 2009 | | | 2008 | | | 2007 | | | 2006 | | | 2005(a) | |
Net asset value, beginning of year | | $ | 6.62 | | | $ | 13.98 | | | $ | 13.37 | | | $ | 11.16 | | | $ | 10.00 | |
Income (loss) from investment operations: | | | | | | | | | | | | | | | | | | | | |
Net investment income (loss) (b) | | | (0.01 | ) | | | (0.02 | ) | | | (0.02 | ) | | | (0.05 | ) | | | (0.01 | ) |
Net realized and unrealized gain (loss) on investments | | | 3.79 | | | | (7.22 | ) | | | 1.72 | | | | 2.32 | | | | 1.17 | |
| | | | | | | | | | | | | | | | | | | | |
Total from investment operations | | | 3.78 | | | | (7.24 | ) | | | 1.70 | | | | 2.27 | | | | 1.16 | |
Less distributions from: | | | | | | | | | | | | | | | | | | | | |
Net investment income | | | — | | | | — | | | | 0.05 | | | | 0.01 | | | | — | |
Net realized gain | | | — | | | | 0.12 | | | | 1.04 | | | | 0.05 | | | | — | |
| | | | | | | | | | | | | | | | | | | | |
Total distributions | | | — | | | | 0.12 | | | | 1.09 | | | | 0.06 | | | | — | |
| | | | | | | | | | | | | | | | | | | | |
Net asset value, end of year | | $ | 10.40 | | | $ | 6.62 | | | $ | 13.98 | | | $ | 13.37 | | | $ | 11.16 | |
| | | | | | | | | | | | | | | | | | | | |
Total return (%) | | | 57.10 | | | | (51.82 | ) | | | 13.06 | | | | 20.32 | | | | 11.60 | (c) |
Ratios to average daily net assets (%): | | | | | | | | | | | | | | | | | | | | |
Expenses, net of waivers and reimbursements | | | 1.65 | | | | 1.65 | | | | 1.60 | | | | 1.65 | | | | 1.65 | (d) |
Expenses, before waivers and reimbursements | | | 1.83 | | | | 1.62 | | | | 1.60 | | | | 1.71 | | | | 2.57 | (d) |
Net investment income (loss), net of waivers and reimbursements | | | (0.16 | ) | | | (0.20 | ) | | | (0.16 | ) | | | (0.40 | ) | | | (0.40 | )(d) |
Net investment income (loss), before waivers and reimbursements | | | (0.34 | ) | | | (0.17 | ) | | | (0.16 | ) | | | (0.46 | ) | | | (1.32 | )(d) |
| | | | | | | | | | | | | | | | | | |
| | | Class I | |
| | | Periods Ended December 31, | |
| | | 2009 | | 2008 | | | 2007 | | 2006 | | | 2005(a) | |
Net asset value, beginning of year | | $ | 6.67 | | $ | 14.01 | | | $ | 13.41 | | $ | 11.16 | | | $ | 10.00 | |
Income (loss) from investment operations: | | | | | | | | | | | | | | | | | | |
Net investment income (loss) (b) | | | 0.01 | | | 0.01 | | | | 0.03 | | | (0.03 | ) | | | 0.00 | * |
Net realized and unrealized gain (loss) on investments | | | 3.83 | | | (7.23 | ) | | | 1.71 | | | 2.34 | | | | 1.16 | |
| | | | | | | | | | | | | | | | | | |
Total from investment operations | | | 3.84 | | | (7.22 | ) | | | 1.74 | | | 2.31 | | | | 1.16 | |
Less distributions from: | | | | | | | | | | | | | | | | | | |
Net investment income | | | 0.02 | | | — | | | | 0.10 | | | 0.01 | | | | — | |
Net realized gain | | | — | | | 0.12 | | | | 1.04 | | | 0.05 | | | | — | |
| | | | | | | | | | | | | | | | | | |
Total distributions | | | 0.02 | | | 0.12 | | | | 1.14 | | | 0.06 | | | | — | |
| | | | | | | | | | | | | | | | | | |
Net asset value, end of year | | $ | 10.49 | | $ | 6.67 | | | $ | 14.01 | | $ | 13.41 | | | $ | 11.16 | |
| | | | | | | | | | | | | | | | | | |
Total return (%) | | | 57.51 | | | (51.56 | ) | | | 13.34 | | | 20.68 | | | | 11.60 | (c) |
Ratios to average daily net assets (%): | | | | | | | | | | | | | | | | | | |
Expenses, net of waivers and reimbursements | | | 1.31 | | | 1.31 | | | | 1.29 | | | 1.40 | | | | 1.40 | (d) |
Expenses, before waivers and reimbursements | | | 1.31 | | | 1.28 | | | | 1.29 | | | 1.46 | | | | 2.32 | (d) |
Net investment income (loss), net of waivers and reimbursements | | | 0.11 | | | 0.11 | | | | 0.18 | | | (0.25 | ) | | | (0.15 | )(d) |
Net investment income (loss), before waivers and reimbursements | | | 0.11 | | | 0.14 | | | | 0.18 | | | (0.31 | ) | | | (1.07 | )(d) |
| | | | | | | | | | | | | | | | |
| | | Periods Ended December 31, | |
| | | 2009 | | 2008 | | 2007 | | 2006 | | 2005(a) | |
Supplemental data for all classes: | | | | | | | | | | | | | | | | |
Net assets at end of year (in thousands) | | $ | 390,851 | | $ | 291,988 | | $ | 401,459 | | $ | 231,969 | | $ | 50,534 | |
Portfolio turnover rate (%) | | | 136 | | | 78 | | | 88 | | | 109 | | | 127 | (d) |
| (a) | | For the period November 1, 2005 (Commencement of Operations) to December 31, 2005. |
| (b) | | Excludes $0.01, $(0.02), $0.05, $0.00, and $0.11 of PFIC mark to market, which is treated as ordinary income for Federal tax purposes for the years 2009, 2008, 2007, 2006 and 2005, respectively. |
| (c) | | Total return is not annualized for periods that are less than a year. |
| (d) | | Rates are annualized for periods that are less than a year. |
| * | | Amount is less than $0.005 per share. |
Performance cited represents past performance. Past performance does not guarantee future results and current performance may be lower or higher than the data quoted. Results shown are annual returns, which assume reinvestment of dividends and capital gains. Investment returns and principal will fluctuate and you may have a gain or loss when you sell shares. For the most current month-end performance information, please call 1-800-742-7272 or visit our Web site at www.williamblairfunds.com.
Note: Net investment income (loss) per share is based on the average shares outstanding during the year.
126 Annual Report | December 31, 2009 |
Financial Highlights
Emerging Markets Growth Fund
| | | | | | | | | | | | | | | | | | | | |
| | | Class N | |
| | | Periods Ended December 31, | |
| | | 2009 | | | 2008 | | | 2007 | | | 2006 | | | 2005(a) | |
Net asset value, beginning of year | | $ | 7.46 | | | $ | 21.92 | | | $ | 19.42 | | | $ | 14.17 | | | $ | 10.00 | |
Income (loss) from investment operations: | | | | | | | | | | | | | | | | | | | | |
Net investment income (loss) (b) | | | 0.00 | * | | | 0.11 | | | | (0.10 | ) | | | (0.04 | ) | | | (0.01 | ) |
Net realized and unrealized gain (loss) on investments | | | 5.51 | | | | (13.63 | ) | | | 7.23 | | | | 5.41 | | | | 4.26 | |
| | | | | | | | | | | | | | | | | | | | |
Total from investment operations | | | 5.51 | | | | (13.52 | ) | | | 7.13 | | | | 5.37 | | | | 4.25 | |
Less distributions from: | | | | | | | | | | | | | | | | | | | | |
Net investment income | | | 0.10 | | | | — | | | | 0.09 | | | | 0.01 | | | | — | |
Net realized gain | | | — | | | | 0.94 | | | | 4.54 | | | | 0.11 | | | | 0.08 | |
| | | | | | | | | | | | | | | | | | | | |
Total distributions | | | 0.10 | | | | 0.94 | | | | 4.63 | | | | 0.12 | | | | 0.08 | |
| | | | | | | | | | | | | | | | | | | | |
Net asset value, end of year | | $ | 12.87 | | | $ | 7.46 | | | $ | 21.92 | | | $ | 19.42 | | | $ | 14.17 | |
| | | | | | | | | | | | | | | | | | | | |
Total return (%) | | | 73.85 | | | | (61.71 | ) | | | 37.75 | | | | 37.90 | | | | 42.52 | (c) |
Ratios to average daily net assets (%): | | | | | | | | | | | | | | | | | | | | |
Expenses, net of waivers and reimbursements | | | 1.70 | | | | 1.67 | | | | 1.65 | | | | 1.65 | | | | 1.55 | (d) |
Expenses, before waivers and reimbursements | | | 1.81 | | | | 1.65 | | | | 1.69 | | | | 1.78 | | | | 1.91 | (d) |
Net investment income (loss), net of waivers and reimbursements | | | 0.04 | | | | 0.65 | | | | (0.45 | ) | | | (0.22 | ) | | | (0.11 | )(d) |
Net investment income (loss), before waivers and reimbursements | | | (0.07 | ) | | | 0.67 | | | | (0.49 | ) | | | (0.35 | ) | | | (0.47 | )(d) |
| | | | | | | | | | | | | | | | | | | |
| | | Class I | |
| | | Periods Ended December 31, | |
| | | 2009 | | 2008 | | | 2007 | | | 2006 | | | 2005(a) | |
Net asset value, beginning of year | | $ | 7.51 | | $ | 21.99 | | | $ | 19.47 | | | $ | 14.19 | | | $ | 10.00 | |
Income (loss) from investment operations: | | | | | | | | | | | | | | | | | | | |
Net investment income (loss) (b) | | | 0.03 | | | 0.15 | | | | (0.04 | ) | | | (0.01 | ) | | | 0.01 | |
Net realized and unrealized gain (loss) on investments | | | 5.54 | | | (13.69 | ) | | | 7.26 | | | | 5.41 | | | | 4.26 | |
| | | | | | | | | | | | | | | | | | | |
Total from investment operations | | | 5.57 | | | (13.54 | ) | | | 7.22 | | | | 5.40 | | | | 4.27 | |
Less distributions from: | | | | | | | | | | | | | | | | | | | |
Net investment income | | | 0.13 | | | — | | | | 0.16 | | | | 0.01 | | | | — | |
Net realized gain | | | — | | | 0.94 | | | | 4.54 | | | | 0.11 | | | | 0.08 | |
| | | | | | | | | | | | | | | | | | | |
Total distributions | | | 0.13 | | | 0.94 | | | | 4.70 | | | | 0.12 | | | | 0.08 | |
| | | | | | | | | | | | | | | | | | | |
Net asset value, end of year | | $ | 12.95 | | $ | 7.51 | | | $ | 21.99 | | | $ | 19.47 | | | $ | 14.19 | |
| | | | | | | | | | | | | | | | | | | |
Total return (%) | | | 74.18 | | | (61.60 | ) | | | 38.13 | | | | 38.07 | | | | 42.72 | (c) |
Ratios to average daily net assets (%): | | | | | | | | | | | | | | | | | | | |
Expenses, net of waivers and reimbursements | | | 1.41 | | | 1.41 | | | | 1.40 | | | | 1.40 | | | | 1.40 | (d) |
Expenses, before waivers and reimbursements | | | 1.41 | | | 1.39 | | | | 1.40 | | | | 1.47 | | | | 1.76 | (d) |
Net investment income (loss), net of waivers and reimbursements | | | 0.31 | | | 0.91 | | | | (0.20 | ) | | | (0.06 | ) | | | 0.04 | (d) |
Net investment income (loss), before waivers and reimbursements | | | 0.31 | | | 0.93 | | | | (0.20 | ) | | | (0.13 | ) | | | (0.32 | )(d) |
| | | | | | | | | | | | | | | | |
| | | Periods Ended December 31, | |
| | | 2009 | | 2008 | | 2007 | | 2006 | | 2005(a) | |
Supplemental data for all classes: | | | | | | | | | | | | | | | | |
Net assets at end of year (in thousands) | | $ | 1,038,260 | | $ | 385,588 | | $ | 1,165,854 | | $ | 813,649 | | $ | 249,348 | |
Portfolio turnover rate (%) | | | 113 | | | 118 | | | 100 | | | 113 | | | 77 | (d) |
| (a) | | For the period June 6, 2005 (Commencement of Operations) to December 31, 2005. |
| (b) | | Excludes $0.15, $(0.09), $0.21, $0.00, and $0.11 of PFIC mark to market, which is treated as ordinary income for Federal tax purposes for the years 2009, 2008, 2007, 2006 and 2005, respectively. |
| (c) | | Total return is not annualized for periods that are less than a year. |
| (d) | | Rates are annualized for periods that are less than a year. |
| * | | Amount is less than $0.005 per share. |
Performance cited represents past performance. Past performance does not guarantee future results and current performance may be lower or higher than the data quoted. Results shown are annual returns, which assume reinvestment of dividends and capital gains. Investment returns and principal will fluctuate and you may have a gain or loss when you sell shares. For the most current month-end performance information, please call 1-800-742-7272 or visit our Web site at www.williamblairfunds.com.
Note: Net investment income (loss) per share is based on the average shares outstanding during the year.
December 31, 2009 | William Blair Funds 127 |
Financial Highlights
Emerging Leaders Growth Fund
| | | | | | | |
| | | Class I | |
| | | Periods Ended
December 31, | |
| | | 2009 | | 2008(a) | |
Net asset value, beginning of year | | $ | 4.79 | | $ | 10.00 | |
Income (loss) from investment operations: | | | | | | | |
Net investment income (loss) (b) | | | 0.02 | | | 0.04 | |
Net realized and unrealized gain (loss) on investments | | | 3.73 | | | (5.25 | ) |
| | | | | | | |
Total from investment operations | | | 3.75 | | | (5.21 | ) |
Less distributions from: | | | | | | | |
Net investment income | | | 0.11 | | | 0.00 | * |
Net realized gain | | | — | | | — | |
| | | | | | | |
Total distributions | | | 0.11 | | | 0.00 | |
| | | | | | | |
Net asset value, end of year | | $ | 8.43 | | $ | 4.79 | |
| | | | | | | |
Total return (%) | | | 78.38 | | | (52.09 | )(c) |
Ratios to average daily net assets (%): | | | | | | | |
Expenses, net of waivers and reimbursements | | | 1.40 | | | 1.40 | (d) |
Expenses, before waivers and reimbursements | | | 1.54 | | | 1.56 | (d) |
Net investment income (loss), net of waivers and reimbursements | | | 0.37 | | | 0.70 | (d) |
Net investment income (loss), before waivers and reimbursements | | | 0.23 | | | 0.54 | (d) |
| | | | | | | |
| | | Periods Ended
December 31, | |
| | | 2009 | | 2008(a) | |
Supplemental data for all classes: | | | | | | | |
Net assets at end of year (in thousands) | | $ | 115,136 | | $ | 46,676 | |
Portfolio turnover rate (%) | | | 176 | | | 151 | (d) |
| (a) | | For the period March 26, 2008 (Commencement of Operations) to December 31, 2008. |
| (b) | | Excludes $1.29 and $0.00 of PFIC mark to market, which is treated as ordinary income for Federal tax purposes for the years 2009 and 2008. |
| (c) | | Total return is not annualized for periods that are less than a year. |
| (d) | | Rates are annualized for periods that are less than a year. |
| * | | Amount is less than $0.005 per share. |
Performance cited represents past performance. Past performance does not guarantee future results and current performance may be lower or higher than the data quoted. Results shown are annual returns, which assume reinvestment of dividends and capital gains. Investment returns and principal will fluctuate and you may have a gain or loss when you sell shares. For the most current month-end performance information, please call 1-800-742-7272 or visit our Web site at www.williamblairfunds.com.
Note: Net investment income (loss) per share is based on the average shares outstanding during the year.
128 Annual Report | December 31, 2009 |
Financial Highlights
Value Discovery Fund
| | | | | | | | | | | | | | | | | | | |
| | | Class N | |
| | | Years Ended December 31, | |
| | | 2009 | | 2008 | | | 2007 | | | 2006 | | | 2005 | |
Net asset value, beginning of year | | $ | 8.33 | | $ | 11.31 | | | $ | 16.27 | | | $ | 14.95 | | | $ | 22.70 | |
Income (loss) from investment operations: | | | | | | | | | | | | | | | | | | | |
Net investment income (loss) | | | 0.06 | | | 0.09 | | | | 0.02 | | | | 0.03 | | | | (0.02 | ) |
Net realized and unrealized gain (loss) on investments | | | 2.13 | | | (3.02 | ) | | | (0.96 | ) | | | 3.22 | | | | 0.14 | |
| | | | | | | | | | | | | | | | | | | |
Total from investment operations | | | 2.19 | | | (2.93 | ) | | | (0.94 | ) | | | 3.25 | | | | 0.12 | |
Less distributions from: | | | | | | | | | | | | | | | | | | | |
Net investment income | | | 0.03 | | | 0.05 | | | | — | | | | 0.01 | | | | — | |
Net realized gain | | | — | | | — | | | | 4.02 | | | | 1.92 | | | | 7.87 | |
| | | | | | | | | | | | | | | | | | | |
Total distributions | | | 0.03 | | | 0.05 | | | | 4.02 | | | | 1.93 | | | | 7.87 | |
| | | | | | | | | | | | | | | | | | | |
Net asset value, end of year | | $ | 10.49 | | $ | 8.33 | | | $ | 11.31 | | | $ | 16.27 | | | $ | 14.95 | |
| | | | | | | | | | | | | | | | | | | |
Total return (%) | | | 26.24 | | | (25.85 | ) | | | (5.54 | ) | | | 21.78 | | | | 0.49 | |
Ratios to average daily net assets (%): | | | | | | | | | | | | | | | | | | | |
Expenses, net of waivers and reimbursements | | | 1.29 | | | 1.29 | | | | 1.33 | | | | 1.34 | | | | 1.34 | |
Expenses, before waivers and reimbursements | | | 1.78 | | | 1.82 | | | | 1.66 | | | | 1.75 | | | | 1.64 | |
Net investment income (loss), net of waivers and reimbursements | | | 0.68 | | | 0.84 | | | | 0.10 | | | | 0.21 | | | | (0.22 | ) |
Net investment income (loss), before waivers and reimbursements | | | 0.19 | | | 0.31 | | | | (0.23 | ) | | | (0.20 | ) | | | (0.52 | ) |
| | | | | | | | | | | | | | | | | | | |
| | | Class I | |
| | | Years Ended December 31, | |
| | | 2009 | | 2008 | | | 2007 | | | 2006 | | | 2005 | |
Net asset value, beginning of year | | $ | 8.45 | | $ | 11.50 | | | $ | 16.51 | | | $ | 15.12 | | | $ | 22.82 | |
Income (loss) from investment operations: | | | | | | | | | | | | | | | | | | | |
Net investment income (loss) | | | 0.08 | | | 0.11 | | | | 0.09 | | | | 0.03 | | | | 0.00 | * |
Net realized and unrealized gain (loss) on investments | | | 2.16 | | | (3.08 | ) | | | (1.01 | ) | | | 3.30 | | | | 0.17 | |
| | | | | | | | | | | | | | | | | | | |
Total from investment operations | | | 2.24 | | | (2.97 | ) | | | (0.92 | ) | | | 3.33 | | | | 0.17 | |
Less distributions from: | | | | | | | | | | | | | | | | | | | |
Net investment income | | | 0.04 | | | 0.08 | | | | 0.07 | | | | 0.02 | | | | — | |
Net realized gain | | | — | | | — | | | | 4.02 | | | | 1.92 | | | | 7.87 | |
| | | | | | | | | | | | | | | | | | | |
Total distributions | | | 0.04 | | | 0.08 | | | | 4.09 | | | | 1.94 | | | | 7.87 | |
| | | | | | | | | | | | | | | | | | | |
Net asset value, end of year | | $ | 10.65 | | $ | 8.45 | | | $ | 11.50 | | | $ | 16.51 | | | $ | 15.12 | |
| | | | | | | | | | | | | | | | | | | |
Total return (%) | | | 26.56 | | | (25.77 | ) | | | (5.31 | ) | | | 22.10 | | | | 0.70 | |
Ratios to average daily net assets (%): | | | | | | | | | | | | | | | | | | | |
Expenses, net of waivers and reimbursements | | | 1.09 | | | 1.09 | | | | 1.09 | | | | 1.09 | | | | 1.14 | |
Expenses, before waivers and reimbursements | | | 1.50 | | | 1.57 | | | | 1.37 | | | | 1.50 | | | | 1.39 | |
Net investment income (loss), net of waivers and reimbursements | | | 0.86 | | | 1.06 | | | | 0.52 | | | | 0.16 | | | | (0.02 | ) |
Net investment income (loss), before waivers and reimbursements | | | 0.45 | | | 0.58 | | | | 0.24 | | | | (0.25 | ) | | | (0.27 | ) |
| | | | | | | | | | | | | | | |
| | | Years Ended December 31, |
| | | 2009 | | 2008 | | 2007 | | 2006 | | 2005 |
Supplemental data for all classes: | | | | | | | | | | | | | | | |
Net assets at end of year (in thousands) | | $ | 54,859 | | $ | 36,249 | | $ | 47,118 | | $ | 146,777 | | $ | 70,439 |
Portfolio turnover rate (%) | | | 62 | | | 87 | | | 102 | | | 162 | | | 125 |
| * | | Amount is less than $0.005 per share. |
Performance cited represents past performance. Past performance does not guarantee future results and current performance may be lower or higher than the data quoted. Results shown are annual returns, which assume reinvestment of dividends and capital gains. Investment returns and principal will fluctuate and you may have a gain or loss when you sell shares. For the most current month-end performance information, please call 1-800-742-7272 or visit our Web site at www.williamblairfunds.com.
Note: Net investment income (loss) per share is based on the average shares outstanding during the year.
December 31, 2009 | William Blair Funds 129 |
Financial Highlights
Bond Fund
| | | | | | | | | | | |
| | | Class N | |
| | | Periods Ended December 31, | |
| | | 2009 | | 2008 | | | 2007(a) | |
Net asset value, beginning of year | | $ | 9.82 | | $ | 10.07 | | | $ | 10.00 | |
Income (loss) from investment operations: | | | | | | | | | | | |
Net investment income (loss) | | | 0.48 | | | 0.47 | | | | 0.31 | |
Net realized and unrealized gain (loss) on investments | | | 0.59 | | | (0.31 | ) | | | 0.02 | |
| | | | | | | | | | | |
Total from investment operations | | | 1.07 | | | 0.16 | | | | 0.33 | |
Less distributions from: | | | | | | | | | | | |
Net investment income | | | 0.49 | | | 0.41 | | | | 0.26 | |
Net realized gain | | | — | | | — | | | | — | |
| | | | | | | | | | | |
Total distributions | | | 0.49 | | | 0.41 | | | | 0.26 | |
| | | | | | | | | | | |
Net asset value, end of year | | $ | 10.40 | | $ | 9.82 | | | $ | 10.07 | |
| | | | | | | | | | | |
Total return (%) | | | 11.11 | | | 1.64 | | | | 3.38 | (b) |
Ratios to average daily net assets (%): | | | | | | | | | | | |
Expenses, net of waivers and reimbursements | | | 0.65 | | | 0.65 | | | | 0.65 | (c) |
Expenses, before waivers and reimbursements | | | 1.40 | | | 2.47 | | | | 0.81 | (c) |
Net investment income (loss), net of waivers and reimbursements | | | 4.76 | | | 4.69 | | | | 4.80 | (c) |
Net investment income (loss), before waivers and reimbursements | | | 4.01 | | | 2.87 | | | | 4.64 | (c) |
| | | | | | | | | | | |
| | | Class I | |
| | | Periods Ended December 31, | |
| | | 2009 | | 2008 | | | 2007(a) | |
Net asset value, beginning of year | | $ | 9.72 | | $ | 10.04 | | | $ | 10.00 | |
Income (loss) from investment operations: | | | | | | | | | | | |
Net investment income (loss) | | | 0.49 | | | 0.48 | | | | 0.32 | |
Net realized and unrealized gain (loss) on investments | | | 0.59 | | | (0.31 | ) | | | 0.02 | |
| | | | | | | | | | | |
Total from investment operations | | | 1.08 | | | 0.17 | | | | 0.34 | |
Less distributions from: | | | | | | | | | | | |
Net investment income | | | 0.49 | | | 0.49 | | | | 0.30 | |
Net realized gain | | | — | | | — | | | | — | |
| | | | | | | | | | | |
Total distributions | | | 0.49 | | | 0.49 | | | | 0.30 | |
| | | | | | | | | | | |
Net asset value, end of year | | $ | 10.31 | | $ | 9.72 | | | $ | 10.04 | |
| | | | | | | | | | | |
Total return (%) | | | 11.40 | | | 1.72 | | | | 3.50 | (b) |
Ratios to average daily net assets (%): | | | | | | | | | | | |
Expenses, net of waivers and reimbursements | | | 0.50 | | | 0.50 | | | | 0.50 | (c) |
Expenses, before waivers and reimbursements | | | 0.58 | | | 0.71 | | | | 0.67 | (c) |
Net investment income (loss), net of waivers and reimbursements | | | 4.92 | | | 4.90 | | | | 4.95 | (c) |
Net investment income (loss), before waivers and reimbursements | | | 4.84 | | | 4.69 | | | | 4.78 | (c) |
| | | | | | | | | | |
| | | Periods Ended December 31, | |
| | | 2009 | | 2008 | | 2007(a) | |
Supplemental data for all classes: | | | | | | | | | | |
Net assets at end of year (in thousands) | | $ | 147,344 | | $ | 74,613 | | $ | 68,483 | |
Portfolio turnover rate (%) | | | 29 | | | 52 | | | 38 | (c) |
| (a) | | For the period May 1, 2007 (Commencement of Operations) to December 31, 2007. |
| (b) | | Total return is not annualized for periods that are less than a year. |
| (c) | | Rates are annualized for periods that are less than a year. |
Performance cited represents past performance. Past performance does not guarantee future results and current performance may be lower or higher than the data quoted. Results shown are annual returns, which assume reinvestment of dividends and capital gains. Investment returns and principal will fluctuate and you may have a gain or loss when you sell shares. For the most current month-end performance information, please call 1-800-742-7272 or visit our Web site at www.williamblairfunds.com.
Note: Net investment income (loss) per share is based on the average shares outstanding during the year.
130 Annual Report | December 31, 2009 |
Financial Highlights
Income Fund
| | | | | | | | | | | | | | | | | | | |
| | | Class N | |
| | | Years Ended December 31, | |
| | | 2009 | | 2008 | | | 2007 | | | 2006 | | | 2005 | |
Net asset value, beginning of year | | $ | 8.69 | | $ | 9.29 | | | $ | 9.74 | | | $ | 9.83 | | | $ | 10.19 | |
Income (loss) from investment operations: | | | | | | | | | | | | | | | | | | | |
Net investment income (loss) | | | 0.40 | | | 0.37 | | | | 0.45 | | | | 0.44 | | | | 0.47 | |
Net realized and unrealized gain (loss) on investments | | | 0.44 | | | (0.59 | ) | | | (0.35 | ) | | | (0.04 | ) | | | (0.30 | ) |
| | | | | | | | | | | | | | | | | | | |
Total from investment operations | | | 0.84 | | | (0.22 | ) | | | 0.10 | | | | 0.40 | | | | 0.17 | |
Less distributions from: | | | | | | | | | | | | | | | | | | | |
Net investment income | | | 0.46 | | | 0.38 | | | | 0.55 | | | | 0.49 | | | | 0.53 | |
Net realized gain | | | — | | | — | | | | — | | | | — | | | | — | |
| | | | | | | | | | | | | | | | | | | |
Total distributions | | | 0.46 | | | 0.38 | | | | 0.55 | | | | 0.49 | | | | 0.53 | |
| | | | | | | | | | | | | | | | | | | |
Net asset value, end of year | | $ | 9.07 | | $ | 8.69 | | | $ | 9.29 | | | $ | 9.74 | | | $ | 9.83 | |
| | | | | | | | | | | | | | | | | | | |
Total return (%) | | | 9.88 | | | (2.46 | ) | | | 1.08 | | | | 4.25 | | | | 1.71 | |
Ratios to average daily net assets (%): | | | | | | | | | | | | | | | | | | | |
Expenses, net of waivers and reimbursements | | | 0.85 | | | 0.90 | | | | 0.79 | | | | 0.74 | | | | 0.73 | |
Expenses, before waivers and reimbursements | | | 0.93 | | | 0.93 | | | | 0.81 | | | | 0.80 | | | | 0.73 | |
Net investment income (loss), net of waivers and reimbursements | | | 4.48 | | | 4.38 | | | | 4.73 | | | | 4.54 | | | | 4.09 | |
Net investment income (loss), before waivers and reimbursements | | | 4.41 | | | 4.35 | | | | 4.71 | | | | 4.48 | | | | 4.09 | |
| | | | | | | | | | | | | | | | | | | |
| | | Class I | |
| | | Years Ended December 31, | |
| | | 2009 | | 2008 | | | 2007 | | | 2006 | | | 2005 | |
Net asset value, beginning of year | | $ | 8.64 | | $ | 9.30 | | | $ | 9.69 | | | $ | 9.82 | | | $ | 10.15 | |
Income (loss) from investment operations: | | | | | | | | | | | | | | | | | | | |
Net investment income (loss) | | | 0.41 | | | 0.39 | | | | 0.47 | | | | 0.45 | | | | 0.52 | |
Net realized and unrealized gain (loss) on investments | | | 0.43 | | | (0.59 | ) | | | (0.34 | ) | | | (0.04 | ) | | | (0.33 | ) |
| | | | | | | | | | | | | | | | | | | |
Total from investment operations | | | 0.84 | | | (0.20 | ) | | | 0.13 | | | | 0.41 | | | | 0.19 | |
Less distributions from: | | | | | | | | | | | | | | | | | | | |
Net investment income | | | 0.48 | | | 0.46 | | | | 0.52 | | | | 0.54 | | | | 0.52 | |
Net realized gain | | | — | | | — | | | | — | | | | — | | | | — | |
| | | | | | | | | | | | | | | | | | | |
Total distributions | | | 0.48 | | | 0.46 | | | | 0.52 | | | | 0.54 | | | | 0.52 | |
| | | | | | | | | | | | | | | | | | | |
Net asset value, end of year | | $ | 9.00 | | $ | 8.64 | | | $ | 9.30 | | | $ | 9.69 | | | $ | 9.82 | |
| | | | | | | | | | | | | | | | | | | |
Total return (%) | | | 9.89 | | | (2.26 | ) | | | 1.36 | | | | 4.33 | | | | 1.92 | |
Ratios to average daily net assets (%): | | | | | | | | | | | | | | | | | | | |
Expenses, net of waivers and reimbursements | | | 0.66 | | | 0.72 | | | | 0.60 | | | | 0.62 | | | | 0.58 | |
Net investment income (loss), net of waivers and reimbursements | | | 4.67 | | | 4.57 | | | | 4.91 | | | | 4.66 | | | | 4.24 | |
| | | | | | | | | | | | | | | |
| | | Years Ended December 31, |
| | | 2009 | | 2008 | | 2007 | | 2006 | | 2005 |
Supplemental data for all classes: | | | | | | | | | | | | | | | |
Net assets at end of year (in thousands) | | $ | 117,608 | | $ | 140,435 | | $ | 204,630 | | $ | 297,077 | | $ | 310,496 |
Portfolio turnover rate (%) | | | 40 | | | 38 | | | 34 | | | 33 | | | 41 |
Performance cited represents past performance. Past performance does not guarantee future results and current performance may be lower or higher than the data quoted. Results shown are annual returns, which assume reinvestment of dividends and capital gains. Investment returns and principal will fluctuate and you may have a gain or loss when you sell shares. For the most current month-end performance information, please call 1-800-742-7272 or visit our Web site at www.williamblairfunds.com.
Note: Net investment income (loss) per share is based on the average shares outstanding during the year.
December 31, 2009 | William Blair Funds 131 |
Financial Highlights
Low Duration Fund
| | | | |
| | | Class N | |
| | | Period Ended
December 31, | |
| | | 2009(a) | |
Net asset value, beginning of period | | $ | 10.00 | |
Income (loss) from investment operations: | | | | |
Net investment income (loss) | | | 0.01 | |
Net realized and unrealized gain (loss) on investments | | | (0.07 | ) |
| | | | |
Total from investment operations | | | (0.06 | ) |
Less distributions from: | | | | |
Net investment income | | | 0.01 | |
Net realized gain | | | — | |
| | | | |
Total distributions | | | 0.01 | |
| | | | |
Net asset value, end of period | | $ | 9.93 | |
| | | | |
Total return (%) | | | (0.60 | )(b) |
Ratios to average daily net assets (%): | | | | |
Expenses, net of waivers and reimbursements | | | 0.70 | (c) |
Expenses, before waivers and reimbursements | | | 0.94 | (c) |
Net investment income (loss), net of waivers and reimbursements | | | 1.27 | (c) |
Net investment income (loss), before waivers and reimbursements | | | 1.03 | (c) |
| | | | |
| | | Class I | |
| | | Period Ended
December 31, | |
| | | 2009(a) | |
Net asset value, beginning of period | | $ | 10.00 | |
Income (loss) from investment operations: | | | | |
Net investment income (loss) | | | 0.01 | |
Net realized and unrealized gain (loss) on investments | | | (0.07 | ) |
| | | | |
Total from investment operations | | | (0.06 | ) |
Less distributions from: | | | | |
Net investment income | | | 0.01 | |
Net realized gain | | | — | |
| | | | |
Total distributions | | | 0.01 | |
| | | | |
Net asset value, end of period | | $ | 9.93 | |
| | | | |
Total return (%) | | | (0.59 | )(b) |
Ratios to average daily net assets (%): | | | | |
Expenses, net of waivers and reimbursements | | | 0.55 | (c) |
Expenses, before waivers and reimbursements | | | 0.79 | (c) |
Net investment income (loss), net of waivers and reimbursements | | | 1.39 | (c) |
Net investment income (loss), before waivers and reimbursements | | | 1.15 | (c) |
| | | | |
| | | Period Ended
December 31, | |
| | | 2009(a) | |
Supplemental data for all classes: | | | | |
Net assets at end of period (in thousands) | | $ | 95,134 | |
Portfolio turnover rate (%) | | | — | (c) |
| (a) | | For the period December 1, 2009 (Commencement of Operations) to December 31, 2009. |
| (b) | | Total return is not annualized for periods that are less than a year. |
| (c) | | Rates are annualized for periods that are less than a year. |
Performance cited represents past performance. Past performance does not guarantee future results and current performance may be lower or higher than the data quoted. Results shown are annual returns, which assume reinvestment of dividends and capital gains. Investment returns and principal will fluctuate and you may have a gain or loss when you sell shares. For the most current month-end performance information, please call 1-800-742-7272 or visit our Web site at www.williamblairfunds.com.
Note: Net investment income (loss) per share is based on the average shares outstanding during the year.
132 Annual Report | December 31, 2009 |
Financial Highlights
Ready Reserves Fund
| | | | | | | | | | | | | | | | |
| | | Class N |
| | | Years Ended December 31, |
| | | 2009 | | | 2008 | | 2007 | | 2006 | | 2005 |
Net asset value, beginning of year | | $ | 1.00 | | | $ | 1.00 | | $ | 1.00 | | $ | 1.00 | | $ | 1.00 |
Income (loss) from investment operations: | | | | | | | | | | | | | | | | |
Net investment income (loss) | | | 0.00 | * | | | 0.02 | | | 0.05 | | | 0.04 | | | 0.03 |
Net realized and unrealized gain (loss) on investments | | | — | | | | — | | | — | | | — | | | — |
| | | | | | | | | | | | | | | | |
Total from investment operations | | | 0.00 | * | | | 0.02 | | | 0.05 | | | 0.04 | | | 0.03 |
Less distributions from: | | | | | | | | | | | | | | | | |
Net investment income | | | 0.00 | * | | | 0.02 | | | 0.05 | | | 0.04 | | | 0.03 |
Net realized gain | | | — | | | | — | | | — | | | — | | | — |
| | | | | | | | | | | | | | | | |
Total distributions | | | 0.00 | * | | | 0.02 | | | 0.05 | | | 0.04 | | | 0.03 |
| | | | | | | | | | | | | | | | |
Net asset value, end of year | | $ | 1.00 | | | $ | 1.00 | | $ | 1.00 | | $ | 1.00 | | $ | 1.00 |
| | | | | | | | | | | | | | | | |
Total return (%) | | | 0.10 | | | | 2.20 | | | 4.75 | | | 4.47 | | | 2.62 |
Ratios to average daily net assets (%): | | | | | | | | | | | | | | | | |
Expenses, net of waivers and reimbursements | | | 0.46 | | | | 0.60 | | | 0.63 | | | 0.63 | | | 0.64 |
Expenses, before waivers and reimbursements | | | 0.66 | | | | — | | | — | | | — | | | — |
Net investment income (loss), net of waivers and reimbursements | | | 0.11 | | | | 2.12 | | | 4.63 | | | 4.38 | | | 2.57 |
Net investment income (loss), before waivers and reimbursements | | | (0.09 | ) | | | — | | | — | | | — | | | — |
| | | | | | | | | | | | | | | |
| | | Years Ended December 31, |
| | | 2009 | | 2008 | | 2007 | | 2006 | | 2005 |
Supplemental data for all classes: | | | | | | | | | | | | | | | |
Net assets at end of year (in thousands) | | $ | 1,352,901 | | $ | 1,841,189 | | $ | 1,399,537 | | $ | 1,195,593 | | $ | 1,091,854 |
| * | | Amount is less than $0.005 per share. |
Performance cited represents past performance. Past performance does not guarantee future results and current performance may be lower or higher than the data quoted. Results shown are annual returns, which assume reinvestment of dividends and capital gains. Investment returns and principal will fluctuate and you may have a gain or loss when you sell shares. For the most current month-end performance information, please call 1-800-742-7272 or visit our Web site at www.williamblairfunds.com.
Note: Net investment income (loss) per share is based on the average shares outstanding during the year.
December 31, 2009 | William Blair Funds 133 |
REPORT OF INDEPENDENT REGISTERED PUBLIC ACCOUNTING FIRM
To the Board of Trustees and Shareholders of
William Blair Funds
We have audited the accompanying statement of assets and liabilities, including the portfolios of investments, of the Growth Fund, Large Cap Growth Fund, Small Cap Growth Fund, Mid Cap Growth Fund, Small-Mid Cap Growth Fund, Global Growth Fund, International Growth Fund, International Equity Fund, International Small Cap Growth Fund, Emerging Markets Growth Fund, Emerging Leaders Growth Fund, Value Discovery Fund, Bond Fund, Income Fund, Low Duration Fund and Ready Reserves Fund (collectively, the Portfolios) (sixteen of the Portfolios constituting the William Blair Funds) as of December 31, 2009, and the related statement of operations, statements of changes in net assets and financial highlights for the periods indicated therein. These financial statements and financial highlights are the responsibility of the Portfolios’ management. Our responsibility is to express an opinion on these financial statements and financial highlights based on our audits.
We conducted our audits in accordance with the standards of the Public Company Accounting Oversight Board (United States). Those standards require that we plan and perform the audits to obtain reasonable assurance about whether the financial statements and financial highlights are free of material misstatement. We were not engaged to perform an audit of the Portfolios’ internal control over financial reporting. Our audits included consideration of internal control over financial reporting as a basis for designing audit procedures that are appropriate in the circumstances, but not for the purpose of expressing an opinion on the effectiveness of the Portfolios’ internal control over financial reporting. Accordingly, we express no such opinion. An audit also includes examining, on a test basis, evidence supporting the amounts and disclosures in the financial statements and financial highlights, assessing the accounting principles used and significant estimates made by management, and evaluating the overall financial statement presentation. Our procedures included confirmation of securities owned as of December 31, 2009, by correspondence with the custodian and brokers or by other appropriate auditing procedures where replies from brokers were not received. We believe that our audits provide a reasonable basis for our opinion.
In our opinion, the financial statements and financial highlights referred to above present fairly, in all material respects, the financial position for each of the above mentioned Portfolios of the William Blair Funds at December 31, 2009, the results of their operations, the changes in their net assets and financial highlights for the periods indicated therein, in conformity with U.S. generally accepted accounting principles.

Chicago, Illinois
February 22, 2010
134 Annual Report | December 31, 2009 |
Trustees and Officers (Unaudited). The trustees and officers of the William Blair Funds, their year of birth, their principal occupations during the last five years, their affiliations, if any, with William Blair & Company, L.L.C., and other significant affiliations are set forth below. The address of each trustee and officer is 222 West Adams Street, Chicago, Illinois 60606.
| | | | | | | | | | |
Name and Year of Birth | | Position(s)
Held with
Fund | | Term of
Office and
Length of
Time
Served(1) | | Principal Occupation(s) During Past 5 Years | | Number of
Portfolios
in Fund
Complex
Overseen
by Trustee | | Other Directorships Held by Trustee/Officer |
Interested Trustees | | | | | | | | | | |
Frederick Conrad Fischer,
1934* | | Chairman of the Board of Trustees | | Since 1987 | | Principal, William Blair & Company, L.L.C.; Partner, APM Limited Partnership; Limited Partner, WB Holdings, L.P. (since November 2008) | | 18 | | Trustee Emeritus, Chicago Child Care Society, a non-profit organization; Trustee Emeritus, Kalamazoo College |
| | | | | |
Michelle R. Seitz,
1965* | | Trustee and President | | Since 2002 Since 2007 | | Principal, William Blair & Company, L.L.C.; Limited Partner, WB Holdings, L.P. (since November 2008); Member, WBC GP, L.L.P. (since November 2008) | | 18 | | N/A |
| | | | |
Non-Interested Trustees | | | | | | | | |
Ann P. McDermott,
1939 | | Trustee | | Since 1996 | | Board member and officer for various civic and charitable organizations over the past thirty years; professional experience prior thereto, registered representative for New York Stock Exchange firm | | 18 | | Northwestern University, Women’s Board; Rush Presbyterian St. Luke’s Medical Center, Women’s Board; University of Chicago, Women’s Board; Visiting Nurses Association, Honorary Director |
| | | | | |
Phillip O. Peterson,
1944 | | Trustee | | Since 2007 | | Trustee of Strong Funds Liquidating Trusts since 2005 and President, Strong Mutual Funds, 2004-2005; formerly, Partner, KPMG LLP | | 18 | | The Hartford Group of Mutual Funds (87 portfolios) |
| | | | | |
Donald J. Reaves,
1946 | | Trustee | | Since 2004 | | Chancellor, Winston-Salem State University; formerly, Vice President for Administration and Chief Financial Officer, University of Chicago 2002-2007. | | 18 | | American Student Assistance Corp., guarantor of student loans; Amica Mutual Insurance Company |
| | | | | |
Donald L. Seeley,
1944 | | Trustee | | Since 2003 | | Director, Applied Investment Management Program, University of Arizona Department of Finance, formerly, Vice Chairman and Chief Financial Officer, True North Communications, Inc., marketing communications and advertising firm | | 18 | | Warnaco Group, Inc., intimate apparel, sportswear, and swimwear manufacturer; Center for Furniture Craftsmanship (not-for-profit) |
| | | | | |
Thomas J. Skelly,
1951 | | Trustee | | Since 2007 | | Managing Partner of various divisions at Accenture | | 18 | | First MetLife Investors Insurance Company |
| | | | | |
Robert E. Wood II,
1938 | | Trustee | | Since 1999 | | Retired; formerly, Executive Vice President, Morgan Stanley Dean Witter | | 18 | | Chairman, Add-Vision, Inc., manufacturer of surface animation systems; Chairman Micro-Combustion, LLC |
December 31, 2009 | William Blair Funds 135 |
| | | | | | | | |
Name and Year of Birth | | Position(s)
Held with
Fund | | Term of
Office and
Length of
Time
Served(1) | | Principal Occupation(s) During Past 5 Years(2) | | Other Directorships Held by Trustee/Officer |
Officers | | | | | | | | |
Michael P. Balkin,
1959 | | Senior Vice President Vice President | | Since 2009 2008-2009 | | Principal, William Blair & Company, L.L.C. Associate, William Blair & Company, L.L.C.; former Chief Investment Officer, Magnetar Investment Management | | N/A |
| | | | |
Karl W. Brewer,
1966 | | Senior Vice President | | Since 2000 | | Principal, William Blair & Company, L.L.C. | | N/A |
| | | | |
David C. Fording,
1967 | | Senior Vice President Vice President | | Since 2009 2006-2009 | | Principal, William Blair & Company, L.L.C. Associate, William Blair & Company, L.L.C.; former Portfolio Manager, TIAA-CREF. | | N/A |
| | | | |
James S. Golan,
1961 | | Senior Vice President | | Since 2005 | | Principal, William Blair & Company, L.L.C. | | N/A |
| | | | |
W. George Greig,
1952 | | Senior Vice President | | Since 1996 | | Principal, William Blair & Company, L.L.C. | | N/A |
| | | | |
Michael A. Jancosek,
1959 | | Senior Vice President | | Since 2004 | | Principal, William Blair & Company L.L.C. | | N/A |
| | | | |
John F. Jostrand,
1954 | | Senior Vice President | | Since 1999 | | Principal, William Blair & Company, L.L.C. | | N/A |
| | | | |
Robert C. Lanphier, IV,
1956 | | Senior Vice President | | Since 2003 | | Principal, William Blair & Company, L.L.C. | | Chairman, AG. Med, Inc. |
| | | | |
Mark T. Leslie,
1967 | | Senior Vice President Vice President | | Since 2008 2005-2008 | | Principal, William Blair & Company, L.L.C. Associate, William Blair & Company, L.L.C. formerly, U.S. Bancorp Asset Management | | N/A |
| | | | |
Matthew A. Litfin,
1972 | | Senior Vice President | | Since 2008 | | Principal, William Blair & Company, L.L.C. | | N/A |
| | | | |
Kenneth J. McAtamney
1966 | | Senior Vice President | | Since 2008 | | Principal, William Blair & Company, L.L.C. | | N/A |
| | | | |
Todd M. McClone,
1968 | | Senior Vice President Vice President | | Since 2006 2005-2006 | | Principal, William Blair & Company, L.L.C. Associate, William Blair & Company, L.L.C. | | N/A N/A |
| | | | |
Tracy McCormick,
1954 | | Senior Vice President | | Since 2008 | | Principal, William Blair & Company, L.L.C. | | N/A |
| | | | |
David Merjan,
1960 | | Senior Vice President | | Since 2008 | | Principal, William Blair & Company, L.L.C. | | N/A |
136 Annual Report | December 31, 2009 |
| | | | | | | | |
Name and Year of Birth | | Position(s)
Held with
Fund | | Term of
Office and
Length of
Time
Served(1) | | Principal Occupation(s) During Past 5 Years(2) | | Other Directorships Held by Trustee/Officer |
David S. Mitchell,
1960 | | Senior Vice President | | Since 2004 | | Principal, William Blair & Company, L.L.C. | | N/A |
| | | | |
David P. Ricci,
1958 | | Senior Vice President | | Since 2006 | | Principal, William Blair & Company, L.L.C. | | N/A |
| | | | |
Richard W. Smirl,
1967 | | Senior Vice President | | Since 2004 | | Principal, William Blair & Company, L.L.C. | | N/A |
| | | | |
Jeffrey A. Urbina,
1955 | | Senior Vice President | | Since 1998 | | Principal, William Blair & Company, L.L.C. | | N/A |
| | | | |
Christopher T. Vincent,
1956 | | Senior Vice President | | Since 2004 | | Principal, William Blair & Company, L.L.C. | | N/A |
| | | | |
Chad M. Kilmer,
1975 | | Vice President | | Since 2006 | | Associate, William Blair & Company, L.L.C.; former analyst and Portfolio Manager U.S. Bancorp Asset Management. | | N/A |
| | | | |
Paul J. Sularz,
1967 | | Vice President | | Since 2009 | | Associate, William Blair & Company, L.L.C.; Vice President, J.P. Morgan Securities, Inc. | | N/A |
| | | | |
Terence M. Sullivan,
1944 | | Vice President | | Since 1997 | | Associate, William Blair & Company, L.L.C. | | N/A |
| | | | |
Walter R. Randall, Jr.,
1960 | | Chief Compliance Officer | | Since 2009 | | Associate, William Blair & Company, L.L.C.; Associate Counsel and Chief Compliance Officer, Calamos Investments; Assistant General Counsel, American Century Investments. | | N/A |
| | | | |
Colette M. Garavalia,
1961 | | Treasurer | | Since 2009 | | Associate, William Blair & Company, L.L.C. | | N/A |
| | | | |
| | Secretary | | 2000-2009 | | Associate, William Blair & Company, L.L.C.; | | N/A |
| | | | |
Andrew T. Pfau,
1970 | | Secretary | | Since 2009 | | Associate, William Blair & Company, L.L.C.; Associate, Bell, Boyd & Lloyd, LLP; Associate, Sidley Austin LLP | | N/A |
| * | | Mr. Fischer and Ms. Seitz are interested persons of the William Blair Funds because each is a principal of William Blair & Company, L.L.C., the Funds’ investment advisor, principal underwriter and distributor. |
| (1) | | Each Trustee serves until the election and qualification of a successor, or until death, resignation or retirement or removal as provided in the Fund’s Declaration of Trust. Retirement for non-interested Trustees occurs no later than at the conclusion of the first regularly scheduled Board meeting of the Fund’s fiscal year that occurs after the Trustee’s 72nd birthday. The Fund’s officers except the Chief Compliance Officer, are elected annually by the Trustees. The Fund’s Chief Compliance Officer is designated by the Board of Trustees and may only be removed by action of the Board of Trustees, including a majority of the non-interested Trustees. |
| (2) | | In November 2008, all current principals of William Blair & Company, L.L.C. also became limited partners in WB Holdings, L.P. |
The Statement of Additional Information for the William Blair Funds includes additional information about the trustees and is available without charge by calling 1-800-635-2886 (in Massachusetts 1-800-635-2840) or by writing the Fund.
December 31, 2009 | William Blair Funds 137 |
Approval of the Low Duration Fund’s Management Agreement
On October 27, 2009, the Board of Trustees of the William Blair Funds (the “Trust”), including those Trustees who are not interested persons of the Trust as defined by the Investment Company Act of 1940 (the “Independent Trustees”), approved the Management Agreement between the Trust, on behalf of the William Blair Low Duration Fund (the “Fund”), and William Blair & Company, L.L.C. (the “Advisor”). On September 15, October 26 and 27, 2009, the Board met to consider the approval of the Management Agreement. On October 26 and 27, 2009, the Independent Trustees also met independently of Trust management and the interested Trustees of the Trust to consider the approval of the Management Agreement. The Independent Trustees reviewed materials provided by the Advisor for the approval of the Management Agreement and were assisted by independent legal counsel in making their determination. The Board considered the following factors in making their determination, but did not identify any single factor or group of factors as all important or controlling and considered all factors together.
Nature, Quality and Extent of Services. In evaluating the nature, quality and extent of services expected to be provided by the Advisor to the Fund, the Board noted that the Advisor is a quality firm with a reputation for integrity and honesty that employs high quality people. The Board considered biographical information about the Fund’s portfolio managers, financial information regarding the Advisor, the compliance regime created by the Advisor and the proposed financial support of the Fund. The Board considered the Advisor’s past experience managing a low duration bond strategy and the Advisor’s experience in managing new funds. Based upon all relevant factors, the Board concluded that the nature, quality and extent of the services to be provided by the Advisor to the Fund are expected to be satisfactory.
The Independent Trustees reviewed performance information for the one-, three-, five- and ten-year periods for the Advisor’s Low Duration Fixed Income composite and the Merrill Lynch 3-month U.S. Treasury Bill Index, the Fund’s benchmark (the “Benchmark”). The performance information indicated that the Advisor’s Low Duration Fixed Income composite performed satisfactorily relative to the Benchmark for all periods.
Fees and Expenses. The Board reviewed the proposed advisory fee for the Fund and reviewed information comparing the advisory fee to a peer group of funds provided by Lipper Inc. The Lipper peer group for the Fund consisted of other no-load retail short investment-grade debt funds. In considering the information, the Board noted that the proposed advisory fee for the Fund was in the low end of the Lipper peer group. The Board also considered that the Advisor has proposed to limit total expenses, including waiving advisory fees, if necessary, for each share class of the Fund. The Board also reviewed the Advisor’s fee schedule for its Low Duration separate accounts. On the basis of the information provided, the Board concluded that the proposed advisory fee was reasonable and appropriate in light of the nature, quality and extent of services expected to be provided by the Advisor.
Profitability. With respect to the estimated profitability of the Management Agreement to the Advisor, the Board considered the proposed advisory fee, the expected size of the Fund and the Advisor’s agreement to limit total expenses. The Board concluded that the expected profits to be realized by the Advisor were not unreasonable.
Economies of Scale. The Board considered the extent to which economies of scale would be realized as the Fund grows and whether fee levels reflect these economies of scale. The Board considered whether the proposed advisory fee was reasonable in relation to the projected asset size of the Fund. In considering whether fee levels reflect economies of scale for the benefit of Fund investors, the Board reviewed the Fund’s advisory fee compared to peer funds, the Fund’s projected asset size, the Fund’s estimated expense ratios and the Advisor’s agreement to limit total expenses, and concluded that the advisory fee was reasonable.
Other Benefits to the Advisor. The Board considered benefits to be derived by the Advisor from its relationship with the Fund. The Board concluded that, after taking into account these benefits, the proposed advisory fee was reasonable.
Conclusion. Based upon all of the information considered and the conclusions reached, the Board determined that the terms of the Management Agreement are fair and reasonable and that the approval of the Management Agreement is in the best interests of the Fund.
138 Annual Report | December 31, 2009 |
(unaudited)
Proxy Voting
A description of the policies and procedures that the Fund uses to determine how to vote proxies relating to portfolio securities and information regarding how the Fund voted proxies relating to portfolio securities for the most recent 12-month period ended June 30 are available without charge, upon request, by calling 1-800-635-2886 (in Massachusetts 1-800-635-2840), at www.williamblairfunds.com and on the SEC’s website at http://www.sec.gov.
Quarterly Portfolio Schedules
Each Portfolio files its complete schedule of portfolio holdings with the SEC for the first and third fiscal quarters of each fiscal year (quarters ended March 31 and September 30) on Form N-Q. The Fund’s Forms N-Q are available on the SEC’s website at http://www.sec.gov and may be reviewed and copied at the SEC’s Public Reference Room in Washington, D.C. Information on the operation of the SEC’s Public Reference Room may be obtained by calling 1-800-SEC-0330. The Fund’s Forms N-Q are also available on the Fund’s website at www.williamblairfunds.com.
Additional Federal Income Tax Information: (unaudited)
The following table provides the percentage of the 2009 year-end distributions that qualify for the dividend received deduction, and the qualified dividend income percentage:
| | | | | | |
Portfolio | | Dividend
Received
Deduction% | | | Qualified
Dividend
Income% | |
Growth | | 100.00 | % | | 100.00 | % |
Large Cap Growth | | 100.00 | % | | 100.00 | % |
Small Cap Growth | | 0.00 | % | | 0.00 | % |
Mid Cap Growth | | 0.00 | % | | 0.00 | % |
Small-Mid Cap Growth | | 14.95 | % | | 100.00 | % |
Global Growth | | 100.00 | % | | 100.00 | % |
International Growth | | 0.00 | % | | 100.00 | % |
International Equity | | 1.73 | % | | 100.00 | % |
International Small Cap Growth | | 0.00 | % | | 100.00 | % |
Emerging Markets Growth | | 0.00 | % | | 69.26 | % |
Emerging Leaders Growth | | 0.00 | % | | 57.56 | % |
Value Discovery | | 100.00 | % | | 100.00 | % |
Bond | | 0.00 | % | | 0.00 | % |
Income | | 0.00 | % | | 0.00 | % |
Low Duration | | 0.00 | % | | 0.00 | % |
Ready Reserves | | 0.00 | % | | 0.00 | % |
In January 2010, you were notified on IRS Form 1099-Div or substitute 1099 DIV as to the Federal tax status of the distributions received by you in the calendar year 2009.
December 31, 2009 | William Blair Funds 139 |
Useful Information About Your Report (unaudited)
Please refer to this information when reviewing the Expense Example for each Portfolio.
Expense Example
As a shareholder of a Portfolio, you incur two types of costs: (1) transaction costs such as redemption fees and (2) ongoing costs, including management fees, distribution (12b-1) fees (for Class N shares except for the Ready Reserves Portfolio), service fees (for Class N shares of the Ready Reserves Portfolio), shareholder administration fees (for Class N and Class I shares of the Global Growth Portfolio, the International Small Cap Growth Portfolio, the Emerging Markets Growth Portfolio, the Bond Portfolio and the Low Duration Portfolio and Class I shares of the Emerging Leaders Growth Portfolio) and other Portfolio expenses. The example is intended to help you understand your ongoing costs (in dollars) of investing in the Portfolio and to compare these costs with the ongoing costs of investing in other mutual funds. To do so, compare the Portfolio’s 5% hypothetical example with the 5% hypothetical examples that appear in the shareholder reports of other funds. The example is based on an investment of $1,000 invested at the beginning of the period and held for the entire six-month period from June 30, 2009 to December 31, 2009.
Actual Expenses
In each example, the first line for each share class in the table provides information about the actual account values and actual expenses. These expenses reflect the effect of any expense cap applicable to the share class during the period. Without this expense cap, the costs shown in the table would have been higher. You may use the information in this line, together with the amount you invested, to estimate the expenses that you paid over the period. Simply divide your account value by $1,000 (example, an $8,600 account value divided by $1,000 = 8.6), then multiply the result by the number in the first line under the heading entitled “Expenses Paid During the Period” to estimate the expenses you paid on your account during the period.
Hypothetical Example for Comparison Purposes
In each example, the second line for each share class in the table provides information about hypothetical account values and hypothetical expenses based on the Portfolio’s actual expense ratio and an assumed rate of return of 5% per year before expenses. This is not the Portfolio’s actual return. The hypothetical account values and expenses may not be used to estimate the actual ending account balance or expenses you paid for the period. You may use this information to compare the ongoing costs of investing in the Portfolio to other funds. To do so, compare this 5% hypothetical example with the 5% hypothetical examples that appear in the shareholder reports of other funds.
Please note that the expenses shown in both examples are meant to highlight your ongoing costs only and do not reflect any transactional costs or account type fees, such as redemption fees and IRA Fiduciary Administration fees, respectively. These fees are fully described in the prospectus. Therefore, the second line of each share class in the table is useful in comparing ongoing costs only and will not help you determine the relative costs of owning different funds. In addition, if these transactional costs or account fees were included, your costs would have been higher.
140 Annual Report | December 31, 2009 |
Fund Expenses (unaudited)
The examples below show you the ongoing costs (in dollars) of investing in your fund and allows you to compare these costs with those of other mutual funds. Please refer to the previous page for a detailed explanation of the information presented on this chart.
| | | | | | | | | | | | |
Expense Example | | Beginning
Account Value
7/1/2009 | | Ending
Account Value
12/31/2009 | | Expenses Paid
During the
Period (a) | | Annualized
Expense Ratio | |
Growth Fund | | | | | | | | | | | | |
Class N—actual return | | $ | 1,000.00 | | $ | 1,180.20 | | $ | 6.76 | | 1.23 | % |
Class N—hypothetical 5% return | | | 1,000.00 | | | 1,019.00 | | | 6.26 | | 1.23 | |
Class I—actual return | | | 1,000.00 | | | 1,182.60 | | | 4.79 | | 0.87 | |
Class I—hypothetical 5% return | | | 1,000.00 | | | 1,020.82 | | | 4.43 | | 0.87 | |
Large Cap Growth Fund | | | | | | | | | | | | |
Class N—actual return | | | 1,000.00 | | | 1,191.50 | | | 6.79 | | 1.23 | |
Class N—hypothetical 5% return | | | 1,000.00 | | | 1,019.00 | | | 6.26 | | 1.23 | |
Class I—actual return | | | 1,000.00 | | | 1,194.00 | | | 5.42 | | 0.98 | |
Class I—hypothetical 5% return | | | 1,000.00 | | | 1,020.27 | | | 4.99 | | 0.98 | |
Small Cap Growth Fund | | | | | | | | | | | | |
Class N—actual return | | | 1,000.00 | | | 1,218.90 | | | 8.33 | | 1.49 | |
Class N—hypothetical 5% return | | | 1,000.00 | | | 1,017.69 | | | 7.58 | | 1.49 | |
Class I—actual return | | | 1,000.00 | | | 1,220.60 | | | 6.60 | | 1.18 | |
Class I—hypothetical 5% return | | | 1,000.00 | | | 1,019.26 | | | 6.01 | | 1.18 | |
Mid Cap Growth Fund | | | | | | | | | | | | |
Class N—actual return | | | 1,000.00 | | | 1,195.70 | | | 7.53 | | 1.36 | |
Class N—hypothetical 5% return | | | 1,000.00 | | | 1,018.35 | | | 6.92 | | 1.36 | |
Class I—actual return | | | 1,000.00 | | | 1,197.20 | | | 6.15 | | 1.11 | |
Class I—hypothetical 5% return | | | 1,000.00 | | | 1,019.61 | | | 5.65 | | 1.11 | |
Small-Mid Cap Growth Fund | | | | | | | | | | | | |
Class N—actual return | | | 1,000.00 | | | 1,205.50 | | | 7.56 | | 1.36 | |
Class N—hypothetical 5% return | | | 1,000.00 | | | 1,018.35 | | | 6.92 | | 1.36 | |
Class I—actual return | | | 1,000.00 | | | 1,207.50 | | | 6.18 | | 1.11 | |
Class I—hypothetical 5% return | | | 1,000.00 | | | 1,019.61 | | | 5.65 | | 1.11 | |
Global Growth Fund | | | | | | | | | | | | |
Class N—actual return | | | 1,000.00 | | | 1,208.00 | | | 8.63 | | 1.55 | |
Class N—hypothetical 5% return | | | 1,000.00 | | | 1,017.39 | | | 7.88 | | 1.55 | |
Class I—actual return | | | 1,000.00 | | | 1,210.60 | | | 7.24 | | 1.30 | |
Class I—hypothetical 5% return | | | 1,000.00 | | | 1,018.65 | | | 6.61 | | 1.30 | |
International Growth Fund | | | | | | | | | | | | |
Class N—actual return | | | 1,000.00 | | | 1,215.30 | | | 8.15 | | 1.46 | |
Class N—hypothetical 5% return | | | 1,000.00 | | | 1,017.85 | | | 7.43 | | 1.46 | |
Class I—actual return | | | 1,000.00 | | | 1,216.60 | | | 6.59 | | 1.18 | |
Class I—hypothetical 5% return | | | 1,000.00 | | | 1,019.26 | | | 6.01 | | 1.18 | |
International Equity Fund | | | | | | | | | | | | |
Class N—actual return | | | 1,000.00 | | | 1,205.60 | | | 7.73 | | 1.39 | |
Class N—hypothetical 5% return | | | 1,000.00 | | | 1,018.20 | | | 7.07 | | 1.39 | |
Class I—actual return | | | 1,000.00 | | | 1,206.40 | | | 6.67 | | 1.20 | |
Class I—hypothetical 5% return | | | 1,000.00 | | | 1,019.16 | | | 6.11 | | 1.20 | |
International Small Cap Growth Fund | | | | | | | | | | | | |
Class N—actual return | | | 1,000.00 | | | 1,259.10 | | | 9.40 | | 1.65 | |
Class N—hypothetical 5% return | | | 1,000.00 | | | 1,016.89 | | | 8.39 | | 1.65 | |
Class I—actual return | | | 1,000.00 | | | 1,259.70 | | | 7.40 | | 1.30 | |
Class I—hypothetical 5% return | | | 1,000.00 | | | 1,018.65 | | | 6.61 | | 1.30 | |
Emerging Markets Growth Fund | | | | | | | | | | | | |
Class N—actual return | | | 1,000.00 | | | 1,306.10 | | | 9.82 | | 1.69 | |
Class N—hypothetical 5% return | | | 1,000.00 | | | 1,016.69 | | | 8.59 | | 1.69 | |
Class I—actual return | | | 1,000.00 | | | 1,308.10 | | | 8.14 | | 1.40 | |
Class I—hypothetical 5% return | | | 1,000.00 | | | 1,018.15 | | | 7.12 | | 1.40 | |
December 31, 2009 | William Blair Funds 141 |
| | | | | | | | | | | | |
Expense Example | | Beginning
Account Value
7/1/2009 | | Ending
Account Value
12/31/2009 | | Expenses Paid
During the
Period (a) | | Annualized
Expense Ratio | |
Emerging Leaders Growth Fund | | | | | | | | | | | | |
Class I—actual return | | $ | 1,000.00 | | $ | 1,314.50 | | $ | 8.17 | | 1.40 | % |
Class I—hypothetical 5% return | | | 1,000.00 | | | 1,018.15 | | | 7.12 | | 1.40 | |
Value Discovery Fund | | | | | | | | | | | | |
Class N—actual return | | | 1,000.00 | | | 1,270.10 | | | 7.38 | | 1.29 | |
Class N—hypothetical 5% return | | | 1,000.00 | | | 1,018.70 | | | 6.56 | | 1.29 | |
Class I—actual return | | | 1,000.00 | | | 1,271.70 | | | 6.24 | | 1.09 | |
Class I—hypothetical 5% return | | | 1,000.00 | | | 1,019.71 | | | 5.55 | | 1.09 | |
Bond Fund | | | | | | | | | | | | |
Class N—actual return | | | 1,000.00 | | | 1,058.40 | | | 3.42 | | 0.66 | |
Class N—hypothetical 5% return | | | 1,000.00 | | | 1,021.88 | | | 3.36 | | 0.66 | |
Class I—actual return | | | 1,000.00 | | | 1,060.10 | | | 2.60 | | 0.50 | |
Class I—hypothetical 5% return | | | 1,000.00 | | | 1,022.68 | | | 2.55 | | 0.50 | |
Income Fund | | | | | | | | | | | | |
Class N—actual return | | | 1,000.00 | | | 1,045.70 | | | 4.38 | | 0.85 | |
Class N—hypothetical 5% return | | | 1,000.00 | | | 1,020.92 | | | 4.33 | | 0.85 | |
Class I—actual return | | | 1,000.00 | | | 1,045.60 | | | 3.20 | | 0.62 | |
Class I—hypothetical 5% return | | | 1,000.00 | | | 1,022.08 | | | 3.16 | | 0.62 | |
Low Duration Fund | | | | | | | | | | | | |
Class N—actual return(b) | | | 1,000.00 | | | 994.00 | | | 0.59 | | 0.70 | |
Class N—hypothetical 5% return (6 month period) | | | 1,000.00 | | | 1,021.68 | | | 3.57 | | 0.70 | |
Class I—actual return(b) | | | 1,000.00 | | | 994.10 | | | 0.47 | | 0.55 | |
Class I—hypothetical 5% return (6 month period) | | | 1,000.00 | | | 1,022.43 | | | 2.80 | | 0.55 | |
Ready Reserve Fund | | | | | | | | | | | | |
Class N—actual return | | | 1,000.00 | | | 1,000.10 | | | 1.51 | | 0.30 | |
Class N—hypothetical 5% return | | | 1,000.00 | | | 1,023.69 | | | 1.53 | | 0.30 | |
| (a) | | Expenses are equal to the annualized expense ratio, multiplied by the average account value over the period, multiplied by the number of days in the period 184, and divided by 365 (to reflect the one-half year period). |
| (b) | | For the period December 1, 2009 (Commencement of Operations) to December 31, 2009. |
142 Annual Report | December 31, 2009 |
BOARD OF TRUSTEES
Frederick Conrad Fischer, Chairman
Principal, William Blair & Company, L.L.C.
Ann P. McDermott
Director and Trustee
Profit and not-for-profit organizations
Phillip O. Peterson
Retired Partner, KPMG LLP
Donald J. Reaves
Chancellor, Winston-Salem State University
Donald L. Seeley
Adjunct Lecturer and Director, University of Arizona Department of Finance
Michelle R. Seitz, President
Principal, William Blair & Company, L.L.C.,
Thomas J. Skelly
Retired Managing Partner, Accenture U.S.
Robert E. Wood II
Retired Executive Vice President, Morgan Stanley Dean Witter
Officers
Michael P. Balkin, Senior Vice President
Karl W. Brewer, Senior Vice President
David C. Fording, Senior Vice President
James S. Golan, Senior Vice President
W. George Greig, Senior Vice President
Michael A. Jancosek, Senior Vice President
John F. Jostrand, Senior Vice President
Robert C. Lanphier, IV, Senior Vice President
Mark T. Leslie, Senior Vice President
Matthew A. Litfin, Senior Vice President
Kenneth J. McAtamney, Senior Vice President
Todd M. McClone, Senior Vice President
Tracy McCormick, Senior Vice President
David Merjan, Senior Vice President
David S. Mitchell, Senior Vice President
David P. Ricci, Senior Vice President
Richard W. Smirl, Senior Vice President
Jeffrey A. Urbina, Senior Vice President
Christopher T. Vincent, Senior Vice President
Chad M. Kilmer, Vice President
Paul J. Sularz, Vice President
Terence M. Sullivan, Vice President
Walter R. Randall, Jr., Chief Compliance Officer
Colette M. Garavalia, Treasurer
Andrew T. Pfau, Secretary
Investment Advisor
William Blair & Company, L.L.C.
Independent Registered Public Accounting Firm
Ernst & Young LLP
Legal Counsel
Vedder Price P.C.
Transfer Agent
Boston Financial Data Services, Inc.
P.O. Box 8506
Boston, MA 02266-8506
For customer assistance, call 1-800-635-2886
(Massachusetts 1-800-635-2840)
December 31, 2009 | William Blair Funds 143 |
Table of Contents
This report is submitted for the general information of the shareholders of the William Blair Funds. It is not authorized for distribution to prospective investors unless accompanied or preceded by a prospectus of the William Blair Funds. Please consider the Funds’ investment objectives, risks, charges, and expenses before investing. This and other information is contained in the Funds’ prospectus, which you may obtain by calling 1-800-742-7272. Read it carefully before you invest or send money. William Blair & Company, LLC., distributor.
December 31, 2009 | William Blair Funds 1 |
GLOBAL MARKETS OVERVIEW
2009 Summary
After a rough start during the first several months of 2009, when investors remained concerned about the breadth and depth of the global financial crisis and recession, the markets rallied strongly beginning in March, after a number of banks reported better than feared results and investors began to believe that the worst was over, bidding up Financials shares as well as lower quality companies. Beginning in September, however, while the market continued to rise, the rally broadened and included sectors such as Healthcare and Consumer Staples, which were left behind the previous six months. During the entire year, Materials and Information Technology were the strongest performers, returning 70.85% and 60.25%, respectively, outperforming the other sectors, while the more defensive Utilities and Telecommunication Services were the biggest laggards, returning 11.21% and 17.06%, respectively. Global equities broadly returned 36.41% during 2009.
Regional performance was virtually a mirror image of 2008, with emerging markets performing the strongest at 82.36%, led by Latin America—specifically Brazil, which was consistently strong the entire year. Emerging Asia, which was led by China in the initial months of 2009, lagged during the remainder of the year, as China trailed, although India, Indonesia, and Taiwan were strong. After concerns about global macroeconomic risk receded during the mid part of 2009 the Central and Eastern European countries in Emerging Markets Europe Mid-East and Africa (EMEA) performed well, as did Russia, which was up 106% in 2009. During the entire year, however EMEA was the worst performing markets region, up approximately 69%, while Emerging Asia was up 79% and Latin America returned approximately 108%. Non-US small cap stocks also performed well during the year, returning 62.91%. While Europe, Australia and Far East (EAFE) lagged small cap and emerging markets during the year, it was up 33.24%, ahead of the U.S., which rose 27.86%. The difference between non-U.S. developed and U.S. stocks, however, was due to U.S. dollar depreciation, as the EAFE rose 26.17% in local terms. Within the developed markets, the more natural resource oriented economies of Pacific Ex-Japan and Canada were the strongest regions, while Pacific Ex-Japan benefited from its proximity to and integration with the strongly performing Asian emerging markets. Japan was the notable laggard, returning 6.12%.
Outlook
It is fair to assert—as far as it goes—that the global cycle is moving through a transition from government-dominated financial stabilization into a more normal recovery and expansion phase. Within that broad context, however, the world’s major economies are performing very differently, as emerging markets lead the way out of the slowdown.
China is the growth leader for the region if not the world, having improved dramatically on almost every measure over just the past six months. Both housing and auto sales in China are showing annualized growth of over 50% at this point. Electricity output, declining a year ago, has accelerated to a year-on-year increase of over 25% in the latest reading. Credit and money supply growth measures are well above trend, and fixed asset investment continues to outpace the economy as a whole.
In the U.S., while leading indicators turned up several months ago, growth rates are still generally negative. Industrial production and personal income are still declining, and retail sales only just turned positive on an annual basis, even against last year’s distressed figures. European economies are still showing dismal comparisons, and Japan is only just beginning to find some stability after a breathtakingly steep decline in output.
2 Annual Report | December 31, 2009 |
The result of this growth disparity between emerging and developed economies is that while they started from the same point a year ago, they now appear to be at different stages of the economic cycle. The strongest economies, especially China, are beginning to be concerned about inflation risk and monetary tightening, while the rest of the world continues to struggle to see any positive effects from its collective stimulus efforts.
‘Asset values’ in China—real estate prices, commodities, stock markets—are beginning to suggest overheating; ‘asset values’ in developed markets, not so much. In the long run, as in 2009, it probably makes more sense to own an apartment in Shanghai or a ranch in Chile than the equivalent in Luxembourg or Arizona, but what about now, when policy and cyclical pressure might be pushing in the opposite direction?
We could see a period ahead of cyclical adjustment in which emerging markets hit a growth and valuation plateau while OECD (Organization for Economic Co-Operation and Development) markets play catch-up with a delayed recovery and still-easy policy settings. In the broader context of Asia being the world’s strongest region, followed by the Western Hemisphere and Europe, a tilt toward developed market recovery would tend to favor Japan and the U.S. in a global context. Similarly, a cooling off in China’s housing and auto sectors might enable a sectoral rotation away from consumer cyclicals and commodities toward longer cycle industrial exposure and even toward more undervalued defensive areas.
Our portfolio exposure is relatively balanced in this context. We have shifted some weighting from emerging to developed Asia, but we would expect to retain at least a neutral position in emerging markets unless we saw signs that cyclical volatility was getting out of hand. We continue to favor areas exposed to investment spending in resources, industry, and infrastructure, in particular Information Technology, automation, engineering services, and electrical equipment.
December 31, 2009 | William Blair Funds 3 |

W. George Greig
INSTITUTIONAL INTERNATIONAL GROWTH FUND
The Institutional International Growth Fund invests primarily in common stocks of foreign growth companies of all sizes.
AN OVERVIEW FROM THE PORTFOLIO MANAGER
Please see page 2 for the Global Markets Overview.
The Institutional International Growth Fund posted a 42.83% increase for the 12 months ended December 31, 2009. By comparison, the Fund’s benchmark, the MSCI All Country World Ex-U.S. IMI Index (net), gained 43.60%.
The Fund outpaced the Index during the fourth quarter but slightly trailed it for the year. Fourth quarter performance was bolstered by strong stock selection in Consumer Staples, Consumer Discretionary, Healthcare and Industrials, in addition to good performance in Developed Asian and emerging markets holdings. Also adding to results was the Fund’s overall regional positioning, although sector positioning and European stock selection detracted from results. During 2009, stock selection was strong across most sectors. A number of the areas of underperformance during 2008 were strong contributors to results during 2009, as was general regional positioning. In particular, Consumer Staples stock selection was strong, augmented by performance in agriculture related companies, coupled with strong results in consumer products holdings. Energy stock selection was also a significant driver of absolute and relative results, given strong performance in a number of the Fund’s energy services and high production growth exploration and production companies. Information Technology stock selection added value due to the weighting and performance of U.K. stocks, coupled with performance in emerging markets technology companies. The key detractors from 2009 relative performance were the quality bias of the Fund in mid-year, coupled with overall sector positioning. Specifically, the Fund’s underweighting in Materials, particularly in mining, was a key detractor from overall results, as Materials was the strongest performing sector during the year.
Portfolio structure changed significantly during 2009 as the Fund moved from a more defensive structure, to one with more exposure to global growth. As of year end the Fund maintained its focus in Consumer Staples and Consumer Discretionary stocks, totaling 25.3%, with a tilt towards Consumer Discretionary, which at 15.4% of the Fund, was above the 9.2% Index weighting. We reduced exposure in Consumer Discretionary from September 30, however, from 19.7%, largely in Japan and Europe, although we also reduced to exposure Emerging Asian Discretionary on valuation concerns. Financials was also marginally reduced from 18.5% of the Fund to 16.8% and remained underweighted versus the 25.9% Index weighting, largely through reductions in developed markets. Energy and Materials exposure increased to 11.1% and 10.2%, respectively, although Materials remained underweighted versus the Index, particularly in Mining holdings. We also increased Healthcare from 5.7% to 7.1%, as this sector underperformed significantly in 2009 and fundamentals appeared sound. Regionally, the Fund remained underweighted in developed Asia and Europe Ex-U.K. in favor of emerging markets and the U.K. Emerging markets, which represented 26.0% of the Fund as of September 30 increased to 29.3%, due both to market appreciation, coupled with additional exposure in Asian and Emerging Markets Europe, Mid-East and Africa (EMEA) and Latin America.
4 Annual Report | December 31, 2009 |
Institutional International Growth Fund
Performance Highlights (unaudited)
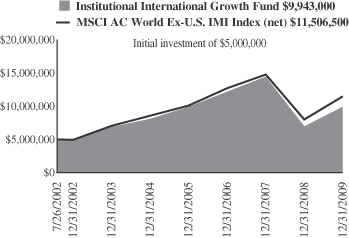
Average Annual Total Return at 12/31/2009
| | | | | | | | | | | | |
| | | 1
Year | | | 3
Year | | | 5
Year | | | Since
Inception | |
Institutional International Growth Fund | | 42.83 | % | | (6.68 | )% | | 4.25 | % | | 9.66 | % |
MSCI All Country
World Ex-U.S.
IMI (net) | | 43.60 | | | (3.43 | ) | | 6.04 | | | 11.82 | |
Performance cited represents past performance. Past performance does not guarantee future results and current performance may be lower or higher than the data quoted. Results shown are average annual returns, which assume reinvestment of dividends and capital gains. Investment returns and principal will fluctuate and you may have a gain or loss when you sell shares. For the most current month-end performance information, please call 1-800-742-7272, or visit our Web site at www.williamblairfunds.com. International investing involves special risk considerations, including currency fluctuations, lower liquidity, economic and political risk.
The performance highlights and graph presented above do not reflect the deduction of taxes that a shareholder would pay on fund distributions or the redemption of fund shares.
The Morgan Stanley Capital International (MSCI) All Country World Ex-U.S. Investable Market Index (IMI) (net) is a free float-adjusted market capitalization weighted index that is designed to measure the equity market performance of developed and emerging markets, excluding the United States. This series approximates the minimum possible dividend reinvestment.
This report identifies the Fund’s investments on December 31, 2009. These holdings are subject to change. Not all stocks in the Fund performed the same, nor is there any guarantee that these stocks will perform as well in the future. Market forecasts provided in this report may not necessarily come to pass.
Sector Diversification (unaudited)
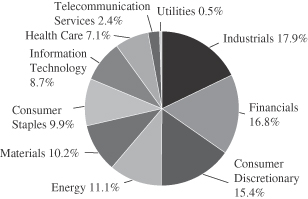
The sector diversification shown is based on the total long-term securities.
December 31, 2009 | William Blair Funds 5 |
Institutional International Growth Fund
Portfolio of Investments, December 31, 2009 (all dollar amounts in thousands)
| | | | | |
Issuer | | Shares | | Value |
| | |
Common Stocks—Europe—23.4% | | | | | |
Belgium—1.9% | | | | | |
Anheuser-Busch InBev S.A. NV (Beverages) | | 350,826 | | $ | 18,161 |
Colruyt S.A. (Food & staples retailing) | | 33,653 | | | 8,119 |
| | | | | |
| | | | | 26,280 |
| | | | | |
Denmark—1.0% | | | | | |
Novo-Nordisk A/S (Pharmaceuticals) | | 121,325 | | | 7,746 |
Novozymes A/S (Chemicals) | | 36,184 | | | 3,764 |
SimCorp A/S (Software) | | 13,397 | | | 2,513 |
| | | | | |
| | | | | 14,023 |
| | | | | |
Finland—0.3% | | | | | |
F-Secure Corporation OYJ (Software) | | 469,261 | | | 1,838 |
Kone OYJ (Machinery) | | 26,631 | | | 1,141 |
Nokian Renkaat OYJ (Auto components) | | 65,058 | | | 1,578 |
| | | | | |
| | | | | 4,557 |
| | | | | |
France—6.5% | | | | | |
Alstom S.A. (Electrical equipment) | | 189,714 | | | 13,268 |
April Group S.A. (Insurance) | | 115,041 | | | 3,988 |
bioMerieux S.A. (Health care equipment & supplies) | | 27,399 | | | 3,201 |
EDF Energies Nouvelles S.A. (Independent power producers & energy traders) | | 122,705 | | | 6,329 |
Essilor International (Health care equipment & supplies) | | 189,507 | | | 11,335 |
*Gemalto NV (Computers & peripherals) | | 47,128 | | | 2,050 |
Hermes International S.C.A. (Textiles, apparel & luxury goods) | | 48,822 | | | 6,499 |
L’ Air Liquide S.A. (Chemicals) | | 173,219 | | | 20,600 |
Orpea (Health care providers & services) | | 59,996 | | | 2,715 |
Schneider Electric S.A. (Electrical equipment) | | 84,178 | | | 9,787 |
Vinci S.A. (Construction & engineering) | | 166,172 | | | 9,351 |
| | | | | |
| | | | | 89,123 |
| | | | | |
Germany—2.0% | | | | | |
BASF Group (Chemicals) | | 292,493 | | | 18,103 |
MAN SE (Machinery) | | 115,657 | | | 8,974 |
| | | | | |
| | | | | 27,077 |
| | | | | |
Ireland—0.3% | | | | | |
Paddy Power plc (Hotels, restaurants & leisure) | | 117,020 | | | 4,136 |
| | | | | |
Italy—0.5% | | | | | |
Ansaldo STS SpA (Transportation infrastructure) | | 173,939 | | | 3,315 |
Diasorin SpA (Health care equipment & supplies) | | 86,714 | | | 3,082 |
| | | | | |
| | | | | 6,397 |
| | | | | |
Netherlands—0.2% | | | | | |
BinckBank N.V. (Capital markets) | | 128,278 | | | 2,298 |
| | | | | |
Norway—1.1% | | | | | |
*Norwegian Air Shuttle ASA (Airlines) | | 60,433 | | | 1,195 |
Opera Software ASA (Internet software & services) | | 425,119 | | | 1,467 |
Statoil ASA (Oil, gas & consumable fuels) | | 527,800 | | | 13,163 |
| | | | | |
| | | | | 15,825 |
| | | | | |
| | | | | |
Issuer | | Shares | | Value |
|
Common Stocks—Europe—23.4%—(Continued) |
Portugal—0.7% | | | | | |
Jeronimo Martins SGPS S.A. (Food & staples retailing) | | 923,686 | | $ | 9,238 |
| | | | | |
Spain—2.4% | | | | | |
Banco Santander, S.A. (Commercial banks) | | 821,117 | | | 13,569 |
Tecnicas Reunidas S.A. (Energy equipment & services) | | 96,106 | | | 5,527 |
Telefonica, S.A. (Diversified telecommunication services) | | 476,090 | | | 13,325 |
| | | | | |
| | | | | 32,421 |
| | | | | |
Sweden—0.4% | | | | | |
Hennes & Maurtiz AB, Class “B” (Specialty retail) | | 105,055 | | | 5,824 |
| | | | | |
Switzerland—6.1% | | | | | |
*ABB Ltd. (Electrical equipment) | | 480,201 | | | 9,253 |
*Actelion, Ltd. (Biotechnology) | | 116,753 | | | 6,236 |
Credit Suisse Group AG (Capital markets) | | 246,920 | | | 12,233 |
Kuehne & Nagel International AG (Marine) | | 58,239 | | | 5,663 |
Novartis AG (Pharmaceuticals) | | 320,978 | | | 17,528 |
*Orascom Development (Hotels, restaurants & leisure) | | 25,491 | | | 1,796 |
Partners Group Global Opportunities, Ltd. (Capital markets) | | 66,230 | | | 8,351 |
SGS S.A. (Professional services) | | 7,660 | | | 10,000 |
Sika AG (Chemicals) | | 2,466 | | | 3,834 |
Sonova Holding AG (Health care equipment & supplies) | | 58,503 | | | 7,088 |
*Temenos Group AG (Software) | | 104,704 | | | 2,698 |
| | | | | |
| | | | | 84,680 |
| | | | | |
| | |
United Kingdom—19.8% | | | | | |
Aberdeen Asset Management plc (Capital markets) | | 1,088,631 | | | 2,339 |
Admiral Group plc (Insurance) | | 264,912 | | | 5,065 |
Aggreko plc (Commercial services & supplies) | | 238,476 | | | 3,560 |
AMEC plc (Energy equipment & services) | | 641,303 | | | 8,171 |
Amlin plc (Insurance) | | 904,834 | | | 5,225 |
Antofagasta plc (Metals & mining) | | 842,255 | | | 13,398 |
Ashmore Group plc (Capital markets) | | 718,666 | | | 3,145 |
*ASOS plc (Internet & catalog retail) | | 334,394 | | | 2,627 |
*Autonomy Corporation plc (Software) | | 449,671 | | | 10,920 |
AVEVA Group plc (Software) | | 96,228 | | | 1,565 |
Barclays plc (Commercial banks) | | 3,001,808 | | | 13,227 |
Bellway plc (Household durables) | | 203,951 | | | 2,688 |
*The Berkeley Group Holdings plc (Household durables) | | 247,155 | | | 3,260 |
BG Group plc (Oil, gas & consumable fuels) | | 767,783 | | | 13,863 |
BHP Billiton Limited (Metals & mining) | | 446,775 | | | 14,243 |
*Blinkx plc (Internet software & services) | | 2,374,700 | | | 643 |
BlueBay Asset Management plc (Capital markets) | | 607,522 | | | 2,957 |
British Sky Broadcasting Group plc (Media) | | 1,441,020 | | | 13,016 |
Britvic plc (Beverages) | | 549,554 | | | 3,604 |
Capita Group plc (Professional services) | | 533,428 | | | 6,450 |
Chemring Group plc (Aerospace & defense) | | 113,138 | | | 5,341 |
See accompanying Notes to Financial Statements.
6 Annual Report | December 31, 2009 |
Institutional International Growth Fund
Portfolio of Investments, December 31, 2009 (all dollar amounts in thousands)
| | | | | |
Issuer | | Shares | | Value |
|
Common Stocks—United Kingdom—19.8%—(Continued) |
*Climate Exchange plc (Diversified financial services) | | 179,980 | | $ | 1,841 |
*Dana Petroleum plc (Oil, gas & consumable fuels) | | 183,614 | | | 3,474 |
Experian plc (Professional services) | | 743,003 | | | 7,339 |
*Heritage Oil plc (Oil, gas, & consumable fuels) | | 573,262 | | | 4,022 |
Michael Page International plc (Professional services) | | 597,538 | | | 3,638 |
Mothercare plc (Multiline retail) | | 231,229 | | | 2,538 |
NEXT plc (Multiline retail) | | 428,254 | | | 14,319 |
Petrofac Limited (Energy equipment & services) | | 445,231 | | | 7,453 |
Reckitt Benckiser plc (Household products) | | 262,566 | | | 14,213 |
Rightmove plc (Media) | | 219,516 | | | 1,783 |
*Rolls-Royce Group plc (Aerospace & defense) | | 1,526,779 | | | 11,890 |
Rotork plc (Electronic equipment & instruments) | | 425,990 | | | 8,140 |
RPS Group plc (Commercial services & supplies) | | 1,187,908 | | | 4,153 |
Serco Group plc (Commercial services & supplies) | | 748,294 | | | 6,382 |
Standard Chartered plc (Commercial banks) | | 792,719 | | | 20,013 |
*Telecity Group plc (Internet software & services) | | 231,427 | | | 1,426 |
Ultra Electronic Holdings plc (Aerospace & defense) | | 180,123 | | | 3,981 |
Vedanta Resources plc (Metals & mining) | | 248,601 | | | 10,398 |
VT Group plc (Aerospace & defense) | | 694,381 | | | 5,796 |
The Weir Group plc (Machinery) | | 356,129 | | | 4,107 |
| | | | | |
| | | | | 272,213 |
| | | | | |
| | |
Emerging Asia—18.3% | | | | | |
China—4.8% | | | | | |
China High Speed Transmission (Electrical equipment) | | 1,952,000 | | | 4,739 |
China Railway Construction Corporation Limited (Construction & engineering) | | 2,030,000 | | | 2,587 |
China Shenhua Energy Company Limited (Oil, gas, & consumable fuels) | | 1,323,000 | | | 6,422 |
*China Zhongwang Holdings Limited (Metals & mining) | | 5,022,400 | | | 4,001 |
CNOOC Limited (Oil, gas & consumable fuels) | | 5,861,000 | | | 9,131 |
Dongfeng Motor Group Company Limited (Automobiles) | | 8,422,000 | | | 12,026 |
Geely Automobile Holdings Limited (Automobiles) | | 4,770,000 | | | 2,603 |
Hengan International Group Co., Ltd. (Personal products) | | 844,000 | | | 6,249 |
Industrial and Commercial Bank of China (Commercial banks) | | 16,239,000 | | | 13,374 |
Minth Group, Ltd. (Auto components) | | 1,572,000 | | | 2,308 |
Shandong Weigao Group Medical Polymer Company, Ltd. (Health care equipment & supplies) | | 632,000 | | | 2,106 |
| | | | | |
| | | | | 65,546 |
| | | | | |
| | | | | |
Issuer | | Shares | | Value |
|
Common Stocks—Emerging Asia—18.3%—(Continued) |
India—5.3% | | | | | |
Bharat Heavy Electricals, Ltd. (Electrical equipment) | | 256,586 | | $ | 13,209 |
Hero Honda Motors Limited (Automobiles) | | 271,560 | | | 9,988 |
Housing Development Finance Corp. (Thrifts & mortgage finance) | | 114,368 | | | 6,544 |
India Infoline Limited (Capital markets) | | 466,384 | | | 1,283 |
Infosys Technologies Limited (IT services) | | 246,980 | | | 13,746 |
Jindal Steel & Power Limited (Metals & mining) | | 540,036 | | | 8,124 |
Larsen & Toubro, Ltd. (Construction & engineering) | | 189,832 | | | 6,835 |
Lupin Limited (Pharmaceuticals) | | 83,908 | | | 2,651 |
Reliance Industries Limited (Oil, gas, & consumable fuels) | | 461,415 | | | 10,781 |
| | | | | |
| | | | | 73,161 |
| | | | | |
Indonesia—2.4% | | | | | |
PT Astra International Tbk (Automobiles) | | 2,737,500 | | | 10,064 |
PT Bank Rakyat Indonesia (Commercial banks) | | 12,063,000 | | | 9,695 |
PT London Sumatra Indonesia (Food products) | | 3,384,000 | | | 2,980 |
PT Telekomunikasi Indonesia Tbk (Diversified telecommunication services) | | 1,943,500 | | | 1,935 |
PT United Tractors Tbk (Machinery) | | 5,337,000 | | | 8,740 |
| | | | | |
| | | | | 33,414 |
| | | | | |
Malaysia—0.9% | | | | | |
CIMB Group Holdings Berhad (Commercial banks) | | 1,392,200 | | | 5,210 |
IOI Corporation Berhad (Food products) | | 2,531,413 | | | 4,031 |
Kuala Lampur Kepg (Food products) | | 579,500 | | | 2,787 |
| | | | | |
| | | | | 12,028 |
| | | | | |
Papua New Guinea—0.3% | | | | | |
Oil Search Limited (Oil, gas, & consumable fuels) | | 672,070 | | | 3,685 |
| | | | | |
South Korea—2.2% | | | | | |
*Amorepacific Corporation (Personal products) | | 4,885 | | | 3,917 |
*Hyundai Mobis (Auto components) | | 34,435 | | | 5,046 |
*Hyundai Motor Company (Automobiles) | | 72,489 | | | 7,503 |
*LG Household & Health Care, Ltd. (Household products) | | 34,681 | | | 8,677 |
*MegaStudy Co., Ltd. (Diversified consumer services) | | 24,718 | | | 5,081 |
| | | | | |
| | | | | 30,224 |
| | | | | |
Taiwan—2.2% | | | | | |
MediaTek Inc. (Semiconductors & semiconductor equipment) | | 326,000 | | | 5,664 |
Siliconware Precision Industries Co., Ltd. (Semiconductors & semiconductor equipment) | | 3,854,000 | | | 5,254 |
See accompanying Notes to Financial Statements.
December 31, 2009 | William Blair Funds 7 |
Institutional International Growth Fund
Portfolio of Investments, December 31, 2009 (all dollar amounts in thousands)
| | | | | |
Issuer | | Shares | | Value |
|
Common Stocks—Emerging Asia—18.3%—(Continued) |
Taiwan Semiconductor Manufacturing Company Ltd. (Semiconductors & semiconductor equipment) | | 7,136,000 | | $ | 14,382 |
Yuanta Financial Holding Co., Ltd. (Capital markets) | | 6,443,000 | | | 4,714 |
| | | | | |
| | | | | 30,014 |
| | | | | |
Thailand—0.2% | | | | | |
CP ALL PCL (Food & staples retailing) | | 3,638,200 | | | 2,706 |
| | | | | |
| | |
Japan—10.7% | | | | | |
Canon, Inc. (Office electronics) | | 343,000 | | | 14,591 |
Daikin Industries, Ltd. (Building products) | | 269,800 | | | 10,656 |
Fanuc, Ltd. (Machinery) | | 94,900 | | | 8,845 |
Gree, Inc. (Internet software & services) | | 47,800 | | | 2,955 |
Honda Motor Company, Ltd. (Automobiles) | | 322,200 | | | 10,932 |
Hoya Corporation (Electronic equipment, instruments & components) | | 251,000 | | | 6,697 |
Jupiter Telecommunications Co., Ltd. (Media) | | 8,065 | | | 7,981 |
kabu.com Securities Co., Ltd. (Capital markets) | | 1,461 | | | 1,411 |
Kakaku.com, Inc. (Internet software & services) | | 545 | | | 2,119 |
Keyence Corporation (Electronic equipment, instruments & components) | | 43,500 | | | 9,028 |
Komatsu, Ltd. (Machinery) | | 511,000 | | | 10,697 |
K’s Holdings Corporation (Specialty retail) | | 96,000 | | | 2,882 |
Kurita Water Industries, Ltd. (Machinery) | | 185,900 | | | 5,841 |
Miraca Holdings, Inc. (Health care equipment & supplies) | | 61,600 | | | 1,695 |
Misumi Group, Inc. (Trading companies & distributors) | | 137,100 | | | 2,347 |
Nitori Company, Ltd. (Specialty retail) | | 59,280 | | | 4,412 |
Park24 Co., Ltd. (Commercial services & supplies) | | 178,100 | | | 1,894 |
Point, Inc. (Specialty retail) | | 82,530 | | | 4,611 |
Softbank Corp. (Wireless telecommunication services) | | 731,400 | | | 17,146 |
Start Today Co., Ltd. (Internet & catalog retail) | | 1,236 | | | 2,262 |
Terumo Corporation (Health care equipment & supplies) | | 146,300 | | | 8,817 |
Unicharm Petcare (Food products) | | 53,100 | | | 1,622 |
USS Co., Ltd. (Specialty retail) | | 2,010 | | | 123 |
YAHOO! Japan Corporation (Internet software & services) | | 24,786 | | | 7,452 |
| | | | | |
| | | | | 147,016 |
| | | | | |
| | |
Asia—7.6% | | | | | |
Australia—4.0% | | | | | |
BHP Billiton Limited—ADR (Metals & mining) | | 460,840 | | | 17,635 |
Energy Resources of Australia Limited (Oil, gas & consumable fuels) | | 139,897 | | | 2,985 |
JB Hi-Fi Limited (Specialty retail) | | 215,704 | | | 4,354 |
QBE Insurance Group Limited (Insurance) | | 763,128 | | | 17,415 |
SEEK Limited (Professional services) | | 118,323 | | | 731 |
WorleyParsons Limited (Energy equipment & services) | | 456,175 | | | 11,845 |
| | | | | |
| | | | | 54,965 |
| | | | | |
| | | | | |
Issuer | | Shares | | Value |
|
Common Stocks—Asia—7.6%—(Continued) |
Hong Kong—2.1% | | | | | |
Li & Fung, Ltd. (Distributors) | | 3,756,000 | | $ | 15,529 |
Noble Group Limited (Trading companies & distributors) | | 5,968,560 | | | 13,690 |
| | | | | |
| | | | | 29,219 |
| | | | | |
Singapore—1.5% | | | | | |
Capitaland, Ltd. (Real estate management & development) | | 2,281,000 | | | 6,767 |
*CapitaMalls Asia Limited (Real estate management & development) | | 2,182,000 | | | 3,945 |
Olam International, Ltd. (Food & staples retailing) | | 2,185,400 | | | 4,106 |
Wilmar International, Ltd. (Food products) | | 1,337,000 | | | 6,079 |
| | | | | |
| | | | | 20,897 |
| | | | | |
| | |
Emerging Latin America—5.7% | | | | | |
Brazil—4.3% | | | | | |
BM&F Bovespa S.A. (Diversified financial services) | | 766,500 | | | 5,393 |
Cyrela Brazil Realty S.A. (Household durables) | | 149,700 | | | 2,107 |
Diagnosticos da America S.A. (Health care providers & services) | | 73,700 | | | 2,412 |
*GP Investments, Ltd. (Capital markets) | | 720,500 | | | 4,221 |
*Hypermarcas S.A. (Personal products) | | 235,758 | | | 5,417 |
Localiza Rent a Car S.A. (Road & rail) | | 429,500 | | | 4,766 |
Lojas Renner S.A. (Multiline retail) | | 183,800 | | | 4,149 |
MRV Engenharia e participacoes, S.A. (Household durables) | | 337,179 | | | 2,731 |
Natura Cosmeticos S.A. (Personal products) | | 467,500 | | | 9,750 |
*OGX Petroleo e Gas Participacoes S.A. (Oil, gas, & consumable fuels) | | 505,400 | | | 4,964 |
PDG Realty S.A. Empreendimentos e Participacoes (Household durables) | | 177,400 | | | 1,768 |
Petroleo Brasileiro S.A. (Oil, gas & consumable fuels) | | 392,287 | | | 9,385 |
SLC Agricola S.A. (Food products) | | 196,800 | | | 1,842 |
| | | | | |
| | | | | 58,905 |
| | | | | |
Chile—0.0% | | | | | |
Banco Santander Chile—GDR (Commercial Banks) | | 5,241 | | | 340 |
| | | | | |
Mexico—0.8% | | | | | |
Banco Compartamos S.A. de C.V. (Consumer finance) | | 544,800 | | | 2,812 |
*Megacable Holdings S.A.B. de C.V. (Media) | | 517,700 | | | 1,092 |
Wal-Mart de Mexico S.A.B. de C.V. (Food & staples retailing) | | 1,545,800 | | | 6,889 |
| | | | | |
| | | | | 10,793 |
| | | | | |
Panama—0.2% | | | | | |
Copa Holdings, S.A. (Airlines)† | | 54,780 | | | 2,984 |
| | | | | |
Peru—0.4% | | | | | |
Credicorp, Ltd. (Commercial banks)† | | 77,308 | | | 5,954 |
| | | | | |
See accompanying Notes to Financial Statements.
8 Annual Report | December 31, 2009 |
Institutional International Growth Fund
Portfolio of Investments, December 31, 2009 (all dollar amounts in thousands)
| | | | | |
Issuer | | Shares | | Value |
| | |
Canada—5.5% | | | | | |
Brookfield Asset Management, Inc., Class “A” (Real estate management & development)† | | 486,962 | | $ | 10,801 |
Canadian Western Bank (Commercial banks) | | 76,700 | | | 1,609 |
*Consolidated Thompson (Metals & mining) | | 385,656 | | | 2,493 |
Crescent Point Energy Corp. (Oil, gas & consumable fuels) | | 257,713 | | | 9,731 |
First Quantum Minerals Ltd. (Metals & mining) | | 136,472 | | | 10,473 |
Niko Resources Ltd. (Oil, gas, & consumable fuels) | | 91,828 | | | 8,640 |
*Pacific Rubiales Energy Corporation (Oil, gas & consumable fuels) | | 451,767 | | | 6,674 |
PetroBakken Energy Ltd. (Oil, gas & consumable fuels) | | 212,219 | | | 6,560 |
Royal Bank of Canada (Commercial banks) | | 200,371 | | | 10,805 |
Tim Hortons, Inc. (Hotels, restaurants & leisure) | | 278,874 | | | 8,567 |
| | | | | |
| | | | | 76,353 |
| | | | | |
| |
Emerging Europe, Mid-East, Africa—5.3% | | | |
Israel—1.4% | | | | | |
Israel Chemicals Limited (Chemicals) | | 573,211 | | | 7,527 |
Teva Pharmaceutical Industries, Ltd.—ADR (Pharmaceuticals) | | 207,861 | | | 11,678 |
| | | | | |
| | | | | 19,205 |
| | | | | |
Egypt—0.1% | | | | | |
Egyptian Financial Group—Hermes Holding S.A.E. (Capital markets) | | 435,370 | | | 1,982 |
| | | | | |
South Africa—2.8% | | | | | |
*Aspen Pharmacare Holdings Limited (Pharmaceuticals) | | 642,928 | | | 6,401 |
Naspers Limited (Media) | | 403,200 | | | 16,318 |
Shoprite Holdings Limited (Food & staples retailing) | | 510,747 | | | 4,491 |
Standard Bank Group Limited (Commercial banks) | | 517,277 | | | 7,105 |
Wilson Bayly Holmes-Ovcon Limited (Construction & engineering) | | 266,560 | | | 3,873 |
| | | | | |
| | | | | 38,188 |
| | | | | |
Turkey—1.0% | | | | | |
Bim Birlesik Magazalar A.S. (Food & staples retailing) | | 138,715 | | | 6,451 |
Turkiye Garanti Bankasi A.S. (Commercial banks) | | 1,575,104 | | | 6,710 |
| | | | | |
| | | | | 13,161 |
| | | | | |
United Arab Emirates—0.0% | | | | | |
First Gulf Bank PJSC (Commercial banks) | | 80,000 | | | 349 |
| | | | | |
Total Common Stocks—96.3%
(cost $1,053,770) | | | 1,325,181 |
| | | | | |
| | | | | | | |
Issuer | | Shares or
Principal
Amount | | Value | |
| | |
Convertible Bond | | | | | | | |
Brazil—0.0% | | | | | | | |
Lupatech S.A., 6.500%, due 4/15/18 (Machinery)** | | $ | 941 | | $ | 582 | |
| | | | | | | |
Total Convertible Bond—0.0%
(cost $492) | | | 582 | |
| | | | | | | |
| | |
Investment in Affiliate | | | | | | | |
William Blair Ready Reserves Fund | | | 4,535,454 | | | 4,535 | |
| | | | | | | |
Total Investment in Affiliate—0.3%
(cost $4,535) | | | 4,535 | |
| | | | | | | |
| | |
Short-Term Investment | | | | | | | |
American Express Credit Corp. Demand Note, VRN 0.081%, due 1/4/10 | | $ | 1,000 | | | 1,000 | |
| | | | | | | |
Total Short-Term Investment—0.1%
(cost $1,000) | | | 1,000 | |
| | | | | | | |
| | |
Repurchase Agreement | | | | | | | |
Fixed Income Clearing Corporation, 0.000% dated 12/31/09, due 1/4/10, repurchase price $58,606, collateralized by FNMA, 5.000% due 2/13/17 | | $ | 58,606 | | | 58,606 | |
| | | | | | | |
Total Repurchase Agreement—4.3%
(cost $58,606) | | | 58,606 | |
| | | | | | | |
Total Investments—101.0%
(cost $1,118,403) | | | 1,389,904 | |
Liabilities, plus cash and other assets—(1.0)% | | | (14,056 | ) |
| | | | | | | |
Net assets—100.0% | | $ | 1,375,848 | |
| | | | | | | |
*Non-income producing securities
† = U.S. listed foreign security
ADR = American Depository Receipt
GDR = Global Depository Receipt
VRN = Variable Rate Note
**Fair valued pursuant to Valuation Procedures adopted by the Board of Trustees. This holding represents 0.04% of the net assets of the Fund at December 31, 2009. This security was also deemed illiquid pursuant to the Fund/Advisor’s Liquidity Procedures.
For securities primarily traded on exchanges or markets that close before the close of regular trading on the New York Stock Exchange, the Fund uses an independent pricing service on a daily basis to fair value price the securities pursuant to Valuation Procedures approved by the Board of Trustees.
See accompanying Notes to Financial Statements.
December 31, 2009 | William Blair Funds 9 |
Institutional International Growth Fund
Portfolio of Investments, December 31, 2009 (all dollar amounts in thousands)
At December 31, 2009, the Fund’s Portfolio of Investments includes the following industry categories:
| | |
Industrials | | 17.9% |
Financials | | 16.8% |
Consumer Discretionary | | 15.4% |
Energy | | 11.1% |
Materials | | 10.2% |
Consumer Staples | | 9.9% |
Information Technology | | 8.7% |
Health Care | | 7.1% |
Telecommunication Services | | 2.4% |
Utilities | | 0.5% |
| | |
Total | | 100.0% |
| | |
At December 31, 2009, the Fund’s Portfolio of Investments includes the following currency categories:
| | |
British Pound Sterling | | 20.5% |
Euro | | 15.2% |
Japanese Yen | | 11.1% |
Swiss Franc | | 6.4% |
Hong Kong Dollar | | 6.1% |
Indian Rupee | | 5.5% |
Canadian Dollar | | 4.9% |
Brazilian Real | | 4.5% |
Australian Dollar | | 4.4% |
South African Rand | | 2.9% |
Singapore Dollar | | 2.6% |
Indonesian Rupiah | | 2.5% |
United States Dollar | | 2.4% |
South Korean Won | | 2.3% |
New Taiwan Dollar | | 2.3% |
Norwegian Krone | | 1.2% |
Danish Krone | | 1.1% |
Turkish Lira | | 1.0% |
All Other Currencies | | 3.1% |
| | |
Total | | 100.0% |
| | |
See accompanying Notes to Financial Statements.
10 Annual Report | December 31, 2009 |
W. George Greig

David Merjan
INSTITUTIONAL INTERNATIONAL EQUITY FUND
The Institutional International Equity Fund invests primarily in common stocks of companies included in the Morgan Stanley Capital International All Country World Ex-U.S. IMI Index (net).
AN OVERVIEW FROM THE PORTFOLIO MANAGERS
Please see page 2 for the Global Markets Overview.
The Institutional International Equity Fund posted a 33.27% increase for the 12 months ended December 31, 2009. By comparison, the Fund’s benchmark, the MSCI All Country World Ex-U.S. IMI Index (net) (the ‘Index’), gained 43.60%.
The Fund outpaced the Index during the first and fourth quarters but lagged for the year. Fourth quarter performance was bolstered by strong stock selection in Consumer Discretionary, Energy, Industrials and Telecommunication Services in addition to good performance in Developed and emerging Asian and Emerging Markets, Europe, Mid-East and Africa (EMEA) holdings. The key detractors from 2009 relative performance were the quality bias of the Fund in mid-year, coupled with a more conservative sector positioning during the initial stages of the rally. Specifically, the Fund’s underweighting in Materials and Financials and overweighting in Healthcare detracted over 6% in relative performance during the period. Augmenting performance was strong Energy, Healthcare, Materials and Telecommunication stock selection. In particular, the Fund’s Energy stocks outperformed the Index by over 35% during the year with strong performance in a number of the Fund’s energy services and high production growth exploration and production companies. Developed European and Japanese Healthcare stocks performed well, while the Fund’s mining names bolstered results.
As of year end the Fund maintained its focus in Industrials and Information Technology at 20.6% and 12.9% of the Fund, respectively, and these sectors were the most overweighted versus the Index. While absolute exposure was reduced throughout the year to 8.8%, Healthcare remained overweighted versus the broad Index at year end. Exposure to Financials totaled 18.9%, down marginally from September 30 through a reduction in developed markets exposure, although this weighting remained well below the Index, as it did throughout the year. Materials holdings totaled 5.1% at year end, well below the 11.1% weighting in the Index. Regionally, the Fund remained underweighted in Developed Asia and Canada in favor of the U.K. Emerging markets approximated the benchmark at approximately 20.8% of the Fund, with a tilt towards Emerging Asia.
December 31, 2009 | William Blair Funds 11 |
Institutional International Equity Fund
Performance Highlights (unaudited)
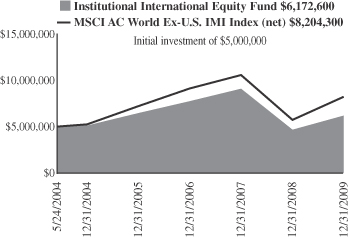
Average Annual Total Return at 12/31/2009
| | | | | | | | | |
| | | 1
Year | | | 3
Year | | | Since
Inception | |
Institutional International Equity Fund | | 33.27 | % | | (7.34 | )% | | 2.84 | % |
MSCI All Country World
Ex-U.S. IMI (net) | | 43.60 | | | (3.43 | ) | | 6.71 | |
Performance cited represents past performance. Past performance does not guarantee future results and current performance may be lower or higher than the data quoted. Results shown are average annual returns, which assume reinvestment of dividends and capital gains. Investment returns and principal will fluctuate and you may have a gain or loss when you sell shares. For the most current month-end performance information, please call 1-800-742-7272, or visit our Web site at www.williamblairfunds.com. From time to time, the investment advisor may waive fees or reimburse expenses for the Fund. Without these waivers, performance would be lower. International investing involves special risk considerations, including currency fluctuations, lower liquidity, economic and political risk.
The performance highlights and graph presented above do not reflect the deduction of taxes that a shareholder would pay on fund distributions or the redemption of fund shares.
The Morgan Stanley Capital International (MSCI) All Country World Ex-U.S. Investable Market Index (IMI) (net) is a free float-adjusted market capitalization weighted index that is designed to measure the equity market performance of developed and emerging markets, excluding the United States. This series approximates the minimum possible dividend reinvestment.
This report identifies the Fund’s investments on December 31, 2009. These holdings are subject to change. Not all stocks in the Fund performed the same, nor is there any guarantee that these stocks will perform as well in the future. Market forecasts provided in this report may not necessarily come to pass.
Sector Diversification (unaudited)
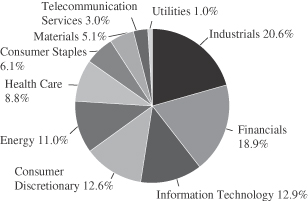
The sector diversification shown is based on the total long-term securities.
12 Annual Report | December 31, 2009 |
Institutional International Equity Fund
Portfolio of Investments, December 31, 2009 (all dollar amounts in thousands)
| | | | | |
Issuer | | Shares | | Value |
| | |
Common Stocks—Europe—31.1% | | | | | |
Belgium—2.5% | | | | | |
Anheuser-Busch Inbev S.A. NV (Beverages) | | 175,762 | | $ | 9,099 |
| | | | | |
Denmark—1.3% | | | | | |
Novo-Nordisk A/S (Pharmaceuticals) | | 74,057 | | | 4,728 |
| | | | | |
France—6.1% | | | | | |
Alstom S.A. (Electrical equipment) | | 75,069 | | | 5,250 |
AXA (Insurance) | | 137,989 | | | 3,240 |
Iliad S.A. (Diversified telecommunication services) | | 31,726 | | | 3,791 |
Schneider Electric S.A. (Electrical equipment) | | 43,197 | | | 5,023 |
Vinci S.A. (Construction & engineering) | | 87,103 | | | 4,901 |
| | | | | |
| | | | | 22,205 |
| | | | | |
Germany—3.4% | | | | | |
E. ON AG (Electric utilities) | | 85,368 | | | 3,583 |
MAN SE (Machinery) | | 50,806 | | | 3,942 |
SAP AG (Software) | | 103,624 | | | 4,940 |
| | | | | |
| | | | | 12,465 |
| | | | | |
Ireland—2.5% | | | | | |
CRH plc (Materials) | | 181,791 | | | 4,943 |
*Ryanair Holdings plc—ADR (Airlines) | | 163,141 | | | 4,375 |
| | | | | |
| | | | | 9,318 |
| | | | | |
Italy—1.7% | | | | | |
Saipem SpA (Energy equipment & services) | | 175,990 | | | 6,074 |
| | | | | |
Netherlands—1.0% | | | | | |
*Qiagen N.V. (Life sciences tools & services) | | 168,972 | | | 3,805 |
| | | | | |
Spain—4.9% | | | | | |
Banco Santander S.A. (Commercial banks) | | 328,601 | | | 5,430 |
Inditex Group (Specialty retail) | | 89,600 | | | 5,596 |
Telefonica, S.A. (Diversified telecommunication services) | | 241,780 | | | 6,767 |
| | | | | |
| | | | | 17,793 |
| | | | | |
Switzerland—7.7% | | | | | |
*ABB, Ltd. (Electrical equipment) | | 225,707 | | | 4,349 |
*Actelion, Ltd. (Biotechnology) | | 63,627 | | | 3,398 |
Credit Suisse Group AG (Capital markets) | | 144,106 | | | 7,139 |
Julius Baer Holding, Ltd. (Capital markets) | | 57,126 | | | 2,009 |
Roche Holdings AG (Pharmaceuticals) | | 31,761 | | | 5,432 |
Sonova Holding AG (Health care equipment & supplies) | | 17,004 | | | 2,060 |
Zurich Financial Services (Insurance) | | 16,822 | | | 3,678 |
| | | | | |
| | | | | 28,065 |
| | | | | |
| | |
United Kingdom—18.5% | | | | | |
AMEC plc (Energy equipment & services) | | 206,722 | | | 2,634 |
Amlin plc (Insurance) | | 319,583 | | | 1,845 |
*Autonomy Corporation plc (Software) | | 193,867 | | | 4,708 |
Barclays plc (Commercial banks) | | 923,366 | | | 4,069 |
BG Group plc (Oil, gas & consumable fuels) | | 393,089 | | | 7,098 |
British Sky Broadcasting Group plc (Media) | | 698,405 | | | 6,309 |
Capita Group plc (Professional services) | | 273,720 | | | 3,310 |
Experian plc (Professional services) | | 297,165 | | | 2,935 |
HSBC Holdings plc (Commercial banks) | | 312,074 | | | 3,550 |
Petrofac Limited (Energy equipment & services) | | 185,016 | | | 3,097 |
| | | | | |
Issuer | | Shares | | Value |
|
Common Stocks—United Kingdom—18.5%—(continued) |
Reckitt Benckiser plc (Household products) | | 122,935 | | $ | 6,655 |
*Rolls-Royce Group plc (Aerospace & defense) | | 731,272 | | | 5,695 |
Rotork plc (Electronic equipment & instruments) | | 103,742 | | | 1,982 |
Standard Chartered plc (Commercial banks) | | 154,497 | | | 3,900 |
Tullow Oil plc (Oil, gas & consumable fuels) | | 203,826 | | | 4,276 |
Vedanta Resources plc (Metals & mining) | | 131,927 | | | 5,518 |
| | | | | |
| | | | | 67,581 |
| | | | | |
| | |
Emerging Asia—13.7% | | | | | |
China—5.1% | | | | | |
China Life Insurance Co., Ltd. (Insurance) | | 895,000 | | | 4,379 |
China Overseas Land & Investment, Ltd. (Real estate management & development) | | 1,658,000 | | | 3,474 |
China Railway Construction Corporation Limited (Construction & engineering) | | 2,376,000 | | | 3,028 |
CNOOC Limited (Oil, gas & consumable fuels) | | 2,570,000 | | | 4,004 |
Li Ning Company Limited (Textiles, apparel & luxury goods) | | 1,007,000 | | | 3,818 |
| | | | | |
| | | | | 18,703 |
| | | | | |
India—4.0% | | | | | |
Bharat Heavy Electricals, Ltd. (Electrical equipment) | | 82,652 | | | 4,255 |
*Cairn India, Ltd. (Oil, gas & consumable fuels) | | 450,098 | | | 2,715 |
HDFC Bank, Ltd.—ADR (Commercial banks) | | 17,849 | | | 2,322 |
Infosys Technologies, Limited (IT services) | | 95,047 | | | 5,290 |
| | | | | |
| | | | | 14,582 |
| | | | | |
Indonesia—0.9% | | | | | |
PT Bank Rakyat Indonesia (Commercial banks) | | 4,021,000 | | | 3,232 |
| | | | | |
South Korea—1.7% | | | | | |
*Hyundai Motor Company (Automobiles) | | 60,867 | | | 6,300 |
| | | | | |
Taiwan—2.0% | | | | | |
MediaTek Inc. (Semiconductors & semiconductor equipment) | | 219,462 | | | 3,813 |
Taiwan Semiconductor, Ltd. (Semiconductors & semiconductor equipment) | | 1,688,809 | | | 3,404 |
| | | | | |
| | | | | 7,217 |
| | | | | |
| | |
Japan—12.6% | | | | | |
Canon Inc. (Office electronics) | | 128,300 | | | 5,458 |
Daikin Industries, Ltd. (Building product) | | 90,900 | | | 3,590 |
Fast Retailing Co., Ltd. (Specialty retail) | | 16,000 | | | 3,007 |
Honda Motor Co., Ltd. (Automobiles) | | 136,800 | | | 4,641 |
Hoya Corporation (Electronic equipment, instruments & components) | | 140,700 | | | 3,754 |
Jupiter Telecommunications Co., Ltd. (Media) | | 3,676 | | | 3,637 |
Keyence Corporation (Electronic equipment, instruments & components) | | 22,800 | | | 4,732 |
Kurita Water Industries, Ltd (Machinery) | | 152,300 | | | 4,785 |
Mitsubishi Corporation (Trading companies & distribution) | | 221,900 | | | 5,527 |
See accompanying Notes to Financial Statements.
December 31, 2009 | William Blair Funds 13 |
Institutional International Equity Fund
Portfolio of Investments, December 31, 2009 (all dollar amounts in thousands)
| | | | | |
Issuer | | Shares | | Value |
|
Common Stocks—Japan—12.6%—(continued) |
Nippon Electric Glass Co., Ltd. (Electronic equipment, instruments & components) | | 236,000 | | $ | 3,248 |
Terumo Corporation (Health care equipment & supplies) | | 60,600 | | | 3,652 |
| | | | | |
| | | | | 46,031 |
| | | | | |
| | |
Asia—7.0% | | | | | |
Australia—2.7% | | | | | |
BHP Billiton Limited—ADR (Metals & mining) | | 49,819 | | | 3,815 |
Woolworths Limited (Food & staples retailing) | | 116,111 | | | 2,912 |
WorleyParsons Limited (Energy equipment & services) | | 121,838 | | | 3,164 |
| | | | | |
| | | | | 9,891 |
| | | | | |
Hong Kong—2.6% | | | | | |
ASM Pacific Technology Limited (Semiconductors & semiconductor equipment) | | 195,300 | | | 1,847 |
Li & Fung, Ltd. (Distributors) | | 948,000 | | | 3,919 |
Noble Group Limited (Trading companies & distributors) | | 1,593,000 | | | 3,654 |
| | | | | |
| | | | | 9,420 |
| | | | | |
Singapore—1.7% | | | | | |
Capitaland, Ltd. (Real estate management & development) | | 1,462,000 | | | 4,337 |
Wilmar International, Ltd.—(Food products) | | 412,000 | | | 1,873 |
| | | | | |
| | | | | 6,210 |
| | | | | |
| | |
Canada—6.0% | | | | | |
Brookfield Asset Management, Inc., Class “A” (Real estate management & development)† | | 162,975 | | | 3,615 |
Canadian National Railway Company (Road & rail)† | | 108,876 | | | 5,919 |
Goldcorp Holdings Co. (Metals & mining)† | | 101,803 | | | 4,005 |
*Research In Motion Limited (Communications equipment)† | | 38,043 | | | 2,569 |
Royal Bank of Canada (Commercial banks) | | 66,852 | | | 3,605 |
Tim Hortons, Inc. (Hotels, restaurants & leisure) | | 71,783 | | | 2,205 |
| | | | | |
| | | | | 21,918 |
| | | | | |
|
Emerging Europe, Mid-East, Africa—4.6% |
Israel—2.2% | | | | | |
Teva Pharmaceutical Industries, Ltd.—ADR (Pharmaceuticals) | | 145,096 | | | 8,152 |
| | | | | |
South Africa—1.5% | | | | | |
Naspers, Ltd. (Media) | | 133,600 | | | 5,407 |
| | | | | |
Turkey—0.9% | | | | | |
Turkiye Garanti Bankasi A.S. (Commercial banks) | | 749,026 | | | 3,191 |
| | | | | |
| | | | | | | |
Issuer | | Shares or
Principal
Amount | | Value | |
| | |
Emerging Latin America—2.6% | | | | | | | |
Brazil—2.4% | | | | | | | |
BM&F Bovespa S.A. (Diversified financial services) | | | 607,971 | | $ | 4,278 | |
Petroleo Brasileiro S.A.—ADR (Oil, gas & consumable fuels) | | | 34,367 | | | 1,639 | |
Weg S.A. (Machinery) | | | 259,100 | | | 2,738 | |
| | | | | | | |
| | | | | | 8,655 | |
| | | | | | | |
Mexico—0.2% | | | | | | | |
Wal-Mart de Mexico Sab de C.V. (Food & staples retailing) | | | 208,000 | | | 927 | |
| | | | | | | |
Total Common Stocks—96.1%
(cost $269,515) | | | 350,969 | |
| | | | | | | |
| | |
Preferred Stock | | | | | | | |
Brazil—1.2% | | | | | | | |
Petroleo Brasileiro S.A. (Oil, gas & consumable fuels) | | | 215,279 | | | 4,537 | |
| | | | | | | |
Total Preferred Stock—1.2%
(cost $2,137) | | | 4,537 | |
| | | | | | | |
| | |
Investment in Affiliate | | | | | | | |
William Blair Ready Reserves Fund | | | 952,677 | | | 953 | |
| | | | | | | |
Total Investment in Affiliate—0.3%
(cost $953) | | | 953 | |
| | | | | | | |
| | |
Repurchase Agreement | | | | | | | |
State Street Bank and Trust Company, 0.000% dated 12/31/09 due 1/4/10, repurchase price $8,815, collateralized by U.S. Treasury Bill, 0.020%, due 2/18/10 | | $ | 8,815 | | | 8,815 | |
| | | | | | | |
Total Repurchase Agreement—2.4%
(cost $8,815) | | | 8,815 | |
| | | | | | | |
Total Investments—100.0%
(cost $281,420) | | | 365,274 | |
Liabilities, plus cash and other assets—0.0% | | | (3 | ) |
| | | | | | | |
Net assets—100.0% | | $ | 365,271 | |
| | | | | | | |
*Non-income producing securities
† = U.S. Listed Foreign Common Stock
ADR = American Depository Receipt
For securities, primarily traded on exchanges or markets that close before the close of regular trading on the New York Stock Exchange, the Fund uses an independent pricing service on a daily basis to fair value price the securities pursuant to Valuation Procedures approved by the Board of Trustees.
See accompanying Notes to Financial Statements.
14 Annual Report | December 31, 2009 |
Institutional International Equity Fund
Portfolio of Investments, December 31, 2009 (all dollar amounts in thousands)
At December 31, 2009, the Fund’s Portfolio of Investments includes the following industry categories:
| | |
Industrials | | 20.6% |
Financials | | 18.9% |
Information Technology | | 12.9% |
Consumer Discretionary | | 12.6% |
Energy | | 11.0% |
Health Care | | 8.8% |
Consumer Staples | | 6.1% |
Materials | | 5.1% |
Telecommunication Services | | 3.0% |
Utilities | | 1.0% |
| | |
Total | | 100.0% |
| | |
At December 31, 2009, the Fund’s Portfolio of Investments includes the following currency categories:
| | |
Euro | | 21.2% |
British Pound Sterling | | 17.8% |
Japanese Yen | | 13.0% |
U.S. Dollar | | 9.6% |
Swiss Franc | | 8.7% |
Hong Kong Dollar | | 7.9% |
Indian Rupee | | 3.9% |
Brazilian Real | | 3.3% |
Singapore Dollar | | 2.8% |
New Taiwan Dollar | | 1.9% |
Australian Dollar | | 1.7% |
South Korean Won | | 1.7% |
Canadian Dollar | | 1.6% |
South African Rand | | 1.5% |
Danish Krone | | 1.3% |
All Other Currencies | | 2.1% |
| | |
Total | | 100.0% |
| | |
See accompanying Notes to Financial Statements.
December 31, 2009 | William Blair Funds 15 |

Jeffery A. Urbina
INTERNATIONAL SMALL CAP GROWTH FUND
The International Small Cap Growth Fund primarily invests in a diversified portfolio of common stocks of small cap companies in developed and emerging markets.
AN OVERVIEW FROM THE PORTFOLIO MANAGER
Please see page 2 for the Global Markets Overview.
The International Small Cap Growth Fund posted a 57.84% increase (Institutional Class) for the 12 months ended December 31, 2009. By comparison, the Fund’s benchmark, the MSCI All Country Ex-U.S. Small Cap Index (net) (the ‘Index’), gained 62.91%.
The Fund outpaced the Index during the fourth quarter, but trailed it for the year. Fourth quarter performance was bolstered by strong stock selection across most sectors and regions. In particular, Consumer Discretionary and Consumer Staples stock selection was strong in Europe and emerging markets, mining exposure added value within Materials, and Information Technology (IT) stock selection was strong across most regions. During 2009, the Fund trailed the ACWI Ex-U.S. Small Cap Index but was well ahead of the World Ex-U.S. Small Cap Index. Augmenting performance was good stock selection across most sectors and regions, with significant value added in Consumer Staples, Energy, IT and Materials. Within Energy, a number of the service companies that were significant detractors from 2008 performance added value in 2009, while Baidu, Inc., Aixtron Aktiengesellschaft AG, Autonomy Corporation plc, ASM Pacific Technology Limited and Gree, Inc. performed strongly in IT. Detracting from 2009 results, however, was the Fund’s underweightings in the strong Materials sector and Asian emerging markets, coupled with Japanese Consumer Discretionary, Consumer Staples and IT stock selection.
As of December 31, the Fund maintained its focus on Consumer Staples and Consumer Discretionary, Industrials and IT at 7.9%, 18.6%, 21.7% and 15.9% of the Fund, respectively. Financials, which represented 12.6% of the Fund as of year-end, remained underweighted versus the ACWI Ex-U.S. Small Cap Index, while the 12.2% Healthcare exposure was nearly double the Index weighting. The Fund was most underweighted in Financials and Materials and most overweighted in Healthcare and IT as of year end. Regionally, the Fund was overweighted in Europe (31.4% v. 26.9%) and the U.K. (21.0% v. 14.1%), and underweighted in emerging markets (14.4% v. 24.2%). During the quarter we reduced exposure in Japan across most sectors from 20.3% to 17.4%.
16 Annual Report | December 31, 2009 |
International Small Cap Growth Fund
Performance Highlights (unaudited)
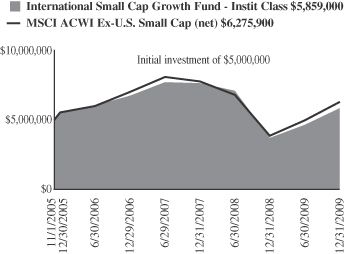
Average Annual Total Return at 12/31/2009
| | | | | | | | | |
| | | 1
Year | | | 3
Year | | | Since
Inception | |
International Small Cap Growth Fund Institutional Class | | 57.84 | % | | (4.59 | )% | | 3.86 | % |
MSCI All Country World
Ex-U.S. Small Cap Index (net) | | 62.91 | | | (3.52 | ) | | 5.59 | |
Performance cited represents past performance. Past performance does not guarantee future results and current performance may be lower or higher than the data quoted. Results shown are average annual returns, which assume reinvestment of dividends and capital gains. Investment returns and principal will fluctuate and you may have a gain or loss when you sell shares. For the most current month-end performance information, please call 1-800-742-7272, or visit our Web site at www.williamblairfunds.com. From time to time, the investment advisor may waive fees or reimburse expenses for the Fund. Without these waivers, performance would be lower. International investing involves special risk considerations, including currency fluctuations, lower liquidity, economic and political risk.
The performance highlights and graph presented above do not reflect the deduction of taxes that a shareholder would pay on fund distributions or the redemption of fund shares.
The Morgan Stanley Capital International (MSCI) All Country World Ex-U.S. Small Cap Index (net) is a free float-adjusted market capitalization weighted index that is designed to measure the equity market performance of small capitalization developed and emerging markets, excluding the United States. This series approximates the minimum possible dividend reinvestment.
This report identifies the Fund’s investments on December 31, 2009. These holdings are subject to change. Not all stocks in the Fund performed the same, nor is there any guarantee that these stocks will perform as well in the future. Market forecasts provided in this report may not necessarily come to pass.
Sector Diversification (unaudited)
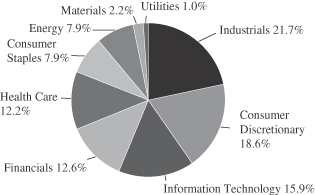
The sector diversification shown is based on the total long-term securities.
December 31, 2009 | William Blair Funds 17 |
International Small Cap Growth Fund
Portfolio of Investments, December 31, 2009 (all dollar amounts in thousands)
| | | | | |
Issuer | | Shares | | Value |
| | |
Common Stocks—Europe—30.5% | | | | | |
Austria—0.3% | | | | | |
Schoeller-Bleckmann Oilfield Equipment AG (Energy equipment & services) | | 23,296 | | $ | 1,143 |
| | | | | |
Denmark—0.2% | | | | | |
SimCorp A/S (Software) | | 4,690 | | | 880 |
| | | | | |
Finland—0.7% | | | | | |
F-Secure OYJ (Software) | | 426,058 | | | 1,669 |
Nokian Renkaat OYJ (Auto components) | | 47,262 | | | 1,146 |
| | | | | |
| | | | | 2,815 |
| | | | | |
France—6.2% | | | | | |
April Group S.A. (Insurance) | | 96,389 | | | 3,341 |
bioMerieux S.A. (Health care
equipment & supplies) | | 82,366 | | | 9,624 |
*Boursorama (Capital markets) | | 137,625 | | | 1,903 |
EDF Energies Nouvelles S.A. (Independent power providers & energy trader) | | 72,503 | | | 3,739 |
*Gemalto N.V. (Computers & peripherals) | | 94,859 | | | 4,127 |
Orpea (Heath care providers & services) | | 33,725 | | | 1,526 |
| | | | | |
| | | | | 24,260 |
| | | | | |
Germany—5.9% | | | | | |
Aixtron Aktiengesellschaft AG (Semiconductors & semiconductor equipment) | | 216,882 | | | 7,289 |
CTS Eventim AG (Media) | | 66,977 | | | 3,278 |
*Qiagen N.V. (Life sciences tools & services) | | 351,553 | | | 7,917 |
Wire Card AG (IT services) | | 319,676 | | | 4,420 |
| | | | | |
| | | | | 22,904 |
| | | | | |
Greece—0.2% | | | | | |
Jumbo S.A. (Specialty retail) | | 83,034 | | | 1,050 |
| | | | | |
Ireland—1.9% | | | | | |
*Norkom Group plc (Software) | | 215,133 | | | 453 |
Paddy Power plc (Hotels, restaurants, & leisure) | | 191,412 | | | 6,765 |
| | | | | |
| | | | | 7,218 |
| | | | | |
Italy—3.1% | | | | | |
Ansaldo STS SpA (Transportation infrastructure) | | 190,132 | | | 3,624 |
Diasorin SpA (Health care equipment & supplies) | | 108,514 | | | 3,856 |
Trevi Finanziaria SpA (Construction & engineering) | | 296,946 | | | 4,700 |
| | | | | |
| | | | | 12,180 |
| | | | | |
Luxembourg—1.8% | | | | | |
Oriflame Cosmetics S.A. (Personal products) | | 116,775 | | | 6,963 |
| | | | | |
Netherlands—1.0% | | | | | |
BinckBank N.V. (Capital markets) | | 219,226 | | | 3,927 |
| | | | | |
Norway—0.6% | | | | | |
*Norwegian Air Shuttle ASA (Airlines) | | 72,356 | | | 1,431 |
Opera Software ASA (Internet software & services) | | 263,405 | | | 909 |
| | | | | |
| | | | | 2,340 |
| | | | | |
Portugal—0.6% | | | | | |
Jeronimo Martins (Food & staples retailing) | | 249,376 | | | 2,494 |
| | | | | |
| | | | | |
Issuer | | Shares | | Value |
|
Common Stocks—Europe—30.5%—(continued) |
Spain—2.0% | | | | | |
Tecnicas Reunidas S.A. (Energy equipment & services) | | 138,577 | | $ | 7,970 |
| | | | | |
Switzerland—6.0% | | | | | |
*Orascom Development Holding AG (Hotels, restaurants & leisure) | | 35,906 | | | 2,530 |
Partners Group Global Opportunities, Ltd. (Capital markets) | | 69,004 | | | 8,700 |
Sika AG (Chemicals) | | 2,571 | | | 3,998 |
*Temenos Group AG (Software) | | 312,986 | | | 8,065 |
| | | | | |
| | | | | 23,293 |
| | | | | |
United Kingdom—20.5% | | | | | |
Aberdeen Asset Management plc (Capital markets) | | 1,605,702 | | | 3,450 |
Aggreko plc (Commercial services & supplies) | | 489,918 | | | 7,314 |
Amlin plc (Insurance) | | 1,239,802 | | | 7,159 |
Ashmore Group plc (Capital markets) | | 530,967 | | | 2,324 |
*ASOS plc (Internet & catalog retail) | | 100,775 | | | 792 |
AVEVA Group plc (Software) | | 71,776 | | | 1,167 |
*The Berkeley Group Holdings plc (Household durables) | | 194,633 | | | 2,567 |
*Blinkx plc (Internet software & services) | | 3,979,517 | | | 1,077 |
BlueBay Asset Management plc (Capital markets) | | 174,222 | | | 848 |
Britvic plc (Beverages) | | 643,852 | | | 4,222 |
*Ceres Power Holdings plc (Electrical equipment) | | 262,261 | | | 676 |
Chemring Group plc (Aerospace & defense) | | 113,780 | | | 5,371 |
Connaught plc (Commercial services & supplies) | | 197,416 | | | 1,130 |
*Dana Petroleum plc (Oil, gas, & consumable fuels) | | 314,492 | | | 5,951 |
Domino’s Pizza UK & IRL plc (Hotels, restaurants, & leisure) | | 206,254 | | | 990 |
*Heritage Oil plc (Oil, gas, & consumable fuels) | | 142,573 | | | 1,000 |
Intertek Group plc (Professional services) | | 101,882 | | | 2,059 |
Michael Page International plc (Professional services) | | 906,076 | | | 5,517 |
Micro Focus International plc (Software) | | 419,987 | | | 3,072 |
Mothercare plc (Multiline retail) | | 238,221 | | | 2,615 |
Petrofac, Ltd. (Energy equipment & services) | | 287,269 | | | 4,809 |
RPS Group plc (Commercial services & supplies) | | 1,180,344 | | | 4,127 |
Serco Group plc (Commercial services & supplies) | | 529,087 | | | 4,512 |
*Telecity Group plc (Internet software & services) | | 529,697 | | | 3,265 |
The Weir Group plc (Machinery) | | 354,564 | | | 4,089 |
| | | | | |
| | | | | 80,103 |
| | | | | |
Japan—17.0% | | | | | |
ABC-Mart, Inc. (Specialty retail) | | 145,614 | | | 4,039 |
Aeon Delight Co., Ltd. (Commercial services & supplies) | | 73,200 | | | 1,037 |
EPS Co., Ltd. (Life sciences tools & services) | | 254 | | | 996 |
Exedy Corporation (Auto components) | | 146,500 | | | 3,051 |
F.C.C. Co., Ltd. (Auto components) | | 109,009 | | | 1,931 |
Goldcrest Co., Ltd. (Real estate management & development) | | 130,050 | | | 3,642 |
See accompanying Notes to Financial Statements.
18 Annual Report | December 31, 2009 |
International Small Cap Growth Fund
Portfolio of Investments, December 31, 2009 (all dollar amounts in thousands)
| | | | | |
Issuer | | Shares | | Value |
|
Common Stocks—Japan—17.0% —(continued) |
Gree, Inc. (Internet software & services) | | 72,130 | | $ | 4,460 |
kabu.com Securities Co., Ltd. (Capital markets) | | 1,280 | | | 1,236 |
Kakaku.com, Inc. (Internet software & services) | | 558 | | | 2,169 |
K’s Holdings Corporation (Specialty retail) | | 126,100 | | | 3,785 |
Kurita Water Industries, Ltd. (Machinery) | | 234,400 | | | 7,364 |
M3, Inc. (Health care technology) | | 130 | | | 393 |
Miraca Holdings Inc. (Health care equipment & supplies) | | 257,800 | | | 7,095 |
Nabtesco Corporation (Machinery) | | 220,000 | | | 2,520 |
Nitori Company, Ltd. (Specialty retail) | | 48,400 | | | 3,603 |
Osaka Securities Exchange Co., Ltd. (Diversified financial services) | | 1,205 | | | 5,744 |
Park24 Co., Ltd. (Commercial services & supplies) | | 417,500 | | | 4,441 |
Point, Inc. (Specialty retail) | | 76,740 | | | 4,288 |
Start Today Co., Ltd. (Internet & catalog retail) | | 245 | | | 448 |
Unicharm Petcare Corporation (Food products) | | 104,205 | | | 3,183 |
Zappallas, Inc. (Internet software & services) | | 572 | | | 901 |
| | | | | |
| | | | | 66,326 |
| | | | | |
| | |
Emerging Asia—13.0% | | | | | |
China—11.6% | | | | | |
AAC Acoustic Technologies Holdings Inc. (Communications equipment) | | 1,153,559 | | | 1,906 |
China Dongxiang (Group) Co., Ltd. (Textiles, apparel, & luxury goods) | | 3,907,000 | | | 3,015 |
China Green (Holdings) Limited (Food products) | | 1,580,556 | | | 1,497 |
China High Speed Transmission (Electrical equipment) | | 1,921,000 | | | 4,664 |
Comba Telecom Systems Holdings Limited (Communications equipment) | | 3,825,635 | | | 4,443 |
* Concord Medical Services Holdings Limited—ADR (Health care providers & services) | | 43,588 | | | 377 |
* E-House (China) Holdings Limited—ADR (Real estate management & development) | | 198,590 | | | 3,598 |
Geely Automobile Holdings Limited (Automobiles) | | 2,605,000 | | | 1,422 |
Golden Eagle Retail Group, Ltd. (Multiline retail) | | 285,000 | | | 578 |
Li Ning Co., Ltd. (Textile, apparel & luxury goods) | | 1,118,873 | | | 4,243 |
Lonking Holdings Limited (Machinery) | | 6,755,000 | | | 4,655 |
Minth Group Limited (Auto components) | | 2,677,384 | | | 3,930 |
Shandong Weigao Group Medical Polymer Company, Ltd. (Health care equipment & supplies) | | 264,800 | | | 882 |
Wasion Group Holdings Limited (Electronic equipment, instruments, & components) | | 2,880,000 | | | 2,993 |
Zhuzhou CSR Times Electric Co., Ltd. (Electrical equipment) | | 3,393,865 | | | 6,926 |
| | | | | |
| | | | | 45,129 |
| | | | | |
India—1.0% | | | | | |
India Infoline Limited (Capital markets) | | 357,426 | | | 983 |
Lupin Limited (Pharmaceuticals) | | 91,530 | | | 2,891 |
| | | | | |
| | | | | 3,874 |
| | | | | |
| | | | | |
Issuer | | Shares | | Value |
|
Common Stocks—Emerging Asia—13.0%—(continued) |
South Korea—0.2% | | | | | |
*Megastudy Co., Ltd. (Diversified consumer services) | | 4,575 | | $ | 940 |
| | | | | |
Taiwan—0.2% | | | | | |
Tripod Technology Corporation (Electronic equipment, instruments, & components) | | 205,000 | | | 692 |
| | | | | |
| | |
Asia—7.5% | | | | | |
Australia—3.3% | | | | | |
Cochlear Limited (Health care equipment & supplies) | | 70,249 | | | 4,338 |
JB Hi-Fi Limited (Specialty retail) | | 326,642 | | | 6,594 |
SEEK Limited (Professional services) | | 345,571 | | | 2,134 |
| | | | | |
| | | | | 13,066 |
| | | | | |
Hong Kong—1.7% | | | | | |
ASM Pacific Technology Limited (Semiconductors & semiconductor equipment) | | 700,700 | | | 6,625 |
| | | | | |
New Zealand—0.5% | | | | | |
Fisher & Paykel Healthcare Corp., Ltd. (Health care equipment & supplies) | | 741,038 | | | 1,810 |
| | | | | |
Singapore—2.0% | | | | | |
Midas Holdings Limited (Metals & mining) | | 2,718,000 | | | 1,769 |
Olam International, Ltd. (Food & staples retailing) | | 3,111,700 | | | 5,846 |
| | | | | |
| | | | | 7,615 |
| | | | | |
Canada—3.0% | | | | | |
Niko Resources Ltd. (Oil, gas, & consumable fuels) | | 40,032 | | | 3,766 |
*Pacific Rubiales Energy Corporation (Oil, gas & consumable fuels) | | 376,472 | | | 5,562 |
*Red Back Mining Inc. (Metals & mining) | | 177,949 | | | 2,552 |
| | | | | |
| | | | | 11,880 |
| | | | | |
|
Emerging Europe, Mid-East, Africa—2.9% |
Russia—0.1% | | | | | |
*CTC Media, Inc. (Media)† | | 37,759 | | | 562 |
| | | | | |
South Africa—2.3% | | | | | |
*Aspen Pharmacare Holdings Limited (Pharmaceuticals) | | 233,940 | | | 2,329 |
Mr Price Group Limited (Specialty retail) | | 208,695 | | | 987 |
Shoprite Holdings, Limited (Food & staples retailing) | | 447,600 | | | 3,935 |
Wilson Bayly Holmes-Ovcon Limited (Construction & engineering) | | 106,171 | | | 1,543 |
| | | | | |
| | | | | 8,794 |
| | | | | |
Turkey—0.5% | | | | | |
BIM Birlesik Magazalar A.S. (Food & staples retailing) | | 45,077 | | | 2,096 |
| | | | | |
| | |
Emerging Latin America—2.9% | | | | | |
Brazil—2.9% | | | | | |
*Anhanguera Educacional Participacoes S.A. (Diversified consumer services) | | 62,703 | | | 896 |
See accompanying Notes to Financial Statements.
December 31, 2009 | William Blair Funds 19 |
International Small Cap Growth Fund
Portfolio of Investments, December 31, 2009 (all dollar amounts in thousands)
| | | | | | |
Issuer | | Shares or
Principal
Amount | | Value |
|
Common Stocks—Emerging Latin America—2.9%—(continued) |
Brasil Brokers Participacoes S.A. (Real estate management & development) | | | 280,000 | | $ | 1,042 |
Diagnosticos da America S.A. (Health care providers & services) | | | 75,300 | | | 2,465 |
Localiza Rent a Car S.A. (Road & rail) | | | 181,500 | | | 2,014 |
Lojas Renner S.A. (Multiline retail) | | | 72,100 | | | 1,628 |
PDG Realty S.A. Empreendimentos e Participacoes (Household durables) | | | 231,900 | | | 2,311 |
Rodobens Negocioa Imobiliarios S.A. (Household durables) | | | 93,500 | | | 965 |
| | | | | | |
| | | | | | 11,321 |
| | | | | | |
Total Common Stocks—97.3%
(cost $307,348) | | | 380,270 |
| | | | | | |
| | |
Convertible Bond | | | | | | |
Brazil—0.2% | | | | | | |
Lupatech S.A., 6.500% due 4/15/18 (Machinery)** | | $ | 959 | | | 592 |
| | | | | | |
Total Convertible Bond—0.2%
(cost $501) | | | 592 |
| | | | | | |
| | |
Investment in Affiliate | | | | | | |
William Blair Ready Reserves Fund | | | 488,883 | | | 489 |
| | | | | | |
Total Investment in Affiliate—0.1%
(cost $489) | | | 489 |
| | | | | | |
| | |
Short-Term Investment | | | | | | |
American Express Credit Corp. Demand Note, VRN 0.081%, due 1/4/10 | | $ | 500 | | | 500 |
| | | | | | |
Total Short-Term Investment—0.1%
(cost $500) | | | 500 |
| | | | | | |
| | |
Repurchase Agreement | | | | | | |
Fixed Income Clearing Corporation, 0.000% dated 12/31/09, due 1/4/10, repurchase price $3,891, collateralized by FNMA,
4.375%, due 7/17/23 | | $ | 3,891 | | | 3,891 |
| | | | | | |
Total Repurchase Agreement—1.0%
(cost $3,891) | | | 3,891 |
| | | | | | |
Total Investments—98.7%
(cost $312,729) | | | 385,742 |
Cash and other assets, less liabilities—1.3% | | | 5,109 |
| | | | | | |
Net assets—100.0% | | $ | 390,851 |
| | | | | | |
*Non-income producing securities
† = U.S. listed foreign security
ADR = American Depository Receipt
VRN = Variable Rate Note
**Fair value pursuant to Valuation Procedures adopted by the Board of Trustees. This holding represents 0.15% of the net assets at December 31, 2009. This securities was also deemed illiquid pursuant to the Fund/Advisor’s Liquidity Procedures.
For securities primarily traded on exchanges or markets that close before the close of regular trading on the New York Stock Exchange, the Fund uses an independent pricing service on a daily basis to fair value price the securities pursuant to Valuation Procedures approved by the Board of Trustees.
At December 31, 2009 the Fund’s Portfolio of Investments includes the following industry categories:
| | |
Industrials | | 21.7% |
Consumer Discretionary | | 18.6% |
Information Technology | | 15.9% |
Financials | | 12.6% |
Health Care | | 12.2% |
Energy | | 7.9% |
Consumer Staples | | 7.9% |
Materials | | 2.2% |
Utilities | | 1.0% |
| | |
Total | | 100.0% |
| | |
At December 31, 2009 the Fund’s Portfolio of Investments includes the following currency categories:
| | |
Euro | | 22.6% |
British Pound Sterling | | 21.0% |
Japanese Yen | | 17.4% |
Hong Kong Dollar | | 12.5% |
Swiss Franc | | 6.1% |
Australian Dollar | | 3.4% |
Canadian Dollar | | 3.1% |
Brazilian Real | | 3.1% |
South African Rand | | 2.3% |
Singapore Dollar | | 2.0% |
Swedish Krone | | 1.8% |
U.S. Dollar | | 1.2% |
Indian Rupee | | 1.0% |
All other currencies | | 2.5% |
| | |
Total | | 100.0% |
| | |
See accompanying Notes to Financial Statements.
20 Annual Report | December 31, 2009 |

Todd M. McClone
Jeffrey A. Urbina
EMERGING MARKETS GROWTH FUND
The Emerging Markets Growth Fund primarily invests in a diversified portfolio of equity securities issued by growth companies in emerging economies worldwide.
AN OVERVIEW FROM THE PORTFOLIO MANAGERS
Please see page 2 for the Global Markets Overview.
The Emerging Markets Growth Fund posted a 74.33% increase (Institutional Class) for the 12 months ended December 31, 2009. By comparison, the Fund’s benchmark, the MSCI Emerging Markets IMI Index (the ‘Index’), gained 82.36%.
The Fund fell slightly behind the Index during the fourth quarter and trailed it for the year. Portfolio results were augmented by Consumer Discretionary and Staples stock selection and weightings, coupled with strong Energy stock selection. In addition, Emerging Asia and Latin America stock selection was strong. Specifically, the Fund’s exposure to the Asian automobile industry added value, as did strong performance by Naspers, Ltd., Russian grocery stores and Latin American holdings. Detracting from fourth quarter results was Middle Eastern exposure, in the wake of the Dubai world debt concerns. The Fund posted a strong absolute return during 2009, but trailed the broad Indices. While stock selection was strong across most sectors throughout the year, sector positioning was the biggest drag on results, particularly during the first half of 2009. In particular, the Fund’s Consumer Staples holdings outperformed the Index by approximately 20%, Information Technology stock selection was augmented by Taiwanese exposure, and Brazilian and Chinese exploration and production companies boosted Energy performance.
As of December 31, the Fund maintained its focus on Consumer Discretionary and Consumer Staples stocks at 31.0% of the Fund, well ahead of the Index weighting. While Information Technology decreased by approximately 3% during the quarter, it approximated the Index weighting. Financials, Materials and Telecommunication Services remained the most underweighted during the period, while Consumer (Discretionary and Staples) was the most overweighted exposure. Regionally, the Fund remained underweighted in Emerging Asia and Emerging Markets Europe, Mid-East and Africa (EMEA) in favor of Latin America.
December 31, 2009 | William Blair Funds 21 |
Emerging Markets Growth Fund
Performance Highlights (unaudited)
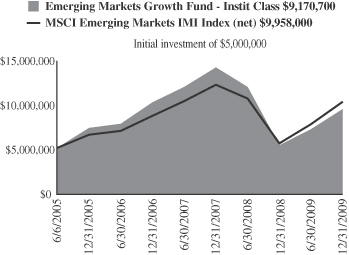
Average Annual Total Return at 12/31/2009
| | | | | | | | | |
| | | 1
Year | | | 3
Year | | | Since
Inception | |
Emerging Markets Growth Fund Institutional Class | | 74.33 | % | | (2.48 | )% | | 14.13 | % |
MSCI Emerging Markets IMI (net) | | 82.36 | | | 5.63 | | | 16.20 | |
Performance cited represents past performance. Past performance does not guarantee future results and current performance may be lower or higher than the data quoted. Results shown are average annual returns, which assume reinvestment of dividends and capital gains. Investment returns and principal will fluctuate and you may have a gain or loss when you sell shares. For the most current month-end performance information, please call 1-800-742-7272, or visit our Web site at www.williamblairfunds.com. From time to time, the investment advisor may waive fees or reimburse expenses for the Fund. Without these waivers, performance would be lower. International investing involves special risk considerations, including currency fluctuations, lower liquidity, economic and political risk.
The performance highlights and graph presented above do not reflect the deduction of taxes that a shareholder would pay on fund distributions or the redemption of fund shares.
The Morgan Stanley Capital International (MSCI) Emerging Markets Investable Market Index (IMI) (net) is a free float-adjusted market capitalization weighted index that is designed to measure the equity market performance of emerging markets. This series approximates the minimum possible dividend reinvestment.
This report identifies the Fund’s investments on December 31, 2009. These holdings are subject to change. Not all stocks in the Fund performed the same, nor is there any guarantee that these stocks will perform as well in the future. Market forecasts provided in this report may not necessarily come to pass.
Sector Diversification (unaudited)
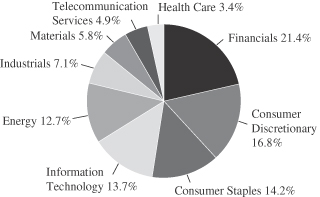
The sector diversification shown is based on the total long-term securities.
22 Annual Report | December 31, 2009 |
Emerging Markets Growth Fund
Portfolio of Investments, December 31, 2009 (all dollar amounts in thousands)
| | | | | |
Issuer | | Shares | | Value |
| |
Common Stocks—Emerging Asia—51.9% | | | |
China—20.4% | | | | | |
AAC Acoustic Technologies Holdings Inc. (Communications equipment) | | 1,511,949 | | $ | 2,498 |
Angang Steel Company Limited (Metals & mining) | | 5,192,000 | | | 11,322 |
Anhui Conch Cement Company Limited (Construction materials) | | 938,000 | | | 5,994 |
Belle International Holdings Limited (Specialty retail) | | 4,629,200 | | | 5,363 |
China Dongxiang (Group) Co., Ltd. (Textiles, apparel, & luxury goods) | | 7,084,000 | | | 5,466 |
China High Speed Transmission (Electrical equipment) | | 2,352,000 | | | 5,711 |
China Life Insurance Co., Ltd. (Insurance) | | 3,020,000 | | | 14,778 |
China Overseas Land & Investment, Lts. (Real estate management & development) | | 3,468,000 | | | 7,266 |
China Railway Construction Corporation Limited (Construction & engineering) | | 8,129,000 | | | 10,358 |
China Shenhua Energy Company Limited (Oil, gas, & consumable fuels) | | 4,493,406 | | | 21,812 |
China Vanke Co., Ltd. (Real estate management & development) | | 7,423,234 | | | 9,276 |
*China Zhongwang Holdings Limited (Metals & mining) | | 8,088,800 | | | 6,443 |
*Concord Medical Services Holdings Limited—ADR (Health care providers & services) | | 68,593 | | | 593 |
CNOOC Limited (Oil, gas & consumable fuels) | | 15,686,000 | | | 24,438 |
Dongfeng Motor Group Company Limited (Automobiles) | | 7,180,000 | | | 10,253 |
*E-House (China) Holdings Limited—ADR (Real estate management & development) | | 120,653 | | | 2,186 |
Geely Automobile Holdings Limited (Automobiles) | | 3,650,000 | | | 1,992 |
Golden Eagle Retail Group, Ltd. (Multiline retail) | | 719,000 | | | 1,458 |
Hengan International Group Co., Ltd. (Personal products) | | 353,000 | | | 2,614 |
Industrial and Commercial Bank of China (Commercial banks) | | 43,717,000 | | | 36,004 |
Li Ning Co., Ltd. (Textiles, apparel & luxury goods) | | 1,042,500 | | | 3,953 |
Lonking Holdings Limited (Machinery) | | 3,974,000 | | | 2,738 |
Shandong Weigao Group Medical Polymer Company, Ltd. (Health care equipment & supplies) | | 640,700 | | | 2,135 |
Tencent Holdings, Ltd. (Internet software & services) | | 134,000 | | | 2,898 |
Wasion Group Holdings Limited (Electronic equipment, instruments, & components) | | 2,256,000 | | | 2,345 |
Zhuzhou CSR Times Electric Co., Ltd. (Electrical equipment) | | 1,199,861 | | | 2,449 |
Zijin Mining Group Company Limited (Metals & mining) | | 7,266,000 | | | 6,887 |
ZTE Corporation (Communications equipment) | | 458,400 | | | 2,818 |
| | | | | |
| | | | | 212,048 |
| | | | | |
India—8.5% | | | | | |
Bharat Heavy Electricals, Ltd. (Electrical equipment) | | 188,598 | | | 9,709 |
| | | | | |
Issuer | | Shares | | Value |
|
Common Stocks—Emerging Asia—51.9%—(continued) |
*Cairn India, Ltd. (Oil, gas & consumable fuels) | | 1,286,792 | | $ | 7,761 |
Dabur India Limited (Personal products) | | 688,638 | | | 2,337 |
Financial Technologies (India) Limited (Software) | | 71,919 | | | 2,063 |
HDFC Bank, Ltd. (Commercial banks) | | 154,385 | | | 5,625 |
Hero Honda Motors Limited (Automobiles) | | 148,903 | | | 5,477 |
Housing Development Finance Corp. (Thrifts & mortgage finance) | | 90,110 | | | 5,156 |
India Infoline Limited (Capital markets) | | 894,226 | | | 2,460 |
Infosys Technologies Limited (IT services) | | 196,058 | | | 10,912 |
Jindal Steel & Power Limited (Metals & mining) | | 827,566 | | | 12,450 |
Larsen & Toubro, Ltd. (Construction & engineering) | | 146,373 | | | 5,270 |
Lupin Limited (Pharmaceuticals) | | 85,565 | | | 2,703 |
Maruti Suzuki India Limited (Automobiles) | | 159,033 | | | 5,305 |
Reliance Industries Limited (Oil, gas, & consumable fuels) | | 455,921 | | | 10,653 |
| | | | | |
| | | | | 87,881 |
| | | | | |
Indonesia—2.6% | | | | | |
PT Astra International Tbk (Automobiles) | | 3,428,000 | | | 12,603 |
PT Bank Rakyat Indonesia (Commercial banks) | | 9,490,000 | | | 7,627 |
*PT Ciputra Development Tbk (Real estate management & development) | | 27,192,728 | | | 1,402 |
PT Telekomunikasi Indonesia Tbk (Diversified telecommunication services) | | 2,414,000 | | | 2,403 |
PT United Tractors Tbk (Machinery) | | 1,911,500 | | | 3,130 |
| | | | | |
| | | | | 27,165 |
| | | | | |
Malaysia—1.0% | | | | | |
CIMB Group Holdings Berhad (Commercial banks) | | 2,677,500 | | | 10,019 |
| | | | | |
Papua New Guinea—0.7% | | | | | |
Oil Search Limited (Oil, gas, & consumable fuels) | | 1,392,177 | | | 7,633 |
| | | | | |
South Korea—8.9% | | | | | |
*Amorepacific Corporation (Personal products) | | 7,244 | | | 5,808 |
*Hyundai Mobis (Auto components) | | 84,788 | | | 12,425 |
*Hyundai Motor Company (Automobiles) | | 235,739 | | | 24,402 |
*LG Household & Health Care, Ltd. (Household products) | | 36,527 | | | 9,138 |
*Megastudy Co., Ltd. (Diversified consumer services) | | 11,421 | | | 2,348 |
*NHN Corporation (Internet software & services) | | 35,244 | | | 5,825 |
Samsung Electronics Co., Ltd. (Semiconductors & semiconductor equipment) | | 23,520 | | | 16,128 |
Samsung Fire & Marine Insurance Co., Ltd. (Insurance) | | 52,571 | | | 8,999 |
*Shinsegae Co., Ltd. (Food & staples retailing) | | 10,680 | | | 4,933 |
*Taewoong Co., Ltd. (Machinery) | | 38,801 | | | 2,494 |
| | | | | |
| | | | | 92,500 |
| | | | | |
See accompanying Notes to Financial Statements.
December 31, 2009 | William Blair Funds 23 |
Emerging Markets Growth Fund
Portfolio of Investments, December 31, 2009 (all dollar amounts in thousands)
| | | | | |
Issuer | | Shares | | Value |
|
Common Stocks—Emerging Asia—51.9%—(continued) |
Taiwan—9.0% | | | | | |
Hon Hai Precision Industry Co., Ltd. (Electronic equipment, instruments, & components) | | 7,244,100 | | $ | 33,878 |
MediaTek Inc. (Semiconductors & semiconductor equipment) | | 995,142 | | | 17,290 |
Siliconware Precision Industries Co., Ltd. (Semiconductors & semiconductor equipment) | | 3,995,000 | | | 5,446 |
Taiwan Semiconductor Manufacturing Company Ltd. (Semiconductors & semiconductor equipment) | | 15,434,947 | | | 31,109 |
Tripod Technology Corporation (Electronic equipment, instruments, & components) | | 301,000 | | | 1,015 |
Yuanta Financial Holding Co., Ltd. (Capital markets) | | 6,691,000 | | | 4,896 |
| | | | | |
| | | | | 93,634 |
| | | | | |
Thailand—0.8% | | | | | |
CP ALL PCL (Food & staples retailing) | | 8,625,000 | | | 6,416 |
Minor International PCL (Hotels, restaurants, & leisure) | | 5,447,300 | | | 1,846 |
| | | | | |
| | | | | 8,262 |
| | | | | |
| | |
Emerging Latin America—22.3% | | | | | |
Brazil—12.6% | | | | | |
*Anhanguera Educacional Participacoes S.A. (Diversified consumer services) | | 162,800 | | | 2,326 |
Banco Santander (Brasil) S.A.—GDR (Commercial banks) | | 786,438 | | | 10,963 |
BM&F Bovespa S.A. (Diversified financial services) | | 869,600 | | | 6,119 |
*BR Malls Participacoes S.A. (Real estate management & development) | | 594,100 | | | 7,337 |
Brasil Brokers Participacoes S.A. (Real estate management & development) | | 438,200 | | | 1,631 |
Companhia de Bebidas das Americas-AMBEV—ADR (Beverages) | | 188,211 | | | 19,026 |
*GP Investments, Ltd.—GDR (Capital markets) | | 487,800 | | | 2,858 |
Diagnosticos da America S.A. (Health care providers & services) | | 130,500 | | | 4,272 |
*Hypermarcas S.A. (Personal products) | | 398,414 | | | 9,154 |
Iguatemi Empresa de Shopping Centers S.A. (Real estate management & development) | | 86,115 | | | 1,682 |
Localiza Rent a Car S.A. (Road & rail) | | 443,200 | | | 4,918 |
Lojas Renner S.A. (Multiline retail) | | 203,500 | | | 4,594 |
M. Dias Branco S.A. Industria e Comercio de Alimentos (Food products) | | 112,400 | | | 2,712 |
MRV Engenharia e Participacoes, S.A. (Household durables) | | 1,115,880 | | | 9,037 |
Natura Cosmeticos S.A. (Personal products) | | 414,200 | | | 8,639 |
*OGX Petroleo e Gas Participacoes S.A. (Oil, gas, & consumable fuels) | | 600,000 | | | 5,893 |
PDG Realty S.A. Empreendimentos e Participacoes (Household durables) | | 833,100 | | | 8,302 |
Rodobens Negocioa Imobiliarios S.A. (Household durables) | | 152,500 | | | 1,574 |
Totvs S.A. (Software) | | 60,500 | | | 4,101 |
Vale S.A.—ADR (Metals & mining) | | 366,875 | | | 10,650 |
WEG S.A. (Machinery) | | 438,400 | | | 4,633 |
| | | | | |
| | | | | 130,421 |
| | | | | |
| | | | | |
Issuer | | Shares | | Value |
|
Common Stocks—Emerging Latin America—22.3%—(continued) |
Chile—1.2% | | | | | |
Banco Santander Chile—GDR (Commercial Banks) | | 8,417 | | $ | 545 |
S.A.C.I. Falabella S.A. (Multiline retail) | | 2,041,832 | | | 12,051 |
| | | | | |
| | | | | 12,596 |
| | | | | |
Columbia—0.5% | | | | | |
Ecopetrol S.A. (Oil, gas, & consumable fuels) | | 4,488,290 | | | 5,447 |
| | | | | |
Mexico—6.8% | | | | | |
America Movil S.A.B. de C.V. (Wireless telecommunication services) | | 8,962,500 | | | 21,081 |
Banco Compartamos S.A.B. de C.V. (Consumer finance) | | 591,300 | | | 3,052 |
*Desarrolladora Homex S.A.B. de C.V.—ADR (Household durables) | | 171,281 | | | 5,759 |
Fomento Economico Mexicano S.A.B. de C.V.—ADR (Beverages) | | 168,817 | | | 8,083 |
Grupo Televisa S.A.B. de C.V.—ADR (Media) | | 611,847 | | | 12,702 |
*Megacable Holdings S.A.B. de C.V. (Media) | | 851,400 | | | 1,796 |
Wal-Mart de Mexico S.A.B. de C.V. (Food & staples retailing) | | 3,963,100 | | | 17,662 |
| | | | | |
| | | | | 70,135 |
| | | | | |
Panama—0.2% | | | | | |
Copa Holdings S.A. (Airlines)† | | 36,845 | | | 2,007 |
| | | | | |
Peru—1.0% | | | | | |
Credicorp, Ltd. (Commercial banks)† | | 137,920 | | | 10,623 |
| | | | | |
| |
Emerging Europe, Mid-East, Africa—17.4% | | | |
Egypt—0.6% | | | | | |
Egyptian Financial Group—Hermes Holding S.A.E. (Capital markets) | | 282,784 | | | 1,288 |
Orascom Construction Industries (Construction & engineering) | | 116,106 | | | 5,261 |
| | | | | |
| | | | | 6,549 |
| | | | | |
Israel—1.8% | | | | | |
Teva Pharmaceutical Industries, Ltd.—ADR (Pharmaceuticals) | | 325,971 | | | 18,313 |
| | | | | |
Qatar—0.4% | | | | | |
Qatar National Bank S.A.Q. (Commercial banks) | | 114,559 | | | 4,660 |
| | | | | |
Russia—5.6% | | | | | |
*CTC Media, Inc. (Media)† | | 101,632 | | | 1,514 |
Magnit—CLS (Food & staples retailing)† | | 237,268 | | | 16,341 |
Mobile TeleSystems OJSC—ADR (Wireless telecommunication services) | | 158,360 | | | 7,742 |
Novatek OAO—GDR (Oil, gas, & consumable fuels) | | 114,800 | | | 7,499 |
Vimpel-Communications OJSC—ADR (Diversified telecommunication services) | | 462,026 | | | 8,589 |
*X 5 Retail Group N.V.—GDR (Food & staples retailing) | | 520,150 | | | 16,488 |
| | | | | |
| | | | | 58,173 |
| | | | | |
See accompanying Notes to Financial Statements.
24 Annual Report | December 31, 2009 |
Emerging Markets Growth Fund
Portfolio of Investments, December 31, 2009 (all dollar amounts in thousands)
| | | | | | |
Issuer | | Shares or
Principal
Amount | | Value |
|
Emerging Europe, Mid-East, Africa—17.4%—(continued) |
South Africa—6.0% | | | | | | |
AngloGold Ashanti Limited (Metals & mining) | | | 117,181 | | $ | 4,747 |
*Aspen Pharmacare Holdings Limited (Pharmaceuticals) | | | 590,966 | | | 5,884 |
Mr Price Group Limited (Specialty retail) | | | 519,279 | | | 2,455 |
MTN Group, Ltd. (Wireless telecommunication services) | | | 629,347 | | | 10,017 |
Naspers, Ltd. (Media) | | | 345,387 | | | 13,978 |
Shoprite Holdings Limited (Food & staples retailing) | | | 596,598 | | | 5,245 |
Standard Bank Group Limited (Commercial banks) | | | 1,134,012 | | | 15,576 |
Wilson Bayly Holmes-Ovcon Limited (Construction & engineering) | | | 279,734 | | | 4,064 |
| | | | | | |
| | | | | | 61,966 |
| | | | | | |
Turkey—2.6% | | | | | | |
Bim Birlesik Magazalar A.S. (Food & staples retailing) | | | 118,235 | | | 5,498 |
Coca Cola Icecek A.S. (Beverages) | | | 300,966 | | | 3,009 |
Turkiye Garanti Bankasi A.S. (Commercial banks) | | | 4,420,308 | | | 18,830 |
| | | | | | |
| | | | | | 27,337 |
| | | | | | |
United Arab Emirates—0.4% | | | | | | |
Aldar Properties PJSC (Real estate management & development) | | | 1,588,719 | | | 2,101 |
First Gulf Bank PJSC (Commercial banks) | | | 479,819 | | | 2,095 |
| | | | | | |
| | | | | | 4,196 |
| | | | | | |
Total Common Stocks—91.6%
(cost $696,307) | | | 951,565 |
| | | | | | |
| | |
Preferred Stocks | | | | | | |
Brazil—5.4% | | | | | | |
All America Latina Logistica (Road & rail) | | | 870,100 | | | 8,146 |
Itau Unibanco Banco Multiplo S.A. (Commercial banks) | | | 487,254 | | | 10,828 |
Petroleo Brasileiro S.A. (Oil, gas & consumable fuels) | | | 1,740,480 | | | 36,679 |
| | | | | | |
| | | | | | 55,653 |
| | | | | | |
Total Preferred Stocks—5.4%
(cost $39,888) | | | 55,653 |
| | | | | | |
| | |
Convertible Bond | | | | | | |
Brazil—0.1% | | | | | | |
Lupatech S.A., 6.500% 4/15/18 (Machinery)** | | $ | 1,602 | | | 990 |
| | | | | | |
Total Convertible Bond—0.1%
(cost $838) | | | 990 |
| | | | | | |
| | |
Investment in Affiliate | | | | | | |
William Blair Ready Reserves Fund | | | 66,214 | | | 66 |
| | | | | | |
Total Investment in Affiliate—0.0%
(cost $66) | | | 66 |
| | | | | | |
| | |
Short-Term Investment | | | | | | |
American Express Credit Corp. Demand Note, VRN 0.081%, due 1/4/10 | | $ | 2,000 | | | 2,000 |
| | | | | | |
Total Short-Term Investment—0.2%
(cost $2,000) | | | 2,000 |
| | | | | | |
| | | | | | | |
Issuer | | Principal
Amount | | Value | |
| | |
Repurchase Agreement | | | | | | | |
Fixed Income Clearing Corporation,
0.000% dated 12/31/09 due 1/4/10, repurchase price $33,460, collateralized by FNMA, 4.875%, due 12/15/16 | | $ | 33,460 | | $ | 33,460 | |
| | | | | | | |
Total Repurchase Agreement—3.2%
(cost $33,460) | | | 33,460 | |
| | | | | | | |
Total Investments—100.5%
(cost $772,559) | | | 1,043,734 | |
Liabilities, plus cash and other assets—(0.5)% | | | (5,474 | ) |
| | | | | | | |
Net assets—100.0% | | $ | 1,038,260 | |
| | | | | | | |
† = U.S. listed Foreign Security
ADR = American Depository Receipt
GDR = Global Depository Receipt
VRN = Variable Rate Note
** = Fair valued pursuant to Valuation Procedures adopted by the Board of Trustees. This holding represents 0.10% of the Fund’s net assets at December 31, 2009. This security was also deemed illiquid pursuant to the Fund/Advisor’s Liquidity Procedures.
For securities primarily traded on exchanges or markets that close before the close of regular trading on the New York Stock Exchange the Fund uses an independent pricing service on a daily basis to fair value price the securities pursuant to Valuation Procedures approved by the Board of Trustees.
At December 31, 2009, the Fund’s Portfolio of Investments includes the following industry categories:
| | |
Financials | | 21.4% |
Consumer Discretionary | | 16.8% |
Consumer Staples | | 14.2% |
Information Technology | | 13.7% |
Energy | | 12.7% |
Industrials | | 7.1% |
Materials | | 5.8% |
Telecommunication Services | | 4.9% |
Health Care | | 3.4% |
| | |
Total | | 100.0% |
| | |
At December 31, 2009, the Fund’s Portfolio of Investments includes the following currency categories:
| | |
Hong Kong Dollar | | 20.8% |
U.S. Dollar | | 15.8% |
Brazilian Real | | 14.5% |
New Taiwan Dollar | | 9.3% |
South Korean Won | | 9.2% |
Indian Rupee | | 8.7% |
South African Rand | | 6.2% |
Mexican Nuevo Peso | | 4.3% |
Indonesian Rupiah | | 2.7% |
Turkish Lira Spot | | 2.7% |
Chilean Peso | | 1.2% |
Malaysian Ringgit | | 1.0% |
All Other Currencies | | 3.6% |
| | |
Total | | 100.0% |
| | |
See accompanying Notes to Financial Statements.
December 31, 2009 | William Blair Funds 25 |
Todd M. McClone
Jeffrey A. Urbina
EMERGING LEADERS GROWTH FUND
The Emerging Leaders Growth Fund invests primarily in a diversified portfolio of equity securities including common stocks, issued by companies in emerging markets with a market capitalization of at least $3 billion at the time of the Fund’s investment.
AN OVERVIEW FROM THE PORTFOLIO MANAGERS
Please see page 2 for the Global Markets Overview.
The Emerging Leaders Growth Fund posted an increase of 78.93% (Institutional Class) for the 12 months ended December 31, 2009. By comparison, the Fund’s benchmark, the MSCI Emerging Markets Large Cap Index (net) (the ‘Index’) gained 75.92% during the same period.
The Fund outpaced the Index during the fourth quarter and for the year. Fourth quarter results were bolstered by good stock selection in Consumer Staples, Energy, and Materials holdings, coupled with overweightings in Consumer Discretionary and Consumer Staples and an underweighting in Telecommunication Services. In addition, the Fund had strong stock selection in Asia and Emerging Markets, Europe, Mid-East and Africa (EMEA). During 2009, the Fund had strong stock selection across most sectors, which drove performance during the period. In particular, strong performance by Energy names OGX Petroleo e Gas Participacoes S.A. and Petroleo Brasileiro S.A., EMEA Financials, and overall Latin American Financials exposure boosted results. In addition, the Fund’s infrastructure-related Asian Industrials holdings performed well, as did the Fund’s mining companies. Regional positioning and stock selection were also strong. Somewhat detracting from strong absolute and relative results was the Fund’s overweighting in Consumer Staples and underweightings in Energy and Materials.
As of year end, the Fund maintained its focus on Consumer Discretionary and Consumer Staples stocks at 35.0% of the Fund, well ahead of the 8.6% Index weighting, and an increase from year end 2008, when Consumer Discretionary and Consumer Staples holdings approximated 20.1%. This increase was driven by Consumer Discretionary, which increased from 4.3% to 18.9%. Information Technology (IT) approximated the Index at 13.8% as of year end, but increased from 9.6% at year end 2008 due to a higher weighting in Asian technology companies. These increases were funded by a decrease in Healthcare from 7.3% to 0.0% and Telecommunication Services from 15.7% to 2.9%. While Financials represented 22.1% of the Fund as of year end, it was slightly underweighted versus the Index and remained a relatively stable weighting during the year. As of year end 2009, the Fund was most underweighted in Telecommunication Services, Energy and Materials and most overweighted in Consumer Discretionary and Consumer Staples. Regionally, the Fund was focused on Emerging Asia at 57.1% of the Fund at the expense of EMEA and Latin America. Exposure in Emerging Asia increased throughout the year from 42.0%, while Emerging Latin America decreased from 26.8% to 19.9%.
26 Annual Report | December 31, 2009 |
Emerging Leaders Growth Fund
Performance Highlights (unaudited)
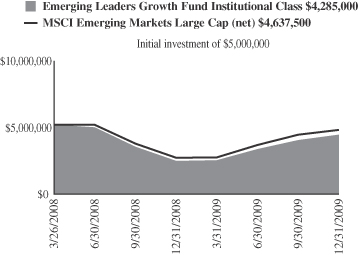
Average Annual Total Return at 12/31/2009
| | | | | | |
| | | 1
Year | | | Since
Inception | |
Emerging Leaders Growth
Fund Institutional Class | | 78.93 | % | | (8.34 | )% |
MSCI Emerging Markets
Large Cap (net) | | 75.92 | | | (4.16 | ) |
Performance cited represents past performance. Past performance does not guarantee future results and current performance may be lower or higher than the data quoted. Results shown are average annual total returns, which assume reinvestment of dividends and capital gains. Investment returns and principal will fluctuate and you may have a gain or loss when you sell shares. For the most current month-end performance information, please call 1-800-742-7272, or visit our Web site at www.williamblairfunds.com. International investing includes special risk considerations, including currency fluctuations, lower liquidity, economic and political risk. From time to time, the investment advisor may waive fees or reimburse expenses for the Fund. Without these waivers, performance would be lower.
The performance highlights and graph presented above do not reflect the deduction of taxes that a shareholder would pay on fund distributions or the redemption of fund shares.
The Morgan Stanley Capital International (MSCI) Emerging Markets Large Cap Index (net) is a free float-adjusted market capitalization weighted index that is designed to measure market performance of large capitalization on stocks in emerging markets. This series approximates the minimum possible dividend reinvestment.
This report identifies the Fund’s investments on December 31, 2009. These holdings are subject to change. Not all stocks in the Fund performed the same, nor is there any guarantee that these stocks will perform as well in the future. Market forecasts provided in this report may not necessarily come to pass.
Sector Diversification (unaudited)
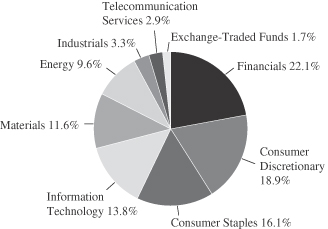
The sector diversification shown is based on the total long-term securities.
December 31, 2009 | William Blair Funds 27 |
Emerging Leaders Growth Fund
Portfolio of Investments, December 31, 2009 (all dollar amounts in thousands)
| | | | | |
Issuer | | Shares | | Value |
| |
Common Stocks—Emerging Asia—57.1% | | | |
China—23.7% | | | | | |
Belle International Holdings Limited (Specialty retail) | | 2,010,000 | | $ | 2,328 |
China Dongxiang (Group) Co., Ltd. (Textiles, apparel, & luxury goods) | | 1,966,000 | | | 1,517 |
China Life Insurance Co., Ltd. (Insurance) | | 523,000 | | | 2,559 |
China Overseas Land & Investment, Ltd. (Real estate management & development) | | 538,240 | | | 1,128 |
China Shenhua Energy Company Limited (Oil, gas, & consumable fuels) | | 418,500 | | | 2,032 |
CNOOC Limited (Oil, gas & consumable fuels) | | 1,486,000 | | | 2,315 |
* Ctrip.com International, Ltd.—ADR (Hotels, restaurants, & leisure) | | 15,582 | | | 1,120 |
Dongfeng Motor Group Company Limited (Automobiles) | | 852,000 | | | 1,217 |
Golden Eagle Retail Group Limited (Multiline retail) | | 437,000 | | | 886 |
Hengan International Group Co., Ltd. (Personal products) | | 313,000 | | | 2,317 |
Industrial and Commercial Bank of China (Commercial banks) | | 3,490,000 | | | 2,874 |
Tencent Holdings, Ltd. (Internet software & services) | | 189,600 | | | 4,101 |
Want Want China Holdings Limited (Food products) | | 2,476,000 | | | 1,729 |
Zijin Mining Group Company Limited (Metals & mining) | | 1,198,000 | | | 1,136 |
| | | | | |
| | | | | 27,259 |
| | | | | |
India—12.8% | | | | | |
Bharat Heavy Electricals, Ltd. (Electrical equipment) | | 25,837 | | | 1,330 |
* Cairn India, Ltd. (Oil, gas & consumable fuels) | | 228,185 | | | 1,376 |
HDFC Bank, Ltd. (Commercial banks) | | 59,047 | | | 2,152 |
Housing Development Finance Corp. (Thrifts & mortgage finance) | | 26,209 | | | 1,500 |
Infosys Technologies Limited (IT services) | | 29,926 | | | 1,666 |
Jindal Steel & Power Limited (Metals & mining) | | 172,111 | | | 2,589 |
Larsen & Toubro, Ltd. (Construction & engineering) | | 37,029 | | | 1,333 |
Maruti Suzuki India Limited (Automobiles) | | 42,791 | | | 1,427 |
Nestle India Limited (Food products) | | 23,627 | | | 1,291 |
| | | | | |
| | | | | 14,664 |
| | | | | |
Indonesia—4.5% | | | | | |
PT Astra International Tbk (Automobiles) | | 508,500 | | | 1,870 |
PT Bank Rakyat Indonesia (Commercial banks) | | 2,464,000 | | | 1,980 |
PT Telekomunikasi Indonesia Tbk (Diversified telecommunication services) | | 242,000 | | | 241 |
PT United Tractors Tbk (Machinery) | | 680,500 | | | 1,114 |
| | | | | |
| | | | | 5,205 |
| | | | | |
Malaysia—1.8% | | | | | |
CIMB Group Holdings Berhad (Commercial banks) | | 546,900 | | | 2,047 |
| | | | | |
| | | | | |
Issuer | | Shares | | Value |
|
Common Stocks—Emerging Asia—57.1%—(continued) |
South Korea—9.2% | | | | | |
* Amorepacific Corporation (Personal products) | | 1,747 | | $ | 1,401 |
* Hyundai Mobis (Auto components) | | 11,899 | | | 1,743 |
* Hyundai Motor Company (Automobiles) | | 16,511 | | | 1,709 |
LG Household & Health Care, Ltd. (Household products) | | 6,907 | | | 1,728 |
* NHN Corporation (Internet software & services) | | 8,361 | | | 1,382 |
Samsung Electronics Co., Ltd. (Semiconductors & semiconductor equipment) | | 3,870 | | | 2,654 |
| | | | | |
| | | | | 10,617 |
| | | | | |
Taiwan—5.1% | | | | | |
Hon Hai Precision Industry Co., Ltd. (Electronic equipment, instruments & components) | | 523,000 | | | 2,446 |
Mediatek Inc. (Semiconductors & semiconductor equipment) | | 122,200 | | | 2,123 |
Taiwan Semiconductor Manufacturing Company Ltd. (Semiconductors & semiconductor equipment) | | 652,919 | | | 1,316 |
| | | | | |
| | | | | 5,885 |
| | | | | |
| | |
Emerging Latin America—19.9% | | | | | |
Brazil—14.9% | | | | | |
Banco Santander (Brasil) S.A.—GDR (Commercial banks) | | 101,691 | | | 1,418 |
BM&F Bovespa S.A. (Diversified financial services) | | 205,090 | | | 1,443 |
Companhia de Bebidas das Americas-AMBEV—ADR (Beverages) | | 13,860 | | | 1,401 |
Cyrela Brazil Realty (Household durables) | | 102,000 | | | 1,435 |
Natura Cosmeticos S.A. (Personal products) | | 64,300 | | | 1,341 |
PDG Realty S.A. Empreendimentos e Participacoes (Household durables) | | 142,000 | | | 1,415 |
Petroleo Brasileiro S.A.—ADR (Oil, gas & consumable fuels) | | 106,648 | | | 5,085 |
Vale S.A.—ADR (Metals & mining) | | 125,614 | | | 3,647 |
| | | | | |
| | | | | 17,185 |
| | | | | |
Mexico—4.2% | | | | | |
America Movil S.A.B. de C.V.—ADR (Wireless telecommunication services) | | 27,894 | | | 1,310 |
Grupo Televisa S.A.B. de C.V.—ADR (Media) | | 71,607 | | | 1,487 |
Wal-Mart de Mexico S.A.B. de C.V. (Food & staples retailing) | | 466,700 | | | 2,080 |
| | | | | |
| | | | | 4,877 |
| | | | | |
Peru—0.8% | | | | | |
Credicorp, Ltd. (Commercial banks)† | | 12,503 | | | 963 |
| | | | | |
| |
Emerging Europe, Mid-East, Africa—13.6% | | | |
Israel—1.2% | | | | | |
Israel Chemicals Limited (Chemicals) | | 108,135 | | | 1,420 |
| | | | | |
Russia—7.0% | | | | | |
Magnit-CLS (Food & staples retailing)† | | 19,657 | | | 1,354 |
Sberbank—CLS (Commercial banks)† | | 1,090,418 | | | 3,063 |
See accompanying Notes to Financial Statements.
28 Annual Report | December 31, 2009 |
Emerging Leaders Growth Fund
Portfolio of Investments, December 31, 2009 (all dollar amounts in thousands)
| | | | | | |
Issuer | | Shares or
Principal
Amount | | Value |
|
Common Stocks—Emerging Europe, Mid-East, Africa—13.6%—(continued) |
Vimpel-Communications OJSC—ADR (Diversified telecommunication services) | | | 90,938 | | $ | 1,690 |
* X5 Retail Group N.V.—GDR (Food & staples retailing) | | | 59,850 | | | 1,901 |
| | | | | | |
| | | | | | 8,008 |
| | | | | | |
South Africa—2.8% | | | | | | |
Naspers, Ltd. (Media) | | | 78,900 | | | 3,193 |
| | | | | | |
Turkey—2.6% | | | | | | |
Bim Birlesik Magazalar A.S. (Food & staples retailing) | | | 34,854 | | | 1,621 |
Turkiye Garanti Bankasi A.S. (Commercial banks) | | | 316,478 | | | 1,348 |
| | | | | | |
| | | | | | 2,969 |
| | | | | | |
| | |
United Kingdom—3.7% | | | | | | |
Vedanta Resources plc (Metals & mining) | | | 102,759 | | | 4,298 |
| | | | | | |
Total Common Stocks—94.3%
(cost $76,081) | | | 108,590 |
| | | | | | |
| | |
Preferred Stock | | | | | | |
Brazil—2.2% | | | | | | |
Banco Itau Holding Financeira S.A. (Commercial banks) | | | 114,485 | | $ | 2,544 |
| | | | | | |
Total Preferred Stock—2.2%
(cost $1,114) | | | 2,544 |
| | | | | | |
| | |
Exchange-Traded Fund | | | | | | |
China—1.6% | | | | | | |
iShares FTSE/Xinhua A50 China Tracker | | | 987,000 | | | 1,899 |
| | | | | | |
Total Exchange-Traded Fund—1.6%
(cost $1,901) | | | 1,899 |
| | | | | | |
| | |
Investment in Affiliate | | | | | | |
William Blair Ready Reserves Fund | | | 440 | | | 440 |
| | | | | | |
Total Investment in Affiliate—0.4%
(cost $440) | | | 440 |
| | | | | | |
| | |
Repurchase Agreement | | | | | | |
State Street Bank and Trust Company,
0.000% dated 12/31/09 due 1/4/10, repurchase price $1,235, collateralized by U.S. Treasury Bill, 0.020%, due 2/18/10 | | $ | 1,235 | | | 1,235 |
| | | | | | |
Total Repurchase Agreement—1.1%
(cost $1,235) | | | 1,235 |
| | | | | | |
Total Investments—99.6%
(cost $80,771) | | | 114,708 |
Cash and other assets, less liabilities—0.4% | | | 428 |
| | | | | | |
Net assets—100.0% | | $ | 115,136 |
| | | | | | |
* = Non-income producing securities
† = U.S. listed Foreign Security
ADR = American Depository Receipt
GDR = Global Depository Receipt
For securities primarily traded on exchanges or markets that close before the close of regular trading on the New York Stock Exchange the Fund uses an independent pricing service on a daily basis to fair value price the securities pursuant to Valuation Procedures approved by the Board of Trustees.
At December 31, 2009, the Fund’s Portfolio of Investments includes the following industry categories:
| | |
Financials | | 22.1% |
Consumer Discretionary | | 18.9% |
Consumer Staples | | 16.1% |
Information Technology | | 13.9% |
Materials | | 11.6% |
Energy | | 9.5% |
Industrials | | 3.3% |
Telecommunication Services | | 2.9% |
Exchange-Traded Fund | | 1.7% |
| | |
Total | | 100.0% |
| | |
At December 31, 2009, the Fund’s Portfolio of Investments includes the following currency categories:
| | |
Hong Kong Dollar | | 24.8% |
U.S. Dollar | | 21.6% |
Indian Rupee | | 13.0% |
South Korean Won | | 9.4% |
Brazilian Real | | 7.2% |
New Taiwan Dollar | | 5.2% |
Indonesian Rupiah | | 4.6% |
British Pound Sterling | | 3.8% |
South African Rand | | 2.8% |
Mexican Nuevo Peso | | 1.9% |
Malaysian Ringgit | | 1.8% |
Turkish Lira | | 1.4% |
Israeli Shekel | | 1.3% |
New Turkish Lira | | 1.2% |
| | |
Total | | 100.0% |
| | |
See accompanying Notes to Financial Statements.
December 31, 2009 | William Blair Funds 29 |
Fixed-Income Market Overview
2009 Summary
In less than one year the fixed income markets have experienced returns of a magnitude not seen in the last 10 years, including two of the best and worst quarters during that time.
During the first quarter the Federal Reserve Board applied an additional and non-traditional monetary policy of purchasing securities to try to lower mortgage rates. The Fed’s move followed a very similar one by U.K monetary authorities, and marked the third time since the second world war that the Fed has pursued this type of quantitative easing policy.
The Fed was indeed successful in bringing rates on 30-year fixed rate mortgages down, starting a mini-refinancing wave that continued into the second quarter.
To restart consumer lending, the Federal Reserve implemented TALF, the Term Asset-Backed Securities Loan Facility, a program introduced in November of 2008. TALF supports the issuance of asset-backed securities (ABS) collateralized by student loans, auto loans, credit card loans, and loans guaranteed by the Small Business Administration (SBA). Following moderate success late in the first quarter with the issuance of auto loans that were securitized, this program gained important momentum in the second quarter.
In late March, U.S. Treasury Secretary Geithner unveiled the Public-Private Investment Program (P-PIP) to buy toxic assets from banks’ balance sheets, and the program was met with guarded optimism in the marketplace.
Lastly, the “stress test” results released by the Obama administration for many of the largest financial institutions were also acceptable, allowing these firms to raise equity capital, even at its dilutive cost.
The fixed-income markets had moved from a period of extreme risk aversion during the fourth quarter of last year to one where investors sought to add risk.
Corporate Bonds were clearly the beneficiaries of the favorable move in equity prices that started during the middle of March. The strength in investment grade bond prices helped provide a sense of stability and normalization to the credit markets, and ultimately to investment grade risk premiums or spreads. As this normalcy returned to the investment grade bond market, investors recognized value in quality liquid, fixed-income securities.
Excess returns were positive across the “spread” sectors during the second quarter, but were led by the returns in the Corporate Bond sector, which experienced its best quarter in more than 20 years.
The first half of the year was characterized by valuations we would describe as exceptionally cheap and attractive for fixed-income investors. As a result, quite a bit of cash came into the fixed-income market.
September marked the one-year anniversary of a whole series of major events involving financial institutions, including the U.S Treasury’s takeover of government-sponsored enterprises (GSEs) Fannie Mae and Freddie Mac, the failure of Lehman Brothers, the government bailout of AIG and Bank of America’s agreement to acquire Merrill Lynch.
The psychological hold that these events had on the on the risk-taking mentality of the fixed-income markets represented a major hurdle for fixed-income investors. As confidence in the markets returned, so did investors’ appetite for risk.
30 Annual Report | December 31, 2009 |
It was also an important quarter from the standpoint that investors realized that in an economy with significant slack in resource utilization and employment, inflation is not an imminent prospect. As the perceived threat of inflation subsided, rates on 10-year Treasury securities fell.
Finally, flows into bond mutual funds were quite robust, as investors were attracted to yields that were higher than other short-term fixed-income investments.
The primary factor influencing the fixed income markets during the fourth quarter was the U.S. employment situation. Job losses began to moderate significantly during the fourth quarter, which was viewed favorably and a positive sign for the domestic economy.
Consequently, growth estimates for the nation’s Gross Domestic Product (GDP) for the first half of 2010 steadily increased from 3% to as high as 4.5%.
However, the employment picture and expectations for strengthening GDP growth led to upward pressure on interest rates, and most specifically U.S. Treasury securities, as the year drew to a close.
In particular, the last month of the year was very tough on bond investors as they faced the headwinds of a rising short- and long-term interest rate environment.
Outlook
In spite of the rising GDP forecasts, many economic statistics indicate a subpar recovery is underway, which reflects the fact that lingering credit issues still remain. The credit markets are healing, but some dislocations continue to exist.
The fixed income markets are in unprecedented times of low Federal Reserve policy rates—specifically the Federal Funds rate—and the Fed controls the short end of the interest rate yield curve.
The fixed income markets are trying to balance the extreme credit dislocation of the past year with massive government intervention. We believe the next phase of this recovery process will be less government involvement and more private sector economic activity and growth.
The Federal Reserve continued to espouse their policy of low short-term rates for an extended period of time. The Fed, however, did appear to float a number of “trial balloons” to the marketplace indicating that at some point the numerous and non-traditional government programs in place to provide support and stimulus to the economy would be phased out or withdrawn.
There were several relatively minor events during the fourth quarter that were worth noting, including Dubai’s credit problems, rescheduling of debt and subsequent bailout by other Gulf neighbors, and the downgrade of the sovereign debt of a number of other countries, including Portugal, Italy, Greece and Spain. The theme connecting all of these events were the relatively short but violent credit cycles that bond investors have experienced for the last two years.
This all sets up for a very interesting 2010.
We are encouraged that the fixed-income markets have been able to absorb major potential policy changes in the health care and financial services industries with relatively minor changes in risk premiums.
We don’t anticipate any major changes in Federal Reserve policy or interest rates until late 2010.
December 31, 2009 | William Blair Funds 31 |

Christopher T. Vincent
BOND FUND
The Bond Fund seeks to outperform the Barclays Capital U.S. Aggregate Bond Index by maximizing total return through a combination of income and capital appreciation.
AN OVERVIEW FROM THE PORTFOLIO MANAGER
Please see page 30 for the Fixed Income Market Overview.
How did the Fund perform during the past year? How did the Fund’s performance compare to its benchmark?
The Bond Fund posted a 11.47% increase on a total return basis (Institutional Shares) for the 12 months ended December 31, 2009. By comparison, the Fund’s benchmark, the Barclays Capital Aggregate Bond Index, gained 5.93%, while the Fund’s peer group, the Morningstar Intermediate-Term Bond Category, gained 13.97%.
During 2009, the Fund benefitted from its overweight position in investment grade Corporate Bonds and seasoned Mortgage-backed securities, and a corresponding underweight position in U.S. Treasury securities.
Corporate Bonds in particular had an exceptional year. During the April-June period, the Corporate Bond sector experienced its best quarter in more than 20 years.
Offsetting the Fund’s strong performance was the Fund’s lack of exposure to lower quality, high-yield securities, as many of these issues rebounded as the year progressed. In addition, the Fund’s longer duration hurt performance somewhat as interest rates continued to rise in early June.
The third quarter was a very positive one for the Fund, with a great deal of the Fund’s total return generated by a combination of lower interest rates and a rally in the major “spread” sectors—Agency Mortgage-backed securities and Corporate Bonds.
Flows into bond mutual funds were also quite robust, as investors were attracted to yields that were higher than other short-term fixed-income investments.
Risk premiums continued to contract during the fourth quarter, which tended to insulate the portfolio against upward pressure from rising interest rates.
We were significant buyers of investment grade Corporate Bonds, primarily in the new issue market during the first half of the year, and in the secondary market as well, taking advantage of the favorable market fundamentals.
We feel that Corporate Bonds are moderately attractive, and intend to maintain an overweight position in that sector. We believe that we are still in an environment where Corporate Bonds will perform favorably, based on the prospects for the economy stabilizing and eventually recovering.
We anticipate seeing a continuation of a trend that has been in place for several years of foreign-domiciled commercial enterprises being attracted to access our capital markets for funding.
One example of such a company is Macquarie Group Ltd., an Australian-based diversified financial services company. Macquarie is a recent purchase and addition to the Fund’s portfolio of investments.
32 Annual Report | December 31, 2009 |
Another company, also a recent portfolio addition, is Motiva, a joint venture for oil refining between Shell Oil Company and Saudi Arabia’s Aramco.
We expect this trend of foreign companies issuing dollar-denominated securities to continue, and we believe it is both an interesting and encouraging example that global commerce has not regressed—nor been negatively impacted—by protectionist sentiment.
At year end, the Bond Fund’s average maturity stood at 6.4 years, while its duration was 4.5 years.
December 31, 2009 | William Blair Funds 33 |
Bond Fund
Performance Highlights (unaudited)
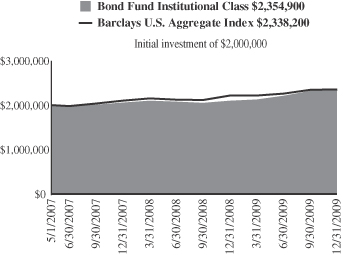
Average Annual Total Return at 12/31/2009
| | | | | | |
| | | 1
Year | | | Since
Inception | |
Bond Fund Institutional Class | | 11.47 | % | | 6.28 | % |
Barclays Capital U.S. Aggregate Bond Index | | 5.93 | | | 6.00 | |
Performance cited represents past performance. Past performance does not guarantee future results and current performance may be lower or higher than the data quoted. Results shown are average annual total returns, which assume reinvestment of dividends and capital gains. Investment returns and principal will fluctuate and you may have a gain or loss when you sell shares. For the most current month-end performance information, please call 1-800-742-7272, or visit our Web site at www.williamblairfunds.com. From time to time, the investment advisor may waive fees or reimburse expenses for the Fund. Without these waivers, performance would be lower.
The performance highlights and graph presented above do not reflect the deduction of taxes that a shareholder would pay on fund distributions or the redemption of fund shares.
The Barclays Capital U.S. Aggregate Bond Index indicates broad intermediate government/corporate bond market performance.
This report identifies the Fund’s investments on December 31, 2009. These holdings are subject to change. Not all investments in the Fund performed the same, nor is there any guarantee that these investments will perform as well in the future. Market forecasts provided in this report may not necessarily come to pass.
Sector Diversification (unaudited)
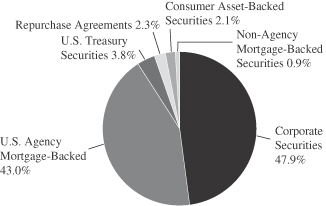
The sector diversification shown is based on the total investments.
34 Annual Report | December 31, 2009 |
Bond Fund
Portfolio of Investments, December 31, 2009 (all dollar amounts in thousands)
| | | | | | | | |
| | | Principal
Amount | | Value |
|
U.S. Government and U.S. Government Agency—47.2% |
U.S. Treasury Inflation Indexed Notes/Bonds—1.8% | | | | | | | | |
U.S. Treasury Inflation Indexed Note, 1.875%, due 7/15/13 | | | | $ | 588 | | $ | 620 |
U.S. Treasury Inflation Indexed Note, 2.375%, due 1/15/17 | | | | | 1,072 | | | 1,158 |
U.S. Treasury Inflation Indexed Bond, 3.875%, due 4/15/29 | | | | | 657 | | | 846 |
| | | | | | | | |
Total U.S. Treasury Inflation Indexed Notes/Bonds | | | | | | | | 2,624 |
| | | | | | | | |
U.S. Treasury—2.0% | | | | | | | | |
U.S. Treasury Note,
4.750%, due 5/15/14 | | | | | 595 | | | 655 |
U.S. Treasury Note,
4.750%, due 8/15/17 | | | | | 1,300 | | | 1,410 |
U.S. Treasury Note,
3.125%, due 5/15/19 | | | | | 1,000 | | | 947 |
| | | | | | | | |
Total U.S. Treasury Obligations | | | | | | | | 3,012 |
| | | | | | | | |
Government National Mortgage Association (GNMA)—0.5% | | | | | | | | |
GNR 2006-67 GB,
4.279%, due 9/16/34, VRN | | | | | 750 | | | 782 |
| | | | | | | | |
Total GNMA Mortgage Obligations | | | | | | | | 782 |
| | | | | | | | |
Federal Home Loan Mortgage Corp. (FHLMC)—7.2% | | | | | | | | |
#G90024, 7.000%, due 1/20/13 | | | | | 68 | | | 71 |
#G30093, 7.000%, due 12/1/17 | �� | | | | 45 | | | 50 |
#G30255, 7.000%, due 7/1/21 | | | | | 100 | | | 111 |
#G12792, 4.500%, due 12/1/21 | | | | | 654 | | | 679 |
#D95897, 5.500%, due 3/1/23 | | | | | 327 | | | 347 |
#G30372, 5.000%, due 9/1/27 | | | | | 784 | | | 811 |
#G10728, 7.500%, due 7/1/32 | | | | | 356 | | | 400 |
#C01385, 6.500%, due 8/1/32 | | | | | 503 | | | 544 |
#A62179, 6.000%, due 6/1/37 | | | | | 1,174 | | | 1,266 |
#A63539, 6.000%, due 7/1/37 | | | | | 1,598 | | | 1,723 |
#G03170, 6.500%, due 8/1/37 | | | | | 1,339 | | | 1,440 |
#A66843, 6.500%, due 10/1/37 | | | | | 1,308 | | | 1,412 |
#A78138, 5.500%, due 6/1/38 | | | | | 1,672 | | | 1,774 |
| | | | | | | | |
Total FHLMC Mortgage Obligations | | | | | | | | 10,628 |
| | | | | | | | |
Federal National Mortgage Association (FNMA)—35.7% | | | | | | | | |
#535559, 7.500%, due 9/1/12 | | | | | 218 | | | 223 |
#598453, 7.000%, due 6/1/15 | | | | | 2 | | | 2 |
#689612, 5.000%, due 5/1/18 | | | | | 557 | | | 588 |
#695910, 5.000%, due 5/1/18 | | | | | 952 | | | 1,007 |
#747903, 4.500%, due 6/1/19 | | | | | 506 | | | 526 |
#745735, 5.000%, due 3/1/21 | | | | | 769 | | | 808 |
#253847, 6.000%, due 5/1/21 | | | | | 338 | | | 364 |
#900725, 6.000%, due 8/1/21 | | | | | 270 | | | 291 |
#255956, 5.500%, due 10/1/25 | | | | | 2,608 | | | 2,757 |
#545437, 7.000%, due 2/1/32 | | | | | 260 | | | 289 |
#545759, 6.500%, due 7/1/32 | | | | | 2,850 | | | 3,079 |
#254548, 5.500%, due 12/1/32 | | | | | 1,236 | | | 1,301 |
#735415, 6.500%, due 12/1/32 | | | | | 1,432 | | | 1,547 |
#684601, 6.000%, due 3/1/33 | | | | | 2,434 | | | 2,639 |
#555522, 5.000%, due 6/1/33 | | | | | 640 | | | 659 |
| | | | | | | | | |
| | | NRSRO
Rating
(unaudited) | | | Principal
Amount | | Value |
| | | |
Federal National Mortgage Association (FNMA)—(continued) | | | | | | | | | |
#190337, 5.000%, due 7/1/33 | | | | | $ | 772 | | $ | 795 |
#190340, 5.000%, due 9/1/33 | | | | | | 2,445 | | | 2,519 |
#254868, 5.000%, due 9/1/33 | | | | | | 1,184 | | | 1,220 |
#555783, 4.500%, due 10/1/33 | | | | | | 2,230 | | | 2,244 |
#555800, 5.500%, due 10/1/33 | | | | | | 550 | | | 578 |
#555880, 5.500%, due 11/1/33 | | | | | | 641 | | | 674 |
#725027, 5.000%, due 11/1/33 | | | | | | 955 | | | 984 |
#756153, 5.500%, due 11/1/33 | | | | | | 1,482 | | | 1,558 |
#725231, 5.000%, due 2/1/34 | | | | | | 986 | | | 1,016 |
#725205, 5.000%, due 3/1/34 | | | | | | 1,890 | | | 1,948 |
#725220, 5.000%, due 3/1/34 | | | | | | 916 | | | 944 |
#725232, 5.000%, due 3/1/34 | | | | | | 2,736 | | | 2,819 |
#725238, 5.000%, due 3/1/34 | | | | | | 1,670 | | | 1,721 |
#725424, 5.500%, due 4/1/34 | | | | | | 690 | | | 726 |
#725611, 5.500%, due 6/1/34 | | | | | | 606 | | | 637 |
#786546, 6.000%, due 7/1/34 | | | | | | 1,179 | | | 1,270 |
#190353, 5.000%, due 8/1/34 | | | | | | 502 | | | 517 |
#745092, 6.500%, due 7/1/35 | | | | | | 810 | | | 875 |
#357944, 6.000%, due 9/1/35 | | | | | | 148 | | | 159 |
#829306, 6.000%, due 9/1/35 | | | | | | 378 | | | 403 |
#843487, 6.000%, due 10/1/35 | | | | | | 343 | | | 365 |
#848782, 6.500%, due 1/1/36 | | | | | | 1,136 | | | 1,224 |
#849191, 6.000%, due 1/1/36 | | | | | | 129 | | | 138 |
#745349, 6.500%, due 2/1/36 | | | | | | 1,599 | | | 1,716 |
#831540, 6.000%, due 6/1/36 | | | | | | 278 | | | 295 |
#893318, 6.500%, due 8/1/36 | | | | | | 334 | | | 359 |
#256859, 5.500%, due 8/1/37 | | | | | | 1,603 | | | 1,676 |
#928561, 6.000%, due 8/1/37 | | | | | | 992 | | | 1,068 |
#948689, 6.000%, due 8/1/37 | | | | | | 1,817 | | | 1,930 |
#888967, 6.000%, due 12/1/37 | | | | | | 1,823 | | | 1,947 |
#934006, 6.500%, due 9/1/38 | | | | | | 1,985 | | | 2,153 |
| | | | | | | | | |
Total FNMA Mortgage Obligations | | | | | | | | | 52,558 |
| | | | | | | | | |
| | | |
Non-Agency Mortgage-Backed Obligations—0.9% | | | | | | | | | |
Countrywide Alternative Loan Trust, 2003-11T1, Tranche M,
4.750%, due 7/25/18 | | CCC | | | | 271 | | | 231 |
LSSCO, 2004-2, Tranche M2,
3.477%, due 2/28/33, VRN* | | CC | | | | 166 | | | 44 |
FHASI, 2004-AR4, Tranche 3A1,
4.628%, due 8/25/34, VRN | | Aaa | | | | 571 | | | 528 |
Chase Mortgage Finance Corporation, 2006-A1, Tranche 2A3,
6.000%, due 9/25/36 | | B3 | | | | 700 | | | 480 |
| | | | | | | | | |
Total Non-Agency Mortgage-Backed Obligations | | | | | | | | | 1,283 |
| | | | | | | | | |
| | | |
Consumer Asset-Backed Securities—2.2% | | | | | | | | | |
AESOP Funding II, LLC, 2009-2A, A, 5.680%, due 2/20/13 | | Aaa | | | | 1,100 | | | 1,136 |
Hertz Vehicle Financing, 2009-2A, A1, 4.260%, due 3/15/14 | | Aaa | | | | 850 | | | 847 |
First Plus 1997-4 M1,
7.640%, due 9/11/23* | | AA | † | | | 199 | | | 184 |
Aames Mortgage Trust, 2001-1,
Tranche M2, 7.588%, due 6/25/31 | | A | | | | 133 | | | 93 |
See accompanying Notes to Financial Statements.
December 31, 2009 | William Blair Funds 35 |
Bond Fund
Portfolio of Investments, December 31, 2009 (all dollar amounts in thousands)
| | | | | | | | |
| | | NRSRO
Rating
(unaudited) | | Principal
Amount | | Value |
| | | |
Consumer Asset-Backed Securities—(continued) | | | | | | | | |
CWL, 2003-5, Tranche MF2,
5.959%, due 11/25/33 | | Aa3 | | $ | 200 | | $ | 108 |
Renaissance Home Equity Loan Trust, 2004-2, Tranche M5,
6.455%, due 7/25/34 | | A | | | 463 | | | 127 |
Soundview Home Equity Loan Trust, 2005-B, Tranche M1,
5.635%, due 5/25/35 | | AA+ | | | 72 | | | 70 |
Mid-State Trust 2004-1, Tranche A, 6.005%, due 8/15/37 | | Aaa | | | 672 | | | 632 |
| | | | | | | | |
Total Consumer Asset-Backed Securities | | | | | | | | 3,197 |
| | | | | | | | |
| | | |
Corporate Obligations—47.8% | | | | | | | | |
General Dynamics,
1.800%, due 7/15/11 | | A | | | 500 | | | 506 |
Morgan Stanley Dean Witter & Co., 6.600%, due 4/1/12 | | A | | | 545 | | | 593 |
Simon Property Group, Inc.,
6.350%, due 8/28/12 | | A- | | | 1,000 | | | 1,067 |
Cox Communications, Inc.,
7.125%, due 10/1/12 | | BBB | | | 700 | | | 778 |
Wells Fargo & Company,
4.375%, due 1/31/13 | | AA- | | | 350 | | | 364 |
The Kroger Co.,
5.500%, due 2/1/13 | | BBB | | | 430 | | | 459 |
Weatherford International Ltd.,
5.150%, due 3/15/13 | | BBB+ | | | 650 | | | 681 |
John Deere Capital Corporation,
4.500%, due 4/3/13 | | A | | | 700 | | | 735 |
Citigroup,
5.500%, due 4/11/13 | | A+ | | | 1,500 | | | 1,555 |
General Electric Capital Corporation, 4.800%, due 5/1/13 | | AA+ | | | 600 | | | 627 |
CME Group, Inc.,
5.750%, due 2/15/14 | | AA | | | 700 | | | 766 |
PACCAR, Inc.,
6.875%, due 2/15/14 | | AA- | | | 800 | | | 902 |
PepsiAmericas, Inc.,
4.375%, due 2/15/14 | | A+ | | | 300 | | | 312 |
American Movil S.A.B. de C.V.,
5.500%, due 3/1/14 | | A3 | | | 700 | | | 743 |
Coca-Cola Enterprises, Inc.,
7.375%, due 3/3/14 | | A | | | 1,000 | | | 1,160 |
Smith International, Inc.,
8.625%, due 3/15/14 | | BBB+ | | | 970 | | | 1,122 |
General Electric Capital Corporation, 5.900%, due 5/13/14 | | AA+ | | | 225 | | | 243 |
Bank of America,
7.375%, due 5/15/14 | | A+ | | | 700 | | | 794 |
American Express Company,
7.250%, due 5/20/14 | | A+ | | | 500 | | | 564 |
Capital One Financial Corporation,
7.375%, due 5/23/14 | | A- | | | 1,235 | | | 1,398 |
State Street Corporation,
4.300%, due 5/30/14 | | A+ | | | 350 | | | 362 |
Hewlett-Packard Company,
4.750%, due 6/2/14 | | A+ | | | 800 | | | 854 |
| | | | | | | | |
| | | NRSRO
Rating
(unaudited) | | Principal
Amount | | Value |
|
Corporate Obligations—(continued) |
St. Jude Medical, Inc.,
3.750%, due 7/15/14 | | A | | $ | 1,000 | | $ | 1,011 |
Petrohawk Energy Corporation,
10.500%, due 8/1/14 | | B | | | 1,000 | | | 1,093 |
Macquarie Group,
7.300%, due 8/1/14 | | A2 | | | 1,000 | | | 1,080 |
D.R. Horton, Inc.
5.625%, due 9/15/14 | | BB | | | 1,000 | | | 968 |
SBC Communications Inc.,
5.100%, due 9/15/14 | | A | | | 1,250 | | | 1,345 |
Goldman Sachs Group, Inc.,
5.000%, due 10/1/14 | | A1 | | | 545 | | | 575 |
CODELCO, Inc.—144A,*
4.750%, due 10/15/14 | | A1 | | | 400 | | | 428 |
Boeing Capital Corporation,
3.250%, due 10/27/14 | | A+ | | | 1,400 | | | 1,390 |
Crown Castle International Corp.,
9.000%, due 1/15/15 | | B+ | | | 1,000 | | | 1,065 |
DuPont (E.I.) de Nemours and Company, 3.250%, due 1/15/15 | | A | | | 500 | | | 495 |
Georgia-Pacific, LLC,
7.000%, due 1/15/15 | | BB+ | | | 1,000 | | | 1,013 |
Yum! Brands, Inc.,
4.250%, due 9/15/15 | | BBB- | | | 350 | | | 351 |
Omnicom Group, Inc.,
5.900%, due 4/15/16 | | A- | | | 750 | | | 799 |
Yum! Brands, Inc.,
6.250%, due 4/15/16 | | BBB- | | | 700 | | | 752 |
Owens-Brockway,
7.375%, due 5/15/16 | | BB+ | | | 750 | | | 774 |
MetLife, Inc.,
6.750%, due 6/1/16 | | A | | | 1,000 | | | 1,120 |
SABMiller plc,
6.500%, due 7/1/16 | | BBB+ | | | 700 | | | 768 |
Petrobras International Finance Company, 6.125%, due 10/6/16 | | Baa1 | | | 400 | | | 429 |
DuPont (E.I.) de Nemours and Company, 5.250%, due 12/15/16 | | A | | | 500 | | | 528 |
Comcast Corporation,
6.500%, due 1/15/17 | | BBB+ | | | 350 | | | 387 |
Corrections Corporation of America, 7.750%, due 6/1/17 | | BB | | | 575 | | | 592 |
ERP Operating Limited Partnership, 5.750%, due 6/15/17 | | A- | | | 1,100 | | | 1,100 |
J.P. Morgan Chase & Co.,
6.125%, due 6/27/17 | | A1 | | | 600 | | | 634 |
BB&T Corporation,
4.900%, due 6/30/17 | | A2 | | | 665 | | | 647 |
American Express, Company,
6.150%, due 8/28/17 | | A+ | | | 1,000 | | | 1,045 |
IBM Corporation,
5.700%, due 9/14/17 | | A+ | | | 1,250 | | | 1,367 |
Exelon Generation Company, LLC., 6.200%, due 10/1/17 | | A3 | | | 1,100 | | | 1,179 |
Toll Brothers Finance Corporation, 8.910%, due 10/15/17 | | BBB- | | | 950 | | | 1,079 |
Union Pacific Corporation,
5.750%, due 11/15/17 | | BBB | | | 800 | | | 844 |
See accompanying Notes to Financial Statements.
36 Annual Report | December 31, 2009 |
Bond Fund
Portfolio of Investments, December 31, 2009 (all dollar amounts in thousands)
| | | | | | | | |
| | | NRSRO
Rating
(unaudited) | | Principal
Amount | | Value |
|
Corporate Obligations—(continued) |
Wells Fargo & Company,
5.625%, due 12/11/17 | | AA- | | $ | 1,000 | | $ | 1,040 |
Kohl’s Corporation,
6.250%, due 12/15/17 | | BBB+ | | | 350 | | | 387 |
The Goldman Sachs Group, Inc.,
6.150%, due 4/1/18 | | A1 | | | 950 | | | 1,017 |
Morgan Stanley,
6.625%, due 4/1/18 | | A | | | 950 | | | 1,027 |
General Electric Capital Corporation, 5.625%, due 5/1/18 | | AA+ | | | 350 | | | 359 |
Philip Morris International, Inc.,
5.650%, due 5/16/18 | | A+ | | | 1,000 | | | 1,052 |
Time Warner Cable,
6.750%, due 7/1/18 | | BBB | | | 1,000 | | | 1,099 |
Merrill Lynch & Co., Inc.,
6.875%, due 11/15/18 | | A+ | | | 1,075 | | | 1,152 |
Anheuser-Busch InBev,
7.750%, due 1/15/19 | | BBB+ | | | 700 | | | 820 |
FedEx Corporation,
8.000%, due 1/15/19 | | BBB | | | 750 | | | 903 |
CSX Corporation,
7.375%, due 2/1/19 | | BBB- | | | 800 | | | 914 |
Honeywell International, Inc.,
5.000%, due 2/15/19 | | A | | | 925 | | | 958 |
Pfizer, Inc.,
6.200%, due 3/15/19 | | AA | | | 1,250 | | | 1,390 |
Abbott Laboratories,
5.125%, due 4/1/19 | | AA | | | 900 | | | 941 |
BHP Billiton Finance (USA) Limited, 6.500%, due 4/1/19 | | A+ | | | 1,300 | | | 1,491 |
Owens Corning,
9.000%, due 6/15/19 | | BBB- | | | 950 | | | 1,059 |
Jeffries Group, Inc.,
8.500%, due 7/15/19 | | BBB | | | 1,300 | | | 1,421 |
Discovery Communications, LLC, 5.625%, due 8/15/19 | | Baa2 | | | 500 | | | 516 |
Roper Industries, Inc.,
6.250%, due 9/1/19 | | BBB- | | | 1,225 | | | 1,275 |
Halliburton Company,
6.150%, due 9/15/19 | | A | | | 1,250 | | | 1,396 |
Boston Properties Limited Partnership, 5.875%, due 10/15/19 | | A- | | | 1,500 | | | 1,505 |
Iron Mountain Incorporated,
8.000%, due 6/15/20 | | B+ | | | 1,000 | | | 1,015 |
VRN = Variable Rate Notes
NRSRO = Nationally Recognized Statistical Rating Organization—The credit quality ratings of the securities in the Fund reflect the highest category rating by either Fitch Ratings, Moody’s Investors Service Inc., or Standard & Poor’s, a division of the McGraw-Hill Companies, Inc.
The obligations of certain U. S. Government-sponsored securities are neither issued nor guaranteed by the U.S. Treasury.
* Deemed illiquid pursuant to the Fund/Advisor’s Liquidity Procedures. These holdings represent 0.71% of the net assets of the Fund at December 31, 2009.
† As of January 26th, 2010, Fitch has lowered the rating on this security to C.
| | | | | | | | | |
| | | NRSRO
Rating(unaudited) | | Principal
Amount | | Value | |
|
Corporate Obligations—(continued) | |
Ras Laffan Lng II,
5.298%, due 9/30/20* | | Aa2 | | $ | 400 | | $ | 403 | |
Southwest Airlines Co.,
6.150%, due 8/1/22 | | A | | | 701 | | | 702 | |
The Kroger Co.,
8.000%, due 9/15/29 | | BBB | | | 325 | | | 391 | |
Conoco Funding Company,
7.250%, due 10/15/31 | | A1 | | | 400 | | | 463 | |
Kohl’s Corporation,
6.000%, due 1/15/33 | | BBB+ | | | 400 | | | 405 | |
Pacific Gas and Electric Company, 6.050%, due 3/1/34 | | A | | | 750 | | | 783 | |
Wisconsin Electric Power Company, 5.700%, due 12/1/36 | | A1 | | | 500 | | | 504 | |
Comcast Corporation,
6.450%, due 3/15/37 | | BBB+ | | | 650 | | | 670 | |
J.P. Morgan Chase & Co.,
6.400%, due 5/15/38 | | Aa3 | | | 350 | | | 385 | |
Cox Communications, Inc.,
6.950%, due 6/1/38 | | BBB | | | 350 | | | 371 | |
General Electric Capital Corporation, 6.875%, due 1/10/39 | | AA+ | | | 750 | | | 775 | |
ConocoPhillips Company,
6.500%, due 2/1/39 | | A1 | | | 400 | | | 444 | |
| | | | | | | | | |
Total Corporate Obligations | | | | | | | | 70,476 | |
| | | | | | | | | |
Total Long-term Investments—98.1%
(cost $138,047) | | | | | | 144,560 | |
| | | | | | | | | |
Repurchase Agreement | | | | | | | | | |
State Street Bank and Trust Company, 0.000% dated 12/31/09, due 1/4/10, repurchase price $3,443, collateralized by U.S. Treasury Bill, 0.020%, due 2/18/10 | | AAA | | | 3,443 | | | 3,443 | |
| | | | | | | | | |
Total Repurchase Agreement—2.3%
(cost $3,443) | | | | | | 3,443 | |
| | | | | | | | | |
Total Investments—100.4%
(cost $141,490) | | | | | | 148,003 | |
| | | | | | | | | |
Liabilities, plus cash and other assets—(0.4)% | | | (659 | ) |
| | | | | | | | | |
Net Assets—100.0% | | $ | 147,344 | |
| | | | | | | | | |
See accompanying Notes to Financial Statements.
December 31, 2009 | William Blair Funds 37 |
Christopher T. Vincent

Paul J. Sularz
LOW DURATION FUND
The Low Duration Fund seeks to outperform the Merrill Lynch 1-Year U.S. Treasury Note Index by investing in a diversified portfolio of investment grade low duration debt securities.
AN OVERVIEW FROM THE PORTFOLIO MANAGERS
Please see page 30 for the Fixed Income Market Overview.
The William Blair Low Duration Fund seeks to maximize total return by investing in a diversified portfolio of investment grade low duration debt securities.
AN OVERVIEW FROM THE PORTFOLIO MANAGERS
We are pleased to have the Low Duration Fund become the newest addition to the William Blair Fund Family and would like to thank our shareholders for investing with us.
We are enthusiastic about the opportunities available to us as the managers of the Low Duration Fund. The Fund seeks to outperform the total return of the Merrill Lynch 1-Year U.S. Treasury Bill Index (the Fund’s Benchmark) through an actively managed diversified portfolio of securities.
In managing the Fund we will emphasize individual security selection, as well as shifts in the Fund’s portfolio among market sectors. In addition, we will also actively manage the Fund’s average duration relative to the Benchmark. Other important investment criteria are as follows:
| | • | | The Fund will invest in U.S.-dollar-denominated securities. |
| | • | | The broad sectors represented in the portfolio will include government securities, corporate debt securities issued by domestic and foreign companies, mortgage-backed securities and asset-backed securities. |
| | • | | The Fund will invest primarily in investment grade securities rated in the highest three categories at time of purchase by at least one of the following three nationally recognized statistical rating organizations: Fitch Ratings, Moody’s Investors Service, Inc. and Standard & Poor’s, a division of The McGraw-Hill Companies, Inc. |
How did the Fund perform since its inception? How did the Fund’s performance compare to its benchmark?
The Low Duration Fund commenced operations on December 1, 2009. Through the period ended December 31, 2009, the Fund posted a slight decrease of (0.58)% (Institutional Shares). By comparison, the Merrill Lynch 1-Year U.S. Treasury Note Index, decreased (0.15)%, for this same time period.
What were the most significant factors impacting Fund performance during the last month of 2009? What factors were behind the Fund’s performance versus the benchmark?
The primary factor influencing the fixed income markets during the fourth quarter was the U.S. employment situation. Job losses began to moderate significantly during the fourth quarter, which was viewed favorably and a positive sign for the domestic economy.
Consequently, growth estimates for the nation’s Gross Domestic Product (GDP) for the first half of 2010 steadily increased from 3% to as high as 4.5%.
38 Annual Report | December 31, 2009 |
However, the employment picture and expectations for strengthening GDP growth led to upward pressure on interest rates, and most specifically U.S. Treasury securities, as the year drew to a close.
In particular, the last month of the year was very tough on bond investors as they faced the headwinds of rising short- and long-term interest rates. The roughly 0.50% increase in the 2-Year U.S. Treasury Note in 30 days provides an example of the challenging environment the new Fund faced.
The Fund invested capital as the Fund’s asset flows grew steadily from its inception.
It is worth noting that the Low Duration Fund paid its first dividend of $0.00989 per share (Class N Shares) on December 30, 2009, to shareholders of record on December 28, 2009.
How is the Fund’s portfolio currently structured?
The majority of the Fund’s portfolio is invested in seasoned U.S. Government-guaranteed short duration Mortgage-backed Fannie Mae and Fredie Mac securities. This is the Fund’s major sector emphasis. We favor such securities because they pay monthly principal and interest, which we then are able to reinvest. The benefits of this strategy are evident in a rising rate environment such as the one we experienced during the month of December.
The Fund kept its exposure to cash and cash equivalents extremely low, given the very low rates currently available from money market instruments.
December 31, 2009 | William Blair Funds 39 |
Low Duration Fund
Performance Highlights (unaudited)
Average Annual Total Return at 12/31/2009
| | | |
| | | Since
Inception | |
Low Duration Fund Institutional Class | | (0.58 | )% |
Merrill Lynch 1-Year U.S. Treasury Note Index | | (0.15 | ) |
Performance cited represents past performance. Past performance does not guarantee future results and current performance may be lower or higher than the data quoted. Results shown are average annual total returns, which assume reinvestment of dividends and capital gains. Investment returns and principal will fluctuate and you may have a gain or loss when you sell shares. For the most current month-end performance information, please call 1-800-742-7272, or visit our Web site at www.williamblairfunds.com. From time to time, the investment advisor may waive fees or reimburse expenses for the Fund. Without these waivers, performance would be lower. Class N shares are available to the general public without a sales load. Class I shares are available to certain institutional investors and advisory clients of William Blair & Company, L.L.C., without a sales load or distribution fees (12b-1).
The performance highlights and graph presented above do not reflect the deduction of taxes that a shareholder would pay on fund distributions or the redemption of fund shares.
The Merrill Lynch 1-Year U.S. Treasury Note Index is comprised of a single U.S. Treasury Note issue purchased at the beginning of the month and held for a full month. Each month the index is rebalanced and the issue selected is the outstanding U.S. Treasury Note that matures closest to, but not beyond one year from the rebalancing date.
This report identifies the Fund’s investments on December 31, 2009. These holdings are subject to change. Not all investments in the Fund performed the same, nor is there any guarantee that these investments will perform as well in the future. Market forecasts provided in this report may not necessarily come to pass.
Sector Diversification (unaudited)
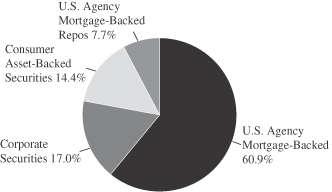
The sector diversification shown is based on the total investments.
40 Annual Report | December 31, 2009 |
Low Duration Fund
Portfolio of Investments, December 31, 2009 (all dollar amounts in thousands)
| | | | | | | | |
| | | NRSRO
Rating
(unaudited) | | Principal
Amount | | Value |
|
U.S. Government and U.S. Government Agency—50.7% |
Federal Home Loan Mortgage Corp. (FHLMC)—20.9% | | | | | | | | |
#M80822, 3.500%, due 3/1/10 | | | | $ | 4,002 | | $ | 4,066 |
#M80856, 4.500%, due 10/1/10 | | | | | 149 | | | 152 |
#M80898, 4.500%, due 2/1/11 | | | | | 245 | | | 256 |
#G11320, 6.000%, due 4/1/14 | | | | | 950 | | | 1,015 |
#G11211, 6.000%, due 7/1/16 | | | | | 533 | | | 570 |
#G11187, 5.500%, due 9/1/16 | | | | | 658 | | | 699 |
#G11337, 5.500%, due 11/1/17 | | | | | 2,446 | | | 2,604 |
#E96536, 5.000%, due 3/1/18 | | | | | 751 | | | 792 |
#E95355, 5.000%, due 4/1/18 | | | | | 806 | | | 849 |
#E01377, 4.500%, due 5/1/18 | | | | | 810 | | | 843 |
#G11618, 4.500%, due 5/1/18 | | | | | 3,855 | | | 4,020 |
#E01488, 5.000%, due 10/1/18 | | | | | 822 | | | 867 |
#E99895, 5.000%, due 10/1/18 | | | | | 1,681 | | | 1,772 |
#G11506, 5.500%, due 12/1/18 | | | | | 638 | | | 679 |
#G11567, 5.500%, due 12/1/18 | | | | | 697 | | | 742 |
| | | | | | | | |
Total FHLMC Mortgage Obligations | | | | | | | | 19,926 |
| | | | | | | | |
Federal National Mortgage Association (FNMA)—29.8% | | | | | | | | |
#255325, 4.500%, due 7/1/11 | | | | | 847 | | | 881 |
#735647, 5.000%, due 12/1/17 | | | | | 3,395 | | | 3,578 |
#681310, 4.500%, due 2/1/18 | | | | | 769 | | | 801 |
#675717, 5.000%, due 3/1/18 | | | | | 822 | | | 866 |
#257188, 4.500%, due 4/1/18 | | | | | 990 | | | 1,029 |
#656564, 5.000%, due 4/1/18 | | | | | 3,652 | | | 3,847 |
#656573, 5.000%, due 6/1/18 | | | | | 468 | | | 493 |
#709848, 5.000%, due 6/1/18 | | | | | 459 | | | 483 |
#722106, 4.500%, due 7/1/18 | | | | | 3,568 | | | 3,719 |
#711991, 5.000%, due 8/1/18 | | | | | 442 | | | 466 |
#743183, 5.000%, due 10/1/18 | | | | | 169 | | | 178 |
#749596, 5.000%, due 11/1/18 | | | | | 572 | | | 603 |
#770853, 4.500%, due 4/1/19 | | | | | 1,816 | | | 1,889 |
#725445, 4.500%, due 5/1/19 | | | | | 1,032 | | | 1,073 |
#995234, 5.000%, due 7/1/19 | | | | | 3,849 | | | 4,057 |
#MA0124, 4.000%, due 7/1/19 | | | | | 1,879 | | | 1,922 |
#785259, 5.000%, due 8/1/19 | | | | | 702 | | | 739 |
#745240, 4.500%, due 12/1/19 | | | | | 966 | | | 1,006 |
#735401, 5.500%, due 3/1/20 | | | | | 635 | | | 676 |
| | | | | | | | |
Total FNMA Mortgage Obligations | | | | | | | | 28,306 |
| | | | | | | | |
|
Consumer Asset-Backed Securities—12.0% |
Nissan Receivables Owner Trust, 2009-1, A2, 3.920%, due 4/15/11 | | AAA | | | 428 | | | 431 |
Volkswagen Auto Lease Trust, 2009-A, A2, 2.870%, due 7/15/11 | | AAA | | | 146 | | | 148 |
Honda Auto Receivables Owner Trust, 2009-2, A2, 2.220%, due 8/15/11 | | AAA | | | 140 | | | 141 |
Nissan Auto Lease Trust, 2009-A, A3, 2.920%, due 12/15/11 | | AAA | | | 610 | | | 621 |
Ford Credit Auto Owner Trust, 2009-D, A2, 1.210%, due 1/15/12 | | AAA | | | 500 | | | 501 |
Volkswagen Auto Lease Trust, 2009-A, A3, 3.410%, due 4/16/12 | | AAA | | | 1,000 | | | 1,025 |
Harley-Davidson Motorcycle Trust, 2009-1, A2, 2.520%, due 5/15/12 | | AAA | | | 100 | | | 101 |
BA Credit Card Trust, 2008-A9, A9, 4.070%, due 7/16/12 | | AAA | | | 200 | | | 201 |
| | | | | | | | |
| | | NRSRO
Rating
(unaudited) | | Principal
Amount | | Value |
|
Consumer Asset-Backed Securities—(continued) |
Chase Issuance Trust, 2009-A6, A6, 1.083%, due 7/16/12, VRN | | AAA | | $ | 1,300 | | $ | 1,305 |
CNH Equipment Trust, 2009-C, A2, 0.950%, due 8/15/12 | | AAA | | | 1,000 | | | 999 |
Citibank Credit Card Issuance Trust, 2005-A7,
4.750%, due 10/22/12 | | AAA | | | 200 | | | 206 |
CarMax Auto Owner Trust, 2009-1, A3, 4.120%, due 3/15/13 | | AAA | | | 421 | | | 436 |
Ford Credit Auto Owner Trust, 2009-A, A3A, 3.960%, due 5/15/13 | | AAA | | | 600 | | | 619 |
Ford Credit Auto Owner Trust, 2009-D, A3, 2.170%, due 10/15/13 | | AAA | | | 1,160 | | | 1,171 |
John Deere Owner Trust, 2009-A, A3, 2.590%, due 10/15/13 | | AAA | | | 1,000 | | | 1,016 |
John Deere Owner Trust, 2009-B, A3, 1.570%, due 10/15/13 | | AAA | | | 450 | | | 450 |
Harley-Davidson Motorcycle Trust, 2009-1, A3, 3.190%, due 11/15/13 | | AAA | | | 1,007 | | | 1,029 |
American Express Credit Account Master Trust, 2007-5, A,
0.263%, due 12/15/14, VRN | | AAA | | | 1,000 | | | 987 |
| | | | | | | | |
Total Consumer Asset-Backed Securities | | | | | | | | 11,387 |
| | | | | | | | |
|
Corporate Obligations—14.1% |
Procter & Gamble International Funding SCA, 1.350%, due 8/26/11 | | AA- | | | 1,000 | | | 1,005 |
Shell International Finance B.V., 1.300%, due 9/22/11 | | AA+ | | | 1,000 | | | 1,002 |
Morgan Stanley, 3.250%, due 12/1/11 | | AAA | | | 1,000 | | | 1,037 |
BP Capital Markets plc,
3.125%, due 3/10/12 | | AA+ | | | 1,000 | | | 1,030 |
The Goldman Sachs Group, Inc., 3.250%, due 6/15/12 | | AAA | | | 1,000 | | | 1,039 |
General Electric Capital Corporation, 3.500%, due 8/13/12 | | AA+ | | | 1,000 | | | 1,021 |
Bank of America Corporation,
5.375%, due 9/11/12 | | A+ | | | 1,000 | | | 1,061 |
ConocoPhillips,
4.750%, due 10/15/12 | | A | | | 1,000 | | | 1,072 |
Citigroup, Inc., 5.300%, due 10/17/12 | | A+ | | | 1,000 | | | 1,042 |
Wells Fargo & Company,
5.250%, due 10/23/12 | | AA- | | | 1,000 | | | 1,068 |
Morgan Stanley, 5.250%, due 11/2/12 | | A | | | 1,000 | | | 1,064 |
Caterpillar Financial Services,
1.900%, due 12/17/12 | | A | | | 1,000 | | | 996 |
PACCAR Financial Corporation, 1.950%, due 12/17/12 | | AA- | | | 1,000 | | | 990 |
| | | | | | | | |
Total Corporate Obligations | | | | | | | | 13,427 |
| | | | | | | | |
Total-Long Term Investments—76.8%
(cost $73,614) | | | | | | 73,046 |
| | | | | | | | |
See accompanying Notes to Financial Statements.
December 31, 2009 | William Blair Funds 41 |
Low Duration Fund
Portfolio of Investments, December 31, 2009 (all dollar amounts in thousands)
| | | | | | | | |
| | | NRSRO
Rating
(unaudited) | | Principal
Amount | | Value |
Repurchase Agreement | | | | | | | | |
State Street Bank and Trust Company, 0.000% dated 12/31/09, due 1/4/10, repurchase price $6,139, collateralized by U.S. Treasury Bill,
0.020%, due 2/18/10 | | AAA | | $ | 6,139 | | $ | 6,139 |
| | | | | | | | |
Total Repurchase Agreement—6.4%
(cost $6,139) | | | | | | 6,139 |
| | | | | | | | |
Total Investments—83.2%
(cost $79,753) | | | | | | 79,185 |
Cash and other assets, less liabilities—16.8% | | | 15,949 |
| | | | | | | | |
Net assets—100.0% | | $ | 95,134 |
| | | |
VRN = Variable Rate Note
NRSRO = Nationally Recognized Statistical Rating Organization—The credit quality ratings of the securities in the Fund reflect the highest category rating by either Fitch Ratings, Moody’s Investors Service Inc., or Standard & Poor’s, a division of the McGraw-Hill Companies, Inc.
The obligations of certain U. S. Government-sponsored securities are neither issued nor guaranteed by the U. S. Treasury.
See accompanying Notes to Financial Statements.
42 Annual Report | December 31, 2009 |
Statements of Assets and Liabilities
December 31, 2009 (dollar amounts in thousands)
| | | | | | | | | | | | |
| | | Institutional
International
Growth
Fund | | | Institutional
International
Equity
Fund | | | International
Small Cap
Growth
Fund | |
Assets | | | | | | | | | | | | |
Investments in securities, at cost | | $ | 1,113,868 | | | $ | 280,467 | | | $ | 312,240 | |
Investments in Affiliated Fund, at cost | | | 4,535 | | | | 953 | | | | 489 | |
| | | | | | | | | | | | |
| | | |
Investments in securities, at value | | $ | 1,385,369 | | | $ | 364,321 | | | $ | 385,253 | |
Investments in Affiliated Fund, at net asset value | | | 4,535 | | | | 953 | | | | 489 | |
Foreign currency, at value (cost $1,823, $3,294, $2,754) | | | 1,836 | | | | 3,330 | | | | 2,777 | |
Receivable for securities sold | | | 2,096 | | | | 631 | | | | 2,473 | |
Receivable for fund shares sold | | | 500 | | | | — | | | | 762 | |
Dividends and interest receivable | | | 1,480 | | | | 473 | | | | 570 | |
Unrealized appreciation on forward foreign currency contracts | | | 4,511 | | | | — | | | | — | |
| | | | | | | | | | | | |
Total assets | | | 1,400,327 | | | | 369,708 | | | | 392,324 | |
Liabilities | | | | | | | | | | | | |
Payable for investment securities purchased | | | 23,008 | | | | 3,270 | | | | 853 | |
Payable for fund shares redeemed | | | 215 | | | | 800 | | | | 173 | |
Management fee payable | | | 1,096 | | | | 308 | | | | 321 | |
Distribution and shareholder administration fee payable | | | — | | | | — | | | | 31 | |
Foreign tax liability | | | 49 | | | | 12 | | | | 16 | |
Other accrued expenses | | | 111 | | | | 47 | | | | 79 | |
| | | | | | | | | | | | |
Total liabilities | | | 24,479 | | | | 4,437 | | | | 1,473 | |
| | | | | | | | | | | | |
Net Assets | | $ | 1,375,848 | | | $ | 365,271 | | | $ | 390,851 | |
| | | | | | | | | | | | |
Capital | | | | | | | | | | | | |
Composition of Net Assets | | | | | | | | | | | | |
Par value of shares of beneficial interest | | $ | 113 | | | $ | 37 | | | $ | 37 | |
Capital paid in excess of par value | | | 1,585,180 | | | | 485,686 | | | | 491,576 | |
Accumulated net investment income (loss) | | | (4,182 | ) | | | 1 | | | | (191 | ) |
Accumulated net realized gain (loss) | | | (481,246 | ) | | | (204,352 | ) | | | (173,603 | ) |
Net unrealized appreciation (depreciation) of investments and foreign currencies | | | 275,983 | | | | 83,899 | | | | 73,032 | |
| | | | | | | | | | | | |
Net Assets | | $ | 1,375,848 | | | $ | 365,271 | | | $ | 390,851 | |
| | | | | | | | | | | | |
| | | |
Net Assets | | $ | 1,375,848 | | | $ | 365,271 | | | | | |
Shares Outstanding | | | 112,767,271 | | | | 37,103,604 | | | | | |
Net Asset Value Per Share | | $ | 12.20 | | | $ | 9.84 | | | | | |
| | | |
Institutional Share Class | | | | | | | | | | | | |
Net Assets | | | | | | | | | | $ | 165,436 | |
Shares Outstanding | | | | | | | | | | | 15,705,800 | |
Net Asset Value Per Share | | | | | | | | | | $ | 10.53 | |
See accompanying Notes to Financial Statements.
December 31, 2009 | William Blair Funds 43 |
Statements of Operations
for the Year Ended December 31, 2009 (all amounts in thousands)
| | | | | | | | | | | | |
| | | Institutional
International
Growth
Fund | | | Institutional
International
Equity
Fund | | | International
Small Cap
Growth
Fund | |
Investment income | | | | | | | | | | | | |
Dividends | | $ | 23,561 | | | $ | 7,664 | | | $ | 5,218 | |
Less foreign tax withheld | | | (1,470 | ) | | | (616 | ) | | | (281 | ) |
Dividend income from Affiliated Fund | | | 8 | | | | 1 | | | | 2 | |
Interest | | | 41 | | | | 11 | | | | 13 | |
| | | | | | | | | | | | |
Total income | | | 22,140 | | | | 7,060 | | | | 4,952 | |
Expenses | | | | | | | | | | | | |
Investment advisory fees | | | 10,872 | | | | 3,305 | | | | 3,237 | |
Distribution fees | | | — | | | | — | | | | 30 | |
Shareholder services fees | | | — | | | | — | | | | 208 | |
Custodian fees | | | 341 | | | | 136 | | | | 147 | |
Transfer agent fees | | | 29 | | | | 11 | | | | 120 | |
Professional fees | | | 77 | | | | 47 | | | | 35 | |
Registration fees | | | 51 | | | | 31 | | | | 64 | |
Shareholder reporting fees | | | 19 | | | | 4 | | | | 47 | |
Trustee fees | | | 43 | | | | 14 | | | | 12 | |
Other expenses | | | 4 | | | | 65 | | | | 71 | |
| | | | | | | | | | | | |
Total expenses before waiver | | | 11,436 | | | | 3,613 | | | | 3,971 | |
Expenses reimbursed to (waived or absorbed by) the Advisor | | | — | | | | — | | | | (20 | ) |
| | | | | | | | | | | | |
Net expenses | | | 11,436 | | | | 3,613 | | | | 3,951 | |
| | | | | | | | | | | | |
Net investment income (loss) | | | 10,704 | | | | 3,447 | | | | 1,001 | |
Net realized gain (loss) on transactions from: | | | | | | | | | | | | |
Investments | | | (116,044 | ) | | | (66,056 | ) | | | (29,463 | ) |
Foreign currency transactions | | | (1,703 | ) | | | (450 | ) | | | (845 | ) |
| | | | | | | | | | | | |
Total net realized gain (loss) | | | (117,747 | ) | | | (66,506 | ) | | | (30,308 | ) |
| | | |
Change in net unrealized appreciation (depreciation) of: | | | | | | | | | | | | |
Investments | | | 515,065 | | | | 151,093 | | | | 174,223 | |
Foreign currency translations | | | 4,742 | | | | 113 | | | | 31 | |
| | | | | | | | | | | | |
Change in net unrealized appreciation (depreciation) | | | 519,807 | | | | 151,206 | | | | 174,254 | |
| | | | | | | | | | | | |
Net increase (decrease) in net assets resulting from operations | | $ | 412,764 | | | $ | 88,147 | | | $ | 144,947 | |
| | | | | | | | | | | | |
See accompanying Notes to Financial Statements.
44 Annual Report | December 31, 2009 |
Statements of Changes in Net Assets
for the Years Ended December 31, 2009 and 2008 (all amounts in thousands)
| | | | | | | | | | | | | | | | | | | | | | | | |
| | | Institutional
International
Growth
Fund | | | Institutional
International
Equity
Fund | | | International
Small Cap
Growth
Fund | |
| | | 2009 | | | 2008 | | | 2009 | | | 2008 | | | 2009 | | | 2008 | |
Operations | | | | | | | | | | | | | | | | | | | | | | | | |
Net investment income (loss) | | $ | 10,704 | | | $ | 27,956 | | | $ | 3,447 | | | $ | 6,512 | | | $ | 1,001 | | | $ | 772 | |
Net realized gain (loss) on investments and foreign currency transactions | | | (117,747 | ) | | | (351,750 | ) | | | (66,506 | ) | | | (137,158 | ) | | | (30,308 | ) | | | (143,651 | ) |
Change in net unrealized appreciation (depreciation) of investments and foreign currency translations | | | 519,807 | | | | (788,174 | ) | | | 151,206 | | | | (204,958 | ) | | | 174,254 | | | | (138,270 | ) |
| | | | | | | | | | | | | | | | | | | | | | | | |
Net increase (decrease) in net assets resulting from operations | | | 412,764 | | | | (1,111,968 | ) | | | 88,147 | | | | (335,604 | ) | | | 144,947 | | | | (281,149 | ) |
Distributions to shareholders from | | | | | | | | | | | | | | | | | | | | | | | | |
Net investment income | | | (18,261 | ) | | | — | | | | (2,719 | ) | | | — | | | | (778 | ) | | | — | |
Net realized gain | | | — | | | | (59,710 | ) | | | — | | | | (6,489 | ) | | | — | | | | (4,881 | ) |
| | | | | | | | | | | | | | | | | | | | | | | | |
| | | (18,261 | ) | | | (59,710 | ) | | | (2,719 | ) | | | (6,489 | ) | | | (778 | ) | | | (4,881 | ) |
Capital stock transactions | | | | | | | | | | | | | | | | | | | | | | | | |
Net proceeds from sale of shares | | | 165,765 | | | | 133,829 | | | | 20,848 | | | | 126,297 | | | | 139,125 | | | | 259,319 | |
Shares issued in reinvestment of income dividends and capital gain distributions | | | 16,959 | | | | 59,025 | | | | 2,587 | | | | 6,176 | | | | 676 | | | | 4,719 | |
Less cost of shares redeemed | | | (199,645 | ) | | | (168,222 | ) | | | (104,043 | ) | | | (48,108 | ) | | | (185,107 | ) | | | (87,479 | ) |
| | | | | | | | | | | | | | | | | | | | | | | | |
Net increase (decrease) in net assets resulting from capital share transactions | | | (16,921 | ) | | | 24,632 | | | | (80,608 | ) | | | 84,365 | | | | (45,306 | ) | | | 176,559 | |
| | | | | | | | | | | | | | | | | | | | | | | | |
Increase (decrease) in net assets | | | 377,582 | | | | (1,147,046 | ) | | | 4,820 | | | | (257,728 | ) | | | 98,863 | | | | (109,471 | ) |
Net assets | | | | | | | | | | | | | | | | | | | | | | | | |
Beginning of year | | $ | 998,266 | | | $ | 2,145,312 | | | $ | 360,451 | | | $ | 618,179 | | | $ | 291,988 | | | $ | 401,459 | |
| | | | | | | | | | | | | | | | | | | | | | | | |
End of year | | $ | 1,375,848 | | | $ | 998,266 | | | $ | 365,271 | | | $ | 360,451 | | | $ | 390,851 | | | $ | 291,988 | |
| | | | | | | | | | | | | | | | | | | | | | | | |
Undistributed net investment income (loss) at the end of the year | | $ | (4,182 | ) | | $ | 2,184 | | | $ | 1 | | | $ | (277 | ) | | $ | (191 | ) | | $ | (120 | ) |
| | | | | | | | | | | | | | | | | | | | | | | | |
See accompanying Notes to Financial Statements.
December 31, 2009 | William Blair Funds 45 |
Statements of Assets and Liabilities
December 31, 2009 (dollar amounts in thousands)
| | | | | | | | | | | | | | | | |
| | | Emerging
Markets
Growth
Fund | | | Emerging
Leaders
Fund | | | Bond
Fund | | | Low
Duration
Fund | |
Assets | | | | | | | | | | | | | | | | |
Investments in securities, at cost | | $ | 772,493 | | | $ | 80,331 | | | $ | 141,490 | | | $ | 79,753 | |
Investments in Affiliated Fund, at cost | | | 66 | | | | 440 | | | | — | | | | — | |
| | | | | | | | | | | | | | | | |
| | | | |
Investments in securities, at value | | $ | 1,043,668 | | | $ | 114,268 | | | $ | 148,003 | | | $ | 79,185 | |
Investments in Affiliated Fund, at net asset value | | | 66 | | | | 440 | | | | — | | | | — | |
Foreign currency, at value (cost $4,432, $6, $-, $-) | | | 4,480 | | | | 6 | | | | — | | | | — | |
Prepaid expense | | | — | | | | — | | | | — | | | | 47 | |
Receivable for securities sold | | | 4,896 | | | | — | | | | — | | | | — | |
Receivable for fund shares sold | | | 490 | | | | 763 | | | | 3,498 | | | | 16,105 | |
Dividends and interest receivable | | | 389 | | | | 85 | | | | 1,500 | | | | 288 | |
| | | | | | | | | | | | | | | | |
Total assets | | | 1,053,989 | | | | 115,562 | | | | 153,001 | | | | 95,625 | |
Liabilities | | | | | | | | | | | | | | | | |
Payable for investment securities purchased | | | 1,956 | | | | 245 | | | | 5,586 | | | | — | |
Payable for fund shares redeemed | | | 12,556 | | | | — | | | | 10 | | | | 460 | |
Management fee payable | | | 1,014 | | | | 127 | | | | 2 | | | | 3 | |
Distribution and shareholder administration fee payable | | | 32 | | | | 1 | | | | 17 | | | | 9 | |
Foreign tax liability | | | 41 | | | | 9 | | | | — | | | | — | |
Other accrued expenses | | | 130 | | | | 44 | | | | 42 | | | | 19 | |
| | | | | | | | | | | | | | | | |
Total liabilities | | | 15,729 | | | | 426 | | | | 5,657 | | | | 491 | |
| | | | | | | | | | | | | | | | |
Net Assets | | $ | 1,038,260 | | | $ | 115,136 | | | $ | 147,344 | | | $ | 95,134 | |
| | | | | | | | | | | | | | | | |
Capital | | | | | | | | | | | | | | | | |
Composition of Net Assets | | | | | | | | | | | | | | | | |
Par value of shares of beneficial interest | | $ | 80 | | | $ | 14 | | | $ | 14 | | | $ | 10 | |
Capital paid in excess of par value | | | 1,003,100 | | | | 114,019 | | | | 141,782 | | | | 95,693 | |
Accumulated net investment income (loss) | | | (7,584 | ) | | | (297 | ) | | | — | | | | — | |
Accumulated net realized gain (loss) | | | (228,574 | ) | | | (32,537 | ) | | | (965 | ) | | | (1 | ) |
Net unrealized appreciation (depreciation) of investments and foreign currencies | | | 271,238 | | | | 33,937 | | | | 6,513 | | | | (568 | ) |
| | | | | | | | | | | | | | | | |
Net Assets | | $ | 1,038,260 | | | $ | 115,136 | | | $ | 147,344 | | | $ | 95,134 | |
| | | | | | | | | | | | | | | | |
| | | | |
Institutional Share Class | | | | | | | | | | | | | | | | |
Net Assets | | $ | 830,660 | | | $ | 106,313 | | | $ | 16,226 | | | $ | 13,500 | |
Shares Outstanding | | | 63,772,581 | | | | 12,607,600 | | | | 1,575,857 | | | | 1,359,518 | |
Net Asset Value Per Share | | $ | 13.03 | | | $ | 8.43 | | | $ | 10.30 | | | $ | 9.93 | |
See accompanying Notes to Financial Statements.
46 Annual Report | December 31, 2009 |
Statements of Operations
for the Year Ended December 31, 2009 (all amounts in thousands)
| | | | | | | | | | | | | | | | |
| | | Emerging
Markets
Growth
Fund | | | Emerging
Leaders
Fund | | | Bond
Fund | | | Low
Duration
Fund(a) | |
Investment income | | | | | | | | | | | | | | | | |
Dividends | | $ | 13,643 | | | $ | 1,797 | | | $ | — | | | $ | — | |
Less foreign tax withheld | | | (1,173 | ) | | | (169 | ) | | | — | | | | — | |
Dividend income from Affiliated Fund | | | 1 | | | | — | | | | — | | | | — | |
Interest | | | 25 | | | | 2 | | | | 6,673 | | | | 109 | |
| | | | | | | | | | | | | | | | |
Total income | | | 12,496 | | | | 1,630 | | | | 6,673 | | | | 109 | |
Expenses | | | | | | | | | | | | | | | | |
Investment advisory fees | | | 7,825 | | | | 981 | | | | 370 | | | | 17 | |
Distribution fees | | | 54 | | | | — | | | | 4 | | | | — | |
Shareholder services fees | | | 224 | | | | 8 | | | | 162 | | | | 8 | |
Custodian fees | | | 491 | | | | 124 | | | | 52 | | | | 3 | |
Transfer agent fees | | | 137 | | | | 2 | | | | 33 | | | | 1 | |
Professional fees | | | 58 | | | | 33 | | | | 32 | | | | 15 | |
Registration fees | | | 88 | | | | 48 | | | | 40 | | | | — | |
Shareholder reporting fees | | | 29 | | | | 3 | | | | 7 | | | | 1 | |
Trustee fees | | | 20 | | | | 3 | | | | 4 | | | | — | |
Other expenses | | | 119 | | | | 20 | | | | 8 | | | | — | |
| | | | | | | | | | | | | | | | |
Total expenses before waiver | | | 9,045 | | | | 1,222 | | | | 712 | | | | 45 | |
Expenses reimbursed to (waived or absorbed by) the Advisor | | | (25 | ) | | | (99 | ) | | | (115 | ) | | | (14 | ) |
| | | | | | | | | | | | | | | | |
Net expenses | | | 9,020 | | | | 1,123 | | | | 597 | | | | 31 | |
| | | | | | | | | | | | | | | | |
Net investment income (loss) | | | 3,476 | | | | 507 | | | | 6,076 | | | | 78 | |
Net realized gain (loss) on transactions from: | | | | | | | | | | | | | | | | |
Investments | | | (57,782 | ) | | | 3,463 | | | | 284 | | | | — | |
Foreign currency transactions | | | (1,779 | ) | | | (258 | ) | | | — | | | | — | |
| | | | | | | | | | | | | | | | |
Total net realized gain (loss) | | | (59,561 | ) | | | 3,205 | | | | 284 | | | | — | |
| | | | |
Change in net unrealized appreciation (depreciation) of: | | | | | | | | | | | | | | | | |
Investments | | | 461,326 | | | | 51,098 | | | | 7,229 | | | | (568 | ) |
Foreign currency translations | | | 22 | | | | — | | | | — | | | | — | |
| | | | | | | | | | | | | | | | |
Change in net unrealized appreciation (depreciation) | | | 461,348 | | | | 51,098 | | | | 7,229 | | | | (568 | ) |
| | | | | | | | | | | | | | | | |
Net increase (decrease) in net assets resulting from operations | | $ | 405,263 | | | $ | 54,810 | | | $ | 13,589 | | | $ | (490 | ) |
| | | | | | | | | | | | | | | | |
| (a) | | For the period from December 1, 2009 (Commencement of Operations) to December 31, 2009. |
See accompanying Notes to Financial Statements.
December 31, 2009 | William Blair Funds 47 |
Statements of Changes in Net Assets
for the Years Ended December 31, 2009 and 2008 (all amounts in thousands)
| | | | | | | | | | | | | | | | | | | | | | | | | | | | |
| | | Emerging
Markets
Growth
Fund | | | Emerging
Leaders
Fund | | | Bond
Fund | | | Low
Duration
Fund | |
| | | 2009 | | | 2008 | | | 2009 | | | 2008(a) | | | 2009 | | | 2008 | | | 2009(b) | |
Operations | | | | | | | | | | | | | | | | | | | | | | | | | | | | |
Net investment income (loss) | | $ | 3,476 | | | $ | 7,819 | | | $ | 507 | | | $ | 359 | | | $ | 6,076 | | | $ | 3,542 | | | $ | 78 | |
Net realized gain (loss) on investments and foreign currency transactions | | | (59,561 | ) | | | (167,170 | ) | | | 3,205 | | | | (35,250 | ) | | | 284 | | | | (939 | ) | | | — | |
Change in net unrealized appreciation (depreciation) of investments and foreign currency translations | | | 461,348 | | | | (484,606 | ) | | | 51,098 | | | | (17,161 | ) | | | 7,229 | | | | (1,455 | ) | | | (568 | ) |
| | | | | | | | | | | | | | | | | | | | | | | | | | | | |
Net increase (decrease) in net assets resulting from operations | | | 405,263 | | | | (643,957 | ) | | | 54,810 | | | | (52,052 | ) | | | 13,589 | | | | 1,148 | | | | (490 | ) |
Distributions to shareholders from | | | | | | | | | | | | | | | | | | | | | | | | | | | | |
Net investment income | | | (11,127 | ) | | | — | | | | (1,588 | ) | | | (87 | ) | | | (6,213 | ) | | | (3,517 | ) | | | (86 | ) |
Net realized gain | | | — | | | | (41,761 | ) | | | — | | | | — | | | | — | | | | — | | | | — | |
| | | | | | | | | | | | | | | | | | | | | | | | | | | | |
| | | (11,127 | ) | | | (41,761 | ) | | | (1,588 | ) | | | (87 | ) | | | (6,213 | ) | | | (3,517 | ) | | | (86 | ) |
Capital stock transactions | | | | | | | | | | | | | | | | | | | | | | | | | | | | |
Net proceeds from sale of shares | | | 422,203 | | | | 81,613 | | | | 42,409 | | | | 107,010 | | | | 77,912 | | | | 18,146 | | | | 97,472 | |
Shares issued in reinvestment of income dividends and capital gain distributions | | | 10,336 | | | | 41,234 | | | | 1,466 | | | | 80 | | | | 4,029 | | | | 2,956 | | | | 37 | |
Less cost of shares redeemed | | | (174,003 | ) | | | (217,395 | ) | | | (28,637 | ) | | | (8,275 | ) | | | (16,586 | ) | | | (12,603 | ) | | | (1,799 | ) |
| | | | | | | | | | | | | | | | | | | | | | | | | | | | |
Net increase (decrease) in net assets resulting from capital share transactions | | | 258,536 | | | | (94,548 | ) | | | 15,238 | | | | 98,815 | | | | 65,355 | | | | 8,499 | | | | 95,710 | |
| | | | | | | | | | | | | | | | | | | | | | | | | | | | |
Increase (decrease) in net assets | | | 652,672 | | | | (780,266 | ) | | | 68,460 | | | | 46,676 | | | | 72,731 | | | | 6,130 | | | | 95,134 | |
Net assets | | | | | | | | | | | | | | | | | | | | | | | | | | | | |
Beginning of year | | $ | 385,588 | | | $ | 1,165,854 | | | $ | 46,676 | | | $ | — | | | $ | 74,613 | | | $ | 68,483 | | | $ | — | |
| | | | | | | | | | | | | | | | | | | | | | | | | | | | |
End of year | | $ | 1,038,260 | | | $ | 385,588 | | | $ | 115,136 | | | $ | 46,676 | | | $ | 147,344 | | | $ | 74,613 | | | $ | 95,134 | |
| | | | | | | | | | | | | | | | | | | | | | | | | | | | |
Undistributed net investment income (loss) at the end of the year | | $ | (7,584 | ) | | $ | (674 | ) | | $ | (297 | ) | | $ | (52 | ) | | $ | — | | | $ | 10 | | | $ | — | |
| | | | | | | | | | | | | | | | | | | | | | | | | | | | |
| (a) | | For the period from March 26, 2008 (Commencement of Operations) to December 31, 2008. |
| (b) | | For the period from December 1, 2009 (Commencement of Operations) to December 31, 2009. |
See accompanying Notes to Financial Statements.
48 Annual Report | December 31, 2009 |
Notes to Financial Statements
(1) Significant Accounting Policies
The following is a summary of the William Blair Funds’ (the “Fund”) significant accounting policies in effect during the year covered by the financial statements, which are in accordance with U.S. generally accepted accounting principles.
(a) Description of the Fund
William Blair Funds is a diversified mutual fund registered under the Investment Company Act of 1940, as amended, as an open-end management investment company. The number of shares authorized for this Fund is unlimited. The Fund currently consists of the following eighteen portfolios (the “Portfolios”), each with its own investment objective and policies.
| | |
Equity Portfolios | | International Equity Portfolios |
Growth | | International Growth |
Large Cap Growth | | International Equity |
Small Cap Growth | | Institutional International Growth |
Mid Cap Growth | | Institutional International Equity |
Small-Mid Cap Growth | | International Small Cap Growth |
Value Discovery | | Emerging Markets Growth |
Global Equity Portfolio | | Emerging Leaders Growth |
Global Growth | | Fixed-Income Portfolios |
| | Bond |
| | Income |
| | Low Duration |
| |
| | Money Market Portfolio |
| | Ready Reserves |
The investment objectives of the Portfolios are as follows:
| | |
Equity | | Long-term capital appreciation. |
Global Equity | | Long-term capital appreciation. |
International Equity | | Long-term capital appreciation. |
Fixed-Income | | High level of current income with relative stability of principal.
(Maximize total return—Low Duration) |
Money Market | | Current income, a stable share price and daily liquidity. |
The Institutional International Growth Portfolio, the Institutional International Equity Portfolio and the Institutional Share Classes of the International Small Cap Growth Portfolio, the Emerging Markets Growth Portfolio, the Emerging Leaders Growth Portfolio, Bond Portfolio, and the Low Duration Portfolio are the only Portfolios covered in this report.
(b) Share Classes
Three different classes of shares of the International Small Cap Growth Fund, Emerging Markets Growth Fund, Bond Fund and the Low Duration Fund currently exist: N, I and Institutional. Two different classes of shares of the Emerging Leaders Growth Fund currently exist: I and Institutional. This report includes financial information for only the Institutional Class. The Institutional share class is sold to institutional investors, including but not limited to employee benefit plans, endowments, foundations, trusts and corporations, who are able to meet the Fund’s high minimum investment requirement. The minimum initial investment required is $5 million ($2 million for the Bond Portfolio).
Investment income realized and unrealized gains and losses, and certain Portfolio level expenses and expense reductions, if any, are allocated based on the relative net assets of each class, except for certain class specific expenses, which are charged directly to the appropriate class. Differences in class expenses may result in the payment of different per share dividends by class. All share classes of the Portfolios have equal rights with respect to voting subject to class specific arrangements.
December 31, 2009 | William Blair Funds 49 |
(c) Investment Valuation
The market value of domestic equity securities and options is determined by valuing securities traded on national securities exchanges or markets or in the over-the-counter markets at the last sales price or, if applicable, the official closing price or, in the absence of a sale on the date of valuation, at the latest bid price.
The Board of Trustees has determined that the passage of time between when the foreign exchanges or markets close and when the Funds compute their net asset values could cause the value of international securities to no longer be representative or accurate and, as a result, necessitates that such securities be fair valued on a daily basis. Accordingly, for international securities, if the foreign exchange or market on which a security is primarily traded closes before the close of regular trading on the New York Stock Exchange (generally 4:00 p.m. Eastern time), the Funds use an independent pricing service on a daily basis to fair value price the security as of the close of regular trading on the New York Stock Exchange. As a result, a Portfolio’s value for a security may be different from the last sale price (or the latest bid price). The independent pricing service may not provide a fair value price for all international securities owned by a Portfolio trading on a foreign exchange or market that closes before the close of regular trading on the New York Stock Exchange. For these securities and all other foreign securities, the value of the security is determined based upon the last sale price on the foreign exchange or market on which it is primarily traded and in the currency of that market as of the close of the appropriate exchange or, if there have been no sales during that day, at the latest bid price.
Long-term, fixed-income securities are valued based on market quotations, or by independent pricing services that use prices provided by market makers or matrixes that produce estimates of fair market values obtained from yield data relating to instruments or securities with similar characteristics.
Investments in other funds are valued at the underlying fund’s net asset value on the date of valuation. Other securities, and all other assets, including securities for which a market price is not available, or the value of which is affected by a significant valuation event, are valued at fair value as determined in good faith by the Pricing Committee or Valuation Committee, in accordance with the Fund’s Valuation Procedures approved by the Board of Trustees. As of December 31, 2009, there were securities held in the Institutional International Growth, International Small Cap Growth and Emerging Markets Growth Portfolios requiring fair valuation pursuant to the Fund’s Valuation Procedures.
(d) Investment income and transactions
Dividend income is recorded on the ex-dividend date, except for those dividends from certain foreign securities that are recorded when the information is available.
Interest income is recorded on an accrual basis, adjusted for amortization of premium or discount. Variable rate bonds and floating rate notes earn interest at coupon rates that fluctuate at specific time intervals. The interest rate shown on the Portfolio of Investments for the Bond Fund and Low Duration Fund were the rates in effect on December 31, 2009. Put bonds may be redeemed at the discretion of the holder on specified dates prior to maturity.
Premiums and discounts are accreted and amortized on a straight-line basis for short-term investments and on an effective interest method for long-term investments.
Paydown gains and losses on mortgage and asset-backed securities are treated as an adjustment to interest income. For the year ended December 31, 2009, the Bond Portfolio recognized an increase of interest income and a decrease of net realized loss of $(120) (in thousands). This reclassification had no effect on the net asset value of the Portfolio.
The Funds do not isolate that portion of the results of operations resulting from changes in foreign exchange rates on investments from the fluctuations arising from changes in market prices of securities held. Such fluctuations are included with the net realized and unrealized gain or loss from investments.
Reported net realized foreign currency gains or losses arise from disposition of foreign currency, the difference in the foreign exchange rates between the trade and settlement dates on securities transactions, and the difference between the amounts of dividends, interest and foreign withholding taxes recorded on the ex-date or accrual date and the U.S. dollar equivalent of the amounts actually received or paid. Net unrealized foreign exchange gains and losses arise from changes (due to the changes in the exchange rate) in the value of foreign currency and other assets and liabilities denominated in foreign currencies held at period end.
50 Annual Report | December 31, 2009 |
Security and shareholder transactions are accounted for no later than one business day following the trade date. However, for financial reporting purposes, security and shareholder transactions are accounted for on the trade date of the last business day of the reporting period. Realized gains and losses from securities transactions are recognized on a specifically identified cost basis.
Awards from class action litigation may be recorded as a reduction of cost. If the Portfolios no longer own the applicable securities, the proceeds are recorded as realized gains.
(e) Share Valuation and Dividends to Shareholders
Shares are sold and redeemed on a continuous basis at net asset value. The net asset value per share is determined by dividing the Portfolio’s net assets by the number of shares outstanding as of the close of regular trading on the New York Stock Exchange, which is generally 4:00 p.m. Eastern time, on each day the Exchange is open.
Dividends from net investment income, if any, are declared at least annually for all Portfolios covered by this report except the Bond Portfolio and Low Duration Portfolio which is declared monthly. Capital gain distributions, if any, are declared at least annually in December. Dividends payable to shareholders are recorded on the ex-dividend date.
(f) Foreign Currency Translation and Foreign Currency Forward Contracts
The Portfolios (excluding the Bond Portfolio and the Low Duration Portfolio) may invest in securities denominated in foreign currencies. As such, assets and liabilities denominated in foreign currencies are translated into U.S. dollar amounts at the current exchange rate on the date of valuation. The values of foreign investments, forward open foreign currency contracts, and cash denominated in foreign currencies are translated into U.S. dollars using a spot market rate of exchange as of the time of the determination of each Fund’s net asset value, typically 4:00 p.m. Eastern time on days when there is regular trading on the New York Stock Exchange. Payables and receivables for securities transactions, dividends, interest income and tax reclaims are translated into U.S. dollars using a spot market rate of exchange as of 4:00 p.m. Eastern time. Settlement of purchases and sales and dividend and interest receipts are translated into U.S. dollars using a spot market rate of exchange as of 11:00 a.m. Eastern time.
(g) Income Taxes
Each Portfolio intends to comply with the provisions of Subchapter M of the Internal Revenue Code available to regulated investment companies. Each portfolio intends to make the requisite distributions of income and capital gains to its shareholders sufficient to relieve it from all, or substantially all, federal income and excise taxes. No provision for federal income and excise taxes has been made.
The Institutional International Growth, Institutional International Equity, International Small Cap Growth, Emerging Markets Growth, and Emerging Leaders Growth Portfolios may be subject to a tax imposed on net realized gains on securities of certain foreign countries.
Each Portfolio is subject to the provisions of Accounting Standards Codification (ASC) 740 Income Taxes, formally known as FASB (Financial Accounting Standards Board) Interpretation No. 48, Accounting for Uncertainties in Income Taxes. ASC 740 provides guidance for how uncertain tax positions should be recognized, measured, presented and disclosed in the financial statements. Management has evaluated the implications of ASC 740 and all of the uncertain tax positions of the Portfolios and has determined that no liability is required to be recorded in the financial statements as of December 31, 2009 and December 31, 2008.
The statute of limitations on the Funds’ tax returns for each of the tax years in the four year period ended December 31, 2009, remains open and the returns are subject to examination.
December 31, 2009 | William Blair Funds 51 |
The Portfolios have elected to mark-to-market their investments in Passive Foreign Investment Companies (“PFICs”) for Federal income tax purposes. The Portfolios also treat the deferred loss associated with current and prior year wash sales as an adjustment to the cost of investments for tax purposes. The cost of investments for Federal income tax purposes and related gross unrealized appreciation/(depreciation) and net unrealized appreciation/(depreciation) at December 31, 2009 were as follows (in thousands):
| | | | | | | | | | | | | |
Portfolio | | Cost of
Investments | | Gross
Unrealized
Appreciation | | Gross
Unrealized
Depreciation | | Net
Unrealized
Appreciation/
(Depreciation) | |
Institutional International Growth | | $ | 1,138,382 | | $ | 268,706 | | $ | 17,184 | | $ | 251,522 | |
Institutional International Equity | | | 289,149 | | | 80,825 | | | 4,700 | | | 76,125 | |
International Small Cap Growth | | | 318,052 | | | 75,074 | | | 7,384 | | | 67,690 | |
Emerging Markets Growth | | | 811,449 | | | 238,586 | | | 6,301 | | | 232,285 | |
Emerging Leaders Growth | | | 84,208 | | | 30,674 | | | 174 | | | 30,500 | |
Bond | | | 141,580 | | | 7,379 | | | 956 | | | 6,423 | |
Low Duration | | | 79,754 | | | 58 | | | 626 | | | (568 | ) |
The timing and characterization of certain income and capital gain distributions are determined annually in accordance with Federal income tax regulations that may differ from U.S. generally accepted accounting principles. As a result, net investment income or loss and net realized gain or loss for a reporting period may differ from the amount distributed during such period. In addition, the Portfolios may periodically record reclassifications among certain capital accounts to reflect differences between financial reporting and income tax basis distributions. The reclassifications were reported in order to reflect the tax treatment for certain permanent differences that exist between income tax regulations and U.S. generally accepted accounting principles. The reclassifications generally relate to section 988 currency gains and losses, and recharacterization of unrealized appreciation on PFICs (Passive Foreign Investment Corporations). These reclassifications have no impact on the net asset values of the Portfolio. Accordingly, at December 31, 2009 (the Funds’ most recent fiscal year end), the following reclassifications were recorded (in thousands):
| | | | | | | | | | | | |
Portfolio | | Accumulated Net
Investment Income (Loss) | | | Accumulated Net Realized Gain/(Loss) | | | Capital Paid in Excess of Par Value | |
Institutional International Growth | | $ | 1,191 | | | $ | (1,190 | ) | | $ | (1 | ) |
Institutional International Equity | | | (450 | ) | | | 449 | | | | 1 | |
International Small Cap Growth | | | (294 | ) | | | 301 | | | | (7 | ) |
Emerging Markets Growth | | | 741 | | | | (741 | ) | | | — | |
Emerging Leaders Growth | | | 836 | | | | (836 | ) | | | — | |
Bond | | | 127 | | | | (120 | ) | | | (7 | ) |
Low Duration | | | 8 | | | | (1 | ) | | | (7 | ) |
Distributions from net realized gains for book purposes may include short-term capital gains, which are included as ordinary income for tax purposes. The tax character of distributions paid during 2009 and 2008 was as follows (in thousands):
| | | | | | | | | | | | | | | | | | |
| | | Distributions Paid in 2009 | | | | Distributions Paid in 2008 | | |
Portfolio | | Ordinary Income | | Long-Term Capital Gains | | Total Distributions | | Ordinary Income | | Long-Term Capital Gains | | Total
Distributions |
Institutional International Growth | | $ | 18,261 | | $ | — | | $ | 18,261 | | $ | 1,671 | | $ | 58,039 | | $ | 59,710 |
Institutional International Equity | | | 2,719 | | | — | | | 2,719 | | | 1,947 | | | 4,542 | | | 6,489 |
International Small Cap Growth | | | 778 | | | — | | | 778 | | | — | | | 4,881 | | | 4,881 |
Emerging Markets Growth | | | 11,127 | | | — | | | 11,127 | | | 10,054 | | | 31,707 | | | 41,761 |
Emerging Leaders Growth | | | 1,588 | | | — | | | 1,588 | | | 87 | | | — | | | 87 |
Bond | | | 6,213 | | | — | | | 6,213 | | | 3,517 | | | — | | | 3,517 |
Low Duration (a) | | | 86 | | | — | | | 86 | | | — | | | — | | | — |
| (a) | | For the period from December 1, 2009 (commencement of operations) to December 31, 2009. |
52 Annual Report | December 31, 2009 |
As of December 31, 2009, the components of distributable earnings on a tax basis were as follows (in thousands):
| | | | | | | | | | | | | | |
Portfolio | | Undistributed Ordinary Income | | Accumulated Capital and Other Losses | | | Undistributed Long-Term Gain | | Net Unrealized Appreciation/ Depreciation | |
Institutional International Growth | | $ | 5,359 | | $ | (466,326 | ) | | $ | — | | $ | 251,522 | |
Institutional International Equity | | | — | | | (196,577 | ) | | | — | | | 76,125 | |
International Small Cap Growth | | | — | | | (168,452 | ) | | | — | | | 67,690 | |
Emerging Markets Growth | | | 2,427 | | | (199,632 | ) | | | — | | | — | |
Emerging Leaders Growth | | | 130 | | | (29,527 | ) | | | — | | | 30,500 | |
Bond | | | — | | | (875 | ) | | | — | | | 6,423 | |
Low Duration | | | — | | | (1 | ) | | | — | | | (568 | ) |
As of December 31, 2009, the Portfolios have unused capital loss carry forwards available for Federal income tax purposes to be applied against future gains, if any. If not applied, the carryforward will expire as follows (in thousands):
| | | | | | | | | | | | | | | | | | | | | | | | | | | |
Portfolio | | 2010 | | 2011 | | 2012 | | 2013 | | 2014 | | 2015 | | 2016 | | 2017 | | Total |
Institutional International Growth | | $ | — | | $ | — | | $ | — | | $ | — | | $ | — | | $ | — | | $ | 188,201 | | $ | 278,110 | | $ | 466,311 |
Institutional International Equity | | | — | | | — | | | — | | | — | | | — | | | — | | | 83,536 | | | 113,087 | | | 196,623 |
International Small Cap Growth | | | — | | | — | | | — | | | — | | | — | | | — | | | 81,949 | | | 86,330 | | | 168,279 |
Emerging Markets Growth | | | — | | | — | | | — | | | — | | | — | | | — | | | 84,442 | | | 115,253 | | | 199,695 |
Emerging Leaders Growth | | | — | | | — | | | — | | | — | | | — | | | — | | | 21,249 | | | 8,278 | | | 29,527 |
Bond | | | — | | | — | | | — | | | — | | | — | | | 135 | | | 559 | | | 174 | | | 868 |
Low Duration | | | — | | | — | | | — | | | — | | | — | | | — | | | — | | | 1 | | | 1 |
For the period from November 1, 2009 through December 31, 2009, the following Portfolios incurred net realized capital losses, foreign currency losses or PFIC losses. Each Portfolio intends to treat this loss as having occurred in fiscal year 2010 for Federal income tax purposes (in thousands):
| | | | | | | | | |
Portfolio | | Capital
Amount | | Currency
Amount | | PFIC
Amount |
Institutional International Growth | | $ | — | | $ | — | | $ | — |
Institutional International Equity | | | — | | | 41 | | | — |
International Small Cap Growth | | | — | | | 211 | | | — |
Emerging Markets Growth | | | — | | | — | | | — |
Emerging Leaders Growth | | | — | | | — | | | — |
Bond | | | 7 | | | — | | | — |
Low Duration | | | — | | | — | | | — |
(h) Repurchase Agreements
The Portfolios may enter into repurchase agreements with a select group of counterparties, whereby the Portfolios acquire ownership of a debt security and the counterparty agrees, at the time of sale, to repurchase the debt security from the Portfolios at a mutually agreed upon time and price. The Portfolios’ policy is to take possession of the debt security as collateral under the repurchase agreements. The Portfolios minimize credit risk by monitoring credit exposure to the counterparty and by monitoring the collateral value on an ongoing basis.
(i) Use of Estimates
The preparation of financial statements in conformity with U.S. generally accepted accounting principles requires management to make estimates and assumptions that affect the amounts reported in the financial statements. Actual results may differ from those estimates.
(j) Fair Value Measurements
The Portfolios are subject to ASC 820 Fair Value Measurement and Disclosures, formally known as SFAS (Statement of Financial Accounting Standards) No. 157, “Fair Value Measurement.” In accordance with ASC 820, “fair value” is defined as the price that a Portfolio would receive upon selling a security in an orderly transaction to an independent buyer in the principal or most advantageous market for the investment. Various inputs are used in determining the value of a Portfolio’s
December 31, 2009 | William Blair Funds 53 |
investments. ASC 820 established a three-tier hierarchy of inputs to classify fair value measurements for disclosure purposes. The three-tier hierarchy of inputs is summarized in the three broad levels listed below.
| | • | | Level 1—Quoted prices in active markets for an identical security. |
| | • | | Level 2—Prices determined using other significant observable inputs. Observable inputs are inputs that other market participants would use in pricing a security. These may include quoted prices for similar securities, interest rates, prepayment speeds, credit risk and others. |
| | • | | Level 3—Prices determined using significant unobservable inputs. In situations where quoted prices or observable inputs are unavailable (for example, when there is little or no market activity for an investment), unobservable inputs may be used. Unobservable inputs reflect the Fund’s own assumptions about the factors market participants would use in pricing an investment, and would be based on the best information available. |
The inputs or methodology used for valuing an investment are not necessarily an indication of the risk associated with investing in those securities. For example, money market securities are valued using amortized cost, in accordance with rules under the 1940 Act. Generally, amortized cost approximates the current fair value of a security, but since the value is not obtained from a quoted price in an active market, such securities are reflected as Level 2.
At December 31, 2009, the Portfolios held no other financial instruments, such as options or futures, that required fair valuation.
As of December 31, 2009, the hierarchical input levels of securities in each Portfolio are as follows (in thousands):
| | | | | | | | | | | | | | | |
| | | Institutional
International
Growth | | Institutional
International
Equity | | International
Small Cap
Growth | | Emerging
Markets
Growth | | Emerging
Leaders
Growth |
Investments in securities | | | | | | | | | | | | | | | |
Level 1—Quoted prices | | | | | | | | | | | | | | | |
Common stock | | $ | 173,658 | | $ | 52,172 | | $ | 27,738 | | $ | 286,573 | | $ | 29,525 |
Preferred stock | | | — | | | 4,537 | | | — | | | 47,507 | | | 2,544 |
Exchange-Traded Fund | | | — | | | — | | | — | | | — | | | 1,899 |
Short-term investments | | | 4,535 | | | 953 | | | 489 | | | 66 | | | 440 |
Level 2—Other significant observable inputs | | | | | | | | | | | | | | | |
Common stock | | | 1,151,523 | | | 298,797 | | | 352,531 | |
| 673,138
| | | 79,065 |
Convertible bonds | | | 582 | | | — | | | 593 | | | 990 | | | — |
Short-term investments | | | 59,606 | | | 8,815 | | | 4,391 | | | 35,460 | | | 1,235 |
Level 3—Significant unobservable inputs | | | | | | | | | | | | | | | |
None | | | — | | | — | | | — | | | — | | | — |
| | | | | | | | | | | | | | | |
Total investments in securities | | $ | 1,389,904 | | $ | 365,274 | | $ | 385,742 | | $ | 1,043,734 | | $ | 114,708 |
| | | | | | | | | | | | | | | |
Other financial instruments | | | | | | | | | | | | | | | |
Level 2—Other significant observable inputs | | | | | | | | | | | | | | | |
Forward foreign currency contracts | | $ | 4,511 | | | — | | | — | | | — | | | — |
| | | | | | | | | | | | | | | |
| | | | | | |
| | | Bond | | Low
Duration
Bond |
Investments in securities | | | | | | |
Level 1—Quoted prices | | | | | | |
None | | $ | — | | $ | — |
Level 2—Other significant observable inputs | | | | | | |
US Government and agency bonds | | | 69,604 | | | 48,232 |
Corporate bonds | | | 69,371 | | | 13,426 |
Asset backed bonds | | | 5,585 | | | 11,388 |
Short-term investments | | | 3,443 | | | 6,139 |
Level 3—Significant unobservable inputs | | | | | | |
None | | | — | | | — |
| | | | | | |
Total investments in securities | | $ | 148,003 | | $ | 79,185 |
| | | | | | |
54 Annual Report | December 31, 2009 |
The following is a reconciliation of Level 3 securities for which significant unobservable inputs were used to determine fair value:
| | | | | | | | | | | | | | | | | | | | |
| | | Balance
January 1, 2009 | | Net
Purchases/
(Sales) | | | Transfers
to/from
Level 3 | | Change in
Unrealized
Gain (Loss) | | Realized
Gain (Loss) | | | Balance
December 31, 2009 |
Bond | | $ | 43 | | $ | (15 | ) | | $ | — | | $ | 28 | | $ | (56 | ) | | $ | — |
(k) Subsequent Events
The Funds’ management has have evaluated subsequent events through the issuance of their financial statements on February 22, 2010 and determined no subsequent event occurred.
(2) Accounting Pronouncements
In January 2010, the Financial Accounting Standards Board (“FASB”) issued Accounting Standards Update “Improving Disclosures about Fair Value Measurements” that requires additional disclosures regarding fair value measurements. Certain required disclosures are effective for interim and annual reporting periods beginning after December 15, 2009, and other required disclosures are effective for fiscal years beginning after December 15, 2010, and for interim periods within those fiscal years. Management is currently evaluating the impact it will have on its financial statement disclosures.
In June 2009, the FASB issued SFAS No. 168, “The FASB Accounting Standards Codification™ and the Hierarchy of Generally Accepted Accounting Principles—a replacement of FASB Statement No 162” (“SFAS 168”). SFAS 168 replaces SFAS No. 162, “The Hierarchy of Generally Accepted Accounting Principles” and establishes the “FASB Accounting Standards Codification™” (“Codification”) as the source of authoritative accounting principles recognized by the FASB to be applied by nongovernmental entities in the preparation of financial statements in conformity with U.S. GAAP. All guidance contained in the Codification carries an equal level of authority. On the effective date of SFAS 168, the Codification will supersede all then-existing non-SEC accounting and reporting standards. All other non-grandfathered non-SEC accounting literature not included in the Codification will become non-authoritative. SFAS 168 is effective for financial statements issued for interim and annual periods ending after September 15, 2009. The Funds adopted and incorporated this statement, and it did not have a significant impact on the determination or reporting of the Funds’ financial statements.
(3) Transactions with Affiliates
(a) Management and Expense Limitation Agreements
The Institutional International Growth and Institutional International Equity Portfolios have a management agreement with William Blair & Company L.L.C. (the “Company”) for investment advisory, administrative, and other accounting services. The Portfolios pay the Company an annual fee, payable monthly, based on a specified percentage of its average daily net assets. A summary of the annual rates expressed as a percentage of average daily net assets is as follows:
| | | |
First $500 million | | 1.00 | % |
Next $500 million | | 0.95 | % |
In excess of $1 billion | | 0.90 | % |
The International Small Cap Growth Portfolio pays the Company a 1.00% annual fee payable monthly, based on its average daily net assets. The Emerging Markets Growth Portfolio and Emerging Leaders Growth Portfolio pay the Company a 1.10% annual fee payable monthly, based on its average daily net assets. The Bond Portfolio pays the Company a 0.30% annual fee payable monthly, based on its average daily net assets.
All of the Portfolios, except Institutional International Growth Fund, have also entered into Expense Limitation Agreements with the Company. Under the terms of these agreements, the Advisor will waive its management fee and/or reimburse the Portfolio for expenses in excess of the agreed upon rate. The amount the Advisor owes a Portfolio as of the report date is recorded as the Receivable from Advisor on the Statement of Assets and Liabilities. The Advisor reimburses the Portfolios on an annual basis. Under the terms of these Agreements, the Company has agreed to waive its advisory fees and/or absorb
December 31, 2009 | William Blair Funds 55 |
other operating expenses through April 30, 2010, if total expenses of the Portfolios exceed the following rates (as a percentage of average daily net assets):
| | | | | | |
Portfolio | | Effective
May 1, 2008
through
April 30, 2009 | | | Effective
May 1, 2009
through
April 30, 2010 | |
Institutional International Equity | | 1.10 | % | | 1.10 | % |
International Small Cap Growth | | 1.25 | % | | 1.25 | % |
Emerging Markets Growth | | 1.25 | % | | 1.25 | % |
Emerging Leaders Growth | | 1.25 | % | | 1.25 | % |
Bond | | 0.35 | % | | 0.35 | % |
Low Duration | | N/A | | | 0.40 | %(a) |
| (a) | | Effective December 1, 2009 through April 30, 2011. |
For a period of three years subsequent to the Commencement of Operations of the Portfolio, the Company is entitled to reimbursement from the Emerging Leaders Growth and Bond Portfolios for previously waived fees and expenses to the extent the overall expense ratio remains below the percentages indicated. The total amount available for recapture at December 31, 2009 is $140, $285 and $14 (in thousands) for the Emerging Leaders Growth, Bond and Low Duration Bond Portfolio respectively. As a result, the total expense ratio for a Portfolio during the period the agreement is in effect will not fall below the percentage indicated.
For the year ended December 31, 2009, the fees incurred by the Portfolio and related fee waivers were as follows (in thousands):
| | | | | | | | | | | | |
Portfolio | | Fund
Level
Waiver | | Class I
Specific
Waiver | | Class N
Specific
Waiver | | Total
Waiver |
International Small Cap Growth | | $ | — | | $ | — | | $ | 20 | | $ | 20 |
Emerging Markets Growth | | | — | | | — | | | 25 | | | 25 |
Emerging Leaders Growth | | | 98 | | | 1 | | | — | | | 99 |
Bond | | | 96 | | | 3 | | | 16 | | | 115 |
Low Duration | | | 14 | | | — | | | — | | | 14 |
(b) Investments in Affiliated Portfolio
Pursuant to the rules of the 1940 Act, each of the Portfolios of the Fund may invest in the William Blair Ready Reserves Portfolio (“Ready Reserves”), an open-end money market portfolio managed by the Advisor. Ready Reserves Portfolio is used as a cash management option by the other Portfolios in the Fund. The Advisor waives management fees in an amount equal to the management fee and service fee that Ready Reserves receives based on the Portfolio’s net assets, less any waivers if applicable. The fees waived with respect to each Portfolio for the year ended December 31, 2009 are listed below. Distributions received from Ready Reserves are reflected as “Dividend income from Affiliated Fund” in each Portfolio’s Statement of Operations. Amounts relating to the Portfolios’ investments in Ready Reserves were as follows for the year ended December 31, 2009 (in thousands):
| | | | | | | | | | | | | | | | | | | | | |
| | | 12/31/08
Value | | Purchases | | Sales | | Fees
Waived | | Dividend
Income | | 12/31/09
Value | | Percent
of Net
Assets | |
Institutional International Growth | | $ | 12,528 | | $ | 7 | | $ | 8,000 | | $ | 21 | | $ | 8 | | $ | 4,535 | | 0.3 | % |
Institutional International Equity | | | 4,949 | | | 9,004 | | | 13,000 | | | 8 | | | 1 | | | 953 | | 0.3 | % |
International Small Cap Growth | | | 3,287 | | | 2 | | | 2,800 | | | 5 | | | 2 | | | 489 | | 0.1 | % |
Emerging Markets Growth | | | 2,065 | | | 1 | | | 2,000 | | | 2 | | | 1 | | | 66 | | 0.0 | % |
Emerging Leaders Growth | | | 740 | | | 500 | | | 800 | | | 1 | | | — | | | 440 | | 0.4 | % |
56 Annual Report | December 31, 2009 |
(4) Investment Transactions
Investment transactions, excluding money market instruments, for the year ended December 31, 2009, were as follows (in thousands):
| | | | | | | |
Portfolio | | Purchases | | Sales | |
Institutional International Growth | | $ | 1,350,884 | | $ | (1,387,695 | ) |
Institutional International Equity | | | 249,943 | | | (328,727 | ) |
International Small Cap Growth | | | 425,453 | | | (469,087 | ) |
Emerging Markets Growth | | | 1,000,892 | | | (768,098 | ) |
Emerging Leaders Growth | | | 163,646 | | | (150,579 | ) |
Bond | | | 110,740 | | | (34,843 | ) |
Income | | | 73,657 | | | (33 | ) |
(5) Forward Foreign Currency Contracts
The Portfolios (excluding the Bond Portfolio) from time to time may enter into forward foreign currency contracts with the Fund’s custodian and other counterparties in an attempt to hedge against a decline in the value of foreign currency against the U.S. dollar. The Portfolios bear the market risk that arises from changes in foreign currency rates and bear the credit risk if the counterparty fails to perform under the contract.
For the year ended December 31, 2009, the Institutional International Growth and Institutional International Equity Portfolios engaged in forward foreign currency contracts with total volume (in thousands) of $483,700 and $14,700, respectively.
The following table presents the value of open forward foreign currency contracts as of December 31, 2009 and their respective location on the Statement of Assets and Liabilities (values in thousands):
| | | | | | | | | | |
| | | Assets | | Liabilities |
Fund | | Statement of Assets and
Liabilities Location | | Value | | Statement of Assets and
Liabilities Location | | Value |
Institutional International Growth | | Unrealized appreciation on foreign
forward currency contracts | | $ | 4,511 | | Unrealized depreciation on foreign
forward currency contracts | | $ | — |
The effect of forward foreign currency contracts on the Statements of Operations for the year ended December 31, 2009 (values in thousands):
| | | | |
Realized gain (loss) recognized in foreign currency transactions | | | |
Fund | | Value | |
Institutional International Growth | | $ | 9,964 | |
Institutional International Equity | | | (71 | ) |
| |
Change in unrealized gain (loss) recognized in foreign currency translations | | | |
Fund | | Value | |
Institutional International Growth | | $ | 4,511 | |
The following table presents open forward foreign currency contracts as of December 31, 2009 (values in thousands):
| | | | | | | | | | | |
Institutional International Growth Fund | | Settlement Date | | Currency Received | | Currency Delivered | | Unrealized
Gain/Loss |
Swiss Francs | | 3/17/2010 | | USD | 20,586 | | CHF | 21,286 | | $ | 167 |
European Monetary Unit | | 3/16/2010 | | USD | 72,455 | | EUR | 50,548 | | | 1,998 |
British Pound Sterling | | 3/17/2010 | | USD | 93,206 | | GBP | 57,731 | | | 794 |
Japanese Yen | | 3/18/2010 | | USD | 28,928 | | JPY | 2,693,207 | | | 1,552 |
| | | | | | | | | | | |
| | | | | | | | | | $ | 4,511 |
| | | | | | | | | | | |
December 31, 2009 | William Blair Funds 57 |
(6) Fund Share Transactions
The following table summarizes the activity in capital shares of each Portfolio (in thousands):
| | | | | | | | | | | | | |
| | | Dollars | |
| | | For the year ended December 31, 2009 | |
Portfolio | | Sales | | Reinvested
Distributions | | Redemptions | | Net change in
Net Assets
relating to fund
share activity | |
Institutional International Growth | | $ | 165,765 | | $ | 16,959 | | $ | 199,645 | | $ | (16,921 | ) |
Institutional International Equity | | | 20,848 | | | 2,587 | | | 104,043 | | | (80,608 | ) |
International Small Cap Growth | | | 30,712 | | | 427 | | | 141,722 | | | (110,583 | ) |
Emerging Markets Growth | | | 347,835 | | | 8,712 | | | 138,100 | | | 218,447 | |
Emerging Leaders Growth | | | 38,546 | | | 1,366 | | | 27,894 | | | 12,018 | |
Bond | | | 5,199 | | | 772 | | | 1,064 | | | 4,907 | |
Low Duration (a) | | | 13,501 | | | — | | | — | | | 13,501 | |
| |
| | | Dollars | |
| | | For the year ended December 31, 2008 | |
Portfolio | | Sales | | Reinvested
Distributions | | Redemptions | | Net change in
Net Assets
relating to fund
share activity | |
Institutional International Growth | | $ | 133,829 | | $ | 59,025 | | $ | 168,222 | | $ | 24,632 | |
Institutional International Equity | | | 126,297 | | | 6,176 | | | 48,108 | | | 84,365 | |
International Small Cap Growth | | | 142,503 | | | 3,161 | | | 12,596 | | | 133,068 | |
Emerging Markets Growth | | | 34,013 | | | 32,217 | | | 104,349 | | | (38,119 | ) |
Emerging Leaders Growth (b) | | | 100,679 | | | 79 | | | 7,902 | | | 92,856 | |
Bond | | | 553 | | | 523 | | | 2,185 | | | (1,109 | ) |
| |
| | | Shares | |
| | | For the year ended December 31, 2009 | |
Portfolio | | Sales | | Reinvested
Distributions | | Redemptions | | Net change in
Net Assets
relating to fund
share activity | |
Institutional International Growth | | | 16,035 | | | 1,423 | | | 20,023 | | | (2,565 | ) |
Institutional International Equity | | | 2,541 | | | 270 | | | 14,163 | | | (11,352 | ) |
International Small Cap Growth | | | 3,235 | | | 41 | | | 16,155 | | | (12,879 | ) |
Emerging Markets Growth | | | 36,231 | | | 690 | | | 12,815 | | | 24,106 | |
Emerging Leaders Growth | | | 6,962 | | | 167 | | | 3,666 | | | 3,463 | |
Bond | | | 532 | | | 77 | | | 108 | | | 501 | |
Low Duration (a) | | | 1,360 | | | — | | | — | | | 1,360 | |
| |
| | | Shares | |
| | | For the year ended December 31, 2008 | |
Portfolio | | Sales | | Reinvested
Distributions | | Redemptions | | Net change in
Net Assets
relating to fund
share activity | |
Institutional International Growth | | | 8,158 | | | 6,903 | | | 11,459 | | | 3,602 | |
Institutional International Equity | | | 11,840 | | | 846 | | | 5,365 | | | 7,321 | |
International Small Cap Growth | | | 13,065 | | | 473 | | | 1,387 | | | 12,151 | |
Emerging Markets Growth | | | 4,314 | | | 4,250 | | | 5,552 | | | 3,012 | |
Emerging Leaders Growth (b) | | | 9,918 | | | 16 | | | 789 | | | 9,145 | |
Bond | | | 55 | | | 54 | | | 221 | | | (112 | ) |
| (a) | | For the period from December 1, 2009 (Commencement of Operations) to December 31, 2009. |
| (b) | | 2008 information is for the period from March 26, 2008 (Commencement of Operations) to December 31, 2008. |
58 Annual Report | December 31, 2009 |
Financial Highlights
Institutional International Growth Fund
| | | | | | | | | | | | | | | | |
| | | |
| | | Years Ended December 31, |
| | | 2009 | | 2008 | | | 2007 | | 2006 | | 2005 |
Net asset value, beginning of year | | $ | 8.66 | | $ | 19.20 | | | $ | 19.39 | | $ | 18.11 | | $ | 16.06 |
Income (loss) from investment operations: | | | | | | | | | | | | | | | | |
Net investment income (loss)(a) | | | 0.10 | | | 0.25 | | | | 0.15 | | | 0.11 | | | 0.09 |
Net realized and unrealized gain (loss) on investments | | | 3.61 | | | (10.24 | ) | | | 3.30 | | | 4.09 | | | 3.53 |
| | | | | | | | | | | | | | | | |
Total from investment operations | | | 3.71 | | | (9.99 | ) | | | 3.45 | | | 4.20 | | | 3.62 |
Less distributions from: | | | | | | | | | | | | | | | | |
Net investment income | | | 0.17 | | | — | | | | 0.35 | | | 0.38 | | | 0.15 |
Net realized gain | | | — | | | 0.55 | | | | 3.29 | | | 2.54 | | | 1.42 |
| | | | | | | | | | | | | | | | |
Total distributions | | | 0.17 | | | 0.55 | | | | 3.64 | | | 2.92 | | | 1.57 |
| | | | | | | | | | | | | | | | |
Net asset value, end of year | | $ | 12.20 | | $ | 8.66 | | | $ | 19.20 | | $ | 19.39 | | $ | 18.11 |
| | | | | | | | | | | | | | | | |
Total return (%) | | | 42.83 | | | (51.99 | ) | | | 18.49 | | | 23.45 | | | 22.76 |
Ratios to average daily net assets (%): | | | | | | | | | | | | | | | | |
Expenses, net of waivers and reimbursements | | | 1.01 | | | 0.98 | | | | 1.02 | | | 1.03 | | | 1.05 |
Expenses, before waivers and reimbursements | | | 1.01 | | | 0.98 | | | | 1.02 | | | 1.03 | | | 1.05 |
Net investment income (loss), net of waivers and reimbursements | | | 0.95 | | | 1.68 | | | | 0.74 | | | 0.54 | | | 0.52 |
Net investment income (loss), before waivers and reimbursements | | | 0.95 | | | 1.68 | | | | 0.74 | | | 0.54 | | | 0.52 |
| |
| | | |
| | | Years Ended December 31, |
| | | 2009 | | 2008 | | | 2007 | | 2006 | | 2005 |
Supplemental data for all classes: | | | | | | | | | | | | | | | | |
Net assets at end of year (in thousands) | | $ | 1,375,848 | | $ | 998,266 | | | $ | 2,145,312 | | $ | 1,875,341 | | $ | 1,555,414 |
Portfolio turnover rate (%) | | | 125 | | | 86 | | | | 61 | | | 74 | | | 74 |
| (a) | | Excludes $0.05, $(0.10), $0.06, $0.29, and $0.10 of PFIC mark to market, which is treated as ordinary income for Federal tax purposes for the years 2009, 2008, 2007, 2006 and 2005, respectively. |
Performance cited represents past performance. Past performance does not guarantee future results and current performance may be lower or higher than the data quoted. Results shown are annual returns, which assume reinvestment of dividends and capital gains. Investment returns and principal will fluctuate and you may have a gain or loss when you sell shares. For the most current month-end performance information, please call 1-800-742-7272 or visit our Web site at www.williamblairfunds.com.
Note: Net investment income (loss) per share is based on the average shares outstanding during the year.
December 31, 2009 | William Blair Funds 59 |
Financial Highlights
Institutional International Equity Fund
| | | | | | | | | | | | | | | | | |
| | | | |
| | | Years Ended December 31, | |
| | | 2009 | | 2008 | | | 2007 | | 2006 | | 2005 | |
Net asset value, beginning of year | | $ | 7.44 | | $ | 15.03 | | | $ | 14.27 | | $ | 12.04 | | $ | 10.20 | |
Income (loss) from investment operations: | | | | | | | | | | | | | | | | | |
Net investment income (loss)(a) | | | 0.09 | | | 0.15 | | | | 0.13 | | | 0.07 | | | 0.00 | * |
Net realized and unrealized gain (loss) on investments | | | 2.38 | | | (7.60 | ) | | | 2.42 | | | 2.37 | | | 1.86 | |
| | | | | | | | | | | | | | | | | |
Total from investment operations | | | 2.47 | | | (7.45 | ) | | | 2.55 | | | 2.44 | | | 1.86 | |
Less distributions from: | | | | | | | | | | | | | | | | | |
Net investment income | | | 0.07 | | | — | | | | 0.22 | | | 0.16 | | | 0.02 | |
Net realized gain | | | — | | | 0.14 | | | | 1.57 | | | 0.05 | | | — | |
| | | | | | | | | | | | | | | | | |
Total distributions | | | 0.07 | | | 0.14 | | | | 1.79 | | | 0.21 | | | 0.02 | |
| | | | | | | | | | | | | | | | | |
Net asset value, end of year | | $ | 9.84 | | $ | 7.44 | | | $ | 15.03 | | $ | 14.27 | | $ | 12.04 | |
| | | | | | | | | | | | | | | | | |
Total return (%) | | | 33.27 | | | (49.57 | ) | | | 18.36 | | | 20.22 | | | 18.26 | |
Ratios to average daily net assets (%): | | | | | | | | | | | | | | | | | |
Expenses, net of waivers and reimbursements | | | 1.09 | | | 1.05 | | | | 1.09 | | | 1.10 | | | 1.10 | |
Expenses, before waivers and reimbursements | | | 1.09 | | | 1.05 | | | | 1.06 | | | 1.12 | | | 1.35 | |
Net investment income (loss), net of waivers and reimbursements | | | 1.04 | | | 1.26 | | | | 0.86 | | | 0.50 | | | 0.31 | |
Net investment income (loss), before waivers and reimbursements | | | 1.04 | | | 1.26 | | | | 0.89 | | | 0.48 | | | 0.06 | |
| |
| | | | |
| | | Years Ended December 31, | |
| | | 2009 | | 2008 | | | 2007 | | 2006 | | 2005 | |
Supplemental data for all classes: | | | | | | | | | | | | | | | | | |
Net assets at end of year (in thousands) | | $ | 365,271 | | $ | 360,451 | | | $ | 618,179 | | $ | 598,375 | | $ | 250,929 | |
Portfolio turnover rate (%) | | | 78 | | | 91 | | | | 66 | | | 79 | | | 84 | |
| (a) | | Excludes $0.00, $(0.07), $0.01, $0.23, and $0.27 of PFIC mark to market, which is treated as ordinary income for Federal tax purposes for the years 2009, 2008, 2007, 2006 and 2005, respectively. |
| * | | Amount is less than $0.005 per share. |
Performance cited represents past performance. Past performance does not guarantee future results and current performance may be lower or higher than the data quoted. Results shown are annual returns, which assume reinvestment of dividends and capital gains. Investment returns and principal will fluctuate and you may have a gain or loss when you sell shares. For the most current month-end performance information, please call 1-800-742-7272 or visit our Web site at www.williamblairfunds.com.
Note: Net investment income (loss) per share is based on the average shares outstanding during the year.
60 Annual Report | December 31, 2009 |
Financial Highlights
International Small Cap Growth Fund
Institutional Class Shares
| | | | | | | | | | | | | | | | | | |
| | | | |
| | | Periods Ended December 31, | |
| | | 2009 | | 2008 | | | 2007 | | 2006 | | | 2005(a) | |
Net asset value, beginning of year | | $ | 6.69 | | $ | 14.04 | | | $ | 13.43 | | $ | 11.16 | | | $ | 10.00 | |
Income (loss) from investment operations: | | | | | | | | | | | | | | | | | | |
Net investment income (loss)(b) | | | 0.04 | | | 0.03 | | | | 0.05 | | | (0.01 | ) | | | 0.00 | * |
Net realized and unrealized gain (loss) on investments | | | 3.83 | | | (7.26 | ) | | | 1.72 | | | 2.34 | | | | 1.16 | |
| | | | | | | | | | | | | | | | | | |
Total from investment operations | | | 3.87 | | | (7.23 | ) | | | 1.77 | | | 2.33 | | | | 1.16 | |
Less distributions from: | | | | | | | | | | | | | | | | | | |
Net investment income | | | 0.03 | | | — | | | | 0.12 | | | 0.01 | | | | 0.00 | * |
Net realized gain | | | — | | | 0.12 | | | | 1.04 | | | 0.05 | | | | — | |
| | | | | | | | | | | | | | | | | | |
Total distributions | | | 0.03 | | | 0.12 | | | | 1.16 | | | 0.06 | | | | 0.00 | * |
| | | | | | | | | | | | | | | | | | |
Net asset value, end of year | | $ | 10.53 | | $ | 6.69 | | | $ | 14.04 | | $ | 13.43 | | | $ | 11.16 | |
| | | | | | | | | | | | | | | | | | |
Total return (%) | | | 57.84 | | | (51.53 | ) | | | 13.53 | | | 20.86 | | | | 11.62 | (c) |
Ratios to average daily net assets (%): | | | | | | | | | | | | | | | | | | |
Expenses, net of waivers and reimbursements | | | 1.13 | | | 1.14 | | | | 1.14 | | | 1.25 | | | | 1.25 | (d) |
Expenses, before waivers and reimbursements | | | 1.13 | | | 1.11 | | | | 1.14 | | | 1.31 | | | | 2.17 | (d) |
Net investment income (loss), net of waivers and reimbursements | | | 0.48 | | | 0.28 | | | | 0.32 | | | (0.12 | ) | | | 0.00 | (d) |
Net investment income (loss), before waivers and reimbursements | | | 0.48 | | | 0.32 | | | | 0.32 | | | (0.18 | ) | | | 0.92 | (d) |
| |
| | | | |
| | | Periods Ended December 31, | |
| | | 2009 | | 2008 | | | 2007 | | 2006 | | | 2005(a) | |
Supplemental data for all classes: | | | | | | | | | | | | | | | | | | |
Net assets at end of year (in thousands) | | $ | 390,851 | | $ | 291,988 | | | $ | 401,459 | | $ | 231,969 | | | $ | 50,534 | |
Portfolio turnover rate (%) | | | 136 | | | 78 | | | | 88 | | | 109 | | | | 127 | (d) |
| (a) | | For the period November 1, 2005 (Commencement of Operations) to December 31, 2005. |
| (b) | | Excludes $0.01, $(0.02), $0.05, $0.00, and $0.11 of PFIC mark to market, which is treated as ordinary income for Federal tax purposes for the years 2009, 2008, 2007, 2006 and 2005, respectively. |
| (c) | | Total return is not annualized for periods that are less than a year. |
| (d) | | Rates are annualized for periods that are less than a year. |
| * | | Amount is less than $0.005 per share. |
Performance cited represents past performance. Past performance does not guarantee future results and current performance may be lower or higher than the data quoted. Results shown are annual returns, which assume reinvestment of dividends and capital gains. Investment returns and principal will fluctuate and you may have a gain or loss when you sell shares. For the most current month-end performance information, please call 1-800-742-7272 or visit our Web site at www.williamblairfunds.com.
Note: Net investment income (loss) per share is based on the average shares outstanding during the year.
December 31, 2009 | William Blair Funds 61 |
Financial Highlights
Emerging Markets Growth Fund
Institutional Class Shares
| | | | | | | | | | | | | | | | | | |
| | | | |
| | | Periods Ended December 31, | |
| | | 2009 | | 2008 | | | 2007 | | | 2006 | | 2005(a) | |
Net asset value, beginning of year | | $ | 7.56 | | $ | 22.07 | | | $ | 19.54 | | | $ | 14.20 | | $ | 10.00 | |
Income (loss) from investment operations: | | | | | | | | | | | | | | | | | | |
Net investment income (loss)(b) | | | 0.06 | | | 0.17 | | | | (0.01 | ) | | | 0.02 | | | 0.01 | |
Net realized and unrealized gain (loss) on investments | | | 5.55 | | | (13.74 | ) | | | 7.27 | | | | 5.44 | | | 4.27 | |
| | | | | | | | | | | | | | | | | | |
Total from investment operations | | | 5.61 | | | (13.57 | ) | | | 7.26 | | | | 5.46 | | | 4.28 | |
Less distributions from: | | | | | | | | | | | | | | | | | | |
Net investment income | | | 0.14 | | | — | | | | 0.19 | | | | 0.01 | | | — | |
Net realized gain | | | — | | | 0.94 | | | | 4.54 | | | | 0.11 | | | 0.08 | |
| | | | | | | | | | | | | | | | | | |
Total distributions | | | 0.14 | | | 0.94 | | | | 4.73 | | | | 0.12 | | | 0.08 | |
| | | | | | | | | | | | | | | | | | |
Net asset value, end of year | | $ | 13.03 | | $ | 7.56 | | | $ | 22.07 | | | $ | 19.54 | | $ | 14.20 | |
| | | | | | | | | | | | | | | | | | |
Total return (%) | | | 74.33 | | | (61.51 | ) | | | 38.21 | | | | 38.49 | | | 42.82 | (c) |
Ratios to average daily net assets (%): | | | | | | | | | | | | | | | | | | |
Expenses, net of waivers and reimbursements | | | 1.22 | | | 1.22 | | | | 1.25 | | | | 1.25 | | | 1.25 | (d) |
Expenses, before waivers and reimbursements | | | 1.22 | | | 1.20 | | | | 1.25 | | | | 1.32 | | | 1.61 | (d) |
Net investment income (loss), net of waivers and reimbursements | | | 0.54 | | | 1.08 | | | | (0.05 | ) | | | 0.09 | | | 0.19 | (d) |
Net investment income (loss), before waivers and reimbursements | | | 0.54 | | | 1.10 | | | | (0.05 | ) | | | 0.02 | | | (0.17 | )(d) |
| |
| | | | |
| | | Periods Ended December 31, | |
| | | 2009 | | 2008 | | | 2007 | | | 2006 | | 2005(a) | |
Supplemental data for all classes: | | | | | | | | | | | | | | | | | | |
Net assets at end of year (in thousands) | | $ | 1,038,260 | | $ | 385,588 | | | $ | 1,165,854 | | | $ | 813,649 | | $ | 249,348 | |
Portfolio turnover rate (%) | | | 113 | | | 118 | | | | 100 | | | | 113 | | | 77 | (d) |
| (a) | | For the period June 6, 2005 (Commencement of Operations) to December 31, 2005. |
| (b) | | Excludes $0.15, $(0.09), $0.21, $0.00, and $0.11 of PFIC mark to market, which is treated as ordinary income for Federal tax purposes for the years 2009, 2008, 2007, 2006 and 2005, respectively. |
| (c) | | Total return is not annualized for periods that are less than a year. |
| (d) | | Rates are annualized for periods that are less than a year. |
| * | | Amount is less than $0.005 per share. |
Performance cited represents past performance. Past performance does not guarantee future results and current performance may be lower or higher than the data quoted. Results shown are annual returns, which assume reinvestment of dividends and capital gains. Investment returns and principal will fluctuate and you may have a gain or loss when you sell shares. For the most current month-end performance information, please call 1-800-742-7272 or visit our Web site at www.williamblairfunds.com.
Note: Net investment income (loss) per share is based on the average shares outstanding during the year.
62 Annual Report | December 31, 2009 |
Financial Highlights
Emerging Leaders Growth Fund
Institutional Class Shares
| | | | | | | |
| | | | |
| | | Periods Ended December 31, | |
| | | 2009 | | 2008(a) | |
Net asset value, beginning of year | | $ | 4.78 | | $ | 10.00 | |
Income (loss) from investment operations: | | | | | | | |
Net investment income (loss)(b) | | | 0.04 | | | 0.04 | |
Net realized and unrealized gain (loss) on investments | | | 3.73 | | | (5.26 | ) |
| | | | | | | |
Total from investment operations | | | 3.77 | | | (5.22 | ) |
Less distributions from: | | | | | | | |
Net investment income | | | 0.12 | | | 0.00 | * |
Net realized gain | | | — | | | — | |
| | | | | | | |
Total distributions | | | 0.12 | | | 0.00 | |
| | | | | | | |
Net asset value, end of year | | $ | 8.43 | | $ | 4.78 | |
| | | | | | | |
Total return (%) | | | 78.93 | | | (52.11 | )(c) |
Ratios to average daily net assets (%): | | | | | | | |
Expenses, net of waivers and reimbursements | | | 1.25 | | | 1.25 | (d) |
Expenses, before waivers and reimbursements | | | 1.36 | | | 1.41 | (d) |
Net investment income (loss), net of waivers and reimbursements | | | 0.58 | | | 0.70 | (d) |
Net investment income (loss), before waivers and reimbursements | | | 0.47 | | | 0.54 | (d) |
| |
| | | | |
| | | Periods Ended December 31, | |
| | | 2009 | | 2008(a) | |
Supplemental data for all classes: | | | | | | | |
Net assets at end of year (in thousands) | | $ | 115,136 | | $ | 46,676 | |
Portfolio turnover rate (%) | | | 176 | | | 151 | (d) |
| (a) | | For the period May 1, 2007 (Commencement of Operations) to December 31, 2007. |
| (b) | | Excludes $1.29 and $0.00 of PFIC mark to market, which is treated as ordinary income for Federal tax purposes for the years 2009 and 2008. |
| (b) | | Total return is not annualized for periods that are less than a year. |
| (c) | | Rates are annualized for periods that are less than a year. |
| * | | Amount is less than $0.005 per share. |
Performance cited represents past performance. Past performance does not guarantee future results and current performance may be lower or higher than the data quoted. Results shown are annual returns, which assume reinvestment of dividends and capital gains. Investment returns and principal will fluctuate and you may have a gain or loss when you sell shares. For the most current month-end performance information, please call 1-800-742-7272 or visit our Web site at www.williamblairfunds.com.
Note: Net investment income (loss) per share is based on the average shares outstanding during the year.
December 31, 2009 | William Blair Funds 63 |
Financial Highlights
Bond Fund
Institutional Class Shares
| | | | | | | | | | | |
| | | | |
| | | Periods Ended December 31, | |
| | | 2009 | | 2008 | | | 2007(a) | |
Net asset value, beginning of year | | $ | 9.72 | | $ | 10.00 | | | $ | 10.00 | |
Income (loss) from investment operations: | | | | | | | | | | | |
Net investment income (loss) | | | 0.51 | | | 0.50 | | | | 0.32 | |
Net realized and unrealized gain (loss) on investments | | | 0.58 | | | (0.31 | ) | | | 0.03 | |
| | | | | | | | | | | |
Total from investment operations | | | 1.09 | | | 0.19 | | | | 0.35 | |
Less distributions from: | | | | | | | | | | | |
Net investment income | | | 0.51 | | | 0.47 | | | | 0.35 | |
Net realized gain | | | — | | | — | | | | 0.00 | * |
| | | | | | | | | | | |
Total distributions | | | 0.51 | | | 0.47 | | | | 0.35 | |
| | | | | | | | | | | |
Net asset value, end of year | | $ | 10.30 | | $ | 9.72 | | | $ | 10.00 | |
| | | | | | | | | | | |
Total return (%) | | | 11.47 | | | 1.95 | | | | 3.57 | (b) |
Ratios to average daily net assets (%): | | | | | | | | | | | |
Expenses, net of waivers and reimbursements | | | 0.34 | | | 0.35 | | | | 0.35 | (c) |
Expenses, before waivers and reimbursements | | | 0.43 | | | 0.56 | | | | 0.52 | (c) |
Net investment income (loss), net of waivers and reimbursements | | | 5.07 | | | 5.04 | | | | 5.09 | (c) |
Net investment income (loss), before waivers and reimbursements | | | 4.98 | | | 4.83 | | | | 4.92 | (c) |
| |
| | | | |
| | | Periods Ended December 31, | |
| | | 2009 | | 2008 | | | 2007(a) | |
Supplemental data for all classes: | | | | | | | | | | | |
Net assets at end of year (in thousands) | | $ | 147,344 | | $ | 74,613 | | | $ | 68,483 | |
Portfolio turnover rate (%) | | | 29 | | | 52 | | | | 38 | (c) |
| (a) | | For the period May 1, 2007 (Commencement of Operations) to December 31, 2007. |
| (b) | | Total return is not annualized for periods that are less than a year. |
| (c) | | Rates are annualized for periods that are less than a year. |
| * | | Amount is less than $0.005 per share. |
Performance cited represents past performance. Past performance does not guarantee future results and current performance may be lower or higher than the data quoted. Results shown are annual returns, which assume reinvestment of dividends and capital gains. Investment returns and principal will fluctuate and you may have a gain or loss when you sell shares. For the most current month-end performance information, please call 1-800-742-7272 or visit our Web site at www.williamblairfunds.com.
Note: Net investment income (loss) per share is based on the average shares outstanding during the year.
64 Annual Report | December 31, 2009 |
Financial Highlights
Low Duration Fund
Institutional Class Shares
| | | | |
| | | | |
| | | Period Ended December 31, | |
| | | 2009(a) | |
Net asset value, beginning of period | | $ | 10.00 | |
Income (loss) from investment operations: | | | | |
Net investment income (loss) | | | 0.01 | |
Net realized and unrealized gain (loss) on investments | | | (0.07 | ) |
| | | | |
Total from investment operations | | | (0.06 | ) |
Less distributions from: | | | | |
Net investment income | | | 0.01 | |
Net realized gain | | | — | |
| | | | |
Total distributions | | | 0.01 | |
| | | | |
Net asset value, end of period | | $ | 9.93 | |
| | | | |
Total return (%) | | | (0.58 | )(b) |
Ratios to average daily net assets (%): | | | | |
Expenses, net of waivers and reimbursements | | | 0.40 | (c) |
Expenses, before waivers and reimbursements | | | 0.64 | (c) |
Net investment income (loss), net of waivers and reimbursements | | | 1.54 | (c) |
Net investment income (loss), before waivers and reimbursements | | | 1.30 | (c) |
| |
| | | | |
| | | Period Ended December 31, | |
| | | 2009(a) | |
Supplemental data for all classes: | | | | |
Net assets at end of period (in thousands) | | $ | 95,134 | |
Portfolio turnover rate (%) | | | — | (c) |
| (a) | | For the period December 1, 2009 (Commencement of Operations) to December 31, 2009. |
| (b) | | Total return is not annualized for periods that are less than a year. |
| (c) | | Rates are annualized for periods that are less than a year. |
Performance cited represents past performance. Past performance does not guarantee future results and current performance may be lower or higher than the data quoted. Results shown are annual returns, which assume reinvestment of dividends and capital gains. Investment returns and principal will fluctuate and you may have a gain or loss when you sell shares. For the most current month-end performance information, please call 1-800-742-7272 or visit our Web site at www.williamblairfunds.com.
Note: Net investment income (loss) per share is based on the average shares outstanding during the year.
December 31, 2009 | William Blair Funds 65 |
REPORT OF INDEPENDENT REGISTERED PUBLIC ACCOUNTING FIRM
To the Board of Trustees and Shareholders of
William Blair Funds
We have audited the accompanying statement of assets and liabilities, including the portfolios of investments, of the Institutional International Growth Fund, Institutional International Equity Fund, International Small Cap Growth Fund, Emerging Markets Growth Fund, Emerging Leaders Growth Fund, Bond Fund, and Low Duration Fund (collectively, the Portfolios) (seven of the Portfolios constituting the William Blair Funds) as of December 31, 2009, and the related statement of operations, the statements of changes in net assets and financial highlights for the periods indicated therein. These financial statements and financial highlights are the responsibility of the Portfolios’ management. Our responsibility is to express an opinion on these financial statements and financial highlights based on our audits.
We conducted our audits in accordance with the standards of the Public Company Accounting Oversight Board (United States). Those standards require that we plan and perform the audits to obtain reasonable assurance about whether the financial statements and financial highlights are free of material misstatement. We were not engaged to perform an audit of the Portfolios’ internal control over financial reporting. Our audits included consideration of internal control over financial reporting as a basis for designing audit procedures that are appropriate in the circumstances, but not for the purpose of expressing an opinion on the effectiveness of the Portfolios’ internal control over financial reporting. Accordingly, we express no such opinion. An audit also includes examining, on a test basis, evidence supporting the amounts and disclosures in the financial statements and financial highlights, assessing the accounting principles used and significant estimates made by management, and evaluating the overall financial statement presentation. Our procedures included confirmation of securities owned as of December 31, 2009, by correspondence with the custodian and brokers or by other appropriate auditing procedures where replies from brokers were not received. We believe that our audits provide a reasonable basis for our opinion.
In our opinion, the financial statements and financial highlights referred to above present fairly, in all material respects, the financial position of each of the above mentioned Portfolios of the William Blair Funds at December 31, 2009, the results of their operations, changes in their net assets and financial highlights for the periods indicated therein, in conformity with U.S. generally accepted accounting principles.

Chicago, Illinois
February 22, 2010
66 Annual Report | December 31, 2009 |
Trustees and Officers (Unaudited). The trustees and officers of the William Blair Funds, their year of birth, their principal occupations during the last five years, their affiliations, if any, with William Blair & Company, L.L.C., and other significant affiliations are set forth below. The address of each trustee and officer is 222 West Adams Street, Chicago, Illinois 60606.
| | | | | | | | | | |
Name and Year of Birth | | Position(s)
Held with
Fund | | Term of
Office and
Length of
Time
Served(1) | | Principal Occupation(s) During Past 5 Years | | Number of
Portfolios
in Fund
Complex
Overseen
by Trustee | | Other Directorships Held by Trustee/Officer |
Interested Trustees | | | | | | | | | | |
Frederick Conrad Fischer,
1934* | | Chairman of the Board of Trustees | | Since 1987 | | Principal, William Blair & Company, L.L.C.; Partner, APM Limited Partnership; Limited Partner, WB Holdings, L.P. (since November 2008) | | 18 | | Trustee Emeritus, Chicago Child Care Society, a non-profit organization; Trustee Emeritus, Kalamazoo College |
| | | | | |
Michelle R. Seitz,
1965* | | Trustee and President | | Since 2002 Since 2007 | | Principal, William Blair & Company, L.L.C.; Limited Partner, WB Holdings, L.P. (since November 2008); Member, WBC GP, L.L.P. (since November 2008) | | 18 | | N/A |
| | | | |
Non-Interested Trustees | | | | | | | | |
Ann P. McDermott,
1939 | | Trustee | | Since 1996 | | Board member and officer for various civic and charitable organizations over the past thirty years; professional experience prior thereto, registered representative for New York Stock Exchange firm | | 18 | | Northwestern University, Women’s Board; Rush Presbyterian St. Luke’s Medical Center, Women’s Board; University of Chicago, Women’s Board; Visiting Nurses Association, Honorary Director |
| | | | | |
Phillip O. Peterson,
1944 | | Trustee | | Since 2007 | | Trustee of Strong Funds Liquidating Trusts since 2005 and President, Strong Mutual Funds, 2004-2005; formerly, Partner, KPMG LLP | | 18 | | The Hartford Group of Mutual Funds (87 portfolios) |
| | | | | |
Donald J. Reaves,
1946 | | Trustee | | Since 2004 | | Chancellor, Winston-Salem State University; formerly, Vice President for Administration and Chief Financial Officer, University of Chicago 2002-2007. | | 18 | | American Student Assistance Corp., guarantor of student loans; Amica Mutual Insurance Company |
| | | | | |
Donald L. Seeley,
1944 | | Trustee | | Since 2003 | | Director, Applied Investment Management Program, University of Arizona Department of Finance, formerly, Vice Chairman and Chief Financial Officer, True North Communications, Inc., marketing communications and advertising firm | | 18 | | Warnaco Group, Inc., intimate apparel, sportswear, and swimwear manufacturer; Center for Furniture Craftsmanship (not-for-profit) |
| | | | | |
Thomas J. Skelly,
1951 | | Trustee | | Since 2007 | | Managing Partner of various divisions at Accenture | | 18 | | First MetLife Investors Insurance Company |
| | | | | |
Robert E. Wood II,
1938 | | Trustee | | Since 1999 | | Retired; formerly, Executive Vice President, Morgan Stanley Dean Witter | | 18 | | Chairman, Add-Vision, Inc., manufacturer of surface animation systems; Chairman Micro-Combustion, LLC |
December 31, 2009 | William Blair Funds 67 |
| | | | | | | | |
Name and Year of Birth | | Position(s)
Held with
Fund | | Term of
Office and
Length of
Time
Served(1) | | Principal Occupation(s) During Past 5 Years(2) | | Other Directorships Held by Trustee/Officer |
Officers | | | | | | | | |
Michael P. Balkin,
1959 | | Senior Vice President Vice President | | Since 2009 2008-2009 | | Principal, William Blair & Company, L.L.C. Associate, William Blair & Company, L.L.C.; former Chief Investment Officer, Magnetar Investment Management | | N/A |
| | | | |
Karl W. Brewer,
1966 | | Senior Vice President | | Since 2000 | | Principal, William Blair & Company, L.L.C. | | N/A |
| | | | |
David C. Fording,
1967 | | Senior Vice President Vice President | | Since 2009 2006-2009 | | Principal, William Blair & Company, L.L.C. Associate, William Blair & Company, L.L.C.; former Portfolio Manager, TIAA-CREF. | | N/A |
| | | | |
James S. Golan,
1961 | | Senior Vice President | | Since 2005 | | Principal, William Blair & Company, L.L.C. | | N/A |
| | | | |
W. George Greig,
1952 | | Senior Vice President | | Since 1996 | | Principal, William Blair & Company, L.L.C. | | N/A |
| | | | |
Michael A. Jancosek,
1959 | | Senior Vice President | | Since 2004 | �� | Principal, William Blair & Company L.L.C. | | N/A |
| | | | |
John F. Jostrand,
1954 | | Senior Vice President | | Since 1999 | | Principal, William Blair & Company, L.L.C. | | N/A |
| | | | |
Robert C. Lanphier, IV,
1956 | | Senior Vice President | | Since 2003 | | Principal, William Blair & Company, L.L.C. | | Chairman, AG. Med, Inc. |
| | | | |
Mark T. Leslie,
1967 | | Senior Vice President Vice President | | Since 2008 2005-2008 | | Principal, William Blair & Company, L.L.C. Associate, William Blair & Company, L.L.C. formerly, U.S. Bancorp Asset Management | | N/A |
| | | | |
Matthew A. Litfin,
1972 | | Senior Vice President | | Since 2008 | | Principal, William Blair & Company, L.L.C. | | N/A |
| | | | |
Kenneth J. McAtamney
1966 | | Senior Vice President | | Since 2008 | | Principal, William Blair & Company, L.L.C. | | N/A |
| | | | |
Todd M. McClone,
1968 | | Senior Vice President Vice President | | Since 2006 2005-2006 | | Principal, William Blair & Company, L.L.C. Associate, William Blair & Company, L.L.C. | | N/A N/A |
| | | | |
Tracy McCormick,
1954 | | Senior Vice President | | Since 2008 | | Principal, William Blair & Company, L.L.C. | | N/A |
| | | | |
David Merjan,
1960 | | Senior Vice President | | Since 2008 | | Principal, William Blair & Company, L.L.C. | | N/A |
68 Annual Report | December 31, 2009 |
| | | | | | | | |
Name and Year of Birth | | Position(s)
Held with
Fund | | Term of
Office and
Length of
Time
Served(1) | | Principal Occupation(s) During Past 5 Years(2) | | Other Directorships Held by Trustee/Officer |
David S. Mitchell,
1960 | | Senior Vice President | | Since 2004 | | Principal, William Blair & Company, L.L.C. | | N/A |
| | | | |
David P. Ricci,
1958 | | Senior Vice President | | Since 2006 | | Principal, William Blair & Company, L.L.C. | | N/A |
| | | | |
Richard W. Smirl,
1967 | | Senior Vice President | | Since 2004 | | Principal, William Blair & Company, L.L.C. | | N/A |
| | | | |
Jeffrey A. Urbina,
1955 | | Senior Vice President | | Since 1998 | | Principal, William Blair & Company, L.L.C. | | N/A |
| | | | |
Christopher T. Vincent,
1956 | | Senior Vice President | | Since 2004 | | Principal, William Blair & Company, L.L.C. | | N/A |
| | | | |
Chad M. Kilmer,
1975 | | Vice President | | Since 2006 | | Associate, William Blair & Company, L.L.C.; former analyst and Portfolio Manager U.S. Bancorp Asset Management. | | N/A |
| | | | |
Paul J. Sularz,
1967 | | Vice President | | Since 2009 | | Associate, William Blair & Company, L.L.C.; Vice President, J.P. Morgan Securities, Inc. | | N/A |
| | | | |
Terence M. Sullivan,
1944 | | Vice President | | Since 1997 | | Associate, William Blair & Company, L.L.C. | | N/A |
| | | | |
Walter R. Randall, Jr.,
1960 | | Chief Compliance Officer | | Since 2009 | | Associate, William Blair & Company, L.L.C.; Associate Counsel and Chief Compliance Officer, Calamos Investments; Assistant General Counsel, American Century Investments. | | N/A |
| | | | |
Colette M. Garavalia,
1961 | | Treasurer | | Since 2009 | | Associate, William Blair & Company, L.L.C. | | N/A |
| | | | |
| | Secretary | | 2000-2009 | | Associate, William Blair & Company, L.L.C.; | | N/A |
| | | | |
Andrew T. Pfau,
1970 | | Secretary | | Since 2009 | | Associate, William Blair & Company, L.L.C.; Associate, Bell, Boyd & Lloyd, LLP; Associate, Sidley Austin LLP | | N/A |
| * | | Mr. Fischer and Ms. Seitz are interested persons of the William Blair Funds because each is a principal of William Blair & Company, L.L.C., the Funds’ investment advisor, principal underwriter and distributor. |
| (1) | | Each Trustee serves until the election and qualification of a successor, or until death, resignation or retirement or removal as provided in the Fund’s Declaration of Trust. Retirement for non-interested Trustees occurs no later than at the conclusion of the first regularly scheduled Board meeting of the Fund’s fiscal year that occurs after the Trustee’s 72nd birthday. The Fund’s officers except the Chief Compliance Officer, are elected annually by the Trustees. The Fund’s Chief Compliance Officer is designated by the Board of Trustees and may only be removed by action of the Board of Trustees, including a majority of the non-interested Trustees. |
| (2) | | In November 2008, all current principals of William Blair & Company, L.L.C. also became limited partners in WB Holdings, L.P. |
The Statement of Additional Information for the William Blair Funds includes additional information about the trustees and is available without charge by calling 1-800-635-2886 (in Massachusetts 1-800-635-2840) or by writing the Fund.
December 31, 2009 | William Blair Funds 69 |
Approval of the Low Duration Fund’s Management Agreement
On October 27, 2009, the Board of Trustees of the William Blair Funds (the “Trust”), including those Trustees who are not interested persons of the Trust as defined by the Investment Company Act of 1940 (the “Independent Trustees”), approved the Management Agreement between the Trust, on behalf of the William Blair Low Duration Fund (the “Fund”), and William Blair & Company, L.L.C. (the “Advisor”). On September 15, October 26 and 27, 2009, the Board met to consider the approval of the Management Agreement. On October 26 and 27, 2009, the Independent Trustees also met independently of Trust management and the interested Trustees of the Trust to consider the approval of the Management Agreement. The Independent Trustees reviewed materials provided by the Advisor for the approval of the Management Agreement and were assisted by independent legal counsel in making their determination. The Board considered the following factors in making their determination, but did not identify any single factor or group of factors as all important or controlling and considered all factors together.
Nature, Quality and Extent of Services. In evaluating the nature, quality and extent of services expected to be provided by the Advisor to the Fund, the Board noted that the Advisor is a quality firm with a reputation for integrity and honesty that employs high quality people. The Board considered biographical information about the Fund’s portfolio managers, financial information regarding the Advisor, the compliance regime created by the Advisor and the proposed financial support of the Fund. The Board considered the Advisor’s past experience managing a low duration bond strategy and the Advisor’s experience in managing new funds. Based upon all relevant factors, the Board concluded that the nature, quality and extent of the services to be provided by the Advisor to the Fund are expected to be satisfactory.
The Independent Trustees reviewed performance information for the one-, three-, five- and ten-year periods for the Advisor’s Low Duration Fixed Income composite and the Merrill Lynch 3-month U.S. Treasury Bill Index, the Fund’s benchmark (the “Benchmark”). The performance information indicated that the Advisor’s Low Duration Fixed Income composite performed satisfactorily relative to the Benchmark for all periods.
Fees and Expenses. The Board reviewed the proposed advisory fee for the Fund and reviewed information comparing the advisory fee to a peer group of funds provided by Lipper Inc. The Lipper peer group for the Fund consisted of other no-load retail short investment-grade debt funds. In considering the information, the Board noted that the proposed advisory fee for the Fund was in the low end of the Lipper peer group. The Board also considered that the Advisor has proposed to limit total expenses, including waiving advisory fees, if necessary, for each share class of the Fund. The Board also reviewed the Advisor’s fee schedule for its Low Duration separate accounts. On the basis of the information provided, the Board concluded that the proposed advisory fee was reasonable and appropriate in light of the nature, quality and extent of services expected to be provided by the Advisor.
Profitability. With respect to the estimated profitability of the Management Agreement to the Advisor, the Board considered the proposed advisory fee, the expected size of the Fund and the Advisor’s agreement to limit total expenses. The Board concluded that the expected profits to be realized by the Advisor were not unreasonable.
Economies of Scale. The Board considered the extent to which economies of scale would be realized as the Fund grows and whether fee levels reflect these economies of scale. The Board considered whether the proposed advisory fee was reasonable in relation to the projected asset size of the Fund. In considering whether fee levels reflect economies of scale for the benefit of Fund investors, the Board reviewed the Fund’s advisory fee compared to peer funds, the Fund’s projected asset size, the Fund’s estimated expense ratios and the Advisor’s agreement to limit total expenses, and concluded that the advisory fee was reasonable.
Other Benefits to the Advisor. The Board considered benefits to be derived by the Advisor from its relationship with the Fund. The Board concluded that, after taking into account these benefits, the proposed advisory fee was reasonable.
Conclusion. Based upon all of the information considered and the conclusions reached, the Board determined that the terms of the Management Agreement are fair and reasonable and that the approval of the Management Agreement is in the best interests of the Fund.
70 Annual Report | December 31, 2009 |
(unaudited)
Proxy Voting
A description of the policies and procedures that the Fund uses to determine how to vote proxies relating to portfolio securities and information regarding how the Fund voted proxies relating to portfolio securities for the most recent 12-month period ended June 30 are available without charge, upon request, by calling 1-800-635-2886 (in Massachusetts 1-800-635-2840), at www.williamblairfunds.com and on the SEC’s website at http://www.sec.gov.
Quarterly Portfolio Schedules
Each Portfolio files its complete schedule of portfolio holdings with the SEC for the first and third fiscal quarters of each fiscal year (quarters ended March 31 and September 30) on Form N-Q. The Fund’s Forms N-Q are available on the SEC’s website at http://www.sec.gov and may be reviewed and copied at the SEC’s Public Reference Room in Washington, D.C. Information on the operation of the SEC’s Public Reference Room may be obtained by calling 1-800-SEC-0330. The Fund’s Forms N-Q are also available on the Fund’s website at www.williamblairfunds.com.
Additional Federal Income Tax Information: (unaudited)
The following table provides the percentage of the 2009 year-end distributions that qualify for the dividend received deduction, and the qualified dividend income percentage:
| | | | | | |
Portfolio | | Dividend
Received
Deduction% | | | Qualified
Dividend
Income% | |
Institutional International Growth | | 0.00 | % | | 100.00 | % |
Institutional International Equity | | 1.30 | % | | 100.00 | % |
International Small Cap Growth | | 0.00 | % | | 100.00 | % |
Emerging Markets Growth | | 0.00 | % | | 69.26 | % |
Emerging Leaders Growth | | 0.00 | % | | 57.56 | % |
Bond | | 0.00 | % | | 0.00 | % |
Low Duration | | 0.00 | % | | 0.00 | % |
In January 2010, you were notified on IRS Form 1099-Div or substitute 1099 DIV as to the Federal tax status of the distributions received by you in the calendar year 2009.
December 31, 2009 | William Blair Funds 71 |
Useful Information About Your Report (unaudited)
Please refer to this information when reviewing the Expense Example for each Portfolio.
Expense Example
As a shareholder of a Portfolio, you incur ongoing costs, including management fees and other Portfolio expenses. The example is intended to help you understand your ongoing costs (in dollars) of investing in the Portfolio and to compare these costs with the ongoing costs of investing in other mutual funds. To do so, compare the Portfolio’s 5% hypothetical example with the 5% hypothetical examples that appear in the shareholder reports of other funds. The example is based on an investment of $1,000 invested at the beginning of the period and held for the entire six-month period from July 1, 2009 to December 31, 2009.
Actual Expenses
In each example, the first line for each share class in the table provides information about the actual account values and actual expenses. These expenses reflect the effect of any expense cap applicable to the share class during the period. Without this expense cap, the costs shown in the table would have been higher. You may use the information in this line, together with the amount you invested, to estimate the expenses that you paid over the period. Simply divide your account value by $1,000 (example, an $8,600 account value divided by $1,000 = 8.6), then multiply the result by the number in the first line under the heading entitled “Expenses Paid During the Period” to estimate the expenses you paid on your account during the period.
Hypothetical Example for Comparison Purposes
In each example, the second line for each share class in the table provides information about hypothetical account values and hypothetical expenses based on the Portfolio’s actual expense ratio and an assumed rate of return of 5% per year before expenses. This is not the Portfolio’s actual return. The hypothetical account values and expenses may not be used to estimate the actual ending account balance or expenses you paid for the period. You may use this information to compare the ongoing costs of investing in the Portfolio to other funds. To do so, compare this 5% hypothetical example with the 5% hypothetical examples that appear in the shareholder reports of other funds.
Please note that the expenses shown in both examples are meant to highlight your ongoing costs only and do not reflect any transactional costs or account type fees. These fees are fully described in the prospectus. Therefore, the second line of each share class in the table is useful in comparing ongoing costs only and will not help you determine the relative costs of owning different funds.
72 Annual Report | December 31, 2009 |
Fund Expenses (unaudited)
The examples below show you the ongoing costs (in dollars) of investing in your fund and allows you to compare these costs with those of other mutual funds. Please refer to previous page for a detailed explanation of the information presented on this chart.
| | | | | | | | | | | | |
Expense Example | | Beginning
Account Value
7/1/2009 | | Ending
Account Value
12/31/2009 | | Expenses Paid
During the
Period(a) | | Annualized
Expense Ratio | |
Institutional International Growth Fund | | | | | | | | | | | | |
Institutional Class—actual return | | $ | 1,000.00 | | $ | 1,221.00 | | $ | 5.60 | | 1.00 | % |
Institutional Class—hypothetical 5% return | | | 1,000.00 | | | 1,020.16 | | | 5.09 | | 1.00 | |
Institutional International Equity Fund | | | | | | | | | | | | |
Class I—actual return | | | 1,000.00 | | | 1,207.70 | | | 6.07 | | 1.09 | |
Institutional Class—hypothetical 5% return . | | | 1,000.00 | | | 1,019.71 | | | 5.55 | | 1.09 | |
International Small Cap Growth Fund | | | | | | | | | | | | |
Institutional Class—actual return | | | 1,000.00 | | | 1,261.60 | | | 6.27 | | 1.10 | |
Institutional Class—hypothetical 5% return | | | 1,000.00 | | | 1,019.66 | | | 5.60 | | 1.10 | |
Emerging Markets Growth Fund | | | | | | | | | | | | |
Institutional Class—actual return . | | | 1,000.00 | | | 1,310.10 | | | 6.99 | | 1.20 | |
Institutional Class—hypothetical 5% return | | | 1,000.00 | | | 1,019.16 | | | 6.11 | | 1.20 | |
Emerging Leaders Growth Fund | | | | | | | | | | | | |
Institutional Class—actual return | | | 1,000.00 | | | 1,313.80 | | | 7.29 | | 1.25 | |
Institutional Class—hypothetical 5% return | | | 1,000.00 | | | 1,018.90 | | | 6.36 | | 1.25 | |
Bond Fund | | | | | | | | | | | | |
Institutional Class—actual return | | | 1,000.00 | | | 1,060.10 | | | 1.82 | | 0.35 | |
Institutional Class—hypothetical 5% return | | | 1,000.00 | | | 1,023.44 | | | 1.79 | | 0.35 | |
Low Duration Fund | | | | | | | | | | | | |
Institutional Class—actual return(b) | | | 1,000.00 | | | 994.20 | | | 0.34 | | 0.40 | |
Institutional Class—hypothetical 5% return(6 month period) | | | 1,000.00 | | | 1,023.19 | | | 2.04 | | 0.40 | |
| (a) | | Expenses are equal to the annualized expense ratio, multiplied by the average account value over the period, multiplied by the number of days in the period 184, and divided by 365 (to reflect the one-half year period). |
| (b) | | For the period December 1, 2009 (Commencement of Operations) to December 31, 2009. |
December 31, 2009 | William Blair Funds 73 |
BOARD OF TRUSTEES
Frederick Conrad Fischer, Chairman
Principal, William Blair & Company, L.L.C.
Ann P. McDermott
Director and Trustee
Profit and not-for-profit organizations
Phillip O. Peterson
Retired Partner, KPMG LLP
Donald J. Reaves
Chancellor, Winston-Salem State University
Donald L. Seeley
Adjunct Lecturer and Director, University of Arizona Department of Finance
Michelle R. Seitz, President
Principal, William Blair & Company, L.L.C.,
Thomas J. Skelly
Retired Managing Partner, Accenture U.S.
Robert E. Wood II
Retired Executive Vice President, Morgan Stanley Dean Witter
Officers
Michael P. Balkin, Senior Vice President
Karl W. Brewer, Senior Vice President
David C. Fording, Senior Vice President
James S. Golan, Senior Vice President
W. George Greig, Senior Vice President
Michael A. Jancosek, Senior Vice President
John F. Jostrand, Senior Vice President
Robert C. Lanphier, IV, Senior Vice President
Mark T. Leslie, Senior Vice President
Matthew A. Litfin, Senior Vice President
Kenneth J. McAtamney, Senior Vice President
Todd M. McClone, Senior Vice President
Tracy McCormick, Senior Vice President
David Merjan, Senior Vice President
David S. Mitchell, Senior Vice President
David P. Ricci, Senior Vice President
Richard W. Smirl, Senior Vice President
Jeffrey A. Urbina, Senior Vice President
Christopher T. Vincent, Senior Vice President
Chad M. Kilmer, Vice President
Paul J. Sularz, Vice President
Terence M. Sullivan, Vice President
Walter R. Randall, Jr., Chief Compliance Officer
Colette M. Garavalia, Treasurer
Andrew T. Pfau, Secretary
Investment Advisor
William Blair & Company, L.L.C.
Independent Registered Public Accounting Firm
Ernst & Young LLP
Legal Counsel
Vedder Price P.C.
Transfer Agent
Boston Financial Data Services, Inc.
P.O. Box 8506
Boston, MA 02266-8506
For customer assistance, call 1-800-635-2886
(Massachusetts 1-800-635-2840)
74 Annual Report | December 31, 2009 |

As of the end of the period covered by this Form N-CSR, the Registrant has adopted a code of ethics that applies to its principal executive officer and principal financial officer. Such code of ethics is posted on the Registrant’s website: www.williamblairfunds.com. There were no amendments to or waivers of the code of ethics during the period covered by this report.
| Item 3. | Audit Committee Financial Expert |
The Registrant’s Board of Trustees has determined that the Registrant has at least one “audit committee financial expert” (as defined in Item 3 of Form N-CSR) serving on its Audit Committee. Mr. Donald L. Seeley, the Registrant’s audit committee financial expert, is “independent” for purposes of Item 3 to Form N-CSR.
An “audit committee financial expert” is not an “expert” for any purpose, including for purposes of Section 11 of the Securities Act of 1933, as a result of being designated as an “audit committee financial expert.” Further, the designation of a person as an “audit committee financial expert” does not mean that the person has any greater duties, obligations, or liability than those imposed on the person without the “audit committee financial expert” designation. Similarly, the designation of a person as an “audit committee financial expert” does not affect the duties, obligations, or liability of any other member of the audit committee or Board of Trustees.
| Item 4. | Principal Accountant Fees and Services |
Audit Fees
For the fiscal years ended December 31, 2008 and 2009, Ernst & Young, LLP, the Registrant’s principal accountant (“E&Y”), billed the Registrant $484,000 and $488,500, respectively, for professional services rendered for the audit of the Registrant’s annual financial statements or services that are normally provided in connection with statutory and regulatory filings.
Audit-Related Fees
For the fiscal years ended December 31, 2008 and 2009, E&Y billed the Registrant $2,500 and $0, respectively, for assurance and related services that are reasonably related to the performance of the audit of the Registrant’s financial statements and that are not reported above, such as reviewing prospectuses and SEC filings. For the fiscal years ended December 31, 2008 and 2009, E&Y provided no audit-related services to William Blair & Company L.L.C., the Registrant’s investment advisor (“William Blair”) or any of its control affiliates that were for engagements directly related to the Registrant’s operations and financial reporting.
Tax Fees
For the fiscal years ended December 31, 2008 and 2009, E&Y billed the Registrant $90,500 and $108,475, respectively, for professional services rendered for tax compliance, tax advice and tax planning. Such services consisted of preparation of tax returns, year-end distribution review, qualifying dividend income analysis and computation of foreign tax credit pass-through. For the fiscal years ended December 31, 2008 and 2009, E&Y did not bill William Blair and its control affiliates for any services that were for engagements directly related to the Registrant’s operations and financial reporting.
All Other Fees
For the fiscal years ended December 31, 2008 and 2009, E&Y did not bill the Registrant for products and services other than the services reported above. For the fiscal years ended December 31, 2008 and 2009, E&Y provided no other services to William Blair or any of its control affiliates that were for engagements directly related to the Registrant’s operations and financial reporting.
Audit Committee Pre-Approval Policies and Procedures
Pursuant to Registrant’s Audit Committee Charter (the “Charter”), the Audit Committee is responsible for pre-approving any engagement of the principal accountant to provide non-prohibited services to the Registrant, including the fees and other compensation to be paid to the principal accountant, to the extent required by Rule 2-01(c)(7) of Regulation S-X. Pursuant to the Charter, the Audit Committee is also responsible for pre-approving any engagement of the principal accountant, including the fees and other compensation to be paid to the principal accountant, to provide non-audit services to the Registrant’s investment advisor (or any entity controlling, controlled by, or under common control with the adviser that provides ongoing services to the Registrant), if the engagement relates directly to the operations and financial reporting of the Registrant, to the extent required by Rule 2-01(c)(7) of Regulation S-X. The Chair of the Audit Committee may grant the pre-approval referenced above for non-prohibited and non-audit services. All such delegated pre-approvals will be presented to the Audit Committee no later than the next Audit Committee meeting.
Non-Audit Fees
For the fiscal years ended December 31, 2008 and 2009, E&Y billed the Registrant $90,500 and $108,475, respectively, in non-audit fees (tax services). For the same periods, E&Y billed William Blair and its control affiliates $0 and $0, respectively, in non-audit fees. The Registrant’s Audit Committee has considered whether the provision of non-audit services that were rendered to William Blair or any of its control affiliates that were not pre-approved pursuant to Rule 2-01(c)(7)(ii) of Regulation S-X is compatible with maintaining E&Y’s independence.
| Item 5. | Audit Committee of Listed Registrants |
Not Applicable to this Registrant, insofar as the Registrant is not a listed company.
| Item 6. | Schedule of Investments |
See Schedule of Investments in Item 1
| Item 7. | Disclosure of Proxy Voting Policies and Procedures for Closed-End Management Investment Companies |
Not applicable to this Registrant, insofar as the Registrant is not a closed-end management investment company.
| Item 8. | Portfolio Managers of Closed Investment Companies |
Not applicable to this Registrant, insofar as the Registrant is not a closed-end management investment company.
| Item 9. | Purchase of Equity Securities by Closed-End Management Investment Companies and Affiliated Purchasers |
Not applicable to this Registrant, insofar as the Registrant is not a closed-end management investment company.
| Item 10. | Submission of Matters to a Vote of Security Holders |
There have been no material changes to the procedures by which shareholders may recommend nominees to the Registrant’s Board of Trustees since the Registrant last provided disclosure in response to this item.
Controls and Procedures
(a) The Registrant’s principal executive and principal financial officer, or persons performing similar functions, have concluded that the Registrant’s Disclosure Controls and Procedures (as defined in Rule 30a-3(c) under the Investment Company Act of 1940, as amended (the “1940 Act”) (17 CFR 270.30a-3(c)) are effective, as of a date within 90 days of the filing date of this report that includes the disclosure required by this paragraph, based on their evaluation of these controls and procedures required by Rule 30a-3 (b) under the 1940 Act (17 CFR 270.30a-3(b) and Rules 13a-15(b) or 15d-15(b) under the Exchange Act (17 CFR 240.13a-15(b) or 240.15d-15(b)).
(b) There were no changes in the Registrant’s internal control over financial reporting (as defined in Rule 30a-3(d) under the 1940 Act (17 CFR 270.30a-3(d)) that occurred during the final quarter of the period covered by this report that has materially affected, or is reasonably likely to materially affect, the Registrant’s internal control over financial reporting.
12. (a) (1) Code of Ethics
Not applicable because it is posted on Registrant’s website.
12. (a) (2) (1)
Certification of Principal Executive Officer Required by Rule 30a-2(a) of the Investment Company Act
12. (a) (2) (2)
Certification of Principal Financial Officer Required by Rule 30a-2(a) of the Investment Company Act.
12. (a) (3)
Not applicable to this Registrant.
12. (b)
Certification of Chief Executive Officer and Certification of Chief Financial Officer Required by Rule 30a-2(b) of the Investment Company Act
Signatures
Pursuant to the requirements of the Securities Exchange Act of 1934 and the Investment Company Act of 1940, the Registrant has duly caused this report to be signed on its behalf by the undersigned, thereunto duly authorized.
| | |
| | | William Blair Funds |
| |
| | | /s/ Michelle R. Seitz |
| By: | | Michelle R. Seitz |
| | | President (Chief Executive Officer) |
Date: February 22, 2010
Pursuant to the requirements of the Securities Exchange Act of 1934 and the Investment Company Act of 1940, this report has been signed below by the following persons on behalf of the Registrant and in the capacities and on the dates indicated
| | |
| By: | | Michelle R. Seitz |
| | | President (Chief Executive Officer) |
Date: February 22, 2010
| | |
| By: | | Colette M. Garavalia |
| | | Treasurer (Chief Financial Officer) |
Date: February 22, 2010