UNITED STATES
SECURITIES AND EXCHANGE COMMISSION
Washington, D.C. 20549
Form N-CSR
CERTIFIED SHAREHOLDER REPORT OF REGISTERED
MANAGEMENT INVESTMENT COMPANIES
Investment Company Act File Number 811-5344
William Blair Funds
(Exact name of registrant as specified in charter)
| | |
| 222 West Adams Street, Chicago, IL | | 60606 |
| (Address of principal executive offices) | | (Zip Code) |
Michelle R. Seitz
William Blair Funds
222 West Adams Street, Chicago, IL 60606
(Name and address of agent for service)
Registrant’s telephone number, including area code: 312-236-1600
Date of fiscal year end: December 31
Date of reporting period: December 31, 2012
Form N-CSR is to be used by management investment companies to file reports with the Commission not later than 10 days after the transmission to stockholders of any report that is required to be transmitted to stockholders under Rule 30e-1 under the Investment Company Act of 1940 (17 CFR 270.30e-1). The Commission may use the information provided on Form N-CSR in its regulatory, disclosure review, inspection, and policymaking roles.
A registrant is required to disclose the information specified by Form N-CSR, and the Commission will make this information public. A Registrant is not required to respond to the collection of information contained in Form N-CSR unless the form displays a currently valid Office of Management and Budget (“OMB”) control number. Please direct comments concerning the accuracy of the information collection burden estimates and any suggestions for reducing the burden to Secretary, Securities and Exchange Commission, 450 Fifth Street, NW, Washington, DC 20549-0609. The OMB has reviewed this collection of information under the clearance requirements of 44 U.S.C. (ss) 3507.
| Item 1. | December 31, 2011 Annual Reports transmitted to shareholders. |

ANNUAL REPORT
DECEMBER 31, 2011
Table of Contents
December 31, 2011 | William Blair Funds 1 |
The views expressed in the commentary for each Fund reflect those of the portfolio management team only through the end of the period of the report as stated on the cover. The portfolio management team’s views are subject to change at any time based on market and other conditions and should not be construed as a recommendation. Statements involving predictions, assessments, analyses, or outlook for individual securities, industries, market sectors, and/or markets involve risks and uncertainties, and there is no guarantee they will come to pass.
This report is submitted for the general information of the shareholders of the William Blair Funds. It is not authorized for distribution to prospective investors unless accompanied or preceded by a prospectus of the William Blair Funds. Please carefully consider the Funds’ investment objectives, risks, charges, and expenses before investing. This and other information is contained in the Funds’ prospectus, which you may obtain by calling 1-800-742-7272. Read it carefully before you invest or send money.
2 Annual Report | December 31, 2011 |
PERFORMANCE AS OF DECEMBER 31, 2011—CLASS N SHARES (Unaudited)
| | | | | | | | | | | | | | | | | | | | |
| | | 1 Yr. | | | 3 Yr. | | | 5 Yr. | | | 10 Yr
(or since
inception) | | | Inception
Date | | Overall
Morningstar
Rating |
Growth Fund | | | | | | | | | | | | | | | | | | | | |
Class N | | | (1.93 | ) | | | 15.82 | | | | 1.87 | | | | 2.91 | | | 3/20/1946 | | «««
Among 1,478 Large Growth Funds |
Morningstar Large Growth | | | (2.46 | ) | | | 15.34 | | | | 0.79 | | | | 2.29 | | | | |
Russell 3000® Growth | | | 2.18 | | | | 18.09 | | | | 2.46 | | | | 2.74 | | | | |
S&P 500 Index | | | 2.11 | | | | 14.11 | | | | (0.25 | ) | | | 2.92 | | | | | |
| | | | | | |
Large Cap Growth Fund | | | | | | | | | | | | | | | | | | | | |
Class N | | | (3.64 | ) | | | 13.71 | | | | 0.00 | | | | 0.24 | | | 12/27/1999 | | «««
Among 1,478 Large Growth Funds |
Morningstar Large Growth | | | (2.46 | ) | | | 15.34 | | | | 0.79 | | | | 2.29 | | | | |
Russell 1000® Growth | | | 2.64 | | | | 18.02 | | | | 2.50 | | | | 2.60 | | | | |
| | | | | | |
Small Cap Growth Fund | | | | | | | | | | | | | | | | | | | | |
Class N | | | (13.31 | ) | | | 19.52 | | | | (2.35 | ) | | | 5.74 | | | 12/27/1999 | | ««
Among 676 Small Growth Funds |
Morningstar Small Growth | | | (3.55 | ) | | | 18.45 | | | | 1.30 | | | | 4.38 | | | | |
Russell 2000® Growth | | | (2.91 | ) | | | 19.00 | | | | 2.09 | | | | 4.48 | | | | |
| | | | | | |
Mid Cap Growth Fund | | | | | | | | | | | | | | | | | | | | |
Class N | | | 1.65 | | | | 19.69 | | | | 5.11 | | | | 5.10 | | | 2/1/2006 | | «««««
Among 659 Mid-Cap Growth Funds |
Morningstar Mid-Cap Growth | | | (3.96 | ) | | | 18.63 | | | | 2.01 | | | | — | | | | |
Russell MidCap® Growth | | | (1.65 | ) | | | 22.06 | | | | 2.44 | | | | 2.78 | | | | |
| | | | | | |
Small-Mid Cap Growth Fund | | | | | | | | | | | | | | | | | | | | |
Class N | | | (0.27 | ) | | | 20.74 | | | | 4.25 | | | | 6.75 | | | 12/29/2003 | | ««««
Among 659 Mid-Cap Growth Funds |
Morningstar Mid-Cap Growth | | | (3.96 | ) | | | 18.63 | | | | 2.01 | | | | — | | | | |
Russell 2500TM Growth | | | (1.57 | ) | | | 21.57 | | | | 2.89 | | | | 6.00 | | | | |
| | | | | | |
Global Growth Fund | | | | | | | | | | | | | | | | | | | | |
Class N | | | (3.47 | ) | | | 17.80 | | | | — | | | | (4.71 | ) | | 10/15/2007 | | «««««
Among 697 World Stock Funds |
Morningstar World Stock | | | (7.93 | ) | | | 12.35 | | | | — | | | | — | | | | |
MSCI All Country World IMI (net) | | | (7.89 | ) | | | 12.84 | | | | — | | | | (5.40 | ) | | | |
| | | | | | |
International Growth Fund | | | | | | | | | | | | | | | | | | | | |
Class N | | | (14.51 | ) | | | 13.46 | | | | (3.83 | ) | | | 5.81 | | | 10/1/1992 | | «««
Among 213 Foreign Large Growth Funds |
Morningstar Foreign Large Growth | | | (12.30 | ) | | | 11.79 | | | | (2.69 | ) | | | 5.33 | | | | |
MSCI All Country World Ex-U.S. IMI (net) | | | (14.31 | ) | | | 11.53 | | | | (2.74 | ) | | | 6.95 | | | | |
| | | | | | |
International Equity Fund | | | | | | | | | | | | | | | | | | | | |
Class N | | | (12.87 | ) | | | 8.64 | | | | (5.01 | ) | | | 2.35 | | | 5/24/2004 | | ««
Among 213 Foreign Large Growth Funds |
Morningstar Foreign Large Growth | | | (12.30 | ) | | | 11.79 | | | | (2.69 | ) | | | — | | | | |
MSCI World Ex-U.S. (net) | | | (12.21 | ) | | | 8.53 | | | | (4.09 | ) | | | 4.68 | | | | |
MSCI All Country World Ex-U.S. IMI (net) | | | (14.31 | ) | | | 11.53 | | | | (2.74 | ) | | | 6.24 | | | | | |
| | | | |
International Small Cap Growth Fund | | | | | | | | | | | | | |
Class N | | | (12.16 | ) | | | 20.21 | | | | (1.10 | ) | | | 3.96 | | | 11/1/2005 | | «««
Among 129 Foreign Small/Mid Growth Funds |
Morningstar Foreign Small/Mid Growth | | | (14.72 | ) | | | 15.94 | | | | (2.62 | ) | | | — | | | | |
MSCI All Country World Ex-U.S. Small Cap (net) | | | (18.50 | ) | | | 18.46 | | | | (1.73 | ) | | | 4.09 | | | | |
Please see the next page for important disclosure information.
December 31, 2011 | William Blair Funds 3 |
PERFORMANCE AS OF DECEMBER 31, 2011—CLASS N SHARES (Unaudited)—CONTINUED
| | | | | | | | | | | | | | | | | | | | |
| | | 1 Yr. | | | 3 Yr. | | | 5 Yr. | | | 10 Yr
(or since
inception) | | | Inception
Date | | Overall
Morningstar
Rating |
Emerging Markets Growth Fund | | | | | | | | | | | | | |
Class N | | | (17.29 | ) | | | 21.08 | | | | (1.31 | ) | | | 9.72 | | | 6/6/2005 | | «««
Among 352 Diversified Emerging Markets Funds |
Morningstar Diversified Emerging Markets | | | (19.86 | ) | | | 18.32 | | | | 0.40 | | | | — | | | | |
MSCI Emerging Markets IMI (net) | | | (19.49 | ) | | | 20.74 | | | | 2.61 | | | | 10.46 | | | | |
| | | | |
Emerging Leaders Growth Fund | | | | | | | | | | | | | |
Class N | | | (19.55 | ) | | | — | | | | — | | | | (2.85 | ) | | 5/3/2010 | | Not rated. |
Morningstar Diversified Emerging Markets | | | (19.86 | ) | | | — | | | | — | | | | — | | | | | |
MSCI Emerging Markets Large Cap (net) | | | (17.65 | ) | | | — | | | | — | | | | (2.90 | ) | | | | |
| | | | | | |
Emerging Markets Small Cap Growth Fund | | | | | | | | | | | | | | | | | | | | |
Class N | | | — | | | | — | | | | — | | | | (2.70 | ) | | 10/24/2011 | | Not rated. |
MSCI Emerging Markets Small Cap (net) | | | — | | | | — | | | | — | | | | (6.32 | ) | | | | |
| | | | |
Large Cap Value Fund | | | | | | | | | | | | | |
Class N | | | — | | | | — | | | | — | | | | (0.19 | ) | | 10/24/2011 | | Not rated. |
Russell 1000® Value | | | — | | | | — | | | | — | | | | 1.66 | | | | | |
| | | | |
Small Cap Value Fund | | | | | | | | | | | | | |
Class N | | | (6.95 | ) | | | 15.43 | | | | 1.50 | | | | 6.28 | | | 12/23/1996 | | «««
Among 302 Small Value Funds |
Morningstar Small Value | | | (4.45 | ) | | | 16.87 | | | | 0.20 | | | | 7.10 | | | | |
Russell 2000® Value | | | (5.50 | ) | | | 12.36 | | | | (1.87 | ) | | | 6.40 | | | | |
| | | | |
Mid Cap Value Fund | | | | | | | | | | | | | |
Class N | | | (0.34 | ) | | | — | | | | — | | | | 4.70 | | | 5/3/2010 | | Not rated. |
Morningstar Mid-Cap Value | | | (3.96 | ) | | | — | | | | — | | | | — | | | | | |
Russell Midcap® Value | | | (1.38 | ) | | | — | | | | — | | | | 3.38 | | | | | |
| | | | |
Small-Mid Cap Value Fund | | | | | | | | | | | | | |
Class N | | | — | | | | — | | | | — | | | | 4.50 | | | 12/15/2011 | | Not rated. |
Russell 2500® Value Index | | | — | | | | — | | | | — | | | | 4.20 | | | | | |
| | | | |
Bond Fund | | | | | | | | | | | | | |
Class N | | | 7.41 | | | | 8.78 | | | | — | | | | 6.68 | | | 5/1/2007 | | «««
Among 1,018 Intermediate-Term Bond Funds |
Morningstar Intermediate-term Bond | | | 5.86 | | | | 9.22 | | | | — | | | | — | | | | |
Barclays Capital U.S. Aggregate Bond | | | 7.84 | | | | 6.77 | | | | — | | | | 6.52 | | | | |
| | | | |
Income Fund | | | | | | | | | | | | | |
Class N | | | 5.21 | | | | 7.02 | | | | 3.86 | | | | 3.94 | | | 10/1/1990 | | ««««
Among 353 Short-Term Bond Funds |
Morningstar Short-term Bond | | | 1.66 | | | | 5.12 | | | | 3.48 | | | | 3.38 | | | | |
Barclays Capital Intermediate Govt./Credit Bond | | | 5.80 | | | | 5.65 | | | | 5.88 | | | | 5.20 | | | | |
4 Annual Report | December 31, 2011 |
PERFORMANCE AS OF DECEMBER 31, 2011—CLASS N SHARES (Unaudited)—CONTINUED
| | | | | | | | | | | | | | | | | | | | |
| | | 1 Yr. | | | 3 Yr. | | | 5 Yr. | | | 10 Yr
(or since
inception) | | | Inception
Date | | Overall
Morningstar
Rating |
Low Duration Fund | | | | | | | | | | | | | |
Class N | | | 1.73 | | | | — | | | | — | | | | 1.43 | | | 12/1/2009 | | Not rated. |
Morningstar Ultra Short Bond | | | 0.25 | | | | — | | | | — | | | | — | | | | | |
Merrill Lynch 1-Year U.S. Treasury Note | | | 0.57 | | | | — | | | | — | | | | 0.60 | | | | | |
| | | | |
Ready Reserves Fund | | | | | | | | | | | | | |
Class N | | | 0.01 | | | | 0.04 | | | | 1.40 | | | | 1.67 | | | 6/22/1988 | | Not rated. |
AAA Money Market Funds | | | 0.01 | | | | 0.07 | | | | 1.39 | | | | 1.62 | | | | | |
Performance cited represents past performance. Past performance does not guarantee future results and current performance may be lower or higher than the data quoted. Results shown are average annual total returns, which assume reinvestment of dividends and capital gains. Investment returns and principal will fluctuate and you may have a gain or a loss when you sell shares. For the most current month-end performance information, please call 1-800-742-7272, or visit our Web site at www.williamblairfunds.com. From time to time, the investment advisor may waive fees or reimburse expenses for the Fund. Without these waivers, performance would be lower. Investing in smaller companies involves special risks, including higher volatility and lower liquidity. International and emerging markets investing involves special risk considerations, including currency fluctuations, lower liquidity, economic and political risk. As interest rates rise, bond prices will fall and bond funds may become more volatile. Class N shares are available to the general public without a sales load.
Morningstar Ratings™ are as of 12/31/2011 and are subject to change every month. The ratings are based on a risk-adjusted return measure that accounts for variation in a fund’s monthly performance, placing more emphasis on downward variations and rewarding consistent performance. The top 10% of funds in each Category receive 5 stars, the next 22.5% receive 4 stars, the middle 35% receive 3 stars, the next 22.5% receive 2 stars, and the bottom 10% receive 1 star. The Overall Morningstar Rating for a fund is derived from a weighted-average of the performance figures associated with its three-, five- and ten-year (if applicable) Morningstar Rating metrics. The 3/5/10 year Morningstar ratings were as follows: Growth Fund «««/««««/««« and Large Cap Growth Fund «««/«««/««, out of 1,478/1,279/804 large growth funds; Small Cap Growth Fund «««/«/«««, out of 676/573/368 small growth funds; Mid Cap Growth Fund ««««/«««««/NA and Small-Mid Cap Growth Fund ««««/««««/NA out of 659/596/NA mid cap growth funds; Global Growth Fund «««««/NA/NA out of 697/NA/NA world stocks; International Growth Fund ««««/«««/««« and International Equity Fund «««/««/NA out of 213/164/96 foreign large growth funds; International Small Cap Growth Fund ««««/«««/NA out of 129/108/NA foreign small/mid growth funds; Emerging Markets Growth Fund ««««/««/NA and Emerging Leaders Growth Fund ««««/NA/NA, out of 352/237/NA diversified emerging markets growth funds; Small Cap Value Fund «««/««««/««« out of 302/264/145 small value funds; Income Fund ««««/«««/«««« out of 353/322/179 short-term bond funds; Bond Fund «««/NA/NA out of 1,018/NA/NA intermediate-term bond fund.
Please carefully consider the Funds’ investment objectives, risks, charges, and expenses before investing. This and other information is contained in the Funds’ prospectus, which you may obtain by calling 1-800-742-7272. Read it carefully before you invest or send money.
See accompanying Notes to Financial Statements.
December 31, 2011 | William Blair Funds 5 |

David C. Fording

John F. Jostrand
GROWTH FUND
The Growth Fund seeks long-term capital appreciation.
AN OVERVIEW FROM THE PORTFOLIO MANAGERS
The Growth Fund decreased 1.93% on a total return basis (Class N Shares) for the 12 months ended December 31, 2011. By comparison, the Fund’s benchmark, the Russell 3000® Growth Index, increased 2.18%.
We were disappointed in our near-term results; however, the fund has a solid performance record over the long-term as demonstrated by its outperformance over the benchmark for the ten year period.
The year was challenging for investors as uncertainty remained high, both here and abroad, and many worried about debt contagion, economic health, and the ability of governments to set policy in order to stabilize financial markets. Performance of equities remained greatly impacted by macroeconomic and political issues globally as demonstrated by elevated stock correlations. Remarkably, in 2011, given the uncertainty and volatility, the Russell 3000® Growth Index rose modestly. Most of the gains occurred in the first half of the year, despite headwinds from the Middle East crisis and Japanese earthquake; investors reacted positively to better-than-anticipated corporate earnings, economic reports, and had a growing level of confidence in the economic recovery. However, by the second half of the year investors were shaken by rising European sovereign debt concerns. Also, in the U.S., political gridlock ensued, the government’s credit rating was downgraded, and economic data weakened in the third quarter. Trading volatility was high and investors sought safety in more defensive Utilities, Consumer Staples, mega caps and high dividend yielding groups.
The fund’s performance was impacted by stock specific issues. It also had style headwinds as macro concerns flared and stock correlations rose to new highs presenting a challenge for active managers. Generally in periods of high stock correlations, stocks trade similarly and are influenced by macro or policy events, rather than company specific results. This is a difficult environment for active bottom up managers as they focus on the underlying company fundamentals, rather than predicting government policy outcomes or GDP trends. In 2011 this was demonstrated by the return of the Russell 3000® Growth Index being in the top quintile when compared to the returns of the funds in the Morningstar Large Growth universe. Given the uncertainty, investors sought safety above all else. We maintained our investment discipline and did not flock to perceived safe groups at the expense of investing in quality companies with attractive growth profiles. Over time, we believe compounded earnings growth and high returns are clear drivers of stock performance, and while on occasion, macro issues may rise to the forefront, they are typically for a limited time. Most notably, our underweights in both Consumer Staples and mega cap stocks hurt relative results. Also, our underweight in the highest dividend yielding stocks was a detractor. We do not have a dividend yield threshold as part of our investment process. The portfolio had more than 60% of its assets invested in the lowest yielding group or those stocks with less than a 1% dividend yield. Importantly, we added value through stock selection in this larger, more growth-oriented group.
In order to provide some context, the return spreads between groups perceived as “safe” versus those perceived as having higher risk were wide and an underweight in the best groups posed a challenge for relative performance. Within the Russell 3000® Growth Index, the Consumer Staples sector rose 15.10% versus Industrials which fell 2.68%; mega caps (>$50 billion in market capitalization) gained 8.29% while small caps (<$3 billion in market capitalization) lost 3.94%; and lastly, high yielding stocks (dividend yield >3%) rose 17.44% in comparison to low dividend yielding (<1% in dividend yield) which lost 3.96%.
6 Annual Report | December 31, 2011 |
In terms of our portfolio holdings, the Energy sector was a struggle. Suncor Energy, Inc., an integrated Canadian oil and gas company, declined on the uncertainty around the strength of global growth and oil demand, which is critical to profitable extraction of oil in the Canadian oil sands. Also, we did not own Exxon Mobil, a large integrated oil company and one of the largest benchmark weights. It rose 19% in the period, and not owning it detracted from relative results. Another sector detractor was Health Care, primarily due to our position in Illumina, Inc., the technology leader in genotyping. It declined on a preannounced revenue shortfall in the fourth quarter due to uncertainty in funding budgets resulting in delayed spending by its customers. We continue to own the stock, believing that the firm is well positioned to take advantage of the secular trend in genetic sequencing adoption. Outside of Energy and Health Care, there were two notable laggards. Manpower, Inc., an employment service company, came under pressure as investors had concerns over the elevated macroeconomic headwinds, particularly in Europe, its largest market. As the global economy continues to recover albeit at a slow pace, the firm should benefit from secular growth in worldwide demand for temporary staffing. In Information Technology (IT), Dolby Laboratories, Inc. declined due to concerns over potential sustained softness in the PC end market as well as the strength in Apple products which do no utilize Dolby technologies. We sold this position because we had better opportunities elsewhere in our view.
Our greatest contributor to results was McDonald’s Corporation, one of our largest holdings. This Consumer Discretionary stock had solid earnings reports throughout the period; and we believe it should continue to benefit from strong store traffic, its product offering with broad menu pricing as well as exceptional execution by management. Another strong performer was Green Mountain Coffee Roasters, Inc. Its stock rallied in the first nine months of the year on better-than-expected earnings reports due to sales gains; during this period, we trimmed it into strength which is consistent with our discipline. In our view, the consumer adoption rate remains strong and likely will continue, especially with Starbucks and Dunkin Donuts entering the Keurig ecosystem. Also, the company has a compelling first mover advantage, and it should perpetuate some of its competitive strengths with a next generation brewer. In terms of sectors, our best performer was the Materials sector where more defensive positions, such as Airgas, Inc. and Ecolab, Inc., held up well. Also, the Industrials sector was notable. Fastenal Co. gained ground on strong sales growth with the roll-out of the vending machines initiative and increased international business while Goodrich Corporation, a leader in aerospace systems, rallied on the announcement of its acquisition by United Technologies. Additionally, we had two other holdings that were acquired—Rightnow Technologies and Atheros Communications both in IT—which helped our results.
As you know, our investment process is a bottom up, fundamental research driven approach, which leverages our global research capabilities. Our stock selection has led us to larger sector positions in Information Technology, Industrials, Health Care and Consumer Discretionary. Over the year, our sector exposures did not change drastically. Information Technology and Health Care both rose modestly while Consumer Staples declined. In regard to Consumer Staples, it is our largest underweight. Historically, we prefer to invest in companies with more attractive long-term growth rates, which in general are found in other sectors. In 2011, many investors sought out this group for its defensive characteristics; we believe relative valuations in the sector are broadly unattractive. With the volatility, we trimmed our winners, and were opportunistic adding several new names to the portfolio such as Amazon.com, Inc. We have a high degree of confidence in our investment process and find our current holdings attractive on quality and growth metrics.
Looking ahead into 2012 and similar to last year, we continue to be cautiously optimistic on the U.S. economy; growth will likely remain at a slow pace. Toward the end of 2011, signs were encouraging on the employment front and in terms of consumer spending though we are cautious on the latter unless the former continues to strengthen. Also, U.S. corporations remain strong with solid profits in a difficult environment and healthy balance sheets with significant cash positions. The Federal Reserve persists with its accommodative stance, which should assist businesses and consumers further. Likewise, many other central banks around the globe cut interest rates as inflationary concerns fell over the course of 2011. However,
December 31, 2011 | William Blair Funds 7 |
investors are likely to remain uneasy over policy risks and their macro implications. Globally, ongoing structural challenges in the largest developed economies remain. Policy decisions will play a large role which raises the possibility of stalemates or brinksmanship, neither of which would aid an already fragile investor psychology. Periodic bouts of volatility are likely.
As always, our philosophy, process and disciplines remain in full force. This framework will lead us to quality growth companies with unique competitive advantages, superior as well as sustainable earnings growth, and strong management teams. In our view, these companies will perform well over the long-term against peers and the overall market.
8 Annual Report | December 31, 2011 |
Growth Fund
Performance Highlights (Unaudited)
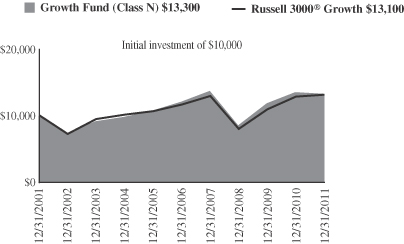
Average Annual Total Return at 12/31/2011
| | | | | | | | | | | | | | | | |
| | | 1
Year | | | 3
Year | | | 5
Year | | | 10
Year | |
Class N | | | (1.93 | )% | | | 15.82 | % | | | 1.87 | % | | | 2.91 | % |
Class I | | | (1.60 | ) | | | 16.18 | | | | 2.22 | | | | 3.22 | |
Russell 3000® Growth Index | | | 2.18 | | | | 18.09 | | | | 2.46 | | | | 2.74 | |
S&P 500 Index | | | 2.11 | | | | 14.11 | | | | (0.25 | ) | | | 2.92 | |
Performance cited represents past performance. Past performance does not guarantee future results and current performance may be lower or higher than the data quoted. Results shown are average annual returns, which assume reinvestment of dividends and capital gains. Investment returns and principal will fluctuate and you may have a gain or loss when you sell shares. For the most current month-end performance information, please call 1-800-742-7272, or visit our Web site at www.williamblairfunds.com. Class N shares are available to the general public without a sales load. Class I shares are available to certain institutional investors and advisory clients of William Blair & Company L.L.C. without a sales load or distribution (12b-1) or service fees.
The performance highlights and graph presented above do not reflect the deduction of taxes that a shareholder would pay on fund distributions or the redemption of fund shares.
The Russell 3000® Growth Index consists of large, medium, and small capitalization companies with above average price-to-book ratios and forecasted growth rates. The index is weighted by market capitalization and large/medium/small companies make up approximately 80%/15%/5% of the index.
The S&P 500 Index indicates broad larger capitalization equity market performance.
This report identifies the Fund’s investments on December 31, 2011. These holdings are subject to change. Not all stocks in the Fund performed the same, nor is there any guarantee that these stocks will perform as well in the future. Market forecasts provided in this report may not necessarily come to pass.
Sector Diversification (Unaudited)
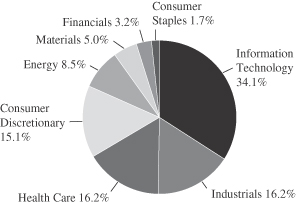
The sector diversification shown is based on the total long-term securities.
December 31, 2011 | William Blair Funds 9 |
Growth Fund
Portfolio of Investments, December 31, 2011 (all dollar amounts in thousands)
| | | | | | | | |
Issuer | | Shares | | | Value | |
| | |
Common Stocks | | | | | | | | |
Information Technology—33.3% | | | | | | | | |
*Apple, Inc. | | | 84,985 | | | $ | 34,419 | |
*Broadcom Corporation Class “A” | | | 274,300 | | | | 8,053 | |
*eBay, Inc. | | | 492,200 | | | | 14,928 | |
*Genpact, Ltd.† | | | 602,818 | | | | 9,012 | |
*Google, Inc. Class “A” | | | 40,605 | | | | 26,227 | |
*Juniper Networks, Inc. | | | 294,000 | | | | 6,000 | |
*Monolithic Power Systems, Inc. | | | 614,800 | | | | 9,265 | |
QUALCOMM, Inc. | | | 324,540 | | | | 17,752 | |
*Silicon Laboratories, Inc. | | | 304,140 | | | | 13,206 | |
*SolarWinds, Inc. | | | 244,800 | | | | 6,842 | |
Solera Holdings, Inc. | | | 159,400 | | | | 7,100 | |
TE Connectivity, Ltd.† | | | 345,200 | | | | 10,636 | |
*Trimble Navigation, Ltd. | | | 338,500 | | | | 14,691 | |
VeriSign, Inc. | | | 289,800 | | | | 10,352 | |
| | | | | | | | |
| | | | | | | 188,483 | |
| | | | | | | | |
Health Care—15.8% | | | | | | | | |
*Align Technology, Inc. | | | 209,600 | | | | 4,973 | |
Allergan, Inc. | | | 115,900 | | | | 10,169 | |
*Celgene Corporation | | | 147,980 | | | | 10,004 | |
*Cerner Corporation | | | 85,900 | | | | 5,261 | |
*DaVita, Inc. | | | 175,400 | | | | 13,297 | |
*DexCom, Inc. | | | 418,200 | | | | 3,893 | |
*Gilead Sciences, Inc. | | | 257,435 | | | | 10,537 | |
*Haemonetics Corporation | | | 110,800 | | | | 6,783 | |
*IDEXX Laboratories, Inc. | | | 141,318 | | | | 10,876 | |
*Illumina, Inc. | | | 178,500 | | | | 5,441 | |
*NxStage Medical, Inc. | | | 464,415 | | | | 8,257 | |
| | | | | | | | |
| | | | | | | 89,491 | |
| | | | | | | | |
Industrials—15.8% | | | | | | | | |
Fastenal Co. | | | 248,458 | | | | 10,835 | |
Goodrich Corporation | | | 90,600 | | | | 11,207 | |
*IHS, Inc. Class “A” | | | 201,314 | | | | 17,345 | |
*Jacobs Engineering Group, Inc. | | | 332,800 | | | | 13,505 | |
Manpower, Inc. | | | 149,900 | | | | 5,359 | |
*Polypore International, Inc. | | | 156,300 | | | | 6,876 | |
The Corporate Executive Board Co. | | | 221,339 | | | | 8,433 | |
*TransDigm Group, Inc. | | | 103,980 | | | | 9,949 | |
*Trimas Corporation | | | 327,862 | | | | 5,885 | |
| | | | | | | | |
| | | | | | | 89,394 | |
| | | | | | | | |
Consumer Discretionary—14.7% | | | | | | | | |
*Amazon.com, Inc. | | | 65,100 | | | | 11,269 | |
Gentex Corporation | | | 290,900 | | | | 8,608 | |
Harley-Davidson, Inc. | | | 226,599 | | | | 8,808 | |
| | | | | | | | |
Issuer | | Shares or
Principal
Amount | | | Value | |
| | |
Common Stocks—(continued) | | | | | | | | |
Consumer Discretionary—(continued) | | | | | | | | |
*K12, Inc. | | | 244,688 | | | $ | 4,390 | |
McDonald’s Corporation | | | 334,964 | | | | 33,607 | |
*Tempur-Pedic International, Inc. | | | 126,800 | | | | 6,661 | |
*Urban Outfitters, Inc. | | | 371,100 | | | | 10,227 | |
| | | | | | | | |
| | | | | | | 83,570 | |
| | | | | | | | |
Energy—8.3% | | | | | | | | |
*Cameron International Corporation | | | 147,547 | | | | 7,258 | |
Occidental Petroleum Corporation | | | 156,800 | | | | 14,692 | |
Schlumberger, Ltd.† | | | 244,800 | | | | 16,722 | |
Suncor Energy, Inc.† | | | 284,600 | | | | 8,205 | |
| | | | | | | | |
| | | | | | | 46,877 | |
| | | | | | | | |
Materials—4.8% | | | | | | | | |
Airgas, Inc. | | | 132,000 | | | | 10,307 | |
Ecolab, Inc. | | | 242,720 | | | | 14,032 | |
*Stillwater Mining Co. | | | 294,300 | | | | 3,078 | |
| | | | | | | | |
| | | | | | | 27,417 | |
| | | | | | | | |
Financials—3.1% | | | | | | | | |
*IntercontinentalExchange, Inc. | | | 117,500 | | | | 14,165 | |
Jones Lang LaSalle, Inc. | | | 53,300 | | | | 3,265 | |
| | | | | | | | |
| | | | | | | 17,430 | |
| | | | | | | | |
Consumer Staples—1.6% | | | | | | | | |
*Green Mountain Coffee Roasters, Inc. | | | 203,900 | | | | 9,145 | |
| | | | | | | | |
Total Common Stocks—97.4%
(cost $488,294) | | | | 551,807 | |
| | | | | | | | |
| | |
Repurchase Agreement | | | | | | | | |
Fixed Income Clearing Corporation, 0.000% dated 12/30/11, due 1/3/12, repurchase price $12,603, collateralized by U.S. Treasury Note, 1.750%, due 1/31/14 | | $ | 12,603 | | | | 12,603 | |
| | | | | | | | |
Total Repurchase Agreement—2.2%
(cost $12,603) | | | | 12,603 | |
| | | | | | | | |
Total Investments—99.6%
(cost $500,897) | | | | 564,410 | |
Cash and other assets, less liabilities—0.4% | | | | 2,332 | |
| | | | | | | | |
Net assets—100.0% | | | $ | 566,742 | |
| | | | | | | | |
* Non-income producing securities
† U.S. listed foreign security
See accompanying Notes to Financial Statements.
10 Annual Report | December 31, 2011 |

James S. Golan

David P. Ricci
LARGE CAP GROWTH FUND
The Large Cap Growth Fund seeks long-term capital appreciation.
AN OVERVIEW FROM THE PORTFOLIO MANAGERS
The Large Cap Growth Fund decreased 3.64% on a total return basis (Class N Shares) for the 12 months ended December 31, 2011. By comparison, the Fund’s benchmark, the Russell 1000® Growth Index, increased 2.64%.
We were disappointed in this near-term performance.
The year was challenging for investors as uncertainty remained high, both here and abroad, and many worried about debt contagion, economic health, and the ability of governments to set policy in order to stabilize financial markets. Performance of equities remained greatly impacted by macroeconomic and political issues globally as demonstrated by elevated stock correlations. Remarkably, in 2011, given the uncertainty and volatility, the Russell 1000® Growth Index rose modestly. Most of the gains occurred in the first half of the year, despite headwinds from the Middle East crisis and Japanese earthquake; investors reacted positively to better-than-anticipated corporate earnings, economic reports, and had a growing level of confidence in the economic recovery. However, by the second half, investors were shaken by rising European sovereign debt concerns. Also, in the U.S., political gridlock ensued, the government’s credit rating was downgraded, and economic data weakened in the third quarter. Trading volatility was high and investors sought safety in more defensive Utilities, Consumer Staples, mega caps, and high dividend yielding groups.
The fund’s performance was impacted by stock selection. It also had style headwinds as macro concerns flared and stock correlations rose to new highs presenting a challenge for active managers. Generally in periods of high stock correlations, stocks trade similarly and are influenced by macro or policy events, rather than company specific results. This is a difficult environment for active bottom up managers as they focus on the underlying company fundamentals, rather than predicting government policy outcomes or GDP trends. In 2011, this was demonstrated by the return of the Russell 1000® Growth Index being in the top quintile when compared to the returns of the funds in the Morningstar Large Growth universe. Given the uncertainty, investors sought safety above all else. We maintained our investment discipline and did not flock to perceived safe groups at the expense of investing in quality companies with attractive growth profiles. Over time, we believe compounded earnings growth and high returns are the clear drivers of stock performance, and while on occasion, macro issues may rise to the forefront, they are typically for a limited time. Most notably, our underweights in both Consumer Staples and mega cap stocks hurt relative results. Also, our underweight in the highest dividend yielding stocks was a detractor. We do not have a dividend yield threshold as part of our investment process. The portfolio had little exposure to higher yielding stocks or stocks with greater than a 2% dividend yield; our exposure was about 7% while the benchmark was more than 34%.
In order to provide some context, the return spreads between groups perceived as “safe” versus those perceived as having higher risk were wide and an underweight in the best groups posed a challenge for relative performance. Within the Russell 1000® Growth Index, the Consumer Staples sector rose 15.15% versus Industrials which fell 2.71%; mega cap or stocks (>$50 billion in market capitalization) gained 8.29% while small caps (<$3billion in market capitalization) lost 8.27%; and lastly, high yielding stocks (dividend yield >3%) rose 18.32% in comparison to low dividend yielding (<1% in dividend yield) that lost 3.99%.
Our largest sector detractor was Energy. Suncor Energy, an integrated Canadian oil and gas company, declined on the uncertainty around the strength of global growth and oil demand, which is critical to profitable extraction of oil in the Canadian oil sands. This position was
December 31, 2011 | William Blair Funds 11 |
sold in December. Also, we did not own Exxon Mobil, a large integrated oil company, and one of the largest benchmark weights. It rose 19% in the period, and not owing it hurt relative results. Consumer Staples stocks were also a notable laggard due to Green Mountain Coffee Roasters, Inc. and no exposure to Phillip Morris—a high dividend yielder that rose 40%— detracting from relative results. On Green Mountain Coffee Roasters, Inc., we started a position in early December after the stock came under pressure in November on a disappointing revenue figure (despite being up 91% year-over-year) due to changes in wholesale ordering patterns by grocery and wholesale clubs and not a result of a shift in end demand. This stock declined further in mid December as investors were jittery about the important holiday gift giving season. In our view, the consumer adoption rate remains strong and likely will continue, especially with Starbucks and Dunkin Donuts entering the Keurig ecosystem. Additionally, select Information Technology stocks were relative underperformers. One of the weakest overall holdings was Dolby Laboratories, Inc.; it declined on concerns over potential sustained softness in the PC end market and the strength of Apple products which do not utilize Dolby technologies. Microsoft was notable as well; despite its attractive earnings reports driven by its business division (Office 2010) and entertainment and devices group (Xbox 360 console and Kinect), the market was unwilling to reward the stock due to concerns over slowing PC sales, especially in consumer, and competition from tablets (e.g. iPads). We sold both of these Technology positions because we had better opportunities.
The greatest positive relative performance was from the Industrial sector. Goodrich, a leader in aerospace systems, rallied on the announcement of its acquisition by United Technologies. As a result, it was sold from the portfolio. W.W. Grainger, Inc., a high quality industrial distributor, had solid earnings reports throughout the year driven by attractive sales growth. In this highly fragmented North American industrial distribution sector, we believe it is well positioned to experience market share gains from Stock Keeping Unit (SKU) expansion and sales force increases. Also, on a sector basis, Materials was helpful to results due our position in Praxair, Inc., an industrial gas company. It continued to have a high project backlog and exceptional management execution. In our view, Praxair, Inc. will benefit from growth drivers in emerging market expansion, new project starts, rising capitalization and pricing. Other notable contributors were in Consumer Discretionary. Starbucks Corporation was added to the portfolio in May and benefited from solid sales figures and store traffic, as well as its announced introduction into the highly profitable single serve K-cup market. Nike, Inc., the world’s largest provider of athletic footwear, apparel, and equipment, rose nicely driven by sales momentum in North America and China as well as strong execution. Nike Inc.’s strengths remain its brand, product innovation, and marketing (World Cup/Olympics upcoming). Its growth will benefit from continued emerging market expansion, price increases as a result of brand strength, and improved operational efficiencies.
As you know, our investment process is a bottom up, fundamental research driven approach, which leverages our global research capabilities. We are committed to building a quality growth large cap portfolio with strong competitive results against benchmarks and peers. In our view, it is important to focus more narrowly, with greater position sizes, on companies that are long-term strategically advantaged and can sustain growth in excess of the benchmark. At end of 2011, the portfolio held 40 stocks, which the largest 15 stocks accounted for about 55% of total assets. For comparison at the end of December 2010, we held 42 names and the top 15 were 50% of assets. In terms of sectors, our stock selection has led us to large sector positions in Information Technology, Consumer Discretionary, and Industrials. In the year, our sector exposures only changed modestly. Information Technology and Consumer Staples both rose while Industrials and Energy declined.
Looking ahead into 2012 and similar to last year, we continue to be cautiously optimistic on the U.S. economy; growth will likely remain at a slow pace. Toward the end of 2011, signs were encouraging on the employment front and in terms of consumer spending though we are cautious on the latter unless the former continues to strengthen. Also, U.S. corporations remain strong with solid profits in a difficult environment and healthy balance sheets with significant cash positions. The Federal Reserve persists with its accommodative stance, which should assist businesses and consumers further. Likewise, many other central banks around
12 Annual Report | December 31, 2011 |
the globe cut interest rates as inflationary concerns fell over the course of 2011. However, investors are likely to remain uneasy over policy risks and their macro implications. Globally, ongoing structural challenges in the largest developed economies remain. Policy decisions will play a large role which raises the possibility of stalemates or brinksmanship, neither of which would aid an already fragile investor psychology. Periodic bouts of volatility are likely.
As always, our philosophy, process and disciplines remain in full force. This framework will lead us to quality growth companies with unique competitive advantages, superior as well as sustainable earnings growth, and strong management teams. In our view, these companies will perform well over the long-term against peers and the overall market.
December 31, 2011 | William Blair Funds 13 |
Large Cap Growth Fund
Performance Highlights (Unaudited)
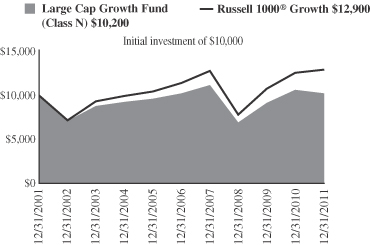
Average Annual Total Return at 12/31/2011
| | | | | | | | | | | | | | | | |
| | | 1
Year | | | 3
Year | | | 5
Year | | | 10
Year | |
Class N | | | (3.64 | )% | | | 13.71 | % | | | 0.00 | % | | | 0.24 | % |
Class I | | | (3.54 | ) | | | 13.94 | | | | 0.20 | | | | 0.47 | |
Russell 1000® Growth Index | | | 2.64 | | | | 18.02 | | | | 2.50 | | | | 2.60 | |
Performance cited represents past performance. Past performance does not guarantee future results and current performance may be lower or higher than the data quoted. Results shown are average annual total returns, which assume reinvestment of dividends and capital gains. Investment returns and principal will fluctuate and you may have a gain or loss when you sell shares. For the most current month-end performance information, please call 1-800-742-7272, or visit our Web site at www.williamblairfunds.com. From time to time, the investment advisor may waive fees or reimburse expenses for the Fund. Without these waivers, performance would be lower. Class N shares are available to the general public without a sales load. Class I shares are available to certain institutional investors and advisory clients of William Blair & Company, L.L.C., without a sales load or distribution (12b-1) or service fees.
The performance highlights and graph presented above do not reflect the deduction of taxes that a shareholder would pay on fund distributions or the redemption of fund shares.
The Russell 1000® Growth Index consists of large capitalization companies with above average price-to-book ratios and forecasted growth rates.
This report identifies the Fund’s investments on December 31, 2011. These holdings are subject to change. Not all stocks in the Fund performed the same, nor is there any guarantee that these stocks will perform as well in the future. Market forecasts provided in this report may not necessarily come to pass.
Sector Diversification (Unaudited)
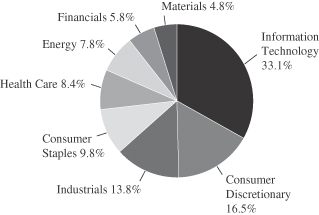
The sector diversification shown is based on the total long-term securities.
14 Annual Report | December 31, 2011 |
Large Cap Growth Fund
Portfolio of Investments, December 31, 2011 (all dollar amounts in thousands)
| | | | | | | | |
Issuer | | Shares | | | Value | |
| | |
Common Stocks | | | | | | | | |
Information Technology—32.9% | | | | | | | | |
Accenture plc† | | | 13,720 | | | $ | 730 | |
*Apple, Inc. | | | 4,930 | | | | 1,997 | |
*Broadcom Corporation Class “A” | | | 14,040 | | | | 412 | |
*Citrix Systems, Inc. | | | 8,170 | | | | 496 | |
*eBay, Inc. | | | 25,710 | | | | 780 | |
*Google, Inc. Class “A” | | | 2,023 | | | | 1,307 | |
*Juniper Networks, Inc. | | | 19,650 | | | | 401 | |
QUALCOMM, Inc. | | | 18,195 | | | | 995 | |
TE Connectivity, Ltd.† | | | 18,220 | | | | 561 | |
*Trimble Navigation, Ltd. | | | 12,260 | | | | 532 | |
| | | | | | | | |
| | | | | | | 8,211 | |
| | | | | | | | |
Consumer Discretionary—16.4% | | | | | | | | |
*Amazon.com, Inc. | | | 2,010 | | | | 348 | |
*Discovery Communications, Inc. | | | 8,580 | | | | 351 | |
Harley-Davidson, Inc. | | | 18,310 | | | | 712 | |
Johnson Controls, Inc. | | | 12,560 | | | | 393 | |
NIKE, Inc. Class “B” | | | 10,590 | | | | 1,021 | |
*priceline.com, Inc. | | | 545 | | | | 255 | |
Starbucks Corporation | | | 21,850 | | | | 1,005 | |
| | | | | | | | |
| | | | | | | 4,085 | |
| | | | | | | | |
Industrials—13.7% | | | | | | | | |
Donaldson Co., Inc. | | | 5,620 | | | | 383 | |
*Jacobs Engineering Group, Inc. | | | 10,250 | | | | 416 | |
Precision Castparts Corporation | | | 4,590 | | | | 756 | |
Rockwell Automation, Inc. | | | 3,100 | | | | 228 | |
*Stericycle, Inc. | | | 5,070 | | | | 395 | |
United Parcel Service, Inc. Class “B” | | | 7,490 | | | | 548 | |
W.W. Grainger, Inc. | | | 3,680 | | | | 689 | |
| | | | | | | | |
| | | | | | | 3,415 | |
| | | | | | | | |
Consumer Staples—9.8% | | | | | | | | |
Colgate-Palmolive Co. | | | 6,800 | | | | 628 | |
*Green Mountain Coffee Roasters, Inc. | | | 12,400 | | | | 556 | |
Mead Johnson Nutrition Co. | | | 11,680 | | | | 803 | |
Whole Foods Market, Inc. | | | 6,510 | | | | 453 | |
| | | | | | | | |
| | | | | | | 2,440 | |
| | | | | | | | |
Health Care—8.4% | | | | | | | | |
Allergan, Inc. | | | 7,015 | | | | 615 | |
Cardinal Health, Inc. | | | 7,120 | | | | 289 | |
Issuer | | Shares or
Principal
Amount | | | Value | |
| | |
Common Stocks—(continued) | | | | | | | | |
Health Care—(continued) | | | | | | | | |
*DaVita, Inc. | | | 7,620 | | | $ | 578 | |
*Gilead Sciences, Inc. | | | 14,730 | | | | 603 | |
| | | | | | | | |
| | | | | | | 2,085 | |
| | | | | | | | |
Energy—7.7% | | | | | | | | |
National Oilwell Varco, Inc. | | | 6,810 | | | | 463 | |
Occidental Petroleum Corporation | | | 5,390 | | | | 505 | |
Schlumberger, Ltd.† | | | 14,160 | | | | 967 | |
| | | | | | | | |
| | | | | | | 1,935 | |
| | | | | | | | |
Financials—5.7% | | | | | | | | |
*Affiliated Managers Group, Inc. | | | 4,480 | | | | 430 | |
American Express Co. | | | 10,530 | | | | 496 | |
T Rowe Price Group, Inc. | | | 8,810 | | | | 502 | |
| | | | | | | | |
| | | | | | | 1,428 | |
| | | | | | | | |
Materials—4.7% | | | | | | | | |
Praxair, Inc. | | | 7,045 | | | | 753 | |
*Syngenta AG—ADR | | | 7,210 | | | | 425 | |
| | | | | | | | |
| | | | | | | 1,178 | |
| | | | | | | | |
Total Common Stocks—99.3%
(cost $20,888) | | | | 24,777 | |
| | | | | | | | |
| | |
Repurchase Agreement | | | | | | | | |
Fixed Income Clearing Corporation, 0.000% dated 12/30/11, due 1/3/12, repurchase price $233, collateralized by FHLMC, 4.500%, due 1/15/14 | | $ | 233 | | | | 233 | |
| | | | | | | | |
Total Repurchase Agreement—0.9%
(cost $233) | | | | 233 | |
| | | | | | | | |
Total Investments—100.2%
(cost $21,121) | | | | 25,010 | |
Liabilities, plus cash and other assets—(0.2)% | | | | (61 | ) |
| | | | | | | | |
Net assets—100.0% | | | $ | 24,949 | |
| | | | | | | | |
See accompanying Notes to Financial Statements.
December 31, 2011 | William Blair Funds 15 |
ADR = American Depository Receipt
† U.S. listed foreign security
* Non-income producing securities

Michael P. Balkin

Karl W. Brewer
SMALL CAP GROWTH FUND
The Small Cap Growth Fund seeks long-term capital appreciation.
AN OVERVIEW FROM THE PORTFOLIO MANAGERS
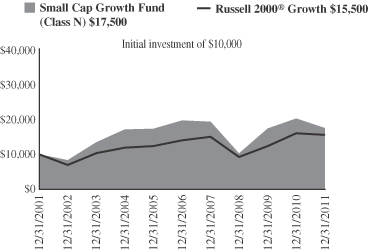
The Small Cap Growth Fund decreased 13.31% on a total return basis (Class N shares) for the 12 months ended December 31, 2011. By comparison the Fund’s benchmark, the Russell 2000® Growth Index, declined 2.91%.
Market Review
The U.S. equity markets finished a volatile 2011 with a robust rally in the fourth quarter, bringing most large cap indices just into positive territory for the year and leaving most small cap indices just below breakeven. The Russell 2000® Growth Index was up 14.99% in the fourth quarter and -2.91% for the year overall. The William Blair Small Cap Growth Fund did not keep pace in the fourth quarter’s rapid ascent. For the year overall, the strategy underperformed the benchmark as well.
The aforementioned volatility in 2011 was caused by the opposing forces of mostly positive U.S. economic data and corporate fundamentals contrasted against numerous concerns about the global economy and geo-political environment. During the first half of the year, investors mostly looked through Middle Eastern and North African uprisings and the Japanese natural disaster as corporate fundamentals remained robust. However, during the third quarter, the market corrected swiftly. This was driven primarily by the European sovereign debt crisis spreading more dramatically to larger Euro-zone countries beyond Greece. Domestically, political brinksmanship over the debt ceiling debate deteriorated investor and public sentiment about our leadership, contributing to the selloff as well. While the European sovereign debt crisis remained at the forefront of concerns throughout the fourth quarter, investor sentiment improved considerably as the focus moved instead to better-than-expected corporate earnings, employment, housing and industrial production reports late in the year.
From a style and sector perspective, the market environment within the Russell 2000® Growth Index was much different in the fourth quarter than it was for the year overall. Higher beta stocks did well in the fourth quarter but underperformed for the year. This can be seen in sector performance as well. Some of the more cyclically-driven sectors outperformed in the fourth quarter (e.g., Energy +28.16%, Industrials +20.74%) while underperforming for the year overall (e.g., Industrials -2.07%, Energy -6.27%). On the other hand, the typically-defensive Consumer Staples and Health Care sectors outperformed for the year (+13.36% and +1.93%, respectively) while underperforming in the final quarter (+6.89% and +11.33%, respectively).
Portfolio Review
The Fund’s underperformance for the year was most dramatic in the first quarter. In that quarter, the strategy’s three defining characteristics—its contrarian bias, valuation sensitivity and smaller market cap bias—were out of favor in the market and caused a great deal of the underperformance during the period. Over the balance of the year, while the style headwinds were more muted, stock selection continued to be subpar. For the year overall, stock selection in Consumer Discretionary (e.g., Office Depot, Inc. and WMS Industrials, Inc.) and Health Care (e.g., ExamWorks Group, Inc. and Kensey Nash Corporation) were two of the weakest areas of the portfolio. ICG Group, Inc. and Cowen Group, Inc. within Financials and Demand Media within Information Technology were other meaningful detractors for the year. On the other hand, stock selection in Industrials (e.g., On Assignment, Inc. and TransDigm Group, Inc.) and Energy were two areas of positive relative performance.
16 Annual Report | December 31, 2011 |
For the fourth quarter specifically, the Fund’s underperformance was the result of negative stock selection. ICG Group, Inc. and First Cash Financial Services, Inc. within Financials and Kensey Nash Corporation within Health Care were a few of the weakest performers. Positively contributing to relative performance were On Assignment, Inc., Oil States International, Inc. and Monolithic Power Systems, Inc.. These stocks are discussed in greater detail later in this year-end review.
As investors in the strategy ourselves, we are keenly aware this year’s underperformance represents the second consecutive year of underperformance. As we discussed last year, 2010 was a combination of negative stock selection and style headwinds, similar to 2011 discussed above. Below, given our bottom-up orientation, and as we do each quarter, we aim to give you more information on some of the fourth quarter’s worst performing stocks, all 5 of which we continue to hold. It may also be worth noting that we continue to hold 8 of the 10 worst detractors from 2011 relative return. We still believe we have a portfolio of attractive investment ideas and are confident we can produce the superior stock selection that has driven solid results over the long-term track record of this Fund.
Market Outlook
Looking forward, the improved economic data over the past few months increases the probability that the economic recovery is self-sustaining. The health of the global financial system due to European sovereign debt problems and the prospects for emerging market growth continue to be two of the largest macro-economic risks. In addition, 2012 will bring events such as the U.S. presidential election, austerity debates, potential standoffs with Iran and North Korea and other unforeseen events that will undoubtedly spur uncertainty in investor psyche. That said, the level of investor pessimism is already high, stock market valuations are reasonably attractive and earnings expectations for 2012 have been reduced over the past few months. All of these are often advantageous for prospective equity returns.
In the end, while we factor various economic scenarios into our stock picking, we focus our time on constructing the portfolio from a bottom-up perspective. We continue to find good ideas across sectors, and are confident the Fund consists of well-managed companies with solid competitive positions whose stocks are at attractive valuations compared to the growth and consistency of their business.
Contributors to Return (Fourth Quarter)
Brookdale Senior Living, Inc. (BKD) operates senior living facilities in the United States. The company offers three main types of facilities; Independent Living, Assisted Living, and Continuing Care Retirement Communities. Reason for outperformance: Improved prospects regarding the economy, and specifically housing, helped the stock over the three-month period. Action: We maintained our position during the quarter. The stock was extremely volatile during 2011 as it was one of our largest contributors to return in the first and fourth quarters and one of the largest detractors from return in the second and third quarters. However, we continue to own the stock given its long-term prospects. Our investment thesis centers around Brookdale Senior Living, Inc.’s strong competitive position in the senior living industry, enabling the company to capitalize on an aging population and a dearth of new senior living facilities being built.
Monolithic Power Systems, Inc. (MPWR) designs, manufactures and markets analog power integrated circuit solutions and mixed-signal semiconductors. Reason for outperformance: Sentiment improved on the stock as investors anticipated increasing design wins over the coming quarters. Action: We maintained our position in the stock after the move. We continue to believe the company’s ultra low cost structure, and therefore competitive pricing, combined with strong design capabilities will allow the company to steal market share and drive above average long-term earnings growth.
December 31, 2011 | William Blair Funds 17 |
Oil States International, Inc. (OIS) is a diversified energy services firm. The company manufacturers capital equipment for deepwater production facilities and subsea pipelines and provides services to the oil and gas industry such as remote site accommodations and production-related rental tools. Reason for outperformance: In addition to the overall energy sector performing well, the company reported a very strong earnings report during the quarter. It saw particular business momentum in its accommodations and tool rental businesses. Action: We maintained our position in the stock following the positive move. We continue to believe the company’s accommodations and off-shore products divisions are strong long-term growth drivers, and that its management team and strong returns on capital make the stock an attractive investment as well.
On Assignment, Inc. (ASGN) is a professional staffing firm that provides flexible and permanent staffing solutions in specialty skills including Laboratory, Healthcare, Physician, Information Technology and Engineering. Reason for outperformance: General improvement in economic data, especially in employment figures, helped boost the stock during the quarter. Importantly, the company also reported strong results, as the company is seeing strength in Information Technology staffing and an improvement in Healthcare staffing. Action: We trimmed the stock on strength but continue to hold a position as we believe the company’s niche and differentiated staffing solutions should enable the company to gain market share and produce superior, long-term earnings growth.
Six Flags Entertainment Corporation (SIX) owns and operates regional theme, water and zoological parks throughout North America. Reason for outperformance: After purchasing this stock early in the quarter following the third quarter’s economic-sensitivity led sell-off, the stock rebounded swiftly as those economic fears receded during the fourth quarter. In addition, while overall attendance was down primarily due to weather, revenue per capita was up nicely, a metric many are watching to gauge the success of the current management team. Action: We maintained our position following the move as we believe the management team is focused on improving the monetization of its Six Flags Entertainment Corporation brand, representing a meaningful earnings growth opportunity for the company.
Detractors from Return (Fourth Quarter)
First Cash Financial Services, Inc. (FCFS) provides consumer financial services and related specialty products, primarily through its network of pawn shops in the United States and Mexico. Reason for underperformance: After the company’s solid growth the past couple of years, investors became concerned that recent decelerating growth was likely to continue, particularly in the Mexican market. The selloff in the price of gold impacted sentiment as well given the company’s inventory of jewelry. Action: We added to our position on weakness given the company’s strong management team, barriers to entry in the US market and substantial growth opportunity particularly in the Mexican market.
ICG Group, Inc.’s (ICGE) primary business, ICG Commerce, is an outsourced procurement provider for corporate customers’ non-core expenses such as freight and media buying. Reason for underperformance: The company announced disappointing earnings and forward revenue guidance as a few large customer deals were pushed out. The company noted the approval process and economic environment were lengthening the sales cycle. Action: We added to our position on the weakness as we believe ICG Commerce’s value proposition is substantial for customers. Given the amount of expense savings it provides to a typical customer, the return on that customer’s investment is very attractive. In addition, the sizable global procurement market should provide a long runway for growth.
Kensey Nash Corporation (KNSY) develops, manufactures and processes resorbable biomaterial products, incorporating the company’s collagen technology and synthetic polymers. The company sells its products through strategic partners into a variety of medical end markets such as orthopedics, spine, sports medicine and general surgery. Reason for underperformance: The company announced it was entering mediation with one of its
18 Annual Report | December 31, 2011 |
partners, St. Jude Medical, regarding historical and future royalty payments relating to Angio-Seal, a St. Jude vascular closure device with Kensey Nash Corporation content. Action: We added to our position on weakness as we believe the company’s diversified mix of innovative products will drive superior long-term earnings growth despite the near term negative business development.
NxStage Medical, Inc. (NXTM) develops and markets novel technologies for the treatment of kidney failure, primarily for the at-home hemodialysis market. Reason for underperformance: Despite what we feel are strong underlying trends in home hemodialysis, the company reported worse than expected international sales, in part due to accounting changes that were likely misunderstood by many investors. The stock’s strong performance in previous quarters likely contributed to the fourth quarter decline as well, as some investors took profits. Action: We maintained our position as we believe NxStage Medical, Inc. is poised to benefit from the trend to home hemodialysis, a trend likely to continue given evidence it produces better patient outcomes at lower cost to the health care system.
Polypore International, Inc. (PPO) develops highly engineered microporous membranes enabling the management of ions, gases and particles. The company’s technology is used in lithium ion and lead-acid battery separators, hemodialysis and blood oxygenation applications within healthcare, and various microfiltration, ultrafiltration and gasification/degasification industrial applications. Reason for underperformance: Despite healthy business trends, the weakness during the quarter was primarily driven by global economic concerns, capacity expansion causing the potential need for a capital raise, and negative sentiment toward battery separation technology in the electric vehicle market. Action: We added to the position on the selloff as we believe the company’s capacity additions and demand for its technologies will boost revenue and margins over the coming year.
December 31, 2011 | William Blair Funds 19 |
Small Cap Growth Fund
Performance Highlights (Unaudited)
Average Annual Total Return at 12/31/2011
| | | | | | | | | | | | | | | | |
| | | 1
Year | | | 3
Year | | | 5
Year | | | 10
Year | |
Class N | | | (13.31 | )% | | | 19.52 | % | | | (2.35 | )% | | | 5.74 | % |
Class I | | | (13.13 | ) | | | 19.87 | | | | (2.07 | ) | | | 6.03 | |
Russell 2000® Growth Index | | | (2.91 | ) | | | 19.00 | | | | 2.09 | | | | 4.48 | |
Performance cited represents past performance. Past performance does not guarantee future results and current performance may be lower or higher than the data quoted. Results shown are average annual total returns, which assume reinvestment of dividends and capital gains. Investment returns and principal will fluctuate and you may have a gain or loss when you sell shares. For the most current month-end performance information, please call 1-800-742-7272, or visit our Web site at www.williamblairfunds.com. Investing in smaller companies involves special risks, including higher volatility and lower liquidity. Smaller Capitalization stocks are also more sensitive to purchase/sale transactions and changes in the issuer’s financial condition. From time to time, the investment advisor may waive fees or reimburse expenses for the Fund. Without these waivers, performance would be lower. Class N shares are available to the general public without a sales load. Class I shares are available to certain institutional investors and advisory clients of William Blair & Company, L.L.C., without a sales load or distribution (12b-1) or service fees.
The performance highlights and graph presented above do not reflect the deduction of taxes that a shareholder would pay on fund distributions or the redemption of fund shares.
The Russell 2000® Growth Index is an unmanaged composite of the smallest 2000 stocks of the Russell 3000® Growth Index.
This report identifies the Fund’s investments on December 31, 2011. These holdings are subject to change. Not all stocks in the Fund performed the same, nor is there any guarantee that these stocks will perform as well in the future. Market forecasts provided in this report may not necessarily come to pass.
Sector Diversification (Unaudited)
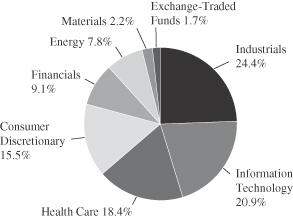
The sector diversification shown is based on the total long-term securities.
20 Annual Report | December 31, 2011 |
Small Cap Growth Fund
Portfolio of Investments, December 31, 2011 (all dollar amounts in thousands)
| | | | | | | | |
Issuer | | Shares | | | Value | |
| | |
Common Stocks | | | | | | | | |
Industrials—25.6% | | | | | | | | |
*CAI International, Inc. | | | 519,700 | | | $ | 8,034 | |
*Cenveo, Inc. | | | 1,284,645 | | | | 4,368 | |
*Clean Harbors, Inc. | | | 164,390 | | | | 10,477 | |
*CoStar Group, Inc. | | | 88,713 | | | | 5,920 | |
*Franklin Covey Co. | | | 767,830 | | | | 6,503 | |
*Furmanite Corporation | | | 670,335 | | | | 4,230 | |
*GrafTech International, Ltd. | | | 413,242 | | | | 5,641 | |
Healthcare Services Group, Inc. | | | 459,810 | | | | 8,134 | |
*Heritage-Crystal Clean, Inc. | | | 331,211 | | | | 5,485 | |
*Higher One Holdings, Inc. | | | 472,180 | | | | 8,707 | |
*Huron Consulting Group, Inc. | | | 180,303 | | | | 6,985 | |
*ICF International, Inc. | | | 353,833 | | | | 8,768 | |
*Mistras Group, Inc. | | | 259,781 | | | | 6,622 | |
*Navigant Consulting, Inc. | | | 624,160 | | | | 7,122 | |
*On Assignment, Inc. | | | 795,231 | | | | 8,891 | |
*Polypore International, Inc. | | | 275,730 | | | | 12,129 | |
*Thermon Group Holdings, Inc. | | | 334,680 | | | | 5,897 | |
*TransDigm Group, Inc. | | | 85,864 | | | | 8,215 | |
*Trimas Corporation | | | 547,734 | | | | 9,832 | |
| | | | | | | | |
| | | | | | | 141,960 | |
| | | | | | | | |
Information Technology—19.1% | | | | | | | | |
*Bottomline Technologies, Inc. | | | 67,337 | | | | 1,560 | |
*Cavium, Inc. | | | 213,442 | | | | 6,068 | |
*ExlService Holdings, Inc. | | | 262,304 | | | | 5,868 | |
*iGate Corporation | | | 350,400 | | | | 5,512 | |
*Inuvo, Inc. | | | 861,747 | | | | 611 | |
j2 Global Communications, Inc. | | | 183,318 | | | | 5,159 | |
*MaxLinear, Inc. Class “A” | | | 888,007 | | | | 4,218 | |
*Monolithic Power Systems, Inc. | | | 510,596 | | | | 7,695 | |
*Plexus Corporation | | | 172,580 | | | | 4,725 | |
*RealPage, Inc. | | | 247,670 | | | | 6,259 | |
*Silicon Laboratories, Inc. | | | 177,097 | | | | 7,689 | |
*SolarWinds, Inc. | | | 221,370 | | | | 6,187 | |
Syntel, Inc. | | | 133,020 | | | | 6,221 | |
*Tangoe, Inc. | | | 6,422 | | | | 99 | |
*TeleTech Holdings, Inc. | | | 621,970 | | | | 10,076 | |
*Ultimate Software Group, Inc. | | | 84,746 | | | | 5,519 | |
*ValueClick, Inc. | | | 797,990 | | | | 12,999 | |
*Vertro, Inc. | | | 847,343 | | | | 873 | |
*Volterra Semiconductor Corporation | | | 334,251 | | | | 8,560 | |
| | | | | | | | |
| | | | | | | 105,898 | |
| | | | | | | | |
Health Care—18.1% | | | | | | | | |
*Air Methods Corporation | | | 140,811 | | | | 11,891 | |
*athenahealth, Inc. | | | 33,125 | | | | 1,627 | |
*Brookdale Senior Living, Inc. | | | 485,970 | | | | 8,451 | |
*ExamWorks Group, Inc. | | | 864,923 | | | | 8,199 | |
*Haemonetics Corporation | | | 105,415 | | | | 6,453 | |
*HealthSouth Corporation | | | 369,390 | | | | 6,527 | |
*Integra LifeSciences Holdings Corporation | | | 189,968 | | | | 5,857 | |
*Kensey Nash Corporation | | | 483,937 | | | | 9,287 | |
*NxStage Medical, Inc. | | | 421,557 | | | | 7,495 | |
| | |
Common Stocks—(continued) | | | | | | | | |
Health Care—(continued) | | | | | | | | |
*Quidel Corporation | | | 399,056 | | | $ | 6,038 | |
*SXC Health Solutions Corporation† | | | 109,380 | | | | 6,178 | |
*Team Health Holdings, Inc. | | | 284,212 | | | | 6,273 | |
*The Providence Service Corporation | | | 481,223 | | | | 6,622 | |
Trinity Biotech plc—ADR | | | 952,354 | | | | 9,695 | |
| | | | | | | | |
| | | | | | | 100,593 | |
| | | | | | | | |
Consumer Discretionary—15.3% | | | | | | | | |
*Amerigon, Inc. | | | 829,160 | | | | 11,824 | |
*Dreams, Inc. | | | 2,671,926 | | | | 5,745 | |
*Genesco, Inc. | | | 106,233 | | | | 6,559 | |
*Grand Canyon Education, Inc. | | | 341,356 | | | | 5,448 | |
Jarden Corporation | | | 230,937 | | | | 6,900 | |
MDC Partners, Inc. Class “A”† | | | 130,063 | | | | 1,758 | |
*Office Depot, Inc. | | | 3,052,050 | | | | 6,562 | |
*Shuffle Master, Inc. | | | 592,730 | | | | 6,947 | |
Six Flags Entertainment Corporation | | | 182,400 | | | | 7,522 | |
*Steven Madden, Ltd. | | | 187,645 | | | | 6,474 | |
*Teavana Holdings, Inc. | | | 317,508 | | | | 5,963 | |
Texas Roadhouse, Inc. | | | 381,044 | | | | 5,678 | |
*U.S. Auto Parts Network, Inc. | | | 1,045,169 | | | | 4,567 | |
*WMS Industries, Inc. | | | 139,567 | | | | 2,864 | |
| | | | | | | | |
| | | | | | | 84,811 | |
| | | | | | | | |
Financials—8.9% | | | | | | | | |
*Cowen Group, Inc. | | | 2,940,710 | | | | 7,616 | |
*First Cash Financial Services, Inc. | | | 260,670 | | | | 9,147 | |
*FirstService Corporation† | | | 224,972 | | | | 5,960 | |
*ICG Group, Inc. | | | 1,183,845 | | | | 9,139 | |
*Manning & Napier, Inc. | | | 470,583 | | | | 5,878 | |
Marlin Business Services Corporation | | | 292,532 | | | | 3,715 | |
*National Financial Partners Corporation | | | 606,346 | | | | 8,198 | |
| | | | | | | | |
| | | | | | | 49,653 | |
| | | | | | | | |
Energy—7.7% | | | | | | | | |
*Atwood Oceanics, Inc. | | | 140,160 | | | | 5,577 | |
Berry Petroleum Co. | | | 133,280 | | | | 5,600 | |
*Bill Barrett Corporation | | | 140,160 | | | | 4,775 | |
*Hornbeck Offshore Services, Inc. | | | 220,653 | | | | 6,845 | |
*Laredo Petroleum Holdings, Inc. | | | 150,365 | | | | 3,353 | |
*Oasis Petroleum, Inc. | | | 234,470 | | | | 6,821 | |
*Oil States International, Inc. | | | 126,570 | | | | 9,666 | |
| | | | | | | | |
| | | | | | | 42,637 | |
| | | | | | | | |
Materials—2.2% | | | | | | | | |
*Horsehead Holding Corporation | | | 442,840 | | | | 3,990 | |
PolyOne Corporation | | | 218,384 | | | | 2,522 | |
*Stillwater Mining Co. | | | 546,656 | | | | 5,718 | |
| | | | | | | | |
| | | | | | | 12,230 | |
| | | | | | | | |
Total Common Stocks—96.9%
(cost $517,079) | | | | 537,782 | |
| | | | | | | | |
See accompanying Notes to Financial Statements.
December 31, 2011 | William Blair Funds 21 |
Small Cap Growth Fund
Portfolio of Investments, December 31, 2011 (all dollar amounts in thousands)
| | | | | | | | |
Issuer | | Shares or
Principal
Amount | | | Value | |
| | |
Exchange-Traded Fund | | | | | | | | |
iShares Russell 2000 Growth Index Fund | | | 112,725 | | | $ | 9,495 | |
| | | | | | | | |
Total Exchange-Traded Fund—1.7%
(cost $9,152) | | | | 9,495 | |
| | |
Repurchase Agreement | | | | | | | | |
Fixed Income Clearing Corporation, 0.000% dated 12/30/11, due 1/3/12, repurchase price $6,596, collateralized by U.S. Treasury Note, 1.750%, due 01/31/14 | | $ | 6,596 | | | | 6,596 | |
| | | | | | | | |
Total Repurchase Agreement—1.2%
(cost $6,596) | | | | 6,596 | |
| | | | | | | | |
Total Investments—99.8%
(cost $532,827) | | | | 553,873 | |
Cash and other assets, less liabilities—0.2% | | | | 865 | |
| | | | | | | | |
Net assets—100.0% | | | $ | 554,738 | |
| | | | | | | | |
ADR American Depository Receipt
* Non-income producing securities
† U.S. listed foreign security
If the Fund’s portfolio holdings represent ownership of 5% or more of the voting securities of a company, the company is deemed to be an affiliate as defined in the Investment Company Act of 1940. The Small Cap Growth Fund had the following transactions during the year ended December 31, 2011 with companies deemed affiliated during the year or at December 31, 2011.
| | | | | | | | | | | | | | | | | | | | | | | | | | |
| | | | | Share Activity | | | Year Ended
December 31, 2011 | |
| | | | | | | | | | | | | | | | | (in thousands) | |
Security Name | | Balance
12/31/2010 | | | Purchases | | | Sales | | | Balance
12/31/2011 | | | Value | | | Dividends
Included
in Income | |
p | | Dreams, Inc. | | | 3,285,457 | | | | 189,497 | | | | 803,028 | | | | 2,671,926 | | | | $5,745 | | | | $— | |
| | Duckwall-ALCO Stores, Inc. | | | 429,693 | | | | — | | | | 429,693 | | | | — | | | | — | | | | — | |
| | Franklin Covey, Co | | | 758,841 | | | | 141,689 | | | | 132,700 | | | | 767,830 | | | | 6,503 | | | | — | |
| | Gaiam, Inc. Class “A” | | | 1,050,272 | | | | — | | | | 1,050,272 | | | | — | | | | — | | | | — | |
p | | Inuvo, Inc. | | | 861,747 | | | | — | | | | — | | | | 861,747 | | | | 611 | | | | — | |
p | | Kensey Nash Corporation | | | 424,466 | | | | 154,271 | | | | 94,800 | | | | 483,937 | | | | 9,287 | | | | — | |
| | Kona Grill, Inc. | | | 1,019,792 | | | | — | | | | 1,019,792 | | | | — | | | | — | | | | — | |
| | Marlin Business Services Corporation | | | 718,870 | | | | — | | | | 426,338 | | | | 292,532 | | | | 3,715 | | | | 18 | |
| | On Assignment Inc | | | 2,248,382 | | | | 262,429 | | | | 1,715,580 | | | | 795,231 | | | | 8,891 | | | | — | |
| | Princeton Review, Inc. | | | 3,519,896 | | | | — | | | | 3,519,896 | | | | — | | | | — | | | | — | |
| | Trinity Biotech plc | | | 1,903,563 | | | | — | | | | 951,209 | | | | 952,354 | | | | 9,695 | | | | 144 | |
| | United Western Bancorp, Inc. | | | 2,290,015 | | | | — | | | | 2,290,015 | | | | — | | | | — | | | | — | |
| | U.S. Autoparts Network, Inc. | | | 1,448,391 | | | | 170,447 | | | | 573,669 | | | | 1,045,169 | | | | 4,567 | | | | — | |
p | | Vertro, Inc. | | | 847,343 | | | | — | | | | — | | | | 847,343 | | | | 873 | | | | — | |
| | | | | | | | | | | | | | | | | | | | | | | | | | |
| | | | | | | | | | | | | | | | | | | | $ | 49,887 | | | | $162 | |
| | | | | | | | | | | | | | | | | | | | | | | | | | |
p Affiliated company at December 31, 2011. The Small Cap Growth Fund’s total value in companies deemed to be affiliated at December 31, 2011 was $16,516 (in thousands).
See accompanying Notes to Financial Statements.
22 Annual Report | December 31, 2011 |

Robert C. Lanphier, IV
David P. Ricci
MID CAP GROWTH FUND
The Mid Cap Growth Fund seeks long-term capital appreciation.
AN OVERVIEW FROM THE PORTFOLIO MANAGERS
The Mid Cap Growth Fund posted a 1.65% increase on a total return basis (Class N Shares) for the 12 months ended December 31, 2011. By comparison, the Fund’s benchmark, the Russell Midcap® Growth Index, declined 1.65% during the period.
Market Review
The U.S. equity markets finished a volatile 2011 with a robust rally in the fourth quarter, bringing most large cap indices just into positive territory for the year and leaving most small cap indices just below breakeven. The Russell Midcap® Growth Index was up 11.24% in the fourth quarter and -1.65% for the year overall. As one might expect in such an environment, the William Blair Mid Cap Growth Fund did not keep pace in the fourth quarter’s rapid ascent. However, it outperformed for the year overall.
The aforementioned volatility in 2011 was associated with the opposing forces of mostly positive though uneven U.S. economic data and corporate fundamentals compared to numerous concerns about the global economy and geo-political environment. During the first half of the year, investors mostly looked through Middle Eastern and North African uprisings and the Japanese natural disaster as corporate fundamentals remained robust. However, during the third quarter, the market corrected swiftly. This was driven primarily by the European sovereign debt crisis spreading more dramatically to larger Euro-zone countries beyond Greece. Domestically, volatility in leading economic indicators and political brinksmanship over the debt ceiling debate likely contributed to the selloff as well. While the European sovereign debt crisis remained at the forefront of concerns throughout the fourth quarter, investor sentiment improved considerably as the focus moved instead to better-than-expected corporate earnings, employment, housing and industrial production reports domestically late in the year.
Given the market dynamics discussed above, the fourth quarter and calendar year 2011 were near mirror images of each other from a sector and style perspective. Higher beta stocks did well in the fourth quarter but underperformed for the year. The more cyclically-driven Energy, Materials and Industrials sectors led the market in the fourth quarter while they were the worst performing sectors, along with Financials, for the year overall. The opposite was true for the typically-defensive Consumer Staples and Health Care sectors as they outperformed for the year while underperforming in the final quarter. Also noteworthy for the year was Information Technology underperforming and Consumer Discretionary outperforming as consumers reduced savings and perhaps as interest rates declined and employment gradually improved.
Portfolio Review
The Fund’s outperformance for the year is attributable to superior stock selection and a modest style benefit. Our more conservative investment approach (i.e. typical lower portfolio beta) was a positive as investors sought less market risk given overall market volatility. More importantly, stock selection across a variety of sectors boosted results above the benchmark. The largest source of this was Green Mountain Coffee Roasters, Inc. within Consumer Staples. Airgas, Inc. and Ecolab, Inc., within Materials, contributed to the outperformance along with HMS Holdings Corporation and Perrigo Co. within Health Care. Information Technology and Industrials stock selection was also positive. Detracting from relative performance were WMS Holdings and Harmon International Industries, Inc. within Consumer Discretionary, Newfield Exploration within Energy and Greenhill & Company within Financials.
December 31, 2011 | William Blair Funds 23 |
For the fourth quarter specifically, the Fund’s underperformance was the result of a style headwind and negative stock selection. While our typical lower beta was a headwind during the market’s swift fourth quarter rally, stock selection was the main detractor for the three month period. Green Mountain Coffee Roasters, Inc. corrected swiftly and was responsible for the underperformance. Energy stock selection, including Southwestern Energy Co., detracted as well. On the other hand, positive contributors were CarMax, Inc. and Gentex Corporation within Consumer Discretionary and Silicon Laboratories, Inc. and Trimble Navigation, Ltd. within Information Technology.
Market Outlook
Looking forward, the improved economic data in the U.S. over the past few months increases the probability that the economic recovery is self-sustaining. As we said last quarter, the health of the global financial system due to European sovereign debt problems and the prospects for emerging market growth continue to be two of the largest macro-economic risks. In addition, 2012 will bring events such as the U.S. presidential election, austerity debates, potential standoffs with Iran and North Korea and other unforeseen events that will undoubtedly spur uncertainty in investor psyche. That said, the level of investor pessimism is already high, stock market valuations are reasonably attractive and earnings expectations for 2012 have been reduced over the past few months. All of these are often advantageous for prospective equity returns.
In the end, while we factor various economic scenarios into our stock picking, we focus our time on constructing the portfolio from a bottom-up perspective. We continue to find good long-term investment ideas across sectors, and are confident the Fund consists of well-managed companies with solid business franchises whose stocks are at attractive valuations compared to the growth and consistency of their business.
Contributors to Return (Fourth Quarter)
Fastenal Co. (FAST) is a distributor of various industrial supplies, from nuts and bolts to shovels and work gloves. Reason for outperformance: The stock performed well in the fourth quarter and throughout the year due in part to improving growth prospects from internal initiatives, such as industrial supply vending machines and government sales specialists. Improved economic sentiment in the fourth quarter combined with the company’s domestic focus, likely contributed to the stock’s performance as well. Action: We trimmed our position on strength, but continue to own this long-time holding as we believe it can continue to gain market share in the highly fragmented industrial distribution market.
HMS Holdings Corporation (HMSY) provides a variety of cost containment, coordination of benefits and program integrity services for government-sponsored health and human services programs, including state Medicaid agencies, the Veterans Health Administration and the Centers for Medicare & Medicaid Services. The company’s solutions aim to help clients reduce costs by detecting fraud and administrative inefficiencies in their programs. Reason for outperformance: The company announced the acquisition of the leading Medicare Recovery Audit Contractor, expanding its recovery services into the Federal arena and bolstering its recovery service offering to existing State contracts. Action: We trimmed our position after the positive move in the stock, but continue to believe the company’s solutions can improve government efficiency.
CarMax, Inc. (KMX) is a specialty retailer operating in the highly fragmented used car market. The company buys, reconditions and sells used cars at their used car superstores as well as offering financing options, extended service plans and repair services. Reason for outperformance: After underperforming during the third quarter on economic concerns, the stock rebounded strongly in the fourth quarter as economic data improved. The company also announced an increase in planned new store expansion over the next few years. Action: We maintained our position as we continue to believe in CarMax’s differentiated business model and therefore its ability to gain market share within the fragmented used car market.
24 Annual Report | December 31, 2011 |
Silicon Laboratories, Inc. (SLAB) is a semiconductor company. The company designs analog and mixed signal integrated circuits for use in mobile phones, PC modems, satellite set top boxes, radio tuners, and office networking equipment. Reason for outperformance: The company announced better-than-expected new design wins during the quarter. Specifically, the company’s innovative products are seeing demand from the smartphone touchscreen, networking equipment and flat panel TV markets. Action: We maintained our position in the stock as we believe the company’s research and development engine will continue to produce innovative solutions, propelling superior long-term earnings growth.
Trimble Navigation, Ltd. (TRMB) develops and markets products embedded with its global positioning systems (GPS) technology to commercial and governmental customers for use in the construction and agriculture industries. Reason for outperformance: Improved economic sentiment and continued strong business momentum drove the stock higher in the fourth quarter. Trimble Navigation, Ltd.’s improved Mobile Solutions division and overall distribution system drove fundamental strength in the quarter. Action: We maintained our position as we believe the company’s solutions are well positioned for growth in the construction, agriculture and fleet management businesses.
Detractors from Return (Fourth Quarter)
Cerner Corporation (CERN) provides healthcare information technology solutions, devices and services primarily to physician offices and hospitals. Reason for underperformance: Market sentiment shifted markedly during October as investors started viewing this previously “safe” health care holding as “at risk” given its lofty valuation and if the company’s remarkable 30%+ new business bookings growth in 2011 became unsustainable. Action: We trimmed our position but continue to hold a position as we believe Cerner Corporation, as the market leader, will continue to benefit from secular trends in healthcare IT.
Green Mountain Coffee Roasters, Inc. (GMCR) sells its Keurig line of single cup brewers, along with coffee and tea “K-cups” for use in these machines. Reason for underperformance: While being the largest contributor to relative return for 2011 as a whole, the stock sold off sharply during the fourth quarter. Early in the quarter, during the company’s quiet period, a prominent short seller published a short case on the stock, citing concerns about the long-term market opportunity for the company, patent expirations in 2012 and certain accounting practices. This pessimism surrounding the stock was compounded when the company reported a rare disappointment in revenues which the company attributed to short-term changes in buying patterns by grocery and wholesale club customers. Action: After trimming our position substantially through the first nine months of the year, we added to our position on the selloff. We continue to believe the company’s earnings potential is much greater than it is today, as consumer adoption of the Keurig single-serve brewing system remains robust.
Illumina, Inc. (ILMN) develops and markets integrated systems used in the gene sequencing and genotyping markets. The company’s machines enable medical and academic institutions to understand the genetic make-up of individuals, which allows for more productive research in disease treatment and prevention. Reason for underperformance: In the third quarter, the company announced a large revenue disappointment in early October. Slowing government funding to research institutions combined with increased productivity of Illumina, Inc.’s highly-successful Hi-Seq systems created an imbalance between demand and capacity. Action: We added to our position during the quarter as we believe the fundamental weakness in the business is short-term in nature and that long-term demand for sequencing remains robust. This partly is evidenced by the recent announcements of large genome center openings.
Polypore International, Inc. (PPO) develops highly engineered microporous membranes enabling the management of ions, gases and particles. The company’s technology is used in lithium ion and lead-acid battery separators, hemodialysis and blood oxygenation applications within healthcare, and various microfiltration, ultrafiltration and gasification/degasification industrial applications. Reason for underperformance: Despite healthy business trends, the
December 31, 2011 | William Blair Funds 25 |
stock weakness during the quarter was primarily driven by short-term start up costs, potential dilution from new capacity expansion, and negative sentiment toward the electric vehicle market due to reported battery fires with the Chevrolet Volt in crash tests. Action: We added to the position on the selloff as we believe the company’s capacity additions and demand for its technologies will boost growth over the long term. In addition, Chevrolet announced structural improvements to its electric battery, which should eliminate any lingering concerns about the electric vehicle opportunity.
Solera Holdings, Inc. (SLH) provides software and services to the automobile insurance claims processing industry. Reason for underperformance: The sovereign debt crisis and economic concerns out of Europe, along with a weak euro, weighed on the stock given the company’s revenue exposure to the region. Action: We maintained our position in the stock given the company’s strong long-term competitive position and as a secular rise in global car ownership should increase demand for the company’s software solutions for insurance claims processing. In addition, we believe a great deal of economic impact has been priced into Solera Inc.’s consensus earnings expectations.
26 Annual Report | December 31, 2011 |
Mid Cap Growth Fund
Performance Highlights (Unaudited)
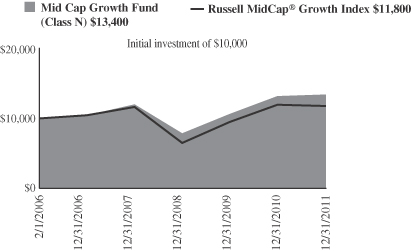
Average Annual Total Return at 12/31/2011
| | | | | | | | | | | | | | | | |
| | | 1
Year | | | 3
Year | | | 5
Year | | | Since
Inception(a) | |
Class N | | | 1.65 | % | | | 19.69 | % | | | 5.11 | % | | | 5.10 | % |
Class I | | | 1.86 | | | | 19.97 | | | | 5.39 | | | | 5.39 | |
Russell MidCap® Growth Index | | | (1.65 | ) | | | 22.06 | | | | 2.44 | | | | 2.78 | |
| | (a) | | For the period from February 1, 2006 (Commencement of Operations) to December 31, 2011. |
Performance cited represents past performance. Past performance does not guarantee future results and current performance may be lower or higher than the data quoted. Results shown are average annual total returns, which assume reinvestment of dividends and capital gains. Investment returns and principal will fluctuate and you may have a gain or loss when you sell shares. For the most current month-end performance information, please call 1-800-742-7272, or visit our Web site at www.williamblairfunds.com. Investing in medium capitalization companies involves special risks, including higher volatility and lower liquidity. Medium Capitalization stocks are also more sensitive to purchase/sale transactions and changes in the issuer’s financial condition. From time to time, the investment advisor may waive fees or reimburse expenses for the Fund. Without these waivers, performance would be lower. Class N shares are available to the general public without a sales load. Class I shares are available to certain institutional investors and advisory clients of William Blair & Company, L.L.C., without a sales load or distribution (12b-1) or service fees.
The performance highlights and graph presented above do not reflect the deduction of taxes that a shareholder would pay on fund distributions or the redemption of fund shares.
The Russell MidCap® Growth Index is an index that is constructed to provide a comprehensive and unbiased barometer of the mid-cap growth market.
This report identifies the Fund’s investments on December 31, 2011. These holdings are subject to change. Not all stocks in the Fund performed the same, nor is there any guarantee that these stocks will perform as well in the future. Market forecasts provided in this report may not necessarily come to pass.
Sector Diversification (Unaudited)
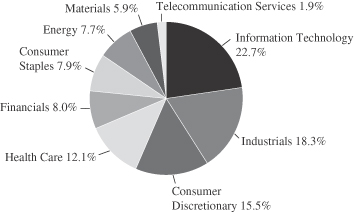
The sector diversification shown is based on the total long-term securities.
December 31, 2011 | William Blair Funds 27 |
Mid Cap Growth Fund
Portfolio of Investments, December 31, 2011 (all dollar amounts in thousands)
| | | | | | | | |
Issuer | | Shares | | | Value | |
| | |
Common Stocks | | | | | | | | |
Information Technology—22.3% | | | | | | | | |
Amphenol Corporation | | | 65,900 | | | $ | 2,991 | |
*Cavium, Inc. | | | 83,900 | | | | 2,385 | |
*Citrix Systems, Inc. | | | 49,900 | | | | 3,030 | |
*Concur Technologies, Inc. | | | 32,530 | | | | 1,652 | |
FLIR Systems, Inc. | | | 51,000 | | | | 1,279 | |
*Genpact, Ltd.† | | | 157,003 | | | | 2,347 | |
*Informatica Corporation | | | 15,600 | | | | 576 | |
*Silicon Laboratories, Inc. | | | 106,810 | | | | 4,638 | |
*SolarWinds, Inc. | | | 51,400 | | | | 1,437 | |
Solera Holdings, Inc. | | | 66,092 | | | | 2,944 | |
TE Connectivity, Ltd.† | | | 62,700 | | | | 1,932 | |
*Trimble Navigation, Ltd. | | | 99,500 | | | | 4,318 | |
VeriSign, Inc. | | | 85,000 | | | | 3,036 | |
| | | | | | | | |
| | | | | | | 32,565 | |
| | | | | | | | |
Industrials—17.9% | | | | | | | | |
*Clean Harbors, Inc. | | | 38,500 | | | | 2,453 | |
Donaldson Co., Inc. | | | 33,800 | | | | 2,301 | |
Expeditors International of Washington, Inc. | | | 35,500 | | | | 1,454 | |
Fastenal Co. | | | 95,550 | | | | 4,167 | |
Gardner Denver, Inc. | | | 27,000 | | | | 2,081 | |
J.B. Hunt Transport Services, Inc. | | | 34,700 | | | | 1,564 | |
*Jacobs Engineering Group, Inc. | | | 60,200 | | | | 2,443 | |
*Polypore International, Inc. | | | 60,100 | | | | 2,644 | |
Rockwell Automation, Inc. | | | 20,800 | | | | 1,526 | |
*Stericycle, Inc. | | | 21,630 | | | | 1,685 | |
*TransDigm Group, Inc. | | | 39,650 | | | | 3,794 | |
| | | | | | | | |
| | | | | | | 26,112 | |
| | | | | | | | |
Consumer Discretionary—15.2% | | | | | | | | |
*Bed Bath & Beyond, Inc. | | | 44,360 | | | | 2,572 | |
*CarMax, Inc. | | | 177,570 | | | | 5,412 | |
*Chipotle Mexican Grill, Inc. | | | 2,160 | | | | 730 | |
Dick’s Sporting Goods, Inc. | | | 101,929 | | | | 3,759 | |
Gentex Corporation | | | 113,080 | | | | 3,346 | |
Harman International Industries, Inc. | | | 55,006 | | | | 2,092 | |
*Lululemon Athletica, Inc. | | | 31,000 | | | | 1,446 | |
*O’Reilly Automotive, Inc. | | | 35,680 | | | | 2,853 | |
| | | | | | | | |
| | | | | | | 22,210 | |
| | | | | | | | |
Health Care—11.9% | | | | | | | | |
*CareFusion Corporation | | | 61,839 | | | | 1,571 | |
*Cerner Corporation | | | 25,600 | | | | 1,568 | |
*DaVita, Inc. | | | 33,800 | | | | 2,563 | |
*HMS Holdings Corporation | | | 115,200 | | | | 3,684 | |
*IDEXX Laboratories, Inc. | | | 37,472 | | | | 2,884 | |
*Illumina, Inc. | | | 86,820 | | | | 2,646 | |
Perrigo Co. | | | 24,800 | | | | 2,413 | |
| | | | | | | | |
| | | | | | | 17,329 | |
| | | | | | | | |
Issuer | | Shares or
Principal
Amount | | | Value | |
| | |
Common Stocks—(continued) | | | | | | | | |
Financials—7.9% | | | | | | | | |
*Affiliated Managers Group, Inc. | | | 34,075 | | | $ | 3,270 | |
*First Republic Bank | | | 51,800 | | | | 1,586 | |
*IntercontinentalExchange, Inc. | | | 17,650 | | | | 2,128 | |
*LPL Investment Holdings, Inc. | | | 69,497 | | | | 2,122 | |
T Rowe Price Group, Inc. | | | 41,500 | | | | 2,363 | |
| | | | | | | | |
| | | | | | | 11,469 | |
| | | | | | | | |
Consumer Staples—7.8% | | | | | | | | |
*Green Mountain Coffee Roasters, Inc. | | | 98,546 | | | | 4,420 | |
McCormick & Co., Inc. | | | 46,700 | | | | 2,354 | |
Mead Johnson Nutrition Co. | | | 67,100 | | | | 4,612 | |
| | | | | | | | |
| | | | | | | 11,386 | |
| | | | | | | | |
Energy—7.5% | | | | | | | | |
*Cameron International Corporation | | | 64,600 | | | | 3,178 | |
*Denbury Resources, Inc. | | | 117,570 | | | | 1,775 | |
*FMC Technologies, Inc. | | | 45,800 | | | | 2,392 | |
Range Resources Corporation | | | 37,200 | | | | 2,304 | |
*Southwestern Energy Co. | | | 41,070 | | | | 1,312 | |
| | | | | | | | |
| | | | | | | 10,961 | |
| | | | | | | | |
Materials—5.9% | | | | | | | | |
Airgas, Inc. | | | 53,700 | | | | 4,193 | |
Ecolab, Inc. | | | 74,900 | | | | 4,330 | |
| | | | | | | | |
| | | | | | | 8,523 | |
| | | | | | | | |
Telecommunication Services—1.9% | | | | | | | | |
*SBA Communications Corporation | | | 63,100 | | | | 2,711 | |
| | | | | | | | |
Total Common Stocks—98.3%
(cost $132,160) | | | | | | | 143,266 | |
| | | | | | | | |
| | |
Repurchase Agreement | | | | | | | | |
Fixed Income Clearing Corporation, 0.000% dated 12/30/11, due 1/3/12, repurchase price $2,433, collateralized by FHLMC, 4.500%, due 1/15/14 | | $ | 2,433 | | | | 2,433 | |
| | | | | | | | |
Total Repurchase Agreement—1.7%
(cost $2,433) | | | | 2,433 | |
| | | | | | | | |
Total Investments—100.0%
(cost $134,593) | | | | 145,699 | |
Cash and other assets, less liabilities—0.0% | | | | 55 | |
| | | | | | | | |
Net assets—100.0% | | | $ | 145,754 | |
| | | | | | | | |
See accompanying Notes to Financial Statements.
28 Annual Report | December 31, 2011 |
* Non-income producing securities
† U.S. listed foreign security
Karl W. Brewer
Robert C. Lanphier, IV

Matthew A. Litfin
SMALL-MID CAP GROWTH FUND
The Small-Mid Cap Growth Fund seeks long-term capital appreciation.
AN OVERVIEW FROM THE PORTFOLIO MANAGERS
The Small-Mid Cap Growth Fund decreased 0.27% on a total return basis (Class N Shares) for the 12 months ended December 31, 2011. By comparison, the Fund’s benchmark, the Russell 2500TM Growth Index, declined 1.57% during the period.
Market Review
The U.S. equity markets finished a volatile 2011 with a robust rally in the fourth quarter, bringing most large cap indices just into positive territory for the year and leaving most small cap indices just below breakeven. The Russell 2500TM Growth Index returned +13.51% in the fourth quarter and -1.57% for the year overall. While the William Blair Small-Mid Cap Growth Fund did not keep pace in the fourth quarter’s rapid ascent, it outperformed for the year overall.
The aforementioned volatility in 2011 was caused by the opposing forces of mostly positive U.S. economic data and corporate fundamentals contrasted against numerous concerns about the global economy and geo-political environment. During the first half of the year, investors mostly looked through Middle Eastern and North African uprisings and the Japanese natural disaster as corporate fundamentals remained robust. However, during the third quarter, the market corrected swiftly. This was driven primarily by the European sovereign debt crisis spreading more dramatically to larger Euro-zone countries beyond Greece. Domestically, political brinksmanship over the debt ceiling debate deteriorated investor and public sentiment about our leadership, contributing to the selloff as well. While the European sovereign debt crisis remained at the forefront of concerns throughout the fourth quarter, investor sentiment improved considerably as the focus moved instead to better-than-expected corporate earnings, employment, housing and industrial production reports late in the year.
From a style and sector perspective, the market environment within the Russell 2500TM Growth was much different in the fourth quarter than it was for the year overall. Higher beta stocks did well in the fourth quarter but underperformed for the year. Some of the more cyclically-driven sectors outperformed in the fourth quarter (e.g., Energy +26.42%, Industrials +20.88%) while underperforming for the year overall (e.g., Industrials -1.38%, Energy -4.07%). On the other hand, the typically-defensive Consumer Staples and Health Care sectors outperformed for the year while underperforming in the final quarter.
Portfolio Review
The Fund’s outperformance for the year is attributable to stock selection and a modest style benefit. Our more conservative investment approach (i.e. typical lower portfolio beta) was a positive as investors sought less market risk given overall market volatility. More importantly, stock selection across a variety of sectors boosted results above the benchmark. This was most prevalent in the Energy sector as Petrohawk and Cabot Oil & Gas Corporation outperformed. Green Mountain Coffee Roasters, Inc. within Consumer Staples boosted relative performance for the year along with Airgas, Inc. and Celanese Corporation within Materials. On the downside, K12, Inc. and Urban Outfitters within Consumer Discretionary and Jones Lang LaSalle, Inc. within Financials hurt relative performance for 2011.
December 31, 2011 | William Blair Funds 29 |
For the fourth quarter specifically, the Fund’s underperformance was the result of a style headwind and negative stock selection. While our typical lower beta was a headwind during the market’s swift fourth quarter rally, stock selection was the main detractor for the three month period. This was most pronounced in Health Care as Illumina, Perrigo, Co. and Cerner Corporation underperformed. Stock selection in Industrials (e.g., Stericycle, Inc.), Energy (KiOR Inc.) and Consumer Staples (Green Mountain Coffee Roasters, Inc.) detracted as well. Benefitting relative performance was stock selection in Information Technology (e.g., RightNow Technologies), Materials (e.g., Celanese Corporation) and Financials (Invesco, Ltd., Affiliated Managers Group, Inc.).
Market Outlook
Looking forward, the improved economic data over the past few months increases the probability that the economic recovery is self-sustaining. As we said last quarter, the health of the global financial system due to European sovereign debt problems and the prospects for emerging market growth continue to be two of the largest macro-economic risks. In addition, 2012 will bring events such as the U.S. presidential election, austerity debates, potential standoffs with Iran and North Korea and other unforeseen events that will undoubtedly spur uncertainty in investor psyche. That said, the level of investor pessimism is already high, stock market valuations are reasonably attractive and earnings expectations for 2012 have been reduced over the past few months. All of these are often advantageous for prospective equity returns.
In the end, while we factor various economic scenarios into our stock picking, we focus our time on constructing the portfolio from a bottom-up perspective. We continue to find good ideas across sectors, and are confident the Fund consists of well-managed companies with solid competitive positions whose stocks are at attractive valuations compared to the growth and consistency of their business.
Contributors to Return (Fourth Quarter)
Celanese Corporation (CE) is a specialty chemical and materials company. Its diversified product portfolio includes chemicals and polymers used in paints and coatings, electronics (batteries and liquid crystal displays) and food and beverage applications (sweeteners for Red Bull and Gatorade). Reason for outperformance: After underperforming in the third quarter on broad economic concerns, improved economic sentiment in the fourth quarter helped move the stock higher. Action: We maintained our position on the move. Our investment thesis remains that investors have yet to fully appreciate Celanese Corporation’s waning dependence on commodity chemicals and increased exposure to faster growth and higher margin specialty chemicals and polymers. In addition, Wall Street has not yet appreciated the company’s new proprietary technology for manufacturing ethanol from coal, which has the potential to be monetized meaningfully over the long term.
Fastenal, Co. (FAST) is a distributor of various industrial supplies, from nuts and bolts to shovels and work gloves. Reason for outperformance: The stock performed well in the fourth quarter and throughout the year due in part to internal growth initiatives, such as industrial supply vending machines and government sales specialists. Improved economic sentiment in the fourth quarter contributed to the stock’s performance as well. Action: We trimmed our position on strength, but continue to own this long-time holding as we believe it can continue to gain market share in the highly fragmented industrial distribution market.
HMS Holdings Corporation (HMSY) provides a variety of cost containment, coordination of benefits and program integrity services for government-sponsored health and human services programs, including state Medicaid agencies, the Veterans Health Administration and the Centers for Medicare & Medicaid Services. The company’s solutions aim to help clients reduce costs by detecting fraud and administrative inefficiencies in their programs. Reason
30 Annual Report | December 31, 2011 |
for outperformance: The company announced the acquisition of the leading Medicare Recovery Audit Contractor, expanding its recovery services into the Federal arena and bolstering its recovery service offering to existing State contracts. Action: We continue to hold a position in the stock after the positive move as we believe the company’s solutions can improve government efficiency, as detection of fraud waste and abuse continues to have strong bipartisan support.
RightNow Technologies (RNOW) provides its corporate customers a cloud-based multi-channel customer service solution, allowing them to interact with clients and prospects via the phone, email, Web, chat and social media all on one common platform. Reason for outperformance: During October, the company announced it was being acquired by a large cap technology company, Oracle. Action: We liquidated our position on the news.
Team Health Holdings, Inc. (TMH) provides outsourced physician staffing and administrative services to the healthcare industry, with particular focus on outsourced emergency department solutions. Reason for outperformance: A solid earnings report and increased awareness of the company’s value proposition among investors likely drove the stock higher in the fourth quarter. Given cost pressures and increased quality demands in the healthcare field, more hospitals are searching for ways to be more efficient while improving clinical outcomes, which has increased the demand for Team Health’s solutions. Action: We maintained our position in the stock given the long-term earnings growth potential of the company and the industry.
Detractors from Return (Fourth Quarter)
Cerner Corporation (CERN) provides healthcare information technology solutions, devices and services primarily to physician offices and hospitals. Reason for underperformance: The market became increasingly concerned that the company’s 30%+ new business bookings growth in 2011 was unsustainable as many investors questioned the adoption level and size of the market. Given the stock’s solid performance in 2011 prior to the fourth quarter, a rich valuation contributed to the decline. Action: We maintained our position as we believe Cerner Corporation, as the market leader, will continue to benefit from secular trends in healthcare Information Technology.
Green Mountain Coffee Roasters, Inc. (GMCR) sells its Keurig line of single cup brewers, along with coffee and tea “K-cups” for use in these machines. Reason for underperformance: While being the largest contributor to relative return for 2011 as a whole, the stock sold off during the fourth quarter primarily due to two reasons. First, early in the quarter, during the company’s quiet period, a prominent short seller published a short case on the stock, citing concerns about the long-term market opportunity for the company, patent expirations in 2012 and certain accounting practices. This pessimism surrounding the stock was compounded when the company reported a rare disappointment in revenues. While revenues were up roughly 95% in the quarter versus the prior year period, this level was below expectations. The company said it was caused by short-term changes in buying patterns by grocery and wholesale club customers. Action: After trimming our position substantially through the first nine months of the year, we added to our position on the selloff. We continue to believe the company’s earnings potential is much greater than it is today, in part due to third party surveys we commissioned throughout the year to monitor demand in the single serve coffee market. Furthermore, we believe the company’s competitive position is strong relative to the inevitable increase in competition over the next couple of years.
Illumina (ILMN) develops and markets integrated systems used in the gene sequencing and genotyping markets. The company’s machines enable medical and academic institutions to understand the genetic make-up of individuals which allows for more productive research in disease treatment and prevention. Reason for underperformance: As we mentioned in our third quarter letter, the company announced a large revenue disappointment in early October. This recent fundamental weakness is likely the result of delayed government funding to
December 31, 2011 | William Blair Funds 31 |
research institutions and due to increased productivity of Illumina’s systems which has reduced the company’s revenue per sequencing run. Action: We liquidated our position as we believe the current fundamental weakness could be emblematic of a smaller-than-expected long-term total addressable market, but we will continue to monitor developments in this nascent industry.
K12, Inc. (LRN) services the Kindergarten through grade-12 virtual public school market by selling these schools online curriculum, books and other learning materials, as well as management and technology services. Reason for underperformance: Despite better-than-expected revenue and enrollment growth, recent acquisition activity and internal investments have hurt the bottom line and have lessened visibility into future earnings. Also, in mid-December, The New York Times published a negative article about online charter schools and specifically K12, Inc., primarily focused on standardized test scores. Many of the dynamics in the article are well known and the article did not present a thorough analysis of the company or this burgeoning industry. Nonetheless, investor sentiment toward the stock sank after it was published. Action: We continue to hold a position in the stock as we believe the company’s education solutions are strong and that the company will continue to gain market share versus traditional solutions.
KiOR, Inc. (KIOR) is a renewable fuels company whose technology converts low-cost, abundant and sustainable non-food biomass (e.g., wood chips) into traditional hydrocarbon-based oil. Reason for underperformance: After being one of the largest contributors to relative return in the third quarter, the stock came under pressure in the fourth quarter as investors became more concerned about capital expenditures and financing for the company’s Mississippi production facility. Action: We maintained our relatively small position in the stock given the commercial potential for the company’s renewable fuel capabilities.
32 Annual Report | December 31, 2011 |
Small-Mid Cap Growth Fund
Performance Highlights (Unaudited)
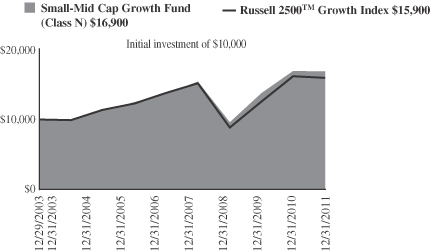
Average Annual Total Return at 12/31/2011
| | | | | | | | | | | | | | | | |
| | | 1
Year | | | 3
Year | | | 5
Year | | | Since
Inception(a) | |
Class N | | | (0.27 | )% | | | 20.74 | % | | | 4.25 | % | | | 6.75 | % |
Class I | | | 0.01 | | | | 21.09 | | | | 4.53 | | | | 7.02 | |
Russell 2500™ Growth Index | | | (1.57 | ) | | | 21.57 | | | | 2.89 | | | | 6.00 | |
| | (a) | | For the period from December 29, 2003 (Commencement of Operations) to December 31, 2011. | |
Performance cited represents past performance. Past performance does not guarantee future results and current performance may be lower or higher than the data quoted. Results shown are average annual total returns, which assume reinvestment of dividends and capital gains. Investment returns and principal will fluctuate and you may have a gain or loss when you sell shares. For the most current month-end performance information, please call 1-800-742-7272, or visit our Web site at www.williamblairfunds.com. Investing in smaller and medium capitalization companies involves special risks, including higher volatility and lower liquidity. Smaller and medium capitalization stocks are also more sensitive to purchase/sale transactions and changes in the issuer’s financial condition. From time to time, the investment advisor may waive fees or reimburse expenses for the Fund. Without these waivers, performance would be lower. Class N shares are available to the general public without a sales load. Class I shares are available to certain institutional investors and advisory clients of William Blair & Company, L.L.C., without a sales load or distribution (12b-1) or service fees.
The performance highlights and graph presented above do not reflect the deduction of taxes that a shareholder would pay on fund distributions or the redemption of fund shares.
The Russell 2500™ Growth Index measures the performance of those Russell 2500 companies with above average price-to-book ratios and forecasted growth rates.
This report identifies the Fund’s investments on December 31, 2011. These holdings are subject to change. Not all stocks in the Fund performed the same, nor is there any guarantee that these stocks will perform as well in the future. Market forecasts provided in this report may not necessarily come to pass.
Sector Diversification (Unaudited)
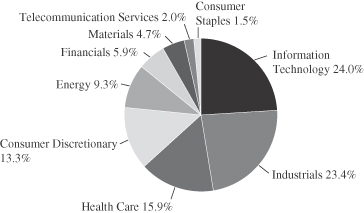
The sector diversification shown is based on the total long-term securities.
December 31, 2011 | William Blair Funds 33 |
Small-Mid Cap Growth Fund
Portfolio of Investments, December 31, 2011 (all dollar amounts in thousands)
| | | | | | | | |
Issuer | | Shares | | | Value | |
| | |
Common Stocks | | | | | | | | |
Information Technology—22.8% | | | | | | | | |
*ANSYS, Inc. | | | 55,300 | | | $ | 3,168 | |
*Aruba Networks, Inc. | | | 118,600 | | | | 2,196 | |
*Booz Allen Hamilton Holding Corporation | | | 233,565 | | | | 4,029 | |
*Cavium, Inc. | | | 127,673 | | | | 3,630 | |
*Concur Technologies, Inc. | | | 45,200 | | | | 2,296 | |
*Genpact, Ltd.† | | | 162,300 | | | | 2,426 | |
*Informatica Corporation | | | 74,300 | | | | 2,744 | |
j2 Global Communications, Inc. | | | 100,375 | | | | 2,825 | |
*MICROS Systems, Inc. | | | 62,300 | | | | 2,902 | |
Molex, Inc. | | | 146,628 | | | | 3,499 | |
NIC, Inc. | | | 231,700 | | | | 3,084 | |
*Polycom, Inc. | | | 206,800 | | | | 3,371 | |
*RealPage, Inc. | | | 153,900 | | | | 3,889 | |
*Riverbed Technology, Inc. | | | 159,900 | | | | 3,758 | |
*Silicon Laboratories, Inc. | | | 85,660 | | | | 3,719 | |
*SolarWinds, Inc. | | | 89,700 | | | | 2,507 | |
*Trimble Navigation, Ltd. | | | 64,500 | | | | 2,799 | |
*Ultimate Software Group, Inc. | | | 38,225 | | | | 2,489 | |
*Wright Express Corp. | | | 48,000 | | | | 2,605 | |
| | | | | | | | |
| | | | | | | 57,936 | |
| | | | | | | | |
Industrials—22.3% | | | | | | | | |
*Allegiant Travel Co. | | | 51,565 | | | | 2,751 | |
*BE Aerospace, Inc. | | | 67,953 | | | | 2,631 | |
*Corrections Corporation of America | | | 119,755 | | | | 2,439 | |
*CoStar Group, Inc. | | | 43,858 | | | | 2,927 | |
Fastenal Co. | | | 114,070 | | | | 4,975 | |
*GrafTech International, Ltd. | | | 214,026 | | | | 2,921 | |
Healthcare Services Group, Inc. | | | 271,683 | | | | 4,806 | |
*Huron Consulting Group, Inc. | | | 76,300 | | | | 2,956 | |
*ICF International, Inc. | | | 127,725 | | | | 3,165 | |
Manpower, Inc. | | | 68,450 | | | | 2,447 | |
*Polypore International, Inc. | | | 46,700 | | | | 2,054 | |
Robert Half International, Inc. | | | 128,300 | | | | 3,651 | |
Roper Industries, Inc. | | | 35,100 | | | | 3,049 | |
*Stericycle, Inc. | | | 74,670 | | | | 5,818 | |
The Corporate Executive Board Co. | | | 125,735 | | | | 4,791 | |
*TransDigm Group, Inc. | | | 27,408 | | | | 2,622 | |
*Trimas Corporation | | | 140,448 | | | | 2,521 | |
| | | | | | | | |
| | | | | | | 56,524 | |
| | | | | | | | |
Health Care—15.2% | | | | | | | | |
*athenahealth, Inc. | | | 61,474 | | | | 3,020 | |
*Brookdale Senior Living, Inc. | | | 127,876 | | | | 2,224 | |
*Cerner Corporation | | | 51,536 | | | | 3,157 | |
*Covance, Inc. | | | 80,100 | | | | 3,662 | |
*HealthSouth Corporation | | | 209,800 | | | | 3,707 | |
*HMS Holdings Corporation | | | 145,792 | | | | 4,662 | |
*Hologic, Inc. | | | 256,800 | | | | 4,496 | |
*IDEXX Laboratories, Inc. | | | 45,005 | | | | 3,464 | |
| | |
Common Stocks—(continued) | | | | | | | | |
Health Care—(continued) | | | | | | | | |
Perrigo Co. | | | 26,756 | | | $ | 2,603 | |
*SXC Health Solutions Corporation† | | | 68,216 | | | | 3,853 | |
*Team Health Holdings, Inc. | | | 162,100 | | | | 3,577 | |
| | | | | | | | |
| | | | | | | 38,425 | |
| | | | | | | | |
Consumer Discretionary—12.7% | | | | | | | | |
*CarMax, Inc. | | | 96,100 | | | | 2,929 | |
Dick’s Sporting Goods, Inc. | | | 123,390 | | | | 4,551 | |
Gentex Corporation | | | 127,000 | | | | 3,758 | |
*K12, Inc. | | | 103,650 | | | | 1,860 | |
*O’Reilly Automotive, Inc. | | | 32,450 | | | | 2,594 | |
Strayer Education, Inc. | | | 38,500 | | | | 3,742 | |
*Tempur-Pedic International, Inc. | | | 43,100 | | | | 2,264 | |
Texas Roadhouse, Inc. | | | 177,243 | | | | 2,641 | |
Tractor Supply Co. | | | 56,000 | | | | 3,928 | |
*Under Armour, Inc. | | | 54,760 | | | | 3,931 | |
| | | | | | | | |
| | | | | | | 32,198 | |
| | | | | | | | |
Energy—8.8% | | | | | | | | |
Cabot Oil & Gas Corporation | | | 31,800 | | | | 2,414 | |
Core Laboratories N.V.† | | | 40,200 | | | | 4,581 | |
*Dresser-Rand Group, Inc. | | | 56,000 | | | | 2,795 | |
Helmerich & Payne, Inc. | | | 49,300 | | | | 2,877 | |
*KiOR, Inc. | | | 146,299 | | | | 1,489 | |
Oceaneering International, Inc. | | | 58,400 | | | | 2,694 | |
*Oil States International, Inc. | | | 49,600 | | | | 3,788 | |
SM Energy Co. | | | 24,300 | | | | 1,776 | |
| | | | | | | | |
| | | | | | | 22,414 | |
| | | | | | | | |
Financials—5.6% | | | | | | | | |
*Affiliated Managers Group, Inc. | | | 53,909 | | | | 5,172 | |
*FirstService Corporation† | | | 85,575 | | | | 2,267 | |
Invesco, Ltd.† | | | 165,800 | | | | 3,331 | |
Jones Lang LaSalle, Inc. | | | 57,900 | | | | 3,547 | |
| | | | | | | | |
| | | | | | | 14,317 | |
| | | | | | | | |
Materials—4.5% | | | | | | | | |
Airgas, Inc. | | | 58,400 | | | | 4,560 | |
Celanese Corporation | | | 94,100 | | | | 4,166 | |
*Rockwood Holdings, Inc. | | | 68,000 | | | | 2,677 | |
| | | | | | | | |
| | | | | | | 11,403 | |
| | | | | | | | |
Telecommunication Services—1.9% | | | | | | | | |
*SBA Communications Corporation | | | 111,700 | | | | 4,799 | |
| | | | | | | | |
Consumer Staples—1.5% | | | | | | | | |
*Green Mountain Coffee Roasters, Inc. | | | 83,226 | | | | 3,733 | |
| | | | | | | | |
Total Common Stocks—95.3%
(cost $225,293) | | | | 241,749 | |
| | | | | | | | |
See accompanying Notes to Financial Statements.
34 Annual Report | December 31, 2011 |
Small-Mid Cap Growth Fund
Portfolio of Investments, December 31, 2011 (all dollar amounts in thousands)
| | | | | | | | |
Issuer | | Principal
Amount | | | Value | |
| | |
Repurchase Agreement | | | | | | | | |
Fixed Income Clearing Corporation, 0.000% dated 12/30/11, due 1/3/12, repurchase price $8,131, collateralized by U.S. Treasury Note, 1.750%, due 1/31/14 | | $ | 8,131 | | | $ | 8,131 | |
| | | | | | | | |
Total Repurchase Agreement—3.2%
(cost $8,131) | | | | 8,131 | |
| | | | | | | | |
Total Investments—98.5%
(cost $233,424) | | | | 249,880 | |
Cash and other assets, less liabilities—1.5% | | | | 3,717 | |
| | | | | | | | |
Net assets—100.0% | | | $ | 253,597 | |
| | | | | | | | |
* Non-income producing securities
† U.S. listed foreign security
See accompanying Notes to Financial Statements.
December 31, 2011 | William Blair Funds 35 |
GLOBAL MARKETS OVERVIEW
Summary
After a positive start, 2011 hit a rough patch as the markets centered on the continuing European debt crisis, developed sovereign credit rating downgrades and concerns of a potential global contagion effect. Daily market volatility centered on investors’ perception of governmental wherewithal to deal with these issues and on news flow of their progress. Despite the focus on developed markets, emerging markets were no safe haven during the period, as inflationary pressures precipitated monetary policy tightening across most emerging markets, and as concerns about Chinese overinvestment and infrastructure overbuild intensified during the third quarter. Despite these concerns, economic indicators in the United States remained stable, the Eurozone moved closer to tighter fiscal and monetary policy integration, and corporate performance generally remained strong. These concerns continue to affect global markets, however, as details surrounding “Europe’s Grand Bargain” have not been finalized and financial system liquidity, while improving, remains relatively tight. The market also remains focused on incremental data points in China regarding infrastructure spending, property market values, and asset quality, the overall tradeoff between inflation and economic growth, and the resulting implications for global growth. Finally, concerns linger about the profitability and capital position of financials, along with the implications of the 2008 and the European debt crisis on regulation, capital requirements, asset quality and prospective loan growth.
Given this backdrop, the global equity market ended 2011 down 7.89%, despite an early year rally and October bounce. While globally there was virtually no difference attributable to style, outside the U.S., the MSCI ACWI Ex-US Growth Index underperformed the Value Index by approximately 70 basis points. Small cap stocks were down nearly 16% outside the U.S. during 2011, underperforming their larger capitalization counterparts, with the exception of Japan. The more defensive sectors outperformed, as Health Care and Consumer Staples were each up approximately 7%, while Materials and Financials were the worst performing sectors, down 18% and 21%, respectively. After depreciating most of the year, the U.S. Dollar appreciated versus most developed market currencies beginning in September to end the year with slight appreciation. The notable exception was the Japanese yen, which appreciated versus most currencies globally.
Despite the concerns about debt downgrades and the European debt situation as a whole, developed markets significantly outpaced emerging markets, as the World Index was down 6.03%, well ahead of the -19.49% MSCI Emerging Markets Index return. The U.S. was a key driver of that strong relative performance, as it eked out a 0.63% return for the year, well ahead of almost all other developed markets. Japan, after falling significantly following March’s earthquake and tsunami, rebounded mid year only to retreat during the fourth quarter. It ended the year down nearly 13%, although it benefited from the Yen’s appreciation. Similarly Europe, which began the year strongly, was the epicenter of concern for most of the year, and ended 2011 down over 16%, led on the downside by Greece (-61%) and, to a lesser extent, Austria (-34%), Finland (-31%), and Israel (-29%). Conversely, Switzerland, which was down 8%, was a key outperformer in Europe. Other developed markets countries that performed well on a relative basis included Canada and the U.K.
The three emerging markets regions; Emerging Asia, Emerging Europe, Mid-East, Africa, and Emerging Latin America, were each down between 19% to 21% during 2011, although country returns varied significantly even within regions. Indonesia was the only emerging market country with a positive return, up 4.31%, on continued growth. Other countries that were top performers included Mexico, South Africa, and Thailand. Conversely, the worst performing emerging market country was Egypt, which was down 47.62%, following the regime change in January and persisting uncertainty throughout the remainder of the year. India was also down significantly, falling 39%, due partially to a depreciating Rupee,
36 Annual Report | December 31, 2011 |
but also due to concerns about inflationary pressures, high costs, and the overall competitive environment within that country. Central and Eastern Europe generally suffered along with the travails of Western Europe, due to financial market integration and follow on effects. After underperforming a large percentage of the year, China ended the year in the middle of the pack, down approximately 21%, due to an 8% fourth quarter rally.
Outlook
It has been twelve years since the historic highs of the 1999-2000 bull market. During that time, the world economy has been through a post-bubble consolidation, a credit-fueled expansion, a severe recession, and a tentative recovery (2010-2011) that has been challenged by persistent doubts about the sustainability of global growth. Economic performance has been volatile over the whole period, and conventional assumptions about the viability of policy regimes and the financial system have come under attack.
It has been predominantly a bear market cycle, with major developed markets all still below their early-2000 peaks. Corporate performance has been strong over the last decade—profit growth has far outpaced economic growth around the world; at the same time, emerging market equity values have expanded significantly. Nevertheless, overall market returns have been significantly impacted by an erosion of confidence. Earnings multiples on global markets have contracted in eight out of the last twelve years, declining from a high of 25x earnings in 2000 to lows of just above ten times in 2008 and 2011.
Price to Earnings ratios contracted in both 2010 and 2011, reflecting caution in expectations for both growth and valuation. Institutional, hedge fund, and retail investors have swung decisively to the pessimistic end of the long-term sentiment spectrum in the last several years. Strategists like Albert Edwards of Societe Generale, investors like Jeremy Grantham of GMO, and media sources such as the Daily Telegraph and ZeroHedge provide an array of negative perspectives on capital markets ranging from overleverage and financial disorder to permanent impairment of growth to the assertion that valuation and profitability measures are illusory.
Consensus expectations today are built around a scenario of moderate European recession (with continuing risk of financial instability), a cooling effect on global growth from bank deleveraging, an unpredictable deceleration in investment growth in China, and chronic sluggishness in the U.S. If the economic and financial conditions behind those assumptions begin to change at the margin, there could be scope for improvement in the market return environment, especially given the modest starting point on valuations.
After months of crisis headlines, at this point the prospects for change do seem to be improving. In Europe, the extended and expanded Long-Term Refinancing Operation (LTRO) facility has brought funding relief to the banks and strengthened the tone of recent bond auctions. China has seen selective easing measures enacted as inflation has begun to recede, and other emerging market authorities are easing as well. U.S. economic indicators are continuing to improve amid signs that the government is preparing a more activist approach to the lingering housing market problems.
From here, critical indicators to watch will include U.S. employment data, Greek debt negotiations, peripheral European country budget debates, Chinese housing and industrial activity, and the trend in corporate profitability as growth decelerates. If there is observable improvement in three or more of these five key benchmarks of global economic performance, the market environment could turn a good deal more positive in 2012.
December 31, 2011 | William Blair Funds 37 |

W. George Greig

Kenneth J. McAtamney
GLOBAL GROWTH FUND
The Global Growth Fund seeks long-term capital appreciation.
AN OVERVIEW FROM THE PORTFOLIO MANAGERS
The Global Growth Fund posted a 3.47% decrease (Class N Shares) for the 12 months ended December 31, 2011. By comparison, the Fund’s benchmark, the MSCI All Country World IMI (net) index declined 7.89%.
The Fund outpaced the index during the full year of 2011. Despite lagging early in the year on the European low quality rally, the Global Growth Fund’s full year outperformance was driven by its focus on quality companies with strong operating performance. In the slowing growth environment experienced during the latter part of the year, those companies with stronger intrinsic growth capabilities provided positive relative stock performance. As a result, performance was strong across most sectors, particularly Information Technology (IT), Consumer Discretionary, Industrials and Financials. Apple, Inc, Gree, Inc. and International Business Machines Corporation all contributed within IT. In addition, the Fund benefitted from Hewlett Packard’s bid for Autonomy. Within Consumer Discretionary, stock selection was strong with Starbucks, Hyundai Motor, Yum! Brands, Nike, O’Reilly Automotive, and Hansen Natural (Monster Beverage) all contributing to outperformance. Industrial sector outperformance was driven by Grainger, Rolls-Royce, Weir Group, Babcock International and Experian. Financials stock selection benefited from the underweighting in commercial and investment banks throughout the year. Despite the Health Care sector outpacing the market overall, our Fund returns were hurt by poor stock selections in that sector. Energy sector under-exposure and stock selection also detracted from performance throughout the year.
The overall complexion of the Fund did not change dramatically throughout 2011. Consumer Discretionary and IT sectors were the consistent overweights, as well as Industrials, although to a declining degree. The largest underweights were consistently in the Financials and Materials sectors. The U.S. weighting remained high—given historical Fund positioning—at a near benchmark level. We believe economic stability and valuation is relatively attractive in the U.S. The global emerging markets were uncharacteristically under-represented in the Fund this year, which aided relative performance. This could be an area of renewed focus for us as the outlook in China in particular becomes more (positively) visible. The biggest variables that could impact 2012 performance based on the Fund’s current positioning are the economic growth and stability in China, and the political deliberations and policy measures within the European Union.
38 Annual Report | December 31, 2011 |
Global Growth Fund
Performance Highlights (Unaudited)
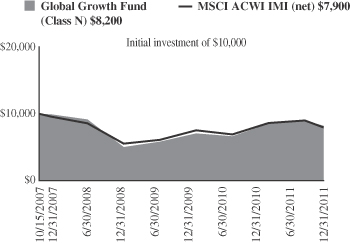
Average Annual Total Return at 12/31/2011
| | | | | | | | | | | | |
| | | 1
Year | | | 3
Year | | | Since
Inception(a) | |
Class N | | | (3.47 | )% | | | 17.80 | % | | | (4.71 | )% |
Class I | | | (3.26 | ) | | | 18.06 | | | | (4.45 | ) |
MSCI All Country World IMI (net) | | | (7.89 | ) | | | 12.84 | | | | (5.40 | ) |
| | (a) | | For the period from October 15, 2007 (Commencement of Operations) to December 31, 2011. |
Performance cited represents past performance. Past performance does not guarantee future results and current performance may be lower or higher than the data quoted. Results shown are average annual total returns, which assume reinvestment of dividends and capital gains. Investment returns and principal will fluctuate and you may have a gain or loss when you sell shares. For the most current month-end performance information, please call 1-800-742-7272, or visit our Web site at www.williamblairfunds.com. Investing in smaller and medium capitalization companies involves special risks, including higher volatility and lower liquidity. Smaller and medium capitalization stocks are also more sensitive to purchase/sale transactions and changes in the issuer’s financial condition. International investing involves special risk considerations, including currency fluctuations, lower liquidity, economic and political risk. From time to time, the investment advisor may waive fees or reimburse expenses for the Fund. Without these waivers, performance would be lower. Class N shares are available to the general public without a sales load. Class I shares are available to certain institutional investors and advisory clients of William Blair & Company, L.L.C., without a sales load or distribution fees (12b-1).
The performance highlights and graph presented above do not reflect the deduction of taxes that a shareholder would pay on fund distributions or the redemption of fund shares.
The Morgan Stanley Capital International (MSCI) All Country World Investable Market Index (IMI) (net) is a free float-adjusted market capitalization weighted index that is designed to measure the equity market of developed and emerging markets. This series approximates the minimum possible dividend reinvestment.
This report identifies the Fund’s investments on December 31, 2011. These holdings are subject to change. Not all stocks in the Fund performed the same, nor is there any guarantee that these stocks will perform as well in the future. Market forecasts provided in this report may not necessarily come to pass.
Sector Diversification (Unaudited)
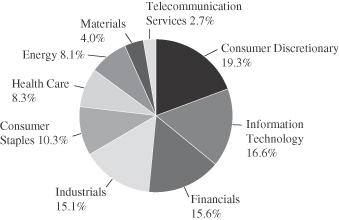
The sector diversification shown is based on the total long-term securities.
December 31, 2011 | William Blair Funds 39 |
Global Growth Fund
Portfolio of Investments, December 31, 2011 (all dollar amounts in thousands)
| | | | | | | | |
Issuer | | Shares | | | Value | |
|
Common Stocks | |
| | |
Western Hemisphere—47.7% | | | | | | | | |
Canada—4.6% | | | | | | | | |
Brookfield Asset Management, Inc. Class “A” (Real estate management & development)† | | | 18,987 | | | $ | 522 | |
Peyto Exploration & Development Corporation (Oil, gas & consumable fuels) | | | 9,866 | | | | 236 | |
Saputo, Inc. (Food products) | | | 16,081 | | | | 616 | |
The Toronto-Dominion Bank (Commercial banks) | | | 7,613 | | | | 570 | |
| | | | | | | | |
| | | | | | | 1,944 | |
| | | | | | | | |
United States—43.1% | | | | | | | | |
*Affiliated Managers Group, Inc. (Capital markets) | | | 4,825 | | | | 463 | |
American Express Co. (Consumer finance) | | | 15,527 | | | | 732 | |
AMETEK, Inc. (Electrical equipment) | | | 10,575 | | | | 445 | |
*Apple, Inc. (Computers & peripherals) | | | 3,133 | | | | 1,269 | |
Church & Dwight Co., Inc. (Household products) | | | 10,084 | | | | 462 | |
*Citrix Systems, Inc. (Software) | | | 7,447 | | | | 452 | |
*Clean Harbors, Inc. (Commercial services & supplies) | | | 4,525 | | | | 288 | |
Colgate-Palmolive Co. (Household products) | | | 6,685 | | | | 618 | |
CR Bard, Inc. (Health care equipment & supplies) | | | 4,786 | | | | 409 | |
*DaVita, Inc. (Health care providers & services) | | | 6,705 | | | | 508 | |
*Discovery Communications, Inc. Class “A” (Media) | | | 12,551 | | | | 514 | |
*Express Scripts, Inc. (Health care providers & services) | | | 11,696 | | | | 523 | |
Exxon Mobil Corporation (Oil, gas & consumable fuels) | | | 10,717 | | | | 908 | |
*Hansen Natural Corporation (Beverages) | | | 6,774 | | | | 624 | |
*IDEXX Laboratories, Inc. (Health care equipment & supplies) | | | 5,668 | | | | 436 | |
International Business Machines Corporation (IT services) | | | 4,859 | | | | 894 | |
j2 Global Communications, Inc. (Internet software & services) | | | 7,924 | | | | 223 | |
JPMorgan Chase & Co. (Diversified financial services) | | | 18,563 | | | | 617 | |
McCormick & Co., Inc. (Food products) | | | 9,360 | | | | 472 | |
NIKE, Inc. Class “B” (Textiles, apparel & luxury goods) | | | 7,790 | | | | 751 | |
*O’Reilly Automotive, Inc. (Specialty retail) | | | 6,975 | | | | 558 | |
*priceline.com, Inc. (Internet & catalog retail) | | | 1,199 | | | | 561 | |
QUALCOMM, Inc. (Communications equipment) | | | 15,064 | | | | 824 | |
Starbucks Corporation (Hotels, restaurants & leisure) | | | 18,228 | | | | 839 | |
*Tempur-Pedic International, Inc. (Household durables) | | | 7,863 | | | | 413 | |
The Walt Disney Co. (Media) | | | 16,135 | | | | 605 | |
*Thermo Fisher Scientific, Inc. (Life sciences tools & services) | | | 10,873 | | | | 489 | |
United Parcel Service, Inc. Class “B” (Air freight & logistics) | | | 8,791 | | | | 643 | |
W.W. Grainger, Inc. (Trading companies & distributors) | | | 3,292 | | | | 616 | |
Williams-Sonoma, Inc. (Specialty retail) | | | 8,999 | | | | 347 | |
Yum! Brands, Inc. (Hotels, restaurants & leisure) | | | 14,461 | | | | 853 | |
| | | | | | | | |
| | | | | | | 18,356 | |
| | | | | | | | |
| | |
Common Stocks—(continued) | | | | | | | | |
| | |
United Kingdom—19.3% | | | | | | | | |
Abcam plc (Biotechnology) | | | 34,689 | | | $ | 197 | |
Ashmore Group plc (Capital markets) | | | 64,902 | | | | 337 | |
Babcock International Group plc (Commercial services & supplies) | | | 26,694 | | | | 305 | |
BG Group plc (Oil, gas & consumable fuels) | | | 31,426 | | | | 672 | |
BHP Billiton plc (Metals & mining) | | | 22,925 | | | | 668 | |
Burberry Group plc (Textiles, apparel & luxury goods) | | | 15,737 | | | | 290 | |
Compass Group plc (Hotels, restaurants & leisure) | | | 66,592 | | | | 632 | |
Diageo plc (Beverages) | | | 34,935 | | | | 763 | |
Experian plc (Professional services) | | | 45,406 | | | | 617 | |
Hargreaves Lansdown plc (Capital markets) | | | 27,793 | | | | 186 | |
Meggitt plc (Aerospace & defense) | | | 32,929 | | | | 180 | |
Pearson plc (Media) | | | 31,326 | | | | 589 | |
Petrofac, Ltd. (Energy equipment & services) | | | 19,297 | | | | 432 | |
*Rolls-Royce Holdings plc (Aerospace & defense) | | | 64,487 | | | | 747 | |
Standard Chartered plc (Commercial banks) | | | 24,827 | | | | 543 | |
The Weir Group plc (Machinery) | | | 17,520 | | | | 553 | |
Vodafone Group plc (Wireless telecommunication services) | | | 186,966 | | | | 519 | |
| | | | | | | | |
| | | | | | | 8,230 | |
| | | | | | | | |
| | |
Europe, Mid-East—14.6% | | | | | | | | |
Denmark—1.7% | | | | | | | | |
Coloplast A/S Class “B” (Health care equipment & supplies) | | | 1,591 | | | | 229 | |
Novozymes A/S (Chemicals) | | | 16,745 | | | | 517 | |
| | | | | | | | |
| | | | | | | 746 | |
| | | | | | | | |
France—1.2% | | | | | | | | |
Essilor International S.A. (Health care equipment & supplies) | | | 6,969 | | | | 492 | |
| | | | | | | | |
Germany—2.7% | | | | | | | | |
Aixtron AG (Semiconductors & semiconductor equipment) | | | 6,047 | | | | 77 | |
Brenntag AG (Trading companies & distributors) | | | 3,586 | | | | 334 | |
SAP AG (Software) | | | 14,018 | | | | 741 | |
| | | | | | | | |
| | | | | | | 1,152 | |
| | | | | | | | |
Israel—1.1% | | | | | | | | |
*Check Point Software Technologies, Ltd. (Software)† | | | 8,761 | | | | 460 | |
| | | | | | | | |
Italy—2.2% | | | | | | | | |
Saipem SpA (Energy equipment & services) | | | 16,985 | | | | 722 | |
Tod’s SpA (Textiles, apparel & luxury goods) | | | 2,567 | | | | 210 | |
| | | | | | | | |
| | | | | | | 932 | |
| | | | | | | | |
Sweden—1.5% | | | | | | | | |
Atlas Copco AB (Machinery) | | | 30,155 | | | | 648 | |
| | | | | | | | |
Switzerland—4.2% | | | | | | | | |
Nestle S.A. (Food products) | | | 13,321 | | | | 766 | |
Partners Group Holding AG (Capital markets) | | | 3,026 | | | | 528 | |
*Syngenta AG (Chemicals) | | | 1,646 | | | | 482 | |
| | | | | | | | |
| | | | | | | 1,776 | |
| | | | | | | | |
See accompanying Notes to Financial Statements.
40 Annual Report | December 31, 2011 |
Global Growth Fund
Portfolio of Investments, December 31, 2011 (all dollar amounts in thousands)
| | | | | | | | |
Issuer | | Shares | | | Value | |
| |
Common Stocks—(continued) | | | | | |
| |
Emerging Asia—8.8% | | | | | |
China—3.3% | | | | | | | | |
*Baidu, Inc.—ADR (Internet software & services) | | | 4,841 | | | $ | 564 | |
Industrial and Commercial Bank of China, Ltd. Class “H” (Commercial banks) | | | 1,413,185 | | | | 839 | |
| | | | | | | | |
| | | | | | | 1,403 | |
| | | | | | | | |
Indonesia—1.3% | | | | | | | | |
PT Bank Rakyat Indonesia (Commercial banks) | | | 748,000 | | | | 557 | |
| | | | | | | | |
South Korea—4.2% | | | | | | | | |
*Hyundai Motor Co. (Automobiles) | | | 4,522 | | | | 836 | |
Samsung Electronics Co., Ltd. (Semiconductors & semiconductor equipment) | | | 1,060 | | | | 973 | |
| | | | | | | | |
| | | | | | | 1,809 | |
| | | | | | | | |
| | |
Japan—5.0% | | | | | | | | |
Exedy Corporation (Auto components) | | | 5,700 | | | | 164 | |
Fanuc, Ltd. (Machinery) | | | 3,700 | | | | 566 | |
Gree, Inc. (Internet software & services) | | | 16,500 | | | | 569 | |
Miraca Holdings, Inc. (Health care providers & services) | | | 5,400 | | | | 215 | |
Softbank Corporation (Wireless telecommunication services) | | | 20,400 | | | | 601 | |
| | | | | | | | |
| | | | | | | 2,115 | |
| | | | | | | | |
| | |
Emerging Latin America—1.6% | | | | | | | | |
Brazil—1.0% | | | | | | | | |
BR Malls Participacoes S.A. (Real estate management & development) | | | 43,400 | | | | 422 | |
| | | | | | | | |
Chile—0.6% | | | | | | | | |
Banco Santander Chile—ADR (Commercial banks) | | | 3,313 | | | | 251 | |
| | | | | | | | |
| |
Emerging Europe, Mid-East, Africa—1.0% | | | | | |
South Africa—1.0% | | | | | | | | |
Sasol, Ltd. (Oil, gas & consumable fuels) | | | 9,176 | | | | 438 | |
| | | | | | | | |
| | |
Asia—1.0% | | | | | | | | |
Singapore—1.0% | | | | | | | | |
Keppel Corporation, Ltd. (Industrial conglomerates) | | | 57,500 | | | | 412 | |
| | | | | | | | |
Total Common Stocks—99.0%
(cost $37,725) | | | | 42,143 | |
| | | | | | | | |
Issuer | | Principal
Amount | | | Value | |
| | |
Repurchase Agreement | | | | | | | | |
Fixed Income Clearing Corporation, 0.000% dated 12/30/11, due 1/3/12, repurchase price $457, collateralized by FHLMC, 4.500%, due 1/15/14 | | $ | 457 | | | $ | 457 | |
| | | | | | | | |
Total Repurchase Agreement—1.1%
(cost $457) | | | | 457 | |
| | | | | | | | |
Total Investments—100.1%
(cost $38,182) | | | | 42,600 | |
Liabilities, plus cash and other assets—(0.1)% | | | | (26 | ) |
| | | | | | | | |
Net assets—100.0% | | | $ | 42,574 | |
| | | | | | | | |
ADR American Depository Receipt
† U.S. listed foreign security
*Non-income producing securities
For securities primarily traded on exchanges or markets that close before the close of regular trading on the New York Stock Exchange, the Fund may use an independent pricing service to fair value price the securities pursuant to Valuation Procedures approved by the Board of Trustees.
At December 31, 2011, the Fund’s Portfolio of Investments includes the following industry categories:
| | | | |
Consumer Discretionary | | | 19.3% | |
Information Technology | | | 16.6% | |
Financials | | | 15.6% | |
Industrials | | | 15.1% | |
Consumer Staples | | | 10.3% | |
Health Care | | | 8.3% | |
Energy | | | 8.1% | |
Materials | | | 4.0% | |
Telecommunication Services | | | 2.7% | |
| | | | |
Total | | | 100.0% | |
| | | | |
At December 31, 2011, the Fund’s Portfolio of Investments includes the following currency categories:
| | | | |
U.S. Dollar | | | 47.8% | |
British Pound Sterling | | | 19.5% | |
Euro | | | 6.1% | |
Japanese Yen | | | 5.0% | |
South Korean Won | | | 4.3% | |
Swiss Franc | | | 4.2% | |
Canadian Dollar | | | 3.4% | |
Hong Kong Dollar | | | 2.0% | |
Danish Krone | | | 1.8% | |
Swedish Krona | | | 1.5% | |
Indonesian Rupiah | | | 1.3% | |
South African Rand | | | 1.1% | |
Brazilian Real | | | 1.0% | |
All Other Currencies | | | 1.0% | |
| | | | |
Total | | | 100.0% | |
| | | | |
See accompanying Notes to Financial Statements.
December 31, 2011 | William Blair Funds 41 |
W. George Greig
INTERNATIONAL GROWTH FUND
The International Growth Fund seeks long-term capital appreciation.
AN OVERVIEW FROM THE PORTFOLIO MANAGER
The International Growth Fund posted a 14.51% decrease (Class N Shares) for the 12 months ended December 31, 2011. By comparison, the Fund’s benchmark, the MSCI All Country World Ex-U.S. IMI Index (net), declined 14.31%.
Despite outpacing the market for the last nine months of the year due to its focus on high quality companies with good operating performance, the Fund had a market-like return, as it lagged early in the year on the European low quality rally. Performance was strong across most sectors, with particular value added in Consumer Discretionary, Industrials, and Information Technology (IT). Within Consumer Discretionary, the Fund’s Auto, Media and Retailing stock selection added value, as did performance by Property Management companies. Industrials stock selection was augmented by strong performance in Capital Goods and Machinery, along with the overweighting and stock selection in Commercial and Professional Services. IT stock selection was bolstered by good performance amongst internet-related holdings, in addition to strong operating performance by SAP AG and Autonomy, as Hewlett-Packard Company bid to acquire the company. Detracting from 2011 results was Consumer Staples, Health Care and Telecommunication Services stock selection. Consumer Staples performance was hurt largely during the first half of the year as increasing raw materials prices hampered margins and corporate growth outlook, while large cap European Pharmaceutical holdings dragged on Health Care performance.
While year-end sector positioning was substantially unchanged since December 2010, it masked changes that occurred throughout the year. In particular, after being underweighted in European Financials most of the year, this segment was increased during the fourth quarter, although commercial banks remained underweighted more broadly in favor of insurance and asset management. Consumer Discretionary totaled 14.0% of the Fund, higher than the 9.9% Index weighting, due largely to a focus in autos and retailing and, to some extent, media. Health Care and IT each represented approximately 9% of the Fund, slight increases since year-end 2010, but ahead of Index weightings approximating 7%. The Resources sectors remained the most underweighted, totaling 19.4% of the Fund compared to 23.3% for the Index, due largely to lower mining exposure, although the overall sector weightings increased throughout the year. Regionally, the Fund’s emerging markets exposure was 20.7%, below the 23.2% Index weighting, due to lower weightings in Asia and EMEA (Europe, Mid-East and Africa) in favor of Latin America. The reduction below market weighting occurred during the first quarter on inflationary and growth concerns. Developed Asia was also significantly underweighted in favor of Europe Ex-U.K. and the U.K., although the weighting in Japan was ahead of the Index during the first and second quarters.
42 Annual Report | December 31, 2011 |
International Growth Fund
Performance Highlights (Unaudited)
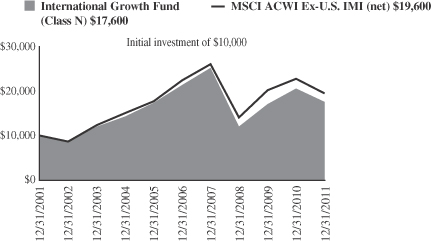
Average Annual Total Return at 12/31/2011
| | | | | | | | | | | | | | | | |
| | | 1
Year | | | 3
Year | | | 5
Year | | | 10
Year | |
Class N | | | (14.51 | )% | | | 13.46 | % | | | (3.83 | )% | | | 5.81 | % |
Class I | | | (14.23 | ) | | | 13.80 | | | | (3.53 | ) | | | 6.11 | |
MSCI All Country World Ex-U.S. IMI (net) | | | (14.31 | ) | | | 11.53 | | | | (2.74 | ) | | | 6.95 | |
Performance cited represents past performance. Past performance does not guarantee future results and current performance may be lower or higher than the data quoted. Results shown are average annual total returns, which assume reinvestment of dividends and capital gains. Investment returns and principal will fluctuate and you may have a gain or loss when you sell shares. For the most current month-end performance information, please call 1-800-742-7272, or visit our Web site at www.williamblairfunds.com. From time to time, the investment advisor may waive fees or reimburse expenses for the Fund. Without these waivers, performance would be lower. International investing involves special risk considerations, including currency fluctuations, lower liquidity, economic and political risk. Class N shares are available to the general public without a sales load. Class I shares are available to certain institutional investors and advisory clients of William Blair & Company, L.L.C., without a sales load or distribution (12b-1) or service fees.
The performance highlights and graph presented above do not reflect the deduction of taxes that a shareholder would pay on fund distributions or the redemption of fund shares.
The Morgan Stanley Capital International (MSCI) All Country World Ex-U.S. Investable Market Index (IMI) (net) is a free float-adjusted market capitalization weighted index that is designed to measure the equity market performance of developed and emerging markets, excluding the United States. This series approximates the minimum possible dividend reinvestment.
This report identifies the Fund’s investments on December 31, 2011. These holdings are subject to change. Not all stocks in the Fund performed the same, nor is there any guarantee that these stocks will perform as well in the future. Market forecasts provided in this report may not necessarily come to pass.
Sector Diversification (Unaudited)
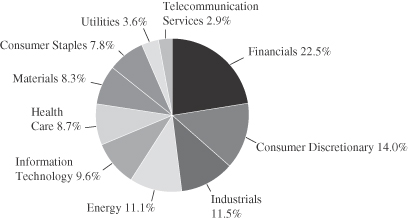
The sector diversification shown is based on the total long-term securities.
December 31, 2011 | William Blair Funds 43 |
International Growth Fund
Portfolio of Investments, December 31, 2011 (all dollar amounts in thousands)
| | | | | | | | |
Issuer | | Shares | | | Value | |
|
Common Stocks | |
|
Europe, Mid-East—33.1% | |
Denmark—0.7% | | | | | | | | |
Coloplast A/S (Health care equipment & supplies) | | | 127,365 | | | $ | 18,318 | |
SimCorp A/S (Software) | | | 30,179 | | | | 4,608 | |
| | | | | | | | |
| | | | | | | 22,926 | |
| | | | | | | | |
Finland—1.0% | | | | | | | | |
Nokian Renkaat Oyj (Auto components) | | | 494,210 | | | | 15,914 | |
UPM-Kymmene Oyj (Paper & forest products) | | | 1,495,453 | | | | 16,471 | |
| | | | | | | | |
| | | | | | | 32,385 | |
| | | | | | | | |
France—6.0% | | | | | | | | |
AXA S.A. (Insurance) | | | 3,566,446 | | | | 46,366 | |
BNP Paribas S.A. (Commercial banks) | | | 1,242,952 | | | | 48,824 | |
Cie de St-Gobain (Building products) | | | 546,214 | | | | 20,971 | |
Essilor International S.A. (Health care equipment & supplies) | | | 470,566 | | | | 33,223 | |
Sanofi (Pharmaceuticals) | | | 354,218 | | | | 26,017 | |
Suez Environnement Co. (Multi-utilities) | | | 1,539,351 | | | | 17,734 | |
| | | | | | | | |
| | | | | | | 193,135 | |
| | | | | | | | |
Germany—7.9% | | | | | | | | |
Aixtron AG (Semiconductors & semiconductor equipment) | | | 605,792 | | | | 7,723 | |
BASF SE (Chemicals) | | | 335,088 | | | | 23,371 | |
Bayer AG (Pharmaceuticals) | | | 788,524 | | | | 50,415 | |
Bayerische Motoren Werke AG (Automobiles) | | | 579,906 | | | | 38,848 | |
Delticom AG (Specialty retail) | | | 27,909 | | | | 2,409 | |
Deutsche Bank AG (Capital markets) | | | 848,266 | | | | 32,316 | |
Gerry Weber International AG (Textiles, apparel & luxury goods) | | | 208,345 | | | | 6,356 | |
Infineon Technologies AG (Semiconductors & semiconductor equipment) | | | 650,121 | | | | 4,894 | |
Lanxess AG (Chemicals) | | | 320,761 | | | | 16,606 | |
MTU Aero Engines Holding AG (Aerospace & defense) | | | 220,840 | | | | 14,131 | |
SAP AG (Software) | | | 1,075,047 | | | | 56,838 | |
| | | | | | | | |
| | | | | | | 253,907 | |
| | | | | | | | |
Ireland—1.3% | | | | | | | | |
Paddy Power plc (Hotels, restaurants & leisure) | | | 165,944 | | | | 9,561 | |
*Ryanair Holdings plc—ADR (Airlines) | | | 331,902 | | | | 9,247 | |
Shire plc (Pharmaceuticals) | | | 630,919 | | | | 21,977 | |
| | | | | | | | |
| | | | | | | 40,785 | |
| | | | | | | | |
Israel—0.5% | | | | | | | | |
*Check Point Software Technologies, Ltd. (Software)† | | | 295,251 | | | | 15,512 | |
| | | | | | | | |
Italy—0.1% | | | | | | | | |
*Salvatore Ferragamo Italia SpA (Textiles, apparel & luxury goods) | | | 356,305 | | | | 4,694 | |
| | | | | | | | |
Luxembourg—0.7% | | | | | | | | |
Millicom International Cellular S.A. (Wireless telecommunication services) | | | 226,942 | | | | 22,737 | |
| | | | | | | | |
|
Common Stocks—Europe, Mid-East—33.1%—(continued) | |
Netherlands—5.0% | | | | | | | | |
ASML Holding N.V. (Semiconductors & semiconductor equipment) | | | 647,994 | | | $ | 27,236 | |
Royal Dutch Shell plc (Oil, gas & consumable fuels) | | | 1,960,490 | | | | 74,716 | |
Unilever N.V. (Food products) | | | 1,703,183 | | | | 58,569 | |
| | | | | | | | |
| | | | | | | 160,521 | |
| | | | | | | | |
Norway—1.5% | | | | | | | | |
*Norwegian Air Shuttle ASA (Airlines) | | | 308,757 | | | | 2,852 | |
Opera Software ASA (Internet software & services) | | | 884,091 | | | | 4,302 | |
Statoil ASA (Oil, gas & consumable fuels) | | | 1,614,500 | | | | 41,436 | |
| | | | | | | | |
| | | | | | | 48,590 | |
| | | | | | | | |
Spain—1.5% | | | | | | | | |
Banco Santander S.A. (Commercial banks) | | | 597,863 | | | | 4,542 | |
Inditex S.A. (Specialty retail) | | | 452,541 | | | | 37,063 | |
Viscofan S.A. (Food products) | | | 220,300 | | | | 8,172 | |
| | | | | | | | |
| | | | | | | 49,777 | |
| | | | | | | | |
Sweden—1.5% | | | | | | | | |
Elekta AB (Health care equipment & supplies) | | | 290,821 | | | | 12,614 | |
Getinge AB (Health care equipment & supplies) | | | 873,065 | | | | 22,125 | |
JM AB (Household durables) | | | 294,765 | | | | 4,797 | |
Mekonomen AB (Specialty retail) | | | 122,013 | | | | 3,989 | |
NIBE Industrier AB (Building products) | | | 330,569 | | | | 4,887 | |
| | | | | | | | |
| | | | | | | 48,412 | |
| | | | | | | | |
Switzerland—5.4% | | | | | | | | |
*Dufry Group (Specialty retail) | | | 63,727 | | | | 5,865 | |
*Geberit AG (Building products) | | | 68,854 | | | | 13,268 | |
*Glencore International plc (Metals & mining) | | | 6,777,175 | | | | 41,258 | |
*Julius Baer Group, Ltd. (Capital markets) | | | 411,542 | | | | 16,097 | |
*Meyer Burger Technology AG (Machinery) | | | 106,749 | | | | 1,671 | |
Nestle S.A. (Food products) | | | 735,105 | | | | 42,261 | |
*Orascom Development Holding AG (Hotels, restaurants & leisure) | | | 161,234 | | | | 2,463 | |
Partners Group Holding AG (Capital markets) | | | 88,396 | | | | 15,424 | |
SGS S.A. (Professional services) | | | 9,782 | | | | 16,194 | |
Sika AG (Chemicals) | | | 6,644 | | | | 12,520 | |
Xstrata plc (Metals & mining) | | | 553,517 | | | | 8,407 | |
| | | | | | | | |
| | | | | | | 175,428 | |
| | | | | | | | |
| | |
United Kingdom—24.1% | | | | | | | | |
Abcam plc (Biotechnology) | | | 2,132,874 | | | | 12,090 | |
Aggreko plc (Commercial services & supplies) | | | 422,301 | | | | 13,228 | |
AMEC plc (Energy equipment & services) | | | 1,290,096 | | | | 18,182 | |
Amlin plc (Insurance) | | | 2,091,758 | | | | 10,197 | |
Ashmore Group plc (Capital markets) | | | 2,032,563 | | | | 10,543 | |
Babcock International Group plc (Commercial services & supplies) | | | 2,078,436 | | | | 23,741 | |
Barclays plc (Commercial banks) | | | 14,512,182 | | | | 39,677 | |
BG Group plc (Oil, gas & consumable fuels) | | | 2,258,140 | | | | 48,272 | |
BHP Billiton plc (Metals & mining) | | | 2,013,909 | | | | 58,721 | |
See accompanying Notes to Financial Statements.
44 Annual Report | December 31, 2011 |
International Growth Fund
Portfolio of Investments, December 31, 2011 (all dollar amounts in thousands)
| | | | | | | | |
Issuer | | Shares | | | Value | |
|
Common Stocks—United Kingdom—24.1%—(continued) | |
Burberry Group plc (Textiles, apparel & luxury goods) | | | 816,557 | | | $ | 15,027 | |
Carphone Warehouse Group plc (Specialty retail) | | | 2,335,791 | | | | 11,209 | |
Centrica plc (Multi-utilities) | | | 9,829,151 | | | | 44,161 | |
Croda International plc (Chemicals) | | | 355,259 | | | | 9,953 | |
Diageo plc (Beverages) | | | 2,775,782 | | | | 60,631 | |
Dunelm Group plc (Specialty retail) | | | 1,144,483 | | | | 7,710 | |
Experian plc (Professional services) | | | 762,458 | | | | 10,367 | |
Halma plc (Electronic equipment, instruments & components) | | | 1,502,877 | | | | 7,711 | |
Hargreaves Lansdown plc (Capital markets) | | | 590,617 | | | | 3,949 | |
Hiscox, Ltd. (Insurance) | | | 1,028,989 | | | | 5,969 | |
IG Group Holdings plc (Diversified financial services) | | | 1,408,685 | | | | 10,433 | |
John Wood Group plc (Energy equipment & services) | | | 912,014 | | | | 9,079 | |
Johnson Matthey plc (Chemicals) | | | 1,029,583 | | | | 29,357 | |
Jupiter Fund Management plc (Capital markets) | | | 1,916,115 | | | | 6,460 | |
Lancashire Holdings, Ltd. (Insurance) | | | 1,190,490 | | | | 13,395 | |
Meggitt plc (Aerospace & defense) | | | 2,102,053 | | | | 11,517 | |
Moneysupermarket.com Group plc (Internet software & services) | | | 1,922,629 | | | | 3,135 | |
Next plc (Multiline retail) | | | 321,779 | | | | 13,677 | |
*Ocado Group plc (Internet & catalog retail) | | | 3,715,033 | | | | 3,139 | |
Petrofac, Ltd. (Energy equipment & services) | | | 1,532,242 | | | | 34,290 | |
Prudential plc (Insurance) | | | 1,689,253 | | | | 16,750 | |
Restaurant Group plc (Hotels, restaurants & leisure) | | | 742,967 | | | | 3,437 | |
Rightmove plc (Media) | | | 62,550 | | | | 1,208 | |
*Rolls-Royce Holdings plc (Aerospace & defense) | | | 2,731,126 | | | | 31,662 | |
Rotork plc (Machinery) | | | 183,846 | | | | 5,510 | |
RPS Group plc (Commercial services & supplies) | | | 1,154,966 | | | | 3,229 | |
Scottish & Southern Energy plc (Electric utilities) | | | 2,147,522 | | | | 43,056 | |
Spirax-Sarco Engineering plc (Machinery) | | | 378,322 | | | | 11,005 | |
*Sports Direct International plc (Specialty retail) | | | 619,214 | | | | 2,052 | |
St James’s Place plc (Insurance) | | | 999,767 | | | | 5,038 | |
Standard Chartered plc (Commercial banks) | | | 1,114,719 | | | | 24,392 | |
*Telecity Group plc (Internet software & services) | | | 1,115,027 | | | | 11,204 | |
*The Berkeley Group Holdings plc (Household durables) | | | 810,726 | | | | 16,066 | |
The Capita Group plc (Professional services) | | | 336,128 | | | | 3,281 | |
The Weir Group plc (Machinery) | | | 776,385 | | | | 24,500 | |
Tullow Oil plc (Oil, gas & consumable fuels) | | | 994,511 | | | | 21,654 | |
Victrex plc (Chemicals) | | | 414,017 | | | | 7,047 | |
| | | | | | | | |
| | | | | | | 776,911 | |
| | | | | | | | |
|
Emerging Asia—12.1% | |
China—1.3% | | | | | | | | |
AAC Technologies Holdings, Inc. (Communications equipment) | | | 1,586,000 | | | | 3,561 | |
*China Minzhong Food Corporation, Ltd. (Food products) | | | 2,256,000 | | | | 1,418 | |
|
Common Stocks—Emerging Asia—12.1%—(continued) | |
China—(continued) | | | | | | | | |
Dongyue Group (Chemicals) | | | 10,082,000 | | | $ | 6,646 | |
Golden Eagle Retail Group, Ltd. (Multiline retail) | | | 3,486,000 | | | | 7,370 | |
Lenovo Group, Ltd. (Computers & peripherals) | | | 24,074,000 | | | | 16,056 | |
*Sun Art Retail Group, Ltd. (Food & staples retailing) | | | 2,768,171 | | | | 3,461 | |
Yingde Gases (Chemicals) | | | 3,739,000 | | | | 3,818 | |
| | | | | | | | |
| | | | | | | 42,330 | |
| | | | | | | | |
India—2.1% | | | | | | | | |
Axis Bank, Ltd. (Commercial banks) | | | 418,282 | | | | 6,365 | |
HDFC Bank, Ltd. (Commercial banks) | | | 1,374,931 | | | | 11,051 | |
Lupin, Ltd. (Pharmaceuticals) | | | 818,771 | | | | 6,905 | |
Shriram Transport Finance Co., Ltd. (Consumer finance) | | | 69,855 | | | | 554 | |
Sun Pharmaceutical Industries, Ltd. (Pharmaceuticals) | | | 1,099,182 | | | | 10,300 | |
Tata Consultancy Services, Ltd. (IT services) | | | 1,477,538 | | | | 32,293 | |
| | | | | | | | |
| | | | | | | 67,468 | |
| | | | | | | | |
Indonesia—1.5% | | | | | | | | |
PT Bank Rakyat Indonesia (Commercial banks) | | | 29,772,000 | | | | 22,163 | |
PT Kalbe Farma Tbk (Pharmaceuticals) | | | 22,868,000 | | | | 8,575 | |
PT United Tractors Tbk (Machinery) | | | 5,993,606 | | | | 17,417 | |
| | | | | | | | |
| | | | | | | 48,155 | |
| | | | | | | | |
Malaysia—0.4% | | | | | | | | |
Kuala Lumpur Kepong Bhd (Food products) | | | 1,586,300 | | | | 11,359 | |
| | | | | | | | |
Papua New Guinea—0.4% | | | | | | | | |
Oil Search, Ltd. (Oil, gas & consumable fuels) | | | 2,028,346 | | | | 12,966 | |
| | | | | | | | |
Philippines—0.3% | | | | | | | | |
Alliance Global Group, Inc. (Industrial conglomerates) | | | 36,731,000 | | | | 8,661 | |
| | | | | | | | |
South Korea—5.2% | | | | | | | | |
*Celltrion, Inc. (Pharmaceuticals) | | | 150,482 | | | | 4,742 | |
*Hyundai Mobis (Auto components) | | | 95,061 | | | | 24,095 | |
*Hyundai Motor Co. (Automobiles) | | | 202,227 | | | | 37,391 | |
Samsung Electronics Co., Ltd. (Semiconductors & semiconductor equipment) | | | 60,965 | | | | 55,990 | |
*Samsung Engineering Co., Ltd. (Construction & engineering) | | | 134,659 | | | | 23,554 | |
Samsung Fire & Marine Insurance Co., Ltd. (Insurance) | | | 125,219 | | | | 22,935 | |
| | | | | | | | |
| | | | | | | 168,707 | |
| | | | | | | | |
Thailand—0.9% | | | | | | | | |
Advanced Info Service PCL (Wireless telecommunication services) | | | 2,333,600 | | | | 10,392 | |
*Bangkok Dusit Medical Services PCL (Health care providers & services) | | | 2,150,100 | | | | 5,588 | |
Kasikornbank PCL (Commercial banks) | | | 3,461,500 | | | | 13,660 | |
| | | | | | | | |
| | | | | | | 29,640 | |
| | | | | | | | |
See accompanying Notes to Financial Statements.
December 31, 2011 | William Blair Funds 45 |
International Growth Fund
Portfolio of Investments, December 31, 2011 (all dollar amounts in thousands)
| | | | | | | | |
Issuer | | Shares | | | Value | |
|
Common Stocks—(continued) | |
| | |
Japan—12.0% | | | | | | | | |
Ain Pharmaciez, Inc. (Food & staples retailing) | | | 64,700 | | | $ | 3,110 | |
Daito Trust Construction Co., Ltd. (Real estate management & development) | | | 208,500 | | | | 17,878 | |
Dr Ci:Labo Co., Ltd. (Personal products) | | | 950 | | | | 5,054 | |
Exedy Corporation (Auto components) | | | 356,100 | | | | 10,275 | |
F.C.C. Co., Ltd. (Auto components) | | | 252,203 | | | | 5,125 | |
FamilyMart Co., Ltd. (Food & staples retailing) | | | 204,400 | | | | 8,259 | |
Fanuc, Ltd. (Machinery) | | | 204,400 | | | | 31,283 | |
Fast Retailing Co., Ltd. (Specialty retail) | | | 128,400 | | | | 23,355 | |
Gree, Inc. (Internet software & services) | | | 529,100 | | | | 18,230 | |
K’s Holdings Corporation (Specialty retail) | | | 360,200 | | | | 14,273 | |
Kakaku.com, Inc. (Internet software & services) | | | 227,600 | | | | 8,345 | |
Kaken Pharmaceutical Co., Ltd. (Pharmaceuticals) | | | 444,000 | | | | 5,901 | |
Keyence Corporation (Electronic equipment, instruments & components) | | | 93,600 | | | | 22,570 | |
Miraca Holdings, Inc. (Health care providers & services) | | | 210,500 | | | | 8,382 | |
Nitori Co., Ltd. (Specialty retail) | | | 278,870 | | | | 26,159 | |
ORIX Corporation (Diversified financial services) | | | 403,560 | | | | 33,346 | |
Sawai Pharmaceutical Co., Ltd. (Pharmaceuticals) | | | 24,300 | | | | 2,523 | |
Sharp Corporation (Household durables) | | | 1,716,000 | | | | 15,004 | |
Ship Healthcare Holdings, Inc. (Health care providers & services) | | | 222,800 | | | | 4,869 | |
SMC Corporation (Machinery) | | | 103,900 | | | | 16,765 | |
Softbank Corporation (Wireless telecommunication services) | | | 1,181,600 | | | | 34,802 | |
Start Today Co., Ltd. (Internet & catalog retail) | | | 233,100 | | | | 5,454 | |
Sumitomo Mitsui Financial Group, Inc. (Commercial banks) | | | 2,234,500 | | | | 62,242 | |
United Arrows, Ltd. (Specialty retail) | | | 169,500 | | | | 3,272 | |
| | | | | | | | |
| | | | | | | 386,476 | |
| | | | | | | | |
| | |
Emerging Latin America—6.9% | | | | | | | | |
Brazil—4.0% | | | | | | | | |
BR Malls Participacoes S.A. (Real estate management & development) | | | 1,047,200 | | | | 10,173 | |
BR Properties S.A. (Real estate management & development) | | | 672,600 | | | | 6,671 | |
CETIP S.A.—Balcao Organizado de Ativos e Derivativos (Capital markets) | | | 348,600 | | | | 5,037 | |
Cia de Concessoes Rodoviarias (Transportation infrastructure) | | | 2,000,700 | | | | 13,107 | |
Cia Hering (Specialty retail) | | | 659,600 | | | | 11,479 | |
Cielo S.A. (IT services) | | | 68,400 | | | | 1,768 | |
Iochpe-Maxion S.A. (Machinery) | | | 410,800 | | | | 5,561 | |
*OGX Petroleo e Gas Participacoes S.A. (Oil, gas & consumable fuels) | | | 2,484,700 | | | | 18,143 | |
Petroleo Brasileiro S.A. (Oil, gas & consumable fuels) | | | 3,681,600 | | | | 45,397 | |
*T4F Entretenimento S.A. (Media) | | | 626,100 | | | | 3,843 | |
Tractebel Energia S.A. (Independent power producers & energy traders) | | | 555,700 | | | | 8,926 | |
| | | | | | | | |
| | | | | | | 130,105 | |
| | | | | | | | |
|
Common Stocks—Emerging Latin America—6.9%—(continued) | |
Chile—1.8% | | | | | | | | |
Banco Santander Chile—ADR (Commercial banks) | | | 190,156 | | | $ | 14,395 | |
*CFR Pharmaceuticals S.A. (Pharmaceuticals) | | | 26,791,981 | | | | 6,297 | |
ENTEL Chile S.A. (Wireless telecommunication services) | | | 510,390 | | | | 9,481 | |
Parque Arauco S.A. (Real estate management & development) | | | 5,743,388 | | | | 9,353 | |
Sociedad Quimica y Minera de Chile S.A.—ADR (Chemicals) | | | 245,133 | | | | 13,200 | |
Sonda S.A. (IT services) | | | 1,706,854 | | | | 4,091 | |
| | | | | | | | |
| | | | | | | 56,817 | |
| | | | | | | | |
Mexico—0.3% | | | | | | | | |
Compartamos S.A.B. de C.V. (Consumer finance) | | | 5,127,000 | | | | 6,282 | |
*Genomma Lab Internacional S.A.B. de C.V. (Pharmaceuticals) | | | 2,675,156 | | | | 5,159 | |
| | | | | | | | |
| | | | | | | 11,441 | |
| | | | | | | | |
Panama—0.2% | | | | | | | | |
Copa Holdings S.A. (Airlines)† | | | 86,762 | | | | 5,090 | |
| | | | | | | | |
Peru—0.6% | | | | | | | | |
Credicorp, Ltd. (Commercial banks)† | | | 186,437 | | | | 20,409 | |
| | | | | | | | |
| | |
Canada—5.3% | | | | | | | | |
Alimentation Couche Tard, Inc. (Food & staples retailing) | | | 688,262 | | | | 21,416 | |
Brookfield Asset Management, Inc. Class “A” (Real estate management & development)† | | | 1,454,865 | | | | 39,980 | |
Canadian Western Bank (Commercial banks) | | | 327,304 | | | | 8,289 | |
*Celtic Exploration, Ltd. (Oil, gas & consumable fuels) | | | 134,283 | | | | 3,015 | |
CI Financial Corporation (Capital markets) | | | 684,140 | | | | 14,170 | |
Crescent Point Energy Corporation (Oil, gas & consumable fuels) | | | 325,921 | | | | 14,364 | |
Dollarama, Inc. (Multiline retail) | | | 295,866 | | | | 12,924 | |
Home Capital Group, Inc. (Thrifts & mortgage finance) | | | 75,778 | | | | 3,652 | |
Intact Financial Corporation (Insurance) | | | 158,121 | | | | 9,084 | |
Intact Financial Corporation—144A (Insurance) | | | 83,672 | | | | 4,807 | |
Peyto Exploration & Development Corporation (Oil, gas & consumable fuels) | | | 584,172 | | | | 13,986 | |
Saputo, Inc. (Food products) | | | 85,677 | | | | 3,282 | |
Tim Hortons, Inc. (Hotels, restaurants & leisure) | | | 432,507 | | | | 20,956 | |
| | | | | | | | |
| | | | | | | 169,925 | |
| | | | | | | | |
| | |
Asia—4.0% | | | | | | | | |
Australia—0.5% | | | | | | | | |
Iluka Resources, Ltd. (Metals & mining) | | | 1,097,986 | | | | 17,407 | |
| | | | | | | | |
Hong Kong—1.8% | | | | | | | | |
AIA Group, Ltd. (Insurance) | | | 8,275,000 | | | | 25,837 | |
China High Precision Automation Group, Ltd. (Electronic equipment, instruments & components)**§ | | | 2,624,000 | | | | 694 | |
See accompanying Notes to Financial Statements.
46 Annual Report | December 31, 2011 |
International Growth Fund
Portfolio of Investments, December 31, 2011 (all dollar amounts in thousands)
| | | | | | | | |
Issuer | | Shares or
Principal
Amount | | | Value | |
|
Common Stocks—Asia—4.0%—(continued) | |
Hong Kong—(continued) | | | | | | | | |
Hutchison Telecommunications Hong Kong Holdings, Ltd. (Diversified telecommunication services) | | | 21,348,000 | | | $ | 8,219 | |
Sa Sa International Holdings, Ltd. (Specialty retail) | | | 8,530,000 | | | | 4,723 | |
SmarTone Telecommunications Holdings, Ltd. (Wireless telecommunication services) | | | 4,450,000 | | | | 7,701 | |
Value Partners Group, Ltd. (Capital markets) | | | 8,989,000 | | | | 4,606 | |
Wynn Macau, Ltd. (Hotels, restaurants & leisure) | | | 2,452,800 | | | | 6,158 | |
| | | | | | | | |
| | | | | | | 57,938 | |
| | | | | | | | |
Singapore—1.7% | | | | | | | | |
*Biosensors International Group, Ltd. (Health care equipment & supplies) | | | 4,908,000 | | | | 5,411 | |
CapitaMalls Asia, Ltd. (Real estate management & development) | | | 10,708,000 | | | | 9,329 | |
*Global Logistic Properties, Ltd. (Real estate management & development) | | | 11,887,000 | | | | 16,084 | |
Keppel Corporation, Ltd. (Industrial conglomerates) | | | 3,454,300 | | | | 24,769 | |
| | | | | | | | |
| | | | | | | 55,593 | |
| | | | | | | | |
| |
Emerging Europe, Mid-East, Africa—1.7% | | | | | |
South Africa—1.1% | | | | | | | | |
Life Healthcare Group Holdings Pte, Ltd. (Health care providers & services) | | | 3,252,931 | | | | 8,317 | |
Shoprite Holdings, Ltd. (Food & staples retailing) | | | 972,528 | | | | 16,409 | |
The Foschini Group, Ltd. (Specialty retail) | | | 880,181 | | | | 11,447 | |
| | | | | | | | |
| | | | | | | 36,173 | |
| | | | | | | | |
Turkey—0.6% | | | | | | | | |
BIM Birlesik Magazalar A.S. (Food & staples retailing) | | | 285,394 | | | | 7,912 | |
Turkiye Halk Bankasi A.S. (Commercial banks) | | | 2,167,584 | | | | 11,331 | |
| | | | | | | | |
| | | | | | | 19,243 | |
| | | | | | | | |
Total Common Stocks—99.2%
(cost $3,144,195) | | | | 3,201,623 | |
| | | | | | | | |
| | |
Convertible Bond | | | | | | | | |
Brazil—0.0% | | | | | | | | |
Lupatech S.A., 6.500%, due 4/15/18 (Machinery)**§ | | $ | 2,875 | | | | 747 | |
| | | | | | | | |
Total Convertible Bond—0.0%
(cost $1,491) | | | | 747 | |
| | | | | | | | |
| | |
Repurchase Agreement | | | | | | | | |
Fixed Income Clearing Corporation, 0.000% dated 12/30/11, due 1/3/12, repurchase price $41,628, collateralized by FHLMC, 4.500%, due 1/15/14; U.S. Treasury Note, 1.750%, due 1/31/14 | | $ | 41,628 | | | $ | 41,628 | |
| | | | | | | | |
Total Repurchase Agreement—1.3%
(cost $41,628) | | | | 41,628 | |
| | | | | | | | |
Total Investments—100.5%
(cost $3,187,314) | | | | 3,243,998 | |
Liabilities, plus cash and other assets—(0.5)% | | | | (15,096 | ) |
| | | | | | | | |
Net assets—100.0% | | | $ | 3,228,902 | |
| | | | | | | | |
ADR American Depository Receipt
*Non-income producing securities
† U.S. listed foreign security
** Fair valued pursuant to Valuation Procedures adopted by the Board of Trustees. These holdings represent 0.04% of the Fund’s net assets at December 31, 2011.
§ Deemed illiquid pursuant to Liquidity Procedures approved by the Board of Trustees. These holdings represent 0.04% of the net assets at December 31, 2011.
For securities primarily traded on exchanges or markets that close before the close of regular trading on the New York Stock Exchange, the Fund may use an independent pricing service to fair value price the securities pursuant to Valuation Procedures approved by the Board of Trustees.
At December 31, 2011, the Fund’s Portfolio of Investments includes the following industry categories:
| | | | |
Financials | | | 22.5% | |
Consumer Discretionary | | | 14.0% | |
Industrials | | | 11.5% | |
Energy | | | 11.1% | |
Information Technology | | | 9.6% | |
Health Care | | | 8.7% | |
Materials | | | 8.3% | |
Consumer Staples | | | 7.8% | |
Utilities | | | 3.6% | |
Telecommunication Services | | | 2.9% | |
| | | | |
Total | | | 100.0% | |
| | | | |
See accompanying Notes to Financial Statements.
December 31, 2011 | William Blair Funds 47 |
International Growth Fund
Portfolio of Investments, December 31, 2011 (all dollar amounts in thousands)
At December 31, 2011, the Fund’s Portfolio of Investments includes the following currency categories:
| | | | |
British Pound Sterling | | | 28.8% | |
Euro | | | 19.6% | |
Japanese Yen | | | 12.1% | |
South Korean Won | | | 5.3% | |
Brazilian Real | | | 4.1% | |
Canadian Dollar | | | 4.1% | |
Swiss Franc | | | 3.9% | |
U.S. Dollar | | | 3.7% | |
Hong Kong Dollar | | | 3.1% | |
Swedish Krona | | | 2.2% | |
Indian Rupee | | | 2.1% | |
Singapore Dollar | | | 1.8% | |
Norwegian Krone | | | 1.5% | |
Indonesian Rupiah | | | 1.5% | |
South African Rand | | | 1.1% | |
All Other Currencies | | | 5.1% | |
| | | | |
Total | | | 100.0% | |
| | | | |
See accompanying Notes to Financial Statements.
48 Annual Report | December 31, 2011 |

David Merjan
INTERNATIONAL EQUITY FUND
The International Equity Fund seeks long-term capital appreciation.
AN OVERVIEW FROM THE PORTFOLIO MANAGER
The International Equity Fund posted a 12.87% decrease (Class N Shares) for the 12 months ended December 31, 2011. By comparison, the Fund’s benchmark, the MSCI World Ex-U.S. (net) Index declined 12.21%, while the MSCI All Country World Ex-U.S. IMI Index (net), dropped 14.31%.
The Fund approximated its benchmark Index during 2011. Full year performance was bolstered by strong stock selection across a number of sectors, with significant value added in Consumer Discretionary, Information Technology (IT) and Materials. The Fund’s Consumer Discretionary holdings were up over 2%, while the Index return was -14.82% for the year. Within Consumer Discretionary, Automobiles stock selection added significant value due to Hyundai Motor Co., which continued to take market share in the U.S. and maintained margins. Burberry Group plc also performed well on strong luxury demand in emerging markets, coupled with generally stable developed market demand. Tim Hortons, Inc., the Canadian doughnut purveyor, was another key performer during the year on good same store sales, coupled with an improving U.S. business. Retailing and media also performed well during the period. IT stock selection was driven by the weighting and stock selection in the Software and Services industry group, as SAP AG continued to exceed market expectations for operating performance, and Autonomy was acquired by Hewlett-Packard Company. Materials stock selection was bolstered by good stock selection both in Chemicals and Mining, coupled with the underweighting in the weak mining sector. Detracting from full year performance was large cap European Pharmaceutical performance on concerns about competition for key drugs. Consumer Staples and Energy also detracted from 2011 performance, with the underweighting and stock selection in Oil/Gas, coupled with underperformance by Nestle S.A. at the beginning of the year on increased raw material costs. Regionally, emerging markets exposure detracted from overall performance as developed markets generally outperformed. Europe and Canadian stock selection was strong over the period, while Developed Asian stock selection dragged on performance.
Throughout 2011, the Fund maintained its overweighting in Consumer Discretionary and IT at the expense of Resources and Financials. Consumer Discretionary totaled 14.4% of the Fund as of year-end 2011, an increase of 2% during the year, but a slight decline since September 30. Media, Specialty Retail and Hotels/Restaurants were the key overweightings within Consumer Discretionary during the period. IT represented 11.2% of the Fund at year-end, a slight increase from September 30 and year-end 2010, but well above the 4.3% Index weighting, due to a larger focus on Software/Services and Semiconductors. Industrials, while representing 14.9% of the Fund as of year-end, above the 11.8% Index weighting, was decreased substantially during mid year, particularly in Capital Equipment holdings on concerns about a slowdown in earnings growth. Financials was persistently underweighted throughout 2011, and ended the year totaling 19.9%, below the 22.6% Index weighting, given the Fund’s underweighting in Commercial Banks and Insurance companies. This weight increased, however, from 16.2% as of September 30, as we increased European bank holdings on a slightly improving outlook and very low valuations. This increase was in high quality companies with good balance sheet structures, which had been punished given uncertainty surrounding the European debt situation. Resources totaled 16.4% of the Fund as of year end, below the 23.0% index weighting, and a decrease from 18.9% as of year-end 2010, due to moderating Oil/Gas and Mining exposure. Regionally, emerging markets totaled 13.9% as of year-end 2011, and declined consistently throughout the year from 19.3% as of year-end 2010, on concerns about inflationary pressures and potential fixed asset overinvestment in China. The U.K. was overweighted throughout the year, not because of the domestic U.K. economy, but due to the quality of the companies and the multi-national nature of their revenue stream. Conversely, Developed Asia was underweighted throughout 2011.
December 31, 2011 | William Blair Funds 49 |
International Equity Fund
Performance Highlights (Unaudited)
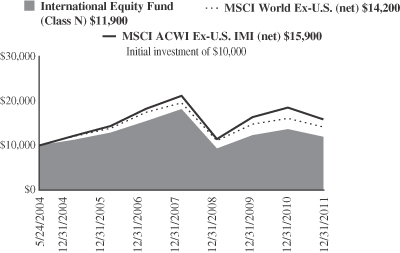
Average Annual Total Return at 12/31/2011
| | | | | | | | | | | | | | | | |
| | | 1
Year | | | 3
Year | | | 5
Year | | | Since
Inception(a) | |
Class N | | | (12.87 | )% | | | 8.64 | % | | | (5.01 | )% | | | 2.35 | % |
Class I | | | (12.68 | ) | | | 8.87 | | | | (4.79 | ) | | | 2.62 | |
MSCI World Ex-U.S. (net) | | | (12.21 | ) | | | 8.53 | | | | (4.09 | ) | | | 4.68 | |
MSCI All Country World Ex-U.S. IMI (net) | | | (14.31 | ) | | | 11.53 | | | | (2.74 | ) | | | 6.24 | |
| | (a) | | For the period from May 24, 2004 (Commencement of Operations) to December 31, 2011. | |
Performance cited represents past performance. Past performance does not guarantee future results and current performance may be lower or higher than the data quoted. Results shown are average annual returns, which assume reinvestment of dividends and capital gains. Investment returns and principal will fluctuate and you may have a gain or loss when you sell shares. For the most current month-end performance information, please call 1-800-742-7272, or visit our Web site at www.williamblairfunds.com. From time to time the investment advisor may waive fees or reimburse expenses for the Fund. Without these waivers, performance would be lower. International investing involves special risk considerations, including currency fluctuations, lower liquidity, economic and political risk. Class N shares are available to the general public without a sales load. Class I shares are available to certain institutional investors and advisory clients of William Blair & Company L.L.C. without a sales load or distribution (12b-1) or service fees.
The performance highlights and graph presented above do not reflect the deduction of taxes that a shareholder would pay on fund distributions or the redemption of fund shares.
The Morgan Stanley Capital International (MSCI) World Ex-U.S. (net) is a free float-adjusted market capitalization weighted index that is designed to measure the equity market performance of developed markets, excluding the United States. This series approximates the minimum possible dividend reinvestment.
The Morgan Stanley Capital International (MSCI) All Country World Ex-U.S. Investable Market Index (IMI) (net) is a free float-adjusted market capitalization weighted index that is designed to measure the equity market performance of developed and emerging markets, excluding the United States. This series approximates the minimum possible dividend reinvestment.
On May 1, 2011, the Fund’s benchmark changed from the MSCI All Country World Ex-U.S. IMI (net) to the MSCI World Ex-U.S. (net). The primary reason for this change is to compare the Fund to a benchmark that more closely reflects the market capitalization focus the Fund uses in its investment strategy.
This report identifies the Fund’s investments on December 31, 2011 . These holdings are subject to change. Not all stocks in the Fund performed the same, nor is there any guarantee that these stocks will perform as well in the future. Market forecasts provided in this report may not necessarily come to pass.
Sector Diversification (Unaudited)
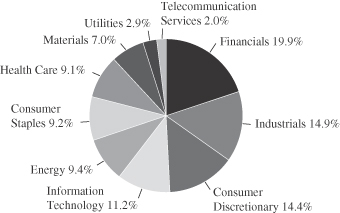
The sector diversification shown is based on the total long-term securities.
50 Annual Report | December 31, 2011 |
International Equity Fund
Portfolio of Investments, December 31, 2011 (all dollar amounts in thousands)
| | | | | | | | |
Issuer | | Shares | | | Value | |
|
Common Stocks | |
| | |
Europe, Mid-East—35.3% | | | | | | | | |
Denmark—1.7% | | | | | | | | |
Novo Nordisk A/S (Pharmaceuticals) | | | 11,189 | | | $ | 1,286 | |
| | | | | | | | |
France—4.7% | | | | | | | | |
AXA S.A. (Insurance) | | | 65,625 | | | | 853 | |
BNP Paribas S.A. (Commercial banks) | | | 25,670 | | | | 1,008 | |
Cie Generale des Etablissements Michelin (Auto components) | | | 7,929 | | | | 469 | |
Essilor International S.A. (Health care equipment & supplies) | | | 17,925 | | | | 1,266 | |
| | | | | | | | |
| | | | | | | 3,596 | |
| | | | | | | | |
Germany—7.5% | | | | | | | | |
BASF SE (Chemicals) | | | 11,660 | | | | 813 | |
Deutsche Bank AG (Capital markets) | | | 25,348 | | | | 966 | |
Fresenius Medical Care AG & Co. KGaA (Health care providers & services) | | | 25,709 | | | | 1,747 | |
Infineon Technologies AG (Semiconductors & semiconductor equipment) | | | 105,798 | | | | 796 | |
SAP AG (Software) | | | 26,105 | | | | 1,380 | |
| | | | | | | | |
| | | | | | | 5,702 | |
| | | | | | | | |
Ireland—2.9% | | | | | | | | |
*Ryanair Holdings plc—ADR (Airlines) | | | 25,325 | | | | 706 | |
Shire plc (Pharmaceuticals) | | | 41,839 | | | | 1,457 | |
| | | | | | | | |
| | | | | | | 2,163 | |
| | | | | | | | |
Israel—2.9% | | | | | | | | |
*Check Point Software Technologies, Ltd. (Software)† | | | 22,982 | | | | 1,208 | |
Teva Pharmaceutical Industries, Ltd.—ADR (Pharmaceuticals) | | | 23,970 | | | | 967 | |
| | | | | | | | |
| | | | | | | 2,175 | |
| | | | | | | | |
Italy—2.0% | | | | | | | | |
Saipem SpA (Energy equipment & services) | | | 35,806 | | | | 1,522 | |
| | | | | | | | |
Netherlands—4.2% | | | | | | | | |
ASML Holding N.V. (Semiconductors & semiconductor equipment) | | | 20,029 | | | | 842 | |
Royal Dutch Shell plc (Oil, gas & consumable fuels) | | | 29,934 | | | | 1,141 | |
Unilever N.V. (Food products) | | | 34,958 | | | | 1,202 | |
| | | | | | | | |
| | | | | | | 3,185 | |
| | | | | | | | |
Spain—2.4% | | | | | | | | |
Banco Santander S.A. (Commercial banks) | | | 111,430 | | | | 846 | |
Inditex S.A. (Specialty retail) | | | 11,780 | | | | 965 | |
| | | | | | | | |
| | | | | | | 1,811 | |
| | | | | | | | |
Sweden—1.0% | | | | | | | | |
Atlas Copco AB (Machinery) | | | 34,322 | | | | 738 | |
| | | | | | | | |
Switzerland—6.0% | | | | | | | | |
*ABB, Ltd. (Electrical equipment) | | | 43,222 | | | | 814 | |
*Glencore International plc (Metals & mining) | | | 104,375 | | | | 635 | |
*Julius Baer Group, Ltd. (Capital markets) | | | 18,855 | | | | 737 | |
Nestle S.A. (Food products) | | | 21,875 | | | | 1,258 | |
*Syngenta AG (Chemicals) | | | 3,669 | | | | 1,074 | |
| | | | | | | | |
| | | | | | | 4,518 | |
| | | | | | | | |
| | |
Common Stocks—(continued) | | | | | | | | |
| | |
United Kingdom—27.1% | | | | | | | | |
Barclays plc (Commercial banks) | | | 602,707 | | | $ | 1,648 | |
BG Group plc (Oil, gas & consumable fuels) | | | 53,875 | | | | 1,152 | |
British Sky Broadcasting Group plc (Media) | | | 73,660 | | | | 838 | |
Burberry Group plc (Textiles, apparel & luxury goods) | | | 52,513 | | | | 966 | |
Centrica plc (Multi-utilities) | | | 210,491 | | | | 946 | |
Compass Group plc (Hotels, restaurants & leisure) | | | 156,886 | | | | 1,489 | |
Diageo plc (Beverages) | | | 60,481 | | | | 1,321 | |
Experian plc (Professional services) | | | 73,879 | | | | 1,004 | |
HSBC Holdings plc (Commercial banks) | | | 119,703 | | | | 909 | |
Johnson Matthey plc (Chemicals) | | | 27,381 | | | | 781 | |
Pearson plc (Media) | | | 63,010 | | | | 1,184 | |
Petrofac, Ltd. (Energy equipment & services) | | | 43,064 | | | | 964 | |
Prudential plc (Insurance) | | | 151,216 | | | | 1,499 | |
*Rolls-Royce Holdings plc (Aerospace & defense) | | | 128,930 | | | | 1,495 | |
Scottish & Southern Energy plc (Electric utilities) | | | 60,189 | | | | 1,207 | |
Standard Chartered plc (Commercial banks) | | | 47,507 | | | | 1,040 | |
The Capita Group plc (Professional services) | | | 20,275 | | | | 198 | |
Tullow Oil plc (Oil, gas & consumable fuels) | | | 34,970 | | | | 761 | |
Vodafone Group plc (Wireless telecommunication services) | | | 390,985 | | | | 1,086 | |
| | | | | | | | |
| | | | | | | 20,488 | |
| | | | | | | | |
| | |
Canada—9.7% | | | | | | | | |
Brookfield Asset Management, Inc. Class “A” (Real estate management & development)† | | | 39,452 | | | | 1,084 | |
Canadian National Railway Co. (Road & rail)† | | | 13,285 | | | | 1,044 | |
Goldcorp, Inc. (Metals & mining)† | | | 19,474 | | | | 862 | |
National Bank of Canada (Commercial banks) | | | 13,250 | | | | 938 | |
Saputo, Inc. (Food products) | | | 21,888 | | | | 839 | |
The Toronto-Dominion Bank (Commercial banks) | | | 20,843 | | | | 1,561 | |
Tim Hortons, Inc. (Hotels, restaurants & leisure) | | | 20,070 | | | | 972 | |
| | | | | | | | |
| | | | | | | 7,300 | |
| | | | | | | | |
| | |
Japan—9.5% | | | | | | | | |
Canon, Inc. (Office electronics) | | | 22,400 | | | | 992 | |
Daito Trust Construction Co., Ltd. (Real estate management & development) | | | 10,500 | | | | 900 | |
Fanuc, Ltd. (Machinery) | | | 6,400 | | | | 979 | |
Fast Retailing Co., Ltd. (Specialty retail) | | | 6,700 | | | | 1,219 | |
Keyence Corporation (Electronic equipment, instruments & components) | | | 4,200 | | | | 1,013 | |
Mitsubishi Corporation (Trading companies & distributors) | | | 43,100 | | | | 871 | |
Nitori Co., Ltd. (Specialty retail) | | | 8,950 | | | | 840 | |
Softbank Corporation (Wireless telecommunication services) | | | 13,200 | | | | 389 | |
| | | | | | | | |
| | | | | | | 7,203 | |
| | | | | | | | |
| | |
Emerging Asia—8.2% | | | | | | | | |
China—1.9% | | | | | | | | |
Belle International Holdings, Ltd. (Specialty retail) | | | 380,000 | | | | 662 | |
China Shenhua Energy Co., Ltd. (Oil, gas & consumable fuels) | | | 174,000 | | | | 755 | |
| | | | | | | | |
| | | | | | | 1,417 | |
| | | | | | | | |
See accompanying Notes to Financial Statements.
December 31, 2011 | William Blair Funds 51 |
International Equity Fund
Portfolio of Investments, December 31, 2011 (all dollar amounts in thousands)
| | | | | | | | |
Issuer | | Shares | | | Value | |
|
Common Stocks—Emerging Asia—8.2%—(continued) | |
India—0.8% | | | | | | | | |
Tata Consultancy Services, Ltd. (IT services) | | | 27,949 | | | $ | 611 | |
| | | | | | | | |
Indonesia—1.1% | | | | | | | | |
PT Bank Rakyat Indonesia (Commercial banks) | | | 1,120,000 | | | | 834 | |
| | | | | | | | |
South Korea—4.4% | | | | | | | | |
*Hyundai Motor Co. (Automobiles) | | | 5,927 | | | | 1,096 | |
Samsung Electronics Co., Ltd. (Semiconductors & semiconductor equipment) | | | 1,602 | | | | 1,471 | |
*Samsung Engineering Co., Ltd. (Construction & engineering) | | | 4,592 | | | | 803 | |
| | | | | | | | |
| | | | | | | 3,370 | |
| | | | | | | | |
| | |
Emerging Latin America—4.8% | | | | | | | | |
Brazil—2.6% | | | | | | | | |
Cia de Bebidas das Americas—ADR (Beverages) | | | 34,979 | | | | 1,263 | |
Embraer S.A.—ADR (Aerospace & defense) | | | 28,404 | | | | 716 | |
| | | | | | | | |
| | | | | | | 1,979 | |
| | | | | | | | |
Mexico—1.2% | | | | | | | | |
Wal-Mart de Mexico S.A.B. de C.V. (Food & staples retailing) | | | 336,700 | | | | 924 | |
| | | | | | | | |
Panama—1.0% | | | | | | | | |
Copa Holdings S.A. (Airlines)† | | | 12,544 | | | | 736 | |
| | | | | | | | |
| | |
Asia—2.6% | | | | | | | | |
Australia—1.3% | | | | | | | | |
BHP Billiton, Ltd.—ADR (Metals & mining) | | | 14,092 | | | | 995 | |
| | | | | | | | |
Singapore—1.3% | | | | | | | | |
Keppel Corporation, Ltd. (Industrial conglomerates) | | | 132,000 | | | | 947 | |
| | | | | | | | |
| | |
Emerging Europe, Mid-East, Africa—0.9% | | | | | | | | |
South Africa—0.9% | | | | | | | | |
Sasol, Ltd. (Oil, gas & consumable fuels) | | | 14,538 | | | | 694 | |
| | | | | | | | |
Total Common Stocks—98.1%
(cost $70,311) | | | | 74,194 | |
| | | | | | | | |
Total Investments—98.1%
(cost $70,311) | | | | 74,194 | |
Cash and other assets, less liabilities—1.9% | | | | 1,463 | |
| | | | | | | | |
Net assets—100.0% | | | $ | 75,657 | |
| | | | | | | | |
ADR American Depository Receipt
* Non-income producing securities
† U.S. listed foreign security
For securities primarily traded on exchanges or markets that close before the close of regular trading on the New York Stock Exchange, the Fund may use an independent pricing service to fair value price the securities pursuant to Valuation Procedures approved by the Board of Trustees.
At December 31, 2011, the Fund’s Portfolio of Investments includes the following industry categories:
| | | | |
Financials | | | 19.9% | |
Industrials | | | 14.9% | |
Consumer Discretionary | | | 14.4% | |
Information Technology | | | 11.2% | |
Energy | | | 9.4% | |
Consumer Staples | | | 9.2% | |
Health Care | | | 9.1% | |
Materials | | | 7.0% | |
Utilities | | | 2.9% | |
Telecommunication Services | | | 2.0% | |
| | | | |
Total | | | 100.0% | |
| | | | |
At December 31, 2011, the Fund’s Portfolio of Investments includes the following currency categories:
| | | | |
British Pound Sterling | | | 30.8% | |
Euro | | | 19.8% | |
U.S. Dollar | | | 12.9% | |
Japanese Yen | | | 9.7% | |
Canadian Dollar | | | 5.8% | |
Swiss Franc | | | 5.2% | |
South Korean Won | | | 4.5% | |
Hong Kong Dollar | | | 3.1% | |
Danish Krone | | | 1.7% | |
Singapore Dollar | | | 1.3% | |
Mexican Peso | | | 1.3% | |
Indonesian Rupiah | | | 1.1% | |
All Other Currencies | | | 2.8% | |
| | | | |
Total | | | 100.0% | |
| | | | |
See accompanying Notes to Financial Statements.
52 Annual Report | December 31, 2011 |

Jeffrey A. Urbina
INTERNATIONAL SMALL CAP GROWTH FUND
The International Small Cap Growth Fund seeks long-term capital appreciation.
AN OVERVIEW FROM THE PORTFOLIO MANAGER
The International Small Cap Growth Fund posted a 12.16% decrease (Class N Shares) for the 12 months ended December 31, 2011. By comparison, the Fund’s benchmark, the MSCI All Country Ex-U.S. Small Cap Index (net), declined 18.50%.
Performance was driven by strong stock selection across regions and sectors. From a sector perspective, Financials, Information Technology (IT) and Materials were the key drivers of performance, although all sectors added value, with the exception of Energy. The underweighting in Europe and focus on Asset Management and Insurance added value in Financials, and as management teams generally executed well relative to the universe as a whole. IT stock selection benefited from the focus and performance of Internet Software/Services and IT Services holdings, while the underweighting in Metals/Mining and Chemicals stock selection drove Materials returns. Energy stock selection was hampered by Oil/Gas performance.
From a sector positioning perspective, Consumer Discretionary (25.1%), Healthcare (15.8%) and IT (16.7%) remained significantly overweighted relative to the Index throughout the entire year, while Financials (13.1%) and Materials (2.6%) were most significantly underweighted with only minor changes in sector weightings throughout 2011. On the other hand, Consumer Staples steadily increased from approximately 4% as of December 2010 to 8.3% as of year-end 2011 due to higher weightings in Food and Food Retailing. Industrials were also significantly reduced during the period on lower Machinery and Professional Services exposure, given moderating operating performance. After increasing during the first half of the year from 17% to at or above the 20% Index weighting, Japanese exposure ended the year 12.9%, as we significantly reduced Consumer, Financials and Industrials exposures. These assets were redeployed into Asia Ex-Japan, Canada and, to some extent, in Emerging Markets, which totaled 24.5% as of year-end, above the 22.2% Index weighting, due to the higher weighting in EMEA (Europe, Mid-East and Africa) and Latin America at the expense of Emerging Asia.
December 31, 2011 | William Blair Funds 53 |
International Small Cap Growth Fund
Performance Highlights (Unaudited)
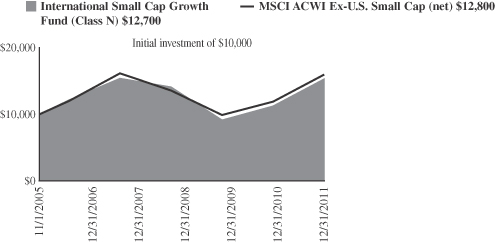
Average Annual Total Return at 12/31/2011
| | | | | | | | | | | | | | | | |
| | | 1
Year | | | 3
Year | | | 5
Year | | | Since
Inception(a) | |
Class N | | | (12.16 | )% | | | 20.21 | % | | | (1.10 | )% | | | 3.96 | % |
Class I | | | (11.84 | ) | | | 20.58 | | | | (0.76 | ) | | | 4.30 | |
MSCI AC World Ex-U.S. Small Cap Index (net) | | | (18.50 | ) | | | 18.46 | | | | (1.73 | ) | | | 4.09 | |
| | (a) | | For the period from November 1, 2005 (Commencement of Operations) to December 31, 2011. |
Performance cited represents past performance. Past performance does not guarantee future results and current performance may be lower or higher than the data quoted. Results shown are average annual returns, which assume reinvestment of dividends and capital gains. Investment returns and principal will fluctuate and you may have a gain or loss when you sell shares. For the most current month-end performance information, please call 1-800-742-7272, or visit our Web site at www.williamblairfunds.com. Smaller capitalization stock are also more sensitive to purchase/sale transactions and changes in the issuer’s financial condition. From time to time, the investment advisor may waive fees or reimburse expenses for the Fund. Without these waivers, performance would be lower. International investing involves special risk considerations, including currency fluctuations, lower liquidity, economic and political risk. Class N shares are available to the general public without a sales load. Class I shares are available to certain institutional investors and advisory clients of William Blair & Company L.L.C. without a sales load or distribution (12b-1) fees.
The performance highlights and graph presented above do not reflect the deduction of taxes that a shareholder would pay on fund distributions or the redemption of fund shares.
The Morgan Stanley Capital International (MSCI) All Country World Ex-U.S. Small Cap Index (net) is a free float-adjusted market capitalization weighted index that is designed to measure the equity market performance of small capitalization developed and emerging markets, excluding the United States. This series approximates the minimum possible dividend reinvestment.
This report identifies the Fund’s investments on December 31, 2011. These holdings are subject to change. Not all stocks in the Fund performed the same, nor is there any guarantee that these stocks will perform as well in the future. Market forecasts provided in this report may not necessarily come to pass.
Sector Diversification (Unaudited)
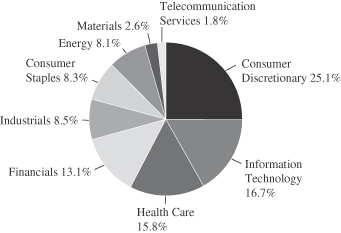
The sector diversification shown is based on the total long-term securities.
54 Annual Report | December 31, 2011 |
International Small Cap Growth Fund
Portfolio of Investments, December 31, 2011 (all dollar amounts in thousands)
| | | | | | | | |
Issuer | | Shares | | | Value | |
| | |
Common Stocks | | | | | | | | |
| | |
Europe—22.6% | | | | | | | | |
Finland—1.0% | | | | | | | | |
Nokian Renkaat Oyj (Auto components) | | | 228,528 | | | $ | 7,359 | |
| | | | | | | | |
Germany—6.9% | | | | | | | | |
Aixtron AG (Semiconductors & semiconductor equipment) | | | 659,861 | | | | 8,412 | |
Delticom AG (Specialty retail) | | | 35,197 | | | | 3,038 | |
ElringKlinger AG (Auto components) | | | 224,609 | | | | 5,576 | |
Gerry Weber International AG (Textiles, apparel & luxury goods) | | | 171,252 | | | | 5,224 | |
MTU Aero Engines Holding AG (Aerospace & defense) | | | 170,437 | | | | 10,906 | |
Wincor Nixdorf AG (Computers & peripherals) | | | 232,278 | | | | 10,381 | |
Wirecard AG (IT services) | | | 345,265 | | | | 5,550 | |
| | | | | | | | |
| | | | | | | 49,087 | |
| | | | | | | | |
Ireland—1.4% | | | | | | | | |
Paddy Power plc (Hotels, restaurants & leisure) | | | 170,315 | | | | 9,812 | |
| | | | | | | | |
Italy—2.7% | | | | | | | | |
De’Longhi SpA (Household durables) | | | 477,455 | | | | 4,221 | |
*Salvatore Ferragamo Italia SpA (Textiles, apparel & luxury goods) | | | 591,443 | | | | 7,792 | |
Tod’s SpA (Textiles, apparel & luxury goods) | | | 59,014 | | | | 4,816 | |
*Yoox SpA (Internet & catalog retail) | | | 236,517 | | | | 2,553 | |
| | | | | | | | |
| | | | | | | 19,382 | |
| | | | | | | | |
Norway—0.4% | | | | | | | | |
Opera Software ASA (Internet software & services) | | | 627,230 | | | | 3,052 | |
| | | | | | | | |
Spain—2.1% | | | | | | | | |
Viscofan S.A. (Food products) | | | 402,566 | | | | 14,933 | |
| | | | | | | | |
Sweden—4.8% | | | | | | | | |
Elekta AB (Health care equipment & supplies) | | | 354,223 | | | | 15,364 | |
JM AB (Household durables) | | | 680,223 | | | | 11,070 | |
Mekonomen AB (Specialty retail) | | | 86,842 | | | | 2,839 | |
NIBE Industrier AB (Building products) | | | 360,985 | | | | 5,337 | |
| | | | | | | | |
| | | | | | | 34,610 | |
| | | | | | | | |
Switzerland—3.3% | | | | | | | | |
*Meyer Burger Technology AG (Machinery) | | | 324,045 | | | | 5,071 | |
Partners Group Holding AG (Capital markets) | | | 107,323 | | | | 18,727 | |
| | | | | | | | |
| | | | | | | 23,798 | |
| | | | | | | | |
| | |
United Kingdom—20.9% | | | | | | | | |
Abcam plc (Biotechnology) | | | 1,133,920 | | | | 6,428 | |
*ASOS plc (Internet & catalog retail) | | | 209,103 | | | | 4,014 | |
Aveva Group plc (Software) | | | 309,675 | | | | 6,877 | |
Babcock International Group plc (Commercial services & supplies) | | | 1,304,077 | | | | 14,896 | |
*Blinkx plc (Internet software & services) | | | 1,531,578 | | | | 1,820 | |
Carphone Warehouse Group plc (Specialty retail) | | | 424,161 | | | | 2,035 | |
Croda International plc (Chemicals) | | | 129,953 | | | | 3,641 | |
Dunelm Group plc (Specialty retail) | | | 524,645 | | | | 3,534 | |
Elementis plc (Chemicals) | | | 1,681,016 | | | | 3,582 | |
*EnQuest plc (Oil, gas & consumable fuels) | | | 1,900,415 | | | | 2,729 | |
|
Common Stocks—United Kingdom—20.9%—(continued) | |
Fidessa Group plc (Software) | | | 113,164 | | | $ | 2,659 | |
Halma plc (Electronic equipment, instruments & components) | | | 1,029,085 | | | | 5,280 | |
Hargreaves Lansdown plc (Capital markets) | | | 782,001 | | | | 5,228 | |
Hikma Pharmaceuticals plc (Pharmaceuticals) | | | 392,631 | | | | 3,780 | |
IG Group Holdings plc (Diversified financial services) | | | 1,499,148 | | | | 11,103 | |
*Imagination Technologies Group plc (Computers & peripherals) | | | 940,451 | | | | 8,018 | |
Lancashire Holdings, Ltd. (Insurance) | | | 1,090,332 | | | | 12,268 | |
Moneysupermarket.com Group plc (Internet software & services) | | | 3,400,087 | | | | 5,544 | |
*Ocado Group plc (Internet & catalog retail) | | | 670,815 | | | | 567 | |
Restaurant Group plc (Hotels, restaurants & leisure) | | | 801,136 | | | | 3,706 | |
*Salamander Energy plc (Oil, gas & consumable fuels) | | | 1,199,181 | | | | 3,760 | |
Spirax-Sarco Engineering plc (Machinery) | | | 326,571 | | | | 9,499 | |
*Sports Direct International plc (Specialty retail) | | | 1,574,379 | | | | 5,218 | |
St James’s Place plc (Insurance) | | | 1,105,662 | | | | 5,572 | |
Synergy Health plc (Health care providers & services) | | | 243,952 | | | | 3,207 | |
*Telecity Group plc (Internet software & services) | | | 1,078,314 | | | | 10,835 | |
Victrex plc (Chemicals) | | | 264,276 | | | | 4,498 | |
| | | | | | | | |
| | | | | | | 150,298 | |
| | | | | | | | |
| | |
Emerging Asia—13.2% | | | | | | | | |
China—3.0% | | | | | | | | |
AAC Technologies Holdings, Inc. (Communications equipment) | | | 1,623,559 | | | | 3,646 | |
Comba Telecom Systems Holdings, Ltd. (Communications equipment) | | | 4,463,526 | | | | 3,598 | |
Haitian International Holdings, Ltd. (Machinery) | | | 4,498,496 | | | | 3,869 | |
Hengdeli Holdings, Ltd. (Specialty retail) | | | 15,368,000 | | | | 5,026 | |
Spreadtrum Communications, Inc.—ADR (Semiconductors & semiconductor equipment)† | | | 165,481 | | | | 3,455 | |
*WuXi PharmaTech Cayman, Inc.—ADR (Life sciences tools & services)† | | | 160,947 | | | | 1,777 | |
| | | | | | | | |
| | | | | | | 21,371 | |
| | | | | | | | |
India—2.1% | | | | | | | | |
CRISIL, Ltd. (Diversified financial services) | | | 213,930 | | | | 3,569 | |
eClerx Services, Ltd. (Professional services) | | | 161,806 | | | | 2,102 | |
Ipca Laboratories, Ltd. (Pharmaceuticals) | | | 353,225 | | | | 1,835 | |
*Jubilant Foodworks, Ltd. (Hotels, restaurants & leisure) | | | 257,293 | | | | 3,655 | |
Motherson Sumi Systems, Ltd. (Auto components) | | | 841,485 | | | | 2,159 | |
Oberoi Realty, Ltd. (Real estate management & development) | | | 405,384 | | | | 1,602 | |
| | | | | | | | |
| | | | | | | 14,922 | |
| | | | | | | | |
Indonesia—3.5% | | | | | | | | |
PT Harum Energy Tbk (Oil, gas & consumable fuels) | | | 12,248,000 | | | | 9,253 | |
PT Indofood CBP Sukses Makmur Tbk (Food products) | | | 12,965,000 | | | | 7,435 | |
See accompanying Notes to Financial Statements.
December 31, 2011 | William Blair Funds 55 |
International Small Cap Growth Fund
Portfolio of Investments, December 31, 2011 (all dollar amounts in thousands)
| | | | | | | | |
Issuer | | Shares | | | Value | |
|
Common Stocks—Emerging Asia—13.2%—(continued) | |
Indonesia—(continued) | | | | | | | | |
PT Kalbe Farma Tbk (Pharmaceuticals) | | | 10,284,500 | | | $ | 3,856 | |
PT Perusahaan Perkebunan London Sumatra Indonesia Tbk (Food products) | | | 18,415,500 | | | | 4,570 | |
| | | | | | | | |
| | | | | | | 25,114 | |
| | | | | | | | |
South Korea—0.9% | | | | | | | | |
*Daum Communications Corporation (Internet software & services) | | | 66,097 | | | | 6,885 | |
| | | | | | | | |
Taiwan—3.1% | | | | | | | | |
E Ink Holdings, Inc. (Electronic equipment, instruments & components) | | | 2,413,000 | | | | 3,148 | |
Hiwin Technologies Corporation (Machinery) | | | 436,000 | | | | 3,542 | |
Powertech Technology, Inc. (Semiconductors & semiconductor equipment) | | | 2,464,000 | | | | 5,216 | |
Simplo Technology Co., Ltd. (Computers & peripherals) | | | 615,500 | | | | 3,598 | |
TSRC Corporation (Chemicals) | | | 2,720,600 | | | | 6,676 | |
| | | | | | | | |
| | | | | | | 22,180 | |
| | | | | | | | |
Thailand—0.6% | | | | | | | | |
*Bangkok Dusit Medical Services PCL (Health care providers & services) | | | 1,761,200 | | | | 4,577 | |
| | | | | | | | |
Japan—12.9% | | | | | | | | |
Ain Pharmaciez, Inc. (Food & staples retailing) | | | 132,700 | | | | 6,379 | |
CyberAgent, Inc. (Media) | | | 3,171 | | | | 10,304 | |
Dr Ci:Labo Co., Ltd. (Personal products) | | | 1,549 | | | | 8,241 | |
Exedy Corporation (Auto components) | | | 244,300 | | | | 7,049 | |
F.C.C. Co., Ltd. (Auto components) | | | 384,209 | | | | 7,807 | |
K’s Holdings Corporation (Specialty retail) | | | 230,100 | | | | 9,118 | |
Kakaku.com, Inc. (Internet software & services) | | | 158,400 | | | | 5,808 | |
M3, Inc. (Health care technology) | | | 821 | | | | 3,701 | |
Miraca Holdings, Inc. (Health care providers & services) | | | 383,500 | | | | 15,271 | |
Sawai Pharmaceutical Co., Ltd. (Pharmaceuticals) | | | 65,500 | | | | 6,799 | |
Ship Healthcare Holdings, Inc. (Health care providers & services) | | | 223,200 | | | | 4,878 | |
Start Today Co., Ltd. (Internet & catalog retail) | | | 155,100 | | | | 3,629 | |
United Arrows, Ltd. (Specialty retail) | | | 196,500 | | | | 3,794 | |
| | | | | | | | |
| | | | | | | 92,778 | |
| | | | | | | | |
| | |
Asia—8.9% | | | | | | | | |
Australia—2.6% | | | | | | | | |
Cochlear, Ltd. (Health care equipment & supplies) | | | 231,101 | | | | 14,655 | |
Iress Market Technology, Ltd. (IT services) | | | 607,170 | | | | 4,303 | |
| | | | | | | | |
| | | | | | | 18,958 | |
| | | | | | | | |
Hong Kong—5.1% | | | | | | | | |
ASM Pacific Technology, Ltd. (Semiconductors & semiconductor equipment) | | | 838,200 | | | | 9,406 | |
*Haier Electronics Group Co., Ltd. (Household durables) | | | 7,780,000 | | | | 6,962 | |
Sa Sa International Holdings, Ltd. (Specialty retail) | | | 9,518,000 | | | | 5,270 | |
|
Common Stocks—Asia—8.9%—(continued) | |
Hong Kong—(continued) | | | | | | | | |
SmarTone Telecommunications Holdings, Ltd. (Wireless telecommunication services) | | | 7,445,000 | | | $ | 12,883 | |
Value Partners Group, Ltd. (Capital markets) | | | 4,313,000 | | | | 2,210 | |
| | | | | | | | |
| | | | | | | 36,731 | |
| | | | | | | | |
Singapore—1.2% | | | | | | | | |
*Biosensors International Group, Ltd. (Health care equipment & supplies) | | | 3,535,000 | | | | 3,897 | |
First Resources, Ltd. (Food products) | | | 2,982,000 | | | | 3,472 | |
Goodpack, Ltd. (Air freight & logistics) | | | 841,000 | | | | 895 | |
| | | | | | | | |
| | | | | | | 8,264 | |
| | | | | | | | |
| | |
Canada—8.0% | | | | | | | | |
Canadian Western Bank (Commercial banks) | | | 217,600 | | | | 5,511 | |
*Celtic Exploration, Ltd. (Oil, gas & consumable fuels) | | | 462,102 | | | | 10,374 | |
Dollarama, Inc. (Multiline retail) | | | 232,374 | | | | 10,150 | |
Home Capital Group, Inc. (Thrifts & mortgage finance) | | | 105,423 | | | | 5,081 | |
*Legacy Oil + Gas, Inc. (Oil, gas & consumable fuels) | | | 831,529 | | | | 8,554 | |
Petrominerales, Ltd. (Oil, gas & consumable fuels) | | | 317,847 | | | | 5,167 | |
Peyto Exploration & Development Corporation (Oil, gas & consumable fuels) | | | 507,608 | | | | 12,153 | |
Total Energy Services, Inc. (Energy equipment & services) | | | 8,648 | | | | 147 | |
| | | | | | | | |
| | | | | | | 57,137 | |
| | | | | | | | |
| |
Emerging Europe, Mid-East, Africa—6.3% | | | | | |
Poland—0.7% | | | | | | | | |
Lubelski Wegiel Bogdanka S.A. (Oil, gas & consumable fuels) | | | 152,701 | | | | 4,598 | |
| | | | | | | | |
Russia—0.3% | | | | | | | | |
*Etalon Group Ltd.—144A—GDR (Real estate management & development)† | | | 516,849 | | | | 2,429 | |
| | | | | | | | |
South Africa—4.3% | | | | | | | | |
Capitec Bank Holdings, Ltd. (Commercial banks) | | | 231,968 | | | | 5,115 | |
Clicks Group, Ltd. (Multiline retail) | | | 1,803,149 | | | | 10,326 | |
Coronation Fund Managers, Ltd. (Capital markets) | | | 1,984,323 | | | | 5,580 | |
Life Healthcare Group Holdings Pte, Ltd. (Health care providers & services) | | | 2,392,361 | | | | 6,117 | |
Mr Price Group, Ltd. (Specialty retail) | | | 406,903 | | | | 4,022 | |
| | | | | | | | |
| | | | | | | 31,160 | |
| | | | | | | | |
Turkey—1.0% | | | | | | | | |
Tofas Turk Otomobil Fabrikasi A.S. (Automobiles) | | | 1,112,295 | | | | 3,477 | |
Turkiye Sinai Kalkinma Bankasi A.S. (Commercial banks) | | | 3,754,548 | | | | 3,628 | |
| | | | | | | | |
| | | | | | | 7,105 | |
| | | | | | | | |
| | |
Emerging Latin America—5.0% | | | | | | | | |
Brazil—3.3% | | | | | | | | |
Arezzo Industria e Comercio S.A. (Textiles, apparel & luxury goods) | | | 399,396 | | | | 4,968 | |
See accompanying Notes to Financial Statements.
56 Annual Report | December 31, 2011 |
International Small Cap Growth Fund
Portfolio of Investments, December 31, 2011 (all dollar amounts in thousands)
| | | | | | | | |
Issuer | | Shares or
Principal
Amount | | | Value | |
|
Common Stocks—Emerging Latin America—5.0%—(continued) | |
Brazil—(continued) | | | | | | | | |
CETIP S.A.—Balcao Organizado de Ativos e Derivativos (Capital markets) | | | 287,855 | | | $ | 4,159 | |
OdontoPrev S.A. (Health care providers & services) | | | 402,300 | | | | 5,737 | |
Raia Drogasil S.A. (Food & staples retailing) | | | 375,400 | | | | 2,610 | |
*Restoque Comercio e Confeccoes de Roupas S.A. (Textiles, apparel & luxury goods) | | | 221,800 | | | | 3,246 | |
*T4F Entretenimento S.A. (Media) | | | 487,400 | | | | 2,992 | |
| | | | | | | | |
| | | | | | | 23,712 | |
| | | | | | | | |
Chile—0.6% | | | | | | | | |
*CFR Pharmaceuticals S.A. (Pharmaceuticals) | | | 16,669,705 | | | | 3,918 | |
| | | | | | | | |
Mexico—0.7% | | | | | | | | |
*Genomma Lab Internacional S.A.B. de C.V. (Pharmaceuticals) | | | 2,516,520 | | | | 4,853 | |
| | | | | | | | |
Panama—0.4% | | | | | | | | |
Copa Holdings S.A. (Airlines)† | | | 53,767 | | | | 3,155 | |
| | | | | | | | |
Total Common Stocks—97.8%
(cost $721,613) | | | | 702,178 | |
| | | | | | | | |
| | |
Convertible Bond | | | | | | | | |
Brazil—0.0% | | | | | | | | |
Lupatech S.A., 6.500%, due 4/15/18 (Machinery)**§ | | $ | 959 | | | | 249 | |
| | | | | | | | |
Total Convertible Bond—0.0%
(cost $497) | | | | 249 | |
| | | | | | | | |
| | |
Repurchase Agreement | | | | | | | | |
Fixed Income Clearing Corporation, 0.000% dated 12/30/11, due 1/3/12, repurchase price $12,882, collateralized by FHLB, 4.500%, due 1/15/14 | | | 12,882 | | | | 12,882 | |
| | | | | | | | |
Total Repurchase Agreement—1.8%
(cost $12,882) | | | | 12,882 | |
| | | | | | | | |
Total Investments—99.6%
(cost $734,992) | | | | 715,309 | |
Cash and other assets, less liabilities—0.4% | | | | 2,912 | |
| | | | | | | | |
Net assets—100.0% | | | $ | 718,221 | |
| | | | | | | | |
ADR American Depository Receipt
GDR Global Depository Receipt
* Non-income producing securities
† U.S. listed foreign security
** Fair valued pursuant to Valuation Procedures adopted by the Board of Trustees. This holding represents 0.03% of the Fund’s net assets at December 31, 2011.
§ Deemed illiquid pursuant to Liquidity Procedures approved by the Board of Trustees. This holding represents 0.03% of the net assets at December 31, 2011.
For securities primarily traded on exchanges or markets that close before the close of regular trading on the New York Stock Exchange, the Fund may use an independent pricing service to fair value price the securities pursuant to Valuation Procedures approved by the Board of Trustees.
At December 31, 2011, the Fund’s Portfolio of Investments includes the following industry categories:
| | | | |
Consumer Discretionary | | | 25.1% | |
Information Technology | | | 16.7% | |
Health Care | | | 15.8% | |
Financials | | | 13.1% | |
Industrials | | | 8.5% | |
Consumer Staples | | | 8.3% | |
Energy | | | 8.1% | |
Materials | | | 2.6% | |
Telecommunication Services | | | 1.8% | |
| | | | |
Total | | | 100.0% | |
| | | | |
At December 31, 2011, the Fund’s Portfolio of Investments includes the following currency categories:
| | | | |
British Pound Sterling | | | 21.4% | |
Euro | | | 15.0% | |
Japanese Yen | | | 13.2% | |
Canadian Dollar | | | 8.1% | |
Hong Kong Dollar | | | 7.5% | |
Swedish Krona | | | 4.9% | |
South African Rand | | | 4.4% | |
Indonesian Rupiah | | | 3.6% | |
Brazilian Real | | | 3.4% | |
Swiss Franc | | | 3.4% | |
New Taiwan Dollar | | | 3.2% | |
Australian Dollar | | | 2.7% | |
Indian Rupee | | | 2.1% | |
U.S. Dollar | | | 1.6% | |
Singapore Dollar | | | 1.2% | |
Turkish Lira | | | 1.0% | |
All Other Currencies | | | 3.3% | |
| | | | |
Total | | | 100.0% | |
| | | | |
See accompanying Notes to Financial Statements.
December 31, 2011 | William Blair Funds 57 |

Todd M. McClone
Jeffrey A. Urbina
EMERGING MARKETS GROWTH FUND
The Emerging Markets Growth Fund seeks long-term capital appreciation.
AN OVERVIEW FROM THE PORTFOLIO MANAGERS
The Emerging Markets Growth Fund posted a 17.29% decrease (Class N Shares) for the 12 months ended December 31, 2011. By comparison, the Fund’s benchmark, the MSCI Emerging Markets IMI Index (net), declined 19.49%.
Performance was augmented by strong stock selection across most sectors and regions, coupled with overall sector positioning. Consumer Discretionary, Financials, Industrials, Materials and Utilities stock selection were the key contributors to outperformance. Within Consumer Discretionary, the Fund’s overweighting in the strongly performing Auto industry added value as did the weighting and stock selection in Retailing. Financials stock selection was bolstered by strong Commercial Banks, Insurance and Real Estate performance. Industrials value added was driven by good performance across Capital Goods and Transportation holdings. Materials benefited from the Fund’s focus and stock selection in Chemicals at the expense of Mining. Utilities stock selection was largely driven by strong performance in CPFL Energia S.A., the Brazilian power generation company, as management executed well and earnings results were ahead of expectations during the period. From a regional perspective, the Fund added significant value in Emerging Asia due largely to China, India, and Korea stock selection, along with the overweighting in the strongly performing Indonesian market at the expense of India. Brazilian and South African stock selection added significant value as well, more than offsetting weakness in Russia.
The Fund’s significant focus in Consumer remained constant throughout 2011 with approximately 32% invested in Consumer Discretionary and Consumer Staples companies, a slight increase from year end 2010. The Index weighting in Consumer totaled 17.4%. Within Discretionary, the Fund’s focus was on Autos and Retail, while Consumer Staples exposure was largest in Beverages and Food/Staples Retailing. Information Technology (IT) exposure increased steadily throughout 2011 from 11.1% as of year end 2010 to 16.8% as of September 30, to the 19.1% year-end 2011 weighting, which was well ahead of the 13.24% Index weighting. Internet Software and IT Services were the two industries with consistently higher exposure, although the significant underweighting in Semiconductors moderated over the year as well. Conversely, Financials, while underweighted at year end 2010, was reduced throughout the year, particularly in Commercial Banks and Real Estate. As of year end, Financials represented 15.9% of the Fund, well below the 23.0% Index weighting. Resources were consistently underweighted throughout 2011, totaling 19.2% as of year end 2010, and decreased to 12.8% as of year end 2011, well below the 26.0% Index weighting, due largely to a reduction in Mining on a slower company growth outlook. Regionally, the Fund remained consistently overweighted in Latin America at the expense of Asia (largely China and India) and EMEA (Europe, Middle East, and Africa), due to lower Russia and Central/Eastern Europe exposure.
58 Annual Report | December 31, 2011 |
Emerging Markets Growth Fund
Performance Highlights (Unaudited)
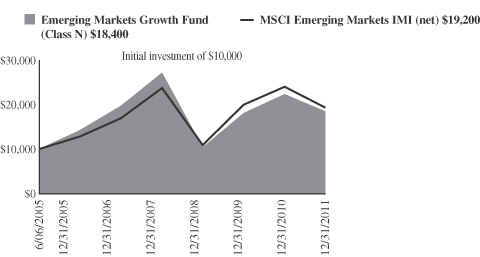
Average Annual Total Return at 12/31/2011
| | | | | | | | | | | | | | | | |
| | | 1
Year | | | 3
Year | | | 5
Year | | | Since
Inception(a) | |
Class N | | | (17.29 | )% | | | 21.08 | % | | | (1.31 | )% | | | 9.72 | % |
Class I | | | (17.00 | ) | | | 21.40 | | | | (1.04 | ) | | | 9.99 | |
MSCI Emerging Markets
IMI (net) | | | (19.49 | ) | | | 20.74 | | | | 2.61 | | | | 10.46 | |
| | (a) | | For the period from June 6, 2005 (Commencement of Operations) to December 31, 2011. |
Performance cited represents past performance. Past performance does not guarantee future results and current performance may be lower or higher than the data quoted. Results shown are average annual returns, which assume reinvestment of dividends and capital gains. Investment returns and principal will fluctuate and you may have a gain or loss when you sell shares. For the most current month-end performance information, please call 1-800-742-7272, or visit our Web site at www.williamblairfunds.com. From time to time, the investment advisor may waive fees or reimburse expenses for the Fund. Without these waivers, performance would be lower. International investing involves special risk considerations, including currency fluctuations, lower liquidity, economic and political risk. Class N shares are available to the general public without a sales load. Class I shares are available to certain institutional investors and advisory clients of William Blair & Company L.L.C. without a sales load or distribution (12b-1) fees.
The performance highlights and graph presented above do not reflect the deduction of taxes that a shareholder would pay on fund distributions or the redemption of fund shares.
The Morgan Stanley Capital International (MSCI) Emerging Markets Investable Market Index (IMI) (net) is a free float-adjusted market capitalization weighted index that is designed to measure the equity market performance of emerging markets. This series approximates the minimum possible dividend reinvestment.
This report identifies the Fund’s investments on December 31, 2011. These holdings are subject to change. Not all stocks in the Fund performed the same, nor is there any guarantee that these stocks will perform as well in the future. Market forecasts provided in this report may not necessarily come to pass.
Sector Diversification (Unaudited)
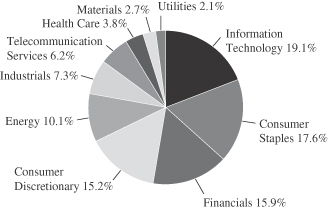
The sector diversification shown is based on the total long-term securities.
December 31, 2011 | William Blair Funds 59 |
Emerging Markets Growth Fund
Portfolio of Investments, December 31, 2011 (all dollar amounts in thousands)
| | | | | | | | |
Issuer | | Shares | | | Value | |
| | |
Common Stocks | | | | | | | | |
| | |
Emerging Asia—54.3% | | | | | | | | |
China—13.1% | | | | | | | | |
AAC Technologies Holdings, Inc. (Communications equipment) | | | 1,071,949 | | | $ | 2,407 | |
*Baidu, Inc.—ADR (Internet software & services) | | | 68,407 | | | | 7,967 | |
Belle International Holdings, Ltd. (Specialty retail) | | | 4,721,000 | | | | 8,230 | |
China BlueChemical, Ltd. (Chemicals) | | | 1,564,000 | | | | 1,184 | |
CNOOC, Ltd. (Oil, gas & consumable fuels) | | | 9,094,000 | | | | 15,901 | |
Comba Telecom Systems Holdings, Ltd. (Communications equipment) | | | 3,812,496 | | | | 3,073 | |
Dongfeng Motor Group Co., Ltd. (Automobiles) | | | 5,634,000 | | | | 9,663 | |
Golden Eagle Retail Group, Ltd. (Multiline retail) | | | 2,253,000 | | | | 4,763 | |
*Haier Electronics Group Co., Ltd. (Household durables) | | | 2,146,000 | | | | 1,920 | |
Haitian International Holdings, Ltd. (Machinery) | | | 2,422,185 | | | | 2,083 | |
Hengdeli Holdings, Ltd. (Specialty retail) | | | 6,680,000 | | | | 2,185 | |
Lenovo Group, Ltd. (Computers & peripherals) | | | 12,448,000 | | | | 8,302 | |
Ping An Insurance Group Co. of China, Ltd. Class “H” (Insurance) | | | 1,167,000 | | | | 7,693 | |
Spreadtrum Communications, Inc.—ADR (Semiconductors & semiconductor equipment) | | | 97,818 | | | | 2,043 | |
*Sun Art Retail Group, Ltd. (Food & staples retailing) | | | 5,808,000 | | | | 7,261 | |
Tencent Holdings, Ltd. (Internet software & services) | | | 252,200 | | | | 5,069 | |
Want Want China Holdings, Ltd. (Food products) | | | 11,401,000 | | | | 11,377 | |
*WuXi PharmaTech Cayman, Inc.—ADR (Life sciences tools & services) | | | 193,714 | | | | 2,139 | |
Yingde Gases (Chemicals) | | | 2,146,000 | | | | 2,191 | |
*Youku.com, Inc.—ADR (Internet software & services) | | | 150,415 | | | | 2,357 | |
| | | | | | | | |
| | | | | | | 107,808 | |
| | | | | | | | |
India—10.5% | | | | | | | | |
Asian Paints, Ltd. (Chemicals) | | | 78,064 | | | | 3,811 | |
Axis Bank, Ltd. (Commercial banks) | | | 427,341 | | | | 6,503 | |
Bajaj Auto, Ltd. (Automobiles) | | | 156,236 | | | | 4,682 | |
Dabur India, Ltd. (Personal products) | | | 1,293,345 | | | | 2,422 | |
Housing Development Finance Corporation (Thrifts & mortgage finance) | | | 614,535 | | | | 7,546 | |
IndusInd Bank, Ltd. (Commercial banks) | | | 438,126 | | | | 1,863 | |
Infosys Technologies, Ltd. (IT services) | | | 229,498 | | | | 11,961 | |
ITC, Ltd. (Tobacco) | | | 3,050,676 | | | | 11,564 | |
*Jubilant Foodworks, Ltd. (Hotels, restaurants & leisure) | | | 151,942 | | | | 2,158 | |
Lupin, Ltd. (Pharmaceuticals) | | | 536,363 | | | | 4,523 | |
Motherson Sumi Systems, Ltd. (Auto components) | | | 592,108 | | | | 1,519 | |
Nestle India, Ltd. (Food products) | | | 51,479 | | | | 3,969 | |
Shriram Transport Finance Co., Ltd. (Consumer finance) | | | 29,503 | | | | 234 | |
Sun Pharmaceutical Industries, Ltd. (Pharmaceuticals) | | | 415,484 | | | | 3,894 | |
|
Common Stocks—Emerging Asia—54.3%—(continued) | |
India—(continued) | | | | | | | | |
Tata Consultancy Services, Ltd. (IT services) | | | 583,577 | | | $ | 12,754 | |
Tata Motors, Ltd. (Automobiles) | | | 1,823,672 | | | | 6,137 | |
| | | | | | | | |
| | | | | | | 85,540 | |
| | | | | | | | |
Indonesia—5.9% | | | | | | | | |
PT Astra International Tbk (Automobiles) | | | 1,757,000 | | | | 14,339 | |
PT Bank Rakyat Indonesia (Commercial banks) | | | 19,033,000 | | | | 14,169 | |
PT Harum Energy Tbk (Oil, gas & consumable fuels) | | | 2,320,500 | | | | 1,753 | |
PT Indo Tambangraya Megah (Oil, gas & consumable fuels) | | | 1,140,000 | | | | 4,859 | |
PT Kalbe Farma Tbk (Pharmaceuticals) | | | 5,861,500 | | | | 2,198 | |
PT Perusahaan Perkebunan London Sumatra Indonesia Tbk (Food products) | | | 9,965,500 | | | | 2,473 | |
PT Unilever Indonesia Tbk (Household products) | | | 2,495,000 | | | | 5,173 | |
PT United Tractors Tbk (Machinery) | | | 1,052,757 | | | | 3,059 | |
| | | | | | | | |
| | | | | | | 48,023 | |
| | | | | | | | |
Malaysia—2.1% | | | | | | | | |
Axiata Group Bhd (Wireless telecommunication services) | | | 3,973,000 | | | | 6,442 | |
CIMB Group Holdings Bhd (Commercial banks) | | | 2,535,100 | | | | 5,950 | |
Kuala Lumpur Kepong Bhd (Food products) | | | 611,300 | | | | 4,377 | |
| | | | | | | | |
| | | | | | | 16,769 | |
| | | | | | | | |
Papua New Guinea—1.5% | | | | | | | | |
Oil Search, Ltd. (Oil, gas & consumable fuels) | | | 1,973,416 | | | | 12,615 | |
| | | | | | | | |
Philippines—0.3% | | | | | | | | |
Alliance Global Group, Inc. (Industrial conglomerates) | | | 8,965,300 | | | | 2,114 | |
| | | | | | | | |
South Korea—12.1% | | | | | | | | |
*Celltrion, Inc. (Pharmaceuticals) | | | 90,002 | | | | 2,836 | |
*Honam Petrochemical Corporation (Chemicals) | | | 15,291 | | | | 3,955 | |
*Hyundai Mobis (Auto components) | | | 34,338 | | | | 8,704 | |
*Hyundai Motor Co. (Automobiles) | | | 86,112 | | | | 15,922 | |
*LG Household & Health Care, Ltd. (Household products) | | | 21,702 | | | | 9,184 | |
Samsung Electronics Co., Ltd. (Semiconductors & semiconductor equipment) | | | 36,296 | | | | 33,334 | |
*Samsung Engineering Co., Ltd. (Construction & engineering) | | | 71,894 | | | | 12,575 | |
Samsung Fire & Marine Insurance Co., Ltd. (Insurance) | | | 35,464 | | | | 6,496 | |
*Samsung Heavy Industries Co., Ltd. (Machinery) | | | 251,713 | | | | 6,096 | |
| | | | | | | | |
| | | | | | | 99,102 | |
| | | | | | | | |
Taiwan—6.7% | | | | | | | | |
Catcher Technology Co., Ltd. (Computers & peripherals) | | | 751,000 | | | | 3,485 | |
Hiwin Technologies Corporation (Machinery) | | | 245,000 | | | | 1,990 | |
Hon Hai Precision Industry Co., Ltd. (Electronic equipment, instruments & components) | | | 6,192,191 | | | | 16,953 | |
See accompanying Notes to Financial Statements.
60 Annual Report | December 31, 2011 |
Emerging Markets Growth Fund
Portfolio of Investments, December 31, 2011 (all dollar amounts in thousands)
| | | | | | | | |
Issuer | | Shares | | | Value | |
|
Common Stocks—Emerging Asia—54.3%—(continued) | |
Taiwan—(continued) | | | | | | | | |
HTC Corporation (Communications equipment) | | | 489,800 | | | $ | 8,040 | |
MediaTek, Inc. (Semiconductors & semiconductor equipment) | | | 483,000 | | | | 4,427 | |
Powertech Technology, Inc. (Semiconductors & semiconductor equipment) | | | 1,328,000 | | | | 2,811 | |
Simplo Technology Co., Ltd. (Computers & peripherals) | | | 571,300 | | | | 3,340 | |
*TPK Holding Co., Ltd. (Electronic equipment, instruments & components) | | | 254,400 | | | | 3,315 | |
TSRC Corporation (Chemicals) | | | 1,622,500 | | | | 3,981 | |
*Yuanta Financial Holding Co., Ltd. (Capital markets) | | | 11,978,641 | | | | 6,112 | |
| | | | | | | | |
| | | | | | | 54,454 | |
| | | | | | | | |
Thailand—2.1% | | | | | | | | |
Advanced Info Service PCL (Wireless telecommunication services) | | | 524,600 | | | | 2,336 | |
CP ALL PCL (Food & staples retailing) | | | 3,973,000 | | | | 6,517 | |
Kasikornbank PCL (Commercial banks) | | | 1,647,100 | | | | 6,500 | |
Siam Makro PCL (Food & staples retailing) | | | 225,600 | | | | 1,709 | |
| | | | | | | | |
| | | | | | | 17,062 | |
| | | | | | | | |
| | |
Emerging Latin America—24.5% | | | | | | | | |
Argentina—0.5% | | | | | | | | |
MercadoLibre, Inc. (Internet software & services) | | | 49,092 | | | | 3,905 | |
| | | | | | | | |
Brazil—13.2% | | | | | | | | |
BR Malls Participacoes S.A. (Real estate management & development) | | | 450,716 | | | | 4,378 | |
BR Properties S.A. (Real estate management & development) | | | 200,505 | | | | 1,989 | |
CETIP S.A.—Balcao Organizado de Ativos e Derivativos (Capital markets) | | | 335,082 | | | | 4,841 | |
Cia de Bebidas das Americas—ADR (Beverages) | | | 705,234 | | | | 25,452 | |
Cia de Concessoes Rodoviarias (Transportation infrastructure) | | | 955,000 | | | | 6,257 | |
Cia Hering (Specialty retail) | | | 260,170 | | | | 4,528 | |
CPFL Energia S.A.—ADR (Electric utilities) | | | 253,830 | | | | 7,160 | |
Embraer S.A.—ADR (Aerospace & defense) | | | 425,222 | | | | 10,724 | |
Lojas Renner S.A. (Multiline retail) | | | 155,600 | | | | 4,038 | |
OdontoPrev S.A. (Health care providers & services) | | | 155,622 | | | | 2,219 | |
*OGX Petroleo e Gas Participacoes S.A. (Oil, gas & consumable fuels) | | | 1,038,160 | | | | 7,581 | |
PDG Realty S.A. Empreendimentos e Participacoes (Household durables) | | | 1,448,587 | | | | 4,582 | |
Raia Drogasil S.A. (Food & staples retailing) | | | 316,094 | | | | 2,198 | |
Redecard S.A. (IT services) | | | 533,800 | | | | 8,354 | |
Totvs S.A. (Software) | | | 219,995 | | | | 3,923 | |
Tractebel Energia S.A. (Independent power producers & energy traders) | | | 627,754 | | | | 10,083 | |
| | | | | | | | |
| | | | | | | 108,307 | |
| | | | | | | | |
|
Common Stocks—Emerging Latin America—24.5%—(continued) | |
Chile—4.0% | | | | | | | | |
Banco Santander Chile—ADR (Commercial banks) | | | 164,176 | | | $ | 12,428 | |
*CFR Pharmaceuticals S.A. (Pharmaceuticals) | | | 9,600,643 | | | | 2,256 | |
ENTEL Chile S.A. (Wireless telecommunication services) | | | 154,626 | | | | 2,872 | |
S.A.C.I. Falabella (Multiline retail) | | | 711,082 | | | | 5,530 | |
Sociedad Quimica y Minera de Chile S.A.—ADR (Chemicals) | | | 119,940 | | | | 6,459 | |
Sonda S.A. (IT services) | | | 1,234,542 | | | | 2,959 | |
| | | | | | | | |
| | | | | | | 32,504 | |
| | | | | | | | |
Colombia—0.5% | | | | | | | | |
Pacific Rubiales Energy Corporation (Oil, gas & consumable fuels) | | | 239,424 | | | | 4,402 | |
| | | | | | | | |
Mexico—5.4% | | | | | | | | |
America Movil S.A.B. de C.V. (Wireless telecommunication services) | | | 13,834,279 | | | | 15,644 | |
Coca-Cola Femsa S.A.B. de C.V.—ADR (Beverages) | | | 49,628 | | | | 4,725 | |
*Genomma Lab Internacional S.A.B. de C.V. (Pharmaceuticals) | | | 2,044,934 | | | | 3,943 | |
Wal-Mart de Mexico S.A.B. de C.V. (Food & staples retailing) | | | 7,237,700 | | | | 19,865 | |
| | | | | | | | |
| | | | | | | 44,177 | |
| | | | | | | | |
Peru—0.9% | | | | | | | | |
Credicorp, Ltd. (Commercial banks)† | | | 65,885 | | | | 7,212 | |
| | | | | | | | |
|
Emerging Europe, Mid-East, Africa—15.7% | |
Poland—0.4% | | | | | | | | |
Eurocash S.A. (Food & staples retailing) | | | 431,285 | | | | 3,567 | |
| | | | | | | | |
Qatar—1.7% | | | | | | | | |
Industries Qatar QSC (Industrial conglomerates) | | | 372,133 | | | | 13,592 | |
| | | | | | | | |
Russia—1.3% | | | | | | | | |
*Etalon Group Ltd.—144A—GDR (Real estate management & development) | | | 510,600 | | | | 2,400 | |
Magnit OAO (Food & staples retailing)† | | | 67,441 | | | | 5,828 | |
*Magnit OJSC (Food & staples retailing) | | | 7,830 | | | | 676 | |
*Mail.ru Group, Ltd.—GDR (Internet software & services) | | | 72,538 | | | | 1,886 | |
| | | | | | | | |
| | | | | | | 10,790 | |
| | | | | | | | |
South Africa—9.6% | | | | | | | | |
Clicks Group, Ltd. (Multiline retail) | | | 556,767 | | | | 3,188 | |
Life Healthcare Group Holdings Pte, Ltd. (Health care providers & services) | | | 2,637,788 | | | | 6,744 | |
Mr Price Group, Ltd. (Specialty retail) | | | 604,538 | | | | 5,976 | |
MTN Group, Ltd. (Wireless telecommunication services) | | | 1,286,907 | | | | 22,913 | |
Naspers, Ltd. (Media) | | | 131,207 | | | | 5,741 | |
Sasol, Ltd. (Oil, gas & consumable fuels) | | | 377,150 | | | | 18,011 | |
Shoprite Holdings, Ltd. (Food & staples retailing) | | | 412,721 | | | | 6,963 | |
The Foschini Group, Ltd. (Specialty retail) | | | 391,571 | | | | 5,093 | |
Truworths International, Ltd. (Specialty retail) | | | 437,301 | | | | 4,001 | |
| | | | | | | | |
| | | | | | | 78,630 | |
| | | | | | | | |
See accompanying Notes to Financial Statements.
December 31, 2011 | William Blair Funds 61 |
Emerging Markets Growth Fund
Portfolio of Investments, December 31, 2011 (all dollar amounts in thousands)
| | | | | | | | |
Issuer | | Shares or
Principal
Amount | | | Value | |
|
Common Stocks—Emerging Europe, Mid-East, Africa—15.7% —(continued) | |
Turkey—2.7% | | | | | | | | |
BIM Birlesik Magazalar A.S. (Food & staples retailing) | | | 100,545 | | | $ | 2,787 | |
Tofas Turk Otomobil Fabrikasi A.S. (Automobiles) | | | 886,821 | | | | 2,772 | |
Turkiye Garanti Bankasi A.S. (Commercial banks) | | | 3,026,479 | | | | 9,429 | |
Turkiye Halk Bankasi A.S. (Commercial banks) | | | 1,345,683 | | | | 7,035 | |
| | | | | | | | |
| | | | | | | 22,023 | |
| | | | | | | | |
Total Common Stocks—94.5%
(cost $789,368) | | | | | | | 772,596 | |
| | | | | | | | |
| | |
Preferred Stocks | | | | | | | | |
Brazil—3.7% | | | | | | | | |
Itau Unibanco Holding S.A. (Commercial banks) | | | 823,600 | | | | 15,008 | |
Petroleo Brasileiro S.A. (Oil, gas & consumable fuels) | | | 1,369,738 | | | | 15,781 | |
| | | | | | | | |
| | | | | | | 30,789 | |
| | | | | | | | |
Total Preferred Stocks—3.7%
(cost $32,596) | | | | | | | 30,789 | |
| | | | | | | | |
| | |
Convertible Bond | | | | | | | | |
Brazil—0.1% | | | | | | | | |
Lupatech S.A., 6.500%, due 4/15/18 (Machinery)**§ | | $ | 1,602 | | | | 416 | |
| | | | | | | | |
Total Convertible Bond—0.1%
(cost $831) | | | | 416 | |
| | | | | | | | |
| | |
Repurchase Agreement | | | | | | | | |
Fixed Income Clearing Corporation, 0.000% dated 12/30/11, due 1/3/12, repurchase price $8,235, collateralized by U.S. Treasury Note, 1.750%, due 1/31/14 | | | 8,235 | | | | 8,235 | |
| | | | | | | | |
Total Repurchase Agreement—1.0%
(cost $8,235) | | | | 8,235 | |
| | | | | | | | |
Total Investments—99.3%
(cost $831,030) | | | | 812,036 | |
Cash and other assets, less liabilities—0.7% | | | | 5,810 | |
| | | | | | | | |
Net assets—100.0% | | | $ | 817,846 | |
| | | | | | | | |
ADR American Depository Receipt
GDR Global Depository Receipt
* Non-income producing securities
† U.S. listed foreign security
** Fair valued pursuant to Valuation Procedures adopted by the Board of Trustees. This holding represents 0.05% of the Fund’s net assets at December 31, 2011.
§ Deemed illiquid pursuant to Liquidity Procedures approved by the Board of Trustees. This holding represents 0.05% of the Fund’s net assets at December 31, 2011.
For securities primarily traded on exchanges or markets that close before the close of regular trading on the New York Stock Exchange, the Fund may use an independent pricing service to fair value price the securities pursuant to Valuation Procedures approved by the Board of Trustees.
At December 31, 2011, the Fund's Portfolio of Investments includes the following industry categories:
| | | | |
Information Technology | | | 19.1% | |
Consumer Staples | | | 17.6% | |
Financials | | | 15.9% | |
Consumer Discretionary | | | 15.2% | |
Energy | | | 10.1% | |
Industrials | | | 7.3% | |
Telecommunication Services | | | 6.2% | |
Health Care | | | 3.8% | |
Materials | | | 2.7% | |
Utilities | | | 2.1% | |
| | | | |
Total | | | 100.0% | |
| | | | |
At December 31, 2011, the Fund's Portfolio of Investments includes the following currency categories:
| | | | |
U.S. Dollar | | | 12.9% | |
South Korean Won | | | 12.3% | |
Brazilian Real | | | 12.0% | |
Hong Kong Dollar | | | 11.6% | |
Indian Rupee | | | 10.6% | |
South African Rand | | | 9.8% | |
New Taiwan Dollar | | | 6.8% | |
Indonesian Rupiah | | | 6.0% | |
Mexican Peso | | | 4.9% | |
Turkish Lira | | | 2.7% | |
Thai Baht | | | 2.1% | |
Malaysian Ringgit | | | 2.1% | |
Chilean Peso | | | 1.7% | |
Qatari Rial | | | 1.7% | |
Australian Dollar | | | 1.6% | |
All Other Currencies | | | 1.2% | |
| | | | |
Total | | | 100.0% | |
| | | | |
See accompanying Notes to Financial Statements.
62 Annual Report | December 31, 2011 |
Todd M. McClone
Jeffrey A. Urbina
EMERGING LEADERS GROWTH FUND
The Emerging Leaders Growth Fund seeks long-term capital appreciation.
AN OVERVIEW FROM THE PORTFOLIO MANAGERS
The Emerging Leaders Growth Fund posted a 19.55% decrease (Class N Shares) for the 12 months ended December 31, 2011. By comparison, the Fund’s benchmark, the MSCI Emerging Markets Large Cap Index (net) declined 17.65% during the same period.
The primary detractors from 2011 performance were the overweighting in India for the majority of the year, coupled with underperformance in Taiwanese Information Technology (IT) and in Russia during the first quarter. India underperformed on concerns about an increasing interest rate environment, coupled with increasing costs and slowing growth. Taiwanese IT performance was hampered by concerns about global supply chain issues following the Japanese earthquake and tsunami, in addition to changing competitive dynamics within smartphones and tablets and the impact on the supply chain. Russian underperformance was driven by a lack of Energy exposure. Key positive contributors to 2011 results included the significant weightings in Consumer at the expense of Materials, coupled with strong performance in Materials and IT. Within Materials, the Fund’s significant underweighting in the underperforming Mining segment added value, as did strong relative performance in Chemicals and Construction Materials. Within IT, Samsung Electronics Co. Ltd. was a key contributor to full year performance, on strong demand for its handsets, which more than offset broad semiconductor weakness. Baidu, Inc. was a strong performer within IT as well, on strong revenue growth and market share gains and good execution by Management. The Fund also outpaced the Index in Technology Hardware, due largely to Fund holdings Lenovo Group, Ltd. on its strong Chinese market position and market share gains globally, and TPK Holding Co. Ltd., the Taiwanese touch panel manufacturer, on expectations of continued strong demand for tablets.
Consumer weightings increased throughout the year from 27.3% as of year-end 2010 to 36.8% at year-end 2011, well ahead of the 14.3% Index weighting. The overweighting was largely in Emerging Asia, and largely in Automobiles, Specialty Retailing, Food/Staples Retailing and Personal Products. Conversely, Resources decreased substantially from 27.2% as of year-end 2010 to 11.0% as of year-end 2011, due to a significant reduction in Materials on a slower growth outlook in Mining in particular. Financials, while totaling 19.8% of the Fund, remained relatively static during the year and ended below the Index’s 24.4% weighting, given lower Commercial Banks exposure amidst the increasing interest rate environment. IT increased throughout the year from 9.9% to nearly 14.9% ahead of the 13.9% Index weighting given the increase in IT Services. From a regional perspective, the Fund maintained its overweighting in Latin America, albeit a moderated overweighting, while EMEA (Europe, Middle East, and Africa) increased from 12.9% of the Fund as of year-end 2010 to 18.8%.
December 31, 2011 | William Blair Funds 63 |
Emerging Leaders Growth Fund
Performance Highlights (Unaudited)
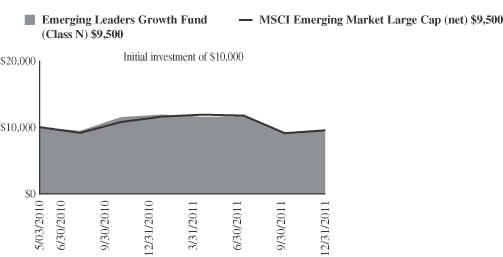
Average Annual Total Return at 12/31/2011
| | | | | | | | | | | | |
| | | 1
Year | | | 3
Year | | | Since
Inception | |
Class N | | | (19.55) | % | | | — | % | | | (2.85 | )%(a) |
MSCI Emerging Markets Large Cap Index (net) | | | (17.65) | | | | — | | | | (2.90 | )(a) |
Class I | | | (19.34) | | | | 21.19 | | | | (4.14 | )(b) |
MSCI Emerging Markets Large Cap Index (net) | | | (17.65) | | | | 19.68 | | | | (2.65 | )(b) |
| | (a) | | For the period from May 3, 2010 (Commencement of Operations) to December 31, 2011. | |
| | (b) | | For the period from March 26, 2008 (Commencement of Operations) to December 31, 2011. | |
Performance cited represents past performance. Past performance does not guarantee future results and current performance may be lower or higher than the data quoted. Results shown are average annual total returns, which assume reinvestment of dividends and capital gains. Investment returns and principal will fluctuate and you may have a gain or loss when you sell shares. For the most current month-end performance information, please call 1-800-742-7272, or visit our Web site at www.williamblairfunds.com. International investing involves special risk considerations, including currency fluctuations, lower liquidity, economic and political risk. From time to time, the investment advisor may waive fees or reimburse expenses for the Fund. Without these waivers, performance would be lower. Class N shares are available to the general public without a sales load. Class I shares are available to certain institutional investors and advisory clients of William Blair & Company, L.L.C., without a sales load or distribution fees (12b-1).
The performance highlights and graph presented above do not reflect the deduction of taxes that a shareholder would pay on fund distributions or the redemption of fund shares.
The Morgan Stanley Capital International (MSCI) Emerging Markets Large Cap Index (net) is a free float-adjusted market capitalization weighted index that is designed to measure market performance of large capitalization stocks in emerging markets. This series approximates the minimum possible dividend reinvestment.
This report identifies the Fund’s investments on December 31, 2011. These holdings are subject to change. Not all stocks in the Fund performed the same, nor is there any guarantee that these stocks will perform as well in the future. Market forecasts provided in this report may not necessarily come to pass.
Sector Diversification (Unaudited)
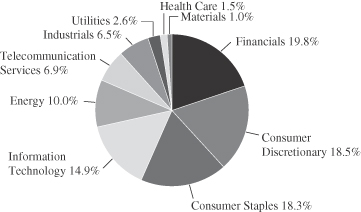
The sector diversification shown is based on the total long-term securities.
64 Annual Report | December 31, 2011 |
Emerging Leaders Growth Fund
Portfolio of Investments, December 31, 2011 (all dollar amounts in thousands)
| | | | | | | | |
Issuer | | Shares | | | Value | |
| | |
Common Stocks | | | | | | | | |
| | |
Emerging Asia—56.0% | | | | | | | | |
China—14.2% | | | | | | | | |
*Baidu, Inc.—ADR (Internet software & services) | | | 5,707 | | | $ | 665 | |
Belle International Holdings, Ltd. (Specialty retail) | | | 580,000 | | | | 1,011 | |
CNOOC, Ltd. (Oil, gas & consumable fuels) | | | 1,065,000 | | | | 1,862 | |
Dongfeng Motor Group Co., Ltd. (Automobiles) | | | 336,000 | | | | 576 | |
Lenovo Group, Ltd. (Computers & peripherals) | | | 754,000 | | | | 503 | |
Ping An Insurance Group Co. of China, Ltd. Class “H” (Insurance) | | | 73,000 | | | | 481 | |
*Sun Art Retail Group, Ltd. (Food & staples retailing) | | | 622,500 | | | | 778 | |
Tencent Holdings, Ltd. (Internet software & services) | | | 18,200 | | | | 366 | |
Want Want China Holdings, Ltd. (Food products) | | | 563,000 | | | | 562 | |
| | | | | | | | |
| | | | | | | 6,804 | |
| | | | | | | | |
India—13.5% | | | | | | | | |
Bajaj Auto, Ltd. (Automobiles) | | | 11,652 | | | | 349 | |
HDFC Bank, Ltd. (Commercial banks) | | | 80,798 | | | | 649 | |
Housing Development Finance Corporation (Thrifts & mortgage finance) | | | 51,193 | | | | 629 | |
Infosys Technologies, Ltd. (IT services) | | | 18,171 | | | | 947 | |
ITC, Ltd. (Tobacco) | | | 242,469 | | | | 919 | |
Larsen & Toubro, Ltd. (Construction & engineering) | | | 13,800 | | | | 259 | |
Nestle India, Ltd. (Food products) | | | 4,149 | | | | 320 | |
Sun Pharmaceutical Industries, Ltd. (Pharmaceuticals) | | | 76,373 | | | | 716 | |
Tata Consultancy Services, Ltd. (IT services) | | | 46,185 | | | | 1,009 | |
Tata Motors, Ltd. (Automobiles) | | | 200,541 | | | | 675 | |
| | | | | | | | |
| | | | | | | 6,472 | |
| | | | | | | | |
Indonesia—6.6% | | | | | | | | |
PT Astra International Tbk (Automobiles) | | | 178,500 | | | | 1,457 | |
PT Bank Rakyat Indonesia (Commercial banks) | | | 1,522,500 | | | | 1,134 | |
PT Unilever Indonesia Tbk (Household products) | | | 276,500 | | | | 573 | |
| | | | | | | | |
| | | | | | | 3,164 | |
| | | | | | | | |
Malaysia—2.0% | | | | | | | | |
CIMB Group Holdings Bhd (Commercial banks) | | | 397,200 | | | | 932 | |
| | | | | | | | |
South Korea—13.5% | | | | | | | | |
*Hyundai Mobis (Auto components) | | | 4,179 | | | | 1,059 | |
*Hyundai Motor Co. (Automobiles) | | | 7,802 | | | | 1,443 | |
*LG Household & Health Care, Ltd. (Household products) | | | 1,987 | | | | 841 | |
Samsung Electronics Co., Ltd. (Semiconductors & semiconductor equipment) | | | 2,440 | | | | 2,241 | |
*Samsung Engineering Co., Ltd. (Construction & engineering) | | | 4,914 | | | | 859 | |
| | | | | | | | |
| | | | | | | 6,443 | |
| | | | | | | | |
|
Common Stocks— Emerging Asia—56.0%—(continued) | |
Taiwan—3.1% | | | | | | | | |
Hon Hai Precision Industry Co., Ltd. (Electronic equipment, instruments & components) | | | 360,700 | | | $ | 988 | |
HTC Corporation (Communications equipment) | | | 30,850 | | | | 506 | |
| | | | | | | | |
| | | | 1,494 | |
| | | | | | | | |
Thailand—3.1% | | | | | | | | |
CP ALL PCL (Food & staples retailing) | | | 581,000 | | | | 953 | |
Kasikornbank PCL (Commercial banks) | | | 128,000 | | | | 505 | |
| | | | | | | | |
| | | | | | | 1,458 | |
| | | | | | | | |
| | |
Emerging Latin America—20.3% | | | | | | | | |
Brazil—8.5% | | | | | | | | |
BR Malls Participacoes S.A. (Real estate management & development) | | | 76,100 | | | | 739 | |
Cia de Bebidas das Americas—ADR (Beverages) | | | 30,607 | | | | 1,105 | |
Cia de Concessoes Rodoviarias (Transportation infrastructure) | | | 76,000 | | | | 498 | |
CPFL Energia S.A.—ADR (Electric utilities) | | | 19,998 | | | | 564 | |
Embraer S.A.—ADR (Aerospace & defense) | | | 18,766 | | | | 473 | |
Tractebel Energia S.A. (Independent power producers & energy traders) | | | 43,800 | | | | 704 | |
| | | | | | | | |
| | | | 4,083 | |
| | | | | | | | |
Chile—4.3% | | | | | | | | |
Banco Santander Chile—ADR (Commercial banks) | | | 12,274 | | | | 929 | |
S.A.C.I. Falabella (Multiline retail) | | | 82,253 | | | | 640 | |
Sociedad Quimica y Minera de Chile S.A.—ADR (Chemicals) | | | 9,159 | | | | 493 | |
| | | | | | | | |
| | | | 2,062 | |
| | | | | | | | |
Mexico—6.6% | | | | | | | | |
America Movil S.A.B. de C.V.—ADR (Wireless telecommunication services) | | | 65,492 | | | | 1,480 | |
Grupo Financiero Banorte S.A.B. de C.V. (Commercial banks) | | | 158,000 | | | | 478 | |
Wal-Mart de Mexico S.A.B. de C.V. (Food & staples retailing) | | | 431,600 | | | | 1,185 | |
| | | | | | | | |
| | | | 3,143 | |
| | | | | | | | |
Peru—0.9% | | | | | | | | |
Credicorp, Ltd. (Commercial banks)† | | | 3,788 | | | | 414 | |
| | | | | | | | |
| |
Emerging Europe, Mid-East, Africa—18.8% | | | | | |
Qatar—2.2% | | | | | | | | |
Industries Qatar QSC (Industrial conglomerates) | | | 29,458 | | | | 1,076 | |
| | | | | | | | |
Russia—2.9% | | | | | | | | |
Magnit OJSC (Food & staples retailing)† | | | 1,010 | | | | 87 | |
Magnit OJSC—144A—GDR (Food & staples retailing)† | | | 26,631 | | | | 563 | |
Sberbank of Russian Federation (Commercial banks)† | | | 300,414 | | | | 736 | |
| | | | | | | | |
| | | | | | | 1,386 | |
| | | | | | | | |
See accompanying Notes to Financial Statements.
December 31, 2011 | William Blair Funds 65 |
Emerging Leaders Growth Fund
Portfolio of Investments, December 31, 2011 (all dollar amounts in thousands)
| | | | | | | | |
Issuer | | Shares or
Principal
Amount | | | Value | |
|
Common Stocks—Emerging Europe, Mid-East, Africa—18.8%—(continued) | |
South Africa—11.7% | | | | | | | | |
MTN Group, Ltd. (Wireless telecommunication services) | | | 104,366 | | | $ | 1,858 | |
Naspers, Ltd. (Media) | | | 26,849 | | | | 1,175 | |
Sasol, Ltd. (Oil, gas & consumable fuels) | | | 21,876 | | | | 1,045 | |
Shoprite Holdings, Ltd. (Food & staples retailing) | | | 58,628 | | | | 989 | |
Truworths International, Ltd. (Specialty retail) | | | 57,500 | | | | 526 | |
| | | | | | | | |
| | | | | | | 5,593 | |
| | | | | | | | |
Turkey—2.0% | | | | | | | | |
Turkiye Garanti Bankasi A.S. (Commercial banks) | | | 304,189 | | | | 948 | |
| | | | | | | | |
Total Common Stocks—95.1%
(cost $47,735) | | | | 45,472 | |
| | | | | | | | |
| | |
Preferred Stocks | | | | | | | | |
Brazil—6.1% | | | | | | | | |
Itau Unibanco Holding S.A. (Commercial banks) | | | 52,000 | | | | 948 | |
Petroleo Brasileiro S.A. (Oil, gas & consumable fuels) | | | 169,355 | | | | 1,951 | |
| | | | | | | | |
| | | | | | | 2,899 | |
| | | | | | | | |
Total Preferred Stocks—6.1%
(cost $3,150) | | | | 2,899 | |
| | | | | | | | |
| | |
Repurchase Agreement | | | | | | | | |
Fixed Income Clearing Corporation, 0.000% dated 12/30/11, due 1/3/12, repurchase price $405, collateralized by FHLMC, 4.500%, due 1/15/14 | | $ | 405 | | | | 405 | |
| | | | | | | | |
Total Repurchase Agreement—0.8%
(cost $405) | | | | 405 | |
| | | | | | | | |
Total Investments—102.0%
(cost $51,290) | | | | 48,776 | |
Liabilities, plus cash and other assets—(2.0)% | | | | (954 | ) |
| | | | | | | | |
Net assets—100.0% | | | $ | 47,822 | |
| | | | | | | | |
ADR American Depository Receipt
GDR Global Depository Receipt
* Non-income producing securities
† U.S. listed foreign security
For securities primarily traded on exchanges or markets that close before the close of regular trading on the New York Stock Exchange, the Fund may use an independent pricing service to fair value price the securities pursuant to Valuation Procedures approved by the Board of Trustees.
At December 31, 2011, the Fund’s Portfolio of Investments includes the following industry categories:
| | | | |
Financials | | | 19.8% | |
Consumer Discretionary | | | 18.5% | |
Consumer Staples | | | 18.3% | |
Information Technology | | | 14.9% | |
Energy | | | 10.0% | |
Telecommunication Services | | | 6.9% | |
Industrials | | | 6.5% | |
Utilities | | | 2.6% | |
Health Care | | | 1.5% | |
Materials | | | 1.0% | |
| | | | |
Total | | | 100.0% | |
| | | | |
At December 31, 2011, the Fund’s Portfolio of Investments includes the following currency categories:
| | | | |
U.S. Dollar | | | 15.5% | |
Indian Rupee | | | 13.4% | |
South Korean Won | | | 13.3% | |
Hong Kong Dollar | | | 12.7% | |
South African Rand | | | 11.6% | |
Brazilian Real | | | 10.0% | |
Indonesian Rupiah | | | 6.6% | |
Mexican Peso | | | 3.4% | |
New Taiwan Dollar | | | 3.1% | |
Thai Baht | | | 3.0% | |
Qatari Rial | | | 2.2% | |
Turkish Lira | | | 2.0% | |
Malaysian Ringgit | | | 1.9% | |
Chilean Peso | | | 1.3% | |
| | | | |
Total | | | 100.0% | |
| | | | |
See accompanying Notes to Financial Statements.
66 Annual Report | December 31, 2011 |
Todd M. McClone
Jeffrey A. Urbina
EMERGING MARKETS SMALL CAP GROWTH FUND
The Emerging Markets Small Cap Growth Fund seeks long-term capital appreciation by investing in a diversified portfolio of equity securities issued by emerging market small cap companies.
AN OVERVIEW FROM THE PORTFOLIO MANAGERS
We are pleased to have the Emerging Markets Small Cap Growth Fund become one of the newest additions to the William Blair Fund Family and would like to thank our shareholders for investing with us.
We are enthusiastic about the opportunities available to us as the managers of the Emerging Markets Small Cap Growth Fund. As the emerging markets universe has broadened, the small cap universe has become one that is often overlooked by investors, but includes approximately 30% of small cap companies worldwide, as reflected by MSCI Global Small Cap (net) Index. Given William Blair’s expertise in small-mid cap companies and emerging markets in particular, we believe we are well placed to manage a portfolio of quality growth companies within this diverse universe.
The Emerging Markets Small Cap Growth Fund commenced operations on October 24, 2011. Through the period ending December 31, 2011, the Fund posted a decrease of 2.70% (Class N Shares). By comparison, the Fund’s benchmark, the MSCI Emerging Markets Small Cap Index (net), declined 6.32% for this time period.
Fund performance was augmented by strong stock selection across most sectors and regions, coupled with overall sector positioning. Consumer, Financials, Industrials, Materials and Health Care stock selections were the key contributors to outperformance versus the Fund benchmark.
December 31, 2011 | William Blair Funds 67 |
Emerging Markets Small Cap Growth Fund
Performance Highlights (Unaudited)
Average Annual Total Return at 12/31/2011
| | | | |
| | | Since
Inception(a) | |
Class N | | | (2.70 | )% |
Class I | | | (2.70 | ) |
MSCI Emerging Markets Small Cap IMI (net) | | | (6.32 | ) |
| | (a) | | For the period from October 24, 2011 (Commencement of Operations) to December 31, 2011. |
Performance cited represents past performance. Past performance does not guarantee future results and current performance may be lower or higher than the data quoted. Results shown are average annual returns, which assume reinvestment of dividends and capital gains. Investment returns and principal will fluctuate and you may have a gain or loss when you sell shares. For the most current month-end performance information, please call 1-800-742-7272, or visit our Web site at www.williamblairfunds.com. From time to time, the investment advisor may waive fees or reimburse expenses for the Fund. Without these waivers, performance would be lower. International investing involves special risk considerations, including currency fluctuations, lower liquidity, economic and political risk. Class N shares are available to the general public without a sales load. Class I shares are available to certain institutional investors and advisory clients of William Blair & Company L.L.C. without a sales load or distribution (12b-1) fees.
The performance highlights and graph presented above do not reflect the deduction of taxes that a shareholder would pay on fund distributions or the redemption of fund shares.
The Morgan Stanley Capital International (MSCI) Emerging Markets Small Cap Index IMI (net) is a free float-adjusted market capitalization weighted index that is designed to measure the equity market performance of emerging markets. This series approximates the minimum possible dividend reinvestment.
This report identifies the Fund’s investments on December 31, 2011. These holdings are subject to change. Not all stocks in the Fund performed the same, nor is there any guarantee that these stocks will perform as well in the future. Market forecasts provided in this report may not necessarily come to pass.
Sector Diversification (Unaudited)
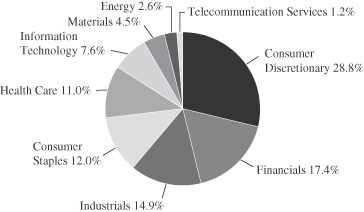
The sector diversification shown is based on the total long-term securities.
68 Annual Report | December 31, 2011 |
Emerging Markets Small Cap Growth Fund
Portfolio of Investments, December 31, 2011 (all dollar amounts in thousands)
| | | | | | | | |
Issuer | | Shares | | | Value | |
| | |
Common Stocks | | | | | | | | |
| | |
Emerging Asia—60.6% | | | | | | | | |
China—11.0% | | | | | | | | |
AAC Technologies Holdings, Inc. (Communications equipment) | | | 14,000 | | | $ | 31 | |
China Lumena New Materials Corporation (Chemicals) | | | 88,000 | | | | 16 | |
China Shanshui Cement Group, Ltd. (Construction materials) | | | 35,000 | | | | 23 | |
*China ZhengTong Auto Services Holdings, Ltd. (Specialty retail) | | | 23,000 | | | | 23 | |
Comba Telecom Systems Holdings, Ltd. (Communications equipment) | | | 19,500 | | | | 16 | |
Dongyue Group (Chemicals) | | | 47,000 | | | | 31 | |
Golden Eagle Retail Group, Ltd. (Multiline retail) | | | 22,000 | | | | 47 | |
*Haier Electronics Group Co., Ltd. (Household durables) | | | 24,000 | | | | 22 | |
Haitian International Holdings, Ltd. (Machinery) | | | 53,000 | | | | 46 | |
Hengdeli Holdings, Ltd. (Specialty retail) | | | 80,000 | | | | 26 | |
Spreadtrum Communications, Inc.—ADR (Semiconductors & semiconductor equipment) | | | 671 | | | | 14 | |
*WuXi PharmaTech Cayman, Inc.—ADR (Life sciences tools & services) | | | 1,672 | | | | 18 | |
Yingde Gases (Chemicals) | | | 35,500 | | | | 36 | |
*Youku.com, Inc.—ADR (Internet software & services) | | | 774 | | | | 12 | |
| | | | | | | | |
| | | | | | | 361 | |
| | | | | | | | |
India—1.8% | | | | | | | | |
CRISIL, Ltd. (Diversified financial services) | | | 1,347 | | | | 22 | |
GlaxoSmithKline Consumer Healthcare, Ltd. (Food products) | | | 768 | | | | 37 | |
| | | | | | | | |
| | | | 59 | |
| | | | | | | | |
Indonesia—14.2% | | | | | | | | |
PT Ace Hardware Indonesia Tbk (Specialty retail) | | | 115,500 | | | | 52 | |
PT Alam Sutera Realty Tbk (Real estate management & development) | | | 450,500 | | | | 23 | |
*PT Bank Tabungan Pensiunan Nasional Tbk (Commercial banks) | | | 115,500 | | | | 43 | |
PT BFI Finance Indonesia Tbk (Consumer finance) | | | 33,500 | | | | 21 | |
PT Ciputra Development Tbk (Real estate management & development) | | | 376,000 | | | | 22 | |
PT Harum Energy Tbk (Oil, gas & consumable fuels) | | | 44,500 | | | | 34 | |
PT Hexindo Adiperkasa Tbk (Trading companies & distributors) | | | 46,000 | | | | 46 | |
*PT Indomobil Sukses Internasional Tbk (Specialty retail) | | | 32,500 | | | | 46 | |
PT Jasa Marga (Transportation infrastructure) | | | 74,000 | | | | 34 | |
PT Kalbe Farma Tbk (Pharmaceuticals) | | | 99,500 | | | | 37 | |
PT Media Nusantara Citra Tbk (Media) | | | 200,500 | | | | 29 | |
PT Mitra Adiperkasa Tbk (Multiline retail) | | | 81,000 | | | | 46 | |
PT Perusahaan Perkebunan London Sumatra Indonesia Tbk (Food products) | | | 91,000 | | | | 23 | |
PT Sumber Alfaria Trijaya Tbk (Food & staples retailing) | | | 18,000 | | | | 8 | |
| | | | | | | | |
| | | | 464 | |
| | | | | | | | |
|
Common Stocks—Emerging Asia—60.6%—(continued) | |
Malaysia—6.9% | | | | | | | | |
Aeon Co. M Bhd (Multiline retail) | | | 8,800 | | | $ | 20 | |
AirAsia BHD (Airlines) | | | 32,600 | | | | 39 | |
Dayang Enterprise Holdings Bhd (Energy equipment & services) | | | 52,400 | | | | 30 | |
Guinness Anchor Bhd (Beverages) | | | 11,900 | | | | 51 | |
KPJ Healthcare Bhd (Health care providers & services) | | | 28,900 | | | | 43 | |
Nestle Malaysia Bhd (Food products) | | | 2,500 | | | | 44 | |
| | | | | | | | |
| | | | 227 | |
| | | | | | | | |
Philippines—5.5% | | | | | | | | |
Alliance Global Group, Inc. (Industrial conglomerates) | | | 182,900 | | | | 43 | |
Security Bank Corporation (Commercial banks) | | | 27,630 | | | | 62 | |
SM Prime Holdings, Inc. (Real estate management & development) | | | 133,100 | | | | 40 | |
Universal Robina Corporation (Food products) | | | 30,800 | | | | 34 | |
| | | | | | | | |
| | | | 179 | |
| | | | | | | | |
South Korea—5.3% | | | | | | | | |
*Daum Communications Corporation (Internet software & services) | | | 357 | | | | 37 | |
Dongbu Insurance Co., Ltd. (Insurance) | | | 800 | | | | 37 | |
*Halla Climate Control Corporation (Auto components) | | | 1,620 | | | | 31 | |
*LG Fashion Corporation (Textiles, apparel & luxury goods) | | | 580 | | | | 20 | |
*Mando Corporation (Auto components) | | | 264 | | | | 47 | |
| | | | | | | | |
| | | | 172 | |
| | | | | | | | |
Taiwan—4.5% | | | | | | | | |
Hiwin Technologies Corporation (Machinery) | | | 5,000 | | | | 41 | |
PChome Online, Inc. (Internet software & services) | | | 6,000 | | | | 37 | |
St Shine Optical Co., Ltd. (Health care equipment & supplies) | | | 3,000 | | | | 32 | |
TSRC Corporation (Chemicals) | | | 16,000 | | | | 39 | |
| | | | | | | | |
| | | | 149 | |
| | | | | | | | |
Thailand—10.8% | | | | | | | | |
*Bangkok Dusit Medical Services PCL (Health care providers & services) | | | 23,700 | | | | 62 | |
BEC World PCL (Media) | | | 21,000 | | | | 30 | |
Dynasty Ceramic PCL (Building products) | | | 14,400 | | | | 28 | |
Home Product Center PCL (Specialty retail) | | | 133,300 | | | | 46 | |
LPN Development PCL (Real estate management & development) | | | 90,600 | | | | 34 | |
Major Cineplex Group PCL (Media) | | | 91,100 | | | | 41 | |
Minor International PCL (Hotels, restaurants & leisure) | | | 49,700 | | | | 18 | |
Robinson Department Store PCL (Multiline retail) | | | 18,200 | | | | 24 | |
Siam Makro PCL (Food & staples retailing) | | | 5,400 | | | | 41 | |
Tisco Financial Group PCL (Commercial banks) | | | 22,900 | | | | 28 | |
| | | | | | | | |
| | | | 352 | |
| | | | | | | | |
| | |
Emerging Latin America—24.4% | | | | | | | | |
Argentina—1.5% | | | | | | | | |
MercadoLibre, Inc. (Internet software & services) | | | 625 | | | | 50 | |
| | | | | | | | |
See accompanying Notes to Financial Statements.
December 31, 2011 | William Blair Funds 69 |
Emerging Markets Small Cap Growth Fund
Portfolio of Investments, December 31, 2011 (all dollar amounts in thousands)
| | | | | | | | |
Issuer | | Shares | | | Value | |
|
Common Stocks—Emerging Latin America—24.4%—(continued) | |
Brazil—16.6% | | | | | | | | |
Amil Participacoes S.A. (Health care providers & services) | | | 3,400 | | | $ | 30 | |
Arezzo Industria e Comercio S.A. (Textiles, apparel & luxury goods) | | | 1,400 | | | | 17 | |
BR Properties S.A. (Real estate management & development) | | | 3,500 | | | | 35 | |
CETIP S.A.—Balcao Organizado de Ativos e Derivativos (Capital markets) | | | 4,000 | | | | 58 | |
Cia Hering (Specialty retail) | | | 2,100 | | | | 37 | |
EcoRodovias Infraestrutura e Logistica S.A. (Transportation infrastructure) | | | 1,900 | | | | 14 | |
Ez Tec Empreendimentos e Participacoes S.A. (Household durables) | | | 5,400 | | | | 46 | |
Iochpe-Maxion S.A. (Machinery) | | | 2,800 | | | | 38 | |
Localiza Rent a Car S.A. (Road & rail) | | | 2,600 | | | | 36 | |
Lojas Renner S.A. (Multiline retail) | | | 1,200 | | | | 31 | |
Mills Estruturas e Servicos de Engenharia S.A. (Trading companies & distributors) | | | 2,043 | | | | 19 | |
OdontoPrev S.A. (Health care providers & services) | | | 2,900 | | | | 41 | |
Raia Drogasil S.A. (Food & staples retailing) | | | 6,900 | | | | 48 | |
*Restoque Comercio e Confeccoes de Roupas S.A. (Textiles, apparel & luxury goods) | | | 2,600 | | | | 38 | |
*T4F Entretenimento S.A. (Media) | | | 1,000 | | | | 6 | |
Totvs S.A. (Software) | | | 1,000 | | | | 18 | |
Valid Solucoes e Servicos de Seguranca em Meios de Pagamento e Identificacao S.A (Commercial services & supplies) | | | 2,600 | | | | 30 | |
| | | | | | | | |
| | | | 542 | |
| | | | | | | | |
Chile—2.9% | | | | | | | | |
ENTEL Chile S.A. (Wireless telecommunication services) | | | 2,117 | | | | 39 | |
Parque Arauco S.A. (Real estate management & development) | | | 13,986 | | | | 23 | |
Sonda S.A. (IT services) | | | 13,493 | | | | 32 | |
| | | | | | | | |
| | | | 94 | |
| | | | | | | | |
Mexico—2.2% | | | | | | | | |
Alsea S.A.B. de C.V. (Hotels, restaurants & leisure) | | | 34,046 | | | | 35 | |
*Genomma Lab Internacional S.A.B. de C.V. (Pharmaceuticals) | | | 19,800 | | | | 38 | |
| | | | | | | | |
| | | | 73 | |
| | | | | | | | |
Panama—1.2% | | | | | | | | |
Copa Holdings S.A. (Airlines)† | | | 703 | | | | 41 | |
| | | | | | | | |
| | |
Emerging Europe, Mid-East, Africa—14.9% | | | | | | | | |
Poland—1.5% | | | | | | | | |
Eurocash S.A. (Food & staples retailing) | | | 3,297 | | | | 27 | |
Lubelski Wegiel Bogdanka S.A. (Oil, gas & consumable fuels) | | | 747 | | | | 23 | |
| | | | | | | | |
| | | | 50 | |
| | | | | | | | |
|
Common Stocks—Emerging Europe, Mid-East, Africa—14.9%—(continued) | |
Russia—1.0% | | | | | | | | |
*Etalon Group Ltd.—144A—GDR (Real estate management & development) | | | 5,141 | | | $ | 24 | |
M Video OJSC (Specialty retail) | | | 1,640 | | | | 9 | |
| | | | | | | | |
| | | | 33 | |
| | | | | | | | |
South Africa—9.5% | | | | | | | | |
Capitec Bank Holdings, Ltd. (Commercial banks) | | | 1,946 | | | | 43 | |
Clicks Group, Ltd. (Multiline retail) | | | 7,028 | | | | 40 | |
Coronation Fund Managers, Ltd. (Capital markets) | | | 14,889 | | | | 42 | |
Life Healthcare Group Holdings Pte, Ltd. (Health care providers & services) | | | 22,898 | | | | 59 | |
Mr Price Group, Ltd. (Specialty retail) | | | 5,215 | | | | 52 | |
The Foschini Group, Ltd. (Specialty retail) | | | 2,994 | | | | 39 | |
Truworths International, Ltd. (Specialty retail) | | | 3,988 | | | | 36 | |
| | | | | | | | |
| | | | | | | 311 | |
| | | | | | | | |
Turkey—2.9% | | | | | | | | |
BIM Birlesik Magazalar A.S. (Food & staples retailing) | | | 1,483 | | | | 41 | |
Tofas Turk Otomobil Fabrikasi A.S. (Automobiles) | | | 8,358 | | | | 26 | |
Trakya Cam Sanayi A.S. (Building products) | | | 10,232 | | | | 13 | |
Turkiye Sinai Kalkinma Bankasi A.S. (Commercial banks) | | | 14,014 | | | | 14 | |
| | | | | | | | |
| | | | | | | 94 | |
| | | | | | | | |
Total Common Stocks—99.3%
(cost $3,266) | | | | | | | 3,251 | |
| | | | | | | | |
| | |
Preferred Stock | | | | | | | | |
Brazil—0.7% | | | | | | | | |
Marcopolo S.A. (Machinery) | | | 5,500 | | | | 21 | |
| | | | | | | | |
Total Preferred Stock—0.7%
(cost $23) | | | | | | | 21 | |
Total Investments—100.0%
(cost $3,289) | | | | | | | 3,272 | |
Cash and other assets, less liabilities—0.0% | | | | | | | — | |
| | | | | | | | |
Net assets—100.0% | | | | | | $ | 3,272 | |
| | | | | | | | |
ADR = American Depository Receipt
GDR = Global Depository Receipt
*Non-income producing securities
† = U.S. listed foreign security
For securities primarily traded on exchanges or markets that close before the close of regular trading on the New York Stock Exchange, the Fund may use an independent pricing service to fair value price the securities pursuant to Valuation Procedures approved by the Board of Trustees.
See accompanying Notes to Financial Statements.
70 Annual Report | December 31, 2011 |
Emerging Markets Small Cap Growth Fund
Portfolio of Investments, December 31, 2011 (all dollar amounts in thousands)
At December 31, 2011, the Fund’s Portfolio of Investments includes the following industry categories:
| | | | |
Consumer Discretionary | | | 28.8% | |
Financials | | | 17.4% | |
Industrials | | | 14.9% | |
Consumer Staples | | | 12.0% | |
Health Care | | | 11.0% | |
Information Technology | | | 7.6% | |
Materials | | | 4.5% | |
Energy | | | 2.6% | |
Telecommunication Services | | | 1.2% | |
| | | | |
Total | | | 100.0% | |
| | | | |
At December 31, 2011, the Fund’s Portfolio of Investments includes the following currency categories:
| | | | |
Brazilian Real | | | 17.2% | |
Indonesian Rupiah | | | 14.2% | |
Thai Baht | | | 10.8% | |
Hong Kong Dollar | | | 9.7% | |
South African Rand | | | 9.5% | |
Malaysian Ringgit | | | 6.9% | |
Philippine Peso | | | 5.5% | |
South Korean Won | | | 5.3% | |
U.S. Dollar | | | 5.1% | |
New Taiwan Dollar | | | 4.5% | |
Chilean Peso | | | 2.9% | |
Turkish Lira | | | 2.9% | |
Mexican Peso | | | 2.2% | |
Indian Rupee | | | 1.8% | |
Euro | | | 1.5% | |
| | | | |
Total | | | 100.0% | |
| | | | |
See accompanying Notes to Financial Statements.
December 31, 2011 | William Blair Funds 71 |

David F. Hone
LARGE CAP VALUE FUND
The Large Cap Value Fund seeks long-term capital appreciation.
AN OVERVIEW FROM THE PORTFOLIO MANAGER
The Large Cap Value Fund commenced operations on October 24, 2011. For this short two-month period ended December 31, 2011, the Fund decreased 0.19% (Class N Shares). By comparison, the Fund’s benchmark the Russell 1000® Value Index rose 1.66%.
Uncertainty remained high during this period, and as a result, so was volatility. Performance of equities remained greatly impacted by macro and political issues globally as demonstrated by elevated stock correlations presenting a challenge for active managers. U.S. equities responded to continued negative news concerning the European debt crisis countered by better U.S. economic data on employment, the housing market and consumer spending. The best sector performers were more defensive (Health Care, Telecommunications Services) while more cyclical groups trailed (Financials and Information Technology).
The Fund had weakness in the Consumer Discretionary sector due to positions in Time Warner Cable, Inc. and General Motors Co., which both declined. Also, Information Technology was lackluster as Symantec Corporation was a drag. Conversely, our stock selection in Industrials was the greatest contributor to results; Kansas City Southern and SPX Corporation’s stock price rose nicely above peers. Lastly, the Telecommunications Services sector was additive due to a position in American Tower Corporation.
Looking ahead into 2012, we continue to be cautiously optimistic on the U.S. economy; growth will likely remain at a slower pace. Toward the end of 2011, signs were encouraging on the employment front and in terms of consumer spendings though we are cautious on the latter unless the former continues to strengthen. Also, U.S. corporations remain strong with solid profits and balance sheets in a difficult environment. The Federal Reserve persists with its accommodative stance, which should assist businesses and consumers further. However, investors may continue to be uneasy over macro worries. Globally, ongoing and uncertain structural challenges in the largest developed economies remain. Policy decisions will likely continue to play a larger role and the market will quickly reflect its confidence in any long-term solutions. While some progress has been made, as new policy decisions are discussed and possibly enacted, volatility may continue as investor confidence is fragile.
Our philosophy, process and disciplines will lead us to undervalued, quality companies that are temporarily out-of-favor. In our view, financial markets can overreact to short-term information creating inefficiencies that can be exploited by taking a longer-term time horizon. As reversion to the mean occurs, we seek to take advantage of the powerful valuation expansion that can be achieved as earnings growth rates resume toward historical levels accompanied by improving investor sentiment.
72 Annual Report | December 31, 2011 |
Large Cap Value Fund
Performance Highlights (Unaudited)
Average Annual Total Return at 12/31/2011
| | | | |
| | | Since
Inception(a) | |
Class N | | | (0.19 | )% |
Class I | | | (0.19 | ) |
Russell 1000® Value Index | | | 1.66 | % |
| | (a) | | For the period from October 24, 2011 (Commencement of Operations) to December 31, 2011. |
Performance cited represents past performance. Past performance does not guarantee future results and current performance may be lower or higher than the data quoted. Results shown are average annual total returns, which assume reinvestment of dividends and capital gains. Investment returns and principal will fluctuate and you may have a gain or loss when you sell shares. For the most current month-end performance information, please call 1-800-742-7272, or visit our Web site at www.williamblairfunds.com. From time to time, the investment advisor may waive fees or reimburse expenses for the Fund. Without these waivers, performance would be lower. Class N shares are available to the general public without a sales load. Class I shares are available to certain institutional investors and advisory clients of William Blair & Company, L.L.C., without a sales load or distribution (12b-1) or service fees.
The performance highlights and graph presented above do not reflect the deduction of taxes that a shareholder would pay on fund distributions or the redemption of fund shares.
The Russell 1000® Value Index consists of large capitalization companies with above average price-to-book ratios and forecasted growth rates.
This report identifies the Fund’s investments on December 31, 2011. These holdings are subject to change. Not all stocks in the Fund performed the same, nor is there any guarantee that these stocks will perform as well in the future. Market forecasts provided in this report may not necessarily come to pass.
Sector Diversification (Unaudited)
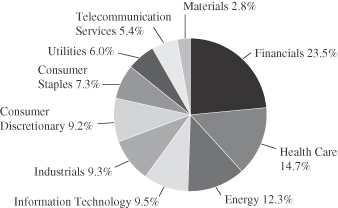
The sector diversification shown is based on the total long-term securities.
December 31, 2011 | William Blair Funds 73 |
Large Cap Value Fund
Portfolio of Investments, December 31, 2011 (all dollar amounts in thousands)
| | | | | | | | |
Issuer | | Shares | | | Value | |
|
Common Stocks | |
Financials—23.3% | |
*CBRE Group, Inc. | | | 1,349 | | | $ | 21 | |
Citigroup, Inc. | | | 1,957 | | | | 51 | |
CNA Financial Corporation | | | 1,075 | | | | 29 | |
Discover Financial Services | | | 2,218 | | | | 53 | |
JPMorgan Chase & Co. | | | 2,136 | | | | 71 | |
Lazard, Ltd. Class “A”† | | | 1,843 | | | | 48 | |
Lincoln National Corporation | | | 1,024 | | | | 20 | |
New York Community Bancorp, Inc. | | | 1,526 | | | | 19 | |
Prudential Financial, Inc. | | | 580 | | | | 29 | |
Regions Financial Corporation | | | 2,972 | | | | 13 | |
State Street Corporation | | | 704 | | | | 28 | |
SunTrust Banks, Inc. | | | 1,619 | | | | 29 | |
The Goldman Sachs Group, Inc. | | | 215 | | | | 19 | |
US Bancorp | | | 1,314 | | | | 36 | |
Wells Fargo & Co. | | | 2,430 | | | | 67 | |
Zions BanCorp. | | | 2,366 | | | | 38 | |
| | | | | | | | |
| | | | 571 | |
| | | | | | | | |
Health Care—14.5% | | | | | | | | |
Amgen, Inc. | | | 665 | | | | 43 | |
Baxter International, Inc. | | | 882 | | | | 44 | |
Cardinal Health, Inc. | | | 1,244 | | | | 51 | |
*Express Scripts, Inc. | | | 497 | | | | 22 | |
Merck & Co., Inc. | | | 1,427 | | | | 54 | |
Pfizer, Inc. | | | 3,208 | | | | 69 | |
UnitedHealth Group, Inc. | | | 677 | | | | 34 | |
*Zimmer Holdings, Inc. | | | 718 | | | | 38 | |
| | | | | | | | |
| | | | 355 | |
| | | | | | | | |
Energy—12.1% | | | | | | | | |
Anadarko Petroleum Corporation | | | 601 | | | | 46 | |
ConocoPhillips | | | 594 | | | | 43 | |
Devon Energy Corporation | | | 680 | | | | 42 | |
Exxon Mobil Corporation | | | 744 | | | | 63 | |
Hess Corporation | | | 525 | | | | 30 | |
Occidental Petroleum Corporation | | | 533 | | | | 50 | |
Schlumberger, Ltd.† | | | 343 | | | | 24 | |
| | | | | | | | |
| | | | 298 | |
| | | | | | | | |
Information Technology—9.4% | | | | | | | | |
*Adobe Systems, Inc. | | | 1,409 | | | | 40 | |
*BMC Software, Inc. | | | 498 | | | | 16 | |
Corning, Inc. | | | 1,642 | | | | 21 | |
Hewlett-Packard Co. | | | 1,669 | | | | 43 | |
Intel Corporation | | | 1,822 | | | | 44 | |
Microsoft Corporation | | | 902 | | | | 24 | |
*Symantec Corporation | | | 2,620 | | | | 41 | |
| | | | | | | | |
| | | | 229 | |
| | | | | | | | |
Industrials—9.1% | | | | | | | | |
General Electric Co. | | | 3,325 | | | | 60 | |
Honeywell International, Inc. | | | 320 | | | | 17 | |
*Kansas City Southern | | | 617 | | | | 42 | |
Rockwell Automation, Inc. | | | 275 | | | | 20 | |
|
Common Stocks—(continued) | |
Industrials—(continued) | | | | | | | | |
SPX Corporation | | | 334 | | | $ | 20 | |
Textron, Inc. | | | 2,285 | | | | 42 | |
Union Pacific Corporation | | | 213 | | | | 23 | |
| | | | | | | | |
| | | | 224 | |
| | | | | | | | |
Consumer Discretionary—9.0% | | | | | | | | |
Brunswick Corporation | | | 1,281 | | | | 23 | |
*General Motors Co. | | | 1,394 | | | | 28 | |
International Game Technology | | | 1,026 | | | | 18 | |
Lear Corporation | | | 413 | | | | 16 | |
Marriott International, Inc. Class “A” | | | 458 | | | | 13 | |
*MGM Resorts International | | | 1,815 | | | | 19 | |
*Saks, Inc. | | | 1,937 | | | | 19 | |
The Walt Disney Co. | | | 1,053 | | | | 40 | |
Time Warner Cable, Inc. | | | 711 | | | | 45 | |
| | | | | | | | |
| | | | 221 | |
| | | | | | | | |
Consumer Staples—7.2% | | | | | | | | |
General Mills, Inc. | | | 1,173 | | | | 47 | |
Kimberly-Clark Corporation | | | 338 | | | | 25 | |
Philip Morris International, Inc. | | | 597 | | | | 47 | |
The Procter & Gamble Co. | | | 866 | | | | 58 | |
| | | | | | | | |
| | | | 177 | |
| | | | | | | | |
Utilities—5.9% | | | | | | | | |
CMS Energy Corporation | | | 2,064 | | | | 45 | |
NextEra Energy, Inc. | | | 702 | | | | 43 | |
Wisconsin Energy Corporation | | | 1,599 | | | | 56 | |
| | | | | | | | |
| | | | 144 | |
| | | | | | | | |
Telecommunication Services—5.3% | | | | | | | | |
American Tower Corporation Class “A” | | | 830 | | | | 50 | |
AT&T, Inc. | | | 943 | | | | 29 | |
CenturyLink, Inc. | | | 791 | | | | 29 | |
Verizon Communications, Inc. | | | 558 | | | | 22 | |
| | | | | | | | |
| | | | 130 | |
| | | | | | | | |
Materials—2.7% | | | | | | | | |
Alcoa, Inc. | | | 2,342 | | | | 21 | |
Freeport-McMoRan Copper & Gold, Inc. | | | 734 | | | | 27 | |
The Dow Chemical Co. | | | 669 | | | | 19 | |
| | | | | | | | |
| | | | 67 | |
| | | | | | | | |
Total Common Stocks—98.5%
(cost $2,423) | | | | 2,416 | |
| | | | | | | | |
Total Investments—98.5%
(cost $2,423) | | | | 2,416 | |
Cash and other assets, less liabilities—1.5% | | | | 37 | |
| | | | | | | | |
Net assets—100.0% | | | $ | 2,453 | |
| | | | | | | | |
ADR American Depository Receipt
*Non-income producing securities
† U.S. listed foreign security
See accompanying Notes to Financial Statements.
74 Annual Report | December 31, 2011 |

Chad M. Kilmer

Mark T. Leslie

David S. Mitchell
SMALL CAP VALUE FUND
The Small Cap Value Fund seeks long-term capital appreciation.
AN OVERVIEW FROM THE PORTFOLIO MANAGERS
The Small Cap Value Fund posted a 6.95% decrease on a total return basis (Class N shares) during the 12 months ended December 31, 2011. By comparison, the Russell 2000® Value Index declined 5.50%.
Market Review
The U.S. equity markets finished a volatile 2011 with a robust rally in the fourth quarter, bringing most large cap indices just into positive territory for the year and leaving most small cap indices just below breakeven. The Russell 2000® Value Index was up 15.97% in the fourth quarter and -5.50% for the year overall. The William Blair Small Cap Value Fund slightly trailed its benchmark in the fourth quarter’s rapid ascent and lagged its benchmark for the year overall.
The aforementioned volatility in 2011 was caused by the opposing forces of mostly positive U.S. economic data and corporate fundamentals compared to numerous concerns about the global economy and geo-political environment. During the first half of the year, investors mostly looked through Middle Eastern and North African uprisings and the Japanese natural disaster as corporate fundamentals remained robust. However, during the third quarter, the market corrected swiftly. This was driven primarily by the European sovereign debt crisis spreading more dramatically to larger Euro-zone countries beyond Greece. Domestically, political brinksmanship over the debt ceiling debate deteriorated investor and public sentiment about our leadership, contributing to the selloff as well. While the European sovereign debt crisis remained at the forefront of concerns throughout the fourth quarter, investor sentiment improved considerably as the focus moved instead to better-than-expected corporate earnings, employment, housing and industrial production reports late in the year.
From a style and sector perspective, the market environment was much different in the fourth quarter than it was for the year overall. Higher beta stocks did well in the fourth quarter but underperformed for the year. Some of the more cyclically-driven sectors outperformed in the fourth quarter (e.g., Industrials +20.28%, Consumer Discretionary +17.95%) while underperforming for the year overall (e.g., Industrials -9.01%, Consumer Discretionary -9.73%). On the other hand, the typically defensive Consumer Staples, Health Care and Utility sectors outperformed for the year while underperforming in the final quarter.
Portfolio Review
Our more conservative investment approach (i.e. typical lower portfolio beta) was a positive as investors sought less market risk given overall market volatility. Stock selection was strong in the Financials and Industrials sectors, with Education Realty Trust, Inc., ProAssurance Corporation, Bank of the Ozarks, Inc., Robbins & Myers, Inc., and Global Defense Tech all enjoying absolute returns greater than 30%. These outsized returns were offset by the Fund’s investments in Digital River, Inc. and Avid Technology (Information Technology), Invacare (Health Care), and Pacific Sunwear of California and American Greetings (Consumer Discretionary); these stocks hurt relative performance during 2011.
For the fourth quarter specifically, the Fund’s performance is attributable to stock selection. While the Energy sector lagged the market, stock selection within the space made it the
December 31, 2011 | William Blair Funds 75 |
Fund’s strongest sector on an absolute and relative basis; Complete Production Services, Inc, Key Energy Services, Inc, and Magnum Hunter Resources Corporation all experienced returns in excess of 60%. On the flip side, there were some underperformers in the portfolio: Invacare, American Greetings, Digital River, Inc., Avid Technology, and EarthLink, Inc. were significant detractors from relative performance.
Market Outlook
Looking forward, the improved economic data over the past few months increases the probability that the economic recovery is self-sustaining. The health of the global financial system due to European sovereign debt problems and the prospects for emerging market growth continue to be two of the largest macro-economic risks. In addition, 2012 will bring events such as the U.S. presidential election, austerity debates, potential standoffs with Iran and North Korea and other unforeseen events that will undoubtedly spur uncertainty in investor psyche. That said, the level of investor pessimism is already high, stock market valuations are reasonably attractive and earnings expectations for 2012 have been reduced over the past few months. All of these are often advantageous for prospective equity returns.
In the end, while we factor various economic scenarios into our stock picking, we focus our time on constructing the Fund from a bottom-up perspective. As always, we remain focused on finding quality companies at discount prices and corporate transformation opportunities. We believe building a fund with these types of companies should produce solid investment results over the long term.
Contributors to Return (Fourth Quarter)
Complete Production Services, Inc. (CPX) offers a range of oil field services, including drilling, completion and production services and product sales. As third quarter earnings releases and subsequent data continue to show, the energy market, with the exception of dry gas, continues to improve. A large part of the third quarter sell-off was related to concern that Europe would send the world, and thus energy prices, into the abyss once more. After underperforming in the third quarter, the stock bounced back; while Europe is still in a state of flux, the market has become more positive relative to Energy as activity in oil-related and liquid-rich gas plays remain strong. The stock also benefitted from the early October announcement that it was being acquired by Superior Energy Services. We trimmed the position on strength.
Key Energy Services, Inc. (KEG) is a well servicing and workover company. Similar to Complete Production Services, Inc. (CPX) discussed above, this stock rebounded after the third quarter Energy sell-off. After trimming our position in the first half of the year, we added to it on the sell-off.
Magnum Hunter Resources Corporation (MHR) is an independent oil and gas company engaged in the acquisition, development and production of oil and natural gas, primarily in West Virginia, North Dakota, Texas and Louisiana. Similar to Complete Production Services, Inc. (CPX) discussed above, this stock rebounded after the third quarter Energy sell-off. During third quarter, Magnum Hunter Resources Corporation had several instances of significant positive news flow that were ignored during the sell-off but were subsequently recognized in the fourth quarter rebound. We maintained our position in the stock
Meredith Corporation (MDP) is a media and marketing company with business centering on magazine and book publishing, television broadcasting, integrated marketing and interactive media. The company announced slightly better than expected first quarter results and, perhaps more importantly, announced a significant enhancement in its strategy to return capital to shareholders. Reflecting confidence in its free cash flow generation, the company announced
76 Annual Report | December 31, 2011 |
a 50% increase to its annual dividend and concurrently announced a new $100 million share repurchase authorization. We took advantage of the stock’s underperformance from earlier in the year and added to it near its 2011 low.
Bank of the Ozarks, Inc. (OZRK) is a bank holding company. Through its banking subsidiary, it provides a wide range of retail and commercial banking services through offices located in Arkansas, Texas, Georgia, Florida, North Carolina, South Carolina and Alabama. The company showed organic loan growth for the first time in five quarters and reported strong third quarter results driven by solid performance from recent FDIC acquisitions as well as an improvement in credit trends. We trimmed our position in the stock following a period of outperformance and continue to hold the stock in our portfolio.
Detractors from Return (Fourth Quarter)
Invacare Corp (IVC) designs, manufactures and distributes home and long-term care medical products that promote recovery and active lifestyles. Invacare surprised the market with an announcement that the U.S. Food and Drug Administration requested a consent decree relating to inspectional observations at one of the company’s primary wheelchair manufacturing facilities. Given the uncertainty resulting from a suspension of operations for an unknown length of time, we chose to exit the position.
Digital River, Inc. (DRIV) provides e-commerce solutions and markets shareware software products. The company reported disappointing earnings guidance. We think valuation is attractive and maintained our position.
American Greetings (AM) designs, manufactures and sells everyday and seasonal greeting cards and other social expression products. American Greetings reported earnings well below expectations on a sudden and unforeseen rise in expenses. Due to the magnitude of the spending to acquire new customers and the unwillingness of the management to give much detail about where the spending was going and how long it would persist we decided to exit the name.
The Hanover Insurance Group, Inc. (THG) underwrites commercial and personal property and casualty insurance coverage. The fourth quarter saw concerns related to the Chaucer acquisition although performance improved as investors got a better understanding of the strategic purpose. Also third quarter results were sub-par, primarily due to above average storm activity that failed for the most part to penetrate reinsurance coverage. We continue to hold a position in the stock.
Avid Technology (AVID) is a provider of digital media content-creation solutions for film, video, audio and broadcast professionals, artists and enthusiasts. AVID reported disappointing third quarter earnings and fundamentals continued to deteriorate in the fourth quarter. We lost confidence in our turnaround thesis and exited the position.
December 31, 2011 | William Blair Funds 77 |
Small Cap Value Fund
Performance Highlights (Unaudited)
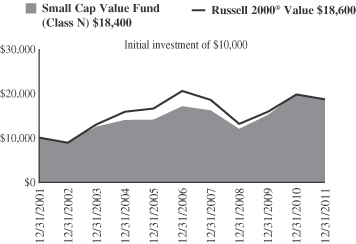
Average Annual Total Return at 12/31/2011
| | | | | | | | | | | | | | | | |
| | | 1
Year | | | 3
Year | | | 5
Year | | | 10
Year | |
Class N | | | (6.95 | )% | | | 15.43 | % | | | 1.50 | % | | | 6.28 | % |
Class I | | | (6.68 | ) | | | 15.71 | | | | 1.72 | | | | 6.51 | |
Russell 2000® Value | | | (5.50 | ) | | | 12.36 | | | | (1.87 | ) | | | 6.40 | |
Performance cited represents past performance. Past performance does not guarantee future results and current performance may be lower or higher than the data quoted. Results shown are average annual total returns, which assume reinvestment of dividends and capital gains. Investment returns and principal will fluctuate and you may have a gain or loss when you sell shares. For the most current month-end performance information, please call 1-800-742-7272, or visit our Web site at www.williamblairfunds.com. Investing in smaller companies involves special risks, including higher volatility and lower liquidity. Smaller Capitalization stocks are also more sensitive to purchase/sale transactions and changes in the issuer’s financial condition. From time to time, the investment advisor may waive fees or reimburse expenses for the Fund. Without these waivers, performance would be lower. Class N shares are available to the general public without a sales load. Class I shares are available to certain institutional investors and advisory clients of William Blair & Company, L.L.C., without a sales load or distribution (12b-1) or service fees.
The performance highlights and graph presented above do not reflect the deduction of taxes that a shareholder would pay on fund distributions or the redemption of fund shares.
The Russell 2000® Value Index consists of small-capitalization companies with below average price-to-book ratios and forecasted growth rates.
This report identifies the Fund’s investments on December 31, 2011. These holdings are subject to change. Not all stocks in the Fund performed the same, nor is there any guarantee that these stocks will perform as well in the future. Market forecasts provided in this report may not necessarily come to pass.
Sector Diversification (Unaudited)
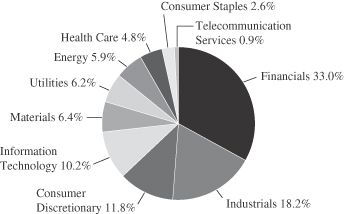
The sector diversification shown is based on the total long-term securities.
78 Annual Report | December 31, 2011 |
Small Cap Value Fund
Portfolio of Investments, December 31, 2011 (all dollar amounts in thousands)
| | | | | | | | |
Issuer | | Shares | | | Value | |
| | |
Common Stocks | | | | | | | | |
Financials—32.7% | | | | | | | | |
Alterra Capital Holdings, Ltd.† | | | 140,895 | | | $ | 3,329 | |
Bank of the Ozarks, Inc. | | | 79,415 | | | | 2,353 | |
Berkshire Hills Bancorp, Inc. | | | 106,405 | | | | 2,361 | |
BioMed Realty Trust, Inc. | | | 189,540 | | | | 3,427 | |
Brandywine Realty Trust | | | 300,930 | | | | 2,859 | |
CoBiz Financial, Inc. | | | 463,025 | | | | 2,672 | |
*Eagle Bancorp, Inc. | | | 192,362 | | | | 2,797 | |
Education Realty Trust, Inc. | | | 281,850 | | | | 2,883 | |
Excel Trust, Inc. | | | 211,490 | | | | 2,538 | |
First Potomac Realty Trust | | | 224,037 | | | | 2,924 | |
FirstMerit Corporation | | | 180,778 | | | | 2,735 | |
Hancock Holding Co. | | | 102,850 | | | | 3,288 | |
Highwoods Properties, Inc. | | | 89,785 | | | | 2,664 | |
LaSalle Hotel Properties | | | 129,322 | | | | 3,131 | |
Meadowbrook Insurance Group, Inc. | | | 272,054 | | | | 2,906 | |
Mid-America Apartment Communities, Inc. | | | 33,865 | | | | 2,118 | |
*National Financial Partners Corporation | | | 196,475 | | | | 2,656 | |
National Retail Properties, Inc. | | | 107,665 | | | | 2,840 | |
Old National Bancorp | | | 301,986 | | | | 3,518 | |
ProAssurance Corporation | | | 39,250 | | | | 3,133 | |
Prosperity Bancshares, Inc. | | | 69,850 | | | | 2,818 | |
*Safeguard Scientifics, Inc. | | | 202,721 | | | | 3,201 | |
Sandy Spring Bancorp, Inc. | | | 115,340 | | | | 2,024 | |
Susquehanna Bancshares, Inc. | | | 299,440 | | | | 2,509 | |
The Hanover Insurance Group, Inc. | | | 66,925 | | | | 2,339 | |
Webster Financial Corporation | | | 152,010 | | | | 3,100 | |
*Western Alliance Bancorp | | | 391,920 | | | | 2,442 | |
| | | | | | | | |
| | | | | | | 75,565 | |
| | | | | | | | |
Industrials—18.0% | | | | | | | | |
Belden, Inc. | | | 71,965 | | | | 2,395 | |
Brady Corporation | | | 91,105 | | | | 2,876 | |
Cubic Corporation | | | 55,295 | | | | 2,410 | |
EMCOR Group, Inc. | | | 132,976 | | | | 3,565 | |
ESCO Technologies, Inc. | | | 65,642 | | | | 1,889 | |
G&K Services, Inc. | | | 97,543 | | | | 2,840 | |
*Hawaiian Holdings, Inc. | | | 302,475 | | | | 1,754 | |
Interface, Inc. | | | 154,820 | | | | 1,787 | |
John Bean Technologies Corporation | | | 93,280 | | | | 1,434 | |
*Kadant, Inc. | | | 112,454 | | | | 2,543 | |
Kaydon Corporation | | | 88,995 | | | | 2,714 | |
*Moog, Inc. | | | 74,085 | | | | 3,255 | |
*Northwest Pipe Co. | | | 65,320 | | | | 1,493 | |
Quanex Building Products Corporation | | | 148,290 | | | | 2,227 | |
Robbins & Myers, Inc. | | | 65,375 | | | | 3,174 | |
TAL International Group, Inc. | | | 87,495 | | | | 2,519 | |
*Tetra Tech, Inc. | | | 129,035 | | | | 2,786 | |
| | | | | | | | |
| | | | | | | 41,661 | |
| | | | | | | | |
Consumer Discretionary—11.6% | | | | | | | | |
*AFC Enterprises, Inc. | | | 155,117 | | | | 2,280 | |
Chico’s FAS, Inc. | | | 170,805 | | | | 1,903 | |
Core-Mark Holding Co., Inc. | | | 49,450 | | | | 1,958 | |
Matthews International Corporation | | | 71,565 | | | | 2,249 | |
Meredith Corporation | | | 92,995 | | | | 3,036 | |
PEP Boys-Manny Moe & Jack | | | 241,537 | | | | 2,657 | |
*Pinnacle Entertainment, Inc. | | | 224,610 | | | | 2,282 | |
Regis Corporation | | | 178,025 | | | | 2,946 | |
*The Children’s Place Retail Stores, Inc. | | | 46,870 | | | | 2,490 | |
The Jones Group, Inc. | | | 211,775 | | | | 2,234 | |
The Men’s Wearhouse, Inc. | | | 88,100 | | | | 2,856 | |
| | | | | | | | |
| | | | | | | 26,891 | |
| | | | | | | | |
| | |
Common Stocks—(continued) | | | | | | | | |
Information Technology—10.0% | | | | | | | | |
ADTRAN, Inc. | | | 97,635 | | | $ | 2,945 | |
*Booz Allen Hamilton Holding Corporation | | | 110,700 | | | | 1,909 | |
*Digital River, Inc. | | | 109,040 | | | | 1,638 | |
Earthlink, Inc. | | | 450,190 | | | | 2,899 | |
*Inphi Corporation | | | 108,865 | | | | 1,302 | |
*Integrated Device Technology, Inc. | | | 317,342 | | | | 1,733 | |
j2 Global, Inc. | | | 77,295 | | | | 2,175 | |
*Monolithic Power Systems, Inc. | | | 152,619 | | | | 2,300 | |
*Parametric Technology Corporation | | | 129,320 | | | | 2,361 | |
*Silicon Laboratories, Inc. | | | 55,350 | | | | 2,403 | |
*Ultra Clean Holdings | | | 249,363 | | | | 1,524 | |
| | | | | | | | |
| | | | | | | 23,189 | |
| | | | | | | | |
Materials—6.3% | | | | | | | | |
Minerals Technologies, Inc. | | | 49,850 | | | | 2,818 | |
PolyOne Corporation | | | 249,590 | | | | 2,883 | |
*RTI International Metals, Inc. | | | 95,690 | | | | 2,221 | |
Sensient Technologies Corporation | | | 92,710 | | | | 3,514 | |
Silgan Holdings, Inc. | | | 79,475 | | | | 3,071 | |
| | | | | | | | |
| | | | | | | 14,507 | |
| | | | | | | | |
Utilities—6.1% | | | | | | | | |
Chesapeake Utilities Corporation | | | 44,290 | | | | 1,920 | |
Northwest Natural Gas Co. | | | 44,695 | | | | 2,142 | |
Portland General Electric Co. | | | 95,690 | | | | 2,420 | |
Southwest Gas Corporation | | | 60,165 | | | | 2,557 | |
UIL Holdings Corporation | | | 67,040 | | | | 2,371 | |
WGL Holdings, Inc. | | | 59,935 | | | | 2,650 | |
| | | | | | | | |
| | | | | | | 14,060 | |
| | | | | | | | |
Energy—5.8% | | | | | | | | |
Berry Petroleum Co. | | | 48,383 | | | | 2,033 | |
*Bill Barrett Corporation | | | 53,575 | | | | 1,825 | |
*Complete Production Services, Inc. | | | 46,180 | | | | 1,550 | |
*Key Energy Services, Inc. | | | 182,610 | | | | 2,825 | |
*Magnum Hunter Resources Corporation | | | 374,636 | | | | 2,019 | |
*Newpark Resources, Inc. | | | 208,850 | | | | 1,984 | |
*Northern Oil and Gas, Inc. | | | 52,323 | | | | 1,255 | |
| | | | | | | | |
| | | | | | | 13,491 | |
| | | | | | | | |
Health Care—4.8% | | | | | | | | |
*CONMED Corporation | | | 97,465 | | | | 2,502 | |
*Greatbatch, Inc. | | | 101,530 | | | | 2,244 | |
*Magellan Health Services, Inc. | | | 64,975 | | | | 3,214 | |
*Mednax, Inc. | | | 42,343 | | | | 3,049 | |
| | | | | | | | |
| | | | | | | 11,009 | |
| | | | | | | | |
Consumer Staples—2.6% | | | | | | | | |
J&J Snack Foods Corporation | | | 42,917 | | | | 2,287 | |
Spartan Stores, Inc. | | | 201,460 | | | | 3,727 | |
| | | | | | | | |
| | | | | | | 6,014 | |
| | | | | | | | |
Telecommunication Services—0.8% | | | | | | | | |
*tw telecom, Inc. | | | 101,245 | | | | 1,962 | |
| | | | | | | | |
Total Common Stocks—98.7%
(cost $218,781) | | | | 228,349 | |
| | | | | | | | |
See accompanying Notes to Financial Statements.
December 31, 2011 | William Blair Funds 79 |
Small Cap Value Fund
Portfolio of Investments, December 31, 2011 (all dollar amounts in thousands)
| | | | | | | | |
Issuer | | Principal
Amount | | | Value | |
| | |
Repurchase Agreement | | | | | | | | |
Fixed Income Clearing Corporation, 0.000% dated 12/30/11, due 1/3/12, repurchase price $5,376, collateralized by U.S. Treasury Notes, 1.750%, due 01/31/14 | | $ | 5,376 | | | $ | 5,376 | |
| | | | | | | | |
Total Repurchase Agreement—2.3%
(cost $5,376) | | | | 5,376 | |
| | | | | | | | |
Total Investments—101.0%
(cost $224,157) | | | | 233,725 | |
Liabilities, plus cash and other assets—(1.0)% | | | | (2,327 | ) |
| | | | | | | | |
Net assets—100.0% | | | $ | 231,398 | |
| | | | | | | | |
† U.S. listed foreign security
* Non-income producing securities
See accompanying Notes to Financial Statements.
80 Annual Report | December 31, 2011 |
Chad M. Kilmer
Mark T. Leslie
David S. Mitchell
MID CAP VALUE FUND
The Mid Cap Value Fund seeks long-term capital appreciation.
AN OVERVIEW FROM THE PORTFOLIO MANAGERS
The Mid Cap Value Fund posted a 0.34% decrease on a total return basis (Class N Shares) during the 12 months ended December 31, 2011. By comparison, the Fund’s benchmark the Russell Midcap® Value Index, decreased 1.38%.
Market Review
The U.S. equity markets finished a volatile 2011 with a robust rally in the fourth quarter, bringing most large cap indices just into positive territory for the year and leaving most small cap indices just below breakeven. The Russell Midcap® Value Index was up 13.37% in the fourth quarter and -1.38% for the year overall. The William Blair Mid Cap Value Fund outperformed in the fourth quarter’s rapid ascent, and it outperformed its benchmark for the year overall.
The aforementioned volatility in 2011 was caused by the opposing forces of mostly positive U.S. economic data and corporate fundamentals compared to numerous concerns about the global economy and geo-political environment. During the first half of the year, investors mostly looked through Middle Eastern and North African uprisings and the Japanese natural disaster as corporate fundamentals remained robust. However, during the third quarter, the market corrected swiftly. This was driven primarily by the European sovereign debt crisis spreading more dramatically to larger Euro-zone countries beyond Greece. Domestically, political brinksmanship over the debt ceiling debate deteriorated investor and public sentiment about our leadership, contributing to the selloff as well. While the European sovereign debt crisis remained at the forefront of concerns throughout the fourth quarter, investor sentiment improved considerably as the focus moved instead to better-than-expected corporate earnings, employment, housing and industrial production reports late in the year.
From a style and sector perspective, the market environment was much different in the fourth quarter than it was for the year overall. Higher beta stocks did well in the fourth quarter but underperformed for the year. Some of the more cyclically-driven sectors outperformed in the fourth quarter (e.g., Energy +21.38%, Industrials +16.62%) while underperforming for the year overall (e.g., Industrials -8.50%, Energy -3.83%). On the other hand, the typically defensive Consumer Staples, Health Care and Utility sectors outperformed for the year while underperforming in the final quarter.
Portfolio Review
The Fund’s outperformance for the year is attributable to superior stock selection and a modest style benefit. Our more conservative investment approach (i.e. typical lower portfolio beta) was a positive as investors sought less market risk given overall market volatility. More importantly, stock selection across a variety of sectors boosted results above the benchmark. The largest source of this was Petrohawk Energy. VF Corporation and DISH Network Corporation, within Consumer Discretionary, along with Carpenter Technology Corporation and Airgas, Inc. (Materials) contributed to the outperformance. On the downside, Oshkosh and Southwest Airlines Co. (Industrials) and Xerox and Atmel Corporation (Information Technology) detracted from relative performance.
December 31, 2011 | William Blair Funds 81 |
The strong stock selection that helped the portfolio outperform its benchmark for the year remained a positive during the fourth quarter. The two sectors that did not contribute to the quarter’s outperformance were Utilities and Energy, but examples of strong stock selection can be found even within the underperforming space; Pioneer Natural Resources Co. and SM Energy Co. both contributed to relative returns. A few of the positions that detracted from returns were The Hanover Insurance Group, Inc. and Discover Financial Services (Financials), Manpower, Inc. (Industrials), and ITC Holdings Corporation (Utilities).
Market Outlook
Looking forward, the improved economic data over the past few months increases the probability that the economic recovery is self-sustaining. The health of the global financial system due to European sovereign debt problems and the prospects for emerging market growth continue to be two of the largest macro-economic risks. In addition, 2012 will bring events such as the U.S. presidential election, austerity debates, potential standoffs with Iran and North Korea and other unforeseen events that will undoubtedly spur uncertainty in investor psyche. That said, the level of investor pessimism is already high, stock market valuations are reasonably attractive and earnings expectations for 2012 have been reduced over the past few months. All of these are often advantageous for prospective equity returns.
In the end, while we factor various economic scenarios into our stock picking, we focus our time on constructing the portfolio from a bottom-up perspective. As always, we remain focused on finding quality companies at discount prices and corporate transformation opportunities. We believe building a fund with these types of companies should produce solid investment results over the long term.
Contributors to Return (Fourth Quarter)
Pioneer Natural Resources Co. (PXD) is an independent oil and gas exploration and production company with current operations in the United States and South Africa. As third quarter earnings releases and subsequent data continue to show, the energy market, with the exception of dry gas, continues to improve. A large part of the Q3 sell-off was related to concern that Europe would send the world, and thus energy prices, into the abyss once more. After underperforming in the third quarter, the stock bounced back; while Europe is still in a state of flux, the market has become more positive relative to Energy as activity in oil-related and liquid-rich gas plays remains strong. The company had excellent results in both the Permian and Eagle Ford Basins which drove strong third quarter results. Subsequent data flow remained positive, and we maintained our position.
Newell Rubbermaid, Inc. (NWL) manufactures and markets branded consumer and commercial products in the areas of cleaning and organization, office products, and tools and hardware, to name a few. The company experienced a strong fourth quarter. The CEO, new as of July 2011, has an impressive background and we expect him to reinvigorate the company. A large restructuring was announced, along with an ongoing focus on cost cutting, a renewed focus on revenue growth and an emphasis on margin improvement. On top of the exciting new focus, Newell Rubbermaid, Inc. announced earnings for the third quarter that met expectations and guidance for the fourth quarter that was acceptable to investors. We continue to have a position in the stock.
Detractors from Return (Fourth Quarter)
The Hanover Insurance Group, Inc. (THG) underwrites commercial and personal property and casualty insurance coverage. The fourth quarter saw concerns related to the Chaucer acquisition although performance improved as investors got a better understanding of the
82 Annual Report | December 31, 2011 |
strategic purpose. Also, third quarter results were sub-par, primarily due to above average storm activity that failed for the most part to penetrate reinsurance coverage. We continue to hold a position in the stock
ITC Holdings Corporation (ITC) is a Midwest electricity transmission company that invests in the electric transmission grid to improve system reliability, expand access to markets, lower the overall cost of delivered energy and allow new generating resources to interconnect to its transmission systems. ITC Holdings Corporation underperformed its small-mid/mid cap utility peers during the fourth quarter in what appears to be some mean reversion in the utility space; there was no fundamental reason for the underperformance during the quarter. It is worth noting that ITC Holdings Corporation was one of the single best performing utility stocks during the volatile and negative returns of the third quarter; as the appetite to accept risk and beta came back during the fourth quarter, we saw a reversal from third quarter’s flight to quality amongst investors. There were some slight concerns during the quarter that ITC Holdings Corporation allowed returns on equity from the Federal Energy Commission to come into question because of the low interest rate environment and other regulated utilities having their allowed returns lowered, but the investment in transmission in our country is so crucial we find it hard to believe the regulators would try to lower the incentive to make America’s power grid infrastructure more reliable. We continue to hold our position.
December 31, 2011 | William Blair Funds 83 |
Mid Cap Value Fund
Performance Highlights (Unaudited)
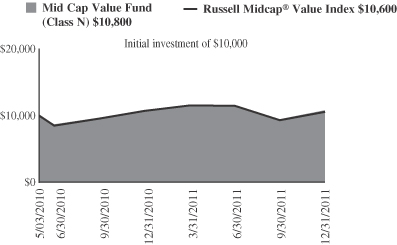
Average Annual Total Return at 12/31/2011
| | | | | | | | |
| | | 1
Yr | | | Since
Inception(a) | |
Class N | | | (0.34 | )% | | | 4.70 | % |
Class I | | | (0.25 | ) | | | 4.94 | |
Russell Midcap® Value Index | | | (1.38 | ) | | | 3.38 | |
| | (a) | | For the period May 3, 2010 (Commencement of Operations) to December 31, 2011. |
Performance cited represents past performance. Past performance does not guarantee future results and current performance may be lower or higher than the data quoted. Results shown are average annual total returns, which assume reinvestment of dividends and capital gains. Investment returns and principal will fluctuate and you may have a gain or loss when you sell shares. For the most current month-end performance information, please call 1-800-742-7272, or visit our Web site at www.williamblairfunds.com. Investing in smaller and medium capitalization companies involves special risks, including higher volatility and lower liquidity. Medium Capitalization stocks are also more sensitive to purchase/sale transactions and changes in the issuer’s financial condition. From time to time, the investment advisor may waive fees or reimburse expenses for the Fund. Without these waivers, performance would be lower. Class N shares are available to the general public without a sales load. Class I shares are available to certain institutional investors and advisory clients of William Blair & Company, L.L.C., without a sales load or distribution (12b-1) or service fees.
The performance highlights and graph presented above do not reflect the deduction of taxes that a shareholder would pay on fund distributions or the redemption of fund shares.
The Russell Midcap® Value Index consists of Midcap-capitalization companies with below average price-to-book ratios and forecasted growth rates.
This report identifies the Fund’s investments on December 31, 2011. These holdings are subject to change. Not all stocks in the Fund performed the same, nor is there any guarantee that these stocks will perform as well in the future. Market forecasts provided in this report may not necessarily come to pass.
Sector Diversification (Unaudited)
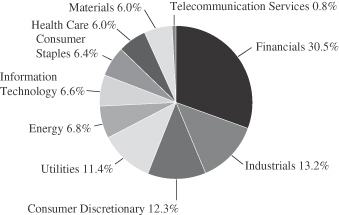
The sector diversification shown is based on the total long-term securities.
84 Annual Report | December 31, 2011 |
Mid Cap Value Fund
Portfolio of Investments, December 31, 2011 (all dollar amounts in thousands)
| | | | | | | | |
Issuer | | Shares | | | Value | |
| | |
Common Stocks | | | | | | | | |
Financials—30.3% | | | | | | | | |
Alexandria Real Estate Equities, Inc. | | | 885 | | | $ | 61 | |
Allied World Assurance Co. Holdings, Ltd.† | | | 655 | | | | 41 | |
American Campus Communities, Inc. | | | 850 | | | | 36 | |
Ameriprise Financial, Inc. | | | 1,780 | | | | 88 | |
Brandywine Realty Trust | | | 6,345 | | | | 60 | |
Discover Financial Services | | | 4,500 | | | | 108 | |
Duke Realty Corporation | | | 3,790 | | | | 46 | |
East West Bancorp, Inc. | | | 3,125 | | | | 62 | |
Equity Residential | | | 795 | | | | 45 | |
Fifth Third Bancorp | | | 9,505 | | | | 121 | |
*Forest City Enterprises, Inc. Class “A” | | | 4,235 | | | | 50 | |
Hancock Holding Co. | | | 1,855 | | | | 59 | |
Host Hotels & Resorts, Inc. | | | 3,755 | | | | 55 | |
New York Community Bancorp, Inc. | | | 4,015 | | | | 50 | |
PartnerRe, Ltd.† | | | 740 | | | | 48 | |
People’s United Financial, Inc. | | | 7,340 | | | | 94 | |
Realty Income Corporation | | | 1,950 | | | | 68 | |
SL Green Realty Corporation | | | 905 | | | | 60 | |
The Hanover Insurance Group, Inc. | | | 1,295 | | | | 45 | |
Unum Group | | | 3,250 | | | | 69 | |
Validus Holdings, Ltd.† | | | 2,055 | | | | 65 | |
Ventas, Inc. | | | 970 | | | | 54 | |
| | | | | | | | |
| | | | | | | 1,385 | |
| | | | | | | | |
Industrials—13.0% | | | | | | | | |
Cintas Corporation | | | 1,765 | | | | 61 | |
Eaton Corporation | | | 1,750 | | | | 76 | |
Hubbell, Inc. Class “B” | | | 1,055 | | | | 71 | |
Manpower, Inc. | | | 1,410 | | | | 50 | |
Pall Corporation | | | 1,130 | | | | 65 | |
Parker Hannifin Corporation | | | 995 | | | | 76 | |
Republic Services, Inc. | | | 1,605 | | | | 44 | |
Rockwell Automation, Inc. | | | 765 | | | | 56 | |
Rockwell Collins, Inc. | | | 1,025 | | | | 57 | |
Snap-On, Inc. | | | 760 | | | | 39 | |
| | | | | | | | |
| | | | | | | 595 | |
| | | | | | | | |
Consumer Discretionary—12.2% | | | | | | | | |
Autoliv, Inc. | | | 640 | | | | 34 | |
*Bed Bath & Beyond, Inc. | | | 740 | | | | 43 | |
Chico’s FAS, Inc. | | | 3,455 | | | | 38 | |
DISH Network Corporation | | | 1,950 | | | | 56 | |
Genuine Parts Co. | | | 920 | | | | 56 | |
H&R Block, Inc. | | | 1,440 | | | | 24 | |
International Game Technology | | | 2,855 | | | | 49 | |
Newell Rubbermaid, Inc. | | | 4,875 | | | | 79 | |
Staples, Inc. | | | 3,780 | | | | 52 | |
VF Corporation | | | 505 | | | | 64 | |
Wyndham Worldwide Corporation | | | 1,630 | | | | 62 | |
| | | | | | | | |
| | | | | | | 557 | |
| | | | | | | | |
Utilities—11.3% | | | | | | | | |
American Water Works Co., Inc. | | | 1,950 | | | | 62 | |
DTE Energy Co. | | | 1,415 | | | | 77 | |
ITC Holdings Corporation | | | 675 | | | | 51 | |
| | |
Common Stocks—(continued) | | | | | | | | |
Utilities—(continued) | | | | | | | | |
Northeast Utilities | | | 2,025 | | | $ | 73 | |
PPL Corporation | | | 3,100 | | | | 91 | |
Wisconsin Energy Corporation | | | 2,130 | | | | 75 | |
Xcel Energy, Inc. | | | 3,140 | | | | 87 | |
| | | | | | | | |
| | | | | | | 516 | |
| | | | | | | | |
Energy—6.6% | | | | | | | | |
Consol Energy, Inc. | | | 1,330 | | | | 49 | |
Patterson-UTI Energy, Inc. | | | 2,095 | | | | 42 | |
Pioneer Natural Resources Co. | | | 770 | | | | 69 | |
*Rowan Cos., Inc. | | | 1,605 | | | | 48 | |
SM Energy Co. | | | 930 | | | | 68 | |
Valero Energy Corporation | | | 1,370 | | | | 29 | |
| | | | | | | | |
| | | | | | | 305 | |
| | | | | | | | |
Information Technology—6.5% | | | | | | | | |
*Atmel Corporation | | | 5,050 | | | | 41 | |
*Ingram Micro, Inc. Class “A” | | | 3,380 | | | | 62 | |
TE Connectivity, Ltd.† | | | 2,295 | | | | 71 | |
VeriSign, Inc. | | | 1,350 | | | | 48 | |
Xerox Corporation | | | 9,710 | | | | 77 | |
| | | | | | | | |
| | | | | | | 299 | |
| | | | | | | | |
Consumer Staples—6.3% | | | | | | | | |
ConAgra Foods, Inc. | | | 2,985 | | | | 79 | |
Corn Products International, Inc. | | | 1,230 | | | | 65 | |
HJ Heinz Co. | | | 1,560 | | | | 84 | |
The Kroger Co. | | | 2,455 | | | | 59 | |
| | | | | | | | |
| | | | | | | 287 | |
| | | | | | | | |
Health Care—5.9% | | | | | | | | |
CIGNA Corporation | | | 1,650 | | | | 69 | |
Hill-Rom Holdings, Inc. | | | 1,900 | | | | 64 | |
*Laboratory Corporation of America Holdings | | | 760 | | | | 65 | |
*Mettler-Toledo International, Inc.† | | | 480 | | | | 71 | |
| | | | | | | | |
| | | | | | | 269 | |
| | | | | | | | |
Materials—5.9% | | | | | | | | |
Airgas, Inc. | | | 795 | | | | 62 | |
Carpenter Technology Corporation | | | 965 | | | | 50 | |
FMC Corporation | | | 715 | | | | 61 | |
Sonoco Products Co. | | | 1,795 | | | | 59 | |
Steel Dynamics, Inc. | | | 2,810 | | | | 37 | |
| | | | | | | | |
| | | | | | | 269 | |
| | | | | | | | |
Telecommunication Services—0.8% | | | | | | | | |
*tw telecom, Inc. | | | 1,910 | | | | 37 | |
| | | | | | | | |
Total Common Stocks—98.8%
(cost $4,421) | | | | 4,519 | |
| | | | | | | | |
Total Investments—98.8%
(cost $4,421) | | | | 4,519 | |
Cash and other assets, less liabilities—1.2% | | | | 54 | |
| | | | | | | | |
Net assets—100.0% | | | $ | 4,573 | |
| | | | | | | | |
See accompanying Notes to Financial Statements.
December 31, 2011 | William Blair Funds 85 |
† U.S. listed foreign security
*Non-income producing securities
Chad M. Kilmer
Mark T. Leslie
David S. Mitchell
SMALL-MID CAP VALUE FUND
The Small-Mid Cap Value Fund seeks long-term capital appreciation.
AN OVERVIEW FROM THE PORTFOLIO MANAGERS
We are pleased to have the Small-Mid Cap Value Fund become one of the newest additions to the William Blair Fund Family and would like to thank the shareholders for investing with us.
We are enthusiastic about the opportunities available to us as the portfolio managers of the Small-Mid Cap Value Fund. We believe the key to successful investing is striking a balance between attractive valuations and solid fundamentals. We look for this balance in two separate ways: quality companies at discount prices and corporate transformation opportunities. Critical to our long-term investment success is controlling stock-specific downside risk, and the consistent application of this philosophy.
The Small-Mid Cap Value Fund commenced operations on December 15, 2011. Through the two-week period ended December 31, 2011, the Fund posted an increase of 4.50% (Class N Shares). By comparison, the Fund’s benchmark, the Russell 2500® Value Index, gained 4.20% for this very short time period.
Portfolio Review
The Fund’s outperformance for the period is attributable to superior stock selection across a variety of sectors.
Market Outlook
Looking forward, the improved economic data over the past few months increases the probability that the economic recovery is self-sustaining. The health of the global financial system due to European sovereign debt problems and the prospects for emerging market growth continue to be two of the largest macro-economic risks. In addition, 2012 will bring events such as the US presidential election, austerity debates, potential standoffs with Iran and North Korea and other unforeseen events that will undoubtedly spur uncertainty in investor psyche. That said, the level of investor pessimism is already high, stock market valuations are reasonably attractive and earnings expectations for 2012 have been reduced over the past few months. All of these are often advantageous for prospective equity returns.
In the end, while we factor various economic scenarios into our stock picking, we focus our time on constructing the portfolio from a bottom-up perspective. As always, we remain focused on finding quality companies at discount prices and corporate transformation opportunities. We believe building a fund with these types of companies should produce solid investment results over the long term.
86 Annual Report | December 31, 2011 |
Small-Mid Cap Value Fund
Performance Highlights (Unaudited)
Performance cited represents past performance. Past performance does not guarantee future results and current performance may be lower or higher than the data quoted. Results shown are average annual total returns, which assume reinvestment of dividends and capital gains. Investment returns and principal will fluctuate and you may have a gain or loss when you sell shares. For the most current month-end performance information, please call 1-800-742-7272, or visit our Web site at www.williamblairfunds.com. Investing in smaller and medium capitalization companies involves special risks, including higher volatility and lower liquidity. Smaller and medium capitalization stocks are also more sensitive to purchase/sale transactions and changes in the issuer’s financial condition. From time to time, the investment advisor may waive fees or reimburse expenses for the Fund. Without these waivers, performance would be lower. Class N shares are available to the general public without a sales load. Class I shares are available to certain institutional investors and advisory clients of William Blair & Company, L.L.C., without a sales load or distribution (12b-1) or service fees.
The performance highlights and graph presented above do not reflect the deduction of taxes that a shareholder would pay on fund distributions or the redemption of fund shares.
Russell 2500® Value Index consists of Midcap-capitalization companies with below average price-to-book ratios and forecasted growth rates.
This report identifies the Fund’s investments on December 31, 2011. These holdings are subject to change. Not all stocks in the Fund performed the same, nor is there any guarantee that these stocks will perform as well in the future. Market forecasts provided in this report may not necessarily come to pass.
Sector Diversification (Unaudited)
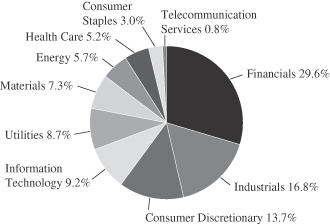
The sector diversification shown is based on the total long-term securities.
Average Annual Total Return at 12/31/2011
| | | | |
| | | Since
Inception(a) | |
Class N | | | 4.50 | % |
Class I | | | 4.50 | |
Russell 2500® Value Index | | | 4.20 | |
| | (a) | | For the period from December 15, 2011 (Commencement of Operations) to December 31, 2011. | |
December 31, 2011 | William Blair Funds 87 |
Small-Mid Cap Value Fund
Portfolio of Investments, December 31, 2011 (all dollar amounts in thousands)
| | | | | | | | |
Issuer | | Shares | | | Value | |
| | |
Common Stocks | | | | | | | | |
Financials—29.0% | | | | | | | | |
Alexandria Real Estate Equities, Inc. | | | 310 | | | $ | 21 | |
Allied World Assurance Co. Holdings, Ltd. | | | 215 | | | | 14 | |
Alterra Capital Holdings, Ltd. | | | 900 | | | | 21 | |
Bank of the Ozarks, Inc. | | | 555 | | | | 16 | |
BioMed Realty Trust, Inc. | | | 1,345 | | | | 24 | |
Brandywine Realty Trust | | | 2,335 | | | | 22 | |
Duke Realty Corporation | | | 930 | | | | 11 | |
East West Bancorp, Inc. | | | 905 | | | | 18 | |
Education Realty Trust, Inc. | | | 1,935 | | | | 20 | |
First Potomac Realty Trust | | | 1,265 | | | | 17 | |
FirstMerit Corporation | | | 1,400 | | | | 21 | |
Hancock Holding Co. | | | 870 | | | | 28 | |
Highwoods Properties, Inc. | | | 645 | | | | 19 | |
LaSalle Hotel Properties | | | 965 | | | | 23 | |
Meadowbrook Insurance Group, Inc. | | | 1,810 | | | | 19 | |
Mid-America Apartment Communities, Inc. | | | 305 | | | | 19 | |
*National Financial Partners Corporation | | | 1,420 | | | | 19 | |
National Retail Properties, Inc. | | | 875 | | | | 23 | |
New York Community Bancorp, Inc. | | | 1,860 | | | | 23 | |
Old National Bancorp | | | 2,195 | | | | 26 | |
People’s United Financial, Inc. | | | 2,625 | | | | 33 | |
ProAssurance Corporation | | | 300 | | | | 24 | |
Prosperity Bancshares, Inc. | | | 525 | | | | 21 | |
Realty Income Corporation | | | 510 | | | | 18 | |
SL Green Realty Corporation | | | 415 | | | | 28 | |
Susquehanna Bancshares, Inc. | | | 2,085 | | | | 17 | |
The Hanover Insurance Group, Inc. | | | 375 | | | | 13 | |
Unum Group | | | 740 | | | | 16 | |
Validus Holdings, Ltd. | | | 810 | | | | 26 | |
Webster Financial Corporation | | | 1,205 | | | | 25 | |
| | | | | | | | |
| | | | | | | 625 | |
| | | | | | | | |
Industrials—16.6% | | | | | | | | |
Belden, Inc. | | | 555 | | | | 19 | |
Brady Corporation | | | 680 | | | | 21 | |
Cubic Corporation | | | 370 | | | | 16 | |
EMCOR Group, Inc. | | | 985 | | | | 26 | |
ESCO Technologies, Inc. | | | 415 | | | | 12 | |
G&K Services, Inc. | | | 635 | | | | 19 | |
*Hawaiian Holdings, Inc. | | | 1,850 | | | | 11 | |
Hubbell, Inc. Class “B” | | | 470 | | | | 31 | |
Interface, Inc. | | | 1,405 | | | | 16 | |
Kaydon Corporation | | | 600 | | | | 18 | |
Manpower, Inc. | | | 440 | | | | 16 | |
*Moog, Inc. | | | 615 | | | | 27 | |
Pall Corporation | | | 520 | | | | 30 | |
Quanex Building Products Corporation | | | 1,225 | | | | 18 | |
Robbins & Myers, Inc. | | | 470 | | | | 23 | |
Snap-On, Inc. | | | 330 | | | | 17 | |
TAL International Group, Inc. | | | 510 | | | | 15 | |
*Tetra Tech, Inc. | | | 1,040 | | | | 22 | |
| | | | | | | | |
| | | | | | | 357 | |
| | | | | | | | |
Consumer Discretionary—13.5% | | | | | | | | |
Autoliv, Inc. | | | 350 | | | | 19 | |
Chico’s FAS, Inc. | | | 1,400 | | | | 16 | |
Core-Mark Holding Co., Inc. | | | 270 | | | | 11 | |
Genuine Parts Co. | | | 285 | | | | 17 | |
H&R Block, Inc. | | | 710 | | | | 12 | |
International Game Technology | | | 1,280 | | | | 22 | |
| | | | | | | | |
Issuer | | Shares | | | Value | |
| | |
Common Stocks—(continued) | | | | | | | | |
Consumer Discretionary—(continued) | | | | | | | | |
Matthews International Corporation | | | 490 | | | $ | 15 | |
Meredith Corporation | | | 720 | | | | 23 | |
Newell Rubbermaid, Inc. | | | 1,390 | | | | 22 | |
PEP Boys-Manny Moe & Jack | | | 1,800 | | | | 20 | |
*Pinnacle Entertainment, Inc. | | | 1,625 | | | | 17 | |
Regis Corporation | | | 1,200 | | | | 20 | |
*The Children’s Place Retail Stores, Inc. | | | 380 | | | | 20 | |
The Jones Group, Inc. | | | 1,175 | | | | 12 | |
The Men’s Wearhouse, Inc. | | | 700 | | | | 23 | |
Wyndham Worldwide Corporation | | | 600 | | | | 23 | |
| | | | | | | | |
| | | | | | | 292 | |
| | | | | | | | |
Information Technology—9.1% | | | | | | | | |
ADTRAN, Inc. | | | 675 | | | | 20 | |
*Atmel Corporation | | | 1,500 | | | | 12 | |
*Booz Allen Hamilton Holding Corporation | | | 1,000 | | | | 17 | |
*Digital River, Inc. | | | 755 | | | | 11 | |
Earthlink, Inc. | | | 3,220 | | | | 21 | |
*Ingram Micro, Inc. Class “A” | | | 1,560 | | | | 29 | |
*Integrated Device Technology, Inc. | | | 2,650 | | | | 15 | |
j2 Global Communications, Inc. | | | 600 | | | | 17 | |
*Monolithic Power Systems, Inc. | | | 1,200 | | | | 18 | |
*Parametric Technology Corporation | | | 1,045 | | | | 19 | |
VeriSign, Inc. | | | 475 | | | | 17 | |
| | | | | | | | |
| | | | | | | 196 | |
| | | | | | | | |
Utilities—8.6% | | | | | | | | |
American Water Works Co., Inc. | | | 795 | | | | 25 | |
ITC Holdings Corporation | | | 235 | | | | 18 | |
Northeast Utilities | | | 755 | | | | 27 | |
Northwest Natural Gas Co. | | | 370 | | | | 18 | |
Portland General Electric Co. | | | 835 | | | | 21 | |
Southwest Gas Corporation | | | 450 | | | | 19 | |
UIL Holdings Corporation | | | 525 | | | | 19 | |
WGL Holdings, Inc. | | | 460 | | | | 20 | |
Wisconsin Energy Corporation | | | 480 | | | | 17 | |
| | | | | | | | |
| | | | | | | 184 | |
| | | | | | | | |
Materials—7.2% | | | | | | | | |
Airgas, Inc. | | | 250 | | | | 19 | |
Carpenter Technology Corporation | | | 270 | | | | 14 | |
FMC Corporation | | | 230 | | | | 20 | |
Minerals Technologies, Inc. | | | 265 | | | | 15 | |
PolyOne Corporation | | | 1,210 | | | | 14 | |
*RTI International Metals, Inc. | | | 505 | | | | 12 | |
Sensient Technologies Corporation | | | 420 | | | | 16 | |
Silgan Holdings, Inc. | | | 485 | | | | 19 | |
Sonoco Products Co. | | | 525 | | | | 17 | |
Steel Dynamics, Inc. | | | 770 | | | | 10 | |
| | | | | | | | |
| | | | | | | 156 | |
| | | | | | | | |
Energy—5.6% | | | | | | | | |
Berry Petroleum Co. | | | 210 | | | | 9 | |
*Bill Barrett Corporation | | | 330 | | | | 11 | |
*Complete Production Services, Inc. | | | 170 | | | | 6 | |
Consol Energy, Inc. | | | 400 | | | | 15 | |
*Key Energy Services, Inc. | | | 840 | | | | 13 | |
*Newpark Resources, Inc. | | | 1,265 | | | | 12 | |
*Northern Oil and Gas, Inc. | | | 385 | | | | 9 | |
Patterson-UTI Energy, Inc. | | | 665 | | | | 13 | |
See accompanying Notes to Financial Statements.
88 Annual Report | December 31, 2011 |
Small-Mid Cap Value Fund
Portfolio of Investments, December 31, 2011 (all dollar amounts in thousands)
| | | | | | | | |
Issuer | | Shares | | | Value | |
| | |
Common Stocks—(continued) | | | | | | | | |
Energy—(continued) | | | | | | | | |
*Rowan Cos., Inc. | | | 520 | | | $ | 16 | |
SM Energy Co. | | | 225 | | | | 16 | |
| | | | | | | | |
| | | | | | | 120 | |
| | | | | | | | |
Health Care—5.1% | | | | | | | | |
*CONMED Corporation | | | 460 | | | | 12 | |
*Greatbatch, Inc. | | | 515 | | | | 11 | |
Hill-Rom Holdings, Inc. | | | 625 | | | | 21 | |
*Magellan Health Services, Inc. | | | 400 | | | | 20 | |
*Mednax, Inc. | | | 365 | | | | 26 | |
*Mettler-Toledo International, Inc. | | | 135 | | | | 20 | |
| | | | | | | | |
| | | | | | | 110 | |
| | | | | | | | |
Consumer Staples—3.0% | | | | | | | | |
Corn Products International, Inc. | | | 540 | | | | 29 | |
J&J Snack Foods Corporation | | | 250 | | | | 13 | |
Spartan Stores, Inc. | | | 1,200 | | | | 22 | |
| | | | | | | | |
| | | | | | | 64 | |
| | | | | | | | |
Telecommunication Services—0.8% | | | | | | | | |
*tw telecom, Inc. | | | 930 | | | | 18 | |
| | | | | | | | |
Total Common Stocks—98.5%
(cost $2,028) | | | | 2,122 | |
| | | | | | | | |
Total Investments—98.5%
(cost $2,028) | | | | 2,122 | |
Cash and other assets, less liabilities—1.5% | | | | 34 | |
| | | | | | | | |
Net assets—100.0% | | | $ | 2,156 | |
| | | | | | | | |
*Non-income producing securities
See accompanying Notes to Financial Statements.
December 31, 2011 | William Blair Funds 89 |
Fixed Income Markets Overview
Summary
In many ways, 2011 brought back some painful memories of 2008. Global stock markets experienced significant volatility, U.S. fixed income assets benefitted from a tremendous flight-to-quality with rates reaching record lows, and segments of the bond market suffered from diminished liquidity. U.S. stocks finished the year positive on the strength of a strong rally during the fourth quarter. Non-U.S. stocks lagged U.S. stocks during the fourth quarter and calendar year 2011.
The European debt crisis took center stage, with the market concentrated on how European policymakers might act to mitigate the precarious fiscal finances of Greece, Italy, and, to a lesser extent, Portugal and Spain. The crisis impacted financial institutions around the globe, with European financial institutions particularly hard-hit due to its holdings of European sovereign debt.
In other parts of the globe, the Japanese earthquake and tsunami had a significant but short-lived impact on the global supply chain during the second quarter, and several Middle East and North African countries experienced violent overthrows of repressive political regimes.
The U.S. faced issues of its own in 2011. Politicians scrambled to a last-hour resolution to increase the debt ceiling in July. In August, Standard & Poor’s downgraded the U.S.’s long-term debt rating to AA+. Economic reports revealed that U.S. growth was stagnant, with notable weaknesses in the labor and housing markets.
The Federal Open Market Committee (FOMC) responded to these challenges with unconventional monetary easing policies. At its August 9 meeting, the FOMC pledged to keep interest rates at lower levels for an extended period of time, stating that conditions “warrant exceptionally low levels for the federal funds rate at least through mid-2013.” The FOMC announced “Operation Twist” at its September 21 meeting, in which it will sell short-term securities and purchase long-term securities. It will also reinvest principal payments into agency mortgage-backed securities to help stimulate the mortgage market.
Dollar-denominated fixed income assets were strong performers in this environment as declining interest rates buoyed returns. The 10-year Treasury note yielded 1.88% at year-end, 4 basis points lower for the quarter and 137 basis points lower for the year. Corporate bonds and mortgage-backed securities gained but lagged Treasuries. TIPS outperformed nominal Treasuries.
Outlook
We believe that the threat of any rapid rise in interest rates is subdued. The FOMC’s stance towards monetary policy has become increasingly accommodative due to concerns over the slow pace of economic growth and job growth.
We expect economic growth to be low, with continued high levels of unemployment and a depressed real estate market constraining growth. However, we do not believe that the economy is at risk of a “double dip” recession in the near term.
Even with the increase in capital market volatility, corporate bond issuance has been steady, albeit at slightly higher new issue concessions (risk premiums) offered by issuers. The wider spreads offered in the market have been partially offset by Treasury yields near historic lows. In addition to wider spreads, we have seen bid/ask spreads widen marginally, but far from the levels experienced in 2008. This is indicative of reduced risk taking by dealers.
We believe that spread sectors are poised to lead the market. Risk premiums across all spreads sectors have moved significantly higher in recent months but not approaching the historically cheap levels experienced in prior years. These valuations, coupled with the strength of corporate balance sheets, make us bullish on spread product relative to Treasuries.
90 Annual Report | December 31, 2011 |

Christopher T. Vincent

Paul J. Sularz
BOND FUND
The Bond Fund seeks to outperform the Barclays Capital U.S. Aggregate Bond Index by maximizing total return through a combination of income and capital appreciation.
AN OVERVIEW FROM THE PORTFOLIO MANAGERS
The Bond Fund posted a 7.41% increase on a total return basis (Class N Shares) for the 12 months ended December 31, 2011. By comparison, the Fund’s benchmark, the Barclays Capital U.S. Aggregate Bond Index, gained 7.84%.
The Bond Fund posted positive performance results in both the fourth quarter and for 2011, in spite of what could be considered headwinds to our style of investing. The Fund outperformed its Barclays Capital U.S. Aggregate Bond Index benchmark during the fourth quarter and slightly underperformed it for the year.
During the fourth quarter, security selection was the main driver of Fund performance. Performance was exceptionally strong among the Fund’s corporate bond holdings and mortgage-backed securities. Among the corporate bonds, selection was strong among the Fund’s financial and industrial holdings. A modest allocation to high yield corporate bonds was additive to performance. Our Mortgage positions experienced slower-than-forecasted prepayment speeds, earned incremental yield over Treasuries, and impacted results favorably.
During 2011, the Fund trailed its benchmark, as sector positioning detracted from performance and overwhelmed the positive effect from security selection. The Fund’s underweight allocation to Treasuries and subsequent overweight allocations to corporate and mortgage-backed securities detracted over the year, as Treasuries were the best-performing sector and risk spreads widened. However, the Fund experienced strong security selection within its corporate and mortgage-backed securities. The same themes that drove security selection results during the fourth quarter impacted the year’s performance favorably.
The portfolio’s duration currently exceeds that of the benchmark. We believe that interest rates will remain range-bound at lower levels over the next year and a half, as the Federal Open Market Committee (FOMC) stated after its August 9th meeting that current conditions “warrant exceptionally low levels for the federal funds rate at least through mid-2013.”
We are overweight agency mortgage-backed securities. We seek pools with better-than-market convexity characteristics through favoring pools with above-market coupon rates comprised of either low loan balances or seasoned pools and avoiding the generic, current-coupon pools that dominate the Mortgage Index. We view specified pool mortgage-backed securities as a cheap alternative to agency debentures (to which we are underweight).
We are overweight investment-grade corporate bonds, as we believe the sector continues to offer good relative value. Within the sector, we are overweight Industrials and Financials. We emphasize companies with positive free cash flow and strong and experienced management teams. We believe that certain names in the financial sector offer value, and we are encouraged by the improvement of balance sheets within the sector despite the regulatory issues facing the industry.
We hold an allocation to high yield bonds near the Fund’s maximum portfolio weight of 10%. We emphasize higher quality (BB- and B-rated) industrial issuers.
We hold an allocation to TIPS (Treasury Inflation-Protected Securities), as we find its embedded option on unexpected inflation to be an appealing feature versus owning nominal Treasury notes.
December 31, 2011 | William Blair Funds 91 |
Bond Fund
Performance Highlights (Unaudited)
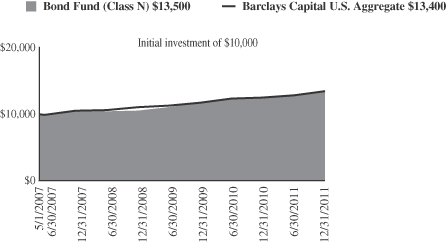
Average Annual Total Return at 12/31/2011
| | | | | | | | | | | | |
| | | 1
Year | | | 3
Year | | | Since
Inception(a) | |
Class N | | | 7.41 | % | | | 8.78 | % | | | 6.68 | % |
Class I | | | 7.62 | | | | 8.96 | | | | 6.83 | |
Barclays Capital U.S. Aggregate Bond Index | | | 7.84 | | | | 6.77 | | | | 6.52 | |
| | (a) | | For the period from May 1, 2007 (Commencement of Operations) to December 31, 2011. | |
Performance cited represents past performance. Past performance does not guarantee future results and current performance may be lower or higher than the data quoted. Results shown are average annual total returns, which assume reinvestment of dividends and capital gains. Investment returns and principal will fluctuate and you may have a gain or loss when you sell shares. For the most current month-end performance information, please call 1-800-742-7272, or visit our Web site at www.williamblairfunds.com. From time to time, the investment advisor may waive fees or reimburse expenses for the Fund. Without these waivers, performance would be lower. Class N shares are available to the general public without a sales load. Class I shares are available to certain institutional investors and advisory clients of William Blair & Company, L.L.C., without a sales load or distribution fees (12b-1).
The performance highlights and graph presented above do not reflect the deduction of taxes that a shareholder would pay on fund distributions or the redemption of fund shares.
The Barclays Capital U.S. Aggregate Bond Index indicates broad intermediate government/corporate bond market performance.
This report identifies the Fund’s investments on December 31, 2011. These holdings are subject to change. Not all investments in the Fund performed the same, nor is there any guarantee that these investments will perform as well in the future. Market forecasts provided in this report may not necessarily come to pass.
Sector Diversification (Unaudited)
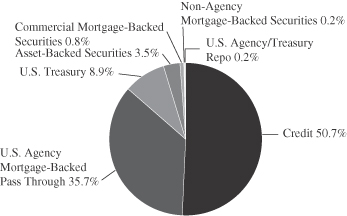
The sector diversification shown is based on the total investments.
92 Annual Report | December 31, 2011 |
Bond Fund
Portfolio of Investments, December 31, 2011 (all amounts in thousands)
| | | | | | | | | | |
Issuer | | Principal
Amount | | | Value | |
|
U.S. Government and U.S. Government Agency—44.3% | |
U.S. Treasury Inflation Indexed Notes/Bonds—8.4% | | | | | | | | | | |
U.S. Treasury Inflation Indexed Note,
2.375%, due 1/15/17 | | | | $ | 5,614 | | | $ | 6,517 | |
U.S. Treasury Inflation Indexed Bond, 3.875%, due 4/15/29 | | | | | 8,264 | | | | 12,878 | |
| | | | | | | | | | |
Total U.S. Treasury Inflation Indexed Notes/Bonds | | | | | | | | | 19,395 | |
| | | | | | | | | | |
U.S. Treasury—0.3% | | | | | | | | | | |
U.S. Treasury Bond,
3.875%, due 8/15/40 | | | | | 500 | | | | 599 | |
| | | | | | | | | | |
Government National Mortgage Association (GNMA)—3.8% | | | | | | | | | | |
GNR 2004-2 M5,
4.891%, due 7/16/34 | | | | | 125 | | | | 140 | |
GNR 2006-67 GB,
4.617%, due 9/16/34, VRN | | | | | 1,590 | | | | 1,686 | |
#699118, 6.000%, due 9/15/38 | | | | | 6,152 | | | | 7,023 | |
| | | | | | | | | | |
Total GNMA Mortgage Obligations | | | | | | | | | 8,849 | |
| | | | | | | | | | |
Federal Home Loan Mortgage Corp. (FHLMC)—8.8% | | | | | | | | | | |
#G90024, 7.000%, due 1/20/13 | | | | | 11 | | | | 12 | |
#G30093, 7.000%, due 12/1/17 | | | | | 29 | | | | 33 | |
#J14232, 3.500%, due 1/1/21 | | | | | 1,527 | | | | 1,595 | |
#G30255, 7.000%, due 7/1/21 | | | | | 61 | | | | 70 | |
#G12792, 4.500%, due 12/1/21 | | | | | 323 | | | | 344 | |
#D95897, 5.500%, due 3/1/23 | | | | | 174 | | | | 190 | |
#J16051, 4.500%, due 7/1/26 | | | | | 1,439 | | | | 1,554 | |
#G01728, 7.500%, due 7/1/32 | | | | | 301 | | | | 360 | |
#C01385, 6.500%, due 8/1/32 | | | | | 313 | | | | 356 | |
#C01623, 5.500%, due 9/1/33 | | | | | 485 | | | | 528 | |
#A15039, 5.500%, due 10/1/33 | | | | | 7 | | | | 8 | |
#G02141, 6.000%, due 3/1/36 | | | | | 1,683 | | | | 1,880 | |
#A62179, 6.000%, due 6/1/37 | | | | | 902 | | | | 1,007 | |
#A63539, 6.000%, due 7/1/37 | | | | | 1,142 | | | | 1,275 | |
#A62858, 6.500%, due 7/1/37 | | | | | 585 | | | | 658 | |
#G03170, 6.500%, due 8/1/37 | | | | | 1,494 | | | | 1,679 | |
#A66843, 6.500%, due 10/1/37 | | | | | 2,098 | | | | 2,380 | |
#A78138, 5.500%, due 6/1/38 | | | | | 1,196 | | | | 1,327 | |
#A81799, 6.500%, due 9/1/38 | | | | | 2,561 | | | | 2,905 | |
#C03665, 9.000%, due 4/1/41 | | | | | 1,786 | | | | 2,183 | |
| | | | | | | | | | |
Total FHLMC Mortgage Obligations | | | | | | | | | 20,344 | |
| | | | | | | | | | |
Federal National Mortgage Association (FNMA)—23.0% | | | | | | | | | | |
#535559, 7.500%, due 9/1/12 | | | | | 8 | | | | 8 | |
#689612, 5.000%, due 5/1/18 | | | | | 314 | | | | 342 | |
#695910, 5.000%, due 5/1/18 | | | | | 646 | | | | 705 | |
#747903, 4.500%, due 6/1/19 | | | | | 271 | | | | 290 | |
#745735, 5.000%, due 3/1/21 | | | | | 702 | | | | 762 | |
#253847, 6.000%, due 5/1/21 | | | | | 188 | | | | 207 | |
#900725, 6.000%, due 8/1/21 | | | | | 162 | | | | 176 | |
#AA2924, 4.500%, due 4/1/24 | | | | | 1,059 | | | | 1,150 | |
#890329, 4.000%, due 4/1/26 | | | | | 558 | | | | 598 | |
#AI9811, 4.500%, due 8/1/26 | | | | | 582 | | | | 632 | |
#AH9564, 3.500%, due 9/1/26 | | | | | 1,174 | | | | 1,243 | |
#545437, 7.000%, due 2/1/32 | | | | | 158 | | | | 184 | |
| | | | | | | | | | | | |
Issuer | | NRSRO
Rating
(unaudited) | | | Principal
Amount | | | Value | |
|
U.S. Government and U.S. Government Agency—44.3%—(continued) | |
Federal National Mortgage Association (FNMA)—(continued) | | | | | | | | | | | | |
#545759, 6.500%, due 7/1/32 | | | | | | $ | 1,701 | | | $ | 1,932 | |
#684601, 6.000%, due 3/1/33 | | | | | | | 1,684 | | | | 1,886 | |
#555430, 5.000%, due 5/1/33 | | | | | | | 852 | | | | 922 | |
#708993, 5.000%, due 6/1/33 | | | | | | | 98 | | | | 108 | |
#254868, 5.000%, due 9/1/33 | | | | | | | 695 | | | | 752 | |
#739243, 6.000%, due 9/1/33 | | | | | | | 1,745 | | | | 1,954 | |
#739331, 6.000%, due 9/1/33 | | | | | | | 824 | | | | 923 | |
#555800, 5.500%, due 10/1/33 | | | | | | | 290 | | | | 317 | |
#555876, 5.500%, due 10/1/33 | | | | | | | 69 | | | | 75 | |
#725027, 5.000%, due 11/1/33 | | | | | | | 567 | | | | 613 | |
#555880, 5.500%, due 11/1/33 | | | | | | | 386 | | | | 422 | |
#555946, 5.500%, due 11/1/33 | | | | | | | 707 | | | | 788 | |
#756153, 5.500%, due 11/1/33 | | | | | | | 1,899 | | | | 2,101 | |
#725205, 5.000%, due 3/1/34 | | | | | | | 3,378 | | | | 3,653 | |
#725232, 5.000%, due 3/1/34 | | | | | | | 3,404 | | | | 3,681 | |
#725238, 5.000%, due 3/1/34 | | | | | | | 1,260 | | | | 1,363 | |
#725249, 5.000%, due 3/1/34 | | | | | | | 287 | | | | 310 | |
#763798, 5.500%, due 3/1/34 | | | | | | | 388 | | | | 430 | |
#725611, 5.500%, due 6/1/34 | | | | | | | 395 | | | | 432 | |
#786546, 6.000%, due 7/1/34 | | | | | | | 802 | | | | 896 | |
#787816, 6.000%, due 7/1/34 | | | | | | | 818 | | | | 916 | |
#190353, 5.000%, due 8/1/34 | | | | | | | 396 | | | | 428 | |
#794474, 6.000%, due 10/1/34 | | | | | | | 174 | | | | 193 | |
#745092, 6.500%, due 7/1/35 | | | | | | | 1,154 | | | | 1,311 | |
#357944, 6.000%, due 9/1/35 | | | | | | | 102 | | | | 113 | |
#829306, 6.000%, due 9/1/35 | | | | | | | 292 | | | | 326 | |
#843487, 6.000%, due 10/1/35 | | | | | | | 242 | | | | 272 | |
#849191, 6.000%, due 1/1/36 | | | | | | | 453 | | | | 506 | |
#848782, 6.500%, due 1/1/36 | | | | | | | 759 | | | | 856 | |
#745349, 6.500%, due 2/1/36 | | | | | | | 984 | | | | 1,111 | |
#895637, 6.500%, due 5/1/36 | | | | | | | 399 | | | | 450 | |
#831540, 6.000%, due 6/1/36 | | | | | | | 164 | | | | 182 | |
#745802, 6.000%, due 7/1/36 | | | | | | | 554 | | | | 620 | |
#886220, 6.000%, due 7/1/36 | | | | | | | 1,166 | | | | 1,306 | |
#893318, 6.500%, due 8/1/36 | | | | | | | 210 | | | | 236 | |
#909480, 6.000%, due 2/1/37 | | | | | | | 1,174 | | | | 1,311 | |
#938440, 6.000%, due 7/1/37 | | | | | | | 565 | | | | 627 | |
#928561, 6.000%, due 8/1/37 | | | | | | | 646 | | | | 724 | |
#948689, 6.000%, due 8/1/37 | | | | | | | 1,418 | | | | 1,573 | |
#946646, 6.000%, due 9/1/37 | | | | | | | 343 | | | | 383 | |
#888967, 6.000%, due 12/1/37 | | | | | | | 2,035 | | | | 2,280 | |
#962058, 6.500%, due 3/1/38 | | | | | | | 3,968 | | | | 4,490 | |
#934006, 6.500%, due 9/1/38 | | | | | | | 1,439 | | | | 1,628 | |
#986856, 6.500%, due 9/1/38 | | | | | | | 902 | | | | 1,012 | |
#991911, 7.000%, due 11/1/38 | | | | | | | 660 | | | | 754 | |
| | | | | | | | | | | | |
Total FNMA Mortgage Obligations | | | | | | | | | | | 53,463 | |
| | | | | | | | | | | | |
|
Non-Agency Mortgage-Backed Obligations—0.2% | |
First Plus Home Loan Trust, 1997-4, Tranche M1,
7.640%, 9/11/23§** | | | D | | | | 199 | | | | 167 | |
First Horizon Asset Securities, Inc., 2004-AR4, Tranche 3A1,
2.712%, 8/25/34, VRN | | | AAA | | | | 387 | | | | 329 | |
| | | | | | | | | | | | |
Total Non-Agency Mortgage-Backed Obligations | | | | | | | | | | | 496 | |
| | | | | | | | | | | | |
See accompanying Notes to Financial Statements.
December 31, 2011 | William Blair Funds 93 |
Bond Fund
Portfolio of Investments, December 31, 2011 (all amounts in thousands)
| | | | | | | | | | | | |
Issuer | | NRSRO
Rating
(unaudited) | | | Principal
Amount | | | Value | |
| |
Asset-Backed Securities—3.5% | | | | | |
Avis Budget Rental Car Funding AESOP LLC—144A, 2009-1A, Tranche A, 9.310%, 10/20/13 | | | Aa1 | | | $ | 2,000 | | | $ | 2,083 | |
Hertz Vehicle Financing
LLC—144A, 2009-2A,
Tranche A1, 4.260%, 3/25/14 | | | Aaa | | | | 2,230 | | | | 2,283 | |
Centre Point Funding LLC—144A, 2010-1A, Tranche 1,
5.430%, 7/20/16 | | | A2 | | | | 2,309 | | | | 2,418 | |
Sierra Receivables Funding Co. LLC—144A, 2011-1A, Tranche A, 3.350%, 4/20/26 | | | A | | | | 1,259 | | | | 1,233 | |
| | | | | | | | | | | | |
Total Asset-Backed Securities | | | | | | | | | | | 8,017 | |
| | | | | | | | | | | | |
| | | |
Corporate Obligations—48.9% | | | | | | | | | | | | |
Bank of America Corporation,
7.375%, due 5/15/14 | | | A | | | | 1,000 | | | | 1,037 | |
D.R. Horton, Inc.,
5.625%, due 9/15/14 | | | BB | | | | 1,535 | | | | 1,581 | |
Corporation Nacional del Cobre de Chile—144A,
4.750%, due 10/15/14 | | | A1 | | | | 1,350 | | | | 1,448 | |
Yum! Brands, Inc.,
6.250%, due 4/15/16 | | | BBB | | | | 1,050 | | | | 1,214 | |
SUPERVALU, Inc.,
8.000%, due 5/1/16 | | | B | + | | | 1,500 | | | | 1,549 | |
Owens-Brockway Glass
Container, Inc.,
7.375%, due 5/15/16 | | | BB | + | | | 1,250 | | | | 1,369 | |
Fiserv, Inc.,
3.125%, due 6/15/16 | | | Baa2 | | | | 1,825 | | | | 1,858 | |
SABMiller plc—144A,
6.500%, due 7/1/16 | | | BBB | + | | | 700 | | | | 818 | |
Petrobras International Finance Co., 6.125%, due 10/6/16 | | | A3 | | | | 1,350 | | | | 1,497 | |
Comcast Corporation,
6.500%, due 1/15/17 | | | BBB | + | | | 350 | | | | 412 | |
Corrections Corporation of America, 7.750%, due 6/1/17 | | | Ba1 | | | | 1,250 | | | | 1,356 | |
ERP Operating L.P.,
5.750%, due 6/15/17 | | | BBB | + | | | 2,000 | | | | 2,217 | |
JPMorgan Chase & Co.,
6.125%, due 6/27/17 | | | A1 | | | | 600 | | | | 659 | |
Smithfield Foods, Inc.,
7.750%, due 7/1/17 | | | BB- | | | | 1,500 | | | | 1,642 | |
American Express Co.,
6.150%, due 8/28/17 | | | A | + | | | 2,000 | | | | 2,287 | |
Capital One Financial Corporation, 6.750%, due 9/15/17 | | | A- | | | | 1,775 | | | | 1,989 | |
Exelon Generation Co. LLC,
6.200%, due 10/1/17 | | | A3 | | | | 1,100 | | | | 1,263 | |
Toll Brothers Finance Corporation, 8.910%, due 10/15/17 | | | BBB- | | | | 1,000 | | | | 1,152 | |
Motorola Solutions, Inc.,
6.000%, due 11/15/17 | | | BBB | | | | 2,000 | | | | 2,242 | |
Triumph Group, Inc.,
8.000%, due 11/15/17 | | | B | + | | | 1,500 | | | | 1,597 | |
Union Pacific Corporation,
5.750%, due 11/15/17 | | | BBB | + | | | 600 | | | | 710 | |
Wells Fargo & Co.,
5.625%, due 12/11/17 | | | AA- | | | | 1,000 | | | | 1,140 | |
|
Corporate Obligations—48.9%—(continued) | |
Kohl’s Corporation,
6.250%, due 12/15/17 | | | BBB | + | | $ | 1,000 | | | $ | 1,191 | |
American Tower Corporation, 4.500%, due 1/15/18 | | | Baa3 | | | | 1,150 | | | | 1,170 | |
Morgan Stanley,
6.625%, due 4/1/18 | | | A2 | | | | 2,000 | | | | 1,975 | |
General Electric Capital Corporation,
5.625%, due 5/1/18 | | | AA | + | | | 1,250 | | | | 1,400 | |
Simon Property Group L.P.,
6.125%, due 5/30/18 | | | A- | | | | 1,750 | | | | 2,009 | |
Time Warner Cable, Inc.,
6.750%, due 7/1/18 | | | BBB | | | | 1,000 | | | | 1,188 | |
Petrohawk Energy Corporation,
7.250%, due 8/15/18 | | | A | | | | 1,000 | | | | 1,125 | |
Merrill Lynch & Co., Inc.,
6.875%, due 11/15/18 | | | A | | | | 1,075 | | | | 1,036 | |
Anheuser-Busch InBev
Worldwide, Inc.,
7.750%, due 1/15/19 | | | A- | | | | 1,400 | | | | 1,813 | |
CSX Corporation,
7.375%, due 2/1/19 | | | BBB | | | | 800 | | | | 997 | |
BHP Billiton Finance USA, Ltd., 6.500%, due 4/1/19 | | | A | + | | | 1,300 | | | | 1,606 | |
Owens Corning,
9.000%, due 6/15/19 | | | BBB- | | | | 1,000 | | | | 1,193 | |
Discovery Communications LLC, 5.625%, due 8/15/19 | | | BBB | | | | 500 | | | | 569 | |
Roper Industries, Inc.,
6.250%, due 9/1/19 | | | Baa2 | | | | 1,800 | | | | 2,127 | |
Republic Services, Inc.,
5.500%, due 9/15/19 | | | BBB | | | | 1,650 | | | | 1,904 | |
Boston Properties L.P.,
5.875%, due 10/15/19 | | | A- | | | | 1,500 | | | | 1,689 | |
Crown Castle International Corporation,
7.125%, due 11/1/19 | | | BB- | | | | 1,500 | | | | 1,620 | |
Toll Brothers Finance Corporation, 6.750%, due 11/1/19 | | | BBB- | | | | 500 | | | | 526 | |
Ford Motor Credit Co. LLC,
8.125%, due 1/15/20 | | | BB | + | | | 2,000 | | | | 2,354 | |
Jarden Corporation,
7.500%, due 1/15/20 | | | B | | | | 1,500 | | | | 1,597 | |
Johnson Controls, Inc.,
5.000%, due 3/30/20 | | | BBB | + | | | 1,625 | | | | 1,808 | |
The Goldman Sachs Group, Inc.,
6.000%, due 6/15/20 | | | A1 | | | | 1,800 | | | | 1,844 | |
Commonwealth Edison Co.,
4.000%, due 8/1/20 | | | A- | | | | 1,000 | | | | 1,077 | |
Citigroup, Inc.,
5.375%, due 8/9/20 | | | A | | | | 2,000 | | | | 2,057 | |
Alcoa, Inc.,
6.150%, due 8/15/20 | | | BBB- | | | | 2,000 | | | | 2,078 | |
Omnicom Group, Inc.,
4.450%, due 8/15/20 | | | BBB | + | | | 2,000 | | | | 2,062 | |
The Goodyear Tire & Rubber Co.,
8.250%, due 8/15/20 | | | B | + | | | 1,500 | | | | 1,635 | |
BE Aerospace, Inc.,
6.875%, due 10/1/20 | | | BB | | | | 1,500 | | | | 1,635 | |
Georgia-Pacific LLC—144A, 5.400%, due 11/1/20 | | | A- | | | | 1,500 | | | | 1,661 | |
See accompanying Notes to Financial Statements.
94 Annual Report | December 31, 2011 |
Bond Fund
Portfolio of Investments, December 31, 2011 (all amounts in thousands)
| | | | | | | | | | | | |
Issuer | | NRSRO
Rating
(unaudited) | | | Principal
Amount | | | Value | |
|
Corporate Obligations—48.9%—(continued) | |
Progress Energy, Inc.,
4.400%, due 1/15/21 | | | BBB | | | $ | 1,625 | | | $ | 1,791 | |
L-3 Communications Corporation,
4.950%, due 2/15/21 | | | BBB- | | | | 2,355 | | | | 2,334 | |
Wyndham Worldwide Corporation,
5.625%, due 3/1/21 | | | BBB- | | | | 1,000 | | | | 1,033 | |
Ball Corporation,
5.750%, due 5/15/21 | | | BB | + | | | 1,500 | | | | 1,571 | |
Energizer Holdings, Inc.—144A, 4.700%, due 5/19/21 | | | BBB- | | | | 2,000 | | | | 2,105 | |
Discovery Communications LLC,
4.375%, due 6/15/21 | | | BBB | | | | 1,000 | | | | 1,056 | |
Praxair, Inc.,
3.000%, due 9/1/21 | | | A | | | | 2,000 | | | | 2,047 | |
O’Reilly Automotive, Inc.,
4.625%, due 9/15/21 | | | BBB- | | | | 2,200 | | | | 2,307 | |
FUEL Trust—144A,
3.984%, due 12/15/22 | | | Baa2 | | | | 2,000 | | | | 2,000 | |
The Kroger Co.,
8.000%, due 9/15/29 | | | BBB | | | | 425 | | | | 583 | |
Conoco Funding Co.,
7.250%, due 10/15/31 | | | A1 | | | | 400 | | | | 555 | |
Kohl’s Corporation,
6.000%, due 1/15/33 | | | BBB | + | | | 1,000 | | | | 1,116 | |
Wisconsin Electric Power Co.,
5.700%, due 12/1/36 | | | A | + | | | 500 | | | | 646 | |
Comcast Corporation,
6.450%, due 3/15/37 | | | BBB | + | | | 650 | | | | 788 | |
Yum! Brands, Inc.,
6.875%, due 11/15/37 | | | BBB | | | | 600 | | | | 766 | |
JPMorgan Chase & Co.,
6.400%, due 5/15/38 | | | Aa3 | | | | 1,400 | | | | 1,625 | |
COX Communications, Inc.—144A, 6.950%, due 6/1/38 | | | BBB | | | | 350 | | | | 400 | |
General Electric Capital Corporation,
6.875%, due 1/10/39 | | | AA | + | | | 750 | | | | 898 | |
|
Corporate Obligations—48.9%—(continued) | |
Abbott Laboratories,
6.000%, due 4/1/39 | | | AA | | | $ | 2,200 | | | $ | 2,795 | |
Burlington Northern Santa Fe LLC, 5.750%, due 5/1/40 | | | A3 | | | | 1,515 | | | | 1,813 | |
Illinois Tool Works, Inc.—144A, 4.875%, due 9/15/41 | | | A | + | | | 850 | | | | 967 | |
Union Pacific Corporation,
4.750%, due 9/15/41 | | | BBB | + | | | 1,400 | | | | 1,525 | |
Aristotle Holding, Inc.—144A, 6.125%, due 11/15/41 | | | BBB | + | | | 2,450 | | | | 2,649 | |
Philip Morris International, Inc.,
4.375%, due 11/15/41 | | | A | | | | 2,000 | | | | 2,079 | |
Gilead Sciences, Inc.,
5.650%, due 12/1/41 | | | A- | | | | 750 | | | | 830 | |
CSX Corporation,
4.750%, due 5/30/42 | | | BBB | | | | 1,200 | | | | 1,238 | |
| | | | | | | | | | | | |
Total Corporate Obligations | | | | | | | | | | | 113,500 | |
| | | | | | | | | | | | |
Total Long-Term Investments—96.9%
(cost $211,270) | | | | 224,663 | |
| | | | | | | | | | | | |
| | | |
Repurchase Agreement | | | | | | | | | | | | |
Fixed Income Clearing Corporation, 0.000% dated 12/30/11, due 1/3/12, repurchase price $564, collateralized by FHLMC, 3.150%, due 10/28/20 | | | Aaa | | | | 564 | | | | 564 | |
| | | | | | | | | | | | |
Total Repurchase Agreement—0.2%
(cost $564) | | | | 564 | |
| | | | | | | | | | | | |
Total Investments—97.1%
(cost $211,834) | | | | 225,227 | |
Cash and other assets, less liabilities—2.9% | | | | 6,789 | |
| | | | | | | | | | | | |
Net assets—100.0% | | | $ | 232,016 | |
| | | | | | | | | | | | |
GNR Government National Mortgage Association
NRSRO Nationally Recognized Statistical Rating Organization—The credit quality ratings of the securities in the Fund reflect the highest category rating by either Fitch Ratings, Moody’s Investors Service Inc., or Standard & Poor’s, a division of the McGraw-Hill Companies, Inc.
The obligations of certain U.S. Government-sponsored securities are neither issued nor guaranteed by the U.S. Treasury.
VRN Variable Rate Note
§ Deemed illiquid pursuant to Liquidity Procedures approved by the Board of Trustees. This holding represents 0.07% of the Fund’s net assets at December 31, 2011.
** Fair valued pursuant to Valuation Procedures adopted by the Board of Trustees. This holding represents 0.07% of the Fund’s net assets at December 31, 2011.
See accompanying Notes to Financial Statements.
December 31, 2011 | William Blair Funds 95 |
Christopher T. Vincent
INCOME FUND
The Income Fund seeks a high level of current income with relative stability of principal.
AN OVERVIEW FROM THE PORTFOLIO MANAGER
The Income Fund posted a 5.21% increase on a total return basis (Class N Shares) for the 12 months ended December 31, 2011. By comparison, the Fund’s benchmark, the Barclays Capital Intermediate Government/Credit Bond Index, gained 5.80%.
The Income Fund posted positive performance results in both the fourth quarter and for 2011, in spite of what could be considered headwinds to our style of investing. Security selection was the main driver of Fund performance.
The Fund outperformed its Barclays Capital Intermediate Government/Credit Bond Index benchmark during the fourth quarter and slightly underperformed it for the year. The Fund’s underweight allocation to Treasuries and subsequent overweight allocations to corporate and mortgage-backed securities detracted somewhat from performance in the third quarter, as Treasuries were the best-performing sector and risk spreads widened. Our modest allocation to high yield corporate bonds also hindered results.
However this strategy served the Fund well in the fourth quarter. The Fund also was underweight sectors of the Corporate Bond market that were the weakest performers, such as Financials. In addition, the Corporate Bonds that we held outperformed, including banks, REITS and Industrials.
Our Mortgage positions experienced slower-than-forecasted prepayment speeds, earned incremental yield over Treasuries, and impacted results favorably.
We are positioned slightly overweight on interest rates with the portfolio’s duration exceeding that of the benchmark. We believe that interest rates will remain range-bound at lower levels over the next year and a half, as the FOMC stated after its August 9th meeting that current conditions “warrant exceptionally low levels for the federal funds rate at least through mid-2013.”
We are overweight agency Mortgage-backed securities. We seek pools with better-than-market convexity characteristics through favoring pools with above-market coupon rates comprised of either low loan balances or seasoned pools and avoiding the generic, current-coupon pools that dominate the Mortgage Index. We view specified pool Mortgage-backed securities as a cheap alternative to agency debentures (to which we are underweight).
We are overweight investment-grade corporate bonds, as we believe the sector continues to offer good relative value. Within the sector, we are overweight Industrials and Financials. We emphasize companies with positive free cash flow and strong and experienced management teams. We believe that certain names in the financial sector offer value, and we are encouraged by the improvement of balance sheets within the sector despite the regulatory issues facing the industry.
We hold an allocation to TIPS (Treasury Inflation-Protected Securities), as we find its embedded option on unexpected inflation to be an appealing feature versus owning nominal Treasury notes.
96 Annual Report | December 31, 2011 |
Income Fund
Performance Highlights (Unaudited)
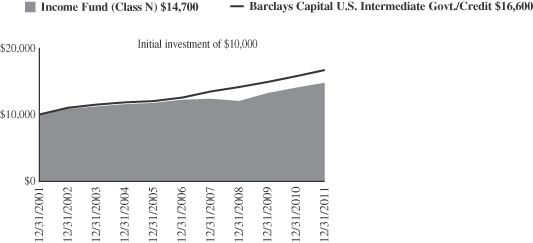
Average Annual Total Return at 12/31/2011
| | | | | | | | | | | | | | | | |
| | | 1
Year | | | 3
Year | | | 5
Year | | | 10
Year | |
Class N | | | 5.21 | % | | | 7.02 | % | | | 3.86 | % | | | 3.94 | % |
Class I | | | 5.46 | | | | 7.21 | | | | 4.07 | | | | 4.11 | |
Barclays Capital Intermediate Government/Credit Bond Index | | | 5.80 | | | | 5.65 | | | | 5.88 | | |
| 5.20
|
|
Performance cited represents past performance. Past performance does not guarantee future results and current performance may be lower or higher than the data quoted. Results shown are average annual total returns, which assume reinvestment of dividends and capital gains. Investment returns and principal will fluctuate and you may have a gain or loss when you sell shares. For the most current month-end performance information, please call 1-800-742-7272, or visit our Web site at www.williamblairfunds.com. From time to time, the investment advisor may waive fees or reimburse expenses for the Fund. Without these waivers, performance would be lower. Class N shares are available to the general public without a sales load. Class I shares are available to certain institutional investors and advisory clients of William Blair & Company, L.L.C., without a sales load or distribution (12b-1) or service fees.
The performance highlights and graph presented above do not reflect the deduction of taxes that a shareholder would pay on fund distributions or the redemption of fund shares.
The Barclays Capital Intermediate Government/Credit Bond Index indicates broad intermediate government/corporate bond market performance.
This report identifies the Fund’s investments on December 31, 2011. These holdings are subject to change. Not all investments in the Fund performed the same, nor is there any guarantee that these investments will perform as well in the future. Market forecasts provided in this report may not necessarily come to pass.
Sector Diversification (Unaudited)
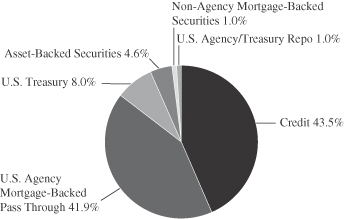
The sector diversification shown is based on the total investments.
December 31, 2011 | William Blair Funds 97 |
Income Fund
Portfolio of Investments, December 31, 2011 (all amounts in thousands)
| | | | | | | | | | |
Issuer | | Principal
Amount | | | Value | |
|
U.S. Government and U.S. Government Agency—49.6% | |
U.S. Treasury Inflation Indexed Notes/Bonds—4.1% | | | | | | | | | | |
U.S. Treasury Inflation Indexed Note,
2.375%, due 1/15/17 | | | | $ | 3,930 | | | $ | 4,562 | |
| | | | | | | | | | |
U.S. Treasury—3.8% | | | | | | | | | | |
U.S. Treasury Note,
3.125%, due 5/15/19 | | | | | 500 | | | | 561 | |
U.S. Treasury Note,
2.625%, due 8/15/20 | | | | | 2,500 | | | | 2,696 | |
U.S. Treasury Strip Principal,
0.000%, due 5/15/20 | | | | | 1,185 | | | | 1,031 | |
| | | | | | | | | | |
Total U.S. Treasury Obligations | | | | | | | | | 4,288 | |
| | | | | | | | | | |
Government National Mortgage Association (GNMA)—0.2% | | | | | | | | | | |
#780405, 9.500%, due 11/15/17 | | | | | 114 | | | | 122 | |
#357322, 7.000%, due 9/15/23 | | | | | 75 | | | | 87 | |
| | | | | | | | | | |
Total GNMA Mortgage Obligations | | | | | | | | | 209 | |
| | | | | | | | | | |
Federal Home Loan Mortgage Corp. (FHLMC)—13.7% | | | | | | | | | | |
#G10708, 6.500%, due 8/1/12 | | | | | 3 | | | | 3 | |
#E72924, 7.000%, due 10/1/13 | | | | | 143 | | | | 145 | |
#E81703, 7.000%, due 5/1/15 | | | | | 193 | | | | 201 | |
#E81697, 8.000%, due 5/1/15 | | | | | 448 | | | | 482 | |
#E81908, 8.500%, due 12/1/15 | | | | | 31 | | | | 32 | |
#J02184, 8.000%, due 4/1/16 | | | | | 298 | | | | 318 | |
#G90022, 8.000%, due 9/17/16 | | | | | 156 | | | | 166 | |
#M30028, 5.500%, due 5/1/17 | | | | | 24 | | | | 24 | |
#E90398, 7.000%, due 5/1/17 | | | | | 470 | | | | 511 | |
#E96536, 5.000%, due 3/1/18 | | | | | 506 | | | | 545 | |
#E97112, 4.000%, due 5/1/18 | | | | | 245 | | | | 262 | |
#B13459, 4.500%, due 4/1/19 | | | | | 158 | | | | 169 | |
#J14232, 3.500%, due 1/1/21 | | | | | 1,528 | | | | 1,596 | |
#C67537, 9.500%, due 8/1/21 | | | | | 4 | | | | 4 | |
#D95621, 6.500%, due 7/1/22 | | | | | 1,577 | | | | 1,760 | |
#E02913, 5.000%, due 6/1/26 | | | | | 905 | | | | 977 | |
#J16051, 4.500%, due 7/1/26 | | | | | 2,667 | | | | 2,880 | |
#A45790, 7.500%, due 5/1/35 | | | | | 299 | | | | 358 | |
#G02141, 6.000%, due 3/1/36 | | | | | 881 | | | | 984 | |
#A66843, 6.500%, due 10/1/37 | | | | | 971 | | | | 1,102 | |
#A81799, 6.500%, due 9/1/38 | | | | | 1,482 | | | | 1,681 | |
#C03665, 9.000%, due 4/1/41 | | | | | 909 | | | | 1,111 | |
| | | | | | | | | | |
Total FHLMC Mortgage Obligations | | | | | | | | | 15,311 | |
| | | | | | | | | | |
Federal National Mortgage Association (FNMA)—27.8% | | | | | | | | | | |
#254788, 6.500%, due 4/1/13 | | | | | 23 | | | | 23 | |
#725315, 8.000%, due 5/1/13 | | | | | 32 | | | | 33 | |
#593561, 9.500%, due 8/1/14 | | | | | 73 | | | | 78 | |
#567027, 7.000%, due 9/1/14 | | | | | 331 | | | | 346 | |
#567026, 6.500%, due 10/1/14 | | | | | 219 | | | | 229 | |
#458124, 7.000%, due 12/15/14 | | | | | 48 | | | | 51 | |
#576554, 8.000%, due 1/1/16 | | | | | 483 | | | | 525 | |
#576553, 8.000%, due 2/1/16 | | | | | 701 | | | | 762 | |
#555747, 8.000%, due 5/1/16 | | | | | 59 | | | | 63 | |
#735569, 8.000%, due 10/1/16 | | | | | 375 | | | | 406 | |
#725410, 7.500%, due 4/1/17 | | | | | 184 | | | | 195 | |
#643217, 6.500%, due 6/1/17 | | | | | 153 | | | | 170 | |
#679247, 7.000%, due 8/1/17 | | | | | 615 | | | | 687 | |
| | | | | | | | | | | | |
Issuer | | NRSRO
Rating
(unaudited) | | | Principal
Amount | | | Value | |
|
U.S. Government and U.S. Government Agency—49.6%—(continued) | |
Federal National Mortgage Association (FNMA)—(continued) | | | | | | | | | |
#685194, 4.500%, due 3/1/18 | | | | | | $ | 843 | | | $ | 903 | |
#689334, 5.000%, due 3/1/18 | | | | | | | 110 | | | | 119 | |
#695910, 5.000%, due 5/1/18 | | | | | | | 554 | | | | 604 | |
#740847, 6.000%, due 10/1/18 | | | | | | | 363 | | | | 395 | |
#323501, 6.500%, due 1/1/19 | | | | | | | 117 | | | | 130 | |
#255358, 5.000%, due 9/1/19 | | | | | | | 154 | | | | 167 | |
#852864, 7.000%, due 7/1/20 | | | | | | | 1,242 | | | | 1,386 | |
#458147, 10.000%, due 8/15/20 | | | | | | | 304 | | | | 345 | |
#835563, 7.000%, due 10/1/20 | | | | | | | 508 | | | | 559 | |
#735574, 8.000%, due 3/1/22 | | | | | | | 326 | | | | 375 | |
#679253, 6.000%, due 10/1/22 | | | | | | | 756 | | | | 833 | |
FNR G93-19 SH,
11.234%, due 4/25/23, VRN | | | | | | | 11 | | | | 15 | |
#AD8164, 4.000%, due 8/1/25 | | | | | | | 903 | | | | 970 | |
#AE1176, 4.000%, due 8/1/25 | | | | | | | 918 | | | | 985 | |
#255956, 5.500%, due 10/1/25 | | | | | | | 216 | | | | 236 | |
#890329, 4.000%, due 4/1/26 | | | | | | | 1,860 | | | | 1,992 | |
#AI4872, 4.500%, due 6/1/26 | | | | | | | 2,200 | | | | 2,390 | |
#AI9811, 4.500%, due 8/1/26 | | | | | | | 873 | | | | 948 | |
#AJ2322, 3.500%, due 10/1/26 | | | | | | | 977 | | | | 1,034 | |
#AJ3203, 4.000%, due 10/1/26 | | | | | | | 1,974 | | | | 2,120 | |
#AJ7724, 4.000%, due 12/1/26 | | | | | | | 1,000 | | | | 1,074 | |
#256639, 5.000%, due 2/1/27 | | | | | | | 65 | | | | 71 | |
#806458, 8.000%, due 6/1/28 | | | | | | | 222 | | | | 267 | |
#880155, 8.500%, due 7/1/29 | | | | | | | 717 | | | | 875 | |
#797846, 7.000%, due 3/1/32 | | | | | | | 786 | | | | 879 | |
#745519, 8.500%, due 5/1/32 | | | | | | | 222 | | | | 272 | |
#654674, 6.500%, due 9/1/32 | | | | | | | 142 | | | | 161 | |
#733897, 6.500%, due 12/1/32 | | | | | | | 273 | | | | 316 | |
#254693, 5.500%, due 4/1/33 | | | | | | | 39 | | | | 42 | |
#555531, 5.500%, due 6/1/33 | | | | | | | 109 | | | | 119 | |
#555591, 5.500%, due 7/1/33 | | | | | | | 65 | | | | 71 | |
#725231, 5.000%, due 2/1/34 | | | | | | | 812 | | | | 879 | |
#725220, 5.000%, due 3/1/34 | | | | | | | 790 | | | | 854 | |
#725232, 5.000%, due 3/1/34 | | | | | | | 791 | | | | 856 | |
#725238, 5.000%, due 3/1/34 | | | | | | | 434 | | | | 469 | |
#725424, 5.500%, due 4/1/34 | | | | | | | 418 | | | | 456 | |
#255630, 5.000%, due 3/1/35 | | | | | | | 48 | | | | 52 | |
#886220, 6.000%, due 7/1/36 | | | | | | | 830 | | | | 930 | |
#928658, 6.500%, due 9/1/37 | | | | | | | 135 | | | | 151 | |
#962058, 6.500%, due 3/1/38 | | | | | | | 1,505 | | | | 1,703 | |
#991911, 7.000%, due 11/1/38 | | | | | | | 528 | | | | 602 | |
| | | | | | | | | | | | |
Total FNMA Mortgage Obligations | | | | | | | | | | | 31,173 | |
| | | | | | | | | | | | |
|
Non-Agency Mortgage-Backed Obligations—1.0% | |
First Plus Home Loan Trust, 1997-4, Tranche M1,
7.640%, 9/11/23**§ | | | D | | | | 676 | | | | 566 | |
First Plus Home Loan Trust, 1997-4, Tranche M2,
7.830%, 9/11/23**§ | | | D | | | | 143 | | | | 104 | |
First Plus Home Loan Trust, 1998-3, Tranche M2, 7.920%, 5/10/24**§ | | | Caa1 | | | | 256 | | | | 247 | |
See accompanying Notes to Financial Statements.
98 Annual Report | December 31, 2011 |
Income Fund
Portfolio of Investments, December 31, 2011 (all amounts in thousands)
| | | | | | | | | | | | |
Issuer | | NRSRO
Rating
(unaudited) | | | Principal
Amount | | | Value | |
|
Non-Agency Mortgage-Backed Obligations—1.0%—(continued) | |
Lehman Structured Securities Corp.—144A, 2004-2, Tranche M1, 2.217%, 2/28/33, VRN§ | | | CCC | | | $ | 346 | | | $ | 159 | |
| | | | | | | | | | | | |
Total Non-Agency Mortgage-Backed Obligations | | | | | | | | | | | 1,076 | |
| | | | | | | | | | | | |
| | |
Asset-Backed Securities—4.6% | | | | | | | | | |
Avis Budget Rental Car Funding AESOP LLC—144A, 2009-1A, Tranche A, 9.310%, 10/20/13 | | | Aa1 | | | | 1,000 | | | | 1,042 | |
Hertz Vehicle Financing LLC—144A, 2009-2A, Tranche A1, 4.260%, 3/25/14 | | | Aaa | | | | 1,500 | | | | 1,536 | |
Centre Point Funding LLC—144A, 2010-1A, Tranche 1,
5.430%, 7/20/16 | | | A2 | | | | 1,418 | | | | 1,485 | |
Citibank Omni Master Trust—144A, 2009-A14A, Tranche A14, 3.028%, 8/15/18, VRN | | | Aaa | | | | 1,000 | | | | 1,049 | |
| | | | | | | | | | | | |
Total Asset-Backed Securities | | | | | | | | | | | 5,112 | |
| | | | | | | | | | | | |
| | |
Corporate Obligations—42.9% | | | | | | | | | |
PACCAR, Inc.,
6.875%, due 2/15/14 | | | A | + | | | 1,000 | | | | 1,120 | |
Bank of America Corporation, 7.375%, due 5/15/14 | | | A | | | | 500 | | | | 518 | |
St. Jude Medical, Inc.,
3.750%, due 7/15/14 | | | A | | | | 500 | | | | 530 | |
AT&T, Inc., 5.100%, due 9/15/14 | | | A2 | | | | 1,250 | | | | 1,377 | |
Corporation Nacional del Cobre de Chile—144A,
4.750%, due 10/15/14 | | | A1 | | | | 1,000 | | | | 1,073 | |
Raytheon Co.,
1.400%, due 12/15/14 | | | A- | | | | 1,000 | | | | 1,005 | |
United Technologies Corporation, 4.875%, due 5/1/15 | | | A | + | | | 1,000 | | | | 1,123 | |
PepsiCo, Inc.,
2.500%, due 5/10/16 | | | Aa3 | | | | 700 | | | | 728 | |
Petrobras International Finance Co., 6.125%, due 10/6/16 | | | A3 | | | | 1,000 | | | | 1,109 | |
BHP Billiton Finance USA, Ltd., 5.400%, due 3/29/17 | | | A | + | | | 1,000 | | | | 1,160 | |
ERP Operating L.P.,
5.750%, due 6/15/17 | | | BBB | + | | | 1,000 | | | | 1,109 | |
JPMorgan Chase & Co.,
6.125%, due 6/27/17 | | | A1 | | | | 1,750 | | | | 1,923 | |
Kimberly-Clark Corporation, 6.125%, due 8/1/17 | | | A | | | | 1,000 | | | | 1,223 | |
American Express Co.,
6.150%, due 8/28/17 | | | A | + | | | 1,500 | | | | 1,716 | |
IBM Corporation,
5.700%, due 9/14/17 | | | Aa3 | | | | 1,750 | | | | 2,119 | |
Capital One Financial Corporation,
6.750%, due 9/15/17 | | | A- | | | | 1,000 | | | | 1,121 | |
Exelon Generation Co. LLC, 6.200%, due 10/1/17 | | | A3 | | | | 1,000 | | | | 1,148 | |
Motorola Solutions, Inc.,
6.000%, due 11/15/17 | | | BBB | | | | 750 | | | | 841 | |
|
Corporate Obligations—42.9%—(continued) | |
Tesco plc—144A,
5.500%, due 11/15/17 | | | A- | | | $ | 1,000 | | | $ | 1,160 | |
Abbott Laboratories,
5.600%, due 11/30/17 | | | AA | | | | 500 | | | | 597 | |
Wells Fargo & Co.,
5.625%, due 12/11/17 | | | AA- | | | | 750 | | | | 855 | |
American Tower Corporation, 4.500%, due 1/15/18 | | | Baa3 | | | | 500 | | | | 509 | |
Morgan Stanley,
6.625%, due 4/1/18 | | | A2 | | | | 750 | | | | 741 | |
General Electric Capital Corporation,
5.625%, due 5/1/18 | | | AA | + | | | 1,725 | | | | 1,932 | |
Philip Morris International, Inc., 5.650%, due 5/16/18 | | | A | | | | 1,250 | | | | 1,479 | |
Simon Property Group L.P., 6.125%, due 5/30/18 | | | A- | | | | 1,000 | | | | 1,148 | |
Time Warner Cable, Inc.,
6.750%, due 7/1/18 | | | BBB | | | | 750 | | | | 891 | |
John Deere Capital Corporation, 5.750%, due 9/10/18 | | | A | | | | 900 | | | | 1,090 | |
Honeywell International, Inc., 5.000%, due 2/15/19 | | | A | | | | 1,225 | | | | 1,426 | |
The Procter & Gamble Co., 4.700%, due 2/15/19 | | | AA- | | | | 500 | | | | 590 | |
Unilever Capital Corporation, 4.800%, due 2/15/19 | | | A | + | | | 500 | | | | 581 | |
Burlington Northern Santa Fe LLC,
4.700%, due 10/1/19 | | | A3 | | | | 1,000 | | | | 1,122 | |
Boston Properties L.P.,
5.875%, due 10/15/19 | | | A- | | | | 1,350 | | | | 1,520 | |
The Boeing Co.,
4.875%, due 2/15/20 | | | A | | | | 1,000 | | | | 1,168 | |
The Goldman Sachs Group, Inc., 6.000%, due 6/15/20 | | | A1 | | | | 1,000 | | | | 1,024 | |
Citigroup, Inc.,
5.375%, due 8/9/20 | | | A | | | | 1,000 | | | | 1,028 | |
Alcoa, Inc.,
6.150%, due 8/15/20 | | | BBB- | | | | 1,000 | | | | 1,039 | |
Omnicom Group, Inc.,
4.450%, due 8/15/20 | | | BBB | + | | | 750 | | | | 773 | |
Georgia-Pacific LLC—144A, 5.400%, due 11/1/20 | | | A- | | | | 450 | | | | 498 | |
Progress Energy, Inc.,
4.400%, due 1/15/21 | | | BBB | | | | 500 | | | | 551 | |
L-3 Communications Corporation,
4.950%, due 2/15/21 | | | BBB- | | | | 1,000 | | | | 991 | |
Energizer Holdings, Inc.—144A,
4.700%, due 5/19/21 | | | BBB- | | | | 750 | | | | 789 | |
Praxair, Inc.,
3.000%, due 9/1/21 | | | A | | | | 1,000 | | | | 1,023 | |
O’Reilly Automotive, Inc.,
4.625%, due 9/15/21 | | | BBB- | | | | 700 | | | | 734 | |
Aristotle Holding, Inc.—144A,
4.750%, due 11/15/21 | | | BBB | + | | | 1,000 | | | | 1,035 | |
Gilead Sciences, Inc.,
4.400%, due 12/1/21 | | | A- | | | | 800 | | | | 847 | |
| | | | | | | | | | | | |
Total Corporate Obligations | | | | | | | | | | | 48,084 | |
| | | | | | | | | | | | |
Total Long-Term Investments—98.1%
(cost $104,857) | | | | 109,815 | |
| | | | | | | | | | | | |
See accompanying Notes to Financial Statements.
December 31, 2011 | William Blair Funds 99 |
Income Fund
Portfolio of Investments, December 31, 2011 (all amounts in thousands)
| | | | | | | | | | | | |
Issuer | | NRSRO
Rating
(unaudited) | | | Principal
Amount | | | Value | |
| | | |
Repurchase Agreement | | | | | | | | | | | | |
Fixed Income Clearing Corporation, 0.000% dated 12/30/11, due 1/3/12, repurchase price $1,136, collateralized by FNMA, 5.000%, due 3/15/16 | | | Aaa | | | $ | 1,136 | | | $ | 1,136 | |
| | | | | | | | | | | | |
Total Repurchase Agreement—1.0%
(cost $1,136) | | | | 1,136 | |
| | | | | | | | | | | | |
Total Investments—99.1%
(cost $105,993) | | | | 110,951 | |
Cash and other assets, less liabilities—0.9% | | | | 1,034 | |
| | | | | | | | | | | | |
Net assets—100.0% | | | $ | 111,985 | |
| | | | | | | | | | | | |
NRSRO Nationally Recognized Statistical Rating Organization—The credit quality ratings of the securities in the Fund reflect the highest category rating by either Fitch Ratings, Moody’s Investors Service Inc., or Standard & Poor’s, a division of the McGraw-Hill Companies, Inc. The obligations of certain U. S. Government-sponsored securities are neither issued nor guaranteed by the U. S. Treasury.
VRN Variable Rate Note
** Fair valued pursuant to Valuation Procedures adopted by the Board of Trustees. These holdings represent 0.82% of the Fund’s net assets at December 31, 2011.
§ Deemed illiquid pursuant to Liquidity Procedures approved by the Board of Trustees. These holdings represent 0.96% of the net assets at December 31, 2011.
See accompanying Notes to Financial Statements.
100 Annual Report | December 31, 2011 |
Christopher T. Vincent
Paul J. Sularz
LOW DURATION FUND
The Low Duration Fund seeks to maximize total return. Total return includes both income and capital appreciation.
AN OVERVIEW FROM THE PORTFOLIO MANAGERS
The Low Duration Fund posted a 1.73% increase on a total return basis (Class N Shares) for the 12 months ended December 31, 2011. By comparison, the Fund’s benchmark, the Merrill Lynch 1-Year U.S. Treasury Note Index, gained 0.57%.
The Fund had a very positive year, with the Fund outperforming its Merrill Lynch 1-Year U.S. Treasury Note Index benchmark. We believe the Fund has been able to outperform the benchmark without sacrificing credit quality. The Fund does not own securities with a rating below “A” from a Nationally Recognized Statistical Rating Organization.
The majority of the Fund’s portfolio is invested in seasoned U.S. Government-guaranteed short duration Mortgage-backed Fannie Mae and Freddie Mac securities. This is the Fund’s major sector emphasis. We favor such securities because they are high quality instruments, provide excellent liquidity, and pay monthly principal and interest, which we then are able to reinvest. The benefits of this strategy are evident in a rising rate environment such as the one we experienced during the first quarter.
Asset-Backed Securities are another segment of the market in which we invest that offers monthly payment of principal and interest. We continued to invest in credit card securitizations issued by top-tier banking institutions. As mentioned, all Asset-Backed Securities held in the Fund must maintain a rating above “A.”
Since the beginning of 2011, we have increased the Fund’s holdings of Asset-Backed Securities whose coupons are reset monthly and are tied to LIBOR—the London Interbank Offered Rate. The income from these securities will rise with any increase in rates and will protect the Fund against falling prices. The percentage of these floating-rate securities in the Fund’s portfolio rose from approximately 15% at the beginning of 2011 to approximately 22% at the end of the year.
The Fund purchased TIPS (Treasury Inflation-Protected Securities) earlier this year. TIPS have been the strongest-performing investment grade security. We believe in holding TIPS instead of nominal Treasuries, as TIPS provide protection against unexpected inflation and diversification benefits.
The Fund kept its exposure to cash and cash equivalents extremely low, given the very low rates currently available from money market instruments.
Assets in the Fund continued to build since the Fund’s inception in 2010, with assets increasing to a new high “watermark” of approximately $157 million at the end of 2011.
While Treasury rates are at historically low levels, corporate risk spreads are at elevated levels last experienced in mid-2009 as the market was recovering from the depths of the credit crisis. In addition, demand for high-quality, fixed-income assets has risen due to increased equity market volatility and the near-zero rates offered by money market instruments.
We structure our Low Duration Fund to earn a competitive yield by emphasizing security selection in agency mortgage-backed securities, asset-backed securities, and high-quality corporate bonds.
December 31, 2011 | William Blair Funds 101 |
Our primary emphasis remains in agency mortgage-backed securities, primarily higher-coupon, low loan balance, 15-year pools. We believe these securities will experience slower prepayments in a lower interest rate environment.
Within the asset-backed sector, we are allocated to short-dated auto and credit card loan receivable pools originated by “Tier 1” issuers. Some of our asset-backed holdings are floating-rate instruments, which help protect principal in a rising interest rate environment.
In the corporate sector, we favor short-dated, high-quality (A-rated or better) bonds of large, systemically important financial institutions, as well as high-quality, blue-chip industrials.
102 Annual Report | December 31, 2011 |
Low Duration Fund
Performance Highlights (Unaudited)
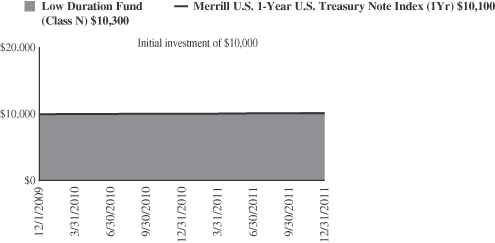
Average Annual Total Return at 12/31/2011
| | | | | | | | |
| | | 1
Year | | | Since
Inception(a) | |
Class N | | | 1.73 | % | | | 1.43 | % |
Class I | | | 1.99 | | | | 1.57 | |
Merrill Lynch 1-Year U.S. Treasury Note Index | | | 0.57 | | | | 0.60 | |
| | (a) | | For the period from December 1, 2009 (Commencement of Operations) to December 31, 2011. | |
Performance cited represents past performance. Past performance does not guarantee future results and current performance may be lower or higher than the data quoted. Results shown are average annual total returns, which assume reinvestment of dividends and capital gains. Investment returns and principal will fluctuate and you may have a gain or loss when you sell shares. For the most current month-end performance information, please call 1-800-742-7272, or visit our Web site at www.williamblairfunds.com. From time to time, the investment advisor may waive fees or reimburse expenses for the Fund. Without these waivers, performance would be lower. Class N shares are available to the general public without a sales load. Class I shares are available to certain institutional investors and advisory clients of William Blair & Company, L.L.C., without a sales load or distribution fees (12b-1).
The performance highlights and graph presented above do not reflect the deduction of taxes that a shareholder would pay on fund distributions or the redemption of fund shares.
The Merrill Lynch 1-Year U.S. Treasury Note Index is comprised of a single U.S. Treasury Note issue purchased at the beginning of the month and held for a full month. Each month the index is rebalanced and the issue selected is the outstanding U.S. Treasury Note that matures closest to, but not beyond one year from the rebalancing date.
This report identifies the Fund’s investments on December 31, 2011. These holdings are subject to change. Not all investments in the Fund performed the same, nor is there any guarantee that these investments will perform as well in the future. Market forecasts provided in this report may not necessarily come to pass.
Sector Diversification (Unaudited)
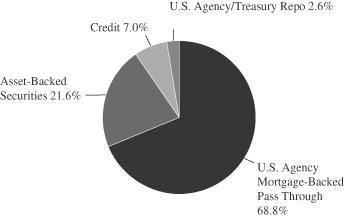
The sector diversification shown is based on the total investments.
December 31, 2011 | William Blair Funds 103 |
Low Duration Fund
Portfolio of Investments, December 31, 2011 (all dollar amounts in thousands)
| | | | | | | | | | |
Issuer | | Principal
Amount | | | Value | |
|
U.S. Government and U.S. Government Agency—68.1% | |
Government National Mortgage Association (GNMA)—0.4% | | | | | | | | | | |
#781567, 5.000%, due 2/15/18 | | | | $ | 101 | | | $ | 108 | |
#606406, 5.000%, due 4/15/18 | | | | | 151 | | | | 164 | |
#003438, 4.500%, due 9/20/18 | | | | | 254 | | | | 276 | |
#003465, 4.500%, due 11/20/18 | | | | | 77 | | | | 84 | |
| | | | | | | | | | |
Total GNMA Mortgage Obligations | | | | | | | | | 632 | |
| | | | | | | | | | |
Federal Home Loan Mortgage Corp. (FHLMC)—23.6% | | | | | | | | | | |
#M80970, 4.500%, due 5/1/12 | | | | | 64 | | | | 64 | |
#M80982, 5.000%, due 7/1/12 | | | | | 185 | | | | 189 | |
#B18053, 5.000%, due 3/1/15 | | | | | 61 | | | | 64 | |
#G11885, 5.000%, due 1/1/16 | | | | | 193 | | | | 207 | |
#E86134, 5.000%, due 11/1/16 | | | | | 202 | | | | 216 | |
#E01337, 4.000%, due 2/1/18 | | | | | 198 | | | | 209 | |
#E96536, 5.000%, due 3/1/18 | | | | | 315 | | | | 340 | |
#E95355, 5.000%, due 4/1/18 | | | | | 402 | | | | 433 | |
#E01377, 4.500%, due 5/1/18 | | | | | 404 | | | | 428 | |
#G11618, 4.500%, due 5/1/18 | | | | | 1,867 | | | | 1,992 | |
#E96700, 5.000%, due 5/1/18 | | | | | 1,161 | | | | 1,250 | |
#E96962, 4.000%, due 6/1/18 | | | | | 196 | | | | 209 | |
#E01411, 5.000%, due 7/1/18 | | | | | 208 | | | | 222 | |
#E01424, 4.000%, due 8/1/18 | | | | | 5 | | | | 6 | |
#G12024, 4.500%, due 8/1/18 | | | | | 502 | | | | 535 | |
#E99963, 4.500%, due 10/1/18 | | | | | 120 | | | | 128 | |
#E01488, 5.000%, due 10/1/18 | | | | | 445 | | | | 477 | |
#E99895, 5.000%, due 10/1/18 | | | | | 897 | | | | 966 | |
#G12093, 4.500%, due 12/1/18 | | | | | 544 | | | | 581 | |
#B11386, 5.000%, due 12/1/18 | | | | | 189 | | | | 203 | |
#B11362, 5.500%, due 12/1/18 | | | | | 28 | | | | 30 | |
#G13367, 5.500%, due 12/1/18 | | | | | 152 | | | | 165 | |
#E01545, 5.000%, due 1/1/19 | | | | | 251 | | | | 269 | |
#B12826, 4.500%, due 3/1/19 | | | | | 855 | | | | 916 | |
#G11766, 5.000%, due 3/1/19 | | | | | 182 | | | | 196 | |
#G13176, 4.000%, due 5/1/19 | | | | | 211 | | | | 224 | |
#G18001, 4.500%, due 7/1/19 | | | | | 245 | | | | 261 | |
#G11596, 5.500%, due 8/1/19 | | | | | 213 | | | | 233 | |
#B16291, 5.000%, due 9/1/19 | | | | | 1,461 | | | | 1,574 | |
#G11605, 5.500%, due 9/1/19 | | | | | 109 | | | | 119 | |
#G11690, 4.000%, due 2/1/20 | | | | | 33 | | | | 35 | |
#G18045, 5.000%, due 3/1/20 | | | | | 200 | | | | 216 | |
#G11892, 4.000%, due 4/1/20 | | | | | 194 | | | | 207 | |
#B19078, 5.000%, due 4/1/20 | | | | | 141 | | | | 152 | |
#G18048, 5.000%, due 4/1/20 | | | | | 134 | | | | 144 | |
#J08152, 5.000%, due 5/1/20 | | | | | 139 | | | | 150 | |
#G11720, 4.500%, due 8/1/20 | | | | | 43 | | | | 45 | |
#J14232, 3.500%, due 1/1/21 | | | | | 2,478 | | | | 2,588 | |
#G12394, 5.000%, due 5/1/21 | | | | | 252 | | | | 271 | |
#G13296, 5.000%, due 5/1/21 | | | | | 691 | | | | 744 | |
#G12113, 5.500%, due 5/1/21 | | | | | 342 | | | | 375 | |
#G12286, 5.000%, due 7/1/21 | | | | | 137 | | | | 147 | |
#G12545, 4.000%, due 10/1/21 | | | | | 266 | | | | 282 | |
#E02322, 5.500%, due 5/1/22 | | | | | 92 | | | | 100 | |
#J06484, 5.500%, due 11/1/22 | | | | | 772 | | | | 845 | |
#C00351, 8.000%, due 7/1/24 | | | | | 127 | | | | 150 | |
#G13695, 4.000%, due 9/1/24 | | | | | 1,849 | | | | 1,977 | |
#G00363, 8.000%, due 6/1/25 | | | | | 163 | | | | 195 | |
#C80329, 8.000%, due 8/1/25 | | | | | 39 | | | | 47 | |
#J13022, 4.000%, due 9/1/25 | | | | | 2,753 | | | | 2,943 | |
|
U.S. Government and U.S. Government Agency—68.1%—(continued) | |
Federal Home Loan Mortgage Corp. (FHLMC)—(continued) | | | | | | | | | | |
#G14150, 4.500%, due 4/1/26 | | | | $ | 3,531 | | | $ | 3,813 | |
#E02912, 5.000%, due 6/1/26 | | | | | 1,823 | | | | 1,964 | |
#E02913, 5.000%, due 6/1/26 | | | | | 1,725 | | | | 1,862 | |
#J16051, 4.500%, due 7/1/26 | | | | | 4,798 | | | | 5,181 | |
| | | | | | | | | | |
Total FHLMC Mortgage Obligations | | | | | | | | | 37,139 | |
| | | | | | | | | | |
Federal National Mortgage Association (FNMA)—44.1% | | | | | | | | | | |
#256224, 5.500%, due 4/1/16 | | | | | 36 | | | | 39 | |
#256559, 5.500%, due 1/1/17 | | | | | 20 | | | | 22 | |
#256606, 5.500%, due 2/1/17 | | | | | 26 | | | | 28 | |
#256646, 5.500%, due 3/1/17 | | | | | 19 | | | | 20 | |
#545898, 5.500%, due 9/1/17 | | | | | 549 | | | | 597 | |
#545899, 5.500%, due 9/1/17 | | | | | 641 | | | | 697 | |
#555029, 5.000%, due 11/1/17 | | | | | 79 | | | | 85 | |
#257067, 5.000%, due 1/1/18 | | | | | 91 | | | | 98 | |
#663692, 5.000%, due 1/1/18 | | | | | 260 | | | | 281 | |
#674713, 5.000%, due 1/1/18 | | | | | 20 | | | | 21 | |
#679305, 5.000%, due 1/1/18 | | | | | 84 | | | | 91 | |
#254591, 5.500%, due 1/1/18 | | | | | 424 | | | | 458 | |
#677680, 4.500%, due 2/1/18 | | | | | 15 | | | | 16 | |
#681310, 4.500%, due 2/1/18 | | | | | 326 | | | | 349 | |
#678938, 5.500%, due 2/1/18 | | | | | 41 | | | | 45 | |
#683100, 5.500%, due 2/1/18 | | | | | 551 | | | | 605 | |
#254684, 5.000%, due 3/1/18 | | | | | 29 | | | | 31 | |
#675717, 5.000%, due 3/1/18 | | | | | 380 | | | | 411 | |
#681361, 5.000%, due 3/1/18 | | | | | 144 | | | | 155 | |
#656564, 5.000%, due 4/1/18 | | | | | 1,957 | | | | 2,113 | |
#696677, 5.000%, due 4/1/18 | | | | | 137 | | | | 148 | |
#702888, 5.000%, due 4/1/18 | | | | | 203 | | | | 219 | |
#695838, 5.500%, due 4/1/18 | | | | | 118 | | | | 129 | |
#929388, 4.500%, due 5/1/18 | | | | | 492 | | | | 525 | |
#254721, 5.000%, due 5/1/18 | | | | | 322 | | | | 348 | |
#702332, 5.000%, due 5/1/18 | | | | | 68 | | | | 74 | |
#704049, 5.500%, due 5/1/18 | | | | | 1,048 | | | | 1,152 | |
#735357, 5.500%, due 5/1/18 | | | | | 1,641 | | | | 1,803 | |
#254785, 4.000%, due 6/1/18 | | | | | 232 | | | | 246 | |
#555622, 4.500%, due 6/1/18 | | | | | 403 | | | | 432 | |
#656573, 5.000%, due 6/1/18 | | | | | 300 | | | | 327 | |
#709848, 5.000%, due 6/1/18 | | | | | 265 | | | | 289 | |
#713380, 4.000%, due 7/1/18 | | | | | 242 | | | | 258 | |
#254802, 4.500%, due 7/1/18 | | | | | 349 | | | | 374 | |
#713807, 4.500%, due 7/1/18 | | | | | 190 | | | | 204 | |
#735003, 5.500%, due 7/1/18 | | | | | 1,751 | | | | 1,924 | |
#254840, 4.000%, due 8/1/18 | | | | | 114 | | | | 122 | |
#682443, 4.000%, due 8/1/18 | | | | | 500 | | | | 532 | |
#730823, 4.000%, due 8/1/18 | | | | | 216 | | | | 230 | |
#734753, 4.000%, due 8/1/18 | | | | | 37 | | | | 40 | |
#711991, 5.000%, due 8/1/18 | | | | | 246 | | | | 268 | |
#254919, 4.000%, due 9/1/18 | | | | | 30 | | | | 32 | |
#740444, 4.500%, due 9/1/18 | | | | | 321 | | | | 344 | |
#734741, 4.000%, due 10/1/18 | | | | | 22 | | | | 23 | |
#743183, 5.000%, due 10/1/18 | | | | | 107 | | | | 116 | |
#255003, 4.000%, due 11/1/18 | | | | | 15 | | | | 16 | |
#747823, 4.000%, due 11/1/18 | | | | | 613 | | | | 657 | |
#749596, 5.000%, due 11/1/18 | | | | | 374 | | | | 408 | |
#745237, 5.000%, due 12/1/18 | | | | | 87 | | | | 94 | |
See accompanying Notes to Financial Statements.
104 Annual Report | December 31, 2011 |
Low Duration Fund
Portfolio of Investments, December 31, 2011 (all dollar amounts in thousands)
| | | | | | | | | | | | |
Issuer | | NRSRO
Rating
(unaudited) | | | Principal
Amount | | | Value | |
|
U.S. Government and U.S. Government Agency—68.1%—(continued) | |
Federal National Mortgage Association (FNMA)—(continued) | | | | | | | | | |
#725171, 4.000%, due 1/1/19 | | | | | | $ | 14 | | | $ | 15 | |
#725168, 4.500%, due 2/1/19 | | | | | | | 255 | | | | 273 | |
#255079, 5.000%, due 2/1/19 | | | | | | | 74 | | | | 80 | |
#766276, 5.000%, due 3/1/19 | | | | | | | 597 | | | | 649 | |
#255233, 4.000%, due 5/1/19 | | | | | | | 528 | | | | 562 | |
#725445, 4.500%, due 5/1/19 | | | | | | | 949 | | | | 1,015 | |
#779363, 5.000%, due 6/1/19 | | | | | | | 112 | | | | 122 | |
#785259, 5.000%, due 8/1/19 | | | | | | | 456 | | | | 496 | |
#725953, 5.000%, due 10/1/19 | | | | | | | 131 | | | | 143 | |
#745240, 4.500%, due 12/1/19 | | | | | | | 548 | | | | 587 | |
#735401, 5.500%, due 3/1/20 | | | | | | | 339 | | | | 369 | |
#735646, 4.500%, due 7/1/20 | | | | | | | 635 | | | | 679 | |
#745440, 4.500%, due 7/1/20 | | | | | | | 11 | | | | 12 | |
#825912, 4.000%, due 9/1/20 | | | | | | | 68 | | | | 72 | |
#836016, 4.500%, due 9/1/20 | | | | | | | 743 | | | | 794 | |
#879607, 5.500%, due 4/1/21 | | | | | | | 149 | | | | 163 | |
#881284, 4.500%, due 12/1/21 | | | | | | | 1,374 | | | | 1,471 | |
#972934, 5.500%, due 2/1/23 | | | | | | | 534 | | | | 585 | |
#254908, 5.000%, due 9/1/23 | | | | | | | 102 | | | | 111 | |
#255165, 4.500%, due 3/1/24 | | | | | | | 129 | | | | 141 | |
#934808, 4.500%, due 3/1/24 | | | | | | | 170 | | | | 185 | |
#AA4519, 4.500%, due 3/1/24 | | | | | | | 2,898 | | | | 3,147 | |
#AA5028, 4.500%, due 4/1/24 | | | | | | | 674 | | | | 732 | |
#190988, 9.000%, due 6/1/24 | | | | | | | 207 | | | | 241 | |
#AC8857, 4.500%,due 12/1/24 | | | | | | | 104 | | | | 112 | |
#AC9560, 5.000%, due 1/1/25 | | | | | | | 4,548 | | | | 4,959 | |
#932449, 4.000%, due 2/1/25 | | | | | | | 660 | | | | 709 | |
#AD0855, 4.000%, due 3/1/25 | | | | | | | 336 | | | | 360 | |
#932723, 4.000%, due 4/1/25 | | | | | | | 800 | | | | 859 | |
#935995, 4.000%, due 6/1/25 | | | | | | | 230 | | | | 247 | |
#AD4677, 4.000%, due 6/1/25 | | | | | | | 2,573 | | | | 2,763 | |
#AD8164, 4.000%, due 8/1/25 | | | | | | | 2,302 | | | | 2,473 | |
#AE1176, 4.000%, due 8/1/25 | | | | | | | 1,032 | | | | 1,109 | |
#AB1459, 4.000%, due 9/1/25 | | | | | | | 266 | | | | 285 | |
#AH2671, 4.000%, due 1/1/26 | | | | | | | 1,893 | | | | 2,033 | |
#890329, 4.000%, due 4/1/26 | | | | | | | 1,860 | | | | 1,992 | |
#AI4856, 4.500%, due 6/1/26 | | | | | | | 2,228 | | | | 2,420 | |
#AI9811, 4.500%, due 8/1/26 | | | | | | | 3,211 | | | | 3,487 | |
#AH9564, 3.500%, due 9/1/26 | | | | | | | 3,679 | | | | 3,894 | |
#AB3608, 3.500%, due 10/1/26 | | | | | | | 3,936 | | | | 4,167 | |
#AI7363, 3.500%, due 10/1/26 | | | | | | | 1,297 | | | | 1,373 | |
#AJ2322, 3.500%, due 10/1/26 | | | | | | | 3,011 | | | | 3,187 | |
#AJ7724, 4.000%, due 12/1/26 | | | | | | | 2,500 | | | | 2,685 | |
| | | | | | | | | | | | |
Total FNMA Mortgage Obligations | | | | | | | | | | | 69,254 | |
| | | | | | | | | | | | |
|
Asset-Backed Securities—21.4% | |
Honda Auto Receivables Owner Trust, 2009-2, Tranche A3,
2.790%, 1/15/13 | | | AAA | | | | 90 | | | | 90 | |
CarMax Auto Owner Trust, 2009-1, Tranche A3,
4.120%, 3/15/13 | | | AAA | | | | 34 | | | | 34 | |
Ford Credit Auto Owner Trust, 2009-A, Tranche A3A,
3.960%, 5/15/13 | | | AAA | | | | 44 | | | | 44 | |
|
Asset-Backed Securities—21.4%—(continued) | |
USAA Auto Owner Trust, 2009-1, Tranche A3,
3.020%, 6/17/13 | | | AAA | | | $ | 1 | | | $ | 1 | |
American Express Issuance Trust, 2007-2, Tranche A,
0.528%, 7/15/13, VRN | | | AAA | | | | 373 | | | | 373 | |
Ally Auto Receivables Trust, 2010-3, Tranche A2,
0.378%, 8/15/13, VRN | | | AAA | | | | 314 | | | | 314 | |
Ford Credit Auto Owner Trust, 2009-B, Tranche A3,
2.790%, 8/15/13 | | | AAA | | | | 139 | | | | 140 | |
John Deere Owner Trust, 2009-B, Tranche A3,
1.570%, 10/15/13 | | | AAA | | | | 250 | | | | 250 | |
Avis Budget Rental Car Funding AESOP LLC—144A, 2009-1A, Tranche A,
9.310%, 10/20/13 | | | Aa1 | | | | 2,000 | | | | 2,084 | |
Harley-Davidson Motorcycle Trust, 2009-1, Tranche A3,
3.190%, 11/15/13 | | | AAA | | | | 353 | | | | 353 | |
CNH Equipment Trust, 2009-C, Tranche A3,
1.850%, 12/16/13 | | | AAA | | | | 4 | | | | 4 | |
Volkswagen Auto Loan Enhanced Trust, 2010-1, Tranche A3,
1.310%, 1/20/14 | | | AAA | | | | 485 | | | | 486 | |
USAA Auto Owner Trust, 2008-3, Tranche A4,
4.710%, 2/18/14 | | | AAA | | | | 25 | | | | 25 | |
Harley-Davidson Motorcycle Trust, 2009-2, Tranche A3,
2.620%, 3/15/14 | | | AAA | | | | 192 | | | | 193 | |
Hertz Vehicle Financing LLC—144A, 2009-2A, Tranche A1,
4.260%, 3/25/14 | | | Aaa | | | | 1,765 | | | | 1,807 | |
BMW Vehicle Owner Trust, 2010-A, Tranche A3,
1.390%, 4/25/14 | | | AAA | | | | 235 | | | | 235 | |
Ford Credit Auto Owner Trust, 2010-A, Tranche A3,
1.320%, 6/15/14 | | | AAA | | | | 367 | | | | 368 | |
Nissan Auto Receivables Owner Trust, 2008-A, Tranche A4,
4.280%, 6/16/14 | | | AAA | | | | 35 | | | | 35 | |
Capital Auto Receivables Asset Trust, 2008-1, Tranche A4B,
1.628%, 7/15/14, VRN | | | AAA | | | | 353 | | | | 355 | |
CNH Equipment Trust, 2010-A, Tranche A3,
1.540%, 7/15/14 | | | AAA | | | | 444 | | | | 445 | |
Nissan Auto Receivables Owner Trust, 2010-A, Tranche A3,
0.870%, 7/15/14 | | | Aaa | | | | 500 | | | | 501 | |
Daimler Chrysler Auto Trust, 2008-A, Tranche A4,
4.480%, 8/8/14 | | | AAA | | | | 444 | | | | 446 | |
See accompanying Notes to Financial Statements.
December 31, 2011 | William Blair Funds 105 |
Low Duration Fund
Portfolio of Investments, December 31, 2011 (all dollar amounts in thousands)
| | | | | | | | | | | | |
Issuer | | NRSRO
Rating
(unaudited) | | | Principal
Amount | | | Value | |
|
Asset-Backed Securities—21.4%—(continued) | |
Mercedes-Benz Auto Lease Trust—144A, 2011-B, Tranche A3,
1.070%, 8/15/14 | | | Aaa | | | $ | 1,500 | | | $ | 1,498 | |
Nissan Auto Receivables Owner Trust, 2009-1, Tranche A3,
5.000%, 9/15/14 | | | AAA | | | | 293 | | | | 296 | |
Porsche Innovative Lease Owner Trust—144A, 2011-1, Tranche A3,
1.090%, 9/22/14 | | | Aaa | | | | 500 | | | | 499 | |
Nissan Master Owner Trust Receivables—144A, 2010-AA, Tranche A,
1.428%, 1/15/15, VRN | | | AAA | | | | 2,000 | | | | 2,015 | |
CNH Equipment Trust, 2010-C, Tranche A3,
1.170%, 5/15/15 | | | AAA | | | | 459 | | | | 459 | |
Harley-Davidson Motorcycle Trust, 2011-2, Tranche A2,
0.710%, 5/15/15 | | | Aaa | | | | 1,500 | | | | 1,498 | |
Discover Card Master Trust, 2007-A2, Tranche A2,
0.886%, 6/15/15, VRN | | | AAA | | | | 192 | | | | 193 | |
Discover Card Master Trust I, 2005-4, Tranche A2,
0.368%, 6/16/15, VRN | | | AAA | | | | 77 | | | | 77 | |
FPL Recovery Funding LLC, 2007-A, Tranche A2,
5.044%, 8/1/15 | | | AAA | | | | 700 | | | | 724 | |
Bank of America Credit Card Trust, 2010-A1, Tranche A1,
0.578%, 9/15/15, VRN | | | AAA | | | | 2,000 | | | | 2,005 | |
Discover Card Master Trust, 2010-A1, Tranche A1,
0.928%, 9/15/15, VRN | | | Aaa | | | | 347 | | | | 349 | |
USAA Auto Owner Trust, 2010-1, Tranche A4,
2.140%, 9/15/15 | | | AAA | | | | 685 | | | | 695 | |
American Express Credit Account Master Trust, 2010-1, Tranche A,
0.528%, 11/16/15, VRN | | | AAA | | | | 500 | | | | 501 | |
Ford Credit Floorplan Master Owner Trust, 2011-1, Tranche A2,
0.878%, 2/15/16, VRN | | | AAA | | | | 1,000 | | | | 999 | |
Hertz Vehicle Financing LLC—144A, 2009-2A, Tranche A2,
5.290%, 3/25/16 | | | Aaa | | | | 2,350 | | | | 2,544 | |
Ally Master Owner Trust, 2011-3, Tranche A1,
0.908%, 5/15/16, VRN | | | Aaa | | | | 1,100 | | | | 1,097 | |
CNH Equipment Trust, 2010-C, Tranche A4,
1.750%, 5/16/16 | | | AAA | | | | 60 | | | | 61 | |
|
Asset-Backed Securities—21.4%—(continued) | |
Avis Budget Rental Car Funding AESOP LLC—144A, 2010-3A, Tranche A,
4.640%, 5/20/16 | | | Aaa | | | $ | 1,400 | | | $ | 1,490 | |
Centre Point Funding LLC—144A, 2010-1A, Tranche 1,
5.430%, 7/20/16 | | | A2 | | | | 1,649 | | | | 1,727 | |
CNH Equipment Trust, 2011-B, Tranche A3,
0.910%, 8/15/16 | | | AAA | | | | 500 | | | | 498 | |
Discover Card Master Trust, 2011-A1, Tranche A1,
0.628%, 8/15/16, VRN | | | Aaa | | | | 1,400 | | | | 1,405 | |
Enterprise Fleet Financing LLC—144A, 2011-2, Tranche A2,
1.430%, 10/20/16 | | | AAA | | | | 2,000 | | | | 1,997 | |
GE Capital Credit Card Master Note Trust, 2011-1, Tranche A,
0.828%, 1/15/17, VRN | | | Aaa | | | | 500 | | | | 503 | |
Discover Card Master Trust, 2010-A2, Tranche A2,
0.858%, 3/15/18, VRN | | | AAA | | | | 350 | | | | 353 | |
Capital One Multi-Asset Execution Trust, 2007-A2, Tranche A2,
0.358%, 12/16/19, VRN | | | AAA | | | | 215 | | | | 209 | |
MBNA Credit Card Master Note Trust, 2004-A3, Tranche A3,
0.538%, 8/16/21, VRN | | | AAA | | | | 300 | | | | 296 | |
Sierra Receivables Funding Co. LLC—144A, 2011-1A, Tranche A,
3.350%, 4/20/26 | | | A | | | | 1,101 | | | | 1,079 | |
| | | | | | | | | | | | |
Total Asset-Backed Securities | | | | | | | | | | | 33,650 | |
| | | | | | | | | | | | |
|
Corporate Obligations—6.9% | |
Bank of America Corporation,
5.375%, due 9/11/12 | | | A | | | | 1,000 | | | | 1,012 | |
Citigroup, Inc.,
5.300%, due 10/17/12 | | | A | | | | 1,000 | | | | 1,016 | |
Wells Fargo & Co.,
5.250%, due 10/23/12 | | | AA- | | | | 1,000 | | | | 1,035 | |
The Goldman Sachs Group, Inc., 5.450%, due 11/1/12 | | | A1 | | | | 1,000 | | | | 1,017 | |
American Express Co.,
4.875%, due 7/15/13 | | | A | + | | | 1,000 | | | | 1,046 | |
JPMorgan Chase & Co.,
1.216%, due 1/24/14, VRN | | | Aa3 | | | | 1,000 | | | | 985 | |
Morgan Stanley,
2.016%, due 1/24/14, VRN | | | A2 | | | | 1,000 | | | | 921 | |
Bank of America Corporation,
1.848%, due 1/30/14, VRN | | | A | | | | 1,000 | | | | 903 | |
See accompanying Notes to Financial Statements.
106 Annual Report | December 31, 2011 |
Low Duration Fund
Portfolio of Investments, December 31, 2011 (all dollar amounts in thousands)
| | | | | | | | | | | | |
Issuer | | NRSRO
Rating
(unaudited) | | | Principal
Amount | | | Value | |
|
Corporate Obligations—6.9%—(continued) | |
Citigroup, Inc.,
1.511%, due 4/1/14, VRN | | | A | | | $ | 1,000 | | | $ | 942 | |
Morgan Stanley,
6.000%, due 5/13/14 | | | A2 | | | | 1,000 | | | | 1,010 | |
General Dynamics Corporation, 1.375%, due 1/15/15 | | | A | | | | 1,000 | | | | 1,011 | |
| | | | | | | | | | | | |
Total Corporate Obligations | | | | | | | | | | | 10,898 | |
| | | | | | | | | | | | |
Total Long-Term Investments—96.4%
(cost $151,313) | | | | 151,573 | |
| | | | | | | | | | | | |
| | | |
Repurchase Agreement | | | | | | | | | | | | |
Fixed Income Clearing Corporation, 0.000% dated 12/30/11, due 1/3/12, repurchase price $4,035, collateralized by FNMA, 5.000%, due 3/15/16 | | | Aaa | | | | 4,035 | | | | 4,035 | |
| | | | | | | | | | | | |
Total Repurchase Agreement—2.6%
(cost $4,035) | | | | 4,035 | |
| | | | | | | | | | | | |
Total Investments—99.0%
(cost $155,348) | | | | 155,608 | |
Cash and other assets, less liabilities—1.0% | | | | 1,539 | |
| | | | | | | | | | | | |
Net assets—100.0% | | | $ | 157,147 | |
| | | | | |
NRSRO Nationally Recognized Statistical Rating Organization—The credit quality ratings of the securities in the Fund reflect the highest category rating by either Fitch Ratings, Moody’s Investors Service Inc., or Standard & Poor’s, a division of the McGraw-Hill Companies, Inc.
The obligations of certain U. S. Government-sponsored securities are neither issued nor guaranteed by the U. S. Treasury.
VRN Variable Rate Note
See accompanying Notes to Financial Statements.
December 31, 2011 | William Blair Funds 107 |
Christopher T. Vincent

Kathleen M. Lynch
READY RESERVES FUND
AN OVERVIEW FROM THE PORTFOLIO MANAGERS
The return for the 12 months ended December 31, 2011, of the Fund’s Class N Shares was 0.01%, versus the 0.01% return of the Fund’s benchmark, the AAA-Rated Money Market Funds Average. Total assets were $1.27 billion at December 31, 2011, virtually unchanged from December 31, 2010.
Federal Reserve Board Monetary policy continued to be the focus of the money markets during 2011.
In 2011, the Federal Open Market Committee (FOMC)—which is comprised of members of the Federal Reserve’s board of governors and selected presidents of the regional Federal Reserve banks—implemented several unconventional policies over concerns of slowing U.S. economic growth.
In August, the FOMC announced that it believed the Fed Funds rate will remain at lower levels through at least mid-2013. In September, the FOMC announced plans for “Operation Twist,” which included buying longer-term securities and selling shorter-term securities. It also announced that it will reinvest principal payments in mortgage-backed securities to help support the mortgage market.
The most recent minutes from the December 13 FOMC meeting made no significant change to existing Fed policy.
The Federal Funds target rate was kept at a range of 0.00 – 0.25%.
The Fed stated that recent signs of improvement in the economy came despite the deterioration of global conditions, and it noted the continuing risk that a European meltdown could undermine the early American recovery.
“The economy has been expanding moderately, notwithstanding some apparent slowing in global growth,” the FOMC said in a statement announcing its decision. It noted an increase in household spending and a decrease in unemployment as signs of improvement.
The December meeting marked the third anniversary of the FOMC’s decision to hold short-term interest rates near zero, a policy it has previously stated it intends to continue through at least the middle of 2013 and possibly longer.
The FOMC also said it will continue its ongoing campaign to cut borrowing costs for businesses and consumers by investing in long-term Treasury securities, funded by proceeds from the sale of its existing holdings of short-term securities.
We believe that until fundamentals in the economy show significant signs of improvement—including gains in employment and strength in the housing market—and until inflation picks up, the Fed will leave its Federal Funds target rate at its existing level.
We continue to favor overnight repurchase agreements, in an effort to maintain a high degree of overnight liquidity.
The Fund also continues to maintain a relatively short Average Maturity. On December 31, 2011, the Fund’s Average Maturity was 41 days, up from 38 at September 30, 2011 and up from 37 at June, 30, 2011, and compared to 37 days on March 31, 2011 and 40 days on December 31, 2010.
108 Annual Report | December 31, 2011 |
Ready Reserves Fund
Performance Highlights (Unaudited)
The Fund’s 7 day yield on December 31, 2011 was 0.01%.
Average Annual Total Returns—Class N Shares period ended December 31, 2011.
| | | | | | | | | | | | | | | | |
| | | 1
Year | | | 3
Year | | | 5
Year | | | 10
Year | |
Ready Reserves Fund Class N | | | 0.01 | % | | | 0.04 | % | | | 1.40 | % | | | 1.67 | % |
AAA Ready Money Market Funds | | | 0.01 | % | | | 0.07 | % | | | 1.39 | % | | | 1.62 | % |
Performance cited represents past performance. Past performance does not guarantee future results and current performance may be lower or higher than the data quoted. For the most current month-end performance information, please call 1-800-742-7272, or visit our Web site at www.williamblairfunds.com. Class N Shares are available to the general public without a sales load. Total return includes reinvestment of income. Yields fluctuate and are not guaranteed. An investment in the Fund is neither insured nor guaranteed by the Federal Deposit Insurance Corp. (FDIC) or any government agency. Although the Fund seeks to preserve the value of your investment at $1.00 per share, it is possible to lose money by investing in the Fund.
The AAA Rated Money Market Funds Average represents the average annual composite performance of all AAA rated First Tier Retail Money Market Funds listed by iMoneyNet data.
This report identifies the Fund’s investments on December 31, 2011. These holdings are subject to change. Not all fixed-income securities in the Fund performed the same, nor is there any guarantee that these fixed-income securities will perform as well in the future. Market forecasts provided in this report may not necessarily come to pass.
Sector Diversification (Unaudited)
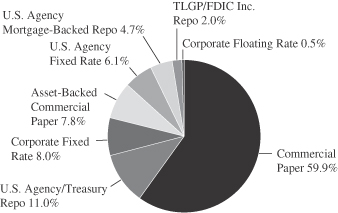
The sector diversification shown is based on the total Investments.
December 31, 2011 | William Blair Funds 109 |
Ready Reserves Fund
Portfolio of Investments, December 31, 2011 (all dollar amounts in thousands)
| | | | | | | | |
Issuer | | Principal
Amount | | | Amortized
Cost | |
|
U.S. Government and U.S. Government Agency—6.1% | |
Federal Home Loan Mortgage Corp. (FHLMC)—2.6% | |
Federal Home Loan Mortgage Corporation,
1.750%-5.125%, 3/5/12-9/21/12 | | $ | 32,006 | | | $ | 32,440 | |
| | | | | | | | |
Total Federal Home Loan Mortgage Corp. (FHLMC) | | | | | | | 32,440 | |
| | | | | | | | |
Federal National Mortgage Association (FNMA)—3.5% | |
Federal National Mortgage Association, 1.000%-5.000%, 1/9/12-11/19/12 | | | 44,214 | | | | 44,837 | |
| | | | | | | | |
Total Federal National Mortgage Association (FNMA) | | | | | | | 44,837 | |
| | | | | | | | |
| | |
Corporate Notes—8.5% | | | | | | | | |
Bank of America Corporation,
2.100%, 4/30/12 | | | 6,085 | | | | 6,125 | |
Brown-Forman Corporation,
5.200%, 4/1/12 | | | 4,275 | | | | 4,324 | |
Caterpillar Financial Services Corporation,
4.700%-5.750%, 2/15/12-3/15/12 | | | 3,815 | | | | 3,847 | |
Citigroup Funding, Inc.,
2.000%, 3/30/12 | | | 12,000 | | | | 12,053 | |
Eli Lilly & Co.,
3.550%, 3/6/12 | | | 10,410 | | | | 10,467 | |
General Electric Capital Corporation,
3.500%-6.000%, 2/15/12-10/19/12 | | | 23,423 | | | | 23,900 | |
International Business Machines Corporation,
0.576%, 6/15/12, VRN | | | 6,575 | | | | 6,576 | |
John Deere Capital Corporation,
5.250%-7.000%, 3/15/12-10/1/12 | | | 9,260 | | | | 9,522 | |
Kimberly-Clark Corporation,
5.625%, 2/15/12 | | | 1,040 | | | | 1,047 | |
Morgan Stanley,
1.950%-2.250%, 3/13/12-6/20/12 | | | 13,825 | | | | 13,918 | |
Praxair, Inc.,
6.375%, 4/1/12 | | | 5,593 | | | | 5,675 | |
Procter & Gamble Co. (The),
1.375%, 8/1/12 | | | 8,625 | | | | 8,678 | |
Shell International Finance BV,
4.950%, 3/22/12 | | | 750 | | | | 758 | |
State Street Corporation,
2.150%, 4/30/12 | | | 1,000 | | | | 1,007 | |
| | | | | | | | |
Total Corporate Notes | | | | | | | 107,897 | |
| | | | | | | | |
| | |
Commercial Paper—59.8% | | | | | | | | |
Abbott Laboratories,
0.030%, 1/17/12 | | | 10,000 | | | | 10,000 | |
American Honda Finance Corporation,
0.110%-0.120%, 1/5/12-1/19/12 | | | 30,000 | | | | 30,000 | |
Caterpillar Financial Services Corporation,
0.050%-0.080%, 1/20/12-2/27/12 | | | 29,438 | | | | 29,436 | |
Chevron Funding Corporation,
0.010%-0.050%, 1/4/12-1/13/12 | | | 48,000 | | | | 48,000 | |
Coca-Cola Co.,
0.070%-0.160%, 1/10/12-4/16/12 | | | 42,385 | | | | 42,380 | |
Colgate Palmolive Co.,
0.010%-0.020%, 1/9/12-1/18/12 | | | 11,500 | | | | 11,500 | |
|
Commercial Paper—59.8%—(continued) | |
Deere & Co.,
0.070%-0.130%, 1/26/12-6/20/12 | | $ | 14,000 | | | $ | 13,996 | |
General Electric Capital Corporation,
0.020%-0.030%, 1/23/12-1/30/12 | | | 20,000 | | | | 20,000 | |
Illinois Tool Works, Inc.,
0.040%, 1/5/12 | | | 20,000 | | | | 20,000 | |
International Business Machines Corporation,
0.050%-0.060%, 1/9/12-1/27/12 | | | 34,000 | | | | 33,999 | |
John Deere Credit, Ltd.,
0.060%-0.100%, 1/4/12-1/25/12 | | | 22,900 | | | | 22,900 | |
Johnson & Johnson,
0.070%-0.110%, 1/23/12-5/1/12 | | | 42,000 | | | | 41,991 | |
Merck & Co., Inc.,
0.060%, 1/9/12-1/11/12 | | | 25,000 | | | | 25,000 | |
Nestle Capital Corporation,
0.050%-0.180%, 1/9/12-5/25/12 | | | 43,000 | | | | 42,993 | |
PACCAR Financial Corporation,
0.050%-0.160%, 1/4/12-3/28/12 | | | 50,996 | | | | 50,992 | |
Pfizer, Inc.,
0.040%, 1/12/12-1/26/12 | | | 29,000 | | | | 28,999 | |
Praxair, Inc.,
0.030%-0.040%, 1/4/12-1/5/12 | | | 26,559 | | | | 26,559 | |
Private Export Funding,
0.100%-0.210%, 2/13/12-3/20/12 | | | 47,000 | | | | 46,988 | |
Procter & Gamble Co. (The),
0.050%-0.100%, 1/10/12-3/27/12 | | | 31,000 | | | | 30,998 | |
Procter & Gamble International Funding,
0.050%-0.060%, 1/3/12-1/5/12 | | | 8,000 | | | | 8,000 | |
Roche Holdings, Inc.,
0.040%-0.070%, 1/3/12-2/6/12 | | | 36,000 | | | | 35,999 | |
Toyota Credit de Puerto Rico Corporation,
0.030%-0.050%, 1/3/12-1/17/12 | | | 53,000 | | | | 53,000 | |
Unilever Capital Corporation,
0.050%-0.170%, 1/3/12-6/6/12 | | | 30,000 | | | | 29,992 | |
United Technologies Corporation,
0.040%, 1/19/12 | | | 10,000 | | | | 10,000 | |
Wal-Mart Stores, Inc.,
0.020%-0.040%, 1/4/12-1/23/12 | | | 47,000 | | | | 47,000 | |
| | | | | | | | |
Total Commercial Paper | | | | | | | 760,722 | |
| | | | | | | | |
|
Asset-Backed Commercial Paper—7.8% | |
Chariot Funding L.L.C.,
0.130%-0.180%, 1/5/12-2/16/12 | | | 46,366 | | | | 46,362 | |
Govco L.L.C.,
0.010%-0.230%, 1/3/12-1/26/12 | | | 52,430 | | | | 52,428 | |
| | | | | | | | |
Total Asset-Backed Commercial Paper | | | | | | | 98,790 | |
| | | | | | | | |
|
Repurchase Agreements—17.7% | |
Bank of America, 0.040% dated 12/30/11, due 1/3/12, repurchase price $60,000, collateralized by U.S. Government Agency securities, 0.000%-5.850%, due 6/29/12-1/15/37 | | | 60,000 | | | | 60,000 | |
Barclays Capital, 0.080% dated 12/30/11, due 1/3/12, repurchase price $25,000, collateralized by FDIC guaranteed security, 1.875%, due 10/22/12 | | | 25,000 | | | | 25,000 | |
See accompanying Notes to Financial Statements.
110 Annual Report | December 31, 2011 |
Ready Reserves Fund
Portfolio of Investments, December 31, 2011 (all dollar amounts in thousands)
| | | | | | | | |
Issuer | | Principal
Amount | | | Amortized
Cost | |
|
Repurchase Agreements—17.7%—(continued) | |
Fixed Income Clearing Corporation, 0.000% dated 12/30/11, due 1/3/12, repurchase price $140,489, collateralized by FHLMC, 1.625%-3.150%, due 12/5/16-10/28/20, and FNMA, 4.377%-5.000%, due 3/15/16-1/23/18 | | $ | 140,489 | | | $ | 140,489 | |
| | | | | | | | |
Total Repurchase Agreements | | | | | | | 225,489 | |
| | | | | | | | |
Total Investments—99.9%
(cost $1,270,175) | | | | 1,270,175 | |
Cash and other assets, less liabilities—0.1% | | | | 1,571 | |
| | | | | | | | |
Net assets—100.0% | | | $ | 1,271,746 | |
| | | | | | | | |
Portfolio Weighted Average Maturity | | | | 41 days | |
VRN Variable Rate Note
See accompanying Notes to Financial Statements.
December 31, 2011 | William Blair Funds 111 |
Statements of Assets and Liabilities
December 31, 2011 (dollar amounts in thousands)
| | | | | | | | | | | | | | | | |
| | | Growth
Fund | | | Large Cap
Growth
Fund | | | Small Cap
Growth
Fund | | | Mid Cap
Growth
Fund | |
Assets | | | | | | | | | | | | | | | | |
Investments in securities, at cost | | $ | 500,897 | | | $ | 21,121 | | | $ | 494,970 | | | $ | 134,593 | |
Investment in Affiliated Companies, at cost | | | — | | | | — | | | | 37,857 | | | | — | |
| | | | | | | | | | | | | | | | |
| | | | |
Investments in securities, at value | | $ | 564,410 | | | $ | 25,010 | | | $ | 537,357 | | | $ | 145,699 | |
Investment in Affiliated Companies, at value | |
| —
|
| | | — | | | | 16,516 | | | | — | |
Receivable for securities sold | | | 92 | | | | — | | | | 20,027 | | | | 331 | |
Receivable for fund shares sold | | | 3,825 | | | | — | | | | 1,461 | | | | 557 | |
Receivable from Advisor | | | — | | | | — | | | | — | | | | 5 | |
Dividend and interest receivable | | | 314 | | | | 19 | | | | 37 | | | | 57 | |
| | | | | | | | | | | | | | | | |
Total assets | | | 568,641 | | | | 25,029 | | | | 575,398 | | | | 146,649 | |
Liabilities | | | | | | | | | | | | | | | | |
Payable for investment securities purchased | | | 698 | | | | — | | | | 2,719 | | | | 598 | |
Payable for fund shares redeemed | | | 632 | | | | 34 | | | | 16,970 | | | | 126 | |
Investment advisory fee payable | | | 359 | | | | 22 | | | | 543 | | | | 115 | |
Distribution fee payable | | | 43 | | | | 1 | | | | 44 | | | | 6 | |
Other accrued expenses | | | 167 | | | | 23 | | | | 384 | | | | 50 | |
| | | | | | | | | | | | | | | | |
Total liabilities | | | 1,899 | | | | 80 | | | | 20,660 | | | | 895 | |
| | | | | | | | | | | | | | | | |
Net Assets | | $ | 566,742 | | | $ | 24,949 | | | $ | 554,738 | | | $ | 145,754 | |
| | | | | | | | | | | | | | | | |
Capital | | | | | | | | | | | | | | | | |
Composition of Net Assets | | | | | | | | | | | | | | | | |
Par value of shares of beneficial interest | | $ | 51 | | | $ | 4 | | | $ | 27 | | | $ | 12 | |
Capital paid in excess of par value | | | 500,222 | | | | 24,545 | | | | 602,880 | | | | 135,225 | |
Accumulated net investment income (loss) | | | — | | | | — | | | | — | | | | — | |
Accumulated net realized gain (loss) | | | 2,956 | | | | (3,489 | ) | | | (69,215 | ) | | | (589 | ) |
Net unrealized appreciation (depreciation) of investments and foreign currencies | | | 63,513 | | | | 3,889 | | | | 21,046 | | | | 11,106 | |
| | | | | | | | | | | | | | | | |
Net Assets | | $ | 566,742 | | | $ | 24,949 | | | $ | 554,738 | | | $ | 145,754 | |
| | | | | | | | | | | | | | | | |
| | | | |
Class N Shares | | | | | | | | | | | | | | | | |
Net Assets | | $ | 204,476 | | | $ | 3,387 | | | $ | 202,341 | | | $ | 30,093 | |
Shares Outstanding | | | 19,056,901 | | | | 492,496 | | | | 10,048,719 | | | | 2,581,412 | |
Net Asset Value Per Share | | $ | 10.73 | | | $ | 6.88 | | | $ | 20.13 | | | $ | 11.66 | |
Class I Shares | | | | | | | | | | | | | | | | |
Net Assets | | $ | 362,266 | | | $ | 21,562 | | | $ | 352,397 | | | $ | 115,661 | |
Shares Outstanding | | | 32,391,123 | | | | 3,065,062 | | | | 16,849,558 | | | | 9,740,364 | |
Net Asset Value Per Share | | $ | 11.18 | | | $ | 7.03 | | | $ | 20.91 | | | $ | 11.87 | |
See accompanying Notes to Financial Statements.
112 Annual Report | December 31, 2011 |
Statements of Operations
for the Year Ended December 31, 2011 (all amounts in thousands)
| | | | | | | | | | | | | | | | |
| | | Growth
Fund | | | Large Cap
Growth
Fund | | | Small Cap
Growth
Fund | | | Mid Cap
Growth
Fund | |
Investment income | | | | | | | | | | | | | | | | |
Dividends | | $ | 4,980 | | | $ | 305 | | | $ | 1,844 | | | $ | 886 | |
Less foreign tax withheld | | | (13 | ) | | | (2 | ) | | | (56 | ) | | | (2 | ) |
Interest | | | 5 | | | | — | | | | 6 | | | | 1 | |
| | | | | | | | | | | | | | | | |
Total income | | | 4,972 | | | | 303 | | | | 1,794 | | | | 885 | |
Expenses | | | | | | | | | | | | | | | | |
Investment advisory fees | | | 4,443 | | | | 228 | | | | 7,864 | | | | 1,221 | |
Distribution fees | | | 536 | | | | 12 | | | | 731 | | | | 45 | |
Custodian fees | | | 22 | | | | 35 | | | | 39 | | | | 38 | |
Transfer agent fees | | | 123 | | | | 8 | | | | 81 | | | | 14 | |
Sub-transfer agent fees | | | | | | | | | | | | | | | | |
Class N | | | 335 | | | | 6 | | | | 449 | | | | 21 | |
Class I | | | 222 | | | | 2 | | | | 677 | | | | 74 | |
Professional fees | | | 51 | | | | 23 | | | | 55 | | | | 27 | |
Registration fees | | | 40 | | | | 26 | | | | 70 | | | | 39 | |
Shareholder reporting fees | | | 35 | | | | 2 | | | | 305 | | | | 17 | |
Trustee fees | | | 23 | | | | 1 | | | | 35 | | | | 4 | |
Other expenses | | | 28 | | | | 5 | | | | 41 | | | | 8 | |
| | | | | | | | | | | | | | | | |
Total expenses before waiver | | | 5,858 | | | | 348 | | | | 10,347 | | | | 1,508 | |
Expenses waived by Advisor | | | — | | | | (66 | ) | | | (678 | ) | | | (50 | ) |
| | | | | | | | | | | | | | | | |
Net expenses | | | 5,858 | | | | 282 | | | | 9,669 | | | | 1,458 | |
| | | | | | | | | | | | | | | | |
Net investment income (loss) | | | (886 | ) | | | 21 | | | | (7,875 | ) | | | (573 | ) |
Realized and unrealized gain (loss) | | | | | | | | | | | | | | | | |
Net realized gain (loss) on transactions from: | | | | | | | | | | | | | | | | |
Investments | | | 27,542 | | | | 3,351 | | | | 27,224 | (a) | | | 13,458 | |
Foreign currency transactions | | | (2 | ) | | | — | | | | — | | | | — | |
| | | | | | | | | | | | | | | | |
Total net realized gain (loss) | | | 27,540 | | | | 3,351 | | | | 27,224 | | | | 13,458 | |
Change in net unrealized appreciation (depreciation) of: | | | | | | | | | | | | | | | | |
Investments | | | (38,002 | ) | | | (4,038 | ) | | | (110,707 | )(a) | | | (12,060 | ) |
Foreign currency translations | | | — | | | | — | | | | — | | | | — | |
| | | | | | | | | | | | | | | | |
Total change in net unrealized appreciation (depreciation) | | | (38,002 | ) | | | (4,038 | ) | | | (110,707 | ) | | | (12,060 | ) |
| | | | | | | | | | | | | | | | |
Net increase (decrease) in net assets resulting from operations | | $ | (11,348 | ) | | $ | (666 | ) | | $ | (91,358 | ) | | $ | 825 | |
| | | | | | | | | | | | | | | | |
| (a) | | Affiliated companies accounted for $(15,309) of the net realized gain on investments and $(21,044) of the change in net unrealized (depreciation) on investments during the year. |
See accompanying Notes to Financial Statements.
December 31, 2011 | William Blair Funds 113 |
Statements of Changes in Net Assets
for the Year Ended December 31, 2011 and the Year Ended December 31, 2010 (all amounts in thousands)
| | | | | | | | | | | | | | | | | | | | | | | | | | | | | | | | |
| | | Growth
Fund | | | Large Cap
Growth
Fund | | | Small Cap
Growth
Fund | | | Mid Cap
Growth
Fund | |
| | | 2011 | | | 2010 | | | 2011 | | | 2010 | | | 2011 | | | 2010 | | | 2011 | | | 2010 | |
Operations | | | | | | | | | | | | | | | | | | | | | | | | | | | | | | | | |
Net investment income (loss) | | $ | (886 | ) | | $ | 329 | | | $ | 21 | | | $ | 32 | | | $ | (7,875 | ) | | $ | (7,283 | ) | | $ | (573 | ) | | $ | (147 | ) |
Net realized gain (loss) on
investments and foreign currency | | | 27,540 | | | | 29,431 | | | | 3,351 | | | | 1,167 | | | | 27,224 | | | | 98,419 | | | | 13,458 | | | | 9,349 | |
Change in net unrealized appreciation (depreciation) on investments and foreign currency | | | (38,002 | ) | | | 35,328 | | | | (4,038 | ) | | | 3,134 | | | | (110,707 | ) | | | 32,801 | | | | (12,060 | ) | | | 10,074 | |
| | | | | | | | | | | | | | | | | | | | | | | | | | | | | | | | |
Net increase (decrease) in net assets resulting from operations | | | (11,348 | ) | | | 65,088 | | | | (666 | ) | | | 4,333 | | | | (91,358 | ) | | | 123,937 | | | | 825 | | | | 19,276 | |
Distributions to shareholders from | | | | | | | | | | | | | | | | | | | | | | | | | |
Net investment income | | | (329 | ) | | | (13 | ) | | | (37 | ) | | | (33 | ) | | | — | | | | — | | | | — | | | | — | |
Net realized gain | | | (16,081 | ) | | | — | | | | — | | | | — | | | | — | | | | — | | | | (11,057 | ) | | | — | |
| | | | | | | | | | | | | | | | | | | | | | | | | | | | | | | | |
| | | (16,410 | ) | | | (13 | ) | | | (37 | ) | | | (33 | ) | | | — | | | | — | | | | (11,057 | ) | | | — | |
Capital stock transactions | | | | | | | | | | | | | | | | | | | | | | | | | | | | | | | | |
Net proceeds from sale of shares | | | 134,130 | | | | 176,362 | | | | 4,139 | | | | 3,077 | | | | 123,447 | | | | 364,595 | | | | 88,823 | | | | 24,389 | |
Shares issued in reinvestment of income dividends and capital gain distributions | | | 14,916 | | | | 11 | | | | 32 | | | | 29 | | | | — | | | | — | | | | 10,898 | | | | — | |
Less cost of shares redeemed | | | (130,159 | ) | | | (85,355 | ) | | | (10,554 | ) | | | (5,682 | ) | | | (368,940 | ) | | | (359,741 | ) | | | (44,983 | ) | | | (13,251 | ) |
| | | | | | | | | | | | | | | | | | | | | | | | | | | | | | | | |
Net increase (decrease) in net assets resulting from capital share transactions | | | 18,887 | | | | 91,018 | | | | (6,383 | ) | | | (2,576 | ) | | | (245,493 | ) | | | 4,854 | | | | 54,738 | | | | 11,138 | |
| | | | | | | | | | | | | | | | | | | | | | | | | | | | | | | | |
Increase (decrease) in net assets | | | (8,871 | ) | | | 156,093 | | | | (7,086 | ) | | | 1,724 | | | | (336,851 | ) | | | 128,791 | | | | 44,506 | | | | 30,414 | |
Net assets | | | | | | | | | | | | | | | | | | | | | | | | | | | | | | | | |
Beginning of year | | | 575,613 | | | | 419,520 | | | | 32,035 | | | | 30,311 | | | | 891,589 | | | | 762,798 | | | | 101,248 | | | | 70,834 | |
| | | | | | | | | | | | | | | | | | | | | | | | | | | | | | | | |
End of year | | $ | 566,742 | | | $ | 575,613 | | | $ | 24,949 | | | $ | 32,035 | | | $ | 554,738 | | | $ | 891,589 | | | $ | 145,754 | | | $ | 101,248 | |
| | | | | | | | | | | | | | | | | | | | | | | | | | | | | | | | |
Accumulated net investment income (loss) at the end of the year | | $ | — | | | $ | 329 | | | $ | — | | | $ | — | | | $ | — | | | $ | — | | | $ | — | | | $ | — | |
| | | | | | | | | | | | | | | | | | | | | | | | | | | | | | | | |
See accompanying Notes to Financial Statements.
114 Annual Report | December 31, 2011 |
Statements of Assets and Liabilities
December 31, 2011 (dollar amounts in thousands)
| | | | | | | | | | | | | | | | |
| | | Small-Mid Cap
Growth
Fund | | | Global
Growth
Fund | | | International
Growth
Fund | | | International
Equity
Fund | |
Assets | | | | | | | | | | | | | | | | |
Investments in securities, at cost | | $ | 233,424 | | | $ | 38,182 | | | $ | 3,187,314 | | | $ | 70,311 | |
| | | | | | | | | | | | | | | | |
| | | | |
Investments in securities, at value | | $ | 249,880 | | | $ | 42,600 | | | $ | 3,243,998 | | | $ | 74,194 | |
Cash | | | — | | | | — | | | | — | | | | 96 | |
Foreign currency, at value (cost $—; $—; $257; $1) | | | — | | | | — | | | | 257 | | | | 1 | |
Receivable for securities sold | | | 1,733 | | | | 854 | | | | 7,380 | | | | 3,123 | |
Receivable for fund shares sold | | | 3,321 | | | | 20 | | | | 8,284 | | | | 2 | |
Receivable from Advisor | | | 11 | | | | 3 | | | | 14 | | | | 11 | |
Dividend and interest receivable | | | 108 | | | | 58 | | | | 6,810 | | | | 170 | |
| | | | | | | | | | | | | | | | |
Total assets | | | 255,053 | | | | 43,535 | | | | 3,266,743 | | | | 77,597 | |
Liabilities | | | | | | | | | | | | | | | | |
Payable for investment securities purchased | | | 1,005 | | | | 876 | | | | 7,850 | | | | 1,767 | |
Payable for fund shares redeemed | | | 166 | | | | — | | | | 23,004 | | | | — | |
Unrealized depreciation on forward foreign currency contracts | | | — | | | | — | | | | 1,799 | | | | — | |
Investment advisory fee payable | | | 217 | | | | 36 | | | | 2,810 | | | | 69 | |
Distribution and shareholder service fee payable | | | 7 | | | | 6 | | | | 276 | | | | 1 | |
Other accrued expenses | | | 61 | | | | 43 | | | | 2,102 | | | | 103 | |
| | | | | | | | | | | | | | | | |
Total liabilities | | | 1,456 | | | | 961 | | | | 37,841 | | | | 1,940 | |
| | | | | | | | | | | | | | | | |
Net Assets | | $ | 253,597 | | | $ | 42,574 | | | $ | 3,228,902 | | | $ | 75,657 | |
| | | | | | | | | | | | | | | | |
Capital | | | | | | | | | | | | | | | | |
Composition of Net Assets | | | | | | | | | | | | | | | | |
Par value of shares of beneficial interest | | $ | 19 | | | $ | 5 | | | $ | 171 | | | $ | 7 | |
Capital paid in excess of par value | | | 236,013 | | | | 55,919 | | | | 4,352,995 | | | | 164,774 | |
Accumulated net investment income (loss) | | | — | | | | (3 | ) | | | 27,949 | | | | 1,379 | |
Accumulated net realized gain (loss) | | | 1,109 | | | | (17,765 | ) | | | (1,207,030 | ) | | | (94,379 | ) |
Net unrealized appreciation (depreciation) of investments and foreign currencies | | | 16,456 | | | | 4,418 | | | | 54,817 | | | | 3,876 | |
| | | | | | | | | | | | | | | | |
Net Assets | | $ | 253,597 | | | $ | 42,574 | | | $ | 3,228,902 | | | $ | 75,657 | |
| | | | | | | | | | | | | | | | |
| | | | |
Class N Shares | | | | | | | | | | | | | | | | |
Net Assets | | $ | 34,123 | | | $ | 3,740 | | | $ | 1,277,534 | | | $ | 6,773 | |
Shares Outstanding | | | 2,624,249 | | | | 461,999 | | | | 68,374,840 | | | | 641,667 | |
Net Asset Value Per Share | | $ | 13.00 | | | $ | 8.10 | | | $ | 18.68 | | | $ | 10.56 | |
Class I Shares | | | | | | | | | | | | | | | | |
Net Assets | | $ | 219,474 | | | $ | 38,834 | | | $ | 1,951,368 | | | $ | 68,884 | |
Shares Outstanding | | | 16,481,039 | | | | 4,801,264 | | | | 102,172,019 | | | | 6,455,664 | |
Net Asset Value Per Share | | $ | 13.32 | | | $ | 8.09 | | | $ | 19.10 | | | $ | 10.67 | |
See accompanying Notes to Financial Statements.
December 31, 2011 | William Blair Funds 115 |
Statements of Operations
for the Year Ended December 31, 2011 (all amounts in thousands)
| | | | | | | | | | | | | | | | |
| | | Small-Mid Cap
Growth
Fund | | | Global
Growth
Fund | | | International
Growth
Fund | | | International
Equity
Fund | |
Investment income | | | | | | | | | | | | | | | | |
Dividends | | $ | 1,403 | | | $ | 848 | | | $ | 120,215 | | | $ | 3,836 | |
Less foreign tax withheld | | | (5 | ) | | | (47 | ) | | | (9,126 | ) | | | (305 | ) |
Interest | | | 2 | | | | — | | | | 293 | | | | 1 | |
| | | | | | | | | | | | | | | | |
Total income | | | 1,400 | | | | 801 | | | | 111,382 | | | | 3,532 | |
Expenses | | | | | | | | | | | | | | | | |
Investment advisory fees | | | 2,469 | | | | 453 | | | | 42,999 | | | | 1,481 | |
Distribution fees | | | 74 | | | | 11 | | | | 4,986 | | | | 27 | |
Shareholder services fees | | | — | | | | 68 | | | | — | | | | — | |
Custodian fees | | | 39 | | | | 70 | | | | 602 | | | | 100 | |
Transfer agent fees | | | 35 | | | | 16 | | | | 341 | | | | 5 | |
Sub-transfer agent fees | | | | | | | | | | | | | | | | |
Class N | | | 37 | | | | 1 | | | | 2,950 | | | | 10 | |
Class I | | | 77 | | | | 2 | | | | 2,010 | | | | 91 | |
Professional fees | | | 40 | | | | 39 | | | | 313 | | | | 54 | |
Registration fees | | | 58 | | | | 43 | | | | 79 | | | | 32 | |
Shareholder reporting fees | | | 17 | | | | — | | | | 598 | | | | — | |
Trustee fees | | | 9 | | | | 2 | | | | 193 | | | | 9 | |
Other expenses | | | 12 | | | | 6 | | | | 239 | | | | 14 | |
| | | | | | | | | | | | | | | | |
Total expenses before waiver | | | 2,867 | | | | 711 | | | | 55,310 | | | | 1,823 | |
Expenses waived by the Advisor | | | (80 | ) | | | (135 | ) | | | (222 | ) | | | (181 | ) |
| | | | | | | | | | | | | | | | |
Net expenses | | | 2,787 | | | | 576 | | | | 55,088 | | | | 1,642 | |
| | | | | | | | | | | | | | | | |
Net investment income (loss) | | | (1,387 | ) | | | 225 | | | | 56,294 | | | | 1,890 | |
Realized and unrealized gain (loss) | | | | | | | | | | | | | | | | |
Net realized gain (loss) on transactions from: | | | | | | | | | | | | | | | | |
Investments | | | 27,339 | | | | 4,624 | | | | 367,730 | | | | 23,368 | |
Foreign currency transactions | | | — | | | | (54 | ) | | | (19,782 | ) | | | (522 | ) |
| | | | | | | | | | | | | | | | |
Total net realized gain (loss) | | | 27,339 | | | | 4,570 | | | | 347,948 | | | | 22,846 | |
Change in net unrealized appreciation (depreciation) of: | | | | | | | | | | | | | | | | |
Investments | | | (27,537 | ) | | | (6,318 | ) | | | (969,027 | ) | | | (36,117 | ) |
Foreign currency translations | | | — | | | | (2 | ) | | | (2,742 | ) | | | (17 | ) |
| | | | | | | | | | | | | | | | |
Total change in net unrealized appreciation (depreciation) | | | (27,537 | ) | | | (6,320 | ) | | | (971,769 | ) | | | (36,134 | ) |
| | | | | | | | | | | | | | | | |
Net increase (decrease) in net assets resulting from operations | | $ | (1,585 | ) | | $ | (1,525 | ) | | $ | (567,527 | ) | | $ | (11,398 | ) |
| | | | | | | | | | | | | | | | |
See accompanying Notes to Financial Statements.
116 Annual Report | December 31, 2011 |
Statements of Changes in Net Assets
for the Year Ended December 31, 2011 and the Year Ended December 31, 2010 (all amounts in thousands)
| | | | | | | | | | | | | | | | | | | | | | | | | | | | | | | | |
| | | Small-Mid Cap
Growth
Fund | | | Global
Growth
Fund | | | International
Growth
Fund | | | International
Equity
Fund | |
| | | 2011 | | | 2010 | | | 2011 | | | 2010 | | | 2011 | | | 2010 | | | 2011 | | | 2010 | |
Operations | | | | | | | | | | | | | | | | | | | | | | | | | | | | | | | | |
Net investment income (loss) | | $ | (1,387 | ) | | $ | (871 | ) | | $ | 225 | | | $ | 51 | | | $ | 56,294 | | | $ | 38,496 | | | $ | 1,890 | | | $ | 2,202 | |
Net realized gain (loss) on investments and foreign currency transactions | | | 27,339 | | | | 22,299 | | | | 4,570 | | | | 3,989 | | | | 347,948 | | | | 706,043 | | | | 22,846 | | | | 30,531 | |
Change in net unrealized appreciation (depreciation) on investments and foreign currency translations | | | (27,537 | ) | | | 16,762 | | | | (6,320 | ) | | | 3,533 | | | | (971,769 | ) | | | 122,523 | | | | (36,134 | ) | | | (21,798 | ) |
| | | | | | | | | | | | | | | | | | | | | | | | | | | | | | | | |
Net increase (decrease) in net assets resulting from operations | | | (1,585 | ) | | | 38,190 | | | | (1,525 | ) | | | 7,573 | | | | (567,527 | ) | | | 867,062 | | | | (11,398 | ) | | | 10,935 | |
Distributions to shareholders from | | | | | | | | | | | | | | | | | | | | | | | | | | | | | | | | |
Net investment income | | | — | | | | — | | | | (174 | ) | | | (12 | ) | | | (6,046 | ) | | | (101,433 | ) | | | — | | | | (2,578 | ) |
Net realized gain | | | (23,013 | ) | | | — | | | | — | | | | — | | | | — | | | | — | | | | — | | | | — | |
| | | | | | | | | | | | | | | | | | | | | | | | | | | | | | | | |
| | | (23,013 | ) | | | — | | | | (174 | ) | | | (12 | ) | | | (6,046 | ) | | | (101,433 | ) | | | — | | | | (2,578 | ) |
Capital stock transactions | | | | | | | | | | | | | | | | | | | | | | | | | | | | | | | | |
Net proceeds from sale of shares | | | 85,339 | | | | 51,303 | | | | 3,738 | | | | 4,844 | | | | 756,415 | | | | 1,498,589 | | | | 26,832 | | | | 59,843 | |
Shares issued in reinvestment of income dividends and capital gain distributions | | | 20,564 | | | | — | | | | 166 | | | | 11 | | | | 5,030 | | | | 92,533 | | | | — | | | | 2,452 | |
Less cost of shares redeemed | | | (35,773 | ) | | | (28,256 | ) | | | (4,508 | ) | | | (5,826 | ) | | | (2,041,149 | ) | | | (1,747,980 | ) | | | (117,832 | ) | | | (190,765 | ) |
| | | | | | | | | | | | | | | | | | | | | | | | | | | | | | | | |
Net increase (decrease) in net assets resulting from capital share transactions | | | 70,130 | | | | 23,047 | | | | (604 | ) | | | (971 | ) | | | (1,279,704 | ) | | | (156,858 | ) | | | (91,000 | ) | | | (128,470 | ) |
| | | | | | | | | | | | | | | | | | | | | | | | | | | | | | | | |
Increase (decrease) in net assets | | | 45,532 | | | | 61,237 | | | | (2,303 | ) | | | 6,590 | | | | (1,853,277 | ) | | | 608,771 | | | | (102,398 | ) | | | (120,113 | ) |
Net assets | | | | | | | | | | | | | | | | | | | | | | | | | | | | | | | | |
Beginning of year | | | 208,065 | | | $ | 146,828 | | | | 44,877 | | | $ | 38,287 | | | | 5,082,179 | | | $ | 4,473,408 | | | | 178,055 | | | $ | 298,168 | |
| | | | | | | | | | | | | | | | | | | | | | | | | | | | | | | | |
End of year | | $ | 253,597 | | | $ | 208,065 | | | $ | 42,574 | | | $ | 44,877 | | | $ | 3,228,902 | | | $ | 5,082,179 | | | $ | 75,657 | | | $ | 178,055 | |
| | | | | | | | | | | | | | | | | | | | | | | | | | | | | | | | |
Accumulated net investment income (loss) at the end of the year | | $ | — | | | $ | — | | | $ | (3 | ) | | $ | (2 | ) | | $ | 27,949 | | | $ | (14,016 | ) | | $ | 1,379 | | | $ | (242 | ) |
| | | | | | | | | | | | | | | | | | | | | | | | | | | | | | | | |
See accompanying Notes to Financial Statements.
December 31, 2011 | William Blair Funds 117 |
Statements of Assets and Liabilities
December 31, 2011 (dollar amounts in thousands)
| | | | | | | | | | | | | | | | |
| | | International
Small Cap
Growth
Fund | | | Emerging
Markets
Growth
Fund | | | Emerging
Leaders
Growth
Fund | | | Emerging
Markets
Small Cap
Growth
Fund | |
Assets | | | | | | | | | | | | | | | | |
Investments in securities, at cost | | $ | 734,992 | | | $ | 831,030 | | | $ | 51,290 | | | $ | 3,289 | |
| | | | | | | | | | | | | | | | |
| | | | |
Investments in securities, at value | | $ | 715,309 | | | $ | 812,036 | | | $ | 48,776 | | | $ | 3,272 | |
Cash | | | — | | | | — | | | | — | | | | 13 | |
Foreign currency, at value (cost $437; $3,992; $111; $—) | | | 436 | | | | 4,000 | | | | 111 | | | | — | |
Receivable for securities sold | | | 2,944 | | | | 4,156 | | | | 375 | | | | — | |
Receivable for fund shares sold | | | 1,614 | | | | 231 | | | | 344 | | | | 12 | |
Receivable from Advisor | | | — | | | | — | | | | — | | | | 14 | |
Dividend and interest receivable | | | 630 | | | | 570 | | | | 23 | | | | 3 | |
| | | | | | | | | | | | | | | | |
Total assets | | | 720,933 | | | | 820,993 | | | | 49,629 | | | | 3,314 | |
Liabilities | | | | | | | | | | | | | | | | |
Payable for investment securities purchased | | | 460 | | | | 1,642 | | | | — | | | | — | |
Payable for fund shares redeemed | | | 899 | | | | 203 | | | | 1,662 | | | | — | |
Unrealized depreciation on forward foreign currency contracts | | | 311 | | | | — | | | | — | | | | — | |
Investment advisory fee payable | | | 588 | | | | 778 | | | | 48 | | | | 3 | |
Distribution and shareholder service fee payable | | | 53 | | | | 23 | | | | 3 | | | | 1 | |
Other accrued expenses | | | 401 | | | | 501 | | | | 94 | | | | 38 | |
| | | | | | | | | | | | | | | | |
Total liabilities | | | 2,712 | | | | 3,147 | | | | 1,807 | | | | 42 | |
| | | | | | | | | | | | | | | | |
Net Assets | | $ | 718,221 | | | $ | 817,846 | | | $ | 47,822 | | | $ | 3,272 | |
| | | | | | | | | | | | | | | | |
Capital | | | | | | | | | | | | | | | | |
Composition of Net Assets | | | | | | | | | | | | | | | | |
Par value of shares of beneficial interest | | $ | 63 | | | $ | 72 | | | $ | 6 | | | $ | 1 | |
Capital paid in excess of par value | | | 798,066 | | | | 867,474 | | | | 53,039 | | | | 3,360 | |
Accumulated net investment income (loss) | | | 4,542 | | | | (1,953 | ) | | | (14 | ) | | | (13 | ) |
Accumulated net realized gain (loss) | | | (64,220 | ) | | | (28,436 | ) | | | (2,650 | ) | | | (58 | ) |
Net unrealized appreciation (depreciation) of investments and foreign currencies | | | (20,230 | ) | | | (19,311 | ) | | | (2,559 | ) | | | (18 | ) |
| | | | | | | | | | | | | | | | |
Net Assets | | $ | 718,221 | | | $ | 817,846 | | | $ | 47,822 | | | $ | 3,272 | |
| | | | | | | | | | | | | | | | |
| | | | |
Class N Shares | | | | | | | | | | | | | | | | |
Net Assets | | $ | 18,991 | | | $ | 17,474 | | | $ | 46 | | | $ | 1,012 | |
Shares Outstanding | | | 1,671,792 | | | | 1,565,714 | | | | 6,028 | | | | 103,994 | |
Net Asset Value Per Share | | $ | 11.36 | | | $ | 11.16 | | | $ | 7.68 | | | $ | 9.73 | |
Class I Shares | | | | | | | | | | | | | | | | |
Net Assets | | $ | 364,574 | | | $ | 124,739 | | | $ | 21,610 | | | $ | 2,260 | |
Shares Outstanding | | | 31,809,860 | | | | 11,088,207 | | | | 2,822,526 | | | | 232,221 | |
Net Asset Value Per Share | | $ | 11.46 | | | $ | 11.25 | | | $ | 7.66 | | | $ | 9.73 | |
See accompanying Notes to Financial Statements.
118 Annual Report | December 31, 2011 |
Statements of Operations
for the Year Ended December 31, 2011 (all amounts in thousands)
| | | | | | | | | | | | | | | | |
| | | International
Small Cap
Growth
Fund | | | Emerging
Markets
Growth
Fund | | | Emerging
Leaders
Growth
Fund | | | Emerging
Markets
Small Cap
Growth
Fund(a) | |
Investment income | | | | | | | | | | | | | | | | |
Dividends | | $ | 16,417 | | | $ | 22,977 | | | $ | 1,944 | | | $ | 12 | |
Less foreign tax withheld | | | (1,173 | ) | | | (1,968 | ) | | | (159 | ) | | | (1 | ) |
Interest | | | 98 | | | | 161 | | | | — | | | | — | |
| | | | | | | | | | | | | | | | |
Total income | | | 15,342 | | | | 21,170 | | | | 1,785 | | | | 11 | |
Expenses | | | | | | | | | | | | | | | | |
Investment advisory fees | | | 7,013 | | | | 10,964 | | | | 921 | | | | 7 | |
Distribution fees | | | 54 | | | | 68 | | | | — | | | | — | |
Shareholder services fees | | | 622 | | | | 294 | | | | 38 | | | | 1 | |
Custodian fees | | | 204 | | | | 434 | | | | 111 | | | | 19 | |
Transfer agent fees | | | 30 | | | | 42 | | | | 18 | | | | 3 | |
Sub-transfer agent fees | | | | | | | | | | | | | | | | |
Class N | | | 34 | | | | 27 | | | | — | | | | — | |
Class I | | | 211 | | | | 74 | | | | — | | | | — | |
Professional fees | | | 86 | | | | 138 | | | | 67 | | | | 18 | |
Registration fees | | | 98 | | | | 75 | | | | 53 | | | | 9 | |
Shareholder reporting fees | | | 74 | | | | 68 | | | | 2 | | | | — | |
Trustee fees | | | 24 | | | | 47 | | | | 4 | | | | — | |
Other expenses | | | 35 | | | | 54 | | | | 10 | | | | — | |
| | | | | | | | | | | | | | | | |
Total expenses before waiver | | | 8,485 | | | | 12,285 | | | | 1,224 | | | | 57 | |
Expenses waived and reimbursed by Advisor | | | — | | | | — | | | | (140 | ) | | | (48 | ) |
| | | | | | | | | | | | | | | | |
Net expenses | | | 8,485 | | | | 12,285 | | | | 1,084 | | | | 9 | |
| | | | | | | | | | | | | | | | |
Net investment income (loss) | | | 6,857 | | | | 8,885 | | | | 701 | | | | 2 | |
Realized and unrealized gain (loss) | | | | | | | | | | | | | | | | |
Net realized gain (loss) on transactions from: | | | | | | | | | | | | | | | | |
Investments | | | 58,878 | | | | 129,522 | | | | 390 | | | | (55 | ) |
Foreign currency transactions | | | 1,557 | | | | (1,986 | ) | | | (278 | ) | | | (20 | ) |
| | | | | | | | | | | | | | | | |
Total net realized gain (loss) | | | 60,435 | | | | 127,536 | | | | 112 | | | | (75 | ) |
Change in net unrealized appreciation (depreciation) of: | | | | | | | | | | | | | | | | |
Investments | | | (154,971 | ) | | | (303,742 | ) | | | (20,141 | ) | | | (17 | ) |
Foreign currency translations | | | (606 | ) | | | (363 | ) | | | (40 | ) | | | — | |
| | | | | | | | | | | | | | | | |
Total change in net unrealized appreciation (depreciation) | | | (155,577 | ) | | | (304,105 | ) | | | (20,181 | ) | | | (17 | ) |
| | | | | | | | | | | | | | | | |
Net increase (decrease) in net assets resulting from operations | | $ | (88,285 | ) | | $ | (167,684 | ) | | $ | (19,368 | ) | | $ | (90 | ) |
| | | | | | | | | | | | | | | | |
| (a) | | For the period from October 24, 2011 (Commencement of Operations) to December 31, 2011. |
See accompanying Notes to Financial Statements.
December 31, 2011 | William Blair Funds 119 |
Statements of Changes in Net Assets
for the Year Ended December 31, 2011 and the Year Ended December 31, 2010 (all amounts in thousands)
| | | | | | | | | | | | | | | | | | | | | | | | | | | | |
| | | International
Small Cap
Growth
Fund | | | Emerging
Markets
Growth
Fund | | | Emerging
Leaders
Growth
Fund | | | Emerging
Markets
Small Cap
Growth
Fund | |
| | | 2011 | | | 2010 | | | 2011 | | | 2010 | | | 2011 | | | 2010 | | | 2011(a) | |
Operations | | | | | | | | | | | | | | | | | | | | | | | | | | | | |
Net investment income (loss) | | $ | 6,857 | | | $ | 3,235 | | | $ | 8,885 | | | $ | 4,305 | | | $ | 701 | | | $ | 468 | | | $ | 2 | |
Net realized gain (loss) on investments and foreign currency transactions | | | 60,435 | | | | 57,094 | | | | 127,536 | | | | 245,341 | | | | 112 | | | | 33,656 | | | | (75 | ) |
Change in net unrealized appreciation (depreciation) on investments and foreign currency translations | | | (155,577 | ) | | | 62,315 | | | | (304,105 | ) | | | 13,556 | | | | (20,181 | ) | | | (16,315 | ) | | | (17 | ) |
| | | | | | | | | | | | | | | | | | | | | | | | | | | | |
Net increase (decrease) in net assets resulting from operations | | | (88,285 | ) | | | 122,644 | | | | (167,684 | ) | | | 263,202 | | | | (19,368 | ) | | | 17,809 | | | | (90 | ) |
Distributions to shareholders from | | | | | | | | | | | | | | | | | | | | | | | | | | | | |
Net investment income | | | (10,724 | ) | | | (2,781 | ) | | | (4,450 | ) | | | (13,461 | ) | | | (307 | ) | | | (255 | ) | | | — | |
Net realized gain | | | — | | | | — | | | | (115,030 | ) | | | — | | | | (3,704 | ) | | | (505 | ) | | | — | |
Return of capital | | | — | | | | — | | | | — | | | | — | | | | (25 | ) | | | — | | | | — | |
| | | | | | | | | | | | | | | | | | | | | | | | | | | | |
| | | (10,724 | ) | | | (2,781 | ) | | | (119,480 | ) | | | (13,461 | ) | | | (4,036 | ) | | | (760 | ) | | | — | |
Capital stock transactions | | | | | | | | | | | | | | | | | | | | | | | | | | | | |
Net proceeds from sale of shares | | | 313,989 | | | | 222,392 | | | | 352,369 | | | | 357,761 | | | | 19,857 | | | | 14,224 | | | | 3,362 | |
Shares issued in reinvestment of income dividends and capital gain distributions | | | 8,514 | | | | 2,417 | | | | 100,061 | | | | 12,072 | | | | 3,491 | | | | 681 | | | | — | |
Less cost of shares redeemed | | | (152,224 | ) | | | (88,572 | ) | | | (597,963 | ) | | | (407,291 | ) | | | (47,023 | ) | | | (52,189 | ) | | | — | |
| | | | | | | | | | | | | | | | | | | | | | | | | | | | |
Net increase (decrease) in net assets resulting from capital share transactions | | | 170,279 | | | | 136,237 | | | | (145,533 | ) | | | (37,458 | ) | | | (23,675 | ) | | | (37,284 | ) | | | 3,362 | |
| | | | | | | | | | | | | | | | | | | | | | | | | | | | |
Increase (decrease) in net assets | | | 71,270 | | | | 256,100 | | | | (432,697 | ) | | | 212,283 | | | | (47,079 | ) | | | (20,235 | ) | | | 3,272 | |
Net assets | | | | | | | | | | | | | | | | | | | | | | | | | | | | |
Beginning of year | | | 646,951 | | | | 390,851 | | | | 1,250,543 | | | | 1,038,260 | | | | 94,901 | | | | 115,136 | | | | — | |
| | | | | | | | | | | | | | | | | | | | | | | | | | | | |
End of year | | $ | 718,221 | | | $ | 646,951 | | | $ | 817,846 | | | $ | 1,250,543 | | | $ | 47,822 | | | $ | 94,901 | | | $ | 3,272 | |
| | | | | | | | | | | | | | | | | | | | | | | | | | | | |
Accumulated net investment income (loss) at the end of the year | | $ | 4,542 | | | $ | (586 | ) | | $ | (1,953 | ) | | $ | (12,327 | ) | | $ | (14 | ) | | $ | (131 | ) | | $ | (13 | ) |
| | | | | | | | | | | | | | | | | | | | | | | | | | | | |
| (a) | | For the period from October 24, 2011 (Commencement of Operations) to December 31, 2011. |
See accompanying Notes to Financial Statements.
120 Annual Report | December 31, 2011 |
Statements of Assets and Liabilities
December 31, 2011 (dollar amounts in thousands)
| | | | | | | | | | | | | | | | |
| | | Large Cap
Value
Fund | | | Small Cap
Value
Fund | | | Mid Cap
Value
Fund | | | Small-Mid
Cap Value
Fund | |
Assets | | | | | | | | | | | | | | | | |
Investments in securities, at cost | | $ | 2,423 | | | $ | 224,157 | | | $ | 4,421 | | | $ | 2,028 | |
| | | | | | | | | | | | | | | | |
| | | | |
Investments in securities, at value | | $ | 2,416 | | | $ | 233,725 | | | $ | 4,519 | | | $ | 2,122 | |
Cash | | | 40 | | | | — | | | | 70 | | | | 70 | |
Receivable for securities sold | | | — | | | | 1,166 | | | | — | | | | 7 | |
Receivable for fund shares sold | | | 12 | | | | 445 | | | | — | | | | — | |
Receivable from Advisor | | | 4 | | | | 45 | | | | — | | | | 16 | |
Dividend and interest receivable | | | 5 | | | | 230 | | | | 9 | | | | 2 | |
| | | | | | | | | | | | | | | | |
Total assets | | | 2,477 | | | | 235,611 | | | | 4,598 | | | | 2,217 | |
Liabilities | | | | | | | | | | | | | | | | |
Payable for investment securities purchased | | | — | | | | 3,776 | | | | — | | | | 44 | |
Payable for fund shares redeemed | | | — | | | | 133 | | | | — | | | | — | |
Investment advisory fee payable | | | 2 | | | | 213 | | | | 8 | | | | 1 | |
Distribution fee payable | | | — | | | | 9 | | | | — | | | | — | |
Other accrued expenses | | | 22 | | | | 82 | | | | 17 | | | | 16 | |
| | | | | | | | | | | | | | | | |
Total liabilities | | | 24 | | | | 4,213 | | | | 25 | | | | 61 | |
| | | | | | | | | | | | | | | | |
Net Assets | | $ | 2,453 | | | $ | 231,398 | | | $ | 4,573 | | | $ | 2,156 | |
| | | | | | | | | | | | | | | | |
Capital | | | | | | | | | | | | | | | | |
Composition of Net Assets | | | | | | | | | | | | | | | | |
Par value of shares of beneficial interest | | $ | 1 | | | $ | 19 | | | $ | 1 | | | $ | 1 | |
Capital paid in excess of par value | | | 2,463 | | | | 228,455 | | | | 4,468 | | | | 2,063 | |
Accumulated net investment income (loss) | | | — | | | | 25 | | | | — | | | | 1 | |
Accumulated net realized gain (loss)
| | | (4 | ) | | | (6,669 | ) | | | 6 | | | | (3 | ) |
Net unrealized appreciation (depreciation) of investments | | | (7 | ) | | | 9,568 | | | | 98 | | | | 94 | |
| | | | | | | | | | | | | | | | |
Net Assets | | $ | 2,453 | | | $ | 231,398 | | | $ | 4,573 | | | $ | 2,156 | |
| | | | | | | | | | | | | | | | |
| | | | |
Class N Shares | | | | | | | | | | | | | | | | |
Net Assets | | $ | 998 | | | $ | 40,712 | | | $ | 58 | | | $ | 860 | |
Shares Outstanding | | | 100,308 | | | | 3,319,567 | | | | 5,582 | | | | 82,300 | |
Net Asset Value Per Share | | $ | 9.95 | | | $ | 12.26 | | | $ | 10.48 | | | $ | 10.45 | |
Class I Shares | | | | | | | | | | | | | | | | |
Net Assets | | $ | 1,455 | | | $ | 190,686 | | | $ | 4,515 | | | $ | 1,296 | |
Shares Outstanding | | | 146,226 | | | | 15,286,545 | | | | 430,960 | | | | 124,011 | |
Net Asset Value Per Share | | $ | 9.95 | | | $ | 12.47 | | | $ | 10.48 | | | $ | 10.45 | |
See accompanying Notes to Financial Statements.
December 31, 2011 | William Blair Funds 121 |
Statements of Operations
for the Year Ended December 31, 2011 (all amounts in thousands)
| | | | | | | | | | | | | | | | |
| | | Large Cap
Value
Fund(a) | | | Small Cap
Value
Fund | | | Mid Cap
Value
Fund | | | Small-Mid
Cap Value
Fund(b) | |
Investment income | | | | | | | | | | | | | | | | |
Dividends | | $ | 12 | | | $ | 2,901 | | | $ | 86 | | | $ | 2 | |
Interest | | | — | | | | 1 | | | | — | | | | — | |
| | | | | | | | | | | | | | | | |
Total income | | | 12 | | | | 2,902 | | | | 86 | | | | 2 | |
Expenses | | | | | | | | | | | | | | | | |
Investment advisory fees | | | 4 | | | | 2,290 | | | | 35 | | | | 1 | |
Distribution fees | | | — | | | | 98 | | | | — | | | | — | |
Custodian fees | | | 8 | | | | 74 | | | | 42 | | | | 2 | |
Transfer agent fees | | | 3 | | | | 36 | | | | 4 | | | | 2 | |
Sub-transfer agent fees | | | | | | | | | | | | | | | | |
Class N | | | — | | | | 56 | | | | — | | | | — | |
Class I | | | — | | | | 151 | | | | — | | | | — | |
Professional fees | | | 13 | | | | 28 | | | | 20 | | | | 10 | |
Registration fees | | | 6 | | | | 42 | | | | 28 | | | | 2 | |
Shareholder reporting fees | | | — | | | | 30 | | | | — | | | | — | |
Trustee fees | | | — | | | | 6 | | | | — | | | | — | |
Other expenses | | | — | | | | 10 | | | | 4 | | | | — | |
| | | | | | | | | | | | | | | | |
Total expenses before waiver | | | 34 | | | | 2,821 | | | | 133 | | | | 17 | |
Expenses waived and reimbursed by the Advisor | | | (29 | ) | | | (359 | ) | | | (93 | ) | | | (16 | ) |
| | | | | | | | | | | | | | | | |
Net expenses | | | 5 | | | | 2,462 | | | | 40 | | | | 1 | |
| | | | | | | | | | | | | | | | |
Net investment income (loss) | | | 7 | | | | 440 | | | | 46 | | | | 1 | |
Realized and unrealized gain (loss) | | | | | | | | | | | | | | | | |
Net realized gain (loss) on transactions from: | | | | | | | | | | | | | | | | |
Investments | | | (4 | ) | | | 890 | | | | 40 | | | | (3 | ) |
Foreign currency transactions | | | — | | | | — | | | | — | | | | — | |
| | | | | | | | | | | | | | | | |
Total net realized gain (loss) | | | (4 | ) | | | 890 | | | | 40 | | | | (3 | ) |
Change in net unrealized appreciation (depreciation) of: | | | | | | | | | | | | | | | | |
Investments | | | (7 | ) | | | (16,890 | ) | | | (92 | ) | | | 94 | |
Foreign currency translations | | | — | | | | — | | | | — | | | | — | |
| | | | | | | | | | | | | | | | |
Total change in net unrealized appreciation (depreciation) | | | (7 | ) | | | (16,890 | ) | | | (92 | ) | | | 94 | |
| | | | | | | | | | | | | | | | |
Net increase (decrease) in net assets resulting from operations | | $ | (4 | ) | | $ | (15,560 | ) | | $ | (6 | ) | | $ | 92 | |
| | | | | | | | | | | | | | | | |
| (a) | | For the period from October 24, 2011 (Commencement of Operations) to December 31, 2011. |
| (b) | | For the period from December 15, 2011 (Commencement of Operations) to December 31, 2011. |
See accompanying Notes to Financial Statements.
122 Annual Report | December 31, 2011 |
Statements of Changes in Net Assets
for the Year Ended December 31, 2011 and the Year Ended December 31, 2010 (all amounts in thousands)
| | | | | | | | | | | | | | | | | | | | | | | | |
| | | Large Cap
Value
Fund | | | Small Cap
Value
Fund | | | Mid Cap
Value
Fund | | | Small-Mid
Cap Value
Fund | |
| | | 2011(a) | | | 2011 | | | 2010 | | | 2011 | | | 2010(b) | | | 2011(c) | |
Operations | | | | | | | | | | | | | | | | | | | | | | | | |
Net investment income (loss) | | $ | 7 | | | $ | 440 | | | $ | 411 | | | $ | 46 | | | $ | 26 | | | $ | 1 | |
Net realized gain (loss) on investments | | | (4 | ) | | | 890 | | | | 9,981 | | | | 40 | | | | 19 | | | | (3 | ) |
Change in net unrealized appreciation (depreciation) on investments | | | (7 | ) | | | (16,890 | ) | | | 20,721 | | | | (92 | ) | | | 190 | | | | 94 | |
| | | | | | | | | | | | | | | | | | | | | | | | |
Net increase (decrease) in net assets resulting from operations | | | (4 | ) | | | (15,560 | ) | | | 31,113 | | | | (6 | ) | | | 235 | | | | 92 | |
Distributions to shareholders from | | | | | | | | | | | | | | | | | | | | | | | | |
Net investment income | | | (7 | ) | | | (489 | ) | | | (404 | ) | | | (48 | ) | | | (21 | ) | | | — | |
Net realized gain | | | — | | | | (8,188 | ) | | | — | | | | (51 | ) | | | (5 | ) | | | — | |
Return of capital | | | — | | | | (333 | ) | | | — | | | | — | | | | — | | | | — | |
| | | | | | | | | | | | | | | | | | | | | | | | |
| | | (7 | ) | | | (9,010 | ) | | | (404 | ) | | | (99 | ) | | | (26 | ) | | | — | |
Capital stock transactions | | | | | | | | | | | | | | | | | | | | | | | | |
Net proceeds from sale of shares | | | 2,457 | | | | 162,792 | | | | 92,468 | | | | 1,698 | | | | 3,162 | | | | 2,064 | |
Shares issued in reinvestment of income dividends and capital gain distributions | | | 7 | | | | 8,075 | | | | 354 | | | | 85 | | | | 27 | | | | — | |
Less cost of shares redeemed | | | — | | | | (79,398 | ) | | | (13,891 | ) | | | (498 | ) | | | (5 | ) | | | — | |
| | | | | | | | | | | | | | | | | | | | | | | | |
Net increase (decrease) in net assets resulting from capital share transactions | | | 2,464 | | | | 91,469 | | | | 78,931 | | | | 1,285 | | | | 3,184 | | | | 2,064 | |
| | | | | | | | | | | | | | | | | | | | | | | | |
Increase (decrease) in net assets | | | 2,453 | | | | 66,899 | | | | 109,640 | | | | 1,180 | | | | 3,393 | | | | 2,156 | |
Net assets | | | | | | | | | | | | | | | | | | | | | | | | |
Beginning of year | | | — | | | | 164,499 | | | | 54,859 | | | | 3,393 | | | | — | | | | — | |
| | | | | | | | | | | | | | | | | | | | | | | | |
End of year | | $ | 2,453 | | | $ | 231,398 | | | $ | 164,499 | | | $ | 4,573 | | | $ | 3,393 | | | $ | 2,156 | |
| | | | | | | | | | | | | | | | | | | | | | | | |
Accumulated net investment income (loss) at the end of the year | | $ | — | | | $ | 25 | | | $ | 127 | | | $ | — | | | $ | 5 | | | $ | 1 | |
| | | | | | | | | | | | | | | | | | | | | | | | |
| (a) | | For the period from October 24, 2011 (Commencement of Operations) to December 31, 2011. |
| (b) | | For the period from May 3, 2010 (Commencement of Operations) to December 31, 2010. |
| (c) | | For the period from December 15, 2011 (Commencement of Operations) to December 31, 2011. |
See accompanying Notes to Financial Statements.
December 31, 2011 | William Blair Funds 123 |
Statements of Assets and Liabilities
December 31, 2011 (dollar amounts in thousands)
| | | | | | | | | | | | | | | | |
| | | Bond
Fund | | | Income
Fund | | | Low
Duration
Fund | | | Ready
Reserves
Fund | |
Assets | | | | | | | | | | | | | | | | |
Investments in securities, at cost | | $ | 211,834 | | | $ | 105,993 | | | $ | 155,348 | | | $ | 1,270,175 | |
| | | | | | | | | | | | | | | | |
| | | | |
Investments in securities, at value | | $ | 225,227 | | | $ | 110,951 | | | $ | 155,608 | | | $ | 1,270,175 | |
Receivable for fund shares sold | | | 4,950 | | | | 470 | | | | 1,150 | | | | — | |
Receivable from Advisor | | | 1 | | | | 1 | | | | 1 | | | | 630 | |
Dividend and interest receivable | | | 2,101 | | | | 861 | | | | 508 | | | | 1,658 | |
| | | | | | | | | | | | | | | | |
Total assets | | | 232,279 | | | | 112,283 | | | | 157,267 | | | | 1,272,463 | |
Liabilities | | | | | | | | | | | | | | | | |
Payable for fund shares redeemed | | | 68 | | | | 163 | | | | 9 | | | | — | |
Investment advisory fee payable | | | 58 | | | | 42 | | | | 40 | | | | 264 | |
Distribution and shareholder service fee payable | | | 21 | | | | 6 | | | | 12 | | | | 386 | |
Other accrued expenses | | | 116 | | | | 87 | | | | 59 | | | | 67 | |
| | | | | | | | | | | | | | | | |
Total liabilities | | | 263 | | | | 298 | | | | 120 | | | | 717 | |
| | | | | | | | | | | | | | | | |
Net Assets | | $ | 232,016 | | | $ | 111,985 | | | $ | 157,147 | | | $ | 1,271,746 | |
| | | | | | | | | | | | | | | | |
Capital | | | | | | | | | | | | | | | | |
Composition of Net Assets | | | | | | | | | | | | | | | | |
Par value of shares of beneficial interest | | $ | 20 | | | $ | 12 | | | $ | 16 | | | $ | 1,272 | |
Capital paid in excess of par value | | | 217,752 | | | | 146,902 | | | | 159,433 | | | | 1,270,407 | |
Accumulated net investment income (loss) | | | 2 | | | | — | | | | — | | | | 108 | |
Accumulated net realized gain (loss) | | | 849 | | | | (39,887 | ) | | | (2,561 | ) | | | (41 | ) |
Net unrealized appreciation (depreciation) of investments | | | 13,393 | | | | 4,958 | | | | 259 | | | | — | |
| | | | | | | | | | | | | | | | |
Net Assets | | $ | 232,016 | | | $ | 111,985 | | | $ | 157,147 | | | $ | 1,271,746 | |
| | | | | | | | | | | | | | | | |
| | | | |
Class N Shares | | | | | | | | | | | | | | | | |
Net Assets | | $ | 8,345 | | | $ | 44,802 | | | $ | 6,260 | | | $ | 1,271,746 | |
Shares Outstanding | | | 764,844 | | | | 4,805,435 | | | | 637,307 | | | | 1,271,802,771 | |
Net Asset Value Per Share | | $ | 10.91 | | | $ | 9.32 | | | $ | 9.82 | | | $ | 1.00 | |
Class I Shares | | | | | | | | | | | | | | | | |
Net Assets | | $ | 154,224 | | | $ | 67,183 | | | $ | 82,828 | | | | | |
Shares Outstanding | | | 14,274,532 | | | | 7,261,027 | | | | 8,432,625 | | | | | |
Net Asset Value Per Share | | $ | 10.80 | | | $ | 9.25 | | | $ | 9.82 | | | | | |
See accompanying Notes to Financial Statements.
124 Annual Report | December 31, 2011 |
Statements of Operations
for the Year Ended December 31, 2011 (all amounts in thousands)
| | | | | | | | | | | | | | | | |
| | | Bond
Fund | | | Income
Fund | | | Low
Duration
Fund | | | Ready
Reserves
Fund | |
Investment income | | | | | | | | | | | | | | | | |
Interest | | $ | 9,795 | | | $ | 4,348 | | | $ | 3,317 | | | $ | 1,835 | |
| | | | | | | | | | | | | | | | |
Total income | | | 9,795 | | | | 4,348 | | | | 3,317 | | | | 1,835 | |
Expenses | | | | | | | | | | | | | | | | |
Investment advisory fees | | | 633 | | | | 473 | | | | 449 | | | | 2,998 | |
Distribution fees | | | 8 | | | | 52 | | | | 9 | | | | — | |
Shareholder services fees | | | 228 | | | | — | | | | 126 | | | | 4,372 | |
Custodian fees | | | 54 | | | | 49 | | | | 67 | | | | 22 | |
Transfer agent fees | | | 23 | | | | 22 | | | | 17 | | | | 27 | |
Sub-transfer agent fees | | | | | | | | | | | | | | | | |
Class N | | | 4 | | | | 47 | | | | — | | | | — | |
Class I | | | 10 | | | | 2 | | | | — | | | | — | |
Professional fees | | | 35 | | | | 38 | | | | 29 | | | | 83 | |
Registration fees | | | 46 | | | | 32 | | | | 56 | | | | 23 | |
Shareholder reporting fees | | | 8 | | | | 16 | | | | 2 | | | | 34 | |
Trustee fees | | | 9 | | | | 5 | | | | 6 | | | | 56 | |
Other expenses | | | 15 | | | | 8 | | | | 11 | | | | 79 | |
| | | | | | | | | | | | | | | | |
Total expenses before waiver | | | 1,073 | | | | 744 | | | | 772 | | | | 7,694 | |
Expenses waived and reimbursed by Advisor | | | (98 | ) | | | (23 | ) | | | (41 | ) | | | (5,984 | ) |
| | | | | | | | | | | | | | | | |
Net expenses | | | 975 | | | | 721 | | | | 731 | | | | 1,710 | |
| | | | | | | | | | | | | | | | |
Net investment income (loss) | | | 8,820 | | | | 3,627 | | | | 2,586 | | | | 125 | |
Realized and unrealized gain (loss) | | | | | | | | | | | | | | | | |
Net realized gain (loss) on transactions from investments | | | | | | | | | | | | | | | | |
Investments | | | 3,325 | | | | 2,582 | | | | 59 | | | | — | |
Foreign currency transactions | | | — | | | | — | | | | — | | | | — | |
| | | | | | | | | | | | | | | | |
Total net realized gain (loss) | | | 3,325 | | | | 2,582 | | | | 59 | | | | — | |
Change in net unrealized appreciation (depreciation) of investments | | | | | | | | | | | | | | | | |
Investments | | | 3,590 | | | | (897 | ) | | | 360 | | | | — | |
Foreign currency translations | | | — | | | | — | | | | — | | | | — | |
| | | | | | | | | | | | | | | | |
Change in net unrealized appreciation (depreciation) | | | 3,590 | | | | (897 | ) | | | 360 | | | | — | |
| | | | | | | | | | | | | | | | |
Net increase (decrease) in net assets resulting from operations | | $ | 15,735 | | | $ | 5,312 | | | $ | 3,005 | | | $ | 125 | |
| | | | | | | | | | | | | | | | |
See accompanying Notes to Financial Statements.
December 31, 2011 | William Blair Funds 125 |
Statements of Changes in Net Assets
for the Year Ended December 31, 2011 and the Year Ended December 31, 2010 (all amounts in thousands)
| | | | | | | | | | | | | | | | | | | | | | | | | | | | | | | | |
| | | Bond
Fund | | | Income
Fund | | | Low
Duration
Fund | | | Ready
Reserves
Fund | |
| | | 2011 | | | 2010 | | | 2011 | | | 2010 | | | 2011 | | | 2010 | | | 2011 | | | 2010 | |
Operations | | | | | | | | | | | | | | | | | | | | | | | | | | | | | | | | |
Net investment income (loss) | | $ | 8,820 | | | $ | 8,051 | | | $ | 3,627 | | | $ | 4,613 | | | $ | 2,586 | | | $ | 1,915 | | | $ | 125 | | | $ | 126 | |
Net realized gain (loss) on investments | | | 3,325 | | | | 2,212 | | | | 2,582 | | | | 2,316 | | | | 59 | | | | (60 | ) | | | — | | | | — | |
Change in net unrealized appreciation (depreciation) on investments | | | 3,590 | | | | 3,290 | | | | (897 | ) | | | 202 | | | | 360 | | | | 468 | | | | — | | | | — | |
| | | | | | | | | | | | | | | | | | | | | | | | | | | | | | | | |
Net increase (decrease) in net assets resulting from operations | | | 15,735 | | | | 13,553 | | | | 5,312 | | | | 7,131 | | | | 3,005 | | | | 2,323 | | | | 125 | | | | 126 | |
Distributions to shareholders from | | | | | | | | | | | | | | | | | | | | | | | | | | | | | | | | |
Net investment income | | | (9,700 | ) | | | (8,566 | ) | | | (4,177 | ) | | | (5,134 | ) | | | (4,103 | ) | | | (2,958 | ) | | | (125 | ) | | | (126 | ) |
Net realized gain | | | (1,831 | ) | | | (494 | ) | | | — | | | | — | | | | — | | | | — | | | | — | | | | — | |
| | | | | | | | | | | | | | | | | | | | | | | | | | | | | | | | |
| | | (11,531 | ) | | | (9,060 | ) | | | (4,177 | ) | | | (5,134 | ) | | | (4,103 | ) | | | (2,958 | ) | | | (125 | ) | | | (126 | ) |
Capital stock transactions | | | | | | | | | | | | | | | | | | | | | | | | | | | | | | | | |
Net proceeds from sale of shares | | | 100,839 | | | | 90,709 | | | | 34,055 | | | | 15,385 | | | | 121,427 | | | | 149,882 | | | | 838,997 | | | | 670,783 | |
Shares issued in reinvestment of income dividends and capital gain distributions | | | 8,489 | | | | 6,013 | | | | 3,514 | | | | 4,350 | | | | 3,322 | | | | 2,297 | | | | 125 | | | | 126 | |
Less cost of shares redeemed | | | (74,292 | ) | | | (55,783 | ) | | | (39,996 | ) | | | (26,063 | ) | | | (109,974 | ) | | | (103,208 | ) | | | (783,919 | ) | | | (807,267 | ) |
| | | | | | | | | | | | | | | | | | | | | | | | | | | | | | | | |
Net increase (decrease) in net assets resulting from capital share transactions | | | 35,036 | | | | 40,939 | | | | (2,427 | ) | | | (6,328 | ) | | | 14,775 | | | | 48,971 | | | | 55,203 | | | | (136,358 | ) |
| | | | | | | | | | | | | | | | | | | | | | | | | | | | | | | | |
Increase (decrease) in net assets | | | 39,240 | | | | 45,432 | | | | (1,292 | ) | | | (4,331 | ) | | | 13,677 | | | | 48,336 | | | | 55,203 | | | | (136,358 | ) |
Net assets | | | | | | | | | | | | | | | | | | | | | | | | | | | | | | | | |
Beginning of year | | | 192,776 | | | | 147,344 | | | | 113,277 | | | | 117,608 | | | | 143,470 | | | | 95,134 | | | | 1,216,543 | | | | 1,352,901 | |
| | | | | | | | | | | | | | | | | | | | | | | | | | | | | | | | |
End of year | | $ | 232,016 | | | $ | 192,776 | | | $ | 111,985 | | | $ | 113,277 | | | $ | 157,147 | | | $ | 143,470 | | | $ | 1,271,746 | | | $ | 1,216,543 | |
| | | | | | | | | | | | | | | | | | | | | | | | | | | | | | | | |
Accumulated net investment income (loss) at the end of the year | | $ | 2 | | | $ | 1 | | | $ | — | | | $ | — | | | $ | — | | | $ | — | | | $ | 108 | | | $ | 86 | |
| | | | | | | | | | | | | | | | | | | | | | | | | | | | | | | | |
See accompanying Notes to Financial Statements.
126 Annual Report | December 31, 2011 |
Notes to Financial Statements
(1) Significant Accounting Policies
The following is a summary of William Blair Funds’ (the “Fund”) significant accounting policies in effect during the year covered by the financial statements, which are in accordance with U.S. generally accepted accounting principles.
(a) Description of the Fund
The Fund is a diversified mutual fund registered under the Investment Company Act of 1940 (the “1940 Act”), as amended, as an open-end management investment company. The Fund currently consists of the following publicly offered twenty-three portfolios (the “Portfolios”), each with its own investment objective and policies. For each Portfolio, the number of shares authorized is unlimited.
| | |
Equity Portfolios Growth Large Cap Growth Small Cap Growth Mid Cap Growth Small-Mid Cap Growth Large Cap Value Small Cap Value Mid Cap Value Small-Mid Cap Value Global Equity Portfolio Global Growth Dynamic Allocation Portfolio Macro Allocation | | International Equity Portfolios International Growth International Equity Institutional International Growth Institutional International Equity International Small Cap Growth Emerging Markets Growth Emerging Leaders Growth Emerging Markets Small Cap Growth Fixed-Income Portfolios Bond Income Low Duration Money Market Portfolio Ready Reserves |
| |
| |
| |
| |
| |
| |
| |
| |
| |
| |
| |
| |
| |
The investment objectives of the Portfolios are as follows:
| | |
Equity | | Long-term capital appreciation. |
Global Equity | | Long-term capital appreciation. |
Dynamic Allocation | | Long-term risk adjusted total return. |
International Equity | | Long-term capital appreciation. |
Fixed-Income | | High level of current income with relative stability of principal.
(Maximize total return—Low Duration) |
Money Market | | Current income, a stable share price and daily liquidity. |
The Institutional International Growth Portfolio, the Institutional International Equity Portfolio, the Institutional Class of the International Small Cap Growth Portfolio, the Emerging Markets Growth Portfolio, the Emerging Leaders Growth Portfolio, the Bond Portfolio and the Low Duration Portfolio issue a separate report.
The Macro Allocation Portfolio has a fiscal year end of October 31, and issues a separate report.
(b) Share Classes
Three different classes of shares currently exist: N, I and Institutional. This report includes financial highlight information for Classes N and I. The table below describes the Class N shares and the Class I shares covered by this report:
| | |
Class | | Description |
| N | | Class N shares are sold to the general public, either directly through the Fund’s distributor or through a select number of financial intermediaries. Class N shares are sold without any sales load, and carry an annual 12b-1 distribution fee (0.25% for the Equity, Global Equity and International Equity Portfolios and 0.15% for the Fixed-Income Portfolios) or a service fee (0.35% for the Money Market Portfolio), a Sub-transfer agent fee that is not a fixed rate and may vary by Portfolio and class, and an annual shareholder administration fee (0.15% for the Global Growth Portfolio, the International Small Cap Growth Portfolio, the Emerging Markets Growth Portfolio, the Emerging Leaders Growth Portfolio, the Emerging Markets Small Cap Growth Portfolio, the Bond Portfolio and the Low Duration Portfolio). |
December 31, 2011 | William Blair Funds 127 |
| | |
Class | | Description |
| I | | Class I shares are sold to a limited group of investors. They do not carry any sales load or distribution fees and generally have lower ongoing expenses than the Class N shares. Class I shares have a Sub-transfer agent fee that is not a fixed rate and may vary by Portfolio and class and the Global Growth Portfolio, the International Small Cap Growth Portfolio, the Emerging Markets Growth Portfolio, the Emerging Leaders Growth Portfolio, the Emerging Markets Small Cap Growth Portfolio, the Bond Portfolio and the Low Duration Portfolio carry an annual shareholder administration fee of 0.15%. |
Sub-transfer fees: The Portfolios may reimburse the Advisor for fees paid to intermediaries such as banks, broker-dealers, financial advisors or other financial institutions for sub-administration, sub-transfer agency and other services provided to investors whose shares are held of record in omnibus, other group accounts, retirement plans or accounts traded through registered securities clearing agents. These fees may vary based on, for example, the nature of services provided, but generally range up to 0.15% of the assets of the class serviced or maintained by the intermediary or up to $15 per shareholder account.
Investment income, realized and unrealized gains and losses, and certain Portfolio level expenses and expense reductions, if any, are allocated based on the relative net assets of each class, except for certain class specific expenses, which are charged directly to the appropriate class. Differences in class expenses may result in the payment of different per share dividends by class. All share classes of the Portfolios have equal rights with respect to voting subject to class specific arrangements.
(c) Investment Valuation
The market value of domestic equity securities is determined by valuing securities traded on national securities markets or in the over-the-counter markets at the last sale price or, if applicable, the official closing price or, in the absence of a recent sale on the date of determination, at the latest bid price.
The value of foreign equity securities is generally determined based upon the last sale price on the foreign exchange or market on which it is primarily traded and in the currency of that market as of the close of the appropriate exchange or, if there have been no sales during that day, at the latest bid price. The Board of Trustees has determined that the passage of time between when the foreign exchanges or markets close and when the Portfolios compute their net asset values could cause the value of foreign equity securities to no longer be representative or accurate and, as a result, may necessitate that such securities be fair valued. Accordingly, for foreign equity securities, the Portfolios may use an independent pricing service to fair value the security as of the close of regular trading on the New York Stock Exchange. As a result, a Portfolio’s value for a security may be different from the last sale price (or the latest bid price).
Fixed-income securities are valued by using market quotations or independent pricing services that use either prices provided by market-makers or matrices that produce estimates of market values obtained from yield data relating to instruments or securities with similar characteristics.
Other securities, and all other assets, including securities for which a market price is not available or is deemed unreliable, (e.g., securities affected by unusual or extraordinary events, such as natural disasters or securities affected by market or economic events, such as bankruptcy filings), or the value of which is affected by a significant valuation event, are valued at a fair value as determined in good faith by, or under the direction of, the Board of Trustees and in accordance with the Fund’s Valuation Procedures. The value of fair valued securities may be different from the last sale price (or the latest bid price), and there is no guarantee that a fair valued security will be sold at the price at which a Portfolio is carrying the security.
Investments in other funds are valued at the underlying fund’s net asset value on the date of valuation. Securities held in the Ready Reserves Portfolio are valued at amortized cost, which approximates market value.
As of December 31, 2011, there were securities held in the International Growth, International Small Cap Growth, Emerging Markets Growth, Emerging Leaders Growth, Emerging Markets Small Cap Growth, Bond and Income Portfolios requiring fair valuation pursuant to the Funds’ Valuation Procedures.
(d) Investment income and transactions
Dividend income is recorded on the ex-dividend date, except for those dividends from certain foreign securities that are recorded when the information is available.
Interest income is recorded on an accrual basis, adjusted for amortization of premium or discount. Variable rate bonds and floating rate notes earn interest at coupon rates that fluctuate at specific time intervals. The interest rates shown in the Portfolio of Investments for the Bond, Income, Low Duration and Ready Reserves Portfolios were the rates in effect on December 31, 2011. Put bonds may be redeemed at the discretion of the holder on specified dates prior to maturity.
128 Annual Report | December 31, 2011 |
Premiums and discounts are accreted and amortized on a straight-line basis for short-term investments and on an effective interest method for long-term investments.
Paydown gains and losses on mortgage and asset-backed securities are treated as an adjustment to interest income. For the year ended December 31, 2011, the Bond, Income and Low Duration Portfolios recognized a reduction of interest income and a decrease of net realized loss of $(879), $(550) and $(1,517), respectively (in thousands). This reclassification had no effect on the net asset value or the net assets of the Portfolios.
The Portfolios do not isolate that portion of the results of operations resulting from changes in foreign exchange rates on investments from the fluctuations arising from changes in market prices of securities held. Such fluctuations are included with the net realized and unrealized gain or loss from investments and foreign currency.
Reported net realized foreign currency gains or losses arise from disposition of foreign currency, the difference in the foreign exchange rates between the trade and settlement dates on securities transactions, and the difference between the amounts of dividends, interest and foreign withholding taxes recorded on the ex-date or accrual date and the U.S. dollar equivalent of the amounts actually received or paid. Net unrealized foreign exchange gains and losses arise from changes (due to the changes in the exchange rate) in the value of foreign currency and other assets and liabilities denominated in foreign currencies held at yearend.
Security and shareholder transactions are accounted for no later than one business day following the trade date. However, for financial reporting purposes, security and shareholder transactions are accounted for on the trade date of the last business day of the reporting year. Realized gains and losses from securities transactions are recognized on a specifically identified cost basis.
Awards from class action litigation may be recorded as a reduction of cost. If the Portfolios no longer own the applicable securities, the proceeds are recorded as realized gains.
(e) Share Valuation and Distributions to Shareholders
Shares are sold and redeemed on a continuous basis at net asset value. The net asset value per share is determined separately for each class by dividing the Portfolio’s net assets attributable to that class by the number of shares of the class outstanding as of the close of regular trading on the New York Stock Exchange (the “Exchange”), which is generally 4:00 p.m. Eastern time, on each day the Exchange is open. Redemption fees may be applicable to redemptions or exchanges within 60 days of purchase. For both Class N and Class I shares, the Equity Portfolios assess a 1% redemption fee on shares sold or exchanged that have been owned 60 days or less and the Global Equity and International Equity portfolios assess a 2% redemption fee on shares sold or exchanged that have been owned 60 days or less as disclosed within the Fund’s Prospectus. The redemption fees collected by the Portfolio are netted against the amount of redemptions for presentation on the Statements of Changes in Net Assets.
The redemption fees collected by the Portfolios were as follows (in thousands):
| | | | | | | | |
| | | Year Ended
December 31,
2011 | | | Year Ended
December 31,
2010 | |
Growth | | $ | 11 | | | $ | 10 | |
Large Cap Growth | | | — | | | | 1 | |
Small Cap Growth | | | 15 | | | | 78 | |
Mid Cap Growth | | | 13 | | | | 2 | |
Small-Mid Cap Growth | | | 8 | | | | — | |
Global Growth | | | 1 | | | | — | |
International Growth | | | 107 | | | | 149 | |
International Equity | | | 4 | | | | 7 | |
International Small Cap Growth | | | 18 | | | | 3 | |
Emerging Markets Growth | | | 4 | | | | 18 | |
Emerging Leaders Growth | | | 1 | | | | — | |
Emerging Markets Small Cap Growth | | | — | | | | N/A | |
Large Cap Value | | | — | | | | N/A | |
Small Cap Value | | | 48 | | | | 20 | |
Mid Cap Value | | | — | | | | — | |
Small-Mid Cap Value | | | — | | | | N/A | |
Distributions from net investment income, if any, of the Growth, Large Cap Growth, Small Cap Growth, Mid Cap Growth, Small-Mid Cap Growth, Global Growth, International Growth, International Equity, International Small Cap Growth,
December 31, 2011 | William Blair Funds 129 |
Emerging Markets Growth, Emerging Leaders Growth, Emerging Markets Small Cap Growth, Large Cap Value, Small Cap Value, Mid Cap Value, and Small-Mid Cap Value Portfolios are declared and paid at least annually. As of April 16, 2011, dividends from the Bond and Income Portfolios are declared daily and paid monthly. Distributions from the Low Duration and Ready Reserves Portfolios are declared daily and paid monthly. Capital gain distributions, if any, are declared and paid at least annually in December. Distributions payable to shareholders are recorded on the ex-dividend date.
(f) Foreign Currency Translation and Forward Foreign Currency Contracts
The Growth, Global Growth, International Growth, International Equity, International Small Cap Growth, Emerging Markets Growth, Emerging Leaders Growth, and Emerging Markets Small Cap Growth Portfolios may invest in securities denominated in foreign currencies. As such, assets and liabilities denominated in foreign currencies are translated into U.S. dollar amounts at the current exchange rate on the date of valuation. The values of foreign investments, open forward foreign currency contracts, and cash denominated in foreign currencies are translated into U.S. dollars using a spot market rate of exchange as of the time of the determination of each Portfolio’s Net Asset Value, typically 4:00 p.m. Eastern time on days when there is regular trading on the New York Stock Exchange. Payables and receivables for securities transactions, dividends, interest income and tax reclaims are translated into U.S. dollars using a spot market rate of exchange as of 4:00 p.m. Eastern time. Settlement of purchases and sales and dividend and interest receipts are translated into U.S. dollars using a spot market rate of exchange as of 11:00 a.m. Eastern time.
(g) Income Taxes
Each Portfolio intends to comply with the provisions of Subchapter M of the Internal Revenue Code available to regulated investment companies. Each Portfolio intends to make the requisite distributions of income and capital gains to its shareholders sufficient to relieve it from all, or substantially all, federal income and excise taxes. No provision for federal income and excise taxes has been made.
The Global Growth, International Growth, International Equity, International Small Cap Growth, Emerging Markets Growth, Emerging Leaders Growth and Emerging Market Small Cap Growth Portfolios may be subject to a tax imposed on net realized and unrealized gains on securities of certain foreign countries.
Management has evaluated all of the uncertain tax positions of the Portfolios and has determined that no liability is required to be recorded in the financial statements.
The statute of limitations on the Portfolios’ tax returns for each of the tax years in the four year period ended December 31, 2011, remains open and the returns are subject to examination.
The Portfolios have elected to mark-to-market their investments in Passive Foreign Investment Companies (“PFICs”) for federal income tax purposes. The Portfolios also treat the deferred loss associated with current and prior year wash sales as an adjustment to the cost of investments for tax purposes. The cost of investments for federal income tax purposes and related gross unrealized appreciation/(depreciation) and net unrealized appreciation (depreciation) at December 31, 2011, were as follows (in thousands):
| | | | | | | | | | | | | | | | |
Portfolio | | Cost of
Investments | | | Gross
Unrealized
Appreciation | | | Gross
Unrealized
Depreciation | | | Net
Unrealized
Appreciation
(Depreciation) | |
Growth | | $ | 503,014 | | | $ | 87,848 | | | $ | 26,452 | | | $ | 61,396 | |
Large Cap Growth | | | 21,378 | | | | 4,248 | | | | 616 | | | | 3,632 | |
Small Cap Growth | | | 542,480 | | | | 80,588 | | | | 69,195 | | | | 11,393 | |
Mid Cap Growth | | | 135,755 | | | | 15,160 | | | | 5,216 | | | | 9,944 | |
Small-Mid Cap Growth | | | 235,101 | | | | 27,301 | | | | 12,522 | | | | 14,779 | |
Global Growth | | | 38,219 | | | | 6,130 | | | | 1,748 | | | | 4,382 | |
International Growth | | | 3,209,867 | | | | 286,400 | | | | 252,269 | | | | 34,131 | |
International Equity | | | 71,088 | | | | 6,167 | | | | 3,061 | | | | 3,106 | |
International Small Cap Growth | | | 741,839 | | | | 52,848 | | | | 79,378 | | | | (26,530 | ) |
Emerging Markets Growth | | | 848,230 | | | | 48,379 | | | | 84,573 | | | | (36,194 | ) |
Emerging Leaders Growth | | | 53,067 | | | | 2,368 | | | | 6,660 | | | | (4,292 | ) |
130 Annual Report | December 31, 2011 |
| | | | | | | | | | | | | | | | |
Portfolio | | Cost of
Investments | | | Gross
Unrealized
Appreciation | | | Gross
Unrealized
Depreciation | | | Net
Unrealized
Appreciation
(Depreciation) | |
Emerging Markets Small Cap Growth | | $ | 3,292 | | | $ | 132 | | | $ | 152 | | | $ | (20 | ) |
Large Cap Value | | | 2,423 | | | | 80 | | | | 87 | | | | (7 | ) |
Small Cap Value | | | 227,141 | | | | 16,149 | | | | 9,565 | | | | 6,584 | |
Mid Cap Value | | | 4,437 | | | | 276 | | | | 194 | | | | 82 | |
Small-Mid Cap Value | | | 2,028 | | | | 97 | | | | 3 | | | | 94 | |
Bond | | | 211,834 | | | | 13,929 | | | | 536 | | | | 13,393 | |
Income | | | 105,993 | | | | 5,703 | | | | 745 | | | | 4,958 | |
Low Duration | | | 155,349 | | | | 1,007 | | | | 748 | | | | 259 | |
Ready Reserves | | | 1,270,175 | | | | — | | | | — | | | | — | |
The timing and characterization of certain income and capital gain distributions are determined annually in accordance with federal income tax regulations that may differ from U.S. generally accepted accounting principles. As a result, net investment income or loss and net realized gain or loss for a reporting period may differ from the amount distributed during such period. In addition, the Portfolios may periodically record reclassifications among certain capital accounts to reflect differences between financial reporting and income tax basis distributions. The reclassifications were reported in order to reflect the tax treatment for certain permanent differences that exist between income tax regulations and U.S. generally accepted accounting principles. The reclassifications generally relate to net operating losses, Section 988 currency gains and losses, PFICs gains and losses, recharacterization of dividends received from investments in Real Estate Investment Trust, paydown gains and losses, expired capital loss carryforwards and redemptions in-kind. These reclassifications have no impact on the net asset values of the Portfolios. Accordingly, at December 31, 2011, the following reclassifications were recorded (in thousands):
| | | | | | | | | | | | |
Portfolio | | Accumulated Net
Investment
Income (Loss) | | | Accumulated
Net Realized
Gain (Loss) | | | Capital
Paid in Excess
of Par Value | |
Growth | | $ | 886 | | | $ | 2 | | | $ | (888 | ) |
Large Cap Growth | | | 16 | | | | — | | | | (16 | ) |
Small Cap Growth | | | 7,875 | | | | — | | | | (7,875 | ) |
Mid Cap Growth | | | 573 | | | | — | | | | (573 | ) |
Small-Mid Cap Growth | | | 1,387 | | | | (1,387 | ) | | | — | |
Global Growth | | | (53 | ) | | | 54 | | | | (1 | ) |
International Growth | | | (8,284 | ) | | | (106,774 | ) | | | 115,058 | |
International Equity | | | (269 | ) | | | 269 | | | | — | |
International Small Cap Growth | | | 8,995 | | | | (8,995 | ) | | | — | |
Emerging Markets Growth | | | 5,939 | | | | (24,168 | ) | | | 18,229 | |
Emerging Leaders Growth | | | (251 | ) | | | 276 | | | | (25 | ) |
Emerging Markets Small Cap Growth | | | (15 | ) | | | 15 | | | | — | |
Large Cap Value | | | — | | | | — | | | | — | |
Small Cap Value | | | 271 | | | | 62 | | | | (333 | ) |
Mid Cap Value | | | (2 | ) | | | 2 | | | | — | |
Small-Mid Cap Value | | | — | | | | — | | | | — | |
Bond | | | 879 | | | | (879 | ) | | | — | |
Income | | | 550 | | | | (550 | ) | | | — | |
Low Duration | | | 1,517 | | | | (1,517 | ) | | | — | |
Ready Reserves | | | 22 | | | | (19 | ) | | | (3 | ) |
Distributions from net realized gains for book purposes may include short-term capital gains, which are included as ordinary income for tax purposes. The tax character of distributions paid during 2011 and 2010 was as follows (in thousands):
| | | | | | | | | | | | | | | | | | | | | | | | |
| | | Distributions Paid in 2011 | | | Distributions Paid in 2010 | |
Portfolio | | Ordinary
Income | | | Long-Term
Capital Gains | | | Total
Distributions | | | Ordinary
Income | | | Long-Term
Capital Gains | | | Total
Distributions | |
Growth | | $ | 329 | | | $ | 16,081 | | | $ | 16,410 | | | $ | 13 | | | $ | — | | | $ | 13 | |
Large Cap Growth | | | 37 | | | | — | | | | 37 | | | | 33 | | | | — | | | | 33 | |
Small Cap Growth | | | — | | | | — | | | | — | | | | — | | | | — | | | | — | |
Mid Cap Growth | | | — | | | | 11,057 | | | | 11,057 | | | | — | | | | — | | | | — | |
Small-Mid Cap Growth | | | 4,367 | | | | 18,646 | | | | 23,013 | | | | — | | | | — | | | | — | |
December 31, 2011 | William Blair Funds 131 |
| | | | | | | | | | | | | | | | | | | | | | | | | | | | |
| | | Distributions Paid in 2011 | | | Distributions Paid in 2010 | |
Portfolio | | Return of
Capital | | | Ordinary
Income | | | Long-Term
Capital Gains | | | Total
Distributions | | | Ordinary
Income | | | Long-Term
Capital Gains | | | Total
Distributions | |
Global Growth | | $ | — | | | $ | 174 | | | $ | — | | | $ | 174 | | | $ | 12 | | | $ | — | | | $ | 12 | |
International Growth | | | — | | | | 6,046 | | | | — | | | | 6,046 | | | | 101,433 | | | | — | | | | 101,433 | |
International Equity | | | — | | | | — | | | | — | | | | — | | | | 2,578 | | | | — | | | | 2,578 | |
International Small Cap Growth | | | — | | | | 10,724 | | | | — | | | | 10,724 | | | | 2,781 | | | | — | | | | 2,781 | |
Emerging Markets Growth | | | — | | | | 4,450 | | | | 115,030 | | | | 119,480 | | | | 13,461 | | | | — | | | | 13,461 | |
Emerging Leaders Growth | | | 25 | | | | 1,278 | | | | 2,733 | | | | 4,036 | | | | 255 | | | | 505 | | | | 760 | |
Emerging Markets Small Cap Growth | | | — | | | | — | | | | — | | | | — | | | | N/A | | | | N/A | | | | N/A | |
Large Cap Value | | | — | | | | 7 | | | | — | | | | 7 | | | | N/A | | | | N/A | | | | N/A | |
Small Cap Value | | | 333 | | | | 429 | | | | 8,248 | | | | 9,010 | | | | 269 | | | | 135 | | | | 404 | |
Mid Cap Value | | | — | | | | 62 | | | | 37 | | | | 99 | | | | 26 | | | | — | | | | 26 | |
Small-Mid Cap Value | | | — | | | | — | | | | — | | | | — | | | | N/A | | | | N/A | | | | N/A | |
Bond | | | — | | | | 9,700 | | | | 1,831 | | | | 11,531 | | | | 8,566 | | | | 494 | | | | 9,060 | |
Income | | | — | | | | 4,177 | | | | — | | | | 4,177 | | | | 5,134 | | | | — | | | | 5,134 | |
Low Duration | | | — | | | | 4,103 | | | | — | | | | 4,103 | | | | 2,958 | | | | — | | | | 2,958 | |
Ready Reserves | | | — | | | | 125 | | | | — | | | | 125 | | | | 126 | | | | — | | | | 126 | |
As of December 31, 2011, the components of distributable earnings on a tax basis were as follows (in thousands):
| | | | | | | | | | | | | | | | |
Portfolio | | Undistributed
Ordinary
Income | | | Accumulated
Capital and
Other Losses | | | Undistributed
Long-Term
Capital Gain | | | Net
Unrealized
Appreciation
(Depreciation) | |
Growth | | $ | — | | | $ | (1,538 | ) | | $ | 6,611 | | | $ | 61,396 | |
Large Cap Growth | | | — | | | | (3,232 | ) | | | — | | | | 3,632 | |
Small Cap Growth | | | — | | | | (59,562 | ) | | | — | | | | 11,393 | |
Mid Cap Growth | | | — | | | | (1,452 | ) | | | 2,025 | | | | 9,944 | |
Small-Mid Cap Growth | | | 18 | | | | (2,331 | ) | | | 5,099 | | | | 14,779 | |
Global Growth | | | — | | | | (17,732 | ) | | | — | | | | 4,382 | |
International Growth | | | 30,132 | | | | (1,188,527 | ) | | | — | | | | 34,131 | |
International Equity | | | 1,407 | | | | (93,637 | ) | | | — | | | | 3,106 | |
International Small Cap Growth | | | 5,874 | | | | (59,252 | ) | | | — | | | | (26,530 | ) |
Emerging Markets Growth | | | — | | | | (13,506 | ) | | | — | | | | (36,194 | ) |
Emerging Leaders Growth | | | — | | | | (931 | ) | | | — | | | | (4,292 | ) |
Emerging Market Small Cap Growth | | | — | | | | (69 | ) | | | — | | | | (20 | ) |
Large Cap Value | | | — | | | | (4 | ) | | | — | | | | (7 | ) |
Small Cap Value | | | — | | | | (3,660 | ) | | | — | | | | 6,584 | |
Mid Cap Value | | | — | | | | — | | | | 22 | | | | 82 | |
Small-Mid Cap Value | | | 1 | | | | (3 | ) | | | — | | | | 94 | |
Bond | | | 2 | | | | (79 | ) | | | 928 | | | | 13,393 | |
Income | | | — | | | | (39,887 | ) | | | — | | | | 4,958 | |
Low Duration | | | — | | | | (2,561 | ) | | | — | | | | 259 | |
Ready Reserves | | | 108 | | | | (41 | ) | | | — | | | | — | |
As of December 31, 2011, the Portfolios have unused capital loss carryforwards available for federal income tax purposes to be applied against future capital gains, if any. If not applied, the carryforwards will expire as follows (in thousands):
| | | | | | | | | | | | | | | | | | | | | | | | | | | | | | | | |
Portfolio | | 2012 | | | 2013 | | | 2014 | | | 2015 | | | 2016 | | | 2017 | | | 2018 | | | Total | |
Large Cap Growth | | $ | — | | | $ | — | | | $ | — | | | $ | — | | | $ | — | | | $ | 2,854 | | | $ | — | | | $ | 2,854 | |
Small Cap Growth | | | — | | | | — | | | | — | | | | — | | | | — | | | | 55,317 | | | | — | | | | 55,317 | |
Global Growth | | | — | | | | — | | | | — | | | | — | | | | 4,371 | | | | 13,127 | | | | — | | | | 17,498 | |
132 Annual Report | December 31, 2011 |
| | | | | | | | | | | | | | | | | | | | | | | | | | | | | | | | |
Portfolio | | 2012 | | | 2013 | | | 2014 | | | 2015 | | | 2016 | | | 2017 | | | 2018 | | | Total | |
International Growth | | $ | — | | | $ | — | | | $ | — | | | $ | — | | | $ | — | | | $ | 1,142,899 | | | $ | — | | | $ | 1,142,899 | |
International Equity | | | — | | | | — | | | | — | | | | — | | | | 10,691 | | | | 81,926 | | | | — | | | | 92,617 | |
International Small Cap Growth | | | — | | | | — | | | | — | | | | — | | | | — | | | | 55,999 | | | | — | | | | 55,999 | |
Income | | | 4,102 | | | | 3,398 | | | | 4,138 | | | | 9,190 | | | | 14,460 | | | | 4,577 | | | | — | | | | 39,865 | |
Low Duration | | | — | | | | — | | | | — | | | | — | | | | — | | | | — | | | | 955 | | | | 955 | |
Ready Reserves | | | 20 | | | | — | | | | — | | | | 2 | | | | — | | | | — | | | | — | | | | 22 | |
The Regulated Investment Company Modernization Act of 2010 (the “Act”) was enacted on December 22, 2010. Under the Act each Portfolio is permitted to carry forward capital losses incurred in taxable years beginning after the date of enactment for an unlimited period. However, any losses incurred in periods after enactment will be required to be utilized prior to the losses incurred in pre-enactment taxable years, which carry an expiration date. Each Portfolio has the following carry forward capital losses without expiration as of December 31, 2011 (in thousands):
| | | | | | | | |
Portfolio | | Short-
Term | | | Long-
Term | |
Emerging Markets Small Cap Growth | | $ | 1 | | | $ | — | |
Low Duration | | | 951 | | | | 406 | |
Ready Reserves | | | 17 | | | | — | |
For the period from November 1, 2011 through December 31, 2011, the following Portfolios incurred realized ordinary loss and capital losses. Ordinary Loss includes losses from currency transactions and PFICs. Each Portfolio intends to treat these losses as having occurred on the first day of fiscal year 2012 for federal income tax purposes (in thousands):
| | | | | | | | | | | | |
Portfolio | | Ordinary
Loss | | | Short-Term
Capital | | | Long-Term
Capital | |
Growth | | $ | — | | | $ | 1,539 | | | $ | — | |
Large Cap Growth | | | — | | | | 378 | | | | — | |
Small Cap Growth | | | — | | | | 6,244 | | | | — | |
Mid Cap Growth | | | — | | | | 1,452 | | | | — | |
Small-Mid Cap Growth | | | — | | | | 2,331 | | | | — | |
Global Growth | | | 3 | | | | 229 | | | | — | |
International Growth | | | — | | | | 45,561 | | | | — | |
International Equity | | | 25 | | | | 985 | | | | — | |
International Small Cap Growth | | | 537 | | | | 2,491 | | | | — | |
Emerging Markets Growth | | | 783 | | | | 9,852 | | | | 2,610 | |
Emerging Leaders Growth | | | 16 | | | | 791 | | | | 81 | |
Emerging Markets Small Cap Growth | | | 13 | | | | 55 | | | | — | |
Large Cap Value | | | — | | | | 4 | | | | — | |
Small Cap Value | | | — | | | | 2,504 | | | | 1,154 | |
Mid Cap Value | | | — | | | | — | | | | — | |
Small-Mid Cap Value | | | — | | | | 4 | | | | — | |
Bond | | | — | | | | 78 | | | | — | |
Income | | | — | | | | 23 | | | | — | |
Low Duration | | | — | | | | 118 | | | | 132 | |
Ready Reserves | | | — | | | | 2 | | | | — | |
(h) Repurchase Agreements
In a repurchase agreement, a Portfolio buys a security at one price and at the time of sale, the seller agrees to repurchase the obligation at a mutually agreed upon time and price (usually within seven days). The repurchase agreement thereby determines the yield during the purchaser’s holding period, while the seller’s obligation to repurchase is secured by the value of the underlying security. William Blair & Company, L.L.C. (“William Blair” or the “Advisor”) will monitor, on an ongoing basis, the value of the underlying securities to ensure that the value always equals or exceeds the repurchase price plus accrued interest. Repurchase agreements could involve certain risks in the event of a default or insolvency of the other party to the agreement, including possible delays or restrictions upon a Portfolio’s ability to dispose of the underlying securities. The risk to a Portfolio is limited to the ability of the seller to pay the agreed upon sum on the delivery date. In the event of default, a repurchase agreement provides that a Portfolio is entitled to sell the underlying collateral. The loss, if any, to a Portfolio will be the difference between the proceeds from the sale and the repurchase price. However, if bankruptcy
December 31, 2011 | William Blair Funds 133 |
proceedings are commenced with respect to the seller of the security, disposition of the collateral by the Portfolio may be delayed or limited. Although no definitive creditworthiness criteria are used, the Advisor reviews the creditworthiness of the banks and non-bank dealers with which a Portfolio enters into repurchase agreements to evaluate those risks. A Portfolio may, for tax purposes, deem repurchase agreements collateralized by U.S. Government securities to be investments in U.S. Government securities.
(i) Use of Estimates
The preparation of financial statements in conformity with U.S. generally accepted accounting principles requires management to make estimates and assumptions that affect the amounts reported in the financial statements. Actual results may differ from those estimates.
(j) Indemnification
In the normal course of business, the Portfolios have entered into contracts in which the Portfolios agree to indemnify the other party or parties against various potential cost or liabilities. The Portfolios’ maximum exposure under these arrangements is unknown. No claim has been made for indemnification pursuant to any such agreement of the Portfolios.
(k) Fair Value Measurements
Fair value is defined as the price that a Portfolio would receive upon selling a security in an orderly transaction to an independent buyer in the principal or most advantageous market for the investment. Various inputs are used in determining the value of a Portfolio’s investments. A three-tier hierarchy of inputs are used to classify fair value measurements for disclosure purposes. The three-tier hierarchy of inputs is summarized in the three broad levels listed below:
| | • | | Level 1—Quoted prices (unadjusted) in active markets for an identical security. |
| | • | | Level 2—Prices determined using other significant observable inputs. Observable inputs are inputs that other market participants would use in pricing a security. These may include quoted prices for similar securities, interest rates, prepayment speeds, credit risk, and others. In addition, other observable inputs such as foreign exchange rates, benchmark securities indices and foreign futures contracts may be utilized in the valuation of certain foreign securities when significant events occur between the last sale on the foreign securities exchange and the time the net asset value of the Portfolio is calculated. |
| | • | | Level 3—Prices determined using significant unobservable inputs. In situations where quoted prices or observable inputs are unavailable (for example, when there is little or no market activity for an investment), unobservable inputs may be used. Unobservable inputs reflect the Portfolio’s own assumptions about the factors market participants would use in pricing an investment, and would be based on the best information available. |
The inputs or methodology used for valuing an investment are not necessarily an indication of the risk associated with investing in those securities. For example, money market securities are valued using amortized cost, in accordance with rules under the 1940 Act. Generally, amortized cost approximates the current fair value of a security, but since the value is not obtained from a quoted price in an active market, such securities are reflected as Level 2.
Any transfers between Level 1 and Level 2 are disclosed, effective as of the beginning of the year, in the tables below with the reasons for the transfers disclosed in a note to the tables, if applicable.
As of December 31, 2011, the hierarchical input levels of securities in each Portfolio, segregated by security class, are as follows (in thousands):
| | | | | | | | | | | | | | | | | | | | | | | | |
Investments in Securities | | Growth | | | Large Cap
Growth | | | Small Cap
Growth | | | Mid Cap
Growth | | | Small-Mid Cap
Growth | | | Global
Growth | |
Level 1—Quoted prices | | | | | | | | | | | | | | | | | | | | | | | | |
Common Stocks | | $ | 551,807 | | | $ | 24,777 | | | $ | 537,782 | | | $ | 143,266 | | | $ | 241,749 | | | $ | 42,143 | |
Exchange Traded Funds | | | — | | | | — | | | | 9,495 | | | | — | | | | — | | | | — | |
Level 2—Other significant observable inputs | | | | | | | | | | | | | | | | | | | | | | | | |
Short-Term Investments | | | 12,603 | | | | 233 | | | | 6,596 | | | | 2,433 | | | | 8,131 | | | | 457 | |
Level 3—Significant unobservable inputs | | | | | | | | | | | | | | | | | | | | | | | | |
None | | | — | | | | — | | | | — | | | | — | | | | — | | | | — | |
| | | | | | | | | | | | | | | | | | | | | | | | |
Total investments in securities | | $ | 564,410 | | | $ | 25,010 | | | $ | 553,873 | | | $ | 145,699 | | | $ | 249,880 | | | $ | 42,600 | |
| | | | | | | | | | | | | | | | | | | | | | | | |
134 Annual Report | December 31, 2011 |
| | | | | | | | | | | | | | | | | | | | | | | | |
Investments in Securities | | International
Growth | | | International
Equity | | | International
Small Cap
Growth | | | Emerging
Markets
Growth | | | Emerging
Leaders
Growth | | | Emerging
Small Cap
Growth | |
Level 1—Quoted prices | | | | | | | | | | | | | | | | | | | | | | | | |
Common Stocks | | $ | 3,200,929 | | | $ | 74,194 | | | $ | 702,178 | | | $ | 772,596 | | | $ | 45,472 | | | $ | 3,251 | |
Preferred Stocks | | | — | | | | — | | | | — | | | | 30,789 | | | | 2,899 | | | | 21 | |
Level 2—Other significant observable inputs | | | | | | | | | | | | | | | | | | | | | | | | |
Short-Term Investments | | | 41,628 | | | | — | | | | 12,882 | | | | 8,235 | | | | 405 | | | | — | |
Level 3—Significant unobservable inputs | | | | | | | | | | | | | | | | | | | | | | | | |
Common Stock | | | 694 | | | | — | | | | — | | | | — | | | | — | | | | — | |
Convertible Bonds | | | 747 | | | | — | | | | 249 | | | | 416 | | | | — | | | | — | |
| | | | | | | | | | | | | | | | | | | | | | | | |
Total investments in securities | | $ | 3,243,998 | | | $ | 74,194 | | | $ | 715,309 | | | $ | 812,036 | | | $ | 48,776 | | | $ | 3,272 | |
| | | | | | | | | | | | | | | | | | | | | | | | |
Other financial instruments—Liability | | | | | | | | | | | | | | | | | | | | | | | | |
Level 2—Other significant observable inputs | | | | | | | | | | | | | | | | | | | | | | | | |
Forward foreign currency contracts | | $ | (1,799 | ) | | | — | | | $ | (311 | ) | | | — | | | | — | | | | — | |
| | | | | | | | | | | | | | | | | | | | | | | | |
| | | | | | | | | | | | | | | | |
Investments in Securities | | Large Cap
Value | | | Small Cap
Value | | | Mid Cap
Value | | | Small-Mid Cap
Value | |
Level 1—Quoted prices | | | | | | | | | | | | | | | | |
Common Stocks | | $ | 2,416 | | | $ | 228,349 | | | $ | 4,519 | | | $ | 2,122 | |
Level 2—Other significant observable inputs | | | | | | | | | | | | | | | | |
Short-Term Investments | | | — | | | | 5,376 | | | | — | | | | — | |
Level 3—Significant unobservable inputs | | | | | | | | | | | | | | | | |
None | | | — | | | | — | | | | — | | | | — | |
| | | | | | | | | | | | | | | | |
Total investments in securities | | $ | 2,416 | | | $ | 233,725 | | | $ | 4,519 | | | $ | 2,122 | |
| | | | | | | | | | | | | | | | |
| | | | | | | | | | | | | | | | |
Investments in Securities | | Bond | | | Income | | | Low Duration | | | Ready
Reserves* | |
Level 1—Quoted Prices | | | | | | | | | | | | | | | | |
None | | $ | — | | | $ | — | | | $ | — | | | $ | — | |
Level 2—Other significant observable inputs | | | | | | | | | | | | | | | | |
U.S. Government and Agency Bonds | | | 102,650 | | | | 55,543 | | | | 107,025 | | | | 77,277 | |
Corporate Bonds | | | 113,500 | | | | 48,084 | | | | 10,898 | | | | 107,897 | |
Asset-Backed Bonds | | | 8,346 | | | | 5,271 | | | | 33,650 | | | | — | |
Commercial Paper | | | — | | | | — | | | | — | | | | 859,512 | |
Short-Term Investments | | | 564 | | | | 1,136 | | | | 4,035 | | | | 225,489 | |
Level 3—Significant unobservable inputs | | | | | | | | | | | | | | | | |
Asset-Backed Bonds | | | 167 | | | | 917 | | | | — | | | | — | |
| | | | | | | | | | | | | | | | |
Total investments in securities | | $ | 225,227 | | | $ | 110,951 | | | $ | 155,608 | | | $ | 1,270,175 | |
| | | | | | | | | | | | | | | | |
| * | | All of the investments held by Ready Reserves are short term investments. |
There were no transfers between Level 1 and Level 2 during the year.
Level 1 Common Stocks are exchange-traded securities with a quoted price. See Portfolio of Investments for Sector Classification.
The following is a reconciliation of Level 3 securities for which significant unobservable inputs were used to determine fair value:
| | | | | | | | | | | | | | | | | | | | | | | | | | | | | | | | | | | | |
| | | Balance
January 1, 2011 | | | Purchases | | | Sales | | | Transfers to Level 3 | | | Transfers from Level 3 | | | Change in Unrealized Gain/(Loss) | | | Realized
Gain/(Loss) | | | Balance
December 31, 2011 | | | Percent of Net Assets | |
Small Cap Growth | | $ | 1,109 | | | $ | — | | | $ | — | | | $ | — | | | $ | (1,109 | ) | | $ | — | | | $ | — | | | | $— | | | | 0.00 | % |
International Growth | | | — | | | | — | | | | — | | | | 1,659 | | | | — | | | | (218 | ) | | | — | | | | 1,441 | | | | 0.04 | % |
International Small Cap Growth | | | — | | | | — | | | | — | | | | 322 | | | | — | | | | (73 | ) | | | — | | | | 249 | | | | 0.03 | % |
Emerging Markets Growth | | | — | | | | — | | | | — | | | | 538 | | | | — | | | | (122 | ) | | | — | | | | 416 | | | | 0.05 | % |
Bond | | | 170 | | | | — | | | | — | | | | — | | | | — | | | | (3 | ) | | | — | | | | 167 | | | | 0.07 | % |
Income | | | 918 | | | | — | | | | — | | | | — | | | | — | | | | (1 | ) | | | — | | | | 917 | | | | 0.82 | % |
December 31, 2011 | William Blair Funds 135 |
The fair value estimates for the Level 3 securities in the International Growth, International Small Cap Growth, Emerging Markets Growth, Bond and Income Portfolios were determined in good faith by the Pricing Committee in consultation with the Valuation Committee, pursuant to the Valuation Procedures adopted by the Board of Trustees. There were various factors considered in reaching this fair value determination, including, but not limited to, the following: the type of security, the extent of public trading of the security, information obtained from a broker-dealer for the security, analysis of the company’s performance, market trends that influence its performance and the potential for an adverse outcome in pending litigation. The change in net unrealized gain (loss) related to those securities held at December 31, 2011 is the same as in the table above, and is included in the change in net unrealized appreciation (depreciation) of investments on the Statement of Operations. The transfers to and from Level 3 were valued using transfer date.
Vitacost.com held in the Small Cap Growth Portfolio was moved from Level 3 to Level 1 because the security resumed trading on a national exchange. China High Precision Automation Group held in the International Growth Portfolio moved from Level 1 to Level 3 due to a trading halt imposed by foreign regulators. The Lupatech convertible bonds held in the International Growth, the International Small Cap Growth and the Emerging Markets Growth Portfolios moved from Level 2 to Level 3 due to a change in observable inputs. The First Plus Home Loan Trust bonds held in the Bond and Income Portfolios remained in Level 3 during the year due to the lack of significant other observable inputs.
(l) Redemptions In-Kind
In accordance with the Fund’s prospectus, the Portfolios may distribute portfolio securities rather than cash as payment for a redemption of fund shares (in-kind redemption). For financial reporting purposes, the Portfolio recognizes a gain or loss on the transfer of securities depending on the market value of those securities on the date of redemption. Gains and losses realized on in-kind redemptions are not recognized for tax purposes and are reclassified from undistributed realized gain (loss) to paid-in capital. During the year ended December 31, 2011, the International Growth and the Emerging Markets Growth Portfolios redeemed in-kind (in thousands) $481,595 and $91,525, respectively, with realized gains of $116,407 and $20,249, respectively.
(2) Accounting Pronouncements
In April 2011, the Financial Accounting Standards Board (“FASB”) issued ASU 2011-03 Reconsideration of Effective Control for Repurchase Agreements. Accounting Standard Update (“ASU”) 2011-03 amends ASC 860, Transfers and Servicing, in relation to the accounting for repurchase agreements and similar agreements that both entitle and obligate a transferor to repurchase or redeem financial assets before their maturity. ASU 2011-03 modifies the criteria for determining effective control of transferred assets and as a result certain agreements may now be accounted for as secured borrowings. ASU 2011-03 is effective prospectively for new transfers and existing transitions that are modified in the first interim or annual period beginning on or after December 15, 2011. At this time, management is evaluating the implication of this change and its impact on the financial statements has not been determined.
On May 12, 2011, the FASB issued ASU 2011-04, modifying Topic 820, Fair Value Measurements and Disclosures. The ASU requires reporting entities to disclose (i) the amounts of any transfers between Level 1 and Level 2, and the reasons for the transfers, (ii) for Level 3 fair value measurements, quantitative information about significant unobservable inputs used, (iii) a description of the valuation processes used by the reporting entity and, (iv) a narrative description of the sensitivity of the fair value measurement to changes in unobservable inputs if a change in those inputs might result in a significantly higher or lower fair value measurement. The effective date of ASU 2011-04 is for interim and annual periods beginning after December 15, 2011. At this time, management is evaluating the implication of this change and its impact on the financial statements has not been determined.
(3) Transactions with Affiliates
(a) Management and Expense Limitation Agreements
Each Portfolio has a management agreement with the Advisor for investment advisory, clerical, bookkeeping and administrative services. Each Portfolio pays the Advisor an annual fee, payable monthly, based on a specified percentage of its average daily net assets. A summary of the annual rates expressed as a percentage of average daily net assets is as follows:
136 Annual Report | December 31, 2011 |
| | | | | | | | | | |
Equity Portfolios | | | | | International Equity Portfolios | | | |
Growth | | | 0.75 | % | | International Growth: | | | | |
Large Cap Growth | | | 0.80 | % | | First $250 million | | | 1.10 | % |
Small Cap Growth | | | 1.10 | % | | Next $4.75 billion | | | 1.00 | % |
Mid Cap Growth | | | 0.95 | % | | Next $5 billion | | | 0.95 | % |
Small-Mid Cap Growth | | | 1.00 | % | | Next $5 billion | | | 0.925 | % |
Large Cap Value | | | 0.80 | % | | In excess of $15 billion | | | 0.90 | % |
Small Cap Value | | | 1.10 | % | | International Equity: | | | | |
Mid Cap Value | | | 0.95 | % | | First $250 million | | | 1.10 | % |
Small-Mid Cap Value | | | 1.00 | % | | In excess of $250 million | | | 1.00 | % |
| | | | | | International Small Cap Growth | | | 1.00 | % |
Global Equity Portfolio | | | | | | Emerging Markets Growth | | | 1.10 | % |
Global Growth | | | 1.00 | % | | Emerging Leaders Growth | | | 1.10 | % |
| | | | | | Emerging Markets Small Cap Growth | | | 1.10 | % |
| | | |
Fixed-Income Portfolios | | | | | Money Market Portfolio | | | |
Bond | | | 0.30 | % | | Ready Reserves: | | | | |
Low Duration | | | 0.30 | % | | First $250 million | | | 0.275 | % |
Income* | | | | | | Next $250 million | | | 0.250 | % |
First $250 million | | | 0.25 | % | | Next $2 billion | | | 0.225 | % |
In excess of $250 million | | | 0.20 | % | | In excess of $2.5 billion | | | 0.200 | % |
| | | | | | | | | | |
*Management fee also includes a charge of 5% of gross income. | | | | | | | |
Some of the Portfolios have also entered into an Expense Limitation Agreement with the Advisor. Under the terms of the agreement, the Advisor will waive its management fee and/or reimburse the Portfolio for expenses in excess of the agreed upon rate. The amount the Advisor owes a Portfolio as of the reporting date is recorded as the Receivable from Advisor on the Statement of Assets and Liabilities. The Advisor reimburses the Portfolios on a monthly basis. Under the terms of the agreement, the Advisor has agreed to waive its advisory fees and/or absorb other operating expenses through April 30, 2012, if total expenses for each class of the following Portfolios exceed the following rates (as a percentage of average daily net assets):
| | | | | | | | | | | | | | | | |
| | | Class N | | | Class I | |
Portfolio | | Effective
May 1, 2011
through
April 30, 2012 | | | Effective
May 1, 2010
through
April 30, 2011 | | | Effective
May 1, 2011
through
April 30, 2012 | | | Effective
May 1, 2010
through
April 30, 2011 | |
Large Cap Growth | | | 1.20 | % | | | 1.20 | % | | | 0.95 | % | | | 0.95 | % |
Small Cap Growth | | | 1.50 | % | | | 1.50 | % | | | 1.25 | % | | | 1.25 | % |
Mid Cap Growth | | | 1.35 | % | | | 1.35 | % | | | 1.10 | % | | | 1.10 | % |
Small-Mid Cap Growth | | | 1.35 | % | | | 1.35 | % | | | 1.10 | % | | | 1.10 | % |
Global Growth | | | 1.50 | % | | | 1.50 | % | | | 1.25 | % | | | 1.25 | % |
International Growth | | | 1.45 | % | | | 1.45 | % | | | 1.20 | % | | | 1.20 | % |
International Equity | | | 1.45 | % | | | 1.45 | % | | | 1.20 | % | | | 1.20 | % |
International Small Cap Growth | | | 1.65 | % | | | 1.65 | % | | | 1.40 | % | | | 1.40 | % |
Emerging Markets Growth | | | 1.70 | % | | | 1.70 | % | | | 1.45 | % | | | 1.45 | % |
Emerging Leaders Growth | | | 1.65 | % | | | 1.65 | % | | | 1.40 | % | | | 1.40 | % |
Emerging Markets Small Cap Growth | | | 1.65 | %(a) | | | N/A | | | | 1.40 | %(a) | | | N/A | |
Large Cap Value | | | 1.20 | %(a) | | | N/A | | | | 0.95 | %(a) | | | N/A | |
Small Cap Value | | | 1.40 | % | | | 1.35 | % | | | 1.15 | % | | | 1.10 | % |
Mid Cap Value | | | 1.35 | % | | | 1.35 | % | | | 1.10 | % | | | 1.10 | % |
Small-Mid Cap Value | | | 1.40 | %(b) | | | N/A | | | | 1.15 | %(b) | | | N/A | |
Bond | | | 0.65 | % | | | 0.65 | % | | | 0.50 | % | | | 0.50 | % |
Income | | | 0.85 | % | | | 0.85 | % | | | 0.70 | % | | | 0.70 | % |
Low Duration | | | 0.70 | % | | | 0.70 | % | | | 0.55 | % | | | 0.55 | % |
| (a) | | Effective October 24, 2011 through April 30, 2013. |
| (b) | | Effective December 15, 2011 through April 30, 2013. |
December 31, 2011 | William Blair Funds 137 |
For a period of three years subsequent to the commencement of operations, the Advisor is entitled to reimbursement for previously waived fees and reimbursed expenses to the extent the overall expense ratio remains below the expense limitation in place at the time the fee was waived and/or the expense was reimbursed. The total amount available for recapture at December 31, 2011 was (in thousands):
| | | | |
| | | Available for
Recapture | |
Emerging Markets Small Cap Growth | | $ | 48 | |
Large Cap Value | | | 29 | |
Mid Cap Value | | | 181 | |
Small-Mid Cap Value | | | 16 | |
Low Duration | | | 153 | |
The Advisor has agreed to voluntarily waive fees and reimburse expenses incurred for the Ready Reserves Portfolio in order to maintain a minimum yield given the current interest rate environment.
For the year ended December 31, 2011, the fee waivers and/or reimbursements for each Portfolio were as follows (in thousands):
| | | | | | | | | | | | | | | | |
Portfolio | | Fund
Level
Waiver | | | Class I
Specific
Waiver | | | Class N
Specific
Waiver | | | Total
Waiver | |
Growth | | $ | — | | | $ | — | | | $ | — | | | $ | — | |
Large Cap Growth | | | 58 | | | | 2 | | | | 6 | | | | 66 | |
Small Cap Growth | | | — | | | | 416 | | | | 262 | | | | 678 | |
Mid Cap Growth | | | — | | | | 36 | | | | 14 | | | | 50 | |
Small-Mid Cap Growth | | | — | | | | 48 | | | | 32 | | | | 80 | |
Global Growth | | | 132 | | | | 2 | | | | 1 | | | | 135 | |
International Growth | | | — | | | | — | | | | 222 | | | | 222 | |
International Equity | | | 80 | | | | 91 | | | | 10 | | | | 181 | |
International Small Cap Growth | | | — | | | | — | | | | — | | | | — | |
Emerging Markets Growth | | | — | | | | — | | | | — | | | | — | |
Emerging Leaders Growth | | | 140 | | | | — | | | | — | | | | 140 | |
Emerging Markets Small Cap Growth | | | 48 | | | | — | | | | — | | | | 48 | |
Large Cap Value | | | 29 | | | | — | | | | — | | | | 29 | |
Small Cap Value | | | 225 | | | | 91 | | | | 43 | | | | 359 | |
Mid Cap Value | | | 93 | | | | — | | | | — | | | | 93 | |
Small-Mid Cap Value | | | 16 | | | | — | | | | — | | | | 16 | |
Bond | | | 83 | | | | 11 | | | | 4 | | | | 98 | |
Income | | | — | | | | — | | | | 23 | | | | 23 | |
Low Duration | | | 37 | | | | 3 | | | | 1 | | | | 41 | |
Ready Reserves | | | 5,984 | | | | — | | | | — | | | | 5,984 | |
(b) Underwriting, Distribution Services and Service Agreements
Each Portfolio, except the Ready Reserves Portfolio, has a Distribution Agreement with William Blair for distribution services to the Portfolios’ Class N shares. Each Portfolio pays William Blair an annual fee, payable monthly, based on a specified percentage of its average daily net assets of Class N shares. The annual rate expressed as a percentage of average daily net assets for Class N is 0.25% for all Portfolios except the Income, Bond and Low Duration Portfolios, which is 0.15%. Pursuant to the Distribution Agreement, William Blair enters into related selling group agreements with various firms at various rates for sales of the Portfolios’ Class N shares.
The Ready Reserves Portfolio has a Service Agreement with William Blair to provide shareholder services and automatic sweep services. The Portfolio pays William Blair an annual fee, payable monthly, based upon 0.35% of the average daily net assets of Class N shares. The Board of Trustees has determined that the amount payable for “service fees” (as defined by FINRA (Financial Industry Regulatory Authority)) will not exceed 0.25% of the average annual net assets attributable to Class N shares.
138 Annual Report | December 31, 2011 |
The Global Growth, International Small Cap Growth, Emerging Markets Growth, Emerging Leaders Growth, Emerging Markets Small Cap Growth, Bond and Low Duration Portfolios have a Shareholder Administration Agreement with William Blair to provide shareholder administration services. Class N and Class I shares of the Portfolios pay William Blair an annual fee, payable monthly, based upon 0.15% of average daily net assets attributable to each class, respectively. For the year ended December 31, 2011, the following fees were incurred (in thousands):
| | | | | | | | | | | | |
Portfolio | | Class N | | | Class I | | | Total | |
Global Growth | | $ | 7 | | | $ | 61 | | | $ | 68 | |
International Small Cap Growth | | | 32 | | | | 590 | | | | 622 | |
Emerging Markets Growth | | | 41 | | | | 253 | | | | 294 | |
Emerging Leaders Growth | | | — | | | | 38 | | | | 38 | |
Emerging Markets Small Cap Growth | | | — | | | | 1 | | | | 1 | |
Bond | | | 8 | | | | 220 | | | | 228 | |
Low Duration | | | 9 | | | | 117 | | | | 126 | |
(4) Investment Transactions
Investment transactions, excluding money market instruments, repurchase agreements and demand notes for the year ended December 31, 2011, were as follows (in thousands):
| | | | | | | | |
Portfolio | | Purchases | | | Sales | |
Growth | | $ | 386,225 | | | $ | (340,772 | ) |
Large Cap Growth | | | 18,933 | | | | (24,943 | ) |
Small Cap Growth | | | 681,275 | | | | (908,675 | ) |
Mid Cap Growth | | | 131,152 | | | | (88,263 | ) |
Small-Mid Cap Growth | | | 220,429 | | | | (184,273 | ) |
Global Growth | | | 34,174 | | | | (33,645 | ) |
International Growth | | | 4,377,557 | | | | (5,517,922 | ) |
International Equity | | | 128,456 | | | | (213,068 | ) |
International Small Cap Growth | | | 745,147 | | | | (581,084 | ) |
Emerging Markets Growth | | | 1,002,446 | | | | (1,229,369 | ) |
Emerging Leaders Growth | | | 117,869 | | | | (143,770 | ) |
Emerging Markets Small Cap Growth | | | 3,909 | | | | (566 | ) |
Large Cap Value | | | 2,540 | | | | (113 | ) |
Small Cap Value | | | 215,897 | | | | (133,900 | ) |
Mid Cap Value | | | 3,776 | | | | (2,569 | ) |
Small-Mid Cap Value | | | 2,063 | | | | (31 | ) |
Bond | | | 105,624 | | | | (75,418 | ) |
Income | | | 47,955 | | | | (49,794 | ) |
Low Duration | | | 125,063 | | | | (109,128 | ) |
(5) Forward Foreign Currency Contracts
The Global Growth, International Growth, International Equity, International Small Cap Growth, Emerging Markets Growth, Emerging Markets Small Cap Growth and Emerging Leaders Growth Portfolios from time to time may enter into forward foreign currency contracts with the Fund's custodian and other counterparties in an attempt to hedge against a decline in the value of foreign currency against the U.S. dollar. The Portfolios bear the market risk that arises from changes in foreign currency rates and bear the credit risk if the counterparty fails to perform under the contract.
For the year ended December 31, 2011, the International Growth, International Equity, and International Small Cap Growth Portfolios engaged in forward foreign currency contracts with notional volume (in thousands) of:
| | | | |
Portfolio | | Average Notional Value | |
International Growth | | $ | 785,922 | |
International Equity | | | 3,088 | |
International Small Cap Growth | | | 31,054 | |
December 31, 2011 | William Blair Funds 139 |
The following tables present the value of forward foreign currency contracts as of December 31, 2011 and their respective location on the Statement of Assets and Liabilities (values in thousands):
| | | | | | | | | | | | |
| | | Assets | | | Liabilities | |
Portfolio | | Statement of Assets and Liabilities Location | | Value | | | Statement of Assets and Liabilities Location | | Value | |
International Growth | | Unrealized appreciation on foreign forward currency contracts | | $ | — | | | Unrealized depreciation on foreign forward currency contracts | | $ | 1,799 | |
International Small Cap Growth | | Unrealized appreciation on foreign forward currency contracts | | | — | | | Unrealized depreciation on foreign forward currency contracts | | | 311 | |
The effect of forward contracts on the Statements of Operations for the year ended December 31, 2011 (values in thousands):
| | | | |
Realized gain (loss) recognized on foreign currency transactions | |
Portfolio | | Value | |
International Growth | | $ | (7,051 | ) |
International Equity | | | (394 | ) |
International Small Cap Growth | | | 2,666 | |
|
Change in net unrealized gain (loss) recognized on foreign currency translations | |
Portfolio | | Value | |
International Growth | | $ | (1,799 | ) |
International Equity | | | 135 | |
International Small Cap Growth | | | (311 | ) |
The following table presents open forward foreign currency contracts as of December 31, 2011 (values in thousands):
| | | | | | | | | | | | | | | | | | |
International Growth | |
Counterparty | | Short Contracts | | Settlement Date | | | Local
Currency | | | Current Value | | | Unrealized
Gain (Loss) | |
Bank of New York | | Japanese Yen | | | 3/22/2012 | | | | 13,813,264 | | | $ | 179,716 | | | $ | (1,799 | ) |
|
International Small Cap Growth | |
Counterparty | | Short Contracts | | Settlement Date | | | Local
Currency | | | Current Value | | | Unrealized
Gain (Loss) | |
Bank of New York | | Japanese Yen | | | 3/22/2012 | | | | 2,389,359 | | | $ | 31,087 | | | $ | (311 | ) |
(6) Fund Share Transactions
The following table summarizes the activity in capital shares of each Portfolio (in thousands):
| | | | | | | | | | | | | | | | | | | | | | | | |
| | | Sales (Dollars) | |
| | | Year Ended December 31, 2011 | | | Year Ended December 31, 2010 | |
Portfolio | | Class N | | | Class I | | | Total | | | Class N | | | Class I | | | Total | |
Growth | | $ | 71,261 | | | $ | 62,869 | | | $ | 134,130 | | | $ | 68,365 | | | $ | 107,997 | | | $ | 176,362 | |
Large Cap Growth | | | 900 | | | | 3,239 | | | | 4,139 | | | | 1,142 | | | | 1,935 | | | | 3,077 | |
Small Cap Growth | | | 30,204 | | | | 93,243 | | | | 123,447 | | | | 108,310 | | | | 256,285 | | | | 364,595 | |
Mid Cap Growth | | | 21,824 | | | | 66,999 | | | | 88,823 | | | | 2,798 | | | | 21,591 | | | | 24,389 | |
Small Mid-Cap Growth | | | 14,552 | | | | 70,787 | | | | 85,339 | | | | 3,028 | | | | 48,275 | | | | 51,303 | |
Global Growth | | | 475 | | | | 3,263 | | | | 3,738 | | | | 1,046 | | | | 3,798 | | | | 4,844 | |
International Growth | | | 280,122 | | | | 476,293 | | | | 756,415 | | | | 876,749 | | | | 621,840 | | | | 1,498,589 | |
International Equity | | | 693 | | | | 26,139 | | | | 26,832 | | | | 1,093 | | | | 58,750 | | | | 59,843 | |
International Small Cap Growth | | | 5,220 | | | | 163,897 | | | | 169,117 | | | | 7,838 | | | | 138,435 | | | | 146,273 | |
Emerging Markets Growth | | | 1,576 | | | | 24,982 | | | | 26,558 | | | | 6,588 | | | | 51,960 | | | | 58,548 | |
Emerging Leaders Growth (a) | | | 34 | | | | 19,823 | | | | 19,857 | | | | 49 | | | | 11,564 | | | | 11,613 | |
Emerging Markets Small Cap Growth (c) | | | 1,040 | | | | 2,322 | | | | 3,362 | | | | — | | | | — | | | | — | |
Large Cap Value (c ) | | | 1,000 | | | | 1,457 | | | | 2,457 | | | | — | | | | — | | | | — | |
Small Cap Value | | | 42,726 | | | | 120,066 | | | | 162,792 | | | | 24,765 | | | | 67,703 | | | | 92,468 | |
Mid Cap Value (b) | | | 81 | | | | 1,617 | | | | 1,698 | | | | 4 | | | | 3,159 | | | | 3,163 | |
Small-Mid Cap Value (d) | | | 823 | | | | 1,241 | | | | 2,064 | | | | — | | | | — | | | | — | |
Bond | | | 4,585 | | | | 41,430 | | | | 46,015 | | | | 1,759 | | | | 65,749 | | | | 67,508 | |
Income | | | 25,156 | | | | 8,899 | | | | 34,055 | | | | 8,860 | | | | 6,525 | | | | 15,385 | |
Low Duration | | | 2,975 | | | | 56,988 | | | | 59,963 | | | | 6,671 | | | | 77,708 | | | | 84,379 | |
Ready Reserves | | | 838,997 | | | | — | | | | 838,997 | | | | 670,783 | | | | — | | | | 670,783 | |
140 Annual Report | December 31, 2011 |
| | | | | | | | | | | | | | | | | | | | | | | | |
| | | Reinvested Distributions (Dollars) | |
| | | Year Ended December 31, 2011 | | | Year Ended December 31, 2010 | |
Portfolio | | Class N | | | Class I | | | Total | | | Class N | | | Class I | | | Total | |
Growth | | $ | 5,705 | | | $ | 9,211 | | | $ | 14,916 | | | $ | — | | | $ | 11 | | | $ | 11 | |
Large Cap Growth | | | — | | | | 32 | | | | 32 | | | | — | | | | 29 | | | | 29 | |
Small Cap Growth | | | — | | | | — | | | | — | | | | — | | | | — | | | | — | |
Mid Cap Growth | | | 2,354 | | | | 8,544 | | | | 10,898 | | | | — | | | | — | | | | — | |
Small Mid-Cap Growth | | | 3,020 | | | | 17,544 | | | | 20,564 | | | | — | | | | — | | | | — | |
Global Growth | | | 4 | | | | 162 | | | | 166 | | | | — | | | | 11 | | | | 11 | |
International Growth | | | — | | | | 5,030 | | | | 5,030 | | | | 50,365 | | | | 42,168 | | | | 92,533 | |
International Equity | | | — | | | | — | | | | — | | | | 174 | | | | 2,278 | | | | 2,452 | |
International Small Cap Growth | | | 182 | | | | 3,176 | | | | 3,358 | | | | 38 | | | | 1,078 | | | | 1,116 | |
Emerging Markets Growth | | | 2,055 | | | | 13,471 | | | | 15,526 | | | | 234 | | | | 1,348 | | | | 1,582 | |
Emerging Leaders Growth (a) | | | 3 | | | | 1,336 | | | | 1,339 | | | | — | | | | 79 | | | | 79 | |
Emerging Markets Small Cap Growth (c) | | | — | | | | — | | | | — | | | | — | | | | — | | | | — | |
Large Cap Value (c) | | | 3 | | | | 4 | | | | 7 | | | | — | | | | — | | | | — | |
Small Cap Value | | | 1,502 | | | | 6,573 | | | | 8,075 | | | | 58 | | | | 296 | | | | 354 | |
Mid Cap Value (b) | | | 1 | | | | 84 | | | | 85 | | | | — | | | | 26 | | | | 26 | |
Small-Mid Cap Value (d) | | | — | | | | — | | | | — | | | | — | | | | — | | | | — | |
Bond | | | 219 | | | | 5,706 | | | | 5,925 | | | | 126 | | | | 4,728 | | | | 4,854 | |
Income | | | 1,249 | | | | 2,265 | | | | 3,514 | | | | 1,462 | | | | 2,888 | | | | 4,350 | |
Low Duration | | | 80 | | | | 1,426 | | | | 1,506 | | | | 54 | | | | 1,211 | | | | 1,265 | |
Ready Reserves | | | 125 | | | | — | | | | 125 | | | | 126 | | | | — | | | | 126 | |
| |
| | | Redemptions (Dollars) | |
| | | Year Ended December 31, 2011 | | | Year Ended December 31, 2010 | |
Portfolio | | Class N | | | Class I | | | Total | | | Class N | | | Class I | | | Total | |
Growth | | $ | 61,036 | | | $ | 69,123 | | | $ | 130,159 | | | $ | 47,695 | | | $ | 37,660 | | | $ | 85,355 | |
Large Cap Growth | | | 4,715 | | | | 5,839 | | | | 10,554 | | | | 925 | | | | 4,757 | | | | 5,682 | |
Small Cap Growth | | | 188,253 | | | | 180,687 | | | | 368,940 | | | | 235,001 | | | | 124,740 | | | | 359,741 | |
Mid Cap Growth | | | 6,014 | | | | 38,969 | | | | 44,983 | | | | 2,034 | | | | 11,217 | | | | 13,251 | |
Small Mid-Cap Growth | | | 7,153 | | | | 28,620 | | | | 35,773 | | | | 4,809 | | | | 23,447 | | | | 28,256 | |
Global Growth | | | 1,725 | | | | 2,783 | | | | 4,508 | | | | 1,468 | | | | 4,358 | | | | 5,826 | |
International Growth | | | 1,472,224 | | | | 568,925 | | | | 2,041,149 | | | | 1,196,684 | | | | 551,296 | | | | 1,747,980 | |
International Equity | | | 6,340 | | | | 111,492 | | | | 117,832 | | | | 4,139 | | | | 186,626 | | | | 190,765 | |
International Small Cap Growth | | | 5,634 | | | | 95,320 | | | | 100,954 | | | | 5,438 | | | | 62,241 | | | | 67,679 | |
Emerging Markets Growth | | | 12,534 | | | | 59,984 | | | | 72,518 | | | | 5,661 | | | | 70,448 | | | | 76,109 | |
Emerging Leaders Growth (a) | | | 30 | | | | 8,683 | | | | 8,713 | | | | — | | | | 6,692 | | | | 6,692 | |
Emerging Markets Small Cap Growth (c) | | | — | | | | — | | | | — | | | | — | | | | — | | | | — | |
Large Cap Value (c) | | | — | | | | — | | | | — | | | | — | | | | — | | | | — | |
Small Cap Value | | | 33,678 | | | | 45,720 | | | | 79,398 | | | | 2,617 | | | | 11,274 | | | | 13,891 | |
Mid Cap Value (b) | | | 24 | | | | 474 | | | | 498 | | | | — | | | | 5 | | | | 5 | |
Small-Mid Cap Value (d) | | | — | | | | — | | | | — | | | | — | | | | — | | | | — | |
Bond | | | 1,033 | | | | 43,605 | | | | 44,638 | | | | 1,085 | | | | 54,078 | | | | 55,163 | |
Income | | | 17,730 | | | | 22,266 | | | | 39,996 | | | | 12,781 | | | | 13,282 | | | | 26,063 | |
Low Duration | | | 3,689 | | | | 63,525 | | | | 67,214 | | | | 1,607 | | | | 69,878 | | | | 71,485 | |
Ready Reserves | | | 783,918 | | | | — | | | | 783,918 | | | | 807,267 | | | | — | | | | 807,267 | |
December 31, 2011 | William Blair Funds 141 |
| | | | | | | | | | | | | | | | | | | | | | | | |
| | | Net Change in Net Assets relating to Fund Share Activity (Dollars) | |
| | | Year Ended December 31, 2011 | | | Year Ended December 31, 2010 | |
Portfolio | | Class N | | | Class I | | | Total | | | Class N | | | Class I | | | Total | |
Growth | | $ | 15,933 | | | $ | 2,954 | | | $ | 18,887 | | | $ | 20,670 | | | $ | 70,348 | | | $ | 91,018 | |
Large Cap Growth | | | (3,815 | ) | | | (2,568 | ) | | | (6,383 | ) | | | 217 | | | | (2,793 | ) | | | (2,576 | ) |
Small Cap Growth | | | (158,049 | ) | | | (87,444 | ) | | | (245,493 | ) | | | (126,691 | ) | | | 131,545 | | | | 4,854 | |
Mid Cap Growth | | | 18,164 | | | | 36,574 | | | | 54,738 | | | | 764 | | | | 10,374 | | | | 11,138 | |
Small Mid-Cap Growth | | | 10,419 | | | | 59,711 | | | | 70,130 | | | | (1,781 | ) | | | 24,828 | | | | 23,047 | |
Global Growth | | | (1,246 | ) | | | 642 | | | | (604 | ) | | | (422 | ) | | | (549 | ) | | | (971 | ) |
International Growth | | | (1,192,102 | ) | | | (87,602 | ) | | | (1,279,704 | ) | | | (269,570 | ) | | | 112,712 | | | | (156,858 | ) |
International Equity | | | (5,647 | ) | | | (85,353 | ) | | | (91,000 | ) | | | (2,872 | ) | | | (125,598 | ) | | | (128,470 | ) |
International Small Cap Growth | | | (232 | ) | | | 71,753 | | | | 71,521 | | | | 2,438 | | | | 77,272 | | | | 79,710 | |
Emerging Markets Growth | | | (8,903 | ) | | | (21,531 | ) | | | (30,434 | ) | | | 1,161 | | | | (17,140 | ) | | | (15,979 | ) |
Emerging Leaders Growth (a) | | | 7 | | | | 12,476 | | | | 12,483 | | | | 49 | | | | 4,951 | | | | 5,000 | |
Emerging Markets Small Cap Growth (c) | | | 1,040 | | | | 2,322 | | | | 3,362 | | | | — | | | | — | | | | — | |
Large Cap Value (c) | | | 1,003 | | | | 1,461 | | | | 2,464 | | | | — | | | | — | | | | — | |
Small Cap Value | | | 10,550 | | | | 80,919 | | | | 91,469 | | | | 22,206 | | | | 56,725 | | | | 78,931 | |
Mid Cap Value (b) | | | 58 | | | | 1,227 | | | | 1,285 | | | | 4 | | | | 3,180 | | | | 3,184 | |
Small-Mid Cap Value (d) | | | 823 | | | | 1,241 | | | | 2,064 | | | | — | | | | — | | | | — | |
Bond | | | 3,771 | | | | 3,531 | | | | 7,302 | | | | 800 | | | | 16,399 | | | | 17,199 | |
Income | | | 8,675 | | | | (11,102 | ) | | | (2,427 | ) | | | (2,459 | ) | | | (3,869 | ) | | | (6,328 | ) |
Low Duration | | | (634 | ) | | | (5,111 | ) | | | (5,745 | ) | | | 5,118 | | | | 9,041 | | | | 14,159 | |
Ready Reserves | | | 55,203 | | | | — | | | | 55,203 | | | | (136,358 | ) | | | — | | | | (136,358 | ) |
| (a) | | For Class N shares the period from May 3, 2010 (Commencement of Operations) to December 31, 2010. |
| (b) | | For the period from May 3, 2010 (Commencement of Operations) to December 31, 2010. |
| (c) | | For the period from October 24, 2011 (Commencement of Operations) to December 31, 2011. |
| (d) | | For the period from December 15, 2011 (Commencement of Operations) to December 31, 2011. |
| | | | | | | | | | | | | | | | | | | | | | | | |
| | | Sales (Shares) | |
| | | Year Ended December 31, 2011 | | | Year Ended December 31, 2010 | |
Portfolio | | Class N | | | Class I | | | Total | | | Class N | | | Class I | | | Total | |
Growth | | | 6,242 | | | | 5,321 | | | | 11,563 | | | | 6,808 | | | | 9,829 | | | | 16,637 | |
Large Cap Growth | | | 125 | | | | 451 | | | | 576 | | | | 182 | | | | 299 | | | | 481 | |
Small Cap Growth | | | 1,396 | | | | 4,242 | | | | 5,638 | | | | 5,035 | | | | 12,133 | | | | 17,168 | |
Mid Cap Growth | | | 1,734 | | | | 5,091 | | | | 6,825 | | | | 261 | | | | 1,998 | | | | 2,259 | |
Small Mid-Cap Growth | | | 997 | | | | 4,690 | | | | 5,687 | | | | 242 | | | | 3,846 | | | | 4,088 | |
Global Growth | | | 59 | | | | 378 | | | | 437 | | | | 139 | | | | 526 | | | | 665 | |
International Growth | | | 13,859 | | | | 22,239 | | | | 36,098 | | | | 45,601 | | | | 31,294 | | | | 76,895 | |
International Equity | | | 58 | | | | 2,177 | | | | 2,235 | | | | 96 | | | | 5,289 | | | | 5,385 | |
International Small Cap Growth | | | 409 | | | | 12,634 | | | | 13,043 | | | | 729 | | | | 12,221 | | | | 12,950 | |
Emerging Markets Growth | | | 110 | | | | 1,744 | | | | 1,854 | | | | 467 | | | | 3,722 | | | | 4,189 | |
Emerging Leaders Growth (a) | | | 3 | | | | 2,073 | | | | 2,076 | | | | 5 | | | | 1,252 | | | | 1,257 | |
Emerging Markets Small Cap Growth (c) | | | 104 | | | | 232 | | | | 336 | | | | — | | | | — | | | | — | |
Large Cap Value (c) | | | 100 | | | | 145 | | | | 245 | | | | — | | | | — | | | | — | |
Small Cap Value | | | 3,200 | | | | 8,897 | | | | 12,097 | | | | 1,978 | | | | 5,844 | | | | 7,822 | |
Mid Cap Value (b) | | | 8 | | | | 151 | | | | 159 | | | | — | | | | 313 | | | | 313 | |
Small-Mid Cap Value (d) | | | 82 | | | | 124 | | | | 206 | | | | — | | | | — | | | | — | |
Bond | | | 421 | | | | 3,871 | | | | 4,292 | | | | 164 | | | | 6,220 | | | | 6,384 | |
Income | | | 2,705 | | | | 967 | | | | 3,672 | | | | 957 | | | | 713 | | | | 1,670 | |
Low Duration | | | 301 | | | | 5,769 | | | | 6,070 | | | | 670 | | | | 7,796 | | | | 8,466 | |
Ready Reserves | | | 838,996 | | | | — | | | | 838,996 | | | | 670,783 | | | | — | | | | 670,783 | |
142 Annual Report | December 31, 2011 |
| | | | | | | | | | | | | | | | | | | | | | | | |
| | | Reinvested Distributions (Shares) | |
| | | Year Ended December 31, 2011 | | | Year Ended December 31, 2010 | |
Portfolio | | Class N | | | Class I | | | Total | | | Class N | | | Class I | | | Total | |
Growth | | | 552 | | | | 854 | | | | 1,406 | | | | — | | | | 1 | | | | 1 | |
Large Cap Growth | | | — | | | | 5 | | | | 5 | | | | — | | | | 4 | | | | 4 | |
Small Cap Growth | | | — | | | | — | | | | — | | | | — | | | | — | | | | — | |
Mid Cap Growth | | | 208 | | | | 742 | | | | 950 | | | | — | | | | — | | | | — | |
Small Mid-Cap Growth | | | 239 | | | | 1,356 | | | | 1,595 | | | | — | | | | — | | | | — | |
Global Growth | | | — | | | | 21 | | | | 21 | | | | — | | | | 1 | | | | 1 | |
International Growth | | | — | | | | 271 | | | | 271 | | | | 2,343 | | | | 1,918 | | | | 4,261 | |
International Equity | | | — | | | | — | | | | — | | | | 15 | | | | 189 | | | | 204 | |
International Small Cap Growth | | | 17 | | | | 286 | | | | 303 | | | | 3 | | | | 83 | | | | 86 | |
Emerging Markets Growth | | | 188 | | | | 1,225 | | | | 1,413 | | | | 15 | | | | 87 | | | | 102 | |
Emerging Leaders Growth (a) | | | 1 | | | | 178 | | | | 179 | | | | — | | | | 8 | | | | 8 | |
Emerging Markets Small Cap
Growth (c) | | | — | | | | — | | | | — | | | | — | | | | — | | | | — | |
Large Cap Value (c) | | | — | | | | 1 | | | | 1 | | | | — | | | | — | | | | — | |
Small Cap Value | | | 128 | | | | 550 | | | | 678 | | | | 4 | | | | 22 | | | | 26 | |
Mid Cap Value (b) | | | — | | | | 8 | | | | 8 | | | | — | | | | 3 | | | | 3 | |
Small-Mid Cap Value (d) | | | — | | | | — | | | | — | | | | — | | | | — | | | | — | |
Bond | | | 20 | | | | 533 | | | | 553 | | | | 12 | | | | 447 | | | | 459 | |
Income | | | 135 | | | | 246 | | | | 381 | | | | 159 | | | | 315 | | | | 474 | |
Low Duration | | | 8 | | | | 145 | | | | 153 | | | | 5 | | | | 122 | | | | 127 | |
Ready Reserves | | | 125 | | | | — | | | | 125 | | | | 126 | | | | — | | | | 126 | |
| |
| | | Redemptions (Shares) | |
| | | Year Ended December 31, 2011 | | | Year Ended December 31, 2010 | |
Portfolio | | Class N | | | Class I | | | Total | | | Class N | | | Class I | | | Total | |
Growth | | | 5,345 | | | | 5,968 | | | | 11,313 | | | | 4,775 | | | | 3,591 | | | | 8,366 | |
Large Cap Growth | | | 633 | | | | 802 | | | | 1,435 | | | | 148 | | | | 761 | | | | 909 | |
Small Cap Growth | | | 8,432 | | | | 7,958 | | | | 16,390 | | | | 11,449 | | | | 5,763 | | | | 17,212 | |
Mid Cap Growth | | | 465 | | | | 2,990 | | | | 3,455 | | | | 187 | | | | 1,030 | | | | 1,217 | |
Small Mid-Cap Growth | | | 478 | | | | 1,908 | | | | 2,386 | | | | 386 | | | | 1,836 | | | | 2,222 | |
Global Growth | | | 204 | | | | 334 | | | | 538 | | | | 209 | | | | 615 | | | | 824 | |
International Growth | | | 68,547 | | | | 27,431 | | | | 95,978 | | | | 61,789 | | | | 28,153 | | | | 89,942 | |
International Equity | | | 549 | | | | 9,168 | | | | 9,717 | | | | 373 | | | | 17,372 | | | | 17,745 | |
International Small Cap Growth | | | 431 | | | | 7,627 | | | | 8,058 | | | | 483 | | | | 5,850 | | | | 6,333 | |
Emerging Markets Growth | | | 911 | | | | 4,152 | | | | 5,063 | | | | 422 | | | | 5,459 | | | | 5,881 | |
Emerging Leaders Growth (a) | | | 3 | | | | 1,006 | | | | 1,009 | | | | — | | | | 728 | | | | 728 | |
Emerging Markets Small Cap Growth (c) | | | — | | | | — | | | | — | | | | — | | | | — | | | | — | |
Large Cap Value (c) | | | — | | | | — | | | | — | | | | — | | | | — | | | | — | |
Small Cap Value | | | 2,509 | | | | 3,505 | | | | 6,014 | | | | 219 | | | | 945 | | | | 1,164 | |
Mid Cap Value (b) | | | 2 | | | | 43 | | | | 45 | | | | — | | | | 1 | | | | 1 | |
Small-Mid Cap Value (d) | | | — | | | | — | | | | — | | | | — | | | | — | | | | — | |
Bond | | | 95 | | | | 4,083 | | | | 4,178 | | | | 101 | | | | 5,087 | | | | 5,188 | |
Income | | | 1,913 | | | | 2,423 | | | | 4,336 | | | | 1,382 | | | | 1,449 | | | | 2,831 | |
Low Duration | | | 373 | | | | 6,432 | | | | 6,805 | | | | 161 | | | | 7,002 | | | | 7,163 | |
Ready Reserves | | | 783,918 | | | | — | | | | 783,918 | | | | 807,267 | | | | — | | | | 807,267 | |
December 31, 2011 | William Blair Funds 143 |
| | | | | | | | | | | | | | | | | | | | | | | | |
| | | Net Change in Shares Outstanding relating to Fund Share Activity (Shares) | |
| | | Year Ended December 31, 2011 | | | Year Ended December 31, 2010 | |
Portfolio | | Class N | | | Class I | | | Total | | | Class N | | | Class I | | | Total | |
Growth | | | 1,449 | | | | 207 | | | | 1,656 | | | | 2,033 | | | | 6,239 | | | | 8,272 | |
Large Cap Growth | | | (508 | ) | | | (346 | ) | | | (854 | ) | | | 34 | | | | (458 | ) | | | (424 | ) |
Small Cap Growth | | | (7,036 | ) | | | (3,716 | ) | | | (10,752 | ) | | | (6,414 | ) | | | 6,370 | | | | (44 | ) |
Mid Cap Growth | | | 1,477 | | | | 2,843 | | | | 4,320 | | | | 74 | | | | 968 | | | | 1,042 | |
Small Mid-Cap Growth | | | 758 | | | | 4,138 | | | | 4,896 | | | | (144 | ) | | | 2,010 | | | | 1,866 | |
Global Growth | | | (145 | ) | | | 65 | | | | (80 | ) | | | (70 | ) | | | (88 | ) | | | (158 | ) |
International Growth | | | (54,688 | ) | | | (4,921 | ) | | | (59,609 | ) | | | (13,845 | ) | | | 5,059 | | | | (8,786 | ) |
International Equity | | | (491 | ) | | | (6,991 | ) | | | (7,482 | ) | | | (262 | ) | | | (11,894 | ) | | | (12,156 | ) |
International Small Cap Growth | | | (5 | ) | | | 5,293 | | | | 5,288 | | | | 249 | | | | 6,454 | | | | 6,703 | |
Emerging Markets Growth | | | (613 | ) | | | (1,183 | ) | | | (1,796 | ) | | | 60 | | | | (1,650 | ) | | | (1,590 | ) |
Emerging Leaders Growth (a) | | | 1 | | | | 1,245 | | | | 1,246 | | | | 5 | | | | 532 | | | | 537 | |
Emerging Markets Small Cap
Growth (c) | | | 104 | | | | 232 | | | | 336 | | | | — | | | | — | | | | — | |
Large Cap Value (c) | | | 100 | | | | 146 | | | | 246 | | | | — | | | | — | | | | — | |
Small Cap Value | | | 819 | | | | 5,942 | | | | 6,761 | | | | 1,763 | | | | 4,921 | | | | 6,684 | |
Mid Cap Value (b) | | | 6 | | | | 116 | | | | 122 | | | | — | | | | 315 | | | | 315 | |
Small-Mid Cap Value (d) | | | 82 | | | | 124 | | | | 206 | | | | — | | | | — | | | | — | |
Bond | | | 346 | | | | 321 | | | | 667 | | | | 75 | | | | 1,580 | | | | 1,655 | |
Income | | | 927 | | | | (1,210 | ) | | | (283 | ) | | | (266 | ) | | | (421 | ) | | | (687 | ) |
Low Duration | | | (64 | ) | | | (518 | ) | | | (582 | ) | | | 514 | | | | 916 | | | | 1,430 | |
Ready Reserves | | | 55,203 | | | | — | | | | 55,203 | | | | (136,358 | ) | | | — | | | | (136,358 | ) |
| (a) | | For Class N shares the period from May 3, 2010 (Commencement of Operations) to December 31, 2010. |
| (b) | | For the period from May 3, 2010 (Commencement of Operations) to December 31, 2010. |
| (c) | | For the period from October 24, 2011 (Commencement of Operations) to December 31, 2011. |
| (d) | | For the period from December 15, 2011 (Commencement of Operations) to December 31, 2011. |
144 Annual Report | December 31, 2011 |
Financial Highlights
Growth Fund
| | | | | | | | | | | | | | | | | | | | |
| | | Class N | |
| | | Years Ended December 31, | |
| | | 2011 | | | 2010 | | | 2009 | | | 2008 | | | 2007 | |
Net asset value, beginning of year | | $ | 11.28 | | | $ | 9.89 | | | $ | 7.12 | | | $ | 11.70 | | | $ | 11.42 | |
Income (loss) from investment operations: | | | | | | | | | | | | | | | | | | | | |
Net investment income (loss) | | | (0.04 | ) | | | (0.01 | ) | | | (0.02 | ) | | | (0.05 | ) | | | (0.04 | ) |
Net realized and unrealized gain (loss) on investments | | | (0.19 | ) | | | 1.40 | | | | 2.79 | | | | (4.35 | ) | | | 1.53 | |
| | | | | | | | | | | | | | | | | | | | |
Total from investment operations | | | (0.23 | ) | | | 1.39 | | | | 2.77 | | | | (4.40 | ) | | | 1.49 | |
Less distributions from: | | | | | | | | | | | | | | | | | | | | |
Net investment income | | | — | | | | — | | | | — | | | | — | | | | — | |
Net realized gain | | | 0.32 | | | | — | | | | — | | | | 0.18 | | | | 1.21 | |
| | | | | | | | | | | | | | | | | | | | |
Total distributions | | | 0.32 | | | | — | | | | — | | | | 0.18 | | | | 1.21 | |
| | | | | | | | | | | | | | | | | | | | |
Net asset value, end of year | | $ | 10.73 | | | $ | 11.28 | | | $ | 9.89 | | | $ | 7.12 | | | $ | 11.70 | |
| | | | | | | | | | | | | | | | | | | | |
Total Return (%) | | | (1.93 | ) | | | 14.05 | | | | 38.90 | | | | (37.61 | ) | | | 13.17 | |
Ratios to average daily net assets (%): | | | | | | | | | | | | | | | | | | | | |
Expenses | | | 1.21 | | | | 1.16 | | | | 1.23 | | | | 1.17 | | | | 1.22 | |
Net investment income (loss) | | | (0.37 | ) | | | (0.13 | ) | | | (0.20 | ) | | | (0.54 | ) | | | (0.35 | ) |
| | | | | | | | | | | | | | | | | | | | |
| | | Class I | |
| | | Years Ended December 31, | |
| | | 2011 | | | 2010 | | | 2009 | | | 2008 | | | 2007 | |
Net asset value, beginning of year | | $ | 11.71 | | | $ | 10.24 | | | $ | 7.35 | | | $ | 12.02 | | | $ | 11.66 | |
Income (loss) from investment operations: | | | | | | | | | | | | | | | | | | | | |
Net investment income (loss) | | | 0.00 | ^ | | | 0.02 | | | | 0.01 | | | | (0.02 | ) | | | 0.00 | ^ |
Net realized and unrealized gain (loss) on investments | | | (0.20 | ) | | | 1.45 | | | | 2.88 | | | | (4.47 | ) | | | 1.57 | |
| | | | | | | | | | | | | | | | | | | | |
Total from investment operations | | | (0.20 | ) | | | 1.47 | | | | 2.89 | | | | (4.49 | ) | | | 1.57 | |
Less distributions from: | | | | | | | | | | | | | | | | | | | | |
Net investment income | | | 0.01 | | | | 0.00 | ^ | | | 0.00 | ^ | | | — | | | | — | |
Net realized gain | | | 0.32 | | | | — | | | | — | | | | 0.18 | | | | 1.21 | |
| | | | | | | | | | | | | | | | | | | | |
Total distributions | | | 0.33 | | | | — | | | | 0.00 | ^ | | | 0.18 | | | | 1.21 | |
| | | | | | | | | | | | | | | | | | | | |
Net asset value, end of year | | $ | 11.18 | | | $ | 11.71 | | | $ | 10.24 | | | $ | 7.35 | | | $ | 12.02 | |
| | | | | | | | | | | | | | | | | | | | |
Total Return (%) | | | (1.60 | ) | | | 14.36 | | | | 39.34 | | | | (37.35 | ) | | | 13.59 | |
Ratios to average daily net assets (%): | | | | | | | | | | | | | | | | | | | | |
Expenses | | | 0.86 | | | | 0.84 | | | | 0.89 | | | | 0.85 | | | | 0.87 | |
Net investment income (loss) | | | (0.03 | ) | | | 0.20 | | | | 0.14 | | | | (0.22 | ) | | | 0.00 | |
| | | | | | | | | | | | | | | | | | | | |
| | | Years Ended December 31, | |
| | | 2011 | | | 2010 | | | 2009 | | | 2008 | | | 2007 | |
Supplemental data for all classes: | | | | | | | | | | | | | | | | | | | | |
Net assets at end of year (in thousands) | | $ | 566,742 | | | $ | 575,613 | | | $ | 419,520 | | | $ | 238,586 | | | $ | 369,644 | |
Portfolio turnover rate (%) | | | 59 | | | | 66 | | | | 67 | | | | 60 | | | | 72 | |
| ^ | | Amount is less than $0.005 per share. |
Note: Net investment income (loss) per share is based on the average shares outstanding during the year.
Performance cited represents past performance. Past performance does not guarantee future results and current performance may be lower or higher than the data quoted. Results shown are annual returns, which assume reinvestment of dividends and capital gains. Investment returns and principal will fluctuate and you may have a gain or loss when you sell shares. For the most current month-end performance information, please call 1-800-742-7272 or visit our Web site at www.williamblairfunds.com.
December 31, 2011 | William Blair Funds 145 |
Financial Highlights
Large Cap Growth Fund
| | | | | | | | | | | | | | | | | | | | |
| | | Class N | |
| | | Years Ended December 31, | |
| | | 2011 | | | 2010 | | | 2009 | | | 2008 | | | 2007 | |
Net asset value, beginning of year | | $ | 7.14 | | | $ | 6.16 | | | $ | 4.68 | | | $ | 7.52 | | | $ | 6.88 | |
Income (loss) from investment operations: | | | | | | | | | | | | | | | | | | | | |
Net investment income (loss) | | | (0.01 | ) | | | (0.00 | )^ | | | (0.01 | ) | | | (0.02 | ) | | | (0.01 | ) |
Net realized and unrealized gain (loss) on investments | | | (0.25 | ) | | | 0.98 | | | | 1.49 | | | | (2.82 | ) | | | 0.65 | |
| | | | | | | | | | | | | | | | | | | | |
Total from investment operations | | | (0.26 | ) | | | 0.98 | | | | 1.48 | | | | (2.84 | ) | | | 0.64 | |
Less distributions from: | | | | | | | | | | | | | | | | | | | | |
Net investment income | | | — | | | | — | | | | — | | | | 0.00 | ^ | | | — | |
Net realized gain | | | — | | | | — | | | | — | | | | — | | | | — | |
| | | | | | | | | | | | | | | | | | | | |
Total distributions | | | — | | | | — | | | | — | | | | 0.00 | ^ | | | — | |
| | | | | | | | | | | | | | | | | | | | |
Net asset value, end of year | | $ | 6.88 | | | $ | 7.14 | | | $ | 6.16 | | | $ | 4.68 | | | $ | 7.52 | |
| | | | | | | | | | | | | | | | | | | | |
Total Return (%) | | | (3.64 | ) | | | 15.91 | | | | 31.62 | | | | (37.76 | ) | | | 9.30 | |
Ratios to average daily net assets (%): | | | | | | | | | | | | | | | | | | | | |
Expenses, net of waivers and reimbursements | | | 1.20 | | | | 1.21 | | | | 1.23 | | | | 1.23 | | | | 1.23 | |
Expenses, before waivers and reimbursements | | | 1.51 | | | | 1.53 | | | | 2.28 | | | | 1.85 | | | | 1.50 | |
Net investment income (loss), net of waivers and reimbursements | | | (0.13 | ) | | | (0.08 | ) | | | (0.13 | ) | | | (0.29 | ) | | | (0.16 | ) |
Net investment income (loss), before waivers and reimbursements | | | (0.44 | ) | | | (0.40 | ) | | | (1.18 | ) | | | (0.91 | ) | | | (0.43 | ) |
| | | | | | | | | | | | | | | | | | | | |
| | | Class I | |
| | | Years Ended December 31, | |
| | | 2011 | | | 2010 | | | 2009 | | | 2008 | | | 2007 | |
Net asset value, beginning of year | | $ | 7.30 | | | $ | 6.30 | | | $ | 4.77 | | | $ | 7.64 | | | $ | 6.99 | |
Income (loss) from investment operations: | | | | | | | | | | | | | | | | | | | | |
Net investment income (loss) | | | 0.01 | | | | 0.02 | | | | 0.01 | | | | 0.00 | ^ | | | 0.01 | |
Net realized and unrealized gain (loss) on investments | | | (0.27 | ) | | | 1.00 | | | | 1.52 | | | | (2.87 | ) | | | 0.64 | |
| | | | | | | | | | | | | | | | | | | | |
Total from investment operations | | | (0.26 | ) | | | 1.01 | | | | 1.53 | | | | (2.87 | ) | | | 0.65 | |
Less distributions from: | | | | | | | | | | | | | | | | | | | | |
Net investment income | | | 0.01 | | | | 0.01 | | | | 0.00 | ^ | | | 0.00 | ^ | | | 0.00 | ^ |
Net realized gain | | | — | | | | — | | | | — | | | | — | | | | — | |
| | | | | | | | | | | | | | | | | | | | |
Total distributions | | | 0.01 | | | | 0.01 | | | | 0.00 | ^ | | | 0.00 | ^ | | | 0.00 | ^ |
| | | | | | | | | | | | | | | | | | | | |
Net asset value, end of year | | $ | 7.03 | | | $ | 7.30 | | | $ | 6.30 | | | $ | 4.77 | | | $ | 7.64 | |
| | | | | | | | | | | | | | | | | | | | |
Total Return (%) | | | (3.54 | ) | | | 16.03 | | | | 32.17 | | | | (37.56 | ) | | | 9.36 | |
Ratios to average daily net assets (%): | | | | | | | | | | | | | | | | | | | | |
Expenses, net of waivers and reimbursements | | | 0.95 | | | | 0.96 | | | | 0.98 | | | | 0.98 | | | | 0.98 | |
Expenses, before waivers and reimbursements | | | 1.16 | | | | 1.16 | | | | 1.26 | | | | 1.21 | | | | 1.20 | |
Net investment income (loss), net of waivers and reimbursements | | | 0.11 | | | | 0.16 | | | | 0.12 | | | | (0.04 | ) | | | 0.18 | |
Net investment income (loss), before waivers and reimbursements | | | (0.10 | ) | | | (0.04 | ) | | | (0.16 | ) | | | (0.27 | ) | | | (0.04 | ) |
| | | | | | | | | | | | | | | | | | | | |
| | | Years Ended December 31, | |
| | | 2011 | | | 2010 | | | 2009 | | | 2008 | | | 2007 | |
Supplemental data for all classes: | | | | | | | | | | | | | | | | | | | | |
Net assets at end of year (in thousands) | | $ | 24,949 | | | $ | 32,035 | | | $ | 30,311 | | | $ | 23,279 | | | $ | 33,667 | |
Portfolio turnover rate (%) | | | 67 | | | | 54 | | | | 88 | | | | 85 | | | | 60 | |
| ^ | | Amount is between $(0.005) and $0.005 per share. |
Note: Net investment income (loss) per share is based on the average shares outstanding during the year.
Performance cited represents past performance. Past performance does not guarantee future results and current performance may be lower or higher than the data quoted. Results shown are annual returns, which assume reinvestment of dividends and capital gains. Investment returns and principal will fluctuate and you may have a gain or loss when you sell shares. For the most current month-end performance information, please call 1-800-742-7272 or visit our Web site at www.williamblairfunds.com.
146 Annual Report | December 31, 2011 |
Financial Highlights
Small Cap Growth Fund
| | | | | | | | | | | | | | | | | | | | |
| | | Class N | |
| | | Years Ended December 31, | |
| | | 2011 | | | 2010 | | | 2009 | | | 2008 | | | 2007 | |
Net asset value, beginning of year | | $ | 23.22 | | | $ | 19.99 | | | $ | 11.79 | | | $ | 23.30 | | | $ | 25.41 | |
Income (loss) from investment operations: | | | | | | | | | | | | | | | | | | | | |
Net investment income (loss) | | | (0.28 | ) | | | (0.21 | ) | | | (0.15 | ) | | | (0.19 | ) | | | (0.33 | ) |
Net realized and unrealized gain (loss) on investments | | | (2.81 | ) | | | 3.44 | | | | 8.35 | | | | (10.73 | ) | | | (0.25 | ) |
| | | | | | | | | | | | | | | | | | | | |
Total from investment operations | | | (3.09 | ) | | | 3.23 | | | | 8.20 | | | | (10.92 | ) | | | (0.58 | ) |
Less distributions from: | | | | | | | | | | | | | | | | | | | | |
Net investment income | | | — | | | | — | | | | — | | | | — | | | | — | |
Net realized gain | | | — | | | | — | | | | — | | | | 0.59 | | | | 1.53 | |
| | | | | | | | | | | | | | | | | | | | |
Total distributions | | | — | | | | — | | | | — | | | | 0.59 | | | | 1.53 | |
| | | | | | | | | | | | | | | | | | | | |
Net asset value, end of year | | $ | 20.13 | | | $ | 23.22 | | | $ | 19.99 | | | $ | 11.79 | | | $ | 23.30 | |
| | | | | | | | | | | | | | | | | | | | |
Total Return (%) | | | (13.31 | ) | | | 16.16 | | | | 69.55 | | | | (46.85 | ) | | | (2.15 | ) |
Ratios to average daily net assets (%): | | | | | | | | | | | | | | | | | | | | |
Expenses, net of waivers and reimbursements | | | 1.50 | | | | 1.50 | | | | 1.50 | | | | 1.50 | | | | 1.49 | |
Expenses, before waivers and reimbursements | | | 1.59 | | | | 1.52 | | | | 1.55 | | | | 1.50 | | | | 1.49 | |
Net investment income (loss), net of waivers and reimbursements | | | (1.25 | ) | | | (1.03 | ) | | | (0.93 | ) | | | (1.05 | ) | | | (1.24 | ) |
Net investment income (loss), before waivers and reimbursements | | | (1.34 | ) | | | (1.05 | ) | | | (0.98 | ) | | | (1.05 | ) | | | (1.24 | ) |
| | | | | | | | | | | | | | | | | | | | |
| | | Class I | |
| | | Years Ended December 31, | |
| | | 2011 | | | 2010 | | | 2009 | | | 2008 | | | 2007 | |
Net asset value, beginning of year | | $ | 24.07 | | | $ | 20.64 | | | $ | 12.14 | | | $ | 23.89 | | | $ | 25.94 | |
Income (loss) from investment operations: | | | | | | | | | | | | | | | | | | | | |
Net investment income (loss) | | | (0.23 | ) | | | (0.16 | ) | | | (0.11 | ) | | | (0.14 | ) | | | (0.25 | ) |
Net realized and unrealized gain (loss) on investments | | | (2.93 | ) | | | 3.59 | | | | 8.61 | | | | (11.02 | ) | | | (0.27 | ) |
| | | | | | | | | | | | | | | | | | | | |
Total from investment operations | | | (3.16 | ) | | | 3.43 | | | | 8.50 | | | | (11.16 | ) | | | (0.52 | ) |
Less distributions from: | | | | | | | | | | | | | | | | | | | | |
Net investment income | | | — | | | | — | | | | — | | | | — | | | | — | |
Net realized gain | | | — | | | | — | | | | — | | | | 0.59 | | | | 1.53 | |
| | | | | | | | | | | | | | | | | | | | |
Total distributions | | | — | | | | — | | | | — | | | | 0.59 | | | | 1.53 | |
| | | | | | | | | | | | | | | | | | | | |
Net asset value, end of year | | $ | 20.91 | | | $ | 24.07 | | | $ | 20.64 | | | $ | 12.14 | | | $ | 23.89 | |
| | | | | | | | | | | | | | | | | | | | |
Total Return (%) | | | (13.13 | ) | | | 16.62 | | | | 70.02 | | | | (46.70 | ) | | | (1.88 | ) |
Ratios to average daily net assets (%): | | | | | | | | | | | | | | | | | | | | |
Expenses, net of waivers and reimbursements | | | 1.25 | | | | 1.25 | | | | 1.20 | | | | 1.20 | | | | 1.20 | |
Expenses, before waivers and reimbursements | | | 1.35 | | | | 1.25 | | | | 1.20 | | | | 1.20 | | | | 1.20 | |
Net investment income (loss), net of waivers and reimbursements | | | (1.00 | ) | | | (0.76 | ) | | | (0.63 | ) | | | (0.75 | ) | | | (0.94 | ) |
Net investment income (loss), before waivers and reimbursements | | | (1.10 | ) | | | (0.76 | ) | | | (0.63 | ) | | | (0.75 | ) | | | (0.94 | ) |
| | | | | | | | | | | | | | | | | | | | |
| | | Years Ended December 31, | |
| | | 2011 | | | 2010 | | | 2009 | | | 2008 | | | 2007 | |
Supplemental data for all classes: | | | | | | | | | | | | | | | | | | | | |
Net assets at end of year (in thousands) | | $ | 554,738 | | | $ | 891,589 | | | $ | 762,798 | | | $ | 401,627 | | | $ | 1,094,419 | |
Portfolio turnover rate (%) | | | 97 | | | | 117 | | | | 122 | | | | 135 | | | | 97 | |
Note: Net investment income (loss) per share is based on the average shares outstanding during the year.
Performance cited represents past performance. Past performance does not guarantee future results and current performance may be lower or higher than the data quoted. Results shown are annual returns, which assume reinvestment of dividends and capital gains. Investment returns and principal will fluctuate and you may have a gain or loss when you sell shares. For the most current month-end performance information, please call 1-800-742-7272 or visit our Web site at www.williamblairfunds.com.
December 31, 2011 | William Blair Funds 147 |
Financial Highlights
Mid Cap Growth Fund
| | | | | | | | | | | | | | | | | | | | |
| | | Class N | |
| | | Years Ended December 31, | |
| | | 2011 | | | 2010 | | | 2009 | | | 2008 | | | 2007 | |
Net asset value, beginning of year | | $ | 12.50 | | | $ | 10.08 | | | $ | 7.41 | | | $ | 11.35 | | | $ | 10.46 | |
Income (loss) from investment operations: | | | | | | | | | | | | | | | | | | | | |
Net investment income (loss) | | | (0.08 | ) | | | (0.05 | ) | | | (0.04 | ) | | | (0.07 | ) | | | (0.07 | ) |
Net realized and unrealized gain (loss) on investments | | | 0.25 | | | | 2.47 | | | | 2.71 | | | | (3.87 | ) | | | 1.59 | |
| | | | | | | | | | | | | | | | | | | | |
Total from investment operations | | | 0.17 | | | | 2.42 | | | | 2.67 | | | | (3.94 | ) | | | 1.52 | |
Less distributions from: | | | | | | | | | | | | | | | | | | | | |
Net investment income | | | — | | | | — | | | | — | | | | — | | | | — | |
Net realized gain | | | 1.01 | | | | — | | | | — | | | | 0.00 | ^ | | | 0.63 | |
| | | | | | | | | | | | | | | | | | | | |
Total distributions | | | 1.01 | | | | — | | | | — | | | | 0.00 | ^ | | | 0.63 | |
| | | | | | | | | | | | | | | | | | | | |
Net asset value, end of year | | $ | 11.66 | | | $ | 12.50 | | | $ | 10.08 | | | $ | 7.41 | | | $ | 11.35 | |
| | | | | | | | | | | | | | | | | | | | |
Total Return (%) | | | 1.65 | | | | 24.01 | | | | 36.03 | | | | (34.71 | ) | | | 14.62 | |
Ratios to average daily net assets (%) | | | | | | | | | | | | | | | | | | | | |
Expenses, net of waivers and reimbursements | | | 1.35 | | | | 1.35 | | | | 1.36 | | | | 1.36 | | | | 1.38 | |
Expenses, before waivers and reimbursements | | | 1.43 | | | | 1.42 | | | | 2.13 | | | | 2.03 | | | | 1.67 | |
Net investment income (loss), net of waivers and reimbursements | | | (0.65 | ) | | | (0.42 | ) | | | (0.51 | ) | | | (0.76 | ) | | | (0.58 | ) |
Net investment income (loss), before waivers and reimbursements | | | (0.73 | ) | | | (0.49 | ) | | | (1.28 | ) | | | (1.43 | ) | | | (0.87 | ) |
| | | | | | | | | | | | | | | | | | | | |
| | | Class I | |
| | | Years Ended December 31, | |
| | | 2011 | | | 2010 | | | 2009 | | | 2008 | | | 2007 | |
Net asset value, beginning of year | | $ | 12.68 | | | $ | 10.20 | | | $ | 7.48 | | | $ | 11.42 | | | $ | 10.49 | |
Income (loss) from investment operations: | | | | | | | | | | | | | | | | | | | | |
Net investment income (loss) | | | (0.05 | ) | | | (0.02 | ) | | | (0.02 | ) | | | (0.05 | ) | | | (0.04 | ) |
Net realized and unrealized gain (loss) on investments | | | 0.25 | | | | 2.50 | | | | 2.74 | | | | (3.89 | ) | | | 1.60 | |
| | | | | | | | | | | | | | | | | | | | |
Total from investment operations | | | 0.20 | | | | 2.48 | | | | 2.72 | | | | (3.94 | ) | | | 1.56 | |
Less distributions from: | | | | | | | | | | | | | | | | | | | | |
Net investment income | | | — | | | | — | | | | — | | | | — | | | | — | |
Net realized gain | | | 1.01 | | | | — | | | | — | | | | 0.00 | ^ | | | 0.63 | |
| | | | | | | | | | | | | | | | | | | | |
Total distributions | | | 1.01 | | | | — | | | | — | | | | 0.00 | ^ | | | 0.63 | |
| | | | | | | | | | | | | | | | | | | | |
Net asset value, end of year | | $ | 11.87 | | | $ | 12.68 | | | $ | 10.20 | | | $ | 7.48 | | | $ | 11.42 | |
| | | | | | | | | | | | | | | | | | | | |
Total Return (%) | | | 1.86 | | | | 24.31 | | | | 36.36 | | | | (34.50 | ) | | | 14.95 | |
Ratios to average daily net assets (%): | | | | | | | | | | | | | | | | | | | | |
Expenses, net of waivers and reimbursements | | | 1.10 | | | | 1.10 | | | | 1.11 | | | | 1.11 | | | | 1.12 | |
Expenses, before waivers and reimbursements | | | 1.13 | | | | 1.15 | | | | 1.28 | | | | 1.23 | | | | 1.37 | |
Net investment income (loss), net of waivers and reimbursements | | | (0.42 | ) | | | (0.14 | ) | | | (0.26 | ) | | | (0.51 | ) | | | (0.32 | ) |
Net investment income (loss), before waivers and reimbursements | | | (0.45 | ) | | | (0.19 | ) | | | (0.43 | ) | | | (0.63 | ) | | | (0.57 | ) |
| | | | | | | | | | | | | | | | | | | | |
| | | Years Ended December 31, | |
| | | 2011 | | | 2010 | | | 2009 | | | 2008 | | | 2007 | |
Supplemental data for all classes: | | | | | | | | | | | | | | | | | | | | |
Net assets at end of year (in thousands) | | $ | 145,754 | | | $ | 101,248 | | | $ | 70,834 | | | $ | 40,526 | | | $ | 45,393 | |
Portfolio turnover rate (%) | | | 70 | | | | 73 | | | | 87 | | | | 76 | | | | 66 | |
| ^ | | Amount is less than $0.005 per share. |
Note: Net investment income (loss) per share is based on the average shares outstanding during the year.
Performance cited represents past performance. Past performance does not guarantee future results and current performance may be lower or higher than the data quoted. Results shown are annual returns, which assume reinvestment of dividends and capital gains. Investment returns and principal will fluctuate and you may have a gain or loss when you sell shares. For the most current month-end performance information, please call 1-800-742-7272 or visit our Web site at www.williamblairfunds.com.
148 Annual Report | December 31, 2011 |
Financial Highlights
Small-Mid Cap Growth Fund
| | | | | | | | | | | | | | | | | | | | |
| | | Class N | |
| | | Years Ended December 31, | |
| | | 2011 | | | 2010 | | | 2009 | | | 2008 | | | 2007 | |
Net asset value, beginning of year | | $ | 14.40 | | | $ | 11.73 | | | $ | 8.16 | | | $ | 13.10 | | | $ | 12.96 | |
Income (loss) from investment operations: | | | | | | | | | | | | | | | | | | | | |
Net investment income (loss) | | | (0.11 | ) | | | (0.09 | ) | | | (0.06 | ) | | | (0.03 | ) | | | (0.12 | ) |
Net realized and unrealized gain (loss) on investments | | | 0.03 | | | | 2.76 | | | | 3.63 | | | | (4.91 | ) | | | 1.71 | |
| | | | | | | | | | | | | | | | | | | | |
Total from investment operations | | | (0.08 | ) | | | 2.67 | | | | 3.57 | | | | (4.94 | ) | | | 1.59 | |
Less distributions from: | | | | | | | | | | | | | | | | | | | | |
Net investment income | | | — | | | | — | | | | — | | | | — | | | | — | |
Net realized gain | | | 1.32 | | | | — | | | | — | | | | 0.00 | ^ | | | 1.45 | |
| | | | | | | | | | | | | | | | | | | | |
Total distributions | | | 1.32 | | | | — | | | | — | | | | 0.00 | ^ | | | 1.45 | |
| | | | | | | | | | | | | | | | | | | | |
Net asset value, end of year | | $ | 13.00 | | | $ | 14.40 | | | $ | 11.73 | | | $ | 8.16 | | | $ | 13.10 | |
| | | | | | | | | | | | | | | | | | | | |
Total Return (%) | | | (0.27 | ) | | | 22.76 | | | | 43.75 | | | | (37.71 | ) | | | 12.34 | |
Ratios to average daily net assets (%): | | | | | | | | | | | | | | | | | | | | |
Expenses, net of waivers and reimbursements | | | 1.35 | | | | 1.35 | | | | 1.36 | | | | 1.36 | | | | 1.36 | |
Expenses, before waivers and reimbursements | | | 1.46 | | | | 1.46 | | | | 1.49 | | | | 1.41 | | | | 1.42 | |
Net investment income (loss), net of waivers and reimbursements | | | (0.77 | ) | | | (0.76 | ) | | | (0.60 | ) | | | (0.26 | ) | | | (0.79 | ) |
Net investment income (loss), before waivers and reimbursements | | | (0.88 | ) | | | (0.87 | ) | | | (0.73 | ) | | | (0.31 | ) | | | (0.85 | ) |
| | | | | | | | | | | | | | | | | | | | |
| | | Class I | |
| | | Years Ended December 31, | |
| | | 2011 | | | 2010 | | | 2009 | | | 2008 | | | 2007 | |
Net asset value, beginning of year | | $ | 14.68 | | | $ | 11.93 | | | $ | 8.27 | | | $ | 13.24 | | | $ | 13.06 | |
Income (loss) from investment operations: | | | | | | | | | | | | | | | | | | | | |
Net investment income (loss) | | | (0.08 | ) | | | (0.06 | ) | | | (0.03 | ) | | | 0.00 | ^ | | | (0.08 | ) |
Net realized and unrealized gain (loss) on investments | | | 0.04 | | | | 2.81 | | | | 3.69 | | | | (4.97 | ) | | | 1.71 | |
| | | | | | | | | | | | | | | | | | | | |
Total from investment operations | | | (0.04 | ) | | | 2.75 | | | | 3.66 | | | | (4.97 | ) | | | 1.63 | |
Less distributions from: | | | | | | | | | | | | | | | | | | | | |
Net investment income | | | — | | | | — | | | | 0.00 | ^ | | | — | | | | — | |
Net realized gain | | | 1.32 | | | | — | | | | — | | | | 0.00 | ^ | | | 1.45 | |
| | | | | | | | | | | | | | | | | | | | |
Total distributions | | | 1.32 | | | | — | | | | 0.00 | ^ | | | 0.00 | ^ | | | 1.45 | |
| | | | | | | | | | | | | | | | | | | | |
Net asset value, end of year | | $ | 13.32 | | | $ | 14.68 | | | $ | 11.93 | | | $ | 8.27 | | | $ | 13.24 | |
| | | | | | | | | | | | | | | | | | | | |
Total Return (%) | | | 0.01 | | | | 23.05 | | | | 44.26 | | | | (37.54 | ) | | | 12.54 | |
Ratios to average daily net assets (%): | | | | | | | | | | | | | | | | | | | | |
Expenses, net of waivers and reimbursements | | | 1.10 | | | | 1.10 | | | | 1.11 | | | | 1.11 | | | | 1.11 | |
Expenses, before waivers and reimbursements | | | 1.12 | | | | 1.11 | | | | 1.18 | | | | 1.17 | | | | 1.17 | |
Net investment income (loss), net of waivers and reimbursements | | | (0.54 | ) | | | (0.50 | ) | | | (0.33 | ) | | | 0.03 | | | | (0.54 | ) |
Net investment income (loss), before waivers and reimbursements | | | (0.56 | ) | | | (0.51 | ) | | | (0.40 | ) | | | (0.03 | ) | | | (0.60 | ) |
| | | | | | | | | | | | | | | | | | | | |
| | | Years Ended December 31, | |
| | | 2011 | | | 2010 | | | 2009 | | | 2008 | | | 2007 | |
Supplemental data for all classes: | | | | | | | | | | | | | | | | | | | | |
Net assets at end of year (in thousands) | | $ | 253,597 | | | $ | 208,065 | | | $ | 146,828 | | | $ | 83,479 | | | $ | 124,501 | |
Portfolio turnover rate (%) | | | 76 | | | | 93 | | | | 112 | | | | 77 | | | | 80 | |
| ^ | | Amount is less than $0.005 per share. |
Note: Net investment income (loss) per share is based on the average shares outstanding during the year.
Performance cited represents past performance. Past performance does not guarantee future results and current performance may be lower or higher than the data quoted. Results shown are annual returns, which assume reinvestment of dividends and capital gains. Investment returns and principal will fluctuate and you may have a gain or loss when you sell shares. For the most current month-end performance information, please call 1-800-742-7272 or visit our Web site at www.williamblairfunds.com.
December 31, 2011 | William Blair Funds 149 |
Financial Highlights
Global Growth Fund
| | | | | | | | | | | | | | | | | | | | |
| | | Class N | |
| | | Years Ended December 31, | |
| | | 2011 | | | 2010 | | | 2009 | | | 2008 | | | 2007(a) | |
Net asset value, beginning of year | | $ | 8.40 | | | $ | 6.97 | | | $ | 4.96 | | | $ | 9.89 | | | $ | 10.00 | |
Income (loss) from investment operations: | | | | | | | | | | | | | | | | | | | | |
Net investment income (loss) (b) | | | 0.02 | | | | (0.01 | ) | | | (0.01 | ) | | | 0.08 | | | | 0.00 | ^ |
Net realized and unrealized gain (loss) on investments | | | (0.31 | ) | | | 1.44 | | | | 2.02 | | | | (4.98 | ) | | | (0.11 | ) |
| | | | | | | | | | | | | | | | | | | | |
Total from investment operations | | | (0.29 | ) | | | 1.43 | | | | 2.01 | | | | (4.90 | ) | | | (0.11 | ) |
Less distributions from: | | | | | | | | | | | | | | | | | | | | |
Net investment income | | | 0.01 | | | | — | | | | — | | | | 0.03 | | | | 0.00 | ^ |
Net realized gain | | | — | | | | — | | | | — | | | | — | | | | — | |
| | | | | | | | | | | | | | | | | | | | |
Total distributions | | | 0.01 | | | | — | | | | — | | | | 0.03 | | | | 0.00 | ^ |
| | | | | | | | | | | | | | | | | | | | |
Net asset value, end of year | | $ | 8.10 | | | $ | 8.40 | | | $ | 6.97 | | | $ | 4.96 | | | $ | 9.89 | |
| | | | | | | | | | | | | | | | | | | | |
Total Return (%)* | | | (3.47 | ) | | | 20.52 | | | | 40.52 | | | | (49.52 | ) | | | (1.10 | ) |
Ratios to average daily net assets (%):** | | | | | | | | | | | | | | | | | | | | |
Expenses, net of waivers and reimbursements | | | 1.50 | | | | 1.52 | | | | 1.55 | | | | 1.55 | | | | 1.55 | |
Expenses, before waivers and reimbursements | | | 1.82 | | | | 1.93 | | | | 2.61 | | | | 2.17 | | | | 2.14 | |
Net investment income (loss), net of waivers and reimbursements | | | 0.29 | | | | (0.09 | ) | | | (0.17 | ) | | | 0.98 | | | | (0.08 | ) |
Net investment income (loss), before waivers and reimbursements | | | (0.03 | ) | | | (0.50 | ) | | | (1.23 | ) | | | 0.36 | | | | (0.67 | ) |
| | | | | | | | | | | | | | | | | | | | |
| | | Class I | |
| | | Years Ended December 31, | |
| | | 2011 | | | 2010 | | | 2009 | | | 2008 | | | 2007(a) | |
Net asset value, beginning of year | | $ | 8.40 | | | $ | 6.96 | | | $ | 4.94 | | | $ | 9.91 | | | $ | 10.00 | |
Income (loss) from investment operations: | | | | | | | | | | | | | | | | | | | | |
Net investment income (loss) (b) | | | 0.04 | | | | 0.02 | | | | 0.00 | ^ | | | 0.08 | | | | 0.00 | ^ |
Net realized and unrealized gain (loss) on investments | | | (0.31 | ) | | | 1.43 | | | | 2.02 | | | | (4.98 | ) | | | (0.09 | ) |
| | | | | | | | | | | | | | | | | | | | |
Total from investment operations | | | (0.27 | ) | | | 1.44 | | | | 2.02 | | | | (4.90 | ) | | | (0.09 | ) |
Less distributions from: | | | | | | | | | | | | | | | | | | | | |
Net investment income | | | 0.04 | | | | 0.00 | ^ | | | 0.00 | ^ | | | 0.07 | | | | 0.00 | ^ |
Net realized gain | | | — | | | | — | | | | — | | | | — | | | | — | |
| | | | | | | | | | | | | | | | | | | | |
Total distributions | | | 0.04 | | | | 0.00 | ^ | | | 0.00 | ^ | | | 0.07 | | | | 0.00 | ^ |
| | | | | | | | | | | | | | | | | | | | |
Net asset value, end of year | | $ | 8.09 | | | $ | 8.40 | | | $ | 6.96 | | | $ | 4.94 | | | $ | 9.91 | |
| | | | | | | | | | | | | | | | | | | | |
Total Return (%)* | | | (3.26 | ) | | | 20.73 | | | | 40.90 | | | | (49.41 | ) | | | (0.85 | ) |
Ratios to average daily net assets (%):** | | | | | | | | | | | | | | | | | | | | |
Expenses, net of waivers and reimbursements | | | 1.25 | | | | 1.27 | | | | 1.30 | | | | 1.30 | | | | 1.30 | |
Expenses, before waivers and reimbursements | | | 1.55 | | | | 1.62 | | | | 1.62 | | | | 1.74 | | | | 1.89 | |
Net investment income (loss), net of waivers and reimbursements | | | 0.52 | | | | 0.16 | | | | 0.05 | | | | 1.05 | | | | 0.14 | |
Net investment income (loss), before waivers and reimbursements | | | 0.22 | | | | (0.19 | ) | | | (0.27 | ) | | | 0.61 | | | | (0.45 | ) |
| | | | | | | | | | | | | | | | | | | | |
| | | Years Ended December 31, | |
| | | 2011 | | | 2010 | | | 2009 | | | 2008 | | | 2007(a) | |
Supplemental data for all classes: | | | | | | | | | | | | | | | | | | | | |
Net assets at end of year (in thousands) | | $ | 42,574 | | | $ | 44,877 | | | $ | 38,287 | | | $ | 28,005 | | | $ | 45,576 | |
Portfolio turnover rate (%)* | | | 75 | | | | 96 | | | | 133 | | | | 124 | | | | 63 | |
| (a) | | For the period October 15, 2007 (Commencement of Operations) to December 31, 2007. |
| (b) | | Excludes $0.00, $0.00, $0.00, $0.00 and $0.00 of PFIC mark to market, which is treated as ordinary income for Federal tax purposes for the years 2011, 2010, 2009, 2008 and 2007, respectively. |
| * | | Rates not annualized for periods that are less than a year. |
| ** | | Rates are annualized for periods that are less than a year. |
| ^ | | Amount is less than $0.005 per share. |
Note: Net investment income (loss) per share is based on the average shares outstanding during the year.
Performance cited represents past performance. Past performance does not guarantee future results and current performance may be lower or higher than the data quoted. Results shown are annual returns, which assume reinvestment of dividends and capital gains. Investment returns and principal will fluctuate and you may have a gain or loss when you sell shares. For the most current month-end performance information, please call 1-800-742-7272 or visit our Web site at www.williamblairfunds.com.
150 Annual Report | December 31, 2011 |
Financial Highlights
International Growth Fund
| | | | | | | | | | | | | | | | | | | | |
| | | Class N | |
| | | Years Ended December 31, | |
| | | 2011 | | | 2010 | | | 2009 | | | 2008 | | | 2007 | |
Net asset value, beginning of year | | $ | 21.85 | | | $ | 18.55 | | | $ | 13.12 | | | $ | 29.12 | | | $ | 27.70 | |
Income (loss) from investment operations: | | | | | | | | | | | | | | | | | | | | |
Net investment income (loss) (a) | | | 0.26 | | | | 0.14 | | | | 0.07 | | | | 0.29 | | | | 0.12 | |
Net realized and unrealized gain (loss) on investments | | | (3.43 | ) | | | 3.58 | | | | 5.47 | | | | (15.54 | ) | | | 4.77 | |
| | | | | | | | | | | | | | | | | | | | |
Total from investment operations | | | (3.17 | ) | | | 3.72 | | | | 5.54 | | | | (15.25 | ) | | | 4.89 | |
Less distributions from: | | | | | | | | | | | | | | | | | | | | |
Net investment income | | | — | | | | 0.42 | | | | 0.11 | | | | — | | | | 0.34 | |
Net realized gain | | | — | | | | — | | | | — | | | | 0.75 | | | | 3.13 | |
| | | | | | | | | | | | | | | | | | | | |
Total distributions | | | — | | | | 0.42 | | | | 0.11 | | | | 0.75 | | | | 3.47 | |
| | | | | | | | | | | | | | | | | | | | |
Net asset value, end of year | | $ | 18.68 | | | $ | 21.85 | | | $ | 18.55 | | | $ | 13.12 | | | $ | 29.12 | |
| | | | | | | | | | | | | | | | | | | | |
Total Return (%) | | | (14.51 | ) | | | 20.09 | | | | 42.27 | | | | (52.33 | ) | | | 18.13 | |
Ratios to average daily net assets (%): | | | | | | | | | | | | | | | | | | | | |
Expenses, net of waivers and reimbursements | | | 1.45 | | | | 1.43 | | | | 1.45 | | | | 1.39 | | | | 1.40 | |
Expenses, before waivers and reimbursements | | | 1.46 | | | | 1.43 | | | | 1.46 | | | | 1.39 | | | | 1.40 | |
Net investment income (loss), net of waivers and reimbursements | | | 1.22 | | | | 0.73 | | | | 0.48 | | | | 1.29 | | | | 0.38 | |
Net investment income (loss), before waivers and reimbursements | | | 1.21 | | | | 0.73 | | | | 0.47 | | | | 1.29 | | | | 0.38 | |
| |
| | | Class I | |
| | | Years Ended December 31, | |
| | | 2011 | | | 2010 | | | 2009 | | | 2008 | | | 2007 | |
Net asset value, beginning of year | | $ | 22.34 | | | $ | 18.95 | | | $ | 13.40 | | | $ | 29.61 | | | $ | 28.10 | |
Income (loss) from investment operations: | | | | | | | | | | | | | | | | | | | | |
Net investment income (loss) (a) | | | 0.30 | | | | 0.20 | | | | 0.12 | | | | 0.37 | | | | 0.21 | |
Net realized and unrealized gain (loss) on investments | | | (3.48 | ) | | | 3.67 | | | | 5.59 | | | | (15.83 | ) | | | 4.86 | |
| | | | | | | | | | | | | | | | | | | | |
Total from investment operations | | | (3.18 | ) | | | 3.87 | | | | 5.71 | | | | (15.46 | ) | | | 5.07 | |
Less distributions from: | | | | | | | | | | | | | | | | | | | | |
Net investment income | | | 0.06 | | | | 0.48 | | | | 0.16 | | | | — | | | | 0.43 | |
Net realized gain | | | — | | | | — | | | | — | | | | 0.75 | | | | 3.13 | |
| | | | | | | | | | | | | | | | | | | | |
Total distributions | | | 0.06 | | | | 0.48 | | | | 0.16 | | | | 0.75 | | | | 3.56 | |
| | | | | | | | | | | | | | | | | | | | |
Net asset value, end of year | | $ | 19.10 | | | $ | 22.34 | | | $ | 18.95 | | | $ | 13.40 | | | $ | 29.61 | |
| | | | | | | | | | | | | | | | | | | | |
Total Return (%) | | | (14.23 | ) | | | 20.47 | | | | 42.63 | | | | (52.17 | ) | | | 18.53 | |
Ratios to average daily net assets (%): | | | | | | | | | | | | | | | | | | | | |
Expenses | | | 1.15 | | | | 1.14 | | | | 1.17 | | | | 1.08 | | | | 1.09 | |
Net investment income (loss) | | | 1.40 | | | | 0.99 | | | | 0.74 | | | | 1.58 | | | | 0.69 | |
| | | | | | | | | | | | | | | | | | | | |
| | | Years Ended December 31, | |
| | | 2011 | | | 2010 | | | 2009 | | | 2008 | | | 2007 | |
Supplemental data for all classes: | | | | | | | | | | | | | | | | | | | | |
Net assets at end of year (in thousands) | | $ | 3,228,902 | | | $ | 5,082,179 | | | $ | 4,473,408 | | | $ | 3,130,938 | | | $ | 8,048,654 | |
Portfolio turnover rate (%) | | | 103 | | | | 99 | | | | 121 | | | | 91 | | | | 56 | |
| (a) | | Excludes $0.00, $0.13, $0.08, $(0.18), and $0.09 of PFIC mark to market, which is treated as ordinary income for Federal tax purposes for the years 2011, 2010, 2009, 2008, and 2007, respectively. |
Note: Net investment income (loss) per share is based on the average shares outstanding during the year.
Performance cited represents past performance. Past performance does not guarantee future results and current performance may be lower or higher than the data quoted. Results shown are annual returns, which assume reinvestment of dividends and capital gains. Investment returns and principal will fluctuate and you may have a gain or loss when you sell shares. For the most current month-end performance information, please call 1-800-742-7272 or visit our Web site at www.williamblairfunds.com.
December 31, 2011 | William Blair Funds 151 |
Financial Highlights
International Equity Fund
| | | | | | | | | | | | | | | | | | | | |
| | | Class N | |
| | | Years Ended December 31, | |
| | | 2011 | | | 2010 | | | 2009 | | | 2008 | | | 2007 | |
Net asset value, beginning of year | | $ | 12.12 | | | $ | 11.07 | | | $ | 8.35 | | | $ | 16.53 | | | $ | 15.21 | |
Income (loss) from investment operations: | | | | | | | | | | | | | | | | | | | | |
Net investment income (loss) (a) | | | 0.13 | | | | 0.06 | | | | 0.09 | | | | 0.10 | | | | 0.09 | |
Net realized and unrealized gain (loss) on investments | | | (1.69 | ) | | | 1.15 | | | | 2.64 | | | | (8.16 | ) | | | 2.55 | |
| | | | | | | | | | | | | | | | | | | | |
Total from investment operations | | | (1.56 | ) | | | 1.21 | | | | 2.73 | | | | (8.06 | ) | | | 2.64 | |
Less distributions from: | | | | | | | | | | | | | | | | | | | | |
Net investment income | | | — | | | | 0.16 | | | | 0.01 | | | | — | | | | 0.14 | |
Net realized gain | | | — | | | | — | | | | — | | | | 0.12 | | | | 1.18 | |
| | | | | | | | | | | | | | | | | | | | |
Total distributions | | | — | | | | 0.16 | | | | 0.01 | | | | 0.12 | | | | 1.32 | |
| | | | | | | | | | | | | | | | | | | | |
Net asset value, end of year | | $ | 10.56 | | | $ | 12.12 | | | $ | 11.07 | | | $ | 8.35 | | | $ | 16.53 | |
| | | | | | | | | | | | | | | | | | | | |
Total Return (%) | | | (12.87 | ) | | | 10.92 | | | | 32.69 | | | | (48.75 | ) | | | 17.68 | |
Ratios to average daily net assets (%): | | | | | | | | | | | | | | | | | | | | |
Expenses, net of waivers and reimbursements | | | 1.45 | | | | 1.45 | | | | 1.45 | | | | 1.45 | | | | 1.45 | |
Expenses, before waivers and reimbursements | | | 1.60 | | | | 1.66 | | | | 1.59 | | | | 1.45 | | | | 1.47 | |
Net investment income (loss), net of waivers and reimbursements | | | 1.09 | | | | 0.55 | | | | 1.03 | | | | 0.80 | | | | 0.52 | |
Net investment income (loss), before waivers and reimbursements | | | 0.94 | | | | 0.34 | | | | 0.89 | | | | 0.80 | | | | 0.50 | |
| |
| | | Class I | |
| | | Years Ended December 31, | |
| | | 2011 | | | 2010 | | | 2009 | | | 2008 | | | 2007 | |
Net asset value, beginning of year | | $ | 12.22 | | | $ | 11.16 | | | $ | 8.44 | | | $ | 16.66 | | | $ | 15.31 | |
Income (loss) from investment operations: | | | | | | | | | | | | | | | | | | | | |
Net investment income (loss) (a) | | | 0.17 | | | | 0.10 | | | | 0.08 | | | | 0.15 | | | | 0.13 | |
Net realized and unrealized gain (loss) on investments | | | (1.72 | ) | | | 1.15 | | | | 2.70 | | | | (8.25 | ) | | | 2.57 | |
| | | | | | | | | | | | | | | | | | | | |
Total from investment operations | | | (1.55 | ) | | | 1.25 | | | | 2.78 | | | | (8.10 | ) | | | 2.70 | |
Less distributions from: | | | | | | | | | | | | | | | | | | | | |
Net investment income | | | — | | | | 0.19 | | | | 0.06 | | | | — | | | | 0.17 | |
Net realized gain | | | — | | | | — | | | | — | | | | 0.12 | | | | 1.18 | |
| | | | | | | | | | | | | | | | | | | | |
Total distributions | | | — | | | | 0.19 | | | | 0.06 | | | | 0.12 | | | | 1.35 | |
| | | | | | | | | | | | | | | | | | | | |
Net asset value, end of year | | $ | 10.67 | | | $ | 12.22 | | | $ | 11.16 | | | $ | 8.44 | | | $ | 16.66 | |
| | | | | | | | | | | | | | | | | | | | |
Total Return (%) | | | (12.68 | ) | | | 11.19 | | | | 32.93 | | | | (48.61 | ) | | | 17.97 | |
Ratios to average daily net assets (%): | | | | | | | | | | | | | | | | | | | | |
Expenses, net of waivers and reimbursements | | | 1.20 | | | | 1.20 | | | | 1.20 | | | | 1.20 | | | | 1.20 | |
Expenses, before waivers and reimbursements | | | 1.33 | | | | 1.28 | | | | 1.39 | | | | 1.22 | | | | 1.25 | |
Net investment income (loss), net of waivers and reimbursements | | | 1.43 | | | | 0.88 | | | | 0.86 | | | | 1.12 | | | | 0.76 | |
Net investment income (loss), before waivers and reimbursements | | | 1.30 | | | | 0.80 | | | | 0.67 | | | | 1.10 | | | | 0.71 | |
| | | | | | | | | | | | | | | | | | | | |
| | | Years Ended December 31, | |
| | | 2011 | | | 2010 | | | 2009 | | | 2008 | | | 2007 | |
Supplemental data for all classes: | | | | | | | | | | | | | | | | | | | | |
Net assets at end of year (in thousands) | | $ | 75,657 | | | $ | 178,055 | | | $ | 298,168 | | | $ | 228,486 | | | $ | 408,609 | |
Portfolio turnover rate (%) | | | 99 | | | | 71 | | | | 88 | | | | 92 | | | | 70 | |
| (a) | | Excludes $0.00, $0.04, $0.00, $0.00, and $(0.07) of PFIC mark to market, which is treated as ordinary income for Federal tax purposes for the years 2011, 2010, 2009, 2008, and 2007, respectively. |
Note: Net investment income (loss) per share is based on the average shares outstanding during the year.
Performance cited represents past performance. Past performance does not guarantee future results and current performance may be lower or higher than the data quoted. Results shown are annual returns, which assume reinvestment of dividends and capital gains. Investment returns and principal will fluctuate and you may have a gain or loss when you sell shares. For the most current month-end performance information, please call 1-800-742-7272 or visit our Web site at www.williamblairfunds.com.
152 Annual Report | December 31, 2011 |
Financial Highlights
International Small Cap Growth Fund
| | | | | | | | | | | | | | | | | | | | |
| | | Class N | |
| | | Years Ended December 31, | |
| | | 2011 | | | 2010 | | | 2009 | | | 2008 | | | 2007 | |
Net asset value, beginning of year | | $ | 13.07 | | | $ | 10.40 | | | $ | 6.62 | | | $ | 13.98 | | | $ | 13.37 | |
Income (loss) from investment operations: | | | | | | | | | | | | | | | | | | | | |
Net investment income (loss) (a) | | | 0.07 | | | | 0.03 | | | | (0.01 | ) | | | (0.02 | ) | | | (0.02 | ) |
Net realized and unrealized gain (loss) on investments | | | (1.66 | ) | | | 2.66 | | | | 3.79 | | | | (7.22 | ) | | | 1.72 | |
| | | | | | | | | | | | | | | | | | | | |
Total from investment operations | | | (1.59 | ) | | | 2.69 | | | | 3.78 | | | | (7.24 | ) | | | 1.70 | |
Less distributions from: | | | | | | | | | | | | | | | | | | | | |
Net investment income | | | 0.12 | | | | 0.02 | | | | — | | | | — | | | | 0.05 | |
Net realized gain | | | — | | | | — | | | | — | | | | 0.12 | | | | 1.04 | |
| | | | | | | | | | | | | | | | | | | | |
Total distributions | | | 0.12 | | | | 0.02 | | | | — | | | | 0.12 | | | | 1.09 | |
| | | | | | | | | | | | | | | | | | | | |
Net asset value, end of year | | $ | 11.36 | | | $ | 13.07 | | | $ | 10.40 | | | $ | 6.62 | | | $ | 13.98 | |
| | | | | | | | | | | | | | | | | | | | |
Total Return (%) | | | (12.16 | ) | | | 25.88 | | | | 57.10 | | | | (51.82 | ) | | | 13.06 | |
Ratios to average daily net assets (%): | | | | | | | | | | | | | | | | | | | | |
Expenses, net of waivers and reimbursements | | | 1.64 | | | | 1.55 | | | | 1.65 | | | | 1.65 | | | | 1.60 | |
Expenses, before waivers and reimbursements | | | 1.64 | | | | 1.55 | | | | 1.83 | | | | 1.62 | | | | 1.60 | |
Net investment income (loss), net of waivers and reimbursements | | | 0.55 | | | | 0.30 | | | | (0.16 | ) | | | (0.20 | ) | | | (0.16 | ) |
Net investment income (loss), before waivers and reimbursements | | | 0.55 | | | | 0.30 | | | | (0.34 | ) | | | (0.17 | ) | | | (0.16 | ) |
| | | | | | | | | | | | | | | | | | | | |
| | | Class I | |
| | | Years Ended December 31, | |
| | | 2011 | | | 2010 | | | 2009 | | | 2008 | | | 2007 | |
Net asset value, beginning of year | | $ | 13.19 | | | $ | 10.49 | | | $ | 6.67 | | | $ | 14.01 | | | $ | 13.41 | |
Income (loss) from investment operations: | | | | | | | | | | | | | | | | | | | | |
Net investment income (loss) (a) | | | 0.12 | | | | 0.07 | | | | 0.01 | | | | 0.01 | | | | 0.03 | |
Net realized and unrealized gain (loss) on investments | | | (1.69 | ) | | | 2.68 | | | | 3.83 | | | | (7.23 | ) | | | 1.71 | |
| | | | | | | | | | | | | | | | | | | | |
Total from investment operations | | | (1.57 | ) | | | 2.75 | | | | 3.84 | | | | (7.22 | ) | | | 1.74 | |
Less distributions from: | | | | | | | | | | | | | | | | | | | | |
Net investment income | | | 0.16 | | | | 0.05 | | | | 0.02 | | | | — | | | | 0.10 | |
Net realized gain | | | — | | | | — | | | | — | | | | 0.12 | | | | 1.04 | |
| | | | | | | | | | | | | | | | | | | | |
Total distributions | | | 0.16 | | | | 0.05 | | | | 0.02 | | | | 0.12 | | | | 1.14 | |
| | | | | | | | | | | | | | | | | | | | |
Net asset value, end of year | | $ | 11.46 | | | $ | 13.19 | | | $ | 10.49 | | | $ | 6.67 | | | $ | 14.01 | |
| | | | | | | | | | | | | | | | | | | | |
Total Return (%) | | | (11.84 | ) | | | 26.24 | | | | 57.51 | | | | (51.56 | ) | | | 13.34 | |
Ratios to average daily net assets (%): | | | | | | | | | | | | | | | | | | | | |
Expenses, net of waivers and reimbursements | | | 1.28 | | | | 1.25 | | | | 1.31 | | | | 1.31 | | | | 1.29 | |
Expenses, before waivers and reimbursements | | | 1.28 | | | | 1.25 | | | | 1.31 | | | | 1.28 | | | | 1.29 | |
Net investment income (loss), net of waivers and reimbursements | | | 0.92 | | | | 0.61 | | | | 0.11 | | | | 0.11 | | | | 0.18 | |
Net investment income (loss), before waivers and reimbursements | | | 0.92 | | | | 0.61 | | | | 0.11 | | | | 0.14 | | | | 0.18 | |
| | | | | | | | | | | | | | | | | | | | |
| | | Years Ended December 31, | |
| | | 2011 | | | 2010 | | | 2009 | | | 2008 | | | 2007 | |
Supplemental data for all classes: | | | | | | | | | | | | | | | | | | | | |
Net assets at end of year (in thousands) | | $ | 718,221 | | | $ | 646,951 | | | $ | 390,851 | | | $ | 291,988 | | | $ | 401,459 | |
Portfolio turnover rate (%)* | | | 85 | | | | 85 | | | | 136 | | | | 78 | | | | 88 | |
| (a) | | Excludes $0.00, $0.15, $0.01, $(0.02), and $0.05 of PFIC mark to market, which is treated as ordinary income for Federal tax purposes for the years 2011, 2010, 2009, 2008, and 2007, respectively. |
Note: Net investment income (loss) per share is based on the average shares outstanding during the year.
Performance cited represents past performance. Past performance does not guarantee future results and current performance may be lower or higher than the data quoted. Results shown are annual returns, which assume reinvestment of dividends and capital gains. Investment returns and principal will fluctuate and you may have a gain or loss when you sell shares. For the most current month-end performance information, please call 1-800-742-7272 or visit our Web site at www.williamblairfunds.com.
December 31, 2011 | William Blair Funds 153 |
Financial Highlights
Emerging Markets Growth Fund
| | | | | | | | | | | | | | | | | | | | |
| | | Class N | |
| | | Years Ended December 31, | |
| | | 2011 | | | 2010 | | | 2009 | | | 2008 | | | 2007 | |
Net asset value, beginning of year | | $ | 15.76 | | | $ | 12.87 | | | $ | 7.46 | | | $ | 21.92 | | | $ | 19.42 | |
Income (loss) from investment operations: | | | | | | | | | | | | | | | | | | | | |
Net investment income (loss) (a) | | | 0.07 | | | | (0.01 | ) | | | 0.00 | ^ | | | 0.11 | | | | (0.10 | ) |
Net realized and unrealized gain (loss) on investments | | | (2.84 | ) | | | 3.02 | | | | 5.51 | | | | (13.63 | ) | | | 7.23 | |
| | | | | | | | | | | | | | | | | | | | |
Total from investment operations | | | (2.77 | ) | | | 3.01 | | | | 5.51 | | | | (13.52 | ) | | | 7.13 | |
Less distributions from: | | | | | | | | | | | | | | | | | | | | |
Net investment income | | | — | | | | 0.12 | | | | 0.10 | | | | — | | | | 0.09 | |
Net realized gain | | | 1.83 | | | | — | | | | — | | | | 0.94 | | | | 4.54 | |
| | | | | | | | | | | | | | | | | | | | |
Total distributions | | | 1.83 | | | | 0.12 | | | | 0.10 | | | | 0.94 | | | | 4.63 | |
| | | | | | | | | | | | | | | | | | | | |
Net asset value, end of year | | $ | 11.16 | | | $ | 15.76 | | | $ | 12.87 | | | $ | 7.46 | | | $ | 21.92 | |
| | | | | | | | | | | | | | | | | | | | |
Total Return (%) | | | (17.29 | ) | | | 23.44 | | | | 73.85 | | | | (61.71 | ) | | | 37.75 | |
Ratios to average daily net assets (%): | | | | | | | | | | | | | | | | | | | | |
Expenses, net of waivers and reimbursements | | | 1.68 | | | | 1.63 | | | | 1.70 | | | | 1.67 | | | | 1.65 | |
Expenses, before waivers and reimbursements | | | 1.68 | | | | 1.63 | | | | 1.81 | | | | 1.65 | | | | 1.69 | |
Net investment income (loss), net of waivers and reimbursements | | | 0.48 | | | | (0.05 | ) | | | 0.04 | | | | 0.65 | | | | (0.45 | ) |
Net investment income (loss), before waivers and reimbursements | | | 0.48 | | | | (0.05 | ) | | | (0.07 | ) | | | 0.67 | | | | (0.49 | ) |
| |
| | | Class I | |
| | | Years Ended December 31, | |
| | | 2011 | | | 2010 | | | 2009 | | | 2008 | | | 2007 | |
Net asset value, beginning of year | | $ | 15.87 | | | $ | 12.95 | | | $ | 7.51 | | | $ | 21.99 | | | $ | 19.47 | |
Income (loss) from investment operations: | | | | | | | | | | | | | | | | | | | | |
Net investment income (loss) (a) | | | 0.11 | | | | 0.04 | | | | 0.03 | | | | 0.15 | | | | (0.04 | ) |
Net realized and unrealized gain (loss) on investments | | | (2.85 | ) | | | 3.03 | | | | 5.54 | | | | (13.69 | ) | | | 7.26 | |
| | | | | | | | | | | | | | | | | | | | |
Total from investment operations | | | (2.74) | | | | 3.07 | | | | 5.57 | | | | (13.54 | ) | | | 7.22 | |
Less distributions from: | | | | | | | | | | | | | | | | | | | | |
Net investment income | | | 0.05 | | | | 0.15 | | | | 0.13 | | | | — | | | | 0.16 | |
Net realized gain | | | 1.83 | | | | — | | | | — | | | | 0.94 | | | | 4.54 | |
| | | | | | | | | | | | | | | | | | | | |
Total distributions | | | 1.88 | | | | 0.15 | | | | 0.13 | | | | 0.94 | | | | 4.70 | |
| | | | | | | | | | | | | | | | | | | | |
Net asset value, end of year | | $ | 11.25 | | | $ | 15.87 | | | $ | 12.95 | | | $ | 7.51 | | | $ | 21.99 | |
| | | | | | | | | | | | | | | | | | | | |
Total Return (%) | | | (17.00 | ) | | | 23.77 | | | | 74.18 | | | | (61.60 | ) | | | 38.13 | |
Ratios to average daily net assets (%): | | | | | | | | | | | | | | | | | | | | |
Expenses, net of waivers and reimbursements | | | 1.38 | | | | 1.36 | | | | 1.41 | | | | 1.41 | | | | 1.40 | |
Expenses, before waivers and reimbursements | | | 1.38 | | | | 1.36 | | | | 1.41 | | | | 1.39 | | | | 1.40 | |
Net investment income (loss), net of waivers and reimbursements | | | 0.77 | | | | 0.26 | | | | 0.31 | | | | 0.91 | | | | (0.20 | ) |
Net investment income (loss), before waivers and reimbursements | | | 0.77 | | | | 0.26 | | | | 0.31 | | | | 0.93 | | | | (0.20 | ) |
| | | | | | | | | | | | | | | | | | | | |
| | | Years Ended December 31, | |
| | | 2011 | | | 2010 | | | 2009 | | | 2008 | | | 2007 | |
Supplemental data for all classes: | | | | | | | | | | | | | | | | | | | | |
Net assets at end of year (in thousands) | | $ | 817,846 | | | $ | 1,250,543 | | | $ | 1,038,260 | | | $ | 385,588 | | | $ | 1,165,854 | |
Portfolio turnover rate (%) | | | 104 | | | | 121 | | | | 113 | | | | 118 | | | | 100 | |
| (a) | | Excludes $0.00, $0.11, $0.15, $(0.09), and $0.21 of PFIC mark to market, which is treated as ordinary income for Federal tax purposes for the years 2011, 2010, 2009, 2008, and 2007, respectively. |
| ^ | | Amount is less than $0.005 per share. |
Note: Net investment income (loss) per share is based on the average shares outstanding during the year.
Performance cited represents past performance. Past performance does not guarantee future results and current performance may be lower or higher than the data quoted. Results shown are annual returns, which assume reinvestment of dividends and capital gains. Investment returns and principal will fluctuate and you may have a gain or loss when you sell shares. For the most current month-end performance information, please call 1-800-742-7272 or visit our Web site at www.williamblairfunds.com.
154 Annual Report | December 31, 2011 |
Financial Highlights
Emerging Leaders Growth Fund
| | | | | | | | |
| | | Class N | |
| | | Periods Ended December 31, | |
| | | 2011 | | | 2010(a) | |
Net asset value, beginning of year | | $ | 10.34 | | | $ | 8.80 | |
Income (loss) from investment operations: | | | | | | | | |
Net investment income (loss) (c) | | | 0.04 | | | | (0.02 | ) |
Net realized and unrealized gain (loss) on investments | | | (2.08 | ) | | | 1.64 | |
| | | | | | | | |
Total from investment operations | | | (2.04 | ) | | | 1.62 | |
Less distributions from: | | | | | | | | |
Net investment income | | | — | | | | 0.02 | |
Net realized gain | | | 0.62 | | | | 0.06 | |
| | | | | | | | |
Total distributions | | | 0.62 | | | | 0.08 | |
| | | | | | | | |
Net asset value, end of year | | $ | 7.68 | | | $ | 10.34 | |
| | | | | | | | |
Total Return (%)* | | | (19.55 | ) | | | 18.43 | |
Ratios to average daily net assets (%):** | | | | | | | | |
Expenses, net of waivers and reimbursements | | | 1.65 | | | | 1.65 | |
Expenses, before waivers and reimbursements | | | 1.83 | | | | 1.71 | |
Net investment income (loss), net of waivers and reimbursements | | | 0.44 | | | | (0.38 | ) |
Net investment income (loss), before waivers and reimbursements | | | 0.26 | | | | (0.44 | ) |
| | | | | | | | | | | | | | | | |
| | | Class I | |
| | | Periods Ended December 31, | |
| | | 2011 | | | 2010 | | | 2009 | | | 2008(b) | |
Net asset value, beginning of year | | $ | 10.35 | | | $ | 8.43 | | | $ | 4.79 | | | $ | 10.00 | |
Income (loss) from investment operations: | | | | | | | | | | | | | | | | |
Net investment income (loss) (c) | | | 0.06 | | | | 0.02 | | | | 0.02 | | | | 0.04 | |
Net realized and unrealized gain (loss) on investments | | | (2.08 | ) | | | 1.98 | | | | 3.73 | | | | (5.25 | ) |
| | | | | | | | | | | | | | | | |
Total from investment operations | | | (2.02 | ) | | | 2.00 | | | | 3.75 | | | | (5.21 | ) |
Less distributions from: | | | | | | | | | | | | | | | | |
Net investment income | | | 0.05 | | | | 0.02 | | | | 0.11 | | | | 0.00 | ^ |
Net realized gain | | | 0.62 | | | | 0.06 | | | | — | | | | — | |
Return of capital | | | 0.00 | ^ | | | — | | | | — | | | | — | |
| | | | | | | | | | | | | | | | |
Total distributions | | | 0.67 | | | | 0.08 | | | | 0.11 | | | | 0.00 | ^ |
| | | | | | | | | | | | | | | | |
Net asset value, end of year | | $ | 7.66 | | | $ | 10.35 | | | $ | 8.43 | | | $ | 4.79 | |
| | | | | | | | | | | | | | | | |
Total Return (%)* | | | (19.34 | ) | | | 23.70 | | | | 78.38 | | | | (52.09 | ) |
Ratios to average daily net assets (%):** | | | | | | | | | | | | | | | | |
Expenses, net of waivers and reimbursements | | | 1.40 | | | | 1.40 | | | | 1.40 | | | | 1.40 | |
Expenses, before waivers and reimbursements | | | 1.58 | | | | 1.52 | | | | 1.54 | | | | 1.56 | |
Net investment income (loss), net of waivers and reimbursements | | | 0.69 | | | | 0.25 | | | | 0.37 | | | | 0.70 | |
Net investment income (loss), before waivers and reimbursements | | | 0.51 | | | | 0.13 | | | | 0.23 | | | | 0.54 | |
| | | | | | | | | | | | | | | | |
| | | Periods Ended December 31, | |
| | | 2011 | | | 2010 | | | 2009 | | | 2008(b) | |
Supplemental data for all classes: | | | | | | | | | | | | | | | | |
Net assets at end of year (in thousands) | | $ | 47,822 | | | $ | 94,901 | | | $ | 115,136 | | | $ | 46,676 | |
Portfolio turnover rate (%)* | | | 142 | | | | 176 | | | | 176 | | | | 151 | |
| (a) | | For the period May 3, 2010 (Commencement of Operations) to December 31, 2010. |
| (b) | | For the period March 26, 2008 (Commencement of Operations) to December 31, 2008. |
| (c) | | Excludes $0.00, $0.96, $1.29 and $0.00 of PFIC mark to market, which is treated as ordinary income for Federal tax purposes for the years 2011, 2010, 2009 and 2008 respectively. |
| * | | Rates not annualized for periods that are less than a year. |
| ** | | Rates are annualized for periods that are less than a year. |
| ^ | | Amount is less than $0.005 per share. |
Note: Net investment income (loss) per share is based on the average shares outstanding during the year.
Performance cited represents past performance. Past performance does not guarantee future results and current performance may be lower or higher than the data quoted. Results shown are annual returns, which assume reinvestment of dividends and capital gains. Investment returns and principal will fluctuate and you may have a gain or loss when you sell shares. For the most current month-end performance information, please call 1-800-742-7272 or visit our Web site at www.williamblairfunds.com.
December 31, 2011 | William Blair Funds 155 |
Financial Highlights
Emerging Markets Small Cap Growth Fund
| | | | |
| | | Class N | |
| | | Period Ended
December 31, | |
| | | 2011(b) | |
Net asset value, beginning of year | | $ | 10.00 | |
Income (loss) from investment operations: | | | | |
Net investment income (loss) (a) | | | 0.00 | ^ |
Net realized and unrealized gain (loss) on investments | | | (0.27 | ) |
| | | | |
Total from investment operations | | | (0.27 | ) |
Less distributions from: | | | | |
Net investment income | | | — | |
Net realized gain | | | — | |
| | | | |
Total distributions | | | — | |
| | | | |
Net asset value, end of year | | $ | 9.73 | |
| | | | |
Total Return (%)* | | | (2.70 | ) |
Ratios to average daily net assets (%):** | | | | |
Expenses, net of waivers and reimbursements | | | 1.65 | |
Expenses, before waivers and reimbursements | | | 9.53 | |
Net investment income (loss), net of waivers and reimbursements | | | 0.08 | |
Net investment income (loss), before waivers and reimbursements | | | (7.80 | ) |
| |
| | | Class I | |
| | | Period Ended
December 31, | |
| | | 2011(b) | |
Net asset value, beginning of year | | $ | 10.00 | |
Income (loss) from investment operations: | | | | |
Net investment income (loss) (a) | | | 0.01 | |
Net realized and unrealized gain (loss) on investments | | | (0.28 | ) |
| | | | |
Total from investment operations | | | (0.27 | ) |
Less distributions from: | | | | |
Net investment income | | | — | |
Net realized gain | | | — | |
| | | | |
Total distributions | | | — | |
| | | | |
Net asset value, end of year | | $ | 9.73 | |
| | | | |
Total Return (%)* | | | (2.70 | ) |
Ratios to average daily net assets (%):** | | | | |
Expenses, net of waivers and reimbursements | | | 1.40 | |
Expenses, before waivers and reimbursements | | | 9.28 | |
Net investment income (loss), net of waivers and reimbursements | | | 0.33 | |
Net investment income (loss), before waivers and reimbursements | | | (7.55 | ) |
| | | | |
| | | | |
| | | Period Ended
December 31, | |
| | | 2011(b) | |
Supplemental data for all classes: | | | | |
Net assets at end of year (in thousands) | | $ | 3,272 | |
Portfolio turnover rate (%)* | | | 17 | |
| (a) | | Excludes $0.00 of PFIC mark to market, which is treated as ordinary income for Federal tax purposes for 2011. |
| (b) | | For the period October 24, 2011 (Commencement of Operations) to December 31, 2011. |
| * | | Rates not annualized for periods that are less than a year. |
| ** | | Rates are annualized for periods that are less than a year. |
| ^ | | Amount is less than $0.005 per share. |
Note: Net investment income (loss) per share is based on the average shares outstanding during the year.
Performance cited represents past performance. Past performance does not guarantee future results and current performance may be lower or higher than the data quoted. Results shown are annual returns, which assume reinvestment of dividends and capital gains. Investment returns and principal will fluctuate and you may have a gain or loss when you sell shares. For the most current month-end performance information, please call 1-800-742-7272 or visit our Web site at www.williamblairfunds.com.
156 Annual Report | December 31, 2011 |
Financial Highlights
Large Cap Value Fund
| | | | |
| | | Class N | |
| | | Period Ended
December 31, | |
| | | 2011(a) | |
Net asset value, beginning of year | | $ | 10.00 | |
Income (loss) from investment operations: | | | | |
Net investment income (loss) | | | 0.03 | |
Net realized and unrealized gain (loss) on investments | | | (0.05 | ) |
| | | | |
Total from investment operations | | | (0.02 | ) |
Less distributions from: | | | | |
Net investment income | | | 0.03 | |
Net realized gain | | | 0.00 | ^ |
| | | | |
Total distributions | | | 0.03 | |
| | | | |
Net asset value, end of year | | $ | 9.95 | |
| | | | |
Total Return (%)* | | | (0.19 | ) |
Ratios to average daily net assets (%):** | | | | |
Expenses, net of waivers and reimbursements | | | 1.20 | |
Expenses, before waivers and reimbursements | | | 7.83 | |
Net investment income (loss), net of waivers and reimbursements | | | 1.41 | |
Net investment income (loss), before waivers and reimbursements | | | (5.22 | ) |
| |
| | | Class I | |
| | | Period Ended
December 31, | |
| | | 2011(a) | |
Net asset value, beginning of year | | $ | 10.00 | |
Income (loss) from investment operations: | | | | |
Net investment income (loss) | | | 0.03 | |
Net realized and unrealized gain (loss) on investments | | | (0.05 | ) |
| | | | |
Total from investment operations | | | (0.02 | ) |
Less distributions from: | | | | |
Net investment income | | | 0.03 | |
Net realized gain | | | 0.00 | ^ |
| | | | |
Total distributions | | | 0.03 | |
| | | | |
Net asset value, end of year | | $ | 9.95 | |
| | | | |
Total Return (%)* | | | (0.19 | ) |
Ratios to average daily net assets (%):** | | | | |
Expenses, net of waivers and reimbursements | | | 0.95 | |
Expenses, before waivers and reimbursements | | | 7.58 | |
Net investment income (loss), net of waivers and reimbursements | | | 1.66 | |
Net investment income (loss), before waivers and reimbursements | | | (4.97 | ) |
| | | | |
| | | | |
| | | Period Ended
December 31, | |
| | | 2011(a) | |
Supplemental data for all classes: | | | | |
Net assets at end of year (in thousands) | | $ | 2,453 | |
Portfolio turnover rate (%)* | | | 5 | |
| (a) | | For the period October 24, 2011 (Commencement of Operations) to December 31, 2011. |
| * | | Rates not annualized for periods that are less than a year. |
| ** | | Rates are annualized for periods that are less than a year. |
| ^ | | Amount is less than $0.005 per share. |
Note: Net investment income (loss) per share is based on the average shares outstanding during the year.
Performance cited represents past performance. Past performance does not guarantee future results and current performance may be lower or higher than the data quoted. Results shown are annual returns, which assume reinvestment of dividends and capital gains. Investment returns and principal will fluctuate and you may have a gain or loss when you sell shares. For the most current month-end performance information, please call 1-800-742-7272 or visit our Web site at www.williamblairfunds.com.
December 31, 2011 | William Blair Funds 157 |
Financial Highlights
Small Cap Value Fund
| | | | | | | | | | | | | | | | | | | | |
| | | Class N | |
| | | Years Ended December 31, | |
| | | 2011 | | | 2010 | | | 2009 | | | 2008 | | | 2007 | |
Net asset value, beginning of year | | $ | 13.71 | | | $ | 10.49 | | | $ | 8.33 | | | $ | 11.31 | | | $ | 16.27 | |
Income (loss) from investment operations: | | | | | | | | | | | | | | | | | | | | |
Net investment income (loss) | | | 0.00 | ^ | | | 0.03 | | | | 0.06 | | | | 0.09 | | | | 0.02 | |
Net realized and unrealized gain (loss) on investments | | | (0.97 | ) | | | 3.22 | | | | 2.13 | | | | (3.02 | ) | | | (0.96 | ) |
| | | | | | | | | | | | | | | | | | | | |
Total from investment operations | | | (0.97 | ) | | | 3.25 | | | | 2.19 | | | | (2.93 | ) | | | (0.94 | ) |
Less distributions from: | | | | | | | | | | | | | | | | | | | | |
Net investment income | | | 0.02 | | | | 0.03 | | | | 0.03 | | | | 0.05 | | | | — | |
Net realized gain | | | 0.46 | | | | — | | | | — | | | | — | | | | 4.02 | |
Return of capital | | | 0.00 | ^ | | | — | | | | — | | | | — | | | | — | |
| | | | | | | | | | | | | | | | | | | | |
Total distributions | | | 0.48 | | | | 0.03 | | | | 0.03 | | | | 0.05 | | | | 4.02 | |
| | | | | | | | | | | | | | | | | | | | |
Net asset value, end of year | | $ | 12.26 | | | $ | 13.71 | | | $ | 10.49 | | | $ | 8.33 | | | $ | 11.31 | |
| | | | | | | | | | | | | | | | | | | | |
Total Return (%) | | | (6.95 | ) | | | 30.94 | | | | 26.24 | | | | (25.85 | ) | | | (5.54 | ) |
Ratios to average daily net assets (%): | | | | | | | | | | | | | | | | | | | | |
Expenses, net of waivers and reimbursements | | | 1.38 | | | | 1.33 | | | | 1.29 | | | | 1.29 | | | | 1.33 | |
Expenses, before waivers and reimbursements | | | 1.60 | | | | 1.57 | | | | 1.78 | | | | 1.82 | | | | 1.66 | |
Net investment income (loss), net of waivers and reimbursements | | | (0.01 | ) | | | 0.25 | | | | 0.68 | | | | 0.84 | | | | 0.10 | |
Net investment income (loss), before waivers and reimbursements | | | (0.23 | ) | | | 0.01 | | | | 0.19 | | | | 0.31 | | | | (0.23 | ) |
| | | | | | | | | | | | | | | | | | | | |
| | | Class I | |
| | | Years Ended December 31, | |
| | | 2011 | | | 2010 | | | 2009 | | | 2008 | | | 2007 | |
Net asset value, beginning of year | | $ | 13.93 | | | $ | 10.65 | | | $ | 8.45 | | | $ | 11.50 | | | $ | 16.51 | |
Income (loss) from investment operations: | | | | | | | | | | | | | | | | | | | | |
Net investment income (loss) | | | 0.03 | | | | 0.05 | | | | 0.08 | | | | 0.11 | | | | 0.09 | |
Net realized and unrealized gain (loss) on investments | | | (0.98 | ) | | | 3.27 | | | | 2.16 | | | | (3.08 | ) | | | (1.01 | ) |
| | | | | | | | | | | | | | | | | | | | |
Total from investment operations | | | (0.95) | | | | 3.32 | | | | 2.24 | | | | (2.97 | ) | | | (0.92 | ) |
Less distributions from: | | | | | | | | | | | | | | | | | | | | |
Net investment income | | | 0.03 | | | | 0.04 | | | | 0.04 | | | | 0.08 | | | | 0.07 | |
Net realized gain | | | 0.46 | | | | — | | | | — | | | | — | | | | 4.02 | |
Return of capital | | | 0.02 | | | | — | | | | — | | | | — | | | | — | |
| | | | | | | | | | | | | | | | | | | | |
Total distributions | | | 0.51 | | | | 0.04 | | | | 0.04 | | | | 0.08 | | | | 4.09 | |
| | | | | | | | | | | | | | | | | | | | |
Net asset value, end of year | | $ | 12.47 | | | $ | 13.93 | | | $ | 10.65 | | | $ | 8.45 | | | $ | 11.50 | |
| | | | | | | | | | | | | | | | | | | | |
Total Return (%) | | | (6.68 | ) | | | 31.16 | | | | 26.56 | | | | (25.77 | ) | | | (5.31 | ) |
Ratios to average daily net assets (%): | | | | | | | | | | | | | | | | | | | | |
Expenses, net of waivers and reimbursements | | | 1.14 | | | | 1.10 | | | | 1.09 | | | | 1.09 | | | | 1.09 | |
Expenses, before waivers and reimbursements | | | 1.30 | | | | 1.29 | | | | 1.50 | | | | 1.57 | | | | 1.37 | |
Net investment income (loss), net of waivers and reimbursements | | | 0.26 | | | | 0.43 | | | | 0.86 | | | | 1.06 | | | | 0.52 | |
Net investment income (loss), before waivers and reimbursements | | | 0.10 | | | | 0.24 | | | | 0.45 | | | | 0.58 | | | | 0.24 | |
| | | | | | | | | | | | | | | | | | | | |
| | | Years Ended December 31, | |
| | | 2011 | | | 2010 | | | 2009 | | | 2008 | | | 2007 | |
Supplemental data for all classes: | | | | | | | | | | | | | | | | | | | | |
Net assets at end of year (in thousands) | | $ | 231,398 | | | $ | 164,499 | | | $ | 54,859 | | | $ | 36,249 | | | $ | 47,118 | |
Portfolio turnover rate (%) | | | 65 | | | | 71 | | | | 62 | | | | 87 | | | | 102 | |
| ^ | | Amount less than $0.005 per share |
Note: Net investment income (loss) per share is based on the average shares outstanding during the year.
Performance cited represents past performance. Past performance does not guarantee future results and current performance may be lower or higher than the data quoted. Results shown are annual returns, which assume reinvestment of dividends and capital gains. Investment returns and principal will fluctuate and you may have a gain or loss when you sell shares. For the most current month-end performance information, please call 1-800-742-7272 or visit our Web site at www.williamblairfunds.com.
158 Annual Report | December 31, 2011 |
Financial Highlights
Mid Cap Value Fund
| | | | | | | | |
| | | Class N | |
| | | Periods Ended
December 31, | |
| | | 2011 | | | 2010(a) | |
Net asset value, beginning of year | | $ | 10.75 | | | $ | 10.00 | |
Income (loss) from investment operations: | | | | | | | | |
Net investment income (loss) | | | 0.12 | | | | 0.09 | |
Net realized and unrealized gain (loss) on investments | | | (0.17 | ) | | | 0.74 | |
| | | | | | | | |
Total from investment operations | | | (0.05 | ) | | | 0.83 | |
Less distributions from: | | | | | | | | |
Net investment income | | | 0.09 | | | | 0.06 | |
Net realized gain | | | 0.13 | | | | 0.02 | |
| | | | | | | | |
Total distributions | | | 0.22 | | | | 0.08 | |
| | | | | | | | |
Net asset value, end of year | | $ | 10.48 | | | $ | 10.75 | |
| | | | | | | | |
Total Return (%)* | | | (0.34 | ) | | | 8.36 | |
Ratios to average daily net assets (%):** | | | | | | | | |
Expenses, net of waivers and reimbursements | | | 1.35 | | | | 1.35 | |
Expenses, before waivers and reimbursements | | | 3.85 | | | | 5.09 | |
Net investment income (loss), net of waivers and reimbursements | | | 1.15 | | | | 0.92 | |
Net investment income (loss), before waivers and reimbursements | | | (1.35 | ) | | | (2.82 | ) |
| |
| | | Class I | |
| | | Periods Ended
December 31, | |
| | | 2011 | | | 2010(a) | |
Net asset value, beginning of year | | $ | 10.76 | | | $ | 10.00 | |
Income (loss) from investment operations: | | | | | | | | |
Net investment income (loss) | | | 0.13 | | | | 0.11 | |
Net realized and unrealized gain (loss) on investments | | | (0.17 | ) | | | 0.75 | |
| | | | | | | | |
Total from investment operations | | | (0.04 | ) | | | 0.86 | |
Less distributions from: | | | | | | | | |
Net investment income | | | 0.11 | | | | 0.08 | |
Net realized gain | | | 0.13 | | | | 0.02 | |
| | | | | | | | |
Total distributions | | | 0.24 | | | | 0.10 | |
| | | | | | | | |
Net asset value, end of year | | $ | 10.48 | | | $ | 10.76 | |
| | | | | | | | |
Total Return (%)* | | | (0.25 | ) | | | 8.66 | |
Ratios to average daily net assets (%):** | | | | | | | | |
Expenses, net of waivers and reimbursements | | | 1.10 | | | | 1.10 | |
Expenses, before waivers and reimbursements | | | 3.60 | | | | 4.92 | |
Net investment income (loss), net of waivers and reimbursements | | | 1.20 | | | | 1.10 | |
Net investment income (loss), before waivers and reimbursements | | | (1.30 | ) | | | (2.72 | ) |
| | | | | | | | |
| | | | |
| | | Periods Ended
December 31, | |
| | | 2011 | | | 2010(a) | |
Supplemental data for all classes: | | | | | | | | |
Net assets at end of year (in thousands) | | $ | 4,573 | | | $ | 3,393 | |
Portfolio turnover rate (%)* | | | 69 | | | | 35 | |
| (a) | | For the period May 3, 2010 (Commencement of Operations) to December 31, 2010. |
| * | | Rates not annualized for periods that are less than a year. |
| ** | | Rates are annualized for periods that are less than a year. |
Note: Net investment income (loss) per share is based on the average shares outstanding during the year.
Performance cited represents past performance. Past performance does not guarantee future results and current performance may be lower or higher than the data quoted. Results shown are annual returns, which assume reinvestment of dividends and capital gains. Investment returns and principal will fluctuate and you may have a gain or loss when you sell shares. For the most current month-end performance information, please call 1-800-742-7272 or visit our Web site at www.williamblairfunds.com.
December 31, 2011 | William Blair Funds 159 |
Financial Highlights
Small-Mid Cap Value Fund
| | | | |
| | | Class N | |
| | | Period Ended
December 31, | |
| | | 2011(a) | |
Net asset value, beginning of year | | $ | 10.00 | |
Income (loss) from investment operations: | | | | |
Net investment income (loss) | | | 0.00 | ^ |
Net realized and unrealized gain (loss) on investments | | | 0.45 | |
| | | | |
Total from investment operations | | | 0.45 | |
Less distributions from: | | | | |
Net investment income | | | — | |
Net realized gain | | | — | |
| | | | |
Total distributions | | | — | |
| | | | |
Net asset value, end of year | | $ | 10.45 | |
| | | | |
Total Return (%)* | | | 4.50 | |
Ratios to average daily net assets (%):** | | | | |
Expenses, net of waivers and reimbursements | | | 1.40 | |
Expenses, before waivers and reimbursements | | | 18.68 | |
Net investment income (loss), net of waivers and reimbursements | | | 0.53 | |
Net investment income (loss), before waivers and reimbursements | | | (16.75 | ) |
| |
| | | Class I | |
| | | Period Ended
December 31, | |
| | | 2011(a) | |
Net asset value, beginning of year | | $ | 10.00 | |
Income (loss) from investment operations: | | | | |
Net investment income (loss) | | | 0.00 | ^ |
Net realized and unrealized gain (loss) on investments | | | 0.45 | |
| | | | |
Total from investment operations | | | 0.45 | |
Less distributions from: | | | | |
Net investment income | | | — | |
Net realized gain | | | — | |
| | | | |
Total distributions | | | — | |
| | | | |
Net asset value, end of year | | $ | 10.45 | |
| | | | |
Total Return (%)* | | | 4.50 | |
Ratios to average daily net assets (%):** | | | | |
Expenses, net of waivers and reimbursements | | | 1.15 | |
Expenses, before waivers and reimbursements | | | 18.43 | |
Net investment income (loss), net of waivers and reimbursements | | | 0.79 | |
Net investment income (loss), before waivers and reimbursements | | | (16.49 | ) |
| | | | |
| | | | |
| | | Period Ended
December 31, | |
| | | 2011(a) | |
Supplemental data for all classes: | | | | |
Net assets at end of year (in thousands) | | $ | 2,156 | |
Portfolio turnover rate (%)* | | | 1 | |
| (a) | | For the period December 15, 2011 (Commencement of Operations) to December 31, 2011. |
| * | | Rates not annualized for periods that are less than a year. |
| ** | | Rates are annualized for periods that are less than a year. |
| ^ | | Amount is less than $0.005 per share. |
Note: Net investment income (loss) per share is based on the average shares outstanding during the year.
Performance cited represents past performance. Past performance does not guarantee future results and current performance may be lower or higher than the data quoted. Results shown are annual returns, which assume reinvestment of dividends and capital gains. Investment returns and principal will fluctuate and you may have a gain or loss when you sell shares. For the most current month-end performance information, please call 1-800-742-7272 or visit our Web site at www.williamblairfunds.com.
160 Annual Report | December 31, 2011 |
Financial Highlights
Bond Fund
| | | | | | | | | | | | | | | | | | | | |
| | | Class N | |
| | | Periods Ended December 31, | |
| | | 2011 | | | 2010 | | | 2009 | | | 2008 | | | 2007(a) | |
Net asset value, beginning of year | | $ | 10.70 | | | $ | 10.40 | | | $ | 9.82 | | | $ | 10.07 | | | $ | 10.00 | |
Income (loss) from investment operations: | | | | | | | | | | | | | | | | | | | | |
Net investment income (loss) | | | 0.43 | | | | 0.46 | | | | 0.48 | | | | 0.47 | | | | 0.31 | |
Net realized and unrealized gain (loss) on investments | | | 0.34 | | | | 0.35 | | | | 0.59 | | | | (0.31 | ) | | | 0.02 | |
| | | | | | | | | | | | | | | | | | | | |
Total from investment operations | | | 0.77 | | | | 0.81 | | | | 1.07 | | | | 0.16 | | | | 0.33 | |
Less distributions from: | | | | | | | | | | | | | | | | | | | | |
Net investment income | | | 0.47 | | | | 0.48 | | | | 0.49 | | | | 0.41 | | | | 0.26 | |
Net realized gain | | | 0.09 | | | | 0.03 | | | | — | | | | — | | | | — | |
| | | | | | | | | | | | | | | | | | | | |
Total distributions | | | 0.56 | | | | 0.51 | | | | 0.49 | | | | 0.41 | | | | 0.26 | |
| | | | | | | | | | | | | | | | | | | | |
Net asset value, end of year | | $ | 10.91 | | | $ | 10.70 | | | $ | 10.40 | | | $ | 9.82 | | | $ | 10.07 | |
| | | | | | | | | | | | | | | | | | | | |
Total Return (%)* | | | 7.41 | | | | 7.86 | | | | 11.11 | | | | 1.64 | | | | 3.38 | |
Ratios to average daily net assets (%):** | | | | | | | | | | | | | | | | | | | | |
Expenses, net of waivers and reimbursements | | | 0.65 | | | | 0.65 | | | | 0.65 | | | | 0.65 | | | | 0.65 | |
Expenses, before waivers and reimbursements | | | 0.76 | | | | 0.70 | | | | 1.40 | | | | 2.47 | | | | 0.81 | |
Net investment income (loss), net of waivers and reimbursements | | | 3.97 | | | | 4.25 | | | | 4.76 | | | | 4.69 | | | | 4.80 | |
Net investment income (loss), before waivers and reimbursements | | | 3.86 | | | | 4.20 | | | | 4.01 | | | | 2.87 | | | | 4.64 | |
| |
| | | Class I | |
| | | Periods Ended December 31, | |
| | | 2011 | | | 2010 | | | 2009 | | | 2008 | | | 2007(a) | |
Net asset value, beginning of year | | $ | 10.59 | | | $ | 10.31 | | | $ | 9.72 | | | $ | 10.04 | | | $ | 10.00 | |
Income (loss) from investment operations: | | | | | | | | | | | | | | | | | | | | |
Net investment income (loss) | | | 0.45 | | | | 0.47 | | | | 0.49 | | | | 0.48 | | | | 0.32 | |
Net realized and unrealized gain (loss) on investments | | | 0.33 | | | | 0.33 | | | | 0.59 | | | | (0.31 | ) | | | 0.02 | |
| | | | | | | | | | | | | | | | | | | | |
Total from investment operations | | | 0.78 | | | | 0.80 | | | | 1.08 | | | | 0.17 | | | | 0.34 | |
Less distributions from: | | | | | | | | | | | | | | | | | | | | |
Net investment income | | | 0.49 | | | | 0.49 | | | | 0.49 | | | | 0.49 | | | | 0.30 | |
Net realized gain | | | 0.09 | | | | 0.03 | | | | — | | | | — | | | | — | |
| | | | | | | | | | | | | | | | | | | | |
Total distributions | | | 0.58 | | | | 0.52 | | | | 0.49 | | | | 0.49 | | | | 0.30 | |
| | | | | | | | | | | | | | | | | | | | |
Net asset value, end of year | | $ | 10.80 | | | $ | 10.59 | | | $ | 10.31 | | | $ | 9.72 | | | $ | 10.04 | |
| | | | | | | | | | | | | | | | | | | | |
Total Return (%)* | | | 7.62 | | | | 7.89 | | | | 11.40 | | | | 1.72 | | | | 3.50 | |
Ratios to average daily net assets (%):** | | | | | | | | | | | | | | | | | | | | |
Expenses, net of waivers and reimbursements | | | 0.50 | | | | 0.50 | | | | 0.50 | | | | 0.50 | | | | 0.50 | |
Expenses, before waivers and reimbursements | | | 0.55 | | | | 0.55 | | | | 0.58 | | | | 0.71 | | | | 0.67 | |
Net investment income (loss), net of waivers and reimbursements | | | 4.17 | | | | 4.41 | | | | 4.92 | | | | 4.90 | | | | 4.95 | |
Net investment income (loss), before waivers and reimbursements | | | 4.12 | | | | 4.36 | | | | 4.84 | | | | 4.69 | | | | 4.78 | |
| | | | | | | | | | | | | | | | | | | | |
| | | Periods Ended December 31, | |
| | | 2011 | | | 2010 | | | 2009 | | | 2008 | | | 2007(a) | |
Supplemental data for all classes: | | | | | | | | | | | | | | | | | | | | |
Net assets at end of year (in thousands) | | $ | 232,016 | | | $ | 192,776 | | | $ | 147,344 | | | $ | 74,613 | | | $ | 68,483 | |
Portfolio turnover rate (%)* | | | 28 | | | | 25 | | | | 29 | | | | 52 | | | | 38 | |
| (a) | | For the period May 1, 2007 (Commencement of Operations) to December 31, 2007. |
| * | | Rates not annualized for periods that are less than a year. |
| ** | | Rates are annualized for periods that are less than a year. |
Note: Net investment income (loss) per share is based on the average shares outstanding during the year.
Performance cited represents past performance. Past performance does not guarantee future results and current performance may be lower or higher than the data quoted. Results shown are annual returns, which assume reinvestment of dividends and capital gains. Investment returns and principal will fluctuate and you may have a gain or loss when you sell shares. For the most current month-end performance information, please call 1-800-742-7272 or visit our Web site at www.williamblairfunds.com.
December 31, 2011 | William Blair Funds 161 |
Financial Highlights
Income Fund
| | | | | | | | | | | | | | | | | | | | |
| | | Class N | |
| | | Years Ended December 31, | |
| | | 2011 | | | 2010 | | | 2009 | | | 2008 | | | 2007 | |
Net asset value, beginning of year | | $ | 9.22 | | | $ | 9.07 | | | $ | 8.69 | | | $ | 9.29 | | | $ | 9.74 | |
Income (loss) from investment operations: | | | | | | | | | | | | | | | | | | | | |
Net investment income (loss) | | | 0.32 | | | | 0.35 | | | | 0.40 | | | | 0.37 | | | | 0.45 | |
Net realized and unrealized gain (loss) on investments | | | 0.15 | | | | 0.19 | | | | 0.44 | | | | (0.59 | ) | | | (0.35 | ) |
| | | | | | | | | | | | | | | | | | | | |
Total from investment operations | | | 0.47 | | | | 0.54 | | | | 0.84 | | | | (0.22 | ) | | | 0.10 | |
| | | | | |
Less distributions from: | | | | | | | | | | | | | | | | | | | | |
Net investment income | | | 0.37 | | | | 0.39 | | | | 0.46 | | | | 0.38 | | | | 0.55 | |
Net realized gain | | | — | | | | — | | | | — | | | | — | | | | — | |
| | | | | | | | | | | | | | | | | | | | |
Total distributions | | | 0.37 | | | | 0.39 | | | | 0.46 | | | | 0.38 | | | | 0.55 | |
| | | | | | | | | | | | | | | | | | | | |
Net asset value, end of year | | $ | 9.32 | | | $ | 9.22 | | | $ | 9.07 | | | $ | 8.69 | | | $ | 9.29 | |
| | | | | | | | | | | | | | | | | | | | |
Total Return (%) | | | 5.21 | | | | 6.04 | | | | 9.88 | | | | (2.46 | ) | | | 1.08 | |
Ratios to average daily net assets (%): | | | | | | | | | | | | | | | | | | | | |
Expenses, net of waivers and reimbursements | | | 0.85 | | | | 0.85 | | | | 0.85 | | | | 0.90 | | | | 0.79 | |
Expenses, before waivers and reimbursements | | | 0.91 | | | | 0.85 | | | | 0.93 | | | | 0.93 | | | | 0.81 | |
Net investment income (loss), net of waivers and reimbursements | | | 3.40 | | | | 3.79 | | | | 4.48 | | | | 4.38 | | | | 4.73 | |
Net investment income (loss), before waivers and reimbursements | | | 3.34 | | | | 3.79 | | | | 4.41 | | | | 4.35 | | | | 4.71 | |
| |
| | | Class I | |
| | | Years Ended December 31, | |
| | | 2011 | | | 2010 | | | 2009 | | | 2008 | | | 2007 | |
Net asset value, beginning of year | | $ | 9.15 | | | $ | 9.00 | | | $ | 8.64 | | | $ | 9.30 | | | $ | 9.69 | |
Income (loss) from investment operations: | | | | | | | | | | | | | | | | | | | | |
Net investment income (loss) | | | 0.34 | | | | 0.37 | | | | 0.41 | | | | 0.39 | | | | 0.47 | |
Net realized and unrealized gain (loss) on investments | | | 0.15 | | | | 0.19 | | | | 0.43 | | | | (0.59 | ) | | | (0.34 | ) |
| | | | | | | | | | | | | | | | | | | | |
Total from investment operations | | | 0.49 | | | | 0.56 | | | | 0.84 | | | | (0.20 | ) | | | 0.13 | |
| | | | | |
Less distributions from: | | | | | | | | | | | | | | | | | | | | |
Net investment income | | | 0.39 | | | | 0.41 | | | | 0.48 | | | | 0.46 | | | | 0.52 | |
Net realized gain | | | — | | | | — | | | | — | | | | — | | | | — | |
| | | | | | | | | | | | | | | | | | | | |
Total distributions | | | 0.39 | | | | 0.41 | | | | 0.48 | | | | 0.46 | | | | 0.52 | |
| | | | | | | | | | | | | | | | | | | | |
Net asset value, end of year | | $ | 9.25 | | | $ | 9.15 | | | $ | 9.00 | | | $ | 8.64 | | | $ | 9.30 | |
| | | | | | | | | | | | | | | | | | | | |
Total Return (%) | | | 5.46 | | | | 6.33 | | | | 9.89 | | | | (2.26 | ) | | | 1.36 | |
Ratios to average daily net assets (%): | | | | | | | | | | | | | | | | | | | | |
Expenses, net of waivers and reimbursements | | | 0.64 | | | | 0.63 | | | | 0.66 | | | | 0.72 | | | | 0.60 | |
Net investment income (loss), net of waivers and reimbursements | | | 3.66 | | | | 4.01 | | | | 4.67 | | | | 4.57 | | | | 4.91 | |
| | | | | | | | | | | | | | | | | | | | |
| | | Years Ended December 31, | |
| | | 2011 | | | 2010 | | | 2009 | | | 2008 | | | 2007 | |
Supplemental data for all classes: | | | | | | | | | | | | | | | | | | | | |
Net assets at end of year (in thousands) | | $ | 111,985 | | | $ | 113,277 | | | $ | 117,608 | | | $ | 140,435 | | | $ | 204,630 | |
Portfolio turnover rate (%) | | | 39 | | | | 29 | | | | 40 | | | | 38 | | | | 34 | |
Note: Net investment income (loss) per share is based on the average shares outstanding during the year.
Performance cited represents past performance. Past performance does not guarantee future results and current performance may be lower or higher than the data quoted. Results shown are annual returns, which assume reinvestment of dividends and capital gains. Investment returns and principal will fluctuate and you may have a gain or loss when you sell shares. For the most current month-end performance information, please call 1-800-742-7272 or visit our Web site at www.williamblairfunds.com.
162 Annual Report | December 31, 2011 |
Financial Highlights
Low Duration Fund
| | | | | | | | | | | | |
| | | Class N | |
| | | Periods Ended December 31, | |
| | | 2011 | | | 2010 | | | 2009(a) | |
Net asset value, beginning of year | | $ | 9.90 | | | $ | 9.93 | | | $ | 10.00 | |
Income (loss) from investment operations: | | | | | | | | | | | | |
Net investment income (loss) | | | 0.15 | | | | 0.13 | | | | 0.01 | |
Net realized and unrealized gain (loss) on investments | | | 0.02 | | | | 0.05 | | | | (0.07 | ) |
| | | | | | | | | | | | |
Total from investment operations | | | 0.17 | | | | 0.18 | | | | (0.06 | ) |
Less distributions from: | | | | | | | | | | | | |
Net investment income | | | 0.25 | | | | 0.21 | | | | 0.01 | |
Net realized gain | | | — | | | | — | | | | — | |
| | | | | | | | | | | | |
Total distributions | | | 0.25 | | | | 0.21 | | | | 0.01 | |
| | | | | | | | | | | | |
Net asset value, end of year | | $ | 9.82 | | | $ | 9.90 | | | $ | 9.93 | |
| | | | | | | | | | | | |
Total Return (%)* | | | 1.73 | | | | 1.86 | | | | (0.60 | ) |
Ratios to average daily net assets (%):** | | | | | | | | | | | | |
Expenses, net of waivers and reimbursements | | | 0.70 | | | | 0.70 | | | | 0.70 | |
Expenses, before waivers and reimbursements | | | 0.73 | | | | 0.78 | | | | 0.94 | |
Net investment income (loss), net of waivers and reimbursements | | | 1.52 | | | | 1.33 | | | | 1.27 | |
Net investment income (loss), before waivers and reimbursements | | | 1.49 | | | | 1.25 | | | | 1.03 | |
| |
| | | Class I | |
| | | Periods Ended December 31, | |
| | | 2011 | | | 2010 | | | 2009(a) | |
Net asset value, beginning of year | | $ | 9.89 | | | $ | 9.93 | | | $ | 10.00 | |
Income (loss) from investment operations: | | | | | | | | | | | | |
Net investment income (loss) | | | 0.17 | | | | 0.15 | | | | 0.01 | |
Net realized and unrealized gain (loss) on investments | | | 0.02 | | | | 0.04 | | | | (0.07 | ) |
| | | | | | | | | | | | |
Total from investment operations | | | 0.19 | | | | 0.19 | | | | (0.06 | ) |
Less distributions from: | | | | | | | | | | | | |
Net investment income | | | 0.26 | | | | 0.23 | | | | 0.01 | |
Net realized gain | | | — | | | | — | | | | — | |
| | | | | | | | | | | | |
Total distributions | | | 0.26 | | | | 0.23 | | | | 0.01 | |
| | | | | | | | | | | | |
Net asset value, end of year | | $ | 9.82 | | | $ | 9.89 | | | $ | 9.93 | |
| | | | | | | | | | | | |
Total Return (%)* | | | 1.99 | | | | 1.89 | | | | (0.59 | ) |
Ratios to average daily net assets (%):** | | | | | | | | | | | | |
Expenses, net of waivers and reimbursements | | | 0.55 | | | | 0.55 | | | | 0.55 | |
Expenses, before waivers and reimbursements | | | 0.58 | | | | 0.63 | | | | 0.79 | |
Net investment income (loss), net of waivers and reimbursements | | | 1.67 | | | | 1.46 | | | | 1.39 | |
Net investment income (loss), before waivers and reimbursements | | | 1.64 | | | | 1.38 | | | | 1.15 | |
| | | | | | | | | | | | |
| | | Periods Ended December 31, | |
| | | 2011 | | | 2010 | | | 2009(a) | |
Supplemental data for all classes: | | | | | | | | | | | | |
Net assets at end of year (in thousands) | | $ | 157,147 | | | $ | 143,470 | | | $ | 95,134 | |
Portfolio turnover rate (%)* | | | 43 | | | | 51 | | | | — | |
| (a) | | For the period December 1, 2009 (Commencement of Operations) to December 31, 2009. |
| * | | Rates not annualized for periods that are less than a year. |
| ** | | Rates are annualized for periods that are less than a year. |
Note: Net investment income (loss) per share is based on the average shares outstanding during the year.
Performance cited represents past performance. Past performance does not guarantee future results and current performance may be lower or higher than the data quoted. Results shown are annual returns, which assume reinvestment of dividends and capital gains. Investment returns and principal will fluctuate and you may have a gain or loss when you sell shares. For the most current month-end performance information, please call 1-800-742-7272 or visit our Web site at www.williamblairfunds.com.
December 31, 2011 | William Blair Funds 163 |
Financial Highlights
Ready Reserves Fund
| | | | | | | | | | | | | | | | | | | | |
| | | Class N | |
| | | Years Ended December 31, | |
| | | 2011 | | | 2010 | | | 2009 | | | 2008 | | | 2007 | |
Net asset value, beginning of year | | $ | 1.00 | | | $ | 1.00 | | | $ | 1.00 | | | $ | 1.00 | | | $ | 1.00 | |
Income (loss) from investment operations: | | | | | | | | | | | | | | | | | | | | |
Net investment income (loss) | | | 0.00 | ^ | | | 0.00 | ^ | | | 0.00 | ^ | | | 0.02 | | | | 0.05 | |
Net realized and unrealized gain (loss) on investments | | | — | | | | — | | | | — | | | | — | | | | — | |
| | | | | | | | | | | | | | | | | | | | |
Total from investment operations | | | 0.00 | ^ | | | 0.00 | ^ | | | 0.00 | ^ | | | 0.02 | | | | 0.05 | |
Less distributions from: | | | | | | | | | | | | | | | | | | | | |
Net investment income | | | 0.00 | ^ | | | 0.00 | ^ | | | 0.00 | ^ | | | 0.02 | | | | 0.05 | |
Net realized gain | | | — | | | | — | | | | — | | | | — | | | | — | |
| | | | | | | | | | | | | | | | | | | | |
Total distributions | | | 0.00 | ^ | | | 0.00 | ^ | | | 0.00 | ^ | | | 0.02 | | | | 0.05 | |
| | | | | | | | | | | | | | | | | | | | |
Net asset value, end of year | | $ | 1.00 | | | $ | 1.00 | | | $ | 1.00 | | | $ | 1.00 | | | $ | 1.00 | |
| | | | | | | | | | | | | | | | | | | | |
Total Return (%) | | | 0.01 | | | | 0.01 | | | | 0.10 | | | | 2.20 | | | | 4.75 | |
Ratios to average daily net assets (%): | | | | | | | | | | | | | | | | | | | | |
Expenses, net of waivers and reimbursements | | | 0.14 | | | | 0.24 | | | | 0.46 | | | | 0.60 | | | | 0.63 | |
Expenses, before waivers and reimbursements | | | 0.62 | | | | 0.61 | | | | 0.66 | | | | 0.60 | | | | 0.63 | |
Net investment income (loss), net of waivers and reimbursements | | | 0.01 | | | | 0.01 | | | | 0.11 | | | | 2.12 | | | | 4.63 | |
Net investment income (loss), before waivers and reimbursements | | | (0.47 | ) | | | (0.36 | ) | | | (0.09 | ) | | | 2.12 | | | | 4.63 | |
| | | | | | | | | | | | | | | | | | | | |
| | | Years Ended December 31, | |
| | | 2011 | | | 2010 | | | 2009 | | | 2008 | | | 2007 | |
Supplemental data for all classes: | | | | | | | | | | | | | | | | | | | | |
Net assets at end of year (in thousands) | | $ | 1,271,746 | | | $ | 1,216,543 | | | $ | 1,352,901 | | | $ | 1,841,189 | | | $ | 1,399,537 | |
| ^ | | Amount is less than $0.005 per share. |
Note: Net investment income (loss) per share is based on the average shares outstanding during the year.
Performance cited represents past performance. Past performance does not guarantee future results and current performance may be lower or higher than the data quoted. Results shown are annual returns, which assume reinvestment of dividends and capital gains. Investment returns and principal will fluctuate and you may have a gain or loss when you sell shares. For the most current month-end performance information, please call 1-800-742-7272 or visit our Web site at www.williamblairfunds.com.
164 Annual Report | December 31, 2011 |
REPORT OF INDEPENDENT REGISTERED PUBLIC ACCOUNTING FIRM
To the Board of Trustees and Shareholders of
William Blair Funds
We have audited the accompanying statements of assets and liabilities, including the portfolios of investments, of the Growth Fund, Large Cap Growth Fund, Small Cap Growth Fund, Mid Cap Growth Fund, Small-Mid Cap Growth Fund, Global Growth Fund, International Growth Fund, International Equity Fund, International Small Cap Growth Fund, Emerging Markets Growth Fund, Emerging Leaders Growth Fund, Emerging Markets Small Cap Growth Fund, Large Cap Value Fund, Small Cap Value Fund, Mid Cap Value Fund, Small-Mid Cap Value Fund, Bond Fund, Income Fund, Low Duration Fund and Ready Reserves Fund (collectively, the Portfolios) (twenty of the Portfolios constituting William Blair Funds) as of December 31, 2011, and the related statements of operations, statements of changes in net assets and financial highlights for the periods indicated therein. These financial statements and financial highlights are the responsibility of the Portfolios’ management. Our responsibility is to express an opinion on these financial statements and financial highlights based on our audits.
We conducted our audits in accordance with the standards of the Public Company Accounting Oversight Board (United States). Those standards require that we plan and perform the audits to obtain reasonable assurance about whether the financial statements and financial highlights are free of material misstatement. We were not engaged to perform an audit of the Portfolios’ internal control over financial reporting. Our audits included consideration of internal control over financial reporting as a basis for designing audit procedures that are appropriate in the circumstances, but not for the purpose of expressing an opinion on the effectiveness of the Portfolios’ internal control over financial reporting. Accordingly, we express no such opinion. An audit also includes examining, on a test basis, evidence supporting the amounts and disclosures in the financial statements and financial highlights, assessing the accounting principles used and significant estimates made by management, and evaluating the overall financial statement presentation. Our procedures included confirmation of securities owned as of December 31, 2011, by correspondence with the custodian and brokers or by other appropriate auditing procedures where replies from brokers were not received. We believe that our audits provide a reasonable basis for our opinion.
In our opinion, the financial statements and financial highlights referred to above present fairly, in all material respects, the financial position for each of the above mentioned Portfolios of William Blair Funds at December 31, 2011, the results of their operations, the changes in their net assets and financial highlights for the periods indicated therein in conformity with U.S. generally accepted accounting principles.

Chicago, Illinois
February 23, 2012
December 31, 2011 | William Blair Funds 165 |
Trustees and Officers (Unaudited). The trustees and officers of the William Blair Funds, their year of birth, their principal occupations during the last five years, their affiliations, if any, with William Blair & Company, L.L.C., and other significant affiliations are set forth below. The address of each trustee and officer is 222 West Adams Street, Chicago, Illinois 60606.
| | | | | | | | | | |
Name and Year of Birth | | Position(s)
Held with
Fund | | Term of
Office and
Length of
Time
Served(1) | | Principal Occupation(s) During Past 5 Years(2) | | Number of
Portfolios
in Fund
Complex
Overseen
by Trustee | | Other Directorships Held by Trustee/Officer |
Interested Trustees | | | | | | | | | | |
Michelle R. Seitz,
1965* | | Chairperson of the Board of Trustees and President | | Trustee since 2002; Chairperson since 2010 Since 2007 | | Principal, William Blair & Company, L.L.C.; Limited Partner, WB Holdings, L.P. (since November 2008); Member, WBC GP, L.L.P. (since November 2008) | | 23 | | Director, William Blair SICAV |
| | | | | |
Richard W. Smirl,
1967* | | Trustee and Senior Vice President | | Trustee since 2010 and Senior Vice President Since 2007 | | Principal, William Blair & Company, L.L.C. | | 23 | | Director, William Blair SICAV |
| | | | |
Non-Interested Trustees | | | | | | | | |
Ann P. McDermott,
1939 | | Trustee | | Since 1996 | | Board member and officer for various civic and charitable organizations over the past thirty years; professional experience prior thereto, registered representative for New York Stock Exchange firm | | 23 | | Northwestern University, Women’s Board; Rush Presbyterian St. Luke’s Medical Center, Women’s Board; University of Chicago, Women’s Board; Visiting Nurses Association, Honorary Director |
| | | | | |
Phillip O. Peterson,
1944 | | Trustee | | Since 2007 | | Retired; formerly, President, Strong Mutual Funds, 2004-2005; formerly, Partner, KPMG LLP | | 23 | | The Hartford Group of Mutual Funds (87 portfolios) |
| | | | | |
Lisa A. Pollina,
1965 | | Trustee | | Since 2011 | | Senior Advisor to head of RBC Financial Group’s International Banking and Insurance division since 2010; formerly, Bank of America Corporation, Global Financial Institutions Executive from 2006-2008 and multiple Advisory from 2008-2010; prior thereto, Managing Partner, Bordeaux Capital from 2002-2006. | | 23 | | Darkstrand, high-speed fiber optic network provider (2009 to 2010); Jane Addams Hull House Association, Board of Trustees (2003 to 2009) |
| | | | | |
Donald J. Reaves,
1946 | | Trustee | | Since 2004 | | Chancellor, Winston-Salem State University since 2007; formerly, Vice President for Administration and Chief Financial Officer, University of Chicago 2002-2007. | | 23 | | American Student Assistance Corp., guarantor of student loans; Amica Mutual Insurance Company |
| | | | | |
Donald L. Seeley,
1944 | | Trustee | | Since 2003 | | Retired; formerly, Director, Applied Investment Management Program, University of Arizona Department of Finance, prior thereto, Vice Chairman and Chief Financial Officer, True North Communications, Inc., marketing communications and advertising firm | | 23 | | Warnaco Group, Inc., intimate apparel, sportswear, and swimwear manufacturer; Center for Furniture Craftsmanship (not-for-profit) |
166 Annual Report | December 31, 2011 |
| | | | | | | | | | |
Name and Year of Birth | | Position(s)
Held with
Fund | | Term of
Office and
Length of
Time
Served(1) | | Principal Occupation(s) During Past 5 Years(2) | | Number of
Portfolios
in Fund
Complex
Overseen
by Trustee | | Other Directorships Held by Trustee/Officer |
Thomas J. Skelly,
1951 | | Trustee | | Since 2007 | | Advisory Board Member for various U.S. Companies; Director and Investment Committee Chairman of the US Accenture Foundation, Inc.; prior to 2005, Managing Partner of various divisions at Accenture | | 23 | | Mutual Trust Financial Group, provider of insurance and investment products; Board Member First MetLife Investors Insurance Company, NY Chartered Company for Metropolitan Life Insurance |
| | | | | |
Officers | | | | | | | | | | |
Michael P. Balkin,
1959 | | Senior Vice President Vice President | | Since 2009 2008-2009 | | Principal, William Blair & Company, L.L.C. Associate, William Blair & Company, L.L.C.; former Partner, Magnetar Capital | | | | N/A |
| | | | | |
Karl W. Brewer,
1966 | | Senior Vice President | | Since 2000 | | Principal, William Blair & Company, L.L.C. | | | | N/A |
| | | | | |
David C. Fording,
1967 | | Senior Vice President Vice President | | Since 2009 2006-2009 | | Principal, William Blair & Company, L.L.C. Associate, William Blair & Company, L.L.C.; former Portfolio Manager, TIAA-CREF. | | | | N/A |
| | | | | |
James S. Golan,
1961 | | Senior Vice President | | Since 2005 | | Principal, William Blair & Company, L.L.C. | | | | N/A |
| | | | | |
W. George Greig,
1952 | | Senior Vice President | | Since 1996 | | Principal, William Blair & Company, L.L.C. | | | | N/A |
| | | | | |
Michael A. Jancosek,
1959 | | Senior Vice President | | Since 2004 | | Principal, William Blair & Company L.L.C. | | | | N/A |
| | | | | |
John F. Jostrand,
1954 | | Senior Vice President | | Since 1999 | | Principal, William Blair & Company, L.L.C. | | | | N/A |
| | | | | |
Chad M. Kilmer,
1975 | | Senior Vice President Vice President | | Since 2011 Since 2006 | | Principal, William Blair & Company, L.L.C. Associate, William Blair & Company, L.L.C.; former analyst and Portfolio Manager U.S. Bancorp Asset Management. | | | | N/A |
| | | | | |
Robert C. Lanphier, IV,
1956 | | Senior Vice President | | Since 2003 | | Principal, William Blair & Company, L.L.C. | | | | Chairman, AG. Med, Inc. |
| | | | | |
Mark T. Leslie,
1967 | | Senior Vice President Vice President | | Since 2008 2005-2008 | | Principal, William Blair & Company, L.L.C. Associate, William Blair & Company, L.L.C. | | | | N/A |
| | | | | |
Matthew A. Litfin,
1972 | | Senior Vice President | | Since 2008 | | Principal, William Blair & Company, L.L.C. | | | | N/A |
| | | | | |
Kenneth J. McAtamney
1966 | | Senior Vice President | | Since 2008 | | Principal, William Blair & Company, L.L.C. | | | | N/A |
December 31, 2011 | William Blair Funds 167 |
| | | | | | | | |
Name and Year of Birth | | Position(s) Held with Fund | | Term of
Office and
Length of Time
Served(1) | | Principal Occupation(s) During Past 5 Years(2) | | Other Directorships Held by Trustee/Officer |
Todd M. McClone,
1968 | | Senior Vice President Vice President | | Since 2006 2005-2006 | | Principal, William Blair & Company, L.L.C. Associate, William Blair & Company, L.L.C. | | N/A N/A |
| | | | |
David Merjan,
1960 | | Senior Vice President | | Since 2008 | | Principal, William Blair & Company, L.L.C. | | N/A |
| | | | |
David S. Mitchell,
1960 | | Senior Vice President | | Since 2004 | | Principal, William Blair & Company, L.L.C. | | N/A |
| | | | |
David P. Ricci,
1958 | | Senior Vice President | | Since 2006 | | Principal, William Blair & Company, L.L.C. | | N/A |
| | | | |
Jeffrey A. Urbina,
1955 | | Senior Vice President | | Since 1998 | | Principal, William Blair & Company, L.L.C. | | N/A |
| | | | |
Christopher T. Vincent,
1956 | | Senior Vice President | | Since 2004 | | Principal, William Blair & Company, L.L.C. | | N/A |
| | | | |
Kathleen M. Lynch,
1971 | | Vice President | | Since 2010 | | Associate, William Blair & Company, L.L.C. | | N/A |
| | | | |
Paul J. Sularz,
1967 | | Vice President | | Since 2009 | | Associate, William Blair & Company, L.L.C.; Vice President, J.P. Morgan Securities, Inc. | | N/A |
| | | | |
David F. Hone,
1967 | | Vice President | | Since 2011 | | Associate, William Blair & Company, L.L.C. (since 2011); prior thereto, Portfolio Manager Large Cap Value, Deutsche Asset Management (2002-2010) | | N/A |
| | | | |
John Abunassar,
1967 | | Vice President | | Since 2011 | | Associate, William Blair & Company, L.L.C. (since 2011); prior thereto, Principal, Guidance Capital LLC (2009-2011); prior thereto. President and CEO of Allegiant Asset | | N/A |
| | | | |
Peter Carl,
1967 | | Vice President | | Since 2011 | | Associate, William Blair & Company L.L.C. (since 2011); prior thereto, Portfolio Manager, Guidance Capital LLC (2006-2011) | | N/A |
| | | | |
D. Trowbridge Elliman III, 1957 | | Vice President | | Since 2011 | | Associate, William Blair & Company L.L.C. (since 2011); prior thereto, Principal, Guidance Capital LLC (2001-2011) | | N/A |
| | | | |
Christopher Walvoord,
1966 | | Vice President | | Since 2011 | | Associate, William Blair & Company, L.L.C. (since 2011); prior thereto, Principal, Guidance Capital LLC (2002-2011) | | N/A |
| | | | |
Brian Ziv,
1957 | | Vice President | | Since 2011 | | Associate, William Blair & Company, L.L.C. (since 2011); prior thereto, Principal, Guidance Capital LLC (2001-2011) | | N/A |
168 Annual Report | December 31, 2011 |
| | | | | | | | |
Name and Year of Birth | | Position(s) Held with Fund | | Term of
Office and
Length of Time
Served(1) | | Principal Occupation(s) During Past 5 Years (2) | | Other Directorships Held by Trustee/Officer |
| | | | |
Brian D. Singer,
1960 | | Vice President | | Since 2011 | | Associate, William Blair & Company, L.L.C. (since 2011); prior thereto, Managing Partner, Singer Partners, LLC (2009-2011); prior thereto, UBS Global Asset Management (Americas) Inc. (2003-2007) | | N/A |
| | | | |
Edwin Denson,
1967 | | Vice President | | Since 2011 | | Associate, William Blair & Company, L.L.C. (since 2011); prior thereto, Managing Partner, Singer Partners, LLC (2009-2011); prior thereto, UBS Global Asset Management (Americas) Inc. (2001-2009) | | N/A |
| | | | |
Thomas Clarke,
1968 | | Vice President | | Since 2011 | | Associate, William Blair & Company, L.L.C. (since 2011); prior thereto, Managing Partner, Singer Partners, LLC (2009-2011); prior thereto, UBS Global Asset Management (Americas) Inc. (2000-2009) | | N/A |
| | | | |
Walter R. Randall, Jr.,
1960 | | Chief Compliance Officer and Assistant Secretary | | Since 2009 | | Associate, William Blair & Company, L.L.C.; Associate Counsel and Chief Compliance Officer, Calamos Investments; Assistant General Counsel, American Century Investments. | | N/A |
| | | | |
Colette M. Garavalia,
1961 | | Treasurer | | Since 2009 | | Associate, William Blair & Company, L.L.C. | | N/A |
| | | | |
| | Secretary | | 2000-2009 | | Associate, William Blair & Company, L.L.C. | | N/A |
| | | | |
Andrew T. Pfau,
1970 | | Secretary | | Since 2009 | | Associate, William Blair & Company, L.L.C.; Associate, Bell, Boyd & Lloyd, LLP; Associate, Sidley Austin LLP | | N/A |
| | | | |
John M. Raczek,
1970 | | Assistant Treasurer | | Since 2010 | | Associate, William Blair & Company, L.L.C.; Manager, Calamos Investments | | N/A |
| * | | Ms. Seitz and Mr. Smirl are interested persons of the William Blair Funds because each is a principal of William Blair & Company, L.L.C., the Fund’s investment advisor, principal underwriter and distributor. |
| (1) | | Each Trustee serves until the election and qualification of a successor, or until death, resignation or retirement or removal as provided in the Fund’s Declaration of Trust. Retirement for non-interested Trustees occurs no later than at the conclusion of the first regularly scheduled Board meeting of the Fund’s fiscal year that occurs after the earlier of (a) the non-interested Trustee’s 72nd birthday or (b) the 15th anniversary of the date that the non-interested Trustee was first elected or appointed as a member of the Board of Trustees. The Fund’s officers, except the Chief Compliance Officer, are elected annually by the Trustees. The Fund’s Chief Compliance Officer is designated by the Board of Trustees and may only be removed by action of the Board of Trustees, including a majority of the non-interested Trustees. |
| (2) | | In November 2008, all principals of William Blair & Company, L.L.C. also became limited partners in WB Holdings, L.P. |
The Statement of Additional Information for the William Blair Funds includes additional information about the trustees and is available without charge by calling 1-800-635-2886 (in Massachusetts 1-800-635-2840) or by writing the Fund.
December 31, 2011 | William Blair Funds 169 |
Trust’s Management Agreement
Approval of the Management Agreement for the William Blair Large Cap Value Fund and the William Blair Emerging Markets Small Cap Growth Fund
On July 26, 2011, the Board of Trustees (the “Board”) of William Blair Funds (the “Trust”), including the Trustees who are not interested persons of the Trust as defined by the Investment Company Act of 1940, as amended (the “Independent Trustees”), approved the Management Agreement between the Trust, on behalf of each of the William Blair Large Cap Value Fund and the William Blair Emerging Markets Small Cap Growth Fund (each a “Fund” and collectively, the “Funds”), and William Blair & Company, L.L.C. (the “Advisor”). On July 25 and 26, 2011, the Board met to consider the approval of the Management Agreement for each Fund. On July 25, 2011, the Independent Trustees also met independently of Trust management and the interested Trustees of the Trust to consider the approval of the Management Agreement for each Fund. The Independent Trustees reviewed materials provided by the Advisor for the approval of the Management Agreement for each Fund and were assisted by independent legal counsel in making their determination. The Board considered the following factors in making its determination, but did not identify any single factor or group of factors as all important or controlling and considered all factors together.
Nature, Quality and Extent of Services. In evaluating the nature, quality and extent of services expected to be provided by the Advisor to the Funds, the Board noted that the Advisor is a quality firm with a reputation for integrity and honesty that employs high quality people. The Board considered biographical information about the proposed portfolio managers for the Funds, financial information regarding the Advisor, the compliance regime created by the Advisor and the proposed financial support of the Funds. With respect to the William Blair Large Cap Value Fund, the Board noted that the proposed portfolio manager had recently joined the Advisor and it had met with the proposed portfolio manager to discuss the Fund. The Board also considered the Advisor’s past experience managing the William Blair Small Cap Value Fund and the William Blair Mid Cap Value Fund. With respect to the Emerging Markets Small Cap Growth Fund, the Board considered that the proposed portfolio managers currently managed or co-managed the William Blair Emerging Markets Growth Fund, the William Blair Emerging Leaders Growth Fund and the William Blair International Small Cap Growth Fund. The Board also considered the Advisor’s experience in managing new funds. Based upon all relevant factors, the Board concluded that the nature, quality and extent of the services to be provided by the Advisor to the Funds were expected to be satisfactory.
Fees and Expenses. The Board reviewed the proposed advisory fee for each Fund and reviewed information comparing each Fund’s advisory fee to separate peer groups of funds provided by Lipper Inc. With respect to the William Blair Large Cap Value Fund, the Lipper peer group for the Fund consisted of other no-load large cap value funds. With respect to the William Blair Emerging Markets Small Cap Growth Fund, the Lipper peer group for the Fund consisted of other no-load international small-/mid-cap growth funds and no-load international multi-cap value funds. In considering the information, the Board noted that the proposed advisory fee for the William Blair Large Cap Value Fund was below the median of its Lipper peer group and that the proposed advisory fee for the William Blair Emerging Markets Small Cap Growth Fund was above the median of its Lipper peer group. The Board reviewed the Advisor’s management fees for the Emerging Markets Growth Fund and the Emerging Leaders Growth Fund. The Board also considered that the Advisor had proposed to limit total expenses for each Fund, including waiving advisory fees, if necessary. On the basis of the information provided, the Board concluded that the proposed advisory fee for each Fund was reasonable and appropriate in light of the nature, quality and extent of services expected to be provided by the Advisor.
Profitability. With respect to the estimated profitability of the Management Agreement to the Advisor for each Fund, the Board considered the proposed advisory fee for each Fund, that each Fund was newly organized and had no assets and the Advisor’s agreement to limit total expenses for each Fund. The Board concluded that the expected profits to be realized by the Advisor with respect to each Fund were not unreasonable.
Economies of Scale. The Board considered the extent to which economies of scale would be realized as each Fund grows and whether fee levels reflect these economies of scale. The Board considered whether the proposed advisory fee for each Fund was reasonable in relation to the projected asset size of the Fund. In considering whether fee levels reflect economies of scale for the benefit of Fund investors, the Board reviewed each Fund’s advisory fee compared to peer funds, each Fund’s projected asset size, each Fund’s estimated expense ratios and the Advisor’s agreement to limit total expenses for each Fund, and concluded that the advisory fee for each Fund was reasonable.
Other Benefits to the Advisor. The Board considered benefits to be derived by the Advisor from its relationship with the Funds. The Board concluded that, after taking into account these benefits, the proposed advisory fee for each Fund was reasonable.
170 Annual Report | December 31, 2011 |
Conclusion. Based upon all of the information considered and the conclusions reached, the Board determined that the terms of the Management Agreement for each Fund are fair and reasonable and that the approval of the Management Agreement is in the best interests of each Fund.
Approval of the Management Agreement for the William Blair Small-Mid Cap Value Fund
On October 25, 2011, the Board of Trustees (the “Board”) of William Blair Funds (the “Trust”), including the Trustees who are not interested persons of the Trust as defined by the Investment Company Act of 1940, as amended (the “Independent Trustees”), approved the Management Agreement between the Trust, on behalf of the William Blair Small-Mid Cap Value Fund (the “Fund”), and William Blair & Company, L.L.C. (the “Advisor”). On October 24 and 25, 2011, the Board met to consider the approval of the Management Agreement. On October 24 and 25, 2011, the Independent Trustees also met independently of Trust management and the interested Trustees of the Trust to consider the approval of the Management Agreement. The Independent Trustees reviewed materials provided by the Advisor for the approval of the Management Agreement and were assisted by independent legal counsel in making their determination. The Board considered the following factors in making its determination, but did not identify any single factor or group of factors as all important or controlling and considered all factors together.
Nature, Quality and Extent of Services. In evaluating the nature, quality and extent of services expected to be provided by the Advisor to the Fund, the Board noted that the Advisor is a quality firm with a reputation for integrity and honesty that employs high quality people. The Board considered biographical information about the proposed portfolio managers for the Fund, financial information regarding the Advisor, the compliance regime created by the Advisor and the proposed financial support of the Fund. The Board considered that the proposed portfolio managers currently co-managed the William Blair Small Cap Value Fund and the William Blair Mid Cap Value Fund. The Board also considered the Advisor’s experience in managing new funds. Based upon all relevant factors, the Board concluded that the nature, quality and extent of the services to be provided by the Advisor to the Fund were expected to be satisfactory.
Fees and Expenses. The Board reviewed the proposed advisory fee for the Fund and reviewed information comparing the Fund’s advisory fee to a separate peer group of funds provided by Lipper Inc. With respect to the Fund, the Lipper peer group consisted of other no-load mid-cap value funds. In considering the information, the Board noted that the proposed advisory fee for the Fund was above the median of its Lipper peer group. The Board also considered that the Advisor had proposed to limit total expenses for the Fund, including waiving advisory fees, if necessary. On the basis of the information provided, the Board concluded that the proposed advisory fee for the Fund was reasonable in light of the nature, quality and extent of services expected to be provided by the Advisor.
Profitability. With respect to the estimated profitability of the Management Agreement to the Advisor for the Fund, the Board considered the proposed advisory fee for the Fund, that the Fund was newly organized and had no assets and the Advisor’s agreement to limit total expenses for the Fund. The Board concluded that the expected profits to be realized by the Advisor with respect to the Fund were not unreasonable.
Economies of Scale. The Board considered the extent to which economies of scale would be realized as the Fund grows and whether fee levels reflect these economies of scale. In considering whether fee levels reflect economies of scale for the benefit of Fund investors, the Board reviewed the Fund’s advisory fee compared to peer funds, the Fund’s estimated expense ratios and the Advisor’s agreement to limit total expenses for the Fund, and concluded that the advisory fee for the Fund was reasonable.
Other Benefits to the Advisor. The Board considered benefits to be derived by the Advisor from its relationship with the Fund. The Board concluded that, after taking into account these benefits, the proposed advisory fee for the Fund was reasonable.
Conclusion. Based upon all of the information considered and the conclusions reached, the Board determined that the terms of the Management Agreement are fair and reasonable and that the approval of the Management Agreement is in the best interests of the Fund.
December 31, 2011 | William Blair Funds 171 |
(unaudited)
Proxy Voting
A description of the policies and procedures that the Fund uses to determine how to vote proxies relating to portfolio securities and information regarding how the Fund voted proxies relating to portfolio securities for the most recent 12-month period ended June 30 are available without charge, upon request, by calling 1-800-635-2886 (in Massachusetts 1-800-635-2840), at www.williamblairfunds.com and on the SEC’s website at http://www.sec.gov.
Quarterly Portfolio Schedules
Each Portfolio files its complete schedule of portfolio holdings with the SEC for the first and third fiscal quarters of each fiscal year (quarters ended March 31 and September 30) on Form N-Q. The Fund’s Forms N-Q are available on the SEC’s website at http://www.sec.gov and may be reviewed and copied at the SEC’s Public Reference Room in Washington, D.C. Information on the operation of the SEC’s Public Reference Room may be obtained by calling 1-800-SEC-0330. The Fund’s Forms N-Q are also available on the Fund’s website at www.williamblairfunds.com.
Additional Federal Income Tax Information: (unaudited)
Under Section 852(b)(3)(C) of the Code, the Funds hereby designate the following amounts as capital gain dividends for the fiscal year ended December 31, 2011:
| | | | | | |
| | | |
Growth | | Mid Cap Growth | | Small-Mid Cap Growth | | Emerging Markets Growth |
$16,081,067 | | $11,056,640 | | $18,645,732 | | $115,030,166 |
| | | |
Bond | | Emerging Leaders Growth | | Small Cap Value | | Mid Cap Value |
$1,831,187 | | $2,732,548 | | $8,247,756 | | $36,445 |
The following table provides the percentage of the 2011 year-end distributions that qualify for the dividend received deduction, and the qualified dividend income percentage:
| | | | | | | | |
Portfolio | | Dividend
Received
Deduction% | | | Qualified
Dividend
Income% | |
Growth | | | 100.00 | % | | | 100.00 | % |
Large Cap Growth | | | 100.00 | % | | | 100.00 | % |
Small Cap Growth | | | 0.00 | % | | | 0.00 | % |
Mid Cap Growth | | | 0.00 | % | | | 0.00 | % |
Small-Mid Cap Growth | | | 29.37 | % | | | 31.29 | % |
Global Growth | | | 100.00 | % | | | 100.00 | % |
International Growth | | | 0.00 | % | | | 100.00 | % |
International Equity | | | 0.00 | % | | | 0.00 | % |
International Small Cap Growth | | | 0.00 | % | | | 100.00 | % |
Emerging Markets Growth | | | 0.10 | % | | | 100.00 | % |
Emerging Leaders Growth | | | 0.00 | % | | | 100.00 | % |
Emerging Markets Small Cap Growth | |
| 0.00
| %
| |
| 0.00
| %
|
Large Cap Value | |
| 100.00
| %
| |
| 100.00
| %
|
Small Cap Value | | | 100.00 | % | | | 100.00 | % |
Mid Cap Value | | | 92.41 | % | | | 100.00 | % |
Small-Mid Cap Value | |
| 0.00
| %
| |
| 0.00
| %
|
Bond | | | 0.00 | % | | | 0.00 | % |
Income | | | 0.00 | % | | | 0.00 | % |
Low Duration | | | 0.00 | % | | | 0.00 | % |
Ready Reserves | | | 0.00 | % | | | 0.00 | % |
In January 2012, you were notified on IRS Form 1099-Div or substitute 1099 DIV as to the Federal tax status of the distributions received by you in the calendar year 2011.
172 Annual Report | December 31, 2011 |
Useful Information About Your Report (unaudited)
Please refer to this information when reviewing the Expense Example for each Portfolio.
Expense Example
As a shareholder of a Portfolio, you incur two types of costs: (1) transaction costs such as redemption fees and (2) ongoing costs, including management fees, distribution (12b-1) fees (for Class N shares except for the Ready Reserves Portfolio), service fees (for Class N shares of the Ready Reserves Portfolio), shareholder administration fees (for Class N and Class I shares of the Global Growth Portfolio, the International Small Cap Growth Portfolio, the Emerging Markets Growth Portfolio, the Emerging Leaders Growth Portfolio, the Emerging Markets Small Cap Growth Portfolio, the Bond Portfolio and the Low Duration Portfolio) and other Portfolio expenses. The example is intended to help you understand your ongoing costs (in dollars) of investing in the Portfolio and to compare these costs with the ongoing costs of investing in other mutual funds. To do so, compare the Portfolio’s 5% hypothetical example with the 5% hypothetical examples that appear in the shareholder reports of other funds. The example is based on an investment of $1,000 invested at the beginning of the period and held for the entire six-month period from July 1, 2011 to December 31, 2011.
Actual Expenses
In each example, the first line for each share class in the table provides information about the actual account values and actual expenses. These expenses reflect the effect of any expense cap applicable to the share class during the period. Without this expense cap, the costs shown in the table would have been higher. You may use the information in this line, together with the amount you invested, to estimate the expenses that you paid over the period. Simply divide your account value by $1,000 (example, an $8,600 account value divided by $1,000 = 8.6), then multiply the result by the number in the first line under the heading entitled “Expenses Paid During the Period” to estimate the expenses you paid on your account during the period.
Hypothetical Example for Comparison Purposes
In each example, the second line for each share class in the table provides information about hypothetical account values and hypothetical expenses based on the Portfolio’s actual expense ratio and an assumed rate of return of 5% per year before expenses. This is not the Portfolio’s actual return. The hypothetical account values and expenses may not be used to estimate the actual ending account balance or expenses you paid for the period. You may use this information to compare the ongoing costs of investing in the Portfolio to other funds. To do so, compare this 5% hypothetical example with the 5% hypothetical examples that appear in the shareholder reports of other funds.
Please note that the expenses shown in both examples are meant to highlight your ongoing costs only and do not reflect any transactional costs or account type fees, such as redemption fees and IRA Fiduciary Administration fees, respectively. These fees are fully described in the prospectus. Therefore, the second line of each share class in the table is useful in comparing ongoing costs only and will not help you determine the relative costs of owning different funds. In addition, if these transactional costs or account fees were included, your costs would have been higher.
December 31, 2011 | William Blair Funds 173 |
Fund Expenses (unaudited)
The examples below show you the ongoing costs (in dollars) of investing in your fund and allows you to compare these costs with those of other mutual funds. Please refer to the previous page for a detailed explanation of the information presented on this chart.
| | | | | | | | | | | | | | | | |
Expense Example | | Beginning
Account Value
7/1/2011 | | | Ending
Account Value
12/31/2011 | | | Expenses Paid
during
the Period(a) | | | Annualized
Expense Ratio
| |
Growth Fund | | | | | | | | | | | | | | | | |
Class N—actual return | | $ | 1,000.00 | | | $ | 928.10 | | | $ | 6.03 | | | | 1.24 | % |
Class N—hypothetical 5% return | | | 1,000.00 | | | | 1,018.95 | | | | 6.31 | | | | 1.24 | |
Class I—actual return | | | 1,000.00 | | | | 929.30 | | | | 4.33 | | | | 0.89 | |
Class I—hypothetical 5% return | | | 1,000.00 | | | | 1,020.72 | | | | 4.53 | | | | 0.89 | |
Large Cap Growth Fund | | | | | | | | | | | | | | | | |
Class N—actual return | | | 1,000.00 | | | | 929.70 | | | | 5.84 | | | | 1.20 | |
Class N—hypothetical 5% return | | | 1,000.00 | | | | 1,019.16 | | | | 6.11 | | | | 1.20 | |
Class I—actual return | | | 1,000.00 | | | | 929.00 | | | | 4.62 | | | | 0.95 | |
Class I—hypothetical 5% return | | | 1,000.00 | | | | 1,020.42 | | | | 4.84 | | | | 0.95 | |
Small Cap Growth Fund | | | | | | | | | | | | | | | | |
Class N—actual return | | | 1,000.00 | | | | 855.10 | | | | 7.01 | | | | 1.50 | |
Class N—hypothetical 5% return | | | 1,000.00 | | | | 1,017.64 | | | | 7.63 | | | | 1.50 | |
Class I—actual return | | | 1,000.00 | | | | 856.30 | | | | 5.90 | | | | 1.26 | |
Class I—hypothetical 5% return | | | 1,000.00 | | | | 1,018.85 | | | | 6.41 | | | | 1.26 | |
Mid Cap Growth Fund | | | | | | | | | | | | | | | | |
Class N—actual return | | | 1,000.00 | | | | 907.60 | | | | 6.54 | | | | 1.36 | |
Class N—hypothetical 5% return | | | 1,000.00 | | | | 1,018.35 | | | | 6.92 | | | | 1.36 | |
Class I—actual return | | | 1,000.00 | | | | 908.90 | | | | 5.29 | | | | 1.10 | |
Class I—hypothetical 5% return | | | 1,000.00 | | | | 1,019.66 | | | | 5.60 | | | | 1.10 | |
Small-Mid Cap Growth Fund | | | | | | | | | | | | | | | | |
Class N—actual return | | | 1,000.00 | | | | 894.30 | | | | 6.45 | | | | 1.35 | |
Class N—hypothetical 5% return | | | 1,000.00 | | | | 1,018.40 | | | | 6.87 | | | | 1.35 | |
Class I—actual return | | | 1,000.00 | | | | 895.20 | | | | 5.25 | | | | 1.10 | |
Class I—hypothetical 5% return | | | 1,000.00 | | | | 1,019.66 | | | | 5.60 | | | | 1.10 | |
Global Growth Fund | | | | | | | | | | | | | | | | |
Class N—actual return | | | 1,000.00 | | | | 909.00 | | | | 7.22 | | | | 1.50 | |
Class N—hypothetical 5% return | | | 1,000.00 | | | | 1,017.64 | | | | 7.63 | | | | 1.50 | |
Class I—actual return | | | 1,000.00 | | | | 910.00 | | | | 6.02 | | | | 1.25 | |
Class I—hypothetical 5% return | | | 1,000.00 | | | | 1,018.90 | | | | 6.36 | | | | 1.25 | |
International Growth Fund | | | | | | | | | | | | | | | | |
Class N—actual return | | | 1,000.00 | | | | 838.40 | | | | 6.77 | | | | 1.46 | |
Class N—hypothetical 5% return | | | 1,000.00 | | | | 1,017.85 | | | | 7.43 | | | | 1.46 | |
Class I—actual return | | | 1,000.00 | | | | 840.00 | | | | 5.43 | | | | 1.17 | |
Class I—hypothetical 5% return | | | 1,000.00 | | | | 1,019.31 | | | | 5.96 | | | | 1.17 | |
International Equity Fund | | | | | | | | | | | | | | | | |
Class N—actual return | | | 1,000.00 | | | | 844.10 | | | | 6.74 | | | | 1.45 | |
Class N—hypothetical 5% return | | | 1,000.00 | | | | 1,017.90 | | | | 7.37 | | | | 1.45 | |
Class I—actual return | | | 1,000.00 | | | | 844.80 | | | | 5.58 | | | | 1.20 | |
Class I—hypothetical 5% return | | | 1,000.00 | | | | 1,019.16 | | | | 6.11 | | | | 1.20 | |
International Small Cap Growth Fund | | | | | | | | | | | | | | | | |
Class N—actual return | | | 1,000.00 | | | | 833.10 | | | | 7.67 | | | | 1.66 | |
Class N—hypothetical 5% return | | | 1,000.00 | | | | 1,016.84 | | | | 8.44 | | | | 1.66 | |
Class I—actual return | | | 1,000.00 | | | | 834.10 | | | | 6.10 | | | | 1.32 | |
Class I—hypothetical 5% return | | | 1,000.00 | | | | 1,018.55 | | | | 6.72 | | | | 1.32 | |
| (a) | | Expenses are equal to the annualized expense ratio, multiplied by the average account value over the period, multiplied by the number of days in the period 184, and divided by 365 (to reflect the one-half year period). |
174 Annual Report | December 31, 2011 |
| | | | | | | | | | | | | | | | |
Expense Example | | Beginning
Account Value
7/1/2011 | | | Ending
Account Value
12/31/2011 | | | Expenses Paid
During
the Period(a) | | | Annualized
Expense Ratio
| |
Emerging Markets Growth Fund | | | | | | | | | | | | | | | | |
Class N—actual return | | $ | 1,000.00 | | | $ | 832.90 | | | $ | 7.95 | | | | 1.72 | % |
Class N—hypothetical 5% return | | | 1,000.00 | | | | 1,016.53 | | | | 8.74 | | | | 1.72 | |
Class I—actual return | | | 1,000.00 | | | | 834.70 | | | | 6.52 | | | | 1.41 | |
Class I—hypothetical 5% return | | | 1,000.00 | | | | 1,018.10 | | | | 7.17 | | | | 1.41 | |
Emerging Leaders Growth Fund | | | | | | | | | | | | | | | | |
Class N—actual return | | | 1,000.00 | | | | 824.50 | | | | 7.59 | | | | 1.65 | |
Class N—hypothetical 5% return | | | 1,000.00 | | | | 1,016.89 | | | | 8.39 | | | | 1.65 | |
Class I—actual return | | | 1,000.00 | | | | 826.50 | | | | 6.45 | | | | 1.40 | |
Class I—hypothetical 5% return | | | 1,000.00 | | | | 1,018.15 | | | | 7.12 | | | | 1.40 | |
Emerging Markets Small Cap Growth Fund | | | | | | | | | | | | | | | | |
Class N—actual return (b) | | | 1,000.00 | | | | 973.00 | | | | 3.03 | | | | 1.65 | |
Class N—hypothetical 5% return (6 month period) | | | 1,000.00 | | | | 1,016.89 | | | | 8.39 | | | | 1.65 | |
Class I—actual return (b) | | | 1,000.00 | | | | 973.00 | | | | 2.57 | | | | 1.40 | |
Class I—hypothetical 5% return (6 month period) | | | 1,000.00 | | | | 1,018.15 | | | | 7.12 | | | | 1.40 | |
Large Cap Value Fund | | | | | | | | | | | | | | | | |
Class N—actual return (b) | | | 1,000.00 | | | | 998.10 | | | | 2.23 | | | | 1.20 | |
Class N—hypothetical 5% return (6 month period) | | | 1,000.00 | | | | 1,019.16 | | | | 6.11 | | | | 1.20 | |
Class I—actual return (b) | | | 1,000.00 | | | | 998.10 | | | | 1.77 | | | | 0.95 | |
Class I—hypothetical 5% return (6 month period) | | | 1,000.00 | | | | 1,020.42 | | | | 4.84 | | | | 0.95 | |
Small Cap Value Fund | | | | | | | | | | | | | | | | |
Class N—actual return | | | 1,000.00 | | | | 910.60 | | | | 6.74 | | | | 1.40 | |
Class N—hypothetical 5% return | | | 1,000.00 | | | | 1,018.15 | | | | 7.12 | | | | 1.40 | |
Class I—actual return | | | 1,000.00 | | | | 911.60 | | | | 5.54 | | | | 1.15 | |
Class I—hypothetical 5% return | | | 1,000.00 | | | | 1,019.41 | | | | 5.85 | | | | 1.15 | |
Mid Cap Value Fund | | | | | | | | | | | | | | | | |
Class N—actual return | | | 1,000.00 | | | | 941.40 | | | | 6.56 | | | | 1.34 | |
Class N—hypothetical 5% return | | | 1,000.00 | | | | 1,018.45 | | | | 6.82 | | | | 1.34 | |
Class I—actual return | | | 1,000.00 | | | | 942.30 | | | | 5.34 | | | | 1.09 | |
Class I—hypothetical 5% return | | | 1,000.00 | | | | 1,019.71 | | | | 5.55 | | | | 1.09 | |
Small-Mid Cap Value Fund | | | | | | | | | | | | | | | | |
Class N—actual return (c) | | | 1,000.00 | | | | 1,045.00 | | | | 0.63 | | | | 1.40 | |
Class N—hypothetical 5% return (6 month period) | | | 1,000.00 | | | | 1,018.15 | | | | 7.12 | | | | 1.40 | |
Class I—actual return (c) | | | 1,000.00 | | | | 1,045.00 | | | | 0.52 | | | | 1.15 | |
Class I—hypothetical 5% return (6 month period) | | | 1,000.00 | | | | 1,019.41 | | | | 5.85 | | | | 1.15 | |
Bond Fund | | | | | | | | | | | | | | | | |
Class N—actual return | | | 1,000.00 | | | | 1,043.90 | | | | 3.35 | | | | 0.65 | |
Class N—hypothetical 5% return | | | 1,000.00 | | | | 1,021.93 | | | | 3.31 | | | | 0.65 | |
Class I—actual return | | | 1,000.00 | | | | 1,043.90 | | | | 2.58 | | | | 0.50 | |
Class I—hypothetical 5% return | | | 1,000.00 | | | | 1,022.68 | | | | 2.55 | | | | 0.50 | |
Income Fund | | | | | | | | | | | | | | | | |
Class N—actual return | | | 1,000.00 | | | | 1,026.60 | | | | 4.39 | | | | 0.86 | |
Class N—hypothetical 5% return | | | 1,000.00 | | | | 1,020.87 | | | | 4.38 | | | | 0.86 | |
Class I—actual return | | | 1,000.00 | | | | 1,027.90 | | | | 3.22 | | | | 0.63 | |
Class I—hypothetical 5% return | | | 1,000.00 | | | | 1,022.03 | | | | 3.21 | | | | 0.63 | |
Low Duration Fund | | | | | | | | | | | | | | | | |
Class N—actual return | | | 1,000.00 | | | | 1,005.90 | | | | 3.54 | | | | 0.70 | |
Class N—hypothetical 5% | | | 1,000.00 | | | | 1,021.68 | | | | 3.57 | | | | 0.70 | |
Class I—actual return | | | 1,000.00 | | | | 1,006.70 | | | | 2.78 | | | | 0.55 | |
Class I—hypothetical 5% | | | 1,000.00 | | | | 1,022.43 | | | | 2.80 | | | | 0.55 | |
Ready Reserve Fund | | | | | | | | | | | | | | | | |
Class N—actual return | | | 1,000.00 | | | | 1,000.10 | | | | 0.50 | | | | 0.10 | |
Class N—hypothetical 5% return | | | 1,000.00 | | | | 1,024.70 | | | | 0.51 | | | | 0.10 | |
| (a) | | Expenses are equal to the annualized expense ratio, multiplied by the average account value over the period, multiplied by the number of days in the period 184, and divided by 365 (to reflect the one-half year period). |
| (b) | | For the period October 24, 2011 (Commencement of Operation) to December 31, 2011. |
| (c) | | For the period December 15, 2011 (Commencement of Operation) to December 31, 2011. |
December 31, 2011 | William Blair Funds 175 |
BOARD OF TRUSTEES
Ann P. McDermott
Director and Trustee
Profit and not-for-profit organizations
Phillip O. Peterson
Retired Partner, KPMG LLP
Lisa A. Pollina
Senior Advisor to RBC Financial Group—International Banking and Insurance Division
Donald J. Reaves
Chancellor, Winston-Salem State University
Donald L. Seeley
Retired Adjunct Lecturer and Director, University of Arizona Department of Finance
Michelle R. Seitz, Chairperson and President
Principal, William Blair & Company, L.L.C.,
Thomas J. Skelly
Retired Managing Partner, Accenture U.S.
Richard W. Smirl, Senior Vice President
Principal, William Blair & Company L.L.C.
Officers
Michael P. Balkin, Senior Vice President
Karl W. Brewer, Senior Vice President
David C. Fording, Senior Vice President
James S. Golan, Senior Vice President
W. George Greig, Senior Vice President
Michael A. Jancosek, Senior Vice President
John F. Jostrand, Senior Vice President
Chad M. Kilmer, Senior Vice President
Robert C. Lanphier, IV, Senior Vice President
Mark T. Leslie, Senior Vice President
Matthew A. Litfin, Senior Vice President
Kenneth J. McAtamney, Senior Vice President
Todd M. McClone, Senior Vice President
David Merjan, Senior Vice President
David S. Mitchell, Senior Vice President
David P. Ricci, Senior Vice President
Jeffrey A. Urbina, Senior Vice President
Christopher T. Vincent, Senior Vice President
Kathleen M. Lynch, Vice President
Paul J. Sularz, Vice President
David F. Hone, Vice President
John Abunassar, Vice President
Peter Carl, Vice President
D. Trowbridge Elliman III, Vice President
Christopher Walvoord, Vice President
Brian Ziv, Vice President
Brian D. Singer, Vice President
Edwin Denson, Vice President
Thomas Clarke, Vice President
Walter R. Randall, Jr., Chief Compliance Officer and Assistant Secretary
Colette M. Garavalia, Treasurer
Andrew T. Pfau, Secretary
John M. Raczek, Assistant Treasurer
Investment Advisor
William Blair & Company, L.L.C.
Independent Registered Public Accounting Firm
Ernst & Young LLP
Legal Counsel
Vedder Price P.C.
Transfer Agent
Boston Financial Data Services, Inc.
P.O. Box 8506
Boston, MA 02266-8506
For customer assistance, call 1-800-635-2886
(Massachusetts 1-800-635-2840)
176 Annual Report | December 31, 2011 |
| | | | |
EQUITY | | GLOBAL EQUITY | | FIXED-INCOME |
Growth Fund | | Global Growth Fund | | Bond Fund |
Large Cap Growth Fund | | | | Income Fund |
Small Cap Growth Fund | | INTERNATIONAL EQUITY | | Low Duration Fund |
Mid Cap Growth Fund | | International Growth Fund | | |
Small-Mid Cap Growth Fund | | International Equity Fund | | MONEY MARKET |
Large Cap Value Fund | | International Small Cap Growth Fund | | Ready Reserves Fund |
Small Cap Value Fund | | Emerging Markets Growth Fund | | |
Mid Cap Value Fund | | Emerging Leaders Growth Fund | | |
Small-Mid Cap Value Fund | | Emerging Markets Small Cap Growth Fund | | |

222 West Adams Street
Chicago, IL 60606
800.742.7272 Ÿ www.williamblairfunds.com
©William Blair & Company, L.L.C., distributor

INSTITUTIONAL
ANNUAL REPORT
DECEMBER 31, 2011
Table of Contents
The views expressed in the commentary for each Fund reflect those of the portfolio management team only through the end of the period of the report as stated on the cover. The portfolio management team’s views are subject to change at any time based on market and other conditions and should not be construed as a recommendation. Statements involving predictions, assessments, analyses, or outlook for individual securities, industries, market sectors, and/or markets involve risks and uncertainties, and there is no guarantee they will come to pass.
This report is submitted for the general information of the shareholders of the William Blair Funds. It is not authorized for distribution to prospective investors unless accompanied or preceded by a prospectus of the William Blair Funds. Please consider the Funds’ investment objectives, risks, charges, and expenses before investing. This and other information is contained in the Funds’ prospectus, which you may obtain by calling 1-800-742-7272. Read it carefully before you invest or send money. William Blair & Company, LLC., distributor.
December 31, 2011 | William Blair Funds 1 |
GLOBAL MARKETS OVERVIEW
Summary
After a positive start, 2011 hit a rough patch as the markets centered on the continuing European debt crisis, developed sovereign credit rating downgrades and concerns of a potential global contagion effect. Daily market volatility centered on investors’ perception of governmental wherewithal to deal with these issues and on news flow of their progress. Despite the focus on developed markets, emerging markets were no safe haven during the period, as inflationary pressures precipitated monetary policy tightening across most emerging markets, and as concerns about Chinese overinvestment and infrastructure overbuild intensified during the third quarter. Despite these concerns, economic indicators in the United States remained stable, the Eurozone moved closer to tighter fiscal and monetary policy integration, and corporate performance generally remained strong. These concerns continue to affect global markets, however, as details surrounding “Europe’s Grand Bargain” have not been finalized and financial system liquidity, while improving, remains relatively tight. The market also remains focused on incremental data points in China regarding infrastructure spending, property market values, and asset quality, the overall tradeoff between inflation and economic growth, and the resulting implications for global growth. Finally, concerns linger about the profitability and capital position of financials, along with the implications of the 2008 and the European debt crisis on regulation, capital requirements, asset quality and prospective loan growth.
Given this backdrop, the global equity market ended 2011 down 7.89%, despite an early year rally and October bounce. While globally there was virtually no difference attributable to style, outside the U.S., the MSCI ACWI Ex-US Growth Index underperformed the Value index by approximately 70 basis points. Small cap stocks were down nearly 16% outside the US during 2011, underperforming their larger capitalization counterparts, with the exception of Japan. The more defensive sectors outperformed, as Health Care and Consumer Staples were each up approximately 7%, while Materials and Financials were the worst performing sectors, down 18% and 21%, respectively. After depreciating most of the year, the U.S. Dollar appreciated versus most developed market currencies beginning in September to end the year with slight appreciation. The notable exception was the Japanese yen, which appreciated versus most currencies globally.
Despite the concerns about debt downgrades and the European debt situation as a whole, developed markets significantly outpaced emerging markets, as the World Index was down 6.03%, well ahead of the -19.49% Emerging Markets Index return. The U.S. was a key driver of that strong relative performance, as it eked out a 0.63% return for the year, well ahead of almost all other developed markets. Japan, after falling significantly following March’s earthquake and tsunami, rebounded mid year only to retreat during the fourth quarter. It ended the year down nearly 13%, although it benefited from the Yen’s appreciation. Similarly Europe, which began the year strongly, was the epicenter of concern for most of the year, and ended 2011 down over 16%, led on the downside by Greece (-61%) and, to a lesser extent, Austria (-34%), Finland (-31%), and Israel (-29%). Conversely, Switzerland, which was down 8%, was a key outperformer in Europe. Other developed markets countries that performed well on a relative basis included Canada and the U.K.
The three emerging markets regions were each down between 19% to 21% during 2011, although country returns varied significantly even within regions. Indonesia was the only emerging market country with a positive return, up 4.31%, on continued growth. Other countries that were top performers included Mexico, South Africa, and Thailand. Conversely, the worst performing emerging market country was Egypt, which was down 47.62%, following the regime change in January and persisting uncertainty throughout the remainder of the year. India was also down significantly, falling 39%, due partially to a depreciating Rupee, but also due to concerns about inflationary pressures, high costs, and the overall
2 Annual Report | December 31, 2011 |
competitive environment within that country. Central and Eastern Europe generally suffered along with the travails of Western Europe, due to financial market integration and follow on effects. After underperforming a large percentage of the year, China ended the year in the middle of the pack, down approximately 21%, due to an 8% fourth quarter rally.
Outlook
It has been twelve years since the historic highs of the 1999-2000 bull market. During that time, the world economy has been through a post-bubble consolidation, a credit-fuelled expansion, a severe recession, and a tentative recovery (2010-2011) that has been challenged by persistent doubts about the sustainability of global growth. Economic performance has been volatile over the whole period, and conventional assumptions about the viability of policy regimes and the financial system have come under attack.
It has been predominantly a bear market cycle, with major developed markets all still below their early-2000 peaks. Corporate performance has been strong over the last decade—profit growth has far outpaced economic growth around the world; at the same time, emerging market equity values have expanded significantly. Nevertheless, overall market returns have been significantly impacted by an erosion of confidence. Earnings multiples on global markets have contracted in eight out of the last twelve years, declining from a high of 25x earnings in 2000 to lows of just above ten times in 2008 and 2011.
PE ratios contracted in both 2010 and 2011, reflecting caution in expectations for both growth and valuation. Institutional, hedge fund, and retail investors have swung decisively to the pessimistic end of the long term sentiment spectrum in the last several years. Strategists like Albert Edwards of Societe Generale, investors like Jeremy Grantham of GMO, and media sources such as the Daily Telegraph and ZeroHedge provide an array of negative perspectives on capital markets ranging from overleverage and financial disorder to permanent impairment of growth to the assertion that valuation and profitability measures are illusory.
Consensus expectations today are built around a scenario of moderate European recession (with continuing risk of financial instability), a cooling effect on global growth from bank deleveraging, an unpredictable deceleration in investment growth in China, and chronic sluggishness in the U.S. If the economic and financial conditions behind those assumptions begin to change at the margin, there could be scope for improvement in the market return environment, especially given the modest starting point on valuations.
After months of crisis headlines, at this point the prospects for change do seem to be improving. In Europe, the extended and expanded LTRO facility has brought funding relief to the banks and strengthened the tone of recent bond auctions. China has seen selective easing measures enacted as inflation has begun to recede, and other emerging market authorities are easing as well. U.S. economic indicators are continuing to improve amid signs that the government is preparing a more activist approach to the lingering housing market problems.
From here, critical indicators to watch will include U.S. employment data, Greek debt negotiations, peripheral European country budget debates, Chinese housing and industrial activity, and the trend in corporate profitability as growth decelerates. If there is observable improvement in three or more of these five key benchmarks of global economic performance, the market environment could turn a good deal more positive in 2012.
December 31, 2011 | William Blair Funds 3 |

W. George Greig
INSTITUTIONAL INTERNATIONAL GROWTH FUND
The Institutional International Growth Fund seeks long-term capital appreciation.
AN OVERVIEW FROM THE PORTFOLIO MANAGER
The Institutional International Growth Fund posted a 13.66% decrease for the 12 months ended December 31, 2011. By comparison, the Fund’s benchmark, the MSCI All Country World Ex-U.S. IMI Index (net), declined 14.31%.
Despite lagging early in the year on the European low quality rally, the Fund’s full year outperformance was driven by its focus on high quality companies with good operating performance. As a result, performance was strong across most sectors, with particular value added in Consumer Discretionary, Industrials, and Information Technology (IT). Within Consumer Discretionary, the Fund’s Auto, Media and Retailing stock selection added value, as did performance by Property Management companies. Industrials stock selection was augmented by strong performance in Capital Goods and Machinery, along with the overweighting and stock selection in Commercial and Professional Services. IT stock selection was bolstered by good performance amongst internet-related holdings, in addition to strong operating performance by SAP AG and Autonomy, as Hewlett-Packard Company bid to acquire the company. Somewhat detracting from 2011 results was Consumer Staples, Health Care and Telecommunication Services stock selection. Consumer Staples performance was hurt largely during the first half of the year as increasing raw materials prices hampered margins and corporate growth outlook, while large cap European Pharmaceutical holdings dragged on Health Care performance.
While year end sector positioning was substantially unchanged since December 2010, it masked changes that occurred throughout the year. In particular, after being underweighted in European Financials most of the year, this segment was increased during the fourth quarter, although Commercial Banks remained underweighted more broadly in favor of Insurance and Asset Management. Consumer Discretionary totaled 14.0% of the Fund, higher than the 9.9% Index weighting, due largely to a focus in Autos and Retailing, and to some extent Media. Health Care and IT each represented approximately 9% of the Fund, slight increases since year-end 2010, but ahead of Index weightings approximating 7%. The Resources sectors remained the most underweighted, totaling approximately 19% of the Fund compared to 23% for the Index, due largely to lower Mining exposure, although the overall sector weightings increased throughout the year. Regionally, the Fund’s emerging markets exposure approximated 21%, below the 23% Index weighting, due to lower weightings in Asia and EMEA (Europe, Middle East, and Africa) in favor of Latin America. The reduction below market weighting occurred during the first quarter on inflationary and growth concerns. Developed Asia was also significantly underweighted in favor of Europe Ex-U.K. and the U.K., although the weighting in Japan was ahead of the Index during the first and second quarters.
4 Annual Report | December 31, 2011 |
Institutional International Growth Fund
Performance Highlights (unaudited)
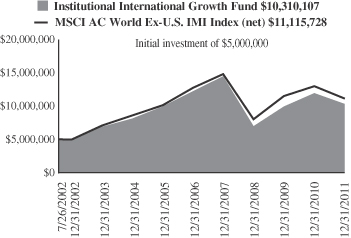
Average Annual Total Return at 12/31/2011
| | | | | | | | | | | | | | | | |
| | | 1
Year | | | 3
Year | | | 5
Year | | | Since
Inception(a) | |
Institutional
International
Growth Fund | | | (13.66 | )% | | | 13.99 | % | | | (3.37 | )% | | | 7.95 | % |
MSCI All Country World Ex-U.S.
IMI (net) | | | (14.31 | ) | | | 11.53 | | | | (2.74 | ) | | | 8.84 | % |
| | (a) | | For the period July 26, 2002 (Commencement of Operations) to December 31, 2011. |
Performance cited represents past performance. Past performance does not guarantee future results and current performance may be lower or higher than the data quoted. Results shown are average annual returns, which assume reinvestment of dividends and capital gains. Investment returns and principal will fluctuate and you may have a gain or loss when you sell shares. For the most current month-end performance information, please call 1-800-742-7272, or visit our Web site at www.williamblairfunds.com. International investing involves special risk considerations, including currency fluctuations, lower liquidity, economic and political risk.
The performance highlights and graph presented above do not reflect the deduction of taxes that a shareholder would pay on fund distributions or the redemption of fund shares.
The Morgan Stanley Capital International (MSCI) All Country World Ex-U.S. Investable Market Index (IMI) (net) is a free float-adjusted market capitalization weighted index that is designed to measure the equity market performance of developed and emerging markets, excluding the United States. This series approximates the minimum possible dividend reinvestment.
This report identifies the Fund’s investments on December 31, 2011. These holdings are subject to change. Not all stocks in the Fund performed the same, nor is there any guarantee that these stocks will perform as well in the future. Market forecasts provided in this report may not necessarily come to pass.
Sector Diversification (unaudited)
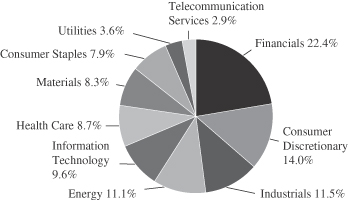
The sector diversification shown is based on the total long-term securities.
December 31, 2011 | William Blair Funds 5 |
Institutional International Growth Fund
Portfolio of Investments, December 31, 2011 (all dollar amounts in thousands)
| | | | | | | | |
Issuer | | Shares | | | Value | |
| |
Common Stocks | | | | | |
| |
Europe, Mid-East—32.8% | | | | | |
Denmark—0.7% | | | | | | | | |
Coloplast A/S (Health care equipment & supplies) | | | 60,247 | | | $ | 8,664 | |
SimCorp A/S (Software) | | | 14,275 | | | | 2,180 | |
| | | | | | | | |
| | | | 10,844 | |
| | | | | | | | |
Finland—1.0% | | | | | | | | |
Nokian Renkaat Oyj (Auto components) | | | 233,774 | | | | 7,528 | |
UPM-Kymmene Oyj (Paper & forest products) | | | 701,315 | | | | 7,724 | |
| | | | | | | | |
| | | | 15,252 | |
| | | | | | | | |
France—5.9% | | | | | | | | |
AXA S.A. (Insurance) | | | 1,687,017 | | | | 21,933 | |
BNP Paribas S.A. (Commercial banks) | | | 587,947 | | | | 23,095 | |
Cie de St-Gobain (Building products) | | | 258,373 | | | | 9,920 | |
Essilor International S.A. (Health care equipment & supplies) | | | 222,589 | | | | 15,715 | |
Sanofi (Pharmaceuticals) | | | 166,648 | | | | 12,240 | |
Suez Environnement Co. (Multi-utilities) | | | 723,469 | | | | 8,334 | |
| | | | | | | | |
| | | | 91,237 | |
| | | | | | | | |
Germany—7.8% | | | | | | | | |
Aixtron AG (Semiconductors & semiconductor equipment) | | | 286,555 | | | | 3,653 | |
BASF SE (Chemicals) | | | 158,505 | | | | 11,055 | |
Bayer AG (Pharmaceuticals) | | | 372,991 | | | | 23,848 | |
Bayerische Motoren Werke AG (Automobiles) | | | 274,310 | | | | 18,376 | |
Delticom AG (Specialty retail) | | | 13,202 | | | | 1,140 | |
Deutsche Bank AG (Capital markets) | | | 401,251 | | | | 15,286 | |
Gerry Weber International AG (Textiles, apparel & luxury goods) | | | 98,552 | | | | 3,007 | |
Infineon Technologies AG (Semiconductors & semiconductor equipment) | | | 305,146 | | | | 2,297 | |
Lanxess AG (Chemicals) | | | 151,728 | | | | 7,855 | |
MTU Aero Engines Holding AG (Aerospace & defense) | | | 104,463 | | | | 6,684 | |
SAP AG (Software) | | | 505,205 | | | | 26,710 | |
| | | | | | | | |
| | | | 119,911 | |
| | | | | | | | |
Ireland—1.3% | | | | | | | | |
Paddy Power plc (Hotels, restaurants & leisure) | | | 78,496 | | | | 4,522 | |
*Ryanair Holdings plc—ADR (Airlines) | | | 156,998 | | | | 4,374 | |
Shire plc (Pharmaceuticals) | | | 298,440 | | | | 10,396 | |
| | | | | | | | |
| | | | | | | 19,292 | |
| | | | | | | | |
Israel—0.5% | | | | | | | | |
*Check Point Software Technologies, Ltd. (Software)† | | | 139,661 | | | | 7,338 | |
| | | | | | | | |
Italy—0.1% | | | | | | | | |
*Salvatore Ferragamo Italia SpA (Textiles, apparel & luxury goods) | | | 170,861 | | | | 2,251 | |
| | | | | | | | |
Luxembourg—0.7% | | | | | | | | |
Millicom International Cellular S.A. (Wireless telecommunication services) | | | 107,347 | | | | 10,755 | |
| | | | | | | | |
|
Common Stocks—Europe, Mid-East—32.8%—(continued) | |
Netherlands—4.9% | | | | | | | | |
ASML Holding N.V. (Semiconductors & semiconductor equipment) | | | 306,517 | | | $ | 12,883 | |
Royal Dutch Shell plc (Oil, gas & consumable fuels) | | | 927,360 | | | | 35,342 | |
Unilever N.V. (Food products) | | | 805,648 | | | | 27,705 | |
| | | | | | | | |
| | | | 75,930 | |
| | | | | | | | |
Norway—1.5% | | | | | | | | |
*Norwegian Air Shuttle ASA (Airlines) | | | 143,400 | | | | 1,325 | |
Opera Software ASA (Internet software & services) | | | 418,197 | | | | 2,035 | |
Statoil ASA (Oil, gas & consumable fuels) | | | 763,700 | | | | 19,600 | |
| | | | | | | | |
| | | | 22,960 | |
| | | | | | | | |
Spain—1.5% | | | | | | | | |
Banco Santander S.A. (Commercial banks) | | | 282,804 | | | | 2,149 | |
Inditex S.A. (Specialty retail) | | | 214,063 | | | | 17,532 | |
Viscofan S.A. (Food products) | | | 104,207 | | | | 3,865 | |
| | | | | | | | |
| | | | 23,546 | |
| | | | | | | | |
Sweden—1.5% | | | | | | | | |
Elekta AB (Health care equipment & supplies) | | | 137,566 | | | | 5,967 | |
Getinge AB (Health care equipment & supplies) | | | 412,981 | | | | 10,465 | |
JM AB (Household durables) | | | 139,431 | | | | 2,269 | |
Mekonomen AB (Specialty retail) | | | 57,715 | | | | 1,887 | |
NIBE Industrier AB (Building products) | | | 156,367 | | | | 2,312 | |
| | | | | | | | |
| | | | 22,900 | |
| | | | | | | | |
Switzerland—5.4% | | | | | | | | |
*Dufry Group (Specialty retail) | | | 30,144 | | | | 2,774 | |
*Geberit AG (Building products) | | | 32,569 | | | | 6,276 | |
*Glencore International plc (Metals & mining) | | | 3,205,771 | | | | 19,516 | |
*Julius Baer Group, Ltd. (Capital markets) | | | 194,670 | | | | 7,614 | |
*Meyer Burger Technology AG (Machinery) | | | 46,810 | | | | 733 | |
Nestle S.A. (Food products) | | | 347,723 | | | | 19,991 | |
*Orascom Development Holding AG (Hotels, restaurants & leisure) | | | 76,090 | | | | 1,162 | |
Partners Group Holding AG (Capital markets) | | | 41,814 | | | | 7,296 | |
SGS S.A. (Professional services) | | | 4,627 | | | | 7,660 | |
Sika AG (Chemicals) | | | 3,143 | | | | 5,923 | |
Xstrata plc (Metals & mining) | | | 261,827 | | | | 3,977 | |
| | | | | | | | |
| | | | 82,922 | |
| | | | | | | | |
United Kingdom—23.8% | | | | | | | | |
Abcam plc (Biotechnology) | | | 1,008,902 | | | | 5,719 | |
Aggreko plc (Commercial services & supplies) | | | 199,759 | | | | 6,257 | |
AMEC plc (Energy equipment & services) | | | 610,247 | | | | 8,601 | |
Amlin plc (Insurance) | | | 989,453 | | | | 4,823 | |
Ashmore Group plc (Capital markets) | | | 961,452 | | | | 4,987 | |
Babcock International Group plc (Commercial services & supplies) | | | 983,151 | | | | 11,230 | |
Barclays plc (Commercial banks) | | | 6,864,619 | | | | 18,768 | |
BG Group plc (Oil, gas & consumable fuels) | | | 1,068,156 | | | | 22,834 | |
BHP Billiton plc (Metals & mining) | | | 952,629 | | | | 27,776 | |
Burberry Group plc (Textiles, apparel & luxury goods) | | | 386,251 | | | | 7,108 | |
Carphone Warehouse Group plc (Specialty retail) | | | 1,102,691 | | | | 5,292 | |
Centrica plc (Multi-utilities) | | | 4,649,430 | | | | 20,889 | |
See accompanying Notes to Financial Statements.
6 Annual Report | December 31, 2011 |
Institutional International Growth Fund
Portfolio of Investments, December 31, 2011 (all dollar amounts in thousands)
| | | | | | | | |
Issuer | | Shares | | | Value | |
|
Common Stocks—United Kingdom—23.8%—(continued) | |
Croda International plc (Chemicals) | | | 168,046 | | | $ | 4,708 | |
Diageo plc (Beverages) | | | 1,313,013 | | | | 28,680 | |
Dunelm Group plc (Specialty retail) | | | 537,329 | | | | 3,620 | |
Experian plc (Professional services) | | | 356,212 | | | | 4,843 | |
Halma plc (Electronic equipment, instruments & components) | | | 710,898 | | | | 3,648 | |
Hargreaves Lansdown plc (Capital markets) | | | 279,377 | | | | 1,868 | |
Hiscox, Ltd. (Insurance) | | | 486,737 | | | | 2,823 | |
IG Group Holdings plc (Diversified financial services) | | | 666,342 | | | | 4,935 | |
John Wood Group plc (Energy equipment & services) | | | 431,405 | | | | 4,295 | |
Johnson Matthey plc (Chemicals) | | | 487,018 | | | | 13,886 | |
Jupiter Fund Management plc (Capital markets) | | | 906,369 | | | | 3,056 | |
Lancashire Holdings, Ltd. (Insurance) | | | 563,131 | | | | 6,336 | |
Meggitt plc (Aerospace & defense) | | | 994,323 | | | | 5,448 | |
Moneysupermarket.com Group plc (Internet software & services) | | | 909,451 | | | | 1,483 | |
Next plc (Multiline retail) | | | 151,297 | | | | 6,431 | |
*Ocado Group plc (Internet & catalog retail) | | | 1,733,551 | | | | 1,465 | |
Petrofac, Ltd. (Energy equipment & services) | | | 724,788 | | | | 16,220 | |
Prudential plc (Insurance) | | | 799,058 | | | | 7,923 | |
Restaurant Group plc (Hotels, restaurants & leisure) | | | 343,998 | | | | 1,592 | |
Rightmove plc (Media) | | | 28,129 | | | | 543 | |
*Rolls-Royce Holdings plc (Aerospace & defense) | | | 1,291,890 | | | | 14,977 | |
Rotork plc (Machinery) | | | 86,511 | | | | 2,593 | |
RPS Group plc (Commercial services & supplies) | | | 530,811 | | | | 1,484 | |
Scottish & Southern Energy plc (Electric utilities) | | | 1,015,831 | | | | 20,367 | |
Spirax-Sarco Engineering plc (Machinery) | | | 178,956 | | | | 5,205 | |
*Sports Direct International plc (Specialty retail) | | | 290,100 | | | | 961 | |
St James’s Place plc (Insurance) | | | 470,800 | | | | 2,373 | |
Standard Chartered plc (Commercial banks) | | | 527,290 | | | | 11,538 | |
*Telecity Group plc (Internet software & services) | | | 527,435 | | | | 5,300 | |
*The Berkeley Group Holdings plc (Household durables) | | | 383,493 | | | | 7,599 | |
The Capita Group plc (Professional services) | | | 155,629 | | | | 1,519 | |
The Weir Group plc (Machinery) | | | 367,249 | | | | 11,589 | |
Tullow Oil plc (Oil, gas & consumable fuels) | | | 470,428 | | | | 10,243 | |
Victrex plc (Chemicals) | | | 195,840 | | | | 3,333 | |
| | | | | | | | |
| | | | 367,168 | |
| | | | | | | | |
|
Emerging Asia—11.9% | |
China—1.3% | | | | | | | | |
AAC Technologies Holdings, Inc. (Communications equipment) | | | 746,000 | | | | 1,675 | |
*China Minzhong Food Corporation, Ltd. (Food products) | | | 1,067,000 | | | | 671 | |
Dongyue Group (Chemicals) | | | 4,769,000 | | | | 3,144 | |
Golden Eagle Retail Group, Ltd. (Multiline retail) | | | 1,649,000 | | | | 3,486 | |
Lenovo Group, Ltd. (Computers & peripherals) | | | 11,388,000 | | | | 7,595 | |
|
Common Stocks—Emerging Asia—11.9%—(continued) | |
China—(continued) | | | | | | | | |
*Sun Art Retail Group, Ltd. (Food & staples retailing) | | | 1,300,000 | | | $ | 1,625 | |
Yingde Gases (Chemicals) | | | 1,758,000 | | | | 1,795 | |
| | | | | | | | |
| | | | 19,991 | |
| | | | | | | | |
India—2.1% | | | | | | | | |
Axis Bank, Ltd. (Commercial banks) | | | 197,858 | | | | 3,011 | |
HDFC Bank, Ltd. (Commercial banks) | | | 650,376 | | | | 5,228 | |
Lupin, Ltd. (Pharmaceuticals) | | | 387,299 | | | | 3,266 | |
Shriram Transport Finance Co., Ltd. (Consumer finance) | | | 32,343 | | | | 256 | |
Sun Pharmaceutical Industries, Ltd. (Pharmaceuticals) | | | 519,940 | | | | 4,873 | |
Tata Consultancy Services, Ltd. (IT services) | | | 698,912 | | | | 15,275 | |
| | | | | | | | |
| | | | 31,909 | |
| | | | | | | | |
Indonesia—1.5% | | | | | | | | |
PT Bank Rakyat Indonesia (Commercial banks) | | | 14,083,000 | | | | 10,484 | |
PT Kalbe Farma Tbk (Pharmaceuticals) | | | 10,817,000 | | | | 4,056 | |
PT United Tractors Tbk (Machinery) | | | 2,835,151 | | | | 8,239 | |
| | | | | | | | |
| | | | 22,779 | |
| | | | | | | | |
Malaysia—0.3% | | | | | | | | |
Kuala Lumpur Kepong Bhd (Food products) | | | 742,600 | | | | 5,318 | |
| | | | | | | | |
Papua New Guinea—0.4% | | | | | | | | |
Oil Search, Ltd. (Oil, gas & consumable fuels) | | | 959,457 | | | | 6,133 | |
| | | | | | | | |
Philippines—0.2% | | | | | | | | |
Alliance Global Group, Inc. (Industrial conglomerates) | | | 17,374,700 | | | | 4,097 | |
| | | | | | | | |
South Korea—5.2% | | | | | | | | |
*Celltrion, Inc. (Pharmaceuticals) | | | 71,146 | | | | 2,242 | |
*Hyundai Mobis (Auto components) | | | 44,966 | | | | 11,397 | |
*Hyundai Motor Co. (Automobiles) | | | 95,658 | | | | 17,687 | |
Samsung Electronics Co., Ltd. (Semiconductors & semiconductor equipment) | | | 28,838 | | | | 26,485 | |
*Samsung Engineering Co., Ltd. (Construction & engineering) | | | 63,352 | | | | 11,081 | |
Samsung Fire & Marine Insurance Co., Ltd. (Insurance) | | | 59,232 | | | | 10,849 | |
| | | | | | | | |
| | | | 79,741 | |
| | | | | | | | |
Thailand—0.9% | | | | | | | | |
Advanced Info Service PCL (Wireless telecommunication services) | | | 1,092,400 | | | | 4,865 | |
*Bangkok Dusit Medical Services PCL (Health care providers & services) | | | 1,017,000 | | | | 2,643 | |
Kasikornbank PCL (Commercial banks) | | | 1,637,400 | | | | 6,461 | |
| | | | | | | | |
| | | | 13,969 | |
| | | | | | | | |
|
Japan—11.8% | |
Ain Pharmaciez, Inc. (Food & staples retailing) | | | 31,100 | | | | 1,495 | |
Daito Trust Construction Co., Ltd. (Real estate management & development) | | | 98,600 | | | | 8,455 | |
See accompanying Notes to Financial Statements.
December 31, 2011 | William Blair Funds 7 |
Institutional International Growth Fund
Portfolio of Investments, December 31, 2011 (all dollar amounts in thousands)
| | | | | | | | |
Issuer | | Shares | | | Value | |
|
Common Stocks—Japan—11.8%—(continued) | |
Dr Ci:Labo Co., Ltd. (Personal products) | | | 446 | | | $ | 2,373 | |
Exedy Corporation (Auto components) | | | 168,500 | | | | 4,862 | |
F.C.C. Co., Ltd. (Auto components) | | | 119,352 | | | | 2,425 | |
FamilyMart Co., Ltd. (Food & staples retailing) | | | 96,700 | | | | 3,907 | |
Fanuc, Ltd. (Machinery) | | | 96,700 | | | | 14,800 | |
Fast Retailing Co., Ltd. (Specialty retail) | | | 60,600 | | | | 11,022 | |
Gree, Inc. (Internet software & services) | | | 250,300 | | | | 8,624 | |
K’s Holdings Corporation (Specialty retail) | | | 169,000 | | | | 6,697 | |
Kakaku.com, Inc. (Internet software & services) | | | 104,800 | | | | 3,842 | |
Kaken Pharmaceutical Co., Ltd. (Pharmaceuticals) | | | 208,000 | | | | 2,765 | |
Keyence Corporation (Electronic equipment, instruments & components) | | | 44,300 | | | | 10,682 | |
Miraca Holdings, Inc. (Health care providers & services) | | | 97,700 | | | | 3,890 | |
Nitori Co., Ltd. (Specialty retail) | | | 131,930 | | | | 12,375 | |
ORIX Corporation (Diversified financial services) | | | 190,900 | | | | 15,774 | |
Sawai Pharmaceutical Co., Ltd. (Pharmaceuticals) | | | 11,200 | | | | 1,163 | |
Sharp Corporation (Household durables) | | | 812,000 | | | | 7,100 | |
Ship Healthcare Holdings, Inc. (Health care providers & services) | | | 105,400 | | | | 2,303 | |
SMC Corporation (Machinery) | | | 49,100 | | | | 7,923 | |
Softbank Corporation (Wireless telecommunication services) | | | 557,900 | | | | 16,432 | |
Start Today Co., Ltd. (Internet & catalog retail) | | | 110,000 | | | | 2,574 | |
Sumitomo Mitsui Financial Group, Inc. (Commercial banks) | | | 1,057,000 | | | | 29,443 | |
United Arrows, Ltd. (Specialty retail) | | | 80,200 | | | | 1,548 | |
| | | | | | | | |
| | | | 182,474 | |
| | | | | | | | |
|
Emerging Latin America—6.9% | |
Brazil—4.0% | | | | | | | | |
BR Malls Participacoes S.A. (Real estate management & development) | | | 494,600 | | | | 4,805 | |
BR Properties S.A. (Real estate management & development) | | | 318,200 | | | | 3,156 | |
CETIP S.A.—Balcao Organizado de Ativos e Derivativos (Capital markets) | | | 164,300 | | | | 2,374 | |
Cia de Concessoes Rodoviarias (Transportation infrastructure) | | | 946,400 | | | | 6,200 | |
Cia Hering (Specialty retail) | | | 312,000 | | | | 5,430 | |
Cielo S.A. (IT services) | | | 33,000 | | | | 853 | |
Iochpe-Maxion S.A. (Machinery) | | | 193,200 | | | | 2,615 | |
*OGX Petroleo e Gas Participacoes S.A. (Oil, gas & consumable fuels) | | | 1,175,300 | | | | 8,582 | |
Petroleo Brasileiro S.A. (Oil, gas & consumable fuels) | | | 1,741,500 | | | | 21,474 | |
*T4F Entretenimento S.A. (Media) | | | 296,200 | | | | 1,818 | |
Tractebel Energia S.A. (Independent power producers & energy traders) | | | 262,900 | | | | 4,223 | |
| | | | | | | | |
| | | | 61,530 | |
| | | | | | | | |
Chile—1.7% | | | | | | | | |
Banco Santander Chile—ADR (Commercial banks) | | | 89,802 | | | | 6,798 | |
*CFR Pharmaceuticals S.A. (Pharmaceuticals) | | | 12,636,452 | | | | 2,970 | |
|
Common Stocks—Emerging Latin America—6.9%—(continued) | |
Chile—(continued) | | | | | | | | |
ENTEL Chile S.A. (Wireless telecommunication services) | | | 241,427 | | | $ | 4,485 | |
Parque Arauco S.A. (Real estate management & development) | | | 2,716,764 | | | | 4,424 | |
Sociedad Quimica y Minera de Chile S.A.—ADR (Chemicals) | | | 115,954 | | | | 6,244 | |
Sonda S.A. (IT services) | | | 807,384 | | | | 1,935 | |
| | | | | | | | |
| | | | 26,856 | |
| | | | | | | | |
Mexico—0.4% | | | | | | | | |
Compartamos S.A.B. de C.V. (Consumer finance) | | | 2,407,900 | | | | 2,951 | |
*Genomma Lab Internacional S.A.B. de C.V. (Pharmaceuticals) | | | 1,253,262 | | | | 2,417 | |
| | | | | | | | |
| | | | 5,368 | |
| | | | | | | | |
Panama—0.2% | | | | | | | | |
Copa Holdings S.A. (Airlines)† | | | 40,436 | | | | 2,372 | |
| | | | | | | | |
Peru—0.6% | | | | | | | | |
Credicorp, Ltd. (Commercial banks)† | | | 88,189 | | | | 9,654 | |
| | | | | | | | |
| | |
Canada—5.2% | | | | | | | | |
Alimentation Couche Tard, Inc. (Food & staples retailing) | | | 325,565 | | | | 10,130 | |
Brookfield Asset Management, Inc. Class “A” (Real estate management & development)† | | | 688,187 | | | | 18,911 | |
Canadian Western Bank (Commercial banks) | | | 154,803 | | | | 3,920 | |
*Celtic Exploration, Ltd. (Oil, gas & consumable fuels) | | | 62,722 | | | | 1,408 | |
CI Financial Corporation (Capital markets) | | | 323,615 | | | | 6,703 | |
Crescent Point Energy Corporation (Oil, gas & consumable fuels) | | | 154,169 | | | | 6,795 | |
Dollarama, Inc. (Multiline retail) | | | 139,952 | | | | 6,113 | |
Home Capital Group, Inc. (Thrifts & mortgage finance) | | | 34,637 | | | | 1,669 | |
Intact Financial Corporation (Insurance) | | | 79,600 | | | | 4,573 | |
Intact Financial Corporation —144A (Insurance) | | | 29,445 | | | | 1,692 | |
Peyto Exploration & Development Corporation (Oil, gas & consumable fuels) | | | 276,328 | | | | 6,616 | |
Saputo, Inc. (Food products) | | | 39,669 | | | | 1,520 | |
Tim Hortons, Inc. (Hotels, restaurants & leisure) | | | 204,586 | | | | 9,913 | |
| | | | | | | | |
| | | | 79,963 | |
| | | | | | | | |
|
Asia—4.0% | |
Australia—0.5% | | | | | | | | |
Iluka Resources, Ltd. (Metals & mining) | | | 519,374 | | | | 8,234 | |
| | | | | | | | |
Hong Kong—1.8% | | | | | | | | |
AIA Group, Ltd. (Insurance) | | | 3,914,200 | | | | 12,221 | |
China High Precision Automation Group, Ltd. (Electronic equipment, instruments & components)**§ | | | 1,127,000 | | | | 298 | |
Hutchison Telecommunications Hong Kong Holdings, Ltd. (Diversified telecommunication services) | | | 10,098,000 | | | | 3,888 | |
Sa Sa International Holdings, Ltd. (Specialty retail) | | | 4,036,000 | | | | 2,235 | |
SmarTone Telecommunications Holdings, Ltd. (Wireless telecommunication services) | | | 2,105,000 | | | | 3,643 | |
See accompanying Notes to Financial Statements.
8 Annual Report | December 31, 2011 |
Institutional International Growth Fund
Portfolio of Investments, December 31, 2011 (all dollar amounts in thousands)
| | | | | | | | |
Issuer | | Shares or
Principal
Amount | | | Value | |
|
Common Stocks—Asia—4.0%—(continued) | |
Hong Kong—(continued) | | | | | | | | |
Value Partners Group, Ltd. (Capital markets) | | | 4,252,000 | | | $ | 2,179 | |
Wynn Macau, Ltd. (Hotels, restaurants & leisure) | | | 1,153,200 | | | | 2,895 | |
| | | | | | | | |
| | | | 27,359 | |
| | | | | | | | |
Singapore—1.7% | | | | | | | | |
*Biosensors International Group, Ltd. (Health care equipment & supplies) | | | 2,322,000 | | | | 2,560 | |
CapitaMalls Asia, Ltd. (Real estate management & development) | | | 4,993,000 | | | | 4,350 | |
*Global Logistic Properties, Ltd. (Real estate management & development) | | | 5,623,000 | | | | 7,608 | |
Keppel Corporation, Ltd. (Industrial conglomerates) | | | 1,634,300 | | | | 11,718 | |
| | | | | | | | |
| | | | 26,236 | |
| | | | | | | | |
|
Emerging Europe, Mid-East, Africa—1.7% | |
South Africa—1.1% | | | | | | | | |
Life Healthcare Group Holdings Pte, Ltd. (Health care providers & services) | | | 1,538,716 | | | | 3,934 | |
Shoprite Holdings, Ltd. (Food & staples retailing) | | | 460,030 | | | | 7,762 | |
The Foschini Group, Ltd. (Specialty retail) | | | 416,347 | | | | 5,415 | |
| | | | | | | | |
| | | | 17,111 | |
| | | | | | | | |
Turkey—0.6% | | | | | | | | |
BIM Birlesik Magazalar A.S. (Food & staples retailing) | | | 134,998 | | | | 3,742 | |
Turkiye Halk Bankasi A.S. (Commercial banks) | | | 1,025,321 | | | | 5,360 | |
| | | | | | | | |
| | | | 9,102 | |
| | | | | | | | |
Total Common Stocks—98.1%
(cost $1,496,335) | | | | 1,512,502 | |
| | | | | | | | |
| |
Convertible Bond | | | | | |
Brazil—0.0% | | | | | | | | |
Lupatech S.A., 6.500%, due 4/15/18 (Machinery)**§ | | $ | 941 | | | $ | 244 | |
| | | | | | | | |
Total Convertible Bond—0.0%
(cost $488) | | | | 244 | |
| | | | | | | | |
|
Repurchase Agreement | |
Fixed Income Clearing Corporation, 0.000% dated 12/30/11, due 1/3/12, repurchase price $21,933, collateralized by U.S. Treasury Note, 1.000%, due 1/15/14 | | | 21,933 | | | | 21,933 | |
| | | | | | | | |
Total Repurchase Agreement—1.4%
(cost $21,933) | | | | 21,933 | |
| | | | | | | | |
Total Investments—99.5%
(cost $1,518,756) | | | | 1,534,679 | |
Cash and other assets, less liabilities—0.5% | | | | 7,915 | |
| | | | | | | | |
Net assets—100.0% | | | $ | 1,542,594 | |
| | | | | | | | |
ADR = American Depository Receipt
* Non-income producing securities
† = U.S. listed foreign security
** = Fair valued pursuant to Valuation Procedures adopted by the Board of Trustees. These holdings represent 0.04% of the Fund’s net assets at December 31, 2011.
§ = Deemed illiquid pursuant to Liquidity Procedures approved by the Board of Trustees. These holdings represent 0.04% of the net assets at December 31, 2011.
For securities primarily traded on exchanges or markets that close before the close of regular trading on the New York Stock Exchange, the Fund may use an independent pricing service to fair value price the securities pursuant to Valuation Procedures approved by the Board of Trustees.
At December 31, 2011, the Fund’s Portfolio of Investments includes the following industry categories:
| | | | |
Financials | | | 22.4% | |
Consumer Discretionary | | | 14.0% | |
Industrials | | | 11.5% | |
Energy | | | 11.1% | |
Information Technology | | | 9.6% | |
Health Care | | | 8.7% | |
Materials | | | 8.3% | |
Consumer Staples | | | 7.9% | |
Utilities | | | 3.6% | |
Telecommunication Services | | | 2.9% | |
| | | | |
Total | | | 100.0% | |
| | | | |
At December 31, 2011, the Fund’s Portfolio of Investments includes the following currency categories:
| | | | |
British Pound Sterling | | | 28.8% | |
Euro | | | 19.7% | |
Japanese Yen | | | 12.1% | |
South Korean Won | | | 5.3% | |
Brazilian Real | | | 4.1% | |
Canadian Dollar | | | 4.0% | |
Swiss Franc | | | 3.9% | |
U.S. Dollar | | | 3.7% | |
Hong Kong Dollar | | | 3.1% | |
Swedish Krona | | | 2.2% | |
Indian Rupee | | | 2.1% | |
Singapore Dollar | | | 1.8% | |
Norwegian Krone | | | 1.5% | |
Indonesian Rupiah | | | 1.5% | |
South African Rand | | | 1.1% | |
All Other Currencies | | | 5.1% | |
| | | | |
Total | | | 100.0% | |
| | | | |
See accompanying Notes to Financial Statements.
December 31, 2011 | William Blair Funds 9 |

David Merjan
INSTITUTIONAL INTERNATIONAL EQUITY FUND
The Institutional International Equity Fund seeks long-term capital appreciation.
AN OVERVIEW FROM THE PORTFOLIO MANAGER
The Institutional International Equity Fund posted a 12.12% decrease (Class N Shares) for the 12 months ended December 31, 2011. By comparison, the Fund’s benchmark, the MSCI World Ex-U.S. (net) Index declined 12.30%, while the All Country World Ex-U.S. IMI Index (net), dropped 14.31%.
The Fund approximated its benchmark Index during 2011. Full year performance was bolstered by strong stock selection across a number of sectors, with significant value added in Consumer Discretionary, Information Technology (IT) and Materials. The Fund’s Consumer Discretionary holdings were up over 2%, while the Index return was -14.82% for the year. Within Consumer Discretionary, automobiles stock selection added significant value due to Hyundai Motor Co., which continued to take market share in the U.S. and maintained margins. Burberry Group plc also performed well on strong luxury demand in emerging markets, coupled with generally stable developed market demand. Tim Hortons, Inc., the Canadian doughnut purveyor, was another key performer during the year on good same store sales, coupled with an improving U.S. business. Retailing and media also performed well during the period. IT stock selection was driven by the weighting and stock selection in the Software and Services industry group, as SAP AG continued to exceed market expectations for operating performance, and Autonomy Corporation plc was acquired by Hewlett-Packard Company. Materials stock selection was bolstered by good stock selection both in Chemicals and Mining, coupled with the underweighting in the weak mining sector. Detracting from full year performance was large cap European Pharmaceutical performance on concerns about competition for key drugs. Consumer Staples and Energy also detracted from 2011 performance, with the underweighting and stock selection in Oil/Gas, coupled with underperformance by Nestle S.A. at the beginning of the year on increased raw material costs. Regionally, emerging markets exposure detracted from overall performance as developed markets generally outperformed. Europe and Canadian stock selection was strong over the period, while developed asian stock selection dragged on performance.
Throughout 2011, the Fund maintained its overweighting in Consumer Discretionary and IT at the expense of Resources and Financials. Consumer Discretionary totaled approximately 14% of the Fund as of year end 2011, an increase of 2% during the year, but a slight decline since September 30. Media, Specialty Retail and Hotels/Restaurants were the key overweightings within Consumer Discretionary during the period. IT represented 11.2% of the Fund at year end, a slight increase from September 30 and year end 2010, but well above the 4.3% Index weighting, due to a larger focus on Software/Services and Semiconductors. Industrials, while representing 14.9% of the Fund as of year end, above the 11.8% Index weighting, was decreased substantially during mid year, particularly in Capital Equipment holdings on concerns about a slowdown in earnings growth. Financials was persistently underweighted throughout 2011, and ended the year totaling 19.9%, below the 22.6% Index weighting, given the Fund’s underweighting in Commercial Banks and Insurance Companies. This weight increased, however, from the 16.1% as of September 30, as we increased European bank holdings on a slightly improving outlook and very low valuations. This increase was in high quality companies with good balance sheet structures, which had been punished given uncertainty surrounding the European debt situation. Resources totaled approximately 16% of the Fund as of year end, below the 22% index weighting, and a decrease from 24% as of year end 2010, due to moderating Oil/Gas and Mining exposure. Regionally, emerging markets totaled 14.2% as of year end 2011, and declined consistently throughout the year from 19.8% as of year end 2010, on concerns about inflationary pressures and potential fixed asset overinvestment in China. The U.K. was overweighted throughout the year, not because of the domestic U.K. economy, but due to the quality of the companies and the multi-national nature of their revenue stream. Conversely, developed asia was underweighted throughout 2011.
10 Annual Report | December 31, 2011 |
Institutional International Equity Fund
Performance Highlights (unaudited)
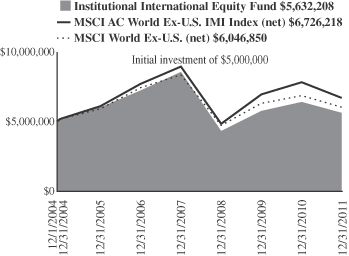
Average Annual Total Return 12/31/2011
| | | | | | | | | | | | | | | | |
| | | 1
Year | | | 3
Year | | | 5
Year | | | Since
Inception(a) | |
Institutional International Equity Fund | | | (12.12 | )% | | | 9.18 | % | | | (4.93 | )% | | | 1.69 | % |
MSCI World
Ex-U.S. (net) | | | (12.21 | ) | | | 8.53 | | | | (4.09 | ) | | | 2.72 | |
MSCI All Country World Ex-U.S.
IMI (net) | | | (14.31 | ) | | | 11.53 | | | | (2.74 | ) | | | 4.27 | |
| | (a) | | For the period December 1, 2004 (Commencement of Operations) to December 31, 2011. |
Performance cited represents past performance. Past performance does not guarantee future results and current performance may be lower or higher than the data quoted. Results shown are average annual returns, which assume reinvestment of dividends and capital gains. Investment returns and principal will fluctuate and you may have a gain or loss when you sell shares. For the most current month-end performance information, please call 1-800-742-7272, or visit our Web site at www.williamblairfunds.com. From time to time, the investment advisor may waive fees or reimburse expenses for the Fund. Without these waivers, performance would be lower. International investing involves special risk considerations, including currency fluctuations, lower liquidity, economic and political risk.
The performance highlights and graph presented above do not reflect the deduction of taxes that a shareholder would pay on fund distributions or the redemption of fund shares.
The Morgan Stanley Capital International (MSCI) World Ex-U.S. (net) is a free float-adjusted market capitalization weighted index that is designed to measure the equity market performance of developed markets, excluding the United States. This series approximates the minimum possible dividend reinvestment.
The Morgan Stanley Capital International (MSCI) All Country World Ex-U.S. Investable Market Index (IMI) (net) is a free float-adjusted market capitalization weighted index that is designed to measure the equity market performance of developed and emerging markets, excluding the United States. This series approximates the minimum possible dividend reinvestment.
On May 1, 2011, the Fund’s benchmark changed from the MSCI All Country World Ex-U.S. IMI (net) to the MSCI World Ex-U.S. (net). The primary reason for this change is to compare the Fund to a benchmark that more closely reflects the market capitalization focus the Fund uses in its investment strategy.
This report identifies the Fund’s investments on December 31, 2011. These holdings are subject to change. Not all stocks in the Fund performed the same, nor is there any guarantee that these stocks will perform as well in the future. Market forecasts provided in this report may not necessarily come to pass.
Sector Diversification (unaudited)
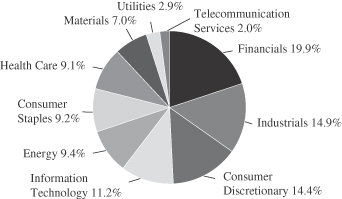
The sector diversification shown is based on the total long-term securities.
December 31, 2011 | William Blair Funds 11 |
Institutional International Equity Fund
Portfolio of Investments, December 31, 2011 (all dollar amounts in thousands)
| | | | | | | | |
Issuer | | Shares | | | Value | |
| | |
Common Stocks | | | | | | | | |
| | |
Europe, Mid-East—35.3% | | | | | | | | |
Denmark—1.7% | | | | | | | | |
Novo Nordisk A/S (Pharmaceuticals) | | | 16,507 | | | $ | 1,897 | |
| | | | | | | | |
France—4.7% | | | | | | | | |
AXA S.A. (Insurance) | | | 96,629 | | | | 1,256 | |
BNP Paribas S.A. (Commercial banks) | | | 37,798 | | | | 1,485 | |
Cie Generale des Etablissements Michelin (Auto components) | | | 11,675 | | | | 690 | |
Essilor International S.A. (Health care equipment & supplies) | | | 26,393 | | | | 1,864 | |
| | | | | | | | |
| | | | | | | 5,295 | |
| | | | | | | | |
Germany—7.5% | | | | | | | | |
BASF SE (Chemicals) | | | 17,169 | | | | 1,197 | |
Deutsche Bank AG (Capital markets) | | | 37,297 | | | | 1,421 | |
Fresenius Medical Care AG & Co. KGaA (Health care providers & services) | | | 37,855 | | | | 2,572 | |
Infineon Technologies AG (Semiconductors & semiconductor equipment) | | | 155,782 | | | | 1,173 | |
SAP AG (Software) | | | 38,438 | | | | 2,032 | |
| | | | | | | | |
| | | | | | | 8,395 | |
| | | | | | | | |
Ireland—2.9% | | | | | | | | |
*Ryanair Holdings plc—ADR (Airlines) | | | 37,289 | | | | 1,039 | |
Shire plc (Pharmaceuticals) | | | 61,605 | | | | 2,146 | |
| | | | | | | | |
| | | | | | | 3,185 | |
| | | | | | | | |
Israel—2.9% | | | | | | | | |
*Check Point Software Technologies, Ltd. (Software)† | | | 33,839 | | | | 1,778 | |
Teva Pharmaceutical Industries, Ltd.—ADR (Pharmaceuticals) | | | 35,295 | | | | 1,424 | |
| | | | | | | | |
| | | | | | | 3,202 | |
| | | | | | | | |
Italy—2.0% | | | | | | | | |
Saipem SpA (Energy equipment & services) | | | 52,723 | | | | 2,242 | |
| | | | | | | | |
Netherlands—4.2% | | | | | | | | |
ASML Holding N.V. (Semiconductors & semiconductor equipment) | | | 29,492 | | | | 1,239 | |
Royal Dutch Shell plc (Oil, gas & consumable fuels) | | | 44,045 | | | | 1,679 | |
Unilever N.V. (Food products) | | | 51,473 | | | | 1,770 | |
| | | | | | | | |
| | | | | | | 4,688 | |
| | | | | | | | |
Spain—2.4% | | | | | | | | |
Banco Santander S.A. (Commercial banks) | | | 164,074 | | | | 1,246 | |
Inditex S.A. (Specialty retail) | | | 17,345 | | | | 1,421 | |
| | | | | | | | |
| | | | | | | 2,667 | |
| | | | | | | | |
Sweden—1.0% | | | | | | | | |
Atlas Copco AB (Machinery) | | | 50,537 | | | | 1,087 | |
| | | | | | | | |
Switzerland—6.0% | | | | | | | | |
*ABB, Ltd. (Electrical equipment) | | | 63,642 | | | | 1,198 | |
*Glencore International plc (Metals & mining) | | | 153,577 | | | | 935 | |
*Julius Baer Group, Ltd. (Capital markets) | | | 27,763 | | | | 1,086 | |
Nestle S.A. (Food products) | | | 32,210 | | | | 1,852 | |
*Syngenta AG (Chemicals) | | | 5,402 | | | | 1,581 | |
| | | | | | | | |
| | | | | | | 6,652 | |
| | | | | | | | |
| | | | | | | | |
Issuer | | Shares | | | Value | |
| | |
Common Stocks—(continued) | | | | | | | | |
| | |
United Kingdom—27.1% | | | | | | | | |
Barclays plc (Commercial banks) | | | 887,453 | | | $ | 2,426 | |
BG Group plc (Oil, gas & consumable fuels) | | | 79,271 | | | | 1,695 | |
British Sky Broadcasting Group plc (Media) | | | 108,461 | | | | 1,234 | |
Burberry Group plc (Textiles, apparel & luxury goods) | | | 77,323 | | | | 1,423 | |
Centrica plc (Multi-utilities) | | | 309,937 | | | | 1,393 | |
Compass Group plc (Hotels, restaurants & leisure) | | | 231,006 | | | | 2,192 | |
Diageo plc (Beverages) | | | 89,055 | | | | 1,945 | |
Experian plc (Professional services) | | | 108,782 | | | | 1,479 | |
HSBC Holdings plc (Commercial banks) | | | 176,278 | | | | 1,339 | |
Johnson Matthey plc (Chemicals) | | | 40,317 | | | | 1,150 | |
Pearson plc (Media) | | | 92,778 | | | | 1,743 | |
Petrofac, Ltd. (Energy equipment & services) | | | 63,409 | | | | 1,419 | |
Prudential plc (Insurance) | | | 222,657 | | | | 2,208 | |
*Rolls-Royce Holdings plc (Aerospace & defense) | | | 189,842 | | | | 2,201 | |
Scottish & Southern Energy plc (Electric utilities) | | | 88,625 | | | | 1,777 | |
Standard Chartered plc (Commercial banks) | | | 69,951 | | | | 1,531 | |
The Capita Group plc (Professional services) | | | 30,579 | | | | 298 | |
Tullow Oil plc (Oil, gas & consumable fuels) | | | 51,454 | | | | 1,120 | |
Vodafone Group plc (Wireless telecommunication services) | | | 575,704 | | | | 1,599 | |
| | | | | | | | |
| | | | | | | 30,172 | |
| | | | | | | | |
| | |
Canada—9.6% | | | | | | | | |
Brookfield Asset Management, Inc. Class “A” (Real estate management & development)† | | | 58,091 | | | | 1,596 | |
Canadian National Railway Co. (Road & rail)† | | | 19,562 | | | | 1,537 | |
Goldcorp, Inc. (Metals & mining)† | | | 28,674 | | | | 1,269 | |
National Bank of Canada (Commercial banks) | | | 19,510 | | | | 1,382 | |
Saputo, Inc. (Food products) | | | 32,229 | | | | 1,235 | |
The Toronto-Dominion Bank (Commercial banks) | | | 30,690 | | | | 2,298 | |
Tim Hortons, Inc. (Hotels, restaurants & leisure) | | | 29,541 | | | | 1,431 | |
| | | | | | | | |
| | | | | | | 10,748 | |
| | | | | | | | |
| | |
Japan—9.5% | | | | | | | | |
Canon, Inc. (Office electronics) | | | 33,000 | | | | 1,462 | |
Daito Trust Construction Co., Ltd. (Real estate management & development) | | | 15,500 | | | | 1,329 | |
Fanuc, Ltd. (Machinery) | | | 9,400 | | | | 1,439 | |
Fast Retailing Co., Ltd. (Specialty retail) | | | 9,800 | | | | 1,783 | |
Keyence Corporation (Electronic equipment, instruments & components) | | | 6,200 | | | | 1,495 | |
Mitsubishi Corporation (Trading companies & distributors) | | | 63,500 | | | | 1,283 | |
Nitori Co., Ltd. (Specialty retail) | | | 13,150 | | | | 1,233 | |
Softbank Corporation (Wireless telecommunication services) | | | 19,400 | | | | 571 | |
| | | | | | | | |
| | | | | | | 10,595 | |
| | | | | | | | |
See accompanying Notes to Financial Statements.
12 Annual Report | December 31, 2011 |
Institutional International Equity Fund
Portfolio of Investments, December 31, 2011 (all dollar amounts in thousands)
| | | | | | | | |
Issuer | | Shares | | | Value | |
| | |
Common Stocks—(continued) | | | | | | | | |
| | |
Emerging Asia—8.2% | | | | | | | | |
China—1.9% | | | | | | | | |
Belle International Holdings, Ltd. (Specialty retail) | | | 560,000 | | | $ | 976 | |
China Shenhua Energy Co., Ltd. (Oil, gas & consumable fuels) | | | 256,500 | | | | 1,113 | |
| | | | | | | | |
| | | | | | | 2,089 | |
| | | | | | | | |
India—0.8% | | | | | | | | |
Tata Consultancy Services, Ltd. (IT services) | | | 41,153 | | | | 899 | |
| | | | | | | | |
Indonesia—1.1% | | | | | | | | |
PT Bank Rakyat Indonesia (Commercial banks) | | | 1,649,500 | | | | 1,228 | |
| | | | | | | | |
South Korea—4.4% | | | | | | | | |
*Hyundai Motor Co. (Automobiles) | | | 8,727 | | | | 1,614 | |
Samsung Electronics Co., Ltd. (Semiconductors & semiconductor equipment) | | | 2,359 | | | | 2,166 | |
*Samsung Engineering Co., Ltd. (Construction & engineering) | | | 6,762 | | | | 1,183 | |
| | | | | | | | |
| | | | | | | 4,963 | |
| | | | | | | | |
| | |
Emerging Latin America—4.8% | | | | | | | | |
Brazil—2.6% | | | | | | | | |
Cia de Bebidas das Americas—ADR (Beverages) | | | 51,504 | | | | 1,859 | |
Embraer S.A.—ADR (Aerospace & defense) | | | 41,823 | | | | 1,055 | |
| | | | | | | | |
| | | | | | | 2,914 | |
| | | | | | | | |
Mexico—1.2% | | | | | | | | |
Wal-Mart de Mexico S.A.B. de C.V. (Food & staples retailing) | | | 495,700 | | | | 1,360 | |
| | | | | | | | |
Panama—1.0% | | | | | | | | |
Copa Holdings S.A. (Airlines)† | | | 18,470 | | | | 1,084 | |
| | | | | | | | |
| | |
Asia—2.6% | | | | | | | | |
Australia—1.3% | | | | | | | | |
BHP Billiton, Ltd.—ADR (Metals & mining) | | | 20,750 | | | | 1,466 | |
| | | | | | | | |
Singapore—1.3% | | | | | | | | |
Keppel Corporation, Ltd. (Industrial conglomerates) | | | 194,000 | | | | 1,391 | |
| | | | | | | | |
| |
Emerging Europe, Mid-East, Africa—0.9% | | | | | |
South Africa—0.9% | | | | | | | | |
Sasol, Ltd. (Oil, gas & consumable fuels) | | | 21,406 | | | | 1,022 | |
| | | | | | | | |
Total Common Stocks—98.0%
(cost $100,982) | | | | 109,241 | |
| | | | | | | | |
| | | | | | | | |
Issuer | | Principal
Amount | | | Value | |
| | |
Repurchase Agreement | | | | | | | | |
Fixed Income Clearing Corporation, 0.000% dated 12/30/11, due 1/3/12, repurchase price $179, collateralized by FHLMC, 4.500%, due 1/15/14 | | $ | 179 | | | $ | 179 | |
| | | | | | | | |
Total Repurchase Agreement—0.2%
(cost $179) | | | | 179 | |
| | | | | | | | |
Total Investments—98.2%
(cost $101,161) | | | | 109,420 | |
Cash and other assets, less liabilities—1.8% | | | | 2,054 | |
| | | | | | | | |
Net assets—100.0% | | | $ | 111,474 | |
| | | | | | | | |
ADR = American Depository Receipt
* Non-income producing securities
† = U.S. listed foreign security
For securities primarily traded on exchanges or markets that close before the close of regular trading on the New York Stock Exchange, the Fund may use an independent pricing service to fair value price the securities pursuant to Valuation Procedures approved by the Board of Trustees.
| | | | |
At December 31, 2011, the Fund's Portfolio of Investments includes the
following industry categories: | |
Financials | | | 19.9% | |
Industrials | | | 14.9% | |
Consumer Discretionary | | | 14.4% | |
Information Technology | | | 11.2% | |
Energy | | | 9.4% | |
Consumer Staples | | | 9.2% | |
Health Care | | | 9.1% | |
Materials | | | 7.0% | |
Utilities | | | 2.9% | |
Telecommunication Services | | | 2.0% | |
| | | | |
Total | | | 100.0% | |
| | | | |
At December 31, 2011, the Fund's Portfolio of Investments includes the following currency categories:
| | | | |
British Pound Sterling | | | 30.8% | |
Euro | | | 19.8% | |
U.S. Dollar | | | 12.9% | |
Japanese Yen | | | 9.7% | |
Canadian Dollar | | | 5.8% | |
Swiss Franc | | | 5.2% | |
South Korean Won | | | 4.5% | |
Hong Kong Dollar | | | 3.1% | |
Danish Krone | | | 1.7% | |
Singapore Dollar | | | 1.3% | |
Mexican Peso | | | 1.3% | |
Indonesian Rupiah | | | 1.1% | |
All Other Currencies | | | 2.8% | |
| | | | |
Total | | | 100.0% | |
| | | | |
See accompanying Notes to Financial Statements.
December 31, 2011 | William Blair Funds 13 |

Jeffrey A. Urbina
INTERNATIONAL SMALL CAP GROWTH FUND
The International Small Cap Growth Fund seeks long-term capital appreciation.
AN OVERVIEW FROM THE PORTFOLIO MANAGER
The International Small Cap Growth Fund posted a 11.60% decrease (Institutional Class Shares) for the 12 months ended December 31, 2011. By comparison, the Fund’s benchmark, the MSCI All Country Ex-U.S. Small Cap Index (net), declined 18.50%.
Performance was driven by strong stock selection across regions and sectors. From a sector perspective, Financials, Information Technology (IT) and Materials were the key drivers of performance, although all sectors added value, with the exception of Energy. The underweighting in Europe and focus on Asset Management and Insurance added value in Financials, and as management teams generally executed well relative to the universe as a whole. IT stock selection benefited from the focus and performance of Internet Software/Services and IT Services holdings, while the underweighting in Metals/Mining and Chemicals stock selection drove Materials returns. Energy stock selection was hampered by Oil/Gas performance.
From a sector positioning perspective, Consumer Discretionary (25.1%), Healthcare (15.8%) and IT (16.7%) remained significantly overweighted relative to the market throughout the entire year, while Financials (13.1%) and Materials (2.6%) were most significantly underweighted with only minor changes in sector weightings throughout 2011. On the other hand, Consumer Staples steadily increased from approximately 4% as of December 2010 to 8.3% as of year end 2011 due to higher weightings in Food and Food Retailing. Industrials were also significantly reduced during the period on lower Machinery and Professional Services exposure, given moderating operating performance. After increasing during the first half of the year from 17% to at or above the 20% Index weighting, Japanese exposure ended the year 12.9%, as we significantly reduced Consumer, Financials and Industrials exposures. These assets were redeployed into Asia Ex-Japan, Canada and, to some extent, in Emerging Markets, which totaled 24.5% as of year end, above the 22.2% Index weighting, due to the higher weighting in EMEA (Europe, Mid-East and Africa) and Latin America at the expense of Emerging Asia.
14 Annual Report | December 31, 2011 |
International Small Cap Growth Fund
Performance Highlights (unaudited)
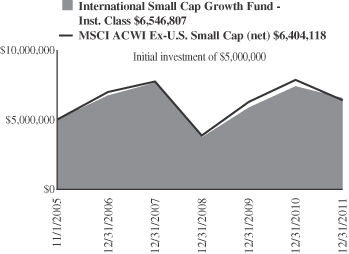
Average Annual Total Return at 12/31/2011
| | | | | | | | | | | | | | | | |
| | | 1
Year | | | 3
Year | | | 5
Year | | | Since
Inception(a) | |
Institutional Class | | | (11.60 | )% | | | 20.82 | % | | | (0.60 | )% | | | 4.47 | % |
MSCI All Country World Ex-U.S. Small Cap
Index (net) | | | (18.50 | ) | | | 18.46 | | | | (1.73 | ) | | | 4.09 | |
| | (a) | | For the period November 1, 2005 (Commencement of Operations) to December 31, 2011. |
Performance cited represents past performance. Past performance does not guarantee future results and current performance may be lower or higher than the data quoted. Results shown are average annual returns, which assume reinvestment of dividends and capital gains. Investment returns and principal will fluctuate and you may have a gain or loss when you sell shares. For the most current month-end performance information, please call 1-800-742-7272, or visit our Web site at www.williamblairfunds.com. Investing in smaller companies involves special risks, including higher volatility and lower liquidity. Smaller capitalization stocks are also more sensitive to purchase/sale transactions and changes in the issuer’s financial condition. From time to time, the investment advisor may waive fees or reimburse expenses for the Fund. Without these waivers, performance would be lower. International investing involves special risk considerations, including currency fluctuations, lower liquidity, economic and political risk.
The performance highlights and graph presented above do not reflect the deduction of taxes that a shareholder would pay on fund distributions or the redemption of fund shares.
The Morgan Stanley Capital International (MSCI) All Country World Ex-U.S. Small Cap Index (net) is a free float-adjusted market capitalization weighted index that is designed to measure the equity market performance of small capitalization developed and emerging markets, excluding the United States. This series approximates the minimum possible dividend reinvestment.
This report identifies the Fund’s investments on December 31, 2011. These holdings are subject to change. Not all stocks in the Fund performed the same, nor is there any guarantee that these stocks will perform as well in the future. Market forecasts provided in this report may not necessarily come to pass.
Sector Diversification (unaudited)
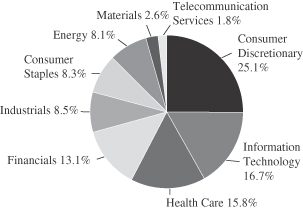
The sector diversification shown is based on the total long-term securities.
December 31, 2011 | William Blair Funds 15 |
International Small Cap Growth Fund
Portfolio of Investments, December 31, 2011 (all dollar amounts in thousands)
| | | | | | | | |
Issuer | | Shares | | | Value | |
| | |
Common Stocks | | | | | | | | |
| | |
Europe—22.6% | | | | | | | | |
Finland—1.0% | | | | | | | | |
Nokian Renkaat Oyj (Auto components) | | | 228,528 | | | $ | 7,359 | |
| | | | | | | | |
Germany—6.9% | | | | | | | | |
Aixtron AG (Semiconductors & semiconductor equipment) | | | 659,861 | | | | 8,412 | |
Delticom AG (Specialty retail) | | | 35,197 | | | | 3,038 | |
ElringKlinger AG (Auto components) | | | 224,609 | | | | 5,576 | |
Gerry Weber International AG (Textiles, apparel & luxury goods) | | | 171,252 | | | | 5,224 | |
MTU Aero Engines Holding AG (Aerospace & defense) | | | 170,437 | | | | 10,906 | |
Wincor Nixdorf AG (Computers & peripherals) | | | 232,278 | | | | 10,381 | |
Wirecard AG (IT services) | | | 345,265 | | | | 5,550 | |
| | | | | | | | |
| | | | | | | 49,087 | |
| | | | | | | | |
Ireland—1.4% | | | | | | | | |
Paddy Power plc (Hotels, restaurants & leisure) | | | 170,315 | | | | 9,812 | |
| | | | | | | | |
Italy—2.7% | | | | | | | | |
De’Longhi SpA (Household durables) | | | 477,455 | | | | 4,221 | |
*Salvatore Ferragamo Italia SpA (Textiles, apparel & luxury goods) | | | 591,443 | | | | 7,792 | |
Tod’s SpA (Textiles, apparel & luxury goods) | | | 59,014 | | | | 4,816 | |
*Yoox SpA (Internet & catalog retail) | | | 236,517 | | | | 2,553 | |
| | | | | | | | |
| | | | | | | 19,382 | |
| | | | | | | | |
Norway—0.4% | | | | | | | | |
Opera Software ASA (Internet software & services) | | | 627,230 | | | | 3,052 | |
| | | | | | | | |
Spain—2.1% | | | | | | | | |
Viscofan S.A. (Food products) | | | 402,566 | | | | 14,933 | |
| | | | | | | | |
Sweden—4.8% | | | | | | | | |
Elekta AB (Health care equipment & supplies) | | | 354,223 | | | | 15,364 | |
JM AB (Household durables) | | | 680,223 | | | | 11,070 | |
Mekonomen AB (Specialty retail) | | | 86,842 | | | | 2,839 | |
NIBE Industrier AB (Building products) | | | 360,985 | | | | 5,337 | |
| | | | | | | | |
| | | | | | | 34,610 | |
| | | | | | | | |
Switzerland—3.3% | | | | | | | | |
*Meyer Burger Technology AG (Machinery) | | | 324,045 | | | | 5,071 | |
Partners Group Holding AG (Capital markets) | | | 107,323 | | | | 18,727 | |
| | | | | | | | |
| | | | | | | 23,798 | |
| | | | | | | | |
United Kingdom—20.9% | | | | | | | | |
Abcam plc (Biotechnology) | | | 1,133,920 | | | | 6,428 | |
*ASOS plc (Internet & catalog retail) | | | 209,103 | | | | 4,014 | |
Aveva Group plc (Software) | | | 309,675 | | | | 6,877 | |
Babcock International Group plc (Commercial services & supplies) | | | 1,304,077 | | | | 14,896 | |
*Blinkx plc (Internet software & services) | | | 1,531,578 | | | | 1,820 | |
Carphone Warehouse Group plc (Specialty retail) | | | 424,161 | | | | 2,035 | |
Croda International plc (Chemicals) | | | 129,953 | | | | 3,641 | |
Dunelm Group plc (Specialty retail) | | | 524,645 | | | | 3,534 | |
Elementis plc (Chemicals) | | | 1,681,016 | | | | 3,582 | |
*EnQuest plc (Oil, gas & consumable fuels) | | | 1,900,415 | | | | 2,729 | |
|
Common Stocks—Europe—22.6%—(continued) | |
United Kingdom—(continued) | | | | | | | | |
Fidessa Group plc (Software) | | | 113,164 | | | $ | 2,659 | |
Halma plc (Electronic equipment, instruments & components) | | | 1,029,085 | | | | 5,280 | |
Hargreaves Lansdown plc (Capital markets) | | | 782,001 | | | | 5,228 | |
Hikma Pharmaceuticals plc (Pharmaceuticals) | | | 392,631 | | | | 3,780 | |
IG Group Holdings plc (Diversified financial services) | | | 1,499,148 | | | | 11,103 | |
*Imagination Technologies Group plc (Computers & peripherals) | | | 940,451 | | | | 8,018 | |
Lancashire Holdings, Ltd. (Insurance) | | | 1,090,332 | | | | 12,268 | |
Moneysupermarket.com Group plc (Internet software & services) | | | 3,400,087 | | | | 5,544 | |
*Ocado Group plc (Internet & catalog retail) | | | 670,815 | | | | 567 | |
Restaurant Group plc (Hotels, restaurants & leisure) | | | 801,136 | | | | 3,706 | |
*Salamander Energy plc (Oil, gas & consumable fuels) | | | 1,199,181 | | | | 3,760 | |
Spirax-Sarco Engineering plc (Machinery) | | | 326,571 | | | | 9,499 | |
*Sports Direct International plc (Specialty retail) | | | 1,574,379 | | | | 5,218 | |
St James’s Place plc (Insurance) | | | 1,105,662 | | | | 5,572 | |
Synergy Health plc (Health care providers & services) | | | 243,952 | | | | 3,207 | |
*Telecity Group plc (Internet software & services) | | | 1,078,314 | | | | 10,835 | |
Victrex plc (Chemicals) | | | 264,276 | | | | 4,498 | |
| | | | | | | | |
| | | | | | | 150,298 | |
| | | | | | | | |
| | |
Emerging Asia—13.2% | | | | | | | | |
China—3.0% | | | | | | | | |
AAC Technologies Holdings, Inc. (Communications equipment) | | | 1,623,559 | | | | 3,646 | |
Comba Telecom Systems Holdings, Ltd. (Communications equipment) | | | 4,463,526 | | | | 3,598 | |
Haitian International Holdings, Ltd. (Machinery) | | | 4,498,496 | | | | 3,869 | |
Hengdeli Holdings, Ltd. (Specialty retail) | | | 15,368,000 | | | | 5,026 | |
Spreadtrum Communications, Inc.—ADR (Semiconductors & semiconductor equipment)† | | | 165,481 | | | | 3,455 | |
*WuXi PharmaTech Cayman, Inc.—ADR (Life sciences tools & services)† | | | 160,947 | | | | 1,777 | |
| | | | | | | | |
| | | | | | | 21,371 | |
| | | | | | | | |
India—2.1% | | | | | | | | |
CRISIL, Ltd. (Diversified financial services) | | | 213,930 | | | | 3,569 | |
eClerx Services, Ltd. (Professional services) | | | 161,806 | | | | 2,102 | |
Ipca Laboratories, Ltd. (Pharmaceuticals) | | | 353,225 | | | | 1,835 | |
*Jubilant Foodworks, Ltd. (Hotels, restaurants & leisure) | | | 257,293 | | | | 3,655 | |
Motherson Sumi Systems, Ltd. (Auto components) | | | 841,485 | | | | 2,159 | |
Oberoi Realty, Ltd. (Real estate management & development) | | | 405,384 | | | | 1,602 | |
| | | | | | | | |
| | | | | | | 14,922 | |
| | | | | | | | |
Indonesia—3.5% | | | | | | | | |
PT Harum Energy Tbk (Oil, gas & consumable fuels) | | | 12,248,000 | | | | 9,253 | |
See accompanying Notes to Financial Statements.
16 Annual Report | December 31, 2011 |
International Small Cap Growth Fund
Portfolio of Investments, December 31, 2011 (all dollar amounts in thousands)
| | | | | | | | |
Issuer | | Shares | | | Value | |
|
Common Stocks—Emerging Asia—13.2%—(continued) | |
Indonesia—(continued) | | | | | | | | |
PT Indofood CBP Sukses Makmur Tbk (Food products) | | | 12,965,000 | | | $ | 7,435 | |
PT Kalbe Farma Tbk (Pharmaceuticals) | | | 10,284,500 | | | | 3,856 | |
PT Perusahaan Perkebunan London Sumatra Indonesia Tbk (Food products) | | | 18,415,500 | | | | 4,570 | |
| | | | | | | | |
| | | | | | | 25,114 | |
| | | | | | | | |
South Korea—0.9% | | | | | | | | |
*Daum Communications Corporation (Internet software & services) | | | 66,097 | | | | 6,885 | |
| | | | | | | | |
Taiwan—3.1% | | | | | | | | |
E Ink Holdings, Inc. (Electronic equipment, instruments & components) | | | 2,413,000 | | | | 3,148 | |
Hiwin Technologies Corporation (Machinery) | | | 436,000 | | | | 3,542 | |
Powertech Technology, Inc. (Semiconductors & semiconductor equipment) | | | 2,464,000 | | | | 5,216 | |
Simplo Technology Co., Ltd. (Computers & peripherals) | | | 615,500 | | | | 3,598 | |
TSRC Corporation (Chemicals) | | | 2,720,600 | | | | 6,676 | |
| | | | | | | | |
| | | | | | | 22,180 | |
| | | | | | | | |
Thailand—0.6% | | | | | | | | |
*Bangkok Dusit Medical Services PCL (Health care providers & services) | | | 1,761,200 | | | | 4,577 | |
| | | | | | | | |
Japan—12.9% | | | | | | | | |
Ain Pharmaciez, Inc. (Food & staples retailing) | | | 132,700 | | | | 6,379 | |
CyberAgent, Inc. (Media) | | | 3,171 | | | | 10,304 | |
Dr Ci:Labo Co., Ltd. (Personal products) | | | 1,549 | | | | 8,241 | |
Exedy Corporation (Auto components) | | | 244,300 | | | | 7,049 | |
F.C.C. Co., Ltd. (Auto components) | | | 384,209 | | | | 7,807 | |
K’s Holdings Corporation (Specialty retail) | | | 230,100 | | | | 9,118 | |
Kakaku.com, Inc. (Internet software & services) | | | 158,400 | | | | 5,808 | |
M3, Inc. (Health care technology) | | | 821 | | | | 3,701 | |
Miraca Holdings, Inc. (Health care providers & services) | | | 383,500 | | | | 15,271 | |
Sawai Pharmaceutical Co., Ltd. (Pharmaceuticals) | | | 65,500 | | | | 6,799 | |
Ship Healthcare Holdings, Inc. (Health care providers & services) | | | 223,200 | | | | 4,878 | |
Start Today Co., Ltd. (Internet & catalog retail) | | | 155,100 | | | | 3,629 | |
United Arrows, Ltd. (Specialty retail) | | | 196,500 | | | | 3,794 | |
| | | | | | | | |
| | | | | | | 92,778 | |
| | | | | | | | |
| | |
Asia—8.9% | | | | | | | | |
Australia—2.6% | | | | | | | | |
Cochlear, Ltd. (Health care equipment & supplies) | | | 231,101 | | | | 14,655 | |
Iress Market Technology, Ltd. (IT services) | | | 607,170 | | | | 4,303 | |
| | | | | | | | |
| | | | | | | 18,958 | |
| | | | | | | | |
Hong Kong—5.1% | | | | | | | | |
ASM Pacific Technology, Ltd. (Semiconductors & semiconductor equipment) | | | 838,200 | | | | 9,406 | |
|
Common Stocks—Asia—8.9%—(continued) | |
Hong Kong—(continued) | | | | | | | | |
*Haier Electronics Group Co., Ltd. (Household durables) | | | 7,780,000 | | | $ | 6,962 | |
Sa Sa International Holdings, Ltd. (Specialty retail) | | | 9,518,000 | | | | 5,270 | |
SmarTone Telecommunications Holdings, Ltd. (Wireless telecommunication services) | | | 7,445,000 | | | | 12,883 | |
Value Partners Group, Ltd. (Capital markets) | | | 4,313,000 | | | | 2,210 | |
| | | | | | | | |
| | | | | | | 36,731 | |
| | | | | | | | |
Singapore—1.2% | | | | | | | | |
*Biosensors International Group, Ltd. (Health care equipment & supplies) | | | 3,535,000 | | | | 3,897 | |
First Resources, Ltd. (Food products) | | | 2,982,000 | | | | 3,472 | |
Goodpack, Ltd. (Air freight & logistics) | | | 841,000 | | | | 895 | |
| | | | | | | | |
| | | | | | | 8,264 | |
| | | | | | | | |
Canada—8.0% | | | | | | | | |
Canadian Western Bank (Commercial banks) | | | 217,600 | | | | 5,511 | |
*Celtic Exploration, Ltd. (Oil, gas & consumable fuels) | | | 462,102 | | | | 10,374 | |
Dollarama, Inc. (Multiline retail) | | | 232,374 | | | | 10,150 | |
Home Capital Group, Inc. (Thrifts & mortgage finance) | | | 105,423 | | | | 5,081 | |
*Legacy Oil + Gas, Inc. (Oil, gas & consumable fuels) | | | 831,529 | | | | 8,554 | |
Petrominerales, Ltd. (Oil, gas & consumable fuels) | | | 317,847 | | | | 5,167 | |
Peyto Exploration & Development Corporation (Oil, gas & consumable fuels) | | | 507,608 | | | | 12,153 | |
Total Energy Services, Inc. (Energy equipment & services) | | | 8,648 | | | | 147 | |
| | | | | | | | |
| | | | | | | 57,137 | |
| | | | | | | | |
| |
Emerging Europe, Mid-East, Africa—6.3% | | | | | |
Poland—0.7% | | | | | | | | |
Lubelski Wegiel Bogdanka S.A. (Oil, gas & consumable fuels) | | | 152,701 | | | | 4,598 | |
| | | | | | | | |
Russia—0.3% | | | | | | | | |
*Etalon Group Ltd.—144A—GDR (Real estate management & development)† | | | 516,849 | | | | 2,429 | |
| | | | | | | | |
South Africa—4.3% | | | | | | | | |
Capitec Bank Holdings, Ltd. (Commercial banks) | | | 231,968 | | | | 5,115 | |
Clicks Group, Ltd. (Multiline retail) | | | 1,803,149 | | | | 10,326 | |
Coronation Fund Managers, Ltd. (Capital markets) | | | 1,984,323 | | | | 5,580 | |
Life Healthcare Group Holdings Pte, Ltd. (Health care providers & services) | | | 2,392,361 | | | | 6,117 | |
Mr Price Group, Ltd. (Specialty retail) | | | 406,903 | | | | 4,022 | |
| | | | | | | | |
| | | | | | | 31,160 | |
| | | | | | | | |
Turkey—1.0% | | | | | | | | |
Tofas Turk Otomobil Fabrikasi A.S. (Automobiles) | | | 1,112,295 | | | | 3,477 | |
Turkiye Sinai Kalkinma Bankasi A.S. (Commercial banks) | | | 3,754,548 | | | | 3,628 | |
| | | | | | | | |
| | | | | | | 7,105 | |
| | | | | | | | |
See accompanying Notes to Financial Statements.
December 31, 2011 | William Blair Funds 17 |
International Small Cap Growth Fund
Portfolio of Investments, December 31, 2011 (all dollar amounts in thousands)
| | | | | | | | |
Issuer | | Shares or
Principal
Amount | | | Value | |
|
Common Stocks—(continued) | |
| | |
Emerging Latin America—5.0% | | | | | | | | |
Brazil—3.3% | | | | | | | | |
Arezzo Industria e Comercio S.A. (Textiles, apparel & luxury goods) | | | 399,396 | | | $ | 4,968 | |
CETIP S.A.—Balcao Organizado de Ativos e Derivativos (Capital markets) | | | 287,855 | | | | 4,159 | |
OdontoPrev S.A. (Health care providers & services) | | | 402,300 | | | | 5,737 | |
Raia Drogasil S.A. (Food & staples retailing) | | | 375,400 | | | | 2,610 | |
*Restoque Comercio e Confeccoes de Roupas S.A. (Textiles, apparel & luxury goods) | | | 221,800 | | | | 3,246 | |
*T4F Entretenimento S.A. (Media) | | | 487,400 | | | | 2,992 | |
| | | | | | | | |
| | | | | | | 23,712 | |
| | | | | | | | |
Chile—0.6% | | | | | | | | |
*CFR Pharmaceuticals S.A. (Pharmaceuticals) | | | 16,669,705 | | | | 3,918 | |
| | | | | | | | |
Mexico—0.7% | | | | | | | | |
*Genomma Lab Internacional S.A.B. de C.V. (Pharmaceuticals) | | | 2,516,520 | | | | 4,853 | |
| | | | | | | | |
Panama—0.4% | | | | | | | | |
Copa Holdings S.A. (Airlines)† | | | 53,767 | | | | 3,155 | |
| | | | | | | | |
Total Common Stocks—97.8%
(cost $721,613) | | | | 702,178 | |
| | | | | | | | |
| | |
Convertible Bond | | | | | | | | |
Brazil—0.0% | | | | | | | | |
Lupatech S.A., 6.500%, due 4/15/18 (Machinery)**§ | | $ | 959 | | | | 249 | |
| | | | | | | | |
Total Convertible Bond—0.0%
(cost $497) | | | | 249 | |
| | | | | | | | |
| | |
Repurchase Agreement | | | | | | | | |
Fixed Income Clearing Corporation, 0.000% dated 12/30/11, due 1/3/12, repurchase price $12,882, collateralized by FHLB, 4.500%, due 1/15/14 | | | 12,882 | | | | 12,882 | |
| | | | | | | | |
Total Repurchase Agreement—1.8%
(cost $12,882) | | | | 12,882 | |
| | | | | | | | |
Total Investments—99.6%
(cost $734,992) | | | | 715,309 | |
Cash and other assets, less liabilities—0.4% | | | | 2,912 | |
| | | | | | | | |
Net assets—100.0% | | | $ | 718,221 | |
| | | | | | | | |
ADR = American Depository Receipt
GDR = Global Depository Receipt
* Non-income producing securities
† = U.S. listed foreign security
** = Fair valued pursuant to Valuation Procedures adopted by the Board of Trustees. This holding represents 0.03% of the Fund’s net assets at December 31, 2011.
§ = Deemed illiquid pursuant to Liquidity Procedures approved by the Board of Trustees. This holding represents 0.03% of the net assets at December 31, 2011.
For securities primarily traded on exchanges or markets that close before the close of regular trading on the New York Stock Exchange, the Fund may use an independent pricing service to fair value price the securities pursuant to Valuation Procedures approved by the Board of Trustees.
At December 31, 2011, the Fund’s Portfolio of Investments includes the following industry categories:
| | | | |
Consumer Discretionary | | | 25.1% | |
Information Technology | | | 16.7% | |
Health Care | | | 15.8% | |
Financials | | | 13.1% | |
Industrials | | | 8.5% | |
Consumer Staples | | | 8.3% | |
Energy | | | 8.1% | |
Materials | | | 2.6% | |
Telecommunication Services | | | 1.8% | |
| | | | |
Total | | | 100.0% | |
| | | | |
At December 31, 2011, the Fund’s Portfolio of Investments includes the following currency categories:
| | | | |
British Pound Sterling | | | 21.4% | |
Euro | | | 15.0% | |
Japanese Yen | | | 13.2% | |
Canadian Dollar | | | 8.1% | |
Hong Kong Dollar | | | 7.5% | |
Swedish Krona | | | 4.9% | |
South African Rand | | | 4.4% | |
Indonesian Rupiah | | | 3.6% | |
Brazilian Real | | | 3.4% | |
Swiss Franc | | | 3.4% | |
New Taiwan Dollar | | | 3.2% | |
Australian Dollar | | | 2.7% | |
Indian Rupee | | | 2.1% | |
U.S. Dollar | | | 1.6% | |
Singapore Dollar | | | 1.2% | |
Turkish Lira | | | 1.0% | |
All Other Currencies | | | 3.3% | |
| | | | |
Total | | | 100.0% | |
| | | | |
See accompanying Notes to Financial Statements.
18 Annual Report | December 31, 2011 |

Todd M. McClone
Jeffrey A. Urbina
EMERGING MARKETS GROWTH FUND
The Emerging Markets Growth Fund seeks long-term capital appreciation.
AN OVERVIEW FROM THE PORTFOLIO MANAGERS
The Emerging Markets Growth Fund posted a 16.82% decrease (Institutional Class Shares) for the 12 months ended December 31, 2011. By comparison, the Fund’s benchmark, the MSCI Emerging Markets IMI Index (net), declined 19.49%.
Performance was augmented by strong stock selection across most sectors and regions, coupled with overall sector positioning. Consumer Discretionary, Financials, Industrials, Materials and Utilities stock selection were the key contributors to outperformance. Within Consumer Discretionary, the Fund’s overweighting in the strongly performing Auto industry added value as did the weighting and stock selection in Retailing. Financials stock selection was bolstered by strong Commercial Banks, Insurance and Real Estate performance. Industrials value added was driven by good performance across Capital Goods and Transportation holdings. Materials benefited from the Fund’s focus and stock selection in Chemicals at the expense of Mining. Utilities stock selection was largely driven by strong performance in CPFL Energia S.A., the Brazilian power generation company, as management executed well and earnings results were ahead of expectations during the period. From a regional perspective, the Fund added significant value in Emerging Asia due largely to China, India, and Korea stock selection, along with the overweighting in the strongly performing Indonesian market at the expense of India. Brazilian and South African stock selection added significant value as well, more than offsetting weakness in Russia.
The Fund’s significant focus in Consumer remained constant throughout 2011 with approximately 32% invested in Consumer Discretionary and Consumer Staples companies, a slight increase from year end 2010. The Index weighting in Consumer totaled 17.4%. Within Discretionary, the Fund’s focus was on Autos and Retail, while Consumer Staples exposure was largest in Beverages and Food/Staples Retailing. Information Technology (IT) exposure increased steadily throughout 2011 from 11.1% as of year end 2010 to 16.8% as of September 30, to the 19.1% year-end 2011 weighting, which was well ahead of the 13.24% Index weighting. Internet Software and IT Services were the two industries with consistently higher exposure, although the significant underweighting in Semiconductors moderated over the year as well. Conversely, Financials, while underweighted at year end 2010, was reduced throughout the year, particularly in Commercial Banks and Real Estate. As of year end, Financials represented 15.9% of the Fund, well below the 23.0% Index weighting. Resources were consistently underweighted throughout 2011, totaling 19.2% as of year end 2010, and decreased to 12.8% as of year end 2011, well below the 26.0% Index weighting, due largely to a reduction in Mining on a slower company growth outlook. Regionally, the Fund remained consistently overweighted in Latin America at the expense of Asia (largely China and India) and EMEA (Europe, Middle East, and Africa), due to lower Russia and Central/Eastern Europe exposure.
December 31, 2011 | William Blair Funds 19 |
Emerging Markets Growth Fund
Performance Highlights (unaudited)
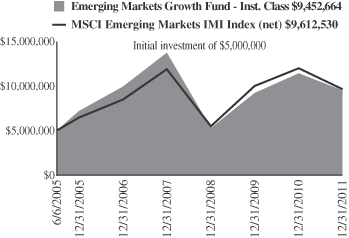
Average Annual Total Return at 12/31/2011
| | | | | | | | | | | | | | | | |
| | | 1
Year | | | 3
Year | | | 5
Year | | | Since
Inception(a) | |
Institutional Class | | | (16.82 | )% | | | 21.57 | % | | | (0.90 | )% | | | 10.17 | % |
MSCI Emerging
Markets
IMI (net) | | | (19.49 | ) | | | 20.74 | | | | 2.61 | | | | 10.46 | |
| | (a) | | For the period June 6, 2005 (Commencement of Operations) to December 31, 2011. |
Performance cited represents past performance. Past performance does not guarantee future results and current performance may be lower or higher than the data quoted. Results shown are average annual returns, which assume reinvestment of dividends and capital gains. Investment returns and principal will fluctuate and you may have a gain or loss when you sell shares. For the most current month-end performance information, please call 1-800-742-7272, or visit our Web site at www.williamblairfunds.com. From time to time, the investment advisor may waive fees or reimburse expenses for the Fund. Without these waivers, performance would be lower. International investing involves special risk considerations, including currency fluctuations, lower liquidity, economic and political risk.
The performance highlights and graph presented above do not reflect the deduction of taxes that a shareholder would pay on fund distributions or the redemption of fund shares.
The Morgan Stanley Capital International (MSCI) Emerging Markets Investable Market Index (IMI) (net) is a free float-adjusted market capitalization weighted index that is designed to measure the equity market performance of emerging markets. This series approximates the minimum possible dividend reinvestment.
This report identifies the Fund’s investments on December 31, 2011. These holdings are subject to change. Not all stocks in the Fund performed the same, nor is there any guarantee that these stocks will perform as well in the future. Market forecasts provided in this report may not necessarily come to pass.
Sector Diversification (unaudited)
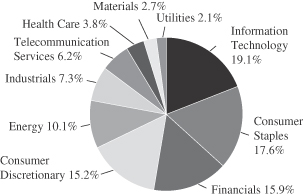
The sector diversification shown is based on the total long-term securities.
20 Annual Report | December 31, 2011 |
Emerging Markets Growth Fund
Portfolio of Investments, December 31, 2011 (all dollar amounts in thousands)
| | | | | | | | |
Issuer | | Shares | | | Value | |
| | |
Common Stocks | | | | | | | | |
| | |
Emerging Asia—54.3% | | | | | | | | |
China—13.1% | | | | | | | | |
AAC Technologies Holdings, Inc. (Communications equipment) | | | 1,071,949 | | | $ | 2,407 | |
*Baidu, Inc.—ADR (Internet software & services) | | | 68,407 | | | | 7,967 | |
Belle International Holdings, Ltd. (Specialty retail) | | | 4,721,000 | | | | 8,230 | |
China BlueChemical, Ltd. (Chemicals) | | | 1,564,000 | | | | 1,184 | |
CNOOC, Ltd. (Oil, gas & consumable fuels) | | | 9,094,000 | | | | 15,901 | |
Comba Telecom Systems Holdings, Ltd. (Communications equipment) | | | 3,812,496 | | | | 3,073 | |
Dongfeng Motor Group Co., Ltd. (Automobiles) | | | 5,634,000 | | | | 9,663 | |
Golden Eagle Retail Group, Ltd. (Multiline retail) | | | 2,253,000 | | | | 4,763 | |
*Haier Electronics Group Co., Ltd. (Household durables) | | | 2,146,000 | | | | 1,920 | |
Haitian International Holdings, Ltd. (Machinery) | | | 2,422,185 | | | | 2,083 | |
Hengdeli Holdings, Ltd. (Specialty retail) | | | 6,680,000 | | | | 2,185 | |
Lenovo Group, Ltd. (Computers & peripherals) | | | 12,448,000 | | | | 8,302 | |
Ping An Insurance Group Co. of China, Ltd. Class “H” (Insurance) | | | 1,167,000 | | | | 7,693 | |
Spreadtrum Communications, Inc.—ADR (Semiconductors & semiconductor equipment) | | | 97,818 | | | | 2,043 | |
*Sun Art Retail Group, Ltd. (Food & staples retailing) | | | 5,808,000 | | | | 7,261 | |
Tencent Holdings, Ltd. (Internet software & services) | | | 252,200 | | | | 5,069 | |
Want Want China Holdings, Ltd. (Food products) | | | 11,401,000 | | | | 11,377 | |
*WuXi PharmaTech Cayman, Inc.—ADR (Life sciences tools & services) | | | 193,714 | | | | 2,139 | |
Yingde Gases (Chemicals) | | | 2,146,000 | | | | 2,191 | |
*Youku.com, Inc.—ADR (Internet software & services) | | | 150,415 | | | | 2,357 | |
| | | | | | | | |
| | | | | | | 107,808 | |
| | | | | | | | |
India—10.5% | | | | | | | | |
Asian Paints, Ltd. (Chemicals) | | | 78,064 | | | | 3,811 | |
Axis Bank, Ltd. (Commercial banks) | | | 427,341 | | | | 6,503 | |
Bajaj Auto, Ltd. (Automobiles) | | | 156,236 | | | | 4,682 | |
Dabur India, Ltd. (Personal products) | | | 1,293,345 | | | | 2,422 | |
Housing Development Finance Corporation (Thrifts & mortgage finance) | | | 614,535 | | | | 7,546 | |
IndusInd Bank, Ltd. (Commercial banks) | | | 438,126 | | | | 1,863 | |
Infosys Technologies, Ltd. (IT services) | | | 229,498 | | | | 11,961 | |
ITC, Ltd. (Tobacco) | | | 3,050,676 | | | | 11,564 | |
*Jubilant Foodworks, Ltd. (Hotels, restaurants & leisure) | | | 151,942 | | | | 2,158 | |
Lupin, Ltd. (Pharmaceuticals) | | | 536,363 | | | | 4,523 | |
Motherson Sumi Systems, Ltd. (Auto components) | | | 592,108 | | | | 1,519 | |
Nestle India, Ltd. (Food products) | | | 51,479 | | | | 3,969 | |
Shriram Transport Finance Co., Ltd. (Consumer finance) | | | 29,503 | | | | 234 | |
Sun Pharmaceutical Industries, Ltd. (Pharmaceuticals) | | | 415,484 | | | | 3,894 | |
|
Common Stocks—Emerging Asia—54.3%—(continued) | |
India—(continued) | | | | | | | | |
Tata Consultancy Services, Ltd. (IT services) | | | 583,577 | | | $ | 12,754 | |
Tata Motors, Ltd. (Automobiles) | | | 1,823,672 | | | | 6,137 | |
| | | | | | | | |
| | | | | | | 85,540 | |
| | | | | | | | |
Indonesia—5.9% | | | | | | | | |
PT Astra International Tbk (Automobiles) | | | 1,757,000 | | | | 14,339 | |
PT Bank Rakyat Indonesia (Commercial banks) | | | 19,033,000 | | | | 14,169 | |
PT Harum Energy Tbk (Oil, gas & consumable fuels) | | | 2,320,500 | | | | 1,753 | |
PT Indo Tambangraya Megah (Oil, gas & consumable fuels) | | | 1,140,000 | | | | 4,859 | |
PT Kalbe Farma Tbk (Pharmaceuticals) | | | 5,861,500 | | | | 2,198 | |
PT Perusahaan Perkebunan London Sumatra Indonesia Tbk (Food products) | | | 9,965,500 | | | | 2,473 | |
PT Unilever Indonesia Tbk (Household products) | | | 2,495,000 | | | | 5,173 | |
PT United Tractors Tbk (Machinery) | | | 1,052,757 | | | | 3,059 | |
| | | | | | | | |
| | | | | | | 48,023 | |
| | | | | | | | |
Malaysia—2.1% | | | | | | | | |
Axiata Group Bhd (Wireless telecommunication services) | | | 3,973,000 | | | | 6,442 | |
CIMB Group Holdings Bhd (Commercial banks) | | | 2,535,100 | | | | 5,950 | |
Kuala Lumpur Kepong Bhd (Food products) | | | 611,300 | | | | 4,377 | |
| | | | | | | | |
| | | | | | | 16,769 | |
| | | | | | | | |
Papua New Guinea—1.5% | | | | | | | | |
Oil Search, Ltd. (Oil, gas & consumable fuels) | | | 1,973,416 | | | | 12,615 | |
| | | | | | | | |
Philippines—0.3% | | | | | | | | |
Alliance Global Group, Inc. (Industrial conglomerates) | | | 8,965,300 | | | | 2,114 | |
| | | | | | | | |
South Korea—12.1% | | | | | | | | |
*Celltrion, Inc. (Pharmaceuticals) | | | 90,002 | | | | 2,836 | |
*Honam Petrochemical Corporation (Chemicals) | | | 15,291 | | | | 3,955 | |
*Hyundai Mobis (Auto components) | | | 34,338 | | | | 8,704 | |
*Hyundai Motor Co. (Automobiles) | | | 86,112 | | | | 15,922 | |
*LG Household & Health Care, Ltd. (Household products) | | | 21,702 | | | | 9,184 | |
Samsung Electronics Co., Ltd. (Semiconductors & semiconductor equipment) | | | 36,296 | | | | 33,334 | |
*Samsung Engineering Co., Ltd. (Construction & engineering) | | | 71,894 | | | | 12,575 | |
Samsung Fire & Marine Insurance Co., Ltd. (Insurance) | | | 35,464 | | | | 6,496 | |
*Samsung Heavy Industries Co., Ltd. (Machinery) | | | 251,713 | | | | 6,096 | |
| | | | | | | | |
| | | | | | | 99,102 | |
| | | | | | | | |
Taiwan—6.7% | | | | | | | | |
Catcher Technology Co., Ltd. (Computers & peripherals) | | | 751,000 | | | | 3,485 | |
Hiwin Technologies Corporation (Machinery) | | | 245,000 | | | | 1,990 | |
See accompanying Notes to Financial Statements.
December 31, 2011 | William Blair Funds 21 |
Emerging Markets Growth Fund
Portfolio of Investments, December 31, 2011 (all dollar amounts in thousands)
| | | | | | | | |
Issuer | | Shares | | | Value | |
|
Common Stocks—Emerging Asia—54.3%—(continued) | |
Taiwan—(continued) | | | | | | | | |
Hon Hai Precision Industry Co., Ltd. (Electronic equipment, instruments & components) | | | 6,192,191 | | | $ | 16,953 | |
HTC Corporation (Communications equipment) | | | 489,800 | | | | 8,040 | |
MediaTek, Inc. (Semiconductors & semiconductor equipment) | | | 483,000 | | | | 4,427 | |
Powertech Technology, Inc. (Semiconductors & semiconductor equipment) | | | 1,328,000 | | | | 2,811 | |
Simplo Technology Co., Ltd. (Computers & peripherals) | | | 571,300 | | | | 3,340 | |
*TPK Holding Co., Ltd. (Electronic equipment, instruments & components) | | | 254,400 | | | | 3,315 | |
TSRC Corporation (Chemicals) | | | 1,622,500 | | | | 3,981 | |
*Yuanta Financial Holding Co., Ltd. (Capital markets) | | | 11,978,641 | | | | 6,112 | |
| | | | | | | | |
| | | | | | | 54,454 | |
| | | | | | | | |
Thailand—2.1% | | | | | | | | |
Advanced Info Service PCL (Wireless telecommunication services) | | | 524,600 | | | | 2,336 | |
CP ALL PCL (Food & staples retailing) | | | 3,973,000 | | | | 6,517 | |
Kasikornbank PCL (Commercial banks) | | | 1,647,100 | | | | 6,500 | |
Siam Makro PCL (Food & staples retailing) | | | 225,600 | | | | 1,709 | |
| | | | | | | | |
| | | | | | | 17,062 | |
| | | | | | | | |
| | |
Emerging Latin America—24.5% | | | | | | | | |
Argentina—0.5% | | | | | | | | |
MercadoLibre, Inc. (Internet software & services) | | | 49,092 | | | | 3,905 | |
| | | | | | | | |
Brazil—13.2% | | | | | | | | |
BR Malls Participacoes S.A. (Real estate management & development) | | | 450,716 | | | | 4,378 | |
BR Properties S.A. (Real estate management & development) | | | 200,505 | | | | 1,989 | |
CETIP S.A.—Balcao Organizado de Ativos e Derivativos (Capital markets) | | | 335,082 | | | | 4,841 | |
Cia de Bebidas das Americas—ADR (Beverages) | | | 705,234 | | | | 25,452 | |
Cia de Concessoes Rodoviarias (Transportation infrastructure) | | | 955,000 | | | | 6,257 | |
Cia Hering (Specialty retail) | | | 260,170 | | | | 4,528 | |
CPFL Energia S.A.—ADR (Electric utilities) | | | 253,830 | | | | 7,160 | |
Embraer S.A.—ADR (Aerospace & defense) | | | 425,222 | | | | 10,724 | |
Lojas Renner S.A. (Multiline retail) | | | 155,600 | | | | 4,038 | |
OdontoPrev S.A. (Health care providers & services) | | | 155,622 | | | | 2,219 | |
*OGX Petroleo e Gas Participacoes S.A. (Oil, gas & consumable fuels) | | | 1,038,160 | | | | 7,581 | |
PDG Realty S.A. Empreendimentos e Participacoes (Household durables) | | | 1,448,587 | | | | 4,582 | |
Raia Drogasil S.A. (Food & staples retailing) | | | 316,094 | | | | 2,198 | |
Redecard S.A. (IT services) | | | 533,800 | | | | 8,354 | |
Totvs S.A. (Software) | | | 219,995 | | | | 3,923 | |
|
Common Stocks—Emerging Latin America—24.5%—(continued) | |
Brazil—(continued) | | | | | | | | |
Tractebel Energia S.A. (Independent power producers & energy traders) | | | 627,754 | | | $ | 10,083 | |
| | | | | | | | |
| | | | | | | 108,307 | |
| | | | | | | | |
Chile—4.0% | | | | | | | | |
Banco Santander Chile—ADR (Commercial banks) | | | 164,176 | | | | 12,428 | |
*CFR Pharmaceuticals S.A. (Pharmaceuticals) | | | 9,600,643 | | | | 2,256 | |
ENTEL Chile S.A. (Wireless telecommunication services) | | | 154,626 | | | | 2,872 | |
S.A.C.I. Falabella (Multiline retail) | | | 711,082 | | | | 5,530 | |
Sociedad Quimica y Minera de Chile S.A.—ADR (Chemicals) | | | 119,940 | | | | 6,459 | |
Sonda S.A. (IT services) | | | 1,234,542 | | | | 2,959 | |
| | | | | | | | |
| | | | | | | 32,504 | |
| | | | | | | | |
Colombia—0.5% | | | | | | | | |
Pacific Rubiales Energy Corporation (Oil, gas & consumable fuels) | | | 239,424 | | | | 4,402 | |
| | | | | | | | |
Mexico—5.4% | | | | | | | | |
America Movil S.A.B. de C.V. (Wireless telecommunication services) | | | 13,834,279 | | | | 15,644 | |
Coca-Cola Femsa S.A.B. de C.V.—ADR (Beverages) | | | 49,628 | | | | 4,725 | |
*Genomma Lab Internacional S.A.B. de C.V. (Pharmaceuticals) | | | 2,044,934 | | | | 3,943 | |
Wal-Mart de Mexico S.A.B. de C.V. (Food & staples retailing) | | | 7,237,700 | | | | 19,865 | |
| | | | | | | | |
| | | | | | | 44,177 | |
| | | | | | | | |
Peru—0.9% | | | | | | | | |
Credicorp, Ltd. (Commercial banks)† | | | 65,885 | | | | 7,212 | |
| | | | | | | | |
| |
Emerging Europe, Mid-East, Africa—15.7% | | | | | |
Poland—0.4% | | | | | | | | |
Eurocash S.A. (Food & staples retailing) | | | 431,285 | | | | 3,567 | |
| | | | | | | | |
Qatar—1.7% | �� | | | | | | | |
Industries Qatar QSC (Industrial conglomerates) | | | 372,133 | | | | 13,592 | |
| | | | | | | | |
Russia—1.3% | | | | | | | | |
*Etalon Group Ltd.—144A—GDR (Real estate management & development) | | | 510,600 | | | | 2,400 | |
Magnit OAO (Food & staples retailing)† | | | 67,441 | | | | 5,828 | |
*Magnit OJSC (Food & staples retailing) | | | 7,830 | | | | 676 | |
*Mail.ru Group, Ltd.—GDR (Internet software & services) | | | 72,538 | | | | 1,886 | |
| | | | | | | | |
| | | | | | | 10,790 | |
| | | | | | | | |
South Africa—9.6% | | | | | | | | |
Clicks Group, Ltd. (Multiline retail) | | | 556,767 | | | | 3,188 | |
Life Healthcare Group Holdings Pte, Ltd. (Health care providers & services) | | | 2,637,788 | | | | 6,744 | |
Mr Price Group, Ltd. (Specialty retail) | | | 604,538 | | | | 5,976 | |
MTN Group, Ltd. (Wireless telecommunication services) | | | 1,286,907 | | | | 22,913 | |
Naspers, Ltd. (Media) | | | 131,207 | | | | 5,741 | |
See accompanying Notes to Financial Statements.
22 Annual Report | December 31, 2011 |
Emerging Markets Growth Fund
Portfolio of Investments, December 31, 2011 (all dollar amounts in thousands)
| | | | | | | | |
Issuer | | Shares or
Principal
Amount | | | Value | |
|
Common Stocks—Emerging Europe, Mid-East, Africa—15.7%—(continued) | |
South Africa—(continued) | | | | | | | | |
Sasol, Ltd. (Oil, gas & consumable fuels) | | | 377,150 | | | $ | 18,011 | |
Shoprite Holdings, Ltd. (Food & staples retailing) | | | 412,721 | | | | 6,963 | |
The Foschini Group, Ltd. (Specialty retail) | | | 391,571 | | | | 5,093 | |
Truworths International, Ltd. (Specialty retail) | | | 437,301 | | | | 4,001 | |
| | | | | | | | |
| | | | | | | 78,630 | |
| | | | | | | | |
Turkey—2.7% | | | | | | | | |
BIM Birlesik Magazalar A.S. (Food & staples retailing) | | | 100,545 | | | | 2,787 | |
Tofas Turk Otomobil Fabrikasi A.S. (Automobiles) | | | 886,821 | | | | 2,772 | |
Turkiye Garanti Bankasi A.S. (Commercial banks) | | | 3,026,479 | | | | 9,429 | |
Turkiye Halk Bankasi A.S. (Commercial banks) | | | 1,345,683 | | | | 7,035 | |
| | | | | | | | |
| | | | | | | 22,023 | |
| | | | | | | | |
Total Common Stocks—94.5%
(cost $789,368) | | | | 772,596 | |
| | | | | | | | |
| | |
Preferred Stocks | | | | | | | | |
Brazil—3.7% | | | | | | | | |
Itau Unibanco Holding S.A. (Commercial banks) | | | 823,600 | | | | 15,008 | |
Petroleo Brasileiro S.A. (Oil, gas & consumable fuels) | | | 1,369,738 | | | | 15,781 | |
| | | | | | | | |
| | | | | | | 30,789 | |
| | | | | | | | |
Total Preferred Stocks—3.7%
(cost $32,596) | | | | 30,789 | |
| | | | | | | | |
| | |
Convertible Bond | | | | | | | | |
Brazil—0.1% | | | | | | | | |
Lupatech S.A., 6.500%, due 4/15/18 (Machinery)**§ | | $ | 1,602 | | | | 416 | |
| | | | | | | | |
Total Convertible Bond—0.1%
(cost $831) | | | | 416 | |
| | | | | | | | |
| | |
Repurchase Agreement | | | | | | | | |
Fixed Income Clearing Corporation, 0.000% dated 12/30/11, due 1/3/12, repurchase price $8,235, collateralized by U.S. Treasury Note, 1.750%, due 1/31/14 | | | 8,235 | | | | 8,235 | |
| | | | | | | | |
Total Repurchase Agreement—1.0%
(cost $8,235) | | | | 8,235 | |
| | | | | | | | |
Total Investments—99.3%
(cost $831,030) | | | | 812,036 | |
Cash and other assets, less liabilities—0.7% | | | | 5,810 | |
| | | | | | | | |
Net assets—100.0% | | | $ | 817,846 | |
| | | | | | | | |
ADR = American Depository Receipt
GDR = Global Depository Receipt
* Non-income producing securities
† = U.S. listed foreign security
** = Fair valued pursuant to Valuation Procedures adopted by the Board of Trustees. This holding represents 0.05% of the Fund’s net assets at December 31, 2011.
§ = Deemed illiquid pursuant to Liquidity Procedures approved by the Board of Trustees. This holding represents 0.05% of the net assets at December 31, 2011.
For securities primarily traded on exchanges or markets that close before the close of regular trading on the New York Stock Exchange, the Fund may use an independent pricing service to fair value price the securities pursuant to Valuation Procedures approved by the Board of Trustees.
At December 31, 2011, the Fund’s Portfolio of Investments includes the following industry categories:
| | | | |
Information Technology | | | 19.1% | |
Consumer Staples | | | 17.6% | |
Financials | | | 15.9% | |
Consumer Discretionary | | | 15.2% | |
Energy | | | 10.1% | |
Industrials | | | 7.3% | |
Telecommunication Services | | | 6.2% | |
Health Care | | | 3.8% | |
Materials | | | 2.7% | |
Utilities | | | 2.1% | |
| | | | |
Total | | | 100.0% | |
| | | | |
At December 31, 2011, the Fund’s Portfolio of Investments includes the following currency categories:
| | | | |
U.S. Dollar | | | 12.9% | |
South Korean Won | | | 12.3% | |
Brazilian Real | | | 12.0% | |
Hong Kong Dollar | | | 11.6% | |
Indian Rupee | | | 10.6% | |
South African Rand | | | 9.8% | |
New Taiwan Dollar | | | 6.8% | |
Indonesian Rupiah | | | 6.0% | |
Mexican Peso | | | 4.9% | |
Turkish Lira | | | 2.7% | |
Thai Baht | | | 2.1% | |
Malaysian Ringgit | | | 2.1% | |
Chilean Peso | | | 1.7% | |
Qatari Rial | | | 1.7% | |
Australian Dollar | | | 1.6% | |
All Other Currencies | | | 1.2% | |
| | | | |
Total | | | 100.0% | |
| | | | |
See accompanying Notes to Financial Statements.
December 31, 2011 | William Blair Funds 23 |
Todd M. McClone
Jeffrey A. Urbina
EMERGING LEADERS GROWTH FUND
The Emerging Leaders Growth Fund seeks long-term capital appreciation.
AN OVERVIEW FROM THE PORTFOLIO MANAGERS
The Emerging Leaders Growth Fund posted a 19.30% decrease (Institutional Class Shares) for the 12 months ended December 31, 2011. By comparison, the Fund’s benchmark, the MSCI Emerging Markets Large Cap Index (net) declined 17.65% during the same period.
The primary detractors from 2011 performance were the overweighting in India for the majority of the year, coupled with underperformance in Taiwanese Information Technology (IT) and in Russia during the first quarter. India underperformed on concerns about an increasing interest rate environment, coupled with increasing costs and slowing growth. Taiwanese IT performance was hampered by concerns about global supply chain issues following the Japanese earthquake and tsunami, in addition to changing competitive dynamics within smartphones and tablets and the impact on the supply chain. Russian underperformance was driven by a lack of Energy exposure. Key positive contributors to 2011 results included the significant weightings in Consumer at the expense of Materials, coupled with strong performance in Materials and IT. Within Materials, the Fund’s significant underweighting in the underperforming Mining segment added value, as did strong relative performance in chemicals and construction materials. Within IT, Samsung Electronics Co. Ltd. was a key contributor to full year performance, on strong demand for its handsets, which more than offset broad semiconductor weakness. Baidu, Inc. was a strong performer within IT as well, on strong revenue growth and market share gains and good execution by Management. The Fund also outpaced the Index in technology hardware, due largely to Fund holdings Lenovo Group, Ltd. on its strong Chinese market position and market share gains globally, and TPK Holding Co. Ltd., the Taiwanese touch panel manufacturer, on expectations of continued strong demand for tablets.
Consumer weightings increased throughout the year from 27.3% as of year-end 2010 to 36.8% at year-end 2011, well ahead of the 14.3% Index weighting. The overweighting was largely in Emerging Asia, and largely in Automobiles, Specialty Retailing, Food/Staples Retailing and Personal Products. Conversely, Resources decreased substantially from 27.2% as of year-end 2010 to 11.0% as of year-end 2011, due to a significant reduction in Materials on a slower growth outlook in Mining in particular. Financials, while totaling 19.8% of the Fund, remained relatively static during the year and ended below the Index’s 24.4% weighting, given lower Commercial Banks exposure amidst the increasing interest rate environment. IT increased throughout the year from 9.9% to nearly 14.9%, ahead of the 13.9% Index weighting given the increase in IT Services. From a regional perspective, the Fund maintained its overweighting in Latin America, albeit a moderated overweighting, while EMEA (Europe, Middle East, and Africa) increased from 12.9% of the Fund as of year-end 2010 to 18.8%.
24 Annual Report | December 31, 2011 |
Emerging Leaders Growth Fund
Performance Highlights (unaudited)
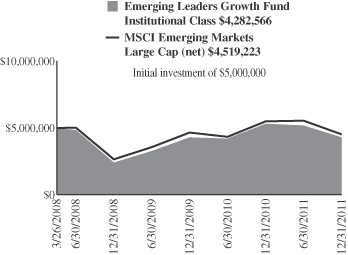
Average Annual Total Return at 12/31/2011
| | | | | | | | | | | | |
| | | 1
Year | | | 3
Year | | | Since
Inception(a) | |
Institutional Class | | | (19.30 | )% | | | 21.38 | % | | | (4.03 | )% |
MSCI Emerging Markets
Large Cap (net) | | | (17.65 | ) | | | 19.68 | | | | (2.65 | ) |
| | (a) | | For the period March 26, 2008 (Commencement of Operations) to December 31, 2011. |
Performance cited represents past performance. Past performance does not guarantee future results and current performance may be lower or higher than the data quoted. Results shown are average annual total returns, which assume reinvestment of dividends and capital gains. Investment returns and principal will fluctuate and you may have a gain or loss when you sell shares. For the most current month-end performance information, please call 1-800-742-7272, or visit our Web site at www.williamblairfunds.com. International investing includes special risk considerations, including currency fluctuations, lower liquidity, economic and political risk. From time to time, the investment advisor may waive fees or reimburse expenses for the Fund. Without these waivers, performance would be lower.
The performance highlights and graph presented above do not reflect the deduction of taxes that a shareholder would pay on fund distributions or the redemption of fund shares.
The Morgan Stanley Capital International (MSCI) Emerging Markets Large Cap Index (net) is a free float-adjusted market capitalization weighted index that is designed to measure market performance of large capitalization on stocks in emerging markets. This series approximates the minimum possible dividend reinvestment.
This report identifies the Fund’s investments on December 31, 2011. These holdings are subject to change. Not all stocks in the Fund performed the same, nor is there any guarantee that these stocks will perform as well in the future. Market forecasts provided in this report may not necessarily come to pass.
Sector Diversification (unaudited)
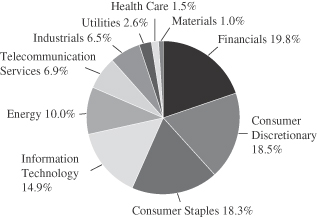
The sector diversification shown is based on the total long-term securities.
December 31, 2011 | William Blair Funds 25 |
Emerging Leaders Growth Fund
Portfolio of Investments, December 31, 2011 (all dollar amounts in thousands)
| | | | | | | | |
Issuer | | Shares | | | Value | |
|
Common Stocks | |
|
Emerging Asia—56.0% | |
China—14.2% | |
*Baidu, Inc.—ADR (Internet software & services) | | | 5,707 | | | $ | 665 | |
Belle International Holdings, Ltd. (Specialty retail) | | | 580,000 | | | | 1,011 | |
CNOOC, Ltd. (Oil, gas & consumable fuels) | | | 1,065,000 | | | | 1,862 | |
Dongfeng Motor Group Co., Ltd. (Automobiles) | | | 336,000 | | | | 576 | |
Lenovo Group, Ltd. (Computers & peripherals) | | | 754,000 | | | | 503 | |
Ping An Insurance Group Co. of China, Ltd. Class “H” (Insurance) | | | 73,000 | | | | 481 | |
*Sun Art Retail Group, Ltd. (Food & staples retailing) | | | 622,500 | | | | 778 | |
Tencent Holdings, Ltd. (Internet software & services) | | | 18,200 | | | | 366 | |
Want Want China Holdings, Ltd. (Food products) | | | 563,000 | | | | 562 | |
| | | | | | | | |
| | | | 6,804 | |
| | | | | | | | |
India—13.5% | | | | | | | | |
Bajaj Auto, Ltd. (Automobiles) | | | 11,652 | | | | 349 | |
HDFC Bank, Ltd. (Commercial banks) | | | 80,798 | | | | 649 | |
Housing Development Finance Corporation (Thrifts & mortgage finance) | | | 51,193 | | | | 629 | |
Infosys Technologies, Ltd. (IT services) | | | 18,171 | | | | 947 | |
ITC, Ltd. (Tobacco) | | | 242,469 | | | | 919 | |
Larsen & Toubro, Ltd. (Construction & engineering) | | | 13,800 | | | | 259 | |
Nestle India, Ltd. (Food products) | | | 4,149 | | | | 320 | |
Sun Pharmaceutical Industries, Ltd. (Pharmaceuticals) | | | 76,373 | | | | 716 | |
Tata Consultancy Services, Ltd. (IT services) | | | 46,185 | | | | 1,009 | |
Tata Motors, Ltd. (Automobiles) | | | 200,541 | | | | 675 | |
| | | | | | | | |
| | | | 6,472 | |
| | | | | | | | |
Indonesia—6.6% | | | | | | | | |
PT Astra International Tbk (Automobiles) | | | 178,500 | | | | 1,457 | |
PT Bank Rakyat Indonesia (Commercial banks) | | | 1,522,500 | | | | 1,134 | |
PT Unilever Indonesia Tbk (Household products) | | | 276,500 | | | | 573 | |
| | | | | | | | |
| | | | 3,164 | |
| | | | | | | | |
Malaysia—2.0% | | | | | | | | |
CIMB Group Holdings Bhd (Commercial banks) | | | 397,200 | | | | 932 | |
| | | | | | | | |
South Korea—13.5% | | | | | | | | |
*Hyundai Mobis (Auto components) | | | 4,179 | | | | 1,059 | |
*Hyundai Motor Co. (Automobiles) | | | 7,802 | | | | 1,443 | |
*LG Household & Health Care, Ltd. (Household products) | | | 1,987 | | | | 841 | |
Samsung Electronics Co., Ltd. (Semiconductors & semiconductor equipment) | | | 2,440 | | | | 2,241 | |
*Samsung Engineering Co., Ltd. (Construction & engineering) | | | 4,914 | | | | 859 | |
| | | | | | | | |
| | | | 6,443 | |
| | | | | | | | |
|
Common Stocks—Emerging Asia—56.0%—(continued) | |
Taiwan—3.1% | | | | | | | | |
Hon Hai Precision Industry Co., Ltd. (Electronic equipment, instruments & components) | | | 360,700 | | | $ | 988 | |
HTC Corporation (Communications equipment) | | | 30,850 | | | | 506 | |
| | | | | | | | |
| | | | 1,494 | |
| | | | | | | | |
Thailand—3.1% | | | | | | | | |
CP ALL PCL (Food & staples retailing) | | | 581,000 | | | | 953 | |
Kasikornbank PCL (Commercial banks) | | | 128,000 | | | | 505 | |
| | | | | | | | |
| | | | 1,458 | |
| | | | | | | | |
|
Emerging Latin America—20.3% | |
Brazil—8.5% | |
BR Malls Participacoes S.A. (Real estate management & development) | | | 76,100 | | | | 739 | |
Cia de Bebidas das Americas—ADR (Beverages) | | | 30,607 | | | | 1,105 | |
Cia de Concessoes Rodoviarias (Transportation infrastructure) | | | 76,000 | | | | 498 | |
CPFL Energia S.A.—ADR (Electric utilities) | | | 19,998 | | | | 564 | |
Embraer S.A.—ADR (Aerospace & defense) | | | 18,766 | | | | 473 | |
Tractebel Energia S.A. (Independent power producers & energy traders) | | | 43,800 | | | | 704 | |
| | | | | | | | |
| | | | 4,083 | |
| | | | | | | | |
Chile—4.3% | | | | | | | | |
Banco Santander Chile—ADR (Commercial banks) | | | 12,274 | | | | 929 | |
S.A.C.I. Falabella (Multiline retail) | | | 82,253 | | | | 640 | |
Sociedad Quimica y Minera de Chile S.A.—ADR (Chemicals) | | | 9,159 | | | | 493 | |
| | | | | | | | |
| | | | 2,062 | |
| | | | | | | | |
Mexico—6.6% | | | | | | | | |
America Movil S.A.B. de C.V.—ADR (Wireless telecommunication services) | | | 65,492 | | | | 1,480 | |
Grupo Financiero Banorte S.A.B. de C.V. (Commercial banks) | | | 158,000 | | | | 478 | |
Wal-Mart de Mexico S.A.B. de C.V. (Food & staples retailing) | | | 431,600 | | | | 1,185 | |
| | | | | | | | |
| | | | 3,143 | |
| | | | | | | | |
Peru—0.9% | | | | | | | | |
Credicorp, Ltd. (Commercial banks)† | | | 3,788 | | | | 414 | |
| | | | | | | | |
| | |
Emerging Europe, Mid-East, Africa—18.8% | | | | | | | | |
Qatar—2.2% | | | | | | | | |
Industries Qatar QSC (Industrial conglomerates) | | | 29,458 | | | | 1,076 | |
| | | | | | | | |
Russia—2.9% | | | | | | | | |
Magnit OJSC (Food & staples retailing)† | | | 1,010 | | | | 87 | |
Magnit OJSC—144A—GDR (Food & staples retailing)† | | | 26,631 | | | | 563 | |
Sberbank of Russian Federation (Commercial banks)† | | | 300,414 | | | | 736 | |
| | | | | | | | |
| | | | 1,386 | |
| | | | | | | | |
See accompanying Notes to Financial Statements.
26 Annual Report | December 31, 2011 |
Emerging Leaders Growth Fund
Portfolio of Investments, December 31, 2011 (all dollar amounts in thousands)
| | | | | | | | |
Issuer | | Shares or
Principal
Amount | | | Value | |
|
Common Stocks—Emerging Europe, Mid-East,
Africa—18.8%—(continued) | |
South Africa—11.7% | | | | | | | | |
MTN Group, Ltd. (Wireless telecommunication services) | | | 104,366 | | | $ | 1,858 | |
Naspers, Ltd. (Media) | | | 26,849 | | | | 1,175 | |
Sasol, Ltd. (Oil, gas & consumable fuels) | | | 21,876 | | | | 1,045 | |
Shoprite Holdings, Ltd. (Food & staples retailing) | | | 58,628 | | | | 989 | |
Truworths International, Ltd. (Specialty retail) | | | 57,500 | | | | 526 | |
| | | | | | | | |
| | | | 5,593 | |
| | | | | | | | |
Turkey—2.0% | | | | | | | | |
Turkiye Garanti Bankasi A.S. (Commercial banks) | | | 304,189 | | | | 948 | |
| | | | | | | | |
Total Common Stocks—95.1%
(cost $47,735) | | | | 45,472 | |
| | | | | | | | |
| | |
Preferred Stocks | | | | | | | | |
Brazil—6.1% | | | | | | | | |
Itau Unibanco Holding S.A. (Commercial banks) | | | 52,000 | | | | 948 | |
Brazil—6.1%—(continued) | |
Petroleo Brasileiro S.A. (Oil, gas & consumable fuels) | | | 169,355 | | | | 1,951 | |
| | | | | | | | |
| | | | 2,899 | |
| | | | | | | | |
Total Preferred Stocks—6.1%
(cost $3,150) | | | | 2,899 | |
| | | | | | | | |
| | |
Repurchase Agreement | | | | | | | | |
Fixed Income Clearing Corporation, 0.000% dated 12/30/11, due 1/3/12, repurchase price $405, collateralized by FHLMC, 4.500%, due 1/15/14 | | $ | 405 | | | $ | 405 | |
| | | | | | | | |
Total Repurchase Agreement—0.8%
(cost $405) | | | | 405 | |
| | | | | | | | |
Total Investments—102.0%
(cost $51,290) | | | | 48,776 | |
Liabilities, plus cash and other assets—(2.0)% | | | | (954 | ) |
| | | | | | | | |
Net assets—100.0% | | | $ | 47,822 | |
| | | | | | | | |
ADR = American Depository Receipt
GDR = Global Depository Receipt
* Non-income producing securities
† = U.S. listed foreign security
For securities primarily traded on exchanges or markets that close before the close of regular trading on the New York Stock Exchange, the Fund may use an independent pricing service to fair value price the securities pursuant to Valuation Procedures approved by the Board of Trustees.
At December 31, 2011, the Fund’s Portfolio of Investments includes the following industry categories:
| | | | |
Financials | | | 19.7% | |
Consumer Discretionary | | | 18.4% | |
Consumer Staples | | | 18.4% | |
Information Technology | | | 14.9% | |
Energy | | | 10.1% | |
Telecommunication Services | | | 6.9% | |
Industrials | | | 6.5% | |
Utilities | | | 2.6% | |
Health Care | | | 1.5% | |
Materials | | | 1.0% | |
| | | | |
Total | | | 100.0% | |
| | | | |
At December 31, 2011, the Fund’s Portfolio of Investments includes the following currency categories:
| | | | |
U.S. Dollar | | | 15.5% | |
Indian Rupee | | | 13.4% | |
South Korean Won | | | 13.3% | |
Hong Kong Dollar | | | 12.7% | |
South African Rand | | | 11.6% | |
Brazilian Real | | | 10.0% | |
Indonesian Rupiah | | | 6.6% | |
Mexican Peso | | | 3.4% | |
New Taiwan Dollar | | | 3.1% | |
Thai Baht | | | 3.0% | |
Qatari Rial | | | 2.2% | |
Turkish Lira | | | 2.0% | |
Malaysian Ringgit | | | 1.9% | |
Chilean Peso | | | 1.3% | |
| | | | |
Total | | | 100.0% | |
| | | | |
See accompanying Notes to Financial Statements.
December 31, 2011 | William Blair Funds 27 |
FIXED-INCOME MARKETS OVERVIEW
Summary
In many ways, 2011 brought back some painful memories of 2008. Global stock markets experienced significant volatility, U.S. fixed income assets benefitted from a tremendous flight-to-quality with rates reaching record lows, and segments of the bond market suffered from diminished liquidity. U.S. stocks finished the year positive on the strength of a strong rally during the fourth quarter. Non-U.S. stocks lagged U.S. stocks during the fourth quarter and calendar year 2011.
The European debt crisis took center stage, with the market concentrated on how European policymakers might act to mitigate the precarious fiscal finances of Greece, Italy, and, to a lesser extent, Portugal and Spain. The crisis impacted financial institutions around the globe, with European financial institutions particularly hard-hit due to its holdings of European sovereign debt.
In other parts of the globe, the Japanese earthquake and tsunami had a significant but short-lived impact on the global supply chain during the second quarter, and several Middle East and North African countries experienced violent overthrows of repressive political regimes.
The U.S. faced issues of its own in 2011. Politicians scrambled to a last-hour resolution to increase the debt ceiling in July. In August, Standard & Poor’s downgraded the U.S.’s long-term debt rating to AA+. Economic reports revealed that U.S. growth was stagnant, with notable weaknesses in the labor and housing markets.
The Federal Open market Committee (FOMC) responded to these challenges with unconventional monetary easing policies. At its August 9 meeting, the FOMC pledged to keep interest rates at lower levels for an extended period of time, stating that conditions “warrant exceptionally low levels for the federal funds rate at least through mid-2013.” The FOMC announced “Operation Twist” at its September 21 meeting, in which it will sell short-term securities and purchase long-term securities. It will also reinvest principal payments into agency mortgage-backed securities to help stimulate the mortgage market.
Dollar-denominated fixed income assets were strong performers in this environment as declining interest rates buoyed returns. The 10-year Treasury note yielded 1.88% at year-end, 4 basis points lower for the quarter and 137 basis points lower for the year. Corporate bonds and mortgage-backed securities gained but lagged Treasuries. TIPS outperformed nominal Treasuries.
Outlook
We believe that the threat of any rapid rise in interest rates is subdued. The FOMC’s stance towards monetary policy has become increasingly accommodative due to concerns over the slow pace of economic growth and job growth.
At its August 9 meeting, the FOMC stated that it believes the current conditions “warrant exceptionally low levels for the federal funds rate at least through mid-2013.” At its September 21 meeting, the FOMC announced “Operation Twist,” which includes plans to sell shorter-term securities and buy longer-term securities, as well as reinvesting principal payments into mortgage-backed securities to help stimulate the mortgage market.
We expect economic growth to be low, with continued high levels of unemployment and a depressed real estate market constraining growth. However, we do not believe that the economy is at risk of a “double dip” in the near term.
28 Annual Report | December 31, 2011 |
Even with the increase in capital market volatility, corporate bond issuance has been steady, albeit at slightly higher new issue concessions (risk premiums) offered by issuers. The wider spreads offered in the market have been partially offset by Treasury yields near historic lows. In addition to wider spreads, we have seen bid/ask spreads widen marginally, but far from the levels experienced in 2008. This is indicative of reduced risk taking by dealers.
We believe that spread sectors are poised to lead the market. Risk premiums across all spreads sectors have moved significantly higher in recent months but not approaching the historically cheap levels experienced in prior years. These valuations, coupled with the strength of corporate balance sheets, make us bullish on spread product relative to Treasuries.
December 31, 2011 | William Blair Funds 29 |

Christopher T. Vincent

Paul J. Sularz
BOND FUND
The Bond Fund seeks to outperform the Barclays Capital U.S. Aggregate Bond Index by maximizing total return through a combination of income and capital appreciation.
AN OVERVIEW FROM THE PORTFOLIO MANAGERS
The Bond Fund posted a 7.88% increase on a total return basis (Institutional Class Shares) for the 12 months ended December 31, 2011. By comparison, the Fund’s benchmark, the Barclays Capital U.S. Aggregate Bond Index, gained 7.84%.
The Bond Fund posted positive performance results in both the fourth quarter and for 2011, in spite of what could be considered headwinds to our style of investing. The Fund outperformed its Barclays Capital U.S. Aggregate Bond Index benchmark during the fourth quarter and for the year.
During the fourth quarter, security selection was the main driver of Fund performance. Performance was exceptionally strong among the Fund’s corporate bond holdings and mortgage-backed securities. Among the corporate bonds, selection was strong among the Fund’s financial and industrial holdings. A modest allocation to high yield corporate bonds was additive to performance. Our Mortgage positions experienced slower-than-forecasted prepayment speeds, earned incremental yield over Treasuries, and impacted results favorably.
During 2011, the Fund tracked its benchmark, as sector positioning detracted from performance and overwhelmed the positive effect from security selection. The Fund experienced strong security selection within its corporate and mortgage-backed securities. The same themes that drove security selection results during the fourth quarter impacted the year’s performance favorably. However, the Fund’s underweight allocation to Treasuries and subsequent overweight allocations to corporate and mortgage-backed securities detracted over the year, as Treasuries were the best-performing sector and risk spreads widened.
We are positioned slightly overweight on interest rates with the portfolio’s duration exceeding that of the benchmark. We believe that interest rates will remain range-bound at lower levels over the next year and a half, as the Federal Open Market Committee (FOMC) stated after its August 9th meeting that current conditions “warrant exceptionally low levels for the federal funds rate at least through mid-2013.”
We are overweight agency mortgage-backed securities. We seek pools with better-than-market convexity characteristics through favoring pools with above-market coupon rates comprised of either low loan balances or seasoned pools and avoiding the generic, current-coupon pools that dominate the Mortgage Index. We view specified pool mortgage-backed securities as a cheap alternative to agency debentures (to which we are underweight).
We are overweight investment-grade corporate bonds, as we believe the sector continues to offer good relative value. Within the sector, we are overweight Industrials and Financials. We emphasize companies with positive free cash flow and strong and experienced management teams. We believe that certain names in the financial sector offer value, and we are encouraged by the improvement of balance sheets within the sector despite the regulatory issues facing the industry.
We hold an allocation to high yield bonds near the Fund’s maximum portfolio weight of 10%. We emphasize higher quality (BB- and B-rated) industrial issuers.
We hold an allocation to TIPS (Treasury Inflation-Protected Securities), as we find its embedded option on unexpected inflation to be an appealing feature versus owning nominal Treasury notes.
30 Annual Report | December 31, 2011 |
Bond Fund
Performance Highlights (unaudited)
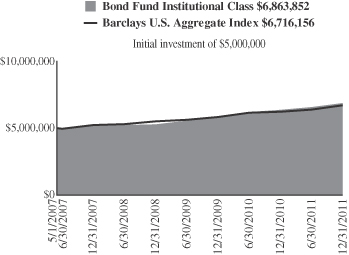
Average Annual Total Return at 12/31/2011
| | | | | | | | | | | | |
| | | 1
Year | | | 3
Year | | | Since
Inception(a) | |
Institutional Class | | | 7.88 | % | | | 9.13 | % | | | 7.01 | % |
Barclays Capital U.S. Aggregate Bond Index | | | 7.84 | | | | 6.77 | | | | 6.52 | |
| | (a) | | For the period May 1, 2007 (Commencement of Operations) to December 31, 2011. |
Performance cited represents past performance. Past performance does not guarantee future results and current performance may be lower or higher than the data quoted. Results shown are average annual total returns, which assume reinvestment of dividends and capital gains. Investment returns and principal will fluctuate and you may have a gain or loss when you sell shares. For the most current month-end performance information, please call 1-800-742-7272, or visit our Web site at www.williamblairfunds.com. From time to time, the investment advisor may waive fees or reimburse expenses for the Fund. Without these waivers, performance would be lower.
The performance highlights and graph presented above do not reflect the deduction of taxes that a shareholder would pay on fund distributions or the redemption of fund shares.
The Barclays Capital U.S. Aggregate Bond Index indicates broad intermediate government/corporate bond market performance.
This report identifies the Fund’s investments on December 31, 2011. These holdings are subject to change. Not all investments in the Fund performed the same, nor is there any guarantee that these investments will perform as well in the future. Market forecasts provided in this report may not necessarily come to pass.
Sector Diversification (unaudited)
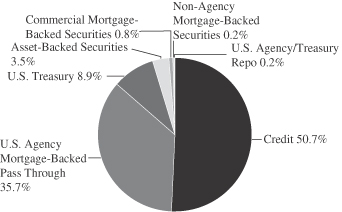
The sector diversification shown is based on the total investments.
December 31, 2011 | William Blair Funds 31 |
Bond Fund
Portfolio of Investments, December 31, 2011 (all dollar amounts in thousands)
| | | | | | | | | | |
Issuer | | Principal
Amount | | | Value | |
|
U.S. Government and U.S. Government Agency—44.3% | |
U.S. Treasury Inflation Indexed Notes/Bonds—8.4% | |
U.S. Treasury Inflation Indexed Note,
2.375%, due 1/15/17 | | $ | 5,614 | | | $ | 6,517 | |
U.S. Treasury Inflation Indexed Bond,
3.875%, due 4/15/29 | | | 8,264 | | | | 12,878 | |
| | | | | | | | |
Total U.S. Treasury Inflation Indexed Notes/Bonds | | | | | | | 19,395 | |
| | | | | | | | |
U.S. Treasury—0.3% | | | | | | | | |
U.S. Treasury Bond, 3.875%, due 8/15/40 | | | 500 | | | | 599 | |
| | | | | | | | |
Government National Mortgage Association (GNMA)—3.8% | |
GNR 2004-2 M5, 4.891%, due 7/16/34 | | | 125 | | | | 140 | |
GNR 2006-67 GB, 4.617%, due 9/16/34, VRN | | | 1,590 | | | | 1,686 | |
#699118, 6.000%, due 9/15/38 | | | 6,152 | | | | 7,023 | |
| | | | | | | | |
Total GNMA Mortgage Obligations | | | | | | | 8,849 | |
| | | | | | | | |
Federal Home Loan Mortgage Corp. (FHLMC)—8.8% | |
#G90024, 7.000%, due 1/20/13 | | | 11 | | | | 12 | |
#G30093, 7.000%, due 12/1/17 | | | 29 | | | | 33 | |
#J14232, 3.500%, due 1/1/21 | | | 1,527 | | | | 1,595 | |
#G30255, 7.000%, due 7/1/21 | | | 61 | | | | 70 | |
#G12792, 4.500%, due 12/1/21 | | | 323 | | | | 344 | |
#D95897, 5.500%, due 3/1/23 | | | 174 | | | | 190 | |
#J16051, 4.500%, due 7/1/26 | | | 1,439 | | | | 1,554 | |
#G01728, 7.500%, due 7/1/32 | | | 301 | | | | 360 | |
#C01385, 6.500%, due 8/1/32 | | | 313 | | | | 356 | |
#C01623, 5.500%, due 9/1/33 | | | 485 | | | | 528 | |
#A15039, 5.500%, due 10/1/33 | | | 7 | | | | 8 | |
#G02141, 6.000%, due 3/1/36 | | | 1,683 | | | | 1,880 | |
#A62179, 6.000%, due 6/1/37 | | | 902 | | | | 1,007 | |
#A63539, 6.000%, due 7/1/37 | | | 1,142 | | | | 1,275 | |
#A62858, 6.500%, due 7/1/37 | | | 585 | | | | 658 | |
#G03170, 6.500%, due 8/1/37 | | | 1,494 | | | | 1,679 | |
#A66843, 6.500%, due 10/1/37 | | | 2,098 | | | | 2,380 | |
#A78138, 5.500%, due 6/1/38 | | | 1,196 | | | | 1,327 | |
#A81799, 6.500%, due 9/1/38 | | | 2,561 | | | | 2,905 | |
#C03665, 9.000%, due 4/1/41 | | | 1,786 | | | | 2,183 | |
| | | | | | | | |
Total FHLMC Mortgage Obligations | | | | | | | 20,344 | |
| | | | | | | | |
Federal National Mortgage Association (FNMA)—23.0% | |
#535559, 7.500%, due 9/1/12 | | | 8 | | | | 8 | |
#689612, 5.000%, due 5/1/18 | | | 314 | | | | 342 | |
#695910, 5.000%, due 5/1/18 | | | 646 | | | | 705 | |
#747903, 4.500%, due 6/1/19 | | | 271 | | | | 290 | |
#745735, 5.000%, due 3/1/21 | | | 702 | | | | 762 | |
#253847, 6.000%, due 5/1/21 | | | 188 | | | | 207 | |
#900725, 6.000%, due 8/1/21 | | | 162 | | | | 176 | |
#AA2924, 4.500%, due 4/1/24 | | | 1,059 | | | | 1,150 | |
#890329, 4.000%, due 4/1/26 | | | 558 | | | | 598 | |
#AI9811, 4.500%, due 8/1/26 | | | 582 | | | | 632 | |
#AH9564, 3.500%, due 9/1/26 | | | 1,174 | | | | 1,243 | |
#545437, 7.000%, due 2/1/32 | | | 158 | | | | 184 | |
#545759, 6.500%, due 7/1/32 | | | 1,701 | | | | 1,932 | |
#684601, 6.000%, due 3/1/33 | | | 1,684 | | | | 1,886 | |
#555430, 5.000%, due 5/1/33 | | | 852 | | | | 922 | |
#708993, 5.000%, due 6/1/33 | | | 98 | | | | 108 | |
#254868, 5.000%, due 9/1/33 | | | 695 | | | | 752 | |
#739243, 6.000%, due 9/1/33 | | | 1,745 | | | | 1,954 | |
#739331, 6.000%, due 9/1/33 | | | 824 | | | | 923 | |
#555800, 5.500%, due 10/1/33 | | | 290 | | | | 317 | |
Issuer | | NRSRO
Rating
(unaudited) | | | Principal
Amount | | | Value | |
|
U.S. Government and U.S. Government Agency—(continued) | |
Federal National Mortgage Association (FNMA)—(continued) | |
#555876, 5.500%, due 10/1/33 | | | $ | 69 | | | $ | 75 | |
#725027, 5.000%, due 11/1/33 | | | | 567 | | | | 613 | |
#555880, 5.500%, due 11/1/33 | | | | 386 | | | | 422 | |
#555946, 5.500%, due 11/1/33 | | | | 707 | | | | 788 | |
#756153, 5.500%, due 11/1/33 | | | | 1,899 | | | | 2,101 | |
#725205, 5.000%, due 3/1/34 | | | | 3,378 | | | | 3,653 | |
#725232, 5.000%, due 3/1/34 | | | | 3,404 | | | | 3,681 | |
#725238, 5.000%, due 3/1/34 | | | | 1,260 | | | | 1,363 | |
#725249, 5.000%, due 3/1/34 | | | | 287 | | | | 310 | |
#763798, 5.500%, due 3/1/34 | | | | 388 | | | | 430 | |
#725611, 5.500%, due 6/1/34 | | | | 395 | | | | 432 | |
#786546, 6.000%, due 7/1/34 | | | | 802 | | | | 896 | |
#787816, 6.000%, due 7/1/34 | | | | 818 | | | | 916 | |
#190353, 5.000%, due 8/1/34 | | | | 396 | | | | 428 | |
#794474, 6.000%, due 10/1/34 | | | | 174 | | | | 193 | |
#745092, 6.500%, due 7/1/35 | | | | 1,154 | | | | 1,311 | |
#357944, 6.000%, due 9/1/35 | | | | 102 | | | | 113 | |
#829306, 6.000%, due 9/1/35 | | | | 292 | | | | 326 | |
#843487, 6.000%, due 10/1/35 | | | | 242 | | | | 272 | |
#849191, 6.000%, due 1/1/36 | | | | 453 | | | | 506 | |
#848782, 6.500%, due 1/1/36 | | | | 759 | | | | 856 | |
#745349, 6.500%, due 2/1/36 | | | | 984 | | | | 1,111 | |
#895637, 6.500%, due 5/1/36 | | | | 399 | | | | 450 | |
#831540, 6.000%, due 6/1/36 | | | | 164 | | | | 182 | |
#745802, 6.000%, due 7/1/36 | | | | 554 | | | | 620 | |
#886220, 6.000%, due 7/1/36 | | | | 1,166 | | | | 1,306 | |
#893318, 6.500%, due 8/1/36 | | | | 210 | | | | 236 | |
#909480, 6.000%, due 2/1/37 | | | | 1,174 | | | | 1,311 | |
#938440, 6.000%, due 7/1/37 | | | | 565 | | | | 627 | |
#928561, 6.000%, due 8/1/37 | | | | 646 | | | | 724 | |
#948689, 6.000%, due 8/1/37 | | | | 1,418 | | | | 1,573 | |
#946646, 6.000%, due 9/1/37 | | | | 343 | | | | 383 | |
#888967, 6.000%, due 12/1/37 | | | | 2,035 | | | | 2,280 | |
#962058, 6.500%, due 3/1/38 | | | | 3,968 | | | | 4,490 | |
#934006, 6.500%, due 9/1/38 | | | | 1,439 | | | | 1,628 | |
#986856, 6.500%, due 9/1/38 | | | | 902 | | | | 1,012 | |
#991911, 7.000%, due 11/1/38 | | | | 660 | | | | 754 | |
| | | | | | | | | | | | |
Total FNMA Mortgage Obligations | | | | 53,463 | |
| | | | | | | | | | | | |
| |
Non-Agency Mortgage-Backed Obligations—0.2% | | | | | |
First Plus Home Loan Trust, 1997-4, Tranche M1, 7.640%, 9/11/23§** | | | D | | | | 199 | | | | 167 | |
First Horizon Asset Securities, Inc., 2004-AR4, Tranche 3A1, 2.712%, 8/25/34, VRN | | | AAA | | | | 387 | | | | 329 | |
| | | | | | | | | | | | |
Total Non-Agency Mortgage-Backed Obligations | | | | | | | | | | | 496 | |
| | | | | | | | | | | | |
| |
Asset-Backed Securities—3.5% | | | | | |
Avis Budget Rental Car Funding AESOP LLC—144A, 2009-1A, Tranche A, 9.310%, 10/20/13 | | | Aa1 | | | | 2,000 | | | | 2,083 | |
Hertz Vehicle Financing LLC—144A, 2009-2A, Tranche A1, 4.260%, 3/25/14 | | | Aaa | | | | 2,230 | | | | 2,283 | |
Centre Point Funding LLC—144A, 2010-1A, Tranche 1, 5.430%, 7/20/16 | | | A2 | | | | 2,309 | | | | 2,418 | |
See accompanying Notes to Financial Statements.
32 Annual Report | December 31, 2011 |
Bond Fund
Portfolio of Investments, December 31, 2011 (all dollar amounts in thousands)
| | | | | | | | | | | | |
Issuer | | NRSRO
Rating
(unaudited) | | | Principal
Amount | | | Value | |
|
Asset-Backed Securities—(continued) | |
Sierra Receivables Funding Co. LLC—144A, 2011-1A, Tranche A, 3.350%, 4/20/26 | | | A | | | $ | 1,259 | | | $ | 1,233 | |
| | | | | | | | | | | | |
Total Asset-Backed Securities | | | | | | | | | | | 8,017 | |
| | | | | | | | | | | | |
| | | |
Corporate Obligations—48.9% | | | | | | | | | | | | |
Bank of America Corporation, 7.375%, due 5/15/14 | | | A | | | | 1,000 | | | | 1,037 | |
D.R. Horton, Inc., 5.625%, due 9/15/14 | | | BB | | | | 1,535 | | | | 1,581 | |
Corporation Nacional del Cobre de Chile—144A, 4.750%, due 10/15/14 | | | A1 | | | | 1,350 | | | | 1,448 | |
Yum! Brands, Inc.,
6.250%, due 4/15/16 | | | BBB | | | | 1,050 | | | | 1,214 | |
SUPERVALU, Inc., 8.000%, due 5/1/16 | | | B+ | | | | 1,500 | | | | 1,549 | |
Owens-Brockway Glass Container, Inc., 7.375%, due 5/15/16 | | | BB+ | | | | 1,250 | | | | 1,369 | |
Fiserv, Inc.,
3.125%, due 6/15/16 | | | Baa2 | | | | 1,825 | | | | 1,858 | |
SABMiller plc—144A, 6.500%, due 7/1/16 | | | BBB+ | | | | 700 | | | | 818 | |
Petrobras International Finance Co., 6.125%, due 10/6/16 | | | A3 | | | | 1,350 | | | | 1,497 | |
Comcast Corporation,
6.500%, due 1/15/17 | | | BBB+ | | | | 350 | | | | 412 | |
Corrections Corporation of America, 7.750%, due 6/1/17 | | | Ba1 | | | | 1,250 | | | | 1,356 | |
ERP Operating L.P., 5.750%, due 6/15/17 | | | BBB+ | | | | 2,000 | | | | 2,217 | |
JPMorgan Chase & Co., 6.125%, due 6/27/17 | | | A1 | | | | 600 | | | | 659 | |
Smithfield Foods, Inc., 7.750%, due 7/1/17 | | | BB- | | | | 1,500 | | | | 1,642 | |
American Express Co., 6.150%, due 8/28/17 | | | A+ | | | | 2,000 | | | | 2,287 | |
Capital One Financial Corporation, 6.750%, due 9/15/17 | | | A- | | | | 1,775 | | | | 1,989 | |
Exelon Generation Co. LLC,
6.200%, due 10/1/17 | | | A3 | | | | 1,100 | | | | 1,263 | |
Toll Brothers Finance Corporation, 8.910%, due 10/15/17 | | | BBB- | | | | 1,000 | | | | 1,152 | |
Motorola Solutions, Inc.,
6.000%, due 11/15/17 | | | BBB | | | | 2,000 | | | | 2,242 | |
Triumph Group, Inc.,
8.000%, due 11/15/17 | | | B+ | | | | 1,500 | | | | 1,597 | |
Union Pacific Corporation,
5.750%, due 11/15/17 | | | BBB+ | | | | 600 | | | | 710 | |
Wells Fargo & Co.,
5.625%, due 12/11/17 | | | AA- | | | | 1,000 | | | | 1,140 | |
Kohl’s Corporation,
6.250%, due 12/15/17 | | | BBB+ | | | | 1,000 | | | | 1,191 | |
American Tower Corporation, 4.500%, due 1/15/18 | | | Baa3 | | | | 1,150 | | | | 1,170 | |
Morgan Stanley,
6.625%, due 4/1/18 | | | A2 | | | | 2,000 | | | | 1,975 | |
General Electric Capital Corporation, 5.625%, due 5/1/18 | | | AA+ | | | | 1,250 | | | | 1,400 | |
| | | | | | | | | | | | |
Issuer | | NRSRO
Rating
(unaudited) | | | Principal
Amount | | | Value | |
| |
Corporate Obligations—(continued) | | | | | |
Simon Property Group L.P.,
6.125%, due 5/30/18 | | | A- | | | $ | 1,750 | | | $ | 2,009 | |
Time Warner Cable, Inc.,
6.750%, due 7/1/18 | | | BBB | | | | 1,000 | | | | 1,188 | |
Petrohawk Energy Corporation, 7.250%, due 8/15/18 | | | A | | | | 1,000 | | | | 1,125 | |
Merrill Lynch & Co., Inc.,
6.875%, due 11/15/18 | | | A | | | | 1,075 | | | | 1,036 | |
Anheuser-Busch InBev Worldwide, Inc., 7.750%, due 1/15/19 | | | A- | | | | 1,400 | | | | 1,813 | |
CSX Corporation,
7.375%, due 2/1/19 | | | BBB | | | | 800 | | | | 997 | |
BHP Billiton Finance USA, Ltd., 6.500%, due 4/1/19 | | | A+ | | | | 1,300 | | | | 1,606 | |
Owens Corning,
9.000%, due 6/15/19 | | | BBB- | | | | 1,000 | | | | 1,193 | |
Discovery Communications LLC, 5.625%, due 8/15/19 | | | BBB | | | | 500 | | | | 569 | |
Roper Industries, Inc.,
6.250%, due 9/1/19 | | | Baa2 | | | | 1,800 | | | | 2,127 | |
Republic Services, Inc.,
5.500%, due 9/15/19 | | | BBB | | | | 1,650 | | | | 1,904 | |
Boston Properties L.P.,
5.875%, due 10/15/19 | | | A- | | | | 1,500 | | | | 1,689 | |
Crown Castle International Corporation, 7.125%, due 11/1/19 | | | BB- | | | | 1,500 | | | | 1,620 | |
Toll Brothers Finance Corporation, 6.750%, due 11/1/19 | | | BBB- | | | | 500 | | | | 526 | |
Ford Motor Credit Co. LLC,
8.125%, due 1/15/20 | | | BB+ | | | | 2,000 | | | | 2,354 | |
Jarden Corporation,
7.500%, due 1/15/20 | | | B | | | | 1,500 | | | | 1,597 | |
Johnson Controls, Inc.,
5.000%, due 3/30/20 | | | BBB+ | | | | 1,625 | | | | 1,808 | |
The Goldman Sachs Group, Inc., 6.000%, due 6/15/20 | | | A1 | | | | 1,800 | | | | 1,844 | |
Commonwealth Edison Co.,
4.000%, due 8/1/20 | | | A- | | | | 1,000 | | | | 1,077 | |
Citigroup, Inc.,
5.375%, due 8/9/20 | | | A | | | | 2,000 | | | | 2,057 | |
Alcoa, Inc.,
6.150%, due 8/15/20 | | | BBB- | | | | 2,000 | | | | 2,078 | |
Omnicom Group, Inc.,
4.450%, due 8/15/20 | | | BBB+ | | | | 2,000 | | | | 2,062 | |
The Goodyear Tire & Rubber Co., 8.250%, due 8/15/20 | | | B+ | | | | 1,500 | | | | 1,635 | |
BE Aerospace, Inc.,
6.875%, due 10/1/20 | | | BB | | | | 1,500 | | | | 1,635 | |
Georgia-Pacific LLC—144A, 5.400%, due 11/1/20 | | | A- | | | | 1,500 | | | | 1,661 | |
Progress Energy, Inc.,
4.400%, due 1/15/21 | | | BBB | | | | 1,625 | | | | 1,791 | |
L-3 Communications Corporation, 4.950%, due 2/15/21 | | | BBB- | | | | 2,355 | | | | 2,334 | |
Wyndham Worldwide Corporation, 5.625%, due 3/1/21 | | | BBB- | | | | 1,000 | | | | 1,033 | |
Ball Corporation,
5.750%, due 5/15/21 | | | BB+ | | | | 1,500 | | | | 1,571 | |
See accompanying Notes to Financial Statements.
December 31, 2011 | William Blair Funds 33 |
Bond Fund
Portfolio of Investments, December 31, 2011 (all dollar amounts in thousands)
| | | | | | | | | | | | |
Issuer | | NRSRO
Rating
(unaudited) | | | Principal
Amount | | | Value | |
| |
Corporate Obligations—(continued) | | | | | |
Energizer Holdings, Inc.—144A, 4.700%, due 5/19/21 | | | BBB- | | | $ | 2,000 | | | $ | 2,105 | |
Discovery Communications LLC, 4.375%, due 6/15/21 | | | BBB | | | | 1,000 | | | | 1,056 | |
Praxair, Inc.,
3.000%, due 9/1/21 | | | A | | | | 2,000 | | | | 2,047 | |
O’Reilly Automotive, Inc.,
4.625%, due 9/15/21 | | | BBB- | | | | 2,200 | | | | 2,307 | |
FUEL Trust—144A,
3.984%, due 12/15/22 | | | Baa2 | | | | 2,000 | | | | 2,000 | |
The Kroger Co.,
8.000%, due 9/15/29 | | | BBB | | | | 425 | | | | 583 | |
Conoco Funding Co.,
7.250%, due 10/15/31 | | | A1 | | | | 400 | | | | 555 | |
Kohl’s Corporation,
6.000%, due 1/15/33 | | | BBB+ | | | | 1,000 | | | | 1,116 | |
Wisconsin Electric Power Co., 5.700%, due 12/1/36 | | | A+ | | | | 500 | | | | 646 | |
Comcast Corporation,
6.450%, due 3/15/37 | | | BBB+ | | | | 650 | | | | 788 | |
Yum! Brands, Inc.,
6.875%, due 11/15/37 | | | BBB | | | | 600 | | | | 766 | |
JPMorgan Chase & Co.,
6.400%, due 5/15/38 | | | Aa3 | | | | 1,400 | | | | 1,625 | |
COX Communications, Inc.—144A, 6.950%, due 6/1/38 | | | BBB | | | | 350 | | | | 400 | |
General Electric Capital Corporation, 6.875%, due 1/10/39 | | | AA+ | | | | 750 | | | | 898 | |
Abbott Laboratories,
6.000%, due 4/1/39 | | | AA | | | | 2,200 | | | | 2,795 | |
Burlington Northern Santa Fe LLC, 5.750%, due 5/1/40 | | | A3 | | | | 1,515 | | | | 1,813 | |
Illinois Tool Works, Inc.—144A, 4.875%, due 9/15/41 | | | A+ | | | | 850 | | | | 967 | |
Union Pacific Corporation, 4.750%, due 9/15/41 | | | BBB+ | | | | 1,400 | | | | 1,525 | |
Aristotle Holding, Inc.—144A, 6.125%, due 11/15/41 | | | BBB+ | | | | 2,450 | | | | 2,649 | |
Philip Morris International, Inc., 4.375%, due 11/15/41 | | | A | | | | 2,000 | | | | 2,079 | |
Gilead Sciences, Inc.,
5.650%, due 12/1/41 | | | A- | | | | 750 | | | | 830 | |
CSX Corporation,
4.750%, due 5/30/42 | | | BBB | | | | 1,200 | | | | 1,238 | |
| | | | | | | | | | | | |
Total Corporate Obligations | | | | | | | | | | | 113,500 | |
| | | | | | | | | | | | |
Total Long-Term Investments—96.9%
(cost $211,270) | | | | 224,663 | |
| | | | | | | | | | | | |
| | | | | | | | | | | | |
Issuer | | NRSRO
Rating
(unaudited) | | | Principal
Amount | | | Value | |
| | | |
Repurchase Agreement | | | | | | | | | | | | |
Fixed Income Clearing Corporation, 0.000% dated 12/30/11, due 1/3/12, repurchase price $564, collateralized by FHLMC, 3.150%, due 10/28/20 | | | Aaa | | | $ | 564 | | | $ | 564 | |
| | | | | | | | | | | | |
Total Repurchase Agreement—0.2%
(cost $564) | | | | 564 | |
| | | | | | | | | | | | |
Total Investments—97.1%
(cost $211,834) | | | | 225,227 | |
Cash and other assets, less liabilities—2.9% | | | | 6,789 | |
| | | | | | | | | | | | |
Net assets—100.0% | | | $ | 232,016 | |
| | | | | | | | | | | | |
NRSRO = Nationally Recognized Statistical Rating Organization—The credit quality ratings of the securities in the Fund reflect the highest category rating by either Fitch Ratings, Moody’s Investors Service Inc., or Standard & Poor’s, a division of the McGraw-Hill Companies, Inc.
The obligations of certain U. S. Government-sponsored securities are neither issued nor guaranteed by the U. S. Treasury.
VRN = Variable Rate Note
§ = Deemed illiquid pursuant to Liquidity Procedures approved by the Board of Trustees. This holding represents 0.07% of the net assets at December 31, 2011.
** = Fair valued pursuant to Valuation Procedures adopted by the Board of Trustees. This holding represents 0.07% of the Fund’s net assets at December 31, 2011.
See accompanying Notes to Financial Statements.
34 Annual Report | December 31, 2011 |
Christopher T. Vincent
Paul J. Sularz
LOW DURATION FUND
The Low Duration Fund seeks to maximize total return. Total return includes both income and capital appreciation.
AN OVERVIEW FROM THE PORTFOLIO MANAGERS
The Low Duration Fund posted a 2.14% increase on a total return basis (Institutional Class Shares) for the 12 months ended December 31, 2011. By comparison, the Fund’s benchmark, the the Merrill Lynch 1-Year U.S. Treasury Note Index, gained 0.57%.
The Fund had a very positive, with the Fund outperforming its Merrill Lynch 1-Year U.S. Treasury Note Index benchmark. We believe the Fund has been able to outperform the benchmark without sacrificing credit quality. The Fund does not own securities with a rating below “A” from a Nationally Recognized Statistical Rating Organization.
The majority of the Fund’s portfolio is invested in seasoned U.S. Government-guaranteed short duration Mortgage-backed Fannie Mae and Freddie Mac securities. This is the Fund’s major sector emphasis. We favor such securities because they are high quality instruments, provide excellent liquidity, and pay monthly principal and interest, which we then are able to reinvest. The benefits of this strategy are evident in a rising rate environment such as the one we experienced during the first quarter.
Asset-Backed Securities are another segment of the market in which we invest that offers monthly payment of principal and interest. We continued to invest in credit card securitizations issued by top-tier banking institutions. As mentioned, all Asset-Backed Securities held in the Fund must maintain a rating above “A.”
Since the beginning of 2011 we have increased the Fund’s holdings of Asset-backed securities whose coupons are reset monthly and are tied to LIBOR—the London Interbank Offered Rate. The income from these securities will rise with any increase in rates and will protect the Fund against falling prices. The percentage of these floating-rate securities in the Fund’s portfolio rose from approximately 15% at the beginning of 2011 to approximately 22% at the end of the year.
The Fund purchased TIPS (Treasury Inflation-Protected Securities) earlier this year. TIPS have been the strongest-performing investment grade security. We believe in holding TIPS instead of nominal Treasuries, as TIPS provide protection against unexpected inflation and diversification benefits.
The Fund kept its exposure to cash and cash equivalents extremely low, given the very low rates currently available from money market instruments.
Assets in the Fund continued to build since the Fund’s inception in 2010, with assets increasing to a new high “watermark” of approximately $157 million at the end of 2011.
While Treasury rates are at historically low levels, corporate risk spreads are at elevated levels last experienced in mid-2009 as the market was recovering from the depths of the credit crisis. In addition, demand for high-quality, fixed-income assets has risen due to increased equity market volatility and the near-zero rates offered by money market instruments.
We structure our Low Duration Fund to earn a competitive yield by emphasizing security selection in agency mortgage-backed securities, asset-backed securities, and high-quality corporate bonds.
December 31, 2011 | William Blair Funds 35 |
Our primary emphasis remains in agency mortgage-backed securities, primarily higher-coupon, low loan balance, 15-year pools. We believe these securities will experience slower prepayments in a lower interest rate environment.
Within the asset-backed sector, we are allocated to short-dated auto and credit card loan receivable pools originated by “Tier 1” issuers. Some of our asset-backed holdings are floating-rate instruments, which help protect principal in a rising interest rate environment.
In the corporate sector, we favor short-dated, high-quality (A-rated or better) bonds of large, systemically important financial institutions, as well as high-quality, blue-chip industrials.
36 Annual Report | December 31, 2011 |
Low Duration Fund
Performance Highlights (unaudited)
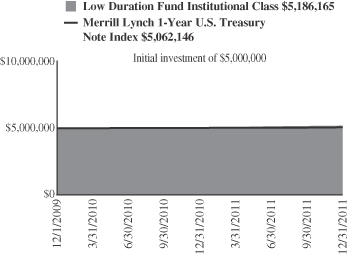
Average Annual Total Return at 12/31/2011
| | | | | | | | |
| | | 1
Year | | | Since
Inception(a) | |
Institutional Class | | | 2.14 | % | | | 1.77 | % |
Merrill Lynch 1-Year U.S.
Treasury Note Index | | | 0.57 | | | | 0.60 | |
| | (a) | | For the period December 1, 2009 (Commencement of Operations to December 31, 2011. |
Performance cited represents past performance. Past performance does not guarantee future results and current performance may be lower or higher than the data quoted. Results shown are average annual total returns, which assume reinvestment of dividends and capital gains. Investment returns and principal will fluctuate and you may have a gain or loss when you sell shares. For the most current month-end performance information, please call 1-800-742-7272, or visit our Web site at www.williamblairfunds.com. From time to time, the investment advisor may waive fees or reimburse expenses for the Fund. Without these waivers, performance would be lower.
The performance highlights and graph presented above do not reflect the deduction of taxes that a shareholder would pay on fund distributions or the redemption of fund shares.
The Merrill Lynch 1-Year U.S. Treasury Note Index is comprised of a single U.S. Treasury Note issue purchased at the beginning of the month and held for a full month. Each month the index is rebalanced and the issue selected is the outstanding U.S. Treasury Note that matures closest to, but not beyond one year from the rebalancing date.
This report identifies the Fund’s investments on December 31, 2011. These holdings are subject to change. Not all investments in the Fund performed the same, nor is there any guarantee that these investments will perform as well in the future. Market forecasts provided in this report may not necessarily come to pass.
Sector Diversification (unaudited)
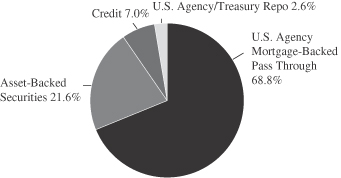
The sector diversification shown is based on the total investments.
December 31, 2011 | William Blair Funds 37 |
Low Duration Fund
Portfolio of Investments, December 31, 2011 (all dollar amounts in thousands)
| | | | | | | | | | |
Issuer | | | | Principal
Amount | | | Value | |
|
U.S. Government and U.S. Government Agency—68.1% | |
Government National Mortgage Association (GNMA)—0.4% | | | | | | | | | | |
#781567, 5.000%, due 2/15/18 | | | | $ | 101 | | | $ | 108 | |
#606406, 5.000%, due 4/15/18 | | | | | 151 | | | | 164 | |
#003438, 4.500%, due 9/20/18 | | | | | 254 | | | | 276 | |
#003465, 4.500%, due 11/20/18 | | | | | 77 | | | | 84 | |
| | | | | | | | | | |
Total GNMA Mortgage Obligations | | | | | | | | | 632 | |
| | | | | | | | | | |
Federal Home Loan Mortgage Corp. (FHLMC)—23.6% | | | | | | | | | | |
#M80970, 4.500%, due 5/1/12 | | | | | 64 | | | | 64 | |
#M80982, 5.000%, due 7/1/12 | | | | | 185 | | | | 189 | |
#B18053, 5.000%, due 3/1/15 | | | | | 61 | | | | 64 | |
#G11885, 5.000%, due 1/1/16 | | | | | 193 | | | | 207 | |
#E86134, 5.000%, due 11/1/16 | | | | | 202 | | | | 216 | |
#E01337, 4.000%, due 2/1/18 | | | | | 198 | | | | 209 | |
#E96536, 5.000%, due 3/1/18 | | | | | 315 | | | | 340 | |
#E95355, 5.000%, due 4/1/18 | | | | | 402 | | | | 433 | |
#E01377, 4.500%, due 5/1/18 | | | | | 404 | | | | 428 | |
#G11618, 4.500%, due 5/1/18 | | | | | 1,867 | | | | 1,992 | |
#E96700, 5.000%, due 5/1/18 | | | | | 1,161 | | | | 1,250 | |
#E96962, 4.000%, due 6/1/18 | | | | | 196 | | | | 209 | |
#E01411, 5.000%, due 7/1/18 | | | | | 208 | | | | 222 | |
#E01424, 4.000%, due 8/1/18 | | | | | 5 | | | | 6 | |
#G12024, 4.500%, due 8/1/18 | | | | | 502 | | | | 535 | |
#E99963, 4.500%, due 10/1/18 | | | | | 120 | | | | 128 | |
#E01488, 5.000%, due 10/1/18 | | | | | 445 | | | | 477 | |
#E99895, 5.000%, due 10/1/18 | | | | | 897 | | | | 966 | |
#G12093, 4.500%, due 12/1/18 | | | | | 544 | | | | 581 | |
#B11386, 5.000%, due 12/1/18 | | | | | 189 | | | | 203 | |
#B11362, 5.500%, due 12/1/18 | | | | | 28 | | | | 30 | |
#G13367, 5.500%, due 12/1/18 | | | | | 152 | | | | 165 | |
#E01545, 5.000%, due 1/1/19 | | | | | 251 | | | | 269 | |
#B12826, 4.500%, due 3/1/19 | | | | | 855 | | | | 916 | |
#G11766, 5.000%, due 3/1/19 | | | | | 182 | | | | 196 | |
#G13176, 4.000%, due 5/1/19 | | | | | 211 | | | | 224 | |
#G18001, 4.500%, due 7/1/19 | | | | | 245 | | | | 261 | |
#G11596, 5.500%, due 8/1/19 | | | | | 213 | | | | 233 | |
#B16291, 5.000%, due 9/1/19 | | | | | 1,461 | | | | 1,574 | |
#G11605, 5.500%, due 9/1/19 | | | | | 109 | | | | 119 | |
#G11690, 4.000%, due 2/1/20 | | | | | 33 | | | | 35 | |
#G18045, 5.000%, due 3/1/20 | | | | | 200 | | | | 216 | |
#G11892, 4.000%, due 4/1/20 | | | | | 194 | | | | 207 | |
#B19078, 5.000%, due 4/1/20 | | | | | 141 | | | | 152 | |
#G18048, 5.000%, due 4/1/20 | | | | | 134 | | | | 144 | |
#J08152, 5.000%, due 5/1/20 | | | | | 139 | | | | 150 | |
#G11720, 4.500%, due 8/1/20 | | | | | 43 | | | | 45 | |
#J14232, 3.500%, due 1/1/21 | | | | | 2,478 | | | | 2,588 | |
#G12394, 5.000%, due 5/1/21 | | | | | 252 | | | | 271 | |
#G13296, 5.000%, due 5/1/21 | | | | | 691 | | | | 744 | |
#G12113, 5.500%, due 5/1/21 | | | | | 342 | | | | 375 | |
#G12286, 5.000%, due 7/1/21 | | | | | 137 | | | | 147 | |
#G12545, 4.000%, due 10/1/21 | | | | | 266 | | | | 282 | |
#E02322, 5.500%, due 5/1/22 | | | | | 92 | | | | 100 | |
#J06484, 5.500%, due 11/1/22 | | | | | 772 | | | | 845 | |
#C00351, 8.000%, due 7/1/24 | | | | | 127 | | | | 150 | |
#G13695, 4.000%, due 9/1/24 | | | | | 1,849 | | | | 1,977 | |
#G00363, 8.000%, due 6/1/25 | | | | | 163 | | | | 195 | |
#C80329, 8.000%, due 8/1/25 | | | | | 39 | | | | 47 | |
#J13022, 4.000%, due 9/1/25 | | | | | 2,753 | | | | 2,943 | |
|
U.S. Government and U.S. Government Agency—(continued) | |
Federal Home Loan Mortgage Corp. (FHLMC)—(continued) | | | | | | | | | | |
#G14150, 4.500%, due 4/1/26 | | | | $ | 3,531 | | | $ | 3,813 | |
#E02912, 5.000%, due 6/1/26 | | | | | 1,823 | | | | 1,964 | |
#E02913, 5.000%, due 6/1/26 | | | | | 1,725 | | | | 1,862 | |
#J16051, 4.500%, due 7/1/26 | | | | | 4,798 | | | | 5,181 | |
| | | | | | | | | | |
Total FHLMC Mortgage Obligations | | | | | | | | | 37,139 | |
| | | | | | | | | | |
Federal National Mortgage Association (FNMA)—44.1% | | | | | | | | | | |
#256224, 5.500%, due 4/1/16 | | | | | 36 | | | | 39 | |
#256559, 5.500%, due 1/1/17 | | | | | 20 | | | | 22 | |
#256606, 5.500%, due 2/1/17 | | | | | 26 | | | | 28 | |
#256646, 5.500%, due 3/1/17 | | | | | 19 | | | | 20 | |
#545898, 5.500%, due 9/1/17 | | | | | 549 | | | | 597 | |
#545899, 5.500%, due 9/1/17 | | | | | 641 | | | | 697 | |
#555029, 5.000%, due 11/1/17 | | | | | 79 | | | | 85 | |
#257067, 5.000%, due 1/1/18 | | | | | 91 | | | | 98 | |
#663692, 5.000%, due 1/1/18 | | | | | 260 | | | | 281 | |
#674713, 5.000%, due 1/1/18 | | | | | 20 | | | | 21 | |
#679305, 5.000%, due 1/1/18 | | | | | 84 | | | | 91 | |
#254591, 5.500%, due 1/1/18 | | | | | 424 | | | | 458 | |
#677680, 4.500%, due 2/1/18 | | | | | 15 | | | | 16 | |
#681310, 4.500%, due 2/1/18 | | | | | 326 | | | | 349 | |
#678938, 5.500%, due 2/1/18 | | | | | 41 | | | | 45 | |
#683100, 5.500%, due 2/1/18 | | | | | 551 | | | | 605 | |
#254684, 5.000%, due 3/1/18 | | | | | 29 | | | | 31 | |
#675717, 5.000%, due 3/1/18 | | | | | 380 | | | | 411 | |
#681361, 5.000%, due 3/1/18 | | | | | 144 | | | | 155 | |
#656564, 5.000%, due 4/1/18 | | | | | 1,957 | | | | 2,113 | |
#696677, 5.000%, due 4/1/18 | | | | | 137 | | | | 148 | |
#702888, 5.000%, due 4/1/18 | | | | | 203 | | | | 219 | |
#695838, 5.500%, due 4/1/18 | | | | | 118 | | | | 129 | |
#929388, 4.500%, due 5/1/18 | | | | | 492 | | | | 525 | |
#254721, 5.000%, due 5/1/18 | | | | | 322 | | | | 348 | |
#702332, 5.000%, due 5/1/18 | | | | | 68 | | | | 74 | |
#704049, 5.500%, due 5/1/18 | | | | | 1,048 | | | | 1,152 | |
#735357, 5.500%, due 5/1/18 | | | | | 1,641 | | | | 1,803 | |
#254785, 4.000%, due 6/1/18 | | | | | 232 | | | | 246 | |
#555622, 4.500%, due 6/1/18 | | | | | 403 | | | | 432 | |
#656573, 5.000%, due 6/1/18 | | | | | 300 | | | | 327 | |
#709848, 5.000%, due 6/1/18 | | | | | 265 | | | | 289 | |
#713380, 4.000%, due 7/1/18 | | | | | 242 | | | | 258 | |
#254802, 4.500%, due 7/1/18 | | | | | 349 | | | | 374 | |
#713807, 4.500%, due 7/1/18 | | | | | 190 | | | | 204 | |
#735003, 5.500%, due 7/1/18 | | | | | 1,751 | | | | 1,924 | |
#254840, 4.000%, due 8/1/18 | | | | | 114 | | | | 122 | |
#682443, 4.000%, due 8/1/18 | | | | | 500 | | | | 532 | |
#730823, 4.000%, due 8/1/18 | | | | | 216 | | | | 230 | |
#734753, 4.000%, due 8/1/18 | | | | | 37 | | | | 40 | |
#711991, 5.000%, due 8/1/18 | | | | | 246 | | | | 268 | |
#254919, 4.000%, due 9/1/18 | | | | | 30 | | | | 32 | |
#740444, 4.500%, due 9/1/18 | | | | | 321 | | | | 344 | |
#734741, 4.000%, due 10/1/18 | | | | | 22 | | | | 23 | |
#743183, 5.000%, due 10/1/18 | | | | | 107 | | | | 116 | |
#255003, 4.000%, due 11/1/18 | | | | | 15 | | | | 16 | |
#747823, 4.000%, due 11/1/18 | | | | | 613 | | | | 657 | |
#749596, 5.000%, due 11/1/18 | | | | | 374 | | | | 408 | |
#745237, 5.000%, due 12/1/18 | | | | | 87 | | | | 94 | |
#725171, 4.000%, due 1/1/19 | | | | | 14 | | | | 15 | |
See accompanying Notes to Financial Statements.
38 Annual Report | December 31, 2011 |
Low Duration Fund
Portfolio of Investments, December 31, 2011 (all dollar amounts in thousands)
| | | | | | | | | | | | |
Issuer | | NRSRO
Rating
(unaudited) | | | Principal
Amount | | | Value | |
|
U.S. Government and U.S. Government Agency—(continued) | |
Federal National Mortgage Association (FNMA)—(continued) | | | | | | | | | |
#725168, 4.500%, due 2/1/19 | | | | | | $ | 255 | | | $ | 273 | |
#255079, 5.000%, due 2/1/19 | | | | | | | 74 | | | | 80 | |
#766276, 5.000%, due 3/1/19 | | | | | | | 597 | | | | 649 | |
#255233, 4.000%, due 5/1/19 | | | | | | | 528 | | | | 562 | |
#725445, 4.500%, due 5/1/19 | | | | | | | 949 | | | | 1,015 | |
#779363, 5.000%, due 6/1/19 | | | | | | | 112 | | | | 122 | |
#785259, 5.000%, due 8/1/19 | | | | | | | 456 | | | | 496 | |
#725953, 5.000%, due 10/1/19 | | | | | | | 131 | | | | 143 | |
#745240, 4.500%, due 12/1/19 | | | | | | | 548 | | | | 587 | |
#735401, 5.500%, due 3/1/20 | | | | | | | 339 | | | | 369 | |
#735646, 4.500%, due 7/1/20 | | | | | | | 635 | | | | 679 | |
#745440, 4.500%, due 7/1/20 | | | | | | | 11 | | | | 12 | |
#825912, 4.000%, due 9/1/20 | | | | | | | 68 | | | | 72 | |
#836016, 4.500%, due 9/1/20 | | | | | | | 743 | | | | 794 | |
#879607, 5.500%, due 4/1/21 | | | | | | | 149 | | | | 163 | |
#881284, 4.500%, due 12/1/21 | | | | | | | 1,374 | | | | 1,471 | |
#972934, 5.500%, due 2/1/23 | | | | | | | 534 | | | | 585 | |
#254908, 5.000%, due 9/1/23 | | | | | | | 102 | | | | 111 | |
#255165, 4.500%, due 3/1/24 | | | | | | | 129 | | | | 141 | |
#934808, 4.500%, due 3/1/24 | | | | | | | 170 | | | | 185 | |
#AA4519, 4.500%, due 3/1/24 | | | | | | | 2,898 | | | | 3,147 | |
#AA5028, 4.500%, due 4/1/24 | | | | | | | 674 | | | | 732 | |
#190988, 9.000%, due 6/1/24 | | | | | | | 207 | | | | 241 | |
#AC8857, 4.500%, due 12/1/24 | | | | | | | 104 | | | | 112 | |
#AC9560, 5.000%, due 1/1/25 | | | | | | | 4,548 | | | | 4,959 | |
#932449, 4.000%, due 2/1/25 | | | | | | | 660 | | | | 709 | |
#AD0855, 4.000%, due 3/1/25 | | | | | | | 336 | | | | 360 | |
#932723, 4.000%, due 4/1/25 | | | | | | | 800 | | | | 859 | |
#935995, 4.000%, due 6/1/25 | | | | | | | 230 | | | | 247 | |
#AD4677, 4.000%, due 6/1/25 | | | | | | | 2,573 | | | | 2,763 | |
#AD8164, 4.000%, due 8/1/25 | | | | | | | 2,302 | | | | 2,473 | |
#AE1176, 4.000%, due 8/1/25 | | | | | | | 1,032 | | | | 1,109 | |
#AB1459, 4.000%, due 9/1/25 | | | | | | | 266 | | | | 285 | |
#AH2671, 4.000%, due 1/1/26 | | | | | | | 1,893 | | | | 2,033 | |
#890329, 4.000%, due 4/1/26 | | | | | | | 1,860 | | | | 1,992 | |
#AI4856, 4.500%, due 6/1/26 | | | | | | | 2,228 | | | | 2,420 | |
#AI9811, 4.500%, due 8/1/26 | | | | | | | 3,211 | | | | 3,487 | |
#AH9564, 3.500%, due 9/1/26 | | | | | | | 3,679 | | | | 3,894 | |
#AB3608, 3.500%, due 10/1/26 | | | | | | | 3,936 | | | | 4,167 | |
#AI7363, 3.500%, due 10/1/26 | | | | | | | 1,297 | | | | 1,373 | |
#AJ2322, 3.500%, due 10/1/26 | | | | | | | 3,011 | | | | 3,187 | |
#AJ7724, 4.000%, due 12/1/26 | | | | | | | 2,500 | | | | 2,685 | |
| | | | | | | | | | | | |
Total FNMA Mortgage Obligations | | | | | | | | | | | 69,254 | |
| | | | | | | | | | | | |
|
Asset-Backed Securities—21.4% | |
Honda Auto Receivables Owner Trust, 2009-2, Tranche A3, 2.790%, 1/15/13 | | | AAA | | | | 90 | | | | 90 | |
CarMax Auto Owner Trust, 2009-1, Tranche A3, 4.120%, 3/15/13 | | | AAA | | | | 34 | | | | 34 | |
Ford Credit Auto Owner Trust, 2009-A, Tranche A3A, 3.960%, 5/15/13 | | | AAA | | | | 44 | | | | 44 | |
USAA Auto Owner Trust, 2009-1, Tranche A3, 3.020%, 6/17/13 | | | AAA | | | | 1 | | | | 1 | |
Issuer | | NRSRO
Rating
(unaudited) | | | Principal
Amount | | | Value | |
|
Asset-Backed Securities—(continued) | |
American Express Issuance Trust, 2007-2, Tranche A, 0.528%, 7/15/13, VRN | | | AAA | | | $ | 373 | | | $ | 373 | |
Ally Auto Receivables Trust, 2010-3, Tranche A2, 0.378%, 8/15/13, VRN | | | AAA | | | | 314 | | | | 314 | |
Ford Credit Auto Owner Trust, 2009-B, Tranche A3,
2.790%, 8/15/13 | | | AAA | | | | 139 | | | | 140 | |
John Deere Owner Trust, 2009-B, Tranche A3, 1.570%, 10/15/13 | | | AAA | | | | 250 | | | | 250 | |
Avis Budget Rental Car Funding AESOP LLC—144A, 2009-1A, Tranche A, 9.310%, 10/20/13 | | | Aa1 | | | | 2,000 | | | | 2,084 | |
Harley-Davidson Motorcycle Trust, 2009-1, Tranche A3,
3.190%, 11/15/13 | | | AAA | | | | 353 | | | | 353 | |
CNH Equipment Trust, 2009-C, Tranche A3, 1.850%, 12/16/13 | | | AAA | | | | 4 | | | | 4 | |
Volkswagen Auto Loan Enhanced Trust, 2010-1, Tranche A3, 1.310%, 1/20/14 | | | AAA | | | | 485 | | | | 486 | |
USAA Auto Owner Trust, 2008-3, Tranche A4, 4.710%, 2/18/14 | | | AAA | | | | 25 | | | | 25 | |
Harley-Davidson Motorcycle Trust, 2009-2, Tranche A3,
2.620%, 3/15/14 | | | AAA | | | | 192 | | | | 193 | |
Hertz Vehicle Financing
LLC—144A, 2009-2A, Tranche A1, 4.260%, 3/25/14 | | | Aaa | | | | 1,765 | | | | 1,807 | |
BMW Vehicle Owner Trust, 2010-A, Tranche A3, 1.390%, 4/25/14 | | | AAA | | | | 235 | | | | 235 | |
Ford Credit Auto Owner Trust, 2010-A, Tranche A3,
1.320%, 6/15/14 | | | AAA | | | | 367 | | | | 368 | |
Nissan Auto Receivables Owner Trust, 2008-A, Tranche A4, 4.280%, 6/16/14 | | | AAA | | | | 35 | | | | 35 | |
Capital Auto Receivables Asset Trust, 2008-1, Tranche A4B, 1.628%, 7/15/14, VRN | | | AAA | | | | 353 | | | | 355 | |
CNH Equipment Trust, 2010-A, Tranche A3, 1.540%, 7/15/14 | | | AAA | | | | 444 | | | | 445 | |
Nissan Auto Receivables Owner Trust, 2010-A, Tranche A3, 0.870%, 7/15/14 | | | Aaa | | | | 500 | | | | 501 | |
Daimler Chrysler Auto Trust, 2008-A, Tranche A4, 4.480%, 8/8/14 | | | AAA | | | | 444 | | | | 446 | |
Mercedes-Benz Auto Lease
Trust—144A, 2011-B, Tranche A3, 1.070%, 8/15/14 | | | Aaa | | | | 1,500 | | | | 1,498 | |
Nissan Auto Receivables Owner Trust, 2009-1, Tranche A3, 5.000%, 9/15/14 | | | AAA | | | | 293 | | | | 296 | |
Porsche Innovative Lease Owner Trust—144A, 2011-1, Tranche A3, 1.090%, 9/22/14 | | | Aaa | | | | 500 | | | | 499 | |
See accompanying Notes to Financial Statements.
December 31, 2011 | William Blair Funds 39 |
Low Duration Fund
Portfolio of Investments, December 31, 2011 (all dollar amounts in thousands)
| | | | | | | | | | | | |
Issuer | | NRSRO
Rating
(unaudited) | | | Principal
Amount | | | Value | |
|
Asset-Backed Securities—(continued) | |
Nissan Master Owner Trust Receivables—144A, 2010-AA, Tranche A, 1.428%, 1/15/15, VRN | | | AAA | | | $ | 2,000 | | | $ | 2,015 | |
CNH Equipment Trust, 2010-C, Tranche A3, 1.170%, 5/15/15 | | | AAA | | | | 459 | | | | 459 | |
Harley-Davidson Motorcycle Trust, 2011-2, Tranche A2,
0.710%, 5/15/15 | | | Aaa | | | | 1,500 | | | | 1,498 | |
Discover Card Master Trust, 2007-A2, Tranche A2, 0.886%, 6/15/15, VRN | | | AAA | | | | 192 | | | | 193 | |
Discover Card Master Trust I, 2005-4, Tranche A2,
0.368%, 6/16/15, VRN | | | AAA | | | | 77 | | | | 77 | |
FPL Recovery Funding LLC, 2007-A, Tranche A2, 5.044%, 8/1/15 | | | AAA | | | | 700 | | | | 724 | |
Bank of America Credit Card Trust, 2010-A1, Tranche A1, 0.578%, 9/15/15, VRN | | | AAA | | | | 2,000 | | | | 2,005 | |
Discover Card Master Trust, 2010-A1, Tranche A1, 0.928%, 9/15/15, VRN | | | Aaa | | | | 347 | | | | 349 | |
USAA Auto Owner Trust, 2010-1, Tranche A4, 2.140%, 9/15/15 | | | AAA | | | | 685 | | | | 695 | |
American Express Credit Account Master Trust, 2010-1, Tranche A, 0.528%, 11/16/15, VRN | | | AAA | | | | 500 | | | | 501 | |
Ford Credit Floorplan Master Owner Trust, 2011-1, Tranche A2, 0.878%, 2/15/16, VRN | | | AAA | | | | 1,000 | | | | 999 | |
Hertz Vehicle Financing LLC—144A, 2009-2A, Tranche A2, 5.290%, 3/25/16 | | | Aaa | | | | 2,350 | | | | 2,544 | |
Ally Master Owner Trust, 2011-3, Tranche A1, 0.908%, 5/15/16, VRN | | | Aaa | | | | 1,100 | | | | 1,097 | |
CNH Equipment Trust, 2010-C, Tranche A4, 1.750%, 5/16/16 | | | AAA | | | | 60 | | | | 61 | |
Avis Budget Rental Car Funding AESOP LLC—144A, 2010-3A, Tranche A, 4.640%, 5/20/16 | | | Aaa | | | | 1,400 | | | | 1,490 | |
Centre Point Funding LLC—144A, 2010-1A, Tranche 1,
5.430%, 7/20/16 | | | A2 | | | | 1,649 | | | | 1,727 | |
CNH Equipment Trust, 2011-B, Tranche A3, 0.910%, 8/15/16 | | | AAA | | | | 500 | | | | 498 | |
Discover Card Master Trust, 2011-A1, Tranche A1, 0.628%, 8/15/16, VRN | | | Aaa | | | | 1,400 | | | | 1,405 | |
Enterprise Fleet Financing LLC—144A, 2011-2, Tranche A2, 1.430%, 10/20/16 | | | AAA | | | | 2,000 | | | | 1,997 | |
GE Capital Credit Card Master Note Trust, 2011-1, Tranche A, 0.828%, 1/15/17, VRN | | | Aaa | | | | 500 | | | | 503 | |
Discover Card Master Trust, 2010-A2, Tranche A2, 0.858%, 3/15/18, VRN | | | AAA | | | | 350 | | | | 353 | |
Capital One Multi-Asset Execution Trust, 2007-A2, Tranche A2, 0.358%, 12/16/19, VRN | | | AAA | | | | 215 | | | | 209 | |
|
Asset-Backed Securities—(continued) | |
MBNA Credit Card Master Note Trust, 2004-A3, Tranche A3, 0.538%, 8/16/21, VRN | | | AAA | | | $ | 300 | | | $ | 296 | |
Sierra Receivables Funding Co. LLC—144A, 2011-1A, Tranche A, 3.350%, 4/20/26 | | | A | | | | 1,101 | | | | 1,079 | |
| | | | | | | | | | | | |
Total Asset-Backed Securities | | | | | | | | | | | 33,650 | |
| | | | | | | | | | | | |
| | | |
Corporate Obligations—6.9% | | | | | | | | | | | | |
Bank of America Corporation, 5.375%, due 9/11/12 | | | A | | | | 1,000 | | | | 1,012 | |
Citigroup, Inc., 5.300%, due 10/17/12 | | | A | | | | 1,000 | | | | 1,016 | |
Wells Fargo & Co., 5.250%, due 10/23/12 | | | AA- | | | | 1,000 | | | | 1,035 | |
The Goldman Sachs Group, Inc., 5.450%, due 11/1/12 | | | A1 | | | | 1,000 | | | | 1,017 | |
American Express Co., 4.875%, due 7/15/13 | | | A+ | | | | 1,000 | | | | 1,046 | |
JPMorgan Chase & Co., 1.216%, due 1/24/14, VRN | | | Aa3 | | | | 1,000 | | | | 985 | |
Morgan Stanley, 2.016%, due 1/24/14, VRN | | | A2 | | | | 1,000 | | | | 921 | |
Bank of America Corporation, 1.848%, due 1/30/14, VRN | | | A | | | | 1,000 | | | | 903 | |
Citigroup, Inc., 1.511%, due 4/1/14, VRN | | | A | | | | 1,000 | | | | 942 | |
Morgan Stanley, 6.000%, due 5/13/14 | | | A2 | | | | 1,000 | | | | 1,010 | |
General Dynamics Corporation, 1.375%, due 1/15/15 | | | A | | | | 1,000 | | | | 1,011 | |
| | | | | | | | | | | | |
Total Corporate Obligations | | | | | | | | | | | 10,898 | |
| | | | | | | | | | | | |
Total Long-Term Investments—96.4%
(cost $151,313) | | | | 151,573 | |
| | | | | | | | | | | | |
| | | |
Repurchase Agreement | | | | | | | | | | | | |
Fixed Income Clearing Corporation, 0.000% dated 12/30/11, due 1/3/12, repurchase price $4,035, collateralized by FNMA, 5.000%, due 3/15/16 | | | Aaa | | | | 4,035 | | | | 4,035 | |
| | | | | | | | | | | | |
Total Repurchase Agreement—2.6%
(cost $4,035) | | | | 4,035 | |
| | | | | | | | | | | | |
Total Investments—99.0%
(cost $155,348) | | | | 155,608 | |
Cash and other assets, less liabilities—1.0% | | | | 1,539 | |
| | | | | | | | | | | | |
Net assets—100.0% | | | $ | 157,147 | |
| | | | | | | | | | | | |
NRSRO = Nationally Recognized Statistical Rating Organization—The credit quality ratings of the securities in the Fund reflect the highest category rating by either Fitch Ratings, Moody’s Investors Service Inc., or Standard & Poor’s, a division of the McGraw-Hill Companies, Inc.
The obligations of certain U. S. Government-sponsored securities are neither issued nor guaranteed by the U. S. Treasury.
VRN = Variable Rate Note
See accompanying Notes to Financial Statements.
40 Annual Report | December 31, 2011 |
Statements of Assets and Liabilities
December 31, 2011 (dollar amounts in thousands)
| | | | | | | | | | | | |
| | | Institutional
International
Growth
Fund | | | Institutional
International
Equity
Fund | | | International
Small Cap
Growth
Fund | |
Assets | | | | | | | | | | | | |
Investments in securities, at cost | | $ | 1,518,756 | | | $ | 101,161 | | | $ | 734,992 | |
| | | | | | | | | | | | |
| | | |
Investments in securities, at value | | $ | 1,534,679 | | | $ | 109,420 | | | $ | 715,309 | |
Foreign currency, at value (cost $136; $1; $437) | | | 135 | | | | 1 | | | | 436 | |
Receivable for securities sold | | | 3,490 | | | | 4,592 | | | | 2,944 | |
Receivable for fund shares sold | | | 10,261 | | | | — | | | | 1,614 | |
Dividend and interest receivable | | | 1,656 | | | | 245 | | | | 630 | |
| | | | | | | | | | | | |
Total assets | | | 1,550,221 | | | | 114,258 | | | | 720,933 | |
Liabilities | | | | | | | | | | | | |
Payable for investment securities purchased | | | 3,716 | | | | 2,599 | | | | 460 | |
Payable for fund shares redeemed | | | 1,458 | | | | — | | | | 899 | |
Unrealized depreciation on
forward foreign currency contracts | | | 837 | | | | — | | | | 311 | |
Investment advisory fee payable | | | 1,247 | | | | 119 | | | | 588 | |
Distribution and shareholder service fee payable | | | — | | | | — | | | | 53 | |
Other payables and accrued expenses | | | 369 | | | | 66 | | | | 401 | |
| | | | | | | | | | | | |
Total liabilities | | | 7,627 | | | | 2,784 | | | | 2,712 | |
| | | | | | | | | | | | |
Net Assets | | $ | 1,542,594 | | | $ | 111,474 | | | $ | 718,221 | |
| | | | | | | | | | | | |
Capital | | | | | | | | | | | | |
Composition of Net Assets | | | | | | | | | | | | |
Par value of shares of beneficial interest | | $ | 124 | | | $ | 12 | | | $ | 63 | |
Capital paid in excess of par value | | | 1,718,538 | | | | 232,629 | | | | 798,066 | |
Accumulated net investment income (loss) | | | 16,015 | | | | (25 | ) | | | 4,542 | |
Accumulated net realized gain (loss) | | | (206,932 | ) | | | (129,391 | ) | | | (64,220 | ) |
Net unrealized appreciation (depreciation) of
investments and foreign currencies | | | 14,849 | | | | 8,249 | | | | (20,230 | ) |
| | | | | | | | | | | | |
Net Assets | | $ | 1,542,594 | | | $ | 111,474 | | | $ | 718,221 | |
| | | | | | | | | | | | |
| | | |
Net Assets | | $ | 1,542,594 | | | $ | 111,474 | | | | | |
Shares Outstanding | | | 124,474,829 | | | | 12,024,106 | | | | | |
Net Asset Value Per Share | | $ | 12.39 | | | $ | 9.27 | | | | | |
Institutional Share Class | | | | | | | | | | | | |
Net Assets | | | | | | | | | | $ | 334,656 | |
Shares Outstanding | | | | | | | | | | | 29,077,351 | |
Net Asset Value Per Share | | | | | | | | | | $ | 11.51 | |
See accompanying Notes to Financial Statements.
December 31, 2011 | William Blair Funds 41 |
Statements of Operations
for the Year Ended December 31, 2011 (dollar amounts in thousands)
| | | | | | | | | | | | |
| | | Institutional
International
Growth
Fund | | | Institutional
International
Equity
Fund | | | International
Small Cap
Growth
Fund | |
Investment income | | | | | | | | | | | | |
Dividends | | $ | 45,678 | | | $ | 6,310 | | | $ | 16,417 | |
Less foreign tax withheld | | | (3,414 | ) | | | (503 | ) | | | (1,173 | ) |
Interest | | | 105 | | | | 2 | | | | 98 | |
| | | | | | | | | | | | |
Total income | | | 42,369 | | | | 5,809 | | | | 15,342 | |
Expenses | | | | | | | | | | | | |
Investment advisory fees | | | 16,019 | | | | 2,246 | | | | 7,013 | |
Distribution fees | | | — | | | | — | | | | 54 | |
Shareholder services fees | | | — | | | | — | | | | 622 | |
Custodian fees | | | 316 | | | | 113 | | | | 204 | |
Transfer agent fees | | | 34 | | | | 6 | | | | 30 | |
Sub-transfer agent fees | | | | | | | | | | | | |
Class N | | | — | | | | — | | | | 34 | |
Class I | | | — | | | | — | | | | 211 | |
Professional fees | | | 167 | | | | 60 | | | | 86 | |
Registration fees | | | 62 | | | | 21 | | | | 98 | |
Shareholder reporting fees | | | 33 | | | | 2 | | | | 74 | |
Trustee fees | | | 68 | | | | 13 | | | | 24 | |
Other expenses | | | 82 | | | | 15 | | | | 35 | |
| | | | | | | | | | | | |
Total expenses | | | 16,781 | | | | 2,476 | | | | 8,485 | |
| | | | | | | | | | | | |
Expenses waived by Advisor | | | — | | | | (5 | ) | | | — | |
| | | | | | | | | | | | |
Net expenses | | | 16,781 | | | | 2,471 | | | | 8,485 | |
| | | | | | | | | | | | |
Net investment income (loss) | | | 25,588 | | | | 3,338 | | | | 6,857 | |
Realized and unrealized gain (loss) | | | | | | | | | | | | |
Net realized gain (loss) on transactions from: | | | | | | | | | | | | |
Investments | | | 74,637 | | | | 31,088 | | | | 58,878 | |
Foreign currency transactions | | | (6,146 | ) | | | (1,143 | ) | | | 1,557 | |
| | | | | | | | | | | | |
Total net realized gain (loss) | | | 68,491 | | | | 29,945 | | | | 60,435 | |
Change in net unrealized appreciation (depreciation) of: | | | | | | | | | | | | |
Investments | | | (328,624 | ) | | | (61,527 | ) | | | (154,971 | ) |
Foreign currency translations | | | (1,109 | ) | | | 97 | | | | (606 | ) |
| | | | | | | | | | | | |
Total change in net unrealized appreciation (depreciation) | | | (329,733 | ) | | | (61,430 | ) | | | (155,577 | ) |
| | | | | | | | | | | | |
Net increase (decrease) in net assets resulting from operations | | $ | (235,654 | ) | | $ | (28,147 | ) | | $ | (88,285 | ) |
| | | | | | | | | | | | |
See accompanying Notes to Financial Statements.
42 Annual Report | December 31, 2011 |
Statements of Changes in Net Assets
for the Year Ended December 31, 2011 and 2010 (dollar amounts in thousands)
| | | | | | | | | | | | | | | | | | | | | | | | |
| | | Institutional
International
Growth
Fund | | | Institutional
International
Equity
Fund | | | International
Small Cap
Growth
Fund | |
| | | 2011 | | | 2010 | | | 2011 | | | 2010 | | | 2011 | | | 2010 | |
Operations | | | | | | | | | | | | | | | | | | | | | | | | |
Net investment income (loss) | | $ | 25,588 | | | $ | 17,077 | | | $ | 3,338 | | | $ | 3,226 | | | $ | 6,857 | | | $ | 3,235 | |
Net realized gain (loss) on investments and foreign currency transactions | | | 68,491 | | | | 220,735 | | | | 29,945 | | | | 44,790 | | | | 60,435 | | | | 57,094 | |
Change in net unrealized appreciation (depreciation) on investments and foreign currency transactions | | | (329,733 | ) | | | 68,599 | | | | (61,430 | ) | | | (14,220 | ) | | | (155,577 | ) | | | 62,315 | |
| | | | | | | | | | | | | | | | | | | | | | | | |
Net increase (decrease) in net assets resulting from operations | | | (235,654 | ) | | | 306,411 | | | | (28,147 | ) | | | 33,796 | | | | (88,285 | ) | | | 122,644 | |
Distributions to shareholders from | | | | | | | | | | | | | | | | | | | | | | | | |
Net investment income | | | (1,997 | ) | | | (35,383 | ) | | | (2,326 | ) | | | (4,059 | ) | | | (10,724 | ) | | | (2,781 | ) |
Net realized gain | | | — | | | | — | | | | — | | | | — | | | | — | | | | — | |
| | | | | | | | | | | | | | | | | | | | | | | | |
| | | (1,997 | ) | | | (35,383 | ) | | | (2,326 | ) | | | (4,059 | ) | | | (10,724 | ) | | | (2,781 | ) |
Capital stock transactions | | | | | | | | | | | | | | | | | | | | | | | | |
Net proceeds from sale of shares | | | 357,122 | | | | 585,127 | | | | 12,843 | | | | 31,823 | | | | 313,989 | | | | 222,392 | |
Shares issued in reinvestment of income dividends and capital gain distributions | | | 1,885 | | | | 33,238 | | | | 2,328 | | | | 3,868 | | | | 8,514 | | | | 2,417 | |
Less cost of shares redeemed | | | (464,979 | ) | | | (379,024 | ) | | | (164,692 | ) | | | (139,231 | ) | | | (152,224 | ) | | | (88,572 | ) |
| | | | | | | | | | | | | | | | | | | | | | | | |
Net increase (decrease) in net assets resulting from capital share transactions | | | (105,972 | ) | | | 239,341 | | | | (149,521 | ) | | | (103,540 | ) | | | 170,279 | | | | 136,237 | |
| | | | | | | | | | | | | | | | | | | | | | | | |
Increase (decrease) in net assets | | | (343,623 | ) | | | 510,369 | | | | (179,994 | ) | | | (73,803 | ) | | | 71,270 | | | | 256,100 | |
Net assets | | | | | | | | | | | | | | | | | | | | | | | | |
Beginning of Year | | $ | 1,886,217 | | | $ | 1,375,848 | | | $ | 291,468 | | | $ | 365,271 | | | $ | 646,951 | | | $ | 390,851 | |
| | | | | | | | | | | | | | | | | | | | | | | | |
End of Year | | $ | 1,542,594 | | | $ | 1,886,217 | | | $ | 111,474 | | | $ | 291,468 | | | $ | 718,221 | | | $ | 646,951 | |
| | | | | | | | | | | | | | | | | | | | | | | | |
Accumulated net investment income (loss) at the end of the Year | | $ | 16,015 | | | $ | (4,934 | ) | | $ | (25 | ) | | $ | (357 | ) | | $ | 4,542 | | | $ | (586 | ) |
| | | | | | | | | | | | | | | | | | | | | | | | |
See accompanying Notes to Financial Statements.
December 31, 2011 | William Blair Funds 43 |
Statements of Assets and Liabilities
December 31, 2011 (dollar amounts in thousands)
| | | | | | | | | | | | | | | | |
| | | Emerging
Markets
Growth
Fund | | | Emerging
Leaders
Growth
Fund | | | Bond Fund | | | Low
Duration
Fund | |
Assets | | | | | | | | | | | | | | | | |
Investments in securities, at cost | | $ | 831,030 | | | $ | 51,290 | | | $ | 211,834 | | | $ | 155,348 | |
| | | | | | | | | | | | | | | | |
| | | | |
Investments in securities, at value | | $ | 812,036 | | | $ | 48,776 | | | $ | 225,227 | | | $ | 155,608 | |
Foreign currency, at value (cost $3,922; $111; $—; $—) | | | 4,000 | | | | 111 | | | | — | | | | — | |
Receivable for securities sold . | | | 4,156 | | | | 375 | | | | — | | | | — | |
Receivable for fund shares sold | | | 231 | | | | 344 | | | | 4,950 | | | | 1,150 | |
Receivable from Advisor . | | | — | | | | — | | | | 1 | | | | 1 | |
Dividend and interest receivable . | | | 570 | | | | 23 | | | | 2,101 | | | | 508 | |
| | | | | | | | | | | | | | | | |
Total assets | | | 820,993 | | | | 49,629 | | | | 232,279 | | | | 157,267 | |
Liabilities | | | | | | | | | | | | | | | | |
Payable for investment securities purchased | | | 1,642 | | | | — | | | | — | | | | — | |
Payable for fund shares redeemed | | | 203 | | | | 1,662 | | | | 68 | | | | 9 | |
Investment advisory fee payable | | | 778 | | | | 48 | | | | 58 | | | | 40 | |
Distribution and shareholder service fee payable | | | 23 | | | | 3 | | | | 21 | | | | 12 | |
Other payables and accrued expenses | | | 501 | | | | 94 | | | | 116 | | | | 59 | |
| | | | | | | | | | | | | | | | |
Total liabilities | | | 3,147 | | | | 1,807 | | | | 263 | | | | 120 | |
| | | | | | | | | | | | | | | | |
Net Assets | | $ | 817,846 | | | $ | 47,822 | | | $ | 232,016 | | | $ | 157,147 | |
| | | | | | | | | | | | | | | | |
Capital | | | | | | | | | | | | | | | | |
Composition of Net Assets | | | | | | | | | | | | | | | | |
Par value of shares of beneficial interest | | $ | 72 | | | $ | 6 | | | $ | 20 | | | $ | 16 | |
Capital paid in excess of par value | | | 867,474 | | | | 53,039 | | | | 217,752 | | | | 159,433 | |
Accumulated net investment income (loss) | | | (1,953 | ) | | | (14 | ) | | | 2 | | | | — | |
Accumulated net realized gain (loss) | | | (28,436 | ) | | | (2,650 | ) | | | 849 | | | | (2,561 | ) |
Net unrealized appreciation (depreciation) of investments and foreign currencies | | | (19,311 | ) | | | (2,559 | ) | | | 13,393 | | | | 259 | |
| | | | | | | | | | | | | | | | |
Net Assets | | $ | 817,846 | | | $ | 47,822 | | | $ | 232,016 | | | $ | 157,147 | |
| | | | | | | | | | | | | | | | |
| | | | |
Institutional Share Class | | | | | | | | | | | | | | | | |
Net Assets | | $ | 675,633 | | | $ | 26,166 | | | $ | 69,447 | | | $ | 68,059 | |
Shares Outstanding | | | 59,708,640 | | | | 3,419,548 | | | | 6,432,683 | | | | 6,926,678 | |
Net Asset Value Per Share | | $ | 11.32 | | | $ | 7.65 | | | $ | 10.80 | | | $ | 9.83 | |
See accompanying Notes to Financial Statements.
44 Annual Report | December 31, 2011 |
Statements of Operations
for the Year Ended December 31, 2011 (dollar amounts in thousands)
| | | | | | | | | | | | | | | | |
| | | Emerging
Markets
Growth
Fund | | | Emerging
Leaders
Growth
Fund | | | Bond
Fund | | | Low
Duration
Fund | |
Investment income | | | | | | | | | | | | | | | | |
Dividends | | $ | 22,977 | | | $ | 1,944 | | | $ | — | | | $ | — | |
Less foreign tax withheld | | | (1,968 | ) | | | (159 | ) | | | — | | | | — | |
Interest | | | 161 | | | | — | | | | 9,795 | | | | 3,317 | |
| | | | | | | | | | | | | | | | |
Total income | | | 21,170 | | | | 1,785 | | | | 9,795 | | | | 3,317 | |
Expenses | | | | | | | | | | | | | | | | |
Investment advisory fees | | | 10,964 | | | | 921 | | | | 633 | | | | 449 | |
Distribution fees | | | 68 | | | | — | | | | 8 | | | | 9 | |
Shareholder services fees | | | 294 | | | | 38 | | | | 228 | | | | 126 | |
Custodian fees | | | 434 | | | | 111 | | | | 54 | | | | 67 | |
Transfer agent fees | | | 42 | | | | 18 | | | | 23 | | | | 17 | |
Sub-transfer agent fees | | | | | | | | | | | | | | | | |
Class N | | | 27 | | | | — | | | | 4 | | | | — | |
Class I | | | 74 | | | | — | | | | 10 | | | | — | |
Professional fees | | | 138 | | | | 67 | | | | 35 | | | | 29 | |
Registration fees | | | 75 | | | | 53 | | | | 46 | | | | 56 | |
Shareholder reporting fees | | | 68 | | | | 2 | | | | 8 | | | | 2 | |
Trustee fees | | | 47 | | | | 4 | | | | 9 | | | | 6 | |
Other expenses | | | 54 | | | | 10 | | | | 15 | | | | 11 | |
| | | | | | | | | | | | | | | | |
Total expenses before waiver | | | 12,285 | | | | 1,224 | | | | 1,073 | | | | 772 | |
Expenses waived by the Advisor | | | — | | | | (140 | ) | | | (98 | ) | | | (41 | ) |
| | | | | | | | | | | | | | | | |
Net expenses | | | 12,285 | | | | 1,084 | | | | 975 | | | | 731 | |
| | | | | | | | | | | | | | | | |
Net investment income (loss) | | | 8,885 | | | | 701 | | | | 8,820 | | | | 2,586 | |
Realized and unrealized gain (loss) | | | | | | | | | | | | | | | | |
Net realized gain (loss) on transactions from: | | | | | | | | | | | | | | | | |
Investments | | | 129,522 | | | | 390 | | | | 3,325 | | | | 59 | |
Foreign currency transactions | | | (1,986 | ) | | | (278 | ) | | | — | | | | — | |
| | | | | | | | | | | | | | | | |
Total net realized gain (loss) | | | 127,536 | | | | 112 | | | | 3,325 | | | | 59 | |
Change in net unrealized appreciation (depreciation) of: | | | | | | | | | | | | | | | | |
Investments | | | (303,742 | ) | | | (20,141 | ) | | | 3,590 | | | | 360 | |
Foreign currency translations | | | (363 | ) | | | (40 | ) | | | — | | | | — | |
| | | | | | | | | | | | | | | | |
Total change in net unrealized appreciation (depreciation) | | | (304,105 | ) | | | (20,181 | ) | | | 3,590 | | | | 360 | |
| | | | | | | | | | | | | | | | |
Net increase (decrease) in net assets resulting from operations | | $ | (167,684 | ) | | $ | (19,368 | ) | | $ | 15,735 | | | $ | 3,005 | |
| | | | | | | | | | | | | | | | |
See accompanying Notes to Financial Statements.
December 31, 2011 | William Blair Funds 45 |
Statements of Changes in Net Assets
for the Year Ended December 31, 2011 and 2010 (dollar amounts in thousands)
| | | | | | | | | | | | | | | | | | | | | | | | | | | | | | | | |
| | | Emerging
Markets
Growth
Fund | | | Emerging
Leaders
Growth
Fund | | | Bond
Fund | | | Low
Duration
Fund | |
| | | 2011 | | | 2010 | | | 2011 | | | 2010 | | | 2011 | | | 2010 | | | 2011 | | | 2010 | |
Operations | | | | | | | | | | | | | | | | | | | | | | | | | | | | | | | | |
Net investment income (loss) | | $ | 8,885 | | | $ | 4,305 | | | $ | 701 | | | $ | 468 | | | $ | 8,820 | | | $ | 8,051 | | | $ | 2,586 | | | $ | 1,915 | |
Net realized gain (loss) on investments and foreign currency transactions | | | 127,536 | | | | 245,341 | | | | 112 | | | | 33,656 | | | | 3,325 | | | | 2,212 | | | | 59 | | | | (60 | ) |
Change in net unrealized appreciation (depreciation) on investments and foreign currency transactions | | | (304,105 | ) | | | 13,556 | | | | (20,181 | ) | | | (16,315 | ) | | | 3,590 | | | | 3,290 | | | | 360 | | | | 468 | |
| | | | | | | | | | | | | | | | | | | | | | | | | | | | | | | | |
Net increase (decrease) in net assets resulting from operations | | | (167,684 | ) | | | 263,202 | | | | (19,368 | ) | | | 17,809 | | | | 15,735 | | | | 13,553 | | | | 3,005 | | | | 2,323 | |
Distributions to shareholders from | | | | | | | | | | | | | | | | | | | | | | | | | | | | | | | | |
Net investment income | | | (4,450 | ) | | | (13,461 | ) | | | (307 | ) | | | (255 | ) | | | (9,700 | ) | | | (8,566 | ) | | | (4,103 | ) | | | (2,958 | ) |
Net realized gain | | | (115,030 | ) | | | — | | | | (3,704 | ) | | | (505 | ) | | | (1,831 | ) | | | (494 | ) | | | — | | | | — | |
Return of capital | | | — | | | | — | | | | (25 | ) | | | — | | | | — | | | | — | | | | — | | | | — | |
| | | | | | | | | | | | | | | | | | | | | | | | | | | | | | | | |
| | | (119,480 | ) | | | (13,461 | ) | | | (4,036 | ) | | | (760 | ) | | | (11,531 | ) | | | (9,060 | ) | | | (4,103 | ) | | | (2,958 | ) |
Capital stock transactions | | | | | | | | | | | | | | | | | | | | | | | | | | | | | | | | |
Net proceeds from sale of shares | | | 352,369 | | | | 357,761 | | | | 19,857 | | | | 14,224 | | | | 100,839 | | | | 90,709 | | | | 121,427 | | | | 149,882 | |
Shares issued in reinvestment of income dividends and capital gain distributions | | | 100,061 | | | | 12,072 | | | | 3,491 | | | | 681 | | | | 8,489 | | | | 6,013 | | | | 3,322 | | | | 2,297 | |
Less cost of shares redeemed | | | (597,963 | ) | | | (407,291 | ) | | | (47,023 | ) | | | (52,189 | ) | | | (74,292 | ) | | | (55,783 | ) | | | (109,974 | ) | | | (103,208 | ) |
| | | | | | | | | | | | | | | | | | | | | | | | | | | | | | | | |
Net increase (decrease) in net assets resulting from capital share transactions | | | (145,533 | ) | | | (37,458 | ) | | | (23,675 | ) | | | (37,284 | ) | | | 35,036 | | | | 40,939 | | | | 14,775 | | | | 48,971 | |
| | | | | | | | | | | | | | | | | | | | | | | | | | | | | | | | |
Increase (decrease) in net assets | | | (432,697 | ) | | | 212,283 | | | | (47,079 | ) | | | (20,235 | ) | | | 39,240 | | | | 45,432 | | | | 13,677 | | | | 48,336 | |
Net assets | | | | | | | | | | | | | | | | | | | | | | | | | | | | | | | | |
Beginning of year | | | 1,250,543 | | | | 1,038,260 | | | | 94,901 | | | | 115,136 | | | | 192,776 | | | | 147,344 | | | | 143,470 | | | | 95,134 | |
| | | | | | | | | | | | | | | | | | | | | | | | | | | | | | | | |
End of year | | $ | 817,846 | | | $ | 1,250,543 | | | $ | 47,822 | | | $ | 94,901 | | | $ | 232,016 | | | $ | 192,776 | | | $ | 157,147 | | | $ | 143,470 | |
| | | | | | | | | | | | | | | | | | | | | | | | | | | | | | | | |
Accumulated net investment income (loss) at the end of the year | | $ | (1,953 | ) | | $ | (12,327 | ) | | $ | (14 | ) | | $ | (131 | ) | | $ | 2 | | | $ | 1 | | | $ | — | | | $ | — | |
| | | | | | | | | | | | | | | | | | | | | | | | | | | | | | | | |
See accompanying Notes to Financial Statements.
46 Annual Report | December 31, 2011 |
Notes to Financial Statements
(1) Significant Accounting Policies
The following is a summary of William Blair Funds’ (the “Fund”) significant accounting policies in effect during the year covered by the financial statements, which are in accordance with U.S. generally accepted accounting principles.
(a) Description of the Fund
The Fund is a diversified mutual fund registered under the Investment Company Act of 1940 (the “1940 Act”), as amended, as an open-end management investment company. The number of shares authorized for this Fund is unlimited. The Fund currently consists of the following publicly offered twenty-three portfolios (the “Portfolios”), each with its own investment objective and policies. For each Portfolio, the number of shares authorized is unlimited.
| | |
Equity Portfolios | | International Equity Portfolios |
Growth Large Cap Growth Small Cap Growth Mid Cap Growth Small-Mid Cap Growth Large Cap Value Small Cap Value Mid Cap Value Small-Mid Cap Value Global Equity Portfolio Global Growth Dynamic Allocation Portfolio Macro Allocation | | International Growth International Equity Institutional International Growth Institutional International Equity International Small Cap Growth Emerging Markets Growth Emerging Leaders Growth Emerging Markets Small Cap Growth Fixed-Income Portfolios Bond Income Low Duration Money Market Portfolio Ready Reserves |
The investment objectives of the Portfolios are as follows:
| | |
Equity | | Long-term capital appreciation. |
Global Equity | | Long-term capital appreciation. |
Dynamic Allocation | | Long-term risk adjusted total return. |
International Equity | | Long-term capital appreciation. |
Fixed-Income | | High level of current income with relative stability of principal.
(Maximize total return—Low Duration) |
Money Market | | Current income, a stable share price and daily liquidity. |
The Institutional International Growth Portfolio, the Institutional International Equity Portfolio and the Institutional Share Classes of the International Small Cap Growth Portfolio, the Emerging Markets Growth Portfolio, the Emerging Leaders Growth Portfolio, Bond Portfolio, and the Low Duration Portfolio are the only Portfolios covered in this report.
The Macro Allocation Portfolio has a fiscal year end of October 31, and issues a separate report.
(b) Share Classes
Three different classes of shares of the Global Growth, International Small Cap Growth, Emerging Markets Growth, Emerging Leaders Growth, Emerging Markets Small Cap Growth, Bond and the Low Duration Portfolios currently exist: N, I and Institutional. This report includes financial information for only the Institutional Class. The Institutional share class is sold to institutional investors, including but not limited to employee benefit plans, endowments, foundations, trusts and corporations, who are able to meet the Fund’s high minimum investment requirement. The minimum initial investment required is $5 million. The Global Growth and Emerging Markets Small Cap Growth Portfolios do not have any shareholders in the Institutional Class as of December 31, 2011.
December 31, 2011 | William Blair Funds 47 |
Investment income realized and unrealized gains and losses, and certain Portfolio level expenses and expense reductions, if any, are allocated based on the relative net assets of each class, except for certain class specific expenses, which are charged directly to the appropriate class. Differences in class expenses may result in the payment of different per share dividends by class. All share classes of the Portfolios have equal rights with respect to voting subject to class specific arrangements.
(c) Investment Valuation
The market value of domestic equity securities is determined by valuing securities traded on national securities markets or in the over-the-counter markets at the last sale price or, if applicable, the official closing price or, in the absence of a recent sale on the date of determination, at the latest bid price.
The value of foreign equity securities is generally determined based upon the last sale price on the foreign exchange or market on which it is primarily traded and in the currency of that market as of the close of the appropriate exchange or, if there have been no sales during that day, at the latest bid price. The Board of Trustees has determined that the passage of time between when the foreign exchanges or markets close and when the Portfolios compute their net asset values could cause the value of foreign equity securities to no longer be representative or accurate, and as a result, may necessitate that such securities be fair valued. Accordingly, for foreign equity securities, the Portfolios may use an independent pricing service to fair value the security as of the close of regular trading on the New York Stock Exchange. As a result, a Portfolio’s value for a security may be different from the last sale price (or the latest bid price).
Fixed-income securities are valued by using market quotations or independent pricing services that use either prices provided by market-makers or matrices that produce estimates of market values obtained from yield data relating to instruments or securities with similar characteristics.
Other securities, and all other assets, including securities for which a market price is not available or is deemed unreliable, (e.g., securities affected by unusual or extraordinary events, such as natural disasters or securities affected by market or economic events, such as bankruptcy filings), or the value of which is affected by a significant valuation event, are valued at a fair value as determined in good faith by, or under the direction of, the Board of Trustees and in accordance with the Trust’s valuation procedures. The value of fair valued securities may be different from the last sale price (or the latest bid price), and there is no guarantee that a fair valued security will be sold at the price at which a Portfolio is carrying the security.
Investments in other funds are valued at the underlying fund’s net asset value on the date of valuation. As of December 31, 2011, there were securities held in the Institutional International Growth, International Small Cap Growth, Emerging Markets Growth and Bond Portfolios requiring fair valuation pursuant to the Funds’ Valuation Procedures.
(d) Investment income and transactions
Dividend income is recorded on the ex-dividend date, except for those dividends from certain foreign securities that are recorded when the information is available.
Interest income is recorded on an accrual basis, adjusted for amortization of premium or discount. Variable rate bonds and floating rate notes earn interest at coupon rates that fluctuate at specific time intervals. The interest rate shown on the Portfolio of Investments for the Bond Fund and Low Duration Fund were the rates in effect on December 31, 2011. Put bonds may be redeemed at the discretion of the holder on specified dates prior to maturity.
Premiums and discounts are accreted and amortized on a straight-line basis for short-term investments and on an effective interest method for long-term investments.
Paydown gains and losses on mortgage and asset-backed securities are treated as an adjustment to interest income. For the year ended December 31, 2011, the Bond and Low Duration Portfolios recognized an increase of interest income and a decrease of net realized loss of $(879) and $(1,517), respectively (in thousands). This reclassification had no effect on the net asset value or the net assets of the Portfolios.
The Funds do not isolate that portion of the results of operations resulting from changes in foreign exchange rates on investments from the fluctuations arising from changes in market prices of securities held. Such fluctuations are included with the net realized and unrealized gain or loss from investments.
48 Annual Report | December 31, 2011 |
Reported net realized foreign currency gains or losses arise from disposition of foreign currency, the difference in the foreign exchange rates between the trade and settlement dates on securities transactions, and the difference between the amounts of dividends, interest and foreign withholding taxes recorded on the ex-date or accrual date and the U.S. dollar equivalent of the amounts actually received or paid. Net unrealized foreign exchange gains and losses arise from changes (due to the changes in the exchange rate) in the value of foreign currency and other assets and liabilities denominated in foreign currencies held at year end.
Security and shareholder transactions are accounted for no later than one business day following the trade date. However, for financial reporting purposes, security and shareholder transactions are accounted for on the trade date of the last business day of the reporting period. Realized gains and losses from securities transactions are recognized on a specifically identified cost basis.
Awards from class action litigation may be recorded as a reduction of cost. If the Portfolios no longer own the applicable securities, the proceeds are recorded as realized gains.
(e) Share Valuation and Dividends to Shareholders
Shares are sold and redeemed on a continuous basis at net asset value. The net asset value per share is determined by dividing the Portfolio’s net assets by the number of shares outstanding as of the close of regular trading on the New York Stock Exchange, which is generally 4:00 p.m. Eastern time, on each day the Exchange is open.
Dividends from net investment income, if any, are declared at least annually for the Institutional International Growth, Institutional International Equity, International Small Cap Growth, Emerging Markets Growth and Emerging Leaders Growth Portfolios. Effective April 16, 2011, dividends for the Bond Portfolio are declared daily and paid monthly. Dividends from the Low Duration Portfolios are declared daily and paid monthly. Dividends payable to shareholders are recorded on the ex-dividend date.
(f) Foreign Currency Translation and Foreign Currency Forward Contracts
The Portfolios (excluding the Bond and Low Duration Portfolios) may invest in securities denominated in foreign currencies. As such, assets and liabilities denominated in foreign currencies are translated into U.S. dollar amounts at the current exchange rate on the date of valuation. The values of foreign investments, forward open foreign currency contracts, and cash denominated in foreign currencies are translated into U.S. dollars using a spot market rate of exchange as of the time of the determination of each Fund’s net asset value, typically 4:00 p.m. Eastern time on days when there is regular trading on the New York Stock Exchange (the “Exchange”). Payables and receivables for securities transactions, dividends, interest income and tax reclaims are translated into U.S. dollars using a spot market rate of exchange as of 4:00 p.m. Eastern time. Settlement of purchases and sales and dividend and interest receipts are translated into U.S. dollars using a spot market rate of exchange as of 11:00 a.m. Eastern time.
(g) Income Taxes
Each Portfolio intends to comply with the provisions of Subchapter M of the Internal Revenue Code available to regulated investment companies. Each portfolio intends to make the requisite distributions of income and capital gains to its shareholders sufficient to relieve it from all, or substantially all, federal income and excise taxes. No provision for federal income and excise taxes has been made.
The Institutional International Growth, Institutional International Equity, International Small Cap Growth, Emerging Markets Growth, and Emerging Leaders Growth Portfolios may be subject to a tax imposed on net realized and unrealized gains on securities of certain foreign countries.
Management has evaluated all of the uncertain tax positions of the Portfolios and has determined that no liability is required to be recorded in the financial statements.
The statute of limitations on the Portfolios’ tax returns for each of the tax years in the four year period ended December 31, 2011 remains open and the returns are subject to examination.
December 31, 2011 | William Blair Funds 49 |
The Portfolios have elected to mark-to-market their investments in Passive Foreign Investment Companies (“PFICs”) for federal income tax purposes. The Portfolios also treat the deferred loss associated with current and prior year wash sales as an adjustment to the cost of investments for tax purposes. The cost of investments for federal income tax purposes and related gross unrealized appreciation (depreciation) and net unrealized appreciation (depreciation) at December 31, 2011 were as follows (in thousands):
| | | | | | | | | | | | | | | | |
Portfolio | | Cost of
Investments | | | Gross
Unrealized
Appreciation | | | Gross
Unrealized
Depreciation | | | Net
Unrealized
Appreciation
(Depreciation) | |
Institutional International Growth | | | $1,525,481 | | | $ | 121,957 | | | $ | 112,759 | | | $ | 9,198 | |
Institutional International Equity | | | 103,270 | | | | 10,754 | | | | 4,605 | | | | 6,149 | |
International Small Cap Growth | | | 741,839 | | | | 52,848 | | | | 79,378 | | | | (26,530 | ) |
Emerging Markets Growth | | | 848,230 | | | | 48,379 | | | | 84,573 | | | | (36,194 | ) |
Emerging Leaders Growth | | | 53,067 | | | | 2,368 | | | | 6,660 | | | | (4,292 | ) |
Bond | | | 211,834 | | | | 13,929 | | | | 536 | | | | 13,393 | |
Low Duration | | | 155,349 | | | | 1,007 | | | | 748 | | | | 259 | |
The timing and characterization of certain income and capital gain distributions are determined annually in accordance with federal income tax regulations that may differ from U.S. generally accepted accounting principles. As a result, net investment income or loss and net realized gain or loss for a reporting period may differ from the amount distributed during such period. In addition, the Portfolios may periodically record reclassifications among certain capital accounts to reflect differences between financial reporting and income tax basis distributions. The reclassifications were reported in order to reflect the tax treatment for certain permanent differences that exist between income tax regulations and U.S. generally accepted accounting principles. The reclassifications generally relate to Section 988 currency gains and losses, PFIC gains and losses, paydown gains and losses and redemptions in-kind. These reclassifications have no impact on the net asset values of the Portfolios. Accordingly, at December 31, 2011, the following reclassifications were recorded (in thousands):
| | | | | | | | | | | | |
Portfolio | | Accumulated Net
Investment Income (Loss) | | | Accumulated Net Realized Gain (Loss) | | | Capital Paid in Excess of Par Value | |
Institutional International Growth | | $ | (2,642 | ) | | $ | 2,642 | | | $ | — | |
Institutional International Equity | | | (679 | ) | | | 701 | | | | (22 | ) |
International Small Cap Growth | | | 8,995 | | | | (8,995 | ) | | | — | |
Emerging Markets Growth | | | 5,939 | | | | (24,168 | ) | | | 18,229 | |
Emerging Leaders Growth | | | (251 | ) | | | 276 | | | | (25 | ) |
Bond | | | 879 | | | | (879 | ) | | | — | |
Low Duration | | | 1,517 | | | | (1,517 | ) | | | — | |
Distributions from net realized gains for book purposes may include short-term capital gains, which are included as ordinary income for tax purposes. The tax character of distributions paid during 2011 and 2010 was as follows (in thousands):
| | | | | | | | | | | | | | | | | | | | | | | | | | | | |
| | | Distributions Paid in 2011 | | | Distributions Paid in 2010 | |
Portfolio | | Return of
Capital | | | Ordinary Income | | | Long-Term Capital Gains | | | Total Distributions | | | Ordinary Income | | | Long-Term Capital Gains | | | Total
Distributions | |
Institutional International Growth | | $ | — | | | $ | 1,997 | | | $ | — | | | $ | 1,997 | | | $ | 35,383 | | | $ | — | | | $ | 35,383 | |
Institutional International Equity | | | — | | | | 2,326 | | | | — | | | | 2,326 | | | | 4,059 | | | | — | | | | 4,059 | |
International Small Cap Growth | | | — | | | | 10,724 | | | | — | | | | 10,724 | | | | 2,781 | | | | — | | | | 2,781 | |
Emerging Markets Growth | | | — | | | | 4,450 | | | | 115,030 | | | | 119,480 | | | | 13,461 | | | | — | | | | 13,461 | |
Emerging Leaders Growth | | | 25 | | | | 1,278 | | | | 2,733 | | | | 4,036 | | | | 255 | | | | 505 | | | | 760 | |
Bond | | | — | | | | 9,700 | | | | 1,831 | | | | 11,531 | | | | 8,566 | | | | 494 | | | | 9,060 | |
Low Duration | | | — | | | | 4,103 | | | | — | | | | 4,103 | | | | 2,958 | | | | — | | | | 2,958 | |
As of December 31, 2011, the components of distributable earnings on a tax basis were as follows (in thousands):
| | | | | | | | | | | | | | | | |
Portfolio | | Undistributed Ordinary Income | | | Accumulated Capital and Other Losses | | | Undistributed Long-Term Capital Gain | | | Net Unrealized Appreciation (Depreciation) | |
Institutional International Growth | | $ | 17,088 | | | $ | (202,354 | ) | | $ | — | | | $ | 9,198 | |
Institutional International Equity | | | — | | | | (127,316 | ) | | | — | | | | 6,149 | |
International Small Cap Growth | | | 5,874 | | | | (59,252 | ) | | | — | | | | (26,530 | ) |
Emerging Markets Growth | | | — | | | | (13,506 | ) | | | — | | | | (36,194 | ) |
50 Annual Report | December 31, 2011 |
| | | | | | | | | | | | | | | | |
Portfolio | | Undistributed Ordinary Income | | | Accumulated Capital and Other Losses | | | Undistributed Long-Term Capital Gain | | | Net Unrealized Appreciation (Depreciation) | |
Emerging Leaders Growth | | $ | — | | | $ | (931 | ) | | $ | — | | | $ | (4,292 | ) |
Bond | | | 2 | | | | (79 | ) | | | 928 | | | | 13,393 | |
Low Duration | | | — | | | | (2,561 | ) | | | — | | | | 259 | |
As of December 31, 2011, the Portfolios have unused capital loss carry forwards available for federal income tax purposes to be applied against future gains, if any. If not applied, the carryforward will expire as follows (in thousands):
| | | | | | | | | | | | | | | | |
Portfolio | | 2016 | | | 2017 | | | 2018 | | | Total | |
Institutional International Growth | | $ | — | | | $ | 182,481 | | | $ | — | | | $ | 182,481 | |
Institutional International Equity | | | 13,581 | | | | 113,087 | | | | — | | | | 126,668 | |
International Small Cap Growth | | | — | | | | 55,999 | | | | — | | | | 55,999 | |
Low Duration | | | — | | | | — | | | | 955 | | | | 955 | |
The Regulated Investment Company Modernization Act of 2010 (the “Act”) was enacted on December 22, 2010. Under the Act each Portfolio is permitted to carry forward capital losses incurred in taxable years beginning after the date of enactment for an unlimited period. However, any losses incurred in periods after enactment will be required to be utilized prior to the losses incurred in pre-enactment taxable years, which carry an expiration date. Each Portfolio has the following carry forward capital losses without expiration as of December 31, 2011 (in thousands):
| | | | | | | | |
Portfolio | | Short
Term | | | Long
Term | |
Low Duration | | $ | 951 | | | $ | 406 | |
For the period from November 1, 2011 through December 31, 2011, the following Portfolios incurred realized ordinary loss and capital losses. Ordinary Loss includes losses from currency transactions and PFICs. Each Portfolio intends to treat these losses as having occurred on the first day of fiscal year 2012 for federal income tax purposes (in thousands):
| | | | | | | | | | | | |
Portfolio | | Ordinary Loss | | | Short-Term Capital | | | Long-Term Capital | |
Institutional International Growth | | $ | — | | | $ | 19,637 | | | $ | — | |
Institutional International Equity | | | 19 | | | | 613 | | | | — | |
International Small Cap Growth | | | 537 | | | | 2,491 | | | | — | |
Emerging Markets Growth | | | 783 | | | | 9,852 | | | | 2,610 | |
Emerging Leaders Growth | | | 16 | | | | 791 | | | | 81 | |
Bond | | | — | | | | 78 | | | | — | |
Low Duration | | | — | | | | 118 | | | | 132 | |
(h) Repurchase Agreements
In a repurchase agreement, a Portfolio buys a security at one price and at the time of sale, the seller agrees to repurchase the obligation at a mutually agreed upon time and price (usually within seven days). The repurchase agreement thereby determines the yield during the purchaser’s holding period, while the seller’s obligation to repurchase is secured by the value of the underlying security. William Blair & Company, L.L.C. (the “Advisor”) will monitor, on an ongoing basis, the value of the underlying securities to ensure that the value always equals or exceeds the repurchase price plus accrued interest. Repurchase agreements could involve certain risks in the event of a default or insolvency of the other party to the agreement, including possible delays or restrictions upon a Portfolio’s ability to dispose of the underlying securities. The risk to a Portfolio is limited to the ability of the seller to pay the agreed upon sum on the delivery date. In the event of default, a repurchase agreement provides that a Portfolio is entitled to sell the underlying collateral. The loss, if any, to a Portfolio will be the difference between the proceeds from the sale and the repurchase price. However, if bankruptcy proceedings are commenced with respect to the seller of the security, disposition of the collateral by the Portfolio may be delayed or limited. Although no definitive creditworthiness criteria are used, the Advisor reviews the creditworthiness of the banks and non-bank dealers with which a Portfolio enters into repurchase agreements to evaluate those risks. A Portfolio may, for tax purposes, deem repurchase agreements collateralized by U.S. Government securities to be investments in U.S. Government securities.
December 31, 2011 | William Blair Funds 51 |
(i) Use of Estimates
The preparation of financial statements in conformity with U.S. generally accepted accounting principles requires management to make estimates and assumptions that affect the amounts reported in the financial statements. Actual results may differ from those estimates.
(j) Indemnification
In the normal course of business, the Portfolios have entered into contracts in which the Portfolios agree to indemnify the other party or parties against various potential cost or liabilities. The Portfolios’ maximum exposure under these arrangements is unknown. No claim has been made for indemnification pursuant to any such agreement of the Portfolios.
(k) Fair Value Measurements
Fair value is defined as the price that a Portfolio would receive upon selling a security in an orderly transaction to an independent buyer in the principal or most advantageous market for the investment. Various inputs are used in determining the value of a Portfolio’s investments. A three-tier hierarchy of inputs is used to classify fair value measurements for disclosure purposes. The three-tier hierarchy of inputs is summarized in the three broad levels listed below.
| | • | | Level 1—Quoted prices (unadjusted) in active markets for an identical security. |
| | • | | Level 2—Prices determined using other significant observable inputs. Observable inputs are inputs that other market participants would use in pricing a security. These may include quoted prices for similar securities, interest rates, prepayment speeds, credit risk, and others. In addition, other observable inputs such as foreign exchange rates, benchmark securities indices and foreign futures contracts may be utilized in the valuation of certain foreign securities when significant events occur between the last sale on the foreign securities exchange and the time the net asset value of the Portfolio is calculated. |
| | • | | Level 3—Prices determined using significant unobservable inputs. In situations where quoted prices or observable inputs are unavailable (for example, when there is little or no market activity for an investment), unobservable inputs may be used. Unobservable inputs reflect the Portfolio’s own assumptions about the factors market participants would use in pricing an investment, and would be based on the best information available. |
The inputs or methodology used for valuing an investment are not necessarily an indication of the risk associated with investing in those securities. For example, money market securities are valued using amortized cost, in accordance with rules under the 1940 Act. Generally, amortized cost approximates the current fair value of a security, but since the value is not obtained from a quoted price in an active market, such securities are reflected as Level 2.
Any transfers between Level 1 and Level 2 are disclosed, effective as of the beginning of the year, in the tables below with the reasons for the transfers disclosed in a note to the tables, if applicable.
As of December 31, 2011, the hierarchical input levels of securities in each Portfolio, segregated by security class, are as follows (in thousands):
| | | | | | | | | | | | | | | | | | | | |
| | | Institutional
International
Growth | | | Institutional
International
Equity | | | International
Small Cap
Growth | | | Emerging
Markets
Growth | | | Emerging
Leaders
Growth | |
Investments in securities | | | | | | | | | | | | | | | | | | | | |
Level 1—Quoted prices | | | | | | | | | | | | | | | | | | | | |
Common Stocks | | $ | 1,512,204 | | | $ | 109,241 | | | $ | 702,178 | | | $ | 772,596 | | | $ | 45,472 | |
Preferred Stocks | | | — | | | | — | | | | — | | | | 30,789 | | | | 2,899 | |
Level 2—Other significant observable inputs | | | | | | | | | | | | | | | | | | | | |
Short-Term Investments | | | 21,933 | | | | 179 | | | | 12,882 | | | | 8,235 | | | | 405 | |
Level 3—Significant unobservable inputs | | | | | | | | | | | | | | | | | | | | |
Common Stock | | | 298 | | | | — | | | | — | | | | — | | | | — | |
Convertible Bonds | | | 244 | | | | — | | | | 249 | | | | 416 | | | | — | |
| | | | | | | | | | | | | | | | | | | | |
Total investments in securities | | $ | 1,534,679 | | | $ | 109,420 | | | $ | 715,309 | | | $ | 812,036 | | | $ | 48,776 | |
| | | | | | | | | | | | | | | | | | | | |
Other financial instruments—Liabilities | | | | | | | | | | | | | | | | | | | | |
Level 2—Other significant observable inputs | | | | | | | | | | | | | | | | | | | | |
Forward foreign currency contracts | | $ | (837 | ) | | | | | | $ | (311 | ) | | | | | | | | |
| | | | | | | | | | | | | | | | | | | | |
52 Annual Report | December 31, 2011 |
| | | | | | | | |
| | | Bond | | | Low
Duration | |
Investments in securities | | | | | | | | |
Level 1—Quoted Prices | | | | | | | | |
None | | $ | — | | | $ | — | |
Level 2—Other significant observable inputs | | | | | | | | |
U.S. Government and Agency Bonds | | | 102,650 | | | | 107,025 | |
Corporate Bonds | | | 113,500 | | | | 10,898 | |
Asset Backed Bonds | | | 8,346 | | | | 33,650 | |
Short-Term Investments | | | 564 | | | | 4,035 | |
Level 3—Significant unobservable inputs | | | | | | | | |
Asset Backed Bonds | | | 167 | | | | — | |
| | | | | | | | |
Total investments in securities | | $ | 225,227 | | | $ | 155,608 | |
| | | | | | | | |
There were no transfers between Level 1 and Level 2 during the year.
Level 1 Common Stocks are exchange-traded securities with a quoted price. See Portfolio of Investments for Sector Classification.
The following is a reconciliation of Level 3 securities for which significant unobservable inputs were used to determine fair value:
| | | | | | | | | | | | | | | | | | | | | | | | | | | | | | | | | | | | |
| | | Balance
January 1, 2011 | | | Purchases | | | Sales | | | Transfers
to
Level 3 | | | Transfers
from
Level 3 | | | Change in
Unrealized
Gain/Loss | | | Realized
Gain/Loss | | | Balance
December 31, 2011 | | | Percent
of Net
Assets | |
Institutional International Growth | | $ | — | | | $ | — | | | $ | — | | | $ | 614 | | | $ | — | | | $ | (72 | ) | | $ | — | | | $ | 542 | | | | 0.04 | % |
International Small Cap Growth | | | — | | | | — | | | | — | | | | 322 | | | | — | | | | (73 | ) | | | — | | | | 249 | | | | 0.03 | % |
Emerging Markets Growth | | | — | | | | — | | | | — | | | | 538 | | | | — | | | | (122 | ) | | | — | | | | 416 | | | | 0.05 | % |
Bond | | | 170 | | | | — | | | | — | | | | — | | | | — | | | | (3 | ) | | | — | | | | 167 | | | | 0.07 | % |
The fair value estimates for the Level 3 securities in the Institutional International Growth, International Small Cap Growth, Emerging Markets Growth and Bond Portfolios were determined in good faith by the Pricing Committee in consultation with the Valuation Committee, pursuant to the Valuation Procedures adopted by the Board of Trustees. There were various factors considered in reaching this fair value determination, including, but not limited to, the following: the type of security, the extent of public trading of the security, information obtained from a broker-dealer for the security, analysis of the company’s performance, market trends that influence its performance and the potential for an adverse outcome in pending litigation. The change in unrealized gain (loss) related to those securities held at December 31, 2011 agree to the table above, and is included in the change in net unrealized appreciation (depreciation) of investments on the Statement of Operations. The transfers to and from Level 3 were valued using transfer date.
China High Precision Automation Group Common Stock held in the Institutional International Growth Fund Portfolio moved from Level 1 to Level 3 due to a trade halt imposed by foreign regulators. The Lupatech convertible bonds held in the Institutional International Growth Fund Portfolio, the International Small Cap Growth Portfolio and the Emerging Markets Growth Portfolio moved from Level 2 to Level 3 due to a change in observable inputs. The First Plus Home Loan Trust bond held in the Bond Portfolio remained in Level 3 during the period due to the lack of significant other observable inputs.
(l) Redemptions In- Kind
In accordance with the Funds’ prospectus, the Portfolios may distribute portfolio securities rather than cash as payment for a redemption of fund shares (in-kind redemption). For financial reporting purposes, the Portfolio recognizes a gain or loss on the transfer of securities depending on the market value of those securities on the date of redemption. Gains and losses realized on in-kind redemptions are not recognized for tax purposes and are reclassified from undistributed realized gain (loss) to paid-in capital. During the year ended December 31, 2011, the Emerging Markets Growth Portfolio transferred in-kind (in thousands) $91,525 for a realized gain of $20,249.
December 31, 2011 | William Blair Funds 53 |
(2) Accounting Pronouncements
In April 2011, the Financial Accounting Standards Board (“FASB”) issued Accounting Standard Update (“ASU”) 2011-03 Reconsideration of Effective Control for Repurchase Agreements. ASU 2011-03 amends ASC 860, Transfers and Servicing, in relation to the accounting for repurchase agreements and similar agreements that both entitle and obligate a transferor to repurchase or redeem financial assets before their maturity. ASU 2011-03 modifies the criteria for determining effective control of transferred assets and as a result certain agreements may now be accounted for as secured borrowings. ASU 2011-03 is effective prospectively for new transfers and existing transitions that are modified in the first interim or annual period beginning on or after December 15, 2011. At this time, management is evaluating the implication of this change and its impact on the financial statements has not been determined.
On May 12, 2011, the FASB issued ASU 2011-04, modifying Topic 820, Fair Value Measurements and Disclosures. The ASU requires reporting entities to disclose (i) the amounts of any transfers between Level 1 and Level 2, and the reasons for the transfers, (ii) for Level 3 fair value measurements, quantitative information about significant unobservable inputs used, (iii) a description of the valuation processes used by the reporting entity and, (iv) a narrative description of the sensitivity of the fair value measurement to changes in unobservable inputs if a change in those inputs might result in a significantly higher or lower fair value measurement. The effective date of ASU 2011-04 is for interim and annual periods beginning after December 15, 2011. At this time, management is evaluating the implication of this change and its impact on the financial statements has not been determined.
(3) Transactions with Affiliates
(a) Management and Expense Limitation Agreements
Each Portfolio has a management agreement with the Advisor for investment advisory, clerical, bookkeeping and administrative services. Each Portfolio pays the Advisor an annual fee, payable monthly, based on a specified percentage of its average daily net assets. A summary of the annual rates expressed as a percentage of average daily net assets is as follows:
| | | | | | | | | | |
International Portfolios: | | | | | Fixed-Income Portfolios | | | |
Institutional International Growth: | | | | | | Bond | | | 0.30% | |
First $500 million | | | 1.00% | | | Low Duration | | | 0.30% | |
Next $500 million | | | 0.95% | | | | | | | |
Next $1.5 billion | | | 0.90% | | | | | | | |
Next $2.5 billion | | | 0.875% | | | | | | | |
Next $5 billion | | | 0.85% | | | | | | | |
Next $5 billion | | | 0.825% | | | | | | | |
In excess of $15 billion | | | 0.80% | | | | | | | |
Institutional International Equity: | | | | | | | | | | |
First $500 million | | | 1.000% | | | | | | | |
Next $500 million | | | 0.950% | | | | | | | |
In excess of $1 billion | | | 0.900% | | | | | | | |
International Small Cap Growth | | | 1.00% | | | | | | | |
Emerging Markets Growth | | | 1.10% | | | | | | | |
Emerging Leaders Growth | | | 1.10% | | | | | | | |
All of the Portfolios, except Institutional International Growth, have also entered into Expense Limitation Agreements with the Advisor. Under the terms of these agreements, the Advisor will waive its management fee and/or reimburse the Portfolio for expenses in excess of the agreed upon rate. The amount the Advisor owes a Portfolio as of the report date is recorded as the Receivable from Advisor on the Statement of Assets and Liabilities. The Advisor reimburses the Portfolios on an monthly basis. Under the terms of these agreements, the Advisor has agreed to waive its advisory fees and/or absorb other operating expenses through April 30, 2012, if total expenses of the Portfolios exceed the following rates (as a percentage of average daily net assets):
| | | | | | | | |
Portfolio | | Effective
May 1, 2011
through
April 30, 2012 | | | Effective
May 1, 2010
through
April 30, 2011 | |
Institutional International Equity | | | 1.10 | % | | | 1.10 | % |
International Small Cap Growth | | | 1.25 | % | | | 1.25 | % |
Emerging Markets Growth | | | 1.30 | % | | | 1.30 | % |
Emerging Leaders Growth | | | 1.25 | % | | | 1.25 | % |
Bond | | | 0.35 | % | | | 0.35 | % |
Low Duration | | | 0.40 | % | | | 0.40 | % |
54 Annual Report | December 31, 2011 |
For a period of three years subsequent to the Commencement of Operations of the Portfolio, the Advisor is entitled to reimbursement from the Emerging Leaders Growth and Low Duration Portfolios for previously waived fees and expenses to the extent the overall expense ratio remains below the percentages indicated. The total amount available for recapture at December 31, 2011 is $153 (in thousands) for the Low Duration Portfolio. As a result, the total expense ratio for a Portfolio during the period the agreement is in effect will not fall below the percentage indicated.
For the period ended December 31, 2011, the fees waivers and/or reimbursements for each Portfolio were as follows (in thousands):
| | | | | | | | | | | | |
Portfolio | | Fund
Level
Waiver | | | Class
Specific
Waiver* | | | Total
Waiver | |
Institutional International Equity | | $ | 5 | | | $ | — | | | $ | 5 | |
Emerging Leaders Growth | | | 140 | | | | — | | | | 140 | |
Bond | | | 83 | | | | 15 | | | | 98 | |
Low Duration | | | 37 | | | | 4 | | | | 41 | |
| * | | Class specific waivers include waivers on Class N and Class I, which are included in a separate report. |
(4) Investment Transactions
Investment transactions, excluding money market instruments, repurchase agreements and demand notes for the year ended December 31, 2011 were as follows (in thousands):
| | | | | | | | |
Portfolio | | Purchases | | | Sales | |
Institutional International Growth | | $ | 1,864,580 | | | $ | (1,922,291 | ) |
Institutional International Equity | | | 199,441 | | | | (348,861 | ) |
International Small Cap Growth | | | 745,147 | | | | (581,084 | ) |
Emerging Markets Growth | | | 1,002,446 | | | | (1,229,369 | ) |
Emerging Leaders Growth | | | 117,869 | | | | (143,770 | ) |
Bond | | | 105,624 | | | | (75,418 | ) |
Low Duration | | | 125,063 | | | | (109,128 | ) |
(5) Forward Foreign Currency Contracts
The Portfolios (excluding the Bond and Low Duration Portfolios) from time to time may enter into forward foreign currency contracts with the Fund’s custodian and other counterparties in an attempt to hedge against a decline in the value of foreign currency against the U.S. dollar. The Portfolios bear the market risk that arises from changes in foreign currency rates and bear the credit risk if the counterparty fails to perform under the contract.
For the year ended December 31, 2011, the Institutional International Growth, Institutional International Equity, and International Small Cap Growth Portfolios engaged in forward foreign currency contracts with notional volume (in thousands) of:
| | | | |
Portfolio | | Average
Notional
Value | |
Institutional International Growth | | $ | 304,515 | |
Institutional International Equity | | | 5,276 | |
International Small Cap Growth | | | 31,054 | |
The following tables present the value of forward foreign currency contracts as of December 31, 2011 and their respective location on the Statement of Assets and Liabilities (values in thousands):
| | | | | | | | | | | | |
| | | Assets | | | Liabilities | |
Portfolio | | Statement of Assets and
Liabilities Location | | Value | | | Statement of Assets and
Liabilities Location | | Value | |
Institutional International Growth | | Unrealized appreciation on foreign
forward currency contracts | | $ | — | | | Unrealized depreciation on foreign
forward currency contracts | | $ | 837 | |
International Small Cap Growth | | Unrealized appreciation on foreign
forward currency contracts | | | — | | | Unrealized depreciation on foreign
forward currency contracts | | | 311 | |
December 31, 2011 | William Blair Funds 55 |
The effect of forward contracts on the Statements of Operations for the year ended December 31, 2011 (values in thousands):
| | | | |
Realized gain (loss) recognized in foreign currency transactions | |
Portfolio | | Value | |
Institutional International Growth | | $ | (597 | ) |
Institutional International Equity | | | (722 | ) |
International Small Cap Growth | | | 2,666 | |
|
Change in unrealized gain (loss) recognized in foreign currency translations | |
Portfolio | | Value | |
Institutional International Growth | | $ | (837 | ) |
Institutional International Equity | | | 227 | |
International Small Cap Growth | | | (311 | ) |
The following table presents open forward foreign currency contracts as of December 31, 2011 (values in thousands):
| | | | | | | | | | | | | | | | | | |
Institutional International Growth | |
Counterparty | | Short Contracts | | Settlement
Date | | | Local
Currency | | | Current
Value | | | Unrealized
Loss | |
Bank of New York | | Japanese Yen | | | 3/22/2012 | | | | 6,425,553 | | | $ | 83,599 | | | $ | (837 | ) |
|
International Small Cap Growth | |
Counterparty | | Short Contracts | | Settlement
Date | | | Local
Currency | | | Current
Value | | | Unrealized
Loss | |
Bank of New York | | Japanese Yen | | | 3/22/2012 | | | | 2,389,359 | | | $ | 31,087 | | | $ | (311 | ) |
(6) Fund Share Transactions
The following table summarizes the activity in capital shares for Institutional Classes of each Portfolio (in thousands):
| | | | | | | | | | | | | | | | |
| | | Dollars | |
| | | For the year ended December 31, 2011 | |
Portfolio | | Sales | | | Reinvested
Distributions | | | Redemptions | | | Net change in Net
Assets relating to
fund share activity | |
Institutional International Growth | | $ | 357,122 | | | $ | 1,885 | | | $ | 464,979 | | | $ | (105,972 | ) |
Institutional International Equity | | | 12,843 | | | | 2,328 | | | | 164,692 | | | | (149,521 | ) |
International Small Cap Growth | | | 144,872 | | | | 5,156 | | | | 51,270 | | | | 98,758 | |
Emerging Markets Growth | | | 325,754 | | | | 84,592 | | | | 525,445 | | | | (115,099 | ) |
Emerging Leaders Growth | | | — | | | | 2,152 | | | | 38,310 | | | | (36,158 | ) |
Bond | | | 54,824 | | | | 2,564 | | | | 29,654 | | | | 27,734 | |
Low Duration . | | | 61,464 | | | | 1,816 | | | | 42,760 | | | | 20,520 | |
| |
| | | Dollars | |
| | | For the year ended December 31, 2010 | |
Portfolio | | Sales | | | Reinvested
Distributions | | | Redemptions | | | Net change in Net
Assets relating to
fund share activity | |
Institutional International Growth | | $ | 585,127 | | | $ | 33,238 | | | $ | 379,024 | | | $ | 239,341 | |
Institutional International Equity | | | 31,823 | | | | 3,868 | | | | 139,231 | | | | (103,540 | ) |
International Small Cap Growth | | | 76,119 | | | | 1,301 | | | | 20,893 | | | | 56,527 | |
Emerging Markets Growth | | | 299,213 | | | | 10,490 | | | | 331,182 | | | | (21,479 | ) |
Emerging Leaders Growth | | | 2,611 | | | | 602 | | | | 45,497 | | | | (42,284 | ) |
Bond | | | 23,201 | | | | 1,159 | | | | 620 | | | | 23,740 | |
Low Duration. | | | 65,503 | | | | 1,032 | | | | 31,723 | | | | 34,812 | |
56 Annual Report | December 31, 2011 |
| | | | | | | | | | | | | | | | |
| | | Shares | |
| | | For the year ended December 31, 2011 | |
Portfolio | | Sales | | | Reinvested
Distributions | | | Redemptions | | | Net change in Net
Assets relating to
fund share activity | |
Institutional International Growth | | | 26,212 | | | | 156 | | | | 33,111 | | | | (6,743 | ) |
Institutional International Equity | | | 1,239 | | | | 259 | | | | 16,514 | | | | (15,016 | ) |
International Small Cap Growth | | | 11,931 | | | | 463 | | | | 4,109 | | | | 8,285 | |
Emerging Markets Growth | | | 22,566 | | | | 7,647 | | | | 34,501 | | | | (4,288 | ) |
Emerging Leaders Growth | | | — | | | | 288 | | | | 4,453 | | | | (4,165 | ) |
Bond | | | 5,142 | | | | 239 | | | | 2,774 | | | | 2,607 | |
Low Duration | | | 6,225 | | | | 184 | | | | 4,328 | | | | 2,081 | |
| |
| | | Shares | |
| | | For the year ended December 31, 2010 | |
Portfolio | | Sales | | | Reinvested
Distributions | | | Redemptions | | | Net change in Net
Assets relating to
fund share activity | |
Institutional International Growth | | | 45,848 | | | | 2,351 | | | | 29,748 | | | | 18,451 | |
Institutional International Equity | | | 3,407 | | | | 365 | | | | 13,836 | | | | (10,064 | ) |
International Small Cap Growth | | | 6,879 | | | | 100 | | | | 1,893 | | | | 5,086 | |
Emerging Markets Growth | | | 22,585 | | | | 677 | | | | 23,038 | | | | 224 | |
Emerging Leaders Growth | | | 271 | | | | 60 | | | | 5,354 | | | | (5,023 | ) |
Bond | | | 2,199 | | | | 109 | | | | 58 | | | | 2,250 | |
Low Duration. | | | 6,561 | | | | 104 | | | | 3,179 | | | | 3,486 | |
December 31, 2011 | William Blair Funds 57 |
Financial Highlights
Institutional International Growth Fund
| | | | | | | | | | | | | | | | | | | | |
| | | Years Ended December 31, | |
| | | 2011 | | | 2010 | | | 2009 | | | 2008 | | | 2007 | |
Net asset value, beginning of year | | $ | 14.37 | | | $ | 12.20 | | | $ | 8.66 | | | $ | 19.20 | | | $ | 19.39 | |
Income (loss) from investment operations: | | | | | | | | | | | | | | | | | | | | |
Net investment income (loss) (a) | | | 0.21 | | | | 0.14 | | | | 0.10 | | | | 0.25 | | | | 0.15 | |
Net realized and unrealized gain (loss) on investments | | | (2.17 | ) | | | 2.31 | | | | 3.61 | | | | (10.24 | ) | | | 3.30 | |
| | | | | | | | | | | | | | | | | | | | |
Total from investment operations | | | (1.96 | ) | | | 2.45 | | | | 3.71 | | | | (9.99 | ) | | | 3.45 | |
Less distributions from: | | | | | | | | | | | | | | | | | | | | |
Net investment income | | | 0.02 | | | | 0.28 | | | | 0.17 | | | | — | | | | 0.35 | |
Net realized gain | | | — | | | | — | | | | — | | | | 0.55 | | | | 3.29 | |
| | | | | | | | | | | | | | | | | | | | |
Total distributions | | | 0.02 | | | | 0.28 | | | | 0.17 | | | | 0.55 | | | | 3.64 | |
| | | | | | | | | | | | | | | | | | | | |
Net asset value, end of year | | $ | 12.39 | | | $ | 14.37 | | | $ | 12.20 | | | $ | 8.66 | | | $ | 19.20 | |
| | | | | | | | | | | | | | | | | | | | |
Total Return (%) | | | (13.66 | ) | | | 20.10 | | | | 42.83 | | | | (51.99 | ) | | | 18.49 | |
Ratios to average daily net assets (%): | | | | | | | | | | | | | | | | | | | | |
Expenses | | | 0.99 | | | | 0.99 | | | | 1.01 | | | | 0.98 | | | | 1.02 | |
Net investment income (loss) | | | 1.51 | | | | 1.12 | | | | 0.95 | | | | 1.68 | | | | 0.74 | |
| | | | | | | | | | | | | | | | | | | | |
| | | 2011 | | | 2010 | | | 2009 | | | 2008 | | | 2007 | |
Supplemental data for all classes: | | | | | | | | | | | | | | | | | | | | |
Net assets at end of year (in thousands) | | $ | 1,542,594 | | | $ | 1,886,217 | | | $ | 1,375,848 | | | $ | 998,266 | | | $ | 2,145,312 | |
Portfolio turnover rate (%) | | | 111 | | | | 99 | | | | 125 | | | | 86 | | | | 61 | |
| (a) | | Excludes $0.00, $0.09, $0.05, $(0.10), and $0.06 of PFIC mark to market which is treated as ordinary income for Federal tax purposes for the years 2011, 2010, 2009, 2008, and 2007 respectively. |
Note: Net investment income (loss) per share is based on the average shares outstanding during the year.
Performance cited represents past performance. Past performance does not guarantee future results and current performance may be lower or higher than the data quoted. Results shown are annual returns, which assume reinvestment of dividends and capital gains. Investment returns and principal will fluctuate and you may have a gain or loss when you sell shares. For the most current month-end performance information, please call 1-800-742-7272 or visit our Web site at www.williamblairfunds.com.
58 Annual Report | December 31, 2011 |
Financial Highlights
Institutional International Equity Fund
| | | | | | | | | | | | | | | | | | | | |
| | | Years Ended December 31, | |
| | | 2011 | | | 2010 | | | 2009 | | | 2008 | | | 2007 | |
Net asset value, beginning of year | | $ | 10.78 | | | $ | 9.84 | | | $ | 7.44 | | | $ | 15.03 | | | $ | 14.27 | |
Income (loss) from investment operations: | | | | | | | | | | | | | | | | | | | | |
Net investment income (loss)(a) | | | 0.16 | | | | 0.10 | | | | 0.09 | | | | 0.15 | | | | 0.13 | |
Net realized and unrealized gain (loss) on investments | | | (1.47 | ) | | | 0.99 | | | | 2.38 | | | | (7.60 | ) | | | 2.42 | |
| | | | | | | | | | | | | | | | | | | | |
Total from investment operations | | | (1.31 | ) | | | 1.09 | | | | 2.47 | | | | (7.45 | ) | | | 2.55 | |
Less distributions from: | | | | | | | | | | | | | | | | | | | | |
Net investment income | | | 0.20 | | | | 0.15 | | | | 0.07 | | | | — | | | | 0.22 | |
Net realized gain | | | — | | | | — | | | | — | | | | 0.14 | | | | 1.57 | |
| | | | | | | | | | | | | | | | | | | | |
Total distributions | | | 0.20 | | | | 0.15 | | | | 0.07 | | | | 0.14 | | | | 1.79 | |
| | | | | | | | | | | | | | | | | | | | |
Net asset value, end of year | | $ | 9.27 | | | $ | 10.78 | | | $ | 9.84 | | | $ | 7.44 | | | $ | 15.03 | |
| | | | | | | | | | | | | | | | | | | | |
Total Return (%) | | | (12.12 | ) | | | 11.12 | | | | 33.27 | | | | (49.57 | ) | | | 18.36 | |
Ratios to average daily net assets (%): | | | | | | | | | | | | | | | | | | | | |
Expenses, net of waivers and reimbursements | | | 1.10 | | | | 1.07 | | | | 1.09 | | | | 1.05 | | | | 1.09 | |
Expenses, before waivers and reimbursements | | | 1.10 | | | | 1.07 | | | | 1.09 | | | | 1.05 | | | | 1.06 | |
Net investment income (loss), net of waivers and reimbursements | | | 1.48 | | | | 0.97 | | | | 1.04 | | | | 1.26 | | | | 0.86 | |
Net investment income (loss), before waivers and reimbursements | | | 1.48 | | | | 0.97 | | | | 1.04 | | | | 1.26 | | | | 0.89 | |
| | | | |
| | | Years Ended December 31, | |
| | | 2011 | | | 2010 | | | 2009 | | | 2008 | | | 2007 | |
Supplemental data for all classes: | | | | | | | | | | | | | | | | | | | | |
Net assets at end of year (in thousands) | | $ | 111,474 | | | $ | 291,468 | | | $ | 365,271 | | | $ | 360,451 | | | $ | 618,179 | |
Portfolio turnover rate (%) | | | 91 | | | | 73 | | | | 78 | | | | 91 | | | | 66 | |
| (a) | | Excludes $0.00, $0.04, $0.00, $0.00, and $(0.07) of PFIC mark to market which is treated as ordinary income for Federal tax purposes for the years 2011, 2010, 2009, 2008, and 2007 respectively. |
Note: Net investment income (loss) per share is based on the average shares outstanding during the year.
Performance cited represents past performance. Past performance does not guarantee future results and current performance may be lower or higher than the data quoted. Results shown are annual returns, which assume reinvestment of dividends and capital gains. Investment returns and principal will fluctuate and you may have a gain or loss when you sell shares. For the most current month-end performance information, please call 1-800-742-7272 or visit our Web site at www.williamblairfunds.com.
December 31, 2011 | William Blair Funds 59 |
Financial Highlights
International Small Cap Growth Fund
| | | | | | | | | | | | | | | | | | | | |
| | | Institutional Class Shares | |
| | | Years Ended December 31, | |
| | | 2011 | | | 2010 | | | 2009 | | | 2008 | | | 2007 | |
Net asset value, beginning of year | | $ | 13.24 | | | $ | 10.53 | | | $ | 6.69 | | | $ | 14.04 | | | $ | 13.43 | |
Income (loss) from investment operations: | | | | | | | | | | | | | | | | | | | | |
Net investment income (loss) (a) | | | 0.14 | | | | 0.09 | | | | 0.04 | | | | 0.03 | | | | 0.05 | |
Net realized and unrealized gain (loss) on investments | | | (1.68 | ) | | | 2.69 | | | | 3.83 | | | | (7.26 | ) | | | 1.72 | |
| | | | | | | | | | | | | | | | | | | | |
Total from investment operations | | | (1.54 | ) | | | 2.78 | | | | 3.87 | | | | (7.23 | ) | | | 1.77 | |
Less distributions from: | | | | | | | | | | | | | | | | | | | | |
Net investment income | | | 0.19 | | | | 0.07 | | | | 0.03 | | | | — | | | | 0.12 | |
Net realized gain | | | — | | | | — | | | | — | | | | 0.12 | | | | 1.04 | |
| | | | | | | | | | | | | | | | | | | | |
Total distributions | | | 0.19 | | | | 0.07 | | | | 0.03 | | | | 0.12 | | | | 1.16 | |
| | | | | | | | | | | | | | | | | | | | |
Net asset value, end of year | | $ | 11.51 | | | $ | 13.24 | | | $ | 10.53 | | | $ | 6.69 | | | $ | 14.04 | |
| | | | | | | | | | | | | | | | | | | | |
Total Return (%) | | | (11.60 | ) | | | 26.40 | | | | 57.84 | | | | (51.53 | ) | | | 13.53 | |
Ratios to average daily net assets (%): | | | | | | | | | | | | | | | | | | | | |
Expenses, net of waivers and reimbursements | | | 1.08 | | | | 1.08 | | | | 1.13 | | | | 1.14 | | | | 1.14 | |
Expenses, before waivers and reimbursements | | | 1.08 | | | | 1.08 | | | | 1.13 | | | | 1.11 | | | | 1.14 | |
Net investment income (loss), net of waivers and reimbursements | | | 1.10 | | | | 0.77 | | | | 0.48 | | | | 0.28 | | | | 0.32 | |
Net investment income (loss), before waivers and reimbursements | | | 1.10 | | | | 0.77 | | | | 0.48 | | | | 0.31 | | | | 0.32 | |
| | | | | | | | | | | | | | | | | | | | |
| | | Years Ended December 31, | |
| | | 2011 | | | 2010 | | | 2009 | | | 2008 | | | 2007 | |
Supplemental data for all classes: | | | | | | | | | | | | | | | | | | | | |
Net assets at end of year (in thousands) | | $ | 718,221 | | | $ | 646,951 | | | $ | 390,851 | | | $ | 291,988 | | | $ | 401,459 | |
Portfolio turnover rate (%) | | | 85 | | | | 85 | | | | 136 | | | | 78 | | | | 88 | |
| (a) | | Excludes $0.00, $0.15, $0.01, $(0.02), and $0.05 of PFIC mark to market which is treated as ordinary income for Federal tax purposes for the years 2011, 2010, 2009, 2008, and 2007 respectively. |
Note: Net investment income (loss) per share is based on the average shares outstanding during the year.
Performance cited represents past performance. Past performance does not guarantee future results and current performance may be lower or higher than the data quoted. Results shown are annual returns, which assume reinvestment of dividends and capital gains. Investment returns and principal will fluctuate and you may have a gain or loss when you sell shares. For the most current month-end performance information, please call 1-800-742-7272 or visit our Web site at www.williamblairfunds.com.
60 Annual Report | December 31, 2011 |
Financial Highlights
Emerging Markets Growth Fund
| | | | | | | | | | | | | | | | | | | | |
| | | Institutional Class Shares | |
| | | Years Ended December 31, | |
| | | 2011 | | | 2010 | | | 2009 | | | 2008 | | | 2007 | |
Net asset value, beginning of year | | $ | 15.96 | | | $ | 13.03 | | | $ | 7.56 | | | $ | 22.07 | | | $ | 19.54 | |
Income (loss) from investment operations: | | | | | | | | | | | | | | | | | | | | |
Net investment income (loss)(a) | | | 0.14 | | | | 0.06 | | | | 0.06 | | | | 0.17 | | | | (0.01 | ) |
Net realized and unrealized gain (loss) on investments | | | (2.87 | ) | | | 3.05 | | | | 5.55 | | | | (13.74 | ) | | | 7.27 | |
| | | | | | | | | | | | | | | | | | | | |
Total from investment operations | | | (2.73 | ) | | | 3.11 | | | | 5.61 | | | | (13.57 | ) | | | 7.26 | |
Less distributions from: | | | | | | | | | | | | | | | | | | | | |
Net investment income | | | 0.08 | | | | 0.18 | | | | 0.14 | | | | — | | | | 0.19 | |
Net realized gain | | | 1.83 | | | | — | | | | — | | | | 0.94 | | | | 4.54 | |
| | | | | | | | | | | | | | | | | | | | |
Total distributions | | | 1.91 | | | | 0.18 | | | | 0.14 | | | | 0.94 | | | | 4.73 | |
| | | | | | | | | | | | | | | | | | | | |
Net asset value, end of year | | $ | 11.32 | | | $ | 15.96 | | | $ | 13.03 | | | $ | 7.56 | | | $ | 22.07 | |
| | | | | | | | | | | | | | | | | | | | |
Total Return (%) | | | (16.82 | ) | | | 23.91 | | | | 74.33 | | | | (61.51 | ) | | | 38.21 | |
Ratios to average daily net assets (%): | | | | | | | | | | | | | | | | | | | | |
Expenses, net of waivers and reimbursements | | | 1.19 | | | | 1.17 | | | | 1.22 | | | | 1.22 | | | | 1.25 | |
Expenses, before waivers and reimbursements | | | 1.19 | | | | 1.17 | | | | 1.22 | | | | 1.20 | | | | 1.25 | |
Net investment income (loss), net of waivers and reimbursements | | | 0.93 | | | | 0.43 | | | | 0.54 | | | | 1.08 | | | | (0.05 | ) |
Net investment income (loss), before waivers and reimbursements | | | 0.93 | | | | 0.43 | | | | 0.54 | | | | 1.10 | | | | (0.05 | ) |
| | | | |
| | | Years Ended December 31, | |
| | | 2011 | | | 2010 | | | 2009 | | | 2008 | | | 2007 | |
Supplemental data for all classes: | | | | | | | | | | | | | | | | | | | | |
Net assets at end of year (in thousands) | | $ | 817,846 | | | $ | 1,250,543 | | | $ | 1,038,260 | | | $ | 385,588 | | | $ | 1,165,854 | |
Portfolio turnover rate (%) | | | 104 | | | | 121 | | | | 113 | | | | 118 | | | | 100 | |
| (a) | | Excludes $0.00, $0.11, $0.15, $(0.09), and $0.21 of PFIC mark to market which is treated as ordinary income for Federal tax purposes for the years 2011, 2010, 2009, 2008, and 2007 respectively. |
Note: Net investment income (loss) per share is based on the average shares outstanding during the year.
Performance cited represents past performance. Past performance does not guarantee future results and current performance may be lower or higher than the data quoted. Results shown are annual returns, which assume reinvestment of dividends and capital gains. Investment returns and principal will fluctuate and you may have a gain or loss when you sell shares. For the most current month-end performance information, please call 1-800-742-7272 or visit our Web site at www.williamblairfunds.com.
December 31, 2011 | William Blair Funds 61 |
Financial Highlights
Emerging Leaders Growth Fund
| | | | | | | | | | | | | | | | |
| | | Institutional Class Shares | |
| | | Periods Ended December 31, | |
| | | 2011 | | | 2010 | | | 2009 | | | 2008(a) | |
Net asset value, beginning of year | | $ | 10.35 | | | $ | 8.43 | | | $ | 4.78 | | | $ | 10.00 | |
Income (loss) from investment operations: | | | | | | | | | | | | | | | | |
Net investment income (loss) (b) | | | 0.09 | | | | 0.04 | | | | 0.04 | | | | 0.04 | |
Net realized and unrealized gain (loss) on investments | | | (2.10 | ) | | | 1.97 | | | | 3.73 | | | | (5.26 | ) |
| | | | | | | | | | | | | | | | |
Total from investment operations | | | (2.01 | ) | | | 2.01 | | | | 3.77 | | | | (5.22 | ) |
Less distributions from: | | | | | | | | | | | | | | | | |
Net investment income | | | 0.06 | | | | 0.03 | | | | 0.12 | | | | 0.00 | ^ |
Net realized gain | | | 0.63 | | | | 0.06 | | | | — | | | | — | |
Return of capital | | | 0.00 | ^ | | | — | | | | — | | | | — | |
| | | | | | | | | | | | | | | | |
Total distributions | | | 0.69 | | | | 0.09 | | | | 0.12 | | | | 0.00 | ^ |
| | | | | | | | | | | | | | | | |
Net asset value, end of year | | $ | 7.65 | | | $ | 10.35 | | | $ | 8.43 | | | $ | 4.78 | |
| | | | | | | | | | | | | | | | |
Total Return (%)* | | | (19.30 | ) | | | 23.84 | | | | 78.93 | | | | (52.11 | ) |
Ratios to average daily net assets (%):** | | | | | | | | | | | | | | | | |
Expenses, net of waivers and reimbursements | | | 1.25 | | | | 1.26 | | | | 1.25 | | | | 1.25 | |
Expenses, before waivers and reimbursements | | | 1.41 | | | | 1.35 | | | | 1.36 | | | | 1.41 | |
Net investment income (loss), net of waivers and reimbursements | | | 0.90 | | | | 0.50 | | | | 0.58 | | | | 0.70 | |
Net investment income (loss), before waivers and reimbursements | | | 0.74 | | | | 0.41 | | | | 0.47 | | | | 0.54 | |
| | | | |
| | | Periods Ended December 31, | |
| | | 2011 | | | 2010 | | | 2009 | | | 2008(a) | |
Supplemental data for all classes: | | | | | | | | | | | | | | | | |
Net assets at end of year (in thousands) | | $ | 47,822 | | | $ | 94,901 | | | $ | 115,136 | | | $ | 46,676 | |
Portfolio turnover rate (%) | | | 142 | | | | 176 | | | | 176 | | | | 151 | |
| (a) | | For the period March 26, 2008 (Commencement of Operations) to December 31, 2008. |
| (b) | | Excludes $0.00, $0.96, $1.29, and $0.00 of PFIC mark to market which is treated as ordinary income for Federal tax purposes for the years 2011, 2010, 2009, and 2008 respectively. |
| * | | Rates not annualized for periods that are less than a year. |
| ** | | Rates are annualized for periods that are less than a year. |
| ^ | | Amount is less than $0.005 per share. |
Note: Net investment income (loss) per share is based on the average shares outstanding during the year.
Performance cited represents past performance. Past performance does not guarantee future results and current performance may be lower or higher than the data quoted. Results shown are annual returns, which assume reinvestment of dividends and capital gains. Investment returns and principal will fluctuate and you may have a gain or loss when you sell shares. For the most current month-end performance information, please call 1-800-742-7272 or visit our Web site at www.williamblairfunds.com.
62 Annual Report | December 31, 2011 |
Financial Highlights
Bond Fund
| | | | | | | | | | | | | | | | | | | | |
| | | Institutional Class Shares | |
| | | Periods Ended December 31, | |
| | | 2011 | | | 2010 | | | 2009 | | | 2008 | | | 2007(a) | |
Net asset value, beginning of year | | $ | 10.58 | | | $ | 10.30 | | | $ | 9.72 | | | $ | 10.00 | | | $ | 10.00 | |
Income (loss) from investment operations: | | | | | | | | | | | | | | | | | | | | |
Net investment income (loss) | | | 0.45 | | | | 0.48 | | | | 0.51 | | | | 0.50 | | | | 0.32 | |
Net realized and unrealized gain (loss) on investments | | | 0.36 | | | | 0.34 | | | | 0.58 | | | | (0.31 | ) | | | 0.03 | |
| | | | | | | | | | | | | | | | | | | | |
Total from investment operations | | | 0.81 | | | | 0.82 | | | | 1.09 | | | | 0.19 | | | | 0.35 | |
Less distributions from: | | | | | | | | | | | | | | | | | | | | |
Net investment income | | | 0.50 | | | | 0.51 | | | | 0.51 | | | | 0.47 | | | | 0.35 | |
Net realized gain | | | 0.09 | | | | 0.03 | | | | — | | | | — | | | | 0.00 | |
| | | | | | | | | | | | | | | | | | | | |
Total distributions | | | 0.59 | | | | 0.54 | | | | 0.51 | | | | 0.47 | | | | 0.35 | |
| | | | | | | | | | | | | | | | | | | | |
Net asset value, end of year | | $ | 10.80 | | | $ | 10.58 | | | $ | 10.30 | | | $ | 9.72 | | | $ | 10.00 | |
| | | | | | | | | | | | | | | | | | | | |
Total Return (%)* | | | 7.88 | | | | 8.06 | | | | 11.47 | | | | 1.95 | | | | 3.57 | |
Ratios to average daily net assets (%):** | | | | | | | | | | | | | | | | | | | | |
Expenses, net of waivers and reimbursements | | | 0.35 | | | | 0.35 | | | | 0.34 | | | | 0.35 | | | | 0.35 | |
Expenses, before waivers and reimbursements | | | 0.39 | | | | 0.40 | | | | 0.43 | | | | 0.56 | | | | 0.52 | |
Net investment income (loss), net of waivers and reimbursements | | | 4.24 | | | | 4.54 | | | | 5.07 | | | | 5.04 | | | | 5.09 | |
Net investment income (loss), before waivers and reimbursements | | | 4.20 | | | | 4.49 | | | | 4.98 | | | | 4.83 | | | | 4.92 | |
| | | Years Ended December 31, | |
| | | 2011 | | | 2010 | | | 2009 | | | 2008 | | | 2007(a) | |
Supplemental data for all classes: | | | | | | | | | | | | | | | | | | | | |
Net assets at end of year (in thousands) | | $ | 232,016 | | | $ | 192,776 | | | $ | 147,344 | | | $ | 74,613 | | | $ | 68,483 | |
Portfolio turnover rate (%) | | | 28 | | | | 25 | | | | 29 | | | | 52 | | | | 38 | |
| (a) | | For the period May 1, 2007 (Commencement of Operations) to December 31, 2007. |
| * | | Rates not annualized for periods that are less than a year. |
| ** | | Rates are annualized for periods that are less than a year. |
Note: Net investment income (loss) per share is based on the average shares outstanding during the year.
Performance cited represents past performance. Past performance does not guarantee future results and current performance may be lower or higher than the data quoted. Results shown are annual returns, which assume reinvestment of dividends and capital gains. Investment returns and principal will fluctuate and you may have a gain or loss when you sell shares. For the most current month-end performance information, please call 1-800-742-7272 or visit our Web site at www.williamblairfunds.com.
December 31, 2011 | William Blair Funds 63 |
Financial Highlights
Low Duration Fund
| | | | | | | | | | | | | | |
| | | Institutional Class Shares | |
| | | Periods Ended December 31, | |
| | | 2011 | | | | | 2010 | | | 2009 (a) | |
Net asset value, beginning of year | | $ | 9.90 | | | | | $ | 9.93 | | | $ | 10.00 | |
Income (loss) from investment operations: | | | | | | | | | | | | | | |
Net investment income (loss) | | | 0.18 | | | | | | 0.16 | | | | 0.01 | |
Net realized and unrealized gain (loss) on investments | | | 0.03 | | | | | | 0.05 | | | | (0.07 | ) |
| | | | | | | | | | | | | | |
Total from investment operations | | | 0.21 | | | | | | 0.21 | | | | (0.06 | ) |
Less distributions from: | | | | | | | | | | | | | | |
Net investment income | | | 0.28 | | | | | | 0.24 | | | | 0.01 | |
Net realized gain | | | — | | | | | | — | | | | — | |
| | | | | | | | | | | | | | |
Total distributions | | | 0.28 | | | | | | 0.24 | | | | 0.01 | |
| | | | | | | | | | | | | | |
Net asset value, end of year | | $ | 9.83 | | | | | $ | 9.90 | | | $ | 9.93 | |
| | | | | | | | | | | | | | |
Total Return (%)* | | | 2.14 | | | | | | 2.15 | | | | (0.58 | ) |
Ratios to average daily net assets (%):** | | | | | | | | | | | | | | |
Expenses, net of waivers and reimbursements | | | 0.40 | | | | | | 0.40 | | | | 0.40 | |
Expenses, before waivers and reimbursements | | | 0.42 | | | | | | 0.48 | | | | 0.64 | |
Net investment income (loss), net of waivers and reimbursements | | | 1.81 | | | | | | 1.61 | | | | 1.54 | |
Net investment income (loss), before waivers and reimbursements | | | 1.79 | | | | | | 1.53 | | | | 1.30 | |
| | | Periods Ended December 31, | |
| | | 2011 | | | | | 2010 | | | 2009 (a) | |
Supplemental data for all classes: | | | | | | | | | | | | | | |
Net assets at end of year (in thousands) | | $ | 157,147 | | | | | $ | 143,470 | | | $ | 95,134 | |
Portfolio turnover rate (%)* | | | 43 | | | | | | 51 | | | | — | |
| (a) | | For the period December 1, 2009 (Commencement of Operations) to December 31, 2009. |
| * | | Rates not annualized for periods that are less than a year. |
| ** | | Rates are annualized for periods that are less than a year. |
Note: Net investment income (loss) per share is based on the average shares outstanding during the year.
Performance cited represents past performance. Past performance does not guarantee future results and current performance may be lower or higher than the data quoted. Results shown are annual returns, which assume reinvestment of dividends and capital gains. Investment returns and principal will fluctuate and you may have a gain or loss when you sell shares. For the most current month-end performance information, please call 1-800-742-7272 or visit our Web site at www.williamblairfunds.com.
64 Annual Report | December 31, 2011 |
REPORT OF INDEPENDENT REGISTERED PUBLIC ACCOUNTING FIRM
To the Board of Trustees and Shareholders of
William Blair Funds
We have audited the accompanying statements of assets and liabilities, including the portfolios of investments, of the Institutional International Growth Fund, Institutional International Equity Fund, International Small Cap Growth Fund, Emerging Markets Growth Fund, Emerging Leaders Growth Fund, Bond Fund, and Low Duration Fund (collectively, the Portfolios) (seven of the Portfolios constituting William Blair Funds) as of December 31, 2011, and the related statements of operations, statements of changes in net assets and financial highlights for the periods indicated therein. These financial statements and financial highlights are the responsibility of the Portfolios’ management. Our responsibility is to express an opinion on these financial statements and financial highlights based on our audits.
We conducted our audits in accordance with the standards of the Public Company Accounting Oversight Board (United States). Those standards require that we plan and perform the audits to obtain reasonable assurance about whether the financial statements and financial highlights are free of material misstatement. We were not engaged to perform an audit of the Portfolios’ internal control over financial reporting. Our audits included consideration of internal control over financial reporting as a basis for designing audit procedures that are appropriate in the circumstances, but not for the purpose of expressing an opinion on the effectiveness of the Portfolios’ internal control over financial reporting. Accordingly, we express no such opinion. An audit also includes examining, on a test basis, evidence supporting the amounts and disclosures in the financial statements and financial highlights, assessing the accounting principles used and significant estimates made by management, and evaluating the overall financial statement presentation. Our procedures included confirmation of securities owned as of December 31, 2011, by correspondence with the custodian and brokers or by other appropriate auditing procedures where replies from brokers were not received. We believe that our audits provide a reasonable basis for our opinion.
In our opinion, the financial statements and financial highlights referred to above present fairly, in all material respects, the financial position of each of the above mentioned Portfolios of William Blair Funds at December 31, 2011, the results of their operations, changes in their net assets and financial highlights for the periods indicated therein, in conformity with U.S. generally accepted accounting principles.
Ernst & Young LLP
Chicago, Illinois
February 23, 2012
December 31, 2011 | William Blair Funds 65 |
APPROVAL OF THE MANAGEMENT AGREEMENT FOR THE WILLIAM BLAIR EMERGING MARKETS SMALL CAP GROWTH FUND
On July 26, 2011, the Board of Trustees (the “Board”) of William Blair Funds (the “Trust”), including the Trustees who are not interested persons of the Trust as defined by the Investment Company Act of 1940, as amended (the “Independent Trustees”), approved the Management Agreement between the Trust, on behalf of the William Blair Emerging Markets Small Cap Growth Fund (the “Fund”), and William Blair & Company, L.L.C. (the “Advisor”). On July 25 and 26, 2011, the Board met to consider the approval of the Management Agreement. On July 25, 2011, the Independent Trustees also met independently of Trust management and the interested Trustees of the Trust to consider the approval of the Management Agreement . The Independent Trustees reviewed materials provided by the Advisor for the approval of the Management Agreement and were assisted by independent legal counsel in making their determination. The Board considered the following factors in making its determination, but did not identify any single factor or group of factors as all important or controlling and considered all factors together.
Nature, Quality and Extent of Services. In evaluating the nature, quality and extent of services expected to be provided by the Advisor to the Fund, the Board noted that the Advisor is a quality firm with a reputation for integrity and honesty that employs high quality people. The Board considered biographical information about the proposed portfolio managers for the Fund, financial information regarding the Advisor, the compliance regime created by the Advisor and the proposed financial support of the Fund. The Board considered that the proposed portfolio managers currently managed or co-managed the William Blair Emerging Markets Growth Fund, the William Blair Emerging Leaders Growth Fund and the William Blair International Small Cap Growth Fund. The Board also considered the Advisor’s experience in managing new funds. Based upon all relevant factors, the Board concluded that the nature, quality and extent of the services to be provided by the Advisor to the Fund were expected to be satisfactory.
Fees and Expenses. The Board reviewed the proposed advisory fee for the Fund and reviewed information comparing the Fund’s advisory fee to a separate peer group of funds provided by Lipper Inc. With respect to the Fund, the Lipper peer group consisted of other no-load international small-/mid-cap growth funds and no-load international multi-cap value funds. In considering the information, the Board noted that the proposed advisory fee for the William Blair Emerging Markets Small Cap Growth Fund was above the median of its Lipper peer group. The Board reviewed the Advisor’s management fees for the Emerging Markets Growth Fund and the Emerging Leaders Growth Fund. The Board also considered that the Advisor had proposed to limit total expenses for the Fund, including waiving advisory fees, if necessary. On the basis of the information provided, the Board concluded that the proposed advisory fee for the Fund was reasonable and appropriate in light of the nature, quality and extent of services expected to be provided by the Advisor.
Profitability. With respect to the estimated profitability of the Management Agreement to the Advisor for the Fund, the Board considered the proposed advisory fee for the Fund, that the Fund was newly organized and had no assets and the Advisor’s agreement to limit total expenses for the Fund. The Board concluded that the expected profits to be realized by the Advisor with respect to the Fund were not unreasonable.
Economies of Scale. The Board considered the extent to which economies of scale would be realized as the Fund grows and whether fee levels reflect these economies of scale. The Board considered whether the proposed advisory fee for the Fund was reasonable in relation to the projected asset size of the Fund. In considering whether fee levels reflect economies of scale for the benefit of Fund investors, the Board reviewed the Fund’s advisory fee compared to peer funds, the Fund’s projected asset size, the Fund’s estimated expense ratios and the Advisor’s agreement to limit total expenses for the Fund, and concluded that the advisory fee for the Fund was reasonable.
Other Benefits to the Advisor. The Board considered benefits to be derived by the Advisor from its relationship with the Fund. The Board concluded that, after taking into account these benefits, the proposed advisory fee for the Fund was reasonable.
Conclusion. Based upon all of the information considered and the conclusions reached, the Board determined that the terms of the Management Agreement are fair and reasonable and that the approval of the Management Agreement is in the best interests of the Fund.
66 Annual Report | December 31, 2011 |
Trustees and Officers (Unaudited). The trustees and officers of the William Blair Funds, their year of birth, their principal occupations during the last five years, their affiliations, if any, with William Blair & Company, L.L.C., and other significant affiliations are set forth below. The address of each trustee and officer is 222 West Adams Street, Chicago, Illinois 60606.
| | | | | | | | | | |
Name and Year of Birth | | Position(s)
Held with
Fund | | Term of
Office and
Length of
Time
Served(1) | | Principal Occupation(s) During Past 5 Years(2) | | Number of
Portfolios
in Fund
Complex
Overseen
by Trustee | | Other Directorships Held by Trustee/Officer |
Interested Trustees | | | | | | | | | | |
Michelle R. Seitz,
1965* | | Chairperson of the Board of Trustees and President | | Trustee since 2002; Chairperson since 2010 Since 2007 | | Principal, William Blair & Company, L.L.C.; Limited Partner, WB Holdings, L.P. (since November 2008); Member, WBC GP, L.L.P. (since November 2008) | | 23 | | Director, William Blair SICAV |
| | | | | |
Richard W. Smirl,
1967* | | Trustee and Senior Vice President | | Trustee since 2010 and Senior Vice President since 2007 | | Principal, William Blair & Company, L.L.C. | | 23 | | Director, William Blair SICAV |
| | | | |
Non-Interested Trustees | | | | | | | | |
Ann P. McDermott,
1939 | | Trustee | | Since 1996 | | Board member and officer for various civic and charitable organizations over the past thirty years; professional experience prior thereto, registered representative for New York Stock Exchange firm | | 23 | | Northwestern University, Women’s Board; Rush Presbyterian St. Luke’s Medical Center, Women’s Board; University of Chicago, Women’s Board; Visiting Nurses Association, Honorary Director |
| | | | | |
Phillip O. Peterson,
1944 | | Trustee | | Since 2007 | | Retired; formerly, President, Strong Mutual Funds, 2004-2005; formerly, Partner, KPMG LLP | | 23 | | The Hartford Group of Mutual Funds (87 portfolios) |
| | | | | |
Lisa A. Pollina,
1965 | | Trustee | | Since 2011 | | Senior Advisor to head of RBC Financial Group’s International Banking and Insurance division since 2010; formerly, Bank of America Corporation, Global Financial Institutions Executive from 2006-2008 and multiple Advisory from 2008-2010; prior thereto, Managing Partner, Bordeaux Capital from 2002-2006. | | 23 | | Darkstrand, high-speed fiber optic network provider (2009 to 2010); Jane Addams Hull House Association, Board of Trustees (2003 to 2009) |
| | | | | |
Donald J. Reaves,
1946 | | Trustee | | Since 2004 | | Chancellor, Winston-Salem State University since 2007; formerly, Vice President for Administration and Chief Financial Officer, University of Chicago 2002-2007. | | 23 | | American Student Assistance Corp., guarantor of student loans; Amica Mutual Insurance Company |
December 31, 2011 | William Blair Funds 67 |
| | | | | | | | | | |
Name and Year of Birth | | Position(s)
Held with
Fund | | Term of
Office and
Length of
Time
Served(1) | | Principal Occupation(s) During Past 5 Years(2) | | Number of
Portfolios
in Fund
Complex
Overseen
by Trustee | | Other Directorships Held by Trustee/Officer |
Donald L. Seeley,
1944 | | Trustee | | Since 2003 | | Retired; formerly, Director, Applied Investment Management Program, University of Arizona Department of Finance, prior there to, Vice Chairman and Chief Financial Officer, True North Communications, Inc., marketing communications and advertising firm | | 23 | | Warnaco Group, Inc., intimate apparel, sportswear, and swimwear manufacturer; Center for Furniture Craftsmanship (not-for-profit) |
| | | | | |
Thomas J. Skelly,
1951 | | Trustee | | Since 2007 | | Advisory Board member for various U.S. companies; Director and Investment Committee Chairman of the US Accenture Foundation, Inc.; prior to 2005, Managing Partner of various divisions at Accenture | | 23
| | Mutual Trust Financial Group, provider of insurance and investment products; Board Member, First MetLife Investors Insurance Company, NY Chartered Company for Metropolitan Life Insurance |
Officers | | | | | | | | | | |
Michael P. Balkin,
1959 | | Senior Vice President | | Since 2009 | | Principal, William Blair & Company, L.L.C. | | | | N/A |
| | | | | |
| | Vice President | | 2008-2009 | | Associate, William Blair & Company, L.L.C.; former Partner, Magnetar Capital | | | | |
| | | | | |
Karl W. Brewer,
1966 | | Senior Vice President | | Since 2000 | | Principal, William Blair & Company, L.L.C. | | | | N/A |
| | | | | |
David C. Fording,
1967 | | Senior Vice President | | Since 2009 | | Principal, William Blair & Company, L.L.C. | | | | N/A |
| | | | | |
| | Vice President | | 2006-2009 | | Associate, William Blair & Company, L.L.C.; former Portfolio Manager, TIAA-CREF. | | | | |
| | | | | |
James S. Golan,
1961 | | Senior Vice President | | Since 2005 | | Principal, William Blair & Company, L.L.C. | | | | N/A |
| | | | | |
W. George Greig,
1952 | | Senior Vice President | | Since 1996 | | Principal, William Blair & Company, L.L.C. | | | | N/A |
| | | | | |
Michael A. Jancosek,
1959 | | Senior Vice President | | Since 2004 | | Principal, William Blair & Company L.L.C. | | | | N/A |
| | | | | |
John F. Jostrand,
1954 | | Senior Vice President | | Since 1999 | | Principal, William Blair & Company, L.L.C. | | | | N/A |
| | | | | |
Chad M. Kilmer,
1975 | | Senior Vice President | | Since 2011 | | Associate, William Blair & Company, L.L.C.; former analyst and Portfolio | | | | N/A |
| | | | | |
Robert C. Lanphier, IV,
1956 | | Senior Vice President | | Since 2003 | | Principal, William Blair & Company, L.L.C. | | | | Chairman, AG. Med, Inc. |
68 Annual Report | December 31, 2011 |
| | | | | | | | |
Name and Year of Birth | | Position(s)
Held with
Fund | | Term of
Office and
Length of
Time
Served(1) | | Principal
Occupation(s)
During Past 5 Years(2) | | Other Directorships Held by Trustee/Officer |
Mark T. Leslie,
1967 | | Senior Vice President | | Since 2008 | | Principal, William Blair & Company, L.L.C. | | N/A |
| | | | |
| | Vice President | | 2005-2008 | | Associate, William Blair & Company, L.L.C. | | |
| | | | |
Matthew A. Litfin,
1972 | | Senior Vice President | | Since 2008 | | Principal, William Blair & Company, L.L.C. | | N/A |
| | | | |
Kenneth J. McAtamney
1966 | | Senior Vice President | | Since 2008 | | Principal, William Blair & Company, L.L.C. | | N/A |
| | | | |
Todd M. McClone,
1968 | | Senior Vice President | | Since 2006 | | Principal, William Blair & Company, L.L.C. | | N/A |
| | | | |
| | Vice President | | 2005-2006 | | Associate, William Blair & Company, L.L.C. | | N/A |
| | | | |
David Merjan,
1960 | | Senior Vice President | | Since 2008 | | Principal, William Blair & Company, L.L.C. | | N/A |
| | | | |
David S. Mitchell,
1960 | | Senior Vice President | | Since 2004 | | Principal, William Blair & Company, L.L.C. | | N/A |
| | | | |
David P. Ricci,
1958 | | Senior Vice President | | Since 2006 | | Principal, William Blair & Company, L.L.C. | | N/A |
| | | | |
Richard W. Smirl,
1967 | | Senior Vice President | | Since 2004 | | Principal, William Blair & Company, L.L.C. | | N/A |
| | | | |
Jeffrey A. Urbina,
1955 | | Senior Vice President | | Since 1998 | | Principal, William Blair & Company, L.L.C. | | N/A |
| | | | |
Christopher T. Vincent,
1956 | | Senior Vice President | | Since 2004 | | Principal, William Blair & Company, L.L.C. | | N/A |
| | | | |
Kathleen M. Lynch,
1971 | | Vice President | | Since 2010 | | Associate, William Blair & Company, L.L.C. | | N/A |
| | | | |
Paul J. Sularz,
1967 | | Vice President | | Since 2009 | | Associate, William Blair & Company, L.L.C.; Vice President, J.P. Morgan Securities, Inc. | | N/A |
| | | | |
David F. Hone,
1967 | | Vice President | | Since 2011 | | Associate, William Blair & Company, L.L.C. (since 2011); prior thereto, Portfolio Manager, Large Cap Value, Deutsche Asset Management (2002-2010) | | N/A |
| | | | |
John Abunassar,
1967 | | Vice President | | Since 2011 | | Associate, William Blair & Company, L.L.C. (since 2011); prior thereto, Principal, Guidance Capital LLC (2009-2011); prior thereto, President and CEO of Allegiant Asset | | N/A |
| | | | |
Peter Carl,
1967 | | Vice President | | Since 2011 | | Associate, William Blair & Company L.L.C. (since 2011); prior thereto, Portfolio Manager, Guidance Capital LLC (2006-2011) | | N/A |
December 31, 2011 | William Blair Funds 69 |
| | | | | | | | |
Name and Year of Birth | | Position(s)
Held with
Fund | | Term of
Office and
Length of
Time
Served(1) | | Principal
Occupation(s)
During Past 5 Years(2) | | Other Directorships Held by Trustee/Officer |
D. Trowbridge Elliman III,
1957 | | Vice President | | Since 2011 | | Associate, William Blair & Company L.L.C. (since 2011); prior thereto, Principal, Guidance Capital LLC (2001-2011) | | N/A |
| | | | |
Christopher Walvoord,
1966 | | Vice President | | Since 2011 | | Associate, William Blair & Company, L.L.C. (since 2011); prior thereto, Principal, Guidance Capital LLC (2002-2011) | | N/A |
| | | | |
Brian Ziv,
1957 | | Vice President | | Since 2011 | | Associate, William Blair & Company, L.L.C. (since 2011); prior thereto, Principal, Guidance Capital LLC (2001-2011) | | N/A |
| | | | |
Brian D. Singer,
1960 | | Vice President | | Since 2011 | | Associate, William Blair & Company, L.L.C. (since 2011); prior thereto, Managing Partner, Singer Partners, LLC (2009-2011); prior thereto, UBS Global Asset Management (Americas) Inc. (2003-2007) | | N/A |
| | | | |
Edwin Denson,
1967 | | Vice President | | Since 2011 | | Associate, William Blair & Company, L.L.C. (since 2011); prior thereto, Managing Partner, Singer Partners, LLC (2009-2011); prior thereto, UBS Global Asset Management (Americas) Inc. (2001-2009) | | N/A |
| | | | |
Thomas Clarke,
1968 | | Vice President | | Since 2011 | | Associate, William Blair & Company, L.L.C. (since 2011); prior thereto, Managing Partner, Singer Partners, LLC (2009-2011); prior thereto, UBS Global Asset Management (Americas) Inc. (2000-2009) | | N/A |
| | | | |
Walter R. Randall, Jr.,
1960 | | Chief Compliance Officer and Assistant Secretary | | Since 2009 | | Associate, William Blair & Company, L.L.C.; Associate Counsel and Chief Compliance Officer, Calamos Investments; Assistant General Counsel, American Century Investments. | | N/A |
| | | | |
Colette M. Garavalia,
1961 | | Treasurer | | Since 2009 | | Associate, William Blair & Company, L.L.C. | | N/A |
| | | | |
| | Secretary | | 2000-2009 | | Associate, William Blair & Company, L.L.C. | | N/A |
70 Annual Report | December 31, 2011 |
| | | | | | | | |
Name and Year of Birth | | Position(s)
Held with
Fund | | Term of
Office and
Length of
Time
Served(1) | | Principal
Occupation(s)
During Past 5 Years(2) | | Other��Directorships Held by Trustee/Officer |
Andrew T. Pfau,
1970 | | Secretary | | Since 2009 | | Associate, William Blair & Company, L.L.C.; Associate, Bell, Boyd & Lloyd, LLP; Associate, Sidley Austin LLP | | N/A |
| | | | |
John M. Raczek,
1970 | | Assistant Treasurer | | Since 2010 | | Associate, William Blair & Company, L.L.C.; Manager, Calamos Investments | | N/A |
| * | | Ms. Seitz and Mr. Smirl are interested persons of the William Blair Funds because each is a principal of William Blair & Company, L.L.C., the Fund’s investment advisor, principal underwriter and distributor. |
| (1) | | Each Trustee serves until the election and qualification of a successor, or until death, resignation or retirement or removal as provided in the Fund’s Declaration of Trust. Retirement for non-interested Trustees occurs no later than at the conclusion of the first regularly scheduled Board meeting of the Fund’s fiscal year that occurs after the earlier of (a) the non-interested Trustee’s 72nd birthday or (b) the 15th anniversary of the date that the non-interested Trustee was first elected or appointed as a member of the Board of Trustees. The Fund’s officers, except the Chief Compliance Officer, are elected annually by the Trustees. The Fund’s Chief Compliance Officer is designated by the Board of Trustees and may only be removed by action of the Board of Trustees, including a majority of the non-interested Trustees. |
| (2) | | In November 2008, all principals of William Blair & Company, L.L.C. also became limited partners in WB Holdings, L.P. |
The Statement of Additional Information for the William Blair Funds includes additional information about the trustees and is available without charge by calling 1-800-635-2886 (in Massachusetts 1-800-635-2840) or by writing the Fund.
December 31, 2011 | William Blair Funds 71 |
(unaudited)
Proxy Voting
A description of the policies and procedures that the Fund uses to determine how to vote proxies relating to portfolio securities and information regarding how the Fund voted proxies relating to portfolio securities for the most recent 12-month period ended December 31 are available without charge, upon request, by calling 1-800-635-2886 (in Massachusetts 1-800-635-2840), at www.williamblairfunds.com and on the SEC’s website at http://www.sec.gov.
Quarterly Portfolio Schedules
Each Portfolio files its complete schedule of portfolio holdings with the SEC for the first and third fiscal quarters of each fiscal year (quarters ended March 31 and September 30) on Form N-Q. The Fund’s Forms N-Q are available on the SEC’s website at http://www.sec.gov and may be reviewed and copied at the SEC’s Public Reference Room in Washington, D.C. Information on the operation of the SEC’s Public Reference Room may be obtained by calling 1-800-SEC-0330. The Fund’s Forms N-Q are also available on the Fund’s website at www.williamblairfunds.com.
Additional Federal Income Tax Information: (unaudited)
Under Section 852(b)(3)(C) of the Code, the Funds hereby designate the following amounts as capital gain dividends for the fiscal year ended December 31, 2011:
| | | | |
Emerging Markets Growth | | Emerging Leaders Growth | | Bond |
$115,030,166 | | $2,732,548 | | $1,831,187 |
The following table provides the percentage of the 2011 year-end distributions that qualify for the dividend received deduction, and the qualified dividend income percentage:
| | | | | | | | |
Portfolio | | Dividend
Received
Deduction% | | | Qualified
Dividend
Income% | |
Institutional International Growth | | | 0.00 | % | | | 80.38 | % |
Institutional International Equity | | | 0.00 | % | | | 100.00 | % |
International Small Cap Growth | | | 0.00 | % | | | 100.00 | % |
Emerging Markets Growth | | | 0.10 | % | | | 100.00 | % |
Emerging Leaders Growth | | | 0.00 | % | | | 100.00 | % |
Bond | | | 0.00 | % | | | 0.00 | % |
Low Duration | | | 0.00 | % | | | 0.00 | % |
In January 2012, you were notified on IRS Form 1099-Div or substitute 1099 DIV as to the Federal tax status of the distributions received by you in the calendar year 2011.
72 Annual Report | December 31, 2011 |
Useful Information About Your Report (unaudited)
Please refer to this information when reviewing the Expense Example for each Portfolio.
Expense Example
As a shareholder of a Portfolio, you incur ongoing costs, including management fees and other Portfolio expenses. The example is intended to help you understand your ongoing costs (in dollars) of investing in the Portfolio and to compare these costs with the ongoing costs of investing in other mutual funds. To do so, compare the Portfolio’s 5% hypothetical example with the 5% hypothetical examples that appear in the shareholder reports of other funds. The example is based on an investment of $1,000 invested at the beginning of the period and held for the entire six-month period from July 1, 2011 to December 31, 2011.
Actual Expenses
In each example, the first line for each share class in the table provides information about the actual account values and actual expenses. These expenses reflect the effect of any expense cap applicable to the share class during the period. Without this expense cap, the costs shown in the table would have been higher. You may use the information in this line, together with the amount you invested, to estimate the expenses that you paid over the period. Simply divide your account value by $1,000 (example, an $8,600 account value divided by $1,000 = 8.6), then multiply the result by the number in the first line under the heading entitled “Expenses Paid During the Period” to estimate the expenses you paid on your account during the period.
Hypothetical Example for Comparison Purposes
In each example, the second line for each share class in the table provides information about hypothetical account values and hypothetical expenses based on the Portfolio’s actual expense ratio and an assumed rate of return of 5% per year before expenses. This is not the Portfolio’s actual return. The hypothetical account values and expenses may not be used to estimate the actual ending account balance or expenses you paid for the period. You may use this information to compare the ongoing costs of investing in the Portfolio to other funds. To do so, compare this 5% hypothetical example with the 5% hypothetical examples that appear in the shareholder reports of other funds.
Please note that the expenses shown in both examples are meant to highlight your ongoing costs only and do not reflect any transactional costs or account type fees. These fees are fully described in the prospectus. Therefore, the second line of each share class in the table is useful in comparing ongoing costs only and will not help you determine the relative costs of owning different funds.
December 31, 2011 | William Blair Funds 73 |
Fund Expenses; (unaudited)
The example below shows you the ongoing costs (in dollars) of investing in your fund and allows you to compare these costs with those of other mutual funds. Please refer to the previous page for a detailed explanation of the information presented in these charts.
| | | | | | | | | | | | | | | | |
Expense Example | | Beginning
Account Value
7/1/2011 | | | Ending
Account Value
7/31/2011 | | | Expenses Paid
during the
Period(a) | | | Annualized
Expense Ratio | |
Institutional International Growth Fund | | | | | | | | | | | | | | | | |
Institutional Class—actual return | | $ | 1,000.00 | | | $ | 845.10 | | | $ | 4.65 | | | | 1.00 | % |
Institutional Class—hypothetical 5% return | | | 1,000.00 | | | | 1,020.16 | | | | 5.09 | | | | 1.00 | |
Institutional International Equity Fund | | | | | | | | | | | | | | | | |
Class I—actual return | | | 1,000.00 | | | | 848.10 | | | | 5.31 | | | | 1.14 | |
Institutional Class—hypothetical 5% return | | | 1,000.00 | | | | 1,019.46 | | | | 5.80 | | | | 1.14 | |
International Small Cap Growth Fund | | | | | | | | | | | | | | | | |
Institutional Class—actual return | | | 1,000.00 | | | | 835.40 | | | | 5.04 | | | | 1.09 | |
Institutional Class— hypothetical 5% return | | | 1,000.00 | | | | 1,019.71 | | | | 5.55 | | | | 1.09 | |
Emerging Markets Growth Fund | | | | | | | | | | | | | | | | |
Institutional Class—actual return | | | 1,000.00 | | | | 835.50 | | | | 5.55 | | | | 1.20 | |
Institutional Class—hypothetical 5% return | | | 1,000.00 | | | | 1,019.16 | | | | 6.11 | | | | 1.20 | |
Emerging Leaders Growth Fund | | | | | | | | | | | | | | | | |
Institutional Class—actual return | | | 1,000.00 | | | | 826.20 | | | | 5.75 | | | | 1.25 | |
Institutional Class—hypothetical 5% return | | | 1,000.00 | | | | 1,018.90 | | | | 6.36 | | | | 1.25 | |
Bond Fund | | | | | | | | | | | | | | | | |
Institutional Class—actual return | | | 1,000.00 | | | | 1,045.70 | | | | 1.80 | | | | 0.35 | |
Institutional Class—hypothetical 5% return | | | 1,000.00 | | | | 1,023.44 | | | | 1.79 | | | | 0.35 | |
Low Duration Fund | | | | | | | | | | | | | | | | |
Institutional Class—actual return | | | 1,000.00 | | | | 1,007.40 | | | | 2.02 | | | | 0.40 | |
Institutional Class—hypothetical 5% return | | | 1,000.00 | | | | 1,023.19 | | | | 2.04 | | | | 0.40 | |
| (a) | | Expenses are equal to the annualized expense ratio, multiplied by the average account value over the period, multiplied by the number of days in the period 184, and divided by 365 (to reflect the one-half year period). |
74 Annual Report | December 31, 2011 |
BOARD OF TRUSTEES
Ann P. McDermott
Director and Trustee
Profit and not-for-profit organizations
Phillip O. Peterson
Retired Partner, KPMG LLP
Lisa A. Pollina
Senior Advisor to RBC Financial Group-International Banking and Insurance Division.
Donald J. Reaves
Chancellor, Winston-Salem State University
Donald L. Seeley
Retired Adjunct Lecturer and Director, University of Arizona Department of Finance
Michelle R. Seitz, Chairperson and President
Principal, William Blair & Company, L.L.C.
Thomas J. Skelly
Retired Managing Partner, Accenture U.S.
Richard W. Smirl, Senior Vice President
Principal, William Blair & Company, L.L.C.
Officers
Michael P. Balkin, Senior Vice President
Karl W. Brewer, Senior Vice President
David C. Fording, Senior Vice President
James S. Golan, Senior Vice President
W. George Greig, Senior Vice President
Michael A. Jancosek, Senior Vice President
John F. Jostrand, Senior Vice President
Chad M. Kilmer, Senior Vice President
Robert C. Lanphier, IV, Senior Vice President
Mark T. Leslie, Senior Vice President
Matthew A. Litfin, Senior Vice President
Kenneth J. McAtamney, Senior Vice President
Todd M. McClone, Senior Vice President
David Merjan, Senior Vice President
David S. Mitchell, Senior Vice President
David P. Ricci, Senior Vice President
Jeffrey A. Urbina, Senior Vice President
Christopher T. Vincent, Senior Vice President
Kathleen M. Lynch, Vice President
Paul J. Sularz, Vice President
David F. Hone, Vice President
John Abunassar, Vice President
Peter Carl, Vice President
D. Trowbridge Elliman III, Vice President
Christopher Walvoord, Vice President
Brian Ziv, Vice President
Brian D. Singer, Vice President
Edwin Denson, Vice President
Thomas Clarke, Vice President
Walter R. Randall, Jr., Chief Compliance Officer an Assistant Secretary
Colette M. Garavalia, Treasurer
Andrew T. Pfau, Secretary
John Raczek, Assistant Treasurer
Investment Advisor
William Blair & Company, L.L.C.
Independent Registered Public Accounting Firm
Ernst & Young LLP
Legal Counsel
Vedder Price P.C.
Transfer Agent
Boston Financial Data Services, Inc.
P.O. Box 8506
Boston, MA 02266-8506
For customer assistance, call 1-800-635-2886
(Massachusetts 1-800-635-2840)
December 31, 2011 | William Blair Funds 75 |
| | |
INTERNATIONAL EQUITY | | FIXED-INCOME |
Institutional International Growth Fund | | Bond Fund - Institutional Class Shares |
Institutional International Equity Fund | | Low Duration Fund - Institutional Class Shares |
International Small Cap Growth Fund - Institutional Class Shares | | |
Emerging Markets Growth Fund - Institutional Class Shares | | |
Emerging Leaders Growth Fund - Institutional Class Shares | | |

222 West Adams Street
Chicago, IL 60606
800.742.7272 Ÿ www.williamblairfunds.com
©William Blair & Company, L.L.C., distributor
As of the end of the period covered by this Form N-CSR, the Registrant has adopted a code of ethics that applies to its principal executive officer and principal financial officer. Such code of ethics is posted on the Registrant’s website: www.williamblairfunds.com. There were no amendments to or waivers of the code of ethics during the period covered by this report.
| Item 3. | Audit Committee Financial Expert |
The Registrant’s Board of Trustees has determined that the Registrant has at least one “audit committee financial expert” (as defined in Item 3 of Form N-CSR) serving on its Audit Committee. Mr. Phillip O. Peterson, the Registrant’s audit committee financial expert, is “independent” for purposes of Item 3 to Form N-CSR.
An “audit committee financial expert” is not an “expert” for any purpose, including for purposes of Section 11 of the Securities Act of 1933, as a result of being designated as an “audit committee financial expert.” Further, the designation of a person as an “audit committee financial expert” does not mean that the person has any greater duties, obligations, or liability than those imposed on the person without the “audit committee financial expert” designation. Similarly, the designation of a person as an “audit committee financial expert” does not affect the duties, obligations, or liability of any other member of the audit committee or Board of Trustees.
| Item 4. | Principal Accountant Fees and Services |
Audit Fees
For the fiscal years ended December 31, 2010 and 2011, Ernst & Young, LLP, the Registrant’s principal accountant (“E&Y”), billed the Registrant $501,000 and $559,500, respectively, for professional services rendered for the audit of the Registrant’s annual financial statements or services that are normally provided in connection with statutory and regulatory filings.
Audit-Related Fees
For the fiscal years ended December 31, 2010 and 2011, E&Y billed the Registrant $3,000 and $8,000, respectively, for assurance and related services that are reasonably related to the performance of the audit of the Registrant’s financial statements and that are not reported above, such as reviewing prospectuses and SEC filings. For the fiscal years ended December 31, 2010 and 2011, E&Y provided no audit-related services to William Blair & Company L.L.C., the Registrant’s investment advisor (“William Blair”) or any of its control affiliates that were for engagements directly related to the Registrant’s operations and financial reporting.
Tax Fees
For the fiscal years ended December 31, 2010 and 2011, E&Y billed the Registrant $117,850 and $138,500, respectively, for professional services rendered for tax compliance, tax advice and tax planning. Such services consisted of preparation of tax returns, year-end distribution review, qualifying dividend income analysis and computation of foreign tax credit pass-through. For the fiscal years ended December 31, 2010 and 2011, E&Y did not bill William Blair and its control affiliates for any services that were for engagements directly related to the Registrant’s operations and financial reporting.
All Other Fees
For the fiscal years ended December 31, 2010 and 2011, E&Y did not bill the Registrant for products and services other than the services reported above. For the fiscal years ended December 31, 2010 and 2011, E&Y provided no other services to William Blair or any of its control affiliates that were for engagements directly related to the Registrant’s operations and financial reporting.
Audit Committee Pre-Approval Policies and Procedures
Pursuant to Registrant’s Audit Committee Charter (the “Charter”), the Audit Committee is responsible for pre-approving any engagement of the principal accountant to provide non-prohibited services to the Registrant, including the fees and other compensation to be paid to the principal accountant, to the extent required by Rule 2-01(c)(7) of Regulation S-X. Pursuant to the Charter, the Audit Committee is also responsible for pre-approving any engagement of the principal accountant, including the fees and other compensation to be paid to the principal accountant, to provide non-audit services to the Registrant’s investment advisor (or any entity controlling, controlled by, or under common control with the adviser that provides ongoing services to the Registrant), if the engagement relates directly to the operations and financial reporting of the Registrant, to the extent required by Rule 2-01(c)(7) of Regulation S-X. The Chair of the Audit Committee may grant the pre-approval referenced above for non-prohibited and non-audit services. All such delegated pre-approvals will be presented to the Audit Committee no later than the next Audit Committee meeting.
Non-Audit Fees
For the fiscal years ended December 31, 2010 and 2011, E&Y billed the Registrant $117,850 and $138,500, respectively, in non-audit fees (tax services). For the same periods, E&Y billed William Blair and its control affiliates $97,000 and $119,000 (Custodian SAS 70 Report), respectively, in non-audit fees. The Registrant’s Audit Committee has considered whether the provision of non-audit services that were rendered to William Blair or any of its control affiliates that were not pre-approved pursuant to Rule 2-01(c)(7)(ii) of Regulation S-X is compatible with maintaining E&Y’s independence.
| Item 5. | Audit Committee of Listed Registrants |
Not Applicable to this Registrant, insofar as the Registrant is not a listed company.
| Item 6. | Schedule of Investments |
See Schedule of Investments in Item 1
| Item 7. | Disclosure of Proxy Voting Policies and Procedures for Closed-End Management Investment Companies |
Not applicable to this Registrant, insofar as the Registrant is not a closed-end management investment company.
| Item 8. | Portfolio Managers of Closed Investment Companies |
Not applicable to this Registrant, insofar as the Registrant is not a closed-end management investment company.
| Item 9. | Purchase of Equity Securities by Closed-End Management Investment Companies and Affiliated Purchasers |
Not applicable to this Registrant, insofar as the Registrant is not a closed-end management investment company.
| Item 10. | Submission of Matters to a Vote of Security Holders |
There have been no material changes to the procedures by which shareholders may recommend nominees to the Registrant’s Board of Trustees since the Registrant last provided disclosure in response to this item.
Controls and Procedures
(a) The Registrant’s principal executive and principal financial officer, or persons performing similar functions, have concluded that the Registrant’s Disclosure Controls and Procedures (as defined in Rule 30a-3(c) under the Investment Company Act of 1940, as amended (the “1940 Act”) (17 CFR 270.30a-3(c)) are effective, as of a date within 90 days of the filing date of this report that includes the disclosure required by this paragraph, based on their evaluation of these controls and procedures required by Rule 30a-3 (b) under the 1940 Act (17 CFR 270.30a-3(b) and Rules 13a-15(b) or 15d-15(b) under the Exchange Act (17 CFR 240.13a-15(b) or 240.15d-15(b)).
(b) There were no changes in the Registrant’s internal control over financial reporting (as defined in Rule 30a-3(d) under the 1940 Act (17 CFR 270.30a-3(d)) that occurred during the final quarter of the period covered by this report that has materially affected, or is reasonably likely to materially affect, the Registrant’s internal control over financial reporting.
12. (a) (1) Code of Ethics
Not applicable because it is posted on Registrant’s website.
12. (a) (2) (1)
Certification of Principal Executive Officer Required by Rule 30a-2(a) of the Investment Company Act
12. (a) (2) (2)
Certification of Principal Financial Officer Required by Rule 30a-2(a) of the Investment Company Act.
12. (a) (3)
Not applicable to this Registrant.
12. (b)
Certification of Chief Executive Officer and Certification of Chief Financial Officer Required by Rule 30a-2(b) of the Investment Company Act
Signatures
Pursuant to the requirements of the Securities Exchange Act of 1934 and the Investment Company Act of 1940, the Registrant has duly caused this report to be signed on its behalf by the undersigned, thereunto duly authorized.
| | |
| | | William Blair Funds |
| |
| | | /s/ Michelle R. Seitz |
| By: | | Michelle R. Seitz |
| | | President (Chief Executive Officer) |
Date: February 23, 2012
Pursuant to the requirements of the Securities Exchange Act of 1934 and the Investment Company Act of 1940, this report has been signed below by the following persons on behalf of the Registrant and in the capacities and on the dates indicated
| | |
| By: | | Michelle R. Seitz |
| | | President (Chief Executive Officer) |
Date: February 23, 2012
| | |
| By: | | Colette M. Garavalia |
| | | Treasurer (Chief Financial Officer) |
Date: February 23, 2012