UNITED STATES
SECURITIES AND EXCHANGE COMMISSION
Washington, D.C. 20549
FORM N-CSR
CERTIFIED SHAREHOLDER REPORT OF REGISTERED
MANAGEMENT INVESTMENT COMPANIES
Investment Company Act file number 811-05349
Goldman Sachs Trust
(Exact name of registrant as specified in charter)
71 South Wacker Drive, Chicago, Illinois 60606
(Address of principal executive offices) (Zip code)
| | |
| Caroline Kraus, Esq. | | Copies to: |
| Goldman, Sachs & Co. | | Geoffrey R.T. Kenyon, Esq. |
| 200 West Street | | Dechert LLP |
| New York, New York 10282 | | 100 Oliver Street |
| | 40th Floor |
| | Boston, MA 02110-2605 |
(Name and address of agents for service)
Registrant’s telephone number, including area code: (312) 655-4400
Date of fiscal year end: August 31
Date of reporting period: February 28, 2014
| ITEM 1. | REPORTS TO STOCKHOLDERS. |
| | The Semi-Annual Report to Stockholders is filed herewith. |
Goldman Sachs Funds

| | | | |
| | |
| Semi-Annual Report | | | | February 28, 2014 |
| | |
| | | | Fundamental Equity Growth Funds |
| | | | Capital Growth |
| | | | Concentrated Growth |
| | | | Flexible Cap Growth |
| | | | Focused Growth |
| | | | Growth Opportunities |
| | | | Small/Mid Cap Growth |
| | | | Strategic Growth |
| | | | Technology Tollkeeper |
| | | | U.S. Equity |

Goldman Sachs Fundamental Equity Growth Funds
| | | | |
TABLE OF CONTENTS | | | | |
| |
Principal Investment Strategies and Risks | | | 1 | |
| |
Investment Process | | | 3 | |
| |
Market Review | | | 4 | |
| |
Portfolio Management Discussions and Performance Summaries | | | 6 | |
| |
Schedules of Investments | | | 60 | |
| |
Financial Statements | | | 82 | |
| |
Financial Highlights | | | 92 | |
| |
Notes to Financial Statements | | | 110 | |
| |
Other Information | | | 131 | |
| | | | |
| | | |
| NOT FDIC-INSURED | | May Lose Value | | No Bank Guarantee |
GOLDMAN SACHS FUNDAMENTAL EQUITY GROWTH FUNDS
Principal Investment Strategies and Risks
This is not a complete list of risks that may affect the Funds. For additional information concerning the risks applicable to the Funds, please see the Funds’ Prospectuses.
The Goldman Sachs Capital Growth Fund invests primarily in U.S. equity investments. The Fund’s equity investments are subject to market risk, which means that the value of the securities in which it invests may go up or down in response to the prospects of individual companies, particular sectors and/or general economic conditions. Different investment styles (e.g., “growth”) tend to shift in and out of favor, and at times the Fund may underperform other funds that invest in similar asset classes.
The Goldman Sachs Concentrated Growth Fund invests primarily in U.S. equity investments and invests, under normal circumstances, in approximately 30-40 companies. The Fund’s equity investments are subject to market risk, which means that the value of the securities in which it invests may go up or down in response to the prospects of individual companies, particular sectors and/or general economic conditions. The securities of mid- and small-capitalization companies involve greater risks than those associated with larger, more established companies and may be subject to more abrupt or erratic price movements. Different investment styles (e.g., “growth”) tend to shift in and out of favor, and at times the Fund may underperform other funds that invest in similar asset classes. The Fund is “non-diversified” and may invest more of its assets in fewer issuers than “diversified” funds. Accordingly, the Fund may be more susceptible to adverse developments affecting any single issuer held in its portfolio and to greater losses resulting from these developments.
The Goldman Sachs Flexible Cap Growth Fund invests primarily in U.S. equity investments in small-, mid- and large-capitalization issuers. The Fund’s equity investments are subject to market risk, which means that the value of the securities in which it invests may go up or down in response to the prospects of individual companies, particular sectors and/or general economic conditions. The securities of mid- and small-capitalization companies involve greater risks than those associated with larger, more established companies and may be subject to more abrupt or erratic price movements. Different investment styles (e.g., “growth”) tend to shift in and out of favor, and at times the Fund may underperform other funds that invest in similar asset classes.
The Goldman Sachs Focused Growth Fund invests primarily in U.S. equity investments and invests, under normal circumstances, in approximately 20-25 companies. The Fund’s equity investments are subject to market risk, which means that the value of the securities in which it invests may go up or down in response to the prospects of individual companies, particular industry sectors and/or general economic conditions. The securities of mid- and small-capitalization companies involve greater risks than those associated with larger, more established companies and may be subject to more abrupt or erratic price movements. Different investment styles (e.g., “growth”) tend to shift in and out of favor, and at times the Fund may underperform other funds that invest in similar asset classes. The Fund is “non-diversified” and may invest more of its assets in fewer issuers than “diversified” funds. Accordingly, the Fund may be more susceptible to adverse developments affecting any single issuer held in its portfolio and to greater losses resulting from these developments.
The Goldman Sachs Growth Opportunities Fund invests primarily in U.S. equity investments with a primary focus on mid-capitalization companies. The Fund’s equity investments are subject to market risk, which means that the value of the securities in which it invests may go up or down in response to the prospects of individual companies, particular sectors and/or general economic conditions. The securities of mid- and small-capitalization companies involve greater risks than those associated with larger, more established companies and may be subject to more abrupt or erratic price movements. Different investment styles (e.g., “growth”) tend to shift in and out of favor, and at times the Fund may underperform other funds that invest in similar asset classes.
1
GOLDMAN SACHS FUNDAMENTAL EQUITY GROWTH FUNDS
The Goldman Sachs Small/Mid Cap Growth Fund invests primarily in equity investments with a primary focus on mid- and small-capitalization companies. The Fund’s equity investments are subject to market risk, which means that the value of the securities in which it invests may go up or down in response to the prospects of individual companies, particular sectors and/or general economic conditions. The securities of mid- and small-capitalization companies involve greater risks than those associated with larger, more established companies and may be subject to more abrupt or erratic price movements. Different investment styles (e.g., “growth”) tend to shift in and out of favor, and at times the Fund may underperform other funds that invest in similar asset classes.
The Goldman Sachs Strategic Growth Fund invests primarily in U.S. equity investments. The Fund’s equity investments are subject to market risk, which means that the value of the securities in which it invests may go up or down in response to the prospects of individual companies, particular sectors and/or general economic conditions. Different investment styles (e.g., “growth”) tend to shift in and out of favor, and at times the Fund may underperform other funds that invest in similar asset classes.
The Goldman Sachs Technology Tollkeeper FundSM invests primarily in equity securities of high quality technology, media or service companies that adopt or use technology to improve their cost structure, revenue opportunities or competitive advantage (“Technology Tollkeeper” companies). Because the Fund concentrates its investments in certain specific industries, the Fund is subject to greater risk of loss as a result of adverse economic, business or other developments affecting those industries than if its investments were more diversified across different industries. Stock prices of internet and internet-related companies in particular may be especially volatile. The securities of mid- and small-capitalization companies involve greater risks than those associated with larger, more established companies and may be subject to more abrupt or erratic price movements. Different investment styles (e.g., “growth”) tend to shift in and out of favor, and at times the Fund may underperform other funds that invest in similar asset classes.
The Goldman Sachs U.S. Equity Fund invests primarily in large-capitalization U.S. equity investments. The Fund’s equity investments are subject to market risk, which means that the value of the securities in which it invests may go up or down in response to the prospects of individual companies, particular sectors and/or general economic conditions. Different investment styles (e.g., “growth” and “value”) tend to shift in and out of favor, and at times the Fund may underperform other funds that invest in similar asset classes.
2
GOLDMAN SACHS FUNDAMENTAL EQUITY GROWTH FUNDS
What Differentiates the Goldman Sachs Growth Team’s Investment Process?
For over 30 years, the Goldman Sachs Growth Team has consistently applied a three-step investment process based on our belief that wealth is created through the long-term ownership of growing businesses.


| n | | Make decisions as long-term business owners rather than as stock traders |
| n | | Perform in-depth, fundamental research |
| n | | Focus on long-term structural and competitive advantages |
Result
Performance driven by the compounding growth of businesses over time — not short-term market movements
Long-term participation in growing businesses — less reliance on macroeconomic predictions, market timing, sector rotation or momentum

Identify high quality growth businesses. Some required investment criteria include:
| n | | Established brand names |
| n | | Recurring revenue streams |
| n | | Long product life cycles |
| n | | Favorable long-term growth prospects |
Result
Investments in businesses that we believe are strategically positioned for consistent, sustainable long-term growth

| n | | Perform rigorous valuation analysis of every potential investment |
| n | | Use valuation tools and analytics to ensure that the high-quality business franchises we have identified also represent sound investments |
Result
Good investment decisions based on solid understanding of what each business is worth
Attractive buying opportunities as the stock prices of quality growth businesses fluctuate over time
3
MARKET REVIEW
Goldman Sachs Fundamental Equity Growth Funds
Market Review
Overall, U.S. equities advanced for the six months ended February 28, 2014 (the “Reporting Period”) with broad sector participation. The Standard & Poor’s 500® Index (the “S&P 500® Index”) ended the Reporting Period with a gain of 15.07%, and the Russell 3000® Index generated a return of 15.83%.
The U.S. equity market enjoyed four consecutive months of gains from September through December 2013. The S&P 500® Index made record highs in December 2013, as the U.S. Federal Reserve (the “Fed”) ended seven months of speculation and announced it would finally begin tapering its asset purchases, signaling confidence in the U.S. economy. Days later, the U.S. revised upward its Gross Domestic Product (“GDP”) growth estimate for the third quarter of 2013 to an annualized pace of 4.1%, the fastest rate in two years. Importantly, stronger consumption accounted for most of the upward revision.
U.S. equities, along with global developed market equities broadly, stumbled in January 2014 on renewed concerns about a variety of issues in the growth and emerging markets, including lower manufacturing activity in China. However, developed market equities, including those of the U.S., snapped back in February 2014. Indeed, the S&P 500® Index made a fresh high in February 2014, as merger and acquisition activity picked up and corporate earnings announcements reflected top-line growth, even though overall management guidance for 2014 was less optimistic than the consensus view. Underlying economic activity during February 2014 was not as strong as it had been at the end of 2013, with disappointing payroll and retail sales reports, though it was unclear how much severe winter weather across most of the U.S. was to blame. Furthermore, a downward revision of fourth quarter 2013 GDP to an annualized rate of 2.4% from 3.2% indicated the consumer was resilient but not quite as strong as previously thought.
For the Reporting Period overall, small-cap companies performed best with mid-cap companies close behind. While generating solid double-digit positive returns, large-cap stocks followed at some distance. Growth stocks outpaced value stocks across the capitalization spectrum. (All as measured by Russell Investments indices.) Within the S&P 500® Index, all ten sectors made gains during the Reporting Period. The health care, industrials, information technology and materials sectors led returns, driven by improving earnings growth. Telecommunication services eked out a positive return but significantly underperformed the broader market.
4
MARKET REVIEW
Looking Ahead
While equity markets have rallied substantially since March 2009, underlying economic growth has actually been slow and uneven. The global macroeconomic challenges and uncertainties in recent years dampened the confidence and sentiment of investors and company managements alike. We believe increased merger and acquisition activity seen during the Reporting Period is a sign that mindsets are now changing as economic growth improves. Looking forward, then, we expect more companies to be rewarded for increasing capital expenditures, research and development spending, merger and acquisition activity and hiring, rather than for keeping excessive cash on balance sheets and paying dividends.
We expect the anticipated acceleration in economic growth to drive strong corporate earnings growth, particularly in the developed markets. With most developed markets trading near historical average valuations at the end of the Reporting Period, we believe earnings growth will likely be the main driver of equity performance going forward. In the U.S., we are looking for an increase in revenues to drive further earnings growth. As such, not all areas of the market are likely to participate to the same extent. At the end of the Reporting Period, we favored many innovative industries in the information technology, health care and industrials sectors and had select exposure in financials. Should we indeed move into a phase of economic growth, we are more cautious on areas of the market related to the previous economic environment, such as commodity-related industries and yield-oriented sectors. Already, average stock and sector correlations were notably lower at the end of the Reporting Period than in recent years, which, in our view, increases opportunities for active managers.
The greatest risk to our view comes from anything that negatively impacts confidence and sentiment and that hinders growth momentum. For example, we believe a pause in reforms of the Japanese economy or in the European banking system or a return to partisan gridlock in the U.S. government might impact our view. While we believe that central banks tightening too quickly would be a negative for the equity markets as well, a modest increase in interest rates is consistent with improving economic growth and would not be a risk to our view.
We intend to use our forward-looking, active management approach to investing as we seek to appropriately position the Fundamental Equity Growth Funds for what we believe to be a new growth-oriented environment. As always, we continue to focus on building quality portfolios through intense bottom-up research and believe such a disciplined strategy will help us position the Fundamental Equity Growth Funds effectively in these still uncertain times.
5
PORTFOLIO RESULTS
Goldman Sachs Capital Growth Fund
Portfolio Composition
The Fund invests primarily in U.S. equity investments. Since the Fund’s inception, the Goldman Sachs Growth Equity Investment Team has focused on several key investment criteria that it believes can drive a company’s growth over the long term. These characteristics are: dominant market share, established brand name, pricing power, recurring revenue stream, free cash flow, high returns on invested capital, predictable growth, sustainable growth, long product life cycle, enduring competitive advantage, favorable demographic trends and excellent management. The Team strives to purchase these companies at reasonable valuations in order to capture the full benefits of their growth.
Portfolio Management Discussion and Analysis
Below, the Goldman Sachs Growth Equity Investment Team discusses the Goldman Sachs Capital Growth Fund’s (the “Fund”) performance and positioning for the six-month period ended February 28, 2014 (the “Reporting Period”).
| Q | | How did the Fund perform during the Reporting Period? |
| A | | During the Reporting Period, the Fund’s Class A, B, C, Institutional, Service, IR and R Shares generated cumulative total returns, without sales charges, of 18.10%, 17.64%, 17.67%, 18.34%, 18.06%, 18.26% and 17.93%, respectively. These returns compare to the 17.84% cumulative total return of the Fund’s benchmark, the Russell 1000® Growth Index (with dividends reinvested) (the “Russell Index”), during the same period. |
| Q | | What key factors were responsible for the Fund’s performance during the Reporting Period? |
| A | | Stock selection overall contributed most to the Fund’s performance relative to the Russell Index during the Reporting Period. |
| Q | | Which equity market sectors most significantly affected Fund performance? |
| A | | Effective stock selection in the consumer staples, telecommunication services and financials sectors helped the Fund’s performance most relative to the Russell Index. Detracting from the Fund’s relative results most was weak stock selection in the health care, materials and consumer discretionary sectors. |
| Q | | What were some of the Fund’s best-performing individual stocks? |
| A | | The Fund benefited most relative to the Russell Index from positions in specialty coffee and coffeemakers company Green Mountain Coffee Roasters, biotechnology company Regeneron Pharmaceuticals and premium spirits company Beam. |
| | | Shares of Green Mountain Coffee Roasters, a new purchase for the Fund during the Reporting Period, gained after the announcement that Coca-Cola would purchase a 10% stake in the company, while additionally entering into a 10-year agreement to explore producing Coca-Cola products for use with its Keurig Cold beverage system. The company also benefited from recent exposure to Starbucks, Dunkin Donuts, Folgers and Costco brands along with a new sustainable business structure that segments U.S. and Canada operations. With positive free cash flows and strong earnings quality, we believe the company has a solid long-term growth opportunity, competitive margins, improving return on invested capital and a credible management team and board. (As of March 10, 2014, Green Mountain Coffee Roasters changed its company name to Keurig Green Mountain.) |
| | | Regeneron Pharmaceuticals was a top contributor to the Fund’s relative performance during the Reporting Period. Its shares gained as its flagship treatment, Eylea, continued to be well received by the market. At the end of the Reporting Period, we maintained our conviction in the company and believed that in addition to Eylea, designed to treat macular degeneration, the company has a strong product pipeline for the treatment of high cholesterol and asthma. The company’s cholesterol drug in particular has received positive feedback in trials, and the responses from cardiologists suggest there is |
6
PORTFOLIO RESULTS
| | a large addressable market for the drug. We believed its valuation at the end of the Reporting Period presented a compelling risk/reward opportunity. |
| | | Shares of Beam gained as a leading Japanese whiskey company, Suntory Holdings, announced it had reached an agreement to purchase Beam. The deal is expected to close in the second quarter of 2014 pending approval. It is always encouraging when the value of one of the Fund’s holdings is recognized by a strategic player within the industry, and our investment thesis plays out through an acquisition. We believe Beam is a high quality growth business given it is operating in a fragmented industry with improving secular tailwinds, high barriers to entry, attractive margins and returns on invested capital. Therefore, we were not surprised Beam became an acquisition target. |
| Q | | Which stocks detracted significantly from the Fund’s performance during the Reporting Period? |
| A | | Detracting most from the Fund’s results relative to its benchmark index were positions in fashion retailer L Brands, global clothing manufacturer PVH and natural resources and production company Anadarko Petroleum. |
| | | L Brands, with subsidiaries that include Victoria’s Secret and Bath & Body Works, was a top detractor from the Fund’s performance. Its shares moved sharply lower after reporting same-store sales growth that was below consensus expectations in both November and December 2013. Despite such weakness, we were encouraged by the strength of L Brands’ U.S. business, and we believe many of the company’s brands resonate globally, leading us to a positive view on the company’s international business. At the end of the Reporting Period, we maintained our conviction in the stock, based on our belief that future growth may be driven by its continued growth in U.S. square footage, product expansion into natural adjacencies and international expansion. In February 2014, L Brands announced a special dividend of $1.00 and also raised its dividend by approximately 13%, sending its shares sharply higher. |
| | | Shares of PVH declined as the company provided softer than expected earnings guidance for 2013 and 2014 given management’s cautious views on the global economy and global apparel sales, a headwind experienced by many retailers at the end of 2013. As a result, there were concerns that retail inventory levels were high, which may lead retailers to delay orders for PVH’s clothing. We believe this dynamic is transient in nature and is an industry-wide issue as opposed to specific to PVH. In addition, unexpected expenses related to its Warnaco Group acquisition, which closed earlier in 2013, were a key factor in its guidance. At the end of the Reporting Period, we believed PVH remained one of the best positioned names in the industry, given we expect it to reap benefits from its Warnaco Group acquisition and to benefit from its disproportionately large exposure to a recovery in Europe. In addition, we believe that should PVH’s higher margin brands, like Tommy Hilfiger and Calvin Klein, grow faster than PVH’s heritage business, as we anticipate, the company’s operating profit growth may accelerate meaningfully. |
| | | Anadarko Petroleum detracted from the Fund’s relative returns during the Reporting Period. Its shares declined following weak third quarter 2013 earnings and on a December 2013 ruling holding Anadarko Petroleum responsible for environmental and health claims related to Tronox, a chemical company subsidiary spun off by the company in 2005. We believe this setback is temporary, and our long-term investment thesis on the company remains unchanged. At the end of the Reporting Period, we believed Anadarko Petroleum was well positioned given its proven reserves, quality of asset portfolio and significant development opportunities. |
| Q | | How did the Fund use derivatives and similar instruments during the Reporting Period? |
| A | | During the Reporting Period, we did not use derivatives as part of an active management strategy. |
7
PORTFOLIO RESULTS
| Q | | Did the Fund make any significant purchases or sales during the Reporting Period? |
| A | | We initiated a Fund position in leading home improvement retailer Home Depot. While Home Depot is a mature retailer, we believe it has strong cash returns and is well positioned in an attractive home improvement segment that is still in the early stages of a recovery. The company is improving in-store efficiencies with information technology, shedding non-core business and reinvesting in its supply chain and service, which should enhance profitability and return on capital, in our opinion. We believe Home Depot has a solid earnings and free cash flow growth profile over the next few years and was trading, at the time of purchase, at an attractive valuation. |
| | | We established a Fund position in Comcast, a company focused on mass media, entertainment and communications. We were attracted to Comcast for several reasons. First, we believed its valuation at the time of purchase was attractive relative to its peers and traditional media. Second, Comcast has a cable asset that, in our view, should allow the company both to perform better than its peers and to benefit from strong cyclical and secular themes supporting the cable industry. Finally, we see potential upside through Comcast increasing its balance sheet leverage to repurchase shares or to potentially make a strategic acquisition. |
| | | Conversely, we exited the Fund’s position in electronic payment company MasterCard during the Reporting Period. The stock performed well in 2013, and, in our view, was subsequently valued at a premium based on relatively high forward expectations. We also believe consensus estimates did not account for any adverse regulatory changes that could occur in an electronic payments industry that is rapidly changing. Therefore, we decided to reallocate capital into what we considered to be more attractive risk/reward opportunities. |
| | | We sold the Fund’s position in industrial gas supplier Praxair. We decided to reallocate capital into Airgas, a company with a similar growth profile to Praxair but whose stock was trading at a more compelling valuation, in our view. |
| Q | | Were there any notable changes in the Fund’s weightings during the Reporting Period? |
| A | | In constructing the Fund’s portfolio, we focus on picking stocks rather than on making industry or sector bets. We seek to outpace the benchmark index by overweighting stocks that we expect to outperform and underweighting those that we think may lag. Consequently, changes in its sector weights are generally the direct result of individual stock selection or of stock appreciation or depreciation. That said, during the Reporting Period, the Fund’s exposure to consumer discretionary and materials increased and its allocations to health care, industrials and telecommunication services decreased relative to the Russell Index. |
| Q | | How was the Fund positioned relative to its benchmark index at the end of February 2014? |
| A | | At the end of February 2014, the Fund had overweighted positions relative to the Russell Index in the consumer discretionary and financials sectors. On the same date, the Fund had underweighted positions compared to the Russell Index in industrials, telecommunication services and consumer staples. The Fund was rather neutrally weighted to the Russell Index in materials, information technology, energy and health care and had no position at all in utilities on February 28, 2014. |
| Q | | Were any changes to the Fund’s portfolio management team during the Reporting Period? |
| A | | There were no changes to the Fund’s portfolio management team during the Reporting Period. |
8
FUND BASICS
Capital Growth Fund
as of February 28, 2014
| | | | | | | | | | |
| | PERFORMANCE REVIEW | |
| | | September 1, 2013–February 28, 2014 | | Fund Total Return
(based on NAV)1 | | | Russell 1000®
Growth Index2 | |
| | Class A | | | 18.10 | % | | | 17.84 | % |
| | Class B | | | 17.64 | | | | 17.84 | |
| | Class C | | | 17.67 | | | | 17.84 | |
| | Institutional | | | 18.34 | | | | 17.84 | |
| | Service | | | 18.06 | | | | 17.84 | |
| | Class IR | | | 18.26 | | | | 17.84 | |
| | | Class R | | | 17.93 | | | | 17.84 | |
| | 1 | | The net asset value (“NAV”) represents the net assets of the class of the Fund (ex-dividend) divided by the total number of shares of the class outstanding. The Fund’s performance reflects the reinvestment of dividends and other distributions. The Fund’s performance does not reflect the deduction of any applicable sales charges. |
| | 2 | | The Russell 1000® Growth Index (with dividends reinvested) is an unmanaged index that measures the performance of those Russell 1000 companies with higher price-to-book ratios and higher forecasted growth values. The Index figures do not reflect any deduction for fees, expenses or taxes. It is not possible to invest directly in an index. |
| | | | | | | | | | | | | | |
| | STANDARDIZED TOTAL RETURNS3 |
| | | For the period ended 12/31/13 | | One Year | | | Five Years | | Ten Years | | Since Inception | | Inception Date |
| | Class A | | | 24.41 | % | | 19.00% | | 6.06% | | 9.16% | | 4/20/90 |
| | Class B | | | 24.18 | | | 19.21 | | 6.01 | | 7.13 | | 5/01/96 |
| | Class C | | | 29.36 | | | 19.46 | | 5.87 | | 5.02 | | 8/15/97 |
| | Institutional | | | 32.19 | | | 20.84 | | 7.09 | | 6.21 | | 8/15/97 |
| | Service | | | 31.51 | | | 20.24 | | 6.56 | | 5.69 | | 8/15/97 |
| | Class IR | | | 31.98 | | | 20.67 | | N/A | | 6.60 | | 11/30/07 |
| | | Class R | | | 31.30 | | | 20.05 | | N/A | | 6.08 | | 11/30/07 |
| | 3 | | The Standardized Total Returns are average annual total returns as of the most recent calendar quarter-end. They assume reinvestment of all distributions at NAV. These returns reflect a maximum initial sales charge of 5.5% for Class A Shares and the assumed contingent deferred sales charge for Class B Shares (5% maximum declining to 0% after six years) and the assumed contingent deferred sales charge for Class C Shares (1% if redeemed within 12 months of purchase). Class B Shares convert to Class A Shares on or about the fifteenth day of the last month of the calendar year that is eight years after purchase. Returns for Class B Shares for the period after the conversion reflect the performance of Class A Shares. Because Institutional, Service, Class IR and Class R Shares do not involve a sales charge, such a charge is not applied to their Standardized Total Returns. The Fund’s Class B Shares are no longer available for purchase by new or existing shareholders (although current Class B shareholders may continue to reinvest income and capital gains distributions into Class B Shares, and Class B shareholders may continue to exchange their shares for Class B Shares of certain other Goldman Sachs Funds). |
The returns set forth in the tables above represent past performance. Past performance does not guarantee future results. The Fund’s investment return and principal value will fluctuate so that an investor’s shares, when redeemed, may be worth more or less than their original cost. Current performance may be lower or higher than the performance quoted above. Please visit our web site at www.GSAMFUNDS.com to obtain the most recent month-end returns. Performance reflects applicable fee waivers and/or expense limitations in effect during the periods shown. In their absence, performance would be reduced. Returns do not reflect the deduction of taxes that a shareholder would pay on Fund distributions or the redemption of Fund shares.
9
FUND BASICS
| | | | | | | | | | |
| | EXPENSE RATIOS4 | | | | | | | | |
| | | | | Net Expense Ratio (Current) | | | Gross Expense Ratio (Before Waivers) | |
| | Class A | | | 1.15 | % | | | 1.50 | % |
| | Class B | | | 1.90 | | | | 2.25 | |
| | Class C | | | 1.90 | | | | 2.25 | |
| | Institutional | | | 0.75 | | | | 1.10 | |
| | Service | | | 1.25 | | | | 1.60 | |
| | Class IR | | | 0.90 | | | | 1.25 | |
| | | Class R | | | 1.40 | | | | 1.75 | |
| | 4 | | The expense ratios of the Fund, both current (net of applicable fee waivers and/or expense limitations) and before waivers (gross of applicable fee waivers and/or expense limitations) are as set forth above according to the most recent publicly available Prospectus for the Fund and may differ from the expense ratios disclosed in the Financial Highlights in this report. The Fund’s waivers and/or expense limitations will remain in place through at least December 29, 2014, and prior to such date the investment adviser may not terminate the arrangements without the approval of the Fund’s Board of Trustees. If these arrangements are discontinued in the future, the expense ratios may change without shareholder approval. |
| | | | | | | | |
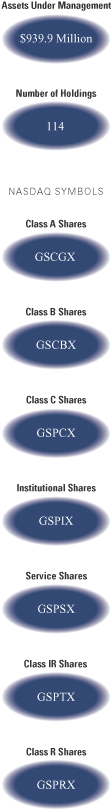
| | TOP TEN HOLDINGS AS OF 2/28/145 |
| | | Holding | | % of Net Assets | | | Line of Business |
| | Apple, Inc. | | | 4.3 | % | | Computers & Peripherals |
| | Google, Inc. Class A | | | 3.8 | | | Internet Software & Services |
| | QUALCOMM, Inc. | | | 2.8 | | | Communications Equipment |
| | Oracle Corp. | | | 2.5 | | | Software |
| | Microsoft Corp. | | | 2.0 | | | Software |
| | CBRE Group, Inc. Class A | | | 1.9 | | | Real Estate Management &
Development |
| | The Home Depot, Inc. | | | 1.7 | | | Specialty Retail |
| | Gilead Sciences, Inc. | | | 1.7 | | | Biotechnology |
| | Honeywell International, Inc. | | | 1.6 | | | Aerospace & Defense |
| | | Colgate-Palmolive Co. | | | 1.6 | | | Household Products |
| | 5 | | The top 10 holdings may not be representative of the Fund’s future investments. |
10
FUND BASICS
|
| FUND VS. BENCHMARK SECTOR ALLOCATIONS6 |
| As of February 28, 2014 |
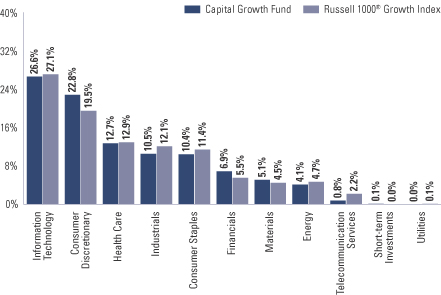
| | 6 | | The Fund is actively managed and, as such, its composition may differ over time. Consequently, the Fund’s overall sector allocations may differ from percentages contained in the graph above. The above graph categorizes investments using Global Industry Classification Standard (“GICS”), however, the sector classifications used by the portfolio management team may differ from GICS. The percentage shown for each investment category reflects the value of investments in that category as a percentage of market value. Short-term investments represent repurchase agreements. The above graph depicts the Fund’s investments but may not represent the Fund’s market exposure due to the exclusion of certain derivatives, if any, as listed in the Additional Investment Information section of the Schedule of Investments. |
11
PORTFOLIO RESULTS
Goldman Sachs Concentrated Growth Fund
Portfolio Composition
The Fund invests primarily in U.S. equity investments. The Fund typically holds 30-40 high quality growth companies and tends to be more concentrated in individual holdings, industries and sectors than the typical broadly diversified large-cap growth fund. Since the Fund’s inception, the Goldman Sachs Growth Equity Investment Team has focused on several key investment criteria that it believes can drive a company’s growth over the long term. These characteristics are: dominant market share, established brand name, pricing power, recurring revenue stream, free cash flow, high returns on invested capital, predictable growth, sustainable growth, long product life cycle, enduring competitive advantage, favorable demographic trends and excellent management. The Team strives to purchase these companies at reasonable valuations in order to capture the full benefits of their growth.
Portfolio Management Discussion and Analysis
Below, the Goldman Sachs Growth Equity Investment Team discusses the Goldman Sachs Concentrated Growth Fund’s (the “Fund”) performance and positioning for the six-month period ended February 28, 2014 (the “Reporting Period”).
| Q | | How did the Fund perform during the Reporting Period? |
| A | | During the Reporting Period, the Fund’s Class A, B, C, Institutional, IR and R Shares generated cumulative total returns, without sales charges, of 17.11%, 16.74%, 16.70%, 17.43%, 17.33% and 17.02%, respectively. These returns compare to the 17.84% cumulative total return of the Fund’s benchmark, the Russell 1000® Growth Index (with dividends reinvested) (the “Russell Index”), during the same period. |
| Q | | What key factors were responsible for the Fund’s performance during the Reporting Period? |
| A | | The Fund generated double-digit absolute gains, but sector allocation overall detracted from its performance relative to the Russell Index during the Reporting Period. Stock selection as a whole contributed positively to the Fund’s results. |
| Q | | Which equity market sectors most significantly affected Fund performance? |
| A | | Challenging stock selection in the health care, consumer discretionary and energy sectors detracted from the Fund’s relative results most during the Reporting Period. Sector positioning in health care, industrials and financials also hurt. Effective stock selection in the information technology and financials sectors helped the Fund’s performance most relative to the Russell Index. Sector positioning in the consumer staples sector also buoyed results. |
| Q | | Which stocks detracted significantly from the Fund’s performance during the Reporting Period? |
| A | | Detracting most from the Fund’s results relative to its benchmark index were positions in natural resources and production company Anadarko Petroleum, global clothing manufacturer PVH and fashion retailer L Brands. |
| | Anadarko Petroleum detracted from the Fund’s relative returns during the Reporting Period. Its shares declined following weak third quarter 2013 earnings and on a December 2013 ruling holding Anadarko Petroleum responsible for environmental and health claims related to Tronox, a chemical company subsidiary spun off by the company in 2005. We believe this setback is temporary, and our long-term investment thesis on the company remains unchanged. At the end of the Reporting Period, we believed Anadarko Petroleum was well positioned given its proven reserves, quality of asset portfolio and significant development opportunities. |
| | Shares of PVH declined as the company provided softer than expected earnings guidance for 2013 and 2014 given management’s cautious views on the global economy and global apparel sales, a headwind experienced by many retailers at the end of 2013. As a result, there were concerns that retail inventory levels were high, which may lead retailers to delay orders for PVH’s clothing. We believe this dynamic is transient in nature and is an industry-wide issue as opposed to specific to PVH. In addition, unexpected |
12
PORTFOLIO RESULTS
| | expenses related to its Warnaco Group acquisition, which closed earlier in 2013, were a key factor in its guidance. At the end of the Reporting Period, we believed PVH remained one of the best positioned names in the industry, given we expect it to reap benefits from its Warnaco Group acquisition and to benefit from its disproportionately large exposure to a recovery in Europe. In addition, we believe that should PVH’s higher margin brands, like Tommy Hilfiger and Calvin Klein, grow faster than PVH’s heritage business, as we anticipate, the company’s operating profit growth may accelerate meaningfully. |
| | L Brands, with subsidiaries that include Victoria’s Secret and Bath & Body Works, was a top detractor from the Fund’s performance. Its shares moved sharply lower after reporting same-store sales growth that was below consensus expectations in both November and December 2013. Despite such weakness, we were encouraged by the strength of L Brands’ U.S. business, and we believe many of the company’s brands resonate globally, leading us to a positive view on the company’s international business. At the end of the Reporting Period, we maintained our conviction in the stock, based on our belief that future growth may be driven by its continued growth in U.S. square footage, product expansion into natural adjacencies and international expansion. In February 2014, L Brands announced a special dividend of $1.00 and also raised its dividend by approximately 13%, sending its shares sharply higher. |
| Q | | What were some of the Fund’s best-performing individual stocks? |
| A | | The Fund benefited most relative to the Russell Index from positions in leading Internet search and technology company Google, fast-casual restaurant operator Chipotle Mexican Grill and biotechnology company Regeneron Pharmaceuticals. |
| | Google was the top contributor to the Fund’s relative performance during the Reporting Period. Its shares rose after the company reported strong third and fourth quarter 2013 results, with revenue and earnings that exceeded consensus estimates, as Google Websites and Core Google posted strong operating profit growth. Its shares also reacted positively preceding the fourth quarter 2013 earnings release when Google announced it was selling Motorola Mobility to Lenovo. Additionally, strong performance may be attributed to its acquisition of Nest Labs, a smart-home technology company that manufactures Wi-Fi-enabled, self-learning, programmable thermostats and smoke detectors. At the end of the Reporting Period, Google continued to be the dominant search engine, and we believe the company remains well positioned to monetize online advertising and the shift to mobile. The company also continues to invest in new product initiatives outside of its core search business, which could offer future growth opportunities. In our view, Google’s stock at the end of the Reporting Period was trading at a reasonable valuation for what we consider to be a high quality franchise with a strong long-term growth profile. |
| | Chipotle Mexican Grill contributed positively to the Fund’s relative performance during the Reporting Period. Despite reporting third quarter 2013 earnings slightly below consensus, same-store sales growth exceeded expectations due to the roll-out of catering, better customer throughput during peak periods, increased advertising and the introduction of a new menu item, Sofritas (braised tofu). We expect the company to raise its prices in 2014, which should benefit same-store sales growth and margins going forward. We believe that Chipotle Mexican Grill is a high quality growth franchise with an attractive business model, effective management and strong brand recognition. At the end of the Reporting Period, we also believed the company was well positioned for long-term growth by increasing same-store sales and expanding its domestic and international store count. |
| | Regeneron Pharmaceuticals was a top contributor to the Fund’s relative performance during the Reporting Period. Its shares gained as its flagship treatment, Eylea, continued to be well received by the market. At the end of the Reporting Period, we maintained our conviction in the company and believed that in addition to Eylea, designed to treat macular degeneration, the company has a strong product pipeline for the treatment of high cholesterol and asthma. The company’s cholesterol drug in particular has received positive feedback in trials, and the responses from cardiologists suggest there is a large addressable market for the drug. We believed its valuation at the end of the Reporting Period presented a compelling risk/reward opportunity. |
| Q | | How did the Fund use derivatives and similar instruments during the Reporting Period? |
| A | | During the Reporting Period, we did not use derivatives as part of an active management strategy. |
13
PORTFOLIO RESULTS
| Q | | Did the Fund make any significant purchases or sales during the Reporting Period? |
| A | | We initiated a Fund position in EMC, a leading information storage technologies company. EMC is a market leader in storage hardware and has the opportunity, in our view, to continue to take share of a relatively fragmented market. We believe the company is well positioned to take advantage of future technological changes, as its forward-looking management team has a history of embracing and driving change. Shares of EMC significantly lagged the market during the Reporting Period, but we believe its depressed valuation, coupled with multiple potential growth drivers and disciplined capital allocation, support an attractive risk/ reward opportunity. |
| | We established a Fund position in professional networking website LinkedIn. We believe LinkedIn has an attractive growth runway and that its website and content provide an example of disruptive technology that is early in its life cycle. (Disruptive technology is defined as new ways of doing things that disrupt or overturn traditional business methods and practices.) While the stock may not appear overly inexpensive on a number of valuation metrics, we believe it warrants a premium valuation, as the company could continue to exceed earnings expectations should it capture additional subscribers and develop its platform as we anticipate. |
| | Conversely, we exited the Fund’s position in Salesforce.com, a provider of enterprise cloud computing and social enterprise solutions. While we remain positive on the fundamentals of the company, given the stock’s strong performance in 2013, we decided to reallocate capital to opportunities with what we considered to have more attractive risk/reward profiles. |
| | We eliminated the Fund’s position in consumer goods company Procter & Gamble during the Reporting Period. While we are positive on the return of the company’s former chief executive officer, announced earlier in 2013, we believe much of the good news and growth initiatives were already priced into the company’s shares. Therefore, we decided to sell the position and reallocate the capital into higher conviction companies. |
| Q | | Were there any notable changes in the Fund’s weightings during the Reporting Period? |
| A | | In constructing the Fund’s portfolio, we focus on picking stocks rather than on making industry or sector bets. We seek to outpace the benchmark index by overweighting stocks that we expect to outperform and underweighting those that we think may lag. Consequently, changes in its sector weights are generally the direct result of individual stock selection or of stock appreciation or depreciation. That said, during the Reporting Period, the Fund’s exposure to consumer discretionary and health care increased and its allocations to energy and information technology decreased relative to the Russell Index. |
| Q | | How was the Fund positioned relative to its benchmark index at the end of February 2014? |
| A | | At the end of February 2014, the Fund had overweighted positions relative to the Russell Index in the financials and consumer discretionary sectors. On the same date, the Fund had underweighted positions compared to the Russell Index in consumer staples, materials and industrials. The Fund was rather neutrally weighted to the Russell Index in information technology, telecommunication services, health care and energy and had no position at all in the utilities sector on February 28, 2014. |
| Q | | Were there any changes to the Fund’s portfolio management team during the Reporting Period? |
| A | | There were no changes to the Fund’s portfolio management team during the Reporting Period. |
14
FUND BASICS
Concentrated Growth Fund
as of February 28, 2014
| | | | | | | | | | |
| | PERFORMANCE REVIEW | |
| | | September 1, 2013–February 28, 2014 | | Fund Total Return
(based on NAV)1 | | | Russell 1000®
Growth Index2 | |
| | Class A | | | 17.11 | % | | | 17.84 | % |
| | Class B | | | 16.74 | | | | 17.84 | |
| | Class C | | | 16.70 | | | | 17.84 | |
| | Institutional | | | 17.43 | | | | 17.84 | |
| | Class IR | | | 17.33 | | | | 17.84 | |
| | | Class R | | | 17.02 | | | | 17.84 | |
| | 1 | | The net asset value (“NAV”) represents the net assets of the class of the Fund (ex-dividend) divided by the total number of shares of the class outstanding. The Fund’s performance reflects the reinvestment of dividends and other distributions. The Fund’s performance does not reflect the deduction of any applicable sales charges. |
| | 2 | | The Russell 1000® Growth Index (with dividends reinvested) is an unmanaged index that measures the performance of those Russell 1000 companies with higher price-to-book ratios and higher forecasted growth values. The Index figures do not reflect any deduction for fees, expenses or taxes. It is not possible to invest directly in an index. |
| | | | | | | | | | | | | | |
| | STANDARDIZED TOTAL RETURNS3 |
| | | For the period ended 12/31/13 | | One Year | | | Five Years | | Ten Years | | Since Inception | | Inception Date |
| | Class A | | | 22.28 | % | | 18.32% | | 5.53% | | 7.02% | | 9/03/02 |
| | Class B | | | 22.76 | | | 18.54 | | 5.47 | | 6.98 | | 9/03/02 |
| | Class C | | | 27.20 | | | 18.79 | | 5.33 | | 6.73 | | 9/03/02 |
| | Institutional | | | 29.90 | | | 20.17 | | 6.55 | | 7.98 | | 9/03/02 |
| | Class IR | | | 29.66 | | | 19.97 | | N/A | | 5.61 | | 11/30/07 |
| | | Class R | | | 29.01 | | | 19.40 | | N/A | | 5.11 | | 11/30/07 |
| | 3 | | The Standardized Total Returns are average annual total returns as of the most recent calendar quarter-end. They assume reinvestment of all distributions at NAV. These returns reflect a maximum initial sales charge of 5.5% for Class A Shares and the assumed contingent deferred sales charge for Class B Shares (5% maximum declining to 0% after six years) and the assumed contingent deferred sales charge for Class C Shares (1% if redeemed within 12 months of purchase). Class B Shares convert to Class A Shares on or about the fifteenth day of the last month of the calendar year that is eight years after purchase. Returns for Class B Shares for the period after the conversion reflect the performance of Class A Shares. Because Institutional, Class IR and Class R Shares do not involve a sales charge, such a charge is not applied to their Standardized Total Returns. The Fund’s Class B Shares are no longer available for purchase by new or existing shareholders (although current Class B shareholders may continue to reinvest income and capital gains distributions into Class B Shares, and Class B shareholders may continue to exchange their shares for Class B Shares of certain other Goldman Sachs Funds). |
The returns represent past performance. Past performance does not guarantee future results. The Fund’s investment return and principal value will fluctuate so that an investor’s shares, when redeemed, may be worth more or less than their original cost. Current performance may be lower or higher than the performance quoted above. Please visit our Web site at www.GSAMFUNDS.com to obtain the most recent month-end returns. Performance reflects applicable fee waivers and/or expense limitations in effect during the periods shown. In their absence, performance would be reduced. Returns do not reflect the deduction of taxes that a shareholder would pay on Fund distributions or the redemption of Fund shares.
15
FUND BASICS
| | | | | | | | | | |
| | EXPENSE RATIOS4 | |
| | | | | Net Expense Ratio (Current) | | | Gross Expense Ratio (Before Waivers) | |
| | Class A | | | 1.26 | % | | | 1.62 | % |
| | Class B | | | 2.01 | | | | 2.37 | |
| | Class C | | | 2.01 | | | | 2.37 | |
| | Institutional | | | 0.86 | | | | 1.23 | |
| | Class IR | | | 1.01 | | | | 1.38 | |
| | | Class R | | | 1.51 | | | | 1.87 | |
| | 4 | | The expense ratios of the Fund, both current (net of applicable fee waivers and/or expense limitations) and before waivers (gross of applicable fee waivers and/or expense limitations) are as set forth above according to the most recent publicly available Prospectus for the Fund and may differ from the expense ratios disclosed in the Financial Highlights in this report. The Fund’s waivers and/or expense limitations will remain in place through at least December 29, 2014, and prior to such date the investment adviser may not terminate the arrangements without the approval of the Fund’s Board of Trustees. If these arrangements are discontinued in the future, the expense ratios may change without shareholder approval. |
| | | | | | | | |
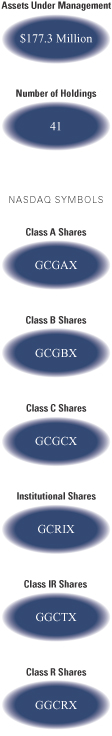
| | TOP TEN HOLDINGS AS OF 2/28/145 |
| | | Holding | | % of Net Assets | | | Line of Business |
| | Google, Inc. Class A | | | 5.0 | % | | Internet Software & Services |
| | American Tower Corp. | | | 4.4 | | | Real Estate Investment Trusts |
| | QUALCOMM, Inc. | | | 3.9 | | | Communications Equipment |
| | Equinix, Inc. | | | 3.7 | | | Internet Software & Services |
| | CBRE Group, Inc. Class A | | | 3.5 | | | Real Estate Management &
Development |
| | Amazon.com, Inc. | | | 3.3 | | | Internet & Catalog Retail |
| | Costco Wholesale Corp. | | | 3.1 | | | Food & Staples Retailing |
| | NIKE, Inc. Class B | | | 2.9 | | | Textiles, Apparel & Luxury Goods |
| | eBay, Inc. | | | 2.9 | | | Internet Software & Services |
| | | Dollar General Corp. | | | 2.9 | | | Multiline Retail |
| | 5 | | The top 10 holdings may not be representative of the Fund’s future investments. |
16
FUND BASICS
|
| FUND VS. BENCHMARK SECTOR ALLOCATIONS6 |
| As of February 28, 2014 |
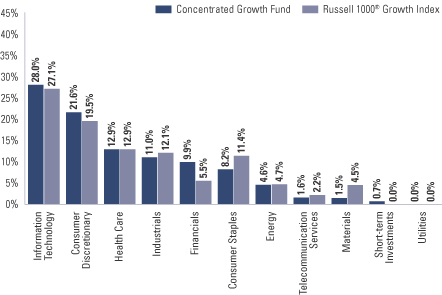
| | 6 | | The Fund is actively managed and, as such, its composition may differ over time. Consequently, the Fund’s overall sector allocations may differ from the percentages contained in the graph above. The graph categorizes investments using Global Industry Classification Standard (“GICS”), however, the sector classifications used by the portfolio management team may differ from GICS. The percentage shown for each investment category reflects the value of investments in that category as a percentage of market value. Short-term investments represent repurchase agreements. The graph depicts the Fund’s investments but may not represent the Fund’s market exposure due to the exclusion of certain derivatives, if any, as listed in the Additional Investment Information section of the Schedule of Investments. |
17
PORTFOLIO RESULTS
Goldman Sachs Flexible Cap Growth Fund
Portfolio Composition
The Fund invests primarily in U.S. equity investments in small-, mid- and large-capitalization issuers. Since the Fund’s inception, the Goldman Sachs Growth Equity Investment Team has focused on several key investment criteria that it believes can drive a company’s growth over the long term. These characteristics are: dominant market share, established brand name, pricing power, recurring revenue stream, free cash flow, high returns on invested capital, predictable growth, sustainable growth, long product life cycle, enduring competitive advantage, favorable demographic trends and excellent management. The Team strives to purchase these companies at reasonable valuations in order to capture the full benefits of their growth.
Portfolio Management Discussion and Analysis
Below, the Goldman Sachs Growth Equity Investment Team discusses the Goldman Sachs Flexible Cap Growth Fund’s (the “Fund”) performance and positioning for the six-month period ended February 28, 2014 (the “Reporting Period”).
| Q | | How did the Fund perform during the Reporting Period? |
| A | | During the Reporting Period, the Fund’s Class A, C, Institutional, IR and R Shares generated cumulative total returns, without sales charges, of 18.66%, 18.19%, 18.94%, 18.82% and 18.58%, respectively. These returns compare to the 17.95% cumulative total return of the Fund’s benchmark, the Russell 3000® Growth Index (with dividends reinvested) (the “Russell Index”), during the same period. |
| Q | | What key factors were responsible for the Fund’s performance during the Reporting Period? |
| A | | Stock selection overall contributed most to the Fund’s performance relative to the Russell Index during the Reporting Period. |
| Q | | Which equity market sectors most significantly affected Fund performance? |
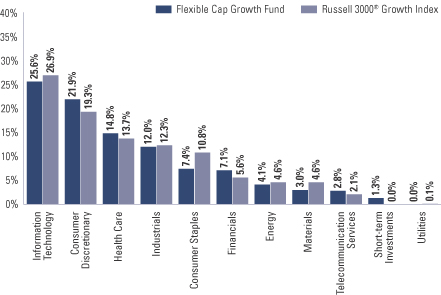
| A | | Effective stock selection in the information technology, consumer staples and telecommunication services sectors helped the Fund’s performance most relative to the Russell Index. Having an underweighted allocation to consumer staples, which was the second-weakest sector in the Russell Index during the Reporting Period, also boosted the Fund’s relative results. Challenging stock selection in industrials, health care and materials detracted most from the Fund’s relative results during the Reporting Period. |
| Q | | What were some of the Fund’s best-performing individual stocks? |
| A | | The Fund benefited most relative to the Russell Index from positions in leading Internet search and technology company Google, Internet radio service provider Pandora Media and specialty coffee and coffeemakers company Green Mountain Coffee Roasters. |
| | | Google was the top contributor to the Fund’s relative performance during the Reporting Period. Its shares rose after the company reported strong third and fourth quarter 2013 results, with revenue and earnings that exceeded consensus estimates, as Google Websites and Core Google posted strong operating profit growth. Its shares also reacted positively preceding the fourth quarter 2013 earnings release when Google announced it was selling Motorola Mobility to Lenovo. Additionally, strong performance may be attributed to its acquisition of Nest Labs, a smart-home technology company that manufactures Wi-Fi-enabled, self-learning, programmable thermostats and smoke detectors. At the end of the Reporting Period, Google continued to be the dominant search engine, and we believe the company remains well positioned to monetize online advertising and the shift to mobile. The company also continues to invest in new product initiatives outside of its core search business, which could offer future growth opportunities. In our view, Google’s stock at the end of the Reporting Period was trading at a reasonable valuation for what we consider to be a high quality franchise with a strong long-term growth profile. |
18
PORTFOLIO RESULTS
| | | The strong performance of Pandora Media was driven in part by strong growth in key audience metrics, including listener hours, share of total U.S. radio listening and number of active listeners. The company’s stock was further bolstered by the announcement of a new chief executive officer. Pandora Media also announced it would begin rolling out in-car advertising in the first quarter of 2014. In our view, the company is well positioned to monetize mobile and gain market share within the terrestrial radio market, as its active user base continues to grow. We believe the company’s differentiated business model, strong brand recognition and first-mover advantage, along with a continued shift to online advertising, should also help support growth. |
| | | Shares of Green Mountain Coffee Roasters, a new purchase for the Fund during the Reporting Period, gained after the announcement that Coca-Cola would purchase a 10% stake in the company, while additionally entering into a 10-year agreement to explore producing Coca-Cola products for use with its Keurig Cold beverage system. The company also benefited from recent exposure to Starbucks, Dunkin Donuts, Folgers and Costco brands along with a new sustainable business structure that segments U.S. and Canada operations. With positive free cash flows and strong earnings quality, we believe the company has a solid long-term growth opportunity, competitive margins, improving return on invested capital and a credible management team and board. (As of March 10, 2014, Green Mountain Coffee Roasters changed its company name to Keurig Green Mountain.) |
| Q | | Which stocks detracted significantly from the Fund’s performance during the Reporting Period? |
| A | | Detracting most from the Fund’s results relative to its benchmark index were positions in social networking website operator Facebook, global clothing manufacturer PVH and natural resources and production company Anadarko Petroleum. |
| | | We initiated a Fund position in Facebook two weeks before the end of the Reporting Period. The company detracted from relative results because it was a strong performer throughout the Reporting Period, when the Fund did not yet own a position in its shares. Facebook’s good results were due largely to strong mobile advertising revenue, as advertiser demand has been catching up to mobile usage and driving solid growth. Facebook also announced it is exploring options for mobile payment products. We believe the company is well positioned to continue to grow in the mobile advertising space as usage shifts from desktop to mobile. Overall, we remain positive on the company and believe the stock was trading, at the end of the Reporting Period, at a reasonable valuation, supported by its industry leading position and considerable opportunity to monetize its extensive user base. |
| | | Shares of PVH declined as the company provided softer than expected earnings guidance for 2013 and 2014 given management’s cautious views on the global economy and global apparel sales, a headwind experienced by many retailers at the end of 2013. As a result, there were concerns that retail inventory levels were high, which may lead retailers to delay orders for PVH’s clothing. We believe this dynamic is transient in nature and is an industry-wide issue as opposed to specific to PVH. In addition, unexpected expenses related to its Warnaco Group acquisition, which closed earlier in 2013, were a key factor in its guidance. At the end of the Reporting Period, we believed PVH remained one of the best positioned names in the industry, given we expect it to reap benefits from its Warnaco Group acquisition and to benefit from its disproportionately large exposure to a recovery in Europe. In addition, we believe that should PVH’s higher margin brands, like Tommy Hilfiger and Calvin Klein, grow faster than PVH’s heritage business, as we anticipate, the company’s operating profit growth may accelerate meaningfully. |
| | | Anadarko Petroleum detracted from the Fund’s relative returns during the Reporting Period. Its shares declined following weak third quarter 2013 earnings and on a December 2013 ruling holding Anadarko Petroleum responsible for environmental and health claims related to Tronox, a chemical company subsidiary spun off by the company in 2005. We believe this setback is temporary, and our long-term investment thesis on the company remains unchanged. At the end of the Reporting Period, we believed Anadarko Petroleum was well positioned given its proven reserves, quality of asset portfolio and significant development opportunities. |
19
PORTFOLIO RESULTS
| Q | | How did the Fund use derivatives and similar instruments during the Reporting Period? |
| A | | During the Reporting Period, we did not use derivatives as part of an active management strategy. |
| Q | | Did the Fund make any significant purchases or sales during the Reporting Period? |
| A | | We initiated a Fund position in EMC, a leading information storage technologies company. EMC is a market leader in storage hardware and has the opportunity, in our view, to continue to take share of a relatively fragmented market. We believe the company is well positioned to take advantage of future technological changes, as its forward-looking management team has a history of embracing and driving change. Shares of EMC significantly lagged the market during the Reporting Period, but we believe its depressed valuation, coupled with multiple potential growth drivers and disciplined capital allocation, support an attractive risk/ reward opportunity. |
| | | We established a Fund position in leading home improvement retailer Home Depot. While Home Depot is a mature retailer, we believe it has strong cash returns and is well positioned in an attractive home improvement segment that is still in the early stages of a recovery. The company is improving in-store efficiencies with information technology, shedding non-core business and reinvesting in its supply chain and service, which should enhance profitability and return on capital. We believe Home Depot has a solid earnings and free cash flow growth profile over the next few years and was trading, at the time of purchase, at an attractive valuation. |
| | | Conversely, we exited the Fund’s position in electronic payment company MasterCard during the Reporting Period. The stock performed well in 2013, and, in our view, was subsequently valued at a premium based on relatively high forward expectations. We also believe consensus estimates did not account for any adverse regulatory changes that could occur in an electronic payments industry that is rapidly changing. Therefore, we decided to reallocate capital into what we considered to be more attractive risk/reward opportunities. |
| | | We sold the Fund’s position in industrial gas supplier Praxair. We decided to reallocate capital into Airgas, a company with a similar growth profile to Praxair but whose stock was trading at a more compelling valuation, in our view. |
| Q | | Were there any notable changes in the Fund’s weightings during the Reporting Period? |
| A | | In constructing the Fund’s portfolio, we focus on picking stocks rather than on making industry or sector bets. We seek to outpace the benchmark index by overweighting stocks that we expect to outperform and underweighting those that we think may lag. Consequently, changes in its sector weights are generally the direct result of individual stock selection or of stock appreciation or depreciation. That said, during the Reporting Period, the Fund’s exposure to consumer discretionary and health care increased and its allocations to consumer staples, information technology and financials decreased relative to the Russell Index. |
| Q | | How was the Fund positioned relative to its benchmark index at the end of February 2014? |
| A | | At the end of February 2014, the Fund had overweighted positions relative to the Russell Index in the consumer discretionary, financials and health care sectors. On the same date, the Fund had underweighted positions compared to the Russell Index in consumer staples, materials and information technology and was rather neutrally weighted to the Russell Index in telecommunication services, energy and industrials. The Fund had no position at all in the utilities sector on February 28, 2014. |
| Q | | Were there any changes to the Fund’s portfolio management team during the Reporting Period? |
| A | | There were no changes to the Fund’s portfolio management team during the Reporting Period. |
20
FUND BASICS
Flexible Cap Growth Fund
as of February 28, 2014
| | | | | | | | | | |
| | PERFORMANCE REVIEW | | | | | | | | |
| | | September 1, 2013–February 28, 2014 | | Fund Total Return
(based on NAV)1 | | | Russell 3000®
Growth Index2 | |
| | Class A | | | 18.66 | % | | | 17.95 | % |
| | Class C | | | 18.19 | | | | 17.95 | |
| | Institutional | | | 18.94 | | | | 17.95 | |
| | Class IR | | | 18.82 | | | | 17.95 | |
| | | Class R | | | 18.58 | | | | 17.95 | |
| | 1 | | The net asset value (“NAV”) represents the net assets of the class of the Fund (ex-dividend) divided by the total number of shares of the class outstanding. The Fund’s performance reflects the reinvestment of dividends and other distributions. The Fund’s performance does not reflect the deduction of any applicable sales charges. |
| | 2 | | The unmanaged Russell 3000® Growth Index (with dividends reinvested) measures the performance of the 3,000 largest U.S. companies based on total market capitalization. The Index figures do not reflect any deduction for fees, expenses or taxes. It is not possible to invest directly in an index. |
| | | | | | | | | | | | | | |
| | STANDARDIZED TOTAL RETURNS3 |
| | | For the period ended 12/31/13 | | One Year | | | Five Years | | Since Inception | | | Inception Date |
| | Class A | | | 25.84 | % | | 19.42% | | | 8.87 | % | | 1/31/08 |
| | Class C | | | 30.98 | | | 19.88 | | | 9.14 | | | 1/31/08 |
| | Institutional | | | 33.78 | | | 21.26 | | | 10.39 | | | 1/31/08 |
| | Class IR | | | 33.54 | | | 21.08 | | | 10.22 | | | 1/31/08 |
| | | Class R | | | 32.88 | | | 20.48 | | | 9.68 | | | 1/31/08 |
| | 3 | | The Standardized Total Returns are average annual total returns as of the most recent calendar quarter-end. They assume reinvestment of all distributions at NAV. These returns reflect a maximum initial sales charge of 5.5% for Class A Shares and the assumed contingent deferred sales charge for Class C Shares (1% if redeemed within 12 months of purchase). Because Institutional, Class IR and Class R Shares do not involve a sales charge, such a charge is not applied to their Standardized Total Returns. |
The returns set forth in the tables above represent past performance. Past performance does not guarantee future results. The Fund’s investment return and principal value will fluctuate so that an investor’s shares, when redeemed, may be worth more or less than their original cost. Current performance may be lower or higher than the performance quoted above. Please visit our web site at www.GSAMFUNDS.com to obtain the most recent month-end returns. Performance reflects applicable fee waivers and/or expense limitations in effect during the periods shown. In their absence, performance would be reduced. Returns do not reflect the deduction of taxes that a shareholder would pay on Fund distributions or the redemption of Fund shares.
21
FUND BASICS
| | | | | | | | | | |
| | EXPENSE RATIOS4 | |
| | | | | Net Expense Ratio (Current) | | | Gross Expense Ratio (Before Waivers) | |
| | Class A | | | 1.26 | % | | | 3.62 | % |
| | Class C | | | 2.01 | | | | 4.32 | |
| | Institutional | | | 0.86 | | | | 3.18 | |
| | Class IR | | | 1.01 | | | | 3.35 | |
| | | Class R | | | 1.51 | | | | 3.91 | |
| | 4 | | The expense ratios of the Fund, both current (net of applicable fee waivers and/or expense limitations) and before waivers (gross of applicable fee waivers and/or expense limitations) are as set forth above according to the most recent publicly available Prospectus for the Fund and may differ from the expense ratios disclosed in the Financial Highlights in this report. The Fund’s waivers and/or expense limitations will remain in place through at least December 29, 2014, and prior to such date the investment adviser may not terminate the arrangements without the approval of the Fund’s Board of Trustees. If these arrangements are discontinued in the future, the expense ratios may change without shareholder approval. |
| | | | | | | | |
| | TOP TEN HOLDINGS AS OF 2/28/145 |
| | | Holding | | % of Net Assets | | | Line of Business |
| | Google, Inc. Class A | | | 4.7 | % | | Internet Software & Services |
| | Apple, Inc. | | | 4.0 | | | Computers & Peripherals |
| | QUALCOMM, Inc. | | | 3.0 | | | Communications Equipment |
| | SBA Communications Corp. Class A | | | 2.0 | | | Wireless Telecommunication Services |
| | NIKE, Inc. Class B | | | 2.0 | | | Textiles, Apparel & Luxury Goods |
| | Amazon.com, Inc. | | | 2.0 | | | Internet & Catalog Retail |
| | Equinix, Inc. | | | 1.9 | | | Internet Software & Services |
| | Oracle Corp. | | | 1.8 | | | Software |
| | Costco Wholesale Corp. | | | 1.8 | | | Food & Staples Retailing |
| | | CBRE Group, Inc. Class A | | | 1.7 | | | Real Estate Management &
Development |
| | 5 | | The top 10 holdings may not be representative of the Fund’s future investments. |
22
FUND BASICS
| | |
| FUND VS. BENCHMARK SECTOR ALLOCATIONS6 |
| As of February 28, 2014 |
| | 6 | | The Fund is actively managed and, as such, its composition may differ over time. Consequently, the Fund’s overall sector allocations may differ from the percentages contained in the graph above. The graph categorizes investments using Global Industry Classification Standard (“GICS”), however, the sector classifications used by the portfolio management team may differ from GICS. The percentage shown for each investment category reflects the value of investments in that category as a percentage of market value. Short-term investments represent repurchase agreements. The graph depicts the Fund’s investments but may not represent the Fund’s market exposure due to the exclusion of certain derivatives, if any, as listed in the Additional Investment Information section of the Schedule of Investments. |
23
PORTFOLIO RESULTS
Goldman Sachs Focused Growth Fund
Portfolio Composition
The Fund invests primarily in U.S. equity investments. Since the Fund’s inception, the Goldman Sachs Growth Equity Investment Team has focused on several key investment criteria that it believes can drive a company’s growth over the long term. These characteristics are: dominant market share, established brand name, pricing power, recurring revenue stream, free cash flow, high returns on invested capital, predictable growth, sustainable growth, long product life cycle, enduring competitive advantage, favorable demographic trends and excellent management. The Team strives to purchase these companies at reasonable valuations in order to capture the full benefits of their growth.
Portfolio Management Discussion and Analysis
Below, the Goldman Sachs Growth Equity Investment Team discusses the Goldman Sachs Focused Growth Fund’s (the
“Fund”) performance and positioning for the six-month period ended February 28, 2014 (the “Reporting Period”).
| Q | | How did the Fund perform during the Reporting Period? |
| A | | During the Reporting Period, the Fund’s Class A, C, Institutional, IR and R Shares generated cumulative total returns, without sales charges, of 17.56%, 17.14%, 17.81%, 17.72% and 17.40%, respectively. These returns compare to the 17.84% cumulative total return of the Fund’s benchmark, the Russell 1000® Growth Index (with dividends reinvested) (the “Russell Index”), during the same period. |
| Q | | What key factors were responsible for the Fund’s performance during the Reporting Period? |
| A | | The Fund generated double-digit absolute gains, but sector allocation overall detracted from its performance relative to the Russell Index during the Reporting Period. Stock selection as a whole contributed positively to the Fund’s results. |
| Q | | Which equity market sectors most significantly affected Fund performance? |
| A | | Challenging stock selection in consumer discretionary, health care and energy and having an underweighted allocation to health care, which significantly outpaced the Russell Index during the Reporting Period, detracted from the Fund’s relative results most. Effective stock selection in the consumer staples, information technology and telecommunication services sectors and having an underweighted allocation to consumer staples, which was the second-weakest sector in the Russell Index during the Reporting Period, helped the Fund’s performance most relative to the Russell Index. |
| Q | | Which stocks detracted significantly from the Fund’s performance during the Reporting Period? |
| A | | Detracting most from the Fund’s results relative to its benchmark index were positions in global clothing manufacturer PVH, natural resources and production company Anadarko Petroleum and fashion retailer L Brands. |
| | Shares of PVH declined as the company provided softer than expected earnings guidance for 2013 and 2014 given management’s cautious views on the global economy and global apparel sales, a headwind experienced by many retailers at the end of 2013. As a result, there were concerns that retail inventory levels were high, which may lead retailers to delay orders for PVH’s clothing. We believe this dynamic is transient in nature and is an industry-wide issue as opposed to specific to PVH. In addition, unexpected expenses related to its Warnaco Group acquisition, which closed earlier in 2013, were a key factor in its guidance. At the end of the Reporting Period, we believed PVH remained one of the best positioned names in the industry, given we expect it to reap benefits from its Warnaco Group acquisition and to benefit from its disproportionately large exposure to a recovery in Europe. In addition, we believe that should PVH’s higher margin brands, like Tommy Hilfiger and Calvin Klein, grow faster than PVH’s heritage business, as we anticipate, the company’s operating profit growth may accelerate meaningfully. |
| | Anadarko Petroleum detracted from the Fund’s relative returns during the Reporting Period. Its shares declined following weak third quarter 2013 earnings and on a December 2013 ruling holding Anadarko Petroleum responsible for environmental and health claims related to |
24
PORTFOLIO RESULTS
| | Tronox, a chemical company subsidiary spun off by the company in 2005. We believe this setback is temporary, and our long-term investment thesis on the company remains unchanged. At the end of the Reporting Period, we believed Anadarko Petroleum was well positioned given its proven reserves, quality of asset portfolio and significant development opportunities. |
| | L Brands, with subsidiaries that include Victoria’s Secret and Bath & Body Works, was a top detractor from the Fund’s performance. Its shares moved sharply lower after reporting same-store sales growth that was below consensus expectations in both November and December 2013. Despite such weakness, we were encouraged by the strength of L Brands’ U.S. business, and we believe many of the company’s brands resonate globally, leading us to a positive view on the company’s international business. At the end of the Reporting Period, we maintained our conviction in the stock, based on our belief that future growth may be driven by its continued growth in U.S. square footage, product expansion into natural adjacencies and international expansion. In February 2014, L Brands announced a special dividend of $1.00 and also raised its dividend by approximately 13%, sending its shares sharply higher. |
| Q | | What were some of the Fund’s best-performing individual stocks? |
| A | | The Fund benefited most relative to the Russell Index from positions in premium spirits company Beam, leading Internet search and technology company Google and biotechnology company Regeneron Pharmaceuticals. |
| | Shares of Beam gained as a leading Japanese whiskey company, Suntory Holdings, announced it had reached an agreement to purchase Beam. The deal is expected to close in the second quarter of 2014 pending approval. In our view, it is always encouraging when the value of one of the Fund’s holdings is recognized by a strategic player within the industry, and our investment thesis plays out through an acquisition. We believe Beam is a high quality growth business given it is operating in a fragmented industry with improving secular tailwinds, high barriers to entry, attractive margins and returns on invested capital. Therefore, we were not surprised Beam became an acquisition target. |
| | Google was a top contributor to the Fund’s relative performance during the Reporting Period. Its shares rose after the company reported strong third and fourth quarter 2013 results, with revenue and earnings that exceeded consensus estimates, as Google Websites and Core Google posted strong operating profit growth. Its shares also reacted positively preceding the fourth quarter 2013 earnings release when Google announced it was selling Motorola Mobility to Lenovo. Additionally, strong performance may be attributed to its acquisition of Nest Labs, a smart-home technology company that manufactures Wi-Fi-enabled, self-learning, programmable thermostats and smoke detectors. At the end of the Reporting Period, Google continued to be the dominant search engine, and we believe the company remains well positioned to monetize online advertising and the shift to mobile. The company also continues to invest in new product initiatives outside of its core search business, which could offer future growth opportunities. In our view, Google’s stock at the end of the Reporting Period was trading at a reasonable valuation for what we consider to be a high quality franchise with a strong long-term growth profile. |
| | Regeneron Pharmaceuticals was another strong contributor to the Fund’s relative performance during the Reporting Periods. Its shares gained as its flagship treatment, Eylea, continued to be well received by the market. At the end of the Reporting Period, we maintained our conviction in the company and believed that in addition to Eylea, designed to treat macular degeneration, the company has a strong product pipeline for the treatment of high cholesterol and asthma. The company’s cholesterol drug in particular has received positive feedback in trials, and the responses from cardiologists suggest there is a large addressable market for the drug. We believed its valuation at the end of the Reporting Period presented a compelling risk/reward opportunity. |
25
PORTFOLIO RESULTS
| Q | | How did the Fund use derivatives and similar instruments during the Reporting Period? |
| A | | During the Reporting Period, we did not use derivatives as part of an active management strategy. |
| Q | | Did the Fund make any significant purchases or sales during the Reporting Period? |
| A | | We initiated a Fund position in YUM! Brands, which franchises and operates restaurants worldwide under well- known brands KFC, Pizza Hut, Taco Bell, Little Sheep and East Dawning. Its stock had recently lagged the overall market and its peers, providing what we considered to be an attractive entry point to start building a position in the company. In our view, same-store sales have likely bottomed and should improve from here. We believe YUM! Brands is a high quality company positioned well to grow earnings per share and has a strong history of growing return on invested capital and being a good steward of shareholder capital. |
| | We established a Fund position in eBay, which we believe represents one of the best risk/reward opportunities in the global e-commerce industry. Along with its payment engine business, PayPal, eBay has been playing offense following several years of rebuilding confidence as the company navigated a turnaround. The company, for example, has been innovating in both its Marketplaces and PayPal businesses and has also been positioning itself as the partner of choice for merchants. It appears that eBay continues to improve the user experience, and we believe the company is well positioned to take advantage of the secular trend toward e-commerce and growth of mobile usage. Further, in our view, eBay was attractively valued relative to both its peers and the broad market at the time of purchase. |
| | Conversely, we sold the Fund’s positions in personal computer and mobile peripherals giant Apple and oilfield services company Schlumberger. While we still like the fundamentals of each company and believe there are catalysts for growth ahead, we decided to reallocate the capital into higher conviction ideas given the focused nature of this Fund. |
| Q | | Were there any notable changes in the Fund’s weightings during the Reporting Period? |
| A | | In constructing the Fund’s portfolio, we focus on picking stocks rather than on making industry or sector bets. We seek to outpace the benchmark index by overweighting stocks that we expect to outperform and underweighting those that we think may lag. Consequently, changes in its sector weights are generally the direct result of individual stock selection or of stock appreciation or depreciation. That said, during the Reporting Period, the Fund’s exposure to consumer discretionary and health care increased and its allocations to energy, financials, industrials and information technology decreased relative to the Russell Index. |
| Q | | How was the Fund positioned relative to its benchmark index at the end of February 2014? |
| A | | At the end of February 2014, the Fund had overweighted positions relative to the Russell Index in the financials, consumer discretionary, telecommunication services and information technology sectors. On the same date, the Fund had underweighted positions compared to the Russell Index in consumer staples, industrials, health care and energy. The Fund had no positions at all in the utilities or materials sectors on February 28, 2014. |
| Q | | Were there any changes to the Fund’s portfolio management team during the Reporting Period? |
| A | | There were no changes to the Fund’s portfolio management team during the Reporting Period. |
26
FUND BASICS
Focused Growth Fund
as of February 28, 2014
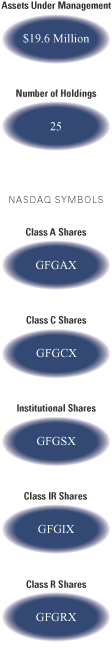
| | | | | | | | | | |
| | PERFORMANCE REVIEW | | | | | | | | |
| | | September 1, 2013–February 28, 2014 | | Fund Total Return
(based on NAV)1 | | | Russell 1000®
Growth Index2 | |
| | Class A | | | 17.56 | % | | | 17.84 | % |
| | Class C | | | 17.14 | | | | 17.84 | |
| | Institutional | | | 17.81 | | | | 17.84 | |
| | Class IR | | | 17.72 | | | | 17.84 | |
| | | Class R | | | 17.40 | | | | 17.84 | |
| | 1 | | The net asset value (“NAV”) represents the net assets of the class of the Fund (ex-dividend) divided by the total number of shares of the class outstanding. The Fund’s performance reflects the reinvestment of dividends and other distributions. The Fund’s performance does not reflect the deduction of any applicable sales charges. |
| | 2 | | The Russell 1000® Growth Index (with dividends reinvested) is an unmanaged market capitalization weighted index of the 1000 largest U.S. companies with higher price-to-book ratios and higher forecasted growth values. The Index figures do not include any deduction for fees, expenses or taxes. It is not possible to invest directly in an unmanaged index. |
| | | | | | | | | | |
| | STANDARDIZED TOTAL RETURNS3 | | | | | |
| | | For the period ended 12/31/13 | | One Year | | | Since Inception | | Inception Date |
| | Class A | | | 20.39 | % | | 19.86% | | 1/31/12 |
| | Class C | | | 25.38 | | | 22.53 | | 1/31/12 |
| | Institutional | | | 27.98 | | | 23.96 | | 1/31/12 |
| | Class IR | | | 27.78 | | | 23.77 | | 1/31/12 |
| | | Class R | | | 27.11 | | | 23.14 | | 1/31/12 |
| | 3 | | The Standardized Total Returns are cumulative total returns as of the most recent calendar quarter-end. They assume reinvestment of all distributions at NAV. These returns reflect a maximum initial sales charge of 5.5% for Class A Shares and the assumed contingent deferred sales charge for Class C Shares (1% if redeemed within 12 months of purchase). Because Institutional, Class IR and Class R Shares do not involve a sales charge, such a charge is not applied to their Standardized Total Returns. |
The returns set forth in the tables above represent past performance. Past performance does not guarantee future results. The Fund’s investment return and principal value will fluctuate so that an investor’s shares, when redeemed, may be worth more or less than their original cost. Current performance may be lower or higher than the performance quoted above. Please visit our web site at www.GSAMFUNDS.com to obtain the most recent month-end returns. Performance reflects applicable fee waivers and/or expense limitations in effect during the periods shown. In their absence, performance would be reduced. Returns do not reflect the deduction of taxes that a shareholder would pay on Fund distributions or the redemption of Fund shares.
27
FUND BASICS
| | | | | | | | | | |
| | EXPENSE RATIOS4 | | | | | | | | |
| | | | | Net Expense Ratio (Current) | | | Gross Expense Ratio (Before Waivers) | |
| | Class A | | | 1.24 | % | | | 6.12 | % |
| | Class C | | | 1.99 | | | | 6.91 | |
| | Institutional | | | 0.84 | | | | 4.59 | |
| | Class IR | | | 1.00 | | | | 6.58 | |
| | | Class R | | | 1.49 | | | | 7.08 | |
| | 4 | | The expense ratios of the Fund, both current (net of applicable fee waivers and/or expense limitations) and before waivers (gross of applicable fee waivers and/or expense limitations) are as set forth above according to the most recent publicly available Prospectus for the Fund and may differ from the expense ratios disclosed in the Financial Highlights in this report. The Fund’s waivers and/or expense limitations will remain in place through at least December 29, 2014, and prior to such date the investment adviser may not terminate the arrangements without the approval of the Fund’s Board of Trustees. If these arrangements are discontinued in the future, the expense ratios may change without shareholder approval. |
| | | | | | | | |
| | TOP TEN HOLDINGS AS OF 2/28/145 |
| | | Holding | | % of Net Assets | | | Line of Business |
| | CBRE Group, Inc. Class A | | | 5.7 | % | | Real Estate Management & Development |
| | QUALCOMM, Inc. | | | 5.5 | | | Communications Equipment |
| | PVH Corp. | | | 5.4 | | | Textiles, Apparel & Luxury Goods |
| | Google, Inc. Class A | | | 5.1 | | | Internet Software & Services |
| | Equinix, Inc. | | | 5.0 | | | Internet Software & Services |
| | Yum! Brands, Inc. | | | 4.8 | | | Hotels, Restaurants & Leisure |
| | eBay, Inc. | | | 4.7 | | | Internet Software & Services |
| | EMC Corp. | | | 4.7 | | | Computers & Peripherals |
| | American Tower Corp. | | | 4.6 | | | Real Estate Investment Trusts |
| | | NIKE, Inc. Class B | | | 4.5 | | | Textiles, Apparel & Luxury Goods |
| | 5 | | The top 10 holdings may not be representative of the Fund’s future investments. |
28
FUND BASICS
| | | | |
| FUND VS. BENCHMARK SECTOR ALLOCATIONS6 |
| As of February 28, 2014 |
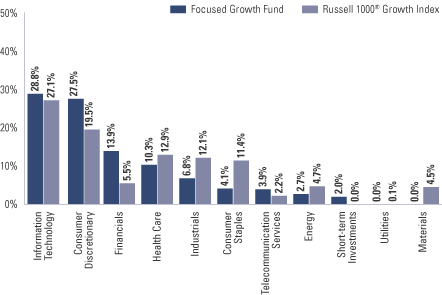
| | 6 | | The Fund is actively managed and, as such, its composition may differ over time. Consequently, the Fund’s overall sector allocations may differ from the percentages contained in the graph above. The graph categorizes investments using the Global Industry Classification Standard (“GICS”), however, the sector classifications used by the portfolio management team may differ from GICS. The percentage shown for each investment category reflects the value of investments in that category as a percentage of market value. Short-term investments represent repurchase agreements. The graph depicts the Fund’s investments but may not represent the Fund’s market exposure due to the exclusion of certain derivatives, if any, as listed in the Additional Investment Information section of the Schedule of Investments. |
29
PORTFOLIO RESULTS
Goldman Sachs Growth Opportunities Fund
Portfolio Composition
The Fund invests primarily in medium-sized growth companies with a market capitalization between $1 and $10 billion. Since the Fund’s inception, the Goldman Sachs Growth Equity Investment Team has focused on several key investment criteria that it believes can drive a company’s growth over the long term. These characteristics are: dominant market share, established brand name, pricing power, recurring revenue stream, free cash flow, high returns on invested capital, predictable growth, sustainable growth, long product life cycle, enduring competitive advantage, favorable demographic trends and excellent management. The Team strives to purchase these companies at reasonable valuations in order to capture the full benefits of their growth.
Portfolio Management Discussion and Analysis
Below, the Goldman Sachs Growth Equity Investment Team discusses the Goldman Sachs Growth Opportunities Fund’s (the “Fund”) performance and positioning for the six-month period ended February 28, 2014 (the “Reporting Period”).
| Q | | How did the Fund perform during the Reporting Period? |
| A | | During the Reporting Period, the Fund’s Class A, B, C, Institutional, Service, IR and R Shares generated cumulative total returns, without sales charges, of 17.25%, 16.78%, 16.79%, 17.45%, 17.16%, 17.38% and 17.05%, respectively. These returns compare to the 18.08% cumulative total return of the Fund’s benchmark, the Russell Midcap® Growth Index (with dividends reinvested) (the “Russell Index”), during the same period. |
| Q | | What key factors were responsible for the Fund’s performance during the Reporting Period? |
| A | | The Fund generated double-digit absolute gains, but both stock selection and sector allocation overall detracted from its performance relative to the Russell Index during the Reporting Period. |
| Q | | Which equity market sectors most significantly affected Fund performance? |
| A | | Detracting most from the Fund’s relative results was challenging stock selection in the industrials, health care and consumer discretionary sectors. Effective stock selection in the consumer staples, information technology and energy sectors helped the Fund’s performance most relative to the Russell Index. |
| Q | | Which stocks detracted significantly from the Fund’s performance during the Reporting Period? |
| A | | Detracting most from the Fund’s results relative to its benchmark index were positions in oncology-focused pharmaceuticals company ARIAD Pharmaceuticals, global clothing manufacturer PVH and health care revenue enhancement and recovery services provider HMS Holdings. |
| | ARIAD Pharmaceuticals, a biopharmaceutical company focused on the discovery, development and commercialization of small-molecule drugs for the treatment of cancer, was a top detractor from performance. The company has developed two drug assets, one approved for chronic myeloid leukemia (“CML”) and the other a lung cancer drug still in development. During the fourth quarter of 2013, ARIAD Pharmaceutical’s stock declined after the Food & Drug Administration (“FDA”) placed a partial clinical hold on enrollment in all trials of Iclusig, the company’s approved CML drug, due to the risk of blood clots among participants. Subsequently, the company halted the phase 3 trial and active marketing of Iclusig. Given the unexpected material setback, we exited the Fund’s position in favor of other opportunities with what we considered to be more attractive risk/return profiles. |
| | Shares of PVH declined as the company provided softer than expected earnings guidance for 2013 and 2014 given management’s cautious views on the global economy and global apparel sales, a headwind experienced by many retailers at the end of 2013. As a result, there were concerns that retail inventory levels were high, which may lead retailers to delay orders for PVH’s clothing. We believe this |
30
PORTFOLIO RESULTS
| | dynamic is transient in nature and is an industry-wide issue as opposed to specific to PVH. In addition, unexpected expenses related to its Warnaco Group acquisition, which closed earlier in 2013, were a key factor in its guidance. At the end of the Reporting Period, we believed PVH remained one of the best positioned names in the industry, given we |
| | expect it to reap benefits from its Warnaco Group acquisition and to benefit from its disproportionately large exposure to a recovery in Europe. In addition, we believe that should PVH’s higher margin brands, like Tommy Hilfiger and Calvin Klein, grow faster than PVH’s heritage business, as we anticipate, the company’s operating profit growth may accelerate meaningfully. |
| | HMS Holdings was a top detractor from the Fund’s relative results during the Reporting Period. Along with unfavorable fourth quarter 2013 earnings, there was significant uncertainty surrounding the status of the re-procurement of its large existing contract with Medicare. We believe lingering headwinds were due to negative news surrounding how Medicare was limiting the opportunity under the existing contract and that the actual awarding of the new contract was being dragged out. However, at the end of the Reporting Period, we remained positive on the company’s base business and felt the stock was discounting the full loss of its existing Medicare contract. If HMS Holdings were to retain the contract or win a larger portion of the opportunity, we believe we would see meaningful upside in the company’s earnings power and share price. |
| Q | | What were some of the Fund’s best-performing individual stocks? |
| A | | The Fund benefited most relative to the Russell Index from positions in specialty coffee and coffeemakers company Green Mountain Coffee Roasters, Internet radio service provider Pandora Media and fast-casual restaurant operator Chipotle Mexican Grill. |
| | Shares of Green Mountain Coffee Roasters, a new purchase for the Fund during the Reporting Period, gained after the announcement that Coca-Cola would purchase a 10% stake in the company, while additionally entering into a 10-year agreement to explore producing Coca-Cola products for use with its Keurig Cold beverage system. The company also benefited from recent exposure to Starbucks, Dunkin Donuts, Folgers and Costco brands along with a new sustainable business structure that segments U.S. and Canada operations. With positive free cash flows and strong earnings quality, we believe the company has a solid long-term growth opportunity, competitive margins, improving return on invested capital and a credible management team and board. (As of March 10, 2014, Green Mountain Coffee Roasters changed its company name to Keurig Green Mountain.) |
| | The strong performance of Pandora Media was driven in part by strong growth in key audience metrics, including listener hours, share of total U.S. radio listening and number of active listeners. The company’s stock was further bolstered by the announcement of a new chief executive officer. Pandora Media also announced it would begin rolling out in-car advertising in the first quarter of 2014. In our view, the company is well positioned to monetize mobile and gain market share within the terrestrial radio market, as its active user base continues to grow. We believe the company’s differentiated business model, strong brand recognition and first-mover advantage, along with a continued shift to online advertising, should also help support growth. |
| | Chipotle Mexican Grill contributed positively to the Fund’s relative performance during the Reporting Period. Despite reporting third quarter 2013 earnings slightly below consensus, same-store sales growth exceeded expectations due to the roll-out of catering, better customer throughput during peak periods, increased advertising and the introduction of a new menu item, Sofritas (braised tofu). We expect the company to raise its prices in 2014, which should benefit same-store sales growth and margins going forward. We believe that Chipotle Mexican Grill is a high quality growth franchise with an attractive business model, effective management and strong brand recognition. At the end of the Reporting Period, we also believed the company was well positioned for long-term growth by increasing same-store sales and expanding its domestic and international store count. |
31
PORTFOLIO RESULTS
| Q | | How did the Fund use derivatives and similar instruments during the Reporting Period? |
| A | | During the Reporting Period, we did not use derivatives as part of an active management strategy. |
| Q | | Did the Fund make any significant purchases or sales during the Reporting Period? |
| A | | We established a Fund position in professional networking website LinkedIn. We believe LinkedIn has an attractive growth runway and that its website and content provide an example of disruptive technology that is early in its life cycle. (Disruptive technology is defined as new ways of doing things that disrupt or overturn traditional business methods and practices.) While the stock may not appear overly inexpensive on a number of valuation metrics, we believe it warrants a premium valuation, as the company could continue to exceed earnings expectations should it capture additional subscribers and develop its platform as we anticipate. |
| | We initiated a Fund position in teen clothing and accessory discount retailer Five Below. This decision followed a third quarter 2013 earnings report that was below expectations, and we felt consequent selling pressure gave us an opportunity to establish the position at an attractive entry point. We took advantage of forward guidance that disappointed the market, especially for same-store sales growth that was in line with the company’s long-term target. We view this company as a high potential, early stage retailer. Five Below describes itself as the “five and dime for the iPhone generation.” Its dollar store-like concept and teenage target customer are differentiated in the retail industry, and we do not know of a competitor that shares its positioning. While its massive square footage growth is key to the opportunity, we also believe its margins have ample room to move higher, potentially driving earnings growth in excess of sales growth should be the business gain scale. |
| | Conversely, we exited the Fund’s position in Salesforce.com, a provider of enterprise cloud computing and social enterprise solutions. While we remain positive on the fundamentals of the company, given the stock’s strong performance in 2013, we decided to reallocate capital to opportunities with what we considered to have more attractive risk/reward profiles. |
| | We sold the Fund’s position in Pioneer Natural Resources, an independent oil and gas exploration and production company focused on onshore U.S. properties, primarily in the Permian and Eagle Ford basins. The company had reported mixed fourth quarter 2013 results. In our view, the company’s valuation seemed less attractive by the end of the Reporting Period, and we decided to exit the position in favor of higher conviction ideas. |
| Q | | Were there any notable changes in the Fund’s weightings during the Reporting Period? |
| A | | In constructing the Fund’s portfolio, we focus on picking stocks rather than on making industry or sector bets. We seek to outpace the benchmark index by overweighting stocks that we expect to outperform and underweighting those that we think may lag. Consequently, changes in its sector weights are generally the direct result of individual stock selection or of stock appreciation or depreciation. That said, during the Reporting Period, the Fund’s exposure to consumer discretionary and health care increased and its allocations to financials and information technology decreased relative to the Russell Index. |
| Q | | How was the Fund positioned relative to its benchmark index at the end of February 2014? |
| A | | At the end of February 2014, the Fund had overweighted positions relative to the Russell Index in the health care, telecommunication services and financials sectors. On the same date, the Fund had underweighted positions compared to the Russell Index in industrials, information technology, consumer discretionary and consumer staples. The Fund was rather neutrally weighted to the Index in energy and materials and had no position at all in utilities on February 28, 2014. |
| Q | | Were there any changes to the Fund’s portfolio management team during the Reporting Period? |
| A | | There were no changes to the Fund’s portfolio management team during the Reporting Period. |
32
FUND BASICS
Growth Opportunities Fund
as of February 28, 2014
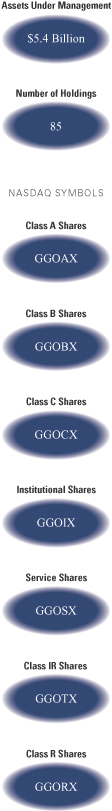
| | | | | | | | | | |
| | PERFORMANCE REVIEW | | | | | | | | |
| | | September 1, 2013–February 28, 2014 | | Fund Total Return
(based on NAV)1 | | | Russell Midcap®
Growth Index2 | |
| | Class A | | | 17.25 | % | | | 18.08 | % |
| | Class B | | | 16.78 | | | | 18.08 | |
| | Class C | | | 16.79 | | | | 18.08 | |
| | Institutional | | | 17.45 | | | | 18.08 | |
| | Service | | | 17.16 | | | | 18.08 | |
| | Class IR | | | 17.38 | | | | 18.08 | |
| | | Class R | | | 17.05 | | | | 18.08 | |
| | 1 | | The net asset value (“NAV”) represents the net assets of the class of the Fund (ex-dividend) divided by the total number of shares of the class outstanding. The Fund’s performance reflects the reinvestment of dividends and other distributions. The Fund’s performance does not reflect the deduction of any applicable sales charges. |
| | 2 | | The Russell Midcap® Growth Index (with dividends reinvested) is an unmanaged market capitalization weighted index that measures the performance of those Russell Midcap companies with higher price-to-book ratios and higher forecasted growth values. The Index figures do not reflect any deduction for fees, expenses or taxes. It is not possible to invest directly in an index. |
| | | | | | | | | | | | | | | | | | |
| | STANDARDIZED TOTAL RETURNS3 |
| | | For the period ended 12/31/13 | | One Year | | | Five Years | | Ten Years | | | Since Inception | | | Inception Date |
| | Class A | | | 24.59 | % | | 21.61% | | | 9.32 | % | | | 11.31% | | | 5/24/99 |
| | Class B | | | 25.39 | | | 21.84 | | | 9.27 | | | | 11.34 | | | 5/24/99 |
| | Class C | | | 29.74 | | | 22.07 | | | 9.12 | | | | 10.92 | | | 5/24/99 |
| | Institutional | | | 32.38 | | | 23.48 | | | 10.38 | | | | 12.19 | | | 5/24/99 |
| | Service | | | 31.67 | | | 22.87 | | | 9.83 | | | | 11.63 | | | 5/24/99 |
| | Class IR | | | 32.17 | | | 23.29 | | | N/A | | | | 9.54 | | | 11/30/07 |
| | | Class R | | | 31.51 | | | 22.69 | | | N/A | | | | 9.01 | | | 11/30/07 |
| | 3 | | The Standardized Total Returns are average annual total returns as of the most recent calendar quarter-end. They assume reinvestment of all distributions at NAV. These returns reflect a maximum initial sales charge of 5.5% for Class A Shares and the assumed contingent deferred sales charge for Class B Shares (5% maximum declining to 0% after six years) and the assumed contingent deferred sales charge for Class C Shares (1% if redeemed within 12 months of purchase). Class B Shares convert to Class A Shares on or about the fifteenth day of the last month of the calendar year that is eight years after purchase. Returns for Class B Shares for the period after the conversion reflect the performance of Class A Shares. Because Institutional, Service, Class IR and Class R Shares do not involve a sales charge, such a charge is not applied to their Standardized Total Returns. The Fund’s Class B Shares are no longer available for purchase by new or existing shareholders (although current Class B shareholders may continue to reinvest income and capital gains distributions into Class B Shares, and Class B shareholders may continue to exchange their shares for Class B Shares of certain other Goldman Sachs Funds). |
The returns set forth in the tables above represent past performance. Past performance does not guarantee future results. The Fund’s investment return and principal value will fluctuate so that an investor’s shares, when redeemed, may be worth more or less than their original cost. Current performance may be lower or higher than the performance quoted above. Please visit our web site at www.GSAMFUNDS.com to obtain the most recent month-end returns. Performance reflects applicable fee waivers and/or expense limitations in effect during the periods shown. In their absence, performance would be reduced. Returns do not reflect the deduction of taxes that a shareholder would pay on Fund distributions or the redemption of Fund shares.
33
FUND BASICS
| | | | | | | | | | |
| | EXPENSE RATIOS4 | |
| | | | | Net Expense Ratio (Current) | | | Gross Expense Ratio (Before Waivers) | |
| | Class A | | | 1.35 | % | | | 1.41 | % |
| | Class B | | | 2.10 | | | | 2.16 | |
| | Class C | | | 2.10 | | | | 2.16 | |
| | Institutional | | | 0.95 | | | | 1.01 | |
| | Service | | | 1.45 | | | | 1.51 | |
| | Class IR | | | 1.10 | | | | 1.16 | |
| | | Class R | | | 1.60 | | | | 1.66 | |
| | 4 | | The expense ratios of the Fund, both current (net of applicable fee waivers and/or expense limitations) and before waivers (gross of applicable fee waivers and/or expense limitations) are as set forth above according to the most recent publicly available Prospectus for the Fund and may differ from the expense ratios disclosed in the Financial Highlights in this report. The Fund’s waivers and/or expense limitations will remain in place through at least December 29, 2014, and prior to such date the investment adviser may not terminate the arrangements without the approval of the Fund’s Board of Trustees. If these arrangements are discontinued in the future, the expense ratios may change without shareholder approval. |
| | | | | | | | |
| | TOP TEN HOLDINGS AS OF 2/28/145 |
| | | Holding | | % of Net Assets | | | Line of Business |
| | CBRE Group, Inc. Class A | | | 2.6 | % | | Real Estate Management & Development |
| | SBA Communications Corp. Class A | | | 2.5 | | | Wireless Telecommunication Services |
| | Dollar General Corp. | | | 2.3 | | | Multiline Retail |
| | Equinix, Inc. | | | 2.2 | | | Internet Software & Services |
| | C.R. Bard, Inc. | | | 2.2 | | | Health Care Equipment & Supplies |
| | Xilinx, Inc. | | | 2.1 | | | Semiconductors & Semiconductor
Equipment |
| | Agilent Technologies, Inc. | | | 2.0 | | | Life Sciences Tools & Services |
| | Sensata Technologies Holding NV | | | 2.0 | | | Electrical Equipment |
| | PVH Corp. | | | 2.0 | | | Textiles, Apparel & Luxury Goods |
| | | L Brands, Inc. | | | 1.9 | | | Specialty Retail |
| | 5 | | The top 10 holdings may not be representative of the Fund’s future investments. |
34
FUND BASICS
| | | | |
| FUND VS. BENCHMARK SECTOR ALLOCATIONS6 |
| As of February 28, 2014 |
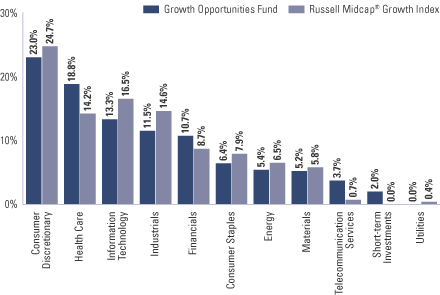
| | 6 | | The Fund is actively managed and, as such, its composition may differ over time. Consequently, the Fund’s overall sector allocations may differ from the percentages contained in the graph above. The graph categorizes investments using the Global Industry Classification Standard (“GICS”), however, the sector classifications used by the portfolio management team may differ from GICS. The percentage shown for each investment category reflects the value of investments in that category as a percentage of market value. Short-term investments represent repurchase agreements. The graph depicts the Fund’s investments but may not represent the Fund’s market exposure due to the exclusion of certain derivatives, if any, as listed in the Additional Investment Information section of the Schedule of Investments. |
35
PORTFOLIO RESULTS
Goldman Sachs Small/Mid Cap Growth Fund
Portfolio Composition
The Fund invests primarily in small and medium sized growth companies. These companies have public stock market capitalizations within the outside range of the market capitalizations of companies constituting the Russell 2000® Growth Index and the Russell Midcap® Growth Index (as of February 28, 2014, the outside capitalization range of these companies was between $47 million and $27.5 billion). Since the Fund’s inception, the Goldman Sachs Growth Equity Investment Team has focused on several key investment criteria that it believes can drive a company’s growth over the long term. These characteristics are: dominant market share, established brand name, pricing power, recurring revenue stream, free cash flow, high returns on invested capital, predictable growth, sustainable growth, long product life cycle, enduring competitive advantage, favorable demographic trends and excellent management. The Team strives to purchase these companies at reasonable valuations in order to capture the full benefits of their growth.
Portfolio Management Discussion and Analysis
Below, the Goldman Sachs Growth Equity Investment Team discusses the Goldman Sachs Small/Mid Cap Growth Fund’s (the “Fund”) performance and positioning for the six-month period ended February 28, 2014 (the “Reporting Period”).
| Q | | How did the Fund perform during the Reporting Period? |
| A | | During the Reporting Period, the Fund’s Class A, B, C, Institutional, Service, IR and R Shares generated cumulative total returns, without sales charges, of 16.84%, 16.43%, 16.44%, 17.08%, 16.74%, 17.00% and 16.71%, respectively. These returns compare to the 19.17% cumulative total return of the Fund’s benchmark, the Russell 2500® Growth Index (with dividends reinvested) (the “Russell Index”), during the same period. |
| Q | | What key factors were responsible for the Fund’s performance during the Reporting Period? |
| A | | The Fund generated double-digit absolute gains, but stock selection as a whole detracted from the Fund’s results. Sector allocation overall also detracted from its performance relative to the Russell Index during the Reporting Period, albeit more modestly. |
| Q | | Which equity market sectors most significantly affected Fund performance? |
| A | | Challenging stock selection in industrials, health care and information technology detracted from the Fund’s relative results most during the Reporting Period. Having an underweighted allocation to the industrials sector, which outpaced the Russell Index during the Reporting Period, also hurt. Effective stock selection in the financials and consumer discretionary sectors helped the Fund’s performance most relative to the Russell Index. |
| Q | | Which stocks detracted significantly from the Fund’s performance during the Reporting Period? |
| A | | Detracting most from the Fund’s results relative to its benchmark index were positions in oncology-focused pharmaceuticals company ARIAD Pharmaceuticals, tile manufacturer Tile Shop Holdings and communications access systems and software provider Calix. |
| | ARIAD Pharmaceuticals, a biopharmaceutical company focused on the discovery, development and commercialization of small-molecule drugs for the treatment of cancer, was a top detractor from performance. The company has developed two drug assets, one approved for chronic myeloid leukemia (“CML”) and the other a lung cancer drug still in development. During the fourth quarter of 2013, ARIAD Pharmaceutical’s stock declined after the Food & Drug Administration (“FDA”) placed a partial clinical hold on enrollment in all trials of Iclusig, the company’s approved CML drug, due to the risk of blood clots among participants. Subsequently, the company halted the phase 3 trial and active marketing of Iclusig. Given the unexpected material setback, we exited the Fund’s position in favor of other opportunities with what we considered to be more attractive risk/return profiles. |
36
PORTFOLIO RESULTS
| | Shares of Tile Shop Holdings declined dramatically in November 2013 following allegations of fraud at the company. The allegations are that Tile Shop Holdings has been acquiring material amounts of product from a Chinese supplier that was owned and operated by the brother-in-law of the company’s chief executive officer. This relationship had not been disclosed, and the company has allegedly been using this business arrangement to manipulate earnings. While we believe the stock reaction may have been exaggerated, we decided to sell out of the Fund’s position as we believe this news called the company’s management into question. |
| | Calix is a provider of broadband communications access systems and software for network architectures that enable communications service providers to connect their residential and business subscribers. The year 2013 was a difficult one for telecommunication spending, and the company’s shares were weak as a result. However, we believe this industry weakness is a short-term issue, and Calix remains well positioned, in our view, for market share gains, as we expect more telecommunication operators to invest in their broadband networks as they upgrade to the higher speeds that consumers demand. |
| Q | | What were some of the Fund’s best-performing individual stocks? |
| A | | The Fund benefited most relative to the Russell Index from positions in Internet radio service provider Pandora Media, premium fashion brand designer and marketer Kate Spade and clinical stage biopharmaceutical company Synageva BioPharma. |
| | The strong performance of Pandora Media was driven in part by strong growth in key audience metrics, including listener hours, share of total U.S. radio listening and number of active listeners. The company’s stock was further bolstered by the announcement of a new chief executive officer. Pandora Media also announced it would begin rolling out in-car advertising in the first quarter of 2014. In our view, the company is well positioned to monetize mobile and gain market share within the terrestrial radio market, as its active user base continues to grow. We believe the company’s differentiated business model, strong brand recognition and first-mover advantage, along with a continued shift to online advertising, should also help support growth. |
| | Kate Spade, formerly Fifth & Pacific Companies, was a strong performer during the Reporting Period. The company has a portfolio of retail-based premium fashion brands, and the stock was boosted by an impressive set of third quarter 2013 earnings driven largely by growth in its flagship brand, Kate Spade. In addition, investors reacted positively as the company finalized the sale of its Juicy Couture brand and announced the sale of another one of its non-core brands, Lucky Brand Jeans. We believe these sales should benefit Kate Spade and allow it to focus on its core Kate Spade brand. |
| | Shares of Synageva BioPharma performed well on the back of positive clinical data points for its lead orphan disease drug to treat patients with lysosomal acid lipase deficiency. In addition, the company is advancing its pipeline of products addressing a variety of other orphan diseases, providing a number of other avenues for potential revenue growth. (An orphan disease is defined as a rare disease that affects fewer than 200,000 individuals in the U.S.) |
| Q | | How did the Fund use derivatives and similar instruments during the Reporting Period? |
| A | | During the Reporting Period, we did not use derivatives as part of an active management strategy. |
| Q | | Did the Fund make any significant purchases or sales during the Reporting Period? |
| A | | During the Reporting Period, we initiated a Fund position in Norwegian Cruise Line Holdings, a global cruise line operator. We believe the company is the fastest growing cruise operator with the highest visibility yet is one of the most attractively valued. Norwegian Cruise Line Holdings has a relatively young fleet and is adding new, more efficient ships to its fleet, which we believe should drive growth and improve margins over the next few years. In addition, the company has a strong management team, in our view, which is focused on increasing margins and returns. |
| | We established a Fund position in Guidewire Software, a company in the software industry that manages property and casualty insurance premiums through its claims, policy and billing software. We believe Guidewire Software is well positioned for growth, as insurers start to modernize legacy core systems they have in place. In our opinion, Guidewire Software has an attractive recurring revenue business model, as it sells term licenses. |
| | Conversely, we sold the Fund’s position in Lazard, a financial advisory and asset management company. The stock had performed well, as the market had appreciated the improving margins of the business. However, we grew concerned about some of the fundamentals of the business, in |
37
PORTFOLIO RESULTS
| | particular about the risk of outflows from some of its funds given some challenging performance. Therefore, we decided to reallocate capital to opportunities with what we believed were more attractive risk/reward profiles. |
| | We exited the Fund’s position in MICROS Systems, a software provider for the restaurant and hospitality industries. While we believe the company fundamentals remain healthy, the stock performed well in 2013, and so we sold out in favor of higher conviction ideas. |
| Q | | Were there any notable changes in the Fund’s weightings during the Reporting Period? |
| A | | In constructing the Fund’s portfolio, we focus on picking stocks rather than on making industry or sector bets. We seek to outpace the benchmark index by overweighting stocks that we expect to outperform and underweighting those that we think may lag. Consequently, changes in its sector weights are generally the direct result of individual stock selection or of stock appreciation or depreciation. That said, during the Reporting Period, the Fund’s exposure to consumer discretionary increased and its allocation to energy decreased relative to the Russell Index. |
| Q | | How was the Fund positioned relative to its benchmark index at the end of February 2014? |
| A | | At the end of February 2014, the Fund had overweighted positions relative to the Russell Index in the consumer discretionary, telecommunication services, financials, energy and health care sectors. On the same date, the Fund had underweighted positions compared to the Russell Index in materials, information technology and industrials. The Fund was rather neutrally weighted to the Russell Index in consumer staples and had no position at all in utilities on February 28, 2014. |
| Q | | Were there any changes to the Fund’s portfolio management team during the Reporting Period? |
| A | | There were no changes to the Fund’s portfolio management team during the Reporting Period. |
38
FUND BASICS
Small/Mid Cap Growth Fund
as of February 28, 2014
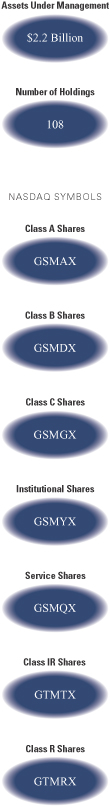
| | | | | | | | | | |
| | PERFORMANCE REVIEW | |
| | | September 1, 2013–February 28, 2014 | | Fund Total Return (based on NAV)1 | | | Russell 2500® Growth Index2 | |
| | Class A | | | 16.84 | % | | | 19.17 | % |
| | Class B | | | 16.43 | | | | 19.17 | |
| | Class C | | | 16.44 | | | | 19.17 | |
| | Institutional | | | 17.08 | | | | 19.17 | |
| | Service | | | 16.74 | | | | 19.17 | |
| | Class IR | | | 17.00 | | | | 19.17 | |
| | | Class R | | | 16.71 | | | | 19.17 | |
| | 1 | | The net asset value (“NAV”) represents the net assets of the class of the Fund (ex-dividend) divided by the total number of shares of the class outstanding. The Fund’s performance reflects the reinvestment of dividends and other distributions. The Fund’s performance does not reflect the deduction of any applicable sales charges. |
| | 2 | | The Russell 2500® Growth Index (with dividends reinvested) is an unmanaged index that measures the performance of the small- to mid-cap growth segment of the US equity universe. The Russell 2500® Growth Index is constructed to provide a comprehensive and unbiased barometer of the small- to mid-cap growth market. Based on ongoing empirical research of investment manager behavior, the methodology used to determine growth probability approximates the aggregate small- to mid-cap growth manager’s opportunity set. The Index figures do not reflect any deduction for fees, expenses or taxes. It is not possible to invest directly in an index. |
| | | | | | | | | | | | |
| | STANDARDIZED TOTAL RETURNS3 |
| | | For the period ended 12/31/13 | | One Year | | | Five Years | | Since Inception | | Inception Date |
| | Class A | | | 28.09 | % | | 23.23% | | 10.88% | | 6/30/05 |
| | Class B | | | 29.31 | | | 23.52 | | 10.79 | | 6/30/05 |
| | Class C | | | 33.55 | | | 23.71 | | 10.74 | | 6/30/05 |
| | Institutional | | | 36.06 | | | 25.13 | | 12.02 | | 6/30/05 |
| | Service | | | 35.41 | | | 24.52 | | 11.45 | | 6/30/05 |
| | Class IR | | | 35.87 | | | 24.96 | | 10.69 | | 11/30/07 |
| | | Class R | | | 35.24 | | | 24.35 | | 10.15 | | 11/30/07 |
| | 3 | | The Standardized Total Returns are average annual total returns as of the most recent calendar quarter-end. They assume reinvestment of all distributions at NAV. These returns reflect a maximum initial sales charge of 5.5% for Class A Shares and the assumed contingent deferred sales charge for Class B Shares (5% maximum declining to 0% after six years) and the assumed contingent deferred sales charge for Class C Shares (1% if redeemed within 12 months of purchase). Class B Shares convert to Class A Shares on or about the fifteenth day of the last month of the calendar year that is eight years after purchase. Returns for Class B Shares for the period after the conversion reflect the performance of Class A Shares. Because Institutional, Service, Class IR and Class R Shares do not involve a sales charge, such a charge is not applied to their Standardized Total Returns. The Fund’s Class B Shares are no longer available for purchase by new or existing shareholders (although current Class B shareholders may continue to reinvest income and capital gains distributions into Class B Shares, and Class B shareholders may continue to exchange their shares for Class B Shares of certain other Goldman Sachs Funds). |
The returns set forth in the tables above represent past performance. Past performance does not guarantee future results. The Fund’s investment return and principal value will fluctuate so that an investor’s shares, when redeemed, may be worth more or less than their original cost. Current performance may be lower or higher than the performance quoted above. Please visit our web site at www.GSAMFUNDS.com to obtain the most recent month-end returns. Performance reflects applicable fee waivers and/or expense limitations in effect during the periods shown. In their absence, performance would be reduced. Returns do not reflect the deduction of taxes that a shareholder would pay on Fund distributions or the redemption of Fund shares.
39
FUND BASICS
| | | | | | | | | | |
| | EXPENSE RATIOS4 | |
| | | | | Net Expense Ratio (Current) | | | Gross Expense Ratio (Before Waivers) | |
| | Class A | | | 1.34 | % | | | 1.49 | % |
| | Class B | | | 2.09 | | | | 2.24 | |
| | Class C | | | 2.09 | | | | 2.24 | |
| | Institutional | | | 0.94 | | | | 1.09 | |
| | Service | | | 1.44 | | | | 1.59 | |
| | Class IR | | | 1.09 | | | | 1.24 | |
| | | Class R | | | 1.59 | | | | 1.74 | |
| | 4 | | The expense ratios of the Fund, both current (net of applicable fee waivers and/or expense limitations) and before waivers (gross of applicable fee waivers and/or expense limitations) are as set forth above according to the most recent publicly available Prospectus for the Fund and may differ from the expense ratios disclosed in the Financial Highlights in this report. The Fund’s waivers and/or expense limitations will remain in place through at least December 29, 2014, and prior to such date the investment adviser may not terminate the arrangements without the approval of the Fund’s Board of Trustees. If these arrangements are discontinued in the future, the expense ratios may change without shareholder approval. |
| | | | | | | | |
| | TOP TEN HOLDINGS AS OF 2/28/145 |
| | | Holding | | % of Net Assets | | | Line of Business |
| | CBRE Group, Inc. Class A | | | 2.2 | % | | Real Estate Management & Development |
| | Healthcare Services Group, Inc. | | | 2.0 | | | Commercial Services & Supplies |
| | SBA Communications Corp. Class A | | | 1.9 | | | Wireless Telecommunication Services |
| | Graco, Inc. | | | 1.9 | | | Machinery |
| | Kate Spade & Co. | | | 1.9 | | | Textiles, Apparel & Luxury Goods |
| | Sensata Technologies Holding NV | | | 1.8 | | | Electrical Equipment |
| | Dril-Quip, Inc. | | | 1.8 | | | Energy Equipment & Services |
| | The Hain Celestial Group, Inc. | | | 1.7 | | | Food Products |
| | FleetCor Technologies, Inc. | | | 1.7 | | | IT Services |
| | | PVH Corp. | | | 1.6 | | | Textiles, Apparel & Luxury Goods |
| | 5 | | The top 10 holdings may not be representative of the Fund’s future investments. |
40
FUND BASICS
| | | | |
| FUND VS. BENCHMARK SECTOR ALLOCATIONS6 |
| As of February 28, 2014 |
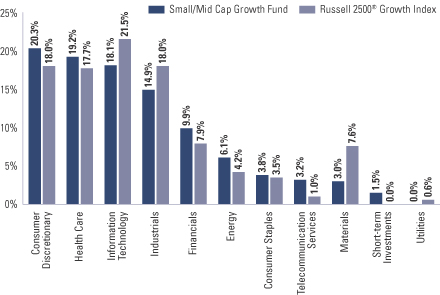
| | 6 | | The Fund is actively managed and, as such, its composition may differ over time. Consequently, the Fund’s overall sector allocations may differ from the percentages contained in the graph above. The graph categorizes investments using the Global Industry Classification Standard (“GICS”), however, the sector classifications used by the portfolio management team may differ from GICS. The percentage shown for each investment category reflects the value of investments in that category as a percentage of market value. Short-term investments represent repurchase agreements. The graph depicts the Fund’s investments but may not represent the Fund’s market exposure due to the exclusion of certain derivatives, if any, as listed in the Additional Investment Information section of the Schedule of Investments. |
41
PORTFOLIO RESULTS
Goldman Sachs Strategic Growth Fund
Portfolio Composition
The Fund invests primarily in U.S. equity investments. Since the Fund’s inception, the Goldman Sachs Growth Equity Investment Team has focused on several key investment criteria that it believes can drive a company’s growth over the long term. These characteristics are: dominant market share, established brand name, pricing power, recurring revenue stream, free cash flow, high returns on invested capital, predictable growth, sustainable growth, long product life cycle, enduring competitive advantage, favorable demographic trends and excellent management. The Team strives to purchase these companies at reasonable valuations in order to capture the full benefits of their growth.
Portfolio Management Discussion and Analysis
Below, the Goldman Sachs Growth Equity Investment Team discusses the Goldman Sachs Strategic Growth Fund’s
(the “Fund”) performance and positioning for the six-month period ended February 28, 2014 (the “Reporting Period”).
| Q | | How did the Fund perform during the Reporting Period? |
| A | | During the Reporting Period, the Fund’s Class A, B, C, Institutional, Service, IR and R Shares generated cumulative total returns, without sales charges, of 18.86%, 18.47%, 18.33%, 19.14%, 18.75%, 18.94% and 18.67%, respectively. These returns compare to the 17.84% cumulative total return of the Fund’s benchmark, the Russell 1000® Growth Index (with dividends reinvested) (the “Russell Index”), during the same period. |
| Q | | What key factors were responsible for the Fund’s performance during the Reporting Period? |
| A | | Stock selection overall contributed most to the Fund’s performance relative to the Russell Index during the Reporting Period. |
| Q | | Which equity market sectors most significantly affected Fund performance? |
| A | | Effective stock selection in the information technology and consumer staples sectors helped the Fund’s performance most relative to the Russell Index. Having an underweighted allocation to telecommunication services, which was the weakest sector in the Russell Index during the Reporting Period, also boosted relative results. Challenging stock selection in materials, health care and consumer discretionary detracted from the Fund’s relative results most during the Reporting Period. |
| Q | | What were some of the Fund’s best-performing individual stocks? |
| A | | The Fund benefited most relative to the Russell Index from positions in specialty coffee and coffeemakers company Green Mountain Coffee Roasters, leading Internet search and technology company Google and fast-casual restaurant operator Chipotle Mexican Grill. |
| | Shares of Green Mountain Coffee Roasters, a new purchase for the Fund during the Reporting Period, gained after the announcement that Coca-Cola would purchase a 10% stake in the company, while additionally entering into a 10-year agreement to explore producing Coca-Cola products for use with its Keurig Cold beverage system. The company also benefited from recent exposure to Starbucks, Dunkin Donuts, Folgers and Costco brands along with a new sustainable business structure that segments U.S. and Canada operations. With positive free cash flows and strong earnings quality, we believe the company has a solid long-term growth opportunity, competitive margins, improving return on invested capital and a credible management team and board. (As of March 10, 2014, Green Mountain Coffee Roasters changed its company name to Keurig Green Mountain.) |
| | Google was a top contributor to the Fund’s relative performance during the Reporting Period. Its shares rose after the company reported strong third and fourth quarter 2013 results, with revenue and earnings that exceeded consensus estimates, as Google Websites and Core Google posted strong operating profit growth. Its shares also reacted positively preceding the fourth quarter 2013 earnings release when Google announced it was selling Motorola Mobility to Lenovo. Additionally, strong performance may be attributed |
42
PORTFOLIO RESULTS
| | to its acquisition of Nest Labs, a smart-home technology company that manufactures Wi-Fi-enabled, self-learning, programmable thermostats and smoke detectors. At the end of the Reporting Period, Google continued to be the dominant search engine, and we believe the company remains well positioned to monetize online advertising and the shift to mobile. The company also continues to invest in new product initiatives outside of its core search business, which could offer future growth opportunities. In our view, Google’s stock at the end of the Reporting Period was trading at a reasonable valuation for what we consider to be a high quality franchise with a strong long-term growth profile. |
| | Chipotle Mexican Grill contributed positively to the Fund’s relative performance during the Reporting Period. Despite reporting third quarter 2013 earnings slightly below consensus, same-store sales growth exceeded expectations due to the roll-out of catering, better customer throughput during peak periods, increased advertising and the introduction of a new menu item, Sofritas (braised tofu). We expect the company to raise its prices in 2014, which should benefit same-store sales growth and margins going forward. We believe that Chipotle Mexican Grill is a high quality growth franchise with an attractive business model, effective management and strong brand recognition. At the end of the Reporting Period, we also believed the company was well positioned for long-term growth by increasing same-store sales and expanding its domestic and international store count. |
| Q | | Which stocks detracted significantly from the Fund’s performance during the Reporting Period? |
| A | | Detracting most from the Fund’s results relative to its benchmark index were positions in natural resources and production company Anadarko Petroleum, global clothing manufacturer PVH and wholesale club retailer Costco Wholesale. |
| | Anadarko Petroleum detracted from the Fund’s relative returns during the Reporting Period. Its shares declined following weak third quarter 2013 earnings and on a December 2013 ruling holding Anadarko Petroleum responsible for environmental and health claims related to Tronox, a chemical company subsidiary spun off by the company in 2005. We believe this setback is temporary, and our long-term investment thesis on the company remains unchanged. At the end of the Reporting Period, we believed Anadarko Petroleum was well positioned given its proven reserves, quality of asset portfolio and significant development opportunities. |
| | Shares of PVH declined as the company provided softer than expected earnings guidance for 2013 and 2014 given management’s cautious views on the global economy and global apparel sales, a headwind experienced by many retailers at the end of 2013. As a result, there were concerns that retail inventory levels were high, which may lead retailers to delay orders for PVH’s clothing. We believe this dynamic is transient in nature and is an industry-wide issue as opposed to specific to PVH. In addition, unexpected expenses related to its Warnaco Group acquisition, which closed earlier in 2013, were a key factor in its guidance. At the end of the Reporting Period, we believed PVH remained one of the best positioned names in the industry, given we expect it to reap benefits from its Warnaco Group acquisition and to benefit from its disproportionately large exposure to a recovery in Europe. In addition, we believe that should PVH’s higher margin brands, like Tommy Hilfiger and Calvin Klein, grow faster than PVH’s heritage business, as we anticipate, the company’s operating profit growth may accelerate meaningfully. |
| | Costco Wholesale detracted from the Fund’s relative results following two consecutive quarters of softer than expected earnings reports. Despite the near-term headwinds the company was facing, we remained positive on the company over the longer term. The annual membership fee charged by the company generates high margin recurring revenue while incentivizing members to shop at its stores. Membership renewal rates have remained high, even when the fees are raised. In our view, this shows that customers enjoy the shopping experience and value Costco Wholesale’s offering of bulk goods at attractive prices. At the end of the Reporting Period, we believed that Costco Wholesale’s ability to operate profitably outside the U.S. provides it with an opportunity to open new stores and drive continued earnings growth. |
43
PORTFOLIO RESULTS
| Q | | How did the Fund use derivatives and similar instruments during the Reporting Period? |
| A | | During the Reporting Period, we did not use derivatives as part of an active management strategy. |
| Q | | Did the Fund make any significant purchases or sales during the Reporting Period? |
| A | | We initiated a Fund position in EMC, a leading information storage technologies company. EMC is a market leader in storage hardware and has the opportunity, in our view, to continue to take share of a relatively fragmented market. We believe the company is well positioned to take advantage of future technological changes, as its forward-looking management team has a history of embracing and driving change. Shares of EMC significantly lagged the market during the Reporting Period, but we believe its depressed valuation, coupled with multiple potential growth drivers and disciplined capital allocation, support an attractive risk/ reward opportunity. |
| | We established a Fund position in YUM! Brands, which franchises and operates restaurants worldwide under well- known brands KFC, Pizza Hut, Taco Bell, Little Sheep and East Dawning. Its stock had recently lagged the overall market and its peers, providing what we considered to be an attractive entry point to start building a position in the company. In our view, same-store sales have likely bottomed and should improve from here. We believe YUM! Brands is a high quality company positioned well to grow earnings per share and has a strong history of growing return on invested capital and being a good steward of shareholder capital. |
| | Conversely, we sold the Fund’s position in electronic payment company MasterCard during the Reporting Period. The stock performed well in 2013, and, in our view, was subsequently valued at a premium based on relatively high forward expectations. We also believe consensus estimates did not account for any adverse regulatory changes that could occur in an electronic payments industry that is rapidly changing. Therefore, we decided to reallocate capital into what we considered to be more attractive risk/reward opportunities. |
| | We exited the Fund’s position in Salesforce.com, a provider of enterprise cloud computing and social enterprise solutions. While we remain positive on the fundamentals of the company, given the stock’s strong performance in 2013, we decided to reallocate capital to opportunities with what we considered to have more attractive risk/reward profiles. |
| Q | | Were there any notable changes in the Fund’s weightings during the Reporting Period? |
| A | | In constructing the Fund’s portfolio, we focus on picking stocks rather than on making industry or sector bets. We seek to outpace the benchmark index by overweighting stocks that we expect to outperform and underweighting those that we think may lag. Consequently, changes in its sector weights are generally the direct result of individual stock selection or of stock appreciation or depreciation. That said, during the Reporting Period, the Fund’s exposure to materials, consumer staples and health care increased and its allocations to information technology and energy decreased relative to the Russell Index. |
| Q | | How was the Fund positioned relative to its benchmark index at the end of February 2014? |
| A | | At the end of February 2014, the Fund had overweighted positions relative to the Russell Index in the financials and health care sectors. On the same date, the Fund had underweighted positions compared to the Russell Index in telecommunication services, materials, industrials and consumer staples. The Fund was rather neutrally weighted to the Russell Index in energy, information technology and consumer discretionary and had no position at all in utilities on February 28, 2014. |
| Q | | Were there any changes to the Fund’s portfolio management team during the Reporting Period? |
| A | | There were no changes to the Fund’s portfolio management team during the Reporting Period. |
44
FUND BASICS
Strategic Growth Fund
as of February 28, 2014
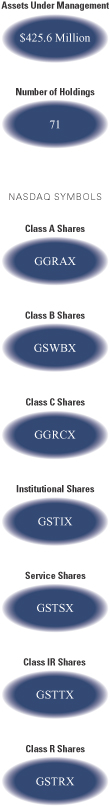
| | | | | | | | | | |
| | PERFORMANCE REVIEW | |
| | | September 1, 2013–February 28, 2014 | | Fund Total Return
(based on NAV)1 | | | Russell 1000®
Growth Index2 | |
| | Class A | | | 18.86 | % | | | 17.84 | % |
| | Class B | | | 18.47 | | | | 17.84 | |
| | Class C | | | 18.33 | | | | 17.84 | |
| | Institutional | | | 19.14 | | | | 17.84 | |
| | Service | | | 18.75 | | | | 17.84 | |
| | Class IR | | | 18.94 | | | | 17.84 | |
| | | Class R | | | 18.67 | | | | 17.84 | |
| | 1 | | The net asset value (“NAV”) represents the net assets of the class of the Fund (ex-dividend) divided by the total number of shares of the class outstanding. The Fund’s performance reflects the reinvestment of dividends and other distributions. The Fund’s performance does not reflect the deduction of any applicable sales charges. |
| | 2 | | The Russell 1000® Growth Index (with dividends reinvested) is an unmanaged market capitalization weighted index that measures the performance of those Russell 1000 companies with higher price-to-book ratios and higher forecasted growth values. The Index figures do not reflect any deduction for fees, expenses or taxes. It is not possible to invest directly in an index. |
| | | | | | | | | | | | | | | | | | | | |
| | STANDARDIZED TOTAL RETURNS3 |
| | | For the period ended 12/31/13 | | One Year | | | Five Years | | | Ten Years | | | Since Inception | | | Inception Date |
| | Class A | | | 24.75 | % | | | 18.06% | | | | 5.82% | | | | 2.70 | % | | 5/24/99 |
| | Class B | | | 25.22 | | | | 18.25 | | | | 5.76 | | | | 2.68 | | | 5/24/99 |
| | Class C | | | 29.72 | | | | 18.49 | | | | 5.60 | | | | 2.33 | | | 5/24/99 |
| | Institutional | | | 32.51 | | | | 19.85 | | | | 6.84 | | | | 3.51 | | | 5/24/99 |
| | Service | | | 31.80 | | | | 19.27 | | | | 6.38 | | | | 3.09 | | | 5/24/99 |
| | Class IR | | | 32.26 | | | | N/A | | | | N/A | | | | 18.27 | | | 01/06/09 |
| | | Class R | | | 31.72 | | | | N/A | | | | N/A | | | | 17.77 | | | 01/06/09 |
| | 3 | | The Standardized Total Returns are average annual total returns as of the most recent calendar quarter-end. They assume reinvestment of all distributions at NAV. These returns reflect a maximum initial sales charge of 5.5% for Class A Shares and the assumed contingent deferred sales charge for Class B Shares (5% maximum declining to 0% after six years) and the assumed contingent deferred sales charge for Class C Shares (1% if redeemed within 12 months of purchase). Class B Shares convert to Class A Shares on or about the fifteenth day of the last month of the calendar year that is eight years after purchase. Returns for Class B Shares for the period after the conversion reflect the performance of Class A Shares. Because Institutional, Service, Class IR and Class R Shares do not involve a sales charge, such a charge is not applied to their Standardized Total Returns. The Fund’s Class B Shares are no longer available for purchase by new or existing shareholders (although current Class B shareholders may continue to reinvest income and capital gains distributions into Class B Shares, and Class B shareholders may continue to exchange their shares for Class B Shares of certain other Goldman Sachs Funds). |
The returns set forth in the tables above represent past performance. Past performance does not guarantee future results. The Fund’s investment return and principal value will fluctuate so that an investor’s shares, when redeemed, may be worth more or less than their original cost. Current performance may be lower or higher than the performance quoted above. Please visit our web site at www.GSAMFUNDS.com to obtain the most recent month-end returns. Performance reflects applicable fee waivers and/or expense limitations in effect during the periods shown. In their absence, performance would be reduced. Returns do not reflect the deduction of taxes that a shareholder would pay on Fund distributions or the redemption of Fund shares.
45
FUND BASICS
| | | | | | | | | | |
| | EXPENSE RATIOS4 | |
| | | | | Net Expense Ratio (Current) | | | Gross Expense Ratio (Before Waivers) | |
| | Class A | | | 1.15 | % | | | 1.54 | % |
| | Class B | | | 1.90 | | | | 2.29 | |
| | Class C | | | 1.90 | | | | 2.29 | |
| | Institutional | | | 0.75 | | | | 1.14 | |
| | Service | | | 1.25 | | | | 1.64 | |
| | Class IR | | | 0.90 | | | | 1.29 | |
| | | Class R | | | 1.34 | | | | 1.73 | |
| | 4 | | The expense ratios of the Fund, both current (net of applicable fee waivers and/or expense limitations) and before waivers (gross of applicable fee waivers and/or expense limitations) are as set forth above according to the most recent publicly available Prospectus for the Fund and may differ from the expense ratios disclosed in the Financial Highlights in this report. The Fund’s waivers and/or expense limitations will remain in place through at least December 29, 2014, and prior to such date the investment adviser may not terminate the arrangements without the approval of the Fund’s Board of Trustees. If these arrangements are discontinued in the future, the expense ratios may change without shareholder approval. |
| | | | | | | | |
| | TOP TEN HOLDINGS AS OF 2/28/145 |
| | | Holding | | % of Net Assets | | | Line of Business |
| | Google, Inc. Class A | | | 4.7 | % | | Internet Software & Services |
| | QUALCOMM, Inc. | | | 3.0 | | | Communications Equipment |
| | American Tower Corp. | | | 3.0 | | | Real Estate Investment Trusts |
| | Apple, Inc. | | | 2.8 | | | Computers & Peripherals |
| | Amazon.com, Inc. | | | 2.6 | | | Internet & Catalog Retail |
| | Costco Wholesale Corp. | | | 2.4 | | | Food & Staples Retailing |
| | Equinix, Inc. | | | 2.3 | | | Internet Software & Services |
| | CBRE Group, Inc. Class A | | | 2.2 | | | Real Estate Management &
Development |
| | eBay, Inc. | | | 2.2 | | | Internet Software & Services |
| | | Honeywell International, Inc. | | | 2.1 | | | Aerospace & Defense |
| | 5 | | The top 10 holdings may not be representative of the Fund’s future investments. |
46
FUND BASICS
|
| FUND VS. BENCHMARK SECTOR ALLOCATIONS6 |
| As of February 28, 2014 |
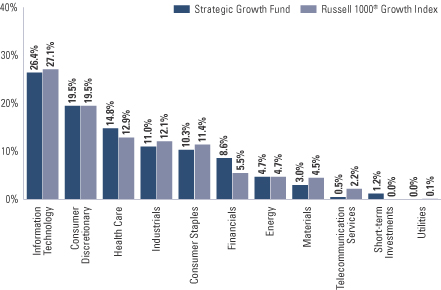 |
| | 6 | | The Fund is actively managed and, as such, its composition may differ over time. Consequently, the Fund’s overall sector allocations may differ from the percentages contained in the graph above. The graph categorizes investments using Global Industry Classification Standard (“GICS”), however, the sector classifications used by the portfolio management team may differ from GICS. The percentage shown for each investment category reflects the value of investments in that category as a percentage of market value. Short-term investments represent repurchase agreements. The graph depicts the Fund’s investments but may not represent the Fund’s market exposure due to the exclusion of certain derivatives, if any, as listed in the Additional Investment Information section of the Schedule of Investments. |
47
PORTFOLIO RESULTS
Goldman Sachs Technology Tollkeeper Fund
Portfolio Composition
The Fund invests primarily in equity securities of high quality technology, media or service companies that adopt or use technology to improve their cost structure, revenue opportunities or competitive advantage (“Technology Tollkeeper” companies). The Goldman Sachs Growth Equity Investment Team believes Technology Tollkeeper connotes a promising growth business. Like a toll collector for a highway or bridge, Technology Tollkeeper companies may grow revenue by increasing “traffic,” or customers and sales, and raising “tolls,” or prices, and margins. The Team believes that the characteristics of recurring revenue or the ability to generate free cash flow should enable them to consistently grow their business.
Portfolio Management Discussion and Analysis
Below, the Goldman Sachs Growth Equity Investment Team discusses the Goldman Sachs Technology Tollkeeper Fund’s (the “Fund”) performance and positioning for the six-month period ended February 28, 2014 (the “Reporting Period”).
| Q | | How did the Fund perform during the Reporting Period? |
| A | | During the Reporting Period, the Fund’s Class A, B, C, Institutional, Service and IR Shares generated cumulative total returns, without sales charges, of 22.81%, 22.34%, 22.34%, 23.06%, 22.79% and 22.91%, respectively. These returns compare to the 20.01% cumulative total return of the Fund’s benchmark, the NASDAQ Composite Index (the “NASDAQ Index”), during the same period. |
| Q | | What key factors were responsible for the Fund’s performance during the Reporting Period? |
| A | | Stock selection overall contributed most to the Fund’s performance relative to the NASDAQ Index during the Reporting Period. |
| Q | | Which equity market sectors most significantly affected Fund performance? |
| A | | As both the Fund and the NASDAQ Index have the majority of their respective assets allocated to the information technology sector and our Team’s focus is on picking stocks that fit our definition of a Technology Tollkeeper company, broad equity market sector performance generally does not have a meaningful impact on relative performance. That said, effective stock selection in consumer discretionary, information technology and financials boosted the Fund’s relative results as did having no exposure to the consumer staples sector, which lagged the NASDAQ Index during the Reporting Period. Detracting most from the Fund’s relative results was having no position in the health care sector, which significantly outpaced the NASDAQ Index during the Reporting Period. |
| Q | | What were some of the Fund’s best-performing individual stocks? |
| A | | The Fund benefited most relative to the NASDAQ Index from positions in Internet radio service provider Pandora Media, leading Internet search and technology company Google and social networking website operator Facebook. |
| | The strong performance of Pandora Media was driven in part by strong growth in key audience metrics, including listener hours, share of total U.S. radio listening and number of active listeners. The company’s stock was further bolstered by the announcement of a new chief executive officer. Pandora Media also announced it would begin rolling out in-car advertising in the first quarter of 2014. In our view, the company is well positioned to monetize mobile and gain market share within the terrestrial radio market, as its active user base continues to grow. We believe the company’s differentiated business model, strong brand recognition and first-mover advantage, along with a continued shift to online advertising, should also help support growth. |
| | Google was a top contributor to the Fund’s relative performance during the Reporting Period. Its shares rose after the company reported strong third and fourth quarter 2013 results, with revenue and earnings that exceeded consensus estimates, as Google Websites and Core Google posted strong operating profit growth. Its shares also reacted positively preceding the fourth quarter 2013 earnings release when Google announced it was selling Motorola Mobility to Lenovo. Additionally, strong performance may be attributed |
48
PORTFOLIO RESULTS
| | to its acquisition of Nest Labs, a smart-home technology company that manufactures Wi-Fi-enabled, self-learning, programmable thermostats and smoke detectors. At the end of the Reporting Period, Google continued to be the dominant search engine, and we believe the company remains well positioned to monetize online advertising and the shift to mobile. The company also continues to invest in new product initiatives outside of its core search business, which could offer future growth opportunities. In our view, Google’s stock at the end of the Reporting Period was trading at a reasonable valuation for what we consider to be a high quality franchise with a strong long-term growth profile. |
| | Facebook was a top contributor to the Fund’s relative results during the Reporting Period. Its shares performed well as the company continued to exceed analysts’ earnings expectations. Results were due largely to strong mobile advertising revenue, as advertiser demand has been catching up to mobile usage and driving solid growth. Facebook also announced it is exploring options for mobile payment products. We believe the company is well positioned to continue to grow in the mobile advertising space as usage shifts from desktop to mobile. Overall, we remain positive on the company and believe the stock was trading, at the end of the Reporting Period, at a reasonable valuation, supported by its industry leading position and considerable opportunity to monetize its extensive user base. |
| Q | | Which stocks detracted significantly from the Fund’s performance during the Reporting Period? |
| A | | Detracting most from the Fund’s results relative to its benchmark index were positions in professional networking website LinkedIn, communications access systems and software provider Calix and data and information management software applications provider CommVault Systems. |
| | A new purchase for the Fund during the Reporting Period, shares of LinkedIn declined following fourth quarter 2013 earnings results that were below expectations, despite generally positive analyst reactions to its $120 million acquisition of Bright, a data analytics company that matches job seekers with employers. While the stock showed signs of controversy, we believe LinkedIn has an attractive growth runway and that its website and content provide an example of disruptive technology that is early in its life cycle. (Disruptive technology is defined as new ways of doing things that disrupt or overturn traditional business methods and practices.) While the stock may not appear overly inexpensive on a number of valuation metrics, we believe it warrants a premium valuation, as the company could continue to exceed earnings expectations should it capture additional subscribers and develop its platform as we anticipate. |
| | Calix is a provider of broadband communications access systems and software for network architectures that enable communications service providers to connect their residential and business subscribers. The year 2013 was a difficult one for telecommunication spending, and the company’s shares were weak as a result. However, we believe this industry weakness is a short-term issue, and Calix remains well positioned, in our view, for market share gains, as we expect more telecommunication operators to invest in their broadband networks as they upgrade to the higher speeds the consumer demands. |
| | Shares of CommVault Systems fell on investor concerns that deferred revenue was lower than estimates, as a large deal related to Dell was recognized and rolled off its balance sheet. Despite this short-term issue, the company accelerated license growth and beat consensus revenue estimates. In our view, the market was underappreciating the potential of the company’s new solutions platform, Simpana 10. We believe this product expands the company’s addressable market and may drive revenue growth and margin expansion going forward. |
| Q | | How did the Fund use derivatives and similar instruments during the Reporting Period? |
| A | | During the Reporting Period, we did not use derivatives as part of an active management strategy. |
| Q | | Did the Fund make any significant purchases or sales during the Reporting Period? |
| A | | In addition to the purchase of LinkedIn, already mentioned, we initiated a Fund position in ServiceNow, a software-as-a-service (“SaaS”) provider of information technology service management software. Its services include a suite of applications built on a proprietary platform that automates workflow and integrates related business processes. We believe ServiceNow is a disruptive share gainer in the sizable information technology operations management software industry. The company recently introduced and has had early success in a number of software modules, which we believe could become a greater portion of its revenues as the company penetrates its existing customer base. In addition, only a modest percentage of Global 2000 organizations currently use ServiceNow’s applications, indicating, we believe, that there is a significant opportunity to expand its |
49
PORTFOLIO RESULTS
| | customer base. At the time of purchase, we believe the stock was attractively valued relative to its peers, despite a higher growth rate and the disruptive and broad nature of its solutions. (Global 2000 organizations are those listed in an annual ranking of the top 2,000 public companies in the world by Forbes. The ranking is based on a mix of sales, profit, assets and market value.) |
| | Conversely, we exited the Fund’s position in MICROS Systems, a software provider for the restaurant and hospitality industries. While we believe the company fundamentals remain healthy, the stock performed well in 2013, and so we sold out in favor of higher conviction ideas. |
| | We sold the Fund’s position in Juniper Networks, which designs and sells products and services that provide customers with network infrastructure. Shares of Juniper Networks rose following its announcement that Elliot Management, an activist hedge fund, had taken a stake in the company. We decided to take profits given what we consider to be the uncertainty and potential challenges created from an activist getting involved with the business. |
| Q | | Were there any notable changes in the Fund’s weightings during the Reporting Period? |
| A | | In constructing the Fund’s portfolio, we focus on picking stocks rather than on making industry or sector bets. We seek to outpace the benchmark index by overweighting stocks that we expect to outperform and underweighting those that we think may lag. Consequently, changes in its sector weights are generally the direct result of individual stock selection or of stock appreciation or depreciation. That said, during the Reporting Period, there were no notable changes in the Fund’s sector weightings relative to the NASDAQ Index. |
| Q | | How was the Fund positioned relative to its benchmark index at the end of February 2014? |
| A | | At the end of February 2014, the Fund’s most significant overweighting relative to the NASDAQ Index continued to be in the information technology sector. The Fund also had an overweighted position relative to the NASDAQ Index, albeit more modest, in telecommunication services. On the same date, the Fund had underweighted positions compared to the NASDAQ Index in consumer discretionary and financials. The Fund had no exposure to the consumer staples, energy, health care, materials, industrials and utilities sectors on February 28, 2014. |
| Q | | Were there any changes to the Fund’s portfolio management team during the Reporting Period? |
| A | | On December 27, 2013, Jonathan A. Neitzell, Lawrence Tankel and Michael DeSantis, CFA, were added as portfolio managers of the Fund, joining Steven M. Barry and Jeffrey Rabinowitz, CFA. |
50
FUND BASICS
Technology Tollkeeper Fund
as of February 28, 2014
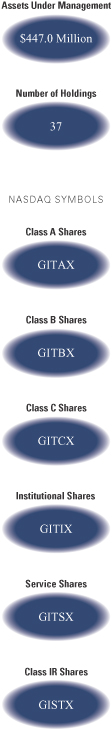
| | | | | | | | | | |
| | PERFORMANCE REVIEW | |
| | | September 1, 2013–February 28, 2014 | | Fund Total Return
(based on NAV)1 | | | NASDAQ
Composite Index2 | |
| | Class A | | | 22.81 | % | | | 20.01 | % |
| | Class B | | | 22.34 | | | | 20.01 | |
| | Class C | | | 22.34 | | | | 20.01 | |
| | Institutional | | | 23.06 | | | | 20.01 | |
| | Service | | | 22.79 | | | | 20.01 | |
| | | Class IR | | | 22.91 | | | | 20.01 | |
| | 1 | | The net asset value (“NAV”) represents the net assets of the class of the Fund (ex-dividend) divided by the total number of shares of the class outstanding. The Fund’s performance reflects the reinvestment of dividends and other distributions. The Fund’s performance does not reflect the deduction of any applicable sales charges. |
| | 2 | | The NASDAQ Composite Index is a broad-based capitalization-weighted index of all NASDAQ National Market and small-cap stocks. The Index figures do not reflect any deduction for fees, expenses or taxes. It is not possible to invest directly in an index. |
| | | | | | | | | | | | | | | | | | | | |
| | STANDARDIZED TOTAL RETURNS3 |
| | | For the period ended 12/31/13 | | One Year | | | Five Years | | | Ten Years | | | Since Inception | | | Inception Date |
| | Class A | | | 21.52 | % | | | 21.69 | % | | | 9.14 | % | | | 3.81 | % | | 10/1/99 |
| | Class B | | | 22.50 | | | | 21.99 | | | | 9.08 | | | | 3.76 | | | 10/1/99 |
| | Class C | | | 26.56 | | | | 22.18 | | | | 8.95 | | | | 3.43 | | | 10/1/99 |
| | Institutional | | | 29.06 | | | | 23.58 | | | | 10.21 | | | | 4.64 | | | 10/1/99 |
| | Service | | | 28.40 | | | | 22.98 | | | | 9.69 | | | | 4.14 | | | 10/1/99 |
| | | Class IR | | | 28.89 | | | | N/A | | | | N/A | | | | 13.75 | | | 9/30/10 |
| | 3 | | The Standardized Total Returns are average annual total returns as of the most recent calendar quarter-end. They assume reinvestment of all distributions at NAV. These returns reflect a maximum initial sales charge of 5.5% for Class A Shares and the assumed contingent deferred sales charge for Class B Shares (5% maximum declining to 0% after six years) and the assumed contingent deferred sales charge for Class C Shares (1% if redeemed within 12 months of purchase). Class B Shares convert to Class A Shares on or about the fifteenth day of the last month of the calendar year that is eight years after purchase. Returns for Class B Shares for the period after the conversion reflect the performance of Class A Shares. Because Institutional, Service and Class IR Shares do not involve a sales charge, such a charge is not applied to their Standardized Total Returns. The Fund’s Class B Shares are no longer available for purchase by new or existing shareholders (although current Class B shareholders may continue to reinvest income and capital gains distributions into Class B Shares, and Class B shareholders may continue to exchange their shares for Class B Shares of certain other Goldman Sachs Funds). |
The returns set forth in the tables above represent past performance. Past performance does not guarantee future results. The Fund’s investment return and principal value will fluctuate so that an investor’s shares, when redeemed, may be worth more or less than their original cost. Current performance may be lower or higher than the performance quoted above. Please visit our web site at www.GSAMFUNDS.com to obtain the most recent month-end returns. Performance reflects applicable fee waivers and/or expense limitations in effect during the periods shown. In their absence, performance would be reduced. Returns do not reflect the deduction of taxes that a shareholder would pay on Fund distributions or the redemption of Fund shares.
51
FUND BASICS
| | | | | | | | | | |
| | EXPENSE RATIOS4 | |
| | | | | Net Expense Ratio (Current) | | | Gross Expense Ratio (Before Waivers) | |
| | Class A | | | 1.50 | % | | | 1.55 | % |
| | Class B | | | 2.25 | | | | 2.30 | |
| | Class C | | | 2.25 | | | | 2.30 | |
| | Institutional | | | 1.10 | | | | 1.15 | |
| | Service | | | 1.60 | | | | 1.65 | |
| | | Class IR | | | 1.25 | | | | 1.30 | |
| | 4 | | The expense ratios of the Fund, both current (net of applicable fee waivers and/or expense limitations) and before waivers (gross of applicable fee waivers and/or expense limitations) are as set forth above according to the most recent publicly available Prospectus for the Fund and may differ from the expense ratios disclosed in the Financial Highlights in this report. The Fund’s waivers and/or expense limitations will remain in place through at least December 29, 2014, and prior to such date the investment adviser may not terminate the arrangements without the approval of the Fund’s Board of Trustees. If these arrangements are discontinued in the future, the expense ratios may change without shareholder approval. |
| | | | | | | | |
| | TOP TEN HOLDINGS AS OF 2/28/145 |
| | | Holding | | % of Net Assets | | | Line of Business |
| | Apple, Inc. | | | 6.9 | % | | Computers & Peripherals |
| | Google, Inc. Class A | | | 6.4 | | | Internet Software & Services |
| | QUALCOMM, Inc. | | | 5.6 | | | Communications Equipment |
| | Amazon.com, Inc. | | | 4.3 | | | Internet & Catalog Retail |
| | SBA Communications Corp. Class A | | | 4.0 | | | Wireless Telecommunication Services |
| | Equinix, Inc. | | | 4.0 | | | Internet Software & Services |
| | EMC Corp. | | | 4.0 | | | Computers & Peripherals |
| | Facebook, Inc. Class A | | | 3.9 | | | Internet Software & Services |
| | LinkedIn Corp. Class A | | | 3.7 | | | Internet Software & Services |
| | | Oracle Corp. | | | 3.5 | | | Software |
| | 5 | | The top 10 holdings may not be representative of the Fund’s future investments. |
52
FUND BASICS
|
| FUND VS. BENCHMARK SECTOR ALLOCATIONS6 |
| As of February 28, 2014 |
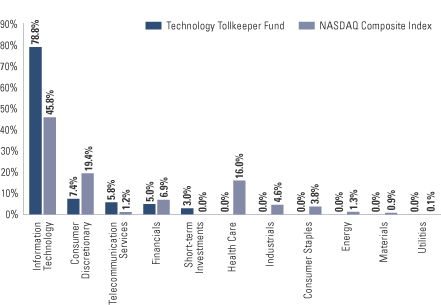 |
| | 6 | | The Fund is actively managed and, as such, its composition may differ over time. Consequently, the Fund’s overall sector allocations may differ from the percentages contained in the graph above. The graph categorizes investments using the Global Industry Classification Standard (“GICS”), however, the sector classifications used by the portfolio management team may differ from GICS. The percentage shown for each investment category reflects the value of investments in that category as a percentage of market value. Short-term investments represent repurchase agreements. The graph depicts the Fund’s investments but may not represent the Fund’s market exposure due to the exclusion of certain derivatives, if any, as listed in the Additional Investment Information section of the Schedule of Investments. |
53
PORTFOLIO RESULTS
Goldman Sachs U.S. Equity Fund
Portfolio Composition
The Fund invests primarily in large-capitalization U.S. equity investments. Since the Fund’s inception, the Goldman Sachs Growth Equity Investment Team and the Goldman Sachs Fundamental Equity Value Investment Team have focused on several key investment criteria that they believe can drive a company’s growth over the long term. These characteristics are: dominant market share, established brand name, pricing power, recurring revenue stream, free cash flow, high returns on invested capital, predictable growth, sustainable growth, long product life cycle, enduring competitive advantage, favorable demographic trends and excellent management. The Teams strive to purchase these companies at reasonable valuations in order to capture the full benefits of their growth.
Portfolio Management Discussion and Analysis
Below, the Goldman Sachs Growth Equity Investment Team and the Goldman Sachs Fundamental Equity Value Investment Team discuss the Goldman Sachs U.S. Equity Fund’s (the “Fund”) performance and positioning for the six-month period ended February 28, 2014 (the “Reporting Period”).
| Q | | How did the Fund perform during the Reporting Period? |
| A | | During the Reporting Period, the Fund’s Class A, C, Institutional, IR and R Shares generated cumulative total returns, without sales charges, of 15.27%, 14.79%, 15.48%, 15.42% and 15.06%, respectively. These returns compare to the 15.07% cumulative total return of the Fund’s benchmark, the Standard & Poor’s 500® Index (the “S&P 500® Index”), during the same period. |
| Q | | What key factors were responsible for the Fund’s performance during the Reporting Period? |
| A | | Stock selection overall contributed most to the Fund’s performance relative to the S&P 500® Index during the Reporting Period. |
| Q | | Which equity market sectors most significantly affected Fund performance? |
| A | | Effective stock selection in the telecommunication services, energy and financials sectors helped the Fund’s relative results most. The only two sectors to detract from the Fund’s performance relative to the S&P 500® Index were health care and materials, attributable to weak stock selection in each and to having an underweighted allocation to materials, which outpaced the S&P 500® Index during the Reporting Period. |
| Q | | What were some of the Fund’s best-performing individual stocks? |
| A | | The Fund benefited most relative to the S&P 500® Index from positions in aerospace and defense company Boeing, premium spirits company Beam and wireless tower company SBA Communications. |
| | Boeing’s commercial and defense businesses drove positive results during the Reporting Period, supported by strong rates of production and order growth acceleration. Further, Boeing raised its full year earnings guidance during the fourth quarter of 2013 and announced its intention to increase production rates based on demand for the 787 family and the seemingly promising launch of the 787-10. In December 2013, the company raised its dividend and increased share repurchase authorization to nearly $11 billion over the next two to three years. At the end of the Reporting Period, we continued to believe that Boeing maintained a strong backlog, which provides high visibility in the company’s outlook. |
| | Shares of Beam gained as a leading Japanese whiskey company, Suntory Holdings, announced it had reached an agreement to purchase Beam. The deal is expected to close in the second quarter of 2014 pending approval. It is always encouraging when the value of one of the Fund’s holdings is recognized by a strategic player within the industry, and our investment thesis plays out through an acquisition. We believe Beam is a high quality growth business given it is operating in a fragmented industry with improving secular tailwinds, high barriers to entry, attractive margins and |
54
PORTFOLIO RESULTS
| | returns on invested capital. Therefore, we were not surprised Beam became an acquisition target. |
| | During the Reporting Period, SBA Communications saw strong growth in its core leasing revenue, and we believe improving investor sentiment surrounding the industry was a tailwind for the stock as well. In our view, the fundamentals of the tower industry remain robust and should continue to drive several years of growth in SBA Communications’ business, both domestically and internationally. We further believe the rollout of high speed LTE (long-term evolution) wireless service, which is currently driving the U.S. leasing business, should be followed by several years of growth from investment in adding capacity to these initial networks. At the end of the Reporting Period, we maintained conviction in the tower companies over the long term, as demand for mobile content shows no sign of slowing, and wireless carriers are increasingly adding capacity to support higher usage, network upgrades and improved coverage. |
| Q | | Which stocks detracted significantly from the Fund’s performance during the Reporting Period? |
| A | | Detracting most from the Fund’s results relative to its benchmark index were positions in oncology-focused pharmaceuticals company ARIAD Pharmaceuticals, natural/ organic grocery retailer Whole Foods Market and wholesale club retailer Costco Wholesale. |
| | ARIAD Pharmaceuticals, a biopharmaceutical company focused on the discovery, development and commercialization of small-molecule drugs for the treatment of cancer, was a top detractor from performance. The company has developed two drug assets, one approved for chronic myeloid leukemia (“CML”) and the other a lung cancer drug still in development. During the fourth quarter of 2013, ARIAD Pharmaceutical’s stock declined after the Food & Drug Administration (“FDA”) placed a partial clinical hold on enrollment in all trials of Iclusig, the company’s approved CML drug, due to the risk of blood clots among participants. Subsequently, the company halted the phase 3 trial and active marketing of Iclusig. Given the unexpected material setback, we exited the Fund’s position in favor of other opportunities with what we considered to be more attractive risk/return profiles. |
| | Shares of Whole Foods Market declined after the company reported lower than expected comparable same-store sales growth due to a combination of lower inflation, new store sales cannibalization and a generally weaker consumer environment. Despite the near-term overhang, we believe Whole Foods Market should maintain its dominant market position and continue to grow as it invests ahead of competitors in opening new stores and increasing its product selection. We further believe the company can leverage its position as the largest purchaser of organic foods in the country to become more competitive on price and appeal to a broader customer base. At the end of the Reporting Period, we believed Whole Foods Market was attractively valued for a company with strong market share and an opportunity to generate above average growth relative to its peers. (Sales cannibalization is defined as intra-organizational sales diversion.) |
| | Costco Wholesale detracted from the Fund’s relative results following two consecutive quarters of softer than expected earnings reports. Despite the near-term headwinds the company was facing, we remained positive on the company over the longer term. The annual membership fee charged by the company generates high margin recurring revenue while incentivizing members to shop at its stores. Membership renewal rates have remained high, even when the fees are raised. In our view, this shows that customers enjoy the shopping experience and value Costco Wholesale’s offering of bulk goods at attractive prices. At the end of the Reporting Period, we believed that Costco Wholesale’s ability to operate profitably outside the U.S. provides it with an opportunity to open new stores and drive continued earnings growth. |
| Q | | How did the Fund use derivatives and similar instruments during the Reporting Period? |
| A | | During the Reporting Period, we did not use derivatives as part of an active management strategy. |
| Q | | Did the Fund make any significant purchases or sales during the Reporting Period? |
| A | | We initiated a Fund position in YUM! Brands, which franchises and operates restaurants worldwide under well- known brands KFC, Pizza Hut, Taco Bell, Little Sheep and East Dawning. Its stock had recently lagged the overall market and its peers, providing what we considered to be an attractive entry point to start building a position in the company. In our view, same-store sales have likely bottomed and should improve from here. We believe YUM! Brands is a high quality company positioned well to grow earnings per share and has a strong history of growing return on invested capital and being a good steward of shareholder capital. |
| | We established a Fund position in Colgate-Palmolive. Primarily, Colgate-Palmolive produces and sells consumer |
55
PORTFOLIO RESULT
| | products, including oral health care, personal and home care and pet nutrition. The company has significant exposure to markets outside the U.S. and is well positioned, in our view, to benefit from the long-term improvement of global hygiene and health and wellness. We believe that as emerging and growth markets further develop, the consumption of oral health care products is likely to increase, with Colgate-Palmolive a likely long-term beneficiary. We also are positive on the company’s management team and believe they have a demonstrated history of enhancing shareholder return through dividends and share repurchases. |
| | Conversely, we eliminated the Fund’s position in consumer goods company Procter & Gamble during the Reporting Period. While we are positive on the return of the company’s former chief executive officer, announced earlier in 2013, we believe much of the good news and growth initiatives were already priced into the company’s shares. Therefore, we decided to sell the position and reallocate the capital into higher conviction companies. |
| | We exited the Fund’s position in electronic payment company MasterCard during the Reporting Period. The stock performed well in 2013, and, in our view, was subsequently valued at a premium based on relatively high forward expectations. We also believe consensus estimates did not account for any adverse regulatory changes that could occur in an electronic payments industry that is rapidly changing. Therefore, we decided to reallocate capital into what we considered to be more attractive risk/reward opportunities. |
| Q | | Were there any notable changes in the Fund’s weightings during the Reporting Period? |
| A | | In constructing the Fund’s portfolio, we focus on picking stocks rather than on making industry or sector bets. We seek to outpace the benchmark index by overweighting stocks that we expect to outperform and underweighting those that we think may lag. Consequently, changes in its sector weights are generally the direct result of individual stock selection or of stock appreciation or depreciation. That said, during the Reporting Period, the Fund’s exposure to utilities increased and its allocations to health care, industrials and information technology decreased compared to the S&P 500® Index. |
| Q | | How was the Fund positioned relative to its benchmark index at the end of February 2014? |
| A | | At the end of February 2014, the Fund had overweighted positions relative to the S&P 500® Index in financials and information technology. On the same date, the Fund had underweighted positions compared to the S&P 500® Index in materials, industrials, utilities and consumer staples and was rather neutrally weighted to the S&P 500® Index in consumer discretionary, energy, health care and telecommunication services. |
| Q | | Were there any changes to the Fund’s portfolio management team during the Reporting Period? |
| A | | There were no changes to the Fund’s portfolio management team during the Reporting Period. |
56
FUND BASICS
U.S. Equity Fund
as of February 28, 2014
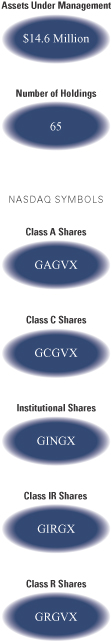
| | | | | | | | | | |
| | PERFORMANCE REVIEW | |
| | | September 1, 2013–February 28, 2014 | | Fund Total Return
(based on NAV)1 | | | S&P 500® Index2 | |
| | Class A | | | 15.27 | % | | | 15.07 | % |
| | Class C | | | 14.79 | | | | 15.07 | |
| | Institutional | | | 15.48 | | | | 15.07 | |
| | Class IR | | | 15.42 | | | | 15.07 | |
| | | Class R | | | 15.06 | | | | 15.07 | |
| | 1 | | The net asset value (“NAV”) represents the net assets of the class of the Fund (ex-dividend) divided by the total number of shares of the class outstanding. The Fund’s performance reflects the reinvestment of dividends and other distributions. The Fund’s performance does not reflect the deduction of any applicable sales charges. |
| | 2 | | The S&P 500® Index is the Standard & Poor’s 500 Composite Index of 500 stocks, an unmanaged index of common stock prices. The Index figures do not reflect any deduction for fees, expenses or taxes. It is not possible to invest directly in an index. |
| | | | | | | | | | |
| | STANDARDIZED TOTAL RETURNS3 |
| | | For the period ended 12/31/13 | | One Year | | | Since Inception | | Inception Date |
| | Class A | | | 25.61 | % | | 12.75% | | 11/30/09 |
| | Class C | | | 30.92 | | | 13.45 | | 11/30/09 |
| | Institutional | | | 33.55 | | | 14.78 | | 11/30/09 |
| | Class IR | | | 33.40 | | | 14.60 | | 11/30/09 |
| | | Class R | | | 32.62 | | | 14.02 | | 11/30/09 |
| | 3 | | The Standardized Total Returns are average annual total returns as of the most recent calendar quarter-end. They assume reinvestment of all distributions at NAV. These returns reflect a maximum initial sales charge of 5.5% for Class A Shares and the assumed contingent deferred sales charge for Class C Shares (1% if redeemed within 12 months of purchase). Because Institutional, Class IR and Class R Shares do not involve a sales charge, such a charge is not applied to their Standardized Total Returns. |
The returns set forth in the tables above represent past performance. Past performance does not guarantee future results. The Fund’s investment return and principal value will fluctuate so that an investor’s shares, when redeemed, may be worth more or less than their original cost. Current performance may be lower or higher than the performance quoted above. Please visit our web site at www.GSAMFUNDS.com to obtain the most recent month-end returns. Performance reflects applicable fee waivers and/or expense limitations in effect during the periods shown. In their absence, performance would be reduced. Returns do not reflect the deduction of taxes that a shareholder would pay on Fund distributions or the redemption of Fund shares.
57
FUND BASICS
| | | | | | | | | | |
| | EXPENSE RATIOS4 | |
| | | | | Net Expense Ratio (Current) | | | Gross Expense Ratio (Before Waivers) | |
| | Class A | | | 1.18 | % | | | 3.66 | % |
| | Class C | | | 1.93 | | | | 4.41 | |
| | Institutional | | | 0.78 | | | | 3.24 | |
| | Class IR | | | 0.93 | | | | 3.39 | |
| | | Class R | | | 1.43 | | | | 3.80 | |
| | 4 | | The expense ratios of the Fund, both current (net of applicable fee waivers and/or expense limitations) and before waivers (gross of applicable fee waivers and/or expense limitations) are as set forth above according to the most recent publicly available Prospectus for the Fund and may differ from the expense ratios disclosed in the Financial Highlights in this report. The Fund’s waivers and/or expense limitations will remain in place through at least December 29, 2014, and prior to such date the investment adviser may not terminate the arrangements without the approval of the Fund’s Board of Trustees. If these arrangements are discontinued in the future, the expense ratios may change without shareholder approval. |
| | | | | | | | |
| | TOP TEN HOLDINGS AS OF 2/28/145 |
| | | Holding | | % of Net Assets | | | Line of Business |
| | General Electric Co. | | | 3.9 | % | | Industrial Conglomerates |
| | Microsoft Corp. | | | 3.4 | | | Software |
| | Devon Energy Corp. | | | 3.1 | | | Oil, Gas & Consumable Fuels |
| | Exxon Mobil Corp. | | | 3.1 | | | Oil, Gas & Consumable Fuels |
| | Google, Inc. Class A | | | 3.0 | | | Internet Software & Services |
| | JPMorgan Chase & Co. | | | 2.9 | | | Commercial Banks |
| | Apple, Inc. | | | 2.8 | | | Computers & Peripherals |
| | Merck & Co., Inc. | | | 2.7 | | | Pharmaceuticals |
| | Bank of America Corp. | | | 2.6 | | | Commercial Banks |
| | | The Boeing Co. | | | 2.4 | | | Aerospace & Defense |
| | 5 | | The top 10 holdings may not be representative of the Fund’s future investments. |
58
FUND BASICS
|
| FUND VS. BENCHMARK SECTOR ALLOCATIONS6 |
| As of February 28, 2014 |
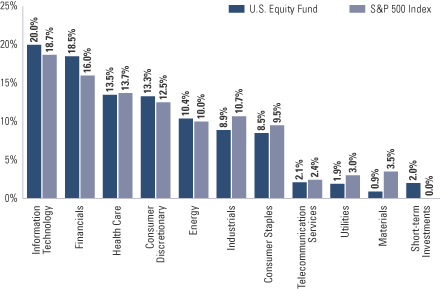 |
| | 6 | | The Fund is actively managed and, as such, its composition may differ over time. Consequently, the Fund’s overall sector allocations may differ from the percentages contained in the graph above. The graph categorizes investments using Global Industry Classification Standard (“GICS”), however, the sector classifications used by the portfolio management team may differ from GICS. The percentage shown for each investment category reflects the value of investments in that category as a percentage of market value. Short-term investments represent repurchase agreements. The graph depicts the Fund’s investments but may not represent the Fund’s market exposure due to the exclusion of certain derivatives, if any, as listed in the Additional Investment Information section of the Schedule of Investments. |
59
GOLDMAN SACHS CAPITAL GROWTH FUND
Schedule of Investments
February 28, 2014 (Unaudited)
| | | | | | | | |
Shares | | | Description | | Value | |
| | | | | | | | |
| | Common Stocks – 99.7% | |
| | Aerospace & Defense – 4.4% | |
| | 163,966 | | | Honeywell International, Inc. | | $ | 15,484,949 | |
| | 34,670 | | | Precision Castparts Corp. | | | 8,940,699 | |
| | 81,403 | | | The Boeing Co. | | | 10,494,475 | |
| | 57,296 | | | United Technologies Corp. | | | 6,704,778 | |
| | | | | | | | |
| | | | | | | 41,624,901 | |
| | |
| | Air Freight & Logistics – 0.6% | |
| | 39,976 | | | FedEx Corp. | | | 5,330,000 | |
| | |
| | Auto Components – 0.7% | |
| | 110,983 | | | BorgWarner, Inc. | | | 6,819,905 | |
| | |
| | Beverages – 2.1% | |
| | 73,662 | | | Coca-Cola Enterprises, Inc. | | | 3,468,007 | |
| | 150,449 | | | PepsiCo., Inc. | | | 12,046,451 | |
| | 99,790 | | | The Coca-Cola Co. | | | 3,811,978 | |
| | | | | | | | |
| | | | | | | 19,326,436 | |
| | |
| | Biotechnology – 5.6% | |
| | 88,815 | | | Amgen, Inc. | | | 11,014,836 | |
| | 38,767 | | | Celgene Corp.* | | | 6,231,795 | |
| | 192,270 | | | Gilead Sciences, Inc.* | | | 15,918,034 | |
| | 28,305 | | | Pharmacyclics, Inc.* | | | 3,924,771 | |
| | 25,586 | | | Regeneron Pharmaceuticals, Inc.* | | | 8,507,345 | |
| | 85,179 | | | Vertex Pharmaceuticals, Inc.* | | | 6,887,574 | |
| | | | | | | | |
| | | | | | | 52,484,355 | |
| | |
| | Building Products – 0.7% | |
| | 54,169 | | | Armstrong World Industries, Inc.* | | | 2,973,337 | |
| | 69,992 | | | Fortune Brands Home & Security, Inc. | | | 3,271,426 | |
| | | | | | | | |
| | | | | | | 6,244,763 | |
| | |
| | Capital Markets – 0.6% | |
| | 69,395 | | | T. Rowe Price Group, Inc. | | | 5,632,792 | |
| | |
| | Chemicals – 4.0% | |
| | 77,708 | | | Airgas, Inc. | | | 8,376,922 | |
| | 84,454 | | | Ecolab, Inc. | | | 9,099,919 | |
| | 31,739 | | | Monsanto Co. | | | 3,491,925 | |
| | 25,503 | | | PPG Industries, Inc. | | | 5,045,003 | |
| | 60,160 | | | The Sherwin-Williams Co. | | | 12,060,877 | |
| | | | | | | | |
| | | | | | | 38,074,646 | |
| | |
| | Commercial Services & Supplies – 0.5% | |
| | 105,457 | | | Waste Connections, Inc. | | | 4,563,124 | |
| | |
| | Communications Equipment – 2.8% | |
| | 348,685 | | | QUALCOMM, Inc. | | | 26,252,494 | |
| | |
| | Computers & Peripherals – 5.5% | |
| | 76,926 | | | Apple, Inc. | | | 40,481,538 | |
| | 432,653 | | | EMC Corp. | | | 11,409,060 | |
| | | | | | | | |
| | | | | | | 51,890,598 | |
| | |
| | Construction & Engineering* – 0.2% | |
| | 60,004 | | | Quanta Services, Inc. | | | 2,112,741 | |
| | |
| | | | | | | | |
| | Common Stocks – (continued) | |
| | Consumer Finance* – 0.3% | |
| | 117,382 | | | SLM Corp. | | $ | 2,810,125 | |
| | |
| | Containers & Packaging – 1.1% | |
| | 141,408 | | | Avery Dennison Corp. | | | 7,044,946 | |
| | 70,639 | | | Crown Holdings, Inc.* | | | 3,180,168 | |
| | | | | | | | |
| | | | | | | 10,225,114 | |
| | |
| | Diversified Financial Services – 2.0% | |
| | 171,140 | | | Citigroup, Inc. | | | 8,322,538 | |
| | 32,043 | | | IntercontinentalExchange Group, Inc.* | | | 6,691,860 | |
| | 81,429 | | | MSCI, Inc.* | | | 3,559,262 | |
| | | | | | | | |
| | | | | | | 18,573,660 | |
| | |
| | Electrical Equipment* – 0.7% | |
| | 156,840 | | | Sensata Technologies Holding NV | | | 6,373,978 | |
| | |
| | Electronic Equipment, Instruments & Components – 0.3% | |
| | 32,838 | | | Amphenol Corp. Class A | | | 2,890,401 | |
| | |
| | Energy Equipment & Services – 2.1% | |
| | 47,074 | | | Cameron International Corp.* | | | 3,015,560 | |
| | 51,462 | | | Halliburton Co. | | | 2,933,334 | |
| | 146,445 | | | Schlumberger Ltd. | | | 13,619,385 | |
| | | | | | | | |
| | | | | | | 19,568,279 | |
| | |
| | Food & Staples Retailing – 2.8% | |
| | 90,868 | | | Costco Wholesale Corp. | | | 10,613,382 | |
| | 56,424 | | | Wal-Mart Stores, Inc. | | | 4,214,873 | |
| | 204,603 | | | Whole Foods Market, Inc. | | | 11,058,792 | |
| | | | | | | | |
| | | | | | | 25,887,047 | |
| | |
| | Food Products – 2.6% | |
| | 76,625 | | | Green Mountain Coffee Roasters, Inc.* | | | 8,411,893 | |
| | 82,665 | | | McCormick & Co., Inc. | | | 5,488,956 | |
| | 114,674 | | | The Hain Celestial Group, Inc.* | | | 10,240,388 | |
| | | | | | | | |
| | | | | | | 24,141,237 | |
| | |
| | Health Care Equipment & Supplies – 3.3% | |
| | 235,239 | | | Abbott Laboratories | | | 9,357,807 | |
| | 58,685 | | | Becton Dickinson & Co. | | | 6,761,686 | |
| | 77,072 | | | C.R. Bard, Inc. | | | 11,110,700 | |
| | 86,268 | | | CareFusion Corp.* | | | 3,496,442 | |
| | | | | | | | |
| | | | | | | 30,726,635 | |
| | |
| | Health Care Providers & Services – 0.9% | |
| | 48,806 | | | McKesson Corp. | | | 8,641,102 | |
| | |
| | Hotels, Restaurants & Leisure – 5.7% | |
| | 17,391 | | | Chipotle Mexican Grill, Inc.* | | | 9,829,567 | |
| | 53,445 | | | Las Vegas Sands Corp. | | | 4,556,186 | |
| | 97,038 | | | Marriott International, Inc. Class A | | | 5,262,371 | |
| | 123,890 | | | Norwegian Cruise Line Holdings Ltd.* | | | 4,245,710 | |
| | 168,135 | | | Starbucks Corp. | | | 11,930,860 | |
| | 82,767 | | | Tim Hortons, Inc. | | | 4,490,110 | |
| | 183,286 | | | Yum! Brands, Inc. | | | 13,577,827 | |
| | | | | | | | |
| | | | | | | 53,892,631 | |
| | |
| | |
| 60 | | The accompanying notes are an integral part of these financial statements. |
GOLDMAN SACHS CAPITAL GROWTH FUND
| | | | | | | | |
Shares | | | Description | | Value | |
| | | | | | | | |
| | Common Stocks – (continued) | |
| | Household Durables* – 0.5% | |
| | 131,318 | | | Toll Brothers, Inc. | | $ | 5,122,715 | |
| | |
| | Household Products – 2.5% | |
| | 119,020 | | | Church & Dwight Co., Inc. | | | 8,090,980 | |
| | 245,491 | | | Colgate-Palmolive Co. | | | 15,424,199 | |
| | | | | | | | |
| | | | | | | 23,515,179 | |
| | |
| | Industrial Conglomerates – 1.2% | |
| | 145,071 | | | Danaher Corp. | | | 11,096,481 | |
| | |
| | Insurance – 0.4% | |
| | 40,712 | | | Aon PLC | | | 3,484,947 | |
| | |
| | Internet & Catalog Retail* – 2.8% | |
| | 42,370 | | | Amazon.com, Inc. | | | 15,342,177 | |
| | 8,268 | | | Priceline.com, Inc. | | | 11,152,209 | |
| | | | | | | | |
| | | | | | | 26,494,386 | |
| | |
| | Internet Software & Services* – 8.4% | |
| | 152,436 | | | eBay, Inc. | | | 8,958,664 | |
| | 63,318 | | | Equinix, Inc. | | | 12,027,887 | |
| | 192,473 | | | Facebook, Inc. Class A | | | 13,176,701 | |
| | 29,000 | | | Google, Inc. Class A | | | 35,253,850 | |
| | 24,628 | | | LinkedIn Corp. Class A | | | 5,025,097 | |
| | 63,140 | | | Pandora Media, Inc. | | | 2,362,699 | |
| | 48,110 | | | Rackspace Hosting, Inc. | | | 1,769,005 | |
| | | | | | | | |
| | | | | | | 78,573,903 | |
| | |
| | IT Services – 2.2% | |
| | 47,631 | | | Cognizant Technology Solutions Corp. Class A* | | | 4,956,482 | |
| | 34,618 | | | Fiserv, Inc.* | | | 2,009,575 | |
| | 33,593 | | | FleetCor Technologies, Inc.* | | | 4,364,738 | |
| | 49,904 | | | International Business Machines Corp. | | | 9,240,724 | |
| | | | | | | | |
| | | | | | | 20,571,519 | |
| | |
| | Life Sciences Tools & Services – 0.8% | |
| | 132,292 | | | Agilent Technologies, Inc. | | | 7,531,384 | |
| | |
| | Machinery – 1.4% | |
| | 51,098 | | | Caterpillar, Inc. | | | 4,954,973 | |
| | 59,267 | | | Cummins, Inc. | | | 8,648,241 | |
| | | | | | | | |
| | | | | | | 13,603,214 | |
| | |
| | Media – 4.5% | |
| | 279,874 | | | Comcast Corp. Class A | | | 14,466,687 | |
| | 101,844 | | | Discovery Communications, Inc. Class A* | | | 8,485,642 | |
| | 64,188 | | | Scripps Networks Interactive Class A | | | 5,214,633 | |
| | 435,650 | | | Twenty-First Century Fox, Inc. Class A | | | 14,611,701 | |
| | | | | | | | |
| | | | | | | 42,778,663 | |
| | |
| | Multiline Retail* – 1.2% | |
| | 187,617 | | | Dollar General Corp. | | | 11,238,258 | |
| | |
| | Oil, Gas & Consumable Fuels – 2.0% | |
| | 61,577 | | | Anadarko Petroleum Corp. | | | 5,182,320 | |
| | 74,906 | | | Antero Resources Corp.* | | | 4,519,828 | |
| | |
| | | | | | | | |
| | Common Stocks – (continued) | |
| | Oil, Gas & Consumable Fuels – (continued) | |
| | 17,050 | | | Exxon Mobil Corp. | | $ | 1,641,404 | |
| | 30,144 | | | Noble Energy, Inc. | | | 2,072,701 | |
| | 10,012 | | | Pioneer Natural Resources Co. | | | 2,014,214 | |
| | 80,616 | | | Valero Energy Corp. | | | 3,867,956 | |
| | | | | | | | |
| | | | | | | 19,298,423 | |
| | |
| | Pharmaceuticals – 2.1% | |
| | 109,087 | | | Mylan, Inc.* | | | 6,061,965 | |
| | 149,064 | | | Roche Holding AG ADR | | | 5,741,364 | |
| | 155,293 | | | Sanofi ADR | | | 8,050,389 | |
| | | | | | | | |
| | | | | | | 19,853,718 | |
| | |
| | Real Estate Investment Trusts – 1.0% | |
| | 116,284 | | | American Tower Corp. | | | 9,473,657 | |
| | |
| | Real Estate Management & Development* – 1.9% | |
| | 647,306 | | | CBRE Group, Inc. Class A | | | 18,092,203 | |
| | |
| | Road & Rail – 0.8% | |
| | 40,428 | | | Union Pacific Corp. | | | 7,292,403 | |
| | |
| | Semiconductors & Semiconductor Equipment – 1.3% | |
| | 243,530 | | | Xilinx, Inc. | | | 12,712,266 | |
| | |
| | Software – 6.0% | |
| | 65,908 | | | Adobe Systems, Inc.* | | | 4,521,948 | |
| | 32,596 | | | CommVault Systems, Inc.* | | | 2,245,212 | |
| | 492,889 | | | Microsoft Corp. | | | 18,882,578 | |
| | 592,997 | | | Oracle Corp. | | | 23,192,113 | |
| | 57,622 | | | Salesforce.com, Inc.* | | | 3,593,884 | |
| | 59,769 | | | ServiceNow, Inc.* | | | 4,067,878 | |
| | | | | | | | |
| | | | | | | 56,503,613 | |
| | |
| | Specialty Retail – 4.3% | |
| | 126,031 | | | CarMax, Inc.* | | | 6,103,681 | |
| | 132,349 | | | Dick’s Sporting Goods, Inc.* | | | 7,103,171 | |
| | 198,344 | | | L Brands, Inc. | | | 11,172,718 | |
| | 195,533 | | | The Home Depot, Inc. | | | 16,039,572 | |
| | | | | | | | |
| | | | | | | 40,419,142 | |
| | |
| | Textiles, Apparel & Luxury Goods – 2.9% | |
| | 279,708 | | | Kate Spade & Co.* | | | 9,571,608 | |
| | 115,401 | | | NIKE, Inc. Class B | | | 9,035,898 | |
| | 65,165 | | | PVH Corp. | | | 8,238,811 | |
| | | | | | | | |
| | | | | | | 26,846,317 | |
| | |
| | Thrifts & Mortgage Finance – 0.7% | |
| | 282,279 | | | MGIC Investment Corp.* | | | 2,529,220 | |
| | 272,387 | | | Radian Group, Inc. | | | 4,235,618 | |
| | | | | | | | |
| | | | | | | 6,764,838 | |
| | |
| | Tobacco – 0.5% | |
| | 59,999 | | | Philip Morris International, Inc. | | | 4,854,519 | |
| | |
| | |
| The accompanying notes are an integral part of these financial statements. | | 61 |
GOLDMAN SACHS CAPITAL GROWTH FUND
Schedule of Investments (continued)
February 28, 2014 (Unaudited)
| | | | | | | | |
Shares | | | Description | | Value | |
| | | | | | | | |
| | Common Stocks – (continued) | |
| | Wireless Telecommunication Services* – 0.8% | |
| | 80,288 | | | SBA Communications Corp. Class A | | $ | 7,641,009 | |
| | |
| | TOTAL COMMON STOCKS | | | | |
| | (Cost $659,787,584) | | $ | 937,849,721 | |
| | |
| | | | | | | | | | | | |
Principal
Amount | | Interest
Rate | | | Maturity
Date | | | Value | |
| | | | | | | | | | | | |
| Short-term Investment(a) – 0.1% | |
| Repurchase Agreement – 0.1% | |
Joint Repurchase Agreement Account II | |
| $600,000 | | | 0.055 | % | | | 03/03/14 | | | $ | 600,000 | |
| (Cost $600,000) | | | | | |
| |
| TOTAL INVESTMENTS – 99.8% | | | | | |
| (Cost $660,387,584) | | | $ | 938,449,721 | |
| |
| OTHER ASSETS IN EXCESS OF LIABILITIES – 0.2% | | | | 1,436,803 | |
| |
| NET ASSETS – 100.0% | | | $ | 939,886,524 | |
| |
| | |
| The percentage shown for each investment category reflects the value of investments in that category as a percentage of net assets. |
* | | Non-income producing security. |
(a) | | Joint repurchase agreement was entered into on February 28, 2014. Additional information appears on pages 79-81. |
| | |
|
Investment Abbreviation: |
ADR | | —American Depositary Receipt |
|
| | |
| 62 | | The accompanying notes are an integral part of these financial statements. |
GOLDMAN SACHS CONCENTRATED GROWTH FUND
Schedule of Investments
February 28, 2014 (Unaudited)
| | | | | | | | |
Shares | | | Description | | Value | |
| | | | | | | | |
| | Common Stocks – 99.3% | |
| | Aerospace & Defense – 4.7% | |
| | 40,055 | | | Honeywell International, Inc. | | $ | 3,782,794 | |
| | 17,993 | | | Precision Castparts Corp. | | | 4,640,035 | |
| | | | | | | | |
| | | | | | | 8,422,829 | |
| | |
| | Air Freight & Logistics – 2.2% | |
| | 29,443 | | | FedEx Corp. | | | 3,925,635 | |
| | |
| | Biotechnology* – 2.5% | |
| | 13,444 | | | Regeneron Pharmaceuticals, Inc. | | | 4,470,130 | |
| | |
| | Chemicals – 1.5% | |
| | 13,591 | | | The Sherwin-Williams Co. | | | 2,724,724 | |
| | |
| | Communications Equipment – 3.9% | |
| | 91,571 | | | QUALCOMM, Inc. | | | 6,894,381 | |
| | |
| | Computers & Peripherals – 5.2% | |
| | 7,874 | | | Apple, Inc. | | | 4,143,614 | |
| | 192,805 | | | EMC Corp. | | | 5,084,268 | |
| | | | | | | | |
| | | | | | | 9,227,882 | |
| | |
| | Diversified Financial Services – 1.9% | |
| | 16,545 | | | IntercontinentalExchange Group, Inc. | | | 3,455,258 | |
| | |
| | Energy Equipment & Services – 2.5% | |
| | 47,975 | | | Schlumberger Ltd. | | | 4,461,675 | |
| | |
| | Food & Staples Retailing – 5.4% | |
| | 47,046 | | | Costco Wholesale Corp. | | | 5,494,973 | |
| | 73,950 | | | Whole Foods Market, Inc. | | | 3,996,997 | |
| | | | | | | | |
| | | | | | | 9,491,970 | |
| | |
| | Food Products – 0.9% | |
| | 24,375 | | | McCormick & Co., Inc. | | | 1,618,500 | |
| | |
| | Health Care Equipment & Supplies – 4.4% | |
| | 112,594 | | | Abbott Laboratories | | | 4,478,989 | |
| | 22,494 | | | C.R. Bard, Inc. | | | 3,242,735 | |
| | | | | | | | |
| | | | | | | 7,721,724 | |
| | |
| | Health Care Providers & Services – 2.2% | |
| | 22,200 | | | McKesson Corp. | | | 3,930,510 | |
| | |
| | Hotels, Restaurants & Leisure – 5.3% | |
| | 4,568 | | | Chipotle Mexican Grill, Inc.* | | | 2,581,879 | |
| | 35,674 | | | Starbucks Corp. | | | 2,531,427 | |
| | 58,318 | | | Yum! Brands, Inc. | | | 4,320,198 | |
| | | | | | | | |
| | | | | | | 9,433,504 | |
| | |
| | Household Products – 1.9% | |
| | 53,848 | | | Colgate-Palmolive Co. | | | 3,383,270 | |
| | |
| | Industrial Conglomerates – 2.5% | |
| | 58,000 | | | Danaher Corp. | | | 4,436,420 | |
| | |
| | Internet & Catalog Retail* – 3.3% | |
| | 15,989 | | | Amazon.com, Inc. | | | 5,789,617 | |
| | |
| | Internet Software & Services* – 14.1% | |
| | 88,137 | | | eBay, Inc. | | | 5,179,811 | |
| | |
| | | | | | | | |
| | Common Stocks – (continued) | |
| | Internet Software & Services* – (continued) | |
| | 34,083 | | | Equinix, Inc. | | $ | 6,474,407 | |
| | 7,332 | | | Google, Inc. Class A | | | 8,913,146 | |
| | 21,744 | | | LinkedIn Corp. Class A | | | 4,436,646 | |
| | | | | | | | |
| | | | | | | 25,004,010 | |
| | |
| | Life Sciences Tools & Services – 2.0% | |
| | 60,752 | | | Agilent Technologies, Inc. | | | 3,458,611 | |
| | |
| | Machinery – 1.6% | |
| | 28,731 | | | Caterpillar, Inc. | | | 2,786,045 | |
| | |
| | Media – 2.5% | |
| | 129,974 | | | Twenty-First Century Fox, Inc. Class A | | | 4,359,328 | |
| | |
| | Multiline Retail* – 2.9% | |
| | 85,783 | | | Dollar General Corp. | | | 5,138,402 | |
| | |
| | Oil, Gas & Consumable Fuels – 2.1% | |
| | 44,034 | | | Anadarko Petroleum Corp. | | | 3,705,901 | |
| | |
| | Pharmaceuticals – 1.8% | |
| | 62,402 | | | Sanofi ADR | | | 3,234,920 | |
| | |
| | Real Estate Investment Trusts – 4.4% | |
| | 96,199 | | | American Tower Corp. | | | 7,837,332 | |
| | |
| | Real Estate Management & Development* – 3.5% | |
| | 220,675 | | | CBRE Group, Inc. Class A | | | 6,167,866 | |
| | |
| | Semiconductors & Semiconductor Equipment – 2.5% | |
| | 84,315 | | | Xilinx, Inc. | | | 4,401,243 | |
| | |
| | Software – 2.3% | |
| | 104,129 | | | Oracle Corp. | | | 4,072,485 | |
| | |
| | Specialty Retail – 2.2% | |
| | 68,087 | | | L Brands, Inc. | | | 3,835,341 | |
| | |
| | Textiles, Apparel & Luxury Goods – 5.5% | |
| | 66,409 | | | NIKE, Inc. Class B | | | 5,199,825 | |
| | 35,945 | | | PVH Corp. | | | 4,544,526 | |
| | | | | | | | |
| | | | | | | 9,744,351 | |
| | |
| | Wireless Telecommunication Services* – 1.6% | |
| | 29,834 | | | SBA Communications Corp. Class A | | | 2,839,302 | |
| | |
| | TOTAL COMMON STOCKS | |
| | (Cost $127,915,145) | | $ | 175,973,166 | |
| | |
| | |
| The accompanying notes are an integral part of these financial statements. | | 63 |
GOLDMAN SACHS CONCENTRATED GROWTH FUND
Schedule of Investments (continued)
February 28, 2014 (Unaudited)
| | | | | | | | | | |
Principal
Amount | | Interest
Rate | | Maturity
Date | | | Value | |
| Short-term Investment(a) – 0.7% | |
| Repurchase Agreement – 0.7% | | | | | |
| Joint Repurchase Agreement Account II | |
| $1,300,000 | | 0.055% | | | 03/03/14 | | | $ | 1,300,000 | |
| (Cost $1,300,000) | | | | | | | | |
| |
| TOTAL INVESTMENTS – 100.0% | |
| (Cost $129,215,145) | | | | | | $ | 177,273,166 | |
| |
OTHER ASSETS IN EXCESS OF
LIABILITIES – 0.0% | | | | 49,514 | |
| |
| NET ASSETS – 100.0% | | | $ | 177,322,680 | |
| |
| | |
| The percentage shown for each investment category reflects the value of investments in that category as a percentage of net assets. |
* | | Non-income producing security. |
(a) | | Joint repurchase agreement was entered into on February 28, 2014. Additional information appears on pages 79-81. |
| | |
|
Investment Abbreviation: |
ADR | | —American Depositary Receipt |
|
| | |
| 64 | | The accompanying notes are an integral part of these financial statements. |
GOLDMAN SACHS FLEXIBLE CAP GROWTH FUND
Schedule of Investments
February 28, 2014 (Unaudited)
| | | | | | | | |
Shares | | | Description | | Value | |
| | | | | | | | |
| | Common Stocks – 98.2% | |
| | Aerospace & Defense – 2.1% | |
| | 1,813 | | | Honeywell International, Inc. | | $ | 171,220 | |
| | 531 | | | Precision Castparts Corp. | | | 136,934 | |
| | | | | | | | |
| | | | | | | 308,154 | |
| | |
| | Air Freight & Logistics – 0.9% | |
| | 1,028 | | | FedEx Corp. | | | 137,063 | |
| | |
| | Auto Components* – 0.4% | |
| | 1,954 | | | Gentherm, Inc. | | | 55,259 | |
| | |
| | Beverages – 0.9% | |
| | 1,618 | | | PepsiCo., Inc. | | | 129,553 | |
| | |
| | Biotechnology – 6.6% | |
| | 734 | | | Amgen, Inc. | | | 91,031 | |
| | 843 | | | BioMarin Pharmaceutical, Inc.* | | | 68,283 | |
| | 847 | | | Celgene Corp.* | | | 136,155 | |
| | 1,498 | | | Cepheid, Inc.* | | | 80,383 | |
| | 847 | | | Foundation Medicine, Inc.* | | | 30,179 | |
| | 2,983 | | | Gilead Sciences, Inc.* | | | 246,962 | |
| | 642 | | | Medivation, Inc.* | | | 46,166 | |
| | 333 | | | Pharmacyclics, Inc.* | | | 46,174 | |
| | 406 | | | Regeneron Pharmaceuticals, Inc.* | | | 134,995 | |
| | 1,380 | | | Vertex Pharmaceuticals, Inc.* | | | 111,587 | |
| | | | | | | | |
| | | | | | | 991,915 | |
| | |
| | Capital Markets – 0.6% | |
| | 1,076 | | | T. Rowe Price Group, Inc. | | | 87,339 | |
| | |
| | Chemicals – 3.0% | |
| | 1,463 | | | Airgas, Inc. | | | 157,712 | |
| | 555 | | | Ecolab, Inc. | | | 59,801 | |
| | 1,365 | | | International Flavors & Fragrances, Inc. | | | 128,023 | |
| | 517 | | | The Sherwin-Williams Co. | | | 103,648 | |
| | | | | | | | |
| | | | | | | 449,184 | |
| | |
| | Commercial Banks – 0.4% | |
| | 1,250 | | | First Republic Bank | | | 64,963 | |
| | |
| | Commercial Services & Supplies – 2.4% | |
| | 5,135 | | | Healthcare Services Group, Inc. | | | 138,285 | |
| | 3,769 | | | Interface, Inc. | | | 72,591 | |
| | 714 | | | Stericycle, Inc.* | | | 81,396 | |
| | 1,729 | | | Waste Connections, Inc. | | | 74,814 | |
| | | | | | | | |
| | | | | | | 367,086 | |
| | |
| | Communications Equipment – 3.0% | |
| | 6,049 | | | QUALCOMM, Inc. | | | 455,429 | |
| | |
| | Computers & Peripherals – 5.2% | |
| | 1,140 | | | Apple, Inc. | | | 599,914 | |
| | 6,867 | | | EMC Corp. | | | 181,083 | |
| | | | | | | | |
| | | | | | | 780,997 | |
| | |
| | Construction & Engineering* – 0.8% | |
| | 3,359 | | | Quanta Services, Inc. | | | 118,270 | |
| | |
| | | | | | | | |
| | Common Stocks – (continued) | |
| | Consumer Finance – 1.1% | |
| | 7,169 | | | SLM Corp. | | $ | 171,626 | |
| | |
| | Diversified Financial Services* – 1.9% | |
| | 821 | | | IntercontinentalExchange Group, Inc. | | | 171,458 | |
| | 2,437 | | | MSCI, Inc. | | | 106,521 | |
| | | | | | | | |
| | | | | | | 277,979 | |
| | |
| | Diversified Telecommunication Services* – 0.8% | |
| | 3,858 | | | TW telecom, Inc. | | | 118,093 | |
| | |
| | Electrical Equipment – 1.5% | |
| | 730 | | | Hubbell, Inc. Class B | | | 87,264 | |
| | 3,363 | | | Sensata Technologies Holding NV* | | | 136,673 | |
| | | | | | | | |
| | | | | | | 223,937 | |
| | |
| | Electronic Equipment, Instruments & Components – 0.9% | |
| | 1,558 | | | Amphenol Corp. Class A | | | 137,135 | |
| | |
| | Energy Equipment & Services – 2.4% | |
| | 1,697 | | | Cameron International Corp.* | | | 108,710 | |
| | 927 | | | Dril-Quip, Inc.* | | | 99,708 | |
| | 1,568 | | | Schlumberger Ltd. | | | 145,824 | |
| | | | | | | | |
| | | | | | | 354,242 | |
| | |
| | Food & Staples Retailing – 2.8% | |
| | 2,340 | | | Costco Wholesale Corp. | | | 273,312 | |
| | 2,844 | | | Whole Foods Market, Inc. | | | 153,718 | |
| | | | | | | | |
| | | | | | | 427,030 | |
| | |
| | Food Products – 1.8% | |
| | 1,228 | | | McCormick & Co., Inc. | | | 81,539 | |
| | 1,048 | | | The Hain Celestial Group, Inc.* | | | 93,587 | |
| | 1,355 | | | TreeHouse Foods, Inc.* | | | 96,557 | |
| | | | | | | | |
| | | | | | | 271,683 | |
| | |
| | Health Care Equipment & Supplies – 2.7% | |
| | 3,429 | | | Abbott Laboratories | | | 136,406 | |
| | 1,234 | | | C.R. Bard, Inc. | | | 177,894 | |
| | 2,148 | | | CareFusion Corp.* | | | 87,058 | |
| | | | | | | | |
| | | | | | | 401,358 | |
| | |
| | Health Care Providers & Services – 2.6% | |
| | 1,907 | | | ExamWorks Group, Inc.* | | | 69,377 | |
| | 869 | | | Henry Schein, Inc.* | | | 103,446 | |
| | 532 | | | McKesson Corp. | | | 94,190 | |
| | 1,395 | | | MEDNAX, Inc.* | | | 84,844 | |
| | 1,473 | | | Surgical Care Affiliates, Inc.* | | | 44,809 | |
| | | | | | | | |
| | | | | | | 396,666 | |
| | |
| | Health Care Technology* – 0.4% | |
| | 3,254 | | | HMS Holdings Corp. | | | 66,577 | |
| | |
| | Hotels, Restaurants & Leisure – 4.2% | |
| | 239 | | | Chipotle Mexican Grill, Inc.* | | | 135,085 | |
| | 1,627 | | | Marriott International, Inc. Class A | | | 88,232 | |
| | |
| | |
| The accompanying notes are an integral part of these financial statements. | | 65 |
GOLDMAN SACHS FLEXIBLE CAP GROWTH FUND
Schedule of Investments (continued)
February 28, 2014 (Unaudited)
| | | | | | | | |
Shares | | | Description | | Value | |
| | | | | | | | |
| | Common Stocks – (continued) | |
| | Hotels, Restaurants & Leisure – (continued) | |
| | 1,900 | | | Starbucks Corp. | | $ | 134,824 | |
| | 1,832 | | | Tim Hortons, Inc. | | | 99,386 | |
| | 2,261 | | | Yum! Brands, Inc. | | | 167,495 | |
| | | | | | | | |
| | | | | | | 625,022 | |
| | |
| | Household Durables* – 0.5% | |
| | 2,828 | | | M/I Homes, Inc. | | | 70,417 | |
| | |
| | Household Products – 1.1% | |
| | 1,321 | | | Church & Dwight Co., Inc. | | | 89,802 | |
| | 1,309 | | | Colgate-Palmolive Co. | | | 82,244 | |
| | | | | | | | |
| | | | | | | 172,046 | |
| | |
| | Industrial Conglomerates – 0.8% | |
| | 1,615 | | | Danaher Corp. | | | 123,531 | |
| | |
| | Internet & Catalog Retail* – 3.0% | |
| | 817 | | | Amazon.com, Inc. | | | 295,836 | |
| | 120 | | | Priceline.com, Inc. | | | 161,861 | |
| | | | | | | | |
| | | | | | | 457,697 | |
| | |
| | Internet Software & Services* – 10.9% | |
| | 4,195 | | | eBay, Inc. | | | 246,540 | |
| | 1,475 | | | Equinix, Inc. | | | 280,191 | |
| | 2,482 | | | Facebook, Inc. Class A | | | 169,918 | |
| | 583 | | | Google, Inc. Class A | | | 708,724 | |
| | 686 | | | LinkedIn Corp. Class A | | | 139,971 | |
| | 2,224 | | | Pandora Media, Inc. | | | 83,222 | |
| | | | | | | | |
| | | | | | | 1,628,566 | |
| | |
| | IT Services* – 1.4% | |
| | 798 | | | FleetCor Technologies, Inc. | | | 103,684 | |
| | 4,370 | | | InterXion Holding NV | | | 104,837 | |
| | | | | | | | |
| | | | | | | 208,521 | |
| | |
| | Life Sciences Tools & Services – 1.0% | |
| | 2,548 | | | Agilent Technologies, Inc. | | | 145,058 | |
| | |
| | Machinery – 3.0% | |
| | 962 | | | Caterpillar, Inc. | | | 93,285 | |
| | 1,628 | | | Graco, Inc. | | | 127,033 | |
| | 1,053 | | | IDEX Corp. | | | 79,049 | |
| | 3,279 | | | Kennametal, Inc. | | | 143,423 | |
| | | | | | | | |
| | | | | | | 442,790 | |
| | |
| | Media – 2.1% | |
| | 1,218 | | | Discovery Communications, Inc. Class A* | | | 101,484 | |
| | 1,154 | | | Scripps Networks Interactive Class A | | | 93,751 | |
| | 3,408 | | | Twenty-First Century Fox, Inc. Class A | | | 114,304 | |
| | | | | | | | |
| | | | | | | 309,539 | |
| | |
| | Multiline Retail* – 1.7% | |
| | 2,294 | | | Burlington Stores, Inc. | | | 62,511 | |
| | 3,192 | | | Dollar General Corp. | | | 191,201 | |
| | | | | | | | |
| | | | | | | 253,712 | |
| | |
| | | | | | | | |
| | Common Stocks – (continued) | |
| | Oil, Gas & Consumable Fuels – 1.7% | |
| | 1,277 | | | Anadarko Petroleum Corp. | | $ | 107,472 | |
| | 936 | | | Antero Resources Corp.* | | | 56,478 | |
| | 1,287 | | | Whiting Petroleum Corp.* | | | 88,430 | |
| | | | | | | | |
| | | | | | | 252,380 | |
| | |
| | Pharmaceuticals – 1.4% | |
| | 2,412 | | | Roche Holding AG ADR | | | 92,901 | |
| | 2,266 | | | Sanofi ADR | | | 117,469 | |
| | | | | | | | |
| | | | | | | 210,370 | |
| | |
| | Real Estate Investment Trusts – 1.1% | |
| | 1,978 | | | American Tower Corp. | | | 161,148 | |
| | |
| | Real Estate Management & Development* – 1.7% | |
| | 9,154 | | | CBRE Group, Inc. Class A | | | 255,854 | |
| | |
| | Road & Rail* – 0.5% | |
| | 3,181 | | | Roadrunner Transportation Systems, Inc. | | | 74,785 | |
| | |
| | Semiconductors & Semiconductor Equipment – 1.2% | |
| | 3,462 | | | Xilinx, Inc. | | | 180,717 | |
| | |
| | Software – 2.8% | |
| | 591 | | | CommVault Systems, Inc.* | | | 40,708 | |
| | 849 | | | Guidewire Software, Inc.* | | | 45,515 | |
| | 7,026 | | | Oracle Corp. | | | 274,787 | |
| | 935 | | | ServiceNow, Inc.* | | | 63,636 | |
| | | | | | | | |
| | | | | | | 424,646 | |
| | |
| | Specialty Retail – 5.3% | |
| | 1,630 | | | Dick’s Sporting Goods, Inc. | | | 87,482 | |
| | 2,447 | | | Five Below, Inc.* | | | 94,307 | |
| | 2,962 | | | L Brands, Inc. | | | 166,849 | |
| | 1,492 | | | PetSmart, Inc. | | | 100,054 | |
| | 1,479 | | | Restoration Hardware Holdings, Inc.* | | | 100,158 | |
| | 2,093 | | | The Home Depot, Inc. | | | 171,689 | |
| | 857 | | | Tiffany & Co. | | | 79,915 | |
| | | | | | | | |
| | | | | | | 800,454 | |
| | |
| | Textiles, Apparel & Luxury Goods – 4.6% | |
| | 920 | | | Carter’s, Inc. | | | 69,304 | |
| | 735 | | | Deckers Outdoor Corp.* | | | 54,647 | |
| | 2,981 | | | Kate Spade & Co.* | | | 102,010 | |
| | 3,790 | | | NIKE, Inc. Class B | | | 296,757 | |
| | 1,384 | | | PVH Corp. | | | 174,979 | |
| | | | | | | | |
| | | | | | | 697,697 | |
| | |
| | Thrifts & Mortgage Finance* – 0.3% | |
| | 4,896 | | | MGIC Investment Corp. | | | 43,868 | |
| | |
| | Tobacco – 0.7% | |
| | 1,330 | | | Philip Morris International, Inc. | | | 107,610 | |
| | |
| | Wireless Telecommunication Services* – 2.0% | |
| | 3,123 | | | SBA Communications Corp. Class A | | | 297,216 | |
| | |
| | TOTAL COMMON STOCKS | | | | |
| | (Cost $10,120,268) | | $ | 14,735,182 | |
| | |
| | |
| 66 | | The accompanying notes are an integral part of these financial statements. |
GOLDMAN SACHS FLEXIBLE CAP GROWTH FUND
| | | | | | | | | | | | |
Principal Amount | | Interest
Rate | | | Maturity
Date | | | Value | |
| | | | | | | | | | | | |
| Short-term Investment(a) – 1.3% | |
| Repurchase Agreement – 1.3% | | | | | |
Joint Repurchase Agreement Account II | | | | | |
| $200,000 | | | 0.055 | % | | | 03/03/14 | | | $ | 200,000 | |
| (Cost $200,000) | | | | | |
| |
| TOTAL INVESTMENTS – 99.5% | | | | | |
| (Cost $10,320,268) | | | $ | 14,935,182 | |
| |
OTHER ASSETS IN EXCESS OF LIABILITIES – 0.5% | | | | 75,248 | |
| |
| NET ASSETS – 100.0% | | | $ | 15,010,430 | |
| |
| | |
| The percentage shown for each investment category reflects the value of investments in that category as a percentage of net assets. |
* | | Non-income producing security. |
(a) | | Joint repurchase agreement was entered into on February 28, 2014. Additional information appears on pages 79-81. |
| | |
|
Investment Abbreviation: |
ADR | | —American Depositary Receipt |
|
| | |
| The accompanying notes are an integral part of these financial statements. | | 67 |
GOLDMAN SACHS FOCUSED GROWTH FUND
Schedule of Investments
February 28, 2014 (Unaudited)
| | | | | | | | |
Shares | | | Description | | Value | |
| | Common Stocks – 97.6% | |
| | Air Freight & Logistics – 3.2% | |
| | 4,740 | | | FedEx Corp. | | $ | 631,984 | |
| | |
| | Biotechnology* – 3.1% | |
| | 1,788 | | | Regeneron Pharmaceuticals, Inc. | | | 594,510 | |
| | |
| | Communications Equipment – 5.5% | |
| | 14,284 | | | QUALCOMM, Inc. | | | 1,075,442 | |
| | |
| | Computers & Peripherals – 4.7% | |
| | 34,677 | | | EMC Corp. | | | 914,433 | |
| | |
| | Diversified Financial Services – 3.5% | |
| | 3,301 | | | IntercontinentalExchange Group, Inc. | | | 689,381 | |
| | |
| | Food & Staples Retailing – 4.1% | |
| | 6,788 | | | Costco Wholesale Corp. | | | 792,838 | |
| | |
| | Health Care Equipment & Supplies – 4.4% | |
| | 21,702 | | | Abbott Laboratories | | | 863,306 | |
| | |
| | Hotels, Restaurants & Leisure – 7.3% | |
| | 6,985 | | | Starbucks Corp. | | | 495,656 | |
| | 12,629 | | | Yum! Brands, Inc. | | | 935,556 | |
| | | | | | | | |
| | | | | | | 1,431,212 | |
| | |
| | Industrial Conglomerates – 3.5% | |
| | 9,021 | | | Danaher Corp. | | | 690,016 | |
| | |
| | Internet & Catalog Retail* – 4.2% | |
| | 2,286 | | | Amazon.com, Inc. | | | 827,761 | |
| | |
| | Internet Software & Services* – 14.8% | |
| | 15,611 | | | eBay, Inc. | | | 917,459 | |
| | 5,153 | | | Equinix, Inc. | | | 978,864 | |
| | 828 | | | Google, Inc. Class A | | | 1,006,558 | |
| | | | | | | | |
| | | | | | | 2,902,881 | |
| | |
| | Multiline Retail* – 2.8% | |
| | 9,050 | | | Dollar General Corp. | | | 542,095 | |
| | |
| | Oil, Gas & Consumable Fuels – 2.7% | |
| | 6,275 | | | Anadarko Petroleum Corp. | | | 528,104 | |
| | |
| | Pharmaceuticals – 2.8% | |
| | 10,650 | | | Sanofi ADR | | | 552,096 | |
| | |
| | Real Estate Investment Trusts – 4.6% | |
| | 11,090 | | | American Tower Corp. | | | 903,502 | |
| | |
| | Real Estate Management & Development* – 5.7% | |
| | 40,065 | | | CBRE Group, Inc. Class A | | | 1,119,817 | |
| | |
| | Semiconductors & Semiconductor Equipment – 3.7% | |
| | 13,926 | | | Xilinx, Inc. | | | 726,937 | |
| | |
| | Specialty Retail – 3.2% | |
| | 10,962 | | | L Brands, Inc. | | | 617,489 | |
| | |
| | Textiles, Apparel & Luxury Goods – 9.9% | |
| | 11,260 | | | NIKE, Inc. Class B | | | 881,658 | |
| | 8,354 | | | PVH Corp. | | | 1,056,196 | |
| | | | | | | | |
| | | | | | | 1,937,854 | |
| | |
| | Common Stocks – (continued) | |
| | Wireless Telecommunication Services* – 3.9% | |
| | 8,022 | | | SBA Communications Corp. Class A | | $ | 763,454 | |
| | |
| | TOTAL COMMON STOCKS | | | | |
| | (Cost $16,898,337) | | $ | 19,105,112 | |
| | |
| | | | | | | | | | | | | | |
Principal Amount | | | Interest Rate | | | Maturity
Date | | | Value | |
| | Short-term Investment(a) – 2.0% | |
| | Repurchase Agreement – 2.0% | |
| Joint Repurchase Agreement Account II | |
| $ | 400,000 | | | | 0.055 | % | | | 03/03/14 | | | $ | 400,000 | |
| | (Cost $400,000) | | | | | |
| | |
| | TOTAL INVESTMENTS – 99.6% | |
| | (Cost $17,298,337) | | | $ | 19,505,112 | |
| | |
| OTHER ASSETS IN EXCESS OF
LIABILITIES – 0.4% |
| | | 70,239 | |
| | |
| | NET ASSETS – 100.0% | | | $ | 19,575,351 | |
| | |
| | |
| The percentage shown for each investment category reflects the value of investments in that category as a percentage of net assets. |
* | | Non-income producing security. |
(a) | | Joint repurchase agreement was entered into on February 28, 2014. Additional information appears on pages 79-81. |
| | |
|
Investment Abbreviation: |
ADR | | —American Depositary Receipt |
|
| | |
| 68 | | The accompanying notes are an integral part of these financial statements. |
GOLDMAN SACHS GROWTH OPPORTUNITIES FUND
Schedule of Investments
February 28, 2014 (Unaudited)
| | | | | | | | |
Shares | | | Description | | Value | |
| | Common Stocks – 99.4% | |
| | Biotechnology* – 5.8% | |
| | 250,524 | | | Alexion Pharmaceuticals, Inc. | | $ | 44,292,643 | |
| | 323,531 | | | BioMarin Pharmaceutical, Inc. | | | 26,206,011 | |
| | 1,029,486 | | | Cepheid, Inc. | | | 55,242,219 | |
| | 371,650 | | | Incyte Corp. | | | 23,882,229 | |
| | 405,464 | | | Medivation, Inc. | | | 29,156,916 | |
| | 306,696 | | | Pharmacyclics, Inc. | | | 42,526,467 | |
| | 101,916 | | | Regeneron Pharmaceuticals, Inc. | | | 33,887,070 | |
| | 733,746 | | | Vertex Pharmaceuticals, Inc. | | | 59,330,702 | |
| | | | | | | | |
| | | | | | | 314,524,257 | |
| | |
| | Capital Markets – 1.6% | |
| | 1,095,755 | | | T. Rowe Price Group, Inc. | | | 88,942,433 | |
| | |
| | Chemicals – 5.2% | |
| | 779,620 | | | Airgas, Inc. | | | 84,043,036 | |
| | 361,736 | | | Ecolab, Inc. | | | 38,977,054 | |
| | 816,612 | | | International Flavors & Fragrances, Inc. | | | 76,590,040 | |
| | 400,115 | | | The Sherwin-Williams Co. | | | 80,215,055 | |
| | | | | | | | |
| | | | | | | 279,825,185 | |
| | |
| | Commercial Banks – 1.3% | |
| | 1,300,523 | | | First Republic Bank | | | 67,588,180 | |
| | |
| | Commercial Services & Supplies – 1.2% | |
| | 903,676 | | | Healthcare Services Group, Inc. | | | 24,335,995 | |
| | 928,107 | | | Waste Connections, Inc. | | | 40,159,190 | |
| | | | | | | | |
| | | | | | | 64,495,185 | |
| | |
| | Construction & Engineering* – 1.0% | |
| | 1,481,415 | | | Quanta Services, Inc. | | | 52,160,622 | |
| | |
| | Consumer Finance – 1.5% | |
| | 3,341,740 | | | SLM Corp. | | | 80,001,256 | |
| | |
| | Diversified Financial Services – 3.0% | |
| | 435,008 | | | IntercontinentalExchange Group, Inc. | | | 90,847,071 | |
| | 1,650,989 | | | MSCI, Inc.* | | | 72,164,729 | |
| | | | | | | | |
| | | | | | | 163,011,800 | |
| | |
| | Diversified Telecommunication Services* – 1.2% | |
| | 2,193,553 | | | TW telecom, Inc. | | | 67,144,657 | |
| | |
| | Electrical Equipment – 5.1% | |
| | 1,025,482 | | | AMETEK, Inc. | | | 54,596,662 | |
| | 668,625 | | | Hubbell, Inc. Class B | | | 79,927,432 | |
| | 214,624 | | | Roper Industries, Inc. | | | 29,107,307 | |
| | 2,685,808 | | | Sensata Technologies Holding NV* | | | 109,151,237 | |
| | | | | | | | |
| | | | | | | 272,782,638 | |
| | |
| | Electronic Equipment, Instruments & Components – 1.5% | |
| | 892,716 | | | Amphenol Corp. Class A | | | 78,576,862 | |
| | |
| | Energy Equipment & Services – 3.9% | |
| | 1,595,067 | | | Cameron International Corp.* | | | 102,179,992 | |
| | 186,120 | | | Core Laboratories NV | | | 34,999,866 | |
| | |
| | Common Stocks – (continued) | |
| | Energy Equipment & Services – (continued) | |
| | 671,741 | | | Dril-Quip, Inc.* | | $ | 72,252,462 | |
| | | | | | | | |
| | | | | | | 209,432,320 | |
| | |
| | Food & Staples Retailing – 1.5% | |
| | 1,511,017 | | | Whole Foods Market, Inc. | | | 81,670,469 | |
| | |
| | Food Products – 3.7% | |
| | 217,359 | | | Green Mountain Coffee Roasters, Inc. | | | 23,861,671 | |
| | 585,030 | | | McCormick & Co., Inc. | | | 38,845,992 | |
| | 942,783 | | | The Hain Celestial Group, Inc.* | | | 84,190,522 | |
| | 771,175 | | | TreeHouse Foods, Inc.* | | | 54,953,930 | |
| | | | | | | | |
| | | | | | | 201,852,115 | |
| | |
| | Health Care Equipment & Supplies – 3.3% | |
| | 805,639 | | | C.R. Bard, Inc. | | | 116,140,918 | |
| | 1,539,083 | | | CareFusion Corp.* | | | 62,379,034 | |
| | | | | | | | |
| | | | | | | 178,519,952 | |
| | |
| | Health Care Providers & Services* – 1.8% | |
| | 546,030 | | | Henry Schein, Inc. | | | 64,999,411 | |
| | 496,806 | | | MEDNAX, Inc. | | | 30,215,741 | |
| | | | | | | | |
| | | | | | | 95,215,152 | |
| | |
| | Health Care Technology* – 1.0% | |
| | 2,678,969 | | | HMS Holdings Corp. | | | 54,811,706 | |
| | |
| | Hotels, Restaurants & Leisure – 5.6% | |
| | 145,884 | | | Chipotle Mexican Grill, Inc.* | | | 82,455,096 | |
| | 879,339 | | | Marriott International, Inc. Class A | | | 47,686,554 | |
| | 1,736,175 | | | Norwegian Cruise Line Holdings Ltd.* | | | 59,498,717 | |
| | 285,251 | | | Panera Bread Co. Class A* | | | 51,721,712 | |
| | 1,091,217 | | | Tim Hortons, Inc. | | | 59,198,522 | |
| | | | | | | | |
| | | | | | | 300,560,601 | |
| | |
| | Household Products – 1.2% | |
| | 982,858 | | | Church & Dwight Co., Inc. | | | 66,814,687 | |
| | |
| | Internet Software & Services* – 4.9% | |
| | 631,774 | | | Equinix, Inc. | | | 120,011,789 | |
| | 417,687 | | | LinkedIn Corp. Class A | | | 85,224,856 | |
| | 1,522,407 | | | Pandora Media, Inc. | | | 56,968,470 | |
| | | | | | | | |
| | | | | | | 262,205,115 | |
| | |
| | IT Services* – 1.6% | |
| | 681,583 | | | FleetCor Technologies, Inc. | | | 88,558,079 | |
| | |
| | Life Sciences Tools & Services – 3.5% | |
| | 1,922,961 | | | Agilent Technologies, Inc. | | | 109,474,170 | |
| | 151,788 | | | Mettler-Toledo International, Inc.* | | | 37,303,419 | |
| | 964,737 | | | PerkinElmer, Inc. | | | 43,721,881 | |
| | | | | | | | |
| | | | | | | 190,499,470 | |
| | |
| | |
| The accompanying notes are an integral part of these financial statements. | | 69 |
GOLDMAN SACHS GROWTH OPPORTUNITIES FUND
Schedule of Investments (continued)
February 28, 2014 (Unaudited)
| | | | | | | | |
Shares | | | Description | | Value | |
| | | | | | | | |
| | Common Stocks – (continued) | |
| | Machinery – 3.0% | |
| | 1,266,884 | | | Graco, Inc. | | $ | 98,854,958 | |
| | 1,371,998 | | | Kennametal, Inc. | | | 60,011,193 | |
| | | | | | | | |
| | | | | | | 158,866,151 | |
| | |
| | Media – 2.2% | |
| | 613,780 | | | Discovery Communications, Inc. Class A* | | | 51,140,150 | |
| | 821,085 | | | Scripps Networks Interactive Class A | | | 66,704,945 | |
| | | | | | | | |
| | | | | | | 117,845,095 | |
| | |
| | Multiline Retail* – 2.3% | |
| | 2,094,897 | | | Dollar General Corp. | | | 125,484,330 | |
| | |
| | Oil, Gas & Consumable Fuels* – 1.6% | |
| | 434,331 | | | Antero Resources Corp. | | | 26,207,533 | |
| | 871,278 | | | Whiting Petroleum Corp. | | | 59,865,511 | |
| | | | | | | | |
| | | | | | | 86,073,044 | |
| | |
| | Pharmaceuticals – 3.6% | |
| | 294,678 | | | Actavis PLC* | | | 65,070,796 | |
| | 732,450 | | | Mylan, Inc.* | | | 40,702,246 | |
| | 356,605 | | | Shire PLC ADR | | | 58,893,316 | |
| | 915,502 | | | Zoetis, Inc. | | | 28,398,872 | |
| | | | | | | | |
| | | | | | | 193,065,230 | |
| | |
| | Real Estate Management & Development* – 2.6% | |
| | 5,017,159 | | | CBRE Group, Inc. Class A | | | 140,229,594 | |
| | |
| | Semiconductors & Semiconductor Equipment – 4.3% | |
| | 1,894,776 | | | Altera Corp. | | | 68,799,317 | |
| | 1,053,911 | | | Linear Technology Corp. | | | 49,365,191 | |
| | 2,129,987 | | | Xilinx, Inc. | | | 111,185,321 | |
| | | | | | | | |
| | | | | | | 229,349,829 | |
| | |
| | Software* – 1.3% | |
| | 523,399 | | | Guidewire Software, Inc. | | | 28,059,421 | |
| | 582,452 | | | ServiceNow, Inc. | | | 39,641,683 | |
| | | | | | | | |
| | | | | | | 67,701,104 | |
| | |
| | Specialty Retail – 7.1% | |
| | 1,075,656 | | | Dick’s Sporting Goods, Inc. | | | 57,730,458 | |
| | 1,759,473 | | | Five Below, Inc.* | | | 67,810,089 | |
| | 1,840,624 | | | L Brands, Inc. | | | 103,682,350 | |
| | 957,886 | | | PetSmart, Inc. | | | 64,235,835 | |
| | 577,777 | | | Restoration Hardware Holdings, Inc.* | | | 39,127,058 | |
| | 516,794 | | | Tiffany & Co. | | | 48,191,041 | |
| | | | | | | | |
| | | | | | | 380,776,831 | |
| | |
| | Textiles, Apparel & Luxury Goods – 6.2% | |
| | 465,655 | | | Deckers Outdoor Corp.* | | | 34,621,449 | |
| | 2,491,492 | | | Kate Spade & Co.* | | | 85,258,856 | |
| | 845,901 | | | PVH Corp. | | | 106,947,264 | |
| | 354,922 | | | Ralph Lauren Corp. | | | 57,170,836 | |
| | |
| | Common Stocks – (continued) | |
| | Textiles, Apparel & Luxury Goods – 6.2% | |
| | 182,227 | | | Under Armour, Inc. Class A* | | $ | 20,618,985 | |
| | 449,721 | | | VF Corp. | | | 26,349,153 | |
| | | | | | | | |
| | | | | | | 330,966,543 | |
| | |
| | Thrifts & Mortgage Finance* – 0.8% | |
| | 4,779,601 | | | MGIC Investment Corp. | �� | | 42,825,225 | |
| | |
| | Trading Companies & Distributors – 1.5% | |
| | 313,766 | | | W.W. Grainger, Inc. | | | 80,016,605 | |
| | |
| | Wireless Telecommunication Services* – 2.5% | |
| | 1,420,414 | | | SBA Communications Corp. Class A | | | 135,180,800 | |
| | |
| | TOTAL COMMON STOCKS | | | | |
| | (Cost $3,691,991,872) | | $ | 5,347,573,122 | |
| | |
| | | | | | | | | | |
Principal Amount | | Interest
Rate | | Maturity
Date | | | Value | |
| Short-term Investment(a) – 2.1% | |
| Repurchase Agreement – 2.1% | |
Joint Repurchase Agreement Account II | |
| $109,600,000 | | 0.055% | | | 03/03/14 | | | $ | 109,600,000 | |
| (Cost $109,600,000) | | | | | |
| |
| TOTAL INVESTMENTS – 101.5% | | | | | |
| (Cost $3,801,591,872) | | | $ | 5,457,173,122 | |
| |
LIABILITIES IN EXCESS OF
OTHER ASSETS – (1.5)% | | | | (79,222,501 | ) |
| |
| NET ASSETS – 100.0% | | | $ | 5,377,950,621 | |
| |
| | |
| The percentage shown for each investment category reflects the value of investments in that category as a percentage of net assets. |
* | | Non-income producing security. |
(a) | | Joint repurchase agreement was entered into on February 28, 2014. Additional information appears on pages 79-81. |
| | |
|
Investment Abbreviation: |
ADR | | —American Depositary Receipt |
|
| | |
| 70 | | The accompanying notes are an integral part of these financial statements. |
GOLDMAN SACHS SMALL/MID CAP GROWTH FUND
Schedule of Investments
February 28, 2014 (Unaudited)
| | | | | | | | |
Shares | | | Description | | Value | |
| | | | | | | | |
| | Common Stocks – 98.1% | |
| | Aerospace & Defense* – 0.7% | |
| | 450,481 | | | Aerovironment, Inc. | | $ | 14,073,026 | |
| | |
| | Auto Components* – 0.6% | |
| | 460,226 | | | Gentherm, Inc. | | | 13,015,191 | |
| | |
| | Biotechnology* – 7.9% | |
| | 1,658,651 | | | Achillion Pharmaceuticals, Inc. | | | 5,805,278 | |
| | 572,139 | | | Cepheid, Inc. | | | 30,700,979 | |
| | 111,767 | | | Clovis Oncology, Inc. | | | 8,898,889 | |
| | 446,410 | | | Five Prime Therapeutics, Inc. | | | 6,231,884 | |
| | 143,073 | | | Foundation Medicine, Inc. | | | 5,097,691 | |
| | 191,559 | | | Incyte Corp. | | | 12,309,581 | |
| | 247,544 | | | Medivation, Inc. | | | 17,800,889 | |
| | 379,471 | | | Neurocrine Biosciences, Inc. | | | 6,690,074 | |
| | 194,038 | | | Ophthotech Corp. | | | 6,533,259 | |
| | 147,855 | | | Pharmacyclics, Inc. | | | 20,501,574 | |
| | 702,856 | | | Regulus Therapeutics, Inc. | | | 7,893,073 | |
| | 191,413 | | | Stemline Therapeutics, Inc. | | | 4,949,940 | |
| | 630,779 | | | Swedish Orphan Biovitrum AB ADR | | | 8,330,756 | |
| | 98,485 | | | Synageva BioPharma Corp. | | | 11,293,275 | |
| | 112,000 | | | Ultragenyx Pharmaceutical, Inc. | | | 6,245,120 | |
| | 160,167 | | | Vertex Pharmaceuticals, Inc. | | | 12,951,104 | |
| | | | | | | | |
| | | | | | | 172,233,366 | |
| | |
| | Capital Markets – 1.1% | |
| | 775,105 | | | HFF, Inc. Class A | | | 24,725,850 | |
| | |
| | Chemicals – 2.5% | |
| | 262,044 | | | Airgas, Inc. | | | 28,248,343 | |
| | 274,501 | | | International Flavors & Fragrances, Inc. | | | 25,745,449 | |
| | | | | | | | |
| | | | | | | 53,993,792 | |
| | |
| | Commercial Banks – 2.9% | |
| | 686,677 | | | Eagle Bancorp, Inc.* | | | 23,525,554 | |
| | 422,299 | | | First Republic Bank | | | 21,946,879 | |
| | 332,471 | | | Independent Bank Group, Inc. | | | 17,866,992 | |
| | | | | | | | |
| | | | | | | 63,339,425 | |
| | |
| | Commercial Services & Supplies – 3.9% | |
| | 1,635,254 | | | Healthcare Services Group, Inc. | | | 44,037,390 | |
| | 871,089 | | | Interface, Inc. | | | 16,777,174 | |
| | 72,410 | | | Stericycle, Inc.* | | | 8,254,740 | |
| | 374,715 | | | Waste Connections, Inc. | | | 16,213,918 | |
| | | | | | | | |
| | | | | | | 85,283,222 | |
| | |
| | Communications Equipment* – 0.4% | |
| | 1,055,317 | | | Calix, Inc. | | | 8,389,770 | |
| | |
| | Computers & Peripherals* – 0.7% | |
| | 361,288 | | | Electronics for Imaging, Inc. | | | 16,113,445 | |
| | |
| | Construction & Engineering* – 0.9% | |
| | 585,559 | | | Quanta Services, Inc. | | | 20,617,532 | |
| | |
| | Consumer Finance – 1.5% | |
| | 1,360,168 | | | SLM Corp. | | | 32,562,422 | |
| | |
| | | | | | | | |
| | Common Stocks – (continued) | |
| | Containers & Packaging – 0.5% | |
| | 218,953 | | | Avery Dennison Corp. | | $ | 10,908,239 | |
| | |
| | Diversified Financial Services* – 1.3% | |
| | 671,035 | | | MSCI, Inc. | | | 29,330,940 | |
| | |
| | Diversified Telecommunication Services* – 1.3% | |
| | 943,441 | | | TW telecom, Inc. | | | 28,878,729 | |
| | |
| | Electrical Equipment – 4.0% | |
| | 290,489 | | | Hubbell, Inc. Class B | | | 34,725,055 | |
| | 84,518 | | | Roper Industries, Inc. | | | 11,462,331 | |
| | 996,334 | | | Sensata Technologies Holding NV* | | | 40,491,014 | |
| | | | | | | | |
| | | | | | | 86,678,400 | |
| | |
| | Electronic Equipment, Instruments & Components – 2.5% | |
| | 282,233 | | | Amphenol Corp. Class A | | | 24,842,149 | |
| | 403,715 | | | IPG Photonics Corp.* | | | 28,974,625 | |
| | | | | | | | |
| | | | | | | 53,816,774 | |
| | |
| | Energy Equipment & Services – 3.2% | |
| | 88,806 | | | Core Laboratories NV | | | 16,699,968 | |
| | 367,305 | | | Dril-Quip, Inc.* | | | 39,507,326 | |
| | 194,243 | | | Geospace Technologies Corp.* | | | 14,912,035 | |
| | | | | | | | |
| | | | | | | 71,119,329 | |
| | |
| | Food Products* – 2.8% | |
| | 422,591 | | | The Hain Celestial Group, Inc. | | | 37,737,376 | |
| | 341,661 | | | TreeHouse Foods, Inc. | | | 24,346,763 | |
| | | | | | | | |
| | | | | | | 62,084,139 | |
| | |
| | Health Care Equipment & Supplies – 2.6% | |
| | 508,276 | | | CareFusion Corp.* | | | 20,600,426 | |
| | 378,450 | | | DexCom, Inc.* | | | 17,068,095 | |
| | 80,958 | | | Teleflex, Inc. | | | 8,256,907 | |
| | 553,554 | | | Tornier NV* | | | 10,628,237 | |
| | | | | | | | |
| | | | | | | 56,553,665 | |
| | |
| | Health Care Providers & Services* – 4.5% | |
| | 364,271 | | | Acadia Healthcare Co., Inc. | | | 18,009,558 | |
| | 560,499 | | | ExamWorks Group, Inc. | | | 20,390,954 | |
| | 166,031 | | | Henry Schein, Inc. | | | 19,764,330 | |
| | 406,778 | | | MEDNAX, Inc. | | | 24,740,238 | |
| | 547,253 | | | Surgical Care Affiliates, Inc. | | | 16,647,436 | |
| | | | | | | | |
| | | | | | | 99,552,516 | |
| | |
| | Health Care Technology* – 1.1% | |
| | 1,215,901 | | | HMS Holdings Corp. | | | 24,877,335 | |
| | |
| | Hotels, Restaurants & Leisure – 4.9% | |
| | 643,703 | | | Bloomin’ Brands, Inc.* | | | 16,182,693 | |
| | 411,738 | | | Chuy’s Holdings, Inc.* | | | 16,391,290 | |
| | 280,015 | | | Jack in the Box, Inc.* | | | 16,086,862 | |
| | 701,148 | | | Norwegian Cruise Line Holdings Ltd.* | | | 24,028,342 | |
| | 115,063 | | | Panera Bread Co. Class A* | | | 20,863,223 | |
| | 262,598 | | | Tim Hortons, Inc. | | | 14,245,942 | |
| | | | | | | | |
| | | | | | | 107,798,352 | |
| | |
| | |
| The accompanying notes are an integral part of these financial statements. | | 71 |
GOLDMAN SACHS SMALL/MID CAP GROWTH FUND
Schedule of Investments (continued)
February 28, 2014 (Unaudited)
| | | | | | | | |
Shares | | | Description | | Value | |
| | Common Stocks – (continued) | |
| | Household Durables*(a) – 1.4% | |
| | 1,232,063 | | | M/I Homes, Inc. | | $ | 30,678,369 | |
| | |
| | Household Products – 0.9% | |
| | 295,303 | | | Church & Dwight Co., Inc. | | | 20,074,698 | |
| | |
| | Internet Software & Services* – 2.8% | |
| | 166,790 | | | Equinix, Inc. | | | 31,683,429 | |
| | 804,012 | | | Pandora Media, Inc. | | | 30,086,129 | |
| | | | | | | | |
| | | | | | | 61,769,558 | |
| | |
| | IT Services – 3.7% | |
| | 870,505 | | | EVERTEC, Inc. | | | 21,118,451 | |
| | 278,761 | | | FleetCor Technologies, Inc.* | | | 36,219,417 | |
| | 979,209 | | | InterXion Holding NV* | | | 23,491,224 | |
| | | | | | | | |
| | | | | | | 80,829,092 | |
| | |
| | Leisure Equipment & Products* – 0.5% | |
| | 1,033,678 | | | Black Diamond, Inc. | | | 10,936,313 | |
| | |
| | Life Sciences Tools & Services – 2.0% | |
| | 443,975 | | | Bruker Corp.* | | | 10,095,992 | |
| | 42,011 | | | Mettler-Toledo International, Inc.* | | | 10,324,623 | |
| | 520,704 | | | PerkinElmer, Inc. | | | 23,598,305 | |
| | | | | | | | |
| | | | | | | 44,018,920 | |
| | |
| | Machinery – 4.1% | |
| | 534,212 | | | Graco, Inc. | | | 41,684,562 | |
| | 313,770 | | | IDEX Corp. | | | 23,554,714 | |
| | 573,831 | | | Kennametal, Inc. | | | 25,099,368 | |
| | | | | | | | |
| | | | | | | 90,338,644 | |
| | |
| | Media* – 0.1% | |
| | 396,091 | | | RLJ Entertainment, Inc. | | | 1,742,800 | |
| | |
| | Multiline Retail* – 0.8% | |
| | 608,373 | | | Burlington Stores, Inc. | | | 16,578,164 | |
| | |
| | Oil, Gas & Consumable Fuels* – 2.8% | |
| | 544,277 | | | Laredo Petroleum, Inc. | | | 14,200,187 | |
| | 429,366 | | | Rex Energy Corp. | | | 8,157,954 | |
| | 167,023 | | | Rosetta Resources, Inc. | | | 7,410,810 | |
| | 472,712 | | | Whiting Petroleum Corp. | | | 32,480,042 | |
| | | | | | | | |
| | | | | | | 62,248,993 | |
| | |
| | Pharmaceuticals* – 1.0% | |
| | 268,141 | | | Aratana Therapeutics, Inc. | | | 6,266,455 | |
| | 217,786 | | | Revance Therapeutics, Inc. | | | 5,864,977 | |
| | 452,611 | | | Sagent Pharmaceuticals, Inc. | | | 9,577,249 | |
| | | | | | | | |
| | | | | | | 21,708,681 | |
| | |
| | Real Estate Management & Development* – 2.2% | |
| | 1,745,504 | | | CBRE Group, Inc. Class A | | | 48,786,837 | |
| | |
| | Road & Rail* – 1.3% | |
| | 1,222,173 | | | Roadrunner Transportation Systems, Inc. | | | 28,733,287 | |
| | |
| | | | | | | | |
| | Common Stocks – (continued) | |
| | Semiconductors & Semiconductor Equipment – 3.0% | |
| | 356,627 | | | Hittite Microwave Corp.* | | $ | 21,033,860 | |
| | 270,184 | | | Linear Technology Corp. | | | 12,655,419 | |
| | 623,427 | | | Xilinx, Inc. | | | 32,542,889 | |
| | | | | | | | |
| | | | | | | 66,232,168 | |
| | |
| | Software* – 5.0% | |
| | 287,017 | | | CommVault Systems, Inc. | | | 19,769,731 | |
| | 398,930 | | | Guidewire Software, Inc. | | | 21,386,637 | |
| | 504,629 | | | Mavenir Systems, Inc. | | | 7,796,518 | |
| | 264,115 | | | NetSuite, Inc. | | | 30,396,995 | |
| | 293,669 | | | ServiceNow, Inc. | | | 19,987,112 | |
| | 205,708 | | | Solarwinds, Inc. | | | 9,499,596 | |
| | | | | | | | |
| | | | | | | 108,836,589 | |
| | |
| | Specialty Retail – 5.3% | |
| | 436,478 | | | Dick’s Sporting Goods, Inc. | | | 23,425,774 | |
| | 726,240 | | | Five Below, Inc.* | | | 27,989,290 | |
| | 186,511 | | | Lumber Liquidators Holdings, Inc.* | | | 20,008,900 | |
| | 290,693 | | | PetSmart, Inc. | | | 19,493,873 | |
| | 384,168 | | | Restoration Hardware Holdings, Inc.* | | | 26,015,857 | |
| | | | | | | | |
| | | | | | | 116,933,694 | |
| | |
| | Textiles, Apparel & Luxury Goods – 6.7% | |
| | 306,739 | | | Carter’s, Inc. | | | 23,106,649 | |
| | 188,091 | | | Deckers Outdoor Corp.* | | | 13,984,566 | |
| | 1,190,402 | | | Kate Spade & Co.* | | | 40,735,556 | |
| | 281,007 | | | PVH Corp. | | | 35,527,715 | |
| | 296,907 | | | Under Armour, Inc. Class A* | | | 33,595,027 | |
| | | | | | | | |
| | | | | | | 146,949,513 | |
| | |
| | Thrifts & Mortgage Finance* – 0.8% | |
| | 1,915,415 | | | MGIC Investment Corp. | | | 17,162,118 | |
| | |
| | Wireless Telecommunication Services* – 1.9% | |
| | 440,504 | | | SBA Communications Corp. Class A | | | 41,922,766 | |
| | |
| | TOTAL COMMON STOCKS | | | | |
| | (Cost $1,612,823,188) | | $ | 2,152,426,663 | |
| | |
| | |
| 72 | | The accompanying notes are an integral part of these financial statements. |
GOLDMAN SACHS SMALL/MID CAP GROWTH FUND
| | | | | | | | | | | | | | |
Principal Amount | | | Interest
Rate | | | Maturity
Date | | | Value | |
| | Short-term Investment(b) – 1.5% | |
| | Repurchase Agreement – 1.5% | |
| Joint Repurchase Agreement Account II | |
| $ | 32,900,000 | | | | 0.055 | % | | | 03/03/14 | | | $ | 32,900,000 | |
| | (Cost $32,900,000) | | | | | |
| | |
| | TOTAL INVESTMENTS – 99.6% | | | | | |
| | (Cost $1,645,723,188) | | | $ | 2,185,326,663 | |
| | |
| OTHER ASSETS IN EXCESS OF
LIABILITIES – 0.4% |
| | | 9,509,355 | |
| | |
| | NET ASSETS – 100.0% | | | $ | 2,194,836,018 | |
| | |
| | |
| The percentage shown for each investment category reflects the value of investments in that category as a percentage of net assets. |
* | | Non-income producing security. |
(a) | | Represents an affiliated issuer. |
(b) | | Joint repurchase agreement was entered into on February 28, 2014. Additional information appears on pages 79-81. |
| | |
|
Investment Abbreviation: |
ADR | | —American Depositary Receipt |
|
| | |
| The accompanying notes are an integral part of these financial statements. | | 73 |
GOLDMAN SACHS STRATEGIC GROWTH FUND
Schedule of Investments
February 28, 2014 (Unaudited)
| | | | | | | | |
Shares | | | Description | | Value | |
| | Common Stocks – 98.7% | |
| | Aerospace & Defense – 4.9% | |
| | 95,602 | | | Honeywell International, Inc. | | $ | 9,028,653 | |
| | 30,678 | | | Precision Castparts Corp. | | | 7,911,242 | |
| | 31,540 | | | The Boeing Co. | | | 4,066,137 | |
| | | | | | | | |
| | | | | | | 21,006,032 | |
| | |
| | Air Freight & Logistics – 1.4% | |
| | 42,945 | | | FedEx Corp. | | | 5,725,857 | |
| | |
| | Beverages – 1.6% | |
| | 45,779 | | | PepsiCo., Inc. | | | 3,665,524 | |
| | 76,978 | | | The Coca-Cola Co. | | | 2,940,560 | |
| | | | | | | | |
| | | | | | | 6,606,084 | |
| | |
| | Biotechnology – 5.3% | |
| | 33,979 | | | Amgen, Inc. | | | 4,214,075 | |
| | 9,765 | | | Celgene Corp.* | | | 1,569,724 | |
| | 78,021 | | | Gilead Sciences, Inc.* | | | 6,459,359 | |
| | 22,631 | | | Regeneron Pharmaceuticals, Inc.* | | | 7,524,807 | |
| | 35,299 | | | Vertex Pharmaceuticals, Inc.* | | | 2,854,277 | |
| | | | | | | | |
| | | | | | | 22,622,242 | |
| | |
| | Capital Markets – 0.6% | |
| | 33,417 | | | T. Rowe Price Group, Inc. | | | 2,712,458 | |
| | |
| | Chemicals – 3.1% | |
| | 34,989 | | | Airgas, Inc. | | | 3,771,814 | |
| | 36,761 | | | Monsanto Co. | | | 4,044,445 | |
| | 25,776 | | | The Sherwin-Williams Co. | | | 5,167,573 | |
| | | | | | | | |
| | | | | | | 12,983,832 | |
| | |
| | Communications Equipment – 3.0% | |
| | 171,804 | | | QUALCOMM, Inc. | | | 12,935,123 | |
| | |
| | Computers & Peripherals – 4.8% | |
| | 22,631 | | | Apple, Inc. | | | 11,909,338 | |
| | 323,193 | | | EMC Corp. | | | 8,522,599 | |
| | | | | | | | |
| | | | | | | 20,431,937 | |
| | |
| | Consumer Finance – 0.8% | |
| | 133,796 | | | SLM Corp. | | | 3,203,076 | |
| | |
| | Diversified Financial Services – 2.0% | |
| | 37,538 | | | Citigroup, Inc. | | | 1,825,473 | |
| | 31,801 | | | IntercontinentalExchange Group, Inc.* | | | 6,641,321 | |
| | | | | | | | |
| | | | | | | 8,466,794 | |
| | |
| | Electrical Equipment* – 0.8% | |
| | 86,036 | | | Sensata Technologies Holding NV | | | 3,496,503 | |
| | |
| | Electronic Equipment, Instruments & Components – 0.7% | |
| | 35,455 | | | Amphenol Corp. Class A | | | 3,120,749 | |
| | |
| | Energy Equipment & Services – 3.0% | |
| | 67,676 | | | Cameron International Corp.* | | | 4,335,325 | |
| | 92,303 | | | Schlumberger Ltd. | | | 8,584,179 | |
| | | | | | | | |
| | | | | | | 12,919,504 | |
| | |
| | Common Stocks – (continued) | |
| | Food & Staples Retailing – 4.7% | |
| | 88,627 | | | Costco Wholesale Corp. | | $ | 10,351,634 | |
| | 49,982 | | | Wal-Mart Stores, Inc. | | | 3,733,655 | |
| | 112,034 | | | Whole Foods Market, Inc. | | | 6,055,438 | |
| | | | | | | | |
| | | | | | | 20,140,727 | |
| | |
| | Food Products – 1.6% | |
| | 29,321 | | | McCormick & Co., Inc. | | | 1,946,914 | |
| | 55,076 | | | The Hain Celestial Group, Inc.* | | | 4,918,287 | |
| | | | | | | | |
| | | | | | | 6,865,201 | |
| | |
| | Health Care Equipment & Supplies – 3.9% | |
| | 172,292 | | | Abbott Laboratories | | | 6,853,776 | |
| | 36,450 | | | Becton Dickinson & Co. | | | 4,199,769 | |
| | 37,669 | | | C.R. Bard, Inc. | | | 5,430,363 | |
| | | | | | | | |
| | | | | | | 16,483,908 | |
| | |
| | Health Care Providers & Services – 1.5% | |
| | 35,477 | | | McKesson Corp. | | | 6,281,203 | |
| | |
| | Hotels, Restaurants & Leisure – 4.8% | |
| | 8,902 | | | Chipotle Mexican Grill, Inc.* | | | 5,031,499 | |
| | 79,900 | | | Starbucks Corp. | | | 5,669,704 | |
| | 33,062 | | | Tim Hortons, Inc. | | | 1,793,614 | |
| | 104,062 | | | Yum! Brands, Inc. | | | 7,708,913 | |
| | | | | | | | |
| | | | | | | 20,203,730 | |
| | |
| | Household Products – 1.6% | |
| | 107,111 | | | Colgate-Palmolive Co. | | | 6,729,784 | |
| | |
| | Industrial Conglomerates – 1.8% | |
| | 98,260 | | | Danaher Corp. | | | 7,515,907 | |
| | |
| | Internet & Catalog Retail* – 4.0% | |
| | 29,914 | | | Amazon.com, Inc. | | | 10,831,860 | |
| | 4,517 | | | Priceline.com, Inc. | | | 6,092,710 | |
| | | | | | | | |
| | | | | | | 16,924,570 | |
| | |
| | Internet Software & Services* – 12.1% | |
| | 157,228 | | | eBay, Inc. | | | 9,240,289 | |
| | 50,602 | | | Equinix, Inc. | | | 9,612,356 | |
| | 92,325 | | | Facebook, Inc. Class A | | | 6,320,569 | |
| | 16,475 | | | Google, Inc. Class A | | | 20,027,834 | |
| | 30,567 | | | LinkedIn Corp. Class A | | | 6,236,891 | |
| | | | | | | | |
| | | | | | | 51,437,939 | |
| | |
| | Life Sciences Tools & Services – 1.4% | |
| | 104,105 | | | Agilent Technologies, Inc. | | | 5,926,698 | |
| | |
| | Machinery – 2.1% | |
| | 46,151 | | | Caterpillar, Inc. | | | 4,475,262 | |
| | 30,515 | | | Cummins, Inc. | | | 4,452,749 | |
| | | | | | | | |
| | | | | | | 8,928,011 | |
| | |
| | Media – 2.7% | |
| | 57,183 | | | Discovery Communications, Inc. Class A* | | | 4,764,488 | |
| | 205,976 | | | Twenty-First Century Fox, Inc. Class A | | | 6,908,435 | |
| | | | | | | | |
| | | | | | | 11,672,923 | |
| | |
| | |
| 74 | | The accompanying notes are an integral part of these financial statements. |
GOLDMAN SACHS STRATEGIC GROWTH FUND
| | | | | | | | |
Shares | | | Description | | Value | |
| | Common Stocks – (continued) | |
| | Multiline Retail* – 2.0% | |
| | 141,689 | | | Dollar General Corp. | | $ | 8,487,171 | |
| | |
| | Oil, Gas & Consumable Fuels – 1.7% | |
| | 59,726 | | | Anadarko Petroleum Corp. | | | 5,026,540 | |
| | 33,727 | | | Antero Resources Corp.* | | | 2,035,087 | |
| | | | | | | | |
| | | | | | | 7,061,627 | |
| | |
| | Pharmaceuticals – 2.7% | |
| | 57,627 | | | Mylan, Inc.* | | | 3,202,333 | |
| | 55,360 | | | Roche Holding AG ADR | | | 2,132,251 | |
| | 120,893 | | | Sanofi ADR | | | 6,267,093 | |
| | | | | | | | |
| | | | | | | 11,601,677 | |
| | |
| | Real Estate Investment Trusts – 3.0% | |
| | 156,436 | | | American Tower Corp. | | | 12,744,841 | |
| | |
| | Real Estate Management & Development* – 2.2% | |
| | 331,520 | | | CBRE Group, Inc. Class A | | | 9,265,984 | |
| | |
| | Semiconductors & Semiconductor Equipment – 1.5% | |
| | 125,580 | | | Xilinx, Inc. | | | 6,555,276 | |
| | |
| | Software – 4.1% | |
| | 202,388 | | | Microsoft Corp. | | | 7,753,484 | |
| | 214,191 | | | Oracle Corp. | | | 8,377,010 | |
| | 22,100 | | | ServiceNow, Inc.* | | | 1,504,126 | |
| | | | | | | | |
| | | | | | | 17,634,620 | |
| | |
| | Specialty Retail – 2.5% | |
| | 112,875 | | | L Brands, Inc. | | | 6,358,249 | |
| | 54,135 | | | The Home Depot, Inc. | | | 4,440,694 | |
| | | | | | | | |
| | | | | | | 10,798,943 | |
| | |
| | Textiles, Apparel & Luxury Goods – 3.5% | |
| | 112,100 | | | NIKE, Inc. Class B | | | 8,777,430 | |
| | 47,569 | | | PVH Corp. | | | 6,014,149 | |
| | | | | | | | |
| | | | | | | 14,791,579 | |
| | |
| | Tobacco – 0.8% | |
| | 42,674 | | | Philip Morris International, Inc. | | | 3,452,753 | |
| | |
| | Wireless Telecommunication Services* – 0.5% | |
| | 23,607 | | | SBA Communications Corp. Class A | | | 2,246,678 | |
| | |
| | TOTAL COMMON STOCKS | | | | |
| | (Cost $315,603,884) | | $ | 419,981,941 | |
| | |
| | | | | | | | | | | | | | |
Principal
Amount | | | Interest
Rate | | | Maturity
Date | | | Value | |
| | Short-term Investment(a) – 1.2% | |
| | Repurchase Agreement – 1.2% | |
| Joint Repurchase Agreement Account II | |
| $ | 5,200,000 | | | | 0.055 | % | | | 03/03/14 | | | $ | 5,200,000 | |
| | (Cost $5,200,000) | | | | | |
| | |
| | TOTAL INVESTMENTS – 99.9% | | | | | |
| | (Cost $320,803,884) | | | $ | 425,181,941 | |
| | |
| OTHER ASSETS IN EXCESS OF
LIABILITIES – 0.1% |
| | | 419,310 | |
| | |
| | NET ASSETS – 100.0% | | | $ | 425,601,251 | |
| | |
| | |
| The percentage shown for each investment category reflects the value of investments in that category as a percentage of net assets. |
* | | Non-income producing security. |
(a) | | Joint repurchase agreement was entered into on February 28, 2014. Additional information appears on pages 79-81. |
| | |
|
Investment Abbreviation: |
ADR | | —American Depositary Receipt |
|
| | |
| The accompanying notes are an integral part of these financial statements. | | 75 |
GOLDMAN SACHS TECHNOLOGY TOLLKEEPER FUND
Schedule of Investments
February 28, 2014 (Unaudited)
| | | | | | | | |
| Shares | | | Description | | Value | |
| | | | | | | | |
| | Common Stocks – 98.0% | | | | |
| | Communications Equipment – 6.0% | | | | |
| | 215,204 | | | Calix, Inc.* | | $ | 1,710,872 | |
| | 333,203 | | | QUALCOMM, Inc. | | | 25,086,854 | |
| | | | | | | | |
| | | | | | | 26,797,726 | |
| | |
| | Computers & Peripherals – 11.8% | | | | |
| | 58,407 | | | Apple, Inc. | | | 30,736,100 | |
| | 95,972 | | | Electronics For Imaging, Inc.* | | | 4,280,351 | |
| | 675,348 | | | EMC Corp. | | | 17,808,927 | |
| | | | | | | | |
| | | | | | | 52,825,378 | |
| | |
| | Diversified Financial Services – 1.7% | | | | |
| | 36,767 | | | IntercontinentalExchange Group, Inc. | | | 7,678,420 | |
| | |
| | Diversified Telecommunication Services* – 1.9% | | | | |
| | 273,740 | | | TW telecom, Inc. | | | 8,379,181 | |
| | |
| | Electronic Equipment, Instruments & Components – 1.9% | |
| | 97,924 | | | Amphenol Corp. Class A | | | 8,619,271 | |
| | |
| | Internet & Catalog Retail* – 7.5% | | | | |
| | 53,493 | | | Amazon.com, Inc. | | | 19,369,815 | |
| | 10,325 | | | Priceline.com, Inc. | | | 13,926,773 | |
| | | | | | | | |
| | | | | | | 33,296,588 | |
| | |
| | Internet Software & Services* – 25.3% | | | | |
| | 207,447 | | | eBay, Inc. | | | 12,191,660 | |
| | 93,865 | | | Equinix, Inc. | | | 17,830,596 | |
| | 253,913 | | | Facebook, Inc. Class A | | | 17,382,884 | |
| | 23,431 | | | Google, Inc. Class A | | | 28,483,895 | |
| | 81,726 | | | LinkedIn Corp. Class A | | | 16,675,373 | |
| | 394,733 | | | Pandora Media, Inc. | | | 14,770,909 | |
| | 34,889 | | | Twitter, Inc. | | | 1,915,755 | |
| | 99,534 | | | Yandex NV Class A | | | 3,732,525 | |
| | | | | | | | |
| | | | | | | 112,983,597 | |
| | |
| | IT Services* – 6.0% | | | | |
| | 85,794 | | | Cognizant Technology Solutions Corp. Class A | | | 8,927,723 | |
| | 61,214 | | | FleetCor Technologies, Inc. | | | 7,953,535 | |
| | 409,830 | | | InterXion Holding NV | | | 9,831,822 | |
| | | | | | | | |
| | | | | | | 26,713,080 | |
| | |
| | Real Estate Investment Trusts – 3.3% | | | | |
| | 183,092 | | | American Tower Corp. | | | 14,916,505 | |
| | |
| | Semiconductors & Semiconductor Equipment – 5.9% | | | | |
| | 195,126 | | | Altera Corp. | | | 7,085,025 | |
| | 109,726 | | | Hittite Microwave Corp.* | | | 6,471,639 | |
| | 244,704 | | | Xilinx, Inc. | | | 12,773,549 | |
| | | | | | | | |
| | | | | | | 26,330,213 | |
| | |
| | | | | | | | |
| | Common Stocks – (continued) | | | | |
| | Software – 22.7% | | | | |
| | 173,928 | | | Adobe Systems, Inc.* | | $ | 11,933,200 | |
| | 131,078 | | | CommVault Systems, Inc.* | | | 9,028,653 | |
| | 216,612 | | | Guidewire Software, Inc.* | | | 11,612,569 | |
| | 167,368 | | | Microsoft Corp. | | | 6,411,868 | |
| | 107,388 | | | NetSuite, Inc.* | | | 12,359,285 | |
| | 404,090 | | | Oracle Corp. | | | 15,803,960 | |
| | 205,736 | | | Salesforce.com, Inc.* | | | 12,831,754 | |
| | 215,896 | | | ServiceNow, Inc.* | | | 14,693,882 | |
| | 51,898 | | | Solarwinds, Inc.* | | | 2,396,650 | |
| | 45,845 | | | VMware, Inc. Class A* | | | 4,403,412 | |
| | | | | | | | |
| | | | | | | 101,475,233 | |
| | |
| | Wireless Telecommunication Services* – 4.0% | | | | |
| | 189,075 | | | SBA Communications Corp. Class A | | | 17,994,268 | |
| | |
| | TOTAL COMMON STOCKS | | | | |
| | (Cost $290,196,722) | | $ | 438,009,460 | |
| | |
| | | | | | | | | | | | | | |
Principal Amount | | | Interest
Rate | | | Maturity
Date | | | Value | |
| | | | | | | | | | | | | | |
| | Short-term Investment(a) – 3.0% | |
| | Repurchase Agreement – 3.0% | |
| Joint Repurchase Agreement Account II | |
| $ | 13,600,000 | | | | 0.055 | % | | | 03/03/14 | | | $ | 13,600,000 | |
| | (Cost $13,600,000) | |
| | |
| | TOTAL INVESTMENTS – 101.0% | |
| | (Cost $303,796,722) | | | $ | 451,609,460 | |
| | |
| LIABILITIES IN EXCESS OF
OTHER ASSETS – (1.0)% |
| | | (4,620,161 | ) |
| | |
| | NET ASSETS – 100.0% | | | $ | 446,989,299 | |
| | |
| | |
| The percentage shown for each investment category reflects the value of investments in that category as a percentage of net assets. |
* | | Non-income producing security. |
(a) | | Joint repurchase agreement was entered into on February 28, 2014. Additional information appears on pages 79-81. |
| | |
| 76 | | The accompanying notes are an integral part of these financial statements. |
GOLDMAN SACHS U.S. EQUITY FUND
Schedule of Investments
February 28, 2014 (Unaudited)
| | | | | | | | |
| Shares | | | Description | | Value | |
| | | | | | | | |
| | Common Stocks – 98.2% | |
| | Aerospace & Defense – 2.4% | |
| | 2,762 | | | The Boeing Co. | | $ | 356,077 | |
| | |
| | Air Freight & Logistics – 1.7% | |
| | 1,857 | | | FedEx Corp. | | | 247,594 | |
| | |
| | Automobiles – 0.5% | |
| | 2,012 | | | General Motors Co. | | | 72,834 | |
| | |
| | Biotechnology* – 3.4% | |
| | 2,300 | | | Gilead Sciences, Inc. | | | 190,417 | |
| | 536 | | | Regeneron Pharmaceuticals, Inc. | | | 178,220 | |
| | 1,520 | | | Vertex Pharmaceuticals, Inc. | | | 122,907 | |
| | | | | | | | |
| | | | | | | 491,544 | |
| | |
| | Capital Markets – 1.0% | |
| | 4,908 | | | Morgan Stanley, Inc. | | | 151,166 | |
| | |
| | Chemicals – 0.9% | |
| | 1,211 | | | Airgas, Inc. | | | 130,546 | |
| | |
| | Commercial Banks – 8.0% | |
| | 23,149 | | | Bank of America Corp. | | | 382,653 | |
| | 2,755 | | | Citigroup, Inc. | | | 133,976 | |
| | 7,563 | | | JPMorgan Chase & Co. | | | 429,730 | |
| | 5,865 | | | SunTrust Banks, Inc. | | | 220,993 | |
| | | | | | | | |
| | | | | | | 1,167,352 | |
| | |
| | Communications Equipment – 1.9% | |
| | 3,731 | | | QUALCOMM, Inc. | | | 280,907 | |
| | |
| | Computers & Peripherals – 5.0% | |
| | 768 | | | Apple, Inc. | | | 404,152 | |
| | 12,234 | | | EMC Corp. | | | 322,611 | |
| | | | | | | | |
| | | | | | | 726,763 | |
| | |
| | Consumer Finance – 1.0% | |
| | 2,054 | | | Capital One Financial Corp. | | | 150,825 | |
| | |
| | Electric Utilities – 1.1% | |
| | 5,039 | | | FirstEnergy Corp. | | | 155,100 | |
| | |
| | Energy Equipment & Services – 2.8% | |
| | 3,691 | | | Halliburton Co. | | | 210,387 | |
| | 2,205 | | | Schlumberger Ltd. | | | 205,065 | |
| | | | | | | | |
| | | | | | | 415,452 | |
| | |
| | Food & Staples Retailing – 5.3% | |
| | 2,268 | | | Costco Wholesale Corp. | | | 264,902 | |
| | 3,782 | | | The Kroger Co. | | | 158,617 | |
| | 2,177 | | | Wal-Mart Stores, Inc. | | | 162,622 | |
| | 3,554 | | | Whole Foods Market, Inc. | | | 192,094 | |
| | | | | | | | |
| | | | | | | 778,235 | |
| | |
| | Food Products – 1.7% | |
| | 4,030 | | | ConAgra Foods, Inc. | | | 114,452 | |
| | 2,028 | | | McCormick & Co., Inc. | | | 134,659 | |
| | | | | | | | |
| | | | | | | 249,111 | |
| | |
| | | | | | | | |
| | Common Stocks – (continued) | |
| | Health Care Equipment & Supplies – 3.8% | |
| | 7,241 | | | Abbott Laboratories | | $ | 288,047 | |
| | 1,246 | | | Becton Dickinson & Co. | | | 143,564 | |
| | 833 | | | C.R. Bard, Inc. | | | 120,085 | |
| | | | | | | | |
| | | | | | | 551,696 | |
| | |
| | Health Care Providers & Services – 2.6% | |
| | 899 | | | McKesson Corp. | | | 159,168 | |
| | 2,822 | | | UnitedHealth Group, Inc. | | | 218,056 | |
| | | | | | | | |
| | | | | | | 377,224 | |
| | |
| | Hotels, Restaurants & Leisure – 2.7% | |
| | 2,437 | | | Starbucks Corp. | | | 172,930 | |
| | 3,062 | | | Yum! Brands, Inc. | | | 226,833 | |
| | | | | | | | |
| | | | | | | 399,763 | |
| | |
| | Household Durables* – 1.2% | |
| | 4,699 | | | Toll Brothers, Inc. | | | 183,308 | |
| | |
| | Household Products – 1.5% | |
| | 3,423 | | | Colgate-Palmolive Co. | | | 215,067 | |
| | |
| | Industrial Conglomerates – 3.9% | |
| | 22,334 | | | General Electric Co. | | | 568,847 | |
| | |
| | Insurance – 5.0% | |
| | 5,426 | | | American International Group, Inc. | | | 270,052 | |
| | 2,822 | | | Prudential Financial, Inc. | | | 238,685 | |
| | 2,765 | | | The Hartford Financial Services Group, Inc. | | | 97,300 | |
| | 1,597 | | | The Travelers Cos., Inc. | | | 133,893 | |
| | | | | | | | |
| | | | | | | 739,930 | |
| | |
| | Internet & Catalog Retail* – 1.6% | |
| | 658 | | | Amazon.com, Inc. | | | 238,262 | |
| | |
| | Internet Software & Services* – 6.6% | |
| | 4,316 | | | eBay, Inc. | | | 253,651 | |
| | 772 | | | Equinix, Inc. | | | 146,649 | |
| | 356 | | | Google, Inc. Class A | | | 432,772 | |
| | 626 | | | LinkedIn Corp. Class A | | | 127,729 | |
| | | | | | | | |
| | | | | | | 960,801 | |
| | |
| | Machinery – 0.9% | |
| | 1,334 | | | Caterpillar, Inc. | | | 129,358 | |
| | |
| | Media – 0.9% | |
| | 4,046 | | | Twenty-First Century Fox, Inc. Class A | | | 135,703 | |
| | |
| | Multi-Utilities – 0.9% | |
| | 2,938 | | | PG&E Corp. | | | 129,448 | |
| | |
| | Multiline Retail* – 1.1% | |
| | 2,671 | | | Dollar General Corp. | | | 159,993 | |
| | |
| | Oil, Gas & Consumable Fuels – 7.6% | |
| | 7,074 | | | Devon Energy Corp. | | | 455,707 | |
| | 4,709 | | | Exxon Mobil Corp. | | | 453,335 | |
| | 4,935 | | | Southwestern Energy Co.* | | | 204,013 | |
| | | | | | | | |
| | | | | | | 1,113,055 | |
| | |
| | |
| The accompanying notes are an integral part of these financial statements. | | 77 |
GOLDMAN SACHS U.S. EQUITY FUND
Schedule of Investments (continued)
February 28, 2014 (Unaudited)
| | | | | | | | |
| Shares | | | Description | | Value | |
| | | | | | | | |
| | Common Stocks – (continued) | |
| | Pharmaceuticals – 3.8% | |
| | 2,621 | | | Eli Lilly & Co. | | $ | 156,238 | |
| | 6,969 | | | Merck & Co., Inc. | | | 397,163 | |
| | | | | | | | |
| | | | | | | 553,401 | |
| | |
| | Real Estate Investment Trusts – 2.0% | |
| | 3,572 | | | American Tower Corp. | | | 291,011 | |
| | |
| | Real Estate Management & Development* – 1.4% | |
| | 7,511 | | | CBRE Group, Inc. Class A | | | 209,933 | |
| | |
| | Semiconductors & Semiconductor Equipment – 3.3% | |
| | 5,056 | | | Altera Corp. | | | 183,583 | |
| | 3,496 | | | Intel Corp. | | | 86,561 | |
| | 3,979 | | | Xilinx, Inc. | | | 207,704 | |
| | | | | | | | |
| | | | | | | 477,848 | |
| | |
| | Software – 3.4% | |
| | 12,863 | | | Microsoft Corp. | | | 492,782 | |
| | |
| | Specialty Retail – 2.1% | |
| | 2,338 | | | L Brands, Inc. | | | 131,699 | |
| | 4,121 | | | The Gap, Inc. | | | 180,294 | |
| | | | | | | | |
| | | | | | | 311,993 | |
| | |
| | Textiles, Apparel & Luxury Goods – 3.1% | |
| | 4,445 | | | NIKE, Inc. Class B | | | 348,043 | |
| | 846 | | | PVH Corp. | | | 106,960 | |
| | | | | | | | |
| | | | | | | 455,003 | |
| | |
| | Wireless Telecommunication Services* – 2.1% | |
| | 3,164 | | | SBA Communications Corp. Class A | | | 301,118 | |
| | |
| | TOTAL COMMON STOCKS | | | | |
| | (Cost $11,281,273) | | $ | 14,369,050 | |
| | |
| | | | | | | | | | | | | | |
Principal
Amount | | | Interest
Rate | | | Maturity
Date | | | Value | |
| | | | | | | | | | | | | | |
| | Short-term Investment(a) – 2.0% | |
| | Repurchase Agreement – 2.0% | |
| Joint Repurchase Agreement Account II | |
| $ | 300,000 | | | | 0.055 | % | | | 03/03/14 | | | $ | 300,000 | |
| | (Cost $300,000) | |
| | |
| | TOTAL INVESTMENTS – 100.2% | |
| | (Cost $11,581,273) | | | $ | 14,669,050 | |
| | |
| LIABILITIES IN EXCESS OF
OTHER ASSETS – (0.2)% |
| | | (31,732 | ) |
| | |
| | NET ASSETS – 100.0% | | | $ | 14,637,318 | |
| | |
| | |
| The percentage shown for each investment category reflects the value of investments in that category as a percentage of net assets. |
* | | Non-income producing security. |
(a) | | Joint repurchase agreement was entered into on February 28, 2014. Additional information appears on pages 79-81. |
| | |
| 78 | | The accompanying notes are an integral part of these financial statements. |
GOLDMAN SACHS FUNDAMENTAL EQUITY GROWTH FUNDS
Schedule of Investments
February 28, 2014 (Unaudited)
|
| ADDITIONAL INVESTMENT INFORMATION |
JOINT REPURCHASE AGREEMENT ACCOUNT II — At February 28, 2014, the Funds had undivided interests in the Joint Repurchase Agreement Account II, with a maturity date of March 3, 2014, as follows:
| | | | | | | | | | | | |
| Fund | | Principal Amount | | | Maturity Value | | | Collateral Allocation Value | |
Capital Growth | | $ | 600,000 | | | $ | 600,003 | | | $ | 614,048 | |
Concentrated Growth | | | 1,300,000 | | | | 1,300,006 | | | | 1,330,436 | |
Flexible Cap Growth | | | 200,000 | | | | 200,001 | | | | 204,683 | |
Focused Growth | | | 400,000 | | | | 400,002 | | | | 409,365 | |
Growth Opportunities | | | 109,600,000 | | | | 109,600,501 | | | | 112,166,018 | |
Small/Mid Cap Growth | | | 32,900,000 | | | | 32,900,151 | | | | 33,670,274 | |
Strategic Growth | | | 5,200,000 | | | | 5,200,024 | | | | 5,321,745 | |
Technology Tollkeeper | | | 13,600,000 | | | | 13,600,062 | | | | 13,918,411 | |
U.S. Equity | | | 300,000 | | | | 300,001 | | | | 307,024 | |
| | |
| The accompanying notes are an integral part of these financial statements. | | 79 |
GOLDMAN SACHS FUNDAMENTAL EQUITY GROWTH FUNDS
Schedule of Investments (continued)
February 28, 2014 (Unaudited)
|
| ADDITIONAL INVESTMENT INFORMATION (continued) |
REPURCHASE AGREEMENTS — At February 28, 2014, the Principal Amounts of the Funds’ interest in the Joint Repurchase Agreement Account II were as follows:
| | | | | | | | | | | | | | | | | | | | | | | | | | | | | | | | | | | | | | | | |
| Counterparty | | Interest
Rate | | | Capital
Growth | | | Concentrated
Growth | | | Flexible
Cap
Growth | | | Focused
Growth | | | Growth
Opportunities | | | Small/Mid Cap
Growth | | | Strategic
Growth | | | Technology
Tollkeeper | | | U.S. Equity | |
BNP Paribas Securities Co. | | | 0.050 | % | | $ | 19,752 | | | $ | 42,795 | | | $ | 6,584 | | | $ | 13,168 | | | $ | 3,607,953 | | | $ | 1,083,044 | | | $ | 171,180 | | | $ | 447,702 | | | $ | 9,876 | |
BNP Paribas Securities Co. | | | 0.060 | | | | 46,087 | | | | 99,855 | | | | 15,362 | | | | 30,725 | | | | 8,418,558 | | | | 2,527,104 | | | | 399,421 | | | | 1,044,639 | | | | 23,043 | |
Citigroup Global Markets, Inc. | | | 0.050 | | | | 151,429 | | | | 328,096 | | | | 50,476 | | | | 100,952 | | | | 27,660,975 | | | | 8,303,340 | | | | 1,312,382 | | | | 3,432,384 | | | | 75,714 | |
Citigroup Global Markets, Inc. | | | 0.060 | | | | 158,012 | | | | 342,361 | | | | 52,671 | | | | 105,342 | | | | 28,863,627 | | | | 8,664,355 | | | | 1,369,443 | | | | 3,581,618 | | | | 79,007 | |
Merrill Lynch & Co., Inc. | | | 0.050 | | | | 40,372 | | | | 87,473 | | | | 13,457 | | | | 26,915 | | | | 7,374,657 | | | | 2,213,743 | | | | 349,892 | | | | 915,103 | | | | 20,186 | |
TD Securities (USA) LLC | | | 0.050 | | | | 92,174 | | | | 199,710 | | | | 30,725 | | | | 61,449 | | | | 16,837,115 | | | | 5,054,207 | | | | 798,841 | | | | 2,089,277 | | | | 46,087 | |
TD Securities (USA) LLC | | | 0.060 | | | | 92,174 | | | | 199,710 | | | | 30,725 | | | | 61,449 | | | | 16,837,115 | | | | 5,054,207 | | | | 798,841 | | | | 2,089,277 | | | | 46,087 | |
| TOTAL | | | | | | $ | 600,000 | | | $ | 1,300,000 | | | $ | 200,000 | | | $ | 400,000 | | | $ | 109,600,000 | | | $ | 32,900,000 | | | $ | 5,200,000 | | | $ | 13,600,000 | | | $ | 300,000 | |
| | |
| 80 | | The accompanying notes are an integral part of these financial statements. |
GOLDMAN SACHS FUNDAMENTAL EQUITY GROWTH FUNDS
|
| ADDITIONAL INVESTMENT INFORMATION (continued) |
At February 28, 2014, the Joint Repurchase Agreement Account II was fully collateralized by:
| | | | | | | | |
| Issuer | | Interest Rates | | | Maturity Dates | |
Federal Farm Credit Bank | | | 0.175% to 4.375 | % | | | 01/06/15 to 02/21/34 | |
Federal Home Loan Bank | | | 0.875 to 5.375 | | | | 05/18/16 to 09/11/20 | |
Federal Home Loan Mortgage Corp. | | | 0.310 to 6.750 | | | | 04/01/14 to 02/01/44 | |
Federal National Mortgage Association | | | 0.375 to 7.250 | | | | 04/01/14 to 03/01/44 | |
Government National Mortgage Association | | | 2.500 to 8.500 | | | | 07/15/18 to 02/15/44 | |
Tennessee Valley Authority | | | 5.250 | | | | 09/15/39 | |
United States Treasury Bills | | | 0.000 | | | | 03/27/14 to 04/03/14 | |
United States Treasury Bond | | | 2.750 | | | | 08/15/42 | |
United States Treasury Floating Rate Note | | | 0.095 | | | | 01/31/16 | |
United States Treasury Inflation Protected Securities | | | 1.625 to 1.750 | | | | 01/15/15 to 01/15/28 | |
United States Treasury Notes | | | 1.000 to 3.625 | | | | 02/28/19 to 05/15/21 | |
United States Treasury Coupon-Only Stripped Securities | | | 0.000 | | | | 05/15/14 to 05/15/41 | |
United States Treasury Principal-Only Stripped Securities | | | 0.000 | | | | 02/15/15 to 05/15/43 | |
| | |
| The accompanying notes are an integral part of these financial statements. | | 81 |
GOLDMAN SACHS FUNDAMENTAL EQUITY GROWTH FUNDS
Statements of Assets and Liabilities
February 28, 2014 (Unaudited)
| | | | | | |
| | | | | Capital Growth Fund | |
| | Assets: | | | | |
| | Investments of unaffiliated issuers, at value (cost $659,787,584, $127,915,145, $10,120,268, $16,898,337, $3,691,991,872, $1,584,518,565, $315,603,884, $290,196,722 and $11,281,273) | | $ | 937,849,721 | |
| | Investments of affiliated issuers, at value (cost $0, $0, $0, $0, $0, $28,304,623, $0, $0 and $0) | | | — | |
| | Repurchase agreement, at value which equals cost | | | 600,000 | |
| | Cash | | | 10,012 | |
| | Receivables: | | | | |
| | Investments sold | | | 2,966,019 | |
| | Dividends and interest | | | 1,042,421 | |
| | Foreign tax reclaims | | | 70,002 | |
| | Fund shares sold | | | 69,601 | |
| | Reimbursement from investment adviser | | | 54,095 | |
| | Other assets | | | 49,836 | |
| | Total assets | | | 942,711,707 | |
| | | | | | |
| | Liabilities: | | | | |
| | Payables: | | | | |
| | Fund shares redeemed | | | 1,702,265 | |
| | Amounts owed to affiliates | | | 824,703 | |
| | Investments purchased | | | — | |
| | Accrued expenses and other liabilities | | | 298,215 | |
| | Total liabilities | | | 2,825,183 | |
| | | | | | |
| | Net Assets: | | | | |
| | Paid-in capital | | | 615,317,693 | |
| | Undistributed (distributions in excess of) net investment income (loss) | | | (346,508 | ) |
| | Accumulated net realized gain | | | 46,853,079 | |
| | Net unrealized gain | | | 278,062,260 | |
| | | NET ASSETS | | $ | 939,886,524 | |
| | | Net Assets: | | | | |
| | | Class A | | $ | 697,638,825 | |
| | | Class B | | | 18,395,592 | |
| | | Class C | | | 81,111,958 | |
| | | Institutional | | | 135,913,933 | |
| | | Service | | | 1,169,102 | |
| | | Class IR | | | 2,610,499 | |
| | | Class R | | | 3,046,615 | |
| | | Total Net Assets | | $ | 939,886,524 | |
| | | Shares Outstanding $0.001 par value (unlimited shares authorized): | | | | |
| | | Class A | | | 26,321,495 | |
| | | Class B | | | 829,292 | |
| | | Class C | | | 3,661,891 | |
| | | Institutional | | | 4,822,647 | |
| | | Service | | | 45,106 | |
| | | Class IR | | | 97,930 | |
| | | Class R | | | 116,983 | |
| | | Net asset value, offering and redemption price per share:(a) | | | | |
| | | Class A | | | $26.50 | |
| | | Class B | | | 22.18 | |
| | | Class C | | | 22.15 | |
| | | Institutional | | | 28.18 | |
| | | Service | | | 25.92 | |
| | | Class IR | | | 26.66 | |
| | | Class R | | | 26.04 | |
| | (a) | | Maximum public offering price per share for Class A Shares of the Capital Growth, Concentrated Growth, Flexible Cap Growth, Focused Growth, Growth Opportunities, Small/Mid Cap Growth, Strategic Growth, Technology Tollkeeper and U.S. Equity Funds is $28.04, $19.10, $13.10, $15.08, $30.59, $21.92, $13.40, $19.49 and $16.47, respectively. At redemption, Class B and Class C Shares may be subject to a contingent deferred sales charge, assessed on the amount equal to the lesser of the current net asset value or the original purchase price of the shares. |
| | |
| 82 | | The accompanying notes are an integral part of these financial statements. |
GOLDMAN SACHS FUNDAMENTAL EQUITY GROWTH FUNDS
| | | | | | | | | | | | | | | | | | | | | | | | |
| | | Concentrated Growth Fund | | | Flexible Cap Growth Fund | | Focused Growth Fund | | | Growth Opportunities Fund | | Small/Mid Cap Growth Fund | | | Strategic Growth Fund | | Technology Tollkeeper Fund | | | U.S. Equity Fund |
| | | | | | | | | | | | | | | | | | | | | | | | |
| | | $175,973,166 | | | $14,735,182 | | $ | 19,105,112 | | | $5,347,573,122 | | $ | 2,121,748,294 | | | $419,981,941 | | $ | 438,009,460 | | | $14,369,050 |
| | | — | | | — | | | — | | | — | | | 30,678,369 | | | — | | | — | | | — |
| | | 1,300,000 | | | 200,000 | | | 400,000 | | | 109,600,000 | | | 32,900,000 | | | 5,200,000 | | | 13,600,000 | | | 300,000 |
| | | 23,980 | | | 84,394 | | | 64,512 | | | 20,852 | | | 228,669 | | | 91,285 | | | 10,771 | | | 14,919 |
| | | | | | | | | | | | | | | | | | | | | | | | |
| | | — | | | 45,378 | | | — | | | 34,489,693 | | | 15,916,649 | | | 3,003,220 | | | 4,976,121 | | | — |
| | | 158,764 | | | 9,748 | | | 17,399 | | | 4,735,830 | | | 765,112 | | | 414,175 | | | 92,612 | | | 26,965 |
| | | 13,243 | | | — | | | — | | | — | | | — | | | 31,343 | | | — | | | 233 |
| | | 111,544 | | | 31 | | | 341,250 | | | 7,349,237 | | | 7,833,254 | | | 573,483 | | | 704,083 | | | 213 |
| | | 17,446 | | | 35,259 | | | 34,858 | | | 27,117 | | | — | | | 29,847 | | | 12,305 | | | 13,011 |
| | | 4,769 | | | 6,192 | | | 5,673 | | | 105,520 | | | 47,955 | | | 10,353 | | | 27,726 | | | 5,818 |
| | | 177,602,912 | | | 15,116,184 | | | 19,968,804 | | | 5,503,901,371 | | | 2,210,118,302 | | | 429,335,647 | | | 457,433,078 | | | 14,730,209 |
| | | | | | | | | | | | | | | | | �� | | | | | | | |
| | | | | | | | | | | | | | | | | | | | | | | | |
| | | | | | | | | | | | | | | | | | | | | | | | |
| | | 82,107 | | | 8,014 | | | — | | | 21,700,283 | | | 3,054,962 | | | 365,796 | | | 778,583 | | | 2,462 |
| | | 118,781 | | | 12,017 | | | 11,969 | | | 4,338,963 | | | 1,871,950 | | | 279,033 | | | 484,187 | | | 9,691 |
| | | — | | | 17,356 | | | 316,902 | | | 99,277,303 | | | 10,148,004 | | | 2,976,181 | | | 8,971,278 | | | — |
| | | 79,344 | | | 68,367 | | | 64,582 | | | 634,201 | | | 207,368 | | | 113,386 | | | 209,731 | | | 80,738 |
| | | 280,232 | | | 105,754 | | | 393,453 | | | 125,950,750 | | | 15,282,284 | | | 3,734,396 | | | 10,443,779 | | | 92,891 |
| | | | | | | | | | | | | | | | | | | | | | | | |
| | | | | | | | | | | | | | | | | | | | | | | | |
| | | 114,275,109 | | | 9,813,592 | | | 16,595,452 | | | 3,469,022,896 | | | 1,610,506,637 | | | 302,631,449 | | | 287,344,510 | | | 10,855,774 |
| | | 15,519 | | | (22,563) | | | (1,705 | ) | | (8,185,815) | | | (12,247,842 | ) | | 273,793 | | | (3,928,229 | ) | | 20,093 |
| | | 14,974,031 | | | 604,484 | | | 774,829 | | | 261,530,666 | | | 56,973,357 | | | 18,317,903 | | | 15,760,280 | | | 673,674 |
| | | 48,058,021 | | | 4,614,917 | | | 2,206,775 | | | 1,655,582,874 | | | 539,603,866 | | | 104,378,106 | | | 147,812,738 | | | 3,087,777 |
| | | | $177,322,680 | | | $15,010,430 | | $ | 19,575,351 | | | $5,377,950,621 | | $ | 2,194,836,018 | | | $425,601,251 | | $ | 446,989,299 | | | $14,637,318 |
| | | | | | | | | | | | | | | | | | | | | | | | | |
| | | | $9,271,703 | | | $5,575,038 | | $ | 71,341 | | | $1,234,963,231 | | $ | 804,528,611 | | | $99,271,093 | | $ | 270,770,045 | | | $4,579,525 |
| | | | 329,708 | | | — | | | — | | | 8,977,708 | | | 4,596,805 | | | 918,269 | | | 5,489,536 | | | — |
| | | | 3,401,383 | | | 1,243,139 | | | 37,527 | | | 192,248,282 | | | 212,606,287 | | | 11,329,345 | | | 59,397,113 | | | 237,754 |
| | | | 163,892,805 | | | 8,054,325 | | | 19,435,821 | | | 3,661,624,586 | | | 981,562,325 | | | 312,893,812 | | | 95,487,291 | | | 9,525,065 |
| | | | — | | | — | | | — | | | 60,115,815 | | | 8,091,132 | | | 100,259 | | | 11,366,568 | | | — |
| | | | 413,283 | | | 87,914 | | | 15,412 | | | 138,036,464 | | | 151,996,548 | | | 1,077,821 | | | 4,478,746 | | | 201,108 |
| | | | 13,798 | | | 50,014 | | | 15,250 | | | 81,984,535 | | | 31,454,310 | | | 10,652 | | | — | | | 93,866 |
| | | | $177,322,680 | | | $15,010,430 | | $ | 19,575,351 | | | $5,377,950,621 | | $ | 2,194,836,018 | | | $425,601,251 | | $ | 446,989,299 | | | $14,637,318 |
| | | | | | | | | | | | | | | | | | | | | | | | | |
| | | | 513,552 | | | 450,414 | | | 5,006 | | | 42,722,404 | | | 38,849,245 | | | 7,839,357 | | | 14,703,060 | | | 294,330 |
| | | | 20,133 | | | — | | | — | | | 363,544 | | | 240,612 | | | 82,160 | | | 333,069 | | | — |
| | | | 208,039 | | | 106,344 | | | 2,665 | | | 7,877,563 | | | 11,134,690 | | | 1,012,020 | | | 3,604,117 | | | 15,526 |
| | | | 8,741,098 | | | 629,845 | | | 1,355,856 | | | 116,161,235 | | | 45,709,607 | | | 23,638,380 | | | 4,888,715 | | | 610,009 |
| | | | — | | | — | | | — | | | 2,128,634 | | | 396,583 | | | 7,932 | | | 624,059 | | | — |
| | | | 22,723 | | | 6,942 | | | 1,076 | | | 4,684,117 | | | 7,209,171 | | | 81,394 | | | 230,501 | | | 12,892 |
| | | | 776 | | | 4,110 | | | 1,071 | | | 2,887,659 | | | 1,545,267 | | | 846 | | | — | | | 6,039 |
| | | | | | | | | | | | | | | | | | | | | | | | | |
| | | | $18.05 | | | $12.38 | | | $14.25 | | | $28.91 | | | $20.71 | | | $12.66 | | | $18.42 | | | $15.56 |
| | | | 16.38 | | | — | | | — | | | 24.69 | | | 19.10 | | | 11.18 | | | 16.48 | | | — |
| | | | 16.35 | | | 11.69 | | | 14.08 | | | 24.40 | | | 19.09 | | | 11.19 | | | 16.48 | | | 15.31 |
| | | | 18.75 | | | 12.79 | | | 14.33 | | | 31.52 | | | 21.47 | | | 13.24 | | | 19.53 | | | 15.61 |
| | | | — | | | — | | | — | | | 28.24 | | | 20.40 | | | 12.64 | | | 18.21 | | | — |
| | | | 18.19 | | | 12.66 | | | 14.33 | | | 29.47 | | | 21.08 | | | 13.24 | | | 19.43 | | | 15.60 |
| | | | 17.79 | | | 12.17 | | | 14.23 | | | 28.39 | | | 20.36 | | | 12.59 | | | — | | | 15.54 |
| | |
| The accompanying notes are an integral part of these financial statements. | | 83 |
GOLDMAN SACHS FUNDAMENTAL EQUITY GROWTH FUNDS
Statements of Operations
For the Six Months Ended February 28, 2014 (Unaudited)
| | | | | | |
| | | | | Capital Growth Fund | |
| | Investment income: | | | | |
| | Dividends (net of foreign withholding taxes of $6,354, $0, $128, $0, $98,500, $35,277, $2,615, $0 and $133) | | $ | 4,943,221 | |
| | Interest | | | 1,261 | |
| | Total investment income | | | 4,944,482 | |
| | | | | | |
| | Expenses: | | | | |
| | Management fees | | | 4,535,095 | |
| | Distribution and Service fees(a) | | | 1,333,950 | |
| | Transfer Agent fees(a) | | | 761,235 | |
| | Printing and mailing costs | | | 99,103 | |
| | Registration fees | | | 56,976 | |
| | Custody, accounting and administrative services | | | 54,757 | |
| | Shareholder meeting expense | | | 48,482 | |
| | Professional fees | | | 46,000 | |
| | Trustee fees | | | 11,584 | |
| | Service Share fees — Shareholder Administration Plan | | | 1,342 | |
| | Service Share fees — Service Plan | | | 1,342 | |
| | Other | | | 9,743 | |
| | Total expenses | | | 6,959,609 | |
| | Less — expense reductions | | | (1,604,363 | ) |
| | Net expenses | | | 5,355,246 | |
| | NET INVESTMENT INCOME (LOSS) | | | (410,764 | ) |
| | | | | | |
| | Realized and unrealized gain (loss): | | | | |
| | Net realized gain (loss) from: | | | | |
| | Investments (including commission recapture of $13,072, $4,384, $0, $0, $87,230, $0, $10,287, $8,580 and $0) | | | 126,450,391 | |
| | Foreign currency transactions | | | (606 | ) |
| | Net change in unrealized gain on: | | | | |
| | Investments — unaffiliated issuers | | | 24,689,179 | |
| | Investments — affiliated issuers | | | — | |
| | Foreign currency transactions | | | 575 | |
| | Net realized and unrealized gain | | | 151,139,539 | |
| | NET INCREASE IN NET ASSETS RESULTING FROM OPERATIONS | | $ | 150,728,775 | |
| | (a) | | Class specific Distribution and Service, and Transfer Agent fees were as follows: |
| | | | | | | | | | | | | | | | | | | | | | | | | | | | | | | | | | | | | | | | | | | | |
| | | Distribution and Service Fees | | | Transfer Agent Fees | |
Fund | | Class A | | | Class B | | | Class C | | | Class R | | | Class A | | | Class B | | | Class C | | | Institutional | | | Service | | | Class IR | | | Class R | |
Capital Growth | | $ | 837,441 | | | $ | 94,294 | | | $ | 395,372 | | | $ | 6,843 | | | $ | 636,455 | | | $ | 17,916 | | | $ | 75,121 | | | $ | 26,567 | | | $ | 215 | | | $ | 2,361 | | | $ | 2,600 | |
Concentrated Growth | | | 11,378 | | | | 1,634 | | | | 15,499 | | | | 32 | | | | 8,648 | | | | 310 | | | | 2,945 | | | | 31,423 | | | | — | | | | 363 | | | | 12 | |
Flexible Cap Growth | | | 6,325 | | | | — | | | | 5,542 | | | | 115 | | | | 4,807 | | | | — | | | | 1,053 | | | | 1,371 | | | | — | | | | 101 | | | | 43 | |
Focused Growth | | | 76 | | | | — | | | | 154 | | | | 36 | | | | 58 | | | | — | | | | 29 | | | | 3,234 | | | | — | | | | 14 | | | | 14 | |
Growth Opportunities | | | 1,472,880 | | | | 45,534 | | | | 914,838 | | | | 189,199 | | | | 1,119,389 | | | | 8,651 | | | | 173,819 | | | | 684,897 | | | | 12,217 | | | | 112,553 | | | | 71,896 | |
Small/Mid Cap Growth | | | 872,761 | | | | 22,644 | | | | 905,269 | | | | 68,913 | | | | 663,298 | | | | 4,302 | | | | 172,001 | | | | 167,809 | | | | 1,653 | | | | 117,731 | | | | 26,187 | |
Strategic Growth | | | 117,285 | | | | 5,226 | | | | 51,290 | | | | 20 | | | | 89,136 | | | | 993 | | | | 9,745 | | | | 56,143 | | | | 18 | | | | 929 | | | | 7 | |
Technology Tollkeeper | | | 309,941 | | | | 28,762 | | | | 270,514 | | | | — | | | | 235,555 | | | | 5,465 | | | | 51,397 | | | | 16,475 | | | | 2,241 | | | | 3,588 | | | | — | |
U.S. Equity | | | 4,706 | | | | — | | | | 846 | | | | 210 | | | | 3,577 | | | | — | | | | 161 | | | | 1,815 | | | | — | | | | 179 | | | | 80 | |
| | |
| 84 | | The accompanying notes are an integral part of these financial statements. |
GOLDMAN SACHS FUNDAMENTAL EQUITY GROWTH FUNDS
| | | | | | | | | | | | | | | | | | | | | | | | | | | | | | | | | | | | | | | | | | | | | | |
| | | Concentrated
Growth Fund | | | | | Flexible Cap Growth Fund | | | | | Focused
Growth Fund | | | | | Growth
Opportunities Fund | | | | | Small/Mid Cap
Growth Fund | | | | | Strategic
Growth Fund | | | | | Technology
Tollkeeper Fund | | | | | U.S. Equity
Fund | |
| | | | | | | | | | | | | | | | | | | | | | | | | | | | | | | | | | | | | | | | | | | | | | |
| | $ | 790,488 | | | | | $ | 57,877 | | | | | $ | 68,759 | | | | | $ | 19,020,698 | | | | | $ | 5,529,969 | | | | | $ | 1,997,428 | | | | | $ | 1,218,727 | | | | | $ | 105,852 | |
| | | 618 | | | | | | 39 | | | | | | 33 | | | | | | 14,643 | | | | | | 14,563 | | | | | | 1,173 | | | | | | 1,611 | | | | | | 14 | |
| | | 791,106 | | | | | | 57,916 | | | | | | 68,792 | | | | | | 19,035,341 | | | | | | 5,544,532 | | | | | | 1,998,601 | | | | | | 1,220,338 | | | | | | 105,866 | |
| | | | | | | | | | | | | | | | | | | | | | | | | | | | | | | | | | | | | | | | | | | | | | |
| | | | | | | | | | | | | | | | | | | | | | | | | | | | | | | | | | | | | | | | | | | | | | |
| | | 850,199 | | | | | | 65,874 | | | | | | 81,463 | | | | | | 23,695,389 | | | | | | 9,403,376 | | | | | | 1,934,615 | | | | | | 2,025,816 | | | | | | 46,482 | |
| | | 28,543 | | | | | | 11,982 | | | | | | 266 | | | | | | 2,622,451 | | | | | | 1,869,587 | | | | | | 173,821 | | | | | | 609,217 | | | | | | 5,762 | |
| | | 43,701 | | | | | | 7,375 | | | | | | 3,349 | | | | | | 2,183,422 | | | | | | 1,152,981 | | | | | | 156,971 | | | | | | 314,721 | | | | | | 5,812 | |
| | | 20,122 | | | | | | 14,967 | | | | | | 8,512 | | | | | | 223,602 | | | | | | 83,192 | | | | | | 34,001 | | | | | | 64,763 | | | | | | 15,276 | |
| | | 27,719 | | | | | | 45,137 | | | | | | 44,660 | | | | | | 55,833 | | | | | | 47,894 | | | | | | 43,311 | | | | | | 29,912 | | | | | | 30,791 | |
| | | 25,363 | | | | | | 27,513 | | | | | | 22,503 | | | | | | 132,096 | | | | | | 83,918 | | | | | | 37,962 | | | | | | 36,505 | | | | | | 27,711 | |
| | | 4,641 | | | | | | 3,653 | | | | | | 3,371 | | | | | | 102,655 | | | | | | 46,653 | | | | | | 10,072 | | | | | | 26,972 | | | | | | 3,460 | |
| | | 42,719 | | | | | | 39,777 | | | | | | 40,668 | | | | | | 43,834 | | | | | | 43,520 | | | | | | 38,240 | | | | | | 40,591 | | | | | | 36,425 | |
| | | 10,520 | | | | | | 10,292 | | | | | | 10,104 | | | | | | 17,550 | | | | | | 12,994 | | | | | | 10,840 | | | | | | 10,774 | | | | | | 10,294 | |
| | | — | | | | | | — | | | | | | — | | | | | | 76,359 | | | | | | 10,330 | | | | | | 113 | | | | | | 14,005 | | | | | | — | |
| | | — | | | | | | — | | | | | | — | | | | | | 76,359 | | | | | | 10,330 | | | | | | 113 | | | | | | 14,005 | | | | | | — | |
| | | 4,024 | | | | | | 2,520 | | | | | | 3,723 | | | | | | 44,248 | | | | | | 17,966 | | | | | | 6,968 | | | | | | 6,420 | | | | | | 3,233 | |
| | | 1,057,551 | | | | | | 229,090 | | | | | | 218,619 | | | | | | 29,273,798 | | | | | | 12,782,741 | | | | | | 2,447,027 | | | | | | 3,193,701 | | | | | | 185,246 | |
| | | (280,102 | ) | | | | | (154,234 | ) | | | | | (148,222 | ) | | | | | (1,155,436 | ) | | | | | (1,402,364 | ) | | | | | (724,623 | ) | | | | | (59,313 | ) | | | | | (123,070 | ) |
| | | 777,449 | | | | | | 74,856 | | | | | | 70,397 | | | | | | 28,118,362 | | | | | | 11,380,377 | | | | | | 1,722,404 | | | | | | 3,134,388 | | | | | | 62,176 | |
| | | 13,657 | | | | | | (16,940 | ) | | | | | (1,605 | ) | | | | | (9,083,021 | ) | | | | | (5,835,845 | ) | | | | | 276,197 | | | | | | (1,914,050 | ) | | | | | 43,690 | |
| | | | | | | | | | | | | | | | | | | | | | | | | | | | | | | | | | | | | | | | | | | | | | |
| | | | | | | | | | | | | | | | | | | | | | | | | | | | | | | | | | | | | | | | | | | | | | |
| | | | | | | | | | | | | | | | | | | | | | | | | | | | | | | | | | | | | | | | | | | | | | |
| | | 24,714,170 | | | | | | 1,239,633 | | | | | | 1,097,528 | | | | | | 392,192,826 | | | | | | 87,477,022 | | | | | | 30,494,114 | | | | | | 19,716,487 | | | | | | 1,098,183 | |
| | | — | | | | | | (8 | ) | | | | | — | | | | | | (4,171 | ) | | | | | (1,072 | ) | | | | | (270 | ) | | | | | — | | | | | | — | |
| | | | | | | | | | | | | | | | | | | | | | | | | | | | | | | | | | | | | | | | | | | | | | |
| | | 2,430,160 | | | | | | 1,036,598 | | | | | | 1,426,999 | | | | | | 427,347,398 | | | | | | 204,613,816 | | | | | | 35,363,937 | | | | | | 65,441,289 | | | | | | 703,670 | |
| | | — | | | | | | — | | | | | | — | | | | | | — | | | | | | 6,943,446 | | | | | | — | | | | | | — | | | | | | — | |
| | | — | | | | | | 8 | | | | | | — | | | | | | 4,292 | | | | | | 1,044 | | | | | | 254 | | | | | | — | | | | | | — | |
| | | 27,144,330 | | | | | | 2,276,231 | | | | | | 2,524,527 | | | | | | 819,540,345 | | | | | | 299,034,256 | | | | | | 65,858,035 | | | | | | 85,157,776 | | | | | | 1,801,853 | |
| | $ | 27,157,987 | | | | | $ | 2,259,291 | | | | | $ | 2,522,922 | | | | | $ | 810,457,324 | | | | | $ | 293,198,411 | | | | | $ | 66,134,232 | | | | | $ | 83,243,726 | | | | | $ | 1,845,543 | |
| | |
| The accompanying notes are an integral part of these financial statements. | | 85 |
GOLDMAN SACHS FUNDAMENTAL EQUITY GROWTH FUNDS
Statements of Changes in Net Assets
| | | | | | | | | | |
| | | | | Capital Growth Fund | |
| | | | | For the
Six Months Ended
February 28, 2014
(Unaudited) | | | For the Fiscal
Year Ended
August 31, 2013 | |
| | From operations: | |
| | Net investment income (loss) | | $ | (410,764 | ) | | $ | 2,894,569 | |
| | Net realized gain | | | 126,449,785 | | | | 125,825,982 | |
| | Net change in unrealized gain (loss) | | | 24,689,754 | | | | (7,691,558 | ) |
| | Net increase in net assets resulting from operations | | | 150,728,775 | | | | 121,028,993 | |
| | | | | | | | | | |
| | Distributions to shareholders: | | | | | | | | |
| | From net investment income | | | | | | | | |
| | Class A Shares | | | (1,685,518 | ) | | | (690,472 | ) |
| | Class B Shares | | | — | | | | — | |
| | Class C Shares | | | — | | | | — | |
| | Institutional Shares | | | (651,899 | ) | | | (395,128 | ) |
| | Service Shares | | | (1,578 | ) | | | (417 | ) |
| | Class IR Shares | | | (11,151 | ) | | | (10,114 | ) |
| | Class R Shares | | | (4,232 | ) | | | (3,429 | ) |
| | From net realized gains | | | | | | | | |
| | Class A Shares | | | (137,515,085 | ) | | | — | |
| | Class B Shares | | | (4,533,042 | ) | | | — | |
| | Class C Shares | | | (18,780,747 | ) | | | — | |
| | Institutional Shares | | | (26,252,486 | ) | | | — | |
| | Service Shares | | | (222,125 | ) | | | — | |
| | Class IR Shares | | | (539,137 | ) | | | — | |
| | Class R Shares | | | (562,868 | ) | | | — | |
| | Total distributions to shareholders | | | (190,759,868 | ) | | | (1,099,560 | ) |
| | | | | | | | | | |
| | From share transactions: | | | | | | | | |
| | Proceeds from sales of shares | | | 22,930,949 | | | | 78,419,489 | |
| | Reinvestment of distributions | | | 179,706,369 | | | | 1,032,918 | |
| | Cost of shares redeemed | | | (78,285,531 | ) | | | (194,960,552 | ) |
| | Net increase (decrease) in net assets resulting from share transactions | | | 124,351,787 | | | | (115,508,145 | ) |
| | TOTAL INCREASE (DECREASE) | | | 84,320,694 | | | | 4,421,288 | |
| | | | | | | | | | |
| | Net assets: | | | | | | | | |
| | Beginning of period | | | 855,565,830 | | | | 851,144,542 | |
| | End of period | | $ | 939,886,524 | | | $ | 855,565,830 | |
| | Undistributed (distributions in excess of) net investment income (loss) | | $ | (346,508 | ) | | $ | 2,418,634 | |
| | |
| 86 | | The accompanying notes are an integral part of these financial statements. |
GOLDMAN SACHS FUNDAMENTAL EQUITY GROWTH FUNDS
| | | | | | | | | | | | | | | | | | | | | | |
| | | Concentrated Growth Fund | | | | | Flexible Cap Growth Fund | |
| | | For the
Six Months Ended
February 28, 2014
(Unaudited) | | | | | For the Fiscal
Year Ended
August 31, 2013 | | | | | For the
Six Months Ended
February 28, 2014
(Unaudited) | | | | | For the Fiscal
Year Ended
August 31, 2013 | |
| | | | | | | | | | | | | | | | | | | | | | |
| | $ | 13,657 | | | | | $ | 893,044 | | | | | $ | (16,940 | ) | | | | $ | 15,769 | |
| | | 24,714,170 | | | | | | 24,348,485 | | | | | | 1,239,625 | | | | | | 1,448,192 | |
| | | 2,430,160 | | | | | | (4,517,877 | ) | | | | | 1,036,606 | | | | | | 405,725 | |
| | | 27,157,987 | | | | | | 20,723,652 | | | | | | 2,259,291 | | | | | | 1,869,686 | |
| | | | | | | | | | | | | | | | | | | | | | |
| | | | | | | | | | | | | | | | | | | | | | |
| | | | | | | | | | | | | | | | | | | | | | |
| | | — | | | | | | (355,613 | ) | | | | | — | | | | | | — | |
| | | — | | | | | | (218 | ) | | | | | — | | | | | | — | |
| | | — | | | | | | (1,983 | ) | | | | | — | | | | | | — | |
| | | (258,083 | ) | | | | | (419,468 | ) | | | | | (12,391 | ) | | | | | — | |
| | | — | | | | | | — | | | | | | — | | | | | | — | |
| | | (275 | ) | | | | | (4,247 | ) | | | | | — | | | | | | — | |
| | | — | | | | | | (24 | ) | | | | | — | | | | | | — | |
| | | | | | | | | | | | | | | | | | | | | | |
| | | (886,939 | ) | | | | | — | | | | | | (620,899 | ) | | | | | (713,810 | ) |
| | | (36,576 | ) | | | | | — | | | | | | — | | | | | | — | |
| | | (341,863 | ) | | | | | — | | | | | | (139,480 | ) | | | | | (102,494 | ) |
| | | (14,924,877 | ) | | | | | — | | | | | | (813,854 | ) | | | | | (539,715 | ) |
| | | — | | | | | | — | | | | | | — | | | | | | — | |
| | | (37,654 | ) | | | | | — | | | | | | (11,334 | ) | | | | | (18,987 | ) |
| | | (1,284 | ) | | | | | — | | | | | | (5,635 | ) | | | | | (7,512 | ) |
| | | (16,487,551 | ) | | | | | (781,553 | ) | | | | | (1,603,593 | ) | | | | | (1,382,518 | ) |
| | | | | | | | | | | | | | | | | | | | | | |
| | | | | | | | | | | | | | | | | | | | | | |
| | | 8,875,729 | | | | | | 100,006,573 | | | | | | 2,103,176 | | | | | | 3,352,588 | |
| | | 16,211,286 | | | | | | 741,898 | | | | | | 1,591,368 | | | | | | 1,362,254 | |
| | | (16,328,375 | ) | | | | | (114,987,264 | ) | | | | | (1,351,250 | ) | | | | | (6,470,712 | ) |
| | | 8,758,640 | | | | | | (14,238,793 | ) | | | | | 2,343,294 | | | | | | (1,755,870 | ) |
| | | 19,429,076 | | | | | | 5,703,306 | | | | | | 2,998,992 | | | | | | (1,268,702 | ) |
| | | | | | | | | | | | | | | | | | | | | | |
| | | | | | | | | | | | | | | | | | | | | | |
| | | 157,893,604 | | | | | | 152,190,298 | | | | | | 12,011,438 | | | | | | 13,280,140 | |
| | $ | 177,322,680 | | | | | $ | 157,893,604 | | | | | $ | 15,010,430 | | | | | $ | 12,011,438 | |
| | $ | 15,519 | | | | | $ | 260,220 | | | | | $ | (22,563 | ) | | | | $ | 6,768 | |
| | |
| The accompanying notes are an integral part of these financial statements. | | 87 |
GOLDMAN SACHS FUNDAMENTAL EQUITY GROWTH FUNDS
Statements of Changes in Net Assets (continued)
| | | | | | | | | | |
| | | | | Focused Growth Fund | |
| | | | | For the
Six Months Ended
February 28, 2014
(Unaudited) | | | For the Fiscal
Year Ended
August 31, 2013 | |
| | From operations: | |
| | Net investment income (loss) | | $ | (1,605 | ) | | $ | 47,770 | |
| | Net realized gain | | | 1,097,528 | | | | 770,220 | |
| | Net change in unrealized gain | | | 1,426,999 | | | | 410,224 | |
| | Net increase in net assets resulting from operations | | | 2,522,922 | | | | 1,228,214 | |
| | | | | | | | | | |
| | Distributions to shareholders: | | | | | | | | |
| | From net investment income | | | | | | | | |
| | Class A Shares | | | — | | | | (261 | ) |
| | Class C Shares | | | — | | | | (11 | ) |
| | Institutional Shares | | | (26,580 | ) | | | (27,074 | ) |
| | Class IR Shares | | | (10 | ) | | | (54 | ) |
| | Class R Shares | | | — | | | | (11 | ) |
| | From net realized gains | | | | | | | | |
| | Class A Shares | | | (3,925 | ) | | | (115 | ) |
| | Class B Shares | | | — | | | | — | |
| | Class C Shares | | | (2,323 | ) | | | (21 | ) |
| | Institutional Shares | | | (1,063,316 | ) | | | (8,003 | ) |
| | Service Shares | | | — | | | | — | |
| | Class IR Shares | | | (938 | ) | | | (22 | ) |
| | Class R Shares | | | (935 | ) | | | (22 | ) |
| | Total distributions to shareholders | | | (1,098,027 | ) | | | (35,594 | ) |
| | | | | | | | | | |
| | From share transactions: | | | | | | | | |
| | Proceeds from sales of shares | | | 6,330,067 | | | | 10,726,282 | |
| | Reinvestment of distributions | | | 1,098,027 | | | | 35,593 | |
| | Cost of shares redeemed | | | (2,220,983 | ) | | | (2,496,650 | ) |
| | Net increase in net assets resulting from share transactions | | | 5,207,111 | | | | 8,265,225 | |
| | TOTAL INCREASE | | | 6,632,006 | | | | 9,457,845 | |
| | | | | | | | | | |
| | Net assets: | | | | | | | | |
| | Beginning of period | | | 12,943,345 | | | | 3,485,500 | |
| | End of period | | $ | 19,575,351 | | | $ | 12,943,345 | |
| | Undistributed (distributions in excess of) net investment income (loss) | | $ | (1,705 | ) | | $ | 26,490 | |
| | |
| 88 | | The accompanying notes are an integral part of these financial statements. |
GOLDMAN SACHS FUNDAMENTAL EQUITY GROWTH FUNDS
| | | | | | | | | | | | | | | | | | | | | | |
| | | Growth Opportunities Fund | | | | | Small/Mid Cap Growth Fund | |
| | | For the
Six Months Ended
February 28, 2014
(Unaudited) | | | | | For the Fiscal
Year Ended
August 31, 2013 | | | | | For the
Six Months Ended
February 28, 2014
(Unaudited) | | | | | For the Fiscal
Year Ended
August 31, 2013 | |
| | | | | | | | | | | | | | | | | | | | | | |
| | $ | (9,083,021 | ) | | | | $ | (9,310,204 | ) | | | | $ | (5,835,845 | ) | | | | $ | (6,895,027 | ) |
| | | 392,188,655 | | | | | | 356,949,267 | | | | | | 87,475,950 | | | | | | 86,225,576 | |
| | | 427,351,690 | | | | | | 460,291,144 | | | | | | 211,558,306 | | | | | | 182,347,374 | |
| | | 810,457,324 | | | | | | 807,930,207 | | | | | | 293,198,411 | | | | | | 261,677,923 | |
| | | | | | | | | | | | | | | | | | | | | | |
| | | | | | | | | | | | | | | | | | | | | | |
| | | | | | | | | | | | | | | | | | | | | | |
| | | — | | | | | | — | | | | | | — | | | | | | — | |
| | | — | | | | | | — | | | | | | — | | | | | | — | |
| | | — | | | | | | — | | | | | | — | | | | | | — | |
| | | — | | | | | | — | | | | | | — | | | | | | — | |
| | | — | | | | | | — | | | | | | — | | | | | | — | |
| | | | | | | | | | | | | | | | | | | | | | |
| | | (89,135,434 | ) | | | | | (71,926,329 | ) | | | | | (34,915,088 | ) | | | | | (19,824,908 | ) |
| | | (816,955 | ) | | | | | (869,553 | ) | | | | | (241,378 | ) | | | | | (235,890 | ) |
| | | (16,251,524 | ) | | | | | (12,084,546 | ) | | | | | (9,748,706 | ) | | | | | (4,682,209 | ) |
| | | (240,888,335 | ) | | | | | (173,115,031 | ) | | | | | (40,240,222 | ) | | | | | (14,180,476 | ) |
| | | (4,773,288 | ) | | | | | (4,124,099 | ) | | | | | (402,842 | ) | | | | | (332,236 | ) |
| | | (8,961,670 | ) | | | | | (5,489,820 | ) | | | | | (6,136,306 | ) | | | | | (2,347,737 | ) |
| | | (5,816,843 | ) | | | | | (3,762,229 | ) | | | | | (1,398,747 | ) | | | | | (941,534 | ) |
| | | (366,644,049 | ) | | | | | (271,371,607 | ) | | | | | (93,083,289 | ) | | | | | (42,544,990 | ) |
| | | | | | | | | | | | | | | | | | | | | | |
| | | | | | | | | | | | | | | | | | | | | | |
| | | 614,365,666 | | | | | | 1,326,672,073 | | | | | | 521,390,560 | | | | | | 824,387,644 | |
| | | 287,053,890 | | | | | | 213,144,060 | | | | | | 81,410,266 | | | | | | 38,750,263 | |
| | | (710,428,122 | ) | | | | | (1,472,345,304 | ) | | | | | (208,027,860 | ) | | | | | (331,918,085 | ) |
| | | 190,991,434 | | | | | | 67,470,829 | | | | | | 394,772,966 | | | | | | 531,219,822 | |
| | | 634,804,709 | | | | | | 604,029,429 | | | | | | 594,888,088 | | | | | | 750,352,755 | |
| | | | | | | | | | | | | | | | | | | | | | |
| | | | | | | | | | | | | | | | | | | | | | |
| | | 4,743,145,912 | | | | | | 4,139,116,483 | | | | | | 1,599,947,930 | | | | | | 849,595,175 | |
| | $ | 5,377,950,621 | | | | | $ | 4,743,145,912 | | | | | $ | 2,194,836,018 | | | | | $ | 1,599,947,930 | |
| | $ | (8,185,815 | ) | | | | $ | 897,206 | | | | | $ | (12,247,842 | ) | | | | $ | (6,411,997 | ) |
| | |
| The accompanying notes are an integral part of these financial statements. | | 89 |
GOLDMAN SACHS FUNDAMENTAL EQUITY GROWTH FUNDS
Statements of Changes in Net Assets (continued)
| | | | | | | | | | |
| | | | | Strategic Growth Fund | |
| | | | | For the
Six Months Ended
February 28, 2014
(Unaudited) | | | For the Fiscal
Year Ended
August 31, 2013 | |
| | From operations: | |
| | Net investment income (loss) | | $ | 276,197 | | | $ | 2,390,844 | |
| | Net realized gain | | | 30,493,844 | | | | 54,393,479 | |
| | Net change in unrealized gain (loss) | | | 35,364,191 | | | | (3,646,456 | ) |
| | Net increase in net assets resulting from operations | | | 66,134,232 | | | | 53,137,867 | |
| | | | | | | | | | |
| | Distributions to shareholders: | | | | | | | | |
| | From net investment income | | | | | | | | |
| | Class A Shares | | | (72,015 | ) | | | (768,074 | ) |
| | Institutional Shares | | | (1,083,693 | ) | | | (1,757,888 | ) |
| | Service Shares | | | (39 | ) | | | (540 | ) |
| | Class IR Shares | | | (2,932 | ) | | | (2,531 | ) |
| | Class R Shares | | | (14 | ) | | | (13 | ) |
| | From net realized gains | | | | | | | | |
| | Class A Shares | | | (12,687,895 | ) | | | (12,147,881 | ) |
| | Class B Shares | | | (163,134 | ) | | | (108,492 | ) |
| | Class C Shares | | | (1,543,546 | ) | | | (659,516 | ) |
| | Institutional Shares | | | (36,102,729 | ) | | | (14,440,628 | ) |
| | Service Shares | | | (12,312 | ) | | | (5,491 | ) |
| | Class IR Shares | | | (120,720 | ) | | | (24,554 | ) |
| | Class R Shares | | | (1,136 | ) | | | (318 | ) |
| | Total distributions to shareholders | | | (51,790,165 | ) | | | (29,915,926 | ) |
| | | | | | | | | | |
| | From share transactions: | | | | | | | | |
| | Proceeds from sales of shares | | | 58,898,429 | | | | 124,321,981 | |
| | Reinvestment of distributions | | | 50,216,795 | | | | 29,155,483 | |
| | Cost of shares redeemed | | | (40,018,805 | ) | | | (282,323,776 | ) |
| | Net increase (decrease) in net assets resulting from share transactions | | | 69,096,419 | | | | (128,846,312 | ) |
| | TOTAL INCREASE (DECREASE) | | | 83,440,486 | | | | (105,624,371 | ) |
| | | | | | | | | | |
| | Net assets: | | | | | | | | |
| | Beginning of period | | | 342,160,765 | | | | 447,785,136 | |
| | End of period | | $ | 425,601,251 | | | $ | 342,160,765 | |
| | Undistributed net investment income (loss) | | $ | 273,793 | | | $ | 1,156,289 | |
| | |
| 90 | | The accompanying notes are an integral part of these financial statements. |
GOLDMAN SACHS FUNDAMENTAL EQUITY GROWTH FUNDS
| | | | | | | | | | | | | | | | | | | | | | |
| | | Technology Tollkeeper Fund | | | | | U.S. Equity Fund | |
| | | For the
Six Months Ended
February 28, 2014
(Unaudited) | | | | | For the Fiscal
Year Ended
August 31, 2013 | | | | | For the
Six Months Ended
February 28, 2014
(Unaudited) | | | | | For the Fiscal
Year Ended
August 31, 2013 | |
| | | | | | | | | | | | | | | | | | | | | | |
| | $ | (1,914,050 | ) | | | | $ | (3,256,843 | ) | | | | $ | 43,690 | | | | | $ | 104,203 | |
| | | 19,716,487 | | | | | | 8,785,321 | | | | | | 1,098,183 | | | | | | 1,005,160 | |
| | | 65,441,289 | | | | | | 33,870,056 | | | | | | 703,670 | | | | | | 1,019,786 | |
| | | 83,243,726 | | | | | | 39,398,534 | | | | | | 1,845,543 | | | | | | 2,129,149 | |
| | | | | | | | | | | | | | | | | | | | | | |
| | | | | | | | | | | | | | | | | | | | | | |
| | | | | | | | | | | | | | | | | | | | | | |
| | | — | | | | | | — | | | | | | (14,081 | ) | | | | | (20,678 | ) |
| | | — | | | | | | — | | | | | | (59,761 | ) | | | | | (76,416 | ) |
| | | — | | | | | | — | | | | | | — | | | | | | — | |
| | | — | | | | | | — | | | | | | (978 | ) | | | | | (1,243 | ) |
| | | — | | | | | | — | | | | | | (206 | ) | | | | | (60 | ) |
| | | | | | | | | | | | | | | | | | | | | | |
| | | (3,390,217 | ) | | | | | — | | | | | | (342,004 | ) | | | | | — | |
| | | (91,485 | ) | | | | | — | | | | | | — | | | | | | — | |
| | | (836,560 | ) | | | | | — | | | | | | (14,635 | ) | | | | | — | |
| | | (1,086,772 | ) | | | | | — | | | | | | (780,489 | ) | | | | | — | |
| | | (169,169 | ) | | | | | — | | | | | | — | | | | | | — | |
| | | (53,596 | ) | | | | | — | | | | | | (16,071 | ) | | | | | — | |
| | | — | | | | | | — | | | | | | (7,485 | ) | | | | | — | |
| | | (5,627,799 | ) | | | | | — | | | | | | (1,235,710 | ) | | | | | (98,397 | ) |
| | | | | | | | | | | | | | | | | | | | | | |
| | | | | | | | | | | | | | | | | | | | | | |
| | | 55,615,710 | | | | | | 95,925,924 | | | | | | 2,262,303 | | | | | | 2,296,952 | |
| | | 5,055,079 | | | | | | — | | | | | | 1,079,150 | | | | | | 83,817 | |
| | | (59,086,488 | ) | | | | | (128,391,119 | ) | | | | | (1,180,934 | ) | | | | | (3,257,595 | ) |
| | | 1,584,301 | | | | | | (32,465,195 | ) | | | | | 2,160,519 | | | | | | (876,826 | ) |
| | | 79,200,228 | | | | | | 6,933,339 | | | | | | 2,770,352 | | | | | | 1,153,926 | |
| | | | | | | | | | | | | | | | | | | | | | |
| | | | | | | | | | | | | | | | | | | | | | |
| | | 367,789,071 | | | | | | 360,855,732 | | | | | | 11,866,966 | | | | | | 10,713,040 | |
| | $ | 446,989,299 | | | | | $ | 367,789,071 | | | | | $ | 14,637,318 | | | | | $ | 11,866,966 | |
| | $ | (3,928,229 | ) | | | | $ | (2,014,179 | ) | | | | $ | 20,093 | | | | | $ | 51,429 | |
| | |
| The accompanying notes are an integral part of these financial statements. | | 91 |
GOLDMAN SACHS CAPITAL GROWTH FUND
Financial Highlights
Selected Data for a Share Outstanding Throughout Each Period
| | | | | | | | | | | | | | | | | | | | | | | | | | | | | | |
| | | | | | | | Income (loss) from
investment operations | | | Distributions
to shareholders | |
| | | Year - Share Class | | Net asset
value,
beginning
of period | | | Net
investment
income (loss)(a) | | | Net realized
and unrealized
gain (loss) | | | Total from
investment
operations | | | From net
investment
income | | | From net
realized
gains | | | Total
distributions | |
| | FOR THE SIX MONTHS ENDED FEBRUARY 28, (UNAUDITED) | |
| | 2014 - A | | $ | 28.13 | | | $ | (0.01 | ) | | $ | 4.75 | | | $ | 4.74 | | | $ | (0.08 | ) | | $ | (6.29 | ) | | $ | (6.37 | ) |
| | 2014 - B | | | 24.49 | | | | (0.10 | ) | | | 4.08 | | | | 3.98 | | | | — | | | | (6.29 | ) | | | (6.29 | ) |
| | 2014 - C | | | 24.46 | | | | (0.10 | ) | | | 4.08 | | | | 3.98 | | | | — | | | | (6.29 | ) | | | (6.29 | ) |
| | 2014 - Institutional | | | 29.57 | | | | 0.05 | | | | 5.01 | | | | 5.06 | | | | (0.16 | ) | | | (6.29 | ) | | | (6.45 | ) |
| | 2014 - Service | | | 27.62 | | | | (0.02 | ) | | | 4.66 | | | | 4.64 | | | | (0.05 | ) | | | (6.29 | ) | | | (6.34 | ) |
| | 2014 - IR | | | 28.28 | | | | 0.03 | | | | 4.77 | | | | 4.80 | | | | (0.13 | ) | | | (6.29 | ) | | | (6.42 | ) |
| | 2014 - R | | | 27.75 | | | | (0.04 | ) | | | 4.67 | | | | 4.63 | | | | (0.05 | ) | | | (6.29 | ) | | | (6.34 | ) |
| | | | | | | | | | | | | | | | | | | | | | | | | | | | | | |
| FOR THE FISCAL YEARS ENDED AUGUST 31, | | | | | |
| | 2013 - A | | | 24.40 | | | | 0.10 | (e) | | | 3.66 | | | | 3.76 | | | | (0.03 | ) | | | — | | | | (0.03 | ) |
| | 2013 - B | | | 21.37 | | | | (0.08 | )(e) | | | 3.20 | | | | 3.12 | | | | — | | | | — | | | | — | |
| | 2013 - C | | | 21.35 | | | | (0.08 | )(e) | | | 3.19 | | | | 3.11 | | | | — | | | | — | | | | — | |
| | 2013 - Institutional | | | 25.64 | | | | 0.21 | (e) | | | 3.84 | | | | 4.05 | | | | (0.12 | ) | | | — | | | | (0.12 | ) |
| | 2013 - Service | | | 23.96 | | | | 0.07 | (e) | | | 3.60 | | | | 3.67 | | | | (0.01 | ) | | | — | | | | (0.01 | ) |
| | 2013 - IR | | | 24.53 | | | | 0.18 | (e) | | | 3.67 | | | | 3.85 | | | | (0.10 | ) | | | — | | | | (0.10 | ) |
| | 2013 - R | | | 24.14 | | | | 0.03 | (e) | | | 3.62 | | | | 3.65 | | | | (0.04 | ) | | | — | | | | (0.04 | ) |
| | 2012 - A | | | 20.49 | | | | 0.02 | | | | 3.93 | | | | 3.95 | | | | (0.04 | ) | | | — | | | | (0.04 | ) |
| | 2012 - B | | | 18.06 | | | | (0.13 | ) | | | 3.44 | | | | 3.31 | | | | — | | | | — | | | | — | |
| | 2012 - C | | | 18.03 | | | | (0.13 | ) | | | 3.45 | | | | 3.32 | | | | — | | | | — | | | | — | |
| | 2012 - Institutional | | | 21.54 | | | | 0.10 | | | | 4.12 | | | | 4.22 | | | | (0.12 | ) | | | — | | | | (0.12 | ) |
| | 2012 - Service | | | 20.13 | | | | — | (f) | | | 3.85 | | | | 3.85 | | | | (0.02 | ) | | | — | | | | (0.02 | ) |
| | 2012 - IR | | | 20.66 | | | | 0.08 | | | | 3.93 | | | | 4.01 | | | | (0.14 | ) | | | — | | | | (0.14 | ) |
| | 2012 - R | | | 20.31 | | | | (0.03 | ) | | | 3.88 | | | | 3.85 | | | | (0.02 | ) | | | — | | | | (0.02 | ) |
| | 2011 - A | | | 17.68 | | | | 0.03 | | | | 2.78 | | | | 2.81 | | | | — | | | | — | | | | — | |
| | 2011 - B | | | 15.70 | | | | (0.11 | ) | | | 2.47 | | | | 2.36 | | | | — | | | | — | | | | — | |
| | 2011 - C | | | 15.68 | | | | (0.12 | ) | | | 2.47 | | | | 2.35 | | | | — | | | | — | | | | — | |
| | 2011 - Institutional | | | 18.57 | | | | 0.12 | | | | 2.91 | | | | 3.03 | | | | (0.06 | ) | | | — | | | | (0.06 | ) |
| | 2011 - Service | | | 17.39 | | | | 0.01 | | | | 2.73 | | | | 2.74 | | | | — | | | | — | | | | — | |
| | 2011 - IR | | | 17.81 | | | | 0.31 | | | | 2.58 | | | | 2.89 | | | | (0.04 | ) | | | — | | | | (0.04 | ) |
| | 2011 - R | | | 17.57 | | | | (0.03 | ) | | | 2.77 | | | | 2.74 | | | | — | | | | — | | | | — | |
| | 2010 - A | | | 16.95 | | | | 0.01 | | | | 0.72 | | | | 0.73 | | | | — | | | | — | | | | — | |
| | 2010 - B | | | 15.15 | | | | (0.11 | ) | | | 0.66 | | | | 0.55 | | | | — | | | | — | | | | — | |
| | 2010 - C | | | 15.14 | | | | (0.11 | ) | | | 0.65 | | | | 0.54 | | | | — | | | | — | | | | — | |
| | 2010 - Institutional | | | 17.72 | | | | 0.10 | | | | 0.75 | | | | 0.85 | | | | — | | | | — | | | | — | |
| | 2010 - Service | | | 16.68 | | | | (0.01 | ) | | | 0.72 | | | | 0.71 | | | | — | | | | — | | | | — | |
| | 2010 - IR | | | 17.02 | | | | 0.07 | | | | 0.72 | | | | 0.79 | | | | — | | | | — | | | | — | |
| | 2010 - R | | | 16.88 | | | | (0.01 | ) | | | 0.70 | | | | 0.69 | | | | — | | | | — | | | | — | |
| | 2009 - A | | | 22.40 | | | | — | (f) | | | (4.58 | ) | | | (4.58 | ) | | | — | | | | (0.87 | ) | | | (0.87 | ) |
| | 2009 - B | | | 20.33 | | | | (0.10 | ) | | | (4.21 | ) | | | (4.31 | ) | | | — | | | | (0.87 | ) | | | (0.87 | ) |
| | 2009 - C | | | 20.31 | | | | (0.10 | ) | | | (4.20 | ) | | | (4.30 | ) | | | — | | | | (0.87 | ) | | | (0.87 | ) |
| | 2009 - Institutional | | | 23.26 | | | | 0.06 | | | | (4.73 | ) | | | (4.67 | ) | | | — | | | | (0.87 | ) | | | (0.87 | ) |
| | 2009 - Service | | | 22.09 | | | | (0.02 | ) | | | (4.52 | ) | | | (4.54 | ) | | | — | | | | (0.87 | ) | | | (0.87 | ) |
| | 2009 - IR | | | 22.44 | | | | 0.03 | | | | (4.58 | ) | | | (4.55 | ) | | | — | | | | (0.87 | ) | | | (0.87 | ) |
| | 2009 - R | | | 22.37 | | | | (0.03 | ) | | | (4.59 | ) | | | (4.62 | ) | | | — | | | | (0.87 | ) | | | (0.87 | ) |
| | (a) | | Calculated based on the average shares outstanding methodology. |
| | (b) | | Assumes investment at the net asset value at the beginning of the period, reinvestment of all dividends and distributions, a complete redemption of the investment at the net asset value at the end of the period and no sales or redemption charges. Total returns would be reduced if a sales or redemption charge was taken into account. Returns do not reflect the deduction of taxes that a shareholder would pay on Fund distributions or the redemption of Fund shares. Total returns for periods less than one full year are not annualized. |
| | (c) | | The Fund’s portfolio turnover rate is calculated in accordance with regulatory requirements, without regard to transactions involving short term investments and certain derivatives. If such transactions were included, the Fund’s portfolio turnover rate may be higher. |
| | (e) | | Reflects income recognized from special dividends which amounted to $0.06 per share and 0.21% of average net assets. |
| | (f) | | Amount is less than $0.005 per share. |
| | (g) | | Amount is less than 0.005% of average net assets. |
| | |
| 92 | | The accompanying notes are an integral part of these financial statements. |
GOLDMAN SACHS CAPITAL GROWTH FUND
| | | | | | | | | | | | | | | | | | | | | | | | | | | | | | | | | | | | | | | | |
| | | | | | | | | | | | | | | | | | | | | | | | | | | | | | | | | | |
| | | Net asset
value, end
of period | | | | | Total
return(b) | | | | | Net assets,
end of
period
(in 000s) | | | | | Ratio of
net expenses
to average
net assets | | | | | Ratio of
total expenses
to average
net assets | | | | | Ratio of
net investment
income (loss)
to average
net assets | | | | | Portfolio
turnover
rate(c) | |
| | | | | | | | | | | | | | | | | | | | | | | | | | | | | | | | | | | | | | | | |
| | $ | 26.50 | | | | | | 18.10 | % | | | | $ | 697,639 | | | | | | 1.16 | %(d) | | | | | 1.51 | %(d) | | | | | (0.07 | )%(d) | | | | | 44 | % |
| | | 22.18 | | | | | | 17.64 | | | | | | 18,396 | | | | | | 1.91 | (d) | | | | | 2.26 | (d) | | | | | (0.82 | )(d) | | | | | 44 | |
| | | 22.15 | | | | | | 17.67 | | | | | | 81,112 | | | | | | 1.91 | (d) | | | | | 2.26 | (d) | | | | | (0.82 | )(d) | | | | | 44 | |
| | | 28.18 | | | | | | 18.34 | | | | | | 135,914 | | | | | | 0.76 | (d) | | | | | 1.11 | (d) | | | | | 0.33 | (d) | | | | | 44 | |
| | | 25.92 | | | | | | 18.06 | | | | | | 1,169 | | | | | | 1.26 | (d) | | | | | 1.61 | (d) | | | | | (0.17 | )(d) | | | | | 44 | |
| | | 26.66 | | | | | | 18.26 | | | | | | 2,610 | | | | | | 0.91 | (d) | | | | | 1.26 | (d) | | | | | 0.18 | (d) | | | | | 44 | |
| | | 26.04 | | | | | | 17.93 | | | | | | 3,047 | | | | | | 1.41 | (d) | | | | | 1.76 | (d) | | | | | (0.31 | )(d) | | | | | 44 | |
| | | | | | | | | | | | | | | | | | | | | | | | | | | | | | | | | | | | | | | | |
| | | | | | | | | | | | | | | | | | | | | | | | | | | | | | | | | | | | | | | | |
| | | 28.13 | | | | | | 15.41 | | | | | | 630,495 | | | | | | 1.14 | | | | | | 1.50 | | | | | | 0.38 | (e) | | | | | 52 | |
| | | 24.49 | | | | | | 14.60 | | | | | | 19,329 | | | | | | 1.89 | | | | | | 2.25 | | | | | | (0.34 | )(e) | | | | | 52 | |
| | | 24.46 | | | | | | 14.57 | | | | | | 75,375 | | | | | | 1.89 | | | | | | 2.25 | | | | | | (0.37 | )(e) | | | | | 52 | |
| | | 29.57 | | | | | | 15.89 | | | | | | 124,795 | | | | | | 0.74 | | | | | | 1.10 | | | | | | 0.75 | (e) | | | | | 52 | |
| | | 27.62 | | | | | | 15.32 | | | | | | 980 | | | | | | 1.24 | | | | | | 1.60 | | | | | | 0.27 | (e) | | | | | 52 | |
| | | 28.28 | | | | | | 15.75 | | | | | | 2,112 | | | | | | 0.89 | | | | | | 1.25 | | | | | | 0.67 | (e) | | | | | 52 | |
| | | 27.75 | | | | | | 15.15 | | | | | | 2,480 | | | | | | 1.39 | | | | | | 1.75 | | | | | | 0.13 | (e) | | | | | 52 | |
| | | 24.40 | | | | | | 19.24 | | | | | | 662,127 | | | | | | 1.14 | | | | | | 1.48 | | | | | | 0.09 | | | | | | 55 | |
| | | 21.37 | | | | | | 18.27 | | | | | | 27,428 | | | | | | 1.89 | | | | | | 2.23 | | | | | | (0.66 | ) | | | | | 55 | |
| | | 21.35 | | | | | | 18.36 | | | | | | 73,162 | | | | | | 1.89 | | | | | | 2.23 | | | | | | (0.66 | ) | | | | | 55 | |
| | | 25.64 | | | | | | 19.64 | | | | | | 83,466 | | | | | | 0.74 | | | | | | 1.08 | | | | | | 0.42 | | | | | | 55 | |
| | | 23.96 | | | | | | 19.08 | | | | | | 1,072 | | | | | | 1.24 | | | | | | 1.58 | | | | | | (0.02 | ) | | | | | 55 | |
| | | 24.53 | | | | | | 19.48 | | | | | | 2,415 | | | | | | 0.89 | | | | | | 1.23 | | | | | | 0.36 | | | | | | 55 | |
| | | 24.14 | | | | | | 18.92 | | | | | | 1,475 | | | | | | 1.39 | | | | | | 1.73 | | | | | | (0.12 | ) | | | | | 55 | |
| | | 20.49 | | | | | | 15.89 | | | | | | 662,256 | | | | | | 1.14 | | | | | | 1.47 | | | | | | 0.13 | | | | | | 58 | |
| | | 18.06 | | | | | | 15.03 | | | | | | 38,824 | | | | | | 1.89 | | | | | | 2.22 | | | | | | (0.61 | ) | | | | | 58 | |
| | | 18.03 | | | | | | 14.99 | | | | | | 72,314 | | | | | | 1.89 | | | | | | 2.22 | | | | | | (0.62 | ) | | | | | 58 | |
| | | 21.54 | | | | | | 16.33 | | | | | | 299,223 | | | | | | 0.74 | | | | | | 1.07 | | | | | | 0.53 | | | | | | 58 | |
| | | 20.13 | | | | | | 15.76 | | | | | | 953 | | | | | | 1.24 | | | | | | 1.57 | | | | | | 0.03 | | | | | | 58 | |
| | | 20.66 | | | | | | 16.20 | | | | | | 1,472 | | | | | | 0.89 | | | | | | 1.22 | | | | | | 1.64 | | | | | | 58 | |
| | | 20.31 | | | | | | 15.59 | | | | | | 567 | | | | | | 1.39 | | | | | | 1.72 | | | | | | (0.12 | ) | | | | | 58 | |
| | | 17.68 | | | | | | 4.31 | | | | | | 707,444 | | | | | | 1.14 | | | | | | 1.47 | | | | | | 0.07 | | | | | | 31 | |
| | | 15.70 | | | | | | 3.63 | | | | | | 55,429 | | | | | | 1.89 | | | | | | 2.22 | | | | | | (0.66 | ) | | | | | 31 | |
| | | 15.68 | | | | | | 3.57 | | | | | | 75,203 | | | | | | 1.89 | | | | | | 2.22 | | | | | | (0.67 | ) | | | | | 31 | |
| | | 18.57 | | | | | | 4.80 | | | | | | 344,601 | | | | | | 0.74 | | | | | | 1.07 | | | | | | 0.52 | | | | | | 31 | |
| | | 17.39 | | | | | | 4.26 | | | | | | 988 | | | | | | 1.24 | | | | | | 1.57 | | | | | | (0.03 | ) | | | | | 31 | |
| | | 17.81 | | | | | | 4.64 | | | | | | 8 | | | | | | 0.89 | | | | | | 1.22 | | | | | | 0.36 | | | | | | 31 | |
| | | 17.57 | | | | | | 4.09 | | | | | | 412 | | | | | | 1.39 | | | | | | 1.72 | | | | | | (0.08 | ) | | | | | 31 | |
| | | 16.95 | | | | | | (19.11 | ) | | | | | 966,913 | | | | | | 1.25 | | | | | | 1.48 | | | | | | — | (g) | | | | | 49 | |
| | | 15.15 | | | | | | (19.73 | ) | | | | | 83,648 | | | | | | 2.00 | | | | | | 2.23 | | | | | | (0.75 | ) | | | | | 49 | |
| | | 15.14 | | | | | | (19.69 | ) | | | | | 84,936 | | | | | | 2.00 | | | | | | 2.23 | | | | | | (0.75 | ) | | | | | 49 | |
| | | 17.72 | | | | | | (18.78 | ) | | | | | 212,977 | | | | | | 0.85 | | | | | | 1.08 | | | | | | 0.40 | | | | | | 49 | |
| | | 16.68 | | | | | | (19.17 | ) | | | | | 1,462 | | | | | | 1.35 | | | | | | 1.58 | | | | | | (0.13 | ) | | | | | 49 | |
| | | 17.02 | | | | | | (18.90 | ) | | | | | 8 | | | | | | 1.00 | | | | | | 1.23 | | | | | | 0.23 | | | | | | 49 | |
| | | 16.88 | | | | | | (19.29 | ) | | | | | 106 | | | | | | 1.50 | | | | | | 1.73 | | | | | | (0.19 | ) | | | | | 49 | |
| | |
| The accompanying notes are an integral part of these financial statements. | | 93 |
GOLDMAN SACHS CONCENTRATED GROWTH FUND
Financial Highlights
Selected Data for a Share Outstanding Throughout Each Period
| | | | | | | | | | | | | | | | | | | | | | | | | | | | | | |
| | | | | | | | Income (loss) from
investment operations | | | Distributions
to shareholders | |
| | | Year - Share Class | |
Net asset
value,
beginning
of period | | | Net
investment
income (loss)(a) | | | Net realized
and unrealized
gain (loss) | | | Total from
investment
operations | | | From net
investment
income | | | From net
realized
gains | | | Total
distributions | |
| | FOR THE SIX MONTHS ENDED FEBRUARY 28, (UNAUDITED) | |
| | 2014 - A | | $ | 17.05 | | | $ | (0.03 | ) | | $ | 2.86 | | | $ | 2.83 | | | $ | — | | | $ | (1.83 | ) | | $ | (1.83 | ) |
| | 2014 - B | | | 15.67 | | | | (0.09 | ) | | | 2.63 | | | | 2.54 | | | | — | | | | (1.83 | ) | | | (1.83 | ) |
| | 2014 - C | | | 15.65 | | | | (0.09 | ) | | | 2.62 | | | | 2.53 | | | | — | | | | (1.83 | ) | | | (1.83 | ) |
| | 2014 - Institutional | | | 17.63 | | | | 0.01 | | | | 2.97 | | | | 2.98 | | | | (0.03 | ) | | | (1.83 | ) | | | (1.86 | ) |
| | 2014 - IR | | | 17.15 | | | | (0.01 | ) | | | 2.90 | | | | 2.89 | | | | (0.02 | ) | | | (1.83 | ) | | | (1.85 | ) |
| | 2014 - R | | | 16.84 | | | | (0.05 | ) | | | 2.83 | | | | 2.78 | | | | — | | | | (1.83 | ) | | | (1.83 | ) |
| | | | | | | | | | | | | | | | | | | | | | | | | | | | | | |
| | FOR THE FISCAL YEARS ENDED AUGUST 31, | |
| | 2013 - A | | | 14.97 | | | | 0.11 | (e) | | | 2.03 | | | | 2.14 | | | | (0.06 | ) | | | — | | | | (0.06 | ) |
| | 2013 - B | | | 13.81 | | | | (0.05 | )(e) | | | 1.92 | | | | 1.87 | | | | (0.01 | ) | | | — | | | | (0.01 | ) |
| | 2013 - C | | | 13.79 | | | | (0.06 | )(e) | | | 1.93 | | | | 1.87 | | | | (0.01 | ) | | | — | | | | (0.01 | ) |
| | 2013 - Institutional | | | 15.48 | | | | 0.09 | (e) | | | 2.18 | | | | 2.27 | | | | (0.12 | ) | | | — | | | | (0.12 | ) |
| | 2013 - IR | | | 15.07 | | | | 0.12 | (e) | | | 2.07 | | | | 2.19 | | | | (0.11 | ) | | | — | | | | (0.11 | ) |
| | 2013 - R | | | 14.80 | | | | 0.01 | (e) | | | 2.06 | | | | 2.07 | | | | (0.03 | ) | | | — | | | | (0.03 | ) |
| | 2012 - A | | | 12.64 | | | | — | (f) | | | 2.33 | | | | 2.33 | | | | — | | | | — | | | | — | |
| | 2012 - B | | | 11.75 | | | | (0.09 | ) | | | 2.15 | | | | 2.06 | | | | — | | | | — | | | | — | |
| | 2012 - C | | | 11.73 | | | | (0.09 | ) | | | 2.15 | | | | 2.06 | | | | — | | | | — | | | | — | |
| | 2012 - Institutional | | | 13.07 | | | | 0.05 | | | | 2.41 | | | | 2.46 | | | | (0.05 | ) | | | — | | | | (0.05 | ) |
| | 2012 - IR | | | 12.73 | | | | 0.04 | | | | 2.34 | | | | 2.38 | | | | (0.04 | ) | | | — | | | | (0.04 | ) |
| | 2012 - R | | | 12.52 | | | | (0.03 | ) | | | 2.31 | | | | 2.28 | | | | — | | | | — | | | | — | |
| | 2011 - A | | | 10.91 | | | | (0.01 | ) | | | 1.74 | | | | 1.73 | | | | — | | | | — | | | | — | |
| | 2011 - B | | | 10.22 | | | | (0.10 | ) | | | 1.63 | | | | 1.53 | | | | — | | | | — | | | | — | |
| | 2011 - C | | | 10.20 | | | | (0.10 | ) | | | 1.63 | | | | 1.53 | | | | — | | | | — | | | | — | |
| | 2011 - Institutional | | | 11.25 | | | | 0.04 | | | | 1.80 | | | | 1.84 | | | | (0.02 | ) | | | — | | | | (0.02 | ) |
| | 2011 - IR | | | 10.97 | | | | 0.04 | | | | 1.73 | | | | 1.77 | | | | (0.01 | ) | | | — | | | | (0.01 | ) |
| | 2011 - R | | | 10.83 | | | | (0.04 | ) | | | 1.73 | | | | 1.69 | | | | — | | | | — | | | | — | |
| | 2010 - A | | | 10.51 | | | | (0.02 | ) | | | 0.42 | | | | 0.40 | | | | — | | | | — | | | | — | |
| | 2010 - B | | | 9.92 | | | | (0.11 | ) | | | 0.41 | | | | 0.30 | | | | — | | | | — | | | | — | |
| | 2010 - C | | | 9.90 | | | | (0.11 | ) | | | 0.41 | | | | 0.30 | | | | — | | | | — | | | | — | |
| | 2010 - Institutional | | | 10.79 | | | | 0.02 | | | | 0.44 | | | | 0.46 | | | | — | | | | — | | | | — | |
| | 2010 - IR | | | 10.54 | | | | 0.03 | | | | 0.40 | | | | 0.43 | | | | — | | | | — | | | | — | |
| | 2010 - R | | | 10.46 | | | | (0.05 | ) | | | 0.42 | | | | 0.37 | | | | — | | | | — | | | | — | |
| | 2009 - A | | | 13.54 | | | | (0.02 | ) | | | (3.01 | ) | | | (3.03 | ) | | | — | | | | — | | | | — | |
| | 2009 - B | | | 12.88 | | | | (0.09 | ) | | | (2.87 | ) | | | (2.96 | ) | | | — | | | | — | | | | — | |
| | 2009 - C | | | 12.85 | | | | (0.09 | ) | | | (2.86 | ) | | | (2.95 | ) | | | — | | | | — | | | | — | |
| | 2009 - Institutional | | | 13.85 | | | | 0.01 | | | | (3.07 | ) | | | (3.06 | ) | | | — | | | | — | | | | — | |
| | 2009 - IR | | | 13.55 | | | | (0.01 | ) | | | (3.00 | ) | | | (3.01 | ) | | | — | | | | — | | | | — | |
| | 2009 - R | | | 13.51 | | | | (0.05 | ) | | | (3.00 | ) | | | (3.05 | ) | | | — | | | | — | | | | — | |
| | (a) | | Calculated based on the average shares outstanding methodology. |
| | (b) | | Assumes investment at the net asset value at the beginning of the period, reinvestment of all dividends and distributions, a complete redemption of the investment at the net asset value at the end of the period and no sales or redemption charges. Total returns would be reduced if a sales or redemption charge was taken into account. Returns do not reflect the deduction of taxes that a shareholder would pay on Fund distributions or the redemption of Fund shares. Total returns for periods less than one full year are not annualized. |
| | (c) | | The Fund’s portfolio turnover rate is calculated in accordance with regulatory requirements, without regard to transactions involving short term investments and certain derivatives. If such transactions were included, the Fund’s portfolio turnover rate may be higher. |
| | (e) | | Reflects income recognized from a special dividend which amounted to $0.06 per share and 0.35% of average net assets. |
| | (f) | | Amount is less than $0.005 per share. |
| | |
| 94 | | The accompanying notes are an integral part of these financial statements. |
GOLDMAN SACHS CONCENTRATED GROWTH FUND
| | | | | | | | | | | | | | | | | | | | | | | | | | | | | | | | | | | | | | | | |
| | | | | | | | | | | | | | | | | | | | | | | | | | | | | | | | | | |
| | | Net asset
value, end
of period | | | | | Total
return(b) | | | | | Net assets,
end of
period
(in 000s) | | | | | Ratio of
net expenses
to average
net assets | | | | | Ratio of
total expenses
to average
net assets | | | | | Ratio of
net investment
income (loss)
to average
net assets | | | | | Portfolio
turnover
rate(c) | |
| | | | | | | | | | | | | | | | | | | | | | | | | | | | | | | | | | | | | | | | |
| | $ | 18.05 | | | | | | 17.11 | % | | | | $ | 9,272 | | | | | | 1.27 | %(d) | | | | | 1.60 | %(d) | | | | | (0.34 | )%(d) | | | | | 31 | % |
| | | 16.38 | | | | | | 16.74 | | | | | | 330 | | | | | | 2.02 | (d) | | | | | 2.35 | (d) | | | | | (1.09 | )(d) | | | | | 31 | |
| | | 16.35 | | | | | | 16.70 | | | | | | 3,401 | | | | | | 2.02 | (d) | | | | | 2.35 | (d) | | | | | (1.07 | )(d) | | | | | 31 | |
| | | 18.75 | | | | | | 17.43 | | | | | | 163,893 | | | | | | 0.87 | (d) | | | | | 1.20 | (d) | | | | | 0.06 | (d) | | | | | 31 | |
| | | 18.19 | | | | | | 17.33 | | | | | | 413 | | | | | | 1.02 | (d) | | | | | 1.35 | (d) | | | | | (0.08 | )(d) | | | | | 31 | |
| | | 17.79 | | | | | | 17.02 | | | | | | 14 | | | | | | 1.51 | (d) | | | | | 1.84 | (d) | | | | | (0.58 | )(d) | | | | | 31 | |
| | | | | | | | | | | | | | | | | | | | | | | | | | | | | | | | | | | | | | | | |
| | | | | | | | | | | | | | | | | | | | | | | | | | | | | | | | | | | | | | | | |
| | | 17.05 | | | | | | 14.36 | | | | | | 8,476 | | | | | | 1.26 | | | | | | 1.62 | | | | | | 0.69 | (e) | | | | | 57 | |
| | | 15.67 | | | | | | 13.55 | | | | | | 316 | | | | | | 2.01 | | | | | | 2.37 | | | | | | (0.37 | )(e) | | | | | 57 | |
| | | 15.65 | | | | | | 13.57 | | | | | | 2,561 | | | | | | 2.01 | | | | | | 2.37 | | | | | | (0.39 | )(e) | | | | | 57 | |
| | | 17.63 | | | | | | 14.81 | | | | | | 146,183 | | | | | | 0.86 | | | | | | 1.23 | | | | | | 0.56 | (e) | | | | | 57 | |
| | | 17.15 | | | | | | 14.61 | | | | | | 346 | | | | | | 1.01 | | | | | | 1.38 | | | | | | 0.76 | (e) | | | | | 57 | |
| | | 16.84 | | | | | | 14.13 | | | | | | 12 | | | | | | 1.51 | | | | | | 1.87 | | | | | | 0.09 | (e) | | | | | 57 | |
| | | 14.97 | | | | | | 18.38 | | | | | | 92,207 | | | | | | 1.26 | | | | | | 1.57 | | | | | | 0.01 | | | | | | 33 | |
| | | 13.81 | | | | | | 17.48 | | | | | | 395 | | | | | | 2.01 | | | | | | 2.32 | | | | | | (0.74 | ) | | | | | 33 | |
| | | 13.79 | | | | | | 17.51 | | | | | | 2,877 | | | | | | 2.01 | | | | | | 2.32 | | | | | | (0.72 | ) | | | | | 33 | |
| | | 15.48 | | | | | | 18.80 | | | | | | 56,118 | | | | | | 0.86 | | | | | | 1.17 | | | | | | 0.39 | | | | | | 33 | |
| | | 15.07 | | | | | | 18.69 | | | | | | 584 | | | | | | 1.01 | | | | | | 1.32 | | | | | | 0.28 | | | | | | 33 | |
| | | 14.80 | | | | | | 18.08 | | | | | | 10 | | | | | | 1.51 | | | | | | 1.82 | | | | | | (0.22 | ) | | | | | 33 | |
| | | 12.64 | | | | | | 15.86 | | | | | | 109,826 | | | | | | 1.30 | | | | | | 1.56 | | | | | | (0.08 | ) | | | | | 35 | |
| | | 11.75 | | | | | | 14.97 | | | | | | 496 | | | | | | 2.05 | | | | | | 2.31 | | | | | | (0.83 | ) | | | | | 35 | |
| | | 11.73 | | | | | | 15.00 | | | | | | 2,000 | | | | | | 2.05 | | | | | | 2.31 | | | | | | (0.82 | ) | | | | | 35 | |
| | | 13.07 | | | | | | 16.35 | | | | | | 126,113 | | | | | | 0.90 | | | | | | 1.16 | | | | | | 0.33 | | | | | | 35 | |
| | | 12.73 | | | | | | 16.13 | | | | | | 437 | | | | | | 1.05 | | | | | | 1.31 | | | | | | 0.28 | | | | | | 35 | |
| | | 12.52 | | | | | | 15.60 | | | | | | 9 | | | | | | 1.55 | | | | | | 1.81 | | | | | | (0.29 | ) | | | | | 35 | |
| | | 10.91 | | | | | | 3.81 | | | | | | 108,338 | | | | | | 1.30 | | | | | | 1.56 | | | | | | (0.22 | ) | | | | | 45 | |
| | | 10.22 | | | | | | 3.02 | | | | | | 793 | | | | | | 2.05 | | | | | | 2.31 | | | | | | (0.98 | ) | | | | | 45 | |
| | | 10.20 | | | | | | 3.03 | | | | | | 1,356 | | | | | | 2.05 | | | | | | 2.31 | | | | | | (0.97 | ) | | | | | 45 | |
| | | 11.25 | | | | | | 4.26 | | | | | | 124,258 | | | | | | 0.90 | | | | | | 1.16 | | | | | | 0.18 | | | | | | 45 | |
| | | 10.97 | | | | | | 4.08 | | | | | | 147 | | | | | | 1.05 | | | | | | 1.31 | | | | | | 0.27 | | | | | | 45 | |
| | | 10.83 | | | | | | 3.54 | | | | | | 8 | | | | | | 1.55 | | | | | | 1.81 | | | | | | (0.45 | ) | | | | | 45 | |
| | | 10.51 | | | | | | (22.38 | ) | | | | | 101,233 | | | | | | 1.37 | | | | | | 1.61 | | | | | | (0.27 | ) | | | | | 65 | |
| | | 9.92 | | | | | | (22.98 | ) | | | | | 1,084 | | | | | | 2.12 | | | | | | 2.36 | | | | | | (1.03 | ) | | | | | 65 | |
| | | 9.90 | | | | | | (22.96 | ) | | | | | 1,461 | | | | | | 2.12 | | | | | | 2.36 | | | | | | (1.03 | ) | | | | | 65 | |
| | | 10.79 | | | | | | (22.09 | ) | | | | | 151,504 | | | | | | 0.97 | | | | | | 1.21 | | | | | | 0.13 | | | | | | 65 | |
| | | 10.54 | | | | | | (22.21 | ) | | | | | 7 | | | | | | 1.12 | | | | | | 1.36 | | | | | | (0.07 | ) | | | | | 65 | |
| | | 10.46 | | | | | | (22.58 | ) | | | | | 7 | | | | | | 1.62 | | | | | | 1.86 | | | | | | (0.51 | ) | | | | | 65 | |
| | |
| The accompanying notes are an integral part of these financial statements. | | 95 |
GOLDMAN SACHS FLEXIBLE CAP GROWTH FUND
Financial Highlights
Selected Data for a Share Outstanding Throughout Each Period
| | | | | | | | | | | | | | | | | | | | | | | | | | | | | | |
| | | | | | | | Income (loss) from
investment operations | | | Distributions
to shareholders | |
| | | Year - Share Class | | Net asset
value,
beginning
of period | | | Net
investment
income (loss)(a) | | | Net realized
and unrealized
gain (loss) | | | Total from
investment
operations | | | From net
investment
income | | | From net
realized
gains | | | Total
distributions | |
| FOR THE SIX MONTHS ENDED FEBRUARY 28, (UNAUDITED) | |
| | 2014 - A | | $ | 11.83 | | | $ | (0.02 | ) | | $2.15 | | | | $ | 2.13 | | | $ | — | | | $ | (1.58 | ) | | $ | (1.58 | ) |
| | 2014 - C | | | 11.29 | | | | (0.07 | ) | | | 2.05 | | | | 1.98 | | | | — | | | | (1.58 | ) | | | (1.58 | ) |
| | 2014 - Institutional | | | 12.17 | | | | — | (e) | | | 2.22 | | | | 2.22 | | | | (0.02 | ) | | | (1.58 | ) | | | (1.60 | ) |
| | 2014 - IR | | | 12.05 | | | | (0.01 | ) | | | 2.20 | | | | 2.19 | | | | — | | | | (1.58 | ) | | | (1.58 | ) |
| | 2014 - R | | | 11.66 | | | | (0.04 | ) | | | 2.13 | | | | 2.09 | | | | — | | | | (1.58 | ) | | | (1.58 | ) |
| | | | | | | | | | | | | | | | | | | | | | | | | | | | | | |
| FOR THE FISCAL YEARS ENDED AUGUST 31, | |
| | 2013 - A | | | 11.48 | | | | — | (e)(f) | | | 1.71 | | | | 1.71 | | | | — | | | | (1.36 | ) | | | (1.36 | ) |
| | 2013 - C | | | 11.09 | | | | (0.08 | )(f) | | | 1.64 | | | | 1.56 | | | | — | | | | (1.36 | ) | | | (1.36 | ) |
| | 2013 - Institutional | | | 11.73 | | | | 0.04 | (f) | | | 1.76 | | | | 1.80 | | | | — | | | | (1.36 | ) | | | (1.36 | ) |
| | 2013 - IR | | | 11.64 | | | | 0.03 | (f) | | | 1.74 | | | | 1.77 | | | | — | | | | (1.36 | ) | | | (1.36 | ) |
| | 2013 - R | | | 11.36 | | | | (0.02 | )(f) | | | 1.68 | | | | 1.66 | | | | — | | | | (1.36 | ) | | | (1.36 | ) |
| | 2012 - A | | | 10.38 | | | | (0.02 | ) | | | 1.71 | | | | 1.69 | | | | — | | | | (0.59 | ) | | | (0.59 | ) |
| | 2012 - C | | | 10.12 | | | | (0.10 | ) | | | 1.66 | | | | 1.56 | | | | — | | | | (0.59 | ) | | | (0.59 | ) |
| | 2012 - Institutional | | | 10.55 | | | | 0.02 | | | | 1.75 | | | | 1.77 | | | | — | | | | (0.59 | ) | | | (0.59 | ) |
| | 2012 - IR | | | 10.49 | | | | 0.01 | | | | 1.73 | | | | 1.74 | | | | — | | | | (0.59 | ) | | | (0.59 | ) |
| | 2012 - R | | | 10.30 | | | | (0.05 | ) | | | 1.70 | | | | 1.65 | | | | — | | | | (0.59 | ) | | | (0.59 | ) |
| | 2011 - A | | | 9.41 | | | | (0.04 | ) | | | 1.51 | | | | 1.47 | | | | — | | | | (0.50 | ) | | | (0.50 | ) |
| | 2011 - C | | | 9.25 | | | | (0.12 | ) | | | 1.49 | | | | 1.37 | | | | — | | | | (0.50 | ) | | | (0.50 | ) |
| | 2011 - Institutional | | | 9.53 | | | | — | (e) | | | 1.52 | | | | 1.52 | | | | — | | | | (0.50 | ) | | | (0.50 | ) |
| | 2011 - IR | | | 9.49 | | | | — | (e) | | | 1.50 | | | | 1.50 | | | | — | | | | (0.50 | ) | | | (0.50 | ) |
| | 2011 - R | | | 9.37 | | | | (0.07 | ) | | | 1.50 | | | | 1.43 | | | | — | | | | (0.50 | ) | | | (0.50 | ) |
| | 2010 - A | | | 8.83 | | | | (0.03 | ) | | | 0.61 | | | | 0.58 | | | | — | | | | — | | | | — | |
| | 2010 - C | | | 8.75 | | | | (0.11 | ) | | | 0.61 | | | | 0.50 | | | | — | | | | — | | | | — | |
| | 2010 - Institutional | | | 8.90 | | | | — | (e) | | | 0.63 | | | | 0.63 | | | | — | | | | — | | | | — | |
| | 2010 - IR | | | 8.88 | | | | (0.01 | ) | | | 0.62 | | | | 0.61 | | | | — | | | | — | | | | — | |
| | 2010 - R | | | 8.81 | | | | (0.06 | ) | | | 0.62 | | | | 0.56 | | | | — | | | | — | | | | — | |
| | 2009 - A | | | 10.64 | | | | (0.02 | ) | | | (1.71 | ) | | | (1.73 | ) | | | — | | | | (0.08 | ) | | | (0.08 | ) |
| | 2009 - C | | | 10.60 | | | | (0.08 | ) | | | (1.69 | ) | | | (1.77 | ) | | | — | | | | (0.08 | ) | | | (0.08 | ) |
| | 2009 - Institutional | | | 10.67 | | | | 0.01 | | | | (1.70 | ) | | | (1.69 | ) | | | — | | | | (0.08 | ) | | | (0.08 | ) |
| | 2009 - IR | | | 10.66 | | | | (0.01 | ) | | | (1.69 | ) | | | (1.70 | ) | | | — | | | | (0.08 | ) | | | (0.08 | ) |
| | 2009 - R | | | 10.62 | | | | (0.04 | ) | | | (1.69 | ) | | | (1.73 | ) | | | — | | | | (0.08 | ) | | | (0.08 | ) |
| | (a) | | Calculated based on the average shares outstanding methodology. |
| | (b) | | Assumes investment at the net asset value at the beginning of the period, reinvestment of all dividends and distributions, a complete redemption of the investment at the net asset value at the end of the period and no sales or redemption charges. Total returns would be reduced if a sales or redemption charge was taken into account. Returns do not reflect the deduction of taxes that a shareholder would pay on Fund distributions or the redemption of Fund shares. Total returns for periods less than one full year are not annualized. |
| | (c) | | The Fund’s portfolio turnover rate is calculated in accordance with regulatory requirements, without regard to transactions involving short term investments and certain derivatives. If such transactions were included, the Fund’s portfolio turnover rate may be higher. |
| | (e) | | Amount is less than $0.005 per share. |
| | (f) | | Reflects income recognized from special dividends which amounted to $0.02 per share and 0.20% of average net assets. |
| | |
| 96 | | The accompanying notes are an integral part of these financial statements. |
GOLDMAN SACHS FLEXIBLE CAP GROWTH FUND
| | | | | | | | | | | | | | | | | | | | | | | | | | | | | | | | | | | | | | | | |
| | | | | | | | | | | | | | | | | | | | | | | | | | | | | | | | | | |
| | | Net asset
value, end
of period | | | | | Total
return(b) | | | | | Net assets,
end of
period
(in 000s) | | | | | Ratio of
net expenses
to average
net assets | | | | | Ratio of
total expenses
to average
net assets | | | | | Ratio of
net investment
income (loss)
to average
net assets | | | | | Portfolio
turnover
rate(c) | |
| | | | | | | | | | | | | | | | | | | | | | | | | | | | | | | | | | | | | | | | |
| | $ | 12.38 | | | | | | 18.66 | % | | | | $ | 5,575 | | | | | | 1.28 | %(d) | | | | | 3.61 | %(d) | | | | | (0.41 | )%(d) | | | | | 29 | % |
| | | 11.69 | | | | | | 18.19 | | | | | | 1,243 | | | | | | 2.03 | (d) | | | | | 4.37 | (d) | | | | | (1.16 | )(d) | | | | | 29 | |
| | | 12.79 | | | | | | 18.94 | | | | | | 8,054 | | | | | | 0.88 | (d) | | | | | 3.23 | (d) | | | | | — | (d)(e) | | | | | 29 | |
| | | 12.66 | | | | | | 18.82 | | | | | | 88 | | | | | | 1.03 | (d) | | | | | 3.33 | (d) | | | | | (0.18 | )(d) | | | | | 29 | |
| | | 12.17 | | | | | | 18.58 | | | | | | 50 | | | | | | 1.52 | (d) | | | | | 3.85 | (d) | | | | | (0.65 | )(d) | | | | | 29 | |
| | | | | | | | | | | | | | | | | | | | | | | | | | | | | | | | | | | | | | | | |
| | | | | | | | | | | | | | | | | | | | | | | | | | | | | | | | | | | | | | | | |
| | | 11.83 | | | | | | 16.78 | | | | | | 4,584 | | | | | | 1.26 | | | | | | 3.62 | | | | | | 0.03 | (f) | | | | | 40 | |
| | | 11.29 | | | | | | 15.94 | | | | | | 1,005 | | | | | | 2.01 | | | | | | 4.32 | | | | | | (0.75 | )(f) | | | | | 40 | |
| | | 12.17 | | | | | | 17.23 | | | | | | 6,215 | | | | | | 0.86 | | | | | | 3.18 | | | | | | 0.37 | (f) | | | | | 40 | |
| | | 12.05 | | | | | | 17.08 | | | | | | 167 | | | | | | 1.01 | | | | | | 3.35 | | | | | | 0.26 | (f) | | | | | 40 | |
| | | 11.66 | | | | | | 16.50 | | | | | | 41 | | | | | | 1.51 | | | | | | 3.91 | | | | | | (0.19 | )(f) | | | | | 40 | |
| | | 11.48 | | | | | | 17.11 | | | | | | 7,423 | | | | | | 1.26 | | | | | | 3.14 | | | | | | (0.22 | ) | | | | | 32 | |
| | | 11.09 | | | | | | 16.23 | | | | | | 975 | | | | | | 2.01 | | | | | | 3.89 | | | | | | (0.95 | ) | | | | | 32 | |
| | | 11.73 | | | | | | 17.61 | | | | | | 4,640 | | | | | | 0.86 | | | | | | 2.74 | | | | | | 0.21 | | | | | | 32 | |
| | | 11.64 | | | | | | 17.41 | | | | | | 179 | | | | | | 1.01 | | | | | | 2.89 | | | | | | 0.06 | | | | | | 32 | |
| | | 11.36 | | | | | | 16.84 | | | | | | 63 | | | | | | 1.51 | | | | | | 3.39 | | | | | | (0.43 | ) | | | | | 32 | |
| | | 10.38 | | | | | | 15.42 | | | | | | 15,853 | | | | | | 1.34 | | | | | | 2.59 | | | | | | (0.37 | ) | | | | | 51 | |
| | | 10.12 | | | | | | 14.58 | | | | | | 974 | | | | | | 2.09 | | | | | | 3.34 | | | | | | (1.10 | ) | | | | | 51 | |
| | | 10.55 | | | | | | 15.77 | | | | | | 4,142 | | | | | | 0.94 | | | | | | 2.19 | | | | | | 0.04 | | | | | | 51 | |
| | | 10.49 | | | | | | 15.62 | | | | | | 116 | | | | | | 1.09 | | | | | | 2.34 | | | | | | (0.04 | ) | | | | | 51 | |
| | | 10.30 | | | | | | 15.05 | | | | | | 11 | | | | | | 1.59 | | | | | | 2.84 | | | | | | (0.61 | ) | | | | | 51 | |
| | | 9.41 | | | | | | 6.57 | | | | | | 14,952 | | | | | | 1.35 | | | | | | 2.91 | | | | | | (0.35 | ) | | | | | 61 | |
| | | 9.25 | | | | | | 5.71 | | | | | | 650 | | | | | | 2.10 | | | | | | 3.66 | | | | | | (1.10 | ) | | | | | 61 | |
| | | 9.53 | | | | | | 7.08 | | | | | | 3,145 | | | | | | 0.95 | | | | | | 2.51 | | | | | | 0.04 | | | | | | 61 | |
| | | 9.49 | | | | | | 6.87 | | | | | | 43 | | | | | | 1.10 | | | | | | 2.66 | | | | | | (0.10 | ) | | | | | 61 | |
| | | 9.37 | | | | | | 6.36 | | | | | | 10 | | | | | | 1.60 | | | | | | 3.16 | | | | | | (0.59 | ) | | | | | 61 | |
| | | 8.83 | | | | | | (16.03 | ) | | | | | 11,162 | | | | | | 1.38 | | | | | | 7.98 | | | | | | (0.25 | ) | | | | | 56 | |
| | | 8.75 | | | | | | (16.47 | ) | | | | | 392 | | | | | | 2.13 | | | | | | 8.73 | | | | | | (1.02 | ) | | | | | 56 | |
| | | 8.90 | | | | | | (15.60 | ) | | | | | 4,256 | | | | | | 0.98 | | | | | | 7.58 | | | | | | 0.11 | | | | | | 56 | |
| | | 8.88 | | | | | | (15.71 | ) | | | | | 9 | | | | | | 1.13 | | | | | | 7.73 | | | | | | (0.08 | ) | | | | | 56 | |
| | | 8.81 | | | | | | (16.14 | ) | | | | | 9 | | | | | | 1.63 | | | | | | 8.23 | | | | | | (0.57 | ) | | | | | 56 | |
| | |
| The accompanying notes are an integral part of these financial statements. | | 97 |
GOLDMAN SACHS FOCUSED GROWTH FUND
Financial Highlights
Selected Data for a Share Outstanding Throughout Each Period
| | | | | | | | | | | | | | | | | | | | | | | | | | | | | | |
| | | | | | | | Income (loss) from
investment operations | | | Distributions
to shareholders | |
| | | Year - Share Class | |
Net asset
value,
beginning
of period | | | Net
investment
income (loss)(a) | | | Net realized
and unrealized
gain | | | Total from
investment
operations | | | From net
investment
income | | | From net
realized
gains | | | Total
distributions | |
| | FOR THE SIX MONTHS ENDED FEBRUARY 28, (UNAUDITED) | |
| | 2014 - A | | $ | 12.95 | | | $ | (0.03 | ) | | $ | 2.26 | | | $ | 2.23 | | | $ | — | | | $ | (0.93 | ) | | $ | (0.93 | ) |
| | 2014 - C | | | 12.85 | | | | (0.08 | ) | | | 2.24 | | | | 2.16 | | | | — | | | | (0.93 | ) | | | (0.93 | ) |
| | 2014 - Institutional | | | 13.02 | | | | — | (e) | | | 2.27 | | | | 2.27 | | | | (0.03 | ) | | | (0.93 | ) | | | (0.96 | ) |
| | 2014 - IR | | | 13.01 | | | | (0.01 | ) | | | 2.27 | | | | 2.26 | | | | (0.01 | ) | | | (0.93 | ) | | | (0.94 | ) |
| | 2014 - R | | | 12.95 | | | | (0.05 | ) | | | 2.26 | | | | 2.21 | | | | — | | | | (0.93 | ) | | | (0.93 | ) |
| | | | | | | | | | | | | | | | | | | | | | | | | | | | | | |
| | FOR THE FISCAL YEAR ENDED AUGUST 31, | |
| | 2013 - A | | | 11.35 | | | | 0.01 | (f) | | | 1.66 | | | | 1.67 | | | | (0.05 | ) | | | (0.02 | ) | | | (0.07 | ) |
| | 2013 - C | | | 11.31 | | | | (0.06 | )(f) | | | 1.63 | | | | 1.57 | | | | (0.01 | ) | | | (0.02 | ) | | | (0.03 | ) |
| | 2013 - Institutional | | | 11.38 | | | | 0.07 | (f) | | | 1.66 | | | | 1.73 | | | | (0.07 | ) | | | (0.02 | ) | | | (0.09 | ) |
| | 2013 - IR | | | 11.38 | | | | 0.06 | (f) | | | 1.65 | | | | 1.71 | | | | (0.06 | ) | | | (0.02 | ) | | | (0.08 | ) |
| | 2013 - R | | | 11.34 | | | | — | (e)(f) | | | 1.64 | | | | 1.64 | | | | (0.01 | ) | | | (0.02 | ) | | | (0.03 | ) |
| | | | | | | | | | | | | | | | | | | | | | | | | | | | | | |
| | FOR THE PERIOD ENDED AUGUST 31, | |
| | 2012 - A (Commenced January 31, 2012) | | | 10.00 | | | | — | (e) | | | 1.35 | | | | 1.35 | | | | — | | | | — | | | | — | |
| | 2012 - C (Commenced January 31, 2012) | | | 10.00 | | | | (0.05 | ) | | | 1.36 | | | | 1.31 | | | | — | | | | — | | | | — | |
| | 2012 - Institutional (Commenced January 31, 2012) | | | 10.00 | | | | 0.02 | | | | 1.36 | | | | 1.38 | | | | — | | | | — | | | | — | |
| | 2012 - IR (Commenced January 31, 2012) | | | 10.00 | | | | 0.01 | | | | 1.37 | | | | 1.38 | | | | — | | | | — | | | | — | |
| | 2012 - R (Commenced January 31, 2012) | | | 10.00 | | | | (0.02 | ) | | | 1.36 | | | | 1.34 | | | | — | | | | — | | | | — | |
| | (a) | | Calculated based on the average shares outstanding methodology. |
| | (b) | | Assumes investment at the net asset value at the beginning of the period, reinvestment of all dividends and distributions, a complete redemption of the investment at the net asset value at the end of the period and no sales or redemption charges. Total returns would be reduced if a sales or redemption charge was taken into account. Returns do not reflect the deduction of taxes that a shareholder would pay on Fund distributions or the redemption of Fund shares. Total returns for periods less than one full year are not annualized. |
| | (c) | | The Fund’s portfolio turnover rate is calculated in accordance with regulatory requirements, without regard to transactions involving short term investments and certain derivatives. If such transactions were included, the Fund’s portfolio turnover rate may be higher. |
| | (e) | | Amount is less than $0.005 per share. |
| | (f) | | Reflects income recognized from special dividends which amounted to $0.02 per share and 0.18% of average net assets. |
| | |
| 98 | | The accompanying notes are an integral part of these financial statements. |
GOLDMAN SACHS FOCUSED GROWTH FUND
| | | | | | | | | | | | | | | | | | | | | | | | | | | | | | | | | | | | | | | | |
| | | | | | |
| | | Net asset
value, end
of period | | | | | Total
return(b) | | | | | Net assets,
end of
period
(in 000s) | | | | | Ratio of
net expenses
to average
net assets | | | | | Ratio of
total expenses
to average
net assets | | | | | Ratio of
net investment
income (loss)
to average
net assets | | | | | Portfolio
turnover
rate(c) | |
| | | | | | | | | | | | | | | | | | | | | | | | | | | | | | | | | | | | | | | | |
| | $ | 14.25 | | | | | | 17.56 | % | | | | $ | 71 | | | | | | 1.26 | %(d) | | | | | 3.08 | %(d) | | | | | (0.45 | )%(d) | | | | | 48 | % |
| | | 14.08 | | | | | | 17.14 | | | | | | 38 | | | | | | 2.01 | (d) | | | | | 3.82 | (d) | | | | | (1.14 | )(d) | | | | | 48 | |
| | | 14.33 | | | | | | 17.81 | | | | | | 19,436 | | | | | | 0.86 | (d) | | | | | 2.68 | (d) | | | | | (0.02 | )(d) | | | | | 48 | |
| | | 14.33 | | | | | | 17.72 | | | | | | 15 | | | | | | 1.00 | (d) | | | | | 2.82 | (d) | | | | | (0.18 | )(d) | | | | | 48 | |
| | | 14.23 | | | | | | 17.40 | | | | | | 15 | | | | | | 1.51 | (d) | | | | | 3.32 | (d) | | | | | (0.70 | )(d) | | | | | 48 | |
| | | | | | | | | | | | | | | | | | | | | | | | | | | | | | | | | | | | | | | | |
| | | | | | | | | | | | | | | | | | | | | | | | | | | | | | | | | | | | | | | | |
| | | 12.95 | | | | | | 14.79 | | | | | | 56 | | | | | | 1.24 | | | | | | 6.12 | | | | | | 0.08 | (f) | | | | | 87 | |
| | | 12.85 | | | | | | 13.94 | | | | | | 23 | | | | | | 1.99 | | | | | | 6.91 | | | | | | (0.52 | )(f) | | | | | 87 | |
| | | 13.02 | | | | | | 15.33 | | | | | | 12,838 | | | | | | 0.84 | | | | | | 4.59 | | | | | | 0.53 | (f) | | | | | 87 | |
| | | 13.01 | | | | | | 15.08 | | | | | | 13 | | | | | | 1.00 | | | | | | 6.58 | | | | | | 0.52 | (f) | | | | | 87 | |
| | | 12.95 | | | | | | 14.53 | | | | | | 13 | | | | | | 1.49 | | | | | | 7.08 | | | | | | 0.02 | (f) | | | | | 87 | |
| | | | | | | | | | | | | | | | | | | | | | | | | | | | | | | | | | | | | | | | |
| | | | | | | | | | | | | | | | | | | | | | | | | | | | | | | | | | | | | | | | |
| | | 11.35 | | | | | | 13.50 | | | | | | 35 | | | | | | 1.24 | (d) | | | | | 17.07 | (d) | | | | | 0.04 | (d) | | | | | 23 | |
| | | 11.31 | | | | | | 13.10 | | | | | | 11 | | | | | | 1.99 | (d) | | | | | 17.82 | (d) | | | | | (0.81 | )(d) | | | | | 23 | |
| | | | | | | | | | | | | | | | | | | | | | | | | | | | | | | | | | | | | | | | |
| | | 11.38 | | | | | | 13.80 | | | | | | 3,417 | | | | | | 0.84 | (d) | | | | | 16.67 | (d) | | | | | 0.36 | (d) | | | | | 23 | |
| | | 11.38 | | | | | | 13.80 | | | | | | 11 | | | | | | 0.99 | (d) | | | | | 16.82 | (d) | | | | | 0.22 | (d) | | | | | 23 | |
| | | 11.34 | | | | | | 13.40 | | | | | | 11 | | | | | | 1.49 | (d) | | | | | 17.32 | (d) | | | | | (0.30 | )(d) | | | | | 23 | |
| | |
| The accompanying notes are an integral part of these financial statements. | | 99 |
GOLDMAN SACHS GROWTH OPPORTUNITIES FUND
Financial Highlights
Selected Data for a Share Outstanding Throughout Each Period
| | | | | | | | | | | | | | | | | | | | | | |
| | | | | | | | Income (loss) from
investment operations | | | | |
| | | Year - Share Class | |
Net asset
value,
beginning
of period | | | Net
investment
loss(a) | | | Net realized
and unrealized
gain (loss) | | | Total from
investment
operations | | | Distributions to shareholders from net realized gains | |
| | FOR THE SIX MONTHS ENDED FEBRUARY 28, (UNAUDITED) | | | | | |
| | 2014 - A | | $ | 26.65 | | | $ | (0.08 | )(d) | | $ | 4.53 | | | $ | 4.45 | | | $ | (2.19 | ) |
| | 2014 - B | | | 23.14 | | | | (0.16 | )(d) | | | 3.90 | | | | 3.74 | | | | (2.19 | ) |
| | 2014 - C | | | 22.89 | | | | (0.16 | )(d) | | | 3.86 | | | | 3.70 | | | | (2.19 | ) |
| | 2014 - Institutional | | | 28.83 | | | | (0.03 | )(d) | | | 4.91 | | | | 4.88 | | | | (2.19 | ) |
| | 2014 - Service | | | 26.10 | | | | (0.10 | )(d) | | | 4.43 | | | | 4.33 | | | | (2.19 | ) |
| | 2014 - IR | | | 27.10 | | | | (0.05 | )(d) | | | 4.61 | | | | 4.56 | | | | (2.19 | ) |
| | 2014 - R | | | 26.25 | | | | (0.12 | )(d) | | | 4.45 | | | | 4.33 | | | | (2.19 | ) |
| | | | | | | | | | | | | | | | | | | | | | |
| | FOR THE FISCAL YEARS ENDED AUGUST 31, | | | | | |
| | 2013 - A | | | 23.88 | | | | (0.11 | )(f) | | | 4.53 | | | | 4.42 | | | | (1.65 | ) |
| | 2013 - B | | | 21.10 | | | | (0.25 | )(f) | | | 3.94 | | | | 3.69 | | | | (1.65 | ) |
| | 2013 - C | | | 20.89 | | | | (0.26 | )(f) | | | 3.91 | | | | 3.65 | | | | (1.65 | ) |
| | 2013 - Institutional | | | 25.59 | | | | (0.01 | )(f) | | | 4.90 | | | | 4.89 | | | | (1.65 | ) |
| | 2013 - Service | | | 23.44 | | | | (0.13 | )(f) | | | 4.44 | | | | 4.31 | | | | (1.65 | ) |
| | 2013 - IR | | | 24.19 | | | | (0.05 | )(f) | | | 4.61 | | | | 4.56 | | | | (1.65 | ) |
| | 2013 - R | | | 23.59 | | | | (0.17 | )(f) | | | 4.48 | | | | 4.31 | | | | (1.65 | ) |
| | 2012 - A | | | 21.36 | | | | (0.15 | ) | | | 4.06 | | | | 3.91 | | | | (1.39 | ) |
| | 2012 - B | | | 19.16 | | | | (0.28 | ) | | | 3.61 | | | | 3.33 | | | | (1.39 | ) |
| | 2012 - C | | | 18.99 | | | | (0.28 | ) | | | 3.57 | | | | 3.29 | | | | (1.39 | ) |
| | 2012 - Institutional | | | 22.71 | | | | (0.06 | ) | | | 4.33 | | | | 4.27 | | | | (1.39 | ) |
| | 2012 - Service | | | 21.01 | | | | (0.17 | ) | | | 3.99 | | | | 3.82 | | | | (1.39 | ) |
| | 2012 - IR | | | 21.57 | | | | (0.09 | ) | | | 4.10 | | | | 4.01 | | | | (1.39 | ) |
| | 2012 - R | | | 21.17 | | | | (0.20 | ) | | | 4.01 | | | | 3.81 | | | | (1.39 | ) |
| | 2011 - A | | | 19.09 | | | | (0.16 | ) | | | 2.65 | | | | 2.49 | | | | (0.22 | ) |
| | 2011 - B | | | 17.27 | | | | (0.30 | ) | | | 2.41 | | | | 2.11 | | | | (0.22 | ) |
| | 2011 - C | | | 17.11 | | | | (0.30 | ) | | | 2.40 | | | | 2.10 | | | | (0.22 | ) |
| | 2011 - Institutional | | | 20.21 | | | | (0.07 | ) | | | 2.79 | | | | 2.72 | | | | (0.22 | ) |
| | 2011 - Service | | | 18.80 | | | | (0.18 | ) | | | 2.61 | | | | 2.43 | | | | (0.22 | ) |
| | 2011 - IR | | | 19.23 | | | | (0.10 | ) | | | 2.66 | | | | 2.56 | | | | (0.22 | ) |
| | 2011 - R | | | 18.97 | | | | (0.22 | ) | | | 2.64 | | | | 2.42 | | | | (0.22 | ) |
| | 2010 - A | | | 16.91 | | | | (0.15 | ) | | | 2.33 | | | | 2.18 | | | | — | |
| | 2010 - B | | | 15.42 | | | | (0.26 | ) | | | 2.11 | | | | 1.85 | | | | — | |
| | 2010 - C | | | 15.28 | | | | (0.26 | ) | | | 2.09 | | | | 1.83 | | | | — | |
| | 2010 - Institutional | | | 17.83 | | | | (0.07 | ) | | | 2.45 | | | | 2.38 | | | | — | |
| | 2010 - Service | | | 16.67 | | | | (0.16 | ) | | | 2.29 | | | | 2.13 | | | | — | |
| | 2010 - IR | | | 16.99 | | | | (0.10 | ) | | | 2.34 | | | | 2.24 | | | | — | |
| | 2010 - R | | | 16.85 | | | | (0.19 | ) | | | 2.31 | | | | 2.12 | | | | — | |
| | 2009 - A | | | 21.68 | | | | (0.08 | ) | | | (3.65 | ) | | | (3.73 | ) | | | (1.04 | ) |
| | 2009 - B | | | 20.06 | | | | (0.18 | ) | | | (3.42 | ) | | | (3.60 | ) | | | (1.04 | ) |
| | 2009 - C | | | 19.89 | | | | (0.17 | ) | | | (3.40 | ) | | | (3.57 | ) | | | (1.04 | ) |
| | 2009 - Institutional | | | 22.67 | | | | (0.03 | ) | | | (3.77 | ) | | | (3.80 | ) | | | (1.04 | ) |
| | 2009 - Service | | | 21.41 | | | | (0.11 | ) | | | (3.59 | ) | | | (3.70 | ) | | | (1.04 | ) |
| | 2009 - IR | | | 21.72 | | | | (0.07 | ) | | | (3.62 | ) | | | (3.69 | ) | | | (1.04 | ) |
| | 2009 - R | | | 21.65 | | | | (0.14 | ) | | | (3.62 | ) | | | (3.76 | ) | | | (1.04 | ) |
| | (a) | | Calculated based on the average shares outstanding methodology. |
| | (b) | | Assumes investment at the net asset value at the beginning of the period, reinvestment of all dividends and distributions, a complete redemption of the investment at the net asset value at the end of the period and no sales or redemption charges. Total returns would be reduced if a sales or redemption charge was taken into account. Returns do not reflect the deduction of taxes that a shareholder would pay on Fund distributions or the redemption of Fund shares. Total returns for periods less than one full year are not annualized. |
| | (c) | | The Fund’s portfolio turnover rate is calculated in accordance with regulatory requirements, without regard to transactions involving short term investments and certain derivatives. If such transactions were included, the Fund’s portfolio turnover rate may be higher. |
| | (d) | | Reflects income recognized from a special dividend which amounted to $0.01 per share and 0.09% of average net assets. |
| | (f) | | Reflects income recognized from special dividends which amounted to $0.04 per share and 0.17% of average net assets. |
| | (g) | | Portfolio turnover rates exclude portfolio securities received as a result of in-kind redemptions. |
| | |
| 100 | | The accompanying notes are an integral part of these financial statements. |
GOLDMAN SACHS GROWTH OPPORTUNITIES FUND
| | | | | | | | | | | | | | | | | | | | | | | | | | | | | | | | | | | | | | | | |
| | | | | | | | | | | | | | | | | | | | | | | | | | | | | |
| | | Net asset
value, end
of period | | | | | Total
return(b) | | | | | Net assets,
end of
period
(in 000s) | | | | | Ratio of
net expenses
to average
net assets | | | | | Ratio of
total expenses
to average
net assets | | | | | Ratio of
net investment
loss
to average
net assets | | | | | Portfolio
turnover
rate(c) | |
| | | | |
| | $ | 28.91 | | | | | | 17.25 | % | | | | $ | 1,234,963 | | | | | | 1.36 | %(e) | | | | | 1.40 | %(e) | | | | | (0.60 | )%(d)(e) | | | | | 24 | % |
| | | 24.69 | | | | | | 16.78 | | | | | | 8,978 | | | | | | 2.11 | (e) | | | | | 2.15 | (e) | | | | | (1.36 | )(d)(e) | | | | | 24 | |
| | | 24.40 | | | | | | 16.79 | | | | | | 192,248 | | | | | | 2.11 | (e) | | | | | 2.15 | (e) | | | | | (1.35 | )(d)(e) | | | | | 24 | |
| | | 31.52 | | | | | | 17.45 | | | | | | 3,661,625 | | | | | | 0.96 | (e) | | | | | 1.00 | (e) | | | | | (0.20 | )(d)(e) | | | | | 24 | |
| | | 28.24 | | | | | | 17.16 | | | | | | 60,116 | | | | | | 1.46 | (e) | | | | | 1.50 | (e) | | | | | (0.71 | )(d)(e) | | | | | 24 | |
| | | 29.47 | | | | | | 17.38 | | | | | | 138,036 | | | | | | 1.11 | (e) | | | | | 1.15 | (e) | | | | | (0.34 | )(d)(e) | | | | | 24 | |
| | | 28.39 | | | | | | 17.05 | | | | | | 81,985 | | | | | | 1.61 | (e) | | | | | 1.65 | (e) | | | | | (0.85 | )(d)(e) | | | | | 24 | |
| | | | | | | | | | | | | | | | | | | | | | | | | | | | | | | | | | | | | | | | |
| | | | |
| | | 26.65 | | | | | | 19.84 | | | | | | 1,130,449 | | | | | | 1.35 | | | | | | 1.41 | | | | | | (0.44 | )(f) | | | | | 41 | |
| | | 23.14 | | | | | | 18.94 | | | | | | 9,429 | | | | | | 2.10 | | | | | | 2.16 | | | | | | (1.15 | )(f) | | | | | 41 | |
| | | 22.89 | | | | | | 18.94 | | | | | | 172,010 | | | | | | 2.10 | | | | | | 2.16 | | | | | | (1.19 | )(f) | | | | | 41 | |
| | | 28.83 | | | | | | 20.38 | | | | | | 3,207,925 | | | | | | 0.95 | | | | | | 1.01 | | | | | | (0.05 | )(f) | | | | | 41 | |
| | | 26.10 | | | | | | 19.74 | | | | | | 60,977 | | | | | | 1.45 | | | | | | 1.51 | | | | | | (0.54 | )(f) | | | | | 41 | |
| | | 27.10 | | | | | | 20.18 | | | | | | 91,093 | | | | | | 1.10 | | | | | | 1.16 | | | | | | (0.21 | )(f) | | | | | 41 | |
| | | 26.25 | | | | | | 19.61 | | | | | | 71,263 | | | | | | 1.60 | | | | | | 1.66 | | | | | | (0.71 | )(f) | | | | | 41 | |
| | | 23.88 | | | | | | 19.15 | | | | | | 1,068,187 | | | | | | 1.35 | | | | | | 1.41 | | | | | | (0.67 | ) | | | | | 59 | |
| | | 21.10 | | | | | | 18.29 | | | | | | 12,613 | | | | | | 2.10 | | | | | | 2.16 | | | | | | (1.42 | ) | | | | | 59 | |
| | | 20.89 | | | | | | 18.24 | | | | | | 157,901 | | | | | | 2.10 | | | | | | 2.16 | | | | | | (1.42 | ) | | | | | 59 | |
| | | 25.59 | | | | | | 19.61 | | | | | | 2,710,810 | | | | | | 0.95 | | | | | | 1.01 | | | | | | (0.27 | ) | | | | | 59 | |
| | | 23.44 | | | | | | 19.03 | | | | | | 59,834 | | | | | | 1.45 | | | | | | 1.51 | | | | | | (0.77 | ) | | | | | 59 | |
| | | 24.19 | | | | | | 19.43 | | | | | | 75,702 | | | | | | 1.10 | | | | | | 1.16 | | | | | | (0.42 | ) | | | | | 59 | |
| | | 23.59 | | | | | | 18.83 | | | | | | 54,071 | | | | | | 1.60 | | | | | | 1.66 | | | | | | (0.91 | ) | | | | | 59 | |
| | | 21.36 | | | | | | 12.97 | | | | | | 1,060,320 | | | | | | 1.36 | | | | | | 1.41 | | | | | | (0.70 | ) | | | | | 71 | (g) |
| | | 19.16 | | | | | | 12.13 | | | | | | 16,380 | | | | | | 2.11 | | | | | | 2.16 | | | | | | (1.46 | ) | | | | | 71 | (g) |
| | | 18.99 | | | | | | 12.18 | | | | | | 158,371 | | | | | | 2.11 | | | | | | 2.16 | | | | | | (1.46 | ) | | | | | 71 | (g) |
| | | 22.71 | | | | | | 13.39 | | | | | | 2,843,584 | | | | | | 0.96 | | | | | | 1.01 | | | | | | (0.30 | ) | | | | | 71 | (g) |
| | | 21.01 | | | | | | 12.85 | | | | | | 57,002 | | | | | | 1.46 | | | | | | 1.51 | | | | | | (0.81 | ) | | | | | 71 | (g) |
| | | 21.57 | | | | | | 13.24 | | | | | | 54,912 | | | | | | 1.11 | | | | | | 1.16 | | | | | | (0.43 | ) | | | | | 71 | (g) |
| | | 21.17 | | | | | | 12.68 | | | | | | 33,931 | | | | | | 1.61 | | | | | | 1.66 | | | | | | (0.94 | ) | | | | | 71 | (g) |
| | | 19.09 | | | | | | 12.89 | | | | | | 799,256 | | | | | | 1.37 | | | | | | 1.44 | | | | | | (0.76 | ) | | | | | 57 | (g) |
| | | 17.27 | | | | | | 12.00 | | | | | | 21,174 | | | | | | 2.12 | | | | | | 2.19 | | | | | | (1.51 | ) | | | | | 57 | (g) |
| | | 17.11 | | | | | | 11.98 | | | | | | 129,009 | | | | | | 2.12 | | | | | | 2.19 | | | | | | (1.51 | ) | | | | | 57 | (g) |
| | | 20.21 | | | | | | 13.35 | | | | | | 2,216,786 | | | | | | 0.97 | | | | | | 1.04 | | | | | | (0.35 | ) | | | | | 57 | (g) |
| | | 18.80 | | | | | | 12.78 | | | | | | 60,893 | | | | | | 1.47 | | | | | | 1.54 | | | | | | (0.86 | ) | | | | | 57 | (g) |
| | | 19.23 | | | | | | 13.18 | | | | | | 12,823 | | | | | | 1.12 | | | | | | 1.19 | | | | | | (0.49 | ) | | | | | 57 | (g) |
| | | 18.97 | | | | | | 12.58 | | | | | | 7,954 | | | | | | 1.62 | | | | | | 1.69 | | | | | | (0.97 | ) | | | | | 57 | (g) |
| | | 16.91 | | | | | | (15.03 | ) | | | | | 641,989 | | | | | | 1.45 | | | | | | 1.50 | | | | | | (0.58 | ) | | | | | 78 | |
| | | 15.42 | | | | | | (15.64 | ) | | | | | 27,191 | | | | | | 2.20 | | | | | | 2.25 | | | | | | (1.33 | ) | | | | | 78 | |
| | | 15.28 | | | | | | (15.62 | ) | | | | | 85,240 | | | | | | 2.20 | | | | | | 2.25 | | | | | | (1.33 | ) | | | | | 78 | |
| | | 17.83 | | | | | | (14.66 | ) | | | | | 1,257,148 | | | | | | 1.05 | | | | | | 1.10 | | | | | | (0.19 | ) | | | | | 78 | |
| | | 16.67 | | | | | | (15.08 | ) | | | | | 30,614 | | | | | | 1.55 | | | | | | 1.60 | | | | | | (0.74 | ) | | | | | 78 | |
| | | 16.99 | | | | | | (14.81 | ) | | | | | 1,382 | | | | | | 1.20 | | | | | | 1.25 | | | | | | (0.46 | ) | | | | | 78 | |
| | | 16.85 | | | | | | (15.20 | ) | | | | | 934 | | | | | | 1.70 | | | | | | 1.75 | | | | | | (0.94 | ) | | | | | 78 | |
| | |
| The accompanying notes are an integral part of these financial statements. | | 101 |
GOLDMAN SACHS SMALL/MID CAP GROWTH FUND
Financial Highlights
Selected Data for a Share Outstanding Throughout Each Period
| | | | | | | | | | | | | | | | | | | | | | |
| | | | | | | | Income (loss) from
investment operations | | | | |
| | | Year - Share Class | |
Net asset
value,
beginning
of period | | | Net
investment
loss(a) | | | Net realized
and unrealized
gain (loss) | | | Total from
investment
operations | | | Distributions
to shareholders
from net
realized
gains | |
| | FOR THE SIX MONTHS ENDED FEBRUARY 28, (UNAUDITED) | |
| | 2014 - A | | $ | 18.63 | | | $ | (0.07 | )(d) | | $ | 3.15 | | | $ | 3.08 | | | $ | (1.00 | ) |
| | 2014 - B | | | 17.32 | | | | (0.14 | )(d) | | | 2.92 | | | | 2.78 | | | | (1.00 | ) |
| | 2014 - C | | | 17.31 | | | | (0.14 | )(d) | | | 2.92 | | | | 2.78 | | | | (1.00 | ) |
| | 2014 - Institutional | | | 19.25 | | | | (0.03 | )(d) | | | 3.25 | | | | 3.22 | | | | (1.00 | ) |
| | 2014 - Service | | | 18.38 | | | | (0.08 | )(d) | | | 3.10 | | | | 3.02 | | | | (1.00 | ) |
| | 2014 - IR | | | 18.93 | | | | (0.05 | )(d) | | | 3.20 | | | | 3.15 | | | | (1.00 | ) |
| | 2014 - R | | | 18.35 | | | | (0.10 | )(d) | | | 3.11 | | | | 3.01 | | | | (1.00 | ) |
| | | | | | | | | | | | | | | | | | | | | | |
| | FOR THE FISCAL YEARS ENDED AUGUST 31, | |
| | 2013 - A | | | 15.52 | | | | (0.11 | )(f) | | | 3.99 | | | | 3.88 | | | | (0.77 | ) |
| | 2013 - B | | | 14.59 | | | | (0.22 | )(f) | | | 3.72 | | | | 3.50 | | | | (0.77 | ) |
| | 2013 - C | | | 14.58 | | | | (0.23 | )(f) | | | 3.73 | | | | 3.50 | | | | (0.77 | ) |
| | 2013 - Institutional | | | 15.95 | | | | (0.06 | )(f) | | | 4.13 | | | | 4.07 | | | | (0.77 | ) |
| | 2013 - Service | | | 15.34 | | | | (0.13 | )(f) | | | 3.94 | | | | 3.81 | | | | (0.77 | ) |
| | 2013 - IR | | | 15.72 | | | | (0.08 | )(f) | | | 4.06 | | | | 3.98 | | | | (0.77 | ) |
| | 2013 - R | | | 15.34 | | | | (0.15 | )(f) | | | 3.93 | | | | 3.78 | | | | (0.77 | ) |
| | 2012 - A | | | 13.67 | | | | (0.12 | ) | | | 2.63 | | | | 2.51 | | | | (0.66 | ) |
| | 2012 - B | | | 12.98 | | | | (0.21 | ) | | | 2.48 | | | | 2.27 | | | | (0.66 | ) |
| | 2012 - C | | | 12.98 | | | | (0.21 | ) | | | 2.47 | | | | 2.26 | | | | (0.66 | ) |
| | 2012 - Institutional | | | 13.98 | | | | (0.06 | ) | | | 2.69 | | | | 2.63 | | | | (0.66 | ) |
| | 2012 - Service | | | 13.53 | | | | (0.13 | ) | | | 2.60 | | | | 2.47 | | | | (0.66 | ) |
| | 2012 - IR | | | 13.81 | | | | (0.08 | ) | | | 2.65 | | | | 2.57 | | | | (0.66 | ) |
| | 2012 - R | | | 13.55 | | | | (0.15 | ) | | | 2.60 | | | | 2.45 | | | | (0.66 | ) |
| | 2011 - A | | | 12.08 | | | | (0.15 | ) | | | 2.01 | | | | 1.86 | | | | (0.27 | ) |
| | 2011 - B | | | 11.57 | | | | (0.24 | ) | | | 1.92 | | | | 1.68 | | | | (0.27 | ) |
| | 2011 - C | | | 11.56 | | | | (0.24 | ) | | | 1.93 | | | | 1.69 | | | | (0.27 | ) |
| | 2011 - Institutional | | | 12.30 | | | | (0.09 | ) | | | 2.04 | | | | 1.95 | | | | (0.27 | ) |
| | 2011 - Service | | | 11.97 | | | | (0.16 | ) | | | 1.99 | | | | 1.83 | | | | (0.27 | ) |
| | 2011 - IR | | | 12.17 | | | | (0.10 | ) | | | 2.01 | | | | 1.91 | | | | (0.27 | ) |
| | 2011 - R | | | 12.01 | | | | (0.18 | ) | | | 1.99 | | | | 1.81 | | | | (0.27 | ) |
| | 2010 - A | | | 10.63 | | | | (0.12 | ) | | | 1.57 | | | | 1.45 | | | | — | |
| | 2010 - B | | | 10.25 | | | | (0.20 | ) | | | 1.52 | | | | 1.32 | | | | — | |
| | 2010 - C | | | 10.25 | | | | (0.21 | ) | | | 1.52 | | | | 1.31 | | | | — | |
| | 2010 - Institutional | | | 10.78 | | | | (0.07 | ) | | | 1.59 | | | | 1.52 | | | | — | |
| | 2010 - Service | | | 10.54 | | | | (0.13 | ) | | | 1.56 | | | | 1.43 | | | | — | |
| | 2010 - IR | | | 10.68 | | | | (0.09 | ) | | | 1.58 | | | | 1.49 | | | | — | |
| | 2010 - R | | | 10.59 | | | | (0.15 | ) | | | 1.57 | | | | 1.42 | | | | — | |
| | 2009 - A | | | 12.25 | | | | (0.05 | ) | | | (1.57 | ) | | | (1.62 | ) | | | — | |
| | 2009 - B | | | 11.90 | | | | (0.11 | ) | | | (1.54 | ) | | | (1.65 | ) | | | — | |
| | 2009 - C | | | 11.90 | | | | (0.11 | ) | | | (1.54 | ) | | | (1.65 | ) | | | — | |
| | 2009 - Institutional | | | 12.37 | | | | (0.02 | ) | | | (1.57 | ) | | | (1.59 | ) | | | — | |
| | 2009 - Service | | | 12.16 | | | | (0.06 | ) | | | (1.56 | ) | | | (1.62 | ) | | | — | |
| | 2009 - IR | | | 12.27 | | | | (0.04 | ) | | | (1.55 | ) | | | (1.59 | ) | | | — | |
| | 2009 - R | | | 12.22 | | | | (0.08 | ) | | | (1.55 | ) | | | (1.63 | ) | | | — | |
| | (a) | | Calculated based on the average shares outstanding methodology. |
| | (b) | | Assumes investment at the net asset value at the beginning of the period, reinvestment of all dividends and distributions, a complete redemption of the investment at the net asset value at the end of the period and no sales or redemption charges. Total returns would be reduced if a sales or redemption charge was taken into account. Returns do not reflect the deduction of taxes that a shareholder would pay on Fund distributions or the redemption of Fund shares. Total returns for periods less than one full year are not annualized. |
| | (c) | | The Fund’s portfolio turnover rate is calculated in accordance with regulatory requirements, without regard to transactions involving short term investments and certain derivatives. If such transactions were included, the Fund’s portfolio turnover rate may be higher. |
| | (d) | | Reflects income recognized from special dividends which amounted to $0.02 per share and 0.16% of average net assets. |
| | (f) | | Reflects income recognized from special dividends which amounted to $0.02 per share and 0.14% of average net assets. |
| | |
| 102 | | The accompanying notes are an integral part of these financial statements. |
GOLDMAN SACHS SMALL/MID CAP GROWTH FUND
| | | | | | | | | | | | | | | | | | | | | | | | | | | | | | | | | | | | | | | | |
| | | | | | | | | | | | | | | | | | | | | | | | | | | | | | | | | | |
| | | Net asset
value, end
of period | | | | | Total
return(b) | | | | | Net assets,
end of
period
(in 000s) | | | | | Ratio of
net expenses
to average
net assets | | | | | Ratio of
total expenses
to average
net assets | | | | | Ratio of
net investment
loss
to average
net assets | | | | | Portfolio
turnover
rate(c) | |
| | | | | | | | | | | | | | | | | | | | | | | | | | | | | | | | | | | | | | | | |
| | $ | 20.71 | | | | | | 16.84 | % | | | | $ | 804,529 | | | | | | 1.32 | %(e) | | | | | 1.47 | %(e) | | | | | (0.74 | )%(d)(e) | | | | | 23 | % |
| | | 19.10 | | | | | | 16.43 | | | | | | 4,597 | | | | | | 2.07 | (e) | | | | | 2.22 | (e) | | | | | (1.50 | )(d)(e) | | | | | 23 | |
| | | 19.09 | | | | | | 16.44 | | | | | | 212,606 | | | | | | 2.07 | (e) | | | | | 2.22 | (e) | | | | | (1.48 | )(d)(e) | | | | | 23 | |
| | | 21.47 | | | | | | 17.08 | | | | | | 981,562 | | | | | | 0.92 | (e) | | | | | 1.07 | (e) | | | | | (0.34 | )(d)(e) | | | | | 23 | |
| | | 20.40 | | | | | | 16.74 | | | | | | 8,091 | | | | | | 1.42 | (e) | | | | | 1.57 | (e) | | | | | (0.86 | )(d)(e) | | | | | 23 | |
| | | 21.08 | | | | | | 17.00 | | | | | | 151,997 | | | | | | 1.07 | (e) | | | | | 1.22 | (e) | | | | | (0.48 | )(d)(e) | | | | | 23 | |
| | | 20.36 | | | | | | 16.71 | | | | | | 31,454 | | | | | | 1.57 | (e) | | | | | 1.72 | (e) | | | | | (0.99 | )(d)(e) | | | | | 23 | |
| | | | | | | | | | | | | | | | | | | | | | | | | | | | | | | | | | | | | | | | |
| | | | | | | | | | | | | | | | | | | | | | | | | | | | | | | | | | | | | | | | |
| | | 18.63 | | | | | | 26.18 | | | | | | 592,798 | | | | | | 1.34 | | | | | | 1.49 | | | | | | (0.68 | )(f) | | | | | 37 | |
| | | 17.32 | | | | | | 25.21 | | | | | | 4,573 | | | | | | 2.09 | | | | | | 2.24 | | | | | | (1.40 | )(f) | | | | | 37 | |
| | | 17.31 | | | | | | 25.23 | | | | | | 150,744 | | | | | | 2.09 | | | | | | 2.24 | | | | | | (1.44 | )(f) | | | | | 37 | |
| | | 19.25 | | | | | | 26.68 | | | | | | 725,662 | | | | | | 0.94 | | | | | | 1.09 | | | | | | (0.32 | )(f) | | | | | 37 | |
| | | 18.38 | | | | | | 26.02 | | | | | | 8,495 | | | | | | 1.44 | | | | | | 1.59 | | | | | | (0.77 | )(f) | | | | | 37 | |
| | | 18.93 | | | | | | 26.49 | | | | | | 93,255 | | | | | | 1.09 | | | | | | 1.24 | | | | | | (0.45 | )(f) | | | | | 37 | |
| | | 18.35 | | | | | | 25.82 | | | | | | 24,420 | | | | | | 1.59 | | | | | | 1.74 | | | | | | (0.93 | )(f) | | | | | 37 | |
| | | 15.52 | | | | | | 18.97 | | | | | | 393,284 | | | | | | 1.35 | | | | | | 1.50 | | | | | | (0.83 | ) | | | | | 51 | |
| | | 14.59 | | | | | | 18.11 | | | | | | 4,783 | | | | | | 2.10 | | | | | | 2.25 | | | | | | (1.58 | ) | | | | | 51 | |
| | | 14.58 | | | | | | 18.03 | | | | | | 87,185 | | | | | | 2.10 | | | | | | 2.25 | | | | | | (1.58 | ) | | | | | 51 | |
| | | 15.95 | | | | | | 19.42 | | | | | | 291,636 | | | | | | 0.95 | | | | | | 1.10 | | | | | | (0.43 | ) | | | | | 51 | |
| | | 15.34 | | | | | | 18.87 | | | | | | 6,774 | | | | | | 1.45 | | | | | | 1.60 | | | | | | (0.92 | ) | | | | | 51 | |
| | | 15.72 | | | | | | 19.22 | | | | | | 46,777 | | | | | | 1.10 | | | | | | 1.25 | | | | | | (0.57 | ) | | | | | 51 | |
| | | 15.34 | | | | | | 18.69 | | | | | | 19,156 | | | | | | 1.60 | | | | | | 1.75 | | | | | | (1.07 | ) | | | | | 51 | |
| | | 13.67 | | | | | | 15.30 | | | | | | 403,960 | | | | | | 1.47 | | | | | | 1.50 | | | | | | (0.99 | ) | | | | | 53 | |
| | | 12.98 | | | | | | 14.41 | | | | | | 5,343 | | | | | | 2.22 | | | | | | 2.25 | | | | | | (1.75 | ) | | | | | 53 | |
| | | 12.98 | | | | | | 14.51 | | | | | | 79,875 | | | | | | 2.22 | | | | | | 2.25 | | | | | | (1.74 | ) | | | | | 53 | |
| | | 13.98 | | | | | | 15.77 | | | | | | 340,712 | | | | | | 1.07 | | | | | | 1.10 | | | | | | (0.59 | ) | | | | | 53 | |
| | | 13.53 | | | | | | 15.19 | | | | | | 5,879 | | | | | | 1.57 | | | | | | 1.60 | | | | | | (1.08 | ) | | | | | 53 | |
| | | 13.81 | | | | | | 15.60 | | | | | | 30,858 | | | | | | 1.22 | | | | | | 1.25 | | | | | | (0.71 | ) | | | | | 53 | |
| | | 13.55 | | | | | | 14.97 | | | | | | 15,370 | | | | | | 1.72 | | | | | | 1.75 | | | | | | (1.24 | ) | | | | | 53 | |
| | | 12.08 | | | | | | 13.64 | | | | | | 267,826 | | | | | | 1.50 | | | | | | 1.54 | | | | | | (0.98 | ) | | | | | 48 | |
| | | 11.57 | | | | | | 12.88 | | | | | | 6,024 | | | | | | 2.25 | | | | | | 2.29 | | | | | | (1.73 | ) | | | | | 48 | |
| | | 11.56 | | | | | | 12.78 | | | | | | 47,685 | | | | | | 2.25 | | | | | | 2.29 | | | | | | (1.73 | ) | | | | | 48 | |
| | | 12.30 | | | | | | 14.10 | | | | | | 222,616 | | | | | | 1.10 | | | | | | 1.14 | | | | | | (0.58 | ) | | | | | 48 | |
| | | 11.97 | | | | | | 13.57 | | | | | | 2,762 | | | | | | 1.60 | | | | | | 1.64 | | | | | | (1.07 | ) | | | | | 48 | |
| | | 12.17 | | | | | | 13.95 | | | | | | 15,059 | | | | | | 1.25 | | | | | | 1.29 | | | | | | (0.72 | ) | | | | | 48 | |
| | | 12.01 | | | | | | 13.41 | | | | | | 10,318 | | | | | | 1.75 | | | | | | 1.79 | | | | | | (1.23 | ) | | | | | 48 | |
| | | 10.63 | | | | | | (13.22 | ) | | | | | 122,262 | | | | | | 1.50 | | | | | | 1.68 | | | | | | (0.59 | ) | | | | | 55 | |
| | | 10.25 | | | | | | (13.87 | ) | | | | | 4,882 | | | | | | 2.25 | | | | | | 2.43 | | | | | | (1.32 | ) | | | | | 55 | |
| | | 10.25 | | | | | | (13.87 | ) | | | | | 18,220 | | | | | | 2.25 | | | | | | 2.43 | | | | | | (1.34 | ) | | | | | 55 | |
| | | 10.78 | | | | | | (12.85 | ) | | | | | 103,383 | | | | | | 1.10 | | | | | | 1.28 | | | | | | (0.17 | ) | | | | | 55 | |
| | | 10.54 | | | | | | (13.32 | ) | | | | | 1,196 | | | | | | 1.60 | | | | | | 1.78 | | | | | | (0.71 | ) | | | | | 55 | |
| | | 10.68 | | | | | | (12.96 | ) | | | | | 131 | | | | | | 1.25 | | | | | | 1.43 | | | | | | (0.44 | ) | | | | | 55 | |
| | | 10.59 | | | | | | (13.34 | ) | | | | | 533 | | | | | | 1.75 | | | | | | 1.93 | | | | | | (0.90 | ) | | | | | 55 | |
| | |
| The accompanying notes are an integral part of these financial statements. | | 103 |
GOLDMAN SACHS STRATEGIC GROWTH FUND
Financial Highlights
Selected Data for a Share Outstanding Throughout Each Period
| | | | | | | | | | | | | | | | | | | | | | | | | | | | | | |
| | | | | | | | Income (loss) from
investment operations | | | Distributions
to shareholders | |
| | | Year - Share Class | | Net asset
value,
beginning
of period | | | Net
investment
income (loss)(a) | | | Net realized
and unrealized
gain (loss) | | | Total from
investment
operations | | | From net
investment
income | | | From net
realized
gains | | | Total
distributions | |
| FOR THE SIX MONTHS ENDED FEBRUARY 28, (UNAUDITED) | |
| | 2014 - A | | $ | 12.29 | | | $ | (0.01 | ) | | $ | 2.22 | | | $ | 2.21 | | | $ | (0.01 | ) | | $ | (1.83 | ) | | $ | (1.84 | ) |
| | 2014 - B | | | 11.07 | | | | (0.05 | ) | | | 1.99 | | | | 1.94 | | | | — | | | | (1.83 | ) | | | (1.83 | ) |
| | 2014 - C | | | 11.09 | | | | (0.05 | ) | | | 1.98 | | | | 1.93 | | | | — | | | | (1.83 | ) | | | (1.83 | ) |
| | 2014 - Institutional | | | 12.79 | | | | 0.02 | | | | 2.32 | | | | 2.34 | | | | (0.06 | ) | | | (1.83 | ) | | | (1.89 | ) |
| | 2014 - Service | | | 12.28 | | | | (0.01 | ) | | | 2.21 | | | | 2.20 | | | | (0.01 | ) | | | (1.83 | ) | | | (1.84 | ) |
| | 2014 - IR | | | 12.80 | | | | 0.01 | | | | 2.31 | | | | 2.32 | | | | (0.05 | ) | | | (1.83 | ) | | | (1.88 | ) |
| | 2014 - R | | | 12.26 | | | | (0.02 | ) | | | 2.20 | | | | 2.18 | | | | (0.02 | ) | | | (1.83 | ) | | | (1.85 | ) |
| | | | | | | | | | | | | | | | | | | | | | | | | | | | | | |
| FOR THE FISCAL YEARS ENDED AUGUST 31, | |
| | 2013 - A | | | 11.57 | | | | 0.06 | (e) | | | 1.58 | | | | 1.64 | | | | (0.05 | ) | | | (0.87 | ) | | | (0.92 | ) |
| | 2013 - B | | | 10.53 | | | | (0.03 | )(e) | | | 1.44 | | | | 1.41 | | | | — | | | | (0.87 | ) | | | (0.87 | ) |
| | 2013 - C | | | 10.54 | | | | (0.04 | )(e) | | | 1.46 | | | | 1.42 | | | | — | | | | (0.87 | ) | | | (0.87 | ) |
| | 2013 - Institutional | | | 12.00 | | | | 0.10 | (e) | | | 1.66 | | | | 1.76 | | | | (0.10 | ) | | | (0.87 | ) | | | (0.97 | ) |
| | 2013 - Service | | | 11.59 | | | | 0.03 | (e) | | | 1.61 | | | | 1.64 | | | | (0.08 | ) | | | (0.87 | ) | | | (0.95 | ) |
| | 2013 - IR | | | 12.01 | | | | 0.07 | (e) | | | 1.68 | | | | 1.75 | | | | (0.09 | ) | | | (0.87 | ) | | | (0.96 | ) |
| | 2013 - R | | | 11.53 | | | | 0.03 | (e) | | | 1.60 | | | | 1.63 | | | | (0.03 | ) | | | (0.87 | ) | | | (0.90 | ) |
| | 2012 - A | | | 9.77 | | | | 0.01 | | | | 1.81 | | | | 1.82 | | | | (0.02 | ) | | | — | | | | (0.02 | ) |
| | 2012 - B | | | 8.94 | | | | (0.06 | ) | | | 1.65 | | | | 1.59 | | | | — | | | | — | | | | — | |
| | 2012 - C | | | 8.95 | | | | (0.06 | ) | | | 1.65 | | | | 1.59 | | | | — | | | | — | | | | — | |
| | 2012 - Institutional | | | 10.14 | | | | 0.06 | | | | 1.86 | | | | 1.92 | | | | (0.06 | ) | | | — | | | | (0.06 | ) |
| | 2012 - Service | | | 9.80 | | | | 0.02 | | | | 1.79 | | | | 1.81 | | | | (0.02 | ) | | | — | | | | (0.02 | ) |
| | 2012 - IR | | | 10.10 | | | | 0.04 | | | | 1.87 | | | | 1.91 | | | | — | | | | — | | | | — | |
| | 2012 - R | | | 9.74 | | | | — | (f) | | | 1.79 | | | | 1.79 | | | | — | | | | — | | | | — | |
| | 2011 - A | | | 8.53 | | | | 0.02 | | | | 1.25 | | | | 1.27 | | | | (0.03 | ) | | | — | | | | (0.03 | ) |
| | 2011 - B | | | 7.84 | | | | (0.05 | ) | | | 1.15 | | | | 1.10 | | | | — | | | | — | | | | — | |
| | 2011 - C | | | 7.86 | | | | (0.05 | ) | | | 1.14 | | | | 1.09 | | | | — | | | | — | | | | — | |
| | 2011 - Institutional | | | 8.85 | | | | 0.06 | | | | 1.30 | | | | 1.36 | | | | (0.07 | ) | | | — | | | | (0.07 | ) |
| | 2011 - Service | | | 8.55 | | | | 0.02 | | | | 1.25 | | | | 1.27 | | | | (0.02 | ) | | | — | | | | (0.02 | ) |
| | 2011 - IR | | | 8.84 | | | | 0.04 | | | | 1.29 | | | | 1.33 | | | | (0.07 | ) | | | — | | | | (0.07 | ) |
| | 2011 - R | | | 8.51 | | | | — | (f) | | | 1.24 | | | | 1.24 | | | | (0.01 | ) | | | — | | | | (0.01 | ) |
| | 2010 - A | | | 8.22 | | | | 0.02 | | | | 0.30 | | | | 0.32 | | | | (0.01 | ) | | | — | | | | (0.01 | ) |
| | 2010 - B | | | 7.61 | | | | (0.05 | ) | | | 0.28 | | | | 0.23 | | | | — | | | | — | | | | — | |
| | 2010 - C | | | 7.62 | | | | (0.05 | ) | | | 0.29 | | | | 0.24 | | | | — | | | | — | | | | — | |
| | 2010 - Institutional | | | 8.52 | | | | 0.06 | | | | 0.30 | | | | 0.36 | | | | (0.03 | ) | | | — | | | | (0.03 | ) |
| | 2010 - Service | | | 8.24 | | | | 0.01 | | | | 0.30 | | | | 0.31 | | | | — | | | | — | | | | — | |
| | 2010 - IR | | | 8.51 | | | | 0.04 | | | | 0.32 | | | | 0.36 | | | | (0.03 | ) | | | — | | | | (0.03 | ) |
| | 2010 - R | | | 8.21 | | | | — | (f) | | | 0.30 | | | | 0.30 | | | | — | | | | — | | | | — | |
| | 2009 - A | | | 10.34 | | | | 0.01 | | | | (2.13 | ) | | | (2.12 | ) | | | — | | | | — | | | | — | |
| | 2009 - B | | | 9.65 | | | | (0.04 | ) | | | (2.00 | ) | | | (2.04 | ) | | | — | | | | — | | | | — | |
| | 2009 - C | | | 9.67 | | | | (0.04 | ) | | | (2.01 | ) | | | (2.05 | ) | | | — | | | | — | | | | — | |
| | 2009 - Institutional | | | 10.68 | | | | 0.04 | | | | (2.20 | ) | | | (2.16 | ) | | | — | | | | — | | | | — | |
| | 2009 - Service | | | 10.40 | | | | 0.01 | | | | (2.17 | ) | | | (2.16 | ) | | | — | | | | — | | | | — | |
| | 2009 - IR (Commenced January 6, 2009) | | | 7.07 | | | | 0.02 | | | | 1.42 | | | | 1.44 | | | | — | | | | — | | | | — | |
| | 2009 - R (Commenced January 6, 2009) | | | 6.83 | | | | — | (f) | | | 1.38 | | | | 1.38 | | | | — | | | | — | | | | — | |
| | (a) | | Calculated based on the average shares outstanding methodology. |
| | (b) | | Assumes investment at the net asset value at the beginning of the period, reinvestment of all dividends and distributions, a complete redemption of the investment at the net asset value at the end of the period and no sales or redemption charges. Total returns would be reduced if a sales or redemption charge was taken into account. Returns do not reflect the deduction of taxes that a shareholder would pay on Fund distributions or the redemption of Fund shares. Total returns for periods less than one full year are not annualized. |
| | (c) | | The Fund’s portfolio turnover rate is calculated in accordance with regulatory requirements, without regard to transactions involving short term investments and certain derivatives. If such transactions were included, the Fund’s portfolio turnover rate may be higher. |
| | (e) | | Reflects income recognized from special dividends which amounted to $0.03 per share and 0.29% of average net assets. |
| | (f) | | Amount is less than $0.005 per share. |
| | (g) | | Amount is less than 0.005% of average net assets. |
| | |
| 104 | | The accompanying notes are an integral part of these financial statements. |
GOLDMAN SACHS STRATEGIC GROWTH FUND
| | | | | | | | | | | | | | | | | | | | | | | | | | | | | | | | | | | | | | | | |
| | | | | | | | | | | | | | | | | | | | | | | | | | | | | | | | | | |
| | | Net asset
value, end
of period | | | | | Total
return(b) | | | | | Net assets,
end of period (in 000s) | | | | | Ratio of
net expenses
to average
net assets | | | | | Ratio of
total expenses
to average
net assets | | | | | Ratio of
net investment
income (loss)
to average net assets | | | | | Portfolio
turnover
rate(c) | |
| | | | | | | | | | | | | | | | | | | | | | | | | | | | | | | | | | | | | | | | |
| | $ | 12.66 | | | | | | 18.86 | % | | | | $ | 99,271 | | | | | | 1.16 | %(d) | | | | | 1.53 | %(d) | | | | | (0.13 | )%(d) | | | | | 32 | % |
| | | 11.18 | | | | | | 18.47 | | | | | | 918 | | | | | | 1.91 | (d) | | | | | 2.28 | (d) | | | | | (0.89 | )(d) | | | | | 32 | |
| | | 11.19 | | | | | | 18.33 | | | | | | 11,329 | | | | | | 1.91 | (d) | | | | | 2.28 | (d) | | | | | (0.88 | )(d) | | | | | 32 | |
| | | 13.24 | | | | | | 19.14 | | | | | | 312,894 | | | | | | 0.76 | (d) | | | | | 1.13 | (d) | | | | | 0.27 | (d) | | | | | 32 | |
| | | 12.64 | | | | | | 18.75 | | | | | | 100 | | | | | | 1.26 | (d) | | | | | 1.63 | (d) | | | | | (0.22 | )(d) | | | | | 32 | |
| | | 13.24 | | | | | | 18.94 | | | | | | 1,078 | | | | | | 0.91 | (d) | | | | | 1.28 | (d) | | | | | 0.11 | (d) | | | | | 32 | |
| | | 12.59 | | | | | | 18.67 | | | | | | 11 | | | | | | 1.36 | (d) | | | | | 1.73 | (d) | | | | | (0.30 | )(d) | | | | | 32 | |
| | | | | | | | | | | | | | | | | | | | | | | | | | | | | | | | | | | | | | | | |
| | | | | | | | | | | | | | | | | | | | | | | | | | | | | | | | | | | | | | | | |
| | | 12.29 | | | | | | 15.53 | | | | | | 87,987 | | | | | | 1.15 | | | | | | 1.54 | | | | | | 0.49 | (e) | | | | | 55 | |
| | | 11.07 | | | | | | 14.70 | | | | | | 1,022 | | | | | | 1.90 | | | | | | 2.29 | | | | | | (0.30 | )(e) | | | | | 55 | |
| | | 11.09 | | | | | | 14.68 | | | | | | 9,314 | | | | | | 1.90 | | | | | | 2.29 | | | | | | (0.35 | )(e) | | | | | 55 | |
| | | 12.79 | | | | | | 15.98 | | | | | | 242,865 | | | | | | 0.75 | | | | | | 1.14 | | | | | | 0.81 | (e) | | | | | 55 | |
| | | 12.28 | | | | | | 15.45 | | | | | | 82 | | | | | | 1.25 | | | | | | 1.64 | | | | | | 0.24 | (e) | | | | | 55 | |
| | | 12.80 | | | | | | 15.80 | | | | | | 884 | | | | | | 0.90 | | | | | | 1.29 | | | | | | 0.57 | (e) | | | | | 55 | |
| | | 12.26 | | | | | | 15.36 | | | | | | 6 | | | | | | 1.34 | | | | | | 1.73 | | | | | | 0.22 | (e) | | | | | 55 | |
| | | 11.57 | | | | | | 18.45 | | | | | | 181,257 | | | | | | 1.15 | | | | | | 1.51 | | | | | | 0.14 | | | | | | 54 | |
| | | 10.53 | | | | | | 17.62 | | | | | | 1,482 | | | | | | 1.90 | | | | | | 2.26 | | | | | | (0.60 | ) | | | | | 54 | |
| | | 10.54 | | | | | | 17.71 | | | | | | 8,279 | | | | | | 1.90 | | | | | | 2.26 | | | | | | (0.61 | ) | | | | | 54 | |
| | | 12.00 | | | | | | 18.97 | | | | | | 256,389 | | | | | | 0.75 | | | | | | 1.11 | | | | | | 0.54 | | | | | | 54 | |
| | | 11.59 | | | | | | 18.50 | | | | | | 52 | | | | | | 1.25 | | | | | | 1.61 | | | | | | 0.18 | | | | | | 54 | |
| | | 12.01 | | | | | | 18.85 | | | | | | 321 | | | | | | 0.90 | | | | | | 1.26 | | | | | | 0.38 | | | | | | 54 | |
| | | 11.53 | | | | | | 18.32 | | | | | | 4 | | | | | | 1.40 | | | | | | 1.76 | | | | | | (0.05 | ) | | | | | 54 | |
| | | 9.77 | | | | | | 14.89 | | | | | | 199,185 | | | | | | 1.15 | | | | | | 1.51 | | | | | | 0.19 | | | | | | 40 | |
| | | 8.94 | | | | | | 14.03 | | | | | | 1,834 | | | | | | 1.90 | | | | | | 2.26 | | | | | | (0.56 | ) | | | | | 40 | |
| | | 8.95 | | | | | | 13.87 | | | | | | 8,828 | | | | | | 1.90 | | | | | | 2.26 | | | | | | (0.56 | ) | | | | | 40 | |
| | | 10.14 | | | | | | 15.33 | | | | | | 260,481 | | | | | | 0.75 | | | | | | 1.11 | | | | | | 0.58 | | | | | | 40 | |
| | | 9.80 | | | | | | 14.90 | | | | | | 2 | | | | | | 1.25 | | | | | | 1.61 | | | | | | 0.21 | | | | | | 40 | |
| | | 10.10 | | | | | | 14.99 | | | | | | 125 | | | | | | 0.90 | | | | | | 1.26 | | | | | | 0.42 | | | | | | 40 | |
| | | 9.74 | | | | | | 14.52 | | | | | | 4 | | | | | | 1.40 | | | | | | 1.76 | | | | | | — | (g) | | | | | 40 | |
| | | 8.53 | | | | | | 3.83 | | | | | | 192,744 | | | | | | 1.15 | | | | | | 1.53 | | | | | | 0.22 | | | | | | 60 | |
| | | 7.84 | | | | | | 3.02 | | | | | | 2,716 | | | | | | 1.90 | | | | | | 2.28 | | | | | | (0.55 | ) | | | | | 60 | |
| | | 7.86 | | | | | | 3.15 | | | | | | 9,224 | | | | | | 1.90 | | | | | | 2.28 | | | | | | (0.55 | ) | | | | | 60 | |
| | | 8.85 | | | | | | 4.26 | | | | | | 264,902 | | | | | | 0.75 | | | | | | 1.13 | | | | | | 0.60 | | | | | | 60 | |
| | | 8.55 | | | | | | 3.76 | | | | | | 1 | | | | | | 1.25 | | | | | | 1.63 | | | | | | 0.11 | | | | | | 60 | |
| | | 8.84 | | | | | | 4.25 | | | | | | 10 | | | | | | 0.90 | | | | | | 1.28 | | | | | | 0.39 | | | | | | 60 | |
| | | 8.51 | | | | | | 3.65 | | | | | | 3 | | | | | | 1.40 | | | | | | 1.78 | | | | | | 0.01 | | | | | | 60 | |
| | | 8.22 | | | | | | (20.50 | ) | | | | | 141,371 | | | | | | 1.28 | | | | | | 1.62 | | | | | | 0.12 | | | | | | 62 | |
| | | 7.61 | | | | | | (21.14 | ) | | | | | 3,729 | | | | | | 2.03 | | | | | | 2.37 | | | | | | (0.63 | ) | | | | | 62 | |
| | | 7.62 | | | | | | (21.20 | ) | | | | | 8,447 | | | | | | 2.03 | | | | | | 2.37 | | | | | | (0.63 | ) | | | | | 62 | |
| | | 8.52 | | | | | | (20.22 | ) | | | | | 114,641 | | | | | | 0.88 | | | | | | 1.22 | | | | | | 0.52 | | | | | | 62 | |
| | | 8.24 | | | | | | (20.77 | ) | | | | | 1 | | | | | | 1.38 | | | | | | 1.72 | | | | | | 0.10 | | | | | | 62 | |
| | | 8.51 | | | | | | 20.37 | | | | | | 3 | | | | | | 1.03 | (d) | | | | | 1.37 | (d) | | | | | 0.32 | (d) | | | | | 62 | |
| | | 8.21 | | | | | | 20.20 | | | | | | 3 | | | | | | 1.53 | (d) | | | | | 1.87 | (d) | | | | | 0.05 | (d) | | | | | 62 | |
| | |
| The accompanying notes are an integral part of these financial statements. | | 105 |
GOLDMAN SACHS TECHNOLOGY TOLLKEEPER FUND
Financial Highlights
Selected Data for a Share Outstanding Throughout Each Period
| | | | | | | | | | | | | | | | | | | | | | |
| | | | | | | | Income (loss) from
investment operations | | | | |
| | | Year - Share Class | | Net asset value, beginning of period | | | Net investment loss(a) | | | Net realized and unrealized gain (loss) | | | Total from investment operations | | | Distributions to shareholders from net realized gains | |
| | FOR THE SIX MONTHS ENDED FEBRUARY 28, (UNAUDITED) | |
| | 2014 - A | | $ | 15.20 | | | $ | (0.08 | ) | | $ | 3.54 | | | $ | 3.46 | | | $ | (0.24 | ) |
| | 2014 - B | | | 13.68 | | | | (0.12 | ) | | | 3.16 | | | | 3.04 | | | | (0.24 | ) |
| | 2014 - C | | | 13.68 | | | | (0.13 | ) | | | 3.17 | | | | 3.04 | | | | (0.24 | ) |
| | 2014 - Institutional | | | 16.08 | | | | (0.05 | ) | | | 3.74 | | | | 3.69 | | | | (0.24 | ) |
| | 2014 - Service | | | 15.04 | | | | (0.08 | ) | | | 3.49 | | | | 3.41 | | | | (0.24 | ) |
| | 2014 - IR | | | 16.01 | | | | (0.06 | ) | | | 3.72 | | | | 3.66 | | | | (0.24 | ) |
| | FOR THE FISCAL YEARS ENDED AUGUST 31, | | | | | | | | | | | | | | | | | | | | |
| | 2013 - A | | | 13.62 | | | | (0.12 | ) | | | 1.70 | | | | 1.58 | | | | — | |
| | 2013 - B | | | 12.34 | | | | (0.20 | ) | | | 1.54 | | | | 1.34 | | | | — | |
| | 2013 - C | | | 12.34 | | | | (0.20 | ) | | | 1.54 | | | | 1.34 | | | | — | |
| | 2013 - Institutional | | | 14.34 | | | | (0.06 | ) | | | 1.80 | | | | 1.74 | | | | — | |
| | 2013 - Service | | | 13.49 | | | | (0.13 | ) | | | 1.68 | | | | 1.55 | | | | — | |
| | 2013 - IR | | | 14.30 | | | | (0.09 | ) | | | 1.80 | | | | 1.71 | | | | — | |
| | 2012 - A | | | 11.51 | | | | (0.13 | ) | | | 2.24 | | | | 2.11 | | | | — | |
| | 2012 - B | | | 10.52 | | | | (0.21 | ) | | | 2.03 | | | | 1.82 | | | | — | |
| | 2012 - C | | | 10.51 | | | | (0.21 | ) | | | 2.04 | | | | 1.83 | | | | — | |
| | 2012 - Institutional | | | 12.08 | | | | (0.09 | ) | | | 2.35 | | | | 2.26 | | | | — | |
| | 2012 - Service | | | 11.41 | | | | (0.14 | ) | | | 2.22 | | | | 2.08 | | | | — | |
| | 2012 - IR | | | 12.06 | | | | (0.11 | ) | | | 2.35 | | | | 2.24 | | | | — | |
| | 2011 - A | | | 10.43 | | | | (0.14 | ) | | | 1.22 | | | | 1.08 | | | | — | |
| | 2011 - B | | | 9.60 | | | | (0.21 | ) | | | 1.13 | | | | 0.92 | | | | — | |
| | 2011 - C | | | 9.59 | | | | (0.21 | ) | | | 1.13 | | | | 0.92 | | | | — | |
| | 2011 - Institutional | | | 10.90 | | | | (0.09 | ) | | | 1.27 | | | | 1.18 | | | | — | |
| | 2011 - Service | | | 10.34 | | | | (0.15 | ) | | | 1.22 | | | | 1.07 | | | | — | |
| | 2011 - IR (Commenced September 30, 2010) | | | 12.30 | | | | (0.07 | ) | | | (0.17 | ) | | | (0.24 | ) | | | — | |
| | 2010 - A | | | 9.14 | | | | (0.11 | ) | | | 1.40 | | | | 1.29 | | | | — | |
| | 2010 - B | | | 8.48 | | | | (0.17 | ) | | | 1.29 | | | | 1.12 | | | | — | |
| | 2010 - C | | | 8.47 | | | | (0.17 | ) | | | 1.29 | | | | 1.12 | | | | — | |
| | 2010 - Institutional | | | 9.52 | | | | (0.07 | ) | | | 1.45 | | | | 1.38 | | | | — | |
| | 2010 - Service | | | 9.08 | | | | (0.12 | ) | | | 1.38 | | | | 1.26 | | | | — | |
| | 2009 - A | | | 10.19 | | | | (0.06 | ) | | | (0.99 | ) | | | (1.05 | ) | | | — | |
| | 2009 - B | | | 9.52 | | | | (0.10 | ) | | | (0.94 | ) | | | (1.04 | ) | | | — | |
| | 2009 - C | | | 9.52 | | | | (0.11 | ) | | | (0.94 | ) | | | (1.05 | ) | | | — | |
| | 2009 - Institutional | | | 10.56 | | | | (0.03 | ) | | | (1.01 | ) | | | (1.04 | ) | | | — | |
| | 2009 - Service | | | 10.12 | | | | (0.07 | ) | | | (0.97 | ) | | | (1.04 | ) | | | — | |
| | (a) | | Calculated based on the average shares outstanding methodology. |
| | (b) | | Assumes investment at the net asset value at the beginning of the period, reinvestment of all dividends and distributions, a complete redemption of the investment at the net asset value at the end of the period and no sales or redemption charges. Total returns would be reduced if a sales or redemption charge was taken into account. Returns do not reflect the deduction of taxes that a shareholder would pay on Fund distributions or the redemption of Fund shares. Total returns for periods less than one full year are not annualized. |
| | (c) | | The Fund’s portfolio turnover rate is calculated in accordance with regulatory requirements, without regard to transactions involving short term investments and certain derivatives. If such transactions were included, the Fund’s portfolio turnover rate may be higher. |
| | |
| 106 | | The accompanying notes are an integral part of these financial statements. |
GOLDMAN SACHS TECHNOLOGY TOLLKEEPER FUND
| | | | | | | | | | | | | | | | | | | | | | | | | | | | | | | | | | | | | | | | |
| | | | | | | | | | | | | | | | | | | | | | | | | | | | | | | | | | |
| | | Net asset value, end of period | | | | | Total return(b) | | | | | Net assets, end of period (in 000s) | | | | | Ratio of net expenses to average net assets | | | | | Ratio of total expenses
to average net assets | | | | | Ratio of net investment
loss to average net assets | | | | | Portfolio
turnover rate(c) | |
| | | | | | | | | | | | | | | | | | | | | | | | | | | | | | | | | | | | | | | | |
| | $ | 18.42 | | | | | | 22.81 | % | | | | $ | 270,770 | | | | | | 1.51 | %(d) | | | | | 1.54 | %(d) | | | | | (0.91 | )%(d) | | | | | 24 | % |
| | | 16.48 | | | | | | 22.34 | | | | | | 5,490 | | | | | | 2.26 | (d) | | | | | 2.29 | (d) | | | | | (1.66 | )(d) | | | | | 24 | |
| | | 16.48 | | | | | | 22.34 | | | | | | 59,397 | | | | | | 2.26 | (d) | | | | | 2.29 | (d) | | | | | (1.66 | )(d) | | | | | 24 | |
| | | 19.53 | | | | | | 23.06 | | | | | | 95,487 | | | | | | 1.12 | (d) | | | | | 1.14 | (d) | | | | | (0.51 | )(d) | | | | | 24 | |
| | | 18.21 | | | | | | 22.79 | | | | | | 11,367 | | | | | | 1.61 | (d) | | | | | 1.64 | (d) | | | | | (1.01 | )(d) | | | | | 24 | |
| | | 19.43 | | | | | | 22.91 | | | | | | 4,479 | | | | | | 1.27 | (d) | | | | | 1.29 | (d) | | | | | (0.64 | )(d) | | | | | 24 | |
| | | | | | | | | | | | | | | | | | | | | | | | | | | | | | | | | | | | | | | | |
| | | 15.20 | | | | | | 11.60 | | | | | | 228,424 | | | | | | 1.50 | | | | | | 1.55 | | | | | | (0.85 | ) | | | | | 33 | |
| | | 13.68 | | | | | | 10.86 | | | | | | 5,854 | | | | | | 2.25 | | | | | | 2.30 | | | | | | (1.61 | ) | | | | | 33 | |
| | | 13.68 | | | | | | 10.86 | | | | | | 50,278 | | | | | | 2.25 | | | | | | 2.30 | | | | | | (1.59 | ) | | | | | 33 | |
| | | 16.08 | | | | | | 12.13 | | | | | | 70,416 | | | | | | 1.10 | | | | | | 1.15 | | | | | | (0.43 | ) | | | | | 33 | |
| | | 15.04 | | | | | | 11.49 | | | | | | 10,167 | | | | | | 1.60 | | | | | | 1.65 | | | | | | (0.95 | ) | | | | | 33 | |
| | | | 16.01 | | | | | | 11.96 | | | | | | 2,651 | | | | | | 1.25 | | | | | | 1.30 | | | | | | (0.59 | ) | | | | | 33 | |
| | | 13.62 | | | | | | 18.28 | | | | | | 239,355 | | | | | | 1.50 | | | | | | 1.55 | | | | | | (1.06 | ) | | | | | 43 | |
| | | 12.34 | | | | | | 17.25 | | | | | | 8,034 | | | | | | 2.25 | | | | | | 2.30 | | | | | | (1.82 | ) | | | | | 43 | |
| | | 12.34 | | | | | | 17.36 | | | | | | 50,682 | | | | | | 2.25 | | | | | | 2.30 | | | | | | (1.81 | ) | | | | | 43 | |
| | | 14.34 | | | | | | 18.65 | | | | | | 49,238 | | | | | | 1.10 | | | | | | 1.15 | | | | | | (0.66 | ) | | | | | 43 | |
| | | 13.49 | | | | | | 18.18 | | | | | | 10,977 | | | | | | 1.60 | | | | | | 1.65 | | | | | | (1.15 | ) | | | | | 43 | |
| | | | 14.30 | | | | | | 18.52 | | | | | | 2,569 | | | | | | 1.25 | | | | | | 1.30 | | | | | | (0.81 | ) | | | | | 43 | |
| | | 11.51 | | | | | | 10.35 | | | | | | 244,288 | | | | | | 1.50 | | | | | | 1.52 | | | | | | (1.07 | ) | | | | | 64 | |
| | | 10.52 | | | | | | 9.58 | | | | | | 10,408 | | | | | | 2.25 | | | | | | 2.27 | | | | | | (1.82 | ) | | | | | 64 | |
| | | 10.51 | | | | | | 9.59 | | | | | | 50,424 | | | | | | 2.25 | | | | | | 2.27 | | | | | | (1.82 | ) | | | | | 64 | |
| | | 12.08 | | | | | | 10.83 | | | | | | 54,356 | | | | | | 1.10 | | | | | | 1.12 | | | | | | (0.66 | ) | | | | | 64 | |
| | | 11.41 | | | | | | 10.35 | | | | | | 10,826 | | | | | | 1.60 | | | | | | 1.62 | | | | | | (1.18 | ) | | | | | 64 | |
| | | | 12.06 | | | | | | (1.95) | | | | | | 2,449 | | | | | | 1.25 | (d) | | | | | 1.27 | (d) | | | | | (0.59 | )(d) | | | | | 64 | |
| | | 10.43 | | | | | | 14.11 | | | | | | 225,873 | | | | | | 1.50 | | | | | | 1.63 | | | | | | (1.03 | ) | | | | | 97 | |
| | | 9.60 | | | | | | 13.21 | | | | | | 13,547 | | | | | | 2.25 | | | | | | 2.38 | | | | | | (1.78 | ) | | | | | 97 | |
| | | 9.59 | | | | | | 13.22 | | | | | | 47,001 | | | | | | 2.25 | | | | | | 2.38 | | | | | | (1.78 | ) | | | | | 97 | |
| | | 10.90 | | | | | | 14.50 | | | | | | 32,538 | | | | | | 1.10 | | | | | | 1.23 | | | | | | (0.63 | ) | | | | | 97 | |
| | | | 10.34 | | | | | | 13.88 | | | | | | 11,324 | | | | | | 1.60 | | | | | | 1.73 | | | | | | (1.12 | ) | | | | | 97 | |
| | | 9.14 | | | | | | (10.22) | | | | | | 196,405 | | | | | | 1.50 | | | | | | 1.67 | | | | | | (0.76 | ) | | | | | 52 | |
| | | 8.48 | | | | | | (10.92) | | | | | | 17,643 | | | | | | 2.25 | | | | | | 2.42 | | | | | | (1.49 | ) | | | | | 52 | |
| | | 8.47 | | | | | | (10.94) | | | | | | 44,420 | | | | | | 2.25 | | | | | | 2.42 | | | | | | (1.51 | ) | | | | | 52 | |
| | | 9.52 | | | | | | (9.85) | | | | | | 21,790 | | | | | | 1.10 | | | | | | 1.27 | | | | | | (0.37 | ) | | | | | 52 | |
| | | | 9.08 | | | | | | (10.28) | | | | | | 6,111 | | | | | | 1.60 | | | | | | 1.77 | | | | | | (0.88 | ) | | | | | 52 | |
| | |
| The accompanying notes are an integral part of these financial statements. | | 107 |
GOLDMAN SACHS U.S. EQUITY FUND
Financial Highlights
Selected Data for a Share Outstanding Throughout Each Period
| | | | | | | | | | | | | | | | | | | | | | | | | | | | | | |
| | | | | | | | Income (loss) from
investment operations | | | Distributions
to shareholders | |
| | | Year - Share Class | | Net asset
value,
beginning
of period | | | Net
investment
income (loss)(a) | | | Net realized
and unrealized
gain (loss) | | | Total from
investment
operations | | | From net
investment
income | | | From net
realized
gains | | | Total
distributions | |
| | FOR THE SIX MONTHS ENDED FEBRUARY 28, (UNAUDITED) | |
| | 2014 - A | | $ | 14.79 | | | $ | 0.03 | | | $ | 2.17 | | | $ | 2.20 | | | $ | (0.06 | ) | | $ | (1.37 | ) | | $ | (1.43 | ) |
| | 2014 - C | | | 14.58 | | | | (0.02 | ) | | | 2.12 | | | | 2.10 | | | | — | | | | (1.37 | ) | | | (1.37 | ) |
| | 2014 - Institutional | | | 14.85 | | | | 0.06 | | | | 2.17 | | | | 2.23 | | | | (0.10 | ) | | | (1.37 | ) | | | (1.47 | ) |
| | 2014 - IR | | | 14.83 | | | | 0.05 | | | | 2.17 | | | | 2.22 | | | | (0.08 | ) | | | (1.37 | ) | | | (1.45 | ) |
| | 2014 - R | | | 14.78 | | | | 0.01 | | | | 2.16 | | | | 2.17 | | | | (0.04 | ) | | | (1.37 | ) | | | (1.41 | ) |
| | | | | | | | | | | | | | | | | | | | | | | | | | | | | | |
| FOR THE FISCAL YEARS ENDED AUGUST 31, | |
| | 2013 - A | | | 12.30 | | | | 0.09 | | | | 2.48 | | | | 2.57 | | | | (0.08 | ) | | | — | | | | (0.08 | ) |
| | 2013 - C | | | 12.13 | | | | (0.01 | ) | | | 2.46 | | | | 2.45 | | | | — | | | | — | | | | — | |
| | 2013 - Institutional | | | 12.35 | | | | 0.14 | | | | 2.50 | | | | 2.64 | | | | (0.14 | ) | | | — | | | | (0.14 | ) |
| | 2013 - IR | | | 12.34 | | | | 0.12 | | | | 2.50 | | | | 2.62 | | | | (0.13 | ) | | | — | | | | (0.13 | ) |
| | 2013 - R | | | 12.29 | | | | 0.04 | | | | 2.51 | | | | 2.55 | | | | (0.06 | ) | | | — | | | | (0.06 | ) |
| | 2012 - A | | | 10.71 | | | | 0.08 | | | | 1.66 | | | | 1.74 | | | | (0.04 | ) | | | (0.11 | ) | | | (0.15 | ) |
| | 2012 - C | | | 10.61 | | | | (0.01 | ) | | | 1.64 | | | | 1.63 | | | | — | | | | (0.11 | ) | | | (0.11 | ) |
| | 2012 - Institutional | | | 10.76 | | | | 0.13 | | | | 1.65 | | | | 1.78 | | | | (0.08 | ) | | | (0.11 | ) | | | (0.19 | ) |
| | 2012 - IR | | | 10.73 | | | | 0.11 | | | | 1.65 | | | | 1.76 | | | | (0.04 | ) | | | (0.11 | ) | | | (0.15 | ) |
| | 2012 - R | | | 10.70 | | | | 0.05 | | | | 1.65 | | | | 1.70 | | | | — | (e) | | | (0.11 | ) | | | (0.11 | ) |
| | 2011 - A | | | 9.55 | | | | 0.03 | | | | 1.21 | | | | 1.24 | | | | (0.05 | ) | | | (0.03 | ) | | | (0.08 | ) |
| | 2011 - C | | | 9.49 | | | | (0.05 | ) | | | 1.21 | | | | 1.16 | | | | (0.01 | ) | | | (0.03 | ) | | | (0.04 | ) |
| | 2011 - Institutional | | | 9.57 | | | | 0.08 | | | | 1.22 | | | | 1.30 | | | | (0.08 | ) | | | (0.03 | ) | | | (0.11 | ) |
| | 2011 - IR | | | 9.56 | | | | 0.06 | | | | 1.22 | | | | 1.28 | | | | (0.08 | ) | | | (0.03 | ) | | | (0.11 | ) |
| | 2011 - R | | | 9.53 | | | | 0.01 | | | | 1.20 | | | | 1.21 | | | | (0.01 | ) | | | (0.03 | ) | | | (0.04 | ) |
| | | | | | | | | | | | | | | | | | | | | | | | | | | | | | |
| | FOR THE PERIOD ENDED AUGUST 31, | |
| | 2010 - A (Commenced November 30, 2009) | | | 10.00 | | | | 0.03 | | | | (0.47 | ) | | | (0.44 | ) | | | (0.01 | ) | | | — | | | | (0.01 | ) |
| | 2010 - C (Commenced November 30, 2009) | | | 10.00 | | | | (0.02 | ) | | | (0.49 | ) | | | (0.51 | ) | | | — | (e) | | | — | | | | — | (e) |
| | 2010 - Institutional (Commenced November 30, 2009) | | | 10.00 | | | | 0.06 | | | | (0.48 | ) | | | (0.42 | ) | | | (0.01 | ) | | | — | | | | (0.01 | ) |
| | 2010 - IR (Commenced November 30, 2009) | | | 10.00 | | | | 0.05 | | | | (0.48 | ) | | | (0.43 | ) | | | (0.01 | ) | | | — | | | | (0.01 | ) |
| | 2010 - R (Commenced November 30, 2009) | | | 10.00 | | | | 0.01 | | | | (0.47 | ) | | | (0.46 | ) | | | (0.01 | ) | | | — | | | | (0.01 | ) |
| | (a) | | Calculated based on the average shares outstanding methodology. |
| | (b) | | Assumes investment at the net asset value at the beginning of the period, reinvestment of all dividends and distributions, a complete redemption of the investment at the net asset value at the end of the period and no sales or redemption charges. Total returns would be reduced if a sales or redemption charge was taken into account. Returns do not reflect the deduction of taxes that a shareholder would pay on Fund distributions or the redemption of Fund shares. Total returns for periods less than one full year are not annualized. |
| | (c) | | The Fund’s portfolio turnover rate is calculated in accordance with regulatory requirements, without regard to transactions involving short term investments and certain derivatives. If such transactions were included, the Fund’s portfolio turnover rate may be higher. |
| | (e) | | Amount is less than $0.005 per share. |
| | |
| 108 | | The accompanying notes are an integral part of these financial statements. |
GOLDMAN SACHS U.S. EQUITY FUND
| | | | | | | | | | | | | | | | | | | | | | | | | | | | | | | | | | | | | | | | |
| | | | | | | | | | | | | | | | | | | | | | | | | | | | | | | | | | |
| | | Net asset
value, end
of period | | | | | Total
return(b) | | | | | Net assets,
end of
period
(in 000s) | | | | | Ratio of
net expenses
to average
net assets | | | | | Ratio of
total expenses
to average
net assets | | | | | Ratio of
net investment
income (loss)
to average
net assets | | | | | Portfolio
turnover
rate(c) | |
| | | | | | | | | | | | | | | | | | | | | | | | | | | | | | | | | | | | | | | | |
| | $ | 15.56 | | | | | | 15.27 | % | | | | $ | 4,580 | | | | | | 1.20 | %(d) | | | | | 3.03 | %(d) | | | | | 0.42 | %(d) | | | | | 35 | % |
| | | 15.31 | | | | | | 14.79 | | | | | | 238 | | | | | | 1.95 | (d) | | | | | 3.76 | (d) | | | | | (0.32 | )(d) | | | | | 35 | |
| | | 15.61 | | | | | | 15.48 | | | | | | 9,525 | | | | | | 0.80 | (d) | | | | | 2.66 | (d) | | | | | 0.78 | (d) | | | | | 35 | |
| | | 15.60 | | | | | | 15.42 | | | | | | 201 | | | | | | 0.95 | (d) | | | | | 2.81 | (d) | | | | | 0.63 | (d) | | | | | 35 | |
| | | 15.54 | | | | | | 15.06 | | | | | | 94 | | | | | | 1.45 | (d) | | | | | 3.30 | (d) | | | | | 0.13 | (d) | | | | | 35 | |
| | | | | | | | | | | | | | | | | | | | | | | | | | | | | | | | | | | | | | | | |
| | | | | | | | | | | | | | | | | | | | | | | | | | | | | | | | | | | | | | | | |
| | | 14.79 | | | | | | 21.05 | | | | | | 2,869 | | | | | | 1.18 | | | | | | 3.66 | | | | | | 0.68 | | | | | | 61 | |
| | | 14.58 | | | | | | 20.20 | | | | | | 126 | | | | | | 1.93 | | | | | | 4.41 | | | | | | (0.09 | ) | | | | | 61 | |
| | | 14.85 | | | | | | 21.56 | | | | | | 8,646 | | | | | | 0.78 | | | | | | 3.24 | | | | | | 1.06 | | | | | | 61 | |
| | | 14.83 | | | | | | 21.39 | | | | | | 174 | | | | | | 0.93 | | | | | | 3.39 | | | | | | 0.90 | | | | | | 61 | |
| | | 14.78 | | | | | | 20.83 | | | | | | 51 | | | | | | 1.43 | | | | | | 3.80 | | | | | | 0.29 | | | | | | 61 | |
| | | 12.30 | | | | | | 16.37 | | | | | | 3,331 | | | | | | 1.18 | | | | | | 3.63 | | | | | | 0.69 | | | | | | 76 | |
| | | 12.13 | | | | | | 15.45 | | | | | | 158 | | | | | | 1.93 | | | | | | 4.38 | | | | | | (0.05 | ) | | | | | 76 | |
| | | 12.35 | | | | | | 16.71 | | | | | | 7,142 | | | | | | 0.78 | | | | | | 3.23 | | | | | | 1.11 | | | | | | 76 | |
| | | 12.34 | | | | | | 16.52 | | | | | | 70 | | | | | | 0.93 | | | | | | 3.38 | | | | | | 0.97 | | | | | | 76 | |
| | | 12.29 | | | | | | 16.02 | | | | | | 12 | | | | | | 1.43 | | | | | | 3.88 | | | | | | 0.45 | | | | | | 76 | |
| | | 10.71 | | | | | | 12.94 | | | | | | 3,110 | | | | | | 1.18 | | | | | | 4.88 | | | | | | 0.29 | | | | | | 51 | |
| | | 10.61 | | | | | | 12.19 | | | | | | 139 | | | | | | 1.93 | | | | | | 5.63 | | | | | | (0.42 | ) | | | | | 51 | |
| | | 10.76 | | | | | | 13.54 | | | | | | 5,945 | | | | | | 0.78 | | | | | | 4.48 | | | | | | 0.72 | | | | | | 51 | |
| | | 10.73 | | | | | | 13.32 | | | | | | 241 | | | | | | 0.93 | | | | | | 4.63 | | | | | | 0.56 | | | | | | 51 | |
| | | 10.70 | | | | | | 12.70 | | | | | | 11 | | | | | | 1.43 | | | | | | 5.13 | | | | | | 0.08 | | | | | | 51 | |
| | | | | | | | | | | | | | | | | | | | | | | | | | | | | | | | | | | | | | | | |
| | | | | | | | | | | | | | | | | | | | | | | | | | | | | | | | | | | | | | | | |
| | | 9.55 | | | | | | (4.44 | ) | | | | | 777 | | | | | | 1.18 | (d) | | | | | 11.67 | (d) | | | | | 0.37 | (d) | | | | | 63 | |
| | | 9.49 | | | | | | (5.10 | ) | | | | | 14 | | | | | | 1.93 | (d) | | | | | 12.42 | (d) | | | | | (0.29 | )(d) | | | | | 63 | |
| | | 9.57 | | | | | | (4.20 | ) | | | | | 4,351 | | | | | | 0.78 | (d) | | | | | 11.27 | (d) | | | | | 0.74 | (d) | | | | | 63 | |
| | | 9.56 | | | | | | (4.31 | ) | | | | | 20 | | | | | | 0.93 | (d) | | | | | 11.42 | (d) | | | | | 0.62 | (d) | | | | | 63 | |
| | | 9.53 | | | | | | (4.65 | ) | | | | | 10 | | | | | | 1.43 | (d) | | | | | 11.92 | (d) | | | | | 0.10 | (d) | | | | | 63 | |
| | |
| The accompanying notes are an integral part of these financial statements. | | 109 |
GOLDMAN SACHS FUNDAMENTAL EQUITY GROWTH FUNDS
Notes to Financial Statements
February 28, 2014
Goldman Sachs Trust (the “Trust”) is a Delaware statutory trust registered under the Investment Company Act of 1940, as amended (the “Act”), as an open-end management investment company. The following table lists those series of the Trust that are included in this report (collectively, the “Funds” or individually a “Fund”), along with their corresponding share classes and respective diversification status under the Act:
| | | | |
| Fund | | Share Classes Offered* | | Diversified/ Non-diversified |
Capital Growth,
Growth Opportunities, Small/Mid Cap Growth and Strategic Growth | | A, B, C, Institutional, Service, IR and R | | Diversified |
| Concentrated Growth | | A, B, C, Institutional, IR and R | | Non-diversified |
| Flexible Cap Growth and U.S. Equity | | A, C, Institutional, IR and R | | Diversified |
| Focused Growth | | A, C, Institutional, IR and R | | Non-diversified |
Technology Tollkeeper | | A, B, C, Institutional, Service and IR | | Diversified |
| * | | Class B Shares are generally no longer available for purchase by current or prospective investors. |
Class A Shares are sold with a front-end sales charge of up to 5.50%. Class B Shares were sold with a contingent deferred sales charge (“CDSC”) that declines from 5.00% to zero, depending upon the period of time the shares are held. Class C Shares are sold with a CDSC of 1.00%, which is imposed on redemptions made within 12 months of purchase. Institutional, Service, Class IR and Class R Shares are not subject to a sales charge.
Goldman Sachs Asset Management, L.P. (“GSAM”), an affiliate of Goldman, Sachs & Co. (“Goldman Sachs”), serves as investment adviser to the Funds pursuant to a management agreement (the “Agreement”) with the Trust.
110
GOLDMAN SACHS FUNDAMENTAL EQUITY GROWTH FUNDS
|
| 2. SIGNIFICANT ACCOUNTING POLICIES |
The financial statements have been prepared in accordance with accounting principles generally accepted in the United States of America (“GAAP”) and require management to make estimates and assumptions that may affect the reported amounts and disclosures. Actual results may differ from those estimates and assumptions.
A. Investment Valuation — The Funds’ valuation policy is to value investments at fair value.
B. Investment Income and Investments — Investment income includes interest income and dividend income, net of any foreign withholding taxes, less any amounts reclaimable. Interest income is accrued daily and adjusted for amortization of premiums and accretion of discounts. Dividend income is recognized on ex-dividend date or, for certain foreign securities, as soon as such information is obtained subsequent to the ex-dividend date. Investment transactions are reflected on trade date. Realized gains and losses are calculated using identified cost. Investment transactions are recorded on the following business day for daily net asset value (“NAV”) calculations. Any foreign capital gains tax is accrued daily based upon net unrealized gains, and is payable upon sale of such investments.
C. Class Allocations and Expenses — Investment income, realized and unrealized gain (loss), and non-class specific expenses of each Fund are allocated daily based upon the proportion of net assets of each class. Class specific expenses, where applicable, are borne by the respective share classes and include Distribution and Service, Transfer Agent and Service and Shareholder Administration fees. Non-class specific expenses directly incurred by a Fund are charged to that Fund, while such expenses incurred by the Trust are allocated across the respective Funds on a straight-line and/or pro-rata basis depending upon the nature of the expenses.
D. Federal Taxes and Distributions to Shareholders — It is each Fund’s policy to comply with the requirements of the Internal Revenue Code of 1986, as amended (the “Code”), applicable to regulated investment companies (mutual funds) and to distribute each year substantially all of its investment company taxable income and capital gains to its shareholders. Accordingly, the Funds are not required to make any provisions for the payment of federal income tax.
Distributions to shareholders are recorded on the ex-dividend date. Income and capital gains distributions, if any, are declared and paid annually. Net capital losses are carried forward to future fiscal years and may be used to the extent allowed by the Code to offset any future capital gains. Losses that are carried forward will retain their character as either short-term or long-term capital losses. Utilization of capital loss carryforwards will reduce the requirement of future capital gains distributions.
The characterization of distributions to shareholders for financial reporting purposes is determined in accordance with federal income tax rules, which may differ from GAAP. The source of each Fund’s distributions may be shown in the accompanying financial statements as either from net investment income, net realized gain or capital. Certain components of the Funds’ net assets on the Statements of Assets and Liabilities reflect permanent GAAP/tax differences based on the appropriate tax character.
E. Commission Recapture — GSAM, on behalf of certain Funds, may direct portfolio trades, subject to seeking best execution, to various brokers who have agreed to rebate a portion of the commissions generated. Such rebates are made directly to a Fund as cash payments and are included in net realized gain (loss) from investments on the Statements of Operations.
111
GOLDMAN SACHS FUNDAMENTAL EQUITY GROWTH FUNDS
Notes to Financial Statements (continued)
February 28, 2014
|
| 3. INVESTMENTS AND FAIR VALUE MEASUREMENTS |
The fair value of a financial instrument is the amount that would be received to sell an asset or paid to transfer a liability in an orderly transaction between market participants at the measurement date (i.e., the exit price). GAAP establishes a fair value hierarchy that prioritizes the inputs to valuation techniques used to measure fair value. The hierarchy gives the highest priority to unadjusted quoted prices in active markets for identical assets or liabilities (Level 1 measurements) and the lowest priority to unobservable inputs (Level 3 measurements). The levels used for classifying investments are not necessarily an indication of the risk associated with investing in these investments. The three levels of the fair value hierarchy are described below:
Level 1 — Unadjusted quoted prices in active markets that are accessible at the measurement date for identical, unrestricted assets or liabilities;
Level 2 — Quoted prices in markets that are not active or financial instruments for which significant inputs are observable (including, but not limited to, quoted prices for similar investments, interest rates, foreign exchange rates, volatility and credit spreads), either directly or indirectly;
Level 3 — Prices or valuations that require significant unobservable inputs (including GSAM) assumptions in determining fair value measurement).
The Trustees have adopted Valuation Procedures that govern the valuation of the portfolio investments held by the Funds, including investments for which market quotations are not readily available. The Trustees have delegated to GSAM day-to-day responsibility for implementing and maintaining internal controls and procedures related to the valuation of the Funds’ portfolio investments. To assess the continuing appropriateness of pricing sources and methodologies, GSAM regularly performs price verification procedures and issues challenges as necessary to third party pricing vendors or brokers, and any differences are reviewed in accordance with the Valuation Procedures.
A. Level 1 and Level 2 Fair Value Investments — The valuation techniques and significant inputs used in determining the fair values for investments classified as Level 1 and Level 2 are as follows:
Equity Securities — Equity securities and investment companies traded on a United States (“U.S.”) securities exchange or the NASDAQ system, or those located on certain foreign exchanges, including but not limited to the Americas, are valued daily at their last sale price or official closing price on the principal exchange or system on which they are traded. If no sale occurs, equity securities and exchange traded investment companies are valued at the last bid price for long positions and at the last ask price for short positions. Investments in investment companies (other than those that are exchange traded) are valued at the NAV on the valuation date. To the extent these investments are actively traded, they are classified as Level 1 of the fair value hierarchy.
Unlisted equity securities for which market quotations are available are valued at the last sale price on the valuation date, or if no sale occurs, at the last bid price. Securities traded on certain foreign securities exchanges are valued daily at fair value determined by an independent fair value service (if available) under Valuation Procedures approved by the Trustees and consistent with applicable regulatory guidance. The independent fair value service takes into account multiple factors including, but not limited to, movements in the securities markets, certain depositary receipts, futures contracts and foreign currency exchange rates that have occurred subsequent to the close of the foreign securities exchange. These investments are generally classified as Level 2 of the fair value hierarchy.
112
GOLDMAN SACHS FUNDAMENTAL EQUITY GROWTH FUNDS
|
| 3. INVESTMENTS AND FAIR VALUE MEASUREMENTS (continued) |
Debt Securities — Debt securities for which market quotations are readily available are valued daily on the basis of quotations supplied by dealers or an independent pricing service approved by the Trustees. The pricing services may use valuation models or matrix pricing, which consider: (i) yield or price with respect to bonds that are considered comparable in characteristics such as rating, interest rate and maturity date or (ii) quotations from securities dealers to determine current value. Short-term debt obligations that mature in sixty days or less and that do not exhibit signs of credit deterioration are valued at amortized cost, which approximates fair value. With the exception of treasury securities of G8 countries (not held in money market funds), which are generally classified as Level 1, these investments are generally classified as Level 2 of the fair value hierarchy.
Short Term Investments — Short-term investments having a maturity of 60 days or less are generally valued at amortized cost which approximates fair market value. These investments are classified as Level 2 of the fair value hierarchy.
Repurchase Agreements — Repurchase agreements involve the purchase of securities subject to the seller’s agreement to repurchase the securities at a mutually agreed upon date and price, under the terms of a Master Repurchase Agreement (“MRA”). During the term of a repurchase agreement, the value of the underlying securities held as collateral on behalf of a Fund, including accrued interest is required to exceed the value of the repurchase agreement, including accrued interest. The underlying securities for all repurchase agreements are held at the Funds’ custodian or designated sub-custodians under tri-party repurchase agreements.
In December 2011, the Financial Accounting Standards Board (“FASB”) issued an Accounting Standards Update (“ASU”) No. 2011-11: Disclosures about Offsetting Assets and Liabilities (“netting”) on the Statements of Assets and Liabilities that are subject to master netting arrangements or similar agreements. ASU 2011-11 was amended by ASU No. 2013-01, clarifying which investments and transactions are subject to the netting disclosure. The scope of the disclosure requirements is limited to derivative instruments, repurchase agreements and reverse repurchase agreements, and securities borrowing and securities lending transactions. This information is intended to enable users of the Funds’ financial statements to evaluate the effect or potential effect of netting arrangements on the Funds’ financial position.
For financial reporting purposes, the Funds do not offset financial assets and financial liabilities that are subject to master netting arrangements or similar agreements on the Statements of Assets and Liabilities.
A MRA governs transactions between a Fund and select counterparties. A MRA contains provisions for, among other things, initiation, income payments, events of default and maintenance of securities for repurchase agreements. A MRA also permits offsetting with collateral to create one single net payment in the event of default or similar events, including the bankruptcy or insolvency of a counterparty.
If the seller defaults, a Fund could suffer a loss to the extent that the proceeds from the sale of the underlying securities and other collateral held by the Fund are less than the repurchase price and the Fund’s costs associated with delay and enforcement of the repurchase agreement. In addition, in the event of default or insolvency of the seller, a court could determine that a Fund’s interest in the collateral is not enforceable, resulting in additional losses to the Fund.
113
GOLDMAN SACHS FUNDAMENTAL EQUITY GROWTH FUNDS
Notes to Financial Statements (continued)
February 28, 2014
|
| 3. INVESTMENTS AND FAIR VALUE MEASUREMENTS (continued) |
At February 28, 2014, the Funds’ investment in a repurchase agreement was subject to enforceable MRAs. The repurchase agreement on a net basis was as follows:
| | | | | | | | | | | | | | | | | | | | | | | | | | | | | | | | | | | | |
| Repurchase Agreements | | Capital
Growth | | | Concentrated
Growth | | | Flexible
Cap
Growth | | | Focused Growth | | | Growth
Opportunities | | | Small/Mid
Cap
Growth | | | Strategic Growth | | | Technology
Tollkeeper | | | U.S. Equity | |
Total gross amount
presented in Statements
of Assets and Liabilities | | $ | 600,000 | | | $ | 1,300,000 | | | $ | 200,000 | | | $ | 400,000 | | | $ | 109,600,000 | | | $ | 32,900,000 | | | $ | 5,200,000 | | | $ | 13,600,000 | | | $ | 300,000 | |
Non-cash Collateral
offsetting(1) | | | (600,000 | ) | | | (1,300,000 | ) | | | (200,000 | ) | | | (400,000 | ) | | | (109,600,000 | ) | | | (32,900,000 | ) | | | (5,200,000 | ) | | | (13,600,000 | ) | | | (300,000 | ) |
Net Amount(2) | | $ | — | | | $ | — | | | $ | — | | | $ | — | | | $ | — | | | $ | — | | | $ | — | | | $ | — | | | $ | — | |
| (1) | | At February 28, 2014, the value of the collateral received from each seller exceeded the value of the related repurchase agreements. |
| (2) | | Net amount represents the net amount due from the counterparty in the event of a default based on the contractual set-off rights under the agreement. |
Pursuant to exemptive relief granted by the Securities and Exchange Commission (“SEC”) and terms and conditions contained therein, the Funds, together with other funds of the Trust and registered investment companies having management agreements with GSAM or its affiliates, may transfer uninvested cash into joint accounts, the daily aggregate balance of which is invested in one or more repurchase agreements. Under these joint accounts, the Funds maintain pro-rata credit exposure to the underlying repurchase agreements’ counterparties. With the exception of certain transaction fees, the Funds are not subject to any expenses in relation to these investments.
B. Level 3 Fair Value Investments — To the extent that the aforementioned significant inputs are unobservable, or if quotations are not readily available, or if GSAM believes that such quotations do not accurately reflect fair value, the fair value of the Funds’ investments may be determined under Valuation Procedures approved by the Trustees. GSAM, consistent with its procedures and applicable regulatory guidance, may make an adjustment to the most recent valuation prices of either domestic or foreign securities in light of significant events to reflect what it believes to be the fair value of the securities at the time of determining a Fund’s NAV. Significant events which could affect a large number of securities in a particular market may include, but are not limited to: significant fluctuations in U.S. or foreign markets; market dislocations; market disruptions; or unscheduled market closings. Significant events which could also affect a single issuer may include, but are not limited to: corporate actions such as reorganizations, mergers and buy-outs; ratings downgrades; and bankruptcies.
114
GOLDMAN SACHS FUNDAMENTAL EQUITY GROWTH FUNDS
|
| 3. INVESTMENTS AND FAIR VALUE MEASUREMENTS (continued) |
C. Fair Value Hierarchy — The following is a summary of the Funds’ investments and derivatives classified in the fair value hierarchy as of February 28, 2014:
| | | | | | | | | | | | |
| | | |
| CAPITAL GROWTH | | | | | | | | | | | | |
| | | |
| Investment Type | | Level 1 | | | Level 2 | | | Level 3 | |
| Assets | | | | | | | | | | | | |
Common Stock and/or Other Equity Investments | | $ | 937,849,721 | | | $ | — | | | $ | — | |
Short-term Investments | | | — | | | | 600,000 | | | | — | |
| Total | | $ | 937,849,721 | | | $ | 600,000 | | | $ | — | |
| | | | | | | | | | | | |
| | | |
| CONCENTRATED GROWTH | | | | | | | | | | | | |
| | | |
| Investment Type | | Level 1 | | | Level 2 | | | Level 3 | |
| Assets | | | | | | | | | | | | |
Common Stock and/or Other Equity Investments | | $ | 175,973,166 | | | $ | — | | | $ | — | |
Short-term Investments | | | — | | | | 1,300,000 | | | | — | |
| Total | | $ | 175,973,166 | | | $ | 1,300,000 | | | $ | — | |
| | | |
| FLEXIBLE CAP GROWTH | | | | | | | | | | | | |
| | | |
| Investment Type | | Level 1 | | | Level 2 | | | Level 3 | |
| Assets | | | | | | | | | | | | |
Common Stock and/or Other Equity Investments | | $ | 14,735,182 | | | $ | — | | | $ | — | |
Short-term Investments | | | — | | | | 200,000 | | | | — | |
| Total | | $ | 14,735,182 | | | $ | 200,000 | | | $ | — | |
| | | |
| FOCUSED GROWTH | | | | | | | | | | | | |
| | | |
| Investment Type | | Level 1 | | | Level 2 | | | Level 3 | |
| Assets | | | | | | | | | | | | |
Common Stock and/or Other Equity Investments | | $ | 19,105,112 | | | $ | — | | | $ | — | |
Short-term Investments | | | — | | | | 400,000 | | | | — | |
| Total | | $ | 19,105,112 | | | $ | 400,000 | | | $ | — | |
| | | |
| GROWTH OPPORTUNITIES | | | | | | | | | | | | |
| | | |
| Investment Type | | Level 1 | | | Level 2 | | | Level 3 | |
| Assets | | | | | | | | | | | | |
Common Stock and/or Other Equity Investments | | $ | 5,347,573,122 | | | $ | — | | | $ | — | |
Short-term Investments | | | — | | | | 109,600,000 | | | | — | |
| Total | | $ | 5,347,573,122 | | | $ | 109,600,000 | | | $ | — | |
115
GOLDMAN SACHS FUNDAMENTAL EQUITY GROWTH FUNDS
Notes to Financial Statements (continued)
February 28, 2014
|
| 3. INVESTMENTS AND FAIR VALUE MEASUREMENTS (continued) |
| | | | | | | | | | | | |
| | | |
| SMALL/MID CAP GROWTH | | | | | | | | | | | | |
| | | |
| Investment Type | | Level 1 | | | Level 2 | | | Level 3 | |
| Assets | | | | | | | | | | | | |
Common Stock and/or Other Equity Investments | | $ | 2,144,095,907 | | | $ | 8,330,756 | | | $ | — | |
Short-term Investments | | | — | | | | 32,900,000 | | | | — | |
| Total | | $ | 2,144,095,907 | | | $ | 41,230,756 | | | $ | — | |
| | | | | | | | | | | | |
| | | |
| STRATEGIC GROWTH | | | | | | | | | | | | |
| | | |
| Investment Type | | Level 1 | | | Level 2 | | | Level 3 | |
| Assets | | | | | | | | | | | | |
Common Stock and/or Other Equity Investments | | $ | 419,981,941 | | | $ | — | | | $ | — | |
Short-term Investments | | | — | | | | 5,200,000 | | | | — | |
| Total | | $ | 419,981,941 | | | $ | 5,200,000 | | | $ | — | |
| | | |
| TECHNOLOGY TOLLKEEPER | | | | | | | | | | | | |
| | | |
| Investment Type | | Level 1 | | | Level 2 | | | Level 3 | |
| Assets | | | | | | | | | | | | |
Common Stock and/or Other Equity Investments | | $ | 438,009,460 | | | $ | — | | | $ | — | |
Short-term Investments | | | — | | | | 13,600,000 | | | | — | |
| Total | | $ | 438,009,460 | | | $ | 13,600,000 | | | $ | — | |
| | | |
| U.S. EQUITY | | | | | | | | | | | | |
| | | |
| Investment Type | | Level 1 | | | Level 2 | | | Level 3 | |
| Assets | | | | | | | | | | | | |
Common Stock and/or Other Equity Investments | | $ | 14,369,050 | | | $ | — | | | $ | — | |
Short-term Investments | | | — | | | | 300,000 | | | | — | |
| Total | | $ | 14,369,050 | | | $ | 300,000 | | | $ | — | |
For further information regarding security characteristics, see the Schedules of Investments.
116
GOLDMAN SACHS FUNDAMENTAL EQUITY GROWTH FUNDS
|
| 4. AGREEMENTS AND AFFILIATED TRANSACTIONS |
A. Management Agreement — Under the Agreement, GSAM manages the Funds, subject to the general supervision of the Trustees.
As compensation for the services rendered pursuant to the Agreement, the assumption of the expenses related thereto and administration of the Funds’ business affairs, including providing facilities, GSAM is entitled to a management fee, accrued daily and paid monthly, equal to an annual percentage rate of each Fund’s average daily net assets.
For the six months ended February 28, 2014, contractual and effective net management fees with GSAM were at the following rates:
| | | | | | | | | | | | | | | | | | | | | | | | | | | | | | |
| | | | | Contractual Management Rate | | | Effective Net
Management
Rate | |
| Fund | | | | First
$1 billion | | | Next
$1 billion | | | Next
$3 billion | | | Next
$3 billion | | | Over
$8 billion | | | Effective
Rate | | |
Capital Growth | | | | | 1.00 | % | | | 0.90 | % | | | 0.80 | % | | | 0.80 | % | | | 0.80 | % | | | 1.00 | % | | | 0.70 | %# |
Concentrated Growth | | | | | 1.00 | | | | 0.90 | | | | 0.86 | | | | 0.84 | | | | 0.82 | | | | 1.00 | | | | 0.81 | # |
Flexible Cap Growth | | | | | 1.00 | | | | 0.90 | | | | 0.86 | | | | 0.84 | | | | 0.82 | | | | 1.00 | | | | 0.81 | # |
Focused Growth | | | | | 1.00 | | | | 0.90 | | | | 0.86 | | | | 0.84 | | | | 0.82 | | | | 1.00 | | | | 0.79 | # |
Growth Opportunities | | | | | 1.00 | | | | 1.00 | | | | 0.90 | | | | 0.86 | | | | 0.84 | | | | 0.94 | | | | 0.90 | # |
Small/Mid Cap Growth | | | | | 1.00 | | | | 1.00 | | | | 0.90 | | | | 0.86 | | | | 0.84 | | | | 1.00 | | | | 0.85 | # |
Strategic Growth | | | | | 1.00 | | | | 0.90 | | | | 0.86 | | | | 0.84 | | | | 0.82 | | | | 1.00 | | | | 0.71 | # |
Technology Tollkeeper | | | | | 1.00 | | | | 0.90 | | | | 0.86 | | | | 0.84 | | | | 0.82 | | | | 1.00 | | | | 1.00 | |
U.S. Equity | | | | | 0.70 | | | | 0.63 | | | | 0.60 | | | | 0.59 | | | | 0.58 | | | | 0.70 | | | | 0.70 | |
| # | | GSAM agreed to waive a portion of its management fee rates, set forth in the Funds’ most recent prospectuses. These waivers will be effective through at least December 29, 2014, and prior to such date GSAM may not terminate the arrangements without the approval of the Trustees. The Effective Net Management Rates above are calculated based on management rates before and after waivers had been adjusted, if applicable. |
B. Distribution and Service Plans — The Trust, on behalf of each Fund, has adopted Distribution and Service Plans (the “Plans”). Under the Plans, Goldman Sachs, which serves as distributor (the “Distributor”), is entitled to a fee accrued daily and paid monthly, for distribution services and personal and account maintenance services, which may then be paid by Goldman Sachs to authorized dealers, at the following annual rates calculated on a Fund’s average daily net assets of each respective share class:
| | | | | | | | | | | | | | | | |
| | | Distribution and Service Plan Rates | |
| | | Class A* | | | Class B | | | Class C | | | Class R* | |
Distribution Plan | | | 0.25 | % | | | 0.75 | % | | | 0.75 | % | | | 0.50 | % |
Service Plan | | | — | | | | 0.25 | | | | 0.25 | | | | — | |
| * | | With respect to Class A and Class R Shares, the Distributor at its discretion may use compensation for distribution services paid under the Distribution Plan to compensate service organizations for personal and account maintenance services and expenses as long as such total compensation does not exceed the maximum cap on “service fees” imposed by the Financial Industry Regulatory Authority. |
117
GOLDMAN SACHS FUNDAMENTAL EQUITY GROWTH FUNDS
Notes to Financial Statements (continued)
February 28, 2014
|
| 4. AGREEMENTS AND AFFILIATED TRANSACTIONS (continued) |
C. Distribution Agreement — Goldman Sachs, as Distributor of the shares of the Funds pursuant to a Distribution Agreement, may retain a portion of the Class A front end sales charge and Class B and Class C Shares’ CDSC. For the six months ended February 28, 2014, Goldman Sachs advised that it retained the following amounts:
| | | | | | | | | | | | | | |
| | | | | Front End
Sales Charge | | | Contingent Deferred
Sales Charge | |
| Fund | | | | Class A | | | Class B | | | Class C | |
Capital Growth | | | | $ | 12,949 | | | $ | — | | | $ | 333 | |
Concentrated Growth | | | | | 855 | | | | — | | | | — | |
Flexible Cap Growth | | | | | 881 | | | | N/A | | | | — | |
Focused Growth | | | | | 68 | | | | N/A | | | | — | |
Growth Opportunities | | | | | 39,288 | | | | — | | | | 284 | |
Small/Mid Cap Growth | | | | | 102,810 | | | | — | | | | 4 | |
Strategic Growth | | | | | 4,233 | | | | — | | | | — | |
Technology Tollkeeper | | | | | 8,141 | | | | — | | | | 300 | |
U.S. Equity | | | | | 148 | | | | N/A | | | | 1 | |
D. Service Plan and Shareholder Administration Plan — The Trust, on behalf of each Fund that offers Service Shares, has adopted a Service Plan and a Shareholder Administration Plan. These plans allow for service organizations to provide varying levels of personal and account maintenance and shareholder administration services to their customers who are beneficial owners of such shares. The Service Plan and Shareholder Administration Plan each provide for compensation to the service organizations which is accrued daily and paid monthly at an annual rate of 0.25% (0.50% in aggregate) of the average daily net assets of the Service Shares.
E. Transfer Agency Agreement — Goldman Sachs also serves as the transfer agent of the Funds for a fee pursuant to the Transfer Agency Agreement. The fees charged for such transfer agency services are accrued daily and paid monthly at annual rates as follows: 0.19% of the average daily net assets of Class A, Class B, Class C, Class IR and Class R Shares; and 0.04% of the average daily net assets of Institutional and Service Shares.
118
GOLDMAN SACHS FUNDAMENTAL EQUITY GROWTH FUNDS
|
| 4. AGREEMENTS AND AFFILIATED TRANSACTIONS (continued) |
F. Other Expense Agreements and Affiliated Transactions — GSAM has agreed to limit certain “Other Expenses” of the Funds (excluding transfer agent fees and expenses, service fees and shareholder administration fees (as applicable), taxes, interest, brokerage fees, shareholder meetings, litigation, indemnification and extraordinary expenses) to the extent such expenses exceed, on an annual basis, a percentage rate of the average daily net assets of each Fund. Such Other Expense reimbursements, if any, are accrued daily and paid monthly. In addition, the Funds are not obligated to reimburse GSAM for prior fiscal year expense reimbursements, if any. The Other Expense limitations as an annual percentage rate of average daily net assets for Capital Growth, Concentrated Growth, Flexible Cap Growth, Focused Growth, Growth Opportunities, Small/Mid Cap Growth, Strategic Growth, Technology Tollkeeper and U.S. Equity Funds are 0.004%, 0.014%, 0.014%, 0.014%, 0.014%, 0.064%, 0.004%, 0.064% and 0.044%, respectively. These Other Expense limitations will remain in place through at least December 29, 2014, and prior to such date GSAM may not terminate the arrangements without the approval of the Trustees. The Funds bear their respective share of costs related to proxy and shareholder meetings, and GSAM has agreed to reimburse each Fund to the extent such expenses exceed a specified percentage of the Fund’s net assets. In addition, the Funds have entered into certain offset arrangements with the custodian and the transfer agent, which may result in a reduction of the Funds’ expenses and are received irrespective of the application of the “Other Expense” limitations described above.
For the six months ended February 28, 2014, these expense reductions, including any fee waivers and Other Expense reimbursements, were as follows:
| | | | | | | | | | | | | | |
| Fund | | | | Management
Fee Waiver | | | Other
Expense
Reimbursements | | | Total
Expense
Reductions | |
Capital Growth | | | | $ | 1,344,342 | | | $ | 260,021 | | | $ | 1,604,363 | |
Concentrated Growth | | | | | 161,538 | | | | 118,564 | | | | 280,102 | |
Flexible Cap Growth | | | | | 12,516 | | | | 141,718 | | | | 154,234 | |
Focused Growth | | | | | 17,107 | | | | 131,115 | | | | 148,222 | |
Growth Opportunities | | | | | 991,780 | | | | 163,656 | | | | 1,155,436 | |
Small/Mid Cap Growth | | | | | 1,402,364 | | | | — | | | | 1,402,364 | |
Strategic Growth | | | | | 561,038 | | | | 163,585 | | | | 724,623 | |
Technology Tollkeeper | | | | | — | | | | 59,313 | | | | 59,313 | |
U.S. Equity | | | | | — | | | | 123,070 | | | | 123,070 | |
119
GOLDMAN SACHS FUNDAMENTAL EQUITY GROWTH FUNDS
Notes to Financial Statements (continued)
February 28, 2014
|
| 4. AGREEMENTS AND AFFILIATED TRANSACTIONS (continued) |
As of February 28, 2014, the amounts owed to affiliates of the Funds were as follows:
| | | | | | | | | | | | | | | | | | |
| Fund | | | | Management
Fees | | | Distribution
and Service
Fees | | | Transfer
Agent
Fees | | | Total | |
Capital Growth | | | | $ | 500,268 | | | $ | 206,190 | | | $ | 118,245 | | | $ | 824,703 | |
Concentrated Growth | | | | | 107,380 | | | | 4,572 | | | | 6,829 | | | | 118,781 | |
Flexible Cap Growth | | | | | 8,844 | | | | 1,964 | | | | 1,209 | | | | 12,017 | |
Focused Growth | | | | | 11,333 | | | | 47 | | | | 589 | | | | 11,969 | |
Growth Opportunities | | | | | 3,586,120 | | | | 408,856 | | | | 343,987 | | | | 4,338,963 | |
Small/Mid Cap Growth | | | | | 1,359,454 | | | | 316,726 | | | | 195,770 | | | | 1,871,950 | |
Strategic Growth | | | | | 225,971 | | | | 27,701 | | | | 25,361 | | | | 279,033 | |
Technology Tollkeeper | | | | | 333,664 | | | | 99,083 | | | | 51,440 | | | | 484,187 | |
U.S. Equity | | | | | 7,630 | | | | 1,058 | | | | 1,003 | | | | 9,691 | |
G. Line of Credit Facility — As of February 28, 2014, the Funds participated in a $780,000,000 committed, unsecured revolving line of credit facility (the “facility”) together with other funds of the Trust and registered investment companies having management agreements with GSAM or its affiliates (“Other Borrowers”). Pursuant to the terms of the facility, the Funds and Other Borrowers could increase the credit amount by an additional $220,000,000, for a total of up to $1,000,000,000. This facility is to be used solely for temporary or emergency purposes, which may include the funding of redemptions. The interest rate on borrowings is based on the federal funds rate. The facility also requires a fee to be paid by the Funds based on the amount of the commitment that has not been utilized. For the six months ended February 28, 2014, the Funds did not have any borrowings under the facility.
H. Other Transactions with Affiliates — For the six months ended February 28, 2014, Goldman Sachs earned $674, $3, $3,388, $12,397 and $3,564 in brokerage commissions from portfolio transactions, on behalf of the Capital Growth, Flexible Cap Growth, Growth Opportunities, Small/Mid Cap Growth and Technology Tollkeeper Funds, respectively.
An investment by a Fund representing greater than 5% of the voting securities of an issuer makes that issuer an affiliated person (as defined by the Act) of such Fund. The following table provides information about the investment by the Small/Mid Cap Growth Fund in shares of issuers of which the Fund is an affiliate for the six months ended February 28, 2014:
| | | | | | | | | | | | | | | | | | | | | | | | |
| Name of Affiliated Issuer | | Number of
Shares Held
Beginning
of Period | | | Shares
Bought | | | Shares
Sold | | | Number of
Shares Held
End of Period | | | Value at
End of Period | | | Dividend
Income | |
M/I Homes, Inc. | | | 910,679 | | | | 321,384 | | | | — | | | | 1,232,063 | | | $ | 30,678,369 | | | $ | — | |
120
GOLDMAN SACHS FUNDAMENTAL EQUITY GROWTH FUNDS
|
| 4. AGREEMENTS AND AFFILIATED TRANSACTIONS (continued) |
As of February 28, 2014, the Goldman Sachs Group, Inc. was the beneficial owner of 5% or more of outstanding Class C, Institutional, Class IR and Class R Shares of the following funds:
| | | | | | | | | | | | | | | | | | |
| Fund | | | | Class C | | | Institutional | | | Class IR | | | Class R | |
Concentrated Growth | | | | | — | % | | | — | % | | | — | % | | | 100 | % |
Flexible Cap Growth | | | | | — | | | | — | | | | 20 | | | | 34 | |
Focused Growth | | | | | 40 | | | | — | | | | 100 | | | | 100 | |
Strategic Growth | | | | | — | | | | — | | | | — | | | | 54 | |
U.S. Equity | | | | | 7 | | | | 31 | | | | 9 | | | | 18 | |
| | |
| 5. PORTFOLIO SECURITIES TRANSACTIONS | | |
The cost of purchases and proceeds from sales and maturities of long-term securities for the six months ended February 28, 2014, were as follows:
| | | | | | | | | | |
| Fund | | | | Purchases | | | Sales and Maturities | |
Capital Growth | | | | $ | 399,917,796 | | | $ | 464,693,225 | |
Concentrated Growth | | | | | 53,004,846 | | | | 60,138,362 | |
Flexible Cap Growth | | | | | 4,503,017 | | | | 3,806,013 | |
Focused Growth | | | | | 11,556,515 | | | | 7,650,353 | |
Growth Opportunities | | | | | 1,186,783,495 | | | | 1,381,348,007 | |
Small/Mid Cap Growth | | | | | 704,653,054 | | | | 433,134,571 | |
Strategic Growth | | | | | 142,174,548 | | | | 124,396,603 | |
Technology Tollkeeper | | | | | 96,708,938 | | | | 109,505,994 | |
U.S. Equity | | | | | 5,384,100 | | | | 4,562,943 | |
As of the Funds’ most recent fiscal year end, August 31, 2013, the Funds had certain timing differences on a tax basis as follows:
| | | | | | | | | | | | | | | | | | | | | | | | | | | | | | | | | | | | |
| | | Capital Growth | | | Concentrated Growth | | | Flexible
Cap
Growth | | | Focused Growth | | | Growth
Opportunities | | | Small/Mid
Cap
Growth | | | Strategic Growth | | | Technology Tollkeeper | | | U.S.
Equity | |
Timing differences
(Qualified Late Year Loss Deferrals) | | $ | — | | | $ | — | | | $ | (7,188 | ) | | $ | — | | | $ | — | | | $ | (6,610,249 | ) | | $ | — | | | $ | (5,810,063 | ) | | $ | — | |
121
GOLDMAN SACHS FUNDAMENTAL EQUITY GROWTH FUNDS
Notes to Financial Statements (continued)
February 28, 2014
|
| 6. TAX INFORMATION (continued) |
As of February 28, 2014, the Funds’ aggregate security unrealized gains and losses based on cost for U.S. federal income tax purposes were as follows:
| | | | | | | | | | | | | | | | | | | | | | | | | | | | | | | | | | | | |
| | | Capital Growth | | | Concentrated
Growth | | | Flexible
Cap
Growth | | | Focused
Growth | | | Growth
Opportunities | | | Small/Mid
Cap
Growth | | | Strategic
Growth | | | Technology
Tollkeeper | | | U.S Equity | |
Tax Cost | | $ | 663,524,573 | | | $ | 129,531,088 | | | $ | 10,404,317 | | | $ | 17,321,687 | | | $ | 3,815,471,398 | | | $ | 1,650,817,108 | | | $ | 321,215,710 | | | $ | 303,956,284 | | | $ | 11,687,562 | |
Gross unrealized gain | | | 281,419,348 | | | | 48,867,344 | | | | 4,683,716 | | | | 2,289,583 | | | | 1,691,272,969 | | | | 562,140,931 | | | | 105,947,875 | | | | 150,100,915 | | | | 3,158,349 | |
Gross unrealized loss | | | (6,494,200 | ) | | | (1,125,266 | ) | | | (152,851 | ) | | | (106,158 | ) | | | (49,571,245 | ) | | | (27,631,376 | ) | | | (1,981,644 | ) | | | (2,447,739 | ) | | | (176,861 | ) |
Net unrealized gain | | $ | 274,925,148 | | | $ | 47,742,078 | | | $ | 4,530,865 | | | $ | 2,183,425 | | | $ | 1,641,701,724 | | | $ | 534,509,555 | | | $ | 103,966,231 | | | $ | 147,653,176 | | | $ | 2,981,488 | |
The differences between GAAP-basis and tax-basis unrealized gains (losses) is attributable primarily to wash sales, differences in tax treatment of partnerships and underlying fund investments.
GSAM has reviewed the Funds’ tax positions for all open tax years (the current and prior three years, as applicable) and has concluded that no provision for income tax is required in the Funds’ financial statements. Such open tax years remain subject to examination and adjustment by tax authorities.
The Funds’ risks include, but are not limited to, the following:
Liquidity Risk — The Funds may make investments that are illiquid or that may become less liquid in response to market developments or adverse investor perceptions. Illiquid investments may be more difficult to value. Liquidity risk may also refer to the risk that a Fund will not be able to pay redemption proceeds within the allowable time period because of unusual market conditions, an unusually high volume of redemption requests, or other reasons. To meet redemption requests, a Fund may be forced to sell investments at an unfavorable time and/or under unfavorable conditions.
Market and Credit Risks — In the normal course of business, the Funds trade financial instruments and enter into financial transactions where risk of potential loss exists due to changes in the market (market risk). Additionally, the Funds may also be exposed to credit risk in the event that an issuer fails to perform or that an institution or entity with which the Funds have unsettled or open transactions defaults.
Non-Diversification Risk — Each of the Concentrated Growth and Focused Growth Funds is non-diversified, meaning that it is permitted to invest a larger percentage of its assets in fewer issuers than diversified mutual funds. Thus, each fund may be more susceptible to adverse developments affecting any single issuer held in its portfolio, and may be more susceptible to greater losses because of these developments.
122
GOLDMAN SACHS FUNDAMENTAL EQUITY GROWTH FUNDS
|
| 7. OTHER RISKS (continued) |
Portfolio Concentration Risk — The Technology Tollkeeper Fund invests primarily in equity investments in high-quality technology, media, or service companies that adopt or use technology to improve their cost structure, revenue opportunities or competitive advantage (“Technology Tollkeeper” companies). Because of its focus on technology, media and service companies, the Technology Tollkeeper Fund is subject to greater risk of loss as a result of adverse economic, business or other developments than if its investments were diversified across different industry sectors. The Technology Tollkeeper Fund may also invest in a relatively few number of issuers. Thus, the Technology Tollkeeper Fund may be more susceptible to adverse developments affecting any single issuer held in its portfolio and may be more susceptible to greater losses because of these developments.
Shareholder Concentration Risk — Certain funds, accounts, individuals or Goldman Sachs affiliates may from time to time own (beneficially or of record) or control a significant percentage of the Funds’ shares. Redemptions by these entities of their holdings in the Funds may impact the Funds’ liquidity and NAV. These redemptions may also force the Funds to sell securities.
Under the Trust’s organizational documents, its Trustees, officers, employees and agents are indemnified, to the extent permitted by the Act and state law, against certain liabilities that may arise out of performance of their duties to the Funds. Additionally, in the course of business, the Funds enter into contracts that contain a variety of indemnification clauses. The Funds’ maximum exposure under these arrangements is unknown, as this would involve future claims that may be made against the Funds that have not yet occurred. However, GSAM believes the risk of loss under these arrangements to be remote.
Subsequent events after the Statement of Assets and Liabilities date have been evaluated through the date the financial statements were issued. GSAM has concluded that there is no impact requiring adjustment or disclosure in the financial statements.
123
GOLDMAN SACHS FUNDAMENTAL EQUITY GROWTH FUNDS
Notes to Financial Statements (continued)
February 28, 2014
|
| 10. SUMMARY OF SHARE TRANSACTIONS |
Share activity is as follows:
| | | | | | | | | | | | | | | | |
| | | Capital Growth Fund | |
| | | | |
| | | For the Six Months Ended
February 28, 2014
(Unaudited) | | | For the Fiscal Year Ended
August 31, 2013 | |
| | | | |
| | | Shares | | | Dollars | | | Shares | | | Dollars | |
| | | | |
| Class A Shares | | | | | | | | | | | | | | | | |
Shares sold | | | 474,573 | | | $ | 12,843,015 | | | | 782,296 | | | $ | 20,303,620 | |
Reinvestment of distributions | | | 5,245,663 | | | | 131,666,132 | | | | 26,769 | | | | 652,349 | |
Shares converted from Class B(a) | | | 73,725 | | | | 1,981,717 | | | | 213,902 | | | | 5,575,895 | |
Shares redeemed | | | (1,884,384 | ) | | | (51,558,888 | ) | | | (5,751,236 | ) | | | (149,977,517 | ) |
| | | | 3,909,577 | | | | 94,931,976 | | | | (4,728,269 | ) | | | (123,445,653 | ) |
| Class B Shares | | | | | | | | | | | | | | | | |
Shares sold | | | 10,416 | | | | 240,951 | | | | 19,789 | | | | 449,087 | |
Reinvestment of distributions | | | 207,751 | | | | 4,371,080 | | | | — | | | | — | |
Shares converted to Class A(a) | | | (86,549 | ) | | | (1,981,717 | ) | | | (244,716 | ) | | | (5,575,895 | ) |
Shares redeemed | | | (91,701 | ) | | | (2,141,268 | ) | | | (269,032 | ) | | | (6,086,904 | ) |
| | | | 39,917 | | | | 489,046 | | | | (493,959 | ) | | | (11,213,712 | ) |
| Class C Shares | | | | | | | | | | | | | | | | |
Shares sold | | | 134,083 | | | | 2,993,020 | | | | 234,022 | | | | 5,317,790 | |
Reinvestment of distributions | | | 807,423 | | | | 16,963,982 | | | | — | | | | — | |
Shares redeemed | | | (361,369 | ) | | | (8,307,387 | ) | | | (579,587 | ) | | | (13,124,430 | ) |
| | | | 580,137 | | | | 11,649,615 | | | | (345,565 | ) | | | (7,806,640 | ) |
| Institutional Shares | | | | | | | | | | | | | | | | |
Shares sold | | | 203,493 | | | | 5,867,419 | | | | 1,811,083 | | | | 50,068,184 | |
Reinvestment of distributions | | | 953,235 | | | | 25,413,239 | | | | 14,360 | | | | 366,743 | |
Shares redeemed | | | (554,294 | ) | | | (15,580,247 | ) | | | (860,695 | ) | | | (23,300,368 | ) |
| | | | 602,434 | | | | 15,700,411 | | | | 964,748 | | | | 27,134,559 | |
| Service Shares | | | | | | | | | | | | | | | | |
Shares sold | | | 3,723 | | | | 94,906 | | | | 4,080 | | | | 103,713 | |
Reinvestment of distributions | | | 7,946 | | | | 195,070 | | | | 15 | | | | 371 | |
Shares redeemed | | | (2,049 | ) | | | (53,564 | ) | | | (13,351 | ) | | | (362,650 | ) |
| | | | 9,620 | | | | 236,412 | | | | (9,256 | ) | | | (258,566 | ) |
| Class IR Shares | | | | | | | | | | | | | | | | |
Shares sold | | | 14,033 | | | | 440,753 | | | | 37,355 | | | | 970,030 | |
Reinvestment of distributions | | | 21,811 | | | | 550,288 | | | | 410 | | | | 10,026 | |
Shares redeemed | | | (12,618 | ) | | | (333,863 | ) | | | (61,502 | ) | | | (1,622,684 | ) |
| | | | 23,226 | | | | 657,178 | | | | (23,737 | ) | | | (642,628 | ) |
| Class R Shares | | | | | | | | | | | | | | | | |
Shares sold | | | 17,068 | | | | 450,885 | | | | 46,789 | | | | 1,207,065 | |
Reinvestment of distributions | | | 22,146 | | | | 546,578 | | | | 142 | | | | 3,429 | |
Shares redeemed | | | (11,613 | ) | | | (310,314 | ) | | | (18,653 | ) | | | (485,999 | ) |
| | | | 27,601 | | | | 687,149 | | | | 28,278 | | | | 724,495 | |
NET INCREASE (DECREASE) | | | 5,192,512 | | | $ | 124,351,787 | | | | (4,607,760 | ) | | $ | (115,508,145 | ) |
| (a) | | Class B Shares convert into Class A Shares on or about the fifteenth day of the last month of the calendar quarter that is eight years after the initial purchase date of either the Fund or another Goldman Sachs Fund. |
124
GOLDMAN SACHS FUNDAMENTAL EQUITY GROWTH FUNDS
| | | | | | | | | | | | | | | | | | | | | | | | | | | | | | |
| Concentrated Growth Fund | | | Flexible Cap Growth Fund | |
For the Six Months Ended
February 28, 2014
(Unaudited) | | | For the Fiscal Year Ended
August 31, 2013 | | | For the Six Months Ended
February 28, 2014
(Unaudited) | | | For the Fiscal Year Ended
August 31, 2013 | |
| Shares | | | Dollars | | | Shares | | | Dollars | | | Shares | | | Dollars | | | Shares | | | Dollars | |
| | | | | | | | | | | | | | | | | | | | | | | | | | | | | | |
| | 51,339 | | | $ | 909,865 | | | | 142,344 | | | $ | 2,254,400 | | | | 55,560 | | | $ | 693,753 | | | | 62,646 | | | $ | 710,147 | |
| | 46,697 | | | | 806,000 | | | | 23,698 | | | | 352,580 | | | | 52,752 | | | | 620,899 | | | | 69,117 | | | | 702,914 | |
| | 540 | | | | 9,272 | | | | 1,187 | | | | 18,951 | | | | — | | | | — | | | | — | | | | — | |
| | (82,286 | ) | | | (1,476,676 | ) | | | (5,830,587 | ) | | | (93,122,296 | ) | | | (45,475 | ) | | | (559,599 | ) | | | (390,852 | ) | | | (4,364,635 | ) |
| | 16,290 | | | | 248,461 | | | | (5,663,358 | ) | | | (90,496,365 | ) | | | 62,837 | | | | 755,053 | | | | (259,089 | ) | | | (2,951,574 | ) |
| | | | | | | | | | | | | | | | | | | | | | | | | | | | | | |
| | 1,870 | | | | 30,647 | | | | 225 | | | | 3,463 | | | | — | | | | — | | | | — | | | | — | |
| | 1,156 | | | | 18,123 | | | | 9 | | | | 118 | | | | — | | | | — | | | | — | | | | — | |
| | (594 | ) | | | (9,272 | ) | | | (1,286 | ) | | | (18,951 | ) | | | — | | | | — | | | | — | | | | — | |
| | (2,439 | ) | | | (39,248 | ) | | | (7,381 | ) | | | (106,933 | ) | | | — | | | | — | | | | — | | | | — | |
| | (7 | ) | | | 250 | | | | (8,433 | ) | | | (122,303 | ) | | | — | | | | — | | | | — | | | | — | |
| | | | | | | | | | | | | | | | | | | | | | | | | | | | | | |
| | 43,812 | | | | 713,085 | | | | 25,908 | | | | 375,989 | | | | 16,428 | | | | 190,828 | | | | 31,512 | | | | 340,972 | |
| | 13,114 | | | | 205,364 | | | | 111 | | | | 1,519 | | | | 11,545 | | | | 128,615 | | | | 9,746 | | | | 95,129 | |
| | (12,587 | ) | | | (206,124 | ) | | | (70,884 | ) | | | (1,087,873 | ) | | | (10,634 | ) | | | (124,240 | ) | | | (40,167 | ) | | | (430,948 | ) |
| | 44,339 | | | | 712,325 | | | | (44,865 | ) | | | (710,365 | ) | | | 17,339 | | | | 195,203 | | | | 1,091 | | | | 5,153 | |
| | | | | | | | | | | | | | | | | | | | | | | | | | | | | | |
| | 384,542 | | | | 7,170,930 | | | | 5,858,528 | | | | 97,293,176 | | | | 95,904 | | | | 1,207,595 | | | | 201,334 | | | | 2,270,881 | |
| | 845,482 | | | | 15,142,586 | | | | 24,979 | | | | 383,410 | | | | 67,892 | | | | 824,885 | | | | 51,636 | | | | 538,564 | |
| | (778,401 | ) | | | (14,563,858 | ) | | | (1,218,537 | ) | | | (20,291,651 | ) | | | (44,615 | ) | | | (556,379 | ) | | | (137,902 | ) | | | (1,576,897 | ) |
| | 451,623 | | | | 7,749,658 | | | | 4,664,970 | | | | 77,384,935 | | | | 119,181 | | | | 1,476,101 | | | | 115,068 | | | | 1,232,548 | |
| | | | | | | | | | | | | | | | | | | | | | | | | | | | | | |
| | — | | | | — | | | | — | | | | — | | | | — | | | | — | | | | — | | | | — | |
| | — | | | | — | | | | — | | | | — | | | | — | | | | — | | | | — | | | | — | |
| | — | | | | — | | | | — | | | | — | | | | — | | | | — | | | | — | | | | — | |
| | — | | | | — | | | | — | | | | — | | | | — | | | | — | | | | — | | | | — | |
| | | | | | | | | | | | | | | | | | | | | | | | | | | | | | |
| | 2,691 | | | | 51,202 | | | | 5,032 | | | | 79,472 | | | | 768 | | | | 9,767 | | | | 2,577 | | | | 29,408 | |
| | 2,182 | | | | 37,929 | | | | 284 | | | | 4,247 | | | | 942 | | | | 11,334 | | | | 1,793 | | | | 18,561 | |
| | (2,320 | ) | | | (42,469 | ) | | | (23,920 | ) | | | (378,434 | ) | | | (8,613 | ) | | | (110,984 | ) | | | (5,875 | ) | | | (67,660 | ) |
| | 2,553 | | | | 46,662 | | | | (18,604 | ) | | | (294,715 | ) | | | (6,903 | ) | | | (89,883 | ) | | | (1,505 | ) | | | (19,691 | ) |
| | | | | | | | | | | | | | | | | | | | | | | | | | | | | | |
| | — | | | | — | | | | 5 | | | | 73 | | | | 101 | | | | 1,233 | | | | 103 | | | | 1,180 | |
| | 76 | | | | 1,284 | | | | 1 | | | | 24 | | | | 487 | | | | 5,635 | | | | 706 | | | | 7,086 | |
| | — | | | | — | | | | (5 | ) | | | (77 | ) | | | (4 | ) | | | (48 | ) | | | (2,805 | ) | | | (30,572 | ) |
| | 76 | | | | 1,284 | | | | 1 | | | | 20 | | | | 584 | | | | 6,820 | | | | (1,996 | ) | | | (22,306 | ) |
| | 514,874 | | | $ | 8,758,640 | | | | (1,070,289 | ) | | $ | (14,238,793 | ) | | | 193,038 | | | $ | 2,343,294 | | | | (146,431 | ) | | $ | (1,755,870 | ) |
125
GOLDMAN SACHS FUNDAMENTAL EQUITY GROWTH FUNDS
Notes to Financial Statements (continued)
February 28, 2014
|
| 10. SUMMARY OF SHARE TRANSACTIONS (continued) |
Share activity is as follows:
| | | | | | | | | | | | | | | | |
| | | Focused Growth Fund | |
| | | | |
| | | For the Six Months Ended
February 28, 2014
(Unaudited) | | | For the Fiscal Year Ended
August 31, 2013 | |
| | | | |
| | | Shares | | | Dollars | | | Shares | | | Dollars | |
| | | | |
| Class A Shares | | | | | | | | | | | | | | | | |
Shares sold | | | 1,367 | | | $ | 19,155 | | | | 18,047 | | | $ | 222,105 | |
Reinvestment of distributions | | | 288 | | | | 3,925 | | | | 33 | | | | 375 | |
Shares converted from Class B(a) | | | — | | | | — | | | | — | | | | — | |
Shares redeemed | | | (1,006 | ) | | | (14,366 | ) | | | (16,776 | ) | | | (212,589 | ) |
| | | | 649 | | | | 8,714 | | | | 1,304 | | | | 9,891 | |
| Class B Shares | | | | | | | | | | | | | | | | |
Shares sold | | | — | | | | — | | | | — | | | | — | |
Reinvestment of distributions | | | — | | | | — | | | | — | | | | — | |
Shares converted to Class A(a) | | | — | | | | — | | | | — | | | | — | |
Shares redeemed | | | — | | | | — | | | | — | | | | — | |
| | | | — | | | | — | | | | — | | | | — | |
| Class C Shares | | | | | | | | | | | | | | | | |
Shares sold | | | 705 | | | | 10,005 | | | | 786 | | | | 10,000 | |
Reinvestment of distributions | | | 172 | | | | 2,323 | | | | 2 | | | | 33 | |
Shares redeemed | | | — | | | | — | | | | — | | | | — | |
| | | | 877 | | | | 12,328 | | | | 788 | | | | 10,033 | |
| Institutional Shares | | | | | | | | | | | | | | | | |
Shares sold | | | 448,185 | | | | 6,300,907 | | | | 864,997 | | | | 10,494,177 | |
Reinvestment of distributions | | | 79,497 | | | | 1,089,896 | | | | 3,066 | | | | 35,077 | |
Shares redeemed | | | (158,131 | ) | | | (2,206,617 | ) | | | (181,929 | ) | | | (2,284,061 | ) |
| | | | 369,551 | | | | 5,184,186 | | | | 686,134 | | | | 8,245,193 | |
| Service Shares | | | | | | | | | | | | | | | | |
Shares sold | | | — | | | | — | | | | — | | | | — | |
Reinvestment of distributions | | | — | | | | — | | | | — | | | | — | |
Shares redeemed | | | — | | | | — | | | | — | | | | — | |
| | | | — | | | | — | | | | — | | | | — | |
| Class IR Shares | | | | | | | | | | | | | | | | |
Shares sold | | | — | | | | — | | | | — | | | | — | |
Reinvestment of distributions | | | 69 | | | | 948 | | | | 7 | | | | 75 | |
Shares redeemed | | | — | | | | — | | | | — | | | | — | |
| | | | 69 | | | | 948 | | | | 7 | | | | 75 | |
| Class R Shares | | | | | | | | | | | | | | | | |
Shares sold | | | — | | | | — | | | | — | | | | — | |
Reinvestment of distributions | | | 68 | | | | 935 | | | | 3 | | | | 33 | |
Shares redeemed | | | — | | | | — | | | | — | | | | — | |
| | | | 68 | | | | 935 | | | | 3 | | | | 33 | |
NET INCREASE | | | 371,214 | | | $ | 5,207,111 | | | | 688,236 | | | $ | 8,265,225 | |
| (a) | | Class B Shares convert into Class A Shares on or about the fifteenth day of the last month of the calendar quarter that is eight years after the initial purchase date of either the Fund or another Goldman Sachs Fund. |
126
GOLDMAN SACHS FUNDAMENTAL EQUITY GROWTH FUNDS
| | | | | | | | | | | | | | | | | | | | | | | | | | | | | | |
| Growth Opportunities Fund | | | Small/Mid Cap Growth Fund | |
For the Six Months Ended
February 28, 2014
(Unaudited) | | | For the Fiscal Year Ended
August 31, 2013 | | | For the Six Months Ended
February 28, 2014
(Unaudited) | | | For the Fiscal Year Ended
August 31, 2013 | |
| Shares | | | Dollars | | | Shares | | | Dollars | | | Shares | | | Dollars | | | Shares | | | Dollars | |
| | | | | | | | | | | | | | | | | | | | | | | | | | | | | | |
| | 4,357,720 | | | $ | 121,980,499 | | | | 12,233,224 | | | $ | 302,631,754 | | | | 9,498,411 | | | $ | 188,251,135 | | | | 17,150,018 | | | $ | 294,266,573 | |
| | 3,023,596 | | | | 81,878,972 | | | | 2,964,499 | | | | 66,165,624 | | | | 1,717,157 | | | | 33,226,981 | | | | 1,264,232 | | | | 19,013,728 | |
| | 2,702 | | | | 74,425 | | | | 21,308 | | | | 518,641 | | | | 1,886 | | | | 36,524 | | | | 7,411 | | | | 120,916 | |
| | (7,074,181 | ) | | | (198,389,148 | ) | | | (17,543,354 | ) | | | (430,721,979 | ) | | | (4,189,503 | ) | | | (82,911,631 | ) | | | (11,933,630 | ) | | | (199,903,037 | ) |
| | 309,837 | | | | 5,544,748 | | | | (2,324,323 | ) | | | (61,405,960 | ) | | | 7,027,951 | | | | 138,603,009 | | | | 6,488,031 | | | | 113,498,180 | |
| | | | | | | | | | | | | | | | | | | | | | | | | | | | | | |
| | 3,680 | | | | 87,673 | | | | 20,659 | | | | 435,900 | | | | 9,123 | | | | 165,803 | | | | 24,636 | | | | 384,779 | |
| | 32,371 | | | | 750,045 | | | | 40,326 | | | | 785,947 | | | | 10,394 | | | | 185,839 | | | | 13,116 | | | | 184,412 | |
| | (3,134 | ) | | | (74,425 | ) | | | (24,356 | ) | | | (518,641 | ) | | | (2,036 | ) | | | (36,524 | ) | | | (7,929 | ) | | | (120,916 | ) |
| | (76,761 | ) | | | (1,828,581 | ) | | | (227,035 | ) | | | (4,852,054 | ) | | | (40,894 | ) | | | (747,683 | ) | | | (93,599 | ) | | | (1,446,910 | ) |
| | (43,844 | ) | | | (1,065,288 | ) | | | (190,406 | ) | | | (4,148,848 | ) | | | (23,413 | ) | | | (432,565 | ) | | | (63,776 | ) | | | (998,635 | ) |
| | | | | | | | | | | | | | | | | | | | | | | | | | | | | | |
| | 721,347 | | | | 17,114,640 | | | | 1,405,412 | | | | 29,696,309 | | | | 2,611,081 | | | | 47,850,111 | | | | 3,537,266 | | | | 56,721,898 | |
| | 525,007 | | | | 12,022,661 | | | | 457,704 | | | | 8,824,234 | | | | 451,785 | | | | 8,073,399 | | | | 276,804 | | | | 3,887,979 | |
| | (881,883 | ) | | | (21,056,307 | ) | | | (1,909,356 | ) | | | (40,801,494 | ) | | | (636,580 | ) | | | (11,653,291 | ) | | | (1,083,784 | ) | | | (16,931,575 | ) |
| | 364,471 | | | | 8,080,994 | | | | (46,240 | ) | | | (2,280,951 | ) | | | 2,426,286 | | | | 44,270,219 | | | | 2,730,286 | | | | 43,678,302 | |
| | | | | | | | | | | | | | | | | | | | | | | | | | | | | | |
| | 13,506,465 | | | | 410,314,382 | | | | 34,727,613 | | | | 919,287,356 | | | | 10,696,153 | | | | 219,565,817 | | | | 23,251,789 | | | | 407,963,732 | |
| | 5,904,682 | | | | 174,188,106 | | | | 5,195,727 | | | | 125,061,145 | | | | 1,609,624 | | | | 32,272,964 | | | | 793,208 | | | | 12,285,172 | |
| | (14,521,871 | ) | | | (442,225,388 | ) | | | (34,564,391 | ) | | | (917,322,619 | ) | | | (4,300,904 | ) | | | (88,221,048 | ) | | | (4,622,412 | ) | | | (80,411,154 | ) |
| | 4,889,276 | | | | 142,277,100 | | | | 5,358,949 | | | | 127,025,882 | | | | 8,004,873 | | | | 163,617,733 | | | | 19,422,585 | | | | 339,837,750 | |
| | | | | | | | | | | | | | | | | | | | | | | | | | | | | | |
| | 193,822 | | | | 5,263,977 | | | | 518,500 | | | | 12,411,028 | | | | 120,329 | | | | 2,351,949 | | | | 240,416 | | | | 3,995,304 | |
| | 133,648 | | | | 3,536,321 | | | | 140,297 | | | | 3,068,305 | | | | 8,212 | | | | 156,610 | | | | 6,203 | | | | 92,110 | |
| | (535,202 | ) | | | (14,567,416 | ) | | | (875,381 | ) | | | (21,050,652 | ) | | | (194,268 | ) | | | (3,807,814 | ) | | | (225,941 | ) | | | (3,737,411 | ) |
| | (207,732 | ) | | | (5,767,118 | ) | | | (216,584 | ) | | | (5,571,319 | ) | | | (65,727 | ) | | | (1,299,255 | ) | | | 20,678 | | | | 350,003 | |
| | | | | | | | | | | | | | | | | | | | | | | | | | | | | | |
| | 1,663,787 | | | | 47,449,188 | | | | 1,539,363 | | | | 38,563,477 | | | | 2,822,024 | | | | 56,947,832 | | | | 3,131,544 | | | | 53,476,928 | |
| | 324,816 | | | | 8,961,670 | | | | 241,799 | | | | 5,476,736 | | | | 311,646 | | | | 6,136,306 | | | | 153,792 | | | | 2,345,328 | |
| | (665,669 | ) | | | (19,013,615 | ) | | | (1,549,017 | ) | | | (40,081,976 | ) | | | (851,679 | ) | | | (17,233,138 | ) | | | (1,333,056 | ) | | | (22,260,249 | ) |
| | 1,322,934 | | | | 37,397,243 | | | | 232,145 | | | | 3,958,237 | | | | 2,281,991 | | | | 45,851,000 | | | | 1,952,280 | | | | 33,562,007 | |
| | | | | | | | | | | | | | | | | | | | | | | | | | | | | | |
| | 441,470 | | | | 12,155,307 | | | | 968,929 | | | | 23,646,249 | | | | 319,695 | | | | 6,257,913 | | | | 458,086 | | | | 7,578,430 | |
| | 214,811 | | | | 5,716,115 | | | | 170,855 | | | | 3,762,069 | | | | 71,370 | | | | 1,358,167 | | | | 63,446 | | | | 941,534 | |
| | (483,834 | ) | | | (13,347,667 | ) | | | (716,411 | ) | | | (17,514,530 | ) | | | (176,678 | ) | | | (3,453,255 | ) | | | (439,434 | ) | | | (7,227,749 | ) |
| | 172,447 | | | | 4,523,755 | | | | 423,373 | | | | 9,893,788 | | | | 214,387 | | | | 4,162,825 | | | | 82,098 | | | | 1,292,215 | |
| | 6,807,389 | | | $ | 190,991,434 | | | | 3,236,914 | | | $ | 67,470,829 | | | | 19,866,348 | | | $ | 394,772,966 | | | | 30,632,182 | | | $ | 531,219,822 | |
127
GOLDMAN SACHS FUNDAMENTAL EQUITY GROWTH FUNDS
Notes to Financial Statements (continued)
February 28, 2014
|
| 10. SUMMARY OF SHARE TRANSACTIONS (continued) |
Share activity is as follows:
| | | | | | | | | | | | | | | | |
| | | Strategic Growth Fund | |
| | | | |
| | | For the Six Months Ended
February 28, 2014
(Unaudited) | | | For the Fiscal Year Ended
August 31, 2013 | |
| | | | |
| | | Shares | | | Dollars | | | Shares | | | Dollars | |
| | | | |
| Class A Shares | | | | | | | | | | | | | | | | |
Shares sold | | | 593,870 | | | $ | 7,574,543 | | | | 1,239,874 | | | $ | 14,385,523 | |
Reinvestment of distributions | | | 1,036,245 | | | | 12,414,216 | | | | 1,197,404 | | | | 12,752,339 | |
Shares converted from Class B(a) | | | 619 | | | | 7,592 | | | | 4,049 | | | | 47,035 | |
Shares redeemed | | | (948,160 | ) | | | (12,062,392 | ) | | | (10,957,113 | ) | | | (126,479,116 | ) |
| | | | 682,574 | | | | 7,933,959 | | | | (8,515,786 | ) | | | (99,294,219 | ) |
| Class B Shares | | | | | | | | | | | | | | | | |
Shares sold | | | 7,840 | | | | 85,032 | | | | 5,019 | | | | 51,369 | |
Reinvestment of distributions | | | 12,307 | | | | 130,328 | | | | 9,625 | | | | 92,882 | |
Shares converted to Class A(a) | | | (696 | ) | | | (7,592 | ) | | | (4,478 | ) | | | (47,035 | ) |
Shares redeemed | | | (29,639 | ) | | | (323,920 | ) | | | (58,620 | ) | | | (616,716 | ) |
| | | | (10,188 | ) | | | (116,152 | ) | | | (48,454 | ) | | | (519,500 | ) |
| Class C Shares | | | | | | | | | | | | | | | | |
Shares sold | | | 119,826 | | | | 1,308,356 | | | | 206,430 | | | | 2,125,543 | |
Reinvestment of distributions | | | 100,742 | | | | 1,068,877 | | | | 51,981 | | | | 502,138 | |
Shares redeemed | | | (48,596 | ) | | | (533,487 | ) | | | (203,912 | ) | | | (2,177,359 | ) |
| | | | 171,972 | | | | 1,843,746 | | | | 54,499 | | | | 450,322 | |
| Institutional Shares | | | | | | | | | | | | | | | | |
Shares sold | | | 3,786,868 | | | | 49,664,350 | | | | 8,900,827 | | | | 107,141,001 | |
Reinvestment of distributions | | | 2,915,104 | | | | 36,467,953 | | | | 1,427,641 | | | | 15,775,437 | |
Shares redeemed | | | (2,048,171 | ) | | | (26,862,332 | ) | | | (12,705,100 | ) | | | (152,927,521 | ) |
| | | | 4,653,801 | | | | 59,269,971 | | | | (2,376,632 | ) | | | (30,011,083 | ) |
| Service Shares | | | | | | | | | | | | | | | | |
Shares sold | | | 543 | | | | 6,640 | | | | 9,067 | | | | 101,589 | |
Reinvestment of distributions | | | 888 | | | | 10,619 | | | | 495 | | | | 5,271 | |
Shares redeemed | | | (215 | ) | | | (2,699 | ) | | | (7,368 | ) | | | (85,195 | ) |
| | | | 1,216 | | | | 14,560 | | | | 2,194 | | | | 21,665 | |
| Class IR Shares | | | | | | | | | | | | | | | | |
Shares sold | | | 19,628 | | | | 255,885 | | | | 42,909 | | | | 516,009 | |
Reinvestment of distributions | | | 9,877 | | | | 123,652 | | | | 2,447 | | | | 27,085 | |
Shares redeemed | | | (17,165 | ) | | | (233,975 | ) | | | (3,065 | ) | | | (37,792 | ) |
| | | | 12,340 | | | | 145,562 | | | | 42,291 | | | | 505,302 | |
| Class R Shares | | | | | | | | | | | | | | | | |
Shares sold | | | 280 | | | | 3,623 | | | | 78 | | | | 947 | |
Reinvestment of distributions | | | 97 | | | | 1,150 | | | | 31 | | | | 331 | |
Shares redeemed | | | — | | | | — | | | | (7 | ) | | | (77 | ) |
| | | | 377 | | | | 4,773 | | | | 102 | | | | 1,201 | |
NET INCREASE (DECREASE) | | | 5,512,092 | | | $ | 69,096,419 | | | | (10,841,786 | ) | | $ | (128,846,312 | ) |
| (a) | | Class B Shares convert into Class A Shares on or about the fifteenth day of the last month of the calendar quarter that is eight years after the initial purchase date of either the Fund or another Goldman Sachs Fund. |
128
GOLDMAN SACHS FUNDAMENTAL EQUITY GROWTH FUNDS
| | | | | | | | | | | | | | | | | | | | | | | | | | | | | | |
| Technology Tollkeeper Fund | | | U.S. Equity Fund | |
For the Six Months Ended
February 28, 2014
(Unaudited) | | | For the Fiscal Year Ended
August 31, 2013 | | | For the Six Months Ended
February 28, 2014
(Unaudited) | | | For the Fiscal Year Ended
August 31, 2013 | |
| Shares | | | Dollars | | | Shares | | | Dollars | | | Shares | | | Dollars | | | Shares | | | Dollars | |
| | | | | | | | | | | | | | | | | | | | | | | | | | | | | | |
| | 1,669,045 | | | $ | 28,373,668 | | | | 3,330,212 | | | $ | 47,276,729 | | | | 91,187 | | | $ | 1,437,842 | | | | 81,129 | | | $ | 1,130,629 | |
| | 185,420 | | | | 3,133,600 | | | | — | | | | — | | | | 23,914 | | | | 356,084 | | | | 1,660 | | | | 20,678 | |
| | 29,380 | | | | 471,939 | | | | 61,708 | | | | 875,582 | | | | — | | | | — | | | | — | | | | — | |
| | (2,206,876 | ) | | | (37,272,194 | ) | | | (5,945,671 | ) | | | (84,620,365 | ) | | | (14,794 | ) | | | (227,129 | ) | | | (159,626 | ) | | | (2,156,641 | ) |
| | (323,031 | ) | | | (5,292,987 | ) | | | (2,553,751 | ) | | | (36,468,054 | ) | | | 100,307 | | | | 1,566,797 | | | | (76,837 | ) | | | (1,005,334 | ) |
| | | | | | | | | | | | | | | | | | | | | | | | | | | | | | |
| | 2,348 | | | | 35,604 | | | | 15,936 | | | | 196,123 | | | | — | | | | — | | | | — | | | | — | |
| | 5,077 | | | | 76,914 | | | | — | | | | — | | | | — | | | | — | | | | — | | | | — | |
| | (32,700 | ) | | | (471,939 | ) | | | (68,269 | ) | | | (875,582 | ) | | | — | | | | — | | | | — | | | | — | |
| | (69,618 | ) | | | (1,083,426 | ) | | | (170,534 | ) | | | (2,181,855 | ) | | | — | | | | — | | | | — | | | | — | |
| | (94,893 | ) | | | (1,442,847 | ) | | | (222,867 | ) | | | (2,861,314 | ) | | | — | | | | — | | | | — | | | | — | |
| | | | | | | | | | | | | | | | | | | | | | | | | | | | | | |
| | 220,444 | | | | 3,382,220 | | | | 467,402 | | | | 5,940,736 | | | | 6,088 | | | | 92,866 | | | | 2,333 | | | | 31,696 | |
| | 44,283 | | | | 670,880 | | | | — | | | | — | | | | 997 | | | | 14,635 | | | | — | | | | — | |
| | (336,888 | ) | | | (5,049,114 | ) | | | (897,831 | ) | | | (11,406,789 | ) | | | (198 | ) | | | (3,001 | ) | | | (6,705 | ) | | | (89,789 | ) |
| | (72,161 | ) | | | (996,014 | ) | | | (430,429 | ) | | | (5,466,053 | ) | | | 6,887 | | | | 104,500 | | | | (4,372 | ) | | | (58,093 | ) |
| | | | | | | | | | | | | | | | | | | | | | | | | | | | | | |
| | 1,086,832 | | | | 19,311,122 | | | | 2,471,966 | | | | 37,461,563 | | | | 44,798 | | | | 699,572 | | | | 73,713 | | | | 997,650 | |
| | 53,912 | | | | 965,022 | | | | — | | | | — | | | | 45,793 | | | | 683,691 | | | | 4,954 | | | | 61,836 | |
| | (631,358 | ) | | | (11,180,325 | ) | | | (1,525,248 | ) | | | (22,983,417 | ) | | | (62,728 | ) | | | (950,715 | ) | | | (74,640 | ) | | | (984,023 | ) |
| | 509,386 | | | | 9,095,819 | | | | 946,718 | | | | 14,478,146 | | | | 27,863 | | | | 432,548 | | | | 4,027 | | | | 75,463 | |
| | | | | | | | | | | | | | | | | | | | | | | | | | | | | | |
| | 191,074 | | | | 3,218,275 | | | | 261,208 | | | | 3,647,817 | | | | — | | | | — | | | | — | | | | — | |
| | 9,274 | | | | 155,067 | | | | — | | | | — | | | | — | | | | — | | | | — | | | | — | |
| | (252,071 | ) | | | (4,276,712 | ) | | | (399,276 | ) | | | (5,608,576 | ) | | | — | | | | — | | | | — | | | | — | |
| | (51,723 | ) | | | (903,370 | ) | | | (138,068 | ) | | | (1,960,759 | ) | | | — | | | | — | | | | — | | | | — | |
| | | | | | | | | | | | | | | | | | | | | | | | | | | | | | |
| | 74,369 | | | | 1,294,821 | | | | 94,442 | | | | 1,402,956 | | | | — | | | | — | | | | 8,128 | | | | 104,750 | |
| | 3,007 | | | | 53,596 | | | | — | | | | — | | | | 1,143 | | | | 17,049 | | | | 100 | | | | 1,243 | |
| | (12,455 | ) | | | (224,717 | ) | | | (108,526 | ) | | | (1,590,117 | ) | | | (4 | ) | | | (58 | ) | | | (2,182 | ) | | | (27,120 | ) |
| | 64,921 | | | | 1,123,700 | | | | (14,084 | ) | | | (187,161 | ) | | | 1,139 | | | | 16,991 | | | | 6,046 | | | | 78,873 | |
| | | | | | | | | | | | | | | | | | | | | | | | | | | | | | |
| | — | | | | — | | | | — | | | | — | | | | 2,042 | | | | 32,023 | | | | 2,465 | | | | 32,227 | |
| | — | | | | — | | | | — | | | | — | | | | 516 | | | | 7,691 | | | | 5 | | | | 60 | |
| | — | | | | — | | | | — | | | | — | | | | (2 | ) | | | (31 | ) | | | (2 | ) | | | (22 | ) |
| | — | | | | — | | | | — | | | | — | | | | 2,556 | | | | 39,683 | | | | 2,468 | | | | 32,265 | |
| | 32,499 | | | $ | 1,584,301 | | | | (2,412,481 | ) | | $ | (32,465,195 | ) | | | 138,752 | | | $ | 2,160,519 | | | | (68,668 | ) | | $ | (876,826 | ) |
129
GOLDMAN SACHS FUNDAMENTAL EQUITY GROWTH FUNDS
Voting Results of Special Meeting of Shareholders (Unaudited)
A Special Meeting (the “Meeting”) of the Goldman Sachs Trust (“GST”) was held on October 15, 2013 to consider and act upon the proposal below:
At the Meeting, Donald C. Burke, Joseph P. LoRusso, Herbert J. Markley, James A. McNamara, and Roy W. Templin were elected to the Trust’s Board of Trustees. In electing trustees, the Trust’s shareholders voted as follows:
| | | | | | | | | | | | | | | | |
Election of Trustees | | For | | | Against | | | Withheld | | | Broker Non-Votes | |
Donald C. Burke | | | 53,388,642,395.715 | | | | 0 | | | | 1,150,861,851.704 | | | | 0 | |
Joseph P. LoRusso | | | 53,405,131,628.159 | | | | 0 | | | | 1,134,372,619.260 | | | | 0 | |
Herbert J. Markley | | | 53,435,916,168.391 | | | | 0 | | | | 1,103,588,079.028 | | | | 0 | |
James A. McNamara | | | 53,432,564,581.647 | | | | 0 | | | | 1,106,939,665.772 | | | | 0 | |
Roy W. Templin | | | 53,435,142,748.551 | | | | 0 | | | | 1,104,361,498.868 | | | | 0 | |
| | | | | | | | | | | | | | | | |
In addition to the individuals named above, Ashok N. Bakhru, John P. Coblentz, Jr., Diana M. Daniels, Jessica Palmer, Richard P. Strubel and Alan A. Shuch continue to serve on the Trust’s Board of Trustees.
130
GOLDMAN SACHS FUNDAMENTAL EQUITY GROWTH FUNDS
Fund Expenses — Six Month Period Ended February 28, 2014 (Unaudited)
As a shareholder of Class A, Class B, Class C, Institutional, Service, Class IR or Class R Shares of a Fund, you incur two types of costs: (1) transaction costs, including sales charges on purchase payments (with respect to Class A Shares), contingent deferred sales charges on redemptions (with respect to Class B and Class C Shares), and (2) ongoing costs, including management fees; distribution and service (12b-1) fees (with respect to Class A, Class B, Class C and Class R Shares); and other Fund expenses. This Example is intended to help you understand your ongoing costs (in dollars) of investing in Class A, Class B, Class C, Institutional, Service, Class IR or Class R Shares of the Funds and to compare these costs with the ongoing costs of investing in other mutual funds.
The Example is based on an investment of $1,000 invested at the beginning of the period and held for the entire period from September 1, 2013 through February 28, 2014.
Actual Expenses — The first line under each share class in the table below provides information about actual account values and actual expenses. You may use the information in this line, together with the amount you invested, to estimate the expenses that you paid over the period. Simply divide your account value by $1,000 (for example, an $8,600 account value divided by $1,000=8.6), then multiply the result by the number in the first line under the heading entitled “Expenses Paid” to estimate the expenses you paid on your account during this period.
Hypothetical Example for Comparison Purposes — The second line under each share class in the table below provides information about hypothetical account values and hypothetical expenses based on the Funds’ actual net expense ratios and an assumed rate of return of 5% per year before expenses, which is not the Funds’ actual return. The hypothetical account values and expenses may not be used to estimate the actual ending account balance or expenses you paid for the period. You may use this information to compare the ongoing costs of investing in the Funds and other funds. To do so, compare this 5% hypothetical example with the 5% hypothetical examples that appear in the shareholder reports of the other funds.
Please note that the expenses shown in the table are meant to highlight your ongoing costs only and do not reflect any transactional costs, such as sales charges, redemption fees, or exchange fees. Therefore, the second line of the table is useful in comparing ongoing costs only, and will not help you determine the relative total costs of owning different funds. In addition, if these transactional costs were included, your costs would have been higher.
| | | | | | | | | | | | | | | | | | | | | | | | | | | | | | | | | | | | | | | | | | | | | | | | | | | | | | | | | | | | |
| | | Capital Growth Fund | | | Concentrated Growth Fund | | | Flexible Cap Growth Fund | | | Focused Growth Fund | | | Growth Opportunities Fund | |
| Share Class | | Beginning
Account
Value
9/1/13 | | | Ending
Account
Value
2/28/14 | | | Expenses
Paid
for the
6 months
ended
2/28/14* | | | Beginning
Account
Value
9/1/13 | | | Ending
Account
Value
2/28/14 | | | Expenses
Paid
for the
6 months
ended
2/28/14* | | | Beginning
Account
Value
9/1/13 | | | Ending
Account
Value
2/28/14 | | | Expenses
Paid
for the
6 months
ended
2/28/14* | | | Beginning
Account
Value
9/1/13 | | | Ending
Account
Value
2/28/14 | | | Expenses
Paid
for the
6 months
ended
2/28/14* | | | Beginning
Account
Value
9/1/13 | | | Ending
Account
Value
2/28/14 | | | Expenses
Paid
for the
6 months
ended
2/28/14* | |
| Class A | | | | | | | | | | | | | | | | | | | | | | | | | | | | | | | | | | | | | | | | | | | | | | | | | | | | | | | | | | | | |
Actual | | $ | 1,000.00 | | | $ | 1,181.00 | | | $ | 6.27 | | | $ | 1,000.00 | | | $ | 1,171.10 | | | $ | 6.84 | | | $ | 1,000.00 | | | $ | 1,186.60 | | | $ | 6.94 | �� | | $ | 1,000.00 | | | $ | 1,175.60 | | | $ | 6.80 | | | $ | 1,000.00 | | | $ | 1,172.50 | | | $ | 7.33 | |
Hypothetical 5% return | | | 1,000.00 | | | | 1,019.04 | + | | | 5.81 | | | | 1,000.00 | | | | 1,018.50 | + | | | 6.36 | | | | 1,000.00 | | | | 1,018.45 | + | | | 6.41 | | | | 1,000.00 | | | | 1,018.55 | + | | | 6.31 | | | | 1,000.00 | | | | 1,018.05 | + | | | 6.80 | |
| Class B | | | | | | | | | | | | | | | | | | | | | | | | | | | | | | | | | | | | | | | | | | | | | | | | | | | | | | | | | | | | |
Actual | | | 1,000.00 | | | | 1,176.40 | | | | 10.31 | | | | 1,000.00 | | | | 1,167.40 | | | | 10.86 | | | | N/A | | | | N/A | | | | N/A | | | | N/A | | | | N/A | | | | N/A | | | | 1,000.00 | | | | 1,167.80 | | | | 11.34 | |
Hypothetical 5% return | | | 1,000.00 | | | | 1,015.32 | + | | | 9.54 | | | | 1,000.00 | | | | 1,014.78 | + | | | 10.09 | | | | N/A | | | | N/A | | | | N/A | | | | N/A | | | | N/A | | | | N/A | | | | 1,000.00 | | | | 1,014.33 | + | | | 10.54 | |
| Class C | | | | | | | | | | | | | | | | | | | | | | | | | | | | | | | | | | | | | | | | | | | | | | | | | | | | | | | | | | | | |
Actual | | | 1,000.00 | | | | 1,176.70 | | | | 10.31 | | | | 1,000.00 | | | | 1,167.00 | | | | 10.85 | | | | 1,000.00 | | | | 1,181.90 | | | | 10.98 | | | | 1,000.00 | | | | 1,171.40 | | | | 10.82 | | | | 1,000.00 | | | | 1,167.90 | | | | 11.34 | |
Hypothetical 5% return | | | 1,000.00 | | | | 1,015.32 | + | | | 9.54 | | | | 1,000.00 | | | | 1,014.78 | + | | | 10.09 | | | | 1,000.00 | | | | 1,014.73 | + | | | 10.14 | | | | 1,000.00 | | | | 1,014.83 | + | | | 10.04 | | | | 1,000.00 | | | | 1,014.33 | + | | | 10.54 | |
| Institutional | | | | | | | | | | | | | | | | | | | | | | | | | | | | | | | | | | | | | | | | | | | | | | | | | | | | | | | | | | | | |
Actual | | | 1,000.00 | | | | 1,183.40 | | | | 4.11 | | | | 1,000.00 | | | | 1,174.30 | | | | 4.69 | | | | 1,000.00 | | | | 1,189.40 | | | | 4.78 | | | | 1,000.00 | | | | 1,178.10 | | | | 4.64 | | | | 1,000.00 | | | | 1,174.50 | | | | 5.18 | |
Hypothetical 5% return | | | 1,000.00 | | | | 1,021.03 | + | | | 3.81 | | | | 1,000.00 | | | | 1,020.48 | + | | | 4.36 | | | | 1,000.00 | | | | 1020.43 | + | | | 4.41 | | | | 1,000.00 | | | | 1,020.53 | + | | | 4.31 | | | | 1,000.00 | | | | 1,020.03 | + | | | 4.81 | |
| Service | | | | | | | | | | | | | | | | | | | | | | | | | | | | | | | | | | | | | | | | | | | | | | | | | | | | | | | | | | | | |
Actual | | | 1,000.00 | | | | 1,180.60 | | | | 6.81 | | | | N/A | | | | N/A | | | | N/A | | | | N/A | | | | N/A | | | | N/A | | | | N/A | | | | N/A | | | | N/A | | | | 1,000.00 | | | | 1,171.60 | | | | 7.86 | |
Hypothetical 5% return | | | 1,000.00 | | | | 1,018.55 | + | | | 6.31 | | | | N/A | | | | N/A | | | | N/A | | | | N/A | | | | N/A | | | | N/A | | | | N/A | | | | N/A | | | | N/A | | | | 1,000.00 | | | | 1,017.56 | + | | | 7.30 | |
| Class IR | | | | | | | | | | | | | | | | | | | | | | | | | | | | | | | | | | | | | | | | | | | | | | | | | | | | | | | | | | | | |
Actual | | | 1,000.00 | | | | 1,182.60 | | | | 4.92 | | | | 1,000.00 | | | | 1,173.30 | | | | 5.50 | | | | 1,000.00 | | | | 1,188.20 | | | | 5.59 | | | | 1,000.00 | | | | 1,177.20 | | | | 5.40 | | | | 1,000.00 | | | | 1,173.80 | | | | 5.98 | |
Hypothetical 5% return | | | 1,000.00 | | | | 1,020.28 | + | | | 4.56 | | | | 1,000.00 | | | | 1,019.74 | + | | | 5.11 | | | | 1,000.00 | | | | 1,019.69 | + | | | 5.16 | | | | 1,000.00 | | | | 1,019.84 | + | | | 5.01 | | | | 1,000.00 | | | | 1,019.29 | + | | | 5.56 | |
| Class R | | | | | | | | | | | | | | | | | | | | | | | | | | | | | | | | | | | | | | | | | | | | | | | | | | | | | | | | | | | | |
Actual | | | 1,000.00 | | | | 1,179.30 | | | | 7.62 | | | | 1,000.00 | | | | 1,170.20 | | | | 8.13 | | | | 1,000.00 | | | | 1,185.80 | | | | 8.24 | | | | 1,000.00 | | | | 1,174.00 | | | | 8.14 | | | | 1,000.00 | | | | 1,170.50 | | | | 8.66 | |
Hypothetical 5% return | | | 1,000.00 | | | | 1,017.80 | + | | | 7.05 | | | | 1,000.00 | | | | 1,017.31 | + | | | 7.55 | | | | 1,000.00 | | | | 1,017.26 | + | | | 7.60 | | | | 1,000.00 | | | | 1,017.31 | + | | | 7.55 | | | | 1,000.00 | | | | 1,016.81 | + | | | 8.05 | |
131
GOLDMAN SACHS FUNDAMENTAL EQUITY GROWTH FUNDS
Fund Expenses — Six Month Period Ended February 28, 2014 (Unaudited) (continued)
| | | | | | | | | | | | | | | | | | | | | | | | | | | | | | | | | | | | | | | | | | | | | | | | |
| | | Small/Mid Cap Growth Fund | | | Strategic Growth Fund | | | Technology Tollkeeper Fund | | | U.S. Equity Fund | |
| Share Class | | Beginning
Account
Value
9/1/13 | | | Ending
Account
Value
2/28/14 | | | Expenses
Paid for the
6 months ended
2/28/14* | | | Beginning
Account
Value
9/1/13 | | | Ending
Account
Value
2/28/14 | | | Expenses
Paid for the
6 months ended
2/28/14* | | | Beginning
Account
Value
9/1/13 | | | Ending
Account
Value
2/28/14 | | | Expenses
Paid for the
6 months ended
2/28/14* | | | Beginning
Account
Value
9/1/13 | | | Ending
Account
Value
2/28/14 | | | Expenses
Paid for the
6 months ended
2/28/14* | |
| Class A | | | | | | | | | | | | | | | | | | | | | | | | | | | | | | | | | | | | | | | | | | | | | | | | |
Actual | | $ | 1,000.00 | | | $ | 1,168.40 | | | $ | 7.10 | | | $ | 1,000.00 | | | $ | 1,188.60 | | | $ | 6.29 | | | $ | 1,000.00 | | | $ | 1,228.10 | | | $ | 8.34 | | | $ | 1,000.00 | | | $ | 1,152.70 | | | $ | 6.41 | |
Hypothetical 5% return | | | 1,000.00 | | | | 1,018.25 | + | | | 6.61 | | | | 1,000.00 | | | | 1,019.04 | + | | | 5.81 | | | | 1,000.00 | | | | 1,017.31 | + | | | 7.55 | | | | 1,000.00 | | | | 1,018.84 | + | | | 6.01 | |
| Class B | | | | | | | | | | | | | | | | | | | | | | | | | | | | | | | | | | | | | | | | | | | | | | | | |
Actual | | | 1,000.00 | | | | 1,164.30 | | | | 11.11 | | | | 1,000.00 | | | | 1,184.70 | | | | 10.35 | | | | 1,000.00 | | | | 1,223.40 | | | | 12.46 | | | | N/A | | | | N/A | | | | N/A | |
Hypothetical 5% return | | | 1,000.00 | | | | 1,014.53 | + | | | 10.34 | | | | 1,000.00 | | | | 1,015.32 | + | | | 9.54 | | | | 1,000.00 | | | | 1,013.59 | + | | | 11.28 | | | | N/A | | | | N/A | | | | N/A | |
| Class C | | | | | | | | | | | | | | | | | | | | | | | | | | | | | | | | | | | | | | | | | | | | | | | | |
Actual | | | 1,000.00 | | | | 1,164.40 | | | | 11.11 | | | | 1,000.00 | | | | 1,183.30 | | | | 10.34 | | | | 1,000.00 | | | | 1,223.40 | | | | 12.46 | | | | 1,000.00 | | | | 1,147.90 | | | | 10.38 | |
Hypothetical 5% return | | | 1,000.00 | | | | 1,014.53 | + | | | 10.34 | | | | 1,000.00 | | | | 1,015.32 | + | | | 9.54 | | | | 1,000.00 | | | | 1,013.59 | + | | | 11.28 | | | | 1,000.00 | | | | 1,015.13 | + | | | 9.74 | |
| Institutional | | | | | | | | | | | | | | | | | | | | | | | | | | | | | | | | | | | | | | | | | | | | | | | | |
Actual | | | 1,000.00 | | | | 1,170.80 | | | | 4.95 | | | | 1,000.00 | | | | 1,191.40 | | | | 4.13 | | | | 1,000.00 | | | | 1,230.60 | | | | 6.19 | | | | 1,000.00 | | | | 1,154.80 | | | | 4.27 | |
Hypothetical 5% return | | | 1,000.00 | | | | 1,020.23 | + | | | 4.61 | | | | 1,000.00 | | | | 1,021.03 | + | | | 3.81 | | | | 1,000.00 | | | | 1,019.24 | + | | | 5.61 | | | | 1,000.00 | | | | 1,020.83 | + | | | 4.01 | |
| Service | | | | | | | | | | | | | | | | | | | | | | | | | | | | | | | | | | | | | | | | | | | | | | | | |
Actual | | | 1,000.00 | | | | 1,167.40 | | | | 7.63 | | | | 1,000.00 | | | | 1,187.50 | | | | 6.83 | | | | 1,000.00 | | | | 1,227.90 | | | | 8.89 | | | | N/A | | | | N/A | | | | N/A | |
Hypothetical 5% return | | | 1,000.00 | | | | 1,017.75 | + | | | 7.10 | | | | 1,000.00 | | | | 1,018.55 | + | | | 6.31 | | | | 1,000.00 | | | | 1,016.81 | + | | | 8.05 | | | | N/A | | | | N/A | | | | N/A | |
| Class IR | | | | | | | | | | | | | | | | | | | | | | | | | | | | | | | | | | | | | | | | | | | | | | | | |
Actual | | | 1,000.00 | | | | 1,170.00 | | | | 5.76 | | | | 1,000.00 | | | | 1,189.40 | | | | 4.94 | | | | 1,000.00 | | | | 1,229.10 | | | | 7.02 | | | | 1,000.00 | | | | 1,154.20 | | | | 5.07 | |
Hypothetical 5% return | | | 1,000.00 | | | | 1,019.49 | + | | | 5.36 | | | | 1,000.00 | | | | 1,020.28 | + | | | 4.56 | | | | 1,000.00 | | | | 1,018.50 | + | | | 6.36 | | | | 1,000.00 | | | | 1,020.08 | + | | | 4.76 | |
| Class R | | | | | | | | | | | | | | | | | | | | | | | | | | | | | | | | | | | | | | | | | | | | | | | | |
Actual | | | 1,000.00 | | | | 1,167.10 | | | | 8.44 | | | | 1,000.00 | | | | 1,186.70 | | | | 7.37 | | | | N/A | | | | N/A | | | | N/A | | | | 1,000.00 | | | | 1,150.60 | | | | 7.73 | |
Hypothetical 5% return | | | 1,000.00 | | | | 1,017.01 | + | | | 7.85 | | | | 1,000.00 | | | | 1,018.05 | + | | | 6.80 | | | | N/A | | | | N/A | | | | N/A | | | | 1,000.00 | | | | 1,017.60 | + | | | 7.25 | |
| * | | Expenses for each share class are calculated using each Fund’s annualized net expense ratio for each class, which represents the ongoing expenses as a percentage of net assets for the six months ended February 28, 2014. Expenses are calculated by multiplying the annualized net expense ratio by the average account value for the period; then multiplying the result by the number of days in the most recent fiscal half year; and then dividing that result by the number of days in the fiscal year. The annualized net expense ratios for the period were as follows: |
| | | | | | | | | | | | | | | | | | | | | | | | | | | | |
| Fund | | Class A | | | Class B | | | Class C | | | Institutional | | | Service | | | Class IR | | | Class R | |
Capital Growth | | | 1.16 | % | | | 1.91 | % | | | 1.91 | % | | | 0.76 | % | | | 1.26 | % | | | 0.91 | % | | | 1.41 | % |
Concentrated Growth | | | 1.27 | | | | 2.02 | | | | 2.02 | | | | 0.87 | | | | N/A | | | | 1.02 | | | | 1.51 | |
Flexible Cap Growth | | | 1.28 | | | | N/A | | | | 2.03 | | | | 0.88 | | | | N/A | | | | 1.03 | | | | 1.52 | |
Focused Growth | | | 1.26 | | | | N/A | | | | 2.01 | | | | 0.86 | | | | N/A | | | | 1.00 | | | | 1.51 | |
Growth Opportunities | | | 1.36 | | | | 2.11 | | | | 2.11 | | | | 0.96 | | | | 1.46 | | | | 1.11 | | | | 1.61 | |
Small/Mid Cap Growth | | | 1.32 | | | | 2.07 | | | | 2.07 | | | | 0.92 | | | | 1.42 | | | | 1.07 | | | | 1.57 | |
Strategic Growth | | | 1.16 | | | | 1.91 | | | | 1.91 | | | | 0.76 | | | | 1.26 | | | | 0.91 | | | | 1.36 | |
Technology Tollkeeper | | | 1.51 | | | | 2.26 | | | | 2.26 | | | | 1.12 | | | | 1.61 | | | | 1.27 | | | | N/A | |
U.S. Equity | | | 1.20 | | | | N/A | | | | 1.95 | | | | 0.80 | | | | N/A | | | | 0.95 | | | | 1.45 | |
| + | | Hypothetical expenses are based on each Fund’s actual annualized net expense ratios and an assumed rate of return of 5% per year before expenses. |
132
FUNDS PROFILE
Goldman Sachs Funds

Goldman Sachs is a premier financial services firm, known since 1869 for creating thoughtful and customized investment solutions in complex global markets.
Today, the Investment Management Division of Goldman Sachs serves a diverse set of clients worldwide, including private institutions, public entities and individuals. With approximately $807.6 billion in assets under management as of December 31, 2013, Goldman Sachs Asset Management (“GSAM”) has portfolio management teams located around the world and our investment professionals bring firsthand knowledge of local markets to every investment decision. GSAM’s assets under management includes assets managed by Goldman Sachs Asset Management, L.P. and its Investment Advisory Affiliates.
|
| OVERVIEW OF GOLDMAN SACHS FUNDS |

Money Market1
Financial Square FundsSM
| n | | Financial Square Tax-Exempt Funds |
| n | | Financial Square Federal Fund |
| n | | Financial Square Government Fund |
| n | | Financial Square Money Market Fund |
| n | | Financial Square Prime Obligations Fund |
| n | | Financial Square Treasury Instruments Fund |
| n | | Financial Square Treasury Obligations Fund |
Fixed Income
Short Duration and Government
| n | | High Quality Floating Rate Fund |
| n | | Limited Maturity Obligations Fund |
| n | | Short Duration Government Fund |
| n | | Short Duration Income Fund |
| n | | Inflation Protected Securities Fund |
Multi-Sector
| n | | Core Plus Fixed Income Fund |
Municipal and Tax-Free
| n | | High Yield Municipal Fund |
| n | | Short Duration Tax-Free Fund |
Single Sector
| n | | Investment Grade Credit Fund |
| n | | High Yield Floating Rate Fund |
| n | | Emerging Markets Debt Fund |
| n | | Local Emerging Markets Debt Fund |
| n | | Dynamic Emerging Markets Debt Fund |
Corporate Credit
| n | | Long Short Credit Strategies Fund2 |
Fundamental Equity
| n | | Small Mid Cap Value Fund |
| n | | Small/Mid Cap Growth Fund |
| n | | Flexible Cap Growth Fund |
| n | | Concentrated Growth Fund |
| n | | Technology Tollkeeper Fund |
| n | | Growth Opportunities Fund |
| n | | Rising Dividend Growth Fund |
Structured Equity
| n | | Structured Tax-Managed Equity Fund |
| n | | Structured International Tax-Managed Equity Fund |
| n | | U.S. Equity Dividend and Premium Fund |
| n | | International Equity Dividend and Premium Fund |
Equity Insights3
| n | | Small Cap Equity Insights Fund |
| n | | U.S. Equity Insights Fund |
| n | | Small Cap Growth Insights Fund |
| n | | Large Cap Growth Insights Fund |
| n | | Large Cap Value Insights Fund |
| n | | Small Cap Value Insights Fund |
| n | | International Small Cap Insights Fund |
| n | | International Equity Insights Fund |
| n | | Emerging Markets Equity Insights Fund |
Fundamental Equity
International
| n | | Strategic International Equity Fund |
| n | | Focused International Equity Fund4 |
| n | | International Small Cap Fund |
| n | | Emerging Markets Equity Fund |
| n | | BRIC Fund (Brazil, Russia, India, China) |
Select Satellite5
| n | | Real Estate Securities Fund |
| n | | International Real Estate Securities Fund |
| n | | Commodity Strategy Fund |
| n | | Dynamic Allocation Fund |
| n | | Absolute Return Tracker Fund |
| n | | Managed Futures Strategy Fund |
| n | | MLP Energy Infrastructure Fund |
| n | | Multi-Manager Alternatives Fund |
| n | | Multi-Asset Real Return Fund |
| n | | Retirement Portfolio Completion Fund |
| n | | Fixed Income Macro Strategies Fund |
Total Portfolio Solutions5
| n | | Balanced Strategy Portfolio |
| n | | Growth and Income Strategy Portfolio |
| n | | Growth Strategy Portfolio |
| n | | Equity Growth Strategy Portfolio |
| n | | Income Strategies Portfolio |
| n | | Satellite Strategies Portfolio |
| n | | Enhanced Dividend Global Equity Portfolio |
| n | | Tax Advantaged Global Equity Portfolio |
| 1 | | An investment in a money market fund is neither insured nor guaranteed by the Federal Deposit Insurance Corporation (“FDIC”) or any other government agency. Although the Funds seek to preserve the value of your investment at $1.00 per share, it is possible to lose money by investing in the Funds. |
| 2 | | Effective at the close of business March 21, 2014, the Credit Strategies Fund was reorganized with and into the Long Short Credit Strategies Fund. |
| 3 | | Effective at the close of business May 3, 2013, the Goldman Sachs Structured Large Cap Growth, Structured Large Cap Value, Structured Small Cap Equity, Structured Small Cap Growth, Structured Small Cap Value, Structured U.S. Equity, Structured Emerging Markets Equity, Structured International Equity and Structured International Small Cap Funds were renamed the Goldman Sachs Large Cap Growth Insights, Large Cap Value Insights, Small Cap Equity Insights, Small Cap Growth Insights, Small Cap Value Insights, U.S. Equity Insights, Emerging Markets Equity Insights, International Equity Insights and International Small Cap Insights Funds, respectively. |
| 4 | | Effective at the close of business February 28, 2014, the Goldman Sachs Concentrated International Equity Fund was renamed the Goldman Sachs Focused International Equity Fund. |
| 5 | | Individual Funds within the Total Portfolio Solutions and Select Satellite categories will have various placement on the risk/return spectrum and may have greater or lesser risk than that indicated by the placement of the general Total Portfolio Solutions or Select Satellite category. |
Financial Square FundsSM is a registered service mark of Goldman, Sachs & Co.
| *This | | list covers open-end funds only. Please visit our website at www.GSAMFUNDS.com to learn about our closed-end funds. |
| | |
TRUSTEES Ashok N. Bakhru, Chairman Donald C. Burke John P. Coblentz, Jr. Diana M. Daniels Joseph P. LoRusso Herbert J. Markley James A. McNamara Jessica Palmer Alan A. Shuch Richard P. Strubel Roy W. Templin | | OFFICERS James A. McNamara, President Scott M. McHugh, Principal Financial Officer and Treasurer Caroline L. Kraus, Secretary |
| |
GOLDMAN, SACHS & CO. Distributor and Transfer Agent | | GOLDMAN SACHS ASSET MANAGEMENT, L.P. Investment Adviser |
Visit our Web site at www.GSAMFUNDS.com to obtain the most recent month-end returns.
Goldman Sachs Asset Management, L.P. 200 West Street, New York, New York 10282
The reports concerning the Funds included in this shareholder report may contain certain forward-looking statements about the factors that may affect the performance of the Funds in the future. These statements are based on Fund management’s predictions and expectations concerning certain future events and their expected impact on the Funds, such as performance of the economy as a whole and of specific industry sectors, changes in the levels of interest rates, the impact of developing world events, and other factors that may influence the future performance of the Funds. Management believes these forward-looking statements to be reasonable, although they are inherently uncertain and difficult to predict. Actual events may cause adjustments in portfolio management strategies from those currently expected to be employed.
A description of the policies and procedures that the Funds use to determine how to vote proxies relating to portfolio securities and information regarding how a Fund voted proxies relating to portfolio securities during the most recent 12-month period ended June 30 is available (I) without charge, upon request by calling 1-800-526-7384 (for Retail Shareholders) or 1-800-621-2550 (for Institutional Shareholders); and (II) on the Securities and Exchange Commission (“SEC”) Web site at http://www.sec.gov.
The Funds file their complete schedule of portfolio holdings with the SEC for the first and third quarters of each fiscal year on Form N-Q. The Funds’ Forms N-Q are available on the SEC’s Web site at http://www.sec.gov within 60 days after the Funds’ first and third fiscal quarters. The Funds’ Forms N-Q may be reviewed and copied at the SEC’s Public Reference Room in Washington, D.C. and information on the operation of the Public Reference Room may also be obtained by calling 1-800-SEC-0330. Form N-Q may be obtained upon request and without charge by calling 1-800-526-7384 (for Retail Shareholders) or 1-800-621-2550 (for Institutional Shareholders).
The website links provided are for your convenience only and are not an endorsement or recommendation by GSAM of any of these websites or the products or services offered. GSAM is not responsible for the accuracy and validity of the content of these websites.
The Global Industry Classification Standard (GICS) was developed by and is the exclusive property and a service mark of Morgan Stanley Capital International Inc. (MSCI) and Standard & Poor’s, a division of The McGraw-Hill Companies, Inc. (S&P) and is licensed for use by Goldman Sachs. Neither MSCI, S&P nor any other party involved in making or compiling the GICS or any GICS classifications makes any express or implied warranties or representations with respect to such standard or classification (or the results to be obtained by the use thereof), and all such parties hereby expressly disclaim all warranties of originality, accuracy, completeness, merchantability or fitness for a particular purpose with respect to any of such standard or classification. Without limiting any of the foregoing, in no event shall MSCI, S&P, any of their affiliates or any third party involved in making or compiling the GICS or any GICS classifications have any liability for any direct, indirect, special, punitive, consequential or any other damages (including lost profits) even if notified of the possibility of such damages.
Holdings and allocations shown are as of February 28, 2014 and may not be representative of future investments. Fund holdings should not be relied on in making investment decisions and should not be construed as research or investment advice regarding particular securities. Current and future holdings are subject to risk.
Economic and market forecasts presented herein reflect our judgment as of the date of this presentation and are subject to change without notice. These forecasts do not take into account the specific investment objectives, restrictions, tax and financial situation or other needs of any specific client. Actual data will vary and may not be reflected here. These forecasts are subject to high levels of uncertainty that may affect actual performance. Accordingly, these forecasts should be viewed as merely representative of a broad range of possible outcomes. These forecasts are estimated, based on assumptions, and are subject to significant revision and may change materially as economic and market conditions change. Goldman Sachs has no obligation to provide updates or changes to these forecasts. Case studies and examples are for illustrative purposes only.
This material is not authorized for distribution to prospective investors unless preceded or accompanied by a current Prospectus or summary prospectus, if applicable. Investors should consider a Fund’s objective, risks, and charges and expenses, and read the summary prospectus, if available, and/or the Prospectus carefully before investing or sending money. The summary prospectus, if available, and the Prospectus contain this and other information about a Fund and may be obtained from your authorized dealer or from Goldman, Sachs & Co. by calling (retail – 1-800-526-7384) (institutional – 1-800-621-2550).
© 2014 Goldman Sachs. All rights reserved. 126471.MF.MED.TMPL/4/2014 EQGRWSAR14/197K
The information required by this Item is only required in an annual report on this Form N-CSR.
| ITEM 3. | AUDIT COMMITTEE FINANCIAL EXPERT. |
The information required by this Item is only required in an annual report on this Form N-CSR.
| ITEM 4. | PRINCIPAL ACCOUNTANT FEES AND SERVICES. |
The information required by this Item is only required in an annual report on this Form N-CSR.
| ITEM 5. | AUDIT COMMITTEE OF LISTED REGISTRANTS. |
| ITEM 6. | SCHEDULE OF INVESTMENTS. |
| | Schedule of Investments is included as part of the Report to Stockholders filed under Item 1. |
| ITEM 7. | DISCLOSURE OF PROXY VOTING POLICIES AND PROCEDURES FOR CLOSED-END MANAGEMENT INVESTMENT COMPANIES. |
| ITEM 8. | PORTFOLIO MANAGERS OF CLOSED-END MANAGEMENT INVESTMENT COMPANIES. |
| ITEM 9. | PURCHASES OF EQUITY SECURITIES BY CLOSED-END MANAGEMENT INVESTMENT COMPANY AND AFFILIATED PURCHASERS. |
| ITEM 10. | SUBMISSION OF MATTERS TO A VOTE OF SECURITY HOLDERS. |
| | There have been no material changes to the procedures by which shareholders may recommend nominees to the registrant’s board of trustees. |
| ITEM 11. | CONTROLS AND PROCEDURES. |
| | (a) | The registrant’s principal executive and principal financial officers, or persons performing similar functions have concluded that the registrant’s disclosure controls and procedures (as defined in Rule 30a-3(c) under the Investment Company Act of 1940, as amended (the “1940 Act”)) are effective as of a date within 90 days of the filing of this report that includes the disclosure required by this paragraph, based on the evaluation of these controls and procedures required by Rule 30a-3(b) under the 1940 Act and 15d-15(b) under the Securities Exchange Act of 1934, as amended. |
| | (b) | There were no changes in the registrant’s internal control over financial reporting (as defined in Rule 30a-3(d) under the 1940 Act) that occurred during the registrant’s second fiscal quarter of the period covered by this report that have materially affected, or are reasonably likely to materially affect, the registrant’s internal control over financial reporting. |
| | | | |
(a)(1) | | The information required by this Item is only required in an annual report on this Form N-CSR. |
| | |
| (a)(2) | | Exhibit 99.CERT | | Certifications pursuant to Section 302 of the Sarbanes-Oxley Act of 2002 filed herewith. |
| | |
| (b) | | Exhibit 99.906CERT | | Certifications pursuant to Section 906 of the Sarbanes-Oxley Act of 2002 filed herewith. |
SIGNATURES
Pursuant to the requirements of the Securities Exchange Act of 1934 and the Investment Company Act of 1940, the registrant has duly caused this report to be signed on its behalf by the undersigned, thereunto duly authorized.
| | |
| | | Goldman Sachs Trust |
| |
| By: | | /s/ James A. McNamara |
| |
| | |
| | James A. McNamara |
| | President/Principal Executive Officer |
| | Goldman Sachs Trust |
| |
| Date: | | May 7, 2014 |
Pursuant to the requirements of the Securities Exchange Act of 1934 and the Investment Company Act of 1940, this report has been signed below by the following persons on behalf of the registrant and in the capacities and on the dates indicated.
| | |
| By: | | /s/ James A. McNamara |
| |
| | |
| | James A. McNamara |
| | President/Principal Executive Officer |
| | Goldman Sachs Trust |
| |
| Date: | | May 7, 2014 |
| |
| By: | | /s/ Scott McHugh |
| |
| | |
| | Scott McHugh |
| | Principal Financial Officer |
| | Goldman Sachs Trust |
| |
| Date: | | May 7, 2014 |